proceedings - International Nuclear Information System (INIS)
256
PROCEEDINGS SECOND NATIONAL CHEMICAL ENGINEERING CONFERENCE HE PROCESS INDUSTRIES IN AUSTRALIA JULY 10, 11 AND 12, 1974 ILUKA HOTEL, SURFERS PARADISE, QUEENSLAND. THE INSTITUTIO ENGINEERS
-
Upload
khangminh22 -
Category
Documents
-
view
1 -
download
0
Transcript of proceedings - International Nuclear Information System (INIS)

P R O C E E D I N G S
SECOND NATIONAL CHEMICAL ENGINEERING CONFERENCE
HE PROCESS INDUSTRIES IN AUSTRALIA
JULY 10, 11 AND 12, 1974
ILUKA HOTEL,
SURFERS PARADISE,
QUEENSLAND.
THE INSTITUTIO ENGINEERS

CONFERENCE ORGANIZATION
EDITOR OF PROCEEDINGS: R.G. RICE
ORGANIZING COMMITTEE
G.L. BAKER (CHAIRMAN)L.S. LEUNG (SECRETARY)
P.C. BROOKS R.F. CANEPJ. HETHERINGTON L .S .HERBERTJ. MCINERNEY D.J. NICKLIND.N. PERKINS R Q P.SCEE.T. WHITE
PAPERS COMMITTEE
R.G. RICE (CO-CHAIRMAN)E.T. WHITE (CO-CHAIRMAN)
CHARLES L.S.LEUNG B.M. WOODS
ORGANISER
INSTITUTION OF CHEMICAL ENGINEERS,QUEENSLAND GROUP,C/- DEPARTMENT OF CHEMICAL ENGINEERING,UNIVERSITY OF QUEENSLAND,ST. LUCIA. QUEENSLAND. 4067.
COSPONSORS
THE ROYAL AUSTRALIAN CHEMICAL INSTITUTETHE INSTITUTION OF ENGINEERS, AUSTRALIAAUSTRALIAN INSTITUTE OF FOOD SCIENCE AND TECHNOLOGYTHE INSTITUTE OF FUEL - AUSTRALIAN MEMBERSHIPINSTITUTION OF INSTRUMENTATION AND CONTROL, AUSTRALIA

TABLE OF CONTENTS
SESSION 1 - PLANNING, DEVELOPMENT, MANAGEMENT OF PROCESS
PAGE
ENGINEERING PLANNING AND ENVIRONMENTAL MANAGEMENTK.P. Stark, D.J. Close and A.B. Pomeroy 5. 15
INTEGRATED PROJECT CONTROL - E.D. Plomley 16- 25
INFORMATION SYSTEMS IN THE DEVELOPMENT AND MANAGEMENT OFPROCESSES - V. Davies 26- .,1
NEW CONCEPTS IN RESEARCH MANAGEMENT IN THE PROCESS INDUSTRIESW.P. Macmillan 32- 37
AMDEPHOS - A CHEMICAL PROCESS FOR DEHOSPHORISATION OF IRON OREJ.E.A. Gooden, I/V.M. Walker and R.J. Allen 38- 49
A NEW PROCESS FOR THE PRODUCTION OF SYNTHETIC BATTERY GRADE
MANGANESE DIOXIDE -P.H. Scaife, D.A.J. Swnkels, R.K.C. Ward and J.E. Lewis 50- 59
COMMISSIONING CHEMICAL PROCESS PLANT - E. Schepers 6 0 - 6 9
SESSION 2 - PROCESS OPERATIONS
TOTAL ACCIDENT CONTROL -A. Nuberg 70- 78
STATIC ELECTRICITY GENERATION BY FLOWING HYDROCARBON LIQUIDSJ.A. Agnew 79- 87
DEVELOPMENT OF COATED ROTARY LIME AS A SUBSTITUTE FOR FLUORSPAR IN
BASIC STEELMAKING PROCESSES - C.W.P. Finn, C.J. Cripps Clark and M.J. McCarthy 88- 98
CADMIUM VOLATILISATION FROM PHOSPHATE ROCK -W.M. Walker and J. R. Tuff ley 99-108
AN INEXPENSIVE WAY OF INCREASING SEPARATION EFFICIENCY AND
CAPACITY OF PACKED COLUMNS -P.O. Brooks, B.E.T. Mutton, L.S. Leung and
D.J. Nicklin 109-114
THERMAL DESIGN OF BLISTER COPPER CASTING WHEEL - R.S. Dutton 115-125
SECONDARY COOLING FOR INDUSTRIAL COOLING SYSTEMS - I.D. Crealy 126-134
TREATMENT OF SLURRY WASTE BY CENTRIFUGES -E.G. Skinner 135-146
SESSION 3 - SELECTED TOPICS
VISTAS OF CHEMICAL RESEARCH - 0. Levenspiel (notpublished)
TECHNOLOGY PLUS SCARCITY EQUALS SUFFICIENCY? -D.J. Nicklin and S.P. Moodie 147-154
CONTROL IN 2001 - D.N. Sutherland, R.J, Batterham and J.A. Frew 155-160
LARGE SCALE NITROGEN FIXATION BY MICROBIAL MEANS -P.I/I/. Street and C.J. D. Fell ..161-170
THE CHEMICAL ENGINEERING LITERATURE - QUO VADIS? - M.H.I. Baird 171-179
PROSPECTS AND PROBLEMS IN MINING PROCESSING -A PERSONAL VIEW -A.J. Lynch 180-186
CHEMICAL ENGINEERING IN THE YEAR 2000 - 0. Potter (notpublished)
SESSION 4- AUTOMATION IN THE PROCESS INDUSTRIES
IMPROVED PROCESS PERFORMANCE VIA ADVANCED COMPUTER CONTROLTECHNIQUES -D.G. Fisher, D.E. Seborg and Fl.B. Newell 187-197
COMPUTER CONTROL OF SUGAR PAN CRYSTALLIZERS - RJ. Batterham, J.A. Frew
andP.G. Wright 198-207
PAGE
OPTIMAL CONTROL APPLIED TO BATCH CRYSTALLISATION OF SUGAR
N.W. Reesand P.S. Flitch 208-218
COMPUTER CONTROL ON A SUGAR MILL CRUSHING TRAIN - R.A. Allaway 219-233
COMPUTER CONTROL OF A STOCK FEED PROCESSING PLANT - R.L. Muller 234-240
PREDICTION OF THE BEHAVIOUR OF PACKED ADSORBENT BEDS - D.J. Close 241-253
SESSION 5 - SOLIDS HANDLING
THE PRODUCTION OF SINTERABLE URANIUM DIOXIDE IN A PULSEDFLUIDISED BED REACTOR -A.G. Fane, A.H. LePage, andP.G. Alfredson 254-263
REDUCTION OF WIND-BLOWING OF STOCKPILES OF GRANULAR MATERIALS
A.K. Johnston 264-271
MODERN ASPECTS OF THE THEORIES AND EXPERIENCE RELATED TO THEPROPERTIES OF BULK SOLIDS - D.F. Bagster 272-281
VELOCITY PROFILES IN PNEUMATIC TRANSPORT - G. 7. Wilkinson 282-293
OPTIMUM CHUTE PROFILES IN GRAVITY FLOW OF GRANULAR MATERIALSA.W. Roberts, C. Chiarella and W. Charleton 294 303
MEASUREMENTS OF POWDER STRENGTH AT ELEVATED TEMPERATURES BYA NEW METHOD - E.G. Potter and S.G Szirmai 304-314
SESSION 6 - FUEL AND ENERGY SYSTEMS
THE PRODUCTION OF LIQUID FUELS FROM COAL IN QUEENSLAND -D.J. Nick/in 315-320
RESEARCH INTO THE UTILIZATION OF VICTORIAN COAL FOR POWERGENERATION - L.J. Gamer 321-330
THE USE OF SOLAR ENERGY IN PROCESS INDUSTRIES -CM Sapsford 331-340
COAL COMBUSTION FOR POWER GENERATION - I.W. Smith 341-349
IN-SITU - GASIFICATION OF THICK SEAMS FOR POWER AND SYNTHESIS GAS/. Mc.C. Stewart 350-359
FACTORS AFFECTING PARTICLE SIZE IN FLUIDISED CARBONISATION OF COALD. Barrett and A. Basoeki 360-370
THE DESIGN AND CALIBRATION OF SUCTION PYROMETERS - G.D. Sergent andJ. Zingarelli 371-380
SESSION 7 - INDUSTRY AND THE ENVIRONMENT
MATHEMATICAL MODELLING OF ESTUARINE POLLUTION - i.A. Furzer,R M. Pitblado, R.G.H. Prince and T. Wood 381-390
FLUIDISED-BED COMBUSTION AS A SOLUTION TO THE ENVIRONMENTAL PROBLEMSOF COAL MINING WASTE - G. a Donau Szpindler, P.L. Waters and C.C. Young 391-403
REDUCTION OF PARTICULARE EMISSIONS TO AIR BY AN IMPROVED ASSESSMENT
OF ELECTROS!ATlCPRfcClPlTATORS-C.AaPau/son am/E.G. Potter 404-411
THERMAL DEWATERING OF ORGANIC MATERIALS - D.G. Evans, S.R. Siemon andW.R.B. Martin 412-420
ENVIRONMENTAL ASPECTS OF URANIUM EXTRACTION - J.A. Lackey 421-430
POLLUTION ABATEMENT FROM THE FACTORY MANAGER'S VIEWPOINT-4.0. Gay (not published)
PAGE
SESSION 8 ~ NEW TRENDS IN FOOD PROCESSING
THE PRODUCTION OF PROTEIN FROM WHOLE BLOOD - B.W. Wilson 431-438
SEPARATION OF MIXTURES ON THE BASIS OF MELTING POINTS -J.D. Esdaile,
R. Close and B.W. Wilson 439-448
RHEOLOGY AND ITS IMPORTANT IN FOOD PROCESSING - D.V. Boger, C. Tin 449 460
REVERSE OSMOSIS AND ULTRA FILTRATION FOR FOOD PROCESSING -B.H. Smith 461-467
AEROBIC BIOLOGICAL TREATMENT OF ANAEROB1CALLY DIGESTED WHEYG.J. Sewards, and G.A. Holder 468-480
THE AUSTRALIAN REVERSING SPIN FLAME STERILIZER -D.J. Casimir 481-491
INVESTIGATION INTO THE EXTRACTION AND DRYING OF PECTIN AND THE DRYING
OF CITRUS PEELS - F. Molynex 492-503

- 5 -
National Chemical Engineering Conference 197 U
PROCESS INDUSTRIES IN AUSTRALIA - IMPACT AND GROWTH
Surfers Paradise, Queensland
July 10 to 12th,
ENGINEERING PLANNING AND ENVIRONMENTAL MANAGEMENT
K.P. Stark, B.E., B.Econ., Ph.D., M.I.E.Aust.D.J. Close, B.E., M.Eng.Sc., Ph.D., M.I.E.Aust.A.B. Pomeroy, B.Sc.
S U M M A R Y
The concept of environmental management is complex and involves theintertwining of social, political, economic, technological and ecologicalforces with .the aim of protecting the environment. In the world of today,it is no longer reasonable for an engineer to isolate the technologicalimplications of his design from these environmental considerations whichhave become critical components of engineering planning and operations.
A simple model study indicative of the more complex problems imposedby advances in technology, yet illustrative of the extent of interactionbetween chemical engineering expansion, natural resources and theenvironment, is presented. This example envisages expanding technologicaldevelopment around a tropical river estuary which receives effluents fromindustrial plants and agricultural areas. At some stage in this developmentthe ecology of the estuary changes sufficiently to endanger the life cycleof a particular organism (Balanus) , which is affected by the decreasingquality of the marine environment.
The model, which presents basic hydrodynamic, energy transfer andbiological relations in an interactive computational environments is usedto test the effects of various operating policies on the organismpopulation.
Stark, Professor of Systems Engineering,Close, Senior Lecturer, Engineering,Pomeroy, Tutor, Engineering,
James Cook University of North Queensland.

- 6 -
Subscripts^
a Refers to adults
Refers to larvae
Due to oxygen deficiency
Refers to cypris
Due to salt deficiency
Due to excessive temperature
Due to predators and fooddeficiency
NOMENCLATURE
A Number of adults
C Concentration of animals m 3
Dp Larval diffusivity m?day 1
k Death rate day 1
L Number of larvae
R Number of cypris
x Coordinate in RiverFlow Direction m
0 Time
1. INTRODUCTION
Industrial expansion and population growth are always accompanied by someadjustment to the environment. At some stage in this process seemingly trivialchanges in growth can trigger unanticipated and destructive consequences whichcan have long term impact on the environmental system. Environmental managementimplies a complex systems approach which involves the intertwining of social,political, economic, technological and ecological forces with the aim ofprotecting the environment.
Unfortunately the system involved is so complex that it is not possible tocompletely analyse the simultaneous detailed behaviour of every system component.Nevertheless, it is no longer reasonable for an engineer to isolate thetechnological implications of his design from the environmental and ecologicalconsiderations which today have become critical components of engineeringplanning and operations.
It is necessary therefore to integrate the traditional engineering approachwith ecology and other appropriate disciplines so that a methodology can bedeveloped for assessing and predicting the environmental impact of technologicalchanges.
A model which simulates the system behaviour under a variety of environmentalpolicies is an essential tool for the decision-makers who are responsible forthe management of the system.
A simple model study indicative of the more complex problems imposed byadvances in technology, yet illustrative of the extent of interaction betweenchemical engineering expansion, natural resources and the environment, ispresented in this paper. This example envisages expanding technologicaldevelopment around a tropical river estuary which receives effluents fromindustrial plants and agricultural areas. At some stage in this developmentthe ecology of the estuary changes sufficiently to endanger the life cycleof a particular organism (Balanus), which is affected by the decreasing qualityof the marine environment.
2. THE MODEL ENVIRONMENT
The system under study is illustrated schematically in Figure 1 and ismodelled by using both a modular and hierarchical structure. The modular approachis applied to each of the seven major sub-systems. These sub-system models areused as overlays in the master program which is arranged as in Figure 2, Thehierarchical structure is used by the executive control program which directsthe sequence of overlay operations and arranges the transfer of informationfrom one sub-system overlay to another. The model is designed to be operatedin an 'on-line1 interactive mode so that the user is given considerableflexibility in arranging the overlay sequences.
Farmlands
IndustrialEffluent
Industry
IndustrialEffluent Salinity )
Temperature)Oxygen )
Figure 1. Schematic illustration of System Components
The major sub-system models are a) The River Transport Modelb) The Technology Modelc) The Atmospheric-Energy Modeld) The Oceanic Energy Modele) The Water Quality Modelf) The Ecology Modelg) The Population Model.
The river transport model is concerned with the aspects of the hydrology, thehydraulics and the hydrodynamics of the river flow. The river runoff is determinedby the hydrologic cycle for the system. The hydraulic characteristics evaluatethe stream depth as it runs along the length of the river and the hydrodynamicstudy supplies velocities, dispersion and diffusion coefficients.
The technology model supplies the pollution and effluent loads which areimposed on the system by development in its catchment area.
The atmospheric energy and oceanic energy models supply the details oftemperature, rainfall, tide, waves, winds and radiation that the model mayrequire.
Va^er quality model uses the necessary information from overlays ofthe other models to calculate the quality of water in each reach of the river interms of the level of oxygen, the salinity, the temperature and the biologicaloxygen demand.
The ecology model will eventually model the impact of system changes on alllevels of fauna and flora in the benthic and euphotic zones. At this stage onlyone population viz. Balanus Is modelled as it is necessary to develop thetechnique before attempting to expand the complexity of the model-system.
The population model uses information from each of the other sub-systemmodels to determine the birth-rate and death-rate coefficients that areappropriate for each reach of the river at each step. In this way the completepopulation growth patterns of all stages of growth are continually calculated.
Details of each of the sub-system models, except the population model, havebeen described elsewhere : . It is pertinent here to define the population modelin more detail because it will illuminate the approach that must be undertakenin comprehensive environmental system studies.

- 8 -
3. THE POPULATION SEGMENT
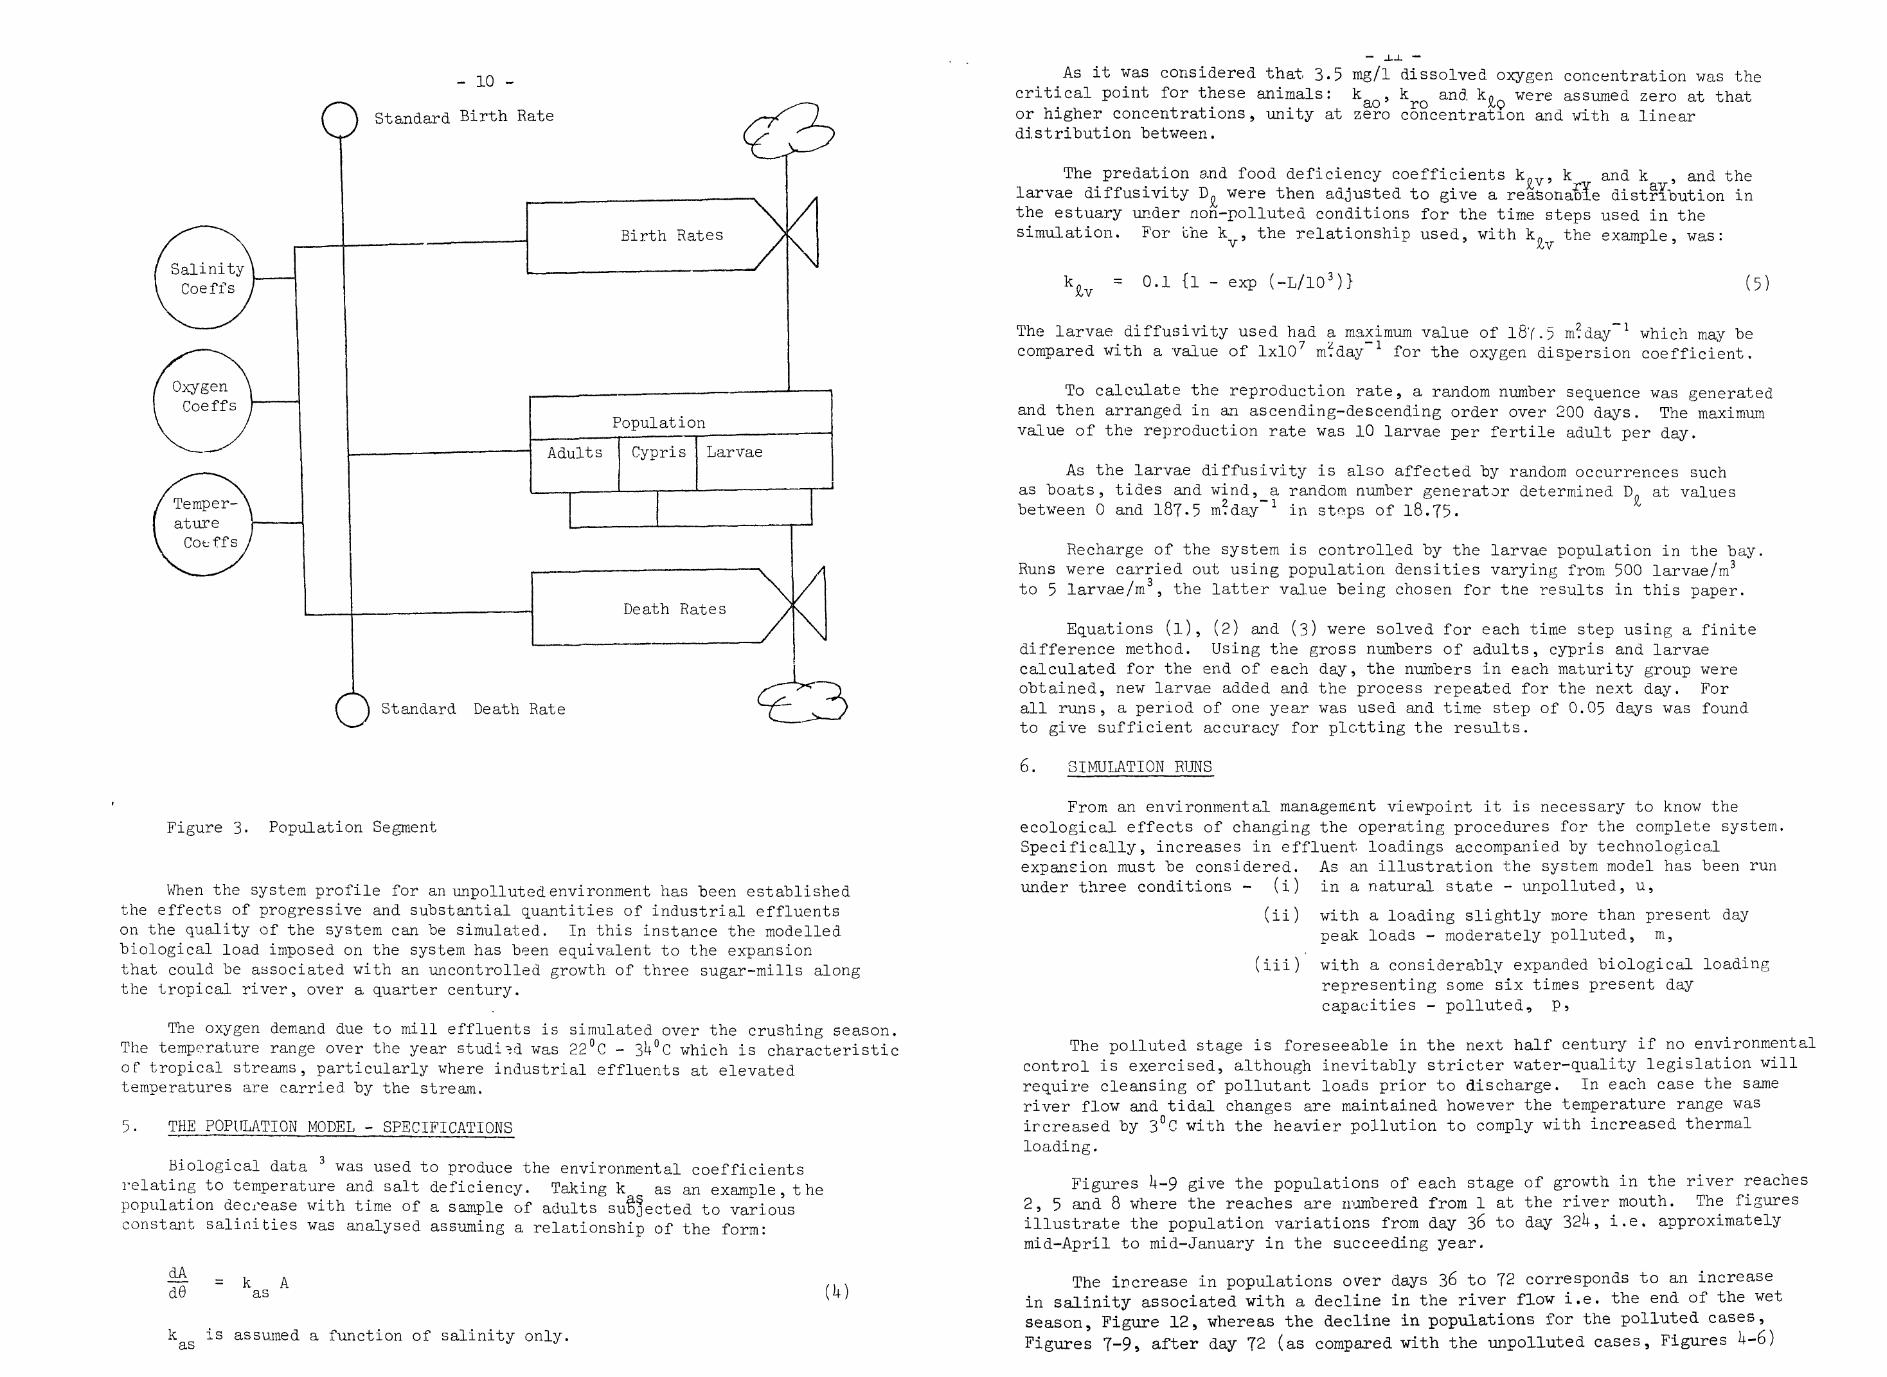
Figure 3 shows the principal determinants of population levels with theirappropriate positive and negative growth rates for each stage of growth usingthe systems dynamics approach of Forrester
The life cycle of the barnacle (Balanus] chosen for study is modelled inthree main stages - the nauplius or larval stage, the cypris and the adult. Thenauplius progresses through a number of sub-stages and takes about 30 days toreach -maturity. It then changes into the cypris form and seeks a suitablesubstrate for settlement. As the cypris has a life expectancy of approximatelyone day it will die if a suitable site is not found. The successful cyprischanges to an adult which in turn takes about 90 days to reach maturity andthus continue the life cycle. The adult is sessile and thus immobile, thecypris is effectively immobile but the distribution of the larvae iscontrolled by the circulation pattern in the estuary as this life form isplanktonic.
ExecutiveSubroutine
HousekeepingData FilesPolicy changesInteractive
Eiver Transport Model
HydrologyHydraulicsHydrodynamicsDiffusionDispersion
Technology Model
AgriculturalIndustrialResident!a] •
Atmospheric Model
Sun - RadiationRainTemperature
Oceanic Model
WavesTidesSalinity
Ecology Model
FloraFaunaFood ChainsPopulations
- Euphotic- Benthic
WaterQualityModel
OxygenNitrogenD.O.B.O.D.SalinityTemperature
Barnacle[Birth Rate][Death Rate]Coefficients
Figure 2. Model Structure
Barnacles
PopulationBR./DR./Larvae-Cypris-Adults
- 9 -The basic modelling strategy adopted was to treat the larvae, cypris and
adults as total groups continuously subjected to predation and death due toenvironmental factors. The larvae and adult groups were also subdivided intothirty and ninety subgroups respectively, corresponding to their daily maturitylevel. At the end of each day each maturity subgroup was moved into the nextmore mature subgroup, each subgroup increasing or decreasing in the same ratioas the main group. For the special subgroup cases the following treatment wasused -
(i) The 90th or fertile adult subgroup was reinforced by the 89th adultsubgroup;
(ii) all cypris became the first or least mature adult subgroup-
(iii) the 30th or most mature larvae subgroup became the cypris;
(iv) the least mature larvae subgroup was formed by adding thoseproduced by the fertile adults to 1/30 of all larvae arrivingby swimming or drifting with the current.
During each time step the following equations were employed
3C
3C
do=-(krs k + k + k ) Cro rt rv r
do as+ k
ao + k ) Cat av a
(1)
(2)
(3)
The three forms are each subjected to deaths due to excessive temperatures(coefficients subscripted t), low oxygen concentrations (coefficients subscriptedo), low salt concentrations (coefficients subscripted s), and predation andfood deficiencies (coefficients subscripted v). As well there is assumed to bea Fickian diffusion like process increasing or decreasing the larvae concentration.
h. SYSTEM SPECIFICATIONS
The model is designed as a simulation tool which can be used to handle avariety of environmental systems, but, for ease in explanation it will bedescribed in terms of a specific application. A 9 Km stretch of a tropicalriver with tributary is modelled over a full calendar year in equal time stepsof 0.05 days. The hydrologic characteristics of the catchment area are usedto determine the river runoff and the hydraulics of the river provide theflow characteristics. The year modelled^ was 19^6; a very low total flowyear although the peak flow was 250 m?S 1. The estuarine conditions areincorporated by averaging tidal variations over a tidal cycle. Under theseconditions, restricted to natural inflow to the river, the water qualitycharacteristics in terms of biological oxygen demand - BOD, dissolved oxygen -DO, temperature, salinity and organic matter can be modelled as by Pomeroy andStark1. Salinities were determined in the water quality model (Figure 2) andtemperatures were obtained from long, term measurements. Eleven river reacheseach of 800 metres length were used in the simulation and at each time stepthe one dimensional hydrodynamics and the water quality of each reach weredetermined. This information was then matched with the population dynamics ofthe important species of river life,both faunal and floral. In this case thebarnacle population is considered as being indicative of the quality of thesystem environment. This is, obviously an oversimplification of the real ecosystemwith its complex set of interrelated living species^but is sufficiently realisticto portray the interactions of the system components and to allow an evaluationof the effects that growth and decay rates and different operating policies haveon the quality of the environment.
- 10 -
Standard Birth Rate
Temper-ature
Cot-ffs
Birth Rates
Population
Adults Cypris Larvae
Death Rates
Standard Death Rate
Figure 3- Population Segment
When the system profile for an unpolluted environment has been establishedthe effects of progressive and substantial quantities of industrial effluentson the quality of the system can be simulated. In this instance the modelledbiological load imposed on the system has been equivalent to the expansionthat could be associated with an uncontrolled growth of three sugar-mills alongthe tropical river, over a quarter century.
The oxygen demand due to mill effluents is simulated over the crushing season.The temperature range over the year studied was 22°C - 3H°C which is characteristicof tropical streams, particularly where industrial effluents at elevatedtemperatures are carried by the stream.
5. THE POPULATION MODEL - SPECIFICATIONS
Biological data 3 was used to produce the environmental coefficientsrelating to temperature and salt deficiency. Taking k as an example, thepopulation decrease with time of a sample of adults subjected to variousconstant salinities was analysed assuming a relationship of the form:
= k A-i A Iv .rid0 as
k is assumed a function of salinity only,as
— _L_L
As it was considered that 3.5 mg/1 dissolved oxygen concentration was thecritical point for these animals: kaQ, kro and k. were assumed zero at thator higher concentrations, unity at zero concentration and with a lineardistribution between.
The predation and food deficiency coefficients k0,r. k and k , and the(Iv^ 7*17" £} V
larvae diffusivity D^ were then adjusted to give a reasonable distribution inthe estuary under non-polluted conditions for the time steps used in thesimulation. For one k , the relationship used, with k0 the example, was:v
= 0.1 {l - exp (-L/103)} (5)
The larvae diffusivity used had a maximum value of lQ'( .5 m^day * which may becompared with a value of 1x10⁷ mfday l for the oxygen dispersion coefficient.
To calculate the reproduction rate, a random number sequence was generatedand then arranged in an ascending-descending order over 200 days. The maximumvalue of the reproduction rate was 10 larvae per fertile adult per day.
As the larvae diffusivity is also affected by random occurrences suchas boats, tides and wind,_a random number generator determined Dg at valuesbetween 0 and 187.5 m^day"1 in stops of 18.75.
Recharge of the system is controlled by the larvae population in the bay.Runs were carried out using population densities varying from 500 larvae/m3
to 5 larvae/m , the latter value being chosen for tne results in this paper.
Equations (l), (2) and (3) were solved for each time step using a finitedifference method. Using the gross numbers of adults, cypris and larvaecalculated for the end of each day, the numbers in each maturity group wereobtained, new larvae added and the process repeated for the next day. Forall runs, a period of one year was used and time step of 0.05 days was foundto give sufficient accuracy for plotting the results.
6. SIMULATION RUNS
From an environmental management viewpoint it is necessary to know theecological effects of changing the operating procedures for the complete system.Specifically, increases in effluent loadings accompanied by technologicalexpansion must be considered. As an illustration the system model has been rununder three conditions - (i) in a natural state - unpolluted, u,
(ii) with a loading slightly more than present daypeak loads - moderately polluted, m,
(iii) with a considerably expanded biological loadingrepresenting some six times present daycapacities - polluted, p»
The polluted stage is foreseeable in the next half century if no environmentalcontrol is exercised, although inevitably stricter water-quality legislation willrequire cleansing of pollutant loads prior to discharge. In each case the sameriver flow and tidal changes are maintained however the temperature range wasincreased by 3°C with the heavier pollution to comply with increased thermalloading.
Figures h-9 give the populations of each stage of growth in the river reaches2, 5 and 8 where the reaches are numbered from 1 at the river mouth. The figuresillustrate the population variations from day 36 to day 32^, i.e. approximatelymid-April to mid-January in the succeeding year.
The increase in populations over days 36 to 72 corresponds to an increasein salinity associated with a decline in the river flow i.e. the end of the wetseason, Figure 12, whereas the decline in populations for the polluted cases,Figures 7-9, after day 72 (as compared with the unpolluted cases, Figures U-6)

\\ 0
0
Cypris
P 0 L L IJ T
o
Adults
t D
36 '06 180
Figure -4.
252 324 36 108 180 252 32i
Figure 5-
36 108 180
Figure 6.
3/4
5
r
V
Larvae
P 0i
*
E n
3F 108 183
Figure 7-
\M xv
<+ 36 108 180
Figure 8.
252 324 18C36 108
Figure 9-
252 32
?\
o
oj
Day 216Adult/Reach
Day ?l6Larvae/Reach
\
X
Reach No.i i \ \
1 2 3
Figure 10.
OL8 9
DayNo.
072
lit It216288360
Temp .0°C31.322.619.622.331.033.9
Salinityppt.5 .^2
28.830.lt31.832.12H.1
Flown^S"1
260372196
8l
DO mg/LPolluted (p)
> l t . O> l t . O
0.8200
>k.O
DO rag/LMod. polluted ( m )
> l t . O> l t . O> l t .O
3-50> l t . O
Figure 12. System Characteristics Reach 2.
- 13 -have "been caused "by the onset of the cane crushing season which extends untilday 288 (December) of each year.
The effects of pollution whereby only very small populations of cypris andadults extend even as far as reach 5 i.e. approximately k Km upstream areobvious from a comparision of Figures 5 and 8, and 6 and 9.
Figures 10 and 11 illustrate the populations of adults and larvae respectivelyfor each reach on a particular day 216 (end of September) for the three casespolluted (p) , unpolluted (u) and moderately polluted (m). The rapid decline inpopulation for the polluted cases is obvious on the log scales. Further althoughthe polluted waters extend well downstream of reach h (Figure 12) it is seenfrom Figures 10 and 11 that both larvae and adults appear as far upstream asreaches 6 and k respectively. They have only a transitory life in these pollutedwaters as shown in Table 1 which gives the age distribution of adults in thefirst few reaches. Wo adults are found beyond reach 1 on day 2l6 for the pollutedcase and no mature adults (older than 90 days) are found beyond reach 2 for themoderately polluted case. On the other hand mature barnacles (over 90 days)are found upstream as far as reach 8 in the unpolluted case. Indeed for thepolluted cases a considerable part of the stream is dead from the ecologicalviewpoint.
It should be obvious from this limited series of results that a detailedunderstanding of the ecological behaviour of the system in terms of barnaclepopulations can be obtained by a study of the model simulations.
NUMBER IN EACH AGE GROUPAGE GROUPING - DAYS
0-9 10-29UnpollutedReach 1 309,223 512,085
2 58,30U 5^,80U3 11,720 • 10,U02h 2,58U \ 2,3295 365 UlU
Moderate Pollution ;Reach 1 338,375 86,723
2 TO ,,226 3 ,873 5,201 665k -
Polluted iReach 1 10,lU2
2 8613 79 -
30-149 50-69
170,35528,QliO5,6751,3^0231
162,0857,122
15
~*I
^7,3087,2171,325
liOO131
52,5821,326
-
70-89
68,U4li10,6651,613302101
72,6251,818
90 +
75,7689,6601,291*2255
75,7681,61*9
1i
ADULT/AGE/DISTRIBUTION BY REACH
TABLE l._
7. ENVIRONMENTAL IMPACT STUDIES
It is always easy to criticise environmental matters without knowing thefacts. It is also relatively simple to perform spot checks on floral and faunalpopulations and deduce erroneous conclusions. It is also possible to framerestrictive legislation by setting simplistic legal limits for environmentalquality. None of these approaches can be condoned from a scientific or longterm management viewpoint.
What is required is the ability to understand the dynamic effects ofsuperimposed and cumulative stages of development on a given environmentalsystem. Such an ability can be provided by a simulation model study aspresented here.

-J--T
Growing concern regarding the impact of modern man on the natural environmenthas resulted in increased legislation requiring environmental impact studies forall new developments. Such studies should require a clear understanding ofthe system behaviour if they are to provide meaningful assessment of the effectsof the proposal on the environment. Such an understanding is not possible formost developments unless a carefully designed analytical model of the systemis used. Further development of such models will be an essential task for thelegislators if the cumulative effect of a variety of developments is to bedetermined.
8. A MANAGEMENT TOOL
From a management viewpoint the approach outlined is successful for tworeasons (i) the simulation model enables the manager to test various policies -any of the system variables can be altered and the model re-run to display theeffect on system behaviour; and (ii) the manager of the system can use themodel as a very powerful tool to argue the effects of proposed policy and todemonstrate to other decision-makers or opponents the environmental soundnessof the project.
It should be pointed out that the proposed model meets all the requirementsof a satisfactory management tool 5. It corresponds closely to the mental modelof the system as it uses overlays of the different sub-systems so that managementcan nominate changes to different sectors of the system and investigate theireffect. The vocabulary of the model is standard as each of the input variablesis a well understood system variable whereas new relationships and additionalsub-systems can easily be incorporated. It is not suggested that management wouldbe responsible for the development of the model detail which would requiresystems analysts in conjunction with the users but it is anticipated that managementwould nave an accurate overview of the model structure and would be prepared touse it in an interactive fashion.
9. INTERACTIVE, DYNAMIC PLANNING FACILITY
One of the principal advantages of simulation models is lost if thecapability of interactive discourse with the program is not available 6. Thusthis model is being developed to be used in conjunction with an on-line time-sharing computer with a graphics display terminal. In this mode of operationthe user is given the choice of a number of control measures which can be takenfor each simulation run. The variety of options available will be displayedon a visual-display screen and the user selects his control by cursor-activatedor light-pen pointer. The successive stages of system behaviour are thendisplayed on the screen as the model computacions are completed, giving the userthe ability to intervene when the system 'misbehaves1 or fails to meet certainpredefined criteria. New system variables can then be nominated interactivelyand the system simulation continued or restarted.
10. CONCLUSIONS
It is possible using a combination of conventional engineering analyticaltools and a systems dynamics simulation technique to construct useful numericalmodels of complex interdisciplinary systems.
Such models are useful tools for studying the behaviour of ecological systemsas they are affected by technological development. They can also prove extremelyuseful when it is necessary to undertake comparative benefits and costs foralternative sets of policies - or when the effect of a particular decision on thesystem must be evaluated before implementing a policy change, or, simply, when itis necessary to assess the environmental impact of a decision.
The description of a model that has been developed to study the effects ofpollution in a tropical river system has been presented and the ecological impactof the pollutant load has been represented by studying the population dynamicsof one inhabitant of the system. Obviously more complex models will be requiredTor most major industrial developments. The techniques outlined here are, however,
- 15 -directly relevant and the approach used can be expanded to include many moresub-system sectors which will involve the development of the appropriate systemoverlays as computer programs.
In the example given the effect on the barnacle population in time and spacefor different pollution loads, under a number of specified conditions, has beendemonstrated. The resourcefulness and viability of natural systems, has beenillustrated by the example given and, from a management viewpoint, the modelappears to be an acceptable and necessary tool.
The development of complex analytical simulation tools such as this modelobviously require efficient computer facilities and, if such tools are toprovide assistance in the decision-making process, it is essential that themodel is designed to be used in an interactive computational environment.
Finally, it must be pointed out that in the near future models much morecomplex than the example given here will be required as simulation tools availableto each level of environmental management. Then it wi]1 be possible for theappropriate operating policy to be specified by the planner, the manager, theengineer and the politician.
REFERENCED
1. Pomeroy, A.B. and Stark, K.P. - "Water Quality Simulation in a TropicalRiver System", Proc. Thermofluids Conf. - Therm.il Discharge, EngineeringEcology, I.E.Aust, Sydney, December, 1972, pp. 82-89.
2. Forrester, J.W. - Principles of Systems, Wright-Allen Press, 1968.
3. Lucas5 J.S. and Draper, M. - personal communication, see acknowledgementbelow.
U. Odum, E.P. - Fundamentals of Ecology, 3rd Ed., W.B. Saunders Co., 1971.
5. Weissman, P., Kalan, G. and Platts, D. - "Systems Dynamics as a Toolfor Resource Management" Report E-2702 Charles Stark Draper Laboratory,M.I.T., 1972.
6. Martin, J. - Design of Man-Computer Dialogues. Prentice Hall, 1973.
ACKNOWLEDGEMENT
The authors are grateful to Dr. J.S. Lucas and Mr. M. Draper, BiologicalSciences, James Cook University of North Queensland, for assistance with thebiological data used in the model development.

- 16 - - IT -
INTEGRATED PROJECT CONTROL
National Chemical Engineering Conference 1974
PROCESS INDUSTRIES IN AUSTRALIA - IMPACT AND GROWTH
Surfers Paradise, Queensland
July 10th to 12th, 1974
INTEGRATED PROJECT CONTROL
by
E . D . P l o m l e y , B . E . ( C h e m ) , M . I . E . A u s t
S U M M A R Y
The Project Manager in charge of a large or complex projectneeds a system of project control which enables him to correlateproject cost, physical progress, and cash flow.
Most existing systems require elements of subjective judgementto relate these factors, or present the data in formats thatare difficult to interpret.
"Integrated Project Control" establishes the relationship indirect, integrated and quantitative terms. Deviations fromthe plan are expressed by three "IPC variances", which arerelated by a simple equation.
Together these variances provide the Project Manager with avaluable overview of project performance, as a basis for controlaction.
P l o m l e y , W.D. Scott § Co. Pty. Ltd., Project Engineering
Large or complex projects have always presented a control problemto the Project Manager. This is the challenge of integrating hiscontrol of three vital aspects of the project: cost, physical progressand quality.
The Basic Problem
The basic problem is manifest when the Project Accountant reports,say, a cost overrun of $10,000 to date against the planned budget forthe same period. The Project Manager is usually required to explainthis overrun in terms of
(a) progress that has been more rapid than expected, indicatingan early finish; or
(b) low cost estimating (or poor productivity), indicating a costoverrun on completion; or
(c) some combination of both.
The third factor, quality, may also be responsible. The costoverrun could be the result of excessive quality being built into theproject. This, however, is difficult to quantify, and is outsidethe scope of this paper.
Previous Work
The standard approach to this problem for the last 10 - 15 yearshas been through the use of PERT-Cost1' .
In es s endiscrete "tasas signed an egation of theis known as tgraphi cally,final cost an
A second"Accomplishmecumulative doBy comparingslopes and thends of the sand relate co
Shortcomings
ce, PERT-Cost requires the proks" or ''work packages". At tstimated cost. At any givense originally-estimated costs,he value-of-work-performed.to the cost incurred to date,d completion date can be prepa
approach was proposed by Blocnt/Cost Procedure" (AGP). Thliars (y axis) against cumulatthe actual and planned curves,e spatial relationships of theeveral cost periods, the Projest and progress to date.
ject to be broken intohe outset each task ispoint in time the aggre--for all tasks completed,
This is related, usuallyHence, estimates of
red .
3k under the titleis involved plottingive accomplishment (x axis)in terms of their relativepoints representing the
ct Manager could assess
While the mathematics of both approaches are sound, they havebeen used, if at all, with some reluctance by most project managersA subjective reconciliation process seems to be the norm.
In particular, the ACP approach is difficult to interpret.Most managers are accustomed to "time" as the independent variableon a graph, and the unaccustomed use of "accomplishment" is hard toaccept. Moreover, it is not easy to assess the managerial significance of variances in the relative slopes of the planned and actualcurves.
In the case of PERT-Cost, tabulations of data on Planned Cost,Actual Cost, and Value of Work, such as are produced by a computer,are formidable and do not re?idilv nrovide a guide to management

- 18 -
action Even when presented by the computer in graphical form, thecurves suffer from rounding off of plotting points and are stillviewed with some suspicion by many practising project managers.
Scope of the Paper
Project control, as with other forms of feedback control, isbased on the familiar "universal control loop" illustrated in Figure 1.
This paper is concerned only with the elements of the loopdescribed as "Compare Results" and "Assess Significance". A tech-nique will be described for measuring the error signal ("e" in thefigure), in terms which enable its significance to be assessed, as abasis for the most appropriate corrective action.
The technique is mainly limited to labour-type costs, i.e. thosecosts which occur progressively through the project and which arerelated, in a more or less direct way, to the work achieved. Thus itexcludes costs of a capital nature which, for reasons discussed laterin the paper, are amenable to control procedures of a different type.
The "Integrated Project Control" Approach
In essence, the approach to project control described in thispaper is based on I wo premises:-
(a) That Management control action is based on "variance" from theplan. This is the parameter shown as "e" in Figure 1. Bothits magnitude and sign are significant.
(b) That three quantities are important - physical progress, cost,and cash flow (or rate at which resources are being applied tothe project). These three are interrelated, but must beseparately identified to enable Management to act on an informedbasis .
These principles are embodied in the approach known as "IntegratedProject Control" or IPC. This technique was developed in 1973 tomeet the project control needs of the Department of the Navy. Datafor control action is presented in the form of three IPC varianceswhich are interrelated by a simple equation.
In the next section of this paper the basic terms are definedand the formulae developed. In the final section of the papervarious aspects and limitations of the technique are discussed insome detail.
DERIVATION OF FORMULAE
De fini tions
Application of Integrated Project Control, as with PERT-Cost,is based on the analysis of the project into a series of discretework packages. The following definitions are used:-
(a) Estimated Cost (EC). The cost, as estimated in advance, to
(b)
(c)
carry out a package of work.
Actual Cost (AC). The incurred cost of all work which hasactually been carried out.
Scheduled Cost (SC). The "Estimated Cost" (as defined above)of that work which was scheduled to be carried out during thetime period under consideration. Sometimes referred to as the"planned phasing of expenditure".
- 19 -
(d) Value Achieved (VA). The "Estimated Cost" (as defined above)or "worth" of the work which was actually carried out duringthe time period under consideration.
(e) Cost to Finish (CTF). The cost to finish a package of workwhich is in progress at a particular point in time, based on anassessment of the status of the package at that time.
(f) Cost Outlook (COL). The final total cost of a package of work(or group of packages) as estimated at some point in time duringthe execution of the package. Sometimes referred to as"indicated cost" .
Calculation of Value Achieved
At any given point during the execution of the project, at whichit is desirable to assess the status of the project, the work packagesfall into three mutually exclusive categories:
(a) Work packages completed
(b) Work packages not yet started
(c) Work packages started but not yet completed ("work in progress").
The general formula for calculation of value achieved for a workpackage is:
VA = EC - CTF.
For packages in category (a), CTF = 0 and the formula reduces to:
VA = EC.
For packages in category (b), EC = CTF, and hence VA = 0.
For work in progress it is necessary to estimate the cost tofinish each package, and apply CTF to the formula. It is apparentthat, under certain unfavourable conditions, VA can be negative.
This approach is preferred to the alternative estimating of"percentage complete". This point is discussed further in laterparagraphs.
IPC Variances
(a)
The three fundamental IPC variances are defined as : -
"RAVAR", the Rate of Achievement Variance. This is the actualachievement to date, minus that which it was planned would havebeen achieved in the same time period.
RAVAR VA - SC.
(b)
(c)
A negative value of RAVAR indicates an unfavourable situation,viz that progress is slower than expected and suggests that, ifcorrective action is not applied, the project will finish late.
"REVAR", the Rate of Expenditure Variance. This is thescheduled cost to date, minus the actual cost.
REVAR = SC - AC.
A negative value of REVAR indicates that expenditure to date hasbeen higher than had been expected, and that problems in fundingthe project could be expected.
"CIVAR", the Cost Incurred Variance. This is the value achievedto date, minus the cost incurred in achieving it.
r T VA D \T A A r

- 20 -
A negative value of CIVAR indicates that the work which hasbeen completed to date has cost more than had been expectedand suggests that, if corrective action is not applied, theproject will overrun its budget.
Summary
The formulae can be summarised thus
RAVARREVARCIVAR
Obviously,
RAVAR
VA - SCSC - ACVA - AC
CIVAR - REVAR.
Cost Outlook
The cost outlook for the project is the sum of the cost to dateand the total cost to finish all future work.
COL AC + ZCTF
From the cost aspect alone, the variance that is of greatestconcern to Management is the projected variance in the ultimate costThis has been termed COLVAR, the "cost outlook variance".
COLVAR COL (original) - COL (latest)
In calculating COLVAR, Management may elect to put CTF equal tothe original EC, for all those packages not yet started. In thiscase ,
COLVAR = CIVAR.
However, it is usually prudent to take the opportunity to reviewthese ECs in the light of experience to date, escalation in wagerates, etc., and thus obtain a COLVAR which is different from CIVAR.In this case CIVAR reflects only past cost variances, whereas COLVARalso takes into account the latest estimate of future cost variances.
Illustration of Variances
The three principal variances, RAVAR, REVAR and CIVAR, can beillustrated with reference to the familiar project "S-curve"(Fig. 2).
This is the curve of cumulative progress or expenditure (plannedor actual), which for the typical project assumes an "S" shape asshown. However, the actual shape of the curve is not material tothe illustration of the variances.
In the example shown, at review time t the actual cost incurredis Ca, showing a cost overrun to date compared to the scheduledcost Cs . However, the value achieved is shown as Va, in excess ofthat which had been expected at the of the review.
- 21 -
Thus :
RAVARREVARCIVAR
V - C (pos itive)cL S
C - C (negative)V - C (negative)a a
That is, the Project Manager would conclude that, respectively,
achievement is ahead of schedulecash flow is in excess of budgetcosts are overrunning.
Thus he is in a good position to exercise appropriatecorrective action,,
DISCUSSION OF THE APPROACH
In this final section various aspects of the IPC approachare discussed.
Source of Data
The three formulae for the variances require the input ofonly three types of data - scheduled cost, actual cost, and valueachieved.
"Scheduled cost" is usually obtained as one output of thenetwork analysis of the project, provided resources or costs havebeen estimated for each activity. This is the "S-curve" ofFig. 2. Many computer programs can print out this curve, or the data,on demand.
"Actual cost" should be readily obtained as the cost incurred,or man-hours worked, to date on the project.
"Value achieved" is, as already indicated, calculated from theestimated cost of each work package, adjusted for the estimatedCTF for each package that is in progress as at the date of review.This estimation replaces the estimates of "percentage complete"that are usually called for in review systems.
"Actual Cost" Definition
It is noteworthy that, for an assessment of overall projectstatus, it is not necessary for "actual cost" to be identified ascharges to individual work packages. Only the total cost to theproject is required. In practice, "actual cost" data are usuallysegregated automatically, through participants' own accountingsystems.
Sometimes, it is considered desirable to allocate costs toindividual work packages through an appropriate cost coding system,for the purposes of assessing and improving the cost estimates.It should be recognised that this is a separate purpose, and thatsuch segregation is not essential to the process of IPC.

- 22 -- 23 -
Units and Additivity
The units of cost may be either in dollars or in man-hours,etc. The equations are equally valid in either case, providedof course that consistent units are used throughout.
Monetary units are often preferred, since they enable theaddition of labour and materials costs. The results are expressedin the terms in which project "success" are usually measured.
However this can cause problems in longer projects, whereescalation in unit labour costs will cause cost variancesindependently of any variances in the labour content. Similarly,projects executed in different years are more readily compared ifrecords are kept in man-hours or man-days. The use of cost indexescan overcome this in some cases, provided they truly reflect changesin the costs of the resource mix involved.
Also, in some cases (e.g. for work by Government Departments)labour costs cannot be expressed in realistic dollar terms. Insuch cases, use of man-hours or man-days may be the preferredapproach.
Provided again that consistent units are used, the variancesare algebraically additive across individual work packages or anyother divisions of the project. Thus the overall performance ofthe project can be measured as an aggregation of performances inindividual areas.
Percentage Complete vs Cost to Finish
It will be recalled that the IPC concept relied on estimatesof "cost to finish" for all packages in progress at the reviewpoint; and that this parameter was preferred to the more usual"percentage complete".
Estimates of "percentage complete" for a given task tendto confuse the percentage of the work content which has beencompleted, the percentage of the allowed man-days which have beenworked, and the percentage of the allowed total time which haselapsed.
Yet, as the IPC approach shows, the differences between thesethree measures are real, and generally of vital significance.Furthermore it is not possible to represent the case of the negative"value achieved", when percentages are used. Yet this situation isa very real possibility in some projects.
For these reasons, estimates of "percentage complete" generallyprove to be optimistic, and result in the "90% syndrome" so familiarto many project managers. On the other hand, calling for estimatesof "cost to finish" encourages supervisors to assess the magnitudeof future problems, rather than to look back at past history.Estimates thus tend to be more realistic.
Materials Cost
Throughout the discussion so far, only the labour aspects ofthe project have been considered to the exclusion of materials costs.The IPC approach is basically unsuited to the control of costs for themajor material or capital items of a project. These costs must becontrolled, of course, but using different techniques. The broaddimensions of capital costs are usually determined at the time theproject is authorised, and control therefore reduces to
(a) control of commitments against original estimates, and
(b) control of invoicing against commitments.
Report Format
Figure 2 shows suggested report formats, to be supplied byproject participants to the Project Manager. Form A representsperformance in the latest cost period, while Form B representscumulative project performance to date.
CONCLUSION
The technique known as Integrated Project Control provides theProject Manager with an integrated set of variances to measureproject performance.
The variances cover the three fundamental parameters of theproject, viz cost, physical progress, and cash flow (or rate ofapplication of resources). Because of the integral relationshipbetween them, any trend noted in one variance can be directly andquantitatively analysed in terms of trends in the other two.
This technique should prove to be of great value to thepractising Project Manager.
References
1 .
2 .
US Department of Defense and NASA Guide: PERT-Cost SystemsDesign (June 1962) .
Paige, H.W. "How PERT-Cost Helps the General Manager"HER Nov-Dec 1963.
Block, E.B. "Accomplishment/Cost: better project control"HER, May-June 1971.

TAKECORRECTIVE
ACTION
ASSESSSIGNIFICANCE
Fig. 1: CONTROL LOOP
cumulativevalue orcost
ACTIONPROCEEDS
MEASURERESULTS
PLAN OREXPECTEDRESULTS
time
I
COST/ PERFORMANCE REPORT [ Participant /Contractor Cost Ref.
^ - CURRENT PERIOD j
A J A X P R O J E C T !
Work
Package
Details
^ ^_
Total
Estimated
Cost
( E C )
•x. — -
Scheduled
Cost
This Period
(SO
Actual
Cost
This Period
( A C )
Estimated
Cost to
Finish
( C T F )
i
^ ___
Value
Achieved
This Period
( V A )
V A
Cost
Incurred
Report Period
From:
To-
R I A N C E S
Rate of
Achievement
( C I V A R ) ( R A V A R )
1t
i\
L--* — u~-*-
iii
' ~- — - — »_^_ —
Rate ofExpenditure
( R E V A R )— . _ — — — « ~ — m
Fig. 2: PROJECT "S" CURVE
COST/ PERFORMANCE REPORT
U - CUMULATIVE PERIOD
A J A X P R O J E C Ti* i
Work ' Scheduled i Actual
Package Cost , cost
Details Cumulative ; Cumulative
(SO ! ( A C )1
(
\
Participant /Contractor
Value
Achieved
Cumulative
( V A )
*
i
,
~^~^
Cost
Outlook
( C O L )
^-^__—
Cost Ref.
Cost
Outlook
( C O L V A R )
' "-—- _
V A R 1 A N
CostIncurred
( C I V A R )
Report Period
From:
To:
C E S
Rate of Rate of
Achievement Expenditure
( R A V A R ) ( R E V A R )
1
\
\
i

- 26 -
National Chemical Engineering Conference 1974
PROCESS INDUSTRIES IN AUSTRALIA
Surfers Paradise,
IMPACT AND GROWTH
Queensland
thJuly 10 to 12 , 1974
INFORMATION SYSTEMS IN THE DEVELOPMENT
AND MANAGEMENT OF PROCESSES
by
VINCE DAVIES B.Sc., PH. D., A.R.I.C.
Different types of models described in the literature canbe put together to form part of an information system. Sucha system can be used to help manage the day to day operationof processes and to plan for the long term development of theprocesses. Equipment performance, capital and productionbudget information can be readily obtained.
There are a number of publications on models which can be used in industryto assist in the development, planning and management of processes. Thesemodels include:
1. Data adjustment models which take plant data or any other real data andadjust it to fit known constraints e.g. material balance, heat balance.
2.
3.
4.
Equipment models which represent in sufficient detail the actual equipmentand which calculate the chemical and physical output from such equipmentfor any given input. These models can be used in plant design, plantmodification or improved plant operation.
Operating models which determine the production pattern given the rawmaterial supply pattern, equipment failure pattern, market demand patternstorage capacities and a set of operating procedures or priorities basedon the conditions arising within such a system.
Economic models (linear programming) which allocate limited resources tocompeting activities with known constraints and calculate a maximumcontribution to fixed costs and profits.
This paper is concerned with x<rays, in which these models can be usedtogether as part of an information system, to improve processes and processmanagement. The references at the end of this paper give some recentinformation on models and modelling and on what each type of model can do.It is not my intention to go into any further detail on such models except tosay that the key to successful use of models is constant comparison with theprocess to ensure that short term and long term predictions are correct i.e.that the models behave like the processes or operations which they represent.For this reason a little time will be spent on data adjustment which is anessential link between real processes and models.
First let us take a look at the type of information system which can beset up using these models. Figure 1 represents the use of data adjustmentmethods. Every manager looks at process data very critically and works outthe most plausible explanation for a lot of confusing and contradictoryinformation. He makes allowances for the kinds of errors that he has learntto accept from each source e.g. the weighbelt is usually 10% high. He doesnot have time to do a complete material and heat balance but he knows howthe raw material to product efficiency normally runs and what to look for ifit is too high or too low. In this sense the data adjustment procedure modelsthe corrective measures taken by the manager. If a computer has been programmedto do the job properly, it has more information, less distraction and is muchfaster than the manager. In process development work it is essential to getaccurate information. If the limitations imposed by inefficient equipment areto be removed, they must be measured with sufficient accuracy to indicatesmall changes with changes in conditions.
Davies, Process Development Superintendent,Austral-Pacific Fertilizers Ltd., Brisbane.

- 28 -
CORRECTINSTRUMENTERRORS
IMPROVE SAMPLINGAND ANALYTICALPROCEDURES
COMPARE ADJUSTED IFLOWS AND COMPOSITIONS,WITH MEASURED VALUES
A
REPORT ADJUSTED FLOWSAND COMPOSITIONSINCLUDING THOSENOT DIRECTLY IlEASUpDj
IMPROVE DATAADJUSTMENTMETHODS, BIAS•AND STANDARDERROR VALUES
MEASURE FLOWS,TEMPERATURES,PRESSURES ANDCOMPOSITIONS...
CORRECT FORCALIBRATIONFACTORS
ADJUST DATATO FIT KNOWNCONSTRAINTS..
CALCULATE EQUIPMENT PERFORMANCE
EQUIPMENT
Whole Plant
Compressorsand pumps
Towers
Heat exchangers
PERFORMANCE
Raw material, steam, power, water efficiencyand production rate
Throughput, losses, characteristics
Tray efficiency, throughput
Heat loads, fouling factors
FIGURE 1. DATA ADJUSTMENT
Samples are taken for analysis while flowrates, temperatures and pressuresare recorded for all important process streams. Each flowrate is first correctedfor operating conditions since the flowmeters may have been calibrated fortemperatures, pressures, and compositions, somewhat different to the actualprocess values. After correction for calibration factors, the data is made tofit the known constraints in such a manner as to minimise the changes necessarySome data is more reliable and is weighted accordingly. Constraints normallycover each elemental or component material balance and can include heat balance,
The adjusted data is compared with the original plant data and, if it is invery poor agreement, either the source of the data requires some attention or themethod of adjusting the data to fit known constraints could be improved. Aftera number of sets of data have been subjected to this method of adjustment apattern starts to emerge in.icating bias in some measurements and large randomerrors in others. The end result is to seek to improve the instruments and theassumptions used to adjust the data until there is general agreement that thefigures are reliable.
- 29 -
'MODIFY THE:EQUIPMENT
/ \
EQUIPMENTMAINTENANCE
COMPARE PRESENT,PREVIOUS BEST ANDDESIGN PERFORMANCE
CALCULATE THE 1RETURN ON CAPITAL
-•H PROCESS |
I CALCULATE MODEL OUTPUT)DAJA__AJ3JUS_T_MENT! ^JFOR__PRpCESS _CONDITIOHS
CALCULATE-- EQUIPMENT , _
[PEJ^PRMANCEJ^
COST THEiMODIFICATION
CALCULATE THECASH BENEFITS!"
_y
COMPARE EQUIPMENT PERFORMANCEWITH MODEL PERFORMANCE ANDVERIFY OR CORRECT THE MODEL
V
INVESTIGATE EQUIPMENT |MODIFICATION BY MODEL'
N/
OBTAIN PRODUCTION AND1
EFFICIENCY BENEFITS ,
FIGURE 2. EQUIPMENT MODELS
We are now in a position to measure the performance of individual items ofequipment. Figure 2 shows the use of equipment models. The throughput of anitem of equipment may not agree with the model of that item and so the modeland thej. equipment come under scrutiny to resolve the discrepancy. When themodel is regarded as a reasonable device for simulating the performance of theitem of equipment concerned, it can then be used to predict the effects ofchanging operating conditions or modifying the equipment. If the effects ofchanging the operating conditions are catastrophic e.g. for a compressor we maychange suction conditions and exceed safe interstage pressures, temperatures,pin loadings or rod loadings, it is then nice to know it was only a change on amodel and not the real thing. If the effects are beneficial, we may proceedwith caution to make the changes on the plant. If capital is required, theeffects must be translated into cash benefits so that return on capital can becalculated.
Improving one item of equipment does not always have the desired effect onthe plant as a whole. The limitation may be transferred to another item forvery little gain. The order in which debottlenecking takes place can beimportant economically. Figure 3 depicts an operating model which determinesthe outcome in production and efficiency of a given raw material supply pattern,equipment performance, market demand and operating policy. The effects of allof these can be tested by running the model with random numbers to determine theinput patterns. A number of runs gives the range of possibilities. We mustfirst consider the operating problem which we have and the types of questionswhich we might wish to ansxver.
a) We always seem to be short of raw material X during the winter months.Hold a larger stock of X from May to July?
b) The chances are that an item of equipment will fail two or three times ina given period and be out of commission for a few days each time.Duplicate it?
c) Whatever else happens Joe Blow must get his tonnage of product Y on time.Increase product Y storage?

- 30 -
- 31 -*| PROCESS]
. ..__!_.__|DAY TO DMANAGEMEOF PROCE
SHORTTERMMARKETDEMAND
TU/LONGTERMMARKETFORECAST
CASH FLOW,CAPITAL ANDPRODUCTIONBUDGETS
*r—
AYNTss.k-
^DAT
PREDICTEDPRODUCTION, ,STOCKS , "EFFICIENCY
_^ OPERATINGPOLICIES
CONTRIBUTION!TO FIXED 1COST ANDPROFITS
A
A ADJUSTMENT ^EQUIPMENT PERFORMANCElAND IMPROVEMENT
\ /
I OPERATING MODEL DETERMINES LONG TERM•J
•'] EFFECTS OF A GIVEN SET OF OPERATINGPOLICIES, EQUIPMENT PERFORMANCE, RAW
- J MATERIAL SUPPLY AND MARKET DEMAND .
^, ECONOMIC'MODEL I
^
PROEPRIC
/)UCTIING
1RAW MATERIAL | < RAW MATERIAL i" COSTS AND i SUPPLY PATTER! i
PRODUCTREALISATIONS
FIGURE 3. OPERATING MODELS
We might like to find out the effect of using an alternative raw materialsupply, duplicating important pieces of equipment, increasing rax^ material,intermediate or product storage capacity, changing operating policy orchanging maintenance policy. If the model shows reasonable agreement withoperating performance \<re can first try these changes out in the model. Theresulting process throughput, process efficiency, increased working capital,increased labour costs and any other effects can be converted into cash benefitsby normal accounting methods.
Use might also be made at this time of an economic model since one applicationof these such models is to calculate contribution to fixed costs and profits forsatisfying certain market demands with known production at known efficiency. Themodel can be used also to test the sensitivity to changes in raw material costs,process efficiency, process capacity, market changes and product pricing. Ifthe economic model is agreed by all concerned to provide a true picture of changesin contribution for other changes then these benefits do not have to be recalculatedby a number of people before agreement is reached. The model can be run forpredicted plant capacities, efficiencies and market forecasts for a few yearsahead to help in capital budgetting and production budgetting.
This paper was not intended to put forward a complete information system bymodels to suit all applications but just to indicate how models are being used todevelop and manage processes. You may not have access to a computer at presentbut at the current rate of progress this might not be very far away. The generalresentment of computers by management and accountants is also fast disappearing.The main danger with computing is that too much information is sometimes presentedto-managers because of the ability of the computer to churn out pages ofcalculations. At this stage it should be remembered that all information can berefined to produce the correct quantity and quality of information for eachmanager, provided the refining procedure can be expressed as a model. Once thishas been done decision making can be speeded up.
1. A.K.S. Murthy - A least-squares solution to mass balance around a chemicalreactor.
Ind. Eng. Process Des. Develop., 1973, 12, 246
2. Rein Luus and Taina H.I. Jaakola - Optimisation of nonlinear functionssubject to equality constraints. Judicious use of elementary calculus:and random numbers, Ind. Eng. Chem. Process Des. Develop. 1973, 12 (3), 380,
3. Richard R. Klimpel - Operations research: Decision-making tool - 1.Chemical Engineering, 1973, 80 (9), 103.
4. Robin Hills - Simulation for planning and design, Data Processing,May-June 1973, 146.
5. Patrick F. Phelan - Writing and Debugging Computer Programs, ChemicalEngineering, 1973, 80 (13), 98=
6. J.R. Flower and B.D. Whitehead - Computer-aided design:flowsheeting programs.Part I. The Cehmical Engineer, April 1973, 208Part II. The Chemical Engineer, May 1973, 271
A survey of
7. E. Kehat and M. Shacham - Chemical simulation programs - 3 Solution ofsystem of non-linear equations. Process Technology International, 1973, _18_, 181.
8. George E. Mapstone - Forecasting for sales and production. Chemical Engineering,1973, 80 (11), 126.

- 32 - - 33 -
National Chemical Engineering Conference 1974
PROCESS INDUSTRIES IN AUSTRALIA
Surfers Paradise,
IMPACT AND GROWTH
Queensland
thJuly 10 to 12 , 1974
"NEW CONCEPTS IN RESEARCH MANAGEMENT IN THEPROCESS INDUSTRIES"
by
W. P . Macmillan Ph.D. , D 0 I . C 0 , M . I . Chem.Eo
S U M M A R Y
A reason for the present worldwide disenchantment with research is thatcompany management and research workers themselves have too narrow a concept
of the research function.
Products are conceived, developed and introduced to the market in asequence of events more appropriately described as innovation than research.
The essential features of an effective programme of industrial innov-
ation are:-
1. To know what development activities to undertake.
2. To organise resources to achieve successful outcomes inthese projectSo
3. To be able to exploit successful outcomes profitably.
Research is conventionally only concerned with the second or implemen-tive phase. Our concept of research must be broadened to include all threeof the steps outlined and the company organisation structured to facilitatethis concentration on the whole innovative process rather than on researchalone.
10 Introduction.
Research activity in Australia is being subject of late to increasingattention as befits an activity with an important role to play in the futuredevelopment and direction of the process industries in Australia.
A recent survey shows that Australia ranks with Greece, Spain and Irelandof the O.E.C.D. countries in spending a greater proportion of their totalR and D funds in the government rather than the business enterprise sector,In Canada the expenditure in each sector is approximately equal. In mostother OoE.C.D. countries about two to four times as much is spent on R and Din the business sector than in the government sector.
This low level of research activity in the business sector is not helpedby the recognition that much of the research in chemistry in centres of highereducation in Australia is in fields of little or no interest to the processindustries.
In order co compensate for this low level of expenditure and low levelof research assistance from the tertiary educational centres it is necessaryto develop skills in industrial research management of the highest possibleorder.
But research has been the subject of much criticism in recent years forits alleged failure to justify its existance in a commercial enterprise.
There are cases where this has happened because research workers havebeen unwilling to apply themselves to problems of commercial significance.There are cases also in xvhich management has expect too much from research.The real solution to growth in these cases was through aquisition or thelicensing of the technology and plant needed to produce products new to thecompany rather than through in-house research. More significantly thissituation has developed in many companies because management and the re-searchers themselves have not had a clear understanding of the process ofinnovation and its application to their particular firm.
Conversely those firms making the most effective use of their researchand development resources are those that have defined an effective commercialrole for them and have a good company-wide appreciation of the totalinnovative process.
20 Steps in making industrial R and D more effective.
It is essential to recognise that R and D, although a key component,is only part of the total process by which a creative idea is conceived,developed and exploited either by selliug a new product or service profitablyin the market place or reducing production costs.
The term innovation is used to define this process which begins whena new idea is conceived and ends when a financial return is achieved from itsimplementation. It is clearly distinct from the commonly accepted definition ofR and D which may apply to the basic thinking from which the idea flowed or topart of the process in which the idea is developed to technical viability.In addition to technical viability the concept of innovation encompasses alsocommercial viability.
Dr. Macmillan, General Development Manager. Hardboards Australia Ltd., Sydney,

The essential features, therefore, of effective Industrial Innovation
are :-
le To know what development activities to undertake.
2o To organise resources to achieve successful outcomes inthese projects.
3o To be able to exploit successful outcomes profitably.
Many people, management and research worker alike, only conceive ofR and D in the second, implementive sense and it is this restricted outlookthat can make much industrial research ineffective.
One ansx^er to making industrial research and development more effective
is :-
(i) to analyse the innovative patterns existing within thefirm.
(ii) to propagate this understanding of the innovative processwithin the firm particularly as it affects relationshipsbetween individuals and groups; and
(iii) to ensure that the firm's organisation and resources arecompatible with the specific development needs of thecompany.
(a) Defining the patterns of innovation within the firm
The chief executive in the firm responsible for R and D, by makinga critical reveiw of past and present operations, can define innovativepatterns within the company0 The results of such~a study in theAustralian hardboard industry have been published,
The objective of this analysis is to define the main types of in-novative activity within the firm and the critical factors determiningsuccess or failure in innovative projects. It is usually found thatmany groups outside the research department play important roles in theinnovative process and, in a significant number of cases, the criticalfactor responsible for success or failure lay outside the R and D area.
Through such an analysis, management and research workers alikecan convince themselves of the need to expand their concept of the re-search function and to recognise the contributions made by other groupsin translating technical success into a profitable outcome.
Usually it will be found that the majority of problems experiencedhave been in the new product area. Unless there are major personalityor communications problems there should be no conceptual difficulty informulating research programmes in support of production. The problemscan ususally be well defined, the benefits to be gained from a successfuloutcome can be readily calculated whiLst, if the problem is real andsignificant, production people have a need to accept and implement asolution proposed by R and D0
- 35 -
The new product area is more difficult because the initial conceptis less tangible than in a purely technical problem and success dependson how well marketing people can define the market need or opportunityand, finally, establish the product in the market.
The innovative process as it applies to new products will be consideredin detail although the same general principles apply to research supportiveof production or other technical functions„
(b) Innovation in the new product area..
It seems trite to say that the first essential step in innovationis to know what best to do. The more specific the project brief can bemade at the inception of the project the higher the probability of asuccessful outcome and the more rapid progress in the project.
The aim should be to write a project brief for a new product in thesetermsi
"A market for X units per annum is believed to exist for a productwith Y properties if it costs less than $Z per unit."
To establish these specific requirements necessitates close liaisonwith marketing groups at the commencement of the project. It is import-ant to involve marketing at this stage because it is difficult to settechnical development goals until the product properties and cost arespecified. Until the market size and selling price are estimated andthe financial benefit of a successful outcome calculated it is difficultto allocate resources on a rational basis. But, more importantly,securing the early involvement of marketing people in setting realisticcommercial goals smooths the path for the ultimate end of the innovativeprocess; sales in the market place.
Once research and technical goals and priorities have been establish-ed and resources allocated to the project it should be subject to the samereviews and controls as are applied in other sections of the firm,This- implementive part of the innovative process is well understood butfurther difficulties arise once a successful technical outcome is achieved„
A decision must now be made whether and how to exploit the technicalachievemento If the solution were to a production problem there is usuallylittle barrier to its implementation provided there is sufficient return onthe capital expenditure involved. Production people usually have littledifficulty in assimilating the technology involved whilst research peopleare usually sufficiently aware of production methods to be able to assistin the transfer of the innovation from research to production,
However, if the exploitation of research involves the marketing ofa new product two difficulties arise„ Marketing people usually do notunderstand the technical background to the new innovation whilst R and Dpeople are not normally familiar with the procedures involved in launch-ing a new product, A close relationship must exist if this communicationsgap is to be overcome.
The second difficulty arises if the firm does not have a "ProductManager - New Products" whose specific function is to smooth the way for

- 36 -
new product introductions. In these cases one must work through a salesforce knowledgeable in their present fields of selling but needing a lot
of encouragement to sell in unfamiliar areas.
In this situation R and D people may have to function as productmanagers for the new product until it can be absorbed into the normalsales activity. At this stage R and D people usually have the best^knowledge of the product available in the company and should be willingand able to use it to help salesmen sell and make contacts in unfamiliar
fields.
The expertise with which a company handles this translation from theresearch and development phase to the market is the prime determinant inindustrial innovation as success in the market place is the one realmeasure of the success of the project.
3. Organisation for effective industrial innovation.
The preceding discussions will have highlighted the point that thereis more to effective industrial innovation than the establishment of awell equiped research laboratory staffed with competent people „
This is an essential requirement but unless the ability to "do"research is coupled with an equal ability to discern what best to do andan ability to extract profit from successful R and D work then effective
innovation is unlikely to occur.
Acceptance of this concept implies that the executive head of theresearch group must be recognised as one of the senior executives of thecompany and sit on the Board or Committee of Management. Only in thisway \tfill he have the organisational authority to ensure his researchgroup receives the co-operation of other divisions and have access tothe information he needs to formulate a research programme in the bestinterests of the company.
It also requires that the R and D group be fully integrated intothe company structure and it be recognised that they, as well as the moreoperational side of the company, have a responsibility for ensuring thecontinued profitability of the enterprise„ It is important that theR and D workers understand and accept this responsibility;,
Best results are achieved if the company is organised for innovationrather than R and D. This can be done either by giving the research groupthe marketing and development resources needed to progress an idea frominitial concept to sales in the market place or by setting up formalcommunications channels between independent marketing and R and D groups.
Most companies rely on the second method. It is an effective methodif the nature of the innovative process within the firm is well understoodby both marketing and R and D and both groups are committed to achievingsuccessful outcomes and feel a joint involvement to do soa
Few attempts have been made to group together R and D people and thosefrom marketing best able to contribute in goal setting and in exploitingresearch results but this seems to offer the best possibility for capital-ising on the greater enthusiasm and involvement generated within a teamof people xtfith a common purpose„
- 37 -
Introduction of a new product to the market is facilitated if theoriginal concept was soundly based. The more detailed the marketobjectives in terms of cost and properties desired at the commencementof the project the more efficient the R and D involvement can be. Itseems logical to recognise the mutual dependence of marketing and R andD in the new product area by adopting organisational forms that allowfree and unfettered interplay between them.
4 Conclusion
A clear distinction has been shown between innovation, the totalprocess by which a new idea or concept is davalQpuiil and put to profitableuse by the company and the narrower, implementive concept of appliedR and D that is more common to-day.
It is important, particularly in th"> new product area, for thisdifference to be recognised by both management and R and D workers.The patterns of innovation occurring within the firm should be analysedand the development activities organised to facilitate innovation ratherthan R and D alone .
Organisation for innovation in the new product area involves thee?'. .-ibl shment of a close rapport between marketing and R and D at theinception of a project and again in the final stages of the innovativeprocess when the product is introduced to the market.
The same general principles relating R and D to the total innova-tive process apply in process development and cost reduction activities.However, the sharing of a technological approach makes the transfer ofideas from R and D to production people less difficult than in the caseof nextf product development „
R and D management should take the initiative in assessing theapplicability of this wider concept of the research role in theirparticular firms and seeking the charges in organisational thinkingand structure needed to implement it0
5. References
1. "Project Score - Research and Development in Australia1968-69." Department of Science Report No, 5 AustralianGovernment Publication Service Canberra 1973.
2. WhittonW.I. Liversidge lecture to the 1969 ANZAAS Conference
3. Macmillan W.P. "Innovation in the Australian HardboardsIndustry" 1972 Australian Chemical Engineering ConferencePaper .

- 38 -
National Chemical Engineering Conference 1974
PROCESS INDUSTRIES IN AUSTRALIA IMPACT AND GROWTH
Surfers Paradise, Queensland
July 10 to 12th, 1974
"AMDEPHOS" - A CHEMICAL PROCESS FORDEPHOSPHORISATION OF IRON ORE
by
J . E - A . Gooden, W . M . Walker and R.J . Allen
S U M M A R Y
Australia has vast tonnages of iron ore which contains phosphorusin excess of present contract specifications; representative figures are0.15% P in the ore and a contract specification for a maximum annualaverage of 0.06% P in ore shipped to Japan. Where phosphorus exists iniron ores as a discrete mineral, e.g. apatite, or in a distinct phase, itmay be separable by physical methods. If such methods are not applicablesome chemical methods have been found to work on various ores, and theseare summarised in the paper.
The Australian ores studied contain phosphorus not as a discretemineral but diffusely distributed throughout the iron oxide so thatelectron-probe scanning simply shows a general high phosphorus level.Simple leaching is ineffective but a process (AMDEPHOS) has been developedthrough laboratory scale which has proved capable of reducing thephosphorus content of such ores to an acceptable level. The process isapplicable to fine ore, lump ore (in some cases as coarse as 30 mm) andpellets, and results on a number of ore samples are given. It is a two-stage process involving heat-treatment which causes the phosphorus tosegregate, followed by leaching, for which dilute acid and alkali aresuitable. Reagent consumption, regeneration of leachant, conceptual plantdesign and economics are outlined. The application of the process topellets is considered the most promising as the cost of dephosphorisationLS then partly borne by the pelletising process, and pellets, a higher-value commodity than lump ore, are the product. A modified process hasproved effective for a manganese ore.
Gooden, Walker and Allen Amdsl, Adelaide, SA.
- 39 -
1. INTRODUCTION
There are, in the Pilbara region in the north-west of Western Australiamassive tonnages of iron ore which contains phosphorus considerably in excessof contract specifications. Work on this problem at Amdel commenced in 1968when an established iron ore mining and exporting company engaged Amdel toundertake beneficiation testing on ore from a new exploration area. Thecompany's contract for sale of its ore to Japan limited the annual averagephosphorus content to 0.06% P whereas the ore in the new area contained anaverage of about 0.15% P. Such ore, if saleable, would be expected to attracta substantial penalty because of the general undesirability of phosphorus iniron and steel products. Technically it is not difficult to remove the excessivephosphorus during steel-making, but the inconvenience to the steel-maker in theface of a fairly abundant supply of low-phosphorus ores puts the seller of suchan ore at a disadvantage.
The work undertaken at Amdel in 1968 involved physical beneficiation, whichproved quite incapable of lowering the phosphorus content. Optical and micro-chemical methods failed to detect phosphate minerals in polished sections of theore, which consisted of grains of martite scattered through very fine-grainedgoethite, with some cavities containing clay. By electronprobe microanalysis,however, one grain of a calcium phosphate mineral less than 10 microns surroundedby clay was detected in one specimen, and examination of another specimenrevealed that1
"some patches of goethite contain small amounts of phosphorusestimated to be between 0.1 and 0=5% and rarely up to 1%.This is not concentrated in definite mineral grains but isdispersed throughout the goethite, and was probably adsorbedby hydrated iron oxide from phosphate-bearing solutions. Itis not uniformly distributed and much of the goethite showsno phosphorus above background interference. Phosphorus wasnot detected in any grains of martite or hematite."
A more detailed discussion of the form of occurrence of phosphorus inPilbara iron ores has been given recently by Graham2.
It was therefore suggested to the company early in 1969 that a preliminaryexamination be made of chemical methods of dephosphorisation. This was acceptedand this paper covers work carried out for the company between early 1969 and1972, as well as tests made on other ores for other companies.
2. REVIEW OF CHEMICAL METHODS USED FOR DEPHOSPHORTSATION OFIRON AND SIMILAR ORES
2.1 Acid-Leaching
2.1.1 Sulphuric Acid
Martin3 carried out laboratory leaching tests on iron ore concentratesfrom north-western Spain using various concentrations of H2SO^, HC1 and HN03.The ore was ground to minus 45 micrometers and the object was to reduce thephosphorus content from approximately 0.3% to less than 0.075%. The laboratorywork showed the feasibility of the method and a larger-scale study was planned.Engel and Heinen^ tried sulphuric acid but achieved more success with HCl andHN03 (see Sections 2.1.2 and 2.1.3). De la Riva del Brio5 used aqueous acid toleach phosphorus from iron ore. In a later patent6 to Foraco y Proyectos SA,sulphuric acid is stated to be the preferred reagent and the phosphorus is statedto occur in the form of apatite. Foraco y Proyectos, SA hold at least fiveSpanish patents in this field. Spanish patent 321,2317 describes treatment ofiron ores containing 0.3 to 0.7% P at minus 152 micrometers with concentrated

- Ho - - Hi
sulphuric acid in aqueous ore concentrations of 0.5 weight percent. Thesulphuric acid was regenerated. Spanish, patent 326, 612 8 describes theagitation-leaching of minus 152 micrometer ore in a 33% solids suspensionacidified to pH 1.6 with sulphuric acid. Superphosphates were recovered bycentrifuging the turbid supernate. Spanish patent 330, 6309 appears to covera continuous plant for carrying out the process and Spanish patents 334,043and 337, 72010'11 cover some further aspects.
Czechoslovakia apparently possesses some high-phosphorus, low-manganeseores whose hydrometallurgical treatment is discussed in one paper and threeCzech patents. Petlicka and Bastecky12 leached the ore with sulphuric acidto extract iron, manganese and phosphorus and recovered the phosphorus in anIon-exchange column. Their Czech patent 113,626 (Bastecky and Petlicka13)describes recovery of iron and manganese from the solutions by ion-exchange.Czech patent 115,320 (Hadacek et al.,1*) describes leaching with sulphuricacid and oxidation of the solution to precipitate FePO^. Czech patentl 15 , 529(Trencev et al.,15) describes sulphatising roasting or leaching followed byheating to 300-1, 000 °C to convert all phosphorus to insoluble iron phosphates.
Indian patent 67,188 (Deshpande l 6) covers leaching of minus 152 micrometersmanganese ore (0.58% P) with twice its volume of a solution containing 2%HzSOz,, 0.1% HN03. Grinding and leaching could be done simultaneously andthe final phosphorus content was 0.15% P.
Japa-.-'se patent 18,859 to Hitachi Metal Industries (Hirota and Nakamura17)describes moistening of the iron ore of average particle size approximately15? micrometers with 14% by weight of 10 weight percent H2SO<,. After 3 hoursthe ore was washed.
Baryshnikov1 B leached phosphorus from molybdenum concentrates, in whichit occurred to the extent of 0.24% P as apatite, with five to six parts of 2 -2.4% aqueous H2SO<, or HC1. Thirty minutes at 16 to 18°C was required for 95% Pextraction.
2.1.2 Hydrochloric Acid
In addition to the papers by Martin3 and Baryshnikov18 previously mentioned,Engel and Heinen'' leached an iron ore containing 0.56% P from Eureka County,Nevada, USA with acid, preferably HCl. Acid consumption to reduce the phosphoruscontent to approximately one-half was about 20 kg per tonne of ore.
2.1.3 Nitric Acid
and Kucher, Strelets and Lagunov,25 describe investigation of the effect ofparticle size of the sinter, and regeneration of the sodium carbonate.
i ci
'In addition to the paper by Martin , Lucia and Losada1' treated iron oreconcentrates containing 0.3 to 0.5% P with dilute HN03. By leaching at roomtemperature for 30 minutes the phosphorus content was reduced to 0.07%. Khoklovet al20 in the USSR treated roasted manganese ore pellets with 5 to 10% HN03 ata 1:1 solid : liquid ratio to reduce the phosphorus content. Engel and Heinen'1
also removed phosphorus from their iron ore with 5% HN03. Munekata21 roastedpyrite in the temperature range 500-900°C and leached the resulting iron oxidecalcine with 10-70% nitric acid to remove various non--ferrous metals and non-metals including phosphorus.
2^2 Roasting or Leaching jwath_ Alkali
O *"?
Pryashnikov in a USSR patent describes mixing of ground manganese orewith NaOH, drying and roasting at 600-700°C and then washing out silicon aridphosphorus impurities with water. Khuzik, Sasik and Kucher23 considered thatit was necessary to remove silica from manganese concentrates in order to removephosphorus, and accomplished this by roasting with Na20 (presumabJ_y in the formot Na2C03) at 870°C, and leaching the crushed sinter in hot water. Laterpublications from the same workers (Khitrik, Kucher, Rogachev and Lagunov,2*4;
2 6Akatov et al ' investigated sintering with soda at 850 to 950°C and
subsequently leaching with hot water, and also direct leaching with 40% NaOHat 120 to 140°C.
_2_LJ_ Roasting with Chloride Followed by Acid-Leaching
Feld, Franklin and Lampkin27 in US Patent 3,402,041 describe mixing aniron ore with 10% of the chloride of an alkali, alkaline earth, or several othermetals, roasting at 900°C and leaching with 50 kg/tonne of HCl or H2SO^ as 3.9co 5.2% solutions. Lid and CaCl2 gave the best results, and the inventorssuggest that useful results might be attained with as little as 5% chloride,20 kg acid/tonne and roasting at 500 to 1,200°C.
2.4 High-Temperature Solid-State Reduction
Since phosphorus is present as apatite to the extent of 0.8 to 1% P in someEgyptian ores (Aswan and Dabbah) Ezz and Shehata28 carried out a laboratory studyon the rate of reduction of apatite in hydrogen at 600 to 1,300°C. Si02 andA1203 enhanced reduction but CaO arid MgO retarded it. Iron and manganese oxidesdecreased the rate of phosphorus removal as the metals combined with thephosphorus.
Khvichiya and Lomadze29 noted that sintering of Kerch ores with coal partiallyvolatilised the arsenic and phosphorus contents. The best result, 38% As removaland 28% P removal, occurred with 30% coal at a final temperature of 1,100°C.
30Schwarz in a patent assigned to Inland Steel reports arsenic elimination
from iron ores from 0.04% down to 0.015% by heating at 1,000 to 1,100°C in a gasmixture containing 17 to 20% CO or more than 10% CO plus hydrogen. The treat-ment was still effective aven after pelletising the ore with 14% limestone flux.Mixing of 10% coal with the ore and heating to 1,100°C was also effective.Schwarz makes no mention of phosphorus which would be expected to behave in agenerally similar manner though elimination would be expected to be less efficient.
3. APPLICATION OF KNOWN METHODS TO PILBARA ORE
i 3 1Most of the methods listed in the preceding section were tried" on asample of the company's Pilbara ore. Leaching ground ore at 80°C with sulphuricacid, hydrochloric acid and. nitric acid (each at concentrations up to 1.0 N) andcitric acid, oxalic acid and sodium hydroxide (each at 2% by weight) was quiteineffective, as was roasting with 1-3% sodium carbonate or 1% sodium hydroxideat 500-800°C followed by leaching hot water. Heating with coal did not removephosphorus. Heating of ground are with sodium or magnesium chloride followedby acid leaching as patented by Feld et al27 was studied in detail, varyingheating temperature, salt addition and acid concentration. Under suitableconditions the phosphorus content of the ore tested was reduced from 0.12% P to0.05% P. However the addition of salt or some other halide before roastingmeans that only fairly finely-ground ore can be treated, a mixing step is required,corrosion is to be expected in the roaster flues as well as in the leachingequipment, and the cost of the halide must be added.
4. LABORATORY DEVELOPMENT OF THE "AMDEPHOS" PROCESS
4.1 Phosphorus Solubilisation Conditions
3 1Prior to the appearance of the work by Feld et al,27 a systematic study
was made of roasting ground Pilbara ore with small additions of sodium carbonate,and later sodium chloride (added as "salt-point liquor" from solar salt production)

sulphuric acid in aqueous ore concentrations of 0.5 weight percent. Thesulphuric acid was regenerated. Spanish patent 326,612 describes theagitation-leaching of minus 152 micrometer ore in a 33% solids suspensionacidified to pH 1.6 with sulphuric acid. Superphosphates were recovered bycentrifuging the turbid supernate. Spanish patent 330,6309 appears to covera continuous plant for carrying out the process and Spanish patents 334,043and 337,72010'11 cover some further aspects.
Czechoslovakia apparently possesses some high-phosphorus, low-manganeseores whose hydrometallurgical treatment is discussed in one paper and threeCzech patents. Petlicka and Bastecky12 leached the ore with sulphuric acidto extract iron, manganese and phosphorus and recovered the phosphorus in anion-exchange column. Their Czech patent 113,626 (Bastecky and Petlicka13)describes recovery of iron and manganese from the solutions by ion-exchange.Czech patent 115,320 (Hadacek et al.,14) describes leaching with sulphuricacid and oxidation of the solution to precipitate FePO<,. Czech patent 115,529(Trencev et al.,15) describes sulphatising roasting or leaching followed byheating to 300-1,000°C to convert all phosphorus to insoluble iron phosphates.
Indian patent 67,188 (Deshpande16) covers leaching of minus 152 micrometersmanganese ore (0.58% P) with twice its volume of a solution containing 2%H2SO^, 0.1% HN03. Grinding and leaching could be done simultaneously andthe final phosphorus content was 0.15% P.
Japanese patent 18,859 to Hitachi Metal Industries (Hirota and Nakamura )describes moistening of the iron ore of average particle size approximately152 micrometers with 14% by weight of 10 weight percent H2SO<,. After 3 hoursthe ore was washed.
j D
Baryshnikov leached phosphorus from molybdenum concentrates, in whichit occurred to the extent of 0.24% P as apatite, with five to six parts of 2 -2.4% aqueous H2SCU or HC1. Thirty minutes at 16 to 18°C was required for 95% Pextraction.
2.1.2 Hydrochloric Acid
.1 8In addition to the papers by Martin and Baryshnikov previously mentioned,Engel and Heinen4 leached an iron ore containing 0.56% P from Eureka County,Nevada, USA with acid, preferably HCl. Acid consumption to reduce the phosphoruscontent to approximately one-half was about 20 kg per tonne of ore.
2.1.3 Nitric Acid
1 9In addition to the paper by Martin , Lucia and Losada treated iron ore
concentrates containing 0.3 to 0.5% P with dilute HN03. By leaching at roomtemperature for 30 minutes the phosphorus content was reduced to 0.07%. Khoklovet al20 in the USSR treated roasted manganese ore pellets with 5 to 10% HN03 ata''1:1 solid : liquid ratio to reduce the phosphorus content. Engel and Heinen**also removed phosphorus from their iron ore with 5% HN03. Munekata21 roastedpyrite in the temperature range 500-900°C and leached the resulting iron oxidecalcine with 10-70% nitric acid to remove various non-ferrous metals and non-metals including phosphorus.
2.2 Roasting or Leaching with Alkali
n O
Pryashnikov in a USSR patent describes mixing of ground manganese orewith NaOH, drying and roasting at 600-700°C and then washing out silicon andphosphorus impurities with water. Khuzik, Sasik and Kucher23 considered thatit was necessary to remove silica from manganese concentrates in order to removephosphorus, and accomplished this by roasting with Na20 (presumably in the formof Na2C03) at 870°C, and leaching the crushed sinter in hot water. Laterpublications from the same workers (Khitrik, Kucher, Rogachev and Lagunov,
and Kucher, Strelets and Lagunov,25 describe investigation of the effect ofparticle size of the sinter, and regeneration of the sodium carbonate.
Akatov et al26 investigated sintering with soda at 850 to 950°C andsubsequently leaching with hot water, and also direct leaching with 40% NaOHat 120 to 140°C.
2.3 Roasting with Chloride Followed by Acid-Leaching
Feld, Franklin and Lampkin in US Patent 3,402,041 describe mixing aniron ore with 10% of the chloride of an alkali, alkaline earth, or several othermetals, roasting at 900°C and leaching with 50 kg/tonne of HCl or E2SOu as 3.9to 5.2% solutions. LiCl and CaCl2 gave the best results, and the inventorssuggest that useful results might be attained with as little as 5% chloride,20 kg acid/tonne and roasting at 500 to 1,200°C.
2.4 High-Temperature Solid-State Reduction
Since phosphorus is present as apatite to the extent of 0.8 to 1% P in someEgyptian ores (Aswan and Dabbah) Ezz and Shehata28 carried out a laboratory studyon the rate of reduction of apatite in hydrogen at 600 to 1,300°C. Si02 andA1203 enhanced reduction but CaO and MgO retarded it. Iron and manganese oxidesdecreased the rate of phosphorus removal as the metals combined with thephosphorus.
Khvichiya and Lomadze"29 noted that sintering of Kerch ores with coal partiallyvolatilised the arsenic and phosphorus contents. The best result, 38% As removaland 28% P removal, occurred with 30% coal at a final temperature of 1,100°C.
.30Schwarz in a patent assigned to Inland Steel reports arsenic elimination
from iron ores from 0.04% down to 0.015% by heating at 1,000 to 1,100°C in a gasmixture containing 17 to 20% CO or more than 10!".' CO plus hydrogen. The treat-ment was still effective even after pelletising the ore with 14% limestone flux.Mixing of 10% coal with the ore and heating to 1,100°C was also effective.Schwarz makes no mention of phosphorus which would be expected to behave in agenerally similar manner though elimination would be expected to be less efficient.
3. APPLICATION OF KNOWN METHODS TO PILBARA ORE
^ 1Most of the methods listed in the preceding section were tried on asample of the company's Pilbara ore. Leaching ground ore at 80°C with sulphuricacid, hydrochloric acid and nitric acid (each at concentrations up to 1.0 N_) andcitric acid, oxalic acid and sodium hydroxide (each at 2% by weight) was quiteineffective, as was roasting with 1-3% sodium carbonate or 1% sodium hydroxideat 500-800°C followed by leaching hot water. Heating with coal did not removephosphorus. Heating of ground are with sodium or magnesium chloride followedby acid leaching as patented by Feld et al27 was studied in detail, varyingheating temperature, salt addition and ?.cid concentration. Under suitableconditions the phosphorus content of tue ore tested was reduced from 0.12% P to0.05% P. However the addition of salt or some other halide before roastingmeans that only fairly finely-ground ore can be treated, a mixing step is required,corrosion is to be expected in the roaster flues as well as in the leachingequipment, and the cost of the halide must be added.
4. LABORATORY DEVELOPMENT OF THE "AMDEPHOS" PROCESS
4.1 Phosphorus Solubilisation Conditions
3 1
21* .)
Prior to the appearance of the work by Feld et al,27 a systematic study'was made of roasting ground Pilbara ore with small additions of sodium carbonate,and later sodium chloride (added as "salt-point liquor" from solar salt production)

In the presence of the sodium salts and a small amount of carbon, phosphoruswas converted Into a form insoluble in acid, so that the analytical attackhad to be changed to a fusion, or else analysis performed spectrographically.It was finally shown that, in a fairly elevated temperature range salt is notrequired for phosphorus solubilisation, and it actually hinders. The avoidanceof any reagent addition before roasting is a considerable simplification as itpermits lump ores to be treated (as exemplified in a later section). It wasfurthermore found that phosphorus could be dissolved from the heat-treated orenot only by dilute acid, but also by dilute alkali solutions viz sodium hydroxideand in some cases sodium carbonate solution. Figure 1 shows the results of aset of tests on a sample of iron ore pellets, heated at certain^temperaturesfor nominally 1 hour then leached in 0.5 N sulphuric acid at 60°C for 5 hours,or 0.5 N sodium hydroxide at 60°C for 5 hours, followed by water-washing and
drying.
4.2 Mechanism of Phosphorus Solubilisation
Methods for the study of the behaviour of the phosphorus at a level of0.1 - 0.2% P in iron ore are limited. To raise the level of phosphorussufficiently to study its behaviour by x-ray diffraction production of asynthetic very-high-phosphorus ore was resorted to. To a solution of 1016 gof ferric chloride in 3 litres of water was added a solution containing 37.1 gof ammonium dihydrogen phosphate, and the iron precipitated from the warmsolution by addition of excess ammonia solution. After heating and standingthe ferric hydroxide precipitate containing co-precipitated phosphate wasfiltered, washed with dilute ammonia solution and dried to give 529 g ofsynthetic very-high-phosphorus oiu designed to contain 2.0% P if all phosphoruswere co-precipitated (in fact the analysis was 1.74% P)- Batches were heatedto 1000°C alone, and with 4.5% sodium chloride. The unheated and heatedmaterials were examined by x-ray diffraction which showed the synthetic ore tobe amorphous and the heated ore to contain hematite, and detected sodium chloridein the appropriate sample, but did not detect any phosphorus minerals.
Electron-probe microanalysis was used to examine several pellets producedby tailing, with water alone, minus 152 micrometer Pilbara ore (the samematerial as was examined in its original form in the work reported in Section 1),drying, and firing to 1260°C. X-ray diffraction showed the iron in the firedpellets to be exclusively ct-Fe203 (hematite). On electron-probe examination"no phosphorus was detected in the hematite. Small blebs (1-3 microns)containing 5-10% P were found in the silica, associated with Si, Fe and someCa. The phosphorus content of these blebs may in fact be higher than statedas their size is too small for quantitative analysis"31.
It therefore appears that the Ooethite-martite-hematite suite present inthe original ore has been converted completely to crystalline hematite. Itappears that, due to dehydration and recrystallisation of the goethite, thephosphate which was originally diffusely distributed in it has been rejected fromthe hematite crystals into the interstitial gangue, where it has concentratedinto blebs. Either because of the chemical form of these phosphate blebs, orbecause the blebs are more accessible to the leaching solutions, they can be
substantially dissolved in acid.
4.3 Leaching Conditions and Reagent Consumption
Systematic tests32 were carried out, using firstly roasted ground ore andthen fired pellets, to establish satisfactory leaching reagents, concentrations,leaching temperature and time. Dissolution of phosphorus, and also of ironwere measured. Recycling of the leach solution was Investigated.
4.3.1 Acid-Leaching Process
In constant-acidity leaching of roasted ground ore using dilutesulphuric acid it proved necessary to use sulphuric acid of concentrationapproximately 0.2 N or greater for effective phosphorus removal, and a smallproportion of iron Capprox. 0.1% of the ore) xras leached in the first fewminutes. Phosphorus was reduced from 0.15% P in the fired ore to 0.04% Pin 0.1-0.5 hours and provided the acid concentration was maintained at lessthan approximately 1 N no further iron was leached, even up to 5 hours.Pellets required longer for phosphorus removal - of the order of 4-5 hoursto reach 0.05% P. Increased leaching temperature between 50°C and 90°Cdid not greatly affect phosphorus removal nor iron extraction with freshdilute sulphuric acid.
In examining the effect of recycling sulphuric acid leaching solutionsthe phenomenon of ferric phosphate precipitation was observed and investigated.The precipitation above a temperature between 70-90°C gives rise to twovariants in the acid-leaching Amdephos process - if leaching is carried outbelow 70°C the leachant can be recycled until iron and phosphate build up toquite high levels. If leaching is carried out above 90°C ferric phosphateprecipitates at much lower iron and phosphate concentrations and must beremoved in a separate vessel. The precipitation thus provides a dephosphatingstep for the leach solution.
Sulphuric acid consumption was determined in several ways, one being byusing a batch of leach liquor (originally 0.25 N sulphuric acid) with freshbatches of pellets until exhaustion of the leach liquor. By this means,using pellets fired at 1250°C for 0.5 hour, it was determined that 5 kg ofsulphuric acid is required per 1000 kg of pellets to lower the phosphorus contentfrom 0.163% P to 0.05% P. The leaching temperature was 60°C so that no ferricphosphate was re-precipitated. However, if a ferric phosphate precipitationstep is used to regenerate the solution the consumption of sulphuric acid isexpected to be goveVned by its loss in pellet-washing.
(Since completion of this work Lament et al33 have published an extensionof the work by Feld et al27 in which a phosphorus-containing ore was reduced,and in some cases reoxidised in the presence of added calcium chloride, followedby acid-leaching).
4.3.2 Alkali-Leaching Process
Sodium hydroxide solution at concentrations above about 0.2 N was shownt:o be as effective a leachant as sulphuric acid. Withthis leachant iron is not attacked but silica and alumina are. For the company'sore the sodium hydroxide consumption was determined, by repeated leaching untilexhaustion of the leachant, to be 6.7 kg of NaOH per 1000 kg of pellets. Ithas been shown to be technically feasible to at least partially regenerate thesodium hydroxide leachant vi:h line.
4.3.3 Pellet Characteristics
The above discussion has concentrated upon the solution but it is clearthat the behaviour and conditon of the pellets is just as vital. It has beenshown that while very-fine grinding of the ore produces very strong pellets,these pellets are less readily leached. Pellet strength is of great importanceas specifications are set for this property. Washing of the pellets afterleaching is necessary to remove either sulphur (from the sulphuric-acid leachedpellets) or sodium (from the alkali-leaching process) as well as the phosphorusin the solution trapped in the pores. All of these aspects have been investigatedand seme further piloting is required.

4.4 Phosphorus Solubilisatlon Tests on Various Pilbara Ores
Laboratory tests have been carried out on lump ores and pellets for anumber of iron-ore exploration and exporting companies. The materials are simplydesignated as V-Z by request of the companies who have kindly agreed to publicationof these results.
Pellets V-l were balled from ore ground to a surface area of 2000 cm2/g (Blaine)and fired at 1250°C for 30 mins. Leaching with 0.5 N sulphuric acid at 60°Creduced the phosphorus content from 0.155% P to 0.02% P. Leaching with 0.5 Nsodium hydroxide at 60°C reduced the phosphorus content to 0.05% P.
Pellets V-2 were balled from ore ground to 4500 cm2/g (Blaine) and fired forvarious times at a range of temperatures. After firing for 15 minutes at 1200°C,0.5 N sulphuric acid at 90°C reduced the phosphorus content from 0.150% P to0.035% P and 0.5 H sodium hydroxide at 90°C achieved 0.055% P.
Pellets W-l were produced from "A-fines". The phosphorus content was reducedby acid-leaching from 0.104% P to 0.072% P.
Pellets W-2 were produced from "B-fines". The phosphorus content was reduced"from 0. 125% P to 0.026% P by acid-leaching.
Pellets W-3 were produced from "A lump plus fines". The phosphorus content wasreduced by~~acid-leaching from 0.112% P to 0.036% P.
For all these W-ores acid leaching was much more effective than alkali.
Pellets X-l were produced by stage grinding the ore to minus 152 micrometers,the Blaine surface area being measured at 2195 cm2/g, balling and firing. Pelletsfired for 1 hour at 1300°C were dephosphorised by alkali leaching from 0.168% Pto 0.044% P. Acid leaching was less effective on this ore.
Lump Ore X-2 was treated in two size fractions -30 mm +19 mm and -19 mm +13mm. Afterliring at 1300°C for 15 mins, acid leaching (which was more effective on thisore than was alkali) dephosphorised the smaller size fraction from 0.168% P to0.053% P. The larger size fraction was dephosphorised from 0.160% P to 0.082% P.
Pellets Y-l were balled from drill cuttings after grinding to 100% mvaus 152micrometers. The analysis was 0.23% P. Firing at 1200°C for 10 minutesfollowed by acid leaching reduced the phosphorus content from 0.26% P to 0.05% P.
Lump Ore Fractions Z arose from two test pits.
Size FractionTest Pit Interval Treated Before firing After firing After leaching
Phosphorus Content % j
mm
1
1
4
4
4
11-13
8-10
4- 7
8-11
6- 7
1- 5
-30 +19-19 +13-13 + 6
-19 + 6
-19 + 6
-19 + 6
-19 + 6
-19 + 6
0.080,090.10
0.09
0.07
0.105
0.145
0.085
0.11
0.09
0.135
0.215
0.095
0.0350.0350.025
0.045
0.03
0.025
0.055
0.045
The phosphorus content of all eight lump samples, including the coarsestfraction, after heating to 1200°C for 30 mins and leaching with 0.5 N sulphuricacid at 90°C for 5 hours was reduced below 0.06% P.
5. COMMERCIAL IMPLEMENTATION OF THE "AMDEPHOS" PROCESS
5.1 Conceptual Plant Design
Four variants of the process have been outlined, acid-leaching with andwithout regeneration of leachant, and alkali-leaching with and without regeneratiotof leachant. Figure 2 shows a schematic flowsheet for a percolation leachsystem which could be used for the process. Each vessel would in turn be filledwith pellets (estimated time 2 hours), leached (5 hours), washed (2 hours) anddrained and emptied (2 hours). Allowing an additional 1 hour for change-overlosses, total cycle time would be 12 hours, and for a total throughput of 1 x 10⁶
tpa pellets each vessel would be about 180 m3 volume. For an acid system,materials of construction would be rubber-lined steel, while carbon steel wouldbe adequate for an alkali system. No heat need be added to the system otherthan the pellets cooled to about 120°C. After leaching, the spent acid wouldbe returned to storage for make-up with fresh acid or for regeneration. Forno regeneration, apart from the acid consumed (0.5 T tf2SO<, per 100 T pellets),the only acid lost from the system would be that retained by the porous pellets(0.25 T HzSOn per 100 T pellets), the pellets containing about 10% by weight ofliquor. Since only 10% of the solution is lost during each leach, the remainderbeing recycled, the iron and phosphorus in solution will build up to an equilibriumlevel. Providing the temperature is not greater than 70°C, the experimental testshave shown that no ferric phosphate will precipitate at this equilibrium level.
5.2 Process Economics
An order-of-magnitude cost study was made for a plant treating 1 x 10⁶ tpapellets. The cost of pallatising or induration was not included, it beingconsidered that the premium price obtained for pellets adequately covered thisexpense.
For an acid system the total capital cost was estimated as $1.4 x 10⁶, thisbeing made up as follows:
Item
Leach TanksPumpsWeak acid storageCone, acid handlingConveyors
Installed Cost $
940,00088,000105,00070,000158,000
$1,361,000
The operating costs were estimated as follows:
Acid
0.75 T per 100 T pellets @ $35/T
Power
120 kw @ 2c/kwh
Labour
1 man/shift @ $83000 each
Cost $ pa
263,000
28,000
32,000

Overheads
assumed as twice the labour costs
Depreciation
assumed as 8% of total capital pa.
Maintenance
assumed as 3% of total capital pa.
Insurance etc
assumed as 1% of total capital pa.
Total operating costs
Cost $ pa
64,000
112,000
42,000
14,000
$555,000 pa.
i.e. a total treatment cost of 56c per tonne of product.
The major cost is seen to be that for the acid supply. The acid requirementscould be reduced to about 1/3 of the above level by operating a thermal regeneratesystem where the spent acid is heated to 90°C causing ferric phosphate toprecipitate, filtering and cooling before ce-use. The additional capital costfor such a regeneration system is estimated at $0.7 x 10⁶. We therefore findthe additional operating costs for regeneration to be:
on
Steam @ $3 per 1000 kgCooling water @ $3.3 per 100Depreciation @ 8%Maintenance and Insurance
Total additional expense
22,00011,00056,00028,000
$117,000 pa.
This has to be balanced against the savings in acid supply of $175,000 pa.
Hence with acid regeneration, the total operating costs become $497,000 pa.i.e. a total treatment cost of 50c per tonne of product*.
6. FUTURE ROLE OF THE AMDEPHOS PROCESS
As can be seen from the previous section, the Amdephos process is mostlikely to be economically justifiable when the firing process can partly orwholly be debited to another operation. For example the firing of pellets isnecessary for their induration, as well as for phosphorus solubilisation. Inthe case of a goethitic lump ore for which heating results in a considerableincrease in iron content, the cost of firing could be shared between upgradingand dephosphorisation. The possible concomitant removal of other impuritiesalso warrants consideration.
Application to ores of other metals
Amdel has examined the application of the process to manganese ores. SeveralAustralian ores have been shown to have diffuse distribution of phosphorus at anundesirably high level. One ore has been tested and while the behaviour isdifferent from iron ores, two alternative variants of the Amdephos process have
* This is approximately the magnitude of the penalty attributable to an 0.15% Piron ore.
proved effective. A patent application has been lodge '
7. ACKNOWLEDGEMENTS
X-ray diffraction measurements were made by Dr Roger Brown, and electron-probe microanalysis by Peter Schultz. Much of the chemical laboratory workwas carried out by Ulrich Heinzle and Tony Potts. The permission of our clientsand of the Director of Amdel to publish this work is gratefully acknowledged.
8, REFERENCES
1. D'ROZARIO, H.L. and VODIC, P.A. Amdel Report 650 (Sept. 1969).*
2. GRAHAM, J. Proc. Australas. Inst. Min. Metall. No. 246, 41-42, (June 1973).
3. MARTIN, A.L. Rev. Met. (Madrid) 2_(4) 318-320, (1966).
4. ENGEL, A.L. and HEINEN, H.J. US Bur. Mines, Rept-Invest. No. 5449, (1959).
5. DE LA RIVA DEL BRIO, R. Bol. Geol. Minero .79(1) 17-20, (1968).
6. DE LA RIVA DEL BRIO, R. Canadian 852,673 (1970), (to Foraco y Proyectos SA).
7. FORACO Y PROYECTOS SA Spanish 321,231 (1965).
8. FORACO Y PROYECTOS SA Spanish 326,612 (1967).
9. FORACO Y PROYECTOS SA Spanish 330,630 (1967).
10. FORACO Y PROYECTOS SA Spanish 334,043 (1967).
11. FORACO Y PROYECTOS SA Spanish 337,720 (1968).
12. PETLICKA, J. and BASTECKY, V. Hutnicke Listy JL9_(2) 117-122, (1964).
13. BASTECKY, V. and PETLICKA, J. Czech 113,626, (1965).
14. HADACEK, B., STRUBL, R., RIHA, V., KLOC, K., VESELY, V., BASTECKY, V. andPETLICKA, J. Czech 115,320, (1965).
15. TRENCEV, K. , POKORNY, F. , KUCERA, R. andNOVOTNY, L. Czech 115,529, (1965).
16. DESHPANDE, P.M. Indian 67,188, (1959).
17. HIROTA, H. and NAKAMURA, N. Japan 18,859, (1962).
18. BARYSHNIKOV, F.A. Izvest. Sibir. Otdel. Akad. Nauk S.S.S.R. No. 2, 142-4(1959).
19. LUCIA, J.M. and LOSADA, C. Rev. Met. (Madrid) 2_(1) 42-55, (1966).
20. KHOKHLOV, D.G., BESPROZVANNYKH, L.S., KURUMCHIN, K.A., GUSHGHINA, G.G. andIZMODENOV, A.I. U.S.S.R. 232,988, (1968).
21. MUNEKATA, E., SUEHIRO, K. and KOBAYASHI, T. US 3,232,744, (1966).
22. PRYANISHNIKOV, S.S. U.S.S.R. 75,188, (1958).
23. KHUZIK, S.I., SASIK, M.I. and KUCHERA.S. Corn. Zh. (9) 66-69, (1966).
24. KHITRIK, S.I., KUCHER, A.G., ROGACHEV, I.P. and LAGUNOV, Y.V. Met. Koksokhim.No. 11, 80-84, 1968.
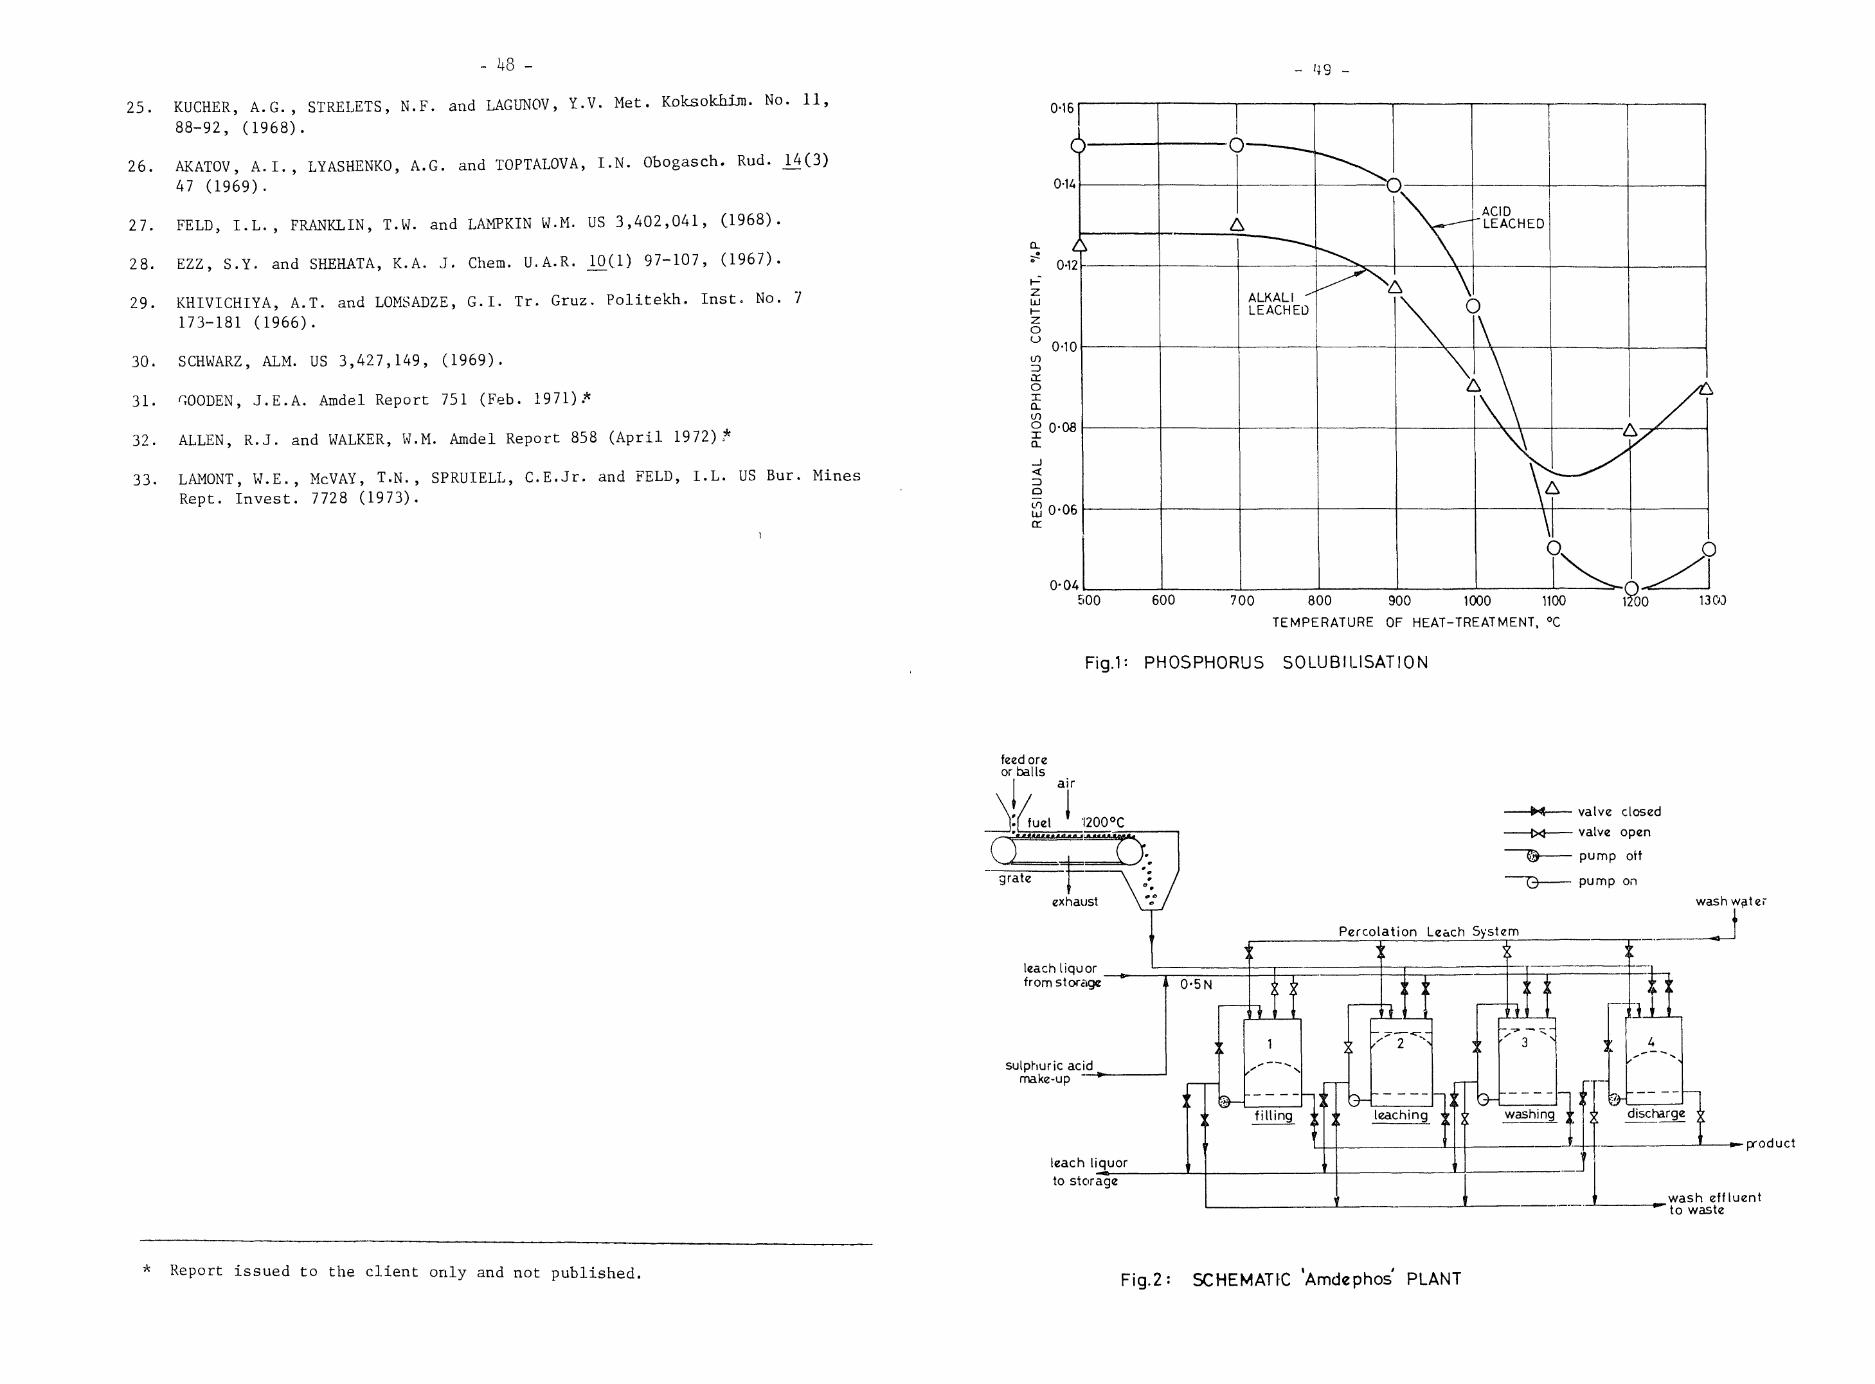
'49 -
25. KUCHER, A.G., STRELETS, N.F. and LAGUNOV, Y.V. Met. Koksokhiro. No. 11,
88-92, (1968).
26. AKATOV, A.I., LYASHENKO, A.G. and TOPTALOVA, I.N. Obogasch. Rud. L4(3)47 (1969).
27. FELD, I.L., FRANKLIN, T.W. and LAMPKIN W.M. US 3,402,041, (1968).
28. EZZ, S.Y. and SHEHATA, K.A. J. Chem. U.A.R. _10(1) 97-107, (1967).
29. KHIVICHIYA, A.T. and LOMSADZE, G.I. Tr. Gruz. Politekh. Inst. No. 7173-181 (1966).
30. SCHWARZ, ALM. US 3,427,149, (1969).
31. GOODEN, J.E.A. Amdel Report 751 (Feb. 1971).*
32. ALLEN, R.J. and WALKER, W.M. Amdel Report 858 (April 1972),*
33. LAMONT, W.E., McVAY, T.N. , SPRUIELL, C.E.Jr. and FELD, I.L. US Bur. MinesRept. Invest. 7728 (1973).
0-16
0-04EiOO 600 700 800 900 1000 1100
TEMPERATURE OF HEAT-TREATMENT, °C
1300
Fig.1: PHOSPHORUS SOLUBILISATION
* Report issued to the client only and not published.
feed oreor balls
air
]'[ fuel ' 1200°C
leach liquorfrom storage
valve closedvalve open
pump off
pump on
Percolation Leach System
T"
sulphuric acidmake-up *"
wash water
J
productleach liquorto storage
wash eff luentto waste
Fig.2: SCHEMATIC Amdephos PLANT

National Chemical Engineering Conference 19741. INTRODUCTION
PROCESS INDUSTRIES IN AUSTRALIA IMPACT AND GROWTH
Surfers Paradise, Queensland
July 10 to 12th, 1974
A NEW PROCESS FOR THE PRODUCTION OF SYNTHETICBATTERY GRADE MANGANESE DIOXIDE
by
1 2 1 1P.H. Scaife , D . A . J . Swinkels , R .K.C. Ward andJ .E. Lewis
SUMMARY
BHP has under development a novel chlorideprocess route to battery grade manganese dioxide fromdioxide ores such as those from Groote Eylandt.
The process is cyclic and requires only makeup quantities of reagents. It consists of leaching inhydrochloric acid, purification and chemical oxidation.The spent liquor is thermally hydrolyzed to regeneratethe main reagents, hydrochloric acid and magnesia.
General process conditions and productquality are discussed.
In 1965 BHP was granted the lease of a major manganese resourceon Groote Eylandt. Soon after the granting of the leases a concentrator wasestablished and the ore mined for metallurgical use. For metallurgical gradeore there are specifications on both chemical composition and size o > materialand a portion of the product from the concentrator is material which is too fineto be acceptable as a feed to electric furnaces used in ferro-manganeseproduction. As a result, the Company's Central Research Laboratoriesundertook a program to investigate other uses for these fines, in particular, toexamine means of processing the fines.
The principal use of manganese is as an alloying agent, primarily insteelmaking where it is added in the form of a ferro-manganese alloy. A smallamount of high purity manganese metal i& also used in very low carbon specialtysteels e .g. , the 200 stainless steel series, as well as in non ferrous alloys,most notably aluminium. More generally, manganese finds application in avariety of areas ranging from fertilizers to catalysts. The largest chemical useof manganese ores is battery grade MnOr>, world sales of which are of the orderof $30M p. a. As this material is produced from manganese in solution, orefines represent an ideal feed to such a process. One of the results of theinvestigation of alternative uses for Groote Eylandt fines, has been thedevelopment of a new chemical process to produce battery active MnO2 for useas the cathode in a conventional Leclanche dry cell,, This process is the subjectof the present paper.
At this point it is wortn noting that, since the ore is basically MnO9,as is the cathode of the Leclanche cell, a change of crystal structure andparticle morphology, together with some reduction of impurities present in theore, are the only changes required to produce material for battery use. Batteryactivity is determined by an ill defined combination of crystal structure, extentof rion stoichiometric composition and bound water, porosity, particle shape,surface area and surface groups and adsorption characteristics. Crystalstructure, however, appears to be the most important characteristic, the gammarho structure being the most desirable^. The control of surface groups, densityand impurity contents implies a solution process for manufacture, and sincethere is no overall change in the oxidation state of manganese, only a smallamount of oxidant, in either chemical or electrochemical form, is required.
2. CURRENT TECHNOLOGY
These are:There are at nresent only two types of commercial process,
1. BHP Central Research Laboratories, Shortland, N . S . W . , 2307.2. Present Address: Orbital Engine Company Pty. Ltd., Morley, W . A . , 6062.
(i) Electrolytic deposition,
and (ii) Manganese carbonate oxidation.
2. 1 Standard Electrolytic Process
Figure 1 .The standard electrolytic process is shown schematically in

GRINDING / CLASSIFYING
REDUCTION ROASTING
E-UP
— — R E D U C T A N T(OIL.CARBON, ETC.)
LEACHING
NEUTRALISATION/FILTRATION
(NH,J SULPHIDE PURIFICATION
-F»(OH)3.SiOj,AljCaSO;
TO WASTE.
-SULPHIDE MUDTO WASTE
ELECTROLYSIS
PRODUCT FINISHING |
BATTERV GRADE
MnO,
FIG. 1Conventional Electrolytic ManganeseDioxide Process.sulphides. The purified electrolyte isdioxide (EMD) by the reaction
The feed to this processcan be either manganese carbonateor manganese dioxide. Since MnO2
does not react readily withsulphuric acid, it must first bereduced to manganese oxide (MnO)which is readily dissolved.Manganese carbonate ore has theadvantage of being directly solubleand thus does not require thereduction roasting step. However,MnCO3 ores are invariably of lowergrade than MnO2 ores and containsignificant quantities of deleteriousimpurities. The manganesesulphate solution is purified byraising the pH to drop out iron, andthe small quantities of silica andalumina dissolved in leaching.; Theiron hydroxide precipitatescavenges a number of deleteriousimpurities (such as As) but asignificant portion of the basemetals remain in solution. Theseare removed by a further purificationstep where a sulphide source isadded to precipitate base metal
then electrolyzed to produce manganese
Mn2+ + 2H 2 O + 4H + 2e . (1
During electrolysis acid is generated and the stripped electrolyte is returned tothe leach stage to dissolve more ore. Approximately 80% of all syntheticmanganese dioxide is produced by this process .
2. 2 Chemical Processing - Oxidation of Manganese Carbonate
Manganese Chemicals Corporation U . S . A . were the first to operatea commercial process of this type. The Belgium Company SEDEMA arecurrently producing Chemical Manganese Dioxide (CMD) via this process andrecently (1970) Japan Metals and Chemical Company were reported to haveconsidered producing CMD with a variant of the process used by ManganeseChemicals Corporation .
The process proposed by Japan Metals and Chemical Company isshown schematically in Figure 2 .
In this process the MnO2 is first reduced by SO?. The MnO isdissolved in sulphuric acid, purified as in the standard electrolytic process anda MnCO3 precipitate produced using NH3 and CO9. The precipitate is then
- 53 -
oxidized by thermal decomposition and the MnO? product purified by furtherleaching and washing.
MnO,
GRINDING CLASSIFYING
LEACHING
PURIFICATION / FILTRATION
to waste
PRECIPITATION
SO,
CaO
co2NH,
FILTRATION
PRODUCT FORMING(ROASTING )
PRODUCT FINISHING
BATTERY GRADEMnO-,
FIG. 2
Commercial Chemical ManganeseDioxide Process (CarbonateDecomposition)
Many of the reactants arerecycled in this process. For example,ammonia is recovered from theammonium sulphate by treatment withlime, producing calcium sulphate as by-product. In addition, by roasting ihecalcium sulphate, sulphur dioxide isregenerated for the dissolution step. Thecarbon dioxide in the manganese carbonateprecipitation step is obtained as a by-product to lime production from limestonecalcining.
3. BHP CMP PROCESS
3.1 Process Outline
In contrast to the above twoprocesses, which are sulphate based,the BHP process is a chloride basedprocess.
The BHP process flowsheet isshown schematically in Figure 3 .
is lightly ground (wet) to around 100% -0. 5mm. The slurriedore is then fed to a glass-lined steel leach vessel and reacted with a mixture ofhydrochloric acid and an inert-metal chloride at a temperature of around 90according to the equation,
C
MnO 4HC1 MnC + C19 + 2H90£* Ci
- . . ( 2 )
Inert chlorides are defined in this context as soluble chlorides which,in themselves, do not appreciably leach manganese-containing materials such asmanganese dioxide ores. The addition of inert chlorides during the hydrochloricacid leaching of the ore greatly increases the leaching ra+e and amount of Mnextraction as illustrated in Figure 4. The base conditions for the experimentsshown in Figure 4 were 100 g, -30.+60 (BSS mesh) MnO2 ore leached with 5 MHC1 at 80°C in a well stirred vessel. The four curves show the %Mn extractedv's time for four different levels of chloride ion concentration namely 5 g ions / 1(no added chlorides); 7, 8 and 9 g ions / 1 for curves A, B, C and D respectively.In these experiments the chloride was added as magnesium chloride. The factthat equation (2) can be so readily reversed, together with the apparentequilibrium limitation in the extraction of manganese from the ore, suggeststhat the high chloride ion level is displacing the equilibrium.
Chlorine generated during the leach cycle is collected for subsequentuse. It is envisaged that the chlorine will not be dried, but stored wet prior touse in the precipitation step.

- 55 -
Mn02 ORE
LEACHING
Mn0
HCI
PURIFICATION
(BY pH ADJUSTMENT)
CHLORINE
-WASTE SOLIDS
REGENERATION
MgCI2*H20—MgO*2HCI
PRECIPITATION
2HCUMgO
MgO
SPENT SOLUTION (MgCI2)
PRODUCT Mn00
is carried out by adding magnesia whilst the solution is hot with the result thatthe iron is precipitated as FeOOH which has the advantage of being more readilyfilterable than Fe(OH)3 normally produced at low temperatures. Depending onthe purity of the ore feed and the requirements of the final product a furtherpurification step may be necessary to remove heavy metals as sulphides.However, with Groote Eylandt ore this is unnecessary.
The pH of the purified leach solution is then acidified to give aprecipitation solution pH of around 1-2. A carbon seed is added, and the leachreaction reversed by passing chlorine (generated in the leaching step) into thesolution. The pH is maintained in the region of 1 . 0 - 2 . 0 by neutralizing the acidgenerated in the reaction by the addition of magnesia. This step is the oasis ofto
a patent by the Dow Chemical Corporation .
After adjustment of the pH in the precipitation to pH 4 - 5 , productMnOp is filtered, washed, dried and bagged.
The spent solution consists mainly of magnesium chloride with asmall amount residual unreacted manganese chloride, the major impuritiesremaining being alkalis. The spent solution is passed to a regeneration stagewhere the magnesia for pH control and the acid for leaching are produced byhigh temperature hydrolysis in a spray, or fluid bed, roaster by the followingreactions
FIG. 3BHP Chemical Manganese Dioxide Process
100
80
60 - /X
UJ
I 40
20 >
t
-TD
h _ —-r^-ft "^ & Ct- D
/ // la ,I,' /I I t./
ff-
20 40 60 80 100 120 140 160 180Tim? (mins)
FIG. 4Effect of Chloride Ion on Leaching of Manganese Dioxide Ores
A variety of metal ions are also leached from the ore and it isnecessary to remove many of these before precipitation of the product MnO9.Barium is first removed by precipitation as the sulphate. A number of theminor nuisance elements are readily removed by raising the pH to around 4 toprecipitate iron which scavenges these ions from solution. This pH adjustment
MgCl H20 MgO + 2 HCI . . . ( 3 )
the process is therefore completely cyclic and only involves make up amounts ofchemicals. The alkali impurities in the feed to the spray roaster pass throughunreacted and exit the cycle with the wash water from the washing of themagnesia. The residual manganese remaining in the feed to the spray roasteris hydrolysed to Mn9Oo and thus no manganese exits the plant with the magnesiawash solution.
The major process inputs are Mn(X ore, make up acid or MgCl? (thelatter being an ideal make up, since it generates both HCI and MgO), and energy(as electric power and fuel oil or natural gas). The output is product MnO? anda small quantity of solid waste. The only liquid waste should be from washingsand minimal pollution problems should result as the impurity in the magnesiawash waters will be small quantities of alkalis and alkaline earths. There shouldbe essentially no manganese in these solutions. .
3. 2 Advantages of BHP Process
The advantages of the BHP process compared to the electrolyticprocess are several fold.
1. The plant requires significantly less labour than aconventional electrolytic plant. It also lends itself toextensive automation and does not include labourintensive operations, e. g. removal of MnX^ fromanodes, as in the conventional process.
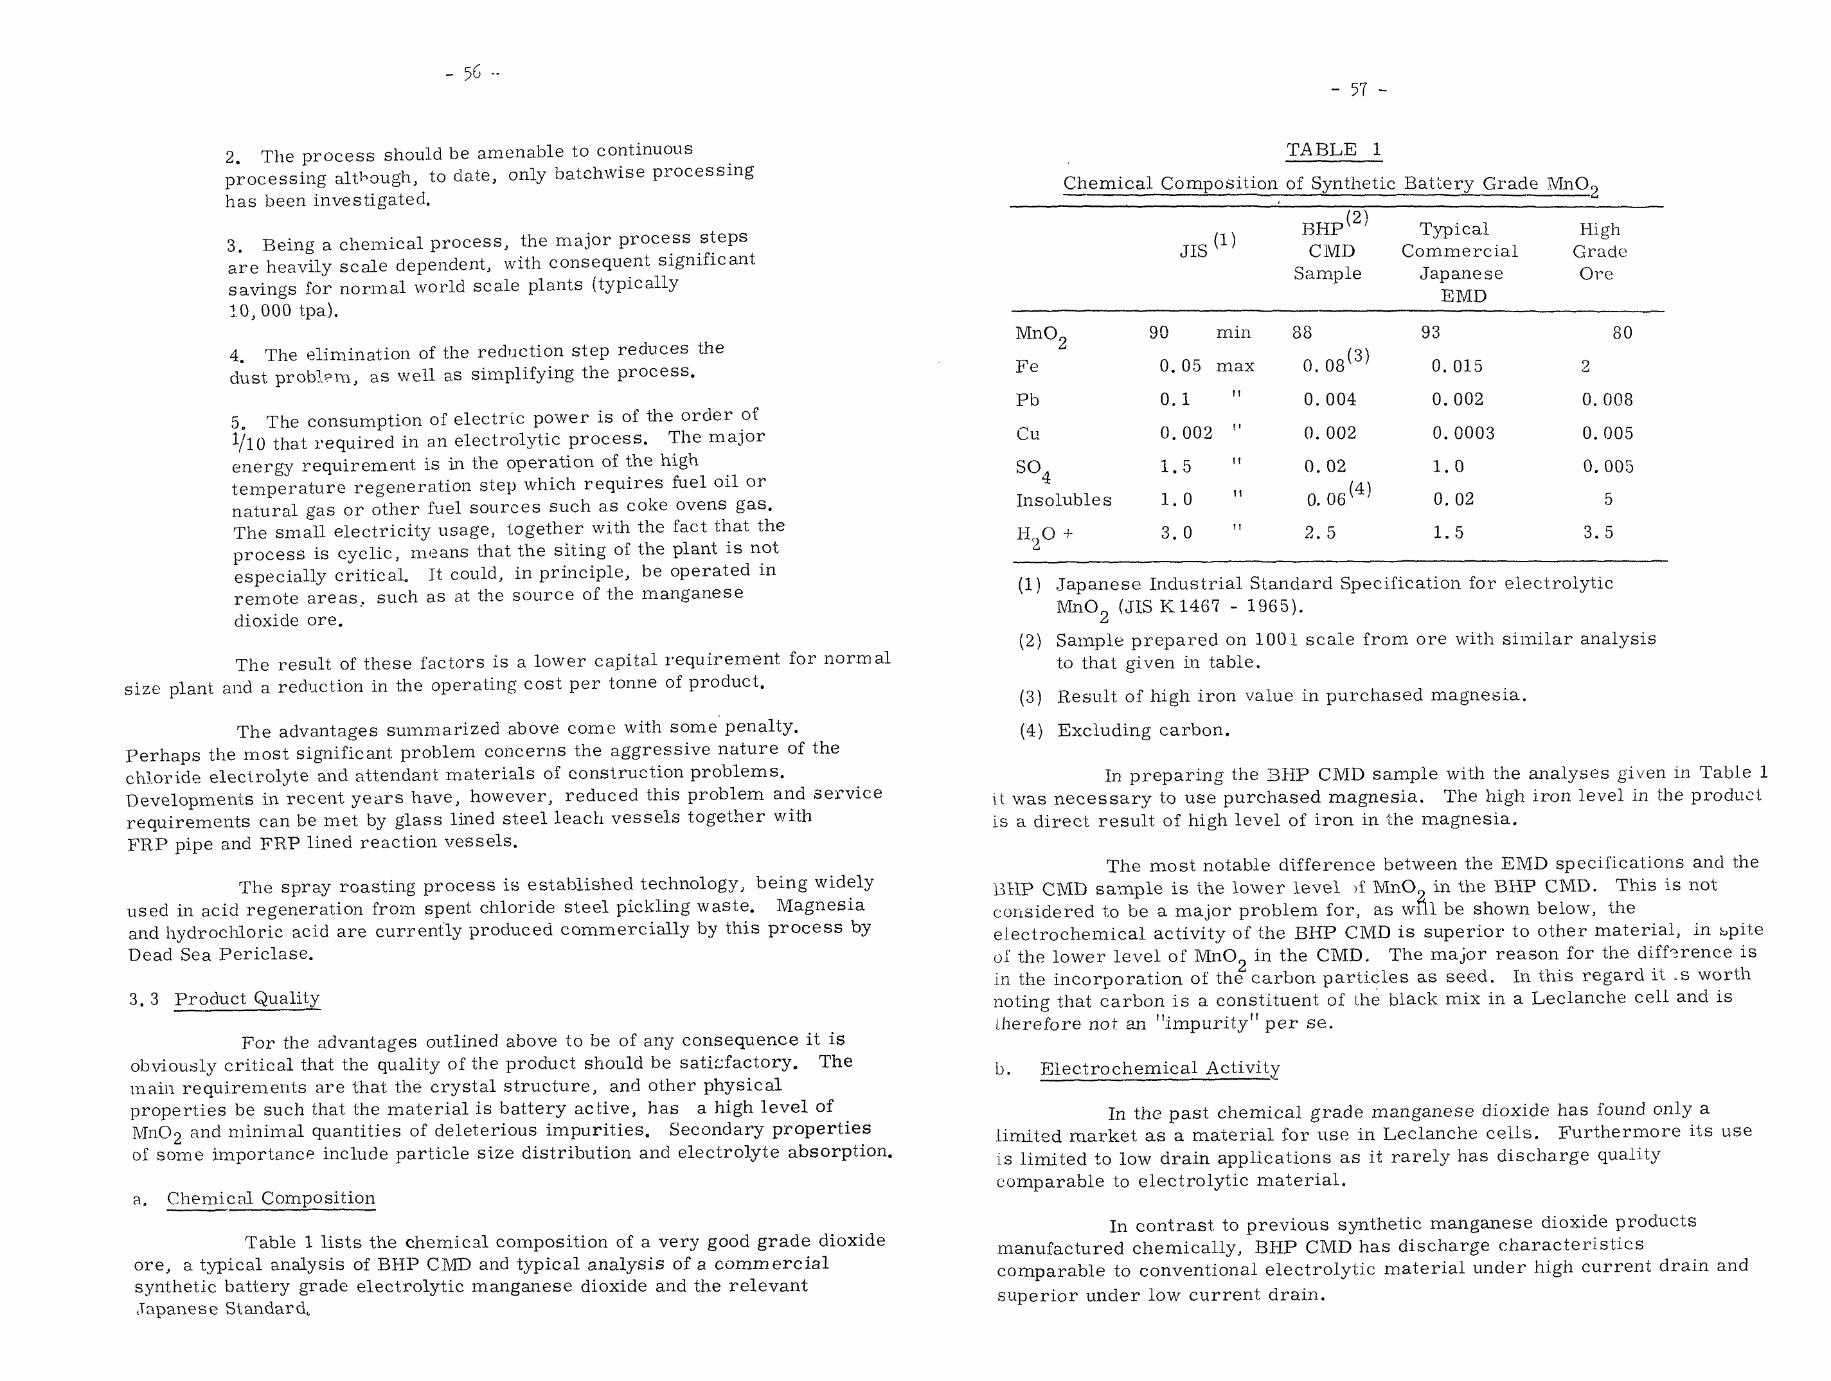
- 57 -
2. The process should be amenable to continuousprocessing although, to date, only batchwise processinghas been investigated.
3. Being a chemical process, the major process stepsare heavily scale dependent, with consequent significantsavings for normal world scale plants (typically10,000 tpa).
4. The elimination of the reduction step reduces thedust problem, as well as simplifying the process.
5. The consumption of electric power is of the order ofVlO that required in an electrolytic process. The majorenergy requirement is in the operation of the hightemperature regeneration step which requires fuel oil ornatural gas or other fuel sources such as coke ovens gas.The small electricity usage, together with the fact that theprocess is cyclic, means that the siting of the plant is notespecially critical. It could, in principle, be operated inremote areas, such as at the source of the manganesedioxide ore.
The result of these factors is a lower capital requirement for normalsize plant and a reduction in the operating cost per tonne of product.
The advantages summarized above come with some penalty.Perhaps the most significant problem concerns the aggressive nature of thechloride electrolyte and attendant materials of construction problems.Developments in recent years have, however, reduced this problem and servicerequirements can be met by glass lined steel leach vessels together withFRP pipe and FRP lined reaction vessels.
The spray roasting process is established technology, being widelyused in acid regeneration from spent chloride steel pickling waste. Magnesiaand hydrochloric acid are currently produced commercially by this process byDead Sea Periclase.
3. 3 Product Quality
For the advantages outlined above to be of any consequence it isobviously critical that the quality of the product should be saticfactory. Themain requirements are that the crystal structure, and other physicalproperties be such that the material is battery active, has a high level ofMnO2 and minimal quantities of deleterious impurities. Secondary propertiesof some importance include particle size distribution and electrolyte absorption.
a. Chemical Composition
Table 1 lists the chemical composition of a very good grade dioxideore, a typical analysis of BHP CMD and typical analysis of a commercialsynthetic battery grade electrolytic manganese dioxide and the relevantJapanese Standard,
TABLE 1
Chemical Composition of Synthetic Battery Grade MnO,
BHP(2)
JISU ) CMDSample
MnO0Li
Fe
Pb
Cu
so4
Insolubles
H20 +
90
0.
0.
0.
1.
1.
3.
min
05 max
1
002 "
5
0
0
88
0.
0.
0.
0.
0.
2.
08 (3>
004
002
02
06< 4>
5
TypicalCommercial
JapaneseEMD
93
0.
0.
0.
1.
0.
1.
015
002
0003
0
02
5
HighGradeOre
2
0.
0.
0.
3.
80
008
005
005
5
5
(1) Japanese Industrial Standard Specification for electrolyticMnO (JIS K1467 - 1965).
(2) Sample prepared on 1001 scale from ore with similar analysisto that given in table.
(3) Result of high iron value in purchased magnesia.
(4) Excluding carbon.
In preparing the BHP CMD sample with the analyses given in Table 1it was necessary to use purchased magnesia. The high iron level in the productis a direct result of high level of iron in the magnesia.
The most notable difference between the EMD specifications and theBHP CMD sample is the lower level >f MnO^ in the BHP CMD. This is notconsidered to be a major problem for, as wul be shown below, theelectrochemical activity of the BHP CMD is superior to other material, in bpiteof the lower level of MnO2 in the CM.D, The major reason for the difference isin the incorporation of the carbon particles as seed. In this regard it ,s worthnoting that carbon is a constituent of the black mix in a Leclanche cell and istherefore not an "impurity" per se.
b. Electrochemical Activity
In the past chemical grade manganese dioxide has found only alimited market as a material for use in Leclanche cells. Furthermore its useis limited to low drain applications as it rarely has discharge qualitycomparable to electrolytic material.
In contrast, to previous synthetic manganese dioxide productsmanufactured chemically, BHP CMD has discharge characteristicscomparable to conventional electrolytic material under high current drain andsuperior under low current drain.

- 59 -
Battery manufacturers are loath to accept any physical tests as ameasure of the quality of a new material, preferring instead to obtain a sample,prepare a batch of batteries and test these. Recently, however, an instrument,known as the Pulse Galvanostatic Analyser6, has been developed by the SouthAfrican CSIR which permits the accurate evaluation of battery activity of anMnOn material.
In essence the method consists of preparing a scaled down version ofa Leclanche cell and discharging this "cell" under constant preset current drain.The time from the start of discharge until the voltage of the cell drops to somearbitrary level, e. g. , 1.0 volt, is a measure of the activity of the MnO2 used.In practice it is usual to choose 1. 0 volts or 0. 75 volts as the cut-off voltage.This technique has been extensively evaluated bv the South African CSIR and theresult correlate well with battery performance'' ' .
In Table 2, results are presented for discharge characteristics(measured by the PGA technique), for a BHP CMD sample and a number ofInternational Common MnO? samples distributed by the Electrochemical Societyin U . S . A .
TABLE 2
Discharge Times and Relative Activity
Sample High Drain
1.0Discharge
Time
i.e.i .e .i . e .BHP
MnO2
MnO2
MnO2
CMD
Sample
Sample
Sample
1
5
7
(EMD)
(CMD)
(NAT ORE)
(sees)
3910
2260
880
3900
250mA/cm
voltRelativeActivity
2Low Drain 10mA/cm"'
1 . 0 voltDischarge Relative
Time Activity(sees)
1.
0.
0.
1.
0
58
23
00
25,
19,
7,
27,
250
990
680
000
1.
0.
0.
1.
0
79
30
07
In Figure 5 discharge characteristics measured by the PGA techniqueare shown for BHP CMD, Natural Ore (ICS No. 7), chemical MnO2 (ICS No. 5),Electrolytic MnO0 (ICS No. 1).z
From Figure 5 and Table 2 it can be seen that BHP CMD hassuperior discharge characteristics to all materials tested as measured by thetime to discharge to either 1. 0 or 0. 75 volts.
3. 4 Current Status of Development
Patents have been granted in Australia, the U . S . A . , Great Britain,Belgium and South Africa and applications are pending in a number of othercountries.
— B.H.P CMDEMD (ICMn02 Sample 1)CMD (ICMn02 Sample 5)Natural OredCMnO? Sample?)
0-8
A 5 6 7 8 9Time (hours)
FIG. 5Discharge Performance of Manganese Dioxides in Simulated Battery Test(PGA) Current Drain - 10mA/cm2
Samples of material have been tested by a number of internationalbattery manufacturers who have confirmed PGA tests which indicated that thebattery activity is at least equivalent to EMD.
Further large scale development work is in progress and batchesof material of sufficient size for test runs in battery manufacturers productionlines are now being produced.
4. REFERENCES
1. Koshiba, J. and S. Nishizawa, Chapter 4, p. 85, vol. 2 in "Electrochemistryof Manganese Dioxide and Manganese Dioxide Batteries in Japan", EdYoshizawa et.al. Electrochemical Society of Japan, 1973.
2. Takahashi, K. J. Metals 22_, (1), 64, 1970.
3. Tamura, H. Chapter 12, p. 189, vol. 2 of reference (1).
4. Swinkels D.A. J., P. H. Scaife, J. B. Lean. U.S . Patent No. 3 ,770,868,November 1973.
5. Moore, W.G. U.S. Patent No. 3,414,440, December 1968.
6. South African Digest, p. 11, June 18, 1971.
7. Schweigart, H. E .L .G. "Depolarisation by Manganese Dioxide InIntermittent Discharge of Leclanche Type Dry Cells", South African CSIRSpecial Report, Chem. 142, October 1971.
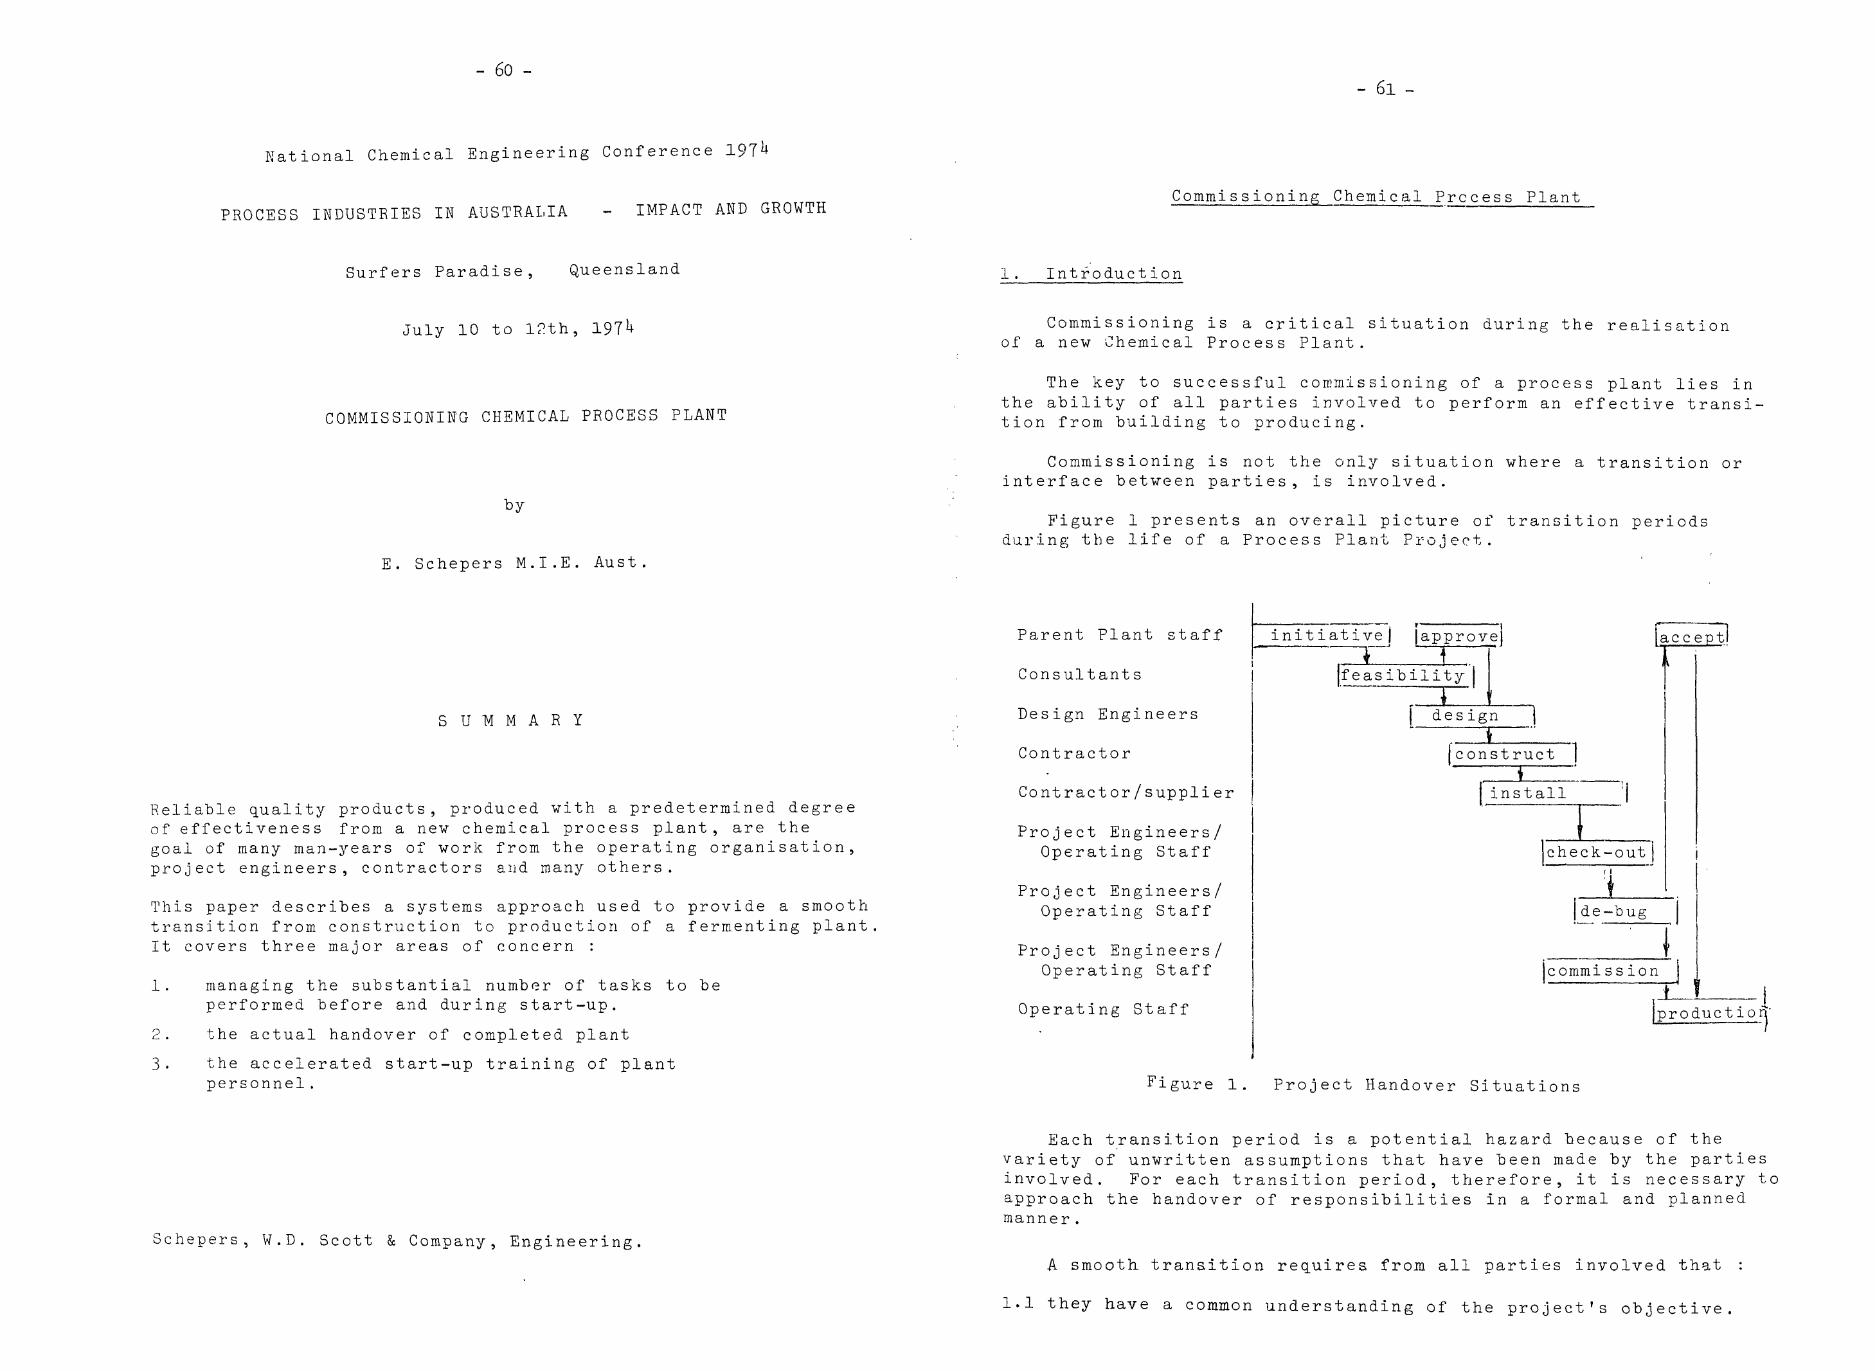
- 60 -- 6i -
National Chemical Engineering Conference
PROCESS INDUSTRIES IN AUSTRALIA - IMPACT AND GROWTHCommissioning Chemical Precess Plant
Surfers Paradise, Queensland 1. Introduction
July 10 to 12th, 197^
COMMISSIONING CHEMICAL PROCESS PLANT
E. Schepers M.I.E. Aust.
Commissioning is a critical situation during the realisationof a new Chemical Process Plant.
The key to successful commissioning of a process plant lies inthe ability of all parties involved to perform an effective transi-tion from "building to producing.
Commissioning is not the only situation where a transition orinterface between parties, is involved.
Figure 1 presents an overall picture of transition periodsduring the life of a Process Plant Project.
S U M M A R Y
Reliable quality products, produced with a predetermined degreeof effectiveness from a new chemical process plant, are thegoal of many man-years of work from the operating organisation,project engineers, contractors and many others.
This paper describes a systems approach used to provide a smoothtransition from construction to production of a fermenting plant.It covers three major areas of concern :
1. managing the substantial number of tasks to beperformed before and during start-up.
2. the actual handover of completed plant
3. the accelerated start-up training of plantpersonnel .
Parent Plant staff
Consultants
Design Engineers
Contractor
Contractor/supplier
Project Engineers/Operating Staff
Project Engineers/Operating Staff
Project Engineers/Operating Staff
Operating Staff
initiative) (approve
1accept!tt
[feasibility I
i- • i.i iff- •• . I.-.-. -..—— n...
| design |
*(construct |
I install
check-out j
|de-bug
commis sion
1 —• iproduct ion'
Figure 1. Project Handover Situations
Schepers, W.D. Scott & Company, Engineering.
Each transition period is a potential hazard because of thevariety of unwritten assumptions that have been made by the partiesinvolved. For each transition period, therefore, it is necessary toapproach the handover of responsibilities in a formal and plannedmanner.
A smooth transition requires from all parties involved that :
1.1 they have a common understanding of the project's objective.

- 62
- 63 -
1
1.3
2 they have a clear understanding of tkeir individualresponsibilities and those of othersthey have established proper communication means andprocedures to assure a coordinated effort throughoutthe handover, and thereafter.they have the proper qualifications and expertise toperform their ownconfidence in the
tasks, but that they also haveother's abilities.
Process Plant Commissioning is not different in this respect.But it has some additional characteristics that warrant givingit special attention in today's conference. These characteristicsare :
1.5 It is the last transition period before the OperatingOrganisation is given the ultimate responsibility of ensuringthe planned return on investment.
1.6 It is the transition period where the invested capital inmodern process plant is at its maximum.
1.7 It is the transition period in which the salaries and wagesof available operating manpower and the investments in rawmaterials form a considerable part of the total workingcapital requirements.
Therefore, it is clear that any disruptions in the orderlyprocess of this fast handover will create delays which can rapidlyescalate resulting in extensive losses in saleable products,outstanding capital investments and tied up working capital.
2. Managing the Commissioning
The management approach used here consists of five steps ofthe well-known management cycle :
2.1 set bhe objectives2.2 plan the activities
3 staff the organisationh direct and monitor progress
take corrective actions
22. U2.5
2.1 The overall objective is to ensure the return on investment whichwas the basis for the appropriation of capital funds to the newprocess plant project. With the size of the investment inprocess plant still increasing these days, it will be clear thatthe proper timing of the start-up has a major influence on theproject's success.
2.2 This proper timing will touch on three major areas of concern :
2.2.1 The planning of the handover of completed plant during thelast phases of the construction and installation. Thiscalls for a formal handover procedure laid down in a"Handover Manual".
2 The planning of the required systems, procedures, materials,and non-process equipment in order to start productionimmediately after handover.
•3 The planning of the major activities involved in trainingand educating the management team, the supervisors, andoperators of the new plant.
2.2
2.2
These three areas must be properly coordinated to ensure asuccessful and smooth commissioning.
Besides timing as a major influence on successful commissioning,the technical quality of the process plant and its reliability alsohelp make a difference between success and failure. The technicalquality is, at the time of commissioning,' completely determined bythe design and construction. Failures in design and constructionthat show up during commissioning can be rectified only by enormousadditional costs. Therefore, it will be clear that for designingand constructing modern chemical process plants, much thought andpreparation must have gone into the selection of the EngineeringConsultants and in the preparation of the project specifications forthem.
The assurance of reliability.on the other hand involves alsothe operating organisation. Their start-up training and later ontheir production improvement training are the major influences forsucces s here.
2.5 In considering the staffing required for commissioning thenew process plant several separate organisations must beinvolved. These include the parent plant operating and stafforganisation, the new plant operating organisation, theengineering consultants with their possible sub-contractorexperts, the contractor and his major subcontractors, etc.
Each of these organisations conducts, within the constraintsof the overall project objective, its tasks in a way whichis profitable to them, This may create situations which runcontradictory to the operating organisation's goals. It isthe operating organisation's responsibility therefore, to setup the various task forces and to establish and maintain ahierarchy of communication and reporting procedures betweenthe various organisations involved.
Three bodies who often work in assistance to the operatingorganisation are worth mentioning in this respect.
2.3.1 the temporary start-up assistance team from the parentplant to assist with technical and administrative matters.
2.3.2 the project engineers to assist with matters concerningthe process plant and possible last minute alterations.
2.3.3 the start-up consultant to assist with the planning ofthe tasks of the operating organisation, the set-up ofthe start-up sub organisations and their communicationspatterns, and the start-up training of the new plantpersonnel.
2.h To round off these project management tasks, the subject ofdirecting and monitoring remains to be commented upon.
One thing stands out clear here : there will not be much timeavailable for extensive deliberations on corrective actionswhen handover nears. Therefore, it is essential that all partiesinvolved with the handover and commissioning of the plant haveenough authority to decide upon normal required actions.

- 6k ~ - 65 -
Cost control procedures should be in agreement with this requirementof quick decision making during handover and start-up.
Finally, to facilitate communications and understanding of eachothers problems during the hectic days of handover, it pays to "bringparties together in a routine meeting pattern in an earlier phasewhen the pressure is less severe. The frequency of meetings shouldincrease when handover nears , this would generate pressures of quickprocessing and distributing of minutes of these meeting.
3. Preparing the Commissioning
A successful commissioning can be obtained when the planninghas been prepared in a comprehensive and systematic way.
3.1 In planning the handover of completed process plant, theoperating organisation together with the project engineersshould prepare a Handover Manual. Such a manual should contain:
3
3
1.1 Information on parts of the process plant to behanded over and their definition.
1.2 the responsibilities and authorities of allstaff involved with these plant parts in relationto pre-handover conditions, actual handoverconditions and thereafter.
3.1.3 the sequence of handing over the various plantparts. This may well vary from the normal produc-tion sequence.
3.1.U the actual formal handover procedures and therepresentatives to be present covering also theacceptance tests and certificates to be used.
1.5 the systems and procedures involved with performinglast minute alterations
1.6 the short list of activities to be completed beforehandover and thereafter and the responsible partnersfor each.
1.7 preliminary time table of handing over the variousparts of the plant
1.8 an approach to checking out the plant equipment ina joint effort between project engineers and operatingstaff.
3
3
3
3
Some of these items can be clarified by an example :
Item 3.1.3 means that it often pays to start-up the operationsin a different sequence than the normal production flow woulddictate.
For a fermenting and processing plant in Puerto Rico it wasdeliberately planned to de-bug the last processing phase first,before the fermenting phase started. By doing this, engineersensured that the processing plant could handle the bulky outputof the fermenting plant. For this reason, fermented "activity",as it was called, had to be shipped by tanker from the parentplant.
Item 3.1.8 will show up later on also when training is
mentioned. At this stage it is worth mentioning that the activeparticipation of the operating organisation with the equipmentcheck-out and de-bugging generates some important advantages. Ittransmits the operating team point of view to the project engineers,it provides an equipment familiarisation period for the operatingteam and it provides a two way communication with the projectengineers.
3.2 Planning the Operating Tasks
The operating organisation should prepare a work breakdownstructure of their pre-start-up activities in line with theestablished techniques of project management. This inventory oftasks and responsibilities should be arranged in a logicalsequence of events. With the addition of duration estimates pertask and coordinated with the plant completion, key dates willgive the master plan of the required preparations.
This master plan should cover activities in such areas as :
3.2.1 -staffing and training for operating the plant.
3.2.2 -public relations and local plant acceptance.
3.2.3 -maintenance, spare parts and power supplies
3.2.^4 -materials supply, stores etc.
3.2.5 -non process equipment supply and installation
3.2.6 -process equipment log sheets
3.2.7 -production engineering
3.2.8 -quality assurance
3.2.9 -safety measures and procedures
3•2.10-handover key dates
3.2.11-start-up costs and control
3.2.12-learning curves and production start-up targets
3•2.13-specific production start-up requirements
3.2.1^-administrative systems and procedures
3.2.15-waste treatment and environmental controls , etc.
All the major activities in these areas should be identified,planned and timed in accordance with the building completion dates.
Start-ups of process plants often have their own peculiaritiesas far as preparing the commissioning is concerned. The above-mentioned fermenting and processing plant in Puerto Rico requiredextensive temporary provisions for holding fermented scrap in bulkuntil it could be disposed of by tanker to sea areas far away fromthe tuna fishing waters around the island.
It also required some elaborate planning in the area of qualityassurance. Each batch of raw materials was first tested out on itsfermenting abilities at the parent plant and then shipped to the siteOnly when the new plant had proven its ability to provide fermented
- 66 -- 67 -
"activity" within th.e proper quality specif icationa, was, itpossible to gradually use local substitutions.
3.3 Planning the Major Training Efforts
As with the planning of the process plant handover of partsand the preparations for a "Handover Manual", it is worth.wh.ilefor the start-up training staff to prepare a "Start-Up TrainingReport" .
This report should be prepared by the operating staff beforethe actual training starts. It should in general cover suchareas as :
3.3.1 Top management's policies and strategies on productionstart-up objectives and manpower training.
3.3.2 Start-up sequence from the operating point of view.This should coincide with the corresponding chapterof the handover manual.
3.3.3 A summary from the handover manual on responsibilities,procedures etc. in relation to handover of completedparts of the process plant.
3.3.4 Production processes from the operating point ofview. Special emphasis should be given to new processesor techniques and locations elsewhere in the world whereidentical processes or equipment can be studied. Also,possible sources of know-how should be analysed here.
3.3.5 Manpower requirements with a sub-division according totheir origin from inside the company or outside, with orwithout previous managerial and technical experience.
3.3.6 Overall training requirements3.3.7 Evaluation of available sources of training facilities
and services and their possible use for start-up.3.3.8 Integrating the manpower build-up to the scheduled
handover dates and preparing of the overall trainingprogram.
3.3.9 Learning curves and production start-up outputs.3.3.lOBudgets, procedures and controls for pre-start-up
expenses and production start-up expenses.
Preparing this "Start-up Training Report" will give the newplant management team the best opportunity to gain familiarity withthe operation. At several points, intensive communication betweenproject engineers, equipment suppliers, contractors is required.This will require input from all parties involved and should beplanned for accordingly.
Preparing the commissioning requires extensive planning and aproject management effort from the operating organisation. Thisproject management expertise is often out of line with theproduction management skills of the new plant operating staff.
This lack of project management skills with the massive amountof work only involved with start-up preparation and training,explains why outside expertise for start-up planning and trainingis being used in large modern projects.
h_. Job Training for Start-Up
Job training for starting up new process plant is almost alwaystailor-made to the operating organisation's needs. Preparation ofthe training program and job instructions should therefore startveil ahead of the handover date. Normally start-up training willspill over into regular production improvement training when acertain pre-established productivity has been reached.
Between the beginning of the preparation and the completionof the start-up training a massive number of staff and operatorsmust be trained. Unfortunately, the natural tendency is to trainthe people as late as possible.
To train a substantial number of people in a relatively shorttime for their specific jobs, there is a need for a fair amount ofinstructors. The start-up training approach as recommended heregenerates the required number of instructors without an uneconomicaloutlay of outside training experts. The approach to acceleratedtraining for start-up is as follows :
each manager,
the supervisor
job training is a line responsibility;should train his own subordinates.
- preparing the job instructions teachesmost about his own job.essentials of the job should be trained first, crosstraining for flexibility and skill training forproduction improvement will come later.
The following steps emerge when this approach is translatedinto start-up training for the operating team including qualitycontrol, maintenance,(See also Figure 2)
services, etc., of the new process plant.
4.1 After a short appreciation course, the department managersprepare the training specifications for their supervisors.
4.2 The supervisors will, after their appreciation course, preparedetailed operation analyses and translate these into specificjob instructions for every part of the new plant organisation.This is a relatively time consuming effort.
4.3 These written instructions should cover such items as :
4.3.1 operating instructions4.3.2 stop, start and emergency procedures4.3.3 trouble shooting procedures4.3.4 daily maintenance by the operators themselves4.3-5 required training aids and materials4.3.6 ability tests
4.4 Department staff and supervisors, together with the projectengineers, will prepare check-out and de-bugging procedures;as described under 3-1.8.
4.5 The supervisors will train their key operators after theyhave been selected. Together they will be involved with theequipment check out and de-bugging. Practical on the jobtraining will be done as much as possible during trial productionruns .
4.6 Simultaneously, selection, hiring and basic training will be donefor all other operating personnel.
4.7 Actual production start-up can now get into full swing with anadequate number of foremen and key operators available to trainthe first shift of operators for their jobs in a short time.

- 68 - - 69 -
Level 1(mngmnt)
Level 2(dept. head)
Level 3(supervisor)
Level h(key operator)
Level 5(operator)
start-up Tin t r o du c t i o n|
staff appreciation
s e l e c t . h i r e
ing speci
supervi
s
s
1
or
approve
apprec j( o p e r a t i o n s ana lyses
j o b i n s t r u c t i o n sI
{ i n s t r u c t [ i n s t r u c t |I
[checkoutdebug supervise,)
t_s el e£t, h i r e job t ra in I! checkou t
j d e b u g produce
hire job training j
produce
Figure 2. "Accelerated Start-Up Training"
Besides the operating team all the other administrative andstaff personnel should be trained at the same time. Although thesame training principles will apply here, more use can be made ofcompany standard manuals on administrative procedures etc.
Introductory training about the new plant in general and companypolicies etc., should be given to all new staff. This type of train-ing should be prepared and given bj- the training department . In caseany basic skills should be taught too, this is also an area where thetraining department should come in. For basic skills in particulareffective use can be made of vacational schools or local technicalcolleges.
In another case of starting a new low pressure nuclear turbinemanufacturing plant in the U.S.A., this concept was extensively used.The company provided several training curriculae while thevocational school provided instructors on their own premises, to teachthe required basic skills to the local workforce interested. Theadvantage of this system was that the company could also get somereading on the potential operator during his vocational schooltraining while he was not yet on tha company's pay roll.
From this it can be taken that the training department has avaried task :
- preparing general company instructions- preparing basic skills curriculae
planning and scheduling all start-up training activities- assisting supervisors with their operation analysis and
preparation of job instructions.- planning and scheduling production improvement training,
cross training etc., after start-up.
A peakload of activities during the production start-up isinevitable.
CONCLUSIONS
In summary, the most important ingredients for a smoothcommissioning of new process plants are :
5 - 2
5 - 3
5 - 5
5.6
5 - 7
A project management approach bypreparing : handover; materials,and training.A twoway communication channel wthe transition from constructingA start-up sequence of operationorganisation.'s efforts in producinvestment.A formal approach to responsibilrelated to last minute alteratioA joint approach from the projecteam to equipment check-out andA well controlled accelerated trtraining for staff and opeiatorsA proper use of available start-teaching and consulting sources
the operating organisation tosystems and procedures supply
ith all parties involved duringand installing to producing,
s that befits the operatinging the required return in
ities , authorities, procedures etc.,ns and actual handover of plant,t engineers and the operatj ngde-bugging.aining approach to start-up•
up expertise from engineering,during the commissioning period.
National Chemical Engineering Conference Tl -
PROCESS INDUSTRIES IN AUSTRALIA - IMPACT AND GROWTH
Surfers Paradise, Queensland
July 10 to 12th, I97;i
TOTAL ACCIDENT CONTROL
INTRODUCTION
Paradoxical though it may sound, the intense concentrationby many safety-minded companies on the prevention of seriousindustrial injuries is also the main barrier to their prevention.
This is one conclusion to he drawn from the concept of TotalAccident Control which has caught the imagination of the SafetyWorld.
By the way of methodology, 1 will review:(1) the concept,(2) the problem, and(3) some pitfalls in implementing the concept.
by
Alfred Nuherg
S U M M A R Y
In Australia and overseas, Total Accident Controlis emerging as a major technique for reducing accidentswhich take their toll of people injured, propertydamaged and profits reduced.
TAC aims to maximise the availability of aCompany's total assets: people and property. Thebenefits of fewer injuries and reduced operating costs,first proven in U.S.A. have been confirmed in Atistralia.
The key activity is accident investigation, notjust serious injury investigation, and the first stepto TAC is "All Injury" control whilst the second stepis "Damage Control". But the implementation of TAC isnot a mechanical transfer of procedures from a sticcess-ful programme to another Company. It requires manage-ment sponsorship, time, and involves the commitment ofpeople to reporting all accidents and the acceptance ofnew standards of excellence in process operation, plantmaintenance, design and construction of plant.
THE CONCEPT
Like many ideas that have saved money, the basis for theconcept of TAC is surprisingly simple when viewed in retrospect.The idea is that an accident is an accident.
There are no big, small or middle-si7,ed accidents. Thesewords describe effects, not what caused them*
So at the outset we can well ask ourselves. What is anaccident ?
Consider a maintenance fitter working on the toy) of a t a l ldistillation column. Suppose that for some recus on the spannerhe is using slips out of his hand:
(1) The spanner may fall at his feet, or to the ground.In both cases he will need to recover the spanner to proceed withhis task. The consequence of the accident is an interruption tothe planned activity. This interruption may be minor or major.
(2) On the other hand, the spanner may also hit the fitter,or some other person below. The injury, if any, may be minor ormajor.
(3) Again, the spanner m;>y hit some object and possibly causedamage to it, or itself.
We have one eiccident but three possible consequences, theeventual outcome in all cases being a matter of chance.
and John"An unintended
CSU Chemicals Ltd, Company Training Officer
what is an accident? Professor Simonds *Urimaldi ti.Ch.E., Ph.U,, define an accident as:occur ence arising out of employment in any kind of business andindustry that either causes personal injury or property damage,or interferes with production of other business activity undersuch circumstances that personal injury might have resulted".
More briefly, Blake 2 says "an accident is an unintendedoccurence that interrupts or interferes with a work activity."
At the risk of being pedantic, we can then define TAC as:the management of those avoidable conditions of circumstanceswhich interrupt or interfere with the attainment of corporateobjectives .

- 73 -72 -
The diagram is a simplistic model of the concept of TAG
mnerformanc
Negative Deviation Action?
No. ofAccidents
75,000OO,OOO
1 ,700,00046?7^1
1•
Ratio of Accidents
SeriousInjury
11111
274,000
OtherInjuries
291001043150
7
Non-Injuries
300500630^23580
7
Source
Heinr i.chLukens Steel Co.?C . A . T .
Bri t i sh Steel Corf).CSR Chemical s I td .
Austra 1 ia :63,000 factories
The concept implies that every enterprise is vulnerable tosome sort of risk and that these risks can be identified,analysed arid controlled, as illustrated by the effectiveness ofsprinklers in Australia*
C h e m i c a l s and. A l l i e d Industry
19601970t97 t1972
T U T U .
A v e r a g eT.CKS s Ha t i o
S P R T N K L K u > L ; D R I S K S
No. ofI1' i r e s
7't
146
31
1
EstimatedLoss S
1,3101,2304,8806 , 4 00
13,820
446ftl
U N S l ' I U N K L U ^ D U T S K S
No. ofFires
5i>
123
23
1
V, s t i ma t e dLoss S
2 ,260 ,000760,000
1 , 536,000555,300
5,131S300
223, 1OO$500
However, because the protective systems in the processindustry .ire not 100% reliable we use the "even-if" principlesof redundancy and diversity. "liven if" one pair of braces failswe always wear two, or we wear a bolt in addition to the bracos.
More Importantly, management needs a system to alert it ofthe what, when, where, extent and causation of all negativedeviations. TAC defines this problem.
Till'; H?(;IJ1,KM
The finding by Hoinrich3 that in a body of 75,000 accidentthere was a ratio of one serious injury to 29 other less severeinjuries, to J>OO non-injury accidents has been known for morethat 40 years - and largely ignored, until recently.
The major work on non-injury accidents resulting in propertydamage is that by Bird et al on the experience of the lukens,~>teel Co., Pennsylvania, U.S.A.
Z»Lukens found that property damage accidents were five limes
more frenuent in their enterprise than injury accidents, andincurring a loss at the rate of SUS 325,500 per million manhoursworked. This loss of more than ftUS 3 million a year was not Knownto Lukens management. It was hidden in the normal operating andma i n t enanee costs.
A recent study by the Insurance Company of North America (NA1)involved 297 companies from 21 industrial groups, employing 1.7million people. The NAT study found that in ci total of about 1.7million accidents there was a ratio of one serious injury to 10minor injuries, to 30 property damage accidents, to (>00 "nearmisses" which ccmld luive resulted in injury, damage, or both, butas luck would have it. there was neither injury nor damage.
Across the Atlantic the British Steel Corporation found therewas nothing unique about Luken s experience - their accidentaldamage was equivalent to 5no of their total production costs.
Nor is the experience of CMJC unique in Australia.
For example, in a period of 11 weeks a N.S.u. factory 'employing 111 men exper.i enc ed 2/l3 accidents. Of these, 73 resultedin injuries arid 170 in no-injury, hut caused damage to property anddelays to processes cos ted at ^1^1,000.
NoNoNoNoNo
of Disabling Injuriesof Alternate work Injuriesof Doctor Treatment Casesof First Aid Injuriesof Major Damage Incidents
Cost of Major Damage IncidentsNo. of Minor Damage IncidentsCost of Minor Damage Incidents
00
$6,700l6l
$7,400

- 75 -
One finding in this factory was that about 10% of the non-injury accidents had a real potential for injury. Another finding-was that tiie cost of property damage was 100% un-insured and hiddenin the normal manufacturing costs.
Similarly a chemical works in Victoria 5 recorded 43accidents in a three month period which caused damage to plantand buildings. Nohody was killed, nobody was hurt, P.ut theinvestigators reported that, five people could have been hurt,\ttentiori to damage incidents in this factory would thereforeremove the causes of some potential injxaries.
Another important finding was that 28 of these accidentsresulted from inadequacies of equipment design.. Whi 1st L5 woredue to lapse of operator attention. Still another finding wasthai the prevention of these accidents represented a saving of:.i2l,OOO equivalent to 15% of the annual maintenance budget for thisperi od.
The examples illustrate that about the only worthwhile thingthat anyone can do about, something that has already happened, theaccident, is: (l) to recognise it, (2) to analyse it, and(I) to measure it Cor potential adverse effects on the enterprisew i t h a view to minimising the effect, arid/or preventing therecurrence of the cause.
.Surprisingly, recognition of non-injury accidents i.s one ofthe more d i f f i c u l t aspects of T,\C .
.', e(a)
tools, apropert yc . v . 1 .
(b)du r i .r, u s
I ' « ,'•'' 4 1 .-
• j— •tank - C
(c)
tend to see what we want to see, but we need to see:Damage to build.Uigs, machines, vehicles, equipment,
pparat.us, -packaging materials, containers - or any other•
He over-tightened and broke the filter clamp onpump - Cost v!)6when opening line to clean filter, the discharge aridthe casting of the pump was broken - Cost t>38Lo s s of m a t e r i a l , including loss of finality of material
torage, handling, conveyancing or transportation.,eak acid overflowed tank - Cost $20.lie opened the wrong valve putting C8 alcohol into C4
ost ->800Delay to a process, function or activity due to need
for repair, replacement, or making good accidental damage orfan 1 t y ur . g . 1 .
ork likely to result in injury, damage, loss or delay.f!e dropped fire no 7.7.1 e and bruised the treat} - Cost i? 10
'• • "n > 1st one of two pumps was being serviced in the work-shop, he started the other pump which sei.7,ed-up for lackof oi 1 - Cost >2,00()
Understandably these costs inflate a plant's maintenancet, but few engineers know the extent of "unfair" wear and
tear due to human error.
.-...No . ofDamageAccidents
1
6994231?043580
AverageCost$A
532i()483488362
Company
Lukens Steel Co. (1972)British Steel CorporationA N.S.lv. factoryA Victorian Chemical 'worksCSR Chemicals Ltd (197O)
Determining costs won't solve the problem, b\.it in mauvcases it. provides the motivation to do so. Measurement is themost important single aspect of control, and the ultimate fateof TAG must rest on proven overall benefits - a reduction ofinjuries, damage, material losses and process delays.
Lukens experience was that "Damage Control" stipported andreinforced "Injury Control". In addition to fewer and lessserious injuries, the 1959 property damage rate of >US 325,000had been reduced by 80% in 1972 to ftUb 66,000 per million man-hours worked.
Property DamageAt Lukens
Thousands ' US per 1O" manhours
0 100 200 300 400
1959
19651972
Similarly at C6UC there are a number of indices that measurethe benefit of a broadly based accident prevention programme.
N oa t
a s 1 1C .
ra1 ' *
b 1 e B e n e f i t s1' . C h c m i ca Is L t
Lost- t i m e injury.->orious i n j u r yI', in or injuryDa maDa ma*
i
i a i ri
ua 1Over(i
gegeten
itya l l
. u tpu tork ers
ac c ident
d.
f r equency ra te*H nu it
accident "Pan
C
c e cosCapi taon tro 1
productpe
Cr' empl
t1
i
s
CO
onoye
ompensa ti
n
sever iexpr es
H
ty ra tesod a s a %> o f
sts per tonne product
e
Change in 1971
no charige33% down25% down12
8%0%
Down
>4
10
.5%
.r'.
.4%
downdownt o "1 rro'O 2 .1 '),-•>
doi\rnUp
Up
on lie bate up
All rates arc expressed on the basis of 1,000,000 manhoursworked

- 76 - - 77 -
These sort of results indicate that the concept hoi .Isconsiderable promise in reducing accidents and in improving
e fr ici enc i es.
The results also give point to a finding puhlished in "Safeand sound" some years ago hy the British Chemical Industry Council;v>raphrasod, the finding is:- any enterprise which consistentlyexperiences one lost-time injury por 100 employees per annum isinefficient in its use of human and material resources. On this
a s i s .uustralia is grossly inefficient and on a comparativehas is the average Australian manager isI l i a t his North American counterpart.
five times less efficient
i1TFALLS
Chemical engineers who have heard and read much safety, ardwho practice safety as an engineering discipline, should not t h i n kthat "operator error" is the main problem. There is a body ofresearch which suggests that "10".' to 1 [>r/. of the time operatorerror w i l l fail or seriously degrade mission effectiveness". ,\personal study of more than 2,000 published accident case h i s t o r i e sshows that about 70",', of these accidents had their cause in ratherelementary inadequacies of design - elementary in the wisdom ofhi nds i gbt .
For example, on H \ugiist 1c)6?i a worker in one of the largestnetroleum ,-,nd petrochemical complexes in '!'. S . A „ , noticed somebubbles rising in a pit f u l l of water. The pit housed a largeisolating valve on a 21 cm diam. line between a plant and t\%'o.i sobutane spheres .
The worker made a correct analysis "the valve is leaking - thei sobutane must be flushed out of line into the spheresj" andflushed water through the line into one sphere. lie then closedthe i s o l a t i n g valve on this sphere* liut, before he could open thevalve on the other sphere, an accident occurred. what the workerheard and saw was a geyser of water rising out of the pit. Vvh;,the didn't know was tho.t the bonnet of the valve in the pit hadb 1 own off.
The events that now followed had the inevitability of a Gr^eUtragedy. 'The worker made a wrong analysis - he though he had donesomething wrong. He took the wrong action - he closed tue valve hehad started to open, and opened the valve he had just closed, arid('•(;, 000 litres of isobutane escaped.
The primary explosion killed 7i started a fire, secondaryexplosions arid other fires th.-'t burned for two weeks, and Cciusedan insured loss exceeding S35 million.
Hut why did the valve bonnet fly off? There were two directcauses. Firstly, the bonnet holts were badly corroded. Secondly,the w a t e r - introduced into the line was at more than twice thepressure the line was designed for.
Of course, if the water pressure had been less than the iso-butane pressure, similar consequences would have followed. Anyonewi t h doubts is well advised to read "LL-Gas Fires and Explosions",7^c booklet put out hy the National Fire Protection Associationin 1901.
Thackara et al have described the system developed byi'roctor and Gamble for rating mechanical and operational bax.ardsat the plant design stage. The method has wide application and isaimed at 100% TAC. The authors claim that "the programme isjustified not only on ethical grounds but also in terms of money".
» ( '
Hecent papers by Klet.7, '»° underscore a trend of increasingimportance for engineers: quantitative hazard analysis. liut forthe general clevel opment of perception of what could go wrong, 1suggest the accident case history, such as those published hy f. uoManufacturing Chemists' <-.ssn. in t J . S . \ .
The implementation of a TAC programme is sometimes a m a t t e r ofconcern, firstly on account of the potential work.lo.-ul i n v o l v e d , andsec on d1y due to the c os t.
In our experience the workload has not necessitated anv a d d i t -ional people. The reporting, investigation and costing of damageaccidents we found was mainly a matter of organisation. In thematte r of cost, the things done to effect improvement, in retros-pect, needed to bo done anyway, arid generally required l i t t l e orno ca pi ta. 1 :
L; ducat ion: to increase the effectiveness of all employees,
A d r.i i n s t. r a t i o n : to improve the use of manpower and theplanning of work.
i.n ij.i peer J.ng: to improve, existing methods of opera i. ion and tomake hotter use of technology*
Vnother area of concern to many companies who are looking . < tT l.C is the formidable number of forms used by Lukens /f and theBritish Steel Corporation. In point of fact, other companies suchas I erkins i.riginos 1 t.d and C.silC have found that the programme canbe operated with one or two forms.
Another possible pitfall is the extrapolation of Lukens''!i severity rate to another enterprise . My belief is that onlyhighly mechanized or capital intensive industries will hr.ve adamage loss of this order.
A simple, well-established batch process can be expect.ed tohave a smaller loss rr.tio than a complex, new continuous process.
S t i l l another possible pitfall is to atteirpt too much, toosoon. The change; to be effected needs a solid foundation of"sa.oty" adminstra t i on , and, as with r.Jf.P. 10, every enterprisenerds to develop guidelines and ground-rules host suited to theenterprise.
CtNCLLMONS
1, The goal, of safety has for long been the safety of the peoplein the plant. But, by paying attention to serious injuries whichis both natural and laudable, management, has focussed on less thanl°i of the totality of accidents. By so-doing, for every personinfluenced toward safe arid productive behaviour more than 99/v/)
the opportunities to do so have been overlooked.
- 79 -
2. There is nothing new or novel in the philosophy of TAG andnothing that anyone says about it is final or sacrosant. Everyenterprise needs to develop its own guidelines and ground rulesin implementing the concept.
3. The Lessons learned clearly indicate that there needs to bea shift of emphasis from "What has gone wrong?" to "What could gow-ron.e"? And there's nothing new about this either.
li. The application of the concept holds considerable promise forimproving efficiency, personal safety, prodxic t ivity and profitability,
National Chemical Engineering Conference 1974
PROCESS INDUSTRIES IN AUSTRALIA
Surfers Paradise,
IMPACT AND GROWTH
Queensland
thJuly 10 to 12 , 1974
'v c k ri o w 1 e d g e m e n t
Permis s ion to use a c c i d e n t case h i s t o r i e s , s t a t i s t i c s andr e l a t e d i n f o r m a t i o n b y C . S . i < . C h e m i c a l s L t d i s g r a t e f u l l ya c know.led c-ed .
STATIC ELECTRICITY GENERATION BY
FLOWING HYDROCARBON LIQUIDS
by
or en c es
1. Dimonds, i ^ . i l . , and t'iriaialdi, J.V., Safety :<,ana gemerit( Richard >.). Jrwi.n, Inc.)
'J . !Hake, U.l ., Industrial .Safety ( Pr ent ice-Ha 1. 1 , .Inc.)
~. lleinric.h, II.'.-.'., Industrial Accident. Prevention (McOrawHi .1 I Mook Co . Inc.)
'i . Bird, I1' . h . , arid Germaine, G.L.^ Damage Control ( .American.Mana gement Associati on )
5, Nuberg, A., "Appraisal for Total Loss Coritro.l", .\ustralian?>:> f oty News, May-June 197^
b. Thackara, •..!)., et al, "An apj)roach to the problems of processhazards in plant design", ^ym. Inst. Ch. lings., Manchester
7. Klot-/,, T.A-, "Specifying and Designing Protective Systems",.->ym. on Loss \'r event i on , . m. Inst. Ch. Cngs. 197^.
>'. Klet'/,, T . A . "Hazard .'.na Lysis - A l.uant i tn t i ve Approach to^afoty", Sym on ^:ajor Loss .Prevention in the Process Industries,Inst. Ch. i'^ng. London l97l»
9. Fletcher, J . \ . , and Douglas, II. M., Total Environmental Control(Hunter Aose Co. )
10. Martin, .S .. M . !•' . , "iJamage Control - The Concept", ProceedingsVictorian Industrial Safety Convention, 1973 o
J. B. AGNEW
S U M M A R Y
The transfer of hydrocarbon liquids through piping systems is apotentially hazardous operation if the dangers of static electricity build-up are not recognised and the necessary preventative measures taken.Numerous fires and explosions have occurred around the world (and here inAustralia) as a result of static discharge during drum-filling and tanker-loading operations, resulting in loss of life and equipment damage runninginto many millions of dollars.
The mechanism of static generation is outlined and some commonhazardous situations are discussed.
A portable demonstration rig has been developed to illustrate therapid build-up of static charge during the pumping of kerosine. This canbe used to illustrate some of the important hazards encountered inindustry.
kAgnew, Dept. of Chem. Eng., Monash University, Clayton 3168, Victoria

NOTATION
QS
I"ReSct£
£o
K
T
INTRODUCTION
- 80 -
Streaming current (A)Charge (A sec)Initial charge (A sec)Gas law constantReynold's numberSchmidt numbertimerelative dielectric constant (dimensionless)dielectric constant of vacuum (A sec/V m)specific conductance (A "V/m)relaxation time (sec)
Although the phenomenon of static electrification has been known for manyyears, major problems arising from it are of more recent vintage. Numerous firesand explosions have been attributed to static discharge during the handling,processing and transportation of combustible gases, liquids and dusts, resultingin hundreds of millions of dollars worth of damage to equipment and property aswell as the loss of many lives. In 1968, Mobil's large drum-filling plant atPulpit Point in Sydney burned to the ground: the cost of this one fire alone was$750,000, but fortunately there was no loss of life. In the same year there wasa fire at a drum-filling plant in Townsville and also an explosion in a tank truckat Fremantle which resulted in the death of the driver.
Despite the many disasters which have occurred, there is still considerableignorance among those working in potentially hazardous situations concerning thedangers of static electricity. Education of such personnel is not particularlyeffective unless the danger can be clearly demonstrated and not just talked about.
In order to supplement the usual safety lectures given to operationspersonnel, a short film has been produced by Mobil Oil Australia Ltd. inconjunction with the Department of Chemical Engineering at Monash UniversityIn addition a portable demonstration rig has been developed at Monash to helpreinforce the instructional process.
Before proceeding to discuss some of the more common hazardous situationsinvolving hydrocarbon liquids, the mechanism of charge generation will beoutlined. The demonstration rig will then be described. It is proposed to usethis to illustrate some of the points raised during presentation of the paper atthe Conference.
THE MECHANISM OF STATIC CaARGE GENERATION
Static electricity is generated whenever two dissimilar materials are broughtinto contact and then are separated e.g. (i) when two solid phases in contact moverelative to each other; (ii) when a liquid moves past a solid surface; (iii) whena gas moves past a liquid or a solid.
The flow of aqueous solutions past conducting surfaces is commonlyencountered but gives rise to no observable charge phenomena. However, whenliquids of low electrical conductivity such as hydrocarbons flow past conductingsurfaces, charge generation and accumulation can be sufficient to cause electricaldischarge.
(2)Gavis *" has summarized observed phenomena in relation to the flow of
hydrocarbon liquids through pipes and filters as follows:
1. A pure non-conducting liquid will not electrify. The addition of soluteswhich increase the conductivity of a liquid causes an increase in chargegeneration initially, but as further solute is added, the charge
generation decreases. The conductivity range in which generation has been
- 81 -reported to occur is 0.1 to 10,000 picomhos per metre; at 100,000 picomhosper metre the rate becomes immeasurably small.
2. Flow of liquids against a surface is necessary. In tubes the rate ofcharge generation depends on the flow velocity, being greater forturbulent flow than for laminar flow.
3. The nature of the surface affects the generation rate. Metals give thehighest rate, with comparatively little difference between differentmetals. Electrification also occurs in glass, plastic and rubber tube;with respect to the small currents observed, these act as conductors. Thesign of the charge may be positive or negative, depending on the nature ofthe impurities present in the liquid and the nature of the surface.
4. The generation rate in tubes depends initially on tube length, withdecreasing dependence as length increases; the rate finally becomesindependent of length for long tubes.
5. Charge is generated continuously.
The mechanism of charge generation is generally considered in terms ofseparation of ions of opposite charge at the solid - liquid interface bypreferential adsorption, to form an electrical "double layer". This concept wasoriginally put forward in discrete form by Helruholtz in 1879 and was latermodified by Gouy and Chapman for the observed distribution of charge in theliquid phase: this is illustrated in Figure 1.
Dynamic equilibrium exists in the double layer: conduction of ions by virtueof the potential gradient is just balanced by diffusion in the opposite directionresulting from the concentration gradient. In liquids of high electricalconductivity, the charge density falls to zero at very small distances from thewall - distances in the order of molecular dimensions. However, in hydrocarbonsthe charge distribution may extend into the liquid for distances in the order ofmillimetres. The fact that the double layer is so thick in liquids of lowconductivity is the basic reason why they become so easily electrified.
Consider now a hydrocarbon liquid in turbulent flow through a grounded metalpipe, as shown in Figure 2. Negative ions (arbitrarily) are adsorbed on the pipewall, while the positive ions are distributed in a diffuse layer in the liquid.When the liquid conductivity is extremely low, most of the positive ions willreside in the turbulent core and will be swept away. Fresh liquid entering thepipe contains an equal number of positive and negative ions, while liquidleaving contains an excess of positive ions. Thus a potential gradient is setup along the tube length. Adsorbed negative ions d.i scharge near tne entrance andare replaced by negative ions diffusing to the metal surface, thus maintaining acurrent. As the concentration of negative ions decreases downstream from theentrance, the rate of discharge also decreases. The concentration of positiveions increases with distance downstream, asymptotically to some limiting value,before being swept out into the collecting vessel shown.
The flow of electricity caused by the entrainment of charge by a flowingfluid is known as the streaming oupv&nt. It can be shown that the streamingcurrent developed in pipe flow is governed by the rate of mass transfer:
= 0.034 £ £ R T v Reo
°'8 Sc°'3 (1)
(2)This relationship has been verified by Gavis ^"' and others using differenthydrocarbons and different ionizing solutes. Hence it can be used withreasonable confidence to predict an approximate average value of current to beexpected in smooth tubes.
The charge accumulated in a liquid of low conductivity begins to leak awayonce the source of generation is removed. This phenomenon is known as rFor a stationary charged fluid which completely fills its container, the

- 82 -
relaxation of charge can be satisfactorily described by :
Q = Q exp(-t / i) ... (2)
where T is known as the relaxation time. An estimate of the relaxation time fora particular liquid can be obtained from :
T = £ E /Ko
... (3)
(3)Other physical situations are considered by Klinkenberg and Van der Minne
For pure benzene the relaxation time is 61 hours; the addition of a few parts permillion of an antistatic additive can reduce this to 0.02 seconds (4).
CONDITIONS FOR THE EXISTENCE OF AN ELECTROSTATIC HAZARD
A hazardous situation exists when the following conditions are fulfilled :
1. Relative movement between two dissimilar materials such that staticelectricity is generated.
2. Insulation, to prevent opposite charges re-uniting, and to allowaccumulation of charge to produce a high electrostatic potential.
3. Static discharge by sparking, with sufficient energy to cause ignition.
4. Existence of a flammable mixture :n the vicinity of the spark.
Minimal energy requirements for sparking have been reported to be about 0.1rnJ for hydrocarbon vapours in air, 1 mJ for flammable mists in air, and 10 mJ fordusts in air (4). Such energy levels are not difficult to obtain by simplecharging mechanisms, e.g. a person can become electrostatically charged to apotential of 10 kV simply by sliding across the seat of a car and stepping out ofthe vehicle; since a man's electrical capacitance is approximately 300 pF, hecould produce a spark of 15 mJ.
ELIMINATION OF HAZARDS
Elimination of any of the conditions listed above will remove the dangerof fire or explosion being caused by static electricity. For the particular caseof hydrocarbon liquids flowing through pipe systems, the following methods areuseful either individually or in combination :
1. Reduce flow rates.
2.
3.
4.
Bonding and grounding are effective for good conductors in eliminatinghigh potential differences.
Incorporate provision for charge relaxation- (e.g. an enlarged sectionof pipe) before discharge of liquid into a vessel.
Add :ntistatic additives if possible to increase the liquidconductivity.
SOME COMMON HAZARDOUS SITUATIONS— . _____ ___ ^
1. Switch Loading. This term refers to the process of loading a liquidinto a tank or compartment which previously held a liquid of different vapourpressure. When a liquid of low vapour pressure (e.g. kerosine) is loaded into atank containing the vapour of a more volatile liquid (e.g. gasoline), absorptionof the vapour into the liquid can cause air to be drawn into the vapour space togive a mixture in the flammable range somewhere between the liquid surface andthe entry point. Directly after switching from the transfer of one product toanother through the same equipment, a substantial change in static generation canoccur; this can result in sparking from the discharge nozzle to the liquid
- 83 -surface or to the metal wall, thus igniting the flammable vapour mixture. Theprecautions normally taken to avoid such an occurrence involve gas-freeing thecompartment, keeping the liquid velocity below 1 m/s until the discharge pipeis submerged, grounding the tank and using antistatic additive
2. Filters. The insertion of a filter in a line through which ahydrocarbon liquid is being pumped can have a dramatic effect on the chargingcurrent. Klinkenberg and Van der Minne report a case in which the chargingcurrent increased by a factor of 20 when a filter was used. In addition togrounding of the filter container and use of an antistatic additive, theprovision of adequate relaxation time is most important before final dischargefrom the system.
3. Plastic Hoses and Containers. Non-conducting hoses, buckets and pipescan be particularly dangerous as they are not able to provide an adequate pathto earth. Figures 3 and 4 show arc discharge from a plain P.V.C. hose throughwhich kerosine is being pumped. Surface voltages measured were in the order of30 to 40 kV with an ungrounded filter in the circuit. Hoses of this type havebeen used for discharging motor spirit from small overhead tanks in outbackareas ; even though gravity feed has been employed there have been reports ofsparking from the hose in hot , dry conditions . Offending hoses have now beenreplaced with hoses which have much higher electrical conductivity.
The use of plastic buckets for collecting drainings from tanks is apractice to be avoided, as hydrocarbons can retain accumulated charge for someconsiderable time. When the liquid is eventually peered from the bucket,sparking can occur from the liquid, surface and this can ignite flammable vapourin the immediate vicinity.
DEMONSTRATION RIG
In order to demonstrate the ease with which dangerously high electrostaticpotentials can be developed, a simple demonstration rig has been designed andbuilt at the Department of Chemical Engineering, Monash University.
A flow diagram of the rig is shown in Figure 5. It includes a small"Marino" centrifugal pump driven by a 0.5 horsepower motor; a "Fram" filter(12 g.p.m. capacity); a bucket (plastic or metal); short lengths of plasticwater hose. The rotameter shown is optional. The pump and filter are mountedseparately on perspex stands so that they are isolated from each other and fromearth. The complete rig has been so designeu that it can fit into two smalltool boxes for ease of transportation.
All that is required for demonstration is a small quantity of kerosine(about 1 gallon) and a 240 volt power supply for the pump.
Voltages of 30 to 50 kV are developed within a few seconds of commencementof flow. This level of potential is quite sufficient to give an easily visiblespark which has sufficient energy to ignite a gasoline - air vapour mixture.
CONCLUSION
Static electricity is a common occurrence in hydrocarbon flow systems.Hazardous situations may arise from relatively simple operations. The dangersare not always appreciated by operations personnel. Educational programmesshould include an actual demonstration of how easily and quickly high voltagescan be developed to produce sparking. A portable demonstration rig has beenproduced for this purpose.
ACKNOWLEDGEMENTS
The author wishes to acknowledge the major contribution made byMr. E. Bartlett of the Department, of Chemical Engineering, Monash University,to the development of the demonstration rig. The author would also like to

- Qh -thank Mobil Oil Australia Ltd for initiating and supporting this work and fordonating a copy of the film which was made.
REFERENCES
1.
2.
3.
4.
5.
"Static-Generation" : a film produced by Mobil Oil Australia Ltd inconjunction with the Department of Chemical Engineering, MonashUniversity (1973).
Gavis, J. A.l.Ch.E. 6th Loss Prevention Symposium San Francisco,California, November (1971).
Klinkenberg, A. and Van der Minne, J.L. : "Electrostatics in thePetroleum Industry", Elsevier, Amsterdam (1958).
Eichel, F.G., Chem. Eng. , March 13, p. 153 (1967).
Australian Standard 1020-1970 : "S.A.A. Static Electricity Code" (1970)
- 4
- 4- 4
- 4
- 4
-4
-4-4-4
———_
—_
——————
-—
4
4
4
4
4
4
4
4
4
4 x^
4 ' x-
/4
/4
/4
/4
+ /
4 /'
•~- -f—
- 4_
—- 4_
—
- 4-
- 4-__
- 4
j4
4
4
4
4
4
4
4
4
4
(i) Discrete (ii) Diffuse - high K (iii) Diffuse - low
Fig. 1 : Double Layer representations
HydrocarbonFlow
4 -4 -
_i L....
"x ^ x xj> i VT
Conducting pipe
44
4
4
4444-+•t-
33
Receiver
4 4 4 - 4 4 -
Fig. 2 : Diagrammatic representation of chargegeneration in pipe flow

- 86 -
Fig. 3: Electrostatic discharge from P.V.C. hose inflow circuit with filter.
Fig, 4: Close-up of electrostatic discharge fromP.V.C. hose.
Filter :H
BucketPump
Fig. 5 : Flow diagram of demonstration rig forstatic charge generation.

- 89 -
National Chemical Engineering Conference 1974
PROCESS INDUSTRIES IN AUSTRALIA - IMPACT AND GROWTH
Surfers Paradise, Queensland
July 10 to 12th, 1973
DEVELOPMENT OF COATED ROTARY LIME AS ASUBSTITUTE FOR FLUORSPAR IN BASIC
STEELMAKING PROCESSES
C.W. P. Finn, C.J. Cripps Clark and M. J. McCarthy
SUMMARY
The concept of coating lime with iron ore during calcination isdeveloped from a review of the mechanism of lime solution in basic oxygensteeimaking (BOS) slags and the role of fluorspar flux or its alternatives.Laboratory experimental work on coating the lime and testing itseffectiveness in a BOS slag of critical composition is described. It isshown to be feasible to coat lime and that, whereas uncoated lime is slowto react with the slag, the coated lime reacts rapidly and dissolves. It isconcluded that manufacture should be feasible, and that the material willbe effective, with a slight economic advantage.
The authors are members of the Iron and Steel Section,BHP Central Research Laboratories, Shortland, N. S. W., 2307.
INTRODUCTION
Burnt lime is used in basic oxygen steeimaking (BOS) to promote theremoval of sulphur and phosphorus which are detrimental to final steel quality.This requires the rapid solution of the solid lime in the slag (mainly ironsilicate) first formed in the BOS vessel during the blow. The mechanism ofsolution of lime depends on its structure and on the reactions in the lime / slagmterfacial region 1-7
The structure of the burnt lime is dependent on the raw limestone and,more importantly, on the temperature reached during calcination. Hard-burning,at temperatures of the order of 1400 C, produces a relatively coarse-grained,chemically unreactive, sintered structure with large pores and fissures. Soft-burning, at about 1000 C, yields a finer, more porous structure, with a larger,more reactive, surface area. However, during the steeimaking process, as thetemperature rises from 1400 to 1600°C, any solid lime remaining in the slagtends to become hard-burnt.
At the lime / slag interface, there are two competing reactionspossible for the lime:
(a) Absorption of iron oxide to form low m.p. calcium ferrites;
(b) Reaction with silica in the slag to form solid silicates, mainly dicalciumsilicate, Ca0 SiO. (abbreviated to C9S).
LJ 4r dt
The first reaction tends to bring the lime into solution while the second tends toform a solid layer around the lime inhibiting the solution of lime in the slag.The difference in rate of solution of hard and soft burnt limes (assumingnegligible reburning) is related to the first reaction. The denser structure ofhard burnt lime inhibits the absorption of FeO and formation of liquid ferrite;instead it provides a continuous foundation for an adherent C9S layer.Conversely, FeO is readily absorbed in the porous structure of soft burnt lime,dissolves it, dilutes the CaO and inhibits the formation of a continuous layer ofc2s.
This layer decreases the rate of further reaction until it is dissolvedor mechanically broken or removed. Its solution can be promoted by addition toHie slag of fluxes which readily dissolve in the slag and lower the liquidustemperature at the C2S end of the pseudo-binary mixture with thai flux6. Ironoxides have this action but alumina (once dissolved), fluorspar and borates aremore effective.
High FeO slags can promote the solution of lime directly and thesolution of C2S but, in practice, FeO concentrations are not sufficient unlessthe lime is burnt at an uneconomically low temperature. Fluorspar, CaF2, isthe standard flux for promotion of lime solution. Increasing demand anddecreasing availability of metallurgical grade fluorspar have however, causedsharp increases in its unit cost and led to an intensive search by many steelcompanies for suitable alternatives, either naturally occurring minerals or

- 90 - - 91 -
synthetic mixtures. Few unqualified performance data are available for thesematerials and variations in plant practices render comparison difficult, butBuxton and Sandaluk have tested 15 proposed substitutes, some natural andsome synthetic, in a 45kg experimental BOS furnace. The overall assessment,in terms of various steelmaking parameters such as % lime in solution,basicity, % silica at mid heat, sulphur and phosphorus partitions, indicated thatonly colemanite, borax, manganese ore and an iron oxide-titania synthetic werecomparable to fluorspar. Large proportions of synthetic ferrite have also beenfound effective in practice .
The economic aspects of substitution involve the cost of thesubstitute, its rate of consumption and its cooling effect, reflected in the amountof scrap that cannot be consumed in a process in which there is no externalheating. For fluorspar practice, these costs total of the order of 30^ per tonneof steel depending on the plant., relative costs of scrap and hot metal and theruling cost of fluorspar. In the case of synthetics, the cost of manufacture maybe critical because it can present problems due to the high melting point of somefeed materials and the corrosive nature of the product. Possible methods ofmanufacture include pelletization, vertical or rotary kiln firing, cold orhydrothermal briquetting, sintering or melting in a hot blast cupola. Theseprocessing costs can add substantially to the basic raw material costs.
An alternative approach to the problem which has been investigatedin these laboratories is to prevent the formation of the dicalcium silicate layerrather than attempt to dissolve it once formed. From consideration of themechanism of lime solution, it was postulated that, if each lime particle weresurface impregnated with iron oxide prior to contact with the BOS slag, thislayer, at temperature, would form an intermediate liquid phase between thelime and the slag preventing the formation of an adherent layer of dicalciumsilicate. It was also postulated that this phase would advance into the limeparticle ahead of its external surface as solution progressed.
For the material to compete economically, no separate treatmentcould be entertained because, with the whole of the lime (about 60kg per tonnesteel) having to be processed, the additional cost of treatment, including theeffect on the proportion of scrap charged to the furnace, must be less than thecost of fluorspar (approximately $5 per tonne of lime at present market costs).The feasibility of forming the iron oxide rich coating by charging iron ore withlimestone in the rotary kiln was investigated since this would require minimumcapital and operating costs. Experiments in the laboratory were undertaken to:
(a) determine the feasibility of producing coated lime in a kiln;
(b) establish the parameters (temperature, proportion of ore etc., ) withsufficient confidence to make larger scale tests;
(c) determine if the postulated mechanism did occur and whether thematerial could eliminate the use of fluorspar.
Since the economics depend largely on performance in the plant, they could notbe assessed accurately in the laboratory trials.
Subsequent to the first favourable results being obtained in thisi nseries of experiments, Rogovtsev et al. iu reported the production and testing of
this type of material. However, they used millscale (oxides formed on steelduring hot rolling) and encountered the formation of accretions within the kiln,Avhich indicated the need for special processing (the addition of the millscale tothe high temperature zone of the kiln). Secondly, the tests of its effectivenessin BOS heats, though indicating more rapid solution of the lime, wereconducted with more fluorspar than in the heats used for comparison. Since thepreliminary trials already conducted in these laboratories had indicated thataccretions could be avoided, the present work was continued to determine\\hether trials on the plant could be justified in spite of the Russian findings.
EXPERIMENTAL PRODUCTION OF COATED LIME
A small rotary furnace was used to examine manufacture since it isenvisaged that a rotary kiln would be used in practice. The furnace, rotating atG r . p . m . , was lined with chrome bonded magnesia castable refractory (Kaiser"Permanente") to internal dimensions of 550mm long and 400mm dia., withaxial ports 40mm dia., for firing and gas exit. The furnace was charged and
-,n1ied through a 50mm dia., port in the cylindrical wall blocked with artmovable plug and sampled through the gas exit port. The furnace was firedwith an axial propane /oxygen burner (C. I. G. "Bazooka" Chassis type) togenerate the required temperatures in the short working volume. Temperaturegradients in the charge, measured by optical pyrometer, were less than 20°Cfrom end to end.
Materials selected for the manufacture tests were those likely to beused in practice, viz Mt. Newman hematite (-6 +1 mm) and Tsukumi limestone(-30 +10 mm). Goethitic fines were also used in some runs.
In the experimental trials, the furnace was preheated to some 200 Clower than the final temperature required, the limestone and ore (about 7kglotal mass) were added and the charge was heated to roughly follow the progressthrough the critical zone of the kiln. Samples were taken at intervals and thenature of the tumbling action of the charge was monitored.
Based on these trials, in which maximum temperature, ore type andratio of ore to stone were varied, it is anticipated that satisfactory product wouldbe obtained by charging between 5% and 10% hematitic fine ore ( -6+1 mm) with thelimestone and burning to a maximum temperature of approximately 1260°C,depending on the ore. Tests in a full scale kiln are necessary to firm up theseestimates. Ringing of the kiln, due to accretions adhering to the wall, mayresult from excessive temperatures or too high a proportion of ore.
Petrographic and XRD examination of the coating produced on thelime, Fig. 1, indicates that, at the surface, it comprises mainly grains of asaturated solution of FeO in CaO, abbreviated herein to C(W)':S with grainboundary matrix of dicalcium ferrite, C?F, occasionally containing some:|: This material is described in the Joint Committee on Powder Diffraction
Standards 1971, Card 21-917, after Allen and Snow^11) as Calcium Iron Oxideand piven the misleading formula of FeO. CaO

- 93 -
magnetite, M, and metallic iron, I. Below the surface, the structure isgradually depleted of the C F matrix and the C(W) decreases in FeO content,eventually becoming pure lime.
LABORATORY TESTS OF COATED LIME
The standard empirical tests involving rate of slaking in water*•** ^°are not applicable. While testing in a miniature BOS vessel, as done by Buxtonand Sandaluk8, has attractions, it suffers from inability to study the effect ofthe coating on the mechanism of lime solution. With the difficulty in ensuringthat the miniature furnace represents plant operations, it was decided to studythe mechanism cf solution in a critical slag composition and compare the rate ofsolution with that of uncoated lime.
Tests were made in an inductively heated closed iron cruciblecontaining the slag at 1400°C under a flowing Ar atmosphere. Two pieces ofLime were suspended on an inverted "T" shaped holder, preheated above theslag to prevent chilling, then immersed for the required time and rapidlyremoved from the crucible.
The samples were either ground for chemical or XRD analysis ormounted and sectioned for XRD or petrographic examination, as required toidentify the various phases. The constituents found included pure lime(abbreviated C), FeO in solid solution in lime (C (W) ), dicalcium ferrite (CpF),hematite (H), magnetite (M), metallic iron (I), woliastonite (C S), dicalciumsilicate (CLS) and trie ale ium silicate (CLS). The slag structure variedconsiderably due to effects such as cooling and reoxidation, but the maincomponents were C^S, CS, M and C^F, with H sometimes present. Slag recoverywas difficult because the large volume change associated with C9Stransformations caused the slag to separate from the lime and often spall off.
Initial tosts were made with small pieces of burnt lime from the plantand coated lime from the rotary furnace. The irregular shapes of theparticles and variability of structure, especially in the uncoated lime, preventedreproducible results from being obtained, while the drilling of holes in theparticles was particularly difficult. Flaw-free limestone was therefore cut intoregular blocks (4mm x 13mm x 18mm), drilled and fired. Coated lime,containing about 10% Fe O , was made by treating blocks fired at 1400°C withan alcohol slurry of iron ore (-0. 076 mm) and firing them again at 1300°C toproduce a surface structure similar to that obtained by calcining in the rotaryfurnace with ore. An argon atmosphere was used for the second firing because,in air, the iron oxide did not penetrate the surface. The lime was burnt at ahigher temperature than in the rotary furnace so that reproducible andequivalent coating structures were obtained. Similarly, hard-burnt blocks(calcining temperature 1400 C) were found to be more reproducible than soft-burnt lime (950 C) in the comparison tests so the majority of tests used theformer.
In dips of coated and uncoated hard-burnt lime blocks, for from 1. 5to 40 minutes, the coated lime was always highly discoloured throughout (i.e.penetrated by FeO etc. , ) and often distorted or partially or completely dissolved.
The uncoated lime was, generally, only partially penetrated and the initial sizeand shape were retained. The degree of penetration was measured by areadetermination on a quantitative television microscope or by chemical analysisfor free lime. There was considerable scatter in the results but the rate ofpenetration did tend to increase markedly with FeO content of the slag (~3% permin at 35% FeO. approaching 10% per min at 40% FeO).
Similar results were observed with the rotary furnace coated limeand burnt lime from the plant respectively but the results were uncertain due toihe effects of flaws and the difficulty of drilling and attaching samples to theinverted T bar.
The interiors of coated (discoloured) and uncoated blocks are shownin Fig. 2. Coated blocks exhibited C(W) grains throughout in a nearly continuousmatrix of CgF containing some CgS, M and occasionally I. In the uncoatedparticles, pure unaffected C gave place to a slightly discoloured structure, i . e . ,imsaturated C(W) with some small amounts of Cr,F in some grain boundarypositions.
Typical lime / slag interfacial structures are shown in Fig. 3. Theinterior of the coated lime is C(W) in a matrix of C?F containing rather more Cr,Sand some M. At the surface there are distinct layers of C F containing some M,then more or less regular hexagonal CoS in a matrix of C2F, then a thin layer ofC9F and a thicker (0. 05mm) layer of CpS extending into the slag. In contrast,
t^j
the uncoated lime exhibits unreacted lime (blurred and transparent in Fig. 3(b) )very close to the surface, C(W) with only very minor proportions of C2F and M,then a thick (0. 1mm) layer of C2$ in contact with the slag. Soft-burnt lime wasalso dipped in the same slag and hard-burnt lime was dipped in a slag containingabout 2. 5% fluorspar. Both were completely penetrated and exhibited the type ofinterfacial structure shown in Fig. 3(a).
DISCUSSION
Manufacture of Coated Lime
Detailed interpretation of the mechanisms involved in coatingformation and lime solution is beyond the scope of this paper. Briefly, theformation of the coating in the rotary kiln involves two consecutive reactions:
(a) Formation of liquid calcium ferrites from contact of lime and iron oxide(initially solid/ solid reaction);
(b) Absorption of the liquid in the porous lime, accompanied by solution of FeOin the lime to form C(W) and solution of CaO in the ferrite until itsolidifies.
The lime being very reactive, the liquid would be absorbed quicklybut, if there is excessive ore in the charge, the rate of production of liquidcalcium ferrites on the surface could exceed the rate of absorption, in which caseparticles would tend to agglomerate and accretions build up on the walls.

Plant trials of the manufacture would be needed to determine theoptimum temperature and ore ratio. The major production problem is likely tobe the formation of accretions, as observed by Rogovtsev et al. . However, itis expected that the millscale they used, being relatively fine and lamellar,would contact the lime surface intimately with consequent rapid formation ofl i q u i d ferrites. In contrast, with a small proportion of coarser equiaxed ore inthe charge, point contact over moving surfaces would occur so that the liquidcalcium ferrite would be abosrbed before it contacts other surfaces.
Tests of Lime Solution
The laboratory tests show markedly different characteristics ofreaction with the slag for coated and uncoated lirne. Furthermore, thebehaviour for coated lime is the same as for very soft-burnt lime and for limein fluorspar bearing slag.
For the coated lime, if it absorbs sufficient iron oxide ahead of itscontact with silicates:
(a) The particle assumes a structure of small C(W) grains in a largelycontinuous matrix of low m.p. C0F which renders it mechanically weakand therefore readily disintegrated in the turbulent conditions of the BOSprocess;
(b SiO? present in solution, or as €2$, forms CgS, which generallyprecipitates as separate hexagonal prisms and these provide lessresistance to further absorption of liquid slag than CoS, which forms amore continuous layer effective in preventing further reaction.
For the uncoated hard-burnt lime:
(a) A layer of C(W) forms on the surface with insufficient C2F being producedto weaken the particle mechanically or react the CoS layer with lime;
(b) The C(W) layer is a firm basis on which C2S forms a continuous layerwhich prevents further reaction unless it is dissolved from the exterior.
These results confirm the postulated mechanisms and indicate that apreliminary coating with iron oxide can provide sufficient calcium ferrite toalter the mechanism radically and thereby obtain rapid solution of the lime intothe slag.
Applicability to Plant Operations
Conditions in the BOS furnace cannot be characterised accurately sono quantitat ive comparison can be made between furnace and laboratory tests.However, the conditions chosen for test are probably relatively unfavourable forlime solution in that the temperature is low, there is relatively little agitationand the slag is nearly, if not actually, saturated with the inhibiting species.FeO contents, though higher than the final values, are probably a reasonablevalue for the localised conditions that the lime is exposed to during the blow.
- 95 -
Particle size is smaller (mean absorption path about 2mm instead of 10-20 mm)which tends to counteract the low temperature and quiescent conditions free ofagitation and abrasion. The similarity of structure obtained with coated limeand soft-burnt lime in the fluoride free slag and with hard-burnt lime in slagcontaining fluorspar is clear indication that the coated lime will be effective inBOS practice.
In spite of this evidence, testing both the manufacture and theeffectiveness of the material on the plant is necessary to optimise practice,confirm the results and establish the economic advantages. Sufficient materialfor at least one furnace campaign (say 500 heats) is required to determine theeffect on lining life and measure the effectiveness. Heat-to-heat variationsoccur in the feed (temperature and composition of the hot metal and theproportion of scrap), the grade of steel made and the furnace characteristics,necessitating changes in the amount of lime added, the oxygen blowingcharacteristics etc. Measurement of effectiveness is largely qualitative, e .g . ,die tendency for "slopping" (overflow of slag) which depends on furnace wear,feed and blowing practice. Quantitative comparison is best achieved through thephosphorus partition, (% P^^S m s^-ag) / (% P in steel), but, since this variesconsiderably from heat to heat, about 70 heats with the new material would berequired to establish that a 10% difference in mep.n phosphorus partitions isstatistically significant at the 95% confidence level.
Economic assessment involves cost of production of the coated limerelative to the equivalent amount of fluorspar saved and the effects within thefurnace, in particular the change in scrap chargeable to what is essentially anautogenous process, with no external heating. The absence of spar increasesthe amount of lime required to obtain the same CaO/SiOo ratio, while the ore inthe lime adds iron units but has a greater cooling effect than the spar, thusreducing the amount of scrap chargeable to the furnace. Overall, the savingfrom using coated lime is estimated to be a few cents per tonne of steel. If thenew material increases yield or saves lime because it is more effective, thesaving could be considerably greater. Changes in kiln productivity cannot beestimated without trials but it is noteworthy that the radiation heat transfer isincreased markedly by the introduction of ore with its higher emissivity1 . Onthe other hand, the need for close control of the maximum kiln temperature mayl imi t its throughput.
CONCLUSIONS
Laboratory work on the manufacture and solution in a critical BOSslag composition has indicated that it should be feasible to manufacture limecoated with iron oxide in a rotary kiln providing proportion and size and kilntemperature are controlled and that the material should be as effective asiiuorspar in promoting the solution of lime in basic oxygen steelmaking.
The use of coated rotary lime is anticipated to provide some costadvantages due to savings in fluorspar but plant trials are required to confirmihe economic aspects.

- 96
ACKNOWLEDGEMENTS
The permission of the Broken Hill Proprietary Company Limited topublish this work is acknowledged. The authors are grateful for the assistancereceived in chemical and petrographic analysis, particularly f^om Mr. E. J.Bagnall in interpretation of the structures.
REFERENCES
1. Obst, K . H . , & Stradtman, J.,Arch iv f . d. Eisenhuttenwesen, 1969, 4 0 ( 8 ) , 615-617.
2. vom Ende, EL, e ta l . ,A r c h i v f . d . Eisenhuttenwesen, 1968, 3 8 1 ( 3 ) , 177-187.
3. Bardenheuer, F. , vom Ende, EL, & Oberhauser, P.G. ,Stahlu. Eisen, 1968, 8_8 (23), 1285-1290.
4. Hachtel, L., Fix, W. , & Tromel, G. ,A r c h i v f . d. Eisenhuttenwesen, 1972, 4 3 ( 5 ) , 361-369.
5. Schlitt, W.J . , & Healy, G. W.,Ceramic Bull. , 1971, 5_0 (12), 954.
6. Obst, K . , & Stradtman, J.,J. South African Inst. Min. Met., 1972, Jan., 158.
7. Bardenheuer, F., Kauder, G., & van Wedd, K. ,A r c h i v f . d. Eisenhuttenwesen, 1973, 4 4 ( 2 ) , 111-118.
8. Buxton, F . M . , & Sandaluk, P. A . ,Paper presented at AISI - Regional Technical Meeting, Pittsburgh,Pa., November 9, 1972.
9. Yamamoto, S., Yoshii, M. , & Ichinoke, M.,Tetsu to Hagane, 1971, 57_ (4), S98-S102.
10. Rogovtsev, N . L , e t a l . ,Steel in the USSR, 1972, 2_ (7), 518-520.
11. Allen, W . C . , & Snow, R .B . ,J. Am. Ceram. Soc., 1955, ^8, 264-280.
12. ASTM Standard C110-71 "Physical Testing of Quick Lime andHydrated Lime".
13. Behrens, K.F . , Koenitzer, J. , & Kootz, T.,J. Metals, 1965, 17_ (7), 776-781.
14. McCarthy, M. J. , e ta l . , unpublished work.
- 97 -
C
Fig. 1 Coated Rotary Lime (x!50) Air etched
(a)Coated Lime
(b)Uncoated
Fig. 2 Interior of Lime Block after dipping in slag for 2. 5 min. (x!50) slagcomposition: CaO/SiOQ = 1.2, % FeO = 27 Air etched
£
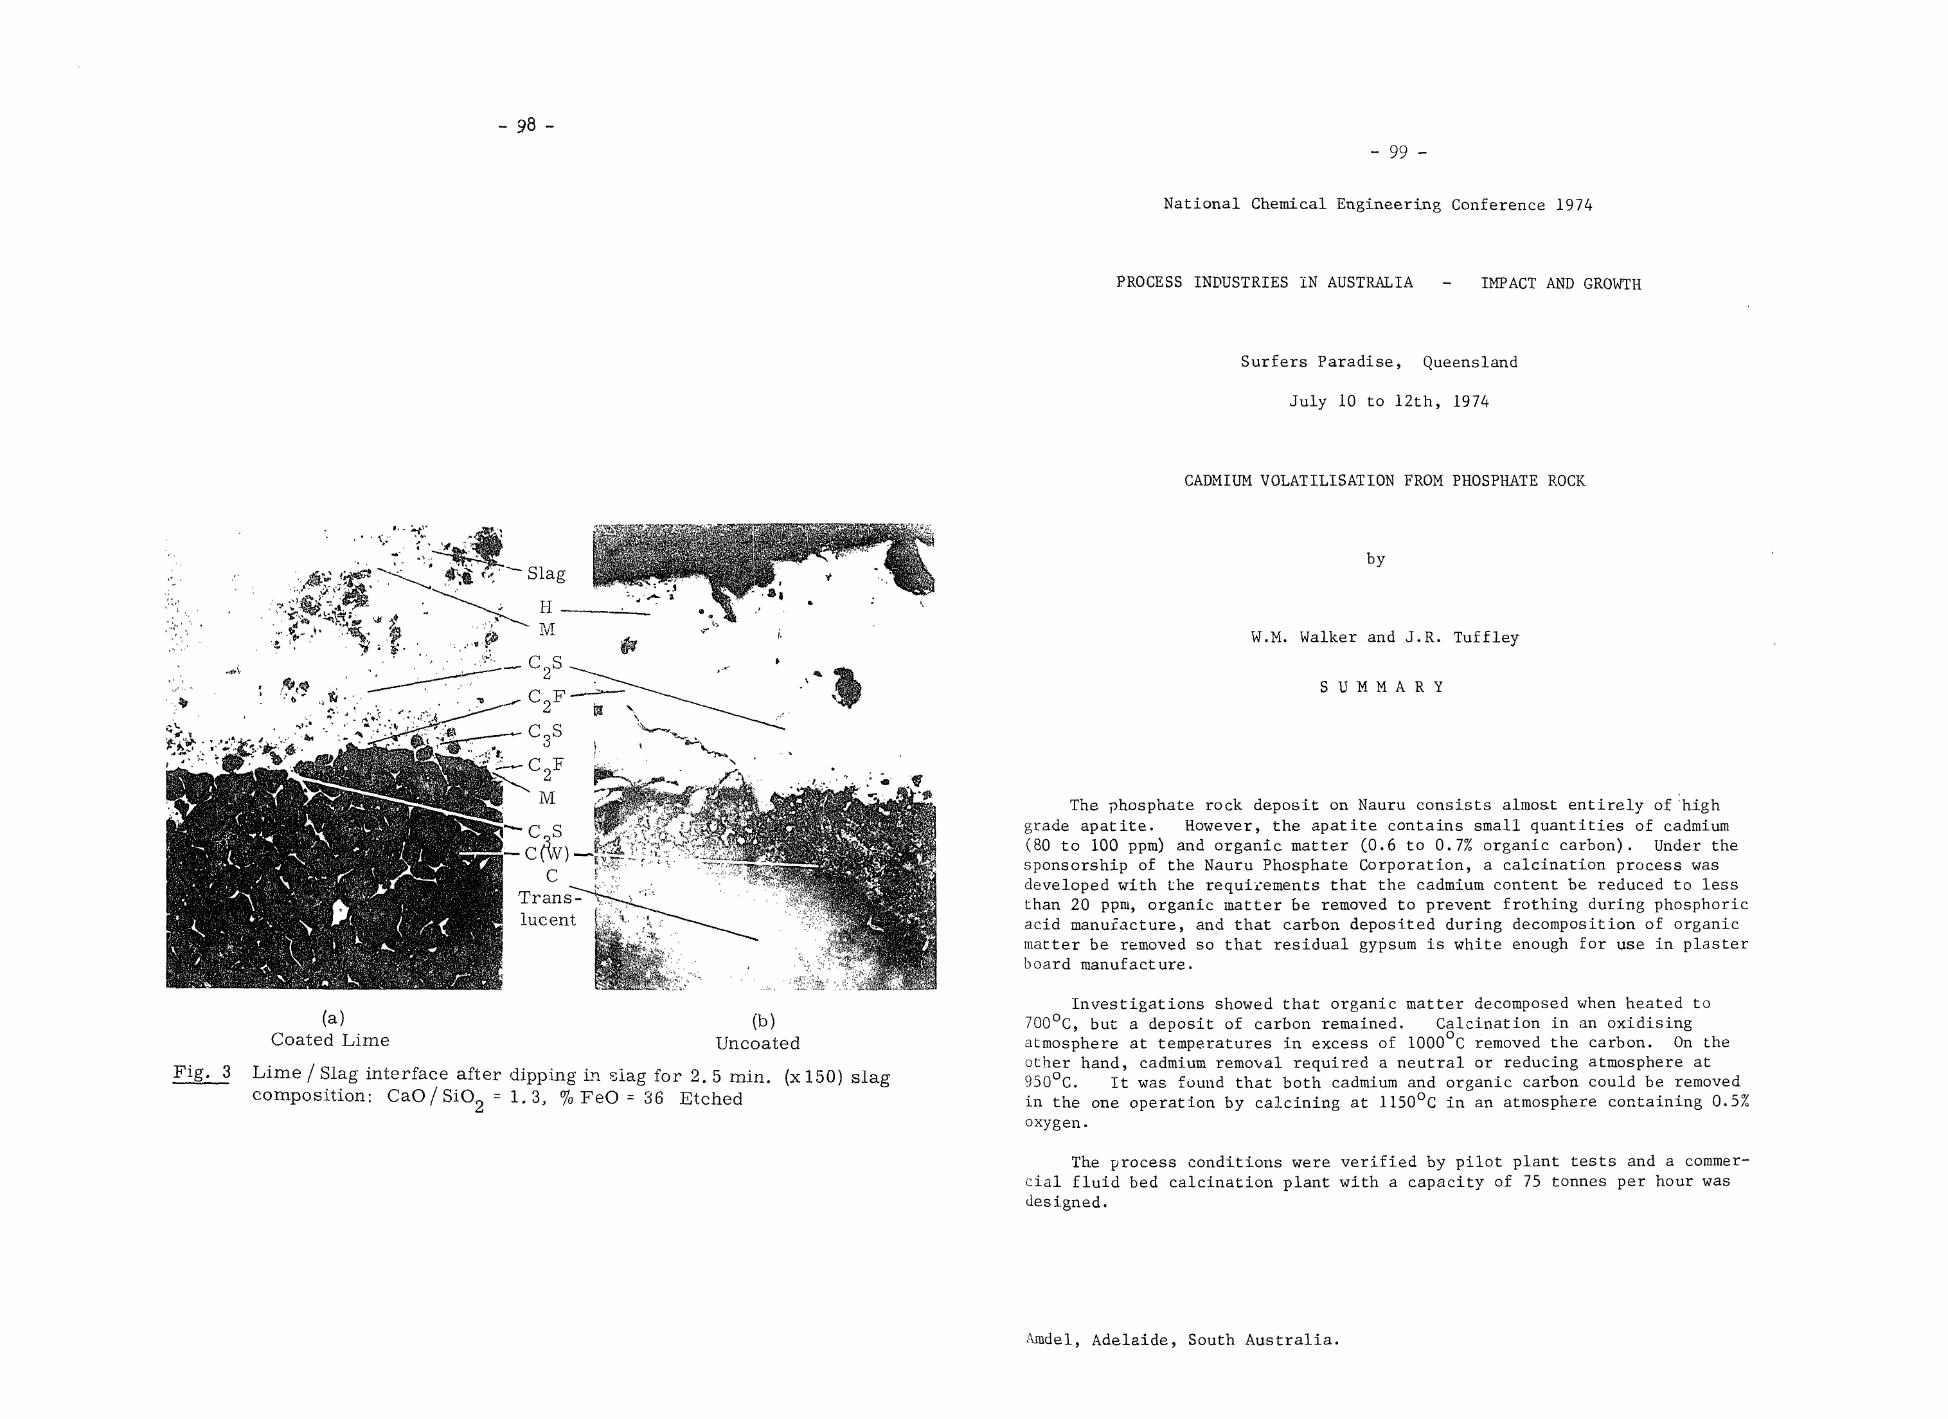
- 99 -
National Chemical Engineering Conference 1974
PROCESS INDUSTRIES IN AUSTRALIA IMPACT AND GROWTH
Surfers Paradise, Queensland
July 10 to 12th, 1974
CADMIUM VOLATILISATION FROM PHOSPHATE ROCK
(a)Coated Lime
(b)Uncoated
Fig- 3 Lime / Slag interface after dipping in slag for 2. 5 min. (x 150) slagcomposition: CaO/SiO2 = 1. 3, % FeO = 36 Etched
by
W.M. Walker and J .R. Tuffley
S U M M A R Y
The phosphate rock deposit on Nauru consists almost entirely of 'highgrade apatite. However, the apatite contains small quantities of cadmium(80 to 100 ppra) and organic matter (0.6 to 0.7% organic carbon). Under thesponsorship of the Nauru Phosphate Corporation, a calcination process wasdeveloped with the requirements that the cadmium content be reduced to lessthan 20 ppni, organic matter be removed to prevent frothing during phosphoricacid manufacture, and that carbon deposited during decomposition of organicmatter be removed so that residual gypsum is white enough for use in plasterboard manufacture.
Investigations showed that organic matter decomposed when heated to700°C, but a deposit of carbon remained. Calcination in an oxidisingatmosphere at temperatures in excess of 1000 C removed the carbon. On theother hand, cadmium removal required a neutral or reducing atmosphere at950°C. It was found that both cadmium and organic carbon could be removedin the one operation by calcining at 1150°C in an atmosphere containing 0.5%oxygen.
The process conditions were verified by pilot plant tests and a commer-cial fluid bed calcination plant with a capacity of 75 tonnes per hour wasdesigned.
Amdel, Adelaide, South Australia.

-- 100 -
INTRODUCTION
Nauru is a small Pacific Ocean island having an area of about 2,200hectares and lying some 50 km south of the equator and 2,900 km north-eastof Australia. The greater part of the island is covered by a phosphaterock deposit. Little or no overburden occurs and the deposit varies indepth up to 24 m with an average depth of about 7.6m. Because of thecovering of tropical vegetation, the top layer (50 to 300 mm in depth) isconsiderably contaminated with organic matter, containing over 2% organiccarbon. This layer is stripped before mining the remainder of the deposit.
The phosphate deposit consists almost entirely of high grade apatitewith very low content of iron and aluminium. It exhibits a high chemicalreactivity. A typical chemical analysis of Nauru rock is presented inTable I.
NECESSITY FOR CALCINATION
There were three main reasons leading to the decision by the NauruPhosphate Commission to install a calcination plant at Nauru.
Firstly, while in phosphoric acid production, good overall P205recovery is achieved with relatively low consumption of sulphuric acid,owing to the contained organic matter and carbonate, a significant amountof stable foam is produced leading to operational difficulties. Thephosphoric acid product is highly coloured and therefore not attractive topotential customers.
TABLE I: TYPICAL ANALYSIS OF NAURU PHOSPHATE ROCK
% Weight (dry basis) % Weight (dry basis)
P205CaOCO 2A1203 + Fe203FSi02MgO
38.452.72.510.412.700.070.35
Na20K20ClCombined waterOrganic carbonCd (ppm)
0.250.020.013.000.7080
Secondly, much of the organic carbon reports in the by-product gypsumgiving a grey colour and while this is suitable for the manufacture by plasterboard, a white product would have greater customer appeal and therefore moredemand.
Finally, in the manufacture of fertilizers whether these be superphosphaf.esor made from phosphoric acid, virtually all of the cadmium contained in thephosphate rock reports in the fertilizer. Now while it has long been recognisedthat cadmium contained in the fumes from smelters, foundries, galvanising worksand the like Is a health hazard, it is only more recently that concern hasbeen growing over the amount of cadmium contained in the food we eat. A verysevere case of cadmium poisoning occurred in a Japanese village where for yearsthe villagers had been eating rice and soyabeans irrigated with river waterpolluted with cadmium (and lead and zinc) leached from mining tips. Thiscase was due to extreme contamination but normally the problem is more insidious,the cadmium levels being very low. We do not yet know the levels at whichcontinuous intake of cadmium may prove dangerous.
- 101 -
It has been shown (C.K. Williams and D.J. David, Australian Journalof Soil Research, 1973, 11 (in press) ) that when top dressing with phosphatefertilizer containing cadmium, the cadmium remains in the top layer of soilwhere it is available to plants. Certain plants and particularly root andleaf crops can absorb the metal and although the levels found in Australiancrops were very low (0.01 - 0.04 ppm in cereals, 0.01 - 0.02 ppm in processedneas) and indeed were much lower than reported data for American crops, it wasrecommended that cadmium levels should be carefully monitored.
In Japan, legislation is being introduced to limit the cadmium contentof imported phosphate rock to 20 ppm and this therefore became the primereason for calcining Nauru phosphate.
EXPERIMENTAL WORK
While low temperature calcination of phosphate rock for the decompositionof organics is a fairly common technique, the volatilisation of cadmium fromphosphate was a completely new problem and required experimentation to optimisethe conditions.
Equipment Used
The experimental work was carried out mainly by batch testing in anexternally heated 0.15 m diameter fluid bed reactor with confirmatory testsbeing made by continuous operation in a 0.45 m diameter fluid bed pilot plant.
The 0.15 m diameter reactor was constructed of type 310 stainless steelwith an expanded top section of 0.3 m diameter and an overall height of 2.4 m.The reactor was located in a refractory-lined combustion chamber fired withcompressed town's gas and with natural draught of air. The supply of gas tothe combustion chamber was automatically controlled by a proportional controllerconnected to a motorised valve so as to maintain a constant bed temperature.The fluidising gas was drawn either from an air compressor or from gas cylinders(e.g. N2, H2, C02 etc) or by mixing these in the required proportions. Thefluidising gas was preheated by passing through coils of type 310 stainlesssteel located in the top part of the combustion chamber before passing to thewindbox and so through the bubble cap distributor plate. The exhaust gaseswere cycloned to remove fines elutriated from the bed before venting toatmosphere. The temperatures of the preheated fluidising gases, the fluidbed and within the cyclone were measured using chrome1-alumel thermocouplesand recorder.
The batches tested were of 10 kg of phosphate rock, precrushed to minus6 mm size. A sample probe was used to extract small samples from the fluidbed for assaying after various time intervals.
The 0.45 m diameter fluid bed used for continuous operation piloting wasrefractory lined with a type 310 stainless steel distributor plate. 1'heoverall reactor height was 3.9 m and the nominal bed depth was 1m. Apressure-sealed table feeder with variable speed drive was used for feedingand the product overflowed fror. the bed to a sealed product hopper. ^ Theexhaust gases were cycloned before venting to atmosphere with the fines beingdischarged to a collection hopper. The weights of the feed and product hopperswere continuously recorded. The windbox was fired using compressed town sgas for start up and thereafter distillate oil was pumped directly into thebed through an atomising nozzle (air was used for atomising). The fuel ratevas automatically controlled to maintain a constant bed temperature. AlliJ.ow rates of gas or liquid were metered through rotameter tubes, and air-surged tapping points connected to mercury manometers were used to measure thec'Utributor, bed, cyclone and scrubbing system pressure losses. Chrome 1-alumelt:onaocouples in type 310 stainless steel sheaths were used to measure thetaraperatures throughout the system, these being connected to a 12 point recorder.A gas sample from the scrubbed exhaust was continuously analysed for oxygen content

- 102 -
Results - Organic Decomposition
It is well documented chat organics can be decomposed by calcinationat temperatures of the order of 800°C. Tests were therefore not made solelyto examine this aspect, but from calcines roasted for other reasons the resultsgiven in Table II show that even under reducing conditions the problems offoaming and acid colouration can be overcome by calcination.
TABLE II: ORGANIC DECOMPOSITION
Sample Max. Foam Heightmm
Acid Colour
HeadCalcine 900°C, neutralatmosphere
Calcine 850°C, reducingatmosphere
32
8
8
Dark brown
colourless
colourless
Results - Carbon Oxidation
Gypsum samples were received from a potential customer with comments ontheir acceptability for plaster board manufacture on the grounds of whiteness.Using an EEL Reflectance Photometer to quantify these comments, it was foundthat a reflectance from the gypsum of 70% of that of a magnesium oxide standardwas necessary for the gypsum to be acceptable. This gypsum whiteness was incurn related to a calcine whiteness of 55%.
Batch tests were made at varying temperature? up to 1150°C and withvarying levels of oxygen in the fluidising gases. The batches were bothheated to the operating temperature and cooled in a nitrogen atmosphere toprevent oxidation during these periods. Samples were withdrawn from the bedat \ hour intervals and the calcines examined for whiteness. The resultsobtained are shown in Figure 1.
It can be seen that at 1000°C, an atmosphere containing 10% 02 wasrequired to obtain the minimum allowable whiteness (55%) in less than onehour. At 1100 C, a similar result was obtained in a 1% 02 atmosphere, whileat 1150°C a very much better result was obtained with only 0.5% 02. Minimumretention time required in this case was \ hour. The results illustrate therapid change in oxidation rate with change in temperature, whereas a change ingas composition or retention time has a much lesser effect.
Results - Cadmium Volatilisation
Batch tests were made at varying temperatures up to 1150°C and withatmospheies varying from mildly reducing to mildly oxidising. The batcheswere heated to the operating temperature and cooled in an air atmosphere tominimise cadmium volatilisation during these periods. Samples were withdrawnfrom the bed at \ hour intervals and assayed for cadmium. The results obtainedfor runs under neutral or mildly reducing conditions are shown in Figure 2,while Figure 3 shows the data obtained under oxidising conditions. In all casesthe phosphate rock had an initial cadmium content of 87 ppm.
From Figure 2 it can be seen that for the runs at 950°C the addition ofeither hydrogen or small amounts of water vapour to the atmosphere increasedthe rate at which the cadmium was removed. Why water vapour should assistin this way is not clearly understood, but some water vapour (about 12% byvolume) will be present, in the commercial plant from the combustion of the fuel
- 103 -
,-;]. With a neutral atmosphere (a mixture of nit'" .en and ca-'>on dioxide was-,,Lod in all tests) increasing the temperature ii Ceases the rate of --r.dir.iumelimination, and at 1100°C a satisfactory level was obtained after a retentiontime of -2 hour. To operate at this condition would however require a two-stageei Liaination process because sufficient carbon elimination could not be achieveduu-ier the same conditions.
From the oxidising data on Figure 3, it can be seen that operation at 1100°Cwith 1% oxygen, a condition which would eliminate carbon, requires a retentionU me of 1 hours to reduce the cadmium to a satisfactory level. Commercialoperation at this condition is therefore very doubtful. By raising the temperatureto 1150°C a significant improvement in cadmium elimination is achieved, a retentiontime of 20 minutes being required with 0.5% oxygen and a time of 25 minutes with1" oxygen to achieve the target value of 20 ppm residual cadmium. The cadmiumlevel was reduced to 8 ppm after 45 minutes at 1150°C, 0.5% oxygen.
These results for the volatilisation of cadmium agree qualitatively withthose of Kellogg (Trans, of the Met. Soc. of All-IE, Vol 236, May 1966, p. 604)where the partial pressure of the cadmium was shown to be inversely proportionalco the square root of the oxygen pressure.
Results - Continuous Pilot Plant Operation
On the basis of the above tests, the conditions chosen for the continuousoperation of the 0.45 m diameter pilot plant, both for confirmation testing andfor the production of a bulk sample for customer evaluation, were 1150°C, 0.5%oxygen and a nominal retention time of 45 minutes for the single calcinationstage.
The commercial plant, for reasons of thermal economy, was envisaged as amulti-stage fluid-bed system, with the first stage being a drying and preheatingstage, the second stage being for calcination and subsequent stages being forproduct cooling and air-preheating (see Figure 4). Apart from preheating thefeed, the first stage was also to enable elutriation of fines from the system(for subsequent palletisation elsewhere) and so not only produce a relativelydust free product but avoid the problem of the high temperature calcination ofthe fines. Piloting was therefore carried out as a two-stage process to simulatethe first two stages of the commercial plant. In the first stage the phosphaterock, already crushed to minus 6 mm size, was dried and preheated and fed to thecalcination stage, at a temperature of approximately 200°C. The gas velocity inthe first stage was sufficient to elutriate up to 250 urn particles with only thecoarser particles being fed to the calcination stage. Particle size breakdowndue to dehydration and thermal shock was measured in both stages. Assays of theproduct are given in Table III and particle size analysis in Table IV. Apartfrom these results, the reactivity of the calcine was measured as the time rateof disappearance of free sulphuric acid during an acidulation test (simulatingsuperphosphate manufacture) and found to be not significantly poorer thanun.calc.ined material.
The results obtained from the continuous piloting run compared favourablywith those from the batch tests. Cadmium elimination was marginally betterwhile carbon removal was slightly worse. Both were well within the requiredspecification even allowing for the addition of the relatively uncalcinedcyclone dust. Results obtained during the run also indicated that the oxygencontent of the gases could vary between 0.3 and 1.0% without significantlyaltering the product quality.
DESIGN OF COMMERCIAL UNIT
Amdel joined forces with Evans Deakin Industries Limited, a Brisbane-based-puipment manufacturer, to jointly tender for the design, construction, erection
<nid commissioning of a calcination plant on Nauru to produce 75 tph of calcinedproduct.
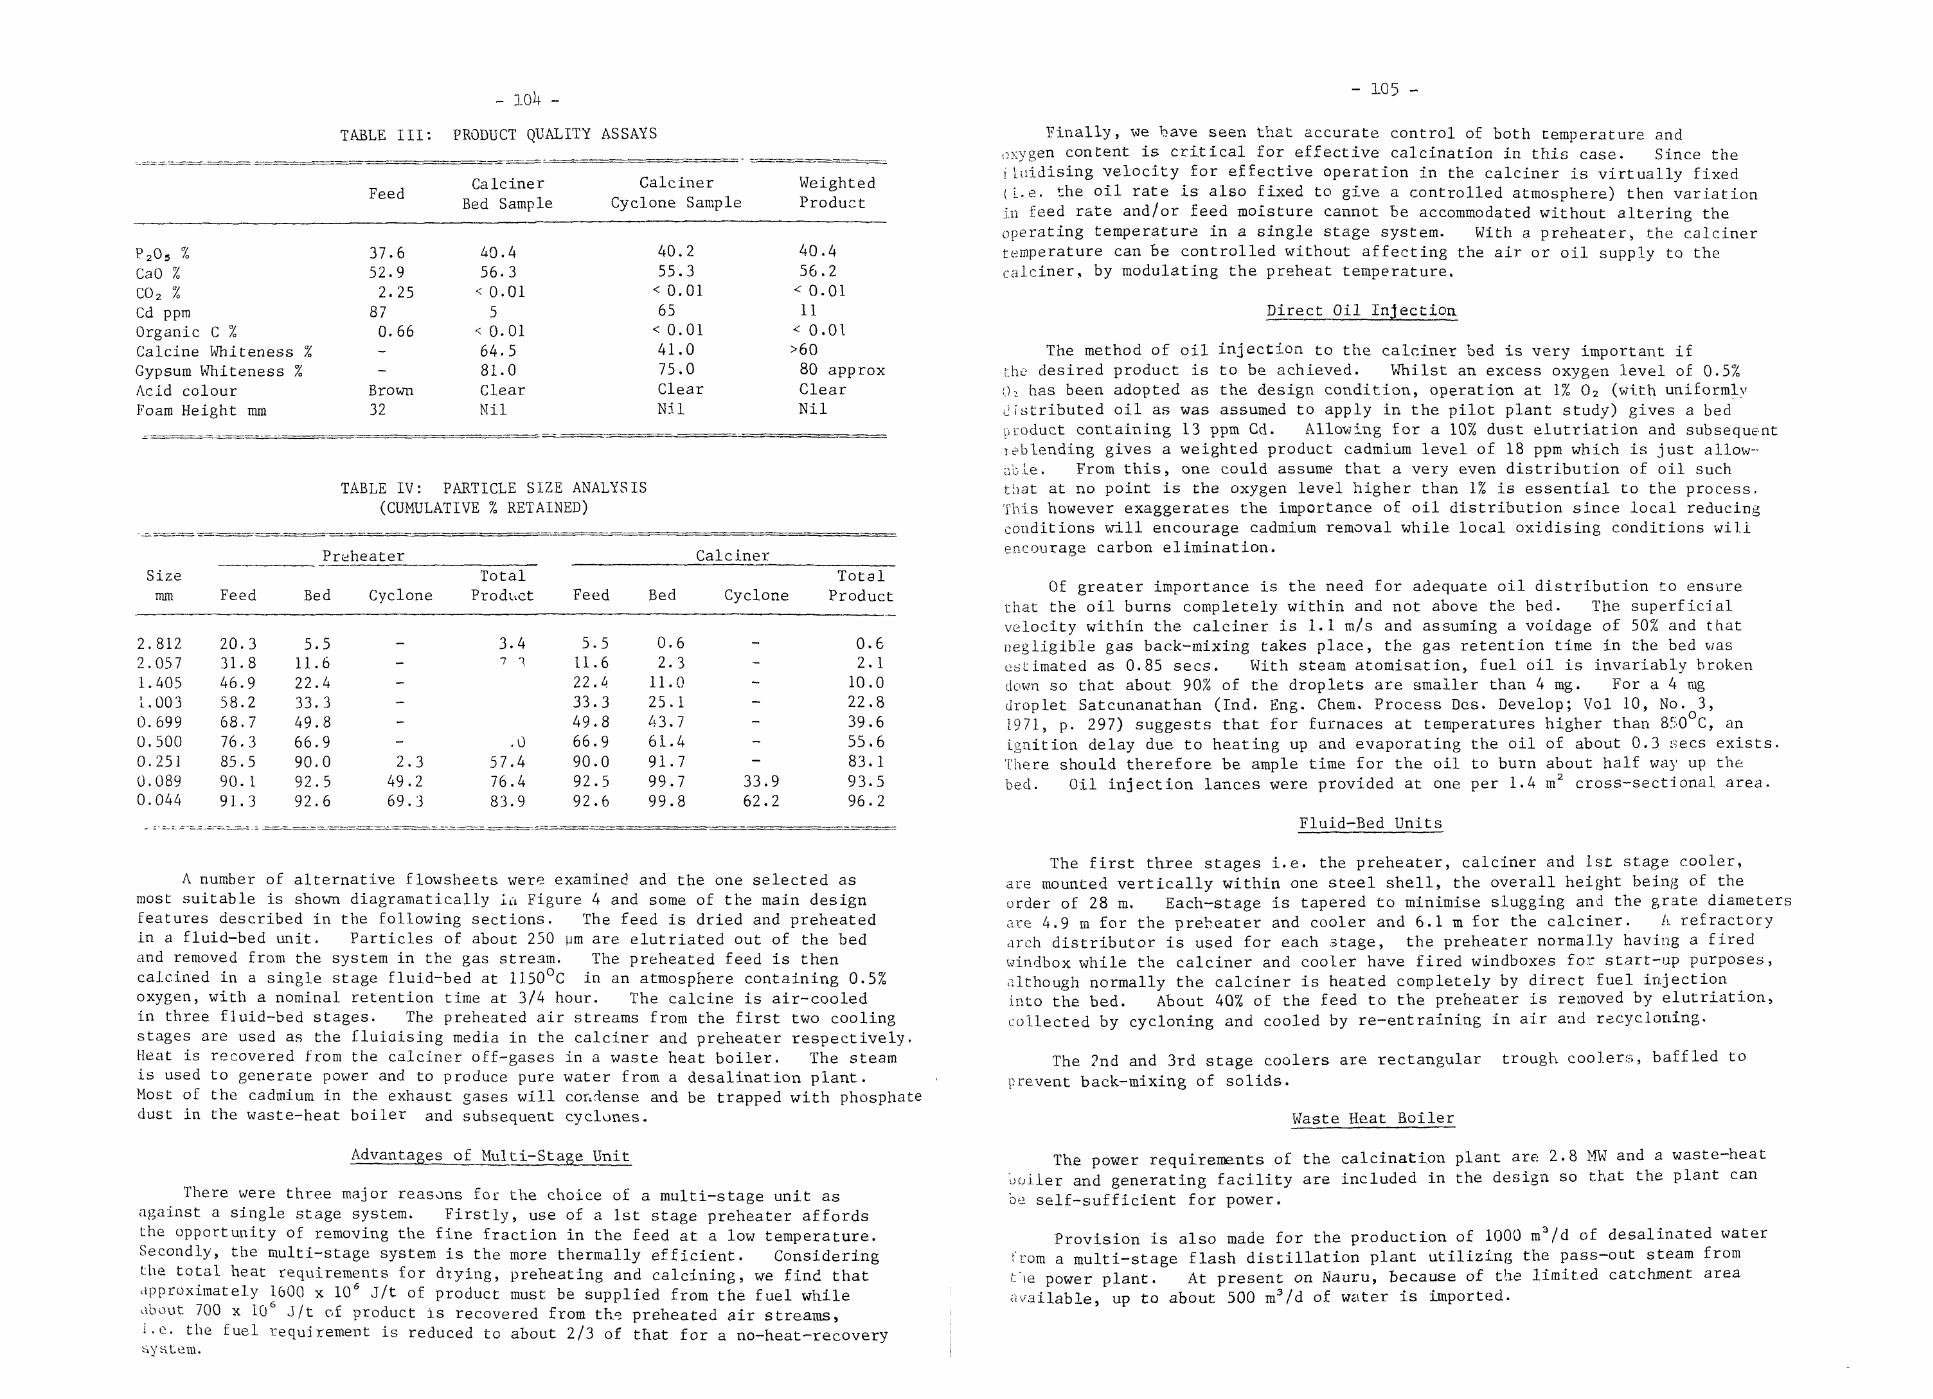
- 105 -
TABLE III: PRODUCT QUALITY ASSAYS
P20S %CaO %CO 2 %Cd ppmOrganic C %Calcine Whiteness %Gypsum Whiteness %Acid colourFoam Height mm
Feed
37.652.92.25870.66--Brown32
CalcinerBed Sample
40.456.3< 0.015
< 0.0164.581.0ClearMil
CalcinerCyclone Sample
40.255.3< 0.0165< 0.0141.075.0ClearNil
WeightedProduct
40.456.2< 0.0111< 0.01>6080 approxClearNil
TABLE IV: PARTICLE SIZE ANALYSIS(CUMULATIVE % RETAINED)
Sizemm
2.8122.0571.405L.0030.6990.5000.2510.0890.044
Feed
20.331,846.958.268.776.385.590. 191.3
Fret
Bed
5.511.622.433.349.866.990.092.592.6
leater
Cyclone
—
-----2.349.269.3
TotalProduct
3.47 1
.057.476.483.9
Feed
5.511.622.433.349.866.990.092.592.6
Calciner
Bed Cyclone
0.62.311.025.143.761.491.799.7 33.999.8 62.2
TotalProduct
0.62.110.022.839.655.683.193.596.2
A number of alternative flowsheets were examined and the one selected asmost suitable is shown diagramatically iu Figure 4 and some of the main designfeatures described in the following sections. The feed is dried and preheatedin a fluid-bed unit. Particles of about 250 urn are elutriated out of the bedand removed from the system in the gas stream. The preheated feed is thencalcined in a single stage fluid-bed at 1150°C in an atmosphere containing 0.5%oxygen, with a nominal retention time at 3/4 hour. The calcine is air-cooledin three fluid-bed stages. The preheated air streams from the first two coolingstages are used as the fluiaising media in the calciner and preheater respectively.Heat is recovered from the calciner off-gases in a waste heat boiler. The steamis used to generate power and to produce pure water from a desalination plant.Most of the cadmium in the exhaust gases will condense and be trapped with phosphatedust in the waste-heat boiler and subsequent cyclones.
Advantages of Multi-Stage Unit
There were three major reasons for the choice of a multi-stage unit asagainst a single stage system. Firstly, use of a 1st stage preheater affordsthe opportunity of removing the fine fraction in the feed at a low temperature.Secondly, the multi-stage system is the more thermally efficient. Consideringthe total heat requirements for dtying, preheating and calcining, we find thatapproximately 1600 x 106 J/t of product must be supplied from the fuel whileabout 700 x 106 J/t of product is recovered from the preheated air streams,
the fuel requirement is reduced to about 2/3 of that for a no-heat-recovery
Finally, we have seen that accurate control of both temperature andoxygen content is critical for effective calcination in this case. Since thei luidising velocity for effective operation in the calciner is virtually fixed(I.e. the oil rate is also fixed to give a controlled atmosphere) then variationin feed rate and/or feed moisture cannot be accommodated without altering theoperating temperature in a single stage system. With a preheater, the calcinertemperature can be controlled without affecting the air or oil supply to thecalciner, by modulating the preheat temperature.
Direct Oil Injection.
The method of oil injection to the calciner bed is very important ifr.he desired product is to be achieved. Whilst an excess oxygen level of 0.5%Oi has been adopted as the design condition, operation at 1% 02 (with uniformlyDistributed oil as was assumed to apply in the pilot plant study) gives a bedproduct containing 13 ppm Cd. Allowing for a 10% dust elutriation and subsequentleb lending gives a weighted product cadmium level of 18 ppm which is just allow-able, From this, one could assume that a very even distribution of oil suchthat at no point is the oxygen level higher than 1% is essential to the process -This however exaggerates the importance of oil distribution since local reducingconditions will encourage cadmium removal while local oxidising conditions willencourage carbon elimination.
Of greater importance is the need for adequate oil distribution to ensurethat the oil burns completely within and not above the bed. The superficialvelocity within the calciner is 1.1 m/s and assuming a voidage of 50% and thatnegligible gas back-mixing takes place, the gas retention time in the bed wasestimated as 0.85 sees. With steam atomisation, fuel oil is invariably brokendown so that about, 90% of the droplets are smaller than 4 mg. For a 4 ragdroplet Satcunanathan (Ind. Eng. Chem. Process DCS. Develop; Vol 10, No. 3,1971, p. 297) suggests that for furnaces at temperatures higher than 850 C, anignition delay due to heating up and evaporating the oil of about 0.3 sees exists.There should therefore be ample time for the oil to burn about half way up thebed. Oil injection lances were provided at one per 1.4 m2 cross-sectional area.
Fluid-Bed Units
The first three stages i.e. the preheater, calciner and 1st stage cooler,are mounted vertically within one steel shell, the overall height being of theorder of 28 m. Each-stage is tapered to minimise slugging and the grate diametersare 4.9 m for the prebeater and cooler and 6.1 m for the calciner. A refractoryarch distributor is used for each stage, the preheater normally having a firedwindbox while the calciner and cooler have fired windboxes fo?: start-up purposes,although normally the calciner is heated completely by direct fuel injectioninto the bed. About 40% of the feed to the preheater Is removed by elutriation,collected by cycloning and cooled by re-entraining in air and recy cloning.
The 2nd and 3rd stage coolers are rectangular trough coolers, baffled toprevent back- mixing of solids.
Waste Heat Boiler
The power requirements of the calcination plant are 2.8 MW and a waste-heatboiler arid generating facility are included in the design so that the plant canbe self-sufficient for power.
Provision is also made for the production of 1000 m3/d of desalinated waterfrom a multi-stage flash distillation plant utilizing the pass-out steam fromt"ie power plant. At present on Nauru, because of the limited catchment areaavailable, up to about 500 m3/d of water is imported.

- io6 -
Apart from recovering heat from the calciner exhaust gases, the wasteheat boiler cools the gases to a level at which the volatilised cadmium willcondense, probably in the oxide form. The gas stream also contains the dustnot collected by a single stage cyclone. This phosphate dust and the con-densed cadmium will be collected from the waste heat boiler and subsequentcyclones.
ACKNOWLEDGEMENTS
The permission of the Nauru Phosphate Corporation, Evans Deakin IndustriesLtd and the Director of Amdel to publish this paper is gratefully acknowledged.
- 107 -
70~
1100°C1000°C 10'/9021000°C 58/. 02
950°C neut. atmos950°C 2°/0 H2
1000°C neut.atmos
950°C with addedwater
1100°C neut.atmos
30r Fig.3
1100°C 20/»02
0 0-5 1-0CALCINATION TIME, hrs

- 108 - - 109 -
FEED
TO STACK
TO FINESCOOLING
& PELLETPLANT
PRtHEATER
~ 250°C
TO STACK
BOILER
CADMIUM SOLIDS—*~ TO WASTE
TO STACK
CALCINER1150°C
0-5°/o 02
PRODUCT75tph
AIR BLOWER500 kW AIR BLOWER
1050 kW AIR BLOWER600 kW
National Chemical Engineering Conference 197
PROCESS INDUSTRIES IK AUSTRALIA - IMPACT AND GROWTH
Surfers Paradise, Queensland
July 10 to 12th, 197 H
AN INEXPENSIVE WAY OF INCREASING SEPARATION EFFICIENCY
AND CAPACITY OF PACKED COLUMNS.
P.C. Brooks*, B.E.T. Hutton+, L.S. Leung*
and D.J. Nicklin
S U M M A R Y
A simple and practical method of increasing packed column capacity in counter-current gas liquid flov is outlined. The method consists of the introductionof a simple control system to permit stable operation of the column atflooding flowrates characterized by a high liquid holdup and a high gaspressure gradient.
For normal operation below flooding flowrates a method is described foroperating the packed column in a new mode of operation. Up to six foldsincrease of mass transfer coefficient, k^a, has been observed for this newmode of operation.
Fig. A ' - ABBREVIATED FLOW SHEET FOR PROCESS
°Professor, ^Reader, +Research Student, Department of Chemical Engineering,University of Queensland, Brisbane, Q. 067.

- no -Introduction
For countercurrent cont.acting of gases and liquids in packed towers, such asin gas absorption and gas stripping, the upper limits of the gas and liquid flow-rates are set by onset of flooding. At a given liquid rate, a gas rate of about0.7 times the flooding gas rate is normally chosen for operation. Operating atflooding flowrates is normally avoided because of the instability and higheroperating costs associated with flooding.
By the introduction of a simple control system on a packed column, stableoperation of the packed column can be achieved at flowrates with liquid holdup andpressure gradient greater than or equal to those for normal flooding conditions.The cost of the modification is low and can lead to a substantial increase in thecapacity and efficiency of the packed column. The control system may also beused for increasing seperation efficiency at below normal flooding flowrates. Thepenalty for increased separation efficiency and capacity, or just an increase inseperation efficiency is higher pressure loss.
Operation at Flooding Flowrates
Stable operation of a packed column at flooding flowrates can be achieved by:
(1) initiating flooding at the bottom of the column(2) allowing flooding conditions to propagate to near the top of the column
and controlling the pressure difference across the column by the gas flowrate orthe liquid flowrate.
Several ways may be used to achieve objecting (l). One method consists ofinstalling a valve in the liquid outlet line from the bottom of the column (ifthere is no valve in the line already). During operation the valve is to bethrottled or closed for a short period sufficient to build up the liquid levelinside the tower to the level of the grid. The column will then start to floodat the grid and the liquid outlet valve can then be opened. Another way toinitiate flooding from the grid is to use a grid with smaller free area fractionwith characteristic flooding velocities slightly less than those for the packedcolumn.
Thus at flooding flowrates flooding will initiate from the grid and propagateupwards. Stable operation at these flow rates can be achieved by the introductionof a simple control system for controlling pressure difference by either theliquid flowrate or the gas flowrate as shown in Figure l(a) or l(b) respectively.The pressure difference may be controlled within the range corresponding to thatat flooding for about 90% of the entire column.
Operation at Below Normal Flooding Flowrates
At below normal flooding velocities it has been shown elsewhere1 that twopossible modes of operation are possible: viz. (i) a normal mode with lowliquid holdup and low pressure drop and (ii) an unstable mode (the flooded mode)with hign liquid holdup, and high pressure gradient, and high mass transfercoefficient.
If Increase in separation efficiency of a packed column is required atnormal operating flowrates (i.e. below the normal flooding velocities), thecontrol system described in Figures l(a) and (b) may be used to stabilize theflooded mode of operation. However a more restrictive grid will be required toinitiate flooding at the grid at the operating flowrates.
Results and Discussion
Experiments have been carried out in our U" diameter five feet high packed columnto demonstrate stable operation at flooding flowrates and the flooded mode of
operation using a control arrangement described in Figure 1. Details of the
experimental work, including mass transfer studies, have been reportedelsewhere1'2. Some of the experimental results are summarised in Tables 1 and
Table 1 compares the operating condition of the column for normal operatingflowrates (i.e. at TO to Q0% flooding flowrate) and at flooding flowrates.Operation at flooding flowrates was achieved as described previously (Figurel(a)) and pressure drops and gas flowrates reported are time a,verage values. Itcan be seen that operation at flooding can be achieved with significantly higherpressure gradient and higher liquid holdup. Stable operation was achievedwithout difficulties with fluctuation in gas flowrate less than ±10% of theaverage value and fluctuation of pressure difference across the column within±15%. We believe an industrial packed column may be modified to operate inthis way. Often it is more desirable to stabilize the operation by keeping afixed gas rate and using the liquid flowrate to control pressure difference asshown in Figure l(b).
Table 2 presents typical mass transfer results obtained in the four inchcolumn for absorption of carbon dioxide into water. The table compares the masstransfer coefficient, k^a, for normal operation and operation in the floodedmode at the same flowrates. Our results suggest that, at the same flowrates, asix fold increase in kj a can be achieved by changing from the normal mode ofoperation to the flooded mode of operation. The high holdup characterized bythe flooded mode of operation may be a further advantage for systems in whichabsorption is accompanied by a fast irreversible reaction(such as the absorptionof C00 into a caustic alkaline solution for instance).
Liquid Rate
kgmole/hrjn
Flooded Mode
(Average)Gas Rate r
kgmole/hian£
29603600
Normal Mode
29603600
2919.5
2215.0
(Average)Gas PressureGradientmH 0/m
0.50.5
0.250.25
(Average)Liquid Holdup
0.250.28
0.080.08
Table 1 Increase in Capacity of the Packed Columnat Flooded Mode of Operation.

113 -
Liquid Rate
kgmole/hr-m
Flooded Mode
(Average)Gas Rate ,kgmole/hrm^
(Average)Gas PressureGradientmH00/m
(Average)Liquid Holdup
c.
Flooded Mode of Operation.
References
Mass TransferCoefficientkTaJLt
(1/hr)
53001320021000
Normal Mode
53001320021000
Table 2
120130108
120130108
Increase in
0.70.600.50
0.250.250.25
Efficiency of the
0.220.220.25
0.080.120.18
Packed Column at the
60130266
102hho
1. "A Second Mode of Operating Packed Columns and Wetted Wall Columns",D.J. Nicklin, B.E.T. Hutton and L.S. Leung, Department of Chemical Engineering,University of Queensland, St. Lucia, Australia.
2. Hutton, B.E.T., Ph.D. Thesis (197 ) Department of Chemical Engineering,University of Queensland, St. Lucia, Australia.
UQUID INLET LINE
GAS OUTLET LINE
PACKEDCOLUMN
RESTRICTIVE PACKING^
GRID SUPPORT
>P.C,
GAS INLET LINE
OUTLET LINE
FIGURE 1(a) ARRANGEMENT FOR OPERATING A
PACKED COLUMN AT FLOODING CONDITIONS
WITH INLET GAS FLOW MANIPULATED .

- 115 -
National Chemical Engineering Conference 1974
PROCESS INDUSTRIES IN AUSTRALIA IMPACT AND GROWTH
Surfers Paradise, Queensland
GAS OUTLET LINE
PACKEDCOLUMN
RESTRICTIVE PACKINGGRID SUPPORT-
&P.CJ
.LIQUID INLETLINE
,GAS INLETLINE
OUTLET LINE
FIGURE 1(b) ARRANGEMENT FOR OPERATING A
PACKED COLUMN AT FLOODING CONDITIONS
WITH LIQUID FLOW MANIPULATED.
July 10 to 12th, 1974
THERMAL DESIGN OF BLISTER COPPER CASTING WHEEL
by
R.S. DUTTON
S U M M A R Y
Most continuous casting wheels are water cooled, but at the newPeko-Wallsend Metals Ltd. copper smelting plant at. Warego, NorthernTerritory, water is scarce and expensive. There were considerableeconomies to be made if water cooling could be replaced by naturalcooling. The operation was not fully continuous since 20 tonnes ofblister copper was to be poured over a period of 30 minutes, with theinterval between pourings being 3h hours. One tone arid half tonneingots were required, so the real problem was to ensure that the ingotswould solidified by the time they reached the automatic lift-outmechanism.
The recognised casting wheel manufacturers, offering conservativedesigns, unanimously recommended water cooling, however, Peko-Wallsendcommissioned Davy-Ashmore Pty. Ltd. to examine the design more closely.The design problem was examined by using a plant-test checked computersimulation of t^e complex unsteady state heat transfer situation.
The design study showed that one tonne blister copper ingots could besafely produced using either cast iron or copper moulds having a base thicknessof eight inches. The study also showed that half tonne ingots could onlybe safely produced by the use of a copper mould having a base thicknessof eight inches. Cast iron moulds for this duty were found to be unableto dissipate the heat from the ingot within the time available betweeningot pouring and lift-off.

- 116 - 117 -
INTRODUCTION
Peko-Wall send Metals Ltd. have recently commissioned their copper smeltingplant located at Warrego, Northern Territory. The plant is designed toconcentrate, smelt and produce blister copper, cast into ingot form, along withother mineral products.
Davy-Ashmore Pty. Ltd., and an associated company, Ashmore, Benson andPease, of Great Gritain, supplied a number of major items of plant equipment.One of these plant items was a semi-continuous casting wheel which was requiredto cast the product blister copper into ingots.
The thermal design of the casting wheel, as described in this paper, wascarried out by Davy-Ashmore Pty. Ltd. in conjunction with Peko-Wallsend MetalsLtd.
DESIGN BASIS
DUTY REQUIREMENTS
The casting wheel was required to cast 20 tonnes of molten blister copper,poured at 1260 C, into either half tonne or one tonne ingots, in a 30-rninutepouring period. The time between the start of each pouring cycle was to be4 hours.
A stated requirement of the design of the casting wheel was that the coolingof the moulds should be by natural cooling and not by using a circulating water,forced cooling.system.
The half tonne ingots were required to have the same dimensions as thosecurrently being produced by Mt. Morgan Ltd., Mt. Morgan, Queensland. Thedimensions were to be approximately 3' -3" x 2'-9" x 3" deep.
DESIGN OBJECTIVES
The prime objective of the thermal design of the casting wheel was to specifythe number and size of the moulds to achieve the duty requirements whileminimising both operating and capital costs.
To achieve the overall objective it. was necessary to set an initial objectiveof examining the thermal system and to develop a method of analysis, and to gainan understanding of the important system parameters.
After this initial study it was apparent that experimental work was desirableto confirm the analysis method and to help determine more closely the importantthermal properties of blister copper. The experimental work and the comparisonbetween observed and predicted cooling performance formed a later design objectivewhich led on to the achievement of the overall design objective.
DESIGN CONSIDERATIONS
NUMBER OF MOULDS ON WHEEL
The major duty requirement, of being able to cast 20 tonnes of blister copperinto half^tonne or one tonne moulds in 30 minutes, specified the relationship
number of moulds on the wheel, the rotation time of the wheel and
hence the ingot cooling time, and the number of rotations required to completethe 20 tonne pour.
The number of moulds on the wheel was also the major factor determining thesise of the casting wheel.
For a casting wheel of 10 moulds, the wheel would have to rotate twice totake the complete pour as one tonne ingot?, or four times if half tonne ingotswere required. This would result in wheel rotation times of 15 minutes or 1\minutes respectively.
For a 20 mould wheel, a single rotation would be needed for one tonne ingots,or two rotations for half tonne ingots. The wheel rotation times would be 30minutes and 15 minutes respectively.
It was obvious that the shorter wheel rotation time required the ingot to becooled to an acceptable lift-out temperature in a shorter time. What was evenmore obvious was that the last but one rotation of ingots cast had to reach thelift-out temperature within the cooling period available.
At this early stage in the equipment design it was estimated that, to achievethe necessary cooling performance, each mould on the ID mould wheel would have tobe about 4 times the weight of the mould required for a 20 mould wheel.
From this estimate it was considered that the larger wheel would have lowercombined capital and operating costs.
However, the final wheel size determining factor was, that if the castingwheel contained more than 14 moulds, then the casting house building would haveto be increased in size, at considerable capital cost.
From these considerations, the 14 mould wheel was chosen as the optimum size.This configuration results in the wheel making 2-12/14 rotations for theproduction of half tonne ingots, or 1-6/14 rotations for the casting of one tonneingots. Wheel rotation times are. 13 minutes and 21 minutes respectively.
INGOT LIFT-OUT POSITION
between the
As a part of the design of the casting wheel, the optimum location of theingot lift-out mechanism was required to be determined. The most convenientlift-out point, from ingot handling considerations, was after about 270 rotationfrom the pouring point. It was felt, that by increasing the period oftime during which the mould was empty and cooling down prior to the next ingotbeing poured into it, a saving in the size of the mould may be made.
MATERIAL OF CONSTRUCTION OF MOULDS
The casting wheel mould design was initially studied using only cast ironmoulds because previous casting experience of Peko-Wallsend and associatedCompanies had shown this mould construction material to be satisfactory.
It was considered, however, that if copper moulds could be used, they couldbo cast at the plant-site and thus eliminate the cost of transporting cast ironmoulds from the nearest, though remote, iron foundry. In addition, copper mouldswould have the advantage that discarded, cracked or worn moulds could beeconomically reclaimed by recycling through the mould forming process.
A factor which was seen as a potential major problem in the use of coppermoulds was that it was possible that copper moulds would be subject to overheating
and possible sticking of the ingot to the mould.

- 118 - - 119 -
Nevertheless, the advantages of using copper moulds were considered to besufficiently worthwhile to warrant investigation.
THERMAL DESIGN A1S1D SIZE OF MOULDS
From discussion with Peko-Wallsend on the planned method of operation, itbecame apparent that the requirement of completing the pour in 30 minutes didnot imply that the last poured ingots had to be removed at any set time, otherthan that the wheel had to be ready when the next pour was about to begin.This conclusion allowed the design to assume that the full wheel capacity oflast poured ingots could remain in the moulds until they were sufficiently cooledto allow lift-out, even if the time required to cool approached 30-40 minutes.
Thus, the thermal design was required to confirm that with 14 moulds on thewheel, the ingots cast during the last but one complete wheel rotation had cooledsufficiently during the period of rotation to enable them to be removed from themoulds - to allow the final round of ingots to be poured.
For the production of half tonne ingots it was necessary to confirm that thesecond ingot poured into a mould would be cooled to an acceptable lift-outtemperature by the time that ingot reached the lift-out mechanism. For one tonneingots it was necessary to confirm that the first ingot poured into a mould wouldbe cooled to the lift-out temperature by the time it reached the lift-out point.
The thermal design therefore required the establishment of the complexunsteady state heat transfer situation existing between the ingot, the mould andthe surroundings.
As part of the stated duty requirements, the size of the ingot was fixedwith regard to the overall dimensions and ingot weight. The fixed ingotdimensions largely fixed the plan size of the ingot mould, leaving only the mouldthickness to be varied according to the required thermal performance of the mould.
THERMAL DESIGN
UNSTEADY STATE HEAT TRANSFER AND METHOD OF ANALYSIS
The nature of an ingot casting operation is inherently an unsteady state headtransfer situation where the heat source temperature is reducing with time, andmost frequently, the temperature of the mould or heat sink is accordingly increas-ing. Radiation and convection heat losses are also usually varying with time.
The heat transfer situation of a cyclic operating casting wheel, where thereare both heating and cooling periods to account for, adds further complexity tothe basic model.
To adequately predict the performance of the casting wheel design, thecomplete unsteady state heat transfer system needed to be examined in considerabledetail.
The methods available for the analysis of such a heat transfer system includepartial differential calculus, finite difference techniques and various analoguesimulations; however, the most available method of analysis to Davy-Ashmore wasthe method based on finite difference techniques.
It was considered that, because the mould thickness dimension was likely tob'3 substantially less than the mould plan dimensions, the direction of heat flowwould be predominantly through the mould from the ingot-mould interface to the
much greater than the plan-'; area of the ingot. Thus, the thermal situationcould be considered as unidirectional and analysed by the so-called "SchmidtMethod".
In the application of the Schmidt Method of analysis, modifications weremade to the basic method to allow the inclusion of the radiation and convectionlosses and the effect of the interfacial thermal resistance between the ingot andthe mould.
The most important simplifying assumption made in the heat transfer analysiswas that the temperature drop across the copper ingot was small, and that theingot temperature corresponded to the bulk average temperature of the ingot atany particular time.
This assumption was considered to be reasonable because the resistance toheat transfer within the copper ingot is very much less than the resistance toheat transfer from the copper to the surroundings or to the mould. On completionof the mould analysis calculations, this assumption was tested. An instantaneousheat transfer rate from the ingot to the mould at the beginning of the ingotcooling period was calculated, and from this could be calculated the necessarytemperature difference over the ingot thickness to allow this heat transfer rateto obtain. The calculation indicated that the temperature drop across the ingotwas less than 5% of the temperature difference between the ingot and the mould;therefore, the assumption was considered justifiable.
Another assumption made was that the period of time during which the ingotwas poured was small in comparison with the total cooling time. Thus, for thepurposes of the analysis, it was considered the ingot arrived instantaneouslyin the mould.
A further assumption was made regarding the maximum allowable lift-outtemperature of an ingot. It was considered that, to provide for the attainmentof some mechanical strength by the just solidified ingot, the maximum allowablelift-out temperature should be 1680 F.
CONDUCTION HEAT TRANSFER AND INTERFACIAL RESISTANCE
The most significant factor affecting the cooling time of a cast ingot isthe rate at which heat can be transferred from the ingot into the mould.
For an ingot of fixed size and a mould of a certain material, the maincontrolling factor in the rate of heat transfer is the temperature drop acrossthe mould from the hot ingot to the cold mould. Thus, the cold temperature isthe only independent variable, and this can be controlled either by removing theheat from the mould as it accumulates (i.e. by water cooling the mould) or byproviding sufficient bulk of mould that the cold temperature is only slowlyincreased as the heat is accepted by the mould.
The water cooling method of controlling the rate of ingot cooling wasspecifically not allowable by the duty requirements, and consequently the mouldbulk was required to be varied to ensure that the ingot cooled within theavailable time period corresponding to the rotation time of the wheel,.
A second, and extremely important factor in the determination of theconductive heat transfer is the resistance to heat transfer caused by the inter-facial contact surface between the ingot and the mould. The contact resistancecan be caused by scale, dross or any mould lining that may be used during theoperation. In the analysis carried out, due allowance has been made for thisresistance to heat transfer.

120 - - 121 -
RADIATION AND CONVECTION HEAT LOSSES
After heat loss by conduction to the ingot mould, the next most importantmethod of heat loss from the ingot is by radiation to the surroundings.Initially, all radiation loss is from the top surface of the ingot; however, asthe mould heats up, radiation from the mould surfaces becomes increasinglysignificant. In the analysis of the radiation losses, account has been takenof the nature and size of the radiating surfaces involved.
In the study of the heat transfer situation of casting an ingot, theconvection heat losses are the smallest in magnitude of the various heat lossmechanisms. However, because of the high temperature involved, the convectionlosses are of considerable significance and have been included in the detailedanalysis. Although the casting wheel is indexed around its axis, the convectionsituation has been considered to be one of natural convection.
PROPERTIES OF BLISTER COPPER AND MOULD MATERIALS
Blister copper is a crude copper product requiring refinement before it isindustrially useful. A typical analysis is:-
CuPbFeNi
99.00 - 99.40%Approx. 0.10%Approx. 0.05%Approx. 0.01%
the balance being traces of zinc, sulphur, arsenic, tin, bismuth and gold.
It is known that the impurities present alter the thermal properties ofblister copper from those of "pure" copper.
The initial analyses of the thermal performance of mould designs usedestimatedproperties of the blister copper based on literature data for "pure"copper. This was recognised as being an approximation that could seriouslyaffect the validity of the resultant mould design.
The thermal properties of the mould materials were similarly unknown, andonce again the initial work was done using literature data.
A most important system property, namely the heat transfer coefficientbetween the ingot and the mould, could only be guessed at.
To achieve satisfactory thermal performance of the ingot casting system,realistic values of the physical properties of the materials involved werenecessary.
INGOT AND MOULD TEMPERATURE HISTORIES
During the course of the heat transfer analysis, the ingot temperaturehistory was determined by heat balance methods. Due allowance was made for thereducing temperature of the ingot during the liquid cooling period, followedby the constant temperature solidification period and then of the reducingtemperature of the ingot after complete solidification.
Upon completion of the analysis for the first poured ingot, the removalof the ingot was simulated and the analysis continued during the short mouldcooling period.
FIG. 1: TEST RIG FITTED WORK MOULD AND INGOT THERMOCOUPLES.
FIT. 2: POURING COPPER INTO INSTRUMENTED MOULD.

- L/.J
- 122 -
At the appropriate time, the pouring of the second ingot into the hot mouldwas simulated and th.e cooling performance again analysed as the ingot solidified,cooled and was lifted out.
The analysis was continued until the complete ingot casting operation hadbeen simulated.
An important part of the analysis was to determine the initial temperatureof the mould, resulting from the previous 30 minutes casting operation, at thestart of the casting operation being analysed. From initial calculations, themould temperature on completion of a casting operation was determined. The mouldwas allowed to cool by heat loss to it's surroundings for approximately3 hours. From these computations the residual mould temperature was estimatedto be approximately 300 F at the beginning of the subsequent pouring period.
TESTWORK AND DEVELOPMENT OF THE HEAT TRANSFER MODEL
On completion of the initial mould performance analyses it became apparantthat to achieve a reliable mould design, confirmation of the more important,but uncertain, system parameters was necessary.
Determination of the critical properties of the blister copper, viz.latent heat of fusion, specific heat and solidification temperature, was seento be a complex laboratory problem. In addition to the copper properties,information was required regarding the heat transfer coefficient between theingot and the mould, and confirmation was required as to what was an acceptableingot lift-out temperature.
It was felt that the copper properties and the heat transfer data couldbe most satisfactorily obtained by doing a plant test simulation of thecasting wheel operation. The cooling performance could be followed by a numberof specially located thermocouples connected to a multi-point recorder, andthen compared with the model prediction of the performance under identicalconditions. The various properties and parameters could be arrived at by makingadjustments to their values, within reasonable limits, as required, tomatch up predicted and actual performance data.
Accordingly, a test program was undertaken at the Mt. Morgan Ltd. coppersmelting plant, Mt. Morgan, Queensland, whereby a specially instrumented castiron mould (Fig. 1) was preheated to approximately 400 F before pouring intoit a half tonne charge of blister copper. (Fig 2) . As the copper cooled,the mould temperature was followed by the embedded thermocouples.
The ingot was allowed to cool in the mould until, from the operator'sexperience, it was able to be lifted out. The period from pouring to lift-outwas about 10 minutes, and after a short cooling period of 2-3 minutes, a secondhalf tonne charge of copper was poured into the same mould. Once again themould temperature profile was plotted by the recorder until the second ingot
\was able to be lifted out. The plant tests confirmed that 1680 F was asatisfactorily safe lift-out temperature and that after the casting operationthe mould would cool to a temperature of approximately 300 F just prior tothe start of the next pouring period.
Immediately prior to the testwork, the heat transfer model was transcribedinto a computer program written in the FORTRAN language. The program wastested against manual calculations made previously.
In the course of matching up the predicted and actual cooling performance,only the ingot specific heat and the conduction heat transfer coefficient required
COtYIPARgSON OF EXPERIMENTAL COOLING DATA WITH PREDICTEDCOOLING DATA (USING FINALIZED SYSTEM PARAMETERS)
LEGEND: EXPERIMENTAL DATA
PREDICTED DATA--
____ ^SECOND INGOTLIFTED OFF(Simulation)
20« LOCATION OF THERMOCOUPLES
Expressed as%of mouSd thicknessthrough the mould from thetop surface of the mould
^SECOND INGOTLIFTED OFF(Experimental)
I INGOT1 TEMPERATURE
SECOND COPPER POUR
FIRST INGOTLIFTED OFF
\i INGOTTEMPERATURE
FIRST COPPERPOUR
0
significant variation from previously assumed values. The remaining systemdata appeared to be satisfactory. Fig. 3 shows the comparison of measured
cooling performance versus model predicted cooling performance using thefinalized system parameters.
On completion of the plant testwork and subsequent matching of predictedand observed performance it was considered that the system parameters andanalysis method were sufficiently valid to allow the final mould designworkto proceed.
'.•OPPER MOULDS
The results of casting calculations for hair tonne and one tonne ingotsinto blister copper moulds showed that satisfactory operation could becicKieved for both ingot sizes with a mould design having a base thickness of 8"
The performance of the copper moulds was found to be very much bettert-han that of the cast iron moulds previously examined. The improvement wasthat heat was conducted through the mould quickly, thus allowing higher heattransfer rates to the mould to be maintained during the cooling period.
RESULTANT MOULD DESIGNS
INGOT LIFT-OUT POSITION
An early result of mould performance analysis was the determinationthat the conditions of rotation time of the wheel under study did not giverise to an optimum ingot lift-out position from considerations of mould cooling,
The heat loss from the mould during the cooling time was significant,but it had only a very minor effect on the thermal performance of the mould.It was found that the closer the lift-out position was to the pour position,the smaller the moulds needed to be to achieve the desired ingot lift-outtemperature.
Thus the lift-off position was chosen on the grounds of ease of ingothandling and the time required for any mould preparation prior to the next ingotbeing Doured.
The lift-out position selected was 270position.
CAST IRON MOULDS
oaround the wheel from the pour
The most important result of the casting wheel mould design calculations,based on the use of cast iron moulds, was that while one tonne ingots couldbe safely cast on the wheel at the required pouring rate, half tonne ingotscould not.
The initial calculations, done prior to the Mt. Morgan tests and usingestimated data, showed that half tonne ingot casting, at the required pouringrate, could be safely achieved. However, owing to the substantially increasedblister copper specific heat and conduction heat transfer resistance, as foundfrom the test work, the half tonne ingots poured on the second rotation ofthe wheel would fail to reach a safe lift-out temperature by the time theyarrived at the lift-out mechanism.
The reason for the ingot failing to cool sufficiently in the timeavailable was that the thermal conductivity of the cast iron mould wasinsufficient to conduct the heat away from the ingot into the bulk of themould. This was demonstrated by almost identical ingot temperatures beingproduced by moulds whose thickness ranged from 8" to 14" of cast iron, withall other factors being equal. Temperature drops across the mould of up to1000 F were obtained in these calculations.
It was found that the maximum temperature drop lively to exist acrossthe mould was in the region of 300 - 400 F. It was considered that thismore even mould temperature profile could help prolong the life of the mouldbefore the onset of crazing and cracking of the mould inner surfaces.
Throughout the analyses using copper moulds, the likelihood of mould-ingotfusion was watched. It appears that the situation will not arise whereby theinner surface of the mould will approach the copper melting temperature of 1980 FIt is considered that the maximum tolerable mould surface temperature shouldbe limited to 1680 F to avoid the possibility of deformation of the mouldwhilst copper is being poured into it. The major factor, affecting thetemperature attained by the mould inner surface, is the conduction heat transfercoefficient. It appears that some form of mould preparation would be a soundsafeguard against the possibility of mould softening, however, this would havea corresponding, and adverse effect on the temperature the ingot would achieveby the time it arrived at the lift-out mechanism.
CONCLUSIONS
Within the stated limits of this design study, the casting wheel operation,producing one tonne blister copper ingots, can be safely and satisfactorilyachieved using either cast iron or blister copper moulds having a minimum base
thickness of eight inches.
However, it has been concluded that the production of half tonne blistercopper ingots can only be safely achieved by the use of blister copper mouldshaving a minimum base thickness of eight inches. It has been shown that acast iron mould for this duty would be unable to dissipate the heat from theingot within the time available between pouring and lift-out.
1.
2.
3.
REFERENCES
Schenk, H., "Heat Transfer Engineering", Longmans,
London, 1962.
Sherwood, T.K., & Reed, C.E., "Applied Mathematics inChemical Engineering", McGraw-Hill Book
Company, New York, 1939.
Kubaschewski, Evans and Alcock, "MetallurgicalThermochemistry", Pergamon Press, 4th Ed., 1967.
- 126 -
National Chemical Engineering Conference 1974
PROCESS INDUSTRIES IN AUSTRALIA IMPACT AND GROWTH
Surfers Paradise, Queensland
July 10 to 12th, 1974
SECONDARY COOLING FOR
INDUSTRIAL COOLING SYSTEMS
by
I .D. CREALYB.E. , C .Eng . , M.I .Chem.E,
S U M M A R Y
Too often, process engineers consider that the onlyindustrial cooling systems available to them are (a) coolingtowers and (b) air coolers. The use of readily availablesea, river or estuary water is out of the question because,amongst other things, of the cost of equipment required towithstand the corrosion and fouling characteristics of suchwater.
The relatively recent application of plate heat ex-changers with wetted parts of titanium, has changed thissituation. These units have enabled the concept of usingsea, etc. water (secondary water) to cool a fresh watercircuit (the actual process heat transfer fluid - henceprimary water), to become an economically viable alternativeindustrial cooling system. In this system, the large runningcosts of cooling towers are offset by having a closed freshwater circuit where (a) expensive chemically treated make-up water is not required, and (b) pumping costs are also reduced,
If such secondary cooling water is available, whetheras sea, river or estuary water, and if its use is allowed,then such a secondary cooling system usually offers a veryeconomical solution to the problem of cooling industrialcooling water.
127 -
SECONDARY COOLING FOR INDUSTRIAL COOL1N3 SYSTEMS.
One of the major problems in most processes is thedisposal of waste heat. This is becoming an increasinglydifficult problem for the process engineer, particularlywith the growing incidence of pollution and public aware-ness of environmental disturbances. There are two basicmedia into which heat can be dissipated - the atmosphereor the hydrosphere (i.e. rivers, lakes, oceans).
Hitherto, the use of rivers etc. for heat dissipationhas been restricted due to problems with corrosion, foulingetc. This has resulted in the more extensive use of aircoolers and cooling towers.
However, the development of heat exchangers incorrosion resistant materials (eg. titanium) and with lowfouling charateristics, at competitive prices, has broughtforward the concept of using inexpensive sea, estuary orriver water as the process heat sink.
ATMOSPHERIC COOLING.
Fresh water circulating within a plant and picking upheat from the various processes can be cooled by air heatexchangers or cooling towers.
Air Heat Exchangers.
Cooling the circulating fresh water indirectly byusing air in heat exchangers is advantageous because nosecondary water is required and there are no restrictionsin heating air. Some air heat exchangers are designed instandard modules, which makes it easy to increase the sizeof the heat exchanger if and when necessary. As the watercircuit is closed, make-up water is not needed.
Due to the low heat transfer coefficient, however,an air heat exchanger is always very bulky and thus re-quires a larger space. The latter factor is of minorimportance if, for instance, the air heat exchangers canbe installed on the roof of d building. However, as theunits are heavy, they require expensive foundations. Also,an air heat exchanger is equipped with fans which arenormally very noisy and often have very high power consumpt-ion.
Air heat exchangers arc thus an expensive investment,but their operating costs are moderate compared to coolingtowers. However, if the air is not pure, air heat exchangerscan be corroded in a short time. They can become fouledquickly and are difficult to clean. Thus air heat exchangersare used mainly when no secondary water is available or whenpollution problems make it impossible to use water. Theyare well suited for high temperature differences between theliquid and the air.
Crealy, ALFA-LAVAL.

- 128 - - 129 -
Cooling Towers.
In a cooling tower, the fresh water is cooled withair mainly through evaporation. There are many differentdesigns for such towers, but the basic principle is thesame for all. Cooling is achieved by air that comes indirect contact with the water, and thus part of it is con-tinuously lost through evaporation. Most cooling towersuse fans but some big towers are designed for naturaldraught.
Although the investment costs of cooling towers arenot normally high, the necessity for adding high qualitychemically treated make-up water makes for high runningcosts. Due to evaporation and the continuous drain toavoid excessive concentrations of minerals in the water,3-5 per cent of the circulating flow must be continuouslyadded. The cost of this treated make-up water can be quitesubstantial. Good quality water must be used and must betreated many times. To avoid oxygen in the water causingcorrosion, chemicals must be added. Additional chemicalsmust also be added to compensate for the acidity which iscaused by dissolution of sulphur dioxide from the air.01her reasons for additives are, for example, to eliminatemarine growth in the equipment. Mechanical fouling byairborne dust can also be a hazard.
A cooling tower is normally rather bulky and thusrequires a large amount of space, especially the largehyperbolic towers. They also have a negative effect on theenvironment because of plumes. The use of cooling towersis usually justified when the air is pure and clean, andfresh water with low mineral content is available as make-up water.
SECONDARY WATER COOLING.
The other way to cool the primary internal circulatingwater is by using secondary water and performing the coolingin a water/water heat exchanger. Secondary water may bewater from the sea, a lake, a river, or in the case of ashortage of natural resources, even cooling tower waterwhich is not desirable in the process equipment for theabove reasons.
As the fresh water circulates in a fully closed system,problems such as corrosion, fouling, etc., are concentratedin the water/water heat exchanger itself and do not reachthe expensive processing equipment. Therefore it is importantthat the heat exchanger is constructed of a material whichis completely resistant to the water it will process. It isalso important that the heat exchanger is easy to clean sothat its effectiveness is always at a maximum. Other importantfactors are for example, space requirements, flexibility etc.
This method of cooling the internal primary coolingwater is often preferable for environmental reasons. Theonly factory which can possibly present a problem is warmingthe secondary cooling water.
ATMOSPHERIC COOLING - The cooling tower disposes of processwaste heat directly to the atmospherevia evaporation.
t
SECONDARY COOLING The secool system utilises inexpensivesea, etc. water (secondary water) tocool the primary fresh water circuit.
I

- 130 --
In some cases there are restrictions upon heating thiswater above a specified temperature, and in other casesrestrictions against using this water at all. However, thequantity and the placement of the discharge can generallybe regulated to meet Statutory requirements.
Where such restrictions upon heating the secondarywater do exist, this water can still be used as make-upwater for a cooling tower. Here, of course, heat is dis-sipated to the atmosphere.
Moreover, as this cooling tcwer water is mostlycorrosive, it is normally used as secondary water only,and the actual process cooling is effected with fresh,primary water. This system takes advantage of a cheapnatural water supply but avoids the thermal pollutionproblem often involved with such water, particularlyriver water.
Plate Heat Exchangers in Secondary Cooling.
The water/water heat exchanger is, of course, thecritical part of the secondary cooliig system, and hereplate heat exchangers (PHE's) are most often employed.
The advantages of PHE's have been described in anumber of articles as has the working principle ' 2, 3.To surrvnarise, however, the plate heat exchanger consistsof a pack of gasketted plates which are pressed togetherso that the warm and cold flows pass through alternatechannels.
4-'U ,The factors which make this type of exchangerbest choice as the primary/secondary heat interchangerare as follows.
1. No welding means that hard-to-weld but easy-to-pressmaterials can be used at low prices. This makes unitsin titanium highly competitive and able to handle anykind of natural water up to 110°C without corrotionrisk.
2. PHE's can be rebuilt and extended without effort.
3. No "extra surface margin" has to be incorporatedif exact thermal duty is unknown at the planning stage.
4. The whole surface is accessible for inspectionand/or manual cleaning.
5. Normally, PHE's can be opened and inspected withoutremoving any connecting pipes.
6. In case of gasket or material failure, however un-likely, the unit can be returned to operation afterremoval of the defective plates.
7. With high induced turbulence and low hydraulicdiameter, even low flow rates give high heat transfer.At a given pumping energy per unit area the plate heatexchanger gives higher heat transfer than tube-and-shell heat exchangers.^
- 131 -
8. PHE's are easy to install, because of their lowweight and small space requirements. It is usuallynot necessary to arrange for special foundations,or even to bolt the units down.
The above advantages place the PHE as the best choicefor the secondary cooler, and todate some hundreds of unitshave been installed throughout the world in this role. Abroadening of this concept is the increasing use of PHE'sas secondary coolers on ships.
RELATIVE COST OF OPERATION - Cooling Towers vs Secondary Cooling
The viability of the secondary cooling system will dependupon running costs, or more particularly the difference intotal operating costs between one cooling system and theother.
The most significant costs with cooling towers arenet water make-up cost, fresh water pumping cost and fan'running cost. Secondary cooling involves fresh water pumpingcost, and secondary water cost. The capital cost of the twosystems must also be introduced, and a D.C.P. analysis usedto evaluate the optimum system.
Such an analysis is beyond the scope of this paper,but some idea of the relative costs may be obtained byconsidering a cooling system involving the circulation of1,000,000 gph of fresh water. We will assume (a) operationfor 8000 hours per year, (b) power costs of 1 /KWH (i.e.75 /rf/100 HP-HR) and (c) water make-up cost of 25 jd/1000 gals.
1. Net Water Make-up Costs.
Typically about 3-4%water is lost from a coolingtower in spray, evaporation and blow-down. The resultantmake-up water requirement is by far the most significantcost, in the operation of a cooling tower system.
Net water make-up cost = 0.03 x 106 x 8000 x 0.25 x 10"
= |60,QOO per annum.
2. Fresh water Pumping Cost.
Here the pumping cost is the same for secondary coolingas for a cooling tower, except that with the closed systemthere is no loss of static head. If we assume that thecooling tower is 20 ft high, then the additional HP requiredfor the cooling tower pumps (at 75% pump efficiency) is
1.0 x 10 x 20 _ 0 „ 1Q7 lb>ft/Hr =0.75
= 3 x 140
.". Additional running cost for cooling tower pumps =
140 x 8000 x ~~ = $8400/annum.

-- 132 -
3. Fan Running Cost versus Secondary Water Pumping Cost .
A typical installed fan HP for a cooling tower systemof 1,000,000 gph is about 400 HP* If we assume that secon-dary water pump has the same capacity as the primary waterpump, and operates at a total head of about 60 ft., thenpump HP required is also about 400 HP.
However, the main water/water heat exchanger is designedto operate at the highest expected secondary water temperature,which may only occur on a few days of the year. At other timesthis temperature is below the design value, and hence lesssecondary water .i s required. Up to 60% reduction in powerused can be obtained by using either a continuously variable,or a two-speed motor. If we allow for a 30% reduction thencost savings of secondary water pump over fans are againapproximately $8000/annum.
4. Other Considerations .
- 133 -
Summing up: if secondary cooling water is available,and if its use is allowed, then a secondary coolingsystem usually offers the most economical solution tothe problem of cooling industrial cooling water.
Certain other factors should also be considered.Space savings obtained by using a plate heat exchanger in-stallation over cooling towers are often a significantconsideration. This factor varies widely from plant to plant,and is also more of a capital cost - therefore it will notbe considered further.
Other factors, such as maintenance, should also beevaluated. Apart from chlorination of the unit, and manualcleaning during plant shut-downs, very little maintenanceis required with a secondary cooling system.
5 . Summary of Cost Savings.
In this simple example, the net cost advantage in termsof running costs only, is about $76,000 per year in favourof secondary cooling. A D.C.F. analysis would then showthe allowable difference in capital cost, which is about$400,000 at 10% cost of capital and 10 year straight linedepreciation.
CONCLUSIONS .
The above example should not be taken as implying thatsecondary cooling is the panacea for industrial cooling. Itdoes, however, serve to highlight the high running costs ofa conventional cooling tower system, and points out that aneconomically viable alternative is often available.
Too often, process engineers consider that the coolingtower, and to a lesser extent, air coolers, are the only in-dustrial cooling systems available. This stems from the factthat, until recently, no material was available that wouldenable a secondary cooling system to compete with cooling towers
The application of titanium in plate heat exchangershas changed this situation. Titanium is fully resistant tosea water, brackish water etc. and today can be pressed invery thin sheets - thus the price of a PHE with wetted partsof titanium is only a little higher than a stainless steelunit for the same duty.

- 135 -
REFERENCES.
National Chemical Engineering Conference 1974
PROCESS INDUSTRIES IN AUSTRALIA IMPACT AND GROWTH
1. Marriott, J. "THE IDEAL HEAT EXCHANGER,
Chem. Eng., April 5, 1971.
Surfers Paradise, Queensland
July 10 to 12th, 1974
Alfa-Laval THERMAL HANDBOOK 1969. TREATMENT OF SLURRY WASTE
Crealy, I.D., "THE CHOICE OF HEAT EXCHANGERS FOR PROCESSING",
Australian Process Engineering, August, 1973.
Dahlgren & Jensen, "COMPARISON OF HEAT EXCHANGE SURFACES",
Chem. Proc. Eng., August, 1970.
BY CENTRIFUGES
by
E.G. SKINNER.Dipl. Chem.Eng,
S U M M A R Y
Industry is a large user of natural resources,air, water, oil, etc. until fairly recently there waslittle thought of recovery of these fluids after usagea single time. Due to economics and the emphasis on theecology there is today a searching for re-use or multipleusage of these natural resources.
By the use of centrifuges of various designs -fitting to the application - many former waste productsare now valuable by-products, water is re-used, oilsand solvents recovered and purified, metals and mineralsregained and upgraded.
The treatment of water and sewage sludge can bemade more transportable and less space demanding,
Skinner, ALFA-LAVAL.

- 136 -
TREATMENT OF SLURRY WASTES BY CENTRIFUGES.
Introduction.
A centrifuge is basically an accelerated gravitysettler, engineered to give a considerable saving in timeof sedimentation, space requirements and often labour usage.In many instances the centrifuge incorporates a filter medium.The laws that govern particles for sedimentation and filtrationapply to centrifuges; but the force of gravity 'g1 is greater,in some instances,, the exceptional, this higher 'g1 operatesagainst the efficient separation of liquid/liquid/solids.Care should be taken in using any centrifuge for a processseparation, there is usually a correct unit for the duty.
A guide to the choice of the correct unit is given inthe two accompanying figures:-
Fig. 1 Shows the limits on the size of particles that can behandled by a particular design of centrifuge.
Fig. 2 Shows the limits on the quantity of solids that isnormally acceptable to the centrifuge for efficientoperation.
Particle
r~'o I Particle siZ-E. °r
Fig Solids content of the.
It is always good policy to allow the centrifuge supplierto install the unit of his choice; this choice could be basedon experience of similar products or by experimentation on asample of the slurry in question.
- 137 -
Based on the above let us look at processes wherecentrifuges are being used to provide a return income oncapital invested, when processing slurries which were con-sidered waste products to the main stream; but now veryessential by-products for the complete operation of the plant.We will consider various processes in industrial groups, thecentrifuge type being used is named, the reason for the selection is given, t-ne return in products is mentioned.
THE FOOD INDUSTRY.
In the production of wine the grape juice is depectonisedand allowed to stand in tanks to clarify. The settled sludgeis passed to hermetic, high speed, disc bowl, solids ejectingclarifier centrifuges. The return to the winery in extra productpays for the unit in about two vintages;the problem of a sloppywaste is removed.
2. Slaughterhouse.
A good slaughterhouse uses the whole animal as product.After killing, the blood is drained, the offal and skin removed.When the flesh has been stripped from the carcase the latter,together with any "off" specification whole beasts are tarns-ported to the by-products plant.
Blood recovery: the drained blood is collected in alarge tank, then is gradually fed to a smaller direct steamheated tank,where the temperature is raised. This hot bloodstream is contacted by a special steam injector while beingpumped to a decanter centrifuge - a time interval is necessaryto allow the steam to coagulate the blood at 90°c. The cen-trifuge recovers about 95% of the insoluble solids, giving dliquid suitable for discharge to drain. The solids are dis-charged at about 25%moisture and further dried.
Tallow & Mealdistirctpressurecharged.
Recovery: the offal, carcases, dead (asfrom killed) beasts ore placed in a large steam heatedcooker. After a suitable interval the cook is dis-
The solids - meatmeal, fine bone etc. - are separatedfrom the liquids - tallow and water - in a decanter centrifugeand sent to a drier. The liquid stream is purified to give adry tallow in a high speed, disc bowl, solids ejecting centrifuge
Fig. 3 Tallow & Meal Recovery;
DECANTER
COARSE SOUDS
H I G H S P E E D , DISC
&OWL, SOLIDS ET£CT-
INC CENTRIFUGE
TALLOWWATER
FINE SOUDS

- 138 - - 139 -
3. Brewery_.
In the production of beer there are various clarifi-cation stages where centrifuges are in use. A recent usageof a very simple conical bowl filtering centrifuge was forthe recovery of wort from the spent hops.
Wort, containing the spent hops, is allowed to settlein tanks and the settled solids were discharged as waste. Bypumping this thick fibrous slurry to the above centrifugea brewery can recover sufficient wort to pay for the unitin about a week. The discharged solids are dry enough to betransported by truck.
FIBRE INDUSTRY.
1. Pulp and Papej: JProduct ion.
In the paper industry a considerable amount of water isused together with large quantities of fine chemicals. Thereis wastage of these fine chemicals - not all adhere to thepaper - which are carried, with fine fibre, in the watereffluent. This effluent is settled in gravity settlers and theunderflow is treated in decanter centrifuges, the chemicalsand fibres are returned to the process for re-use,
2. Fibreglass Blankets for Insulation Material.
In the manufacture of glass wool, the glass is meltedand sprayed as fine filament, by the action of steam or air.The fibres are formed to the desired thickness on a chain con-veyor, treated with a thermosetting binder and carried throughcompression rolls and ovens to produce semi-rigid sheets.
The continuous chain conveyor has to be cleaned by waterspray in order to give an evenly finished sheet. This waternaturally picks up fibre and binder which would clog the spraynozzles if not removed. To send the water to drain would bewasteful, illegal and expensive, hence re-use of the water isdesirable.
Clarification of the water by filtration was practiced;but, due to the nature of the contaminants, these filters wereout of service for cleaning more often than in operation. Acentrifuge was tested and proved to be very efficient; for thisduty the high speed,disc bowl solids ejecting unit is ideal.The centrifuge is in operation continuously, the sludge isejected at timed intervals, the water continuously re-cycledand the duty being not an arduous one, there is little 'down-time' for maintenance.
3. Wool Processing.
The water used in wool scouring contains a large quantityof dirt, but also a high percentage of grease - lanolin. Thisgrease is recovered by the use of centrifuges, A two stageprocess is employed.
The first stage centrifuge, normally of the high speed,disc bowl, nozzle discharge type is used to produce a creamcontaining the grease, a nozzle discharge containing the solids(grit, sand etc.) carried in water and a water stream returnedto the wool scour. The cream is further treated in a high speed,disc bowl centrifuge, after preheating, to produce a goodquality lanolin and water.
Fig. 4 Wool Scour Grease Recovery;
WATER
SCOURSTEAHA
HICH SPEED DISC
BOWL SOLIDS
EJECTING CENTRIFUGE
HICH SPEED. DISC ftOUVL
NOZ.ZL.E DISCHARGE CENTRIFUGE I DIKT
D1HT
ENGINEERING INDUSTRY.
1. Metal Cutting.
This industry uses expensive lubricants in order topreserve the cutting edge of tools and produce a final metalsurface which is machined to a fine finish. To a large extentthe economics are based on the life of the lubricant, if thiscan be recovered for re-use after being discarded the economicsare very much on the plus side.
Large chips of metal, (range 0.2 to 20 mm mesh), are re-moved in a filtering continuous basket centrifuge, pusher type;the 'throughs1 (less than 0.2 mm) and any water picked up inthe oil are removed in a high speed, disc bowl solids ejectingtype centrifuge.
Fig. 5 Recovery of cutting oil;
SWARF «•
CUTTING OIL
PUSHER
H\CV\ SPEED DISC &OWL.
SOUOS
OIL
FINE SOL\DS
COARSE
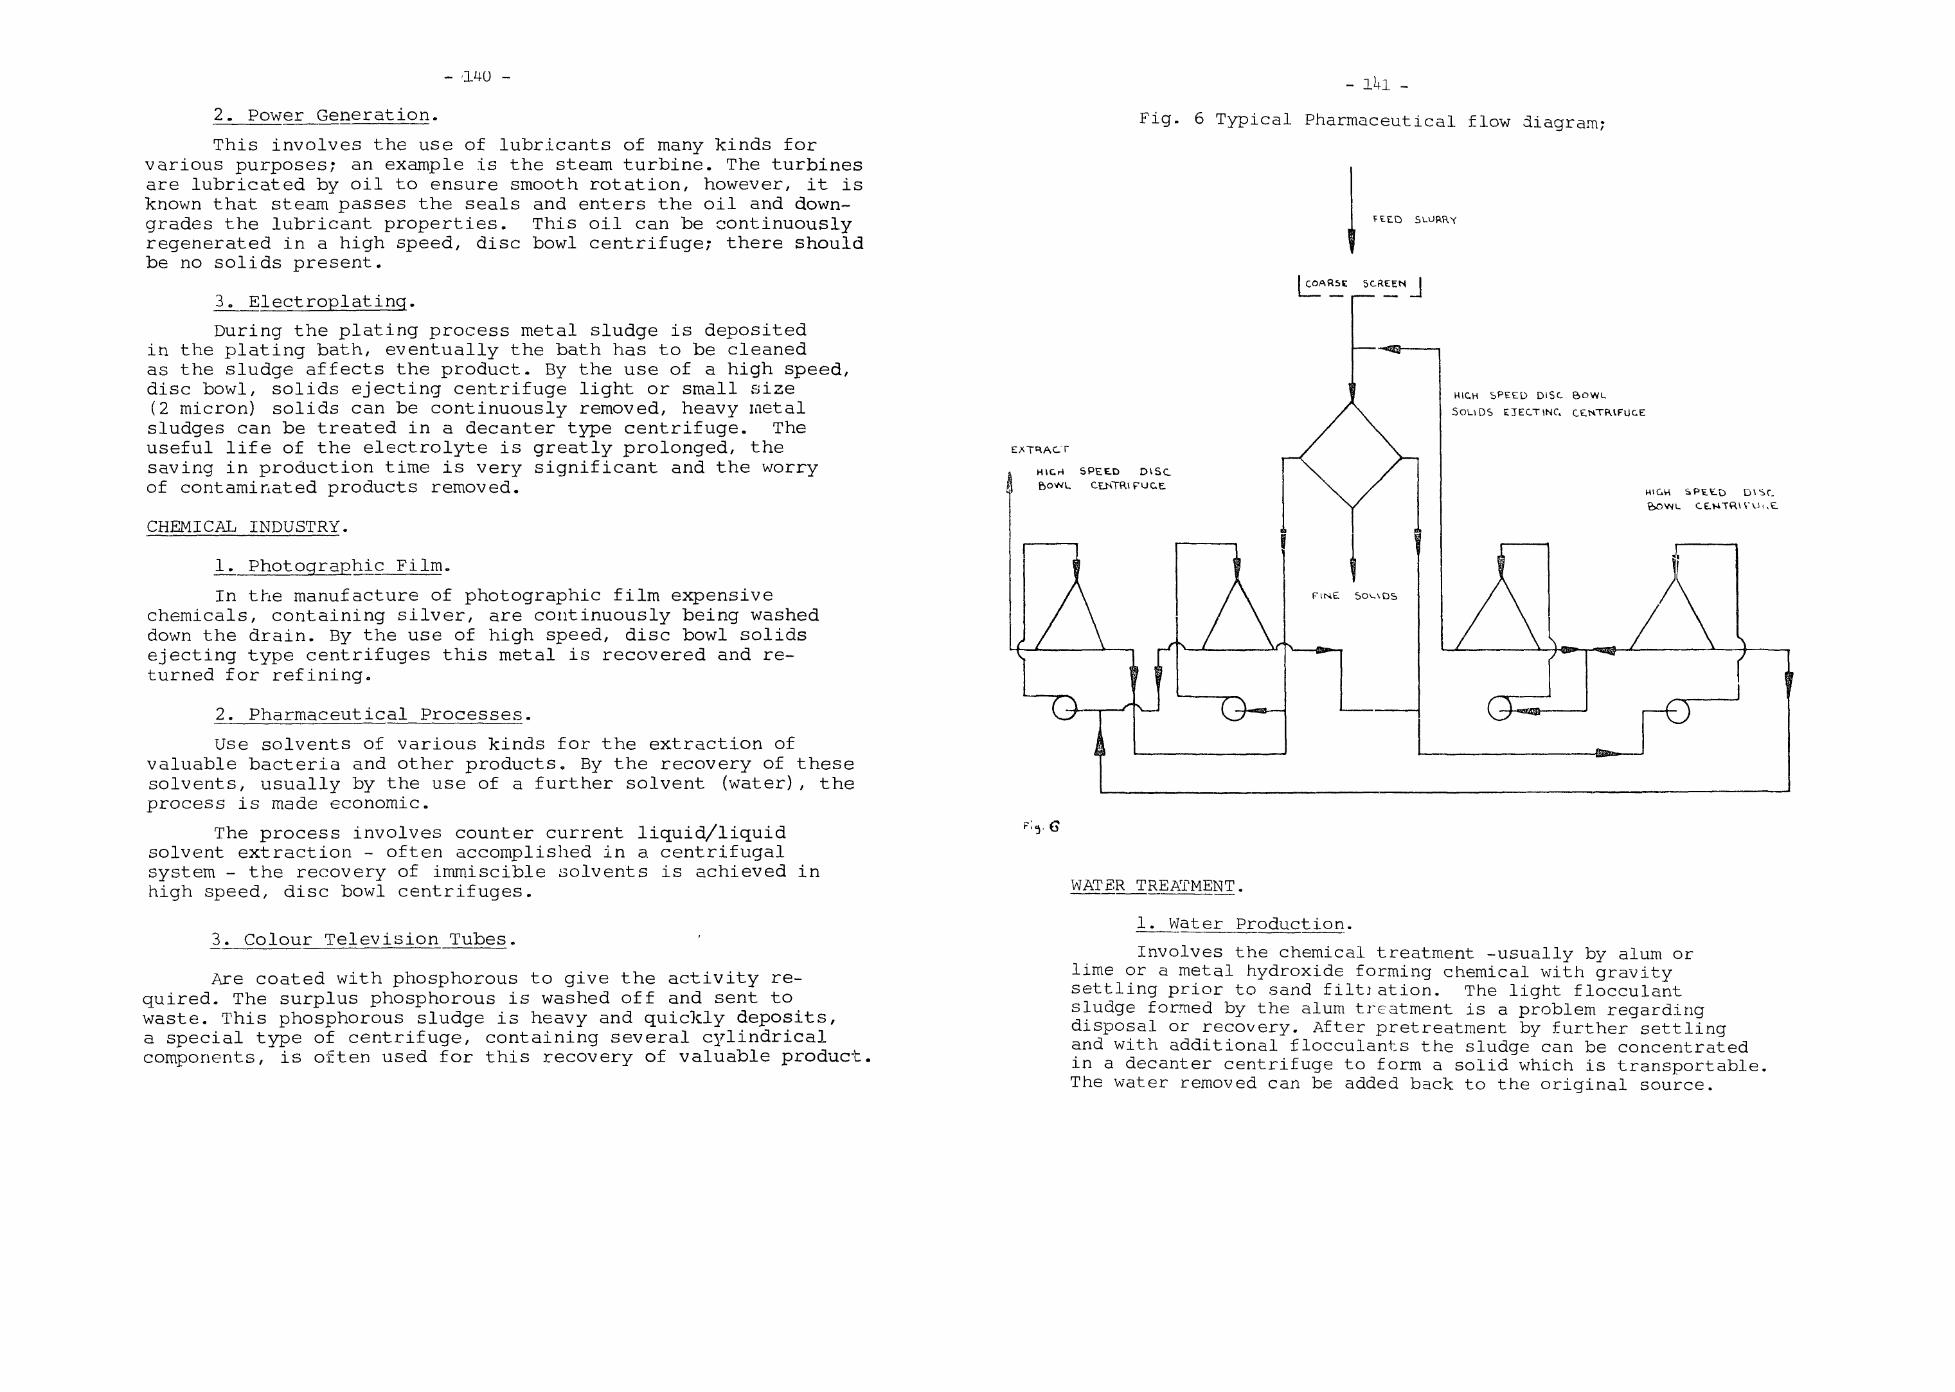
- '140 -
2. Power Generation.
This involves the use of lubricants of many kinds forvarious purposes; an example is the steam turbine. The turbinesare lubricated by oil to ensure smooth rotation, however/ it isknown that steam passes the seals and enters the oil and down-grades the lubricant properties. This oil can be continuouslyregenerated in a high speed, disc bowl centrifuge; there shouldbe no solids present.
3. Electroplating.
During the plating process metal sludge is depositedin the plating bath, eventually the bath has to be cleanedas the sludge affects the product. By the use of a high speed,disc bowl, solids ejecting centrifuge light or small size(2 micron) solids can be continuously removed, heavy metalsludges can be treated in a decanter type centrifuge. Theuseful life of the electrolyte is greatly prolonged, thesaving in production time is very significant and the worryof contaminated products removed.
CHEMICAL INDUSTRY.
1. Photographic Film.
In the manufacture of photographic film expensivechemicals, containing silver, are continuously being washeddown the drain. By the use of high speed, disc bowl solidsejecting type centrifuges this metal is recovered and re-turned for refining.
2. Pharmaceutical Processes.
Use solvents of various kinds for the extraction ofvaluable bacteria and other products. By the recovery of thesesolvents, usually by the use of a further solvent (water), theprocess is made economic.
The process involves counter current liquid/liquidsolvent extraction - often accomplished in a. centrifugalsystem - the recovery of immiscible solvents is achieved inhigh speed, disc bowl centrifuges.
3. Colour Television Tubes.
Are coated with phosphorous to give the activity re-quired. The surplus phosphorous is washed off and sent towaste. This phosphorous sludge is heavy and quickly deposits,a special type of centrifuge, containing several cylindricalcomponents, is often used for this recovery of valuable product,
- Ha -
Fig. 6 Typical Pharmaceutical flow diagram;
I COfCOARSE SCREEN I•W*MB H flB w^4
EAT^ACT
H1CH EeD DISCBOWL CEKTR\FIJC.E
HICH SPEED DISC BOWL
SOLI OS EJECT INC. CE-NTfUFUCE
F,<
WATER TREATMENT.
1. Water Production.
Involves the chemical treatment -usually by alum orlime or a metal hydroxide forming chemical with gravitysettling prior to sand filtjation. The light flocculantsludge formed by the alum treatment is a problem regardingdisposal or recovery. After pretreatment by further settlingand with additional flocculants the sludge can be concentratedin a decanter centrifuge to form a solid which is transportable,The water removed can be added back to the original source.

2. Sewage Sludge.
The treatment of sewage is now carried out by variousmeans using, or not using, chemicals to improve the outgoingwater. The sludge removed is still the big problem! By treat-ment of the gravity settled, digested or otherwise, sludgewith a suitable polyelectrolyte the solids can be recoveredto a transportable consistency when centrifuged in a speciallydesigned decanter type centrifuge. The solids can now be usedas landfill or incinerated; the water is re-circulated to theentrance of the sewage plant.
Fig. 7 Typical sewage sludge treatment.
A filtering centrifuge will produce a cake of amuch drier consistency than the rotary vacuum filters,hence giving a product which does not raise the moisturecontent of the main product to unacceptable limits. Thewater is sufficiently clean for re-use in the wa^-hery.
ADDENDUM.
Diagramatic studies of various types of centrifuges
LIME
RAW SEWAGEWATER
PRIMARY
TA IB.
DIGESTER
O.S. SUUDCE
AERATOR
o o o o oo o o o o
o o o o o
DECANTER
2.37 D«a. SUIDCE. WATEIK
3. Coal Washery.
With modern coal mining mechanical equipment the finesfraction (less than 20 mm) is increasing in quantity; in thewashing of coal this fraction tends to run with the water andis a loss of valuable product.
The fraction larger than 0.5 mm is easily recovered invarious designs of continuous filtering centrifuges, the con-centrate is often sent to the water storage dams or filteredin rotary vacuum filters.
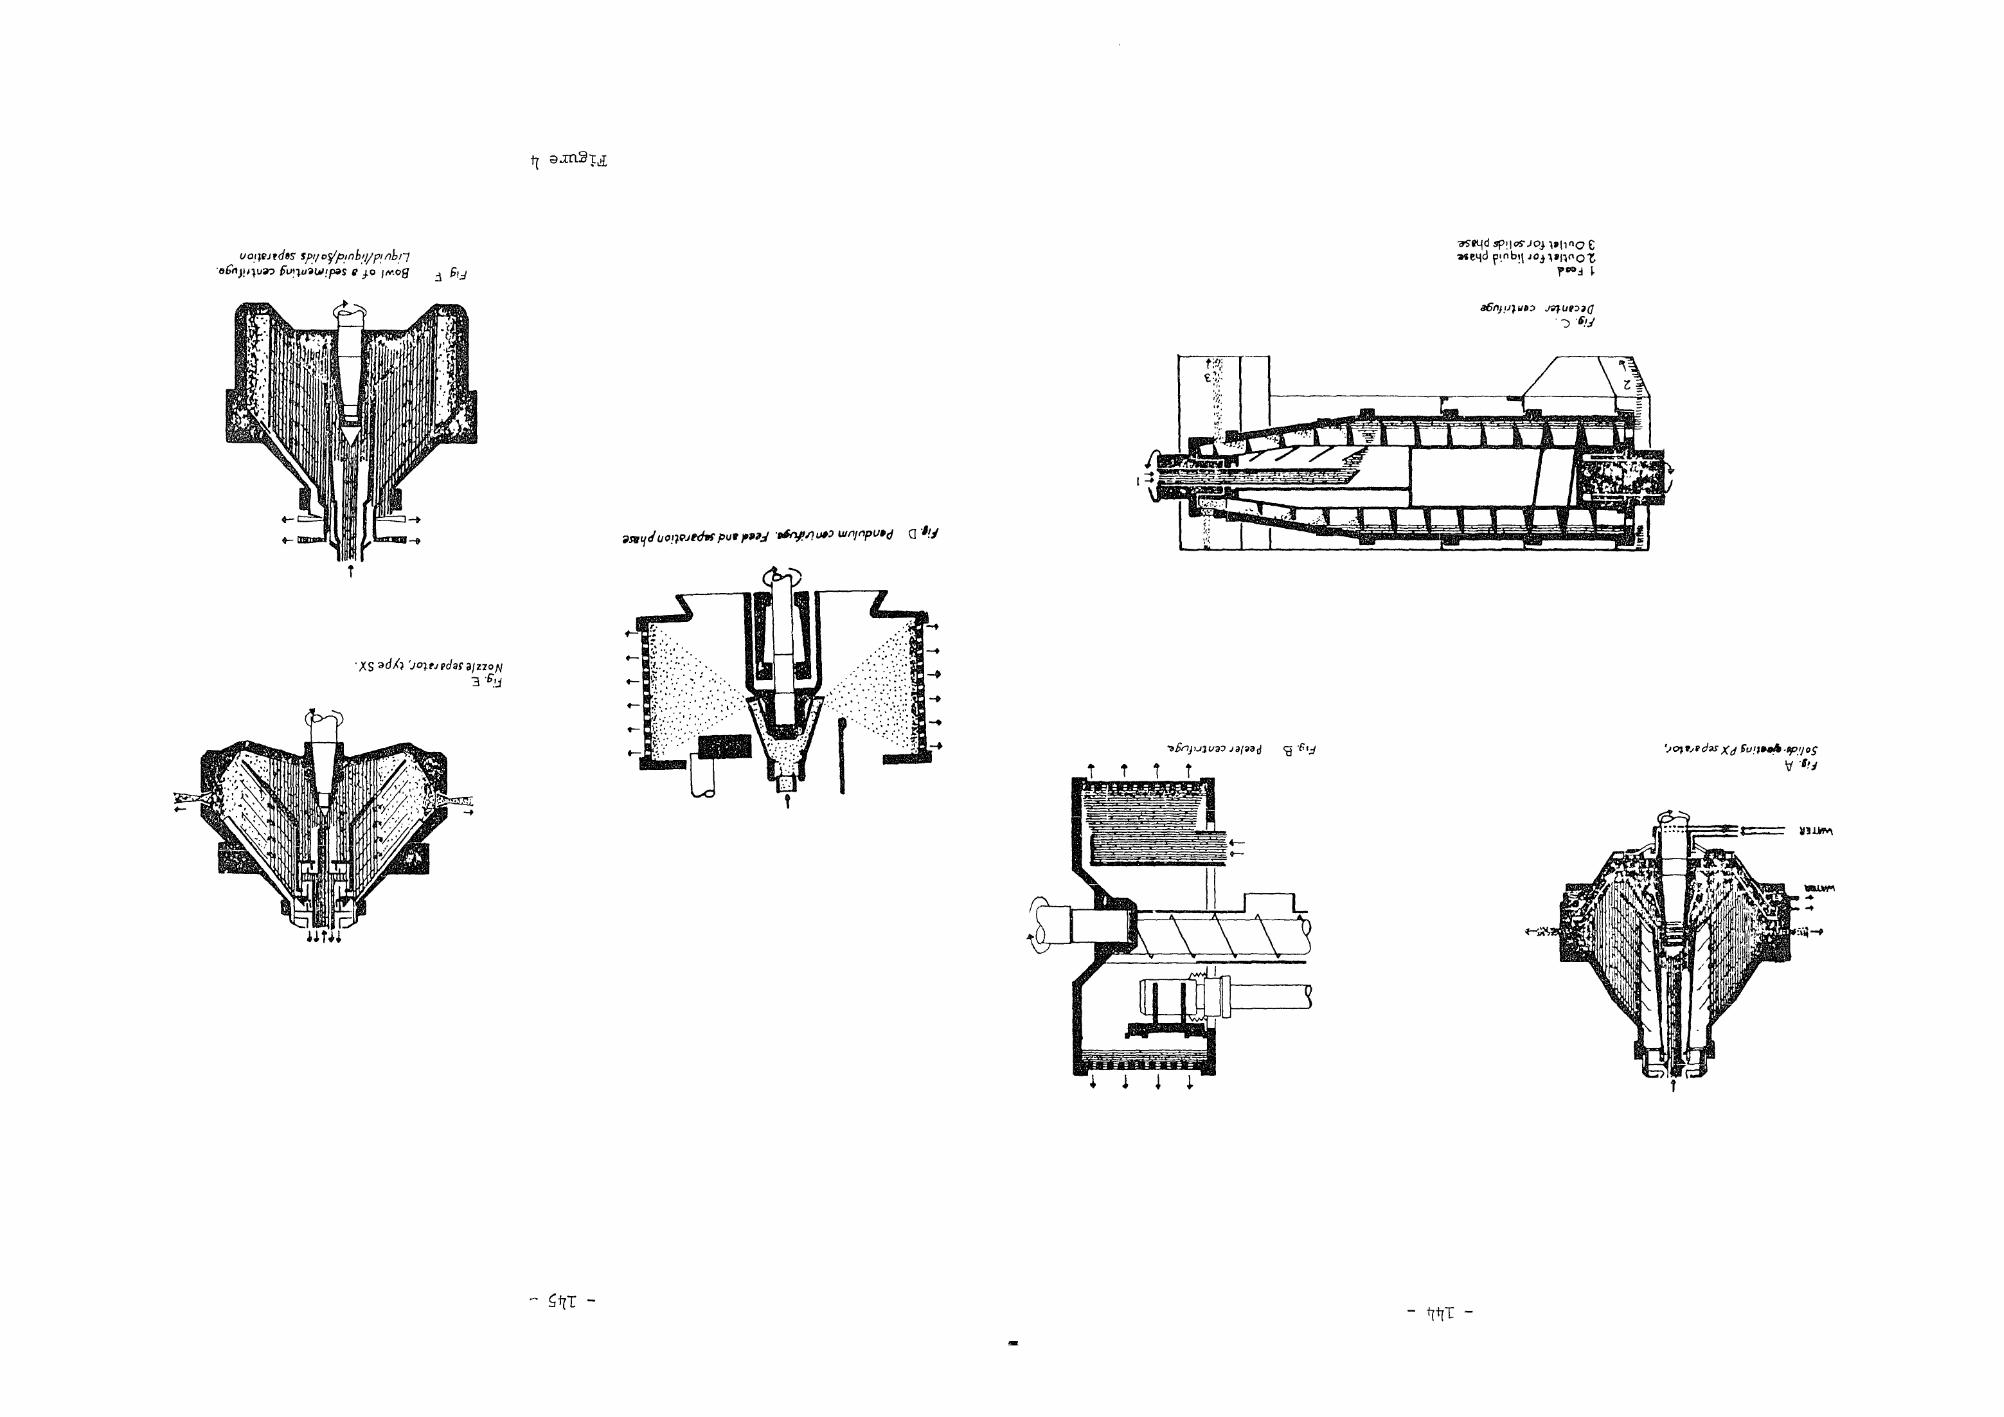
j i
f y
-T T t T

National Chemical Engineering Conference 19TU
Filtrate
Q.C»n'»caJ filtering ctntr^uoc.
H§. H.I Fig. H.2..Pusher etn\rifuge. 2-ffta$e rnodsl with wathing device. Separation Pusher centrifuge. /tA was/im« c/«vi'c«. 0. of
PROCESS INDUSTRIES IN AUSTRALIA
Surfers Paradise,
July 10 to 12th,
IMPACT AND GROWTH
Queensland
SCARCITY + TECHNOLOGY = SUFFICIENCY?
D.J. Nicklin and
S.P. Moodie
S U M M A R Y
The respective contributions of natural resources andtechnology towards future production are discussed. Depletionof natural resources is certain to continue and hence some ofthe recent predictions of doom. Technology however is a very powerfulagent of production, one which is not depleted, and the authorsargue that it should continue to compensate for diminishing resourcesto give a continuing high standard of living.
Nicklin, University of Queensland, Chemical Engineering
Moodie, University of Queensland, Chemical Engineering

Malthus to Meadows
The spectre of Man being threatened by scarcity of material resources is afamiliar theme. In 1798 Malthus1 argued that "the power of population isinfinitely greater than the power in the earth to produce subsistence for man",but since population growth is limited by the means of subsistence availablefrom the Earth's resources, the consequent ]ot of Mankind is "misery and vice".
In 1908 President Roosevelt was sufficiently worried by the apparent run-downof U.S. mineral reserves that he called a meeting of State Governors. As aconsequence a large scale survey was undertaken, and enough additional reserveswere found to allay concern.
Similar predictions have been made more recently; one study, in particular,has been well publicized - "The Limits to Growth" by Meadows et al . Its basicthesis is that continuing growth in population and industrialization will eventuallyclash catastrophically with the finite limits of the Earth's resources: "The basicmode of the world system is exponential growth of population and capital followedby collapse".
A major part of the study was to show, using computer simulation of a worldmodel, how the interacting effects of population, agriculture, industry, pollutionand resources can cause collapse, and the result of one such simulation can beshown thus:
* «* population^ %'
food per capita
industrial output
1900 2100
The, "Atandasid" wontd model, tun aAAumcA no majoi change, in the.physical, economic on. social. tie£ation;>htpA that have.goveAmd the. de.ve.topme.nt o^ the. mnJLd t>y£tem. kitplotte.d heJie. faoViow hiAtotitcal valuer £tom 1900 to 1970. Food,induA&itai output, and population gfiow e.x.pone.ntial£y untit the.lapidiy diminishing sieAouAce. bat>e. ^oicu a 6lou)dou)n in induA&iial.growth. Because o{] natural de£ay& in the. Ay&tew, both populationand po.ttati.on continue, to incAe,a^e. ^on. borne, time. afiteA the. pe.ak ofiinduAtAiatization. Population gtiowth it> fainattg halte.d by a Ai^e. inthe. de.ath Aate. due. to decAea/sed ^ood and medicalTaken from "The Limits to Growth", Meadows et al.
The gloomy predictions of Malthus and others have not (yet) been fulfilled.Can anything be learnt from these apparent failures to help us assess similarbut more recent predictions?
The fault of most predictions lies not in their logical development, butrather in the assumptions on which they are based. Malthus and his successorsare surely right when they say that continuing growth and finite resources musteventually clash. What they ignore, however, is the ability of social change andtechnological advance to change tastes, moderate growth rates, discover andexploit new resources and develop substitutes.
Productivity and Factors of Production
According to the economists productivity results from the combination ofvarious inputs or "factors of production": Natural resources, labour, capi ta 1 ,entrepreneur ship and technology. In "The Limits to Growth" the ma, in ornpho.:; i:; L:;on natural resources, shortages of which lead to decreasing production (of food otr)and thence to eventual world collapse. Meadows seems to have given insufficientattention to the possibilities of substitution between the various factors ofproduction, in particular technology's ability to compensate, or more thancompensate, for the depletion of natural resources.
Natural Resources and Depletion
In "The Limits to Growth" resource scarcity is defined in terms of an"exponential reserve index", the number of years that reserves will lant i f th'.-current growth rate of consumption continues. Such estimates are hard to makr.-with much reliability due to inadequate knowledge of present reserves, as welJ •>.:,yet undiscovered reserves. Furthermore, the assumption of continued exponentialgrowth in consumption is particularly restrictive, as it ignores the possibilityof changes in the pattern of demand by effectively precluding any considerationof price.
Price acts as a rationing device, tending to allocate resources betweencompeting uses, with at least some claim to efficiency. As prices rise, lessessential uses will be discouraged and the scarce commodity will be put to useswhich society values more. Prices also act as signals for the future - if pricesare rising, exploration of new reserves will be encouraged, previously uneconomicreserves will become economic and research and development will start, or hasten,in the search for new techniques, substitute materials and so on.
So far we have talked of resource scarcity in terms of the interactions ofeconomic forces and geological fact, but there is one other important force,politics. The Arab oil embargo is a recent example showing how politically inducedscarcity can occur. Such scarcity can cause considerable short-term problems whilepeople and institutions adjust to the new situation. In the long term, however,the effects will be similar to those from scarcity caused by other factors andthere will be similar responses of increased exploration, innovation andsubstitution.
Bearing in mind trese qualifications, let us get some idea of resourcescarcity, both in the world and in Australia.

- 150 -
Resource Static Reserve Index, 1970(years)
a Exponential Reserve Index, 1970(years)
World Australia Australia
Bauxite lUU U50Iron Ore 336 UOCBlack Coal 832 260Copper SO 32Tin 35 32Oil ^5 20
36 (12%)50 (1%)50 (1.7$)22 (5$)27 (1.5$)12 (8$)
r
a 1970 Reserves - 1970 Production•
b Predicted annual growth rate in bracketsc Estimates from "The Utilization of Queensland Coals" P.J. McKeough,
Department of Chemical Engineering, University of Queensland, 1972.Other estimates from "Australian Mineral Industry Quarterly "Review",Vol. 25, No's. 2 and h.
There is some conflict over the interpretation of figures such as these. In"The Limits to Growth" exponential reserve indexes of fifty years and more werestill considered to be a cause for concern, and reliable enough to be uyed forpolicy decisions. According to Noakes an exponential index of about, thirtyyears "could veil be regarded as the threshold of concern in the field of mineralconservation", and he argues further that the level of confidence of longer termprojections is sufficiently low that they are not a good guide for current, policy.
One of the main causes of world collapse advanced in "The Limits to Growth"is the depletion of non-renewable resources. The authors argue that even iftechnology can overcome material shortages (and they doubt whether it can) worldcollapse is merely postponed, occurring eventually due to some associated causesuch as increased pollution. A major criticism of the "Limits" study is thatthe variables used are too highly aggregated and to have one variable to representall non-renewable resources is too simplistic and masks important differences.While it is undeniable that there are ultimate physical limits to growth inthe world, it is extremely unlikely that widespread depletion of non-renewableresources will be a major problem in the next forty or fifty years. Ratherthere will be shortages in a few particular resources, and in such a situationit is conceivable that technology can alleviate at least some of the associatedproblems.
Technology - The Past Record
How important is technology compared wi^h the other factors of production?There was a four-fold increase in per capita income in the last century or soand economists estimate that between 50% arid 8(3% of this increase can beattributed to technology. So technology has been fundamental in increasingproductivity from existing factors of production. Furthermore it has increasedthe supply of certain commodities by developing new resources and substitutes inresponse to impending shortages, and these are numerous examples of this:
(i) The lowest grade of copper that can be handled economically has declinedfrom about 3% in the l880's to almost Q.h% now.
(ii) With advances in the technology of the Bayer process, alumina can nowbe produced economically from high Silica Bauxite ores (15% now compared with amaximum of Q% in the 19 0's) and we no longer depend on the smaller reserves oflow silica ores. '
- 151 -
(iii) The high world price for wool in the early 1950's was the signal forthe rapid development of the synthetic textile industry. Here technology notonly overcame the problem of a shortage of wool but the substitutes that weredeveloped now largely dominate the market that once was wool's.
Technology - The Future Possibilities
It is difficult to predict with much confidence how technology will developin the future, and to forecast how successfully it will respond to future problems.One thing that does appear certain is society's continuing and growing need forenergy. A cheap and plentiful supply of energy from nuclear reactors isprobably the most important assumption of any optimistic assessment of technology'srole in the future.
(a) Nuclear Energy
While nuclear energy will be an important, if not the most importantenergy source in the future, there are a number of constraints on its use.
The environmental and safety aspects of nuclear reactors still pose problems,and there appears no way to completely eliminate the hazard of a nuclear explosion.With appropriate safety measures the probability of such an event occurring will beextremely small, but the consequence if a failure did occur could be disastrous.There is also concern over the possibility of smaller-scale leaks of radioactivematerial and with disposal of radioactove wastes. This concern seems justifiedin view of recent leakages from a U.S. waste disposal site.
Another consideration is that of thermal pollution. Studies have beenundertaken which indicate that thermal pollution may be an eventual limit to thegrowth in energy consumption.? As nuclear power stations generally have lowerthermal efficiencies than fossil-fuelled stations, this could prove to be alimiting factor in the widespread use of nuclear energy.
The advent of breeder reactors offers a virtually inexhaustible supply ofenergy, but it may not always be cheaper than energy from current fossil fuelsources. In the U.S.A. the high price of coal means that despite higher capitalcosts, electricity from nuclear plants will be cheaper than from coal burningplants." In Australia, however, the relatively lower price of coal will meanthat nuclear energy is unlikely to be competitive before the 1990's.9 thissubstitution may be hastened as coal and other hydrocarbons become more valuedas chemical feed stocks than as energy sources - a trend that seems inevitable.
At present only about 20% of our energy needs are met by electricity. Ifnuclear energy is to be the prime source of energy in the future, either avirtual technological revolution will be required for electricity to becomethe predominant form of energy, or other forms of energy; such as fuel cells orthe hydrogen economy proposal of Bockris10., must be developed.
Even with these qualifications nuclear reactors will have significantapplications in future technology, apart from their use as direct energy source.A steel making process using existing nuclear reactors and fluidized bed furnaceshas been proposed, and present indications are that steel may be producedsubstantially cheaper this way than by the current blast furnace/basic oxygenprocess. -1 The necessary technology has not yet been fully developed, butcommercial operations should commence by the early 1980's. The prospect of ashortage of coking coal can only hasten this process of technological substitution.Other likely "process heat" applications of nuclear reactors are in the manufactureof synthetic hydrocarbon via coal gasification, and in bitumen production from tarsands.-^
While nuclear energy is not without problems, there appear to be no insuperablebarriers to its widespread use. Its potential (and that of solar energy) is such

- 152 -
that we can be reasonably optimistic about energy supplies in the future.
(b) Minerals
It is more difficult to predict how technology might alleviate scarcityin minerals other than hydrocarbons. Considerable advances are likely inexploration and in more efficient mining and processing techniques. Recyclingwill become increasingly important, especially as prices of scarce minerals rise,and this would seem to be a promising area for new technologies.
Development of substitutes is another way that technology can avertshortages and examples of the possibilities of substitution are manifest - glass,steel and concrete are in many ways substitutes for one another as structuralbuilding materials; copper and aluminium compete as electrical conductors, yet bothare inferior conductors to silver; and either molybdenum or tungsten can be usedto impart similar properties to alloy steels.
Of course there are few perfect substitutes, but differences in price canmake up for any deficiencies in desired properties. It is indeed difficult tothink of any metal whose properties make it indispensable.
(c) Time lags
In the past, imminent shortages of resources have been avoided bytechnological developments, and it is at least plausible that technologies can besimilarly developed in the future. The difficulty, however, is the speed at whichsuch technologies can be developed in order that transitory, but severe scarcityproblems may be avoided. There is a time lag associated with technologicalinnovation, often of the order of fifteen to twenty years, and this may get longerin the future, as growing awareness of the environmental impact of some technologiesresults in more stringent testing before commercial application. If the apparentlife of a resource is less than this time lag there are prospects of temporaryshortages while new technologies are developed or substitutes found.
This appears to be one problem with which the price mechanism cannot cope,since the time lag of technological innovation is roughly equal to, and perhapsgreater than, the time horizon of the market. Thus for example, the price of aparticular resource may not rise much in response to an impending shortage untilthose within the market find they have insufficient reserves for, say, fifteen years,their economic time horizon. After this stage is reached the price will rise, andthe search for substitutes and new technologies will commence in earnest. If, however,such developments take longer than fifteen years, say twenty years, there will bea five year hiatus until the technology catches up.
If this possibility is accepted, it would appear to provide a case forgovernment intervention. If the government views the future differently from themarket, it may try to raise prices by buying (and stockpiling for the future at thesame time) or it may encourage more Research and Development than would otherwise beundertaken at that time to allow for any technological time lag.
Sufficiency
It is not possible to give a definite and objective answer to our question:"Will technology be able to overcome the problem of impending shortage and provide uswith'sufficient' resources?"
We do not know enough about the earth's resources and we can only make roughestimates of the future demands on natural resources. Our only real way offorecasting technology's role is by extrapolation from the present, and this is arather risky procedure. Further, it is not possible to make an objective judgementabout sufficiency. For many people on earth, sufficiency means enough to live on,but in Australia and other developed countries, sufficiency implies considerably morethan mere subsistence. Notions of sufficiency also change with time - cars are nowregarded more a.s a necessity than as a luxury, as they were forty or fifty years ago.ufficiency" then requires value judgements,'and in particular it entails questions
- 153 -
of the distribution of wealth, both between people of each generation, and betweendifferent generations.
With these considerations in mind, our own answer is "yes". Of the variousfactors of production, technology is probably the most powerful. It has been omajor factor in improving life in the past, and there are reasonable indicationsthat it can continue to do so in the future.
Continued technological advancement will be essential in order to ensuresufficient material resources for the future. We need technology, as much aschanges in our social, economic and cultural framework, to solve problems ofgrowth that are evident now and which will continue in the future. We must ensure,however, that technology does not exacerbate any such problems.
Technology can be powerful, but we cannot absolve ourselves from anyresponsibility for the future, in the hope that technology can overcome thedifficulties that we make for future generations.
Postscript
While writing this paper, we could not find any predictions about life in 197Umade thirty or so years ago. This is a pity, and to rectify the situation foranybody giving a paper on a similar topic in 2001 we have included a list of somequantities which we think will give some indication of what life will be like in 2001We have made our estimates, and leave space for yours.
Quantity
(Prices in 19TU Dollars)
Population : World: Australia: Sydney
Working week (hours)Annual leave (weeks )Average wage ($)Retirement age (years)Copper ($/lb)Aluminium "Beef "Wool "Timber ($/100 super feet)UK Minicomputer ($)Airfare to U.K. "MG TC "^ acre block, Sydney "10 oz beer "Deposit on soft drink bottles "1 gallon Super gasoline "% of electric cars% of compact cars in U.S.Average number of children per familyNumber of psychiatrists per hear% of engineering to total graduates% of chemical engineering to total graduatesPollut ion ( index )National park per head (index)
197
3.5 x 10?13 x 10;3 x 10
UOh
115650.6?.26
1.001.50TO
5000700300015000
0.230.050.550502.6
1/20,0006.81.311
2001Our Your
Estimate Estimate
8 x 10?22 x 1057 x 10306
23060l.Uo.30
3.003.00
2802000600
2300060000
o.Uo0.200.851352.U
1/2,0005.01.00.60.2
"s

References
1. "First Essay on Population", T.R. Malthus, 1798, Ch. 1.
2. "The Limits to Growth", D.H. Meadow et.al, Earth Island Ltd., (London), 1972,
3. Ibid, p Ih2.
h. "Mineral Conservation in Australia - A Preliminary Analysis", L.C. Noakes,Australian Mineral Industry Quarterly Review, Vol. 25, No. 2.
5- "Thinking About the Future, a Critique of THE LIMITS TO GROWTH", Ed. by .H.S.D. Cole et.al., Chatto and Windus (London), 1973.
6. "Thinking about the Future", op.cit. p 39-
7. "Thermal Pollution", D. Martin, B.E. Thesis, University of Queensland.
8. "Social Instructions and Nuclear Energy", A.M. Weinberg, Science, Vol. 177>July 1972, p 27.
9. Twenty-First Annual Report, Australian Atomic Energy Commission, p 20.
10. "A Hydrogen Economy", J. O'M. Bockris, Science, vol. 176, June 1972, p 1323.
11. "Steelmaking with Heat from the atom", N. Valery, New Scientist, 13thSeptember, 1973, p 60.
12. "The GGA High Temperature Gas-Cooled Reactor: A General Discussion",J.W. Landis, Journal of the British Nuclear Energy Society, Vol. 12, No. hOctober 1973, p 367-
- 155 -
National Chemical Engineering Conference 197*1
PROCESS INDUSTRIES IN AUSTRALIA
Surfers Paradise,
IMPACT AND GROWTH
Queensland
thJuly 10 to 12 , 197
CONTROL IN 2001
by
R.J. Batterham, J.A. Frew, & D.N. Sutherland
S U M M A R Y
Dramatic changes have taken place during recent years in the fieldof process control. At such a time it is dangerous to extrapolatepresent trends to the end of the century so the likely developments ofcurrent practice in terms of equipment and applications are outlinedover a period of perhaps the next decade. Looking further ahead theeconomic, social, and technical climate prevailing in the world at theturn of the century will affect the type of control technology required.General suggestions are made as to what will be required of thetheoreticians and the equipment manufacturers if the process controlengineer is to have the tools necessary for his task.
CSIRO, Division of Chemical Engineering,
Introduction - 157 -
During the last decade or so there have "been dramatic changes in the controlof processes within the chemical industry. The first computer control installationwas over 15 years ago, installed at Fleetwood "by the Imperial Chemical Industries,and this has "been followed by a host of installations in many industries. Theconventional chemical industry and in particular the petrochemical industry are nowhighly automated and instrumented and the ideas and expertise have spilled overinto more traditional, less science "based, industries. A recent survey indicatedthat the first process control computer was installed in the Canadian mining andmetal processing industry in 196 and by 1971 there were ^5 on-line processorsoperating. One can now see in factories on-line gas chromatographs, X-ray analysers,infra-red and gamma ray absorbtion meters and other sophisticated instruments whichwere merely laboratory tools ten years ago.
Some notion of the rate of progress in this field can be gauged from thepublished literature. The Industrial and Engineering Chemistry Annual Reviewsdid not begin covering the subject until 1956. In this year the word Automationwas added to the title of the review previously named Computers, Statistics, andMathematics. Only two years later the subject matter was split and a title ofProcess Control and Automation used. Even this field rapidly became too largefor comprehensive review and by 1.96k only UOO references were cited as selectedfrom more than 1200. It seems that the expansion may have slowed somewhat inthe last few years but the field is now so vast that it is difficult to be sure.
In the wake of such a period of rapid change the projection of past trendsfor the next three decades will probably be very misleading. Extrapolation ofthe publishing trend would indicate more papers published than people to read orwrite them! Similarly the expenditure on instrumentation and control equipmentmight be shown to outstrip plant costs - a situation of the tail wagging the dogwith plants consisting mainly of instruments, controls, and computers! A morefruitful policy is to look ten years or so ahead where we can have some confidencein extrapolating the present and following this to speculate in more general termson the prospects further ahead.
Our objective then will be two-fold. Firstly it will be to consider theforeseeable future. Computer technology has consistently outstripped even thewildest expectations, but more fundamental limits seem to be coming into playand we are probably in a better position now, than in the past, to see where wewill be in ten years time. Similarly in the field of control there seem to be noimminent revolutions and it is likely that present patterns will be developedfurther over the next decade.
Secondly we shall look towards the year 2001. It is impossible to do thisin isolation without assuming some knowledge of the shape that chemical engineeringwill take at the end of the century and also the shape of the economic and politicalworld in which we shall be living. A lot is said of the approaching limits ofpopulation, raw materials and energy resources. Even if the present predictionsare rather alarmist it is certain that all these factors will impinge on the typeof processes being controlled, the type and level of the variables being measuredand most importantly on the criteria considered desirable for optimum processperformance.
The Next Decade
Equipment We can confidently expect continued development of instrument andcomputer technology. To date the common variables which are measured re-main flow,temperature, pressure and level, but there will no doubt be a great proliferationin the methods of stream analysis, measurements which are very much the provinceof the chemical process where matter is converted in a controlled manner. Manyof the laboratory procedures for wet chemical analysis, liquid phase chromatography,specific ion electrodes, spectrometric methods of various types and lazer based
optical techniques will move from the laboratory to the factory. Automaticprocesses will be devised to telescope in time some of these rather time consumingprocedures so making them of some use for on-line predictive work.
Many of these techniques require considerable computation and interpretationin order to extract the desired information from the measurements. The increasingpower, cheapness and compactness of computers will be a major factor in the develop-ment of these more sophisticated sensors. Such instruments will have their ownmicro computers as an integral part and much of the data reduction will be donelocally before transmission of the results of the calculation to a central processoror to a linked controller. The power of such midget computers will permit quite-sophisticated interpretation of spectra or chromatograms to be made continuously.
With the increasing availability of computing power it will be possible tohandle more and more complex systems. Already in space applications, admittedlywith few economic restraints, process models are manipulated with several thousandsof variables so in chemical plants, where the number is generally an order ofmagnitude less, the problems will soon become of manageable proportions. Thepotential of large computers is perhaps still barely appreciated and it will takethe next decade for this power to be fully harnessed.
Changes will come too at the operator-controller interface. One of the major-problems with computers centres on the transfer of information into or out of the-machine. Higher level inputs of the spoken word or the hand-written page willundoubtedly become important and may find application in the control context. F:utmore important than this will be the depth at which the operator can communicate.Information of the current state of the plant will be available in a readilydigestible form rather than as rax? instrument measurements, and similarly hi::implementation of operating strategy will be supported by the controller th^senabling him, for example, to demand a change in product specification with thesystem selecting and implementing the optimum policy to bring about the desiredchange. The full power of the computer will be readily available to the operator.
Applications The next decade should see many applications of process rr.odellir.?and on-line optimization of the type currently used to a limited extent. Cheapercomputing power and improved instruments will both aid in achieving better estirr.8.~esof the state of the system and will enable more realistic plant models to be useifor predictive control purposes. With a considerable amount of the data analysisdone locally at the instrument the central processor will be available forsubstantial optimization calculations r id will permit more complex and usefulcriteria to be used for specifying the desired plant performance. The verysubstantial efforts of recent years which have been expended on process modellingare likely to bear some fruit. Nevertheless it seems that efforts to produce acomplete process description will not be necessary or economic, let alone possible.What are required are simple models including the dominant dynamic characteristicshence model reduction techniques and efficient computational methods for dealingwith the resulting equations are crucial.
It must be said that large commitments of equipment and personnel will berequired and dramatic improvements in plant performance are unlikely. Theapplication of the so called Optimum Control Theory will probably increase plantefficiency by no more than a few percent and this improvement is gained at theprice of considerable effort. There is no panacea here, yet even small increasesin plant efficiency can often critically affect profitability and if one looksbeyond the immediate future to the days of scarcer raw ma.terials and resourcesand to the time when very severe penalties will be incurred for the disposal ofundesireable waste products, the efficiency and the close control of plant operationwill become crucial.

- 158 -
For at least a decade cynics have been shaking their heads sadly at eachnew DDC installation and predicting disaster yet more and more installations aremade and despite the problems inevitable in such a new technology hard headedbusiness men in all industries see this as the way forward. There is no reasonfor them to change this policy.
2001
The impetus for automatic control in the process industries has been pri-marily economic. It has blossomed in a climate where labour is expensive andscarce and where capital is available for expenditure on plant. Its pay-offhas been in reduced labour charges and in increased plant efficiency. Anadditional bonus, which is less easy to quantify in financial terms is theincrease in safety of operation of the plants using hazardous materials orconditions. In some instances safety is of overriding importance.
If one looks ahead to the end of the century the emphasis of control andoptimisation will be very different. The days of increasing leisure are alreadywith us and in thirty years the amount of human effort required to produce thegoods for the then overaffluent society will be at most a couple of days perweek. Retirement age will fall and years of education rise but the ideal ofthe sanctity of labour, so carefully nurtured by the Puritans will take generationsto die. It is deeply rooted in West and East alike and it has only been thecontinued expansion of population, world trade, and standards of living whichhave, so far, been able to absorb the results of the trend to automation withouttoo serious a social upheaval. The days of continuing expansion cannot remainindefinitely and even if predictions of population and resources are only partiallytrue the emphasis will be on economic stability rather than growth and onconservation and maximum utilization of resources rather than simple profitability.
The problem of surplus labour is likely to be a very real one in socialterms and the stability of our society relies on a satisfactory solution beingfound. Many developing countries today have high unemployment and the commonpractice of introducing advanced technology with large automated plants onlyexaggerates such a situation. A large pool of people without work presents acontinual threat to civil order and the solution so often seen is the militarystate. Looking ahead to 2001 our own situation may not be so very different andalready high unemployment rates are considered as normal in some advanced countriesIt seems unlikely that a zero growth economy based on advanced technology will beable to maintain full employment even in an essentially service economy where mostof the work force is concerned with services rather than production. The emphasisthen must change from replacement of labour, and automation of plant operationwill become less important and may even be undesireable. In view of this, controlsystems will probably be designed to incorporate operators as essential componentsof a compucer control system. Already, laboratory experiments have shown suchsystems to have unique advantages.
As populations become more static at a level greatly in excess of todaysand some of the primary raw material and energy sources become more preciousnew emphasis will be placed on the efficiency of extraction, processing andenergy requirements, and on the control of environmental pollution in a greatlycrowded world.
There is little doubt thatcontrol research and practice. FossTheory considerable gap exists today between
has argued very convincingly that thereason for this is not that practical men are lagging behind in understandingand applying the theories already developed, but rather the fact that thetheoreticians have not tackled the fundamental problems peculiar to the controlof chemical processes. All too often the pattern has been that powerful techniquesdeveloped and proven in other fields have been transferred rather indiscriminantlyto chemical engineering systems and resulted in academically interesting butpractically sterile exercises. .
- 159 -
In chemical processes we are dealing with systems of many variabj.es. Manyof these variables interact strongly but few of them are measured or, in fact,even amenable to measurements. Coupled with this is the fact that the control:;f-ructure of the system is not defined - we can in principle take any or all of:, variety of control actions from the information derived from any or all of anumber of possible sensing elements. These characteristics make the processcontrol problem different from others in the control field and also make theproblems of process modelling and estimation of state parameters very difficult.
The most important thing we would like to know is related to the design ofcontrol systems. A theoretical basis is surely needed. The current practice ofdetermining the basic control structure by selecting controlled and measuredvariables on the basis of experience and intuition must be replaced by some formalmethod for reaching the best solution in an efficient and organised manner.'Optimal1 control policies when applied to an existing plant configuration canat best provide a sub-optimal solution and in most cases the results of suchexercises have been rather small improvements. The potential for optimisationwould appear to be very much greater in the design phase. Which of the manyvariables is it worthwhile measuring, taking into account the cost of the sensorsand the additional value of the information derived from such a measurement on theplant configuration problem? In the same context what are the best variables tocontrol in order to achieve the desired objectives? Another area which is verymuch the province of the experienced engineer and on which we would like guidancefrom design theory is what plant modifications might be made in the interests ofcontrollability of the system. The need for such modifications can become onlytoo apparent when the plant is commissioned and operated.
Further problems for future theoreticians are to produce low order modelsof large multi-variable processes, to include the dynamic characteristics in amanageable form, and to estimate the process parameters of a sparsely measuredand strongly interacting system.
The practicising control engineer would like answers to these questions.The problems are very basic and of formidable magnitude. If the answers areavailable in 2001 then the theoreticians will have done very well.
Practice On the practical side we shall undoubtedly have cheaper, more powerfulcomputers, instruments of great flexibility and sophistication, data transmissionlinks to controllers, reading, speaking and listening control stations. In orderto keep perspective in this wealth of superb gadgetry let us suggest some importantcharacteristics which we would like to see in 2001. We have told the theoreticianswhat questions we would like answered. What would we hope to see in the practicalcontrol systems at the end of the century.
In instruments we shall be looking most of all for robustness and sensitivity.Reliability is always of prime importance and will become even more vital. Processconditions will "become more extreme as materials of construction improve and theemphasis on utilization of resources increases. The other pressures for minimizingnoxious effluents and increasing the safety of personnel near hazardous plant willforce high standards of reliability on instruments operating in increasingly ruggedsurroundings.
And great sensitivity will be needed in these unfriendly environments. Moreaccurate plant sensing will be needed to optimise output and recovery where largerewards will come from efficient operation. Very sensitive monitors will beneeded to check on trace emissions of a wide variety of unwanted materials in apollution conscious world where heavy penalties will be levied on those exceedingallowable limits.

- 160 -- 161 -
There will be economic pressures for standardised, modular systems. Verycomplex networks will be in use with micro computers located at sensing instrumentsand controllers communicating with each other and with one or more centralprocessors. Standardisation is desirable to enable such complex networks to bebuilt up and maintained with a minimum of cost and effort. Modularity of thevarious items will give the desired flexibility for expansion or replacement ofexisting equipment. Ease of installation and maintainance will become a primerequirement.
The obvious requirement we shall look for is reliability of the overallsystems. The complexity of such networks will put great emphasis on the stabilityof the operating system and this stability is of overriding importance. Theclimate of falling equipment costs and rising labour costs will mean increasinglythat the very expensive and time consuming task of getting 'bugs' out of the systemmay become prohibitive. Large safety factors must be built into the software sinceany resultant additional costs of hardware will be small in comparison with thecost of system failure or modification. Already 'software' costs are becomingincreasingly important and the whole aim of future developments must be to minimisethe effort involved in this phase.
Conclusions
Computer control is here to stay and developments of increasingly complexsystems will continue with an emphasis on sophisticated analysis and instrumentation.The requirements of a crowded world in 2001 will be full and efficient utilizationof resources and careful control of the environment. To meet these challengestheoretical advances are needed, particularly in the design of control systemsand on the practical side units of greater robustness and sensitivity will beneeded.
References
1. J.H.C. Scrimgeour, W.A. Gow, F. Kelly, L.K. Neuouen, R. Littlewood andA.I. Jonson, IFAC Symposium on Automatic Control in Mining Mineral &Processing (Sydney, 1973) p2^5 (The Institution of Engineers AustralianNational Conference Publication No.73A).
2. A.S. Foss A.I.Ch.E.Jl9 20? (1973).
National Chemical Engineering Conference 1974
PROCESS INDUSTRIES IN AUSTRALIA IMPACT AND GROWTH
Surfers Paradise, Queensland
July 10 to 12th, 1974
LARGE SCALE NITROGEN FIXATION BY MICROBIAL MEANS
by
P.W STREET and C.J .D. FELL
S U M M A R Y
Demand for fixed nitrogen for agricultural purposes is likely toincrease threefold by 2001. Because of the high energy requirementof the conventional fixation process and its basis on petroleum-type raw materials it is unlikely that the increase in demand will besatisfied by this process. However, intensive commercial cultureof free living nitrogen fixing microorganisms such as the Azotobactercould offer an attractive alternative means of nitrogen fixation.Growth studies on these microorganisms show that under controlledconditions they have a fast growth rate and high nitrogen fixationefficiency. Moreover, they appear capable of growth on a widerange of carbohydrate rich aqueous wastes.
School of Chemical Engineering, The University of New South Wales

- 162 - - 163 -
Nitrogen is one of the fundamental elements of life. Almost all animals,plants and microorganisms must have a supply of nitrogen compounds to survive,yet these compounds are relatively scarce in soil and water and indeed are oftenthe limiting factor to growth.
Nonetheless, the earth's known reserves of nitrogen are vastbe seen from the following table;
1This can
Nitrogen Reserves
Igneous rocksSedimentary rocksAtmosphere
kg Nitrogen/m Land Surface370 ,000
8707 , 5 5 0
However, the nitrogen available in rock forms is generally unavailable and thebiosphere relies on nitrogen originating from the atmosphere.
Fixation of nitrogen from the atmosphere has in the past primarily occurred bybiochemical processes in a series of nitrogen fixing microorganisms (certain bacteriaand blue-green algae). It is estimated that the nitrogen produced in this wayamounts, on a world-wide basis, to 2-5 x 10 tons per annum , and is responsiblefor the fertility of virgin soils. When such soils are cultivated and regularlycropped, the nitrogen level drops quickly unless replenished either by addition ofartificially fixed nitrogen or by crop rotation in one phase of which a nodulatedlegume is planted. The latter approach, though attractive in ecological terms,denies the use of the land for its normal cash crop during the legume phase and islimited to environments for which suitable legumes exist.
Most modern intensive farming employs artificially fixed nitrogen. Indeed,the very basis of the so-called 'Green Revolution1 is the availability of fixednitrogen supplements to ensure the continued high level of productivity achievedusing the new 'miracle1 grains.
Some idea of the growth in demand for industrially fixed nitrogen can be obtainedfrom the table below which gives production figures for fixed nitrogen in the U . S . A .This country produces and consumes approximately one quarter of the world's output,primarily for agricultural purposes.
U.S . Production of Fixed Nitrogen2,3
Year
19031933196319711973
Production (xlO =•• metric tons)
0.10.63.88.79 .0
It is d i f f i cu l t to estimate a worldwide demand for industrially fixed nitrogencirca 2001 , but , if it is assumed that the world per capita consumption will rise tothat presently applicable in the U .S .A . (not an unreasonable assumption in view ofthe predominant use of fixed nitrogen to produce basic foodstuffs by intensiveagriculture) then, allowing for a world population of 6000 million , the demand willthen be 114 million metric tons per annum, or, over three times the quantitypresently available.
It is unlikely that this demand will be met by additional factories based on theconventional nitrogen fixation process. This process, which results in the productionof ammonia, operates at high pressure, has a high energy requirement, and is basedon petroleum or natural gas feedstocks, both of which are in increasingly shortsupply. It has been estimated that the cost of ammonia produced by theconventional process will increase by 50% by 1985, with further considerableincreases thereafter, this despite the economic advantages of scale to be had fromthe 1000 plus tons/day plants now on the drawing board
It therefore becomes of considerable interest to review available knowledge onnitrogen fixation by both chemical and biochemical means with the aim of identifyingpossible alternative processes which merit further attention.
ENERGETICS OF NITROGEN FIXATION
Atmospheric nitrogen is normally fixed by ^reduction process in which ammoniais produced according to the following reaction
/
N +3
+ 24 Kcals at 15°C
The reduction of nitrogen by molecular hydrogen is exothermic at room temperatureand the equilibrium favours almost complete ammonia formation. The rate of re-action is, however, extremely slow, as the activation energy of the uncatalysedreaction is greater than 80 Kcals/mole.
In the industrial situation the ammonia synthesis reaction must always becatalysed, and operated at high temperatures, despite the adverse affect oftemperature on the equilibrium as can be seen from the following table :
Calculated Equilibrium Percentages of Ammonia
oTemperature G
0200400500
1000
At 1 Atm.
10015.3
0 .440.130 .004
At 100 Atm.
10080.625.110.4
0.44
The effect of having to use a high temperature is partially offset by using highpressure, typically from 200 to 1000 atmospheres. Even under these severeconditions practical reaction rates are critically dependent on effective catalysts.
In contrast, the fixation of nitrogen in microorganisms occurs at atmospherictemperature and pressure, with the aid of relatively mild reducing agents. Thissuggests the existence within such microorganisms of a highly efficient enzymiccatalyst. The nature of this enzyme is as yet not completely clear .
INDUSTRIAL NITROGEN FIXATION PROCESSES9
Meldrum has recently reviewed the history of processes developed for theindustrial fixation of nitrogen. The first successful process, the electric arcprocess was commercialised by Birkeland and Eyde in 1904 and led to the productionof calcium nitrate. Then followed a process in which calcium cyanamide wasproduced by contacting calcium carbide with nitrogen at high temperature. Both ofthese processes have now fallen into disuse.
- 161* -
Modern processes rely on the direct synthesis of ammonia by contact ofrelatively pure nitrogen and hydrogen in the presence of a catalyst at elevatedtemperature and pressure. The key to the successful application of directsynthesis lies in the economic production of hydrogen. During the 1950's thiswas derived from coke by the water gas shift reaction, but it is now manufacturedeither from natural gas or petroleum naphtha.
A comparison of the energy requirements of the various industrial fixationprocesses is given below:
Comparison of Enorgy Costs for Industrial N-Fixatlon Processes
Process Total Energy Cost $/KgNitrogen
Birkeland-EydeCalcium CyanamideCoke Based AmmoniaNatural Gas Based Ammonia
0.190.080.0440.014
Industrially fixed nitrogen is used as a fertiliser either in the form of anhydrousammonia, in which'case it is directly injected beneath the soil, or is furtherprocessed into ammonium nitrate or urea , in which form it can be more readilytransported and applied. The current cost of fertiliser nitrogen in Australia (ureaor ammonium nitrate) approximates $0.1 5-0. 20/Kg .
BIOLOGICAL FIXATION OF NITROGEN
Although it is believed that the bulk of agriculturally useful biological nitrogenfixation can be attributed to relatively few species of microorganisms, there isevidence that many microorganisms do in fact fix nitrogen . These may be sub-divided into free living microorganisms and those living in a symbiotic relationshipwith a host, usually a higher plant, or other microorganism. Of the free livingmicroorganisms both autrophic and heterotrophic species exist.
The agriculturally important microorganisms are the blue-green algae, and thegenera Azotobacter and Rhizobium. The first of these is photosynthetic and isthought to be responsible for the high level of fixed nitrogen in otherwise unfertilisedrice paddies. Azotobacter, on the other hand, is a free living aerobic micro-organism and is responsible for nitrogen fixation in nitrogen deficient soils.Rhizobium in contrast, lives in the root nodules of leguminous plants, and willonly fix nitrogen when in the bacteroid form in the nodule. The nitrogen fixingability of Rhizobium is well appreciated by Australian agriculturalists as the legumesubterranean clover has found wide acceptance as a pasture in southern parts ofthe continent.
The first step in nitrogen fixation by nitrogen fixing microorganisms has beenshown to be the production of ammonia. This is then utilised by the micro-organism to synthesise amino acids and proteins essential for its growth. Themechanism of biological fixation of nitrogen in various microorganisms is still notfully understood. It has been shown that, in Azotobacter for instance, twoproteins make up the nitrogenase (the term given to the nitrogen-fixing enzymesystem). The exact structure of these proteins is not known, but it has beenfound that they contain trace quantities of iron and molybdenum, thus suggestingthe possibility of active centres within the protein molecule on which the molecular
nitrogen to be reduced is adsorbed. Elucidation of the mechanism oi nitrogenfixation in microorganisms is of considerable current interest because of itspossible implications in suggesting alternative catalysts for industrial nitrogenfixation.
FUTURE PROVISION OF FIXED NITROGEN FOR AGRICULTURAL PURPOSES
Whilst it is possible that future requirements of fixed nitrogen for agriculturalpurposes will continue to be derived from processes not too dissimilar from thepresent process, perhaps employing improved catalysts and certainly alternativeraw materials, considerable disquiet is currently being expressed by ecologistsover the long term use of ammonia, ammonium nitrate and urea as the primeagricultural nitrogen supplements.
This concern arise from the ease with which these particular fertilisers areleached from the soil and their subsequent accumulation in water courses. Thenitrogen balance of such water courses is seriously disturbed and the abundanceof inorganic nitrates encourages massive algal growth which is short lived and leadsto an eventual drop in the dissolved oxygen content of the water (eutrophication) .Indeed, Bergersen has suggested that this form of pollution, which is responsiblefor grave ecological damage to U.S.A. inland waterways such as Lake Erie, will beexacerbated in Australia because of the low rainfall, low stream flows and lowerturnover of ground water here present.
There is also a suggestion that the prolonged.use of inorganic fertilisers leadsto irreparable damage to soil, destroying its tilth . This is a result of a dropin soil content of oligosaccharides and the like, which are normally excreted bysoil microorganisms present in virgin soil. Little is however known about the longterm effects of this on soil productivity.
Another factor militating against the use of inorganic fertilisers is their relativeinefficiency. Studies have shown that the amount of nitrogen appearing in theharvested tops of many crops amounts to only one third to one half of the inorganicfixed nitrogen supplied, The remainder of the nitrogen is irreplaceably lost.Unlike other fertilisers, it does not build up in the soil to provide a 'bank1 againstfuture demands.
For all of these reasons it is prudent at this time to examine alternative formsof fixed nitrogen and the processes by which these may be produced. Apart fromthe fixed nitrogen available from the routine planting of legumes, the only sourceof fixed nitrogen for agriculture which offers promise in both ecological andpractical terms would seem to be that arising from the commercial harvesting offree living nitrogen fixing bacteria.
2Attempts , principally in the U.S .S .R. , to promote the activity of free living
nitrogen fixing bacteria in the soil by supplying them with carbohydrate nutrimentshave already been made, but have not.been particularly successful. However, ithas been separately established "" that the growth rate of free living micro-organisms of the genera Azotobacter can be extremely high in favourable environ-ments , especially when the oxygen level in the neighbourhood of the cell is closelycontrolled. These microorganisms would therefore appear to offer a possible routeto producing fixed nitrogen for agricultural purposes. Certainly the factors affect-ing their growth and rate of nitrogen fixation merit further investigation. The presentpaper now explores experimental findings on these microorganism? in considerablymore detail.

- 166 -
- 167 -PREVIOUS STUDIES OF AZOTOBACTER
Azotobacter have been shown to be capable of growth on nitrogen free sub-strates ranging from carbohydrates to methane. Under favourable growth conditionstheir efficiency of nitrogen fixation is h igh, being reported as 30-40 mgm. of nitrogenfixed per gm. of carbon source consumed^ / ^ 2 . Moreover, they are relatively fastgrowing microorganisms with a doubling time of 1.5-2 hours being characteristic^.
11-14Independent investigations have shown that the growth rate and nitrogen
fixation efficiency of Azotobacter are very dependent on the oxygen level in the cellenvironment. At a pO. (i .e. oxygen partial pressure)of less than 0.09 atm. , cellgrowth becomes oxygen dependent, whilst at high pO 's cell growth is inhibited.Under favourable po~ conditions the growth rate of the cell becomes solely dependenton the speed of the biochemical processes occurring within the cell provided thatthe cell is not nitrogen limited. The mechanism whereby oxygen inhibits cell growthis not yet fully understood.
However, there have been several attempts to ascertain the optimal growthconditions for the microorganism^ / I 4 , 1 5 . it is not considered that the results ofthese investigations are especially meaningful because of the lack of care thatprevious investigators have taken in measuring levels of oxygen and nitrogenin the cell environment.
In microbiological circles it has become customary to base oxygen and nitrogenlevels in solution on the composition of the gas phase supplied to the fermentor.When fast growing microorganismsar2being studied such a practice is no longeracceptable as the level of oxygen in solution (expressed as a partial pressure) candrop significantly below that in the gas phase. Although it has recently becomepossible, by reason of the polarogiaphicoxygen electrode, to measure the level ofoxygen in solution directly, this new technique has not yet been applied as fullyas would be desirable to the study of Azotobacter growth rates as a function ofenvironmental oxygen and nitrogen levels.
It was accordingly decided to undertake an experimental programme in whichAzotobacter microorganisms were cultured under both batch and continuousconditions at carefully controlled oxygen and nitrogen levels. From this programmeit was hoped to ascertain the likely maximum nitrogen fixation efficiency of themicroorganisms, and the conditions under which this occurred.
EXPERIMENTAL
The particular microorganism chosenfor study was Azotobacter vinelandii fromthe culture collection of the Department of Agricultural Microbiology at the Universityof Sydney. During the experimental programme master cultures and subcultures ofthis microorganism were maintained on nitrogen free agar slopes and kept in moisturetight containers at 0 C.
The growth medium used was a modified nitrogen free medium based on severalprevious formulations '. Care was taken in its preparation to avoid the formationof a precipitate which would confound optical density measurements.
The experimental fermentor and associated equipment are shown in F ig . l . Thefermentor itself was similar to that described by Baker and used successfully bythe Agricultural Research Council Unit of Nitrogen Fixation at the University ofSussex. The pot volume of the fermentor was one litre, with a working volume ofapproximately 500 mis.
Fig. 1 Experimental Fermentor and Associated Equipment
A. FermentorB. Main Media ReceiverC. Phosphate ReceiverD. Gas CylinderE. Needle ValvesF. Soap Film Meters
G. Peristaltic PumpH. Oxygen RecorderI. Magnetic St irrer DriveJ. Aseptic Overflow ReceiverK. Water Bath for Specific Growth Rate
Tests
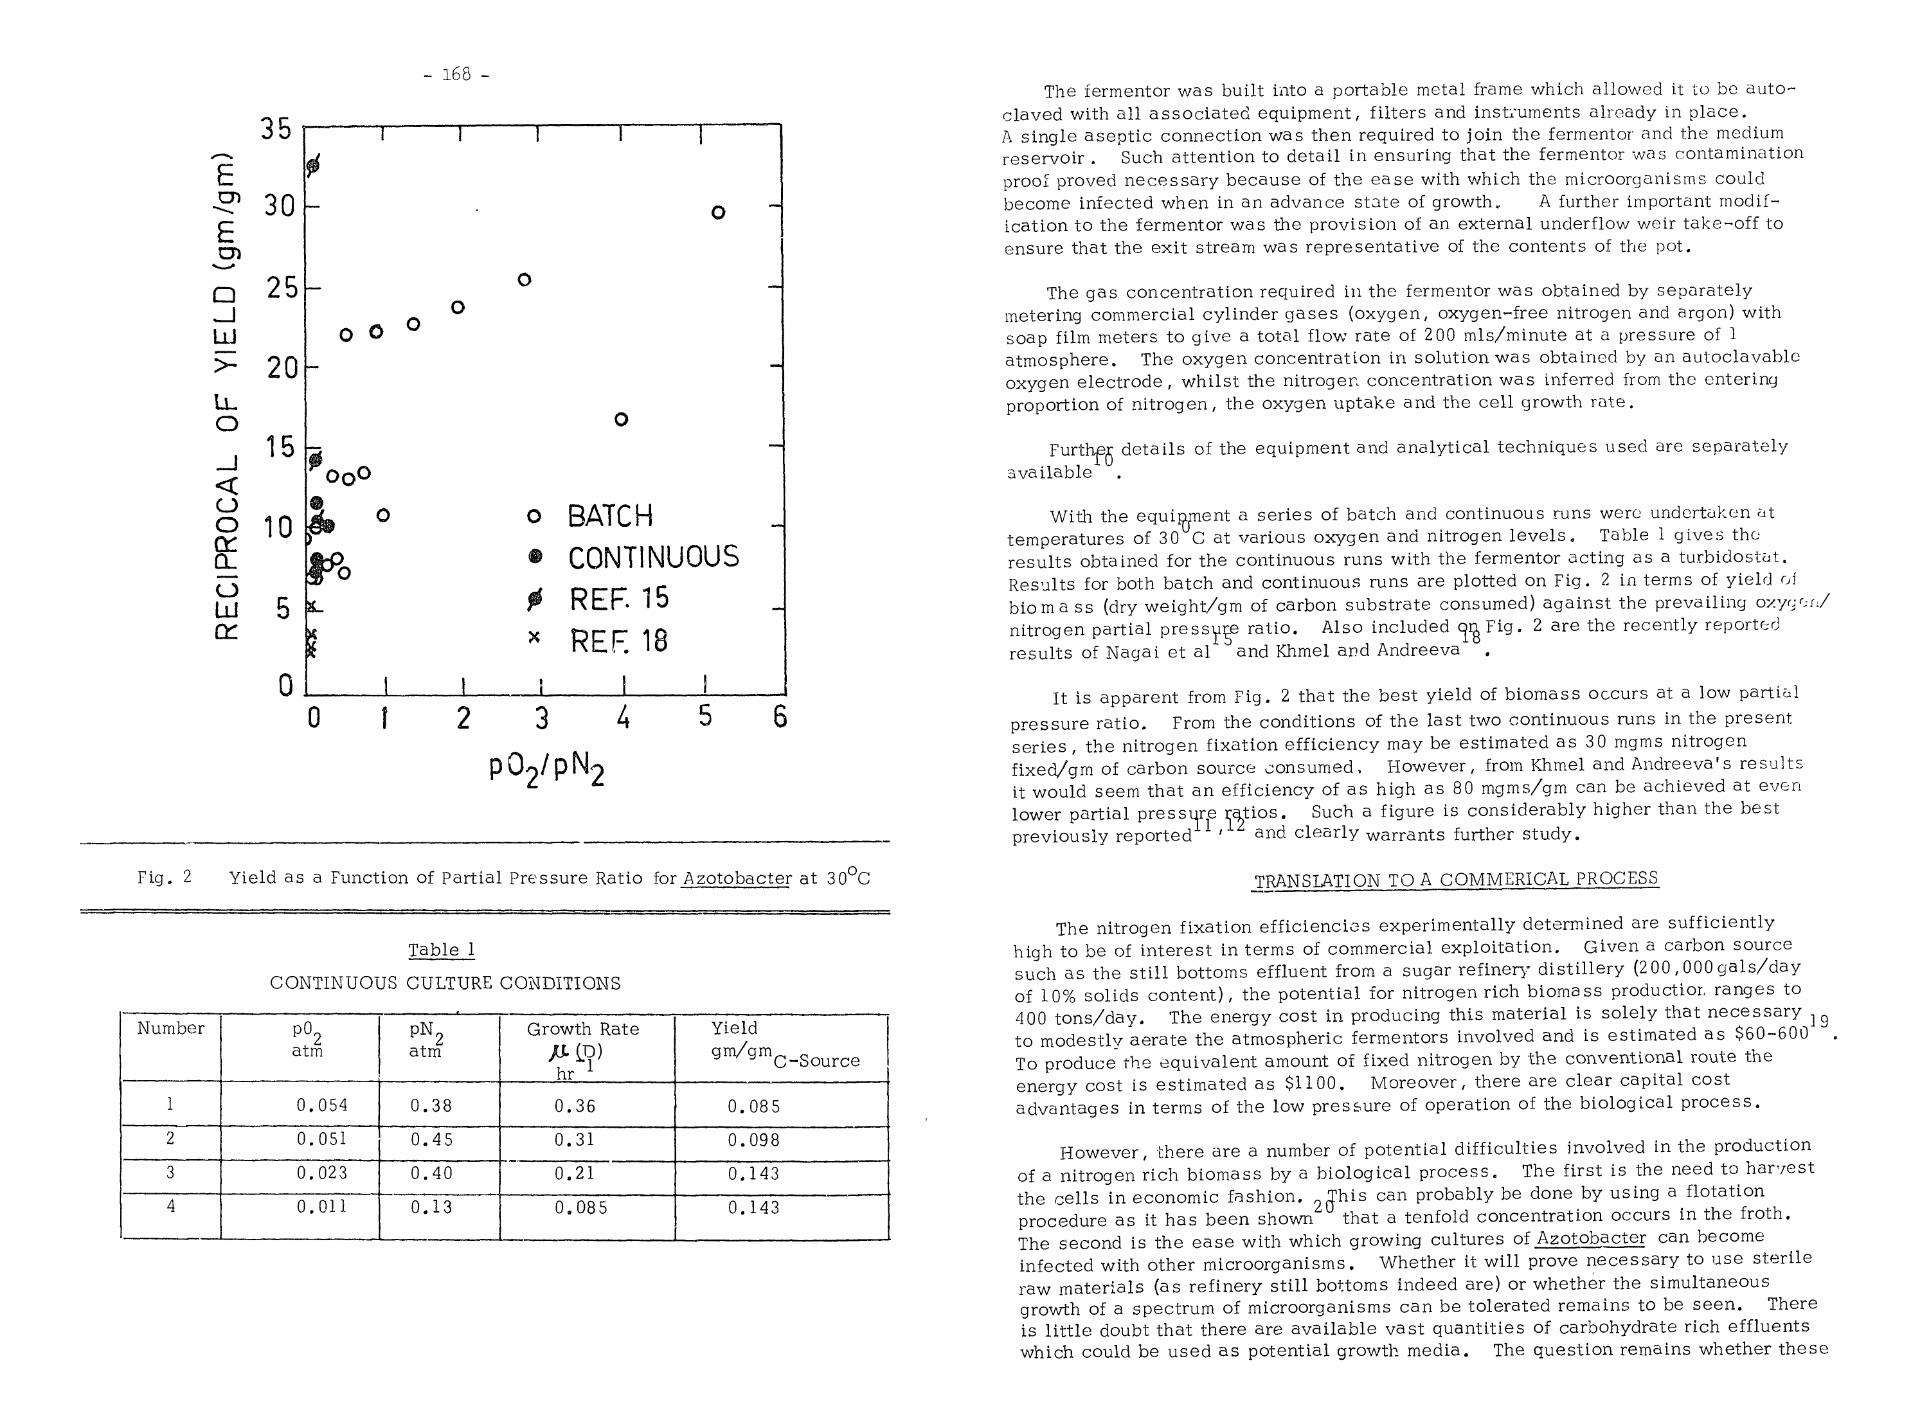
- 168 -
Q_1UJ
LLO
OOora.oLUCE
35
30
25
20
15
10
o o
OQ°
O o BATCH© CONTINUOUS
* REF. 15
* REE 180 I I I 1 1
0 f 2 3 4 5 6
Fig. 2 Yield as a Function of Partial Pressure Ratio for Azotobacter at 30°C
Table 1
CONTINUOUS CULTURE CONDITIONS
Number
1
2
3
4
Po2atm
0.054
0.051
0.023
0.011
PN2
atm
0.38
0.45
0.40
0.13
Growth Rate/HP)hr L
0.36
0.31
0.21
0.085
Yieldgm/gmc_Source
0.085
0.098
0.143
0.143
The fermentor was built into a portable metal frame which allowed it to be auto-claved with all associated equipment, filters and instruments already in place.A single aseptic connection was then required to join the fermentor and the mediumreservoir . Such attention to detail in ensuring that the fermentor was contaminationproof proved necessary because of the ease with which the microorganisms couldbecome infected when in an advance state of growth„ A further important modif-ication to the fermentor was the provision of an external underflow weir take-off toensure that the exit stream was representative of the contents of the pot.
The gas concentration required in the fermentor was obtained by separatelymetering commercial cylinder gases (oxygen, oxygen-free nitrogen and argon) withsoap film meters to give a total flow rate of 200 mis/minute at a pressure of 1atmosphere. The oxygen concentration in solution was obtained by an autoclavableoxygen electrode, whilst the nitrogen concentration was inferred from the enteringproportion of nitrogen, the oxygen uptake and the cell growth rate.
Further details of the equipment and analytical techniques used are separatelyavailable
With the equipment a series of batch and continuous runs were undertaken attemperatures of 30 C at various oxygen and nitrogen levels. Table 1 gives theresults obtained for the continuous runs with the fermentor acting as a turbidostut.Results for both batch and continuous runs are plotted on Fig. 2 in terms of yield ofbio ma ss (dry weight/gm of carbon substrate consumed) against the prevailing oxygon/nitrogen partial pressure ratio. Also included ^Fig. 2 are the recently reportedresults of Nagai et al and Khmel and Andreeva .
It is apparent from Fig. 2 that the best yield of biomass occurs at a low partialpressure ratio. From the conditions of the last two continuous runs in the present.series, the nitrogen fixation efficiency may be estimated as 30 mgms nitrogenfixed/gm of carbon source consumed, However, from Khmel and Andreeva's resultsit would seem that an efficiency of as high as 80 mgms/gm can be achieved at evenlower partial pressure ratios. Such a figure is considerably higher than the bestpreviously reported ' and clearly warrants further study.
TRANSLATION TO A COMMER1CAL PROCESS
The nitrogen fixation efficiencies experimentally determined are sufficientlyhigh to be of interest in terms of commercial exploitation. Given a carbon sourcesuch as the still bottoms effluent from a sugar refinery distillery (200 ,000 gals/dayof 10% solids content), the potential for nitrogen rich biomass productior. ranges to400 tons/day. The energy cost in producing this material is solely that necessary ]g
to modestly aerate the atmospheric fermentors involved and is estimated as $60-600 ,To produce the equivalent amount of fixed nitrogen by the conventional route theenergy cost is estimated as $1100. Moreover, there are clear capital costadvantages in terms of the low pressure of operation of the biological process.
However, there are a number of potential difficulties involved in the productionof a nitrogen rich biomass by a biological process. The first is the need to harvestthe cells in economic fashion. This can probably be done by using a flotationprocedure as it has been shown that a tenfold concentration occurs in the froth.The second is the ease with which growing cultures of Azotobacter can becomeinfected with other microorganisms. Whether it will prove necessary to use sterileraw materials (as refinery still bottoms indeed are) or whether the simultaneousgrowth of a spectrum of microorganisms can be tolerated remains to be seen. Thereis little doubt that there are available vast quantities of carbohydrate rich effluentswhich could be used as potential growth media. The question remains whether these

- 1YU - - 171 -
will have to be sterilised by a technique such as ultra filtration before use.
CONCLUSION
The next millenium may well see the intensive culture of free living micro-organisms on suitable, waste carbohydrates as a method of fixing atmosphericnitrogen. Whilst , for the moment, the economics of the process are uncertainand need further investigation, the yield of nitrogen rich biomass per unit ofcarbon source consumed at the optimum oxygen/nitrogen partial pressure ratio isencouragingly high. Moreover, the biomass product is a rich fertiliser withdistinctly favourable ecological characteristics. It could also find use as a rawmaterial for the growth of single cell protein or as a feedstock for intensive fishfarming. In any event, it would seem highly desirable that further investigationof the biological route to fixed nitrogen take place.
REFERENCES
1. Bergersen, F .J . , Paper presented at Nitrogen Fixation Symposium,Melbourne, 1969 (R .A .C . I . )
2. Henzell, E .F . , ibid.3. Anon, Chemical and Engineering News, June 4 , 1973, p. 114. Ehrlich, P . R . and Ehrlich, A.H. , 'Population, Resources and Environment1,
Freeman, San Francisco, (1972)5. Anon, Chemical and Engineering News , March 26, 1973, p. 116. Finneran, J.A. , Buividas, L.J. and Walen, N. , Hydrocarbon Proc.
April 1972, p. 1277. Chatt, J. , Paper presented at Nitrogen Fixation Symposium, Melbourne,
1969 (R .A .C . I . )8. Anon, Chemical and Engineering News, Sept. 24, 1973, p. 159. Meldrum, F .R. , Paper presented at Nitrogen Fixation Symposium,
Melbourne, 1969 (R .A .C . I . )10. Street, P. W. , Ph.D. Thesis, University of N.S .W. , (1973)11. Dalton, H. and Postgate, J .R. , J. gen. Microbiol., 54, 463 (1969)12. Dalton, H. and Postgate, J.R. , ibid, 5_6, 397 (1969)13. Drozd, J. and Postgate, J .R. , ibid, 6,3_, 63 (1970)14. Parker, C.A. and Scutt, P . B . , Biochim. Biophys. Acta, 3_8_, 230 (1960)15. Nagai , S. , Nishizawa, Y. and Aiba , S. , J. Gen. Microbiol. 59 , (2)
163 (1969)16. Aiba, S. , Nagai, S. and Nishizawa, Y. , I. Ferment. Technol, 45,
452 (1967)17. Baker, K. , Laboratory Practice, 1_7, 817 (1968)18. Khmel, I .A. andAdreeva, N . B . , Proc. 4th Symp. Cont. Cult. Micro.,
Prague, June 196819. Cooney, C.L. and Wang, D . I . C . , inCanale , R . P . (Ed . ) , 'Biological
Waste Treatment', Interscience, London, 197120. Lovelock, H . R . J . , Arch. Mikrobial, 61, (3) , 302 (1968)
National Chemical Engineering Conference 1974
PROCESS INDUSTRIES IN AUSTRALIA
Surfers Paradise,
IMPACT AND GROWTH
Queensland
July 10 to 1 9th
, 1974
The Chemical Engineering Literature - Quo Vadis?
by
M.H.I. Baird
S U M M A R Y
The author, a former Associate Editor of the CanadianJournal of Chemical Engineering, discusses the chemicalengineering literature under the following headings.
Rapid recent growthReviewing and editorial proceduresFinancial problemsBalancing academic and industrial contentFuture trends
Department of Chemical Engineering,
McMaster University, Hamilton, Ontario, Canada.(presently on sabbatical leave at the University of Queensland).

• 172 -
Scientific men must often experience a feeling not far removed fromalarm, when we contemplate the flood of new knowledge which each yearbrings with it. New societies spring into existence, with their Proceedingsand Transactions, laden with the latest discoveries, and new journalscontinually appear in response to the growing demand for popular science.Every year the additions to the common stock of knowledge become morebulky, if not more valuable; and one is impelled to ask, Where is this toend? Most students of science who desire something more than a generalknowledge, feel that their powers of acquisition and retention are alreadyseverely taxed. It would seem that any considerable addition to the burdenof existing information would make it intolerable.
(Lord Rayleigh, The Academy, _5, 176 (1874)
Like most university scientists and engineers I have contributed to theinformation explosion without being very concerned by it. My lack of concernended in September 1969 when the Editor of the Canadian Journal of ChemicalEngineering, Dr. L.W. Shemilt, asked me to become Assistant Editor. Very soon Ibecame embroiled in the day-to-day process or reviewing and revision, acceptanceand rejection, publication and perishing; the infernal triangle between readers,authors and editors. Since relinquishing the post with the C.J.Ch.E. I have beentrying to see the wood for the trees; but this is difficult for one whose job hasinvolved not only the individual trees, but brushwood, undergrowth and on occasions,dense jungle. In emerging from this jungle I will first view the chemicalengineering literature, then describe the editorial process and then finallyoutline some of the problems and directions for future development.
The main English language chemical engineering journals can be classedin two categories.
"Fundamental Journals"
Chemica] Engineering Science (Pergamon)A.I.Ch.E. Journal (A.I.Ch.E.)Ind. Eng. Chem. Fundamentals (A.C.S.)Ind. Eng. Chem. Process Design & Development (A.C.S.)Canadian Journal of Chemical Engineering (C.S.Ch.E.)Transactions Instn. of Chemical Engineers (I,Chem.E.)Chemical Engineering Journal (Elsevier)
- with these characteristics:
Articles are reviewed externallyContributions mainly from universitiesScientific criteria applied
No advertising carriedPage charges usually necessary
"Applied Journals"
Chemical Engineering (McGraw-Hill)Chemical Engineering Progress (A.I.Ch.E.)Chemical Technology (A.C.S.)Chemical Engineer (I.Chem.E.)Process Technology International (I.P.C.)Chemical and Engineering News (A.C.S.)
- with these characteristics:
Articles reviewed only by ed. staffMany industrial contributionsQualitative and Descriptive
- ITS -
Actual plant experience"News Items" encouragedLargely financed by advertising
often paid to authors
The existence of such a well-defined classification is an unfortunate butperhaps inevitable development in our profession. Back in the forties and earlyfifties, chemical engineers in universities and industry spoke more or less thesame language. Teachers in the universities used the "unit operations" ortechnology-oriented approach which was very much the same as that usedindustrially. If you read "Chemical Engineering Progress" or "Industrial andEngineering Chemistry" of the iate forties you will find a wide spectrum ofmaterial, ranging from news releases about new plants to quite basic articles onfluidisation, multistage contactors and the like.
In about the mid-nine teen fifties, engineering scientists began to make theirpresence felt. It was increasingly realised that the complex underlying processesin chemical engineering required a scientific approach by engineers, using thecomputer and sophisticated mathematical methods, and resulting hopefully in ageneral description of a process for a wide variety of conditions. Above all,"scale-up" would ideally be possible without resort to expensive pilot-plantexperiments, as had indeed been shown in the development of uranium extractionprocesses. Another critical factor in the growth of engineering science wasthe successful Russian space program of the late nineteen fifties. This led theAmericans to encourage the expansion of their engineering schools to provide thescience-oriented specialists that would be needed for rocketry, space technologyand related activities. Concurrently, governments in western countries initiateda large total expansion of the universities. This was supposedly done in thename of social progress (vide the Robbins report in the U.K.) but hindsightsuggests that an economic and political factor was being considered. The very highbirth rates of the late nineteen forties had generated a population "bulge" andgovernments hoped that by increasing the holdup in the universities in the 1960s ,large-scale unemployment of the younger generation could be avoided.
The effect of these several factors on chemical engineering was to bring abouta very substantial growth in university activity and particularly in graduateschools. The additional university staff who were hired were young, often freshPh.D.'s with no industrial experience at all, and with a strong engineeringscience orientation. In Canada for example, the number of chemical engineeringstaff more than doubled, from 80 to O, in the five years from 1963 to 1968.
Figure 1 shows this growth and also the growth in the annual number ofpapers received by C.J.Ch.E, Coincidentally, there is almost a 1 to 1correspondence! During the period from 1963 to 1968 the compound growth rate was17% per annum 3 but this has dropped off in recent years. The sharp drop in papersreceived in 1972 is probably an aberration and I would say that the trend istowards a levelling off at about 200 papers per year.
The growth of engineering science research at the universities hasresulted in the separation between fundamental and applied journals that Ireferred to above. Journals such as Chemical Engineering Science, I. & E.G.Fundamentals and the Chemical Engineering Journal were created in response to therising tide of science-oriented papers. The A.I.Ch.E. built up the A.I.Ch.E.Journal as its journal for fundamental papers, while developing ChemicalEngineering Progress as its outlet to a more general readership concerned withindustrial news and professional affairs. The Canadian Journal of ChemicalEngineering which was started in 1957 as a small "mixed" (applied + fundamental)journal has evolved into a largel}* fundamental journal with -world-widecontributions and readership.

- Ilk -ORIGIN OF CONTRIBUTIONS 7la
by country: CanadaU.S.A.Rest of EuropeU.K.Other Countries
UniversitiesGovernmentIndustry
50285512
9055
by institution:
The C.J.Ch.E. statistics on origins of papers received are fairly typicalin that the great majority of papers come from universities. Only about 50% ofthe input is from Canada; the remainder comes from diverse sources. Sometimesthey are written in diverse English!
SUBJECT MATTER %
Fluid Mechanics 21Control, App. Math.^ Sim. etc. 18Thermodynamics 15Reaction Kinetics 15Heat Transfer 12Mass Transfer 8Processes 6Operations 5
The subject matter seems at first glance to be satisfactorily distributed;but the editors and many readers have been concerned about the small numbers ofindustrially oriented contributions received, e.g. on process studies.
The editorial procedure is very similar to those used by the otherfundamental journals. The percentages of acceptance and rejection are alsoquite similar .
REVISIONBY AUTHOR
PAPERS [SUBMITTED > —TO EDITORJ
2 OR 3--» REVIEWERS
EDITOR+ FURTHERREVIEW
65%
5%w
EDITOR ACCEPTED
REJECTED
An important first step in the editorial process is the selection of reviewers,Policies differ in this respect. Some journals use a quite small panel ofperhaps 30-40 reviewers who are known and trusted by the editors. However, theload per reviewer can be excessive. I remember sending a heat transfer paper toa professor in the U.S., only to have it sent back unreviewed with an apologetic
- 175 -
note. He had just returned from a month's absence and found nine papersawaiting his review!
At the C.J.Ch.E., the editors range widely in the quest for informedreviews, with the aid of various classified research directories. In a typicalyear 350 potential reviewers, many of whom are unknown personally to the editors,may be approached. If a returned review appears to be superficial, an alternatereviewer is often sought.
It is interesting to note that superficial and scrappy reviews are oftenreceived from some of the most eminent and prolific researchers. One also learnsnot to send a paper for review to Deans or Department Heads between the months ofSeptember and May, with a few honorable exceptions! Some of the most thoroughand constructive reviews have come from people at the lower and middle levels, whohave been working quietly and productively on their research without thedistractions of prolific and fragmentary publication, attendance at remote overseasconferences, etc. Industrial sources often provide good reviews, but it is hardto locate industrial reviewers because the published research directories arenearly all confined to the universities.
After the completed reviews are returned to the editors, a decision has tobe made. Most commonly, this is to send the paper back to the author for revisionon some of these grounds:
Minor ClarificationsSyntax, typographical effors, shorteningInadequate literature surveyUnjustified claims or assumptionsReworking of theory or results etc.
Sometimes, the paper is beyond any possible revision and a polite, but firmletter of rejection must be written to the author. Some of the commonest groundsfor rejection are given below:
Inappropriate subjectUnoriginal (published elsewhere)Meaningless experimentsInapplicable theoriesCompletely incomprehensible etc.
It is rather unusual for a paper to be accepted outright; both of thereviews received have to be almost completely favourable, barring the oddtypographical or syntax error. More usually, acceptance is granted after theauthor has satisfactorily carried out the revisions requested; the author mayalternatively send in a rebuttal of those of the reviewers' comments that hedisagrees with, and the editor may accept the rebuttal. Sometimes this decisioncalls for consultation of yet another reviewer, so the process can become quitedrawn out. The main criteria for acceptability are:
OriginalityClarityAttention to previous literatureMeaningful observationsCorrect theoryScope or applicability
The average intervals between the submission and publication of papers inthe C.J.Ch.E. are given in Figure 2. The shaded area represents the time for theprocess of reviewing, revision, editorial consideration, etc,, up to the date ofacceptance. Thereafter the manuscript is sent to the publication departmentat the Head Office of the C.S.Ch.E., where it is marked up for the typesetters.In the last few months, it has been possible to reduce the average overall delayto about 8 months, but it is hard to envisage any significant further reduction

without some sacrifice in the thoroughness of the editorial process.
A large component of the publication delay can be related to the financialoperation of a journal. It works like this. The income of a journal consistspartly of subscriptions, partly of grants (either from government or from aprofessional society) and sometimes of "page charges" which are requested fromauthors. These charges are usually between $25.00 and $50.00. per printed page,so for a typical paper the charge might be $250.00= All the journals allow pagecharges to be "waived" if good reasons are given for inability to pay, forinstance lack of grant support or problems with foreign currency conversion.
Publisher
pagecharge?4j
Government••
grant?
COSTS
subscription
Readers
cash flow
information
The total estimated income of a journal is budgeted at the start of eachyear, and costs (mainly printing) must match income. Unfortunately it mayhappen that more papers are accepted than can be economically printed in agiven year. This leads to a "backlog" of papers awaiting publication and ifthe situation is not watched carefully it can become acute. Several years agothe A. I .Ch .E . Journal had a two-year delay between the acceptance and publicationof a paper. Since then their position has improved greatly^ and they have now eveaannounced the abolition of page charges. However, for most of the fundamentaljournals including the C . J . C h . E . , page charges remain as a necessary evil.
A learned journal differs from a commerciall" operated magazine ornewspaper. In a commercial publication, the editors are told how many column-inches can be economically printed in an issue; they then simply select enoughof the available material to fill that space. In a learned journal, acceptancefor publication has nothing to do with how much space is available; ideally thepage space should be made available according to how many papers are found tomerit publication. In the short term, it has been a constant struggle toequilibrate the demand by authors for publication space with the ever-risingcosts of printing and production of a journal. In the long term, spacehas increased to meet author demand, with the cost being met by increasedsubscription rates, page charges and government assistance.
The increases in subscription rates have caused a gradual drop inindividual reader subscriptions. More and more the individual reader relieson a library for journals, with photocopies being made of articles he wishesto study in detail. Another reason for the drop in individual subscriptions,is that one or two journals no longer give a chemical engineer a sufficientbreadth of view. Even the seven major english language journals listedearlier in this paper would not alone be a satisfactory basis for a literaturesurvey. For example, in my own research area of pulsatile flow I have torefer quite often to journals in these areas:
mechanical engineeringacoustics and vibrationbioengineering and medicineaerospace technology
This cross-referring is all very well, until one realizes that the number ofjournals has been doubling every 15 years since about 1750 3. Since Rayleigh
- 177 -complained In 1374 about the proliferation of journals, their number has risenfrom 5,000 to about 500,000.
What then is the answer to Rayleigh's despairing question; where is this to end?Rayleigh himself in a later part of his article suggested that the developmentof science would eventually lead to greater simplicity as the masses ofpublished material began to fit into a pattern. This is a valid, but ratheroptimistic statement. Experience has shown that as fast as basic sciencedevelops, so has the inflow of new data provided us with very large regions ofknowledge where simplicity has yet to penetrate. The situation is furthercomplicated by purely theoretical "material which is mathematically correct butinvolves assumptions which have not been checked against experimental data.The best one can hope for is a dynamic equilibrium. Another point that Rayleighmade in 1874 is the need for critical reviews to cover recent published work.Computerised information retrieval has now largely supi rseded the "grocers list"type of review which was just a classified bibliography, but there is still areal need for critical reviews in which the author does more than just assemblethe references. This type of review is now being actively encouraged by theA.I.Ch.E.Journal, C.J.Ch.E. and notably the Trans.I.Chem.E. with their verysuccessful commissioned review articles.
One of the most persistent problems for the chemical engineering literatureis that of applied versus fundamental content. There is no question that therapid growth of graduate schools in the past fifteen years has generated a floodof papers that has tended to dilute the industrial contributions. Also, theclimate in the chemical industry has changed. Competition has intensified andeven the largest companies can no longer afford the luxury of a fundamentalresearch department which freely publishes its findings. This is very understand-able, but the "fundamental" journals must find ways of keeping industry involvedin their activities. The university sector of the profession is the source ofgraduates for industry and everything must be done to prevent the journals frombecoming sterile compilations of intellectual exercises unrelated to practice.If the industrialists will not publish their research, they can at least be calledupon to review some of the academic papers. Experience on this score has beenfavourable as far as the C.J .Ch.E. is concerned. The other way of involvingindustry is in the writing of critical reviews relating fundamental and applieddevelopments.
oThe overall exponential growth of scientific and technical journals raises
physical problems with which librarians are painfully familiar. The technicalmeans are now available for compact storage of information (microfilm, microfiche,computer memories, etc.) but very few journals offer themselves in a format otherthan the printed volume. The economics of new technology, the reader problemswith it (e.g. microfilm machines that break down) and above all the immenseconvenience to the reader of a printed volume on a shelf, suggest that innovationwill be slow in coming.
However, we need not be afraid that we or our descendants will be engulfedin a flood of publications. To extrapolate past rates of expansion to the year2050 gives us 16 million scientific journals'. The truth of the matter is thatany biological system can grow exponentially only if conditions are favourable.A point is reached where the system runs out of nutrients or begins to bepoisoned by its waste products, and then the growth curve levels off or declines.This is illustrated on a small scale in Figure 1: in the period 1963-68 academicchemical engineering research in Canada appeared to grow at the astoundingcompound rate of 17%. In more recent years, the government support to Canadianuniversities has grown only slowly and the rate of submission of papers haslevelled off correspondingly.
To summarise, I think that the chemical engineering literature can lookforward to a period of relatively slow growth with perhaps more emphasis on processtechnology and less on fundamental phenomena studied in isolation. Governmentsupport for research is certainly moving strongly away from the "engineeringscience" approach as an end in itself. There are encouraging signs that criticalreview articles will increasingly play a part in quelling the effects of thepast "information explosion" and in bringing out the useful and significant

fD bdn c
rt>HJ t-(LO -
X-N 3t-^f • I
03 O
O 3
H-O3
H-O
033
rt
fD
MOQ
O
3OfD
X
OcnH-O
fD H •C fD O
O •M$ pro 3 ^•"4 O fDFT" M H-- O Cu
OQ •*
3 03 fDO^ 3fD Cfi ?>M[ H"l 1""
fD O
• 1-4O C^
O 3 O3" OQ CfD 3* K3 3* *~3 03
C M
OQ H-
TJ rti-i H-O O
OQ 3
03•dfD
- i-i
i o^ enUl fD
CO fD
3 03M C rtO 03U1 h-1 CO
~*1H-1 fD T3MD fD O• i rt cnLO H- H-
OQ iO O
>
M•
O
M
fD XO 3fD 133 Ocr4 cnrt) H->-i 03
I— ' (-1
O 03• 3a,
O3
03rt-
C OJrt )-<H- CXO3 >cn 3
3CT1 CX 03
I"C3a.toO 33 OQ
fDfDrtH-
1-4fD >W •
if -M03 Ort nrfD •
op4 oe 3-i-4 H-O O•? 03H- OQh-1 O
fDftO
25ow
fD WO T303 fDCL nfD rtcn enA
OHi
ft3*fD
fD3O
OC
oCrt13Crt
rtrrfD
fD3
0Q
3fDrot-4H-3
OQ
cnoH-fD3rtH-WrtCO
H-3
fD
1303Wrt
rt«!O
CD
DELAY , MONTHSNUMBER
ro CD
;omrv>
m
m13cCDCo
o
omr~
O2
CDCD
CD~JO
CD
-< 77.
E M
CD
CD m2
-n
dm1— *
"Dlt>
CO
moo;oo
m
rsXi
r5
H
n
£>
coenOJ
en4*
enen
_s O)^^C^ ^^
m <*>^») en
en00
enCO
-j0
^
ro
1
1 "•"
—
—
X— it
2c
_ SCDm
o~T\
-D
~~ o~nmCOCOO3DCO
O
1i>o
— — r\i roen o on o 01O O o o oi 1 1 1 I 1 1 1 1 1 1 1 1 1I 1 1 1 1
> X ©
> © x
> © X
D> ©*^
ii it > @x13 -DS> ^-o -o .rn m > x ©$ s> 3J > @ X
8 S-o < > © xH mrn o0 > > ® x
^^3> 2!
;s > £> >^C C3> r~
5» > •p
•* « ^
o
m
h1

- 180 -- 181 -
INTRODUCTION
National Chemical Engineering Conference 1974
PROCESS INDUSTRIES IN AUSTRALIA - IMPACT AND GROWTH
Surfers Paradise, Queensland
July 10 to 12th, 1974
PROSPECTS AND PROBLEMS IN MINERAL PROCESSING - A PERSONAL VIEW
by
A. J, LYNCH
S U M M A R Y
The dominant feature of mineral processing in 200.1 will be thesize of the plants3 capacities of the order of 250000 tonnes per daynot being unusal. This will be due to increases in metal and mineralconsumptions and3 in many cases3 to decreases in ore grades. It isnot anticipated that there will be a major change in processingtechniques.
Mineral processing problems in 20£1 will be in the areas ofresidue disposal, plant design and operation^ and fine particleconcentration.
LYNCH, A. J., Director, Julius Kruttschnitt Mineral Research Centre,Department of Mining and Metallurgical Engineering,University of Queensland, St. Lucia.
This paper is concerned with mineral processing in the future. Myinterpretation of the purpose of this exercise is to make an attempt
to predict the requirements of the process engineering industriesat that time so that suitable education and research policies can bedeveloped. Mineral processing is discussed in this paper, a mineral beingdefined as "a substance which is obtained by mining"1. Mineral processingis a generic term for a group of operations which include size reductionand separation, physical concentration including flotation, and thickeningand filtration. Pyro~, hydro- and electro-metallurgical processes willnot be discussed although there is no doubt that developments affectingthese processes will be such that serious problems will arise in comingyears.
Some predictions can be made about mineral processing operations inthe future, for instance, the sizes and capacities of processing machineswill continue to increase because the trend is for treatment costs todecrease as machine capacities increase, and the complete automaticcontrol of concentrators by digital computers will become common. In thiscontext the comment was even made recently that "it is inconceivable thatthe development and application of new technology - which is implicitlyassumed in expectations of exponentially expanding demand - could somehowpass the minerals and mineral-using industries by"2. These predictionsmay all coine true but it must be realised that there are problems to besolved and years of effort and large investments of money will be requiredif these are to be solved.
A significant feature of mineral processing which should not beignored in future research planning is that developments in the past havealways been slow, and this has not been due to a lack of ability or ingenuityof engineers or to a shortage of research funds. The only exception tothis as far as I know x as the introduction of hydrocyclones to replacerake classifiers. Thus from concept to final proving and acceptance ofnew processes a period of at least 20 years has been common, for instanceflotation and pelletising^?^ and even developments such as on-streamanalysis and computer control have taken 15 years to reach generalacceptance. The reasons have been that problems have arisen in large-scale application which have taken a lot of time and money to solve. Thereis little reason to suppose that affairs will be different in the future.
The approach taken in this paper is to look at mineral requirementsas they may exist in 2001 and then at the problems which may be created inmeeting these requirements,
PROSPECTS
The approximate tonnages of minerals which were subjected to grindingprocesses throughout the world in 1971 (excluding Russia, China and someother countries from which data were unavailable) were*
Limestone - 1200Phosphate rock - 90Bauxite - 65Taconite - 350Sulphides (for base matal production) - 500
106 tonnesi?I!
ftM
Sources of information include Engineering and Mining Journal, andvarious yearbooks which contain metal and mineral statistics.

- 182 -
It is clear that there will be a major increase in mineral requirementsby 2001 and this may be illustrated with reference to copper. The averageannual growth rate for copper is 4.45%5, and 6.3 * 106 tonnes of copperwere produced from ores in 1971. If this growth rate continues to 2001the requirement for copper at that time will be approximately 24 x 105 tonnes.This growth rate may not be sustained due to substitution of copper byother materials and to other reasons, and some of the requirement may bemet by production from other sources such as recycling of wastes and in-situleaching. However it is probable that ac least 15 x 105 tonnes will berequired from ores which require fine grinding and flotation.
Approximately 300 x 105 tonnes of copper ore were processed in1971. If it is assumed that the average grade of ore to be processed in2001 xtfill be half the average grade in 1971 the tonnes processed in 2001will be at least 1500 x 106, or 5 times the present tonnage. There arenow several plants in various areas of the world with capacities inthe range of 50 - 100 x 1Q3 tonnes per day and by the year 2001 it canbe expected that plants with capacities exceeding 250 x 1Q3 tonnes per daywill be common. The development and proving of an entirely new methodof extracting metal from ore may alter this picture but this is unlikely,particularly in the short span of 27 years.
This argument concerning plant capacities may be applied to otherminerals and the picture may change marginally, for instance the growthrate for iron and steel has been quoted as 6% and aluminium as 8%6 so thatthe rates of increase of consumption of these metals are higher than forcopper. However the required increases in plant capacities due to thisreason would be offset by the fact that the ore grades may not declineso rapidly.
The conclusions are that there will be a large increase in metaland mineral requirements by 2001 and that there will be a consequent largeincrease in the tonnages of ores to be processed . Some of the problemswhich will result from this increase are discussed in the next section.
The position I take in defining these problems is that there will beno significant change in the comminution and concentration processes whichare now in use. While I am aware of developments in comminution processes,such as centrifugal milling and the Snyder process, I think that tumblingmills such as ball and autogenous mills will remain the main type ofmachine used for grinding for many decades yet. In the case of concentrationthere is no physical process which even offers a hope of replacing flotation,while gravity, magnetic and electro-static concentration processes willstill be used where appropriate. Leaching, either in-situ or of finelyground ores, is applicable in limited areas only, and no other methods ofin-situ extraction on a large scale can even be envisaged.
PROBLEMS
Three problems which I expect to result from this increase inrequirements for ores and minerals are in the fields of 1. disposalof process residues and wastes, 2. circuit design and operation, and3. fine particle concentration. These will be discussed below.
Disposal of Process Residues and Wastes
Plants with capacities of the order of 20 x J.03 tonnes per day arenow common and there are several plants with capacities of the order of80 - 100 x IQ3 tonnes per day. By 2001 plants which are now regarded as
large will be common and. there will be many plants with capacities ofthe order of 250 x 103 tonnes per day. In the case of plants processingcopper ores over 98 percent of the feed will emerge as residues in pulpscontaining 50 - 70 percent solids by weight and the liquour containingsignificant concentrations of flotation chemicals and salts. Disposalof either the solid residue or the liquor in streams, surface or sub-terranean, lakes or oceans will not be tolerated and in only a fextf caseswill the natural terrain be such that the residue can be stored in valleyswithout creating undue hazards. The alternatives are 1. to createresidue dams which will be in harmony with their surroundings and not havean adverse effect on adjacent flora or fauna, and on which suitablevegetation can be grown, or 2. to develop mining and processing techniqueswhich allow the tailings to be stored ii the mined areas.
The magnitude of the problem of building residue dams may beillustrated by reference to the new dam of the Magma Copper Company atSan Manuel, Arizona . The area of this dam is 2,0 square miles and witha concentrator capacity of 65,000 tonnes per day it will have a lifeof 26 years, reaching a maximum height of 260 ft. Residue dams for plantswith capacities of 250 x 103 tonnes per day will have areas of 8 - 10 squaremiles at the same ultimate height and, where the ore comes from open pits,additional storage area will be required for rock piles for overburdendisposal. Unless holes in the ground and mountains of waste tailings canbe turned into environmental assets by ingenuity, research and carefulplanning, little imagination is required to anticipate, the various problemswhich will arise.
The alternative of storing the tailing in the mined areas, as isalready done to a degree in the cut and fill .method of mining and toa lesser extent in all hydraulic filling operations, is admirable inconcept but difficult in practice. It would probably require thedevelopment of a new system for ore extraction so that the extraction-concentration-tailings storage cycle could proceed on a continuous basisand it would almost certainly require development of a method for tailingsprocessing so that storage could proceed without interference with mining.The problems to be solved in making this alternative work are formidablebut the problems which will be encountered if this alternative is notavailable seem to be even worse.
Circuit Design and Operation
The operating cost and metallurgical efficiency of a circuit dependson the design of the circuit and on the efficiency of the on-line controlsystem. In the case of a size reduction circuit decisions must be madeat the design stage about the proportions of the total required energywhich are to be consumed in the crushing and grinding circuits and aboutthe types, numbers and sizes of <_he comminution machines. Considerationmust also be given to the use of autogenous and pebble mills. Thesedecisions affect the capital cost, the direct operating cost and themetallurgical efficiency and incorrect decisions at the design stagehave an effect which is very expensive to correct or which, if uncorrected,will persist for the life of the plant.
Design procedures at present used are empirical and the use ofaccurate mathematical simulation techniques during design work would beof great benefit. "While major advances have been made in the applicationof simulation techniques to crushing, grinding and flotation processes"these techniques cannot yet be used for scale-up work because experimentaldata suitable for verifying the models so that they can.be used withconfidence have not yet been obtained. Ther°. are strong trends towardsthe use of larger rod arid ball mills and towards the introduction ofautogenous mills, but without information being available on such basicmatters as the effect of mill diameter and speed on the breakage of

- 181* _
particles of different sizes and compositions. This has already causeddifficulties in some plants and it is important that better designprocedures based on simulation techniques are developed. The problemis not in the area of model development, it is in the area of datacollection and much time, effort and expense will be required to collectand analyze data suitable for the extention of scale-up parameters foruse in design by simulation.
The development and testing of on-line control systems for crushing,grinding and flotation circuits is proceeding at a good rate^-H and noproblems are foreseen in this area by 2001. However these techniquesare complex and if they are to become standard operating techniques theduties of the operations engineers will change, and education and trainingmust change accordingly. On present indications I am not at all confidentthat there will be an adequate supply of suitably trained engineers in2001. This is a problem which can be solved readily by resolute actionbut it is also a problem which can drift on and remain unsolved in 25years unless resolute action is taken.
Fine Particle Concentration
Fine particles are already a problem in the following areas
1. in the selective flotati >n of sulphides because thefine particles (less than approximately 15 microns)which are inevitably produced in the grinding circuitfloat slowly irrespective of the nature of their surfaces.This results in a substantial loss of recovery even whenvery fine grinding is not required and extreme difficultyin obtaining a selective flotation process and satisfactoryrecovery when very fine grinding is required,
2. the concentration of coal, phosphates and some othernon-sulphides in which it is very difficult to recoverthe fine particles in a concentrated form. Consequentlyin many cases they are rejected without any serious attemptat recovery and this represents a substantial loss.
The problem of fine particles will increase as the coarser-grained depositswhich are readily amenable to processing are worked out and minerals mustbe extracted from the fine grained deposits which require ultra-finegrinding, and as the necessity to obtain maximum recovery of mineralsfrom deposits becomes greater.
Some attempts have been made, with partial success, to concentratefine particles. For instance Renison Limited has had some success inconcentrating very fine cassiterite particles by gravity methods and someflotation plants operate on very fine sulphide particles. However eventhe best of these processes cannot be regarded as efficient and it isclear that a substantial research effort on fine particle concentrationis required.
The problem of the treatment of fine particles is not new, this sameproblem occurred at Broken Hill and elsewhere in the early years of the20th century. At that time particles below about 100 microns wereregarded as the problem particles. Flotation was developed and this isvery efficient for sulphide particles in the range 15 - 150 microns butless efficient on the very fine particles. If a substantial researcheffort is not developed soon on the concentration of particles below 10
185 -
microns history may repeat itself and we may have the same problem atthe start of the 21st century that we had 100 years previously.
Comments
There is one other problem which I should mention which spans theentire mining-mineral processing field. This is the general problemof size reduction which starts with the extraction of ore from the ore-body by explosives and continues through crushing to fine grinding. Sizereduction achieved at any stage is related to the energy consumed andenergy can be made available for size reduction either as chemical energy,i.e. explosives, or electrical energy, i.e. crushers and tumbling mills.It is customary to assess the efficiency of size reduction achieved byexplosives in terms of mining requirements and of size reduction achievedby electrical energy in terms of milling requirements. The result isthat an extensive study has been made of the size reduction particles ofabout 6 inches in size and smaller for which electrical energy is used,but little data are available on the size reduction of larger masseswhich are broken by explosives. Since breakage is an integral part ofalmost all mineral exploitation systems, either in use or envisaged, andit is a high consumer of energy, it seems to me that detailed studies ofall major breakage processes in terms of total size reduction achievedshould be undertaken so that data for the optimum design of complete systemswith respect to whatever limitations may be imposed should be available.
REFERENCES
1. The Concise Oxford Dictionary of Current English,edition
p. 755 , 4th
2. Commonwealth of Australia. Department of Treasury. Economic PaperNo. 2, "Economic Growth : Is It Worth Having?" Chapter 4. Part 4.
3. Blainey, G. The Rise of Broken Hill, p. 68-77. Macmillan ofAustralia (1968).
4. Davis, E. W. Processing with Taconite, Minnesota Historical Society(1960).
5. Foots, J. W, Mineral Exploration. Address to the Southern QueenslandBranch of the Australasian Institute of Mining and Metallurgy.Sept. 12, 1973.
6. Fisher, Sir George. Metals and Minerals. The Hope of the Future.Address to ANZAAS Conference. Sydney, August, 1972.
7. McGregor, D and Dopson,D. W. How Magma Copper builds tailingsdams at San Manuel. World Mining, pp. 70-73. Vol. 26. No. 3. 1973,
8. Whiten, W. J. Simulation and Model Bui'ld'lng for Mineral Processing.Ph.D. Thesis. University of Queensland (unpublished) (1972).
9. Fewings, J. H. and Whiten, W. J. Crushing Control Systems DevelopmentMount Isa Mines Limited. IFAC Symposium on Automatic Control inMining, Mineral and Metal Processing, pp. 119-124. (1973).
10. Lynch, A. J. Digital Control of Wet Grinding Circuits. A.I.M.E.(Minnesota Section) 45th Annual Meeting. Duluth pp. 58-63 (1972),
186 -
11. Amsden, M.P., Chapman, C. and Reading, M.G. Computer Control ofFlotation at the Ecstall Concentrator. Paper 27. Symposium onApplication of Computer Techniques in the Mineral Industry.Johannesburg. (1972),
- 18? -
National Chemical Engineering Conference 1974
PROCESS INDUSTRIES IN AUSTRALIA - IMPACT AND GROWTH
Surfers Paradise, Queensland
July 10 to 12th, 1974
IMPROVED PROCESS PERFORMANCE VIA ADVANCED COMPUTER CONTROL TECHNIQUES
by
D. Grant Fisher, Dale E. Seborg and Robert B. Newell
SUMMARY
This paper discusses several modern control techniques that have beenapplied to computer controlled pilot plant units at the University ofAlberta and reviews their advantages and disadvantages from the point ofview of an industrial user. Particular emphasis is placed on:
- Modelling Process Systems- Multivariable Feedback Control- Optimal Servo Control- Optimal Filtering and Estimation- Model Reference Adaptive Control- Computer Controlled Startups and Monitoring
Typical sets of data taken from a computer controlled pilot plantevaporator show that techniques such as these can produce significantlybetter results than conventional methods and have tremendous potential forindustrial applications. The objective was not an all encompassing reviewof available techniques but rather a review and discussion of the resultsthat have been obtained in specific projects at the University of Alberta.Additional data, background theory, and a fuller di-cussion of theseprojects are given in the references listed in this paper.
Fisher and Seborg, Department of Chemical Engineering, University ofAlberta, Edmonton, Alberta, Canada T6G 2G6
Newell, Department of Chemical Engineering, Monash University,Wellington Road, Clayton 3168, Victoria, Australia.

Modelling Multi-variable Systems
People in industry frequently dismiss modern control techniques becausethey feel that suitable mathematical models of the process are not available.It is true that a model is needed at some stage in most control system designtechniques. However powerful methods are available for developing suitableprocess models by empirical testing, by theoretical analysis, or by acombination of the two. Some control systems will even learn or adapt tocompensate for changing and/or unknown process parameters. Therefore, thepertinent questions today are "What type of model is required? How compli-cated? How exact?" The general answer is, "The model must be adequate forthe particular application in which it is used." Development of a suitableprocess model should simply be considered as part of the control system designprocedure. In practical applications this could require several iterationsrather than a single definitive step.
A schematic diagram of the pilot-plant evaporator used as the subject ofmost of the investigations reported in this paper is shown in Figure 1. Ithas a complex feed system to permit operation of the equipment in a cyclicfashion or the introduction of load changes and disturbances in the feedconditions. Controlled flows of concentrated triethylene glycol solution, andof water, are temperature-controlled by use of steam heaters, and then mixedin the proportions necessary to produce a feed of the desired flow rate andconcentration. However, this equipment is not included in the model becauseit has a relatively fast dynamic response and does not interact directly withthe state variables of the main evaporator.
The first effect is a short-tube vertical calandria-type unit withnatural circulation. The 9-in. diameter unit has an operating holdup of 2 to4 gal. and its 32 18-in. long 3/4 o.d. stainless steel tubes give about 10 ft2
of heat transfer area. The second effect is a long-tube vertical effect setup for either natural or forced circulation. It has 5 ft2 of heat transfersurface made up of three 6-ft long, 1-in. o.d. tubes. The capacity of itscirculating system is about 3 gal. Further details are available from theauthors.
The evaporator is fully equipped with conventional, industrial typeprocess instruments and uses in-line refractometers to measure the concentra-tion of the glycol solutions. It can be controlled either by conventionalFoxboro electronic controllers or under Direct Digital Control (DDC). Theinterfacing between the evaporator and the computer enables implementation ofcomplex multivariable control schemes using the on-line computing capabilitiesof the digital computer.
Experimental studies on the evaporator have clearly shown that differentmodels are suitable for different applications . For example: a steady statemodel yielded the gains necessary to obtain significant improvement withstatic feedforward control2; simple transfer function models relating specificpairs of input/output variables have proven adequate for dynamic feedforwardcompensation2'3; third-order state-space models have worked as the basis forthe design of multivariable feedforward and feedback systems1*'5; a fifth--orderlinear model appears to be reasonable for most multivariable controltechniques5'6; and a nonlinear dynamic model proved best for off-line simula-tion purposes 5>7 However for some applications such as optimal servo control,parameter estimation (curve fitting) techniques proved necessary to modifysome of the theoretically derived constants in the fifth-order model in orderto obtain better agreement with experimental evaporator data7'8'9 . Inother words, a single model is seldom satisfactory for all stages in thedesign procedure or for use in all parts of the final control system.
- 189 -
The pilot plant evaporator discussed above is obviously simpler than atypical industrial unit. Furthermore the various possible combinations of"forward", "backward" or "parallel" flow of the feed solution and/or theheating medium, when combined with different numbers and/or designs for eacheffect of the evaporator system, mean that most industrial installations willdiffer from one another. The question therefore arises, "Is there a rational,general approach to modelling such systems or must each one be approached onan individual basis?" A generalized approach to the modelling of evaporatorshas been presented by Newell and Fisher . Using the four-step procedureoutlined in reference one to develop a model of the pilot plant evaporator ofFigure 1 led to a system of 10 nonlinear, first-order, ordinary differentialequations. The equations were linearized by considering only perturbationsaround the steady state operating point and put into the standard state-spaceform:
x_(t) = A x_(t) + B ii (t)(1)
£(t) = C x(t)
where: u_, y_ and x_ are the input, output and state vectors respectively.A, B and C are constant-coefficient matrices.
By neglecting factors such as the heat capacity of heat transfer surfaces,the state-space evaporator model can be reduced to lower order x^ithoutsignificant loss in accuracy. The discussion and results that follow arebased on a model with a fifth-order state vector and a sixth-order inputvector made up of three control variables and three disturbance variables (seeNomenclature table).
Earlier investigators using the pilot plant evaporator did not use thegeneral approach outlined above. Their models ranged from first-order tofifth-order, and incorporated such physical assumptions as constant tempera-ture in the second effect. Models obtained by mathematical reduction of thetenth-order model were in good agreement with those derived directly usingsimplifying physical assumptions1'5'9'11'12.
Several methods of reducing the order and complexity of mathematicalmodels, such as that defined by equation (1), have been presented in theliterature. In the modal analysis techniques, as presented by Marshall13 andothers, the "modes" of the mathematical model which decay the fastest, or forother reasons do not contribute significantly to the overall response of thestate variables, are approximated by algebraic relationships and then elimin-ated from the dynamic model. Application of the modal reduction technique tothe tenth-order evaporator model produced a fifth-order model which wasalmost as good as the original tenth-order model in reproducing open-loopresponses. Second, third and fourth-order models were also derived but weresignificantly less accurate1'1/+.
Techniques for process and parameter estimation are frequently requiredto modify the model so it will better approximate the actual performance ofthe process. This is a very broad and complex area that has been reviewed byNieman et al15 and Astrom and Eykhoff16.
Quasi-linearization plus linear programming techniques were used byNieman7'8 to adjust selected parameters of the theoretical nonlinear fifth-order state-space model so it: would be in better agreement with the open-loopresponse data from the evaporator. Figure 2 compares the theoretical modelresponse, the fitted model response and the actual process response for anequivalent disturbance. The change in product concentration here is muchlarger than, occurs in most control studies and therefore tends to over-emphasize the difference between the models. Although there is a significanterror in the response of the theoretical model, it was adequate for most ofthe design methods discussed below.

Our experience with, modelling has been that it is better to err on theside of complexity than to introduce assumptions prematurely or unnecessarily.Derivation of a rigorous model gives the engineer better insight and per-spective and sometimes shows that the sum of certain factors is significanteven though it would appear reasonable to neglect each when they areconsidered individually.
Most control engineers have access to digital computers plus programpackages such as GEMSCOPE17 to assist with the design of control systems andfrequently the final installation involves an on-line, real-time computer.Therefore, although complexity is not desirable for its own sake, it is nolonger reasonable to reject techniques simply because they cannot becalculated by hand or implemented with conventional instruments.
Multivariable Feedback Control
The control objective for the pilot plant evaporator was defined as main-taining the output concentration, C2, at a constant value in spite ofdisturbances in feed conditions. This can be accomplished using conventional,cascaded, single variable control loops as shown in Figure 1: i.e., C2 iscontrolled by manipulating the inlet steam, S; the holdup, W2, is controlledby manipulating the outlet flow, B2, and similarly Wl by Bl. This pairing ofvariables is perhaps "obvious" but can also be derived from various sensi-tivity analyses5'12. Experimental studies showed that reasonable controlcould be obtained with this approach4'5, that feed flow was the most seriousdisturbance, that there were strong interactions between variables (e.g.,Wl ->- Bl -> C2), that simple feedforward compensation would give significantimprovements5'18'15 and that the process was non-linear in nature.
Substitution of direct-digital-control algorithms for the conventionalindustrial controllers'4'5 showed that equivalent performance could be obtainedand emphasized the increased flexibility that DDC provides. It was of coursenecessary to consider additional factors such as sampling time, filterconstants, limits on input or output signals, etc. It is significant,relative to later discussion, that the fifth-order linear evaporator modelwas NOT suitable as a basis for determining values of the controller constantsfor use in the single variable control system shown in Figure 1 (referred toherein as "multi-loop").
The approach taken to develop a multivariable control system was thediscrete version of the "Linear-Quadratic-Gaussian control problem" originallydeveloped by Kalman20'21 and recently the subject of a special issue of theIEEE Transactions on Automatic Control (AC-16, No. 6, 1971). The first step(in the simplest case) is to derive a suitable linear, discrete, state-spacemodel of the process in the form:
x(nT) + A(T) u(nT)(2)
y_(nT) = C x(nT)
The fundamental matrix <j>(T) and the coefficient matrix A(T) can be deriveddirectly from the coefficient matrices in equation (1) and the two models areequivalent at the sampling points if u is constant over the sampling interval.The control objective is then defined as a summed qtaadratic function of thestate and control variables which can be written in simplified form as
N
= L V£f + (3)
-- 191
where: i identifies the time intervale_ is the process error (actual-desired value)
N is a large number (approaching infinity)Q, R are positive semi-definite weighting matrices of constants~ ~ specified by the user
The optimization problem of finding the control, u_, that will minimizethe performance index, J, (as defined by equation (3)) subject to the con-straints implied by equation (2) can be solved using the techniques of dynamicprogramming and results in a feedback control law of the form:
u(nT) = 1C, x(nT)=r r JJ
(4)
where K_ is a matrix of (proportional) control constants. For a given modelthis is essentially a synthesis procedure in which the control engineerspecifies the matrices Q and R in equation (3) and the optimisation proceduregenerates both the form~of the control law and the control constants^.(Unfortunately it is extremely difficult to modify the problem to accommodateconstraints on the state and control variables.) It should be noted that ifK^ is diagonal then equation (4) represents a multi-loop (proportional)control system, i.e., a set of independent, single-variable control loopssuch as used previously on the evaporator.
The procedure has been extended by the authors to includeintegral feedback control, feedforward control18, and provision for modelfollowing during setpoint changes6. The complete control law is given byequation (5) and is illustrated by Figure 5.
u(nT) = x(nT) Kgp (nT) d T ) (5)
The integral feedback action is actually implemented by a partition of
Note that this one method generates the multivariable equivalent ofconventional single variable control techniques. However, more importantly,when applied to the evaporator the multivariable control law proved to bepractical, robust and gave significantly better control than the multi-loopapproach.
Figure 6 shows a direct comparison of the effect of a 20% increase infeed flow rate on the product concentration, C2. It is obvious that multi-variable control is significantly better than conventional methods. Theeconomic advantage of the tighter control would depend on the particularapplication.
Optimal control systems such as those described above require feedbackof the entire state vector and can sometimes result in a controller that ismore complex, or higher order, than is required. As described previously,process models can be reduced in order using techniques such as modalanalysis13'14. The reduced order models can then be used to design lowerorder controllers. However an alternative approach14 is to design the feed--back controller using the best model available and then reduce the order ofthe resulting control law by using techniques such as modal analysis of theclosed-loop system. Experimental results such as those presented in Figure 3show that the best control was obtained using a fifth-order controller (solidline) but that the third-order controller obtained by reducing the tenth-order control law, was better than the controller designed using a third-order model. "Control lav; reduction" thus: represents a new and promisingmethod for simplifying controllers for industrial implementation .

192 -
Optimal Servo Control
Although the multivariable feedback control lavs discussed in theprevious section could handle setpoint changes they were designed primarilyto regulate a process about a set of constant operating conditions. Adifferent approach is advantageous when it is desired to make a grade changeon a production unit or to change the process from one set of operatingconditions to another in an "optimum" manner.
Nieman and Fisher g o have shown that for a discrete, linear, time-invariant system such as that defined by equation (2) and a linear performancecriterion such as minimum-time to implement the change, or minimum sum-of-the-absolute-error between actual and desired values, it is possible to formulatethe optimization problem so that it can be solved by a standard linear pro-gramming package. Furthermore the technique readily accorrmodates constraintson the state and/on? control variables and on the rates of change if desired.Implementation consists simply of outputting the precalculated values of[u_(nT), n = 1,2,3...N] at the appropriate control interval. No on-linecalculations are required and in simple cases the implementation can be donemanually.
However if implemented in an open-loop configuration the technique issensitive to modelling errors and unanticipated disturbances. Real-timecalculation or adjustment of the bang-bang switching times can significantlyreduce the effect of modelling errors or unexpected disturbances. However forpractical, industrial application it is suggested that the optimal, open-loopcontrol policy, u_*, for a specified change be added to the existing feedbackcontrol scheme as illustrated by the dotted boxes in the top part of Figure 7.The calculated optimal trajectory y* is introduced simultaneously into thesetpoint of the feedback controlleFs. If the calculated and actual processresponses are identical then the transient proceeds as in the optimal open-loop case. However if modelling errors, unexpected disturbances, or otherfactors cause the actual outputs, y, to differ from the "optimal" outputs,y*, then the feedback system, although suboptimal, tends to correct for theseerrors10.
The degree of improvement that can be achieved in the response of theevaporator product concentration is illustrated by the data in Figure 8. Thecircles represent the open-loop response of the evaporator to a step changein steam flow. This is the slow way (approx. 2 hr.) to change C2. The dashedcurve shows the C2 response when a step change is introduced into the C2setpoint of a DDC implementation of the multi-loop control scheme illustratedin Figure 1. The solid curve in Figure 8 shows the C2 response when the inputsteam is manipulated in an "optimal", "bang-bang" manner.
In this example the optimal response time of the evaporator is about halfthat obtained using conventional DDC control. Techniques that can producethis degree of improvement in pilot plant applications, justify carefulconsideration by industry.
Model Reference Adaptive Control (MRAC)
Adaptive control techniques are particularly attractive for industrialapplication because the controller parameters are adjusted on-line to compen-sate for uncertainties in the process model and for changing processconditions. The MRAC system shown in Figure 9 has been successfully imple-mented on the evaporator' The closed-loop reference model is chosen so thatmodel output represents the desired process behaviour. (The reference modelshould give physically realizable outputs but does not have to be an accuratemodel of the actual process.) If the process output does not equal the modeloutput then an adaotive control algorithm adilists f.hp. fppdhark rnnfrnl
- 193 -
matrices used on the actual process until the error is eliminated. Theadaptive algorithm22 was developed based on Liapunov stability theory andhence is globally stable. Figure 10 shows the open-loop response of theevaporator to a 20% decrease in feedflow (dash-dot line) plus the "ideal" ordesired response defined by the reference model (solid line). MRAC was usedwith the initial control constants set to zero (le open-loop) and as shown bythe dashed line, quickly brought the process under tight control. Since MRACdoes not require an accurate process model, and because it performed so wellin these pilot plant evaluations, it is an exciting possibility for futureindustrial applications.
Optimal Filtering and Estimation
Two problems common to industrial applications are noise and unmeasuredvariables. Optimal multivariable feedback controllers, in particular, haverelatively high gains, which make them sensitive to measurement noise, andrequire that estimates of all the state variables of the process be available.
If a state-space model of the process is available and if the character-istics of the (random, zero mean) noise are known then it is possible todesign an optimal filter that will minimize the error between the actual andmeasured values of the process variables. A Kalman filter was implemented onthe evaporator2 ~"2^ and at each sampling interval calculated an estimate ofthe state vector, x_, from the equation (6).
x(nT) = x(nT) + K [y_(nT) - Cx(nT)] (6)
where: K is a matrix of constants (calculated offline)
x_ is the value of the state variables calculated from the processmodel using the state estimate and measured inputs from theprevious time interval.
In the ideal case the matrix K is calculated directly from the processmodel and measured noise characteristics. However in applications to thepilot plant evaporator it has been found that the gain matrix K is not sensi-tive to the assumed noise characteristics and that these matrices can betreated as design parameters and adjusted to modify the filter response todifferent process conditions.
Figure 4 shows the measured (solid line), filtered (dashed line) andmodel output values of the product concentration from a simulated evaporatorrun starting with an initial 30% error in C2 and returning to the setpoint.In the ideal case the filtered values (dashed) would coincide with thecalculated values (points).
The filter has been evaluated experimentally in a series of open-loopand closed-loop runs using different process conditions, different disturb-ances and different f ilters23'2'4. In. general terms the conclusions are asfollows:1) The filter is practical, robust, and gives good estimates of the true
values of the process state variables.2) If "tightly tuned" to reject measurement noise it is sensitive to
unmeasured disturbances (i.e., since the calculated states, x_, do not,by definition, show the effect of unmeasured disturbances the filteredvalues x_ calculated from equation (6) do not show the full effect of thesuch disturbances). If the disturbances are measured the performance ofthe filter is excellent.
3) The performance of the filter is relatively insensitive to errors in themodel parameters (specifically, changes of +25% in the holdups in bothevaporator effects produce negligible changes in the filter outputs).
4) The filter can be extended or augmented to provide estimates ofunmeasured states and/or constant biases in the noise signals. (It can

also be extended to provide continuously updated estimates of processparameters that change with time.)
The Kalman optimal multivariable filter, as defined by equation (6), wasfound to be much better in removing noise and introduced less attenuation andphase shift than single-variable exponential filters23.
Control of Discrete Sequences
Most process control applications are concerned with regulating theprocess so that the important variables are maintained at their desired, orsetpoint, values in spite of input disturbances. DDC programs representpackage systems that can be used to control such continuous process applica-tions. Another large class of control problems deals with discrete sequencesof control functions such as occur in grade changes, batch operations,process startups, laboratory procedures, etc. A research project was under-taken to define this problem more quantitatively and to develop a generalizedcomputer program that would be to these discrete sequencing applications,what DDC is to regulatory control applications. The Alberta Discrete ActivityMonitor ^System (ADAMS), which has been developed over the last few years,makes use of network diagram techniques (as used in systems such as CPM andPERT) for offline coordination of the entire project, to define the inter-actions and sequencing of the different activities, and as a basis forscheduling by the on-line executive. Careful consideration is also given tofactors such as operator communication, plant safety, system modularity, theneed to intermix automated and manual operations, plus the need foraccommodating continuing changes.
The ADAMS program has been successfully used to automate the startup ofthe evaporator25 and is recommended for use in applications where a flexible,high-lev el, system program approach is advantageous. After startup theevaporator is normally operated under computer control on a 24 hr/day,unattended, basis. The evaporator is automatically shut down if the computerdetects severe abnormalities in operating conditions. Process "Automation"has also been widely implemented in industry and deserves continuing consider-ation. In many applications it not only replaces manual operations but doesa faster, safer, more efficient and more reliable job. As processes becomemore complex and "experienced operators" more difficult to retain, thejustification for this type of computer control will increase.
CONCLUSIONS
The projects summarized in this paper demonstrate that modern controltechniques, such as optimal multivariable feedback control, servo control andfiltering, produce significantly better results than conventional methodswhen applied to a pilot plant evaporator and should be considered for indus-trial applications.
.-95t— If, 3 1 3 O
30O
O Cnre
3 r-1 00rt o C
o i-1o c/i o.
m -a '< 3fli : yi rt 01
1 Oc3 01
3C3 1-1O. COre 3
c ri nM o 3re 3g rt, in
3 OQ'rt c
O CDO On o
c01rtO
01 n H- •••(3 H. VICL G Oi 3
T3 rrfU 01n H-!-••u nI- O
33 13c c
OJ 3*tr rero re
Cin
3 01 <01 x re>-- 3
ti rr
O" Ofu 3If; 01
300
3 Ort < <la re 01
CLr~: H-3 0*H- 00< "{re 01"I 3cir- O
',' d-t-1 Ocr cto a*rt ro
o -a3 ort n"t 01O rtI-1 O
1-1 m ai it,re o tr H ro
0 T]
O. 03ro c PRODUCT CONCENTRATION, percent
tf 00n ci 1-1re rertID 4>
pr;
r-< CO3 ^.0, 33 C
rr CLrotl CL
fD 01
oo3It
r-t 33-00ro
rtro 3"< ro
rt o
3On>
PRODUCT CONCENTRATION, percentrr Oi C
3 c
rn
3C
o h-. oo
0=CL OI O0 31 itCL -Iro o
rt 33
(0 TO01o
CL eno re H-1-1 h-* a* enCL 01 Ore --x en 3- o o.
3O 00 O
T3 3 inrt CL H'H. 01 ci 33
rea.
ro
O 3 ..3 CL Ift O>-t 01 -t0 CL inh- : a> -a(-* r-t t-{ ore ro 3^ CL 3 yi
com^ O CLCL re re CL01 CL 1- 01
3" ,-N 01^ Ml fjl• o o
PRODUCT CONCENTRATION, percent
t-n
rn
3* r-ti l---- r- 01

o o rex; 3 c:^ rr rer-r ™!-• t O^
3 rcD <
i ~c *z
[I £tf [
I Ok-. r^
rt CID a-
a xc —
•_5 -3D. O
33 If.
PRODUCT CONCENTRATION, percent O 1 (D H-3 O ft) OQft X) CL Cr-l O CT M
3 Oo 3 no. rj o
n3"
n> o
a* h^ rr£> Oi h1-n C n- a. 1-1rr r-r, -d3* H' -Im 3 re
ID 01Tl d- (D
(D a" rrQ, *^ CO
O (D H'T .0 O?! C 3DJ 23i-i n Od. H- r-r
OHi 3 rr3 rJQ. ,- n>rr ^- 33- • C
2S H-O <
*
-oX
OnmenOl
I
n ;*n-n
1[
6x
0a.
PRODUCT CONCENTRATION, percent
C
ro
O-O
O
O
O
O
PRODUCT CONCENTRATION, percent
o
ca>
o
111
5 7
Pi _(D
^ (t)
o —
i 1o 9_
D
5
—_
1 ' I,
1 }\ (
Q X3 \~O Ttrn ^]
rnI — ~7
O FiO m
50 Pim wt/i O-o mO *-ZIS)m
1 _|
' 1
V _
\
\
\
\
\
\
\
\
\*
I
1
in iro 1
i :
00 Oo
3 T)C I
3 nc o
': g
d_ ujcr 3
o
C. HID 3d, Cj
r, &- 'Ua- cr n
c r.•j. c
>- c- n c_? 3 ,
! / • . ( / ;C
n" o ji •_;C 3 rr 3X ftft n 3 O
3" OID n
IDn ui
a,in' uiID oa.
n g~ o
CL
in IDft rr,C/l fD
i—' rr n (DO ID 3^ 3o (D n
197
NOMENCLATURE Dermalsteady-state
14.6 kgProcess variablesState Vector, x, (VI holdup (1st effect)(dimension n) Ci concentration
(1st effect) -',.85%HI enthalpy (1st effect) 335 kJ/kgWl holdup (2nd effect) 15.8 kgC2 concentration
(2nd effect)
Control Vector, u, S steam flowrate(dimension m) Bl bottoms (1st effect)
B2 bottoms (2nd effect)
Load Vector, d,
Output Vector, y,
REFERENCES
F feed flowrateCF feed concentrationHP feed enthalpy
equal to (Wl,W2,C2)~
9.64%
0.86 kg/min1.5 kg/min0.77 kg/min
2.27 kg/min3.2%3.2 kJ/kg
1. NEWELL, R. B. and FISHER, D. G., "Model Development,Reduction and Experimental Evaluation for a DoubleEffect Evaporator", Ind. Eng. Chem. Process Design& Develop., Vol. 11, No. 2, 213-221, (1972).
2. FEHR, M., "Computer Control of an Evaporator", M.Sc.thesis Dept. of Chem. & Pet. Eng., U. of Alberta,(1969).
3. WILSON, A. H., "A Feedforward Control System for aDouble Effect Evaporator", M.Sc. thesis Dept. ofChem. & Pet. Eng., U. of Alberta (1966).
4. JACOBSON, B. A. and FISHER, D. G., "ComputerControl of a Pilot Plant Evaporator", The Chem.Eng. (England), 552-558, Nov. (1973).
5. NEWELL, R. B., "Multivariable Computer Control ofan Evaporator", Ph.D. thesis Dept. of Chem.Eng., U. of Alberta, (1971) (available fromNational Library of Canada).
6. NEWELL, R. B. and FISHER, D. G., "ExperimentalEvaluation of Optimal Multivariable RegulatoryControllers with Model-Following Capabilities",Automatica, Vol. 8, No. 3, 247-262, (1972).
7. NIEMAN, R. E., "Application of Quasilinearization^nd Linear Programming to Control and EstimationProblems", Ph.D. thesis Dept. of Chem. Eng.U. of Alberta, (1971) (available from NationaJLibrary of Canada).
8. NIEMAN, R. E. and FISHER, D. G. "ParameterEstimation Using Quasilinearization and LinearProgramming", Can. J. of Chem. Eng., Vol. 50,No. 6, 802-806 (1972).
9. NIEMAN, R. E. and FISHER, D. G., "ExperimentalEvaluation of Time-Optimal, Open-Loop Control",Trans. Inst. of Chem. Eng., Vol. 51, No. 2,132-140 (1973).
10. NIEMAN, R. E. and FISHER, D. G., "ExperimentalEvaluation of Optimal Multivariable Servo Controlin Conjunction with Conventional RegulatoryControl", Chem. Eng. Communications (1974 in press).
11. ANDRE,. H. and R1TTER, R. A., "Dynamic Response ofa Double Effect Evaporator", Can. J. Chem. Eng.,Vol. 46, 259 (1968).
12. RITTER, R. A. and ANDRE, H., "Evaporator ControlSystem Design", Can. J. Chem. Eng., Vol. 48,No. 6, 696 (1970).
13. MARSHALL, S. A., "An Approximate Method forReducing the Order of a Linear System", Vol. 10,No. 102, 642 (1966).
0.77 kg/min
0.73 kg/rain
2
71°C
Other Variables 01 overhead vapor(1st effect)
02 overhead vapor(2nd effect)
PI pressure (1st effect) 68.9 kN/mP2 pressure (2nd effect) 0.38 m HgTF feed temperature 88°CTl temperature 107°C
(1st effect)T2 temperature
(2nd effect)
Subscripts FB feedbackFF feedforwardI integralm model5P setpointss steady state
14. WILSON, R. G., "Model Reduction and Reduced-OrderControl Law Design", Ph.D. thesis Dept. of Chem.& Pet. Eng., U. of Alberta (1974).
.15. NIEMAN, R. E. , FISHER, D. G. and SEBORG, D. E.,"A Review of Process Identification and ParameterEstimation Techniques", Int. J. of Control, Vol.13, No. 2, 209-264 (197]).
16. ASTROM, K. J. and EYKHOFF, P., "A Survey on SystemIdentification", IFAC Symposium, Prague, Section0, paper 1 (1970) (also Automatica Vol. 7, 123-162 (1971)).
17. FISHER, D. G., WILSON, R. G. and AGOSTINIS, W.,"Description and Applications of a ComputerProgram for Control Systems Design", AutomaticaVol. 8, No. 6, 737-746 (1972).
18. NEWELL, R. B., FISHER, D. G. and SEBORG, D. E.,"Computer Control Using Optimal, MultivariableFeedforward Feedback Algorithms", AIChE Journal,Vol. 18, No. 5, 976-984 (1972).
19. NISENFELD, A. E. and HOYLE, D. L., "DynamicFeedforward Control of Multi-effect Evaporators",Instrumentation Technology, Vol. 17, No. 2, 49(1970).
20. KALMAN, R. E., "A New Approach to Linear Filteringand Prediction Theory", Trans. ASME J. of BasicEng., Vol. 83, 35 (1960). Vol. 83, 95 (1961).
21. KALMAN, R. E. and BUCY, R. S. , ibid. 8_3 (1961).
22. OLIVER, W. K., SEBORG, D. E. and FISHER, D. G.,"Model Reference Adaptive Control Based onLiapunov's Direct Method", Chem. Eng. Comm. (inpress) .
23. HAMILTON, J. C., "An Experimental Investigation ofState Estimation in Multivariable Control Systems",M.Sc. thesis Dept. of Chem. Eng., U. of Alberta,(1972).
24. HAMILTON, J. C., SEBORG, D. E. and FISHER, D. G.,"An Experimental Evaluation of Kalman Filtering",AIChE Journal, Vol. 19, No. 5, 901-909 (1973).
25. HAYWARD, S. W., "Alberta Discrete Activity MonitorSystem (ADAMS)", M.Sc. thesis Dept. of Chem. Eng.,U. of Alberta, (1972).
26. HAYWARD, S. W. and FISHER, D. G., "Alberta DiscreteActivity Monitor Program (ADAMS)", presented at22nd Can. Ch.E. Conference, Toronto, Canada, Sept.
(1972).

- 198 -
National Chemical Engineering Conference
PROCESS INDUSTRIES IN AUSTRALIA - IMPACT AND GROWTH
SURFERS PARADISE, QUEENSLAND
JULY 10 TO 12TH, 1974
COMPUTER CONTROL OF SUGAR PAN CRYSTALLIZERS
R.J. BATTERHAM, J.A. FREW AND P.O. WRIGHT
S U M M A R Y
This paper outlines the progress of a project which aims to apply mathemat-ical modelling and optimal control theory to the examination of methods ofcontrol of sugar vacuum pans. More particularly it deals with laboratoryand industrial trials of different systems of measurements from and controlof pans and then briefly outlines the experience in the application of com-puter control systems to a production raw sugar pan.
Batterham and Frew, CSIRO, Chemical Engng. Dept., Clayton, Vic.
Wright, Sugar Research Institute, Mackay, Q.
_ TOO _*•*—.
GLOSSARY OF TERMS
Brix Refractometer solids content (per cent)
BPR boiling point rise of the massecuite (°C)
C mass of crystals (kg)
CC crystal content, (kg crystal/kg massecuite)
DS dry solids in the mother liquor (fraction)
DSf dry solids in the feed
DT total dissolved solid run into pan at time t(kg)
E evaporation rate (kg/h)
F feed rate (kg/h)
I mass impurities in the pan (kg)
M-fc total mass in the pan (kg)
Mv movement water rate (kg/h)
Pf true purity of the feed (fraction)
S mass dissolved sucrose (kg)
SC solubility coefficient
SS supersaturation coefficient of mother liquor
t, dt time interval
TP time purity (fraction), ratio of S to DS in a syrup
ps (densities of mass, crystal etc.) kg M"3
Q conductivity, mhos
INTRODUCTION
The control of vacuum pans in the raw and refined sugar industry has been ofincreasing interest to technologists in recent years particularly because of theincreased availability of instrumentation and process computers coinciding withthe need to minimise supervisory requirements because of higher manpower cost.As with most other computer control programmes1, economic savings are expected inthe general area of increased throughput, improved quality of the sugar, moreconsistent running of the pan-crystallizer station and a reduced demand onservices, especially of water and steam.
The aim of pan operation is that, given a seed crystal footing and a sugarsyrup supply to produce crystals of a given size in a reasonable time while mini-mising the formation of fine grain through nucleation. For many years this hasbeen carried out rather inefficiently by manual methods. More recently propercontrol of the operating variables has been instituted. The normal control schemenow used in Queensland is shown in Figure 1. This is an analog control schemeusing a vacuum or absolute pressure controller, a steam flow regulator and a feedcontroller operated by some measurement related to the supersaturation. The latteris most often a massecuite electrical conductivity measurement which has a surpris-ingly favourable response to supersaturation changes. A suitable choice of theconductivity set point in such systems cannot, however, be made with any accuracy,and it is recognised that the system, while it gives stable control is of necessitysub optimal in performance. The batch time is not minimised and the supersatura-tion and crystal content in the pan are not independently controlled.

- 200 -201 -
It is obvious that improved throughput can be obtained by improved controland this prompted the authors to carry out a program of work to demonstrate this.The first stage of this vork was to examine fully the behaviour of a mathematicalmodel of the process with a view to establishing the best method of operation ofthe pan.
Optimal Control
The contents of the pan at any stage can be described by the water, impur-ities, dissolved sucrose and crystals present and the temperature. The crystals,because they exist in a range of sizes must be thought of in terms of their sizedistribution which can be expressed in terms of moments having physical signif-icance. Experimental evidence2'3 supports the assumption that during crystalgrowth (i.e. increase in the mean size of the crystals) the size distributionspreads, i.e. the variance increases, but the third central moment remains con-stant. This means that the dynamic behaviour of the size distribution can becharacterized by two quantities, the mean size and the variance. Wright andWhite4 have developed a mathematical model of the crystallization process usingthis approach. They use as a measure of crystal size the 'volume equivalentdiameter* size which is most useful mathematically, and have suggested appropriateexpressions for rate of growth, rate of nucleation, size dispersion for the model.Frew5 has subjected this model to a detailed analysis applying the maximum prin-ciple of Pontryagin to derive a set of operating policies which specify theoptimum control with respect to the current state of the pan. The study has high-lighted the need for accurate determination of supersaturation, crystal contentand mother liquor purity within the pan, and the importance of the nucleationboundary.
Experimental Computer Controlled Pan
To implement the optimal policies on a real pan it is necessary to have ameasure of the supersaturation and the weight of water, impurity sucrose andcrystal present. A pilot scale pan has been built which uses an on-line digitalcomputer to evaluate the above quantities at any time during the strike6.
With the laboratory pan successful operation was possible using the boilingpoint rise as the method of supersaturation measurement and a full computer up-dated mass balance around the pan. A new determination of boiling point rise forpure and impure sucrose solutions was made in the course of this work . Opera-tion with pure sucrose close to the nucleation boundary was achieved withoutformation of false grain.
Industrial Scale Trial
The main differences between the laboratory scale control and the full scaleare firstly, basic control configuration and secondly the circulation of theliquid. On the laboratory pan the heat input, vacuum and evaporation rate wereindependently controlled. In the full scale pan it is more feasible to controlthe steam flow and the vacuum, and superheat effects in large pans render boiling
7point rise techniques inaccurate as a measure of supersaturation . The laboratorypan circulation was guaranteed by a stirrer but many industrial pans rely onnatural circulation only. Thus the industrial trial necessarily explored the bestpractical means of obtaining the correct values of supersaturation and crystalcontent from the pan so that the optimal operating policies could be implemented.
The instrument list for the industrial trial included the following items:
Measurements in the Pan
1. temperature in the pan2. temperature in a pilot pan (for boiling point rise)3. absolute pressure in the panh. level in the pan5. electrical conductivity of pan contents6. crystal content of the contents
Flow Measurements
1. syrup and molasses feed flow - magnetic flow meter2. steam flow - D.P. cell and orifice plate3. water flow to the pan - D.P. cell and orifice plate
Possible measurements not used in the industrial trial were the massecuitedensity, mobility, and evaporated vapour flow. A plunger type crystal contentmeter was developed especially for the trial - the action of this was controlledby the computer. Any analog signals were converted to electric analog formbefore being converted into digital inputs by a multiplexed A/D converter control-led by a PDP-8E mini-computer. Digital or analog outputs were transmitted by thecomputer for control valve actuation. The control programs for the trials wereconveniently written in online version of the Digital Equipment Corp. interpretivelanguage FOCAL, developed by CSIRO.
Methods for Pan Control
(a) Mass Balance Methods
The basis of all mass balance methods is the use of some initial state ofthe pan and then integration of all flows into and out of the pan to give thetotal sugar in the pan (S + C), the total impurities (l), the total water (W) andthe total mass (MT), thus:
where M T = W + S + C + I
the initial conditions required are WQ5 ID and (S + C)Q. During the strike, inte-gration of the flows allows computation of:
S + C = (S + C)0 + /f F DSf Pf dt (l)
I = I0 + /* F DSf (1 - Pf)at (2)
W = W0 + jf F(l - DSf)at - 7j Edt
+ /* % dt (3)
This set of equations, used throughout the strike, is not a model in the predict-ive sense, but it does allow computation of S + C, I, and W. A direct measurementof some kind is required to split the S + C term so that crystal content andsupersaturation can be calculated from:
cc
SSs/w
~(S/WJS~ATSC' 5
where the pure sugar solubility ratio (S/W)gAT may be calculated from solubilitytables and a measurement of the temperature and the solubility coefficient SC canbe represented for the material concerned as:
SC = I - 0.088 I/W (6)

- 202 -
(b) Methods without a. mass balance
If a second measurement related to the supersaturation or crystal content isavailable, it is possible to dispense with many of the features of the massbalance. This is a major simplification, but it has a disadvantage. Withoutmeasurements of feed flow and net evaporation rate it is difficult to run shortterm predictive models that are used to eliminate time lags in the measuringinstruments. The different feasible combinations of measurements which areavailable for non-mass balance control are indicated later.
RESULTS OF INDUSTRIAL TRIAL
Mass Balance Me tncds_
In general, all mass balance techniques require considerable care in theanalyses for the initial conditions and in the measurement of the flows, as errorsare carried right through the strike, or may even accumulate. Despite theserestrictions, reasonable agreement was attained in factory tests. The main pro-blem arose in the choice of the feedback measurement. These are as follows:
Refractometer
Using the transmitter developed by CSIRO8, this technique was quite satis-factory as a method of determining the super saturation and crystal content. Forcontrol purposes, however, the refractometer response is too slow, so that a"predictor" is necessary to eliminate the time lags in the measuring system. Asimple linear model was used to overcome the time lag.
Boiling Point Rise
Extensive measurements were made and the results have been presented else-where. To summarize, the method is usable provided a suitable correlation forsuperheat can be developed.
Conductivity
As a result of 250 samples an explicit form of equation 10 was found to be
= 1.622 + 126. T fi - O.U9683CC + 1.1533TP ...................... (7)SS
Note that the supersaturation and crystal content interact in the expression.This causes some calculation problems when crystal content is not determineddirectly.
Crystal Content
The meter used to measure crystal content is described elsewhere. When thetiming problems were overcome the meter gave good results within one or two percent of the crystal content time measured by analysis. The reading cycle timevaried between one and two minutes.
Non-Mass Balance Techniques
Refractometer, Level and Crystal Content
Of all the techniques used, this was the most satisfactory.
If the level transducer is of the differential pressure type, then for aparallel-sided pan, the transmitter output is directly proportional to the massin the pan, so that Mp is known throughout the strike. Now from the refracto-meter reading the dry solids can be calculated. The crystal content is availabledirect from the meter.
- 203 -
Now S + I + W = Mrpd - CC) ................................ (8)
and using the output of the refractometer, it follows that
S + I = DS MT(l - CC) ............................ ,(9)
and w = (1 » DS)MT(l - CC) ........................ (10)
To compute the supersaturation, it remains only to split the S + I term inequation 9- This can be done by computing the total dissolved solids run into thepan from the start of the strike to time t, and then calculating I, From this andthe feed purity value, S can now be calculated from equation 9.
In the industrial trial accuracy was adequate, but a predictor was necessaryto eliminate the time lags inherent in the refractometer. The method has th-imajor advantage of simplicity and one would therefore expect a high reliability.
Conductivity, Crystal Content and Level
This scheme is similar to the use of conductivity with the mass balance,except that the crystal content is measured directly and the purity is evaluatedas above, which then allows calculation of the supersaturation from equation 7.
Like the previous technique this method has the advantage of simplicity.The method was tested by reconstructing runs using the data logged during otherstrikes. When the variability first expr-r lenced wath the crystal content meterTJas overcome, the accuracy on supersaturation was good. The constant in equation'i however would be expected to change as the material impurity composition alteredand would thus have to be continuously updated.
Refractonteter and Total Density Meter
A simple technique that dees not require a mass-balance uses c. refractometer,a total density meter (radiation gauge) and measurements of level and temperature.From the refractometer the dry solids and hence S/W and the supersaturation may becalculated (using equations 5 to 9). The purity is found from a knowledge of thefeed purity and total solids fed. The liquid density pL follows from:
pL - f(T, DS) ........................... . ...... (11)
The radiation gauge gives a very accurate measure of the total massecuitedensity pM and, as the density of sucrose crystals pK is known, the crystal contentmay be calculated.
PRODUCTION TRIALS
As a result of the industrial trial it was felt that the most practicalapplication of the optimal control principles to high purity raw sugar strikes wasthe non-mass balance technique which utilises a transmitting pan refractometer, anew design of crystal content meter and measurements of level and temperature inthe pan.
In the application of this technique to a factory production pan the approachwas rather cautious. The implementation was made in two stages termed a 'basic'scheme and an 'advanced' scheme.
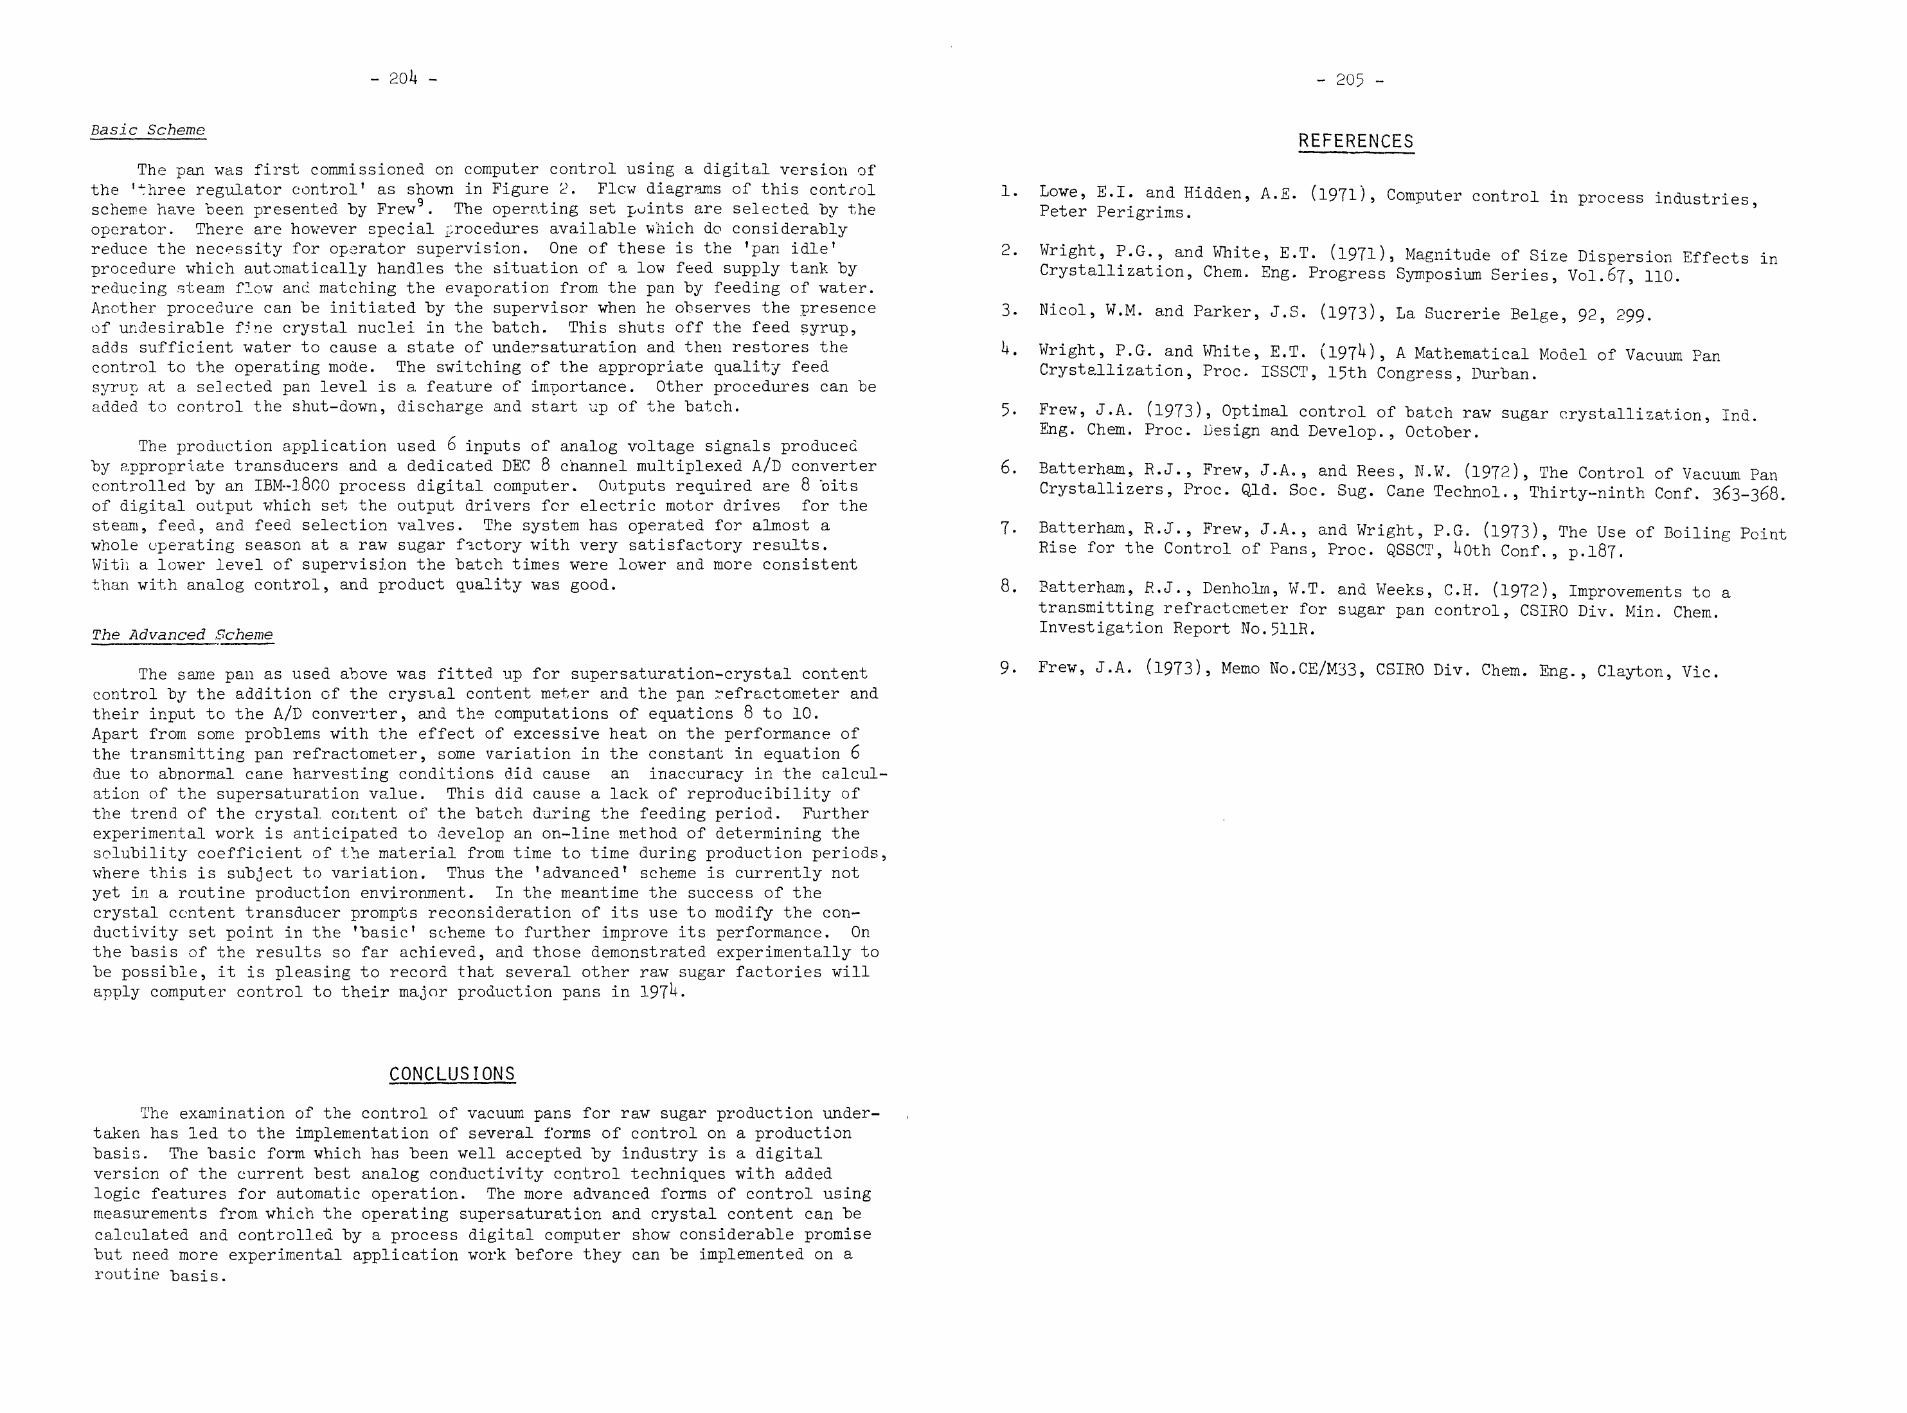
- 201* - - 205 -
Basic Scheme
The pan was first commissioned on computer control using a digital version ofthe 'three regulator control' as shown in Figure 2. Flew diagrams of this controlscheme have been presented "by Frew9. The operating set points are selected by theoperator. There are however special procedures available which do considerablyreduce the necessity for operator supervision. One of these is the 'pan idle'procedure which automatically handles the situation of a low feed supply tank byreducing steam flow and matching the evaporation from the pan by feeding of water.Another procedure can be initiated by the supervisor when he observes the presenceof undesirable f:ne crystal nuclei in the batch. This shuts off the feed syrup,adds sufficient water to cause a state of undersaturation and then restores thecontrol to the operating mode. The switching of the appropriate quality feedsyrup at a selected pan level is a. feature of importance. Other procedures can beadded to control the shut-down, discharge and start up of the batch.
The production application used 6 inputs of analog voltage signals producedby appropriate transducers and a dedicated DEC 8 channel multiplexed A/D convertercontrolled by an IBM--1800 process digital computer. Outputs required are 8 bitsof digital output which set the output drivers for electric motor drives for thesteam, feed, and feed selection valves. The system has operated for almost awhole operating season at a raw sugar factory with very satisfactory results.With a lower level of supervision the batch times were lower and more consistentthan with analog control, and product quality was good.
The Advanced Scheme
The same pan as used above was fitted up for supersaturation-crystal contentcontrol by the addition of the crystal content meter and the pan refractometer andtheir input to the A/D converter, and the computations of equations 8 to 10.Apart from some problems with the effect of excessive heat on the performance ofthe transmitting pan refractometer, some variation in the constant in equation 6due to abnormal cane harvesting conditions did cause an inaccuracy in the calcul-ation of the supersaturation value. This did cause a lack of reproducibility ofthe trend of the crystal, content of the batch during the feeding period. Furtherexperimental work is anticipated to develop an on-line method of determining thesolubility coefficient of the material from time to time during production periods,where this is subject to variation. Thus the 'advanced' scheme is currently notyet in a routine production environment. In the meantime the success of thecrystal content transducer prompts reconsideration of its use to modify the con-ductivity set point in the 'basic' scheme to further improve its performance. Onthe basis of the results so far achieved, and those demonstrated experimentally tobe possible, it is pleasing to record that several other raw sugar factories willapply computer control to their major production pans in
REFERENCES
1. Lowe, E.I. and Hidden, A.E. (1971), Computer control in process industriesPeter Perigrims. '
2. Wright, P.G., and White, E.T. (1971), Magnitude of Size Dispersion Effects inCrystallization, Chem. Eng. Progress Symposium Series, Vol.67, 110.
3. Nicol, W.M. and Parker, J.S. (1973), La Sucrerie Beige, 92, 299.
U. Wright, P.G. and White, E.T. (197M, A Mathematical Model of Vacuum PanCrystallization, Proc. ISSCT, 15th Congress, Durban.
5. Frew, J.A. (1973), Optimal control of batch raw sugar crystallization, Ind.Eng. Chem. Proc. Design and Develop., October.
6. Batterham, R.J., Frew, J.A., and Rees, N.W. (1972), The Control of Vacuum PanCrystallizers, Proc. Qld. Soc. Sug. Cane Technol., Thirty-ninth Conf. 363-368.
7. Batterham, R.J., Frew, J.A., and Wright, P.G. (1973), The Use of Boiling PointRise for the Control of Paris, Proc. QSSCT, Uoth Conf., p.187.
8. Batterham, R.J., Denholin, W.T. and Weeks, C.H. (1972), Improvements to atransmitting refractcmeter for sugar pan control, CSIRO Div. Min. Chem.Investigation Report No.511R.
9. Frew, J.A. (1973), Memo No.CE/M33, CSIRO Div. Chem. Eng., Clayton, Vic.
CONCLUSIONS
The examination of the control of vacuum pans for raw sugar production under-taken has led to the implementation of several forms of control on a productionbasis. The basic form which has been well accepted by industry is a digitalversion of the current best analog conductivity control techniques with addedlogic features for automatic operation. The more advanced forms of control usingmeasurements from which the operating supersaturation and crystal content can becalculated and controlled by a process digital computer show considerable promisebut need more experimental application work before they can be implemented on aroutine basis.
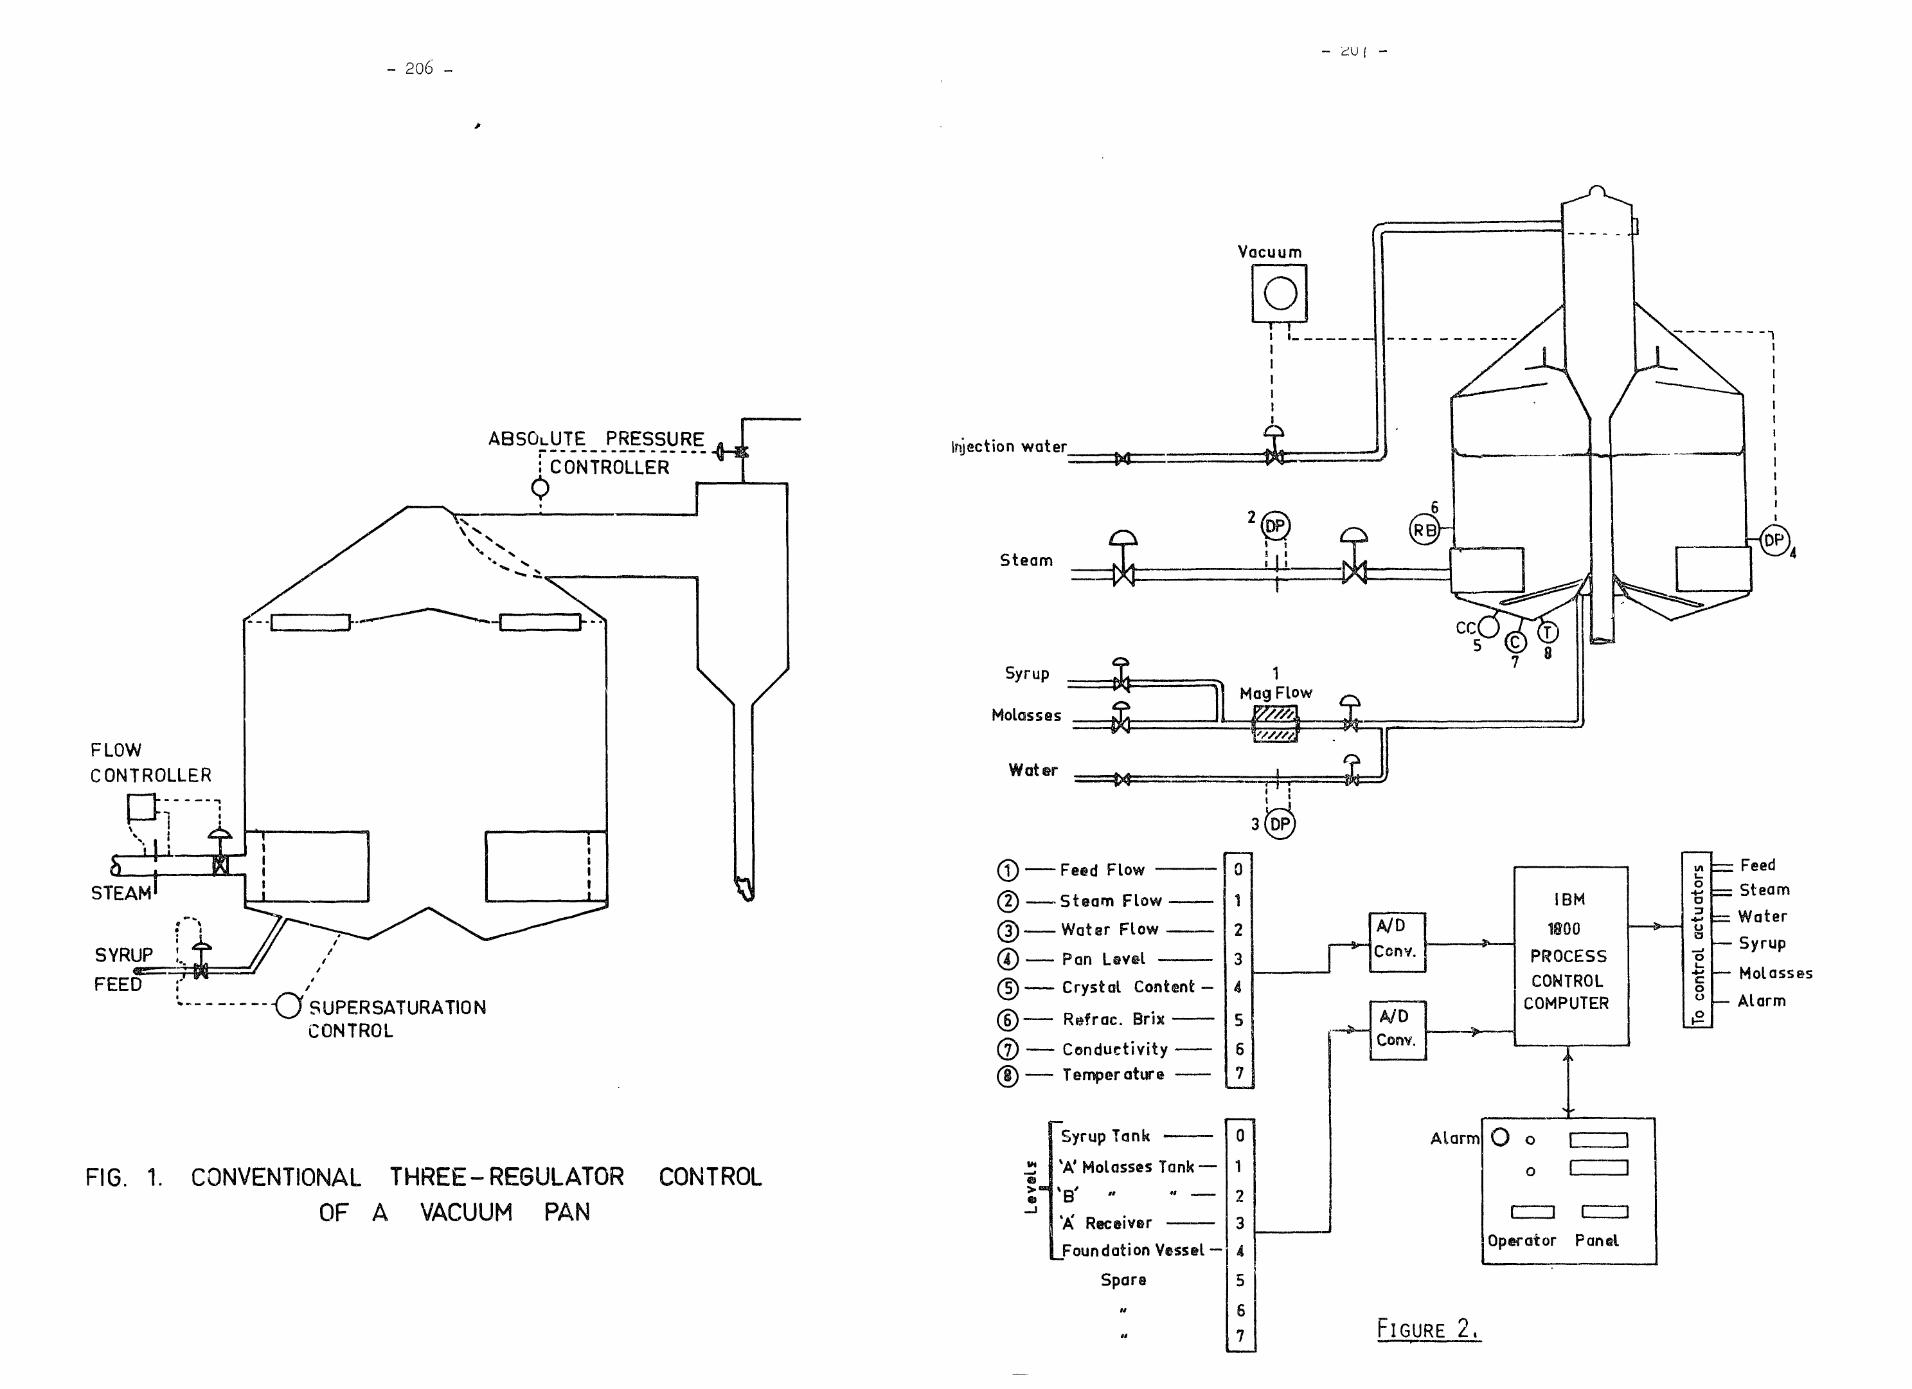
- 206 -
FLOWCONTROLLER
STEAM
SYRUP
FEED
ABSOLUTE _PR_ESSURE
i CONTROLLER0
Injection water
•„. -Q SUPERSATURATIONCONTROL
FIG. 1. CONVENTIONAL THREE-REGULATOR CONTROL
OF A VACUUM PAN
Wotsr
Feed Flow
Steam Flow
Water Flow
Pan
Vacuum
Crystal Content
R^frac. Brix
Conduct iv i tyTemperature
Cony.
M
Syrup Tank
* 'A' Molasses Tank —
'A'
Foundation Vessel
Spare
0
1
2
3
4
5
6
7
A/DConv.
IBM
PROCESS
CONTROL
Alarm o
o
Operator Panel
FIGURE 2,
inO
•4-*a3
•*->Uo
g
FeedSteam
Water

- 208 -
National Chemical Engineering Conference 1974
PROCESS INDUSTRIES IN AUSTRALIA IMPACT AND GROWTH
Surfers Paradise, Queensland
July 10 to 12th, 1974
OPTIMAL CONTROL APPLIED TO THE BATCH CRYSTALLISATION OF SUGAR
by
N . W . Rees and P.S. Ritch
S U M M A R Y
Tnis paper determines the optimum way of growing sugar crystals from footingsize to required final size in minimum time and without producing false grainby nucleation. A non-linear differential equation model is first developedtogether with the constraints on the model. Experimental work shows that foran A strike foiling or a B strike, the model predicts the crystal growthbehaviour well enough to be.adequate for optimal control studies. The optimalcontrol work shows how optimal control policies for the above boilings can bedetermined using a new and efficient numerical procedure. Details of thisprocedure are given.
Rees, University of N . S . W . , Department of Systems and Control, N . S . W .
Ritch, C.P.S. Consulting Pty. Ltd., 9/145 Ebley St., Bondi Junction, N . S . W ,
- 209 -
Introduction
During the last decade a great deal of optimal control theory has beendeveloped but most of it has not been found to be easily applicable. Applicationhas been limited for three reasons:
1. Lack of the proper desire to collaborate both on the part of the controltheoretician and the plant engineer; a fact that is especially complicatedby the knowledge gap between the two groups.
2. Lack of satisfactory models of the physical processes that might be studiedand the resulting dimensionality of many of the models.
3. Lack of efficient numerical methods to solve the optimal control problemespecially in the usual case where the system states and control variablesare constrained.
In this paper the problem of sugar crystallisation is posed and solved.Restrictions (1) and (2) above did not apply since good collaboration and anadequate low order non-linear dynamic model were available. Further the processbeing a batch process could readily be formulated as an optimisation problem inwhich it is required to grow crystals from an initial seeding to a final size inminimum time without creating new crystals by nucleation. The problem describedwas first solved in Ref. 2 by an approximate method using the Penalty Functiontechnique to overcome the state constraints. In the present paper it is solvedexactly by a new and efficient technique developed by Ritch.3 Attempts are atpresent underway by C.S.I .R.O. and the Sugar Research Institute to apply theresults of the work to a sugar crystalliser in Queensland.
Pjroblem Description and Model Development
A schematic diagram of a vacuum pan crystalliser is shown in Fig. 1. Thepan operates under 27" of vacuum in a batch manner. An initial footing of seedcrystals of specified size distribution in a massecuite of sugar, impurities andwater, is fed with a feed of syrup or molasses. Heat is supplied to the systemvia a calandria in such a way that the supersaturation created in the pan isconducive to crystal growth. The feed itself can be used to control the super-saturation, but it is better to do this by controlling both the feed and theevaporation rates of the pan, The immediate aim of this study is to producecrystals of acceptable final size, from the footing in minimum time, using feedand evaporation rates as control variables.
The model used in this report is a simplified version of that described inRef. 1. It is assurmd in the development that the pan operates isothermally andunder constant vacuum and that the size distribution of the crystals does notskew. These assumptions are reasonably valid for the crystallisers under studyand allow an adequate model of the system to be constructed. The model consistsof equations relating the idve states: W - weight of water in the pan, I -weignt of impurities, S - weight of sucrose, r - mass mean radius of the crystalsand y2 ~ tne second moment of the size distribution, to the two control variables:E - evaporation rate and F - total feed rate. The differential equations relatingthe states and the controls are developed from Material Balance, Crystal Popula-tion Balance and Growth Rate Expression. The material balances for the pan ofFig. 1 can be written:
W ( 0 ) = Wo
1(0) - I
(1)
(2)

- 210 -
dS dC= FC P - -^-~
dt Vf dtS(0) = S (3)
where G£ and P represent the concentration and purity of the feed respectively.The crystal population balance is made by determining how many crystals move intoand out of an infinitesimal size range 6r in a period 6t. Crystals grow into andout of this size range, but are also formed by nucleation and affected by sizeuispersion. The net balance of crystals gives a partial differential equationdefining the evolution of the density function as a function of r and t. Thisequation is not easy to solve but an elegant solution exists in terms of themoments of the distribution. For particulate systems like sugar, where crystalgrowth rate is independent of r,5 the distribution can be specified in terms ofits first four moments jj , u , y , y . If we further assume that, no crystals are
roduced by nucleation the moment relatiations become,
at= 0 M (0) = 1
o(4)
at
dp.
dt".dr. , dr
(pdt}
U, (0) = r1 o
v2 (o) =
(5)
(6)
dw(0) = (7)
T i 0 ^ 3 - 4 - M"l 'XT "1 A, ' r -
CLt. ^ O.L- JL Q.L. J
and consequently the total mass of crystal C in the massecuite can be written as,
s-*> __ (8)
where N represents the number of crystals in the pan and e is a scalingfactor given by e = 1.46 x 1G~J.
j
In these moment equations the term (-rr-) represents the growth rate of crys-tals and (pSE) is a measure of the size dispersion factor of the crystals. Boththese quantities must be determined experiatentally. For crystals in a wellstirred pan suitable expressions are given by Wright5 and are,
(iV° I~- = k (SS - 0 .02)expU 2 -- F ( T ) }
P^T = *3 exp(k4 I/W)
(9)
(10)
where F(T) is a temperature dependent term,, kp k 2 r k3 and k^ are known experi-mentally determined constants and SS is the supersaturation in the pan. This isciefineu as,
• c - (£/w) f mo-SATSS — , _ , _ Isc SAT
(ID
where SAT as the percentage sugar at saturation in a pure syrup and SC is thesolubility coefficient. Good correlations representing the dependence of thesequantities on temperature and on the ratio of (I/W) are available and have beenused in this work . 1 ' ^
Liquations ( l ) - ( l l ) represent a complete model of a sugar pan and experimentalstudies have shown its validity for an A and a B strike. The model car be
- 211 -
simplified and put in to the required state form as shown in Ref. 7. Not all thestates are measurable and in particular the initial quantity U2G nmst be knownas well as the number of crystals in the pan N before the evolution of thebehaviour- of the system under controls E and F can be determined. These quantitiescan be most easily determined from the coefficient of variation (standarddeviation) of the initial sample of crystals. Since the technique used foroptimisation in this work is best applied to a discrete set of equations the bestrepresentation of the state equations is in the following form.
A[d u (k) - u][(k) ;x]L(0) - 3.8545- 1 4. JL - JL
= x (k) + Ad u (k) ;x,(0) = 1.9373£ *-t £• jL £
x.(k-H) = x0(k) -f A(cLu,,(k) - d. fx_ (k)S (k) + x. (k)R(k) ] }J J J / 41-:) 4
= 10.831
= 0.250
= 0.0650
x (k+1) = x (k) + AS(k)
;x (0)
;x (0)
= x (k) + A[2x (k)S(k)+R<k)] ;xr(0)
where
and
S(k) = d5{d6x3(k)/[x1(k)-d7x2(k)]-d8}exp[-dgx2(k)/x1(k)]
R l k ) = dluexp[-d11x2(k)/x1(k}]
u is the evaporation rate (Ib./h.)
(12)
(13)
(14)
(15)
(16)
(17)
(18)
u is the feed rate (lb./h.)
x is the weight of water in the pan (Ib.)
x is the weight of impurities in the pan (Ib.)
x is the weight of sucrose in the pan (Ib.)•J
x is the mass mean radius of a crystal (mm.)2
x,- is a moment of the crystal size distribution (mm )5
A is the basic clock interval
u's are constant parameters that have been determined experimentally andwhose values are listed in Ref. 11.
The initial conditions of equations (12) -(16) are typical of the conditions whichexist in the pan at the beginning of an A strike.
System Constraint^
During the development of the above model it was assumed that,
1. No nucleation occurs.
2. The pan is well enough stirred for the variation of growth rate throughoutits volume to be small.
For any real system there are of course also requirements on the maximumand minimum range of the control variables and the pan must not overflow. Allthese conditions can be expressed in the form of control and state constraints
as set up below:
0 <_ u (k) < d = maximum rate of Evaporation
U < u (k) < d = maximum feed ratef. — J. o
d x_(k)D J r >s(k) i+ —±±~± _ d A
x (k)+x (k) 13 [x (k)+x (k)J
(19)
(20)
(21)
(1-d15)d4
r4 :
(k)
2x
[x1(k)+x2(k)+x;j(k)j
0 (22)
(23)
Equations (19) ana (20) are saturation constraints on the evaporation andfeed rates imposed due to physical limitations. Equation (21) defines the"nucleation boundary". If this constraint is violated, the system will producevery fine grain crystals which is undesirable. Equation (22) is a viscosityconstraint which, if violated, results in poor circulation of the massecuite inthe pan. Equation (23) is the'pan full constraint which if exceeded results inthe pan overflowing. Further detail on the model and the constraints can befound in Ref. 7 and Ref 8.
Optimal Contro_l
The optimisation problem associated with a particular sugar strike is easilyset up by requiring that crystals of desired size be produced from the knownfooting in minimum time without violating the constraints of the last section.Tne class of optimisation problems which results falls under the headinq ofoptimal control under multiple state-control constraints. Such problems canalmost never be solved analytically and are also extremely difficult to solvenumerically. Tne results presented in reference 2 were obtained using aPenalty Function technique to change the state constrained problem to anunconstrained problem. Necessary conditions for the minimisation of the uncon-strained problem were set up using Pontryagin's Principle and the resulting twopoint boundary value problem solved by control vector iteration. A conjugategrauient algorithm was used for the minimisation with control saturation builtinto the algorithm as described by Pagurok and Woodside. In agreement with theexperience of others, very slow convergence to the optimal solution was exhibited.On line manipulation of the constants in the penalty function, manual adjustmentsof the step size in the linear search, and other procedures were tried, and didshow some improvement of the convergence rate. Nevertheless the true optimalsolution was never reached, but rather had to be extrapolated by algebraic andphysical arguments from the trajectory obtained by the numerical procedure. Theresults for B molasses gave particular trouble, requiring over 100 jterationsbefore the optimum solution could be extrapolated. For the interested reader amore thorough analysis of this work is given in Frew.
Tne convergence difficulties involved in solving multiple state, controlconstrained problems using Penalty Functions are due to the fact that thePenalty Function term must be large to have the desired effect of constrainingtne states. Consequently the contributions of these terms to tne gradientsinvolved in the minimisation overwhelm the contributions due to the originalperformance criterion. This leads to very slow convergence rates especially inthe initial stages. To overcome these difficulties it was decided to attempt asolution to the problem using a technique developed by Ritch3 which does not
resort to the use of Penalty Functions. The Ritch technique extends the work ofJacobson and Lele10 to the case where there are more constraints than there arecontrols. The direct extension represents the system by continuous equationsbut there are definite advantages to working with discrete equations not theleast of which include the facts that the dimensionality of the problem is not.increased and that the discrete equations can be more easily run out in thecomputer. Thus in what follows the discrete technique will be described.
bisjcrete Optimal Control and the Constraint Separation Principle
The discrete optimisation problem is defined as follows ^
Choose u(k), 0 < k < N-l so as to minimise the performance index:
J = o[x(N),N] + | *[x(k) ,u(k) ,k] (24)
subject to the system difference equations
x(k+l) = ffx(k) ,u)k) ,kl ; x(0) = x (25)— o
and tne inequality constraints
c[x(k),kl <0 k=0,l,...,N (26)ju. —J «..*
where u is an m dimensional control vector; x is an n dimensional state vectorand C is a c dimensional constraint vector.
The key point to notice is that the constraint vector may or may not containthe control explicitly. If tne dynamic equations are substituted in the con-straint equation until the constraint equation has the form,
D[x(k-p) ,u(k-p) ,k~p]<_ 0 k = 0,1,...N (27)
thtnen this form is the o order constraint that has originated by p substitutionsfrom tiie pth order state constraint defined by equation (26) . The first step inthe optimisation procedure is to use the above 0th order constraint to transformtne state equations so that the state constraints are overcome. This is done asfollows:
Let,,u(k) , - a(k) = 0
a(k) < 0 k=0,l,. . .N-p
(28)
(29)
Equations (28) and (29) will force the original constraint to be satisfied.The range over which the slack variable, a(k), is constrained in equation (29)is determined by the order of the constraint from which o(x(k) ,u(k) ,k] //asoriginally uerived.
For tne more general case where the constraint function D[_x(k) ,u(k) ,kj issubject to the two constraints:
a(k) <_ o[x(k) ,u(k) , (30)
where a(k) and b (k) are independent of x(k) and u(k) , equation (29) wouldbecome,
a(k) < a(k) < b(k)

Equation (28) may be solved for u(k) (either analytically or numerically)to give:
u(k) = c[x(k) ,a(k) , (32)
On substituting for u(k) from equation (32) in the state equations (25) andperformance index (24) , the following transformed equations are obtained:
= ffx(k) ,G[x(k) ,ot(k) ,kl ,k*l ; x(0) = x"- -» j. o
N-lJ = 0[x(N) ,w] + kj $[x(k) ,c[x(k) ,a(k) ,k] ,
a(k) < a(k) < b(k)
(33)
(34)
(35)
The problem has therefore been transferred into a set of system equations inwhich the variable a, constrained as in equation (35) , is used as the new controlvariable and by so doing, the original constraints on the system are enforced.The method relies on the ability to solve equations (28) for the controls u(k).These equations in general do not have a solution when the number of constraintfunctions exceeds the number of controls re. However, the Principle of ConstraintSeparation introduced in Refs. 3 and 11 states that the total control intervalmay tie split up into segments over each of which there exists a dominant set ofconstraints of dimension d <^ m; where a constraint set is defined to be dominantover a particular interval of time if enforcing only this set ensures that allconstraints in the system are satisfied over this interval. Thus for example,for the system of equations (12)-(23), constraints (19) and (20) are dominantwhen enforcing only these constraints ensures that constraints (21) to (23) arealso satisfied.
Using the above principle of constraint separation it is therefore possibleto solve the general problem posed by separatinq the control interval into anumber of segments for each of which the transformation technique describedaoove can be used to account for the dominant constraints, since d, the number ofuominant constraints per segment must be < m.
The necessary conditions for an extremal solution are quite standard sincethe overall problem reduces to segments for which the state constraints have beeneliminated. The main features are:
(a) for eacn segment, the original constrained system equations are replaced byan equivalent set of equations of the same dimension and with only controlsaturation constraints via the transformation technique. The necessaryconditions for unconstrained optimisation with control saturation thereforeapply for each segment.
(b) The state and adjoint variables are single-valued at the points of separationof toe segments - henceforth referred to as switch-over points, since atsuch points a switch is made from one set of system equations to another.
Further detail on the Necessary Conditions can be found in Ref. 11.
The switchover points mentioned above are determined automatically asfollows. When a constraint of pth order is violated during the iterative pro-cedure for the optimal control, the point of time p steps previous to theviolation is chosen as the time to switch to the transformed equations andassociated control constraint which ensure that the original constraint will beenforced. Using the fact that the state and adjoint variables are single valued
- 215 -
at the switchover points the iterative procedure (conjugate gradients with controlsaturation) may be continued until the next violation when the above procedure isrepeated. A more detailed description of the numerical procedure is given inRefs. 3 and 11.
Set_ of _Transfprmed_ System_Jiquations__fpr_ the Sugar Pan
The three state constraints are all first order constraints. Also becauseof the way the viscosity and pan full constraints involve x , x and x it followsthat tnese two constraints cannot be simultaneously dominant since a solution toequation (28) would then be impossible.
Since the problem nas two control variables, the Principle of ConstraintSeparation indicates that the control interval may be split up into segments overeach of which a set of dominant constraints of dimension d < 2 exists. There aretherefore nine sets of transformed system equations which must be stored to allowfor all the possible combinations of dominant constraints. These nine sets caterfor che following combinations:
1. Constraint2. Constraint3. Constraint4. Constraint5. Constraint6. Constraint7. Constraint8. Nucleationy. Nucleation
on u, with constraint on u,on u" with nucleation.on u with viscosity,on u, with pan full,on u with nucleation.on u with viscosity,on u with pan full,with viscosity,with pan full.
For the control saturation constraints no slack variables need be introducedsince no substitutions for the controls are required. The controls are simplyclipped when the constraint is reached. Since space is not available to developall the sets of transformed equations a typical set will be developed to show themethod. The nucleation constraint, is algebraically the more difficult so theviscosity constraint is chosen. Let the slack variable B(k) be introduced asfollows:
3
] - [x^k+D + x2(k+l) +1-d _ 2x^
(. —-)d4_x (k+l)x (k+1) :
P ( k ) >_ 0
Substituting for the states from equations (12)-(16) gives,
u _ ( k ) - u, (k) + P ( k ) = 02 1wnere P(k) is given by,
2x?(k)
+ 0(k) = 0
(36)
P ( k ) = - ~ - [x 1 (k)+x 2 (k)+x 3 (k) ]
- d_r[xr(k)S(k) + x.(k)R(k) - Ad S(k)[R(k) -2GL 5 4 25 *•
2AS (k)
Now consider the 6th combination of constraints listed above and determine thetransformed equations for this co:±>ination. Substitute for u.^ using equation(36) gives,
= x (k) + A{(d1-l) u2(k) - P(k)} (37)

- 216 -
x (k+1) = x (k) + Ad u . ( k )•<- *- 2. jL
x (k+1) = x (k) + A{d u (k) - d [x ( k ) s ( k ) + x ( k ) R ( k ) ] }3
b ( k ) > 0
0 < u (k) < d— 2. - - J. o
(38)
(39)
(40)
(41)
where the equations for x^k+1) and x^(k+l) are unchanged from equations (15) and(16) ana the control variables are 6 ( k ) and ^(k) . The complete sets of equationsfor the system are given in Ref. 12. It should £>e noticed that the procedurerequires a great deal of algebraic manipulation since besides the above equationsthe adjoint difference equations and the gradient of the Hamiltonian with respectto the appropriate control variables must be determined for each combination oftwo constraints. This tedious algebra is however preferable to the extremely slowconvergence cnaracteristics associated with solution to the problem usina thePenalty Function Method.
Results and Operating Principles^
Tne above procedure was applied to the two problems of a syrup feed and anolasses feed. Tne minimum time formulation of the problem is equivalent tomaximising the crystal size in a fixed interval of time. The minimum time for aparticular final crystal size may then be simply read off the curve of x^ vs time.For tile syrup feeu, the footing in the pan is less pure than the feed, whereastiie converse is true for the molasses feed case. For this reason, a molassesstrike takes longer to achieve a desired crystal size than a syrup strike and sotne control interval for the syrup strike was chosen as 1.2 hr (N=100 witha-0.012 nr) compared witn 2.4 hr (N=200) for the molasses strike.
Tne two problems converged to the solutions shown in Figs. 2 to 5 in 4 (syrup)and j (molasses) iterations respectively. The reason for the extremely rapidconvergence rates is that the trajectories for the two cases are completely bang-Dang witn respect to the control variables for each segment. i.e. at all pointsin time, two constraints are active. The constraint separation and transforma-tion technique is such that it can maks full use of this property and in factfrom a computational point of view, "the more constraints the merrier". It mustjje remembered however that the more constraints imposed, the more analysis has tobe carried out in the intial stages.
The results shown in Figs. 2-5 have been obtained using syrup of a knownpurity, molasses of a known purity and a specified initial footina in the pan.If any of these conditions are changed the optimal control problem must be re-solved. Fortunately nowever when the problem is resolved for the new conditionstne results have the same basic characteristics as shown in Figs. 2-5. Thus itis possible to extract from the results the general operating principles listed
Following the initial charging of the pan the supersaturation should beraised to the nucleation limit using maximum allowable evaporation ratewith tne feed shut off .
once on the nucleation boundary, feed is admitted if its purity is greatertnan the purity of the mother liquor in the pan. If it is to be admitted,it should be at a maximum rate consistent with maintaining the supersaturationon the nucleation boundary. If the purity of the pan is greater than thatof tne feedstock no feed should be added except to control crystal content.
- 21? -
3. If the crystal content of the pan reaches a critical limit ;feed should beadmitted to maintain the content at this level.
4. Once tne pan is full, the feed should be set equal to the evaporation whichin turn is determined by the nucleation constraint.
The above operating principles can easily be implemented on-line using a smalldigital computer. The main difficulty centres around ways of measurement ofsupersaturation and pan content. The control algorithms themselves are simplefeedback algorithms working on an error signal related to how close the pansupersaturation is tothe predicted nucleation boundary. Further detail ofthis implementation can be found in Refs. 7 and 13.
Finally it is interesting to note that the same procedure was applied to theso called C strike. As mignt be expected the results showed a similarity to tneA strike with the exception of a much more extended time scale. However whereasin the syrup and molasses strike the time trajectories fitted the real systemoperation to within about 10% the results for the C strike were shown to begrossly in error. The main conclusion that can be reached from this is that themodel is grossly inaccurate for the more iirpure and viscom material. Thisconclusion is supported by experimental evidence.
References
1. Wright, P.G. and White, E.T. (1968)1697-1710.
- ISSCT, Proc. 13th. Congress, Taiwan,
2. Rees, N . W . , Frew, J .A . , Batterham, R.J. and Thornton, G.J. - Chera. Eng.Journal, Vol. 3, 1972.
3. Ritch, P.S. - Ph.D. Thesis, UNSW, 1972.
4. Hulbert, and Katz. - Chem. Brig. Sci. , 1964, Vol. 19.
5. Wright, P.G. and White, E.T. - Proc. Qld. o oc. Sugar Cane. Tech.- April 1967.
b. Wright, P.G. - Ph.D. Thesis, University of Queensland, 1972.
7. Rees, N . W . - School of Elec. Enq. Report, UNSW, April, 1972.
8. Frew, J.A. - I and E .G. Process design & development. To be published.
9. Pagurek, B. and Woodside, C .M. - Automatica, Vol. 4, Mo. 5/6, pp. 337-349,1968.
10. Jacobson, u .H . and Lele, M.M. - IEEE Trans. Automatic Control, Vol. AC-14,Uo. 5, pp. 457-464, 1969.
11. Ritch, P.S. - Automatica, Vol. 19, pp. 415-429, 1973.
12. Ritcn, P.S. - Automatica, Vol. 19, pp. 431-440, 1973.
13. Batterham, R.J . , Frew, J.A. and Rees, N . W . - Proc. Qld. Soc. Sugar CaneTeen. , April 1972.

• 218 - - 219 -
Evaporation
National Chemical Engineering Conference 1974-
PROCESS INDUSTRIES IN AUSTRALIA IMPACT AND GROWTH
DhchorgtSurfers Paradise, Queensland
Fig. t Schcnatic DiaBrm af a Su;«r Vicuun P'nJuly 10 to 12th, 1974
t , , I I 10 7 7 U t 71 6 18 B 36 0 '
j
1
i i < ttl i 50 i 57 6 U fi 72
ur1 s t r i V e - _~ y a.'or a 11 jjn and_Fccd ratjjj_versus tiirr
i..:32 ""'
0
-to
9 13 111 J1» J« • 36 0 O J 50 I 57 I II • 72
Fig, l Syrup a t r ike - N u c l e a t i o n , Pan fu l l and Viscosi ty functions
COMPUTER CONTROL ON A SUGAR MILL CRUSHING TRAIN
Mr. Roy A. Allavay
S U M M A R Y
28 j «i 5>: n: 133 -i r.s 2
?3fl 02 37 S 7 2 0 8:* 1000 MS 2 ue 5 \',t
S I lo l t tssga s t r i k e _ _ _ • Njrleat .on, _Pan ful * grd
The paper describes computer control in the productionenvironment of a sugar mill crushing train where thecomputer is used for controlling process streams, sched-uling the start-up and shut-down of the imbibition recyclestreams, monitoring alarm conditions and providing product-ion information to evaluate performance of the crushingtrain.
The actual gains of utilizing a process controlcomputer aro indicated.
Allaway, Mossman Central Mill Co. Ltd.
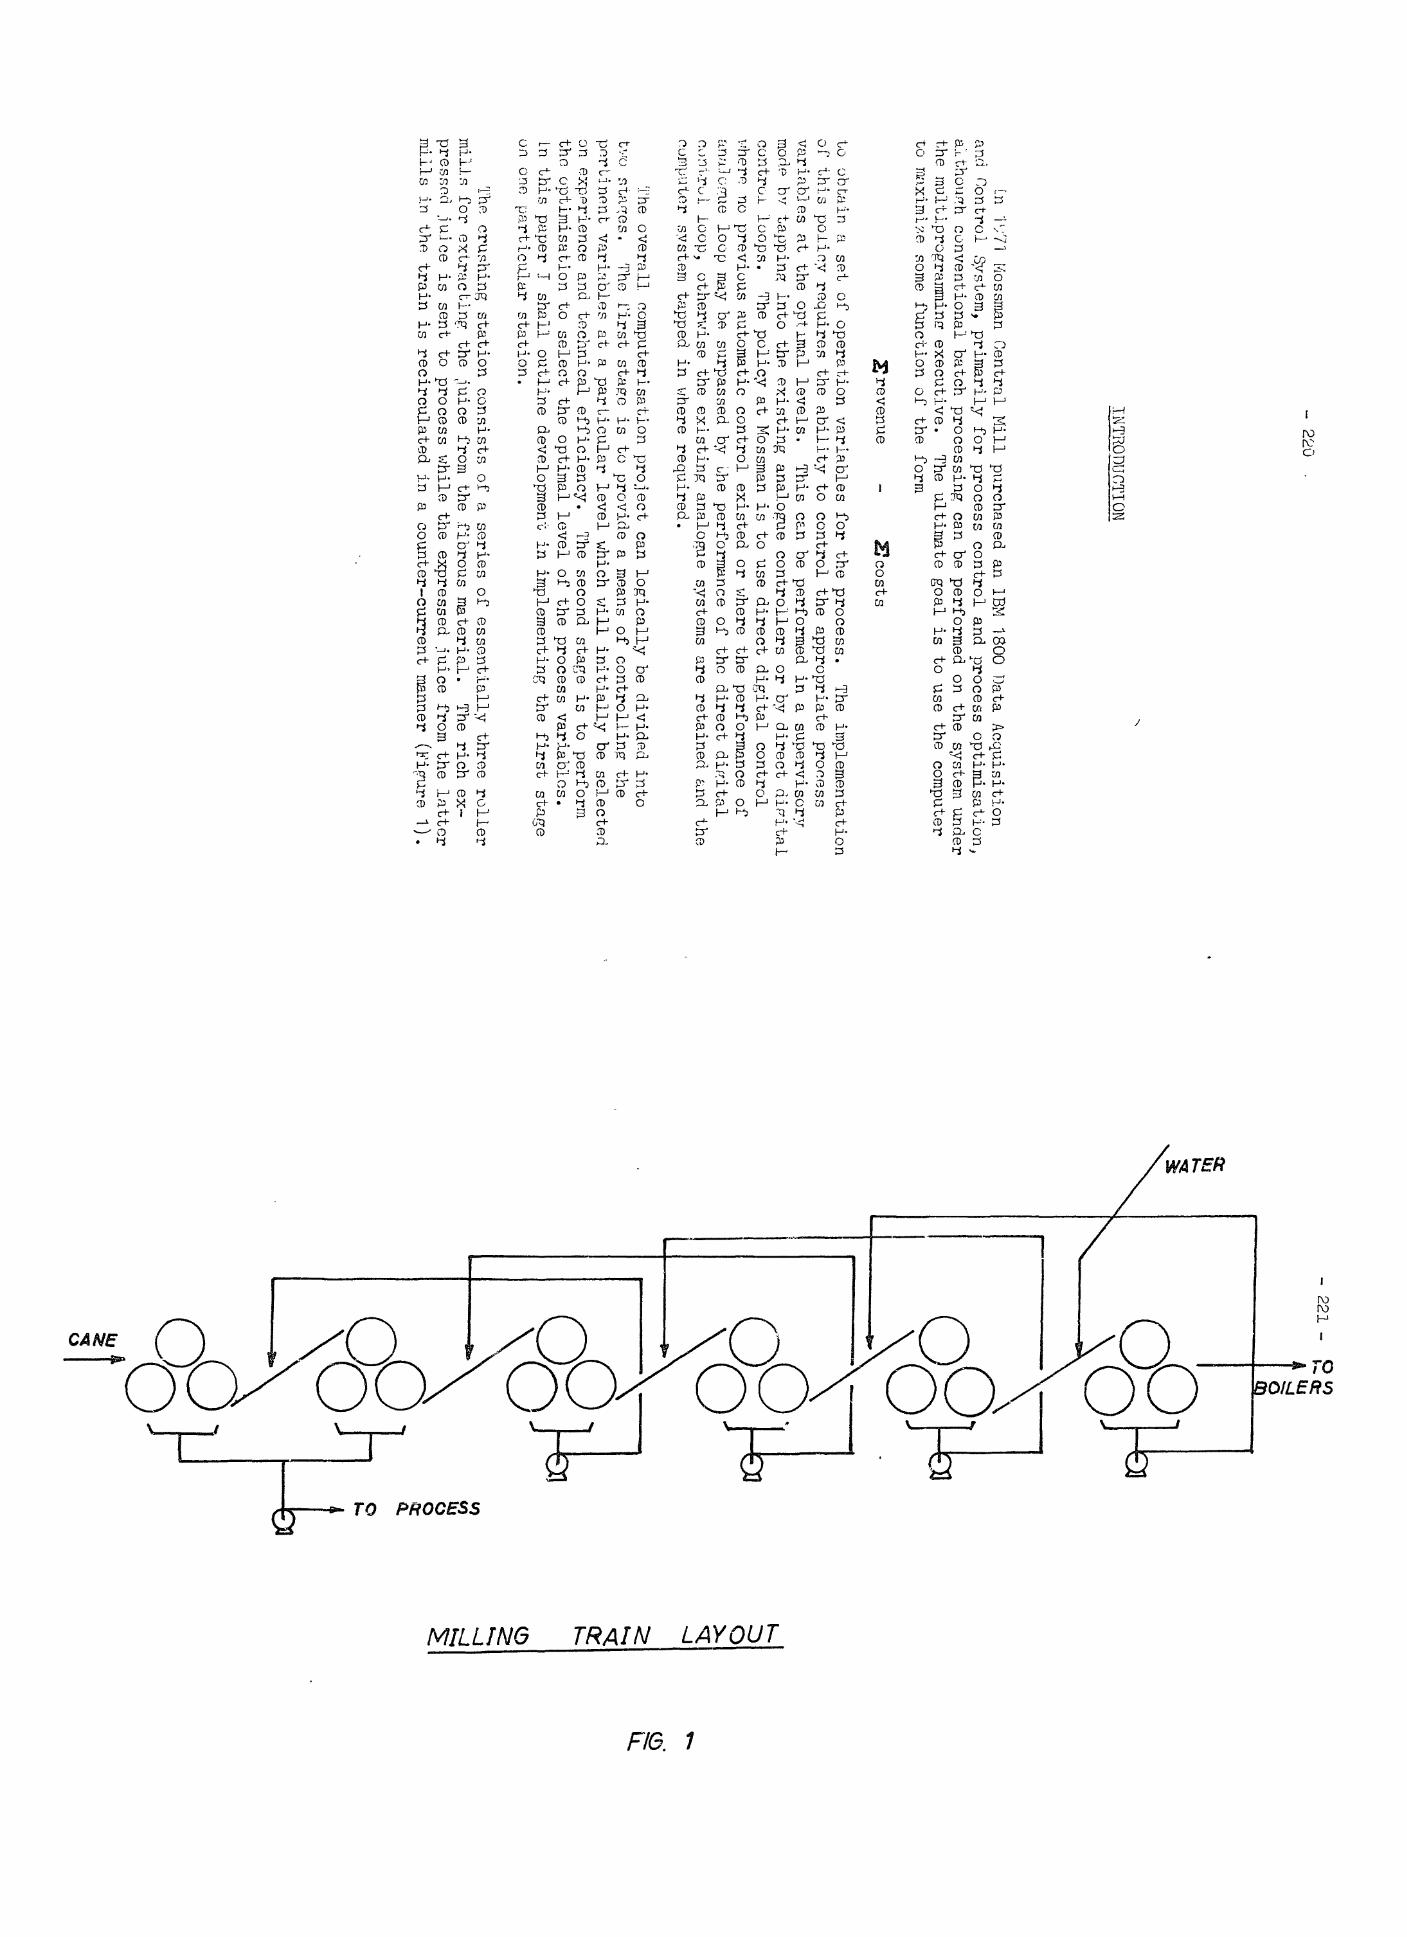
tt 3.\-' O }-•'<-> co :—03 :o Ji
3
d- p
0) OCD
d-4 H-P coI-1'3 co
CDH- 3CO d-
4 d-CD OO
O O& OV-1 CDP 01C+ COCD
H- H-a i-1
CDP
d-o pro 03 CD
I CDO CO
O CD>-$
oCD 4X £
P H-O 3
h-Ul
CD
CD3d-
CD
H-OCD
H5
O3
pc+ c+tr H-Q O
£ OH- OO 3CD M
H-Hj CO4 c+O CO
O
CD P
Hj WH- CDcr 44 H-o CDd en03
o
c+ CDCD cn4 COH- CDP S
P
: d-- 3^
q CD
CD Pc+
-i d->— ' O
H" ^O CD3" Q
CD 4X O! 1—'
t—CD
C
O
trH-cn
0)
3^ 3O
>° •£d- T)h- 4
H- OCO 3P OO- CD
L-J i_j o p
4 CO
CO P
P Md-H- OO pi
d-O
H-3CD
CDI-1O
3CD
C>"
H-
COaCD3
H-3
cx?
CD
COd-
cod-P
CD
CDO
CD HQ Oc+ P
CDCD
O H-h3 Od- H-H- CD
t-~t
O
CD<!CD -
CD
O COHj CD
Od- oCD a.^ co^ d-O Po etjCD QCOCO H-
CO
P d-hJ OH'P T)cr CDo i-bco o
<-r CDCO
< -P
H- -3P 3^
CD
O
CD
P
CD i—, O03 H- O
^ 3P co Td
d-P co CD
c~^~ ^3"d P J—P KJ CO4 O Pc- d-H- H- i—O CO O£ 3I—' d~P C T3
•TJ oCD O CD
CD H- d-
CD" o< p3" P 3H-o 3 Mtr CD o
P TOs: 3 H-H- co aH PM O H1
I-.J 1-1H- ^3 OH- Od- 3 CDH- d-i-j a,
O H-H <!
cr1
p
CDH-3 CD
CO d- H-CD D' 3M 0 d-CD OOd-CD
d-
t-
CO O
O 3co OP
CD
CD3£CD
ooCOd-co
H- cb
CD
roroo
1-3I-HOs:
CANE
WATER
ffiTO PROCESS
MILLING TRAIN LAYOUT
FIG. 1
- 222 -
SCOPE OF MILLING TRAIN SYSTEM
The global input streams to this station ars the cane feed rate orcrushing rate, and the imbibition water rate for use in the counter-currentwashing. Both these streams are under computer control.
It was also considered desirable to monitor pump conditions as anundetected pump failure can cause mechanical downtime. The operationalproblem of switching from the start-up mode to normal running and trans-ferring the necessary pump data to the computer was overcome by startingup and shutting down the pumps in sequence by the computer.
COMPUTER ORGANISATION AND SOFTt/ARE
The IBM 1800 in use has 32K of core and three disk drives capableof storing 0.5 million 16 bit words per drive. The computer runs underthe IBM Multiprogramming Executive (MPX). The computer resources used forthe milling train control consist of a four hundred word core-residentmonitor and a 1K word overlay partition into which about forty coreloadsmay be loaded from disk on request from timers, process interrupts, programinterrupts and other programs. Any programs that execute more frequentlythan about thirty seconds tend to be core resident, while other periodic orevent oriented programs arc loaded into the overlay partition.
In Figure 2 a genera], schematic layout of the software system is.shown illustrating the program and the data linkages of the system andalso the linkage with other computer systems of the Mill. Data is received;?rom the Cane Receival System where cane is weighed, while pertinentinformation such as Mill stops and starts are passed to the juice controlsystem.
All the process coreloads are written in 1800 Assembler languagewhile batch and. keyboard initiated programs for altering control para-meters tend to be written in Fortran.
COMPUTER OFF-LINE ALARM
]n any real-time application of process control it is imperativethat the plant operators are informed immediately of any computer diffi-culties no matter how infrequent. The off-line alarm on the milling trainconsists of a large rotating beacon located at the engine driver's console.Thr, boa con commences flashing when a twenty second physical timer on theconsole times out. Under normal operation the milling train monitor programresets this timer every fifteen seconds by a digital output pulse. The
- 223 -
monitor program tests the validity of data on the digital input and failsto resot the timer if bad data transmission is detected. This type ofalarm provides protection against several computer troubles:-
(a) power failure in the computer room
(b) programs on higher levels of execution looping and locking up C.P.U
(c) digital input failure
(d) failure on the milling train digital output word.
I/hen the failed condition is detected the softwaresystem for the mills holds all digital output other than control valvemovement shut-off and pulsing output, in its present state. This allowsthe operator to switch all systems to manual without interfering withcontinuity of operation.
During the crushing season,in progress, when this paper was written,availability of the system was 0.994-8,, This was considered a bad
season for availability, as £6% of the downtime was caused by a program-ming "bug".
the
IMBIBITION CONTROL
Although it is logical to discuss the operation of the systemdistinct thought groupings, this does not necessarily correspond to theactual program groupings. The program groupings reflect the operation andprocessing aspects as well as the order of implement?tion. The generalprogram flow charts are shown in Figure 2.
2The mathematical model of the milling train shows the significance
of the level of imbibition water expressed as a percentage of fibre rate.It is desirable to control the level of imbibition water addition as comeratio of the fibre rate passing through the milling train, rather than ata fixed flow level. VJhen a fixed flow level is used, a decrease in thefibre rate could lead to a drop in extraction as well as consuming someunnecessary fuel. The ideal solution of adding the imbibition water ansome percentage of the fibre rate is obtained by a cascaded direct digit-ally controlled loop (Figure 3)•
The inner loop comprises of flow control where the flow is read froma turbine flow meter, compared to a set-point held in core, and the controlaction is implemented by driving a motor driven butterfly valve by digital

DATA FROMCANE REGEIVAL
•
C TIMER]
MILLMONITOR
START UPROUTINES
SHUT DOWNROUTINES
DATA
XxRATE
CALCULATIONSNORMALCONTROL
QUEUED BYPROGRAMS
MESSAGESYSTEM
PROCESS
PUMPMONITOR
iIV?
SOFr- WARE SYSTEM
FIG. 2
NO. 6 MILL
FLOWCONTROL.
SET~POINTCALC .
COMPUTER
MILL SPEEDROLLER LIFT
FLOW
ir\jrovnl
IMBIBITION CONTROL LOOP
FfG. 3

- 226 -
- 227 -
output. Ti/o bits of digital output can drive the valve motor in eithercliroction. This type of valve actuator has the advantage of leaving the valvein il,s present position on a computer failure.
'•'he outer loop which runs less frequently than the inner loop, calculatesa suitable set-point. The set-point is arrived at by the following equation:-
imbibition water set-point = fibre rate x imbibition level/unit fibre rate.
The fibre rate is related to the delivery escribed volume (product ofroller length, average opening and roller surface speed) as shown in theAppendix. Over the range of interest this functional relationship is sufficiently.Linear (Figure /,.) not to introduce any significant errors by linearizing thefunction. The escribed volume can be readily computed by measuring the speedof the rollers and the lift of the hydraulically loaded rollers. All the otherfactors in the calculation are reasonably constant for the crushing season, orcan be changed in the program when the physical quantity is altered.
A. magnetic proximity switch and spokes connected to the drive shaft ofthe mill produce a pulse train which enables calculation of the mill speed andhence the surface speed of the rollers. The lift (up to 12.5 mm) of the crushingrollers is measured by a mill developed digital shaft encoder connected to thebearings of the rollers.
The imbibition level per unit fibre rate, the second term in the set-point calculation, is selected to maximise technical efficiency on the millingtrain, although in times of fuel shortage the level may be decreased somewhat,3
and conversely, in periods of excess fuel, the level may be increased to disposeof the excess fuel. The off-line mathematical model may be used to selectthe ifivel to maximise extraction. When the optimisation and integration of thestations is introduced, it is expected that the imbibition level per unit fibrerate will be selected on economic efficiency. The gains in extraction will betraded-off against fuel and capacity costs.
FIBRE RATE-ESCRIBED VOLUME RELATION
34
32
!I 30
23
UjQC03
24
FOR FINAL MILL
46 48
ESCRIBED
50
VOLUME
52
( CU.
54 56
FIG. 4

- 228 -- 229 -
CRUSHING RATE CONTROL
The milling train is one of the major items of capital equipment in a sugarMill so the returns from increasing the throughput of the existing equipmentrather than installing new equipment for an increase in capacity are enormous.One method of doing this is to improve the control to enable driving of theequipment closer to its physical limit.
Under the traditional approach of controlling the rate, the firstmil] in the train operates at a constant speed. A 1 ashing rate isprocessed by an increase in this speed. The crushing xu^o under the constantspeed condition is shown in Figure 5* The variation in crushing rate is dueprimarily to two factors:-
(i) variation in fibre content of cane
(ii) variation in feed bulk density.
The variation in fibre content of cane in the Mossman district is generallyabout 10'/ at any one period in time. The variation in feed density can arisefrom the variation in preparation of cane due to different cane varieties inthe shredding and knifing process. The method of presentation of the preparedcane to the feeders of the first mill can also affect the bulk density of thefeed. V;hen controlling under constant first mill speed the float of the hydraulic-ally loaded rollers results in a variation in the escribed volume with variationsin the hulk feed density.
The current milling theory indicates the escribed volume is related tofibre rate, so controlling the escribed volume at a fixed level providesa constant fibre rate and crushing rate variations should then be only about10°'. '.'ith the wear of roller surface roughness and any decrease in theperformance of the cane shredder, the escribed volume set-point must beadjusted to maintain the desired rate. This may be achieved by a feedbackloop on the crushing1 rate adjusting the escribed volume set-point.
T'hr; control scheme implemented for the task is shown diagramaticallyin r'iroire 6. The speed of the steam enpine is controlled at a desired levelby a conventional pneumatic controller. The escribed volume control loop,which is a cascaded computer control loop, manipulates the set-point of thepneumatic speed loop. The escribed volume is calculated from the roller liftand the mil] speed, which are sensed similarly to the imbibition water controlsystem. The finite difference form of the proportional integral controlleris used fur the control action.
Additional digital features are included in the controller such as nonpeod set-point increase if the roller lift is not greater than the dynamic•ero .lift position, as this indicates there is insufficient feed in the mill.The set-point of the escribed volume loop is trimmed by a crushing rate loop.The crushing rate for a fifteen minute period is calculated from the weighbridge
ofcQ:
Q:
i5to:Dcto
COCt
kl
o10
oo
(UH/3NN01) 31VU

- 230 -
fc5
c/
1
cuuco
(
ii
%«•
4
1
<»
JJ
->
J
^^
li
J
5it
>»
D>
1 C
ON
TR
OL.
i
\iirfl
^
J»
*to
i
«(.•!•
C•«i
^
(.
• 1K
0.
1
8f«jQ: •*• o
fc] ^
'LJ' IT Sg
o Q: <S>. ; O
- ' S(jj Q Uj QC
o 5 Q: o ^"— _ in ft ^^
8 uj- , , „ , ..r5 o
1 CO
? ] 5!* \ . ^^- - s-j • O
O *-* f \^ o ^Q: p:
«ii § lar i §Uj O
f (
i. j O
(t
ll 1 „••*,_s
<o
CO'
231 -
of the individual farmer's bins, together with the cane sampleof the Cane Receival System, which is also under computer control,
the finite difference form of the proportional-integral controller isused for U\e crushing rate loop, but very low gains are used as the crushingrate is a very noisy signal with disturbances from the fibre content of% caneand Taps in the feed material.
The results of this control are shown in Figure 5- The decrease in themagnitude of the fluctuations allows the equipment to operate closer to thephysical limit. An increase in capacity of at least 5}i can be gained alongwith an increase in extractive performance.
PUMP MONITORING
Since an undetected pump failure during crushing may cause a seriousequipment failure, the computer system is used to detect pump failures. V.henany pump motor stops, the hardware is wired to produce an interrupt for thecomputer, whereupon the system tries to restart the pump. If it fails torestart, the associated standby pump is started. Should the standby pumpalso fail the milling train is shut down automatically.
Each pump has a three position switch located at the pump to enablethe pump to be electrically isolated, operated by the computer or operatedmanually. The plant operator may use this switch at any time but caremust be taken when switching pumps off while the mill is crushing,as themill will bo shut down should the standby pump fail to start.
AUTOMATIC START AND STOP OF PUMPS
Since all the process hardware required to automatically start and stopthe eleven pumps on the milling train is already installed for other purposes,the cost of an automatic start-up and shut-down lies solely in the prooTammin?costs. The benefits arise from the ease of implementation and operation of thepump monitoring and from the removal of inadvertent operator error at start-up.
.in the start-up the pump starting sequence is of importance with therecycle streams. Generally there are two possible ways of starting a milling-train. When the train is empty of material, the sequence of starts is fromthe first mill to the final mill, however, when the train is full of materialthe sequence is from the final mill to the first mill. The system must handleboth methods. The start cannot be detected reliably from a sinple criterion.
The two criteria used are the movement of the intermediate bagasse carriersand the mill speed above a predetermined level. After the start has commencedthe pump supplying imbibition fluid to an intermediate carrier is started whenthe intermediate carrier begins to move. The shut-down simply shuts off thepumps as the particular carriers stop.

- 232 -
MANAGEMENT CONTROL
The important variables on the nailing train such as mill speeds, rollerlifts, crushing rate and imbibition water rate are logged every minute whilethe mill is crushing. At the end of each shift the data is condensed andstored on aweekly file and a shift summary is produced. A detailed printedlop1 may be obtained at any time during the shift or for some time afterwardsif desired.
At the end of the week the laboratory analytical data is entered frompunched cards and the actual performance of the millingptrain is comparedto that of the mathematical model of the milling train
When the performance deviates from that predicted for the quality ofmaterial beinp processed, corrective action is taken. It is much morere .liable to detect changes in technical efficiency by trends in the parametersof the model which have physical significance than to examine the overallperformance of extraction which is also influenced by the seasonal changesin cane quality.
CONCLUSION
The benefits from our computerisation are large. As well as the gainsupon which a monetary value can be placed, there are enormous intangiblepains. The system analysis required for computer implementation leads to arrreater understanding of the process and as staff become more familiarwith the mathematical model, management decisions can be made with moreconfidence. The availability of more process information has made operatorsmore keen and more conscientious.
The effect of these intangibles contribute significantly to the overallcompany performance.
REFERENCES
J. Martin "Design of Real-time Computer Systems" Prentice Hall Inc. N..T,
Hurry, C.R. and Holt, J.E. 1967 "The Mechanics of Crushing Sugar Cane"KLsovier.
- 233 -
APPENDIX
RELATIONSHIP BETWEEN FIBRE RATE AND ESCRIBED VOLUME FOR A FINAL MILL
The reabsorption factor k of the milling train measures the relative movement.of the bagasse mat over the roller surface
k = VB (A1)V.E
The reabsorption factor has been correlated in the form
V
*EUsing equations A1 and A2
F J ~ E
+ r VE
VF (A3)
Now for a final mill where supervision of losses is constant it may be shownthat
V_ / Vn ** constantt! P
= K
F - K
where K, c< , are constants.
The relationship between fibre rate and escribed volume using values forthe constants derived at Mossman is shown in Figure 3.

- 23U -
National Chemical Engineering Conference 1974
PROCESS INDUSTRIES IN AUSTRALIA IMPACT AND GROWTH
Surfers Paradise, Queensland
July 10 to 12th, 1974
COMPUTER CONTROL OF A STOCK FEED PROCESSING PLANT
by
R.L. Muller
S U M M A R Y
This paper describes the broad specifications for a computer controlsystem designed concurrently with a new plant converting distillery wasteinto stock feed. There are two separate control systems. One carries outdirect digital control of continuous processes. The other performs batchor step-wise control of discrete processes. Each was designed to be ex-panded beyond the initial requirements of the stock feed plant. Desiqn ofthese systems was based on a philosophy of table driven programmes oper-ating synchronously at fixed clock rates. This enabled a highly flexibleoperator communication program to be incorporated, which gives extensivefacilities for on-line changing, display and inserting of control para- •meters and specifications for feed mixing. Implementation of the systemdemonstrated many of the advantages of computer control over conventionalhard-wired systems.
Muller, The Millaquin Sugar Co. Ltd., Bundaberg, Queensland.
- 235 -Introduction.
The Millaquin Sugar Company was recently faced with the problem of build-ing a new stock feed processing plant. It was recognized at an early stage ofthe design that this was a process that could profitably operate by computercontrol.
The reason for building the plant was to utilize hard-to-treat effluentfrom the company's distillery. Pilot scale investigations had shown that theeffluent could be concentrated by evaporation and mixed with various solid in-gredients to make a suitable feed for cattle in a feed lot. However, Australianfeed mill machinery suppliers had no experience of this type of process, and it-was desirable to keep the control system highly flexible so that alterations tooperating procedures could be easily made during commissioning.
At the same time, it was considered necessary to design a system whichwould handle a number of different feed formulations and operate with a minimumlabour force. Computer control was an obvious candidate. A further influencewas that the company was considering applications of computer control in itsother factories on the site.
An advantage in designing a computer control system at the same time as anew plant, is that full advantage can be taken of the inherent flexibility insuch a system. By contrast with installing computer control in an existing plant,it is possible to arrange a more satisfactory marriage of plant equipment, con-trol elements and instrumentation, computer hardware and software.
Control System Requirements.
There are two distinct sections of plant to be controlled. In the first, acontinuous system, distillery effluent is concentrated by multiple effect evap-oration to produce a thick syrup. The second section is a batch sequential pro-cess for handling solid materials to produce stock feed.
Initially, the continuous section was to have seven contro] loops. However,the system design specified the capability of handling a much larger number, sayfifty to a hundred, to allow for expansion into other areas.
Similarly, the batch processing plant had about a hundred devices such asmotors, valves and conveyors to be switched and about two hundred feedback orinput signals to be read. Again the system design called for capacity to handlemuch more than this.
The batch process consists of a number of operations taking place at thesame time, each operation being a sequence of steps such as turning on conveyors,opening and closing valves and slide gates and activating feeders. Each sequenceis usually repeated continuously. There can be branching within individual se-quences, and there is a degree of interlocking necessary.
Conventional control systems for such processes are usually made up of largenumbers of hard-wired logic modules, or relay ladder networks.' Some may includesequence programmers by cam switches or perforated belts. In some newer feedmills, feed formulations are controlled by punched card readers connected to thehard-wired logic.
The advantages in using a computer include all those normally associatedwith replacement of hard-wired systems: flexibility, reliability, expandability,more advanced functions, etc, but as well, it is possible to program the systemto handle ingredient changes, recipe changes, inventory control, with or with-out operator intervention.

- 236 -
System specification laid down requirements to handle up to twenty paralleloperations to allow for future expansion. The system was to handle all stages offeed production with a minimum of operator intervention. This was to include de-fining ingredients in particular supply bins, recipe formulation, scheduling pro-duction of specified quantities of specified recipes and keeping an inventory ofraw materials and finished products in bins and silos.
Both the continuous section and batch section were to be provided with fac-ilities for on-line changing of parameters by the operator via the computer key-board.
A number of security checks werethe relevant section below.
also required and these are described in
System Design.
The requirement that both continuous and discrete control systems should beflexible and provide comprehensive operator communication led to specificationof table-driven synchronous operation. The control system design was dictated tosome extent by the operator communication system (OPCOM) design.
OPCOM edits and interprets a command string from the keyboard, then takesthe appropriate action. It allows the operator to examine, delete or change datain the tables controlling the continuous and batch systems.
These tables (described later) are :-
Continuous Control :Loop and Algorithm ListsTrend Recorder Display ListInput Channel Data BlockOutput Channel Data Block
Batch Control :Production Schedule TableInventoryBin Allocation TableRecipe TableIngredient Table
The command string is of the form
(LUP), (ALG)(TR)(ICD)(OCD)
(PRS)(INV)(BAT)(REC)(ING)
Action : Table : Table Number : Parameter :where the action mnemonic is interpreted as below.
Parameter Parameter,
Action Meaning
LCIDSTAR
ListChangeInsertDeleteSwitch ICD alarms on or offTurn continuous control algorithms on or offAllocate value to trend recorderAllocate a range to the trend recorder.
The command string may be a full entry or abbreviated as required.
Examples are :-L : REC (abbreviated form) List all elements in the Recipe Table.C : LUP : 2 : ALG : 3 (full) Change the elements in algorithm 3 ofcontrol loop 2.
- 237 -
In this way, the operator can exert full control over the system. Certainof the parameters, such as loop tuning constants, can only be changed when akey switch is set, giving greater security from unauthorised changes.
The continuous control system is a set of programs run one after the otherat regular intervals, under control of the data tables. At the beginning of thesequence, the analog inp.'t program reads in process variables under control ofthe ICD table. This table contains information such as the analog to digitalconverter gain, multiplexer address, scaling factors, engineering units, errorstatus, etc. Alarm scan and alarm print programs then check through the ICD andprint out any alarm conditions such as instrument fault, deviation from setpoints, and high and low limits being exceeded.
The control executive, under control of the LUP and ALG tables, performsthe control function for each loop by operating on the inputs, and parameterssuch as set points, proportional and integral action gain, smoothing constantsetc, to calculate percentage changes in valve positions which are entered inthe OCD table.
Output programs under control of data in the OCD table convert the per-centage change in valve positions into time duration signals and control theturning OH and off of the valve motors.
Other programs scan the TR list and present analog outputs to the multi-channel trend recorder, and perform various switching tasks.
Control algorithms are written as re-entrant subroutines, making it easyto add different types of control action. Some of the algorithms at presentused include :
* two-term control - equivalent in action to a proportional-integralaction controller
* gap action or dead band ~ equivalent to a two-term controller withhigh and low limits. One set of control parameters is used when themeasured value is inside limits, and another set when outside
* cascade - for linking output of one loop to the set point of another* lead-lag - for correcting system dynamics* smoothing - simple exponential smoothing to reduce "noise"* polynomial - for calculating a function of the form
2y = a + bx + ex + ....
* steam flow - for calculating steam mass flow rate by the standardorifice equation.
The batch control system uses programs written in a specially developedcontrol language. An interpretive executive examines the instructions individ-ually and carries out the operations one at a. time. In this way it is similarto a macro assembler language. However, up to twenty separate programs canoperate in parallel with this system. There are 22 instructions so far in thelanguage, which allow devices to be switched on and off, status of devices andflags to be tested, together with simple branching, compare and alarm print
instructions.
Examples of instructions are
ON,V21WAIT, 20TFST, F2,
BATCH2 : ON,V21 (Turn valve 21 on)(Wait for 20 seconds)
BATCH2 (Test whether the flag called F2 is set.If it is set, go to the next instruction.If not set, branch to the next instruction
labelled BATCH2) .
Flags in one program can be set or tested in another, allowing communi-cation between programs, and complex interlocks to be set up.

- 238 -
As well as interpreting instructions, the executive controls digital in-put and output.
Once each instruction cycle (usually each second) all input points arescanned and the status of the points recorded in a bit map in memory called theplant state map (PSM). At the end of the instruction interpretation, outputs arecalculated, and a bit map of desired states is produced, the desired status map(DSM) . This has the same format as the PSM, so a word by word comparison can bemade after each output to see that devices have been set correctly. Some deviceshave inputs for each state, e.g- valves may have an input for open and an inputfor closed. A simple check is made on these to see that they do not appear to beeither both open and closed or neither open nor closed at the one time (as wouldbe the case with a sticking valve or a digital input failure). .
Alarm messages are printed out when input or output failures occur, or inresponse to programmed requests, or to alert the operator to perform some func-tion such as manually feeding ingredients into a premix feed.
A simple computer operation check is made once a second to check the pro-cessor arithmetic and logic. If this fails, the plant is isolated from the com-puter.
Plant Operation
The continuous control section works on a one second cycle. Anv controlloop or analog input can be scanned at periods which are a multiple of one sec-ond. Loops scanned less frequently than once a second can be arranged in such away that loading on analog multiplexer/converter and the central processor isevenly spread. As well as individual loops, groups of loops corresponding tosections of plant can be turned on and off together, either by the operator orby an instruction within a program.
Additions and changes to the continuous control system have demonstratedits flexibility, ease of operator interaction and general superiority to con-ventional analog control.
The feedmill proper is operated by the batch control system. At present,this requires six main programs and six subsidiary programs. These operate inparallel, with one instruction from each executed each second under control ofthe executive described previously.
The major programs control the following functions : materials receival,refilling bins, weigh hopper control, mixer control, distribution of mash pro-duct, distribution of pellet product. All these programs access the data tables,which control the operation.
Mien the system is initially set up. it is necessary to insert an ingred-ient table (ING). This is a list of ingredient names, each of which may have upto four characters, e.g. UREA, GLUC (ground lucerne), PMX2 (premix 2). Once in-serted, the table may be changed by the operator, who may insert or delete in-gredients as required.
Ingredients are stored in bins or silos. Programs access these according totheir contents. The Bin Allocation Table (BAT) is a list of all bins and silosby number, with one of the names from the ING table associated with each entry.This also may be changed by the operator if the function of one of the bins ischanged.
The operating programs keep track of the contents of each bin or silo asmaterial is added or removed. -This is done through the inventory table, (INV)which is similar to the BAT, but has entries for bin volumes, material densi-ties, contents weights. Manual intervention is needed to add weights to themain storage silos when material is received from outside, as there is no auto-matic raw material weigh-in.
- 239 -
Individual feed formulations are listed as recipes. The recipe table, RECcan take up to 32 different formulations. This is set up under control of'theOPCOM system. If the operator writes a command code to insert a recipe, the pro-gram types out the entries in the ingredient table, one at a time. The operatorthen types next to each entry the weights required in the particular formulationEach recipe can have up to 16 ingredients.
Periodically, say once or twice a shift, the operator initiates feed manu-facture by typing in a production schedule (PRS) under guidance of OPCOM. Thereis an entry for each type of feed to be produced. Each entry contains the recipenumber, weight to be produced, a code to describe the type, whether mash or pel-lets, and a destination bin number. After the PRS has been correctly inserted,production is completely automatic, except for some premixes which require man-ual loading of bagged vitamin or mineral concentrates, etc.
Mien a truck of raw materials arrives, the operator selects 'the requiredbin or silo on a rotary switch and presses a button which requests the materialreceiving program. This checks the contents of the bin, and the path through theplant. If this is satisfactory, it turns on the necessary conveyors, elevatorsand bin selectors and a light to instruct the driver to tip in a dump hopper.
If an ingredient bin over the feed mixing section becomes empty, the refill-ing program looks in the BAT table to find the ingredient. If the ingredient namehas a G for its first character, this means the bin holds ground material andmust be refilled via the hammermill. In this case it examines the rest of thename to see if a corresponding unground material is in one of the bins supplyingthe hammermill. It then turns on the mill and activates the bin feeder. The millgrinds material until the bin signal indicates that the ingredient bin is refill-ed. For other ingredients, the system checks whether another bin contains thesame ingredient, and then continues with the current recipe, and searches thesilo section of the BAT for a silo containing the same ingredient as the emptybin. If successful, it will fill the bin from the silo, through a system of gates.conveyors and elevators. If unsuccessful, a message is printed out to alert theoperator that a bin is empty and cannot be refilled automatically.
Feed formulation is carried out in a batch weighing system. Ingredient sup-ply bins supply a conical weigh hopper via individual feeder screws. The hopper,of one tonne capacity, rests on load cells which transmit weight to the computer.From the REC table, the weight of each ingredient is obtained, and the cumulativeweight set point calculated. The feeder operates until slightly less than the setweight is registered. This allows a correction for material "in flight".
Dry ingredients are dropped into the batch mixer, where liquid ingredientsare pumped in. This is controlled by an integrating flowmeter. After mixing for apredetermined time, the batch is dropped into a receiver, and conveyed to its des-tination. Because the programs rur in parallel, but are interlocked, it is pos-sible for three different batches to be concurrently conveyed, mixed and weighed.
Product is either mash, in which case it is conveyed directly to a destin-ation bin, or pellets, in which case it goes to a pellet mill supply mill. A sep-arate program controls the pelletting operation, which includes a pellet mill andvariable speed feeder, feed conditioning by steam heating, an air cooler, gradingscreen, and product elevators. Finally, product goes to one of the destinationbins as before.
Conclusions.
Operation of the plant has confirmed expectations for the computer controlsystem. The flexibility was particularly appreciated during commissioning, whenmany changes were made. The operator communication programs provide a most effect-ive means of interacting with the computer, and provide operators and supervisorswith a valuable tool.

- 2)40 -
The advantages of designing the control system with the plant are apparent.This applies to operators as well. Because they were new to this type of plant,they did not have to unlearn old habits. They accept the computer, and rely onit. If the computer has to be taken off for maintenance or program checking, theoperators clamour to have it back.
Because of the flexibility and expandability designed into the control sys-tem, it is now being extended to other factories on the site, and it is confid-ently expected that further benefits will be gained, particularly from some ofthe more advanced control schemes planned, and interaction with a commercial pro-cessor now installed as a back-up machine.
- 241 -
National Chemical Engineering Conference
PROCESS INDUSTRIES IN AUSTRALIA IMPACT AND GROWTH
Surfers Paradise, Queensland
July 10 to 12th,
PREDICTION OF THE BEHAVIOUR OF PACKED ADSORBENT BEDS
D.J. Close
S U M M A R Y
In dealing with complex processes, it is necessary to have a simpleconcept framework within which the "behaviour of the process can "be under-stood. The introduction of digital computer simulation has not relievedthis problem, since output from such numerical models may itself be beyondreal understanding.
For some years, the author and his colleagues have been engaged in thedevelopment of an analogy between heat transfer and coupled heat and masstransfer. The use of the analogy involves the linearising and uncoupling ofthe conservation and rate equations describing the coupled heat and masstransfer process. The transformed equations are found to have the form ofthe equations for a similar heat transfer only system, and use is then madeof the extensive heat transfer literature to solve the coupled heat and masstransfer system.
In this paper, results of measurements made on a silica gel bed subjectedto a step change in the inlet air state, are compared with predictions usingthe analogy method. The well known Schumann model of packed bed temperatureresponse to a step change in entering fluid temperature is employed inconjunction with the analogy. The' analogy method well predicts the systembehaviour and measured effects due to the non-linear adsorption properties canbe interpreted in terms of these predictions.
Close, James Cook University of North Queensland, Engineering.

NOMENCLATURE- 21*2 -
AvBi
d
F.
H
h
hc
j
K
L
Lec
NTU
P
Pe
Pr
Re
Sc
t
v
W
w
X
a.
Surface area of particles per unit volume of packed bed - m2/m3
Biot Number = h d/K for heat transfer or h^r/pD for mass transferc m D m
Characteristic particle diameter - m
Combined potentials, F\ = t + a. w are average values - UC
Specific enthalpy of adsorbent plus adsorbed material per unit massof "dry" adsorbent - J.kg l
Specific enthalpy of fluid mixture per unit mass of the non-transferrablecomponent - J.kg !
Forced convection heat transfer coefficient - W.m. 2K l
Forced convection mass transfer coefficient - kg.m 2S
Colburn j factor
Thermal conductivity - W.m .K 1
Length of packed bed in fluid flow direction - m
Convective Lewis Number = c
Number of transfer units as defined by Kays and London
Density of "dry" adsorbent - kg.m 3
Peclet Number = Re.Pr for heat transfer or Re.Sc for mass transfer
Prandtl Number
Reynolds Number
Schmidt Number
Temperature - °C
Superficial fluid velocity - m.S l
Adsorbate content of adsorbent per unit mass of dry adsorbent - kg/kg
Adsorbate content of fluid mixture per unit mass of non-transferrablecomponent - kg/kg
Dimension in fluid flow direction - m
System properties = - /81 v - C
e
P
o
System properties defined in .
Packed bed void fraction
Density of fluid mixture;mass of non-transferrable component per unit volumeof mixture
Time - S
Time for sharp fronted change to reach end of packed bed - S. n J _ . h_A (9-x/v)
Dimensionless time = D vP(l-e) \
h_ A xDimensionless length = D v
T
Dimensionless length at x = L. Also equal to WTU
Dimensionless temperature change defined in text
- 2U3 -Subscripts
f
i
m
t
w
At the fluid state
1 or 2
At or in equilibrium with the adsorbent state
Refers to heat transfer
Refers to mass transfer
Superscript
1.
Indicates mean value
INTRODUCTION
For some years, the author and his colleagues have been engaged in thedevelopment and application of an analogy between heat transfer and coupledheat and mass transfer, l '2 '3 '**' 5 's ' 7. The method relies on the transformationof the conservation and rate equations describing a particular process, tosets of equations analogous in form to those describing a similar heat transferonly process. Use is then made of the extensive heat transfer literature,to solve the coupled heat and mass transfer process.
To use this technique, it is generally necessary to assume that the systemthermal and sorption properties are constant, and where more than one transportmechanism occurs, restrictions are placed on the values of groups such as theconvective Lewis number Le . In the case of packed adsorbent beds with throughfluid flow, Le is required to be close to 1, a good approximation for air/watervapour mixtures.
In spite of these restrictions and the fact that the basic process equationscan be solved numerically, it is contended that the application of the analogyprovides a vital concept framework within -which experimental data aid numericalmodel results can be interpreted. This has already been demonstrated for heatand mass regenerators 7 and wheat aeration systems 5. This paper is concernedwith beds or silica gel as used for dehumidification, and the usefulness of theanalogy is demonstrated by comparing predictions from the analogy withmeasurements of the response of a silica gel bed.
2. THE ANALOGY EQUATIONS
A packed adsorbent bed with the characteristics listed below is considered.
(i) The system comprises a porous solid adsorbent, with a fluid mixturecontaining a single adsorbate and a non-transferable component, passingthrough.
(ii) Transfer of heat and the adsorbate between the fluid mixture and theadsorbent, is governed by transfer coefficients. These are eithersurface transfer coefficients, or lumped or overall coefficients inthe case where diffusion in the adsorbent must be taken into account.
(iii) Diffusion and dispersion in the fluid flow direction are neglected,
(iv) The adsorption process is without hysteresis,
(v) The fluid mixture is at constant pressure.
With these assumptions, the conservation and rate equations describing thesystem are written 3 as,
P(l-e) + pve ah8x pe 80 = 0

P(l-e)aw
pE = 0
tm
- h A v
Since h, H and W are all functions of t», w » t and w , the above equations• < . i i m mmay be transformed to,
3F . _if (1)
+ F. + (Le -1) (t -t )if im c f m
(2)
where tf + a,, vf
t + a. wm i m
A necessary restriction on the transformation is that the system thermal andadsorption properties are assumed constant.
To uncouple equations (l) and (2), it is necesary that Le = 1, asituation well approximated by surface transfer coefficients for air/water vapourmixtures. If Le ^ 1, then it has "been shown 8 that the assumption Le = 1 givesreasonable agreement with numerical solutions of the particular case or a stepchange in the state of the entering air. For this case, the initial andboundary conditions are written,
0, n- < 0, F._ = F.Jn.<0), a constant )i it ii i \
. > 0, F = F r i - ^ O , a constant
o, Fim=F.m (Vo) = F (n
(3)
With the coupling terms in (2) neglected, then (l), (2) and (3) form twosets of equations, each identical in form to the equations first solved bySchumann 9, for heat transfer alone in a similar system. Using the method
*j
described in , the known solution to the Schumann model is employed to solvethe coupled heat and mass transfer system.
3. THE EXPERIMENTAL PROGRAMME
Following the development of the analogy and subsequent checking withnumerical solutions ii'8, comparisons with actual bed performance were necessary.For several reasons,, close agreement between predictions and real behaviourwas not expected. Firstly, real beds have highly variable properties,andalso adsorption properties have been shown to be very sensitive to small changesin the form of the isotherm 2. Secondly, the model used to develope the analogyneglects axial diffusion and dispersion and only accounts for radial diffusionin an approximate manner. Thirdly, as Barker 10 shows, correlations for heatand mass surface transfer coefficients are not well established.
- 245 -
For these reasons, the experimental programme was aimed at:
(i) showing that the predicted two front behaviour of the system, viz.the occurrence of the change fronts at a given position, and thedwell state between them agrees with the behaviour of the real system;
(ii) interpreting effects of non-constant system properties in terms ofcalculated values of the y.;
'i'(iii) illustrating the effects of system parameters such as the heat and
mass transfer NTU, on the shapes of the change fronts.
As can be seen from the definition of the r\. , the y. play a role in coupledheat and mass transfer processes, similar to the1ratio of bed to fluid specificheats in the similar heat transfer only process. Consequently the rate atwhich change fronts pass through the bed is determined by the Y- •> "the smearing orwidening of these fronts about an ideal front, being determinedly parameterssuch as the NTU.
h. SYSTEM PROPERTIES
The system thermal and adsorption properties are contained in the shapes ofthe potentials F^, via the a. , and in the capacity ratios y. . The silica gelused in the experimental programme was supplied by Joseph Crosfield and Sons,and their silica gel properties are given in 11.
Using the method outlined in 2, charts of constant F. and y. , were preparedand are shown in Figs. 1 and 2. The data supplied was only appropriate to gelwater contents less than 0.22 kg water/kg dry gel, so a full set was obtainedassuming a saturation water content of 0. 1? kg/kg with an isotherm exhibitingType I behaviour. The experimental programme was arranged so that tests werecarried out within the limits of the known data.
Characteristic particle sizes were required for the two sizes, to 6 and6-22 BSS mesh gel supplied. From each drum, fifty particles were chosen andby placing them on squared paper, the maximum dimension and minimum thicknessat mid length were estimated. The mean values obtained were then used toestablish working values for Reynolds and later, Biot Numbers.
5. EXPERIMENTAL EQUIPMENT AND MEASUREMENTS
A complete description of the experimental apparatus and procedure is given1 0
in . Briefly, air at a predetermined temperature and absolute humidity wasgenerated in one section of the apparatus and delivered to the test bed untilequilibrium was established. Then a new air state wac generated and whensupplied to the test bed approximated a step change in inlet air state. Toavoid thermal capacity effects, the step change was essentially in humidityonly. Wet and dry bulb thermocouples mounted on the bed axis measured bedinlet and outlet air states and the inlet air dew point was also measuredusing a Siemen's precalibrated dew cell 13. Thus the wet bulb psychrometerswere calibrated in situ, so allowing radiation effects to be accounted for.
Measurements were made using a multi-channel potentiometric recorder, andthe most probable errors in temperature and absolute humidity were assessed as±0.22UC and ±0.000 kg water vapour/kg dry air respectively.
6. EXPERIMENTAL RESULTS
A number of experimental runs were made and typical results only are shownhere. Distributions with time or air outlet temperatures and absolute humiditiesare shown in Figs. 3 and k, and corresponding state points are shown on Fig. 2.Test 2, involving a step increase in air inlet absolute humidity covers a smallerrange than Test 1 and this was occasioned by loss of control by the humiditycontroller when large increases in absolute humidity were required. These testswere used to illustrate the form of the two change fronts with the interveningdwell point, and the effect of variable y0 as shown in Fig. U.c.

To illustrate the role of system parameters, results from Tests 3 and k areshown in Fig. 5. Here, only the second change fronts are shown and in dimension-less form so that results from tests carried out under different conditions canbe compared. The method used is to plot T, the fraction of the change betweenthe dwell and final temperature, against 9/6 where 9 is the time required for asquare or sharp change front to pass through the bed. The sharp front is not the"shock" proposed by Amundsen et al lft, but is the front shape achieved in theSchumann model with constant properties, and the surface transfer coefficientsinfinitely large.
Data concerning the test conditions is summarised in Table 1 below.
Table 1.
Summary of Test Conditions
Test No.
123i*
Dry Gel Mass(kg)
2.0?2.072.072.03
Bed Depth(cm)
7.67-67.67-3
Approach AirVelocity(m.s"1)
0.3110.3180.5800.995
Worn. Gel SizeBSS Mesh
6-226-226-22\ - 6
7. PREDICTIONS USING THE ANALOGY
Predicted distributions with time of air outlet temperature and absolutehumidities were obtained using the analogy and the Schumann model solutionpresented by Kays and London b, and are shown in Figs. 3 and U. The F._arestraight line approximations to the curved F. shown in Fig. 1, and the y. areobtained from the y. as described in
To obtain appropriate heat and mass transfer coefficients the relationj = j = 0.33 Re °'3 was employed. The function j = 0.33 Re °'3 is a meanline drawn through the data collected by Barker l u. The characteristic dimensionchosen was 2.8 mm representing the mean of the measured particle maximum lengths.Owing to the factors referredto in Part 3 and the difficult of identifying acharacteristic dimension it is clear that a range of predicted front shapes couldbe produced, all with equal justification.
8. COMPARISION BETWEEN PREDICTIONS AND MEASURED RESULTS
For Test 1 and the first change front in Test 2 there are discrepancies bet-ween the times of occurrence of the measured and predicted fronts. In the caseof the first change front this is largely explained by the imperfect nature ofthe step input and the time lag in the wet bulb psychrometer. In the case ofthe second change front this_discrepancy can be attributed to either anincorrect identification of y? which fixes the position of 9~, or the air flowrate in the vicinity of the bed axis being lower than the area average.Measurements by Price 16 on beds of spheres, show that the latter effect issufficient to explain the discrepancy. Otherwise the form of the two changefronts and the intermediate dwell state, are well predicted for Test 1.
For Test 2, the measured second change front bears no resemblance to thepredicted shape although it occurs at essentially the same time. An explanationof this is suggested by examining the variation in yp as the system changesfrom the dwell to the final state, as shown in Fig. 2. The values of y? firstincrease and decrease, and the influence of this kind of variation in slowingdown and speeding up the passage of the front has been demonstrated theoretically3'8. This test appears to confirm the theoretical findings, but the questionarises as to why the effect was not apparent in Test 1. Only a partialexplanation can be offered in that the y variation for Test 1, as shown by
Fig. 2, is much less. Alternatively, the ridge in y may not be as pronouncedas indicated by Fig. 2, for Test 1 conditions, owing to small variations insilica gel properties.
9. EFFECTS OF SYSTEM PARAMETERS
In a real system, with no heat or mass transfer through the walls, a numberof parameters determine the system behaviour. If particle conduction anddiffusion, and axial conduction and dispersion are included then Biot andPeclet Numbers and the bed NTU, all three on both a heat and mass transfer basis,are identified as system parameters which do not involve the thermal andsorption properties as contained in the a. and y. . For a given adsorbent/ads orb ate/fluid system, these six parameters mus% be used or taken into accountby the designer when achieving a change front of suitable change.
The analogy cannot be applied directly to silica gel beds where particlediffusion is important since the appropriate diffusivity ratio, analogous toLec, is not close to 1
H. The position regarding axial conduction and dispersionat particle Reynolds Numbers greater than 10 is more satisfactory 12, so thatfor beds where the heat and mass Biot Numbers are sufficiently small, appropriateanalogy equations can be formed.
Because the introduction of these additional transport processes increasesthe irreversibilities in the system, and because sets of equations analogousto those for heat (or mass) transfer alone can be formed for certain values ofthe parameters, it seems reasonable to employ concepts from heat transferonly systems to predict trends in the combined system. It is appropriate here
l7to employ the relation presented by Jeffreson for the variance xchange front in a packed bed about the hypothetical sharp front viz.
a
2(l+ya)2
PedL
2(ya):
The estimated values of Pe, Bi, £o for heat transfer (subscript t) andmass transfer (subscript w) , and d/L are shown in Table 2 below, for Tests 3and U.
Table 2.
Parameters for Tests 3 and
Test 3
Test h
Pet
9.53
11.6
Pew
2.0
2.0
Bit
0.125
0.397
Biw
5.90
18.7
£ow
10.5
3.21
d/L
0.0369
0.0171
Since ya » 1, there is little change in Pe, and Pe from Test 3 to Test U,and for the values in Table 2 above the term containing Pe in equation^ is snail,it is to be expected that the change front in Test h should show a highervariance (greater smearing) than Test 3. The states traversed by the systemduring Tests 3 and k were essentially the same so eliminating any effects due toy? variations. The greater smearing of the second change front in Test h isevident in Fig. 5-
10. CONCLUSIONS
The general form of the behaviour of a silica gel bed subjected to a stepchange in the entering air state is shown to be predicted by the analogy methodand the Schumann model. Discrepancies can be traced to the experimental method,
the non-uniform nature of such beds, and property variations with state.

- 2U8 -
The thermal and adsorption properties appear to cause important modificationsto the shape of the second change front. De Vault 18 has introduced the conceptof favourable adsorption properties in isothermal mass transfer. It appearsthat the concept of favourable values of jri may be appropriate for combined heatand mass transfer systems, in that the change fronts can be steepened or smearedby the variation in y~.
Trends in front shape resulting from changes to o and Bi for both heatand mass transfer, are shown to be predictable from heat transfer considerations.There is no reason to suppose that changes in Pe and Pe "will not show equallypredictable trends.
REFERENCES
1. P.J. Banks, Chem. Engng. Sci. 27, 11U3 (1972).
2. D.J. Close and P.J. Banks, Cher,:. Eng. Sci. 2J_, 1157 (1972).
3. P.J. Banks et al, Heat Transfer 1970, Vol. VII, paper CT 3.1Elsevier Amsterdam, 1970.
k. D.J. Close and P.J. Banks, CHEMECA '70, paper 6-2, Butterworths ofAustralia, Sydney, 1970.
5. J.W. Sutherland, P.J. Banks and H.J. Griffiths, J. Agric. Engng Res. l6_368 (1971),
6. I.L. Maclaine-Cross and P.J. Banks, Int. J. Heat Mass Transfer 15 ,1225 (1972).
7. I.L. Maclaine-Cross, First Australasian Conference on Heat and MassTransfer, Section 5.H, Melbourne, 1973-
8. D.J. Close and P.J. Banks, Paper to be published by Chem. Eng. Sci. in
9. T.E.W. Schumann, J. Franklin Inst., 208, 05 (1929).
10. J.J. Barker, Ind. Engng. Chem., 57, 3 (1965).
11. S.A. Mitchell and G.R. Whatmough, Crosfield Research Department RecordReport PM-6H-68 (196U).
12. D.J. Close, Ph.D. Thesis, Monash University, 1971.
13. Siemens Aktiengesellschaft , Instructions A 0501/3e (1968).
lU. H.R. Amundsen et al, Proc . R. Soc. , 268A, 129 (1965).
15. W.M. Kays and A.L. London, Compact Heat Exchangers, McGraw-Hill,
16. J. Price, Trans. Instn. Engrs . Aust., MCJ4_, 1, 7 (1968).
17. C.P. Jeffreson, A.I.Ch.E.J. , 18., 09 (1972).
18. D. De Vault, J. AM. Chem. Soc., 65., 532 (19 3).
60 65
Figure 1. Lines of Constant F. for a Silica Gel/Air/Water System.Silica Gel Data from ll.

251 -
B0.035
0.030
0.025
0.020
hOMbO
0.015
0.010
0.005
25 65
Figure 2. Lines of Constant yi ( ) and y2 ( ) for aSilica Gel/Air/Water System. Silica Gel Data
from 11.
o
0.60 4 8 12 16 .5 1.0 1.5 20 2.5 3.0
miii Ur
Time from Step Change
Figure 3. Variation of Ai Outlet State with Time - Test 1.
X Measured Points- Analogy Solution
3.5
XXXX State Path Test 1State Path Test 2.

Absolute Humiditykg/kg x 102 Temperature C
i x
P S
eno TJM oc H-e-t- at-- c+-O CD3
OS
P
OJC+Pd-a>
I•-3
COc-t-
*+3CO
0)
O
SK
Dimensionless Temperature Change
"*]
2V
l 1 * x 1 h* '^• O ^ H-
1 1 0 3X »— < ft\t~t \V1 ct 3
cn cn1 H-
1 O3
H^ n3 t-3 K-'fD ft) fD fDcn 01 en en
£-U) v^O Osi
^3 <^Cu (I)
cn•t-• o
o
llttuM
Pcn
OH)
0)Oo
non
1
O CD CD O — kC> j^j JN 0> 00 0
j J -j II 1
O
0'f
^-^fc-JO CD3rt>J3UlH-o
« w _,cn r"*03 ro•-9H-
0)
•crt
rot>
ro
\•9 o
D X%.V \—X xX vcv ^v%. ^
^v. "- \ \^ _. 5<o ^
. .SB, ^^ .™" . ^
fc. •
>a\
X— o^
^vvv« ^O
\\•» X ^\ o\ \\ x\ oX
\9
i
rovnoo
1

- 251* -
National Chemical Engineering Conference 1974
PROCESS INDUSTRIES IN AUSTRALIA IMPACT AND GROWTH
Surfers Paradise, Queensland
July 10 to 12th, 1974
THE PRODUCTION OF SINTERABLE URANIUM
DIOXIDE IN A PULSED FLUIDISED BED REACTOR
by
A.G. FANE
A.H. LE PAGE'P.G. ALFREDSON*
S U M M A R Y
Sinterable uranium dioxide i^ usually produced from ammonium diuranate in a two-step process involving calcination and reduction. In this study, a single 0.13 mdiameter pulsed fluidised bed reactor was developed for this application. Bothbatch-continuous and continuous modes of operation involving simultaneous calcination and reduction were demonstrated and a maximum uranium throughput of 17 kg h~Jwas achieved with continuous operation.
The residence time distribution of the particulate phase indicated that thepulsed fluidised bed was equivalent to two unequal sized continuous stirred tankreactors (volume ratio 10 to 1) connected in series. Combination of thisinformation with the kinetics of calcination and reduction suggests that theoverall conversion to uranium dioxide was in excess of 99 per cent for continuousoperation.
Chemical Engineering Section, Australian Atomic EnergyCommission Research Establishment.
Present address: Department of Chemical Engineering,University of New South Wales,
- 255 -
1. INTRODUCTION
Most types of commercial nuclear power reactors are fuelled with uraniumdioxide (U02) in the form of high density sintered pellets of right cylindricalshape. The pellets are fabricated by cold-pressing and sintering techniquesand sinterable U02 powder is usually produced via the ammonium diuranate (ADU)route. In the production of natural U02 powder, this involves precipitation ofADU from uranyl nitrate solution followed by conversion of ADU to U02 bycalcination and reduction with hydrogen. The latter two steps may be carriedout simultaneously or sequentially. If enriched U02 powder is required, theenriched uranium hexafluoride product from the diffusion plant is hvdrolysed touranyl fluoride solution and precipitated as ADU. It is then converted to U02using a calcination-reduction process similar to that for natural uranium, atthe same time ensuring complete removal of occluded fluoride by pyrohydrolysiswith steam.
This paper describes the development of a continuous pulsed fluidised bedreactor for the production of sinterable natural U02 powder from ADU. Theconversion history of a reacting particle was estimated in terms of the residencetime distribution of the particulate. phase in the reactor and the kinetics of thecalcination and reduction reactions,
2, PROPERTIES OF SINTERABLE U02 POWDERS
The essential properties of U02 powder are chemical purity, so that neutron,losses by absorption are low, and sinterability, that is the ability to sinterreproducibly to a high density at relatively low temperatures. Specificationsfor nuclear grade U02 powder do not define the required physical properties of thepowder, or the process to be used in its preparation, but give fabricationconditions which should be used in testing the powder. For example, the Canadianspecification-'- requires, inter alia, that the powder be pressed at not more than276 MPa and sintered in a hydrogenous atmosphere for not more than 1.5 h at atemperature not exceeding 1650°C to give a coherent pellet of density not lessthan 10.4 g ctn"-^. In this work, the required density was increased to 1066 g cm~-arid the allowable sintering time was 4 hours.
In addition, the Canadian specification requires that the microstructure ofsintered U02 pellets be homogeneous and without gross defects. The UO?. powdershould therefore be homogeneous, free from tightly bound agglomerates and shouldnot contain any significant amount of incompletely reduced ADU which will giverise to porosity in the sintered pellets. In particular, the uniformity of thepowder and the reproducibility of its behaviour during fabrica.ion are importantfactors in determining the reject rate of the pellets and the cost of fabrication.
The properties of the U02 powder are a function of the conditions of ADUprecipitation and calcination-reduction. The temperature of calcination-reduction determines the surface area of the U02 powder. As the surface areaincreases, the density of pellets pressed and sintered under.standard conditionsalso increases2. However high surface area powders are more prone to fabricationproblems, such as pellet cracking. Whilst powders with surface areas of 3 to9 m^g-l are suitable for cold-pressing and sintering techniques, a narrower rangeof 4 to 6 m2g-l was desired for the techniques of pellet fabrication developed atthis Research Establishment.
It should be noted that stoichiometric U02 powder is not stable in air atambient temperatures, and absorbs oxygen in an exothermic process. For U02 withsurface areas in the sinterable range, the rate of oxidation may be sufficientlyhigh to make the powder pyrophoric. This characteristic is minimised by acontrolled partial re-oxidation process known as stabilisation.

- 256 -
3. CHOICE OF PULSED FLUIDISAT10N
A wide variety of gas-solid contactors could be used for the conversionof ADU to UC>2 including tray reactors, moving bed reactors and rotary kilns3.However the most satisfactory contactor provides close control of operatingconditions (particularly temperature), allows simultaneous calcination andreduction in a single reactor, requires a minimum of feed preparation, can beoperated on a continuous basis and is mechanically simple.
Fluidised bed technology offers good powder handling and heat transfercharacteristics. However, the only reported attempt^ to calcine and reduce ADUpowder in a conventionally fluidised bed was unsuccessful. This was probablybecause of the friable nature of ADU which leads to a powder with a wide rangeof sizes and a significant portion of fine particles (less than 50 um) . Withsuch powder, conventional fluidisation results in channelling of the gas andelutriation of fines. However, these problems can be overcome by introducing thegas in a series of pulses rather than a continuous stream. Levey and co-workers-3 >°reported early studies of the batch calcination and reduction of ADU to UC>2 in a0.13 m diameter pulsed fluidised bed reactor, with particle sizes in the range 1to 5000 urn.
In pulsed fluidisation the bed movement is largely determined by the pulsefrequency, volume of the pulse chamber and pressure to which it is filled (whichinfluence the pulsed gas velocity and duration of the pulse), bed height and thedesign of the gas distributor^ ? &, Levey^ suggested ad hoc criteria for theselection of pulsing conditions and they have been extended by Alfredson and Doig'"" ,Pulsed fluidisation also offers improved heat transfer characteristics comparedwith conventional fluidisation at the same time-averaged gas flowrates .
The pulsed fluidised bed reactor was therefore judged to be particularlysuitable for this application because of its good heat transfer characteristics,efficient gas-solids contacting and ability to handle material with a wide sizedistribution, including fine particles, as is the case with sinterable U02 powders.
4. PULSED FLUIDISED BED EQUIPMENT
The pulsed fluidised bed reactor system is shown in Figure 1. The reactorwas fabricated from AISI type 321 stainless steel pipe, 0.13 m i.d. (5-inchdiameter Schedule 40) x approximately 1.0 m long. The bottom of the reactor wasa conical shaped gas inlet section, and the top zone, 0.26 m diameter, was apowder disengagement section housing four sintered metal filters. Electricalheating elements were wrapped around the reactor body, and controlled by on-offcontrol lers .
Fluidising gas, a mixture of hydrogen and nitrogen, was fed to the reactorvia a heated inlet pipe in a series of pulses from a chamber isolated by solenoidvalves. Pulse chamber volumes of 2.8 and 11.3 A, were used with a gas supplypressure of 0.35 MPa gauge. The electronic timer which actuated the valves couldbe adjusted to give a wide range of pulse frequencies. With beds ranging from3 to 16 kg UC>2, pulse^ frequencies of 0.5 and 0.75 Hz were used with gas flowratesfrom 0.95 to 1.4 .( s-1
Off-gases leaving the reactor passed through the filters, then through abackup filter before discharging to the vent system. Fine powder which accumulatedon the filters was periodically returned to the reactor by blowback of the filters.A thermal conductivity cell was used to monitor the composition of the exhaust gas.
ADU was fed to the top of the reactor via a screw feeder and a rotary valveand the UC>2 product was removed through the bottom cone via a sealed vibratoryconveyor into the product collector (Figure 1). Some experiments were also carried
- 257 -
out using vibratory feeding of ADU and pneumatic withdrawal of the product .
The U02 was stabilised with a mixture of 10 vol per cent air in nitrogenat ambient temperature in a second pulsed fluidised bed which comprised a0.15 m diameter glass pipe, 1,5 m long, with a perspex bottom inlet section.
Two different modes of operation of the pulsed fluidised bed reactorsystem are considered in this paper: batch-continuous and continuous operation.
5. BATCH- CONTINUOUS OPERATION
ADU was fed essentially continuously to the top of the reactor, the bed wasfluidised with hydrogen-nitrogen at all times, and calcination and reductionoccurred simultaneously in the reactor. The bed of U02 powder was allowed tobuild up to a specified level before being discharged. Prior to discharge, theADU feed was cut off for a short period to avoid incompletely converted materialin the product. A portion of the bed (~ 3 kg UC^) was retained in the reactoras the basis for the next feeding period, and the cycle was then repeated. Thismode of operation has the advantage that complete conversion of ADU is assured,possibly at the expense of lower throughput and consistency of product,
Experiments carried out over a wide range of temperatures indicated thatthe surface area of the product decreased with an increase in the temperature ofcalcination-reduction. Similar results have been obtained from widely differingtypes of equipment^, U . Temperatures in the range 670 to 700°C were required toproduce powders with surface areas in the range 4 to 6 m g . Product qualitywas found to be insensitive to changes in other operating variables, such ashydrogen concentration and flowrate, pulsing conditions and ADU feedrate. Amaximum throughput of 12 kg h~l of UO? was demonstrated with a cycle time ofapproximately one hour.
A series of eight batches was produced in order to investigate the consistencyof the product. The reproducibiiity of the surface area of the individual batchesof powder and the densities of the sintered pellets was very good. Pelletspressed at 276 MPa and sintered at 1600°G in hydrogen for 4 hours had densitiesin the range 10.66 to 10.70 g c m .
These results demonstrate the potential of batch-continuous operation usinga pulsed fluidised bed reactor for the production of sinterable U02 powder.Although the intermittent nature of batch-continuous operation makes automationdifficult, this mode of production has been adopted for uranium processing influidised beds on a production scale*' .
6 • CONT INUOU S OPERAT ION
ADU was fed continuously to the top of the reactor and the product wasremoved continuously from the bottom of the reactor to maintain a constant heightof bed. Screw feeding of ADU and vibratory withdrawal of UC^-were used throughoutThe bed was fluidised with hydrogen-nitrogen mixture at all times and calcinationand reduction occurred simultaneously in the reactor. This mode of operation ismost suitable for a production-scale facility, being readily automated.
A potential limitation of the continuously operated fluidised bed for thistype of process is that the particulate phase of the bed is generally assumed tobe well-mixed. As a result, it is possible that incompletely converted feedmaterial may be present in the product stream. To minimise this problem, themean residence time of particles in the bed was chosen to be very much greaterthan the time required for reaction. Also, since the density of ADU (tap density~ 1.2 g cnr 3) was considerably lower than that of U02 (tap density ~ 2.8 g cm~3),
- 258 -
feeding ADU to the top of the bed and removal of UC>2 from the bottom tookadvantage of any tendency to segregation due to difference in density1^.In addition to these precautions, some experiments were carried out in whichabout 5 per cent of the hydrogen was injected into the product withdrawal system,allowing countercurrent contact of the reducing gas and the hot solids in thisregion.
Our investigations showed that sinterable UC>2 can be produced in a continuouslyoperated pulsed fluidised bed reactor, and in common with the results for batch-continuous operation, the product quality was relatively insensitive to changesin operating conditions^-4. It should be noted that all these experiments werecarried out at ~ 670°C. There was no significant difference between the resultsobtained using ADU feeds with weight mean diameters of 340 |im and 170 urn(3070 < 100 am). This agrees with earlier results1^ for batch experiments usingADU feeds with weight mean diameters of 340 |im and 50 urn, and demonstrates theexcellent powder handling characteristics of the pulsed fluidised bed.
7. MODEL FOR ESTIMATING DEGREE OF CONVERSION
Whilst the principal objective of this work was the production of a U02powder which performed satisfactorily in sintering tests, considerable attentionwas given to the related need for a high degree of conversion from ADU to U02.Because of the potential limitations of continuous operation discussed earlier,studies were carried out to determine the degree of conversion obtained in theexperiments. However, direct measurement of the unconverted material was notpracticable because errors in sampling and analysis made it difficult to distinguishbetween oxygen to uranium ratios of, for example, 2.0 and 2.02, which correspondto 003 contents in U02 from zero to 2 per cent respectively. Consequently, thedegree of conversion was estimated using a model of the particle conversionhistory and from knowledge of the residence time distribution of the solids.
(i) Time for conversion of an ADU particle
When a particle of ADU is introduced into a hot bed of U02 fluidised by amixture of hydrogen and nitrogen, it undergoes a series of changes during con-version to U02. Initially it is heated, rapidly calcined to U03 by an endothermicprocess and reduced concurrently by hydrogen to U308 in an exothermic reaction.The U308 is then converted consecutively to U02 in an exothermic reductionreaction wi ch hydrogen. This model combines the kinetics of the various stepsin the conversion with the heat balance for a particle. The kinetics of thecalcination reaction ADU — »UG3 were obtained by differential thermal analysis14
and the kinetics of the reduction reactions, U03 — 303 -»U02, were obtained bythermogravimetric analysis14? 15 m The kinetics were correlated by equations of theform,
~ = k (1 - X)N. exp (-Efl/R T)
where
and
The val
Xtk7H2M,NR
EaT
ues of
- mol fraction of product material= time (s)= frequency factor (s"1)= mol fraction hydrogen= constants= universal gas constant= activation energy (kJ mol"1)= absolute temperature (K).
the parameters obtained for the three steps were;
ADU
-- 259 -
UCL, k = 2,0 x 10⁸, E = 86.0, M = 0, N = 1;
, k = 14,9, E = 44.0, M = 0.9, N - 0;
U-0 -4 UO , k = 7.8 x 10 , E = 88,4, M = 0.9, N = a variable-J O Z cl
decreasing from 0.65 to zero with increase in temperature and hydrogen concen-tration.
The heat balance for the particle involved a sensible heat transfer termand heat of reaction terms. A particle/bed heat transfer coefficient of
was assumed this being intermediate between the value of 60 W*? 1200 W m" K"1
mea-calculated for the particle/gas coefficient" and the value of 480 Wsured for the wall/bed coefficient . The relative magnitudes of the heats ofreaction were obtained by differential thermal analysis1 . A value of 59 kJ molwas estimated1? for the exothermic reaction U308~> U02, and by comparison theendothermic calcination reaction had a value of 16.8 kJ mol""1 and the exothermicreaction 003— » l Og had a value of 4o kJ mol-1
The model was used to calculate the time for complete conversion of an ADUparticle, following its introduction into a bed fluidised by hydrogen-nitrogenmixtures of varying composition at a temperature of 670°C, Figure 2 shows thecalculated data for particles of 200 and 1000 urn diameter, Although the kineticswere found to be independent of particle sizel5? the calculated conversion timesdiffer mainly because the lower surface to volume ratio of the larger particleresults in a higher interparticle temperature.
RGidence li s v on of the so lid
Experiments were carried out at ambient conditions to determine theresidence time distribution of the solids in a pulsed fluidised bed of U02* Thetechnique used involved a step change of the feed from pure U02 to U02 taggedwith iron. In this study, interest centred on the 'toe', or initial portion,of the distribution becaube ic is those particles which pass through the bedrapidly which will be incompletely reduced.
The data were interpreted in terms of the equivalent number of continuousstirred tank reactors (CSTRs) connected in series. As can be seen from Figure 3which shows the 'toe1 of *, typical residence time distribution, the performancewas intermediate between that for a single CSTR and that for two equal-sizedCSTRs. Accordingly the results were interpreted as the equivalent number offractional CSTRs by best fit of the data to the following relationship14.
-t/t. -t/t,
C = i - - t2)> e
where
t ,t
t +t
fraction of feed having residence time equal to or less than t,
mean residence times in first and second stages, respectively
t, the overall mean residence time, and t/t, = N, the number ofCSTRs connected in series.
These studies showed that the pulsed fluidised bed reactor was equivalent toabout 1.1 CSTRs (Figure 3), This deviation from well-mixed behaviour wasparticularly significant; for an average residence time in the bed of 60 minutes,3.370 of the particles leave the bed within 2 minutes in a single CSTR comparedwith 0.5% in 1.1 CSTRs.

- 260 -
The degree of conversion was estimated for the experiments on continuousoperation using the data in Figures 2 and 3. An average hydrogen concentrationwas assumed based on the known inlet concentration and an outlet concentrationwhich allowed for dilution by the gaseous products of calcination. The fractionof incompletely reduced material was obtained from Figure 3 using the ratio ofthe time for complete conversion (Figure 2) to the mean residence time used inthe experiments. It was assumed that the mean conversion of this incompletelyreduced material was 50 per cent. These results are given in Table 1 along withthe most relevant operating variables. It should be noted that the estimateddegree of conversion does not include an allowance for conversion occurring inthe product withdrawal system for those experiments which made use of hydrogeninjection in that system.
The estimated conversions ranged from 98. A to 99.8 per cent. It is ofinterest to note that the lowest sintered density (Run 1), which was below thespecification requirement of 10.60 g cm~3, corresponded with a marginally lowerconversion and was for operation without hydrogen injection in the withdrawalsystem. However, the acceptable density obtained from Run 3, suggests that lowconversion in the bed can be compensated for by hydrogen injection in the with-drawal system. The use of hydrogen injection is apparently not mandatory, asevidenced by the results for Runs 4 and 7, but it does allow the use of a lowerexcess of hydrogen and lower inlet concentrations.
_ iThe maximum U02 throughput attained in the experiments was 17 kg h which
was the upper limit of operation of the feeding system. The trend of the resultsin Table 1 suggests that the maximum production capacity of the reactor could behigher than 17 kg h~l.
8. CONCLUSIONS
The conversion of ADU to sinterable U02 powder has been carried out on acontinuous basis in a single 0.13 m diameter pulsed fluidised bed reactor for awide range of particle sizes. Two potential modes of operation were demonstrated:batch-continuous operation with a maximum capacity of 12 kg U02h~l, and continuousoperation with a maximum capacity of 17 kg
The residence time distribution of the particulate phase in the pulsedfluidised bed indicates that the system was equivalent to two unequal-sizedcontinuous stirred tank reactors (volume ratio 10 to 1) connected in series.Combination of this information with a model describing the conversion historyof a particle suggests that the overall conversion to U02 was in excess of 99 percent for continuous operation.
9. ACKNOWLEDGEMENTS
The authors wish to thank the Australian Atomic Energy Commission forpermission to publish this paper and gratefully acknowledge the assistance ofMessrs J. Sarbutt, G. Shaw and K. Thompson in the assembly and operation of theequipment. The co-operation of other members of the Chemical Engineering Section,the analytical support of the Inorganic Chemistry Section and the fabrication andassessment work by the Ceramics Section and Physical Metallurgy Group in MaterialsDivision are also gratefully acknowledged.
10. REFERENCES
1. Chalder, G.H. - Uranium Dioxide Powder for the Manufacture of High DensitySintered Pellets, Atomic Energy of Canada Limited Report AECL-1327, Spec.No.MET-61, Issue 1 (1961).
- 261 -
3.
4.
5.
6.
7.
8.
10,
2. Alfredson, P.G. and Janov, J. - Investigation of Batch-tray Calcination -Reduction of Ammonium Diuranate, to Uranium Dioxide, Australian Atomic.Energy Commission Report AAEC/TM599 (1971).
Fane, A.G. - The Production of Sinterable Uranium Dioxide from AmmoniumDiuranate - Part 1: A Review of Gas/Solid Contactors, Australian AtomicEnergy Commission Report AAEC/E282 (1973).
Hawthorn, E., Shortis, L.P. and Lloyd. J.E. - The Fluidised Solids DrywayProcess for the Production of Uranium Tetrafluoride at Springfields. Trans.Instn Chem. Engrs, _3J3, 197-207 (I960).
Levy, R.P. - Gas-Solids Contacting Method, U.S. Patent 3, 164, 440 (19b5).
Heidt, H.M., Levey, R.P. and Hamrin, C.E. - The Use of Fluid Bed Equipmentin Enriched Uranium Processing, Chem. Eng, Prog. Syir.p. Ser* No.65, 6243-51 (1966). ~~
Alfredson, P.G. and Doig, I.D. - A Study of Pulsed Fluidisation of FinePowders, I. Chem, E. Syrnp. Ser. No.33, Session I, 117-139 (1970).
Alfredson, P.G0 and Doig, I.D. - Behaviour of Pulsed Fluidised Beds - Part I:Bed Expansion, Trans. Instn Chem. Engrs, 51_, 232-241 (1973).
Alfredson, P.G. and Doig, I.D. - Behaviour of Pulsed Fluidised Beds, Part IIBed Contraction, Trans. Instn Chem. Engrs, _51_, 242-6 (1973).
Fane, A.G., Le Page, A.H. and Alfredson, P.G. - The Production of SintecableUranium Dioxide from Ammonium Diuranate - Part II: Batch Production in aPulsed Fluidised Bed Reactor, Australian Atomic Energy Commission ReportAAEC/E300 (1973).
11. Woolfrey, J.L. - The Preparation and Calcination of Ammonium Uranates - ALiterature Review, Australian Atomic Energy Commission Report AAEC/TM476(1968).
12. Hackstein, K.G. and Pirk, H. - Production of Sinterable, Slightly EnrichedEnriched Uranium Dioxide in Fluidised--Bed Furnaces, Kerntechnik, No.9,261-263 (1967) [Translation: UKAEA Report Risley Trans. 1540].
13. Rowe, P.N., Nienow, A.W. and Agbim, A.J. - A Preliminary Quantitative Studyof Particle Segregation in Gas Fluidised Beds - Binary Systems of Near-Spherical Particles, Trans. Instn Chem. Engrs, _50, 324-333 (1972).
14. Fane, A.G., Le Page, A.H. and Alfredson, P.G,. - The Production of SinterableUranium Dioxide from Ammonium Diuranate - Part III: Continuous Productionin a Pulsed Fluidised Bed Reactor, Australian Atomic Energy CommissionReport AAEC/E (in press).
15. Le Page, A.H. and Fane, A.G. - The Kinetics of Hydrogen Reduction of U03and U308 Derived from Ammonium Diuranate, J. tnorg. Nucl. Chem,, (In Press.)
16. Wen, C.Y, and Leva, M. - Fluidized Bed Heat Transfer: A Generalized Dense-Phase Correlation, A.I.Ch.E.J. J2, 482-488 (1956).
17. Rand, H.M. and Kubaschewski, 0. - The Thermodynamic Properties of UraniumCompounds. Wiley, New York (1963).

•C -I -I
o
o
oMCO
O
Cd
O
CO"<COH
•c -(i- S~ -g
II
I- i 8 « I I5 5. y * | Sa» cr 5?
3 if I" SL B.
ttl Io i—c-< O
ol-tlO 3
fD
fD
Cl-i
fDC/) Hi3' to
crif
C Orr n>O rr3 H.03 Orr 3H-o cr^* 3fD P-CO OW IfH- O3 3
00 H-to
n- rrH-
IsJ O-j 3
03 CD- O
O95 33 T3Q- 0>
OM rrH- H-3 Orr 3fDrf QJH- rr3
OP -J
3- 03X -CLH 00O n
fjq 03fD 33 C
l— •03 03
t— OON 3OO rrO OO
\; cr^ m .p- co NJ (—"
~~j Cn 01 v-fi ho ro hoUi O O O t_n i_n i~n
h- • h- hO hO 1 — 1 — 1 — 'L/i ho O O Lo O^ i — 'O O O O ho --J O
O Oi i_n O m O O
O O r-1 I— O r-1 O
O^ O^ O O O^ -P" OO•
H— ' 1— • r— ' 1— ' t— ' 1 — '~^J \i O C2 "~~J O^ ho
\^ \^ \@ \£) ^ *^3 v*Q
\& vO **O ^O OO ^O OO
•~J 4> 00 DO 4> O^ CO
t — ' t — ^ t — ' l — 1— ' ! — 'O O O O O O O
-u >j -~j cjv o^ \j< <^n4> OJ O ^O -~J ^~J 4>
2* POO C* ^
^ . ^ r *
< O t-i •<O O 3 Q.f — ' 3 ^ M• n c c5-S 3 rr 00
« fD
H- X 3:0 ^<3 co cu
X-x fD f-T tf
5-a rr O O'—'if H- 00
H- O fDO 3" 3
1
. , *^Q r^ »^
3 ° <-" CLTD "3 fD ifC O O Orr n rr 00
•- — ft) H- fD1— O 3
3
fD• H w^ 2
s^x 3 CL 03fD fD 3
3OfD
?r ooo cm po o-
O 03 c3" ho rr ol fD rrh- ' H-
-v^ o3
O MO W
rr 3 rr'-v 0 < H-
^5 fD 3
^ O W rrNJ !-•• fD
O CL3
- . O coOQ fD H-
3 3O W rr3 H- fDl r^ 'f
00 << fD--x X- 0.
D3
O>f"
COc;
CO
O50
OOz;
ZGO
CO
OT)m
H(—•
i
roa\roi
TIME FOR COMPLETE CONVERSION < s
FRACTIONAL CONCENTRATION OF TRACER IN OUTLET STREAM (C)
MOa?owU3
CO
ow
M n
oMCO
i— icoc;
Oz
o
I—IOC
CO
O
w
oiT)
O
§
00h— i
o2;
iIX)

- 2614 -
National Chemical Engineering Conference 1974
PROCESS INDUSTRIES IN AUSTRALIA IMPACT AND GROWTH
Surfer's Paradise, Queensland
July 10th to 12th, 1974
REDUCTION OF WZNP-8LOWZNG Of
STOCK-PILES OF GRANULAR MATERIALS
b y
A. K. JOHNSTON
S U M M A R Y
Materials such as coal, limestone, sulphur, iron ore etc. ingranular form are frequently stored in open stock-piles. Itis clearly necessary to control wind-blowing of these mater-ials, from both the environmental and economic points ofview.
Theoretical work and experimental observations here present-ed indicate how the geometry of stock-piles may be controlledto limit the effects of wind and reduce the need forthe commonly-used surface spraying of the materials.
A. K. JOHNSTON, University of Newcastle,Mechanical Engineering
- 265 -
INTRODUCTION
Three factors are involved in the movement of heaped granularmaterial by wind :-
(i)
(li)
(iii)
the relative velocity of the air near thesurface of the heap
the granulometry and density of the material
the physical condition of the material-moisturecontent, compaction by wetting and drying, orthe effects of spraying.
The use of a chemical spray to form a protective skin on a stock-pile is becoming quite general and there are commercially availableagents for this purpose. Also some granular materials if soaked withwater and allowed to dry out form a protective crust which can preventwind blowing.
On the assumption that spraying of some kind is probably the bestapproach, we examine the question of how the geometry of stock-pilesmay be exploited to minimise the extent and cost of spraying. Thisobviously will be achieved if we can minimise the area of stock-pileexposed to high relative air velocities. Suppose we consider(Figure 1) the shapes shown in a wind of ambient velocity V0 Arounded heap such as (a) allows the boundary layer to remain attachedacross the top and generates surface velocities approaching 2VQ ,whereas a sharp-pointed heap (b) causes separation at the peak withmaximum surface velocity of the order of 1.4Vo . This suggests thatsharp-cornered geometry may reduce both the magnitude of surfacevelocities and the area exposed to the high velocities, with corres-ponding reduction in the need for spraying of heaps. Furthermorethere is the possibility that a heap such as (b) can provide aconsiderable sheltered downstream region where material may be storedwithout need for spraying.
This matter will first be examined theoretically and then someexperimental observations will be reported.
THEORETICAL CONSIDERATIONS
A two-dimensional inviscid model is set up to examine the twomost interesting aspects of the flow (see Figure 2) - namely thevalue of V1 the maximum surface velocity, and the value of X the
extent of shelter behind the heap.
The assumptions are :-
1. Inviscid flow approaching a triangular obstruction withuniform velocity V<> .
2. The fluid flow breaks away into a free streamline atthe peak of the trianbyle.
3. The fluid enclosed in the region behind the obstruc-tion has negligible effect on the free streamline flow,

- 266 - - 267
(A}
V,,
-p,
J c/fr• OO
O f=-I
I—H
F'/gure 2.
&
The free streamline velocity YI will be greater than V0and this
implies (by Bernoulli) that pressure P, is less than ambient pressurePo. This further implies that the free streamline must curve down-wards as indicated in Figure 2. To generate this situation we adda mirror-image obstruction downstream, using the same approach as
Riabouchinsky to a similar problem. The distance X between theobstructions depends on the pressure P, and the angle 0, and is determinedby the analysis itself; in fact it is-one of the main results of theanalysis.
The mathematics of the analysis by conformal transformation inthe usual free streamline manner is set out in Appendix I.
From this we determine the shape of the free streamline (Figure 3)and hence obtain an idea of the extent of "Shelter" available behind astock-pile of triangular section. Figure 3 shows the free streamlinefor angle 0 = 40 which is a usual angle of repose for granularmaterials.
The above analysis thus provides means for useful estimates ofthe two key aspects of the wind-blowing problem - the extent ofdownstream shelter, and the surface velocity distribution ou thewindward face of the stock-pile. The latter is shown plotted inFigure 3.
EXPERIMENTAL OBSERVATIONS
A model stockpile, approximately 100 scale, made from a triangularpiece of plastic material was set up in a simple wind tunnel andobservations of velocity distribution made, using a hot-wire manometerand pitot probes. The results must be regarded as semi-qualitativebecause no attempt was made to model the boundary layer in an approachingwind and there is a large difference of Reynolds number between model andfull-scale. Nevertheless the model Reynolds number (about 2 x 10J) isprobably large enough to avoid serious scale effects. There was nomoveable granular material on the model, the aim being to confirm thetheoretical findings as to stock-pile surface velocities and the extentof shelter, and to get an indication of the flow pattern in the "sheltered"region, Typical results of these experiments are shown in Figure 4.They indicate that provided the "pick-up velocity" (i.e. the near-surfacevelocity that will entrain the given granular material) is less thansay Q.5V0,Ythen the area of entrainment of the granular material islimited to a part of the upstream face of the heap and there is a largesheltered region downwind of the heap. Further experiments witharrangements shown in Figure 5 showed that the shelter is effective inthese situations.
Some limited experiments were made to examine the "pick-up velocity"as related to moisture content, using two samples of crushed coal gradedrespectively - 14 + 22 mesh and - 30 + 44 mesh. The samples wereplaced in a tray recessed in a horizontal surface in the wind tunnel andthe surface of the coal was made flush and horizontal. Then theambient tunnel velocity at which there was sustained removal of coalparticles by the air was called the "pick-up velocity". While thisdefinition is partly subjective, at least comparative order-of-magnitudefigures resulted.

- 268 -
fa c e ve/o c / A es
of \J0
5
- 269 -
It was found that :-
with 5.5% moisture content
- 14+22 coal picked up at 33 ft/s
-30+24 coal picked up at 24 ft/s
with 8% moisture content neither coalpicked up at 44 ft/s which was the
maximum velocity tried.
Some experiments with powdered sulphur were also made and it wasfound that :-
Sulphur with any moisture content up to 10% requiresa velocity of 33 ft/s to pick up.
Sulphur which has been saturated with water and thendried out does not pick up at any velocity up to67 ft/s which was the maximum tried.
CONCLUSIONS
1. The shape, orientation and positioning of stock-piles ofgranular material can be regulated to minimise tendencyto wind-blowing.
2. The shape should be such that there is a clear discontinuityto cause early break-away of boundary flow into a "freestreamline" as seen in Figure 2,
When this is done the magnitude of near-surface airvelocities can be limited and the extent of areaexposed to higher velocities reduced. This in turncan reduce the extent of stabilising treatment neededor even eliminate the need.
3. The extent of treatment needed depends on the strength ofwind and its variability and on the physical state of thegranular material in the manner indicated.
4. If stockpiles are oriented x-jith axis normal to the directionof prevailing strong winds then there is a considerablearea of shelter (see Figure 5) downwind oi the exposedface which may be used for further stock-piling.
5. The fact that many granular materials if superficiallysaturated with water and allowed to dry out form acohesive crust is interesting. It can mean that selectivespraying of sensitive areas of stock-piles may providevery extensive protection.

A P P E N D I X
FREE-STREAMLINE DEVELOPMENT
Let Figure 2 represent the z plane. Then by three transforma-tions the flow in the z plane is transformed to the uniform flow ofthe w plane, as follows :-
(i) z plane to C (hodograph) plane -
C =dzdw V
where V is magnitude of velocity and a is its direction.
(ii) £ plane to
c' = In
from which
plane -
1V
+ i
(iii) "C," plane to w plane (Schwarz - Christoffeltransformation)
= Adw
+ B,2 2 \ / 2
= A
(w" - az) (^ - I ) 2
w(w + /w2- 1) -a2 -a /a2 - 1In -i- B
2a /a2 - 1 w(w + /w2-! ) -a2 -fa /a2 - 1
The boundary _ICDEF1 is the main interest (or ultimately thefree streamline DE) . This transforms as shown in Figure 6.
C
E
? UAttn^.
I
C E
271 -
The constants A, B, a are evaluated for chosen values of0 by taking known corresponding values of £"* and w for the points
D
, w = ±
= -1), E(r w + 1)
The values of z are then evaluated numerically using a computer,thus determining the shape of the free streamline and any otherinformation required.
REFERENCE:
1. Milne-Thomson : "Theoretical Hydrodynamics", 8th Edition(Macmilaln), 1968.

National Chemical Engineering Conference 197
PROCESS INDUSTRIES IN AUSTRALIA IMPACT AND GROWTH
Surfers Paradise, Queensland
July 10 to 12th, 197*1
MODERN ASPECTS OF THE THEORIES AND EXPERIENCE RELATED
TO THE PROPERTIES OF BULK SOLIDS
by
D.F. BAGSTER*
S U M M A R Y
A review of the present state of knowledge of "bulk solids with particularreference to hunkers. Three aspects are treated, where some significantadvance of knowledge and experience has 'been made in recent years.
(a) Bin loads. Here great emphasis has been placed recently on the"switch" stress which occurs as material changes from a static conditionto a flowing one and enormous stresses can occur on bunker walls.
(b) Flow of solids. The elapse of time and the application of Jenike'stheories to many situations have enabled some workers to provide anobjective appraisal of these theories. Work on the prediction of actualflow rate, especially for cohesive materials, is still largely lacking.
(c) Shear testing. A number of workers have developed shear cells asalternatives to the simple shear cell of Jenike but these have not gainedpopularity. It is suggested a thorough appraisal be made of the meaningof the results obtained from shear cells, especially with regard to theapplication in bunkers •
^University of Sydney, Chemical Engineering.
- 273 -
INTRODUCTION
The storage and handlingof bulk solids is becoming of enormous importanceto Australian industries, with the expansion of mining operations and ofmanufacturing. The growing awareness of the problems associated with handlingsolids is reflected in recent technical literature. This paper is not intendedto be an exhaustive summary of all aspects of the problems, but rather acnsideration of some of the more important areas at present under active study.These aspects are interrelated in that stresses and flow patterns are intimatelyconnected, and that the shear strength of powders are measured to use inpredicting stress and flow behaviour.
BIN LOADS
There has recently grown up an awareness of the high stresses which aflowing mass of solids can produce, compared with stresses in static material.Theimer^° laid great emphasis on allowance for dynamic stresses (in 1969)and the codes available for bunker design do have some allowances for dynamicstresses',20
Recent research however has indicated that factors of safety have not beenadequate and that stresses in bunkers should not simply be considered as staticor as dynamic. Much greater stresses can arise as material begins to move,passing from static to dynamic conditions. Jenike's early explanation ^ wasin terms of a "switch" from static or active conditions to dynamic where thesolid is in the passive state. Figure 1 shows a sketch of static and dynamicwall pressures in a bunker. The fact that the stresses in flow are lower thanthe static ones leads to an area A between the two curves (one for dynamicand the other for static conditions) when the switch has reached level S afterflow has been started by opening the bottom outlet. The deficiercy in asupporting force which arises when the material begins to flow can be taken ascorresponding to the weight of a mass of material in transition from the staticto the dynamic condition, a mass represented by the darkened area in Figure 1.Since this weight is no longer being supported by the material which is flowing,the transition mass exerts its weight as an additional stress or distributedload on the walls.
Jenike's new approach to the problem15 has been to apply the calculus ofvariations to find the minimum value of strain energy of the mass of materialin a silo at some point in time when the solids are in transition from staticto dynamic conditions.
The strain energy of an element of the material of the silo may beexpressed as
dW = - O.de. AdZ (1)
where A = cross sectional area of silo,Z = distance above a datum level
a,e = stress and strain within material, respectively.
In equation (l), strain energy due to shear is neglected. The channel walls
are assumed rigid.
The argument then centres around the recoverable parts of the W andHookean behaviour attributed to the material:-
da. d(a. + av)i ., 1 ±E ~~ E
(2)

- 21k -
Here the superscript refers to elastic behaviour and E, v are taken to beconstant. The problem is treated in one dimension using Janssen's assumptionof stresses being independent of horizontal coordinates, by calculating theminimum value of W between the bottom of the silo and some height where theswitch has reached. (The Janssen equation is used to calculate the boundarystress at that level.)
Figure 2 shows some of Jenike's results for a silo, comparing calculatedstresses from the Janssen formula with those obtained by calculating stressesinvolving minimum strain energy. (The value of Poisson's ratio used was notstated.) It is seen that the new technique predicts considerably greatermaximum stresses.
The strain energy method has not yet been extended for use with a hopperand the present calculation method recommended by Jenikel5 remains; the methodrequires a distributing of the switch load over a height 0.3 D where D is thesilo diameter.
Jenike et al. find good agreement between this calculation method andtheir actual experimental stress values!5.
Another approach to the switch problem, and one not involving the attri-buting of elastic behaviour to the granular mass, is that of WaltersSl,32.He derives equations of the same form as that of the Janssen formula in a waysimilar to Walker's treatment29.
A force balance is applied to the powder flowing below the switch but witha boundary condition calculated from the static conditions still existing above.The method was extended to hoppers but unfortunately applies to relativelynarrow hopper angles (his restriction that 2a + 2£, must be less than l80° isparticularly severe), and a comparison with Jenike's experimental and theoreticalresults was not possible. It is probable that Walter's method may over-estimateswitch stresses however. Returning to Figure 2, Jenike estimates switch stressesas about twice the Janssen prediction. Taking typical values of effective angleof friction and wall friction angle of 50° and 20° respectively and applyingWalter's method leads to a ratio of about thirty times the Janssen figure.
The existence of the switch stress could well be a reason for difficultyin interpreting stress measurements in flowing powders. The switch load isprobably distributed over a narrow band of bunker wall at any time and thisraises the question of what size to make a pressure cell. If it is too largeit may not measure the desired peak, if too small there may be difficulty dueto the grains themselves being of the same order of size as the cell. Therehave been advances in load cell design recently,9,4jlS, especially in theability to achieve significant readings without intolerably large deflectionswhich interact with the bulk of particles.
Another difficulty which has been brought to light recently is that evensmall imperfections or departures from perfect geometry of a bin can have agreat effect on the bin loads which are generated. For example,a cylinder whichdiverges about 0.5 degree outwards towards the bottom exhibits no switchl^.Blair-Fish and Bransby^ have observed, using X-rays of flowing sand in a modelbunker, the formation and reformation of zones of intense shear, and thesecould interfere with the interpretation of small cell stress measurements.
FLOW OF SOLIDS
Jenike's technique for establishing the required span to prevent archingis now well knownll>l2. There have been substantial tests made of the method.Walker's arching tests on fine moist coals30 indicated that that theory combinedwith results of strength properties obtained on the Flow Factor Tester gaveconservative results.
- 275 -•3k
Wright^ in testing several different iron ores concluded that "the JenUebunker design method provides a sound basis for the design of mass flow steelworks bunkers operating under dynamic flow conditions", but also that the"Jenike mass flow bunker outlet sizes were found to be critical but the wallslopes were found to contain an overdesign of between 5-10 degrees before coreflow developed - at least in a wedge-shaped bunker. In spite of this it isrecommended that the Jenike values for wall slopes should always be used".Wright found that arching was not entirely eliminated at the transition zone ofa bunker with surcharge.
Turning to the prediction of discharge rates, Davidson and Nedderman" haveproduced a theoretically based formula for the flow rate of a cohesionlessmaterial in radial flow - the "hour-glass theory".
W =sin a D (3)
where W = mass flow rate,D = diameter of outlet,F = a function of the inlet and outlet radii of the radial flow mass
and of the internal angle of friction of the material,g = acceleration due to gravity,a = half angle of hopper
and p = bulk density of material.
It is based on a force balance on an element in radial flow in a mannersimilar to force balances presented by Savage23, Johansonl^, and Valentin28.
Equation (3) is of the same form as that found by a number of workers,e.g., Beverloo et al.3, and thus contains a fundamental basis to a well-knownphenomenon.
Valentin2^ mentions how difficult it is to predict flow rates for cohesivematerials. Davidson and Nedderman extended their theory to cohesive materialand related it to a theory for extrusion of clays!9 but no experimental com-parison has been made.
Johanson1? has obtained experimental results on iron ore and dolomite andfound very fair agreement with his own theory. His theory uses a force balanceon material at the outlet oC the converging section of a hopper and appears tobe based on sound physical principles, at least for steady flow.
Another aspect which has been given attention in recent years is the effectof the air (or other fluid) on the discharge rates from hoppers. Carleton? hasdeveloped a. force balance which accounts for the fluid drag and which agreeswith experimental findings.
There have also been improvements in the design of instruments to establishthe flow patterns in bunkers, such as the radio pill of Rao and Venkateswarlu2!
SHEAR TESTING
A knowledge of the suitability of various types of strength measurement isas important as the theory of bin loads and yet there has been a lack ofquantitative comparisons between shear cells.
Schwedes?5 has made a comparison with limestone between the results froma "simple shear cell" first developed by Roscoe22 and a Jenike cell. He foundfair agreement provided a correction was made to increase the strengths foundon the Jenike cell. In plotting shear and normal stresses it is usuallyassumed that the plane between the two halves of the cell coincides with the

effective plane of material failure, giving yield locus A in Figure 3. Thecorrection is "based on no longer assuming that this is so, and a maximum"correction" is achieved by assuming in fact that the horizontal or plane ofsplit "between the two parts of the cell is actually one of maximum shear stress.(The major principle stress plane will then be at 45° to the horizontal.)Drawing Mohr's circles through the experimental points then enables a strongerlocus B to be drawn, agreeing closely with Schwedes' results with the simpleshear apparatus.
Much attention has been directed at annular or ring shear cells recently1,2,6,18,24 and these consistently find lower strengths than the Jenike cellfor the same material, as shown on Figure 4. Walker's results with hisPortishead ring cell and his own stress theories agree much more closely withhis arching tests than the results from the Jenike cell combined with theJenike design method30.
Obviously much more fundamental work, as well as empirical comparisons, isneeded to establish the validity of some testing equipment. Studies of strainpatterns indicate non-uniform behaviour in shear cells27,33 and one concern istherefore to interpret what sort of "average" result is being obtained in acell2.
A recent study of larger cells gave the results of some basic work on shearcells, finding, for instance, no consequential difference between results onrectangular and circular shear cells, and no significant shear rate effect atlow rates33. The particle size distribution was found to have a marked effecton strength in contrast to the hypothesis of Jenike^-O, who claims only the finesare important for strength tests.
It is possible to test coal samples from two different mines and recordvery similar values of effective angle of friction and of wall friction, andyet the two coals will have a markedly different propensity to arch in a bunker'.In the face of such a fact it is obvious that the fundamentals of solids floware not yet fully understood.
REFERENCES
1. BAGSTER, D.F. and BRIDGWATER, J., Cn the Design and Use of an AnnularShear Cell", 3rd. Intern. Conf. Chem. Engng. Chem. Equipment and Automation,CHISA, Marionbad, September 1969.
2. BAGSTER, D.F., ARNOLD, P.C., FITZGERALD, T.F. and ROBERTS, A.W., PowderTechnol., In press.
3. BEVERLOO, W.A., LENIGER, H.A. and VAN DER VELDE, J., Chem. Engng. Sci.,15., 260 (1961).
4. BLAIR-FISH, P.M. and BRANSBY, P.L., Trans. Am. Soc. Mech. Engrs. , J. Engng.Ind. 95B, IT (1973).
5- CARLETON, A.J., Powder Technol., 6_, 91 (1972).
6. CARR, J.F. and WALKER, D.M. , Powder Technol., 1_, 369 (1967/68).
7. COULTER, G.C., Private communication.
8. DAVIDSON, J.F. and NEDDERMAN, R.M. , Trans. Instn. Chem. Engrs., _5J_, 29 (1973).
9. HANCOCK, A.W., "Stresses on Bunker Walls", Ph.D. Thesis, CambridgeUniversity, 1970.
10. JENIKE, A.W., ELSEY, P.J. and WOOLLEY, R.H., Proc. Am. Soc. Test. Mat..,60, 1168 (I960).
- 277 -
11. JENIKE, A.Q., "Gravity Flow of Bulk Solids", Bull. No. 108, Utah Engnr.Expt. Stn., University of Utah, 196].
12. JENIKE, A.W. , "Storage and Flow of Solids", Bull. No. 123, Utah Engng.Expt. Stn., University of Utah, 196!*.
13. JENIKE, A.W. and JOHANSON, J.R., Proc. Am. Soc. Civil Engrs., J. Struct.Div., 94- (ST4) 1011 (1968).
111. JENIKE, A.W., JOHANSON, J.R. and CARSON, J.W., Trans. Am. Soc. Mech.Engrs., J. Engng. Ind., 95B, 1 (1973).
15. JENIKE, A.W., JOHANSON, J.R. and CARSON, J.W. , Trans. Am. Soc. Mech.Engrs., J. Engng. Ind., 95B, 6 (1973).
16. JOHANSON, J.R., J. Appl. Mech., 31, 499 (1964).
17. JOHANSON, J.R., Trans. Am. Inst. Mining Engrs., 232, 69 (1965).
18. NOVOSAD, J., Czech. Coll. Chem. Commun., 2£, 2697 (1964).
19. OVENSTON, A. and BENBOW, J.J. , Trans. Brit. Ceram. Soc., 6j_, 543 (1968).
20. PATERSON, W.S., Particulate Matter, 3. (l), 19 (1972).
21. RAO, V.L. and VENKATESWARLU , D. , Powder Technol., 1_, 263 (1973).
ROSCOE, K.H., "An Apparatus for the Application of Simple Shear to Soils",Proc. 3rd. Intern. Conf. Soil Mech. Found. Engng., Vol. 1, p.l86 (1953).
SAVAGE, S.B., Brit. J. Appl. Phys., 16, 1885 (1965).
SCARLETT, B. and TODD, A.C., J. Sci. Instr. 1_, 655 (1968).
SCHWEDES, J., Trans. Am. Soc. Mech. Engrs., J. Engng. Inc., 95B, 55 (1973).
THEIMER, O.F., Trans. Am. Soc. Mech. Engrs., J. Engng. Ind., 9 IB, 460 (1969).
UMEYA, K. , ISODA, T. and KARA, R. . "Some Observations on the Consolidationaland Shearing Mechanisms in two-dimensional Model Tests", First PacificChemical Engineering Conference, Kyoto, 1972.
VALENTIN, F.H.H. , Flow Properties of Bulk Solids: Some Recent Advancesand their Practical Improtance" , in JONES, M.J. (Ed.) Proc. NinthCommonwealth Mining and Metallurgy Congress, 1969, Inst. Mining Met.,London, 1970.
29. WALKER, D.M., Chem. Engng. Sci., 2IL, 975 (1966).
30. WALKER, D.M. , Powder Technol., !_, 228 (1967).
31. WALTERS, J.K. , Chem. Engng. Sci., 28,, 13 (1973).
32. WALTERS, J.K., Chem. Engng. Sci., 26, 799 (1973).
33. WANCHECK, G.A. and FOWKES, R.S., "Materials Handling Research: ShearProperties of Several Granular Materials, U.S. Bureau of Mines, Report
7731, 1973.
34. WRIGHT, H., Trans. Am. Soc. Mech. Engrs., J. Engng. Ind. 95B, 48 (1973).
22.
23.
24.
25.
26.
27.
2 <

- 278 -
LNiXlAJLFLOW
SWITCH
F I G U R E 1 = BUNKER WALL LOADINGS
- 279 -
FIGURE 2 : RADIAL S T R E S S ON
SILO W A L L , H/D = 5
HD
S T R A I NENERGY
Y Dmax

F I G U R E 3 ' - C O R R E C T I O N O F S C H W E D E S
roCOo
<r
F I G U R E 4 : C O M P A R I S O N OF U N C O N F I N E D Y I E L D S T R E N G T H
P O R T I S H E A D & J E N I K E C E L L S
10
unconfinedyield
strength(kN/m2)
0
W A L K E R , in t e rna t iona l Dry Fines Coal, 1 I % moisture, - }/s"meshJ e n ike Cell—~__
P o r t i s h e a d Cel
toQO
BAGSTER, et a!., Ravensworth Coal16-3 % moisture, - 18 mesh
Jen ike Ce l l results-j-Po r t i shead C e l l r e s u l t s ©
20
m a j o r c o n s o l i d a t i n g (kN/m2)

- 282 - - 283 -
National Chemical Engineering Conference 1974
PROCESS INDUSTRIES IN AUSTRALIA IMPACT AND GROWTH
Surfers Paradise, Queensland
July 10 to 12th, 1974
VELOCITY PROFILES IN PNEUMATIC TRANSPORT
by
G.T. Wilkinson, B . E . , Ph.D.*
S U M M A R Y
GLOSSARY OF TERMS
D
r
R
R
uave
"max
/a
P
V
X
pipe diameter, internal
distance from pipe axis
pipe radius = D/2
pipe Reynolds' number assuming no solids present
dimensionless gas velocity
average gas velocity assuming no solids present
maximum gas velocity assuming no solids present
dimensionless wall distance
, ,. . kg solidsloadxng ratxo =
gas density
uave D
:g gas
viscosity of gas (neglecting any solids present)
exponent in power law
Profile u/n = (1 - r/
Air velocity profiles are presented for suspensions of uniformly sizedglass spheres in vertical, counter-gravitational flow in a 5.34 cm. diameterpipe.
The beads were 100 and 120 micron diameter at loading ratios up to 5.Mean gas velocities ranged from 7.1 m/s to 22.3 m/s (Re 40,000 to 125,000).
The solids modified the air velocity profile, such that at loadingratios above about 0.5, the maximum velocity was observed - not at the axisbut - as an annular ring whose diameter increased with solids concentration.The "flattening" of the profile was reflected in the ratio of mean tomaximum air velocity. This ratio increased from 0.83 for pure air to 0.95at a solids loading ratio of 1-5; from thence further solids gave nodetectable change in this ratio.
* Wilkinson, G.T., S.A.I.T. Chemical Technology.

INTRODUCTION
A study of the mechanism of heat transfer to a suspension of small glassbeads in air1, included a number of previously unpublished velocity profiles.In view of the current interest in pneumatic transport systems6 it was decidedto present these profiles because they were extended to quite high solids con-centration, and because their interesting, and perhaps unexpected, shape mayencourage discussion on this complex but important phenomenon.
EXPERIMENTAL
The present data, Tables 1 & 2, were obtained using two sizes of glassbeads (mean diameters of 100 and 120 micron), suspended in air and transportedvertically upwards through 5.34 cm. I.D. tube. The rig has been detailed •previously1 and only the profile measuring equipment will be described here.
The velocity probe, nsisted of a length of cylindrical tubing,1.63 urn. O.D. supporte >nduit diameter. Approximately 100 diametersof straight tube were aij. xrom the point of solids addition, and flowstraightener when used, to the profile traverse point.
A tranverse cylindrical type impact tube was adopted, after some prelim-inary trials with hook-type Pitot tubes, since it was robust, did not distortappreciably under particle bombardment, disturbances to the flow field weresymmetrical and independant of impact hole position and it was readily with-drawn to clear blockages.
Initially a total head hole size of 0.10 mm. diameter was tried - butthe time constant of the system was impracticably large, and the hole had atendency to block. The hole diameter was increased to 0.20 mm. diameterwhich was quite satisfactory. The time constant then being of the order of10 seconds.
It can be shown from potential flow theory that with a ratio of hole-to-probe diameter below 0.15, the correction to the measured impact pressure togive true impact pressure is less than 2%. The 1.63 mm. diameter probe wasselected on the basis of strength, and a satisfactory hole-to-probe diameterratio (0.125).
The probe clamped to the slide of a dial vernier, could be positionedradially to within 0.02 mm. The static piezometer hole was 1.59 mm. dia-meter and positioned 3.18 mm. upstream from the probe. This small displace-ment was done to reduce the effect of fluid acceleration past the probewithout introducing gravity errors. Preliminary trials with various tapsup and down-stream, some with sintered glass plugs to stop ingress ofparticles, showed that this simple method was reliable.
RESULTS
Where profile studies are made, one of the difficulties is the present-ation of the large number of results. This is further compounded in two-phasework by the inclusion of solids parameters. An effort has been made to displayresults clearly, and consequently ?t has been necessary to omit some results inthe graphical presentation. Where parametric curves are presented, the resultscan be interpolated between solids loading ratios.
In Fig. 2, the results of three velocity profile runs for air alone areplotted and compared with the literature. The agreement was satisfactorybeing within 5% of Deissler's correlation. The integrated profiles also com-pared favourably with the venturi readings.
U_ave_The influence of solids on the ratio Umax is shown in Fig. 3. No
correction was made for the Reynolds' number effect3, since this changed thevelocity ratio of the air - only profile by less than 4% over the rangetested, also the correction with solids present is unknown.
The velocity ratio increased from the clean air value of 0.84 to 0.95,when the solids and air mass rates were, approximately equal (a = 1) at whichstage the ratio hardly changed with further increase in solids loading. Noparticle size effect could be distinguished over the limited range studied.
The above presentation hides the significant changes which occurred inair profile shape - particularly at the higher concentrations. Fig. 4 showsactual profiles obtained at Reynolds' numbers 40,000 to 50,000 and Figs. 5 and6 at Re 42,000 to 125,000. These are plotted on semi-log co-ordinates. InFig. 7, these profiles are collected, smoothed, and presented in terms ofvelocity defect as a series of curves parametric in solids loading.
A dip at the axis in the gas-phase profile was obtained for solids loadingsabove 0.5 i|gg±||§. . As the solids concentration was increased, this dip becamemore pronounced, with the position of minimum velocity receding towards the wall.At a loading of 4.65:J, the ring of maximum velocity was barely D (or 0,5 cm.)from the wall. T0~
DISCUSSION
From Fig. 3 it can be seen that the solids did not significantly affect thefluid velocity profile, below a loading of 0.1 kg glggJL Above this, the profileflattened quite rapidly. When the solids k& air loading reached 1.5, thevelocity ratio became constant at 0.95, and was independent of solids loading.
Figs. 4, 5 and 6 show the velocity gradient at the wall increasing with theaddition of solids. The broken lines indicate profiles corrected for probepressure rise near the wall. A dip in the core velocity occurred, which becamemore pronounced at higher loadings.
If this dip was an apparent and not a real effect, it could have been dueto one or more of the following causes:-
(a) Particles entering the dynamic head hole and contributing some of theirmomentum to the pressure reading.
(b) Particles entering the static pressure hole and affecting the reading.
(c) Particles partially blocking either total or static pressure holes causinga change iu the system's time constant.
(d) Swirl.
(e) Probe distortion.
(f) The presence of the probe altering the suspension flow pattern.
It was possible for particles (100 micron diameter) to enter the impacthole (200 micron diameter). At the highest concentrations, the probe had to becleared up to three times during a run. However, the particles would onlyaffect the pressure reading if their momentum could be transferred to the airwithin the probe. This was considered unlikely, and the effect small, sincethe probe diameter was so small that a particle which entered the hole wouldhardly slow down before striking the opposite wall and losing much of itsmomentum. It would rebound off this wall to the other side, and so on untilit came to rest. Most of the energy would be absorbed by the probe walls andnot by the air within. If other particles had already built up inside the probe5

- 286 -
they would tend to capture the newcomer giving it less chance to transfermomentum to the air. In any case, particle momentum contribution would in-crease the dynamic head reading and we seek a mechanism for reducing it.
In the static tapping, the solids built up to a stable level and actedeffectively as a stationary porous plug with no bias to the readings. Inany case, an error in the static pressure would be independant of impact holelocation. Dussourd and Shapiro7 suggest that as long as the area of the holeis less than 5% of the tube mouth area, the effect of particle upstream de-celeration on stagnation pressure will be small. In this instance the ratiowas 1.5%.
An increase in the time constant of the probe set-up, due for example tothe ingress of particles, could lead to low readings when approaching the axis,and high when moving towards the wall. Care was taken when making thesetraverses to ensure that steady state obtained, plus check readings taken atrandom positions across the diameter. These showed no systematic error ofthe above type. Profiles taken some twelve months apart, and at differentReynoldsT numbers showed comparable shapes.
The question of swirl was examined rather closely. It was shown to beabsent in the single phase studies, however, the method of solids addition mayhave promoted swirl, and even if this effect was eliminated by the use of aflow straightener, there may have been a directional swirl produced due to thepossible oriented spin of the particles.
A check was made for the presence of swirl - both with and without theflow straightener installed - without any being detected. By angling theprobe 30° to the incident stream, in both directions, and noting the velocityprofile, it was estimated a swirl component of greater than 0.3 m/sec., 2 cm.from the axis would be detected (by the asymmetry of the profile).
Distortion of the probe under bombardment of particles was thought to besmall, since the probe was readily located at all times, and no permanent setoccurred. Further, any probe distortion would tend to underestimate velocitiesat points away from the axis - especially at the point of profile inflexion.
The probe's presence would certainly alter the suspension flow behaviour.Particles which struck the probe would rebound upstream - possibly with somefocusing effect from the curved conduit wall - where they would collect as a'cloud' hindering the passage of both phases. To minimise this effect, the probesize was chosen as small as practicable. Work by Garrett5 using a significantlylarger probe (although at lower concentrations) did not produce a similar "dip"in the core velocity. It was assumed that this postulated particle cloud had aninsignificant influence on the air profile.
Finally, the integrated two-phase velocity profiles compared favourablywith the venturi readings with a R.M.S. error of +4.2%, and a range from 0 to+9.4%. There seemed to be no correlation between error and solids loading.
It is believed that the probe gave a substantially true picture of thefluid velocity profile in the presence of suspended solids. It is postulatedthat the dip in the core velocity was due to the particle distribution. A con-centration of solids in the core would increase the flow resistance of the airthere, relative to regions near the wall. The reduced fluid velocity wouldencourage a further build-up of particles in the core and an increase of fluidvelocity near the wall, until there was sufficient turbulent energy in thisannular region to re-suspend particles from the core.
- 287
The profiles by Peskin4 did not exhibit a dip in the axial velocity.This could be due to the difference in systems used. Peskin's work was in ahorizontal, square duct. Gravity would tend to even out the concentration soproducing a monotonic profile. Also there would be no wall curvatures effect.
Garrett5 reported results from a 7.6 cm. diameter vertical facility. Therather large probe (1.9 en. diameter) and the method of estimating solids phasepressure contribution made these results less reliable. His corrected profilesagree qualitatively with the present work in that plug-flow conditions wereapproached with an increase in solids loading.
Pratt8 reported results from a 5 cm. diameter vertical rig at pipe Reynolds'numbers 15,000 to 50,000. Increased solids loading flattened the fluid velocityprofile until a critical loading was reached where a dip developed at the conduitaxis. The critical loading at which the form of the velocity profile changed,increased with solids size from approximately 5 ±ILJ?.-ha.ss. beads for 350 mj_cron
Ics solids "§ 3.1 ITglass beads to 0.6 —j|g air— or c -e 77 micron beads. As with the present workthese results were interpreted as indicating that solids were concentrated in thepipe centre.
CONCLUSIONS
1. The presence of 100 y and 120 y glass spheres in air at Reynolds' numbers38,500 to 125,000 caused a change of the air velocity profile in a verticalpipe given by:
uaveumax
0.936 + 0.0848 Iog10 a (0,1 < a < 1.5)
uaveumax
= 0.95 (a < 1.5)
2. The air profile showed a maximum velocity at the pipe axis for a < 0.5.The maximum velocity was a ring for a > 0.5 whose diameter increased witha.
ACKNOWLEDGEMENTS
The author gratefully acknowledges the assistance of Associate ProfessorJ. R. Norman and the financial support of the Australian Atomic Energy Comm-ission.

- 288 -
REFERENCES
1 Wilkinson, G.T. & Norman, J.R., "Heat Transfer to a Suspension of Solidsin a Gas", Trans.I.Chem.E., 45_ T314 (1967).
2 Wilkinson, G.T., "Heat Transfer to Gas-Solids Suspensions", Ph.D. Thesis,U.N.S.W. (1967).
3 Perry, J.H. "Chemical Engineers' Handbook", McGraw-Hill, 4th Ed., p.5-8,(1963).
^ Peskin, R.L. "Basic Studies in Gas-Solids Suspension", College of Engin-eering, Rutgers University, N.J., Reports Nos. 62-1, 62-2, 62-3, 63-1,63-2 (1962-1963).
5 Garrett, T., "Heat Transfer Characteristics of Dilute-Phase Solids-AirSuspension in Turbulent Pipe Flow", Ph.D. Thesis, Cambridge, (1964).
6
7
Boothroyd, R.G. "Flowing Gas-Solids Suspensions", Chapman & Hall, 1971.
Dussourd, J.L. & Shapiro, A.H.Jet Propulsion 2*} (1958), 24.
Pratt, K.C. "Heat Transfer to Solids Laden Gas Streams", Ph.D. Thesis,University of Melbourne (1969),
- 289 -
TABLE 1. AIR VELOCITY PROFILES - 100 micron GLASS BEADS
Run
64
65
63
66
67
TABLE 2.
Run
37
36
38
35
170
39
171
77
74
172
tf
°C
72
69
67
64
60
AIR
f^\
°C
93
92
103
79
91
101
92
86
66
85
Re. No.
38,500
45,200
41,800
50,700
43,200
VELOCITY PROFILES
Re. No.
96,800
125,500
91,900
55,000
86,400
95,300
84,200
53,600
42,000
84,500
.-. .„, -. —umax
0.85
0.93
0.95
0.94
0.96
- 120
Uumax
0.85
0.87
0.87
0.89
0.91
0.90
0.93
0.94
0.96
0.95
a
1.11
1.73
2.13
2.25
5.65
micron
a
1.08
1.16
1.20
1.36
1.48
1.49
1.85
2.09
2.22
2.90
X
7.95
9.56
9.88
9.76
15.37
GLASS BEADS
X
7.40
8.00
7.43
8.26
7.31
7.40
7.80
7.35
15.42
29.40
U-fc)at max.velocity
0.88
0.49
0.25
0.30
0.21
(i - f)at max.velocity
0.88
0.75
0.77
0.69
0.42
0.51
0.32
0.28
0.32
0.65

- 290 - - 291
Probe of $ S
hypod. tubing. \
to \manometer. \
-^ 0 M 1 * ^^ t_. . "'" TH
.
po/nfer^__^ -^
plum b - ,
f
.- -|
• —
T —/
2.50
Hir
bob. ~~ — — O
•- -•
•• . >,-
•.•••'.-''
/
/
x^
^
^/
/
//
//
-«—
i
;
— 5-7-4 0 -
-7-63 0
i
3 - 7 8 0-
j
1
1
M1
fan
\
PJ
i
SL
l f r «
0-20 0hole
/L
/
'/
/,'/
^/
A^/^
soff asbestos
/pads.
/
••:•.-•;.
"'•. ' .
P- •. I'
^-^^si'af/c
tapping .
.;s pens ion
flow .\
a// dimensions
in mm.
FIG. 1 — DIAGRAM MA TIC SKETCH OF TOTAL
HEAD TUBE ASSY.
30
20 —
U
10
0
Deissle r's correlation
Nikur adse.
Clauser.
Re= 119 000
+ Re= 95500
p Re - 53 000
10 100 1000 10000
FIG. 2 — DIMENSIONLESS VELOCITY PROFILES FOR AIR
COMPARED WITH LITERATURE.
O)
0-9
o
"o
L)O
0)
so / /d symbolSr-
with flow slraighterer
0-8 «-.
0 07 0-7
solids loading
10
ratio ( c< )
FIG. 3 VELOCITY RATIO vs SOLIDS LOADING.
100 - 120 micron GLASS BEADS IN AIR
Re = 4 0 000 70 725 000
solid symbols
refer to R.H. radius
Re= 36 500 — 50 700 .
0-05 0-7
relative wall d/stance
FIG. 4 — AIR VELOCITY PROFILES
100 micron GLASS BEADS
0-5_£_ )

3<Y-io
00
CD
QCro
Po
O)
i,
5
0)
QLc/i'~vQ
^>O0)
o
(S)
01
velocity ratioU
Uvelocity ratio U
max Umax
for the various runso o o
CO Co Co
VQro
solids loading (Q5Kto
solids loading (ex.) opu>CD
pOoen
o^o rv>
NJtoCD
velocity defect
2}*
rn3j
O
COO
r^CD(r,
r—O
CD
CD
CDXI
to
oo
3:rnCD
moo
ID3Do~nr~rnCo
0)
cT
Q
a(n*~+.Q•3O0)
O
Co
o
o
en
rovo

- 29k ~- 295 -
National Chemical Engineering Conference 197 1. INTRODUCTION
PROCESS INDUSTRIES IN AUSTRALIA
Surfers Paradise,
IMPACT AND GROWTH
Queensland
thJuly 10 to 12 ,
OPTIMUM CHUTE PROFILES IN GRAVITY FLOW OF GRANULAR MATERIALS
A.W. ROBERTS*,C . CHIAHELLAt ,W. CHARLTON**.
S U M M A R Y
One approach to the problem of finding optimum profiles forgravity flow discharge chutes is to model the system in terms of asingle, representative particle moving under gravity and subjectto various retarding forces.
The paper discusses various possible types of forces retard-ing the flow of granular materials and describes analytical formu-lations and solution methods appropriate for finding chute profilesto maximize exit velocity or minimise transit time.
In bulk granular materials handling installations, gravity flow chutesare used extensively. It is often the case that the flow behaviour is rela-tively unimportant and simple chute geometry suffices. However, situationsdo arise where it is desirable to optimize some flow property such as par-ticle transit time or exit velocity.
Although the physical problem is concerned with a distributed/discretesystem, experimental studies * >2 have shown that, for the fast flow mode,the bulk flow characteristics may be modelled in terms of a representativesingle particle moving subject to tangentially directed forces.
Roberts l'2 has shown that, in terms of the particle model, the dragforces arising from the chute bottom and side walls could be represented byan approximately constant Coulomb friction coefficient. Later work 3 hasfound that, under "fast" one-phase flow conditions, the drag forces are acombination of Coulomb and speed dependent frictional forces with the Cou-lomb coefficient consiting of a constant plus a term inversely proportionalto speed.
Other flow modes may give rise to different patterns of drag forces.For example, in two-phase gravity flow such as in air slides, resistingforces that are some function of speed may predominate. To cater for the mostgeneral case, the optimization formulation should, if possible, be suffi-ciently comprehensive to allow for combinations of drag forces. From an ana-lytical and computational viewpoint, however, some compromise simplificationsmay be necessary.
2. CHUTE PROFILE FOR MINIMUM TRANSIT TIME
In this case, the objective is to obtain minimum stream thickness forstable, fast-flow conditions. There are difficulties with the classicalmethods in setting up and solving for an optimum chute profile when thefrictional forces are Coulomb type. The physical system is analogous to abead on a wire and hence the mathematical description for the retarding forcemust provide for the modulus of the normal reaction force. This in turn makesthe analysis and numerical solution difficult since an awkward two-pointboundary value problem arises in applying either the Calculus c? Variationsor Pontryagin's MiniTium Principle.
In a paper by Charlton and Roberts k this difficulty was avoided byignoring the frictional losses arising from the curvature term in the equa-tion. Calculus of Variations methods were then used to obtain a solution tothe problem approximation.
For the case where the retarding forces do not contain Coulomb typecomponents and are functions of velocity only, the minimum time profile hasbeen obtained by structuring the optimization in the form of a control prob-lem and employing Pontryagin's Principle 5. Solutions for a class of this
University of Newcastle, Newcastle, N.S.W.N.S.W. Institute of Technology, Sydney.Wollongong University College, Wollongong, N.S.W.
- 296
type of retarding force have also been found using a "discrete segments"method 6. Dynamic programming procedures were also tried but in practicethe discrete segments method was found to be the most effective one 5.
More recently 7 the authors have found solutions for the minimumtime problem when the retarding forces are of the very general type dis-cussed in the introduction. The solution method used is a simple and directone based on polynomial approximations to the control variable and solvednumerically by the Newton-Raphson process. With this approach, the prob-lem formulation allows for an arbitrary particle speed, the direction ofwhich may be specified or unspecified.
3. CHUTE PROFILE FOR MAXIMUM EXIT VELOCITY
Cases have arisen in the loading of rail cars with wheat where amaximum exit velocity was required. The same general approach may be usedif it is desired to optimize some component of the exit velocity such asthe horizontal component.
Using a rectangular co-ordinate system and considering only Coulombfriction, Cnarlton and Roberts 8 have investigated chute profiles for maxi-mum exit velocity and deduced certain genera.! conclusions regarding shapes.
4. PROBLEM FORMULATION ANf> SOLUTION METHODS
(a) Maximizing exit velocity :
In reference 8 only Coulomb frictional forces were consideredand the problem dynamics were formulated tfith respect to rectangular posi-tion co-ordinates. This led to an expression for the constraint equation
rxr2 _ 2gy - 2ygx] + 2y y" x2 dx (1)
where vy
= speed= Coulomb
v 0 = initial speedcoefficient
A d2
y -Ax — dx-. ,dt
Although the problem was not "solved" in that a specific chute pro-file was determined, certain deductions regarding profile could be made.For example, the bracketed term depends only on the end point of the chute,while the integral term depends on the chute curvature and hence is influ-enced in both magnitude and sign by y".
To illustrate one possible approach, consider the case of a chutesystem where the representative particle is subject to constant drag force,tangential to its instantaneous direction.
- 297 -
Defining 0 by tan 6 = gj and using 9 and v as dependent
variables with y as the independent variable, the motion constraintequation is
i /Y m k, n
or
mgy dy +
(2)
From (2)
R = constant force per unit mass.
wherevvr = g - cos 9 (3)
v' =A dvdt
From eq. (2), v is maximized when the integral term is a minimum.Further, if the chute end points are the origin and (X, Y),
Ytan 0 dy = X
^f
Thus, the problem is to find 6(y) such as to rninimize the integral
f Y k.,- ~ dy ---- . ( 5 )
J0 cos 9
subject to the constraint equations (3) and (M) .
Using Calculus of Variations, the problem may be written
Y k. k- + X tan 0 + A(W - g + pmin. I =
•'0
dy . ( 6 )
ri . e . min. I = F ( v , v ' ,0 ,9 ' )dy
where \1 and X are Lagrange multipliers. From the integral constraint,X. is known to be a constraint.
A necessary condition for an extremum is that the Euler-Lagrangeequations ,

- 298 -
d f 5F
d 3F36
= 0
= 0
(7a )
(7b )
be satisfied.
From eq. (7a)
X ' = 0 and hence
A is also a constant = A
From eq. (7b)
A = - 1 +
2
A
k^sin
or- A
sin 0 = + A 2 ) = constant (8)
Eq. (8) shows that a solution is 6(y) = constant and hence the requiredchute is a straight line.
If the straight chute solution is substituted back into eq. (2) oneobtains
2gY cos 0 v (9)
where v is exit velocity at (X,Y).
Clearly, the solution does not apply ifo
L L_ + 111 < o{£ cos 0 2YJ
Equation (7) yields a necessary but not sufficient condition for anextremum. However, physical reasoning confirms that the straight path pre-dicted by eq. (8) is an extremum since, under constant drag force, losseswill be minimized when the path length is a minimum.
(b) Minimizing transit time :
The chute profiles obtained in reference 3 were for Coulombtype retarding forces. Relevant equations may be derived as follows.
If ds is an element of arc, the the descent time T may be written
T =dsv
(1+ (y'V
dx (10)
- 299 -
where y' = dx '
If the curvature term in eq. (I) is neglected, for zero initialvelocity
v - C2g(y - yx)T
and this can be substituted into eq. (10) so that the integral to be mini-mized is now of the form
I = f(x,y,y')dx (n)•to
where f( ,y>y') =
The use of eq. (7) yields
[1 + (y')2]Cl + yyf] + 2y"[y - yx] = 0 (12)
and a necessary condition for y(x) to be a minimizing curve of the functionaleq. (11) is that it must satisfy eq. (12).
When the retarding forces are velocity dependent, solutions for the mini-mizing curve have been found using Pontryagin's Minimum Principle 4 but amethod of discrete segments was found to be more efficient 5. In this method,the descent curve is considered to consist of a number of straight line seg-ments. For example, if the drag force is constant, eq. (2) applies and thedescent time is given by
By taking the d:: ;crete form of eq.'s (2) and (13), T becomes a functionof a general discrete angle 0., i.e.
T =T(013 ••' , 0N)
Similarly a discrete form of eq. ( l J ) yields an expression of the form
g(0 l5 ... , 9N) = 0 (15)

- 300 -
The problem then is to minimize eq. (14) subject to constrainteq. (15)- Two approaches have been considered,
(i) Velocity assumed constant over each segment;(ii) Velocity variation on each segment allowed for.
For comparable accuracy, the former requires a large number of seg-ments i.e. large N, while the latter involves more complex expressionsand hence longer computing time per step.
A method that the authors have used and found effective in handlingthe general resisting force situation described in the introduction isbased on polynomial approximations.
Using the 6, v, y variables of equations (2) and (4), 0(y) ortan 6(y) is approximated by a polynomial in y, e.g.
tan 9(y) =N (16)
To illustrate the method, consider the case of velocity dependentretarding forces where a constraint equation similar to (3) would be,
v' V " V COS 0 (17)
cf>(v) is an arbitrary function of v .
Substituting eq. (16) into (13) and at the same time solving eq. (1?)for v, an expression for T is found that depends only on the coefficientsai of eq. (15), i.e.
T = i(a0, a19 ••• , aN) (18)
The integral constraint fixing the end points e.g. eq.(l ) assumes the form
rl+1
- -X = 0 . (19)N a.Y-
, aN) =1=0
The coefficients a. must be chosen so as to minimize eq. (18) underthe constraint eq. (19).
- 301 -
This means that the set of N + 2 non-linear equations to be solved are,
(T + XG) = 0 i = 0, ••• , N
G(aQ, a.., ••(20)
(X is a Lagrange multiplier) .
The Newton-Raphson process has been found very convenient for this 9.
5. DISCUSSION
As far as the problem of minimum transit time is concerned themethod with the most general applicability is the one based onapproximating tan 0(y) by a polynomal. This method has been usedto handle the most general friction term (a combination of Coulomband speed dependent frictlonal forces).
The method of discrete segments works well for the case ofspeed dependent frictional forces but it is difficult to carry outthe analysis when the Coulomb friction term is included.
Further work is in progress to extend these numerical methodsto the problem of maximising the exit velocity.
Some typical minimum transit time curves are given in the dia-gram.

- 302 -
REFERENCES
1. ROBERTS, A.W.; "The dynamics of granular material flow throughcurved chutes". Mech. & Chem. Eng. Trans. Inst. Eng. Aust. VoL.MC3, No. 2, Nov. 1967.
2. ROBERTS, A.W.; "An investigation of the gravity flow of non-cohesive granular materials through chutes". Trans. A.S.M.E.J. Eng. Ind. Vol. 91, Series B, No. 2, May 1969.
3. PARLOUR, R.P.; "Mechanics of granular flow". Unpublished Ph.D.thesis, Univ. of N.S.W., 1971-
4. CHARLTON, W.H. and ROBERTS, W.A.; "Gravity flow of granularmaterials. Analysis of particle transit time". A.S.M.E. Pub.72-MH-33, 2nd Symposium on storage and flow of solids. Chicago,Sept. 1972.
5. CHIARELLA, C. , and CHARUrON, W.H.; "Chute profile for minimumtransit time in gravity flow of granular material". J. Agric.Eng. Res., Vol. 72, 1972.
6. CHIARELLA, C. , CHARLTON, W.H. and ROBERTS, A.W.; "Optimum chuteprofiles in gravity flow of granular materials : A discretesegment solution". Trans. A.S.M.E., Jour. Eng. Ind. paperNo. 73-MH-A.
7. CHIARELLA, C., CHARLTON, W.H. and ROBERTS, A.W.; "Gravity flowof granular materials : Chute profiles for minimum transit tame".Submitted.
8. CHARLTON, W.H. and ROBERTS, A.W.; "Chute profile for maximum exitvelocity in gravity flow of granular material". J. Agric. Eng. Res.,15(3), 1970.
9. CHIARELLA, C.; "Une methode Discrete pour la solution des Problemesde la commande optimale". Presented to French National Colloquiumon Numerical Analysis, 1971.
- 303 -
0Xr
= 0-0 DESCENT TIME =0-7147 SECS
= 0-5 DESCENT T!ME = 0 -7427 SECS
X= 2-0 METRES
Y=1-8323 METRES
MINIMUM TRANSIT TIME WITH COULOMB FRICTION

- 505 -1. INTRODUCTION
National Chemical Engineering Conference 1974
PROCESS INDUSTRIES IN AUSTRALIA
Surfers Paradise,
IMPACT AND GROWTH
Queensland
thJuly 10 to 12 , 1974
MEASUREMENTS OF POWDER STRENGTH AT ELEVATED TEMPERATURES BY A NEW METHOD
by
E.G. POTTER and S.G. SZIRMAI
S U M M A R Y
A new method is described for measuring the tensile strength of weakpowder-compacts at elevated temperatures, by applying stress to thepowder test-piece formed in the shape of two opposed truncated cones,joined at the 8 mm waist. The test-piece is closely supported by metaland glass surfaces, except at the waist, where an unsupported height ofapprox. 0.01 mm corresponds to the eventual plane of brittle fracture.Tension is applied by slowly stretching a long metal spring attachedvertically to the upper support of the powder test-piece. Extensionof the spring at fracture is measured and the tensile strength of thepowder calculated directly. The method also allows a simultaneousshearing force to be applied up to tensile fracture, or the failure canbe produced by shear alone, if desired. The capability of the methodhas been demonstrated by studying the tensile properties of variouspowders as a function of factors such as compaction, particle sizedistribution and shear.
The ability of an unsupported powder to remain intact and resist fracturedepends principally upon
a) the number and strength of interparticle bonds per unit volume, and
b) the extent of mechanical interlocking among particles.
Either factor may dominate depending on circumstances. Thus, damp or moistpowders can derive most of their strength from surface-tension forces associatedwith liquid or viscous films present at interparticle contacts. In contrast,angular particles of irregular shape are capable, of interlocking to form arelatively strong powder even when liquid films are absent and the assembly isessentially dry. The weakest powders would therefore consist of a loose packingof dry hard spheres, coarse rather than fine, and the strength of such an assemblywould largely originate in forces of Van der Waals type between particles.
A practical example of a powder approaching this condition is the fineash (fly-ash) formed when pulverized coal is burned, as in electric powerstations. It is common practice to separate fly-ash from its carrier flue gasby continuous collection in electrostatic precipitators, usually at 100° to200°C. In the precipitator the collected fly-ash clings to vertical platesuntil mechanically dislodged in a coherent mass into hoppers beneath. If theprecipitator is to be effective, the fly-ash as deposited on the plates mustnot be so fragile that it continually sheds particles back into the flue-gasstream nor must it be so adherent that dislodgement is difficult and the passageof gas and of electric current in the precipitator is obstructed. It is, there-fore, relevant to know, and if possible to optimize, the rensile strength ofdust deposits on plates in electrostatic precipitators.
Examination of existing methods for measuring powder strength indicatedthat an extension of their application to the relevant elevated temperaturesand to suitably low tensile strengths would be troublesome and a fresh approachwas made. This paper describes a new method devised for use under these conditionsand gives a selection of the results obtained.
2. BASIS OF METHOD FOR MEASURING TENSILE STRENGTH
In principle, the force necessary to fracture the formed powder is observed.The procedure requires that a gradually increasing tensile stress be appliedaxially to a vertical column of the powder using a helical spring attachedto the powder-support. The powder column eventually suffers brittle fractureat an unsupported plane coinciding with its smallest cross-section, and thefracturing force is estimated from the measured extension of the spring.The tensile strength is calculated as the fracturing force per unit projectedarea of the powder column at the fracture plane.
By keeping the dimensions of the column comparatively small, the tensilestrength may be estimated on less than a gram of powder, and the provision .of an enclosure for elevated-temperature work becomes readily practical. Thechoice of vertical tensioning avoids the sliding or rolling friction correctionsusually associated with horizontal tensioning of a split cylindrical containmentcell. The new method also allows the application of a simultaneous twistingshear stress, or this type of stress can be used alone to fracture the powderif desired.
Potter, CSIRO, Mineral Chemistry
Szirmai, CSIRO, Mineral Chemistry
3.
3.1
Fig.
APPARATUS
The method of forming and supporting the powder column is illustrated inla. The glass funnel A with attached flange F and stem tapering at 10°

... 306 -(See Fig. 3) rests over a cavity in a stainless steel block, B, the cavityforming the frustum of a cone 1.5 mm deep with smallest diameter 8 mm and taper20°. The powder is filled and consolidated into the cavity with the funnelin place as shown, and the excess powder partly fills the funnel. The spring(not shown) attached centrally to the rim of the funnel is then graduallystretched with the block B fixed, and the tensile stress is transmitted to thepoxtfder by virtue of its being gripped by the walls of both funnel and cavity.Actually, a minute vertical slip of about 0.01 mm, as the powder first encountersstress, creates a small unsupported area of powder coincident with the uppersurface of the block where the powder column has its minimum cross-section.Eventually the powder parts cleanly by brittle fracture into two portions(Fig. Ib), and when the vertical oscillations have ceased the distance D ismeasured with a cathetometer and identified with the net extension of the springrequired for fracture of the powder column. For this identification to be validno detectable loss of powder particles from the funnel must take place eitherduring or after fracture; otherwise, distance D is increased by an amount(usually unknown) equivalent to the spillage from the funnel.
In this present work the spring had a sensitivity of 0,, 374 cra/g, and waswound from 0.5 mm diameter phosphor bronze wire to form coils 1.65 cm diameterwith a hanging length of about 60 cm. The spring was suspended from a nylonfilament that passed over a low-friction Teflon pulley and was pulled by asynchronous motor to give a uniform rate of extension of the spring close to1 cm/ruin. Tests at thirty times faster rates of extension gave the same results,and other experiments in which the fracture was delayed up to ?,n hour with tensilestress applied disclosed no detectable pla.stic flow or slip of the powder. Theseobservations confirmed that the powder was failing by purely brittle fracture.The spring was calibrated with the nylon filament in place so as to allow for anyextension of the filament included in the extension of the spring at the momentof powder fracture. The calibration of the spring was regularly checked anddid not change detectably during the course of the work described here.
The stainless-steel block was heated from below by an electric heater(See Fig. 2) and this assembly was mounted on a stainless steel plunger movinginside an oil-filled syringe barrel. This arrangement permitted smooth verticalheight-adjustment and allowed shear stress to be transmitted to the powderby rotation of the plunger through a controlled angle so that the spring appliedthe required torque to the powder during the measurement of its mechanicalstrength.
The temperature of the powder was controlled by the current in the heaterand was measured by a thermocouple set into the stainless-steel block.Disturbances from draughts and excessive heat-losses were avoided by using ademountable cylindrical glass shield with split cover placed round the assemblyas shown in Fig. 2. All of the extensible part of the spring was at ambienttemperature, and a light horizontal bar touching the suspension beneath thepulley stopped adventitious rotational oscillations of the spring.
3.2 Setting-up for Measurement
As expected, the procedure for forming the powder column was important,since density variations or lumps in the powder affected reproducibility.Fracture surfaces that were bulging or stepped were also unacceptable, and toavoid all these disturbing effects a precise routine for setting up the apparatuswas necessary as indicated belox\r.
In particular,the alignment of funnel to cavity was achieved by a form ofvacuum clamp using the detailed design of the stainless-steel block (B in Fig. la)shown in Fig. 4. The flange of the funnel was large enough to cover an emptycircular groove close to the perimeter of the block. A side-arm connected thisgroove to a vacuum pump, and the suction sufficed to keep the funnel clampedto the block while the powder column was being formed. No other method ofclamping funnel to block was found to be as reliable and shock-free, especiallywhen releasing the clamping action immediately before application of tensilestress.
- 30? -The forming of the powder column took place in two stages. First, the
powder (sometimes already hot) was poured into the cavity to a depth of no morethan 1.5 cm in the funnel. The powder was then stirred with a long steel needleto break up any weak agglomerates and to ensure homogeneity. Finally, thepowder was consolidated to the desired degree by repeated very light tampingusing a blunt 4 mm rod. The draught shield was then put in place and thevacuum clamp slowly released. Subsequently, while temperature equilibrium wasbeing established, the powder column was not stressed in any way.
3,3 Concluding the Measurement
The moment of powder-fracture must coincide with the cessation of stretchingthe spring if the distance D in Fig. Ib is not to give an overestimate of thetensile strength of the powder column. It was found that manual switching of thetensioning motor for the spring was not rapid enough to avoid this overestimation,and an automatic system was used in which the slightest upward movement of thefunnel (as occurs at powder-fracture) began to obscure the light falling on aphotoelectric cell, instantly stopping the motor through a photo-relay.
After powder-fracture and the measurement of the distance D, the. powderin the cavity in block B (see Fig. la) was quantitatively removed by suction andweighed. This observation, with the capacity of the cavity (0.099 cm3), gave thebulk density of the powder column. Early tests showed that when the cavitywas as shallow as 1.5 mm and the formation of the column was closely controlled(see above), the bulk density at the fracture plane was correctly estimated bycalculation from the weight of all the powder in the cavity.
4. RESULTS
Some typical results are given in Figs. 5 - 7 . The bulk density determinesthe volume concentration of particle contacts in a powder, and hence bulk densityplays the major role in determining powder strength, as is seen for a power stationfly-ash at 110°C in Fig. 5. Particularly noticeable is the relatively low scatterof the points about the line drawn, and the ability of the method to estimatetensile strengths as low as 0.1 g/cm2.
Some remarkable effects of the simultaneous application of tensile stressand torque are evident for a fly-ash at 100°C in Fig. G. Depending on the valueof the angular twist applied, it was found that the powder column failed atdiminished values of tensile stress, especially over the upper levels of bulkdensity, However,, at the lower bulk densities the tensile strength reached avary low (but still detectable) minimum, leading to the phenomenon of a tensilestrength rising with decreasing bulk density.
Particle size distribution had a marked influence on the tensile strength/bulk density relationship, and Fig. 7 gives results for the same powder in thieesize ranges: 11-18 ytu9 4-6 ym, and <4 ym. The finest powder gave a well-defined line with a negligible scatter of the experimental points, but a broadband o£ points was obtained for the powder composed of particles of intermediatesize. At a given compaction the finer powder gave the higher tensile strength,this effect being enhanced because of the greater compactions possible with thefiner powder. The coarsest powder was associated with such a wide experimentalbcatter that no relation between tensile strength and bulk density could bef'.iscerned. Separate tests, not given in Fig. 7, showed that the addition of asmall percentage of fines to the coarsest powder removed the experimentalscatter and restored the excellent tensile strength/bulk density relationshipexemplified in Fig. 5.
5. CONCLUSIONSrt
1. The tensile strength of a powder has been measured down to 0.1 g/cmusing the vertical extension of a spring to estimate the force required tofracture a formed column of powder.

-308 -
2. The measurement is possible above 100°C using less than a gram of powderand, if required, in the simultaneous presence of a shear stress.
3. The marked effects of bulk density, shear stress, and particle sizeon tensile strength have been quantitatively assessed in preliminary work on apox-7er station fly-ash.
- 309 -
(b )
FlG. l . D I A G R A M M A T I C R E P R E S E N T A T I O N OF FUNNEL
D B L O C K ( a ) BEFORE F R A C T U R E
( b ) AFTER F R A C T U R E

•310 - -• 311 --
G U I D E
THERMO - C O U P L E
HOLLOW S T A I N L E S S
STEEL C Y L I N D E R ,
12cm LONG
S C R E W - F I T T E D T O
HEATER A S S E M B L Y
E L E C T R I C A L L E A D S
TO H E A T E R
T O H Y D R A U L I C S Y S T E M F O R
SMOOTH H E I G H T A D J U S T M E N T
TO S Y N C H R O - MOTOR
H E L I C A L S P R I N G
3 - P IECE D R A U G H T SHIELD
( G L A S S )
FUNNEL SEE F I G . 3
BLOCK SEE F I G . 4
L O C A T I N G D E V I C E
F I T T E D TO HEATER - C A S I N G
E L E C T R I C HEATER E N C A S E D
IN S T A I N L E S S STEEL C Y L I N D E R
F R I C T I O N D R I V E
S Y N C H R O - MOTOR
TO V A C U U M PUMP
E P O X Y - R E S I N PLUG T O
S U P P O R T S Y R I N G E - A S S E M B L Y
20 ml G L A S S - S Y R I N G E
FIG.3. DETAIL OF FUNNEL
1-82 cm
0-5 cm O.D.0 - 3 c m I.D.
C I G . 4 . D E T A I L OF BLOCK
F I G . 2 . A P P A R A T U S D E S I G N

T E N S I L E S T R E N G T H
CDCDCD
rooCD
CDCD N m -2
o
O
oo
o
CO
orn
-<
>
'.*)
ro
T E N S I L E S T R E N G T H
CDCD
roCDCD
OCD
CDCD N m -2
uo-imO
o
—I 3T
m
O JO !Z
CO r- O-< d
s i i
-oo
m70
~~ m
m^B^ i
m
O oo
m o•^.00
-H
VJ1CD
CD
CD*
U1
CD•
—JC3
ro•
CD
VjJ•
CDg cm -2
CD•
-~J\J1
(JD
O3
IUJ

CSII
1000 - - 10-0
800 -- 8 -0
600
CO
LU_1
cn
200 -
CMI
Eo
- 6-0
400 -_ 4-0
2-0
0-6 0-7 0-8 0-9 1-0 1-1 g e m -3
-3600 700 800 900 1000 1200 kg m
BULK DENSITY
FIG.7 . EFFECT OF PART ICLE S I Z E ON TENSILE STRENGTH
O F F L Y - A S H ( G R E A T NORTHERN S E A M )
P A R T I C L E S IZE : <4 j jm, 4 - 6 j u m , A 11-18
- 315 -
National Chemical Engineering Conference 197H
PROCESS INDUSTRIES IN AUSTRALIA IMPACT AND GROWTH
Surfers Paradise, Queensland
July 10 to 12th, 197U
THE PRODUCTION OF LIQUID FUELS FROM COAL IN QUEENSLAND
"by
Professor D.J. Nicklin, B.Sc.App.,B.Sc., B.Econ., Ph.D. , F.I.Chem.E.
S U M M A R Y
Various processes for the manufacture of liquid fuels from coal areconsidered. Feasibility studies indicate that both the H-Coal processand the COED process would be economic at the current price of crudeoil. It is argued that with our existing reserves of coal and oil, wemust eventually be prepared to develop the conversion technology. Further,because of the uncertain supply of crude oil and because of the lag indeveloping coal-to-oil technology, we should give serious considerationto a plant immediately. The COED process is in an advanced state ofdevelopment, and seems to be well suited for Queensland.
Nickliu, University of Queensland, Chem. Engng.

- 316 -Introduction
The technical feasibility of producing liquid fuels from coal has certainly"been demonstrated. Large scale plants were operating in Germany during World WarII, and the complex at Sasc?lmrg in South Africa is veil known. These plants were"built, not because the processes had "been shown to be competitive in a free market ~but rather to provide some degree of self sufficiency in situations where the freeflow of international trade had been suppressed.
Since World War II, coal has not been competitive with crude oil as a sourceof liquid fuels, and no large plants have been built. For much of this time therehas been intensive competition amongst the oil-producing countries - a situationapproximating a price war - and the price of crude oil has until very recentlybeen kept down to about $2 per barrel. Under such conditions, there has just notbeen sufficient incentive to develop coal as an alternative source of liquid fuels.Possible new processes have not been taken beyond the pilot scale, and moderntechnology has not been fully exploited in the older processes.
However the whole energy picture has changed dramatically in the last few yearswith the breakdown of the free market system, the restrictions to the flow of oilacross international boundaries, and the realization that there must be a limit tothe world's reserves. As a result, the price of crude oil has risen several fold;the short term availability has been unreliable; and nations have recognized thisvulnerability to the political whims of Middle East governments not renowned fortheir reliability.
Have all these factors finally tipped the scales in favour of coal as a sourceof liquid fuels - particularly for those countries with limited crude oil reservesbut with abundant coal?
We consider this question in the present paper, and discuss the difficulty ofintegrating a possible new plant into the Australian energy scene. These problemsare discussed in greater detail in a number of reports (l-U) prepared for theQueensland Department of Commercial and Industrial Development by the Department ofChemical Engineering of the University of Queensland.
Different Approaches to Producing Liquid Fuels
Processes can be broadly classified as follows:
o Direct hydrogenationo Gasification followed by synthesis<a Distillation followed by hydrogenation of the oilo Extraction followed by hydrogenation of the extract
Many individual processes are currently being actively researched, but noobvious best process has emerged. In fact as the level of research activityincreases in response to the present "crisis", the position may well become evenmore confused. Thus we can expect to see an increasing flow of data from laboratoryand pilot tests, while there are still uncertainties in the scale-up of processeswhich have already been pilot tested. Scale-up will not be a simple matter.
In this paper the status of various projects is reported. At the Conferencein July it is hoped to report more recent information gathered in the course of avisit overseas to investigate this matter.
The Situation in 1962 - The C.U.R.A.C. Report
The C.U.R.A.C. Report was published in 1962 and was an important effort todefine the areas of research likely to lead to the further exploitation ofAustralia's vast coal reserves. The production of liquid fuels vas considered,and a cost of 30. per Imperial gallon was reported for an advanced FischerTropsch process (i.e. gasification followed by synthesis) in N.S.W. This comparedwith UT.9$ per gallon for a direct hydrogenation process. At this cost, both
- 317 -
orocesses were rated uneconomic, though the C.U.R.A.C. report favoured theflasol process as offering greatest potential.
The C.U.R.A.C. report was an excellent summary of the state of the art in1°62, and we can thus concentrate on the developments since then.
•pThe H-Coal Process
This is a direct hydrogenation process. Dried and ground coal insuspension in heavy gas oil is catalytically hydrogenated to produce refinerygases, naphtha, middle distillate, heavy gas oil, residuum and unconverted coal.
(6 - 10)have been published on H-Coal, some with specificA number of papers
reference to Australia,
Wicklin and Job studied the feasibility of making liquid fuels fromBlackwater coals in Queensland. They pointed out that in the C.U.R.A.C. report,direct hydrogenation and Fischer Trapsch synthesis had been considered in differentsections, and had not been compared directly. They argued that the basis ofcomparison was not consistent - and in fact on several scores favoured FischerTropsch. Thus coal was charged at $12.50 per ton for the hydrogenation process(versus only $2.50 for Fischer Tropsch); capital at 12% versus 8%; a scheme basedon ICI experience was compared with an unproven scheme; and a much smaller plantwas considered. Under these conditions, the difference in gasoline price - ^7-90versus 30.H<£ - no longer seems so great particularly when Fischer Tropschprocessing has the added penalty of producing a very diverse range of products.
Wicklin and Job considered a 100,000 BPD plant at Blackwater using the H-Coalprocess. (This production corresponds to about hO% of Australia's needs.) Theycharged coal at $2.00 per ton, and used performance data reported by HRI. Theycalculated a ROI before tax of 15.7$ on a $363 million investment, assuming agasoline price of 12<? per gallon.
Blackwater coal has not been tested by HRI. However tests have been madeon Australian brown coal, and HRI published a feasibility study of the work^9).For a 50,000 BPD unit, the estimated capital cost was $l66 million, for amanufacturing cost of gasoline of 9-3^ per gallon.
In the light of todays oil prices, these figures are very promising indeed.However the figures are speculative, because we have no plant experience, andcosts tend to escalate rapjdly when new technology is introduced. The H-Coal processhas been tested at the bench scale (25 Ib coal per day) ard in a process developmentunit (about 5000 Ib coal per day). The latter unit had run for 90 days up to 1973,and gave similar performance to the bench unit.
HRI are currently estimating a production cost of crude oil of about $6.00.per barrel W; and they claim H Coal is ready for the next stage of development.This would be a prototype plant, hydrogenating about 500 tons of coal per day.HRI are currently developing a new process for generating the hydrogen, which isrequired to the extent of about 1 -20,000 SCF per ton.
The CONSOL Process
In the COKSOL process for manufacturing liquid fuels, the coal is dissolvedat 650°F in a process-derived solvent. The mixture is filtered, and the liquidhydrogenated at 000 psig.
A 1969 report suggested that a plant capable of producing about 50,000BPD of crude would cost about $200 million. Cost of the product crude was about$5-00. per barrel, and large economies of scale were anticipated for a 250,000 BPDplant for which the cost of crude was $3-23 per barrel.
Unfortunately the CONSOL test plant has experienced considerable mechanicaldifficulties^^ an<i in 1970 the decision was made to convert it to low-sulphuroil production.

- 318 -The COED Process
The FMC Corporation is developing a multi stage fluid bed pyrolysisprocess to produce oil, gas and char. This is the so-called COED process -for Char Oil Energy Development. McKeough^' argued that the process hasconsiderable promise for Queensland.
In the process, coal is carbonised in four or five stages between 320 Cand 900 C. The char can be used for gasification - but it vould be morerealistic to link the plant with a large power station to consume the char.The distillate oil is hydrogenated to a synthetic crude.
A pilot plant treating 36 tons of coal per day was built in 1970 and isfully operational. Many coals have been tested.
McKeough studied the feasibility of a plant consuming 3.12 million tonsof coal per year. He restricted the size of the plant so as not to create aproblem in the disposal of the gaseous products. He pointed out that as threeproducts are proc'iced - oil, gas, and char - the economics are sensitive to theselling price of all three. However the sale of the crude oil accounts forabout two thirds of the revenue. Typical economics (reported by McKeough) are:
Site: GladstoneCoal consumed: 3.12 million tons/annumOil produced: 11,000 BPDLow Btu gas production: 128 million scfdPower production: TOO MWCoal price: $5.00. per tonChar price: $ .50 per tonOil price: $3.80 per barrelFuel gas: 25$ per million BtuROI 20%
The FMC Corporation is currently seeking partners for commercialexploitation of the COED process ^13jt Further feasibility work is continuingwithin our Department.
Tactics for Australia
The future is obviously uncertain regarding the price and availability ofoil from the Middle East, and regarding the discovery of new oil fields inAustralia. We can however, make the following comments regarding our presentposition:
(1) Australia has much greater reserves of coal than oil.
(2) While coal-to-oil conversion is technically feasible, the lag time tomake a plant operational is considerable. (Say 8 years now, U years after1980.)
(3) The economics are still unproven, although feasibility studies indicatethac the present processes would be competitive at an oil price of about $6.00.per barrel.
Under these conditions - and noting the virtual certainty that we willeventually have to produce liquid fuels from coal - there is a strong casefor us to venture now into the oil-from-coal arena. It would be ideal if wecan move in gradually, slowly acquiring the technology, without unduly disturbingthe crude oil supply or refinery capacity.
Which process has greatest potential for Queensland?deficiencies in direct hydrogenation:
There are obvious
o It is an all or nothing venture into which we cannot move gradually.o A large plant would be required in order to achieve the economies of scale.
- 319 -
© Two technologies must be developed simultaneously - the direct hydro-genation process, and its associated hydrogen process (using char).
The COED process, linked with a large power station seems to relievemany of these problems.
© The crude oil is only part of the energy output from the process. Ratherthan try to convert coal entirely to oil, we can dial whatever proportion ismost economic, using the power station as a sink. The material balance isthus much less delicate.
© The economies of the process do not demand a vast production scale, andmarketing problems would be less complex.
o The COED process operates as a net producer of gas, and there is controlover the gas composition so that available markets (for hydrogen, low Btu orhigh Btu gas) can be satisfied.
Q The COED process involves less capital, it is closer to commercializationand does not require an associated hydrogen plant.
Conclusion
It seems certain that fossil fuels will have a place in our total energypicture for many years to come. Because our reserves of coal are much greaterthan our reserves of oil we must count on developing eventually the"substitution technology". Because our reserves of oil are low and the supplyis unreliable, and because it will take time to perfect the technology, weshould immediately conduct a full scale feasibility study for oil-from-coal inQueensland. The COED process would appear to be an ideal process to giveQueensland smooth entry into the field, and consideration should be given tointegrating a plant with our next major power station.
Acknowledgment
The financial support of the Queensland Department of Commercial andIndustrial Development is acknowledged with thanks.
References
1. J.G. Job and D.J. Nicklin, "The Utilization of Queensland Coals",Second half-yearly report, University of Queensland, Dec, 1967-
2. J.G. Job and D.J. Nicklin, "The Utilization of Queensland Coals",Third half-yearly report, University of Queensland, June 1968.
3. J.G. Job and D.J. Nicklin, "Possibilities for New Queensland ChemicalIndustry", University of Queensland, July 1969-
>4. P.J. McKeough and E.T. White, "The Utilization of Queensland Coals,Developments 1968-72", University of Queensland
5. Report of the Coal Utilization Research Advisory Committee,Australian Government Printer, 1962.
6. Hellwigg, K.C. and others, "Convert Liquid Fuels with H-Coal".Paper presented at Sumposium of Fossil Hydrocarbon and MineralProcessing Part IV, 62nd National Meeting, A.I.Ch.E., Salt Lake City,Utah, May, 1967, Paper No. 260.
7. Hydrocarbon Research Inc., "Commercial Process Evaluation of the H CoalHydrogenation Process." Report prepared for U.S. Department of Interior,Office of Coal Research, Dec, 1965.
8. Clarence A. Johnson and others, "Present Status of the H-Coal Process"HRI Internal Publication, 1973.
- 320 -
9- Clarence A. Johnson and others, "Production of Gasoline from AustralianBrown Coal "by the H-Coal Process", Paper presented at the World PetroleumCongress, 1971*
10. J.G. Job and D.J. Nicklin, The Journal of the Institution of Engineers,Australia, Oct-Nov. 1968, p. 253.
11. The Ralph M. Parsons Company, Report prepared for the U.S. Department ofthe Interior, Office of Coal Research, 1969.
12. U.S. Department of the Interior, Office of Coal Research, Annual Report,1972.
13- Chemical and Engineering News, Nov. 26 1973, page 19.
- 321 -
National Chemical Engineering Conference
PROCESS INDUSTRIES IN AUSTRALIA IMPACT AND GROWTH
Surfers Paradise, Queensland
July 10 to 12th,
RESEARCH INTO THE UTILISATION OF VICTORIAN BROWN COALS
FOR POWER GENERATION
L. J. Garner
S U M M A R Y
B.-~~>wn coals or lignites differ from bituminous type coals by virtueof high moisture contents and volatile matter/fixed carbon ratios.Victorian brown coals occupy one end of the spectrum of brown coal qualitybecause of their very high moisture contents (up to approximately ?0% wetbasis) and generally very low ash contents. They present, therefore,special requirements for combustion in power station boilers and aconsiderable research effort has been applied by the State ElectricityCommission of Victoria to solve problems where these occur in practice, andto develop predictive techniques whereby future utilisation might befacilitated.
The paper presents a broad survey of experimental work performed inthe laboratory and field, and concentrates on particular topics whereresults have added significantly to knowledge of coals of this type.Characterisation by the use of analytical information; the nature of thecontained moisture and the factors governing its removal prior tocombustion; breakage properties ~ind the performance of combined milling/drying systems; ignition and combuction, with particular reference tocombustion stability; the behaviour of the inorganic constituents duringand after combustion; furnace aerodynamics and heat transfercharacteristics; on-load and off-load boiler cleaning processes; are allareas in which some measure of original work has been required to adapttechnologies developed, elsewhere and for other purposes to the effectiveuse of Victorian brown coals.
Garner, State Electricity Commission of Victoria, Australia.

- 322 -
RESEARCH INTO THE UTILISATION OF VICTORIAN BROWN COALS
FOR POWER GENERATION
1. The Need for Research
The brown coals of the Latrobe valley in eastern Victoria represent a vastenergy resource that has formed the basis of the electricity generation systemsince the State Electricity Commission was formed in 1918; 55 million tonnes hasbeen mined in the intervening years and production is currently running at a rateof 23 million tonnes per year. New power stations are under construction andmuch larger projects than the existing ones are being planned; the coal reserveswhich, allowing for all factors that could affect their accessibility andrecovery at present-day costs, still amount to 10 000 million tonnes aresufficient to support generating plant to the extent of 22 000 MW (compared withabout 2700 MW today).
The tempo of research into characteristics of the coal deposits that bear ontheir use in power stations has increased over the years. This work has beenstimulated by a growing recognition that, in spite of the extert of continuousdeposits - seams 80-300 metres thick extending over very large areas - and theirvisual uniformity, there is in fact a high degree of variability in propertiesbetween coals from different localities, or at different levels in the onelocality. Early problems in using coal with high moisture contents, andsubsequently coal with high boiler fouling tendencies, date from an era whenforward-looking research in this area was little practised; even today, when asubstantial effort is being mounted, each new facet of utilisation brings with itproblems that demonstrate the risks inherent in applying experience in oneLatrobe Valley situation to predicting behaviour in another.
The difficulties are compounded by the fact that the Latrobe Valley coalsoccupy one end of the spectrum of brown coal quality when viewed world-wide.Figure 1 demonstrates thic; relationship. Moisture contents of Yallourn seamcoal, commonly 66-68% wet basis (about 2.0 parts of water per part of dry coal)can rise to 73% (2.7 parts). Ash contents tend to be very low (less than 2% ofdry coal in many areas), although this does not mean that ash-based problems areminimal. These characteristics give rise to the situation that experience incountries with la.rger-scale operations than Victoria's, and to which it tends tolook for plant designs, is not always relevant to specific local needs. Anelement of risk is also involved in adopting practices that produce satisfactoryresults in less demanding circumstances.
Hence the need for a research program into brown coal properties andbehaviour that will both solve current problems and remove as many as possible ofthe uncertainties that could affect future developments. The State ElectricityCommission of Victoria's Herman Central Scientific Laboratory ie the centre ofthis work, and staff members (of the order of 20 in number) are occupied withdifferent facets of the program. This brief paper can only deal with the rangeof work in a superficial way, and it will only be indicative of the depth inwhich individual projects are pursued.
2. Evaluation of Coal Deposits by the Analysis of Quality Factors
The Herman Central Scientific Laboratory was established ten years ago; oneof its first tasks was to devise rapid methods for analysing the large number ofcoal samples generated by the program of sinking exploratory boreholes in coal-bearing areas. The answer was found in adapting X-ray emission spectrometricanalysis to the examination of coal samples to determine the contents of somenine important inorganic elements without the need for a preliminary incinerationstage. Conventional coal properties (such as moisture content, volatile matterand organic elements) were determined by British and Australian standard methods.Concurrently, the then emerging technique of atomic absorption spectrophotometrywas being applied to examining coal ash and boiler deposits; this has since beenwidely extended to include, for instance, the very small proportions of elementssuch as heavy metals in coal that are important in the environmental context.
- 323 -
The information thus generated has enabled the compositional characteristicsof blocks or layers of coal to be plotted and, in so far as these may be relatedto operational factors, this can be extremely useful. It assists in the delin-eation of the various coal seams present in a locality - this is important, ar,physical properties such as hardness and fracture behaviour vary from seam toccarn.
Other parameters have also found application - the most novel, and probablythe one most used, has been designated the "Fouling Indexn of a coal. This isa value calculated from the contents of selected inorganic constituents, combinedin a formula derived by statistically analysing results from tests in anexperimental furnace to determine the weight of ash deposited on model heatingsurfaces under standard combustion conditions. The principle, first used tomake broad comparisons between various potential open cut sites throughout theregion, has been adapted for use in the narrower context of the variability ofcoal within a given mineable area. Boiler availability, and the margins to beallowed for fouling in proportioning heat transfer surfaces in boilers, areImportant factors, in the estimation of which a knowledge of "Fouling Index"provides some guidance; experience with, for instance, the highly fouling coalfrom the Morwell Open Cut demonstrates the importance of knowing in advance tholikely behaviour of coal from a particular location. Avoiding difficult coalis not always possible or economically desirable, and an ability on the part ofthe plant installed to cope with it is essential.
Factors such as those described lend themselves to statistical analysis(nowadays by computer) and graphical display, and so have become an essentialpart of the exploration and broad evaluation process. Other characteristicsthat relate to specific aspects of utilisation are also amenable to measurementand prediction - grindability and ignitability are examples - and these will bediscussed later in this paper; they bear much more directly on particularfeatures of plant design.
3. Preparation of Coal for Combustion
The coal must be relieved of some part of its original moisture contentbefore it can be burned in the pulverised form now universally adopted for largepower station boilers. The need to also reduce the coal to particles generallyless than 1 mm in size leads to a situation in which rapid drying of the finematerial can be effected. Boiler plant currently installed provides for feedingthe lump coal to a mill through which are drawn, either by the 'fan' action of therotating parts or by a separate exhauster fan, hot gases from the boiler furnace.In an endeavour to establish conditions in the furnace such that combustion isassured, the solid and gaseous products leaving the mill are usually separatedinto a fuel-rich, low volume stream and a lean stream consisting of three-quarters or more of the gas and water vapour from the coal, and one-quarter toone-third of the coal itself.
The systerr involves, therefore, three major processes - milling, drying andseparating. Characteristics of the system such as its aerodynamics and thermo-dynamics must be correctly provided for in design. All three processes and theassociated flow factors are under scrutiny in the Commission's research program.
The normal concepts of grindability do not apply to these coals, which arcsoft and earthy in texture. (Such parameters as Hardgrove Index can bemeasured; they are not very meaningful, although they do reflect differences inhardness.) As a result, the development of large mills for 350 MW (and bigger)boilers has mainly proceeded by scaling up from one size to the next, andproblems brought about by, for instance, the occurrence of pockets of coal invhich the fibrous, woody structure of the original vegetation has been retained,tend to recur.
Size degradation is a natural consequence of thermal, drying; a degree of
shrinkage proportional to the loss of moisture takes place in the outer layer's

- 321* _
of the coal particle, and spalling results. This reinforces the process ofphysical disruption caused by the hammers or vanes of the pulverising mill.
The drying process is more amenable to characterisation. Experiments havebeen conducted in which spherical particles of coal have been exposed to astream of hot nitrogen at various temperatures and velocities, with loss ofmoisture content being measured. A plot of drying time against log (moisturecontent) for each set of gas and particle conditions approximates a straightline, with the value of the exponent in the empirical equation being able to bepredicted on the assumption that the particles are equivalent to water droplets.
The development of this relationship makes it possible to construct amathematical model of the mill/drying system. Heat balance considerations areintroduced to complement the empirical drying equations, and so compute systemoutputs from postulated sets of input parameters. The computed results notonly appear to be logical, but they have been compared with data from planttests with encouraging results; for example, particles larger than 0.3 mm areshown not to dry appreciably within the time available, while those of 0.02 mmsize are completely dried within a few hundredths of a second. After 0.2 -0-3 second, very little further drying occurs. The model promises to be veryuseful in design and optimisation studies.
Much of the initial experimental work associated with a different method ofmoisture removal, the so-called "thermal dewatering" process, was performed inthe Commission's laboratory. This technique, first proposed by Evans and Siemonof the University of Melbourne, supplies heat to the coal under pressureconditions that prevent evaporation; the bulk of the water is removed from thecoal in the liquid form as a result of capillary shrinkage and physico-chemicalchanges resulting in a reduction in hydrophilic characteristics.
The process has the potential to remove water from coal at the rate of0.2 kg of steam supplied for heating per kg of water, compared with 1.2 kg ofsteam if latent heat of vaporisation is required as in normal thermal drying.In practice, reductions in boiler costs that would result from the use of ahigher-grade fuel would be offset by the costs of the batch-type coal preparationplant, and no clear economic advantage as related to power production is seen;however, a reduction in coal requirements by as much as 25 could be achieved,and present economic and resource studies (by government groups concerned withfuel and power) are concentrating rn this feature of the proposed process.
Since separation of the mill outlet stream into fuel-rich and fuel-leancomponents was first practised at Yallourn 'C' Power Station in the early 1950's,all plants have adopted this technique for reducing the tendency towards unstablecombustion. A variety of devices have been tried, including fixed swirl vanesthat concentrate coal by causing it to be thrown to the outside of the milloutlet duct, and splitters operating on streams already non-uniform in coaldistribution by virtue of inertial effects. Inefficiencies and pressure lossesthrough these units, as well as undesirable effects such as wear and adversetrajectories of large particles, prompted a study of the aerodynamic character-istics of gas/particle systems. This lias led to the development of a.separating device, now patented, having a performance superior in many respectsto other forms of separator or concentrator.
The novel feature of this "vortex separator" is an inlet shape designedusing potential flow theory, that maintains favourable pressure gradients overthe whole surface of the shap«, thereby virtually eliminating loss of flowattachment with its resulting turbulence. This is illustrated in Figure 2.Particles, once concentrated in the outer region of the gas flow, remain therebecause they are not subject to remixing, and may be skimmed off with highefficiency together with a small proportion of the gas; the extremely low levelof turbulence reduces the pressure drop through the device to a. small value bycomparison with comparable but less sophisticated separating configurations.
- 325 -
The principles applied to the design of the vortex separator - mathematicaloarticle path tracing and duct boundary shaping - are finding use in theInvestigation of problems in a variety of two-phase flow situations, and inother possible aerodynamic developments.
'f. Ijgnition and Combustion
Although the objective of the work described in the previous section is topresent to the burner fuel in a condition conducive to rapid ignition andcomplete combustion, success is not always achieved. From time to time and forreasons not always understood, the ignition process is retarded - occasionallyto the extent that the coal fails to ignite at all.
Difficulties with ignition have been encountered at all stages of experiencewith burning Victorian brown coals in the pulverised form; severe pulsations offurnace pressure occurred in Yallourn 'C1 Power Station boilers in the early1950' s, and explosions following loss of combustion in 'E' Station boilers causeddamage in the early 1960' s. "Partial separation firing" as described inSection 3 has been the measure adopted to alleviate these problems- However, itis still necessary to stabilise combustion by firing auxiliary fuels in theseboilers relatively frequently. Often coal with an excessively high moisturecontent gives rise to this requirement, and work performed with the 35 kg/hexperimental furnace has characterised the moisture content/stability relation-ships for coal from a number of sources by using the same indicator ofperformance as in a real boiler - pulsations of combustion chamber pressure.High moisture contents in the coal (which must be partly dried to enable it to behandled satisfactorily in the experimental system) are simulated by introducingwater into the flame as a fine spray at the burner mouth. Yallourn coal is lesstolerant to moisture content than other coals tested; the flame radiationtemperature falls to 550°C (virtual extinction) at a coal moisture content of1.83 - 2.2? kg/kg dry coal compared to 2.32 - 2.57 kg for Morwell coal.Equivalent flame cooling by means other ohan water injection (e.g. by radiativeheat exchange) produces the same results. Other things being equal, finer coal.
particles produce a more stable flame.
Observations on full-scale boiler plant support the conclusions reached fromexperimental furnace tests, as do the results of single-particle ignition studiescarried out in the Laboratory. A gas stream of variable temperature, composi-tion and velocity was presented to captive particles of variable size andmoisture content. The time required for the particle to show the first signs o..visible combustion was taken as a relative measure of ignitability. Highmoisture contents retarded ignition, and smaller particles ignited more quick] ythan large particles, although requiring a higher temperature to bring about _ignition. Reduced oxygen partial pressures also required compensation by highergas temperatures. The factor exerting the greatest influence on ignition wasfound to be gas temperature, with ignition rate increasing sharply with increas-ing temperature after a certain threshold value of temperature had been exceeded.
While these effects were consistent for particular samples of coal, coalfrom each source behaved differently, with Yallourn coal the least readily.ignited of those tested, and Morwell coal the most readily. Within the range olcomposition of Yallourn coal some samples have exhibited very poor ignitioncharacteristics, but Morwell coal ignites easily. A lot of work has been aorcto try to isolate the factors that give rise to this different behaviour, and arange of "coal property" studies have been carried out - low surface area and lowporosity have been linked with, low ignition tendencies, and certain cations U.g.iron) operate to increase ignition rates while aluminium and chlorine retardthem. Cations introduced into the coal by ion exchange have the same effects asthe same cations occurring naturally. In spite of all the knowledge accumulatedfrom this work, complete control over the ignition situation has not been able tobe exercised in boiler plant using the tangent firing approach currently favoured
for brown coal combustion by boiler designers.

• 326 - - 327 -
This leads to the question of burner and furnace design. Figure ~$illustrates the extent to which furnace dimensions have increased sincepulverised-fuel firii g was adopted in the SECV system for power station boilers;the process of development has been one of scaling-up rather than of introducingnew or different practices. Rectangular burners, mounted in the corners orwalls and all directed towards the centre of the furnace so that a vortex offlame is established there, have been used exclusively. The main fuel streamand combustion air are introduced at a lower level than the lean product of theseparation system to assist in promoting stable combustion and a high degree ofburn-out. The characteristics of the combustion zone have been extensivelyinvestigated to relate the practical performance of this system to the fuelbehaviour patterns described in the preceding paragraphs.
While the burners deliver fuel to the furnace and provide a degree of mixingof fuel and air, they do not act as the means whereby combustion is initiated andsustained; the rotating core of flame in the furnace is maintained because thefuel stream from each burner interacts with the flame from the adjacent burner.When coal characteristics are unfavourable to ignition, gross effects areexperienced in the furnace and auxiliary firing systems (supplied with pulverisedbriquettes or oil) are used to sustain combustion. It is considered that agreater degree of tolerance to difficult coals can be provided by a moresophisticated approach to burner design, and a development program based oncircular burners and swirling flows is being followed.
Use has been made of work performed at the International Flame ResearchFoundation's experimental station at IJmuiden, Holland, in characterising burnersof this type, and the design parameters developed have been used in conjunctionwith the conditions of coal and air supply encountered with brown coal firing.A multi-level attack has been mounted; cold aerodynamic models have been used toconfirm that the required flow patterns, which incorporate an internal reverseflow zone within the flame, were produced by the configuration adopted; a hotmodel was fitted to the 35 kg/h experimental combustor to confirm that ignitionwould occur in close proximity to the mouth of the burner; a prototype has beeninstalled in a boiler at Yallourn Power Station, and the predictions based on thedesign considerations and small-scale tests have been fulfilled. A diagramshowing the main features of the design is included as Figure *+; the swirlimparted to the secondary flow (that is, the combustion air supply) causes hotcombustion products to be brought back to a point close to the mouth of theburner, where they provide a source of ignition for the incoming coal. Thecareful balancing of mass flows and swirl numbers to generate an appropriateresidence time regime has produced a burner that can operate completelyindependently of other burners in a furnace under normal conditions of coalquality. A test program is now being followed that will determine the burner'scapability over the full span of coal qualities likely to be encountered.
5. Heat Transfer: Boiler Fouling and Deposit Removal
In parallel with the early work on coal properties bearing on specificaspects of utilisation, substantial effort was expended on the problem of ashdeposition on boiler heat transfer surfaces. Morwell brown coal ash, whichdiffejrs from Yallourn ash encountered in earlier stages of development in thatit contains larger amounts of alkali and alkaline earth oxides and salts, gaverise to the first serious occurrences of heavy fouling. The chemistry of thefouling process as related to black coal combustion hnd been studied in Englandand America, but the extremely low ash contents, the virtual absence ofadventitious siliceous minerals and the basic oxides/sulphur relationshipsintroduced different considerations in the Victorian case.
This paper cannot present in detail the results of the various facets ofthe work performed; however, sufficient is now known of the processes of depositformation from these coals to largely satisfy the need for their characterisationand no major projects are current. An indication is given below of the problemareas covered in the studies previously carried out.
While rates of ,.,u deposition vary from one coal to another and theproportions of deposit constituents change with coal source, the same chemicalprocesses operate and. the same broad types of deposit occur in correspondingpositions in boilers fired with different coals. Thus fused deposits (slags),rich in silica and iron, occur around burners, in furnace hoppers and just'.aside gas off-takes. Deposits consisting of fly asli particles bonded by aCrystalline matrix of sodium and calcium sulphates occur on the upper parts of! !;e furnace walls and on radiant superheaters; material of similar mineralogical;;nJ chemical composition forms on convection heating surfaces such as super-r.eaters, economisers and air heaters. The degree of consolidation decreases•i:ul friability increases as temperature levels reduce through the boiler, andfly ash reaching the dust collectors consists of agglomerated particle.';, looselyronded with sulphates and chlorides.
The roles of the various elements have been resolved in tho course of study-ing the fouling processes. Chlorine, for example, which occurs in the coalprimarily as sodium chloride, forms volatile compounds that do not depositsignificantly on high-temperature heat-exchange surfaces. Sulphur, partlyorganic and partly pyritic in the coal, forms intermediates in the combustion',"isos that either react with strongly alkaline solid components in the gas,-troam, or with previously-deposited material so that the sulphate content oficposits is continually increasing. Physico-chemical processes occur withprogressive changes in the overall temperature regime which result from reducinghoat transfer along the boiler gas path; sintering can tak-' place as temperaturesrise in the radiant heat zones, and migration of volatile components withinsulphate-bonded deposits occurs as surface temperatures and deposit thicknessesincrease.
It will be apparent that the ash deposition rates are desirably kept to aminimum if satisfactory boiler availability is to be achieved, and if predictiveorocedures (as described at the end of this section) are to be gainfully employedin design. The most effective way of dealing with the problem that has yet beenused in large-scale practice is the removal of deposited ash from the heatingsurfaces by jets of water or steam. Steam sootblowing has long been practiced,but the use of water has not been highly favoured because of a long-standing fearthat the thermal shocks imparted to the metal pressure parts of the boiler wouldLead to deterioration and failure. The long-term use of water sootblowing infurnaces has demonstrated that this has certainly not been the case with thecarbon steel tubes from which the furnace walls are constructed; some undesirableeffects are recognised as being due to localised restraint situations such as•r-tachment welds, and some are due to interference with the process of naturalCirculation of boiler water through the tubes. In general, however, furnace•leaning using water jets has been most effective and safe.
Cleaning the superheater region is equally necessary and here tubing isoften made from low alloy (Cr, Mo) steel. Investigations have shown that suchmetals at temperatures above 500°C will crack when water jets are used, althoughT/o Cr, Y$> Mo steel will survive 16 000 quench cycles without cracking, bycontrast with 2#$ Cr, 1% Mo which will crack at low cycle numbers. However,r.team sootblowing plant and procedures have been brought to a level of effective-ness that results in acceptable conditions of tube cleanliness being maintainedover the periods of 3000- 000 operating hours now normally achieved by boilers atpower stations fired with Morwell coal.
At the end of these periods of service, the boilers are cleaned off-load;lengthy operation has been found to give rise to accumulations of deposit thatare hard, difficultly soluble and therefore time-consuming to remove. Uneven-ni-;ss of temperature distribution across the width of the outlet section of theboiler (brought about by unbalanced firing arrangements when mills are out of• service) has been found to accentuate this problem, and work has been undertakento try to achieve a better temperature profile by balancing coal feed rate to themills. The deposits also harden after the boiler is taken out of service
Because cold air admitted while the tubes are still filled with hot water causesoutward migration of volatile .salts from inner layers of deposit to form a hard

-- 328 -
and relatively impervious outer layer,situation can be rectified.
Experiments are in hand to see if this
In a different context, the distribution of heat transfer within furnaces isalso a function of flame characteristics and various geometry factors. Not onlyhave extensive experiments been carried out to measure heat flux levels at amultitude of points on the wall surfaces of large boilers so that an empiricalpicture of the effects of design features and fouling processes can be built up,but (in association in the first instance with Sheffield University) work is inhand to enable the prediction of heat transfer rates from basic furnace data.The Hottel-Cohen zone method of analysis is being developed and extended with aview to making it possible to select optimised flame and furnace parameters atthe boiler design stage.
6. Dust Collection and Chimney Emissions
Hazelwood Power Station was the first to be equipped with electrostaticprecipitators to collect fly ash; earlier plants were supplied with mechanicaldust collectors of the multicyclone or multivortex type. Although mechanicalcollectors deal effectively with one of the two major components of the fly ash -the larger, incompletely-burnt particle - they are less efficient than isdesirable on the very fine dust resulting from the release of volatile inorganicconstituents from the coal or the disintegration of the skeletal ash structuresleft after a coal particle has completely burnt. These latter are readilyseparated from the gas flow by electrostatic forces.
The Hazelwood precipitators operate at a satisfactory level of efficiency,the most serious problems encountered being corrosion of electrodes andstructural components. It was anticipated, therefore, that the installation ofprecipitators at the new Yallourn 'W Power Station, and the replacement of themechanical collectors at Yallourn 'E1 by precipitators, would lead to asubstantial improvement in particulate emissione to air over the conditions thatwould apply with mechanical equipment. At the time of writing, theseexpectations have not been fully realised.
While coal from most locations within the Yallourn Open Cut area appears toreact favourably to electrostatic collection, a condition can arise in which theash collected is extremely low in bulk density (0.08 g/ml) and is therefore proneto re-entrainment in the gas stream after being dislodged from the collectingelectrodes by rapping. The factors contributing to the fluffiness of the ashare being sought; they are probably basically chemical (the ash is white, incontrast to the generally orange-red colour of Yallourn coal ash) but may becompounded by the low combustion temperatures encountered in these furnaces.
Another problem recently identified is the inefficiency of collection of thecarbonaceous particles; these lose their charge rapidly at the receivingelectrode, and also become re-entrained. Improvements to combustion shouldreduce the incidence of carbon carryover, although it may be necessa.ry to revertto mechanical separation to some extent to deal with the inevitable charparticles.
The low combustion temperatures referred to above confer a useful advantageon brown coal-fired boilers in respect of the emission of oxides of nitrogen.Concentrations of 200 ppm have been measured in chimney gases; this is lower bya factor of 2 to 3 than levels usually associated with coal firing. The lowsulphur contents of the coals, and the tendency for sulphur to be fixed in theash, means that sulphur oxides emissions have also been found to be low. Theconcentrations are about the same as for nitrogen oxides.
7- Ash Disposal and Utilisation
The systems used for removing and conveying ash from boilers to dumps arecurrently all hydraulic systems, with water recirculating around the circuits.The high content of soluble salts in the ash causes the dissolved solids content
of the water to rise to a level at which some proportion of it must be re JL-ctedso that salts (particularly calcium sulphate) will not precipitate in pipes andvalves. The means of disposal is via an outfall sewer, and problems haveoccurred through the blow-down water reacting with sewage to deposit calciumcarbonate in the sewer pipes. A neat solution to this problem-was possiblethrough the proximity of a paper mill, the effluent from which contains ligninwhich will disperse precipitated calcium carbonate when the two effluents aremixed.
Ash from the new Yallourn 'W Power Station is being conveyed to a worked-out open cut at Yallourn North. This mine presently contains clean water, andit has been calculated that 15 years will elapse before concentrations rise tothe extent that blowing-down will be necessary. The escape of salts into under-ground waters through seepage must be avoided, and monitoring programs have beenset up to keep this matter under observation.
For the future, tests with systems of dry ash disposal are being conducted;in one variation being examined, the ash is damped and pelletised for ease ofhandling, then mixed with overburden. Leaching of soluble salts from the over-burden dump must be prevented in this case also. Another system underexamination is the pipelining of ash and ash solutions to the sea; the materialsought not be incompatible with sea water, but such a. proposal needs carefulconsideration from the environmental point of view.
Unfortunately, no useful outlet for substantial quantities of brown coal flyash has yet emerged; trials are under way in which it is being used as a fillerfor bitumen in road construction, but the traditional pozzalanic avenues areclosed by virtue of the solubility of ash constituents. It is being examined asa possible raw material in the manufacture of lightweight aggregate (e.g. as abloating agent for use in the production of expanded clay) and large quantitiesmight be able to be profitably utilised if success is achieved.
8. Acknowledgments
This summary draws on the results obtained by many of the author'scolleagues, and reported by them in numerous published papers and reports issuedfrom the Herman Central Scientific Laboratory; enquiries seeking detailedinformation about any of the work described should be directed to the Laboratory.The contributions made by these workers are acknowledged, as is the permission ofthe State Electricity Commission of Victoria to publish this paper.
Plolemois. Greece
Pyenter, Sgain_
\ _§y.°Q9 y°l. Hungary
15 20 25 30 35
Ash-Content Of Raw-Coal A L*M
Figure 1 - Rawbrown coals andlignites (after
12-56
Buck and Schuler"Design andOperating Exper-iences of SteamGenerators forLow Grade BrownCoal"). EVTEnergie- uridVerfahrenstechnikGMBH, Stuttgart.

- 330 -
90r
60 ••
36-•
heightin
metres
figure 2 - Vortex separator (note inlet shape)
YALLOURN 'C'&'D' MORWELL YALLOURN 'E' HAZELWOOD YALLQURN'W90 tonne/h 115 tonne/h 430 tonne/h 795tonne/h 1100 tonne/h
1954 1958 1961 1964 197220MW 25MW 120MW 200 MVV 350MW
Figure 3 - Comparative sizes of Latrobe Valley plant
SECONDARY SWIRLER
(ADJUSTABLE) ^
PRIMARV ^TRF AM ( Jt«"ta»> 1 1 "*'-- • — ~""~ I
1 l--r-**--( TAKEN FROM FUEL OUTLET OF /T "^ ^\
\. ' j[r
SEPARATOR ) N^ ^^^
1 U^ - i' ll y*^
-^PRIMARY SWIRLER
FIRING FLOOR
-, — "
c
J
Ns
ECONDARYMR
\\/ \\\^
Xf
E
s,
•*•" — • I. i —.
p.
h/
^
^S. \
.FURNACE/WALL
»
Figure k - Experimental swirl burner
- 331 -
National Chemical Engineering Conference 1974
PROCESS INDUSTRIES IN AUSTRALIA IMPACT AND GROWTH
Surfers Paradise, Queensland
thJuly 10 to 12 , 1974
THE USE OF SOLAR ENERGY IN PROCESS INDUSTRIES
by
C. M. SAPSFORD
S U M M A R Y
The relevance of solar energy in the total energy demand by industriesis first discussed. Sources of solar radiation data and the type ofdata available are described. The problems posed by the daily andseasonal variations of the solar radiation flux, and the random varia-tions superimposed upon these averages by local weather variations areidentified. A method of designing a solar energy collecting system,with thermal storage, is proposed to deal with these variations. Someexamples of process industries which have utilised solar energy are
described.
Sapsford, The University of New South Wales. Mechanical Engineering.

NOMENCLATURE
A
D
F.
H
H,
n
R
u
R
= Surface area of collector.
= Deviation of any one day's total radiation from the monthly mean.
= Heat removal efficiency between collector surface and working fluid.
= Total solar radiation for one day on horizontal surface.
= 12 year monthly mean value of total solar radiation on horizontal surfacefor any month.
= Number of days in a sequence.
= Useful energy going to working fluid from collector.
= Energy losses from collector.
= Geometric factor for converting energy on horizontal surface to energyon inclined surface.
« = Absorptivity of collector to solar radiation.
T = Transmissivity of collector cover to solar radiation.
INTRODUCTION
The overall use of Energy in Australia at present, and predictions of futuretrends of energy demand and supply have been surveyed very extensively in a numberof recent papers, George^, Morse^- , Watson-Munro-^, Watson-Munrol". All of thesepapers use data from many further sources to prepare the predictions but. partic-ular mention should be made of the very comprehensive review by George", in whichthe implication of the recent change of Australian Government, committed to longrange planning of energy utilisation is considered. Professor George also em-phasises the message that many factors other than the present actual cost ofenergy should be given careful consideration before deciding on the energy re-source to be utilised in any particular instance.
One common conclusion of all the papers discussed is that Solar energy shouldbe utilised more extensively than it is at present, since it is a vast naturalresource of income energy as distinct from the fossil fuel reserves of energy, andbecause it is arriving at the earth in far greater quantities than the projectedfuture rates of energy utilisation.
It is the purpose of the present paper to look in more detail at the problemsinvolved in making use of this energy resource with special regard to the processindustries.
1 8Recent studies of energy demand in Australia have used a unit of 10 J as
a convenient basic unit, and during the year 1971-72 the total energy usage wasestimated as 2.7 x 10 °J, George^. Using the solar radiation observations inSydney as representative of the whole continent, then we find that the averagerate of supply of Solar energy on the horizontal surface of Australia is about5 x 10 x (lQl°J). On this evidence it is clear that plenty of energy is avail-able, but the problems which must be solved are involved with the conversion ofthis low flux radiant energy into forms more suitable for the varied ways in whichindustrial and domestic consumers wish to use the energy.
In the recent paper by Morse , a prediction was made that the total annualenergy demand in Australia by the year 2000 would be 7.5 x 10-'-°J, and of this2.0 x lO^J could be supplied from Solar energy: 1.0 x 10 °J in the form of
direct heating and 1.0 x 10 -°J by the growth of vegetation for conversion to fuel.
Morse also makes an estimate of a very considerable investment of the order of$5.0 x 10 in research and developmental work in academic, governmental and in-dustrial areas to make it possible to manufacture and install solar utilisationplant of the magnitude required to meet this prediction.
SOLAR RADIATION DATA
The rate at which Solar radiation arrives at the earth's surface in Australiais reported by 19 stations under the control of the Commonwealth Bureau of Meteor-ology^ and by some other recording authorities including C.S.I.R.O Divisions5'7,DeVries', and The University of New South Wales^. in general, the ocher record-ing authorities make the data available through the Commonwealth Bureau ofMeteorology.
The data is usually available in the form of hourly totals for each hour ofthe day, and from these figures daily totals are calculated. Mean daily andhourly values and yearly totals are also presented in the data. Most data isavailable in the units of mw hr/cm2 for totals but the preferred unit at presentis kJ/m • An important distinction should be made here between the Total solarradiation which includes all of the radiation from Sun and Sky within the hemi-sphere above the horizontal surface, and Diffuse solar radiation which includesall radiation from the Sky except for a cone of included angle of approximately 5°centred on the Sun. In general terms, any solar absorber with a flat surface aiidviewing the Sky in the hemisphere can collect a high proportion of the total solarradiation, while any concentrating collector must be focussed upon the solar beamand can only collect a proportion of the direct solar radiation, whereDirect = Total - Diffuse.
The significance of this distinction is clear from some data for Sydney, forthe year 1972, where the yearly totals were:
Total Solar radiation 6.1 x 10⁶kJ/m2
Diffuse Solar radiation 2.67 x 10⁶kJ/m2.
Naturally the flat plate collector need not be placed on the horizontal and isnormally mounted at an angle bearing some relationship to the latitude of thelocality. Some guidance on the effect of angle of inclination to the horizontal,and also on the effect of azimuth angle East or West of North, is given in a pub-lication by Morse and Czarnecki-*-2. In general it can be said that the total solarradiation incident upon an inclined flat plat solar collector is much more uniformover the year than is the total solar radiation Incident on the horizontal surface.
THE VARIABILITY OF SOLAR RADIATION INCOME
An obvious problem to the designer wishing to utilise solar energy directlyTor any given process is the fact that the radiation arrives at the earth's sur-face at a highly variable rate. One can identify seasonal and daily variationsof the average, but of at least as much importance are the random variations ob-served from the averages for the time of year and the time of day and caused byrandom weather vagaries. To be able to study these variations satisfactorily, itis necessary to have a reasonably long period of observations available, and itis only now that a suitably long series of observations can be studied for themajor centres of population in Australia.
A twelve year series of daily totals for Dry Creek, S.A., has been availablesince 1959, published by Ronython^, and a survey of these twelve year daily totalshas suggested a method of designing solar utilisation equipment to take account ofthe variability discussed. Firstly, it was decided to calculate a twelve yearmonthly mean for each month and to call these Ha. The deviation of any one day'stotal from the monthly mean was then calculated:
D = H - H. (1)

- 33^ -
This equation was made non-dimensional by dividing by Ha
D/H = H/H - 1 .a a (2)
A study was then made of sequences of above average and below average days repre-sented by sequences of positive or negative values of D/Ha, particular attentionbeing given to the values for December and June, representative of summer andwinter operation. The longest sequence of deficit days observed was for 5 daysand it was thus decided to analyse values of D/Ha for all sequences of 2, 3, 4and 5 days. Figures 1 and 2 represent the cumulative deficit or cumulative excesssolar radiation income in sequences over the period and it is interesting to notethat very seldom over the twelve years did the cumulative deficit exceed half theexpected average radiation (nHa) over the n days.
With corresponding data available for any location of interest, the designeris in a position to commence design calculations, and the first decision to bemade is whether all days must be provided for, or whether only a specified propor-tion (say 95% or 90%) of days should be covered. Probably some realistic propor-tion of days will be selected since with only data for a limited number of years(twelve years in this case) one cannot guarantee that a worse sequence than ob-served will not occur in future.
APPLICATION TO SIMPLE FLAT PLATE COLLECTORS
A flat plate collector as discussed earlier can respond to all of the solarradiation even when it is at very low flux in early and late periods of the day,so that a simple performance equation developed in 1955 by Anderson, Hottel andWhillier can be used:
QU/A = FR(HRT<* - QL/A) (3)
In this equation the useful energy collected per unit area of collector is a func-tion of the total radiation for the day, H, and factors which depend upon the de-sign of the collector. If it can be assumed that the characteristics of the col-lector can be grouped into 2 constants, C^ and C^* with values determined for eachmonth, then equation (3) can be rewritten
QU/A = CjH - C2QL/A (4)
If the solar collector assembly performance be studied for each month of the year,the input and output energies can be determined for sequences occurring in thatmonth. It will be assumed that some energy storage facility is provided so thatsolar energy collected on average or above average days should be available to useover the sequences of below average days. It is also obvious that for the storageto be effective it will be necessary to design for the use of only a proportion,K, of the monthly mean solar radiation income for the month. The proportion Kwill be called a utilisation factor. Thus the design utilisation of solar energyfor one day in any chosen month will be KHa, and it is the object of the computa-tion to determine the value of this factor K. The total input energy per unitarea of collector over n days of a deficit sequence and one preceding aboveaverage day is
(5)
Input = C1Ha(n + 2nD/Ha) + C3C1Ha
= C1Ha(n + C3 + £nD/Ha) .
Here the constant C-j represents the proportion of the monthly mean radiation income Ha which can be expected on the preceding day. An analysis of the twelveyear data showed that the values of C3 were
> 1.03 for 95% of occasions in December> 1.045 for 90% of occasions in June> 1.06 for 95% of occasions in December> 1.09 for 90% of occasions in June .
output energy over the corresponding (n + 1) days per unit area of collector is
Output = (n + l)(KHa + C2QL/A) . (6)
Thus the unknown factor K is
K = (C.,/(n + l))(n + Co + ID/HJ - C9QT /AH .-1- —' LL d i_ i_j Cl
(7)
This analysis of the radiation data and the constants relative to any particularsoJar collection device would allow determination of the utilisation factor K, and.is discussed earlier it would be possible to evaluate K for any chosen proportionof days. This chosen proportion can be considered to be a confidence level thatthe equipment will satisfy the energy demands.
APPLICATION TO MORE COMPLEX COLLECTORS
Some solar collectors can be designed to collect the solar energy at highertemperatures by means of concentrating devices. For very high temperatures of3000°C down to approximately 200°C it is necessary to cause the device to followthe path of the sun during the course of any day and the device will only be ableto respond to the Direct radiation concentrated about the. solar beam-'-''. For mod-erate temperatures from 200°C down to the temperature of approximately 60°C rele-vant to the flat plate collector, moderate concentration of the solar energy canbe achieved with a fixed focussing device. A typical example of the latter deviceis described in a publication from Tabor-'-", and a general analysis of concentrat-ing collectors is given by Lof and Duffie^O. All of the concentrating devicesdesigned for heating a working fluid suffer from the limitation that the flux ofsolar radiation must be sufficient to bring the working fluid to the requiredminimum temperature before they can be operative. Thus there is a "threshold"value of solar radiation for such devices.
In order to analyse solar radiation data for use in a concentrating collectorit: is necessary to know the average distribution of solar radiation flux over theday so that only radiation income at a rate greater than the threshold value willbe considered when determining the reduced values of H and Ha. A correspondinganalysis if divergences D of H from Ha will be necessary just as it was for thetotal radiation data studied for the simple collector,.
At this stage no detailed analysis of long term distribution of hourly valuesof sclar radiation has been msde on the lines suggested above, but it is likelythat a useful analysis could be carried out now on the data from Melbourne3, and-in a few years' time the Sydaey data-'--', and other data from the Weather Bureau *,will be of sufficient duration to justify analysis,
EXAMPLE OF ANALYSIS OF DRY CREEK DATA TO DESIGN OF FLAT PLATS WATER HEATER
To illustrate the use o" the proposed method for determining the utilisationfactor K, a simple example will be applied to a flat plate solar water heater.Installation will be at Dry Creek, S.A., and the factor K will be computed for themonths of June and December only. The collector is North facing and inclined todie horizontal at the angle of 40°, this being near the recommended figure of 5°above the latitude of the locality. This orientation allows the collector to beirradiated by approximately 1.90 times the solar radiation flux on the horizontal(RKa) in June and only 0.90 times the horizontal value in December. Losses (QL/A)are assumed at the values specified in Table 1 and all other relevant design fac-tors are calculated in the Table. It is interesting to note that the expecteduseful energy absorbed (QU/A) is shown to be 0.97 times the horizontal monthlymean value in June and 0.48 times the horizontal monthly mean value in December.This advantageous characteristic has been achieved mainly by inclination of thecollector surface but also to some extent by variations in losses, and variationsin transmission and absorption factors due to different angles of incidence. Theapplication of the study of deficit sequences to this collector, in accordancewith equation (7) is carried out in Table 2, using the 90% and 95% confidencelimits applied to the twelve year data for Dry Creek, S.A. Taking the limiting

- 33b - - 337 -
results from this Table, it is clear that for 95% confidence limit it would benecessary to design for daily utilisation of only 34.1% of the monthly mean solarradiation flux (Ha) in December and 60.1% of Ha in June. (The storage capacityprovided would need to be sufficient to store C3C^Ha in each case, times the totalcollector surface area.) It should also be noted that the December limitationoccurs for the single deficit day while the June limitation occurs for the se-quence of two deficit days. Reductions for utilisation factor K must of course beapplied for the longer sequences but these are shown to be not so severe as forthe shorter sequences.
This result indicates that for a solar collector of the type described,installed at Dry Creek, S.A., it would be possible to confidently expect toutilise solar energy at the rate of 5058 kJ per square metre (or 1.403 kwh/m^) ofcollector surface on 95% of all days in June and 9614 kJ per square metre (or2.676 kwh/m2) on 95% of all days in December.
TABLE 1. CHARACTERISTICS OF PROJECTED SOLAR WATER HEATER AT DRY CREEK, S.A.
Ha
R
T<x
FR(C2)
QL/A
QT/A HL a
C = RT^ FVJ -t *-*• <- T"l1 R
' Qu/A
JUNE
8 402
1.90
0.70
0.95
2 501
0.30
1.255
8 160
DECEMBER
28 257
0.90
0.65
0.95
2 090
0.074
0.554
13 668
UNIT
kJ/m^ day
-
-
-
kJ/m day_
__
kJ/m day
Q /A H^u a 0.97 O.A8
TABLE 2. EFFECT OF DEFICIT SEQUENCES UPON PERFORMANCE OF PROJECTED SOLARWATER HEATER WITH CARRY OVER STORAGE AT DRY CREEK, S.A.
n
December
12345
June
12345
£ D/n/H' a
C3 = 1.03 for 95%
A
-0.525-0.8-0.9-1.0-1.2
B
-0.407-0.6-0.6-0.7-0.9
C3 = 1.045 for 95%
-0.632-0.9-1.1-1.3-1.4
-0.480-0.6-0.9-1.0-1.1
KK HaQU/A
C3 = 1.06 for 90%
A B
0.3460.3410.3610.3760.375
0.3870.3840.4090.4130.407
t
A
0.720.710.750.780.78
B
0.800.800.850.860.85
C3 = 1.09 for 90%
0.6010.6110.6370.6550.687
0.7250.7690.7150.7510.769
0.620.630.660.680.71
0.750.790.740.770.79
K Ha
kJ/m day
A B
9 739 10 8269 614 10 82610 157 11 49510 533 11 62010 533 11 495
5 058 6 1035 141 6 4795 350 6 0195 518 6 3125 768 6 479
In this Table A represents calculation with 95% confidence limit and Brepresents calculation with 90% confidence limit.
EXAMPLES OF PROCESS INDUSTRIES WHICH HAVE UTILISED SOLAR ENERGY
Salt Production. The Dry Creek plant operated by I.C.1.(Aust.) Pty.Ltd. nearAdelaide, S.A., has been producing salt for some years - essentially from theevaporation of fresh water from salt water and the subsequent collection of theresidual salts.
Fresh Water from Salt or Brackish Water. A number of large installations havebeen developed by C.S.I.R.O. Division of Mechanical Engineering, to convert saltor brackish water for farm or domestic use. Probably the best known system isLhe town water supply system installed at Coober Pedy. Other systems have beeninstalled at Muresk, W.A., Griffith, N.S.W., Townsville, Q'ld., Darwin, N.T.,and Mt. Derrimut, Vic. Developmental work is continuing at Highett, Vic., andGriffith, N.S.W. The literature on solar stills is very extensive but somevaluable fundamental and review papers are: Eibling, Talbert and Lof°, Morse andRead1^ aad Cooper".
Timber Drying. A timber drying kiln has been built at Griffith, N.S.W. byC.S.I.R.O. Division of Mechanical Engineering and has operated successfully onthe drying of initial charges of Alpine Ash, Read-^. The kiln includes an airheater of 56 m2 and a thermal storage of 19 mm basalt of total volume 15.5 m-*.Design figures indicate that the kiln sis-Quid dry 3.9 m^ of timber from 25% to 16%moisture content in 4 days, A second kiln is being built at Townsville. anddevelopment of the design is being continued.
Water Heating. The experience gained in many domestic installations of solarwater heaters, and the larger scale installations of Public Works Departments,particularly in the Northern Territory, and on a number of motels, should bevaluable to any process industry with a demand for hot water at temperatures upto approximately 60°C. Again, the literature is very extensive but the situationin Australia from recent information on Australian developments is indicated inC.S.I.R.O. Division of Mechanical Engineering Annual Reports, and reference toAustralian commerical manufacturers of solar heaters is regularly published inche annual publication 'Solar Energy Progress in Australia and New Zealand'2.
1.
2.
3.
4.
5.
6.
7.
BIBLIOGRAPHY
Anderson, L.B. Hottel, H.C., Whillier, A. (1955). Solar heating designproblems, in Solar Energy Research. (Ed.) Daniels and Duffle, Univ.of Wisconsin. 1955.
A.N.Z. Section of ISES (yearly). Solar energy progress in Australia andNew Zealand. Australian & New Zealand Section of International SolarEnergy Society, Melbourne. (yearly).
Bonython, C.W. (1959). Solar radiation measurements at Dry Creek, S.A.1947-58. I.C.I. Alkali (Aust.) Pty.Ltd. 1959.
Commonwealth Bureau of Meteorology (yearly). Solar radiation data,Australia. Commonwealth Bureau of Meteorology, Melbourne. (yearly).
C.S.I.R.O. Division of Mechanical Engineering (yearly). Solar radiationrecords. C.S.I.R.O. Div. of Mech. Eng., Highett. (yearly).
Cooper, P.I. (1972). Some factors affecting the absorption of solarradiation in solar stills. Solar Energy, Vol. 13, No. 4, 1972.
DeVries, D.A. (1958). Two years of solar radiation records at Deniliquin,N.S.W. Aust. Met. Mag., 22:36, 1958.

8. Eibling, T.A., Talbert, S.G., Lof, G.O.G. (1970). Digest of technologyof basin type solar stills. International Solar Energy Society,Conference Paper 5/69, Melbourne, March 1970.
9. George, D.W. (1973). Energy resources and usage. The Institution ofEngineers, Australia, Sydney Division. Panel discussion - Maximumutilisation of industrial energy. Feb. 21st, 1973.
10. Lof, G.O.G. and Duffie, J.A. (1963). Optimisation of focussing solarcollector design. Journal. Eng. for Power, p221-228, July 1963.
11. Morse, R.N. (1973). Solar energy as a primary energy source.International Solar Energy Society, ANZ Section. Symposium,Melbourne, Nov. 1973.
12. Morse, R.N. and Czarnecki, J-J. (1958). Flat plate solar absorbers,the effect on incident radiation of inclination and orientation.Report ED6. C.S.I.R.O. Engineering Section, Melbourne, Aug. 1958.
13. Morse, R.N. and Read, W.R. (1968). A rational basis for the engineeringdevelopment of a solar still. Solar Energy, Vol. 12, p5, 1968.
14. Read, W.R. (1973). Solar Timber Kiln. Solar Energy Progress inAustralia and New Zealand, No. 12, p22, July 1973.
15. Sivyer, P.H. (yearly). Solar radiation data, Sydney. The Universityof New South Wales, School of Mechanical and Industrial Engineering,Kensington. (yearly).
16. Tabor, H. (1958). Stationary mirror systems for solar collectors.Solar Energy, Vol. 2, p27-33. 1958.
17. Trombe, F., Gion, L., Royere, C., Robert, J.F. (1973). First resultsobtained with the 1000 kw solar furnace. Solar Energy, Vol. 15,No. 1, p63, 1973.
18. Watson-Munro, C.N. (1973 a). World energy sources for the next century.International Solar Energy Society, ANZ Section. Symposium,Brisbane. June 1, 1973.
19. Watson-Munro, C.N. (1973 b). Report No. 17, Solar Energy Research inAustralia. Aust. Academy of Science. 1973.
- 339 -
-3-5 -

- 3 0 -
National Chemical Engineering Conference 1974
AT
PROCESS INDUSTRIES IN AUSTRALIA
Surfers Paradise,
IMPACT AND GROWTH
Queensland
thJuly 10 to 12 , 1974
COAL COMBUSTION FOR POWER GENERATION
by
I.W. Smith'
S U M M A R Y
Mathematical models have been set up of entrainment and fluidized-bed
combustors employed in power generation. The models incorporate basic
data on particle combustion kinetics. This paper gives brief descrip-
tions of the models, their scope and res ilts. These latter two features
are discussed and used to show to what extent the models, and the data
used in them, need improvement.
CSIRO, Mineral Chemistry.

1. INTRODUCTION
Some 75% of world power needs, and 30% of Australian needs, are met bycoal-fired power generators1. Consequently a substantial part of the researcheffort of the North Ryde laboratory of the Division of Mineral Chemistry hasbeen concerned with the combustion of coal in electricity generating cycles2'3.This work has involved pilot-scale studies of coal burning in entrainment1* andin fluidized bed reactors5, with emphasis on the control of ash behaviour as apollutant6 and as an agent in fouling heat-exchange surfaces7. Related workhas been carried out on the bench scale and also on combustion kinetics8'9 andon the formation and suppression of gaseous pollutants1^11.
It is the purpose of this paper to discuss the progress to date in CSIRO,and elsewhere, with the development of mathematical models, which incorporatebasic data on combustion kinetics8'9, for the simulation and prediction of theperformance of practical combustion systems. Models of entrainment12 andfluidized-bed13 combustors have been formulated. The results of these andother similar mathematical models are used to assess the needs for improvementsin the models and the basic data used in them.
2. CQMBUSTQRS
2.1. Entrainment Combustors
Modern coal-fired power generators are mainly of the type in which coal isburned as pulverized fuel (p.f.). The coal particles are fine, ground so that70 to 80% are below 76 ym in size, and burn as they are carried entrained inair. Details of technical and fundamental principles of p.f. combustionare available.
In brief, the p.f.-fired boiler operates in the manner illustrated in Fig.1. Raw p.f. is blown into the furnace in a stream of primary air, and mixeswith secondary air and recirculated hot gas. The heat from this gas and fromflame radiation pyrolyses the coal in about 0.1 s, driving off volatile matterthat burns rapidly. The residual porous char particles burn at temperatures upto 2500°K, radiating heat into the watei tubes that form the furnace wall. Thetime required for char combustion is of the order of 1 s, and this process,coupled with the removal of heat to the water tubes, largely determines thesize of the furnace. The heat release intensity in the combustion chamber isabout 2 x 10⁵ W/m3.
2.2. Fluidized-bed Combustors
In p.f.-fired boilers combustion intensities are limited by the need toavoid excessive heat fluxes into, and hence failure of, boiler tubes at hightemperatures. Further, considerable problems of boiler availability can arisedue to fouling of heat-exchange surfaces by ash constituents which, for somecoals, are aggressive at combustion temperature.
On the other hand, fluidized-bed combustion gives high combustion intens-ities coupled with high heat removal rates, and reduced corrosion problems dueto the low-temperature (~1200°K) of operation. Detailed descriptions of theprocess are given by Skinner16 and in recent conference proceedings17. Fig. 2shows the main features of such a combustor. Air passes up through a grid andfluidizes the superimposed bed of ash. Coal (upper size about 5 mm) is inject-ed into the bed, burning and releasing heat which is rapidly absorbed by watertubes immersed in the bed.
Combustors of this type have not yet been developed beyond the pilot anddemonstration plant stage. However operation of a large-scale pressurizedexperimental combustor18'19 has shown that heat-release intensities of4 x 10e W/m3 can be attained at 6 atm pressure. This rate is some 20 times
- 3 3 -
higher than in p.f .-fired boilers, leading to the estimate that whereas8000 m3 would be needed to contain a conventional boiler generating 500 MW,only 400 m3 would be needed for a pressurized fluidized-bed unit19.
3, MATHEMATICAL MODELS OF COAL COMBUSTORS
Because of the many factor involved it is not possible as yet to providecomplete mathematical simulation of a practical combustion system20 . Such amodtl would need to take account, for example-, of: flow patterns in threedimensions treating gas and solids separately; the fact that finer particlesburn away quickly leaving coarser particles to burn in a gas of depleted oxygen;the interaction of heat transfer to raw particles, the evolution of volatilematter from them, and the subsequent combustion of the volatiles; the convect-ive and radiative properties of gas-solid suspensions. In the models set up todate, simplifications are made which reflect the information required from themodel .
It is useful at this stage to consider some important features of modelcalculations. Coal is supplied to combustors with a wide spread of particlesizes. In order to reduce calculation demands, whilst taking the necessaryaccount of the effect of particles of different sizes, it is usual to represent
continuous size range by a number of mono-sized fractions. The behaviourof all fractions are then calculated simultaneously. The rate at which theith fraction burns away, dmi/dtj is determined from the relation
g/s (1)
where Ai is the external area of a particle, Ni the number of particles in theith size fractions and Pi is the rate of reaction of carbon combustion per unitexternal area., pi, itself made up of terms that account for transport ofoxygen to, and its subsequent reaction at, the particle, is sensitive to part-icle temperature (TPi) in the case of p.f. combustion8'9. Consequently TPi iscalculated simultaneously with mi from
is
K/s (2)
where Qc,i , Qc,i and QRSI are respectively the rates of heat generation (theproduct of p-j^ and the heat of reaction), convective and radiative heat losses,di, o"i and Cp are respectively the size, density and specific heat of theparticle. Now TPi, AI, pi i.nd the rate of heat generation and loss all dependon di and a± which vary throughout the course of combustion. Therefore changesin these properties must be accounted for when calculating mi and TPi. Further,Pi and TPi depend on the prevailing values of gas temperature and oxygen con-centration, both of which change as combustion proceeds.
In addition to the matters set out above, account needs to be taken ofwhether particles were carried in a dilute suspension with the gas, as in p.f.combustion, or whether they fora a dense bed through which the gas flows, as influidized-bed combustion,
3.1. ENTRAINMENT COMBUSTORS
There are number of mathematical models of p.f. combustion, and details ofsome of the simple ones are discussed elsewhere9. One of the simplest, set upby McKenzie et al. of CSIRO12, deals with conditions in the flame after tuel,air and hot gas mixing and volatile evolution are complete. It was possible,for the furnace modelled, to assume plug (one-dimensional) flow of gas and part-icles. The model was developed with the aim of studying the role of combustionkinetics in simulated flame conditions, simple enough to allow the effect to beseen, but complex enough to give realistic interactions of combustion and heattransfer, the influence of a range of particle size, and so on.

Gibson and Morgan set up a more realistic design-oriented model, takingaccount of axial and radial variation in a cylindrical combustor. Their two-dimensional model was used to simulate, amongst other things, the mixingpattern of fuel, air and recirculated gas. Volatile evolution was not modelled;the volatiles were assumed to be released instantaneously as the fuel enteredthe furnace, and to burn as gas mixing supplied the necessary oxygen. The onlyspecific data required by the model were the magnitude and direction of inputflows and the dimensions of the furnace.
etFig. 3 shows some results of Gibson and Morgan2 and some of McKenzieI: these are discussed in Section 4.
Most p.f.-fired boilers are large and of complex shape (see Fig. 1) andtheir conditions cannot be represented by one- or two-dimensional models.Realistic modelling must take account of variation in three dimensions, as hasbeen done by Zuber and Konecny22 and Spalding and co-workers20'23. The sign-ificance of their results is discussed in Section 4.
In calculating p.f. combustion rates it is (justifiably) assumed that theparticles are small enough to be stationary with respect to the gas. Hence forthe rate calculation it is only necessary to know the rate of diffusive trans-port of oxygen to the particle and the rate of the subsequent chemical reaction.
3.2. Fluidized-bed Combustors
Little has been published on the simulation of combustion in fluidized beds.Avedesian and Davidson2 calculated the burning times of mono-sized volatile-free char or coke particles dispersed in fluidized beds of ash. The model,illustrated in Fig. 4, accounts for the rate of reactant gas exchange betweenbubbles and dense phase, and gas transport through the dense bed to the carbonparticles. For the conditions considered, chemical reactions were sufficientlyrapid to have an effect on the overall reaction rate. Gas was assumed to flowthrough the dense phase at the minimum fluidizing velocity, any gas in excess ofthis passing through the bed in bubbles.
Leung and Smith13 have extended this model to account for the influence ofchemical reaction on the burning rate, and to calculate heat release rates inbeds at specified conditions. The extended model uses kinetic data25 on coalchar determined at temperatures relevant to fluidized-bed combustion. Some ofthe model results were given in Fig. 5, which shows the variation of the amountof carbon burned with bed depth, and the effect of temperature. Between 1000and 1200°K there is very little effect of temperature, but reducing to 800°Kgives a marked drop in conversion at a given bed depth. The small change inconversion at the highest temperatures suggests that the reaction rate is thencontrolled by transport processes (which are insensitive to temperature) - eithertransport from bubble to dense phase, or through the dense phase to the reactingparticle. This is in line with the calculated and measured results of Avedesianand Davidson2^ who found that for large (~lmm) particles burning at practicalcombustion temperatures ( ~1200°K) reaction rates are controlled by mass transferrather than by particle reactivity. On the other hand the notably lower con-versions at 800°K suggest that chemical reaction at the particle (which has anactivation energy of about 20 kcal/mole25) is then, at least in part, influencingreaction rates.
4. DISCUSSION AND CONCLUSIONS
Calculations using the 'one-dimensional1 model of McKenzie et al. and the'two-dimensional' model of Gibson and Morgan for p.f. combustion both yieldresults (Fig. 3) which are in reasonable agreement with the measured relationsbetween carbon burned and furnace length, but less satisfactory agreement withthe measured heat fluxes to the furnace walls. It is apparent that the heat-fluxprediction is not yet sufficiently precise for design purposes. Thus whilst themodels do cast light on flame behaviour, and the Gibson and Morgan model in
particular shows that can be calculated with little prior assumption ofconditions in the furnace, there is considerable development to be undergonebefore quantitative design data can be produced. Zuber and Konec'ny22 calculatetemperature distributions in a practical boiler using the even more demandingequations of a 'three-dimensional' model, and they achieve quite good agreementbetween calculations and measurement, though still not good enough for designpurposes.
The limitations of the models arise in part from simplifications made inorder to allow the calculations to be carried out by available computer facil-ities, i.e. the radiative properties of flames are still repre, ented by element-ary models. However, in addition there is a lack of adequate Kinetic data, anda large part of the error in calculations of flame temperature and radiationarises from a lack of data on volatile evolution and combustion. There is scopefor the incorporation of better kinetic data in improved models of gas-mixingand combustion processes early in the flame,
Models of fluidized-bed combustors are at a much more primitive stage thanmodels of p.f. combustors. The only published models known fail to account forvolatile matter evolution and for the presence of a range of particle sizes.Further, there has been no attempt to make calculations of the coupled processesof heat release and heat removal to boiler tubes immersed in the fluidized bed.In view of the growing importance of the combustion technique17 there is amplescope for greater efforts to perfect more advanced models.
5. ACKNOWLEDGEMENT
Thanks are due to Dr. L,S. Leung for permission to quote unpublishedresults.
6, REFERENCES
1 Coal Research in CSIRO, No. 39, 1 (1970)2 Mulcahy, M.F.R., Coal Research in CSIRO, No. 45,47 (1971)3 Durie, R.A., J. Inst. Fuel, 44, 381 (1971)4 Szpindler, G. a D., CSIRO Div. Min. Chem. Invest. Rept. 81 (1969)5 Waters, P.L. and Watts, A., Proc. Inst. Fuel Conf. 'Combustion and Coal and
Tin Equipment', 2-1 (1968)6 Durie* R.A. and Potter, E.G., Aust. Chem. Process. Engng., 23, 18 (1970)7 Durie, R.A. and Swaine, D.J., Coal Research in CSIRO, No. 45, 9 (1971)8 Smith, I.i\T., Proc. Firf t Australasian Conf. on Heat and Mass Transfer,
Section 6, p. 25, Monash Univ. (1973)9 Smith, I.W., Process and Chem. Eng., 216.-10,8 (1973)10 Smith, M.Y., Combust, and Flame _18_, 293 (1972)11 Williams, D.J., Coal Research in CSIRO, No. 23, 7 (1964)12 McKenzie, A., Smith, I.W. and Szpindler, G., 2D. , Proc. 4th Symp. on Flames
and Industry, J. Inst. Fuel (to be published)13 Leung, L.S. and Smith, I.W. (in preparation)14 CEGB, 'Modern Power Station Practice', Vol. 2 (1963)15 Field, M.A., Gill, D.W., Morgan, B.B. and Hawksley, P.G.W., 'Combustion of
Pulverized Coal', BCURA Leatherhead (1967)16 Skinner, D.G., 'The fluidized Combustion of Coal', Mills and Boon Monograph
CE/3 (1971)17 Proc. 3rd Int. Conf, of Fluidized-bed Combustion, Hues ton Woods Lodge, Ohio
(1972)18 Hoy, H.R. and Roberts, A.G., 64th Annual A.I.Ch.E. Meeting San Francisco
(1971)19 Hoy, H.R., 2nd Int. Conf. on Fluidized-bed Combustion, Session 1, paper 4,
Hueston Woods Lodge, Ohio (1970)20 Patankar, S.U. and Spalding, D.B., Proc. 14th Symp. (Int.) on Combustion,
605 (1973)21 Gibson, M.M. and Morgan, B.B., J. Inst. Fuel, 43, 517 (1970)22 Zuber, I. and Konecny, V., J. Inst. Fuel, 46, 285 (1973)

23 Patankar, S.V. and Spalding, D.B., J. Inst. Fuel, _46_, 279 (1973)24 Avedesian, M.M. and Davidson, J.F., Trans. Inst. Chem. Eng., 51, 121 (1973)25 Sergeant, G.P. and Smith, I.W., Fuel: Lond., 5_2, 52 (1973)
S e c o n d a r y a i r
P.f . andp r ima ry a i rto b u r n e r s
A s h
Flue gas to convec t i veheat e x c h a n g e
W a t e r tube wa l lhea ted by r ad ia t i on
Burn ing s u s p e n s i o nof p a r t i c l e s in gas
Ign i t ion regionwhere fuel , air andhot gas are m ixed
Rec i r cu la t i on of hot gas
F1G.1. R E P R E S E N T A T I O N OF W A L L - F I R E D WATER - TUBE B O I L E R
Wate r
Coal
F lue gas
Bo i le r tube
A i r d i s t r i bu to r
A i r
FIG.2. REPRESENTATION OF A FLUID1ZED - BED BOILER

1-0
0 -5ro
rou
100ro
x13
50
1-0•oCD
ro
0-5
0
o _ro
— <D
ro•*- Cro v_o> _.
= 200
0
2 3 4F u r n a c e length, m
RB
\ • B
10F u r n a c e leng th , m
F I G . 3 . C O M P A R I S O N O F M E A S U R E D A N D C A L C U L A T E D
C O N D I T I O N S IN P.F. FLAMES
A. T w o - d i m e n s i o n a l model o f b i tuminous coal f l a m e withs w i r l ( R e f . 21)
B. One - d i m e n s i o n a l mode l of semi - a n t h r a c i t e f l a m ew i t h o u t s w i r l ( Re f . 12)
M e a s u r e m e n t — C a l c u l a t i o n
- 349 -
Carbonp a r t i c l e
A i r bubbler i s i ng
A
Oxygend i f f u s i n g to
p a r t i c l eAsh bed
FIG.4 . MODEL C O N C E P T OF C A R B O N P A R T I C L E
IN A F L U I D I Z E D BED
•oo>c
co
reu
co
-t—•ure
1-0
0 - 8
0-6
u. 0-4
0
Flu id iz ing veloc i ty : 5 m/s
P a r t i c l e s ize: 1 mm
0-9 1-8
Bed depth, m
2-1
F IG .5 . C A L C U L A T E D R E L A T I O N BETWEEN BED DEPTH AND
CHAR BURNED IN A FLU I D I Z E D - BED C O M B U S T O R

- 350 - 351 -
National Chemical Engineering Conference 1974
PROCESS INDUSTRIES IN AUSTRALIA IMPACT AND GROWTH
Surfers Paradise, Queensland
July 10 to 12th, 1974
"IN-SITU" GASIFICATION OF THICK SEAMS FOR POWER
AND SYNTHESIS GAS
by
I. McC. Stewart
S U M M A R Y
The history of work on "in-situ" gasification is discussed and thepoint is made that present environmental controls and tightness ofsupply of petroleum fuels create a climate very favorable for thismethod of utilization of energy from coal. Large scale operationon reasonably thick seams permits a new approach to gasificationlayouts with great promise for economical operation. It is sub-mitted that combined power generation-synthesis gas production isthe most economical application. An outline of a 2000 MW power;400 MW 5 x 1Q6 total oil/annum layout is presented.
I. McC. Stewart, The University of Newcastle, Chemical Engineering.
1, THE CONCEPT AND HISTORY OF IN-SITU GASI.FICATION
Underground - "in-situ" - gasification of coal was mooted by Sir WilliamSiemens in a paper to the Chemical Society of Great Britain in 1868 and byMendeleev in Russia in about 1888„ Some small scale experiments were made bySir William Ramsay in 1914 in Durham, terminated at the outbreak of World War 1.Large scale experimental work commenced in Russia during the 1930's culminatingIn commercial undertakings of a reasonable size by 1960. It has been statedthat considerable incentive for the work was found in Lenin's writings wherehe advocated the process as a means of alleviating the miserable lot of thecoal miner. This is quite significant as it probably accounts for the generalobjective of Russian work to achieve the whole of the preparation and gasifica-tion by boreholes from the surface, without any underground mining operations.Practical methods of great value were achieved in directed drilling and in"linking" the boreholes by combustion channels. However the reliance on multipleboreholes from the surface did put severe limitations on the scale and efficiencyof operations.
In the western world the "energy crisis" in the 1940!s immediately follow-ing World War II was, for some years, very severe. One of the results wasstimulation of very extensive work in Great Britain and the United States andto a lesser extent in Europe. The general post-war troubles in the coal rainingindustry resulted for these trials also in emphasis on methods of operationfrom the surface only, or at least with very minimal underground operations. Avery high proportion of the total effort and expenditure was concerned withexploration of techniques for these purposes. Some reasonably successful long-term trials were completed and9 despite disappointingly slight analyses of thecombustion and heat transfer processes, a great mass of useful data and ofcommercially practicable techniques has been accumulated.
The present energy crisis, while temporary to the extent of the politicalreduction of supplies from the Arabian gulf, has made more clear than everbefore the dependence of the whole range of industrial activity on regularenergy supply and the ease with which international petroleum supplies can bedisrupted. It does force consideration of the probability that by the turnof the century petroleum supplies will not keep up with the present level ofdemands The rate of growth of nuclear energy is in some doubt while the safedisposal of radioactive refuse is still uncertain; much full scale work isrequired before electric power from direct solar energy makes a major contribution,In either case a carbon fuel is still needed to produce transport fuels or asatisfactory piped gas* Certainly twenty-five years from now coal will be againa major energy source. A very large part of the demand will be for electricpower and for synthesis gas, generated in stations of large capacity. Hopefullythe current pressure for environmental control will continue and disposal ofpart.iculateB gaseous and liquid effluents will be a major consideration inprocess selection.
It will be submitted that for reasonably thick seams - thicker than 5 ftof coal substance reasonably free from faulting - in situ gasification offersvery attractive potential for large scale combined power-synthesis gas pro-duction at costs comparable with full underground mining, and at very muchbetter costs where mining conditions are difficult particularly if the seam isvery thick or has large dirt or high-sulphur bands.
The environmental, advantages are very great in that ash is left "in situ"and liquid effluents would be gasified,, The potential is only realizable withvery large scale units requiring a considerable amount of conventional typemining for development. A great deal of work can be done on models of reason-able size but any working trials must be full scale with a heavy time andcapital commitment. One would not expect a lead time from the present state-of~art to a really large scale operation at less than ten to fifteen years.
On the Australian East coast where we have very limited oil and gasresources and large coal reserves, much of which is in thick seams in which

353 -
the available coal will, in twenty years time, be deeper and more expensiveto work. It therefore seems very timely that we should now begin seriousstudies of the possibilities and of the immediate research programs to initiate.
2. THE ADVANTAGES OF IN-SITU GASIFICATION
The major advantages are that some coal reserves not fully recoverableby other means may be more completely recovered by gasification in-situ andthat ash and other troublesome effluents may be left underground thus avoidingsurface disposal difficulties.
2.1 Recovery of reserves. The initial objective, to recover thin dirtyseams at moderate depths does not appear economic. As will be shown, thequality of the gas falls off and the unit cost rises fairly steeply withdecreased thickness of seam below about four feet of equivalent coal. Howevernormal mining methods can become both difficult and costly when any attempt ismade to secure high recovery of thick seams, particularly if these are atconsiderable depth with high rock stress, or if the "roof" is weak, or ifportion of the seam is not economically saleable. However, under these con-ditions, a first working, recovering from 20% to 50% of the in-situ coal isfrequently an economic proposition and the submission is made that if the firstworking is planned for eventual extraction by in-situ gasification a much betteroverall recovery is possible at a lower overa.11 cost than could be secured byconventional mining methods alone. While most present coal winning in Australia(and the U.S.A.) is from comparatively shallow seams, a very high proportion ofour reserves in both N.S.W. and Queensland are from seams greater than four-feet in thickness and at sufficient depth to expect increased cost and difficultyfrom conventional mining methods.
2.2 Environmental considerations.
The first pressure from environmental concern has been on the smallindustrial unit where the comparatively simple tasks of controlling smoke,reducing grit and dust from the stack gases to an acceptable limit and dis-posing of the larger ash have rendered coal unattractive by comparison withmore costly light furnace oils or the even more costly, but completely clean,natural gas. As oil prices increase the right fuel will be gas either naturalor synthetic. Our gas reserves in central and eastern Australia are not undulylarge and, looking twenty years ahead it may be more advantageous to gasifycoal in the east than transport gas from the N.W.
However for electric-power generation, so far almost completely coal basedin the East, the cost to the large pulverized fuel station of environmentalcontrol is large and increasing. 'Fly ash recovery and disposal may represent upto 10% of the capital cost of the station and have not always satisfied environ-mental standards. Collection of fly-ash is only part of the problem. If powerstations are to continue to be located close to the point of coal productionto avoid the cost and difficulty of coal transport they will move away fromregions of ample water supply and the disposal of fly-ash becomes a real problemby increasing the hardness and dissolved solids content of part of the avail-able water supply. Even for power-stations with ample water supply the pondingof the ash from 20 years operation of a 2000 MW station produces an unpleasantmini-desert and is not without water quality problems. In our fairly water-lesscountry even the disposal of the few hundred gallons per minute of high-solidsmine-water from a conventional colliery is not without problems. For a coal-gasification plant using mined coal liquid effluent disposal to current standardsbecomes a very expensive item. A high output "in-situ" gasification plantproperly designed will use effluent water as part of the gasification medium(provided that seam-water make is not high, and this is unlikely in the majorAustralian reserves).
FACE ADVANCECOMBUSTION ZONE
ISOTHERMS
HJcco
o-^200o
W0
o
0.' 0.2 0.3GASIFICATION RATE tonnes //n length hr
FIGURE 1 - Ideal straight advancingface
(a) Cross section;(b) Strata conduction losses
-• • THE COMBUSTION SYSTEM
3.1 The Single channel producer
The objective is to make under-ground workings as a gas producerwhich will maintain its form as thecarbon consumption spreads into thefixed seam of coal. In essence inplace of the linked multiple chan-nels between small lumps of coal inthe conventional producer, we havea small set of large diameter (300mm or more)channels initially 50 toseveral hundred metres long in asingle piece of coal. An idealisedsystem is shown in Figure 1, across section of a channel along aface of solid coal. Air and gasflow along the channel (normal to theplane of the sketch) gasifies thecoal; the face advances to theright. Behing the face the roofnormally breaks in the "goaf" and,with the ash, provides support forthe overlying strata. This simplesystem does not work mainly becausea large proportion of the air by-passes the face, through the goafand meets and burns with the pro-ducer gas in the gas exit passage,However, a simple advancing linear front permits simple algebraic analysis of thefactors affecting heat loss to the strata (para.3.2).
The "borehole" system isshown in plan in Fig. 2. This gaveexcellent results in the Britishtrials and is really the basis ofthe Russian commercial stations.A set of parallel boreholes aredriven in the seam (e.g. 15" dia-meter, 75 ft spacing and 450 ftlong in a 3 ft seam) from an airinlet heading to gas exit bore-holes (or a gas exit heading)."Bonfires" in the inlet heading areignited and, with continuous airblast, a saw-tooth face developsfunnelling into the boreholes (Fig.2 is taken from a report of a sur-vey of the British P5 trial madeafter the experiment was completed(!))<, Air travels from the inletheading through this broken mater-ial in the goaf, burns back theexposed ribs of coal developingsufficient temperature for the pro-ducer gas reaction C02 + C 2CO
to develop as the throat of theopening is approached. It is clearthat some by-passing will occur.
GAS OUTLETBOREHOLES
REDUCTIONZONE
\ COMBUSTIONZONE
!' I|l|l
BURNED' ii
Ii
/ M i / ' '/ 1 1 1 / | | /
0<T GO/IF 'I J" lln t 1
1 1
I' 1!- JL "
A/0 FURTHERBURNOUTAFTER HOTZONE HASPASSED
IGNITION DRIFT
AIR INTAKE BOREHOLES
FIGURE 2 - Parallel borehole system(From British Trials P5)
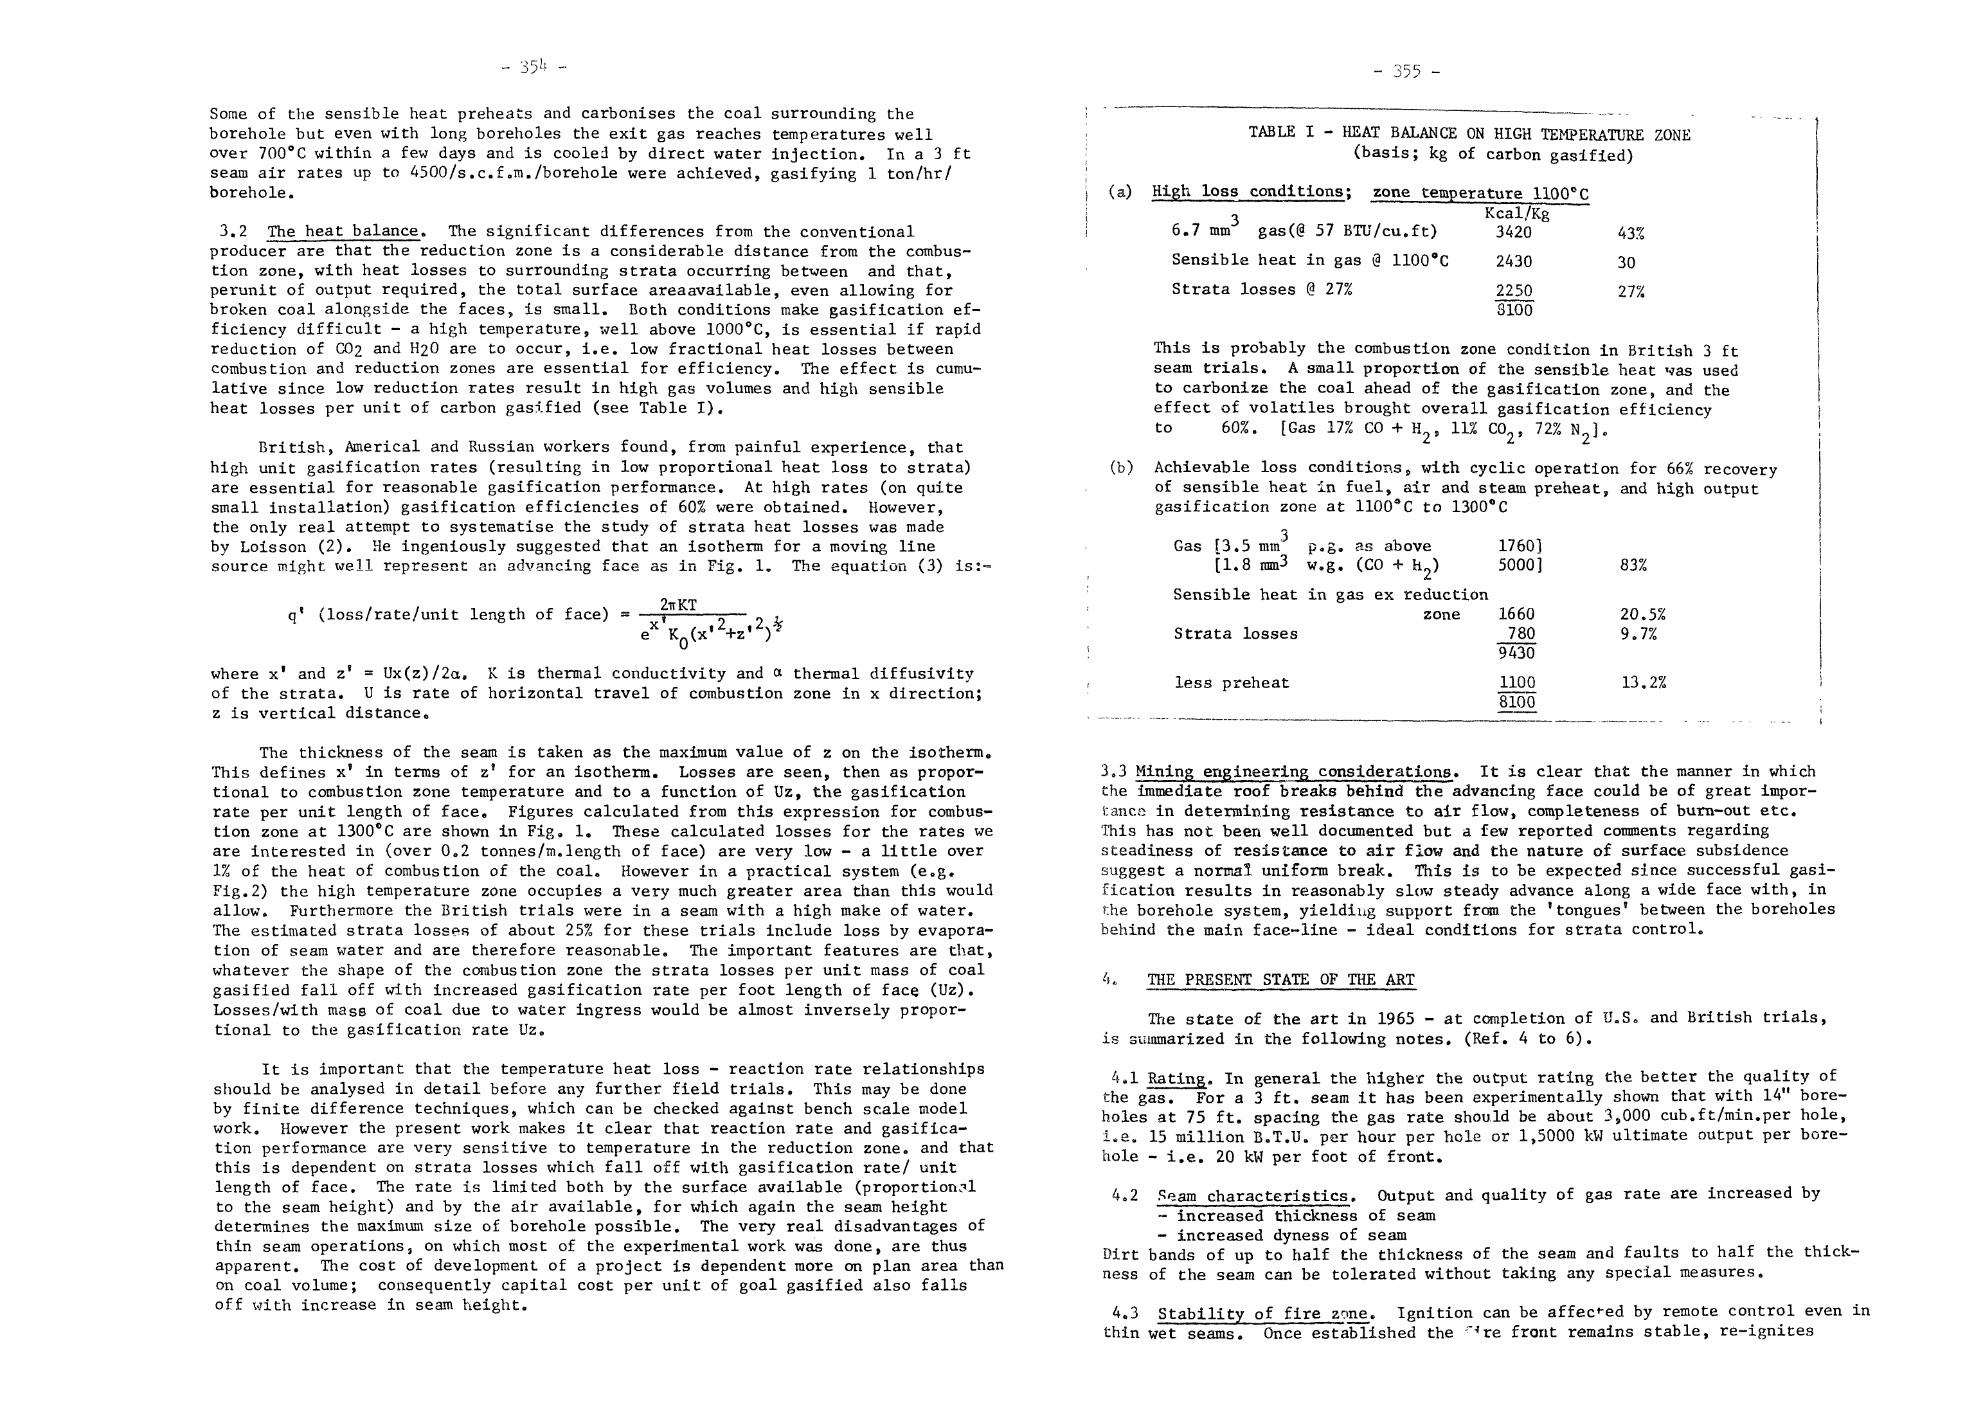
355 -
Some of the sensible heat preheats and carbonises the coal surrounding theborehole but even with long boreholes the exit gas reaches temperatures wellover 700°C within a few days and is cooled by direct water injection. In a 3 ftseam air rates up to 4500/s.c.f.m./borehole were achieved, gasifying 1 ton/hr/borehole.
3.2 The heat balance. The significant differences from the conventionalproducer are that the reduction zone is a considerable distance from the combus-tion zone, with heat losses to surrounding strata occurring between and that,perunit of output required, the total surface areaavailable, even allowing forbroken coal alongside the faces, is small. Both conditions make gasification ef-ficiency difficult - a high temperature, well above 1000°C, is essential if rapidreduction of C02 and H20 are to occur, i.e. low fractional heat losses betweencombustion and reduction zones are essential for efficiency. The effect is cumu-lative since low reduction rates result in high gas volumes and high sensibleheat losses per unit of carbon gasified (see Table I).
British, Americal and Russian workers found, from painful experience, thathigh unit gasification rates (resulting in low proportional heat loss to strata)are essential for reasonable gasification performance. At high rates (on quitesmall installation) gasification efficiencies of 60% were obtained. However,the only real attempt to systematise the study of strata heat losses was madeby Loisson (2). He ingeniously suggested that an isotherm for a moving linesource might well represent an advancing face as in Fig. 1. The equation (3) is:-=
q' (loss/rate/unit length of face) = 2irKTx T_ ,KQ(x
,2, ,2N%' '
where x' and z' = Ux(z)/2cu K is thermal conductivity and ex thermal diffusivityof the strata. U is rate of horizontal travel of combustion zone in x direction;z is vertical distance,,
The thickness of the seam is taken as the maximum value of z on the isotherm,,This defines x' in terms of z' for an isotherm. Losses are seen, then as propor-tional to combustion zone temperature and to a function of Uz, the gasificationrate per unit length of face. Figures calculated from this expression for combus-tion zone at 1300®C are shown in Fig. 1. These calculated losses for the rates weare interested in (over 0.2 tonnes/m.length of face) are very low - a little over1% of the heat of combustion of the coal. However in a practical system (e.g.Fig.2) the high temperature zone occupies a very much greater area than this wouldallow. Furthermore the British trials were in a seam with a high make of water.The estimated strata losses of about 25% for these trials include loss by evapora-tion of seam water and are therefore reasonable. The important features are that,whatever the shape of the combustion zone the strata losses per unit mass of coalgasified fall off with increased gasification rate per foot length of face (Uz).Losses/with mass of coal due to water ingress would be almost inversely propor-tional to the gasification rate Uz0
It is important that the temperature heat loss - reaction rate relationshipsshould be analysed in detail before any further field trials. This may be doneby finite difference techniques, which can be checked against bench scale modelwork. However the present work makes it clear that reaction rate and gasifica-tion performance are very sensitive to temperature in the reduction zone, and thatthis is dependent on strata losses which fall off with gasification rate/ unitlength of face. The rate is limited both by the surface available (proportionalto the seam height) and by the air available, for which again the seam heightdetermines the maximum size of borehole possible. The very real disadvantages ofthin seam operations, on which most of the experimental work was done, are thusapparent. Hie cost of development of a project is dependent more on plan area thanon coal volume; consequently capital cost per unit of goal gasified also fallsoff with increase in seam height.
TABLE I - HEAT BALANCE ON HIGH TEMPERATURE ZONE(basis; kg of carbon gasified)
High loss conditions; zone temperature 1100°C3 Kcal/Kg
6.7 mm gas(@ 57 BTU/cu.ft) 3420
Sensible heat in gas
Strata losses @ 27%
1100°C 2430
22503100
43%
30
27%
This is probably the combustion zone condition in British 3 ftseam trials. A small proportion of the sensible heat was usedto carbonize the coal ahead of the gasification zone, and theeffect of volatiles brought overall gasification efficiencyto 60%. [Gas 17% CO + 11% 72%
(b) Achievable loss conditions 9 with cyclic operation for 66% recoveryof sensible heat in fuel, air and steam preheat, and high outputgasification zone at 1100aC to 1300°C
Gas [3.5 mm p.g. as above[1.8 mm3 w.g. (CO + h_)
176015000]
Sensible heat in gas ex reductionzone 1660
Strata losses 7809430
less preheat 11008100
20.5%9.7%
13.2%
3.3 Mining engineering considerations. It is clear that the manner in whichthe immediate roof breaks behind the advancing face could be of great impor-tance in determining resistance to air flow, completeness of bum-out etc.This has not been well documented but a few reported comments regardingsteadiness of resistance to air flow and the nature of surface subsidencesuggest a normal uniform break. This is to be expected since successful gasi-fication results in reasonably slow steady advance along a wide face with, inr.he borehole system, yielding support from the 'tongues' between the boreholesbehind the main face-line - ideal conditions for strata control.
'*• THE PRESENT STATE OF THE ART
The state of the art in 1965 - at completion of U.Sis summarized in the following notes. (Ref. 4 to 6).
and British trials,
4al Rating. In general the higher the output rating the better the quality ofthe gas. For a 3 ft. seam it has been experimentally shown that with 14" bore-holes at 75 ft. spacing the gas rate should be about 39000 cub.f t/min.per hole,i.e. 15 million B.T.U. per hour per hole or 1,5000 kW ultimate output per bore-hole - i.e. 20 kW per foot of front.
4.2 Seam characteristics. Output and quality of gas rate are increased by- increased thickness of seam- increased dyness of seam
Dirt bands of up to half the thickness of the seam and faults to half the thick-ness of the seam can be tolerated without taking any special measures.
4.3 Stability of fire zone. Ignition can be affected by remote control even inthin wet seams. Once established the ~^re front remains stable, re-ignites

rapidly even when air-blow ceases for several days, and tends to move awayfrom the inlet. The hot zone is quite narrow and heat penetration into ad-jacent strata, or laterally into adjacent panels, is extremely slow. Burn backbehind the ignition zone or laterally beyond the extreme gasification channelsis very small, only a few feet.
A panel may be completely extinguished by partial flooding quite rapidlyand when so extinguished does not re-ignite spontaneously.
Gas can be cooled from over 1000*F to below 300*F by direct water spraysin less than 50 ft. of heading.
4.4 Cyclic operation. A small system in a thin seam has been operated on a"water gas" cycle with total cycle times of 16 to 24 hours and production ofhigh C.V, water gas for periods of over six hours in each cycle. (4)
Systems have also been operated cyclically with low blow rates (lowpower production) followed by high power rates.
4.5 Oxygen. Oxygen enrichment has been tried extensively and has producedreasonably high C.V. gas. The costs are, however, high and for a thick seamwith a load of the 12 hour type usual in electricity supply the writer isconvinced that a "water gas" cycle is better.
4.6 Gas quality. From continuous blowing, producer gas with calorific valueof from 50 to 100 B.T.U. per cub. ft. is produced (according to seam thicknessand dryness). Intermittent steam blows produce gas at over 300 B.T.U. per cubicft.
Gas turbines have been operated satisfactorily for long periods on "in-situ" gas from continuous blow.
4.7 Mining preparation. 14" boreholes have been drilled at reasonable costfrom a 6' x 6' heading for 450 ft. to keep entirely within a 2'4" seam and inthe correct plan direction. It is considered by the team responsible for thisdrilling that in a 6 ft seam holes could be drilled to 900 feet at a reasonablecost.
Stoppings suitable for over 15 Ibs/sq.in. have been built at reasonablecost and have satisfactorily withstood strata pressure from burn-out of anadjacent panel.
^•8 Recovery. The multiple borehole (P5) system achieved a recovery of 92%of the coal within the panel. Barriers between panels and "inaccessible" coaladjacent to the gas outlet points may represent 15% of the area depending onpanel size and layout, giving an overall recoveiy of some 75% to 80% undersuitable conditions.
4.9 Model experiments.experiments (5).
Useful data can be obtained from "hot" model
4.10 Costs. A detailed estimate was made by Sir Alexander Gibhe and Partnerin 1965 for the British National Coal Board for a 60 MW station on an actualsite conservatively using data from the British Trials. It was concluded thatfrom the 3 ft seams available, and with several miles of gas transport becauseof site conditions, energy could be delivered to the station from an "in-situ"gasification establishment, using the parallel borehole technique, at slightlyless cost than from the current prices of mined coal (1).
5. LARGE SCALE PRODUCTION
5.1 Cyclic operation. From the considerations outlined in section 3 it isclear that the active combustion zone should be as compact as possible and thatany contribution to increase temperature in this zone will have a dramaticeffect on efficiency and gas quality. Table I has been computed on a verysimplified basis but does, I believe, fairly represent both the British P5
trials and what could be achievedwith a higher output system designed.for some heat recovery. From thegeneral operating data available acyclic system as in Fig. 3 appears com-pletely feasible and for most of thelife of the panel ample transfer area isavailable in a reasonable borehole sys-tem to recover about 2/3 of the sen-sible heat of outgoing gas in the blowair and steam. Quite apart from theadvantages of having an availablewater gas make and the necessity of asteam purge on reversal, a separatesteam blow is effective in compactingand producing uniform temperature in thecombustion zone. With panels laid outto the dip and gasifying up dip mostof the steam can be produced by directinjection of waste water into the gasi-fying boreholes. An overall cycle timeof 24 hours is feasible and very con-venient to accommodate the normal powerload. It appears at present that,, if
REGEN'VEHEATEXCHANGE
INITIALIGNITION
• (A) steam blow (hen air blow(B) hot gas out(A) hot gas out(B) steam blow then air b/ow
<- combustion o reduction
1'IGURE 3: Diagrammatic arrangementCyclic operation for borehole
system.1-2 represent reversal phases
synthesis gas is required, the mosteconomical system is to combine, thiswith substantial power generation.However, a stesm - steam-oxygen system should be equally applicable to produceprimarily synthesis gas.
Rpugh calculations indicate that for the system shown in Fig. 4 the bore-holes will provide, sufficient surface for the 66% regenerative heat recoveryproposed for 2/3 of the panel life. A number of systems are possible for com-pletion of the panel - preferably design to extend this through to the nextpanel vertically above.
5.2 The necessary size of operation. Any power generation proposal at presentshoulo envisage a 2000 MW load. The requirements in terms of a seam of 8 ft.thickness of coal and for 20 year life are estimated in Table II; for 70% loadfactor and overall 25% efficiency - coal in~situ to generator output.
TABLE II - IN-SITU GASIFICATION FOR 2000 MW; 8 FT. SEAM.
Total area of coal seam
No. of mines - initial 3ultimate 8
fi 936 x 10 m [say 4 miles square].
"Gas producer" panels - approx. 600 m x 250 m.
No. of panels operating at one time 6 to 10
Air blow per panel r- approx. 300,000 m3/hr.
Life per panel 30 - 44 weeks
No. of panels per mine - 36
Mined coal production from development work 2500 t.p.d.
For combined gas-power production.
Power output 1400 M.W.
Gas production - as synthetic Nat, Gas
- as synthetic liquid fuel 5 x 10⁶ bbl
9 31 x 10 m /annum

_flflEMERCENC Y HE A DING
MA IN INTAKE.^ N
VALVES & PIPES,1 U
zn on
nnn
i
— i n r
noi n
ni-Q w v-\ U ftia l-Ft-n — n — n—
5 i-; 'g^i ii iii iin- 'r^- iUj 1QC 1ft: |
§ 11
,_,-! , i»i i i , aii
_, ioo 1
11i
1! ! i
L . _- MM^j][] /G/V/770/V in n r—
"t _J»
-T ? N' v Y jjLI , i , \^
\CINDER \ 1COLLECTION ,
1 l ' 1 1' i l
i i i i i1 ll i ' 1 1
1 1 ' i 1' i l l
1 1 i 1 ii 1 1 I 1
« i i • i 1 i i i ligJrB-i l i ' i l i ' i«h
• 1 1 1 ]' , 1 1I ' l lI ' l l1 1 1 1I ' l li 1
1 ' 1
' ' '1 i l l1 11 ' I 'i ' ii i i '
j [ & DRILLING i
— ij — ij — gg1. ^\ BARRIER i@i — _L — ,
1 — —i i1i i 'i 1i l
Uil ' ^-U l ^uo1 53;i or iUjl 1 rj;g, , 03
oal i 11 i 1 i
1 ' "Ti \D,Pl -J i OF
|, § \SEAMK | O
^ '
g| ' iCo1 1 i^i i ,CD 1 | J ]
*
4-^-4^ HEADING
i — 1 1
n n n r
FIGURE A : 200-300 MW panel layoutApprox. 250 m. x 600 m.
•• 358 -
5.3 Mining Layout. For thissize operation requirements forairways etc. and the desirablepanel size are quite comparablewith those for conventional min-ing. The overall layout of themine plan could be very similarto that for a retreating long-wall system.
A type of panel layout whichmight be used is shown in Fig. 4.To tie it to reality an exercisehas been done on a detailed geo-logical plan of a considerablyfaultee area of the Greta seam.It was found possible to datepanels with adequate access and,in the present state of knowledge,apparently satisfactory "produ-cer" characteristics.
This type of layout has thevary great potential advantageof great flexibility as betweenproduction of coal and gas. Pro-vided that the basic plan wassuitable for gasification theinitial development could be car-ried out without complete commit-ment to a gasification operationwith very little extra cost overthat necessary for a purely con-ventional mining proposal and, at any time, the proportion of coal won duringdevelopment to coal gasified could be varied considerably by variations in"borehole" size and spacing. For thick seams boreholes up to 6 ft or morein diameter are readily achievable with modern mining machinery. When theoperation is considered in this manner it is clear that the extra capital costfor the gasification recovery is not proportionately high (air blowers and gaspipes to balance against a roof support system and high capacity belt conveyors)and for safety purposes an extra access shaft. The cost for gasification is verylow.
6. CONCLUSIONS AND RESEARCH REQUIREMENTS
As outlined above the data available from ten years of trials both success-ful and unsuccessful and from Russian trials and semi-commercial experience issufficient to indicate strongly that large-scale "in-situ" gasification willprove very attractive for power-generation, combined power-synthesis gas produc-tion or even purely synthesis gas production both economically and for environ-mental protection from coal reserves of over 1.5 metres in thickness, particularlywhere these are deep, or have high ash content or bad roof conditions. However,any commercial development must be preceded by a large scale trial which will beexpensive. Before this is undertaken it is essential to establish reliable basesfor design of large thick seam "gas-producer" panels and their control and forsome of the specialized mining work reqxtired, e.g. pressure tight stoppings. Pro-vided that there is good co-operation between the chemical engineer with a com-bustion specialty and the mining engineer these basic investigations could estab-lish firm grounds for a large scale trial, in about five years at quite a modestcost.
The main lines of activity would be:-
(i) Establish those areas and coal seams which are likely in fifteen totwenty-five years time to need "in-situ" gasification for conservational
- 359 -
development,
(ii) Build up a computational program to analyse borehole and cyclic bore-hole type gasification panels and check the mathematical model against availabletest data. Build bench-scale models to check the computational model and thegeneral control behaviour of such systems.
(iii) From likely areas collect relevant information regarding strata beha-viour - roof break characteristics behind extraction lines, behaviour of rib androof and stability of stoppings in stressed areas.
(iv) From this information prepare reliable estimates of costs for a fullscale operation and specify in detail and estimate the costs of a large scaletrial.
REFERENCES
1. "The Underground Gasification of Coal", Sir Alexander Gibbs and PartnerPitman, 1964
also C. Masterman, Jl. Ins t. Fuel,.25,, 1953 p 426 ff.A.Balfour, Colliery Guardian, 203, .1961 p 782 ff.
2. "Heat Transfer in Underground Systems11, R. Loison9 J1.Inst.Fuel,26 , 1953.
3. "Conduction of Heat", Carslaw, H.S. & Jaeger, J.C, C.U.P. 1959.
4. U.S. Bureau of Mines Rl 4164 (1947), 4808 (1951), 5367 (1957)
5. U.S. Bureau of Mines Rl 5605 (1960
6. U.S. Bureau of Mines Rl 5803 (1961)
7. "Low Cost Power and Gas by Underground Gasification", I. McC. Stewart (1965)- (restricted circulation).
ACKNOWLEDGEMENTS
Most of the work reported was done in 1964-65 and thanks are particularlydue to Humphreys and Glasgow Ltd.; Mr. W. Williams (Joint Coal Board); Mr. S.B.McKensey (Hebburn Ltd.); Mr. R. Ainge and Mr. R. Britten (Joint Coal Board)for information, drafting facilities and helpful criticism.

- 360 -
National Chemical Engineering-.Conference 1974
PROCESS INDUSTRIES IN AUSTRALIA IMPACT AND GROWTH
Surfers Paradise, Queensland
July 10 to 12th, 1974
FACTORS AFFECTING PARTICLE SIZE IN FLUIDISED CARBONISATION OF COAL
by
D. Barret t and A. Basoeki
S U M M A R Y
This paper reports on a laboratory scale study of fluidisedcarbonisation of coal at temperatures up to 600°C. The broadconclusions are:-
(a) Under conditions of rapid heating, even weakly cakingcoals agglomerate.
(b) Agglomeration may be reduced or prevented by:-
(1) Reducing the rate of heating.
(2) Diluting with inert material such as char.
(3) Preheating at a temperature lower than a charac-teristic temperature for each coal.
(c) The size of feed and free-flowing residues may beexpressed by the same sort of mathematical relationship.
(d) Factors which reduce agglomeration also reducecenosphere formation.
Barrett, U.N.S.W., Chemical Engineering.
Basoeki, Australian Iron § Steel, Port Kembla.
- 36l -
treduction
The commercial development of low temperature carbonisation islargely dependent upon the economic use of the residual solid pro-duct. This residual char in most cases amounts to 80% or more byweight of the final products. Recent interest, shown in fluidisedcombustion for steam raising in Britain and the U.S.A. suggests thepossibility of a substantial market for char in the future. It isessential therefore to understand the properties of char and theconditions under which it is formed.
This work is concerned with the study of particle size and par-ticle size change under various conditions of carbonisation. Aconsiderable portion of the investigation was devoted to a study ofsome of the conditions which are concerned with agglomeration ofthe fluidised particles.
Swelling and Agglomeration During Carbonisation
When coal particles are heated to a sufficiently high tempera-ture, decomposition take's place and this decomposition may be accom-panied by a temporary plasticity of some of the particles. The com-bination of temporary plasticity and simultaneous evolution of vola-t i l e matter from within the coal grains promotes expansion of theindividual particles. In very small particles where most of thenarticle is plastic at the same time, marked expansion takes placeand cenospheres are formed. With larger particles only parts of agrain are plastic at any one time and the proportionate expansionis much less. Large particles do not assume the completely sphericalshape of cenospheres but retain most of their original shape withsome rounding of edges. Sinnatt and Carlile1 found that cenosphereswere formed only when coal particles were smaller than 0.6 mm.
The degree of swelling must be related to the external restraintwhich is applied to an individual particle and therefore particlesin a static bed would be prevented from expanding freely and ceno-spheres formation and particle swelling should be inhibited underthese conditions. As a corollary it could be expected that the ten-dency for particles to coalesce and form agglomerates would beoreater in a static bed than a fluidised one.
The rate of heating is known to affect the swell ing power ofcoals. The higher the rate of heating the greater the degree ofswelling. Conversely Dulhunty and Harrison2 have shown that at^ery low rates of heating even coals classified as strongly swellingcould be carbonised without swelling. In continuous fluidised car-bonisation, conditions provide very high rates of heating combinedw i t h freedom from restraining forces upon the individual particlesand swelling should be strongly promoted.
Growth by agglomeration in the fluidised state is quite diffe-rent from that of swelling. Agglomeration must take place on con-_tact between particles, one of which at least must be in the plasticstate. The efficiency and time of contact will therefore be lessthan for particles in a static bed. However in continuous fluidisedcarbonisation, where high rates of heat transfer prevail, the conver-sion to plastic particles will be substantially complete at the sametime arid this may more than compensate for a reduced contactingefficiency.
Mechanical attrition which is taking place in the fluid bedwill tend to reduce particle size and this effect can be expectedto increase as the bed turbulence is increased. In any particular

- 362 - - 3b3 -
system both growth and attrition processes should be proceedingsimultaneously so we would expect an extension of the particle sizerange to occur. The change in the mean particle size should showthe relative magnitude of the growth and reduction processes.
Three coals were used in this investigation, all from NewSouth Wales coal fields and identified as Teralba, Metropolitan andGreta coals. The first two coals are steam raising coals of mediumand low voJatile matter content respectively and the Greta coal isa high volatile gas making coal. The properties of the coals areshown in Table 1.
The apparatus used was a laboratory scale batch reactor whichprocessed charges of 100 gms of coal at temperatures up to 600°C,using nitrogen as the fluidising medium. The coal was either fedfrom a pressurised hopper into a hot reactor (shock heating) or al-ternatively heated from cold at controlled rates of heating. Thereactor could be controlled to provide heating rates from 10 to 80°Cper minute. The layout of the unit is shown in Fig.l.
Table 1
Coal Sample
Te ra Lba18x30 BSS mesh30x60 BSS mesh
Metropolitan18x30 BSS mesh30x60 BSS mesh
Greta30x60 BSS mesh
Proximate Analysis wt %
Moisture
1.92.1
1.10.9
2.5
VolatileMatter
31.431.0
19. 819.5
43.3
Ash
13.41 3 . 3
11.511.3
3.2
FixedCar-bon
53.353.6
67.668.3
51.0
Gray-KingCokeType
AA
CC
G2
B.S.C-..-Q "Io w e i -lingIndex
l-l1
h1211
u4
Mini-mumFlui-disi-ngVelo-citySCFM
1.180.42
1.180.42
0.42
Results and Discussion
In many experiments agglomeration of the bed occurred and nonumerical measure of size was possible and attempts to measure thestrength of agglomerates provided meaningless results. In certainexperimental results therefore it was only possible to describe thephysical characteristics of the residue. The descriptions havebeen kept as simple as possible and recognised only three conditionsfor the particles:-
(a) Free-flowing individual particles, either cenospheric orangular.
(b) Free-flowing aggregates which are agglomerations of rela-tively few particles. The arbitrary upper size for anaggregate was -L" mesh size but in practice aggregates werealmost invariably less than 14 BSS mesh.
(c) Agglomeiates, consisting of material greater thansize, normally an agglomerate would be one lump.
Sl\ock_ Heating at Temperatures up to 600°C
The effect of shock heating was to produce complete agglomera-tion of all residues provided that the carbonisation temperatureexceeded a critical value. This value varied from coal to coal andwas approximately 455°C, 490°C and 435°C, for the Teralba, Metropo-litan and Greta coals respectively. Increasing the bed turbulencedid not appear to exert any significant effect upon agglomeration.The results of these experiments are shown in Table 2,
Table 2v •' • •
Coal Feed
Teralba30x60 mesh
Teralba18x30 mesh
Metropolitan30x60 mesh
Metropolitanj 18x30 mesh
(Ire ta30x60 mesh
Gas FlowRateSCFM
0.50
0.850. 500.500. 50
0. 50
1.25
1.47
0. 50
0.850.500.50
1.25
1.45
0. 50
0.500.50
Carboni-sationTemp.°C
600
600525460450
425
600
600
600
600500480
600
600
600
440430
Characteristics of Residue
Completely agglomerated -weakly coherent.
I t II 11 It II
t 1 t! t l || II
II II II II II
Free-flowing, individual ceno-spheric and angular particles.Free-flowing, individual an-gular particles.
Completely agglomerated -weakly coherent.
it M i t i i t i
Completely agglomerated -weakly coherent,
ii ti ii it Mt i i i i i n i i
Free-flowing, individual ceno-spheric and angular particles.
Completely agglomerated -weakly coherent.
11 II II M II
Strongly agglomerated andwell fused.
M M M ii i iFree-flowing, individual ceno-spheric and angular particles.
Carbonisation at Controlled Rates of Heating
a very effectivethere was evide-
- i t mesh
Carbonisation at lower rates of heating is notmethod of controlling agglomeration. For all coalsnee that the strength of the agglomeration was weakened the lowerthe heating rate but only in the case of the Teralba coal were freeFlowing residues produced. The results in Table 3 are for samplesheated at various controlled rates up to a temperature of 600°C.Tn all cases, except the 10°C per minute rate, the total time waskept constant at 30 minutes.
Effect of Dilution of Coal Feed

Mixtures of coal and char particles were shock heated at 600°Cfor a range of dilution ratios and the results, reported in Tahle 4,show that agglomeration can be prevented if the dilution ratio issufficiently high. The level of dilution was greater for the morestrongly coking Greta coal.
Tahle 3
Coal Feed
Teralba30x6030x6018x3030x60
18x3030x60
30x60
30x60
18x30
Metropolitan30x60
30x6018x3030x60
30x60
Greta30x6030x60
HeatingRate°C/min
10101020
2050
50
80
80
10
101033
50
1033
Gas FlowRateSCFM
0.50.851.250.50
1.250.50
0.85
0, 50
1.25
0. 50
0. 851.250.50
0.50
0. 500.50
Characteristics of Residue
Free flowing, no aggregates.I! 1 I II M
M M II II
Free flowing, less than 5% aggre-gates .
n M M i tFree flowing, approx. 101 aggre-gates .Free floiving, less than 5% aggre-gates .Free flowing, approx. 40% aggre-gates .
it it n it
Barely coherent, disintegrates onhandling .
i t i t t i t iI t I t I t 1!
Weakly coherent, completelyagglomerated.
i t t i i t i t
Completely agglomerated.Strongly agglomerated and wellfused .
Table 4
Dilution Ratio
Wt of CharWt of Coal Characteristics of Residue
Teralba2.02,53.0
5.0
Metropolitan2.02.5
4.0
Greta370
Completely agglomerated, weakly coherent.Free flowing, almost entirely aggregates.Free flowing, almost entirely aggregates, nocenospheres.Free flowing, approx. 40% aggregates, no ceno-spheres .
Completely agglomerated, weakly coherent.Free flowing, almost entirely aggregates, nocenospheres.Free flowing, approx. 50% aggregates, no ceno-spheres .
Strongly agglomerated.
- 365 -4 ( C o n t ' d )
Di lu t ion Ratio
Wt of Char}Ttf~of Coal Characterist ics of Residue
i —Greta (Cont'd)5706.08.0
Completely agglomerated, weakly coherent.Free flowing, almost entirely aggregates.Free flowing, approx. 50% aggregates, no cenospheres.
In another series of experiments cold coal particles wereadded to a bed of fluidised char at 600°C. Unless the coal wasadded very slowly so that sufficient time for mixing was allowedagglomeration occurred. In commerical fluidised carbonisation ona continuous basis, conditions would be similar to slow addition ofcoal and serious agglomeration should not arise.
pr e ven t i on of Agg1ome ration
The results of the preceding experiments show that:-
(a) For each coal there exists a critical temperature belowwhich the coal can be heated without producing agglo-meration .
(b) A reduction in heating rate (which may be interpreted asa prolongation of the heating period below the criticaltemperature) tends to eliminate or reduct agglomeration.
Experiments were carried out on the effect of duration andlevel of preheat for the coals and the results show that the closerthe level of preheat to the critical temperature the shorter thetime required to achieve a given reduction in agglomeration. Attemperatures much below the critical temperature, the effect of pre-heat is negligible.a final shock heating
Results are reported in Table 5, and refer totemperature of 600°C in all cases.
Size Analysis and Size Distribution of Free Flowing Residues
The results of size analysis of material less than V' are rep-orted in Table 6. The complete size distribution has not been tabu-lated instead a mathematical expression has been used which classi-fies the significant features of size, such as size uniformity andaverage particle size. The usual functional size distribution rela-tionships such as Rosin Ramler, Log Probability etc. were triedwithout giving a reasonable fit. However, a plot of cumulativeweight percent retained (R) on a linear scale versus particle size(X) on logarithmic scale produced reasonably straight lines over thegreater portion of the range of sizes. Deviations occurred at theextremities which could be attributed to the presence of comparative'ly large cenospheres or small aggregates (at the top size end) andof fines produced by attrition (at the bottom size end). In a fewcases, the size distribution appears to be better represented by apair of joining lines of different slopes. In these cases the twolines represented a division into discrete particles and smallaggregates.
Over the linear portions, the size distribution of the freeflowing residues and the feed material may be represented by thefollowing equation:-

- 366 -
R = 100 log a X-n
-nor by substituting
R = 100 log X'
for the constant ao
o
The constant n is numericaand is a measure of the range ovalue of n, the less uniform isX for R = 0 , may be consideredit is less adequate than X, thebraic difference X between feedthe relative importance of thevalues of average particle sizesize ranges (including the non-bas is i.e.
sx.w.X =
lly equal to the slope of the linef particle size; the smaller thethe material. Xo equal to the size
as a measure of coarseness; however,average particle size. The alge-and residue provides a measure of
growth and attrition processes. Thehave been computed for the completelinear portions) on a geometric
i iSW.
Table 5i
Coal
Teralba30x60
Metropolitan30x60
Greta30x60
TimeMinutes
30
603060
10
20
10
90
30451020
3060
30
PreheatTemp.°C
350
350375375
400
425
455
425
450450480480
400400
430
Characteristics of Residue
Complete agglomeration, weaklycoherent .
I f II M 11
(I 11 M It
Complete agglomeration, weaklycoherent, very fragile.Incomplete agglomeration, residue4 large lumps .Free flowing with cenospheres andlittle aggregates.Free flowing, practically free ofaggregates, cenospheric.
Complete agglomeration, weaklycoherent .
M 11 M II
It II II 11
Free flowing, 20% aggregates.Free flowing, less than 5% aggre-gates .
Strongly agglomerated, vesicular.Strongly agglomerated, reducedvesicularity .Free flowing, 30% aggregates.
Table 6
Coal
TeralbaFeed 30x60 meshShock Heating 425°C
450°C
SizeModulusXomm
0.5100.5040.521
DistributionModulusn
3,252.842.74
MeanParticleSize Xmm
0.3620.3400.352
- 36? -
Table 6 (Cont'd)
Coal
Heating Rate at 0 . 5 SCFM10°C per min.20°C per min.25°C per min.33°C per min.50°C per min.60°C per min.80°C per min.
Flow Rate at 10°C per min.0.50 SCFM0.65 SCFM0.75 SCFM0.85 SCFM
Char Dilution - Shock HeatingDilution Ratio 5 : 2Char: Coal 3:1
5:1 (a)
(b)
llffect of Degree and Durationof Preheat400°C 20 mins .400°C 30 mins .425°C 20 mins.450°C 10 mins.
TeralbaFeed 18x30 meshHeating Rate at 1.25 SCFM
10°C per min.20°C per min.33°C per min. ^50°C per min.80°C per min. (a)
(b)
MetropolitanF e e"T~TOx60 me s hFlash Heating 480°CPreheated 480°C 20 mins.Preheated 480°C 30 mins.
GretaFeed 30x60 meshFlash Heating 430°CPreheated 430°C 30 mins. (a)
(b)
SizeModulusX0mm
0.5000. 5100.5240. 5430. 5610.6010. 840
1.206
0.5000.4820.4700.463
1.151.160.880
DistributionModulusn
2.982.932.922. 772.672.58
Me anParticleSize X~mm
0.3510.3520.3620.3830.3850.434
1 . 81 (for X less than0.500)
1.07 (for X greater than0.500)
2.983.093.163.23
2.552.541.76
0.3510.3410.3350.324
0. 7860.7700.543(Composite)
(For X less than 0.500mm)1.150 1.18
(For X greater than 0.500mm)
0.5210.4720.4680.491
0.791
0.7480.7770.7970.8200.881
2.823.293.262.99
5.01
5.04.664.454.42
0.3710.3480.3400.346
0.644
0.6070.6200.6300.643
0.382(For material less than 0.700mm)
1.492 1.130(For material greater than 0.700mmj
0.4880.5190.5220.520
0.5100.5400.650
3.442.752. 792.61
3.252.642.18
0.3560.3480.3570.347
0.3620.3630.438
(For X less than 0.500 mm)1,150 0.80(For X greater than 0.500 mm)
i

- 369 -
The results show that both attrition and growth processes aretaking place simultaneously and that increased bed turbulence leadsto increased breakage. It also seems probable that the breakage isselective and preferentially reduces the size of the largest parti-cles. This is shown by an increase in. the value of the distributionmodulus n when the flow rate is increased at constant rates ofheating. The effect of heating rate on the growth of the particlesis as expected that for a constant fluidising velocity the higherthe heating rate the greater the growth factor. In a comparisonof effect of particle size the Teralba results indicate that withthe smaller particles a heating rate of 25°C per minute will main-tain X at the value of the feed mean particle size, but that withthe larger particles the proportionate growth effect is less and thefeed mean particleper minute.
size is only maintained at a heating rate of 50°C
Dilution experiments with the Teralba coal suggest that freeflowing aggregates are preferentially formed and an overall growthin particle size and a reduction in distribution modulus takes place.At high levels of dilution aggregate formation still takes placebut there is an excess of diluent particles and so free flowing in-dividual particles are obtained.
The effect of preheat at temperatures below critical producesfree flowing residues and the effect of time and temperature areclearly shown for Teralba and Metropolitan coals.
Production of Cenospheres
The cenospheres produced were of low specific gravity and wereseparated from the unswollen particles by density separation usingwater. The cenospheres themselves were not well developed i.e.they were relatively thick walled and opaque. The effect of thevarious experimental conditions on the formation of cenospheres isshown in Figs. 2 and 3. The results indicate that the productionof cenospheres is favoured by high heating rates, low turbulenceand small particle size. Preheat which inhibits agglomeration alsohas a similar effect on cenospheres formation and appears to be anadditive time-temperature effect.
Conclusions
(i) Although two of the three coals used in this study couldvirtually be classified as non-caking, shock heating in-variably produced completely agglomerated residues whencarbonisation was carried out above a critical tempera-ture level.
(ii) Agglomeration can bewing methods:-
reduced or eliminated by the folio-
(iii)
(a) Dilution with an inert material;
(b) Slow rates of heating;
(c) Preheating of coal below its critical temperature.
The same type of size distribution may be used to describe both feed and free flowing residues and the generalpattern of size distribution remains the same but diffe-rences occur in the degree of particle coarseness, rangeand uniformity of particle size. Other workers workingin dilute and dense phase fluidised carbonisation have
shown that both their feeds and residues were distribu-ted according to the Rosin-Ramier relationship^ anc' 4.It seems therefore that the method of feed preparationwill have a very important effect upon the size distri-bution of the final char residues.
e Terences
3.
Sinnatt, F.S. and Carlile, J.H.G.J.S.C.I. 49, 355-9T (1930).
Dulhunty, J.A. and Harrison, B.L.Fuel 32, pp. 441-50 (1953).
Parry, U.F. et al.U.S.B.M. R.I. 4954 (1953).
Bowl ing , K . M C K . e t al.Symposium on Low Temperature Carbonisation Regional Confe rence ,Hyderabad , India (1961).

Piusomc CAS -""
tOUCAL (AS ««M*ATW
fifPHACTWW LAWNS
OASfitTO' EXHAUST FAN
- 371 -
F i g . 1 . Diagremtio erraapftessata of tte oxperiawntal flaidis«d-bedcarbonisation salt.
10 £0 30 40 50 80 70 80Heating rate, tr, °C/ain.
Fig . 2 . Effect of beating rate on cenoephericcontent of Toralba residue.
National Chemical Engineering Conference 1974
PROCESS INDUSTRIES IN AUSTRALIA
Surfers Paradise,
IMPACT AND GROWTH
Queensland
July 10 to 12th, 1974
THE DESIGN AND CALIBRATION OF SUCTION PYROMETERS
by
G . D . SERGEANT and J . Z I N G A R E L L I
S U M M A R Y
The need for accurate measurement of hot gas temperaturesand for a robust, simple instrument, such as the suctionpyrometer, to do this is considered. The corrections that needto be made to a simple thermocouple when used in a gas streamare reviewed and then used to establish the criteria to be metin the design of suction pyrometers. The two basic designs ofsuction pyrometer are reviewed. The design and construction ofa calibration facility, including details of the gas firedfurnace and ancillary equipment, a heated shield suction pyro-meter for true gas temperature measurment, and the suctionpyrometers to be calibrated is described.
0,50 0.80 0.70
Gas flotr rate, SCFM
0.80
Fig. 3. Effect of gas flow rate of cenoophericcontent of Toralba residue i(-30f 60 DSS me.-lifeed)
Sergeant, G.D., University of New South Wales, Chemical Engineering/Fuel Department.
Zingarelli, J. , University of New South Wales, Chemical Engineering.

- 372 -
1. Introduction.
There is the need to measure hot gas temperatures in indus-trial furnaces as accurately as possible. This is so both ininvestigational work to obtain the best data possible for designpurposes and in routine industrial situations to determine tempe-rature distributions and thermal efficiencies. Fuel efficiencybecomes increasingly significant with higher fuel prices and fuelshortages and also with interchanging of fuels. It has been shownby Wu-L and others^ that in combustion systems where the fuel ischanged from oil to natural gas then the heat flux distributionfrom the hot gases changes. Natural gas flames, unless derivedfrom burners designed to enhance luminosity, have a lower radiantheat transfer in combustion chambers and consequently the exit gastemperatures are higher, which in turn leads to higher heat transferin convective sections. Work carried out by the M.R.S. group ofthe Gas Council in the U.K.2 on natural gas firing of shell boilershas shown that for those dry back boilers designed for high firingrates on oil there is a potential problem if fired with naturalgas at the same rate. Tube end plate temperatures are approached which pre close to the limits of tolerance, under the operatingpressure conditions, of the metal and metal welds used. In thesecircumstances it is obviously important to know as accurately aspossible the temperatures involved, including metal surface tempe-ratures and gas temperatures. There is therefore the need for arobust, simple instrument to measure high gas temperatures, withthe highest accuracy, in industrial plant.
The suction pyrometer has been used for several decades, forgas temperature measurement, in one or other of two basic designswhich will be described later. The measuring element in bothdesigns is of course the thermocouple.
The paper reports the design and construction, in the Depart-ment of Fuel Technology, of a facility for the direct calibrationof suction pyrometers. This involved the design and constructionof an L.P. gas fired furnace and of a true gas (heated shield)suction pyrometer. An attempt was made to use low cost materialsat all stages of construction.
2. Suction Pyrometry.
2.1. Thermocouples .
The thermocouple is a simple convenient element for measuringcanan
temperature since itbecause its output isbe seriously in error iftransparent gas stream.
be made from a variety of materials andelectric voltage. Unfortunately it mayused to measure the temperature of a hot,The equilibrium temperature of the hot
junction of a thermocouple inserted in a gas stream is the result-ant temperature of heat transfer by convection from the gas to thethermocouple; heat transfer by radiation from the thermocouple togases and particularly to walls; a recovery factor, being theconversion of kinetic energy of gas to thermal energy inside theboundary layer at the hot junction; and heat transfer by conductionalong the thermocouple wires if the temperature gradient is notsmall.
A simplified analysis based on the two main forms of heattransfer, convection and radiation, gives
hA (Tg - Tc) = eFaA - T ) (1)
J o
TC
- 373 -
convective heat transfer coefficientareatrue gas temperaturethermocouple measured temperaturewall surface temperatureemissivityradiation angle factorStefan's Constant
T 4 rn 4
Tc =O h
(2)
equtobes u rthe'lscanthe
If Ts does not equal Tc then some residual error remains Atilibrium Tc takes up a value between TS and Ts. Tc can be madeapproach Tg more closely by increasing Ts or h. The first canachieved by interposing a shield between the thermocouple and itsroundings. The shield takes up a temperature between that ofsurroundings and the thermocouple and this higher value becomes
in equation (21 and the error is reduced. More than one shieldbe used and consequently the error further reduced. Thisbasic principle on which shielded thermocouples work.
is
Increasing the velocity of the hot gas over the thermocouplewill increase h and decrease the difference between Tr and Tc g
Equation (1) indicates that the emissivity of the thermocoupleshould also be low. Polished metal surfaces have a low emissivitybut the value increases with .temperature increase and with thedegree of oxidation or surface deposition. If refractory sheathsare used emissivity decreases with temperature increase and thesurface is less sensitive to chemical attack, though deposition mayoccur.
To minimise the conduction effect it is necessary to immersethermocouple wires, having a small diameter and being made frommaterials of low thermal conductivity, in the gas flow for as greata length as possible.
The simple thermocouple could be used for hot gas temperaturemeasurement if the measured value obtained could be corrected forall these factors. The environmental factors need to be well knownfor this to be done and it is not normally practical. In practiceit is therefore preferred to minimise as far as possible thesesources of error by embodying the thermocouple into a suction pyro-meter .
2.2. Suction Pyrometers.
A.
Suction pyrometers have been designed in two ways:~
By designing to ensure that the hot junction of a thermocouplecomes as close as possible to the true gas temperature by theuse of radiation shields and high velocity gas streams leavingonly a small correction for residual error.
By sucking hot gases over a thermocouple located in a watercooled probe. In this case the hot junction never approachesthe true gas temperature but by previous calibration the hotgas temperature is determined.
.2.1. Type A.
R.
Early work on suction pyrometer design was essentially of thistype3>4,5> Schack5 developed suction pyrometer shields of greatcomplexity and he presented mathematical analyses of the performance

- 375 -
of some of them. He also suggested extending the idea of a heatedshield thermocouple proposed by Wenzel and Schultze3 to a heatedshield suction pyrometer. In these earlier stages of development,and perhaps still in some cases, it was not recognised that althoughthe performance of suction pyrometers is vastly superior to that ofsimple thermocouples there still remains some residual error, whichat high temperatures could be appreciable.
A most important contribution to the design of suction pyrome-ters was made by Land and Barber^ and reported in 1954. They deve-loped theoretical and experimental methods of estimating theresidual error. This data was used for the design and constructionof highly accurate commercial instruments.
Central to this work was the concept of "efficiency" (E). Thisis defined as the percentage of the temperature error of a suctionpyrometer with no suction applied which is eliminated when a givensuction is applied. An instrument of 100% efficiency has no resid-ual error when suction is applied. E depends on pyrometer construc-tion, suction velocity and gas temperature but not on environmentalconditions
T - T —g " lc - E)(T
where T0 is the measured temperature with no suction applied.
T rp
f ~ •*• f~\ i
and Tp=o
Landto a giventwo of thethese twoof the inssecond wasindicatedto obtainfrom both
Tg
TC -
Ti r\U
T0 (1 - E)
E
(3)
(4)
(5)
and Barber were able to relate the value of the efficiencymultishield design by a mathematical expression and byoperating characteristics of the pyrometer. The first of
characteristics was the ratio of the 90% response timestrument when suction was applied and then removed. Thea "shape factor" characterising the relationship between
temperature and suction flow rate. Graphs are presenteda value for the efficiency of a pyrometer, of given design,of these approaches.
It should be noted that the values of efficiency obtained werenot used to back calculate the actual temperature from the indica-ted one. The purpose in determining the efficiency of pyrometersin this way was to permit the design of instruments of such high ef-ficiency that the residual error could be neglected. At no stagewere the suction pyrometers used checked against some absolutecriterion.
This over design approach led to some restrictions and disadvan-tages mainly related to the size and complexity of the multishieldsystems necessary to provide high efficiencies at gas temperaturesabove 1200°C. For this purpose the suction pyrometers needed to beof larger diameter; needed a high gas suction rate; were expensiveto build; had a slow dynamic response to changing gas temperatures;the refractory shield designs were very fragile with their efficiencybeing affected by emissivity changes due to coating with dirt, etc.
Land and others' >8,9 carrieci out a great deal of developmentwork in adapting the Land-type suction pyrometer to particularconditions.
1.1.1. Type B.
The suggestion of using a water cooled shield or of withdra-wing the radiation shield system inside a water cooled probe wasreported in the literature in 194810 > H.
Barber et al. developed such an instrument for use in openhearth furnaces. This protected the shield and provided a low butconstant surrounding temperature. However it was Atkinson andHargreaves^ who developed this concept into a calibrated instrument.Prior to this development Atkinson^S designed a directly calibratedmetal shielded pyrometer for gas temperatures up to 1100°C. Heshowed that the efficiency of a suction pyrometer depended only onthe indicated and no-suction temperatures independent of the surro-undings, and to a good approximation that the efficiency dependedonly on the average of the two values. He then developed a calibra-tion furnace and a heated shield pyrometer against which he calibra-ted the efficiency of a metal shield pyrometer as a function of themean of the suction and no-suction temperatures.
From theefficiency istemperatureto be known but
suction and no-suction temperatures the value of theobtained from the calibration chart and the true gas
is then calculated. This approach needs the efficiencynot to a high level of accuracy. This enables a
single shield instrument to be used with the advantage of small size
Atkinson and Hargreaves-^ attempted to build a similar instru-ment with a refractory sheath for temperatures up to 1500°C butinconsistent calibrations were obtained and they developed insteada suction pyrometer consisting of a thermocouple withdrawn insidea water cooled probe.
From equation (2) it can be seen thatsmaller than Tc, or if TS is constant thenThat is the cold constant surroundings of
if T„ is muchs ,. veryTc depends only on Tp.the water cooled prone
enable a direct, one reading calibration of Tg in terms of Tp. Thedi [ference in temperature between TC and Ta may be considerablehut this is not important since the instrufact it is an advantage because it permitstemperatures of the order of 1600°C usingcouples which are cheaper and have higherplatinum thermocouples.
mmerit is calibrated. Inthe measurement of gas
chromel-alumel thermo-e.m.f. outputs than
The advantages claimed for a water cooled calibrated pyrometerare accuracy equal to the complex shield type; smaller in size;low gas suction rate; robust all metal construction; fast dynamicresponse; lower cost than multishield type; direct calibration toknown accuracy and repeatability; higher e.m.f. output fromchromel-alumel thermocouples. Two clearly recognised disadvantagesare the need for a calibration rig and the need for accurate posi-tioning of the hot junction because of the steep temperature profileacross the tube.
2.2.3. The j-teated. Shi e 1 d Typ e .
The heated shield suction pyrometer is based on the principlethat if the temperature of the shield equals that of the gas, thenfrom equation (2) the thermocouple temperature must equal the gastemperature. This situation is detected by comparing suction andno-suction readings, when they are the same the thermocouple andgas temperatures must be equal otherwise the change in convectiveneat transfer, brought about by increased gas velocity, would changethe thermocouple temperature.

-- 376 - - 3TT -
3. The Calibration Rig.
3.]. Furnace Section.
The furnace is shownessentially of a 114mmxlllayer of MI 28 firebricksture of 1550°C, and an ou1280°C. The burner blockand the burner tunnel iscement lined firebricks.6mm diameter holes at thelength of duct equal to tto stabilise.
schematically in Figure 1. It consists4mm vertical duct insulated with an innercapable of withstanding a maximum tempera-
ter layer of MI 26 bricks able to withstandis cast from alumina in a cast iron shell
extended for a further 0.3m by aluminaTertiary air is introduced through thirtyend of the burner tunnel. After this a
en diameters is provided to allow the flow
The combustion gas flow rate in the furnace was chosen to besufficiently large so that the volume of gas withdrawn by the suctionpyrometer would not seriously disturb the flow patterns and tempe-rature profiles in the duct. The maximum flow rate of gas at 1500°Cat 152m/s through a suction pyrometer of inlet port 4mm diameterv\fas calculated. It was determined that this flow should not bemore than 1.5 percentage of the total flow through the calibrationfurnace. This sets the flow rate through the furnace at 70.75normal m
It was decided to design to produce a gas stream exiting fromthe top of the furnace at a maximum temperature of 1500°C whileoperating with as low an adiabatic flame temperature as possible.This is necessary to protect the bricks from excessive temperatures.An estimate of heat loss from the furnace at 1500°C, being the sum ofloss through the walls and radiant loss from the top, was calculatedand this showed that it was possible to produce a gas stream exitingat 1500°C with an adiabatic fiame temperature of 1700°C. This canbe achieved by firing 2.05 normal m3/h of L.P. gas with 30% excessair. This flow rate gives a minimum Reynolds number of about 4000at 1500°C increasing to about 6500 at 400°C.
3.2. Gas and Air Supply.
A maximum rate of 2.05 normal m /h of L.P. gas is consumedwhen firing to give the highest temperature and since the normal45.5kg cylinders will only deliver 0.88 normal m^/h continuouslyit is necessary to connect three cylinders into a manifold and runthe gas supply from there. From the manifold the gas passes througha pressure governor, a controlling globe valve, a rotameter, and anon return valve before connecting in to an air-gas mixing venturi.
itAir is supplied at 85n.m3/h, 690 m bar by a rotary van^ blo-
wer. Because of the positive displacement action of the bloweris possible to use high pressure loss devices such as orifice platesand globe valves to meter and control the flow. The blower cannotbe throttled so a by-pass line is fitted. A non return valve pre-vents gas escaping into the by-pass or tertiary air lines. Thedistribution of air between primary, tertiary and by-pass lines iscontrolled by the adjustment of three valves.
?The orifice plates were designed to meter 67.9 n.m /h for the
primary air ilow and 50.9 n.m3/h for the tertiary air. All calcu-lations and specifications for pipe runs, etc, are in accordancewith B.S. 104214.
Pressure gauges are incorporated at various points in the airand gas flow systems. The air and gas flows can be adjusted to givea range of exit gas temperatures for the furnace from 400°C to 1500°C
5.5. The True Gas Temperature(Heated Shield)Suction Pyrometer.
This instrument is shown in the photograph of Figure 2. Itconsists of a recrystallised alumina tube connected via a gas tightseal into a water cooled probe. A refractory sheathed platinum,olatinum/13% rhodium thermocouple passes through the water cooledprobe and then the refractory tube until the hot junction is located52 mm in from the tube tip. The hot junction is held in an axialposition by means of a refractory spider support. The alumina tubeis wrapped with a heating coil of platinum wire for a distance of45mm from the tip. This heating coil, which is insulated andprotected by a layer of alumina cement, is connected through twoautotransformers to the 240 volt mains supply.
The electrical current passing through the heating wire mustsupply sufficient energy to equal the heat loss from the heated tip.The desired condition is that the inside surface of the aluminatube is equal to the gas temperature (Ts equal to T£). The heatloss is due mainly to radiation from the top half of the tip of thealumina tube which sees colder surroundings, the lower half seesthe hot furnace. Conduction loss along the tube is negligiblecompared to radiation loss at these high temperatures. Convectiveheat transfer to the tip from the gas stream is also negligiblesince they are at approximately the same temperature. Heat losshy convection from the inside wall of the alumina tube is alsosmall as it is close to the gas temperature. A simplified modelcan then be proposed to calculate the amperage required by theheating coil at the highest operating temperature. Conduction fromthe heating wire to the surface is balanced against the radiationloss from the outside surface. For the pyrometer constructed andfor Tw equal to 1550
CC the calculated heat loss is 250 watt. Fromthe resistivity and length of heating c il the required amperagefrom the 240 volt supply can be calculated.
5.4. The Calibrated Water Cooled Suction Pyrometer.
This pyrometer was constructed entirely in stainless steel.with the central suction tube having an internal diameter of 4mm.A chromel-alumel "Thermocoax" thermocouple was used having an over-n i l diameter of 1mm. The hot junction of the thermocouple needsto be located exactly a^d this was achieved by constructing a stain-loss steel spider to support the thermocouple while offering theminimum resistance to gas flow. This particular pyrometer issufficiently long, 1.22m, for the gases to be cooled to less thanLOO°C before leaving the instrument. The complete calibrationfacility is shown in the photograph, Figure 3.
4 . Operation.
The furnace is allowed to establish thermal equilibrium atpredetermined gas and air flow rates. The hot gas temperature'issuing from the top of the furnace is measured by the heatedshield suction pyrometer. Suction is applied to the pyrometer togive a flow rate of 0.57 n.m3/h metered by a rotameter. The currentto the heating coil is adjusted until there iscouple e.m.f. output with and without suction.the true gas temperature.
no change in thermo-This establishes
The water cooled suction pyrometer to be calibrated is insertedinto the gas stream from the opposite side of the furnace and located.->o as to draw gas from as close as possible to the inlet of theheated shield pyrometer. A known suction, in our case 1.14n.mJ)/h,metered by a rotameter, is then applied and the thermocouple e.m.f.

- 378 -
output is recorded. This is repeated for a series of gas tempera-tures and a calibration curve is obtained.
The calibrated suction pyrometer is then ready for use in anindustrial situation under the same condition of gas suction ratethrough the instrument. In practice a water supply is requiredtogether with a gas sampling pump capable of delivering 1.14n.m^/h,a rotameter to measure this flow, and an instrument to record thethermocouple e.m.f.
5. Conclus ion.
- 379 -
Based on the approach of Atkinson and Hargreaves a facilityhas been developed for the calibration of water cooled suctionpyrometers. It's use could be extended to check on the efficiencyof multishielded type suction pyrometers.
6. References.
1. Wu, H.L. J. Inst. of Fuel 4_2_, 316 (1969).
2. Gore, W.A., Gunn, B.C., Horsier, A.G. National Conference onNatural Gas for Industrial Boiler Firing, Institute of Fuel,U.K. 1972.
3. Wenzl, M. and Schulze, E. Mitt. Warmest. Ver. dtsch. Eisen-huttenl No. _9_2_, 649 (1926) . '
4. Mullikin, H.F. Temperature - Its Measurement and Control inScience and Industry. Reinhold 1941.
5. Schack, A. J. Inst. Fuel _12_, 530 (1939).
6. Land, T. and Barber, R.Trans. Soc. Inst. Tech. 6_, 112 (1954).
7. Barber, R., Land, T., Jackson, R. and Thurlow, G. J. Inst.Fuel 27_, 408 (1954).
8. Godridge, A.M. and Thurlow, G. J. Inst. Fuel 2_8_, 601 (1955).
9. Barber, R., Meachen, D. and Bateman, W. J. Iron St°el Inst.185, 343 (1957).
10. Jackson, R. B.C.U.R.A. Monthly Bulletin 1_4 (2) 33 (1950).
11. Godridge, A.M., Jackson, R. and Thurlow, G. Trans. Soc. Inst.Techn/8, 103 (1956) .
12. Atkinson, P.G. and Hargreaves, J.R. Gas Council Res. Comm.GC 57 (1958).
13. Atkinson, P.G. Gas Council Res. Comm. GC 33 (1956).
14. British Standards Institution. B.S.1042 Pt.I: 1964.
SUCTIOM PYRDMETE
TERTtflKYFURINLET
23OO°F
FIRE BRICK
rs. FIG. 1. C A L I B R A T I O N FURNIAGE

- 380 -- 381 -
National Chemical Engineering Conference 1974
PROCESS INDUSTRIES IN AUSTRALIA - IMPACT AND GROWTH
Surfers Paradise, Queensland
July 10 to 12th, 1974
MATHEMATICAL MODELLING OF ESTUARINE POLLUTION
I.A. FURZER, R.M. PITBLADO, R.G.H. PRINCE and T. WOOD.
Figure 2.S U M M A R Y
The paper begins with a concise account of thevarious methods of approach to estuarine modellingand goes on to consider the most commonly used models,those based on the convection-diffusion equation.Following a brief assessment of the experiencereported by overseas .Investigators, suggestions aremade regarding the future developments in estuarinemodelling. These ideas are then demonstrated by apreliminary study of their application to the upperreaches of the Parramatta River. The current stateof the river is first described and the results fromtwo preliminary modelling schemes are then presented.
Furzer,
Pitblado,
Prince,
Wood.
University of Sydney. Chemical Bngng
Figure 3,

I.
- 382 -
THE CURRENT STATUS OF ESTUARINE MODELLING
Introduction
The ability to predict the effects of discharging industrialand domestic pollutants to natural water systems has long beenregarded as a desirable objective and has motivated research anddevelopment in this area in Europe and the USA, principally overthe last two decades. A substantial amount of published work, infact, exists on all aspects of the topic; the most significant -attempt to summarize it to date is undoubtedly the TRACOR report,covering all work carried out up to 1971. Other useful summaries,without quite the same breadth of coverage, might also be mentioned.
Interest in this area in Australia is much more recent, inmarked contrast to the active Australian involvement in otheraspects of water resource engineering. The situation is nowquite different: in most States, major projects are under way-relating to the pollution of coastal, estuarine, and river systems.At present, the exchange of information between various groups islargely limited to individual personal contact and the time isripe for a much larger forum, such as we have at this NationalChemical Engineering Conference.
The prime purpose'of this part of our paper is to summarizethe current status of estuarine pollution modelling. The view islargely based on impressions gain'ed by one of the authors during arecent visit to the Water Pollution Research Laboratory in theUnited Kingdom. The hope is that this necessarily limited andsubjective statement will at least serve to stimulate discussionrelating to the direction of future work in this important areain Australia.
Approaches to Modelling
Physical modelling and mathematical modelling are convenientlabels for the two broad approaches to the simulation of a large-scale system. In the case of a natural water system, the term'hydraulic modelling1 is often used instead of physical modelling.At a recent symposium^ entitled 'Mathematical and HydraulicModelling of Estuarine Pollution1, fifteen papers were concernedwith mathematical modelling and four with hydraulic modelling.The implication to be drawn from this statistic is perhapsexpressed fairly in this way: that the hydraulic model, whilei1. has provided useful information on situations involving thermalpollution or pollution by non-degradable substances, is a doubtfulproposition for systems in which chemical and biochemicaldegradation takes place. The theoretical basis for the similarityof the coupled reaction and mass-transfer processes in model andprototype is far from clear. Estuary models are geometricallydistorted and gravitational-inertial similitude is obtainedthrough the Freudian scale ratios for velocity and time; transferprocesses relating to dispersion and dilution depend primarily oninternal velocity and turbulence, and interphase mass-transfer isdominated by surface structure - none of these factors beingassured by Freudian scaling. On the other hand, if a hydraulicmodel, already built for another purpose exists, it may well_havea use in providing an insight into particular problems relating tothe development of a mathematical model: for example, in determin-ing the initial dispersion and dilution of an effluent.
The area of mathematical modelling encompasses a variety ofapproaches, the least sophisticated being some form of statistical
regression which relates a variable describing water quality tosystem variables (for example, dissolved oxygen ": terms of fresh-water flow, temperature, and tidal range). The statisticalapproach has its uses: in essence it is a digest of fieldobservations, usually taken over a protracted period of time, andcan therefore provide an estimate of the state of the system forany specified set of system parameters, provided they stay withinthe limits of the previous observations. The limitation, though,is the well-known inability of this kind of approach to be trulypredictive - in particular, to deal with the physical changes inthe original system, such as the locations, compositions orquantities of the discharges. The remainder of the discussion,therefore, relates to the more fundamental approaches based onsolutions to the convection-diffusion equation.
Models Based on the Convection-Diffusion Equation
Cartesian axes are chosen such that x is directed along theaxis of the estuary, y is directed vertically upwards, and z isdirected in a horizontal transverse direction. The time-averagedtransport equation for a non-conservative substance may readily beshown to be -
cKuc)at 3x
where
4. 3. (we)3z
33x= ,- I Kx. K
,— 1 zS-R
K.
R
S
t
is the time-average concentration of the substanceare the eddy diffusivities (i = x,y,z)
is a composite term for the reaction rate of thesubstanceis a composite term for the external sources of thesubstanceis time
u, v,w are the Cartesian time-average velocity components
Now, in principle, given a knowledge of the velocity compon-ents and eddy diffusivities as functions of position and time, ofthe reaction kinetics and distribution of external sources, and ofthe initial and boundary conditions of the system, a solution canbe found for the distribution of the substance as a function ofposition and time. In fact, however, the necessary informationis never available in such detail and consequently gross simpli-fications have been found necessary to produce practical solutions.
By suitable spatial and time averaging of the convection-diffusion equation, its dimensionality can be reduced to a moretractable form. The precise description of the averagingprocedure is too detailed to be given here, but a full account of
it can be found elsewhere5; in the words of the TRACOR report,though, 'what averages to use under what circumstances and forwhat estuaries constitutes one of the central questions in theapplication of estuarine models'.
If the spatial averaging is performed over a cross-section ofthe estuary the problem is reduced to a one-dimensional unsteady-state form; in so removing the lateral and vertical variations ofvelocity and concentration, an effective longitudinal dispersionterm is produced in the resultant equation. A further simplification is achieved by considering a time-average over a tidalcycle or over several tidal cycles, thus giving a description ofthe system at a particular state of the tide; the_long-term tidalaverage, for particular states of the tide, is, in effect, the
, c-+-a •»-Q I c- -i -t-ii=> +• i r^rt f r\TT +-h(=> c- vS-f-pTTl .

If the spatial averaging is performed by integrating withrespect to either the lateral or the vertical dimension, a two-dimensional description of the system is obtained. In this casetwo terms associated with longitudinal, and either lateral orvertical, dispersion are produced; they arise because of thevariations in velocity and concentration coupled together. Asabove, time averages over one or more tidal cycles may be taken.
Applications Based on the Convection-Diffusion Models
The steady-state one-dimensional model has, not unexpectedly,been more frequently applied than any of the other possibilitiesmentioned above. In the United Kingdom, the successful outcome of
the Thames investigation using this approach has led to itsapplication to nearly all of the major estuaries. It is now awell-established aid in the long-term management of estuarinesystems; such questions as the long-term effects of changes inthe quantity, quality, and location of polluting loads can readilybe analyzed. Even so, this simplest of all the models has a numberof limitations and considerable caution needs to be exercised inthe interpretation of results obtained from it.7
Steady-state two-dimensional modelling has been undertaken inthose cases where stratification effects are important. The firstattempts to deal with this problem consisted in dividing theestuary into well-mixed layers, each of which being described by a
oone-dimensional model; the Tees estuary is a well-known example.Later on, a full two-dimensional model was recognized to be necess-ary, but has been found to be difficult to validate in practice.More success has been claimed for the two-dimensional modelling
approach by workers in America , but even there the overallimpression appears to be that it cannot be accepted at this stageas a well-established management tool.
Unsteady-state one-dimensional models have been described in9 10the literature ' , but more in a general sense rather than as
particular cases to real systems. The need to describe the short-term response of an estuary to polluting loads is, of course, high-ly desirable: whereas the long-term effect is often quite accept-able, even short periods of locally high pollutant concentrationsmay be quite harmful. At present, useful progress is being madein terms of the unsteady-stage one-dimensional model, as demonstratedin the second pare of this paper; the mere complete unsteady- statetwo-dimensional description, on the other hand, must be regarded asa much longer term objective.
Future Developments
As indicated above, the approach to estuarine modelling basedon the convection-diffusion equation is well established in certainlimited areas. Further progress will undoubtedly come with increasedunderstanding of particular components in the model: the mostimportant needs at this stage are a more precise description of thedispersion process in two and three dimensions, of the kinetics ofthe degradation reactions, and of the sources and sinks for oxygen.
In addition to these specific needs, some comment on possibledevelopments in the general approach to estuarine modelling mightbe made. To date, attempts have largely centred on descriptionsof the overall estuarine system from its fresh water source to its
- 385 -
seaward boundary in terms of a non-adaptive one-dimensional model;small scale problems - such as the junction of a tributary, or ofa bay, with the main tidal river - have in general been excludedfrom consideration. It is not surprising, however/ to find thatthis approach cannot account for such local non-ideal regions. Themodel described in the second part of our paper represents anapproach to overcoming this problem; the one-dimensional model isretained as an important basic element, but other elements describ-ing the non-ideal regions are included. The model is also adaptivethat is, the model structure, and the description of individualelements can be progressively updated as more information iscollected from the prototype system.
II. MATHEMATICAL MODEL FOR THE PARRAMATTA RIVER
A simplified one-dimensional, time dependent mathematical modelhas been written for the upper Parramatta River as the first stagein producing a widely applicable mathematical model for Australianestuaries. The main use of this model will be to indicate thesensitivity of the system to various parameters including reaerationcoefficient, decay rate and dispersion and will thus be a usefultool in determining the allocation of future experimental effort.The model was applied to the upper reaches of the Parramatta Riverfor several reasons: it is a local, grossly polluted estuary, ithas several bays, an important tributary junction with the DuckRiver, and it exhibits various degrees of vertical stratification.The techniques developed for this complex situation should thus beapplicable to many other'estuaries in Australia and lead to bettermanagement and protection of our estuary resources.
The upper reaches of the Parramatta River (Fig. I) are badlypolluted due to local contamination from industry. Water movementin the estuary is primarily due to the tide as the dry weatherfresh water flow into the system is almost negligible. Thuspollutants tend to oscillate backwards and forwards for a substantialperiod before being washed out to sea. The main physical featuresof the upper estuary are the junctions of the Duck River and ofHomebush Bay with the Parramatta River. These junctions willcertainly affect mixing in the River and will require quite carefulstudy.
The initial work has been concerned mainly with modelling thedissolved oxygen (DO) in terms of the biochemical oxygen demand (BOD).Dissolved oxygen is probably the single most important parameterrelating to organic pollution as it is the oxygen level thatdetermines the .amount and quality of life in an estuary. Biochemicaloxygen demand is a total concentration term representing the oxygenrequired to oxidize all the various pollutants in the water includingoxidation of carbon, ammonia, organic nitrogen and nitrite. Themost common measurement of this is the 5-day BOD, being the oxygenabsorbed by a sample over 5 days at 20°C.
The State of the Parramatta River Estuary
Surveys of the oxygen content have been taken at widely spacedtime intervals in the Parramatta River and show values well belowthe 100% saturation value.
A more detailed study was undertaken to evaluate^arious oxygenmeters, and also to examine the variation or cdepth in the estuary. At the highly polluted
•** . -, .« _ v* 4- /-« T.Tc!i V/^ T~ A 1

- 386 -
These measurements were taken over a six-hour period at frequentintervals.
The near surface waters were reasonably well oxygenated withvalues varying from. 80 to 110% of saturation. The lowest readingsof 10% saturation were found at mid-depth, which rose to 60% satura-tion on the incoming tide. The bottom oxygen levels were surprising-ly above the mid-depth levels over a part of the tidal cycle. Theselow dissolved oxygen levels woulcl exclude all fish types.
Similar measurements were also taken at Ermington and thesewere continued for a 12-hour period. Here the dissolved oxygencontent varied from 30 to 60% saturation at the surface and atall depths, except for a surface rise near midday. The variationin depth observed at Silverwater was not observed for large partsof the tidal cycle at Ermington.
These measurements highlight some of the difficulties inmodelling the estuary; at Ermington a vertically well-mixed modelcould adequately describe large parts of the tidal cycle. Thisleads to the simple one-dimensional model, whereas at SilverwaterBridge a more complex model would be required to account for thevertical dissolved oxygen profile.
The BOD and DO mathematical equations were based on theinstantaneous mass balances as described in the paper by Pence,
Jeglic and Thomann . Certain modifications have been made totheir equations, in particular, the advection coefficient, anempirical factor allowing the use of very large time steps, waseliminated as more accurate smaller step sizes were used. Asour model is of a real time type, the dispersion coefficients usedare true coefficients rather than pseudo ones implicitly incorporat-ing allowances for tidal mixing as well as dispersion.
The equations derived from mass balances on BOD and DO are:
_d BODdt V
Advection 1BOD in-out
Dispersion"]BOD in-outj
, ["PollutionBOD in
DecayBOD out
BODdt
d DOdt V
AdvectionlDO in-out
Decay 1DO outj
4- jDispersionI DO in-out
ReaerationDO in
(Freshwaterflow DO in
DOdt
The loss of DO by decay is defined as being equal to the lossof BOD by decay. These equations are intentionally simplified asfar as possible, with several less important terms being omitted.Experimental work now planned will allow their later inclusion howeverThese include terms for photosynthetic production of oxygen by algaeand benthic flora and oxygen consumption by benthic fauna. Also therelationship between nitrate, nitrite, ammonia, and organic nitrogenand their effect on dissolved oxygen has not been considered.
The model parameters were based entirely on literature valuesfor reaeration rates, decay rates, and dispersion coefficients.Flows were estimated using Maritime Services Board charts with depthsoundings and known tidal variations. Dry weather freshwater flowwas taken as 100 ft^/sec. for the Parramatta River and 40 ft /sec.for the Duck River.
Several assumptions were made for the calculation of the BODand DO distributions including:
a) temperature and salinity were assumed constantthroughout the upper estuary;
b) the decay of pollutants was simulated with a singlefirst order rate constant;
c) the BOD and DO concentrations downstream of the modelwere a simple fraction of the BOD and DO concentrationsin the final box;
d) for the partial mixing at the junction model thecrossflows between the box pairs 7-10 and 8-11 weretaken as 5% and 15% of the instantaneous Duck Riverflow respectively;
e) all the polluting discharges could be lumped into twosources, one entering box 6, the other smaller oneentering box 8 (perfect mixing model) and box 11(partial mixing model).
The calculation was started with the initial conditions ofzero BOD throughout the system and everywhere DO 100% saturated. Itwas found that the solution reached within 1% of its final oscillat-ing value after 9 tidal cycles, requiring about 10 seconds ofcomputer time on a CDC 6600.
The predicted distributions of BOD and DO are plotted for thetwo modelling schemes in Figs. 4 and 5. The BOD was found to bevarying more with the tide than the DO, so the BOD distributionswere plotted at high and low tides. A comparison of the two BODdistributions shows that the effect of partial mixing at the junctionis to increase the Duck River BOD values by about 2 mg/1 and reducethe Parramatta River BOD values by about 1 mg/1 compared to theperfect mixing scheme. This change in BOD levels results in alowering of DO values in the Duck River sections by about 5-10%saturation, but in an improvement in the Parramatta River sectionsby about 5% saturation.
There is as yet little data on BOD and DO levels in the upperreaches of the Parramatta River. However, the DO profile measuredby the NSW Department of Health on October 7, 1971, has been plottedalong with the DO predictions for comparitive purposes. _The runswere"calculated for similar conditions, that is high spring tidefollowing a long period of dry weather. The measurements are onlyfor the Parramatta River as no data was t^ken on the Duck River.It can be seen from Figs. 4 and 5 that both modelling schemesproduced reasonable fits for this data, however, the partial mixingat the junction model wa^ superior.
It is now planned to undertake a study on the partial mixingmodel to determine the sensitivity of the decay rate, reaerationrate, dispersion, and mixing factors, on the resultant BOD and DOdistributions.
Experimental work is under way or is planned by the Departmentsof Chemical Engineering, Geology and Geophysics, Microbiology andBiology to make better estimates for these and other parameters.In particular the Department of Chemical Engineering will be under-taking a tracer study in conjunction with the Australian AtomicEnergy Authority to determine the amount of mixing occurring at the

- 388 -
junction of the Duck and Parramatta Rivers and at the mouth of largebays such as Homebush Bay. The Department is also planning work toestimate reaeration rates and decay rates. The sensitivity studywill be an important guide to determining the degree of experimentalaccuracy and hence resource allocation required.
- 389 -
REFERENCES
1. WARD G.H. and ESPEY W.H. (Eds.), <Es.tuarine Modelling: anAssessment1, Water Pollution Control Research Series, Rept.No. 16Q70 DZV. U.S. Government Printing Office, Washington,D.C. (1971) .
2. GILLIGAN R.M., 'Forecasting the Effects of Polluting Dischargeson Estuaries', Chemy. Ind. (1972), 865-74, 909-916, 950-58.
3. BARRETT M.J., 'Predicting the Effect of Pollution in Estuaries',Proc. R. Soc. Lond., B, (1972), 180, 511
4. DEPT. OF THE ENVIRONMENT, 'Mathematical and HydraulicModelling of Estuarine Pollution1, Water Pollution ResearchTechnical Paper No. 13, H.M.S.O. London. (1972).
5. OKUBO A., 'Equations Describing the Diffusion of an IntroducedPollutant in a One-dimensional Estuary1. In 'Studies onOceanography1, University of Tokyo Press, (1964).
6. DEPT. OF SCIENTIFIC AND INDUSTRIAL RESEARCH. 'Effects ofPolluting Discharges on the Thames Estuary1, Water PollutionResearch Technical Paper No. 11, H.M.S.O. London. (1964).
7. POTTER J.H., 'Management of the Tidal Thames'. Contributionto Symposium listed under Reference 4, p95.
8. DOWNING A.L., 'Some Aspects of the Work of the Water PollutionResearch Laboratory*. Association of River AuthoritiesYearbook (1966) .
9. MOLLOWNEY B.M., 'One-dimensional Models of Estuarine Pollution1.Contribution to Symposium listed under Reference 4, p71.
10. PENCE G.D., JEGLIC J.M., and THOMANN, R.Y., 'Time-VaryingDissolved Oxygen Model', Proc.Am.Soc. civ. Engrs. (1968),94 (SA2), 381-402.
Upper Parramatta Ermington BajRiver
Weir
SilverwaterBridge
Homebush Bay
Figure 1: Upper Reaches Parramatta/Duck River System
1 2 3
4 5 6
7 8 9
Figure 2: Perfect mixing of the junction model (9 boxes)
1 1 °1 " 3
4 5 6
7
t 11 n
8
H11
Figure 3: Partial mixing at the junction model (11 boxes)

- 390 -- 391 -
oo
\
oo o
Ioo
cr>
LO
National Chemical Engineering Conference 1974
oH•MH(S)O
PL,
O•H-MU•HT3
CD
•H
03•H4-1h03
PL,
LO
PROCESS INDUSTRIES IN AUSTRALIA
Surfers Paradise,
IMPACT AND GROWTH
Queensland
th
oLO
July 10 to 12 , 1974
FLUIDIZED-BED COMBUSTION AS A SOLUTION TO THE
ENVIRONMENTAL PROBLEMS OF COAL MINING 5vAST/£
by
G. a Donau Szpindler, P.L. Waters and C.C. Young
S U M M A R Y
OO
<DTd•H
g
CDT3•H•M
CTi
CO
(XIoo
ILO
oLO
Pio•H4->U
•H
CL>
)0d
V)-pfi0)
IJH
COnj
O
Q
CO
gH
OPL,
toCO
•H•pU
0)
PL,
.3s•PUCD
^4HSH0)
«*CD
The paper discusses the environmental problems arising from the current practiceof accumulating washery rejects in large dumps, and indicates how these problemscould be reduced by burning rejects in fludized-bed incinerators. The performanceof a 50 kg/h test rig, designed for this purpose, using five different samplesof rejects is described. The following points are discussed: the effects of airand fuel feed rates on bed temperature and how this may be controlled by directand indirect water cooling; heat distribution under various conditions;entrainment of fly-ash; and properties of the burnt rejects and their potentialuses. The purpose of this work was to determine optimum conditions and togather design data for a large scale plant.
Szpindler, CSIRO, Mineral Chemistry
Waters, CSIRO, Mineral Chemistry
Young, CSIRO, Mineral Chemistry

- 392 -
1. INTRODUCTION
In producing clean coking coal for domestic consumption and for exportto Japan, coal washeries in New South Wales and Queensland currently rejectabout 10 million tons of coal-mining waste in the forms of shaley dirt and slurry.The present practice of accumulating these rejects in dumps is causing seriousenvironmental pollution. The black coal industry in Australia is now confrontedwith a major waste-disposal problem. GSIRO is collaborating with the industryto seek a solution to the problem by incinerating the rejects in a fludized bed.
This paper describes the performance of an experimental fluidized-bedcombustor burning coarse washery rejects. The immediate purpose of this workwas to study the feasibility of this process and to obtain data for the desigrof a large pilot plant. (The burning of coal slurry is not discussed hereas methods are still under development.)
2. NATURE AND MAGNITUDE OF THE PROBLEM
Fig. 1 indicates the rapid growth of coal washeries in New South Walessince 1955 in terms of the annual input of raw coal to washing plants and theoutput of refuse. The present total output of rejects from some 38 washeriesis greater than the total coal feed in 1957 when only 20 washeries were operating .The main factor affecting this growth is tb>i recent establishment of large exportmarkets of coking coal to Japan.
TABLE I
PRODUCTION OF WASHERY REFUSE (1971-72)+
('000 tons)
No. of washeries
Input of raw coal
Refuse
Refuse as percentage of raw coal (%)
NSW
38
26,800 *
6,020 *
22.4
QLD
20
17,395
A, 554
26.2
Table 1 gives the production of refuse at coal washeries during 1971-72.The proportion of rejects as a percentage of the raw coal feed varies fromwashery to washery in the range 15-45% but, on average, is 22% and 26% for NewSouth Wales and Queensland washeries respectively. A survey of coal washeriesconducted by the Division of Mineral Chemistry , showed that about four-fifthsof the refuse consisted of coarse shaley material with the ash yield varyingbetween 50 and 80% (dry basis) but on average with 65% ash. The remainder of therefuse consisted of thickened slurries or "tailings" of fine coal and clay withan average ash yield of about 40% (dry basis).
Fig. 2 illustrates the method of disposing of washery rejects at presentcommonly used. The coarse rejects are hauled by truck from the washery to thenearby disposal site and are dumped to form embankments or dams to contain theslurry which is pumped along pipes from the thickener at the washery plant.It costs the coal industry an estimated $10 million (i.e. nearly $l/ton) inhaulage and land to dispose of rejects in this way.
/>
Recalculated for 52 week year
Sources: Joint Coal Board of NSW 25th Ann. Report, 1971-72.
Queensland Coal Board, (private communication).
- 393 -
Dumps of mine waste are sources of environmental pollution. They are liableto spontaneous combustion and some are known to have burnt out of control forseveral years to cause atmospheric pollution from the smoke and fumes evolved.Fine coal or dirt may be blown around by the wind or washed by rain into gulliesand creeks to cause water pollution. With some dumps dilute sulphuric acidformed from the atmospheric oxidation of pyrite may also be leached into streams.But apart from these noxious effluents, dumps of mining waste overlay thenatural landscape and are unsightly. Slurry ponds are a particular nuisancefor they may take months or even years to sediment and dry out because of thepresence of fine clay. Coal mining companies, particularly near populated areas,are under increasing pressure from local government authorities to reduce theseenvironmental problems.
Washery rejects are usually too high in ash to burn in conventionalcombustion appliances. CSIRO's approach is to examine the possibilities offeredby fluidized-bed combustion. Test rig studies by the Division of MineralChemistry indicate that both coarse rejects and slurries with up to 80% totalinerts, i.e. ash plus water, can be burnt satisfactorily in fludized beds.The main advantages of fluidized-bed combustors over conventional appliances are:
(a) They can burn low-grade fuels down to 4.7 MJ/kg (2,000 Btu/lb)with low excess air.
(b) They operate at low bed temperatures, about 850°C, so that ashfusion is unlikely, fouling of surfaces is reduced, more sulphurmay be retained in the bed, and the furnace is cheaper to construct.
(c) Relatively high heat release and heat transfer rates to water tubesimmersed in the bed are attainable.
(d) They can burn coarsely crushed fuel so that the problems of ashremoval should be easier and cheaper than that from pulverized-fuelfired furnaces.
3. EXPERIMENTAL RIG AND TESTS
The test rig is shown diagrammatically in Fig. 3. The furnaceshaft, lined with refractory, has an overall height of 3.6 m (12 ft), and a cross-
O 0
sectional area at the f luidized-bed level of 0.09 m (1 ft ) . The topmost partof the shaft, 1.5 m (5 ft), is expanded into a disengaging space to promotethe fall-out of entrained particles. A bed of burnt rejects, from a previousrun, about 0.25 to 0.5 m (10 to 20 in) in height, is supported on a distributorplate fitted with 36 nozzles. Each nozzle, 50 mm long, has six holesof 3 mm (Ve in) diameter drilled radially through which the fludizing air,used for combustion, is blown.
To start up the rig, the bed is preheated to about 600°C by a propane gasburner playing on the surface of the fludized bed, and the rejects, dried andcrushed to minus 6 mm (h in), are fed pneumatically into the lower part of thebed from a weighed hopper fitted with a screw feeder. There is sufficientresidual coal or carbonaceous matter in the rejects to ignite and to heat up thebed. The bed temperature is usually maintained at about 850°C and, for a givenfuel feed rate, may be controlled by one or more of three ways:
(i) regulation of the air/fuel ratio, (A/F),
(ii) quenching of the bed by direct water injection (Q), or
(iii) heat removal by water-cooled tubes inserted in the bed (CT).
To maintain a constant bed level the burnt rejects are extracted continuous-ly or intermittently from overflow weirs at either the top or the bottom of thebed. (The latter is preferable to prevent the accumulation of oversize particlesin the bed.) Fly ash is recovered efficiently from the flue gas by two dust-separating cyclones.

_ 39 -TABLE II
The test rig is instrumented to measure air, bed and flue temperatures,pressure drops across the air distributor, bed and cyclones, air flow, andcomposition of the flue gas. Pressure manometers across the bed and thermo-couples immersed in the bed are useful in indicating the depth of the bedand its state of fludization. Under normal fluidization, temperatures at thetop and bottom of the bed seldom differ by more than two or three degrees.
To commission the rig, performance tests were initially carried out usinga coal sample with 25% ash. In these tests, the coal feed was preset to aconstant value, say at 10 kg/h (22 Ib/h) , and the flow rate of fludizing airvaried; the equilibrium bed temperature resulting from these two conditionswas measured. The purpose of these tests was to establish the limiting con-ditions and optimum working range of the system.
Similar tests were carried out on samples of washery rejects from differentsources (with about 70 and 47% ash) except that cooling of the bed was effectedby direct water quenching and by cooling tubes, as well as by excess fluidizingair. The purposes of these tests were to determine the optimum throughput orcapacity of the system ami to investigate such problems as the carry-over offines at different fluidizing velocities, and thus to provide design data.In these tests the depth of bed and particle size distribution of the feed(except sample C2) were kept approximately constant and not treated as plantvariables.
4, TEST RESULTS WITH COARSE REJECTS
Table II gives the analysis, bulk density, and size grading of the coalsample and five different samples of raw rejects used in the tests. The rejectswere taken from coal washeries in the Northern and Southern coalfields of NewSouth Wales. Corresponding properties of the burnt rejects (overflow bedmaterial) are given in Table III.
Heat balances were carried out en the f luidized-bed reactor space and theresults expressed in terms of the distribution of heat as a percentage of totalheat input. These data were subject to the error that the waste gas samplesfor analysis were taken from the flue and not from directly over the bed, andwere incomplete, as reactor losses and heat removed by the cooling tubes werenot directly measured.
5. DISCUSSION OF RESULTS
5. 1 Performance Tests with Coal
Fig. 4 shows graphically the effects of the flow rate of fluidizing airand coal feed rates, as the independent variables, on bed temperature as thedependent variable. For a given coal feed rate, say 15 kg/h (33 Ib/h) , reducingthe superficial velocity from 0.9 m/s (3 ft/s) increases the bed temperaturebecause less heat is removed by the flue gas which contains a smaller volume ofexcess air. In practice the upper temperature of the bed (e.g. about 1150°C) islimited by the tendency of the bed to sinter or agglomerate. The lowertemperature of the bed is limited by the extinction of combustion (e.g. about600°C); this state occurs with too much excess air, when heat is removed at agreater rate than it is generated. If the air could be reduced to that requiredfor stoichiometric combustion, then the theoretical bed temperature would beabout 1450°C; further reduction in air would cause partial gasification of thecoal and the temperature of the bed would drop to relatively low temperaturesand could extinguish. If the air flow were to be further reduced to say lessthan 0.15 m/s (0.5 ft/s) the bed would become defluidized and physically inoperable.However, before this would occur, the combustion process would become chemicallyinoperable by virtue of gasification reactions. High rates of air flow areundesirable since these cause excessive amounts of fines to be entrained from thebed.
PROPERTIES OF SAMPLES OF COAL AND WASHERY REJECTS
(As fired)
S A M P L E' • -• • " - ••"- ' — ' ' • • — ...--
ORIGIN (SEAM)
Moisture (a.d.b.)
Ash "— " • '-" '" •'""• -' • .— . . . . - .--. -- , -,-T — .
Volatile Matter "
Calorific Value
Bulk Density
Grindability (G.H.I.)*
Screen Analysis~k in + H ini i-H in + He in•-He in + 30 B.S. mesh-30 +100 B.S. mesh-100 +200 B.S. mesh-200 B.S. mesh
7fa
7fa
%
Btu/lbkJ/kg
lb/ft3
kg/m3
-
7fa7fa
7fa
7/a
7/o
7fa
COAL.....in. i _- , .. , . ,,.,,._,,IM,
Fassifern
• 2.6
23.5
26.9
10,65024,800
n.d.n.d.
n.d.
40.040.020.0--
—
A— • • ' — t, „
Fassifern
2.4
67.0
14.5
3,6008,380
72.0116.7
0.15
23.236.025.29.02.34.3
B
Rulli
1.4
70.7* - - I. i i • -
11.4
3,0707,150
79.5129.0
0.26
17.426.729.414.64.87.1
Cl t c2 D
Bulli, Balgownie1 Woneawilli
1.8
69.1' — - ._
12.6
3,2207,500
78.6127.3
0.26
30.335.421.48.63.31.0
1.8
69.1" i n mimm , M, ,
12.6
3,2207,500
76.8124.5
0.26
17.917.920.212.610.820.6
1.7
46.6- I I I L -'
17.3
7,21016,800
62.9101.9
0.21
22.637.634.93.10.71.1
* Grindability (Grinding Hardness Index)Grindability Test and described in Ref.Lond., 1971, 50, 405).
- as determined by a Modified Hardgrove3 (Agus, F. and Waters, P.L., Fuel:
TABLE III
AVERAGE PROPERTIES OF OVERFLOW BED MATERIAL
R E J E C T S
Bed temperature control duiing the tests
Bulk Density
Grindability (G.H.I .)
Screen Analysis+3-i6 in
-He in +H in-H in rl<6 in-He in + 16 B.S. mesh-16 + 30 B.S. mesh-30 B.S. mesh
lb/ft3
kg/m3
-
%%7la7lo
7la710
A
A/F
60.097.0
0.19*
05.6
26.027.833.4
7.2*
B
A/F
58.094.0
n.d.
0.12.4
14.714.430.937.5
cl
A/F
60.097.0
0.16
0.13.0
17.515.333.830.3
Q
55.289.5
0.13
0.24.3
26.118.935.714.8
D
C/T
63.6103.5
n.d.
0.01.0
10.910.632.345.2
Sample representative of residual material of the bed and not of the testoverflow.A/F - temperature control by air/fuel ratio adjustment.Q " " " direct water quenching.C/T - " " " water cooling tubes.
- 396 -
The operation of the fluidized-bed combustor is therefore limited by:
(a) extinction temperature,
(b) ash or bed clinkering temperature,
(c) stoichiometric air requirements for combustion,
(d) minimum fluidizing velocity, and
(e) fines entrainment velocity.
The optimum working region appears to be within the temperature range 800-900°Cand between flow rates of 0.3 - 0.6 m/s (1.0 - 2.0 ft/s). These conditionsimpose a restriction on the coal feed rate, e.g. 7 - 15 kg/h (15 - 33 Ib/h)when no cooling other than by excess air is used in the present one foot squarecombustor.
5.2 Control of Bed Temperature
Fig. 5 shows a similar set of curves derived for a washery rejects samplewith 69% ash (dry basis) and a calorific value of 7,500 kJ/kg (3,220 Btu/lb)compared with 24,800 kJ/kg (10,680 Btu/lb) for the coal. The feed rate ofrejects is about three times that of coal to generate heat at the same rate.The same set of limitations on temperatures and air flow rates, describedabove, apply.
For the purpose of plant design, it -is desirable to obtain the maximumthroughput of rejects while complying with these limitations. With air onlyas coolant, the feed rate of rejects is limited to about 41 kg/h (90 Ib/h).If higher feed rates, say 54 kg/h (118 Ib/h), were to be used, the bed tempera-tures would be excessively high (i.e about 1100°C). However, by removing heateither by direct water quenching or by water cooling tubes, the bed temperaturecan be brought down to optimum values of about 850°C. The dotted vertical linesin Fig. 5 indicate the extent of this cooling effect (i.e. about 250°C). Thesebed cooling techniques also allow the fluidizing velocity of the air and hencethe amount of excess air to be reduced advantageously. The direct injection ofwater into the bed is the simplest method of bed temperature control, but thesteam generated contributes to the volume of fluidizing gas. (Superficial velocitiescited in the tables and graphs include the contribution made by steam generation.)
5.3 Heat Distribution
The method of controlling br ' temperature by direct or indirect coolinggreatly affects the distrib" >f heat in the products, particularly theenthalpy of the flue gar .rcentage distribution of heat as a functionof the ratio of excess Dotted in Fig. 6 (a) and (b) to illustrate thispoint.
The main loss of heat is as sensible heat in the dry flue gas and isproportional to the excess air factor (see curve 1). Moisture in the flue gas,arising from the fuel and from fluidizing air accounts for about 14% heat loss .(see curve 2). Moisture in the flue gas, arising from quenching water usedin cooling, can similarly extract heat from the bed in proportion to the amountof water. The flue gas also carries away some unburnt carbon fines, representinga loss in combustion efficiency; this form of heat loss decreases to about 4%with high excess air ratio (see curve 3). The lowest line (curve 4) indicatesheat removed as enthalpy in the solid residues removed from the bed and isabout 6% of the total. The upper line (curve 5) represents the total of theselosses, approximately 95% of the total heat input. The unaccounted 'loss'of about 5% would be mainly heat loss from the reactor walls, but would alsoinclude sampling errors. The proportion of heat removed by cooling tubes isestimated by difference, as indicated in Fig. 6 (a) by (CT), and accounts for15 - 25% of heat input.
- 397 -
5.4 Entrainment of Fines
As indicated earlier, high fluidizing velocities cause excessive entrain-ment of fines. This effect is demonstrated quantitatively in Fig. 7 (a).The proportion of fly ash collected in the cyclones, as a percentage of the fuelfeed for two different rejects, is seen to increase with the superficialvelocity of the fluidizing air. As Fig. 7 (b) shows, the percentage of finesbelow 150 urn (100-B.S. mesh) collected in the primary cyclone decreasesproportionally with the fluidizing .velocity . Therefore, with increasing velocitymore fines of increasing particle size are entrained.
The greater proportion of cyclone fines, as Fig. 7 (b) indicates, is below1!>0 ym. The amount collected is 15-30% w/w raw feed for samples C^ and D, whichgreatly exceeds the small percentage (2-4%) of minus 150 ym in the feed material.Therefore most of the cyclone fines must have been generated by size degradationin the bed.
The fines elutriated from the bed and collected in the cyclones containa small percentage of unburnt carbon particles which detracts from combustionefficiency . Most of the total amount of unburnt carbon, 60-90% depending on fuelfeed and conditions, is contained in the cyclone fines, the remainder beingremoved in the extracted bed material. Fig. 7 (c) indicates the influence ofsuperficial velocity on carbon loss, expressed as percentage of heat input.At relatively low velocities in the range 0.3-0.45 m/s (1.0-1.5 f t/s) , carbonloss appears to be approximately constant but increases at higher velocities.Two competing effects probably occur: with increasing velocity there is,on the one hand, the tendency for more fines, including unburnt carbon, to becarried over, and, on the other hand, the tendency for more of the carbon finesto be burnt because of the excess air that usually accompanies increasingvelocity. These two effects combine to give approximately constant carbon lossover the velocity range 0.3-0.45 m/s, but the former effect of more finesentrainment probably predominates at the higher gas velocities and there isinsufficient residence time in the furnace space over the bed for effectualburn-out of carbon particles to occur.
In a commercial plant the cyclone fines would probably be recycled.However, in an incinerator for burning rejects, high thermal efficiency wouldnot be sought unless the waste heat were to be used for power generation.
There is considerable interest in the possibility of using the fly ashrecovered in the cyclone as a pozzolan, or cement additive, provided it is lowin carbon and sufficiently fine, and tests on samples Cpartly with this purpose in view.
C2 and D were conducted
One of the main problems in the design of a commercial plant would be tominimize the emission of duwt through the stack into the atmosphere. (In solvingone form of environmental pollution others must not be created.) Particularattention will have to be given to the design of efficient, yet relativelyinexpensive, dust removal systems such as venturi scrubbers or bag filtersafter the cyclones.
The effect of bed depth was not investigated in these experiments. However,deeper beds, e.g. 0.6 m (2 ft), would be expected to reduce the entrainmentof fines, including unburnt carbon, but would require higher pressures in thesupply of fluidizing air.
5.5 Properties of the Burnt Rejects
A comparison between the properties of the raw rejects (Table II) and burntrejects (Table III) shows that, as the result of incineration, the bulk densityof the material is, in most cases, reduced from over 120 kg/m (75 Ib/ft ) tobelow 100 kg/m3 (60 Ib/ft3) . Also the mean particle size of the burnt rejectsis at least half that of the raw rejects, indicating that shrinkage and size

- 398 -
degradation of particles have occurred. In one case (A) the shale particlesappeared harder after firing but in the others much softer.
The burnt rejects drawn from the bed contain less than 1% (w/w) carbonand conform to standard specifications (ASA 168-1971) as a light-weight fineaggregate for concrete. (However, the particles are possibly too friable andangular in shape to be suitable as aggregate for pumpable structural concrete.)The burnt rejects, when pulverized, may be suitable as a cement additive, as analternative to pulverized fly-ash from power stations, and tests on samplesCj, C and D were carried out partly with this purpose in view.
From an environmental point of view, however, the main objective was toconvert the raw shaley rejects into an inert, dust-free material by burning outthe carbonaceous material. The product resembles light-coloured pottery chips,and does not slack in water as do the raw washery rejects. This material haspotential profitable uses as clean fill, embankment or surfacing material forroad construction, as various forms of building material such as grog in brickmanufacture or cement additive, or as soil conditioner. The material is alsoin a suitable form for the recovery, if warranted, of trace elements.
Since the yield of burnt rejects is about the same as the ash yield of theraw rejects, the cost of dumping, if no satisfactory outlets could be found,would be correspondingly cheaper.
- 399 -
7. ACKNOWLEDGMENTS
The authors wish to make acknowledgements to the Joint Coal Board and tocertain sectors of the coal industry of New South Wales for the washery samplesused in the tests and for helpful discussions.
The authors also wish to thank Mr Frank Agus for the preparation andscreen analysis of samples and Mr Peter Mullins for assistance in operation ofthe test rig.
8. REFERENCES
1. Joint Coal Board, 25th Annual Report 1971-1972.
2. G. a Donau Szpindler and P.L. Waters. A survey of the outputand characteristics of reject material from coal washeries inNew South Wales. CSIRO Minerals Research LaboratoriesInvestigation Report (in preparation).
3. Agus, F. and Waters, P.L., Fuel: Lond., 50, 405 (1971).
6. CONCLUSIONS
Coarse washery rejects with up to 80% total inerts (e.g. 70% ash plus 10%moisture) may be burnt satisfactorily in a fluidized-bed incinerator.
The flow rate of fluidizing air is the main process variable determiningsatisfactory operation. The flow should be sufficiently high above the minimumfluidizing velocity to give effectual bubble action and mixing of the bed, yetlow enough to minimize the carry-over of fines. With a bed of minus 6 mm ( in)of burnt rejects about 0.4m deep,the most satisfactory working region waswithin the range 0.3 - 0.6 m/s (1-2 ft/s).
The amount of fuel injected should be such as to give a reasonably lowexcess air factor of about 1.25-1.50 mainly to economize on air supply.
The bed temperature, which is the dependent variable, should be sufficientlyhigh above the extinction temperature (600°C) to maintain stable combustion,yet sufficiently low to avoid clinkering of the bed. The optimum temperaturerange is between 800-900°C. The bed temperature may be controlled by eitherwater injection into the bed (e.g. 2-10 gal/h ft2 of reactor) or cooling tubesor both. In a commercial unit part of the quenching water would probably beprovided in the form of slurry.
Without water cooling of the bed the normal feed rate of fuel is in the rangeof 73-146 kg/h m2 (15-30 Ib/h ft2) of coaly material or 97.5-195 kg/h m2
(45-90 Ib/h ft2) of dry raw rejects with 67% ash. However, with water cooling,at least twice these feed rates may be attained, with a maximum plant capacityof about 100 kg/h m2(200 Ib/h ft2).
The main benefits of incinerating rejects is to convert them into an inert,light-weight aggregate with potential outlets and to reduce, by at least onethird, the weight of material that would otherwise have to be dumped. Theenvironmental problems and the cost of dumping should be substantially reduced.
Fluidized-bed incinerators appear to offer the most promising method ofdealing with the problem of washery refuse on a large scale, and, if successful,could become adjuncts to coal washeries and form an integral part of coalpreparation processes.

- hOO - - 1+01 ,
30
20
CO
-z.O
10
I N P U T OF
R A W C O A L
; @
' ( 4 0 >
C U M U L A T I V E
R E F U S E
O U T P U T OF
R E F U S E
1955 1960 1965 1970 1975 1980
F I G . 1 . O U T P U T OF R E J E C T S FROM N . S . W . W A S H E R I E S
THE NUMBERS OF WASHERIES IN OPERATION EACH YEAR AREINDICATED IN BRACKETS
RUN-Of-MINE COAL
(100 ton/h)
WET SMALL COAL (50 ton/h I
WET LARGE COAL (25 ton/h)
REJECTS
(20toi/h) :
REFUSE '
ATMOSPHERICPOLLUTIOfJ
FUMES
( DUST )
WATER POLLUTION(ACID)
FIG. 2 T Y P I C A L PRESENT METHOD OF D I S P O S I N G OF W A S H E R Y R E J E C T S
CYCLONE
Jr-HIGH EFFICIENCY
CYCLONE
CRUSHED REJECTSFEED HOPPER
\^ — '"
..,.M • .'•.•".<.;.';.•'
':-:.>.!."v' :'j.\:-'j.»>» ' * • • ^ r > ^ • • .' . .* • * . V * * . r *j
y rvvrvvwWATER INJECTION —
, | CONVEYING AIR —
BURNT REJECTSMAKE-UP
HOPPER
FINES RECYCLEHOPPER
•
1 nj1 1 1, B
^ fc*a —FLUIDIZING AIR-*
— s
\"™™*"1
fc-"^v •• * 1
y4«Jgg -
"
-xi. - .-..•;
;•> ,'vi*;
V=
-T
\\
\\\\\,\
v>^ \NN
-•• \^^,\\\\i
Sv
\^?s^X^1\ \§;Ov
i • i i • «>M • «ti ;
,-.r.v:.
,/.".* •. •••'." • '.
OTtortmifc
1 f J t
i. v-3 J-BLOWER. ^ ^ .
U— J
S^^
111
- DISENGAGINGSPACE
FLUID' BED
^1
WIND BOX '••'.V''',
IZED
\ / II
II
—
U Iy II
• 1
yBINS FOR CYCLONE FINES
V-X"• ,* * • .
BURNT
RFfOVERY
REJECTSOVERFLOW BIN
F I G . 3 . FLOW D I A G R A M OF C S I R O FLU IDI ZED - BED C O M B U S T O R I MK II

£ D ! 9
.0
* =.
oo m \s\
Z f" O O O -D**< T\ TI -n m
°. c
V TOTAL HEAT INPUT < AT BFD T E M P E R A T U R E I
§ §BED T E M P E R A T U R E t ° C )
§ O *-*
§ 8
Oro
2 5
BED TEMPERATURE ( °C I
§ §
± S o
f*i O
-e ^ -
S i
I I2 "=£ §
I
P E R C E N T TOTALHEAT INPUT
PERCENT OF FINES BELOW 150^m RATE OF F L Y - A S H COLLECTION ASIN P R I M A R Y C Y C L O N E PERCENT OF FUEL FEED
CD
CDO
I
>
D
i
DO
OI
o
z-ni—cz
Om
m >to *O Oco -< -
om O o
O ,-n H 2>
or>
O t— O-< 2!
Ooo
mO
-oxO
Oo
O
VI
I
o
o
ot—o
VJl
cp
"S
I
-p-O

— HUM- —
National Chemical Engineering Conference 1974
PROCESS INDUSTRIES IN AUSTRALIA
Surfers Paradise,
IMPACT AND GROWTH
Queensland
thJuly 10 to 12 , 1974
REDUCTION OF PARTICIPATE EMISSIONS TO AIR BY
IMPROVED ASSESSMENT OF ELECTROSTATIC PRECIPITATORS
by
C.A.J. PAULSON and E.G. POTTER
S U M M A R Y
The electrostatic precipitator is established in industry for theremoval of particulates from gas streams. Using electrostatic precipitationtheory, a technique has been developed to plot the results obtained fromprecipitators so that they can be easily compared. This method takesboth precipitator flow and electrical conditions into account and thusthe effects of varying either or both of these parameters are readilyestimated. This is a sounder basis for comparing precipitation resultsthan the more commonly used 'migration velocity', which is dependent on theapplied voltage and the particle size distribution of the dust. Usingthis plotting method for the results obtained in the CSIRO pilot-scaleelectrostatic precipitator for two NSW bituminous coals, it has been shownthat the variation in precipitator performance between the two fly-ashescan be principally attributed to the difference in their particle sizedistributions.
Paulson, CSIRO, Mineral Chemistry
Potter, CSIRO, Mineral Chemistry
1. INTRODUCTION
The electrostatic precipitator is established in industry for the removalof particulates from gases. In normal practice1 the suspended particles arecharged negatively in a corona discharge and then migrate in the associatedfield of about 5 kV/cm to vertical earthed plates. In the case of solid part-icles a coating of powder accumulates on the plates and is periodically dis-lodged into hoppers beneath for later disposal.
2. THE EQUATIONS OF ELECTROSTATIC PRECIPITATION
The precipitation process is operated on-stream with the carrier gasturbulent, and on statistical grounds this means that total collection ofparticles is a goal attainable only in a precipitator of infinite length. Thischaracteristic is summarized in the performance equation deduced in 1922 byDeutsch2, which in its simplest form may be expressed,
In (1-e) = -ou) (1)
where e is the fractional collection efficiency of the precipitator, a is thecollecting area for particles per unit throughput of gas (the specific collect-ing area or S=C.A.), and w is the mean velocity of migration of the particlesin the direction of the applied electric field.
Most workers in the area of precipitation are content to use the Deutschequation to calculate values of to from e and a observed in plant tests. Thevalues of w are then taken as a guide to precipitator performance with particul-ar dusts and used to design precipitators for specific levels of efficiency.This procedure has limited use and can be misleading as is seen later.
Assuming the force on a particle of known charge in a controlled fieldgives rise to its migration according to Stokes' Law, then the value of w can beexpressed following White3 and others >l4, by,
co = apE E /6irr|c p
(2)
where a is the radius of the particle, n is the viscosity of the carrier gas,E is die particle-charging field, Ep is the precipitating field, TT - 22/y,and p = 3D/(D+2), D being the dielectric constant of the particle. Forsiliceous particles such as fly-ash. D usually lies in the range 2 to 10,corresponding to a range of 1% to 2% for the quantity p. For a given carriergas at constant temperature n is constant, and in most commercial designs ofprecipitator Ec and Ep are approximately the same and each is directly pro-portional to the applied voltage. Thus, for a given composition of particle ina carrier gas at constant temperature and substituting for co in (1) and (2), wehave,
log (1-e) = kaaV2 (3)
where k is a constant.
3. THE PRINCIPAL VARIABLES CONTROLLING PRECIPITATOR EFFICIENCY
Equation (3) is essentially an expanded Deutsch equation and is superior toequations (1) and (2) in showing directly the dependence of precipitationefficiency on applied voltage and particle size. These effects are shown graphi-cally for ideal cases in Figures 1 and 2, in which log (1-e) is shown as pre-cipitator collection efficiency. In Figure 1 the three lines correspond to threedifferent applied voltages covering the ratio 2:1. If a vertical section istaken at the extreme right of the figure it is seen that a precipitator efficien-cy of 99% at constant a and applied voltage V is raised to 99.9% by increasingthe voltage by a factor ST but is reduced to 90% upon decreasing the voltage bythe same factor. Clearly the voltage is a most important parameter to maximize
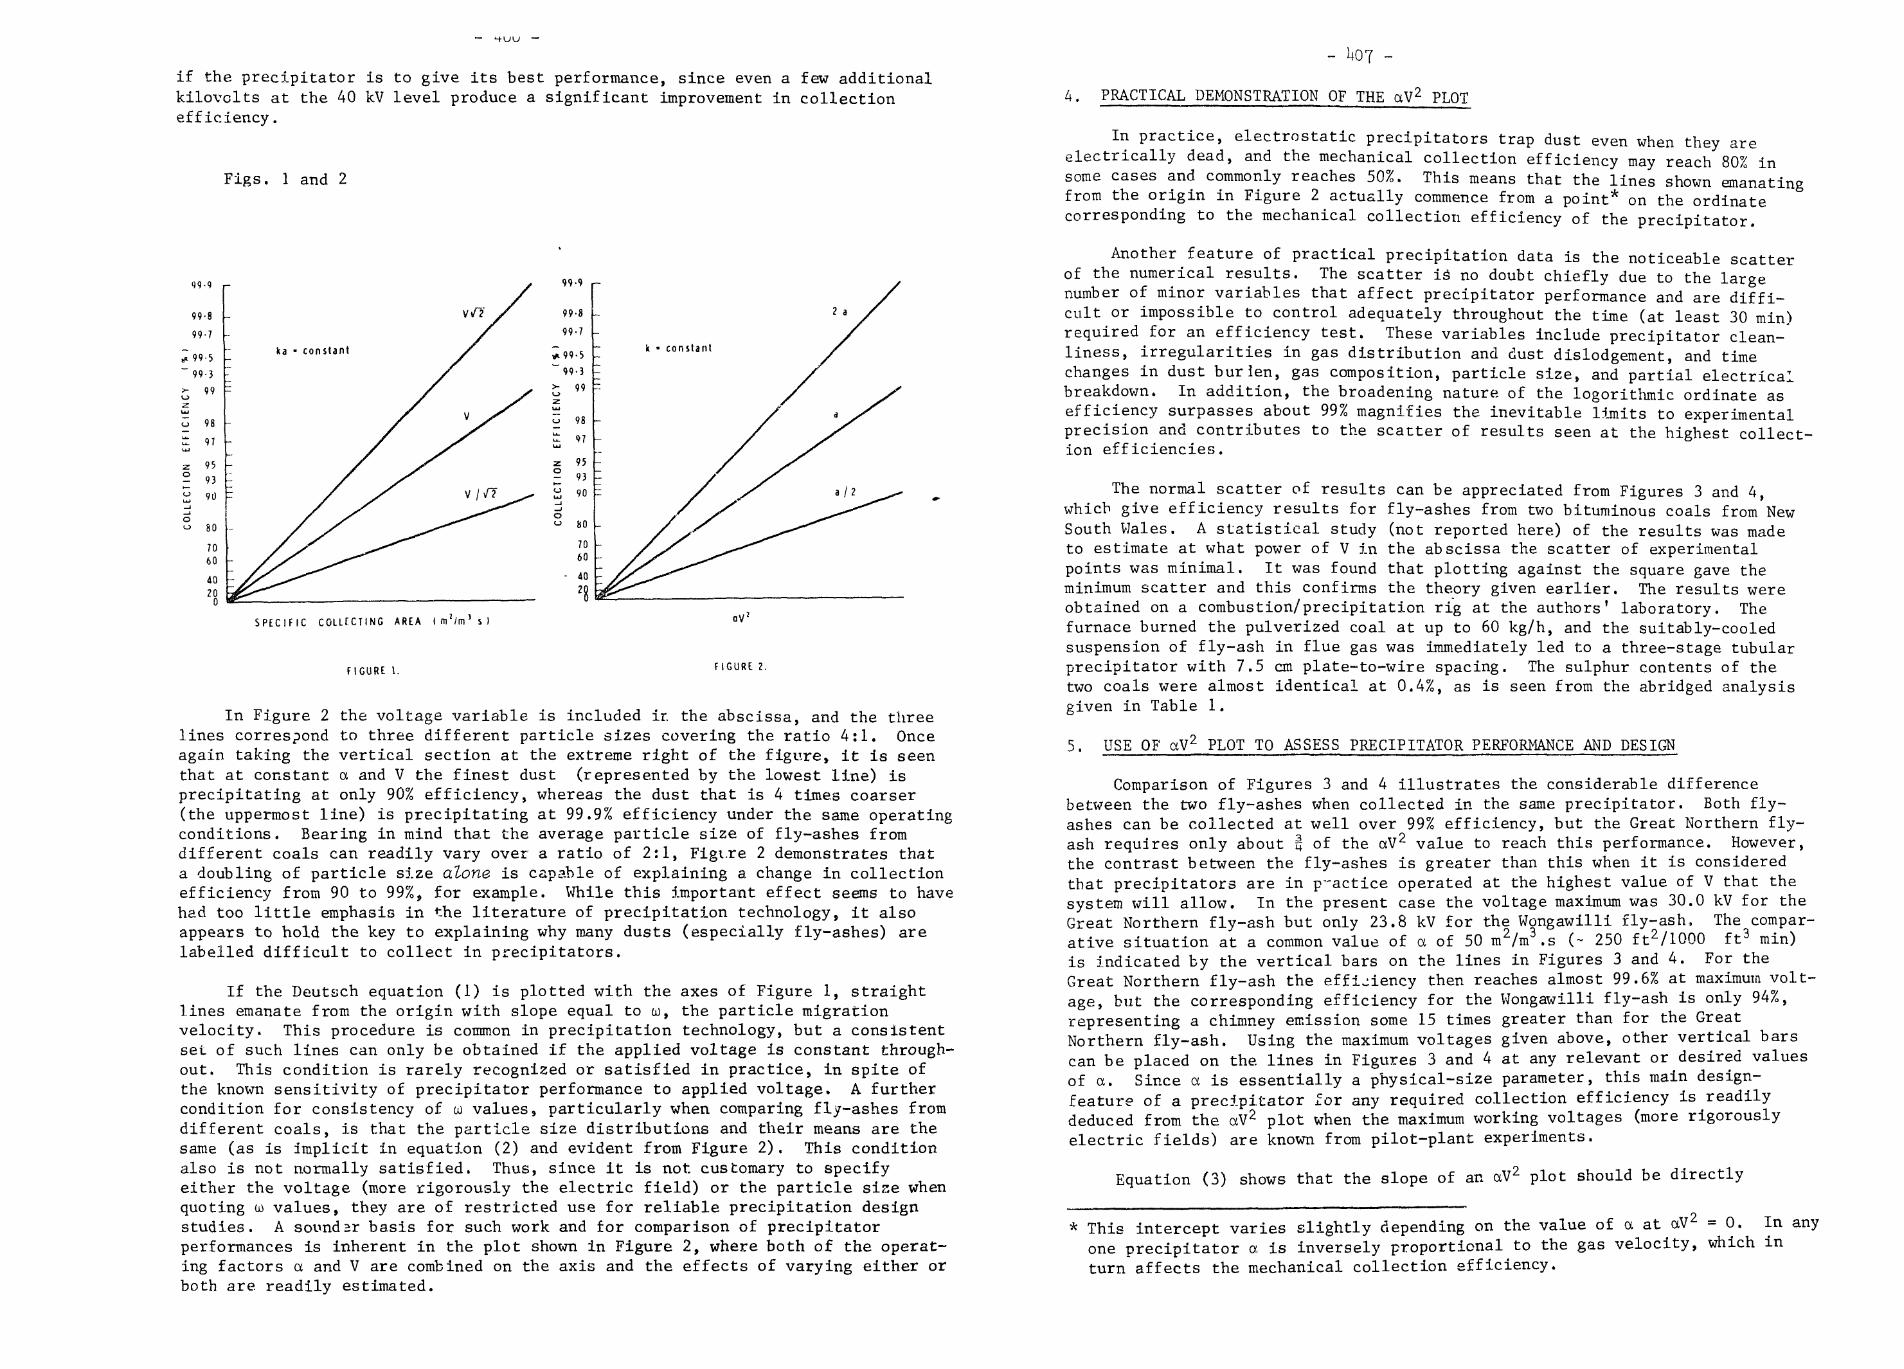
if the precipitator is to give its best performance, since even a few additionalkilovolts at the 40 kV level produce a significant improvement in collectionefficiency.
Figs. 1 and 2
9 9 - 9 r- 9 9 - 9 r-
S P E C I F I C C O L L E C T I N G A R E A ( m ! / m ' s )
F I G U R E \ . f I G U R E 2.
In Figure 2 the voltage variable is included ir. the abscissa, and the threelines correspond to three different particle sizes covering the ratio 4:1. Onceagain taking the vertical section at the extreme right of the figure, it is seenthat at constant a and V the finest dust (represented by the lowest line) isprecipitating at only 90% efficiency, whereas the dust that is 4 times coarser(the uppermost line) is precipitating at 99.9% efficiency under the same operatingconditions. Bearing in mind that the average particle size of fly-ashes fromdifferent coals can readily vary over a ratio of 2:1, Figi.re 2 demonstrates thata doubling of particle size alone is capable of explaining a change in collectionefficiency from 90 to 99%, for example. While this important effect seems to havehad too little emphasis in the literature of precipitation technology, it alsoappears to hold the key to explaining why many dusts (especially fly-ashes) arelabelled difficult to collect in precipitators.
If the Deutach equation (1) is plotted with the axes of Figure 1, straightlines emanate from the origin with slope equal to GO, the particle migrationvelocity. This procedure is common in precipitation technology, but a consistentset of such lines can only be obtained if the applied voltage is constant through-out. This condition is rarely recognized or satisfied in practice, in spite ofthe known sensitivity of precipitator performance to applied voltage. A furthercondition for consistency of w values, particularly when comparing fly-ashes fromdifferent coals, is that the particle size distributions and their means are thesame (as is implicit in equation (2) and evident from Figure 2). This conditionalso is not normally satisfied, Thus, since it is not customary to specifyeither the voltage (more rigorously the electric field) or the particle size whenquoting w values, they are of restricted use for reliable precipitation designstudies. A soundsr basis for such work and for comparison of precipitatorperformances is inherent in the plot shown in Figure 2, where both of the operat-ing factors a and V are combined on the axis and the effects of varying either orboth are. readily estimated.
4. PRACTICAL DEMONSTRATION OF THE aV2 PLOT
In practice, electrostatic precipitators trap dust even when they areelectrically dead, and the mechanical collection efficiency may reach 80% insome cases and commonly reaches 50%. This means that the lines shown emanatingfrom the origin in Figure 2 actually commence from a point* on the ordinatecorresponding to the mechanical collection efficiency of the precipitator.
Another feature of practical precipitation data is the noticeable scatterof the numerical results. The scatter is no doubt chiefly due to the largenumber of minor variables that affect precipitator performance and are diffi-cult or impossible to control adequately throughout the time (at least 30 min)required for an efficiency test. These variables include precipitator clean-'liness, irregularities in gas distribution and dust dislodgement, and timechanges in dust burlen, gas composition, particle size, and partial electricalbreakdown. In addition, the broadening nature of the logorithmic ordinate asefficiency surpasses about 99% magnifies the inevitable limits to experimentalprecision and contributes to the scatter of results seen at the highest collect-ion efficiencies.
The normal scatter of results can be appreciated from Figures 3 and 4,which give efficiency results for fly-ashes from two bituminous coals from NewSouth Wales. A statistical study (not reported here) of the results was madeto estimate at what power of V in the abscissa the scatter of experimentalpoints was minimal. It was found that plotting against the square gave theminimum scatter and this confirms the theory given earlier. The results wereobtained on a combustion/precipitation rig at the authors' laboratory. Thefurnace burned the pulverized coal at up to 60 kg/h, and the suitably-cooledsuspension of fly-ash in flue gas was immediately led to a three-stage tubularprecipitator with 7.5 cm plate-to-wire spacing. The sulphur contents of thetwo coals were almost identical at 0.4%, as is seen from the abridged analysisgiven in Table 1 .
5. USE OF aV2 PLOT TO ASSESS PRECIPITATOR PERFORMANCE AND DESIGN
Comparison of Figures 3 and 4 illustrates the considerable differencebetween the two fly-ashes when collected in the same precipitator. Both fly-ashes can be collected at well over 99% efficiency, but the Great Northern fly-ash requires only about § of the aV2 value to reach this performance. However,the contrast between the fly-ashes is greater than this when it is consideredthat precipitators are in p-actice operated at the highest value of V that thesystem will allow. In the present case the voltage maximum was 30.0 kV for theGreat Northern fly-ash but only 23.8 kV for the Wongawilli fly-ash. The compar-ative situation at a common value of a of 50 m2/m .s (~ 250 ft2/1000 ft3 min)is indicated by the vertical bars on the lines in Figures 3 and 4. For theGreat Northern fly-ash the efficiency then reaches almost 99.6% at maximum volt-age, but the corresponding efficiency for the Wongawilli fly-ash is only 94%,representing a chimney emission some 15 times greater than for the GreatNorthern fly-ash. Using the maximum voltages given above, other vertical barscan be placed on the lines in Figures 3 and 4 at any relevant or desired valuesof a. Since a is essentially a physical-size parameter, this main design-feature of a precipitator for any required collection efficiency is readilydeduced from the aV2 plot when the maximum working voltages (more rigorouslyelectric fields) are known from pilot-plant experiments.
Equation (3) shows that the slope of an aV2 plot should be directly
This intercept varies slightly depending on the value of a at aV =0. In anyone precipitator a is inversely proportional to the gas velocity, which inturn affects the mechanical collection efficiency.

C O L L E C T I O N E F F I C I E N C Y ( % )vO \ 3 *•£}NO sO >O
ocz50
roCD CD
OO
CDV^^ *^O
CD ro VJ1 oo
O .
TO m
O ^ Oss> O —
o ^ ~~4m ^
Q
5S?
O tsi—« m
Os:
o
o o3» —I
O
XX' O
On
VJlCD
ro
X X
00
CD
ro
3«r
C O L L E C T I O N E F F I C I E N C Y ( % )
O CD CD CDooCD
>o>0
>O NO
NO >O
>ooo
OINN I
X
*V5 «m O
« 2v <~O f^
•D— 001^^^ IM bi mO >— « ^
~or- °> o
-H «~
-I_m
t3
mO
-o o— "*••* v>j-H KJ^&>
-**"
^ XO •—jfl j»j f**^
i
O1C
^>-g
i>
0 x^
m
— i
^xx%.^x
XWf X.1 ro N x
— ~ r-5 X X X
< - x V0 ro \"Z. ~ fN> ^ >cu
*» - sDJ,-«- f^0
— ON
Q
a ro
— vn ~~ °°CD
3--^ "" CD
3\jj
~ ro
;*r<;
C>

- Uio -
TABLE 1 COAL ANALYSES ON A DRY BASIS
(Results are given as percentages unless otherwise stated)
C o a l
Ash
Volatile matter
Fixed carbon
Calorific Value (Btu/lb)
Sulphur - Total
Pyritic
Sulphate
Organic
Fixed
Carbon
Hydrogen
Nitrogen
Sulphur (organic)
Oxygen
Great Northern
16.1 -
31.6
52.3
12340
0.43
0.00
0.00
0.37
0.06
69.9 .
4.5
1.3
0.4
7.8
Wongawilli
27.0
21.0
52.0
11060
0.46
0.06
0.00
0.39
0.01
63.9
3.7
1.3
0.4
3.7
proportional to particle size (or to the mean particle size in a mixture ofotherwise identical particles). The slopes of the aV2 plots for the GreatNorthern and Wongawilli fly-ashes are in the ratio 1.47:1, and according to thetheory this should also be the ratio of the mean particle sizes for the twofly-ashes. Determination of the particle size distributions using the Bahcosize analyser gave a ratio of 1.53:1 for the respective 50% cut-off points Theconcordance between these two ratios is a good confirmation of theory in thiscase, and strongly suggests that the principal reason for the widely differentprecipitabilities of Great Northern and Wongawilli fly-ashes is the smallerparticle size of the latter. There is, in fact, no reason to invoke any otherexplanation but fineness for the well-recognized difficulty of precipitatingWongawilli fly-ash. ^
6. CONCLUSIONS
(1) A reliable basis for plotting electrostatic precipitation results, and forcomparing precipitator performances has been demonstrated.
(2) The results obtained whilst burning two bituminous coals from New SouthWales demonstrate the usefulness of this technique in showing the variation inthe precipitation characteristics of different coals.
(3) According to the theory, the ratio of the slopes obtained for two fly-asheswhen plotted on this basis should be the same as the ratio of the particlesizes. In the case of the two NSW coals the ratios were 1.47:1 and 1.53:1respectively, which strongly suggests that a principal cause of different pre-cipitation performances is the variation of the fineness of the dust beingcollected.
7. REFERENCES
1 Rose H.E. and Wood A.J., 'Electrostatic precipitation in theory andpractice', Constable, 212 pp (1966)
2 Deutsch, W. , Bewegung und Ladung de Elektrizitatstra'ge in Zylinder Kondenser.Annln. Phys. _68, 335-344 (1922)
3 White, H.J., Trans. Am. I.E.E. 12., 229 (1953)
4 Pautheniers, M. and Moreau-Hanot, M., Jour. Phys. et Radium, 3, Series 7,500 (1932)

- 1*13 -
National Chemical Engineering Conference 1974
PROCESS INDUSTRIES IN AUSTRALIA
Surfers Paradise,
IMPACT AND GROWTH
Queensland
thJuly 10 to 12 , .1974
THERMAL DEWATERING OF ORGANIC MATERIALS
by
D.G. Evans, S.R. Siemon and VJ.P.B. Martin
S U M M A R Y
Many naturally occurring organic materials contain functional groupswhich readily attach water molecules by hydrogen bonding; under suitableconditions cross-linking by hydrogen-bonded water bridges can occur toyield gels in which the continuous phase is water. This is difficult toremove mechanically, and, up to the present time, the only separationmethod available has been evaporation, which requires large amounts ofenergy, and is often prohibitively expensive. The University of Melbournehas now developed a process of thermal treatment without evaporation,which destroys the gel, causing rejection of the water.
The paper describes the application of this process to the treatmentof such diverse materials as brown coal, lucerne, mycelium recoveredfrom mould cultures, and sewage sludge.
D.G. Evans, Senior Research Officer, Chemical Engineering, University ofMelbourne.
S.R. Siemon, Professor of Chemical Engineering, University of Melbourne.
W.R.B. Martin, Senior Lecturer, Chemical Engineering, University of Melbourne,
jjjTRODUCTION
Solid organic materials of animal or vegetable origin often have largeamounts of water associated with them which must be removed before the materialcan be stored or used. Typical examples are: the removal of water from solidfuels such as wood and coal, both to increase the calorific value and reducetransport costs; removal of water from animal foodstuffs such as hay or lucerneto stabilize the material against microbiological deterioration and reduce trans-port and storage costs; and removal of water from organic wastes to reduce thedisposal problem, and where possible to recover dry material for use as fertil-izer or stockfood.
The molecules of animal or vegetable tissue usually incorporate functionalgroups such as -COOH, -OH, -NH2, etc. which are capable of hydrogen bonding towater molecules. This property permits the living tissue to survive and growin aqueous media, but it also hinders removal of the water from the dead tissue.As a result the water usually cannot be removed by mechanical means, and theonly method available at present is to evaporate it, which is always costlyin energy, and usually also requires expensive heat transfer equipment.
However, many processes exist for modifying the functional-group structurein such a way as to make the material partly or wholly reject the water, e.g.the cooking of some foods, seasoning of timber by drying and partial oxidation,preparation of silage by microbial treatment of pasture grasses, and curingof foods by drying, often coupled with treatment by smoke, sugar, salt, etc.Such processes have usually been developed empirically, and little is knownabout how they work. The process about to be described amounts to an attemptto combine such empirical knowledge with scientific analysis to produce a cheaper,more effective process.
AN IMPROVED PROCESS FOR WATER REMOVAL
We may set the requirements for any improved water removal process asfollows:
(1) In order to conserve energy, evaporation of water should be avoided.
(2) Any chemical changes made to the solid residual material should be suchas to enhance the desired properties, rather than harm them.
(3) Conversion of insoluble to soluble materials should be kept to a minimum,as such soluble materials will be lost in the removed water.
(4) Conversion of solids to gases should be avoided, unless the gases are wastematerials, or if valuable, are readily recovered from the gas phase.
Some years ago a process was devised at the University of Melbourne for theremoval of water from brown coal, based on the above requirements . The prin-ciple adopted was that the coal should be heated to a high enough temperatureto destroy sufficient of the functional groups prfsent to make the coal hydro-phobic, rather than hydrophilic, as in its natural state. The temperaturerequired proved to be in the range 250-300 C, and, in order to heat the coalto this temperature without evaporating any water, it was necessary to carryout the heating process in liquid water under pressure. It was realized at anearly stage of this work that the process would be suitable for dewatering otherorganic materials, and the patents taken out2 have, where possible, allowed forits application to any solid organic material, Naturally the temperature rangesused will not always be the same as for coal, because functional group type andcontent vary from material to material, and in any case the temperature chosenwill usually have to be such as to produce a suitable compromise between the^extent of water removal and the extent of solution or destruction of the solidmaterial.

- hlh -
In the following description of the application of the process to variousorganic materials we will consider not only the removal of water, but also anylimitations imposed by secondary requirements, such as the desire to limit tem-peratures below those at which significant protein breakdown occurs. This inturn means that direct water rejection is not so marked, and attention mustbe given to changes in the material which make the separation of water by mech-anical means more readily attainable.
The apparatus used in most of the experiments was a stainless steel reactionvessel of 0.25 litre capacity, sealed with a cap and rubber 0-ring, capable ofwithstanding a pressure of 20 MPa. The vessel fitted snugly into an aluminiumblock furnace heated by cartridge elements, as shown in Figure 1, A chromel-alumel thermocouple passed through a seal in the lid of the vessel and reachedinto the material being treated.
The usual procedure was to place the test material in the vessel, seal itwith the lid, insert the vessel into the furnace with the valve in the lid open,and turn on the cartridge heaters. When the temperature reached 100°C the waterboiled and steam filled the vessel and displaced the air from it. The valvewas then closed, and heating was continued until the desired temperature wasreached. After this temperature had been held for the desired period (usually10 minutes) the vassel was removed from the furnace, cooled below 100 C, andany evolved gases were removed through the valve and analysed. The treatedmaterial was then usually poured into a Buchner funnel, filtered, and itsmass and moisture content determined. The compositions of the solid residueand the liquid drained from the Buchner "funnel were then determined if necessary.
REMOVAL OF WATER FROM BROWN COAL
Victorian brown coals contain 1.5 to 2 kg of water per kg of dry coal.As the wet coal will not ignite it is necessary to remove most of the waterbefore combustion. To conserve energy this should be done without evaporation,and the treatment used should keep losses of solid material small.
As mentioned earlier, the process described In this paper was developedaround this problem. Experimental work on brown coal has been described fullyelsewhere and will merely be summarized here.
Figure 2 shows the application of the process to Morwell brown coal overthe temperature range 150 C to 300 C. The water removal increases markedly asthe temperature is raised from 150 C to 250 C, at which temperature two thirdsof the water originally present has been removed. The materials balances givenin Figure 3 show that increasing the temperature results in a progressivelygreater loss of solid residue; however, this is acceptable as most of the lossis in the form of water and carbon dioxide formed from the oxygen in the ori-ginal coal. The final dry residue, although lower in mass, is also lower inoxygen content and higher in calorific value than the original dry coal.
Some material is lost as disseisee1 inorganic salts; again this is anadvantage rather than a disadvantage, as the removed salts are largely thoseresponsible for fouling heat transfer surfaces in combustion devices. A smallproportion of the organic material in the coal is also rendered soluble in thewater, and although this does not markedly affect the energy recovery, it doespose a waste water disposal problem.
Figure 4 shows quite clearly that the carbon dioxide and water formedcame from breakdown of the carboxylic and phenolic functional groups, and it13 the loss of these groups which makes the residual material hydrophobic.
TREATMENT OF SEWAGE SLUDGE
Raw sewage sludge contains less than 5% of solid material suspended inwater. Although potentially valuable as a fertilizer, it contains pathogenicmaterial which prevents such use without further treatment. A common practice.in sewage treatment is, therefore, to remove the solid material from the waterand destroy it.
The chemical structure of the solid material is in many ways similar tothat of brown coal, with a high content of hydroxyl and carboxyl groups, butin addition the protein in it contains amino and other groups also capable ofhydrogen bonding. The affinity of these groups for water make it impracticableto remove the water by filtration, and in usual treatment processes the solidmaterial is broken down into soluble, and eventually gaseous, material by micro-bial attack, leaving a small, intractable, solid residue which is dried bydecantation and evaporation.
Thus thermal treatment of sewage sludge under pressure could be consideredsuccessful if it could replace the initial microbial breakdown of solids togive soluble or gaseous products, which are relatively easy to deal with. Anadditional requirement is that it should be easy to filter the residual solidfrom the liquor obtained, to give a material low enough in moisture content tobe incinerated, or alternatively, free from pathogenic material so that it couldbe used as a fertilizer and soil conditioner.
Figure 5 shows the effects of treatment at temperatures from 165 C to 265 C,in the. form of materials balances on the original dry solid. Treatment at 165 Crenders 33% of the solid material soluble in the liquor with another 7% appearingas gas. This breakdown increases as the temperature is further raised until at265 C only 50% of the original dry solid remains, 25% appearing as dissolvedmaterial and 25% as gas. No analyses of these materials were performed.
Figure 6 shows the specifi.c cake resistance of the solid material on theBuchner filter. Treatment at 165°C reduced the cake resistance1* from 500 to30 Gm/kg. Treatment at 215°C reduced it further to 10 Cm/kg, and treatmentat higher temperatures resulted in material so granular that it sedimented inthe filter funnel too fast for specific cake resistances to be measured.
DEWATERING OF MYCELIUM GEL
Mycelium gel is the biomass resulting from the growing of moulds used inthe manufacture of penicillin and other antibiotics. The spent material^re-maining at the end of a run is difficult to dispose of, because it contains agreat excess of protein, and is biologically extremely active. Recovery of theprotein contained in it for addition to chicken or stock food is a possiblemethod for offsetting the disposal costs. However, although the myceliumcontains about 10 kg of water per kg of dry material, its gel structure makesit very difficult to filter.
In the experiments carried out on mycelium gel it was treated at temper-atures from 150 to 260°C. The resulting slurry was filtered on a Buchner filterand the mass and moisture content of the final filter cake were measured. Anygases evolved were collected and analysed, and any unaccounted mass was presumedto have gone into solution. Figure 7 shows the results of materials balancesfor these experiments, and Figure 8 the moisture contents of the filter cakes.
This work established that treatment at 200 C could be used to dispose ofthe mycelium gel, as material with 1.2 kg of water per kg of dry solids mayreadily be destroyed by incineration. However at this temperature only 8% ofthe original dry solids remained on the filter cake, and presumably much gf thenutrient value of the material had been lost. By way of contrast, at 150 C 81-6of the dry solids was retained on the filter cake, but its moisture content was

- 416 -
high, at 3.3 kg per kg of the dry solid. A second series of tests is beingcarried out to see whether modifications to the process can be devised toincrease the yield of nutrients from the gel.
at 7 MPa, which reduced its moisture content to 1.4 kg per kg of dry matter,to produce an acceptable compact." This remained free from fungal and micro-bial attack after several months storage.
DEWATERING OF LUCERNE CONCLUSION
Fodder crops are usually left to dry naturally in the field before balingand storing. During this process the crop loses about three-quarters of itsas-harvested mass, and becomes stabilized against microbial and fungal attack.This traditional method of drying is not only time-consuming, and criticallydependent on suitable weather conditions, but recently it has been establishedthat up to half of the nitrogen originally present becomes lost. This hasled to the development of oil-fired drying kilns for evaporating the moistureto produce a low-moisture, solid residue which can be pressed into soft compacts,ready for storing, transport and use, without further treatment5.
Thus the requirements for drying fodder are similar to those for dryingcoal - production of a low-moisture solid with little loss of the original drymatter (in this case especially its nitrogen content). However the dryingprocess must also stabilize the fodder against deterioration in storage.
Lucerne was selected to test the applicability of the thermal dewateringprocess to fodder treatment, as it is a high nitrogen crop. A series of experi-ments was carried out to test the effect of treatment temperature over the range140 to 190 C. As noted earlier, it was "expected that little nitrogen would belost at 140 C, but losses would increase with temperature. Experiments weretherefore carried out over a range of temperatures to establish the best com-promise between the extent of dewatering and the extent of nitrogen loss fromthe solid residue.
Figure 9 shows materials balances on the basis of the original dry solid,as a function of temperature. Even at 140 C, only 55% of the original drysolid was recovered as solid material, and by 190 C this had fallen to 38%.In all cases about 3% of the original solid appeared as gas (virtually all carbondioxide) and 15-25% as dissolved solid, recovered by evaporation of the filtrate.The remaining 20-30% disappeared either as water of decomposition, volatiledissolved solid lost during evaporation, or as handling losses.
It would be expected that starches and sugars would break down fairlyreadily on heating, to form soluble sugars, but that the proteins would besomewhat more stable, at least at the lower temperatures. The nitrogen balanceof Figure 10 bears this out: at 140 C, 69% of the original nitrogen appearedin the solids retained on the filter paper, but by 190 C nitrogen recovery wasonly 38%, the same as for solids as a whole.
Obviously any practical dewatering process could not afford to be operatedat a temperature greater than 140 C, and probably an even lower temperature isdesirable. Unfortunately the moisture contents of the treated material recov-ered on the filter paper were all slightly higher than the moisture content ofthe original fresh lucerne (2,6 to 3.1 kg of water per kg of dry solids, com-pared with 2.5 kg per kg for the original material). Therefore it becamenecessary to test a mechanical water removal process more potent than simplefiltration, and on the grounds that the evauo^ative drying nrocesses mentionedearlier employ roll presses to form the semi-dry material into compacts, it wasdecided to test th.p effect of mechanical pressing.
A second series of tests was designed to test this point. A new sampleof lucerne, somewhat dryer at 2.2 kg of water per kg of dry matter, was heatedto temperatures of 130 C to 170 C, filtered as before, and then squeezed forone minute on a porous plate at a pressure of 1.8 MPa, to simulate a simple rollpress. As seen from Figure 11, this treatment gave little reduction in moisturecontent. A further sample treated at 130°c was therefore filtered and pressed
As expected, all materials treated reacted in a qualitatively similarmanner. In every case mild heat treatment resulted in a lessened affinity ofwater for the solid material. This effect increased as the treatment temper-ature was increased, but at the same time progressively more of the solidappeared as gas (mostly carbon dioxide from the breakdown of carboxyl groups),water (from breakdown of phenolic and other groups), dissolved salts and dissolvedorganic material, such as simple sugars and amino acids from the breakdown ofmore complex materials. In cases where the treatment temperature has to bekept down to reduce the breakdown of solids, direct water removal is usuallysmall, but simple mechanical treatments such as filtering or pressing will nowsuffice to remove most of the water.
Although it has been shown that the process is applicable to a wide varietyof organic materials, more work needs to be done to delineate the optimum con-ditions of treatment for each material.
ACKNOWLEDGEMENTS
Much of the experimental work reported here was done by undergraduatestudents doing final year Chemical Engineering Research Projects, supervisedby one or other of the authors. Thanks are due to J. Robert, J. Thomas,D. Flentje, J. Park, I.G. Blandford, W.R. Crowe, P.J. Miller, R.J. Ansems,Chiam Heng Foo and A.E. Blaubaum for their various contributions.
REFERENCES
(1) Evans, D.G. and Siemon, S.R. J. Inst. Fuel, 1970, 4_3_, 413.
(2) Evans, D.G. and Siemon, S.R. Process for the separation of water fromsolid organic materials:
Australian Patent 43062G 23.12.68West German rrtent P19026494 21.1.69East German Patent AP72227United States Patent 3552031Canadian Patent 900162Polish Patent 69624
28.5.695.1.7116.5.7223.5.73
(3) Murray, J.B. and Evans, D.G. Fuel, 1972, 51_, 290.
(4) Gale, R.S. Water Pollution Control, 1967, 66_, 622.
(5) Bailey, P.H. J. Inst. Fuel, 1964, 37_, 278.
* Note that pressing the fresh, untreated lucerne at 7 MPa removed no waterat all.
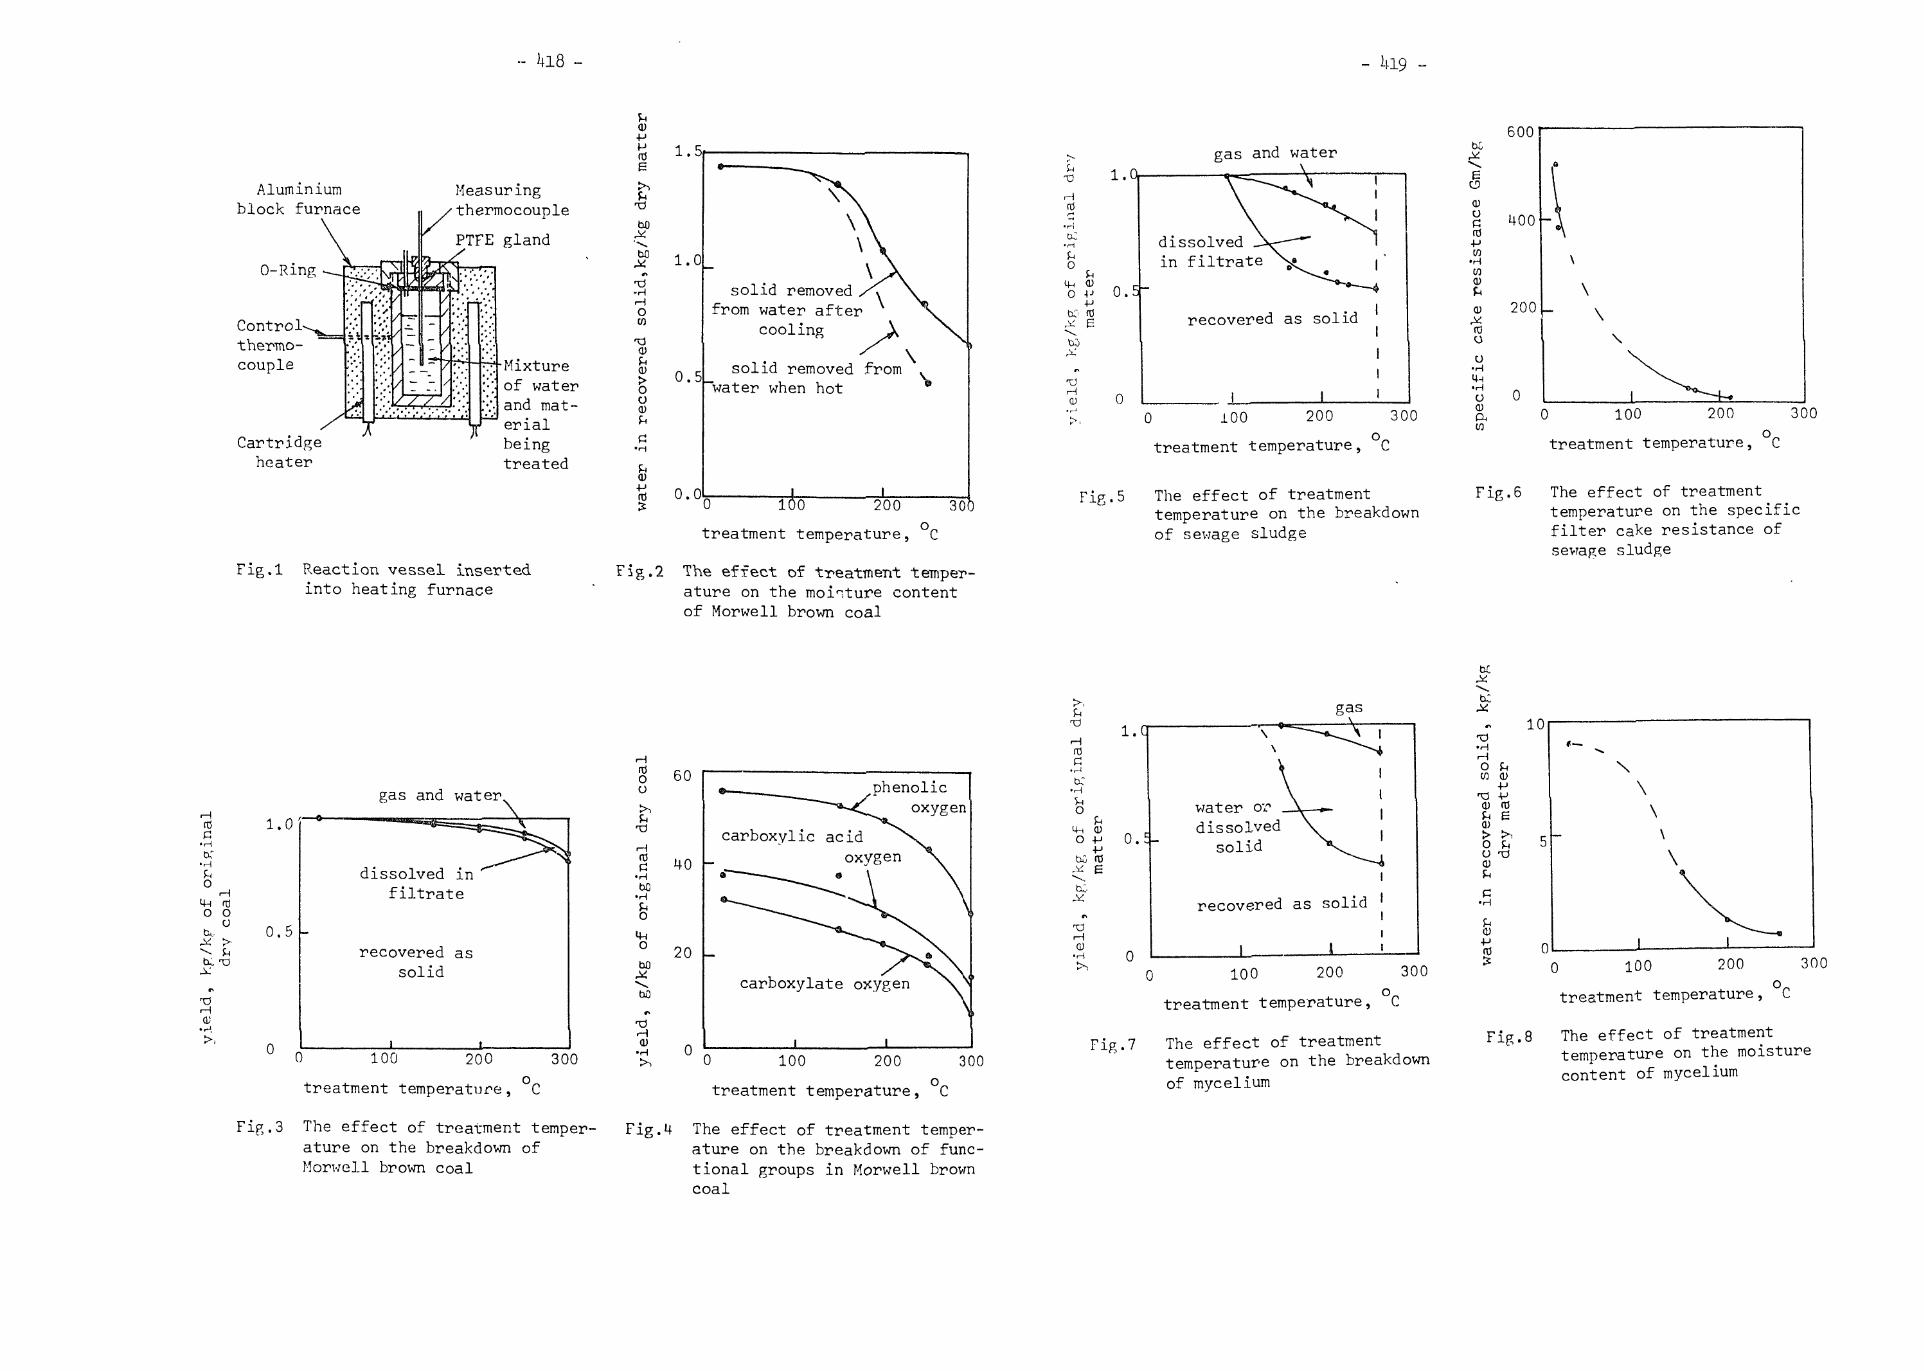
Aluminiumblock furnace
0-Ring
Controlthermo-couple
Cartridgeheater
Measuringthermocouple
PTFE gland
Mixtureof waterand mat-erialbeingtreated
Fig.l Reaction vessel insertedinto heating furnace
0)•pMrde
Ibfj
bO
-HHOW
OO0)
Q)•Pg
6001.5,
1.0
0.5
0.0
solid removedfrom water after
cooling
solid removed from["water when hot
\
200 300o.treatment temperature, C
Fig.2 The effect of treatment temper-ature on the moisture contentof Morwell brown coal
H
gas and water1.0,
Hrd
•H
kO pMH 0)O 4J 0 .
•Pto to,* e\bo
dissolvedin filtrate
recovered as solid
_L
I
', 0 100 200 300
treatment temperature, C
Fig.5 The effect of treatmenttemperature on the breakdownof sewage sludge
bC
O
oCm•PCO
•rHCO0)
Q)A<rdo
O•HIn•HO0)ftw
400
200
Fig. 6
\\
0 100 200 300
treatment temperature, C
The effect of treatmenttemperature on the specificfilter cake resistance ofsewage sludge
gas
HrdC•Htc•HPOH
UH rdO Oo
tk,^ >^ pIX 13
(U
1.0 I
0.5
gas and water
dissolved infiltrate
recovered assolid
0 100 200
treatment temperature,
300
Fig.3 The effect of treatment temper-ature on the breakdown ofMorwell brown coal
rdOo
rdC
•HM
•H
&
UHO
bOX\M
HQ)
•H
Fig
60
20
0
,phenolicoxygen
carboxylic acidoxygen
carboxylate oxygen
0 100 200 300
treatment temperature, C
.4 The effect of treatment temper-ature on the breakdown of func-tional groups in Morwell browncoal
l.crd
bC•H
Op
4n 0) ,_ HO P 0.3-bC rdx E^\
Htt)•H 0
dissolvedsolid
recovered as solid '
100 200 300
treatment temperature, UC
Fig.7 The effect of treatmenttemperature on the breakdownof mycelium
o pCO CD
PT3 P0) rdP 6Q)> >,O Po idcu
0)•Prd
0
N\\
100 200 300
o.treatment temperature, C
Fig.8 The effect of treatmenttemperature on the moisturecontent of mycelium

HftiG
•HbO
•H
O fti
bCy^/ J>
~- Pi'bCT)
-drH
1 .U
0, 5
o.n
lost as 'gas or '""" — f-—water J/*«p
1
I
recovered — p~«as solid
11 1
— iiI
--*;idissolved
xT in
A^ filtrate
1~ I
1i l
100 200 300
treatment temperature, C
Fig.9 The effect of treatmenttemperature on the breakdownof lucerne
X . U
HrtC
•HbO
•Hfc CO O
W)•+H Oo £ 0.5tiQ **H\s f-t
bO
f%
<i> 0.0
1aL.lost in - — "fT
gas I\, >111
recovered -* —in solid '
1i 1
) 100
gnr
V
\V»V -^-dissolved\ in\ filtrate
-«»-
i
200 30
treatment temperature, °C
Fig.10 The effect of treatmenttemperature on the breakdownof nitrogen compounds inlucerne
w•H O,HOw
0) 'HCfl rHw o „a) en I£r ^~* ^^)
-d(U Un•H O
0) bC 1
bC
•rH
(P
"rfl 0
^^ -^ *.s V*~- ^ X
v \ pressed at\ 1.8 MPa\w
pressed at7 MPa
I iis 0 100 200 30(
treatment temperature, C
Fig.11 Reduction of moisture contentof lucerne treated at 130 Cby means of mechanical pressure
National Chemical Engineering Conference 1974
INDUSTRY AND THE ENVIRONMENT
Surfers Paradise, Queensland
July 10 to 12th, 1974
ENVIRONMENTAL ASPECTS OF URANIUM EXTRACTION
by
JcA. Lackey
S U M M A R Y
In the seventies, processing facilities will be constructed in Australiafor the chemical extraction of uranium from its ores and it is expected thatfairly stringent controls will be placed on the quality and quantity ofeffluents from the plants. This paper describes the effluents produced fromthe processing of uranium ores by the acid leaching route and the methods ofwaste treatment that are available to the design engineer.
Potential pollutants can come from either the ore or the chemicals usedin the treatment of the ore. They can end out in two forms - in solids orin liquors. The solid wastes are similar to the tailings of other ores exceptthat they contain much larger than average quantities of radionuclides (thedaughter products of uranium). The liquid effluents contain dissolved radio-nuclides, inorganic soluble salts that were dissolved along with uranium inthe leaching step and organic solvents.
A comprehensive programme for the treatment of wastes from uranium oreprocessing facilities, incorporating methods outlined in this paper, will benecessary to ensure that no despoiling of the environment occurs.
Lackey, Australian Mineral Development Laboratories, Chemical Metallurgy

INTRODUCTION
For the extraction of uranium from its ores, two basic hydrometallurgicalflowsheets have been developed - acid and alkaline leaching. This paper dealsmainly with the acid leaching process as:
(a) In general, acid leaching is the preferred route; and
(b) the acid route produces larger volumes of effluents whichare relatively more toxic.
The following subjects are discussed:
Potential sources of pollution from mining and milling wastesProcess flowsheet descriptionSolids disposalLiquid effluent disposal
POTENTIAL SOURCES OF POLLUTION FROM MINING AND MILLING WASTES
Uranium mining and milling operations provide a range of sources from whichpollution of the environment can result. Some of these are caused by naturalphenomena, for example, rain, heat, wind, etc. on the facilities and others arethe direct result of the processing plant operations in producing a uranium pro-duct .
A list of the major sources are:
1. Gaseous radon - 222 and daughters passing into the air during mining,crushing, grinding and leaching operations. This is more a problemto the mining and mill plant and not to the general public andecology of the region as dispersal and hence dilution of radon - 222and daughters occurs quickly,
2. Natural weathering and leaching from overburden, below grade orematerial, ore stockpiles and ore in the mine itself. Mine waterhas to be pumped out of the mine so it should be pumped into thesystem where other waste liquors are treated. If it is possible watershould be contained from other sources, for example, by building dams,and pumped or drained into the system where other waste liquors aretreated. Methods of treatment are detailed later.
3. Solid waste from leaching and counter current decantation. Thisessentially contains all the radioactive daughters of uranium,
4. Liquor effluents from the processing plant (raffinate, bleed wash,thickener overflow bleed and filtrate) contain chemical and radio-nuclide pollutants.
PROCESS FLOWSHEET DESCRIPTION
The operational details of processing plants vary from ore to ore but thebasic operations are very similar where sulphuric acid is used to leach uraniumfrom the ore - see Figure 1 for a typical flowsheet.
The ore is crushed and wet ground before passing to leaching as a slurry.Sulphuric acid aid an oxidant (where necessary) are added to dissolve theuranium minerals. From leaching, the leach slurry passes to the counter
current decantation circuit where soluble uranium is washed from the solids.The solids, now only in contact with water, pass out of the plant to a tailingspond while the uranium containing pregnant liquor passes on for furtherprocessing.
This liquor is clarified prior to entering the solvent extraction circuitwhere the uranium is extracted into an organic phase. The loaded solvent isstripped with an ammonia/ammonium sulphate solution with the stripped solventrecycled back to extraction. The loaded strip solution passes on to a precipi-tation step where ammonia is used to precipitate the uranium. The precipitateis then thickened, filtered and washed before being fed to a calciner. Thecalcined product is packaged ready for transport from the plant.
From Figure 1, liquid effluents from the plant are raffinate, tailings bleedwash, thickener overflow bleed and filtrate. The actual quantities of wasteinvolved depend on the particular plant and ore but in general the tailings areapproximately 50% solids by weight, that is, the weight of slurry is twice theweight of the ore and the weight of raffinate is three times the weight of theore. The quantity of bleed wash is a function of the plant and ore type andthe combined thickener overflow bleed and filtrate would typically be 50 to100 times the weight of the product. The quantities of the last three effluentsare much less than the first two.
SOLIDS DISPOSAL
Only one. method is considered realistic for the disposal of solids, namely,complete containment in a solids tailings dam. This is the only acceptablemethod as solids contain essentially all of the radioactive daughters of uraniumwith the exception of thorium 230 (approximately 50%). A description of themethods used in the construction of tailings dams is unnecessary as this is awell established technique.
Stabilisation of the tailings dam once it is full of solids is important,particularly as the finer solids tend to concentrate at the surface. Inuranium tailings the fines contain a high proportion of the radioactiveelements and stabilisation is necessary to contain this radioactivity. Threebasic methods can be applied:
1. Covering with rocks and mine wastes.
2. Covering with chemicals and binding agents.
3. Revegetation.
Coarse material has been used to cover the top and sides of tailings damsto prevent wind erosion of fines. Rock and soil adjacent to the waste is theusual material.
This method has the advantage that if a sufficiently thick covering layerhas been applied then the Y~radiation level will be substantially reduced, how-ever, it would be prohibitively expensive in all but a few cases.
Chemical stabilisation involves reacting chemicals with the waste to forman air- and water-resistant crust or layer. Haven and Dean (3) successfullystabilised the solid waste from a uranium mill by an elastomeric polymer appliedto the dike areas and a calcium magnesium lignosulphate to the beach areas.This method is applicable to dry regions where It is unlikely that vegetation

can be sustained. Its cost is comparable to revegetation but it leaves anunsightly area and should only be considered where revegetation is unsuccessful,
Almost all published research on the treatment of tailings dams agree thatby far the most promising stabilisation method is the use of a vegetative cover(2). A cover of vegetation offers a satisfactory and permanent solution to theproblems of wind and water erosion of tailings dams. The subject of revegetationis a very complex one and is beyond the scope of this paper.
In addition to revegetation or chemical stabilisation, it is necessaryto fence off the tailings area with adequate signs indicating that this areais higher in natural radioactivity (mainly y) than is allowable for normal usage,
LIQUID EFFLUENT DISPOSAL
Before describing methods of effluent disposal, it is necessary todetermine the composition of these liquors. Table 1 gives typical analysesof raffinate, combined thickener overflow and filtrate and mine waters.Potential pollutants can be divided into three classes - radionuclides (forexample, radium ~ 226, thorium - 230 and uranium), organics (kerosene, nonanoland tertiary amine) and inorganic salts.
The raffinate contains excessive amounts of radium - 226, thorium - 230organics, acidity, acid sulphate and heavy metals. Thickener overflow andfiltrate contain excessive amounts of radium 226, organics and ammonia. Minewaters would be free of organics, but if sulphides are present in the ore, theywould contain similar inorganic salts as in the raffinate but at lower concen-trations. If no sulphides are present in the ore, the mine waters wouldprobably only contain excessive amounts of radium - 226.
It is of some value now to describe very briefly the effect of thesepotential pollutants on aquatic life and animal life. Both radium - 226 andthorium - 230 deposit in the bones in the body causing a risk of bone cancers,As these two elements are concentrated by some plants and aquatic life (and thusenter the food chain), their tolerated concentrations in water are very low(less than permissible drinking water levels).
Tests on the effluents from uranium processing plants for their toxicityto aquatic life (10) have been carried out and the presence of trace amounts oforganics have been found to be very toxic.
The organic components in the effluent from some plants were sufficientlytoxic, when diluted 250 to 1000 times, to kill 50% of the fish in 72 hours.
The toxicity of inorganic substances in water has been investigated anddocumented (1) rather fully. Fairly low levels of acidity, acid sulphatesand heavy metals have been set as limits for industrial waste waters. It isbeyond the scope of this paper to go into these in any detail.
It is quite apparent that the effluent from uranium mining and millingneed further treatment before any disposal. The following methods have beenused commercially as methods for removing the potential pollutants in theliquors.
1. Radionuclide removal
Neutralisation - The use of lime or limestone and lime to neutralise
liquors to pH 7 to 8 has been accepted as normal practice in many mills as a methodof pollution control. This effectively removed all of the thorium - 230 andabout 80 to 90% of the radium - 226 (5), While substantial amounts of the radiumare removed additional treatment is required to bring the final concentrationdown to meet standards.
Raffinate recycle - The U.S. Bureau of Mines (6-9) investigated the feasi-bility of recycling raffinate to the wash water circuit of counter current de-cantation (CCD) for uranium ore milling using a variety of flowsheets. For theflowsheet shown in Figure 1, the recycling of raffinate does not present anydifficulties and it is possible to reduce the overall volumes of effluent liquorsconsiderably, however, there is a limitation of how much liquor can be recycled.
Due to the radionuclide (Ra and Th) limited solubility, the liquid effluentsare saturated in these elements and reducing the volume flowrate of the effluentsthus reduces the total output of soluble radionuclides. Since the actual con-centrations of Ra and Th are not reduced, further processing is still necessary.This method is useful in combination with other treatment methods that are costdependent on effluent flowrate»
Deep Well Injection - The problem of dealing with excess waste water fromuranium mills at Grants U.S.A. (4) was solved by deep well injection. The dis-posal well had to be drilled below fresh water levels so that mill effluents didnot pollute natural underground water courses. The well consisted of a 17% inchdiameter hole to a depth of 730 feet. An injection casing of 11 inches diameterwas placed inside the large hole and drilled to a depth of 1830 feet. Theeffluents were pumped down this pipe into the disposal zone where they undergomarked changes due to neutralisation, ion exchange and dilution. While thismethod appear to work well, there would still be fears that effluents would reachand pollute fresh water aquifers. It was a rather expensive method.
Use of Barium Salts - The formation of a double precipitate of radiumbarium sulphate as a method of removing radium from uranium mill effluents hasTccisved considerable attention,
This double precipitate is sufficiently insoluble to reduce the concentrationof radium - 226 below acceptable levels. This method has been used in thetreatment of neutral mill waste effluents in the US(1) and Canada(12), Typicaldosing rates of barium chloride (the usual source of soluble barium) have been0,05 to 0.3 g BaCl2/l of effluent in the US and 0,01 g/1 in Canada. Liquorstreated with barium chloride must be free of solids otherwise leaching of radiumJn fine ore particles by barium will result and the liquor will contain moreradium in solution after treatment than before. This method is appropriatewhere liquors are being disposed into natural water courses.
Evaporation-Percolation Ponds - In this method, excess liquor from thetailings ponds is pumped to liquor ponds where it evaporates or percolatesthrough the base of the ponds. This method would not be suitable for alloperations as percolation could contaminate underground streams. In somelocations where there is a high evaporation rate, it would be possible to restrictpercolation and have all the liquors evaporate. Such a method would require alining to be placed at the base of the ponds but it is doubtful if percolationcould be stopped completely. Most materials (for example, compacted earthor clay, concrete, bituminous or asphaltic mixes) will offer reasonableresistance to percolation (as low as 0.2 m/y) provided that the pond subsoil isrelatively impervious. If there is a permeable layer beneath the pond, it willact as a sink and fairly high percolation rates (e.g. greater than 1 m/y) can

be expected. Under these circumstances, membrane linings (for example P.V.C.,polypropylene or rubber), if properly laid, will provide a leakproof lining.The acidic or chemical constituents may cause breakdown of the lining materials andneutralisation as a pretreatment of the liquor may be necessary.
2. Organic Removal
Methods for solvent or organics removal are not well documented. However,contact of the liquor with solids (for example, tailings or inorganic precipi-tates formed by neutralisation of the liquor with lime) has been shown to beeffective in removing the entrained organics. Holding in ponds is alsoeffective as the organics (being less dense than the aqueous phase) separateout on the surface and readily evaporate. This method also appears to besuccessful with the dissolved organics and they are also evaporated.
3. Inorganic Salts
Neutralisation by lime or limestone and lime is a most effective methodof removing the toxic inorganic salts. Free acid is neutralised along withacid sulphates (for example, iron and aluminium) and most of the heavy metalsare precipitated.
The inorganic salts can be disposed of by evaporation (to form anevaporite) or percolation into underground strata.
To remove soluble radionuclides, organics and inorganic salts in theraffinate a composite treatment scheme will have to be used. In general, thefollowing schemes are in order of cost with the first scheme being the cheapest.
Scheme 1 - Raffinate recycle to CCD circuit with the excess liquor eitherflowing to evaporation-percolation ponds with no special lining of the base, orbeing pumped to a deep well. The potential disadvantage of this method is thatthe effluents could find their way into fresh water aquifers.
Scheme 2 - Raffinate recycle to CCD circuit with the excess liquor flowingto evaporation ponds. These ponds would be lined with a compacted clay lining(0.6 m thick) or P.V.C. membrane lining. The compacted clay lining whilerelatively impervious, would still have a seepage rate greater than 0.15 m peryear but the P.V.C. membrane lining if well laid, would be completely sealed.The potential disadvantage of this scheme is that the acidic or chemical com-ponent of the effluents could attack the clay or P.V.C. membrane and result inpercolation of the effluent which eventually may find its way into fresh wateraquifers.
Scheme 3 - Raffinate recycle to CCD circuit with excess liquor along withunderflow slurry from CCD washing being neutralised by lime or limestone andlime. Excess liquor, after clarification, is then treated with barium chlorideto reduce the residual radium. The precipitate is allowed to settle beforeoverflowing into a natural water course. Continuous discharge of excess liquorseven after treatment with barium chloride to reduce radium concentrations isunlikely to provide sufficient safeguards under the environmental conditions ofthe Alligator River areas of the N.T. particularly in the dry season. However,xtfhere adequate dilution of the excess liquor by natural waters can be assuredthis scheme should provide adequate safeguards.
Scheme 4 - Raffinate recycle to CCD circuit with excess liquor along withthe underflow slurry from CCD washing being neutralised by lime or limestone and
lime. Excess liquor passes to evaporation ponds which are lined by compactedclay or a P.V.C. membrane lining. This method should offer adequate safeguardsfor the Alligator River areas of the N.T. but has the disadvantage of holdinglarge volumes of radium bearing liquors. Provided the ponds are well maintainedno significant leakage should occur.
For a typical ore of grade 3 to 4 kg U308/tonne having an acid consumption50 kg/tonne and lime consumption of 25 kg CaO/tonne, the cost of schemes 1 and2 would be a few cents per kg of U308 produced whereas schemes 3 and 4 maycost up to $I/kg U308 (because of the high cost of neutralisation) .
Other plant liquors will probably be bulked together with the raffinatewhile mine waters (unless sulphides are present) will be kept separate. If themine waters only contain radium - 226 in excessive quantities, treatment withbarium chloride will produce an adequate effluent.
The overall method of treatment for a particular mining and millingoperation will depend on the constraints laid down by the Government and thisin turn will probably depend on plant location, for example, proximity topopulation centres, relation to underground hydrology, etc.
CONCLUSION
It is imperative that a waste disposal management programme be initiatedto treat the following efflxients:
1. Solid wastes from the plant.
2. Liquid effluents from the plant.
3. Natural waters that contact radioactive solids from themining operations.
Such a programme will vary from mine to mine and mill to mill.
REFERENCES
1. HEVERLY, R.G. "Unique Disposal Methods are Required for Uranium MillWaste" Mining Engng, Soc, of, June 1968, 52
2. CHENIK, D. "The Promotion of a Vegetative Cover on Mine Slimes Dams andSand Dumps" J. of South African Inst. of Min. and Metall. May 1960, 525
3. HAVENS, R. & DEAN,/K.C. "Chemical Stabilisation of the Uranium Tailingsat Tuba City, Arizona" U.S. Bureau of Mines R I 7288.
4. LYNN, R.D0 & ARLIN, Z.E, "Anaconda Successfully Disposes Uranium MillWaste Water by Deep Well Injection" Mining Engng., Soc. of, July 1962, 49
5. National Lead Company "AN AEC Research and Development Report from Win-chester Laboratory" Topical Report WIN 112 Winchester Mass (1960).
6. TAME, K.E., et al "Disposal of Liquid Waste in the Durango-type UraniumMilling Flowsheet" U.S. Bureau of Mines R I 5874
7. TAME, K.E., et al "Disposal of Radioactive Waste in the Vitro-type UraniumMilling Flowsheet" U.S. Bureau of Mines R I 6011

- U29 -
8. TAME, K.E., et al "Radioactive Waste Disposal in the Shiprock-typeUranium Milling Flowsheet" U.S. Bureau of Mines R I 6045
9. TAME, K.E., et al "Disposal of Liquid Waste in the Resin-In-Pulp-TypeUranium Milling Flowsheet" U.S. Bureau of Mines R I 6114
10. TSIVOGLOU, E.G. & O'CONNELL, R.L. "Nature, Volume and Activity ofUranium Mill Wastes" I.A.E.A. symposium, Radiological Health andSafety in Mining and Milling of Nuclear Materials, Vienna, Vol. 1, 101
11. "Water Quality Criteria", Report of the Committee on, U.S. Dept. ofInterior 1968.
12. YOURT, G.R. "Radiation Hazards and Control at Ontario Uranium Mines"Trans. Inst. of Min. and Met. (Lond.) Oct. 1966, A 182
TABLE 1
Radionuclides
Organic
Inorganic
Heavy Metals**
Ra-226 (3pCi/l)*Th 230 (600pCi/l)U-nat'l (3.4 ppm)
KeroseneNonanolAmine (e.g.
Alamine 336)
Free acid pHSulphateFe" ,
AlMgCaSi02V, P
Ammonia
Raffinate ThickenerOverflow Bleedand Filtrate
2000-10000 pCi/1 10-100 pCi/1* 50000-200000 pCi/1 small* 1-10 ppm <1 ppm
100-200 ppm 50-100 ppm50 ppm 25 ppm
10 ppm 5 ppm
1 to 2 7-810 - 25 g/1 150-200 g/1
0.5 - 10 g/1
0-5 g/10-5 g/10-1 g/1
0.5 - 3 g/1Varying
Many in ppm range
50-75 g/1
MineWaters***
10-100 pCi/1
0-100 ppm
-
2.5 to 8
0-1000 ppm
0-1000 ppm
Many in ppmrange
* Allowable limits for drinking water** For example, Cu, Pb, Zn, Mo, Mn, Cd, Co, etc.***Higher figures applicable if sulphide minerals present in ore

- 1+30 -
ORE
WATER"
SULPHURICACID
WATER
AMMONIA
AMMONIA
WATER
CRUSHING&
GRINDING
LEACHING
COUNTERCURRENT
DECANTATION
0/F
LIQUORCLARIFIER
SOLVENTEXTRACTION
SOLVENTSTRIPPING
PRECIPITATION
THICKENER
National Chemical Engineering Conference
PROCESS INDUSTRIES IN AUSTRALIA
Surfers Paradise,
IMPACT AND GROWTH
Queensland
th
U/F^ TAILINGS (2 TONNE)
July 10 to 12 , 197U
THE PRODUCTION OF PROTEIN FROM WHOLE BLOOD
RAFFINATE (3 TONNE)
B.W. Wilson*
S U M M A R Y
10%SODAASH
^ BLEED WASH (small)
0/F
Pilot plant investigations carried out by the Division of ChemicalEngineering have shown that a pigment free, odour free, proteinpowder can "be produced from abattoir blood by a chemical process.When blood is introduced into acetone containing dilute hydrochloricacid as a stablised air/blood foam, proteins are precipitated andthe haeme pigment splits from the haemoglobin. A protein productis recovered by filtration, washing with acetone and solvent removal,A plant capable of producing 1*30 tons per year from cattle blood hasbeen estimated to cost $300,000. The cost of the protein productcalled "Globein", is expected to be $800-900 per ton.
THICKENER (small)OVERFLOW BLEED
U/F
FILTER FILTRATE (Small)
CAKE
CALCINER
PACKAGING
* B.W. Wilson, CSIRO, Division of Chemical Engineering.
Figure 1:
CONCENTRATEPRODUCT
Typical Flowsheet for Acid Leaching showing Effluents andApprox. Quantities (Basis 1 Tonne. Ore)

- 32 -
1.0 INTRODUCTION
During the past three years shortages and sharp rises in price havestimulated interest in a number of unusual sources of protein. In Australia,one potentially valuable source is animal blood from abattoirs. Largequantities are available annually and the protein content is of the highestvalue nutritionally. The present paper is concerned with the development ofan industrial process for splitting haeme pigment from haemoglobin. Theelimination of this red pigment enables the proteins to be isolated fromanimal blood as a virtually colourless, odourless powder. The product called"Globein" is expected to find a ready market alongside soya protein, ediblecasein and fish flour.
2.0 BACKGROUND INFORMATION
The situation as it exists today in Australia is probably more favourablefor utilisation of blood protein, than in most places in the world. There isa large export industry equipped with modern plant for processing meat underrigidly controlled conditions, and blood is available in large quantities closeto industry and markets for protein. Assuming cattle yield 10 - 15 litres andsheep 2-k litres of blood per head and that the protein content is 18-20 percent for cattle and 15-18 per cent for sheep, these two sources would representapproximately 60,000 tonnes of Globein annually.
Very little progress has been made with the collection of blood fromslaughter houses under hygienic conditions and it usually runs away through floordrains together with some wash water. It is processed further by steamco-agulation and drying, to yield a black powder which is suitable only foranimal feeding purposes. About 25 per cent of its protein value is lost inprocessing and the remainder is utilised very inefficiently when related torequirements for human nutrition (i.e. as poultry, pork etc.).
The only technique for utilising blood for edible purposes which has beentried by the Australian meat industry follows the same pattern as the isolation ofplasma for medical purposes. The red corpuscles are separated in centrifugalequipment resembling a cream separator leaving a colourless solution containing9 per cent protein. The process is ample to apply in meat works but the use ofplasma as a food additive is very difficult to justify on economic groundsbecause the haemoglobin fraction amounting to 60 per cent of the protein inblood has to be rejected as a low grade, non edible by-product. Apart from this,the plasma solution must be used immediately because it is difficult to dry with-out risking loss of its nutritional value. If harvesting of animal blood underhygenic conditions is to be developed on a large scale, it is vital to removethe haeme pigment, so that the whole protein content can be utilised. Thedemand for bland proteins for manufacturing purpose 3 is almost unlimited andthere are few legal or health problems which cannot be readily solved.
When the Australian Meat Industry Research Committee was formed in 1966it was suggested that the CSIRO Division of Chemical Engineering mightconsider the feasibility of a chemical process for the decolourisation of blood.No industrial process existed at that time and as far as the author is aware,there is still no process in use anywhere else in the world. There is, however,considerable information on the chemistry of haemoglobin and laboratory techniquesfor splitting the haeme pigment from blood proteins. Schultz first achievedthis by acidification and solvent extraction, but a more elegant technique basedon direct addition of a haemoglobin fraction to acidified acetone was laterdeveloped by Anson and Mirsky^. Their technique had the advantage that theproteins were not damaged by the chemical reagent used for decolourisation. Inthe absence of acids, Michael^ has shown that the full range of proteins inblood can be recovered in high yields by precipitation with polar solvents.
The Fats and Protein Research Institute of U.S.A. has referred to a laboratoryinvestigation it has had carried out at Texas A & M University in which haemo-globin was precipitated and decolourised by Anson and Mirsky's technique but sofar the application of the reaction to whole blood does not appear to have beenconsidered.
3.0 DEVELOPMENT OF THE SIROGLOBEIN PROCESS
3.1 General Requirements
The present investigation which was commenced in 1965 was based on theAlison and Mirsky technique illustrated in Figure 1. Scaling up this reactiondid not present any chemical engineering problems other than those usual tothe recovery, recirculation and containment of volatile solvents but, even witha relatively simple solvent such as acetone, operation of the process would bequite impractical in the average Australian meat works. A central processingfacility working in conjunction with a number of abattoirs would be morepractical from the point of view of the special equipment required and the economicsof solvent recovery.
As work on the decolourising reaction proceeded, it was clear that it couldbe carried out on whole blood and that it would be a disadvantage to considerfractionation of the haemoglobin. Simply by using a higher acetone to bloodratio, it was quite feasible to remove water from the protein in whole blood andavoid the usual problems associated with air drying. The name "Globein" waschosen for the product by analogy with casein. It should not be confused withthe glcbin protein prepared from a haemoglobin fraction.
3.2 Conditions of Reaction
The Anson-Mirsky reaction takes place very rapidly at room temperature in.acetone containing approximately 0.2-0.5 per cent hydrochloric acid. To obtainmaximum yields of protein curd and to produce the whitest product the acetoneconcentration must be maintained in excess of 85 per cent by weight. In practicethe quantity of acetone is determined by the type of blood (i.e. by the protein/vater ratio) and by the quantities of water added to the blood before the mainreaction. Originally one part by weight of 5 per cent sodium citrate solution per20 parts of blood was added immediately on harvesting, and a further large volumeof water was added just before the decolourising reaction. The main functionof this second addition was to cause rupture of the corpuscles by osmotic pressureand make the haemoglobin protein more accessible to the decolourising reagent.
The addition of water to blood was a disadvantage from the point of viewof acetone recovery and in the initial stages of this investigation the amount ofacetone recycled was approximately 160 times the weight of protein product.In 1967 Piggott^ snowed that'1 the cost of this operation would be a major dis-advantage on an industrial scale and no further development took place until 1972vhen ultra filtration equipment became available for dewatering citrated andplasmolysed blood. The water content was reduced to approximately the same asraw blood and the acetone circulation fell to 100 of acetone to one of solidproduct. Even with this treatment the economics were still marginal and the ^process did not really advance any further until 1973 when Dr. J.R. Yates ofCSIRO Meat Research Laboratories showed that addition of raw blood directly tothe acetone resulted in very effective plasmolysis. This was an important stepforward but a number of problems had to be overcome before the modified techniquecould be made to work on a large scale. For example when it was first tried ona "dust bin" scale very vigorous agitation of the acetone was found to beessential during the addition of the blood in order to complete the decolourisingreaction. This had the negative effect of reducing the particle size of the

protein to the point where filtration and washing became prolonged and difficultoperations. Less vigorous agitation resulted in the production of large floes"but, inevitably, some of the blood corpuscles were not plasmolysed and causeddiscolouration of the final product.
At this point an attempt was made to achieve rupture of the red corpusclesby mechanical shear. Citrated blood was passed through a colloid mill anddirected onto the surface of the acetone reagent under conditions of very gentleagitation. This technique resulted in very efficient decolourisation and at thesame time the protein was precipitated as large curds which greatly facilitatedfiltration and washing on a large scale. When the effect of the colloid millingwas examined more closely, it was found that there was no evidence of mechanicalrupture of the red corpuscles. The main effect was to generate large amounts ofair bubbles in the blood before reaction. When small amounts of foaming agentswere introduced before milling (e.g. sulphonated oleine or gelatine) the volumeof air increased to 30 per cent by volume and the air/blood foam floated on thesurface of the acetone reagent during the decolourising reaction. Extremelylarge stable curds of protein were formed and the product had a very pale colour.
Washing and drainage of the floes was very rapid and the acetone circulationwas reduced to 50 parts by weight per unit of Globein product. The present formof the Siroglobein process which incorporates this foaming step is illustrated inFigure 2.
3-3 Process Economics
It is not proposed to present a detailed account of the process economicsbecause this is being covered by Ip and Farrer^. However, in a preliminaryspot estimate made by the author in January 197 •> a plant capable of producing30 tons of Globein per year from cattle blood was estimated to cost $A300,000and the product cost was estimated to be $A800-900 per ton. At this price,Globein appeared to be marketable in the range between edible casein ($750 perton) and dried blood plasma ($1200 per ton).
The main value of the spot estimate was in pointing out the significantfactors contributing to the product cost. Not unexpectedly, the main contribu-tion was the cost of harvesting and collection of animal blood from abattoirs.The cost of citrated blood delivered to the processing plant was estimated tocontribute approximately $A300 to the cost of the Globein product (i.e. aboutone third). The remainder of the cost was distributed mainly between capitalcosts, labour costs and cost of solvent. Of necessity, the assumed figure forthe capital cost had to contain a large contingency factor. The process is novel,the product completely new and the process still in the early stages ofdevelopment.
The capital cost also reflects a utilisation factor of 27 per cent becauseit will not be possible to operate on a 2k hour basis. In order to obtainoptimum conditions for the precipitation it is essential to pi-ocess bloodwithin a few hours of its collection.
Perhaps the most controversial element in the current cost estimatesis the cost of solvent recovery and solvent make-up. With the solvent circula-tion rate fairly well established at 50:1 on the basis of dry protein, it wasa comparatively simple matter to estimate the cost of redistilling and recirculat-ing acetone. However, it was much more difficult to arrive at a figure forunavoidable acetone losses. According to Cooper", design figures based onminimum losses in side streams usually understate the losses obtained inpractice. The spot costing was, however, based on an assumed figure of 99-5$overall recovery. This gave an actual make-up requirement of 90 tons per year
Compared with the preliminary design figure of 2.5 tons per year. The figureof 99-5 per cent recovery is nevertheless higher than many industrial plantsoperating solvent recovery systems.
If the Globein process is to operate economically there is no doubt thatstrenuous efforts will have to be ..made to minimise acetone losses. At thei-resent stage of development very little can be done to predict losses of this type•iiid it will almost certainly require a pilot plant or a semi-commercial plant toestablish the actual efficiency which can be achieved.
With future prices for acetone likely to exceed the present. $250 per tonthere is also the probability that the present allowance for the cost ofacetone make-up may require an upward adjustment.
H.O FACTORS INFLUENCING APPLICATION OF THE CSIRO GLOBEIW PROCESS
JK] Edibility
As a protein, Globein has an amino-acid spectrum similar to high gradebeef, pork or lamb. In fact, it could be considered as a meat substitute andas such could command a very high price under today's conditions. Table I showsthe amino-acid content of Globein compared with a sample of blood dried care-fully in a vacuum oven. The same table also shows a.n analysis of a dried bloodproduced by a new fluid-bed drying technique being developed in New Zealand.In all cases the analyses indicated a slight loss in some minor amino-acids.A similar effect is observed with edible casein and it is not expected to be alimiting factor from the point of view of nutritional value.
In most trials, the Globein product has been found to be remarkably freeof bacteria because the decolourisation reaction apparently acts as a sterilisationprocess. The acid form stores well for long periods without deterioration.
From the point of view of Health Authorities there are no objections to theuse of refined blood proteins provided the blood is collected hygieriically,animals pass accepted health standards and processing is carried out in anapproved establishment. A residual acetone content of 30 p.p.m. is acceptableby Food Authorities.
U.2 Utilisation
Because Globein is colourless and odourless, it lends itself to blendingwith other foods deficient in amino-acids. It will be particularly suitablefor foods intended for infants, growing children and invalids because of thehigh lysine content and its solubility in water.
IK 3 Availability of Raw Materials
The industrial use of the process now depends on development of newtechniques for harvesting and utilisation. The modernisation of slaughterhouses is long overdue and the innovations introduced to permit hygieniccollection would also improve working conditions. Hopefully, by upgrading thevalue of blood protein, it will be possible to add to the income of the MeatIndustry.
Further work on the technique of harvesting and the utilisation of Globeinis being undertaken in co-operation with CSIRO Meat Research Laboratories inCannon Hill near Brisbane.
5•0 ACKNOWLEDGEMENTS
The writer wishes to acknowledge the advice and suggestions made by

- 37 -
Dr. J.R. Yates of the CSIRO Meat Research Laboratory. The practical assistancegiven by Mr. R. Close and Mr. H. Jacobs in carrying out pilot plant trials isalso gratefully acknovledged.
6.0 REFERENCES
1. Schultz, F.N. Physiol. Chem. 2U, UU9, 1898.
2. Anson, M.L. and Mirsky, A.E. , J. Gen. Physiol., 13, 69, 1930
3. Michael, S.E., B.P. 826,275, Feb. 28, 1958.
U. Piggott, K.L. C.R.L. Internal Memorandum CRL/CE/M-15 August, 1967.
5. Fats and Protein Research Institute Digest No. 96, 20th June, 1972.
6. Yates, J.R., Private Communication 31st March, 1973.
7. Ip, Y and Farrer, J., Feasibility Study of Recovery of EdibleProtein from Animal Blood. (Forthcoming publication).
8. Cooper, C.M., Kirk-Othmer, Encyclopedia of Chemical Technology N.Y.Interscience, 2nd Ed. 18, 562, 1969.
TABLE I AMINO ACID CONTENT OF BLOOD PROTEINS
Lysine
Histidine
Arginine
Tryptophan
Aspartic Acid
Threonine
Serine
Glutamic Acid
Proline
Glycine
Alanine
Valine
Methlonine
Isoleucine
Leucine
Tyrosine
Phenylalanine
e Freezed Blood
9.2
5-6
3.8
1.1<
9.9
5-2
5.U '
8.8
U.O
3.9
7.7
9.1
1.3
0.9
12. U
3.3
7.0
MIRINZProcess
Percentages
9.0
5.5
3.9
1.5
9.3
1*.8]-!.7
8.0
3.U
3.6
7.2
8.8
1.0
0.9
11.73.0
6.7
Siroglobein
9-5
5-7
3.9
2.0
9.5h . 9
U.7
8.3
3.2
3.7
7.3
9.6
1.2
0.8
12.3
3.1
6.8
TOTAL N
98.9
15.0$
93.0
15.2%
96.5
of15.1%

1+38 -
<DOO
c'o>
O)C
o£
D)CO
CM
en
_ 1+39 -
National Chemical Engi' •
PROCESS INDUSTRIES IN AUSTRALIA
Conference
IMPACT AND GROWTH.
Surfers Paradise, Queensland
July 10 to 12th,
SEPARATION OF MIXTURES ON THE BASIS OF MELTING POINTS
J. D. Esdaile, R. Close, & B. ¥. Wilson
SUMMARY
CO co
O-OCO
0X
z
oQ_Joo
UJ
h-LU111 .OUJ
"
rt k
z
QOO_)CO
<DC
h
20h-<
D
DCK2
O
mOOOLU
I
i
CO
?o5CO
_JQ.
t
2;
O
§1
EC
OL
OR
I
RE
AC
T
Q
20K-
FIL
TR
A.L
' /
Oz
WA
SH
\ o00
D
_ al
oz
QCQ
or
—
Ih-oQOCtQ.
ZmOC5
"" T rHIzot-III« 5< I3 38o °o grr 6oCM 4-
UJz
UJ OJo
coi_i08 O
cJ2
CO
(T Q)
c?u.
This paper discusses work on two techniques for separation of mixturesdeveloped from the metallurgical process of liquation, as used to refine tin,by subjecting a mass of crystals to a temperature gradient which increasesfrom the bottom to the top. Related reflux refining processes are first noted,liquation is defined, the multistage nature of reflux refining^is discussed inrelation to a simple binary pnase diagram typical of organic mixtures, and thetwo techniques of simple and forced liquation are discussed.
The use of simple liquation to produce a continuum of butter oil fractionsof increasing melting points is discussed (the low melting point factionscould be used for the production of soft butter, while the "fractions could be used as shortening or for chocolate manufacture)work on forced liquation is discussed in relation to the purification of
acetophenone.
J. D. Esdaile, C.S.I.R.O. Division of Chemical Engineering, Clayton, Victoria.
R. CloseB. W. Wilson

1.0 INTRODUCTION
Some mixtures which are difficult to separate by distillation can betreated by processes involving crystallization and progressive melting byan imposed temperature gradient. The scope of the latter techniques includethe separation of close boiling isomers (used as the starting point forplastics, rubbers and fibres), high temperature sensitive materials, andmixtures of components having high distribution ratios between solid andliquid phases. Two techniques developed from the metallurgical refiningprocess of liquation have advantages over conventional processes (brieflyreviewed below) and these techniques are discussed in relation to thefractionation of butter oil, and the separation of simple organic compounds.
Although the effectiveness of distillation as a separating processhas long been enhanced by the use of reflux, the analogous procedure ofcrystallization and reflux is more complex to apply to systems involvingcrystals and liquid because of the difficulty of handling crystal slurries,•che high entrainment of liquid by crystals, and the problems of passingliquids through a bed of solids without excessive channelling. The firstindustrial-scale application appears to be that of the Phillip's PetroleumCo. ' * in about 1950 employing a column in which the crystals are movedby a piston. A laboratory glass column employing similar principles has beendescribed by McKay et_ al . Further commercial developments include the use ofpulsing for crystal transport as described by Marwil and Kolner , and theBrodie Process developed in Australia. The latter process employs helicalconveyors for scraping cooled and heated surfaces in large horizontal tubes andfor moving the crystals counter-current to the liquid. By careful control ofthe heating and cooling zones, the crystals are grown to a sufficient size tofall by gravity against the liquid reflux generated by heating at the base ofa vertical purification column. The Brodie Process-and the vertical helix-scraped laboratory column described by Betts et &!_ are the only two centre-fed columns known to the authors to employ reflux of both crystals and highmelting point liquid, the crystal reflux being provided by the formation ofcrystals in an imposed temperature gradient in the cooled sections of theseapparatuses. Industrial aspects of continuous fractional crystallizationprocesses, such as scale-up, scope, costs, performance data and product qualityare discussed by McKay and Goard', and by McKay et al".
The liquation process, from which the present techniques were developed,is described by Dennis" and Murach et al_ . It involves the gradual heatingof an iron-containing dross produced by removing the scum formed during tinrefining. The dross contains substantial amounts of entrained metallic tinvhich are removed by placing the dross on the sloping hearth of a reverberatoryfurnace and passing combustion gases of increasingly higher temperatures over it.Under these conditions, a large fraction of the entrained tin coalesces, drainsand flows to the base of the hearth as a liquid whose impurity content and temper-ature gradually increase. The residual solid is returned for smelting to recoverits tin content. The liquation of lead from zinc crusts produced during theParkes Process is discussed by Collins (p. kl2).
Two improved methods of liquation are discussed. Both of these involve heatingthe surface of a crystal slurry and the downward movement of liquid through thecrystals. The first of these, termed simple liquation, is concerned with thecareful crystallization of butter oil in a perforated tray and its remelting,during which liquid percolates through the crystals and drips from perforationsin the tray. The low melting point fractions could be used to make soft butterwhile the higher melting point material could be used for shortening or chocolatemanufacture. This method of butter oil fractionation is the only technique knownto be capable of producing a continuum of butter oil products of increasing melt-ing points. Butter oil cannot, at present, be crystallized to particle sizes suff-iciently large to yield the required minimum settling rate for treatment by other
processes; instead, the liquid must be drained away from the solids. The secondtechnique, termed forced liquation, uses a heated piston which is pressed down-vards on a crystal slurry in a column having a porous base leading to a tubewhose discharge point lies above the column. Since both of these methods involvethe use of a temperature gradient which decreases downwards, back-mixing of theliquid by convection currents is avoided.
The theoretical basis of the separation according to melting points is dis-cussed in "Theoretical Considerations" in relation to a simple binary temperature-composition phase diagram.
2.0 THEORETICAL CONSIDERATIONS
The separation of a high melting point component from liquid by a crystall-ization process may be most simply understood by reference to a simple eutecticbinary phase diagram possessing solid solubility, such as Figure 1, showing theequilibrium behaviour of components A and B according to temperature and molefraction of B (Ng). This diagram shows an arbitary, hypothetical, arrangementin which the a and B phases consist of solutions of B in A and A in B, respectively.Iliis type of phase diagram is common in organic systems according to Marwil andKolner and Brodie , and solid solubility occurs in many of these, according to Bettsei_ al . Below the temperature of the eutectic point, E, only solid phas.es are stable,i.e., a , 3 or a plus 3- Above the eutectic point temperature, the area ofliquid stability, L, is separated from the single phase regions a and 6 by areasin which solid and liquid coexist. The compositions of the liquid and solid inequilibrium are given by the intercepts of a horizontal line, representing constanttemperature, with the boundary lines of the solid plus liquid areas. Thus, ifthe temperature of liquid of composition N^ is lowered to T , crystals will form(in the absence of supercooling) and the equilibrium compositions of liquid andsolid are given by the values N and N , respectively. The potential for separ-ation of B by isothermal batch crystallization is indicated by the distributionratio of B between the solid and liquid phases, i.e. K /N ; which must be greaterthan unity for collection of B in the solid phase. The higher this ratio, themore potentially attractive becomes the prospect of separation by crystallization.
A serious practical limitation of batch crystallization is that the crystalsbecome extensively contaminated by liquid, both occluded and adhering, so thatfollowing separation of the crystals (e.g. by filtering or centrifuging) the actualdistribution ratio of B in liquid to B in solids plus entrained liquid is much lessthan the equilibrium ratio between liquid and liquid-free solids given by the phasediagram. For example, the removal of silver from lead by the Pattinson batch-wisecrystallization process, results in a distribution ratio of silver between the liquidand the solids plus entrained liquid between 3 and h (according to Collins- . P-386)whereas the equilibrium distribution ratio (according to Hansen and Anderko ) isaround 25•
The extent of contamination of crystals separated from the mother liquor isdependent on the crystal shape and size, rate of crystal growth seeding, theequilibrium distribution ratio, and the presence of other components.
Since the development of the Phillips laboratory crystal refiner using an end-fed column and reflux, much cleaner separations (in excess of one theoretical stage)have become possible. This early unit, described by McKay et_ al_ in I960, consistsof a tube of 5or. 10 cm I.D. dia. borosilicate glass free of constrictions, irregul-arities, or scratches, 5 cm long with a matching heating spool 15 cm long at thebase. Crystals are formed separately in liquid to be refined by the addition of dryice, and the resultant slurry is added to the column, the crystals being moved down-vards towards the base heater by means of a porous piston. Product is taken fromthe bottom by means of a needle valve which is used to constrict the flow so that aportion of the liquid is taken as purified product while the remainder is returned
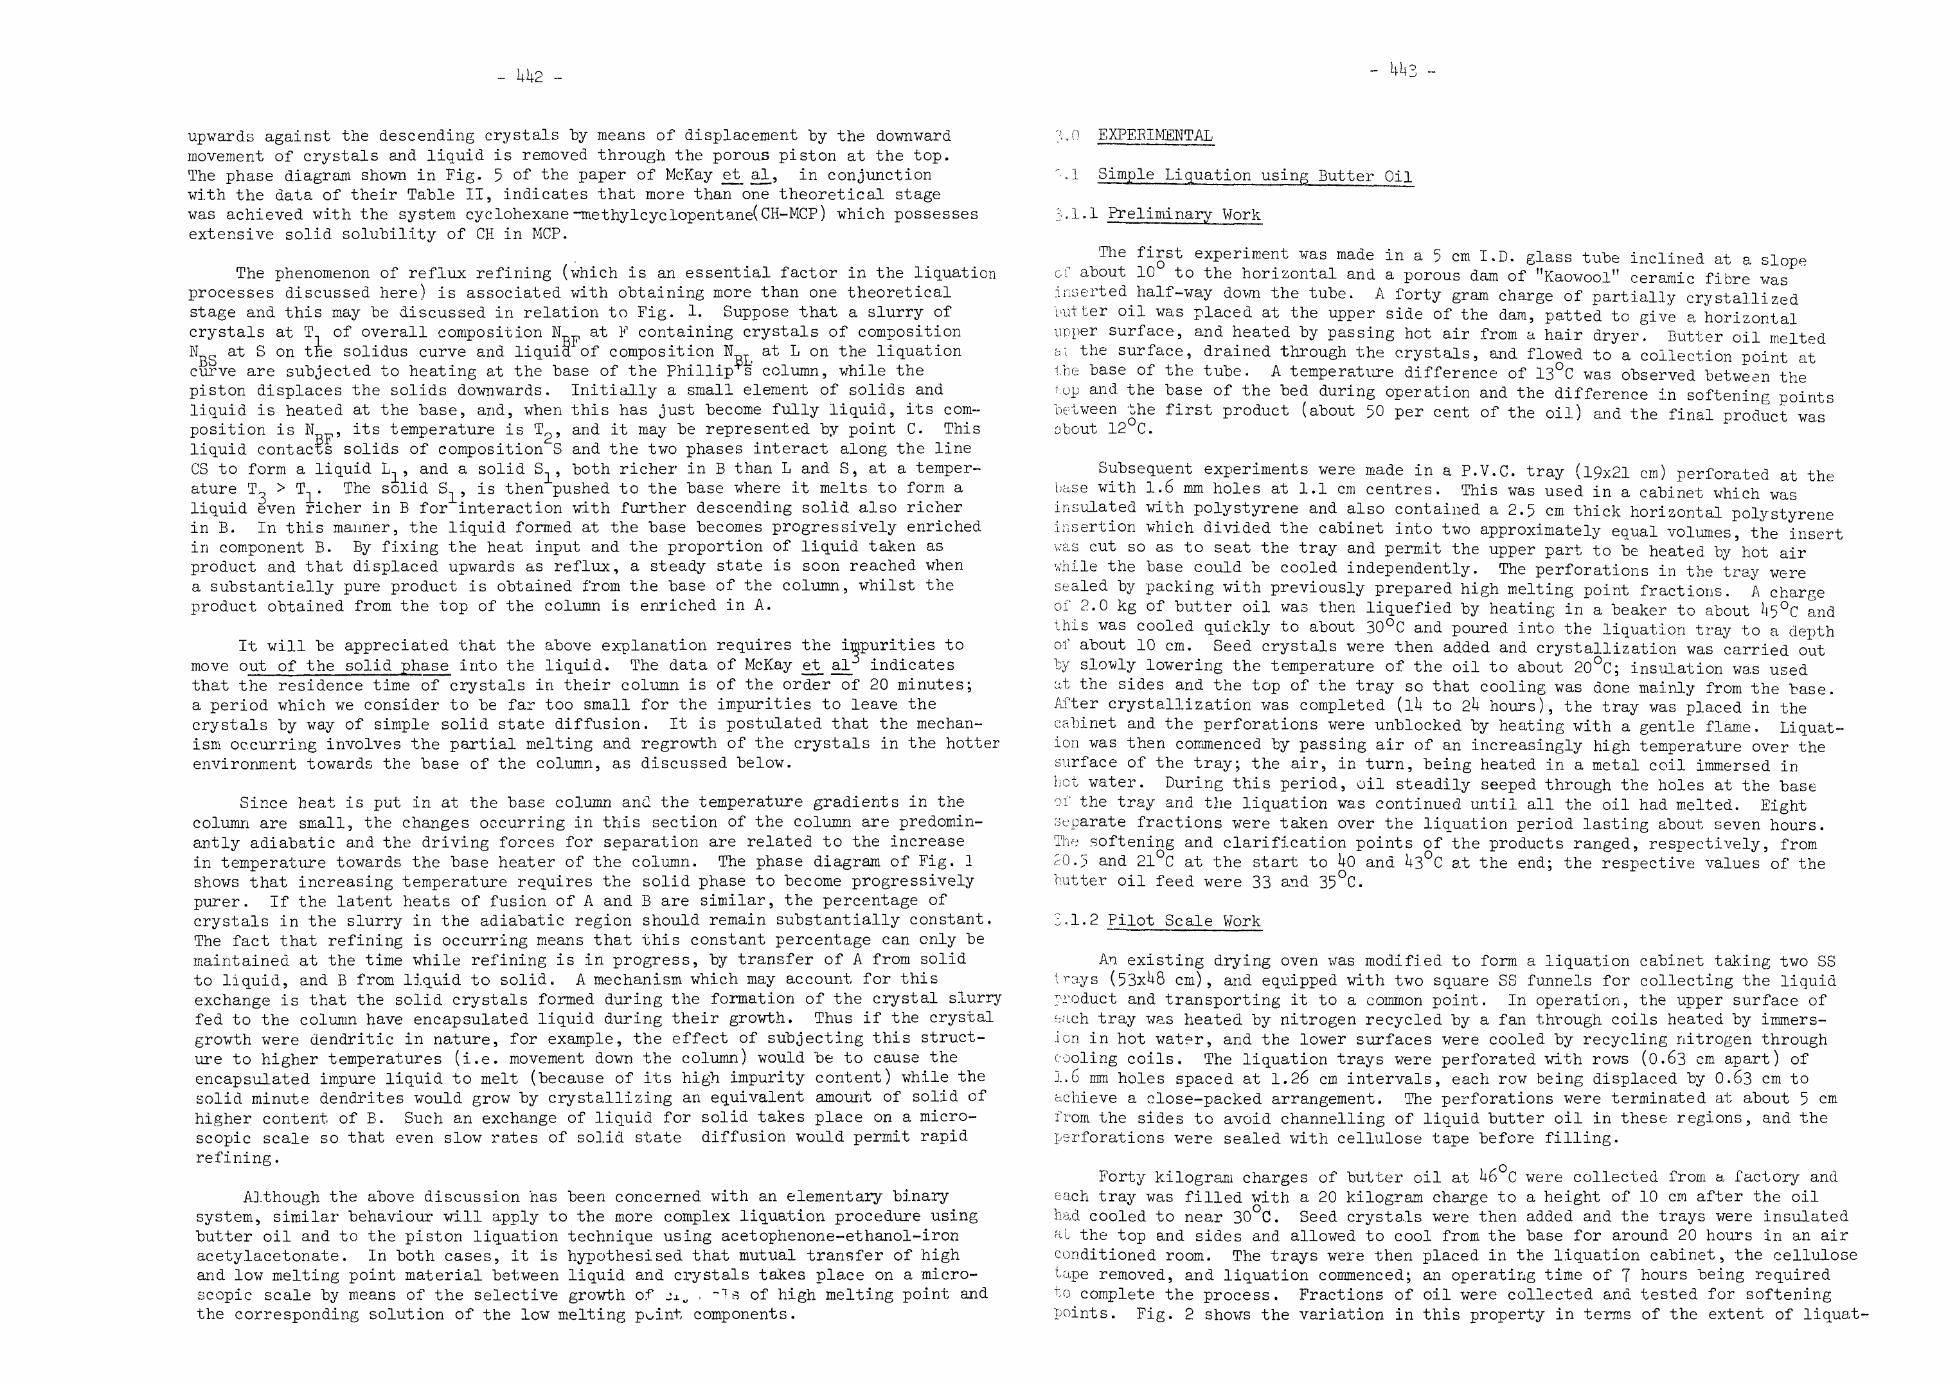
upwards against the descending crystals by means of displacement "by the downwardmovement of crystals and liquid is removed through the porous piston at the top.The phase diagram shown in Fig. 5 of the paper of McKay et al, in conjunctionwith the data of their Table II, indicates that more than one theoretical stagewas achieved with the system cyclohexane-methylcyclopentane(CH-MCP) which possessesextensive solid solubility of CH in MCP.
The phenomenon of reflux refining (which is an essential factor in the liquationprocesses discussed here) is associated with obtaining more than one theoreticalstage and this may be discussed in relation to Fig. 1. Suppose that a slurry ofcrystals at Tn of overall composition IL. at F containing crystals of composition
[ _LJ_L'N „ at S on the solidus curve and liquid of composition N at L on the liquationcurve are subjected to heating at the base of the Phillip s column, while thepiston displaces the solids downwards. Initially a small element of solids andliquid is heated at the base, arid, when this has just become fully liquid, its com-position is W , its temperature is T?, and it may be represented by point C. Thisliquid contacts solids of composition S and the two phases interact along the lineCS to form a liquid L, , and a solid S_, both richer in B than L and S, at a temper-ature T-3 > T, . The solid S, , is then pushed to the base where it melts to form aliquid even richer in B for interaction with further descending solid also richerin B. In this manner, the liquid formed at the base becomes progressively enrichedin component B. By fixing the heat input and the proportion of liquid taken asproduct and that displaced upwards as reflux, a steady state is soon reached whena substantially pure product is obtained from, the base of the column, whilst theproduct obtained from the top of the column is enriched in A.
It will be appreciated that the above explanation requires the impurities tomove out of the solid phase into the liquid. The data of McKay et alj indicatesthat the residence time of crystals in their column is of the order of 20 minutes;a period which we consider to be far too small for the impurities to leave thecrystals by way of simple solid state diffusion. It is postulated that the mechan-ism occurring involves the partial melting and regrowth of the crystals in the hotterenvironment towards the base of the column, as discussed below.
Since heat is put in at the base column and the temperature gradients in thecolumn are small, the changes occurring in this section of the column are predomin-antly adiabatic arid the driving forces for separation are related to the increasein temperature towards the base heater of the column. The phase diagram of Fig. 1shows that increasing temperature requires the solid phase to become progressivelypurer. If the latent heats of fusion of A and B are similar, the percentage ofcrystals in the slurry in the adiabatic region should remain substantially constant.The fact that refining is occurring means that this constant percentage can only bemaintained at the time while refining is in progress, by transfer of A from solidto liquid, and B from liquid to solid. A mechanism which may account for thisexchange is that the solid crystals formed during the formation of the crystal slurryfed to the column have encapsulated liquid during their growth. Thus if the crystalgrowth were dendritic in nature, for example, the effect of subjecting this struct-ure to higher temperatures (i.e. movement down the column) would be to cause theencapsulated impure liquid to melt (because of its high impurity content) while thesolid minute dendrites would grow by crystallizing an equivalent amount of solid ofhigher content of B. Such an exchange of liquid for solid takes place on a micro-scopic scale so that even slow rates of solid state diffusion would permit rapidrefining.
Although the above discussion has been concerned with an elementary binarysystem, similar behaviour will apply to the more complex liquation procedure usingbutter oil and to the piston liquation technique using acetophenone-ethanol-ironacetylacetonate. In both cases, it is hypothesised that mutual transfer of highand low melting point material between liquid and crystals takes place on a micro-scopic scale by means of the selective growth of j±u . -is of high melting point andthe corresponding solution of the low melting point components.
- • - ° EXPERIMENTAL
' • Simple Liquation using Butter Oil
3.1.1 Preliminary Work
The first experiment was made in a 5 cm I.D. glass tube inclined at a slopeof about 10 to the horizontal and a porous dam of "Kaowool" ceramic fibre wasinserted half-way down the tube. A forty gram charge of partially crystallizedi'utter oil was placed at the upper side of the dam, patted to give a horizontalupper surface, and heated by passing hot air from a hair dryer. Butter oil meltedat the surface, drained through the crystals, and flowed to a collection point atthe base of the tube. A temperature difference of 13°C was observed between thetop and the base of the bed during operation and the difference in softening pointsbetween the first product (about 50 per cent of the oil) and the final product wasabout 12°C.
Subsequent experiments were made in a P.V.C. tray (19x21 cm) perforated at thebase with 1.6 mm holes at 1.1 cm centres. This was used in a cabinet which wasinsulated with polystyrene and also contained a 2.5 cm thick horizontal polystyreneinsertion which divided the cabinet into two approximately equal volumes, the insertvas cut so as to seat the tray and permit the upper part to be heated by hot airwhile the base could be cooled independently. The perforations in the tray weresealed by packing with previously prepared high melting point fractions. A chargeof 2.0 kg of butter oil was then liquefied by heating in a beaker to about h5°C andthis was cooled quickly to about 30°C and poured into the liquation tray to a depthof about 10 cm. Seed crystals were then added and crystallization was carried outby slowly lowering the temperature of the oil to about 20°C; insulation was usedat the sides and the top of the tray so that cooling was done mainly from the base.After crystallization was completed (ih to 2 hours), the tray was placed in thecabinet and the perforations were unblocked by heating with a gentle flame. Liquat-ion was then commenced by passing air of an increasingly high temperature over thesurface of the tray; the air, in turn, being heated in a metal coil immersed inhot water. During this period, oil steadily seeped through the holes at the baseof the tray and the liquation was continued until all the oil had melted. Eightseparate fractions were taken over the liquation period lasting about seven hours.The softening and clarification points of the products ranged, respectively, from£0.5 and 21°C at the start to Uo and U3°C at the end; the respective values of thebutter oil feed were 33 and 35°C.
3.1.2 Pilot Scale Work
An existing drying oven was modified to form a liquation cabinet taking two SStrays (53x 8 cm), and equipped with two square SS funnels for collecting the liquidproduct and transporting it to a common point. In operation, the upper surface ofeach tray was heated by nitrogen recycled by a fan through coils heated by immers-ion in hot water, and the lower surfaces were cooled by recycling nitrogen throughcooling coils. The liquation trays were perforated with rows (0.63 cm apart) of1.6 mm holes spaced at 1.26 cm intervals, each row being displaced by 0.63 cm toachieve a close-packed arrangement. The perforations were terminated at about 5 cmfrom the sides to avoid channelling of liquid butter oil in these regions, and theperforations were sealed with cellulose tape before filling.
Forty kilogram charges of butter oil at 6 C were collected from a factory andeach tray was filled with a 20 kilogram charge to a height of 10 cm after the oilhad cooled to near 30 C. Seed crystals were then added and the trays were insulatedat the top and sides and allowed to cool from the base for around 20 hours in an airconditioned room. The trays were then placed in the liquation cabinet, the cellulosetape removed, and liquation commenced; an operating time of 7 hours being requiredto complete the process. Fractions of oil were collected and tested for softeningpoints. Fig. 2 shows the variation in this property in terms of the extent of liquat-

ion.
3.2 Forced Liquation
A sketch of the apparatus used is shown in Fig. 3. The separation occurs ina 5 cm I.D. glass column to which a crystal slurry is added. A bottom exit tube(covered "by a 200 mesh SS screen to confine the crystals within the column) islocated at the base and leads to a discharge point above the top of the column sothat the crystals are surrounded by liquid during operation, a valve is inserted inthis line to allow for degassing of the slurry and to control the extent of reflux.A hollow piston (equipped with an 0-ring to act as a piston ring) is used to movethe crystals and liquid downwards. This contains a top exit tube extending to thebase of the piston which is fitted with a valve to permit degassing (with vacuum),displacement of air from the column and to control the extent of make and reflux.The piston is heated using hot water, and the piston rod is attached to a platformon which weights are placed so as to control the degree of compaction in the column.
The apparatus was tested using a slurry of crystals made from an acetophenonesolution (containing five percent ethanol, together with a small amount of the in-tensely coloured compound iron acetylacetonate as a tracer) by means of a rotatingteflon-coated drum crystallizer cooled internally with a mixture of salt and ice.The slurry was transferred into the column, the piston inserted, and the slurry wasdegassed by vacuum. The piston was then lowered to the top of the crystal bed, thevacuum was disconnected and liquation commenced by applying weights to the piston(about h kg.) and passing hot water thiough the hollow piston. Photographs showingtwo stages of a liquation run are shown in Fig. k.
3.3 Analytical Procedure
The softening and clarification~point temperatures were measured using the ballpenetration method set out by Dixon
H.O DISCUSSIOU.
h.I Simple Liquation
The data of Fig. 2 indicate that the first 35 per cent of the butter oil prod-uced has an approximately constant softening point which, in turn, is close to thefinal temperature to which the oil was cooled during crystallization. Most of thesefirst runnings were produced within a short time of removing the cellulose tape fromthe perforations; it is thus probable that a comparatively large fraction of thebutter oil melts below 20°C. Further tests, using lower terminal crystallizationtemperatures, are planned to give a wider range of separation. The softening temp-eratures of the higher melting point fractions increase progressively, thus indicatingsatisfactory operation. It will be appreciated that the butter oil can be pouredinto the trays in the liquation cabinet so that the crystallization and remelting canbe done in situ. This means, in turn, that problems of handling slurries or theseparation of solids from liquid (i.e. filtration or centrifuging) are avoided.
Successful liquation of butter oil requires that the prior crystallization proced-ure is done carefully. Rapid cooling results in the production of very fine crystalswhich will not permit the liquid to drain. Although, theoretically, the use of ex-tremely slow cooling would produce excessively coarse crystals which would drain tooreadily and leave a dry bed (as occurs with acetophenone), this has not been observedin practice. In operation, the heated surface contains a thin layer of liquid andthis surface descends as a horizontal plane during the course of operation. Themethod adopted here is to cool slowly from the base of a tray so as to form a matrixof high melting material immediately above the perforations and to displace the lowmelting point components upwards; in this way, maximum opportunity is given for re-fining to occur. The rate of heating is adjusted to give as uniform rate of product-ion as possible. Excessively rapid heating produces liquid at the top faster thanit can drain; excessively slow heating reduces production rates. The optimum heating
ra1 requires about 6 to 8 hours for completion,
The quality of the butter oil products is critical from the viewpoints ofrut,ic health and acceptance. The use of P.V.C. for liquation trays, and air forhewing, both resulted in rancid products showing the decomposition indicated byhigh peroxide values. However, the pilot-scale tests using SS trays, and recycledutrogen gas, yielded high quality products of low, medium and high softening pointswhose taste values were assessed '(by the Butter Tasters of the Department of "PrimaryIndustry) as 93, 93+ and 93 per cent, respectively and possessing peroxide values of0.0'.», 0.13 and 0.12, respectively, as determined by the C.S.I.R.O. Division of Dairy
""' Forced Liquation
The photographs of Fig. 1+ show two stages of a forced liquation run. The white::r;;-a advancing ahead of the piston is purified acetophenone while the darker areacontains the iron tracer. The interface between these two regions is sharp, indie-sling that plug flow of the liquid is occurring relative to the solids. No data areavailable for the solid solubility of either iron acetylacetonate or ethanol inao.-Jiophenone so that the number of theoretical stages cannot be assessed. The useof simple liquation on the acetophenone-etnanol-iron acetylacetonale was not success-ful. When a crystal slurry was poured into a simple liquation column, the liquiddrained through the porous base, leaving a dry bed. The liquid formed by continuingtr heat the top of the bed did not drain uniformly but formed channels, leading to}-cor separation. The present apparatus was therefore built with a liquid productlube whose discharge point lies above the column so as to provide a head for keepingthe crystals in the column surrounded by liquid.
Unlike the Phillip's la!oratory column the forced liquation procedure workedsuccessfully on total reflux. Refined product could have been taken by balancingthe proportions of liquid taken from the upper and lower tubes but this procedurehas not yet been investigated.
5.0 CONCLUSION
Two techniques developed from the metallurgical process of liquation have beenconsidered, Simple liquation appears to have application to the separation of thecomplex mixtures of the components comprising butter oil, while forced liquationappears to possess advantages for the separation of mixtures of simple organic com-pounds .
6.0 REFERENCES
(1) Findlay, R.A. and McKay, D.L., Chem. Eng. Progr. Symp. Series 55,No. 25, p. 163 (1959).
(2) Findlay, R.A. and Weedman, J.A., Petrol. Refiner, 37, No. 11, p. 195(1958).
(3) McKay, D.L., Dale, G.H. and Weedman, J.A., Ind. Eng. Chem. 52, p. 197(I960).
(U) Marwil, S.J. and Kolner, S.J., Chem. Eng. Progr., 59, No. 2, p. 60 (1963).
(5) Brodie, J.A.,Inst. Engrs., Aust.(Mech. Chem. Engr.):MC7, p. 37 (1971).
(6) Betts, W.D., Freeman, J.W. and McNeil, D., J. Appl. Chem., 17, p. 180(1968).
(7) McKay, D.L., and Goard, H.W., Chem. Eng. Progr., 6l, No. 11, p. 99 (1965)

(8) McKay, D.L., Dale, G.H. , and Tabler, D.C., Chem. Eng. Progr., 62,No. 11, p. 10U (1966).
(9) Dennis, W.H., Metallurgy of the Non-Ferrous Metals 2nd Ed., Pitman,London, I960, p. 3 1.
(10) Murach, N.N., Sevryukov, IkH., Pol 'kin, S.I. and Bykov, A. Ya.Metallurgy of Tin, Translated by Litwinov, N.W. Ed. Ellwood E.G.,Boston Spa. Yorkshire, England, I960, Vol. 2, p. 360.
(11) Collins, H.F., Metallurgy of Lead, Griff en , London, 1910.
(12) Hansen, M., and Anderko, K. , Constitution of Binary Alloys, McGraw Hill,London, 1958, p. hO.
(13) Dixon, B.D., Aust. Jour. Dairy Technology, p. 22 (1959).LUccD
<DCUJ0.
UJ
Fig 1 Hypothetical Phase Diagram with MutualSolid Solubility
50
0°
h-zO0.
Oz
OJHU.Oco
"0 20 40 60 au 100
% LIQUID PRODUCEDFig. 2 Softening Point of Butter Oil during Liquation
BOTTOM EXIT TUBE
HOT_5WATER
V
/
£
WEIGHTED PISTON RODxX TOP EXIT TUBE
COLD"WATER
&
HEATED/PISTON
-O-RING
t-- 5cm.QUICKFIT
TUBE
V\SLURRY OF Mi
CRYSTALS
ocn^vvvv V - K V - K
WIRE MESH/ SCREEN
Fig. 3 Sketch of Apparatus used forForced Liquation

National Chemical Engineering Conference 1974
PROCESS INDUSTRIES IN AUSTRALIA
Surfers Paradise,
IMPACT AND GROWTH
Queensland
July 10 to 12th, 1974
RHEOLOGY AND ITS IMPORTANCE IN FOOD PROCESSING
by
D. V. BOGER and C. TIU
S U M M A R Y
The student of Food Technology and the practicing Food Technologist arewell aware of the importance and utility of rheology as related tomicroscopic structure, process control, and consumer acceptability of aproduct, but appear reluctant to extend their knowledge of fundamentalrheological behaviour of foods to the area of process evaluation and design.
\
Existing rheological data on molasses are used with conditions andsituations drawn from the Sugar Industry to calculate :
(i) power requirements to pump molasses from bulk to overheadstorage
(ii) the optimum pipe diameterand (iii) the optimum pumping temperature
The calculated results for optimum pipe diameter and optimum pumpingtemperature are compared to conditions actually being employed in industry.Although the examples presented are drawn from a particular industry, theideas and generalizations are applicable to other food products andintermediates where power law behaviour is encountered.
The savings in operating and capital costs that can result fromconsideration of the fundamental rheological properties will ultimatelystimulate their measurement and use and thus represent a new trend in foodprocessing.
Fiure
Boger, Department of Chemical Engineering, Monash University,
Tiu, Department of Chemical Engineering, Monash University.

INTRODUCTION
Rheology, the science of deformation and flow of matter, is important in thefood industry for the following main reasons. Firstly, fundamental rheologicalproperties are related to the microscopic structure of matter. For instance themolecular weight and distribution are related to the viscosity of a solution,while the degree of crosslinking in polymers is related to the elasticity.Secondly, rheological testing is often used in process control. The control ofwheat flour dough during bread making is an example. Thirdly, rheology isrelevant to the acceptability of a product by the consumer. Examples are thespreadability of margarine, the viscosity of a milk shake and the toughness ofmeat. Finally fundamental rheological properties are of direct use for processdesign and evaluation. Pumps, pipelines, etc must be suitable for the materialsfor which they are used.
The student of Food Technology and the practising Food Technologist is wellaware of the importance and utility of rheology as related to microscopicstructure, process control and consumer acceptability but has been reluctant toextend bis knowledge of fundamental rheological properties to their use in processdesign and evaluation. It is in the area of process design and evaluation wherethe Chemical Engineer can be of some help to the Food Technologist and it is thesavings in operating and capital costs which can result from intelligent use offundamental rheological properties which will ultimately stimulate their use inthe food industry.
The need and the use of fundamental rheological properties will bedemonstrated. The material chosen is molasses because its rheological behaviouris uncomplicated and because it is of particular interest in Queensland. Theprocess evaluation examples are drawn directly from the sugar industry. Thetechniques used for the measurement of fundamental rheological properties willnot be reviewed as they are adequately discussed in standard references (1) andquite well understood by the Food Technologist (2).
NON NEWTONIAN FLUIDS
Although a study of Rheology includes the deformation and flow of allmaterials, attention is directed here to the non-Newtonian fluid which isencountered so frequently in the food industry. Examples are many and include,mayonnaise, molasses, soups, jams, chocolate, fats and hydrocolloid solutions.
Newtonian fluids are those exhibiting a direct proportionality or linearrelationship between the shear stress and the shear (strain) rate. That is
= V (1)
where u is the viscosity, a proportionality constant which is independent ofthe shear rate, S, or shear stress, T, and depends only on temperature.
A non-Newtonian fluid exhibits a non-linear relationship between the shearstress and shear rate. If the non-Newtonian fluid shows no time of shear effectsthe shear stress-shear rate relation can quite often be represented by theOstwald-deWaele power law model.
T = K (S)n
(2)
This is an empirical but extremely useful expression based on experimentalexperience. K, the consisting factor and, n, the flow behaviour indexrepresent the intercept on the ordinate at S = 1 and the slope of the log-logplot of the measured shear stress as a function of the imposed shear rate. Themost common behaviour observed is with n less than one. This is thepseudoplastic fluid. As an example consider the shear stress-shear rate behaviourwhich has been observed for a Qunaba C molasses at T = 20°C as is shown on linearcoordinates in Figure 1 (3). Such a determination is called a flow curve. Noticethe observed non-linear behaviour. The same experimental data shown in Figure 1has been replotted on log-log paper in Figure 2. A linear relationship is observed
K - 590 dyne sec /cm for 0.8 "with n - 0.8 and R = 3?u ayne sec /cm" for 0.8 $ S $ 135 sec " It isimportant to realize that n and K as determined from the log-log plot are onlyvalid for the shear rate range in which they were determined and cannot be uspdfor design or process evaluation if the process shear rates are out of this range.
An apparent viscosity can be defined for the power-law fluid using Equations1 and 2.
= K (S)n-1 (3)It is quite clear for n < 1 and from Equation 3, that the apparent viscositydecreases with increasing shear rates. For example the apparent viscosity at200°C of the Qunaba C Molasses, whose flow curve is shown in Figure 1 variesfrom 751 poise at S = 0.085 sec-1 to 218 poise atS = 135 sec"1 thus illustratingthat the viscosity of a non-Newtonian fluid has little meaning unless the shearrate and temperature are both specified. Power law behaviour has also beenreported for soups and sauces (4), apple sauce and banana puree (5) and tomatojuice (6). In many instances, not only for foods, n is nearly independent oftemperature (7). The flow behaviour index, n, and the consistency factor K,obtained from previous work (9) are shown as a function of temperature in Table Ifor the Qunaba C molasses. The results shown in Table I are for6 sec"1 £ S <: 600 sec"1
Table I. Rheological Parameters of a Qunaba C Molasses as a Function ofTemperature.
Temperature,223035404650
o.n
0.860.870.790.840.800.79
i7 j /K, dyne sec /cm32927321013811397.7
In the temperature range 22 $ T $ 50°C, n varied by ± 5 .7% about an averagevalue. Then for design purposes, in this temperature range, n can be regardedas constant and equal to the average value of 0.84. The consistency factor K,can usually be correlated by an Arrhenius type expression
K = a e A/T(4)
wnere a and A are empirical constants and T is the absolute temperature.From the data shown in Table I, a = 1.05 x 10" dyne secn cm"2 andA = 4420°K when 6 $ S <: 600 sec"1 and 20 < T $ 50°C. The influence oftemperature for the Qunaba C molasses can be incorporated into Equation 2 bythe use of Equation 4
T = a e A/T n (5)
It must be emphasised that Equation 5 is only valid for the range of temperatureand shear rates for which a, A and n have been experimentally determined.
SCALE UP OF FUNDAMENTAL DATA
Fundamental shear stress-shear rate-temperature data can be scaled up tomost laminar flow geometries by use of the Robinowitsch-Mooney Equation (8) andthe appropriate geometric factors. For a power-law fluid in laminar pipe flowthe wall shear rate is defined by
8V,w 4n
(6)
where V = average velocity in the pipeD = pipe diameter
Since Equation 5 can be written for tha conditions at the wall of a pipe and

the wall shear stress is given by
w 4L (7)
substitution for T and S in Equation 5 using Equation 6 and 7 yields
n
wDAp4L a eA/T r/3n+l 8V.-.
U~4n~)CD~)J
or
T - V' <:'T — Ix oW
where K = a (
(8)
(9)
(9A)
and ST = e A/nT ,8V,
Specifically for the Qunaba C molasses
-4 n -1K' = 1.10 x 10 dyne sec cm (9B)
and S1 = e5260/T
Equation 9 represents a simple expression for calculation of the headlosses as a result of friction. If the constants defined by Equation 9B areemployed then the result is valid for a •Qunaba C molasses when6 sec"-"- <: S < 600 sec"1 and 22 £ T £ 50°C. Equation 9 is shown in comparisonto the experimental data for the Qunaba C molasses in Figure 3. Note that errorinvolved in the calculation of T from Equations 9 and 9B at no time exceeds4 % which is quite acceptable for design and process evaluation. Theequations are valid for laminar flow, i.e. when
NRe
< 2100 (10)
Process flows for most non-Newtonian fluids are in laminar flow.
MECHANICAL ENERGY BALANCE
Information like that presented in Figure 3 or by Equation 9 used inconjunction ^' h the Mechanical Energy Balance for a non-Newtonian fluid allows
stems to be analyzed. The Mechanical Energy Balance between twoLOW system for a power law fluid is given by
entirepoint
V, 2 V
where
-w =S
rj __
P =
a =
vw =S
1 P -P2 1
+ Ev (ID
vertical height above some arbitrary datum and g Z is thepotential energy per unit mass
pressure
(5n+3) = kinetic energy correction factor forpower law fluids3(3n+l)
friction losses per unit mass
shaft work per unit mass, positive when work done by system
The frictional loss term, E , can be split into two parts, a contributiondue to fully developed flows and a contribution due to losses in valves andfittings, etc.
v (12)
The fully developed frictional losses are determined from
(13)
where T^ is either defined by a plot like that shown in Figure 3 or by anexpression like Equation 9 at the known temperature and flow rate. At a fixedtemperature from Equation 8
= (32• 4n
pD1+n (14)
or in terms of the mass flow rate M
Ap_ = 32yL 4MDl+3n (15)
where K 8n-1
Relatively little if any data are available for determining the frictionallosses for laminar flow of non-Newtonian fluids through valves, bends andfittings. Therefore these losses might be approximated by Newtonian values inlaminar flow such as those listed in Perry (9) but even these values are farfrom complete so that establishment of excess losses in bends and fittings fornon-Newtonian fluids is largely guesswork. Fortunately for many large flowsystems these losses are very small compared to the losses in long straightsections and can be safely neglected in initial calculations although a smallallowance might be made in the final specification.
For many applications the change in kinetic energy is small compared to theother terms in the Mechanical Energy balance and
T-wD1+3lV
(16)
Example Problem
Consider the transfer of molasses from bulk storage to overhead storage asit occurs in one sugar mill. The molasses is transferred at environmentaltemperature and at a rate of 12 tons per hour through a 6 in. line over adistance of 50 ft. through a vertical lift of 30 ft. If the combined pump-motor efficiency is 50% estimate the power requirement? Assume p = 1.2 andT = 25°C.
Using the data presented
n = °'84 ? -9 n -2K = 3 x 10 dyne sec cm = 0.628 Ib sec ftD = 0.5 ftV = 0.51 ft sec-1
p = 74.8 Ib ft~3mThen N =1.27 and flow is laminar Figure 3 or Equation 8 and 9B can nowbe used. From Equations 9B and 9
S' = 3.73 x 10⁸ sec"1
T = (1.10 x 10~4)(3.73 x 10⁸)°'84 = 1.75 x 10³ dyne cm"2w
= 3.66 Ib ft"2
4i L ,Then E = —~ = 19.5 Ib,. ft Ib
v pD f m
If gAZ = 30 Ib, ft Ibf m-1
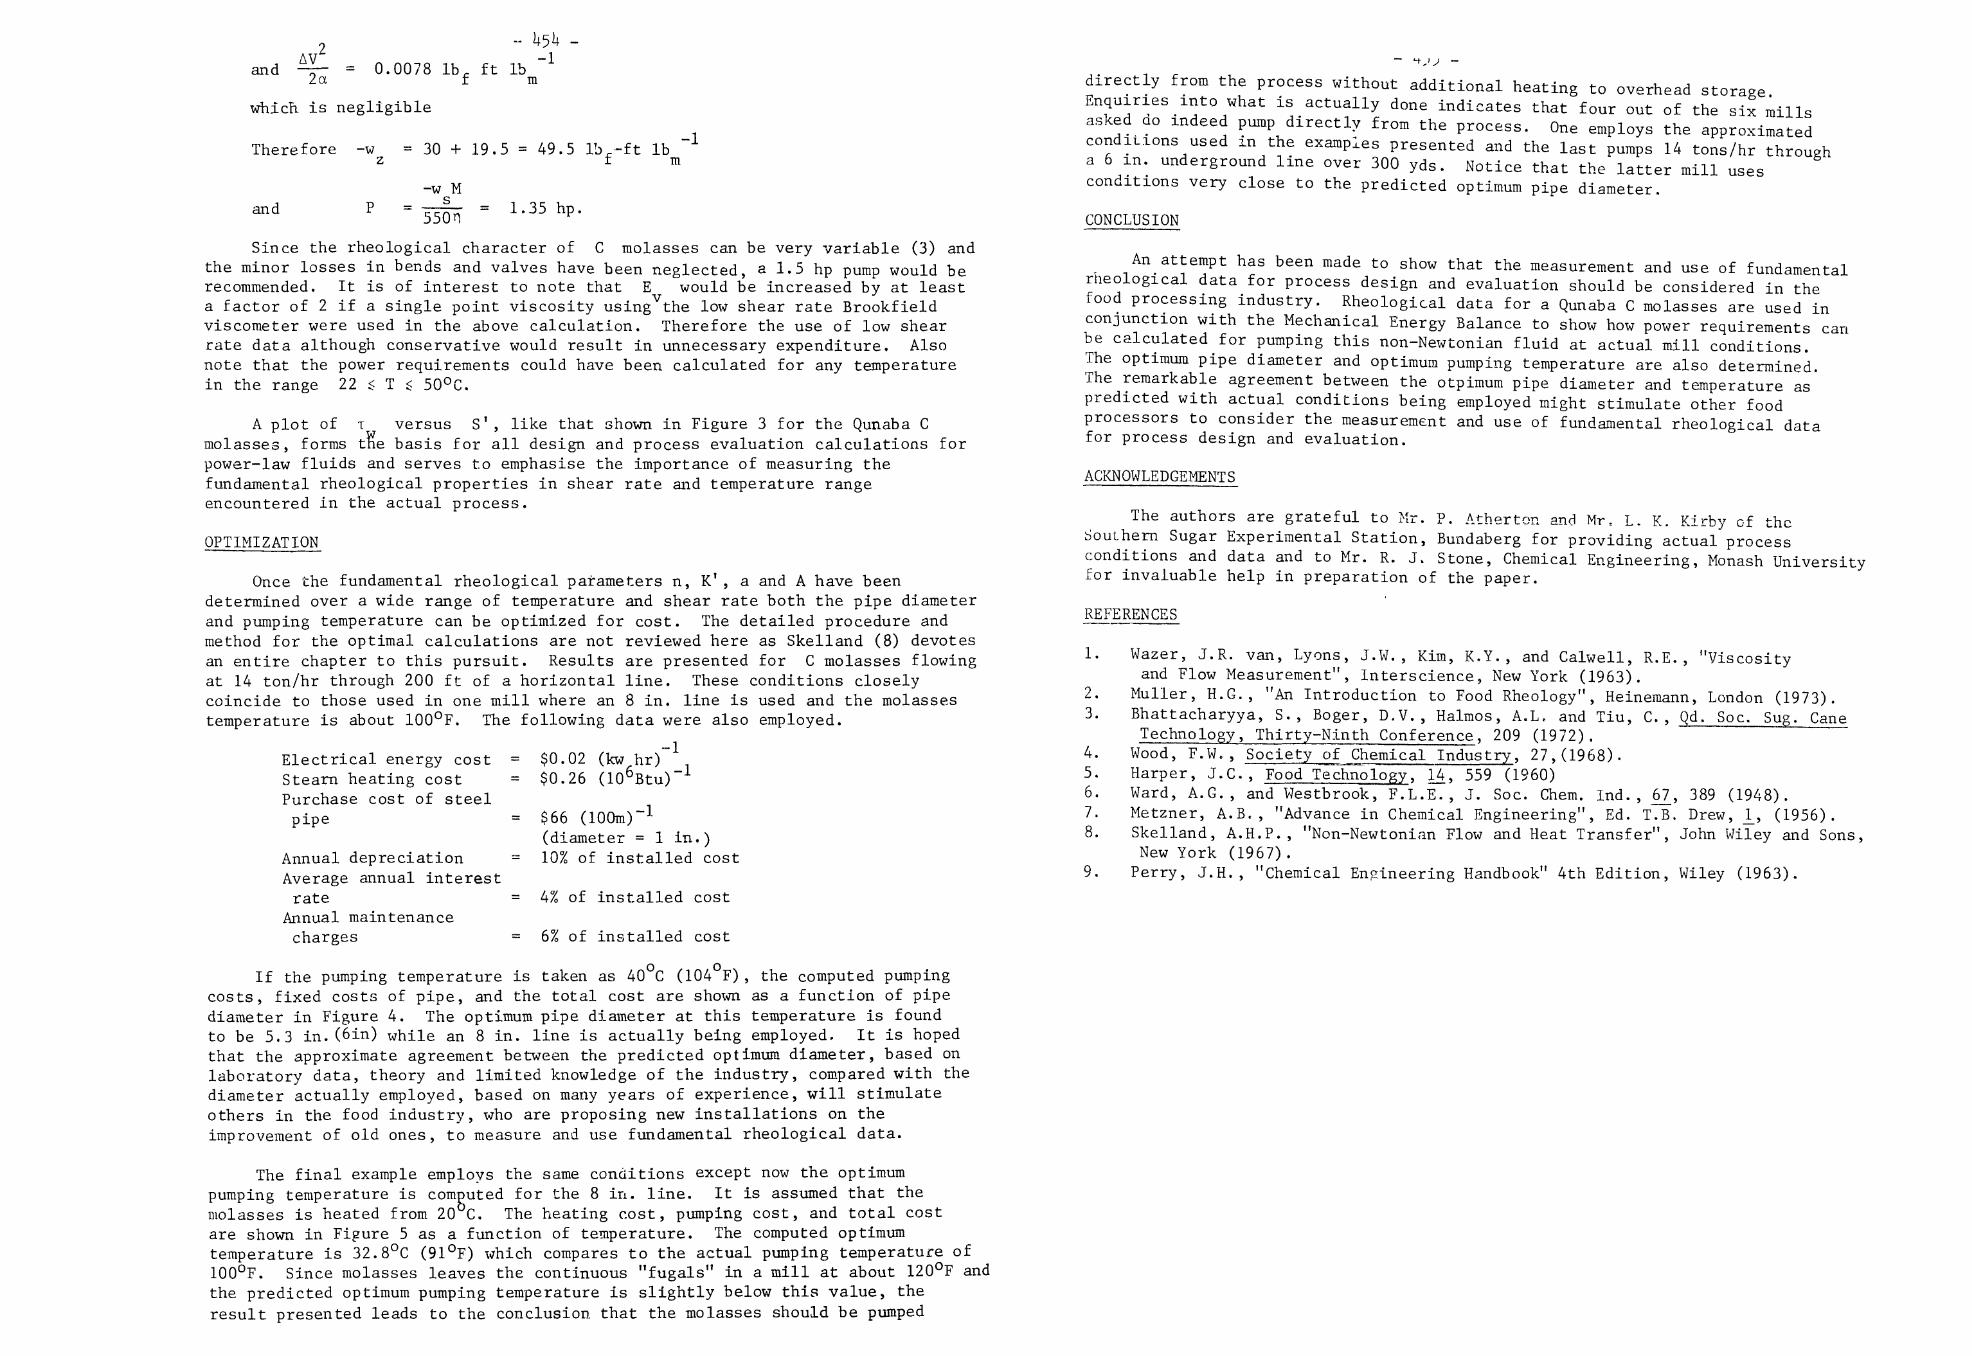
AV~ —1and ~- = 0.0078 Ib. ft Ib
2a f m
which is negligible
Therefore -w = 30 + 19.5 = 49.5 lb -ft Ibz f
and550n
= 1.35 hp,
Since the rheological character of C molasses can be very variable (3) andthe minor losses in bends and valves have been neglected, a 1.5 hp pump would berecommended. It is of interest to note that E would be increased by at least
"Va factor of 2 if a single point viscosity using the low shear rate Brookfieldviscometer were used in the above calculation. Therefore the use of low shearrate data although conservative would result in unnecessary expenditure. Alsonote that the power requirements could have been calculated for any temperaturein the range 22 <: T £ 50°C.
A plot of T versus S 1, like that shown in Figure 3 for the Qunaba Cmolasses, forms the basis for all design and process evaluation calculations forpower-law fluids and serves to emphasise the importance of measuring thefundamental rheological properties in shear rate and temperature rangeencountered in the actual process.
OPTIMIZATION
Once the fundamental rheological parameters n, K1, a and A have beendetermined over a wide range of temperature and shear rate both the pipe diameterand pumping temperature can be optimized for cost. The detailed procedure andmethod for the optimal calculations are not reviewed here as Skelland (8) devotesan entire chapter to this pursuit. Results are presented for C molasses flowingat 14 ton/hr through 200 ft of a horizontal line. These conditions closelycoincide to those used in one mill where an 8 in. line is used and the molassestemperature is about 100°F. The following data were also employed.
Electrical energy costStearn heating costPurchase cost of steelpipe
Annual depreciationAverage annual interestrate
Annual maintenancecharges
= $0.02 (kw hr)"1
= $0.26 (106Btu)~1
= $66 (100m)~]-(diameter = 1 in.)10% of installed cost
= 4% of installed cost
6% of installed cost
If the pumping temperature is taken as 40 C (104 F), the computed pumpingcosts, fixed costs of pipe, and the total cost are shox n as a function of pipediameter in Figure 4. The optimum pipe diameter at this temperature is foundto be 5.3 in.(6in) while an 8 in. line is actually being employed. It is hopedthat the approximate agreement between the predicted optimum diameter, based onlaboratory data, theory and limited knowledge of the industry, compared with thediameter actually employed, based on many years of experience, will stimulateothers in the food industry, who are proposing new installations on theimprovement of old ones, to measure and use fundamental rheological data.
The final example employs the same conditions except now the optimumpumping temperature is computed for the 8 in. line. It is assumed that themolasses is heated from 20 C. The heating cost, pumping cost, and total costare shown in Figure 5 as a function of temperature. The computed optimumtemperature is 32.8°C (91°F) which compares to the actual pumping temperature of100°F. Since molasses leaves the continuous "fugals" in a mill at about 120°F andthe predicted optimum pumping temperature is slightly below this value, theresult presented leads to the conclusion that the molasses should be pumped
directly from the process without additional heating to overhead storageEnquiries _into what is actually done indicates that four out of the six millsasked QO indeed pump directly from the process. One employs the approximatedconditions used in the examples presented and the last pumps 14 tons/hr througha 6 in. underground line over 300 yds. Notice that the latter mill usesconditions very close to the predicted optimum pipe diameter.
CONCLUSION
An attempt has been made to show that the measurement and use of fundamentalrheological data for process design and evaluation should be considered in thefood processing industry. Rheological data for a Qunaba C molasses are used inconjunction with the Mechanical Energy Balance to show how power requirements canbe calculated for pumping this non-Newtonian fluid at actual mill conditions.The optimum pipe diameter and optimum pumping temperature are also determined.The remarkable agreement between the otpimum pipe diameter and temperature aspredicted with actual conditions being employed might stimulate other foodprocessors to consider the measurement and use of fundamental rheological datafor process design and evaluation.
ACKNOWLEDGEMENTS
The authors are grateful to Mr. P. Atherton and Mr, L. K. Kirby of theSouthern Sugar Experimental Station, Bundaberg for providing actual processconditions and data and to Mr. R. J, Stone, Chemical Engineering, Monash Universityfor invaluable help in preparation of the paper.
REFERENCES
1.
2.3.
4.5.6.7.8.
9.
Wazer, J.R. van, Lyons, J.W. , Kim, K.Y. , and Calwell, R.E. , "Viscosityand Flow Measurement", Interscience, New York (1963).
Muller, H.G., "An Introduction to Food Rheology", Heinemann, London (1973).Bhattacharyya, S., Boger, D.V. , Halmos , A.L. and Tiu, C. , Qd. Soc. Sug. CaneTechnology, Thirty-Ninth Conference, 209 (1972).
Wood, F.W. , Society of Chemical Industry, 27, (1968).Harper, J.C., Food Technology, 14, 559 (1960)Ward, A.G., and Westbrook, F.L.E. , J. Soc. Chem. IndMetzner, A.B., "Advance in Chemical Engineering", Ed
6T_, 389 (1948).T.B. Drew, 1_, (1956)._
Skelland, A.H.P. , "Non-Newtonian Flow and Heat Transfer", John Wiley and Sons,New York (1967) .Perry, J.H. , "Chemical Engineering Handbook" 4th Edition, Wiley (1963).

I " I •• ^Hf "• ^^ ^^ | ••B ^Uf ^"^^ ^^F ^"^
Shear Rate S, sec'1

- 458 -
••«
II
h*
1
QUNABA C
o 22°C
p 35°C
.46°C
10
Total Costs, CT
Fixed costs on pipe
3 4 5
Diameter of pipe, inches
Figure 4 Variation of PJjxed Costs, Pumping Costs and TotalCost with. Pipe Diameter (Pumping Temperature = 40°C(104°F)).

National Chemical Engineering Conference 197!*
PROCESS INDUSTRIES IN AUSTRALIA IMPACT AND GROWTH
Surfers Paradise, Queensland
July 10 to 12th, 197
REVERSE OSMOSIS AND ULTRAFILTRATION FOR FOOD PROCESSING
3000
ou
0
Pumping Costs
Heating Costs
B.R. Smith
S U M M A R Y
Reverse osmosis and ultrafiltration as separationand concentration techniques are compared and contrasted.The available membranes and commercial modules aredescr"bed, and the various applications in the foodindui -ies which have been explored are listed. Theuse ol' these membrane methods to recover valuable by-products from whey, at the same time avoiding aserious pollution problem, is discussed and the costsof these processes compared with conventional vacuumevaporation, as used in the food industry, are reviewed.
Smith, CSIRO, Chemical Engineering.
Figure 5 Variation of Heating Costs, Pumping Costs and TotalCosts with Pumping Temperature (Pipe Diameter = 8 in.)

- 1*62 -
INTRODUCTION:
In the last fifteen years, reverse osmosis (RO) has moved from beinga laboratory curiosity to become an important commercial operation. Thisdevelopment is largely the result of the heavy expenditure by the U.S.Government on processes for water desalination. Leitner estimates thatthe total expenditure on reverse osmosis development since I960 is of theorder of US$ 10°. The technology of ultrafiltration (UF) has greatlybenefited from the developments in RO membrane technology, as UF and ROare similar processes in that they both use a memorane to retain somesolutes, and both use pressure to force solvent through the membrane.There are, however, significant differences.
RO membranes act as diffusive transport barriers, and are relativelyimpermeable to inorganic ions in solution, whereas UF membranes act asmolecular screens and only reject solutes of molecular weight greater thanapprox. 1000. RO membranes can be made in a range of permeabilities,and the more porous types probably act as molecular screens also. Forthe rejection of ions by RO membranes the osmooic pressure of the feedsolution (TT) is an important factor, whereas in UF, there is a negligiblysmall osmotic pressure difference across the membrane. For RO, then,the applied hydrostatic pressures must exceed the solution osmotic pressurebefore solvent flow begins, and this leads to much higher pressures(typically k MPa and higher - that's over 600 p.s.i.) being used for RO,compared with the pressures involved in UF (typically 1*0 - TOO kPa - that's6 - 100 p.s.i.)
iiIIiiIIitiiIi
"D_-» _ j_ _ * IIrroteinii. H
Salts Ojj Salts
Water [>j| Water_Jl
Salts
Water <
< IT
J Wat er
|
Salts
Water
P - IT
Water
Salts
Water [>
P > IT
Water
ULTRAFIL2RATION OSMOSIS EQUILIBRIUM REVERSE OSMOSIS
In UF, the permeation rate through the membrane is proportional tothe applied pressure to a first approximation, while in RO, the permeationrate is proportional to the difference between the applied pressure and theosmotic pressure of the feed solution.
MEMBRANES:
The original, and still most widely used RO membrane is made fromcellulose acetate cast as an asymmetric film . A membrane of this typeconsists of a very thin layer of dense polymer (about 0.2 y thick), withno pore structure detectable by the electron microscope at the 100 A° level,supported by a porous sub-layer about 100 y thick with pores ranging up to0.1* y diameter. Other polymers have been developed ^ with a view to over-coming some of the deficiencies of cellulose acetate as a material. Forexample, cellulose acetate membranes are subject to hydrolysis outside acertain pH range, and the membrane properties deteriorate. Aromaticpolyamides in the form of hollow fine fibres look promising for certainapplications. Cellulose acetate is also used for UF membranes, but is being
increasingly superseded by non-cellulosics with greater chemical resistanceand temperature stability.
MODULE DESIGN:
To be incorporated into a practical plant, the membrane has to beassembled into a unit or module, for connection to the feed stream. Thetransition from membrane to module has required solutions to a number ofdifficult engineering problems, and a number of designs are now in commercialproduction. In general, the membrane must be supported on a porous backing,in such a way as to withstand the operating pressures; a large membrane areamust be packed into the smallest volume, to minimize pressure vessel costs;and the feed channels need to be such that concentration polarisation andfouling are minimized without causing significant pressure drops in thefeed or product streams.
*Equipment is now available in six designs :
1. Plate-and-frame, similar in concept to a plate-and--frame filter press.This was the earliest design for experimental work, and has since beenput into commercial production by one company (Die Danske Sukkerfabrikker,D.D.S.).
2. Spiral wound, again an early design. Sandwiches of membrane, backingmaterial and feed-side spacer, sealed on three sides, are wrapped arounda porous product take-off tube, and the whole assembly inserted into apressure tube. (Gulf Environmental Systems).
3. Tubular design, membrane inside a porous tube which acts as its ownpressure vessel. In most designs, the module contains a bundle ofsuch tubes connected by end pieces into a series flow configuration.The porous tubes may be fibreglass, woven nylon, or perforated metal.(Many manufacturers, including Paterson Candy International, Havens,Abcor, etc. ).
1*. Tubular design, membrane outside a porous tube, with a bundle of suchtubes inside a pressure vessel. (Paterson Candy International).
5. Hollow fine fibre, no support, with a bundle of fibres inside apressure vessel. Here the fibres are so fine that they can withstandthe applied pressure unsupported, and although the permeation ratesthrough the dense polymer wall are low, such a large ^cribrane areacan be incorporated into a module that the overall performance is quitesatisfactory. (Du Pont, Dow, Monsanto).For ultrafiltration work, hollow fine fibres with an asymmetric polymerstructure have recently been developed.
6. An array of rectangular porous plates, membrane-covered on the outside,wjth the array set in a rectangular flow channel (Dorr-Oliver, UF only).
For work with food processing streams containing solids in suspension,designs 1, 3 and 6 appear to be the most satisfactory from the point of viewof membrane fouling, and hence cleaning and sanitation. Since most of thesedesigns were developed for water desalination, the ideal, module for foodprocessing may await commercial development. Lowe et al have developed alaboratory scale cell specifically for food processing.
* Slides will be used to illustrate these concepts.

GENERAL FEATURES OF MEMBRANE PROCESSES:
The general advantagesinclude:
membrane processes as separation techniques
1.
2.
3.
1.
2.
3.
no heat is required - thus heat-sensitive materials such as pharma-ceuticals, foods, etc., can be concentrated or fractionated at anysuitable temperature above the solvent freezing point;
modular design - which has economic advantages particularly at thesmall scale1, and
operation is inherently simple, and energy costs are low comparedwith evaporation.
The problems associated with membrane processes include:
fouling of the membrane surface by the feed solution, with consequentloss of performance;
chemical attack of the membrane material by components of the feedsolution; and
due to viscosity or osmotic pressure increases, there is a limiton the solution concentration .which can be achieved in some cases.
APPLICATIONS IN THE FOOD INDUSTRY:
The range of problems to which membrane processes have been appliedis very wide, since besides separation and concentration steps in thedirect production of foodstuffs., there are numerous waste water problemsin the food and allied industries where membrane processes can be used torecover a valuable by-product, to recover clean water for recycle, or tolower the BOD of the waste stream. To illustrate this versatility, someexamples can be described:
1. Fruit Juice Concentration:
The most important factor here is the ability of the membrane to retainaroma molecules. The problems in orange juice concentration by reverseosmosis derive from the pulp and pectine present in straight orangejuice which cause membrane blockage and increased viscosity. Olsen^mentions that a centrifugation step can be used to remove 2% wetsludge before reverse osmosis. These solids are later added to theconcentrate to give it the right texture and taste. Running costs(l97l)» including interest, depreciations and annual membrane replacement,for a plant concentrating 5 tons per hour to half its original volumewere stated to be about 65 i per m^ orange ^uice.
2. Cleaning and Concentration of Enzymes:
One of the established commercial applications for membrane processesis enzyme production. Dilute aqueous solutions can be concentratedat low temperatures, and with an appropriate choice of membrane porosity,undesirable low molecular weight solutes can be removed at the same time.
3. Concentration of Egg White:
Dehydration of egg white without affecting the whipping propertiesof the reconstituted product has proved difficult by conventionalmethods. Even with RO and UF, the shear conditions in the pressurerelief valve can be the cause of significant degradation. D.P.S. claim
- 1*65 -
to have solved this problem^, and to have a 6 ton per day plant incommercial operation.
U. Maple Sap Concentration:
Although not directly of interest in Australia, this work is possiblyrelevant to the cane sugar industry. Maple sap requires a 25- to kO-fold concentration to make maple syrup, and this is conventionally doneby evaporating at atmospheric pressure. Reverse osmosis can be used^to remove 75% of the water much more economically. The remainder ofthe concentration still has to be done by evaporation, as the flavouris developed by the heating. In any case, the osmotic pressure ofthe concentrate would be so high as to lead to a much reduced permeationrate.
5. Preconcentration and recovery:
Other applications described in the literature include the preconcentra-tion of tea and coffee extracts prior to spray drying?5 the treatment ofsoy whey and bean extracts^, and the use of UF to recover starch, etc.,from processing waste streams. With the discharge to sewers of highBOD wastes becoming more expensive, there will be an increasing numberof cases where membrane processes may be used to produce a concentratefor conventional treatment and a permeate for re-use or discharge.
6. Whey Utilization:
Increasing concern about environmental pollution, and changing economicconditions, have together led to interest in whey utilization. Wheyis a by-product of cheese and casein manufacture, and has usually beendischarged to waste, with a fraction being fed to pigs. The problemwith discharging whey to streams, etc., is its high BOD. A whey volumeof 100 m3/day is roughly equivalent in BOD to the domestic seweragefrom a city of 53,000 people. In Australia, about 1.6 million m.3 ofwhey are produced per annum, containing about 8000 tons of protein andabout 70,000 tons of lactose.
In 1970, a number of cheese and casein manufacturers formed theVictorian Whey Utilization Association, to support research and developmenton processes for the commercial utilization of whey. A sizeable researcheffort involves a collaborative group composed from the Dairy ResearchLaboratory of the CSIRO Division of Food Research, the Victorian Department ofAgriculture, and the CSIRO Division of Chemical Engineering.
Membrane processes play a key role in this work. UF can be used toremove protein from whole whey, and this can be dried for stock feed, orpossibly for human consumption. The UF permeate(containing lactose and salts)can be partially concentrated with RO prior to further processing to a varietyof products including lactose and lactose derivatives. RO can also be usedfor the concentration of whole whey, so as to minimize the costs of transport-ing from surrounding dairy factories to a central processing plant. The UFprocessing step is already at the semi-commercial level in Victoria, withthree UF plants of different design installed for comparative experimentsat the Cororooke factory of the Colac Dairying Company. The RO concentrationof whole whey is at the pilot plant stage with a 1-8 m2 membrane area plantat Werribee.

Whole whey ULTRAFILTRATION Protein concentrate
waterlactosesalts
VLow BOD water REY3RSE OSMOSIS Lactose concentrate
With "both processes, the major problem has "been membrane "blockage,with consequent lower throughput, and higher cleaning costs. The DairyResearch Laboratory has developed a method to alleviate the problem inUF, which may be due to the proteins present. In RO, there is theadditional possibility that inorganic salts such as calcium phosphate mayprecipitate at the surface of the membrane, where the concentration ofrejected salt is highest, and so cause membrane blockage.
The RO results on whole whey follow the relationship:
Flux = A. (time)B (1)
In equation (l), B is the "flux decline coefficient", which depends onthe fouling characteristics of the feed solution, the membrane properties,and the hydrodynamics at the membrane surface. The original performanceof the membrane can be regained by using an enzyme-detergent formulation.Baayens and Rosen ° have compared the various causes of flux decline,namely compaction of the membrane under pressure, hydrolysis of the polymer,conversion of the support layer to dense polymer, and fouling of themembrane by impurities, and have predicted the flux decline curves to beexpected in each case. They concluded that membrane compaction was theonly mechanism which would give results that fitted equation (l). Clearlyfurther long-term experiments are required with whole whey. This work iscontinuing.
PROCESS COSTS:
There is a considerable amount of cost information available for ROas a water desalination operation, but the data usually refer to muchlarger plant sizes than would "be expectt-i in the food processing industries.For example, the 680 m^ per day RO plant a4-. Greenfield, Iowa, is reported1^to produce water for 11 to 15 per m • These figures could well berelevant for high volume, dilute process streams, with additional allowancesfor cleaning costs, and more expensive ; jumps and piping. UF costs areexpected to be lower than RO costs because of the lower pressures involved.
For most food processing streams, however, permeation rates will belower because of higher viscosities and osmotic pressures, and membrane
fouling is an added uncertainty. Merson et al -11 estimated order ofmagnitude costs for concentrating 1+5 m^ per day of fruit juice from 10$to hO% solids with an RO process operating at pressures in excess of10 MPa. Their estimate was US$ 1-7 per nP of water removed. Porter andMichaels12 found that the costs of RO and UF competed favourably withother unit operations such as vacuum evaporation or freeze drying. Chianand Selldorf1^ compared UF costs with two-stage vacuum evaporation ofwhey, and found that total operating costs for UF were cheaper over a widerange of plant sizes, especially for smaller sized plants where themodular design of the membrane process was advantageous.
Peeler and Sitnai14, costed the batchwise dewatering of dilutecarbohydrate solutions from 5% to 20% solids using RO. This work isdirectly relevant to the whey utilization work mentioned above, and thebasic feed capacity studied was 1 -0 m^ per day. For three modules (eachwith membrane area 1«7 m - ) in series, operating at U.8l MPa, the totalpermeate removal cost was approximately A$ 2-1 per m3, with the largestcomponent being labour charges. At five times the basic feed capacity,the cost drops to A$ I>k per m3. The authors concluded that - "The costsseem competitive when compared, at the same capacity, to vacuum evapora-tion as currently practised in the food processing industry. The relation-ships between operating pressure, flux and cost of membranes must becarefully examined in long term experiments to enable optimal design ofa commercial plant".
Overall, it must be concluded that RO and UF will almost certainlyfind increasing application in the food and related industries.
REFERENCES:
1. G.F. Leitner, "Process water recovery and re-use by RO",A.I.Ch.E. 73rd National Meeting, Minneapolis, 28-8-72.
2. S. Loeb and S. Sourirajan, UCLA Water Resources Center ReportWRCC-3H, (i960).
3. B.R. Smith, "Reverse Osmosis Membranes", Proc. R.A.C.I., fro, 257, (1973)
U. E. Lowe et al. , "A reverse osmosis unit for food use", Food Technology,_22, 915, (1968).
5. O.J. Olsen, Proceedings of Conference on RO and UF, held at ChemicalCentre, Lund University, 17-5-71, Page 8l.
6. C.O. Willits et al., Food Technology, 21, 2k, (1967).
7. J.C. Underwood and C.O. Willits, Food Technology, 23., 787, (1969).
8.- R.L. Goldsmith et al. , A.I. Ch.E. Symposium Series, 68., (120), 7, (1972)
9. L. Baayens and S.L. Rosen, J. Appl. Pol. Sci. , l6_ (3), 663, (1972).
10. D.H. Moore, Journal AWWA, November 1972, p.?8l.
11. R.L. Merson et al., Dechema-Monographien, Vol. 63, p.1125.
12. M.C. Porter and A.S. Michaels, Chem Tech., April 1971» P-2U8.
13. E.S.K. Chian and J.T. Selldorf, Process Biochem., September 1969, p.^7.
Ih. J.P.K. Peeler and 0. Sitnai, CSIRO Division of Chemical EngineeringReport No. CE/R-38. To be published in J. Food Science.

- U68 -I. INTRODUCTION
National Chemical Engineering Conference 1974Large quantities of both cheese and casein whey are. produced as a by product
rf dairy operations in many countries. Table 1 shows a summary of dairy wheyproduction on a world-wide basis. Typical compositions of cheese and casein"wheyarc shown in Table 2.
PROCESS INDUSTRIES IN AUSTRALIA
Surfers Paradise,
IMPACT AND GROWTH TABLE 1.WORLD WHEY PRODUCTION
Queensland
July 10 to 12th, 1974
AEROBIC BIOLOGICAL TREATMENT OF ANAEROBICALLY
DIGESTED WHEY
by
G.,7. Sawards and G . A o Holder
S U M M A R Y
A two state biological treatment process has been proposed for thetreatment of whey discharged by cheese and casein factories. Thesystem consists of high-rate anaerobic digestion followed by aerobicstabilization of the waste in a conventional activated sludge unit.
This work embodies only the determination of the kinetic parametersdescribing the second stage - the aerobic biological process. Therelationships chosen to describe the system were based on the wellknown Mcnod empirical model describing biological oxidation processes
G. Sewards _ r. „, . -, ^ . • ^ i , ., Department of Chemical Engineering, Monash University/i • riO-LQGl-
Counl Quantity, (Metric Tons/Annul?.)
U.S.A.FranceRussiaGermanyItalyNew ZealandNetherlands
8,100,0006,900,0004,100,0004,000,0002,700,2:0
2, 250,' 000Argentine 2,000,000
1 Australiai U.K.i Canadaj
j Denmark
1,600,0301,100,0001,000,000920,000
* From cheese production only,
TABLE 2.TYPICAL COMPOSITIONS OF CHEESE AND CASEINWHEY
: ComponentCheddar Cheese
Whey% W
Acid CaseiniWhey% w"
WaterFatProteinAshLactoseLactic Acid
93,20.30.90.54.90.2
93.20.11.00,75.1
—
TABLE 3.END-USAGE OF WHEY IN VICTORIA
Pig FoodFertilizerEffluent toEffluent toEffluent to
•
land disposalstreams, lakes,town sewerage
42%19%15%13%7%
TABLE 4.CHARACTERISTICS OF WHEY AS THEY AFFECTPOLLUTION AND BIOLOGICAL TREATMENT
ComponentLactoseProteinPhosphorusNitrogenBODr , t
5-dayCOD
Concentration, mg/1 'i 50,000
9,000150
1,50032,000
26,000t 5-day biochemical oxygen demand* Chemical oxygen demand, 10 minutes
boiling with potassium permanganate.
Many useful food products such asprotein concentrates, yeast, lactose,lactic acid, and various feed supple-ments can be produced from whey 2 3 4_Unfortunately however, many dairiesare too isolated and small to make thecollection and processing of the wheveconomically attractive. In thesecases they whey is regarded merely asa strong organic liquid effluent whichhas to be disposed of as cheaply aspossible without causing too muchpollution. The extent of the disposalproblem in Victoria, Australia isillustrated by Table 3 v.7hich shows ananalysis of the local end-usage of whey,and Table 4 which shows the character-istics of whey as they affect pollutionand biological treatment.
One convenient means of disposing ofstrong organic effluent such as wheyis by biological degradation in a two-stage treatment process as outlined inFigure 1. In the first stage the bio-logical oxygen demand (B.O.D.) of thewhey can be readily reduced from ahout32,000 mg/1 to about 1,000 mg/1. Theproduct from the first stage is thengiven an aerobic treatment in a secondreactor where the B.O.D. is furtherreduced to about 100 mg/1. Theadvantage of the two stage anaerobic--aerobic process is that a usefulproduct (methane) is produced in thefirst (anaerobic) stage whilst thesecond (aerobic) stage is the moreefficient for producing effluent witha low B.O.D. If sufficient methaneis produced in the first stage then,in principle, this methane can be usedas a fuel to power all the equipmentand heating requirements for the twostages. In principle then, a smallself-powered two-stage disposal unitcould be operated.
The purpose of the present investiga-tion :.s to obtain kinetic data forthe processes involved. This dataallows the. design of the treatment unit;to be made on a more scientific basis.The present paper described the deter-mination of kinetic parameters for the
second stage (i.e. aerobic treatment)nrocesfl onlv.

JI. EXPERIMENTAL
A. Equipment
The apparatus used is shown diagramatically in Figure. 2.equipment are :
The main items of
(1)(2)(3)CO(5)(6)(7)(8)(9)
Anaerobically digested -They feed tar.kFeed Pump10 litre capacity 3c.ra:ioa tar.V
litr. Co. pi
Sludge return pumpEffluent collection vesselDissolved oxygen meterOxygen diffusersMagnetic stirrer.
E. Procedure
The feed was obtained from an anaerobic digester fed at a low rate with, dairywhey. The solids were usually removed b}' centrifugation before the anaerobiceffluent ^as fed to the. activated sludge unit.
The five-day 20 C BOD was determined in all cases using a HACK ManometricApparatus, shown in Figure 3. Total suspended and volatile solids wereanalyzed according to the procedure given in Standard Methods The temperatureof the unit was maintained between 18°C and 22 C, room temperature. It is notnecessary to supplement the feed with any essential nutrients, for the ratio BOD : NP was adequate. A typical analysis of the anaerobic feed composition is given inTable 5.
TABLE 5.
TYPICAL DIGESTED WHEY FEED
ComponentBOD 5BODvss.j.NII3_NNO3 ~N
•
Concentration mg/1134,000,000 ;120 :600 i
t Volatile Suspended Solids
III. THEORY
A. Mathematical Model
In order to describe the overall process mathematically a set of equationshas to be compiled, by making assumptions about the processes which occur insidethe reactor. All of the basic aerations used in this paper have been frequentlyused in the waste-tree tin ant literature, sic equations used together withthe basis for their formulation are described in turn below.
(i) Gross Growth Rate
It is assumed that within the reactor there exist active (or viable) cells ofconcentration Xa mg/1 which increase in cellular mass at a rate directly proportionalto their cellular mass at any time, i.e.
,dXa, /1 \( ) = yXa v.i /dt ,synthesis
(ii) Wastage of Active Cells (Endogenous Respiration)
The effect of endogenous respiration and cellular death on the total microbialpopulation is allowed for by means of the equation
(dXl) = ,-b Y (2)dt , l adecay
(iii) Net Growth rate
Combining equation (1) and ( 2 ) , an expression for the net growth rate isobtained
,dXax , , Xanet (3)
(ivj Effect of Substrate Concentration on Cellular Growth Rate.
The kinetic model most widely accepted in waste treatment engineering todescribe the relationship between the limiting nutrient concentration and growthrate is due to Monod '. Waste treatment engineers have found it convenient touse oxygen demands, either chemical or biological, as growth limiting substrates.
_ yMS
(4)
(v)
K+S
_G_rowth yield
Monod expressed the relationship between the mass of bacteria produced and themass CL substrate utilized by a direct proportionality
,dXa
synthesis
dsdt (5)
(vi) Active and Volatile Solids
A variety of methods exist for the determination of the concentration of activesolids in the sludge mass. If the culture were pure and free of other suspendedmatter, the total weight of suspended matter might suffice. However, the flocculentmass obtained in treatment tanks comprises not only living cells, but also non-livingorganic matter and often some inorganic or biologically inert matter.
If the rate of production of non-living, but previously active, matter is ina simple proportion to the rate of breakdown due cell lysis and endogenous respirationthen
dX
dt= b0 X2 a (6)
The net rate of production of volatile solids would then encompass the threeterms previously discussed :- production of living cells, metabolism of livingorganic matter, and production of non-living organic matter. Thus
dX,= yX b, X +
1 a_ X2 adt ' a
Equation (8) groups the endogenous respiration terms
b = b 1 2
(7)
(8)
and so equation (7) becomes
dT - (y - b) xaor dX
dF dt
(9)
(10)
Combining equations (2) and (4), the net production of active cells is given by
(IDdt NET
V— Xa - bl Xa
At zero substrate concentration, S = 0, equation 11 reduces to equation 2. Similarly,au expression of the net rate of production is obtained for equations (1),(4)(5) and(10).

(vii) Rate of utilization of dissolved oxygen.
Oxygen is required both for synthesis, indirectly, and for endogenous respir-ation, directly. Assuming a direct proportionality, the oxygen required is relatedto the rate of synthesis of protoplasm and to the rate of endogenous respiration. Thus
19. = !§.dt ~ al dt >0 X3 a (13)
(viii) Substrate Removal Kinetics
Combining equation (1), (4), (5), the removal of organic matter can be expressedas
_dS_dt
Xa (14)Y K+S
(ix) Methods of Approach
A close look at equation (14) is warranted in order to discuss and examine thevarious methods of approach that have been used to analyze waste treatment systems.
Q
McKinney assumed chat at high 'micro-organism concentrations5 and with allother nutrients in excess, the rate of removal of substrate was first order i.e.
dS-— = - k, Sdt 1
(15)
It x^as assumed that the active cell concentration remained constant and thatK»S, so that
Va(16)
9 10Eckenfelder and Keshavan et al. used a modified expression. A pseudo-second order equation was postulated for low substrate concentrations
(17)dt a
The active cell concentration was recognized as a variable, not as a constant.
Middlebrooks and Garland used equation (I4)for their analysis of the data,and presented some interesting graphs which allowed for the calculation of the twoconstants y_. and K.
M
One factor is common, however, in the methods employed by these three workers.In all cases, the total volatile solids concentration was substituted for the activecell concentration, without allowing for the presence of non-living organic matter.Depending on the state of the activated sludge, the proportion of active cells inthe volatile sludge mass could be as low as ten per cent. These investigators had,in effect, modified equation (10) to yield an equation of the form
dt dt T(18)
and the coefficient 6 was referred to as the specific decay rate. It can readilybe seen that $ will in fact be very much dependent on the active cell concentration,which in turn will depend on the state of the culture and therefore on sludge age.
This could account for the wide scatter of results obtained by various research-ers with a system which is assumed to be easily reproducible. A direct or indirectmethod of estimating the active cell concentration is required before much faith beplaced on the results obtained with any of the discussed methods.
Another item which needs some clarification is the definition of the effluentsubstrate concentration. If the process is evaluated in terms of biological oxygendemand, it must be realized that the total oxygen demand is related not only to theconcentration of soluble organic matter in the effluent, but also to the concentra-tion of curtive cells, since these cells will also require oxygen to meet their normalrequirements for endogenous respiration. Thus, the effluent BOD,, can be evaluatedas follows i
= S + b, X4 a (19)
Bearing these points in mind, the analysis presented in equations (1) to (19)will be used to interpret experimental results obtained with a laboratory activatedsludge unit.
Estimation of bB. Evaluation of Parameters
•1The oxygen utilization by the sludge as a function of time provides an estima-
tion of the endogenous respiration or specific organism decay rate constant, bThe sludge was separated from the supernatant by centrifugation and washed twicebefore placing in the manometric apparatus for the determination of its oxygen up-take rate.
•j Q
In equation (13), if S = 0, -r— will also equal zero, and so
dt •*3 (20)
Mow, since the biological process in the BOD bottle is a batch operation, equation(2) will apply. Integration of this equation leads to
Substituting equation (21) into (20) yields :-
dObQ (X ) eat 3 a o
Using the oxygen uptake data, .the slope of the curve,dO_dt'
(22)
can be obtained.A plot of the logarithm of this value versus time yields an estimate of b1 , as wellas an estimate of the aggregate b., (X ) ,
,j 3. O
Estimation of Y and b0For this purpose, a special experimental run was carried out, commencing at
very low solids concentration. This permitted the initial assumption that theactive cell concentration at the start of the run was close to zero. / ter aperiod during which a low feed rate was employed, the concentration of volatile solidswas measured, and the substrate utilization rate was estimated, A further feedingperiod was conducted, and once again the volatile solids and substrate concentrationswere determined.
The second assumption made was that, over the short feeding periods, the increasein active cell concentration was equal to the increase in volatile solids concentra-tion. The short periods of aeration would not enable a large amount of non-livingorganic material to accumuxate. Thus, equation (10) could be rewirtten as :
At
AX_ a _ Y _AS_At ~ At
(23)
By use of ecmation (23), renumbering that estimates of Xfl, AX , AS and bj areavailable, two independent estimates of the yield constant Y are obtained. Ifdata are also obtained relating to the oxygen uptake of the sludge withdrawn at tfitend of each experiment, the value of b3 (Xa)Q of equation (21) can be determined.The value bo can then be estimated.
Estimate of b
Substitution of equation (21) into equation (12), with S = 0, yields
d XT= - b (X ) e - b. t
a o 1(24)
dt
Integration of equation (24) gives
XT -(25)

Substituting for boundary conditions, t = o, X •- (X ) ,
XT =I ~ 11 - e 1
(26)
Thus b was evaluated by measuring X as a function of time in a batch reactor.
Estimation of b.-2
Direct use of equation (8) enables b« to be calculated from
b2 = bl ~b
Estimation of 3
(27)
Integration of equation (18) with S = 0, and suitable boundary conditions gives
XT - (XT)Q e ~3t (28)
Batch data of the variation of X with time plotted on suitable co-ordinatesgives an estimate of 3-
Estimation of K
The oxygen uptake by the supernatant can be obtained from equation (13) bysetting a1 r. » b~ Xa, since the active cell concentration in tb.p supernatant willbe very small. Thus, from equation (13) -
dOdt
dS_dt
Substituting from equation (14) yields
do ai adt Y (K + S)
(29)
(30)
This equation can be presented in a more convenient form by inverting bothsides.
YKdO/dt a1
(31)
Values for dO/dt and S can be obtained from the supernatant oxygen uptake databy estimating the initial uptake, i.e., the oxygen utilization rate when theconcentration of biodegradable organic material is still given by its BOD. Then,a plot of 1 versus 1_ will yield a straight line and an estimate of K can be
dO/dt Sobtained by dividing the value of the slope of the line by the Y- intercept.
Estimation of y,,, MAn analogue computer simulation technique was employed in order to obtain
estimates of y and simulate the result obtained in the transient response of theunit. All parameters except the maximum specific growth rate have been estimated,therefore suitable fittings of the transient data by use of equations (11) , (12)and (14) will yield estimates of y .
IV. RESULTS AND DISCUSSION
The experimental data obtained was subdivided and reorganized to form 27different sets of data. The results calculated by the method outlined previouslyare as follows :
1. b. and b,,(X )1 3 a o
Run No .
123
-1bL (days )
0.3100.3150.325
4 ' 0.36056
0.3150.325
b x (mg. r1
j cl
501553080
112200
day"1.) 1
!
Y and b
Data from runs 10 and 11 yielded the following :
With data from runs 7 to 9., results were calculated as
b X (mg/l/day)
Data from run No. 13 is shown be]ow, together with the calculated values for b4
rST (mg/1)
14033575408325161
S (mg/1)
228023510
XQ (mg/1)a.
3209902381280719515
ib4
0.370.330.320.320.460.30
5. K
Data from run 12 plotted according to equation (31) yielded ;
K = 40 mg/1
Whenever estimates of Xa, were available, the simulation technique involvedonly searching for a suitable value of y™. Otherwise; a trial and error procedurewas required to determine a value for X as well. The results obtained aresummarised below.
Run No.
141516171819202122
! 23i 24
252627
MM (days )
4.04.04.04.04.04.04.04.04.04.04.03.05.02.5
Table 7 lists the parameters involved and the average estimates obtained.

-- 1*76 -TABLE 7
ESTIMATED PARAMETER VALUES
Parameter f '.Symbol - Value ; Units
yM 4'°K i 40.0Yblb2bb3bA
0.450.320.140.180.160.33
days~lmg/1dim.days~ldays"1
days"days"1
dim.
Table 8 tabulates results obtained by other researchers with various activatedsludge units fed with a number of different wastes.
TABLE 8
ACTIVATED SLUDGE BIOLOGICAL CONSTANTS
Authority Substrate
Graml^ Skim MilkStack13
Eckenf elder1^Drydenl^
; Pearson-| Haas16
GlucosePharmaceuticalChemical
Sewage
(days )Y
2.5 • 0.481.3
—-
-
0.420.650.77
0.45
K(mg/1)100355
—-
-
(days ) :0.0450.087_
0.200
0.05
The nature of endogenous respiration has for a long time been a puzzle. Theso-called "specific organism decay rate constant", or "endogenous respirationconstant" has always been the parameter by which the endogenous respiration character-istics of a system have been defined. Dependence of this constant on sludge ageand food to micro-organism ratios have been reported. (17) (18) It is clear thatdetailed investigation of endogenous respiration must await the development ofreliable methods for measuring the active cell concentrations. The commonly-madeassumption that the concentration of active cells is equal to the concentration ofvolatile suspended solids is often very inaccurate.
An indirect method of determining the active cell concentration has beendeveloped during the course of this work. Specific organism decay rate constantshave been established for a range of active cell concentrations. These concentra-tions are in a direct relationship to the food to micro-organism ratios and to sludgeage. The results obtained for the specific organism decay rate constant, b,, areplotted in Figure 4, as a function of the active cell concentration, Xa. Table 9shows the relationships between the decay rate constant, b^, the active cells andvolatile solids concentrations, Xa and Xrj., and the decay rate constant based onvolatile suspended solids, 3.
TABLE 9
RELATIONSHIPS BETWEEN X , XT AND 6
Xa(mg/1)990
7203202385151280
XT(mg/1)136010200647C42875661320
(days )0.315
0.3150.3100.3250.3600.325
• '•""• ' -•-— — • •—-•••»
(days )0.1150.0480.110----
(2)
Two conclusions can be drawn from this data :-
The specific organism decay rate constant appears to be independentof the active cell concentration and hence of sludge age and food tomicroorganism ratios.
The decay coefficient based on volatile suspended solids is not constantIt is dependent entirely on the state of the culture, which defines therelation between the active cell and volatile solids concentrations.
Further work to determine the relationship between b. andC-TT-dKI/^ -*-
19
X is of coursedesirable.
Adams and Eckenfelder ", working on transient state responses of activatedsludge units, concluded that the pseudo second order rate coefficient, kls which isdirectly proportional to UM, appears to increase under transient conditions. Thiswas attributed to varying proportions of different organisms generated by differentsets of conditions. However, some of the shock loadings to which their units weresubjected were as much as 40 times the normal loading rate. The conditions underwhich the authors' experimental equipment was run were usually very close to steadystate, and hence it was assumed that the system responded as it would under steadystate conditions.
20It has been shown by other workers that the transient behaviour of a
continuous culture flow system could be successfully predicted using the Monodequation. Consequently, an analysis of transient behaviour can result in a satis-factory value of UM. However, the experimental conditions will in each case determinewhether the transient approach is valid or not.
t
Summarizing briefly, the kinetic and stoichiometric characteristics describingan activated sludge unit receiving organic wastes can be determined experimentally bylaboratory-scale work, utilizing the procedures described within the text. Transientstate experimental runs would be conducted, and analysis will be aided by use of amanometric apparatus for determining the oxygen utilization rate of both soluble sub-strates and mixed liquors; and by the use of an analog simulation technique. Completecharacterization of a system could be accomplished in a matter of a few weeks.
The previous section provides tabulated data for other activated sludge, systems.Comparison is seen to be quite favourable in most cases.
alb
b3b4k
K0SSIT'
t
YXaxeT3yyM
NOMENCLATURESynthesis oxygen uptake rate constant, dimensionless.Decay rate constant, day"1.Specific organism decay rate constant, day" .Rate constant for production of non living organicmatter, day"1. ,Endogenous respiration oxygen uptake rate constant, dayActive cell BOD constant, dimensionless.First order rate constant, day .Pseudo-second order rate constant, 1/mg-day.Saturation constant, mg/1.Dissolved oxygen concentration, mg/1.Soluble substrate concentration, mg/1.Total substrate concentration, mg/1.Time, day.Yield constant, dimensionless.Active cell concentration in aeration tank, mg/1.Non-living organic solids concentration, mg/1,Volatile suspended solids concentration, mg/1.
Volatile solids decay rate constant, daySpecific growth rate coefficient, day" , Maximum specific growth rate constant, day
Subscriptso : Initial conditions, at t = 0.
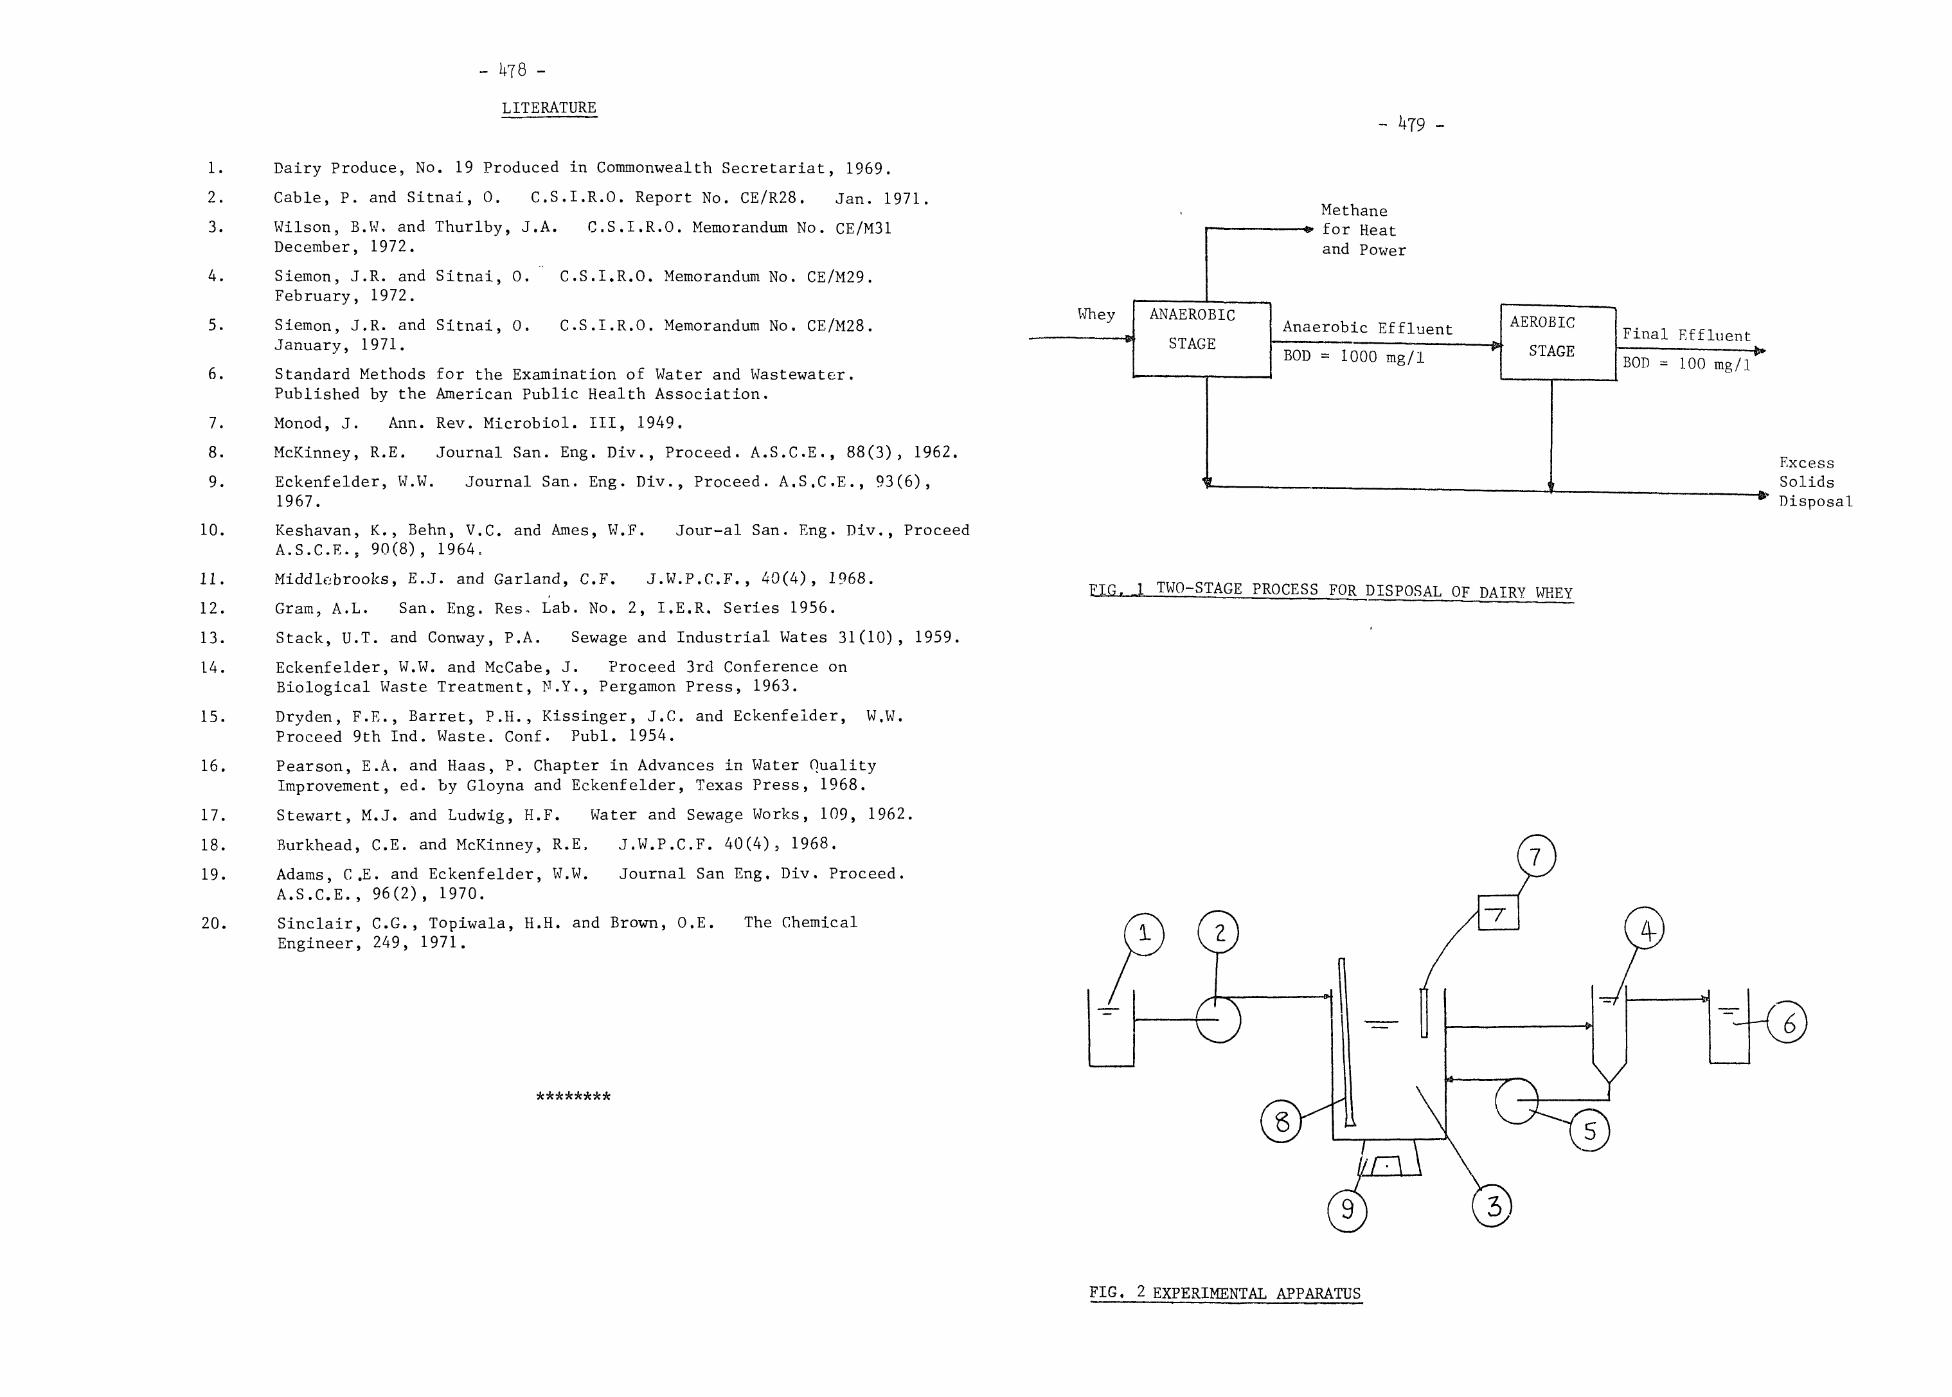
- UT8 -
LITERATURE
1. Dairy Produce, No. 19 Produced in Commonwealth Secretariat, 1969.
2. Cable, P. and Sitnai, 0. C.S.I.R.O. Report No. CE/R28. Jan. 1971.
3. Wilson, B.W, and Thurlby, J.A. C.S.I.R.O. Memorandum No. CE/M31December, 1972.
4. Siemon, J.R. and Sitnai, 0. C.S.I.R.O. Memorandum No. CE/M29.February, 1972.
5. Siemon, J.R. and Sitnai, 0. C.S.I.R.O. Memorandum No. CE/M28.January, 1971.
6. Standard Methods for the Examination of Water and Wastewater.Published by the American Public Health Association.
7. Monod, J. Ann. Rev. Microbiol. Ill, 1949.
8. McKinney, R.E. Journal San. Eng. Div., Proceed. A.S.C.E., 88(3), 1962.
9. Eckenfelder, W.W. Journal San. Eng. Div., Proceed. A.S.C.E., 93(6),1967.
10. Keshavan, K., Behn, V.C. and Ames, W.F. Jour-al San. Eng. Div., ProceedA.S.C.E., 90(8), 1964,
11. Middlebrooks, E.J. and Garland, C.F. J.W.P.C.F., 40(4), 1968.
12. Gram, A.L. San. Eng. Res, Lab. No. 2, I.E.R. Series 1956.
13. Stack, U.T. and Conway, P.A. Sewage and Industrial Wates 31(10), 1959.
14. Eckenfelder, W.W. and McCabe, J. Proceed 3rd Conference onBiological Waste Treatment, N.Y., Pergamon Press, 1963.
15. Dryden, F.E., Barret, P.H., Kissinger, J.C. and Eckenfelder, W.W.Proceed 9th Ind. Waste. Conf. Publ. 1954.
16. Pearson, E.A. and Haas, P. Chapter in Advances in Water QualityImprovement, ed. by Gloyna and Eckenfelder, Texas Press, 1968.
17. Stewart, M.J. and Ludwig, H.F. Water and Sewage Works, 109, 1962.
18. Burkhead, C.E. and McKinney, R.E, J.W.P.C.F. 40(4), 1968.
19. Adams, C.E. and Eckenfelder, W.W. Journal San Eng. Div. Proceed.A.S.C.E., 96(2), 1970.
20. Sinclair, C.G., Topiwala, H.H. and Brown, O.E. The ChemicalEngineer, 249, 1971.
********
Whey ANAEROBIC
STAGE
Methanefor Heatand Power
Anaerobic Effluent
BOD = 1000 mg/1
AEROBIC
STAGEFinal Effluent
BOD = 100 mg/1
ExcessSolidsDisposal
FIG. .1 TWO-STAGE PROCESS FOR DISPOSAL OF DAIRY WHEY
FIG, 2 EXPERIMENTAL APPARATUS

- U80 -
SCREW CLAMP(CLOSED DURING OPERATION)
RUBBER TUBING
VINYL TUBING
SAMPLE BOTTLE
WICK ASSEMBLY(WICK MOISTENED WITH
POTASSIUM HYDROXIDE)
DIRECT READINGSCALE
SEWAGE SAMPLE(157ml)
MERCURY MANOMETER
MERCURY
National Chemical Engineering Conference J.974
PROCESS INDUSTRIES IN AUSTRALIA IMPACT AND GROWTH
Surfers Paradise, Queensland
July 10 to 12th, 1974
THE AUSTRALIAN REVERSING SPIN FLAME STERILIZER
by
Donald John Casimir
INTERNAL STIRRING MAGNET MANOMETER RESERVOIRS U M M A R Y
FIGURE 3 MANOMETRIC B.O.D. APPARATUS
0.4 .
en
4-1cnaoo014Jcfl
0.2
o(UP
003
•Ha
oM
o•HU-t•HOQJaw 0 1 1 1 I I I
0 200 400 600 800 1000 1200
Active cell concentration (mg/1)
FIGURE 4. Relationship between active cell concentration andthe specific organism decay rate constant
The CSIRO Division of Food Research has been actively engagedfor many years in developing techniques for reducing the.severity of the thermal process applied to canned foods, toimprove the quality of these products. This objective hasbeen largely achieved by increasing the rate of heat transferinto and out of the cans by agitating the contents.
Direct heating of canned foods in flames was pioneered inFrance but the use of vigorous agitation of the can contentsis an Australian development which has extended the applic-ation of flame sterilization to many high viscosity foodproducts such as milk custards, and spaghetti and beans intomato sauce.
Design parameters and the operating characteristics of acontinuous reversing-spin flame sterilizer built at theCSIRO Division of Food Research will be described. Theeconomics of the process, product formulations and con-tainer requirements will also be discussed.
Casimir, CSIRO, Division of Food Research.,,

- 1*82 -
Introduction
To survive man must eat and hence one of mans oldest concernsis the preservation of foods that are only in abundance on aseasonal basis. The primary purpose of processing foods, is toprevent the food from becoming inedible from the time it isharvested or compounded in a factory until the time it is con-sumed .
Food has been stabilized by many procedures, for example,freezing, drying, concentrating, pickling, salting and, heatsterilizing. The fact that some 10 cans of food are heatsterilized each year attests the safety and commercial importanceof this process.
Whenever a food is subjected to a thermal process its nutri-tive value, flavour, colour and texture, all of which contributeto acceptability are affected by :-
1. The speed with which the highest temperature is reached,
2. The time the food is held at this temperature, ,-x.id
3. The speed with which the lowest temperature is reached,i.e. the speed of cooling.
Therefore when selecting a thermal process we must alwaysbear in mind the necessity to produce a microbiologically stableproduct, with minimum alteration of the food's natural attributeswith respect to nutrition and quality.
The CSIRO Division of Food Research has been engaged for manyyears in developing techniques for increasing the rapidity anduniformity of heating and cooling of canned products.
The problem is essentially one of increasing the rate of heattransfer to the can wall and removing this heat from the insidesurface of the can wall to the product at such a rate tha'c the filmof product adjacent to the wall does not "burn-on" or degradeappreciably in quality.
Saturated steam at various pressures is the common heatingmedium, but water, organic vapours, air, fluidised beds of hotparticles, and flames have also been used.
Potential of various heating media
Some idea as to the potential of various heating media may beobtained by considering the heat transfer coefficients and thetemperature differences that can be used in commercial practice.
The values in Table 1 for maximum heat flow indicate that forfast heating and cooling rates steam, hot water, and flame heatingshould be considered as heat sources for the heating cycle, andwater used as the cooling medium.
The high value for flame heating does not apply to all thecan wall surface but only to the area of flame impingement whichis about 10-20% of the total wall area in the CSIRO pilot unit.However as the temperature difference is always large a highrate of heat transfer is maintained throughout the flame heatingcycle.
The can wall, not subject to direct flame impingement isheated by the hot combustion gas at about 450 °C and hence heatflow across this surface would approximate 44 x 103 W/m2.
H
rd 4-* °r)
cu G ljG Q) 0
4-> HS O
gi h^•H £ c\j
X 0 gjd H \S 4-1 &
1
o) c:
Hp
soHEH
WHrl
CO
0yS5
§
a
OTE
NTI
ft
tfr
COs
rv*EH
sHw
«H 'H•fH r""*iT3 (d
O WQ) -H OM 4-> H2 0 td G
4-> <d -H O(d M U -Htj Q. tj 1 )
CD a; fdQi (1) pS Lj"H "A* t— i ~
£ U 5 0)a) G o a
EH (U U 0
1)•Vo(d i im G o *H O O 4->P 0 GCO G CD
T3 O -H WG & -H UOfd O 4J -Hc\l<U H O <4-l gH O 0) *W \U M-J > 0) !S
t) (DH rdO -HU CO
H
TA
BLE
(D
O -HW CO
CO10OJooM
o m ^[ j* inrv] H
0 O 0<T> CT> H
H
1 1 1O 0 0
o o oO 0 Oo m -tfro H
1 1 1o o oo o ot> ^ oH H
2i_q
M MQ) G CD
4-> M 4-><d o <d13 U £
(U 4->4-) fd
(0 : CT> -P4J - H OCO W X!
CDG
•H4Jrd
^ (DM
CN n n n n inr^ n H n n
m HH
•
m o o o m in00 H O H G\ CTt
H r* HH
I I I I Io o o o o
**o o o o o m
m o cr> o o moo oo oo n "31
H
I I i l lo t>- r^ o oO H H O ro00 H
H
COfdCDJ_J
o
CO <U04-) W
>H C « ^ laG (1) CO Q) 'u M3 > (D S -H 0)CT>H CO fd 3 r O 4 J =M O fd H H 0) fdO CO O fn PM ^3 £>•
. ^
Gi•HHO
U
on
CTlH
1in
f
0
0)
oHrd
4->fdU
H•r)oDQ)
H
|
*
T3
S3HH •(tf V(& (D
NC -H3 HO -H
^C (U0 4J
CO4JC G)
6 30) HCTl U-J
•H Ha
r\\
P flam
eC
SIR
O
T^
0 G•H
rdOJ CO
id SO
G0 0
4-1
o) fdCO 0)fd M
rQ ^H
CD
fQ CO
Calc
ula
teheat
tran
**

From experimental measurements it was found that a 211 x 4-00(nominally 10-oz.) can having a mass of 0.068 kg and containing0.29 kg of watertemperature IK)
(i.e. requiring the addition of 1253J to raise thecould be heated at 2.39°k7s using a burner having
an impingement area of 1.412 x 10~3m2 and an impingement temp-erature of about 1770°C. Hence the average temperature differencebetween flame and can wall in the impingement area can be taken asabout 1700°C.
transferredo
to the can wall (0.019 m2) from hot450UC, and assuming an overall heat trans-surface of 100 W/m k we can calculate thethis area to be 855 W. Subtracting this
Heat is alsocombustion gas at aboutfer coefficient at thisheat transferred acrossheat flow from the total heat flow to the can we obtain (2995 -855) or 214-0 W to be transferred across the area of flame impinge-
transfer coefficient for the= 890 W/m20K
ment, and hence the overall heatflame heated area =
1.412 x 10- 3 x 1700
Determination of the Thermal Process in a Flame Sterilizer
Thermal destruction of microbial populations at a constanttemperature, T, can be written in terms of a sterilizing value,F, as follows :
\T-121.1,
F = t x 10
where F
T
t
z
sterilizing value
Holding temperature (°C)
Time (minutes) at temperature, T.
Slope of the thermal death-time curve
In physical terms , z represents the increase in temperaturerequired to give a decimal reduction in the time required for in-activation of spores by heat. A value of z=10°C is generallyused and relates to the destruction of spores of the putrefactiveanaerobe 3679 or of Clostridium botulinium.
When the heating and cooling cycles are rapid, as is the casein flame sterilization, it can be assumed that both the temperaturerise to temperature T, and the cooling from temperature T, are fastenough for the respective sterilizing values to be negligible incomparison to the sterilization achieved during holding attemperature T.
Hence providing the cans do not cool in the high temperatureholding section of the flame sterilizer the sterilizing value ofthe process can be calculated from the above equation. To maintaina constant temperature in the holding section it may be necessaryto have small burners there.
However when there is temperature change in the hie;h temp-erature holding section and this change is a linear function oftime, the sterilizing value in this section can be calculatedusing the equation of Cheftel and Thomas (1965) :
T
F = z - A =x 0.4343
B - 121.1- - 121.1
10 - 10 C"
where TR = Highest temp (°C) in the holding section
TA = Lowest temp (°C) in the holding section
6 = Time in Minutes in the holding section
The calculation of sterilization values for canned foods isdiscussed by Board (1972) and some values for specific foods aregiven.
Process economics
Steam usage when processing cans in a stationary retort at121.1 C for two hours using standard procedures is reported bySampson (1934).
Of the total steam usage (150 kg) only 25 kg was actuallyused in heating the cans and contents. The remainder of thesteam was lost as follows :
54.5 kg passed out the vents
24.5 kg was used to heat the retort and crates
17.0 kg was used to heat the condensate in the bottom ofthe retort and
29 kg was used to replace the heat lost through radiation
Hence only 17% of the steam supplied to the retort wasactually used for the sterilization function.
Comparative costs of heating in batch retorts, continuousretorts and flame sterilizers are given by Casimir (1970) and(1972) .
The efficiency of the flame sterilization process based onthe amount of heat needed for the sterilization function (i.e.heating the can and contents) and the calorific value of the gasflow to the CSIRO pilot scale flajne sterilizer is 31%.
Some comparative costs of heating cans of food in severaldifferent units are given in Table 2 based on a basic heat cost of100 for thermal processing in stationary retorts.
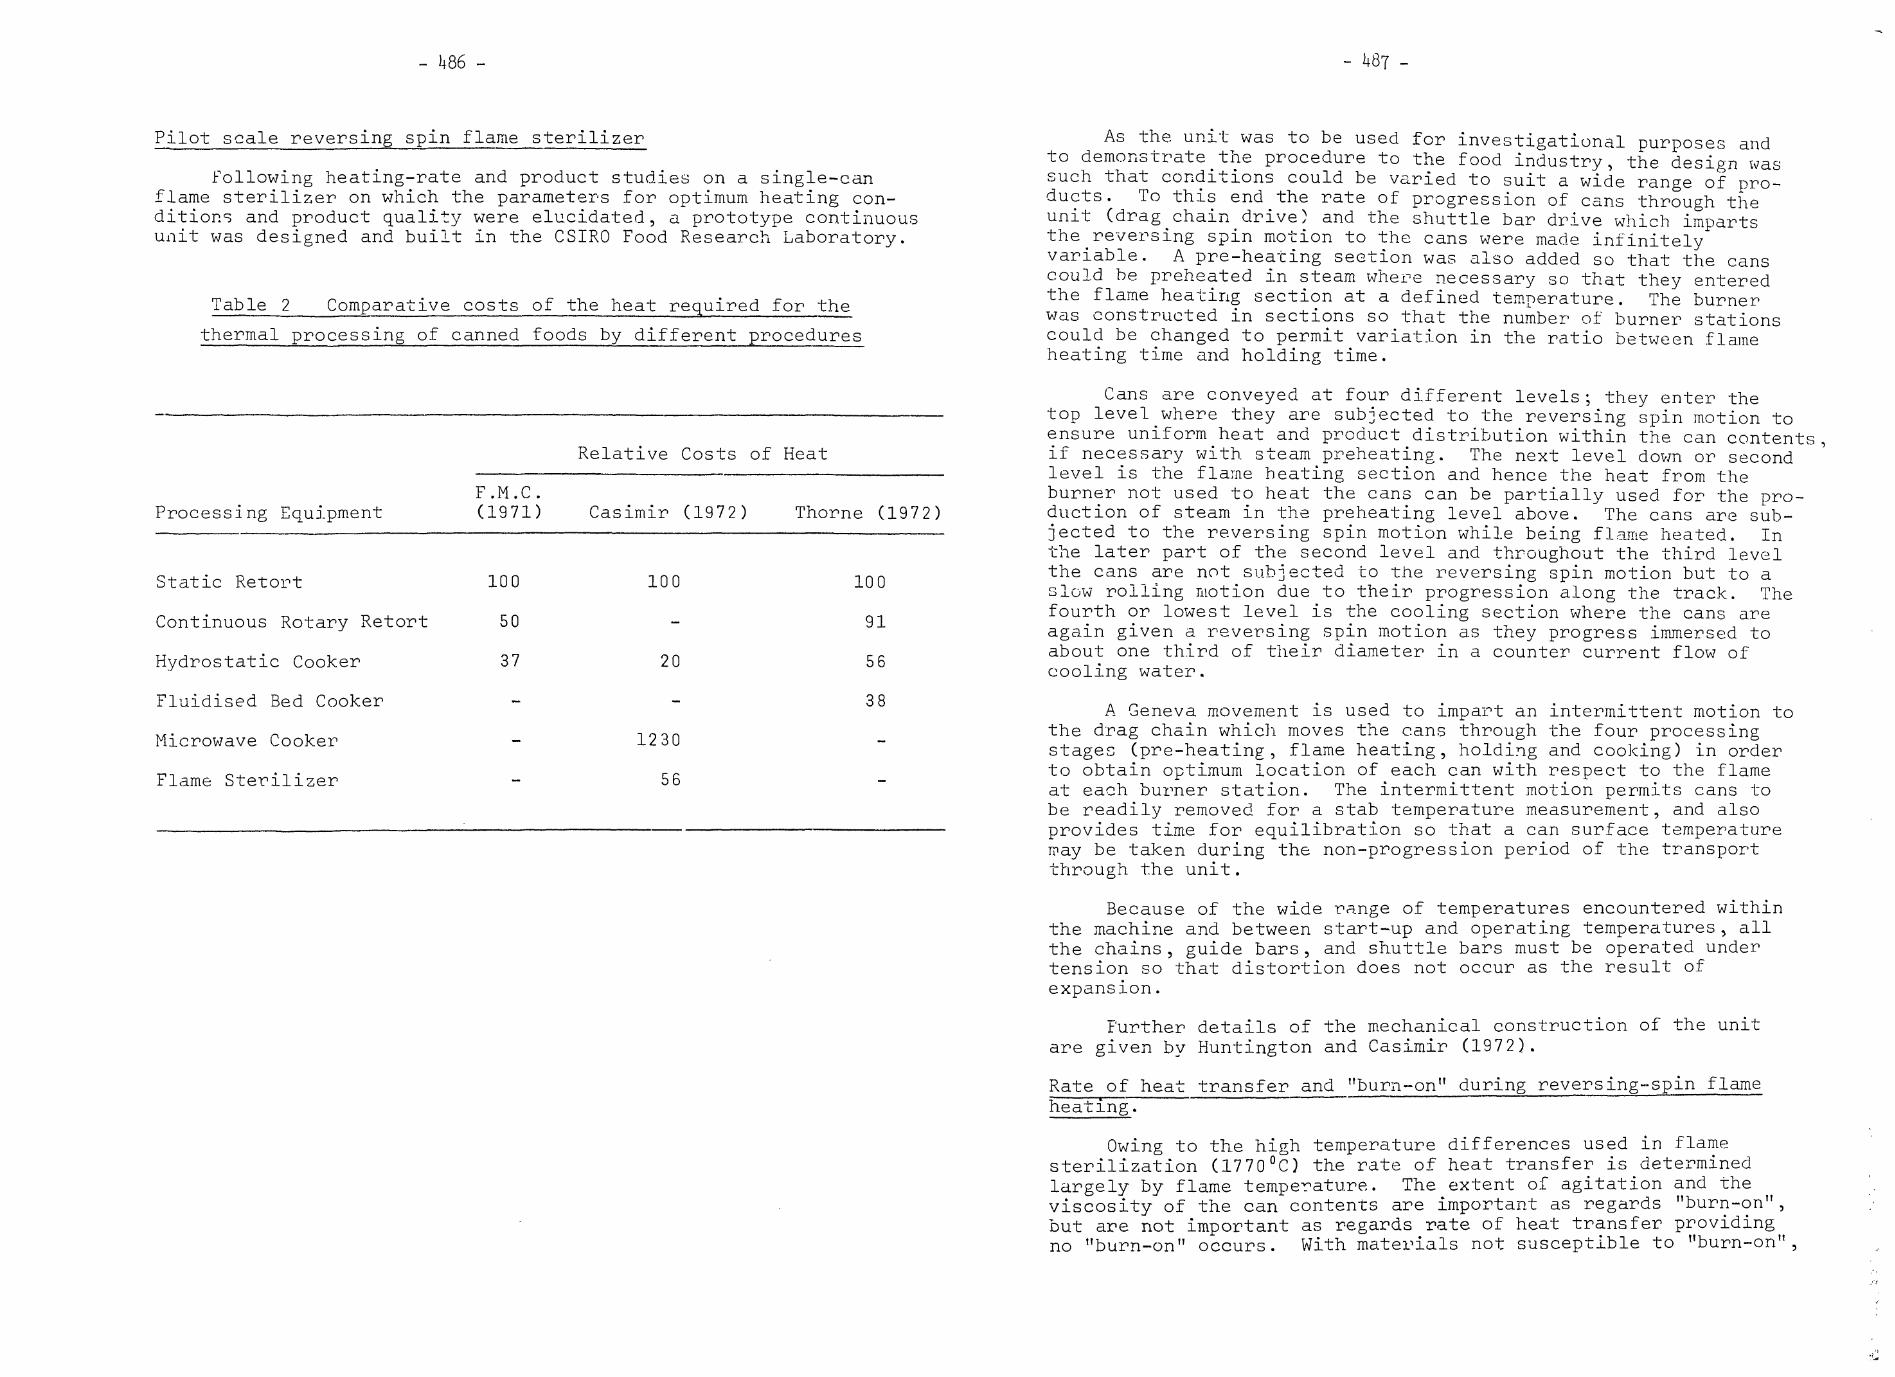
Pilot scale reversing spin flame sterilizer
following heating-rate and product studies on a single-canflame sterilizer on which the parameters for optimum heating con-ditions and product quality were elucidated, a prototype continuousunit was designed and built in the CSIRO Food Research Laboratory.
Table 2 Comparative costs of the heat required for the
thermal processing of canned foods by different procedures
Relative Costs of Heat
Processing EquipmentF.M.C.(1971) Casimir (1972) Thorne (1972)
Static Retort
Continuous Rotary Retort
Hydrostatic Cooker
Fluidised Bed Cooker
Microwave Cooker
100
50
37
Flame Sterilizer
100
20
1230
56
100
91
56
38
As the unit was to be used for investigational purposes andto demonstrate the procedure to the food industry, the design wassuch that conditions could be varied to suit a wide range of pro-ducts. To this end the rate of progression of cans through theunit (drag^chain drive) and the shuttle bar drive which impartsthe reversing spin motion to the cans were made infinitelyvariable. A pre-heating section was also added so that the canscould be preheated in steam where necessary so that they enteredthe flame heating section at a defined temperature. The burnerwas constructed in sections so that the number of burner stationscould be changed to permit variation in the ratio between flameheating time and holding time.
Cans are conveyed at four different levels; they enter thetop level where they are subjected to the reversing spin motion toensure uniform heat and product distribution within the can contents ,if necessary with steam preheating. The next level down or secondlevel is the flarne heating section and hence the heat from theburner not used to heat the cans can be partially used for the pro-duction of steam in the preheating level above. The cans are sub-jected to the reversing spin motion while being flame heated. Inthe later part of the second level and throughout the third levelthe cans are not subjected to the reversing spin motion but to aslow rolling motion due to their progression along the track. Thefourth or lowest level is the cooling section where the cans areagain given a reversing spin motion as they progress immersed toabout one third of their diameter in a counter current flow ofcooling water.
A Geneva movement is used to impart an intermittent motion tothe drag chain which moves the cans through the four processingstages (pre-heating3 flame heating, holding and cooking) in orderto obtain optimum location of each can with respect to the flameat each burner station. The intermittent motion permits cans tobe readily removed for a stab temperature measurement, and alsoprovides time for equilibration so that a can surface temperaturemay be taken during the non-progression period of the transportthrough the unit.
Because of the wide range of temperatures encountered withinthe machine and between start-up and operating temperatures, allthe chains , guide bars, and shuttle bars must be operated undertension so that distortion does not occur as the result ofexpansion.
Further details of the mechanical construction of the unitare given by Huntington and Casimir (1972).
Rate of heat transfer and "burn-on" during reversing-spin flameheating.
Owing to the high temperature differences used in flamesterilization (1770°C) the rate of heat transfer is determinedlargely by flame temperature. The extent of agitation and theviscosity of the can contents are important as regards "burn-on",but are not important as regards rate of heat transfer providingno "burn-on" occurs. With materials not susceptible to "burn-on",

e.g., water and glycerol solutions, rates of heat transfer fromflames to can contents are virtually independent of can motion,whereas in steam heating and water cooling the influence ofagitation upon the film heat transfer coefficient at the innersurface of the can wall is significant.
Hence in flame heating we may assume that the external filmcoefficient is the limiting factor in heat transfer whereas withsteam heating the internal film coefficient is the limitingfactor.
Morgan and Carlson (1961) in a study on the fouling or "burn-on" at heat transfer surfaces in evaporators found the mostimportant parameter to be the temperature of the heat transfersurface.
In flame heating of foods in cans, the can wall temperatureprior to "burn-on" was dependent upon a number of variables suchas the shear forces between the contents and the can wall, theresidence time of the particular elements of the can wall in theflame, and the flame temperature.
Wu (1971), using single strength milk as a test food, foundthat "burn-on1' depended on can wall temperature and that themaximum can wall temperature permissible if "burn-on" was not tooccur was approximately 180°C.
Container Requirements
Since the pressures developed during the thermal processingof canned foods in a flame sterilizer are not counterbalanced,the cans must be capable of withstanding the internal pressureswithout undergoing permanent distortion. With low acid foodswhere product temperatures up TO 130°C are required, the internalpressures developed during the process may reach 275 x 103 N/m2.The temperature of the product reached when sterilizing cannedacid foods (pH <4.2) is normally in the range 80 to 100°C andhence the pressures in the cans are low.
Hence flame sterilization of low acid foods is restricted tosmaller can sizes (less than 0,09 m diameter) whereas acid foodsmay be flame sterilized in larger containers , even as large asdrums.
Certain changes are necessary in the design and constructionof cans if they are to withstand high unbalanced internal pressures.The weakest areas of the can are the ends and the side seam. How-ever, cans for flame sterilization must be produced at a pricecomparable with that of cans for retorting , or at a price whichmay be offset by savings in production costs associated with theflame sterilization process. Alternatively, the flame sterilizedproduct should be of such a quality as to command a price whichoffsets the container cost.
Increase in plate thickness or temper should not be such thatcans are not readily opened by the consumer using a conventionaldomestic can opener.
Aluminium beverage can ends with and without the small "pear-shaped" pull tabs withstand the high internal pressures developedbut the full tear out ends of both aluminium and steel cansrupture at the score line when the product temperature reachesabout 120°C.
The standard side seams 'Strengthened with numerous indentsnow in commercial usage with 2:98 solder are satisfactory for con-sumer size cans up to 0.09 m in diameter when product temperaturesup to 130°C are being used (Casimir 1972).
For flame sterilization, the ends require a single highexpansion ridge with as large a diameter as possible and severalshallow expansion rings permitting end distortion which does notexceed the elastic limit of the metal (Casimir 1972).
Externally lithographed and internally lacquered cans may beflame sterilized as the can wall does not reach temperatures atwhich the lithography or lacquers deteriorate. Also, becausethermal degradation is minimized during flame sterilizationsulphur staining is greatly reduced, making the use of sulphurresistant internal lacquers unnecessary in products such as sweetcorn.
Product Potential
The Australian reversing spin flame sterilizer is a new pro-cess giving faster heating rates than any other process for heatingproducts in cans. For example 211 x 400 cans of milk can beheated at 2.2°K/s, while 211 x 400 can of vacuum pack corn can beheated at rates as high as 3.5°K/Sc
Heating rates in the French Steriflamme are reported byBeauvais et al (1961) and Cheftel and Thomas (1961) as about 0.6°C/sThe heating rate of mushroom? in brine in the "Steriflamme" is re-ported as 0.12°C/s by Lawler (1967) and the heating rates ofcanned peas as 0.16°C/s by Cheftel and Thomas (19G5).
Hence the heating rates and cooling rates in the Australianreversing spin flame sterilizer result in a high temperature,short time thermal process comparable to those used in aseptic pro-cessing, and the products produced are of exceptionally highquality.
The primary criterion required of a product for flamesterilization is that the viscosity during the time the can is inthe flame should permit sufficient agitation of the contents togive an even heat distribution within the can and enough tur-bulence at the inside of the can wall to prevent surface foulingor "burn-on" at the high rates of heat transfer.
Flame sterilization being a new process requires a newapproach to product formulation to obtain maximum advantage fromthe new technique. Casimir and Lewis (1972) described a numberof successful approaches to product formulation for packs to beflame sterilized. Most of the approaches discussed rely_upon^achieving a microbiologically adequate process before thickening_or rehydration is completed. In this way packs such as spaghettiin tomato sauce, macaroni and ravioli in cheese^sauce, and rice-milk puddings have been successfully flame sterilized.

- 490 -
Vacuum packed vegetables have also been flame sterilized.The small amount of liquid in vacuum packs compared with fullybrined packs reduces the amount of heat necessary to achievethe required temperature rise in the can contents, and alsoreduces the amount of heat to be removed during cooling.
Dairy products successfully flame sterilized include milk(plain and flavoured)3 milk concentrates, cream (29% fat), milkcustards3 and milk-rice desserts.
Vegetable products successfully processed include, greenpeas, beans, sweet corn5 asparagus, beetroot, and potatoes inbrine, peas and sweet corn as vacuum packs , and sweet corn andasparagus in white sauce.
Mushrooms nave also been processed as buttons and slices inbrine and as mushrooms in sauce packs.
Fish products processed in the flame sterilizer includeprawns, scallops and mussels both in brine and white sauces.
The future of flame sterilization
The Australian flame sterilization equipment is able totreat a wide range of foodstuffs including highly-viscous foods,such as spaghetti in tomato sauce, rice-milk puddings, and milk-custards .
Tarax Pty. Ltd. have successfully operated for four years aflame sterilizer processing 160 cans per minute of a flavouredmilk drink and are now offering a fully automated Australian de-signed and constructed machine to the food industry.
Interest seems strong, and many food processing companies,both here and overseas , are now considering whether to install thenew flame sterilization equipment developed and manufactured inAustralia.
-- 491 -
REFERENCES
BEAUVAIS, M., THOMAS, G., and CHEFTEL, H. (1961). - a new methodof heat processing canned foods. Fd Technol. 15, ('4),5-9 .
BOARD, P.W. ., (1972). Calculation of sterilization values ofthermal processes for canned foods. Specialist CoursesFd Ind., CSIRO Aust, No. 2, 27-32.
CASIMIR, D.J., (1970). New equipment for the thermal processingof canned foods. Fd. Technol. in Aust., 22, (1) , 8-19.
CASIMIR, D.J. (1972). Economic of flame sterilization. SpecialistCourses Fd Ind., CSIRO Aust., No. 2, 10-11.
CASIMIR, D.J. (1972). Container requirements for flame sterilizationSpecialist Courses Fd Ind., CSIRO Aust., No. 2, 36-41.
CASIMIR, D.J. and LEWIS, P.S., (1972). Product formulationspecifically for flame sterilization. Specialist CoursesFd Ind., CSIRO Aust., No. 2, 59-61.
CHEFTEL, H., and THOMAS, G., (1961). - New method of sterilizingby heat - Heat sterilization without counter pressure.Int. Congr. Cann. Fds. 4th, 133.
CHEFTEL, H., and THOMA.S, G, (1965). Principles and methods forestablishing thermal processes for canned foods. IsraelProgram for Scientific Translations, Jerusalem. U.S.Dept. of Agric. and Nat. Sci. Foundation, Washington D.C.
F.M.C. (1971) Private communication, relating to long cookingproduct.
HUNTINGTON, J.N. and CASIMIR D.J. (1972). Design, construction andoperation of a reversing-roll pilot-scale flamesterilizer. Specialist Courses Fd Ind., CSIRO Aust.,No. 2, 33-35.
LAWLER, F.K. (1967), French process boosts quality cuts costs.Food Engng. February, 65.
MORGAN, A.I., and CARLSON, R.A. (1961). Wail temperature and heatflux measurement in a round tube. Heat Transfer 83,105-110.
SAMPSON, D.F. (1934). The Convention Canner, Fed. 17, reprinted.Sterilization of Canned Foods, American Can Company,•laywood, 111. 1953 page 205.
THORNE, S.N. (1972). Heat processing of canned foods in fluidisedbeds. Aust. Food. Manuf., 41, (6), 10, 13-14.
WU, B.K., (1971). Aspects of heat transfer in flame sterilizationof canned milk. M.Sc, Thesis. Dept. of Food Technology,U.N.S.W.

- 1+92 - - ^93 -
National Chemical Engineering Conference 197**
PROCESS INDUSTRIES IN AUSTRALIA - IMPACT AND GROWTH
Surfers Paradise, QUEENSLAND
July 10 to 12th,
THE EXTRACTION AND DRYING OF PECTIN AND CITRUS PEEL
by
P. MOLYNEUX
PhD., BSc(Lond), BSc(Eng), CEng, MIMechE, M(Hon)
SVIQ(Ven) , FIChemE, MlnstE(Aust)
S U M M A R Y •
Pectin is a natural product contained in the albedo of citrus peels,It is extracted into an aqueous solution by treatment with water. This isa typical mass transfer operation, the rate of extraction being controlledby a number of variables, the most important of which have been found tobe pH, solvent ratio, temperature, relative solvent/solid velocity, andsolid subdivision, and to a more limited extent, the physical parameterspf the extractor. The drying of the precipitated pectin is dependent onthe form in which it is received from the filter, but the drying rate isgreatly influenced by the non newtonian flow properties of the gelatinousprecipitate.
The drying of the extracted citrus peel is typical of the drying of anatural material with shrinkage and surface cracking effects.
A statistical experiment of type 23 is described using the three majorvariables in the extraction rate (pH, solvent ratio and temperature) whichare virtually independent of the physical parameters of the extractor.The resulting canonical equation is obtained by the use of an ANOVAcomputer programme and is optimised for maximum extraction rate %/hour(DM basis).
Some drying rate information on pectin and peel is presented andparticularly in the drying of peel the onset of cracking is related to thetensile strength of the peel in the fully moist and leather-hard condition.Some comparison is made with published information on the industrial scaledrying of these materials.
Head, Department of Chemical Engineering,Swinburne College of Technology.
INTRODUCTION
Pectins are complex acidic polysaccharides which occur in varyingamounts in plant cell walls.
They are obtained by the extraction of plant materials principallyresidues from the manufacture of citrus juices or apple juice, by hotwater, acids or complexing agents and are recovered from the extracts byprecipitation as pectinates by salts of Aluminium, Calcium or Copper orthe pectin can be precipitated directly with organic solvent. With theformer process the pectin must be precipitated by treatment with acidifiedorganic solvent but the solvent losses with this process are much lower.The pectin is in either case separated from the liquor and is then driedand ground.
Pectins are manufactured and used extensively for their unique a b i l i t yto form gels with sugars and acids. They are used for this reason in themanufacture of fruit jellies, jsms cr.d marmalades and although attemptshave been made to replace thomw','th cheaper substitutes like alginates,these have met with very il^ttoc j-uc^iss.
Other food uses are in confectionery, as a stabiliser in ice creamand as a gelling and thickening agent for custards, puddings and other m i l kfood products. Pharmaceutical pectin has also a wide range of uses accountingfor some 10-20% of the market.
Pectins which can be classified as high molecular weight polygalacturonicacid occur in the principal residues available for manufacture such as applepomace and citrus peels.
Table 1.
Plant MaterialTotal pectin substance% of Dry Mass
Apple pomace 15 ~ 20Sugar beet pulp 15 - 20Citrus peels 30 - 35
Pectin is no longer reported as being manufactured in Australia butthe import figures available are as given in Table 11.
Table 11.Annual Import
1967-68 1968-69
Weight of pectin tonne 116.53 1^5.0^Cost in $A $ 261.000 326,000
1969-70
119=022^7*000
Ma n uf ac t u re o f MT
In manufacturing pectin the sol ub; 1 isat ion and extraction is usuallycarried out by a controlled acid hydrolysis. As with the enzymic process,when proto pectin \s solubilised by acid, the reaction is not specific and^at the same time further hydrolysis occurs resulting in partial demethylat ionand gradual degradation of the pectin molecule.
In practice therefore the process of sol ubi 1 isation and extraction is acompromise between obtaining the maximum extraction and the minimum of degradat
The weak pectin extract has then to be separated from the insolubleresidue of spent peel and although this is normally done by pressing, thedifficulties are such that it is preferable to work with a low concentrationand a high temperature so as to facilitate gravity filtration.
on
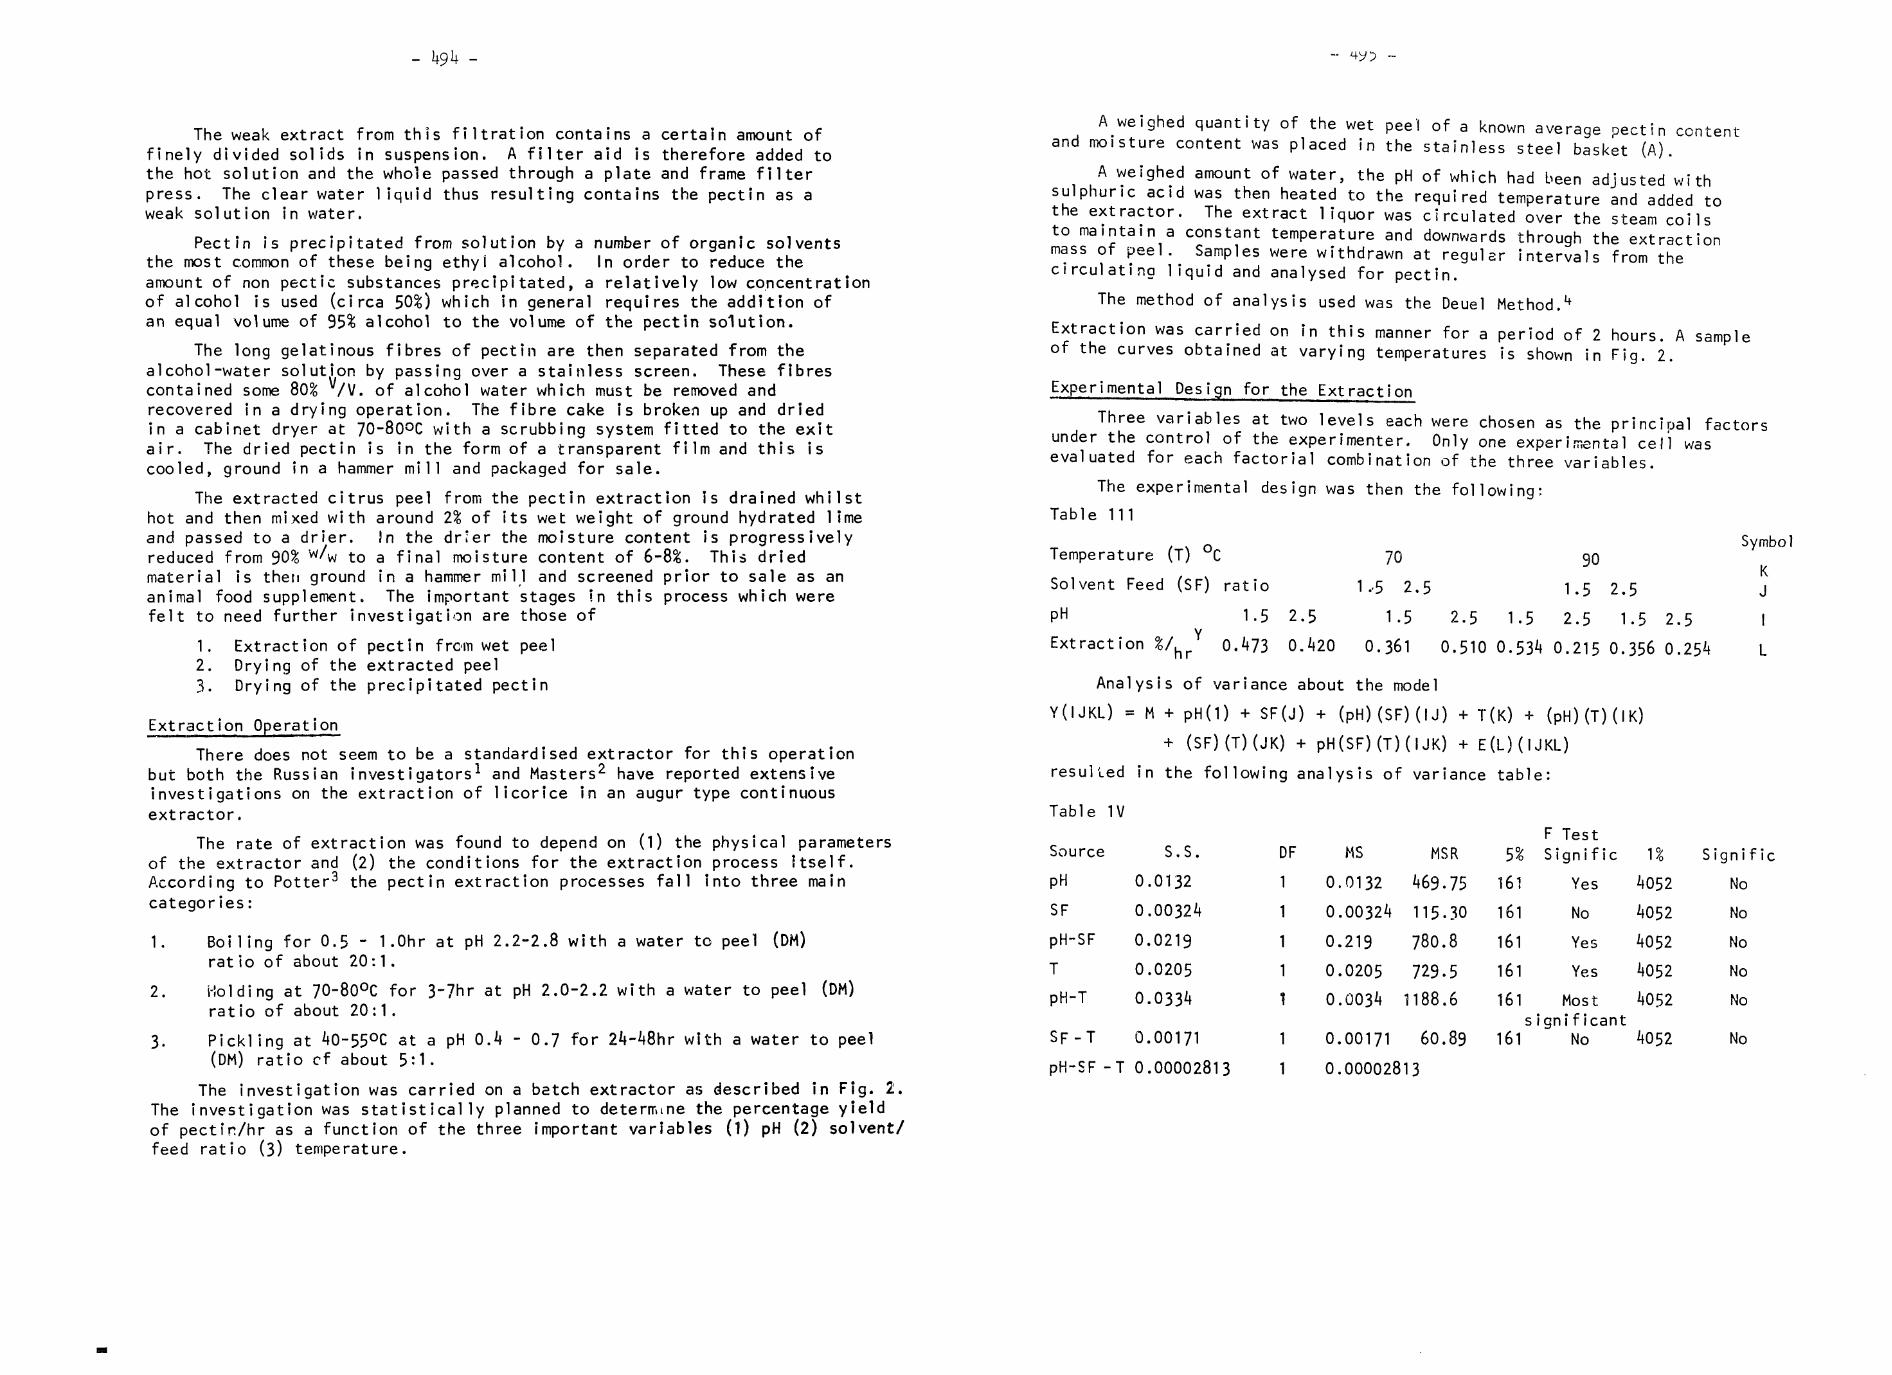
- 1*94 -
The weak extract from this filtration contains a certain amount offinely divided solids in suspension. A filter aid is therefore added tothe hot solution and the whole passed through a plate and frame filterpress. The clear water l i q u i d thus resulting contains the pectin as aweak solution in water.
Pectin is precipitated from solution by a number of organic solventsthe most common of these being ethyl alcohol. In order to reduce theamount of non pectic substances precipitated, a relatively low concentrationof alcohol is used (circa 50%) which in general requires the addition ofan equal volume of 95% alcohol to the volume of the pectin solution.
The long gelatinous fibres of pectin are then separated from thealcohol -water solution by passing over a stainless screen. These fibrescontained some 80% V/V. of alcohol water which must be removed andrecovered in a drying operation. The fibre cake is broken up and driedin a cabinet dryer at 70-80°C with a scrubbing system fitted to the exitair. The dried pectin is in the form of a transparent film and this iscooled, ground in a hammer m i l l and packaged for sale.
The extracted citrus peel from the pectin extraction Is drained whilsthot and then mixed with around 1% of its wet weight of ground hydrated limeand passed to a drier. In the drier the moisture content is progressivelyreduced from 90% w/w to a final moisture content of 6-8%. This driedmaterial is then ground in a hammer m i l l and screened prior to sale as ananimal food supplement. The important stages >n this process which werefelt to need further investigation are those of
1. Extraction of pectin from wet peel2. Drying of the extracted peel3. Drying of the precipitated pectin
Extract Jon Ope ra t i on
There does not seem to be a standardised extractor for this operationbut both the Russian investigators1 and Masters2 have reported extensiveinvestigations on the extraction of licorice in an augur type continuousextractor.
The rate of extraction was found to depend on (1) the physical parametersof the extractor and (2) the conditions for the extraction process itself.According to Potter3 the pectin extraction processes fall into three maincategories :
1. Bo i l i n g for 0.5 - l.Ohr at pH 2.2-2.8 with a water to peel (DM)rat io of about 20: 1 .
3.
Holding at 70-80°C for 3-?hr at pH 2.0-2.2 with a water to peel (DM)ratio of about 20 : 1 .
Pickling at 40-55°C at a pH 0.4 - 0.7 for 24-48hr with a water to peel(DM) ratio cf about 5:1 .
The investigation was carried on a batch extractor as described in Fig. 2.The investigation was statistically planned to determine the percentage yieldof pectin/hr as a function of the three important variables (1) pH (2) solvent/feed ratio (3) temperature.
A weighed quantity of the wet peel of a known average pectin contentand moisture content was placed in the stainless steel basket (A).
A weighed amount of water, the pH of which had been adjusted withsulphuric acid was then heated to the required temperature and added tothe extractor. The extract liquor was circulated over the steam coilsto maintain a constant temperature and downwards through the extractionmass of peel. Samples were withdrawn at regular intervals from thecirculating l i q u i d and analysed for pectin.
The method of analysis used was the Deuel Method.4
Extraction was carried on in this manner for a period of 2 hours. A sampleof the curves obtained at varying temperatures is shown in Fig. 2.
Experimental Design for the Extraction
Three variables at two levels each were chosen as the principal factorsunder the control of the experimenter. Only one experimental cell wasevaluated for each factorial combination of the three variables.
The experimental design was then the following:Table 111
Temperature (T) °C 70
Solvent Feed (SF) ratio 1 .-5 2.5
PH 1 - 5 2.5 1.5 2.5 1.5
90
1.5 2.5
2.5 1.5 2.5
Symbol
KJ
Extraction %/hr 0.473 0.420 0.361 0.510 0.534 0.215 0.356 0.254 L
Analysis of variance about the model
Y(IJKL) = M + PH(1) + SF(J) + (pH)(SF)(U) + T(K) + (PH)(T)(IK)
+ (SF)(T)(JK) + pH(SF)(T)(UK) + E(L)(IJKL)
resulted in the following analysis of variance table:
Table 1V
MS MSR
0.0132 469.75
0.00324 115.30
0.219 780.8
0.0205 729.5
0.0034 1188.6
0.00171 60.89
0.00002813
Source
pH
SF
pH-SF
T
pH-T
SF-TpH-SF -T
S.S.
0.0132
0.00324
0.0219
0.0205
0.0334
0.00171
0.00002813
DF
1
1
1
1
1
1
1
5%161
161
161161161
F TestS » • j™ •ign i r ic
Yes
No
Yes
Yes
Most
n4052
4052
4052
4052
4052
Signi fie
No
No
No
No
Nos ignif icant
161 No 4052 No
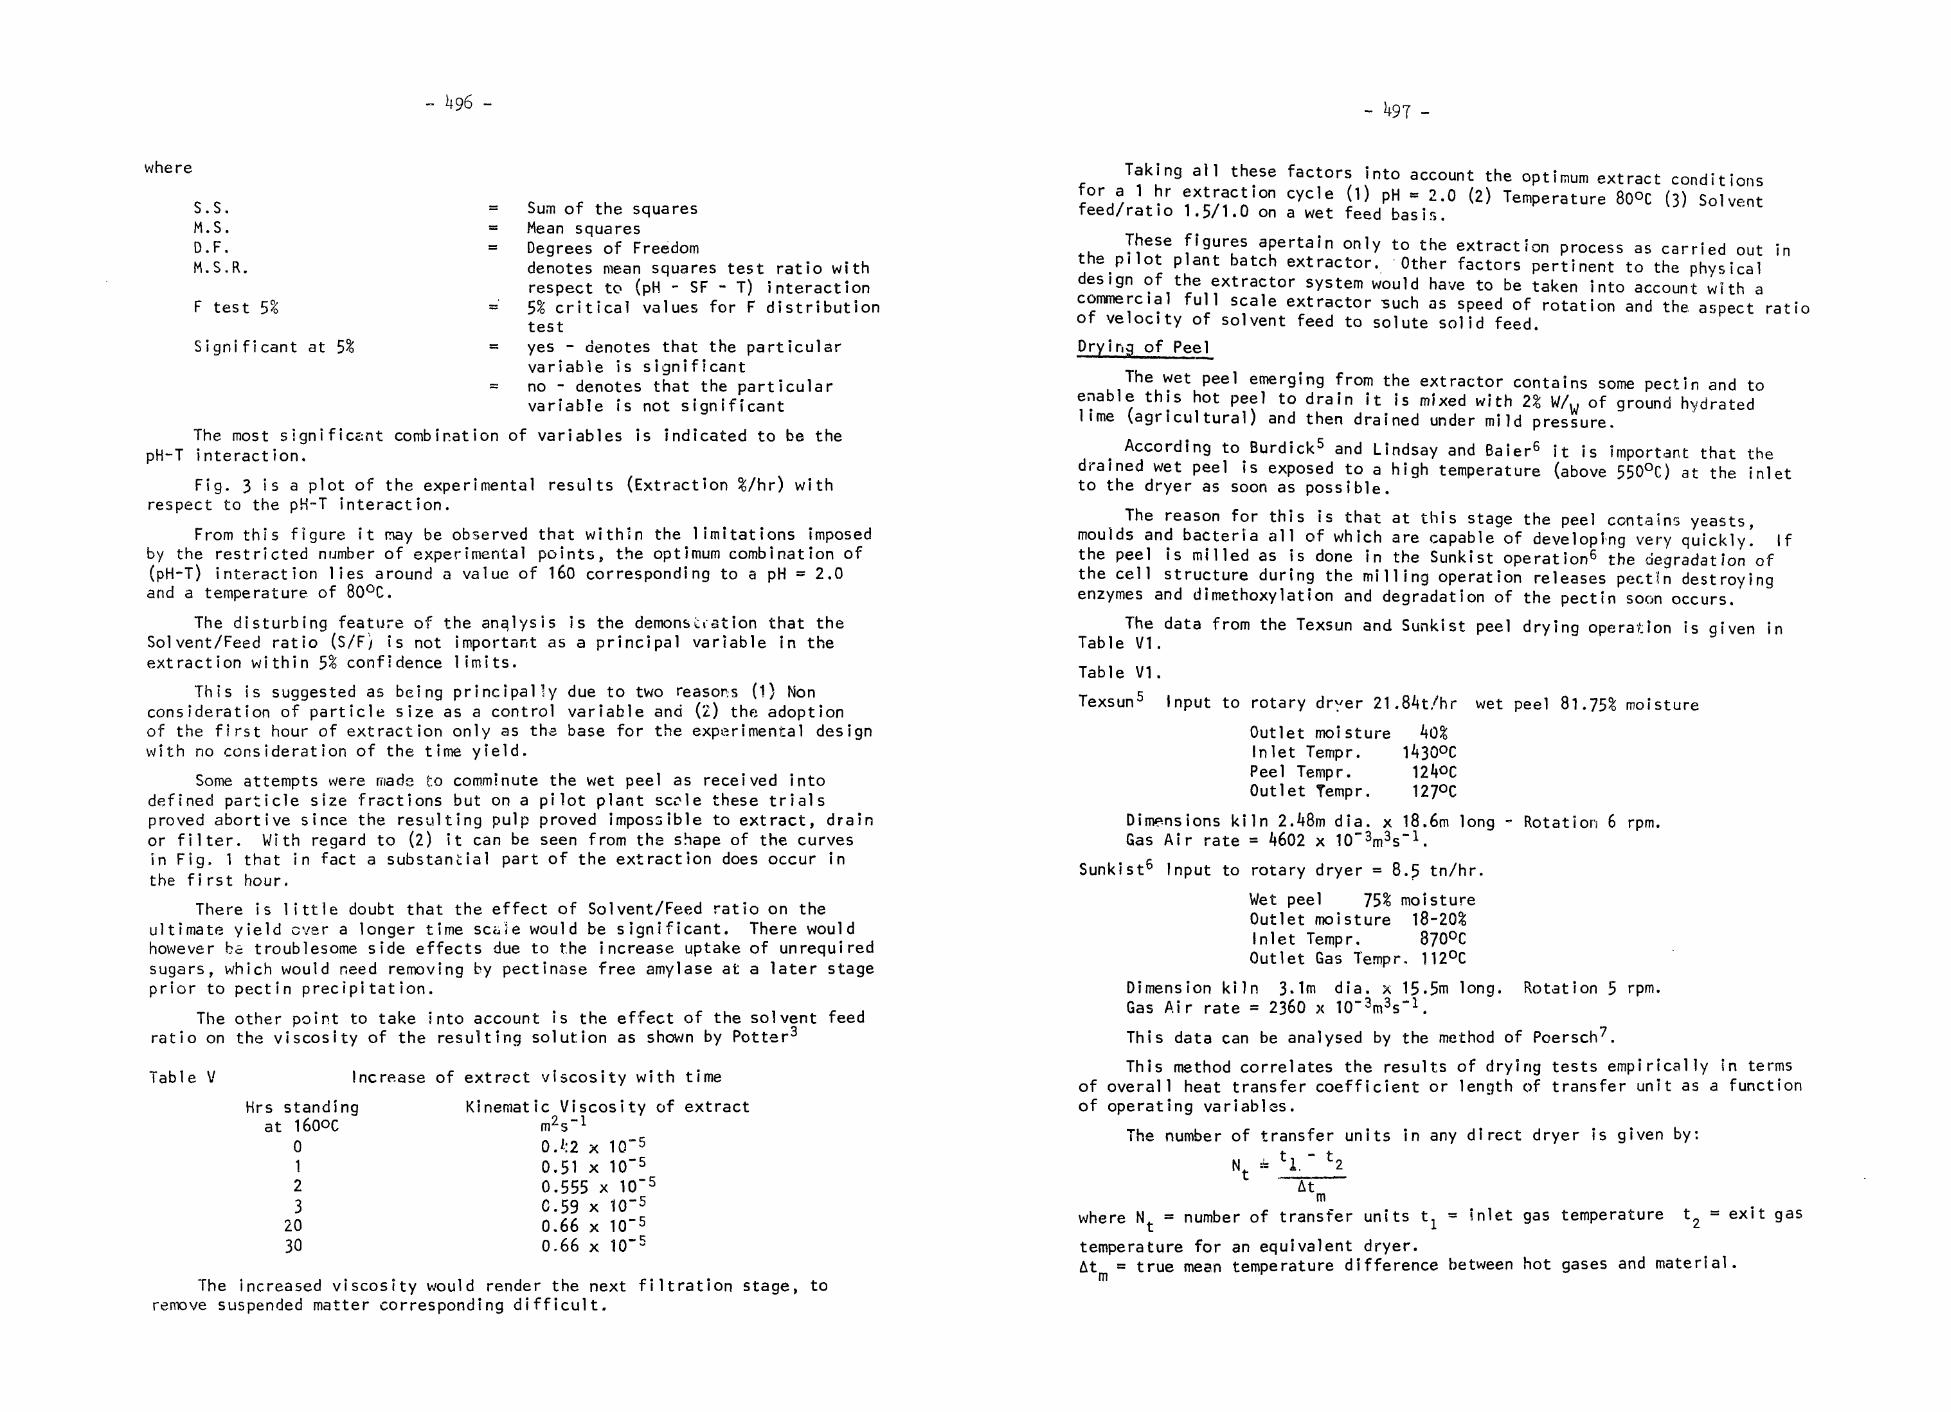
U96 -
where
s.s.M.S.D.F.M.S.R.
F test 5%
Significant at 5%
- Sum of the squares= Mean squares= Degrees of Freedom
denotes mean squares test ratio withrespect to (pH - SF - T) interaction
= 5% critical values for F distributiontest
= yes - denotes that the particularvariable is significant
= no - denotes that the particularvariable is not significant
The most significant combination of variables is indicated to be thepH-T interaction.
Fig. 3 is a plot of the experimental results (Extraction %/hr) withrespect to the pH~T interaction.
From this figure it may be observed that within the limitations imposedby the restricted number of experimental points, the optimum combination of(pH-T) interaction lies around a value of 160 corresponding to a pH = 2.0and a temperature, of 80°C.
The disturbing feature of the analysis is the demonstration that theSolvent/Feed ratio (S/F) is not important as a principal variable in theextraction within 5% confidence limits.
This is suggested as being principally due to two reasons (1) Nonconsideration of particle size as a control variable and (2) the adoptionof the first hour of extraction only as the base for the experimental designwith no consideration of the time yield.
Some attempts were made to comminute the wet peel as received intodefined particle size fractions but on a pilot plant sccle these trialsproved abortive since the resulting pulp proved impossible to extract, drainor filter. With regard to (2) it can be seen from the shape of the curvesin Fig. 1 that in fact a substantial part of the extraction does occur inthe f 5 rst hour.
There is l i t t l e doubt that the effect of Solvent/Feed ratio on theultimate yield ever a longer time sci/ie would be significant. There wouldhowever be troublesome side effects due to the increase uptake of unrequiredsugars, which would need removing by pectinase free amylase at a later stageprior to pectin precipitation.
The other point to take into account is the effect of the solvent feedratio on the viscosity of the resulting solution as shown by Potter3
Table V
Hrs standingat 16QQC
01232030
Increase of extract viscosity with time
Kinematic^Viscosity of extract
-5m2s"1
OJ:2 x 1Q0.51 x 10~5
0.555 x 10~5
C.59 x 10"5
0.66 x 10~5
0.66 x 10"5
The increased viscosity would render the next filtration stage, toremove suspended matter corresponding difficult.
Taking all these factors into account the optimum extract conditionsfor a 1 hr extraction cycle (1) pH = 2.0 (2) Temperature 80°C (3) Solventfeed/ratio 1.5/1.0 on a wet feed basir,. uivtni
These figures apertain only to the extraction process as carried out inthe pilot plant batch extractor. Other factors pertinent to the physicaldesign of the extractor system would have to be taken into account with acommercial full scale extractor such as speed of rotation and the aspect ratioof velocity of solvent feed to solute solid feed.Drying of Peel
The wet peel emerging from the extractor contains some pectin and toenable this hot peel to drain it is mixed with 2% W/w of ground hydratedlime (agricultural) and then drained under m i l d pressure.
According to Burdick5 and Lindsay and Baier6 it is important that thedrained wet peel is exposed to a high temperature (above 550°C) at the inletto the dryer as soon as possible.
The reason for this is that at this stage the peel contains yeasts,moulds and bacteria all of which are capable of developing very quickly! Ifthe peel is milled as is done in the Sunkist operation6 the degradation ofthe cell structure during the m i l l i n g operation releases pectin destroyingenzymes and dimethoxylation and degradation of the pectin soon occurs.
The data from the Texsun and Sunkist peel drying operation is qiven inTable VI.
Table VI.
Texsun5 Input to rotary dryer 21.84t/hr wet peel 81.75% moisture
Outlet moisture kQ%Inlet Tempr. 1430°CPeel Tempr. 124°COutlet Tempr. 127°C
Dimensions kiln 2.48m dia. x 18.6m long - Rotation 6 rpm.Gas Air rate = 4602 x 10"3m3s"1.
Sunkist6 Input to rotary dryer = 8.5 tn/hr.
Wet peel 75% moistureOutlet moisture 18-20%Inlet Tempr. 870°COutlet Gas Tempr. 112°C
Dimension kiln 3.1m dia. x 15.5m long. Rotation 5 rpm.Gas Air rate = 2360 x 10"3m3s"1.
This data can be analysed by the method of Poersch7.
This method correlates the results of drying tests empirically in termsof overall heat transfer coefficient or length of transfer unit as a functionof operating variables.
The number of transfer units in any direct dryer is given by:
M as 1 ~ 2M, "™ a. *-
Atin
where N. = number of transfer units tl « snlet gas temperature t2 = exit gas
temperature for an equivalent dryer.At = true mean temperature difference between hot gases and material,m

1*98 -
The volumetric heat transfer coefficient is given by
V . A td m
A-LTCAtd d m
G = drying gas rate (Kg m"2s"1}
L , = Length of Dryer (m)
The LTU = dAdUV
A = Cross sectn. area dryer (m2)
q , = Total heat transferred (Ws 1)
V, = D-ryer Volume (m3)
C = Specific heat gas Jm 3
Analysing the Texsun and Sunkist data in this manner.
Table V11
Source LTU (m) Nt
Texsun 3.0m 6.15Sunkist 3.46 4.475
Both the heat transfer coefft. and the effective superficial area of theparticles vary between flights and soaking and also possibly change along thedryer as the granules dry out, it is therefore customary to descrj.be the netheat transferred in terms of an averaged portmanteau coefficient Ua for thewhole dryer.
Friedman and Marshall9 propose that
Ua = K.(G)n
DK is a dimensionless coefft. which depends on the number of flights n,.n = 0.66K = 20 (nf-l) in SI units
Then Ua 20(nf-1)G0.66
Ua = volume heat transfer coefft. (Wnf3^1)
G = specific gas rate (Kg m~2s"1)D = shell diameter (m)
Using this correlation a value of 124-130 Wm"3^1 is obtained for theTexsun and Sunkist data which is in agreement with data reported by Kelly10
which gives for a dryer 1m in diameter fitted with 8 flights.
a = U for a gas rate of 1 Kg m"s"2"1
= 2.6
Substituting this value of U in the equation for
p p AnLTU = u s = 7.18m for the Texsun data and N. = ~-=
ATCT r ZJJ'1
d v
This is more in line with the report by Treybal11 that the economicrange of N.T.U. lies between 1.5 and 2.5 for rotary driers. This dramaticchange in the value of Nt reinforces the arguments given by Poersch foraccurate balancing of the dryer.
Thus with a 10% increase in gas volume the same product moisxure couldbe achieved with a dryer only half the original length at the expense of anuneconomical ly high exhaust gas temperature and a correspondingly dangerouslyhigh product temperature.
- 99 -
The experimental investigations described were carried out in anelectrically heated air tray dryer as shown in Fig. 4.
The wet peel (which had an i n i t i a l moisture content of 91%) was placedin each of the perforated trays to a depth of 25mm.
The investigation was primarily conducted in the tray dryer to examinethe effect on the drying rate of the shrinkage and resultant cracking of thepee.._ Shrinkage is caused pr i m a r i l y by the self-contraction of the materialas moisture is removed, the volume of the material being frequently a linearfunction of the mean moisture content during shrinkage.
V = VQ(1+ 3x)
where 3 is the bulk coefficient, only if the material shrinks down to thebone dry condition w i l l Vo equal the moisture free volume of the solid.Since the shrinkage may be anistropic it is sometimes more convenient toconsider linear changes so that
L = LoO+(3x)1/3
= LQ(1+ x)
The coefficient 3/3 is the linear shrinkage coefficient y. Complexcellular capillary materials such as timber and citrus peels, shrink todifferent degrees in the longitudinal, tangential and radial direction tothe grain. Normally shrinkage along the grain is ne g l i g i b l e in timber andthe tangential shrinkage is twice the radial.8
Some values for the linear shrinkage coefficients y for several materialsare given in Table 8 including those obtained for citrus peel.
Table V 1 1 1
Material yMacaroni 0.91Clay Kotly O.?0Clay Kuchino 0.48Wheat flour dough 0.47M i l l e d peat 0.12Chrome tanned calf's leather(normal direction) 0.23Longitudinal direction 0.07Citrus peel 0.42
In so far as the shrinkage coefficient of the citrus peel is s'milarto that of a Kuchino Clay or 'wheat flour dough, the shrinkage behaviour canbe expected to be sim i l a r .
In the conditions of the tray dryer with low temperatures and low dryingrates severe moisture gradients develop between the leather hard surface andthe moist interior and the resulting stresses b u i l t up on the surface causesurface cracking. The interior moisture content of the slab which w i l l createsufficient tensile force on the surface to cause cracking, can be calculatedfrom the tensile strengths of the peels under the various moisture conditions.Tensile strengths of peels at various moisture contents are given in Table 1X.
Table IX
Tensile strength peel 85%mo i s t u reTensile strength peel 6%mo i s t u re
KN m~2 ModulusElasticity E
3502050
Tensile Stress (T)KN nf2
2451435

- 500 -
Drying rate curves are given in Fig. 5, Table X for the conditions inthe tray dryer as follows:Dryer consisted of 5 trays set above each otherDimensions of trays 374.5mm x 542.5mm x 25mm.Wt. of peel per tray 4.62Kg at 90% moisture contentInlet temperature 70°C DB 18<>C. WB.Outlet temperature 53°C DB 52.5°C. WB.Air flow rate 31.62m3s"1
Velocity of air over trays = 457-2 x 10"3ms"1
Final wt. of peel per tray = 1.769 Kg average moisture = 52.3%Total drying time = 69ihr
At this stage It was found that even with extensive shrinkage cracking,the drying rate had been reduced to such an extent that it was necessary tocomminute the peel and finish dry in the rotary dryer to an average 6%moisture.
Using a simplified dryer model
~ = KgA(H -H)d6 ,3 swhere -rr = rate of moisture removaldoKg = air film mass transfer coefficientA = exposed drying surface (H ,H = Humidity at surface and air stream)
Table X Peel Drying Data
Mean moisturecontent M Kg/ .,Kg
Mean drying rateR Kgm"2s"1 x 10"6
8.337.2546.5k5.474.443.6172.4411.936
10*4.8861.61761.61794.39236.70831.201831.201822.942
cracking
comminuted
During the constant rate period of drying
Kg = 2.63 x 10~3(V)°'8 Kg m'V1 AH"1
where V = air velocity over drying surface m s 1
Keey10, has derived an equation to determine the onset of surfacecracking dependent on the shrinkage coefficient y» the moisture gradient atthe surface and the modulus of elasticity. Examining the drying rate curvefor the peel the surface cracking appears at an average moisture content of5.47 Kg water/Kg dry solid.
Taking a base moisture of 8.33 Kg/Kg the surface moisture would be2.61 Kg/Kg and the gradient over 25 mms would be 0.222 Kg/Kg.m.
This is in agreement with the values of shrinkage coefficient, ElasticModulus (E) and tensile stress T obtained for the peel together with thelength (0.53m) over which the cracking takes place.
The equation is
TI YXO) \ / z=b/2X = initial moisture content L = initial length(m)5ubscr?pt s and b0 refer to surface and base
of slab.
Dry i ng of Pec15 n
Pectin is itself, and in aqueous solution a highly non newtonianmaterial in its behaviour.
It is precipitated from aqueous solution with alcohol and the longfibres are filled with a 50% water alcohol solution to the extent of 80% ofthe volume.
The precipitated mass is separated as a crumb and fed to tray dryers.Under the effect of the dryer heat, the equivalent concentrated solution ofpectin flows in a visco elastic manner to form a translucent f i l m ofgelatinous pectin water solution from the surface of which the moisture isremoved by the normal dryer mechanism. As the drying proceeds the f i l mbecomes thinner but displays no cracks or longitudinal and axial shrinkage.The pectin dryer details at Sunkist are as follows.6
Tray area = 18.45m2
Inlet pectin 869.76Kg hr at 50% humidityOutlet pectin 4l3.136Kg hr 5% humidityInlet temperature 80-85°COutlet temperature 32°C
!n our investigation one tray was used.
Tray area 374mm x 542.5mm = 0.2 m2
Inlet pectin 3-52Kg at 88% humidityOutlet pectin 0.475Kg at 20% humidityinlet temperature 70°C DB 18°C WBOutlet temperature 53°C saturatedAir flow Veloc i ty 335.28 .\ 10"3 is"1
Drying time 30 hr
An examination of the pectin drying curve (Fig. 6 Table X1) obtainedtogether wi th the Sunkist data seems to indicate an init ial very high rateof evaporation largely due to the transfer of heat to provide heat ofevaporation to dist i l l the alcohol from the f ibres. The resulting highlyviscous concentrated solution of pectin dr ies by normal evaporative cooling ofwater by mass transfer from the surface. This ties in with visual evidence ofthe drying of the pectin f ibres and correlates wi th in 5% confidence l imitswi th the correlation for mass transfer coefficient from an horizontal surface.
Kg = 2.63 x 10~3X" Kg
or the corresponding expression
AH-1
Kg = .0037 ™ i "/3 Ib mol/ft2hr unit partial pressure differencebm
If this can be accepted as a model of the pectin drying operation then thetest data can be applied to an analysis of the Sunkist pectin drying data.
The scale up criteria is then
R V
\T,1
0.8-2e-lwhere R, Drying rate for Sunkist operation = 3^ -5 x 10"4Kg m~2s
R. R0 are constant drying rates for scales 1 and 2.I *- i M » n » f t
thenV 1335.28
Then for the Sunkist operation the air flow rate
V, = 9.12m s"1

- 502 -
Table X1 Pectin Drying Data
Mean moisture content Kg/ Mean drying rate R Kg m"2s"1x 10~6
5.262.21831.356Q.~J2k0. 360.350
620.103217.626211.071120.61230.15316.38
Alcohol distillation
Conefusions
This work commenced as an attempt to find a solution to a difficultand growing solid waste disposal problem. As in many of these problems theeconomic solution is more difficult than the purely technical one. Sufficientto say that the economic analysis of this technical solution reveals that itcan operate with a modest profit with the social benefit that a waste productcan be converted into a useful commodity, operating as a bonus.
References
1. Korotov, V.P., Shergin, G.M., Nikolaev, A.M., Tr. Kazan Khem Tekh. Inst.37, 150-3 (1968)
2. Masters K. Proc. Biochem. 7, (3) 18-19 1972.
3. Potter, R.S. Proc. Biochem. 1 (10) 378 1966.
i}. Mehlitz, A. Pektin 2nd Edition Applehouse Braunschweig (193*0
5. Burdick, E.M. Modern Chem. Proc. Vol. 1. 210 (1950)
6. Baler, W.E. & Lindsay, C.W. Modern Chem. Proc. Vol. 3 p.192 (195*0 Reinhold
7. Poersch, W. Proc. Eng. 1, (9), 89 (1972).
8. Biggerstaff, T. Forest Prod. Jul. 5. 127, 1965.
9. Friedman, S.J. & Marshall, W.R. Chem. Eng. Prog. 45, 573 (19 9).
10. Keey, D. Drying Princ. & Practice Pergam (1972).
11. Treybal, R.E. Mass Transfer Operations 2nd Editn. McGraw H i l l 1968.
I ! Hois? far remavalof '
STVMESS EXTR/>CTION
Steam Cot]
SteelCirculating Pump
Fiq 1 BOTCH EXTRACTORCITRUS pEFL_
o.i <-.
35-
I .» EXPERIMENTALDESIGN PLOT r£jREXTRACT ICM
cr1 T nte^ac^on..oo 130
bV
2!>0 250 30O
Fl9 5a Drjng Curve for Citrus Peel
Time in Hrs
so 60 70
- 503 -
LOSS OF WEIGHT INDICATQK
Pevforgted Troucontaining Peel 3
.4— inlet Air Wet t, Dry Bulb Thermometer:
Air Blower
Fq 4. Tray Dnpr Thouc i flow
Commmuttd
1-05
0-9
075
-01-5
0-30
EID
tn
• Fig 5b Drijng Rote CurvefbF~Gi rus Peel
O 1-0Mean Moisture Content Peel Kg/Kg
2.0 5.0 U-.O 5-0 6.0 7.0 6-0
60
6b Drying Rale Curve lorPECTIN
40
-30
-l-O
Mean Drying Role Kg m'^S"'
3Q 35075 (-5 3-0 4-5

- 505 -
AUTHOR'S NAME
J.A. Agnew
P.G. Alfredson
R.A. Allaway
R.J. Allen
D.F. Bagster
M.H.I. Baird
D. Barrett
A. Basoeki
R.J. Batterham
D.V. Boger
P.C. Brooks
D.J. Casirnir
W. Charleton
C. Chiarella
D.J. Close
R. Close
I.D. Crealy
C.J. Cripps Clark
V. Davies
R.S. Dutton
J.D. Esdaile
D.G. Evans
A.G. Fane
C.J.D. Fell
C.W.P. Finn
D.G. Fisher
J.A. Frew
I.A. Furzer
L.J. Garner
A.D. Gay
J.E.A. Gooden
G.A. Holder
B.E.T. Hutton
A.K. Johnston
J.A. Lackey
A.H. LePage
L.S. Leung
O. Levenspiel
J.E. Lewis
A.J. Lynch
W.P. Macmillan
W.R.B. Martin
M.J. McCarthy
F. Molyneux
S.P. Moodie
R.L Muiler
R.B. Newell
D.J. Nicklin
A. Nuberg
C.A.J. Paulson
R.M. Pilblado
SESSION
2
5
4
1
5
3
6
6
3 and 482
8
5
5
4 and 1
8
2o"*
1
2
8
7
5
3
2
4
3 and 4
7
6
7
1
8
2
5
7
5
2
3
1
3
1
7
2
8
3
4
4
2, 3 and 6
2
7
7
PAGE
79
254
219
38
272
171
360
360
155,198
449
109
481
294
294
241 &5
439126
88
26
115
439
412
254
161
88
187
155, 198
381
321
not published
38
468109
264
421254
109
not published
50
180
32
412
88
492154
234
187
109, 147,315
70
404
381
AUTHOR'S NAME
E.D. Plomley
A.B. Pomeroy
E.C. Potter
O. Potter
R.G.H. Prince
N.W. Rees
P.S. Ritch
A.W. Roberts
C.M. Sapsford
P.H. Scaife
E. Schepers
D.E. Seborg
G.D. Sergent
GJ. Sewards
S.R. Siemon
E.C. Skinner
B.R. Smith
I.W. Smith
K.P. Stark
I. McC. Stewart
P.W. Street
D.N. Sutherland
D.A.J. Swinkels
S.G. Szirmai
G. a Donau Szpindler
C. Tiu
J.R. Tuffley
W.M. Walker
R.K.C.Ward
P.L. Waters
G.T. Wilkinson
B.W. Wilson
T. Wood
P.G. Wright
C.C. Young
J. Zingarelli
SESSION
1
15,,and 7
3
7
4
4
5
6
1
1
4
6
8
7
2
8
6
1 '
6
3
3
1
5
7
8
2
2and1
1
7
5
8
7
4
7
6
PAGE
16
5
304, 404
not published
381
208
208
294
331
50
60187371468412135
4613415
35016115550304
39144999
99,3850
391282
431, 439381198
391371