Tiro - International Nuclear Information System (INIS)
117
Distribution Category: General, Miscellaneous, and Progress Reports (Nuclear) (UC-500) ANL-94/29 ARGONNE NATIONAL LABORATORY 9700 South Cass Avenue Argonne, IL 60439 SEPARATION SCIENCE AND TECHNOLOGY SEMIANNUAL PROGRESS REPORT April—September 1992 by G. F. Vandegrift, S. Betts,* D. L. Bowers, D. B. Chamberlain, C. J. Conner, J. M. Copple, J. A. Dow.t S. E. Farley,* S. Howard,** J. C. Hutter, D. A. Johnson,tt R. A. Leonard, L. Nunez, D. Redfield, M. C. Regalbuto, J. Sedlet, B. Srinivasan, S. Weber, and D. G. Wygmans Chemical Technology Division September 1994 * Graduate student from University of Illinois, Champaign, IL. t Co-op student from Purdue University, Lafayette, IN. * Co-op student from University of Evansville, Evansville, IN. "* Graduate student from University of Illinois, Champaign, IL. l^ Faculty Research Participant, Spring Arbor College, Spring Arbor, MI. Tiro T
-
Upload
khangminh22 -
Category
Documents
-
view
0 -
download
0
Transcript of Tiro - International Nuclear Information System (INIS)

Distribution Category:General, Miscellaneous, and Progress
Reports (Nuclear) (UC-500)
ANL-94/29
ARGONNE NATIONAL LABORATORY9700 South Cass Avenue
Argonne, IL 60439
SEPARATION SCIENCE AND TECHNOLOGYSEMIANNUAL PROGRESS REPORT
April—September 1992
by
G. F. Vandegrift, S. Betts,* D. L. Bowers, D. B. Chamberlain, C. J. Conner, J. M. Copple,
J. A. Dow.t S. E. Farley,* S. Howard,** J. C. Hutter, D. A. Johnson,tt R. A . Leonard, L. Nunez,D. Redfield, M. C. Regalbuto, J. Sedlet, B. Srinivasan, S. Weber, and D. G. Wygmans
Chemical Technology Division
September 1994
* Graduate student from University of Illinois, Champaign, IL.t Co-op student from Purdue University, Lafayette, IN.* Co-op student from University of Evansville, Evansville, IN."* Graduate student from University of Illinois, Champaign, IL.l̂ Faculty Research Participant, Spring Arbor College, Spring Arbor, MI.
TiroT

TABLE OF CONTENTS
Page
ABSTRACT 1
SUMMARY 1
I. INTRODUCTION 4
II. GENERIC TRUEX MODEL IMPROVEMENTS 5
A. Enhancements to Generic TRUEX Model 5
B. Development of Spreadsheet Algorithms for Speciation and Partitioning Equilibria 5
III. DATA COLLECTION FOR GENERIC TRUEX MODEL 8
A. Zirconium Behavior 8
B. Bromley Constants for H3PO4 10
C. Fluoboric Acid Behavior 10
1. Quantitative Analysis of HBF4 11
2. Extraction of HBF4 12
D. Americium Behavior 14
E. Bismuth Behavior 15
1. Analysis Methodology 152. Measurement of 210Bi-210Po Mixtures 163. Experimental 174. Results and Discussion 17
IV. DEMONSTRATION OF STRONTIUM EXTRACTION COMBINED WITH TRUEX 24
A. Nitric Acid Extraction 24
B. Fitting of TRUEX-SREX Extraction Data to Nitrate Activities 29
C. Combined TRUEX-SREX Processing 37
1. Flowsheet Development 372. Flowsheet Calculations with GTM 423. Preparation for Contactor Tests 504. Preliminary Test 555. Solvent Evaluation 55
V. VERIFICATION TESTS 58
A. Continued Processing of Batch 1 58

TABLE OF CONTENTS (contd)
B. Processing of Batch 2 59
1. Flowsheet Development 592. Discussion of Run 593. Sample Analysis during Processing 62
C. Processing of Batch 2 Waste 67
1. Flowsheet Development 672. Discussion of Run 723. Sample Analysis 73
D. Material Balance 77
1. Plutonium 782. Uranium 803. Lead in the Raffinate 80
E. Processing of Batch 3 81
VI. ADVANCED EVAPORATOR TECHNOLOGY 83
A. Testing of Laboratory-Scale Evaporator 83
1. Preparations for Experimental Work 83
2. Experimental Runs Using Salt-Solution Feeds 84
B. Solubility and Vapor-Liquid Equilibrium Data 89
C. Modeling of Nitric Acid/Nitrate Salt Vapor Pressures 89
1. Calculation of Nitric Acid and Water Activities 90
2. Calculation of Vapor Pressures 94
D. Neutron Activation Analysis 96
E. General Evaporator Design 98
F. Evaporator Upgrade 98VII. DECONTAMINATION OF GROUNDWATERS CONTAINING
VOLATILE ORGANICS 99
REFERENCES 104
IV

LIST OF FIGURES
No. Title Page
1. Effects of HNO3 Concentration on the Fraction of ZrF4 to Zirconium Solution 10
2a. Plot of Calculated logy" for H3PO4-H2O System at 25°C 11
2b. Plot of Calculated and Reported Activities of Water in H3PO4-H2O System at 25°C 11
3. Forward and Reverse Distribution Ratios for 210Bi between 0.3M NaNOyHNO.i Solutionsand TRUEX-NPH as a Function of Equilibrium HNO3 Concentrations 20
4. Forward and Reverse Distribution Ratios for 2lf)Bi between IM NaNO^/HNO^ Solutionsand TRUEX-NPH as a Function of Equilibrium HNO3 Concentrations 20
5. Forward and Reverse Distribution Ratios for 2l0Bi between 4.4M NaNOVHNOi Solutionsand TRUEX-NPH as a Function of Equilibrium HNO3 Concentrations 20
6. Forward and Reverse Distribution Ratios for 210Bi between 7M NaNOyHNO.^ Solutionsand TRUEX-NPH as a Function of Equilibrium HNO3 Concentrations 21
7. Distribution Ratios for 21()Bi between Sodium Nitrate/Nitric Acid Solutionsand TRUEX-NPH as a Function of Initial Nitric Acid Concentration 22
8. Distribution Ratios for 210Bi between Sulfuric/Nitric Acid Solutions and TRUEX-NPHas a Function of Sulfuric Acid Concentration in 3.2M Sodium Nitrate 23
9. Distribution Ratios for 21(,Bi between Oxalic Acid/Nitric Acid/Sodium Nitrate Solutions as aFunction of Oxalic Acid Concentration 23
10. Experimental vs. Calculated Organic-Phase Nitric Acid Concentration forTRUEX-SREX (DAIAP]) Solvent 25
11. Organic Concentration of Nitric Acid vs. Aqueous-Phase Nitric Acid Concentration for().2MCMPO»1.2MEXT 25
12. Concentration of DA| AP|»HNO3 Species in TRUEX-SREX (DA| AP]) Solvent vs.Aqueous HNO3 Activity 26
13. Concentration of CMPO Species for TRUEX-SREX (DA[AP|) Solvent vs.
Aqueous HNO3 Activity 26
14. Concentration of HNO^2EXT vs. Aqueous HNO3 Concentration 27
15. Concentration of HNO^^EXT Complex vs. Aqueous HNO3 Concentration 2716. Concentration of EXT«2HNO3 vs. Aqueous HNO3 Concentration 28
17. Concentration of HNO^'EXT'CMPO vs. Aqueous HNO3 Concentration 28

LIST OF FIGURES (contd)
No. Title Page
18. Distribution Ratios of Strontium between Nitric Acid/Nitrate Salts and the
TRUEX-SREX System 29
19. Calculated Sodium Distribution Ratios vs. Nitrate Activity for the TRUEX-SREX System 32
20. Calculated Magnesium Distribution Ratios vs. Nitrate Activity for the TRUEX-SREX System 32
21. Calculated Aluminum Distribution Ratios vs. Nitrate Activity for the TRUEX-SREX System 33
22. Calculated Calcium Distribution Ratios vs. Nitrate Activity for the TRUEX-SREX System 33
23. Calculated Manganese Distribution Ratios vs. Nitrate Activitv for the TRUbX-SREX System 34
24. Calculated Nickel Distribution Ratios vs. Nitrate Activity for the TRUEX-SREX System 34
25. Calculated Copper Distribution Ratios vs. Nitrate Activity for the TRUEX-SREX System 35
26. Calculated Rubidium Distribution Ratios vs. Nitrate Activity for the TRUEX-SREX System 35
27. Calculated Strontium Distribution Ratios vs. Nitrate Activity for the TRUEX-SREX System 36
28. Calculated Cesium Distribution Ratios vs. Nitrate Activity for the TRUEX-SREX System 36
29. Combined TRUEX-SREX Flowsheet for Cold Tests with HNO3 38
30. Effect of THFTCA and HNO3 on the D Value for Americium 41
31. Effect of THFTCA and HN0 3 on the D Value for Plutonium 41
32. Effect of THFTCA and HNO3 on the D Value for Uranium 42
33. Combined TRUEX-SREX Flowsheet Used in GTM/SASSE Calculations 43
34. The GTM-Calculated Concentration Profile for Nitric Acid in the CombinedTRUEX-SREX Process 47
35. The GTM-Calculated Concentration Profile for Strontium in the CombinedTRUEX-SREX Process 47
36. The GTM-Calculated Concentration Profile for Americium in the CombinedTRUEX-SREX Process 48
37. The GTM-Calculated Concentration Profile for Plutonium in the CombinedTRUEX-SREX Process 48
38. The GTM-Calculated Concentration Profile for Technetium in the CombinedTRUEX-SREX Process 49
VI

LIST OF FIGURES (contd)
No. Title Page
39. The SASSE-Calculated Concentration Profile for THFTCA in the Strip Section 49
40, Flowsheet for NBL Batch 2 Processing 60
4). Scintillation Counting Results vs. Time for DW Samples during NBL Batch 2 Processing 63
42. Scintillation Counting Results vs. Time for DW Samples during Day 1 ofNBL Batch 2 Processing 65
43. Scintillation Counting Results vs. Time for DW Samples during Day 2 ofNBL Batch 2 Processing 65
44. Scintillation Counting Results vs. Time for DW Samples during Day 3 ofNBL Batch 2 Processing 65
45. Scintillation Counting Results vs. Time for DW Samples during Day 4 of
NBL Batch 2 Processing 65
46. Average Scintillation and Gamma Counting Results for DX Samples 68
47. Average Scintillation and Gamma Counting Results for EW Samples 68
48. Average Scintillation and Gamma Counting Results for FW Samples 68
49. Average Scintillation and Gamma Counting Results for GW Samples 69
50. Average Scintillation and Gamma Counting Results for HW Samples 69
51. Average Scintillation and Gamma Counting Results for Acid Rinse (IF) Samples 69
52. Flowsheet for NBL Batch 2 Waste 71
53. Americium and Plutonium Concentrations in the DW Raffinate 73
54. Americium and Plutonium Concentrations in the FW Raffinate 75
55. Americium and Plutonium Concentrations in the GW Raffinate 75
56. Americium and Plutonium Concentrations in the HW Raffinate 76
57. Americium and Plutonium Concentrations in the HP Product 76
58. Americium and Plutonium Concentrations in the Organic Phase Leaving the Column 77
59. Americium and Plutonium Concentrations in the Organic Reservoir 78
60. Americium and Plutonium Concentrations in the Acid Rinse 78
61. Flowsheet for Processing Batch 3 82
Vll

LIST OF FIGURES (contd)
No. Title
62. Floor Plan for Test of Laboratory-Scale Evaporator 84
63. Photograph of the Laboratory-Scale LICON Evaporator 85
64. Schematic of Laboratory-Scale Evaporator, Including Location of Sensors 86
65. Boiling Temperature for Nitric Acid-Water System 90
66. Debye-Hiickel Constant as a Function of Temperature 91
67. Calculated and Measured Activity Coefficient Data for Nitric Acid as Function of MolalConcentrations 92
68. Experimental and Calculated Stoichiometric Activity Coefficients of Nitric Acidat25and50°C 92
69. Experimental and Calculated Activity Coefficients as a Function of Temperature 93
70. Flow Diagram of MASX/MADS Process 99
71. Sparged Gas Reactor Used in the Henry's Law Experiments 100
72. Experimental Data from the Sparged Gas Reactor for Three VOCs and Zero Gas Flow 102
73. Thermodynamic Plots Used to Correlate the Henry's Law Constants forThree VOCs in Sunflower Oil 103
viu

LIST OF TABLES
No. Title Page
1. Major Revisions to the Generic TRUEX Model, Version 2.4.3 5
2. Extraction Constants for the HNO3/TRUEX System at 25°C 7
3. Determination of HBF4 Concentration in Concentrated and Dilute Solutions of HBF4 13
4. Determination of HBF4 Concentration in 0.76M HBF4 Mixed with Three DifferentConcentrations of HNO3 13
5. Distribution Ratios for HBF4 or Mixtures of HBF4 and HNO3 with the TRUEX Solvent 14
6 Distribution Ratios for 24lAm between Nitric Acid and TRUEX-Dodecane 15
7. Distribution Ratios for 210Bi between Nitric Acid and TRUEX-NPH 18
8. Titrated Acid Concentrations vs. Prepared Concentrations 19
9. Aqueous Nitric Acid Concentrations and Bismuth Distribution Ratios for Contactsbetween HNCVNaNCh Salt Solutions and TRUEX-NPH Solvent 19
10. Distribution Ratio for 2l()Bi between Nitric Acid/Sodium Nitrate Solutions with aConstant Nitrate Concentration of 3.2M and TRUEX-NPH Solvent 21
11. Distribution Ratio for 210Bi between Sulfuric Acid/Sodium Nitrate Solutionsand TRUEX-NPH Solvent 22
12. Distribution Ratio for 2l(,Bi between Oxalic Acid/Nitric Acid/Sodium Nitrate Solutionsand TRUEX-NPH Solvent 22
13. The HNO.rExtraction Constants Varied to Fit DA[AP]-Solvent Data 24
14. Distribution Ratios of Inert Constituents in Dissolved Sludge Waste with Solvent of0.2MCMPO-0.2MCE-1.2MTBP-Isopar-L 30
15. Distribution Ratios of Fission Products in Dissolved Sludge Waste with Solvent of0.2MCMPO-().2MCE-I.2MTBP-Isopar-L 30
16. Distribution Ratios of Lanthanide Fission Products in Dissolved Sludge Waste withSolvent of 0.2M. CMPO-0.2M. CE-1.2M. TBP-Isopar-L 30
17. Equations Used for Calculated Distribution Ratios of Cations in theTRUEX-SREX Solvent System 31
18. Activities of Nitrate Ion, Hydrogen Ion, and Water in Complex Nitrate Salt Solution
vs. Nitric Acid Concentration in TRUEX-SREX System 31
19. Effect of Solvent Modifier on the D Values for Nitric Acid 40
20. Component Composition in Various Feed Streams for GTM/SASSE Calculations 44
IX

LIST OF TABLES (contd)
No. Title Page
21. Distribution Ratios for Various Components in GTM/SASSE Calculations 45
22. Stage Composition and Effluent Flow Rates Based on GTM/SASSE Calculations 46
23. Results of Singk-Stage Two-Phase Tests with Solvent Density of 838 g/L 53
24. Results of Single-Stage Two-Phase Tests with Solvent Density of 902 g/Land O/A Flow Ratio of 5.0 54
25. Results of Single-Stage Two-Phase Tests with Solvent Density of 902 g/L 54
26. Effect of Contact with Various Aqueous Phases on Solvent Density 56
27. Effect of Various Aqueous Phases on the Dispersion Number for Three Solvents 56
28. Distribution Ratios for Acidified Filtrate 59
29. Sample Time and Average Scintillation and Gamma Counting Results for DF Samples 63
30. Sample Time and Average Scintillation and Gamma Counting Results for DW Samples 64
31. Sample Time and Average Scintillation and Gamma Counting Results for Carboy Samples 66
32. Sample Time and Average Scintillation and Gamma Counting Results for HP Samples 70
33. Sample Time and Average Scintillation and Gamma Counting Results forBottom-of-Column Samples 70
34. Estimated Feed Composition of NBL Batch 2 Waste 70
35. Predictions of GTM for Specified Flowsheet 72
36. Plutonium and Americium Concentrations in the TRUEX Solvent and the Aqueous FeedSolution for NBL Batch 2 Waste 73
37. Concentration of Americium and Plutonium in theEW Samples 74
38. Composition of the Feed for Batch 2 79
39. Composition of the Plutonium Product Stream for Batch 2 79
40. Feed Composition for Batch 3 81
41. Predictions by GTM for Batch 3 Flowsheet 82
42. Data from Evaporator Test Using a Feed of 6.7 x 10⁴M Sm(NO3)3 87
43. Data from Evaporator Test Using a Feed of 0.5M A1(NO3)3 and 6.7 x 10³MSm(NO3)3 88

LIST OF TABLES (contd)
No. Title Page
44. Results of Eqs. 28-30 to Fit Experimental Data 94
45. Calculated and Experimental PHNO3 and P^o a t 25°C 94
46. Vapor-Liquid Equilibrium Data for NaNO3 and HNO3 System at 130 mm Hg Total Pressure 95
47. Calculated and Actual Concentrations of Samarium Standards 97
48. Calculated and Actual Concentrations of Samarium Standards for Second Run 97
49. Boiling Points and Henry's Law Constants of VOCs at 1000 ppbin Sunflower Oil 102
50. Thermodynamic Quantities of Various VOCs in Sunflower Oil 103
XI

SEPARATION SCIENCE AND TECHNOLOGYSEMIANNUAL PROGRESS REPORT
April—September 1992
ABSTRACT
This document reports on the work done by the Separations Science andTechnology Programs of the Chemical Technology Division, Argonne NationalLaboratory, in the period April-September 1992. This effort is mainly concerned withdeveloping the TRUEX process for removing and concentrating actinides from acidicwaste streams contaminated with transuranic (TRU) elements. The objectives of TRUEXprocessing are to recover valuable TRU elements and to lower disposal costs for thenonTRU waste product of the process. Two other projects are underway with theobjective of developing (1) a membrane-assisted solvent extraction method for treatingnatural and process waters contaminated by volatile organic compounds and(2) evaporation technology for concentrating radioactive waste and product streamssuch as those generated by the TRUEX process.
SUMMARY
The Division's work in separation science and technology is mainly concerned with developing atechnology base for the TRUEX (TRansUranic Extraction) solvent extraction process. The TRUEXprocess extracts, separates, and recovers TRU elements from solutions containing a wide range of nitricacid and nitrate salt concentrations. The extractant found most satisfactory for the TRUEX process isoctyl(phenyl)-N,N-diisobutylcarbamoylmethylphosphine oxide, which is abbreviated CMPO. Thisextractant is combined with tributyi phosphate (TBP) and a diluent to formulate the TRUEX processsolvent. The diluent is typically a normal paraffinic hydrocarbon (NPH) or a nonflammable chlorocarbonsuch as carbon tetrachloride (CCI4) or tetrachloroethylene (TCE).
The objectives of TRUEX processing are to recover valuable TRU elements and to lower disposalcosts for the nonTRU waste product of the process. The major thrust of the development efforts has beenthe Generic TRUEX Model (GTM), which is used with Macintosh or IBM-compatible computers fordesigning TRUEX flowsheets and estimating cost and space requirements for installing TRUEXprocesses for treating specific waste streams.
The GTM version 2.4.3 was distributed to Macintosh and IBM-PC users during April. Effortscontinued to add features to the GTM and make it faster. One of the modules in the GTM calculates aunique solution to the mass-balance equations for CMPOfree and TBPfree during HNO3 extraction byTRUEX solvents. This module was improved by revising the equations needed to calculate CMPO^<.,TBPfn;c, and HNO v All upgraded equations used to calculate CMPOfrce, TBP frce, and [HNO3]OI^ aregiven, as are values for extraction constants used in those equations.
The data base generated for developing the GTM contains information (from the literature andour own laboratory measurements) on the solution and extraction behavior of important feed componentsover a wide range of possible waste-stream and processing conditions. Our recent efforts on expandingthe data base and adding extraction models have focused on zirconium, an important component innuclear fuel cladding; H3PO4, which is found in the nuclear waste storage tanks at Hanford; HBF4, one of

the main constituents in some of the wastes containing TRU elements a( Idaho National EngineeringLaboratory; and bismuth, another important constituent in the Hai ford storage waste tank. As part of thiseffort, we developed a neutron activation analysis method for determining zirconium distribution ratios, amethod for calculating water activities in phosphoric acid solution, a titrimetric ..lethod for estimating theconcentration of HBF4 in the aqueous solutions, and a method for measuring the purity of CMPO for usein the TRUEX solvent. In addition, we measured the distribution ratios for bismuth in the TRUEX-NPHsystem by use of 2l0Bi as a tracer. These measurements indicate that the extraction and stripping steps inthe current TRUEX process will require modification to separate plutonium (and americium) frombismuth.
We have started a project to demonstrate the new TRUEX-SREX process, which is a combinationof the TRUEX process and a recently developed SREX (strontium extraction) process. In August, staff inthe ANL Chemistry Division performed experiments to show that substituting diamyl(amyl) phosphonate(DAI AP]) for TBP in the TRUEX-SREX solvent could essentially eliminate third-phase formation as aproblem, even at high metal loading. This is certainly an improvement, but DA[AP] is a much strongerbase than TBP and extracts more acid into the organic phase. To calculate a flowsheet for using thisprocess solvent, we needed to change the model for nitric acid extraction in the GTM. To do this, weemployed the same set of equilibria equations used for the TRUEX solvent, but modified the constantsrelated to TBP extraction to fit the .solvent containing 1.2M DA[ APj. Based on limited data collected bythe Chemistry Division staff, the extraction behavior of strontium and several other inetal-ion nitrate saltsin the TRUEX-SREX process has been modeled and incorporated into the GTM.
A flowsheet was developed to conduct cold tests of the TRUEX-SREX process with nitric acid ina minicontactor. The combined TRUEX-SREX solvent will selectively extract and partition U, Sr, Bi; theTRU elements such as Am and Pu; the lanthanides; and most of the Tc from Hanford dissolved sludgewastes. Using the GTM and, when appropriate, additional data specific to the TRUEX-SREX process,we evaluated the various sections of the flowsheet design to verify that they will meet process goals forthe subsequent tests with radioactive materials. This modeling effort indicated that solvent loading of Uand Bi will be important in the final process design. This loading will be important not only because ofpossible third-phase formation but also reduced distribution ratios for Am, Bi, and the lanthanides in theextraction section.
A 20-stage minicontactor was set up to experimentally verify the calculated nitric acidconcentrations for the TRUEX-SREX flowsheet. Preliminary tests were initiated to check that thisequipment will work properly when (1) the new TRUEX-SREX solvent, which has a high solvent density,is used, and (2) a new aqueous-phase sampling system is in olace for selected contactor stages. The testswith the actual process solvent were postponed after the dispersion number for the solvent was measuredand found to be too low. We have formulated a new solvent which appears to resolve these problems.Cold testing will begin once this new solvent is prepared.
The GTM was used to design a TRUEX flowsheet for treating plutonium-containing waste(-200 L) generated at ANL and the New Brunswick Laboratory. The plutonium product stream fromBatch 1 has been evaporated and calcined. Two batches of oxide were produced from the calcination.Batch la weighed 6.40 g containing 6.20 g Pu, and Batch lb weighed 21.20 g containing 3.39 g Pu.Batch lb was also contaminated with sodium and potassium. After washing Batch 1b with water toremove sodium and potassium, the weight decreased to 5.5 g.
A second batch of waste (containing 13 g plutonium and 16 g uranium) was processed over fourdays. Also processed was solution containing raffinate from Batch 2 that had unacceptable high activity

levels, acidified carbonates from Batch 2, and various solutions from the glovebox. This processing tookonly a single day to complete.
A tear in the feed carboy caused Batch 2 to leak into a secondary container. Unfortunately, thelead shielding for this carboy was placed in between the carboy and the secondary container. The highlyacidic feed dissolved some of the lead shielding. Therefore, Batch 2 and Batch 2 Waste contained lead,making these solutions mixed waste. Tests were completed to determine if the lead could be precipitated,making the supernatant liquid simply radioactive waste. The lead was not precipitated by eitherhydroxide or sulfate. Because Waste Management Operations at ANL picked up the waste as is, nofurther testing or processing was completed.
Based on an analysis of the process streams for Batch 2 and Batch 2 Waste, we completed aplutonium and uranium material balance. A total of 12.0 g of plutonium was recovered from the 12.5 g ofplutonium remaining in the feed after the feed carboy leak, for a 95% total plutonium recovery. Anestimated 15.3 g of uranium remained in the feed after the feed carboy leak, of which 14.5 g wasrecovered, for a 95% total uranium recovery.
An effort has been initialed to develop evaporator technology for concentrating radioactive wasteand product streams such as those generated by the TRUEX process. A laboratory-scale evaporatorfabricated by LICON Inc. was delivered and installed during this report period. Minor equipmentchanges were made to ensure safe operability. Documentation and data log sheets have been developed,and a safety review was undertaken. Two shakedown runs using feeds of salt solutions were completed.
Prediction of the vapor composition in equilibrium with complex aqueous solutions is animportant need in designing evaporator systems for recovering nitric acid from process and productstreams. According to Raoults law, the thermodynamic activities of nitric acid and water in an aqueoussolution are proportional to their partial pressures in the vapor above that solution. Work was begun inFY 1992 to extend GTM correlations that calculate activities from the present 25°C to all applicabletemperatures. This approach called for adding temperature dependencies to the modified Bromleyequations used in the GTM. Early results show that fitting the binary system (nitric acid/water) called forfirst-order temperature dependencies for three of the six constants in the modified Bromley equation. Ourearly work in fitting literature data for vapor compositions above ternary systems that include a nitrate saltconstituent shows that determining temperature dependencies for the activities of all components may benecessary for accurate vapor-composition predictions.
Technology based on membrane-assisted solvent extraction to remove volatile organiccompounds from groundwater is also under development. Experimental data requires *o design thesystem are being reviewed, and a preliminary design is discussed.

I. INTRODUCTION(G. F. Vandegrift)
The Division's work in separation science and technology is mainly concerned with developing atechnology base for the TRUEX (TRansUranic Extraction) solvent extraction process. The TRUEXprocess extracts, separates, and recovers TRU elements from solutions containing a wide range of nitricacid and nitrate salt concentrations. The extractant found most satisfactory for the TRUEX process isoctyl(phenyl)-N,N-diisobutylcarbamoylmethylphosphine oxide, which is abbreviated CMPO. Thisextractant is combined with tributyl phosphate (TBP) and a diluent to formulate the TRUEX processsolvent. The diluent is typically a normal paraffinic hydrocarbon (NPH) or a nonflammable chlorocarbonsuch as carbon tetrachloride (CC14) or tetrachloroethylene (TCE). The TRUEX flowsheet includes amultistage extraction/scrub section that recovers and purifies the TRU elements from the waste streamand multistage strip sections that separate TRU elements from each other and the solvent. Our currentwork is focused on facilitating the implementation of TRUEX processing of TRU-containing waste andhigh-level defense waste, where such processing can be of financial and operational advantage to theDOE community.
The major effort in TRUEX technology-base development involves developing a generic database and modeling capability for the TRUEX process, referred to as the Generic TRUEX Model (GTM).The GTM will be directly useful for site-specific flowsheet development directed to (1) establishing aTRUEX process for specific waste streams, (2) assessing the economic and facility requirements forinstalling the process, and (3) improving, monitoring, and controlling on-line TRUEX processes. TheGTM is composed of three sections. The heart of the model is the SASSE (Spreadsheet Algorithm forStagewise Solvent Extraction) code, which calculates multistaged, countercurrent flowsheets based ondistribution ratios calculated in the SASPE (Spreadsheet Algorithm for Speciation and PartitioningEquilibria) section. The third section of the GTM, SPACE (Size of Plant and Cost Estimation), estimatesthe space and cost requirements for installing a specific TRUEX process in a glovebox, shielded-cell, orcanyon facility. The development of centrifugal contactors for feed- and site-specific applications is alsoan important part of the effort.
Two other projects have recently been initiated in separation science and technology. Theobjectives of these projects are to develop (1) a membrane-assisted solvent extraction method for treatingnatural and process waters contaminated by volatile organic compounds and (2) evaporation technologyfor concentrating radioactive waste and product streams such as those generated by the TRUEX process.

II. GENERIC TRUEX MODEL IMPROVEMENTS
A. Enhancements to Generic TRUEX Model(J. M. Copple)
The GTM version 2.4.3 was distributed to Macintosh and IBM-PC users during April 1992.The major changes in this release are displayed in Table 1.
Table 1. Major Revisions to the Generic TRUEX Model, Version 2.4.3
• Additional speciation has been added to the SASPE module of the GTM: ZrF4,ZrFfc, and Pu(C2O4>3 have been added.
• Thorium was added to the loading effect module.
• The macro CMPOfJTBPF.XLM (CMPOJTBP on the Macintosh) has been combinedwith the macro DVALUES.XLM (D_Values on the Macintosh) to speed upexecution of the GTM.
• When the GTM terminates with a known error, the error is logged in a file.
• The speciation calculations inside SASPE have been improved. New equations forinitial guesses were added to the speciation calculations to help it converge faster.An error was corrected in taking the partial derivatives of hydrogen with respect tozirconium and hydrogen with respect to phosphate in the Newton-Fiaphson algorithm.This error did not affect the final answer but did affect the rate of convergence for thealgorithm.
• The M&S Equipment Cost Index in SPACE for the years 1989 and 1990 waschanged to actual values instead of estimates.
The newest GTM version runs quicker due to combining two files. "D_Values," the file thatcalculates the distribution ratios of specified components, was combined with SASPE, the file thatcalculates speciation. During a typical case, 21 min was cut off the run. Although the size of thecombined files takes 45K bytes more disk space than the sum of the two files, the time to calculate theresults decreased since there was no longer a need to pass information between the two files. As anadded bonus, the IBM-PC version requires less system resources since one less file has to be open.The combined file is called SASPE. The DJValues file will no longer be included with the GTM.
In addition, the diluent for the SREX (strontium extraction) process was added in the GTM.
B. Development of Spreadsheet Algorithms for Speciation and Partitioning Equilibria(M. C. Regalbuto and G. F. Vandegrift)
The SASPE (Spreadsheet Algorithms for Speciation and Partitioning Equilibria) section ofthe GTM will calculate distribution ratio (D) values for each aqueous phase composition selectedfrom the feed menus or generated in SASSE (Spreadsheet Algorithm for Stagewise SolventExtraction). The many modules to the SASPE section include charge-balance checks of the feedsolution, estimates of densities of complex aqueous solutions, molar-to-mola! activities of aqueousphase species, oxalic-acid additions to fission-product-containing waste to restrict zirconiumextraction, aqueous-phase and organic-phase speciation of individual components, and individual-component distribution ratios.

Another one of these SASPE modules calculates a unique solution to the mass-balanceequations for CMPOfree* and TBPfree* during HNO3 extraction by the TRUEX solvents. Thismodule generated a set of quadratic equations in which TBPfree and CMPOfree could not be solvedexplicitly. A module named CMPOfree-TBPfree was therefore created, and the two equations werecombined to eliminate TBPfree so that only one equation written in terms of CMPOfree needed to besolved. The macro used the Newton-Raphson method to obtain the molar concentration ofCMPOfree. Starting with an initial guess for the concentration of CMPOfree, the next estimate is
™/fnrV+1 r w D n ' f(CMPOfree)CMPOfree = CMPOfree i ( • )f (CMPOfree)
When a value for CMPO'free concentration was obtained that satisfied the combined mass-balance equation, the molar concentration of TBPfree was calculated by using the convergedCMPOfree- After the values for CMPOfree and TBPfree were computed, the molar concentration of[HNO3]org was calculated.
There were a few discrepancies in the way that the CMPOfree, TBPfree, and [HNO3]org
equations were initially programmed into SASPE. The constants used to solve for CMPOfree andTBPfree differed from those used to calculate HNO3; therefore, the values generated by the modulewere wrong. Appropriate changes were made to reflect the fact that the same constants need to beused to calculate CMPOfree, TBPfree, and [HNO3]org The equations solved by the upgradedCMPOfree-TBPfree module are as follows:
= 1 + Kc raH + Kc2aH + Km,aHTBP f r e e + Km2TBP f ree (2)
-(Cm.) + V(Cmi)2 + 8Kc3-aH-CMPQ^ ...H (3)
Trri| = 1 + Kt,-aH + Km,aHCMPOfree + Km2 CMPOfree + Kt3aH2 (4)
T B P f r e e " 4 Kt2aH
[HNO3]0rg = (Kc 3 a H )CMPoL + (Kc, -aH + 2Kc2aH2)CMPOfree (6)
+ (Kt 2aH )TBPL + (Kt,aH + 2Kt3aH2)TBPfree
+ (Km raH + Km2)CMPOfree TBPfree
where CMPOfree and TBPfree are the concentrations of free CMPO and TBP; CMPOT and TBPT arethe total molar concentrations of CMPO and TBP; Cmj and Tm| are variables used to simplify Eqs. 3and 5. The variable aH defines the activity of nitric acid in the aqueous phase, and Kc|, Kc2, KC3, Kt\,Kt2, Kt^, Km|, and Km2 are all extraction constants, given in Table 2.
* That is, not forming an organic-phase compound with nitric acid (e.g., TBP»HNO3,CMPC 2HNO3).

Table 2. Extraction Constants for theHNO/TRUEX System at 25°C
Constant
Kc,Kc2
Kc,Kt,Kt,Kt,Km,Km2
Diluent
NPHa
1.890.0444.630.1810.3560.00011.740
TCEb
1.60.011.660.1570.20301.750
a0.2M CMPO/1.2M TBP in a normalparaffinic diluent.
b0.25M CMPO/0.75M TBP in tetrachloro-ethylene.
As a result of the above work, the CMPOfree-TBPfree module in the GTM was revised. In thisrevision, corrections were made to the equations used to calculate CMPOfree, TBPfree, and HNO3. Thecorrections reflect the addition of the constant Kt3 in the equations that calculate the concentrationsof TBPfree and the addition of the constant Krri2 in the equations used to calculate HNO3concentrations.

III. DATA COLLECTION FOR GENERIC TRUEX MODEL
The mechanistic- and thermodynamic-based equations in the GTM predict the solution andextraction behavior of feed components over a wide range of possible waste-stream and processingconditions. Our recent efforts have been concentrated on adding thermodynamic extraction modelsfor components of interest at DOE waste sites.
A. Zirconium Behavior(S. Howard and L. Nunez)
Zirconium is an important component in nuclear fuel cladding. As the nuclear fuel isdissolved, the zirconium is present in large concentrations. To account in the GTM for the complexzirconium chemistry, a solvent extraction model must be determined on the basis of measured orcalculated distribution ratios. Previously, some experimental distribution ratios were measured withzirconium radiotracer, but the zirconium chemistry at tracer level is plagued with complications suchas metastability as a function of time, polymer formation, and species affinity toward glass and dust.Finally, the tracer concentrations are not realistic to existing nuclear waste. An alternative to tracerstudies is neutron activation analysis (NAA), where larger concentrations of zirconium can be studied.
Neutron activation analysis allows one to measure the amount of a given element X containedin some material Y. The basic steps include irradiating Y with a source of ionizing radiation so that Xchanges to X*, a radioactive isotope of X. An instrumental technique can be employed to "isolate" Xand X* from all other elements in Y (not necessarily totally); the activity of X* is then measured.From this point, the amount of X present can be calculated. For example, in this work, the amount ofzirconium in an aqueous or organic solution will be measured. The equation for the reaction that willbe occurring is:
The ZrF4 may not be in high abundance with low zirconium concentrations (10~8 to 10~9M). Earliertracer studies for zirconium extraction behavior in solutions containing high fluoride concentrationshave not agreed with results at Pacific Northwest Laboratories using actual waste solutions.1 Datawere needed at higher zirconium concentrations; NAA determination of distribution ratios at higherconcentrations of zirconium may be used to assess the effect of fluoride ion. With many distributionratio measurements for zirconium, the stability constants and thermodynamic equilibrium constantsfor organic-phase complexes can be determined. These experiments will be performed at Universityof Illinois (LJI) facilities.
For short-lived neutron activation analysis, both thermal [1.2 x 10¹³ n/(cm2s) at 1.5 MW] andepithermal cadmium-lined [1.0 x 10 ,2 n/(cm2s) at 1.5 MW] irradiation facilities with "rabbit" carriersare available at UI. To account for proper irradiation times, an electronic timer with measurements toone-tenth of a second is in place. For long-term irradiations, a "lazy-Susan" facility with a thermalflux of 3.3 x 10¹² n/(cm2s) at 1.5 MW is capable of irradiating up to 80 samples simultaneously. Forhigher neutron fluxes, an in-core facility for thermal [1.2 x 10'3 n/(cm2-s) at 1.5 MW] and epithermal[1.0 x 10,2 n/(cm2s) at 1.5 MW] irradiation positions is also available.
The UI neutron activation facility is located in the Materials Research Laboratory, where the"rabbit" terminal and counting equipment are available. Three setups are present: a 19% efficient

germanium detector in conjunction with a Compton Suppression system, a 13% efficient y-X detectorcapable of detecting both X- and γ-rays, and a 24% efficient germanium detector in conjunction witha sample changer. A 15% efficient germanium detector is also available for use.
Each irradiated sample will be counted on a 13% efficient γ-x germanium counter for half anhour. The resolution of this detector is 2.0 keV at the 1332 keV cobalt-60 photopeak. Theresolution is defined as the ratio of the full width at half-maximum (FWHM). The detector iscalibrated at 400 eV/channel, and there are 8192 channels.
An important concept in NAA is the detection limit. The detection limit (LD) is defined asthe value at which a given analytical procedure may be relied upon to lead to detection. This value,for NAA, is the minimum number of counts detected above background to be certain that aradioisotope is present:
L D = 4.65 x ^ (8)
where C B is the average background count for a gamma peak. This count is obtained from
CR = C L ! C R x N (9a)
where C L and CR are the number of counts in the channels just left and right of the peak, and N is the
number of channels that the peak spans.2 It is also possible to convert the detection limit to a
minimum detectable concentration (Cm),
C m = ^ ^ L (9b)
where LD is the detection limit in counts, the concentration is in ppm, Ci is the radioisotopeconcentration, and C N is the net counts (total counts in the peak minus Cβ).
While NAA will be used to determine the zirconium distribution ratios, the GTM will be usedto calculate the concentrations of the ZrFn species in the solution, based on current literature stabilityconstants for six zirconium fluoride species. We assumed that the neutral Z.F4 species could beextracted by the TRUEX solvent. Figure 1 shows the calculated effect of HNO3 concentration on thefraction of ZrF4 concentration to total zirconium in solution.*
Unless stated otherwise, calculations and experiments in this report are for 25°C.

10
X
•
o
D
O
+X
a
o
•
aoX
+
0.001 M Zr0.01 M ZΓ
0.005 M ZΓ0.05 M ZrO.lMZr
0.4 I I—I—I . I I I
1 2 3 4 5 6[HNOg], M
Fig. 1. Effects of HNO3 Concentration on the Fraction of ZrF 4 toZirconium Solution (based on GTM speciation calcula-tions). The fluoride concentration was held at four timesthat of zirconium.
B. Bromley Constants for H 3 PO 4
(L. Nunez)
Previous analysis of data from tracer and potentiometric titration experiments yielded amodel for the H3PO4 extraction. In this report period, the activities of H3PO4 were calculated byusing the literature values from vapor-phase pressure measurements (VPM). Data on the activity ofwater (aw) in a H3PO4-H2O system were reported by Elmore et al.3 for molalities ranging from0.1659 to 217.4. To incorporate these data into the GTM, we obtained the constants for the activityof water in the H3PO4 system from the Bromley equation:
(10)
where Zj and Z, are the charges of the cation and anion, I is the ionic strength, A is the Debye-Hiickelconstant, and A, B, p, C, D,... are constants. Figure 2a shows the calculated values for log y° forH3PO4-H2O at 25°C, and Fig. 2b shows the calculated values for a^ determined for the followingconstants in Eq. 10: B = 0.028, P = 0.100, C = -0.001, D = -4.821 x 10⁻⁶, £ = 1.2045 x 10⁻⁷. Theplot (Fig. 2b) shows an excellent correlation of the reported values3 to the calculated values. For arange of 60 molal, the largest aberration is only 6.4%.
C. Fluoboric Acid Behavior
(B. Srinivasan)
Fluoboric acid (HBF4) is one of the main constituents in some of the wastes containingtransuranic elements at Idaho National Engineering Laboratory (INEL). In the TRUEX process, the

11
60o
0.1
0
-0 .1
- 0 . 2
- 0 . 3 •
- 0 . 4
- 0 . 5
- 0 . 6
- 0 . 7
. I . . . . . . - J1•
•
•
1•
. . . . . . . . . . _ ' - -
rf*»—-1
I I
^IH • •
j
i 1
• • i
.„ j
i 1
' " 1j
i —=—i10 20 30 40
Molality of H3PO4
5 0 6 0
Fig. 2a. Plot of Calculated logy° for H^ System at 25°C
0
-0.1
- 0 . 2
-0 .3
-0 .4
- 0 . 5
-0.6 4
-0.8
-0.9
- 1
-1.1
-1.2
-1 .3 j
!
••
: i : i !
*r r
• •F....JL J.
- " } • *
• * -r •*••h j .
*
*
: :
m-T"„ J
•!
L . m . . . _ • • 1
r I
i
i <F j
I |* • • i t
1 1 1 1 110 20 30 40
Molality of H3PO4
50 60
Fig. 2b. Plot of Calculated and Reported Activities of Waterin H3PO4-H2O System (Elmore et al.1) at 25°C
presence of HBF4 may alter the extraction behavior of these elements into the organic phase. Hence,it is essential to know independently about the extraction properties of HBF4.
1. Quantitative Analysis of HBF4
During this report period, a large fraction of the experimental effort was spent onestablishing a reliable titrimetric method of analysis to estimate the concentration of HBF4 in theaqueous and organic phases following extraction. Direct titration of HBF4 against standard solutionof alkali (NaOH) yields multiple end points, which proved difficult to interpret. Because HBF4

12
hydrolyzes appreciably in dilute solutions, acid molecules that can react with NaOH to yield multipleendpoints are created. The hydrolysis reactions of HBF4 are
BF4" + H2O <-> BF3OH- + HF (11)
BF3OH- + H2O o BF2(OH)2- + HF (12)
BF2(OH)2- + H2O <-> BF(OH)3" + HF (13)
BF(OH)3- + H2O <-> B(OH)4" + HF (14)
The total concentration of HBF4 (irrespective of the nature of the acid species) can bedetermined by hydrolyzing the HBF4 completely to B(OH)4~, and titrating the B(OH)4" formedagainst standard acid solution (HC1). The hydrolysis is carried out at elevated temperature (70 to85°C) in the presence of excess Ca2+ to remove the HF formed as insoluble CaF2. As the hydrolysisproceeds, the solution is neutralized by the addition of alkali, and finally made alkaline (pH>l 1)before titration with HC1. The equations governing hydrolysis are
HBF4 + 3H2O -> B(0H)3 + 4HF (15)
CaCl2 + 2HF -* CaF2 + 2HCI (16)
B(OH)3 + NaOH -> NaB(OH)4 (17)
The two equations governing titration are
HC1 + NaOH <-> NaCl + H2O (18)
NaB(OH)4 + HCI <-> B(OH)3 + NaCl + H2O (19)
The pH titration of the hydrolyzed solution results in two end points. The first endpoint represents the excess OH" present in the solution, while the difference between the first andsecond end points represents the amount of B(OH)3 produced by hydrolysis and, therefore, theamount of HBF4 in the titrated solution.
The concentrations of three different solutions of HBF4 (approximately 0.08, 0.8, and8M) were determined using the above procedure, and the results are shown in Table 3. Reproducibleresults were obtained when sufficient time was allowed for quantitative hydrolysis of HBF4 in thesamples. The kinetics of the hydrolysis reaction was not studied. However, this reaction appears togo to completion in about 3 h for all the samples studied.
The above titrimetry procedure was also used to determine the concentration of HBF4
in solutions which are mixtures of HBF4 and HNO3. In these cases, it is necessary to add enoughalkali to neutralize the HNO3 present in the samples before hydrolysis of HBF4. Again reproducibleresults were obtained (see Table 4).
2. Extraction of HBF4
We studied the extraction of HBF4 in aqueous solutions of pure HBF4 (nearly 0.08Mand 0.8M.X as well as in mixtures of HBF4 and HNO3 (nearly 0.8M HBF4 mixed with 0.1M or 0.5M

13
Table 3. Determination of HBF4 Concentration inConcentrated and Dilute Solutions of HBF4.Analysis method involved hydrolysisfollowed by titration against standard HC1.
Determined
7.76M Sol."
7.737.917.268.187.667.847.857.857.85
Mean: 7.79
Concentration
0.78M Sol.a
0.780.760.760.760.780.760.810.81
0.78
ofHBF4,M0.08M Sol.a
0.080.080.08
0.08
a Calculated from percent HBF4, density of stocksolution, and dilution by water.
Table 4. Determination of HBF4 Concentration in 0.76MHBF4
a Mixed with Three Different Concentra-tions of HNO3. Analysis by hydrolysis followedby titration against standard HC1.
Determined Concentration of HBF4, M
0.1MHNO3a 0~5M HNO3
a 5M HNO3a
0.740.730.740.72
0.730.740.730.740.740.75
0.720.720.730.720.73
Mean: 0.73 0.74 0.72
a Calculated from percent HBF4, density of stocksolution, and dilution by water.
or 5M HNO3), by the TRUEX solvent (0.2M CMPO + 1.4M TBP in n-dodecane). The aqueousphase of the acid samples was contacted with the organic phase of the TRUEX solvent forganic-to-aqueous (O/A) volume ratio of 1:1] at 25°C. The aqueous and organic phases were separatedfollowing the contacts, and the HBF4 concentrations in both the phases were determined by thetitrimetry procedure given above. In the case of organic phases, the HBF4 was back extracted intowater, before the titrimetric analysis was initiated. Distribution ratios, defined as concentration ofHBF4 in organic phase divided by concentration of HBF4 in aqueous phase, are given in Table 5.
It is proposed to continue determining D values for other mixtures of HBF4 andHNO3 as part of the ongoing effort to expand the GTM for radioactive wastes containing HBF4.

14
Table 5. Distribution Ratios for HBF4 or Mixtures ofHBF4 and HNO3 with the TRUEX Solvent
[HBFJ, M [HNO3], M D Value
0.08 0.270.21
0.78 0.360.330.350.360.370.360.310.35
0.73 0.1 0.330.33
0.74 0.5 0.280.28
0.72 5 0.050.05
D. Americium Behavior
(J. Sedlet and G. F. Vandegrift)
A rapid method for testing the purity of CMPO is to measure the distribution ratio ofamericium in dilute nitric acid solution. The impurities of concern are acidic agents that extractmetal ions more efficiently at low aqueous phase acidities than the neutral CMPO, and thus givehigher distribution ratios. These will be noticeable at low nitric acid concentrations when thedistribution ratios are low. The distribution ratio at O.OIM.HNO3 is a measure of these impurities.Because very small concentrations of the impurities will affect the distribution ratio at this acidity, theconcentrations of americium or other trivalent ions can affect the results.
A 2 4 1Am stock solution was prepared in 0.01M HNO3. The addition of this stock solutionwould not change the acidity of the aqueous phase to which it is added. A small volume (40 μL) ofthis solution was added to 1 mL of 0.0102M HNO3 and contacted with 1 mL of a used TRUEXsolvent, which had been purified with several carbonate and water washes. The americiumconcentration in the aqueous phase was initially -4.0 x 10'8M- The TRUEX solvent was pre-equilibrated by three contacts with equal volumes of 0.01M HNO3. This same extraction wasrepeated, except that the aqueous phase was made 10 4M in cerium. In addition, the distributionratios were also measured at 2M. HNO3 as a check on the laboratory procedure, since the ratio at thisacidity is well known and would not be affected by the impurities. The results are shown in Table 6.
The distribution ratios at 2M HNO3 a r e v e r v similar to those found earlier, ~25.4 At0.01M HNO3, the ratio without Ce 3 + present indicates a CMPO of satisfactory purity for a TRUEXsolvent. A measure of the acidic impurity concentration is shown by the factor of two decrease in thepresence of cerium ion. The cerium concentration was probably sufficient to react with all the acidic

0.01380.0056
24.525.0
100.198.9
100. i104.0
15
Table 6. Distribution Ratios for 24lAm between Nitric Acid and TRUEX-DoJecane
[HNO3], M [Am3+], M [Ce3+], M Dist. Ratio Material Bal., %
0.01 4 x l 0 8
0.01 4 x l 0 8 lO-4
2.0 4 x l 0 8
2.0 4 x l 0 8 lO 4
impurities, but one cannot be certain without repeating the measurements at higher ceriumconcentrations. A reverse extraction could be performed at 0.01M HNO3 if the americiumconcentration were increased by a factor of ten, and the counting were done by liquid scintillation.We suggest that these measurements be used as a test procedure for new workers to check theirlaboratory technique for performing distribution ratio measurements.
E. Bismuth Behavior(J. Sedlet and S. Weber)
Data on the distribution of bismuth between the organic and aqueous phases in the TRUEXprocess are being collected because, for the Hanford wastes now in single-shell tanks, the initialmethod for separating plutonium from neutron-irradiated uranium used bismuth phosphate tocoprecipitate Pu(IV) and sodium bismuthate to oxidize Pu(IV) to Pu(VI). Thus, these Hanford wastescontain large amounts (of the order of grams per liter) of bismuth, which could be extracted by theTRUEX process.
A radioactive bismuth isotope, 2 l0Bi (1.16-MeV beta emitter, 5.01-day half-life), is being usedto measure distribution ratios at the tracer level. The ratios will then be remeasured in the presence oflow concentrations (milligrams per liter) of stable 209Bi to determine the effect of solvent loading andbismuth solubility and hydrolysis. Isotopic exchange between 2l0Bi and stable 209Bi is expected tooccur rapidly in moderately acidic solution (~ 1M) since bismuth has only one oxidation state (3+)and is not hydrolyzed in strong acid solutions.
The Hanford wastes also contain large concentrations of sodium nitrate, since waste solutionscontained nitric acid and were later neutralized to prevent corrosion of the steel tanks in which theywere stored. The actinides form complexes with oxalate, fluoride, sulfate, and phosphate ions.Oxalate and fluoride may be used to strip the actinides from the solvent phase. Sulfate andphosphate may be present in the waste solution from the chemical processing. For these reasons, wealso determined the distribution ratios of bismuth from aqueous solutions containing varyingamounts of nitric acid with and without sodium nitrate, as well as solutions of sulfuric acid/sodiumnitrate, and oxalic acid/nitric acid/sodium nitrate.
1. Analysis Methodology
Bismuth-2i0 is a convenient bismuth tracer since it can be repeatedly separated fromits parent, 2 l0Pb, a weak beta emitter with a 22.3-yr half-life.* The 210Pb is commercially available
*Bisrnuth-2O7 is preferable since it is a long-lived beta/gamma emitter, but it was not available whenthis work was begun.

16
since it is a member of the 238ij decay series and is a byproduct of uranium ore processing. The: i 0Pb decay scheme is as follows:
MeV) ) 2iom p<1.16 MeV) ) 2 i o p o a(5.3 MeV) 206) m ) p o
22.3y 5.01d 138dp b
If 2 l0Bi is separated from 210Pb and from 2 l0Po, it can be used for distribution ratiomeasurements for about two weeks as long as sufficient radioactivity is obtained. At this time, our2l0Bi sample has grown back into 210Pb to about 80% of its equilibrium value, and the 2 ,0Bi can beseparated again and used for further studies. It is important to retain all the 210Pb and completelyseparate the 2 l0Po from the 210Bi, since the measurement method to be used, liquid scintillationcounting, will not distinguish the polonium alpha particle from the bismuth beta particle at high betaenergies.
The separation method chosen for this work uses a crown ether, 4,4'(5')-bis-t-butylcyclohexano-18-crown-6, absorbed on a purified solid Amberlite resin and operated as achromatographic column.5 The crown ether retains divalent ions very strongly, tetravalent lessstrongly, and trivalent ions poorly. Polonium has two oxidation states in aqueous solution, +2 and +4,and the divalent state is the most stable.
The separation procedure entails loading the column with 2 , 0Pb from 1M HNO3, theacid concentration at which lead is most strongly absorbed, and eluting the 2 l0Bi with 1M HNO3 toobtain a tracer solution for distribution ratio measurements. Because in practice some polonium alsoelutes, a second column is used to remove most of the polonium from the bismuth.
2. Measurement of 2 l 0Bi-2 l 0Po Mixtures
If both 210Bi and 210Po are present and are counted in a liquid scintillation counter inan energy interval in which both are detected, the amounts of each can be calculated by counting attwo or more different times during which appreciable decay of the 2 l0Bi occurs, since the twonuclides have different half-lifes, The governing equations are
C(I) = B + P (20)
C(2) = B e x p ^ t ) + P exp(-?y) + P (21)
F = B[Ap/ap - Ab)] [exp(-AbO - exp(-y)] (22)
where C( 1) and C(2) are the total counting rates at the time of the first and second counts,respectively; B and P are the counting rates due to 2l0Bi and 210Po at the time of the first count,respectively; Xh and Xp are the decay constants of 2l0Bi and 2 l0Po, respectively; P' is the counting rateof the 2 ,0Po arising from the decay of 210Bi; and t is the time between the two counts. SubstitutingEqs. 20 and 22 into 21 and solving for B yield
B = C(2)-C(l)exp(-Xpt)/(M + LM) (23)
where L = X,p/(Xp - Xb) and M = exp(-Xbt) - exp(-Xbt).

17
The decay of 210Po, P, can now be calculated from Eq. 20. Equation 23 can be usedfor any pair of counts if the sample is counted several times, and with an electronic spreadsheet allpairs of counts can be calculated simultaneously. As indicated above, C(l) and C(2) should differsubstantially for best results if significant 210Bi is present.
3. Experimental
Small aliquots of the 2 ,0Bi solution were added to the aqueous phase (nitric acid aloneand with additives) in a glass culture tube, and an equal volume of solvent (TRUEX-NPH) was added.The tubes were placed in a 25°C constant temperature bath for 5 min. The phases were contactedwith a vortex mixer for three 20 s intervals, followed by centrifuging for 1 min. Between each 20-scontact and before centrifugation, the tubes were replaced in the constant temperature bath. Aftercentrifuging, the phases were separated with the use of Pasteur transfer pipettes, and aliquots of eachphase were mixed with 10 mL of Packard Instrument Company Ultima Gold XR scintillation cocktailand counted for beta activity in a Packard liquid scintillation counter. This procedure producedresults for the forward extraction given below. One-half of the organic phase was transferred to asecond culture tube, an equal volume of fresh aqueous solution was added, and the extraction and210Bi measurement procedure described above was repeated. The results given below for the reverseextraction were obtained by this procedure.
In one series of experiments, the 210Bi was added to the organic phase before the firstextraction. For aqueous solutions that contained only nitric acid, the TRUEX-NPH solvent waspreequilibrated with nitric acid by three contacts with equal volume portions of fresh nitric acid of thesame concentration used in the 2l0Bi extraction. For solutions containing sodium nitrate as well,preequilibration is not feasible because the distribution ratios for nitric acid are too high. Instead, theequilibrium nitric acid concentrations were calculated with the GTM.
4. Results and Discussion
The distribution ratios for 210Bi in nitric acid solutions are given in Table 7.Reproducible results were generally not obtained below 1M HNO3. The values in parentheses in thistable are the material balances, which were usually low at low acidities. This implies that the bismuthtracer may have been partially hydrolyzed and lost by concentration on the glass surface or at theliquid/glass interface. To correct for this problem, various methods for making the tracer solutionwere attempted, as described in she footnotes to the table. The only consistent data obtained havebeen for 2M HNO3 and greater. A "solvent loaded" tracer solution was prepared by extracting the2l()Bi from Tracer 3 into TRUEX-NPH (pre-equilibrated with 1.0M. HNO3), and adding the "solventloaded" tracer (Tracer 3A) to the organic phase to perform the contacts. Except at the lowestconcentration, the results appear more consistent than usual, and this method of preparing the tracerwill be studied further.
Distribution ratio measurements were also performed with HNO/NaNO3 solutionssince such values are needed to model bismuth behavior, and we believe that the 210Bi tracer wouldbehave reproducibly at high nitrate concentrations due to complex formation. Table 8 shows thenitric acid concentrations found by titration for the HNO3/NaNO3 solutions. The calculatedequilibrium nitric acid concentrations together with the 210Bi distribution ratios at thoseconcentrations are shown in Table 9 and plotted in Figs. 3-6.

Table 7. Distribution Ratios for 210Bi between Nitric Acid and TRUEX-NPH
[HNO3j,M
0 00951
0.0481
0.0958
0.192
0.359
0.986
Tracer 1.
Forward
178
115
619
Run 1
Reverse
39.9(90%)
710(74%)
1703(86%)
Tracer 1.
Forward
0 394
31.7
186
Run 2
Reverse
4.72(26%)
179(95%)
350(97%)
Tracer 1A
Forward Reverse
Tracer 2
Forward
0.30(36%)
34.8(96%)
80.7
Reverse
0.68134%)
60.0(100%)
106(99%.)
Tracer 2
Forward
0 097(109%)
Reverse
0.25(106%)
Tracer 2A
Forward
0.0101(105%)
Reverse
0.015(97%)
Forward
0.04(76%)
2.41(80.1%)
116.7(81.8%)
Tracer 3Forward- Reverse-
2 1
0.036 0.100(819%)
2.85
Reverse-2
.34(18%,
Tracer 3AReverse-
1
0.72
5.88(94%)
16.47
41 4
Reverse -2
0 049
3.52(96.69%)
11.2
44.4
1.98
3.99
5.78
7.69
61.5(88%)
20.0(87%)
6.78(86%)
3.42(84%)
60.8(97%)
19.5(96%)
6.4(96%)
2.92(89%)
18.3 16.2(94%)
18.6(100%)
18.9(103%)
36(96%)
20.7(98%)
22.37(86%)
20.19(96%)
20.9(89%)
20.7(100%)
17.9(97%)
Notes: Tracer 1 = Prepared without carrierTracer 1A = Tracer 1 with Bi carrier added (2.5 x 10"5M Bi3+)Tracer 2 = 210Bi collected from column into 1M HNO3 + 106M Bi3+ solutionTracer 2A = Aqueous phase made 10"3M in Bi3+ before Tracer 2 was addedTracer 3 = 210Bi eluted from column with 1M HNO3 + 10"3M Bi3+
Tracer 3A = Tracer 3 extracted into TRUEX-NPH; aliquots of TRUEX-NPH added to organic phase

19
Table 8. Titrated Acid Concentrations vs. Prepared Concentrations3
[HNO3].MNominal
0.010.030.050.10.51234
0.3M NaNO3
0.009960.028090.047050.09371
Titrated
1.0MNaNO3
0.008790.026770.04510.087570.46810.96941.8973
3.7922
[HNO3], M
4.4M NaNO3
0.0081240.024060.042180.082480.47360.92971.8642.7685
7M NaNO3
0.007420.025770.043020.09134
aBase was standardized with potassium acid phthalate.
Table 9. Aqueous Nitric Acid Concentrations and BismuthDistribution Ratios for Contacts betweenSalt Solutions and TRUEX-NPH Solvent. Nitric acidconcentrations calculated with GTM.
IHNO3]Forward,
M
0.0015640.0038660.0069860.014630.13770.41320.99921.677
0.0076470.021420.035650.06999
0.00045020.0016340.0028330.006701
0.0047460.014540.024580.048210.27460.62171.262.725
[HNO3]Distribution Reverse,
Ratio M
14.717.1417.916.34
989.31335.6
78.4231.1
27.7749.0316.5626.93
1880.72765.11082.57208.6
137.37268.72304.21348.38304.06191.7891.2426.52
0.3M NaNO3
0.0026150.0073570.013580.029610.3020.79861.6432.768
l.0MNaNO3
0.0094060.026420.044090.08706
4.4M NaNO.s
0.00088440.0033330.0059750.01541
7M NaNO3
0.0069280.021230.035890.070390.39690.8831.7383.577
DistributionRatio
105227034385288940911531.112.3
45.6474.9487.36
116.9
5850197348
8972
226.92376.57391.23397.28217.49139.0661.2815.97

20
Qffl
10
1000
100
10
Fig. 3.
Forward ( A ) and Reverse ( A )Distribution Ratios for 2 , 0 Bi between0.3M NaNO3/HNO3 Solutions andTRUEX-NPH as a Function ofEquilibrium HN03 Concentrations
0.001 0.01 0.1 1Equilibrium [HNO3], M
10
Fig. 4.
Forward ( • ) and Reverse (Q)Distribution Ratios for 2 , 0 Bi betweenlM NaNO3/HNO3 Solutions andTRUEX-NPH as a Function ofEquilibrium HN03 Concentrations
10
1000
•a
Q
S 100
10
0.001 0.01 0.1 1Equilibrium [HN03], M
10
Cβ
09
10"
1000
100
10
10 0.001 0.01 0.1 1
Equilibrium [HNO,], M
10
Fig. 5.
Forward ( • ) and Reverse ( 0 )Distribution Ratios for 2 l 0 Bi between4.4M NaNO3/HNO3 Solutions andTRUEX-NPH as a Function ofEquilibrium HN03 Concentrations

21
10
Fig. 6.
Forward ( • ) and Reverse (O)Distribution Ratios for 2l0Bi between7M NaNO3/HNO3 Solutions andTRUEX-NPH as a Function ofEquilibrium HNO3 Concentrations
100
1 0 - 0.01Equilibrium [HNO3], M
Although there is considerable scatter in the data, some general trends are apparentand are best shown by the 1M NaNO3 solutions (Fig. 4). The distribution ratios initially increase withincreasing nitric acid concentration, as is normally the situation with TRUEX solvent. However, as thenitric acid concentration in the organic phase increases, a point is reached at which the nitric acid tiesup sufficient CMPO to cause the bismuth distribution ratio to decrease. This maximum bismuthextraction occurs at about 0. iM HNO3 in lM NaNO3 solutions and at about 0.01M HNO3 in 4.4MNaNO3. This difference is due to the increased nitric acid extraction at high salt concentrations.
Additional distribution ratios were measured for aqueous phases containing a constantnitrate ion concentration of 3.2M., plus varying amounts of nitric, oxalic, and/or sulfuric acids. Theresults are shown in Tables 10-12 and are plotted in Figs. 7-9. For solutions containing nitric acidand 3.2M nitrate ion (Table 10 and Fig. 7) the distribution ratios are large due to the high nitrateconcentration, but again reach a maximum as the nitric acid concentration increases. Similarcomments apply to the results for the sulfuric acid solutions (Table 11 and Fig. 8). The ratios arehigh, so sulfate does not form a strong complex with bismuth. This is not the case for oxalate ion(Table 12 and Fig. 9). The presence of 0.01M. oxalic acid lowers the distribution ratio by four ordersof magnitude (compare Figs. 8 and 9). This result may be the key to stopping the extraction ofbismuth by the TRUEX solvent.
Table 10. Distribution Ratio for 2 i0Bi between Nitric Acid/Sodium NitrateSolutions with a Constant Nitrate Concentration of 3.2M andTRUEX-NPH Solvent
|HNO3),a [NaNO3] Dist. Ratio Material Balance, %M
0.010.10.51.0
M
3.193.102.702.20
Forward
159103641263
Reverse
11021432443170
Forward
100.097.199.7
101.1
Reverse
10210498.9
100
"Concentration before equilibration.

22
Table 11. Distribution Ratio for 2 l0Bi between Sulfuric Acid/Sodium NitrateSolutions and TRUEX-NPH Solvent
[H2SO4],a [NaNO3],a Dist. Ratio Material Balance, %
M
0.010.020.030.05
M
3.23.23.23.2
Forward
675623797674
Reverse
130814131319960
Forward
106103122102
Reverse
99.999.7
103.899.6
"Concentration before equilibration; HNO3 is highly extractable from theseaqueous solutions.
Table 12. Distribution Ratio for 2 ,0Bi between Oxalic Acid/Nitric Acid/SodiumNitrate Solutions and TRUEX-NPH Solvent
M[HNO3],a
M[NaNO3],
M Dist. Ratio Material Balance, %
0.010.020.030.04
0.020.020.020.02
3.183.183.183.18
0.009430.003460.002240.00158
98.3100.594.9
101.8
Concentration before equilibration; HNO3 is highly extractable from theseaqueous solutions.
10S
5-
D
• Dist Ratio, for I• Dist Ratio.rev |
D
D
.00'. .01 .1 1[HNO3], M
10
Fig. 7. Distribution Ratios for 2 I0Bi between Sodium Nitrate/NitricAcid Solutions and TRUEX-NPH as a Function of InitialNitric Acid Concentration. The nitrate ion concentration waskept constant at 3.2M by the addition of sodium nitrate.

23
10'
Cβ
as 10 3 .
1 C
-
• Dist Ratio.for
O Dist Ratio, rev
0
a
° Oo
•• •
.001 .01
[H2SO4],
.1
Fig. 8. Distribution Ratios for 2 1 0 Bi between Sulfuric/Nitric Acid Solutions and TRUEX-NPH as aFunction of Sulfuric Acid Concentration in3.2M Sodium Nitrate
.001.001 .01
[HNO,], M
Fig. 9. Distribution Ratios for 2 l ( )Bi between Oxalic Acid/Nitric Acid/Sodium Nitrate Solutions as a Functionof Oxalic Acid Concentration. The nitric acid andsodium nitrate concentrations were kept constantat 0.02JM and 3.I8M. respectively.

24
IV. DEMONSTRATION OF STRONTIUM EXTRACTION COMBINED WITH TRUEX
We have started a project to demonstrate the new TRUEX-SREX process, which is acombination of the TRUEX process and a recently developed SREX (strontium extraction) process.The TRUEX extractant, CMPO, selectively extracts and partitions Am, Pu, and U along with bismuthand the lanthanides. The SREX extractant, a crown ether called 4,4'(5')-di-t-butyIcycIohexano-18-crown-6 (also referred to as D-t-BuCHI8C6 or, simply, CE), selectively extracts and partitionsstrontium and, to some extent, technetium. The combined process would be the first step in thepretreatment of dissolved sludge waste from the Hanford site, so that the amount of nuclear waste thathas to be vitrified is greatly reduced, with an attendant major reduction in waste disposal costs. Bothprocesses were developed in the ANL Chemistry Division, and this demonstration project is acooperative effort with that division. Our work includes detailed flowsheet development, solventevaluation, and process demonstration on a laboratory scale using a centrifugal contactor.
A. Nitric Acid Extraction(G. F. Vandegrift)
In August, Horwitz et al. (ANL Chemistry Division) performed experiments to show thatsubstituting diamyl(amyl) phosphonate (DA[APJ) for TBP in the TRUEX-SREX solvent couldessentially eliminate third-phase formation as a problem, even at high metal loading. This is certainlyan improvement, but DA|AP] is a much stronger base than TBP and acts to extract more acid into theorganic phase. To calculate a flowsheet for using this process solvent, we needed to change themodel for nitric acid extraction in the GTM. To do this, the same set of equilibria employed for theTRUEX solvent was used, but the constants related to TBP extraction were modified to fit the solventcontaining 1.2M DA[AP|. Figure 10 shows the fit of the modified GTM model to the experimentaldata. The fit is very good except at the lowest nitric acid concentration. This may be due toexperimental uncertainty or to extraction of nitric acid by a species not accounted for in the model.The equations and constants for the TBP and DA[AP] solvents are shown in Table 13. Note thatCMPO-alone constants were not modified.
Table 13. The HNOrExtraction Constants Varied to Fit DA[ AP]-Solvent Data
Constant
KC3KClKC2KT2KT1KM1KT3
DA|AP|-Solvent Valuea
4.631.89
0.0440.7
0.543 . 2
0.0018
TBP-SolventValue
4.631.89
0.0440.3560.1811.74
0.0001
Species1,
EXT«HNO3
CMPOHNO}EXT2»HNO3
C M P 0 2 H N 0 3
CMPO2»HNO3
CMPOHN03»EXTEXT»2HNO3
Equations
KTl*{HNO3}*EXTfrce
KCl*|HNO3}*CMPO f ree
KT2*{HNO3}*(EXTfree)2
KC2* {HNO3 }2*CMPOfree
KC3*(HNO3}*(CMPOfree)2
KM 1 *{ HNO3} *CMPOfree*EXTfree
KT3*{HNO3)2*EXTfree
aBolded values were varied to fit DA[APj-solvent data.hEXT = TBPorDA|AP,.
As seen by Fig. 11, calculations predict DA|AP] extracts higher concentrations of nitric acidat all aqueous-phase nitric acid concentrations—varying from 75% more at the lower [HNOj]aq to

25
00
2.O
10 T
1 - -
0.1 --
0.01 - -
0.001 - -
0.0001
HNOj-calc
HNO,-exp
0.00001 0.0001 0.001 0.01 0.1
(HNOjlaq.M
10 100
Fig. 10. Experimental vs. Calculated Organic-Phase NitricAcid Concentration for TRUEX-SREX (DA[AP])Solvent. See Table 13.
10 -
SI o.i
0.01 -r
0.001 -:
0.000!
0 01
Fig. 11.
Organic Concentration of Nitric Acid vs.Aqueous-Phase Nitric Acid Concentrationfor 0.2M CMPO«1.2M EXT
0.1 1
[HNOjJaq, M

26
23% at the highest [HNOj]^ measured. Figures 12 ano 13 show the organic-phase concentrations ofthe DA[AP]-HNO3 and CMPO-HNO3 species vs. the activity of nitric acid in the aqueous phase.Figures 14 through 17 compare how individual DA[APJ-HNO3 and TBP-HNO3 speciesconcentrations vary with aqueous nitric acid concentrations. The constants in Table 13 have beenincorporated in the GTM for designing flowsheets for this solvent.
10 T
d
0.001
DAAP-HNO,
DAAPj^HNO,
CMPO-HNOj'DAAP
DAAP«2HNOj
[DAAP1
0.01 -
0.0001 0.001 0.01 0.1 1
{HNO3)aq
10 100
Fig. 12. Concentration of DA[AP]«HNO3 Species in TRUEX-SREX (DA[AP]) Solvent vs.Aqueous HNO3 Activity
0.0001 0.001 0.01
0.0001
10 100
a CMPOHNO,
D CMPO2HNO3
• CMPO-HNO,
CMPOHNO,«DAAP
ICMPO)
Fig. 13. Concentration of CMPO Species for TRUEX-SREX (DA[AP]) Solvent vs.Aqueous HNO3 Activity

0.1 --
0.01 - :
o
0.001 - :
0.0001
0.01 0.1
27
10
Fig. 14.
Concentration of HNO3»2EXTvs. Aqueous HNO3 Concentration
[HNO,J. M
0.01 -r
ffl
0.00001
0.001 -r
0.0001 -r
Fig. 15.
Concentration of HNO3»EXT Complexvs. Aqueous HNO3 Concentration
0.01 0.1 1 0

28
0.00001
0.01
Fig. 16.
Concentration of EXT»2HNO3
vs. Aqueous HNOj Concentration
0.1 1
[HNO,l, M
10
1 7
si
oX
0.1 - -
0.01
0.001 -r
0.0001
0.01
rHNO,'TBP*CMPO]
CMPOHNO.'DAAP
Fig. 17.
Concentration of HNO3«EXT»CMPOvs. Aqueous HNO3 Concentration
0.1 10
[HNO3],

29
B. Fitting of TRUEX-SREX Extraction Data to Nitrate Activities
(G. F. Vandegrift)
Based on limited TRUEX-SREX extraction data collected by Horwitz et al.,6 the extractionbehavior of strontium and several other metal-ion nitrate salts has been modeled and incorporated into theGTM.
100 -,
• Measured D(Sr)
1 .
c/5 o.i •
Q
0.01
0.001
0.0001
1 0 -fe — GTM Calculation J
o.oi o.i i io
{NO3}
Fig. 18. Distribution Ratios of Strontium between Nitric Acid/Nitrate Salts and the
TRUEX-SREX System
The calculated D values for strontium were derived as a function of nitrate activity, {NO3"}, byfitting the following equation:
D S r = K , { N O 3 } 2 / ( l + K 2 { N O ^ ) (24)
The criterion used to optimize the fit
rDSr(calc)-DS r(exp)-|2α LDSr(calc) + DSr(exp)Ji
The fit of the 3TM calculations to the measured data was very good, as shown in Fig. 18. The values for
K| aiiu l<2 to give the fit shown in Fig. 18 are 10.1 and 3.8, respectively.
In a recent programmatic review, Horwitz et al.6 reported on distribution ratios measured for aseries of mono-, di-, and tri-positive metal ions in a complex aqueous solution containing 1 or 3M nitricacid. The composition of these solutions and the distribution ratio of the metal ions are presented inTables 14-16, which are taken directly from that presentation. Although only two data points wereavailable for each constituent, a model was needed in the GTM to calculate the distribution ratios forthese species. Using these data and available nitrate ion complexation constants,7 an equation wasgenerated for extraction of each constituent.

30
Table 14. Distribution Ratios of Inert Constituents in DissolvedSludge Waste with Solvent of 0.2M CMPO-0.2M CE-1.2MTBP-Isopar-L. Provided by Horwitz, et al.6
Constituent
NaMgAlCaMnFeNiCu
Cone,M
0.12I.2X10--,
3.2xlO-2
9.4xl04
3.3xiO"3
0.115.6xl0"3
I J x l O 3
Distribution
1M FNO, :
3.6xl02
2.7xl0-2
6.lxl0-3
2.0x10"'1.2x,0-25.3x10-21.8x10 3
6.9xlO3
Ratios
3M HNO3
9.3x10-22.5x10-28.2xlO"3
1.7x10"'2.4x10-21.8x10"'2.1xl0"3
1.1x10⁻²
Table 15. Distribution Ratios of Fission Products in DissolvedSludge Waste with Solvent of 0.2M CMPO-0.2MCE-1.2MTBP-Isopar-L. Provided by Horwitz, et al.6
Constituent
RbSrUZrMoTcRuRhPdCdCsBa
Cone,
M
2.1xl04
l.OxlO"3
5.5xlO4
2.4x10-31.3xlO4
Trace1.6xl0-3
4.4xl04
4.7x!04
3.4xl0"5
l.OxlO3
4.6xlO-5
DistributionIMHNO3
0.192.91.8
2.7x10-22.3x10"'
9.11.7x10-'<5xlO"2
1.1<5xl0"23.4x10⁻²
1.3
Ratios
3M HNO3
0.31121.7
5.2xl0-2
2.9x10"'3.7
1.2x10-'<5xl0-264x10"'1.2x10'3.9xl02
2.6
Table 16. Distribution Ratios of Lanthanide Fission Productsin Dissolved Sludge Waste with Solvent of0.2M CMPO-0.2M CE-1.2M TBP-Isopar-L.Provided by Horwitz, et al.6
Constituent
LaCePrNdSmEu
Cone,
M
8.7xlO4
2.0x10-37.0xl04
2.4xl0-3
2.2xlO4
4.3xlO"5
Distribution1M HNO3
6.411_10
>1016
Ratios3M HNO,
3.25.9117.28.08.3

31
The method used to calculate the distribution ratio of SKNO^h was described above, and the twodata points for strontium extraction were included in that fit. The other cations were treated in a similarmanner, assuming that the cations were extracted as the neutral salt by the crown ether in the solvent.Therefore, the D values for these cations were proportional to the nitrate activity of the solution to thepower of the cationic charge (e.g., {NO3} to the third power for aluminum and {NO3} to the first powerfor sodium). The second assumption is that nitrate complexes are formed in the aqueous phase; in somecases, data were available for complexation constants7; in others they were assumed analogous to similarelements. The equations used to fit the experimental data are presented in Table 17. Table 18 shows thenitrate, hydrogen, and water activities calculated by the GTM for the solutions identified in Tables 14-16.Figures 19-28 show the calculated curves for each D value vs. nitrate activity. These calculations are nowincluded in the GTM. When more data become available, these equations will be upgraded.
Table 17. Equations Used for Calculated Distribution Ratios of Cations in the TRUEX-SREX Solvent Systema
MetalIon Charge Equation for Distribution Ratio
Notes for NitrateComplexation Constants
NaMg
Al
Ca
Mn
Ni
Cu
Rb
Sr
Cs
12
3
2
2
2
2
1
2
1
0.426*{NO3}/(I + I0 0 6 *{N0 3 | )
0.199*{NO3f2/(l + 1006*{NCM + 10°7*(NO,)2)
0.0448*{NO,}V(! + 1006*{NO3} + 10°7*(NO,}2)
0.141*{NO3 }2/(l + 1006*(NO3} + 10°7*{NO3 }
2)
0.0258*{NO3}2/(l + 10°' *(NO3} + I002*{NO, }2)
0.0l49*{NO3}2/(l + 1006*{NO3} + 10°7*(NO, }2)
0.0181*{NO3}2/(l + 100i*(NO3} + 10°5*{NO,}2)
0.219*{NO3}/(l + 10-°4*(NO3})
10.9*{NO3(2/(l +3.76*{NO3()
0.0806*{NO3}/(! + 1002*{NO3})
Ref. 7
Guess based on Ca, Sr, Ba
Guess based on Sc
Ref. 7
Guess based on Ca. Sr, Ba
Guess based on Ca, Sr, Ba
Guess based on Ca, Sr, Ba
Guess based on Na, K
From fit of all Sr data
Guess based on Na, K
aData from Ref. 6; nitrate complexation constants from Ref. 7.
Table 18. Activities of Nitrate Ion, Hydrogen Ion, and Waterin Complex Nitrate Salt Solution vs. Nitric AcidConcentration in TRUEX-SREX System
IHNO3) in Solution
LOOM
3.00M
(NO-,) {H2O}
1.41
4.42
0.95
0.85
(H}
0.78
3.45

32
i.eoe-oi
1.60E-0t ••
2.00E-02
O . 0 O E * O O I ' ' ' • I ' • ' • I • • • • I • • • ' I • • • • I
O.OOE+00 2.00E»01 4.00E*01 6.00E*01 8.00E*01 1.00E»02
{NO3}
Fig. 19.
Calculated Sodium DistributionRatios vs. Nitrate Activity for theTRUEX-SREX System
1.0OE.0O T
I.OOE-Ot T
1.00E-02 •"
1.00E03 -:
1.00E-04 -
1.00E-05 ••
1.OOEOS - :
1.00E-07 I— II I • - * - "
0.001 0.010 0.100 1.000 10.000 100.000
{NO,}
Fig. 20.
Calculated Magnesium DistributionRatios vs. Nitrate Activity for theTRUEX-SREX System

33
1.00E-02 T
1.00E-03 ••
1.00E-04
1.00E-05
t.OOE-Oe
1.00E-07
t.OOE-08
1.00E-09
1.OOE-1O •
1 . O O E - 1 1
Fig. 21.
Calculated Aluminum DistributionRatios vs. Nitrate Activity for theTRUEX-SREX System
O.OO1 0.010 0.100 1.000 10.000 100.000
{NO3}
1 .UUC-U1
1.00E-02 •
1.00E-03 •
1.00E04
1.00E05
1.00E-06 -
1.00E07
/
/
//
1 1 1 1—• • I
Fig. 22.
Calculated Calcium DistributionRatios vs. Nitrate Activity for theTRUEX-SREX System
0.001 0.010 0.100 1.000 10.000 100.000
{NO3

34
1 .uuq *UU
1.00E01
1.00E-02 •
1.00E-03 -
1.00E-04 -
1.00605 -
1.00E-06 -
1.00E-07 -
1.00E-0B -
;
/
/
/
— i—u, i— i— i— i
0.001 0.010 0.100 1.000 10.000 100.000
Fig. 23.
Calculated Manganese DistributionRatios vs. Nitrate Activity for theTRUEX-SREX System
{NO3}
i.ooe-oi -
1.00E-02 •
1.00E-03 •
5 . 1.00E04 -
Q
1.00E-05 •
1.00E06 •
1.00E-07 •
1.00E-08 -
/
/ i/ f
• /
/
1———H— 1— 1— 1
Fig. 24.
Calculated Nickel DistributionRatios vs. Nitrate Activity for theTRUEX-SREX System
O.OOt 0.010 0.100 1.000 10.000 100.000
(NO3}

35
1.00E.00
1.00EOI
1.00E-02
1.00EO3
U 1.00E-04Q
t.OOE-05 •
1.00E-06 •
1.OOE-O7
1.00E08O.OOI 0010 O.100 1.000 10.000 100.000
{NO3}
Fig. 25.
Calculated Copper DistributionRatios vs. Nitrate Activity for theTRUEX-SREX System
1.00E«00 T
1.00£-040.001 0.010 0.100 1.000
(NO3J
Fig. 26.
Calculated Rubidium DistributionRatios vs. Nitrate Activity for theTRUEX-SREX System
10.000 100.000

36
i ooe.oa -p
1.00E»02 -r
1.00E-01 --
I.OOEtOO -r
1.00E-01 • :
1.00E02 - :
1.00E-03 -
1.00E-04 -
1.00E-05
Fig. 27.
Calculated Strontium DistributionRatios vs. Nitrate Activity for theTRUEX-SREX System
0.001 0.010 0.100 1.000 10.000 100.000
1.00E*00 -F
1.00E-01 -r
1.00E-02 -r
v>
u
1.00E-03 -r
1.00E-04
1.00E-05 -I I
0.001 0.01 10 100
Fig. 28.
Calculated Cesium DistributionRatios vs. Nitrate Activity for theTRUEX-SREX System

37
C. Combined TRUEX-SREX Processing(R. A. Leonard, D. B. Chamberlain, C. J. Conner, G. F. Vandegrift,D. G. Wygmans, J. A. Dow, and S. E. Farley)
We are demonstrating the combined TRUEX-SREX process on a laboratory scale using theANL-designed centrifugal contactor. This effort is being carried out in cooperation with PhilHorwitz, Mark Deitz, and Herb Diamond, of the ANL Chemistry Division and Robin Rogers of theChemistry Department, Northern Illinois University. Our initial tasks are to measure dispersionnumbers for the new solvent, develop a detailed flowsheet for the process, and verify the nitric acidportion of the flowsheet experimentally in a 20-stage minicontactor (2-cm centrifugal contactor).After the initial tasks have been completed, the process flowsheet will be tested in the minicontactorwith radioactive materials.
1. Flowsheet Development
A flowsheet for the combined TRUEX-SREX process, shown in Fig. 29, wasdeveloped for the cold tests such that they will lead to an appropriate design for the subsequent hottests. The cold tests (CI, C2, and C3) focus on the concentration profile of nitric acid in a 20-stageminicontactor (2-cm centrifugal contactor). Using the GTM and, when appropriate, additional dataspecific to the combined TRUEX-SREX process, the flowsheet design was evaluated to ensure that itwill meet process goals for the subsequent tests with radioactive materials. The hot test results will beused to design a flowsheet for the combined TRUEX-SREX process as it relates to the expected rangeof feed compositions for dissolved sludge waste (DSW) from Hanford single-shell tanks.
a. Solvent
The combined TRUEX-SREX solvent consists of 0.2M. CMPO, 0.2M. crownether [the specific crown ether is 4,4'(5')-di-t-butylcyclohexano-18-crown-6, usually referred to hereas CE or D-t-BuCHI8C6], and 1.2M diamyl amylphosphonate (usually written as DA|AP] or DAAP)in Isopar M (a commercial isoparaffinic solvent from Exxon). This combined solvent is referred tohere as PS 9. At the start of this project, 1 2M. TBP was used as the phase modifier instead of DAAPbecause we discovered that DAAP allows for significantly greater loading of the uranium in thesolvent without a second organic phase forming.
b. Feed Composition
The composition of the various feeds for the first cold test will be HNO^ aloneexcept for the carbonate wash section, which would remain O.25M Na2COv This test (CI) will allowus to verify that the nitric acid profile is as expected for the proposed flowsheet. Knowing the nitricacid concentration in each stage is central to designing the rest of the flowsheet. Two follow-on coldtests are planned. The first follow-on test (C2) adds H2C2O4, Fe(NChh, and Sm(NO.,)3 to the TRUfeed and AHNOih to the first scrub feed. The second follow-on test (C3) adds, in addition,tetrahydrofuran-2,3,4,5-tetracarboxylic acid (THFTCA) to the strip feed. These components will beadded as shown in Fig. 29.
c. Extraction Section
In the extraction section, the desired decontamination factor (D.F.) forstrontium in DSW is 33,000. The D.F. value is 550 for Pu, 107 for Am, and 2 for Tc. Considering

The organic (DX) feed is thecombined TRUEX-SREX solventwhich consists of 0.2 M CMPO,0.2 M CE (D-t-BuCH18C6), and1.2MDAAPinlsoparM.
-H. 1DX
ORGANICFEED
12 mL/min(75) D W
AQUEOUSRAFFINATE24 mL/min
(150)
DFFor Test C13.0M HNO3
In addition,forTests C2 and
C3, add:0.1MH2C2O4
0.15M Fe(NO3)3and
0.0005MTRU FEED16 mL/min
(100)
DS1For Test C1:0.04M HNO3
Test C2 and C3-.2.0M AI(NO3)3
SCRUB 12 mL/min
(12.5)
OS20.04M HNO3SCRUB27.3 mL/min
(37.5)
EFFor Tests C1 and C2:
0.01MHNO3
For Test C3:1.0M THFTCA
STRIP4 mL/min
(18.75)
J
FF0.25M Na2CO3
CARBONATE WASH6 mL/min
(37.5)
ES
STRIPSCRUB9 mL/min
(56.25)
i1± 8 9 I 10 ) 11 | 1 2
T13 I 14 15 I 16 17 18 19 20
EW(Sr, Am, Np, Pu, Bi)STRIP EFFLUENT
12 mL/min(75)
Shaded stages indicate where aqueous phase will be sampled from thebottom of the stage at a rate of 0.33 mL/min. The nitric acid profile obtainedwill be compared with that given by the GTM. To offset sampling losses, theflow at DS is 7.3 rather than 6.0 mL/min; at EF, 4.0 rather than 3.0 mL/min.Numbers in ( ) are relative flows for operation with no stage sampling.
FW(Tc, U)
CARBONATEEFFLUENT6 mL/min
(37.5)
Before the FP effluent is reused in Tests C2and C3, it will be washed with 0.1{£ HNO 3 at
an O/A ratio of 2.0.
FPORGANICEFFLUENT12 mL/min
(75)
u>00
Fig. 29. Combined TRUEX-SREX Flowsheet for Cold Tests with HNO3 (THFTCA = tetrahydrofuran-2,3,4,5-tetracarboxylic acid)

39
the expected D values for these components, given below, the key for the good extraction-sectionoperation will be to attain the desired D.F. for strontium. As shown in Fig. 29, the extraction sectionwill have six stages, an O/A flow ratio of 0.5, and a f HNO3] in the DF feed of 3M- With theseoperating conditions, the D.F. for strontium will be 4,100 in the extraction section if DSr is 7.6, aworst case value. This is almost a factor of 10 less than the desired D.F. of 33,000. Because of thehigh aluminum concentration from the scrub feed and the higher acid concentration in every stageexcept stage 1, DSr will be significantly higher than 7.6. For example, if DSr is 11 in every extractionstage, then we could meet the desired D.F. goal in six stages.
In the design of an actual plant for these operating conditions and the DSWfeed, three more extraction stages would be added. The one additional stage should give the desiredD.F. The other two stages would give the extraction section a robust design with respect to variationsin flow rates and feed concentrations. Work within the ANL Chemistry Division shows that thedistribution ratio for strontium stays high no matter how low the strontium concentration drops.Thus, we should expect continuing reductions of the strontium concentration in the aqueous (DW)raffinate with each additional extraction stage.
d. Scrub Section
To keep oxalate and fluoride ions in the DF feed from entering the stripsection, we decided that the scrub (DS) feed should contain enough A1(NO3)3 to complex theseanions and keep them in the aqueous phase. An analysis of this scheme showed that the dissolvedsolids in the strip (EW) raffinate would be mostly AKNO^X-?. To limit the aluminum in the stripraffinate to 10% of the strontium, a split scrub was designed. The first strip (DSI) feed to the secondstrip stage will contain 2M. AKNO^)^. The second strip (DS2) feed to the last scrub stage will contain0.04M HNO3, i.e., essentially water. The number of stages in the second scrub was varied from 1 to 4by using the GTM. From this evaluation, we found that two stages would be sufficient to reach ourgoal for the amount of aluminum in the strip raffinate. However, to obtain a nitric acid concentrationof 0.1-0.25M in the organic phase leaving the scrub section, we had to use three stages in the secondscrub.
Using the GTM and the SASSE worksheet, we showed that as the nitric acidconcentration drops below the lower limit, we pinch the strontium in the scrub section. As we raisethe nitric acid concentration above the upper limit, the ability of THFTCA to strip Am, Pu, and therare earths is reduced. The exact amount of this reduction, which is a function of both [HNO3] andITHFTCAJ, has not been measured at HNO3 concentrations greater than 0.2M- When the phasemodifier is TBP, two stages in the second scrub were calculated to be sufficient; when DAAP, threestages. This additional second scrub stage is required as DAAP extracts HNO3 better than TBP. Theeffect of modifier on HNO3 extraction is shown in Table 19. This table compares the DHNO-, valuesmeasured by Herb Diamond (ANL Chemistry Division), where 1.2M DAAP was used as the modifier,with GTM (Version 2.5a) calculations using 1.2M_ TBP as the modifier. This effect of DAAP on theD values for HNO3 has now been added to the GTM.
As a part of these GTM/SASSE calculations, the effect of the O/A flow ratio(1.5, 2.0, and 4.0) in the second scrub was evaluated. We looked at both the pinching of strontium inthe scrub and the ability to scrub out HNO3. An O/A flow ratio of 2.0 gave the best balance betweena high ratio that does not scrub out enough HNO3 and a low ratio that pinches the strontium.

40
Table 19. Effect of Solvent Modifier on the D Values for Nitric Acid
DHNO3 with DAAP D H N O , with TBP DH N O i(DAAP)[HNO3]aq, M
0.01120.09570.5050.9741.993.015.04
e. Strip
as Modifier
0.15180.1780.4380.4820.4310.3840.330
Section
as Modifier
0.01550.09880.2910.3420.3330.3070.268
DHNOj(TBP)
9.791.801.501.411.291.251.23
Several strip sections were considered. One plan called for two strip sections.The first strip would have used dilute nitric acid (0.04M) to extract americium as well as thelanthanides and strontium. The second strip would have used vinylidene diphosphonic acid (VDPA)or 1-hydroxyethane-1,1 -diphosphonic acid (HEDPA) in the range from 0.1 to 0.25M to take outmost of the other metals in the solvent. Of the two acids, HEDPA is a better stripping agent thanVDPA, but VDPA is easier to decompose than HEDPA. Both stripping agents leave a phosphateresidue that would add to the number of glass logs that need to be formed. Because of this, THFTCAwas considered as an alternative stripping agent. While THFTCA is harder to decompose, it leaves nophosphate residue. A problem with THFTCA is that there is no commercial source. Another possiblestripping agent for the second strip is ammonium oxalate. This has proved to be very effective in ourwork with New Brunswick Laboratory wastes (see Sec. V). The drawback on a plant-scale process isthat significant amounts of ammonium nitrate will be formed, which can be explosive under certaincircumstances. Another possible stripping agent for the second strip is oxalic acid. The problemhere is that oxalic acid forms precipitates at very low concentrations with some of the metals to bestripped.
As the problem of a commercial source for the THFTCA appears to beresolved, it was chosen as the stripping agent. After consideration of two feeds and two effluents invarious combinations for the strip section, the final design is a strip/scrub section which will have twofeeds but only one effluent. In this design, shown in Fig. 29, the THFTCA is introduced in the strip(EF) feed. Only dilute nitric acid is introduced at the strip scrub (ES) feed, which scrubs out theTHFTCA as well as the Sr, Am, and lanthanides. It is desired to have THFTCA in the solvent going tothe carbonate wash section contain only 0.03M THFTCA so that all the carbonate will react with theTHFTCA and still have the bicarbonate ion left. If the D value for THFTCA is 0.5, this low THFTCAconcentration will be reached. It now appears that the D value for THFTCA will be 0.6 or higher. Ifthe D value is 0.6, as is the case for the calculations shown below, the THFTCA in the solvent going tothe carbonate wash section will contain 0.041M THFTCA. During the cold tests, samples will betaken to determine both the concentration of THFTCA in the solvent leaving the strip scrub sectionand the ability of the carbonate wash to remove this THFTCA.
In the design the strip/scrub section, we can account for the effect of theTHFTCA on DAm, DPu, and Du for various concentrations of THFTCA and HN03. The results fromexperimental tests (H. Diamond, CHM Division) and calculated values (GTM version 2.5a) are shownin Figs. 30-32. They show that Am and Pu will be effectively stripped out to the low concentrationlevel required for good process operation, while most of the U will be left in the solvent, where it will

41
be recovered in the carbonate wash section. For the flowsheet calculations, the appropriate D valueshave to be added to the SASSE worksheet for Am, Pu, and THFTCA in the strip/scrub sections asneither THFTCA nor the effects of THFTCA are included in the GTM. We used the GTM tocalculate most D values and then corrected or added D values as needed to the SASSE worksheet todetermine the final concentration profiles for each component. This approach is referred to here asthe "GTM/SASSE calculations."
0.001 -f—'—«—i—t—I—i—"—'—•
: • 0.01
0.001
0.2
-NoTHFTCA(GTM)
"NoTHFTCA(CHM)
• 0.25 MTHFTCA(CHM)
0.5MTHFTCA(CHM)
Fig. 30. Effect of THFTCA and HNO-, on the D Valuefor Americium
1000
a
0.1
0.01
NoTHFTCA(GTM)
• 0.25 MTHFTCA(CHM)
0.5 MTHFTCA(CHM)
Fig. 31. Effect of THFTCA and HNO3 on the D Valuefor Plutonium

42
1000 -t
100 • :
1000
:- 100
0.2
NoTHFTCA(GTM)
-a 0.25 MTHFTCA(CHM)
-o 0.5 MTHFTCA
(CHM)
Fig. 32. Effect of THFTCA and HNO3 on the D Valuefor Uranium
f. Carbonate Wash
The present plans call for a one-stage carbonate wash section to removesolvent-degradation components such as dibutyl phosphoric acid. Most of the U and Tc would alsobe removed in this section. The aqueous (FF) feed for this section would be 0.25M. sodiumcarbonate. Two or three stages would be used instead of the one stage shown if we were notconstrained to 20 stages for this test of the combined TRUEX-SREX process.
g- Acid Rinse
Because we have only 20 process stages, we plan to rinse the liter of FP solventwith 0.1M HNO3 in a separatory funnel at an O/A ratio of 2.0 after test CI. This will re-acidify thesolvent and prepare it for use in tests C2 and C3. The carbonate wash effluent will be checked first toensure that it is still a basic solution, i.e., that it was able to take out all the THFTCA without beingneutralized. If this is not the case, the solvent will be subjected to a second carbonate wash before theacid rinse.
2. Flowsheet Calculations with GTM
The combined TRUEX-SREX flowsheet was evaluated using GTM version 2.5a,which has been updated to include strontium extraction by the crown ether and the higher nitric acidextraction because DAAP is a part of the solvent in place of TBP. However, GTM 2.5a addressesneither the concentration of the stripping agent, THFTCA, nor the effect that THFTCA has on the Dvalue for Am and Pu. These effects were determined by manually entering the appropriate D valuesin the SASSE worksheet from the GTM. The process flowsheet used for the GTM/SASSE analysis isshown in Fig. 33, the feed compositions are listed in Table 20, the D values in Table 21, and theresults in Table 22. Note that the D value for THFTCA is assumed to be 0.6. Some results suggestthat D values for THFTCA can be as high as 1.0. More data are needed in this area since this willaffect the number of stages needed in the strip/scrub section to keep significant amounts of THFTCAfrom ending up in the sodium carbonate wash.

The organic (DX) feed is thecombined TRUEX-SREX solventwhich consists of 0.2M CMPO,0.2 M CE (D-t-BuCH18C6). and1.2MDAAPinlsoparM.
DS1For GTM, use:
0.01MHNO3Normally, only have:
D F 2.0MAi(NO3)3
3.0M HNO3 SCRUB 1
(See table listingcomponent
composition in variousfeed streams for other
DF concentrations)TRU FEED16 mL/min
(100)
DXORGANIC
FEED12 mL/min
(75)
i
DS20.04M HNO3SCRUB26 mL/min
(37.5)
EFFor GTM, use:
0.01MHNO3Add D values for
1.0MTHFTCAin the SASSE worksheet
of the GTMSTRIP
3 mL/min(18.75)
I
FF0.25M Na2CO3
CARBONATE WASH6 mL/min
(37.5)
ESO.OIMHNO3
STRIPSCRUB9 mL/min
(56.25)
11 it! 8
t9 10 11 12 13 14 15 16 17 18 19 20
DWAQUEOUSRAFFINATE24 mL/min
(150)
EW(Sr, Am, Np, Pu, Bi)STRIP EFFLUENT
12 mL/min(75)
FW(Tc. U)
CARBONATEEFFLUr_NT6 mL/min
(37.5)
FP-ORGANICEFFLUENT12 mL/min
(75)
Fig. 33. Combined TRUEX-SREX Flowsheet Used in GTM/SASSE Calculations. Flows relative to TRU feed of 100 are shown in parentheses.

44
Table 20. Component Composition in Various Feed Streams for GTM/SASSE Calculations
Phase:Feed Code:Feed Stage:
Flow Rate, mL/min:
HFeBiAlLaTc
THFTCAZrSr
UO2
AmPu4+
FC2O4
PO4
Org.DX
112
IE-151E-15IE-15IE-15IE-15IE-15IE-15IE-15IE-15IE-15IE-15IE-15IE-15IE-15IE-15
Component
Aq.DF6i6
30.150.001
00.002
0.0000150
0.050.00120.0016E-07
0.0000170.088
0.20.006
Aq.DS1
82
0.0100200000000000
Concentration, M
Aq.DS2
116
0.0400000000000000
Aq.EF143
0.0100000100000000
Aq.ES199
0.0100
000000000000
Aq.FF206
000000000000000
In using the GTM, it was necessary to revise its convergence criteria and make severalother changes so that we could run at the high solvent loadings caused by high concentrations of Uand Bi. With these changes, we found that, at a concentration of 0.03M for both UC>22+ and Bi3+ inthe DF feed, the solvent loading was such that most of the Am, Bi, and lanthanides came out in theDW raffinate. This was also true when both UO2
2+ and Bi3+ were 0.01ML At 0.001M for both UO22+
and Bi3+ in the DF feed, solvent loading was not a problem. This is the case that was used inTables 20-22. Phil Horwitz (CHM Division) points out that UO2
2+ and Bi3+ loading of the solventshould be less severe than predicted by the GTM since, at high concentrations of UC>22+ and Bi3+, theextraction of these nitrates can be treated as though it were done by one CMPO molecule rather thanthe two CMPO molecules used to calculate these loadings in the GTM. Moreover, DAAP by itself is agood extractant for uranium and is likely to be also by bismuth. More work needs to be done onsolvent loading by UO2
2+ and Bi3+ since their concentrations will be high in much of the Hanfordwastes. From these GTM calculations, we conclude that UO22+ and Bi3+ loading will start to become aproblem at some point between 0.002 and 0.02ML
The calculated concentration profiles for H, Sr, Am, Pu, and Tc are given in Figs. 34through 38, respectively, for all 20 process stages. The calculated concentration profile for THFTCAis given in Fig. 39 for the process stages in the strip/scrub section.

Table 21. Distribution Ratios for Various Components in GTM/SASSE Calculations
Section NumberStage Number:
HFeBi
Al
La
Tc
THFTCA
Zr
Sr
UO 2
Am
Am
Pu4*
Pu4t
FC2O4
PO4
11
0.508
0.026
66.77
0.008
27.54
4
0
0.012
6.88
1237
45.91
45.91
1481
1481
0 031
0 004
0.005
1
2
0.465
0.03
48.7
0.009
25.64
2.5
0
0.014
9.05
1411
42.73
42.73
1900
1900
0.037
0.003
0 004
1
3
0.459
0 03
46.4
0.009
25.29
2.5
0
0.014
9.408
1435
42.16
42 16
1957
1957
0.037
0 003
0.004
1
4
0.459
0.03
46.05
0.009
25.23
2.5
0
0.014
9.46
1437
42.05
42 05
1964
1964
0 037
0 003
0.004
1
5
0.459
0.029
45.59
0.009
24.99
2.5
0
0.014
9.468
1429
41 66
41.66
1954
1954
0 037
0.003
0.004
1
6
0.459
0.016
38.79
0.009
21.27
2.5
0
0.014
9.47
1284
35.45
35.45
1754
1754
0.037
0.003
0.004
27
0.729
0.025
80.59
0.01
52.72
6
0
0.376
11.49
2109
87.86
87.86
3214
3214
0.002
0.007
0.002
2
8
0.794
0.025
96.66
0.01
59.34
7
0
13.92
10.72
2148
98.9
98.9
3245
3245
0.002
0 012
0 002
3
9
0.476
0.008
66.62
0.004
13.2
6
0
25.26
2.829
581.8
22
22
2699
2699
0 049
0 052
0011
Distribution
3
10
0.489
0.005
75.83
0.002
9.313
9
0
18.84
1.451
388.7
15.52
15.52
2053
2053
0.105
0 033
0 013
3
11
0.459
0.003
76.38
0.001
5.596
12
0.6
10.23
0.604
254.1
9.327
9.327
1087
1087
0 043
0012
0.011
Ratios
4
12
0 345
0 002
40.9
0.001
1 926
13
0.6
1.643
0.22
108.3
3 2 1
0.15
333.1
0 35
0 008
0 001
0 009
4
13
0 2
6E-04
14.83
0.001
0.487
10
0.6
0.103
0.063
33
0 811
0 016
84.38
0 1
0 014
0 001
0 007
4
14
0.086
8E-04
2.77
0.001
0.069
8
0.6
0 02
0011
6 366
0.115
0 007
15.58
0 07
0 072
0 002
0 001
5
15
0 047
9E-04
0.978
0.001
0.023
7
0.6
0.023
0.005
2.718
0 038
0.007
6.63
0.09
0.164
0 004
IE-04
5
16
0.042
9E-04
0.811
0.001
0.019
7
0.6
0.036
0.004
2.341
0.031
0031
5.708
0 2
0 188
0 008
9E-05
517
0.043
9E-04
0.835
0.001
0.012
7
0.6
0.037
0.003
2.384
0.019
0.019
5 813
0.4
0 182
0.008
8E-05
5
18
0.047
8E-04
0.639
0.001
0.014
7
0.6
0.04
0.003
1.888
0.024
0.024
4.603
0.8
0 137
0 006
5E-05
5
19
0.044
9E-04
0.563
0.001
0 013
7
0.6
0.037
0.003
1.695
0.021
0.021
4 132
4
0 105
0.004
4E-05
6
20
1
0.001
0.001
0.001
0.001
0.001
0
0.002
0.001
9E-04
7E-05
7E-05
0.001
0.001
IE-04
1E-04
IE-04
Notes
a
a
a
a
a
a
b
a
a
a
c
d
c
d
a
a
a
a Values calculated by the GTM and used in the SASSE worksheet.b Values used in SASSE worksheet. Not in the GTM.c Values uilculated by the GTM. They were modified as noted before using in the SASSE workuheet.d Values used in SASSE worksheet. GTM values were corrected for the effects of the THFTCA concentration

Table 22. Stage Composition and Effluent Flow Rates Based on GTM/SASSli Calculations
Section
Stage
Org. Eff Flow,
Aq EfT Flow,
Number:
Number:
niL/min.
mL/min:
Aqueous PhaseH
Fe
Bi
A!
La
Te
THFTCA
Zr
S Γ
UO 2
Am
P u 4 +
F
C 2 O 4
PO 4
Organic Phase
H
Fe
Bi
Al
La
Tc
THFTCA
Zr
Sr
UO 2
Am
Pu 4 +
F
C2O4
PO 4
1
1
23.94
1.895
0.1
9E-12
0.167
6E-10
6E-07
5E-16
0 033
1E-07
2E-16
1E-14
3E-18
0.059
0.134
0.004
0.963
0.003
6E-10
0.001
2E-08
3E-06
5E-31
4E-04
7E-07
3E-13
5E-13
5E-15
0.002
5E-04
2E-05
1
2
2.376
0.102
3E-10
0.168
7E-09
2E-06
1E-18
0.033
4E-07
2E-14
2E-13
2E-16
0.06
0.134
0.004
1.105
0.003
1E-08
0.002
2E-07
5E-06
1E-33
5E-04
4E-06
2E-11
lE-11
3E-13
0.002
4E-04
2E-05
1
3
2.449
0.102
5E-09
0.168
9E-08
3E-06
3E-21
0.034
2E-06
1E-12
4E-12
2E-14
0.06
0.134
0.004
1.125
0.003
2E-07
0.002
2E-06
8E-06
3E-36
5E-04
2E-05
2E-09
2E-10
3E-11
0.002
4E-04
2E-05
1
4
2.459
0.102
1E-07
0.168
1E-06
4E-06
8E-24
0.034
9E-06
lE-10
7E-11
1E-12
0.06
0.134
0.004
1.128
0.003
4E-06
0.002
2E-05
1E-05
8E-39
5E-04
8E-05
2E-07
3E-09
3E-09
0.002
4E-04
2E-05
1
5
2.46
0.102
2E-06
0 168
1E-05
6E-06
2E-26
0.034
4E-05
1E-08
1E-09
lE-10
0.06
0.134
0.004
1.128
0.003
8E-05
0.002
3E-04
2E-05
2E-41
5E-04
4E-04
2E-05
5E-08
3E-07
0.002
4E-04
2E-05
1
6
2.461
0.102
3E-05
0.168
1E-04
8E-06
5E-29
0.034
2E-04
1E-06
2E-08
1E-08
0.06
0.134
0.004
1.128
0.002
0.001
0.002
0.003
2E-05
5E-44
5E-04
0.002
0.001
8E-07
2E-05
0.002
4E-04
2E-05
2
7
1.383
0.003
2E-05
0.504
5E-05
3E-06
4E-31
6E-04
2E-04
6E-07
9E-09
7E-09
0.004
0.002
5E-05
1.008
8E-05
0.001
0.005
0.003
2E-05
4E-46
2E-04
0.002
0.001
8E-07
2E-05
7E-06
1E-05
1E-07
2
8
1 194
1E04
1E-05
0.511
5E-05
3E-C6
3E-33
2E-05
2E-04
6E-07
8E-09
7E-09
4E-05
3E-05
6E-07
0.948
4E-06
0.001
0.005
0.003
2E-05
3E-48
2E-04
0.002
0.001
8E-07
2E-05
6E-08
3E-07
1E-09
Component
3
9
1.468
9E-06
2E-05
0.015
2E-04
3E-06
3E-35
9E-06
9E-04
2E-06
4E-08
8E-09
5E-07
1E-06
9E-09
0.698
7E-08
0.001
7E-05
0.003
2E-05
3E-50
2E-04
0.003
0.001
8E-07
2E-05
3E-08
5E-08
9E-11
3
10
0.971
2E-07
2E-05
3E-04
3E-04
2E-06
3E-37
1E-05
0.002
3E-06
5E-08
1E-08
5E-08
1E-07
3E-10
0.475
1E-09
0.001
6E-07
0.003
2E-05
3E-52
2E-04
0.003
0.001
8E-07
2E-05
6E-09
4E-09
3E-12
»Composition
3
11
0.519
5E-09
2E-05
4E-06
5E-04
2E-06
1E-39
2E-05
0.003
5E-06
9E-08
2E-08
1E-08
8E-09
9E-12
0.238
2E-11
0.001
4E-09
0.003
2E-05
8E-40
2E-04
0.002
0.001
8E-07
2E-05
5E-10
lE-10
1E-13
4
12
12
0.25
4E-11
4E-05
3E-08
0.003
1E-06
0.225
2E-04
0.002
1E-05
8E-07
2E-05
5E-10
lE-10
2E-13
0.086
8E-14
0.002
3E-11
0.005
2E-05
0.135
4E-04
4E-04
0.001
1E-07
8E-06
4E-12
2E-13
1E-15
,M4
13
0 098
3E-13
2E-04
2E-10
0.005
2E-06
0.361
4E-04
4E-04
5E-05
1E-07
8E-06
7E-12
9E-13
2E-15
0.02
2E-16
0.004
2E-13
0.003
2E-05
0.217
4E-05
2E-05
0.002
2E-09
8E-07
1E-13
1E-15
1E-17
4
14
0.03
2E-15
0.002
9E-I3
0.003
2E-06
0.444
4E-05
2E-05
3E-04
3E-09
9E-07
1E-13
6E-15
3E-17
0.003
1E-18
0.006
9E-16
2E-04
2E-05
0.266
8E-07
3E-07
0.002
2E-11
6E-08
9E-15
1E-17
3E-20
5
15
0.013
1E-17
0.007
7E-15
3E-04
3E-06
0.326
1E-06
5E-07
7E-04
4E-11
8E-08
1E-14
5E-17
2E-19
6E-04
1E-20
0.006
7E-18
6E-06
2E-05
0.195
3E-08
3E-09
0.002
3E-13
8E-09
2E-15
2E-19
3E-23
5
16
0.01
9E-20
0 007
6E-17
9E-06
3E-06
0.23
5E-08
7E-09
8E-04
7E-13
1E-08
3E-15
7E-19
1E-21
4E-04
8E-23
0.006
6E-20
2E-07
2E-05
0 138
2E-09
3E-11
0.002
2E-14
2E-09
6E-16
5E-21
1E-25
5
17
0.01
7E-22
0.006
5E-19
3E-07
3E-06
0.153
3E-09
9E-11
9E-04
3E-14
2E-09
8E-16
1E-20
1E-23
4E-04
6E-25
0.005
5E-22
3E-09
2E-05
0.092
lE-10
3E-13
0.002
6E-16
9E-10
1E-16
9E-23
8E-28
5
18
0.01
6E-24
0 005
4E-21
7E-09
3E-06
0.091
2E-10
1E-12
0.001
1E-15
6E-10
2E-16
2E-22
7E-26
5E-04
5E-27
0.003
4E-24
lE-10
2E-05
0.055
6E-12
3E-15
0.002
3E-17
5E-10
3E-17
1E-24
4E-30
5
19
0.01
5E-26
0.002
3E-23
2E-10
2E-06
0.041
9E-12
1E-14
8E-04
4E-17
lE-10
3E-17
3E-24
4E-28
4E-04
4E-29
0 001
3E-26
2E-12
2E-05
0.024
3E-13
3E-17
0.001
9E-19
4E-10
3E-18
1E-26
2E-32
6
20
12
6 06
IE-12
5E-28
0.003
4E-25
6E-12
3E-05
0.049
8E-13
2E-16
0.003
2E-18
8E-10
7E-18
5E-26
5E-30
1E-12
6E-31
3E-06
4E-28
6E-15
3E-08
5E-17
2E-15
2E-19
2E-06
1E-22
1E-12
7E-22
5E-30
5E-34

47
1E+01
1E+00
k i I r—J i-H • — I — • h-1 h-1
7 9 11 13
Stage Number
15
1 1—1—!
17 19
Fig. 34. The GTM-Calculated Concentration Profile for Nitric Acidin the Combined TRUEX-SREX Process
SIooO
7 9 11 13
Stage Number
15 17 19
Fig. 35. The GTM-Calculated Concentration Profile for Strontiumin the Combined TRUEX-SREX Process

48
ooO
I—i—f-i—I—t—i—.—H-i—I—.—h-i—K
1 3 5 7 9 11 13 15 17 19
Stage Number
Fig. 36. The GTM-Calculated Concentration Profile for Americiumin the Combined TRUEX-SREX Process
SIo"oO3Q.
1E-04 -
1E-05 •
1E-06 •
1E-07 •
1E-08 •
1E-09 •
1E-10 •
1E-11 •
1E-12 •
1E-13 -
1E-14 -
H 1 1 1 1 1 1 1 1 . 1 1 1 1 1 r
1 7 9 11 13 15
Stage Number
—'—h
17 19
Fig. 37. The GTM-Calculated Concentration Profile for Plutoniumin the Combined TRUEX-SREX Process

49
51
oOo
1E-04 +—,—I—,—|—,—|—,—I—,—I—,—I—,—I—,—I—,—I
1E-05 •
1E-06
1E-07 •
1E-08 4—"—I—•—I—i—I—•—I—'—I—"—I—'—I—'—I—«—\
1 5 7 9 11 13 15 17 19
Stage Number
Fig. 38. The GTM-Calculated Concentration Profile for Technetiumin the Combined TRUEX-SREX Process
i0.01
0.1 • •
12 13 14 15 16
Strip Stages
17 18 19
Fig. 39. The SASSE-Calculated Concentration Profile for THFTCAin the Strip Section

50
3. Preparation for Contactor Tests
A 20-stage 2-cm centrifugal contactor was set up to experimentally verify thecalculated nitric acid concentrations for the combined TRUEX-SREX flowsheet. Preliminary tests arebeing made to ensure that this equipment works properly when (1) the new TRUEX-SREX solvent isused, and (2) a new aqueous sampling system is in place. Some notes anc observations during thesetup process are reported here.
a. Stand-in Solvent
A possible problem with PS 9 as the combined TRUEX-SREX solvent wasidentified to be its density, which is 875 g/L. By comparison, the density of TRUEX-nDD solvent isonly 856 g/L. The effect of this higher solvent density on minicontactor operation was evaluatedusing our ROTOR model. Results indicated that contactor operation would be borderline for such ahigh solvent density. The problem should show up first at high O/A flow ratios in the contactor.
To explore the effect of high solvent density on minicontactor operation, testswere initiated with a stand-in solvent (TBP in nDD) at solvent densities up to 902 g/L. These tests,which are reported below, showed that the minicontactor was operable at solvent densities up to902 g/L. Thus, the combined TRUEX-SREX solvent, which has a slightly lower density, should befree of density-related operating problems in the minicontactor.
b. Stage Sampling
The possibility of taking a continuous aqueous-phase sample from the bottomof one or more contactor stages was explored in some detail. The problem has three parts. First, wehad to show that we can draw off the aqueous phase at a small flow rate without taking organic phasewith it. Second, we had to design a low-volume sampling system so that the residence time in thesystem is relatively small, no more than 10 min. Third, we had to find a suitable pump capable of lowflow and constant flow rate.
As noted on Fig. 29 (shaded boxes), we would like to take aqueous samples ateight stages, 1, 7, and 9-14 at a sampling flow rate of 0.33 mL/min. To compensate for this liquidloss due to sampling, the flow rate to the second scrub will be increased from 6.0 to 7.3 mL/min, andthat to the strip feed will be increased from 3.0 to 4.0 mL/min.
(1) Aqueous Samples from Bottom of Contactor Stage
To determine the maximum rate at which aqueous samples could bedrawn from the bottom of a contactor stage without organic contamination, tests were performed bycracking open the ball valve for the stage. This valve, located just below the stage, is attached to it by1/4-in. (6.4 cm) stainless steel tubing. These tests showed that, if the sampling flow rate was kept to0.35 mL/min or less, one sees mainly aqueous phase in the sample from the bottom of the stage.
After the special low-volume sampling system described next was inplace, the bottom-flow tests were repeated. For these tests, there was 12 mL/min of organic phase(40% TBP in nDD) and a 16 mL/min of aqueous phase (0.05M nitric acid) flowing through the stagewhile a steady stream of solution dripped from the bottom of the stage. The bottom flow passedthrough a 5-cm length of Viton tubing, where a small clamp controlled its rate. Several tests at flow

51
rates of 0.5 mL/min showed no visible organic phase in the aqueous phase exiting from the bottom ofthe mixing zone. These results suggest that a bottom flow rate of 0.33 mL/min should yield solvent-free aqueous samples.
(2) Low-Volume Sampling System
Initial sampling systems included the ball valve under the stage so thatwe could shut off flow from the bottom of the stage to disconnect the sampling system, and later,open it up to drain the stage easily. The volume in the sampling system was about 3 mL, whichyielded a solution residence time of about 10 min.
A breakthrough in the design of the sampling system allowed us tokeep its volume to under 1 mL, reducing the solution residence time to about 3 min. One key indesigning this low-volume sampling system was allowing the sampling pump to act as the valve forthe sampling line. If the pump is turned off, the valve is closed; if the speed of the pump is turned upto its maximum rate of 6 mL/min, the contents of the stage can be drained in 2 to 3 min. The designof this system is as follows. The aqueous phase is drawn down through a 1/8 in. (3.2 mm) NPT* to1/16 in. (1.6 mm) Swagelok reducer, which screws into the bottom of the contactor stage. Thesample liquid then flows through a short (1 to 2 in. |25 to 50 mm)) length of stainless steel tubing(1/16 in. OD [1.6 mm| and 1/64 in. ID [0.04 mm]) into a 5 ft (1.5 m) length of Viton tubing. Thistubing, which is size #13 (0.8 mm ID), goes from the stage to a multichannel sampling pump wherethe end of the tubing passes through the pump. Details of the pump are presented next.
(3) Multichannel Pump with Low Flow and Constant Flow Rate
For taking bottom samples from several stages at the same time, wetested a Masterflex variable-speed multichannel peristaltic pump. The various parts of the pump areas follows (Cole-Parmer catalog number shown in parentheses): (1) multichannel variable-occlusionpump head (L-07519-00); (2) eight small tubing cartridges (L-07519-60); (3) a variable speed driverwith a ten-turn potentiometer over a 1 to 100 rpm range and a repeatability of ±1 rpm (L-07520-35);and (4) Viton tubing with an inside diameter of 0.8 mm (L-06412-I3). This multichannelMasterflex pump allows eight lines to be pumped at the same time. Each tube is mounted into acartridge designed to hold a particular size of tubing, and then the cartridge is snapped into the pumphead.
Calibration of the driver controller (a 10-turn potentiometer) showedthat pump speed was directly proportional to the controller setting. At no rotation, the controller hasa setting of 0.5 turns; at 100 rpm, 9.5 turns. Initial results showed that pump flow rates weregenerally lower than expected based on the controller setting. Some sampling lines, which had noflow, were discovered to be tangled between the finger guard and the flow-inducing rollers of thepump. Because the small-tubing cartridges completely cover the finger guard and the rollers duringpump operation, these tangled sampling lines went unnoticed for a time. The problem was due to animproper setting of the tubing retainer button located on the feed side of the pump. If this setting isnot right, the Viton tubing can be slowly drawn into the pump. The tubing retainer buttons (locatedon the front and the back of each pump cartridge) are designed to halt this creeping motion. Sinceone cannot ordinarily see the tubing moving into the pump, a white line was marked 5 cm from thefeed side of the pump. We checked every so often to verify that this distance was maintained during
* NPT = National Pipe Thread.

52
pump operation. If movement occurred, the back tubing retainer button was tightened further whilethe pump was operating. Sometimes the movement of the tubing is so slow that it would take severalhours to notice any change. Thus, it is recommended that this system be monitored regularly duringpump operation.
In addition to setting the tubing retainer buttons, one also has to turnan adjustment knob located on each of the small-tubing cartridges to control the occlusion setting(which determines how tightly the pump squeezes the tube). If this control is not tight enough, thepump will act like a leaky valve. When this was observed, we found that several more clockwise turnsof the adjustment knob (that is, higher tension) corrected the problem. When all of the samplinglines were adjusted to the same high occlusion setting, the flow rates of the eight sampling lines wereessentially the same (for example, 0.24 ± 0.02 mL/min) and were independent of liquid height in thelines to the sampling system.
c. Minicontactor Setup and Operation
A 20-stage minicontactor (2-cm contactor) was set up as shown in Fig. 29.No provision was made to recycle any effluent. The interstage lines were fashioned out of a fairlytransparent tubing made of Teflon fluorinated ethylene polypropylene (FEP), with an outsidediameter of 1/2 in. (12.7 mm) and an inside diameter of 3/8 in. (9.5 mm). The system was checkedfor leaks by pumping water through the stages. To protect the contactor motors from possibledamage caused by acid fumes, air purge lines were connected to each stage from a common 20-stemmanifold that is supplied with air at 1.5 scfh (42 L/h). Thus, the average purge air flow to each stageis 35 mL/min.
(I) Normal Two-Phase Operation
To check the system for good operation during two-phase operation,we used 0.05M HNO3 and 40% tributylphosphate (TBP) in normal dodecane (nDD), which has adensity of 838 g/L. After several hours of operation, some aqueous carryover was observed in theorganic interstage lines. This otiier-phase carryover was only seen in stages 1-6, while the remainingorganic interstage lines appeared to be free of aqueous phase. The largest amount of other-phasecarryover appeared to be in the interstage line between stages 2 and 3. To determine how muchaqueous phase was actually present in this line, four organic samples were taken by disconnecting theorganic interstage line from stage 2 to stage 3. While this sample was being collected, the aqueousfeeds and the stage-to-stage flows continued. Because all of the organic phase was being drained atstage 2, the flow of organic phase through the rest of the stages stopped. The average amount ofaqueous phase observed in the organic-phase effluent from stage 2 was 1.05%. Since the otherorganic interstage lines appeared to have less aqueous phase, we assumed that the other stages had lessthan 1% other-phase carryover.
The minicontactor was designed to give less than 1% other-phasecarryover if the total flow rate is 40 mL/min or less. Thus, stage 2 operation was borderline as it wasoperating at total flow rate of 40 mL/min and an O/A flow ratio of 1.0. (Note that the flow rate andO/A flow ratio for stage 2 differ from those in Fig. 29 because an early version of the flowsheet wasused in the initial setup of the minicontactor for the combined TRUEX-SREX tests.) This isapparently a subtle effect of multistage operation as subsequent single-stage tests carried out atstage 2 for three O/A ratios (0.2, 1.0, and 5) gave much better performance (Table 23). As stage 2

53
Table 23. Results of Single-Stage Two-Phase Tests with Solvent Density of 838 g/L
O/A Flow Ratio
0.2
1.0
5.0
Stage
267
267
267
Flow Rate at 1 % Other-PhaseCarryover, mL/min
63 ± 565 ± 677 ± 6
70 ±572 ± 873 ± 8
260 ± 20240 ± 20260 ± 10
Mode of Failure
A in OA in OA inO
A inOA in OA inO
O in AO in AOin A
operation was not significantly out of specification and all other stages operated better, theminicontactor setup was deemed to be satisfactory.
For the single-stage tests at stage 2, both the aqueous (0.05M HNO3)and organic (40% TBP in nDD) phases were fed directly into the stage. Then, to measure other-phase carryover easily, 100-mL samples were taken of the effluent from each exit port. Asappropriate, either the top or bottom of each phase would be poured into a 15-mL centrifuge tubemarked at 0.1 -mL intervals to look for the presence of the other phase. This allowed values of O inA and A in O to be determined to within 0.1%. In these tests, stage failure was defined as more thanI % of the other phase in the organic or aqueous effluent. This is the basis for the mode-of-failurecolumn in Table 23.
Following the same procedure as used for the stage 2 tests, stages 6and 7 were evaluated. The results, also listed in Table 23, show that stage 2 is a very typical stage.These results also suggest that multistage operation can sometimes be slightly degraded relative tosingle-stage operation.
(2) Two-Phase Operation for High Solvent Density
All 20 minicontactor stages were tested individually at an O/A flowratio of 5. At this ratio, the rotor model specifications stated the units would fail first for a higherdensity solvent. The solvent used was 68.6% TBP in nDD, which has a density of 902 ± 7 g/L andcorresponds to 2.51M TBP in the solvent. This high density solvent was used so that the testconditions would be even tougher than those that will be experienced with the TRUEX-SREX solvent.The results, given in Table 24, show that, in all cases, the maximum throughput stayed above thedesign value of 40 mL/min. As expected, the maximum throughput at an O/A flow ratio of 5dropped relative to values obtained for this O/A flow ratio at a lower solvent density (see Table 23),and the mode of failure was O in A for all cases.
After the individual tests of the 20 minicontactor stages at an O/A flowratio of 5, three stages were chosen to investigate operation for O/A ratios over a range from 0.2 to 5.These stages were picked so that we had stages that gave a typical maximum throughput at an O/A of5.0 (stage 2), a high maximum throughput (stage 7), and a low maximum throughput (stage 11).

54
Table 24. Results of Single-Stage Two-PhaseTests with Solvent Density of 902 g/Land O/A Flow Ratio of 5.0
StageNumber
12
34567891011121314151617181920
Mode ofFailure
Oin AO in AOin AOin AOin AOin AOin AOin AOin AOin AOin AOin AOin AOin AOin AOin AOin AOin AOin AOin A
Max. Throughput,mL/min
118±9
114 ± 12139 ± 6
165 + 20
139 ±6117± 17166 ± 18139 ± 6139 + 6
163+ 1970 ± 7
124 ± 15162 ± 18162+ 18122 ± 11122+ 12139 ± 6139 ±6
122 ± 11122 ± 11
The results, given in Table 25, show that, as expected, the largest drop in maximum throughput was atan O/A flow ratio of 5. Maximum throughputs at lower O/A flow ratios are essentially unchanged. Inall cases, the maximum throughput is well above the design throughput for the minicontactor of40 mL/min. Thus, the minicontactor will be suitable for tests with solvents which have a high densityas high as that for the combined TRUEX-SREX solvent.
Table 25. Results of Single-Stage Two-Phase Tests with Solvent Density of 902 g/L
O/A Flow Ratio
0.2
1.0
5.0
Stage
2711
2711
2711
Flow Rate at 1 % Other-PhaseCarryover, mL/min
91 ±2096 ±675 ±690 ± 1078 ± 3
90 ± 10
1I4± 12166 ± 1870 ± 7
Mode of Failure
A in OAin OA in O
BothA inOA inO
Oin AOin AOin A

55
d. Test Plan
In making detailed test plans, we prepared three Excel worksheets. The firstworksheet calculates the volume of each feed stock that will be required and the amount of eachchemical needed based on available materials. The second worksheet gives a step-by-step procedurefor carrying oui test CI, the cold test with only HNO3 and Na2CO3 present. The third worksheetgives a step-by-, tep procedure for carrying out tests C2 and C3, the cold tests with HNO3 and Na2CO3plus oxalate, Fe, Sm, and Al present. In addition, test C3 will introduce THFTCA into the stripsection. The worksheets allow us to estimate the materials that we will need during the tests. Theyalso provide a list of crucial operations and the time that they should be carried out during the test.After the preliminary test discussed next was completed, the worksheets were reviewed and revised.They are now ready for tests CI through C3.
4. Preliminary Test
A preliminary test was performed using the 20-stage minicontactor set up as shown inFig. 29 for the combined TRUEX-SREX flowsheet. The purpose of this test was to (1) check forleaks, (2) determine if the test procedure is workable, and (3) test the sampling pump system. In thistest, the organic phase was 4()c/c TBP in nDD, and the aqueous phase was 0.01M nitric acid.
The results of the preliminary test showed no leaks in the system. The pump forbottom sampling of the aqueous phase at eight stages, as shown in Fig. 29, gave an average samplingrate of 0.28 mL/min. Large amounts of organic phase were discovered in the aqueous samples takenfrom stages I and 12, 50 ± 10* and 78 ± 6%, respectively. Note that stage 1 was used in theexploratory tests reported above without significant organic phase appearing in the sampling flow.Thus, we did not expect to find solvent in the bottom stage samples. None of the other stage samplesshowed a measurable amount of organic phase in the aqueous phase.
After the test, we observed that the Viton tubing was slightly swollen at the endconnected to the stainless steel capillary tube for stages 1 and 12. It is not clear whether the swollentubing was the cause or the result of measurable organic phase in the aqueous phase. At any rate,swollen portions were removed by cutting off about 5 cm of tubing. With this modification, thesampling operation will be used for the cold tests.
The three 20-stage cold tests (CI, C2, and C3) will be done as soon as an appropriatesolvent is identified. The evaluation process to select an appropriate solvent is discussed next.
5. Solvent Evaluation
When the PS 9 solvent was prepared (Sec. IV.C.I.a), its density was measured. Inaddition, the effect of HNO3 and Na2CO^ on its density was determined. The results, given inTable 26, show how density changed by alternating contacts between O.IM HNO3 and 0.25MNaiCO^. The nitric acid increased the density by 0.0044 g/mL, the sodium carbonate by0.0036 g/mL.
After the density of solvent PS 9 was determined, the value of its dispersion number(N|j,> was measured. The results, given in Table 27, show that NDl was low, and the maximum amountof A in O was high. The N^, values were as low as 2.5 x 10⁴ for nitric acid at O/A = 1.0. Sincedesign calculations are based on an NDl value of 8 x I0"4, and maximum throughput (both phases) is

56
Table 26. Effect of Contact with Various Aqueous Phases on Solvent Density
Liquid
WaterPS 9
Solution Contactedwith Liquid
(none)(none)
O.IMHNO3
0.25M Na2CO,0.1MHNO,
O.25M Na2CO,
Density
Measured,g/mL
0.99470.87510.87970.87870.87910.8785
Reference,a
g/mL
0.9955b
0.8/5c
0.8750.8750.8750.875
Apparent
g/mL
__
—
0.00470.00370.00410.0035
Density Gain
%
_
-
0.540.430.470.40
a Except as noted, reference case is solvent that has never been in contact with an aqueous phase.b See Ref. 8.c Measured by Herb Diamond (ANL Chemistry Division).
Table 27. Effect of Various Aqueous Phases on the Dispersion Number for Three Solvents
SolventName
PS 9
PS 10w/oCE
PS 10
AqueousPhase
0.25M Na2CO,O.OIMHNO,0.1MHNO,0.1M HNO30.1MHNO,
3.0M HNO,0.2M THFTCA
0.25M Na2CO,0.IMHNO,
0.25M Na2CO3
0.1MHNO,
O/A
N(Di)xlO4
8.18.39.37.412.47.05.0
9.97.97.1
13.2
= 0.33
Max. A inO, %
548933lc
214
0.4
O/A
N(Di)xlO4
6.34.32.52.79.24.33.5
7.47.16.5
5.1
= 1.0
Max. A inO,%
5473144
314
1
O/A
N(Di)xlO4
1.54.01.62.63.62.94.0
8.77.14.2
4.6
= 3.0Max. A in
O, %
10674156
314
2
Notes
a
b
a The solvent was not contacted with sodium carbonate solution before this test.b These dispersion tests were done at 48 ± 5°C. All others were done at 24.3 + 0.8°C.c For this case, max. O in A is reported. Max. A in O was less. Aqueous phase was the continuous phase.
proportional to NDl, the total throughput for stages containing nitric acid would be reduced to about30% of the nominal 40 mL/min for the 2-cm contactor, that is, to about 12 mL/min. For stagescontaining sodium carbonate, this reduction would be to about 20% of the nominal 40 mL/min forthe 2-cm contactor, that is, to about 8 mL/min. Even with these reductions, the amount of A in Ocould still be as high as 10%. Note that, except where indicated for THFTCA, the amount of O in Awas well below 1 ck for all cases. Overall, then, PS 9 is not a satisfactory solvent.
One test of PS 9, also shown in Table 27, was made at an elevated temperature,48 ± 5°C rather than 24.3 ± 0.8°C. This test showed that PS 9 had improved processing propertiesbased on higher N^, values and lower A in O values. Since elevated temperatures reduce solventviscosity, this suggested that we might be able to improve the solvent by decreasing its viscosity.

57
Thus, the PS 9 solvent was reformulated using Norpar-12 (a commercial normal paraffinic solventfrom Exxon) in place of Isopar M for the diluent. This new solvent, named PS 10, was first testedwithout the crown ether because crown ether was in short supply. Without crown ether, the solventname is PS 10 w/o CE. The results for both new solvents, also given in Table 27, show a muchimproved solvent, which is borderline acceptable for the combined TRUEX-SREX process. When anew shipment of crown ether arrives, we plan to prepare one liter of PS 10 and make the three coldtests CI through C3.
The NDj was measured using a 100-mL cylinder. In this measurement, the position ofthe aqueous-organic interface was noted relative to the interface position when the two phases werecompletely separated, that is, before shaking the cylinder containing the two phases. When themovement of the interface between the two coalescing phases has essentially stopped, that is, nomovement is seen after successive 2 or 3 min intervals, the position of the interface relative to theposition before shaking was used to determine the amount, if any, of A in O or O in A. The time toreach this position was used to determine the NDi value. The amount of A in O or O in A allowed usto estimate the amount of other-phase carryover that we would expect to see during contactorprocessing.

58
V. VERIFICATION TESTS(D. B. Chamberlain, D. L. Bowers, C. J. Conner, J. C. Hutter, R. A. Leonard,
J. Sedlet, D. G. Wygmans, and G. F. Vandegrift)
Laboratory verification tests of the TRUEX process are being carried out to (1) develop abetter understanding of the chemistry of the TRUEX process, (2) test and verify processmodifications, and (3) verify the computer model being developed for predicting species extractionbehavior and calculating flowsheets.
Current verification tests are being completed using plutonium-residue solutions generated bythe New Brunswick Laboratory (NBL). These solutions, generated from the analysis of plutoniumsamples, have been accumulating over the past several years at the New Brunswick Laboratory (NBL)and Argonne National Laboratory (ANL). These residues contain varying concentrations of nitric,sulfuric, phosphoric, and hydrochloric acids, plus U, Pu, Np, and Am. The TRUEX solvent extractionprocess, used to generate the nonTRU waste stream and recover the plutonium from the NBL waste,will be completed in a 20-stage centrifugal contactor installed in a glovebox. The organic solvent isTRUEX-nDD.
A. Continued Processing of Batch 1
The plutonium product stream generated during the processing of Batch I (ANL-93/38,p. 43) has been evaporated and calcined. Two batches of oxide were produced from the calcination.Batch la oxide weighed 6.40 g and contained 6.20 g Pu. Batch lb oxide weighed 21.20 g andcontained 3.39 g Pu. Plutonium content was determined by inductively coupled plasma (ICP)/atomicemission spectroscopy (AES). Further ICP/AES analysis indicated that batch lb was contaminatedwith Na and K. Because Na and K will affect the reduction of plutonium oxide to metal, they had tobe removed before the reduction process. Since sodium and potassium oxides are very water soluble,while plutonium oxide is not, we decided to wash batch lb oxide with water.
Batch lb oxide was placed in a beaker with -300 mL of H2O and stirred for several hours.The solution was filtered to remove the solids, and the pH of the filtrate measured. The pH was >10,indicating that sodium and potassium oxides had been washed out of the solids (group IA oxidesform hydroxides in water). Scintillation counting of the filtrate showed 2760 cpm/^L, indicating thatsome plutonium had been dissolved but not a great deal. The solids were washed again. The pH ofthe filtrate was checked and found to be r>10, indicating that more Na and K had been removed. Thesolids were washed a third time. When the pH of the filtrate was measured this time, it was ~7,indicating that no more Na or K was removed. Batch lb oxide was then dried and ieweighed. Thenew weight was 5.5 g. The nearly 16 g reduction in mass indicates that the sodium and potassiumoxides were washed out by the water. An assay by ICP/AES will be performed on the new oxide todetermine its plutonium content.
The filtrates from the three washings were combined and sampled. Scintillation countingindicated that the combined filtrate contained 490 cpm^L. To determine if the filtrate could beacidified and added to the next feed, distribution ratios (D) of the acidified filtrate were checked. Tocheck D values, 800 μL of 2M HNO3 and 200 μL of filtrate were mixed, and the pH determined. ThepH equaled 1, indicating that the filtrate had been acidified. Next, 1 mL of TRUEX-nDD was addedto the acidified filtrate sample, and the resulting solution mixed. The phases were separated, sampled,and scintillation counted. A 900 μL sample of the aqueous phase was then contacted with 900 μL offresh TRUEX-nDD. The phases were again separated, sampled, and scintillation counted. Finally,800 μL of the aqueous phase was contacted with 800 μL of fresh TRUEX-nDD. The phases were

59
again separated, sampled, and scintillation counted. Distribution ratios for the three contacts were 34,1.0, and 0.4, respectively (see Table 28). The D value for the third contact is very low, but thescintillation counting of the aqueous phase showed that it was 0.47 cpm^L, which is well belowraffinate that we have produced in the past. We concluded that the filtrate can be acidified and addedto the feed tank of the next batch.
Table 28.
Contact No.
123
Distribution Ratios for Acidified Filtrate
Scint.
Aq.
2.10.730.47
Count, cpm^L
Org.
72.10.730.20
Dist. Ratio
341.00.4
B. Processing of Batch 2
I. Flowsheet Development
Batch 2, the second batch of waste received from NBL, contained approximately 13 gof plutonium and 16 g of uranium. Preparations for Batch 2 were completed during the lastreporting period. Processing Batch 2 was accomplished over four days of operation (March 27,March 31, April 6, and April 9, 1992). The base flowsheet for processing is shown in Fig. 40.Changes in flow rates for some feed streams were made during processing, and these changes arenoted in the discussion of the run (Sec. V.B.2).
One change in the flowsheet for this batch worthy of note here is the inclusion of analumina column to aid in solvent cleanup. Based upon batch tests, the solvent quality is greatlyimproved when passed through an alumina column. The alumina helps remove degradation productsand reduces the TRU activity in the solvent. Because the alumina column could only handle 30% ofthe organic flow rate, valves were installed on the HP pump so that we could switch between thealumina column or bypass the alumina column and return the solvent to the DX feed tank (Fig. 40).
2. Discussion of Run
Three problems occurred during the first day of operation. After 23 min ofoperation, the level in the DX tank had dropped below the pump pickup tube, stopping organic flow.The organic effluent (HP) pump had a valve attached to it that was used to direct flow either to thealumina column or to the DX tank. The HP flow had been directed to the column, and the low levelin the DX tank was solved by directing the HP flow into that tank.
After operating for 50 min, the level in the scrub feed tank dropped below the pump.suction line. The length of time that we lost the scrub flow is not known, but based upon a flow rateof 70 mL/min, the feed solution would have lasted about 43 min. This means that we may haveoperated for 7 min without scrub flow.
The third problem was with the americium strip product flow. For this stream, we takea small flow from the interstage line exiting stage 1 1. Although this takeoff worked correctly inprevious runs, we could not remove aqueous phase at 3 mL/min. Therefore, we shut down for

60
GioveboxBoundary
Scrub
AI|NO3|3 2 00U(70 rnL/min)
Am Strip
(50 mumn)
Pu Strip
(NH4|2C2O4 0 28M(12 5 mL/min|
TRU Feed
Na l S6 2 M0 4 6 0E 4 M
Am3* 2 SE a Ml IE 3 U
UO2 ME3MNp 12E&MPO^ o as M
|1OO mL/min|
CarbonateWash #1
Na2CO3 0 25 M1200 mL/min]
CarbonateWash #2
Na2CO3 0 25 M[200 mL/min)
1 micron filter
• — '
^ * _
* - -
TRUEXSolvent
CMPO 0 5 0 ^TBP 1 40MDodscon* diluent
(SO mUmm}
Organic FeedTank
To Hood
Fig. 40. Flowsheet for NBL Batch 2 Processing
approximately 1.5 h so that we could replace this connection with a larger diameter fitting. Afterrestart, we had no further trouble with this flow.
During the shutdown between the first and second days of processing, pump flowrates were checked. The DS and EF solutions collected (about 900 mL of solution) during thesecalibration checks were added to the DF tank. Also during this shutdown, the flow rates for DX, DF,DS, and FF streams were changed.
Neutralization of the DW raffinate in the carboys during the first day had been a verytime-consuming process. This neutralization was accompiished by adding about 2.5 L of 10MNaOH to about 7.5 L of raffinate. Phenolphthalein was used as a color indicator to aid in theprocess. Problems encountered in this process were brought about by the formation of solids,presumably A1(OH)3, in the solution as the NaOH was added. These solids not only turned thesolution into a very thick, viscous mixture, but also made the color change in the phenolphthaleinalmost indistinguishable. It was thus difficult to visually tell when a neutral solution had beenreached. Therefore, we decided to leave the raffinate in an acidic condition but allow room in eachcarboy so that we could neutralize at a later date.
On March 31, 1992, the second day of processing, two abnormalities wereencountered. About 90 min after startup, the plutonium product (FW) collection container waschanged. We noticed two phases in the full container. About 500 mL of solvent was present in the
61
2-L container, although the presence of two phases had not been noted when the container was put inplace upon startup that day.
The reason for the presence of this organic phase in the aqueous stream was notdetermined, nor was there a recurrence of the problem throughout the rest of the processing. Afterprocessing for this day was halted, the plutonium strip stages were drained to determine if any solidswere present. White crystals were seen in the aqueous-phase drainage from stages 16 and 18. Thesecrystals had the same appearance as ammonium oxalate crystals.
Slow phase separation from certain stages during drainage led to questions about thedispersion number in the plutonium strip section. Therefore, after the drainage from all four stageswas combined, the two-phase mixture was shaken, and the time needed for the dispersion to separatewas measured as 37 s. The aqueous-phase drainage was th ;n contacted with solvent that had beenprocessed through the alumina column, and the time needed for the dispersion to separate wasmeasured as 48 s. The increased time needed for separation in the presence of "clean" solvent is hardto explain. However, the other-phase carryover does not appear to be related to a problem in thedispersion number.
The second problem encountered on the second processing day was the presence ofloam in certain stages. Because of the foaming, the DF feed was shut off, while the other pumps wereleft running, to determine if this would stop the foaming. Other problems in the laboratory, however,interrupted the experimenters, and the rest of the system was shut down before the foaming problemcould be thoroughly investigated.
During shutdown, the carbonate wash feeds as well as the acid rinse solution in the DXtank were replaced with fresh solutions. Also, all of the solvent in the DX tank was passed throughthe alumina column during this shutdown.
Upon startup of the "cold" feed pumps on April 6, 1992 (the third day of processing),foaming was again observed in the organic and aqueous effluents from certain stages. In looking fora cause, we noticed that the DW raffinate pump was pumping too slowly to remove the aqueouseffluent from stage 1. Thus, the aqueous phase was backing up in the extraction section. In anattempt to remedy this problem, the pump head for this DW pump was adjusted. Shortly thereafter,the pump head was swung in the wrong direction, causing it to pump the DW raffinate into theaqueous-exit port for stage 1. After this pump problem was fixed, the foam quickly dissipated. Thissuggests that the "foaming" noticed on both the second and third days was not truly foaming at all,but, instead, flooding of the stages with aqueous phase, causing two-phase flow out of the stage exits.
The normal startup procedure was modified slightly on the third day, whereby theflow rate for the DF feed was increased from zero to full flow (100 mL/min) in four equal incrementsover about 30 min. This was done in an attempt to lessen the spike in activity in the DW raffinatestream following initiation of DF flow. This spike in DW activity had been encountered on theprevious two days of processing this batch, as well as in previous processing runs.
Well into the processing run on the third day, the DW flow rate was measured at184 mL/min. Given the changes to the flow rates at the end of the first day of processing, this flowrate should have been 207 mL/min. A quick check of the feed left in the carboy showed that the DFflow was too slow, so the DF pump was adjusted for a faster How.

62
After 209 min of processing on the third day, we ran out of DS scrub solution. Sincethe order for aluminum nitrate had not yet arrived, shutdown procedures were begun. However, thewrong pump was inadvertently shut off. The DW pump was unplugged in place of the DF pump,while all other pumps were left running. About a minute later, this mistake was noticed and corrected,i.e., the DF pump was shut off and the DW pump was restarted. Shutdown was completed about fourminutes later with the shutdown of all pumps. During shutdown, flow rate checks were made on anumber of pumps, and the DS flow rate was decreased.
Startup procedures were again modified for the beginning of processing on thefourth day, April 9, 1992. A "cold" DF feed solution of 500 mL of 3M HNO3, flowing at about50 mL/min, was started when the other feed pumps were started. Once this "cold" feed was passed, thereal DF feed solution was started at 50 mL/min. After 15 min, the DF feed flow was increased to itsnormal value of 103 mL/min.
About two hours after startup, the DF feed flow rate, given the carboy volume, wascalculated to be lower than expected. The pump was adjusted to a setting which was calculated togive 100 mL/min.
Also on the fourth day, we noted that the GF flow was intermittent because the level inthe GF tank was below the pump pickup tube. The time that this condition lasted was not determined.Addition of about 500 mL of fresh carbonate to this tank solved the problem.
Processing of this batch of waste was completed when the DF feeci tank was emptiedon the fourth day, after 805 min of run time. The shutdown of the system included a long flushingtime, during which all pumps except DF continued to run for about another 50 min.
3. Sample Analysis during Processing
The samples taken during processing were counted on scintillation and gammacounters in an isolation room. The DW samples were taken in a hood, and scintillation counted forone minute immediately to ensure that the DW raffinate was within acceptable activity limits. Sampleswere taken of the DW product carboys after each carboy was full and mixed well but before thecarboy was removed from the hood. All other sample collected from the various streams during therun had to be bagged out of the glovebox, and this was usually done at the end of the day. At thattime, all scintillation cocktails and gamma tubes prepared that day were set up to count overnight. Allscintillation samples were made with 10 mL of Ultima Gold in 20-mL plastic scintillation vials.Gamma samples were diluted as necessary to make up a 1-mL solution for consistency in countinggeometry.
Counting results for the DF samples are given in Table 29. The DF feed tank was notmixed during the run, because of the presence of solids in the DF' carboy. These solids hadprecipitated out and would have plugged up the filters on the DF feed line. Even so, Table 29 showsthat the activity in the DF feed remained fairly constant over the run.
During processing, samples of the DW raffinate were taken about every 30 min. TheDW raffinate was pumped out of stage 1 into a 4-L container. A transfer pump then pumped thisraffinate through a l ^ m filter over to the hood, where it fell into a carboy. Samples were taken inthe hood at the line entering the carboy. The transfer pump was usually running, which kept the 4-Lcontainer basically empty. However, when solution in the carboy reached 7-8 L, the transfer pumpwas shut off to allow replacement of the carboy. Since the collection point of DW samples was

63
Table 29. Sample Time and Average Scintillation and Gamma CountingResults for DF Samples
Sample Name
DF-1DF-2DF-3DF-4
SampleTime,min
048
488a
793
AverageScintillation
Counts, cpm^L
46,95151,10244,42245,600
Avg. GammaCounts @ 59.5 keV,
cps^L
17.017.016.812.0
aExact sample time not noted. Estimated value is given.
downstream of the 4-L container, they are not instantaneous samples, but an average sample over ashort period of time.
The DW raffinate activity levels for the complete processing run are reported inTable 30. Average activities are listed, since two scintillation cocktails and two gamma tubes wereprepared for each sample. Gamma activity at 59.5 keV is listed because this is the most abundantgamma signal for 24 lAm.
The alpha activity, as determined by scintillation counting, is the most importantparameter for the DW stream, since this value determines whether the stream is to be considered TRUor non-TRU waste. A plot of alpha activity vs. time for the DW samples is given in Fig. 41. (Note inFig. 41, the x-axis is not to scale because of the bar chart format.) The arrow on the activity spike at641 min of running time indicates that the actual value is off the chart. This spike resulted from thewrong pump being shut off at the end of processing for the third day. As seen from Fig. 41, theprocessing goal of 0.22 dpm^L (corresponding to 0.1 nCi/mL) in the DW raffinate was not met.However, the raffinate activity in the carboys is acceptable to ANL's Waste Management Operationsfor disposal.
The peaks and valleys seen in Fig. 41 can best be understood when the DW activity vs.time chart is broken up into segments representing the individual processing days. The charts of DWalpha activity vs. time for each of the four days of processing are shown in Figs. 42 through 45.
530
Running Time, min
Fig. 41. Scintillation Counting Results vs. Time forDW Samples during NBL Batch 2 Processing

64
Table 30. Sample Time and Average Scintillation and Gamma CountingResults for DW Samples
Sample Name
DW-1DW-2DW-3DW-4DW-5DW-6DW-7DW-8DW-9DW-10DW-11DW-12DW-I3DW-14DW-15DW-16DW-17DW-18DW-19DW-20DW-21DW-22DW-23DW-24DW-25DW-26DW-27DW-28DW-29DW-30DW-31DW-32DW-33DW-34DW-35DW-36DW-37DW-38DW-39DW-40DW-41DW-42DW-43DW-44DW-45DW-46DW-47DW-48DW-49
SampleTime,min
1333436685141151173211221274304326331336349356374384436454461467470478478501531556576606632641647649653657665668675691720742760793814843880901
AverageScintillation
Counts, cpm/^L
1.0041.552.911.311.4!6.58.87.27.4
7.1981.73.6687.248.923.217.613.312.015.92.551.652.2115.518.414.711.412.08.877.767.286.446,2453020.811.68.5610.77.707.206.384.623.793.393.192.913.333.093.122.69
Avg. GammaCounts @ 59.5 keV,
cps/^L
2.05E-031.30E-025.91E-031.O3E-O31.01E-036.25E-042.40E-042.21E-042.92E-041.75E-041.85E-O3
a5.24E-031.8OE-O36.55E-042.53E-043.08E-046.46E-048.87E-045.62E-05
a1.11E-047.24E-046.94E-045.88E-043.99E-044.28E-042.02E-042.41E-042.48E-041.92E-041.61E-041.46E-025.69E-043.53E-048.28E-052.87E-042.84E-041.87E-042.23E-041.34E-048.26E-058.74E-049.76E-058.43E-056.85E-056.55E-059.61E-054.57E-05
aNot detected in this sample.

65
60 -r
ETJ
3 K
' >
ia
Act
iA
lpr
50 -
40 •
3 0 -
20 -
1 0 -
0 -co
I 1.5 Hour^m H Shutdown
II 1IIII LMillro co ID in r-n t io oo <
Running Time,
III!HJUHLJHJT- CO r- T-m f- •- rvji - T- ni ni
min
a• a
>•
i A
ctiv
iA
lphe
908070 i
60 •
50 •
40 •
30 •
20 •
1 0 •
0 •
•1••11•LtM
P-- OCN CO
111ll11.l.B.
I D T-cvj COCO CO
Running
l l•*•<D a>CO • tCO CO
Time,
!••!UULJID M- Ttin r̂ coCO CO CO
min
Fig. 42. Scintillation Counting Results vs.Time for DW Samples during Day 1of NBL Batch 2 Processing
Fig. 43. Scintillation Counting Results vs.Time for DW Samples during Day 2of NBL Batch 2 Processing
530
20 T
<O t -f-co in cot t t
C O C O * - " - CO CO CO CMr - r - o c o i n r ~ o c o*? -q- is> ir> i f t m c o c o
E
5">.
Act
ivi
a<
45
4 0
35
30
25
20
1 5
1 0
JlllUtoCO
a>
Running Time, min
t O C O C O N r^
Running Time, min
Fig. 44. Scintillation Counting Results vs.Time for DW Samples during Day 3of NBL Batch 2 Processing
Fig. 45. Scintillation Counting Results vs.Time for DW Samples during Day 4of NBL Batch 2 Processing

66
As seen in these figures, the peaks in DW activity for days 1 and 3 are associated with startup of thesystem for that day. The first few DW samples for the day had very low activity levels associated withthe cold startup procedure, during which all pumps except DF were running. This low-activity periodis then followed by a spike in activity, which came immediately after the start of the DF feed. Afterthe spike, the activity in the DW samples tapered off slowly, finally reaching a steady state.
In contrast to days 1 and 3, the first samples taken on days 2 and 4 showed highactivity levels. The reason for the high activity level of the first sample on day 2 (274 min) is notclear. No unusual events were recorded for the end of day 1 or the beginning of day 2 that couldaccount for this spike. However, the remaining DW samples for day 2 follow the general patternstated above. The high activity level of the first sample on day 4 (641 min) resulted from the mistakemade in the shutdown procedure at the end of day 3. As can be seen in Fig. 45, this high activity wasquickly flushed out of the system, and by the time the hot DF feed flow was started (at 649 min), theactivity in the DW stream was below 12 dpm^L.
As stated above, the startup procedure for the system was altered during theprocessing of this batch. This was done to decrease the spike in DW activity that occurred when theDF feed was introduced upon startup. Figures 44 and 45 indicate that the startup procedures used ondays 3 and 4 did, indeed, decrease the magnitude of this spike in DW activity.
The activity for the samples of the carboys into which the DW raffinate was pumped isgiven in Table 31. Carboys 1-5 were filled on the first day of processing and were neutralized afterthe sample had been drawn for analysis. Because of high alpha activity levels, carboys 6, 7, and 13were set aside for recycle to the system for further processing as part of the feed for Batch 2 Waste(Sec. V.C). The contents of carboy 1 had already been neutralized by the time we had decided torecycle the carboys; otherwise, carboy I would have also been recycled.
Table 31. Sample Time and Average Scintillation and Gamma CountingResults for Carboy Samples
Sample Name
C-lC-2C-3C-4C-5C-6C-7C-9C-10C-llC-12C-l 3C-14C-l 5C-16C-17
SampleTime,min
6898151190231321367503541586638685731785831877
AverageScintillation
Counts, cpm/pL
49.2813.7626.997.657.4478.0019.5211.2010.247.386.5738.244.393.263.133.11
Avg. GammaCounts @ 59.5 keV,
cps^L
3.75E-035.J7E-048.55E-043.64E-043.50E-042.24E-03I.01E-034.41E-043.36E-04
a2.44E-041.32E-03I.30E-041.23E-047.66E-055.92E-05
aNot detected in this sample.

67
Scintillation and gamma counting results for the rest of the process streams (DX, EW,FW, GW, HW, HP, and acid rinse) are given in Figs. 46-51 and Tables 32 and 33.
Analysis of the organic feed samples (DX) shows an increase in both the gamma andalpha activity at about 350 min into the run (Fig. 46). This corresponds to startup on day two.During startup, the solvent was contaminated, and more than 400 min was required to remove thisactivity from the solvent. The activity in the solvent also increases after 800 min. This could be dueto increased activity in the carbonate washes and/or to more of the solvent bypassing the aluminacolumn.
Counting results for the americium product samples are reported in Fig. 47. Thesedata show a decrease in activity over the first 500 min of the run, followed by an increase in activityover the next 300 min. This is probably due to the problem we had at the beginning of the run withthe EW effluent flow. For the first 90 min of the run, this flow was not being removed from stage 11because the line size was too small. Because this stream was not removed, more americium wasrecycled back into the extraction section, thereby allowing the americium to build up in the system.Once this flow was fixed by replacing the fitting with a larger diameter fitting, the americiumapparently dropped in concentration as it was bled out of the system at 3 mL/min. This appears to bewhat we see in Fig. 47.
Sample analysis of the plutonium strip .solution (FW) is reported in Fig. 48. Thecause for the decrease in activity during day 3 of the run (300-600 min) is not known for sure, butcould be the decrease in the feed flow rate that was noted earlier. The decrease in the gamma countsafter 600 min is probably related to the increase in americium removed by the EW raffinate stream(Fig. 47). With n.ore americium being removed in the americium product stream, less americiumwould end up in the plutonium strip solution.
Sample analyses of the carbonate washes are shown in Figs. 49 and 50. Both showthe general trend of increasing activity, with a drop in activity at the 500-min mark. At that time,both carbonate solutions were replaced with fresh solutions. The decrease in the gamma counts in thefirst carbonate wash (GW, Fig. 49) after the 600-700 min mark is again probably related to theincrease in americium removed by the EW raffinate stream (Fig. 47).
Sample analysis of the acid rinse solution is shown in Fig. 51. The counting trend forthis solution is downward, with spikes at shutdown on day 3 (600 min) and day 4 (800 min). Datafor the organic solvent stream leaving stage 20 (HP) and the solvent exiting the bottom of thealumina column (BC) are reported in Tables 32 and 33. These data generally show low levels ofactivity in both streams, with the solvent exiting the alumina column being two or three times lower.The large spike in activity seen in sample HP-3 is probably related to the startup problems on day 2.
C. Processing of Batch 2 Waste
1. Flowsheet Development
Approximately 46 L of waste was collected from three carboys that had unacceptablehigh activity levels during the processing of Batch 2, acidified carbonate waste from Batch 2, oldsamples, and various other solutions that have been collecting in the glovebox. This waste wasdesignated as NBL Batch 2 Waste. We employed the GTM to generate a flowsheet for processing (hiswaste, using Fig. 40 as a starting point. The feed composition was estimated as shown in Table 34.

68
200 400 600
Time, min
800
-• 1.8E-02
• • 1 . 6 E - 0 2 | O
•• 1.4E-02 £
• • 1.2E-02 ©
•• 1 . 0 E - 0 2 -^
8.0E-03 o, 8
6.0E-03 «
4.0E-03 I
2.0E-03 O
0.0E + 00
1000
Fig. 46.
Average Scintillation and GammaCounting Results for DX Samples
Fig. 47.
Average Scintillation and GammaCounting Results for EW Samples
oCO
200000
180000
160000 '
140000 •
120000 •
100000 •
80000-
60000-
40000 -
20000
0
Scintillation
Gamma".
O
0.0E+00
200 400 600
Time, min
800 1000
350000 ••
300000 • •
-§" 250000 •
« 200000 • •
•2 150000 ••
3 100000-
Scintillation
u 50000 ••
0
Gamma
200
\
•+•
400 600
Time, min
• 6.00E+01
• • 5.00E+01 £
•• 4.00E+01 @
• 3.00E+01 "a- >
5-Jβ• 2.00E+01 g
• 1.00E+01 J
0.00E + 00
800 1000
Fig. 48.
Average Scintillation and GammaCounting Results for FW Samples

69
200 400 600
Time, min
•• 9.00E-03•• 8.00E-03'••7.00E-03-• 6.00E-03
• • 5.00E-03
- 4.00E-03j
• 3.00E-03
• 2.00E-03
•• 1.00E-03
0.00E+00
uo
Fig. 49.Average Scintillation and GammaCounting Results for GW Samples
800 1000
Fig. 50.
Average Scintillation and GammaCounting Results for HW Samples
r 9.00E-03•- 8.00E-03
7.00E-036.00E-035.00E-03
•• 4.00E-033.00E-03
• 2.00E-031.00E-03O.OOE+00
200 4 0 0 6 0 0
Time, min
800 1000
@
35 T
11 Scintillation
200 400 600
Time, min
•• 5.00E-02••4.50E-02•• 4.00E-02-•3.50E-02
• 3 . 0 0 E - 0 2
- - 2 . 5 0 E - 0 2
• • 2 . 0 0 E - 0 2
• 1 . 50E -02
•• 1 .00E-02
• • S.OOE-03
O.OOE + 00
ON
@
800 1000
Fig. 51.
Average Scintillation and GammaCounting Results for Acid Rinse (IF)Samples

70
Table 32. Sample Time and Average Scintillation and Gamma CountingResults for HP Samples
Sample Name
HP-1HP-2HP-3HP-6HP-7HP-8HP-9HP-10HP-11
SampleTime,min
!99241361491559618708780843
AverageScintillation
Counts, cpm^L
6.107.692465.543.861.642.912.943.08
Avg. GammaCounts @ 59.5 keV,
cps^L
a1.70E-04
aaa
3.04E-04aaa
aNot detected in this sample.
Table 33. Sample Time and Average Scintillation and Gamma CountingResults for Bottom-of-Column (BC) Samples
Sample Name
BC-1BC-2BC-3BC-6BC-8BC-9BC-10BC-11BC-12
SampleTime,min
166241361568618708780843910
AverageScintillation
Counts, cpm^L
3.951.103.608.713.921.041.120.80.9
Avg. GammaCounts @ 59.5 keV,
cps^L
7.24E-049.23E-04
aaaa4
aa
aNot detected in this sample.
Table 34. Estimated Feed CompositionofNBL Batch 2 Waste
Component Cone, M
H+ 3.00Al3+ 0.2Na+ 0.05
Am3+ I.6E-7Pu4+ 2.6E-5
F 0.1PO4
3 0.2
Modifications made to the Batch 2 flowsheet (Fig. 52) include decreased flow ratesfor the scrub, americium strip, and plutonium strip; a lower concentration of ammonium oxalate forthe plutonium strip; and a lower concentration of aluminum nitrate for the scrub solution. Finally,the feed flow rate was increased.
The ammonium oxalate concentration was lowered to decrease ihe amount of solidsproduced when this stream is evaporated to dryness. The stoichiometric amount of ammonium

TRU-Feed(200 ml/min)
71
Am Strip0.04 M HNO3
(37 ml/min) of- Or-
Pu Strip0.05 M AmmoniumOxalate(8 ml/min)
Carbonate Washes0.25 M Na2CO3(200 ml/min)
I μm Filters
Non-TRURaffinate(254 ml/min)
Filter
Organic FeecT(50 ml/min)
DW Raffinate Tanks- 9 ( 1 0 liter) Carboys
Of, (~15 ml/min)
Fig. 52. Flowsheet for NBL Batch 2 Waste
oxalate needed to strip the plutonium present in the organic flowing into the plutonium strip sectionis ~0.001M. The concentration used in the strip feed will be 0.05M. which is 20 times greater thanneeded but considerably less than the 0.28M used in Batch 2. The flow rate on this stream wasreduced to decrease the volume of solution to be evaporated.
The aluminum concentration in the scrub was lowered from 2 to 0.1 M. because thefeed does not contain as much phosphate or oxalate, which complexes Pu(IV). The americium stripand scrub flow rates were decreased to reduce the amount of the DW raffinate produced during therun.
The feed flow rate was increased from 100 to 200 mL/min. This will allow a!! of thesolution in the feed carboy to be processed in one day. The plutonium and americium

72
concentrations are so low that the increased flow rate will not significantly affect the extractionsection because of the decreased O/A.
Stages 1-14 were modeled using the GTM (version 2.5). The piutonium strip sectioncould not be modeled because ammonium oxalate is not included in the model. Results from therecommended flowsheet are shown in Table 35. The model predicts that the DW raffinate shouldcontain <1012M Am3+ and Pu4+. This is well below the concentrations needed to satisfy the 0.1 nCi/glimit set by WMO.
Table 35. Predictions of GTM for Specified Flowsheet
StreamIdentity
DXDFDSEFDWEWEPa
FlowRate,
mL/min
502002037
253.97973.02045549.99999
H
1.00E-153.00E+005.00E-024.00E-022.37E+007.73E-022.25E-O3
Al
1.00E-152.00E-011.00E-01
0.00E+001.65E-012.11E-101.12E-19
Component Cone,
Na
1.00E-155.OOE-O20.00E+00O.OOE+003.93E-O21.22E-126.56E-22
Am
1.00E-151.60E-07
O.OOE+00O.OOE+002.10E-139.90E-064.I9E-08
M
Pu4+
1.00E-152.60E-05O.OOE+00O.OOE+003.69E-143.88E-O61.03E-04
F
1.00E-151.00E-0)
O.OOE+00O.OOE+007.87E-022.43E-053.25E-06
PO4
1.00E-152.00E-01O.OOE+00O.OOE+00I.57E-011.19E-099.45E-19
aBecause the piutonium strip section cannot be modeled in the GTM, the organic leaving the americium strip sectionwas labeled EP and reported by the GTM.
2. Discussion of Run
Only two major problems occurred during the run: (1) the DX feed pump was notcalibrated before the run, and (2) the flow rate of the DF feed pump steadily decreased during theinitial stages of the run until the cause was identified and corrected.
Foaming was observed in the organic interstage lines of the extraction section duringthe first 10 min of the run. After this was discovered, we determined that the DX feed pump had notbeen calibrated before the run. The flow rate was then measured as 59 mL/min. After decreasing theflow rate to 50 mL/min, the foaming problem disappeared
The problem with the DFfilter are located on the suction
the feed tank. Evidently this teed hud .iof processing, the DW raffinate tl»u -y.cshould have been 250 mL/mm The S5E-the DF feed rate was calculated u- tv "the flow rate quickly dropped - \ ! : J - :; .;turned off the DF pump and rep'^uj.: • : .back on a couple of minutes iat-r J 5 , , .fore, the l ^ m filter was also ch.ji:_-i-«: 'from the system, after which t?u- J J}- ;: .„-„
adjusted to the correct flow rule \ r .of the run. The l ^ m filter «.*\1LL':::3> ; .The DF pump was unable to pro\uie .•:;.decreased.
feed pun\p w;iv slight h more difficult to fix. A 5 ^ m and ae HI' she 1)5 r:m:p The«-e filters remove any solids present in
:!:':....in: .sr;;, ::z: . 3 pjrtucuLste matter in it. After 150 min- '.'i'j'v:-.-J .ru: r.'!;nJ ",»Jv onJ> !50 mL/min, when it\."!». . . * -- " i ' i - j r j J . j?tJ based on tank depletion,
- ' - . / . : v - t r r^ .V j - ^ ^ . ^ a > increased, buti:L... •: : .. J^- : v » rate several times, we
• • < • • « \ j I"i;,> m- pump was turned
. • ... \ :.,::;, J ^ee:m to help. There-i '.::,-".'•'': • . j : : : i:'ter was removed
i >.'•! ::wi The pump was
' . '' • '.". . . . • - ' ' -""-> iJmrouahout the rest. ?. :•-.•-..:.- Jirt'p across the filter.
•.'•'.. ".--.::*• Jr« r and the flow rate

73
3. Sample Analysis
Samples collected during the processing of Batch 2 Waste were both scintillation andgamma counted to determine the Pu and Am concentrations in the various streams. Samples weretaken of the hot feeds in the glovebox before processing started. The Pu and Am concentrations inthe hot feeds are shown in Table 36.
Table 36. Plutonium and Americium Concentrations in the TRUEX Solventand the Aqueous Feed Solution for NBL Batch 2 Waste
SampleID
DX#1DF#iDF#2
Cone,
Pu
1.88E-045.15E-034.53E-03
Am
3.59E-07a
3.39E-053
2.96E-05b
Total a,cprn^L
3,47011,3009,950
59.5 keV Gamma Count Rate,cps^L
6.1E-030.570.50
aInitial sample.bThis sample taken 124 min into the run.
The DW raffinate exited stage 1, where it was pumped to a 4-L surge tank located inthe contactor glovebox. The raffinate was then pumped from the surge tank into a carboy, where DWraffinate samples were taken about every 20 min.
Figure 53 shows the Am and Pu concentrations in the DW raffinate. The initial(0 min) high concentrations of both Am and Pu probably result from contamination in the raffinatelines and surge tank, but raffinate from the cold feed washed the contamination out, and theconcentrations quickly dropped. A small activity spike was seen when the hot feed was started. Thisactivity spike had been seen in previous runs, but the use of a cold feed reduced the spike. The DWraffinate was not affected by the DF feed pump fluctuations because the extraction section containedmore stages than necessary to reduce the raffinate to its minimum achievable activity.
1 .OE-03 T
o> 1 .OE-04
.2 1 .OE-05
•g. I I his sample iI I is Missing I
X ' • • • — • - 7 •••—• ! • - • - • •••
No duplicate wasavailable for this
sample
1 .OE-08
ThisSample isMissing
100 200 300Time, min
400
Fig. 53. Americium and Plutonium Concentrations in the DW Raffinate

74
The DW raffinate averaged about 20 cpm/^L on the scintillation counter;<0.5 cprn^L was expected. A batch test done with the raffinate during the run showed that theactivity could not be significantly lowered by further contacts with the TRUEX solvent. The D valuefor the raffinate and fresh solvent was 0.22, indicating that the raffinate contained some unextractablespecies. The 20 cprn^L in the raffinate corresponds to 9.1 nCi^L, which is greater than the 0.1 nCi/glimit set by ANL's Waste Management Operations (WMO), but much less than the 100 nCi/g TRUlimit. Since we could not obtain the 0.1 nCi/g limit, we neutralized the raffinate for transport to WMO.
The sample of DW raffinate at 110 min was lost before it could be analyzed, and thelast DW sample was counted by liquid scintillation once before this sample was lost. The plutoniumconcentration in this sample has not been corrected for americium decay since no sample wasavailable for gamma counting.
The DW raffinate was collected in 10 L carboys in a hood next to the glovebox. Thecarboys were filled to approximately 7.5 L. After being filled, they were mixed and a sample wasscintillation counted. If the activity was approximately 20 cpm^L, the carboy was neutralized with10M NaOH. As the NaOH was added, the pH was checked using pH paper. Aluminum present in theraffinate precipitated as the NaOH was added, forming a slurry. When the pH of this slurry reached7, the bottle was capped and removed from the hood.
The EW raffinate is the americium product stream. This stream is taken as a portionof the aqueous phase flowing from stage 11 to stage 10. Table 37 reports the Am and Puconcentration in the EW raffinate samples. Some of the plutonium concentrations were calculated tobe negative because the plutonium concentration was calculated by subtracting the americiumα-activity. Since the americium concentration is based on gamma counting, the plutoniumconcentration is strongly dependent on americium concentration. This is especially true when [Am]is equal to or greater than [Pu]. Such is the case in the EW raffinate. Therefore, plutoniumconcentrations are not reliable for this stream.
Batch 2 had a much higher americium concentration than Batch 2 Waste. Since thestages were never drained between runs, the americium was being washed out of the americiumstrip/scrub section, as seen by the high initial concentration quickly dropping.
Table 37. Concentration of Americium and Plutonium in the EW Samples
Sample
EW#1EW#2EW#3EW#4EW#5
EW#6
Time,
min
47109
169
229
294
364
Cone,
Pu
<0 a
2
6
<0 a
5
<0 a
mg/L
Am
2.91.7
1.7
1.8
1.4
1.6
Total a,
cpm^L
2170013200124001340011900
12200aCorrected plutonium concentrations were <0, which is obviously impossible.
See text.
The FW raffinate is the plutonium product stream, and the majority of the plutoniumis recovered here. This stream is aqueous raffinate that exits stage 15. Figure 54 shows theconcentration of Am and Pu in the FW raffinate. The plutonium decreased steadily for the first halfof the run. Because the feed pump flow rate was decreasing, less plutonium was entering the system,thereby decreasing plutonium concentration in the plutonium product stream. When the feed How

75
O.OE+00
100 200 300
Time, min
400
Fig. 54. Americium and Plutonium Concentrations in the FW Raffinate
rate was increased, the plutonium concentration increased (between 200 and 300 min). Theamericium concentration should follow the same trend as the plutonium concentrations, i.e., decreasesteadily and then rise between 200 and 300 min. However, the concentration dropped steadilythroughout the entire run.
The GW raffinate is the raffinate from the first carbonate wash stage. This stream isrecycled to the feed tank, which holds approximately 1.5 L. Figure 55 shows the Am and Puconcentrations in the GW raffinate. The concentrations remained fairly constant throughout the run.Most of the activity should have been removed from the organic phase before it reached this stage,but a small variation ir concentration would be difficult to detect because of the initially high activitylevel in the GF feed. The GF had initially high activity levels because the feed carbonate was used tocalibrate the carbonate feed pumps.
7.0E-03
M fi.
6.5E-03
2 *
6.0E-03 • •
.2 5.5E-03 • •
5.0E-03 • •
g 4.5E-03 •
U 4.0E-03 •
3.5E-03 -
3.0E-03
100 200
Time, min
300
8.0E-06
400
Fig. 55. Americium and Plutonium Concentrations in the GW Raffinate

76
The HW raffinate is the raffinate from the second carbonate wash stage and is alsorecycled to a 15-L feed tank. Figure 56 shows Am and Pu concentrations in the HW raffinate. Theconcentrations are fairly constant throughout the run, rising only slightly toward the end.
£
'2o3
Cβ
oo
oU
3.5E-04 j
3.4E-04 --
3.3^-04 • •
3.2 04 • •
3.1 L 04 ••
3.0E M ••
2 . 9 E % • •
2.8E- l • •
2.7E-0-S ••
2.6E-04 -•
2.5E-04 - - •+-
100 200 300
Time, min
-p 8.0E-07
•- 7.0E-07
• 6.0E-07
•- 5.0E-07
•- 4.0E-07
-• 3.0E-07
-• 2.0E-07
-• 1.0E-07
•• 0.0E+00
s3
1<
00
c<u
o
u
4 0 0
Fig. 56. Americium and Plutonium Concentrations in the HW Raffinate
The HP product stream is the organic that leaves stage 20. It is either pumped to the
top of the alumina column or into the solvent reservoir, where it bubbles through 0.1M. HNO3.
Figure 57 shows Am and Pu concentrations in the HP product. The concentrations of Am and Pu
decreased slightly throughout the run.
a § 1.5E-05
I I 1-0E-05 +
U 5 . 0 E - 0 6 -
o.oE+00 •+- •+•
100 200 300
Time, min
j 2.0E-08
•• 1 . 8 E - 0 8
- 1 . 6 E - 0 8
•• 1 . 4 E - 0 8
• • 1 . 2 E - 0 8
-• 1.0E-08
•• 8.0E-09
• • 6.0E-09 <
- • 4 . 0 E - 0 9
••2.0E-09
-• O.OE+00
4 0 0
£ c3 O
118
§u
Fig. 57. Americium and Plutonium Concentrations in the HP Product
The column samples are taken as the solvent leaves the alumina column. Solvent
from the HP product is pumped to the alumina column, where it travels through the alumina bed, is
pumped into the solvent reservoir tank, and bubbles through 0.1M HNO3 to reacidify the solvent

77
before being fed to stage 1. The alumina column is a solvent polishing step to remove any solventdegradation products that the carbonate washes are unable to remove. Because the stages where notdrained between the running of Batch 2 and Batch 2 Waste, the solvent remaining in the contactorswas not cleaned with solvent in the reservoir before the run. Therefore, the solvent that exited thecontactors during the first part of the run was pumped directly into the alumina column reservoir.This solvent probably had an initially high activity level; however, as this solvent is washed throughthe column and diluted with the cleaned solvent the activity level should decrease. The slight rise inamericium concentration in the middle of the run, shown in Fig. 58, cannot be explained at this time.
• -2.5E-08 g
•• 2.0E-08 '5
100 200
Time, min
300 400
Fig. 58. Americium and Plutonium Concentrations in theOrganic Phase Leaving the Column
The tank samples are taken from the organic solvent held in the solvent reservoir.This reservoir contains solvent that has been processed through the alumina column and solvent thatbypasses the column. All of the solvent bubbles through 0.1M_ HNO3 to reacidify before being fedto stage I. Figure 59 shows the concentrations of Am and Pu in the solvent reservoir. The Am andPu concentrations decrease throughout the run. The initial activity level was much higher in thesolvent reservoir thai; in the HP product. The activity of the solvent in the reservoir decreased as itwas diluted with solvent of lower activity from the contactors.
Samples were also taken from the acid rinse (initially 0.1M HNO3) that the organicphase bubbles through as it enters the solvent reservoir. The acid rinse reacidifies the organic phasebefore it is fed back to the contactors. Figure 60 shows the concentrations of Am and Pu in the acidrinse. The concentrations in the second sample are much lower than in the first and third samples.This difference cannot be explained.
D. Material Balance
Solutions generated during the processing of Batch 2 and Batch 2 Waste have been analyzedto determine Pu and U concentrations of the various streams. Based on the analysis of these streams,a Pu and U material balance was completed.

78
E3
"cO
_3
00
O
Ct>O
OU
2.0E-04 j
1.8E-04 ••
1 .6E-04 ••
1.4E-04 ••
1.2E-04 • •
1 .OE-04 ••
8.0E-05 -•
6.0E-05 ••
4.0E-05 -•
2.0E-05 -•
0.0E + 00 •-
Am
•+•
j 4.0E-07
-• 3.5E-07
--3.0E-07 «d
-• 2.5E-07 £ c3 O
-• 2.0E-07 ;S 3
•• 1.5E-07 £ 5
-• 1.0E-07 §
-• 5.0E-08
0.0E + 00
0 100 200
Time, min
3 0 0 4 0 0
Fig. 59. Americium and Plutonium Concentrationsin the Organic Reservoir
j 5.0E-06
-• 4.5E-06
•• 4.0E-06
-• 3.5E-06
-• 3.0E-06
•• 2.5E-06
-• 2.0E-06
-• 1.5E-06 <
-• 1.0E-06
-• 5.0E-07
0.0E+00
100 200 300
Time, min
4 0 0
Sic"o
h
Fig. 60. Americium and Plutonium Concentrations in the Acid Rinse
1. Plutonium
Plutonium concentrations were calculated in several ways. The first involved
scintillation counting to find total alpha activity, then subtracting alpha activity due to americium
decay as calculated by the 59.5 keV gamma ray. The remaining alpha activity is assumed to be
caused by decay of plutonium. (This method is denoted "α-y analysis.") The next was scintillation
counting to determine total alpha activity, followed by alpha spectroscopy to determine the
percentage of alpha activity from each isotope (this method is denoted "α-spec analysis"). The final
method was direct measurement of Am and Pu gamma rays (this method is denoted "y analysis").
Batch 2 feed consisted of 53.9 L of solution. Feed samples were analyzed by α-yanalysis and y analysis; the results are reported in Table 38. Isotopic composition of the feed wasassumed to be 90.3% Pu-239, 8.96% Pu-240, and 0 8% Pu-241 based on isotope information

79
Table 38.
Method
α-y analysisγ analysis
Composition ot the Feed
Pu Cone, g/L
2.31E-012.28E-Olb
tor Batch
Total
2
Pu
12.12.
in Feed, g
5±(). 13±0.7
aFeed samples were taken after tear occurred in the feed carboy and theresulting cleanup operations.
bPlutonium concentrations corrected tor γ-ray self-absorption estimatedat 20% and for isotopic composition (only the Pu-239 concentrationis measured directly). The Pu-240 and Pu-241 concentrations mustbe added in using the estimated isotopic ratios.
provided by the NBL on their waste disposal forms, which report a total of 13.3 g of plutonium in
Batch 2. Assuming 12.5 g Pu in the feed, 800 mg Pu was lost in the cleaning operations following a
tear in the feed carboy.
Plutonium was recovered in the plutonium product stream, a total of 14.5 L of
solution. A representative sample was taken of this stream and analyzed using all three methods
(Table 39). The isotopic composition was assumed to be the same as the feed.
Table 39. Composition of the Plutonium Product Stream for Batch 2
Method Pu Cone, g/L Total Pu in Product, g
α-yanalysis 9.04E-01 13.1 ±0.2y analysis 7.61E-0la ll.0±1.3α-specanalysis 8.21E-01b ll.9±0.2
aPlutonium concentrations corrected for γ-ray self-absorption estimatedat 20% and for isotopic composition (only the Pu-239 concentrationis measured directly). The Pu-240 and Pu-241 concentrations mustbe added in using the estimated isotopic ratios.
bThe α-spec analysis only measures Pu-239 and Pu-240. To obtain thetotal plutonium concentration, the amount of Pu-241 must be added inusing the estimated isotopic ratios.
An additional 105 mg of plutonium, which is not included in Taule 39, was accounted
for in the raffinates and in samples collected during the run. All these analyses were done by the
CC-γ method.
The α-spec analysis should yield the best result because the fewest assumptions were
made in calculating the concentration. Therefore, we assume that 11.9 g of plutonium was recovered
in the plutonium product.
The most suspect assumption made in the γ-analysis is that of 20% self-shielding.
Work is underway to better estimate the amount of self-shielding.
In (X-γ analysis, the assumption that any remaining activity is due only to plutonium
after americium α-activity has been subtracted could be a source of error. However, for the specific
activities and concentrations of other materials that decay by α-particles, such as uranium, the
assumption that any residual is due entin y to plutonium should be valid. But α-activity from other
nuclides would explain why the plutoniu: concentration in the product is so much higher than when

80
calculated by the other methods. One such isotope is Pu-238. Since Pu-238 has such a short half-life (87.7 yr) compared to the other plutonium isotopes, very little would be required to increase thetotal α-activity. This analysis assumes that α-activity is only from the decay of Pu-239, Pu-240, andAm-241.
In conclusion, 12.0 g of plutonium was recovered from 12.5 g of plutoniumremaining in the feed after the feed spill for a 95% total plutonium recovery.
2. Uranium
The waste forms reported 16.3 g of uranium. If the same percentage of uranium waslost as plutonium (approximately 6%), 15.3 g of uranium remained in Batch 2 feed after the spill.The ICP/AES analysis, done on the plutonium product stream, determined that it contained 1.0 g/Luranium. Thus, in the 14.5 L of plutonium product solution, 14.5 g of uranium was recovered, for a95c/c total uranium recovery.
3. Lead in the Raffinate
A tear in the feed carboy caused Batch 2 to leak into a secondary container.Unfortunately, the lead shielding for this carboy was placed between the carboy and the secondarycontainer. The highly acidic feed dissolved some of the lead. The lead from the feed is now in theraffinate from Batch 2, most of which was neutralized. When this neutralized raffinate was analyzed,it contained 958 ppm lead. Batch 2 raffinate that contained excessive levels of α-decay was notneutralized and was recycled as the feed for Batch 2 Waste. Therefore, the raffinate from this feedalso contains lead. A sample of Batch 2 Waste raffinate was analyzed before being neutralized andcontained 984 ppm lead. This waste was then neutralized. Batch 2 and Batch 2 Waste are mixedwastes because of the high lead content.
Several experiments were run to determine if the lead could be precipitated, makingthe supernatant liquid simply radioactive waste instead of mixed waste. Two different methods weretried-( 1) raising the pH to 11 to precipitate lead hydroxide and (2) adding sulfuric acid toprecipitate lead sulfate. A sample of the raffinate was drawn and centrifuged to remove any solids.Two 500 μL aliquots were drawn from the centrifuged sample, and a 2 μL spike of Pb-210 stocksolution was added to each sample. The samples were then gamma counted to determine the initialactivity of Pb-210. After the initial counting, five drops of 10M NaOH were added to one sample,and five drops of 7.5% sulfuric acid were added to the other. The samples were centrifuged again,and a 300 μL aliquot was gamma counted from each sample. For both samples nearly all of the leadstayed in solution, as determined by the activity of the Pb-210, indicating that raising the pH oradding sulfuric acid does not effectively precipitate the lead in this solution. It was suggested to co-precipitate the lead with barium sulfate. Therefore, ten drops of a barium nitrate solution were added,and a white precipitate formed immediately. The sample was then centrifuged and all of thesupernatant liquid drawn off. The liquid and the solids were gamma counted and no Pb-210 wasdetected in the supernatant liquid. Nearly all of the activity was recovered in the precipitate,indicating that the Pb-210 had been precipitated. Because WMO picked up the waste as-is, no furthertesting or processing was completed.

E. Processing of Batch 3
The next NBL waste batch to be processed, Batch 3, contains approximately 28 g ofplutonium and 29 g of uranium. Also, an estimated 300 mg of americium was assumed to be presentin the feed. The estimated feed composition for Batch 3 is shown in Table 40.
Table 40. Feed Composition for Batch 3
Component
H+
UO22+
Pu4+
Am3+
PO43"
NOv
Cone, M
5.590.002420.002352.49E-05
0.534.01
To develop a flowsheet for processing Batch 3, the flowsheet for processing Batch 2 was usedas a starting point. Three modifications were made:
1. The scrub flow rate was reduced from 70 to 30 mL/min.
2. The plutonium strip flow rate was reduced from 12 to 8 mL/min.
3. The feed flow was increased from 100 to 120 mL/min.
The feed does not contain as much phosphate as Batch 2. Therefore, the scrub flow rate wasdecreased because not as much aluminum is needed to complex the phosphate. Decreasing the scrubflow rate also reduces the amount of raffinate generated.
The plutonium strip flow rate was decreased from 12 to 8 mL/min to shorten the producttreatment time following the TRUEX run. Evaporating this stream to dryness has proven to be themost time-consuming step in the process. Therefore, with this decrease in the flow rate, the volume ofsolution to be evaporated is reduced, and the time taken to evaporate solutions shouldcorrespondingly decrease.
The feed flow rate was increased slightly to reduce the amount of raffinate generated and tospeed up processing time.
Stages 1-14 were modeled using the GTM (version 2.5). The strip section could not bemodeled because ammonium oxalate is not included in the model. Results from the recommendedflowsheet are shown in Table 41. The model predicts that the DW raffinate should contain<5 x 10 l 2 M Am, Pu, and U. This is well below the concentrations needed to satisfy the 0.1 nCi/glimit set by WMO. The flowsheet that will be used to process Batch 3 is shown in Figure 61. Allpreparations for processing Batch 3 have been completed. Batch 3 material can be received forTRUEX processing as soon as Batch 2 plutonium product stream has been evaporated, calcined,reduced to metal, and shipped out of the building.

82
Table 41. Predictions by GTM for Batch 3 Flowsheet
StreamIdentity
DXDFDS
EF
DW
Am Prod
EPU
Flow Rate,mL/min
50120
30
50
197
3
50
]
5.1
4
3.
b
2
H
.00E-1559E+00.OOF:-O2
.OOE-0242E+00
.89E-02
.38E-03
Al
1.00E-150.00E+002.00E+00
0.00E+00
3.05E-01
1.23E-092.69E-I9
Component Concentration, M
UO2
I.00E-152.42E-O3
O.OOE+00
0.00E+00I.46E-14
4.43E-045.78E-O3
Am
I.(M)E-152.49E-05
O.OOE+00O.OOE+00
I.86E-I2
9 83E-044.91E-07
Pu4+
I.00E-152.35E-03O.OOE+00O.OOE+00
3.55E-14
1.59E-045.63E-03
PO4
1.00E-155.30E-01O.OOE+00O.OOE+00
3.23E-0I
5.70E-U7.96E-23
"Because the plutonium strip section cannot be modeled in the GTM, the organic leaving the americium stripsection was labeled EP and reported by the GTM.
Am Strip0.04 M HNO3
Pu Strip0.05 M AmmoniumOxalate(8 ml/min)
TRU-Fced Carbonate Washes0.25 M Na2CO3(200 ml/min)
Non-TRURaffinate(237 ml/min)
Organic Fcea(50 ml/min)
DW Raffinate Tanks10 liter Carboys
•}O(~ 15 ml/min)
Fig. 61. Flowsheet for Processing Batch 3

83
VI. ADVANCED EVAPORATOR TECHNOLOGY(D. B. Chamberlain, S. Betts, L. Nunez, D. G. Wygmans, and G. F. Vandegrift)
The purpose of this program is to develop evaporator technology for concentrating processradioactive waste and product streams such as those generated by the TRUEX process. Minimizingwaste generation requires that equipment be installed for concentrating both radioactive waste streamsand recycling the decontaminated condensates. A technology that shows a great deal of potential forthis application is an evaporator being developed by LICON Inc. (Pensacola, Florida).
Initial studies will evaluate this technology for concentrating specific process streams in termsof (1) economic and institutional benefits and/or detriments, (2) effectiveness of this technology interms of concentrating radioactive product and waste streams and decontamination factors forradionuclides in the overheads, and (3) the effects of concentration on plant operations. LICON andArgonne will work together to (1) design an evaporator specifically for remote operation and (2) in ahot facility at Argonne, lest the remote operability and maintenance of this evaporator and otherequipment in glovebox, shielded-cell, and canyon facilities. In later stages of the program, thisequipment will be installed in a DOE processing/production plant for actual in-plant demonstration.
A portion of this program initially focused on completing a literature survey, where past dataon mixed phase equilibria (vapor/liquid and vapor/liquid/solid) of aqueous solutions of HNO3 in thepresence of metal nitrate salts were collected, evaluated, and summarized. Information was collectedon water and nitric acid concentrations in the liquid and vapor phases as a function of temperature,pressure, and composition of the aqueous solution (e.g., effects of metal nitrate salts on the volatilitiesof water and nitric acid). Further, solubility data as a function of solution composition were collectedand summarized. These data are important in designing an evaporator for a specific stream, settingconditions of pressure and temperature, predicting effluent rates and compositions for the condensateand the bottoms, and knowing to what degree a stream can be concentrated. The literature survey isalso critical to the design and interpretation of our own experiments to collect data not available inthe literature.
A. Testing of Laboratory-Scale Evaporator
1. Preparations for Experimental Work
A laboratory-scale evaporator, a model FVP-C3 manufactured by LICON, wasdelivered to ANL in late July. Installation and connection to the hood were completed in earlyAugust. The floor plan for the area where the evaporator has been installed is shown in Fig. 62,which indicates the footprint of the evaporator and hood.
Because acid fumes cannot be introduced into the laboratory ventilation . _,stem, weanalyzed ways of eliminating these vapors at the ventilation hood to which the evaporator isconnected. We decided on the use of chemically treated filters, which contain particles on whichvapors are sorbed. These filters are used on vent-less fume hoods available from many manufac-turers. Three such sorptive filters were purchased from Heat Systems, Inc. (Farmingdale, NY). Afilter housing is being fabricated to house these filters at the hood top. A temporary ventilationconnection was made to the hood to allow operation of the evaporator using water and salt solutionsas feed. Once the filter housing is installed, a permanent connection will be needed.

84
3'11
Evaporator Hood Base
• 3' * 4 * 5' *-|
WORK BENCH
3'
WORK BENCH
STAIRS
GLOVE BOX ATM.CONTROL
(Pyroconlactor Project)
Fig. 62. Floor Plan for Test of Laboratory-Scale Evaporator
A safety review was completed for the first phase of the experimental work. Thissafety review covered the equipment setup of the evaporator and support equipment and the initialruns of the evaporator, during which water was evaporated. Those initial runs were made (1) toconfirm that the evaporator is operating correctly and (2) to train ANL personnel in the operatingand maintenance procedures for the evaporator. The safety review did not cover subsequent use ofthe evaporator tr process liquids other than water, although equipment needs were anticipated forthose subsequent processing runs. Most of the changes to the equipment and test plan specified inihe safety review were minor. A second safety review will be undertaken once the final ventilationsystem is in place. This subsequent safety review will cover evaporation of acid solutions.
Shielding of certain parts of the evaporator was a major requirement specified by thesafety review. As a result of those specifications, the bottom, framed-in section of the evaporator hasbeen enclosed using Plexiglas panels. The distillate lines which are routed above this section wereindividually shielded to protect experimenters from sp^ay should a leak in one of these pressurizedlines develop. The distillate lines needed special attention since they can carry pressurized salt andacid solutions. All pressurized piping for the concentrate is .ontained within the bottom, Plexiglas-enclosed section. Figure 63 is a photograph of the unit.
The operation and maintenance manual for the evaporator, supplied by LICON, wasmodified to include the following items: (1) explanation of, and instructions for, the various items onthe control panel, (2) explanation of, and testing procedures for, the automatic shutdown systems,(3) data entry logs for evaporator runs, and (4) instructions for using the electric heaters.
2. Experimental Runs Using Salt-Solution Feeds
Two evaporator runs using salt-solution feeds were completed. The first runemployed a dilute SmfNO^ feed solution and was performed to measure the decontamination factor(DF) that might be expected in this system. The second run used a feed solution of A1(NC>3)3 andSm(NO3)3. Concentration of the A1(NO3>3 was allowed to approach the solubility limit at the end ofthe run in order to estimate the boiling point elevations that can be expected in a high-salt solution.

85
Fig. 63.
Photograph of the Laboratory-ScaleLICON Evaporator
Both tests started with 45 L of feed and stopped when about 10 L of concentrate was left. Noconcentrate product was drawn off during either run. In both runs, electric heaters were used as theheat source. The temperature of the water in the heating loop was 71°C (160°F).
A schematic of the evaporator, giving the location of the conductivity elements (CE),pressure gauges (PI), thermocouples (TC), and flow meters (FI), is shown in Fig. 64. The numberingsystem for the sensors shown in Fig. 64 will be used in the text explaining the test runs.
a. Feed Solution of Sm(NO3)3
The feed for the first experimental run was 6.7 x 10"4M Sm(NC>3)3. Thisconcentration was chosen assuming a DF of I06 and a detection limit of 104 pprn samarium. Sincethe actuai uetection limit for samarium following neutron activation is about 10"5 ppm, we have asafetv factor of 10 to ensure that samarium would be detectable in the distillate.
The test run took 2 h and 44 min from start-up to shut-down. Over that time,the 45 L of feed was evaporated down to about 8 L of concentrate, for a volume reduction of 5.6:1.Assuming total recovery of SmCNO})} in the concentrate, the final concentration of SmCNOj)^ in theconcentrate should be about 3.77 x 10 ?M. About 34 L of distillate was produced during the run.

86
ExternalCoolingWaterInlet
External^ Cnnlino
WaterOutlet
SealWaterOutlet
Fig. 64. Schematic of Laboratory-Scale Evaporator,Including Location of Sensors
Operational and process data were taken every 30 min, and samples of theconcentrate and distillate were taken immediately following the recording of the data. Process datataken during the run are given in Table 42. Because of a problem with the vacuum gauge, theaccuracy of the vacuum data listed in Table 42 should be regarded as around ±102 mm Hg. Somesamples taken during the run were sent out for neutron activation analysis. Analysis of those samplesis underway.
The evaporator-feed flow rate (as measured by FI-605) was adjusted a fewtimes throughout the test to keep the evaporator shell about half full of liquid. This flow rate was setat 4.2 L/min at the beginning of the run, where it stayed until toward the end of the run, when itslowly decreased to 3.8 L/min.

87
Table 42. Data from Evaporator Test Using a Feed of 6.7 x 10'4M Sm(NO3)3
ElapsedTime,min
05175
106
140164
Dist.,TC-5
224849
48
4948
Temp.,
Vapor,TC-6
215253
52
5253
°C
Cone,TC-7
215353
53
5353
Feed,TC-10
214853
52
5353
Vacuum,rnm Hg
560580580
580
560560
DistillateConductivity,
μS/cm
1286
4
32
DistillateProduction,3
L/min
0.200.19
0.23
0.190.17
EvaporationRate.bL/min
0.260.15
0.21
0.22
0.19
"Distillate production measured by recording level increase in distillate tank.^Evaporation rate measured by level decrease in concentrate tank.
An important parameter in the evaporation process using salt-solution feeds is
boiling-point elevation (BPE). As the concentration of dissolved solids in the boiling liquid increases,the boiling temperature of the liquid increases. The BPE is seen as a difference between thetemperature of the boiling liquid (the concentrate) and the temperature of the vapor being driven off.Thus, for the laboratory-scale evaporator, BPE is the difference between the temperatures at TC-7 andTC-6. During this test the BPE was about 1°C (2°F) when the test started and fluctuated between 0.5and 1°C (1 and 2°F) throughout. This fluctuation is probably not real but more likely due to thethermocouple indicator, which reads in 0.5°C (1°F) increments. No BPE was expected during this testbecause of the dilute feed. It is possible that the difference in the two temperatures does not representthe BPE but inaccuracies associated with measuring the temperature of the vapor. That thetemperature difference is not a BPE is supported by the finding that it did not rise over the length ofthe run, as would be expected when concentration occurs.
As seen in Table 42, the conductivity of the distillate dropped from 12 μS/cmat the beginning of the run to a final value of 2 μS/cm. We have not yet studied the correlationbetween the conductivity of the distillate and the amount of dissolved solids present. The onlydeduction that can be drawn from these data is that the distillate contained fewer dissolved solids thanthe distilled water from the laboratory spigot, with which the distillate tank had been filled before therun started.
Distillate production and the evaporation rates reported in Table 42 are basedupon tank level changes. Both rates should be the same; some differences can be expected but theserates should agree over long periods of time.
b. Feed Solution of AI(NO3)3 and Sm(NO 3) 3
The feed for the second experimental run was 0.5M. A1(NO3)3, plus6.7 x lO^MSmCNC^)}. As before, we assumed DF of 106 with a detection limit of 10 3 ppmsamarium. This implies that the samarium detection limit with other metals present is an order ofmagnitude higher than when no other metals are present. Once again a safety factor of 10 wasemployed to allow detection of samarium in the distillate, since the actual detection limit is 10~4 ppm.The aluminum nitrate concentration in the feed was chosen so that the aluminum concentration in theconcentrate at the end of the run would be about 2M.
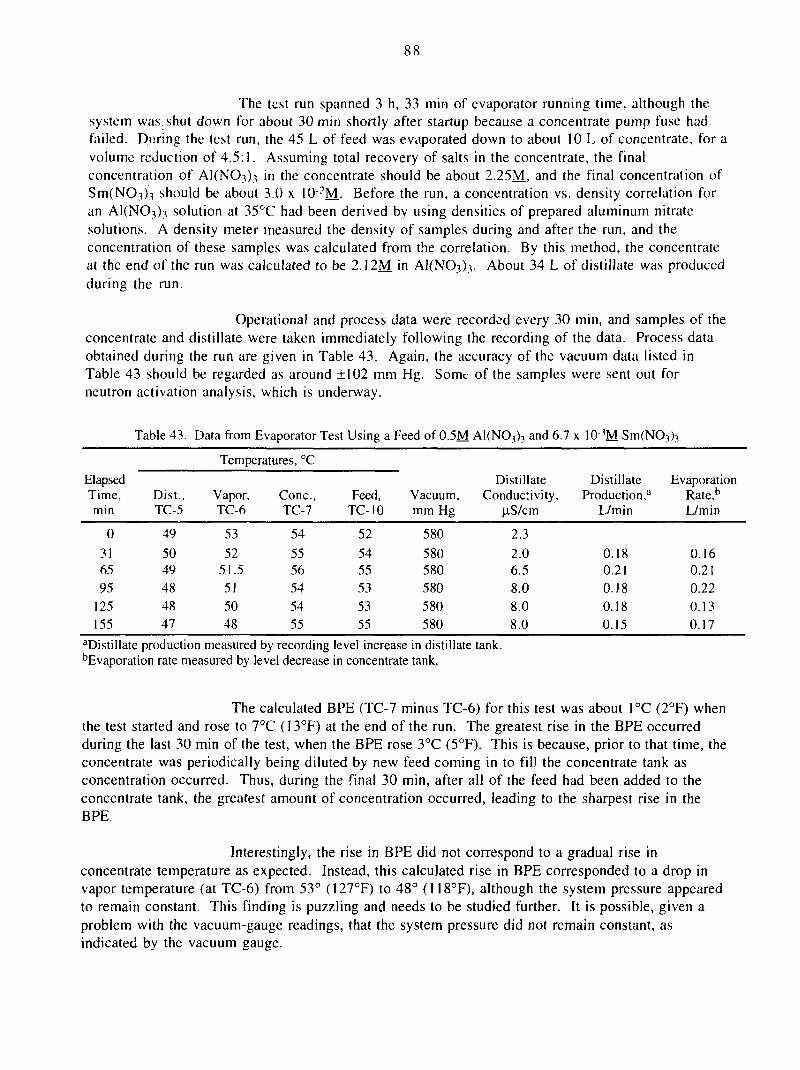
88
The test run spanned 3 h, 33 min of evaporator running time, although thesystem was. shut down for about 30 min shortly after startup because a concentrate pump fuse hadfailed. During the test run, the 45 L of feed was evaporated down to about 10 L of concentrate, for avolume reduction of 4.5:1. Assuming total recovery of salts in the concentrate, the finalconcentration of AUNO.-Oj in the concentrate should be about 2.25M., and the final concentration ofSirKNO-On should be about 3.0 x 10-?M- Before the run, a concentration vs. density correlation foran AKNO})} solution at 35°C had been derived by using densities of prepared aluminum nitratesolutions. A density meter measured the density of samples during and after the run, and theconcentration of these samples was calculated from the correlation. By this method, the concentrateat the end of the run was calculated to be 2.12M. in AKNOi)}. About 34 L of distillate was producedduring the run.
Operational and process data were recorded every 30 min, and samples of theconcentrate and distillate were taken immediately following the recording of the data. Process dataobtained during the run are given in Table 43. Again, the accuracy of the vacuum data listed inTable 43 should be regarded as around ±102 mm Hg. Some of the samples were sent out forneutron activation analysis, which is underway.
Table 43. Data from Evaporator Test Using a Feed of 0.5M A1(NO3)3 and 6.7 x 10 3 M Sm(NO3)3
ElapsedTime,min
0
3165
95125155
Dist.,TC-5
49
5049
48
4847
Temperatures, °C
Vapor,TC-6
53
5251.5
51
5048
Cone,TC-7
54
555654
54
55
Feed,TC-10
52
5455
53
5355
Vacuum,mm Hg
580
580580580
580580
DistillateConductivity,
μS/cm
2.3
2.06.5
8.0
8.0
8.0
DistillateProduction,8
L/min
0.180.21
0.18
0.180.15
EvaporationRate,1,
L/min
0.160.21
0.22
0.130.17
aDistillate production measured by recording level increase in distillate tank.bEvaporation rate measured by level decrease in concentrate tank.
The calculated BPE (TC-7 minus TC-6) for this test was about 1°C (2°F) whenthe test started and rose to 7°C (I3°F) at the end of the run. The greatest rise in the BPE occurredduring the last 30 min of the test, when the BPE rose 3°C (5°F). This is because, prior to that time, theconcentrate was periodically being diluted by new feed coming in to fill the concentrate tank asconcentration occurred. Thus, during the final 30 min, after all of the feed had been added to theconcentrate tank, the greatest amount of concentration occurred, leading to the sharpest rise in theBPE.
Interestingly, the rise in BPE did not correspond to a gradual rise in
concentrate temperature as expected. Instead, this calculated rise in BPE corresponded to a drop invapor temperature (at TC-6) from 53° (127°F) to 48° (118°F), although the system pressure appearedto remain constant. This finding is puzzling and needs to be studied further. It is possible, given aproblem with the vacuum-gauge readings, that the system pressure did not remain constant, asindicated by the vacuum gauge.

89
The drop in vapor temperature throughout the run was also accompanied by adrop in cooling water temperature (at TC-! and TC-2) and distillate temperature (at TC-5). Theexact relationship between the drop in vapor and cooling water temperatures is not immediately clear.
The flow rate for evaporator feed (at FI-605) increased from 4.9 L/min(1.3 gpm) to 5.7 L/min (1.5 gpm) through the run. However, the flow meter FI-605 is calibrated forwater at 21°C (70°F), and the viscosity of the concentrate flowing through the flow meter changedconsiderably as the test progressed. Therefore, the evaporator feed flow rate for this or any testshould be used with caution.
The rise in conductivity over the run, as seen in Table 43, indicates that, asexpected, complete decontamination was not attained.
Following the test run, the concentrate tank was drained. To flush the system,about 14 L of distillate was poured into the concentrate tank, and the evaporator was run for about45 min using the same temperature and flow settings as used during the test. About 2 L wasevaporated from the concentrate during this operation. After the flushing, the concentrate tank wasdrained again, and a density test on the recovered liquid suggested that this concentrate is 0.13M inA1(NC>3)3. Further work is needed to establish an appropriate method of flushing the system aftereach run.
B. Solubility and Vapor-Liquid Equilibrium Data
To design an effective method for concentrating process streams, both solubility andvapor/liquid equilibrium data are needed. Solubility data are needed to determine the amount ofsolution concentration that can be achieved without precipitating components from solution.Vapor/liquid equilibrium data are needed to predict the vapor-phase concentrations for the varioussolution compositions that will be processed. Literature surveys were completed on both topics.
The conditions at which solids precipitate from mixed acid/metal-salt solutions as a functionof temperature, pressure, and composition were obtained from these surveys. Solubility data werecollected for nitrate salts of Al, Ca, Fe, La, Ni, Sm, and Na and for urany! nitrates as a function of acidconcentration at various temperatures. From these data we determined that aluminum nitrate had thelowest solubility of the nitrate salts studied. We also concluded that reducing the pressure decreasesthe boiling point of the system but has little effect on the vapor phase compositions. The presence ofsalts, with the exception of potassium nitrate, tends to salt out the nitric acid into the vapor phase, thusenriching the vapor phase in nitric acid. The solution boiling point also tends to increase as the saltconcentration increases. Results from this survey will be published in a separate ANL report.
C. Modeling of Nitric Acid/Nitrate Salt Vapor Pressures(D. A. Johnson)
The GTM was used to calculate the activities of nitric acid and water in solutions from anevaporator process. These activities will be used to determine the composition of vapors inequilibrium with the solutions. This information will provide the best operating conditions for theLICON evaporator.

1.
90
Calculation of Nitric Acid and Water Activities
Vapor-liquid equilibria and activity coefficient data were collected from literaturereporting relevant data on systems containing nitric acid, water, and metal nitrates. A plot of thevapor-liquid equilibria data obtained for the nitric acid-water system is given in Fig. 65.
U
1E
00
c
"5CQ
1 JrO -
132 -
128 -
124 -
120 -
116 -
112 -
1 Oβ -
92 -
88 -
80 -
b
h ; |
r
;
" 7 — •. '
h
"" T i lr *
1 ;—f
r n^—
1
— ^ ;
J ^
1
V
\
~s
—t —+
1
••—1
— t
—L
v- J
Liquid Phase
Vapor Phase
20 40 60
Mol% Nitric Acid
80 100
Fig. 65. Boiling Temperature for Nitric Acid-Water System. Based on information in Ref. 9.
The data of Davis and DeBruin9 were analyzed to ensure that we adequately
understood the principles of vapor-liquid equilibria as applied to the nitric acid-water system at 25°C.The calculated nitric acid concentrations of Davis and DeBruin were compared with our calculations.An important part of the calculations involved choosing the appropriate standard reference state. Ingeneral, for water (the solvent), the activity coefficient y —> 1 as the concentration of water approachesthe pure liquid state. In the case of nitric acid, the standard state was chosen so y -> 1 as theconcentration or molality of nitric acid goes to zero or infinite dilution. Our calculations now agreewith Davis and DeBruin.
The GTM equations for the activity coefficients and activities of nitric acid and waterwere examined with respect to making calculations at temperatures other than 25°C.
The stoichiometric mean activity coefficients (y°{2) ' n mixed electrolyte solutions arecalculated in the GTM using Bromley's equations.10 The γ̂ j values were obtained from literature andfitted with the following equation:
-AvZi+Z;Vl, , ,
+pi+ci j+Di3+Er1(26)
where AYis the Debye-Hiickel constant; B, p, C, D, and E are constants in Bromley's equations; Zj andZj represent the absolute value of ionic change; and the ionic strength I is calculated assuming

complete dissociation. Since Aγ, the Debye-Hiickel constant, is temperature dependent, we used the
values given by Pitzer1' and determined that
AY = 0.635295 - 0.00171517T + 4.34221 x 10 6 T 2 (27)
The fit of this equation to the data is shown in Fig. 66.
0.62
:ant
C/]
au
Huc
kel
Deb
ye-
0.6
0.58
0.56
0.54
0.52
0.5
0.48
Y.MO + MTx + ... M8'x8 + M9'x9
M0
M1
M2
R
0.63529495849-0.00171517356994.34221124453-06
0.99999838637
260 280 300 340 360320
Temp., K
Correlation Coefficient = 0.999998
Fig. 66. Debye-Hiickel Constant as a Function of Temperature(triangles show Pitzer data" and curve is from Eq. 27)
380
Our work has centered on three areas crucial to using the GTM to calculate activitiesnecessary to determine the composition of the vapor in equilibrium with TRUEX processed solutions.These areas are (1) finding appropriate vapor-liquid data for the nitric acid-water system attemperatures other than 25°C, (2) determining the exact temperature dependence of logYnNo v
(3) determining the activities of nitric acid, nitrates, and water in ternary mixtures at 25°C using theGTM, and (4) calculating the pressures of H2O and HNO3 above the mixtures.
There are several ways of defining activity coefficients depending on the standardstate selected, the concentration scale used, and knowledge of whether ion pairing or incompletedissociation of the electrolyte occurs. For strong electrolytes, the mean activity coefficient (y+) iscommonly calculated. To calculate y± values, it is necessary to know the degree of dissociation at allconcentrations and temperatures. To avoid this requirement, the stoichiometric activity coefficient (ys)is calculated. The GTM uses ys as a basis for calculating activities. Figure 67 shows a plot of theactivity coefficients of nitric acid at 25°C based on data from several sources. The Davis data9

92
represent mean activity coefficient data on the molar scale (Mj- The data of Hamer and Wu,12 on theother hand, represent the mean activity coefficient data based on the molal (m) scale. The GTMmeanwhile uses as the data base stoichiometric activity coefficients.
25°C Davisv
25*C GTM
25°C Hame'r'
0 1 2 3 4 5 6
Cone, molal"2
Fig. 67. Calculated and Measured Activity Coefficient Data for Nitric Acidas Function of Molal Concentrations
Lemire and coworkers carried out extensive studies of the vapor-liquid equilibrium ofnitric acid-water systems at 5()°C.1314 In order to use the latter data for temperature studies, wedetermined whether the activity coefficients calculated by Lemire were stoichiometric activitycoefficients (ys) or mean activity coefficients (y+). Lemire calculated stoichiometric activitycoefficients on the molar scale from Davis, data at 25°C and used similar calculations for activitycoefficients at 50°C. Figure 68 shows a plot of the various values of y, i.e., ys or y+, at 25 and 50°C.Comparison of activity coefficients generated by the GTM (which are ys values) demonstrates that thedata of Lemire are stoichiometric activity coefficients.
•
•
A
O
•
25
25
25°
50
50°
°C
°C
c
°c
c
GTM
13.14
Lemire
H&W,2
GTM
13,14
Lemire
Fig. 68. Experimental and Calculated Stoichiometric Activity Coefficientsof Nitric Acid at 25 and 50°C

93
To determine the temperature dependence of log y, we used Lemire's stoichiometricactivity coefficient data at 25 and 50°C. The GTM was used to fit an equation of the formrecommended by Hamer and Wu12:
UNO,3
_-AVrn
1 +Bm + Cm2 + Dm3 + Em4 (28)
where m is the molal concentration.
In Eq. 28, A, B, P, C, D, and E are potentially functions of temperature. We alreadydetermined A as a function of T (Eq. 27), and B represents the distance of closest approach of ionsand should not be greatly affected by a temperature increase. LogYHNo, data were plotted versus Vrnstarting with the first term on the right-hand side of Eq. 28 and successively adding terms. Theseplots clearly showed that the P and C coefficients are temperature sensitive. Therefore, it was assumedthat
β = p 0 + p,(T - 298.15K) + P2(T - 298.15K)2
C = C o + Cj(T - 298.15K) + C2(T - 298.15K)2
(29)
(30)
The data were fitted to the above equations using least-squares minimization techniques. The resultsof the fits are shown in Fig. 69, and the fitting parameters are given in Table 44. As seen in thisfigure, the calculated and experimental activity coefficients agree very well up to ~49 molal.
Fig. 69. Experimental and Calculated Activity Coefficientsas a Function of Temperature

water:
94
Table 44. Results of Eqs. 28-30 to Fit Experimental Data
A = 0.63529 - 0.0017152T + 4.3422 x 10"6 T2
B = 1.1376p = 0.1024 - 0.0008484 (T - 298.15K)+ 1.5894 xlO- s(T- 298.15K)2
C = -4.77xlO"3 - 0.0004196 (T - 298.15K) + 1.5773 x 10"5(T - 298.15K)2
D = 1.0364 x lO 4
E =-8.35 x I0"7
2. Calculation of Vapor Pressures
The following equations were used to calculate the vapor pressures for nitric acid and
PHNO,
PH2O
where a is the activity.
In Eqs. 31 and 32, PHNO.I anc* PH2O r e P r e s e n t t n e vapor pressures of pure nitric acid
and pure water at the experimental temperature, and y-m = 4.95 at 25°C.
The calculated partial pressures for HNO3 = 8.864 and 19.79M are shown inTable 45 and are compared to experimental data. ,5- ,6 The pressure of 0.030 torr (4.00 Pa) at8.864M HNO3 is subject to considerable experimental error and should be used with discretion. Thefact that the GTM calculation is of the same order of magnitude is significant. The match for PH^Ovalues is much better.
Table 45.
[HNO3],
M8.864
19.79
Calculated and Experimental PHNO, an<J PH^O a t 25°C.Units are torr.
Experimental1516
P H N O ,
0.0300.70
PH2O
14.808.10
Calculated
PHNO,
0.0610.644
PH2O
15.038.81
The above discussion presents a temperature-dependent model of nitric acid activitiesfor a nitric acid-water system. This model uses the temperature dependence of the Debye-Hiickelconstant and the Bromley terms (Eq. 26) for nitric acid to account for the temperature dependenceon the activities. But this approach is difficult to apply to high-level waste due to the lack of knowntemperature dependence on activities for all the available species. Currently, we are pursuing otherempirical methods to solve this problem. Regardless of the method in which the activities of waterand nitric acid are determined, the vapor-liquid equilibrium available from the literature data must beconverted to activity to compare with any model-generated activities. There are substantial vapor-liquid equilibrium data in which the activity of various salts can be extracted as a function oftemperature. One example is the vapor phase equilibrium of sodium nitrate and nitric acid, where

95
extensive data are available for various sodium nitrate concentrations at different pressures. InTable 46, the data are given in units of mole percent nitric acid in the vapor and liquid phases at aconstant total pressure, 130 mm Hg. To obtain y, the initial step is to convert the molarity
Table 46. V
Temp.,
°C
59 8
61.8
63.6
65.7
67.7
69.8
71.9
73.5
75.2
76.2
59.4
61.3
63.4
65.3
67.4
69.1
71.2
73.2
60.7
62.9
64.7
67
68.8
70.8
62.1
64.2
66.3
68.3
Liquid
[HNO3],
M
0.03
0 06
0.09
0.12
0.15
0.18
0.21
0.24
0.27
0.3
0
0.03
0.06
0.09
0.12
0.15
0.18
0.21
0.24
0.27
0.3
0
0.03
0.06
0.09
0.12
0.15
0.18
0.21
0.24
0.27
0.3
0
0.03
0.06
0.09
jpor-Liquid Equilibrium Data for NaNC>3 and HNO3 System at 130 mm Hg
Liquid
[NaNOJ,
M
0.03
0.03
0.03
0.03
0.03
0.03
0.03
0.03
0.03
0.03
0.06
0.06
0.06
0.06
0.06
0.06
0.06
0.06
0.06
0.06
0.06
0.09
0.09
0.09
0.09
0.09
0.09
0.09
0.09
0.09
0.09
0.09
0.12
0.12
0.12
0.12
Liquid
[H2O],
M
0.94
0.91
0.88
0.85
0.82
0.79
0.76
0.73
0.7
0.67
0.94
0.91
0.88
0.85
0.82
0.79
0.76
0.73
0.7
0.67
0.64
0.91
0.88
0.85
0.82
0.79
0.76
0.73
0.7
0.67
0.64
0.61
0.88
0.85
0.82
0.79
Liquid
[HNO3J,
m
1.77E-03
3.66E-03
5.68E-03
7.84E-03
1.02E-02
1.27E-02
1.54E-02
1.83E-02
2.14E-02
2.49E-02
O.OOE+00
1.83E-03
3.79E-03
5.88E-03
8.13E-03
1.05E-02
1.32E-02
1.60E-02
1.90E-02
2.24E-02
2.60E-02
O.OOE+00
1.89E-03
3.92E-03
6.10E-03
8.44E-03
1.10E-02
1.37E-02
1.67E-02
1.99E-02
2.34E-02
2.73E-02
O.OOE+00
1.96E-03
4.07E-03
6.33E-03
Liquid
[NaNO3],
m
1.77E-03
1.83E-03
1.89E-03
1.96E-03
2.03E-03
2.11E-03
2.19E-03
2.28E-03
2.38E-03
2.49E-03
3.55E-03
3.66E-03
3.79E-03
3.92E-03
4.07E-03
4.22E-03
4.39E-03
4.57E-03
4.76E-03
4.98E-03
5.21E-03
5.49E-03
5.68E-03
5.88E-03
6.10E-03
6.33E-03
6.58E-03
6.85E-03
7.14E-03
7.46E-03
7.81E-03
8.20E-03
7.58E-03
7.84E-03
8.13E-03
8.44E-03
Vapor
[HNO3],
M
0.07
0.2
0.55
1.09
2.05
4.07
6.62
10.05
14.2
21.33
0
0.11
0.35
0.78
1.69
3.05
5.23
8.67
0
0.2
0.56
1.08
2.24
4.17
0
0.26
0.72
1.58
Vapor
[HNO3],
M
0.03
0.06
0.09
0.12
0.15
0.18
0.21
0.24
0.27
0.3
0
0.03
0.06
0.09
0.12
0.15
0.18
0.21
0.24
0.27
0.3
0
0.03
0.06
0.09
0.12
0.15
0.18
0.21
0.24
0.27
0.3
0
0.03
0.06
0.09
^sat •
mmHg
319.73
346.89
372.93
405.34
438.32
475.29
514.79
546.65
582.25
604.06
314.51
339.92
369.96
398.99
433.24
462.7
501.33
540.55
331.72
361.17
389.63
426.54
457.38
493.78
351.12
381.97
415.01
448.63
Total Pressure
P.O..
mmHg
130
130
130
130
130
130
130
130
130
130
130
130
130
130
130
130
130
130
130
130
130
130
130
130
130
130
130
130
130
130
130
130
130
130
130
130
y
0.94873
1.2492
2.1303
2.9132
4.0533
6.1845
7.9608
9.9585
11.743
15.302
3.40E+38
1.4023
2.0498
2.8238
4.2259
5.7129
7.534?
9.929
3.40E+38
2.3996
3.1141
3.6574
5.3056
7.3191
3.40E+38
2.9496
3.7589
5.0871

96
to molality, then, for a given temperature, to calculate the saturated partial pressure of the nitric acidby its temperature dependence:
log Psai = 7.5119 - 1406/(T + 221.0) (33)
It is then possible to calculate the activity of the acid using Raoult's law:
Ptoi - a HNO 3 Psm
where YHNO,, is the mole fraction of the vapor, and a ^ o , ••*> t n e activity of nitric acid in solution.Table 46 shows the raw data in terms of the temperature and mole fraction in the liquid and vaporphase, along with the calculated values of activity coefficients. A similar approach can be applied toobtain activity for water.
From the many salt compositions and temperatures, these nitric acid and wateractivities can help to develop an empirical model, analogous to the Bromley model, to determinevapor-liquid equilibrium in the evaporator.
D. Neutron Activation Analysis
Radioactive tracers would appear to be well suited for measuring decontamination factors(DFs). Detection limits for tracers are typically very low; DFs of 105 to 107 are easily measured.The problem with tracers, however, is that the equipment would be contaminated from their use. Thiscomplicates work on the evaporator and increases the cost associated with further tests. In addition,use of radioactivity at LICON (Pensacoia, Florida) is prohibited. Therefore, an element that is notradioactive but can be detected at low concentrations is needed. An analytical procedure calledneutron activation analysis (NAA) is one method that can be used to measure the concentration of theelement at low concentrations.
To be certain that the desired DFs can be determined for the evaporator, we had to assess thedetection limits of our NAA procedure. According to Currie,17 the detection limit is the minimumvalue at which a given analytical procedure may be relied upon to lead to detection. This detectionlimit is defined as
L D = 2.71 + 4 . 6 5 ^ (35)
where μB is the average background counts. For NAA, this value corresponds to the minimumnumber of counts recorded at which a given analysis may be relied upon to lead to detection.Detection limits may also be related to physical quantities. For example, LD may be related to theminimum detectable concentration by means of
L,, = KCD (36)
where K represents an overall calibration factor relating the detector response to the concentrationpresent, and C^ represents the minimum detectable concentration. For NAA, the K factor would beequal to the number of counts per concentration (counts/ppm). If a reference standard with a known

97
concentration is irradiated with the samples of unknown concentration, then the K factor is obtainedfrom the counting data and known concentration of this reference standard. Once the detection limit,LD, and K have been determined, the minimum detectable concentration (C^) may be obtained fromEq. 36.
Experiments were conducted to determine the minimum detectable concentration ofsamarium in solution. Solutions containing 10, 0.001, and 0.0000001 ppm samarium in nitric acidand water were prepared from a samarium standard. The standard used was a samarium atomicabsorption standard consisting of 995 μg/mL samarium in 1 wt % HNO3, purchased from AldrichChemical Company. In NAA, one normally compares a known reference standard to samples ofunknown concentration. In this case, one of the i0 ppm solutions was considered the referencestandard. The concentration of the other samples was then calculated from the experimental data.The results of the calculations are given in Table 47. The results are good for the 10 and 0.001 ppmsolutions. The other sample may have been contaminated during sample preparation or handling.Using Eq. 36, the minimum detectable concentration was found to be 2 x 10 5 ppm. The K factorwas determined from the 10 ppm solution since it was used as the reference standard.
Table 47. Calculated and Actual Concentrations ofSamarium Standards
C o n e , p p m
Actual
100.001
0.001
0.0000001
0.0000001
Calc.
9.9497
0.00107
0.00106
0.000020
O.OOOO23
Percent Error
0.57.06.0—
—
To verify that the data can be reproduced, the experiment was conducted a second time. Inthe second experiment, samarium solutions of 10, 0.1, 0.001, and 0.00001 ppm were prepared. Theresults of the calculations are given in Table 48. The results are good for the 10, 0.1, and 0.001 ppmsolutions. The 30% error in the 0.00001 ppm solution indicates that this concentration is notdetectable. From Eq. 36, the minimum detectable concentration was calculated to be 2 x 10~5 ppm.This result agrees with the first run. The results indicate that a concentration of 0.001 ppm can bedetected, while 0.0001 ppm solution could probably be detected. Note, however, that these results areonly good for the samarium-nitrate/nitric acid/water system. If other salts or impurities areintroduced, the minimum detectable concentration will likely increase.
Table 48. Calculated and Actual Concentrations ofSamarium Standards for Second Run
Cone,
Actual
100.10.10.0010.0010.000000!
ppm
Calc.
9.82570.10130.0992O.OO1O520.0009850.000031
Percent Error
1.741.270.785.201.5030.0

98
E. General Evaporator Design
Criticality safety and materials of construction need to be considered in designing anevaporator operated in a radioactive environment. Based upon a preliminary analysis, nuclearcriticality safety can be achieved by geometry control if the maximum diameter of the evaporatorbody is 15 cm (6 in.). Because of the low concentration of fissile nuclides in many nuclear wastes,administration control may be an alternative control method in some cases. (For this type of control,procedures are put into place that limit the amount of fissile material that can be in the system at anyone time.) ,
Self-heating of concentrate solutions caused by radioactive decay of typical fission-product(strontium and/or cesium and their short-lived daugnters) cr TRU-product solutions from Hanfordlank waste can be accounted for but should not be of great significance to evaporator operation.Generally, the 0.1-30 W/L self-heating will be negligible compared to supplied heat input.
The materials selected for construction of a pilot-scale evaporator are important since acommon problem with nuclear-waste evaporators is mechanical failure due to corrosion. Apreliminary screening of materials was made using published handbooks and reports. The mostcommon material used in construction of such evaporators is 304 stainless steel (SS). Potentiallyuseful materials need to be screened by immersion or electrochemical-corrosion tests. The DOE hasconsiderable experience in adjusting the chemistry of waste solutions and in heat treatment andmanufacturing practices to minimize corrosion, especially in 304 SS vessels. In the future, moreexotic materials than 304 SS may be available, for example, titanium or Hastelloy G-30. Work is stillactive in researching this problem.
F. Evaporator Upgrade
The scope of the evaporator development program was increased this year to incorporate aproject initiated by Argonne's Waste Management Operations (WMO). Waste Management has beenfunded to replace two low-level waste evaporators that have been in operation at Argonne for over 30years. Two LICON-designed evaporators will replace these evaporators. These !wo new evaporators,now scheduled for design, purchase, and installation in FY 1993, will provide a platform forcollecting operating data on the processing of actual waste solutions. Tasks associated with thereplacement of these evaporators will be finalized in the near future.

99
VII. DECONTAMINATION OF GROUNDWATERS CONTAININGVOLATILE ORGANICS
(J. C. Hutter, L. Nunez, D. Redfield, and G. F. Vandegrift)
A membrane-based solvent extraction process is under development to recover dilute (ppb)volatile organic compounds (VOCs) from water and air streams. The VOCs studied includechlorocarbons and hydrocarbonc °^-ecific to waste minimization and remediation needs of theDepartment of Energy (DOE) and U.S. Air Force (USAF). The process uses two unit operations,membrane-assisted solvent extraction (MASX) and membrane-assisted distillation stripping (MADS).The MASX process extracts dilute VOCs from water using a natural oil solvent such as sunflower oil.The MADS process recovers the natural oil solvent and concentrates the VOCs for destruction orreuse. Thermodynamic data are being collected to define the operating conditions of this process.In conjunction with Hoechst Celanese, prototype radial cross-flow modules will be developed andtested for the MASX/MADS application. A field demonstration at Argonne to test the MASX/MADSis being planned in the future.
The MASX/MADS system (Fig. 70) consists of two modular hollow fiber units. In theMASX, the organic phase and aqueous or gas phase are separated by the membrane fiber walls. Thecontaminated water or air is contacted with the nonvolatile organic solvent. As the solvent passesthrough the module, it contacts the feed and continuously removes the VOCs from the air/waterstream by partitioning them to the solvent. The degree of decontamination can be large, up to 1000,and easily achieved by staging the extraction units in series with countercur.vnt flow. Largethroughputs can be achieved by staging the units in parallel. In the MADS unit, the VOC-loadedsolvent is regenerated for recycle to the MASX unit by vaporization of the VOCs.
Gas/liquidSeparator
ContaminatedGroundwater
Extraction Modules
DecontaminatedGroundwater
Stripping Gas
Blower
Nonvolatile Solvent Recycle
Fig. 70. Flow Diagram of MASX/MADS Process
As shown in Fig. 70, contaminated groundwater is fed to the extraction modules where it iscontacted with a nonvolatile solvent. Due to the high distribution ratio of the VOCs in the solvent, theflow rate of the solvent can typically be 10-20 times lov/er than the flow rate of the groundwater. The

100
groundwater leaves the extraction unit decontaminated. The VOC-loaded solvent is fed to the MADSunit, where water dissolved by the solvent, a small amount of the solvent, and most of the VOCs arevaporized. The VOC-rich vapor is then recovered by a condenser, at which point the VOCs can bedestroyed or recycled. The stripping gas is recirculated to the stripping modules. The stripping gasflow is minimized to reduce the energy consumption of the chiller and the blowers. The VOCstripped nonvolatile solvent is then recycled to the MASX to be contacted with more contaminatedgroundwater, and the process is repeated.
The MASX/MADS units may also be placed in the air exhaust of a plant where VOCs arereleased. In this way the MASX/MADS process can be used to eliminate pollution caused byatmospheric releases of VOCs.
Experimental data are being collected to design a pilot-scale MASX/MADS unit. The designof the MADS required measuring Henry's law constants for VOCs in various candidate natural oils.These data were collected using a sparged gas reactor, depicted in Fig. 71. The reactor is made out ofglass and has dimensions of 6.35-cm ID and 63.5-cm long. The reactor holds 1.70 L of liquid whenfull. Nitrogen gas is sparged into the reactor by a sintered glass diffuser. The gas flow rate ismeasured by a factory calibrated Cole-Palmer rotameter Model Nl 12-02. In die presentexperiments, gas flow rates were varied from 0.5 to 3.5 mL/s. Temperature was controlled bycirculating water through an external heating jacket. The heat transfer water was circulated to atemperature-controlled bath. The reactor temperature itself was monitored by a thermocouple.Samples of the liquid were withdrawn from the reactor using a syringe with an extended needle. Amixer was installed inside the reactor to improve the mixing of the high viscosity oil and ensure acompletely mixed liquid phase. The entire reactor was placed inside a fume hood.
Heat Exchanger Jacket Fig. 71.
Sparged Gas Reactor Used in the Henry's LawExperiments
Gas Inlet
Drain Valve
The mass transfer of a sparingly soluble component in a liquid phase to gas phase is aliquid-phase-controlled process. For a fine bubble diffuser system, fine bubbles rapidly approachequilibrium with a sparingly soluble substance in the liquid phase within the first 15 cm of the

101
disengagement of the bubbles from the diffusers. This phenomenon has been successfully applied tomeasure the Henry's law constants for various VOCs in water.18 The technique requires accurateconcentration vs. time data for desorption of a VOC from a sparged reactor. A material balance onthe reactor allows one to calculate the Henry's law constant from the concentration-vs.-time data.
The material balance must include subsurface mass transfer between the dispersed gas and thebulk liquid, as well as mass transfer at the turbulent liquid surface in contact with an infinite sink ofg a s 19,20 j h e Henry's law constant is determined from the portion of the mass transfer due to thesubsurface effects. The subsurface gas dispersion exits the reactor in equilibrium with the completelymixed liquid phase. A material balance for each VOC component is given by
VV L
where VL = volume of reactor, LCoi = VOC concentration, mol/Lt = time, sG = gas rate, mol/sHj = dimensionless Henry's law constantR = universal gas constant, Latm/molKT = temperature, KP = pressure, atm
KLS^S = mass transfer coefficient, s !
Coi*- equilibrium oil concentration, mol/L
The reactor was installed in a fume hood continuously purged with clean air. As the sparge gas exitsthe reactor, it is rapidly entrained by the large gas flow and sent to the building ventilation system.Owing to the high volumetric flow of the fume hood gas, the gas above the reactor's turbulent liquidsurface does not contain any VOCs, and Coj* is zero. Equation 37 can be integrated with the initialcondition, Coj = C01° at t = 0. Thus,
GH:RTC_: /GHjRT \ tlog r3* = - \—p— + KLSas ) v " (38)
The sparged reactor was initially filled with 1000 ppb of each VOC listed in Table 49. Grab sampleswere taken from the reactor, and the concentration-vs.-time results were collected for each VOC.Experiments in the sparged reactor were evaluated with Eq. 38. For G = 0, KLsas was measured. Forthe experiments with gas flow, this value of Kj^as was used to calculate the Henry's law constants (Eq.38). A plot of typical experimental data is shown in Fig. 72. As predicted by Eq. 38, a plot of logC0j/C0l° vs. t is a straight line. The least squares fit of the slope was used in the analysis.
The line for G = 0 in Fig. 72 is for the component methylene chloride. Since all thecomponents were desorbed at almost the same rate, the G = 0 values of KLSas were within about 10%of each other for all the VOCs. This is expected since all these components have about the samediffusivity in the sunflower oil, and the mass transfer coefficient is directly proportional to thediffusivity according to film theory.21 Methylene chloride had the highest estimated diffusivity insunflower oil, and thus it showed the most rapid loss from the sparged reactor in the G = 0 tests.

102
0.0110 15
Time, h
20 25
Fig. 72. Experimental Data from the Sparged Gas Reactorfor Three VOCs and Zero Gas Flow
The Henry's law constants for the VOCs in sunflower oil are summarized in Table 49. TheHenry's law constants in sunflower oil can be correlated with the pure component boiling points ofeach VOC, as given in Table 49. The data indicate that the Henry's law constants decrease as theboiling point increases. Also, because the VOCs are in vapor-liquid equilibrium in a capillarycolumn GC, the retention time is directly related to the partial pressures of the components above thestationary phase. In the table, the components are listed in the order that they elute from the GC.
Table 49. Boiling Points and Henry's Law Constants of VOCs at 1000 ppb in Sunflower Oil
Component
Methylene ChlorideTrans-1,2-DichloroethyleneCis-1,2-DichloroethyleneChloroform1,1,1-TrichIoroethaneCarbon TetrachlorideBenzeneTrichloroethylene
Boiling Pt.,°C (1 atm)
40.047.060.061.774.1
76.680.087.0
RetentionTime, min
10.512.021.924.028.832.035.639.1
50°C
0.0210.0180.0120.00990.0100.00990.0100.0062
Henry's Law Constant
70°C
0.0290.0250.0200.0150.0150.0170.0170.011
90°C
0.0710.0710.0360.0370.0340.0310.0280.019
The Henry's law constants can also be determined from
In H, = A H i ' d i s s • A S i d i s s
RT R(39)

103
Figure 73 shows a plot of In Hj vs. 1/T typical for the VOCs we studied. The thermodynamicquantities obtained from these plots are listed in Table 50. The values of AHJICIJSS agree well with thepublished values of AHvap for the pure components at their boiling points.22 As shown in the table,the pure-component enthalpies are smaller than fhe enthalpies of dissolution from sunflower oil.Thus, more energy is needed to vaporize the VOCs from the sunflower oil as compared to the purecomponents, and the sunflower oil has a high affinity for the VOCs. We have extrapolated ourexperimental Henry's law constant data over a wide range of temperatures (50-90°C), which will beuseful in optimizing the MADS unit.
0 T-
2 . -
-34.
. 4 . -
5 • -
- 6
MethyleneChloride
CarbonTetrachlorideTrichloroethylene
-+• • + • -4-0.0027 0.0028 0.0029 0.003
1/T, K/1
0.0031 0.0032 0.0033
Fig. 73. Thermodynamic Plots Used to Correlate the Henry's Law Constantsfor Three VOCs in Sunflower Oil
Table 50. Thermodynamic Quantities of Various VOCs in Sunflower Oil
Component
Methylene ChlorideTrans-1,2-DichloroethyleneCis-1,2-DichloroethyleneChloroform!, 1,1 -TrichloroethaneCarbon TetrachlorideBenzeneTrichloroethylene
kJ/mol
4342344138403938
kJ/mol
28.1--
29.229.929.830.831.4
J/molK
9694658678837971
The experimental data along with previously published mass transfer data were used todevelop a preliminary design of the MASX/MADS. Future work will concentrate on testingprototype MASX/MADS components in the laboratory to evaluate the technical feasibility of thistechnology.

104
REFERENCES
1. J. L. Swanson, Initial Studies of Pretreatment Methods for Neutralized Cladding Removal Waste(NCRW) Sludge - Results of a Design Basis Experiment, Pacific Northwest Laboratory ReportPNL-7734 (1991).
2. L. A. Currie, "Limits for Qualitative Detection and Quantitative Determination," Anal. Chem. 3,586 (1968).
3. Kelly L. Elmore, Charles M. Mason, and James H. Christensen, "Activity of OrthophosphoricAcid in Aqueous Solution at 25°C from Vapor Pressure Measurements," J. Am. Chem. Soc. 68,2528 (1946).
4. N. Simonzadeh, A. M. Crabtree, L. E. Trevorrow, and G. F. Vandegrift, Radiolysis andHydrolysis of TRUEX-NPH Solvent, Argonne National Laboratory Report ANL-90/14 (1992).
5. E. P. Horwitz, R. Chiarizia, and M. L. Dietz, "A Novel Strontium-Selective ExtractionChromatographic Resin," Solv. Extr. Ion Exch. K), 313 (1992).
6. E. P. Horwitz, M. L. Dietz, R. D. Rogers, and D. B. Chamberlain, "A Combined TRUEX-SREXExtraction/Recovery Process," presented for DOE review at Argonne National Laboratory(May 1992).
7. S. Kotrly and L. Sucha, Handbook of Chemical Equilibria in Analytical Chemistry, John Wileyand Sons, New York, p. 116 (1985).
8. J. A. Dean, Lange's Handbook of Chemistry, 14th ed., McGraw-Hill, New York (1992).
9. W. Davis, Jr., and H. J. DeBruin, "New Activity Coefficients of 0-100 Per Cent Aqueous NitricAcid," J. Inorg. Nucl. Chem. 26, 1069 (1964).
10. L. A. Bromley, "Thermodynamic Properties of Strong Electrolytes in Aqueous Solutions,"AIChE J. 19, 313 (1973).
11. K. S. Pitzer, "Theory: Ion Interaction Approach," in Activity Coefficients in Electrolyte Solutions,K. S. Pitzer, ed., CRC Press, Boca Raton, FL (1991).
12. W. J. Hamer and Y. C. Wu, "Osmotic Coefficients and Mean Activity Coefficients of UnivalentElectrolytes at 25°C," J. Phys. Chem. Ref. Data I , 1047 (1972).
13. R. J. Lemire and C. P. Brown, "Component Activities in the System Thorium Nitrate-Nitric Acid-Water at 25°C," J. Soln. Chem. U , 203 (1982).
14. R. J. Lemire, C. P. Brown, and A. B. Campbell, "Vapor Pressures of Nitric Acid and WaterSystens HNO rH2O and HNOrTh(NO3)4-H2O at 50°C," J. Chem. Eng. Data 30, 421 (1985).
I 5. Howard Silock, Solubilities of Inorganic Compounds, Vol. 3, Ternary and Multi-ComponentSystems of Inorganic Substances, Part I, Pergamon Press, Oxford (1979).

105
16. M. A. Yakimov, V. Y. Mishin, and E. V. C. Zalkind, "The Sodium Nitrate-Nitric Acid-WaterSystem at 25°C," J. Soln. Chem. H (8), 1032 (1966).
17. L. A. Currie, "Limits for Qualitative Detection and Quantitative Determination," Anal. Chem. 3,586 (1968).
18. D. MacKay, W. Y. Shiu, and R. P. Sutherland, "Determination of Air-Water Henry's LawConstants for Hydrophobic Pollutants," Environ. Sci. Technol. H (3), 333-337 (1979).
19. J. R. McWhirter and J. C. Hutter, "Improved Oxygen Mass Transfer Modeling forDiffused/Subsurface Aeration Systems," AIChE J. 3_5_ (9), 1527-1534 (1989).
20. J. C. Hutter, G. F. Vandegrift, L. Nunez, and D. H. Redfield, "Removal of VOCs fromGroundwater using Membrane-Assisted Solvent Extraction," paper presented at the 1992 AIChEMeeting, Miami, FL, November 1-6, 1992.
21. R. B. Bird, W. E. Stewart, and E. N. Lightfoot, Transport Phenomena, John Wiley and Sons,New York (1960).
22. D. R. Lide, ed., CRC Handbook of Chemistry and Physics, 72nd Ed., CRC Press, Boca Raton, FL(1991).

106
Internal:
B. D. BabcockJ. E. BattlesB. A. BuchholzD. J. ChaikoD. B. ChamberlainL. ChenM. K. ClemensC. ConnerJ. M. CoppleJ. C. CunnaneH. Diamond
Distribution for ANL-94/29
D. DongD. W. GreenJ. E. HarmonE. P. HorwitzJ. C. HutterR. J. JaskotJ. J. LaidlerR. A. LeonardC. J. MertzL. Nunez
M. C. RegalbutoJ. SedletW. B. SeefeldtS. A. SlaterB. SrinivasanM. J. SteindlerG. F. VandegriftR. D. WolsonD. G. WygmansTIS Files
(20)
External:
DOE-OSTI, for distribution per UC-500 (97)ANL-E Library (2)ANL-W LibraryManager, Chicago Operations Office, DOEA. Bindokas, DOE-CHJ. Haugen, DOE-CHA. L. Taboas, DOE-CH/AAOChemical Technology Division Review Committee Members:
E. R. Beaver, Monsanto Company, St. Louis, MOD. L. Douglas, Consultant, Bloomington, MNR. K. Genung, Oak Ridge National Laboratory, Oak Ridge, TNJ. G. Kay, Drexel University, Philadelphia, PAG. R. St. Pierre, Ohio State University, Columbus, OHJ. Stringer, F.ectric Power Research Institute, Palo Alto, CAJ. B. Wagner, Arizona State University, Tempe, AZ
M. G. Adamson, Lawrence Livermore National Laboratory, Livermore, CAJ. Allison, USDOE, Office of Waste Operations, Washington, DCS. E. Berk, USDOE, Office of Fusion Energy, Germantown, MDN. E. Bibler, Westinghouse Savannah River Company, Aiken, SCW. Bourcier, Lawrence Livermore National Laboratory, Livermore, CAD. F. Bowersox, Los Alamos National Laboratory, Los Alamos, NML. Brewer, University of California, Berkeley, CAK. A. Chacey, USDOE, Office of Waste Management, Germantown, MDM. O. Cloninger, Mac Technical Services, Inc., Richland, WAM. S. Coops, Lawrence Livermore National Laboratory, Livermore, CAM. Dinehart, Los Alamos National Laboratory, Los Alamos, NMM. C. Dionisio, USDOE, Office of Technology Development, Washington, DCM. Duff, USDOE, Office of Waste Operations, Germantown, MDR. E. Erickson, USDOE, Office of Waste Operations, Germantown, MDR. C. Ewing, University of New Mexico, Albuquerque, NMR. Fish, B&W Fuel Company, Las Vegas, NV

107
C. W. Frank, USDOE, Office of Technology Development, Washington, DCT. M. Hohl, Westinghouse Hanford Company, Richland, WAL. Holton, Pacific Northwest Laboratory, Richland, WAJ. O. Honeyman, Westinghouse Hanford Operations, Richland, WAC. Interrante, U. S. Nuclear Regulatory Commission, Washington, DCC. Jantzen, Westinghouse Savannah River Company, Aiken, SCL. J. Jardine, Lawrence Livermore National Laboratory, Livermore, CAR. T. Jubin, Oak Ridge National Laboratory, Oak Ridge, TNW. S. Ketola, USDOE, West Valley Project Office, West Valley, NYD. A. Knecht, Lockheed Idaho Technology Company, Idaho Falls, IDM. Levenson, Menlo Park, CAS. C. T. Lien, USDOE, Office of Technology Development, Germantown, MDW. Lutze, University of New Mexico, Albuquerque, NMC. P. McGinnis, Oak Ridge National Laboratory, Oak Ridge, TNW. H. McVey, USDOE, Division of LMFBR Fuel Cycle Projects, Germantown, MDR. Morssette, Science Applications International Corp., Las Vegas, NVA. C. Muscatello, LATO Office, Rocky Flats Plant, Golden, COP. K. Nair, Southwest Research Institute, San Antonio, TXJ. L. Nelson, Westinghouse Hanford Co., Richland, WAM. O'Hara, Martin Marietta Energy Systems, Oak Ridge, TND. R. Olander, University of California, Berkeley, CAA. L. Olson, Lockheed Idaho Technology Company, Idaho Falls, IDM. Palmer, Los Alamos National Laboratory, Los Alamos, NMR. Palmer, West Valley Nuclear Services, West Valley, NYG. Pfennigworth, Martin Marietta Energy Systems, Oak Ridge, TNW. G. Ramsey, Westinghouse Savannah River Company, Aiken, SCL. Reichley-Yinger, Columbus, OHC. G. Russomanno, USDOE, Civilian Radioactive Waste Management, Washington, DCP. S. Schaus, Westinghouse Hanford Company, Richland, WAH. Shaw, Lawrence Livermore National Laboratory, Livermore, CAM. W. Shupe, USDOE, Office of Technology Development, Germantown, MDJ. Sproull, Westinghouse Savannah River Company, Aiken, SCD. Stahl, M&O/B&W Fuel Company, Las Vegas, NVR. B. Stout, Lawrence Livermore National Laboratory, Livermore, CAJ. L. Swanson, Pacific Northwest Laboratory, Richland, WAI. R. Tasker, Waste Policy Institute, Gaithersburg, MDD. W. Tedder, Georgia Institute of Technology, Atlanta, GAM. Thompson, Westinghouse Savannah River Company, Aiken, SCT. A. Todd, Lockheed Idaho Technology Company, Idaho Falls, IDUSDOE, Office of Basic Energy Sciences, Washington, DCS. Yarbro, Los Alamos National Laboratory, Los Alamos, NMP. Van Isegham, BELGIUME. Vernaz, Centre d'Etudes Nucleares de la Valle du Rhone, FRANCEL. Werme, Svensk Karnbranslehantering AB, SWEDEN