
XA0102869- - International Nuclear Information System (INIS)
281
XA0102869-
-
Upload
khangminh22 -
Category
Documents
-
view
2 -
download
0
Transcript of XA0102869- - International Nuclear Information System (INIS)

XA0102869-

EDITORIAL NOTE
This report is not a formal publication of the International Atomic Energy Agency (IAEA), and all rightsare reserved by the Agency. The report may, however, be freely reviewed, abstracted, reproduced andtranslated, in part or in whole, but not for sale nor for use in conjunction with commercial purposes.
In preparing some of the material in this document for reproduction, staff of the IAEA have mounted andpaginated the original manuscripts and given some attention to presentation; otherwise it has not beenedited by the IAEA. The views expressed in this report do not necessarily reflect those of the IAEA or ofgovernments of the Member States or organizations under whose auspices the work described herein wascarried out. The use in this report of particular designations of countries or territories does not implyany judgements by the IAEA as to the legal status of such countries or territories, of their authorities andinstitutions or of the delimitation of their boundaries. The mention of specific companies or of theirproducts or brand names does not imply any endorsement or recommendation on the part of the IAEA.The authors are responsible for having obtained the necessary permission for the IAEA to reproduce,translate or use material from sources already protected by copyrights.

PLEASE BE AWARE THATALL OF THE MISSING PAGES IN THIS DOCUMENT
WERE ORIGINALLY BLANK

APPLIED RESEARCH ON AIR POLLUTIONUSING NUCLEAR-RELATED ANALYTICAL TECHNIQUES
Report on the Second Research Co-ordination Meeting
Menai, Australia, 27-31 March 1995
NAHRES-26, IAEA, Vienna (1995)
A report prepared by the IAEA'sSection of Nutritional and Health-Related Environmental Studies
Division of Human HealthDepartment of Research and Isotopes
Single copies of this report are available cost-freeon request from the above address
TABLE OF CONTENTS
PART I. SUMMARY REPORT
ABSTRACT 1
INTRODUCTION 1
LIST OF PARTICIPANTS 4
AGENDA 6
LIST OF DISCUSSION TOPICS 9
SUMMARY OF DISCUSSIONS .""! 13
Appendix 1- Study of Air Pollution in Buenos Aires CityR.R.Pla, MAMoreno, V.Tafuri, G.S.Custo, MAdler 1-1
Appendix 2 - A Twelve Month Study of PM2.5 and PM10 Fine Particle Aerosol Composition in theSydney Region Using Ion Beam Analysis TechniquesD. D. Cohen, GM. Bailey, R. Kondepudi 2-1
Appendix 3 - Background Air Pollution Studies in Urban and Rural Areas in BangladeshM.Khaliquzzaman, S.K. Biswas, SA. Tarafdar, A. Islam, A.H. Khan 3-1
Appendix 4 - Atmospheric Aerosol Studies Using the "Gent" Stacked Filter Unit and Other AerosolCollectors, with Multi-elemental Analysis of the Samples By Nuclear-Related AnalyticalTechniquesW. Maenhaut, F. Frangois, J. Cafmeyer, O. Okunade 4-1
Appendix 5 - Receptor Modeling of Atmospheric Aerosols in the Urban Area of Sao PauloP. Artaxo, W. E. de Castro Junior, M. de Freitas, KM. Longo 5-1
Appendix 6 - Air Pollution in Santiago (Chile) As Studied By Nuclear and Other TechniquesP. Toro, E. Cortes 6-1
Appendix 7 - Studies of the Long-Range Transport of Atmospheric Pollutant Using Nuclear-RelatedAnalytical TechniquesYang Shao Jin 7-1
Appendix 8 - Air Pollution Monitoring in the Czech Republic by Neutron Activation Analysisand Other Analytical MethodsJ. Kudera, J. Santroch, J. Faltejsek, J. Horakova, V. Hnatowicz, V. Vosecek, V. Havranek . 8-1
Appendix 9 - Characterization of Regional Atmospheric Aerosols Over Hungary by PIXEElemental Analysis
E. Koltay, 1. Borbely-Kiss, Gy. Szabo, A.Z. Kiss, I. Rajta, E. Somorjai, E. Meszaros,A. Molnar, L, Bozo , . . . . 9-1

Appendix 10 - Aerosol Composition and its Application in Air Pollution MonitoringS. Sadasivan, B.S. Negi, V. Meenakshy andK.S. V. Nambi 10-1
Appendix 11 - Elemental Analysis of the Suspended Particulate Matter in the Air of Tehran UsingINAA and AAS TechniquesM. Sohrabpour, S. Rostami, M. Athari 11-1
Appendix 12 - The Development of Air Pollution Studies in JamaicaG. C. Lalor, H. Robotham, M. Davis, A. Johnson, J. Preston, C. Grant 12-1
Appendix 13 - Air Pollution in KenyaC. K. Gatebe, R. Kwach, L. N. NjauAndE. A. Mukolwe, A. M. Kinyua,M. J. Mangala andD. M. Maina 13-1
Appendix 14 - Monitoring of Trace Element Air PollutionM. Do Carmo Freitas, M. A. Reis, L. C. Alves, M. A. Gouveia, T. Fernandes,I. Dionisio, R. Pinheiro 14-1
Appendix 15- Trace Element Air Pollution Monitoring Studies in Slovenia Using NuclearAnalytical TechniquesB. SmodiS, R. Jadmovic, B. Stropnik, M. Svetina Gros 15-1
Appendix 16 - Air Pollution in Thailand Using Nuclear-Related Analytical TechniquesW. Chueinta, A. Sirinantavid 16-1
Appendix 17 - Atmospheric Transport of Pollutants to the Eastern Mediterranean BasinG. Tuncel, S. G. Tuncel,N. K.Aras,M. Yatin 17-1
Appendix 18 - Characterization of the Gent PM-10 SamplerP. K. Hopke, YingXie, and T. Raunemaa, S. Biegalski, S. Landsberger 18-1
Appendix 19 - Intercomparison of IAEA, Airborne Particulate Matter Reference MaterialS. Landsberger, De Wu, S. Vermette 19-1

CO-ORDINATED RESEARCH PROGRAMME ON
APPLIED RESEARCH ON AIR POLLUTION
USING NUCLEAR-RELATED ANALYTICAL TECHNIQUES
REPORT ON THE SECOND CO-ORDINATION RESEARCH MEETING
MENAI, 27-31 MARCH 1995
ABSTRACT
A co-ordinated research programme (CRP) on applied research on air pollution using nuclear-related
techniques is a global CRP which started in 1992, and is scheduled to run until early 1997. The purpose of this CRP
is to promote the use of nuclear analytical techniques in air pollution studies, e.g. NAA, XRF, and PIXE for the analysis
of toxic and other trace elements in air particulate matter. The main purposes of the cere programme are i) to support
the use of nuclear and nuclear-related analytical techniques for research and monitoring studies on air pollution, ii) to
identify major sources of air pollution affecting each of the participating countries with particular reference to toxic
heavy metals, and iii) to obtain comparative data on pollution levels in areas of high pollution (e.g. a city centre or a
populated area downwind of a large pollution source) and low pollution (e.g. rural area). This document reports the
discussions held during the second Research Co-ordination Meeting (RCM) for the CRP which took place at ANSTO
in Menai, Australia.
INTRODUCTION
There is growing evidence that elevated levels of airborne particles are correlated with adverse health
effects, including increased occurrence of respiratory symptoms, impairment of pulmonary function, and
higher mortality rates. Although most government regulatory studies now include monitoring of the total mass
of suspended particulates, there is increased concern over the chemical composition of these particulates, and
that particles related to combustion processes seem to be involved in increasing health risks.
The focus of many current studies has been on relating health effects to size-fractionated air
particulate matter (APM), especially on APM with an aerodynamic equivalent diameter (AED) of less than
10 urn, which constitute "inhalable particles", and, further, to particles with AED less than or equal to 2.5
urn, which corresponds to the high-risk respirable fraction. The latter fraction, also known as the fine
particulate fraction, is considered to be a more serious health risk because these particles, derived from
chemical processes, such as combustion, etc., are more toxic than the larger particles, which are derived from
soil and other crustal materials. In addition, the fine respirable particles can be inhaled more deeply into the
lungs, increasing the health risks.
A co-ordinated research programme (CRP) on applied research in air pollution using nuclear-related
techniques was begun in 1992, and has focussed on the chemical analysis of air particulate matter. The
investigations are emphasizing the toxic and trace element composition in the fraction of air particulate less
than 10 yum in diameter, emphasizing the inhalable particles. The core of the CRP is to support the use of
nuclear and nuclear-related analytical techniques for practically-oriented research and monitoring studies on
air pollution; to identify major sources of air pollution affecting each of the participating countries with
1

particular reference to toxic heavy metals and to obtain comparative data on pollution levels in areas of high
pollution (e.g. a city centre or a populated area downwind of a large pollution source) and low pollution (e.g.
rural areas). All the participants are using air sampling devices of the same design to ensure comparability
of the resulting analytical data. A PM-10 air sampler which collects air particulate into two size fractions,
"fine" and "coarse" has been designed by W. Maenhaut of the University of Gent, Belgium, who was
contracted to manufacture and supply each participants in the CRP with a sampler.
The second research co-ordination meeting of the CRP was held at ANSTO, Menai, Australia, from
27 to 31 March 1995. The participants presented summaries of their work since the last RCM was held in
April of 1993. The meeting in Australia not only gave an opportunity for the CRP participants to present
their current results from their studies, but also to discuss strategies aimed at using the data that has been
collected during this CRP.
There were several important outcomes of the meeting. First, from the individual reports on the
status of each project within the CRP, there is beginning to be a "picture" from different parts of the world
about air particulate matter composition and variations with time. This is the first time such data has been
collected using one standard air sampler, to ensure comparability of the data. We will now start to assemble
a central database on the PM-10 analytical data. During discussions, there was a useful exchange of
information and experiences, and a reaffirmation of the definition of the core programme protocols and goals,
to be met by all participants in the CRP. The results of the first Quality Assurance exercise were presented
and the indications are that the quality of the analytical data on the whole was very good; there were no orders
of magnitude problems. There is also data from a significant number of participants on the performance of
fee PM-10 stacked filter unit air sampler, including comparisons wife other air samplers, and it was decided
to prepare a joint publication (the first of fee CRP) on the characterization of the PM-10 sampler. Finally,
there is being established a set of laboratories who have fee capability for reliably measuring inorganic
constituents in air particulate matter. This experience will be immediately useful when fee global air
standards start to change from a PM-10 standard to a PM-2.5 standard, as is already being considered by fee
U.S. EPA.
The meeting was attended by 17 of fee 18 current research agreement and contract holders, one
Agency staff member, and one consultant, as well as personnel from ANSTD. A complete list of fee
participants and fee agenda of fee meeting are given in fee pages immediately following this introduction.
The individual working papers that were presented at fee meeting are given in Part II as appendices.
A number of seminar (workshop) presentations were also made at fee meeting, either by invitation or were
proposed by fee participants. In general, most of fee workshop presentations dealt wife specific problems
that fee participants have encountered in feeir research, experience obtained in fee applications of analytical
techniques or other subjects related to fee CRP objectives. A list of these presentations is given at fee end
of the agenda. In addition to fee working papers presented at fee RCM, one of fee participants who was
unable to attend submitted a project summary, and this report (from Iran) is also included in Part II, Working
Papers.

After the presentation of the working papers and seminars, there was time for extensive discussion
among all the participants of the meeting. The discussions were guided, but not limited to, a list of the
discussion topics that was distributed at the meeting. The list of discussion topics, as well as the summary
of the discussions, are given as the final sections of Part I of this report.

SECOND RESEARCH CO-ORDINATION MEETING (RCM)FOR THE CO-ORDINATED RESEARCH PROGRAMME (CRP) ON
APPLIED RESEARCH ON AIR POLLUTION USING
NUCLEAR-RELATED ANALYTICAL TECHNIQUES
MENAI, AUSTRALIA, 2 7 - 3 1 MARCH 1995
LIST OF PARTICIPANTSDr. Rita Rosa PlaComlsion National de Energia AtomicaRadioisotopos y RadiationesAve. del Libertador 82501429 Buenos AiresArgentinaFax: + 54 1 480 0615Tel.: +54 1 480 0040Email: [email protected]
Dr. David CohenManager, Accelerator ApplicationsAustralian Nuclear Science and
Technology OrganizationLucas Heights Research LaboratoriesPrivate Mailbag 1, Menai NSW 2234AustraliaFax: + 61 02 7179265Tel.: +61 02 7173042Email: [email protected]
Dr. Mohammad KhaliquzzamanAtomic Energy Centre Dhaka4, Kazi Nazrul Islam Ave.P.O. Box 164Raman, Dhaka-1000BangladeshFax: +88 02 863051Email: [email protected]
Mr. Filip FrancoisInstitute for Nuclear SciencesUniversity of GentProeftuinstraat 86, B-9000 GentBelgiumFax: +32 9 264 6699Tel.: +32 9 264 6598Email: [email protected]. ac.be
Prof. Paulo ArtaxoInstituto de FisicaUniversidade de Sao PauloCaixa Postal 66318CEP 05389970, Sao Paulo, S. P.BrazilFax: +55 11 8186749Tel.: +55 11 8187016Email: [email protected]
Mr. Eduardo Cortes ToroComision Chilena de Energia NuclearAmunategui 95Casillia 188-DSantiago de ChileChileFax: +56 2 6991618Tel.: +56 2 2731827Email: e_cortes@reina. Ireina. cchen. cl
Dr. Yang Shao JinDepartment of Nuclear ChemistryInstitute of High Energy PhysicsAcademia SinicaP. 0. Box 2732BeijingPeople's Republic of ChinaFax: +86 1 8213374Tel.: +86 1 2563339Email: [email protected]. ac. en
Dr. Jan KuceraNuclear Physics InstituteAcademy of Sciences of Czech Republic250 58 Rez near PragueThe Czech RepublicFax: +42 2 6857003Tel.: +42 2 66412171Email: [email protected]
Prof. Ede KoltayDept. of Accelerator Development
and Applications, Inst of Nucl. ResearchHungarian Academy of SciencesP.O. Box 51, H-4001 DebrecenHungaryFax: +36 52 416181Tel.: +36 52 417266Email: [email protected]
Ms. Meenakshy VaidyanathanBhabha Atomic Research CentreEnvironmental Assessment DivisionTrombay, Bombay 400 085IndiaFax: +91 22 5560750Tel.: +91 22 5563060Email: magnum!erms@barct I.ernet.in
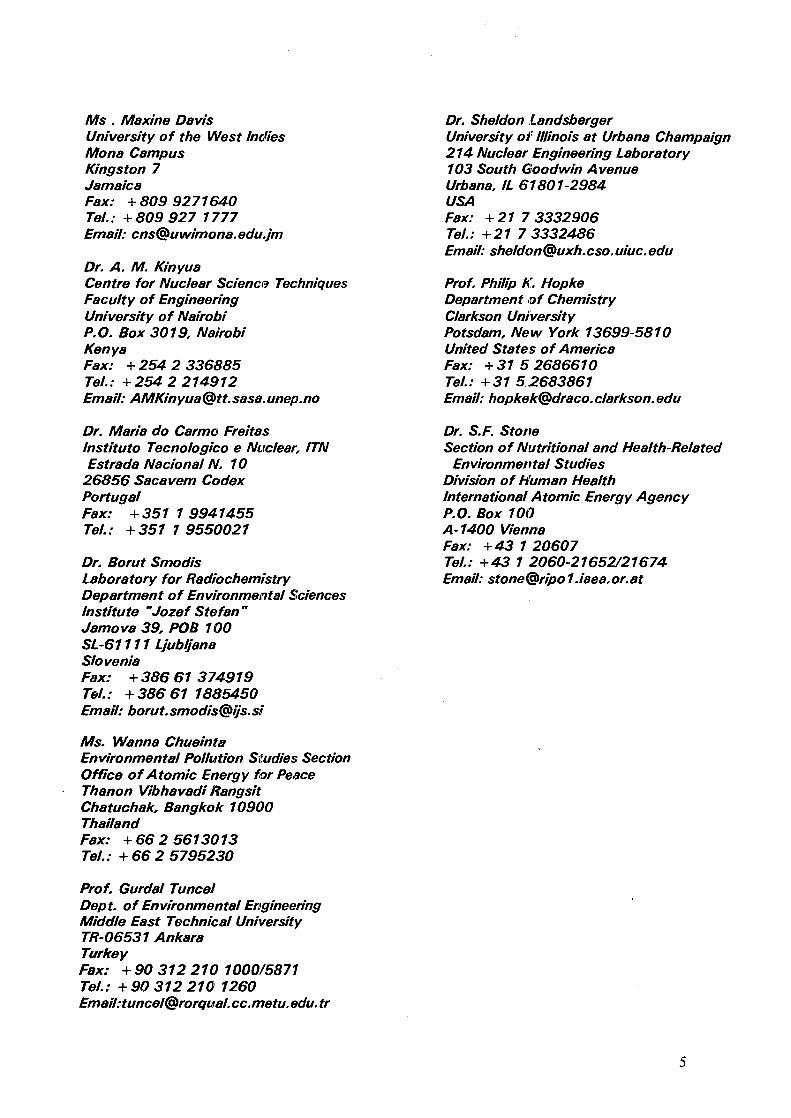
Ms . Maxine DavisUniversity of the West IndiesMona CampusKingston 7JamaicaFax: + 809 9271640Tel.: +809 927 1777Email: [email protected]
Dr. A. M. KinyuaCentre for Nuclear Science TechniquesFaculty of EngineeringUniversity of NairobiP.O. Box 3019, NairobiKenyaFax: +254 2 336885Tel.: +254 2 214912Email: [email protected]
Dr. Maria do Carmo FreitasInstituto Tecno/ogico e Nuclear, ITNEstrada Nacional N. 10
26856 Sacavem CodexPortugalFax: +351 1 9941455Tel.: +357 1 9550021
Dr. Borut SmodisLaboratory for RadiochemistryDepartment of Environmental SciencesInstitute "Jozef Stefan"Jamova 39, POB 100SL-61111 LjubljanaSloveniaFax: +386 61 374919Tel.: +386 61 1885450Email: [email protected]
Ms. Wanna ChueintaEnvironmental Pollution Studies SectionOffice of Atomic Energy for PeaceThanon Vibhavadi RangsitChatuchak, Bangkok 10900ThailandFax: +66 2 5613013Tel.: +66 2 5795230
Prof. Gurdal TuncelDept. of Environmental EngineeringMiddle East Technical UniversityTR-06531 AnkaraTurkeyFax: +90312210 1000/5871Tel.: +90 312 210 1260Email:tuncel@rorqual. cc.metu. edu. tr
Dr. Sheldon LandsbergerUniversity of Illinois at Urbana Champaign214 Nuclear Engineering Laboratory103 South Goodwin AvenueUrbana, IL 61801-2984USAFax: +21 7 3332906Tel.: +21 7 3332486Email: [email protected]
Prof. Philip K. HopkeDepartment of ChemistryClarkson UniversityPotsdam, New York 13699-5810United States of AmericaFax: +31 5 2686610Tel.: +31 52683861Email: hopkek@draco. clarkson. edu
Dr. S.F. StoneSection of Nutritional and Health-Related
Environmental StudiesDivision of Human HealthInternational Atomic Energy AgencyP.O. Box 100A-1400 ViennaFax: +43 1 20607Tel.: +43 1 2060-21652/21674Email: [email protected]

RESEARCH CO-ORDINATION MEETING (RCM) ONAPPLIED RESEARCH ON AIR POLLUTION USINGNUCLEAR-RELATED ANALYTICAL TECHNIQUES
AGENDA
MONDAY, 27 MARCH 1995
09:00 - 09:15 Registration
09:15-09:30 OPENINGWelcomeIntroductions
09:30 -12:00 SESSION 1 Chairs: Kucera J/Yang Shoo Jin,,
Adoption of the agendaStatus report on the Co-ordinated Research Programme andadministrative arrangements for the meeting (Stone SF)
PROGRESS REPORTS (Presentation of working papers, each 30 minutes)
Argentina Pla RRAustralia Cohen D
Bangladesh Khaliquzzaman M
12:00 - 14:00 Lunch/Banking arrangements
14:00 - 17:00 SESSION 2 Chairs: Cohen D/Davis M
PROGRESS REPORTS (continuation)
Belgium Francois FBrazil Artaxo PChile Cortes-Toro EChina Yang Shao JinCzech Republic Kucera J
TUESDAY 28 MARCH 1995
09:00 - 12:00 SESSION 3 Chairs: Freitas MC/ Chueinta W
PROGRESS REPORTS (continuation)
HungaryIndiaIranJamaicaKenya
Koltay EVaidyanathan MSohrabpour MDavis MKinyua AM

13:30-17:30 SESSION 4 Chairs: Koltay E/Kinyua AM
PROGRESS REPORTS (continuation)
Portugal Freitas MCSlovenia Smodis BThailand Chueinta WTurkey Tuncel GUSA Landsberger S
16:30 - 17:30 SESSION 5 Chairs: Pla RR/Vaidyanathan M
SEMINARS (see separate list)Hopke PKStone SF
WEDNESDAY 29 MARCH 199509:00 - 10:00 SESSION 7 Chairs: Pla RR/Vaidyanathan M
SEMINARS (continued)Khaliquzzaman MTuncel G
10:30 - 12:30 SESSION 8 Chairs: Cortes E/Artaxo P/Sohrabpour M
GENERAL DISCUSSION(See separate list of discussion topics)
12:30 - ?? Visit to Sydney (sightseeing), informal group dinner at the HarborReturn to Miranda by train in the evening
THURSDAY 30 MARCH 199509:00 - 13:00 SESSION 9 Chairs: Hopke PK/Khaliquzzaman M/Landsberger S
GENERAL DISCUSSION (continued)See separate list of discussion topics
14:00 - 17:00 Tour of ANSTO facilitiesReactor HIFARSIMS system10 MV TandemIBA PDXE systemSYNROC Plant
FRIDAY 31 MARCH 199509:00 - 9:30 Seminar by Dr. Claudio Tunis, "Accelerator Mass Spectrometry Techniques in
Pollution Studies"

10:00 -12:00 SESSION 10 Chairs: Francois F/Smodis B/Tuncel GGENERAL DISCUSSION (continued)
13:00 - ? SESSION 11 Chair: Stone SF
Final discussions/Report of the meetingCLOSING OF THE MEETING
LIST OF SEMINARS:
Hopke PK Results of the "Gent" PM-10 stacked filter unit characterization tests
Stone SF Trace element composition of air particulate matter in Vienna, Austria
Khaliquzzaman M Mono-standard method in PIXE
Tuncel G Chemical composition of precipitation in the Eastern Mediterranean Basin

RESEARCH CO-ORDINATION MEETING (RCM) ONAPPLIED RESEARCH ON AIR POLLUTION USINGNUCLEAR-RELATED ANALYTICAL TECHNIQUES
LIST OF DISCUSSION TOPICS
PURPOSE AND SCOPE OF THE CRP
1. The Core Programme
1.1 Does the Group agree with the present definition of the core programme?1.2 What are the priorities among the various topics that have been suggested?1.3 Are there any other topics that should be included?(Are any of the supplementary topics
so important that they should be elevated to the core programme?)
2. The Supplementary Programme
2.1 Does the Group agree with the present definition of the supplementary programme?2.2 What are the priorities among the various topics that have been suggested?2.3 Are there any other topics that should be included?
3. What are the expected benefits of this research?
3.1 For the participating countries?3.2 For science in general?
TECHNICAL ASPECTS
4. Selection of sampling sites and types of samples to be collected:
4.1 What were/are the criteria for the selection of sampling sites? Was it possible to followthe suggestions from the first RCM ?
4.2 Are two sites (urban residential and rural) enough for characterization in the coreprogramme?
4.3 What kinds of samples were collected (e.g. paniculate matter, precipitation, biomonitors,or combinations of these)?
4.4 Is the suggested number of samples per site enough over the period of sampling?
5. Sampling techniques and equipment
5.1 Is any additional advice needed on working with the Gent sampler? If problems cameup during use, is advice needed on possible solutions (i.e. volume meter)?
5.2 Did any problems arise when working with the Nuclepore filters (e.g. handling,weighing, etc.) that need to be discussed?
5.3 On the subject of filter blanks (i.e., the recent Br problem), does anyone have-suggestions on alternative sources of filters?
5.4 Should any other kinds of sampling device be provided by the Agency?5.5 How many participants are collecting biomonitors, and are others planning to expand
their activities to include this?5.6 How many participants are collecting precipitation samples, and are other planning to

expand their activities to include this?5.7 Are their any other kinds of sampling techniques or sampling devices that should be
recommended for the Group?5.8 How many participants are using air samplers in addition to the Gent sampler, and are
comparisons being made? Are such comparisons valid?5.9 Are there any comments on meteorological equipment or on data?
6. Analysis:
6.1 Is advice needed on any of the analytical techniques that are being used in the CRP?6.1.1 Are sensitivities adequate for the analysis of the air particulate samples using
the applied techniques (i.e. are participants able to obtain concentrations for areasonable number of elements using their applied analytical techniques)?
6.1.2 For techniques requiring dissolution, what dissolution methods can berecommended?
6.1.3 Were suggestions on sample preparation areas from the previous RCM able tobe followed? Does the Group think these were too sufficient/not sufficientenough?
6.2 Were the participants able to determine a significant number of elements on the list of"recommended elements"?6.2.1 How many participants are able to analyze "black carbon"? Has anyone taken
up the suggestion to obtain calibrated filters either from Gent or fromelsewhere?
6.2.2 How many participants are able to analyze for sulfur?6.3 Should any elements be more emphasized or any that should be added?
6.3.1 Analytes of interest in connection with health effects?6.3.2 Indicator elements for specific sources of pollution?
6.4 Is there a need to identify "reference analytical laboratories" for any particular analytesand/or techniques, and if so, what should be the function of such reference laboratories,e-g-6.4.1 As sources of specialized advice;6.4.2 To assist collection centres that otherwise do not have sufficient analytical
capacity (i.e. in order to be able to analyze more samples, or to determine moreanalytes);
6.4.3 For cross-checking of some of the analyses.
7. Data processing and interpretation:
7.1 What types of software are being used for database management, and what can berecommended (or not recommended)?
7.2 Data evaluation and presentation:7.2.1 What types of software are being used/which are recommended?7.2.2 What types of evaluations are being done(e.g. correlation, enrichment factors,
factor analysis)?7.2.3 Is there any advice needed on data evaluation and presentation?
7.3 Central data processing, i.e. reporting of the Gent sampler data to our central co-ordinator:7.3.1 Are there problems in transmitting the data to the central coordinator? If so,
what are some suggestions to facilitate sending (and receiving) the data?7.3.2 Of those who have already sent data, were the suggested formatting instructions
adequate?
10

7.3.3 Does the central co-ordinator have any comments?
8 Quality Assurance
8.1 How many of the participants have written protocols:
8.1.1 For sampling procedures?8.1.2 For sample preparation procedures?8.1.3 For sample analysis procedures?
8.2 What additional quality assurance procedures can be recommended for:8.2.1 Sampling and sample preparation?8.2.2 Analysis?
8.3 What is the opinion of the Group on the first quality assurance intercomparisonexercise?
8.4 Should another such intercomparison exercise be organized?8.4.1 Of the same sample type (air particulates on filters)?8.4.2 Of another type of sample (e.g. biomonitor, precipitation)?
8.5 Have participants adopted any quality assurance procedures for "in-house" use?
9. Miscellaneous Topics (Looking toward the future)
9.1 Are there any new methods or new analytical techniques that might be applied to thesamples collected in our programme (e.g. solid sampling electrothermal AAS)?
9.2 Use of data to estimate transport and dispersion of air pollutants:9.2.1 How many participants are doing this, or plan to do this?9.2.2 If so, what kind of software is being used?9.2.3 Where can additional information be obtained for this?
9.3 Occupational Health - monitoring of air in the workplace environment:9.3.1 What experiences from this CRP could be applied to such monitoring?9.3.2 What experiences do participants have in such monitoring?9.3.3 What advice would these participants have in beginning a programme of such
monitoring?
ORGANIZATIONAL ASPECTS
10. Funding: have participants found additional sources of funding their researchprogrammed?
11. Co-operation with others: what suggestions are there making or improving co-operationwith others:
11.1 In this CRP (between participants)?11.2 Nationally?11.3 Internationally (e.g. UNEP, WMO, WHO, etc.)?
12. Technical co-operation projects and training: are there any suggestions for futureactivities?
13. Information exchange within the CRP - how can this be best promoted?
11

14. Expert meetings and publications: are there any suggestions for future activities?
15. Publications policy for work done within the framework of the CRP: is the policy adoptedat the previous RCM acceptable?
16. The next RCM: where and when should this be?
12
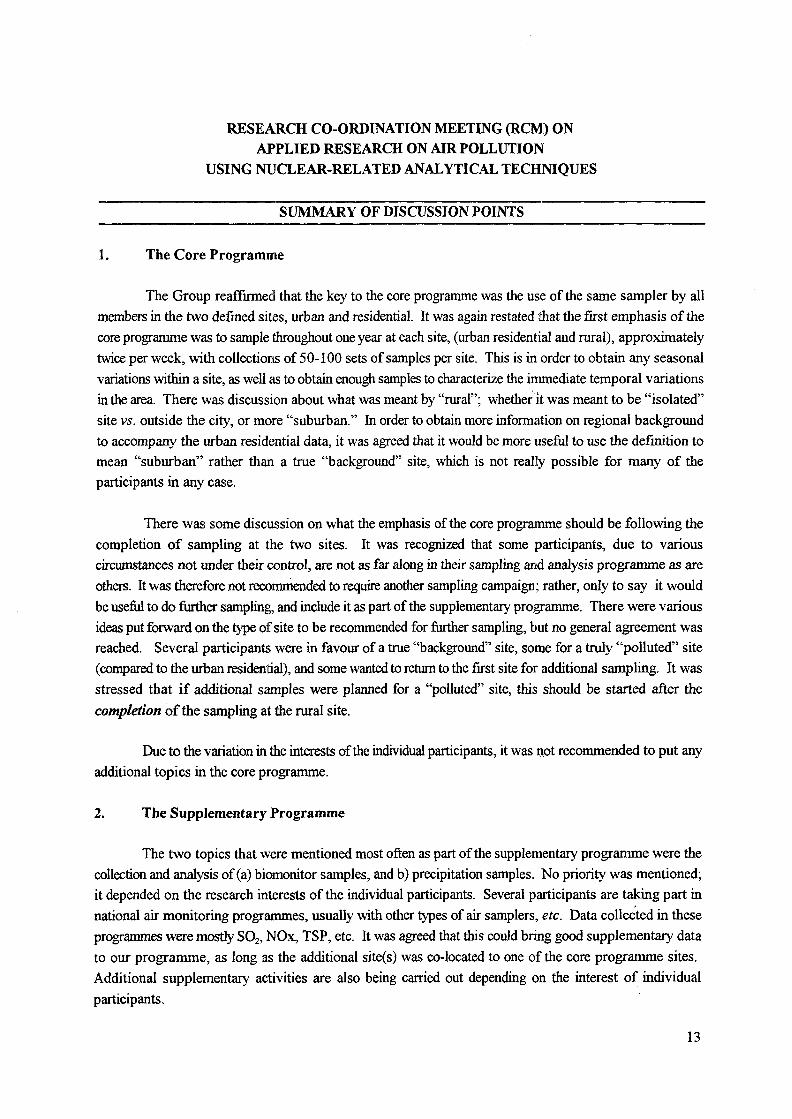
RESEARCH CO-ORDINATION MEETING (RCM) ONAPPLIED RESEARCH ON AIR POLLUTION
USING NUCLEAR-RELATED ANALYTICAL TECHNIQUES
SUMMARY OF DISCUSSION POINTS
1. The Core Programme
The Group reaffirmed that the key to the core programme was the use of the same sampler by all
members in the two defined sites, urban and residential. It was again restated that the first emphasis of the
core programme was to sample throughout one year at each site, (urban residential and rural), approximately
twice per week, with collections of 50-100 sets of samples per site. This is in order to obtain any seasonal
variations within a site, as well as to obtain enough samples to characterize the immediate temporal variations
in the area. There was discussion about what was meant by "rural"; whether it was meant to be "isolated"
site vs. outside the city, or more "suburban." In order to obtain more information on regional background
to accompany the urban residential data, it was agreed that it would be more useful to use the definition to
mean "suburban" rather than a true "background" site, which is not really possible for many of the
participants in any case.
There was some discussion on what the emphasis of the core programme should be following the
completion of sampling at the two sites. It was recognized that some participants, due to various
circumstances not under their control, are not as far along in their sampling arid analysis programme as are
others. It was therefore not recommended to require another sampling campaign; rather, only to say it would
be useful to do further sampling, and include it as part of the supplementary programme. There were various
ideas put forward on the type of site to be recommended for further sampling, but no general agreement was
reached. Several participants were in favour of a true "background" site, some for a truly "polluted" site
(compared to the urban residential), and some wanted to return to the first site for additional sampling. It was
stressed that if additional samples were planned for a "polluted" site, this should be started after the
completion of the sampling at the rural site.
Due to the variation in the interests of the individual participants, it was not recommended to put any
additional topics in the core programme.
2. The Supplementary Programme
The two topics that were mentioned most often as part of the supplementary programme were the
collection and analysis of (a) biomonitor samples, and b) precipitation samples. No priority was mentioned;
it depended on the research interests of the individual participants. Several participants are taking part in
national air monitoring programmes, usually with other types of air samplers, etc. Data collected in these
programmes were mostly SO2, NOx, TSP, etc. It was agreed that this could bring good supplementary data
to our programme, as long as the additional site(s) was co-located to one of the core programme sites.
Additional supplementary activities are also being carried out depending on the interest of individual
participants.
13

3. Expected Benefits of the Research
Several participants indicated that the data from the programme would be used by their nationalgovernments as a basis for regulations on air quality standards, since there are no regulations for traceelement content in air paniculate matter, except in some cases for Pb. It was indicated that the sourceapportionment information would be interesting to government regulatory agencies.
Many participants stressed that the health aspects of the research results should be emphasized, that
the fine particles are the most important and damaging to human health. An important point was made: if
governments decide on a PM-2.5 standard (vs. just PM-10 or TSP), then the participants in our group would
have the expertise! It was noted that many countries follow the standards set by the U.S. EPA. Currently,
a PM-2.5 standard is being seriously discussed in the U.S. EPA, but not yet decided upon.
4. Site selection
The Group had already clarified the definition of the "rural" site (see above). It was recognized that
it was not always possible to follow the recommendation of placing the inlet 2 m above ground (for security,
power or whatever reasons). P.K. Hopke thought that there should only start to be a reduction in the coarse
particle mass vs. "ground" if the sampler was at 10 -15 m above the ground, so small variations in the height
should not be a problem. More important than just a site definition, is that the location of sites, both rural
and urban, be well described. Especially in the urban site, one should look in all directions, and make note
of landmarks, and possible sources that might affect the air particulates {e.g. highway to the West,
incinerator to the North, park to the Southwest, etc.). More guidelines about site selection are available from
P.K. Hopke (EPA guidelines) and G. Tuncel (WMO guidelines).
The duration of the sampling at each site was again reaffirmed to be throughout one year for each
site, in order to obtain enough information to characterize the sites. It is recognized that it will be more
difficult to obtain samples at the rural site compared to the urban one, due to increased difficulty in reaching
the site, and probably increased sampling times. On the sampling times, it was suggested that instead of
going by a strict time {e.g. 48 hours), one should look at the flow rate drop {e.g. 18 lpm to 16 lpm) in order
to obtain enough mass loading on the filters. If the flow rate goes from 18 lpm down to 17.5 1pm, there
probably would not be enough mass loading. However, longer sampling times makes factor analysis more
difficult, due to wind shifts. Sources will be much harder to identify. The conclusion was that the sampling
times should be as short as possible to obtain the information needed, but not too long. It was stressed that
it is important to analyze a few samples from the rural site as early as possible, and adjust the sampling
times accordingly.
For the meteorological information, it was decided that wind direction, wind speed, and precipitation
information are important to record. Rain doesn't appear to change the amount of fine particles, however
there is some effect on the coarse particles. Local airports usually have wind data being recorded constantly;
the usefulness of this data to a particular sampling site depends on the distance away, and the terrain between
the airport and the site. Usually, a distance of 5 -10 km is acceptable, if the terrain is fairly flat. G. Tuncel
14

uses the prevailing wind of the day. P. Artaxo measures in 2 vectors. S. Landsberger suggested the use of
a wind rose, recording how often the wind occurred in certain directions.
5. Sampling
There was discussion on possible errors in the recording of the air volume sampled. P. Artaxo's data
shows that there may be up to 20% measurement variation in the volume meters; therefore, the volume
meters must be calibrated regularly. Many of the volume meters were checked at the beginning of the CRP,
before being shipped, but not all of them. This can be done using a precision dry gas meter that measures
flow rate. Suggestions about where these might be found: at meteorological institutes (universities) or gas
companies.
It was stressed, before sampler use, to make sure that the filters are well-seated into the filter holder,
and also to make sure that the impactor surface is regularly cleaned and well-greased. This will minimize the
bounce-off problem. How often this should be done depends on the loadings involved. If there are high
loadings, the cleaning needs to be done more often, perhaps weekly. Suggested grease to be used: Apiezon,
Vaseline, something with a low trace element blank.
On the topic of filter blanks, there was a quick review of the current problem of increased blank
levels in the new batches of Nuclepore filters, especially for Br. P.K. Hopke has now tested three batches
of Nuclepore filters, the last batch still being 3-4 times higher than the previous "good"batches. He has also
tested polycarbonate etched filters from Poretics, but there was no difference in the blanks. There is still
another type from Fisher that can be tested. F. Francois has looked into Cyclopore filters from Whatman;
however, these filters are not for aerosol use only (as are the Nuclepore filters), are more hydrophilic, and are
not coated with Apiezon. The Br problem, of course, will affect the NAA people a little more than those
using PIXE/XRF, since the high Br will affect the determination of all intermediate-lived nuclides. For PIXE,
there might be a problem with the L line of Al (P. Artaxo says that he does not report AI values, partially for
this reason). If a "clean" batch of filters is eventually found, it was asked if the Agency could buy up a large
number from the tested batch .The problems of doing this quickly enough within the Agency structure were
explained.
It was again stressed that there are two types of Nuclepore filters; aerosol quality filters, and a lower
quality filter, which is much dirtier (used for biological or water analyses). As long as participants use the
correct order number given in the instructions on the use of the air sampler, these are the correct aerosol
quality Nuclepore filters.
On the biomonitor and precipitation samples, it was found that most of the participants are taking
one of these types of samples in addition to the PM-IO samples (about half and half ratio, though a few are
taking both types). The difficulties of handling precipitation samples was stressed.: it is imperative to have
at least a clean bench, if not a clean room for sample preparation. Also, for NAA, one would need to pre-
concentrate somehow (freeze-dry, etc.). The use of AAS, ICP-MS or TRXRF would probably be more suited
for these analyses.
15

• • /
For other useful information, aerosol size distribution would be good additional information for the
sites. This could be done using a cascade impactor sampler. About 10 collections over a year would
probably be enough to characterize a site, because the size distribution should not vary too much over a year,
but enough to get the information about the absolute variation. SEM could also be used, but one would need
to drastically decrease the mass loading to do electron microscopy, or else the particles would be stacked on
top of one another. One would also have to do about 700 particles per filter, and again 10-15 filters per site
to get the information about absolute variation. For EM, graphite coating can be used to attain conductivity
instead of gold, if the filter is to be used later for trace element analysis (but keep in mind that the mass would
be a lot lower).
It was found that about 7 of the participants have done some sort of comparison studies of other
samplers to the Gent sampler. P.K. Hopke agreed to combine the data for a paper on the characterization of
the PM-10 sampler. He asks for the RAW data, and a date of 1 May was decided upon as the deadline to
send comparison data, so he could draft the paper as soon as possible, and "get it back for review. If more
participants want to do comparison studies, it was requested to try to do about 10 samples per comparison
site to obtain valid comparisons.
6. Analysis
For increased quality assurance for comparative data, it was stressed that the best would be to dothe analyses the same way every time. For example in PIXE, if a different person does the analysis, there maybe differences in how the background is fitted, etc. P. Artaxo stresses it is important in PIXE, at least, to doall samples in a set within a short time {e.g. he can do 100 samples in 2-3 days).
There was some discussion on the use of XRF, and there was a difference of opinion on how useful
XRF is for these air filter sample. Many of the participants expressed doubts about the detection limits for
XRF; that they would be too high in many cases to obtain enough useful information. However, A. Kinyua
indicated that although he needs to count for longer times (overnight), he can still obtain information on 8-10
elements. J. Kucera pointed out that his comparison analyses showed much higher uncertainties for the XRF,
even from air filters from polluted regions. It was also stressed that there is a big difference in using source-
excited vs. tube-excited XRF; with tube-excitation, the sensitivity should improve about 2-10 times.
Among the participants who do some sort of filter digestion, it was stressed that to do it properly,
one needs a Class 10 clean room, and distillation apparatus for cleaning and to distill the acids for digestion.
G. Tuncel uses the filter digestate to determine Pb and Ni only; and uses twice distilled nitric acid, which is
enough to solubilize the species of these two elements. E. Cortes uses the method described by Alt, F., et.
al. [Fresenius J. Anal. Chem. (1993)346:693-696].
In ion chromatography, water-soluble ions are much easier to determine. Criticism of IC: PIXE (S)
and IC(Sulfate) agreed in US samples with a correlation of 0.96 or 0.97. The recovery of S, Cl, Br should
be good. Usually for "major" amounts, the nitrate, ammonium, sulfate and chloride numbers should be
acceptable. In a study from the Belgium group, in comparing PIXE and IC, IC was found to be consistently
10% lower.
16

The results of a quick inquiry showed that clean hoods or, at the minimum, defined clean areas are
being used by all participants present.
It was already indicated during the first RCM that it was important to measure black C in the
samples; however, only four participants are currently doing this. P. Artaxo described his reflectance
measurements and will send the information about the instrument to the Agency's Technical Officer for
distribution to interested participants. There are several methods of calibration available, a) direct
comparison to P. Artaxo's instrument (as he did for Chile), b) W. Maenhaut's offer of a calibrated filter, c)
absolute calibration using the burning of acetylene, but this is operationally defined and can be off by 25%.
It does, however, give useful relative information even if an absolute calibration has not been done. It should
be mentioned that black carbon measurements can only be done on the fine particle fraction.
For S measurements, only three participants do NOT have the capability to do S measurements.
NAA people, who don't have Ion Chromatography available, can't really do it to better than 20% because of
isotopic fractionation (+/-15%). However, the relative numbers would probably be good.
For Pb measurements, it was noted that nitric acid is usually enough to get Pb in solution, but one
must be concerned about the acid blank. Four of the participants cannot do Pb in own group and would have
to pay someone for the analyses, which is a problem. P. Artaxo will present a comparison at the next meeting
of Pb by ICP-MS vs. PEXE. He will NOT digest the filters; rather, he will determine elements in the soluble
fraction.
The list of priority elements that was distributed after the first RCM was reviewed, and some
elements were recommended to be removed from the list. These were: Mo, Sn, I, and Hg, because of
analytical difficulties or (for Hg) difficulties in interpreting the results.
The idea of having reference laboratories was received well in principle. However, since some sort
of financial support would be needed to accomplish this, the idea was declared as not feasible at this time.
The idea of circulating one filter around was not received very well. It was decided that another
intercomparison exercise would give much better information.
7. Data processing and interpretation
Among the participants, three types of software are being utilized: Excel, QuatroPro or Lotus. Most
participants also have some sort of statistical package, StatGraphics, Statistica, SCSS, etc.; only two
participants do not. It was noted that the cost of a reasonable statistics package was about $800 - $900, and
also that StatGraphics does most of needed statistical tests. It was also suggested that one can already do
significant statistics using just the spreadsheet programs. It was recommended that two types of exploratory
plots should be done with the datasets: 1) A time series plot for each element and 2) a set of Scatter plots
(element vs. element) for each element, and for fine and coarse fractions separately. In this way, one can find
points that seem strange (outliers).
17
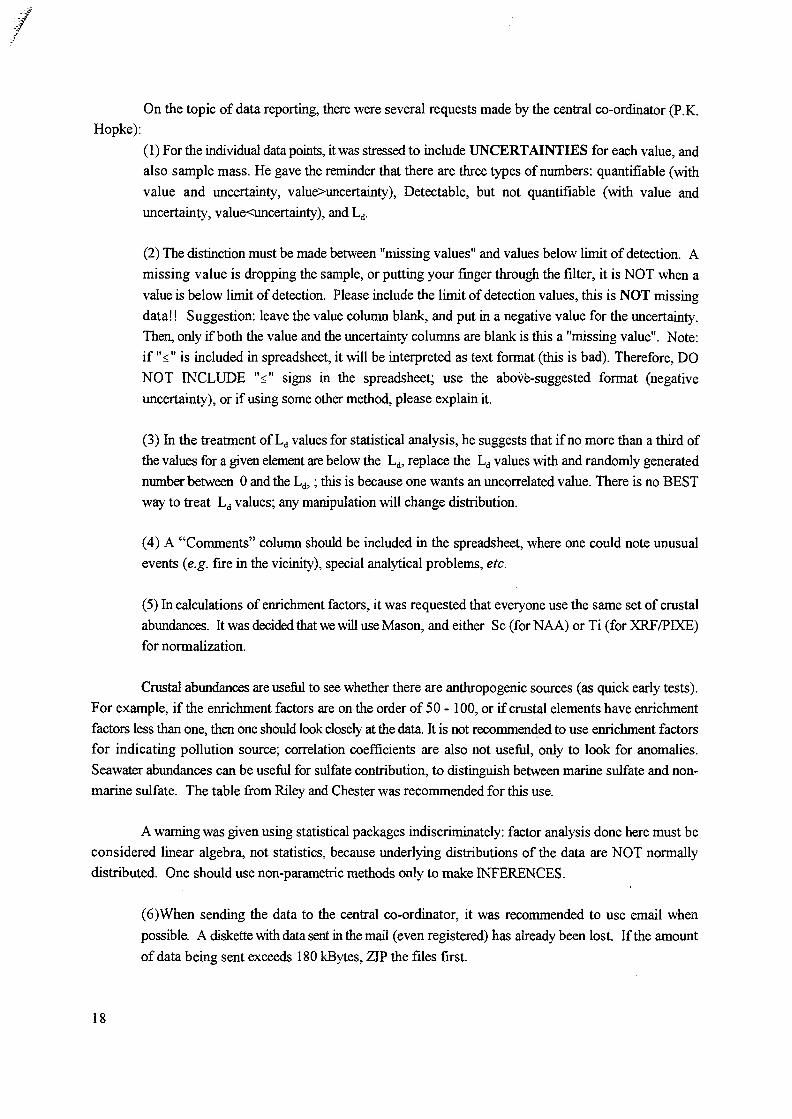
On the topic of data reporting, there were several requests made by the central co-ordinator (P.K.
Hopke):
(1) For the individual data points, it was stressed to include UNCERTAINTIES for each value, and
also sample mass. He gave the reminder that there are three types of numbers: quantifiable (with
value and uncertainty, value>uncertainty), Detectable, but not quantifiable (with value and
uncertainty, value<uncertainty), and Ld.
(2) The distinction must be made between "missing values" and values below limit of detection. A
missing value is dropping the sample, or putting your finger through the filter, it is NOT when a
value is below limit of detection. Please include the limit of detection values, this is NOT missing
data!! Suggestion: leave the value column blank, and put in a negative value for the uncertainty.
Then, only if both the value and the uncertainty columns are blank is this a "missing value". Note:
if "<" is included in spreadsheet, it will be interpreted as text format (this is bad). Therefore, DO
NOT INCLUDE "<" signs in the spreadsheet; use the above-suggested format (negative
uncertainty), or if using some other method, please explain it.
(3) In the treatment of Ld values for statistical analysis, he suggests that if no more than a third of
the values for a given element are below the Ld, replace the Ld values with and randomly generated
number between 0 and the Ld,; this is because one wants an uncorrelated value. There is no BEST
way to treat Ld values; any manipulation will change distribution.
(4) A "Comments" column should be included in the spreadsheet, where one could note unusual
events (e.g. fire in the vicinity), special analytical problems, etc.
(5) In calculations of enrichment factors, it was requested that everyone use the same set of crustal
abundances. It was decided that we will use Mason, and either Sc (for NAA) or Ti (for XRF/PIXE)
for normalization.
Crustal abundances are useful to see whether there are anthropogenic sources (as quick early tests).
For example, if the enrichment factors are on the order of 50 - 100, or if crustal elements have enrichment
factors less than one, then one should look closely at the data. It is not recommended to use enrichment factors
for indicating pollution source; correlation coefficients are also not useful, only to look for anomalies.
Seawater abundances can be useful for sulfate contribution, to distinguish between marine sulfate and non-
marine sulfate. The table from Riley and Chester was recommended for this use.
A warning was given using statistical packages indiscriminately: factor analysis done here must be
considered linear algebra, not statistics, because underlying distributions of the data are NOT normally
distributed. One should use non-parametric methods only to make INFERENCES.
(6)When sending the data to the central co-ordinator, it was recommended to use email when
possible. A diskette with data sent in the mail (even registered) has already been lost. If the amount
of data being sent exceeds 180 kBytes, ZIP the files first.
18

(7) Finally, please send the data a bit at a time, don't wait until the end and send it all at once! For
those whose data has already been received, feedback approximately in early June.
8. Quality Assurance
Most of the participants have written protocols for sampling and sample preparation procedures, less
have ones for the analytical procedures. Everyone appears to be using log sheets for records of the air
sampling.
From recommendations due to experiences from several of the participants, if starting with new or
updated software, it is important to use an old data set for quality assurance.
The opinion was generally positive on the first quality assurance exercise (both on part of
participants and on the organizer). It was noted that there needs to be more work on the analysis of the data
and on interpretation of the results. This will be done by the organizer with the help of some volunteers by
the end of May. Another intercomparison exercise was requested, though the details of how this would be
done still need to be decided upon.
9. Miscellaneous Topics (Looking toward the Future)
There were several modeling programs suggested to be used for estimating transport and dispersion
of air pollutants. For trajectory models, the EPA dispersion models (public domain programs) were
recommended, which works on the PC. There are also gaussian plume models for small urban scale
modeling, but one needs an estimate of stack height.
There are several types of long-range transport models. The first type assumes constant pressure
in atmosphere (isobaric trajectory model) interpolated wind fields in 3 dimensions; directions as a function
of altitude. P.K. Hopke has "Hefter" and "HiSPlit" (from NOAA), which both require a fairly extensive
database (probably need a national database for supplementation). They also require the raw data. One must
pre-process the data in a certain way, and the program then uses the pre-processed data.
The second type of model assumes a constant geopotential temperature (isotropic model), and
assumes adiabatic conditions, constant entropy. This type of model is used to look at transport of China dust
to Hawaii, for example. P.K. Hopke does NOT have this model. The problem is that you have to choose a
pressure, and complex terrain makes it difficult!! 925 mBar at 600 m above ground is typical (but in
mountainous regions, 600 m would run into the mountains!).
It was noted that G. Tuncel has available pre-processed data for the Europe region (Hefter's model)
for Greenland to mid-Africa for the years 1993,1994, and soon for 1992.
It was recommended that local scale dispersion models may be simple enough to be of use to the
participants in the CRP. P.K. Hopke will send them to the technical officer; manuals might be on disk; he
19
-.y
will also try to send an introduction to transport modeling. This will only be useful for rural regional sites,
and ONLY if dominated by LONG-range transport (NOT if dominated by LOCAL transport).
There were several notations and precautions given by various participants with regards to using
these modeling programs. For rural sites, it was noted that back trajectory data is important. One
participant thought that most of models are too complicated in their data handling, and that to make good
use of them one also needs a good EMISSION inventory. However, it was considered a useful exercise for
planning sampling strategies. It was also noted that a number of people are trying to do long-range transport
modeling, e.g. in Germany and Norway.
On the subject of occupational health studies, it was pointed out that most current studies concerned
with indoor monitoring are concerned with volatile organic compounds (VOC's), not trace elements.
Occupational health studies involving trace elements are probably only good for looking at specific analytes
(Pb, Sn, etc.), not for doing general studies, and BOTH organics and inorganics need to be studied; trace
elements alone are not meaningful. The general consensus was that in the workplaces in developing
countries, safety and acute problems are probably more important than chronic problems, and therefore, this
would be a difficult topic for an IAEA CRP.
Several participants do have some experience in such studies. Among them: In the Czech Republic,
there is a V2O5 production plant study, where V is being determined in air particulates, hair, nails, blood, and
urine. In addition, biochemical, haematological, immunological, and genotoxicological parameters are being
investigated in exposed workers and in children living in the vicinity of the plant. In Malaysia, there was a
joint study to try to determine factors affecting nasal cancer (where the rate for this cancer is very high).
Formaldehyde, and trace elements correlations were checked, but nothing correlated. It was noted that one
just can't go into any workplace for sampling as 20 years ago. One needs more sophistication and more time.
In Malaysia, it took more than 2 years to get through all the red tape. The groundwork is MUCH more
complicated than it used to be. In Kenya, there has been monitoring of blood from battery factory workers,
and in India, Pb measurements in children's blood. In Slovenia, Hg and Pb smelters are specific problems.
Studies involving a U mine have also been done there. In Thailand, the Pollution Control Board requested
measurements of some arsenic samples from a residential area near a mine.
It was noted that the problem with most of these studies is usually lack of epidemiological data; e.g.
in an area near a U mine there were only an exposed population of 100; this is too small for an
epidemiological study (one can't distinguish cancer, etc. from other sources). One also may not know the
health status to begin with, so it is difficult to make correlations. In addition, the exposed population is
usually too small to do statistical analysis.
The suggestion was made that it might be easier to get into private homes vs. industries, and one
could study indoor air pollution in general. (What is the effect of urban pollution on indoor air?) hi
developing countries, cooking aerosols (open fires, low-quality coal) would play an important role. Other
advice given was to focus on the specific pollutants the industries are likely to produce. Therefore, one should
have less general sampling; and the analyses should be element- or species-specific, hi some cases, nuclear
methods would be acceptable, or even the method of choice, but not in all cases {e.g. VOC's, Pb).
20

Several of the participants commented on the marked increase of expertise in the current CRP
compared to the previous one (on Solid Waste); i.e. a great improvement in analytical expertise. It was
strongly suggested that the follow-up CRP to this one be one on rainwater as it is a logical extension, and
would again more challenging. Also suggested was a CRP concentrating on more extensive data analysis
from these data and similar data.
There was an extensive discussion on how air quality standards are developed in the U.S. This is
done through "Criteria Documents" and health effects of pollutants are the scientific basis of the regulation.
(Remember: The U.S. EPA is there to protect the public health, not to protect the environment). For history,
the TSP standard was passed in 1972, and in 1987, the PM-10 standard was passed: 50 ug/m3 annual
average, 150 ug/m3 not to be expected to be exceeded more than once per year, with a 3 year rolling average.
Pb and As have not yet been revised; these regulations are still only in TSP. The current concern is that
environmental epidemiological studies show an increase in respiratory-related problems with an increase of
air particulates, with a better correlation with PM-2.5 vs. PM-10. The problem is how to define respiratory-
related problems, and to show that they are related to PM vs. the trace element concentrations or the ozone
or the acidity, etc. Should the regulations be PM-2.5? PM-1? In addition, EPA is talking about decreasing
the limit from 50 ug/m3 down to 30 ug/n!. This probably is too low to be accepted; it would be very
difficult to approve. There needs to be a "reasonable margin of safety" in the regulations, which is hard to
define. However, "correlations" have been noted between fine particles and increased respiratory problems
at 10-30 ug/m3. Cause and effect still needs to be proven with case controls (the studies will have to
determine what people have been exposed to).
10. Funding
Funding is a problem this year for almost everyone, hi the U.S., even the DOE Global Change
program has been cut, which will severely affect the participants from the U.S. It was noted that
participating in this CRP helps the participants to obtain additional funds from government (used as a
justification).
11. Co-operations
There were no new co-operations to report on.
12. Technical co-operation projects and training
On training: S. Landsberger informed the group about a proposal on a group fellowship (IAEA)
training at Illinois. The decision on funding this group fellowship has not yet been made.
13. Information Exchange within the CRP
It was definitely agreed that email is fast becoming the MOST convenient and quick method of
communication. P.K. Hopke is currently writing an introduction on "surfing" the Internet; when it is done,
21

it will be sent to the technical officer and be forwarded to interested participants. It was suggested that we
could set up a web site to deposit data, papers, and to leave messages for other members of the CRP.
Currently, about 13 of us currently have email, and 3 others expect to be connected shortly. Almost
everyone is "planning" to get on or will get access "occasionally". More exploration of the logistics of setting
up a Web site will be done. We will need Hyperlinks; conversion programs are available to convert to the
correct format An alternative idea is that we could set up LIST though it not known if we have the capacity
for this.
14. Expert meetings and conferences
In the report of the 1988 expert meeting, a conference on air pollution was discussed. The main
emphasis was to be on trace elements, but NOT limited to nuclear methods. Argonne may be interested in
co-sponsoring the conference, if it would be on sampling and analytical methods.
15. Publications
The participants were urged to publish their results in appropriate journals; it helps both theindividual and the group. There were several suggestions on possible joint publications, the first being onthe evaluation of "Gent" PM-10 SFU sampler. P.K. Hopke volunteered to draft the paper, with data beingcontributed by 6-7 participants. The second joint publication suggested was on comparative exposure datafrom 20 cities around the world. It was again noted as in the first RCM, that if participants do publish theirown data, they should acknowledge the Agency's support.
16. Next RCM
Several of the participants proposed to look into the possibility of holding the next RCM. Among
them were G. Tuncel ( METU, Ankara, Turkey), J. Kucera (Prague, Czech Republic), and, jointly, P.K.
Hopke and S. Landsberger (USA). The suggestion most well-received, however, was that from M. Davis
(Jamaica). The proposed date for the next meeting was October 1996.
22
XA0102870
Appendix 1
STUDY OF AIR POLLUTION IN BUENOS AIRES CITY
R.R.Pla (*), M.AMoreno (*), V.Tafuri (**), G.S.Custo (***), M.Adler (****\
(*)Comisi6n Nacional de Energia Atomica, Gcia.de Area de Radioisotopos y Radiaciones.Av.del Libertador 8250, (1429) Buenos Aires, Argentina.
(**)Servicio Meteorologico Nacional, INQUIMAE, Ciudad Universitaria, Pabellon II,Buenos Aires, Argentina.
(***)Comisi6n Nacional de Energia Atomica, Gcia.de Investigacion y Desarrollo. Av.delLibertador 8250, (1429) Buenos Aires, Argentina.
(****)Facultad de Ciencias Exactas, Fisicas y Naturales, Departamento de Biologia, CiudadUniversitaria, Pabellon II, Buenos Aires, Argentina.
ABSTRACT
The work performed since 1993, on the study of the elemental profile of Buenos Airesatmosphere is presented. Both, aerosol direct sampling and biomonitors have been used,and the samples have been analized mainly by Instrumental Neutron Activation Analysis(INAA). Due to problems with XRF, Anodic Stripping Voltammetry has been chosen forlead determination and Ion Chromatography for soluble anions. For aerosol directsampling, analytical and sampling methods are described, as well as the sampling campaigns.Experiments have been performed for studying differences between day/night elementalconcentrations along the week and a possible seasonal dependence. Some results of massconcentrations and others from INAA are presented. Sampling with the "Gent sampler"began during August 1994 at an urban residential area of the city. The results of massconcentrations for the first 28 pairs of samples are shown, together with some INAAresults, being this the only technique used for the analysis. Lichens and tree bark were thechosen biomonitors. Sampling and analytical methods by INAA are exposed, presentingsome of the results that have been obtained. The participation in the aerosol analysis for theUshuaia Global Atmospheric Watch Station is also commented.
CORE PROGRAM
INTRODUCTION
Although Buenos Aires is not often mentioned as an example of a very polluted city, thereason might be that until very recently no full attention has been given to the environmentalsituation. Buenos Aires and its surroundings are showing the problems of a huge city with
1-1
nearly one third of the population of the country and a great percentage of its industry,vehicle circulation being considered the most serious source of contamination. This projectis the first attempt to obtain information about the elemental profile of the city atmosphere.
During 1993, the first year of this research contract, sampling was conducted at twosites within the city limits: "site A" with medium / low traffic and "site B" with highervehicule circulation. Sampling was carried out for 12 hour periods with 0.4 \im Nucleporefilters (47 mm diameter), on open front filter holders, at an aproximate flow rate of 10L/min. Samples were taken once a week (weekday) and meteorological broadcast was takeninto account for planning the experiment. Instrumental neutron activation analysis (INAA)was used for determining the concentration of As, Br, Co, Cr, Eu, Fe, La, Na, Rb, Sb andSm, for twenty five samples from the two sites. In accordance with the supposition ofvehicule circulation as the most important pollution source, very high values of bromineenrichment factors were observed. These analysis mainly allowed to optimize samplingprotocols and determination methods for several elements. Due to different reasons, thesampling sites were changed, starting a different sampling agenda. Presently, INAA is beingused as the main analytical technique and for lead determination, an electrochemistrytechnique has been chosen. This decision was taken due to problems in using XRF. In addi-tion some samples are being examined by Ion Chromatography (IC).
During 1994, sampling with the "Gent sampler", the stacked filter unit provided byIAEA, began and up to now, forty two pairs of filters have been taken on a twice a weekbasis. The only analytical technique currently used is INAA, following the same analyticalmethods used for the direct sampling 0.4 um filters.
SAMPLING METHODS
For the samplers other than the Gent one, sampling is done using Nucleopore filters (47mm diameter, pore size 0.4 urn) on open front filter holders, for INAA and IC, protected bya plastic bucket. For lead determination, sampling is done on Millipore filters, of pore size0.45 um and 47 mm diameter. The filters are stabilized at balance room conditions for atleast 24 hours, weighed and sent to sampling places, on the filters holders, in plastic bags.After the end of sampling they are returned to the laboratory for being weighed andanalyzed. Mass concentrations are calculated.
ANALYTICAL METHODS
Instrumental Neutron Activation Analysis (INAA):Once weighed, the filters are folded in a standardized way and put into quartz ampoules.
These are sealed and irradiated in aluminum capsules at the RA-3 reactor (thermal flux3-1013 cm2-s', 4.5 MW) of the Ezeiza Atomic Center, for 5 hours. After the irradiation,the capsules are opened and the ampoules are frozen in liquid nitrogen and cut, transferringthe samples into new plastic vials. The measurements are carried out using a hyperpure Gedetector of 1,9 keV resolution for the 1332.5 keV * Co peak, coupled to a Series 85Canberra multichannel. Two measurements are done after decay times of 7 days and 3-4weeks determining: As, Ba, Br, Ce, Co, Cr, Cs, Eu, Fe, FJf, Hg, K, La, Lu, Na, Rb, Sb, Sc,
1-2

Sm, Ta, Tb, Th, U, Yb and Zn. The spectra are processed using a software developed at thelaboratory. Certified materials from NIST and IAEA are used for quality control and goldfoils as flux monitors.
Ion Chromatography (IC):This analysis is performed at the Air Pollution Center of the Meteorological Service for
major anions (sulfate, nitrate, chloride).
Anodic Stripping Voltammetry (ASV):Due to the necessity of dissolving the filters, different kinds were tested and cellulose
acetate filters were chosen. The dissolution method is as follows: the filter is placed in a di-gesting teflon bomb of 45 ml and 1 ml H2SO4 is added. The bomb is heated in a microwaveoven for 1 min and then is allowed to rest for 5 min. This is done twice, 2 ml HNO3 areadded and four more heating/resting cycles as the one described, are performed to ensurecomplete dissolution. Then 50 ml of bi-distilled water is added to the sample to complete avolume of 50 ml. A PAR 174A polarograph with mercury settled drop electrode, Beckman39016 is used for the analysis. The polarographic cell is a three electrode type, being the ref-erence electrode one of Ag/AgCl and the auxiliary electrode a platinum one. The cells aredisposable plastic ones of 10 ml working capacity. 10 ml of the dissolved sample are placedin the polarographic cell and a current of nitrogen is passed during 5 min. The deposit ismade at a potential of-0.7 V during 360 sec, and it is left 30 sec for equilibrium. The detec-tion stage is done by differential pulse voltamperometry, starting at -0.7 V, with a velocity of2mV/sec. The peak corresponding to the lead anodization appears at -0.35 V. The quantifi-cation is done by the method of standard addition, using Titrisol Merck of 10 ppm Pb.
SAMPLING CAMPAIGNS
Within the study of the elemental profile of Buenos Aires atmosphere, three differentsampling sites have been used, two of them in the city and a third one at Great Buenos Ai-res. One of the city samplers is located at the Microcentro area, a very busy district with se-rious traffic problems and, as consequence, heavily polluted. Beforehand, another place hadbeen used, at an area called Macrocentro, surrounding the Microcentro, with more or lesssimilar characteristics.
a) MacrocentroSampling was performed during November-December 1993 (summer) and April-May
1994 (autumn). About two 7 hour samples per week were taken on Nuclepore 0.4 urn fil-ters at a flow of about 10 1/min. The lowest mass concentration values were 32.8 (summer)and 40.1 jig/m3 (autumn), while the highest, 110.0 (summer) and 83.7 ug/m3 (autumn). Allthe samples collected here (nineteen filters) were analyzed only by INAA.
b) MicrocentroThe importance of this site is due not only for its building and vehicle circulation
characteristics, but for the fact that across the street, an automatic CO analyzer is operating,
1-3

operating, being the values usually above the tolerated maximum of 9 ppm. The samplingwas planned as seasonal intensive campaigns, beginning with the Autumn one.
b.l) Intensive sampling campaign: AutummFrom April 15th to May 2nd, 1994, 24 hour duplicate samples were taken on
Nucleopore filters with a flow of about 10 1/min except during weekends, with a two daysample at 5 1 /min. This campaign had two parts, at the first one both duplicates (tensamples) were analyzed by INAA to examine reproducibility and at the second part (twelvesamples), one filter of each pair was reserved for IC. Elemental and mass concentrations ofthe duplicates showed good accordance, these last ones going from 98.2 - 97.1 ^g/m3 to32.1-32.7/ig/m3.
b.2) Intensive sampling campaign: WinterInstead of 24 hour sampling, a differentiating day/night one was performed and
Millipore filters were included. Sampling period was from July 28th to August 12th TwentyNucleopore and ten Millipore filters were exposed being mass concentration values fornight samples always smaller than those corresponding to day samples.
b.3) Intensive sampling campaign: SpringDuplicate Nucleopore samples and a Millipore one were taken following the winter
scheme from October 27th to November 4th, sampling eighteen Nucleopore and nineMillipore filters. Mass concentration values were higher than those from previouscampaigns.
b.4) Intensive sampling campaigm: Summer.It took place from February 23 rd ro 28th, but no day/nigth differentiation was made.
Ten Nucleopore filters samples and five Millipore ones were taken and their analysis havejust begun.
c) Great Buenos Aires: Ezeiza
This is the location of the Atomic Center, at 40 km from Buenos Aires, at an area ofwoods and grassy lands, with a small neighborhood distant about 10 km, the InternationalAirport (14 km) and the highway leading to it (3 km). Sampling campaigns weresimultaneous with those at Microcentro area, but beginning in winter.
c.l) Intensive campaign: Whiter
From July 28th to August 16th, Nucleopore 48 hour samples were taken at a flow of 101/min. Five samples were taken with mass concentrations from 12.1 to 25.7 /xg/m .
c.2) Intensive campaign: Spring24 hour Nucleopore duplicates and a Millipore filter sample were taken between
October 27th and November 4th (Twelve Nucleopore and six Millipore exposed filters).Mass concentration values, higher than the winter ones, were obtained.
c.3) Intensive campaign: SummerSampling went from February 23rd to 28th, obtaining twelve Nucleopore and six
Millipore samples. Their analysis have just begun.
1-4

For sampling sites Microcentro and Ezeiza, 135 samples have been collected; 57 of themwere for INAA, 42 for IC and 36 for lead determination. Some of the INAA results areexposed in Table I. After having completed the seasonal campaigns (although autummvalues are missed for the Ezeiza site) and once the analysis is done, data evaluation willbegin. Meteorological factors such as rain and wind sectors are going to be taken intoaccount.
INTERCOMPARISON RUN ON PARTICULATE FILTER STANDARDS
The results of the analysis of the particulate filter standards and blanks for the qualitycontrol exercise, were sent to Dr.Landsberger's laboratory as instructed. Twenty fourelements (Na, K, Ca, Sc, Cr, Fe, Co, Zn, As, Se, Br, Rb, Sb, Cs, Ba, La, Ce, Nd, Sm, Eu,Tb, Hf, Th and U) were determined by INAA using the method described in this report.Mass values were also determined.
INTERCOMPARISON OF ATMOSPHERIC AEROSOLS IN TWO SIZEFRACTIONS FROM URBAN RESIDENTIAL AREAS
The stacked filter unit sampler designed at Gent University and provided by IAEA wasinstalled at a Buenos Aires residential urban area with medium traffic. Sampling beganduring August 1994, twice a week, for 24 hours and the filters are being analyzed byINAA, following the method described here. Mass concentration values for the first 28samples, for both coarse and fine fractions are shown in Figure I. For the coarse particlesmass concentrations ranged from 4.58 to 58.85 jug/m3 and for the fine ones, between 2.55and 19.85 /*g/m3.
INAA is used for the determination of As, Ba, Br, Ce, Cr, Cs, Eu, Fe, Hf, La, Lu, Na,Nd, Rb, Sb, Sc, Sm, Ta, Tb, Th, Yb and Zn. Hg and Co were also determined but topossible contamination problems the results were not taken into account. The maximum,minimum, median and average for certain element concentration values, for the ten firstpairs of samples figured in Table II.
Some preliminar enrichment factors, using Wedepohl crustal concentrations and Sc asreference, were calculated. Br and Sb were found to be enriched in both fine and coarsefractions. The ratio between fine and coarse average concentrations for Br was about 3 andfor Sb, aproximately 2. Zn and Cr were enriched in the fine fraction, being the ratio ofenrichment factors for the average concentrations of 8 for Zn and about 9 for Cr. • La, Naand Sm didn't show any enrichment. The high EF values for Br, Sb and Zn are inaccordance with those observed within the Buenos Aires air pollution study using only 0.4fi filters. Presently, more analytical data are being obtained in order to perform a better andmore complete statistical treatment.
OTHER RELATED ACTIVITIES
1-5
A Global Atmospheric Watch Station near Ushuaia city at Tierra del Fuego province isoperating since September 1993. It is part of the World Meteorological OrganizationAtmospheric Watch Surveillance Program. Aerosol samples from two intensive samplingcampaigns have been analyzed by INAA following the protocols established for the BuenosAires samples. At the first intensive sampling campaign, on September 1994, threesamplers were installed collecting forty-seven samples. Different sampling times were triedusing Nucleopore filters, 0.4 and 3 \i pore size. During the second campaign, on November1994, eighty eight samples were collected on four samplers, two of them installed near thestation and the other ones on an island on the Beagle Channel. The samples have beenanalyzed by IC and by INAA, following in this case the methods already described.
SUPPLEMENTARY PROGRAM
INTRODUCTION
As part of the supplementary program, the study of lichens and tree bark, as air pollutionbiomonitors, was started during 1993. As no antecedents were found for the city, anexamination of lichen species and their population was done with the collaboration of theUniversity of Buenos Aires. It allowed to chose the species, Parmotrema reticulatum andUsnea sulcata and to outline the experiment. It was decided to:
- conduct direct sampling at a few places with lichen growing within and outside the citylimits.
- try the use of lichen transplants and lichen bags at some monitoring points.- study lichens from remote areas for baseline levels.- test the use of tree bark as a biomonitor.
The two lichen species chosen for the study are extended all over the country.P.reticulatum was selected for direct sampling and U. sulcata from National Park "ElCopo", Santiago del Estero, for the lichen bags.
As for trees, the municipal inventory of tree species planted at the city, showed Platanusacerifolia and Melia azedarach as the most common ones.
METHODS
Direct samplingSamples of lichen and bark are taken from trees at a height between 1.5 and 2 m. The
sample is placed in a clean plastic bag, sealed and transport to the laboratory. The lichensample is separated from the bark with plastic tools. A first cleaning operation is done toseparate big dust and bark particles and other epyphitic lichen species. Then the sample iswashed in deionized water with gentle agitation. The lichen is dried, first between filterpapers and then in oven at 40°C during 24 hs. The dried material is then ground in an agatemortar for its analysis.
1-6

The same cleaning operation is used for tree bark samples.
Lichen bagsSmall nylon mesh bags containing 1.5 g of Usnea sulcata are place at different sites,
fixed as to move freely in the air. Three bags are used at each sampling location, to becollected after 3, 6 and 9 months of exposure.
Analytical methodsThe biomonitor samples are analyzed by INNA following analytical protocols established
using lichen samples from the Natural and Exact Sciences College of the University ofBuenos Aires.
Aproximately 150 mg of material is weighed, sealed in a quartz ampoules and irradiatedin an aluminum capsule at the R.A.-3 reactor, for 5 hours. Once irradiated, the capsule isopened and the ampoules are frozen in liquid nitrogen and cut, transferring its content into afresh plastic vial. Two measurements are performed with different decay times, using ahyperpure Ge detector and a Series 85 Canberra multichannel. About 7 days after the end ofirradiation, As, Ba, Br, Hg, K, La, Lu, Na, Nd, Sb, Sm, U and Yb are determined. A secondmeasurement is carried out with a decay time of aproximately 30 days for: Ce, Cr, Cs, Co,Eu, Fe, Hf, Hg, Sb, Sc, Se, Sr, Ta, Tb, Zn. For quality control certified reference materialsfrom NIST and IAEA were used for checking and cobalt wires and gold foils were used asflux monitors.
RESULTS
P.reticulatum samples growing at eight different sites were analyzed. Table III showsthe results of three of them, collected at locations with very different characteristics: Lj isfrom a suburb SW of Buenos Aires, L5 is from "El Copo" National Park and L& from asmall island at the Rio de la Plata river. "El Copo"and Martin Garcia island samples, due tothe characteristics of the places, could be used for baseline values.
As vehicule circulation is considered the most important pollution source for the city,differences of bromine concentration are expected amoung samples as the ones compared .Bromine concentrations are in accordance with this assumption, being the value for L]notably higher than for L5 and Lg. The enrichment factors calculated using Wedepohl'scrustal concentration values and Sc as reference are 88 for LI, 27 for L5 and 35 for L6,and with Fe as reference, 91 for L] , 22 for L 5 and 30 for Lg .
The lichen bags from, three sites in the city, were analized. Table IV shows the resultsobtained for one of this places being the exposure times 45 days for L\Q , 108 days for h\\and 205 days for L17 . Although an increasing tendency of bromine concentration withexposure time can be observed, the enrichment factors for Br don't show the same, at leastnot for the first two samples TheEF with Sc as element of reference are 100 for LJQ 60
1-7

for I4 ] and 105 for L^ \ and with Fe as reference: 62 for L\Q , 49 for L\ j and 88 forLl7.
With respect to tree bark, several samples from P.Acerifolia and M. azedarch. fromdifferent locations were analyzed using INAA. Different kinds of experiments wereperformed studying the two selected species from different locations, and P.acerifolia treesgrowing along the same street. Twenty three samples have been analyzed till now and theconcentration results are being considered to investigate the value of the bark asbio monitor, the size of the sample and the planning of a sampling network.
Although only the enrichment factor for Br have been mentioned, and interpretation ofall the other elemental concentration is being done. Direct sampling of lichens as well as theuse of lichen bags is going to continue including lead determination in some of then.
REFERENCES
- CARIDI, A. et al., "Determination of atmospheric lead pollution of automotive origin",Atmosph. Environ. 23 (12) (1989), pp. 2855-2856.- "Sampling and Analytical Methodologies for Instrumental Neutron Activation Analysis ofAirborne Particulate Matter", Training Course Series # 4, IAEA, Vienna (1992).- Reports from the Laboratory of Atmospheric Surveillance, Secretary of Environment anUrban Planning, Municipality of Buenos Aires.- "Contaminaccion del aire", Servicio Meteorologico Nacional, Fuerza Aerea Argentina,Comando de Regiones Aereas. Boletin Informativo Nro. 9.- GILBERT, O. L., "Lichens and air pollution". In: "The Lichens", Academic Press(1973) pp. 443-472.- NASH, T. H., "Lichens as indicators of air pollution", Naturwissenschaften 63 (1976)pp. 364-367.- NIEBOER, E. et al., "Mineral uptake and release by lichens: an overview", TheBryologist 81 (2) (1978) pp. 226-246.- BROWN, D. H., "Uptake of mineral elements and their use in pollution monitoring". In:"The experimental biology of bryophytes", Dyer, A. F. and Duckett, J. G. (ed.), AcademicPress (1984) pp. 229-255.- NIMIS, P. L., "Air quality indicators and indices: the use of plants as bioindicators formonitoring air pollution". Proceedings of the Workshop on Indicators and Risk Analysis".JRC, Ispra, 15-16 May 1990. Colombo, A. G. and Prenazzi, G. (ed.) pp. 93-126.- DE BRUIN, M., "Applying biological monitors and NAA in studies of heavy-metal airpollution" IAEA Bulletin 4/1990 PP. 22-27.- SLOOF, J. E. and WOLTERBEEK, H., "National trace element air pollution monitoringsurvey using epiphytic lichens" Lichenologist 23 (2) (1991) pp. 139-165.- WIERSMA, G. B. et al, "Elemental composition of lichens from a remote Nothofagusforest site in southern Chile", Chemosphere, 24 (2) (1992) pp. 155-167.- KUCERA, J., "Biological monitors of air pollution", Private report.- SLOOF, J. E., "Environmental Lichenology: Biomonitoring Trace-Element Pollution",Interfacultair Reactor Instituut. Delft University of Technology (1993).- "Study of air pollution in Buenos Aires city using neutron activation analysis and X- rayfluorescence". Research Contract 7251/RB. R. R. Pla, G. Custo, V. V. Tafuri. First
1-8

Research Co-ordination Meeting of the Co-ordinated Research Programme "AppliedResearch on Air Pollution using Nuclear Related Analytical Techniques". Vienna, Austria,30 mar. - 2 april, 1993.- PLA, R. R. et al., "Estudio de la contaminacion del aire en la ciudad de Buenos Aires poranalisis por activation neutronica y fluorescencia de rayos X. Etapa preliminar de puesta apunto de los metodos de muestreo y analisis". Primeras Jornadas Nacionales y SextasRegionales sobre Medio Ambiente, La Plata, 8-11 nov. (1993).- PLA, R R. et al., "Estudio de la contaminacion del aire en la ciudad de Buenos Aires".XXII Reunion Anual de la Asociacion Argentina de Tecnologia Nuclear, Buenos Aires, 6 -9nov., (1994).- Research Contract 725/RB, First and Second Reports.
1-9

TABLE I - MICROCENTROAUTUMN CAMPAIGN
11 12 21 22 31 34
MCBaBrCeCoCsEuFeHfHgLaNaRbSbScTaTbThZn
76.41600 ±1000941± 1427.2 ± 6.518.9 ± 1.65.0 ± 1.21.58 ± 0.4025100 ±12001.55 ± 0.877.9 ±2.816.2 ±1.220250 ±380160 ± 6042.6 ±4.75.99 ± 0.15—1.4 ±1.14.75 ± 0.941720 ±130
52.4940 ± 640990 ±1530.6 ± 8.613.7 ±2.25.2 ±1.72.03 ± 0.5022800 ±15003.6 ± 1.111.2±3.815.8 ± 1.419900 ±390145 ± 4144.8 ±5.05.53 ± 0.19—ND<2.73.4 ±1.21780 ±110
72.11800 ± 840972 ±1526.6 ±8.111.0±1.93.7 ±1.72.09 ±0.4322100 ±14001.75 ± 0.855.8 ± 2.811.1 ± 1.120100 ±410ND<16051.7± 5.73.07 ±0.16ND<3.7ND<3.42.6 ± 1.14030 ±180
68.02200 ± 8701050 ±1727.8 ± 7.814.6 ± 2.05.0±1.60.83 ± 0.5519400 ±1400
9.23 ± 0.3512.4 ± 1.421900 ±460ND<16051.5 ± 5.72.70 ± 0.50—ND<5.63.0± 1.13850 ± 170
35.6ND700 ± 55115±9022.1 ±1.522.7 ±3.63.9±1.255900 ±1250013.7 ± 10.0
12.4 ±1.214900 ± 220ND42.4 ±3.48.30 ±0.41ND<19ND<17ND <4.02230± 190
35.72000±870770 ± 61170 ± 15014.6 ± 2.054.9 ± 3.74.1 ± 2.132000
ND<18—13.3 ± 1.314000ND166±11—ND<15ND<13ND1970 ±350
Results in ppm, except MC (mass concentration in g/m3). The figures are statisticalcounting errors.
1-10

TABLE IIMaximum, minimum, median and average for certain elements determined by INAA
COARSE FRACTION
Element Br Cr Fe La Na
MaximumMinimumMedianAverage
67.15.0212.2622.41
3.992.63.623.93
145569378.5616
2.390.2890 . 6 9 1 "•'1.33
1886145389.5691.5
Element Sb Sc Sm Zn
MaximumMinimumMedianAverage
15.50.141.113.54
0.3530.01060.0970.142
0.1650.01730.05150.0602
29.32.412.114.2
FINE FRACTION
Element
Element
Br
Sb
Cr Fe
Sc Sm
La
Zn
MaximumMinimumMedianAverage
7.70.0810.921.65
Results in ng/rn-
0.1250.01390.01640.0401
0.0740.00590.0190.0236
703.423.9531.5
Na
MaximumMinimumMedianAverage
30.133.9815.6817.64
20.41.695.779.04
52364130209
1.020.0470.1240.366
91748135217
1-11

TABLE III
LICHENS FROM DIFFERENT SITES
LI L5 L6
As 1.685 ± 0.061 1.395 + 0.077 1.952 + 0.056Ba 48 + 13 35.1 ±6.1 35.0 + 6.5Br 13.26 ±0.14 4.36 + 0.15 4.51 ± 0.41Ce 2.8+1.2 10.68 + 0.18 8.94 + 0.21Co 0.277 + 0.013 1.052 + 0.019 0.823+0.021Cr 5.70 ± 0.66 3.43+0.16 2.64 + 0.28Cs 0.260 + 0.070 0.904 + 0.059 0.836 + 0.052Eu 0.021+0.052 0.1511+0.0077 0.1119 + 0.0069Fe 1770 ± 160 2395 + 211 827 + 24Hf 0.562 + 0.033 0.348 + 0.028Hg 0.386 + 0.057 ND < 0.04 0.0108 + 0.0090K 1240 ± 300 2127 + 94 1610 ± 58La 3.51 + 0.17 4.519 + 0.068 3.587 + 0.042Lu — 0.045 +0.012 0.026 + 0.0007Na 1169 + 26 931.0 + 6.4 659.3+4.4Nd — 3.93 + 0.61 3.62 + 0.63Rb 8.4 + 3.3 8.1 + 1.0 10.2 + 2.0Sb 0.416 ± 0.054 0.107 ± 0.020 0.095 ± 0.035Sc 0.73 +0.13 0.7818 + 0.0048 0.6222 + 0.0037Sm 0.583 + 0.016 0.8569 + 0.0086 0.7540 + 0.0052Ta — 0.124 + 0.016 0.102 + 0.019Tb — 0.153 ± 0.044 0.170 + 0.043Th — 1.148 + 0.028 0.763+0.028Yb — 0.314 + 0.024 0.267 + 0.025Zn 118 + 23 31.8 + 1.4 40.4+1.9
Results in ppm, + figures are statistical counting errors.
1-12
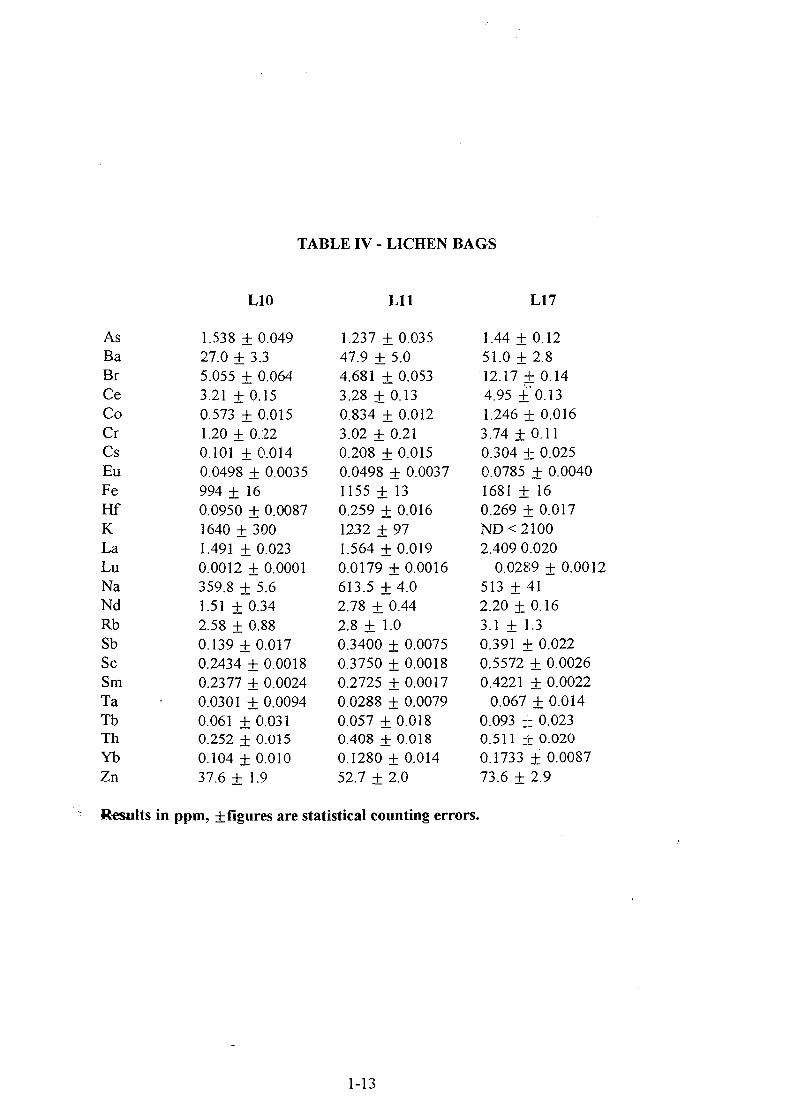
TABLE IV - LICHEN BAGS
L10 Lll L17
As 1.538 ± 0.049 1.237 ± 0.035 1.44 ± 0.12Ba 27.0 + 3.3 47.9 + 5.0 51.0 + 2.8Br 5.055 ± 0.064 4.681+0.053 12.17 ± 0.14Ce 3.21 + 0.15 3.28 + 0.13 4.95 + 0.13Co 0.573 ± 0.015 0.834 ± 0.012 1.246 ± 0.016Cr 1.20 ±0.22 3.02 + 0.21 3.74 ±0.11Cs 0.101 + 0.014 0.208 + 0.015 0.304 ± 0.025Eu 0.0498 ± 0.0035 0.0498 + 0.0037 0.0785 ± 0.0040Fe 994 ± 16 1155 + 13 1681 ± 16Hf 0.0950 ± 0.0087 0.259 ± 0.016 0.269 ± 0.017K 1640 + 300 1232+97 ND<2100La 1.491+0.023 1.564 + 0.019 2.409 0.020Lu 0.0012 + 0.0001 0.0179 + 0.0016 0.0289 + 0.0012Na 359.8 + 5.6 613.5+4.0 513+41Nd 1.51+0.34 2.78 + 0.44 2.20 + 0.16Rb 2.58 ± 0.88 2.8 + 1.0 3.1 ±1.3Sb 0.139 ± 0.017 0.3400 ± 0.0075 0.391 ± 0.022Sc 0.2434 ± 0.0018 0.3750 ± 0.0018 0.5572 ± 0.0026Sm 0.2377 ± 0.0024 0.2725 ± 0.0017 0.4221 ± 0.0022Ta • 0.0301 ± 0.0094 0.0288 ± 0.0079 0.067 ± 0.014Tb 0.061 ± 0.031 0.057 ± 0.018 0.093 ± 0.023Th 0.252 ± 0.015 0.408 ± 0.018 0.511 ±0.020Yb 0.104 ±0.010 0.1280 ±0.014 0.1733 ± 0.0087Zn 37.6 ±1.9 52.7 ± 2.0 73.6 ± 2.9
Results in ppm, ±figures are statistical counting errors.
1-13

Mass concentrations -Coarse fraction
60 ..
lllllllhl ll l.lllen co en en cr> CD co co en co co co CD CD
C 0 C 3 C DC O C O C O C O C O C O C n C D C O C D C r - C O C O C D C D C O C D C DCZ^CD^C^C^CD CO CD CD CD C3 CD CD CD T - ^ d ^ ^ ^ d ^ ^ ^ ^ ^ lLO T— CO CM LO <~~l CM P ^ LO t~~> CM P*1- CO "^T CO t— CO CO CD LO Is** t— CO CT) CD
i— i— CM CsJ CO *— C M C M C M C M f— t— T— CM CM CM - i—
Mass concentrations - Fine fraction
C
o
>—^mocou(fttnd
20-18-1 6 .14 .1 2 -1 0 -
o
6 -4 -2 -I III. llllllll I 1
cncncncocDcncncncncocoa^cocT5<^cncT)CT>CT)cncncncncncncocnmaioDoococoo5ma5mmcno5ooooooooT-T- i - i -7 - r -OOOOOOOODOOOOr-i-r-r-rr^T-T-T-rr:-r-
co (\ i ino CM NI— CM CM CO
CD CM rv. COCM CM CM CM
CO CO CD I D r^-T— -i— CM CM CM
Fig. 1. Mass concentration values for air particulate samples
1-14

XA0102871
Appendix 2
A Twelve Month Study of PM2.5 and PM10 Fine Particle AerosolComposition in the Sydney Region
Using Ion Beam Analysis Techniques.
David D. Cohen, G.M. Bailey, Ramesh Kondepudi
Accelerator ApplicationsANSTO, PMB 1, MENAI, NSW, 2234, Australia
ABSTRACT
The accelerator based ion beam (IBA) analysis techniques of PIXE, PIGME,PESA, and RBS have been used to characterise fine particles at selected sitesin the Sydney region. The four techniques operating simultaneously provideelemental concentrations on 24 chemical species, including H, C, N, 0, F, Na,Al, Si, P, S, Cl, K, Ca, Ti, V; Cr, Mn, Fe, Co, Cu, Ni, Zn, Br and Pb. The totalmass and the elemental carbon by laser integrated plate techniques were alsomeasured. A stacked filter system, built by the University of Gent, Belgiumand supplied by the IAEA was used to provide fine particle data on PM2.5 andPM10 particles. While a cyclone sampler, built at ANSTO, Lucas Heights, wasused to provide data on PM2.5 particles only. The two different types of unitswere operated along side each other for the whole of 1994 and the resultscompared. The use of the multi-elemental IBA techniques also allowed forsome fine particle source fingerprinting to be performed.
SCIENTIFIC BACKGROUND AND SCOPE OF THE PROJECT
There are several reasons for studying and acquiring data on fine atmosphericaerosols in the size range less than 2.5 urn (PM2.5) and less than 10 urn(PM10) in diameter, These include:-
(a) Fine particles are small enough to penetrate deep into the human lungsystem and may be absorbed directly into the blood stream. This may havesignificant health related aspects. Recent international articles haveemphasised the importance of fine particle pollution to health and providedsome evidence for a link between mortality and fine particles [1-5]. The largesteffects were for deaths from respiratory disease and cardiovascular disease.Further data from the US suggests that fine particle levels are positivelyassociated with rates of chronic cough, bronchitis and chest illness in pre-
2-1

adolescent children [6,7]. Health researchers suspect that the smaller theparticles are the more dangerous they can be as smaller particles penetratedeeper into the lungs. 1 he fine particle mass levels considered in these recentstudies range from 10 to 30 ug/m^ for PM2.5 particles and 30 to 200 ug/m3 forPM10 particles. Levels within these ranges are typical for many large citiesaround the world.
(b) PM2.5 particles are fine enough to remain in the atmosphere for sufficienttime to be transported hundreds or even thousands of kilometre. This isimportant for the study of pollution transport across not only state boundariesand national borders but also international borders and even globally.
(c) Fine particles impair visibility by both light scattering, and light absorption.Visibility is a key parameter that affects the public's perception of how bad apollution problem may be.
(d) It is well established that particles affect climate and weather [8]. Sulphateparticles are important for cloud nucleation, they affect the earth's albedo andtherefore the tropospheric cooling. Elemental carbon absorbs and scatterssolar radiation affecting the earth's radiation balance. Naturally occurringevents such as volcanic eruptions and major fires may also provide informationon the global temperature effects of fine particles.
(e) Particle matter also deposits on vegetation and buildings, affecting theirhealth and/ or longevity.
There are several major sources of anthropogenic particles in the atmosphere.These generally include motor vehicles, power generation through coalcombustion and other industrial and combustion processes. The particlesgenerated by these sources can be both fine and coarse, however, combustionprocesses tend to generate the finer particles (PM2.5) and mechanical orgrinding processes the coarse ones. For example, the airborne lead from thecombustion of leaded petrol in motor vehicles is typically fine particle lead (<1urn in diameter). The generation of power through the burning of largeamounts of coal also generates fine particles. Whereas windblown soil andseaspray are generated by mechanical processes and are generally composedof more coarser particles with diameters greater than 10 urn.
For these reasons many developed countries now have some form of regularfine particle monitoring as well as recognised objectives and standards for airquality as related to public health. At present, in many countries there aregoals or standards for the total suspended particulate matter (TSP) with particlediameters <50 urn and for PM10 particles with diameters <10 urn, but not forthe finer particles PM2.5 with diameters <2.5 urn.
Fine particle pollution is becoming more of a major air pollution issue worldwide.
2-2

Since 1989 ANSTO, through its Aerosol Sampling Program - ASP, hasintroduced into Australia accelerator based ion beam analysis (IBA) techniquesfor the study of fine particle data on a large scale[9-15]. These multi-elementalanalysis techniques are non destructive and can provide data for up to 35different elemental species in just a few minutes of machine running time [9].This enables source fingerprints to be obtained and used in fine particle sourcereceptor modelling [16]. The outputs from these modelling codes providedetailed quantitative information on the percentage each source fingerprintcontributes to the total fine particle mass.
This document reports on PM2.5 and PM10 fine particle measurements takenat selected sites in the Sydney region using the Stacked Filter Unit (SFU) builtby Dr Willy Maenhaut from University of Gent, Belgium, and the ASP cyclonesampler built at Lucas Heights. The Gent unit was supplied to us through theIAEA's Co-ordinated Research Program (CRP) on "Applied Research on AirPollution Using Nuclear-Related Analytical Techniques".
METHODS
Since the middle of 1991 ANSTO, in collaboration with the NSW EPA, PacificPower, New South Wales University and the University of Macquarie, has beenoperating a 24 sampler fine particle (PM2.5) network (known as ASP) in NewSouth Wales with a 25th sampler at the global baseline station at Cape Grim innorth western Tasmania. The ASP network covers an area of more than60,000 square kilometres, including Wollongong, Sydney and Newcastle and200 km inland from the coast. The sampling site locations are shown in Fig. 1.The network has collected over 9,000 fine particle filters to date (March 1995)covering an area of NSW which contains nearly 4 million people and analysedthese filters for up to 25 different elemental species. The species measuredincluded total fine mass, elemental carbon, H, C, N, O, F, Na, Al, Si, P, S, Cl, K,Ca, Ti, V, Cr, Mn, Fe, Co, Cu, Ni, Zn, Br and Pb [9]. The complete analysis ofthis dataset for all monitoring sites shown in Fig. 1 for the 18 month samplingperiod from January 1992 to July 1993 has been published in a five volumereport to the funding body, the Energy Research and Development Corporation(ERDC)[15].
In our previous report to the CRP [17], held in Vienna in March 1993, wereported on the accelerator based ion beam analysis (IBA) techniques used atANSTO for data analysis of all of the filters collected from the ASP network.These included, proton induced X-ray emission (PIXE), proton induced gammaray emission (PIGME), proton elastic scattering analysis (PESA) andRutherford Backscattering (RBS). These four techniques, run simultaneouslyon the 3 MV Van de Graaff accelerator, they provided elemental concentrationsfor many key elements from H to Pb with minimum detection limits of around 10
3
2-3

All the filters used in the ASP network are 25 mm diameter Gelman stretchedTeflon filters, typically 200 ug/cm2 thick and well suited to all four of these IBAtechniques. The filters used in the Gent SFU samplers are 47 mm diameterNuclepore polycarbonate filters (8um for 2-10 urn cut-off and 0.4 urn for thePM2.5 cut-off). These filters are typically many times thicker (~1 mg/cm2) thanthe Teflon filters, and hence best suited for PIXE and PIGME analyses only.Hence, the Gent filters were analysed for all species listed in the previousparagraph from F to Pb but not for H, C, N, and O.
The ASP Teflon filters had an effective collection area of 2.27 cm2 withpumping speeds of 22 L/min sampling 32 m3 of air in 24 hours. The Gent SFUfilter collection area was 12.88 cm2 and the pumping speed was typically 16L/min sampling around 23 m3 of air in 24 hours.
At the Liverpool (ASP31) and Lucas Heights (ASP1) sites shown on the map ofFig. 1, ANSTO is operating both a standard ASP PM2.5 sampler [14] and aGent SFU PM2.5/ PM10 sampler along side each other.
The Liverpool site is situated about 30 km west of the centre of Sydney,-but stillwithin the major Sydney and Hawkesbury basins, bounded by the BlueMountain Ranges running roughly north-south through Katoomba (see Fig. 1).The Lucas Heights site is 25 km south west of the centre of Sydney and sits ona plateau overlooking the Sydney basin to the north and east and bounded by30 km of national park to the south. Wollongong to the south of these two sitesis a major industrial city and port with steel production and other heavyindustry. Fine particles may be transported from Wollongong to these sites infavourable southerly winds. East of Liverpool and north of Lucas Heights thereis also significant industrial activity around the Lidcombe site, this includespetro-chemical and other industrial plants. Summer breezes with a northerly oreasterly component may also transport fine particles from central Sydney toboth the Liverpool and Lucas Heights sites.
Sampling with the Gent SFU systems at the two sites commenced in July 1993,at Liverpool filters are run for 24 hours every Wednesday from midnight tomidnight, while at Lucas Heights the Gent sampler has two heads and filtersare run for 24 hours every Sunday and Wednesday throughout the year. Thestandard ASP PM2.5 sampler is run for 24 hours every Wednesday andSunday.
RESULTS
The IBA techniques on the 3 MV Van de Graaff accelerator were calibratedeach run against known thin Micromatter standards evaporated onto thin Mylarbackings. Six standards were used these are Al, Si, NaCI, CaF2, Fe and SrF£.These standards covered the X-ray range of interest (1.2 keV to 18 keV) forPIXE as well as the Al, Na and F analysis by PIGME. The Micromatterstandard elemental concentrations were known to ±5%. The ratio of the
2-4
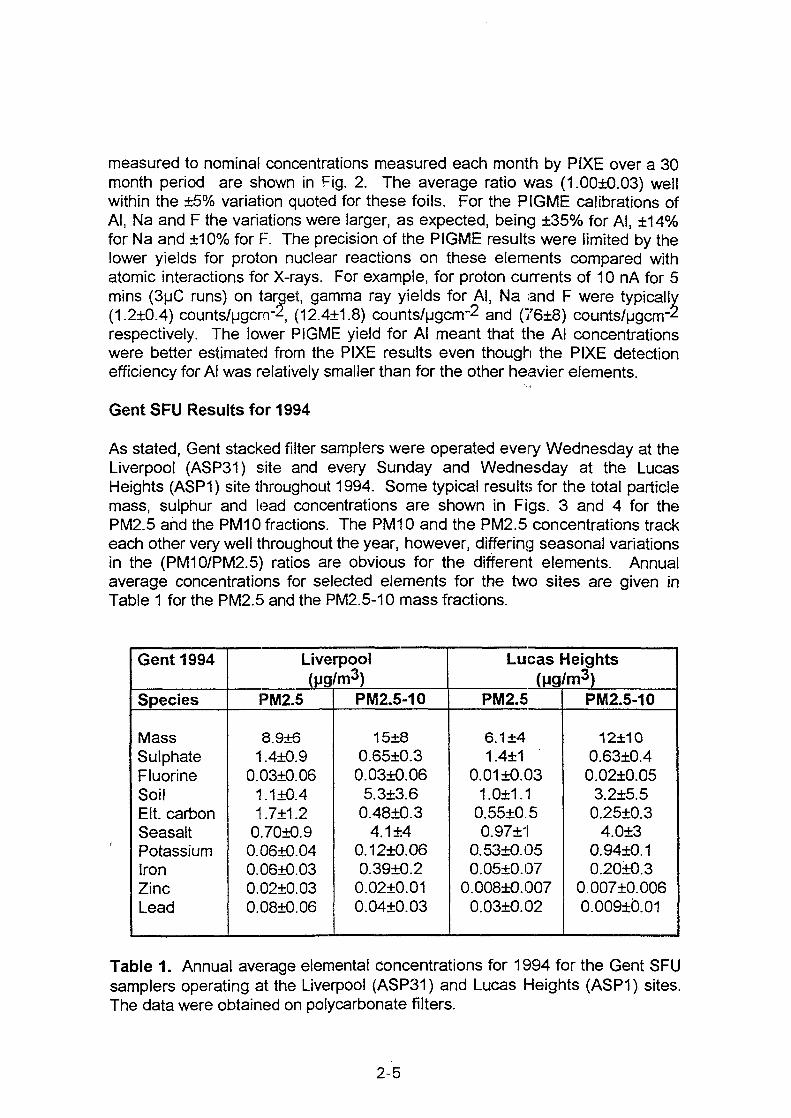
measured to nominal concentrations measured each month by PIXE over a 30month period are shown in Fig. 2. The average ratio was (1.00±0.03) wellwithin the ±5% variation quoted for these foils. For the PIGME calibrations ofAl, Na and F the variations were larger, as expected, being ±35% for Al, ±14%for Na and ±10% for F. The precision of the PIGME results were limited by thelower yields for proton nuclear reactions on these elements compared withatomic interactions for X-rays. For example, for proton currents of 10 nA for 5mins (3uC runs) on target, gamma ray yields for Al, Na and F were typically(1.2±0.4) counts/ugcm-2, (12.4±1.8) counts/ugcrrr^ and (76±8) counts/ugcrrr*respectively. The lower PIGME yield for Al meant that the Al concentrationswere better estimated from the PIXE results even though the PIXE detectionefficiency for Al was relatively smaller than for the other heavier elements.
Gent SFU Results for 1994
As stated, Gent stacked filter samplers were operated every Wednesday at theLiverpool (ASP31) site and every Sunday and Wednesday at the LucasHeights (ASP1) site throughout 1994. Some typical results for the total particlemass, sulphur and lead concentrations are shown in Figs. 3 and 4 for thePM2.5 and the PM10 fractions. The PM10 and the PM2.5 concentrations trackeach other very well throughout the year, however, differing seasonal variationsin the (PM10/PM2.5) ratios are obvious for the different elements. Annualaverage concentrations for selected elements for the two sites are given inTable 1 for the PM2.5 and the PM2.5-10 mass fractions.
Gent 1994
Species
MassSulphateFluorineSoilElt. carbonSeasaltPotassiumIronZincLead
Liverpool(ug/m3)
PM2.5
8.9±61.4±0.9
0.03±0.061.1±0.41.7±1.2
0.70±0.90.06±0.040.06±0.030.02±0.030.08±0.06
PM2.5-10
15±80.65±0.30.03±0.06
5.3±3.60.48±0.3
4.1 ±40.12±0.060.39±0.20.02±0.010.04±0.03
Lucas IHeights(yg/m3)
PM2.5
6.1 ±41.4±1
0.01 ±0.031.0+1.1
0.55±0.50.97±1
0.53±0.050.05±0.07
0.008±0.0070.03±0.02
PM2.5-10
12±100.63±0.4
0.02±0.053.2±5.5
0.25±0.34.0±3
0.94±0.10.20+0.3
0.007±0.0060.009±0.01
Table 1. Annual average elemental concentrations for 1994 for the Gent SFUsamplers operating at the Liverpool (ASP31) and Lucas Heights (ASP1) sites.The data were obtained on polycarbonate filters.
2-5
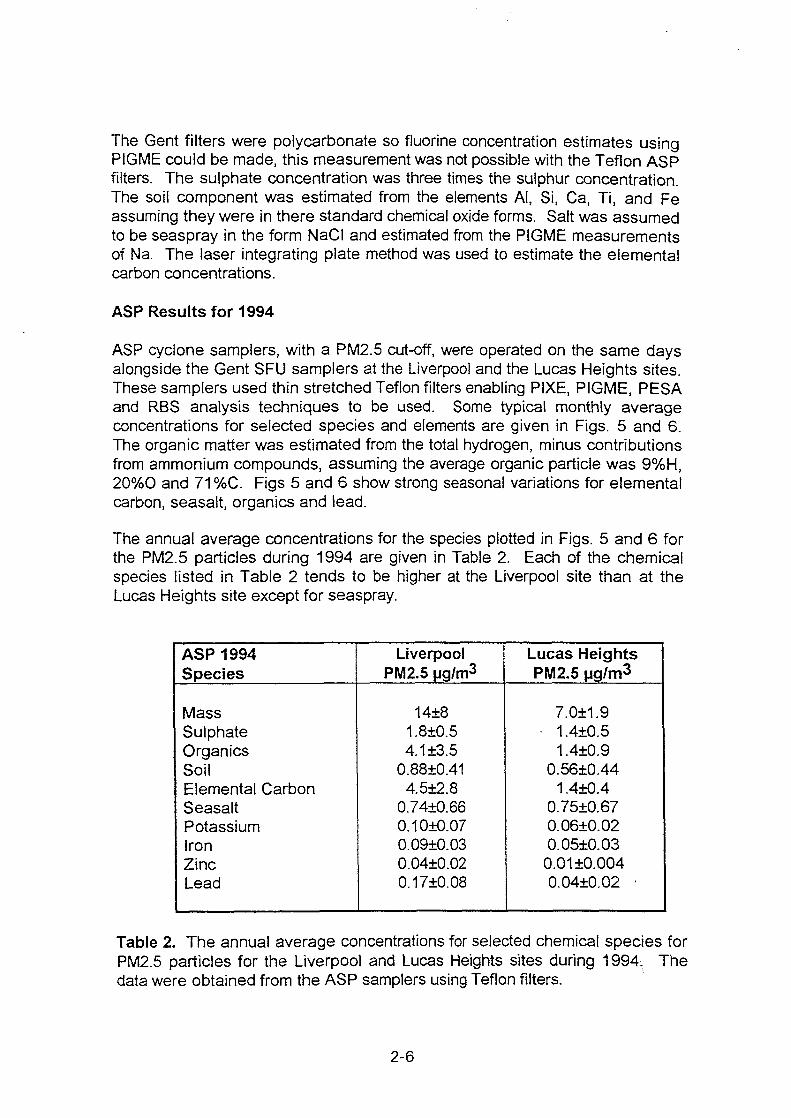
The Gent filters were polycarbonate so fluorine concentration estimates usingPIGME could be made, this measurement was not possible with the Teflon ASPfilters. The sulphate concentration was three times the sulphur concentration.The soil component was estimated from the elements Al, Si, Ca, Ti, and Feassuming they were in there standard chemical oxide forms. Salt was assumedto be seaspray in the form NaCI and estimated from the PIGME measurementsof Na. The laser integrating plate method was used to estimate the elementalcarbon concentrations.
ASP Results for 1994
ASP cyclone samplers, with a PM2.5 cut-off, were operated on the same daysalongside the Gent SFU samplers at the Liverpool and the Lucas Heights sites.These samplers used thin stretched Teflon filters enabling PIXE, PIGME, PESAand RBS analysis techniques to be used. Some typical monthly averageconcentrations for selected species and elements are given in Figs. 5 and 6.The organic matter was estimated from the total hydrogen, minus contributionsfrom ammonium compounds, assuming the average organic particle was 9%H,20%0 and 71 %C. Figs 5 and 6 show strong seasonal variations for elementalcarbon, seasalt, organics and lead.
The annual average concentrations for the species plotted in Figs. 5 and 6 forthe PM2.5 particles during 1994 are given in Table 2. Each of the chemicalspecies listed in Table 2 tends to be higher at the Liverpool site than at theLucas Heights site except for seaspray.
ASP 1994Species
MassSulphateOrganicsSoilElemental CarbonSeasaltPotassiumIronZincLead
LiverpoolPM2.5 ug/m3
14±81.8±0.54.1 ±3.5
0.88±0.414.5±2.8
0.74±0.660.10±0.070.09±0.030.04±0.020.17±0.08
Lucas HeightsPM2.5 ug/m3
7.0±1.91.4±0.51.4±0.9
0.56±0.441.4±0.4
0.75±0.670.06±0.020.05±0.030.01 ±0.0040.04±0.02 •
Table 2. The annual average concentrations for selected chemical species forPM2.5 particles for the Liverpool and Lucas Heights sites during 1994. Thedata were obtained from the ASP samplers using Teflon filters.
2-6

Liverpool is a more urban and industrial site and was therefore expected tohave higher fine particle concentrations. The seaspray concentrations at thetwo sites were very similar and as the figures show both have strong seasonalvariations for this species. This was due to the strong north to north easterlysea breezes that typically blow during the Sydney summer months.
PM2.5 and PM10 Comparison for 1994
The Gent stacked filter unit samples both PM2.5 and PM10 particles onpolycarbonate filters, while the ASP cyclone system only samples PM2.5particles on Teflon filters. Both units are operating alongside each other at theLiverpool and the Lucas Heights sites. The Lucas Heights site operates everyWednesday and Sunday throughout the year whereas the Liverpool site onlyruns on Wednesdays. Therefore there are twice as many samples from theLucas Heights site so this site was chosen to compare the PM2.5 data. Resultsfor the comparison of the Gent and ASP samplers for PM2.5 particles for thewhole of 1994 shown in Fig. 7. The two units follow each other remarkably wellthroughout the year, with the ASP unit averaging 5% higher fine massconcentrations.
The PM10 versus the PM2.5 concentrations for the mass, sulphur and lead forthe Gent units at Liverpool and Lucas Heights are shown in Figs. 8 and 9respectively. The (IPM10/PM2.5) ratios for the fine mass were around 3whereas for the elements sulphur and lead, originating from combustionprocesses, this ratio is below 2 with significantly less spread.
The multi-elemental analysis obtained using the IBA techniques allows one toproduce (PM10/PM2.5) ratios for a range of different elements. Such plots areshown for the Liverpool and Lucas Heights sites, averaged over the year 1994,in Fig. 10. Typically, elements associated with soil (Al, Si, Ti and Fe) andseaspray (Na and Cl) have higher (PM10/PM2.5) ratios, while elementsassociated with combustion processes (F, P, S, Br and Pb) have lower ratios.
Other Fine Particle Measurements
The map of Fig. 1 shows the other major urbanised and industrial areas in thenetwork region, these include Wollongong to the south of Sydney andNewcastle to the north. Table 3 shows the mean value and range of severalkey parameters for these areas. The ASP study found that annual PM2.5averages in rural areas of NSW up to 200 km from Sydney were typically 3 to 5ug/m3 and the fine particle annual average over the whole network was about 8ug/m3 during 1992 and 1993 [15].
In Table 3 the PM2.5 data and the fine sulphate data were taken frorn theERDC report [15] for the period 1992-93 and are yearly averages of daily data.Other data used were the mo'st recent available and was sourced from theNWS EPA quarterly reports for 1991 or 1992, BHP Newcastle,, the Newcastle
2-7

City Council and the NSWEPA 1993 State of the Environment Report and areyearly averages. The numbers in brackets represent the range of the monthlyaverages during that year.
Parameter
TSP (ug/m3)PM10(ug/m3)PM2.5 (ug/m3)SO4 (ug/m3)
S0 2 (ppb)N0 x (ppb)O3 (ppb)
Sydney
70(54-90)30(17-41)12(4-22)
1.7(0.7-3.1)
3(2-6)30(13-64)12(6-29)
Wollongong
65(45-104)25(20-32)
11(4-19)2.0(0.7-4.0) -
3.3(2-5)20(16-22)*
15(8-22)
Newcastle
85(41-135)25(19-47)
13(7-21)1.9(0.7-2.9)
5(3-7)70(31-124)24(21-27)
* Summer 1993 data only available
Table 3. Mean annual values and their ranges for selected parameters forthree major urbanised and industrial cities in New South Wales covered by theASP network.
The mass ratio of PM10 to PM2.5 was typically 2 to 3 in the inner Sydneyregion, but varied widely at other sites. We have also shown that the TSP toPM2.5 mass ratios vary dramatically with season and site across the ASPnetwork area [10,11]. This emphasises the strong need to monitor differentparticle sizes at the same site and not to rely on TSP or even PM10measurements to provide vital fine particle (PM2.5) data.
Single events like the New South Wales bush fires in January 1994 can alsosubstantially raise the fine particle concentrations. The fires covered a largearea of New South Wales including Wollongong, Sydney, Newcastle and largeareas of the north coast. In the first two weeks of January 1994 fine particleconcentrations as measured by the ASP network averaged over 40 ug/m3
peaking at 75 ug/m3 at several sites in Wollongong, Sydney and Newcastle.These peak concentrations were 6 to 7 times the yearly averages at thesesites.
Typical concentrations for some of the chemical species measured by ASP forthe inner Sydney area are compared with fine particle data from other largeinternational cities in Table 4. The four cities given in Table 4 havesignificantly larger populations than Sydney and hence have higher levels of
2-8

fine particle pollution for most parameters listed, with the notable exception oflead and bromine associated with motor vehicles.
Mass (ug/m3)Total PM10Fine PM2.5
Fine Comp.(ug/ma)OrganicsElt. carbon(NH4)2SO4
(NH4)NO3
SoilSeasalt
Tracers (ng/m3)SmokeVCrNiCuZnBrPb
SantiagoChile
10034
NANA8.7NA2.9NA
8801663
2622090
260
MexicoCity
13348
17.37.414.7NA3.6
0.08
2976887
4834167383
LosAngeles
5537
18.55.710.33.63.2
<0.1
<50NANA14402403970
KyotoJapan
6747
.22.0NA
12.0NA1.0NA
2509
NA16601040
Sydney
3012
2.64.52.6NA0.90.9
<200.50.60.63
40115333
Table 4. A comparison of fine particle data in Sydney, taken from the ASPnetwork [15] and other large international cities sampling fine particles [18]. NAmeans not available.
Multielemental Source Fingerprintingi
The multi-elemental capabilities of the accelerator based IBA techniquesprovided us with the opportunity to fingerprint sources of fine particles. Wehave used the extensive database of over 9,000 filters analysed for over 20different chemical species to define 6 source fingerprints [19] relevant to thearea covered by the ASP network shown in Fig. 1. The elements associatedwith these fingerprints are given in Table 5. Each fingerprint contains theseelements in a fixed ratio. Having obtained reliable elemental sourcefingerprints these can be included into the US EPA Chemical Mass Balanceprograms CMB7 [20,21] to estimate the relative contributions of each of thesources to the total fine mass.
2-9

Fingerprint
Motor VehiclesCoal CombustionSmokeSoilSeasprayIndustry
Elements
HINa!AI,Si1SICI)FeIZn1BrJPb1Elt.CH,Na,AI,Si,P,S,K,Ca,Fe,Elt.CH.CI.K.Ca.Elt.CAI,Si,K,Ca,Ti,Mn,FeNa,S,CI,K,Ca,H,P,S,V1Cr!Cu,Pb,Elt.C
Table 5. The elements associated with the six fine particle source fingerprintsused in the work of Cohen et al [19].
This has been done for the Liverpool site for, July (a winter month), December(a summer month) and for the whole of 1994. The results as a percentage ofthe total fine particle (PM2.5) mass are given in Table 6.
ASPPM2.5
Fingerprint
Motor VehiclesSmokeSoilSeasprayIndustry
Total Mass
Percentage Fingerprint Contributions forLiverpool
Winter MonthJuly 1994
68±718±7
3.5±0.911 ±2.6
30±2 ug/m3
Summer MonthDecember 1994
19±5
2.7±0.95.4±0.8
73±7
9.5±0.6 ug/m3
AverageWhole 1994
54±218±125±44±2
35±21
14±8 ug/m3
Table 6. The percentage fingerprint contribution at Liverpool for PM2.5particles for 1994. The US EPA Chemical Mass Balance code CMB7 [20,21]was used to calculate these contributions using local source fingerprintsobtained from Cohen et al [19].
At the Liverpool site more than half the annual fine particle mass is associatedwith motor vehicles, with the winter months being three times higher than thesummer months. Seaspray and windblown soils were roughly constantthroughout the year between 4% and 5% of the total mass. Whereas theindustry contribution averaged about 35% during the year being a much largerpercentage in the summer months compared with the winter months. Smoke
2-10
from bushfires and domestic wood burning averaged about 8% throughout theyear being higher in the winter when more people use wood combustion fires.
PLANS FOR FUTURE WORK
It is planned to continue monitoring PM2.5 and PM10 particles at the LucasHeights and Liverpool sites for a further 12 months at least so comparisons offine particle mass and composition can be made with the 1994 year. This willfurther our knowledge of seasonal trends in the fine particle distributions atthese two sites.
The multi-elementa! IBA techniques have allowed us to perform somepreliminary fine particle source fingerprinting at these sites. This work will befurther extended using principal components analysis and chemical massbalance techniques.
Acknowledgements
We are pleased to acknowledge the collaboration of the University of NewSouth Wales, Macquarie University, the NSW EPA, Pacific Power.and fundingfrom the Energy Research and Development Corporation (ERDC), theCommonwealth EPA and the NSW Environmental Trust during some of the fineparticle data taking phases reported here. We also thank the 3 MV Van deGraaff accelerator staff for operating the ion beam analysis equipment used toanalyse all the data.
REFERENCES
[1] D.W. Dockery, F.E. Speizer, D.O. Stram, J.H. Ware, J.D. Spengler andB.G. Ferris, (1989), Effects of inhalable particles on respiratory health ofchildren, Am. Rev. Diseases, Vol 139, p587-94.
[2] D.W. Dockery, C.A. Pope, X. Xu, J.D. Spengler, J.H. Ware, M.E.Fay, B.G.Ferris, F.E. Speizer, (1993), An association between air pollution and mortalityin six US cities. New England Journal of Medicine, Vol 329, p1753-59.
[3] R.F. Phalen, (1994), PM10 health effects: scientific issues anduncertainties, 4th International Aerosol Conference, Los Angeles, California, 29August-2 September.
[4] C.A. Pope, J. Schwartz and M.R. Ransom, (1992), Daily mortality andPM10 pollution in Utah Valley, Arch, of Environ. Health, Vol 47, p211-217.
[5] J. Schwartz, D.W. Dockery, (1992), Increased mortality in Philadelphiaassociated with daily air pollution concentrations. Am. Rev. Respir. Dis., Vol145, p600-604.
2-11

[6] J.W. Ware, B.G. Ferris and D.W. Dockery, (1986), Effects of SulphurDioxides and Suspended Particulates on Respiratory Health of PreadolescentChildren, Am. Rev. Respir. Diseases, Vol 113, p834-842.
[7] M. Bobak and D.A. Leon, (1992), Air Pollution and infant Mortality in theCzech Republic 1986-1988. The Lancet, Vol 340, p1010-1014.
[8] R.J. Charlson, J. Langner and H. Rodhe. Sulphate Aerosol and Climate.Nature, 348(1990)22.
[9] D.D. Cohen (1992), Ion beam analysis techniques in aerosol analysis,Clean Air, Vo! 26, p113-121.
[10] D.D. Cohen, G.M. Bailey D. Garton, E. Stelcer, P.T. Crisp, T.A. Cahill andR. Eldred. (1994). Some results from a large area network for fine particles inNSW. 12th International Clean Air Conference, Perth, Australia, 21-28 October.
[11] D.D. Cohen, G.M. Bailey D. Garton, E. Stelcer, P.T. Crisp, R. Rothwell, J.Banks and R. Hyde, (1994) Composition and distribution of fine particles in theSydney region. Proceedings of the Air Toxics Conference, Sydney, 10-11August.
[12] D. D. Cohen, P. Crisp, J. Martin, G.M. Bailey, E.Bryant, R. Rothwell, J.Banks, R.Hyde, (1994) A twelve month survey of fine particulate lead levels inmajor population areas of New South Wales, Clean Air, Vol 28, p79-88.
[13] D.D. Cohen, J.W. Martin, G.M. Bailey and P.T. Crisp, (1993), Thedetermination of fine particle sulphur levels in the Wollongong, Newcastle andSydney Areas, Clean Air, Vol 27, p63-71.
[14] D.D. Cohen, J.T. Noorman, D.B. Garton, E. Stelcer, G.M. Bailey, E.P.Johnson, L Ferrari, R. Rothwell, J. Banks, P.T. Crisp and R. Hyde, (1993),Chemical analysis of fine aerosol particles within 200 km of Sydney:introduction to ASP study, Clean Air, Vo! 27, p15-21.
[15] ERDC Study, Final Report Voi i-V, (1995), Contributions of fuelcombustion to pollution by airborne particles in urban and non-urbanenvironments, ANSTO, NSWEPA, Pacific Power, UNSW, MacquarieUniversity.
[16] P.K. Hopke, (1985), Receptor Modelling in Environmental Chemistry, NewYork, John Wiley & Sons.
[17] D.D. Cohen, G.M. Bailey, J.W. Martin and P.T. Crisp (1994), The study ofanthropogenic fine particles transported from urban areas to rural and non-
2-12

urban environments using nuclear related techniques, IAbA report NAHRES-19, Vienna, p33-45.
[18] T.A. Cahill, P.H. Wakabayashi, M. Kassahara, (1994), Influence of organicand sulphate aerosols, by size and time, on visibility in Kyoto. 4th InternationalAerosol Conference, Los Angeles, California, 29 August-2 September.
[19] D.D. Cohen, R. Kondepudi, R. Hyde, M. Young, and P. Crisp,Meteorological and chemical interpretation of air pollution by fine aerosolparticles in the region 200 km around Sydney, F:inal Report NSWEnvironmental Trust Grant, No 1993/RD/G02, March 1995
[20] J.G. Watson, J.A. Cooper and J. Huntzicker. The effective varianceweighting for least squares calculations applied to the mass balance receptormodel. Atmos. Environ., 18 (1984) 1347-1355.
[21] J.G. Watson, N.F. Robinson, J.C. Chow, R.C. Henry, B. Kim, Q.T.Nguyen, E. L. Meyer, T.G. Pace. Receptor model technical series, volume III,CMB7 user's manual, US Environmental Protection Agency, Report EPA-450/4-90-004, January, 1990.
2-13

a s P aerosol sampling projectFig. 1LOCATION MAP
Fig. 1. Location map of the 24 ASP fine particle aerosol samplers within 200 km ofthe city of Sydney. The coal fired power stations serving the Sydney area are alsoshown.
2-14
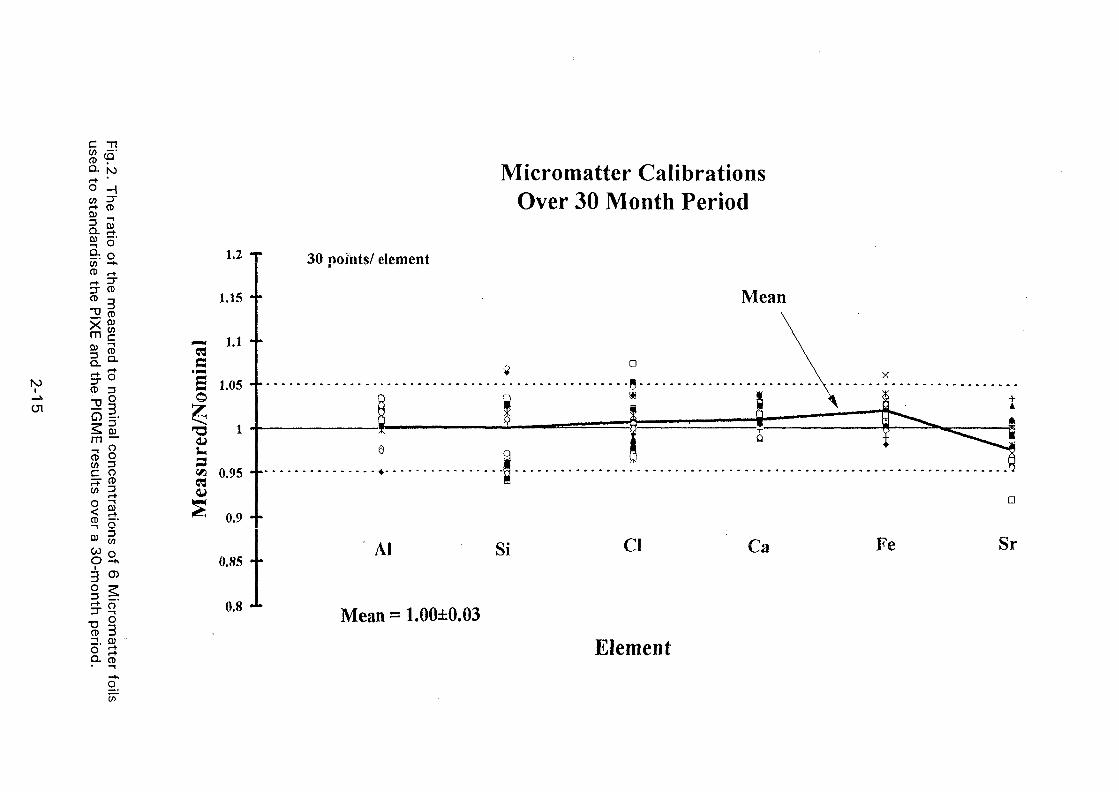
C Tl
<-+ CD
9-. oC O - * >< D r+
CD
0)
S CD
«-+ r +
CD 3
| Im ~~CD OW 3C O
*
30
§ i
CD 3
a
o
1.2 T
0.8 •*•
Micromatter CalibrationsOver 30 Month Period
30 pornts/ element
Mean = 1.00±0.03
Mean
Element

Liverpool 1994, Mass
1OX)
60000 •
50000 - •
40000 fi
30000
• PM10
----a--- PM2.5
I 20000
10000
e \ f > r © T rN « « •» «
Jan - Dec 1994
(b)
2000
Liverpool 1994, Sulphur
PM10
Jan - Dec 1994
(c) Liverpool 1994, Lead
PM10
- - - -a - - PM2.5
Jan - Dec 1994
Fig. 3. Daily fine particle concentrations for (a) mass, (b) sulphur and (c) lead at theLiverpool site during 1994. Data were obtained using the Gent SFU system witha single head which provides information for PM2.5 and PM1O particles everyWednesday.
2-16

Lucas Heights 1994, Mass
PM10
Jan - Dec 1994
Lucas Heights 1994, Sulphur
HiHomniiHH mini t nnm mm
Jan - Dec 1994
(c) Lucas Heights 1994, Lead
PM10
- - a - - - PM2.5
»« <•> ~< m
Jan - Dec 1994
Fig. 4. Daily fine particle concentrations for (a) mass, (b) sulphur and (c) lead at theLucas Heights site during 1994. Data were obtained using the Gent SFU systemwith two heads which provides information for PM2.5 and PM10 particles everyWednesday and Sunday.
2-17
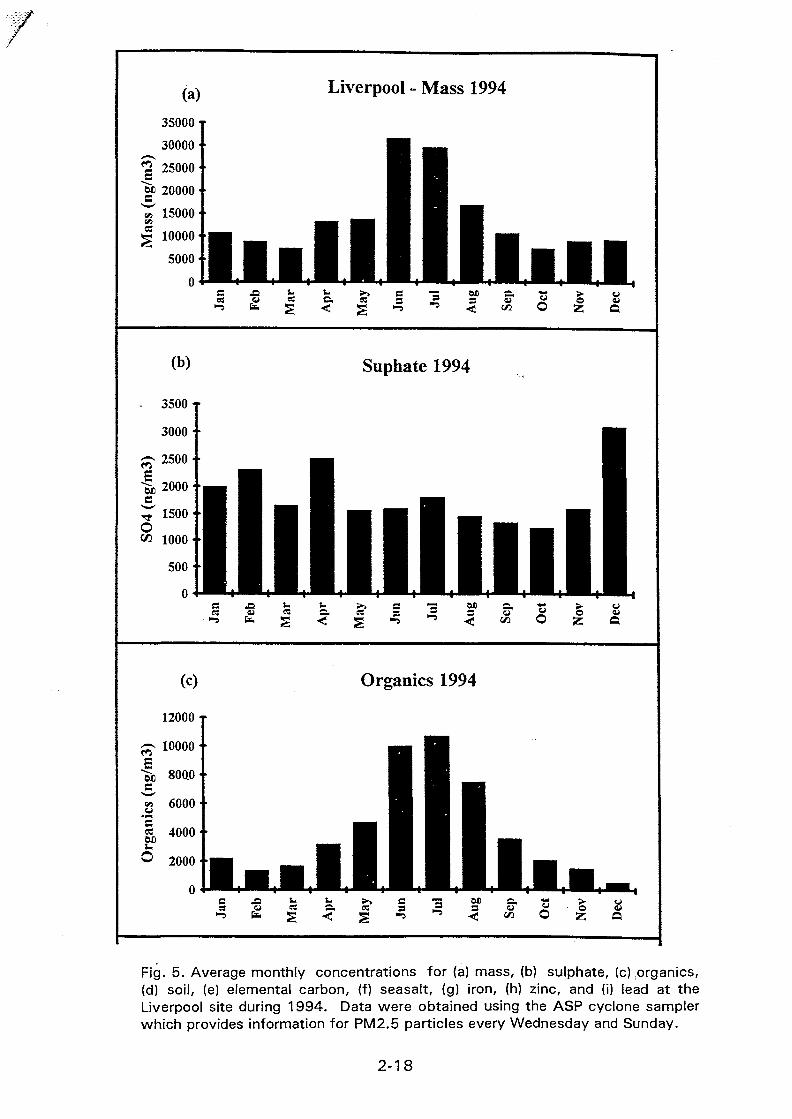
(a)
35000
30000
<£ 25000
"w> 20000
X 15000
j | 10000-
5000-
0-
(b)
- 3500 •
3000-
t% 2500 •
"5b 2000 -c^T 1500•o<» 1000-
500-
0-
(C)
12000
^ 10000
*5b soaos^T 6000
1 40000 2000
0
Liverpool - Mass 1994
II.• • • I M I M I M
Suphate 1994
IlliniumOrganics 1994
S J2 " * ^** C ^3 &£ CM *f ^ OCS ^ ^ S« 05 S ^M 3 ^ — ' O W
" 5 f a g - < j g « - 5 ^ ' - < c « O z ; f i
Fig. 5. Average monthly concentrations for (a) mass, (b) sulphate, (c) organics,(d) soil, (e) elemental carbon, (f) seasalt, (g) iron, (h) zinc, and (i) lead at theLiverpool site during 1994. Data were obtained using the ASP cyclone samplerwhich provides information for PM2.5 particles every Wednesday and Sunday.
2-18

(d) Liverpool - Soil 1994
Elemental Carbon 1994
(0
2500 T
2 0 0 0 • •
Salt 1994
Fig. 5 (continuation)
2-19
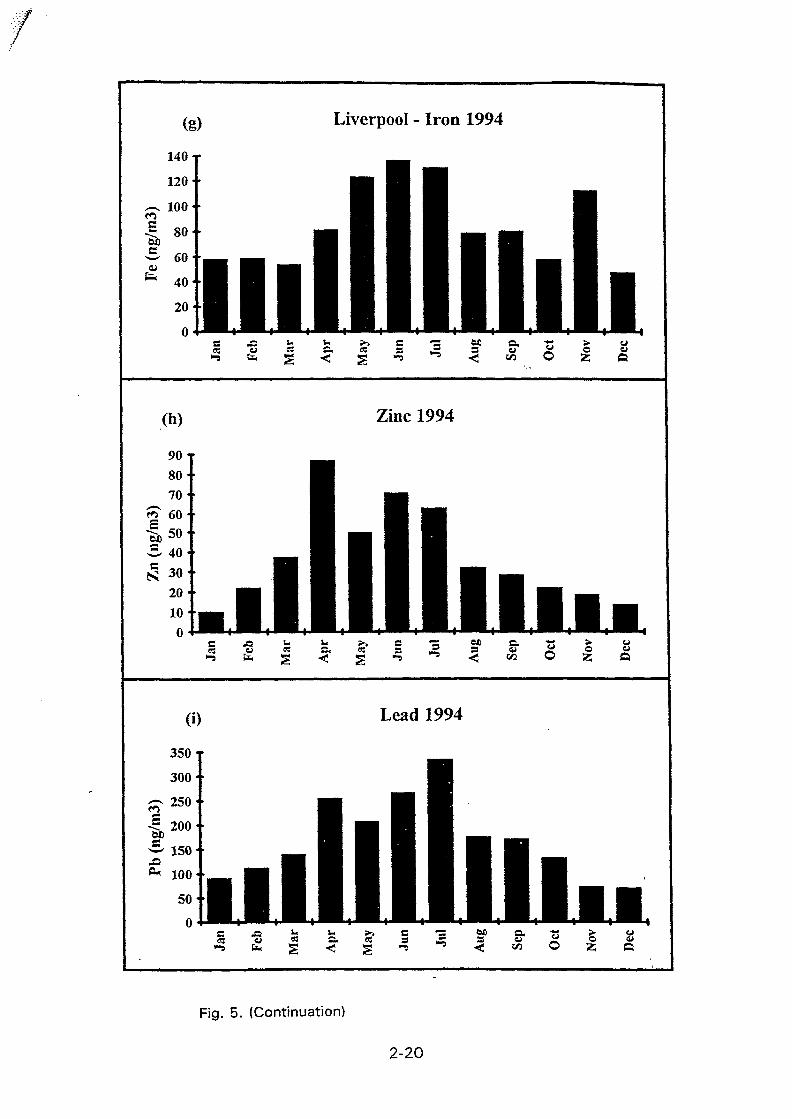
B (n
g/m
:
fa
(
e§
Pb
(nj
(g)
140-
120-
100-
80>
60-
40-
20<
90-
80-
7 0 '
60-50-40-3 0 '
2 0 '
10
0 '
|1
Jan
1Ja
n I
0)
350
300
250
200
150
100
50
0I
1 Ja
n 1
|1Fc
b I
•
Fcb
1
•J1
|1M
ar
I
•••
Mar
1
|1
1 M
ar 1
Liverpool - Iron
^ ^
• l lIIIillli• III1JLIJL
*- « a I< S -> ^
Zinc 1994
•• HI l l l1 1 | 11IIIIIII^J1 I I si
Lead 1994
|
• l l• a l lI l l lJJJU.< S "* ^
1994
II1II
Aug
1
• ,•I
Aug
I
11
Au
gl
1-• Ien O
• •a. "Sen O
ua, -gen O
|
|
|1
Nov
1
IN
ov
1
I
Nov
1
|1
Dec
1
•D
ec
I
I
Dec
1
Fig. 5. (Continuation)
2-20

Lucas Heights - Mass, 1994
(b)
3000 T
Suphate 1994
2500 • • wm
% 2000 •• H
Ihliiimiles c
(c) Organics 1994
Fig. 6. Average monthly concentrations for (a) mass, (b) sulphate, (c) organics,(d) soil, (e) elemental carbon, (f) seasalt, (g) iron, (h) zinc, and (i) lead at the LucasHeights site during 1994. Data were obtained using the ASP cyclone samplerwhich provides information for PM2.5 particles every Wednesday and Sunday.
2-21

(ng/
m
—
IceU
Elt
.
<^.S
****
(d)
2000'1800-1600-1400'1200-1000'800-600'400
200
0
(e)
2500-
2000'
1500'
1000'
500
0
(0
2500-
2000-
1500-
1000'
500
0
I •g «
| |IIMMe XiR W
•I
1|
MJiC XI« fii*-i fa
Mar
1
•1
Mar
Hj
•
Mar
I
Lucas Heights - Soil, 1994
•_ • • • • •• I B 1 1 11_HI_J|H_J|HjHLJHLHLt
«- >> c •= M isa « 3 = 3 «
< s ^ < M
Elemental Carbon 1994
.l -l l l l l lmill, 1 , 1 , 1 , 1 , 1 , 1^ | ^ S ^ ^
Salt 1994
| , , , |»- >-» c •= wo a.a. es 3 2 3 u-< S " < M
•I••• •
0 z
| |
| |
JUL0 1
, |
AMO z
•
Dec
1
IID
ec
•
•I1
Dec
|
Fig. 6. (Continuation)
2-22

(g) Lucas Heights - Iron, 1994
(h) Zinc 1994
0)
80 T
Lead 1994
lJlilllilIIIFig. 6. (Continuation)
2-23

(a)
30000
25000
<| 20000
3 15000
5 IOOOO
5000 • •
Comparison of Gent and ASP SamplersPM2.5 Lucas Heights 1994
0
GentSFU
ASP Teflon
Gent/ASP=0.95±0.4
i - fag I «i* A S / ^ Z P 2 «sgj 91PofBts
Jan - Dec 1994
(b)
30000--
^ 25000 ••
"I 20000-s8 15000 •C5
^ 10000
^ 5000 • •
Comparison of the Gent and ASP SamplersPM2.5 Lucas Heights 1994
0
91 points
ASP=(1.053±0.058)*Gent + (527±437)• R2=0.79
•+•
0 5000 10000 15000 20000 25000 30000
Gent Mass (ng/m3)
Fig. 7. A comparison of the Gent and ASP PM2.5 fine particle concentrations at theLucas Heights site for the whole of 1994.
2-24
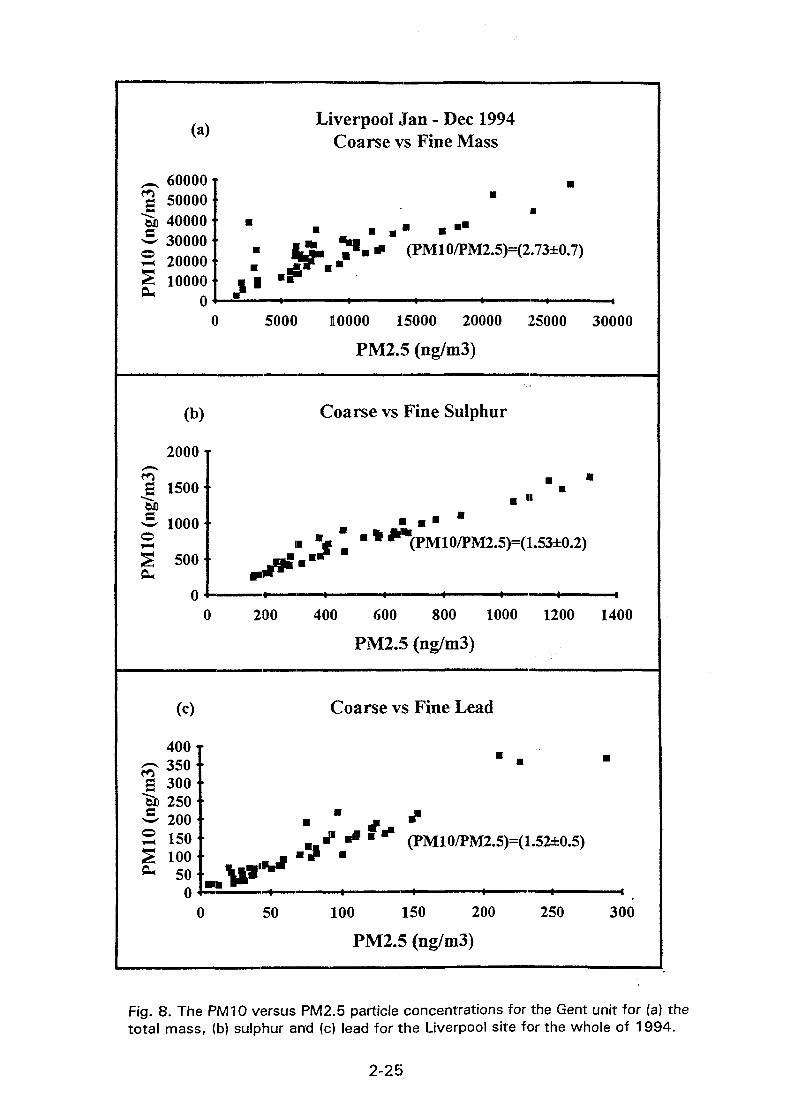
(a)
600005000040000300002000010000
0
Liverpool Jan - Dec 1994Coarse vs Fine Mass
(PM10/PM2.5)=(2.73±0.7)
5000 10000 15000 20000 25000 30000
PM2.5 (ng/m3)
(b)
2000
1500
1000
500'
0
Coarse vs Fine Sulphur
(PM10/PM2.5)=(l-53±0.2)
200 400 600 800 1000 1200 1400
PM2.5 (ng/m3)
(c)
400 T~ 350 •£ 300
~5JD 250w 2002 150S ioo* 50 \p
ois—
Coarse vs Fine Lead
.»(PM10/PM2.5)=(1.52±0.5)
0 50 100 150 200
PM2.5 (ng/m3)
250 300
Fig. 8. The PM10 versus PM2.5 particle concentrations for the Gent unit for (a) thetotal mass, (b) sulphur and (c) lead for the Liverpool site for the whole of 1994.
2-25

(a)
^ 60000
*g 50000
*5fc 40000
w 30000
S 20000
S IOOOO* o l
0
Lucas Heights Jan - Dec 1994Coarse vs Fine Mass
•h " • * (PM10/PM2.5H3.03±1.0)
5000 10000 15000 20000 25000
PM2.5 (ng/m3)
(b)
2500
*$ 2000
1> 1500
o 1000
| 500|
00
Coarse vs Fine Sulphur
(PM10/PM2.5)=(l-50±0.3)
500 1000 1500
PM2.5 (ng/m3)
2000
(c)
140
£T 1 2 °^ 100
cT 60S 40 +ft* 20
0
0
Coarse vs Fine Lead
(PM10/PM2.5)=(1.39±0.5)
20 40 60 80
PM2.5 (ng/m3)
100 120
Fig. 9.The PM10 versus PM2.5 particle concentrations for the Gent unit for (a) thetotal mass, (b) sulphur and (c) lead for the Lucas Heights site for the whole of1994.
2-26

(a) Coarse vs Fine Liverpool - 1994
100 T " : " " " = - " = = = " = " : = = :49 points
10 ' I : : : : : : : : : : : : : : : :
o
0.1
11 -1 r :*hs::I I I J I 1 I I I—1 I ' I—I—I—h-i—I—I I 1 I I—I
sElement
(b) Coarse vs Fine Lucas Heights -199491 points
100 T= I : : : : : : : : : : : : : : : : : : : : : : : : : : : : : : : : " " : : : : : : : : : : : : : : : : :
10 • : : : : : : : : : : : : : : : : :
L I - ' : : :
o.i
%
W
Element
Fig. 10. A plot of average annual (PM10/PM2.5) ratio for various elementsmeasured by the IBA techniques for (a) the Liverpool site and (b) the Lucas Heightssite. Data were obtained using the Gent sampler.
2-27

XAO102872
Appendix 3
Background Air Pollution Studies in Urban and Rural Areas inBangladesh.
M.Khaliquzzaman, S.K. Biswas, S.A. Tarafdar, A. Islam, A.H. Khan*Atomic Energy Centre
P.O. Box-164Dhaka, Bangladesh.
Abstract
Air particulate matter at two size fractions have been collected at an urban station (Dhaka) inBangladesh for one year using a 'Gent' PM-10 stacked filter unit (SFU). Of the samples collected,73 sets of samples (coarse and fine fractions) extending over a period of six months have beenanalyzed to find elemental concentrations using PIXE. These results of the analyses are presentedand discussed.
1. Introduction.
In a previous study analyses of some integral aerosol samples collected from urban andrural areas of Bangladesh were done(1). In the integral sampling some parameters of the samplescan not be strictly defined and as such results reported by different workers can not bemeaningfully compared. It is, therefore, necessary to collect samples in a standard way, so thatthe results from different geographical locations by different workers can be compared. This isbeing done in the current programme using the 'Gent' sampler. As the sizes of particulate matterin very important in determining their impact specially on health, the present programme definesthe sample sizes very specifically. Two types of size fractionated samples namely the coarse andthe fine have now been collected over a period of about one year. Here, we report the chemicalcharacterization of both the groups of samples over a period of six months. The implications ofthe results obtained are briefly discussed.
"Present address: Chemistry Dept., Dhaka University.
3-1

2. Experimental
ling
The samplings were done by using a 'Gent' stacked filter sampler^ .The samplerwas placed on the roof of a 5m high building located about 50m away from road. The roofof the building was flat and the sampling intake was placed 2m above the roof. Thesampling times were varied to ensure that the flow rate remained within the prescribedlimits. This was necessary to ensure the correct size fractionation. In each sampling, onefine and one coarse particulate samples were obtained on nucleopore filters of 47mmdiameter. Particulates of 2-10 urn equivalent aerodynamic diameter (EAD) were collectedon the coarse filter and particulates of <2um EAD were collected on the fine filter. Twoor more samplings were done per week during August,'93 to Sept., '94. No samplingcould be done during the period 3 May ,'94 to 14 June, '94 due to non availability ofnucleopore filters.
Method of Analysis
The PDGE method, both external beam and internal beam were used in theanalyses. In our current experimental setup, it is difficult to monitor the integrated beamcurrent accurately in internal beam experiments. In the external beam experiments,elements lighter than Argon could not be determined due to the high background countsproduced by the Argon in the air. As the internal beam experiments only gaveconcentration in arbitrary units, these were normalized to give the same Fe concentrationas in the external beam experiments. The quality control in the experiments were ensuredby irradiating suitable standards during the experiments. One in every five samplesirradiated was a standard. A spectrum obtained in an internal beam experiment is shownin figure-1. Analyses of spectra were done using the code QXAS. ..
3. Results and Discussion.
Aerosol mass variation
Monthly variation in the aerosol mass for both the coarse and fine fractions areshown in figure-2. It can be seen that the masses are rather similar during the period Aug-Oct. There is a step increase in the mass in November and again during Nov.-Jan. periodthe masses are comparable. This step increase in mass actually coincides with the adventof dry season when the rain fall is scarce. Because of the step increase in the mass inNovember, the results in the following discussions will be grouped in two periods namelyAug-Oct. and Nov.-Jan.
3-2

Composition of the Aerosol.
The monthly averaged concentration of elements in the coarse and fine fractions areshown in tables- 1 and 2 respectively. The cases where the observed concentrations fellbelow the minimum detection limit (MDL) were not considered in the calculation of theaverages. Hence, the averages shown are some what higher than the actual averages.
It can be seen that the concentration of most of the elements are similar duringAug.-Oct. and again during Nov.-Jan. periods. The averaged concentration of elementsduring these two periods are shown in table 3 and 4 respectively along with the standarddeviations. The high standard deviations points to the fact that there is considerable dayto day variation in the elemental concentrations. However, the general trend is theincrease in concentration of most of the elements with aerosol mass increase. There area few exceptions which will be discussed latter.
Enrichment Factors
In order to investigate the variation in the concentration apart from the aerosolmass increase, the enrichment factors compared to crustal abundance's have beencalculated and these are shown in table-5. The crustal abundance data were taken fromMason (4) and the reference element chosen was Ti as we could not determine the Alconcentration in the PDCE method. The enrichment factors (EF) are given by
where
EF; = Enrichment factor for element i.Q = Observed Concentration of element i.Aj = Crustal abundance of element i.The subscript 'Ti' refer to relevant quantities for TI.
The table -5 also shows the EFs for Khartoum and geometrically averaged values for 29cities*3*. These values were recalculated with respect to Ti reference instead of the originalfigures with respect to Al.
Some general trends in the EFs can be clearly seen. The elements for whichenhancements are large are the same in the present case as in the case of 29 city averages.This is in contrast with Khartoum values where no enhancements were observed for Cr,Mn, Ni and Cu. The EFs are generally much higher in the case of finer fraction for S, Zn,As, Br and Pb. This indicates that these elements are mostly from vapour condensates andare most likely to originate from combustion processes. The EF for Cl is higher in Aug.-Oct. for the coarse particle indicating its sea origin. High value of EF for Pb arises fromthe use of leaded gasoline in the country. The EFs for As show very high values specially
3-3

in the fine fraction. It is, therefore, very likely that As has its origin in high temperatureindustrial processes using As such as glass making.
Acknowledgment
Authors wish to thank Dr. M. A. Subhan, Director, Atomic Energy Centre, Dhakafor his whole hearted support in this work.. Thanks are due to staff members of theAccelerator Facilities and Chemistry Divisions of their support. Encouragement andsupport of Mr. M. A. Quaiyum, Chairman, BAEC and Dr. M.A. Wazed Miah, Member,BAEC are gratefully acknowledged.
References
1. A. H. Khan, M. Khaliquzzaman, S.A. Tarafdar, S.K.Biswas, IAEA Report-NAHRES-19(1994)47-57.
2. W. Maenhaut, F. Francoise, J. Cafmayer, IAEA Report-NAHRES-19 (1994) 249.
3. M. A. H. El Tayeb, C.F. Xhoffer, PJ. Van Espen, R.E. Van Grieken. AtmosphericEnvironment. 27B(1993)67.
4. R. Mason, Principles of Geochemistry(1966), Pub. Wiley, New York.
3-4
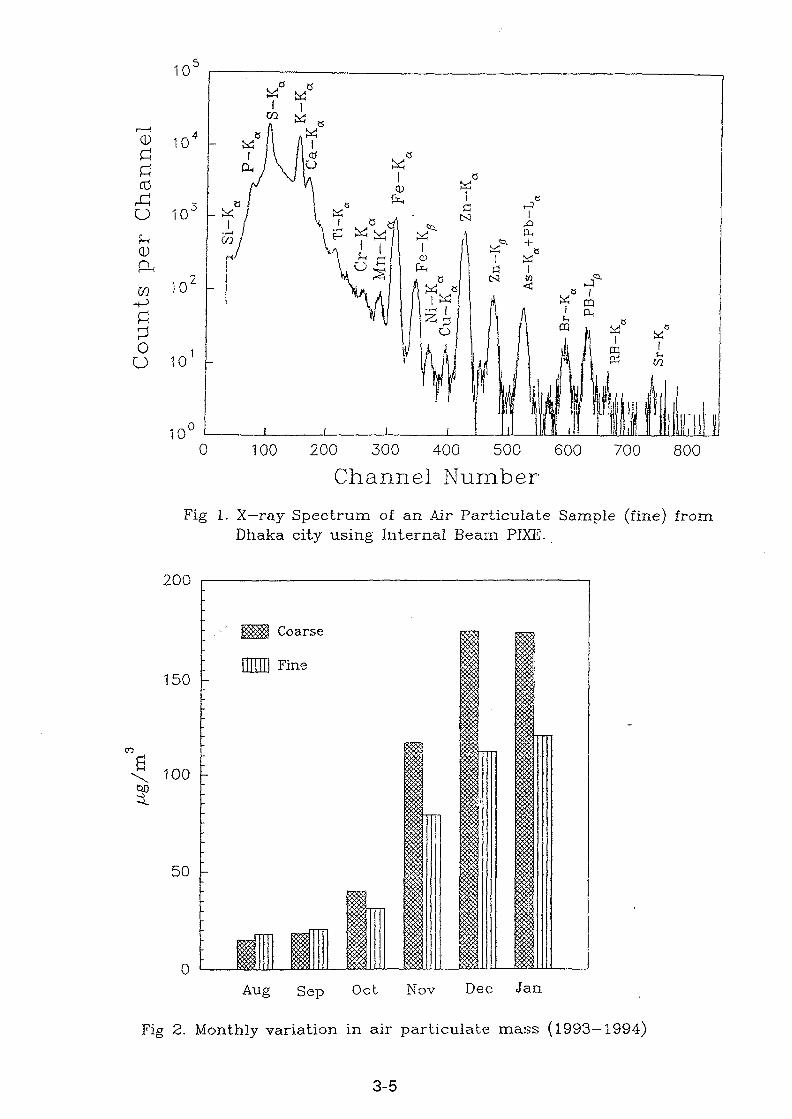
o
CDp t
m
oo
100 200 300 400 500 600
Channel Number700 800
Fig 1. X—my Spectrum of an Air Particulate Sample (fine) fromDhaka city using Internal Beam PIXE.
200
150 -
100 -
50
0Aug Sep Oct Nov Dec Jan
Fig 2. Monthly variation in air particulate mass (1993—1994)
3-5

Table 1 Monthly variation in concentration (ng/m3) of in coarsefraction during August '93 - January '94.
Element
SiPSClKCaTiCrMnFeNiCuZnAsBrRbSr
Pb
Aug
138433.8
27072819349731.15.559.09
372—4.92
1616.254.02——66.3
Sep
177935.6
29253124764538.28.1311.7478—5.82
1568.80
11.1——103
Concentration
Oct
224927.4
43518435780063.46.3216.1649—5.88
18719.826.9-—218
Nov
619832.1
964320
1199266117113.941.7
19486.396.84
38241.964.112.515.9306
(ng/m3)
Dec
7962134.1
2508559
1636267423924.152.7
,24614.3814.6
50380.513714.016.5501
Jan
1173257.8
3055180
2550331530424.762.1
29104.948.68
15537.687.413.616.5440
Table 2. Monthly variation in concentration (ng/m3) of in finefraction during August '93 - January '94.
Element
SiPSClKCaTiCrMnFeNiCuZnAsBrEbSrPb
Aug
30940.
81484.
32110517.4.6.
147—5.
30115.14.__
284
9
0
25271
86
51
Sep
18732.3
61748.0
3439012.5_7.0
111—5.85
23521.522.6__
274
Concentration
Oct
34446.9
92249.0
44410513.2-6.6
1073.845.10
17637.154.6—-
450
Nov
55976.4
1968128
13022462712.112.82705.509.84
41447.1
105.9—
13.4400
(ng/m3)
Dec
77167.0
2218121
12831942911.29.8
2286.367.7
230 •63.115711.6
22.1661
Jan
119581.5
331782
19592972911.814.3250
5.13. 6.3612639.8
131.016.717.5696
3-6

Table 3. Two Group averaged concentration in ng/m3 (Aug.-Oct.,Nov.-Jan.) with standard deviation for coarse fraction.
Element
SiPSClKCaTiCrMnFeNiCuZnAsBrRbSrPb
August- October
Average(N=34)
1815 (34)32.3 (13)332 (34)477 (34)271 (32)652 (34)44.3 (34)6.58 (8)12.3 (34)502 (34)—5.59 (25)
167 (34)13.7 (21)14.1 (34)——
129 (34)
SD
110123.313942213431930.01.576.4
270-1.60
1068.815.6--
106
November-January
Average(N=37)
8259 (37)85.1 (13)
2099 (37)383 (37)1705 (37)2825 (37)214 (37)20.8 (35)51.1 (37)
2390 (37)5.05 (14)
10.3 (36)376 (37)60.9 (25)99.3 (37)13.4 (15)16.35 (25)
418 (37)
SD
345957.8
20505198739919614.119.1
8242.348.2
62345.7104.26.224.87
518
N is the total number of samples; Numbers in the paren-thesiscorresponds to samples which have concentration above thedetection limit.
Table 4. Two Group averaged concentration in ng/m3 (Aug.-Oct.,Nov.-Jan.) with standard deviation for fine fraction.
Element
SiPSClKCaTiCrMnFeNiCuZnAsBrRbSrPb
August- October
Average(N=34)
273 (25)38.6 (10)774 (34)59.0 (34)369 (34)101 (24)14.7 (10)4.52 (1)6.8 (31)
120 (34)3.84 (1)5.62 (29)
235 (34)24.8 (34)30.5 (34)_—
334 (34)
SD
1889.9
38974.0152413.9
2.244
2.1912819.828.5——
271
November-January
Average(N=38)
816 (33)73.3 (20)
2440 (38)114 (38)1450 (38)239 (36)28.3 (3611.6 (30)11.6 (30)247 (38)5.83 (29)7.86 (26)
268 (38)60.2 (38)133 (38)14.1 (4)19.1 (9)
580 (38)
SD
51840.9
126891168211813.95.65.9
114• 2.02
4.8258071.4
1083.16.0
818
N is the total number of samples; Numbers in the paren-thesiscorresponds to samples which have concentration above thedetection limit.
3-7

Table 5. Enhancement factors with respect to Ti.
Element
SiPSClKCaTiCrMnFeNiCuZnAsBrRbSrPb
Coarse
Aug-Oct
0.652.7263.3 -
151-1.041.7813.271.231.01.37.93
126272877——
802
Nov-Jan
0.611.4883.025.11.351.612.141.050.98—
3.0358.5
2501276
0.891.12
537
Fine
Aug-Oct
0.39.8
44556.04.260.8316.762.030.7214.424.0533
14825698
——
6248
Nov-Jan
0.469.66
73056.58.71.0219.01.810.77
11.317.5316
187212966
7.099.91
5635
29
0.481.6
301184
11.7813.81.961.356.63
91.4'" 184
-1190
1.780.54
2331
Khartoum
0.351.1846.859.1
0.350.7910.60.740.750.950.5112.3-72.70.350.48
29.1
3-8

XAO102873
Appendix 4
ATMOSPHERIC AEROSOL STUDIES USING THE "GENT" STACKED FILTERUNIT AND OTHER AEROSOL COLLECTORS, WITH MULTE-ELEMENTALANALYSIS OF THE SAMPLES BY NUCLEAR-RELATED ANALYTICALTECHNIQUES
Willy Maenhaut, Filip Francois, Jan Cafmeyer and Olusola Okunade,Institute for Nuclear Sciences, University of Gent,Proeftuinstraat 86, B-9000 GENT, Belgium.
ABSTRACT
Our research within the core programme of the Co-ordinated ResearchProgramme (CRP) on Air Pollution is described. This included the analysis of theanalytical quality control Nuclepore filter samples, work on the calibration of thePM10 inlet of the "Gent" stacked filter unit (SFU) sampler, and an aerosol study withthis SFU sampler at an urban residential site in Gent. The calibration of the GentPM10 inlet was done through intercomparisons with commercially available PM10samplers, and quite reasonable agreement was obtained. For the study at the urbanresidential site, a total of 118 SFU samples were collected. The samples wereanalyzed for the particulate mass, black carbon and up to 29 elements. The elementswere measured by PDCE and short-irradiation INAA. Median atmosphericconcentrations and enrichment factors were calculated for the fine and coarse sizefractions, and average FINE/COARSE ratios were derived. The medianconcentrations were compared with those from a study, done at the same site in thefall of 1986. The levels of the automotive elements Pb and Br had decreased by afactor of about three relative to 1986, but most other elements exhibited very similarconcentrations. A brief overview is given of the status in our various regional andglobal scale aerosol studies. Finally, our plans for future work are given.
1. SCIENTIFIC BACKGROUND AND SCOPE OF THE PROJECT
It is increasingly recognized that submicrometer-sized atmospheric aerosols havea much greater effect on the earth's radiation balance and thus on regional and globalclimate than previously thought. Especially the fine anthropogenic sulfate particleshave received a lot of attention. Such particles scatter the incoming solar radiation (theso-called direct effect) and they can act as cloud condensation nuclei (CCN) andthereby change the radiative properties of clouds (the indirect effect) [1-6]. Alsovarious other anthropogenic and natural fine particles have similar radiative (and ,climatic) effects. Examples of such fine particles are those emitted by various forms ofbiomass burning, such as fires in savannas and forested areas, and the burning of fuelwood, charcoal and agricultural waste. While the anthropogenic sulfate is mainlypresent over the continents in the northern hemisphere, pyrogenic (biomass burning)particles are predominantly emitted in equatorial and tropical regions, such as Brazil,Africa and southeast Asia. Penner et al. [7] and Dickinson [8] estimated that thecombined direct and indirect radiative effects of smoke aerosols are responsible for a
4-1

global reflection of solar radiation that is comparable to that from the sulfate aerosol.Besides their impact on the earth's radiation balance, aerosols have several othereffects on various areal scales (global, regional, local). Aerosol particles and theirconstituents play an important role in heterogeneous (multi-phase) atmosphericchemistry (and photochemistry) by acting as surfaces and/or catalysts for the reactionson and with various atmospheric trace gases (e.g., oxidation of SO2 to sulfate). As aconsequence of such heterogeneous reactions certain aerosol constituents (elements)may be transformed into a more soluble form and/or other oxidation state [e.g.Fe(III) into Fe(II)], which has implications for the further role of the particles inatmospheric (photochemical) processes and for the chemical and biological availabilityof the elements after wet or dry deposition. Other important effects of aerosolsinclude the reduction of visibility (by fine particles), their role in the ecology (e.g., bycontributing to "acid rain") and their effects on the welfare and health of humans andanimals, and on buildings, structures and materials.
As many of the effects of aerosols depend on their size and chemicalcomposition, it is highly desirable to collect the particles in at least two different sizefractions (coarse and fine) for subsequent chemical analysis. About 4 years ago wetherefore developed the "Gent" version of the stacked filter unit (SFU) sampler [9].Like other SFU variants [e.g., 10,11] it is based on sequential filtration through twoNuclepore filters with different pore sizes [12]. The coarse filter collects the particleslarger than 2 jj.m equivalent aerodynamic diameter (EAD) and the fine filter theparticles <2 u.m EAD [13]. In order to have a well-defined upper cut-point for thecoarse size fraction, the Gent SFU is equipped with a pre-impaction stage, which hasa cut-point (d50-value) of 10 jim EAD and thus acts as a PM10 inlet The "Gent"SFU sampler has been adopted for use in the core programme of the IAEA Co-ordinated Research Programme (CRP) "Applied research on air pollution usingnuclear-related analytical techniques". Within this CRP core programme it is used byresearch groups from almost 20 different countries, including ourselves, to performlocal/regional scale studies on aerosol composition, during a first year at arepresentative urban residential site, and subsequently at a representative rural site.Besides our work for this core programme, we are conducting (or are involved in)various regional and global scale atmospheric aerosol studies. These other studies aredone within the framework of the Belgian Impulse Programme "Global Change" andthe EUROTRAC subproject Air-Sea Exchange (ASE), or within projects that arefunded by the European Union (EU). We are currently involved in two EU projects,i.e., one with P. Artaxo to study aerosols from biomass burning in Brazil, and anotherwith J.-L. Jaffrezo from Grenoble (and several other groups) to study the air to snowtransfer of gaseous and paniculate species in Greenland. All these studies constituteour work within the supplementary programme of the CRP. In these other studies wemake extensive use of the Gent SFU, but we also employ various other size-fractionating sampling devices, in particular cascade impactors, and we are involved inthe development of novel cascade impactors.
The major objectives of our aerosol studies are (a) to identify the major sources,source types and/or source regions of the (fine) aerosol particles and their dominantconstituents, (b) to determine the relative contributions from the various source typesor source regions to the atmospheric levels of the heavy metals, acidifying species, andthe climatically active aerosol constituents (sulfate, black carbon, the fine particulatemass), (c) to gain a better insight in the long-range transport and in the dispersion,
4-2
transformation and removal processes of the aerosol particles and their constituents,and (d) to improve our knowledge on the biogeochemical cycles of the elements. Inour regional and global scale studies, we attempt to discriminate between thecontributions from natural and anthropogenic sources and thus to assess the extent ofthe anthropogenic perturbation. The emphasis in these studies is placed on the Arctic(and Antarctic), on equatorial/tropical regions, and on regions that are downwind ofthe major European anthropogenic source regions. In order to achieve our objectives,the aerosol samples are analyzed by one or more of the following "bulk" analysistechniques: gravimetry (for the particulate mass), a light reflectance technique (forblack carbon), ion chromatography (IC) (for inorganic and organic anions andcations), and particle-induced X-ray emission analysis (PIXE) and instrumentalneutron activation analysis (INAA) (for over 40 elements). To identify the sources(source types) and, if possible, also the source regions of the aierosol constituents, andto quantify the contributions from these sources, the multi-element (multi-component)data sets are examined with receptor models (both chemical mass balance andmultivariate statistical techniques). To pinpoint the source regions more precisely andto assess their impact, the atmospheric levels are related to air mass trajectories, andprocedures and algorithms for this are being developed.
In this paper we will report mainly on our work within the core programme ofthe CRP, but we will also give a brief overview of the status in our various regionaland global scale aerosol studies. Most of these latter studies involve some co-operation with other research groups. Table I gives a list of the various institutions(and persons), with whom we have an on-going co-operation on an aerosol-relatedsubject.
2. METHODS
Our aerosol sampling equipment, sample collection methods, and techniques andmethods for sample analysis and data evaluation are essentially still the same asdescribed in the Report on the first Research Co-ordination Meeting (RCM) of thisCRP [14]. With regard to the sampling equipment, we now also utilize a dichotomoussampler (virtual impactor) [15,16], i.e., for sampling at Sevettijarvi in the FinnishArctic, and we are involved in the development and testing of a small deposit arealow pressure impactor (abbreviated to SDLPI or SDI) [17]. This new cascadeimpactor was especially designed to collect size-fractionated aerosol samples in remotelocations for subsequent chemical analysis by PIXE. This implied that the air flow ratethrough the device should be as high as possible, while at the same time the aerosoldeposit on each stage should remain confined to a small area, so that it can be fully 'enveloped by the proton beam during the PIXE bombardment (the diameter of thebeam is less than 1 cm in a typical PIXE setup). Furthermore, the device shouldprovide good size resolution down to 0.1 y.m equivalent aerodynamic diameter (EAD)or smaller, so that the raw size distribution data can be used in inversion algorithms toderive reliable smooth size distributions. Currently, the most commonly used cascadeimpactor for the collection of aerosols for subsequent PIXE analysis is the model 1-1PIXE International cascade impactor (PCI) (PIXE International Corporation, P.O.Box 2744, Tallahassee, FL 32316, U.S.A.). This model is a single-orifice impactor ofthe Battelle design [18,19]. It has seven impaction stages (numbered 7 through 1) anda back-up filter stage. The collection surfaces of the various stages are mounted on 25
4-3

mm diameter polycarbonate rings, and the loading and unloading of these substraterings in the PCI is fairly straightforward. More important, the aerosol particles arecollected on each impaction stage as a single deposit, which can easily be envelopedby a proton beam of 8 mm diameter. While the latter feature makes the PCI verysuitable for PIXE analysis, the device suffers from the fact that the air flow ratethrough it is only 1 L per min. Also, the cut-point of the last impaction stage is stillrather high (i.e., 0.25 u.m EAD). Other cascade impactors, such as the various variantsof the Berner low pressure impactor (BLPI) [20,21] and the rotating version of themicroorifice uniform deposit impactor (MOUDI) [22,23], do have stage cut-pointsdown to about 0.05 p.m EAD or less and operate at much higher flow rates (25 to 30L per min), but the particles are collected on each stage along a ring or over a ratherlarge area, so that typically only a few percent (5-10%) of the deposit can be coveredby the proton beam during the PIXE bombardment As a consequence, the advantageof the higher flow rate during sampling is entirely lost during the analysis [24]. Thenewly developed SDI is a 12-stage, multinozzle device, but the deposit for each stageremains confined to an area with diameter less than 8 mm. Thus, a large sample tosubstrate area (or mass) ratio is obtained, so that blank corrections are small, and thisfeature is also very advantageous when using the SDI for other analytical techniquesbesides PIXE. The SDI operates at a flow rate of 11.3 L per min and accepts thesame, handy, 25 mm diameter substrate rings as the PCI. The stage pressures varyfrom near ambient pressure for the upper stages (nos. 12 through 6) down to 137 hPadownstream of the lowest stage (stage 1). The number of nozzles varies from 1 (stage12) to 53 (stage 1). In designing the device, it was also taken into account that oneshould be able to operate it under harsh conditions, such as in the Arctic. Therefore,and to ensure vacuum tightness, the impactor bodies (stages) are double-sealed bysilicon O-rings. Furthermore, the impactor is made of high-quality stainless steel andthe nozzle plates are exchangeable. The SDI was calibrated at the FinnishMeteorological Institute (FMI) using monodisperse dioctyl sebacate aerosols, and theexperimental cut-points agreed very well with the theoretical ones. The experimentalcut-points for stages 12 through 1 are 8.78, 4.29, 2.78, 1.74, 1.10, 0.835, 0.620, 0.364,0.242, 0.166, 0.090 and 0.048 \im EAD.
3. RESULTS AND DISCUSSION
3.1. Analysis of the analytical quality control Nuclepore filter samples
Two 47-mm diameter Nuclepore filter blanks and two artificially preparedaerosol filter samples (i.e., one coarse and one fine aerosol sample, each on the samefilter substrate as the blanks) [25] were provided to us at the first RCM of this CRP.The deposit area of the aerosol particles on the filter samples was 9.93 cm2. The fourfilters were weighed at Gent and each filter was subsequently cut up in 3 parts, withone half for analysis by INAA and the two remaining quarters for analysis by PIXE.Each of the two PIXE quarters was subjected to two proton bombardments, with thesecond bombardment one week after the first one. The diameter of the proton beamwas 8 cm, the beam current 150 nA for the blanks and 50 nA for the samples^ and thepreset charge 60 p.C All measurements were done with a so-called "funny filter" [26]interposed between specimen and detector. The PIXE results for both blanks andsamples were expressed in ng per 9.93 cm2, and the data for the samples were not
4-4
corrected for the blank contribution. Matrix effects resulting from the proton energyloss and X-ray attenuation within the 10 nm thick filter substrate were not taken intoconsideration and no corrections for particle size effects were applied. Consequently,the PIXE results for the blank filters should be lower than the real blank values, butthey can be considered as procedural blanks that should be applied in the blankcorrection of the samples. The negligence of the particle size effects has the effectthat the data for the lightest elements (Al, Si) in the coarse aerosol sample areprobably underestimated by about 20-30%. The INAA analysis of the filter halves wasdone as described in [14], and the results were expressed in ng per total filter.Similarly as in the PIXE analysis, the results for the samples were not corrected forthe blank contribution. All individual results (thus 4 PIXE results and 1 INAA resultper element and per filter) were forwarded to S. Landsberger. With regard to thePIXE data, it was indicated that the results from the first PIXE bombardment shouldbe the more correct ones. Furthermore, as both As and Pb were included in the fitsfor the PIXE spectra, it was concluded that the PIXE Pb data may be underestimatedby about 10-20%. For both the coarse and fine aerosol filter samples, PIXE yieldedactual concentration data for 20 elements (Al, Si, P, S, Cl, K, Ca, Ti, V, Cr, Mn, Fe,Ni, Cu, Zn, Br, Rb, Sr, Zr, and Pb) and detection limits for 4 additional elements (Ge,Se, Nb, and Mo). The INAA of the aerosol samples resulted in actual concentrationdata for 32 elements (Na, Mg, Al, Cl, K, Ca, Sc, Ti, V, Cr, Mn, Fe, Co, Ni, Zn, Ga,As, Br, Rb, Cd, In, Sb, I (only for the coarse aerosol), Cs, Ba, La, Sm, Eu, Lu, W, Au,and Th) and in detection limits for 7 other elements (Cu, Se, Sr, Mo, Ag, Sn, and Ce).
3.2. Work on the calibration of the Gent PM10 inlet
The 10 u.m EAD cut-point (d50-value) for the pre-impaction stage of the GentSFU sampler is based on impactor theory calculations [e.g., 27]. It seemed worthwhileto verify this calculated value by experiments. In a co-operation with the NorwegianInstitute for Air Research (NILU), parallel samples were collected in downtown Oslowith the Gent SFU sampler and with a commercial PM10 dichotomous sampler.Coarse and fine particle mass (PM) concentrations were derived for both samplertypes by weighing the filters before and after sampling, and the results are reported inTable II. The agreement between the data from two samplers is reasonable, exceptfor the coarse PM data from 27 April.
A more extensive intercomparison between the "Gent" SFU and an independentsampler was performed by P. Artaxo in Sao Paulo, Brazil [P. Artaxo, privatecommunication, 1995]. The independent sampler was in this case an official p-gaugeair monitoring sampler with PM10 inlet. Almost 70 parallel samples were taken andthe agreement of the PM10 masses from both sampler types was excellent. However,most of the PM is in the fine fraction in Sao Paulo, so that the experiment providedrather information on the accuracy of the volume measurement, the fi-gauge' masscalibration and the particle collection characteristics (efficiency) of the filters, and wasnot so much an intercomparison of the cut-points of the PM10 inlets from the twosamplers.
More direct evaluations of the accuracy of the PM10 cut-point of the Gent inletwere performed by P.K. Hopke [private communication, 1994]. He covered trieimpaction plate of the PM10 inlet with a greased piece of Nuclepore filter and used afine (0.4 u.m pore size) Nuclepore filter at the coarse filter position in the SFU
4-5
cassette. A number of ambient aerosol samples were collected at Clarkson Universityin Potsdam, New York state. The particles on the greased Nuclepore filter (impactionplate) and on the fine filter were examined with an optical microscope. An equivalentphysical (Stokes) diameter was calculated for each individual particle, and assuming aparticle density of 2.5 g/cm3, the Stokes diameters were converted to aerodynamic(unit density) diameters. The number of particles per u.m EAD size interval on boththe greased and fine Nuclepore filter was counted. On the basis of these data andafter correcting for wall losses, a 50% cut-point of 10.5 to 11 nm EAD was derived.
In conclusion, the results from the calibration experiments performed so far arequite comforting. But it would be worthwhile to perform more field experimentsunder more critical conditions, such as at locations where most of the mass is in thecoarse size fraction and at large wind speeds. Intercomparisons between the "Gent"SFU sampler and various other filter samplers under such rather harsh conditionswere conducted by several European groups within the framework of anEUROTRAC ASE campaign on the Atlantic coast at Mace Head, Ireland [28].Unfortunately, none of the other filter samplers was equipped with a PM10 inlet, andthey were essentially all open-face total aerosol samplers. Besides more fieldexperiments, laboratory and wind-tunnel investigations with artificially generatedparticles would be desirable.
3.3. Local/regional scale study of the aerosol composition in an urban residential site,using the "Gent" SFU sampler.
The Institute for Nuclear Sciences was selected as our representative urbanresidential site. The institute is situated within the city of Gent and is about 3 kmsouth of the city center. The major sources of air pollution in the close vicinity areexpected to be residential heating, automotive emissions from a major highway andhighway intersection, a municipal incinerator, and some chemical (plastics) industries.The last aerosol composition study at the same sampling site took place about 7-8years ago. Respirable (<5 jim EAD) atmospheric particles were collected in the fallof 1986 on a small Nuclepore filter (0.75 cm2 filtration area), the samples wereanalyzed by PIXE, and the data were subjected to absolute principal componentanalysis (APCA) [29]. For the current study, the SFU sampler was set up so that thePM10 inlet was situated at about 7 meters above the ground surface. Two dailysamples were collected each week (one on Wednesday, one on Saturday) over aperiod of almost 14 months, i.e. from May 26, 1993, up to July 14, 1994. Eachsampling started typically at 10 a.m. local time and was done over a 24-hour timeperiod, but the effective sampling was usually restricted to 16 or even down to 12hours by means of a timer. The effective sampling time was evenly spread over the24-hour period. The fine and coarse filters of each individual sample (118 SFUsamples in total) and a number of field blanks were analyzed for the particulate mass(PM), black carbon (BC) and for elements by PIXE and INAA. The INAA waslimited to an analysis by short-lived product nuclides, and 14 elements were measured(i.e., Na, Mg, Al, Cl, Ca, Ti, V, Mn, Cu, Br, Sr, In, I and Ba). Up to 26 elements werelooked for in the PIXE spectra (Na, Mg, Al, Si, P, S, Cl, K, Ca, Ti, V, Cr, Mn, Fe, Ni,Cu, Zn, Ga, Se, Br, Rb, Sr, Zr, Nb, Mo and Pb). For elements which could bemeasured with good precision in both PIXE and INAA, good agreement was normallyobserved between the results from the two techniques. This is illustrated in Table III,
4-6

which presents average PIXE/INAA ratios for selected elements in both the fine andcoarse filters. In combining the PIXE and INAA data for an element that wasmeasured by both techniques, we generally took the average of both when the twotechniques gave a similar precision (as calculated from counting statistics). In case oneof the two techniques resulted in data with much better precision, then the data fromthat one technique were taken. For the lightest elements Na, Mg and Al, we alwaysused the INAA results, because of possible particle size effects (X-ray absorption) forthese elements in PIXEL Also for the halogens Cl and Br, we exclusively used theINAA data, because of possible losses during the PIXE bombardment in vacuum (inparticular for the fine particles). The low PIXE/INAA ratio for Br in Table III mostlikely has to be ascribed to such losses.
Using the individual fine and coarse atmospheric concentration data,FINE/COARSE ratios were calculated for each element in every sample and theseratios were subsequently averaged over all 118 samples. The mean FINE/COARSEratios are shown in Fig. 1. For the elements Al, Si, Ca and Ti, which are typicallypredominantly from crustal origin in both size fractions, the mean FINE/COARSEratios are of the order of 0.2-0.3. These results are similar to the crustalFINE/COARSE ratios that we obtained with the Gent SFU sampler at various otherlocations in Europe and in other continents, for example also in southern Africa [30].For the sea-salt and mixed sea-salt/crustal metals Na, Mg, and Sr, the FINE/COARSEratios are about 0.5-0.6.. Several elements exhibit ratios in the range of 0.5 to 2, andPM, the halogens Br and I, and the typical anthropogenic elements BC, S, V, Ni, Zn,In and Pb have FINE/COARSE ratios above 2 (up to 7 for BC and I).
Median concentrations were calculated for PM, BC and the various elements inthe fine and coarse size fractions and for the sum of both fractions (PM10 data), andthis was done for the entire sample set, but also for the separate Wednesday andSaturday samples. The overall medians for the fine and coarse fractions are presentedin Table IV; also indicated in the Table (in square brackets) is the number ofindividual data that were above the detection limit. Table IV further shows acomparison of the results of the current study with those from the 1986 fall study. Asthe upper cut-point for the 1986 Nuclepore filter samples was 5 \im EAD, both thefine fraction (<2 p.m EAD) and PM10 (<10 |im EAD) medians are compared withthe 1986 median values. The comparison is done in terms of ratios of medians. Formost elements, the (SFU Fine/1986) ratio is smaller than 1, whereas the(SFU PM10/1986) ratio is slightly larger than 1. This suggests that the airbornepaniculate levels of those various elements did not change very much since 1986.There are, however, a few noteworthy exceptions. For Br and Pb, the atmosphericlevels seem to be reduced to about one third of the 1986 levels. This reduction has toattributed to an increased use of unleaded gasoline in Belgium and to a lowering ofthe lead in the leaded gasoline (maximum 0.15 g/L now, compared to 0.4 g/L in 1986).Interestingly, it seems that the fine Br and Pb are still mainly attributable to 'automotive emissions. Both elements were highly correlated with each other in thefine size fraction, and the average Br/Pb ratio in this fraction was 0.25±0.10 [N=118].This ratio is slightly lower than the ethyl ratio, but very similar to what was typicallyobserved in urban areas more than 10 years ago [31]. There are also a few elementsfor which the particulate levels seem to have increased at Gent since 1986. This listincludes Mg, Ca, Fe, and perhaps also Cl. These four elements all exhibit(SFU PM10/1986) ratios of 2 or more. The 1986 Cl data should be treated with
4-7

caution, though. For the 1986 sample analysis, PIXE was used exclusively, and it wasalready indicated above that there may be losses for Cl in the PIXE bombardment(particularly in the fine size fraction). The elevated levels of Ca and Mg may point toan increased contribution from cement industry and/or construction of buildings. Inthe APCA on the 1986 data set [29], a separate cement component was tentativelyidentified. That component also exhibited a high loading for Fe, so that the enhancedFe level in the current data set may be related to that same source. An alternativeexplanation for the Ca increase is that it results from the increased use of limestone incoal-fired power plants and various other coal combustion systems (the limestone isadded to capture the SO2 from the coal). However, the fact that the FINE/COARSEratio of Ca is lower than that of any other element (see Fig. 1) seems to be anargument against this explanation. On the other hand, Ca appeared to be quite wellcorrelated with the typical crustal elements Al and Si, which suggests that it wasassociated with crustal-like materials, such as coal fly-ash or soil dust.
The fine, coarse and PM10 medians from the Saturday and Wednesday samplesubsets were compared in terms of ratios (Sat/Wed.). For the crustal, mixedcrustal/sea-salt, and several anthropogenic elements (BC, S, Zn) the (Sat/Wed) ratiowas generally of the order of 0.7-0.8, but, somewhat surprisingly, for Br and Pb it wasabout 1.
Enrichment factors (EF-values), with respect to Mason's average crustal rock[32] and with respect to the bulk sea water composition of Riley and Chester [33],were calculated for the various elements in the fine and coarse size fractions. In thecrustal EF calculations, Al was used as reference element, whereas Na served asreference element for the sea water EFs. The median EF(Al,crust) values for each ofthe two size fractions are presented in Fig. 2. Of interest in the coarse size fraction isthat the EF for Ca is about 6 (Fig. 2a), thus suggesting that most of the Ca has to beattributed to noncrustal sources. As the EF(Na,seaw) for Ca in the same coarsefraction was about 17, this noncrustal Ca cannot be attributed to sea-salt either. Themedian EF(Al,crust) for coarse PM is about 8 (Fig. 2a), so that only a minor fractionof this coarse PM can be assigned to crustal sources. And as was the case for Ca, sea-salt can only be responsible for a small part of the noncrustal coarse PM, since theEF(Na,seaw) was about 7. It is further noteworthy that most of the elements with thehighest FINE/COARSE ratios also tend to have the highest EF(Al,crust) values, evenalready in the coarse size fraction. This is the case for S, V, Ni, Zn, Br, I and Pb. Thehigh EF(Al,crust) value for coarse Cl (and incidentally also for coarse Br) seems to befully due to the contribution from sea-salt (The median EF(Na,seaw) values were 0.69and 0.76 for Cl and Br, respectively).
To provide some idea of the variability of the atmospheric concentrations withsample number, the time trends for PM and a few selected elements are shown in Fig.3. From Fig 3 a, with trends for the coarse size fraction, it can be seen that Na and Altend to be anticorrelated with each other, and reflect the influx of maritime versuscontinental air masses. In the fine size fraction (Fig. 3b), PM, BC and S exhibit quitecoherent time trends. Most other elements also appeared to be rather well correlatedwith the PM in this same size fraction, and the correlation coefficients were clearlyhigher than in the coarse fraction. These good correlations in the fine fraction aremost likely due to the impact of meteorology (ventilation, rain, inversions) on theoverall concentration of the fine PM, and thus also on the concentrations of thevarious fine aerosol constituents.
4-8
3.4. Status of the work in the various regional and global scale studies
Our work within the EUROTRAC ASE subproject focuses on the study of theaerosol composition, sources, transport, transformation and deposition above theNorth Sea and in southern Norway [34]. Over the past two years, an aerosol samplingand analysis exercise was finalized [28], we completed the analytical work for severalintensive sampling campaigns which were done jointly with various other ASE groups,and we worked on the Interpretation of the results [35,36]. We also continued ourlong-term aerosol study in southern Norway.
Our research within the Belgian Impulse Programme Global Change [37] andthe EU funded projects has similar objectives as our EUROTRAC ASE research, butconcentrates on the Arctic and on equatorial/tropical regions. Furthermore, in severalof the studies, the emphasis is placed on the climatically active aerosol particles andconstituents. At the Zeppelin mountain station in Ny Alesund, Spitsbergen, wecontinued our long-term samplings with a modified Sierra-Andersen Hi-Vol cascadeimpactor and with a PIXE cascade impactor (PCI). On the basis of the data from theHi-Vol sampler, the relative contributions from natural (marine biogenic) andanthropogenic sources to the fine non-sea-salt (nss) sulfate were assessed [38]. Thedata from the PCI were used to examine to what extent the size distributions ofvarious particulate species vary over the course of the year. To this end, the raw datawere converted into smooth size distributions by means of a data inversion technique[39]. The new small deposit low pressure impactor (SDI) was tested and employed forsize-fractionated aerosol samplings at Sevettijarvi in the Finnish Arctic and at Summitin Greenland [40]. For the Sevettijarvi site, we also analyzed over 100 virtual impactorsamples by PIXE and INAA. We completed a study on the aerosol composition andsources in the high Arctic [41], and are currently finalizing a study on the aerosol inAlaska.
With regard to the equatorial/tropical component of our research, we interpretedsome of the data sets obtained during the SAFARI-92 campaign [30,42-45], we areperforming a long-term aerosol study at Cuiaba, Brazil, and we started long-termsamplings in Zimbabwe.
We also completed an urban aerosol study in Brazil [46] and were involved inresearch on the particulate emissions and element behaviour during atmosphericcirculating fluidized bed coal combustion [47-52].
4. PLANS FOR FUTURE WORK
With regard to our work under the core programme of the CRP, we willexamine the coarse and fine data sets from the Gent site with receptor modellingtechniques, in particular APCA We will analyze the samples from the rural site byPIXE and short-irradiation INAA Subsequently, we will start the interpretation of thedata from this site. This will include a comparison with the data from the Gent site.
We will continue the work in our various ongoing regional and global scaleaerosol studies. Furthermore, new aerosol samplings will be started very soon in Israeland in southeast Asia and northern Australia, and possibly also in Africa. The study inIsrael aims at examining the impact of long-range transported anthropogenic sulfatefrom Europe and of biomass burning products and desert dust from Africa on theairborne fine particulate mass in the region. The studies in southeast Asia and
4-9

northern Australia will focus on biomass burning aerosols, and will complement ourpast and ongoing studies in southern Africa and Brazil on this subject.
For examining the source regions of the aerosol and its constituents, we willplace increasing emphasis on the relation to air mass trajectories. Some work alongthis line has already been done in co-operation with P.KL Hopke [53]. We havecontacts with several groups in Europe to explore the possibilities of such approachesfurther, and we intend to apply them to our data set from Sevettijarvi in the FinnishArctic and to the data from our long-term aerosol study in Birkenes and Skreadalenin southern Norway.
REFERENCES
[I] CHARLSON, R.J., LANGNER, J., RODHE, H., LEOVY, C.B., WARREN, S.G,Perturbation of the northern hemisphere radiative balance by backscattering fromanthropogenic sulfate aerosols, Tellus 43B (1991) 152-163.
[2] CHARLSON, R.J., SCHWARTZ, S.E., HALES, J.M., CESS, R.D., COAKLEY, J.A,JR., HANSEN, J.E. HOFMANN, D.J., Climate forcing by anthropogenic aerosols,Science 225 (1992) 423-430.
[3] LELIEVELD, J., HEINTZENBERG, J., Sulfate cooling effect on climate through in-cloud oxidation of anthropogenic SO2, Science 258 (1992) 117-120.
[4] LANGNER, J., RODHE, H., CRUTZEN, P.J., ZIMMERMANN, P., Anthropogenicinfluence on the distribution of tropospheric sulphate aerosol, Nature 359 (1992) 712-716.
[5] KIEHL, J.T., BRIEGLEB, B.P., The relative roles of sulfate aerosols and greenhousegases in climate forcing, Science 260 (1993) 311-314.
[6] TAYLOR, K.E., PENNER, J.E., Response of the climate system to atmosphericaerosols and greenhouse gases, Nature 369 (1994) 734-737.
[7] PENNER, J.E., DICKINSON, R., O'NEILL, C.A, Effects of aerosol from biomassburning on the global radiation budget, Science 256 (1992) 1432-1434.
[8] DICKINSON, R.E., "Effect of fires on global radiation budget through aerosol andcloud properties", Fire in the Environment: The Ecological, Atmospheric and ClimaticImportance of Vegetation Fires (CRUTZEN P.J., GOLDAMMER, J.G., Eds.), Wiley,Chicester (1993) 107-122.
[9] MAENHAUT W., FRANCOIS F., CAFMEYER J., "The "Gent" stacked filter unit(SFU) sampler for the collection of aerosols in two size fractions: Description andinstructions for installation and use", Applied Research on Air Pollution using Nuclear-Related Analytical Techniques, Report on the First Research Co-ordination Meeting,Vienna, Austria, 30 March - 2 April 1993, NAHRES-19, IAEA Vienna (1994) 249-263.
[10] CAHILL, T.A, ASBAUGH, L.L., BARONE, J.B., ELDRED, R., FEENEY, PJ.,FLOCCHINI, R.G., GOODART, C, SHADOAN, D.J., WOLFE, 'G., Analysis ofrespirable fractions in atmospheric particles via sequential filtration, J. Air Pollut.Control Assoc. 27 (1977) 675-678.
[II] CAHILL, T.A, ELDRED, R.A, FEENEY, P.J., BEVERIDGE P.J., WILKINSON L.K.,"The stacked filter unit revisited", Transactions, visibility and fine particles (MATHAIC.V., Ed.), Air and Waste Management Association, Pittsburgh, PA USA (1990) 213.
[12] HEIDAM, N.Z., Review: Aerosol fractionation by sequential filtration with Nucleporefilters, Atmos. Environ. 15 (1981) 891-904.
[13] JOHN, W., HERING, S., REISCHL, G., SASAKI, G., Characteristics of Nucleporefilters with large pore sizes - II. Filtration properties, Atmos. Environ. 17 (1983)373-382.
4-10
[14] MAENHAUT, W., FRANCOIS, R, SALMA, I., CAFMEYER, J., GILOT, G,"Regional and global atmospheric aerosol studies using the "Gent" stacked filter unitand other aerosol collectors, with multi-elemental analysis of the samples by nuclear-related analytical techniques", Applied Research on Air Pollution using Nuclear-RelatedAnalytical Techniques, Report on the First Research Co-ordination Meeting, Vienna,Austria, 30 March - 2 April 1993, NAHRES-19, IAEA, Vienna (1994) 59-77.
[15] DZUBAY, T.G., STEVENS, R.K., Ambient air analysis with dichotomous sampler andX-ray fluorescence spectrometer, Environ. Sci. Technol. 9 (1975) 663-668.
[16] LOO, B.W., JAKLEVIC, J.M., GOULDING, F.S., "Dichotomous virtual impactors forlarge scale monitoring of airborne particulate matter", Fine Particles (LIU, B.Y.H., Ed.),Academic, New York (1976) 311-350.
[17] HILLAMO, R.E., MAKELA, T., MAKINEN, M., MAENHAUT, W., "Small depositarea low pressure impactor: Design, calibration and field tests", Abstracts of the FourthInternational Aerosol Conference, Vol. 2 (FLAGAN, R.C., Ed.), Los Angeles, U.S.A.,August 29 - September 2, 1994 (1994) 579-580.
[18] MITCHELL, R.I., PILCHER, J.M., Improved cascade impactor for measuring aerosolparticle sizes, Ind. Bag. Chem. 51 (1959) 1039-1042.
[19] BAUMAN, S., HOUMERE, P.D., NELSON, J.W., Cascade impactor aerosol samplesfor PIXE and PESA analysis, Nucl. Instr. and Meth. 181 (1981) 499-502.
[20] BERNER, A., LURZER, C, Mass size distributions of traffic aerosols at Vienna, J.Phys. Chem. 84 (1980) 2079-2083.-
[21] BERNER A., "Design principles of the AERAS low pressure impactor", Aerosols.Science, Technology, and Industrial Applications of Airborne Particles (LIU, B.Y.H.,PUI, D.Y.H., FISSAN, H.J., Eds.), Elsevier, New York (1984) 139-142.
[22] MSP CORPORATION, Instruction Manual for Model 100 Micro-orifice UniformDeposit Impactor (MOUDI), MSP Corporation, 1313 Fifth Street, S.E., Suite 206,Minneapolis, MN 55414, U.S.A. (1989).
[23] MARPLE, V.A., RUBOW, K.L., BEHM, S.M., A microorifice uniform deposit impactor(MOUDI): Description, calibration, and use, Aerosol Sci. Technol. 14 (1991) 434-446.
[24] MAENHAUT, W., DUCASTEL, G., HILLAMO, R.E., PAKKANEN, T.A., Evaluationof the applicability of the MOUDI impactor for aerosol collections with subsequentmultielement analysis by PIXE, Nucl. Instr. and Meth. 75 (1993) 249-256.
[25] LANDSBERGER, S., VERMETTE, S.J., "Preparation of PM-10 filter standards forinterlaboratory comparison", Applied Research on Air Pollution using Nuclear-RelatedAnalytical Techniques, Report on the First Research Co-ordination Meeting, Vienna,Austria, 30 March - 2 April 1993, NAHRES-19, IAEA, Vienna (1994) 245-248.
[26] MAENHAUT, W., RAEMDONCK, H., Accurate calibration of a Si(Li) detector forPIXE analysis, Nucl. Instr. and Meth. Bl (1984) 123-136.
[27] HINDS, W.C., Aerosol Technology, John Wiley & Sons, New York (1982).[28] FRANCOIS, R, MAENHAUT, W., COLIN, J.-L., LOSNO, R., SCHULZ, M.,
STAHLSCHMIDT, T., SPOKES, L., JICKELLS, T., Intercomparison of elementalconcentrations in total and size-fractionated aerosol samples collected during the MaceHead experiment, April 1991, Atmos. Environ. (1995) in press.
[29] MAENHAUT, W., CAFMEYER, J., Particle induced X-ray emission analysis andmultivariate techniques: an application to the study of the sources of respirableatmospheric particles in Gent, Belgium, J. Trace Microprobe Techn. 5 (1987) 135-158.
[30] MAENHAUT, W., SALMA, I., CAFMEYER, J., ANNEGARN, HJ., ANDREAE,"M.O., Regional atmospheric aerosol composition and sources in the eastern Transvaal,South Africa, and impact of biomass burning, J. Geophys. Res. (1994) submitted.
[31] HARRISON, R.M., STURGES, W.T., The measurement and interpretation of Br/Pbratios in airborne particles, Atmos. Environ. 17 (1983) 311-328.
4-11

[32] MASON, B., Principles of Geochemistry, 3rd ed., Wiley, New York (1966).[33] RILEY, J.P., CHESTER, R., Introduction to Marine Chemistry, Academic, New York
(1971).[34] MAENHAUT, W., FRANCOIS, E, "Elemental composition and sources of atmospheric
aerosols above and around the North Sea", EUROTRAC Annual Report 1993, Part 3ASE (Air-Sea Exchange), EUROTRAC International Scientific Secretariat, Garmisch-Partenkirchen (1994) 112-117.
[35] FRANgOIS, R, MAENHAUT, W., "Chemical composition and sources of thesize-fractionated atmospheric aerosol collected at the Research Platform Nordsee", TheProceedings of EUROTRAC Symposium '94 (BORRELL, P.M., BORRELL, P.,CVTTAS, T. SEILER, W., Eds.), SPB Academic Publishing bv, The Hague, TheNetherlands (1994) 472-476.
[36] SCHULZ, M., STAHLSCHMIDT, T., FRANgOIS, R, MAENHAUT, W., LARSEN,S.E., "The change of aerosol size distributions measured ina Lagrangian-typeexperiment to study deposition and transport processes in the marine atmosphere", TheProceedings of EUROTRAC Symposium '94 (BORRELL, P.M., BORRELL, P.,CVITAS, T. SEILER, W., Eds.), SPB Academic Publishing bv, The Hague, TheNetherlands (1994) 702-706.
[37] MAENHAUT, W., "Composition and origin of the regional atmospheric aerosol at greatdistance from anthropogenic source areas. Assessment of the extent of theanthropogenic perturbation", Belgian Impulse Programme "Global Change", Symposium17 & 18 May 1993, Proceedings, Vol. 1, Belgian Science Policy Office (1993) 5-30.
[38] MAENHAUT, W., DUCASTEL, G., BEYAERT, K, HANSSEN, J.E., "Chemicalcomposition of the summer aerosol at Ny Alesund, Spitsbergen, and relativecontribution of natural and anthropogenic sources to the non-sea-salt sulfate", TheProceedings of EUROTRAC Symposium '94 (BORRELL, P.M., BORRELL, P.,CvTTAS, T. SEILER, W., Eds.), SPB Academic Publishing bv, The Hague, TheNetherlands (1994) 467-471.
[39] MAENHAUT, W., HAVRANEK, V., DUCASTEL, G., HANSSEN, J.E., "Mass sizedistributions for atmospheric particulate elements at the Zeppelin background station inNy Alesund, Spitsbergen", NATO Advanced Research Workshop (ARW) on Processesof Chemical Exchange between the Atmosphere and Polar Snow, II Ciocco, Italy, 18-24March 1995, submitted.
[40] BERGIN, M.H., JAFFREZO, J.L., DAVIDSON, C.I., DIBB, J.E., PANDIS, S.N.,HILLAMO, R., MAENHAUT, W., KUHNS, H.D., MAKELA, T., The contributions ofsnow, fog, and dry deposition to the summer flux of anions and cations at Summit,Greenland, J. Geophys. Res. (1995) in press.
[41] MAENHAUT, W., DUCASTEL, G., LECK, C, NILSSON, E.D., HEINTZENBERG,J., Multielemental composition and sources of the high Arctic atmospheric aerosolduring summer and autumn 1991, Tellus B (1994) submitted.
[42] ANDREAE, M.O., FISHMAN, J., GARSTANG, M., GOLDAMMER, J.G, JUSTICE,CO., LEVINE, J.S., SCHOLES, R.J., STOCKS, B.J., THOMPSON, AM., VANWILGEN B., THE STAREfTRACE-A SAFARI-92 SCIENCE TEAM (includesCAFMEYER, J., MAENHAUT, W., SALMA, I., from the University of Gent),"Biomass burning in the global environment: First results from the IGAC/BIBEX fieldcampaign STARE/TRACE-A/SAFARI-92", Global Atmospheric-Biospheric Chemistry(PRINN, R.G., Ed.), Plenum, New York (1994) 83-101.
[43] SWAP, R., GARSTANG, M., TYSON, P.D., KALLBERG, P., MAENHAUT, W.,TALBOT, R., MACKO, S.A, BROWELL, E.V., "Southern African aerosol transport,loadings and deposition during SAFARI 1992", Proceedings of the Sixth Symposium onGlobal Change Studies, 75th Annual Meeting of the American Meteorological Society,
4-12
January 15-20, 1995, Dallas, Texas (1995) 215-217.[44] SALMA, L, MAENHAUT, W., CAFMEYER, J., ANNEGARN H.J., ANDREAE,
M.O., PIXE analysis of cascade impactor samples collected at the Kruger NationalPark, Nucl. Instr. and Meth. B85 (1994) 849-855.
[45] SWAP, R., GARSTANG, M., MACKO, S., TYSON, P., MAENHAUT, W., ARTAXO,P., KALLBERG, P., TALBOT, R., The long-range transport, of southern Africanaerosols to the tropical South Atlantic, J. Geophys. Res. (1995) in press.
[46] ANDRADE, R, ORSINI, C, MAENHAUT, W., Relation between aerosol sources andmeteorological parameters for inhalable atmospheric particles in Sao Paulo city, Brazil,Atmos. Environ. 28 (1994) 2307-2315.
[47] KAUPPINEN, EX, LIND, T.M., JOUTSENSAARI, J., JOKINIEMI, J.K.,MAENHAUT, W.., ROYSET, O., VADSET, M., "Characteristics of fly ash particlesformed in circulating fluidized bed and pulverized coal fired boilers", Proceedings of theTenth Particulate Control Symposium and Fifth International Conference onElectrostatic Precipitation, April 5-8, 1993, Washington, D.C., Volume 1 (1993) 12 p.
[48] LIND, T., KAUPPINEN, E.I., JOKINIEMI, J.K., MAENHAUT W., PAKKANEN, T.,"Alkali metal behaviour in atmospheric circulating fluidised bed coal combustion", TheImpact of Ash Deposition on Coal Fired Plants. Proceedings of the EngineeringFoundation Conference held at the St. John's Swallow Hotel!, Solihull, England, June20-25, 1993 (WILLIAMSON, J., WIGLEY, F., Eds.), Taylor & Francis (1994) 77-88.
[49] LIND, T., KAUPPINEN, E.I., JOKINIEMI, J.K, MAENHAUT, W, "A field study onthe trace metal behaviour in atmospheric circulating fluidized bed coal combustion",Proceedings of the 25th International Symposium on Combustion, Irvine, California,U.S.A., July 31 - August 5, 1994, in press.
[50] LIND, T., KAUPPINEN, E.I., KURKELA, J., MAENHAUT, W., SHAH, A.,HUGGINS, F., "Mineral, sorbent and sulphur interactions in real-scale CFBC",Proceedings of the 13th International Fluidized Bed Combustion Conference, Orlando,Florida, U.S.A., May 1995, submitted.
[51] LIND, T., KAUPPINEN, E.I., JOKINIEMI, J.K., MAENHAUT, W., Experimentalstudy on the enrichment of trace elements in submicron particles in coal CFBC, J.Aerosol Sci. 24, Suppl. 1 (1993) S589-S590.
[52] LIND, T., KAUPPINEN, E.I., MAENHAUT, W., SHAH, A., HUGGINS, F., Ashvaporization in circulating fluidized bed coal combustion, Aerosol Sci. Technol. (1995)submitted.
[53] LI, C.-L., HOPKE, P.K., PACYNA, J.M., MAENHAUT, W., Identification of thepotential source location for elements observed in aerosol particles collected at NyAlesund, unpublished manuscript.
4-13
TABLE I. CO-OPERATION WITH OTHER RESEARCH GROUPS
a. In Belgium
- Centre for Micro and Trace Analysis, Department of Chemistry, University of Antwerp(UIA): F. Adams, R. Van Grieken, P. Van Espen.
b. In Europe (Belgium excluded)
- Faculty of Physics and Astronomy, Free University of Amsterdam, Amsterdam, TheNetherlands: R.D. Vis.
- Dept. of Nuclear Physics, University of Lund and Lund Institute of Technology, Sweden:K. Malmqvist.
- Norwegian Institute for Air Research (NILU), Kjeller, Norway: J.E. Hanssen and others.- Finnish Meteorological Institute (FMI), Helsinki, Finland: R. Hillamo and others.- Technical Research Centre of Finland (VTT), Espoo, Finland: E. Kauppinen.- Institute for Inorganic and Applied Chemistry, University of Hamburg, Hamburg, Germany:
M. Schulz (and also with several other European universities and institutions within theframework of an EUROTRAC Air-Sea Exchange (ASE) project).
- Biogeochemistry Division, Max Planck Institute for Chemistry, Mainz, Germany: M.O.Andreae, F. Meixner.
- Department of Meteorology, Arrhenius Laboratory, University of Stockholm (MISU),Stockholm, Sweden: C. Leek.
- Laboratoire de Glaciologie et Geophysique de l'Environnement, Saint-Martin-d'Heres,Grenoble, France: J.-L. Jaffrezo (and also with several other European universities andinstitutions within the framework of an EEC project).
- Centre des Faibles Radioactivites, CNRS-CEA, Gif-sur-Yvette, and Universites Paris VII,Paris, France: H. Cachier, A. Gaudichet.
- Institute for Sediment Research, University of Heidelberg, Heidelberg, Germany: J.Matschullat.
- Institut fur Meteorologie und Geophysik der Universitat Wien, Vienna, Austria: P. Seibert.
c. In the U.S.A.
- Department of Chemistry and Department of Civil and Environmental Engineering,Clarkson University, Potsdam, NY, U.S.A.: P.K. Hopke.
- Department of Environmental Sciences, University of Virginia, Charlottesville, VA, U.S.A.:M. Garstang, R.J. Swap.
- Departments of Civil Engineering and Engineering & Public Policy, Carnegie MellonUniversity, Pittsburgh, PA, U.S.A: C.I. Davidson and others.
- Geophysical Institute, University of Alaska, Fairbanks, AK, U.S.A.: G.E. Shaw.- Department of Chemistry and Biochemistry, Arizona State University, AZ, U.S.A.: J.R.
Anderson.
d. In the rest of the world ,
- The Remote Sensing Laboratory, J. Blaustein Inst. for Desert Research, Ben Gurion Univ.of the Negev, Sede Boker Campus, Israel: A. Karnieli.
- Institute of Physics, University of Sao Paulo, Sao Paulo, Brazil: P. Artaxo, F. Andrade.- Schonland Research Centre, University of the Witwatersrand, Johannesburg, South Africa:
H. Annegarn.- Environmental Climatology Group, Department of Geography and Environmental Science,
Monash University, Victoria, Australia: NJ. Tapper.- School of Applied Science, Gippsland Campus, Monash University, Churchill, 3842,
Victoria, Australia: M. Hooper.
4-14

TABLE II. FINE AND COARSE PARTICLE MASS (PM) CONCENTRATIONS,in ng/m3, AS DERIVED FROM PARALLEL COLLECTIONS WITHTHE GENT SFU SAMPLER AND A PM10 DICHOTOMOUSSAMPLER IN OSLO, NORWAY, DURING APRIL 1994
Fine fractiona Coarse fraction13
Date SFU Dicho SFU Dicho
26-4 13.4 12.5 11.4 11.227-4 16.6 15.0 17.3 10.428-4 14.1 12.5 11.1 8.8
a Fine fraction for the Gent SFU: <2 \im EAD;fine fraction for the dichotomous sampler: <2.5 \im EAD.
b Coarse fraction for the Gent SFU: 2-10 |im EAD;coarse fraction for the dichotomous sampler: 2.5-10 u.m EAD.
TABLE III. AVERAGE PIXE/INAA CONCENTRATION RATIOS FORSELECTED ELEMENTS IN THE FINE AND COARSE FILTERSFROM THE SFU SAMPLES COLLECTED AT GENT
Fine filters Coarse filtersElem. x ± s [N]a x ± s [N]a
AlCaVMnBr
0.90 ±
0.94 ±1.01 ±0.62 ±
0.34
0.090.120.20
[83]
[118][113][113]
0.751.000.881.050.90
± 0.12± 0.18± 0.16± 0.13± 0.34
[118][114][107][118][93]
N indicates the number of ratios on which the mean ratio and its associatedstandard deviation are based (maximum 118).
4-15
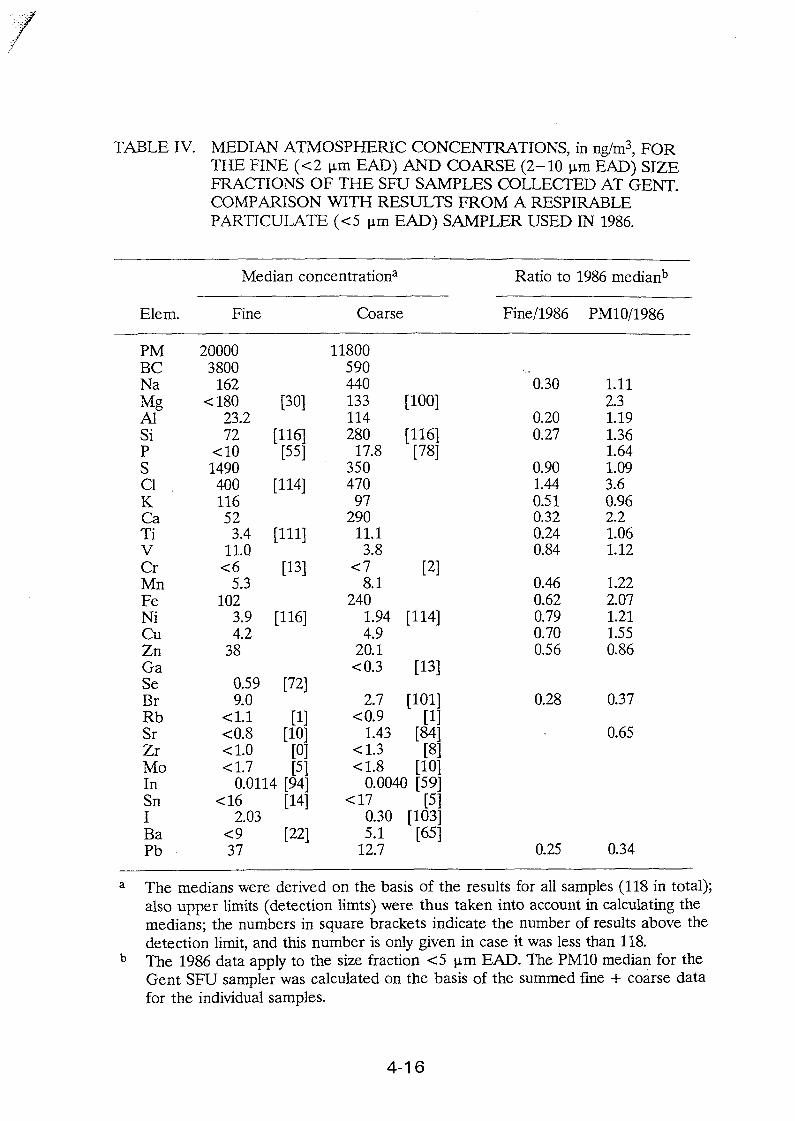
TABLE IV. MEDIAN ATMOSPHERIC CONCENTRATIONS, in ng/m3, FORTHE FINE (<2 \im EAD) AND COARSE (2-10 u.m EAD) SIZEFRACTIONS OF THE SFU SAMPLES COLLECTED AT GENT.COMPARISON WITH RESULTS FROM A RESPIRABLEPARTICULATE (<5 \im EAD) SAMPLER USED IN 1986.
Elem.
PMBCNaMgAlSiP
sClKCaTiVCrMilFeNiCuZnGaSeBrRbSrZrMoInSnIBaPb
Median concentration3
Fine
200003800
162<180
23.272
<101490400116523.4
11.0<6
5.3102
3.94.2
38
0.599.0
<1.1<0.8<1.0<1.7
[30]
[116][55]
[114]
[111]
[13]
[116]
[72]
[1][10][0][51
0.0114 [94]<16
2.03<937
[14]
[22]
Coarse
11800590440133114280
17.835047097
29011.13.8
<78.1
2401.944.9
20.1<0.3
2.7<0.9
1.43<1.3<1.8
[100]
[116][78]
[2]
[114]
[13]
[101][1]
[84][8]
[10]0.0040 [59]
<170.305.1
12.7
[5][103]
[65]
Ratio to
Fine/1986
0.30
0.200.27
0.901.440.510.320.240.84
0.460.620.790.700.56
0.28
0.25
1986 medianb
PM10/1986
1.112.31.191.361.641.093.60.962.21.061.12
1.222.071.211.550.86
0.37
0.65
0.34
The medians were derived on the basis of the results for all samples (118 in total);also upper limits (detection limts) were thus taken into account in calculating themedians; the numbers in square brackets indicate the number of results above thedetection limit, and this number is only given in case it was less than 118.The 1986 data apply to the size fraction <5 |im EAD. The PM10 median for theGent SFU sampler was calculated on the basis of the summed fine + coarse datafor the individual samples.
4-16

mean FINE/COARSE cone, ratio
era"
a o* y
5WO
vi O
I-00
ff B
f l
V/////////////////////////A

1OOOO
1000=
100=
LUcCOT)
PM NaBC/AI Mg
CO
LLUJCco
x>CD
E
100000
10000=
1000=
0.1-PM Na Al P
BC/AI Mg Si
Fig. 2. Median crustal enrichment factors (EFs), relative to Mason's average crustalrock [32] and with Al as reference element, for the PM and 23 elements inthe coarse (a) and fine (b) size fractions of 118 SFU samples from Gent Alsoshown are the median BC/AI concentration ratios.
4-18

CO
100000:
10000=
1000=
10 20 30 40 50 60 70 80 90 100 110 120
100:
sample number
100000=r
10000=
CO
1000=
50 60 70sample number
80 90 100 110 120
Fig. 3. Atmospheric concentrations (in ng/m3) as a function of sample number (timetrends) for the particulate mass (PM) and selected elements in the coarse (a)and fine (b) size fraction at Gent during 1993-1994. The symbols s on thetrend lines indicate the data points for the Saturday samples.
4-19

XA0102874
Appendix 5
RECEPTOR MODELLING OF ATMOSPHERIC AEROSOLS IN THE URBAN AREA OF SAOPAULO
P. ARTAXO, W. E. DE CASTRO, JR., M. DE FREITAS, K. M. LOMGO
Grupo de Estudos de Poluicao do Ar, Departamento de Ffsica Aplicada, Instituto de FfsicaUniversidade de Sao Paulo, USP, Caixa Postal 66318, CEP 05389-970, Sao Paulo, SP,Brazil.
1. INTRODUCTION
The city of Sao Paulo (latitude 23°37'S, longitude 46°39'W) is one of the largesturban areas in the world. It has a population of about 18.4 million<inhabitants in 1990 thatis expected to be about 24 million in year 2000. It is one of the five largest urban areas inthe world. With an altitude of 800 meters, an annual precipitation of 1930 mm, and atemperature range of 15-22°C, it has an unfavorable meteorology for dispersion ofpollutants during the winter months (June to August).
There are two main air pollution sources in the metropolitan area: industrial emissionsand transportation. In terms of industry, the state of Sao Paulo is responsible for 50% ofthe Brazil national gross product of US$ 300 billion. Most of the industries operate in theurban and suburban areas of the greater Sao Paulo. On the positive side, the energy sectorhas a negligible component in terms of direct emission of atmospheric pollutants, due to thefact that 95% of the electricity in Brazil are hydroelectric. In the urban area of Sao Paulo,there is about 4 million vehicles. A large part of the fleet is alcohol-fueled, with about 1.2million automobiles using mainly ethanol. There are 2.2 million gasoline vehicles, and300,000 diesel powered buses and trucks.
During the winter months, a strong inversion layer at low altitude makes it difficultthe dispersion of air pollutants in the urban area. Low wind speed and low precipitation ratehelp to obtain high levels of air pollution in winter. The main pollutants in the urban area are:particulate matter, SO2, ozone and carbon monoxide. There is no lead in the gasoline usedin Sao Paulo, because there is a mixture of about 25% ethanol in the gasoline to reduceautomobile emissions.
2. SAMPLING CAMPAIGN
Aerosols were collected at a site located downtown, at the Medicine Department ofthe University of Sao Paulo. The site is affected by heavy traffic nearby, and the site isrelatively far from industrial emissions. The aerosol sampler was located at the roof of the4-floor Medicine Department building, of about 20 meters to minimize re-suspended soil dustfrom the nearby streets. There is no unpaved roads in the vicinity of the sampling site.
Sampling was performed during June and August 1994, with a 12-hour samplingtime, from 8:00 am to 8:00 pm daily. The sampler was the "Gent" Stacked Filter Unit [2,7],fitted with a specially designed inlet that provided a 50% cut-off diameter of 10//m. Theinlet was designed with an impactor, to collect only particles smaller than 10 //m. Fine andcoarse aerosol particles were sampled with the SFU using Nuclepore filters. The SFU collects
5-1

coarse mode particles (2.0<orp < 10pm) on a 47-mm-diameter, 8-//m pore size Nucleporefilter while a 0.4/vm pore size Nuclepore filter collects the fine mode particles {dp < 2.0 pm)[5]. The flow rate was typically 17 liters per minute. Particle bounce was minimized by theuse of Apiezon coated coarse mode filters, and also by the fact that high relative humiditywas observed during the sampling period. The volume was obtained with volumeintegrators, calibrated with Hastings Precision Mass Flowmeters.
3. ANALYTICAL METHODOLOGY
The elemental concentrations were measured with the particle-induced X rayemission (PIXE) [4] method. It was possible to determine the concentrations of up to 20elements (AI, Si, P, S, Cl, K, Ca, Ti, V, Cr, Mn, Fe, Ni, Cu, Zn, Br, Rb, Sr, Zr, and Pb). Adedicated 5SDH tandem Pelletron accelerator facility, the LAMFI (Laboratorio de Analise deMateriais por Feixes lonicos) from the University of Sao Paulo was used for the PIXEanalysis. A proton beam with an energy of 2.4 MeV was used, with a beam current of 30-50 nA. Irradiation times were 600 seconds. The Sao Paulo PIXE system was calibrated witha large number of MicroMatter standards [6]. The fitting of the X-ray spectra was performedusing the AXIL-PC software [1].
Detection limits are typically 5 ng/m3 for elements in the range 13<Z<22 and0.4 ng/m3 for elements with Z>23. These detection limits were calculated based on asampling flow rate of 17 I per minute sampling time of 12 hours and irradiation time of 600s. The precision of the elemental concentration measurements is typically less than 10%,with 20% for elements with concentration near the detection limit. The fine and coarsefraction aerosol mass concentrations are obtained through gravimetric analysis of theNuclepore filters. The filters were weighed before and after sampling in an electronicmicrobalance with 1 //g sensitivity. Before weighing, the filters are equilibrated for 24 hoursat 50% relative humidity and 20°C temperature. Electrostatic charges are controlled bymeans of 210Po radioactive sources. Detection limit for the aerosol mass concentration is0.3//g m3. Precision is estimated at about 15%. Black carbon concentration was measuredusing a reflectance technique using a photometer calibrated with artificial black carbonstandards.
4. RECEPTOR MODELING
To separate the different components present in the samples using the elementalcomposition, absolute principal factor analysis (APFA) was used [3,8]. APFA offers thepossibility to obtain a quantitative elemental source profile instead of only a qualitativefactor loading matrix as in traditional applications of factor analysis. The absolute elementalsource profiles help in the identification of the factors and can be used to quantitativelycompare the factor composition with the assumed aerosol sources. In principal factoranalysis a model of the variability of the trace element concentrations is constructed so thatthe set of intercorrelated variables is transformed into a set of independent, uncorrelatedvariables. The APFA procedure obtains the elemental mass contribution of each identifiedcomponent by calculating the absolute principal factor scores (APFS) for each sample[Artaxo et al., 1988, 1990]. The elemental concentrations are subsequently regressed onthe APFS to obtain the contribution of each element for each component. These sourceprofiles thus obtained can be compared with values from the literature to gain informationon enrichment and atmospheric chemistry processes [3]. The measured aerosol massconcentration can also be regressed on the APFS to obtain the aerosol total mass sourceapportionment
5-2

Cluster analysis was used to measure the distances in the elemental space betweenthe samples and the variables. Ward's error sum strategy was used to classify the samples,and the squared Euclidean distance was used to measure the distances. SPSS for Windowsversion 6.0 and Statgraphics version 6.0 were used in the receptor Modeling calculations.
5. RESULTS AND DISCUSSION
Figure 1 shows the fine, coarse and inhalable aerosol mass concentration for thesamples collected during this experiment. It is possible to observe the high inhalableparticulate mass concentration, with 6 events exceeding 150//g/nrr! that is the maximumallowed daily concentration for the Brazilian air pollution legislation. There is high dailyvariability, with concentrations varying from 20 to 170 //g/m3.
During the sampling period a beta gauge aerosol monitoring instrument was operatedby the state air pollution control agency (CETESB) nearby our sampling site. Figure 2 showsthe measurements for the two instruments (the beta gauge and the SFU) taken during thesampling period. The beta gauge instruments give hourly values that were integrated for theSFU sampling time. It is possible to observe in Figure 2 the excellent agreement betweenthe SFU measurements and the beta gauge results from CETESB for PM10. This parallelsampling can be used to validate the SFU PM10 inlet against the E5eta gauge instrument.Also the accuracy and precision of the two completely independent methods are relativelylow, otherwise this agreement could never be obtained.
Figure 3 shows the regression curve between the measurements from the twoinstruments. The regression equation is: PM10Beta= PM10SFU*0.992 - 2.214. The R2
value for the regression was 0.86.
200
Sao Paulo Aerosol CharacterizationFine Coarse Inhalable Concentration
' "Ha"' yVV " ' ib" " i b 1 ; ' <165 169 172 177 183 189 195 204 210 216 222 22S 234 240
166 170 173 179 185 191 197 206 212 218 224 230 236 242
1994 Julian DayFine Mode (dp<2 urn) Coarse (2<dp<10 urn)
Figure 1 - Fine, coarse and inhalable aerosol mass concentration.
5-3

CO
E
180
ocO10
CO
Sao Paulo Aerosol CharacterizationPM10 Mass Concentration 1994
0IB1 1 S ' " W " * W 1M !0J »S 215 221
166 171 176 182 189 196 206 211 217 223 230168 172 178 184 192 198 207 213 219 226 236
1994 Julian DayPM10 SFU Gent - — PM10 Beta
Figure 2 - Inhalable aerosol mass concentration (PM10) provided by the betagauge aerosol monitoring instrument operated by the state air pollutioncontrol agency nearby our sampling site and the SFU equipped with an PM10inlet.
The volume integrator was calibrated against a precision Hastings mass flowmeter,giving a ratio of 0.817 for the volume measured by the Volume integrator and the HastingsMFM. The final volume used in calculating concentrations were the values provided by thevolume integrator, corrected for the calibration with the Hastings Mass flowmeter. Figure4 shows the curve obtained with the calibration of the volume integrator and the Hastingsprecision mass flowmeter. One of the main sources of errors in aerosol sampling could bethe integration of the air volume.
Black carbon concentration was measured for all fine mode samples. Figure 5 showsthe time series of the black carbon concentration. Peak values of up to 15//g/m3 wereobserved. The ratio of Black carbon to fine mode aerosol mass concentration can beobserved in figure 6. It is remarkably constant the BC/FPM ratio, with the exception of twosamples. This could mean a unique source for the BC that could contribute significantly tothe fine mode aerosol mass concentration. This source possibly represents the dieselemissions from buses in the urban area of Sao Paulo. This BC/FPM ratio is a relatively high26.1 ±9.7, excluding the two high BC/FPM events.
A total of 82 samples was analyzed by PIXE in the fine fraction, providing elementalconcentrations for 19 elements, black carbon and the gravimetric fine mass concentration.Table 1 shows the average elemental concentrations. It is possible to observe the relativelylow sulfur concentration (1527 ng/m3), compared to the fine mode mass concentration(FPM = 30.9//g/m3). Back carbon has a high value of 7.97//g/m3), showing the relatively highdiesel emissions impact in the Sao Paulo atmosphere.
5-4
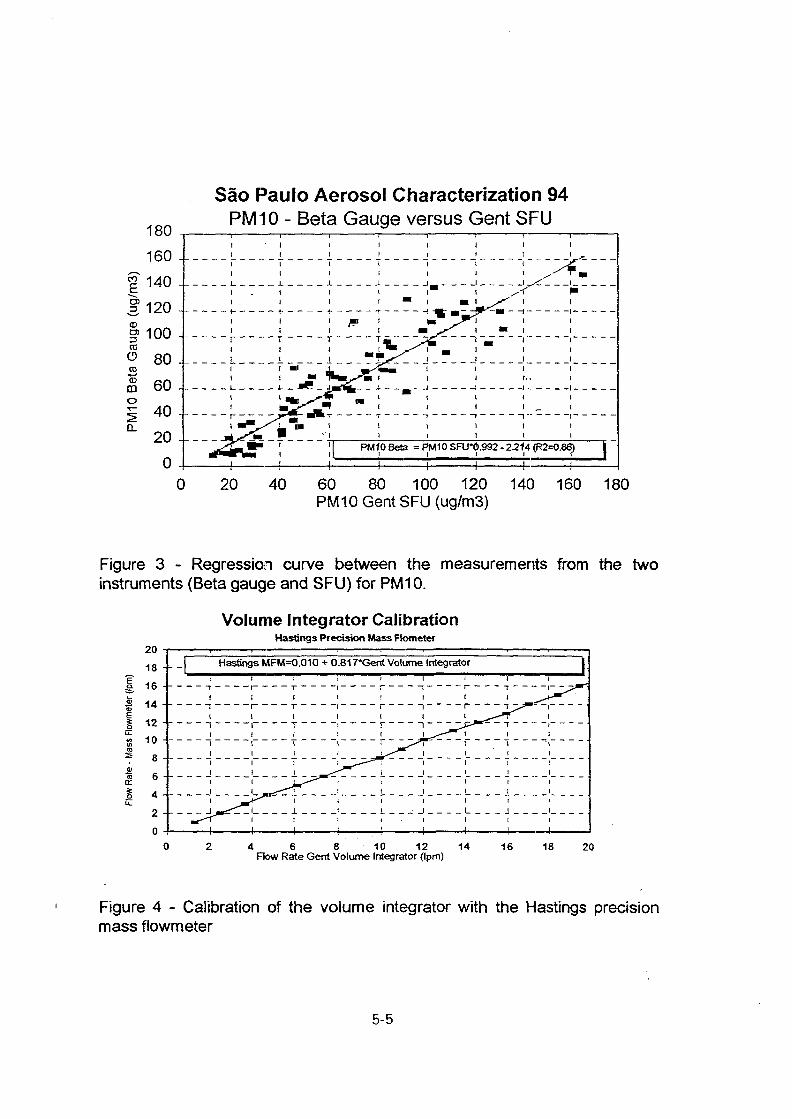
Sao Paulo Aerosol Characterization 94
fICO
CD
Io
180
160
140
120
100
80
60
40
20
0
PMIO-Betai ii i
i ti i
L -L J.1 11 1
1 !1 1
r • T Ti ii i
!-- +
1 1 f.
i Gauge versus Gent SFU!I
I
MD 1
m~ ' *I
\
iii
T^""" •«r ^ -iii
ii
i
PM10 Beta = F*M10 SFU"C).992 - 22U (R2=0.86) I
1 1 !
0 20 40 60 80 100 120PM10 Gent SFU (ug/m3)
140 160 180
Figure 3 - Regression curve between the measurements from the twoinstruments (Beta gauge and SFU) for PM10.
Volume Integrator CalibrationHastings Precision Mass Ftometer
20
18
16
14
12
10
8
6
4
2
0
I Hastings MFM=0.010 + 0.817*Gerrt Volume Integrator JT t I ! 1 1 1 I
T r~ Ti i i
~l T ~ "" Ti i i
1 1 ~ T1 1 11 i
i - -
_r- 'K^^ 1
J.
• I l l J
r ~i r T > ^i i i ^^^^
— r ~i ^J>*~ T1 _!__, -"*"^l
_L^^*"^ I 1J ^ - * " ~ ; | [
r^"r^ i ( 1
f i ii i i
L J Li t I
, ; 1 1
4 6 8 10 12 14Flow Rate Gent Volume Integrator (Ipm)
16 18 20
Figure 4 - Calibration of the volume integrator with the Hastings precisionmass flowmeter
5-5

CO
o
"5
Sao Paulo Aerosol CharacterizationBlack Carbon Concentration
20
oOc:o.atoOO(0
CD
15 -
§ 10
5 -
JS 0 III165 169 172 177 183 189 195 204 210 216 222 228 234 240
166 170 173 179 185 191 197 206 212 218 224 230 236 242
1994 Julian Day
Figure 5 - Black carbon concentration in {ig/m3 in the fine mode.
Sao Paulo Aerosol Characterization 94Ratio of Black Carbon to Fine Mass
100
165 169 172 177 153 189 195 204 210 216 222 228 234 240166 170 173 179 185 191 197 206 212 21B 224 230 236 242
1994 Julian day
Figure 6 - Ratio of black carbon to fine mode aerosol mass concentration.
A total of 82 samples was analyzed by PDCE in the fine fraction, providing
5-6

Table 1 - Sao Paulo Aerosol Characterization Study - 1994 - Fine Mode ElementalConcentrations in ng/m3
Variable
Al
Si
S
Cl
K
Ca
Ti
V
Cr
Mn
Fe
Ni
Cu
Zn
Br
Rb
Sr
Zr
Pb
FPM(*)
BC<*)
Mean
115
175
1527
35.9
530
91.5
15.1
7.25
5.43
21.9
346
6.28
15.3
127
7.77
2.34
1.43
4.84
44.4
30.9
7.97
Std.Dev.
69.5
50.1
1039
27.0
268
39.4
8.34
4.21
3.91
14.7
159
4.04
9.96
104
4.24
1.09
0.47
2.86
35.6
14.9
3.49
Min.
4.48
104
94.9
3.26
36.3
18.2
0.93
0.73
0.25
0.34
46.9
0.33
2.12
5.24
1.25
0.76
1.06
1.98
3.16
3.64
1.62
Max.
253
236
5294
132
1357
217
36.8
19.2
18.1
68.8
887
16.7
52.6
530
17.4
5.33
2.12
9.37
178
79.8
19.3
N
67
16
82
74
82
82
82
82
68
82
82
82
82
82
82
34
6
8
82
82
82
(*) FPM is the aerosol fine mode mass concentration in/yg/m3. BC is the Black Carbon concentrationin /jg/m3. N is the number of samples in which the variable appears above the analytical detection limit.Only values above detection limit were used in calculating average and standard deviation!
Factor analysis with VARIMAX rotation was performed in the elemental data set,including only variables that were measured in all samples. Four factors were statistically
5-7

significant, and the communalities for most of the variables were typically 85%. Table 2shows the VARIMAX rotated factor matrix, with the communalities. Factor 1 has highloadings for Zn, Pb, Cu, BC, Mn and the FPM. This could represent contributions from thetransportation sector, with diesel, gasoline and alcohol emissions. Factor 2 represents soildust with contributions from Ti, K, Ca, FPM, but also with a component of resuspended soildust by traffic, because of the BC, Cu, and Mn components. The fine mode sulfur is alsohigh in this component. The third component with V, Ni, S and Fe could represent the oilcombustion component. The fourth factor is loaded mainly with Br, and it is not clear to usthe source associated with this component.
Table 2 - Sao Paulo Aerosol Characterization Study - 1994 - VARIMAX Rotated FactorMatrix for the Fine Mode Aerosol
Variable
Zn
Pb
Cu
BC
Mn
Ti
K
Ca
FPM
V
Ni
S
Fe
Br
Factor 1
0.89
0.88
0.73
0.65
0.55
0.44
-
0.42
0.48
-
0.44
0.34
0.46
-
Factor 2
-
-
0.35
0.58
0.46
0.82
0.77
0.69
0.56
0.28
-
0.67
0.49
0.46
Factor 3
0.29
-
0.33
-
0.47
-
0.36
-
0.41
0.88
0.82
0.55
0.54
-
Factor 4
-
-
-
-
-
-
0.37
-
0.43
-
-
-
0.31
0.81
Communalities
0.91
0.90
0.79
0.83
0.75
0.90
0.87
0.75
0.90
0.90
0.91
0.89
0.86
0.90*
*0nly factor loadings above 0.25 are shown. The last column shows the communalities for each variable.
The Absolute Principal Factor Analysis model produced the absolute source profilesshowed in Figure 7. It is difficult to make a complete interpretation of the source profiles,but they should represent the absolute elemental concentration associated with each factor.We observe the large S component in the oil combustion profile. Al and Si are significantonly for the resuspended soil dust component.
5-8
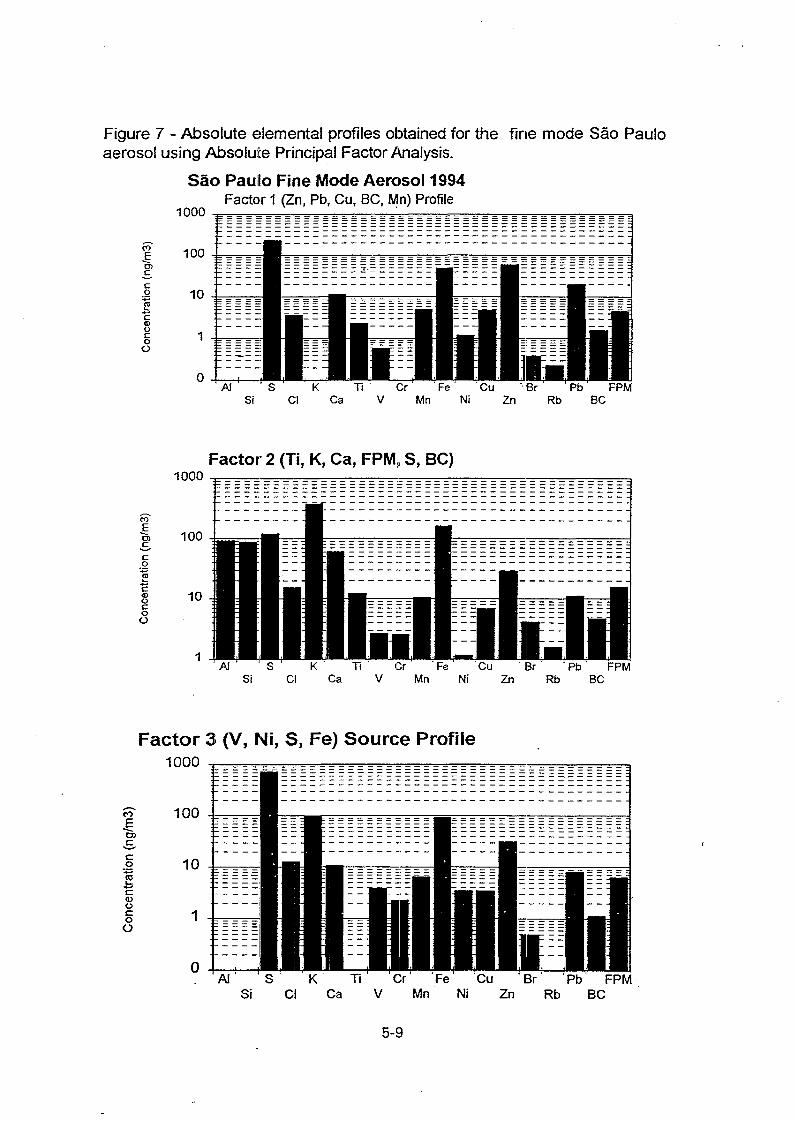
Figure 7 - Absolute elemental profiles obtained for the fine mode Sao Pauloaerosol using Absolute Principal Factor Analysis.
Sao Paulo Fine Mode Aerosol 1994Factor 1 (Zn, Pb, Cu, BC, Mn) Profile
1000
100
10
CO
1co
ioo
lllll 1 1
lllll 1 1
mn 11
in nil
III
. ^-—^-r-B
HI
III III III III III
•91
1 in
ni
nun
i u
nit
3.
| = =
71inininininin
in tn in in in in
1
IIliIIilIIin H
IIII
= •
III
Fe
i lin
ni n
iini n
uni
linn
i uni
ti m
mi m
m
HI
HI
in in in HI
HI
in
(= = = = =•=inniin
' Cu
11 in
ni
mm
11 in
n
HI
HI
III III
III III III III
II II II II
Br '
inHI
•IPb
z: r: — r: z
III III III III HI
mmFPM
Si Cl Ca V Mn Ni Zn Rb BC
CO
co
<Docoo
1000
100
Factor 2 (Ti, K, Ca, FPM, S, BC)
AI S K Ti Cr Fe Cu Br Pb FPMSi Cl Ca V Mn Ni Zn Rb BC
Factor 3 (V, Ni, S, Fe) Source Profile1000
CO
TO
"cCDO
O
O
. AI S K Ti Cr Fe Cu Br 'Pb' FPMSi C! Ca V Mn Ni Zn Rb BC
5-9

Cluster analysis was performed to further investigate the relationship between
the elemental concentrations. The factor scores for each of the retained 4 factors were
also included in the cluster analysis to facilitate the interpretation of the cluster
structure. Figure 8 shows the results for the cluster analysis. It is remarkably similar
to the factor analysis results. It is important to emphasize that the two analyses are
two completely independent techniques.
Figure 8 - Fine Mode Sao Paulo Aerosol 1994 - Cluster Analysis -Ward'sError - Quadratic Euclidean Distance - Z-scores.
Rescaled Distance Cluster Combine
C A SLabel
ZNFAC1_1PBMNFEBCFPMCUVFAC3_1NISFAC4_1BRTIFAC2_1CAK
E 0Num +
11426
13453
1016111217187
1598
5- + -
10 15 20 25h
J
3
JIT
(*) FACX_Y are the factor scores for the 4-factor solution factor analysis.
CONCLUSIONS
The urban area of Sao Paulo has shown high concentrations of inhalable
paniculate matter, indicating air pollution problems. Back carbon concentration
represents 26.1±9.7% of the fine mode aerosol mass, indicating the importance of
diesel emission. Factor analysis was able to separate four factors, with a
transportation-related component, a resuspended soil dust and an oil combustion
component. A fourth factor mainly with Br was also observed. An independent
multivariate analysis technique using Cluster analysis showed very similar elemental
5-10

relationships. The results indicate that the transportation sector gives an important
contribution to fine mode aerosol concentration.
Acknowledgments. We would like to acknowledge Alcides C. Ribeiro, Ana
L. Loureiro and Tarsis Germano for assistance during sampling and PIXE analysis.
We also acknowledge the staff from the Medicine Department from USP for support
during sampling. We acknowledge financial support through a "Tematic project"
grant from F APESP-Fundacao de Amparo a Pesquisa do Estado de Sao Paulo
REFERENCES
Artaxo, P., and C. Orsini, PEXE and receptor models applied to remote aerosol source
apportionment in Brazil, Nucl. Instrum. Methods Phys. Res., B22, 259-263, 1987.
Cahill, T.A., R.A. Eldred, J. Barone, and L. Ashbaugh, Ambient aerosol sampling
with stacked filter units, Rep. Fed. Highway Adminis. FHW-RD-78-178, 78 pp., Air
Qual. Group, Univ. of Calif., Davis, 1979.
Hopke, P.K., Receptor Modeling in Environmental Chemistry, John Wiley, New
York, 1985.
Johansson, S.A.E., and J.L. Campbell, PIXE - A Novel Technique for Elemental
Analysis, John Wiley, New York, 1988.
John, W., S. Hering, G. Reischl, and G. Sasaki, Characteristics of Nuclepore filters
with large pore size, II, Filtration properties, Atmos. Environ., 17, 373-382, 1983.
Orsini, C ; Tabacniks, M.; Artaxo, P.; Andrade, F.; Kerr, A., "Characteristics of fine
and coarse particles of natural and urban aerosols of Brazil", Atmospheric
Environment, Vol. 20, no. 11, pg. 2259-2269, 1986
Parker, R.D., G.H. Buzzard, T.G. Dzubay, and J.P. Bell, A two stage respirable
aerosol sampler using Nuclepore filters in series, Atmos. Environ, 11, 617-621, 1977.
Thurston, G.C., and J.D. Spengler, A quantitative assessment of source contributions
to inhalable particulate matter pollution in metropolitan Boston, Atmos. Environ., 19,
9-25, 1985.
5-11

XAO102875
Appendix 6
AIR POLLUTION IN SANTIAGO (CHILE)AS STUDIED BY NUCLEAR AND OTHER TECHNIQUES
P. TORO1*, E. CORTES2
^epartamento de Quimica, Facultad de Ciencias Fisicas y MatematicasUniversidad de Chile, P.O. Box 2777, Santiago, Chile
2Comisi6n Chilena de Energia Nuclear, P.O. Box 188-D, Santiago, Chile
"Chief Scientific Investigator
Abstract
The elemental characterization of the urban aerosol in Santiago and of a rural area using different non-destructive analyticaltechniques such as PKE, NAA and XRF was performed. In addition, AAS was used for selected samples and intercomparisonpurposes. The distribution of selected elements on membrane filters was studied using XRF. To assure adequate quality of theanalytical data, an analytical quality control exercise was planned and carried out Furthermore, different analytical techniques wereused for the determination of the same elements in the same sample as further quality control procedure.
1. SCIENTIFIC BACKGROUND AND SCOPE OF THE PROJECT
Santiago, the capita]! of Chile is becoming one of the most polluted city in the world as
regards its atmospheric environment. The large number of motor vehicles, for public
transportation and private use, the large number of industries located within urban limits and
adverse topographical and climatic conditions, contribute to the high levels of airborne particulate
matter and gases found in the atmosphere of Santiago.
New actions taken and enforced by the local authorities are helping to decrease the levels
of pollutants in the atmosphere of Santiago. Latest regulations in this direction are the
introduction of catalytic converters in all types of new cars and the renewal of the public
transportation system. The Introduction of high octane number gasoline is expected to affect the
emission of motor vehicles. A new law on environmental conservation request all industries to
revise and improve their emission systems to meet acceptable standards .
The study being carried out within the framework of this project is to only one attempting
to characterize the elemental composition of airborne particulate matter in Santiago. This study
uses several analytical techniques, namely neutron activation analysis (NAA), x ray fluorescence
(XRF), proton induced x ray emission (PIXE) and atomic absorption spectrometry (AAS) to
characterize the aerosols.
6-1

characterize the aerosols.
The present project aims at:
1. to compare the composition of airborne paniculate matter collected in urban area inSantiago with other collected in a "clean" area at about 30 km from downtown,
2. to optimize the analytical methodology, based on NAA, XRF, AAS and PIXE, for
this type of samples,
3. to carry out analysis of wet deposition by ion chromatography and TRXRF; this part
will be included in the supplementary programme,
4. to study the feasibility of using biomonitors for environmental pollution monitoring
in both, the Metropolitan and rural areas,
5. to evaluate the analytical data as regards its analytical quality and to treat it
statistically to attempt the identification of emision sources.
2. MATERIALS AND METHODS
2.1. SAMPLING AND SAMPLE PREPARATION
The collection of airborne particulate matter in Santiago and rural area were carried out
using sample collectors which complies with the PM-10 standard and which were provided by the
IAEA [1].
The results reported here correspond to the analysis of samples collected during a 10 week
period campaign at the end of the winter season in 1993.
For the analysis of the filters with instrumental analytical techniques, i.e., XRF, NAA, and
PIXE, the samples were analysed directly, without any further treatment. When AAS was used,
the samples were dissolved using a procedure developedd and optimized at the AAS laboratory.
The best analytical conditions for each technique were determined experimentally.
2.2. ANALYTICAL TECHNIQUES
The analytical techniques for the analysis of airborne particulate matter collected onto
6-2

membranes were NAA, XRF and PIXE, complemented with AAS for selected elements.
2.3. ANALYTICAL QUALITY ASSESSMENT
Due to the lack of appropriate reference materials for this type of matrix, analytical quality
control was based, mainly, in the exchange of samples among the local participating laboratories
for cross checking the results. For this purpose samples were collerted simultaneously, at the
same collection site during the same time with identical PM-10 samplers over a five day period.
The filters were then analysed by different methods and the results compared.
It would be highly desirable to continue with the preparation and distribution of some kind
of reference materials prepared for this CRP. Previous experience within this CRP has shown that
this kind of exercises are very useful and help to detect problems in the analytical methodologies.
2.4. DATA EVALUATION
The analytical data was interpreted in two ways. On one hand, factor analysis was applied
to the data and, based on this information, elements with similar behaviour and probably of the
same origin, were plot to study correlations between them [2]. On the other hand, the data
obtained from the samples collected in the urban residential sites were compared to that of the
rural station to determine significative differences or similarities among the collection centres.
3. RESULTS
The distribution of the element Fe on the membrane filter was studied by XRF. A collimated
X ray beam of 1 mm diameter was used to survey the membrane in the X and Y directions. The
variation of the concentration of Fe on the membrane ranged from -6.4% to +4.4% in the X axis
and from -5.1% to +5.7% in the Y direction. These variations are shown in Fig. 1. These results
indicate that the airborne particulate matter is distributed in a rather homogeneous way, allowing,
if necessary, the cutting of the membrane and the distribution of the parts to different laboratories.
Among the elements of interest for the project, Fe, Pb and Zn, were determined by XRF.
As a quality control procedure, the same membranes were analysed by NAA for Fe and Zn and
by AAS for Pb and Zn. The results, shown in Figs. 2, 3 and 4, agree quite well.
For quality assurance purposes it was carried out an exercise involving all analytical
techniques available at the participating institutes. Ion chromatography was included, in addition
to the techniques mentioned before, to have another reference value for sulphur. The results for
6-3

13 elements in this exercise are indicated in Table I. Three similar samples collected at the samesite and time and during the same period of time were analysed by NAA to detect any differencein the operating conditions of the PM-10 collectors or due to manipulation of the sample. NAAwas selected for this because the large number of elements it can determine and its non-destructive properties. The results of the analysis of these samples showed that the samplers wereworking in a similar way as regards the mass collected and volume sampled. It has to bementioned that the actual concentration of the elements in the samples is not known, thus thefollowing interpretation is based on a relative basis.
From the data reported it can be seen that most of the analytical techniques used informedsimilar results. However, in the case of chlorine the results reported by ion chromatography aremuch higher than those informed by NAA which might be due to contamination of the samplesduring dissolution. For Cu, XRF presents results much lower than those of NAA in both coarseand fine fractions. Similar situation happens with the data for Zn, where XRF is always lower thanthe other techniques. This is probably because the concentration of Cu and Zn in the samples wereclose to the limit of detection. In the case of higher concentration of Zn, the correlation betweenall three techniques, XRF, NAA and AAS, is quite good as seen in Fig. 4. In Table I wereincluded the elements As, Br and V although these were determine by one technique only becauseof the importance of both elements in air pollution studies.
Around 50 samples from all three sampling stations were analysed using PIXE at thePhysics Institute of the University of Sao Paulo, Brazil by Dr. Paulo Artaxo. It was decided tocarry out these analysis there for the following reasons: (i) the large experience of this laboratoryin the analysis of this kind of samples would give reliable primary information as regards thecharacteristics of the sampling sites, (ii) the large number of samples which could be analysed inone batch, (lii) the non-destructive properties of the PIXE method which would allow the use ofthe same samples as quality control materials for our own laboratories and (iv) the possibility todo a comprehensive statistical interpretation of the data.
In these samples a total of 18 elements were determined by PIXE. In addition, black carbonwas measured by a smoke stain reflectometer. A comparison of the total mass collected in the fineand coarse fractions are presented in Table n. Correlations studies were done to look for elementswith similar behaviour. As can be seen in Fig. 5 the total fine fraction of paniculate mattercorrelates quite well with the concentration of black carbon. The origin of the black carbon canbe attributed to the diesel combustion of the public transportation vehicles. It can also be noticedthat the concentration of fine mater and black carbon is significatively much less in the ruralstation (A) as compared to the urban sites (B, C) [3].
Another significant correlation is between Br and Pb both produced by the combustion
6-4

engines running with lead gasoline as shown in Fig. 6. Again, there is a significant difference in
the concentration of both element (20 fold) when comparing rural and urban sites. The
concentration levels of Br and Pb in the city are rather high with maximums of around 100 ng/m3
and 300 ng/m3, respectively [4].
A group of elements which correlates very well comprises Al, Fe and Si, all of natural
origin, i.e. soil. These elements are represented in Fig. 7. It can be seen that there is not a large
difference in the concentration between the rural and urban stations with an average of around
400 ng/m3.
The elements As, Cu and S constitutes an interesting group. These elements correlate quite
well which indicate a common origin (Fig. 8). There have been controversies regarding the
possible contribution of copper smelters located near Santiago to the airborne paniculate matter
of the city. The fact that the elements As, Cu and S correlates so well could indicate that there is
a contribution of this kind. However, to have a definitive conclusion it is necessary to carry out
more studies.
A factor analysis was performed will all the data for all the elements determined in the fine
fraction of the samples. The results of this study confirms the correlations mentioned above and
clearly distinguish four factors. These factors can be attributed to cars and buses emission, soil,
biomass burning and, possible, copper smelter located near to the Metropolitan Area as seen in
Table m .
4. PLANS FOR FUTURE WORK
The work plan, within the "core" programme for the proposed CRP would include thefollowing:
1. sampling will continue according to the agreement reached during the First RCM for this
CRP. Thus, samples will be collected twice a week at two urbain residential and one rural
sites. The samples will be analysed using non-destructive analytical techniques, i.e., XRF,
PIXE and NAA. As a complement, and for intercomparison purposes, it is also proposed
to use AAS for selected samples.
2. emphasis will be put on analytical quality control to assure adequate quality of the analytical
data, which would be the basis for any interpretationt. Quality control would be done by the
analysys of duplicate samples using several of the analytical techniques available, analysing
appropriate reference materials and through the exchange of samples with other national
6-5

or international institutes dealing with the same subject [5].
As part of the supplementary programme it is planned to collect and analyse wet deposition
in the Santiago metropolitan area. For this purpose a "wet only collector" will be designed and
constructed. Studies of this kind has not been undertaken so far. The total reflection mode of XRF
is available at the Chilean Nuclear Energy Commission, La Reina Nuclear Centre [6]. It is
proposed to implement and develop the necessary procedures for its use in the analysis of wet
deposition and any other matrix for which this techniques has proven to be useful and reliable. In
addition, ionic chromatography could also be applied to the analysis of wet deposition. An attempt
to find and use suitable biomonitors for environmental pollution in the city itself and rural area,
will also be carried out.
ACKNOWLEDGEMENT
The authors are very grateful to Dr. Paulo Artaxo and his group for their important supportto the development of this project and relevant contribution to the interpretation of the data.
6-6.
REFERENCES
[ 1 ] MAENHAUT, W., FRANCOIS, F., CAFMEYER, X, The "Gent" stacked alter unit (SFU)
sampler for the collection of atmopheric aerosols in two size fractions: description and
instructions for installation and use, in Report for the First Research Co-ordination Meeting
for the Co-ordinated Research Programme on Applied Research on Air pollution Using
Nuclear-Related Analytical Techniques, NAHRES-19, IAEA, Vienna, Austria (1994)
[2] DAVIS, J.C., Statistics and data analysis in geology, John Wiley and Sons, Inc., New York
(1973)
[3] TURPIN, B.J., HUNTZICKER, J.J., HERING, S.V., Investigation of Organic Aerosol
Sampling Artifacts in the Los-Angeles Basin, Atmos. Environ. 28 (1994) 3061-3071
[4] MIRANDA, J., et Al., Determination of elemental concentration in atmospheric aerosols
in Mexico City using proton induced X ray emission, proton elastic scattering and laser
absorption, Atmos. Environ. 28 (1994) 2299-2306
[5] METZ, U., HOFFMANN, P., WEINBRUCH, S., ORTNER, H.M., A comparison of X-ray
fluorescence spectrometric (XRF) techniques for the determination of metal traces,
especially in plastics, Mikrochimica Acta 117 (1994) 95-108
[6] WOBRAUSCHEK, P., KREGSAMER, P., STRELI CH., ALGINGER, H., Recent
developments and results in total reflection x ray fluorescence analysis, Advance in X-Ray
Analysis (C.S. BARRET, Eds) Vol. 34, Plenum Press, New York (1991)
6-7

Table I. Results of an intercomparison exercise for the determination of trace elements in air particuiatematter. Values in ug/m3.
Filter Techj
Fine fractionC90FC91FC92F
NAANAANAA
C93FC94F
PIXENAA
C95F _JCI
C96FC97FC98F
C84FC85FC86F
C87FC88FC89F
NAAFRXAAS
NAAPIXECl
AASFRXPIXEI
Coarse fractionC90GC91GC92G
C93GC94GC95G
C96GC97GC98G
C84GC85GC86G
C87GC88GC89G
NAANAANAA
PIXENAACl
NAAFRXAAS
NAAPIXECl
AASFRXPIXE
Ai
0,410,340,42
0,230,37
0,41
0,340,26
0,34
2,582,302,66
3,204,16
3,42
2,791,09
1,34
As
0,130,150,15
0,03
0,03
0,05
0,040,040,04
0,01
0,01
0.G1• • y
Br
0,0640,0640,071
0,085
0,058
0,054
0,0970,1100,111
0,101
0,073
0,069
Ca
0,210,230,31
0,160,24
0,250,660,18
0,220,18
0,190,670,21
1,411.051,48
2,082,68
2,151,931,89
,1,791,05
2,942,611,75
Cl
0,0750,0690,094
0,0561,432
0,055
0,056
0,710
0.1440,1360,131
0.1540,638
0,142
0,1400,0320,463
Cu
0,0340,0390,038
0,042
0,0450,008
0,022
0,017
0,0410,0600,051
0,054^
0,0720,010
0,044
0,014
Fe
0,390,440,44
0,250,61
0,530,52
0,450.26
0,520,27
2,192,122,79
1,924,51
4,732,67
2,981,15
3,111,88
Na
0,340,340,36
0,50
0.34
0.28
0.25
0,13
0.760.770,85
1,72
1.20
0,58
0,85
0.55
Pb
0,2660.368
0,005
0,2970,2190,002
0.1050,103
0,3100,192j0,002
S
4.57
4.97
4,433.40
1.64
1.90
2,09
0.440,90
0,80
V
0,0060,0050,006
0,011
0.010
0.006
0,0060,0050.006
0.012
0.010
0,007
Zn
0,100,130,14
0,070,18
0,150,030,11
0,110,05
0,040,010,03
0,070,060,08
0,050.14
0.100.040,07
0,08
0,130,020,07
6-8

Table II. Comparison of the total mass collected for the fine (FPM) and coarse (CPM) fractions.Values in ng/m3
FilterA11FA13FA15FA16FA18FA19FA22FA24FA25FA28FA30FA32FA34FBOSFB11F813FB14FB26FB27FB29FB30FB31FB32FB33FB34FB35FB36FB37FB40FB41FB45FB46FB47FC01FC02FC03FC04FC07FC09FC10FC12FC13FC15FC16FC18FC20FC23FC25FC26FC28FC29F
FPM209303257424990217793055928982240821898654991095020743209992213024420104735277695010135374275506980630568159418568
5830359326445045435489231219342211374842605377357349132351828720142844598174359122543475548438597572648449229560262680023491282473282239495
CPM100102361622991266182680625225240822157573321095021607923915573549464952610182064574680275693779170568903691643619687148602369228611481189747845578624532227902758655462596271626739137834424669853169673624458248644446019271521480221423743849310728388054416
6-9
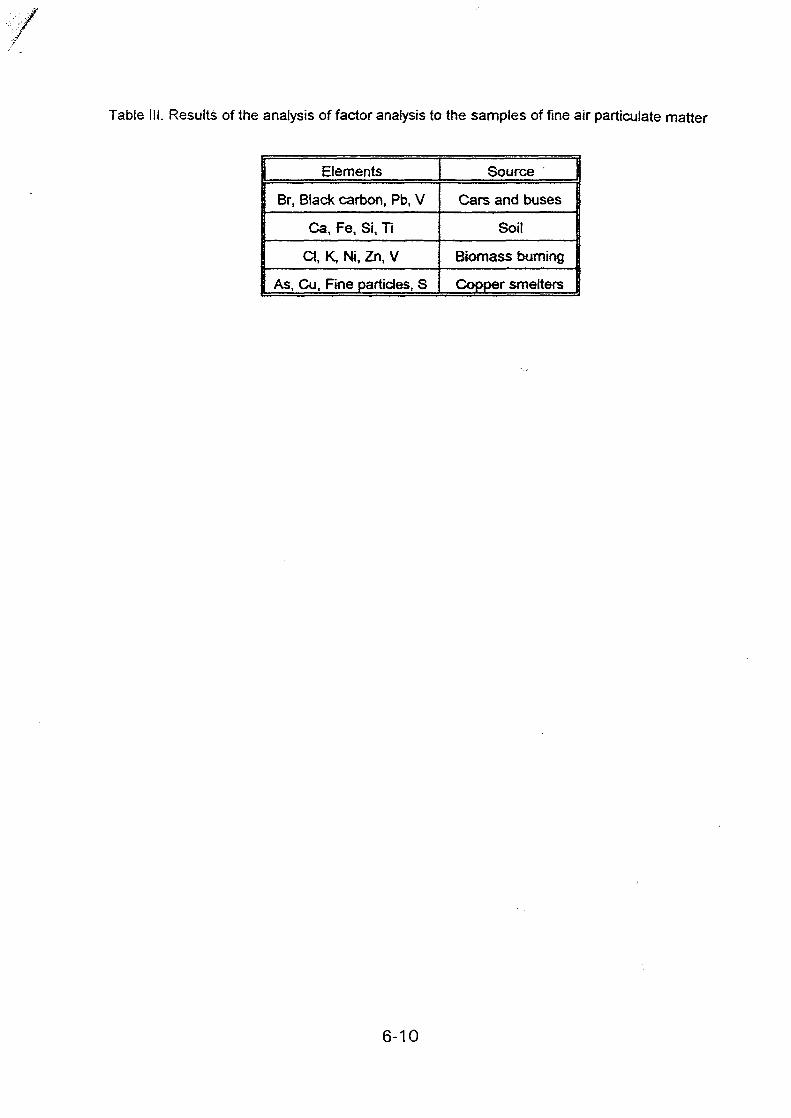
Table III. Results of the analysis of factor analysis to the samples of fine air particulate matter
Elements
Br, Black carbon, Pb, V
Ca, Fe, Si, Ti
a , K, Ni, Zn, V
As, Cu, Fine particles, S
Source
Cars and buses
Soil
Biomass burning
Copper smelters
6-10

1 I I
Posicidn (mm)
-SenMoX —J—SeatidoY
Fig. 1. Variation of the distribution of Fe in the air particulate matter collectedonto membrane filters as measured by XRF.
0,5 1 1,5 2 2,5 3
Data by XRF (ug/m3)
Fig. 2. Comparison of the results reported by NAA and XRF for Fe. Values inug/m3.
6-11

1
CO
£
0.9 j
0,8 jI
0,7 |
0,6 4-II
0,5 -
!a4 +Q
0,3 -
0 ,2 -
0,1 --
0
0 0,1 0,2 0,3 0,4 0,5 0,6 0,7 0,8
Data by XRF (ug/m3)
Fig. 3. Comparison of the results reported by XRF and AAS for Pb. Values inug/m3.
0,9
0,1 0,2 0,3 0,4 0,5
Data by XRF (ug/m3)
joNAA+AASJ
Fig. 4. Comparison of the results reported by XRF, NAA and AAS. Values inug/m3
6-12

CO
E
120000
100000
80000
60000
40000
20000
§ « §o o o o
Samples
- Fine Particle Matter - Black Carbon
Fig. 5. Concentration values for fine particle matter and black carbon in arural (A) and two urban residential (B, C) sites in Santiago. Values in ng/m3.
300
250
200CO
•& 150
100
o ^ ^ ^ f? N No o o o o o oSamples
-Pb -Br
Fig. 6. Concentration values for Br and Pb in a rural (A) and two urbanresidential (B, C) sites in Santiago. Values in ng/m3.
6-13
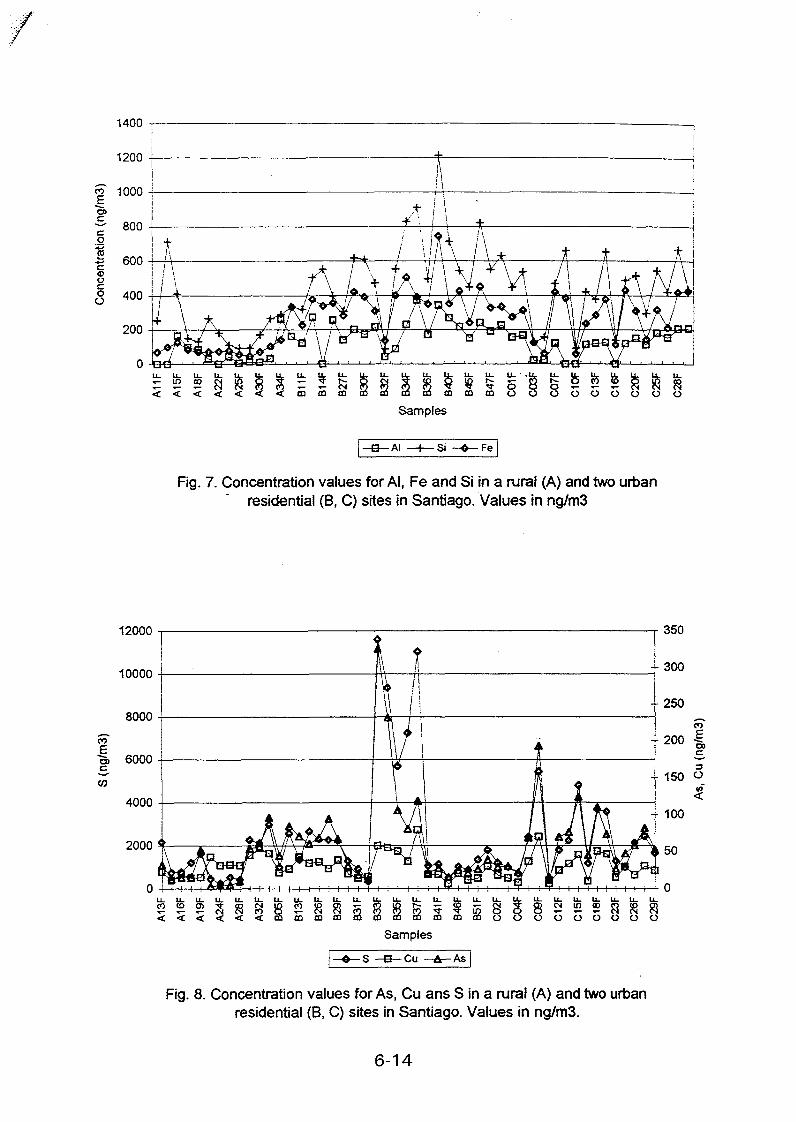
1400
1200
<g 1000
*ffry.w§ § §C Q t D C D
5 § I * § I § §Samples
- B - A I —f— Si —0—Fe
Fig. 7. Concentration values for Al, Fe and Si in a rural (A) and two urbanresidential (B, C) sites in Santiago. Values in ng/m3
CO CD CO 2IA f v r- OT ^
GQ Gu CO CO GO
Samples
U- U. U- U. U. U.
O O O O O O
-S -B-Cu -As
Fig. 8. Concentration values for As, Cu ans S in a rural (A) and two urbanresidential (B, C) sites in Santiago. Values in ng/m3.
6-14

XA0102876
Appendix 7
STUDIES OF THE LONG-RANGE TRANSPORT OF ATMOSPHERIC POLLU-TANT USING NUCLEAR-RELATED ANALYTICAL TECHNIQUESP a r t o f C o o r d i n a t e d Programme: APPLIED RESEARCH ON AIRPOLLUTION USING NUCLEAR RELATED ANALYTICAL TECHNIQUES.
YANG SHAO JIN
Institute Of High Energy Physics, Chinese Academy OfScience, P.O.Box 2732, Beijing, China
ABSTRACT
Atmospheric aerosol and rainwater samples collected in thedifferent Western pacific area were analyzed by instrumentalneutron activation and proton induced x-ray emission to (1)determine the atmospheric concentrations of, trace elementsover the Western Pacific and (2) to estimate the atmosphericdeposition of trace elements and dust- soil material to thisregion.
High aboundance of pollutant and crustal elements relativeto oceanic sources was observed. Some charateristics of marineatmosphere relating to long-range transport of crustal andanthropogenic elements from continent to the remote ocean arediscussed. The total dust-soil particle mass is estimated tobe 0.066-1.2 /ng/m over the Western Pacific Ocean areas. Atmos-pheric inputs of dust-soil particles control the marine par-ticle concentrations of crustal elements.
A total of 99 atmospheric samples with the"Gent" filter unitwas collected during October 1993 and September 1994, at awestern suburb of Beijing, China (40°N,116°E) , and completedthe analysis of these filters by both INAA and PIXE.
1. BACKGROUND AND SCOPE OF PROJECT
Atmospheric aerosol can be transported for long-range by theatmospheric motion, Chinese geographical position is locatedin the westerlies, so aerosol over China can be transportedeastwards to the Pacific Ocean. Therefore, it is one ofimportant causes for marine environment pollution and marinesedimentation.
The role of atmospheric transport and deposition in thebiogeochemical cycling of trace elements has been recognizedonly in the past 20-30 years. Dust-soil aerosol particlestudies are important from a chemical standpoint becausecertain trace elements associated with dust-soil particles,especially iron, and several enriched elements i.e. copperand manganese, are important as catalysts for atmosphericoxidation-reduction reactions. Dust-soil particles reactwith acids, and they often exist as internal mixtures withatmospheric seasalts, sulfaterich particles, or the other typesof aerosols.
7-1

Our studies have been shown that large quantities of soilmaterials are transported by winds out of Asia and over theWestern Pacific Ocean.
2. METHODS
2.1. SAMPLING
The aerosol sampling devices include the "Gent" stackedfilter unit sampler, Anderson cascade impactors and KB-120filter samplers.
For the continuous samplings during a day, we adopted a 8hour collection time per PM-10 sample, at two hours intervals.
Sample changing in the field was conducted with greatcare to minimize contamination. A clean area was preparedin advance for loading and unloading the filters. When onesampling interval was completed, the holder with the filterwas put in a clean plastic bag and brought back to a cleanarea for unloading. Sample filters were sealed in small cleanpolyethylene bags and stored in a freezer until analyzed.
2.2.SAMPLE TREATMENT
All sample processing was conducted in a laminar flow cleanbench, all tools used for this processing were made ofnoncontaminating materials such as polyethylene, or stainlesssteel.
The marine aerosol or the fine and coarse fraction aerosolmass concentrations are obtained through gravimetric analysisof the filter.The filters are weighed before and after sam-pling in a Mettler micro-balance with 1/xg sensitivity. Beforeweighing,the filters are equilibrated for 48 hours at 50% rela-tive humidity and 20°c. All filter handing and weighing wasdone in a clean room.Electrostatic charges are controlled bymeans of 2 1 0Po radioactive source.
2.3.ANALYTICAL TECHNIQUES
Instrumantal neutron activation analysis (INAA)[1] andproton induced x-ray emission (PIXE) [2] techniques wereused to determine the concentrations of 45 elements in theatmospheric aerosol particle samples. Some elements analyzed byINAA and PIXE overlap each other and the two methods are mutu-ally complementary. '
Quality assurance is routinely carried out in our labora-tory by concurrent analysis of suitable standard referencematerials, namely SRM-1648( airborne particulate matter, ),SRM-1632a(trace elements in coal),and SRM-1633a(trace elements incoal fly ash).
7-2

3.RESULTS AND DISCUSSION
3.1.CHARACTERISTICS OF ENRICHMENT FACTOR FOR WESTERN PACIFICAEROSOL
The p r i n c i p a l na tu re - sou rces for most marine atmospherictrace elements are the oceans and earth's crust.The crustal andmarine enrichment factors for selected elements are given inTable 1.
Enrichment factors have shown that many trace elementsexhibit atmospheric concentration ratios similar to those inaverage crustal material or in bulk seawater. Aluminum andsodium are used as reference element for calculating crustaland seawater enrichment factors, respectively. The enrichmentfactors computed in our studies indicate that natural processesmay dominate the atmospheric concentrations of many elements.Seasalt elements ( Na,Cl,Mg,Ca,Br and k) exhibit relativeproportions in marine aerosol particles and rainwater thatgenerally are similar to those in bulk seawater. The seasaltaerosols do not necessarily have the same relative trace ele-ment composition as bulk seawater. Iodine may be affected byfractionation,that occurs during the seawater bubbles brustprocess,it was enriched about 1000-fold on aerosols. A secondgroup of trace elements ( Al,Co,Fe,Mn,Si,and rare earth )often display relative proportions in remote aerosol parti-cles similar to those in average crustal material. The concen-trations of these elements may be controlled by the long-rangetransport of dust-soil aerosol particles from the continents,because the concentrations of crustal elements in aerosolswere high over the ocean area close to the Asian continent anddecreased very rapidly with increasing distance from land,but the crustal enrichment factors do not obviouslydemonstrate that their ultimate source is either crustal ornatural. The enrichment factors computed for a third group ofelements ( As,Cu,Pb,Sb,Se,and Zn ) have shown that these ele-ments are enriched relative to both crustal and seawatersources. I t is suggested that the enrichment elements overthe Western Pacific were influenced mainly by long-rangetransport of anthropogenic pollutants from continent. Thelong-range transport of atmospheric substances from Asia notonly transports dust-soil but also carries pollutants, nutri-ents, and a variety of other atmospheric substances to theremote atmosphere and oceans.
3.2.CHARACTERISTICS OF MARINE RAINWATERI
During this cruise from December 1992 to March 1993, we havecollected 15 rainwater samples at the Western Pacific area. ThePH value of the rain samples varied very little, from 5.3 to5.8, exhibit acidity. This imply that the acidic materialssuch as SO2, N0 x etc., may affect the remote, oceanic environ-ment, those acidic materials are mainly come from continents.
In Table 2, enrichment factors showed that the concentra-tions of Fe,Mn,Co,La,and Si in rainwater were dominated by a
7-3

crustal source. The As,Pb,S,Sb,Se,Zn,Na,Cl,and Br are enrichedrelative to the crustal material,the enrichment of Na,Cl,and Brare due to seasalt. However, enrichment of other elements aredue to anthoropogenic sources. The enrichment factors forelement Na relative to Al in rain were higher than those inaerosols, it is easy to understand that the enrichment factorof Na in rain samples was higher than in aerosols, becauseseasalt is a good cloud condensation nucleus and Na couldbeen enriched in cloud in the process of cloud formation.
3 • 3.DEPOSITION OF ATMOSPHERIC TRACE ELEMENTS AND DUST-SOILPARTICLES IN THE WESTERN PACIFIC OCEAN
In the last year, we have studied the deposition of crustalmaterial and pollutants onto the ocean surface and their con-tribution to marine sediments.
The atmospheric deposition of trace elements can beestimated through the use of a total deposition velocity,V ^ c m s " 1 ) . That is F^=C xVd-Where Fd is the total depositionf lux (/igcm s ) . Ca is the measured concentration of aerosolparticles in air. According to Gao [3] calculated results, forcalculation of the total deposition of trace elements, it isprobably accurate to use V ^ 4.5 cm s for seasalt elements,3 cms"1 for crustal elements, and 0.55 cms"1 for enriched ele-ments. Us ing these total deposition velocities, we calculatedthe total fluxes of atmospheric trace element to the WesternPacific Ocean (Table 3) .
Analysis of the continental components of these marineaerosol particles is to estimate the value of the atmosphericdust-soil.aerosol. We assumed that the concentrations of Alin the aerosol particles reflected the dust-soil loading in theatmosphere, the crustal material is 8.13 % Al by weight.During this cruise from December 1992 to March 1993, the totaldust-soil particle mass is estimated to be 0.066-1.2 /igm overthe Western Pacific Ocean areas. Our data similar to those atEnewetak (0.05-0.68 /igm-3) reported by Uematsu et al.[4].
Atmospheric inputs of dust-soil particles control the marineparticle concentrations of crustal elements, when the amount ofdust-soil in the atmospher-e over the Western- Pacific changed,the amount of crustal elements in aerosol particles changedcorrespondingly. The dust-soil concentrations decreased withincreasing distance from land over the ocean area close toAsian land and fluctuate around its average value over theremote ocean regions. Precipitation amounts and frequenciesalso varied significantly from season to season and from siteto site over the Western Pacific.
4. PLANS FOR FUTURE WORK
In next year, the PM-10 stacked filter unit sampler will beplaced at the rural site of Beijing and a similar samplingprocedure as described in the core programme of CRP will be
7-4

followed,the sampling period range from May 1995 to April 1996.The evaluation will be done in terms of average element con-
centrations, seasonal variation, enrichment factors, source ap-portionment by factor analysis.
The studies on characteristics of marine aerosol particlewill be continued, the data set from Western Pacific Oceanwill be further evaluated, and to analyze the new samplescollected at this regions using INAA and PIXE.
REFERENCES
[1] YANG SHAO JIN, et al. , Determination of elements inairborne particulate at different sizes by neutron acti-vation analysis, Anal. Lab., 4 (1985)10-13.[2] HU ZHAO HUI,et al., PIXE analysis of aerosols from thesouthern city Guangzhou, Nucl.Instru. Methods in Physics Re-search, B22, (1987) .283-288.[3] Y.GAO, et al., Input of atmospheric trace elements andmineral matter to the Yellow sea during the Spring of a low-dust year,J.Geophys.Res.,97,No.D4,(1992)3767-3777.[4] UEMATSU,M.,et al., Transport of mineral aerosol from Asiato the North Pacific Ocean, J.Geophys.Res.,88,(1983)5343-5352 .
7-5
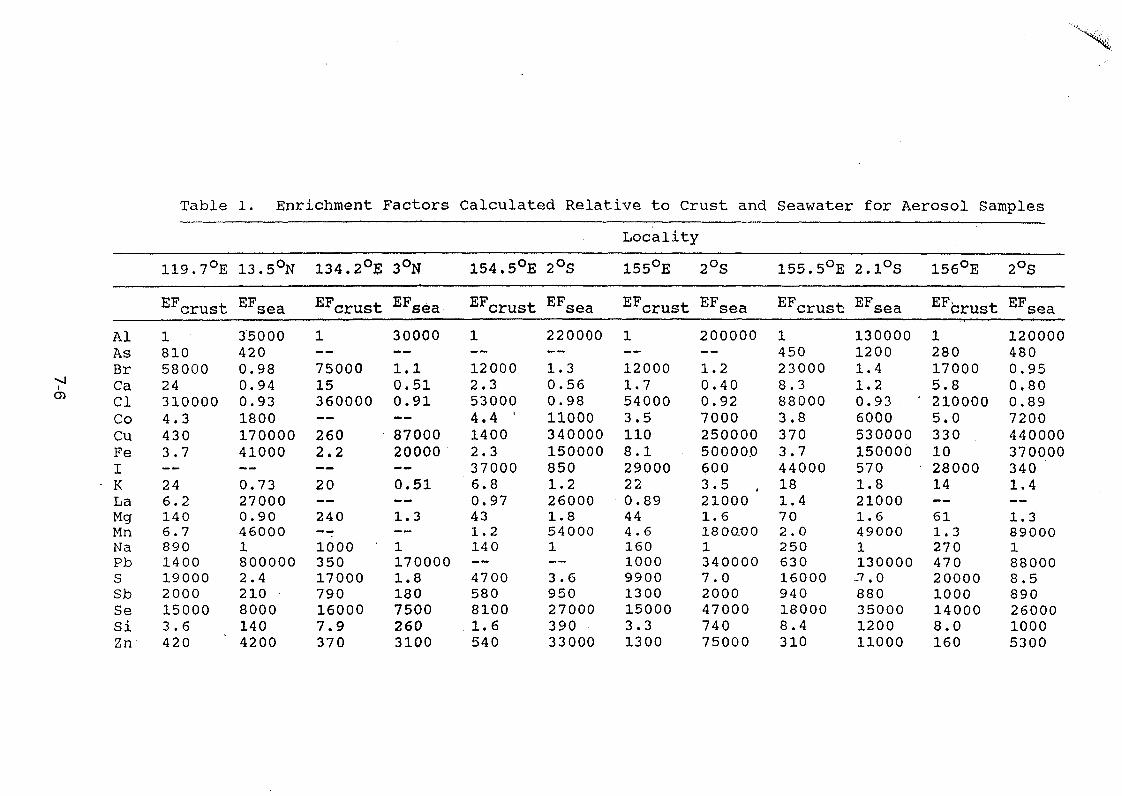
Table 1. Enrichment Factors Calculated Relative to Crust and Seawater for Aerosol Samples
O)
AlAsBrCaClCoCuFeIKLaMgMnNaPbSSbSeSiZn
119.7°E
EFcrust
181058000243100004.34303.7—246.21406.78901400190002000150003.6420
13.5°N
EF
350004200.980.940.93180017000041000—0.73270000.904600018000002.421080001404200
134.2°E
E FCrUSt
1—7500015360000--2602.2——20——240—•1000 •35017000790160007.9370
3°N
EF
30000
1.10.510.91-—8700020000—0.51—_1.3—11700001.818075002603100
154.5°E
EFcrust
1—120002.3530004.4 '14002.3370006.80.97431.2140—470058081001.6540
2°S
EF^sea
220000—1.30.560.98110003400001500008501.2260001.8540001—3.69502700039033000
Locality
155°E
EFcrust
1—120001.7540003.51108.129000220.89444.6160100099001300150003.31300
2°S
EF
200000—1.20.400.92700025000050000.06003.5210001.618OQO013400007.020004700074075000
155.5°E
EFcrust
1450230008.3880003.83703.744000181.4702.025063016000940180008.4310
2.1°S
EFsea
13000012001.41.20.9360005300001500005701.8210001.6490001130000-7.088035000120011000
156°E
EFcrust
1280170005.82100005.0330102800014__.611.3270470200001000140008.0160
2°S
EF
1200004800.950.800.8972004400003700003401.4—1.3890001880008.58902600010005300
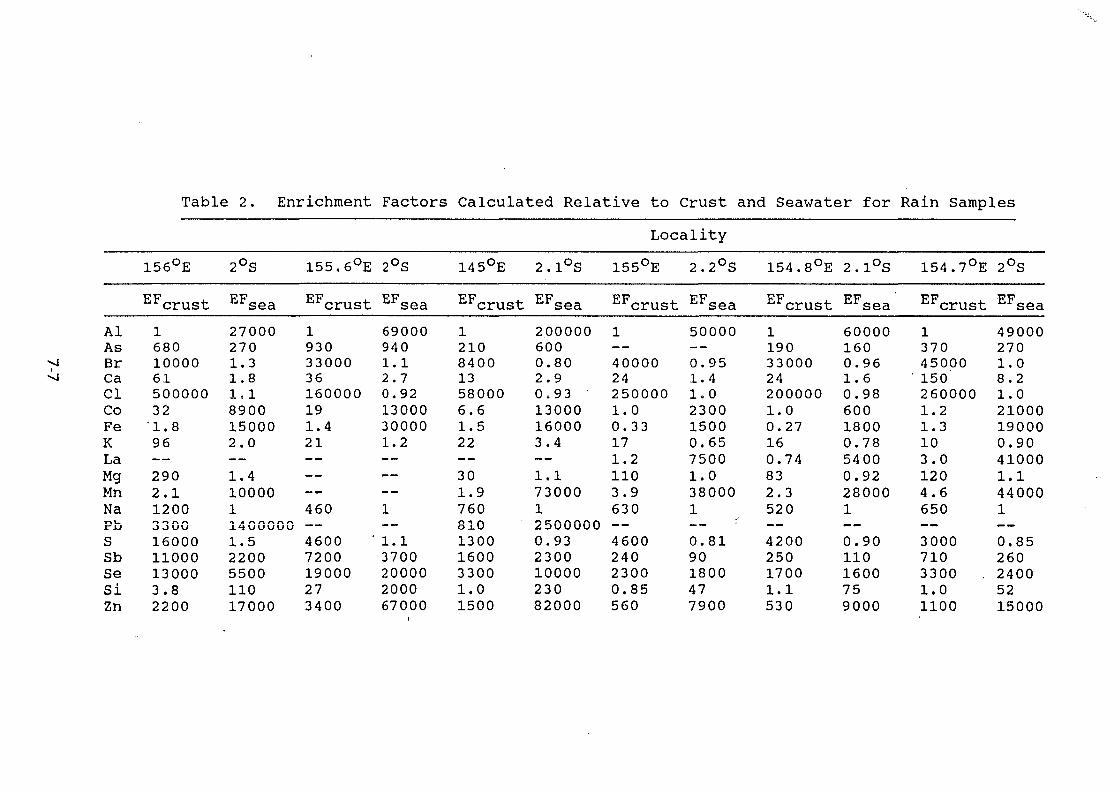
Table 2. Enrichment Factors Calculated Relative to Crust and Seawater for Rain Samples
AlAsBrCaClCoFeKLaMgMnNaFbSSbSeSiZn
156°E
EFcrust
16801000061500000321.896—2902.1120033001600011000130003.82200
2°S
EF"sea270002701.31.81.18900150002.0—1.410000114000001.52200550011017000
155.6°E
EFcrust
19303300036160000191.421———460—4600720019000273400
2°S
EF s e a
690009401.12.70.9213000300001.2———1—1.1370020000200067000
145°E
EFcrust
1210840013580006.61.522--301.9760O J.U
1300160033001.01500
2.1°S
EF"sea2000006000.802.90.9313000160003.4—1.173000125000000.9323001000023082000
Locality
155°E
EFcrust
1—40000242500001.00.33171.21103.9630—460024023000.85560
2.2°S
EFsea
50000—0.951.41.0230015000.6575001.0380001— -0.81901800477900
154.8°E
EFcrust
119033000242000001.00.27160.74832.3520—420025017001.1530
2.1°S
EFsea'
600001600.961.60.9860018000.7854000.92280001—0.901101600759000
154.7°E
EFcrust
137045000
' 1502600001.21.3103.01204.6650—300071033001.01100
2°S
EFsea
490002701.08.21.021000190000.90410001.1440001——0.8526024005215000
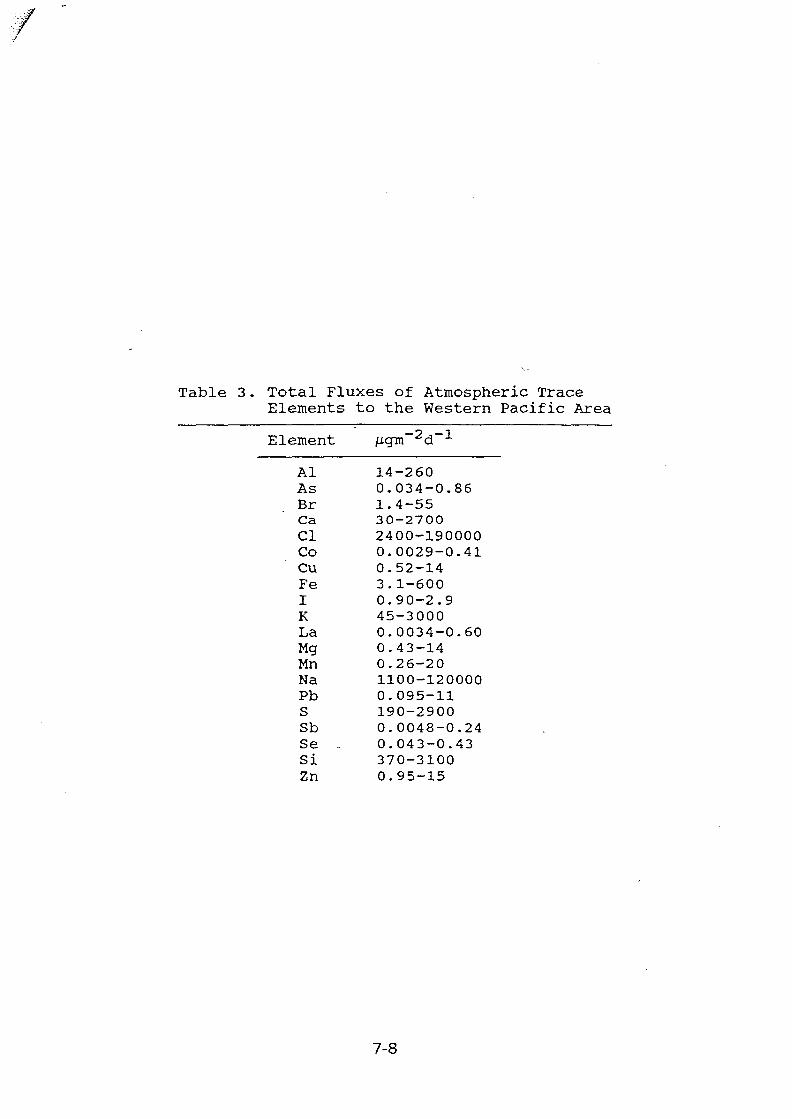
Table 3. Total Fluxes of Atmospheric TraceElements to the Western Pacific Area
Element
AlAsBrCaClCoCuFeIKLaMgMnNaPbSSbSe -SiZn
/xgm 2d -1
14-2600.034-0.861.4-5530-27002400-1900000.0029-0.410.52-143.1-6000.90-2.945-30000.0034-0.600.43-140.26-201100-1200000.095-11190-29000.0048-0.240.043-0.43370-31000.95-15
7-8

Appendix 8
AIR POLLUTION MONITORING IN THE CZECH REPUBLIC BY NEUTRONACTIVATION ANALYSIS AND OTHER ANALYTICAL METHODS
J. Kucera1, J. Santroch2, J. Faltejsek1, J. Horakova1, V. Hnatowicz1, V. Vosecek1,V. Havranek1
1 Academy of Sciences of the Czech Republic, Nuclear Physics Institute, CZ-250 68 Rez nearPrague, Czech Republic2Czech Hydrometeorological Institute, Na Sabatce 17, CZ-143 06 Prague 4 - Komofany,Czech Republic
ABSTRACT XA0102877
INAA results are presented for selected elements determined in samples of air particulatematter (APM) which were collected without particle size fractionation in 5 stations for measur-ing the atmospheric deposition in the Czech Republic (two impact" stations, two backgroundstations, and the Prague suburb) in the period January 1993 - June 1994. A part of INAA re-sults of APM samples obtained using the "Gent" stacked filter unit for fractionation of particlesinto two size fractions which were collected in the Prague suburb in 1994 are reported, as wellas introductory experiments using PIXE. Advantages and drawbacks of employing INAA andEDXRF techniques for analysis of emission and aerosol samples are evaluated from results ofcomparative analyses of identical samples using both techniques. Plans for future work are out-lined.
1. SCIENTIFIC BACKGROUND AND SCOPE OF THE PROJECT
The main reasons for the need of air pollution monitoring in the Czech Republic, as wellas the scope of these activities have already been reported [1,2]. Briefly summarised, regular airpollution monitoring is carried out both in the vicinity of large power plants fuelled with a lowquality lignite, which are mostly located in the Northern Bohemia (impact region), and inbackground stations in rural, locally unpolluted regions in the Bohemian-Moravian Uplands. Inaddition, one of the stations for the regular measurement of atmospheric deposition in theCzech Republic is situated at the Prague suburb. These stations aire operated by the CzechHydrometeorlogical Institute (CHMI) which participates in the project. Some of the stationsbelong to the United Nations' Economic Commission for Europe (UN ECE) EnvironmentalMonitoring and Evaluation Programme (EMEP) and the World Meteorological Organisation(WMO) Global Atmosphere Watch (GAW) networks. A part of results, especially for theimpact region, is also produced in the frame of the US-Czech Science and TechnologyProgramme in which the US Environmental Protection Agency (EPA), the US NationalOceanic and Atmospheric Administration and CHMI take part.
Until very recently, the regular air pollution monitoring has been based on analysing airparticulate matter (APM) collected without the particle size fractionation by employing lowvolume samplers equipped with Synpor 4 membrane ultrafilters with a pore diameter of 0.8um and a filter diameter of 35 mm [1]. This type of sampling will continue in the abovementioned stations. However, joining this IAEA Co-ordinated Research Programme (CRP)gave us also a chance to employ a collector for the size-fractionated APM which conforms tothe PM-10 standard (the Gent stacked filter unit-SFU) using a filter pack with two Nucleporefilters with the pore diameters of 8 and 0.4 um and a filter diameter of 47 mm at selectedstations. It is believed that analysing this type of samples will allow to derive much detailed
8-1

information about the levels of easily volatilized elements such as As, Hg, Sb, Se, etc. whichare mostly bond to finer particles of APM and also to facilitate a further elucidation of sourcesand processes contributing to the air pollution in the Czech Republic.
2. METHODS
2.1. Sampling
Sampling of non-fractionated APM in the impact, background, and the Prague suburbstations changed somewhat compared to that described previously [1]. Four weekly sampleswere combined to form a "monthly" sample which was halved. One half was analysed byINAA to determine 30-35 elements, while the second half was analysed by atomic absorptionspectrometry (AAS) to determine the elements Cd, Cu, Ni, and Pb [2]. Sampling the size-fractionated APM was carried out according to Maenhout et al. [3] in the Prague suburbstation using a two-day sampling period.
2.2. Analysis
INAA procedures for the APM samples have already been described [1,2]. The PIXEtechnique has become available for APM analysis after transfer of the former NAA Laboratoryof the Czech Environmental Institute, Prague to the Academy of Sciences of the CzechRepublic, Nuclear Physics Institute (NPI) at Rez near Prague [4]. The following PEXEexperimental set-up is available at the NPI. A beam of protons with the energy of 2.35 MeVis obtained from a Van de Graff accelerator. The beam collimated to a diameter of 5 mm entersa vacuum target chamber after passing through a thin Al diffusion foil which is used as part ofa monitoring system and simultaneously, to improve the homogeneity of the beam bombardinga sample. The chamber is equipped with a sample changer for 7 samples fixed in standardpolyframes. Characteristic X-rays induced by protons are allowed to leave the chamberthrough a thin exit window formed by a 10 nm mylar foil and are measured employing a Si(Li)detector (active area 80 mm^) with a Be window coupled to a Canberra ACCUSPEC PC-based analyser through the standard associated electronics. A sample-to-detector distance is 30mm, the FWHM energy resolution of the system amounts to 180-190 eV for the 5.9 keV X-rays. Outside the chamber, between the exit window and the detector, a suitable X-rayattenuation filter can be inserted. Determination of a proton dose is carried out by measuring anumber of protons scattered from the Al foil using a surface barrier Si(Au) detector connectedto a separate counter. For the X-ray spectra evaluation, a programme package PIXE-NPIdeveloped at the NPI is available. A schematic drawing of the PIXE set-up at the NPI is shownin Fig.l. Element detection limits without and with a 1 mm polyethylene (PE) filter aredepicted in Fig. 2.
Quality assurance of INAA has been pursued by analysing a 5-10 mg aliquot of NISTSRM 1648 Urban particulate in every batch (30-35 samples) of APM and by participation inthe interlaboratory comparison on PM-10 fine and coarse filter standards prepared forparticipants of this CRP [5]. New possibilities of quality assurance appeared since the PDCEtechnique has became available, because using INAA and PIXE it will be possible to determineabout 10-15 elements in the APM samples by both methods
3. RESULTS AND DISCUSSION
INAA results of the non-fractionated monthly APM samples in five stations formeasuring the atmospheric deposition in the Czech Republic for selected elements which are
8-2

considered to originate mainly by coal combustion (As, Se), oil combustion (V), wasteincineration (Sb, Zn), automobile traffic (Br), and soil weathering (AL, La, Mn, Sc) in theperiod January 1993 - July 1994 are summarised in Table 1.
Table 1. CONTENT OF SELECTED ELEMENTS IN THE NON-FRACTIONATED APMSAMPLES COLLECTED IN THE PERIOD JANUARY 1993 - JUNE 1994 (ng n r 3 )
Element
MinimumMaximum
MeanMedian
MinimumMaximum
MeanMedian
MinimumMaximum
MeanMedian
MinimumMaximum
MeanMedian
MinimumMaximum
MeanMedian
As Se V Sb Zn Br Al La Mn ScImpact station Jizerka, Jizerske mountains
1.5316.135.294.07
0.462.981.431.33
0.985.152.592.03
0.3912.451.0180.928
51.05466575190
1.229.443.543.26
15460931831(5
0.1953.2570.7650.548
3.1612.56.105.40
0.0220.1140.0550.055
Impact station Pfisecnice, Ore mountains2.4742.015.411.8
1.799.454.724.09
1.9010.25.384.47
0.5214.2161.5631.149
54.51900427154
3.5639.99.655.92
29121381054872
0.41213.322.3101.356
3.6728.913.012.1
0.0630.4230.2110.168
Prague-Libus station, the Prague suburb1.2143.08.606.35
0.505.041.701.51
2.9612.886.334.45
0.2373.591.511.28
18.970114098.4
1.0121.07.556.18
3331438824740
0.0971.5490.6970.601
7.7126.416.915.6
0.0360.2890.1730.151
Background station Svratouch, Bohemian-Moravian Uplands1.2317.25.704.70
0.652.391.030.84
0.517.983.252.43
0.3921.3430.7670.637
54.75706688150
2.379.804.794.59
1131262423372
0.1425.1920.9410.441
1.7448045.411.3
0.0150.1980.0730.056
Background station Kosetice, Bohemian-Moravian Uplands0.87412.014.122.75
0.422.250.970.8S
0.4006.562.652.24
0.3012.0400.7200.571
96.71419:520377
1.935.053.373.37
42.1687281241
0.0620.7040.2440.206
0.5918.07.456.83
0.0110.1310.0580.050
The following patterns can be seen in Table 1:• Increased median values of the elements characteristic for coal and lignite
combustion in the impact region, especially in the Prisecnice station compared to thebackground stations, especially in Kosetice, which are apparently due to local pollution causedby firing low quality lignite in power plants.
• Not very much divergent values for V, Sb and Zn in all stations which suggest theorigin of these elements from the long-range transport.
• The highest Br median value in the Prague suburb in accordance with the highestautomobile traffic in this region.
• Somewhat increased values for the elements which originate from soil weatheringin the impact and Prague suburb stations compared to the other localities.
For the core programme of this CRP about 90 samples of particle size fractionated APMwas collected using the Gent SFU in the station Prague-Libus. Of the filters with fine andcoarse APM fractions were analysed by INAA and most of the remaining filters by PDCE. The
8-3

INAA results for coarse and fine fractions in ug per filter, corrected for blank values, aresummarised in Tables 2 and 3, respectively. For elements that could be determined, a median,arithmetic mean, range, and a number of filters where particular elements were determined (N)are given in Tables 2 and 3, while detection limits, their ranges, and a number of filters inwhich particular elements could not be determined are given in the right part of Tables 2 and 3.Information on a sample mass collected are given at the bottom of the Tables. All results aregiven in ug to show the strong influence of the sample mass collected on the possibility todetermine particular elements. As a function of meteorological conditions, 10 to 1390 ug and70 to 1030 ug of coarse and fine fractions were collected during the sampling period whichamounted usually to 48 hours. Obviously, low sample weights hampered determination ofseveral elements. As a result of the filter loading variations, the following pattern was observed.The elements that could most frequently be determined included Al, As, Ca, Ce, Cl, Co, Cs,Cu, Dy, Eu, Fe, Hf, I, K, La, Mn, Na, Sb, Sc, Sm, Ta, Th, Ti, V, W, and Zn and Al, As, Ca,Cd, Co, Cs, Cu, Fe, L K, La, Mn, Na, S, Sb, Sc, Se, Sm, V, W, and Zn in the coarse and finefractions, respectively. On the other hand, the elements that have been determined in filterswith a high loading only or could not be determined at all included Au, Ba, Br, Cd, Cr, Ga,Hg, In, Mo, Ni, Rb, S, Sr, and U and Au, Ba, Br, Ce, CI, Cr, Dy, Eu, Ga, Hf, Hg, In, Mo, Ni,Rb, Sr, Ta, Th, Ti, and U in the coarse and fine fractions, respectively. Apart from variousfilter loadings, element fractionation between the two APM size fractions is also responsible fordifferent possibilities to determine the elements studied in the particular filters. Thefractionation observed is shown in Table 4, where median ratios of the determined elementvalues in the coarse/fine fractions are given, i.e. a ratio > 1 indicates an element enrichment inthe coarse fraction (this also applies to the elements Ba, Cl, Dy, Rb, Ta and U which has notbeen determined in the fine fraction until now), while a ratio < 1 shows an element enrichmentin the fine fraction. The results given here in ug per filter will be converted to ng per g of theAPM mass and to ng per m- of the air volume passed and forwarded to the central dataprocessing to Dr. P.H. Hopke, a participant of the CRP (as agreed at the first CRM) as soon asanalysis of the whole batch of the samples will be completed and the accuracy of PEXE analysisproved. In PIXE preliminary analyses, a test of homogeneity of APM deposition on a fine anda coarse filter was carried out in such a way, that the elemental composition was measuredfrom five spots on the filters selected like on a No. 5 die. A comparison of standard deviationswith a 1 s statistical counting error in Table 5 shows the homogeneity of distribution ofparticular elements and the value of the 1 s statistical counting error demonstrates which typeof measurement (without filter or with the PE filter) is more suitable for determination ofparticular elements.
Related to the CRP was also a comparison of capabilities of the INAA and EDXRFmethods for elemental characterisation of emission and APM samples collected on Teflonfilters within a bilateral co-operation between the Czech Hydrometeorological Institute (andseveral other Czech institutions) and the US EPA. Using a PM10 stacked filter unit severalcoarse and fine fractions of emission samples were collected at a lignite-fired power plant andseveral APM samples (without fractionation) were also collected in the vicinity of the plant inthe Teplice region (a polluted region in the Northern Bohemia). The samples were analysed byemploying both method for quality assurance purposes and to demonstrate advantages anddrawbacks of the particular methods. Analyses by EDXRF were carried out at the US EPA,while INAA was performed at the NPI. Results have been reported in detail elsewhere [6]. Inthe emission samples 22-24 elements and 34-36 elements were determined by the EDXRF andINAA methods, respectively, while the respective numbers for the APM samples with lowerloading amounted to 11-21 elements and to 23-27 elements. The appreciable advantage of the
8-4

Table 2 ELEMENTAL CEIARACTERISATION OF THE APM COARSE FRACTION BYINAAfug]
Element
AlAsAuBaBrCaCdCeClCoCrCsCuDyEuFeGaHfHgIInKLaMnMoNaNiRbSSbScSeSmSrTaThTiUV
wZnMass
Determined valuesMedian
14.50.0408
0.001150.6580.12019.4
0.02190.0363
1.390.006180.202
0.003050.118
0.001430.000420
12.00.0163
0.00120
0.01710.000360
6.010.05490.310
0.01494.630.114
0.060459.8
0.02000.003330.008160.00150
0.0006350.00271
1.230.001880.0992
0.004110.938430
Average18.1
0.05830.00142
0.6580.13821.9
0.02230.0439
1.740.00746
0.1860.00374
0.1670.001510.000491
13.80.0207
0.00132
0.02410.000360
6.950.08510.369
0.01495.71
0.1200.0661
59.80.0223
0.003860.0126
0.00175
0.0006920.00298
1.510.002110.111
0.005151.09513
Min0.375
0.009580.000743
0.6580.07544.39
0.01650.0263
1.060.002110.137
0.0003500.0515
0.0005200.000130
1.750.008930.000450
0.01320.000360
1.330.03130.05480.0149
1.560.09150.0513
59.60.00329
0.0006930.00268
0.000253
0.0003100.000830
0.1900.001700.001570.001340.14010.0
Max63.5
0.2420.00235
L 0.6580.29267.9
L 0.02920.09254.04
0.02750.218
0.01390.773
0.003370.00151
44.30.05510.00398
0.09480.000360
16.50.3681.16
0.014920.00.1620.10460.0
0.05890.01330.0679
0.00588
0.001860.00993
5.210.002750.2910.01883.161390
N2727315
2641421253
272519222613220
251
2618261
26462
2626262601525263
272427
"Values below the det. limitMin
0.001070.4170.113
0.02250.0388
1.590.001930.198
0.07370.0003300.000130
0.004780.000360
0.03260.0151
0.000120
0.0416
0.0113
0.04790.0225
5.66
0.1810.0003200.000430
0.000720
0.000620
Max
0.001071.50
0.113
0.05640.0388
1.590.00193
0.198
0.07370.0007300.000230
0.01300.000670
0.03260.0151
0.000510
0.0416
0.0202
0.1720.0544
131
0.7590.0005700.000430
0.00239
0.00142
N00
2426221
231362
2402851
145
272
26191
261
232125
1
111
271221
24030
8-5

Table 3 : ELEMENTAL CHARACTERISATION OF THE APM FINE FRACTION BYINAA[ng]
Element
AlAsAuBaBrCaCdCeClCoCrCsCuDyEuFeGaHfHgIInKLaMnMoNaNiRbSSbScSeSmSrTaThTiUVWZn
Mass
Determined valuesMedian
2.260.06090.00124
0.2002.41
0.01910.0246
0.002120.376
0.002550.109
0.0001502.78
0.01930.000905
0.02990.0653
0.0001703.92
0.01080.159
0.01382.240.118
1060.0226
0.0004400.0323
0.000247
0.0006600.399
0.08620.00213
1.61570
Average2.93
0.07180.00124
0.2012.87
0.02270.0334
0.002590.376
0.002680.171
0.0001503.02
0.02050.000905
0.02740.0670
0.0001704.02
0.01470.1830.01382.680.114
1020.0240
0.0005560.0382
0.000301
0.0008600.444
0.1010.00246
1.66581
Min0.901
0.006830.00124
0.1931.25
0.01180.0111
0.001670.376
0.001660.0568
0.0001500.789
0.007610.0009000.02020.0397
0.0001700.412
0.003480.01650.0134
1.420.105
34.40.0108
0.0001100.0203
0.000107
0.0005400.235
0.006380.000590
0.10470.0
Max8.75
0.1480.00124
0.2137.80
0.05770.0955
0.006540.376
0.004731.38
0.0001507.70
0.03760.000910
0.03230.134
0.0001706.71
0.04980.4420.01436.55
0.118
1500.0478
0.001760.117
0.000847
0.001630.989
0.2140.00604
3.241030
N27271042614100151
262602271026261
272727226301627272627009120
272627
Values below the det. limitMin
0.001320.4210.283
0.01470.0157
,, 1.760.00243
0.521
0.0003200.000150
0.006360.000590
0.0279
0.000120
0.0188
0.05110.020826.5
0.1800.0004400.000480
0.1520.000680
Max
0.001320.7650.283
0.04060.0157
1.760.002430.521
0.0008600.000230
0.01300.0009000.0279
0.000330
0.0188
0.1260.039494.3
0.4780.0007600.000700
0.2880.00184
N00
2627231131727122611
272501725211
26000
251
2427110010
2727181527
' 010
8-6
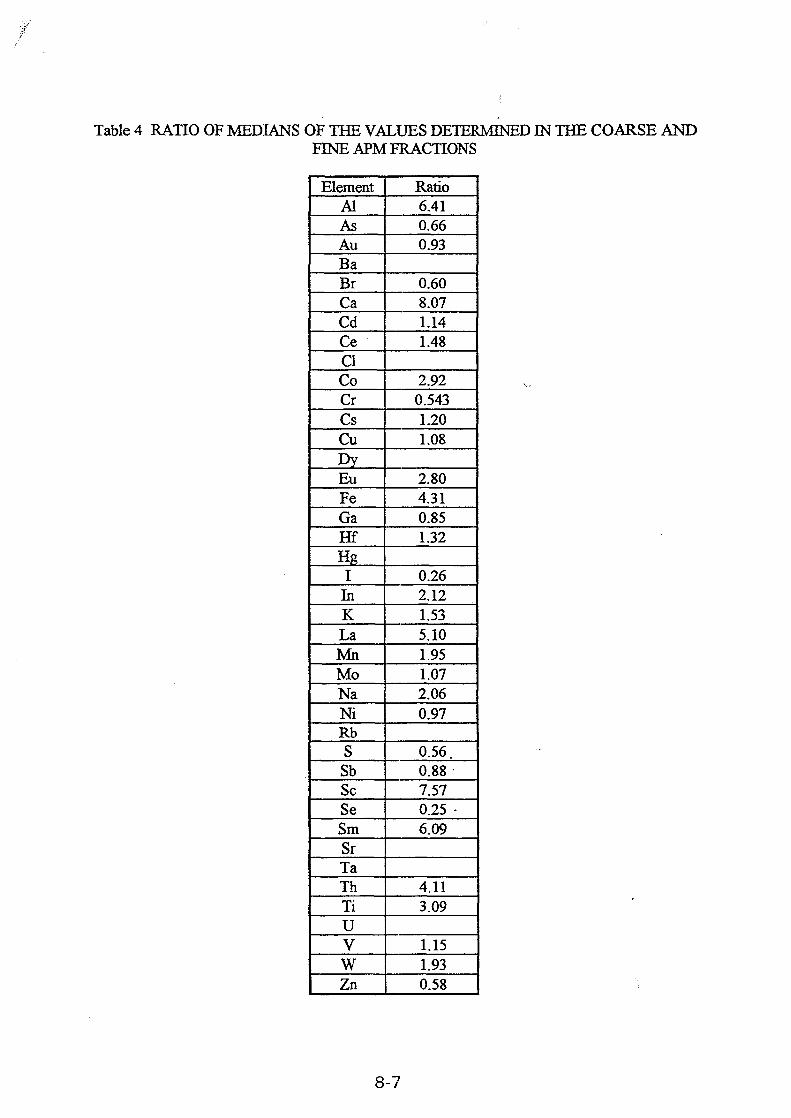
Table 4 RATIO OF MEDIANS OF THE VALUES DETERMINED IN THE COARSE ANDFINE APM FRACTIONS
ElementAlAsAuBaBrCaCdCeClCoCrCsCuDyEuFeGaHfHgI
InKLaMnMoNaNiRbSSbScSeSmSrTaThTiUVWZn
Ratio6.410.660.93
0.608.071.141.48
2.920.5431.201.08
2.804.310.851.32
0.262.121.535.101.951.072.060.97
0.56.0.887.570.25 -6.09
4.113.09
1.151.930.58
8-7

Table 5. HOMOGENEITY TEST OF THE APM DEPOSITION ON A COARSE FILTERBYPIXE
Without a filterElement,Hgcnr2
SiSClKCaTiVCrMnFeNiCuZnBrPb
Mean
1.2382.3810.0950.2640.4930.0850.0130.0060.0140.6340.0050.0040.045ND
0.040
SD
0.1080.1560.0020.0180.0380.0050.0010.0020.0020.0340.0020.0010.002
-0.022
SDr,%8.86.62.66.77.66.26.939.218.25.3
34.435.34.9-
54.6
SCEa
0.0380.0180.0090.0070.0070.004ND
0.0020.0030.010ND
0.0030.005ND
0.025
SCEr,%3.10.89.62.81.55.2-
39.718.51.6_
65.511.4ND63.2
-Mean
NDNDND
0.4480.6410.1080.0140.0060.0140.6290.0050.0060.0540.0040.061
With aSD
---
0.0280.0580.0110.0020.0020.0020.0670.0020.0020.0050.0020.018
1 mm PE filterSDr,%---
6.29.110.317.538.4
' 10.710.739.632.810.056.029.9
SCE
---
0.0390.0200.0060.0030.0020.0020.0080.0010.0020.0030.0040.010
SCEr,%_--
8.73.25.3
21.838.514.71.2
26.627.25.888.116.7
a - 1 s statistical counting error
Table 6. HOMOGENEITY TEST OF THE APM DEPOSITION ON A FINE FILTER BYP K E
Without a filterElement,
SiSClKCaTiVCrMnFeNiCuZnAsBrPb
Mean
0.5275.7030.0640.3930.0870.0200.0180.0050.0110.1670.0070.0030.089ND
0.0100.068
SD
0.0920.519ND
0.0360.0110.0040.0030.0020.0030.0160.0020.0010.010
-ND
0.017
SDr,
17.59.1-
9.113.219.114.930.927.1,9.6
28.730.811.0
--
25.4
SCEa
0.0410.0270.0090.0080.0060.0030.0030.0020.0020.0060.0020.0030.007
--
0.026
SCEr,
7.80.514.62.06.317.415.740.321.93.3
34.894.27.6--
37.9
Mean
NDNDND
0.5210.1520.0300.0180.0070.0090.1710.0080.0060.1000.0220.0100.081
With aSD
---
0.0490.0110.0050.0060.0020.0020.0110.0020.0020.0060.0070.0060.014
1 mm PE filter
spr,---
9.47.418.133.523.124.96.318.335.96.332.253.516.8
SCE
---
0.0410.0150.0050.0030.0020.0020.0040.0010.0010.0040.0040.0040.011
---
7.99.515.818.330.120.82.314.4•23.34.116.240.213.0
a - 1 s statistical counting error
8-8

EDXRF method consists in the capability of determination of several elements which cannot bedetermined by INAA, such as P, S, and especially Pb. On the other hand, employing EDXRFyields determination of a lower number of elements, usually lower by 30% or even 50%compared to INAA, and in many cases, with higher uncertainties. These features make theEDXRF method less suitable for the air pollution studies associated with receptor modellingand/or other types of evaluation using multivariate statistical techniques in which a highnumber of elements determined with low uncertainties is preferred. Selected results of thiscomparison for the elements Al, As, and Cr are shown in Fig. 3, 4, and 5, respectively. Errorbars in these figures show the 1 s statistical counting error.
For the supplementary programme of the CRP, introductory experiments wereperformed on using biomonitors of air pollution by analysing several moss and sphagnumsamples by INAA. Results will be published later.
4. PLANS FOR FUTURE WORK
For the core programme of the CRP, the final evaluation of the results achieved untilnow will be performed as soon as the results by both INAA and PIXE are available. A finetuning and optimising condition for PIXE will be necessary which will include, for instance,employing a "fiinny" (pine hole) filter to be able to measure elements with both lower andhigher Z simultaneously.
A new 1-year collection period will be started using the Gent SFU for the sampling ofsize-fractionated APM in a rural region (the Kosetice background station). These samples willbe analysed by both nuclear-related techniques available, i.e. by PIXE and INAA. Sampling ofthe non-fractionated APM in the 5 stations for measuring the atmospheric deposition in theCzech Republic will also continue. These samples will be analysed by INAA.
For the "supplementary" programme, sampling of moss or sphagnum samples and theiranalysis by INAA will be carried out
REFERENCES
[1] KUCERA, J., OBRUSNlK, I., STARKOVA, B., S A N T R O Q H , J., Use of instrumentalneutron activation analysis in the monitoring of atmospheric pollutants and qualityassurance of the analyses, Proc. IAEA Int. Symp. on Application of Isotopes andRadiation in Conservation of the Environment, Karlsruhe, 9-13 March 1992, IAEAVienna 1992, p.479.
[2] KUCERA, J., S A N T R O C H , J., STARKOVA, B., FALTEJSEK, J., Air pollutionmonitoring in the Czech Republic by neutron activation analysis and other methods,Applied Research on Air Pollution Using Nuclear-Related Techniques, NAHRES-19,IAEA Vienna, 1994, p i l l .
[3]. MAENHOUT, W., FRANCOIS, F., CAFMEYER, J., The "Gent" stacked filter unit(SFU) sampler for the collection of atmospheric aerosols in teo size fractions:Description and instructions for installation and use, Applied Research on Air PollutionUsing Nuclear-Related Techniques, NAHRES-19, IAEA Vienna, 1994, p.249.
[4] HAVRANEK, V., HNATOWICZ, V., KVITEK, J., OBRUSNlK, I., Analysis ofmebrane filters and thick fly ash samples by PIXE, Biol. Trace Element Res. 43/45(1994) 185-193.
8-9

[5] LANDSBERGER, S., VERMETTE S.J., Preparation of PM-10 filter standards forinterlaboratory comparison, Applied Research on Air Pollution Using Nuclear-RelatedTechniques, NAHRES-19, IAEA Vienna, 1994, p.245.
[6] KUCERA, I , FALTEJSEK, J., HNATOWICZ, V., HORAKOVA, J., VOSECEK, V.,S A N T R O C H , J., Air pollution monitoring in the Czech Republic by neutron activationanalysis and other analytical methods, Progress Report of the IAEA Res. Contract7256/R1/RB, Dec. 1993-Oct. 1994, Nuclear Physics Institute, Rez
8-10
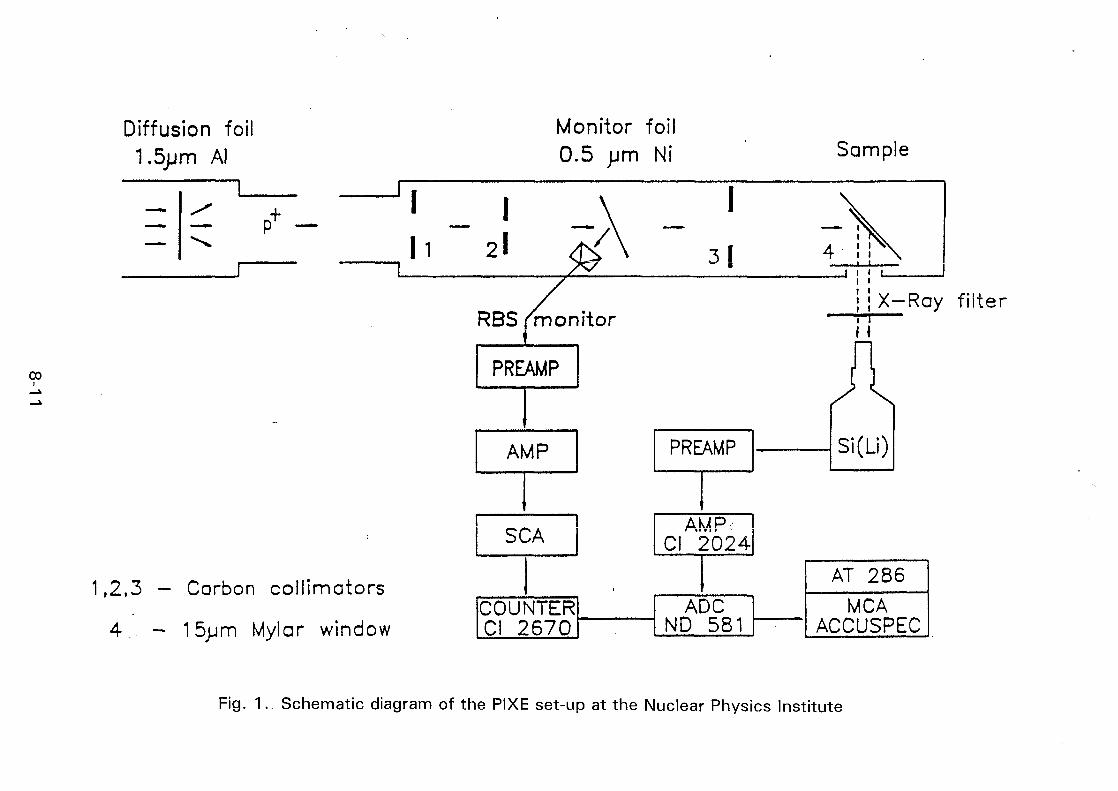
CO
Diffusion foil1.5pm Al
— p
Monitor foil0.5 pm Ni
1,2,3 — Carbon collimators
4.. — 15pm Mylar window
21 31
RBS nnonitor
Sample
X-Ray filteri i
PREAMP
A kA AP
SCA
PREAMP
AMPCl' 2024
COUNTERCl 2670
ADCND 581
/ X
5i(Li)
AT 286
MCAACCUSPEC
Fig. 1.. Schematic diagram of the PIXE set-up at the Nuclear Physics Institute
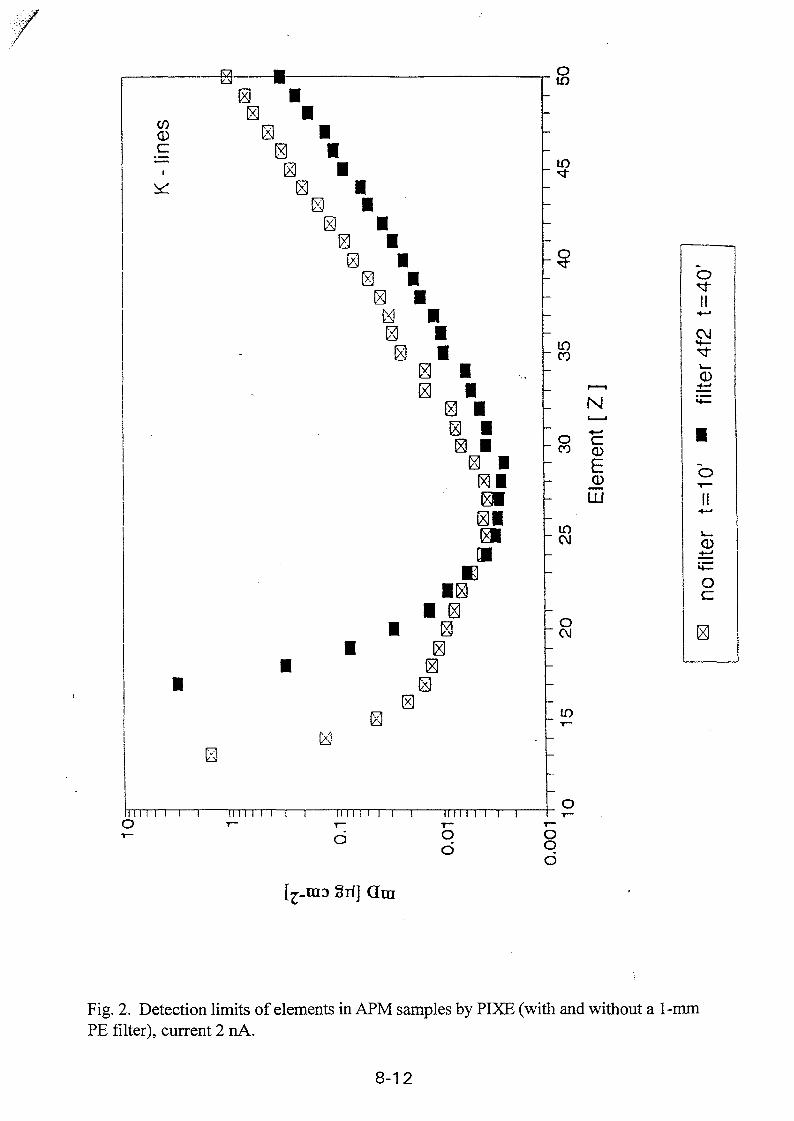
: 10 I
(El I
; •
••i••Hi
m•::
H I M i—i—ro in i i i i—i II II i i i i—r
dII II i i i i—r
T-
qd
oto
io
to
N
EUJ
i n
o(M
in
oqd
§r(] Gin
oI!
O
o
Fig. 2. Detection limits of elements in APM samples by PIXE (with and without a 1-mmPE filter), current 2 nA.
8-12

50
400 -
350-
300 -
250 -
200 -
Al - in
Fine
1
emission
i
samples [jag per filter]
Coarse
Fine—
Coarse
1
i | • j| i j i
200 250 300 350 400 450 500
XRF
Al - in aerosol samples frig per filter]16 -
1 4 -
1 2 -
10 -
8 -
6 -
4 -
2 -
I • I' I • ' I
'I •I • Ii • i
2 4i •
6i
8 101 i
121 i
14
•
1 i
16
XRF
Fig. 3. Results of comparative INAA and EDXRF analyses of emission andaerosol samples for Al.
8-13

0.8-1
0.7-
0 .6-
0.5-
0.4-
0 .3-
As-
Coarse
>
in emission
Fine
1 ' 1
samples [ <3 per
Coarse
1
filter]
Fine
1 1
0.3 0.4 0.70.5 0.6
XRF
As - in aerosol samples [^g per filter]
0.8
1.0-
0.0
Fig. 4. Results of comparative INAA and EDXRF analyses of emission andaerosol samples for As.
8-14

Cr - in emission samples [^g per filter]
1.0-
0.5 0.6
XRF
Cr - in aerosol samples [^g per filter]
0.12-
0.020.02 0.04 0.06 0.08
XRF
0.10 0.12
Fig. 5. Results of comparative INAA and EDXRF analyses of emission andaerosol samples for Cr.
8-15

mil
XAO102878Appendix 9
CHARACTERIZATION OF REGIONAL ATMOSPHERICAEROSOLiJ OVER HUNGARY BY PIXEELEMENTAL ANALYSIS
E. KOLTAY1, I. BORBELY-KISS1, GY. SZABO1, A.Z. KISS1,I. RAJTA1, E. SOMORJAI1, E. MESZAROS2,A. MOLNAR2, L. BOZO3
1 Institute of Nuclear Research, Hungarian Academy of Sciences,P.O.Box 51 , H-4001, Debrecen, Hungary
2 Department of Analytical Chemistry, University of Veszprem,P.O.Box 158, H-8201, Veszprem, Hungary
3 Institute of Atmospheric Physics,P.O.Box 39, H-1675, Budapest, Hungary
Abstract
Earlier PIXE analytical data obtained on rural aerosol samples from Hungary have been extendedby the results of further analyses in the frame of the present international Co-Ordinated ResearchProgramme. Samples have been collected in three more rural, one suburban and two urban stations. Acomparison of the data revealed the distribution of aerosol loading by several trace elements over thecountry, supported the determination of aerosol budget indicating long-range transport from industrialsources and Saharan dust intrusion. The data show that Hungarian air is moderately polluted by aerosolsfrom regional and faraway sources. Methodological results have been obtained in setting up a newmicrobeam channel for individual characterization of aerosol particles.
1. SCIENTIFIC BACKGROUND AND SCOPE OF THE PROJECT
The elemental composition of atmospheric aerosol has been widely studiedin the last decade in Hungary with the aim of the determination of regional airquality as well as the detection of effects of local sources and transport processesinfluencing the physical and chemical properties of the aerosol particles. Aerosolparticles have been collected at a rural station representing the air quality underregional background conditions. The analyses have been carried out by means ofthe proton-induced X-ray emission method. The data set on elementalconcentrations collected sine 1981-82 in several yearly periods have beenevaluated for enrichment factors and elemental signatures. Furthermore, they weresubjected to target transformation factor analysis and transport modelling for amore quantitative treatment. In a later period this work became a part of thenational research programme "STUDY OF THE ORIGIN, TRANSPORT ANDENVIRONMENTAL EFFECTS OF ATMOSPHERIC AEROSOLS BY UP-TO-DATEDETECTION METHODS AND NUMERICAL MODELS", under the auspices andsupport of the National Foundation for Scientific Research, Budapest and our grouphas also been accepted as a participant of the present Co-Ordinated ResearchProgramme of the International Atomic Energy Agency. In the frames offered bythese contracts the research activity has been broadened in many respects:
9-1
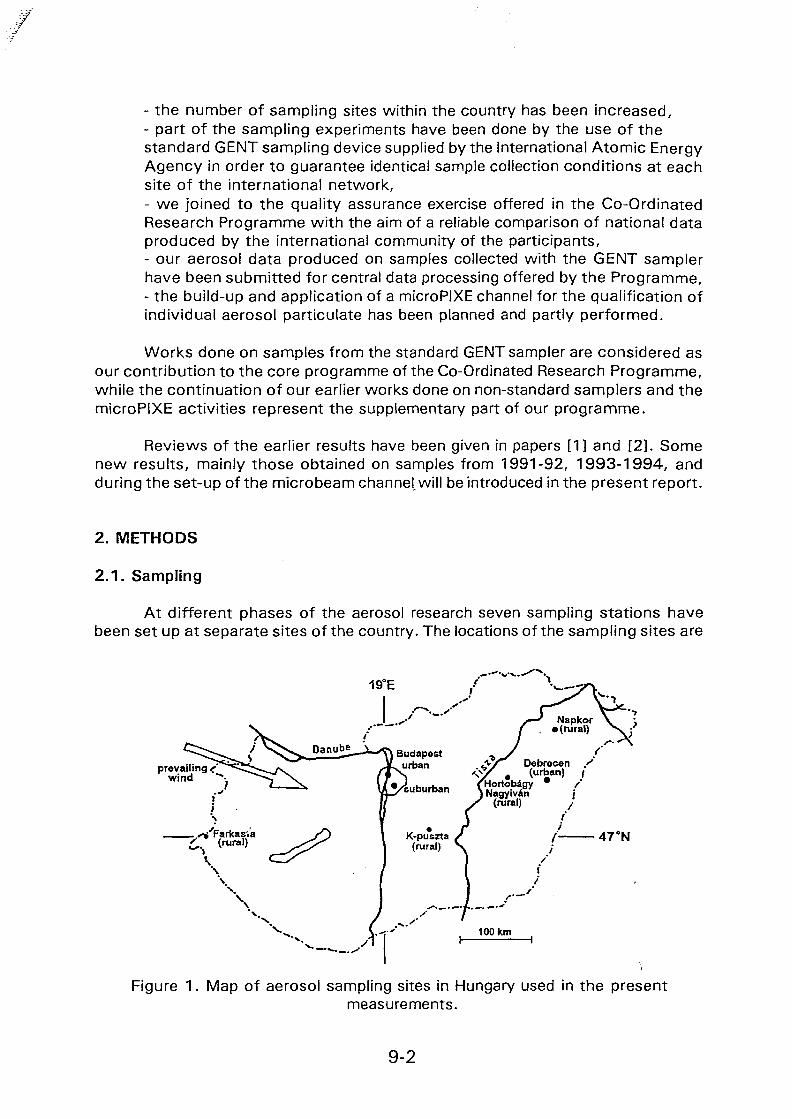
- the number of sampling sites within the country has been increased,- part of the sampling experiments have been done by the use of thestandard GENT sampling device supplied by the International Atomic EnergyAgency in order to guarantee identical sample collection conditions at eachsite of the international network,- we joined to the quality assurance exercise offered in the Co-OrdinatedResearch Programme with the aim of a reliable comparison of national dataproduced by the international community of the participants,- our aerosol data produced on samples collected with the GENT samplerhave been submitted for central data processing offered by the Programme,- the build-up and application of a microPIXE channel for the qualification ofindividual aerosol particulate has been planned and partly performed.
Works done on samples from the standard GENT sampler are considered asour contribution to the core programme of the Co-Ordinated Research Programme,while the continuation of our earlier works done on non-standard samplers and themicroPIXE activities represent the supplementary part of our programme.
Reviews of the earlier results have been given in papers [1] and [2]. Somenew results, mainly those obtained on samples from 1991-92, 1993-1994, andduring the set-up of the microbeam channel, will be introduced in the present report.
2. METHODS
2.1 . Sampling
At different phases of the aerosol research seven sampling stations havebeen set up at separate sites of the country. The locations of the sampling sites are
prevailing <wind "-•
.$/ Debreceny , (urban)
47 °N
Figure 1. Map of aerosol sampling sites in Hungary used in the presentmeasurements.
9-2

shown in the map of F:ig.1. Additional to the rural background station K-PUSZTAsituated in the middle of the country, two further rural sampling sites have beenselected at FARKASFA and NAPKOR, near to the western and eastern borders ofthe country, respectively. In such a way, the variation of aerosol characteristicswere detected along a direction near to that of the prevailing wind. The fourth ruralstation at HORTOBAGY-NAGYIVAN is again centrally situated in the country.Further sampling stations set up in an urban area and suburban region ofBUDAPEST and in an urban site of DEBRECEN yielded pieces of information onlocal emission sources.
The rural sampling sites are situated in country air under regional backgroundconditions, i.e. they are not directly influenced by local pollution sources. TheK-PUSZTA site in central Hungary is an air pollution monitoring background stationof the Hungarian Meteorological Services, while the sites at FARKASFA (WesternHungary) and at NAPKOR (Eastern Hungary) are set up at local radar observatorystations of the same organization. Sampling at K-PUSZTA was made at a height of20 m above forest canopy, while sampling height at other rural sampling stationsamounted to 10 m. Special care has been taken in selecting the HORTO-BAGY-NAGYIVAN rural station situated in an uninhabited part of the Hungariansteppe. Here the equipments are located near to an automated meteorologicalobservation station, which also gives regular information on temperature, wind, andprecipitation data and on the level of C02 and NOX in the air.
An urban station has been set up in the centre of BUDAPEST on the roof ofthe Department of Atomic Physics of the Lorand Eotvos University, at a height of20 m above street level. The BUDAPEST suburban station is situated at thesoutheasterly border of the city at a distance of 15 km from the centre, in thegarden of the Institute of Atmospheric Physics. The sampling height was about 4m above the surface. The second urban station is located in DEBRECEN, at adistance of 220 km from Budapest, in easterly direction. The sampling was madein the garden of the Institute of Nuclear Research, 1.5 km away from the denselypopulated city centre, at a height of 2 m above ground level.
DEBRECEN and HORTOBAGY stations have been selected for producingurban and rural data for the core programme of the Co-Ordinated ResearchProgramme, respectively. In these measurements the GENT sampler was used twotimes a week with pumping speed of 18 l/min and sampling duration of 24 hours,making a total air volume of 24 m3. The mass of total suspended matter collectedhas been measured on each samples by the use of a microbalance. Sampling donein the above sampling sites on non-standard single or two-stage Nucleporesamplers in which an air volume of 1 - 4 m3 was pumped with sampling time of6-24 h as the continuation of our earlier systematic aerosol investigationrepresents part of the supplementary activity in our Co-Ordinated ResearchProgramme.
2.2. Analysis
The research activity is methodologically based on analytical qualification ofaerosol samples by PIXE technique. The analytical chamber on the 5 MV Van de
9-3

• • /
Graaff accelerator of the Institute of Nuclear Research is equipped with asemi-automatic sample changer and facilities for accurate beam currentmeasurement. As an X-ray spectrometer a Canberra SL12160 Si(Li) detector isconnected to a NZ 881 X-ray digital signal processor and analyzer with a personalcomputer. A PIXE computer package named PIXYKLM [3] has been developed forthe evaluation of spectra and concentrations. Methodical details related to themicroPIXE measurements will be described in Chapter 3.
3. RESULTS AND DISCUSSION
3.1 . Elemental concentrations measured in the core programme
According to the point of first priority under the core programme of theCo-Ordinated Research Programme regular sampling of airborne particulate matterhas been started at the DEBRECEN urban station using the GENT stacked filter unitcollector provided by the International Atomic Energy Agency. The samplescollected cover the period 15.09.1993 - 30.09.1994, they represent coarse andfine aerosol fractions at 95 sampling days. The above samples have been analyzedfor elemental concentrations of Al, Si, P, S, Cl, K, Ca, Ti, V, Cr, Mn, Fe, Ni, Cu, Zn,As, Br, Ba, and Pb. The total particulate masses collected on the samples havebeen also measured. Yearly averages of concentrations for the elements have beencalculated together with enrichment factors. Fig. 2. shows the results, differencesbetween the two fractions are clearly seen. A complete statistical evaluation of thedata will be made for all the participating groups in a central evaluation procedure.In order to assure concentration data of comparable quality a Quality AssuranceExercise has been planned. We contributed with PIXE concentration data measuredon particulate filter standards for the elements Al, Si, S, Cl, K, Ca, Sc, Ti, V, Cr,Mn, Fe, Ni, Cu, Zn, Br, and Pb.
adC
toCo
10
102
10'
0
-
Coarse
--
particles
-
TT
(2-lOyu.m)
-r-
10
10*
102
<n 1
* > 1 0 " '
-
r
TT
-Coarse particles
_nn TIr-
-
_
-
-
Al Si P S Cl KCoTi VCrMnFeNiCuZnAsBrBoPb C Al Si P S Cl K Co Ti V CrWnFeNiCuZnAsBrSoPb
Al Si P S Cl KCoTi VCrMnFeNiCuZnAsBrBoPb
Elements
O Fine particles
Al Si P S Cl KCoTi V CrMnFcNiCu2nAs8fBoPb
Elements
Figure 2. Yearly average concentrations and enrichment factors measured onaerosol samples collected with the GENT sampler at DEBRECEN urban station.
9-4
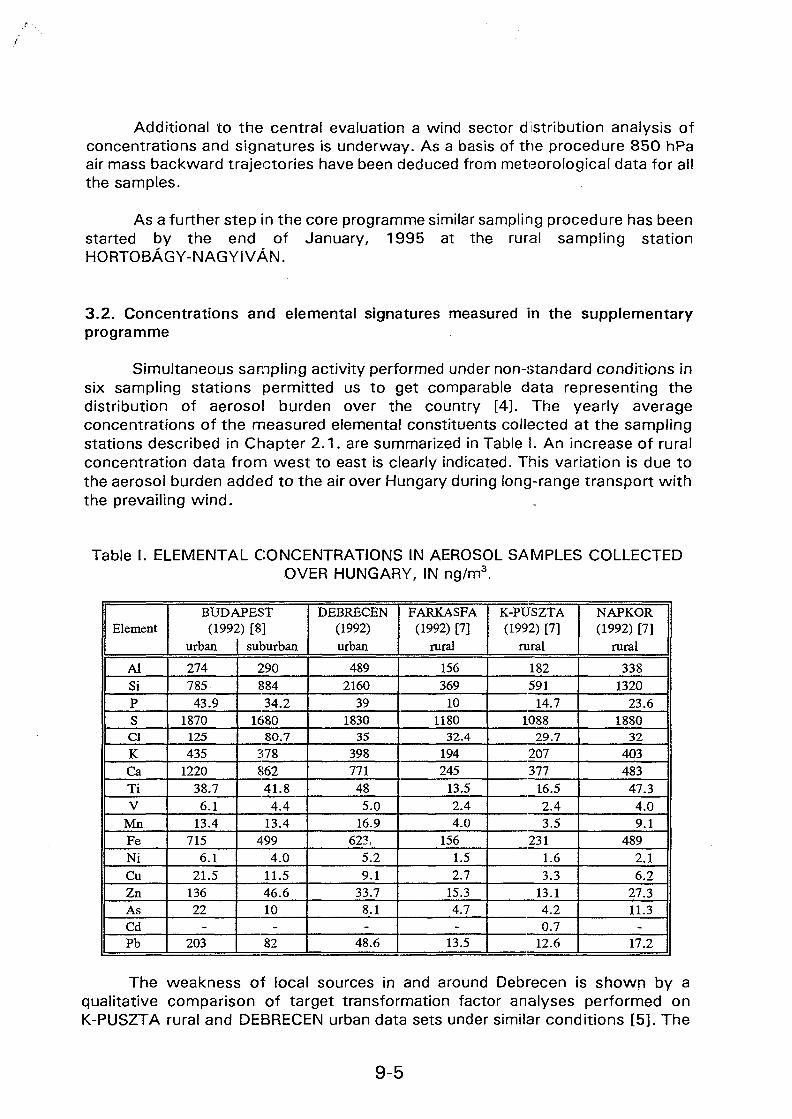
Additional to the central evaluation a wind sector distribution analysis ofconcentrations and signatures is underway. As a basis of the procedure 850 hPaair mass backward trajectories have been deduced from meteorological data for allthe samples.
As a further step in the core programme similar sampling procedure has beenstarted by the end of January, 1995 at the rural sampling stationHORTOBAGY-NAGYIVAN.
3.2. Concentrations and elemental signatures measured in the supplementaryprogramme
Simultaneous sampling activity performed under non-standard conditions \nsix sampling stations permitted us to get comparable data representing thedistribution of aerosol burden over the country [4]. The yearly averageconcentrations of the measured elemental constituents collected at the samplingstations described in Chapter 2 .1 . are summarized in Table I. An increase of ruralconcentration data from west to east is clearly indicated. This variation is due tothe aerosol burden added to the air over Hungary during long-range transport withthe prevailing wind.
Table I. ELEMENTAL CONCENTRATIONS IN AEROSOL SAMPLES COLLECTEDOVER HUNGARY, IN ng/m3.
Element
AlSiPSCl
KCaTiV
MnFeNiCuZnAsCdPb
BUD,"(199:
urban
27478543.9
1870125
4351220
38.76.1
13.4715
6.121.5
13622
-203
d?EST
suburban
29088434.2
168080.7
37886241.8
4.413.4
4994.0
11.546.610
-82
DEBRECEN(1992)urban
4892160
391830
35
398771485.0
16.9623,
5.29.1
33.78.1-
48.6
FARKASFA(1992) [7]
rural
156369
101180
32.4194245
13.52.44.0
1561.52.7
15.34.7-
13.5
K-PUSZTA(1992) [7]
rural
182591
14.71088
29.7207377
16.52.43.5
2311.63.3
13.14.20.7
12.6
NAPKOR(1992) [7]
rural
3381320
23.61880
32
40348347.3
4.09.1
4892.16.2
27.311.3
-17.2
The weakness of local sources in and around Debrecen is shown by aqualitative comparison of target transformation factor analyses performed onK-PUSZTA rural and DEBRECEN urban data sets under similar conditions [5]. The
9-5

number and elemental compositions of the factors revealed and their contributionsto the atmospheric elemental concentrations are much the same in both cases.
In earlier works (paper [2] and references therein) the ratio of elementalconcentrations of the non-crustal part of manganese (Mn*) to non-crustal part ofvanadium (V*) was found to be a practical regional signature well applicable insearching for possible source areas of pollutants aerosols. With individual air masstrajectories or wind sector frequencies in hands the influence of differentgeographic areas to air quality at the receptor site can be estimated. Our PIXEresults for rural and urban sites in Hungary indicate that the country is mainlyinfluenced by air masses of coal combustion characteristics [2]. In Fig.3 windsector distribution polygons for the regional signature Mn*/V* are given as deduced
Figure 3. Wind sector distribution diagrams of Mn*/V signature in DEBRECENurban and K-PUSZTA rural air, together with episodic trajectories with high
signature values.
from rural and urban data assigned to calculated 850 hPa backward air trajectories.The wind sectors were defined according to the most frequent wind directions. Theforms of the corresponding polygons show similar wind sector distributions in ruraland urban cases, however, the tracing power of the signature in urban air seemsto be decreased by the effect of local oil burning emission sources. Fig. 3. alsocontains dates and urban signature values for episodic cases in which signaturesexceed the averages for the respective wind sectors considerably. The appearanceof high episodic values in sectors 2 and 3 can be well compared with theconclusions of paper [6] stressing the role of Donetsk, Moscow and Ural regions
9-6

in the emission of unusual Mn concentration. Events in sector 4 can be ascribedto industrial sources in the Northwestern Balkan as well as in Northern Italy. Highepisodic value in sector 5 indicates a Benelux episode of high signature.
3.3. Atmospheric budget of some elements in aerosol particles
For the estimation of the atmospheric budget of elements V, Mn, Ni, Cu, Zn,Cd, and Pb with important environmental influence total annual emissions - bothcrustal and anthropogenic ones - have been calculated and compared with dry andwet deposition rates over the Hungarian territory [7]. Dry deposition data werededuced from elemental concentrations and dry deposition velocities measured withPIXE [8]. The determination of wet deposition rates was based on concentrationsmeasured in precipitation samples with atomic absorption spectrometry.
Annual anthropogenic emissions were calculated on the basis of Hungarianstatistical data concerning industrial activities and transportation as well as fromemission factors for different industrial sources taken from the literature. Naturalcrustal emissions calculated from average continental data were found to indicateonly weak contributions to the total emitted mass, except for the case of Mn,where natural and anthropogenic components are nearly equal. These conclusionsare also supported by scores obtained from target transformation factor analysis[5].
The emission and deposition data are shown in Table II. Wet deposition ispredominant over the dry one in spite of the relatively low annual amount ofprecipitation over the country. The differences of emission and total depositionmasses are positive for V and Ni indicating that considerable amount of theHungarian emissions of these elements is exported to neighbouring countries withthe prevailing wind north-west to south-east. The negative balance for Mn, Cu, Zn,Cd, and Pb, however reflects the influence of neighbouring countries, mainly ofthose situated north-west to Hungary.
Table II. ATMOSPHERIC BUDGET OF VARIOUS ELEMENTS IN AEROSOL OVERHUNGARY, IN 106g/year.
Element
VMnNiCuZnCdPb
Dry
11.5102.010.910.174.8
1.947.4
Wet
deposition (D)
116310132353
189044.7
726
Total
127.5412.0143.0363.1
1970.046.6
773.0
Emission
(E)
951297419193232
3.9295
E - D
824.0-115.0276.0
-170.0-1735.0
-42.7-478.0
The observed west-to-east increase of elemental concentrations shown inTable I. has a consequence of non-uniform distribution of dry and wet depositionsfor elemental constituents within the country. The area east of river Tisza is
9-7
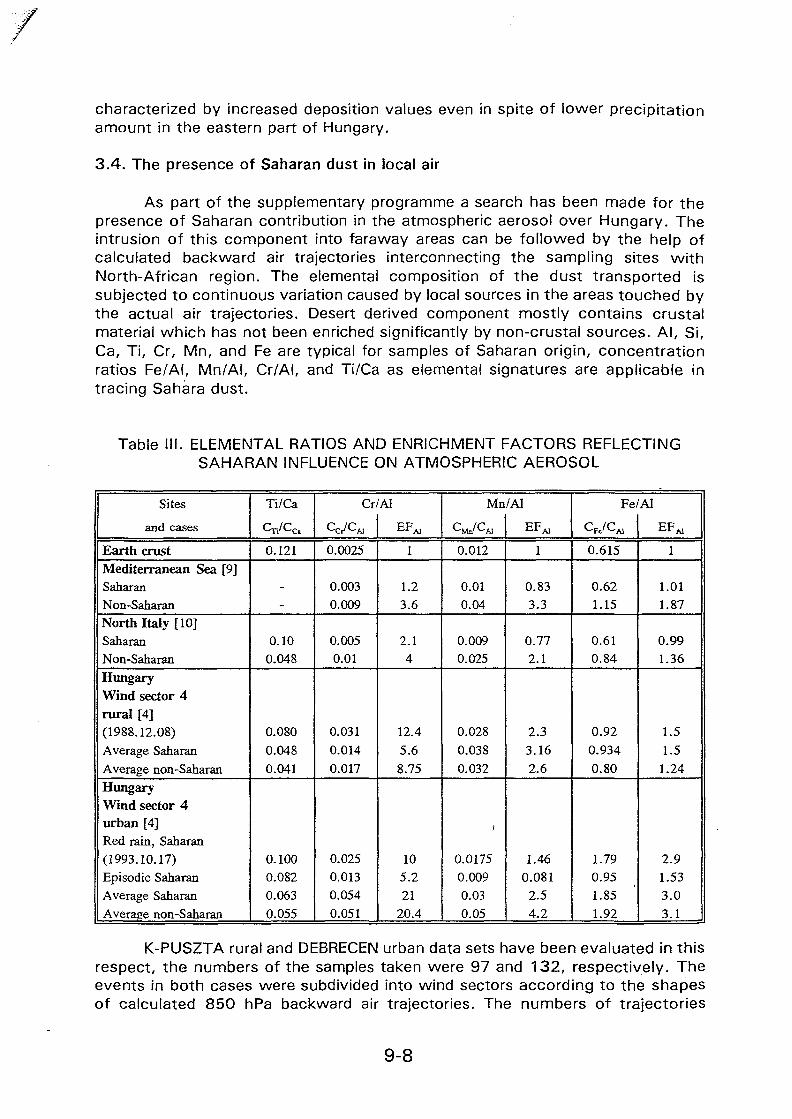
characterized by increased deposition values even in spite of lower precipitationamount in the eastern part of Hungary.
3.4. The presence of Saharan dust in local air
As part of the supplementary programme a search has been made for thepresence of Saharan contribution in the atmospheric aerosol over Hungary. Theintrusion of this component into faraway areas can be followed by the help ofcalculated backward air trajectories interconnecting the sampling sites withNorth-African region. The elemental composition of the dust transported issubjected to continuous variation caused by local sources in the areas touched bythe actual air trajectories. Desert derived component mostly contains crustalmaterial which has not been enriched significantly by non-crustal sources. Al , Si,Ca, Ti, Cr, Mn, and Fe are typical for samples of Saharan origin, concentrationratios Fe/AI, Mn/Al, Cr/AI, and Ti/Ca as elemental signatures are applicable intracing Sahara dust.
Table III. ELEMENTAL RATIOS AND ENRICHMENT FACTORS REFLECTINGSAHARAN INFLUENCE ON ATMOSPHERIC AEROSOL
Sites
and cases
Earth crustMediterranean Sea [9]SaharanNon-SaharanNorth Italy [10]SaharanNon-SaharanHungaryWind sector 4rural [4](1988.12.08)Average SaharanAverage non-SaharanHungaryWind sector 4urban [4]Red rain, Saharan(1993.10.17)Episodic SaharanAverage SaharanAverage non-Saharan
Ti/Ca
Cr/Cc
0.121
-
-
0.100.048
0.0800.0480.041
0.1000.0820.0630.055
Cr/AI
0.0025
0.0030.009
0.0050.01
0.0310.0140.017
0.0250.0130.0540.051
EF^
1
1.23.6
2.14
12.45.68.75
105.221
20.4
Mn/Al
<WCH
0.012
0.010.04
0.0090.025
0.0280.0380.032
.1
0.01750.0090.030.05
EF^
1
0.833.3
0.772.1
2.33.162.6
1.460.081
2.54.2
Fe/AI
CfJCM
0.615
0.621.15
0.610.84
0.920.9340.80
1.790.951.851.92
EFM
1
1.011.87
0.991.36
1.51.5
1.24
2.91.533.03.1
K-PUSZTA rural and DEBRECEN urban data sets have been evaluated in thisrespect, the numbers of the samples taken were 97 and 132, respectively. Theevents in both cases were subdivided into wind sectors according to the shapesof calculated 850 hPa backward air trajectories. The numbers of trajectories
9-8

assigned to wind sector 4 covering West-Mediterranean/North African areaamounted to 24 and 25 in rural and urban cases, respectively. The above caseswere further subdivided into "Non-Saharan", "Saharan", and "episodic Saharan"subgroups. Some elemental ratios and aluminium related enrichment factors aregiven in Table III. for our cases and for Mediterranean and Italian cases describedin papers [9] and [10], respectively. Our urban aerosol filter data are completedwith data measured on a dust sample from wet deposition collected during aSaharan red rain event observed in Hungary (17 October 1993). The similaritybetween Earth crust data and data for the Mediterranean Saharan cases withenrichment factors near to unity is convincing; North Italian rural data are also ofsimilar character [4]. Anthropogenic source over the Appennine and Balkanpeninsulas makes the direct observation of Saharan events in Hungary moredifficult. Fore a more sensitive detection in this geographic latitude an evaluationsimultaneously covering a broader set of elemental ratios could be appropriate.
3.5. Microbeam channel for aerosol characterization
As part of the supplementary programme in the frame of the presentCo-Ordinated Research Programme a new microbeam channel has been built up onour 5 MV Van de Graaff accelerator. Among other planned applications of the newfacility special emphasis will be given to the individual characterization of aerosolparticles collected during our regular sampling activity for the programme.
Supported by independent financial sources (National Foundation forScientific Research, OTKA, Budapest, code: A080 and International AtomicAgency, IAEA, Vienna, code: CRP-7257/R1/RB) the channel has been set up onone of the existing beam channels of the generator. Basic electron optical andelectronic units such as precision entrance slits and antiscattering collimator slits,scanning coils and beam focusing precision quadrupole doublet, x-y-z stage foraccurate target positioning, optical stereo zoom microscope, precision powersupplies for quadrupole lenses, scanning controller and amplifiers, current digitizer
Figure 4. MicroPIXE map of a mesh grid taken with 1 jjm beam diameter.
9-9

and indicator, DAC-ADC interface and software for data acquisition and evaluationhave been delivered for the system by Oxford Microbeams Ltd, while beamtransport channel, vibration-free statives, complete vacuum systems, analyticalchamber with Si(Li)-, Ge(Li)-, surface barrier-, and secondary electron detectors forX-ray, y-ray, charged particle spectroscopy and electron detection, respectively,have been built up by the staff of the Institute. A 486DX66 MHz computer servesthe control, acquisition, and evaluation procedures. While lateral mapping of theelemental constituents in the sample is made by the software delivered with thesystem, the spectrum evaluation code P1XYKLM [3] is used for the quantitativedetermination of elemental concentration values in selected particles.
In the methodological tests performed on the newly erected system wesucceeded in obtaining the guaranteed spatial resolution of 1 //m. Fig. 4. shows thePIXE map of a 12.5 //m mesh grid with 5 jjm bar diameter, taken at a protoncurrent of 30 pA and total collected charge of 7.5 nC, with 128x128 pixel/scanscanning of 25x25 //m scanning amplitude.
The first application for analysing aerosol particles is illustrated in Fig. 5. bythe elemental maps for Si, P, S, Cl, Ca, and K taken under the same scanningconditions. The sample used was collected during the regular sampling procedurewith Gent sampler on coarse Nuclepore filter of 8//m pore diameter. The individualparticles to be seen on the maps have aerodynamic diameters near to the 10 //mcut-off size determined by the pre-impaction plate of the sampling head.Differences and similarities in the separate elemental maps reflect the structure ofthe deposited layer. RBS-, STIM-, and secondary electron maps have been alsoobserved.
PIXEO: Si Ka1 [ PIXEO: P Ka1( PIXEO: S Ka1[ PIXEO: CIKa1(
&\
•?v.
PIXEO. Ca PIXEO: K Ka1{ ADCO PIXE PIXE
Figure 5. MicroPIXE elemental maps taken on a coarse-fraction aerosol sample.For details see the main text.
9-10

The planned systematic analysis of a number of individual particles aims atthe determination of the origin of the particles: different mechanisms are namelyknown to result in different shapes and structures of the aerosol particles.However, before starting this programme, methodological tests aiming at theselection of best sampling technique, the determination and optimization ofprecision, accuracy and minimum detection limits available under our experimentalconditions should be performed.
The application of the microbeam facility for structure investigations ongeological and biological samples have been started as well.
REFERENCES
[1] KOLTAY, E., et al., Characterization of regional atmospheric aerosols overHungary by PIXE elemental analysis, in Applied Research on Air Pollution usingNuclear-related Analytical Techniques, Report NAHRES-19, IAEA, Vienna (1994).
[2] KOLTAY, E., The application of PIXE and PIGE techniques in the analytics ofatmospheric aerosols, Nucl. Instr. Meth. B85 (1994) 75-83.
[3] SZABO, GY., BORBELY-KISS, I., PIXYKLM computer package for PIXE analyses,Nucl. Instr. Meth. B75 (1993) 123-126.
[4] BORBELY-KISS, I., et al., Particle characterization at rural, suburban and urbanaerosol sampling sites in Hungary, in press IJPIXE (1995).
[5] BORBELY-KISS, I., KOLTAY, E., SZABO, GY., Apportionment of atmosphericaerosol collected over Hungary to sources by target transformation factor analysis,Nucl. Instr. Meth. B75 (1993) 287-291.
[6] HACISALIHOGLU, G., ELIYAKUT, F., OLMEZ, I., BALKAS, T.I., TUNCEL, G.,Chemical composition of particles in the Black Sea atmosphere, Atmos. Environ.26A (1992) 3207-3218.
[7] MOLNAR, A., et al., Atmospheric budget of different elements in aerosolparticles over Hungary, in press Atmos. Environ. (1995).
[8] MOLNAR, A., et al., Elemental composition of atmospheric aerosol particlesunder different conditions in Hungary, Atmos. Environ. 27A (1993) 2457-2461.
[9] CHESTER, R., SHARPLES, E.J., SANDERS, G.S., SAYDAM, A.C., Saharan dustincursion over the Tyrrhenian Sea, Atmos. Environ. 18 (1984) 929-935.
[10] BRAGA-MARCAZZAN G.M., et al., Study of regional and long range transportin an Alpine station by PIXE analysis of aerosol particles, Nucl. Instr. Meth. B75(1993)312-316.
9-11

XAO102879
Appendix 10
AEROSOL COMPOSITION AND ITS APPLICATION IN AIR POLLUTIONMONITORING
S.SADASIVAN, B.S. NEGI, V. MEENAKSHY, K.S.V. NAMBI
Environmental Assessment Division, Bhabha Atomic Research Centre,Bombay 400 085, India
ABSTRACT
Air particulate matter was sampled in two size ranges, 2-10 /.im and < 2.0 jumand characterised using nuclear and nuclear- related techniques. The analyticalprocedures used are briefly discussed. Results of analysis of aerosol samplescollected at an urban residential area showed very large dust loads in both sizeranges during most of the year except, during monsoon season. Chemicalcomposition of PM-10 indicates mostly soil and marine origin elementsaccounting for 11-22% of the total mass. Toxic elements As, Sb, Hg, are in therange of 5-10 ngm'3 in < 2.0 jum size whereasPb is ~0.35 jugm3. Results ofelemental emission profile were obtained by burning different domestic fuels inspecially built oven and results are presented.
1. SCIENTIFIC BACKGROUND AND SCOPE OF THE PROJECT
Studies on aerosol composition and their sources in urban areas in India have earlier beencarried out in detail (1-4). However most of these studies deal with total suspended particulatematter and as such do not address the chemical composition of inhalable fraction. With theincreasing knowledge of the significance of the respirable fraction of total suspended particulatematter in inhalation and associated health effects, the need for detailed elemental compositionof PM 10 was realised. The current IAEA - CRP which is aimed at acquiring data on the chemicalcomposition of aerosol in the size ranges of 2-10 and < 2.0 um gave us a chance to undertake thisstudy in India for the first time. The results of this study apart from giving actual amount of toxicor biologically active elements or species in the respirable fraction, also help in identifying thevarious sources responsible.
2. METHODS
The samples were collected in two size ranges 2-10 um and < 2.0 um on 47mmNucleopore filters of 8.0 |jmand0.4 \im pore sizes using Gent Air Sampler with Stacked
10-1
Filter Units supplied by the Agency. The collection unit was placed about 3 m above the
ground and sampling was carried out on a 24hr basis twice a week. The flowrate was
maintained at 17.0 lpm. The blank filters and the loaded filters were desiccated for 24 hours
and weighed to the nearest 0.0 lmg. The sampled air volumes were ~ 10 M3 .
The samples were analyzed by EDXRF with the help of two excitation sources, an 5SFe
radioactive source and a low-power W anode X-ray tube with a Mo secondary target and an
ORTEC Si(Li) detector with a resolution of 180eV at 5.9 keV. After EDXRF analysis the
samples were sealed in individual polythene bags and irradiated with standards in the swimming
pool reactor at BARC at a flux of 5X10¹² neutron cm'V1 for a period of 4h, for INA analysis.
While thin film standards of Ca, Fe, Cu, Sr, Hg and Pb were used in EDXRF analysis, IAEA
Soil-5, Fly Ash EOP and ENO and NBS Orchard Leaf served as primary standards for INAA
measurements. Blank filters were also analyzed as for the samples and corrections were made
where necessary. New softwares have been obtained from IAEA and additional SRMs are
now available. The HPGe with a resolution of 1.9 keV at 1332 keV which is used for INAA
work is connected to a Silena 12 bit ADC and a PC/XT for data acquisition. Due
attention was always paid to quality assurance. Regular analysis of SRMs was undertaken. In
addition we regularly participate in International Inter-comparison Runs. The recent such run
for which the compiled results are available is the one for Marine Sediment (SD-M-2/TM)
(Sadasivan, 1989)(5). We have also participated in two subsequent runs organised by IAEA,
one for marine sediment(IAEA-356) (Meenakshy, 1992), another for Lichen(IAEA-336)
(Meenakshy, 1993) and recently took part in the intercomparison run for total Hg in Human
hair (IAEA-081 and 083) (Meenakshy, 1994). We had also organised such an exercise during
the previous CRP "On the use of nuclear and nuclear related techniques in the study of
environmental pollution associated with solid wastes". Since some elements like Fe, Zn, Br
& As could be measured by both the methods, an internal check is also provided.
3. RESULTS AND DISCUSSION
3.1 Aerosol Mass Concentration in the two Size Ranges
The variation in aerosol mass in two different size fractions over nine morith period
during 1994 are presented in Figure la and lb. The mean mass concentration in both the size
ranges for various months are given in Figure 2a and 2b with the maximum and minimum
values. High values ( ~ 300 ug m"3) were noticed during January through April in 2-10 um size
range, touching a low during monsoon, and again increasing in post monsoon period. The
10-2
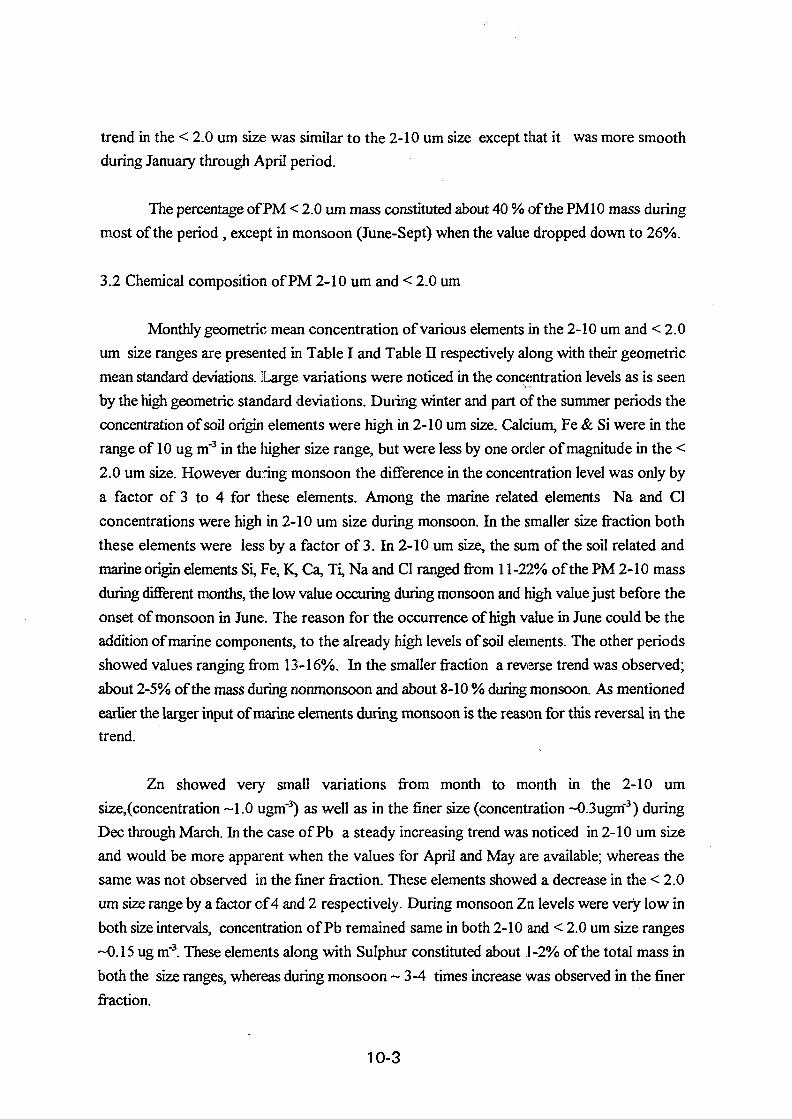
trend in the < 2.0 um size was similar to the 2-10 um size except that it was more smooth
during January through April period.
The percentage of PM < 2.0 um mass constituted about 40 % of the PM10 mass during
most of the period, except in monsoon (June-Sept) when the value dropped down to 26%.
3.2 Chemical composition of PM 2-10 um and < 2.0 um
Monthly geometric mean concentration of various elements In the 2-10 um and < 2.0
um size ranges are presented in Table I and Table JJ respectively along with their geometric
mean standard deviations. Large variations were noticed in the concentration levels as is seen
by the high geometric standard deviations. During winter and part of the summer periods the
concentration of soil origin elements were high in 2-10 um size. Calcium, Fe & Si were in the
range of 10 ug m"3 in the higher size range, but were less by one order of magnitude in the <
2.0 um size. However during monsoon the difference in the concentration level was only by
a factor of 3 to 4 for these elements. Among the marine related elements Na and Cl
concentrations were high in 2-10 um size during monsoon. In the smaller size fraction both
these elements were less by a factor of 3. In 2-10 um size, the sum of the soil related and
marine origin elements Si, Fe, K, Ca, Ti, Na and Cl ranged from 11-22% of the PM 2-10 mass
during different months, the low value occuring during monsoon and high value just before the
onset of monsoon in June. The reason for the occurrence of high value in June could be the
addition of marine components, to the already high levels of soil elements. The other periods
showed values ranging from 13-16%. In the smaller fraction a reverse trend was observed;
about 2-5% of the mass during nonmonsoon and about 8-10 % during monsoon. As mentioned
earlier the larger input of marine elements during monsoon is the reason for this reversal in the
trend.
Zn showed very small variations from month to month in the 2-10 um
size,(concentration ~1.0 ugm'3) as well as in the finer size (concentration ~0.3ugm3) during
Dec through March. In the case of Pb a steady increasing trend was noticed in 2-10 um size
and would be more apparent when the values for April and May are available; whereas the
same was not observed in the finer fraction. These elements showed a decrease in the < 2.0
um size range by a factor of 4 and 2 respectively. During monsoon Zn levels were very low in
both size intervals, concentration of Pb remained same in both 2-10 and < 2.0 um size ranges
-0.15 ug m"3. These elements along with Sulphur constituted about .1-2% of the total mass in
both the size ranges, whereas during monsoon ~ 3-4 times increase was observed in the finer
fraction.
10-3

Distribution of trace elements As, Cr, Sb also showed higher values in the 2-10 size
range by a factor of 2 to 3. But concentration of the elements Cr and Sb during monsoon was
equally distributed in both size ranges.Distribution of Hg was equal in both size ranges in all
seasons studied and there was not much variation in concentration levels as well. As regards
Sulphur a fairly uniform distribution was noticed in both size intervals .While large reduction
in the concentration of Sulphur was observed during monsoon in 2-10 urn, in < 2.0 um size
the concentration levels decreased by a factor of 3-5. This indicates that probably there exists
two different Sulphur components in the < 2.0 um fraction one of which is not easily removed
by precipitation.
Bromine concentration ranged around 20-30 ngm"3 in both size intervals during
December through March. However high incidence of Br input were observed on three
occasions during the month of March when concentration as high as 240 ngm"3 were recorded.
Also the distribution between the two ranges were equal if these high values were excluded.
But during monsoon the levels decreased by half in < 2.0 um size indicating that marine
contribution is mainly in the 2-10 um size range. The percentage of Br of nonmarine origin
comprised of-60% in 2-10 um and -90 in < 2.0 um size range during nonmonsoon period
indicating the predominance of anthropogenic Br in the < 2.0 um size interval. The observed
nonmarine Br to Pb ratio were 0.074±0.015 and 0.042±0.027 in the <2.0 um and 2-10 um size
ranges respectively. The variation in the ratio should be due to different sources/compounds
of Pb and Br. Chemical speciation study could help in identifying specific compounds in the
different size ranges.
The spatial and temporal variations of selected elements in both the size ranges
revealed that Fe concentrations are generally elevated whenever mass concentration are higher.
Further analysis of data using statistical methods are in progress.
3.3 ELEMEMT SOURCE EMISSION PROFILE FROM DOMESTIC FUEL
BURNTNG[7]
Elemental profiles of particulate emissions from burning of Domestic Fuels like
Cowdung, Wood, Charcoal and Hard coal were determined. The combustion assembly
consisted of a firebox of 0.6m x 0.6m xO.3m, tapered to a exhaust pipe of 0.05m dia and 1.0m
height. The samples were collected from the top of the exhaust pipe on Whatman-541 filters
mounted on a perspex holder at a flow rate of 20 l/min. Two or three filters were used within
- half an hour, during which time the fuel is completely burnt. The filters were analysed using
10-4

EDXRF and INAA.
A total of twenty elements could be determined. It was found that Br, Ca, Cl, Fe, K,
Na, Pb, Sc and Zn were prominent in all the fuel emissions whereas S was found only in hard
coal and Ni in cowdung. In order to compare the elemental concnetration in different fuel
emissions, the concentrations of elements were normalised with respect to Fe. It was found
that toxic elements As, Cr, Pb and Cu were higher in the emissions of cowdung than from
other fuel emissions, Cl and K higher in Charcoal, Si from cowdung and Na from wood.
3.4 CHARACTERISATION OF ATMOSPHERIC DUST AT GURUSHIKAR,
MT.ABU[8]
The work on aerosol measurement at Gurushikar, Mt. Abu was continued. Besides
obtaining the elemental concentration levels, attempt was also made to assess the size and
shape of the dust particles by Scanning Electron Microscope. Elemental composition of
individual particles was also determined by electron excited x-ray fluorescence available with
the system.
The dust particles were in the size range of 5 um to 100 urn, the small particles were
found to be embedded in the surface of the larger particles. Most of the particles were
irregular in shape accompanied by a few spherical ones.
The chemical characterization of these particles showed that the large particles which
are irregular in shape comprise mainly of Si. Medium sized particles which are spherical and
highly conducting were rich in Fe content. The small size particles contain Fe, Ca K, and Si and
the ratios of K/Ca and Fe/Si compared very well soil ratios.
4. PLANS FOR FUTURE WORK
The sampling station at Gurushikar, Mt. Abu, located 1700m a.s.1. is commissioned for
air sampling work. Also it is planned to carry out the various Anionic species like SO42',NO3'
Cl and Cationic species namely NH4+ using HPLC. The measurement of total carbon is also
planned in the coming year's programme. Sampling at a remote urban site for one year will also
be carried out.
10-5
REFERENCES
[1] SADASIVAN, S., Trace elements in size separated atmospheric
participates at Trombay, Bombay, India, Sci. Total
Environ.,20 (1981) 109-115.
[2] SADASIVAN, S., NEGI, B.S., MISHRA, U.C., Composition and
sources of aerosols at Trombay, Bombay, Sci. Total Environ.,
40 (1984) 279-286.
[3] NEGI, B.S., SADASIVAN, S., MISHRA, U.C., Aerosol composition and sources in
urban area in India, Atmos. Environment,
21 (1987) 1259-1266.
[4] SADASIVAN, S., NEGI, B.S., MISHRA, U.C., Atmospheric lead
levels in some cities in India, Indian J. Environ. Hlth.,
29, (1987) 280-286.
[5] MEE, L.D., OREGIONI, B., Report No.49, World-wide intercompa
rison of trace element measurement in marine sediments SD-M-
2-TM, IARA, Monaco, 1991.
[6] MEENAKSHY, V., Personal communication, 1994, 1993, 1992.
[7] NEGI, B.S., SADASIVAN, S.,NAMBI,K.S.V., Element source emiss
ion profiles from domestic fuel burning, Pro. Fourth Nation
al Symposium on Environment, Madras, February7-10, 1995,pp
175-178.
[8] NEGI, B.S., SADASIVAN, S.,NAMBI,K.S.V., Characterisation of
atmospheric dust at Gurushikar, Mt. Abu, Paper sent for publ
ication.
10-6

Table I GEOMETRIC MEAN CONCENTRATION AND GEO.STD.DVN. OF VARIOUS ELEMENTS
DURING DIFFERENT MONTHS IN 2-10 UM SIZE.
Nov
Ele. GM GSD
Dec
GM GSD
Jan
GM GSD GM
Feb
GSD GM
Mar
GSD
June
GM GSD
July
GM GSD
SM(ng/m3)
ASBRLACE
CR
SB
SC
CO
EUHG
SI(ug/m3)
S
CLK
CATIV
NAFEZN
PB
0.66
2.96
2.96
6.96
0.72
1.89
6.22
0.25
8.48
0.81
0.51
0.73
6.22
0.75
0.028
1.36
5.47
-0.57
0.32
1.47
1.33
1.71
1.30
2.47
1.37
1.16
1.28
1.30
2.11
1.26
1.24
1.13
1.51
'
1.41
1.46
1.31
2.14
0.45
19.96
10.83
3.80
8.61
140.9
12.0
2.58
7.60
0.26
1.34
12.53
0.89
0.84
0.60
7.00
0.85
1.33
1.65
1.20
1.09
1.63
1.17
1.34
1.07
1.03
1.31
1.08
1.20
1.52
1.08
1.34
1.13
1.16
0.008
2.16
10.28
0.78
0.44
1.11
1.08
1.47
1.53
0.80
13.36
21.17
2.71
9.93
86.23
13.66
2.16
5.86
0.23
4.96
10.45
1.36
0.74
0.46
5.89
0.72
0.02
1.30
8.94
1.00
0.48
1.30
1.85
1.26
1.53
1.21
1.80
1.38
1.48
1.45
1.45
1.22
1.35
1.28
1.66
2.13
1.64
1.50
2.84
1.36
1.37
1.61
1.46
2.09
10.10
28.80
4.02
15.90
109.2
15.27
2.42
6.06
0.24
4.79
10.99
1.06
1.44
0.65
1.74
0.74
0.014
1.21
9.20
0.99
0.68
2.51
1.79
1.41
1.63
1.48
1.45
1.49
1.17
1.24
1.73
1.21
1.36
1.40
1.55
1.41
1.27
1.22
2.15
1.64
1.23
2.12
1.65
2.21
9.08
54.53
3.59
7.41
79.51
11.84
2.12
5.50
2.47
4. 20
14.08
1.20
1,22
0.68
9.80
0.86
0.049
1.39
10.15
0.66
0.81
3.73
3.27
2.57
1.81
1.46
1.73
2.54
1.50
1.54
1.33
1.35
1.29
1.69
1.54
1.26
1.26
1.28
1.62
1.91
1.28
1.96
1.75
0.38
0.48
19.47
1.10
4.25
28.51
0.07
0.62
2.18
0.09
7.93
3.54
0.038
1.15
0.09
2.93
0.18
0.008
3.45
2.55
0.05
0.14
1.29
1.83
1.36
1.28
1.39
1.33
1.87
1.74
1.52
1.43
1.22
1.71
1.69
2.32
3.73
1.38
1.84
1.66
1.77
1.75
1.97
1.21
0.12
22.50
1.10
1.97
13.77
0.07
0.37
0.94
0.07
3.29
1.88
0.016
1. 5?
0.08
0.67
0.07
0.002
3.50
1.42
0.02
0.10
3.00
1.19
1.63
1.86
1.56
1.49
1.46
1.78
1.52
1.44
1.51
1.65
4.79
2.86
3.45
1.99
1.41
1.36
1.58
1.83
1.45

00
Table II GEOMETRIC MEAN CONCENTRATION AND GEO.STD.DVN. OF VARIOUS ELEMENTS
DURING DIFFERENT MONTHS IR&-0O UM SIZE.
Ele.
SM(ng/m3)
ASBR
LA
CE
CR 1
SB
SC
CO
EU
HG
SI(ug/m3)
S
CLK
CATIV
NA
FEZNPB
Nov
GM
0.
12.
2.
2.
4.
19.
0.
0.
4.
0.
0.
0.
0.
0.
0.
0.
0.
0.
0.
0.
38
46
90
36
96
4
85
78
10
17
83
43
48
48
11
007
45
33
08
10
GSD
1
1
1.
1,
1.
1.
t
1.
1.
1.
3.
.36
.83
.70
.33
.71
91
31
95
22
39
0
10
10
0
1
56
4
0
1
0
0
2
1
0
0
0
0
0
0
1,
0
0
Dec
GM
.11
.64
.29
.65
.86
.73
.89
.24
.74
.10
.90
.95
.26
.18
.32
.56
.014
.008
.68
.41
.32
.29
1
1
il
IIIIl
l
l
l
l
ll
I
Il
Il
GSD
.13
.55
.31
.16
.06
.36
.48
.16
.49
.57
.17
.27
.92
.86
.20
.12
.17
.10
.35
.59
Jan
GM
0. 13
6.77
18.39
0.63
2.75
25.63
5.14
0.17
1.37
0.11
3.98
1.84
1.30
0.01
0.25
0.32
0.06
0.00E
0.43
1.13
0.26
0.35
GSD
1.
1.
2.
1.
1.
2.
1.
1.
1.
1.
1.
1.
1.
1.
1.
1.
1
1.
1.
1.
1.
4275
05
68
77
43
5440
51
4537
64
66
41
54
76
21
33
21
22
0
4
29
4
3
27
5
0
1
0
2
1
0
0
0
0
0
0
2
1
0
0.
Feb
GM
.21
.10
.13
.68
.64
.92
.96
.23
.11
.07
.97
.23
.91
.01
.20
.42
.04
.01
.94
.27
.26
.35
2
1
1
1
1
2
1
1
1
1
1
2
1
1
1
2
2
1
1
2
1,
GSD
.83
.79
.32
.39
.64
.38
.56
.35
.58
.50
.35
.60
.55
.66
.49
.94
.70
.64
.37
.09
.46
Mar
GM.
0.
4.
31.
0.
1.
32.
5.
0.
0.
0.4.
1.
1.
0.
0.
0.
0.
0.
0.
0.
0.
0.
17
13
19
32
53
82
28
24
62
11
03
96
09
08
21
32
08
04
36
73
21
36
2
2
1
1
1
1
1
2
1
2
1
1
1
3
3
2
1
1
1
1
1
1.
GSD
.21
.14
.33
.61
.61
.27
.56
.34
.34
.29
.31
.37
.65
.91
.75
.23
.40
.60
.95
.25
.44
.45
June
i
0
0
14
0
2
33
0
0
0
0
8
0
0
0,
0,
0.
0,
0.
1.
0.
0.
0.
3M
.15
.06
.64
.17
.49
.92
.09
.17
.98
.05
.84
.97
.40
.18
.01
.34
.03
1
1
1
1
1
1
2
1
1
1
1
2
1
1
.0071
24
93
05
16
2
1
1
1,
GSD
.33
.22
. 13
.25
.87
.06
.08
.64
.37
.44
.83
.28
.59
.41
.49
.11
.26
.94
.25
July
GM
0
0
11
0
0
15
0
0
0
0
3
0
0
0,
0,
0.
0.
0.
0.
0.
0.
0.
.08
.01
.78
.52
.76
.69
.07
.10
.33
.04
.19
.67
.17
.33
.05
.19
.02
GSD
1
1
1
3
1
1
1
2
1
1
1
3
22
1
1
.0031
77
41
02
09
1
1.2,
1.
.71
.15
.60
.66
.41
.41
.34
.50
.48
.26
.28
.55
.89
.12
.72
.18
.91
.27
.47
,18
36

©
v
O
I
.a
en
v
i
CS2
U5
Z4 co
u
•4 ©
IOT
10-9
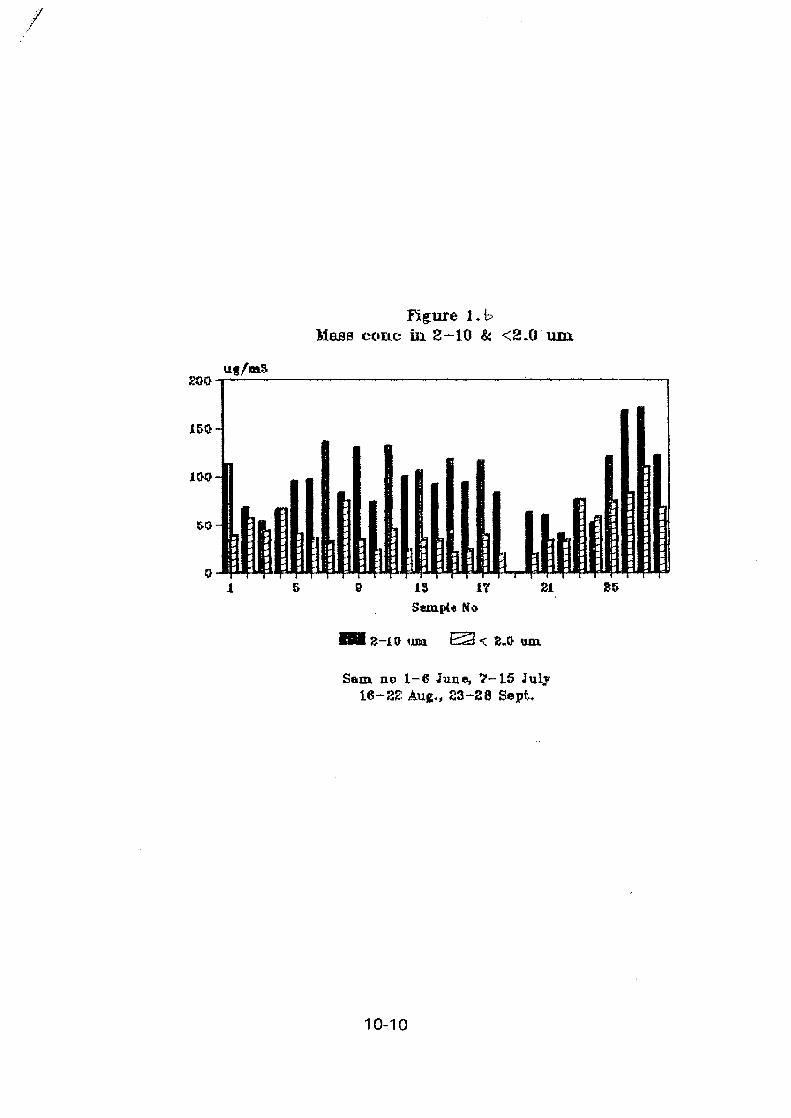
200
Figure 1.1?Mass cone in 2—10 & <2.0 um
is IT
Sample No
JJ-JLtf ilia E 2 < 8.0 uiuSam. no 1-6 June, 7-15 July
16-2S Aug., 23-Z8 Sept,
10-10
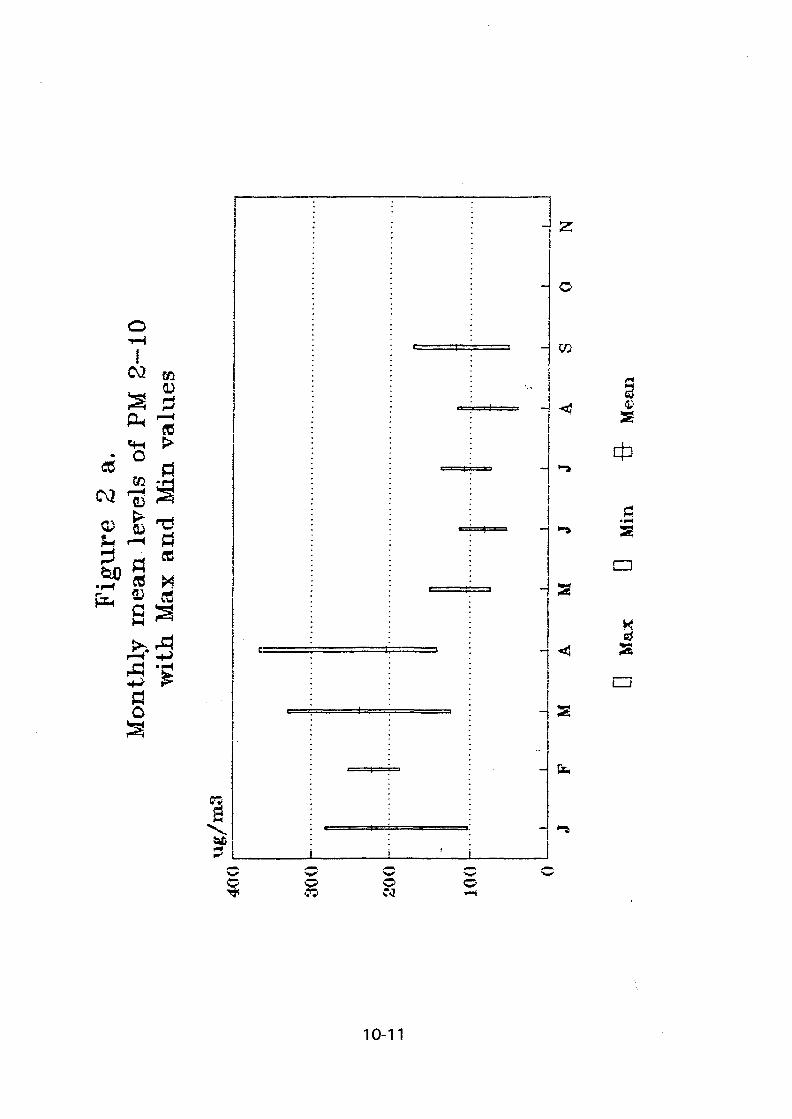
©
I
C\2
as©
M
o
Si!
u.
•
10-11
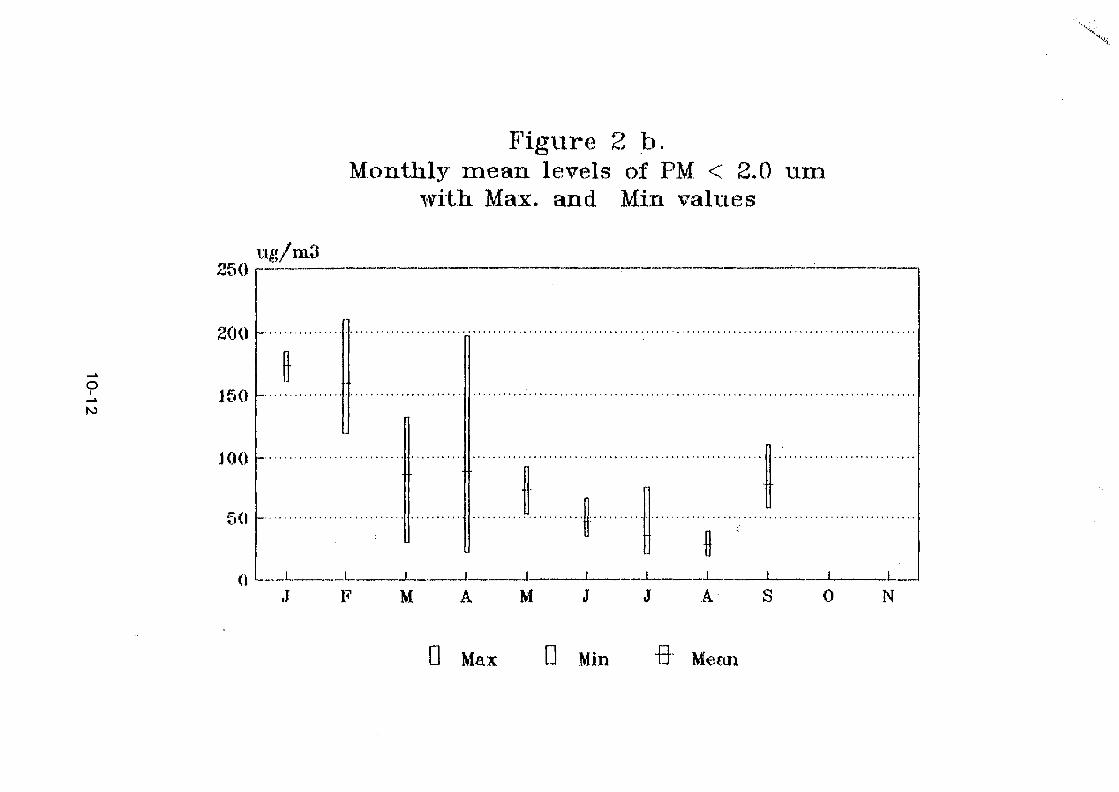
Figure 2 b .Monthly mean levels of PM < 2*0 urn
with Max. and Min values
o
250 i—
200
150
J00
50
0
1
I I 1
1 I •1 1 I
J F M M S 0 N
D Max D Min "9" Mean

XAO102880
Appendix 11
ELEMENTAL ANALYSIS OF THE SUSPENDED PARTICULATE MATTER IN THE AIROF TEHRAN USING INAA AND AAS TECHNIQUES
M. SOHRABPOUR, S. ROSTAMI, M. ATHARI
Gamma Irradiation Center, Atomic Energy Organization of Iran, P.O. Box11365-8486, Tehran, I.R., IRAN
Abstract
A network of ten sampling stations for monitoring the elementalconcentration of the suspended particulate matter (SPM) in the air of Tehranhas been established. Instrumental neutron activation analysis (INAA) andatomic absorption spectrometry (AAS) techniques have been used foranalysis of the Whatman-41 filters collected during the year 1994.Assessment of the preliminary results using the two techniques has producedthe following twenty one elements: Al, Br, Ca, Cd, Ce, Cl, Co, Cr, Cs, Fe, K,Mg, Mn, Na, Ni, Pb, Sb, Sc, Ti, V, Zn. Various standard solutions withknown concentrations of elements, together with standard referencematerials have been used for quality assurance of the measuredconcentrations.
1. INTRODUCTION
Environmental pollution has already passed the critical level in many industrial areasaround the world. While industrial activities presumably has its rewards in terms of jobs andeconomic opportunities to weigh against the unpleasant consequences of pollution, yetthere may be certain cities that may suffer from the ill-effects of the latter withoutnecessarily benefitting from the former opportunities. Tehran, is a city that is only lightlyindustrialized. As such, the industrial effluents may be slight, but the geographical settingand hitherto poor city planning including a lack of proper public transportation system,establishment of environmentally incompatible industrial zones, as well as, inadequate publicparks and green areas has played havoc with the present air quality of Tehran. With apopulation exceeding six million people, and a sprawling area of nearly 600 squarekilometers it is surrounded on the north, northwest, east and south eastern parts by highto medium height (5000-2000 m) mountain ranges. The northern Alborz range essentiallyblocks the moist and rain bearing air from the Caspian Sea to reach Tehran area to wash outthe air pollution. There are some light to medium industries on the western edge, and thereis a cement factory and an oil refinery on the southern fringes of the city. The principalwind directions are also from the west and from the south. And thus a lot of the stackeffluents seemed to be carried to the city proper. Aside from the industrial pollution, thecity traffic has been blamed as the major contributor to the air pollution. Tehran has a fleetof more than one million registered automobiles which they have a gas consumption of 7-8million liters per day. The average age of these cars are more than 10 years. Very few ofthese aging fleet have any pollution-reducing catalytic convenors attached to their gaseousexhaust systems. Also because of their older engine designs, most of the car owners seemto prefer the leaded gasoline presumably for its better anti-knock performance, being
11-1
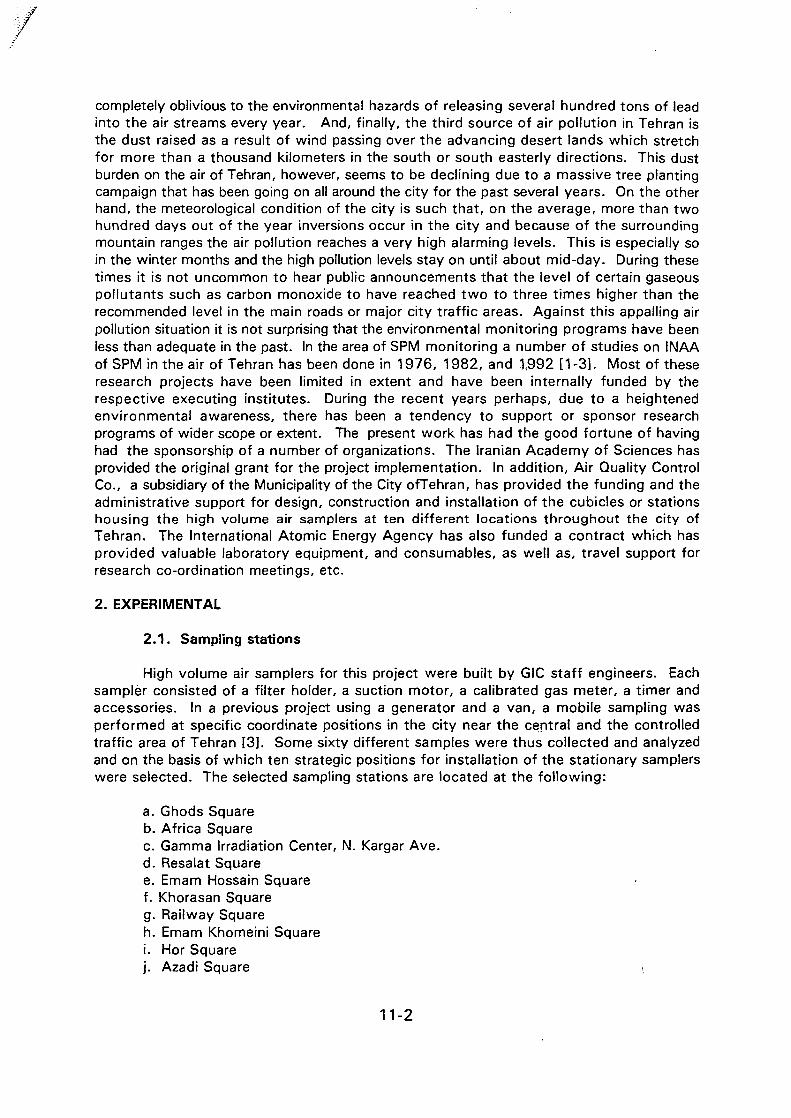
completely oblivious to the environmental hazards of releasing several hundred tons of leadinto the air streams every year. And, finally, the third source of air pollution in Tehran isthe dust raised as a result of wind passing over the advancing desert lands which stretchfor more than a thousand kilometers in the south or south easterly directions. This dustburden on the air of Tehran, however, seems to be declining due to a massive tree plantingcampaign that has been going on all around the city for the past several years. On the otherhand, the meteorological condition of the city is such that, on the average, more than twohundred days out of the year inversions occur in the city and because of the surroundingmountain ranges the air pollution reaches a very high alarming levels. This is especially soin the winter months and the high pollution levels stay on until about mid-day. During thesetimes it is not uncommon to hear public announcements that the level of certain gaseouspollutants such as carbon monoxide to have reached two to three times higher than therecommended level in the main roads or major city traffic areas. Against this appalling airpollution situation it is not surprising that the environmental monitoring programs have beenless than adequate in the past. In the area of SPM monitoring a number of studies on INAAof SPM in the air of Tehran has been done in 1976, 1982, and 1,992 [1-3]. Most of theseresearch projects have been limited in extent and have been internally funded by therespective executing institutes. During the recent years perhaps, due to a heightenedenvironmental awareness, there has been a tendency to support or sponsor researchprograms of wider scope or extent. The present work has had the good fortune of havinghad the sponsorship of a number of organizations. The Iranian Academy of Sciences hasprovided the original grant for the project implementation. In addition, Air Quality ControlCo., a subsidiary of the Municipality of the City ofTehran, has provided the funding and theadministrative support for design, construction and installation of the cubicles or stationshousing the high volume air samplers at ten different locations throughout the city ofTehran. The International Atomic Energy Agency has also funded a contract which hasprovided valuable laboratory equipment, and consumables, as well as, travel support forresearch co-ordination meetings, etc.
2. EXPERIMENTAL
2.1. Sampling stations
High volume air samplers for this project were built by GIC staff engineers. Eachsampler consisted of a filter holder, a suction motor, a calibrated gas meter, a timer andaccessories. In a previous project using a generator and a van, a mobile sampling wasperformed at specific coordinate positions in the city near the central and the controlledtraffic area of Tehran [3]. Some sixty different samples were thus collected and analyzedand on the basis of which ten strategic positions for instaiiation of the stationary samplerswere selected. The selected sampling stations are located at the following:
a. Ghods Squareb. Africa Squarec. Gamma Irradiation Center, N. Kargar Ave.d. Resalat Squaree. Emam Hossain Squaref. Khorasan Squareg. Railway Squareh. Emam Khomeini Squarei. Hor Squarej . Azadi Square
11-2

2.2. Air sampling and measurement techniques
Whatman-41 with a diameter of 12.5 cm were utilized for air sampling. Thesampling were performed twice a week on Mondays and Thursdays in the period of0800-1600 hours. On Thursdays there are no traffic restrictions to travel to the central partof the city and the sampling on this day was to determine the impact of the greater numberof automobiles on the level of pollution in the streets. The actual air sampling started onFebruary of 1994. The air volume pulled through each filter was about 50 cubic meters.The timer on each sampler was set to operate on every other 15-minute interval to help withthe cooling of the suction motor(s). The collected filters were cut into four equal parts.One part was used for AAS analysis, two sections were used for short and long half-lifeisotope (SHL, LHL) neutron activation analysis (NAA). For short SHL NAA quarter sectionfilters were pelletized into 13 mm diameters and placed into a rabbit transfer system forneutron irradiation. For LHL isotopes up to 30 pellets were placed into an aluminum can andreceived long neutron exposures inside the reactor core.
2.3. Sample transfer and handling systems for NAA
Two rabbit transfer systems were designed for handling of the SHL radioisotopes.The main system takes in the standard 5 cm diameter, 10 cm length plastic capsulescontaining the pellet and the stuffing material and carries it over a course of about 700meters to the irradiation position in a period of about 30 seconds. After 0.25 Mw-hrexposure to a flux of about 7x10" 11 cm"-2 sec"-1 it is automatically returned to thelaboratory. It is manually opened in a shielded fixture and the bare pellet is dropped into afunnel and is carried by means of a second pneumatic pellet transfer system (PTS) in frontof a HPGE detector. The total travel and handling time after sample irradiation and the startof the counting is about 2 minutes. Each pellet after the first count is returned to a shieldedand numbered cartridge position where it is stored and returned in front of the detector forsubsequent counting at later time intervals.
2.4. AAS
For AAS technique the standard procedure for dissolving of the filter paper wasfollowed. The measurement of the absorbance was carried out by the GBC model 920spectrometer. The measured absorbance of the unknown sample at the specific wavelengthof each element was compared with the calibration curve generated from the preparedstandard solutions of the same element(s) and from which specific elemental concentrationswere determined. AAS for five elements of Pb, Cd, Ni ,Mn, and Fe has been performedand has been going on with minor variation from the start of the sampling. This set ofelements has been selected to complement those analyzed with NAA method. Thisselection has been based on the element toxicity and also on the basis of low activationcross section or low intensity of the gamma lines of activated isotopes which would makethe NAA method impractical. Mn and Fe determination have also been carried out forcomparison with the NAA measurements.
2.5. INAA
Each irradiated SHL. pellet is transferred automatically, to the detector position whereit is counted for five minutes and returned to a numbered cartridge storage position. Thereit is kept for an hour before it is returned in front of the detector and it is subsequentlycounted for another thirty minutes. For LHL isotopes the irradiated aluminium cans are
11-3

allowed to cool 3-4 weeks post-irradiation and then each pellet is counted for one hour.Maestro II software from ORTEC has been used for taking the gamma spectra and thequantitative analysis has been based on comparator technique which has been performedwith the OMNIGAM software also from ORTEC.
2.6. Quality assurance (QA)
To maintain the accuracy of the measurement results, throughout this work,standard solutions of known element concentrations have been made and measurementhave been carried out to test the retention rate and variability of the different measurementsfor the same sample. For AAS analysis retention rates of greator than 90% for Pb andmore than 85% for other elements have been observed. Relative standard errors for thevariability tests were of the order of 5%. Soil-7 and SL-1 from the set of the IAEAreference materials have been used for comparison and validation purposes for the NAAmeasurements. In each case different samples of the reference materials were prepared,pelletized, irradiated and analyzed and concentration tables were made. Subsequent airfilters were counted and analyzed in comparison with the said tables. The measured valuesof reference material nearly always fell in the reported range of the respective elements.And for the same elements in a given reference material, but under different countinggeometries, agreement within a 10 percent margin was obtained.
3. RESULTS
Figures 1-10 show the monthly averages of the concentration of the elements Fe,Pb, Mn, Ni and Cd for the months of February- December of 1994 for the ten samplingstations. These figures have been based on the AAS data. Figure 11 shows the averageelement concentration of the combined results of the ten stations for the same samplingperiod for the whole city. Figures 12 and 13, for the sampling periods of March to August1994 and June to August 1994, respectively, compare daily variations of the concentrationsof Fe and Mn for the station No. 10, Azadi Square, as measured by INAA and AAStechniques. Table 1 presents the average concentrations of the elements of Al, Br, Ca, Ce,Cl, Co, Cr, Cs, Fe, K, Mg, Mn, Na, Sc, Ti, V, and Zn, as obtained from INAA technique andit is based on the sampling period corresponding to the spring and summer of 1994 for theabove station. This data has been compared to the measured data from the other cities [4].
4. CONCLUSIONS
In this report we have presented the preliminary results of the air monitoring surveysconducted for the assessment of the concentration levels of various polluting elementsexisting in the SPM in Tehran for the year 1994. The data has been generated from the tensampling stations and have been primarily analyzed by AAS technique. Only a small sampleof INAA data (station No. 10) has been presented for comparison purposes. More detailedINAA data will be reported subsequently. Based on the measured values it appears that theconcentration of Pb at majority of the sampling stations in Tehran is higher than therecommended WHO standard of 0.5-1.5 ug/m3 [5]. Since most of the sampling stationsare situated at the major traffic crossing areas, the Pb concentration levels are expected tobe higher than those at the residential and the commercial areas which are represented bythe results derived from station nos. 3 and 1, respectively. Station No. 2 has consistentlydemonstrated very high Pb concentration levels. This appears to be caused by a very heavytraffic load in this square and in the nearby area on the one hand, and a nearly totalblockage of the area by hills and high rise buildings on its western side which seem to
11-4

prevent the prevailing westerly wind from dispersing the accumulating pollution on the otherhand. No significant increase in the Pb concentration in the air during Thursdays comparedwith Mondays was observed. This was attributed to the fact that most of the samplingstations are located just on the boundary of the traffic control area and thus there is noappreciable change in the level of traffic on different days of the week. Additional datafrom the other stations using INAA will be analyzed, compared, and elemental correlationstudies, modelling, etc., will be attempted, and the results shall be reported subsequently.
5. ACKNOWLEDGEMENT
The authors express their appreciation to Mr. M.A . Ghahramani for computergraphics and Ms. M. Asghari for typing of the manuscript .
REFERENCES
[1] OWLYA, A., KASRAI, M., MASSOUMI, R., Nondestructive NAA of atmosphericpollutants, J . Radioanal . Chem. 34 (1976) 381.
[2] MOATTAR, F., RAHIMI, H., ABEDINI, M., Determination of some toxic trace elementsin airborne paniculate matter using NAA, Radio Chem. Radioana. Letters. 50 (1982)269 .
[3] SOHRABPOUR, M., HONARKHAH, H.R., Nuclear-based elemental monitoring of thesuspended paniculate matter in the air of the city of Tehran, Intnl. Conf. Engg.Appl. Mechanics, Sharif University of Technnlogy Tehran, I.R. Iran. (1992) 494.
[4] Proceedings, Appl. Isotopes Radn. Conser. Environment Symp., KarlsruheGermany, IAEA, March (1992).
[5] Air Quality Guidelines for Europe, WHO Pubi. Eur. Series No. 23(1987).
11-5

TABLE I. CONCENTRATION OF THE TRACE ELEMENTSMEASURED BY THE USE OF INAA FOR STATIONNO. 10 AND COMPARISON WITH THE RESULTSFROM OTHER CITIES.
1 ANKARA METUTURKEY;
BRASILIA KINSHASlKQSETICZAIRE>>: GZECHO
SVRATO
GZECHGCE 1 0.01235 | 0.01000 0.00200 0.00160 0.00094CO I 0.00314 } 0.00470 I 0.00220CR_
resj.08771 | 0.00700 {0100500
to"ooo5b"I"o.ooo4b
0.00070.00670
0.^0003T|'_"O00240" I o"O07t0i
"1P 0.00041FE | 2.80435 | 1.60000 j 0.54000J 3.08500 jj 1.49000
SB } 0.00074 ( 0.00060 ( 0.00024 I JlM°J.8.2_ J ? / 0 ^ ^ j).0JD161 jZN j 0.18545 f b.b456o~|~bTO24b6sc~rd-bbi56~j 0.0007b"faAL 15.77688 ] 1
j[b.q698o j[foToooibf
3.53900 "CA I 7.72802MG § 4.399071
02500JI |L
j V | 0.01572 ( iz_i.jz:Tl 0.64639 rCL { 0.00450}NA } 0.70136 j 1.20000 j 0.36000 \
3 MN I 0.086311 0.01000 j 0.00500 \0
t BR j 0.00651 j 0.60000 ] 0.21000K | 1.89263 ] '" j_ 0.87500 ;i 1.02000
11-6

Station No. 1 (Ghods Square)
1.6
» 1.6-
1.4-
1.2-
wooo
5 ' 6 ' 7 ' 8(YEAR 1994)
11 12Cd
Fig. 1. Average monthly element concentration of Fe, Pb,Mn, Ni, and Cd for station No. 1 for 1994.
11-7

Station No. 2 (Africa Square)
CO<
=5
az
IUOzoo
042 Cd
5 6 7 8(YEAR 1994)
10 11 12
Fig. 2. Average monthly element concentration of Fe, Pb7Mn, Ni, and Cd for station No. 2 for 1994.
11.-8

Station No. 3(GIC)
8 10 11 12
(YEAR 1994)
Fig 3. Average monthly element concentration of Fe, Pb,Mn, Ni, and Cd for station No. 3 for 1994.
11-9

Station No. 4 (Resalat Square)
CO<
3
6
UJozoo
n-2 3 -4 5 6 7 8 9
(YEAR 1994)10 11 12
Fig 4 Average monthly element concentration of Fe, Pb,Mri, Ni7 and Cd for station No. 4 for 1994.
11-10

Station No. 5 (Emam Hossain Square)
CO
zo
5EC
MlO2Oo • — / • • • • / • / -Mk
A S 6 7 8
(YEAR 1994)10 11 12
Fig. 5. Average monthly element concentration of Fe, Pb,Mny Ni, and Cd for station No. 5 for 1994.
11-11
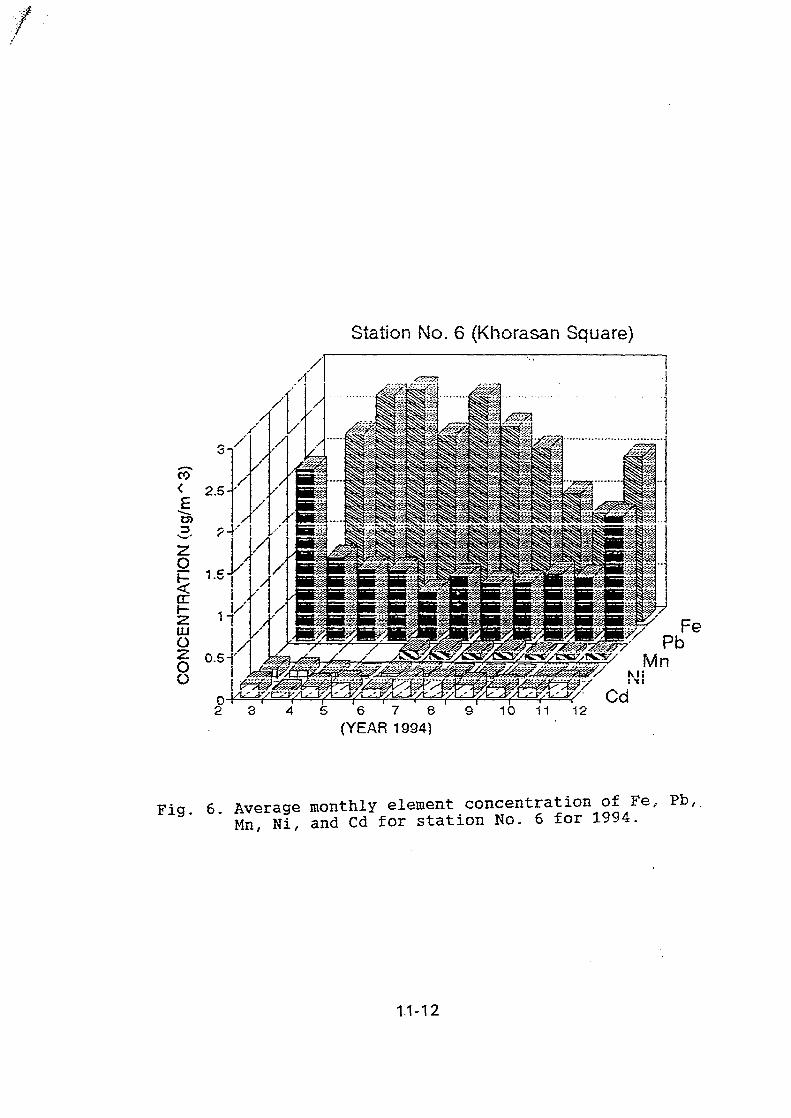
Station No. 6 (Khorasan Square)
CO2.S-
rz 1.5J
a:f -UJOzoo
0.5-}''
Fia 6 Average monthly element concentration of Fe, Pb,Mn, Ni, and Cd for station No. 6 for 1994.
1.1-12

Station No. 7 (Railway Square)
6 7 8 9 10 11 122 3
Fig. 7. Average monthly element concentration of Fe, Pb,Mn, Ni, and Cd for station No. 7 for 1994.
11-13

• /
Station No. 8 (Emam Kh. Square)
CO<
3
EC
111Ozoo
6-1
S-
8 9 10 11 12(YEAR 1994)
Fig 8 Average monthly element concentration of Fe, Pb,* Mn, Ni, and Cd for station No. 8 for 1994.
11-14
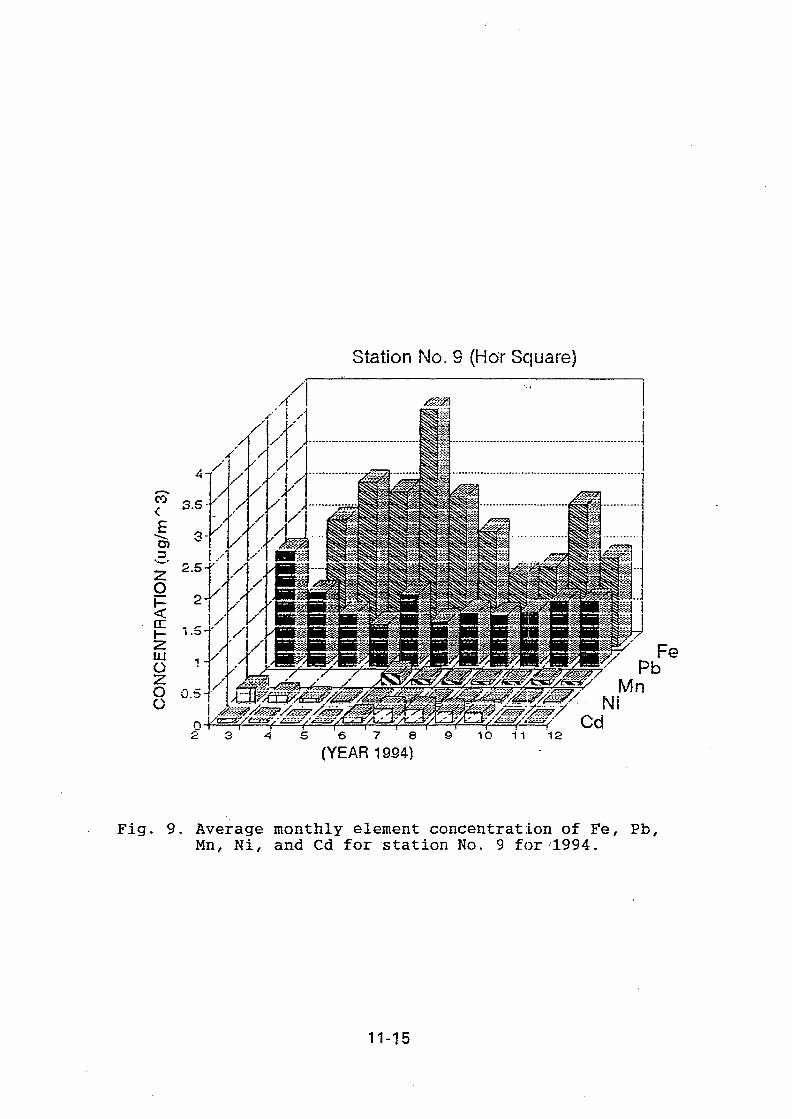
Station No. 9 (HOT Square)
CO
o<2LUOzoo
2 6 7 8 S
(YEAR 1994)1O 11 12
Fig. 9. Average monthly element concentration of Fe, Pb,Mn, Ni, and Cd for station No. 9 for '1994.
11-15

Station No. 10 (Azadi Square)
A/
CO
p
2Of-
£E
LUO2Oo
4 -
3.S-
3-
/
/
2~y\/
i.s-r
0.5
/'
/
/
/
/
/
/
A
/
/
/mm
Vfoft*)
1 ]
2 3 4 5 6 7 8 9(YEAR 1994)
10 11- 12
Fig 10 Average monthly 'element concentration of Fe, Pb,Mn, Ni, and Cd for station No. 10 for 1994.
11-16
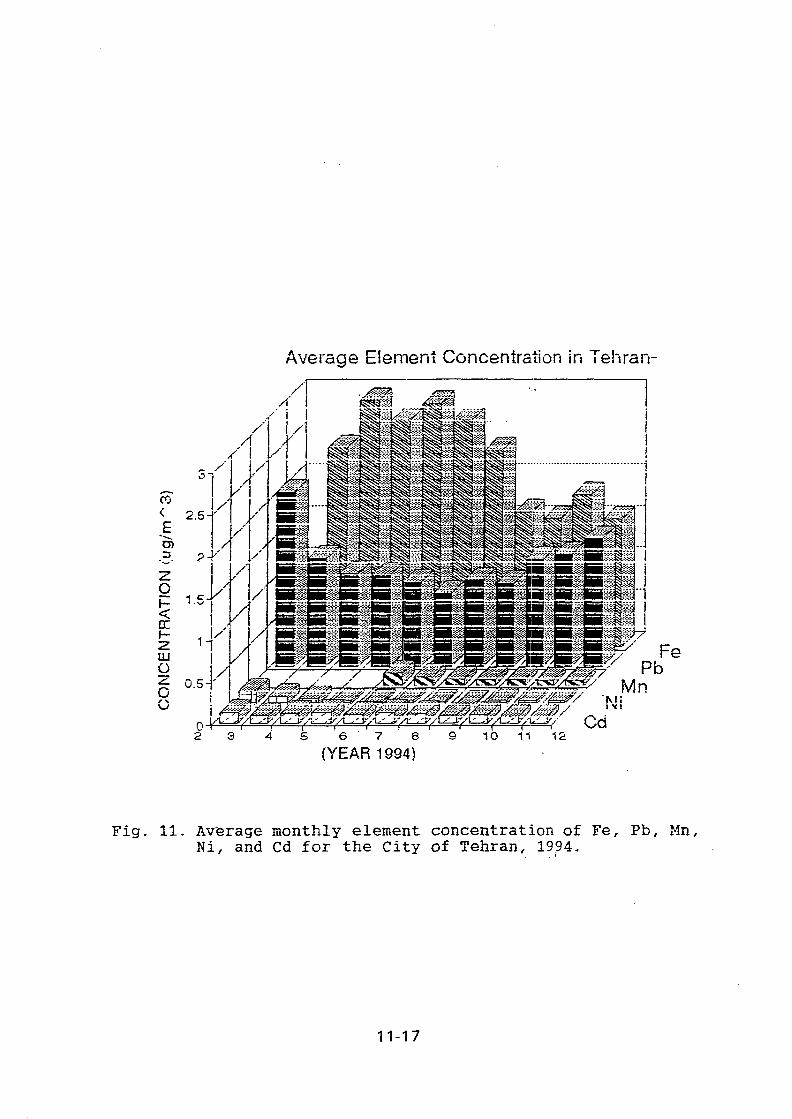
Average Eiement Concentration in Tehran-
CO<
zo<
UJ
O
Fig. 11. Average monthly element concentration of Fe, Pb, Mn,Ni, and Cd for the City of Tehran, 1994.
11-17

18 21 24 27 31DATE (94/3 - 94/8)
34 43
INAA AAS
Fig. 12. Comparison of the daily concentration of Ironfor station No. 10 using two methods of INAAand AAS.
11-18

CO
"co
fpi
oo
0.0440 43 46 49 52
DATE(94/6 - 94/8)55 58
INAA AAS
Fig. 13. Comparison of the daily concentration of Manganesfor station No. 10 using two methods of INAA andAAS.
11-19

XAO103092
Appendix 12
THE DEVELOPMENT OF AIR POLLUTION STUDIES IN JAMAICA
G. C. LALOR, H. ROBOTHAM, M. DAVIS, A JOHNSON, J. PRESTON, C. GRANT
Centre for Nuclear SciencesUniversity of the West Indies, Mona CampusMona, Kingston 7, Jamaica
ABSTRACT
The results of a survey of air particulate matter collected at an urban site in Kingston,Jamaica for two fractions of suspended particulates are reported. The meanconcentration of suspended particulate matter in the <2.5 jum range was 12.4 /Ugm'3
while the mean for the fraction having diameter between 2.5 and 10 jum was 16.4 /ug m'3.The results for selected trace elements obtained by NAA are presented and discussed.
The correlation coefficient between Cl and Na concentrations in the particulates was0.9 and the Cl/Na ratio of 1.4 in the coarse fraction was indicative of sea spray whichcontribute to more than 10% of the coarse fraction. Vanadium was concentrated in thefine fraction but its average of 0.04 /ugm3 in the fine was still below the level ofl/ugm3 set by the World Health Organisation.
Keywords: Atmospheric Particulates, Bromine, Jamaica,
1. SCD2NTBFIC BACKGROUND AND SCOPE OF PROJECT
The Jamaican atmospheric environment has not been comprehensively examined althoughvarious studies have been carried out in localised areas [1,2,3,4]. Studies in Kingston haveshown particularly high Total Suspended Particulates (TSP) concentration [5] much of which isapparently due to cement dust [6], with industrial areas having significantly higher levels ofsuspended particulates than residential areas [7].
Visually, the air quality across Jamaica has obviously deteriorated during the last decade.Kingston, the nation's Capital city has been the worst affected area. This degeneration in air
quality is of concern and should be quantified.
The Centre for Nuclear Sciences (CNS) has been involved in a study for the developmentof monitoring systems and programme for the chemical pollutants in air, water, soils, andsediments. One aspect of this programme involved the quantification and characterisation of totalsuspended particulates in air. This was carried out in rural, agricultural, coastal, industrial andurban areas across the island in order to define typical and acceptable background levels and topinpoint polluted areas for further studies. In addition to high volume samplers, PM10 units wereused to measure the fraction of respirable particles.
12-1

1.1 The Supplementary Programme.
The supplemental programme will include sampling and bio-monitoring at an area in thevicinity of a bauxite/alumina plant. In preparation for this, TSP samples have been taken at a sitenearby. The concentration of TSP found in this area is 30 //g m"3. These samples will beanalysed for elemental concentrations and will give an indication of the elements that should beof interest in the bio-monitoring stage.
2 METHODS
2.1 Sampling
2. /. 1 Description of Area Sampled
Jamaica is located in the Caribbean sea between latitudes 17° and 18° 35' and longitudes76° 15' and 78° 20'. It is about 145 km south of Cuba and 160 km west of Haiti. It is 240 kmlong and 60 - 80 km wide and is mainly a limestone (60%) plateau with a mountainous interior.The southern coast is marked by plains and is affected by ESE - WNW trade winds. The climaticconditions in Jamaica are basically constant with average low temperature of 24 °C in Februaryand an average High on the south Coast of 32°C in August.
Jamaica has two main urban Centers. Kingston, with a population of about seven hundredand fifty thousand, is the capital city and is located on the south east coast of the island. MontegoBay hash a population about eighty thousand is located on the north west coast of the island. TheJamaica Meteorological Services operates weather stations in both cities.
Kingston was selected as a site to be monitored because of its higher population, and itsproximity to the Centre for Nuclear Sciences.
In accordance with the decision made at the first research co-ordination meeting, the sitechosen to be sampled in the first year of the study is an urban residential one. This site is locatedon the grounds of a teachers' training college 4 kilometers from the centre of the Half-Way Tree,which is a major commercial centre of high traffic density. The College is surrounded byresidential communities and elementary schools.
The area in which the sampler is placed is a grass covered lawn with very few areas ofexposed soil near by.
As an initial study a high volume sampler was placed at the site and run for 24 hourperiods. This study showed the TSP concentration to be 40 //g m"3, significantly lower than theaverage TSP concentration level at Half-Way-tree of about 100 //g m-3. The ambientconcentration of elements found was also low. XRF analysis found Pb and Br concentration tobe in the range on average 0.1 and 0.04 //g m'3 respectively, compared with about 0.5 and 0.2 jugm3 for Half-Way-Tree.
12-2

2.1.2 Filter Preparation
Filters were weighed in an air conditioned laboratory controlled at 57% relative humidityand 21 °C. A 210Po alpha emitting source is used to remove the static build-up from the filter.Prior to weighing all filters are left to equilibrate for at least 24 hrs and the 210Po source is usedto remove static from the filters.
As a quality control check, a quality control filter is weighed with each batch of filter.
2.1.3 Sampling
Sampling for the project was done using the Gent Sampler (Maenhaut, 1992) supplied bythe International Atomic Energy Agency (IAEA). Thirty-seven (37) pairs of samples werecollected during the six month period between December 1993 and May 1994. On average two(2) sets of samples were collected per week. In May 1994 the volume meter stopped working andhad to be replaced. The replacement was received on March 7, 1995. Sampling will nowcontinue at the Urban site. Additional Stacked Filter Units (SFUs) have been obtained and wehope to collect a total of five (5) samples per week.
With each sample taken the following information is recorded- Number of the SFU cassette- Start time and end time- Initial and final air volume (as read from meter)- Rotameter flow rate at beginning and end- Time and duration of any interruptions- Weather conditions, overcast, sunny, etc. (additional information to be obtained fromKingston met office)
Once sampling is finished the sealed SFU is returned to CNS. All SFU preparation andfilter weighing takes place the laboratory with the controlled laboratory environment.
In addition to ordinary field samples, field blanks were taken once every two months ascheck on the rate of passive loading. These blank field measurements are taken only after theSFUS have been cleaned.
Once every two weeks the pre-impaction plate and inner surface of the black container arecleaned using ethanol to remove any particles which may have accumulated.
2.2 Analysis
The analysis of the nuclepore filters has not yet been completed. Exposed filters have beenanalysed qualitatively both by XRF and INAA. However, the elemental concentrations were allbelow the detection limits for XRF. We are in the process of setting up a Total Reflection X-RayFluorescence Analysis (TRXRF) System which should provide lower limits. When this iscompleted and the system fully tested, a method will be developed for the analysis of nucleporefilters. In the interim, half the number of samples collected were analysed by INAA. The otherhalf is being stored for analysis by both TR-XRF and INAA.
12-3

2.2.1 Analytical Methods2.2.1.1. Instrumental Neutron Activation Analysis (INAA)
The UWI SLOWPOKE reactor was used to determine the concentrations of Al, Cl, Naand V by INAA [8] using the method of activation constants for quantification. Polyethylenecapsules (1.5 ml) were cut to a height of 8 mm and soaked for 48 hours in 1M Nitric acid. Thevials are then washed with distilled water and then finally with distilled deionised water. Theywere then air dried in the clean room. The sealed vial was placed in a 7 ml vial and this was alsoheat sealed. The nuclepore samples were irradiated for 6 minutes at a flux of 1012 n cm2 s"1.After irradiation the filters were transferred to clean un-irradiated vials for counting. The filterscounted for ten minutes after decay periods of 2 minutes and 2 hr using a high purity germaniumcoaxial photon detector. Table I summarises the detection limits and typical errors thus obtained.The elements which are quantifiable with 6 hour irradiation of the nuclepore samples, at a fluxof 1012 n cm'2 s'1 are also given in Table I.
Table I.Elements and their corresponding nuclides for neutron activation analysis.
Element
Aluminium
Chlorine
Bromine
Iodine
Manganese
Sodium
Vanadium
Samarium
Gold
Arsenic
Antimony
Bromine
Cobalt
Sodium
Nuclide
2gAl
38C1
S0Br
12ST
M M n
2 4Na
52VI 5 3Sm
198Au
76As
122Sb
S2Br
"Co
2 4Na
Analyticaly-rays(keV)
1779
1642
616
442
1811
1368
1434
103
412
559
564
111
1173&1332
1368
Detection limits
Hi?
0.1
0.6
0.04
0.01
0.005
0.1
0.004
n/a
n/a
n/a
n/a
n/a
n/a
n/a
Hgm"3
0.005
0.03
0.002
0.0001
0.0003
0.05
0.0002
n/a
n/a
n/a
n/a
n/a
n/a
n/a
CountingError (%)
Fine
5
20
9
3
5
2
1
5
16
10
n/a
2
9&3
1
Coarse
3
2
10
7
7
1
3
n/a
n/a
n/a
n/a
n/a
n/a
n/an/a - not analysed
12-4

2.2.1.2 X-Ray Fluorescence Analysis (XRF)
The EDXRF spectrometer has been described elsewhere [9]. The irradiation time was1800 seconds and the fluorescence spectrum was stored on an IBM 386 computer.De-convolution and analyses of the spectra were carried out by using the AXIL (Analysis ofX-ray Spectra by Iterative Least-squares Fitting) programme of the quantitative X-ray AnalysisSystem (QXAS) software package provided by the IAEA.
Commercially available thin film standards from Micromatter, Certified ReferenceMaterials (NIST-1832, 1833), and pelletised AR oxides of elements were used for sensitivitycalibration. L-lines were used for elements with Z greater than 70, and using K-lines of elementswith atomic number (Z) less than 37.
2.3 QUALITY CONTROL
2.3.1 Detector
The geranium detector used in INAA was calibrated daily using the following energiesfrom the following sources:
Source133Ba137Cs"'Co
"Co24Na
Energy (keV)356.005661.6451173.241332.5012754.1
Each day the FWHM was monitored daily for any inconsistency. The FWHM for "'Co wastypically 2.18keV for 0-3400 keV energy range.
The accuracy of the analytical method was assessed by the use of certified referencematerials, including NIST reference material 1648 (air particulate matter) and 1632a (Coal FlyAsh. These were analysed in a similar manner as the samples. Reference materials were analysedwith each batch of 12 samples..
3 RESULTS AND DISCUSSION
3.1 Accuracy and Precision
The results obtained for the analysis of Reference Materials were consistent with theexpected values as shown in Table II. Figure 2 shows a plot of Certified vs observed Values forAl and indicate that Al values are accurate over the entire range.
12-5

The results obtained for the analysis of the filters for the elements Al, V, I, Cl, Br, Mn, andNa are given in Appendix A. Table III summarises the results obtained.
Table II Concentration of elements in SRMs
Element
Al (%)
Br (mg kg1)
Cl (mgkg1)
Kmgkg1)
Mn (mg kg"1)
Na (mg kg'1)
VOngkg1)
NIST
exp. value
3.40 ±0.24
520 ± 20
4660 ±140
15.5 ±1.5
910 ±40
4250 ± 220
124 ± 10
SRM1648
lit. value
3.42 ±0.11
505 ± 24[10]
4500 [10]
20
860
4250 ± 20
140 ± 3
NIST
exp. value
3.08 ± 0.03
44.4 ±2.8
880 ±30
1.2 ±0.2
30.5 ± 0.4
860 ± 40
40 ±2
SRM 1632a
lit. value
2.95 ± 0.08
42 ± 2
760 ± 60
1.5 ±0.5
28 ±2
830 ±100
44±3
Table III Results obtained for the analysis of Nuclepore filters by INAA
Element
Suspendedparticulates
Aluminium
Chlorine
Bromine
Iodine
Manganese
Sodium
Vanadium
Fine (diameter <2.5 jim)Concentration (ugm"3)
mean
12.6
0.067
0.072
0.024
0.011
0.0020
0.42
0.040
range
4-25
0.017-0.33
0.027-0.21
0.011 -0.039
0.0031 -0.038
0.0004 - 0.0088
0.16-1.99
0.020 - 0.064
Coarse (2.5 urn < diameter < 10p.m)concentration (p.g m"3)
mean
16.4
0.32
1.51
0.011
0.0060
0.0078
1.25
0.0076
range
11-30
0.09 - 0.58
0.67 - 3.06
0.004 - 0.019
0.002-0.01
0.0010-0.042
0.58-2.51
0.0038 - 0.014
12-6

3.2 Suspended Participates
The average concentration of suspended particulates was between 12.6 ug m"3 for the fines(diameter < 2.5 urn) and 16.4 ug m'3 for the coarse ( 2.5 um < diameter <10 um). This issignificant at the 5% confidence level. The elements Al, Cl and Na were more concentrated inthe coarse fraction than in the fine, while V, I, and Br were more concentrated in the fines. Thesefindings are not surprising since the Al, Na, and Cl are associated with natural sources which tendto produce aerosols of larger diameters while V and Br are usually derived from anthropogenicsources.
The sum of suspended particulates collected was 30 ug m'3 compared with 25 ug nfmeasured in TSP samples collected by high volume sampler. This indicated that a large portionof the suspended particulates is in the respirable size range.
3.2.1 Al,Na,Cl
The concentrations of Al, Na, Cl in coarse and fine fractions were 0.32, 1.3, 1.5 and0.067, 0.42, and 0.071 ug m"3 respectively. The corresponding concentration values in TSP werepreviously found to be 1.1,1.7, and 2.2 ug m"3 [11]. The average concentration values for Naand Cl in the coarse fraction were very close to the value in TSP. The values for Al was aboutone quarter of the values found in TSP. This difference in levels is probably explained by differentsources. Al is generally thought to be derived from soil while Na and Cl were mainly due to seaspray. The Na and Cl in the coarse fraction were correlated with a correlation coefficient of 0.9.(Figure 3) The ratio of Cl to Na is 1.4. This relationship indicates that for this fraction, sea sprayis the main source of these elements. This was consistent with the results found in TSP where thecorrelation coefficient for Na and Cl is 0.9 and a Cl/Na ratio of 1.5. (figure 4) The ratio ofCl/NA in sea spray is 1.8.
In both the coarse fragment and TSP, Na and Cl account for more than 10 % of the totalmass of suspended particulates. The Cl concentration in the fine fraction is at or just above thedetection level for this element. The Na concentration is in the fine fraction is 0.42 ug m'3. Thisis value is close to the calculated value of 0.3 ug m*3 for residual Na in the coarse fraction. Thefine fraction is therefore practically free from the influence of sea spray.
3.2.2 Vanadium
The vanadium concentrations were 0.0076 /zg m'3 for the coarse and 0.041 //g m"3 for thefines. This compare with 0.02 ug m"3 found in TSP. This indicate that V is much moreconcentrated in the fine fraction The higher values found for the fine over and above TSP isprobably due to the difference in the sampling methods. These are well below the limit of 1 ii/gm'3 set by the World Health Organisation [12].
12-7

3.2.3 Lead and Bromine
The Br levels found were 0.011 and 0.024 ug m"3 in the coarse and fine fractionsrespectively. The levels in TSP was 0.037 ugm"3. This would indicate that most of the Br foundis in the fine fraction. Br is expected to be highly correlated with Pb, as Pb and Br in TSP ishighly correlated (r2 = 0.9) [11]. The Br/Pb ratio is 0.38 (figure 6) and is similar to the ratio of0.3 found in commercial gasolines (CNS). The slightly higher value is due to Br from sea spray.Pb is expected to be associated with Br in gasoline because Pb is added to gasoline in the formof organic bromine compounds.
3.3 Conclusions
The average concentration of suspended particulates were between 12.6 ug m'3 for thefines (the diameter < 2.5 um) and 16.4 ug m*3 for the coarse ( 2.5 um < diameter <10 um)
The elements Al, Cl and Na were more concentrated in the coarse fraction than in the fine,while V, I, and Br were more concentrated in the fines.
Sea spray is the main source of the elements Na and Cl in the Coarse fraction.
Na and Cl account for more than 10% of the coarse fraction
4 PLANS FOR FUTURE WORK
1. Analysis of filters for other elements
2. Analysis of remaining filters by TRXRF and INAA.
3. The transplanting of lichen in the industrial study area.
4. Analysis of data by multi-variate statistical analysis.
REFERENCES
[1] USAID, IEED, Government of Jamaica. 1987. Jamaica Country Environmental Profile.
12-8
[2] Thompson, C. A. 1979. Air Pollution in the Vicinity of two Jamaican Bauxite-AluminaPlants. M.Phil thesis, University of the West Indies (Mona).
[3] Thomas, C, Davis, C. S. 1979. Sulphur Dioxide and Paniculate Levels in Spanish Town,in: Proceedings of the Symposium on Environmental Studies in Jamaica, May 1979,Department of Chemistry, University of the West Indies (Mona).
[4] Taylor, P. A., Davis;, C. S. 1979. Source Identification and Chemical Analysis of Dustfall.in: Proceedings of the Symposium on Environmental Studies in Jamaica, May 1979,Department of Chemistry, University of the West Indies (Mona).
[5] ECD, (Environmental Control Division), 1978. Unpublished data, the the Ministry ofHealth, Jamaica, W. I.
[6] Willis, L. A. 1971. Airborne Particulates at Ground Levels in Kingston Jamaica. M.Sc.thesis, University of the West Indies (Mona).
[7] Sewell-Davis, M., 1991. The Chemical Composition of Particulates in the KingstonAtmosphere. M.Phil, thesis, University of the West Indies.
[8] Robotham, H, Lalor, G. C , Mattis A., Rattray, R., Thompson, C. 1987. Trace Elementsin Jamaican Soils. Journal of Radioanalytical and Nuclear Chemistry, 116, 27 - 34.
[9] Johnson, A. H. M. 1993. Elemental Concentrations in Jamaican Soils, MPhil. thesis,University of the West Indies.
[10] Gladney, E. S., Burns, C. E., Perrin, D. R., Roelandts, Gillis, T. E. 1984. StandardReference Material: 1982 Compilation of Elemental Concentration Data for NBSBiological, Geological, and Environmental Standard Reference Materials. Natl. Bur.Stand. (U.S.), Spec. Publ. 260-88.
[11] M. Davis, C. Grant, G. Ho-Yorck-Krui, A. Johnson, G. C. Lalor, H. Robotham, and M.Vutchkov, Suspended Particulates in the Jamaican Atmosphere, Geochemistry and Health,in print
[12] UNEPAVHO 1992. Urban Air Pollution in Megacities of the World, World HealthOrganisation, United Nations Environmental Programme, Backwell, Oxford.
12-9
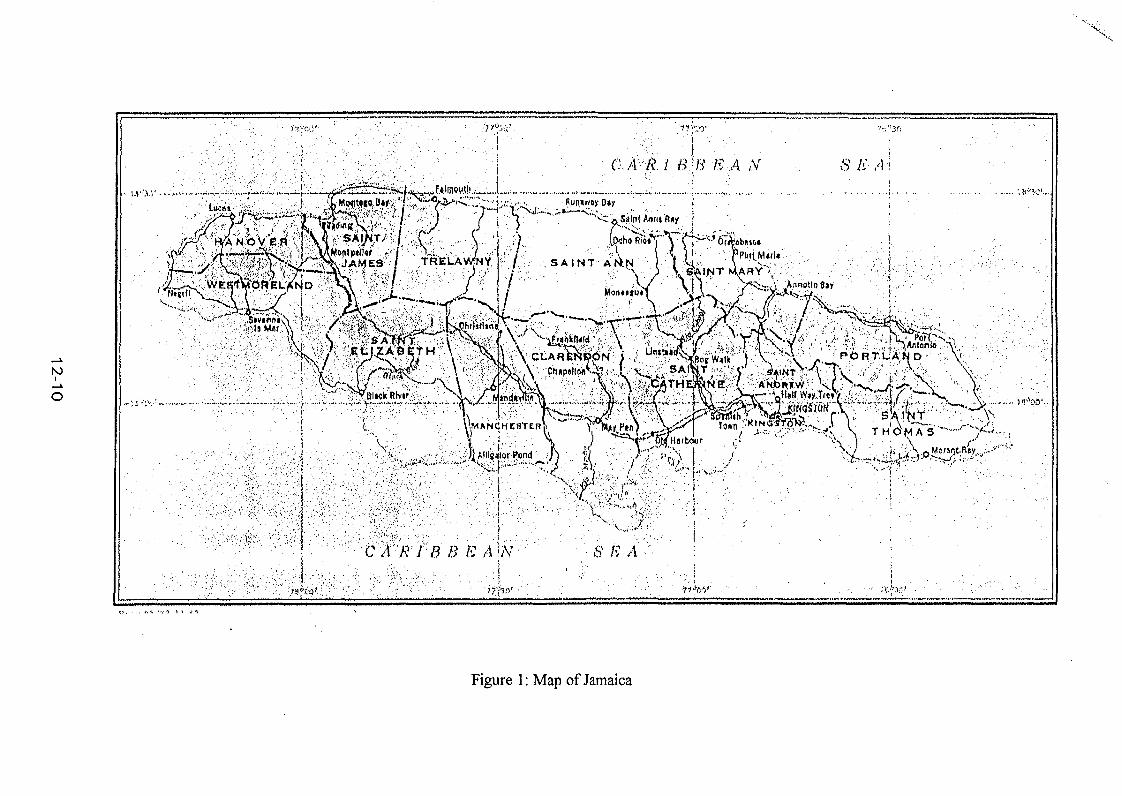
• i.v'.vv ••••—>"-•
Figure 1: Map of Jamaica

,1 C
one.
Fie
dAC
ert
ii
o.o -
3 -
2.5 -
2
1.5 -
1 -
0.5 -
0 -
.^1635
1 1 1 f—
>'^1648
1 1—->—(
0.5 1.5 2 2.5
Observed Al cone. (%)
3.5
Figure 2: Al concentrations in NIST SRMs
o
4 6 8 10 12 14 16
Na Concnetration (ug nT5)
Figure 3: Cl vs Na for an urban residential site
12-11
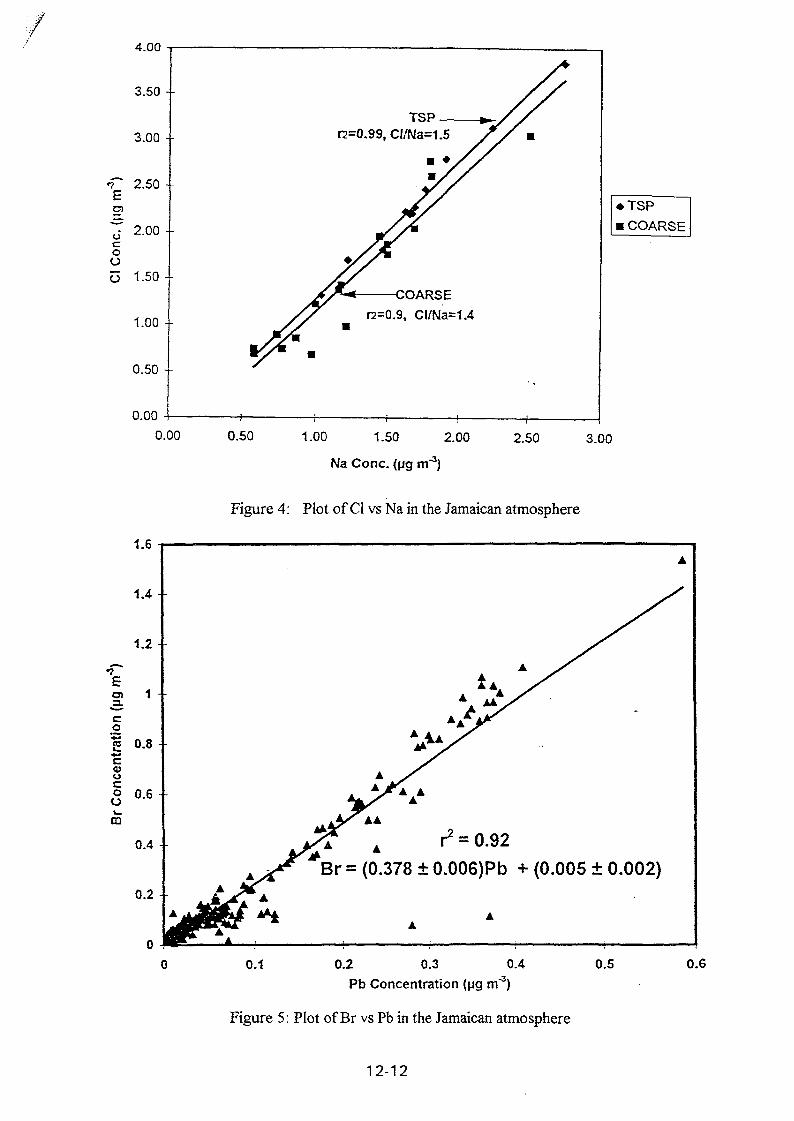
TE
4.00
3.50 --
3.00 - •
2.50 - -
2.00 - -
oo
o 1.50--
1.00 --
0.50
0.00
TSP —n>=0.99, CI/Na=1.5
• •
COARSEr2=0.9, Cl/Na=1.4
• TSP• COARSE
0-00 0.50 1.00 1.50 2.00 2.50 3.00
Na Cone, (jig m"3)
Figure 4: Plot of Cl vs Na in the Jamaican atmosphere
Br = (0.378 ± 0.006)Pb + (0.005 ± 0.002)
0.1 0.2 0.3 0.4
Pb Concentration (pg m"3)0.5 0.6
Figure 5: Plot of Br vs Pb in the Jamaican atmosphere
12-12
XA0103093
Appendix 13
AIR POLLUTION IN KENYA
INVESTIGATORS: C. K. Gatebe, R. Kwach, L. N. Njau and E. A. Mukolwe
Kenya Meteorological Department
P.O. Box 30259 Nairobi, Kenya.
A. M. Kinyua, M. J. Mangala and D. M. Maina
Institute of Nuclear Science
P.O Box 30197, Nairobi, Kenya.
SUMMARY
Energy Dispersive X-ray Fluorescence (EXDRF) analysis of aerosol samples in Nairobi is
presented. Results show that elemental concentrations is of the order of 10^ to lO"10 \igfm^
for most elements analyzed. The total suspended particulate (TSP) matter were between 30 -
80 fig/m3 for the entire sampling period between Dec. 1993 to October 1994. Levels of lead
(Pb) are below WHO guidelines. However, the obtained bromine (Br) to Pb ratio: 0 3 - 0.51,
which is an indication that the origin of Pb is due to the vehicular emissions. This ratio was
particularly high during the month of April to July 1994 which were also found to be very
active in terms of weather parameters.
13-1

SCIENTIFIC BACKGROUND AND SCOPE OF THE PROJECT
The little information available related to air pollution in Kenya indicates an upward trend [1].
High concentrations were found in edible portions in a variety of food crops, and in the soil
within the vicinity of busy arterials. Pb levels of upto 127 fxg/g against the normal range of
0.1 to 1.0 fig/g were found in vegetables and cereals.
In Nairobi, which is the capital city of Kenya, there is no systematic air quality monitoring
programme. Nairobi is indicated as one of the cities where continuous air pollution monitoring
is done under UNEPAVHO Global Environment Monitoring System, data is available only for
the period 1977/78 [1, 2]. SO2 and paniculate matter were found to be near or above the
recommended guidelines at several sites within the city including a suburban and industrial.
Similar results have been obtained by other workers [3,4,5]. Measurements of acidity of rain
showed that rain falling in the Nairobi area is more acidic (pH 5.52) than elsewhere within the
country (Kericho pH 6.1, Meru pH 63 , Garissa pH 7.1). Similar findings [6] have been
obtained using a gaussian model to estimate the acid deposition in various parts of the country.
The central region of the country showed higher acidity values, which were attributed to
industrial activities in Nairobi and its environs towns like Thika which is highly industrialised.
Motor vehicles are also predicted to increase the level of pollutants in Nairobi [7, 8]. A similar
picture [8] for Nairobi is as indicated by Table 1. The predicted increase would mainly be due
to an increase in the number of vehicles and their deteriorating conditions. Although the actual
levels may be significantly different from the estimates, the depicted trends are critical.
Table 1. Estimates of Pollutant Emissions by passenger cars and bases in
Nairobi (tons per day) [8]
Year
1980
2000
CO
77
381
HC
7
38
NOx
4
20
SO2
0.6
3.0
P.M
0.5
2.7
The vehicle population within the city is estimated to be at least 2/3 of the nation vehicle
population [9]. Further more, the traffic volume is also increased by the large daily commuter
traffic between the city and its environs. In this paper, we describe the use of a nuclear
technique, energy dispersive x-ray fluorescence (EDXRF) in air pollution studies carried out
in Nairobi. The period of sampling was between December 1993-October 1994. Results of
analysis of aerosol samples for heavy metals, total particulate matter and some weather
13-2

parameters are presented. This project is being run jointly between Institute of Nuclear
Science (INS) and Kenya Meteorological Department.
METHODS
Sampling
The aerosol exercise for the on going project started in Dec. 1993 at the Kenya Meteorological
Department (KMD) which is about 3000m above sea level and to the north - north west of the
city centre which is about 5km away. It is located in what we call a sub-urban site or a
residential area. The project is a joint venture between INS and KMD assisted by IAEA under
a Co-ordinated Research Project (CRP - KEN/7259).
A Stacked Filter Unit (SFU) developed by the University of Gent, Belgium, is being used.
The instrument measures particulate matter (P M) of upto size 10 (P M 10) which are of major
importance to human health implications.
The unit is able to separate coarse and fine particles. The upper limit for the particle equivalent
aerodynamic diameter (EAD) at 50% collection efficiency for the coarse filter (8(xm) is 2- lOfwn
EAD size fraction, whereas the fine nucleopore, (0.4 ftm) collects particles less than 2fim EAD
The division of the particles into two sizes resembles the human respiratory system, in which
the coarse particles are stopped in the nasal and bronchial region, whereas the fine particles can
penetrate the alveoli and possibly be transported into the body systems. Sampling took place
for more than 10 months during which time the month of April experienced alot of rains. The
average rainfall was 2.4mm with wind blowing mostly from east at 8knots (4 ms"1). During
the sampling period, 400 filters (coarse and fine) were collected for analysis with EDXRF to
determine the heavy metal content. TSP values were determined using the gravimetric method.
Meteorological data such as wind direction and speeds, humidity, temjjerature and rainfall were
recorded. The flow rate was kept at an average of lnP/h over 24h collection period
throughout the whole exercise.
EDXRF Set-up
The EDXRF system used has previously been described [10]. It consists of: a Si(Li) detector
of resolution 190 eV for Mn 1 ^ line at 5.9keV, *09cd x-ray excitation source (25mCi) or X-
ray tube (Mo) together with associated electronics for signal processing and shaping, and a PC
based S-100 multichannel analyser with relevant interface and software.
13-3
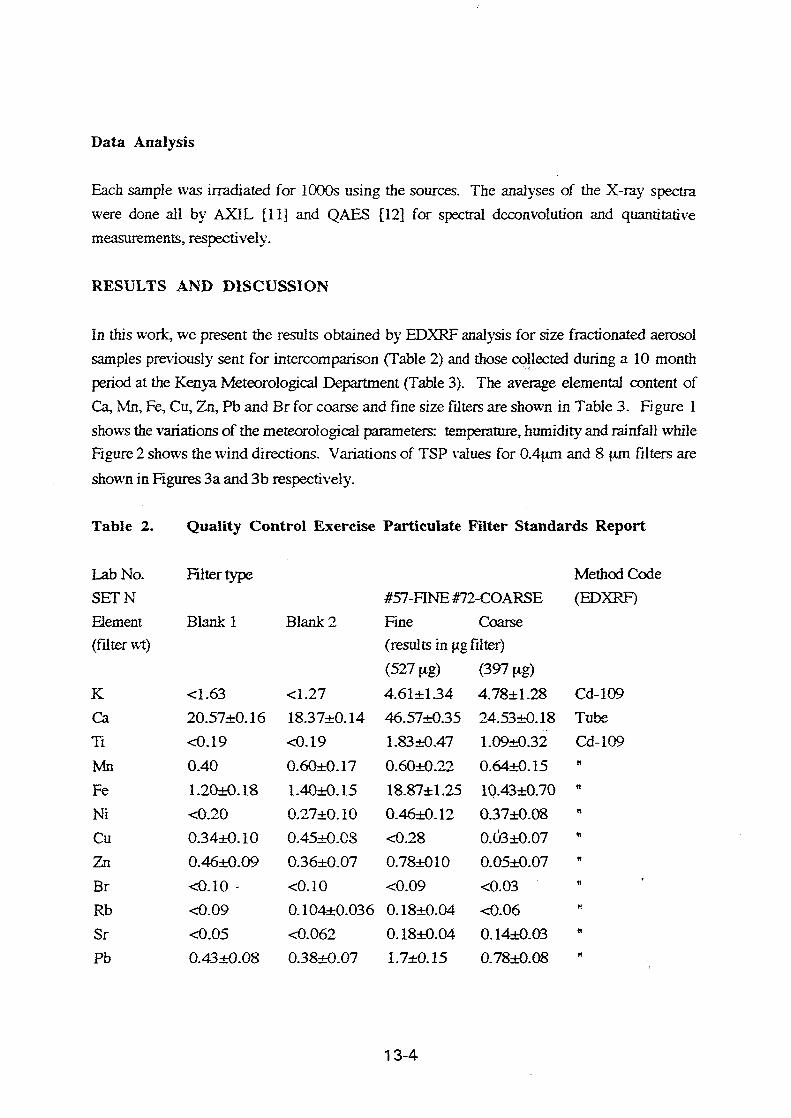
Data Analysis
Each sample was irradiated for 1000s using the sources. The analyses of the X-ray spectrawere done all by AXIL [11] and QAES [12] for spectral deconvolution and quantitativemeasurements, respectively.
RESULTS AND DISCUSSION
In this work, we present the results obtained by EDXRF analysis for size fractionated aerosolsamples previously sent for mtercomparison (Table 2) and those collected during a 10 monthperiod at the Kenya Meteorological Department (Table 3). The average elemental content ofCa, Mn, Fe, Cu, Zn, Pb and Br for coarse and fine size filters are shown in Table 3. Figure 1shows the variations of the meteorological parameters: temperature, humidity and rainfall whileFigure 2 shows the wind directions. Variations of TSP values for 0.4(xm and 8 \im filters areshown in Figures 3a and 3b respectively.
Table 2.
Lab No.SETNElement(filter wt)
K
Ca
Ti
Mn
Fe
Ni
Cu
Zn
Br
Rb
Sr
Pb
Quality Control Exercise
Filter type
Blank 1
<1.6320.57±0.16
<0.19
0.40
1.20+0.18<0.200.34±0.100.46±0.09<0.10 -<0.09
<0.050.43±0.08
Blank 2
<1.2718.37+0.14<0.19
0.60±0.17
1.40±0.150.27±0.100.45±O.0S0.36±0.07
<0.100.104±0.036
<0.0620.38+0.07
Particulate !Filter Standards Report
#57-FINE #72-COARSEFine Coarse(results in ug filter)(527 g)
4.61±1.3446.57±0.35
1.83+0.47
0.60±0.2218.87±1.25
0.46±0.12<0.280.78+010<0.090.18±0.04
0.18±0.041.7±0.15
(397 fig)
4.78±1.2824.53±0.181.09+0.32
0.64±0.15
10.43±0.700.37±0.080.63±0.070.05±0.07
<0.03<0.060.14±0.030.78±0.08
Method Code(EDXRF)
Cd-109TubeCd-109«n
n
«
n
n
«
13-4

Table 3 .
Element
Ca
Mn
Fe
Cu
ZnBrPb
Variation of heavy
period
Fine particles (0.4f*m)
0.033-4.150
.0.001-0.034
0.094-0.360
0.007-0.069
0.008-0.072
0.008-0.098
0.055-0.419
metals levels (fjg/m3) during the samj
Coarse particles (8fim) Source
0.091-3.975 1(>9 Cd
0.004-0.089
0.232-1.580
0.130-0.074
0.007-0.049
0.007-0.060
0.031-0.465
Variations of Ca, Mn, and Zn over the sampling period for the two particle sizes show the same
pattern with concentration values as follows: Ca, (0.03-4.15) ng/m3 for both filter sizes; Mn,
(0.001-0.034) ng/m3 for fine and increases by factors of 2-3 for the coarse; Zn, (0.01-007)
fAg/m3 for both filter sizes. A significant increase by factors of 3 for Ca, 7-10 for Mn and 5-7
for Zn for the month of February-March, 1994, is noted (Figures 4, 5 and 6). This
corresponds to increase of about 3% in TSP values with the following meteorological
conditions: easterly winds (67-1123 degrees), constant temperature 20° C, and increasing
humidity 60% that reached the maximum value (73.4%) in May 1994. The variations with time
for most of the heavy metals follow a similar trend throughout the sampling period which
indicates that their origin is most likely the same and possibly related to the earth crust [13].
The variations of Cu and Pb., indicate considerable high values at the start of the sampling (0.07
and 0.4) ycg/mP^ respectively for both filter sizes. This reduces to average values of 0.01
fig/m- and 0.05 (Ag/rn at the end of the sampling period. The trends (Figures 7,8) for the two
elements are similar, with depletion of both elements at the end of the sampling period. This is
related to the same production mechanism of these elements in the atmosphere since the average
rainfall is too low to be the dominant process in the removal of particles. However, the TSP
vaiue is maximum in April/May 1994 during which the easterly winds were blowing at 2 knots.
Variations of Br for both fine and coarse fillers is constant (0.02 ng/rn^) for most part of the
sampling period upto July (Figure 9). It then increases by factor of 5 in August during which
time there are low TSP values (10 iig/m?) in the dry period with relative humidity 70% and
moderate wind speeds at 9 knots.
13-5

CONCLUSION
The results of analysis show that there are two classes of pollution sources impacting at the
sampling site: a) Fe, Ca, Mn and Zn whose origin can be crustal; b) Cu, Br and Pb
(anthropogenic). Various activities that contribute to suspended paniculate matter in the air are
identified as those due to: cutting of trees, construction, industrial and dust blown from
unpaved roads. The TSP values during the sampling period at the Kenya Meteorological
Department vary between 10 to 50 fxg/m^ for both filter sizes with the variation of heavy
metals as shown in Table 3.
Comparison of this work with previous studies [3, 13], indicate that the TSP values increased
with increasing wind speeds but decreases with reducing relative humidity (Figures 1 and 3).
However, the TSP values have over the past 2 years remained constant
ThePb level in the aerosols is below the World Health Organisation [14] recommended levels
(0.5-1.5 fig/m3). The source of Pb and Br is due to vehicular emissions since those two form
the main additives of our gasoline. It is therefore important that laws pertaining to exhaust
vehicle emissions and compositions are enacted and enforced in the country to make sure that
road worthy vehicles are being used. There is also need to reduce the Pb levels in our gasoline
while the policy makers and urban planners need to be sensitized to take into consideration air
polluting activities in order to ensure low pollution levels for sustainable development
PLANS FOR FUTURE WORK
The project aims to continue sampling PM 10 on continuous basis. It is also hoped to set up
another parallel study with a high volume sampler. This will help us capture paniculate matter
larger than the PM 10 which are also important in aerosol chemistry. Plans are at an advanced
stage to start rainfall analysis for at least five rainfall collection stations in the country. This we
hope, it will give us a good picture of air pollution levels by industrial activities plus long range
transport of aerosol pollutants in the country. This work will be carried out jointly between
Institute of Nuclear Science and Kenya Meteorology Department Bioindicators are still being
studied with the help of the Kenya National Museum (Herbarium), but so far we have not been
able to identify good indicators in the country. However work on this area is envisaged to
continue. We are also hoping for further close collaboration with other participating instutions
under this CRP for more intercomparison, exercises and capacity building plus more donor
funding.
13-6
Analysis of EDXRF data by use of more advanced statistical techniques such as principal
component analysis will be started. This is to give us more insight to the relationships of the
measured parameters if they do exist.
REFERENCES
[1] Gatebe, C.K. and Kinyua, A.M., Total Suspended Paniculate Matter in Air of
some Urban Areas in Kenya - A Review. Int. J. BiochemiPhys. 3, (1994). 11-14
[2] WHO 1987. Air Quality guidelines for Europe. Regional Publications, European
Series No. 23. Copenhagen
[3] Ngugi G.K., Total Suspended Particulate: Condensation nuclei and their size
distribution in Nairobi, MSc. Thesis, University of Nairobi (1983).
[4] Gatebe C. K. (1990). Survey of Paniculate Air Pollutants in Nairobi City Centre
using optical dust sampler, Dept of Meteorology University of Nairobi.
[5] Kollikho W., J.K. Ng'ang'a., C.K. Gatebe,M. S. Rao and A. M. Kinyua 1995:
Measurements of SO2 in Nairobi. International Journal of BioChemiPhysics (in
press).
[6] Ng'ang'a J.K. (1989). Estimation of Acid aerosols in Kenya Using a gaussian
approach: WMO Technical Note No. 785, Secretariat of the World Meteorological
Organisation
[7] Gatebe C. K., A. M. Kinyua, J. K. Ng'ang'a and M.S. Rao 1994. A simple Diffusion
Model for calculating Concentrations from Line Sources in Nairobi. International
Journal of BioChemiPhysics, Vol. 3, Nol., 16 - 27.
[8] FaizA, K. Sinha, M.J.Walsh A. Varma, (1990). Automotive Air Pollution: Issues
and options in Developing countries. Report WPS 492, Infrastructure and Urban
Development Department, The world Bank 1990
[9] Actions towards a Better Nairobi; Report and Recommendations of the Nairobi City
Convention "The Nairobi we want", City Hall, July 27-29. 1993 edited by James G.
Karuga.
13-7

[10] Kinyua A.M., X-ray Fluorescence Analysis of Solid and Liquid Samples, MSc.
Thesis, University of Nairobi (1982).
[11 Van Espen, P., K. Janssens, I.Sweenters: AXIL - X-ray Analysis Software,
Users Manual, Canberra Packard Industries, Benelux (1985).
[12] Kump P. Quantitative Analysis of Environmental Samples (QAES), Ljubljana,
Slovenia (1993).
[13] Karue J., A.M. Kinyua, A.H. S. El-Busaidy, Measured Components in
Total Suspended Particulate Matter in Kenyan Urban Area, Atmospheric
Environment 26B 4 (1992)505-511.
[14] World Health Organisation, Air Quality Guidelines for Europe. Regional
Publications, European Series 23, WHO, Copenhagen (1987).
Acknowledgements
We wish to thank the International Atomic Energy Agency (IAEA) for providing the equipment
and materials used in the sampling exercise under Projects CRP KEN/7259 and KEN/2/003.
We also thank the University of Nairobi, Kenya Meteorological Department (KMD), the
International Science Program (ISP), Uppsala, Sweden, for their material support. Sincere
thanks are also extended to F.M. Nkonge, F.N. Kimonyi and L. N. Murithi for assistance in
data collection, entry and secretarial support services.
13-8
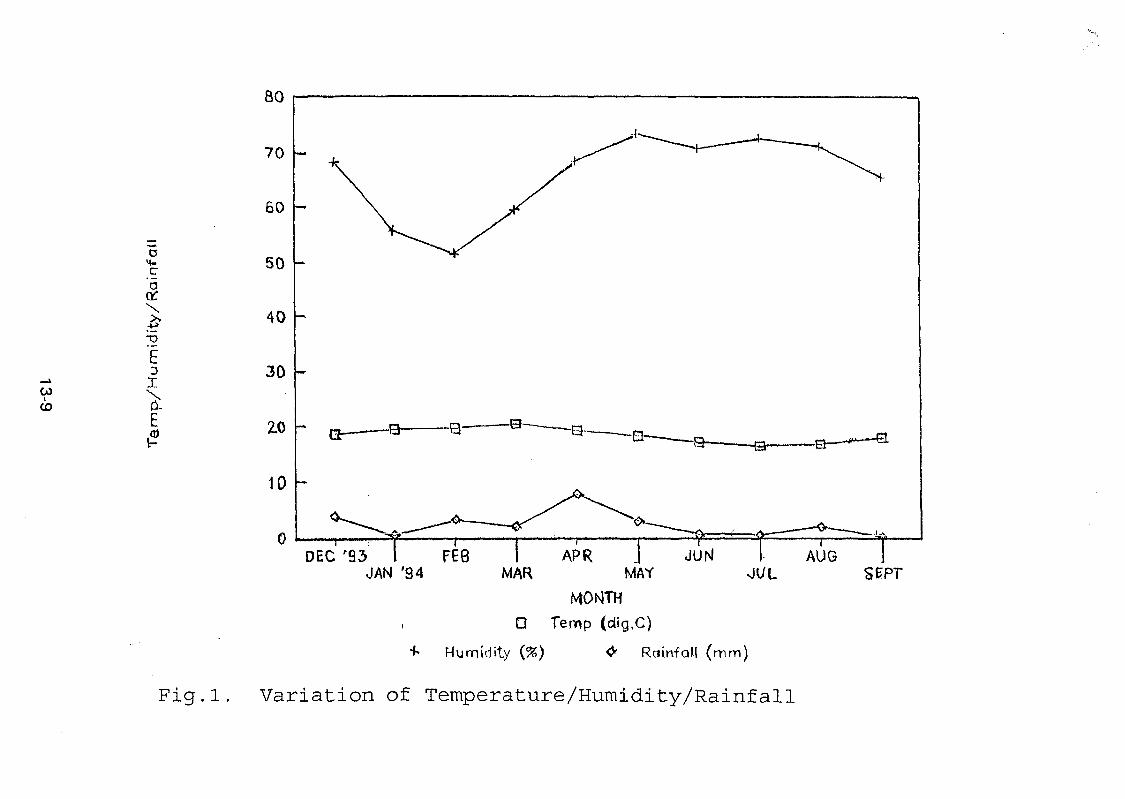
COI
oC
E3
zo -
10 -
0DEC '93 I PE8
JAN '94JUN1 APR ]
MAR MAY
MONTH
Q Temp (dig.C)
Humidity (%) <> Rainfall (mm)
AUGSEPT
Fig.l. Variation of Temperature/Humidity/Rainfall

oU
HiNOW
Fig. 2. Wind direction (in degrees)
13-10

Dec '931an '94 Feb Mar Apr May Jun Jul Aug
Month
Fig. 3(a) Variation of T.S.P. (0.4//m Filter)
Dec '93lan "94 Feb Mar Apr May Jun Jul Aug
Month
Fig. 3(b) Variation of T.S.P. (8.0//m Filter)
13-11

Decl99Stn'94 Feb Mar Apr May Jun Jul Aug
Month
Fig. 4(a) Variation of Ca (0.4f/m Filter)
Oi—I . , . , . 1 r—, r—, , — , r - , r—p
Dec199&n'94 Feb Mar Apr May Jun Jul AugMonth
Fig. 4(b) Variation of Ca {8.0/jm Filter)
13-12
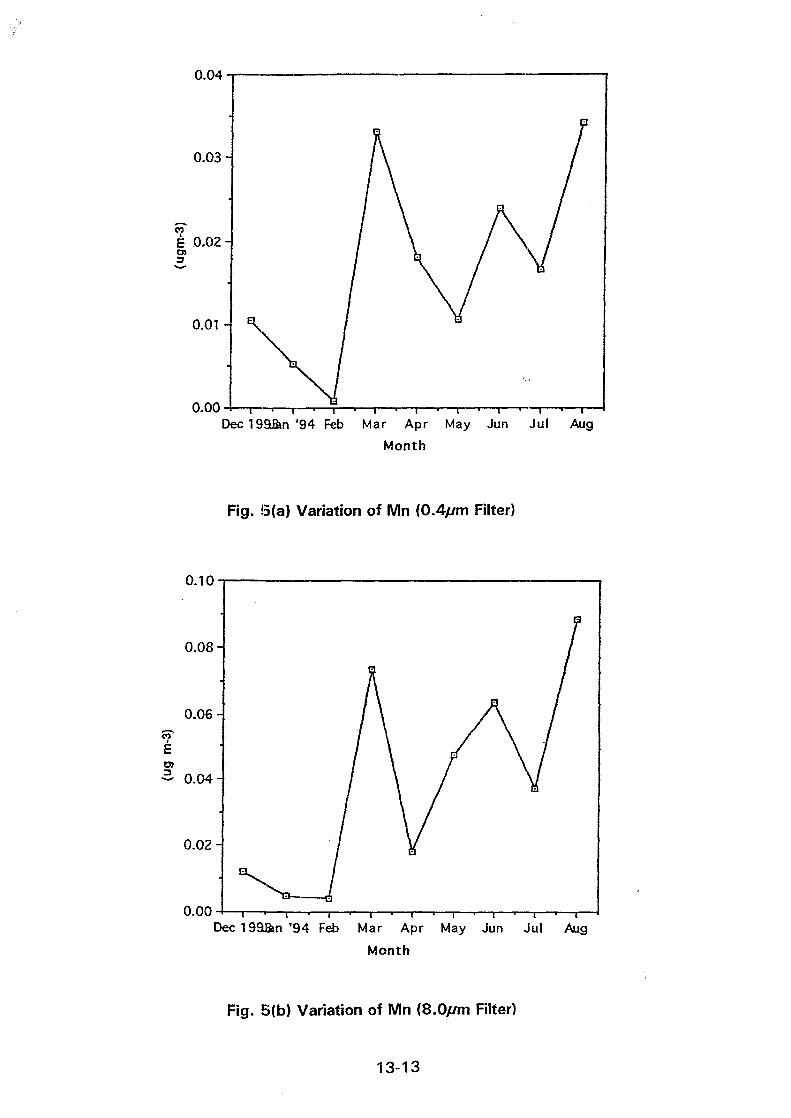
0.04
0.00 ( * I
Dec 199JBin'94 Feb Mar Apr May Jun Jul Aug
Month
Fig. 5(a) Variation of Mn (OApm Filter)
0.10
0.08-
0.06-
~ 0.04
0.02-
0.00-4—r I ' I
Dec199Jin'94 Feb Mar Apr May Jun Jul Aug
Month
Fig. 5{b) Variation of Win (8.0//m Filter)
13-13

f0.08
0.00 1 t . t . t
Dec '931an '94 Feb Mar Apr May Jun Jul Aug
Month
Fig. 6(a) Variation of Zn [OAfim Filter)
0.05
0.04-
0-03-
O33
0.00-4—,—.—.—.—,Dec199&n'94 Feb Mar Apr May Jun Jul Aug
Month
Fig. 6(b) Variation of Zn (8.0//m Filter)
13-14

0.0Dec199J&nf94 Feb Mar Apr May Jun Jul Aug
Month
Fig. 7(a) Variation of Cu {OAfjm Filter)
0.00-4—rDec '93)an '94 Feb Mar Apr May Jun Jul Aug
Month
Fig. 7(b) Variation of Cu (8.0//m Filter)
13-15

4 * 1
Dec199£m'94 Feb Mar Apr May Jun Jul Aug
Month
Fig. 8(a) Variation of Pb {OAfjm Filter)
Dec 199&n '94 Feb Mar Apr May Jun Jul AugMonth
Fig. 8(b) Variation of Pb (8.0//m Filter)
13-16

0.10
I • t • 1 • I • t • I0.00Dec199Jin'94 Feb Mar Apr May Jun Jul Aug
Month
Fig. 9(a) Variation of Br (0.4//m Filter)
0.07
0.00Dec199B»n'94 Feb Mar Apr May Jun Jul Aug
Month
Fig. 9{b) Variation of Br (8.0//m Filter)
13-17
XAO103094
Appendix 14
MONITORING OF TRACE ELEMENT AIR POLLUTION
M. DO CARMO FREITAS, M. A. REIS, L. C. ALVES, M. A. GOUVEIA, T. FERNANDES,I. DIONISIO, R. PINHEIRO
ITN - Institute) Tecnologico e Nuclear, Estrada Nacional 10, 2685 Sacavem, Portugal
Abstract
The Gent PM air sampler equipped with stack filter units, provided by Dr.Maenhaut of the Gent University, was installed at the Lisbon air samplingnetwork, controlled by the Lisbon Air Management Committee (DRARN-LVT/CGA-L), a committee from the Environment Ministry. The air paniculatematter samples were collected each week, sampling 8 h/weekend day and8 h/midweek day (period from October 6, 1993 up to February 15, 1994) and16 h/weekend day and 16 h/midweek day (period from February 17, 1994up to January 11, 1995). The change in time was due to the low masses,obtained using 8 h/day, having been observed that collecting 16 h/day wouldnot collimate the filters. The filter samples were cut up into three parts: onehalf was analyzed by INAA, one fourth by PIXE and the left-over part wasachieved for a possible second INAA or PIXE analysis or for some other typeof analysis. The INAA and PIXE results are presented and discussed. Theresults on the aerosol standards, obtained by INAA, are also presented. Itwas determined concentrations for the following elements: Na, Si, S, Cl, K,Car Sc, Ti, V, Cr, Mn, Fe, Co, Ni, Cu, Zn, Ga, As, Se, Br, Rb, Sr, Mo, Ag, Cd,Sb, Cs, Ba, Lar Ce, Nd, Sm, Eu, Tbr Yb, Lu, Hf, Ta, W, Au, Hg, Pb, Th, andU.
1. SCIENTIFIC BACKGROUND AND SCOPE OF THE PROJECT
The industrial development of Portugal is increasing. Thus, an environmental studyconcerning determination of air pollutants from industrial emissions and identification of thepolluting sources should be pertinent. The cooperation between ICEEN (Instituto de Cienciase Engenharia Nucleares), since January 1, 1995, ITN (Instituto Tecnologico e Nuclear),through this project, and the national authorities for the environment is leading (i) to abetter knowledge of the state of air pollution in Portugal; and (ii) to the undertaking ofdecisions for environmental control. This is consistent with the priorities set by the programof the Portuguese government. Also, the use of nuclear techniques as INAA and PIXE forenvironmental studies is now being quite successful, the techniques having complementaryin determination of the elemental concentrations.
2. METHODS
The air sampler, provided by Dr. Maenhaut of the Gent University (see Fig. 1), wasinstalled at the urban site "Beato", in Lisbon (see Fig. 2). At this site, results on SO2, NO andNox are available and also meteorological data can be obtained. The aerosol filters'(0.4 umand 8 um) were collected each week 8 h/weekend day and 8 h/midweek day: the 8 h werespread in 20 minutes in each of the 24 h, between October 18, 1993 and February 15,1994; afterwards and up to January 11, 1995, the aerosol filters were collected 16h/weekend and 16 h/midweek day: the 16 h were spread in 40 minutes in each of 24 h.
14-1

2.1. INAA
The filters were pressed into polyethylene containers for irradiation. The sampleswere irradiated at the RPI reactor for 14 h at a thermal neutron flux of 1x1013 cm"2 s"1
decayed for 2-3 days and for 4 weeks, and measured each time for 7 to 15 hours in a highpurity germanium detector. The k0-method was used: wires of 0 . 1% Au-AI of 1 mmdiameter (CBNM) were coirradiated as comparators. In the period October 18, 1993 up toApril 2, 1994, the relative method was used to analyse the fine filters; the standards GSS4e GSS5 from the IGGE, diluted in cellulose, were used.
2.2. P1XE
The samples were irradiated in vacuum (10" Torr) with a 1.9 MeV proton beam (20mm2 cross section) and 750 nA/cm2 maximum current density. The total irradiation timewas 30 min. per sample. A 200 eV resolution Si(Li) detector was placed at 90° relative toproton direction; from January 1994 upwards, a 155 eV at 70° relative to proton beam wasused. Spectra were performed with AXIL Computer code V3.0.
3. RESULTS AND DISCUSSION
In Table I, the results on the aerosol standards obtained by INAA are shown; thecomparison with certified values or results of other participants has not been made yet.
Table IConcentration in ng for the aerosol standards (blank subtracted)
Element
AsBrCeCoCr(mg)CsEuFe(mg)HfHgK(mg)LaMn(mg)Na(mg)Rb(mg)SbScSmThZn
Filter 6 (coarse)
84.70134.6358.5712.640.3234.231.6524.863.009.45917.4625.860.51216.260.0946926.398.884.9611.31363.77
Filter 125 (fine)
65.85121.3630.258.960.2902.551.5114.72--10.3817.7603258.65-20.665.182.667.80346.76
Concentration in ng for the blank
Element
BrCoCrEuK(mg)
MnNa(mg)SbScZn
Filter 6 (coarse)
125.203.08316.510.8301.65
11.765.092.960.410194.51
Element
BrCoCr(mg)
KLaMnNa(mg)SbScZn
Filter 125 (fine)
131.993.090.361
915.452.467.191.572.370.40245.56
14-2

- , f ; . -
* . * .
Fig. 1. Gest air sampler, provided by Dr. Maeohauf of the Gent University.
-ig. 2. Urban site "Beato'Vin Lisbon, l o w i n g the stack filter unit with coarse and line filters.
14-3
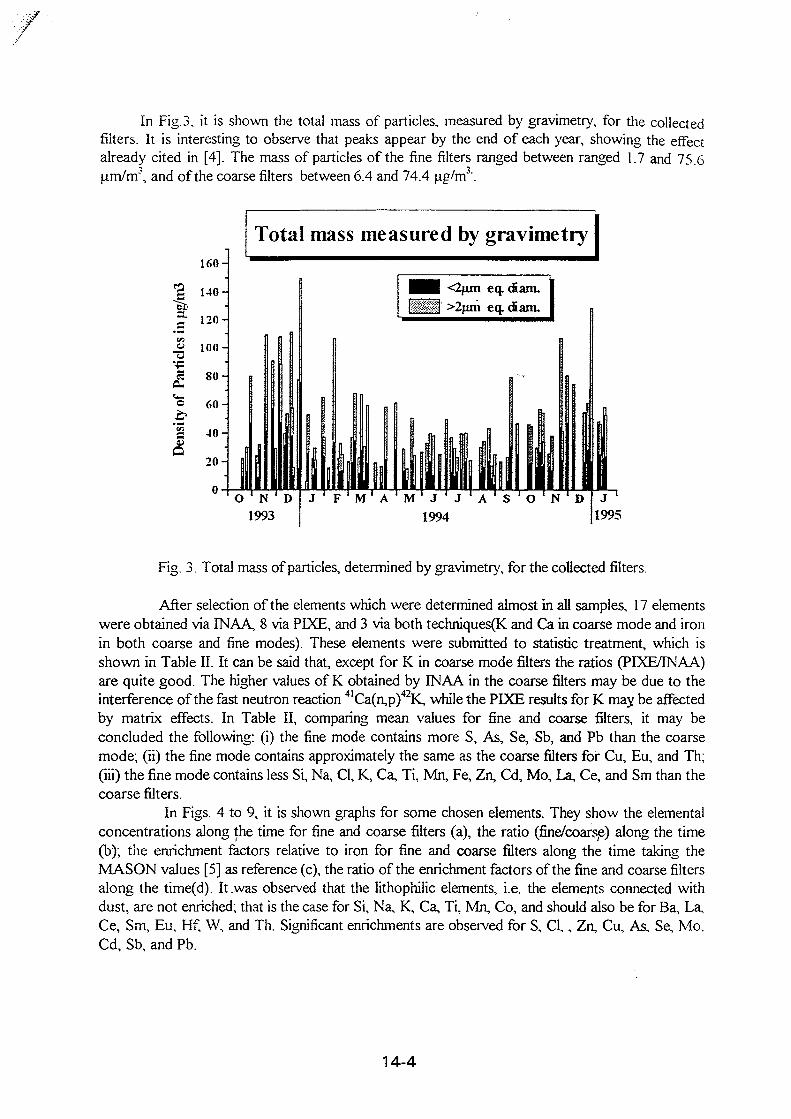
In Fig. 3, it is shown the total mass of particles, measured by gravimetry, for the collectedfilters. It is interesting to observe that peaks appear by the end of each year, showing the effectalready cited in [4]. The mass of particles of the fine filters ranged between ranged 1.7 and 75.6[im/nr, and of the coarse filters between 6.4 and 74.4 ug/m'\
160-
•g 140-
2" 120-
« looH
a sonCu
'o 60-
1 4 0 -
20-
0
Total mass measured by gravimetry
O N D1993
H H <2jun eq. (Earn.',-"> \ >2]im eq. diam.
J F M A M J J A S ^ O N ' D
1994 1995
Fig. 3. Total mass of particles, determined by gravimetry, for the collected filters.
After selection of the elements which were determined almost in all samples, 17 elementswere obtained via INAA, 8 via PIXE, and 3 via both techniques(K and Ca in coarse mode and ironin both coarse and fine modes). These elements were submitted to statistic treatment, which isshown in Table II. It can be said that, except for K in coarse mode filters the ratios (PIXE/INAA)are quite good. The higher values of K obtained by INAA in the coarse filters may be due to theinterference of the fast neutron reaction 41Ca(n,p)42K, while the PIXE results for K may be affectedby matrix effects. In Table II, comparing mean values for fine and coarse filters, it may beconcluded the following: (i) the fine mode contains more S, As, Se, Sb, and Pb than the coarsemode; (ii) the fine mode contains approximately the same as the coarse filters for Cu, Eu, and Th;(iii) the fine mode contains less Si, Na, Cl, K, Ca, Ti, Mn, Fe, Zn, Cd, Mo, La, Ce, and Sm than thecoarse filters.
In Figs. 4 to 9, it is shown graphs for some chosen elements. They show the elementalconcentrations along the time for fine and coarse filters (a), the ratio (fine/coarse) along the time(b); the enrichment factors relative to iron for fine and coarse filters along the time taking theMASON values [5] as reference (c), the ratio of the enrichment factors of the fine and coarse filtersalong the time(d). It .was observed that the lithophilic elements, i.e. the elements connected withdust, are not enriched; that is the case for Si, Na, K, Ca, Ti, Mn, Co, and should also be for Ba, La,Ce, Sm, Eu, Hf, W, and Th. Significant enrichments are observed for S, Cl,, Zn, Cu, As, Se, Mo,Cd, Sb, and Pb.
14-4
4. REFERENCES
[1] FREITAS, M.C., GOUVEIA, M.A., PRUDENCIO, M.I., REIS, M.A., ALVES, L.C.,"Monitorizacao da poluicao atmosferica em elementos-traco", 4a Conferencia Nacional sobre aQualidade do Ambiente, Lisboa, Portugal, 6 a 8 de Abril del994, volume II, pp. M99 a Ml07.
[2] REIS, M.A., ALVES, L.C., FREITAS, M.C., GOUVEIA, M.A., PRUDENCIO, M.I.,WOLTERBEEK, W. TH."Tecnicas analiticas nucleares na monitorizacao da poluicao atmosferica"9a Conferencia Nacional de Fisica, Covilha, Portugal, 19 a 23 de Setembro de 1994.
[3] FREITAS, M.C., REIS, M.A., ALVES, L.C., GOUVEIA, M.A."Monitoring of trace-element air pollution at an urban site in Lisbon using stacked filter units"Abstract accepted for presentation at the 10th International Conference Heavy Metals in theEnvironment, 18-22 September 1995, Hamburg, Germany.
[4] NICHOLSON, K.W., BRANSON, J.R., "Lead concentrations in U.K. urbas air", AtmosphericEnvironment, part B: Urban Atmosphere, vol 27B, n°2 (1993) 265.
[5] MASON, B. "Principles of Geochemistry", 3rd edition, 1966
14-5

H
Ic
B
feO
-o
c
T3
c
4_>
4)
U
&
V*
3
-S
• *
s
u.
8
9
8.-19
4)1
9( T l
8.00
9
9f T l
2.30
9
4)OO
E
g
g
ft
*
8
8©
-
u ;
*~*
<=?
*-:
013505
02
©
, - .
- * •
2,13
©
© '
02 1
8.02
4,1
•196
4,2
m
5.38
9
9
1.99
7A
4,
!:•o
•01
U J
4),
o .
- ^
8u i
4)1311
04,
1
U J
4,2
6.02
E
©
3.89
©
©
c
•oi
453
-
$
©2.
3IE
E-OJ
151
9
4)368
o .
8U J
8
8
9
8.63
E4)1
s
4)
-9
s' U
^ • .
©
1©
1
•02
-it
411
©
Hi
a<?
3.I2
E
9
1.38
.33
9359
c>
411
UJ
»
VUl
o
9
P
U J
4)1
U J
• ©
u :
4)1
UJ
4)2
2.83
E
Sf . ' l
1.93
1.15
©t3ll'J
U J
a
I
01 1
T - l
1.10
4,1
385
I.-*
1.12
©a io'9
©
©
.014)1
-01.9
4
r-i
+ 00
1951
?390J
4,1
U ]
©
2
01
U J
< =
I.I2
E
sUJ
v-i
, - .
?.
o
u:oc
o
f:
i
022.3
24)
2
U J
t l )
1.61
^ >
2.07
E9
UJ
•0
f4
g
9
£3d'5
1.621
83811
4,1311
•03611
02I.
I4E
1
U)
1.59
o
I.I9
E
o
|S.
s
1
—
8U J
3
* • ' .
I.ME
E-O:
7.79
-0
1:1_ i
8UJ
»ot
UJ
f
V3.9500*
1818
UJ
•0
S8
4.03F
.2.
23E
03
1!)
+
©
f
UJ
(/J
0
i :
u
a
ui
Z
1 FI
NK
0-3III
OLJ
4,315
4)2
28E
4)2
.20
9
5
3
4,1
02•H
E
- •
8
g
•01
s
•6
9
• " :
0
g
c
9
9u :
9301
4)2
•03
9
•f.
4).
0!
UJ
V .
8—
8
I.-I8
E4,
U J
u :
t02
1.01 E
0
S
I
E-O
2.18
9
P
9
%
.32E
4,2.5
53.
24E
9
9
3.70
E4,1
U J
• ^
8
9
5.63
E
9
3
9
s93:
>-"
+02
0
3.-I6
E
1•e
1
9in
2.63
9UJ
.31
9
• 0
4,31
2.00
E4)
3.83
E-O
1
9386
**•
•016.
02E
8
9r*i
s
•l.K
9U J
2.9
+01
?
1.69E
a
I
E-O
1.1?
©
.81©
s-0
24)2
H
9
2
10-3889
UJ
sUJ
?
2.3J
E-0
5(f
8u :
+02
1.46E
0
5.83
E
S
I
E4)
1.39
9
9
s?r-
?
0
CO
5.O3E
9U l
?
2
4)1I.
76E
4.19.
39E
-0
3
9Ul
1.2
U ]
rt
00+
6.50
E
?
I.95E
i1
0-3
9.-I9
41
0
< >
£\r~
4,1
I.98E
•01
.0-
8
8
S
2.26
E+O
0•0
1
' '
UJ
**;
83SSJ
9
4.07
E
8w
8
S
+02
6.62
E
£0+
2.O9E
fSc
1
E
0
p
<3
n
CO
i8
0
u;0
+01
1008
8
9.35
E
0
u:
0
g
i
©
u;
1.93
au :
+02
s
+02
1
X
00
301 •)
g
=
8
©
st -
s
s
sr?
11
c
X
-
3
s1
JO
!
5
=!' . • "
O
0.1
—
-
©
c
0
I
i
1
©
1
©
sU]
o<
c
—
3
©
s0. . ,
f:
s
g
s
1
©
©
03911
0
s
s
30
* - *
u :
©
sg
s=
I
9
2.-10
E
9UI
»^
8
S
8
I.89E
0
2.O2E
9t n6IT
0
U J
10+
9.6
IE
0
jo
|
£
j 5.
-I5E
+02
5.82
C
apUJ
•«>
s311
"*0
g
a
©
UJ
8:
i n
1.86
gU J
' •
U J
0
S
is
1
0
P
U
n
1 FI
NK
«**
I I.0
8E5.
28E+
OI
?
7.I3
E
0
62E
8UJv-i
?
5.8
IE
0
2.69
E
3-n i
s
U l
i-i
J0+3J98
+02
c
1 8.
56E
f
8
04E
OO
8
2.83
E
8
©
2.O
3E
?
1.30
f
s0
.87E+
O2
s
*?
1 8.
55E
3su l
00*
• 0
8
38
4.57
E
?UJ
r^
JO" I
t o
s39CS
+02
%
i•i
V
4.26
E1.
54E+
O1
?3.3
2E-i
039J
« ^
gU l
?
2.53
E
0
Ul
S
91I1
-
UJ
&
4.33
E+O
2
©
a
IJ5E
+01
t - '
8Ul
a
16E
—gUJ
~f
8UJ
50
Sa( J l
gU J
S
UJ
+02
r-
V300J |
8
1.82E
9
8
s-§
s
•?3591
Y
S-8UJ
6.1!
0
+01
a
I m
lnln
tunt
0
UJ
2.50
E+02
01UJfS*d
<?302
©
UJ
?:
2.23
E
u:
3i l l
8.35
?UJ
1.0
2
2.39
E+0
3
i
14-6

Beato Oct.93 to Jan.95
100000
10000
1000
I loo£ to
u! I
O.I
0.01
S* . Vv, i*» .
O ' N ' D ' J F M A M J J A S O N D JNtonth W
**. *• -*•* * • 4
V:'.V «
'O'N'D'J'F'M'A'MJ'J'A'S'O'N'D'rMjnlll M
100000
10000
1000
! 100
> 10
i i
0.1
0.01O N D J F M A M'J 'J 'A'S'O'N'D'J
Mmtli M
1000
. 100
5...O N D J F M A^M'J" J^A'S 'O'N'D'J
Sbmh (rf)
'O 'N 'D J F M'A'M'J 'J 'A'S'O NTJNbnUi (a)
I00000 r
10000
1000
| 100
•. 10
O ' N ' D ' J " F ' M ' A ' M ' J ' J ' A ' S ' O ' N ' D ' J
M)iilli (c)
I000r
I1"
3.-"
I1 TO'NT) .I
s*
i,lM'A
!
M'J'J'A S 0 NMm),
t
•
—
i | LD'J
(«
• *
*
SiI Rnuldfor BCT»Lhbo«. fromCtt93 to JurtiS
10000
<000
6000
4000
2000
100000
toooo
1000
100
10
I
0.1
0.01
(TN 'D 'J 'F 'M M'J 'J 'A 'S 'O 'N 'D
(d)
1 j ' f ' M ' A ' M ' J ' J ' X ' S '
Mtltlli
1000
100
rfr=lduhteTFoWP
5...
Ca
O ' N ' D " J ' F ' M ' A ' M ' J ' J ' A ' S ' O ' N ' D ' J
^t>nth (rf)
Fig.4 Elemental concentrations along the time (a), ratio (fine/coarse) along the time (b), enrichment factors along the time (c), ratio of enrichment factorsalong the time (d).

Beato Oct.93 to Jan.95
RgulnrorBtnb-l-hboa. from Ctti>) to Jan.95 I sforBfato-liiboa. fromCU>3 «Jan.9S I
10000
B0OO
! 6000
1 JOOO
2000
-U.0
iifJl
1u ll 40dtN 0 J
(a)
S'O'N'D'J O'N 'D 'J ' F ' M ' A M J J A S O N D )Mmth W
OOIIOO
10000
1000
100
10
O.I
0.01
-r-ft—VAA A
O'N'D 'J
0 0
4* A * * *
—
F'M'iS MJ J
^ ' 3 9
A'S'f N D J
£ o.-i
o.i
0.0
1000
too
J 10
i 1I •••!m. 0.01
n • J ' O ' I ' F M .l l l l l • . Ik' M ' J ' J V S
—
i
aIPMl
ul 0.001
CV7-"^
O ' N ' D ' ; ' F ' M ' A ^ I ' J ' J A ' S ' O ' N ' D ' J^bnlh (</}
00
' O ' N ' D ' J ' F ' M ' A ' M ' J ' J ' A ' S ' O ' N ' D ' JM>nth (a)
O ' N ' D ' J ' F V A ' M J i , \ S O N D J
**- 0)
100001
10000
1000
too
io
! 1
0.1
0.01O ' N ' D ' J ' F ' M ' A ' M ' J "J " A ' S ' O ' N ' f ) 1 J
M>iilli (r)
1000
~ 100
I l0 faA^VA\^^fr»
O'N'O'J ' P ' M ' A ' M ' J ' 1 ' A ' S ' O ' N ' D ' JMmih M
Fig. 5 Elemental concentrations along the time (a), ratio (fine/coarse) along the time (b), enrichment factors along the time (c), ratio of enrichment factorsalong the time (d).

Beato Oct.93 to Jan.95
I Raids rorPoib-thbo». tronCtt93 to.tati95 I
ii i IM m i l i
' O ' N ' O ' J ' F ' M ' A ' M ' J ' J ' A ' S ' O ' N D ' J 'Nblltll W
1000
, 100
10
!• '
j 0.1
0.01
O ' N ' D ' J ' F M A T i l I I A S
As
O N'D'J FM A M J J A S 0 NMjlltil
I'r
RquJbforBffto-Uifbo*, frorofttt^ lo J»rv95 j
O'N'D1J'F'M'A'M'J IJ1A IS'OTNTDT^bm^ (<)
100000
IOOOO
tooo
? IOO
& 10
U:
ui |
0.1
0.01
-L
A
-
A ERSn* |
. « ^ *
O N D J F M V M ) J T S ' O ' N D TNbnlli W
O ' N ' O ' ; ' F ' M ' A ' M ' ; 'III 'A 'S1t
Mo
100
10
0.01
••
**
*
•
O ' N ' D ' J ' F ' M ' A ' M ' J ' J ' A ' S ' O ' N ' D ' J "
for P«b-Lhbo». »q9? I
III irt||i
Se
' O ' N ' D ' J ' F ' M ' A ' M ' J ' J ' A ' S ' O ' N ' O ' J 'MJUDI (•-)
• * *« * • •
•
•
' O ' N ' D ' J ' F ' M ' A ' M 1 J ' J ' A ' S ' O ' N ' D TNbllll l
JI:
<TN D' J ' F ' M ' A ' M J ' J " A ' S ' O ' N ' D ^NbMh (•)
100000
10000
tooo
! too
=. 10
O ' N ' D ' J ' F ' M ' A ' M ' J ' J ' A ' S ' O ' N ' lMinUi (
O ' N ' D ' J ' F ' MtfcfciUjfcA ' M ' J ' J ' A 1 :
T—1~
N D'J
Sb
* •
t,,
••» V"•
• O ' N ' D ' J ' F ' M ' A ' M ' J 1 J ' A ' S ' O ' N ' O ' J '
Fig.6 Elemental concentrations along the time (a), ratio (fine/coarse) along the time (b), enrichment factors along the time (c), ratio of enrichment factorsalong the time (d).

Beato Oct.93 to Jan.95
X
RciulMorDoit>-t.M>o».
r1-J-J
O'N'D" i 'F'M'A'M1 ) ' ) A S 0 N DMintll
I| 1 0
& o.«£ »•«
0.JO.I
_
}
Cd»nmQt9Jll,l»ti9? I
' O ' N ' O ' ) ' K ' M ' A ' M ' ; ' J ' A ' S O ' N ' l > JMtuiti (0
O'N'O1 J 'F 'M'A'M1 J T A ' S ' O ' N ' O 'Ntuilh
| i O O
| 4 0 0
u JOO
c :oo
100
_l_
j l—
1
ii —Ui
Nbntli (c>
from Ctt9J b .I>ti95 I
0
[L—
— —1
II .. ...
Cur Dcwto-l-hho«. from CttW lo Jnn9t I
(ft)
'O'N'O' t 'F'M'A'M' J ' 1 \\ 'S'O'N'tV J '
Minlli W
O'N'I>' J 'F'M'A'MT J 'A'S'O'N'D' JMmili M
IQ00OO
10000
tooo
100
. toi
i
O.I
o.oi O ' N ' D ' J ' F . ' M ' A ' M T J ' A ' J ' O ' N ' D ' JMtn lh (0
&
_ 100
O'N 'D 'J ' F'
j ,v xrr» N
Mn
Fig.7 Elemental concentrations along the time (a), ratio (fine/coarse) along the time (b), enrichment factors along the time (c), ratio of enrichment factorsalong the time (d).

Beato Oct.93 to Jan.95
1 Rgiilh for Bc*to-Lhbo». from Ctt93 ty^PR?? t
io.:O.I
O'N'D'J 'F'M'A'M'J ' J 'A S O T T D TMililli (a)
' N ' D ' J ' F ' M A M ' J ' J ' A ' S ' O ' N D J
Ag
fromOct93ttJ»n.95 I
' O ' N ' D ' J ' F ' M ' A ' M ' J ' J ' A ' S ' O ' N ' I )M-tiUi {r)
O ' N ' D ' J ' F ' M ' A ' M ' J ' J ' A ' S ' O ' N ' D ' J 1
M i n l l i W)
O.«-
OS-
;?<>•<•
S»O.J-
J M .0.1
0.0
10000
tooo
v, 100
I (0
S '0.1
rt ni
J I ID ' I F l l ' A « T I A ' S ' O ' N T I
ON'D'J'F'M'A'M'J'J'A'S O'N'D'JNblltll (0
S «
tO ' N
•
•
'D'
t
• • *
1J ' F ' M ' A M'JM*
•
' J ' A '
*
.1S'O^N
•
D ' J
(»)
—
*
Sm
O ' N ' O ' J ^ W A M ) ; ' A ' S ' O T D JNbnih
mOt93 to Jan.95 . I
TOO
600
200
100 iiktoJ ' J ' A ' S ' O ' N ' I ) ' JjiKii (a)
La
(o)
0.0)
0.00'N'O1 .
in
10000
„ looo
J loo
b i">
o
o
c
rL
o
—
oEHn>Eftom
1J
pK 9
•i
O
-
* «
- ^ -
6 ' N ' D ' 1 J * F ' S1 |A I ' J ' J ' A ' S ' O I l lN'D';
Eu
O ' N ' D ' J ' F ST,VKI J J ' A ' S ' O ' N ' D ' JMll l l l l (^)
Fig. 8 Elemental concentrations along the time (a), ratio (fine/coarse) along the time (b), enrichment factors along the time (c), ratio of enrichment factorsalong the time (d).
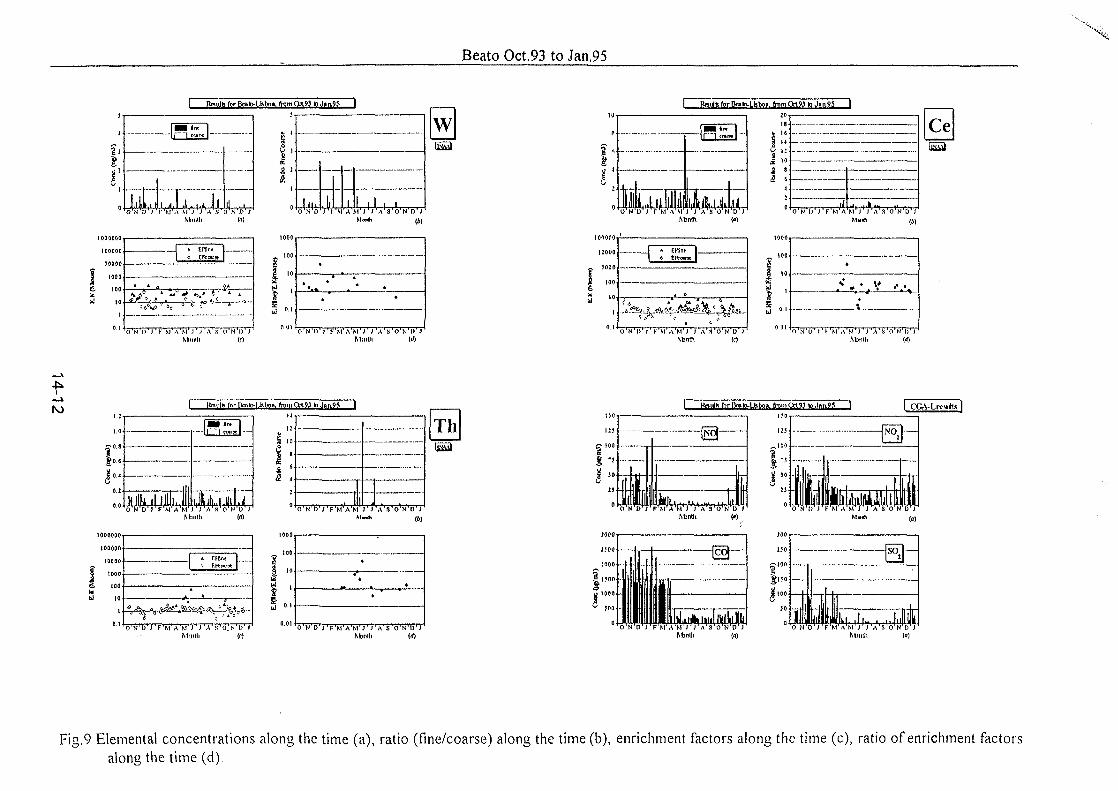
Beato Oct.93 to Jan.95
BoiJ(iforBgi»thbo«.fromat9JloJ«iv95 I I Bai<liforPoi>vUibo». fromOtl93»J»ii95 I
20 j
rr1
1,11u llM
O ' N ' D " J ' F ' M ' A ' M ' J ' J ' A ' S ' O ' N ' D 1 J
Ce
(rf)' O ' N ' I > ' J ' 1 - ' M ' A ' M ' J ' I ' A ' S ' O ' N ' O ' >
S b n t h (r)'O 'N 'U ' J ' K ' M ' A ' M T J ' A ' S ' O ' N D ' J '
Mmitli
I RiMilKfnrIknlo-l>l>o». frDmCO.93 to.Tan.95 I
1.0
0.1
n n Hill*i iii
.1 illli, 1
!••'«• I1( 1 C«II«| —
JlUu.iUM' O ' N ' D ' I ' F ' M ' A ' M ' J ' J ' A ' S ' O WO I
Minlli (a)
0
. 1OND-J'F'W'A'S
-
I
—
• A ' S ' O ' N ' D 1 )
Th
i •
' O ' N ' D ' ) ' F ' M ' A ' M 1 ) ' J ' A ' S ' O j N ' D ' J 'Mill l l i (f)
O N D ' J ' F ' M ' A ' M ' J 1 J ' A ' S ' O ' N ' D ' )Nbmh Ml
O N D f F M A M'J ' J 'A 'S 'O N IMmtli (o)
Fig.9 Elemental concentrations along the time (a), ratio (fine/coarse) along the time (b), enrichment factors along the time (c), ratio of enrichment factorsalong the time (d).

XAO103095
Appendix 15
TRACE ELEMENT AIR POLLUTION MONITORING STUDIES IN SLOVENIA USINGNUCLEAR ANALYTICAL TECHNIQUES
B. Smodis1, R. Ja6imovi<51, B. Stropnik2, M. Svetina Gros2
1 Jozef Stefan Institute, Jamova 39, P.O.Box 100, SI-61111 Ljubljana, Slovenia2ERICo, Koroska 64, SI-63320 Velenje, Slovenia
Up to now, only a few investigations have been performed inSlovenia involving comprehensive studies of trace elements, toxicelements, heavy metals and radioriuclides in the atmosphere. The aim ofthe project is development and application of nuclear and nuclear-relatedanalytical techniques for air pollution studies, leading to formation of adatabase concerning the trace element air pollution of Slovenia. In thisreport, the emphasis is on the methodology and analytical development{neutron activation analysis and X-ray spectrometry), and to a lesserextent on the results obtained up to now. Analytical results for severalcertified reference materials of similar matrix as the real samplesinvestigated are presented and discussed.
1 . SCIENTIFIC BACKGROUND AND SCOPE OF THE PROJECT
The general scope of the project is a better knowledge of the state of airpollution in Slovenia by performing environmental studies involving determinationof trace element air pollution from industrial emissions by analysing airborneparticulate matter, bulk precipitate and biomonitors. On successful completion ofthe project, an improvement in development and application of nuclear and nuclear-related analytical techniques will be achieved, and a database concerning traceelement air pollution of Slovenia will be obtained, possibly leading to appropriatedecisions in environmental control. Particular research objectives are:
1. To improve and further develop analytical techniques for multielementcharacterization of the materials analysed, including speciation of someparticular pollutants (e.g. Hg).
2. To study in more detail some highly polluted areas (e.g. surroundings ofa coal-fired power plant) by applying a more dense monitoring networkand possibly studying health effects caused by the plant on thepopulation living nearby.
3. The application of epiphytic lichens as indicators of toxic heavy metal airpollution in Slovenia in order to get information about the geographicalgradients for particular pollutants.
Close collaboration has been established with the Biotechnical Faculty(Department of Agronomy) of the University of Ljubljana, and the SlovenianInstitute of Forestry in Ljubljana concerning identification of lichen species' and
15-1
sampling. Cooperation is also established with the Hydrometeorological Institute forprovision of meteorological data. Staff from ERICo Velenje, Ecological Research &Industrial Cooperation are giving us assistance in collecting and analysing aerosolsand bulk precipitation around a coal-fired power plant. Collaboration is alsoestablished with the Interfaculty Reactor Institute of Delft University of Technology,The Netherlands, (sampling, sample preparation, data interpretation), the Institutefor Nuclear Sciences of the State University of Gent, Belgium (quality of analyticaldata) and with the Forschungscentrum Julich, Germany (quality of analytical data).
2. METHODS
2.1. Sample collection
Aerosols are collected by means of an in-house constructed single jet sampler[1 ], with a cut-off point of ~ 2.5 //m. The sample inlets are'positioned 1.8 m abovethe ground. The fraction ~ 2.5 to 10 pm is collected on a Nuclepore polycarbonatemembrane filter (37 mm diameter, pore size 0.45 pm), with free air flow reducedto a diameter of 13 mm in order to achieve a higher concentration of coarseparticles in the central part of the filter. The particulate fraction finer than ~ 2.5pm is collected on a Nuclepore polycarbonate membrane filter (47 mm diameter,pore size 0.45 pm). Both filters are held in the original Nuclepore holders. The airflow rate through the separator and both filters is regulated by a critical orificebetween the filters and a GAST oil-less diaphragm vacuum pump (type DO A). Theflow rate is not constant and it decreases by up to 50% from the beginning to theend of the sampling period. The arithmetic median value of the flow rate is about400 L«h"1, representing approximately one third of the rate of human breathing.The flow rate is measured by a rotameter at the beginning of sampling, checkedevery second day and finally at the end of the sampling period. The effectivenessof the separator in defining the two fractions was controlled by examination of thecollected particulates under a scanning electron microscope (LEITZ - AMR); noevidence for collection of particles greater than 2.5 pm in the fine fraction was everfound. Sampling times vary, depending on the minimal flow rate necessary forsuccessful operation of the separator and determination of the content of airparticulates, being from 3 to 14 days.
Bulk precipitation is collected by continuously open collectors and comprisesonly elements and substances which are deposited by sedimentation under theinfluence of gravity. The collection system consists of a polyethylene funnel(diameter 26 cm) and a polyethylene bottle (5 I). The funnel-bottle system ismounted inside a stainless steel cylinder placed on a concrete plate, keeping theupper edge of the funnel 1.3 m above ground level. The opening of the funnel isprotected by a coarse filter mash made of polyethylene (with mesh diameter 2 mm)and a nylon net (pore size 250 pm) in order to prevent ingress of coarse particles(e.g. leaves) and insects. Before each sampling period (1 month), 10 ml cone.HN03 (suprapure) is added to the bottle to preserve the precipitation collected,achieving a final pH of about < 2.
2.2. Sample preparation
The procedure for samples to be analysed by instrumental neutron activation
15-2

analysis is as follows:
Two-hundred milligram aliquots of SRMs are packed in polyethylene ampoules(Kartell, Noviglio, Italy), together with an AI-0.1 % Au alloy wire (Central Bureau forNuclear Measurements, Geel, Belgium) of 1.0 mm diameter and a 0.125 mm Zr foil(Goodfellow, Cambridge, UK), which serve as comparator and fiuence ratemonitors.
APM loaded filters are pelletised with a manual press (Mod. 25011 , Specac,UK) in a pellet die of 5mm diameter and packed the same way as SRMs.
Bulk deposition samples are filtered through Nuclepore polycarbonate 0.45 //mmembrane filters, leading to the separate analysis of water and filtrate.
The procedure for samples to be analysed by energy dispersive X-rayfluorescence spectrometry is as follows:
Loaded filters are weighed on a Mettler balance AE 163 having a precision of10 //g (Mettler Instrumente AG, Switzerland), after neutralising the charge with aNuclepore static eliminator (Nuclepore, Cambridge, USA). Filters are kept in Petridishes prior to the analysis.
2.3. k0 -based instrumental neutron activation analysis (INAA)
All irradiations are made in the carousel faciliy of the TRIGA Mark II reactor ofthe Jozef Stefan Institute (US) at a thermal neutron fiuence rate of 1.1 x 10 1 6 m"2
s"1. The irradiation time for each sample is 18 h. After irradiation the samples aretransferred to clean 5 ml polypropylene mini scintillation vials (Atom Medical Ltd.,Hove, UK) for measurement. The radionuclides used in the determination of 50elements in each sample, their half-lives and gamma-energies measured are givenelsewhere [2]. The samples are measured on an HP Ge detector (Ortec, USA)connected to a Canberra Series 90 multichannel analyser (Canberra Packard, USA).The samples are measured 2 days, 8 days and 14 days after the end of irradiation.They are measured at such a distance (i. e. 2 cm), that the dead time is kept below10% and random coincidences are negligible. The Au comparators are measuredat a large distance (i. e. 16 cm) and their geometry is approximated by a smallcylinder. The Zr foil is measured in the form of discs, and, again, the dead time iskept below 10%. Spectra are processed by the SAMP0 90 program [3]. Effectivesolid angle calculations are made using the SOLANG program [4]. Elementalconcentrations are calculated by the ROMOS program [5]. The relevant nuclearconstants (i. e. k0, Qo factors, etc. are taken from the literature [6-9].
2.4. Energy dispersive X-ray fluorescence spectrometry (EDXRF)
Samples are placed on an in-house constructed automatic sample.changercarousel facility with a capacity of 10 specimens. Two different set-ups are usedfor EDXRF analysis: (i) a 1 GBq 109Cd excitation source (Isotope ProductsLaboratories, Burbank, USA) and a Si(Li) detector (Canberra Industries, Meriden,USA) with an active area of 30 mm2, thickness of 3 mm and FWHM of 165 eV at5.9 keV coupled to a Canberra S 100 multichannel analyser (MCA); (ii) a 1 GBq2 4 1 Am excitation source or a 1.8 GBq 55Fe source (both supplied from IsotopeProducts Laboratories) and a low energy Ge detector (Canberra Industries) with anactive area of 30 mm2 , thickness of 5 mm and FWHM of 140 eV at 5.9 keV.
15-3

Spectra are processed and quantitative analysis performed using AXIL-PC andQAES (Quantitative Analysis of Environmental Samples) software (CanberraIndustries). Both systems were calibrated by using NIST SRM 1832 XRFThin FilmStandard for Al, Si, Ca, V, Mn, Co, and Cu and NIST SRM 1833 XRF Thin FilmStandard for Si, K, Ti, Fe, Zn, and Pb.
3. RESULTS
In 1994, much effort was put into quality assurance. Thus, as well as theanalysis of IAEA Lichen research material and the APM collected on filter media(prepared by S. Landsberger), some other standard (SRMs) or certified referencematerials (CRMs) were analysed by the proposed methods/procedures. The resultsof analysis for several SRMs are presented in Tables 1 - 5 .
A summary of the analytical results for INAA including medium and long half-life nuclides for NIST SRM 1633a Coal Fly Ash and NIST SRM 1570 Spinach arefound in Tables 1 and 2, respectively. It should be pointed out that for thesematerials no short-lived (e.g. in the minute range) radionuclides were analysed.
TABLE 1. COMPARISON OF INAA DATA TO CERTIFIED AND "CONSENSUS"VALUES FOR NIST SRM 1633a COAL FLY ASH.
Element
As (Mgg"1)
Ba (Mgg-1)
Br^gg"1)
Ca (rngg'1)
Ce (Mgg"1)
Co (ngg"1)
Cr (Mgg"!)
Cs (Mgg J)
Eu (^gg1)
Fe (mgg"1)
Ga (Mgg- )
Gd (Mgg-1)
Hf^gg"1)
K (mgg-1)
La (Mgg"1)
Mo (Mgg )
INAA Data3
151 ± 6
1300 ± 70
1.94 ± 0.24
16 ± 4
156 ± 16
42.5 ± 1.7
188 ± 10
10.2 ± 0.4
3.68 ± 0.18
90 ± 3
58 ± 5
25 ± 13
6.3 ± 0.6
18.5 ± 0.7
78 ± 3
31 ± 3
CertifiedValues
145 ± 15
1500
—
11.1 ± 0.1
180
46
196 ± 6
11
4
94.0 ± 1.0
58
—
8
18.8 ± 0.6
—
29
"Consensus"Values
146 ± 4
1420 ± 100
2.3
11.4 ± 0.6
175 ± 7
43 ± 3
194 ± 7
10.5 ± 0.7
3.7 ± 0.2
93.7 ± 2.3
56 ± 3
19 ± 4
7.4 ± 0.3
18.8 ± 0.5
84 ± 8
30 ± 3
Element
Na (Mgg"1)
Nd (Mgg"1)
Rb (Mgg-1)
Sb (Mgg"1)
Sc (Mg^1)
Sc^gg" 1 )
Sm (Mgg"1)
Sr (Mgg"1)
Ta (Mgg1)
Tb (Mgg"1)
Th (Mgg"1)
U (Mgg-1)
W (Mgg"1)
Yb (Mgg"1)
Zn (Mgg"1)
Zr (Mgg'1)
INAA Data"
1710 ± 70
71 ± 6
129 ± 5
6.4 ± 0.3
37.2 ± 1.4
9.3 ±1 .4
15.0 ± 1.3
920 ± 93
1.82 ± 0.09
2.43 ± 0.16
23.9 ± 0.9
9.7 ± 0.9
5.85 ± 0.26
7.7 ± 0.3
216 ± 24
340 ± 70
CertifiedValues
1700 ± 100
—
131 ± 2
6.8 ± 0.4
40
10.3 ± 0.6
—
830 ± 30
—
—
24.7 ± 0.3
10.2 ± 0.1
—
—
220 ± 10
—
"Consensus"Values
1730 ± 110
74 ± 10
138 ± 11
6.9 ± 0.5
39 ± 3
10.0 ± 1.7
17.0 ± 1.5
810 + 40
2.0 ± 0.2
2.5 ± 0.3
25.1 ± 1.4
10.3 ± 0.3
•5.7 ±0.7
7.4 ± 0.7
226 ± 22
330 ± 80
a Uncertainty values are estimated 95 % confidence intervals, based on tsMn with anadditional 3.5 % estimated systematic error [10] combined in quadrature (t = student's t-value, s = standard deviation; n = number of measurements).
15-4

TABLE 2. COMPARISON OF INAA DATA TO CERTIFIED AND "CONSENSUS'VALUES FOR NIST SRM 1570 SPINACH.
Element INAA Data" CertifiedValues
"Consensus"Values
Element INAA Dataa CertifiedValues
"Consensus"Values
Ba 0<gg" )
Br (/igg )
Ca (mgg-1)
Ce (ngg-1)
Co (u£&~ j
Cr OtfiS")
Cs (ngg-1)
Fe fcigg"1)
Kfagg"1)
La (ngg-1)
a See Table
TABLE 3 .
16.0 ± 1.8
48.5 ± 1.8
13.9 ± 0.8
490 ± 50
1.53 ± 0.13
3.7 ± 0.6
66 ± 22
523 ±22
35.5 ± 1.5
310 ± 60
1.
—54
13.5 ± 0.3
—
1.5
4.6 ± 0.3
—
550 ± 20
35.6 + 0.3
370
COMPARISON OF
14.9 ± 2.5
48 ± 4
13.3 ± 0.8
456
1.56 ± 0.12
4.3 ± 0.5
61 ± 9
540 ±30
35.6 ± 1.5
340 ± 40
Mo (ngg"1)
Na (mgg-1)
Rb Oigg"1)
Sb (ngg-1)
Se (ngg"1)
Sm (ngg-1)
Sr Otgg"1)
Th (ngg"1)
Yb (ngg-1)
Zn (Mgg1)
INAA DATA WITH
240 ± 80
14.4 ± 0.7
11.8 ± 0.6
40 ± 20
158 ± 7
51 ± 10
95 ± 7
110 ±30
25 ± 7
48.1 ± 1.7
CERTIFIED
——
12.1 ± 0.2
40
160
—
87 ±2
120 ± 30
—
50 ±2
VALUES
300 ± 80
14.2 ± 1.0
11.5 ± 0.9
40 ± 9
166 ± 11
56 ±24
80 ±5
130
12.5
50 ± 4
FOR NISTSRM 1643c TRACE ELEMENTS IN WATER.
Elem. [fig L"1] n INAA Dataa Certified Values
Ag
As
Ba
Ca [mg I/1]
Cd
Co
Cr
Fe
K [mg L"1]
Mo
Na [mg L'1]
Rb
Se
Sr
Zn
9
9
11
9
8
9
9
8
10
10
9
10
10
11
8
2.4 ± 0.489 + 3
54 + 8
38.2 + 1.1
14.4 ± 1.9
24 + 4
21 + 1
124 + 28
2.43 ± 0.16
104 + 5
12.4 ± 0.2
12.1 ± 1.4
14.2 ± 0.5
278 ± 14
83.9 + 2.5
2.21 ± 0.3082.1 + 1.2
49.6 ± 3.1
36.8 ± 1.4
12.2 + 1.0
23.5 + 0.8
19.0 ± 0.6
106.9 ± 3.0
2.30
104.3 + 1.9
12.19 + 0.36
11.4 ± 0.2
12.7 ± 0.7
264.0 + 2.6
73.9 ± 0.9
a Measure of the uncertainty is the standard deviation (s).
15-5
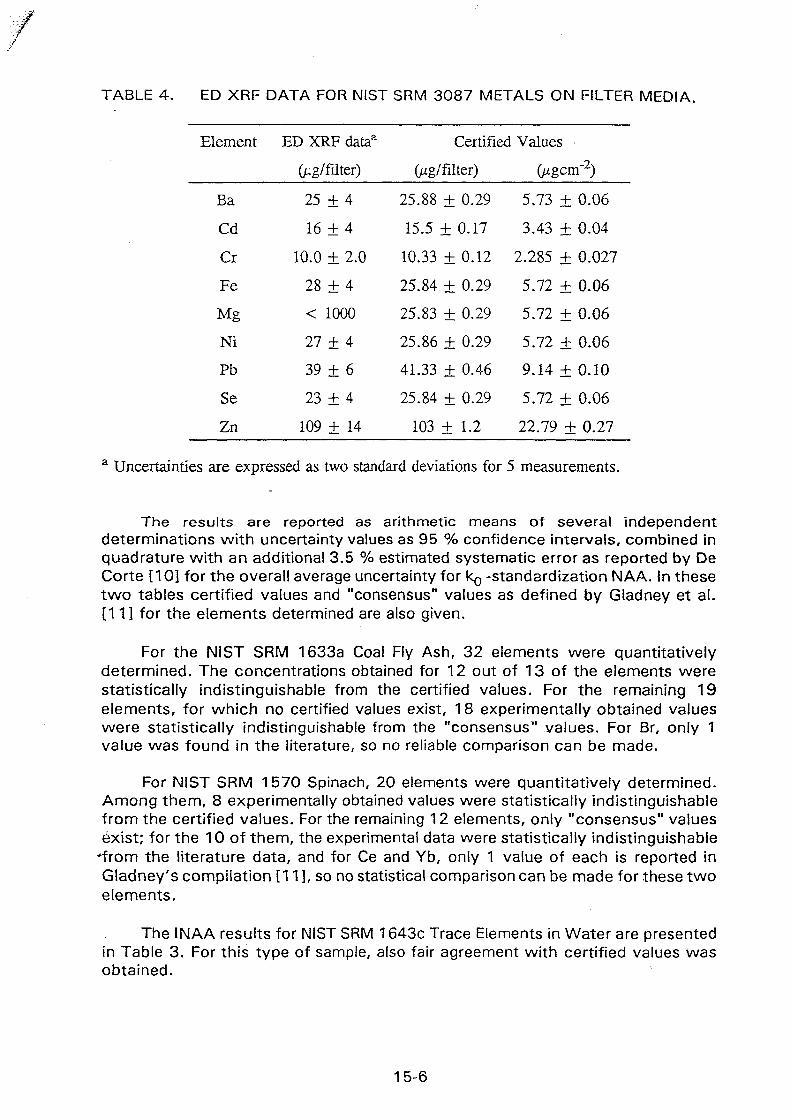
TABLE 4. ED XRF DATA FOR NIST SRM 3087 METALS ON FILTER MEDIA.
Element
Ba
Cd
Cr
Fe
Mg
Ni
Pb
Se
Zn
ED XRF dataa
kg/filter)
25 + 4
16 ± 4
10.0 ± 2.0
28 ± 4
< 1000
27 ± 4
39 + 6
23 + 4
109 ± 14
Certified
Otg/filter)
25.88 ± 0.29
15.5 ± 0.17
10.33 ± 0.12
25.84 + 0.29
25.83 + 0.29
25.86 ± 0.29
41.33 + 0.46
25.84 ± 0.29
103 + 1.2
Values •
Ogcm"2)
5.73 ± 0.06
3.43 + 0.04
2.285 ± 0.027
5.72 + 0.06
5.72 + 0.06
5.72 + 0.06
9.14 + 0.10
5.72 ± 0.06
22.79 + 0.27
a Uncertainties are expressed as two standard deviations for 5 measurements.
The results are reported as arithmetic means of several independentdeterminations with uncertainty values as 95 % confidence intervals, combined inquadrature with an additional 3.5 % estimated systematic error as reported by DeCorte [10] for the overall average uncertainty for k0 -standardization NAA. In thesetwo tables certified values and "consensus" values as defined by Gladney et al.[11] for the elements determined are also given.
For the NIST SRM 1633a Coal Fly Ash, 32 elements were quantitativelydetermined. The concentrations obtained for 12 out of 13 of the elements werestatistically indistinguishable from the certified values. For the remaining 19elements, for which no certified values exist, 18 experimentally obtained valueswere statistically indistinguishable from the "consensus" values. For Br, only 1value was found in the literature, so no reliable comparison can be made.
For NIST SRM 1570 Spinach, 20 elements were quantitatively determined.Among them, 8 experimentally obtained values were statistically indistinguishablefrom the certified values. For the remaining 12 elements, only "consensus" valuesexist; for the 10 of them, the experimental data were statistically indistinguishable
*from the literature data, and for Ce and Yb, only 1 value of each is reported inGladney's compilation [11 ] , so no statistical comparison can be made for these twoelements.
The INAA results for NIST SRM 1643c Trace Elements in Water are presentedin Table 3. For this type of sample, also fair agreement with certified values wasobtained.
15-6

TABLE 5. ED XRF DATA FOR BCR CRM No. 128 FLY ASH ON ARTIFICIALFILTER.
Element
As
Cd
Co
Cr
Cu
Fe
Hg
Mn
Na
Ni
Pb
Th
V
Zn
ED XRF Dataa
(^gg-1)15
< 700
< 300
< 200
< 1000
110 ± 70
35500 ± 1950
< 230
330 ± 210
not measured
130 ± 100
260 ± 115
< 120
< 460
580 ± 60
Certified
(Mgg-1)5
48 ± 2.3
4.6 ± 0.3
53.8 ± 1.9
178
176 ± 9
33800 ± 700
2.1 ± 0.15
479 ± 16
3740 ± 150
194
262 ± 11
17.3
334
581 ± 29
Values
(ngcnr2)
11.9 + 0.6
1.14 ± 0.07
13.3 ± 0.5
44
43.5 ± 2.2
8350 ± 170
0.52 ± 0.04
118 ± 4
924 ± 37
48
64.7 ± 2.7
4.3
82.5
144 ± 7
a Measure of the uncertainty is the 95 % confidence interval.b Results are in /xgg'1 BCR CRM No. 38 Minor and Trace Elements in Fly Ash fromPulverised Coal, with which BCR CRM No. 128 is spiked, and not in /igg"1 filter.
Since the ED XRF technique requires demanding preparation of the target anda knowledge of the attenuation of excitation and fluorescence rays in the samplewhen thick targets are apppiied, this analytical tool was used only for thin (i. e.filter) samples.
The results obtained are presented in Tables 4 and 5. Since the values quotedin the certificate of analysis for the NIST SRM 3087 Metals on Filter Media (seeTable 4) are in //g/filter, the same unit is used for the results of our analysis.Uncertainties are expressed as two standard deviations, in order to be comparablewith the certificate, where they are also quoted in the same way. In addition, thecertified values are also expressed in //gem'2, to be compared with the results forthe other CRMs. It is evident from Table 4 that for all 9 elements certified nostatistical difference between certified and experimentally obtained values could befound, with the exception of Mg, which was below the detection limit (a vacuumshould be applied to the system in order to determine this element).
15-7

A summary of the analytical results for ED XRF of BCR CRM No. 128 Fly AshOn Artificial Filter are found in Table 5. It can be seen that for 5 elements out ofthe 10 certified and for one among the 4 elements which are not certified,quantitative data were obtained. Unfortunately, only the data for Fe and Zn can beaccepted as analytically reliable, with uncertainties of 5.5 % and 10 %,respectively. For the other 4 elements Cu, Mn, Ni and Pb, the experimentallyobtained uncertainties are unacceptable, ranging from 44 % for Pb to 77 % for Ni.When comparing elemental values in surface density units, /ygcrrf2, for NIST SRM3087 and BCR CRM No. 128, it could be noticed that the loadings for the first SRMare approximately two orders of magnitude higher than for the latter one. For theelements As, Cd, Co, Cr, Hg, Th and V in BCR CRM No.128, the mass fractionson the loaded filter are below the detection limit of the method applied, and it canbe concluded that roughly a loading of 0.1 //gem"2 per element is required forquantitative analysis using our ED XRF system.
Using the k0 -standardization method of NAA as implemented in this study,50 elements can in principle be determined from a single irradiation. In real samples,quantitative data for approximately 30 elements can realistically be expected, withthe elemental values statistically indistinguishable from certified ones (20 out of 21as presented in Tables 1 and 2). Using an additional short irradiation (i.e. 5 min),data for an additional 12 elements could be obtained (Al, Cl, Cu, Dy, I, Mg, Mn, Ni,Si, Ti, V, Y). It is well known that Pb cannot be determined by NAA at //gg~1 level,and some other technique (including ED XRF) should be applied for analysis of thisheavy metal.
Since the INAA throughoutput in our laboratory is cca. 12 samples per week,the method is more usable for the analysis of biomonitors, where the number ofsamples is relatively low, rather than for APM collected on filters, where thedemand exceeds the analytical capacity. In the latter case INAA can best be usedas a reference and control method for a limited number of samples analysed by EDXRF.
Using ED XRF with the set-up described, up to 20 elements having Z > 13were usually sought: (i) Si, P, S, K, Ca, Ti and V using an 55Fe exciting sourceconnected to a low energy HP Ge detector, (ii) Cr, Mn, Fe, Ni, Cu, Zn, Pb, Br, Srand Zn using a 109Cd exciting source connected to a Si(Li) detector, and (iii) Cd,Sb and Ba using a 2 4 1Am exciting source connected to a low energy HP Gedetector. This method is much faster than INAA, requiring less than two hours permeasurement thus allowing a throughput of about 60 samples per week whenusing a sample changer and two detectors. It is suitable for processing a largenumber of samples of similar matrix composition such as APM collected on filters;however, the quantity of air sampled should be such as to allow elemental surfacedensities of approximately 0.1 //gcrrf2 in order to ensure acceptable quantitativeanalysis.
Both techniques are currently being implemented for the analysis of bulkprecipitate, lichens as biomonitors for air pollution, and for the analysis of APMcollected by an in-house constructed single-jet APM separator [1 ] , in the frameworkof an air pollution survey in Slovenia. On the basis of experience obtained inimplementing both methods, ED XRF was chosen for the analysis of APM, and theINAA procedure as a control method for the APM, as well as for the analysis of
15-8

bulk precipitate and lichens. The APM separator used is working at average flow-rate of 0.4 m3 h"1 for up to 14 days, collecting up to 1 mg APM cm"2, whichallows quantitative determination of 15 elements, on average, including Si, S, Ni,Cu and Pb, which represent elements complementary to the INAA data. Somepreliminary results concerning air pollution by measuring trace elements in APM andbulk precipitate has already been published, so the details can be found elsewhere[12-14].
4. PLANS FOR FUTURE WORK
It is planned to continue systematic trace element air pollution monitoring andresearch in the vicinity of the SoStanj thermal power plant using nuclear andnuclear-related analytical techniques. Airborne particulate matter, bulk precipitation,as well as lichens as biomonitors will be systematically analysed.
A biomonitoring survey involving epiphytic lichens covering the whole territoryof Slovenia {based on 16X16 km grid) will be completed and statistically evaluated.These samples will be analysed by INAA, XRF, and other, non-nuclear analyticaltechniques, if needed.
REFERENCES
[1] STROPNIK, B., BYRNE, A. R., SMODIS, B., STEGNAR, P., "Chemicalcomposition of airborne particulate matter (APM) in the Saleska Valley,Slovenia, World Clean Air (Proc. 9 t h Congress, Atmospheric Chemistry,Montreal, 1992), Vol.2, Air & Waste Management Association, Pittsburgh(1992) IU-7.08.
[2] SMODiS, B., JACIMOVIC, R., STEGNAR, P., JOVANOVIC, S., Multielementanalysis of NIST proposed SRM 1547 Peach Leaves, J. Radioanal. Nucl.Chem., Articles 160 1 (1992) 101-108.
[3] AARNIO, P. A., ROUTTI, J. T., SANDBERG, J. V., J . Radioanal. Nucl. Chem.,Articles 124 2 (1988) 457-466.
[4] MOENS, L., DE DONDER, J., XILEl, LIN, DE CORTE, F., DE WISPELAERE, A.,SIMONITS, A., HOSTE, J., Nucl. Instr. Methods 187 (1981) 4 5 1 .
[5] MOENS, L., ROOS, P., J. Radioanal. Nucl. Chem., Articles 160 1 (1992) 269-275.
[6] DE CORTE, F., SIMONITS, A., J. Radioanal. Nucl. Chem., Articles 133 1(1989)43-130.
[7] DE CORTE, F., SIMONITS, A., DE WISPELAERE, A., J. Radioanal. Nucl.Chem., Articles 133 (1989) 131-151.
[8] DE CORTE, F., SIMONITS, A., BELLEMANS, F., FREITAS, M. C ,JOVANOVIC, S., SMODlS, B.f ERDTMANN, G., PETRI, H., DE WISPELAERE,A., J . Radioanal. Nucl. Chem., Articles 169 (1993) 125-158.
[9] SMODIS, B., DE CORTE, F., DE WISPELAERE, A., J . Radioanal. Nucl. Chem.,Letters 186 (1994) 183-188.
[10] DE CORTE, F., "The k0 -Standardization Method a Move to the Optimizationof Neutron Activation Analysis", Agregee Thesis, University of Ghent,Belgium, 1987. .
[11] GLADNEY, E. S., O'MALLEY, B. T., ROELANDTS, I., GILLS, T. E., NBS
15-9

Special Publication 260-111, US Department of Commerce, Washington D.C.(1987).
[12] STROPNIK, B., BYRNE, A.R., SMODlS, B., Acta Chim. Slovenica 40 (1993)301-330.
[13] STROPNIK, B., BYRNE, A.R., SMODIS, B., JACIMOVIC, R., Acta Chim.Slovenica 41 (1994) 65-82.
[14] SVETINA GROS, M., SMODIS, B., PIRC, S., Acta Chim. Slovenica 40 (1993)243-253.
15-10
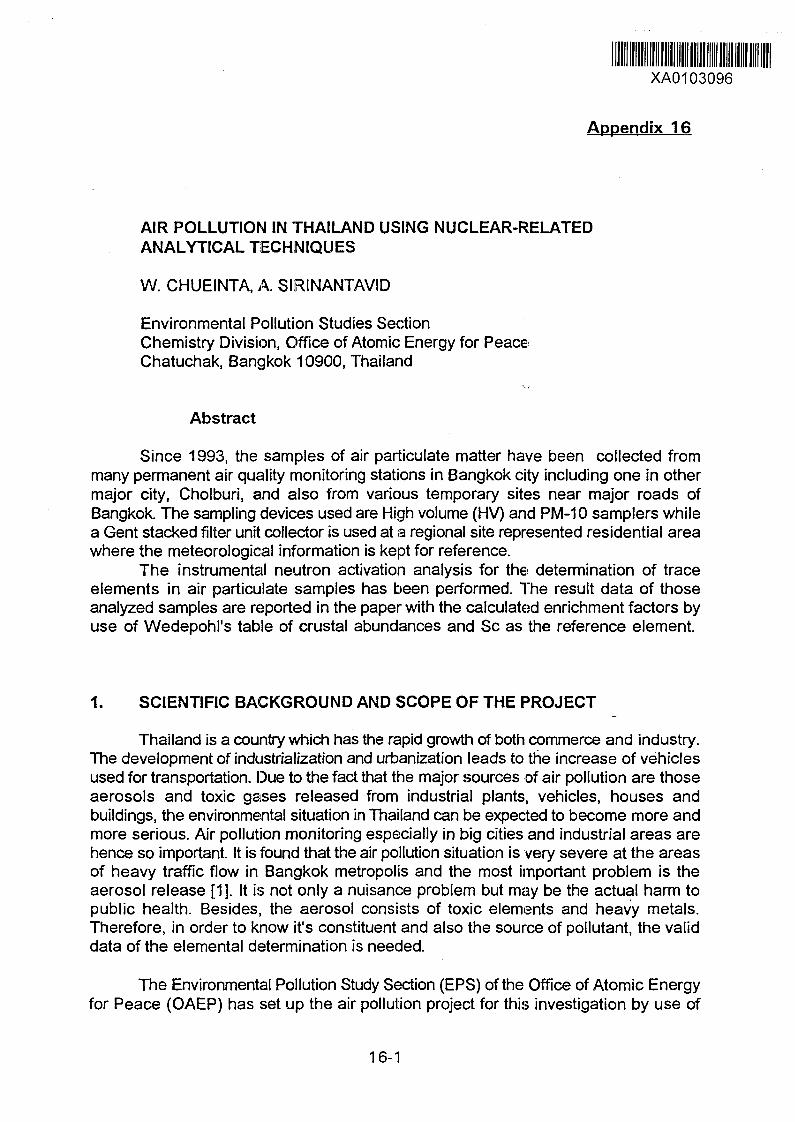
XAO103096
Appendix 16
AIR POLLUTION IN THAILAND USING NUCLEAR-RELATEDANALYTICAL TECHNIQUES
W. CHUEINTA, A. SIRINANTAVID
Environmental Pollution Studies SectionChemistry Division, Office of Atomic Energy for Peace:Chatuchak, Bangkok 10900, Thailand
Abstract
Since 1993, the samples of air particulate matter have been collected frommany permanent air quality monitoring stations in Bangkok city including one in othermajor city, Cholburi, and also from various temporary sites near major roads ofBangkok. The sampling devices used are High volume (HV) and PM-10 samplers whilea Gent stacked filter unit collector is used at a regional site represented residential areawhere the meteorological information is kept for reference.
The instrumental neutron activation analysis for the determination of traceelements in air particulate samples has been performed. The result data of thoseanalyzed samples are reported in the paper with the calculated enrichment factors byuse of Wedepohl's table of crustal abundances and Sc as the reference element.
1. SCIENTIFIC BACKGROUND AND SCOPE OF THE PROJECT
Thailand is a country which has the rapid growth of both commerce and industry.The development of industrialization and urbanization leads to the increase of vehiclesused for transportation. Due to the fact that the major sources of air pollution are thoseaerosols and toxic gases released from industrial plants, vehicles, houses andbuildings, the environmental situation in Thailand can be expected to become more andmore serious. Air pollution monitoring especially in big cities and industrial areas arehence so important. It is found that the air pollution situation is very severe at the areasof heavy traffic flow in Bangkok metropolis and the most important problem is theaerosol release [1]. It is not only a nuisance problem but may be the actual harm topublic health. Besides, the aerosol consists of toxic elements and heavy metals.Therefore, in order to know it's constituent and also the source of pollutant, the validdata of the elemental determination is needed.
The Environmental Pollution Study Section (EPS) of the Office of Atomic Energyfor Peace (OAEP) has set up the air pollution project for this investigation by use of
16-1
Instrumental Neutron Activation Analysis (INAA) which has been widely employed forthe elemental determination of airborne particulate matter (APM) because of it's highsensitivity and versatility. Consequently, to develop our competence and requisiteknowledge and understanding, we have joined to the Co-ordinated ResearchProgramme (CRP) on Applied Research on Air Pollution using Nuclear-relatedTechniques. In Thailand, the collaboration has been established among theEnvironmental Quality Standard Division of the Pollution Control Department, theEnvironmental Health Division of the Health Department and EPS of OAEP.
Under the scope of the project, the following works have been done :a) The analytical quality assurance and the quality control exercise.b) Weekly air sampling for coarse (2-10 //m) and fine (<2 ^m)particles by Gentsampler at the regional site represented residential area selected along theguidelines of Vermette and Larson (Air Sampling Manual : Samplingconsiderations and instrumentation).c) Monthly air sampling of airborne particulate samples by High volume and/orPM-10 samplers at permanent and temporary air quality monitoring stations inBangkok,the capital city, and one station in Cholburi which is one of the EasternSea-board development city.d) The elemental determination of those air particulate samples by INAA.e) Plan for the future.The experiment and the result are presented in the report.
2. METHODS
2.1 Sampling sites and sample collection
The samples of airborne particulate matter have been collected from residentialareas, commercial area, industrial area and areas of heavy traffic flow in Bangkok, anda station in Cholburi.
The air samplers used are as following :a) Stacked filter unit (Gent sampler) which is operated at flow rate 16 litre/minfor twenty-four hours continuously. The coarse and fine fractions are collectedon Nuclepore filters with an 8 //m and 0.4 /xm pore size respectively.b) High volume samplers (GMW 2000H) which is operated at flow rate about 80cu.m/h for twenty-four hours collection of total particulate matter.c) PM-10 sampler (GMW IP10) which is operated at flow rate 80 cu.m/h fortwenty-four hours collection of 10 //m particulate matter.
The detail of the sample collection is summarized in Table I. The meteorologicalinformation of Bangkok near to the site where Gent sampler located are kept forreference [2]. The annual average of each data are shown in Table II.
The filters are weighed before and after loading in order to determine massconcentration. The weighing procedure, for either unused or loaded filters, are drying
16-2

the filter at 40-50°C for 24 hours; keeping at controlled atmosphere,i.e., 25°C and 30-40 % relative humidity, for at lease 24 hours; and then weighing.
Table 1. SAMPLING INFORMATION
Sampling site
BanqkokResidentialCommercialIndustrialCurbside
ResidentialCholburiResidential
Sampler
High volumeHigh volumeHigh volumeHigh volumePM-10Gent SFU
PM-10
Sampling period
Jan 93 - Dec 94Jan 93 - Dec 94Jan 93 - Dec 94Jan 93 - Dec 94May 93 - Dec 94Sep 93 - Aug 94
Jan 93 - Dec 94
No. ofsamples
41(2)22(1)21(1)87(varied).14(1)84(1)
16(1)Total: 285
Numbers shown in the parentheses represent number of stations.
2.2 Analytical procedure
The method of INAA is used for the analysis of trace elements in airborneparticulate samples. The irradiations are done in Thai Research Reactor TRIGA MARKIII (TRR-1/M-1) at the flux density of 7.5 x 10¹² n.cm'2.sec"1 for short-lived radionuclidesand at the flux of 1 x 10¹² n.cm"2.sec1 for medium-lived and long-lived radionuclidesinvestigations. After each irradiation, two of gamma-ray spectroscopy measurementswith Ge(Li) detector connected to S-100 system MCA are carried out. The calculationof elemental concentrations is processed with a software developed at the laboratory[3].
Quality control of the analytical technique is routinely performed by analyses ofcertified reference materials of similar matrix with the samples such as NIES-CRM-8(Vehicle exhaust particulates), IRANT-ECH (Coal fly ash), IAEA-SOIL-7 (Soil) andNIST-SRM-1632a (Coal). Besides, We have also participated in the quality assurance(QA) exercise on the elemental analysis of air particulate filters, including other IAEAintercomparison sample runs, for example recently, the determination of trace elementsin materials relevant to air pollution studies.i.e., in Podsolic soil (IAEA-327N), Coal flyash (IAEA-394) and Urban dust (IAEA-395).
16-3

Table II. METEOROLOGICAL DATA AT GENT SAMPLER'S SITE
Temperature (°C)MeanMaximumMinimum
Relative Humidity (%)MeanMaximumMinimum
Rainfall (mm.)TotalDaily maximum
Wind (knots) "Mean wind speedMax. wind speed
Jan-Dec 1993
29.032.9 (May)22.1 (Jan)
688941
1239.3144.6 (16 Sep)
4.315(10 0ct)
Jan-Aua 1994
29.732.4 (April)24.3 (March)
658748
921.3106.7 (10 June)
4.213 (30 April)
3. RESULT AND DISCUSSION
As shown in Table I, the total number of air filter samples which have beencollected from various sites is two hundred and eighty-five samples. Of this number, thedata of one hundred and thirty-seven samples collected in 1993 is reported in thispaper. The contents of trace and toxic elements in group samples are summarized inTable III to Table X. The ranges, means and standard deviations of the elementalconcentrations and the sample mass are given in the table. In order to obtaininformation about aerosol sources, the average enrichment factors (E.F.) are calculatedusing Wedepohl's value of crustal abundances and by use of Sc as the normalizingelement.
E.F. = (E/Nteerosol(E/N Reference
where E and N are mean concentrations of any element E normalized to aselected element N [4,5].
The concentrations of more than twenty elements are determined in totalsuspended particuiates collected from various sites in Bangkok including coarse andfine particles collected by Gent sampler at residential area. The much higher value ofthe mass concentration of total suspended particulate collected for twenty-four hoursat the curbside is distinguished. Moreover, the highest level of most elemental
16-4

concentrations found at this site can be observed.
The high EFs of Br, Sb and Zn are found in every sites and they show theevidence of air pollution by human activities with motor vehicle exhaust and refuseincineration being the major pollution sources. Comparison of the EFs between the fineand coarse particles (as shown in Table IV) shows that they are generally higher in thefine fraction.
4. PLANS FOR FUTURE WORK
Further work has to be carried on for the study of this project. The following workplans are expected to be implemented in the next year.
a) According to the core programme, emphasis will be put on sampling of fine andcoarse fractions by Gent SFU sampler at urban residential site and rural area.Representative 24 hours samples will be collected on two (or more) days of the week.b) With the collaboration of Pollution Control Department and Health Department,the collection of APM at various sites in Bangkok by High volume and PM-10 airsamplers will be continued.c) It is our interest to include the investigation of the ambient air in other majorcities and industrial regions such as Cholburi and Samutprakarn.d) The analysis of trace elements in those samples will be performed by INAA.Obtaining and evaluation of data.e) Preliminary survey on suitable plant species which can be used for air pollutionmonitoring in Thailand.
REFERENCES
[1 ] POLLUTION CONTROL DEPARTMENT, Pollution in Thailand, Rep. ISBN 974-7571-69-2, Ministry of Science, Technology and Environment, Thailand (1992).
[2] METEOROLOGICAL DEPARTMENT, Climatological Data, Rep., Ministry ofTransport and Communications, Thailand (1993/1994).
[3] NOUCHPRAMOOL, S., 'The *C Computer Program for Elemental Analysis inNeutron Activation Analysis and Environmental Radiation Monitoring",Proceeding of the Fifteenth Conference on Science and Technology, October18-20, 1990, Chiangmai University, Thailand.
[4] WEDEPOHL, K.H., Origin and Distribution of the Elements, Permagon Press,London (1968) 999-1016.
[5] INTERNATIONAL ATOMIC ENERGY AGENCY, Sampling and AnalyticalMethodologies for Instrumental Neutron Activation Analysis of AirborneParticulate Matter, Training Course Series No.4, IAEA, Vienna (1992).
16-5
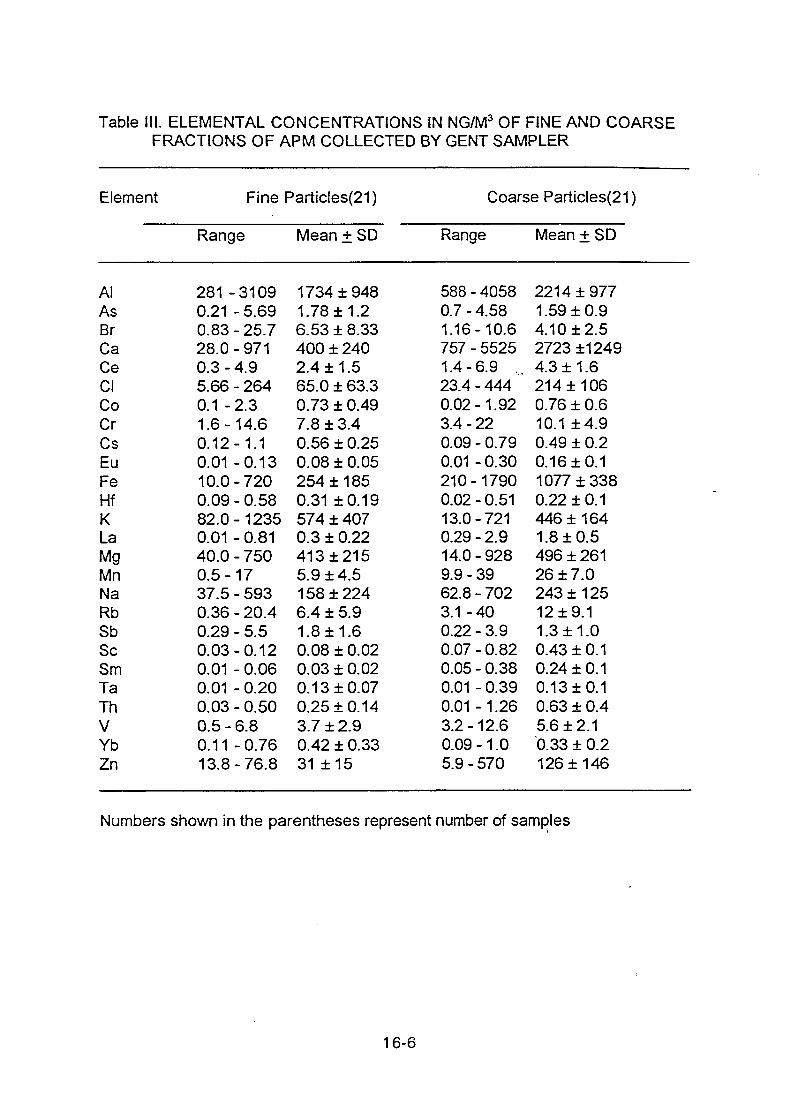
Table III. ELEMENTAL CONCENTRATIONS IN NG/M3 OF FINE AND COARSEFRACTIONS OF APM COLLECTED BY GENT SAMPLER
Element
AlAsBrCaCeClCoCrCsEuFeHfKLaMgMnNaRbSbScSmTaThVYbZn
Fine
Range
281 -31090.21 - 5.690.83-25.728.0 - 9710.3-4.95.66 - 2640.1 -2.31.6-14.60.12-1.10.01-0.1310.0-7200.09 - 0.5882.0-12350.01 - 0.8140.0 - 7500.5-1737.5 - 5930.36 - 20.40.29 - 5.50.03-0.120.01 - 0.060.01 - 0.200.03 - 0.500.5-6.80.11 -0.7613.8-76.8
Particles(21)
Mean ± SD
1734 ±9481.78 ±1.26.53 ± 8.33400 ± 2402.4 ±1.565.0 ± 63.30.73 ± 0.497.8 ± 3.40.56 ± 0.250.08 ± 0.05254 ±1850.31 ±0.19574 ± 4070.3 ± 0.22413±2155.9 ±4.5158 ±2246.4 ± 5.91.8±1.60.08 ± 0.020.03 ± 0.020.13 ±0.070.25 ±0.143.7 ±2.90.42 ± 0.3331 ±15
Coarse Particles(21)
Range
588 - 40580.7-4.581.16-10.6757 - 55251.4-6.9 .23.4 - 4440.02-1.923.4 - 220.09 - 0.790.01 - 0.30210-17900.02 - 0.5113.0-7210.29-2.914.0-9289.9 - 3962.8 - 7023.1 -400.22 - 3.90.07 - 0.820.05 - 0.380.01 - 0.390.01-1.263.2-12.60.09-1.05.9 - 570
Mean + SD
2214 ±9771.59 ±0.94.10 ±2.52723 ±12494.3 ±1.6214 ±1060.76 ± 0.610.1 ±4.90.49 ± 0.20.16 ±0.11077 ±3380.22 ±0.1446 ±1641.8 ±0.5496 ± 26126 ± 7.0243 ±12512 ±9.11.3±1.00.43 ±0.10.24 ±0.10.13 ±0.10.63 ± 0.45.6 ±2.10.33 ± 0.2126 ±146
Numbers shown in the parentheses represent number of samples
16-6
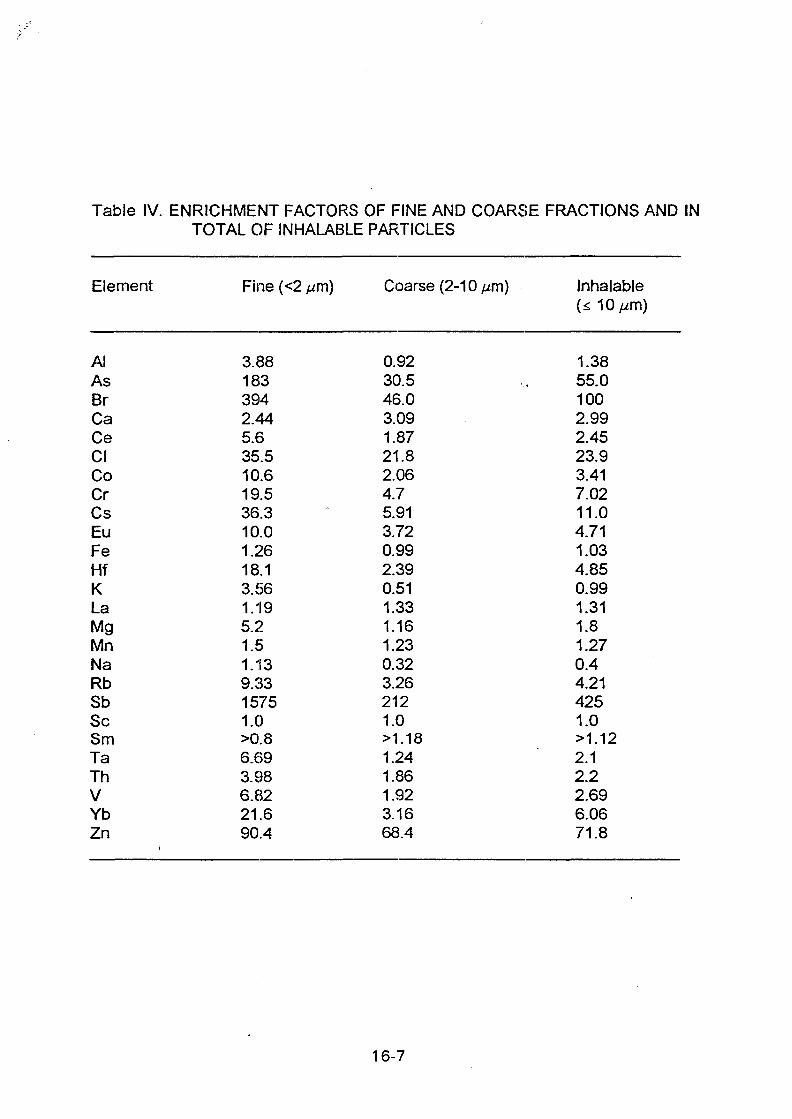
Table IV. ENRICHMENT FACTORS OF FINE AND COARSE FRACTIONS AND INTOTAL OF INHALABLE PARTICLES
Element
AlAsBrCaCeClCoCrCsEuFeHfKLaMgMnNaRbSbScSmTaThVYbZn
Fine (<2 //m)
3.881833942.445.635.510.619.536.310.01.2618.13.561.195.21.51.139.3315751.0>0.86.693.986.8221.690.4
Coarse (2-10//m)
0.9230.546.03.091.8721.82.064.75.913.720.992.390.511.331.161.230.323.262121.0>1.181.241.861.923.1668.4
Inhalable(<; 10//m)
1.3855.01002.992.4523.93.417.0211.04.711.034.850.991.311.81.270.44.214251.0>1.122.12.22.696.0671.8
16-7

Table V. ELEMENTAL CONCENTRATIONS IN APM AT URBAN RESIDENTIALAREA IN NG/M3, SAMPLE MASS AND THE AVERAGE EFS
Element
AlBrCeCoCrCsEuFeHfLaMgMnNaRbSbScSmTaThVYbZn
Sample mass
Range
702-104901.91 -30.61.3-44.80.7 - 2.524.1 - 30.40.26 - 2.60.04 - 0.341270-58300.06-3.110.28 - 7.08326 - 537865.7 - 529395 - 55775.67 - 87.40.15-9.550.11 -1.570.07 - 0.520.33 - 0.790.11 -5.148.94 - 34.80.14-5.7850.7 - 490
63-300(19)
Mean ± SD
4913 ±35767.47 ± 9.011.6 ±14.21.49 ±0.4810.2 ±8.071.26 ±0.710.15 ±0.082810 ±11211.03 ±0.931.87 ±2.232150 ±1627215 ±1501738 ±192042.3 ±21.02.81 ±3.140.66 ± 0.370.22 ± 0.20.5 ± 0.221.58 ±1.4221.5 ±9.112.55 ±2.52213 ±188
173 ±66.2
EF
1.3354.63.282.633.099.92.271.687.280.93.286.611.57.482981.0>0.713.123.054.815.975.3
Number shown in the parenthesis represents number of samples.
16-8

Table VI. ELEMENTAL CONCENTRATIONS IN APM AT COMMERCIAL AREA INNG/M3, SAMPLE MASS AND THE AVERAGE EFS
Element
AlAsBrCaCeCoCrCsEuFeHfKLaMgMnNaRbSbScSmTaThVYb
Sample mass
Range
1491 -71021.58-4.5513.5-89.72690 - 82041.1 -11.61.0-2.827.0 - 55.00.4-1.70.02-0.191540-67900.08 - 0.841214-41510.4 - 8.0416-336538.4 - 848456-41799.9-37.10.6 - 4.20.27 - 0.840.17-0.950.25 - 0.460.15-1.77.56 - 58.60.44-1.2
59-209(10)
Mean ± SD
3137 ±17442.65 ±1.3544.5 ± 27.85326 ± 20696.4 ± 3.51.8 ±0.944.0 ±12.01.1 ±0.50.11 ±0.073901 ±17500.5 ± 0.372502 ± 9424.6 ± 2.32116 ±1057249 ± 2342249 ±116921.7 ±10.62.9 ±1.80.6 ± 0.240.44 ± 0.290.35 ±0.11.2 ±0.632.6 ±14.10.72 ± 0.34
137 ±45.2
EF
0.9336.43584.331.993.514.79.511.832.573.892.072.443.558.42.084.223381.0>1.562.42.557.954.94
Number shown in the parenthesis represents number of samples.
16-9

Table VII. ELEMENTAL CONCENTRATIONS IN APM AT INDUSTRIAL AREA INNG/M3, SAMPLE MASS AND THE AVERAGE EFS
Element
AlBrCeCoCrCsEuFeHfLaMgMnNaRbSbScSmTaThVYbZn
Sample mass(//g/m3)
Range
226-131602.8 - 26.62.2-10.80.6-2.01.7-14.70.1 -2.30.02 - 0.241730-60470.12-2.91.9-9.6284-513228.0 - 493709 - 250310.0-80.00.2-11.70.17-0.920.21 - 0.570.11 -0.560.14-5.412.0-45.00.24-1.254.0-818
66.5-193(11)
i
Mean ± SD
6509 ± 49359.8 ±115.9 ± 2.61.2 ±0.49.7 ± 6.00.9 ± 0.60.13 ±0.083455 ±13400.85 ± 0.884.0 ± 3.72753 ±1568186 ±1481427 ±70945.0 ± 22.03.5 ± 4.60.43 ± 0.220.37 ±0.160.28 ± 0.21.3 ±1.422.0 ±13.00.65 ± 0.33320 ± 309
103 ±37.4
EF
2.711102.563.264.5110.83.023.189.222.966.458.781.912.25701.0>1.832.683.857.546.22174
Number shown in the parenthesis represents number of samples.
16-10
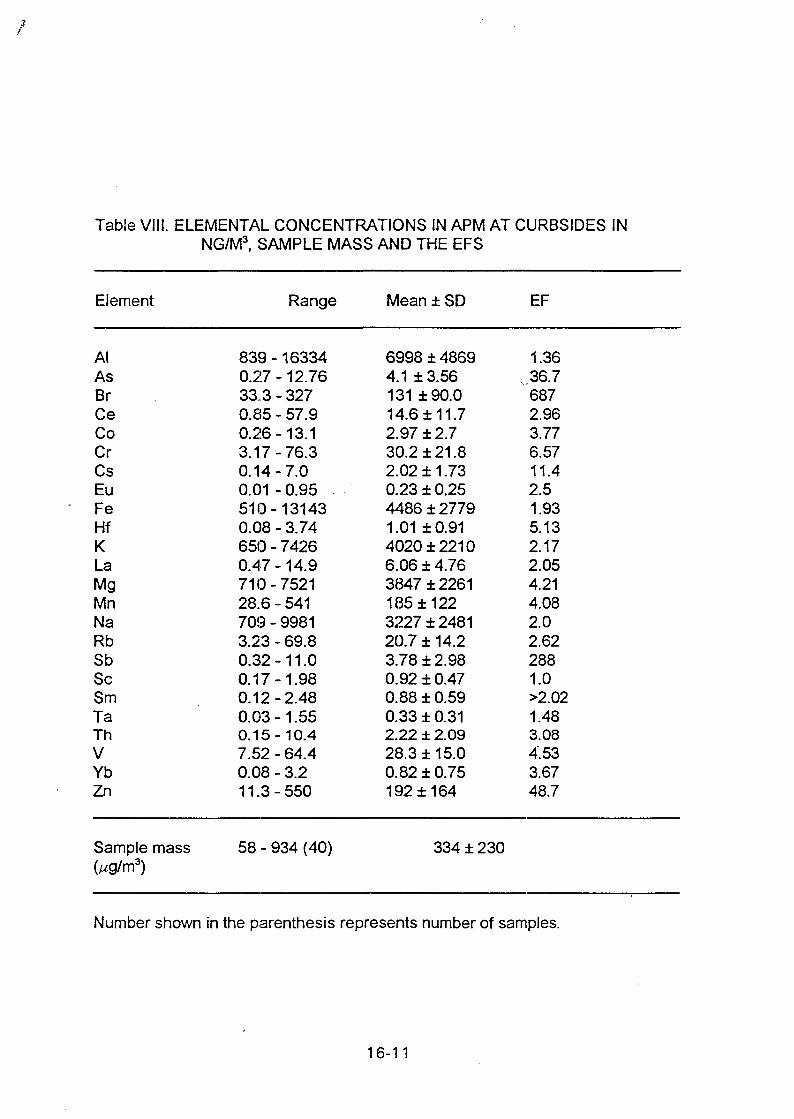
Table VIII. ELEMENTAL CONCENTRATIONS IN APM AT CURBSIDES INNG/M3, SAMPLE MASS AND THE EFS
Element
AlAsBrCeCoCrCsEuFeHfKLaMgMnNaRbSbScSmTaThVYbZn
Sample mass
Range
839-163340.27-12.7633.3 - 3270.85 - 57.90.26-13.13.17-76.30.14-7.00.01 - 0.95510-131430.08 - 3.74650 - 74260.47-14.9710-752128.6 - 541709 - 99813.23 - 69.80.32-11.00.17-1.980.12-2.480.03-1.550.15-10.47.52 - 64.40.08 - 3.211.3-550
58 - 934 (40)
Mean ± SD
6998 ± 48694.1 ±3.56131 ±90.014.6 ±11.72.97 ±2.730.2 ±21.82.02 ±1.730.23 ± 0.254486 ±27791.01 ±0.914020 ±22106.06 ± 4.763847 ± 2261185 ±1223227 ± 248120.7 ± 14.23.78 ± 2.980.92 ± 0.470.88 ± 0.590.33 ± 0.312.22 ± 2.0928.3 ±15.00.82 ± 0.75192 ±164
334 ± 230
EF
1.36.36.7
6872.963.776.5711.42.51.935.132.172.054.214.082.02.622881.0>2.021.483.084.533.6748.7
Number shown in the parenthesis represents number of samples.
16-11

Table IX. ELEMENTAL CONCENTRATIONS IN APM (<10 /an) AT CURBSIDE INNG/M3, SAMPLE MASS AND THE EFS
Element
AlAsBrCeCoCrCsEuFeHfLaMgMnNaRbSbScSmThVYbZn
Sample mass
Range
233 - 57683.76-4.195.5-41.00.64 - 6.580.01 - 2.752.26 - 20.40.05 - 0.840.03 - 0.09466-15910.1 -0.540.71 - 2.451210-713014.0-37.0197-99814.42-18.40.21 -1.550.09 - 0.350.1-0.310.14-0.734.05-14.30.08 - 0.52.8-28.5
36 - 72 (7)
Mean ± SD
3260 ± 26843.98 ± 0.2216.0 ±16.03.23 ± 2.040.97 ± 0.8711.4 ±8.380.44 ± 0.320.07 ± 0.03993 ± 3750.27 ±0.171.49 ±0.693097 ± 237326.0 ± 8.92793 ± 328812.1 ±5.440.84 ± 0.40.21 ±0.10.19 ±0.090.41 ± 0.238.37 ± 3.560.27 ±0.1418.2 ±10.3
54.6 ±13.5
EF
2.771563682.875.3910.910.93.31.876.02.2614.92.517.66.722801.0>1.922.485.875.2920.2
Number shown in the parenthesis represents number of samples.
16-12

Table X. ELEMENTAL CONCENTRATIONS IN APM (<10//m) AT RESIDENTIALAREA IN CHOLBURI IN NG/M3, SAMPLE MASS AND THE EFS
Element
AlAsBrCeCoCrCsEuFeHfLaMgMnNaRbSbScSmTaThVYbZn
Sample mass(//g/m3)
Range
3839-104703.07 - 4.9516.0-21.02.1 -4.80.06 - 0.966.2-14.30.13-1.70.01 -0.15270-24150.02-1.10.5-2.3147-706028.0-199894-42449.2 - 27.70.16-2.10.22 - 0.710.06 - 0.360.21 -0.310.29-4.96.5-14.60.11 -0.495.7 - 59.0
46-158(8)
Mean ± SD
6823 ± 33654.01 ±1.3318.0 ±2.33.7 ± 0.90.66 ± 0.3211.5 ±3.60.88 ± 0.690.06 ± 0.051205 ±6680.44 ± 0.391.4±1.04485 ± 298591.0 ±76.01938 ±113218.0 ±6.20.66 ± 0.630.4 ±0.170.19±0.120.23 ± 0.091.6 ±1.39.6 ±3.10.32 ±0.1333.0 ±23.0
71 ±33
EF
3.0582.62171.71.925.75"11.41.51.195.131.0911.34.622.775.251151.0>1.012.375.093.543.2919.2
Number shown in the parenthesis represents number of samples.
16-13
XAO103097Appendix 17
ATMOSPHERIC TRANSPORT OF POLLUTANTS TO THE EASTERNMEDITERRANEAN BASIN
G. Tuncel, S. G. Tuncel', N. K. Aras', M. Yatin1
Middle East Technical University, Dept. Environmental Eng., 06531 Ankara,Turkey.
'Middle East Technical University, Dept. Chemistry, 06531 Ankara, Turkey.
Abstract : Fine and coarse aerosol samples were collected between February 9 andJune 8, 1993, using the GENT stack filter sampler. Samples were collected onpolycarbonate filters and analyzed for a host of elements by instrumental neutron activationanalysis(INAA), for Pb and Ni by atomic absorbtion spectrometry (AAS) and for SO4", NO3'and CI" ions by ion chromatography (IC). Results have demonstrated that theconcentrations of pollution derived elements decrease from start to the end of the samplingperiod. Concentrations of soil related elements have increased in the same time perioddue to the dry soil which can easily become airborne during summer months. The mainparameters which effect the observed concentrations of elements are the meteorologicalparameters, particularly the mixing height and wind speed and the variations in thestrengths of sources. Since the wind speed is very low in the city of Ankara, dispersionof elements are determined by diffusion mechanism rather than the mass transport bywinds. Six factors were identified and retained in the principal component analysis. Threeof these six factors retained were related with the crustal elements. Different crustalsources were differentiated based on their enrichments with non-crustal elements. Thesethree crustal components were identified as "surface soil" which is enriched by an numberof anthropogenic elements, "road dust" which is enriched by Na and CI plus Pb and "sub-surface soil" which is enriched with the same anthropogenic elements, but not as much asin the first crustal factor. In addition to these crustal components, a "coal combustion"factor which included most of the chalchphilic elements, "motor vehicle" component whichincluded Pb, Br, particulate-Hg" and an oil combustion component which included V andNi were identified.
1. SCIENTIFIC BACKGROUND AND THE SCOPE OF THE PROJECT.
The purpose of the work which is performed as a pait of the core-program in theCRP is to generate data from an urban and a rural atmosphere in Turkey. Suchdata which will also be generated by the other participants of the CRP will resultin a large data base which includes similar data obtained by similar samplingtechniques from different paits of the world. Although this is the aim of the CRPin general, the data generated from rural and urban sites in Turkey will also beused to understand various atmospheric process. The data generated in the Ankara,
17-1

is used to understand participate pollution sources in the city. A sourceapportionment study performed to this end is briefly described in this workingpaper. An extended form will appear in the final report.
The data which is now being generated from a station in the Mediterranean cost ofTurkey will be used to understand transport of pollutants and Saharan Dust to theEastern Mediterranean Basin. Such dat do exist to a certain extend for the WesternMediterranean region, such an extensive data set will be the first one for theEastern part of the basin. Results will be presented in the next CRM and will alsoappear in the final report.
The station which is used to collect samples in the Mediterranean coast is a partin the MED-POL programme, which is an international monitoring programme co-ordinated by the UNEP and WMO and participated by most of the Mediterraneancountries. We are also co-operating with Greek and Israeli research groups tostudy transport of pollutants from Europe to the Eastern Mediterranean basin,through a European Union (EU) project, using our Mediterranean station.
2. METHODS
The sampling techniques and the methods used in analysis of collected sampleswere discussed in detail in the previous working papers and the progress reports.Only a brief summary will be presented in this section.
Samples were collected on the roof of the Environmental Engineering building inthe Middle East Technical University. The sampling site was approximately 15 kmfrom the city center. Samples were collected using two GENT stack filtersamplers, one was provided by the Agency and the other one duplicated in ourshop. In one of the samplers two nuclepore filters with different pore sizes wereused and collected samples were analyzed for major ions, Pb and Ni. In the secondstack filter unit, the coarse filter was polyethylene, but the bottom filter (fine) wasteflon to avoid high Br and Cr blanks in the nuclepore filters.
Collected fine and coarse fraction samples were analyzed by a combination ofINAA, AAS and 1C techniques for major, minor, trace elements and anions. ForINAA analysis, samples were irradiated twice in a neutron flux of lxlO12 n cm"2 s"1.In'adiated samples were counted for three different times with various decay timesin between to determine the concentrations of short and long lived isotopes. ForAAS analysis, half of the filters were digested HNO-, solution to extract Pb and Ni.
17-2

Remaining half of the samples were sonicated in distilled deionized water andinjected in IC for anion measurements.
Meteorological parameters were obtained from Turkish General Directorate ofMeteorology.
3. RESULTS AND DISCUSSION
Average Concentrations of Elements
Concentrations of selected elements measured in this work and similar worksreported in the literature are given in Table 1, together with the coarse-to-fineconcentration ratios. When data is compared with similar measurements in otherurban areas, Ankara appears to be a typical urban site with enhanced effect of coalcombustion.
The city had experienced extensive pollution episodes since 1960's due to bothrapid increase in population and the use of local lignite which has low calorificvalue and high ash and sulphur content for residential heating. However, recentlythe heating mode has changed from poor quality coal to natural gas. The SO2 andparticipate concentrations in the atmosphere have decreased considerably sincethan. A comparison of elemental concentrations measured in the Ankaraatmosphere since early 70's are presented in Table 2. Concentrations of As, Cr,Se, Zn decreased from 1970 to 1993. Interestingly, concentrations of soil elementsalso decreased in the same period.
Temporal Variability of Elemental Concentrations.
Temporal variations in the concentrations of heating related anthropogenic andcrustal elements are depicted in Figure 1. Our sampling period corresponds to bothheating and non-heating periods in the city of Ankara. Because of this,concentrations of elements, which originate from residential heating, including V,As and Se showed a well defined decreasing trend from February to June.
Concentrations of elements associatied with crustal dust, such as Al, Sc and Feshowed a marked increase in the same period. This increase is due to dry soilconditions in the spring and early summer period. The amount of soil that becomeairborne increases when the soil is dry and decreases when it is damp. Such amechanism resulted in the observed increasing trend in the concentrations of soilrelated elements.
17-3

One interesting point is that, concentrations of motor vehicle-related elements suchas Pb also increased from February to June. The observed increase in theconcentrations of motor vehicle elements was due to high concentrations of theseelements in road dust which becomes air borne with more or less the samemechanism with soil, rather than an increase in the motor vehicle emissions durin^spring and early summer.
Effect of Meteorological Parameters on Observed Concentrations of Elements.
One of the common features of all trace element data sets (urban, rural or remote)are large variabilities in the concentrations of elements. This is usually reflectedin high standard deviations. Such aviability in the rural data are due to air masstransport from different source regions, or scavenging of particles from theatmosphere by rain events during transport. However, the same mechanisms failto explain the variability in urban data. The observed concentrations of elementsin urban areas are dominated by local sources and transport of pollutants fromdifferent distant source areas generally have minor influence. Although the raincan be a source of variability in the observed concentrations, generally variabilityin an urban data set can not be fully accounted for by the precipitation.
The two most important source of data variability in urban trace element data arethe variability in source strengths and the variability in meteorological conditions,particularly the mixing height and wind speed.
Mixing Height
In an urban atmosphere, pollutants are considered to be injected into a rectangularbox which height is limited by the mixing height. Since the X and Y dimensionsof the box are fixed bey the geometry of the urban area (considering the wind doesnot exist). The only parameter that cause a variability in the data is the variabilityin the Z direction of the box, or the variability in the mixing height.
We have calculated the hourly mixing height during our sampling period, using thehourly meteorological data and RS303 preprocessor which is designed to calculatethe stability class and mixing height to be used in regulatory air quality models.The relation between the mixing height and the elemental concentrations were theninvestigated.
17-4

Elements related to anthropogenic emissions showed an inverse relation wit themixing height as expected. These elements are quite uniformly distributed over thecity and variations in the mixing depth has a profound influence on observedconcentrations. Elements like Pb which has important sources in the vicinity ofthe station did not show the same well defined trend with the mixing height. Forelements like Pb, variations in the emission intensity is more important thanvariation in meteorological conditions in determining observed concentrations.
Wind Direction and Speed
The wind speed is also an important meteorological parameter which can be oneof the sources in the variability of the concentrations. The particles emitted to theatmosphere can be dispersed either due to mass transport«by winds and diffusion.The later mechanism is more pronounced for small particles at low wind speeds,but mass transport by winds is valid for all size ranges and is probably the mainmechanism at reasonable wind speeds.
The city of Ankara is characterized by very low wind speeds. The wind speedduring night time is approximately 2 m s"1' and it increases to 4 m s"1 during noon.Such low wind speeds can not disperse and remove particles and gas phasepollutants from the city and hence one of the main reasons for the pollution.
The variation in the elemental concentration with changes in the wind speed aregiven in Figure 2. Although a general decrease was observed in the concentrationsof a number of elements with increasing wind speed, the trend is not a consistentone for most of the elements. This lack of one on one relation betweenconcentrations and the wind speed is probably due to low wind speeds over thecity.
The concentrations of elements is expected to change when winds blew fromdifferent directions, because winds from different sectors are expected to bringemissions from different sources. However, the concentrations of elements did notshow a directional preference on wind direction. Average concentrations calculatedfor each wind sector did not change appreciably. The absence of any relationbetween the conceni'rations of elements and the wind direction is again due to slowwind speeds in the city. Apparently, due to slow winds, emissions are mixed quiteuniformly within the mixing height depth. Consequently, observed concentrationsof elements are controlled by diffusion rather mass transport with winds.
17-5
Effect of Residential Heating on observed concentrations of elements
The sampling period which was between February and June covered both heatingseason in Ankara and also the period when heating units were not operated.Consequently temporal variations reflected this change in the residential heatingemissions. Number of anthropogenic elements, such as V, Se, As have showndecreasing trends from February towards June. Such trends were attributed thereductions in heating related emissions over the city, in the previous sections. Theaverage concentrations of elements in heating and non-heating periods are given inTable 3. The heating and non-heating periods were separated at the first day whendaily maximum temperature reaches to 15°C. In the city of Ankara, residentialheating units can only be operated when ambient temperature is less than 15°C,according to a regulation of the local government. The variation of Temperaturein our sampling time is depicted in Figure 3. The first day with daily maximumtemperature reached to 15°C corresponded to April 14th. A transition period of 15days (one week at both sides of that day) was selected and excluded from thecalculations, because heating units were turned on and off during that time. Thesamples which corresponds to days before April 14th were selected as heatingperiod samples and the samples which corresponded to days after April 14th wereselected as non-heating period samples.
Average concentrations of pollution derived elements are all higher during heatingperiod relative to non-heating period. There are very few industrial sources foranthropogenic elements in Ankara. Consequently, emissions related to residentialheating may be a major source for elements which are normally industrial, such asSb.
The soil related elements on the other hand have higher concentrations during non-heating period. This increase is due to increasing amounts of soil which becomeairborne when the soil is dry.
Based on their temporal behaviour, emissions from residential heating units can bean important source for elements V, Ni, As. Cl, Se, Sb, Zn, Cd and Mn.
The variations in the ratios of V-to-noncrustal V (V/ncr-V) are given in Figure 4.The increase in the V/ncr-V ratio in the non heating period indicate that theanthropogenic V decrease whereas crustal V increase during the non-heatjng period.
17-6

Principal Component Analysis
Although temporal variations of elemental concentrations and other tests, such asthe enrichment factors and correlation analysis do provide information on the typesof sources which may contribute on the observed concentration of elements, mostdeterministic test on the contributing sources is the principal component analysis.
Principal component analysis was performed to the data using Statgraphicsstatistical package. Various runs with different number of factors and differentelements are performed. Finally 6 factors were retained based on their eigenvaluesand explainability. The results of the PCA are given in Table 4.
The first factor was consist of anthropogenic elements As, Zn, Sb, SO4= and to a
lesser extend Se, Hg, Ni, V, Mn and attributed to "residential heating". Thesecond factor included most of the soil related elements and identified as "soil".The Factor 3 had ciiistal elements such as La, Al, Fe, Mg, Na and Cl and also hadloadings of anthropogenic elements Ni, V and Mn. This factor was identified as"road dust" due to loadings of Na and Cl.
was another soil related factor. Since it included most of the crustal elements, Pband Br, it is identified as "road dust". The factor 4 included Pb, Br and to a lesserextend Cl, Hg and As and identified as "motor vehicle" factor. The factor fiveincluded Ni and V and identified as "oil". The last factor also included most of thecrustal elements, and identified as "subsurface soil"
The important feature of the generated data set was the presence of three differentfactors all of which are related to airborne dust particles. These factors (Factor 2,Factor 3 and Factor 6) were identified as surface soil, road dust and subsurface soil,respectively. The distinction between them were in the factor loadings of theanthropogenic elements associated with each of the crustal. factors. The factor 2had the highest loadings of pollution derived elements, indicating that the soilrepresented by this factor was exposed to wet and dry deposition of anthropogenicelements. Consequently it is identified as surface soil. The factor 3 containedmost of the crustal elements and a number of anthropogenic elements, including Pband Br. The presence of Pb and Br as well as some other anthropogenic elementsin this factor suggested that it is the road dust. The last crustal factor, namelyfactor 6 had high loadings of crustal elements and small loadings of some of theanthropogenic ones. The composition of factor 5 was similar to that of factor 2,but anthropogenic elements had smaller loadings. This may indicate that the soilis no exposed to atmosphere as that given in factor 2.
17-7

The 6 factors retained explain 79% of the system variance.
4. PLANS FOR FUTURE WORK
The CRP was consist of two phases. In the first phase, we presented data from anurban atmosphere in Turkey. In tine second phase data will be generated from arural site. Tine rural station from which we will generate data is the Mediterraneancoast of Turkey. A station is station is already operational in the Mediterraneancoast of Turkey, since December 1991. We normally analyze most of the elementsby atomic absorbtion spectrometry. But approximately 300 daily aerosol samplescollected in 1993 will be analyzed by INAA and will be rural component of ourcontract. The samples that will be analyzed were already collected and partlyanalyzed by AAS and ion chromatography. The analysis of these samples byINAA and subsequent data inteipretation will make up most of our activities in thenext year.
We will also try to prepare backtrajectories which will be used in the interpretationof data generated from the Antalya station.
In the long run we are planning to generate similar data on trace elementcomposition of aerosol and precipitation from the Black Sea coast of Turkey. Astation, similar to that in the Mediterranean coast was recently established at theBlack Sea coast of Turkey. We have started co collect samples since March 1995.These samples will be analyzed and interpreted to understand the magnitude ofpollution transport from Europe to the Black Sea basin.
We are also hoping to measure gas phase pollutants in both of our rural stations.We already have campaign type measurements of HNO,, NH,, Hg and continuousmeasurements of SO:, NO, NO : and O ; in the Mediterranean station. Thesemeasurements will be continued until a reliable data base'will be established ontheir levels in the Black Sea and Eastern Mediterranean regions. These data willbe the first measurements of some of these parameters in the Mediterranean andBlack Sea regions.
REFERENCES
[1] ANDRADE F. A., ORSIN1 C , MAENHAUT W., Relation between aerosolsources and meteorological parameters for inhalable atmospheric particles inSao Paulo City, Brazil Atmos. Environ., 28 (1994) 2307-2315.
17-8
[2] ZELENKA M. P., WILSON W. E., CHOW J. C. LIOY P. J., A combinedTTFA/CN4B receptor modelling approach and its application to air pollutionsources in Chinia. Atmos. Environ., 28 (1994) 1425-1435.
[3] HUANG X., OLMEZ I., ARAS N. K., GORDON G. E., Emissions of traceelements from motor vehicles: potential marker elements and sourcecomposition profile. Atmos. Environ., 28 (1994) 1385-1391.
[4] GAO N., CHENG M. D., HOPKE P. K., Receptor modelling of airborneionic species collected in SCAQS. Atmos. Environ., 28 (1994) 1447-1470.
[5] BERGAMETTI, G., A. DUTOT, P. BUART MENARD, R. LOSNAO, E.REMOUDAKL Seasonal variability of the elemental composition ofatmospheric aerosol particles over the northwestern Mediterranean, Tellus,41B (1989) 353-361.
[6] M1LLAN M. M., ARTISANO B., ALONSO L., NAVAZO M., CASTRO M.,The effect of meso-scale flows on regional and long range transport in thewestern Mediterranean. Atmos. Environ., 25A (1991) 949-963.
17-9

Table 1. Concentrations of fine particle elements in urban areas,(concentrations are ng m3) unless otherwise noted)
Thiswork
Denver L.A Demaskus Berkshire Gent
Al
BrCr
Ni
NO,
PbSe
VZn
110
213.2
3.1
2100
71
0.48
3,916
3978
5
3
2600
270
38
2290
8
5300
560
120
240
74
45
8.6
224
6
3.6
2.6
49
1.37
14
210
43
3.2
6.2
170
1.4
90

Table 2. Comparison with earlier Ankara data
1993 1989 1975 1977
ANTHROPOGENIC ELEMENTS
AsCr
Sb
$e
V
Zn
Br
5.1
5.4
1.7
0.8
12
60
110
14
27
0.34
1.2
15
90
80
14
21
1.7
116
9.6
90
109
64
14
3.2
82
175
SOIL RELATED ELEMENTS
AlCa
Ce
Fe
La
Sc
640
300
0.9
340
0.5
0.1
690
1100
6.5
1300
3.70.5
3400
8100
9
2070
2
0.61 •
5.3
3600
3."9
0.796
17-11

Table 3. Heating and non-heating season averages ofelements
Al
As
Br
Cd
Cr
Fe
Hg
In
Ni
Pb
Sb
SO4
V
Zn
Se
Heating(ng
83
2L1
23
0.15
3.8
100
0.18
0.04
4.42
83
L73
• * 9780
5.65
19
0.58
Season
± 84
± 2.3
± 18
± 0.11
± 2.98
± 112
± 0.21
± 0.07
± 3.21
± 63
± 2.78
± 12140
± 3.89
± 13
± 0.35
Non-heating(ng m 3
126
0.62
19
0.06
2.46
93
0.18
1.11
58
0.61
1990
1.44
9
0.14
±±±±
±
±±
±
±±
±
±
±
±
season
206
0.78
19
0.07
2.16
132
0.16
1.04
60
0.58
1970
1.29
7
0.17
17-12

Table 4.
As
Zn
Sb
Se
S04=
Hg
Ni
V
Mn
La
Al
Sc
Ce
Fe
Mg
Na
Cl
Pb
Br
Eigenval.
Var.expl.
Factor
FAC I
0.88
0.83
0,82
0.41
0,81
0.37
0.57
0.44
0.34
3.73
36.7
loadings
FAC 2
-
0.35
0.96
0.92
0.65
0.37
2.45
19.9
FAC 3
0.37
0.34
0.36
0.34
0.38
0.56
QM
0.76
0.36
2.43
9.4
FAC 4
0.21
0.39
0.27
0.97 •
' 0.92
2.06
8.5
FAC 5
0.32
0.33
0.63
OJS
0.36
0.45
1.55
4.9
FAC 6
0.21
0.77
0.61
0.41
0.21
0.29
1.30
4.4
Com
0.92
0.73
0.67
0.28
0.66
0.29
0.86
0.92
0.84
0.49
0.44
0.97
0.85
0.74
0.91
0.79
0.41
0.94
0.85
13.5
79%
17-13

2,000
1,500
1,000
500
0
Fe
V/ \ / V
in id m i 11 iiluulnn (mil ui tl n n hnihmlni ilnnliml n .ij.l n iiUnihm I ui\\nhl M nil nihntl
FEB MAR APRMAY JUN
Figure 1. Temporal variations of Fe, Se and V
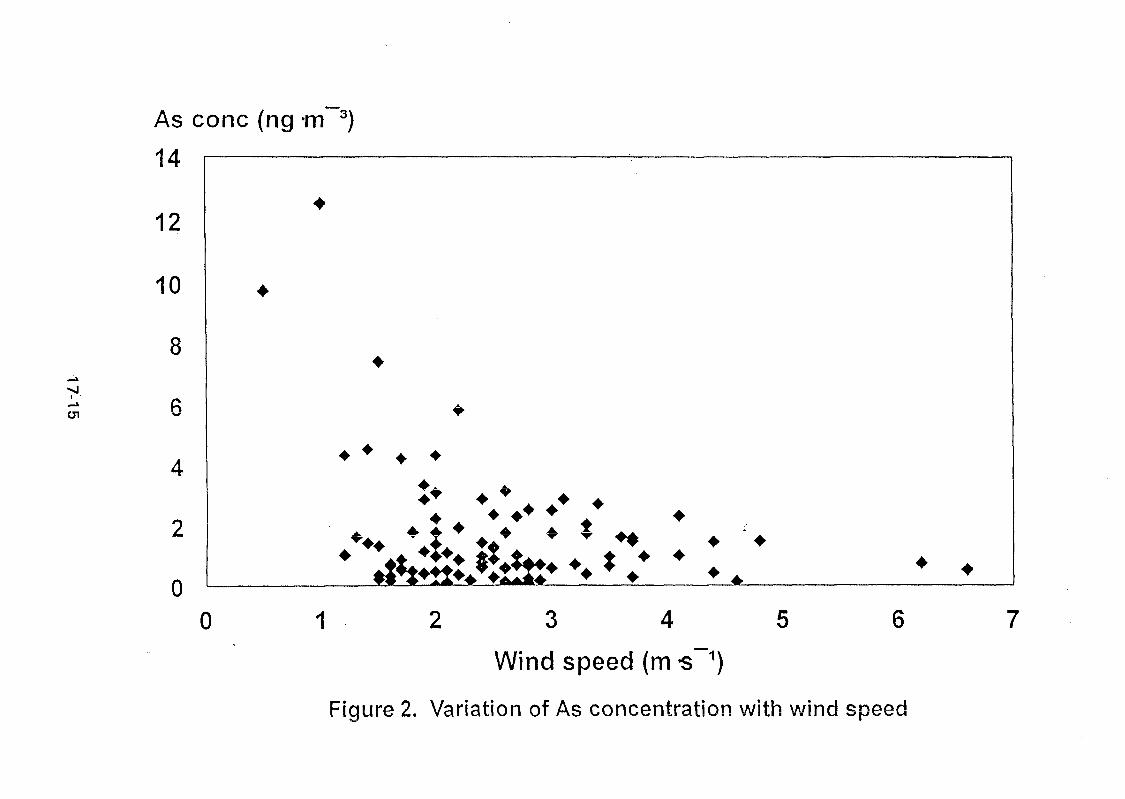
I •
As cone (ng m 3)
14
12
10
8
6
4
2
00 1 2 3 4 5 6
Wind speed (ms""1)
Figure 2. Variation of As concentration with wind speed

40
30
20
oo
Q. 10
0
-10
-20FEB
• • «
• •
MAR APR MAY JUN
Figure 3. Change in temperature during sampling

100
10
1
0,1
0,01
0,001
0,0001
0,00001
0,000001FEB MAR APR MAY JUN
Figure 4. Temporal variations of crustal and non-crustal V

XA0103098
Appendix 18
CHARACTERIZATION OFTHE GENT PM10 SAMPLER
Philip K. Hopke, Ying Xie, and Taisto RaunemaaDepartment of ChemistryClarkson UniversityBox 5810Potsdam, NY 13699-5810 USA
and
Steven Biegalski and Sheldon LandsbergerDepartment of Nuclear EngineeringUniversity of Illinois at Urbana-Champaign103 S. Goodwin StreetUrbana, IL 61801 USA
ABSTRACT
An integral part of the Co-ordinated Research Programme: Applied Research on
Air Pollution using Nuclear-Related Analytical Techniques is the PM10 sampler
that was designed by Dr. W. Maenhaut of the University of Gent. Each
participant was provided with such a sampler so that comparable samples will
be obtained by each of the participating groups. Thus, in order to understand
the characteristics of this sampler, we have undertaken several characterization
studies in which we have examine the aerodynamic collection characteristics of
the impactor inlet and the reproducibility of the sample mass collection. The
sampler does provide a collection efficiency that follows the guidelines for a
PM,0 sampler. Comparing one of the original samplers built at the University of
Gent with a unit built from the same plans at Clarkson University showed good
reproducibility in mass collection.
1. INTRODUCTION
As part of the Coordinated Research Programme: Applied Research on
Air Pollution using Nuclear-Related Analytical Techniques, the International
Atomic Energy Agency contracted with the University of Gent to design and
construct a PM10 sampler so that all of the participating groups would be using
18-1

identical samplers. The sampler was design by Dr. W. Maenhaut and the unit
was described by him in a report at the first Coordinated Research Meeting [1].
The sampling head for the unit is shown in Figure 1. The air enters the
unit through an impactor stage designed to have a 50% collection efficiency at
10 //m. It then is drawn through a stacked-filter unit (SFU). The SFU consists
of a holder for two sequential filters constructed by the Norwegian Centre for
Atmospheric Research (NILU). The initial filter is an 8//m nuclepore filter and
the second filter is an 0.4/ /m pore nuclepore filter. At a flow rate of 18 Lpm,
this unit should act as a dichotomous sampler. The flow through the 8 //m
pores will result in collection of 2.5 //m particles with 50% efficiency. The <
2.5 //m particles are then collected on the 0.4 //m filter.
"O"-ringsStacked FilterUnit
Impactor Stage
Figure 1. Schematic diagram of the sampling head containing the 10//m impactor inletand the NILU SFU.
An important question is whether the system performs as it was '
designed to do. The behavior of the SFU had been established by Cahill and
coworkers [2]. Thus, the primary concern was the verification of the
performance of the impactor stage in the inlet. The other consideration is the
reproducibility with which these systems can be constructed. Additional units
have been constructed at Clarkson University from plans provided by Dr.
Maenhaut. It was sent to the University of Illinois at Urbana-Champaign and
compared with one of the original units prepared at the University of Gent.
18-2
2 EXPERIMENTAL. PROCEDURES
2.1 Inlet Tests
We initially attempted to generate a monodisperse test aerosol using a
vibrating orifice aerosol generator. However, we had substantial
inhomogeneities in the aerosol concentration measured in our small aerosol
chamber. Although we made a number of changes to improve the chamber
behavior, we were unable to obtain sufficient reproducibility and homogeneity
to permit direct testing of the inlet. Thus, an alternative approach was
employed.
The sampler was set up both in a small parking lot near to the Clarkson
University Science Center in which Prof. Hopke's laboratory is situated and
later on the top of the 4 story section of the Science Center. The impactor
collection surface was covered with a disk of mylar coated with a monolayer of
Vaseline® and an 0.4 //m nuclepore filter was place in the first filter location so
that all of the particles would be collected. The filter and! the impactor
collection stage were then examined with an optical microscope. Image fields
of particles were captured using a ccd video camera and a Truevision TARGA-
16® frame grabber board. Image analysis software (MOCHA®) was used to
obtain the maximum and minimum axes. The particles were assumed to
spheroids of revolution having a density of 2.5 g cm'3. The aerodynamic
diameter of the equivalent sphere can be calculated for each particle. The
particle sizes can then be divided into a series of size bins and the number
collected on the filter to the total particle concentration can be estimated. The
total particles in a given size bin equals the number on the impaction stage plus
the number on the filter and then corrected for the wall losses. The wall loss
was estimated by using the wall loss curve for a similar design impactor built
and tested by Risto Hillamo at the University of Helsinki.
2.2 Mass Collection Efficiency Tests
The 2 samplers, one from the University of Gent (UG) and one from
Clarkson University (CU), were placed on the top of a 4 story building on the
University of Illinois campus. The samplers were set up in the conventional
18-3

manner with filters loaded in both stages of the SFU. The filters were
equilibrated at 50% relative humidity and weighed on a microbalance prior to
insertion into the SFU holder. After a 48 hour collection period, the filter
samples were retrieved, equilibrated, and reweighed. The difference in weights
for each filter sample could be calculated and the masses on appropriate pairs
of fine and coarse samples can then be compared.
3 RESULTS
3.1 Inlet Tests
A series of 11 samples were collected and analyzed. The results were
averaged over the series of samples to provide mean collection efficiencies and
an estimate of their variability. The plot of collection efficiency as a function of
aerodynamic diameter is shown in Figure 2. It can be seen that the system is
providing a 50% collection efficiency at 19 //m without the correction for wall
losses.
2 3 4 5 6 7 8 10 20 30 40 50'
Aerodynamic Diameter [p,m]
Figure 2. Collection efficiency as a function of aerodynamic diameter without applyingthe wall loss corrections.
18-4

After applying the corrections for the loss of particles to the wall of the
system, the collection efficiency curve moves to smaller sizes as shown in
Figure 3. Thus, if the wall loss is included, the impactor behaves as expected
from its design.
1.0
0.8
. 1 * 0.6
0.4
0.2
0.0
o
I I
" ~ " i i~: hr 1 1—i.—
> L I I !L J. _ l _I I I1 l I
_ ! I 1---J
'i i ip;r—r •r--
1 1—|—,—i i i i i
t—t—t 1I I \ T I
I I I \ .
I II I
.j . j _ j .
1 \
I II I I \
I I I I
r-I I I I !
I 1\ !•i—i—r~i—r• • A -
I I I I !I I I I I
1 1 1—\—i—|._i—j_i i i i i
LlL-L3 4 5 6 7 8 10 20 30 40 50
Aerodynamic Diameter,
Figure 3. Collection efficiency as a function of aerodynamic diameter after applying thewall loss corrections.
3.2 Mass Collection Efficiency Tests
The results for the 4 fine mass samples are shown in Figure 4 while the
coarse mass values are presented in Figure 5. Figure 6 provides a comparison
of the total mass (fine + coarse) for the 4 pairs of sampling intervals. It can be
seen that the agreement for 3 of the 4 samples is within the measurement error
of the weighing. However, there is a discrepancy for the 3rd sample pairs (9
November 1994). There is no known explanation for the difference. It can be
seen that the discrepancy is larger for the fine fraction samples than it is for the
coarse fraction samples. It seems likely that the erroneous sample would be
the one with lower mass values since it is easier to lose mass than to gain it. It
may be that the fine filter was not fully seated in the SFU. Every more likely is
18-5

that the bottom of the unit was not sealed tightly enough against the gasket
and the SFU and thus, there is air leakage around the
5/11 11/117/11 9/11
Sampling DateFigure 4. Comparison of the fine fraction mass (ng m*3) for the two side-by-sidesamplers.
5/11 7/11 '9/11 11/11
Sampling DateFigure 5. Comparison of the coarse fraction mass (ng m"3) for the two side-by-sidesamplers.
18-6

5/11 7/11 9/11 11/11
Sampling DateFigure 6. Comparison of the total mass (ng m"3) for the two side-by-side samplers.
SFU rather than through the unit. It does show that even with care in
preparing the sampler, there can be errors.
4. SUMMARY
In general the sampler performed well. The inlet behavior is in
accordance with the design specifications and side-by-side reproducibility of
samplers is very good,. It thus appears that the sampler will provide the
aerodynamically well defined samples that can serve as a basis for comparative
analysis of data from the various sampling locations around the world.
REFERENCES
[1] MAENHAUT, W., The "Gent" Stacked Filter Unit (SFU) Sampler for the Collection ofAtmospheric Aerosols in Two Size Fractions: Description and Instructions for Installation andUse, Report No. NAHRES-19, International Atomic Energy Agency, Vienna, 249-263 (1993).
[2] CAHILL, T. A. et al. Analysis of respirable fraction in atmospheric particulates via sequentialfiltration, J. Air Pollut. Contr. Assoc. 27 (1977) 675-678.
18-7

XA0103099
Appendix 19
INTERCOMPARISON OF IAEAAIRBORNE PARTICIPATE MATTER REFERENCE MATERIAL
Sheldon Landsberger, Chief Scientific Investigator and De WuDepartment of Nuclear Engineering
University of IllinoisUrbana, Illinois, USA 61801
Stephen VermetteIllinois State Water Survey
Champaign, Illinois, USA 61821
William CizekDepartment of Computer Science
University of IllinoisUrbana, Illinois, USA 61801
ABSTRACT Fifty air filters with fine and coarse fractions was prepared from NIST 2710contamanated soil. Eighten pairs were made and sent to seventeen laboratories of the CRPprogram on Applied Research on Air Pollution Using Nuclear-Related AnalyticalTechniques for elemental determination. The results of this intercomparison are discussedin this paper.
SCIENTIFIC BACKGROUND AND SCOPE OF THE PROJECT
It is now commonly accepted that the analysis of air filters for trace metals can be
fraught with many potential problems leading to erroneous results. These difficulties
include calibration of the air sampler, field blanks, and calibration of method of choice.
Analysis of air filters has the extra challenge of having the need of sensitive methods for
the low mass of material usually collected. Often air filter samples range from less than
one milligram to tens of milligrams. In the First Research Coordinated Meeting on the Co-
ordinated Research Program (CRP) on Applied Research on Waste Using Nuclear Related
Analytical Techniques it was decided to supply the participants with a new simulated air
filter reference material for analysis. This was the second time such a filter was prepared
19-1
for distribution. Filters were previously distributed to participants at a CRP on solid waste
research including, airborne particles. The results from that intercomparison were
disappointing. Many of the participants did not respond and other had poor results. It was
clear that the analysis of air filters posed a difficult challenge, both in the preparation of the
filters and the determination of then trace metals. It was then decided to organize a CRP
only on air pollution studies and prepare a second air filter for intercomparison.
METHODS
The resuspension of a standard reference material was done as in the first
comparison and has been described previously [1]. This time National Institute of
Standards and Technology (NIST) 2710 contaminated soil was used to prepare filters into
two fractions: fine < 2.5 microns, and coarse <2.5-10 microns. Previously the filter
matrix was a Japanese vehicle exhaust standard prepared by NIES was employed. This
time it was decided to use Nulcepore filters instead of Teflon. Nulcepore filters were
problematic in two ways. One was that they were difficult to handle due to electrostatic
characteristic and a polonium source was used to reduce this effect. The second problem
was that the mass ratio of fine to coarse was not fairly constant. This effect was not seen
when using Teflon filters, either in the previous intercomparison or in other prepared filters
for another study. The varying mass ratio did not appear to compromise the results. One
reason for the varying ratio could be that some elements such as chromium and zinc, which
were in high concentrations in the contaminated soil, were not homogenous at these small
fractions. Thus, more chromium or zinc deposited on the different fractions could have
contributed to the different ratios. Fifty pairs of filters prepared and eighteen pairs were
sent to the participants use PIXE, NAA and XRF techniques. One laboratory used atomic
absorption to determine lead. Our NAA laboratory analyzed six pair of filters to test the
homogeneity of the samples. Most elemental concentrations varied by 20%, although there
were some noticeable exceptions such as chromium in the fine fraction which varied by
almost an order of magnitude.
All filters were pre-weighed in a humidity controlled (40-60%) room and then put
19-2

into the air chamber. Deposited amounts of the fine fraction varied from 280-638
micrograms, while the coarse weights varied from 250 - 1176 micrograms. One set of
filters, fine and coarse, along with two blank filters were sent to each laboratory. All
results were to be reported! in a spreadsheet with mass (nanogram or microgram) of each
element for the four individual filters. This procedure was not followed by all the
participants. Some results came as blank corrected, as ng/cm2, or handwritten out. One
set of results were not understood. The final results (ng/filter) were simply tabulated as the
mass average of the two blanks subtracted from the mass of the fine and coarse results.
These were all tabulated in a spreadsheet. Since none of the filters had the identical
weights, these results were arbitrarily normalized to those of Dr. Willy Maenhaut. The
results from our laboratory for six filters were averaged together.
RESULTS
It was disappointing that no additional standard reference samples were analyzed as
part of a QA/QC program. Simulated air filters are available for XRF and PIXE, while
there are many types of environmental reference material for NAA.. It is not feasible to
show the results for all the methods and all elements determined. Very few of the
participants analyzed the maximum number of elements in the filters. For instance, sulphur
was not reported by all PIXE and XRF participants. Cadmium and mercury, selenium and
others, present in the air filters were also not reported by all the NAA participants. Two
examples are given. One for fine aluminum where the homogeneity is very good and the
intercomparison of the laboratories is in fairly good agreement, with the exception of two
laboratories. The other example is for coarse zinc, where the homogeneity is poor and as
expected the intercomparison as well. It is recommended that each laboratory be self-
critical when comparing their results with those of the homogeneity tests and
intercomparison values.
It was gratifying to see a noticeable improvement in the number of participating
laboratories from the previous intercomparison exercise. As well there were no results
which varied by large factors as was sen in the previous intercomparison or in other IAEA
19-3

intercomparison exercises.
PLANS FOR THE FUTURE
Under the guidance of the IAEA a new set of filters should be prepared and sent out
to the participants. There should be a strict guideline as to the minimum number of
elements to be analyzed- presumably the ones which are associated with air toxics. Some
elements determined should be common to all the methods. All laboratories should also
analyze reference materials as part of the QA/QC program. And finally all both PIXE and
XRF should be used in the homogeneity tests.
19-4
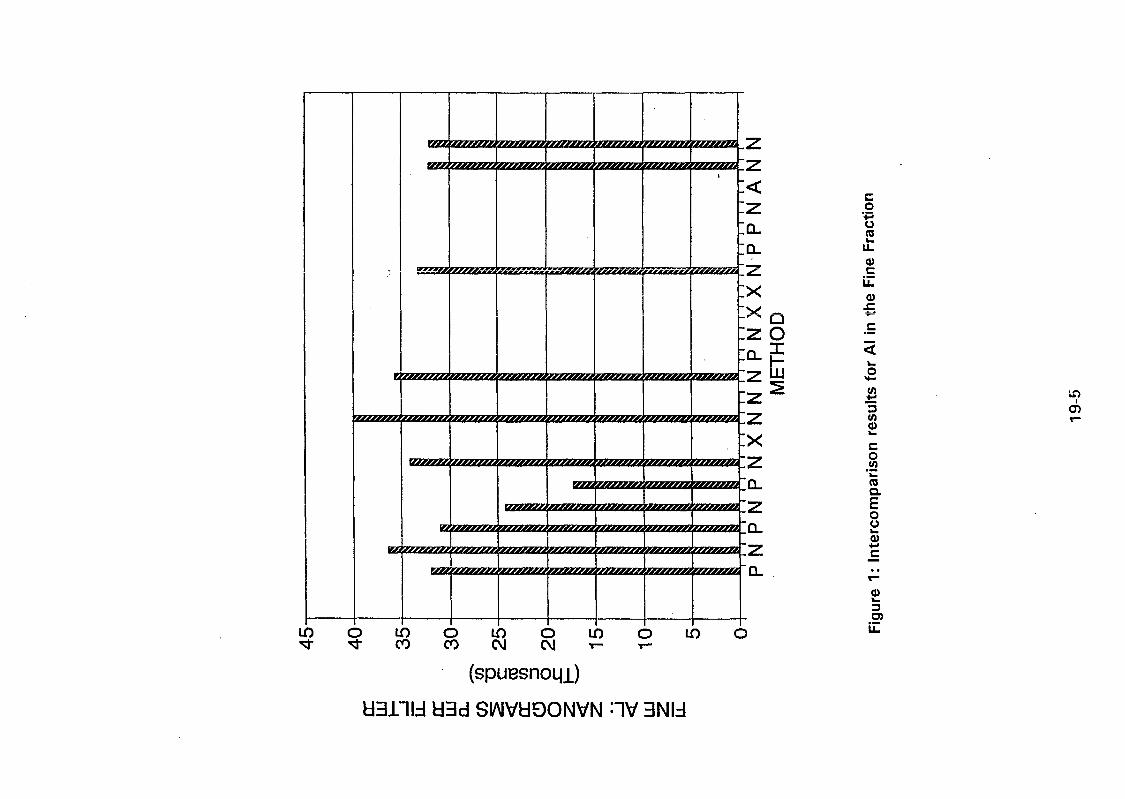
BZZ
uueau
\aamaxaeaieeo.
ICL
:x:x:zo
:z:z:x
^iift^yyyy tyJtMf+
LO O LO O LO O LO^ ^ CO CO CM CM T -
(spuesnogi)
Q
_Z
Q-
O
coO
20)
0)•s=»
C
<
0)
co.22toaoo
a)3
d3il ld d3d SIAIVdOONVN HV 3Nld

CD
C0
CDOo3T30)"t55'o3(D(A
N
3"(D
OO
WO
5"3
500480460440420400380360340320300280260240
Coarse Fraction (Zn)
#48c #60c #20c avgc#112c#18c #8c

Fine
Fra
ctio
n (A
l)
(Thousands)
G)LO
#4
7f
«+-CD>CD
#7
f
COCO
LOCO CO
COCO
CMCO CO
oCO
O}CM
00CM
Figure 3: Homogeneity results for Al in the Fine Fraction (by INAA)
19-7