iftA - International Nuclear Information System (INIS)
291
iftA Hotlce 382 I notice 383 notice 38 1 » Notice 385 Notice 386 notice 387 Notice 388 Notice 389 Notice 390 Notice 391 Notice 392 notice 393 Notice 39lt notice 395 Notice 396 Notice 397 Notice 398 Notice 393 Notice l48a notice 1|83 «c
-
Upload
khangminh22 -
Category
Documents
-
view
0 -
download
0
Transcript of iftA - International Nuclear Information System (INIS)
iftA
Hotlce 382 I notice 383 notice 381» Notice 385 Notice 386 notice 387 Notice 388 Notice 389 Notice 390 Notice 391 Notice 392 notice 393 Notice 39lt notice 395 Notice 396 Notice 397 Notice 398 Notice 393 Notice l48a notice 1|83
« c
ESRO SP-éO Organisation Européenne de Recherches Spatiales LE SATELLITE CEOSTATIONNAIRE DU CERS/ESRO POUR L'ETUDE DE LA MAGNETOSPHERE Copenhague, octobre 1969 v + 269 page)
I. Colloque -le Lyngby
II. ESRO SP-60
III. Textes en anglais (sauf un en français)
ESRO SP-dO Organisation Européenne de Recherches Spatiales LE SATELLITE GEOSTATIONNAIRE DU CERS/ESRO POUR L'ETUDE DE LA MAGNETOSPHERE Copenhague, octobre 1969 v + 269 pages
I. Colloque de Lyngoy
II. ESRO SP-<50
III. Textes en anglais* (sauf un en fran tais)
Le CERS/ESRO a organisé du 15 au 17 octobre 1969, a Lyngby (Danemark), un colloque consacré au futur satellite géostatlonnalre GEOS, destiné à l'étude de la magnetosphère.-La premiere moitié du colloque n été consacrée eux aspects scientifique} d'ensemble du satellite April une icvue des observations recueillies Jusqu'à prisent du ni le voisinage de l'otbllc synchrone, les communications et les discussions ont porte -ur Ici aspects théoriques et expérimentaux de U conjugai';on magnétique; Ici phénomènes ilu plasma magné losphé il que; les interactions ondes- paît leule s; les frontières de la magnéiosplicic, plasma pause comprise, et les variations du champ magnétique observées par ATS - 1; l'étude des sous-orages magne to sphé tiques et la coordination tics observations faites au sol avec tes expériences cmbarquc.es sur ballon cl sur fusée.- Lu seconde moitié traite
U CERS/ESRO a organisé du 15 au 17 octobre 1969, a Lyngby (Danemark), un colloque consacré au futur satellite géostatlonnalre GEOS, destiné à l'étude de U magnéloiphcre.-La première moitié du colloque a été consacrée aux aspects scientifiques d'ensemble du satellite. Après ore revue des observations recueillies jusqu'à présent dans le voisinage de l'orbite synchrone, les communications et les discusiions ont porté sur les aspects théoriques et expérimentaux de ta conjugaison magnétique; les phénomènes du plasma magndtosphé tique; les interactions ondes-particules: les frontières de la magné tosphère, ptasmapausc comprise, et les variations du champ magnétique observées pat ATS - 1; l'étude dei soui-oragcs magnitosphériques et la coordination des observations faites ou sol avec 'es expériences embarquées sur ballon et sur fusée.- La seconde moitié traite
ESRO SP-60 Organisation Européenne de Recherches Spatiales LE SATELLITE GEOSTATIONNAIHE DU CERS/ESRO POUR l.'ÊTUDE'DE LA MAGNETOSPHEUE Copenhague, oc lobre 1969 v + 289pajci
I. Colloque de Lyngby
II. ESRO SP-60
III. Textes en anglais (sauf un en Cran (lis)
ESRO SP-60 Organisation Européenne de Recherches Jpalialcs U: SATELLITE GEOSTATIONNAIRE DU CERS/ESRO POUR L'ETUDE DE LA MAGNETOSPHERE Copenhague, octobre 1969 v + 289 pages
I. Colloque de Lyngby
II. ESRO SP-60
III. Textes en anglais (sauf un en fronçais)
Le CERS/ESKO n organisé du l à au 17 octobre 1969, à Lyngby (Danemark), un colloque cinsacrf au futur satclTc géostatlonnalre GEOS, dcsllnt h l'étude de la magnéto sphère.-La première moitié du colloque a été consacrée aux aspects scientifiques d'ensemble du satellite. Après une revue des obsrivallons recueillies juyju'i présent dant le voisinage de l'orbite lynchronc, les communications et les discussions ont porté sur les aspects théorique! et expérimentaux de la conjugaison magnétique; les phénomènes du plasma magné losphéiiquc; les interaction* ondes-particule s; les frontières de ut mPEnéturphctc. plasmapausc comprise, et les variations du champ magnétique observées par ATS - 1; l'étude des tous-orages magnétotphéflqocs ci la coordination des observations (aitei au sol avec les expériences embarquées sut hillon et sur fusée.- La seconde moitié traite
U CERS/KSROa organisé du 15 au 17 octobre 1969, à Lyngby (Danemark), un colloque consacré au futur satellite géoslalionnaire GEOS, destiné û l'étude de la magn S tosphère .-La première moitié du colloque n été consacrée aux aspects scicm.fiques d'eniemble du satellite. Aptes une revue dei observations recueillie* jusqu'à pié:-;nt dans le voisina^ de l'oihitc synchrone, les communications et les discussions ont porté sur les aspects théorique! et expérimentaux dp lu conjugaison magnétique; les phénomènes du plasma magnétosphétique; les interactions ondes-particules; les frontières de la magnétospliète. plasmapause comprise, et les variations du champ magnétique observées par ATS • 1; l'élude des lous-oragri magnéloiphériquci cl la coordination des observations faites au sol avec les expériences embarquées sur ballon et sur fusée.- La scronde moitié traite
plot puUajlibcment d o questions «tpéiimefliiki, notamment les expériences diki «c t i r a» sur les émissions de particules chargées et d'ondes radio-électrique i; le système de télémesure; let aspects identlflqucs et technique» d u calculateurs embarqués; et, finalement, let experiences poor l'étude du champ élaetriqufc- La dernier exposa traite des détails préliminaires rdstih au satellite géc-stationnai» STRJO.
plus partlailfeirmeal des questions expérimentales, notamment les expériences dites «cth-esi n u les Émissions de particules chargées et d'ondes redlo-éleetriquDs; ls système de télémesure; les wytets scientifiques et techniques des catci'Liteun embarques; et, finalement, les expériences pour l'Étude du champ Électrique.- Le cernlcr expo» traite des details préliminaires relatif» ia satellite géostationnalro SI RIO.
plut particulllrement dci questions expérimentales, notamment les expériences dites «actives» sur 1» êmlsilons de particule» chargées et d'ondei radlû-âectii]Ufis; 1s système de télémesure; les aspects scientifiques et techniques dot calculateurs embarque"); et, finalement. Ira cxyérlences pour l'étude du champ électrique.- La dernltr c*posé traite dw détails préliminaires telitifs au satellite géosUlionnalre 5IR10.
1
plut particulièrement des questions expérimentales, notamment I» expériences dites tncUVea» nir 1 K émissions de partietlei chanjécs et d'ondes radic-élcelriquei; lo système de télémesure; les aspects scientifiques et techniques dci calculateurs embarqués; et, fmatoncnl, les expérience! pour l'Étude du champ Électrique- Le dernier exposé traite tes détails préliminaires rclatifi uu KJWIUIC géostationnalre SIR10.
ESRO SP-60 March 1871
THE ESRO GEOSTATIONARY
MAGNETOSPHERIC SATELLITE
Proceedings ot an ESRO Colloquium helid at lyngby, Denmark, 15-17 October 1969
ORGANISATION EUROPÉENNE DE RECHERCHES SPATIALES EUROPEAN SPACE RESEARCH ORGANISATION 114, avanu* ChaHes de GQUIIO - 92-NouiI ly-sur-Safc» ÎFrcnco)
SUMMARY
The general scientific aspects of the ESRO geostationary magnctcspheric satellite are first considered, beginning with a review of the observations so far made in the vicinity of the synchronous orbit, followed by discussions on theoretical and experimental aspects of magnetic conjugacy; magnclosphcric plasma phenomena: wave-particle interactions; magneto spheric boundaries, covering the plasmapausc, and magnetic variations observed at ATS I ; studies of magne-tospheric substorms and coordination with ground-based observations and balloon-borne and rocket experiments. The second part deals with experimental problems, including active experiments on charged particles and on radiowave emissions; the telemetry system; the scientific and technical aspects of onboard computers; and eleclric field experiments. Preliminary details of the Italian geostationary satellite SIFUO are finally considered.
TABLE OF CONTENTS
GENERAL SCIENTIFIC ASPECTS
Page A kEVlEW OF FIELDS AND PARTICLE OBSERVATIONS MADE JN THE VICINITY OF THE SYNCHRONOUS ORBIT
iy.1. Axford 1
MODELS OF MAGNETIC FIELD LINE GEOMETRY FOR A GEOSTATIONARY SATELLITE
F.D. Barish and J.G. Roederer 31
EXPERIMENTAL RESULTS ON MAGNETIC CONJUGACY F. Mariam 49
MAGNETOSPHERIC PLASMA PHENOMENA AT THE GEOSTATIONARY ORBIT
/. W. Freeman, Jr. and D.T. Young 69
MACRO-INSTABILITIES IN TEE MAGNETOSPHERE K. :,;hindler 79
COMPLEX ELECTRIC FIELD EMISSIONS OBSERVED BY OGO-5 ON IS AUGUST IS68
CF. Kennel. F.L. Scarf. F. V. Coroniti, R.W. FredricksandJ.H. McGekee 91
LOW-FREQUENCY INTERACTIONS D J. Sovthwood 101
THE EFFECT OF RESONANT INTERACTIONS ON OBSERVED FLUX J. W. Dungey and D.J. Southwaad 107
THE PLASMAPAUSE J.O. Thomas I l l
MAGNETIC FIELD VARIATIONS AT ATS I R.L. McPherronandP.J. Coleman, Jr 119
GEOSTATIONARY SATELLITE STUDIES OF MAGNETOSPHERIC SUB-STORMS
P. Rottiwell 145
RESULTS FROM THE ESRO I LOW-ENERGY PARTICLE EXPERIMENT AND THEIR RELATION TO A GEOSTATIONARY SATELLITE PROJECT
R. Riedler 149
OGO-5 LYMAN-ALPHA OBSERVATION OF AURORAL PRECIPITATION J.L. Berteoux 153
MAGNETOSPHERIC SUflSTORMS : GEOSTATIONARY SATELLITE INVESTIGATIONS IN RELATION TO GROUND-BASED OBSERVATIONS
B. Hultqvist 155
COORDINATED GROUND AND SATELLITE OBSERVATIONS O. Holt 159

POSSIBLE FINNISH CONTRIBUTION TO THE GEOSTATION *RY SATELLITE PROJECT
M. Tiuri lil
PERIODIC VARIATIONS OF ELECTRON FLUXES OBSERVED AT SYNCHRONOUS ALTITUDES
G.K. Parks 163
COORDINATED STUDIES OF PRECIPITATED ELECTRONS BY GEOSTATIONARY SATELLITE AND BALLOONS
H. Trefoil 175
AURORAL ROCKET EXPERIMENTS COORDINATED WITH A GEO STATIONARY SATELL;TE
B.N. Maehlum ] 79
THE GEOSTATIONARY SATELLITE AS A DETECTOR O^ ULTRA VIOLET SUNRISE AND SUNSET
RJ. Armstrong 181
EXPERIMENTAL PROBLEMS
CHARGED PARTICLE EMISSION FROM A GEOSTATIONARY SATELLITE
P. Slauning 183
AN ACTIVE RADIOWAVE EMISSION EXPERIMENT M. Petit 201
PRELIMINARY PROPOSAL FOR EXPERIMENTS ON THE ESRO GEOSTATIONARY SATELLITE (GEOS)
G. Marlelli and J. Trou£hlon 213
THE GEOSTATIONARY SATELLITE TELEMETRY SYSTEM W. bothaller 223
THE SCIENTIFIC VALUE OF COMPUTING FACILITIES FOR ESRO SATELLITE MISSIONS
F. Du Cartel 231
CALCULATEURS EMBARQUÉS — QUELQUES CONSIDERATIONS TECHNIQUES
J. Cazemajou 237
PROBLEMS OF DC ELECTRIC FIELD MEASUREMENTS FROM A GEOSTATIONARY SATELLITE
U. Fahteson 249
ELECTRIC FIELD EXPERIMENTS — ALTERNATING FIELDS L.R.O. Storey 267
FUTURE PROGRAMMES
PL/.NS FOR AN ITALIAN GEOSTATIONARY SATELLITE B. Raul 281
PARTICIPANTS 285
A REVIEW OF FIELDS AND PARTICLE OBSERVATIONS MADE IN THE VICINITY OF THE SYNCHRONOUS ORBIT
W. I. Axlbrd Department of Physics
Department of Applied Physics and Information Science
Institute for Pure and Applied Physics University of California, San Diego La Jolla, California 92037
ABSTRACT
The proposed ESRO geostationary satellite would grea:Iy • ^sist projects In observing almost all relevant space phenomena simultaneously from more than one position. This paner surveys the observations so far made from the vicinity of the synchronous orbit and discusses the magnetic field, low-energy cosmic rays, energetic trapped particles, auroral and ring current particles, law-energy plasma in the magnetosphere, quasi-steady electric fields, low-frequency radio noise and tine emissions, ft is suggested that the baek-up satellite be placed in elliptical orbit, between (tay)L = 4ar.dL — 8, in order to make correlations over all separations in longitude and across most of the auroral zone.
I. INTRODUCTION
The satellite era began twelve years ago. In the ensuing period great progress has been made in terms of our understanding of the magnetosphere and of the nearby environment of the Earth in inrcr-planelary space. However, as far as some of the most interesting problems of space physics aie concerned, namely those concerning the aurora and its relationship to geomagnetic storm phenomena, we arc still a long way from being able to provide answers.
For many years the difficulties associât J with making observations of low-energy panicle (luxe: and of electric fields prevented us from effectively tackling the auroral problem. Now, however, these difficulties appear to have been largely overcome and we can accordingly begin to consider making a concentrated effort to observe almost all the relevant phenomena simultaneously from more than one position in space. It is very evident that well-planned observations made from a geostationary satellite can be of great significance especially ir they are carried out in conjunction with observations made at lower altitudes (i.e., ground-based, roclcet and low-altitude satellite observations). The nroposcd ESRO geostationary satellite could be ideal from this point if view, since it is possible to plan a wdl-integraied scientific payload add because there appears to be considerable interest in performing the necessary supporting observations at low altitudes. In this paper we give a survey of the observations that have been made to date from the vicinity of the synchronous orbit as a basis for discussion of possible future observations.
A single geostationary satellite is not sufficient to provide answers to every question as far as the aurora and related phenomena are concerned, even if ic is combined with extensive low-altitude observations. The problem of distinguishing between local time, universal time and spatial effects still remains. A very effective and politically satisfying way of answering this difficulty would be to have an internalional cooperative programme with several geostationary satellites in orbit simultaneously, and situated at appropriate longitudes (e.g., over College, Val d'Or, Liervogur, Kiruna, Dixon Island and Tixie Bay). Alternatively, ESRO could provide the additional coverage itself by using the back-up satellite, which must in any case be built, with the advantage of having experiments identical to those in the primary satellite. If this proposal is
16
H
iorI
V
•J-TT
"«Sa»
2 0
Sagan «ÏSHSSS SMSSS gSK**» «awss» wa^a
0 0 I I I
T T T
L T 2 4 4
04 I i l
T T T
g^^mcm -«rasffiSi SSiBSJSS
I I I
T T
' i '
T T T 12
T T T
zzs&z&n
08 12 16 U T (HOURS)
2 0 2 4
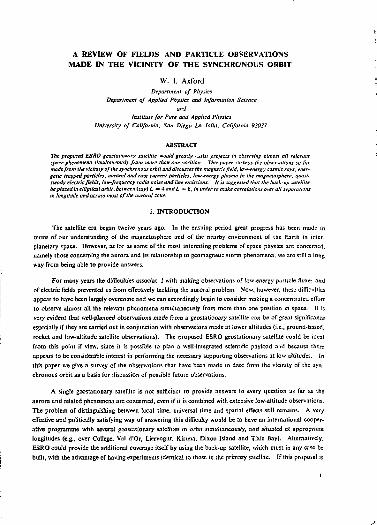
Figure I.- A superposition of ATS-1 mamctograms for aulet days on 4, i . 24. 30 and 31 January 1967 (from Cummings et aL, 1968). H ts the north-south component of the masnt 1c field at the synchronous orbit. V the radial component and D the east-west component. The solid curve was computed from the model of Williams and Mead (1965) with parameters chosen to give a reasonable f.t to the observations.
adopted, it is suggested that the second satellite should not be placed in a synchronous orbit, but rather in
an elliptical orbit (between say L = 4 and L = 8) so that during the lifetime of the satellite pair it is possible
to make constations over all separations in longitude and across most of the auroral zone.
2. THE MAGNETIC HELD
A considerable amount of effort has beea put into computing models of the geomagnetic field (Roederer, 1969) and on the whoie these appear to describe the undisturbed magnctosphere reasonably well (Fairfield, 1968). In particular, the model of WilL 'ms and Mead (1965) provides a good fit to the magnetic field observed at the synchronous orbit during magnetically tjuiet periods, as shown in Fig. 1 (Cummings el a!., 1968). During disturbed periods, however, there are large deviations from the model fields associated with trapped energetic particles (i.e., asymmetric and symmetric ring currents (CahiU, 1966; Cummings and Coleman, 1968a)), field-aligned currents (Zmuda et al., I966; Cummings et a!., 1969a), and the normal and transverse

3 l £ K SAMPLE
" ' ' ' » » 1 I I I I I I I 1 I I 1 I 1 I I I I " I oo 04 os a is M z*
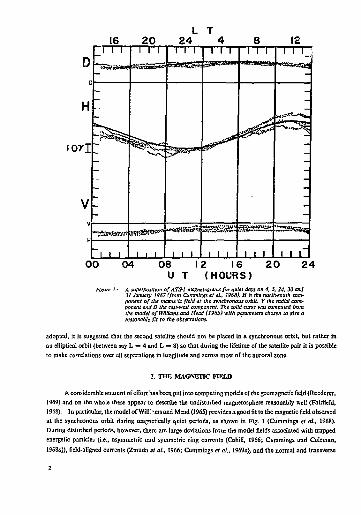
U.T. Figure 2.- College, ATS-I, and Honolulu magnetoKrwns for 25 December 1966 (from
Cummlnxs et al, 1968). Note that the changes In the field seen at ATS-I anC at Honolulu were mr-re pronounced for the substernal that occurred In the pre-mtdnlxht sec:or (Le., before 1V0O hours U.T.> than fa the oost-mldnight sector. Kate also the ore-mldazht depression of the field a! ATS-I and Honolulu and that these msgrsetoiPGns track reasonably claselv.
stresses exerted upon the magnetopause by the solar wind. There ore also relatively rapid variations associated with storm sudden commencements and sudden impulses, penetration ofthe raagnetopause (Cummings and Coleman, 19686), magnetospheric substorms (Coleman and Cummings, 1968; Cur.imiags et ai, 1968), and hydromagnetic waves in the ULF-ELF range (Curamings et al., 1969&; Barfield and Coleman, 1970; McPherron and Coleman, 1970; Sonnerup et a!.. 1969). It is evident from ihe ATS observations that a magnetometer on a geostationary satellite must be able to cope with Held strengths up to - 250 r . with a nominal accuracy + 0.1 f, and with frequencies up to I - 10 Hz. The occasional observations of the magne-topause that are likely to arise will probably place the greitest demands on (he instrument if one hopes (o determine the nature of the held change (e.g. Sonnerjp an-i CahilJ, 1968; Cummings and Coleman, 1968c).
Perhaps the most interesting results obtained from :he ATS observations to date concern the asymmetric ring current and the behaviour of the field during substorms. A typical example of a set of magne-tograms from ATS, Honolulu and College is shown in Fig. 2. Noie how well the Honolulu and ATS records
match, the depression of H which occurs on the dusk side of the Earth and the characteristic sudden recovery of the field at ATS associated with the onset of a substorm at College. The magnetic field is frequently observed to contain a substantial (~ 10y) fluctuating component following the onset of a substorm (McPhenon and Coleman, 1970), and there is some evidence for an association of field-aligned currents with the onset is seen at the satellite (Cummings et a!., 1969a).
Most of these effects can be understood in terms of the following scheme, which is based on the ideas of a number of individuals:
a) magnetic field lines on the front of the magnetosphere are eroded away either by reconnection with the interplanetary magnetic field or by " viscous " interaction and pulled downstream by the solar wind, thus enlarging the tail or the magnetosphere;
b) the magnetosphere attempts to restore itself by allowing The tail field lines to reconnect, contract towards the Earth and then move through into the low-latitude " dou&hnut " region via the familiar convection process;
c) the contraction and convection of tail field lines towards the Earth involves acceleration of any solar wind > lasma trapped on the field lines by diffusion into the " neutral " sheet from the sides of the tail, thus forming the plasma sheet;
d) as the plasma sheet is forced into the night-side magnetosphere the plasma pressure increases and the magnetic field becomes progressively more disturbed, thus giving rise to a " ring current " effect locally;
e) the solar wind continues to enlarge the tail and thus exerts 3 growing pressure on the plasma sheet; f) eventually when the p or the plasma on the inner edge of the plasma sheet reaches some critical
value the plasma is largely expelled into the atmosphere and the magnetic field is locally deflated; g) the collapse of the plasma sheet on the inside leads to an inward movement of the outer parts
of the plasma sheet, continually raising the p" lo the local critical value and thus producing a progressive collapse associated with the progression of the auroral substorm to higher latitudes;
A) as the old plasma sheet is removed the open tail field lines are able .to reconnect with adjacent oppositely-directed partners and contract towards the Earth thus reforming the plasma sheet and relieving the pressure on the tail by allowing it to thin down;
0 tin deflated flux tubes move forward, mostly on the dawn-side of the Earth, thusr^roring the magne-losphcre to something like ils original shape;
J) many of the protons originally associated with the plasma sheet survive to be convected deep into the magnetosphere, drifting to the west, where they form a partial ring current that persists after the substorm but gradually disperses into a symmetrical ring current;
k) the process of tail-building continues, and if it does so at a high ra^esothata sufficient number of substorms occur in rapid succession, the ring current can become so strong (hat a magnetic storm can be said to be in progress
We do not understand every feature of this scheme and could well be wrong about some aspects, nevertheless it seems quite reasonable, being based firmly upon observation such as those shown in Fig. 2. The scheme contains a number of implications 'hat appear to be borne out by experience. Thus it is inevitable that any index of substorm activity should be large during periods when the ring current is being enhanced ï.e. the AE ind« is correlated with dD.i/dt ralher than with D., itself :;Davis and Parthasarathy, 1967) Again, since " open " tail field lines have no means of identifying their proper partners, magnetic conjugacy is rather erratically defined on recently connected field lines that have not had time to unscramble themselves (Piddington, 1967); consequently it is not surprising tha' predictions of conjugate points show à deterioration

FEB 15, 1967
• 65**ELECTR0N COUNT RATE
« 9 O ; ( R I - 9 , B T - 2 0 ) e o - 1 5 0 keV
•90'(R,'Bâ, 8T»25);
I 1 I 1 1 1 1 1 1 1 ^ figure 3- Comparisons between the measured directional count rates far Ditch angles
a = 65° and a = 90' and the calculated count rules from the OCO 3 radia! gradient and trajectories computed from lite Mead model or the magnetosphere (from Pfllzer el at.. 19691. The solid curves represent the results obtained using a best fit of the Mead model to concurrent ATS-1 magnetic field measurements, and the dashed curves revresent J,T- deviation from this best fit.
with increasing latitude in the auroral £onc (Bclon el fl/., 1969), and that there should be a considerable amount of hydromagnetic turbulence associated with substorms. Strong field-aligned currents can also produce marked changes in conjugacy in the regions where they occur. A general review of conjugate phenomena has been given by Wescott (1966), (see also Campbell and Matsushita. 1968). The subject of magneiosphcric substorms has been thoroughly reviewed recently by Akasofu (1968) Hultqvist (1969) and Fcidsiein (1969).
3. LOW-ENERGY COSMIC RAYS
There appears to be no good case to be made for choosing the synchronous orbit for cosmic ray observations in general. However, where observations of very low-energy protons and alpha particles (i.e. — 0.3 -30 MeV/nucIeon) are concerned it appears that interesting information can be obtained on the structure of the outer magneiosphere {Lanzerotti, 1969). In particular, these observations provide us with a better understanding of the processes which control low-energy cosmic ray cut-ofTs, especially symmetrical and asymmetrical ring currents, substorms, tail effects, and piich angle scattering by low-frequency waves. It is evident from ATS and other observations (e.g. Lanzerotti, 1968. 1969; Paulikas and Blake, J969) th3t low-energy particles are often able to penetrate much deeper into the magnetosphere than calculations based on magne-tospheric models would suggest (e.g. Smart et of., 1969; Paulikas et at.. 1963a, b, c). Evidently some sort of diffusion proccssis involved (RothweH, 1959; Ray, (964; LanzeroCti, 1969), but whether it occurs at all local times, or is restricted to the night-side of the magnetosphere (requiring a mixture of pitch angle scattering and L shell splitting) is not clear at present. The anomalies are most evident at low energies; at higher energies (> 40 MeV/nucfeon) it seems possible to modify the Stoermer theory (o give agreement with observe ons (Filius, 1968).
Diurnal variations of the particle intensities observed at the synchronous orbit are commonly evident,
as shown in Fig. 3 (Lanzerotti, 1968, 1969; Paulikas and Blake. 1969). These have characteristics similar to
DRIFT-PSaiODIC ECHOES
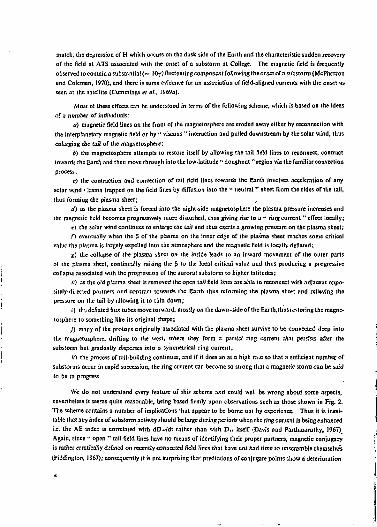
Figure 4- Drift periodic echoes of enerzetic trapped electrons observed from ATS-1 on 22 February 1967(from Brewer et ai. 1969). The peaks and valleys in the fluxes occur at intervals which correspond to the drift period from each enerxv channel

the noon recovery seen at times in riometer observation;. (Leinbach, 1967). However, the spectral response of the particle distribution as far as the diurnal variations is concerned is rather puzzling, since it is sometimes more evident at the higher energies. In general the cut-offs arc reduced when the level of geomagnetic disturbance rs high, but not in a manner which is simply related (o any of the usual activity indices (Lanzcrotti, 1969). Indeed, during subslorms there is evidence ihat the cut-off is at least temporarily enhanced (Barcus, 1969). Changes also occur in association with sudden commencements of geomagnetic storms (Paulikas and Blake, 1970), apparently as a result of acceleration within the magnetosphere and of the passage of spatial variations of the distribution past the satellite.
It is evident from the observations that have been carried out to date that low-energy sclar and galactic cosmic ray experiments on future geostationary satellites should be such that proton and alpha particle spectra can be obtained in the range ~ 0.3 - 30 MeV/nuclcon, with some provision for measurements of the pitch angle distribution and of the anisotropy associated with gradients of the intensity. The spectral and composition measurements can be very useful, especially if it is possible to make a comparison with observations made outside the magnetosphere. Observations of the pitch angle distribution yield information on loss processes associated with scattering by hydro-magnetic waves (to he detected from magnetometer measurements) on the region of access to the magnetosphere (tf it is limited in longitude), and possibly on any acceleration mechanisms. The intensity gradient can be measured quite easily from the anisotropy. which is likely to be quite large if the characteristic length associated with the gradient is comparable with the gyro-radius of the particles.
4. ENERGETIC TRAPPED PARTICLES
In view of the observations described in Section 3 it is clear that one cannot expect to find trapped protons and alpha particles with energies £ 1 MeV/nucleon at the synchronous orbit. It would be interesting however to observe the behaviour of protons and alpha particles with energies ~ 50-400 keV/nucleon, since most of the energetic ions in the " inner belt " probably originate from these panicles as a result of diffusion through third invariant breakdown (e.g., Hess, 1968; Tverskoy, 1969). It is necessary to know the spectrum reasonably well, since this should behave in a predictable manner as a function of L if the electric field fluctuation spectrum and the loss processes are known. The alpha particles provide additional information since they react to a different region of the fluctuation spectrum than protons at the same energy per nucléon and they are also affected differently by toss processes. In fact, there is strong evidence that the alpha particles are lost relatively quickly (Krimrgis, private communication) and for this reason are absent from the inner radiation belt.
Trapped energetic ( > 300 kcV) electrons are commonly observed at the synchronous orbit (Craven, 1966; Owens and Frank, 1968; Pfitzer et a/., 1969; Paulikas et a!.. 19686; 1968c; Lanzerotti et al., I967; Lezniak et ai., 1968). During quiet periods a smooth diurnal variation is apparent, being associated with the motion of the satellite across equal intensity contours in the distorted magnetosphere. During disturbed periods, large variations occur due to both adiabatic and non-adiabatic processes. The more energetic (£ I MeV) electrons are usually depleted during magnetic storms and recover relatively slowly. Sudden changes in the geomagnetic field often give rise to " drift-periodic " fluctuations in — 1 MeV trapped electrons (see Fig. 4) which disperse as a result of the variation of drift period with pitch angle (Brewer et al., 1969).
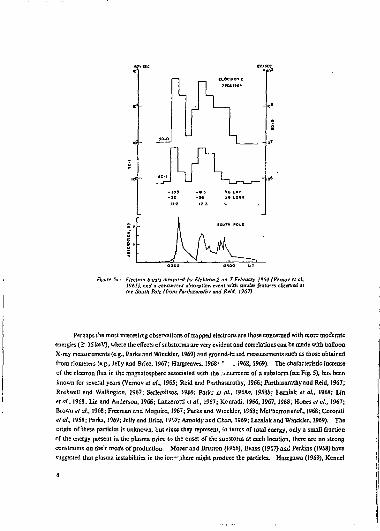
Electron bunts measured bv Ekktron-2 on 7 February 1964 (Vemov et al. 1965). and a concurrent absorption event with similar features observed at the South Pole (from Partkasarathv and Reld. 1967).
Perhaps the raost interesting observations of trapped electrons are those concerned with more moderate energies ( £ 35 keV), where the effects of substorms are very evident and correlations caa be made with balloon X-ray measurements (e.g., Parks and Winckler, 1969) and ground-br sed measurements such as those obtained from riometers (e.g., Jelly and Brice, 1967; Hargreaves, 1968- T , Î96B, 1969). The characteristic increase of the electron flux in the magnstospbere associated with the . incurrence of a substonn (see Fig. 5), has been known for several years (Vemov et al., 1965; Reid and Parthasaralhy, 1966; Parthasarathy and Reid, 1967; Rothwell and Wallinglon, 1967; Serlemitsc-s, 1966; Parks el a!^ 1968a, 1968ft; Lezniak et al.. 1968; Lin eta!., I96S; Lin and Anderson, 1966; Lanzerotli «i al, 1967; Konradi, 1966,1967, 1968; Hones et al., 1967; Brown eta!., 1968; Freeman and Ma guire, 1967; Parks and Winckler, 1968; McPherrone/a/., 1968; Coroniti et a!.. 1958; Parks, 1969; Jelly and Brice, 19C7; Arooldy and Chan, 1969; Lczniak and Winckler, 1969). The origin of these particles is unknown, but since they represent, in terms of total energy, only a small fraction or the energy present in the plasma prior to the onset of the substonn at each location, there are no strong constraints on theY mode of production. Mozerand 0raston(1966), Evans (1967) ami Perkins (1968) have suggested that plasma instabilities in the ion—prière might produce the particles. Hasegawa (1969), Kennel
oo 04 ca iz « so M
U.T.
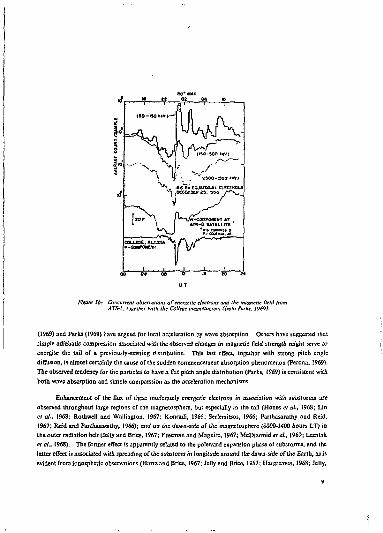
Future 5b.- Concurrent observation* afenemttlc eleanns and the magnetic field from ATS-l. t3g.eth.tr with the College magrtetoxjam (from Parks. 1969).
(1969) and Parfcs (1969) have argued for local acceleration by wave absorption. Others have suggested thai simple adiabatic compression associated with (he observed changes in magnetic field strength might serve lo energise the tail of a previously-existing distribution. This last effect, together with strong pitch angle diffusion, is almost certainly the cause of the sudden commencement absorption phenomenon (Perona, 1969). The observed tendency for the particles (o have a flat pitch angte distribution (Parfcs, 1969) is consistent with both wave absorption and simple compression as the acceleration mechanisms.
Enhancement or the flux of these moderately energetic electrons in association wiîh substorms are observed throughout large regions of the tnagnetosphere, but especially in the tail (Hones et al-, I968; Lin et ai., 1968; Rothwell and Wellington. 1967; Konradi, 1966; Serlemitsos, 1966; Parthasarathy and Reid, 1967; Refd aad Parthasarathy, 1966); and on the dawn-side of the magnetosphere (0000-KOO hours LT) in the outer radiation belt (Jelly and Brice, 1967; Freeman and Maguirc, 1967; McDi&rmid et ai., 1969; Leznialc et ai., 1968). The former effect is apparently related to the poleward expansion phase of substonns, and the latter efièct is associated with spreading of the suhstorra in longitude around the dasvn-side of the Earth, as is evident from ionospheric observations (Hartz and Brice, 1967; Jelly and Brice, 1967; Hat-greaves, 1968; Jelly,

' I ' ' ' ' I ' ' ' ' I ' ELECTRONS E^35Kev
-J ! 1 ! I 1 I I t ^ 1 ) I I 1 I 1_
52 54 5G 58 60 62 64 66 68 70 72 74 76 78 80 82
A= COS"' N ^ Figure 6.- Alouette II observations of latitude profiles of the Intensity of electrons
with E>35keV. In the mornlns! (solid lines) and afternoon (broken lines), during times of magnetic storms (from Meùiarmid et al., 1969). The times and values of B correspond to ths positions on the trajectories where the ir^gnetlc latitude is A = 66".
1968, 1969). On the whole, it appears that the longitudinal spreading is consistent with acceleration of the particles in the midnight sector of the magnetospherc followed by drift to the morning side (Pfitzer and Winckler, 1969), although Parks (1969) has pointed out there are some difficulties with ihis argument. In any case, it is well-established that fresh radiation belt electrons appear on the dawn-side of the magnetosphere (see Fig. 6).
10
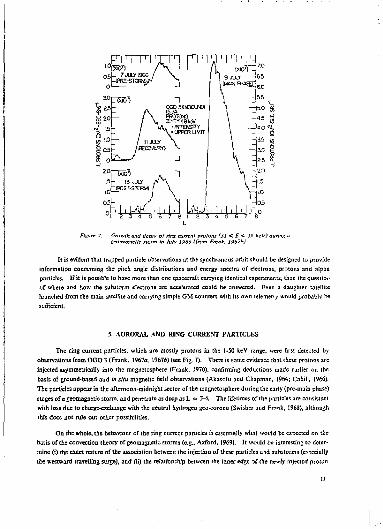
Figure 7.- Growth and decay of ring current protons (31 < E < t9 keV) during a geomagnetic .norm In July 1966 (/rem Frank, ]967b).
It is «vident that trapped particle observations at the synchronous orbit should be designed to provide information concerning the pitch angle distributions and energy spectra of electrons, protons and alpha particles. If it is possible to have more than one spacecraft carrying identical experiments, then the question of where and how the substorm electrons are accelerated could be answered. Even a daughter satellite launched from the main satellite and carrying simple GM counters with its own telemetry would probablv be sufficient.
5. AURORAL AND RING CURRENT PARTICLES
The ring current particles, which arc mostly protons in the 1-50 kcV range, were first detected by observations from OGO 3 (Frank. 1967o, I967A) (sec Fig. 7). There is some evidence :hat these protons arc injected asymmetrically into the magnetosphere (Frank, 1970), confirming deductions made earlier on the basis of ground-based and in silu magnetic field observations (Akasofu and Chapman, 1964; Cahiil, 1966). The particles appear ID the afternoon-midnight sector of the magnetosphere during the early (pre-main phase) stages of a geomagnetic storm, and penetrate as deep as L =; 3-i. The lifetimes of the particles are consistent with loss due to charge-exchange with the neutral hydrogen geo-corona (Swisher and Fr^ik, 1968), although this docs not rule out other possibilities.
On the whole, the behaviour of the ring current particles is essentially what would be expected on the basis of the convection theory of geomagnetic storms <c.g., Axford, 1969). It would be interesting to determine (i) the exact nature of the association between the injection of these particles and substorms (especially the westward traveffing surge), and (u) the relationship between the inner edge af the newly injected proton
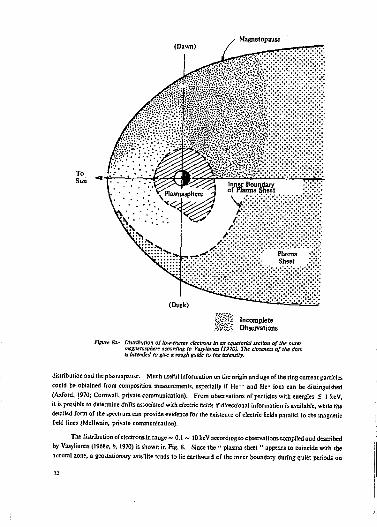
Figure 8a.- Distribution oflow^nergy electrons in an equatorial section of the outer magnetosphcre according to Vasyliunas (1970). The closeness of the dots Is Intended to give a rough guide to the intensity.
distribution and the plasmapause. Much useful information on the origin and age of the ring current particles could be obtained from composition measurements, especially if H e " and He ' ions can be distinguished (Axford, 1970; Cornwall, private communication). From observations of particles with energies £ 1 keV, it is possible to determine drifts associated with electric fields if directional information is available, while the detailed form of the spectrum can provide evidence for the existence of electric fields parallel to the magnetic field lines (MeJIwain, private communication).
The distribution of electrons in range ** O.i ~ lDkcV according to observations compiled and described by Vasyliunas (1968a, b, 1970) is shown in Fig. 8. Since the " plasma sheet " appears to coincide with the auroral zone, a geostationary satellite tends to lie earthward of the inner boundary during quiet periods on
12
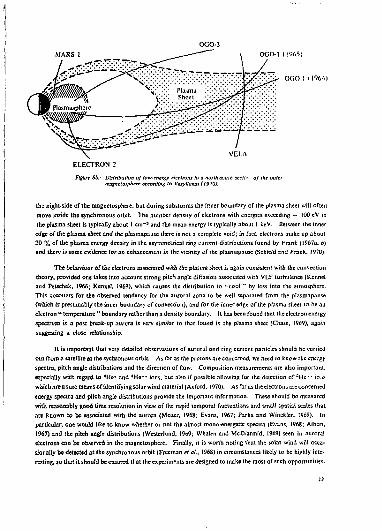
Figure 8b.- Distribution of low-energy electrons In a norih-sauih sectlr of the outer mapietoiphere according ta Vasytkino3(I970).
the night-side of the magnelosphere, but during substorms the inner boundary of the plasma sheet will often move inside the synchronous orbit. The number density of electrons with energies exceeding — 100 eV in the plasma sheet is typically about 1 c m - 3 and the mean energy is typically about I keV. Between the inner edge of the plasma sheet and the ptasmapausc (here is not a complete void; in fact, electrons make up about 20 % of the plasma energy density in the asymmetrical ring current distributions found by Frank (]967a. b) and there is some evidence Tor an enhancement in ihe vicinity of ihe plasmapause (Schield and Frank. 1970)-
The behaviour of theelectrons associated with Ihe plasma sheet is again consistent with the convection theory, provided one takes into account strong pitcS angle diffusion associated with VLF turbulence (Kennel and Petschek, 1966; Kennel, 1969), which causes the distribution to "coot " by loss into the aimosphere. This accounts for the observed tendency for the auroral zone to be well separated from the plasmapausc (which is presumably the inner boundary of convection), and for the inner edge of the plasma sheet to he an electron "temperature" boundary rather than a density boundary. It has been found that the electron energy spectrum to a post break-up aurora is very similar lo that found in the plasma sheet (Chase, 1969), again suggesting a close relationship.
It is important that very detailed observations of auroral and ring current particles should be carried out Iron) a satellite at the sychronous orbit. As far as the protons are concerned, we need to know the energy spectra, pitch angle distributions and the direction of (low. Composition measurements are also important, especially with regard to *He' and *Ke" ions, but also if possible allowing for the detection of s H e " h.n which are a sure means of identifying solar wind material ( Axford, 1970). As far as the electrons are concerned energy spectra and pilch angle distributions provide the important information. These should be measured with reasonably good time resolution in view of the rapid temporal fluctuations and small spatial scales that are known to be associated with the aurora (Mozer, 1968; Evans, 1967: Parks and Winckler, 1969). In particular, one would like to know whether or not ihe almost mono-energetic spectra (Evans, 1968: Albert, 1967) and the pitch angle distributions (Westerlund, !5o9; Whalen and McDiarmid. 1969) seen in auroral electrons can be observed in the magnetosphere. Finally, it is worth noting that the solar wind will occasionally be detected at the synchronous orbit (Freeman el ci, 1968) in circumstances likely to be highly interesting, so that it should be ensured that the experiments are designed to make the most of such opportunities-
13
6. LOW-ENERGY PLASMA IN THE MAGNETOSPHERE
The behaviour of the low-energy (0-100 eV) plasma in the magnctospherc is dominated by electric fields (sec Section 7), an4 b> •.',„ ionosphere. The most important feature of the plasma distribution is the plasmasphere, which extendi to about L ~ 4-6 typically and ends (often quite abruptly) at the plasmapausc, where the number density can fall by a factor - 10s or more within a small fraction of an Earth radius (Carpenter, 1963, 1966; Gringauz et al., 1960; Gringauz, 1969). Within the plasm as pherc the p>asma is apparently in diffusive equilibrium with the ionosphere, the number densities in the equatorial plane at L ~ 4 being typically ~ Iff1 c m - 3 and the composition being ~ 99% H*. ~ 1 % He*. ond~ 0.03% O* (Taylor et al.. 1965; 1969; Harris et al., 1970).
The suggestion that the plasmapause should be associated with the closed equipotential or streamline of the convection pattern described by Axford and Hir.es (1961), was made first by Carpenter (1962). The magnetic flux tubes which lie outside the plosmopause apparently become " open " at some stage during the convection cycle (Nishida, 1966; Brice, 1967), and thus lose the plasma they contain into space (see Axford, 1968a. 1969; Banks and Holzcr, 1968, 1969; Holzer and Banks, 1969). This description accounts for the overall behaviour of the plasmapausc extremely well, and there is apparently no reason to doubt its validity. It permits one to understand why the plasmasphere should shrink during periods of high magnetic activity (Carpenter, 1967; Binsack, 1967; Rycroft and Thomas, 1967; Taylor et at., 1968; Chappell et al 1970; Bezrukikh, 1968/, its temporal variations during substorms (Carpenter and Stone, 1967; Carpenter, 1968), its relationship to the F-region " troughs " (Muldrew, 1965; Sharp, 1966; Rycroft and Thomas, 1967; Taylor et al.. 1969) and the middle latitude red arcs (Bowman, 1969), and of course its shape (Nishïda, 1966; Brice, 1967; Axford, 1969). The behaviour of the" bulge " on the evening sector of the plasmapause suggests that the convection is " gusty " and that when the plasmasphcre is eroded during periods of enhanced convection the •• debris " is detached more or less at the dusk meridian (Carpenter, private communication; see also Axford, 1969, pp. 438-9).
In general, a geostationary satellite will be outside the plasmapause except during relatively quiet periods; the synchronous orbit is most likely to intersect the bulge of the plasmasphere in the dusk-midnight sector. Nevertheless such a satellite is well situated to conduct sounding measurements in order to monitor the position of the piasmapause at the longitude of the satellite. The experiment could be carried out at a fised frequency, say ~ 100 kHz, chosen to be well below the plasma frequency corresponding to typical electron number densities just inside the plasmapause*. Not a great deal would be using a swept-frequency sounder, since the plasmapause is usually rather sharply defined. However a swept-frequency sounder has an advantage in that it could also be used to measure the very low (— I cirr 3) electron densities to be expected in the vicinity of the satellite by the resonance technique, which has been very successful on the Alouette satellites (Nelms and Chapman, 1969). Propagation experiments involving phase and group delay measurements to give the integrated electron density along the line of sight between the satellite and the ground (cf. Eshelman, 1967) and Faraday rotation measurements, could be carried out very effectively from a geostationary satellite, especially in conjunction with the plasmapause sounding experiment described above. It is possible that ripples on or near the plasmapause might also give rise to characteristic scintillations of the satellite transmissions.
* Petit has shown that such a sounder is probably an impractical proposition if it is necessary to operate from the synchronous orbit (see his article in ths present Proceedings).
14
Despite the fact that the synchronous orbit usually lies outside the plasmasphcrc. experiments to measure the composition and density of low-energy ions are worth while, since they give more reliable measurements of extremely low densities than most devices that measure the electron density are capable of in such circumstances. (However, the resonance experiment described above, and impedance probe measurements (e.g. Fahleson, 1967), might also provide satisfactory measurements of the electron density.) The mosi important measurement to be made on low-energy ions involves Ihe anisotropy, since this permits us to infer the magnetospheric convection system (Le. the electric field) relative to the satellite directly. Unfortunately, the ATS-1 experiment (Freeman. 1968: Freeman and Maguire. 1967, Freeman et al.. 1968) was not capable of monitoring (he convection continuously, but it has nevertheless provided some very intriguing results (see Section 7), It seens likely that in this case, the convection was detected only during unusual periods when for some reason the ion density and Row speed were large, and only in the afternoon sector of the magneto-sphere. Possibly these unusual periods corresponded to times when the pSasmaspherc was c-cing eroded and the debris was on its way out of the magneto sphere as described previously ; it would be interesting to détermine wheth'r or not such an effect occurs.
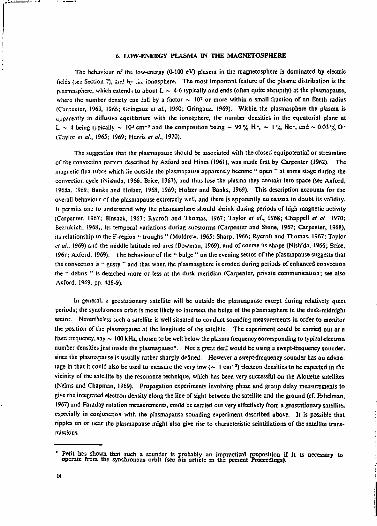
7. QL. SI-STEADY ELECTRIC FIELDS
It has been argued for some time that magnetospheric convection controls the very energetic phenomena (i.e. the ring current, the aurora, substorms and the radiation belts) that are observed in the magneto-sphere (e.g. Axford, 1969). Present evidence strongly supports this point of view and it is therefore important to make extensive measurements of the quasi-steady electric field associated with the convection process. Geostationary satellites are especially well placed as far as making observations of the solar wind induced convection are concerned, and such observations should be given prime consideration if they arc at all possible.
Early attempts to estimate the strength and direction of the convection system and its associated electric field were based on (1) radio observations of the drift of irregular structures in the ionosphere (e.g. scintillations, radar reflections, spaced ionosondes), (2) visual and photographic observations of the motion of auroral forms, and (3) observations of geomagnetic variations interpreted in terms of equivalent ionospheric current systems (sec reviews by Axford and Hines (1961) and Axford (1964, 19686. 1969)). On the whole these observations have provided surprisingly good resulu (e.g. Harang and Trôim, 1961 ; Davis, 1962, 1970) and were a useful guide in deducing the correct convection pattern. More direct methods of detecting the convection and/or the electric field are now available, and so far appear to have confirmed the earlier results and the overall pattern suggested by Axford and Hines (also to some extent implicit in the theory of Dungcy (1961)), The suggested convection pattern is shown in Fig. 9,
Figure 9a.- The solar-wind Induced convection psttems In the geomagnetic equatorial plane looking from the north end axhiding rotation. The plus and minus signs represent roughly where pokriiation chsrges would have to exist to produce the electric field pattern. The flow does not penetrate a region within about 4 RB and to some extent tends to avoid the daystde of the Earth where the Ionospheric conductivity Is large.

• Motion of the feet of the geomagnetic field tines at Ionospheric levels. corresponding to the convection pattern shown In fa). If the Hail conductivity Is dominant, the streamlines also represent current flow lines if the direction of the arrows Is reversed.
Figure 9c- Convection partem In the geomagnetic equatorial plane Including the effects of magnetospheric rotation together vifth the satar-wlad Induced convection shown above. The /lux tubes within the shaded region never become open as they circulate; hence, since they are approximately In equilibrium with the Ionosphere, the tubes forming the plasmasphcre <Axford and Nines. 1961: Nlshlda, 1966; Brice. 1967).
These diagrams ere only schematic and Intended to Indicate the general nature of the flow pattern, tvhK-h could In fact be considerably distorted from the pattern sliowrt (Axford and HInes, 1961).
Ionospheric electric fields can be delected using the incoherent sca t ter t echnique (e.g- W o o d m a n and
Hagfors, 1969; Balsey, 1969). Unfor tunate ly there are no incoherent scat ter facilities a t au ro ra l lat i tudes
that could be used to m a k e compar i sons with observat ions from a geosta t ionary satellite, a l though f rom many
pain ts of view a s trong case can be made for setting up such a facility.
Convcctivc mot ions of p lasma can be observed by t racking identifiable features o f the plasma. T h e
features could be natural (such as a whistler duct or the p lasmapause) , o r artificial (such a s a bar ium ion
cloud). The whistler observat ions were t he first t o suggest t ha t there is a n inwards movement o f p l a sma o n
the night-side of the magnetospbere before and dur ing a subs torm, a s shown in Fig. 10 (Carpen te r a n d S tone ,
1967; Carpenter , 1968; Carpen te r et al., 1968). Normal ly such observa t ions are restricted to duc ts occurr ing
within t he plasmasphere, a n d to the p lasmapause itself; fur thermore only t he radial mot ion of whistler duc ts
has been observed so far, a l though it is possible in principle t o detect the longitudinal c o m p o n e n t as well.
Many bar ium ion release experiments have been conducted to da te b o t h in the ionosphere a n d a t
great distances in the magnetosphere ( e g . Fdppl et al., 1968; Wescot i et al., 1969; Haerende l el al., 1969;
Vôlk, . J 6 9 J . T h e experiments that have been carried ou t in the aurora l z o n e a r e of mos t interest in the
present context and these have shown tha t the general pa t te rn of convect ion m a p p e d o u t t o the equator ia l
p lane of the magnetosphere is essentially consistent with the pa t te rn suggested in F ig . 9 , a n d also wi th the
pat tern deduced from observat ions of the au ro ra by Davis (1962) (Fig. 11). Th i s type of exper iment h a s the
special advantage of providing information o n bo th smal ! a n d large scales over a substant ia] pe r iod o f t ime,
and of allowing compar i sons with visual a u s o r a to be m a d e easily. I t does no t seem reasonable , however , to
place such a n exper iment on a geosta t ionary satellite in view of its " one-shot " n a t u r e a n d the difficulty o f
measuring the direction of mot ion of the ions at t he distance involved.

f ABSORPTION
4.8 J 4.6
• • * - •* " s • „ EQUATORIAL 4 4 RADCU3 OF WHtSTUH PATH m 4 2
EAflTHRAOII
4.0
V/v^._> SB V/v^._> <-v,-.. •
Figure 1G.- Inward movement of whistler ducts associated tvlih a polar rubslorm. Note that the electric field appears at about 0620 UT. which Is some 25 min. prior to the abrupt decrease of the kariiontal comoonent of the zeomaznetic field at Bynj and Great Whole (Carpenter and Stone. 196.').
Figure 11.- Projections Into the equatorial plane of the magneto^ihere of auroral motions from the night of 13-14 February 1958. The dashed line separates regions of primarily westward from primarily eastward motion (from Davis. 19 70).
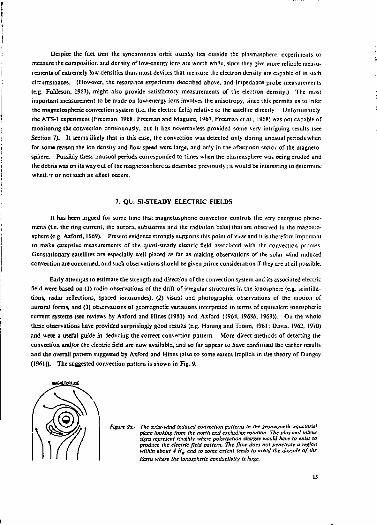
Figure 12.- Half-hour averages of the electric field measured during a balloon flight from Fort Churchill during August 1968. mapped out Into the equatorial plane of the magnttosphere without Including the co-rotation electric field (from Mozer arid Strlin. 1969).
Numerous electric field measurements have been carried with probes on balloons, rockets and satellites. The balloon measurements suffer from contamination by electric fields in the atmosphere, which can vaty with meteorological conditions. However, they have the advantages that the equipment is relatively inexpensive and the experiment can survive for relatively long periods. An example of results obtained from balloon measurements of the electric field carried out by Mozer and Scriin (1969) in the auroral zone near Fort Churchill are shown in Fig. 12. Obviously the data arc rather noisy and do not give an average picture of the electric field pattern, but nevertheless it is evident that the electric field corresponds largely to co-rotational conat ion on the day-sidc of the Earth, and that the direction of the convection on the nighl-side of the magnetospherc is more or less earthwards, as suggested in Fig. 9. Mozer (private communication) has made a comparison of balloon measurements of the east-west component of (he electric field, with estimates made on the basis of the motion of auroral form obtained from all-sxy camera photographs. He finds that the results are normally quite consistent and that large differences occur only during substorms when the poleward

expansion is apparently not related lo outward convection in the midnight >rc:ion, but to the outward propagation of a disturbance (see Section 3). This result suggests that the convection pattern derived by Davis (1962) on the basis of auroral motions is likely to provide a fair indication of the actual pattern.
Electric fiefd measurements have b—T carried out from rocket-borne probes by several groups {e.g., Aggson, 1969; Mozer and Bruston, 1967; rieV.ey el aL, 1968, Potier and Cahill, 1969). The results obtained appear to be valid and consistent with other observations, although there has been some disagreement concerning whether or not the field strength is depressed within regions of high ionospheric electrical conductiviiy. The observed field strengths are of the order or 10-100 m V/metre, which is consistent with the barium ion cloud observations and with estimates based on visual and photographic observations of auroral forms.
Near the equatorial plane of the magnetosphere, at the synchronous orbit, one would expect that the electric fields are about a factor 10 less than those observed in the auroral zone ionosphere (i.e. 1-IOmV/metrc). and accordingly more difficult to measure. There are also experimental difficulties with satellile-borne probes when they are carried outside the plasmasphere, due to the large Debye lengths encountered and the effects or photo-electrons. Nevertheless in view of the great significance of electric field measurements it seems worth while to make an attempt to overcome these difficultés. It should be noted that during substorms there is a contribution to the electric field associated with the changes in the magnetic field thai could be detected from the synchronous orbit, but not from low-altitude experiments.
B. LOW-FREQUENCY RADIO NOISE
There has been considerable attention paid to the effects of microscopic plasma turbulence in causing diffusion of particles in pitch angle and energy (for reviews, sec Kennel, 1969; Roberts, 1969). However, from the point of view of observations, our knowledge of the nature, distribution and temporal behaviour of ELF and VLF radio emissions in the outer magnetosphere is quiu limited. There is a fair amount of information available for regions at high L-values but low altitudes (i.e., in the auroral zones) but it is by no means clear that this is relevant to conditions near the magneto spheric equator in the vicinity of the synchronous orbit (e.g., Gurnett, 1966; Gurnett and O'Brien, 1964; Gurnctt and Mosier, 1969; Gurnett et ai., 1969; Cauffman and Gurnett. !969;Hartz, 1969; McEwan and Barrington, 1967; Taylor and Gurnelt, 196S).
Most of the published information on measurements made in the outer magnetospherc concerns magnetically detected no)M(e.g.. Holixretal., 1966; Russell el al., 1969; Burtis and Helliwell, 1969; Dunckcl et a!.t 1970), although measurements of electrostatic noise have also been carried out (see the article by IfCennel in the present Proceedings). Dunckel et ai. (1970) have found that broad band noise (up to -v 100 kH2) can be detected almost always on the night-side of the magnelosphere at sufficiently great radial distances. In the midnight sector (22DO-0200 LT) the noise is observed as close as L ~ 4, but for earlier or later sectors the minimum L increases rapidly and there is a tendency for a higher probability of occurrence in the sector (0200-0600 LT) rather than in the sector (1800-2200 LT). The noise often exhibits a low-frequency cut-off, the position of which tends to decrease with increasing L down to a minimum of ~ 20 kHz. A high correlation is found to exist between the occurrence of the noise at;d the AE index and there appears also to be sa association between noise bursts and the onset of micropulsa lions in the polar region. It is evident that measurements of this type made from a geostationary satellite will constitute a rich source of new and interesting information, especially if combined with appropriate particle measurements.
19
9 LINE EMISSIONS
There ere some advantages in carrying out measurements of the intensity of various line emissions from the synchronous orbit. If the satellite is designed to investigate auroral phenomena, it would clearly be useful to be able to monitor the integrated auroral emission of some suitable line. For example, it might be possible to obtain information concerning the onset of subsiorms in this way and thus to some extent avoid the difficulties of sorting out time and space variations inherent in observations made from a single satellite. X-ray observations might be especially useful in this respect if t: Î up-going (lux is sufficiently large (spin modulation of the signal received from auroral X-rays could provide a means of distinguishing it from any background associated with the radiation belt particles).
Observations of the geocorona from the synchronous orbit are of some interest, since the entire distribution can be monitored from this position. Presumably the Lyman a and p and Balmer a. lines of ne itral hydrogen are the most important, but neutral helium lines should not be ignored. .If it is true that th-; charge-exchange with the geocoronal neutral hydrogen is the main cause of the decay of the ring current during the recovery phase of magnetic storms, it seems possible that the process can be discerned from emission line observations. Perhaps there is a substantial depiction of the geocorona as a result of charge-exchange with energetic trapped particles; if so, observations of scattered solar Lyman « (and other lines) would disclose ihe effect. The charge-exchange process itself must result in the production of characteristic highly broadened emissions (Hel, Hell, hi) which might be distinguishable from the narrow lines associated with scattered sunlight, hence providing a means of monitoring the decay of the ring current-directly. Finally, we note that since the alpha particle component of the trapped particles that produce the ring current remains trapped in the form of He* ions following charge-exchange with geocoronal H atoms, it should be possible w follow the growth and decay of the He* population by monitoring scattered solar Hell lines. Observations of this type could be especially valuable if the-' were to be combined with particle composition measurements made from the same satellite.
ACKNOWLEDGEMENTS
This research, was supported by the Advanced Research Projects Agency of the Department of Defense and was monitored by the U.S. Army Research Office - Durham under Contract DA-3M24-ARO-D-257, and by NASA under Contract # NGR-05-009-075.
20
REFERENCES
Aggson, T.L.
Akasofu, S.-I.
in Atmospheric Emissions, (B.M. McCormac and A. Omholt, eds.), p. 305, Van Nostrand Rcinhold, New York, 1969.
Polar and Magnetospkeric Svbstorms, D. Rcidcl Publ. Co., Dordrecht-Holland, 1963.
Akasofu, S.-I. Chapman, S.
Planer. Spaa Sri., 12, p. « 7 (1964).
Arnoldy, R.L. Chan, K.W.
/ . Geophys. Res.. 72, p. 5811 (1967).
/ . Geophys. Res.. 74, p. 5019 (1969).
A*ford, W.I. Hints, CO.
Can. J. Phys., 39, p. 1433 (1961).
:i Natural Electromagnetic Phenomena below 30 Kefs, (D.F. BIcil. éd.). p. 5, Plenum Press, New York, 1964. J. Geophys. Res.. 73. p. 6855 (1968a). in Physics of Geomagnetic Phenomena (S. Matsushita and W.H. Campbell, eds.), Academic Presa, New York, I968A. Rev. Geophys.. 7. p. 421 (1969). in Panicles and Fields in the Magnetosphere (B.M. McCormac, éd.), p. 46, D. Reidel Publ. Co., Dordrecht-Holland, 1970.
Balsey, B.B. J. Geophys. Res., 74. p. 2333 (1969).
Banks, P.M. Holzer,T.E.
J. Geophys. Res.. 73. p. 6846 (1968). / . Geophys. Res., 74. p. 3734 (1969).
BarficId,J.N. Coleman, PJ . Jr.
Ibid., p. 4694 (1969).
/ . Geophys. Res.. 75. p. 1943 (1970).
Belon, A.E. Maggs, J.E. Davis, T.N. Vithcr,X.B. Glass, N.W. Hughes, G.F.
/ . Geophys. Res., 74, p. 1 (1969).

Bczrukikh, V.V.
Biiwack, J.H.
Bowman, G.G.
Brewer, H.R. Schulz, M. Eviatar, A.
Brown, W.L. Cahill, L.J., Jr. Davis. L.R. Roberts, CS.
(submitted to Kosm. Isslcd., 1968).
J. Geophys. Res., 21. p. 5231 (1967).
Planet. Space Sci., 17. p. 777 (19G9).
J, Geophys. Res.. 74. p. 159 0969).
/ . Geophys, Res.. 72. p. 5193 (1967).
J. Geophys. Res.. 73. p. 153 (1968).
/ . Geophys. Res.. 74. p. 3002 (1969).
J. Geophys. Res.. 71. p. 4505 (1966).
Radio Science 3, No. 7, (1568). (Prefai.- lo special issue on Conjugate Point Symrxtsium).
Stanford University Radio Sci. Lab. RepL SEL-62-059 (1962). J. Geophys. Res., 6S. p. 1675 (1963). J. Geopiiys. Res., 71. p. 693 (1966). J. Geophys. Res.. 72 n 2969 (1967). Radio Science 3. p. 719 (1968).
Caii -..ter, D.L. Stone, K.
Carpenter, D.L. Walter, F. Barrington, R.E. McEwen, D.J.
Caufiinan, D.P. Gumett, D.A.
Chappell, C.R. Harris, K.K. Sharp, G.W.
Plcnet. Space Sci.. fS. p. 395 (1967).
J. Geophys. Res., 73. p. 2929 (1968).
J. Geophys. Res.. 74. p. 1 l-M (1969).
J. Geophys. Res., 75. p. 3848 (1970).
Coleman, P.J., Jr. Cummin£s, W.D.
J. Geophys. Res.. 74. p. 348 (1969).
Radio Science 3. p. 762 (1968).

Coroniti, F.V. McPherron, R.L. Parks, G.K.
Cummings, W.D. Barfield, J.N. Coleman, P J , Jr.
mings, W.D., Coleman, P.J., Jr.
Cummings, W.D. Cùleman, P.J., Jr.
Cummings, W.D. Lewis, R.R. Coleman, P.J., Jr.
Cummings, W.D. O'Sullivan, RJ., Coleman, PJ., Jr.
Davis, T.N.
Davis, T.N.
Davis, T.N. Parthasarathy, R.
Dunckel, N. Flcklin, B. RofdtD. L. Helliwctl, R.A.
Dungey, J.W.
Eshleman, V.R.
Evans, D.S.
Evans, D.S.
Fahleson, U.
Fairfield, D.H.
Feldslein, Y.L
Filins, R.W.
J. Geophys. Res., p. 1715 (1968).
J. Geophys.. Res.. 71. p. 5643 (1966).
J. Geophys. Res.. 73. p. 6687 (1968).
Radio Science. 3. p. 758 (1968a).
/ . Geophys.. Res.. 73. p. 5699 (19686).
Trans. Am. Geophyj. Un. SO. p. 280 (19ii9a).
J. Geophys. Res.. 74. p. 778 (1969A).
Trans. Am. Geophys. Un.. 42. p. 219 (ISiZ).
J. Geophys. Res., 75. (1970) (in press).
J. Geophys. Res.. 72. p. 5825 (1967).
/ . Geophys. R^s.. 75(1970) (in press).
Phys. Rev. Lett.. 6. 47 (1961).
Science, 158. p. 585 (1967).
J. Geophys. Res.. 72, p. 4281 (1967).
J. Geophys. Res.. 73, p. 2315 (h«8).
Space Sci. Rev.. 7. p. 238 (1967).
J. Geophys. Res.. 73, p. 7329 (1968).
Rev. Geophys., T. p. 179 (1969).
Am. Geophys.. 24. p. 821 (1968).
Fôppl, H. Haerendel, G. Hascr, L. LOst, R. Melzrter, F. Meyer, B. Neuss, H. Rabben, H.-H. Ricger, E. Stocker, J. Stoffregen, W.
J. Geophys. Res., 73. p. 21 (1968).
Freeman, J.W., Jr.
Freeman, J.W., Jr. Warren, C.S. Maguirc, J.J.
Freeman, J.W., Jr. Maguire, J.J.
Gringauz, K.I Bezrukilcb, V.V. Ozerov, V.D. Rybchinsky, R. Ye.
Gringauz, K.I.
Gumett, D.A.
Gumett, D.A. O'Brien BJ.
Guractl. D,A. Mosier, G.W.
Gurnett, D.A. Pfciffer, G.W. Anderson, R.R. Mosier, S.R. Cauffman, D.P.
Haereadcl, G. Lilst.R. Rieger, E. V61k, H.
j . Geophys. Res., 72. p. 1905 (1967o). Ibid.. 3753 119676). / . Gtophys. Res.. 75. p. 1263 (1970).
J. Geophys. Res.. 73, p. 4151 (1968).
Ibid., p. 5719(1968).
J. Geophys. Res.. 72, p. 5257 (1967).
Dokl. Akad. Nauk. USSR. 131, p. 1301 (1960).
Re». Geophys.. 7. p. 339 (1969).
J. Geophys. Res., 71. p. 5599 (1966).
J. Geophys. Res., 69. p. 65 (1964).
J. Geophys. Res.. 74. p. 3979 (1969).
J. Geophys. Res.. 74. p. 4631 (1969).
in Atmospheric Emissions. (B.M. McCorraac and A. Omholt eds.), p. 293, Van Nostrand Rcinhold, New York, 1969.
Harang, L. Trôim, J.
Planet. Space Sci. 5. p. 33 (1961).
/ . Atmas. Terr. Phys.. 30, p. 1461 (1968).
Harris, K.K. Sharp, G.W. Chappell, CR.
Hartz,T.R. Brice, N.M.
Hoizer, R.E. McLcod, M.G. Smith, EJ.
Hoizer, T.E. Banks, P.M.
Hones. E.W.. Jr. Asbridge, J.R. Bame S.J. Strong, LB.
Hones, E.W.. Jr. Bame, S.J. Singer S. Brown, R.R.
Hultqvist, B.
Jelly, D.H. Brice, N.M.
Jelly, D.H.
Jelly, D.H.
Kellcy, M.C. Mozer, F.S. Fahleson, U.V.
Kennel, C F . Petschek, H.E.
J. Geophys. Res., 75, p. 219 (1970).
Planet. Space Sci., 15, p. 301 (1967).
Proc. I.E.E.E.. 57. p. I(M2 (1969).
to be published (1969).
The Radiation Belt and Magnetosphere. Blaisdell Pub!. Co, Waltham Mass., 1968.
J. Geophys. Res., 71, p. (481 (1966).
J. Geophys. Res.. 74. p. 6304 (1969).
J. Geophys. Res.. 72. p. 5879 (1967).
J. Geophys. Res.. 73. p. 6189 (1968).
Rev. Geophys., 7, p. 129 (1969).
J. Geophys. Res.. 72. p. 5919 (1967).
Can. J. Phys.. 46. p. 33 (1968).
Can. J. Phys.. 48. p. 335 (1970).
Trans. Am. Geophys. lin.. 49. p. 739 (Abstract, (1968).
Rev. Geophys., 7, p. 379(1969).
J. Geophys. Res.. 71. p. I (1966).
J. Geophys. Rev.. 71. p. 2317 (1966). J. Geaphys. Res., 72. p. 3829 (1967). J. Geophys. Res.. 73. p. 3449 (1968).
Lanzerolti, L.J.
Lan2crotti, LJ .
Lanzerotti, L.J. Roberts, C.S. Brown. W.L.
Le'mbach, H.
Lezniak, T.W. Ai.ioldy, R-L. Parks, G.K. Winckler, J.R.
Lczniak, T.W. Wincfcler, J.R.
Lin, W.C. McDiarmid, I.B. Burrows, J R .
McDiarmid, I.B. Burrows, J.R. Wilson, Margaret, D.
McEwan, DJ. Barrington, R.E.
McPherron, R.L. Parks, G.K. Coronili, F.V. Ward, S.H.
McPherron, R.L. Coleman, PJ . Jr.
Mozer, F.S.
Mozcr, F.S.
Bruston, P.
Mozer, F.S. Serlin, R.
Phys. Rev. Lett., 21, p. 929 (1968).
in lntercorrelated Satellite Observations Related to Solar Events (Proc. 3rd ESLAB/ESRIN Symposium, Noordwijk, Sept. 1969), p. 205, D. Reidel PubJ. Co., Dordrecht-Holland, 1970.
J. Geophys. Res., 72. p. 5893 (1967).
J. Geophys. Res.. 72, p. 5473 (1967)-
Radio Science. 3, p. 710 (1968).
University of Minnesota, Rept. CR-137 (1969).
J. Geophys. Res.. 71, p. 1827(1966).
Can. J. Phys.. 46. p. 80 (1968).
J. Geophys. Res.. 74. pp. 1749 and 3554 (t969).
Can. J. Phys., 45, p. 13 (1967).
J. Geophys Res.. 73, p. 1697(1968).
/ . Geophys. Res., 75, p. 3927 (1970).
J. Geophys. Res., 73. p. 999 (1968).
J. Geophys. Res.. 71. p. 4461 (1966).
J. Geophys. Res.. 72. p. 1109 (1967).
J. Geophys. Res., 74. p. 4739 (1969).
/ . Geophys. Res., 70, p. 2635 (1965).
Nelms, G.L. Chapman, J. H.
Owens, H-D. Frank, 1~A.
Parks, G.K. Araoldy, R.L. Lezniak, T.W. Winckfcr, J.R.
Parks, G.K. Coroniti, F.V. McPhcrroii, R.L. Anderson, K.A.
Parks, G.K. Winckler.J.R.
Parks, G.K. Wincklcr, J.R.
Paulikas, G.A. Blake, J.B. Freden, S.C
Paulikas, G.A. Blake, J.B. Freden, S.C. Imamoto, S.S.
PauL;'.as, G A. Blake, J.B.
Paulikas, G.A. Blake, J.B.
Perkins, F-W.
Perona, G.
Pfitzer, K.A. Lezniat, T.W. Winckler.J.R.
to appear ID Production and Maintenance of the Polar Ionosphere, (G. Skovli, éd.), (1969).
J. Geophys. Res., 71. p. S669 (1966).
/ Geophys. Res.. ?:. p. 199 (1968).
in Jntercorrelated Satellite Observations Related to Solar Events (Proc. 3rd ESLAB/ESRIN Symposium, Hoordwijlt. Sepr. 1969), p. 351. D. Reidel PubL C \ , Dordrecht-Holland, 1970.
Radio Science. 3, p. 715 (1968a).
J. Geophys. Res.. 73. p. 1685 (1968/.).
Ibid., p. 5786(1968).
J. Geophys. Res., ?4, 4003 (1969).
Planet. Space Set.. 15. p. 917 (1967).
J. Geophys. Res.. 73. p. 87 (1968a).
Ibid., p. 4915 (I968A).
Ibid., p. 5743 (1968c).
J. Geophys. Res.. 74, p. 2161 (1969).
J. Geophys. Res., 75. (1970) (in press).
/ . Geophys. Res.. 73, p. 6631 (1968).
1969 (umpublished).
J. Geophys. Res.. 74, p. 4687 (1969).
Pfilzer, K.A. Winckler.J.R.
Piddington, J.H.
Poller, W.E. Cahill, L.J., Jr.
Reid, G.C. Parthasarathy, R.
Roberts. C.S.
Roederer, J.G.
Rothwell, P.
Roihwell. P. Wallingion V.
Russell, C.T. Holzer, R.E. Smith, EJ.
Ryerofï, M J. Thomas, J.O.
Schield, M.A. Frank, L.A.
Serlemitsos, P.
Sharp, G.W.
Smart, D.F. Shea. M.A. Gall. Ruth
Sonnerup, B.U.O. Cahili.UJ^Jr.
Sonnerup, B.U.O. Cahill, L.J., Jr. Davis, L.R.
Swisher. R.L. Frank, L.A.
Taylor, H.A.. Jr. Brinton, B.C. Smith, C.R.
Ibid., p. 5005 (1969).
Planet. Space Set., J5. p. 733 (1967).
/ . Geophys. Res.. 74. p. 5159 (1969).
J. Geophys. Res.. 69, p. 1737 (1964).
/ . Geophys. Res.. 71, p. 3267 (1966).
Rev. Geophys., 7. p. 305 (1969).
Ibid. p. 77(1969).
/ . Geophys, Res., 64, p. 2026 (1969).
(Abstract) Birkdand Symposium on Aurora and Magnetic Storms. Norway. September 1967, p. 471 (1967).
J. Geophys. Res.. 74. p. 755 (1969).
Imperial College preprint (1967).
J. Geophys. Res.. 75, p. 5401 (1970>.
/ . Geophys, Res., 71, p. 61 (1966).
Ibid., p. 1345 (1966).
J. Geophys. Res., 74. p. 4731 (1969).
/ . Geophys. Res.. 73. p. 1757 (1968).
J. Geophys. Res.. 74. p. 2276 (1969).
J. Geophys. Res., 73. p. 5665 (1968).
J. Geophys. Res.. 70, p. 5769 (1965).

Taylor, H.A., Jr. Brinton, H.C. Pharo, M.W., HI
/ . Geophys. Res., 73, p. 961 (1968).
Taylor, H.A., Jr. Bridton, H.C Carpenter, D.L. Bonner, F.M. Heyborne, R.L.
J. Geophys. Res., 74. p. 3517 (1969).
Taylor, W.W.L. Gumett, D.A.
J. Geophys. Res.. 73. p. 5615 (1968).
Rev. Geophys.. 7, p. 219 (1969).
J. Geophys. Res., 73, p. 2839 <1968o). Ibid., p. 7519 (1968&). to appear in Production and Maintenance of the Polar Ionosphere, (G.Skovli,ed.)(1970).
Vernov, S.N. Chudakov, A.Ye. Vakulov, P.V. Kuznetsov, S.N. Logachev, Yu. T. Sosnovets, E.N. Stolpovskiy, V.G.
Yôlk, H. Haerendel, G.
Trans. All-Union Conference in Space Physics, Moscow, 1965, NASA Tech. Transi. TT F-389. p. 576 (N66-25735).
in fntercorrelcted Satellite Observations Related to Solar Events, (Proc. 3rd ESLAB/ESRIN Symposium, Noordwijk, Sept. 1969) p. 280, D. Reidd PubL Co., Dordrecht-Holland. 1970.
Wescotl, E.M. Stolarik, J.D. Heppner, J.P.
Westerlund,J.H.
Space Sci. Rev., 5, p. 507 (1966).
J. Geophys. Res., 74. p. 3469 (1969).
Ibid., p. 351 (1969).
Wbalen, B.A. McDiannid, I.B.
Atmospheric Emissions, (B.M. McConnac and A. Omholi, eds.), p. 93, Van Nostrand Reinhold, New York, 1969.
Woodman, R.F. Hagfors. T.
Zmnda, A J . Martin, J.H. Heuring, F.T.
J. Geophys. Res.. 70. p. 3017 (1965).
J. Geophys. Res.. 74, p. 1205 (1969).
J. Geophys. Res., 71. p. 5033 (1966).
MODELS OF MAGNETIC FIELD LINE GEOMETRY
FOR A GEOSTATIONARY SATELLITE
F.D. Barish and J.G. Roederer
University of Denver, Denver, Colorado 802] 0, U.S.A.
ABSTRACT
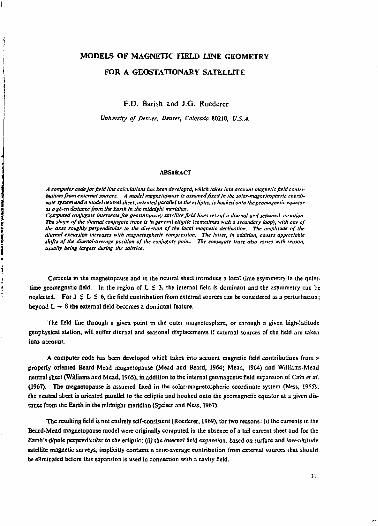
A computer code for field line calculations has been developed, which lakes into account magnetic field contributions from external sources. A model magnelopause is assumed fixed in the solar-magnelospheric coordinate system and a modelneutral sheet, oriented parallelto the ecliptic, is hookedonto the geomagnetic equator at a given distance from the Earth in the midnight meridian. Computed conjugate Intersects for geostationary satellite field lines reveal a diurnal and seasonal variation. The shape af the diurnal conjugate trace is in general elliptic (sometimes r/ith a secondary loop), v/ith one of the axes roughly perpendicular to the direction of the local magnetic declination. The amplitude af the diurnal excursion increases with magnetospheric compression. The latter, in addition, causes appreciable shifts of the diurnal-average position of the conjugate pain.. The conjugate trace also varies with season, usually being largest during the solstice.
Currents in the magnetopause and in the neutral sheet introduce a local lime asymmetry in the quiet-time geomagnetic field. In the region of L S 3, the internal field is dominant and the asymmetry can be neglected. For 3 5 L S 6, the field contribution from external sources can be considered asa perturbation; beyond L ~ 8 the external field becomes a dominant feature.
The field line through a given point in the outer magnctosphere. or through a given high-latitude geophysical station, will suffer diurnal and seasonal displacements if external sources of the field are taken into account.
A computer code has been developed which tak«; into account magnetic field contributions from a properly oriented Beard-Mead magnetopause (Mead and Beard, 1964; Mead, 1964) and Williams-Mead neutral sheet (Williams and Mead, 1965), in addition to the internal geomagnetic held expansion of Cain et al.
(1967). The magnetopause is assumed fixed in the solar-magnetospheric coordinate system (Ness, 1965); the neutral sheet is oriented parallel to the ecliptic and hooked onto the geomagnetic equator at a given distance from the Earth in t ie midnight meridian (Spciscr and Ness, 1967).
The resulting field is not entirely self-consistent (Roederer, 1969), for two reasons: (i) the currents in the Beard-Mead magnetopause model were originally computed in the absence of a tail current sheet and for the Earth'sdipoïe perpendicular to the ecliptic; (ii) tie internal field expansion, based on surface and low-altitude satellite magnetic surveys, implicitly contains a time-average contribution from external sources that should be eliminated before this expansion is used in connection with a cavity field.
31
However, the above inconsistencies should not lead to appreciable errors in field tracing, particularly if one slays sufficiently away (at least several Earth radii) from the magnetopause or the neutral sheet. Theoretical studies have shown that the gross shape of the magnetopause does not depend very critically on the orientation of the dîpole, except near the neutral points (Olson, 1969). It can be shown that most of the external contribution to the geomagnetic field in the region of L < 6 comes from the current system in a tow latitude band of the magnetopause which is only weakly dependent on the orientation of the dipole.
No ring current was included in the model, and thus the calculations do not apply to substorm or main phase storm times. A symmetric, quiet-time ring current would have little effect on conjugate point position although it would certainly alter field line geometry near the minimum-B equator.
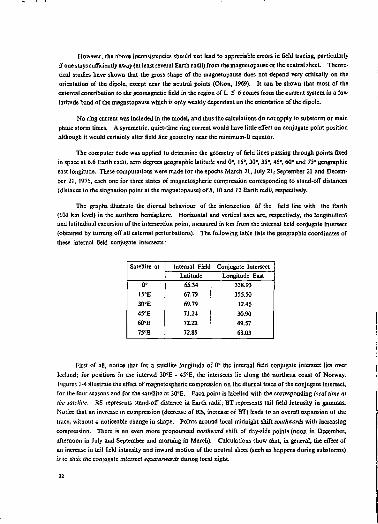
The computer code was applied to determine the geometry of field lines passing through points fixed in space at 6.6 Earth radii, zero degrees geographic latitude *md 0', 15B, 30°, 35°, 45*, 60" and 75' geographic east longitude. These computations were made for the epochs March 21, July 21, September 21 and December 21, 1975, each one for three states of magnetospheric compression corresponding to stand-off distances (distance to the stagnation point at the magnetopause) of 8, 10 and 12 Earth radii, respectively.
The graphs illustrate the diurnal behaviour of the intersection ôf the field line with the Earth (100 km level) in the northern hemisphere. Horizontal and vertical axes are, respectively, the longitudinal and latitudinal excursion of the intersection point, measured in km from the internal field conjugate intersect (obtained by turning off all external perturbations). The following table lists the geographic coordinates of these internal field conjugate intersects:
Satellite at Internal Field Conjugate Intersect Satellite at Latitude Longitude East
o-15-E 30-E 45-E 60-E 75'E
65.34 67.79 69.79 71.24 72.22 72.85
338.93 355.50
12.46 30.90 49.57 68.03
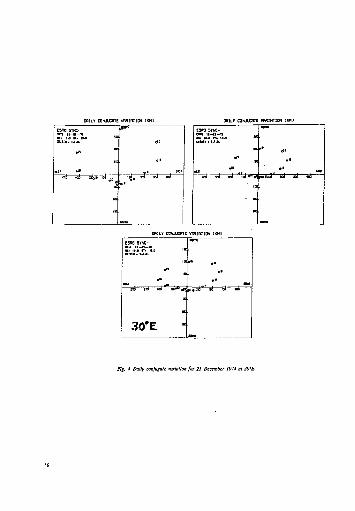
First of all, notice that for a satellite longitude of 0° the internal field conjugate intersect lies over Iceland; for positions in the interval 30°E - 45°E, the intersects lie along the northern coast of Norway. Figures 1 -4 illustrate the effect of magnetospberic compression on the diurnal trace of the conjugete intersect, for the four seasons and for the satellite at 30°E. Each point is labelled with the corresponding local time at the satellite. RS represents stand-off distance in Earth radii; BT represents tail field intensity in gammas. Notice that an increase in compression (decrease of RS, increase of BT) leads to an overall expansion of the trace, without a noticeable change in shape. Points around local midnight shift southwards with increasing compression. There is an even more pronounced northward shift of day-side points (noon in December, afternoon in July and September and morning in March). Calculations show that, in general, the effect of an increase in tail field intensity and inward motion of the neutral sheet (such as happens during substorms) is to shift the conjugate intersect equatontards during local night
32
•J i
DAILY OTWUMTE VRAIfiTI» IKH) D S j a C0MJU31TC V C T I B T I B J
" ""I »
OMlï CfiMJUGCTE v n l f R l W (KMI
Sa». :
•<• • • .* ::
30'E •
Fig. I Dally conjugate variation for 21 March 1975 ai SO'E.
i Dwjusnc vmiRTim IKMI WILY CDHJUOTC VfMIRTION I KM»
•>•
ï • « • • . .
am.* OHJUXTZ mniflTK» iwti
im< -s - J ?
si as a t
» 30 e E
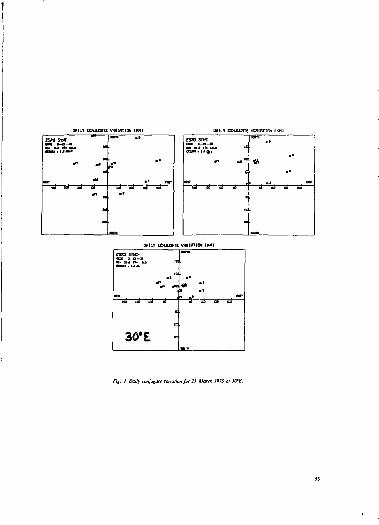
fig. 2 Doily eojugere rcri&ionfer 21 Jvr.e I97J m 30"£.
DB1W COKIBOTE V M I R t l f f t I IW I Cf l lL l raxJUGRTE VRIIRT104 IKX)
- i J - J - J rf -3—â—s!—st-
taiLi muant vmmitsi mm
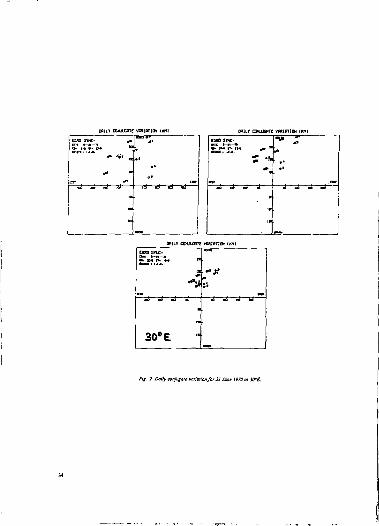
Fig. } Dmiy conjugale TOTlotion fer 21 Sepicmbtr 1975 al 10'E.
DBILÏ CDfuucflie vMiniiON non mur COUJUMTE VMIRTICM IKHI
OBlLÏ CONJUCftTE VKfllBTlCW IKHI
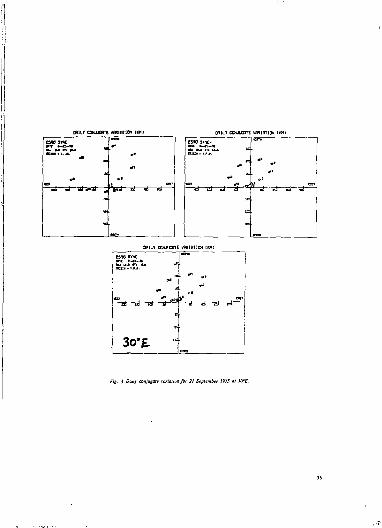
Fig. 4 Daily conjugale reflation for 21 December 1974 al 30'E.
OfllLI COMJUBTTC VfMIRTICh <i DBUT CCXJJGBTt '.•GUlfniGH IKMI
ESQ ST*- I ™ , J "
L-r- > . « • . . .
•= ! ** j* -« n E B P
^ d • J d >d 1=3 t=J
' ,. * •
DHILT DKJUGRIE WWSOlI&l II B]LI CONJUGATE VMIBTIWI II
™- -» «" * »
•• . 1 9
#» l * " j - , ».
'1 «
<y
1 ;̂ I «̂ » ..
^ *z>
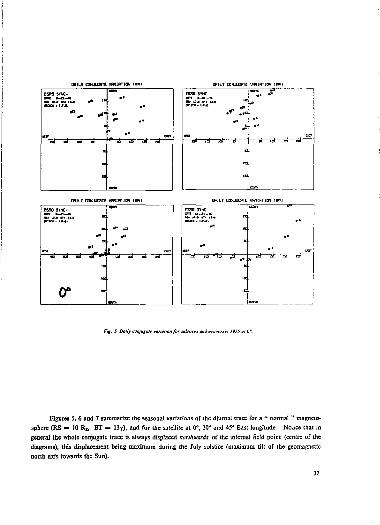
Fjf. J Dally conjugate Tartarian for talttitti and tçu'moxci 1975 m
Figures 5,6 and 7 summarize the seasonal variations of the diurnal trace for a " normal " magneto-sphere (RS = 10 RE, BT = 13Y), and for the satellite at 0*. 30° and 45" East longitude. Noùce that in general the whole conjugate trace is always displaced northwards of the internal field paint (centre of the diagrams), this displacement being maximum during the July solstice (maximum tilt of the geomagnetic north axis towards the Sun).
37
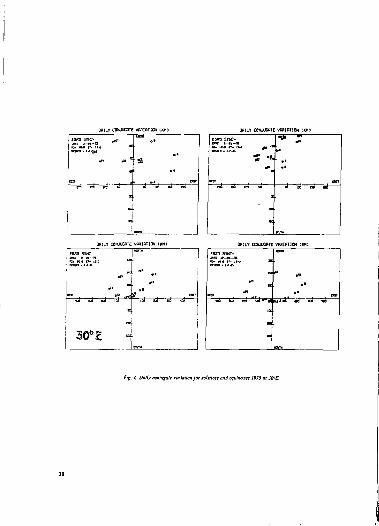
Uf l lL l COHJUGflTE VOTIBTim u DRILY cmuucnTE ««IRTIDN IKH)
Sis- ' : •«a
:
DRILY CONJUGATE VBHIBIION IKMI
tit- - : -Ï •«. ..
• ..
BRILÏ CONJLCBTE V M I R T ] » IKHI
30°!
Est- -
•D<QS nJ uJ «J
/!p. 6 Dally tQuptgaSc variation fer salnlcit and equinoxel 1971 al 5VE.
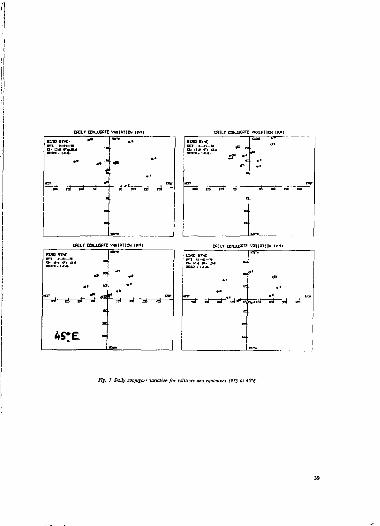
CB1L» CONJUGATE VWIIfiTJCN M
• • • .
WILY COXJUOATE uraiRTICN IK
*• >' ' •
m.
,J c i
.. » « 1
OT 1 M I L » coNjucRTc WWIOTJW ti mi'.T comuGflTi vtmiBiicw
S&- 4" „. m. -•
e *° *g ' j j
« T
4St£ -
Fig. 7 Dcily eonpigu ' Toriaisn for sclsileti and equinoxes 1975 ai 4S'£

Finally, the following Tables give more detailed numerical information c The relevant symbols are:
i the field line geometry.
Date RN RIM BT LONG CALA
BR, BT, BP NLA, NLO
DEL LAT, LONG
year, month, day siand-ofT distance (Earth radii) distance to near edge of neutral sheet (Earth radii) tail field intensity (gammas) geographic east longitude of geostationary satellite geographic latitude of north hemisphere intersection of satellite field line with 100 km level, for internat field (GSFC12/66 coefficients) geographic longitude of same point field magnitude at satellite (gammas) r, theia, phi components of B at satellite latitude, longitude of north-hemisphere intersection of satellite field line, for internal plus external field field line arc length (km) from satellite to north-intersect coordinates of south-intersect field liw arc length from satellite to south-intersect latitude difference between satellite and mini mum-B equator geographic coordinates of the satellite
Note added in proçf ; In iht meantime, a far mure reliable model for a tilted dipale magnetosphere has been producedby W.P. Olson. This model gives similar results to the ones presented here for the equinoxlal periods, but differs appreciably for the solstices. Hence, the numerical results presented liere should be taken only as a crude approximation.
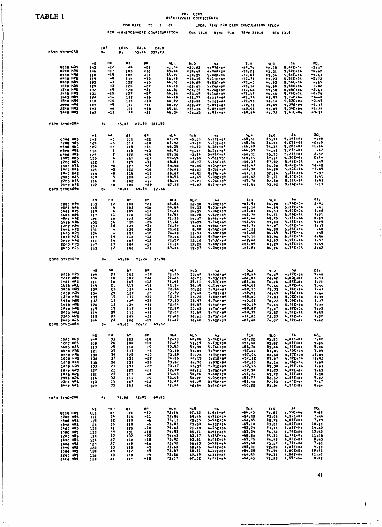
l)»0 J"*-*»»
i» .x -11. i i s.lir-»» -'O.'i tj.M Ï,»li .oi »>!»> -wit» >^«r-g> -yolu •»;»» spl ice .
-I.00 S.S1F-0
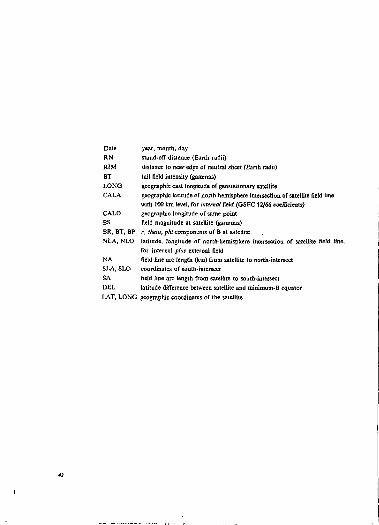
Date year, month, day RN stand-off distance (Earth radii) RIM distance to near edge of neutral sheet (Earth radii) BT tail field intensity (gammas) LONG geographic east longitude of geostationary satellite CALA geographic latitude of north hemisphere intersection of satellite field line
with 100 km level, for internal field (GSFC 12/66 coefficients) CALO geographic longitude of same point BS field magnitude at satellite (gammas) BR, BT, BP r, iheta, phi components of B at satellite NLA, NLO latitude, longitude of north-hemisphere intersection of satellite field Jine,
for internal plus external field NA field line arc length (km) from satellite to north-intersect SLA, SLO coordinates of south-intersect SA field line arc length from satellite to south-intersect DEL latitude difference between satellite and miainmm-B equator LAT, LONG geographic coordinates of the satellite
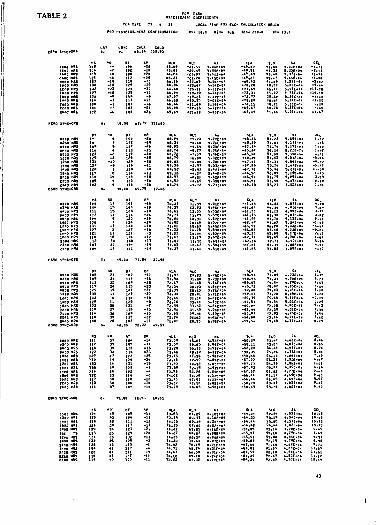
KL» n L 0
t l . t t l.Dlf.O

Date year, month, day RN stand-off distance (Earth radii) RIM distance to near edge of neutral sheet (Earth radii) BT tail field intensity (gammas) LONG geographic east longitude of geostationary satellite CALA geographic latitude of north hemisphere intersection of satellite field Une
with 100 km level, for Internal field (GSFC ¥2/66 coefficients) CALO geographic longitude of same point BS field magnitude at satellite 'gammas) BR, BT, BP r, theta, phi components of B at satellite NLA, NLO latitude, longitude of north-hemisphere intersection of satellite field line,
for inlernal plus external ield NA field line arc length (km) from satellite to north-intersect SLA, SLO coordinates of south-intersect SA field line arc length from satellite to south-intersect DEL latitude difference between satellite and minimum-B equator LAT, LONG geographic coordinates of the satellite
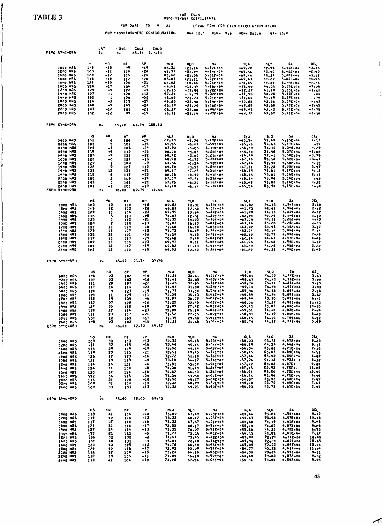
-s».i . H'.ï
Date year, month, day RN stand-off distance (Earth radii) RIM distance to near edge of neutral sheet (Earth radii) BT tail field intensity (gammas) LONG geographic east longitude of geostationary satellite CALA geographic latitude of north hemisphere intersection of satellite field line
with 100 km level, for internal field (GSFC12/66 coefficients) CALO geographic longitude of same point BS field magnitude at satellite (gammas) BR, BT, BP r, tiieta, phi components of B at satellite NLA, NLO latitude, longitude of north-hemisphere intersection of satellite field line,
for internal plus external field NA field line arc length (km) from satellite to north-intersect SLA, SLO coordinates of south-intersect SA field line arc length from satellite to south-intersect DEL latitude difference between satellite and miniroum-B equator LAT, LONG geographic coordinates of the satellite
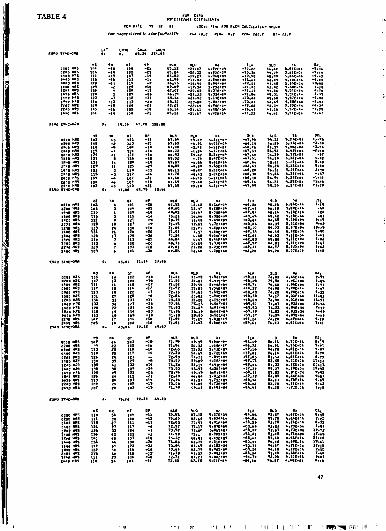
«1"9 lïT-fllO
CI» a tn^-Of
rï»o sr«e-o»»
3t.M s-ïiï-0
II 11
n STMC-WI
ï il
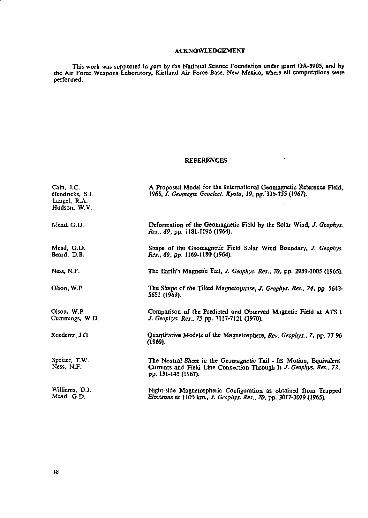
ACKNOWLEDGEMENT
This work >vas supported in part by the National Science Foundation under grant GA-3905, and by the Air Force Weapons Laboratory, Kirtland Air Force Base, New Mexico, where all computations were performed.
Cain. J.C. Hendricks, S.J. Langel, R.A. Hudson, W.V.
A Proposed Model for the International Geomagnetic Reference Field, 1965, J. Geomagit. Geoelect. Kyoto, 19. pp/335-355 (1967).
Deformation of the Geomagnetic Field by the Solar Wind, J. Geophys. Res.. 69, pp. 1181-1196(1964).
Mead, G.D. Beard, D.B.
Shape of thu Geomagnetic Field Solar Wind Boundary, / . Geophys. Res., 69, pp 1169-1180(1564).
Ness, N.F.
Olson, W.P.
The Earth'n Magnetic Tail, / . Geophys. Res., 70, pp. 2989-3005 (1965).
The Shape of the Tilted Magnetopause, J. Geophys. Res., 74, pp. 5642-5651 (1969).
Olson, W.P. Cu minings, WD.
Comparison of the Predicted and Observed Magnetic Field at ATS I J. Geophys. Res., 75 pp. 7117-7121 (1970).
Quantitative Models of the Magnetosphere, Rev. Geophys., 7, pp. 77-96 (1969).
The Neutral Sheet in the Geomagnetic Tail - Its Motion, Equivalent Currents and Field Line Connection Through It J- Geophys. Res., 72. pp. 131-14: (1967).
Williams, D.J. Mead, G.D.
Night-side Magneiospheric Configuration as obtained from Trapped Electrons at IfOOkm., J. Gvcphys. Res., 70, pp. 3017-3029(1965).
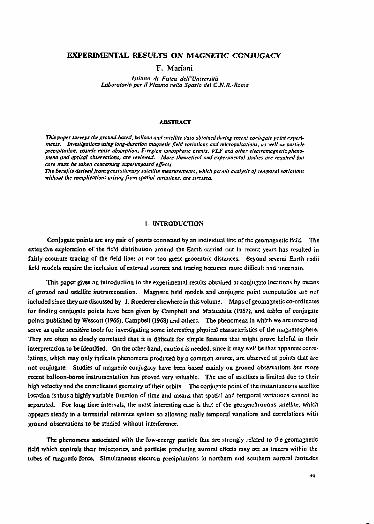
EXPERIMENTAL RESULTS ON MAGNETIC CONJUGACY
F. Mariani htituto di Fislca dell'Universita
Labùratoriù per il Plasma nelîo Spazio del C.N.R.-Roma
ABSTRACT
This paper surveys the ground-based, balloon and satellite data obtained during recent conjugate point experiments. Investigations using long-duration magnetic field variations and micropulsations, as well as panicle precipitation, cosmic noise absorption. F-rrgion ionospheric events. VIS and other electromagnetic phenomena and optical observations, are- reviewed. More theoretical and expérimentai studies are required but care must be taken concerning superimposed effects. The benefits derived from geostationary satellite measurements, which permit analysis of temporal variations without the complications arising from spatial variations, are stressed.
I- INTRODUCTION
Conjugate points are any pair or points connected by an individual line of the geomagnetic field. The extensive exploration of the field distribution around the Earth carried out in recent years has resulted in fairly accurate tracing of the field tines at not too great geocentric distances. Beyond several Earth radii field models require the inclusion of external sources and tracing becomes mote difficult and uncertain.
This paper gives an introduction to the experimental results obtained at conjugate locations by means of ground and satellite instrumentation. Magnetic field models and conjugate point computation are not included since they are discussed by J. Roederer elsewhere in this volume. Maps of geomagnetic co-ordinates for rinding conjugate points have been given by Campbell and Matsushita (1967), and tables of conjugate points published by Wescott (1966), Campbell (1963) and others. The phenomena in which we ore interested serve as quite sensitive toots for investigating some interesting physical characteristics of the magnetosphere. They are often so closely correlated that it is difficult for simple features thai might prove helpful in their interpretation to be identified. On the other hand, caution is needed, since it may well be that apparent correlations, which may only indicate phenomena produced by a common source, are observed at points that arc not conjugate. Studies of magnetic conjugacy have been based mainly on ground observations but more recent balloon-borne instrumentation has proved very valuable. The use of satellites is limited due to their high velocity and the complicated geometry of their orbits. The conjugate point of the instantaneous satellite location is thus a highly variable function of time and means thai spatial and temporal variations cannot be separated. For long time intervals, the most interesting case is that of the geosynchronous satellite, which appears steady in a terrestrial reference system so allowing really temporal variations and correlations with ground observations to be studied without interference.
The phenomena associated with the tow-energy particle flux are strongly related to the geomagnetic field which controls their trajectories, and particles producing auroral effects may act as tracers within the tubes of magnetic force. Simultaneous electron precipitations in northern and southern auroral latitudes
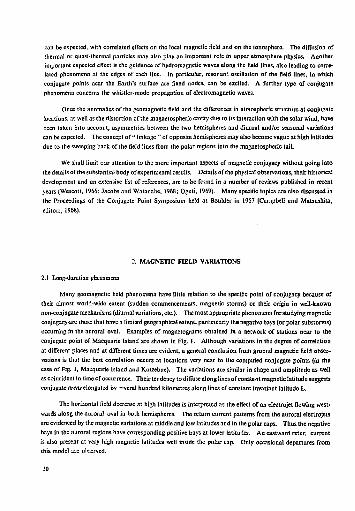
can be expected, with correlated effects on the local magnetic field and on the ionosphere. The diffusion of thermal or quasi-thermal particles may also play an important role in upper atmosphere physics. Another important expected effect is the guidance of hydromagnctic waves along the field lines, also leading to correlated phenomena at the edges of each line. In particular, resonant oscillation ofthe field lines, in which conjugate points near the Earth's surface are fixed nodes, can be excited. A further type of conjugate phenomena concerns the whistler-mode propagation of electromagnetic waves.
Once the anomalies of the geomagnetic field and the differences in atmospheric structure at conjugate locations, as well as the distortion of ihemagnetospheric cavity due to its interaction with the solar wind, have been taken into account, asymmetries between the two hemispheres and diurnal and/or seasonal variations can be expected. The concept of " linkage " of opposite hemispheres may also become vague at high latitudes due to ihe sweeping back of the field lines from the polar regions into the magnetosphcric tail.
We shall limit cur attention to the more important aspects of magnetic conjugacy without going into Ihe details ofthe substantial body of experimental results. Details of the physical observations, their historical development and an extensive list of references, are to be found in a number of reviews published in recent years (Wescott, 1966; Jacobs and Watanabe, 1968; Oguti, 1969). Many specific topics are also discussed in the Proceedings of the Conjugate Point Symposium held at Boulder in 1967 (Canpbell and Matsushita, editors, 1968).
2. MAGNETIC FIELD VARIATIONS
2.1 Long-doration phenomena
Many geomagnetic field phenomena have little relation to Ihe specific point of conjugacy because of their almost world-wide extent (sudden commencements, magnetic storms) or their origin in well-known non-conjugate mechanisms (diurnal variations, etc.). The most appropriate phenomena for studying magnetic conjugacy-are those that have a limited geographical extent, particularly the negative bays (or polar substonns) occurring in the auroral oval. Examples of magnetograms obtained in a network of stations near to the conjugate point of Macquarie Isiand are shown in Fig. 1. Although variations in the degree of correlation at different places and at different times are evident, a general conclusion from ground magnetic field observations is that the best correlation occurs at locations very near to the computed conjugate points (in the case of Fig. 1, Macquarie Island and Kotzebue). The variations arc similar in shape and amplitude as well as coincident in time of occurrence. Their tendency to diffuse along lines ofconsia.it magnetic latitude suggests conjugate areas elongated by -avérai hundred kilometres along lines of constant invariant latitude L.
The horizontal field decrease at high latitudes is interpreted as the effect of an electrojet Sowing westwards along the auroral oval in both hemispheres. The return current patterns from the auroral electrojets are evidenced by the magnetic variations at middle and low latitudes and in the polar caps. Thus the negative bays in the auroral regions have corresponding positive bays at lower latitudes. An eastward retur current is also present at very high magnetic latitudes well inside the polar cap. Only occasional departures from this model are observed.
50
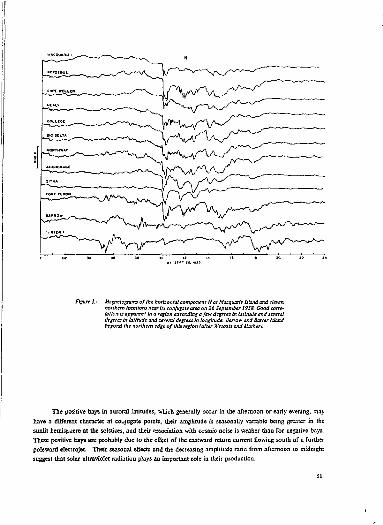
Fi^uit 1.- Mugnelograms of the horizontal component H at MacQuarle island and eleven northern locations near In conjugate area on 26 September 1958. Goad correlation is apparen ' In a region extending a few degrees In latitude and several degrees In latitude and lèverai degrees In longitude. Barrow ar.d Barter Island beyond the northern edge of this region (after Wescott and Mather).
The positive bays tn auroral latitudes, which generally occur in the afternoon or early evening, may have a different character at conjugate points, their amplitude is seasonally variable being greater in the sunlit hemisjiiere at the solstices, and their "aociation with cosmic noise is weaker than for negative bays. These positive bays are probably due to the effect of the eastward return current flowing south of a further poleward eïectrqjet Their seasonal effects and the decreasing amplitude ratio from afternoon to midnight suggest that solar ultraviolet radiation plays an important role in their production.
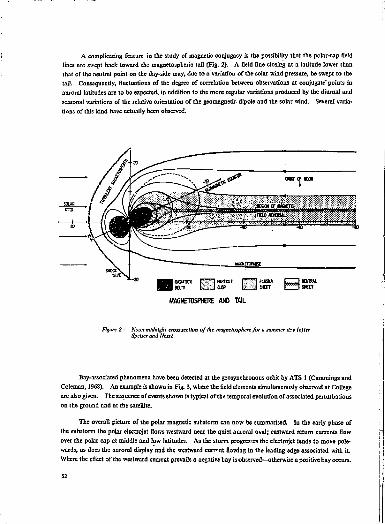
A complicatiug feature in the study of magnetic conjugacy is the possibility that the polar-cap Geld lines are swept back toward the magnetospheric toil (Fig. 2). A field line closing at a latitude lower than that of the neutral point on the day-side may, due to a variation of the solar wind pressure, be swept to the tail. Consequently, fluctuations of the degree of correlation between observations at conjugate* points in auroral latitudes are to be expected, in addition to the more regular variations produced by the diurnal and seasonal variations of the relative orientation of the geomagnetic dipole and the solar wind. Several variations of this kind have actuolly been observed-
•20 •20
« J \ . tJj**^ CPKT V MM
•20
Y ^ vi * "• "T**-iir...il wtm I T WOÊTC. f r f l ' y jHUJ fttUUL
-z>
I/1' X J^- l - '—-Xl - 1—** * ! -%
-z>
— UEKmiPNISE
-z> r~*~lFwnaE {•"""lfuau [ Z ^ ' E f ' M i L-Jeusp f 1 SHEFT p 0 0 3 0 ! SHEET
MAGNETOSPHERE AND TAIL
Bay-associated phenomena have been detected at the geosynchronous orbit by ATS 1 (Cummings and Coleman, 1968). An example is shown in Fig. 3, where the field elements simultaneously observed at College are also given. I"he sequence of events shown is typical of the temporal evolution of associated perturbations on the ground aad at the satellite.
The overall picture of the polar magnetic substorm can now be summarised. In the early phase of the substorm the polar electrojet flows westward near the quiet auroral oval; eastward return currents flow over the polar cap at middle and low latitudes. As the storm progresses the electrojet tends to move polewards, as docs the auroral display and the westward current Sowing in the leading edge associated with i t Where the effect of the westward current prevails a negative bay is observed—otherwise a positive bay occurs.
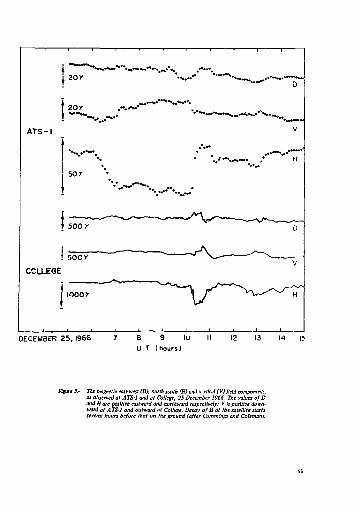
The ma&etlc east-west (D), northscuth (H) and J rtkal (V)fldd components. as observed at ATS-1 and at College, 25 December 1966. The values of D and H are positive eastward and northward respectively; V is positive downward at ATS-1 and outward Pi College. Decay of Hat the satellite starts several hours before that on the ground (after Cummings and Coleman).

2.2 MlcropalsatJna
Magnetic fields in the period-range from 600 to a few tenths of a second ore included in this category. Several difficulties are encountered in the study of micropulsation especially at the higher frequency end of the spectrum, since fast-ran magnetograms are required, while passband limitations can alter the instrumental
output.
It is convenient to distinguish between irregular pulsations (pi) and continuous pulsations (pc). The recent I AG A classification of micropulsaiions is given in Table 1 and an example of pi at conjugate locations is shown in Fig. 4. The overall information from several irregular pulsation studies may be summarised as follows: at high frequency and in high latitudes the occurrence characteristics are similar to those for high-latitude electron précipita;ion, although very dissimilar bursts are also sometimes found. At lower frequencies the region of conjugacy is more extended, whilst a! low latitudes the character of the pulsations sometimes has worldwide dimensions.
TABLE. I
Regular Pulsations Period (seconds)
pc I pc 2 pc 3 pc 4 pc 5
0.2- 5 5 - 10
10- 45 45- 150
150-600
I - 40 40- 150
Irregular Pulsations
0.2- 5 5 - 10
10- 45 45- 150
150-600
I - 40 40- 150
pi I pi 2
0.2- 5 5 - 10
10- 45 45- 150
150-600
I - 40 40- 150
Low-frequency regular pulsations (pc 4 and pc 5) are strongly guided by the field lines polarised as to be expected for Alfvén transverse hydromagnetic waves generated at the Equator and propagated toward conjugate regions of thn ionosphere along field lines. The higher-frequency pulsations, pc 1, have a clear magnelospheric origin. The field variations at high latitudes are guided by the ambient field lines, although propagation to lower latitudes within horizontal ducts may also occur. The oscillations are polarised with a rotation sense around the guiding lines of force. Although this sense is the same for a well-identified family of pc I, both senses have in fact been found (Cendrin and Troitskaia, 1965). The interlaced appearance of pc I micropulsations in opposite hemispheres indicates a bouncing of energy between conjugate points. The intermediate-frequency range, pc 2 and pc 3, is the least studied pc group. The observational characteristics at conjugate locations rule out the possibility of local ionospheric generation.
Clarification of the mechanisms responsible for micro pulsation excitation is required in order to understand their role in magneto-conjugate phenomena. They may be hydromagnetic waves guided by the field lines or be due to interactions between trapped particles and hydromagnetic waves. A further complication arises from the superposition of effctts produced by the different mechanisms.
£4
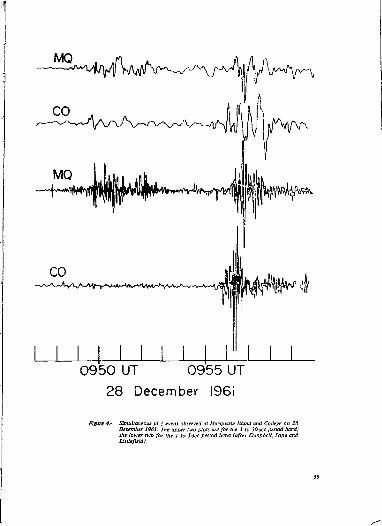
MQ -v^-^/yifwv^/Ar^
H^wJl^^ | | ^ 4 ^
0950 UT 0955 UT 28 December I96i
Figure 4.- Simultaneous pi J event observed or Macaunrie ttlsni and College on 28 December 1961. The upper two plots are for the J to 30-sec period band: the lower two far the I to 5~see pi^riad band (after Compàcll. Pope and Llttlefield).
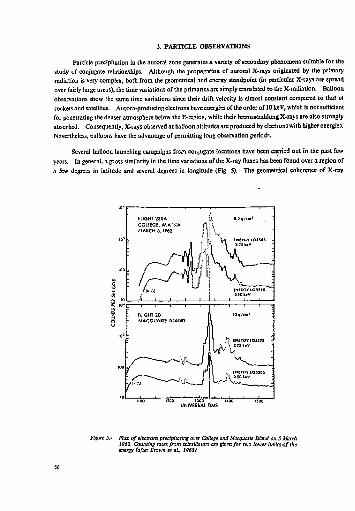
3. PARTICLE OBSERVATIONS
Particle precipitation in the auroral zone generates a variety of secondary phenomena suitable for the study of conjugate relationships. Although the propagation of auroral X-rays originated by the primary radiation is very complex, both from the geometrical and energy standpoint (in particular X-rays are spread over fairly large areas), the time variations of the primaries are simply translated to the X-radiation. Balloon observations show ;he same time variations since their drift velocity is almost constant compared to that of rocketsand satellites. Aurora-producing electrons have énergie of the order of 10 keV, which is not sufficient for penetrating the denser atmosphere below the E-regicn, while their bremsstrahlung X-rays are also strongly absorbed. Consequently, X-rays observed at baL'oon altitudes are produced by electrons with higher energies. Nevertheless, balloons have the advantage of permitting long observation periods.
Several balloon launching campaigns fro.T conjugate locations have been carried out in the past Few years. In general, a gross similarity in the time variations of the X-ray fluxes has been found over a region of a few degrees in latitude and several degrees in longitude (Fig. 5). The geometrical coherence of X-ray
1100 I MO 1)00 HOC 1)00 UNIVERSAL TIME
Figure 5.- Flux of electrons precipitating over College and Macguorie Island on S March 1962. Counting rates from scintillators are given for two lower llmlu of the energy (after Brown et ai, I963).
56

:WJ/«ijJkfcXÏH
Correlation of X-roy pubadotu at Fetrbanki (CoSeee) ami at locations separated by 100 km Ut the r.ortk-south direction (tippet portion} znd by ISO tan In the etat-wat direction (tower portion) on 4 and 5 March 1964 (after Brown et el, 1965>-
activity recorded simultaneously by balloons in fairly close proximity to each other appears to be of the order of 100 km (Fig. 6) with a stiong deterioration at 150 km. This may be extremely important in the study of the detailed structure of conjugate areas; since conjugate points change as a function of time, a series of launchings from locations near to each other is required to trace their time variations. A system of ionospheric currents coincident with the electron precipitation is usually excited, which is similar to that occurring during negative magnetic bays.
The results of co-ordinated high-altitude balioon observations over College and satellite measurements at the ATS 1 satellite show thai regardless of the local time every large spike of the elscuon flu: at the geosynchronous altitude is accompanied by a flux of precipitating electrons, as indicated by an increase of the cosmic

noise absorption at College (Fig. 7). The reverse is also true, the onset acd duration times being almost the same at the two conjugate locations. Although the electron precipitation associated with magnetosphcric substorms is a large-scale phenomenon, there are fine structures having a much smaller correlation. The injection prac-ss is not clear but it appears to be self-limiting in that after reaching a maxattun the flux rapidly decays to an " equilibrium " level of the order of W electrons c m - 1 sec - 1 .
I50"WMT
00 01 02 03 04 05 . 0 6 07 08 09 10 II 12
U . — - J . 1 ... • I , , • , I . • L. 10 M 12 13 14 15 16 17 18 19 20 21 22
Universol Time
Figure 7. - Correlation of electron flux observed at A TS-Î In the energy range SO to ISO teV and magnetic field and cozmlc noise rartatloa at CoUese (after Parks et alj.
Other conjugate particle effects can be expected from auroral electrons back-scattered from the lower atmosphere to the opposite hemisphere. Experimental evidence has been, given by Bhavsar et al. (1966), who found an average lag of about one minute between the light emissions excited by electron precipitatioa above :he conjugate locations of Kerguelen and Yarensk. This delay is to be expected, taking into account the difference in longitude of the two locations and the angular eastwaid electron drift. Balloon measurements of particle precipitation at high altitudes are required OD an extensive basis and our knowledge of conjugate phenomena could greatly benefit from an almost continuous coverage over the auroral region conjugate with the geosynchronous satellite.
S8
!
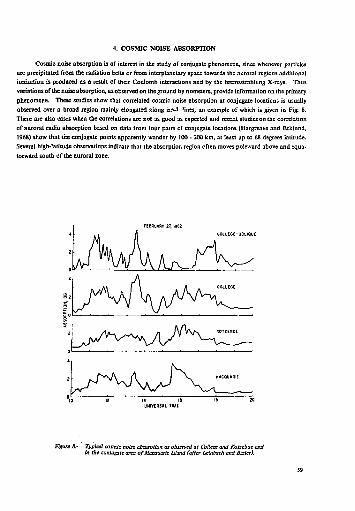
4. COSMIC NOISE ABSORPTION
Cosmic noise absorption is oF interest in the study or conjugate phenomena, since whenever particles are precipitated from the radiation belts or from interplanetary space towards the auroral régions additional ionization is produced as a result of their Coulomb interactions and by the bremsstrahlung X-rays. Thus variations of the noise absorption, as observed on the ground by riometers, provide information on the primary phenomena. These studies show that correlated cosmic noise absorption at conjugate locations is usually observed over a. broad region mainly elongated along isM 'ines, an example of which is given in Fig. 8. There are also cases when the correlations are not as good as expected and recent studies on the correlation of auroral radio absorption based on data fror.i four pairs of conjugate locations (Hargreave and Ecklund, 196S) show that the conjugate points apparently wander by 100 - 200 km, at least up to 68 degrees latitude. Several high-latitude observations indicate that the absorption region often moves poleward above and equa-torward south of the auroral zone.
FEBRUAKr 27, 1962
COtLtOE-OBLIQUE
Figure 8.- Typical comic noise absorption as observed at CoUeee and Kotzebtte ai in the conjugate area of Macauarle Island (after Leiiibach and Boiler).
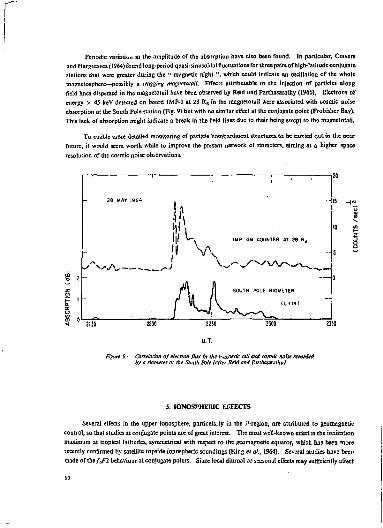
Periodic variation in the amplitude of the absorption have also been found. In particular, Cnivem and Hargreaves (1964) found long-period quasi-sinusoidal fluctuations forthree pairs of high-latitude conjugate stations that were greater during the " magnetic night ", which could indicate an oscillation of the whole magnetosphere—possibly a wagging magnetotail'. Effects attributable to the injection of particles along field lines dispersed in the magnetotail have been observed by Reid and Parthasarathy (1966), Electrons of energy > 45 keV delecled on board IMP-! at 28 RE in ihe magnetomil were associated with cosmic noise absorption at the South Pole station (Fig- 9) but with no similar effect at the conjugate point (Frobishcr Bay). This lack of absorption might indicate a break in the field lines due to their being swept to the magnetotati.
To enable more detailed monitoring of particle bombardment structures to be carried out io. the near future, it would seem worth while to improve the present network of rioraetera, aiming at a higher space resolution of the cosmic noise observations.
28 MAY 1961 .
I1
.!; \
w" \ IMP GM COUNTER AT 26 B ,
!'
\ w" \ IMP GM COUNTER AT 26 B ,
- ' ' ^ - ' V V — — - . . — S* J V ^ ^ v ^ ^ W - W V . ^ ^ _
* l I I SOUTH POLE flIOMETER
VI / \ (L«I41
Figure P.- Correlatkm of electron flux in the magnetic tall and comtlc noise recorded by a riometer at the South Pole {after Reid and Parthasanthv).
5. IONOSPHERIC EFFECTS
Several effects in the upper ionosphere, particulaJy ia the r-rcgion, are attributed to geomagnetic control, so that studies at conjugate points are of great interest. The most well-known effect is the ionization maximum at tropical latitudes, symmetrica] with respect to the geomagnetic equator, which has been more recently confirmed by satellite topside iooospheric soundings (King et a!., 1964). Several studies have beer made of xhsf^l behaviour at conjugate points. Since local diurnal or seasonal effects may sufficiently affect
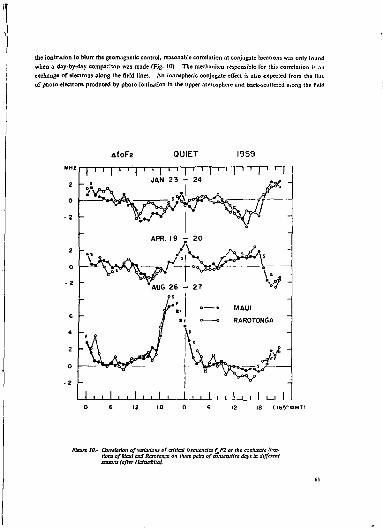
the ioniï-iiion to Wurr the geomagnetic control, reasonable correlation at conjugate locations was only Found when a o*ay-by-day comparison was made (Fig. 10). The mechanism responsible for this correlation is an exchange of electrons along the field lines. An ionospheric conjugate effect is also expected from the flux of photo-electrons produced by photo-ionization in the upper atmosphere and back-scattered along the held
ifoF2 QUIET
I • • I _ L _ i I • • I • • > . . 18 (165°WMT)
Figure 10.' Gofrefatton of variation; of critical freaueneta faF2 at the cantumte locations of Maul and Rsrolonga on three pairs of consécutive days In different seasons (after Matsushita).
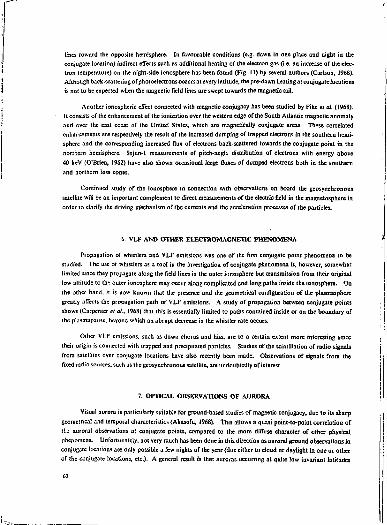
lines toward the opposite hemisphere. In favourable conditions (e.g. dawn in one p lus and night in the conjugate location) indirect effects such as additional heating of the electron gas (i.e. aa increase of the dec-iron temperature) on the night-side ionosphere has been found (Fig. II) by several authors (Carlson, 196S). Although back-scattering of photoelectronsoccursal every latitude, the pre-dawn heating at conjugate locations is not to be expected when the magnetic field lines are swept towards the magnetic tail.
Another ionospheric effect connected with magnetic conjugacy has been studied by Pike et ai. (1968). It consists of the enhancement of the ionization over the western edge of the South Atlantic magnetic anomaly and over the east coast of the United States, which are magnetically conjugate areas. These correlated enforcements are respectively the result of the increased dumping of trapped electrons in the southern hemisphere and the corresponding increased flux of electrons back-scattered towards the conjugate point in the northern hemisphere. Injun-I measurements of pitch-anglt distribution of electrons with energy above 40 keV (O'Brien, 1962) have also shown occasional large fluxes of dumped electrons both in the southern and northern loss cones.
Continued study of the ionosphere in connection with observations on board the geosynchronous satellite will be an important complement to direct measurements of the electric field in the magnetospherc in order to clarify the driving mechanism of the currents and the acceleration processes of the particles.
6. VLF AND OTHER ELECTROMAGNETIC PHENOMENA
Propagation of whistlers and VLF emissions was one of the first conjugate point phenomena to be studied. The use of whistlers as a tool in the investigation of conjugate phenomena is, however, somewhat limited since they propagate along the field lines in the outer ionosphere but transmission from their original low altitude to th* outer ionosphere may occur along complicated and long paths inside the ionosphere. On the other hand, it is now known (hat the presence and the geometrical configuration of the plasmasphere greatly affects the propagation path of VLF emissions. A study of propagation between conjugate points shows (Carpenter et ai, 1968) that this is essentially limited to paths contained inside or on the boundary of the plasmapause, beyond which an abrupt decrease in the whistler rate occurs.
Oiher VLF emissions, such as dawn chorus and hiss, are to a certain extent more interesting since their origin is connected with trapped and precipitated particles. Studies of the scintillation of radio signals from satellites over conjugate locations have also recently been made. Observations of signals from the fixed radio sources, such as the geosynchronous satellite, are undoubtedly of interest.
7. OPTICAL OBSERVATIONS OF AURORA
Visual aurora is particularly suitable Tor ground-based studies of magnetic conjugacy, due to its sharp geometrical and temporal characteristics (Akosofu, 1968). This allows a quasi point-to-point correlation of tli auroral observations at conjugate paints, compared to the more diffuse character of other physical phenomena. Unfortunately, not very much has been done in this direction as auroral ground observations jo. conjugate locations are only possible a Tew nights of the year {due either to cloud or daylight in one or other of the conjugale locations, etc.). A general result is that auroias. occurring at quite low invariant latitudes
62

Z300
2000
* 1 0 oie i i . I M S
229 1 * ---*- 300 * •
37S km
I90O / " " v
/ •~^ I06O
- — 1 . 1
r̂ 3 0 0
- — 1 . 1
S , , , " , , , j s . i . «.ictomcsi
0 - — 1 . 1 , « « • " • ,
2300 * 1 0 occ so. rsas
219 l a /-'",v
zooo - - * • SOO In 373 in / / '
1300
/ / / -1000
3 0 0 e i g S , , , | , .J 8. I . A. lOEOntSBl
com. PT.
injure II.- Variation of the electron temperature Tr for equinox and summer condition! (upper portion) and winter conditions (lower portion) Solar zenith onglet of the am (S.Z.A.) at the place of measurement and If con/usate point are indicated. Winter conditions are appropriate to obstrue the predawn Increase of Î*, (after Carlson).
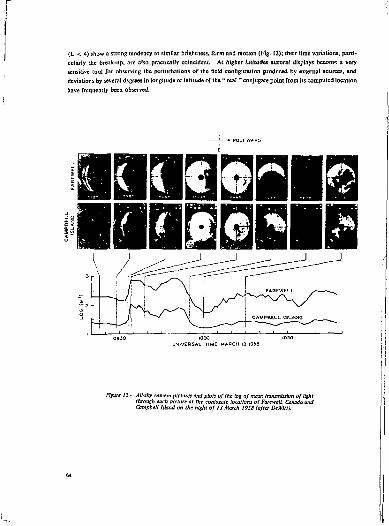
(L < <I) show a strong tendency to similar brightness, form and motion (Fig. 12); their time variations, particularly the break-up, are also practically coincident. At higher latitudes auroral displays become a very sensitive tool for observing the perturbations of the field configuration produced by external sources, and deviations by several degrees in longitude or latitude of the " real " conjugate point from its computed location have frequently been observed.
• All-sky camera pictures and plots of the log of mean transmission of light through each picture at the coniuxate locations of Farewell, Canada and Campbell Island an the night of 11 March 1958 (after DeWUt).
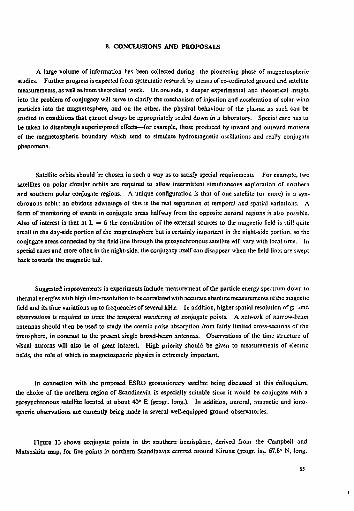
8. CONCLUSIONS AND PROPOSALS
A large volume of information has been collected during the pioneering phase of magnetospheric studies.. Further progress is expected from systematic research by means of co-ordinated ground and satellite measurements, as well as from theoretical work. On outside, a deeper experimental and theoretical insight into the problem of conjugacy will serve to clarify the mechanism of injection and acceleration of solar wind particles into the magnetosphere, and on the other, the physical behaviour of the plasma as such can be Studied in conditions that cannot always be appropriately scaled down in a laboratory. Special care has to be taken to disentangle superimposed effects—for example, those produced by inward and outward motions of the magnetospheric boundary which tend to simulate hydromagnetic oscillations and rcal'y conjugate phenomena.
Satellite orbits should be chosen in such a way as to satisfy special requirements For example, two satellites on polar circular orbits are required to allow intermittent simultaneous exploration of northern and southern polar conjugate regions. A unique configuration is that of one satellite (or more) in a synchronous orbit: an obvious advantage of this is the real separation of temporal and spatial variations. A form of monitoring of events in conjugate areas halfway from the opposite auroral regions is also possible. Also of interest is that at L = 6 the contribution of the external sources to the magnetic field is still quite small in the day-side portion of the magnetosphere but is certainly important in the night-side portion, so the conjugate areas connected by the field line through the geosynchronous satellite will vary with local time. In special cases and more often in the night-side, the conjugacy itself can disappear when the field lines are swept back towards the magnetic tail.
Suggested improvements in experiments include measurement or the particle energy spectrum down to thermal energies with high time-resolution to be correlated with accurate absolute measurements of the magnetic field and its time variations up to frequencies of several kHz. In addition, higher spatial resolution of g; .and observations is required to trace the temporal wandering of conjugate points. A network of narrow-beam antennas should then be used to study the cosmic noise absorption /rom fairly limited cross-sections of the ionosphere, in contrast to the present single broad-beam antennas. Observations of the time structure of visual auroras will also be of great interest. High priority should be given to measurements of electric fields, the role of which in magnetospheric physics is extremely important.
In connection with the proposed ESRO geostationary satellite being discussed at this colloquium, the choice of the northern region of Scandinavia is especially suitable since it would be conjugate with a geosynchronous satellite located at about 40° E (geogr. long.). In addition, auroral, magnetic and ionospheric observations are currently being made in several well-equipped ground observatories.
Figure 13 shows conjugate points in tb*! southern hemisphere, derived from the Campbell and Matsushita map, for five points ir> northern Scandinavia centred around KJruna (geogr. lai. 67.8" N, long.
65
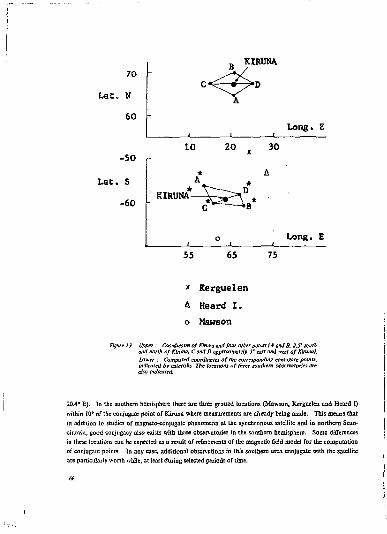
70
U t . N
60
-50
Lac. S
-60
-• ^
KIRUNA
^
1 1 Long. £
10 20 30
KIRUNA t-3Sei Long. E
55 65 75
* Kerguelen A Heard I. o Mawson
- Upper : Coordinate* of Kbuea and four other noma (A and B. 2.S" south and north of Kiruna; C and D approximately S' east and west of Kiruna). Lower : Computed coordinates of the corresponding conjugate points. indicated by asterisks. The locations of three southern observatories are also indicated.
20.4° E). In the southern bemisphere there are three ground locations (Mawson, Kerguelen and Heard I) within 10* of (he conjugate point of Kiruna where measurements are already being made. This means that in addition to studies of magneto-conjugate phenomena at the synchronous satellite and in northern Scandinavia, good conjugacy also exists with three observatories in the southern hemisphere. Some differences in these locations can be expected as a result of refinements of the magnetic field model for the computation of conjugate points. In any case, additional observations in this southern area conjugate with the satellite arc particularly worth while, at least during selected periods of lime.
REFERENCES
Auroral Substorm and M3gneco5pheric Substorm. Space Res. Vtll. pp. 213-242, North Holland , I96K.
Bhavsar, P.D. BlamcDi, J.E. Isaev, S.I. Korotin, A.
A Study or the Aurorae, X-rays, Ionosphere and Related Phenomena from SubauroraJ Zone Stations, Space Res., VI, pp. 1022-1033, Spartan Books, 1966.
Brown, R.R. Anderson, K.A. Anger, C D . Evans, 0.S.
Simultaneous Electron Precipitation in the Northern and Southern Auroral Zones, J. Geophys. Res., 68, pp. 2677-2684 (!96I
Brown, R.R. Barcus, J.R. Parsons, N.R.
Balloon Observation:, of Auroral Zone X-rjys in Conjugal'. Regions - 2. Microbursts and Pulsations, ' Geophys. Res.. 70. pp. 25W-2612 (1965).
Campbell, W.H. Rapid Gee ma gee tic Field Variations Observed at Conjugate Locations, Radio Sci. 3, pp. 726-739 (1968).
Campbell, W.H. Pope, J.H. Littlefield, M.D.
Problems regarding Geomagnetic Micropulsaiions at Conjugale Field Locations on the Earth's Surface. AGU meeting, Stanford, 29 December 1962.
Campbell, W.H. Matsushita, S.
World Maps of Conjugate Co-ordinates and L Contours, J. Geophys. Res., 72, pp. 3518-3521 (1967).
Campbell, W.H. Matsushita, S.
Proceedings Conjugale Point Symposium, Radio Sci.. 3. pi. 645-773 (1968).
Carlson, U.C. Most Recent Studies of Low Latitude Effects due ro Conjugate Locjtion Healing, Radio Sci.. 3. pp. 668-673 (1968).
Carpenter, D.L. Walter, F. Borringtoii, R.E. McEwen, D.J.
Alouette 1 and 2 Observations of Abrupt Changes in Whistler Rate and of VLF Noise Variations at the Plasmapause • a Satellite Ground Study, J. Geophys. Res.. 73. pp. 2929-2940(1968).
Chivers, HJ.A. Hargreaves, J.K.
Ionospheric Absorption in Conjugate Regie .is and possible Oscillation of the Exosphere, Nature 202, pp. &91-893 (1PM).
Cummings, W.D, Coleman. P.J., Jr.
Simultaneous Magnetic Field Variation ai the Earth's Surface and at Synchronous, Equatorial Distance. Part I, Bay-associated Events, Radio Sci.. 3, pp. 758-765 (1968).
The Occurrence of Aurora in Geo magnetically Conjugate Areas. / . Geophys. Res.. 67. pp. 1347-13:52 (1962).
Gendrin, R.E. Troitskaia, V.A.
Preliminary Results of a Micropulsation Experiment at Conjucate Points, J. Res. NBS 69D {Radio Science), pp. 1107-1116 (1965).
Hargreaves, J.K. Ecklund, W.L.
Correlation of Auroral Radio Absorption between Conjugate Points, Points, Radio ScL, 3, pp. 698-7C4 (1968).
Conjugate Point Phenomena associated with Energetic Partie tes. Magnetic Observations, Ann. Geophys., 24. pp. 467-475 (1968).
King, J.W. Smith, P.A. E. -les, D. Fjuks, G.F. Hdro, H.
Preliminary Investigation of the Struaure of the Upper Ionosphere as observed by the Topside Sounder Satellite, Alouette, Proc. R. Soc, A2&Ï. pp. 464-487 (1964).
Ionospheric Absorption of Cosmic Radio Noise at Magnetically Conjugate Auroral Zone Stations, J. Qeophys. Res.. 68. pp. 3375-3382 (1963).
Matsushita, S. Ionospheric F2 Behavior at Conjugate Places in Low Latitudes, Radio SW.,i.pp.65B-«7(lW8).
Direct Observations of Dumping of Electrons at 1000-kilometer Altitude and High Latitudes, J. Geophys. Res., 67, pp. 1227-1233 (1962).
Oguti, T. Conjugate Point Problems, Space Set. Rev.. 9, pp. 745-804, (1969).
Parks, G.K. Arnoldy, R.L. Lezniak, T.W. Wineklcr, J.R.
Correlated Effects of Energetic Electrons at the 6.6 R E Equator and the Auroral Zone during Mngnetospheric Substorms, Radio S.3., 3. pp. 715-719 (1968).
Picke, C.P. Herman, J.R. Gassmann, GJ .
Conjugate F-region Enhancement related to the South Atlantic Magnetic Anomaly, Radio ScL, S, pp. 680-687 (1968).
Reid, G.C. Parthasarathy, R.
Ionospheric Effects of Energetic Electron Bursts in the Tail of the Magnetosphere, J. Geophys. Res., 71. pp. 3267-3272 (1966).
The Neutral Shest in the Geomagnetic Tail; lis Motion, Equivalent Currents and Field Line Connection through tt, J. Geophys. Res., 72. pp. 131-142 (1967).
Wescott, E.M. Magnetoconjugate Phenomena, Space ScL Rev.. 5, pp. 507-561 (1966).
Wescou, E.M. Mather, K.B.
Magnetic Oonjugacy from L = 6 t o L = 1.4—1. Auroral Zone: Conjugate Area, Seasonal Variations and Magnetic Coherence, J. Ceophys. Res., 70, pp. 29-42 (1965).

MAGNETOSPHERIC PLASMA PHENOMENA AT THE GEOSTATIONARY ORBIT
J.W. Freeman, Jr . and D.T. Young
Department of Space Science, ffiVe University, Houston. Texas. V.S.A.
ABSTRACT
The principal phenomena detected by the low-energy plasma detector on board the ATS-1 geostationary satellite are reviewed. They am be classed as: 1 ) direeiedflow ofeool magneiospheric plasma ; 2) magneto-pause plasma flow; 3) plasma sheet dynamics; 4} hydromagnettc wave-induced plasma motion. The magnc-tosphere near the geostationary orbit Is rich In phenomena accessible to a Ion-energy plasma detee'or on a spinning spacecraft; an instrument with a grraier sensitivity and energy dynamic range than the ATS-l would. however, be desirable.
I. INTRODUCTION
The purpose of this paper is to review the principal phenomena detected by the low-energy plasma detector on board the ATS-1 geostationary satellite.
The detector itself was designed primarily for positive ions in the energy range 0 to 50 eV. The detector, a miniature retarding potential analyzer with a continuous channel-multiplier as the sensor, covered this energy range wiih 19 differential energy steps and 2 integral energy steps. Through its integral character the instrument was also sensitive to positive ions of higher energy and electuns of energy greater than 3 kcV (see Freeman1 for a complete description of the experiment). The detector was mounted radially on the satellite equator and the spin axis was normal to the orbital plane.
The principal plasma phenomena detected can be classed in the following categories:
1) Directed flow of cool magneiospheric plasma; 2) Magnetopause plasma flow; 3) Plasma sheet dynamics; 4) Hydromagnetic wave-induced plasma motion.
A review of the data from each of these is now made-
2. DIRECTED FLOW OF COOL MAGNETOSPBERIC PLASMA
Figure I summarises the data from the five events observed during the two and a half months of useful life of the ATS-1 detector. Each of these events represents an occasion when the detector reported statistically significant fluxe* of positive ions of energy less than 50 eV. On each of these occasions the fluxes were found to be highly anisotropic with a flow direction, indicated by the arrows, shown emanating from the location on the geostationary orbit where the event occurred.
69

TYPICAL ANGULAR
DISTRIBUTION (FWKM IN
EVENT DATE Kp DEGREES) TpCK) 9 p <km s
1 7 /2 6 + 24 ~ 1.5 x 1 0 s - 2 0
2 13/1 6 - 2 4 l.7x I 0 3 21
3o 15/2 5-(EGG) 3 0 ~ 5 x l 0 5 - 5 5
3i» 15/2 5- (sac) 24 ~ 5 x l 0 3 - 5 5
Figure L- ATS 1 summary of highly anisotropic fluxes with E < 50 eV.
From Fig. 1 it is seen that these events are associated with a high K9 iddex. All events took place d uring the early main phases of major magnetic storms, with the exception of Event 3 which occurred simultaneously with a storm sudden commencement. This probably explains the different character of the flow direction, radially inward for this event, compared with the sunward or radially outward direction for the other events.
With the exception of Event 5, the occurrences of directed plasma flow appear to favour the noon-to-dusk quadrant. Freeman1 has suggested that this may be explained by the unusually high iou number densities associated with the flows resulting from a removal of the outer regions of the plasmasphere through an increase in the magnetospheric electric field. Cool plasma, originally on predominantly co-rotation dominated orbits would then find itself on a magnetospheric-wide convection Row path that would carry it across the synchronous orbit in the vicinity of the noon-to-dusk quadrant.
The angular distributions for these events, when taken together with the mean flow velocities as measured by the energy spectra, indicate ion temperatures of the order of 101 to 10* 'K.
The flow velocities are consistent with those predicted by Axford and Hines* and indicate magneto-spheric fields of the order of a few raVm-1; about an order of magnitude greater than those generally attributed to the quiet-time field (Vasyiiunas5).
The ion number densities, of the order of 10 ions cm" 1, are consistent with those of a somewhat diluted plasmasphere but above that generally attributed to the plasma trough.
Event 3, and particularly 3n, is consistent with magnctospheric thermal plasma being compressed and forced anti-sunward with the sudden commencement compression of the magnetosphere. A similar flow was seen during Event 2 at a time of sudden compression of the magnetic field. The latter event included a sustained encounter of the ATS-1 satellite with the magnetopause and merits special elaboration.
70
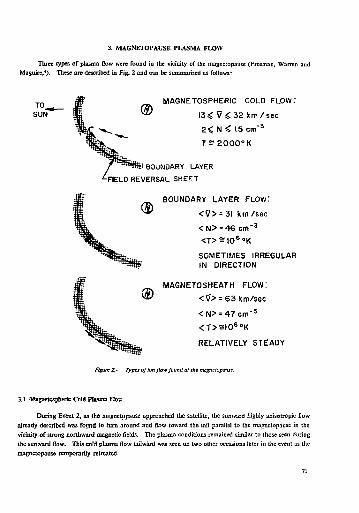
3. MAGNETOFAUSE PLASMA FLOW
Three types of plasma Bow were found in the vicinity of the magnetopause (Freeman, Warren and Maguire,'). These are described in Fig. 2 and can be summarised as follows:
T 0 - « SUN
MAGNETOSPHERIC COLD FLOW:
13^ V £ 3 2 km/sec
2 < N < 15 cm" 3
T==2000°K
Si BOUNDARY LAYER LFIELD REVERSAL SHEET
BOUNDARY LAYER FLOW:
< 7 > = 3I km/sec
< N > = 46 c m " 3
<T> = I 0 6 ° K
SOMETIMES IRREGULAR IN DIRECTION
MAGNETOSHEATH FLOW:
<V> = 63 km/sec
<N> = 4 7 c m " 3
< T > a l 0 6 ° K
RELATIVELY STEADY
Figure 2.- T^pes of ion flow found at the magnetopause.
3.1 Maguetespfteric Cold PItsma FTorr
During Event 2, as the mngnetppause approached the satellite, tbe sunward highly anisotropic ilow already described was found to tum around and Sow toward the tail parallel to the magnetopause in the vicinity of strong northward magnetic fields. The plasma conditions remained similar to those seen during the sunward flow. This cold plasma flow tailwàrd was seen on two other occasions later in the event as the magnetopause temporarily retreated.
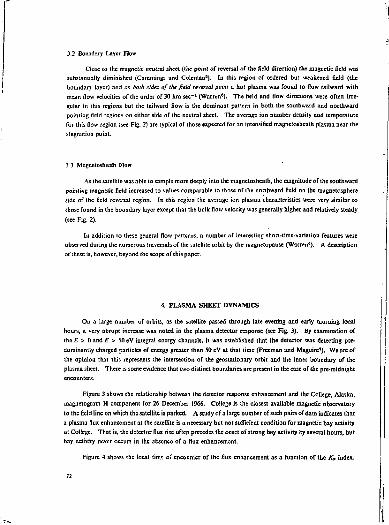
3.2 Boundary Layer Flow
Close (o the magnetic neutral sheet (the point of reversal of the field direction) the magnetic field was substantially diminished (Cummings and Coleman6). In this region of ordered but weakened field (the boundary layer) and an bath sides of the field reversai point a hot plasma was found to flow tailward with mean flow velocities of the order or 30 km sec - 1 (Warren*). The field and flow directions were often irregular in this regions but the tailward flow is the dominant pattern in both the southward and northward pointing field regions on either side of the neutral sheet. The average ion number density and temperature for this flow region (sec Fig. 2) arc typical of those expected for an intensified magnetosheath plasma near the stagnation point.
2 3 Mflgnetosheath Flow
As the satellite was able to sample more deeply into the magnelosheath, the magnitude of the southward pointing magnetic field increased to values comparable lo those of the northward field on the magnetosphere side of the field reversal region. In this region the average ion plasma characteristics were very similar to those found in the boundary layer except that the bulk flow velocity was generally higher and relatively steady (see Fig. 2).
In addition lo these general flow patterns, a number of interesting short-t:me-variation features were observed during the numerous traversais of the satellite orbit by the magnetopause (Warren'). A description of these is, however, beyond the scope of this paper.
4. PLASMA SHEET DYNAMICS
On a large number of orbits, as the satellite passed through late evening and early morning local hours, a very abrupt increase was noted in the plasma detector response (see Fig. 3). By examination of the E > 0 and E > SO eV integral energy channels, it was established that the detector was detecting predominantly charged particles of energy greater than 50 eV at that lime (Freeman and Maguire7). We are of the opinion that this represents the intersection of the geostationary orbit and the inner boundary of the plasma sheet. There is some evidence that two distinct boundaries are present in the ease of the pre-midnight encounters.
Figure 3 shows the relationship between the detector response enhancement and the College, Alaska, magnetogram H component for 26 December 1966. College is the closest available magnetic observatory to the field line on which th: satellite is parked. A study of a large number of such pairs of data indicates that a plasma flux enhancement at the satellite is a necessary but not sufficient condition for magnetic bay activity at College. That is, the detector flux rise often precedes the onset of strong bay activity by several hours, but bay activity never occurs in the absence of a flux enhancement.
Figure 4 shows the local time of encounter of the flux enhancement as a function of the K, index.
72

DEC. 2 6 , 1966
O 1 — 00 14
—L-^^-^TJhj*^
_! I I I I J_
COLLEGE H COMPONENT
U.T.
SUPRATHERMAL ION DETECTOR E>0eV
APPROXIMATE COUNTS PER ACCUMULATION INTERVAL
0 4 IB
08 22
16 06
20 10
00 U.T. 14 L I
9 T—T —i—i—r 1 1 1 1 1 1 1 1 1 1 1 1 1 1 I | _
S _ " • 7 - -. . Kp = 2- FOR PREVIOUS 6 3 HOUR INTERVAL-J
a. 5 _ ^ - • • 4 0 HIGHEST Kp VALUES "
+ ON DAYS WITH 3
• NO ENHANCEMENT + • « •—"—s 2 — • o o o o -
o « o 0
+ «** o o o 1 ooooo —
o n -1 L - J 1 L —1 I I 1 1 1 1 I L—I 1 I I 1 I 1
14 15 IB 17 18 19 20 21 22 23 00 01 02 03 04 OS 06 07 08 09 1000
LOCAL TIME (HOURS) Flgurc4.- K re local time of onset of intense isotropic fluxes.

CHANCE IN K p RELATIVE TO 3 HOUR INTERVAL PRECEDING ENHANCEMENT
NUMBER OF OCCURRENCES
E A a p
ALL OCCURRENCES
K p INCREASE
K p DECREASE
Kp SAME
a)
23
7
2
+ 159 -17
0
6 •
>
HL
r~L JZ_
DAYS ON WHICH SID FLUXES ARE QUIET
DAYS ON WHICH SID ENCOUNTERS FLUX
ENHANCEMENTS
« 5 30 25 20 15 10 DAILY £ K D b)
flgureS.- a) Distribution of SID enhancements v b) Distribution of SID enhancements r
Earlier local times favour higher K,. Figure S shows the number of occurrences for increase, decrease and no change in the KP index from the previous three-hour value. The occurrences of the plasma encounters favour Kr inceases. Also shown are the distributions ofdaysofnosiiprathennal ion flux enhancement and observable flux enhancement versus the daily K9 sum. Again, the correlation v/ith higher fCv is borne out. The correlation of these flux variations with the data from (he ATS-I UCLA magnetometer and the University of Minnesota energetic electron detector is expected to yield more information about the nature of this plasma.
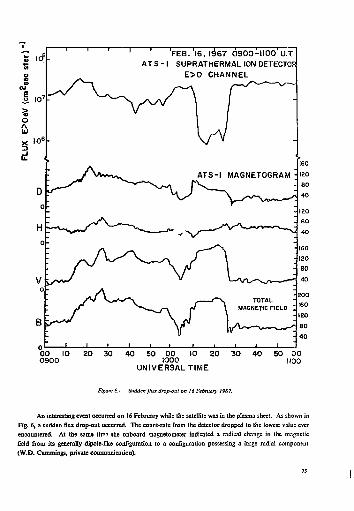
_ l ' 'FEB.'l6, là67 0900-IIOO'u.T A T S - I SUPRATHERMAL ION DETECTOR
E>0 CHANNEL
00 0900
50 00 1000
UNIVERSAL TIME
50 00 1100
Figurée.- Sudden flux dropout on It February 1967.
An interesting event occurred on 16 February while the satellite was in the plasma sheet. As shown in Fig. 6, a sudden flux drop-out occurred. The count-rate from the detector dropped to the lowest value ever encountered. At the same time the onboard magnetometer indicated a radical change in the magnetic field from its generally dipole-like configuration to a configuration possessing a large radial component (W.D. Cummings, private communication).
15
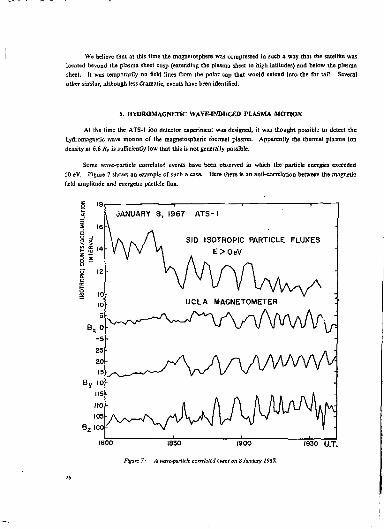
We believe that at this time the magnetosphere was compressed in such a way that the satellite was located beyond the plasma sheet cusp (extending the plasma sheet to high latitudes) and below the plasma sheet. It was temporarily on field lines from the polar cap that would extend into the far tail. Several other similar, although less dramatic, events have been identified.
5. HYDROMAGNETIC WAVE-INDUCED PLASMA MOTION
At the time the ATS-1 ion detector experiment was designed, it was thought possible to detect the hydromagnetic wave motion of the magnetospheric thermal plasma. Apparently the thermal plasma ion density at 6.6 BE is sufficiently low that this is not generally possible.
Some wave-particle correlated events have been observed in which the particle energies exceeded 50 eV. Figure 7 shows an example of such a case. Here there is an an It-correlation between the magnetic field amplitude and energetic particle flux.
18
SID ISOTROPIC PARTICLE FLUXES E>OeV
B R 0 -5 25 20 15
By 10 115 110 105
B , 100
JANUARY 8 ? 1967 ATS-I
UCLA MAGNETOMETER
\r
Figure 7.- A wave-parttclt correlated event on 8 January 1967.
6. SUMMARY
The magnetosphere near the geostationary orbit is rich in phenomena accessible to a low-energy plasma detector on a spinning spacecraft; an instrument with a greater sensitivity and energy dynamic range than the ATS-1 detector would, however, be desirable.
ACKNOWLEDGEMENTS
This research has been supported in part by contracts NSR-44-O0MO0 and NAS5-9561. to thank the UCLA group for making available their magnetometer data.

REFERENCES
1- Freeman. J.W., Jr. Observation of Flow of Low-energy Ions at Synchronous Altitude, J. Geophys. Res., 73, pp. 4151-4158 (1968).
A Unifying Theory of High Latitude Geophysical Phenomena and Geomagnetic Storms, Can. J. Pliys., 39, p. 1433 (1961).
3. Vasyliunas. V.M. A Crude Estimate of the Relationship bclween the Solar Wind Speed and the Magnetospheric Electric Field, J. Geophys. Res., 73, pp. 2529-2530 (1968).
4. Freeman, J.W.. Jr. Warren, C.S. Maguire, J.J.
Plasma Flow Directions at the Magnttopauss on 13 and 14 January 1967, / . Geophys. tes., 73, pp. 5719-5731 (1968).
5. Cuturnings, W.D. Coleman, P.J.
Magnetic Fields in the Magnetopause and Vicinity at Synchronous Altitude, J. Geophys. FTI,, 73, pp. 5699-5718 (1968).
Structure of the Dayside Equatorial Magnetospheric Boundary as deduced from Plasma Flow, Rice University Ph. D. Dissertation. May 1969.
7. Freeman, J.W., Jr. Maguirc, J J .
Gross Local Time Asymmetries at the Synchronous Orbit Altitude, / . Geophys. Hes.. 72, pp. 5257-5264 (1967).

MACRO-INSTABILrj lES IN T H E MAGNETOSPHERE
K . Schindler
European Space Research Institute (ESRIN\ Frascati
ABSTRACT
A number af plasma liabilities of the macroscopic type are considered in relation to their importance in the magnetosphere. ' The extent to which these instabilities can be delected at the geostationary orbit it discussed. It is found that the mirror, exchange and tearing instabilities may play an important part, whereas the Kelvin-Helmholtz instab'Mtiy, if excited on the magnetopause, will probably not have a large effect at L =- 6.6.
1. INTRODUCTION
While an exact definition of the word " macro-instabilities " would not seem to be called for, in somewhat general terms such words as " low-frequency ", " non-resonant " and " fluid-iype " m'^ht be used. It is used in the title of this paper as a general term for the four instabilities discussed in relation to their possible importance in the magnetosphcrc, although other instabilities probably arise.
From the observational point of view it is not easy to differentiate between instabilities and it is even difficult to determine from satellite dat.'i whether there is instability et all,
Pronounced structures observed in the magnetosphcrc m a roughly be of three types.
a) The spectrum originates in the solar wind and the magnetosphere responds passively, b) The magnctosphcre modulates the solar wind spectrum (resonance motion), c) The structure originates in the magnetosphere (instability).
it is relatively easy to determine (a) by simultaneous measurements inside and outside the magneto-sphere. It seems that the adiabatic magnetospheric response to long time-scale changes of the solar wind properties belongs to this category. Evidence for the existence of such adiabatic motions on the lime-scale of days has been discussed by Roederer (1969).
It is, however, much more difficult to distinguish betwern (6) and (c). A complete discussion of the macroscopic waves in the magnetosphere would probably need to consider them in a combined form, despite the underlying physics being qualitatively different. Figure 1 shows magnetometer data at the ATS satellite obtained by Coleman (1970). Because of the high degree of order, resonance motion seems a possibility since instabilities tend to be more irreiular. It seems impossible, however, from the available measurements, to exclude entirely the phenomenon in Fig. 1 being an overstable wave. The best way of deciding is to identify the physical process by combining the results of simultaneous measurements. For instance, some of the instabilities would tend to be more localised in space than is the case f jr resonance motions and the phase correlation would be smaller in the case of an instability.
79
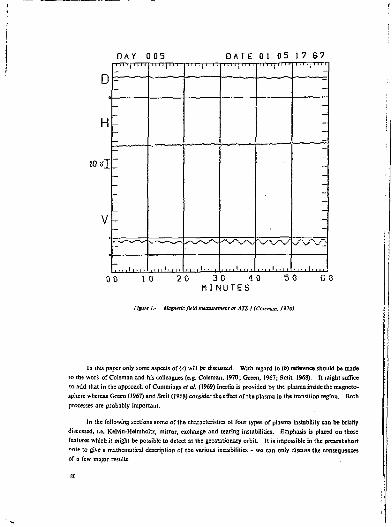
Figure 1.- Magnetic field measu/ement at ATS 1 (CoUmcn, 1970).
In this paper only some aspects of (c) will be discussed. With regard to (b) reference should be made to the work of Coleman and his colleagues (e.g. Coleman, 1970; Green, 1967; Smit: 1968). It might suffice to add that in the approach of Cummîngs et al. (1969) inertia is provided by the plasma inside the magneto-sphere whereas Green (1967) and Smit (1968) consider the effect of the plasma in the transition region. Both processes are probably important.
In the following sections some of the characteristics of four types of plasma instability can be briefly discussed, i.e. Kelvin-He! mholtz, mirror, exchange and tearing instabilities. Emphasis is placed on those features which it might be possible to detect at the geostationary orbit. It is impossible in the present short "ote to give a mathematical description of the various instabilities - we can only discuss the consequences of a few major results.
BO
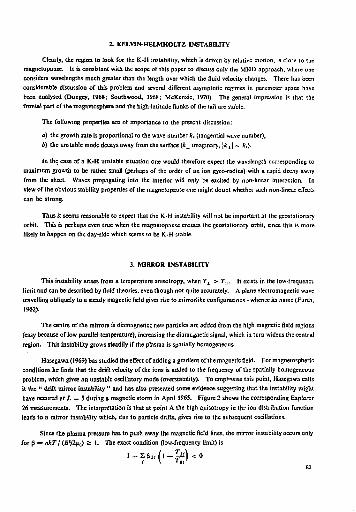
2. KELVIN-HELMHOLTZ INSTABILITY
Clearly, the region to look for the K-H instability, which is driven by relative motion, is close to the magnetopause. It is consistent with the scope or this paper to discuss only the MHD approach, where one considers wavelengths much greater than the length over which the fluid velocity changes. There has been considerable discussion of this problem and several different asymptotic regimes in parameter space have been analysed (Dungey, 1968; Southwood, 1968; McKenae, 1970). The general impression is that the frontal part of the magnetosphere and the high-latitude flanks of the tail are stable.
The following properties are of importance to the present discussion :
a) the growth rate is proportional to the wave number k, (tangential wave number), b) the unstable mode decays away from the surface (kx imaginary, \k±\ ~ k,).
In the case of a K-H unstable situation one would therefore expect the wavelength corresponding to maximum growth to be rather small (perhaps of the order of an ion gyro-radius) with a rapid decay away from the sheet. Waves propagating into the interior will only be excited by non-linear interaction. In view of the obvious stability properties of the magnetopausc one might doubt whether such non-linear effects can be strong.
Thus it seems reasonable to expect thai the K-H instability will not be important at the geostationary orbit- This is perhaps even true when the magnetopause crosses ihe geostationary orbit, since this is more likely to happen on the day-side which seems to be K-H stable.
3. MIRROR INSTABILITY
This instability arises from a temperature anisotropy, when TL > 7*,,. It exists in the low-fr=quenc\ limit and can be described by fluid theories, even though not quite accurately. A plane electromagnetic wave travelling obliquely to a steady magnetic held gives rise to mirrorlike configurations - whence its name (Furth, 1962).
The centre of the mirrors is diamagnetic; new particles are added from the high magnetic field regions (easy because of low parallel temperature), increasing the diamt-gnetic signal, which in turn widens the central region. This instability grows steadily if the plasma is spatially homogeneous.
Hasegawa (1969) has studied the effect of adding a gradient of the magnetic field. For magnetospheric conditions he hods that the drift velocity of the ions is added to the frequency of the spatially homogeneous problem, which gives an unstable oscillatory mode (overstability). To emphasise this point, Hasegawa calls it the " drift mirror instability " and has also presented some evidence suggesting that the instability might have occured at Z. = 5 during a magnetic storm in April 1965. Figure 2 shows the corresponding Explorer 26 measurements. The interpretation is that at point A the high anisotropy in the ion distribution function leads to a mirror instability which, due to particle drifts, gives rise to the subsequent oscillations.
Since the plasma pressure has to push away the magnetic field lines, the mirror instability occurs only forp = ffltT,/(flt/2u.o) & 1. The exact condition (low-frequency limit) is
81

EXPLORER 26
B MEASURED
9=87.5°
8=27.5° SS^S /PROT0NS>l34keV
330 300 _ 270 £ 240 | 210 2 ieo » 150
)0 6'30 7:00 730 8>00 UT APRIL 18,1965
Figure 2- Possible ocai'/ence of a minor Instability Wasegawa, 1969).
Figure 3.- Particle energy density In the magnetosphere during the nialn phase of a moderate geomagnetic storm {Frank, 1967).
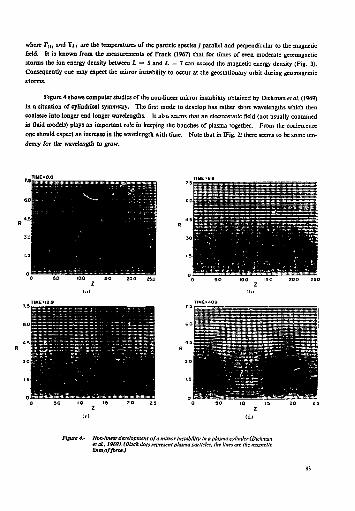
where I'm and T u axe the temperatures of the particle species y parallel and perpendicular to the magnetic field. It is known From the measurements of Frank (1967) that for times of even moderate geomagnetic storms the ion energy density between L => 5 and L = 7 can exceed the magnetic energy density (Fig. 3). Consequently one may expect the miiror instability to occur at the geostationary orbit during geomagnetic storms.
Figure 4 shows computer studies of the non-linear mirror instability obtained by Dickmaner at. (1969) in a situation of cylindrical symmetry. The first mode to develop has rather short wavelengths which then coalesce into longer and longer wavelengths. It also seems that an electrostatic field (not usually contained in Quid models) plays an important rc!e in keeping the bunches of plasma together. From the coalescence one should expect an increase in the wavelength with time. Note that in IFig. 2! there seems to be some tendency for the wavelength to grow.
0 50 100 ISO 20.0 250 - • i •
TIME'409
l ' "> <« l )
Figure 4.- Non-linear development of a mlrmr Instability In a plasma cylinder (Dlckman etoL. 1969). (Black dots represent plasma particles; the lines are the magnetic lines of force.)
33
4. THE INTERCHANGE MODE
The interchange (or " flute ") instability is present when there is a sufficiently sharp boundary such that
the higher pressure is on the concave side of the curved field lines.
A perturbation in the azimuthal direction will lead to centrifugal drifts with different directions for
ions and electrons, so that a space charge field is set up. The corresponding ——— drift is such that it enhances
the original perturbation. Clearly, the energy source is the kinetic energy of the particles.
The growth rates arc not easy to compute. The main difficulty lies in the fact that the space charge
electric field will, to a certain extent, be short-circuited through depolarization currents along the field lines
closing in the ionosphere. The ionospheric conductivity therefore plays an important role.
Chang et al. (1965) have developed a rather detailed theory and have applied it to the region between
3 Rz and S R& using the quiet-time radiation belt spectra. From their estimates the authors conclude that
the day-side ionospheric Pederson conduclivily is more than adequate to prevent the occurrence of inter
changes. However, the night-time lower ionospheric density could place the energetic component of the
belt close to marginal stability and the flute might play some part in limiting the energetic content of the belt.
Swift (1067) discusses the flute instability in a somewhat différent context. Following the idea of Akasofu and Chapman (1963) dial the auroral break-up is related to an enhancement of the ring current. Swift suggests that the ring current plasma has a sufficiently sharp boundary to drive the flute instability. For a density law n ~ /—», 3.2 keV protons and a ring current boundary at 6 A& Swift finds the growth rates given in Fig. 5. He concludes that it is plausible that there is a connection between auroral break-up and the ring current belt.
Some û'fficulties arise with models for auroral précipitation if they invoke instabilities which merely release the kinetic energy of trapped particles (see Hultqvist, 1969). Much more work seems to be necessary, however, before a final answer can be given. If the instability exists, L = 6.6 is a good location to search for it. Clearly, the mode discussed here would perturb the electric field whereas the magnetic field remains unaffected.
It is quite possible that electromagnetic flute instabilities ore also important, but I have not been able to trace any discussion of them in the literature. A rough estimate is, however, available from Bernstein et al. (1958). For cyclindrical symmetry it is sufficient for instability that
|Ap[s> - ^
on a flux surface which is concave to the region of higher pressure, R being the radius of curvature of the
fieldlineandSthedUlanceoverwhichcurvaturehasthesaraesign. Forfî « 1 onecan estimateforinstability S1
where S is the length over which the pressure changes.
It seems that this criterion might be satisfied during magnetic storms when large gradients of the high-energy proton population develop.

THE CIOCENTfltC DISTANCE.
The curves labeled E s O were calculated with the assumption that the iono<phcrc has zero conductivity. The curve calculated with— *••• I assumed th3t the ionosphere has a conductivity of I mho. The ring current boundary was assumed to be at about 6 Earth radii. The average
particle energy assumed was 3-2 kcV.
FigurtS.- Growth rate for ike electrostatic interchange Instability i'Swift, 1967}.
5. TEARING INSTABILITY
While the predominant variations of the flute instability are in ihe plane perpendicular to the magnetic field, the tearing instability has in some sense the opposite geometry, as it is constant along the dim.:ion of the equilibrium current. In those parts of the magnetosphere with approximate rotational symmetry .his means that there is no variation in the azimuthal direction. Since the instability has to bend the field i.nes it will only occur in situations in some regions where p £ 1.
The tearing instability typically changes the magnetic topology in a spontaneous way (note that this process differs qualitatively from steady state merging). As discussed below, the tearing instability can have large-scale cfleclsTor it depends both on the boundary conditions and on the properties of the current distribution. In order to change, the field line topology one has to violate the infinite conductivity lawf + Vy. 8=0.
85
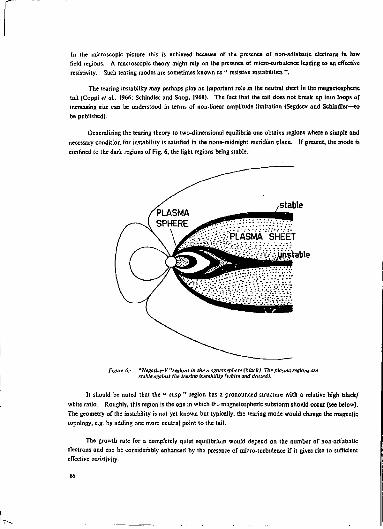
In the microscopic picture this is achieved because of the presence of non-adiabatic electrons in low field regions. A macroscopic theory might rely on the presence of micro-turbulence leading to an effective resistivity. Such tearing modes are sometimes known as " resistive instabilities ".
The tearing instability may perhaps play an important role in the neutral sheet in the magnetospheric tail (Coppi et al., 1966: Schindlcr and Soop, 1968). The fact that the tail does not break up into loops of increasing sue can be understood in terms of non-linear amplitude limitation (Segdeev and Schindlcr—to be published).
Generalising the tearing theory to two-dimensional equilibria one obtains regions where a simple and necessary condition for instability is satisfied in the noon-midnight meridian plane. If present, the mode is confined to ihc dark répons of Fig. 6, the light regions being stable.
Figure a,- "Negative-V "regions in the n.agnetaiphere (black) The plasma regions are stable against lite tearing instability (white and dotted).
It should be noted that the " cusp " region has a pronounced structure with a relative high black/ white ratio. Roughly, this region is the one in which t>- magnetospheric substorm should occur (see below). The geometry of the instability is not yet known but typically, the tearing mode would change the magnetic topology, e.g. by adding one more neutral point to the tail.
The growth rate for a compîetely quist equilibrium would depend on the number of non-adiabattc electrons and can be vonsiderably enhanced by the presence of micro-turbulence if it gives rise to sufficient effective resistivity.
85

An interesting aspect of the cusp region is its considerable field line curvature and the dimension of the region over which the current flows may become of the ord;r of the radius of curvature. This leads to appreciable enhancement of the free energy available to drive the instability, a result which has led to the recent suggestion that there might be a relation between the magnetospheric substorm and the two-dimensional tearing instability (Schindlcr - in press)- The instability would provide rather large electric fields and panicle acceleration.
From the Vela satellite results correlated with ground observations Hones et al. (1968) conclude that the origin of the acceleration of > 45 keV electrons occurring during a magnetospheric substorm must lie closer in than the Vela orbit, i.e. 17 RE. Probably the flux tubes involved touch the Eanh between 55" and 70B magnetic latitude, thereby indicating that geoitationary satellites could be used to observe these phenomena. In fact, as Fig. 7 clearly shows, drastic changes in the electron flux and in the horiaontal component of the magnetic field were measured at the ATS satellite during a substorm (Parks, 1969).
The published experimental data relating to magnetospheric substorms have not led to an identification of the underlying physical process and it seems that more observations and more combined studies of data from different sources are necessary.
150' WMT
UNIVERSAL TIME

6. DISCUSSION
It seems that measurements carried out at geostationary satellites are well-suited Tor shedding light on unstable wave-partide interactions of the macroscopic type. One might therefore ask what measurements are necessary to identify these phent
A necessary requirement is data on the firs I Ihree moments of the distribution functions, as well as the electromagnetic field, at as many different locations as possible. We therefore need the particle spectra data i.-> those energy regions whose contribution to the number density, average velocity and pressure tensor components is not negligible.
At the geostationary orbit the actual particle spectra are very complicated (e.g. Vasyliunas, 1968; Frank, 1967), a few of the salient features being
— the low-energy electron population has a peak energy below ZOO eV, — there are sharp variations in the electron duxes (e.g. I keV s £" s 10 keV) probably related to
changes in the trapping properties across L shells, — the inner edge of the plasma sheet sometimes croises L = 6.6, leading to typical plasma sheet
spectra (Fig. S), — during the main phase of geomagnetic storms a large amount of energy content is in the protons
between 200 eV and SO keV (Fig. 3).
'Low Energy "Ob sert 01 ions- ,
Figure 8- Typical electron spectrum in the outer magnetojphcrc and in the tail (Vasyliunas, 19691

It seems that these phenomena cover the energy range between, say, 10 eV and several lens of keV.
There has been some progress in the space-time resolution problem by the combining of results of more than one satellite with ground observations, ideally, however, much smaller distance separation is needed, as least For some of the total observation time.
Bernstein, I.B. Friedman, E.A-Kruskal, M.D. Kulsrud, R.M.
Chang, D.B. Pearlstein, L.D. Rosenbluth, M.N.
Coleman, P.J., Jr.
Coppi, B. Laval, G. Pellat, R.
Dickman, D.O. Morse, R.L. Nielson, CW.
REFERENCES
/. Ceophys. Res.. 68, p. 3155 (1968).
Proc. R. Soc. A 244, p. 17 (1958).
J. Geophys. Res.. 70, p. 3085 (1965).
Magnetic Field Pulsations at ATS I, Ami. Ceophys.. 26, p. 719 (1970).
Phys. Rev. Leu., 16, p. 1207 (1966).
Phys. Fluids 12, p. 1708 (1969).
in Physics of the Magnetosphere (R.L. Carovillano, J.F. McCIay, H.R. Radoski, eds.), p. 218, D. Reidel Publ. Co., Dordrecht-Holland, 1968.
Frank, L.A.
Furth, H.P.
Green, T.S.
Hasegawa, A.
J. Geophys. Res.. 72, p. 3753 (1967).
Nuclear Fusion Supplement, Part I, p. 169 (1962).
Oscillations of the Magnetosheath, ESRO SN-80 (1967).
Drift Mirror Instability in the Magnetosphere, Phys. Fluids, 12, p. 2642 (1969).

Hones, E.W. Jr. Singer, S. Rao, C.S.R.
Hultqvist. B.
McKenzie.J.F.
Parks. G.K.
Roedercr, J.G.
Schindler, K. Soop, M.
Smit, G.R.
Southwaod, D.J.
Swift, D.W.
Vasyliunas, V.M.
J. Geophys. Rex., p. 7339 (1968).
Auroras and Polar Substorms, Rev. Ceophys.. 7, p. 129 (1969).
Planet. Space Set.. 18, p. ! (1970).
Centre d'Études Spatiale des Rayonnements, Toulouse, Rapport CESR 69-172 (1969) (see also /. Ceophys. Res.. 72, p. 5787(1968).
Rev. Geophys.. 7, p. 77 (1969).
Phy.r. Fluids, 11, p. 1192 (1968).
J. Geophys. Res., 73, p. 4990 (1968).
Planet. Space Sci.. 16, p. 537 (1968).-
Planet. Space Sci., 15, p. 1225 (1967).
J. Geophys. Res., 73, p. 2839 (1968). Centre for Space Rcs> arch, MIT Report C3R-P-69-17 (1969) and in Polar Ionosphere ami Magnetospheric Processes. (G. Skovli, éd.), Gordon and Breach, New York (in press).

COMPLEX ELECTRIC FIELD EMISSIONS
OBSERVED BY CGO-S ON 15 AUGUST 1958
CF. Kennel*, F.L. Scarf, F.V. Coronii:*, R.W. Fredricks and J.H. McGehee, Jr.
Space Sciences Laboratory, TRW Systems Group, One Space Park. Ret'ondo Beach, California 90278
ABSTRACT
This paper presents OGO-5 results from the first broad-band electric field experiment to operate successfully beyondlhe piasmapause, which indicate that processes similar to those encountered in the laboratory may also operate in the magnetospkere. The wave e>ectrlc and magnetic field data from a complex event observed en 15 August I96H, in which various types of electric fietd emissions above the electron cyclotron frequency, as well as electromagnetic chorus activity, occurred near the geomagnetic equator on auroral lines of force near local midnight, are discussed. This event was unusually complex but each wove type had been abstrv.d before. Petalls of the plasma wave detector and the de and wave magnetic field diagnostics are also given.
I. INTRODUCTION
Our understanding of the microscopic plasma turbulence processes controlling the acceleration and loss of Van Allen and auroral particles has up to now been limited by the almost exclusive experimental concentration upon measuring wave magnetic fields in space- As a consequence, the theories of particle loss to the ionosphere have atso been formulated in terms of wave-particle interactions with electromagnetic waves such as whistlers and ion cyclotron waves (Kennel and Petschck,; Cornwall, 1966 1 - ! . However, in laboratory -nirror devices, electrostatic instabilities and turbulence control the particle acceleration and loss. In this paper, we près' t OGO-5 results from the first broad-band electric field experiment to operate successfully beyond the piasmapause. The observations indicate that processes similar to those encountered in the laboratory may also operate in the magnetosphcre.
We will discuss wave electric and magnetic field data from a complex event observed on 15 August 1968, in which various types of electric field emissions above the elec. -on cyclotron frequency, as well as electromagnetic chorus activity, occurred near the geomagnetic equator on auroral lines of force near local midnight. This event is unusual only for its complexity: each type of wave observed on that date has been observed separately on other occasions.
* Permanent address.* Department of Physics, University of California, Los Angeles. California 90024
91
2. DIAGNOSTICS
2.1 Introduction
OGO-5 was launched on *) March 1968 into an elliptical orbit with an initial perigee altitude or 291 km, apogee altitude of 147 000 km (23 Earth radii) and orbital period of 62 hours, 26 minutes. The local time at first apogee was near 10 o'clock, with inclination of 31 *. Power was supplied to the TRW plasma wave detector at 0840 UT on 5 March and the experiment has operated continuously since then. At 1625 UT on 9 March the boom carrying the plasma wave sensors was successfully deployed. In this section, we describe briefly the operation of the plasma wave detector, and mention several other experiments that provide diagnostics essential for our study.
2.2 Plasma Wave Detector
The design and operation of the plasma wave detector has been described by Crook et a/A In addition, several inflight calibrations of the detector at low (0.56 kHz) frequencies have recently been carried out by Scarf « al.*. These indicate that measured electric fi:ld amplitudes are accurate to within a factor of two beyond the plasmapause. We shall, therefore, limit ourselves to a discussion of the nature and sequence of plasma wave data available for analysis.
The plasma wave detector includes five electric dipole and three magnetic loop (search coil) sensors mounted on a 22-foot boom. Three short electric dipole sensors are mounted orthogonally so that all three electric field vector components can be measured in time sequence. Their output is fed into narrow-band (IS per cent, filters with centre frequencies at 0.S6, 1.3, 3.0, 7.35, 14.5, 30.0, and 70.0 kHz. The circuits have 30 ms rise times and 300 ms dec-jy times. In a given frequency band, each exertional component is sampled sequentially for 9.2 seconds; after the 27.6-sccond, three-axis scan, the centre frequency is advanced to the next channel and the axis scan repeated. A complete axis and frequency scan sequence requires 3.26 minutes. The remaining two boom-mounted dipoles are co-linear. Their outputs are monitored through a 200 Hz. centre frequency filter for about 2 seconds of every 9.2 seconds. Because this paper is concerned with high-frequency waves, data from the co-linear dipoles have not been used. The three main electric dipoles do not operate as resistivcly coupled Langmuir probes, but rather they are capacitiYcty coupled to the plasma, since the dipoles'(0.5 m) are shorter thau the Debye tength and the current-collecting area is small. The dipoles measure potential gradients induced across them by ambient electric fields. The three electrostatically shielded magnetic loops are boom-mounted orthogonal to the main dipoles, and are sequentially sampled by axis and by frequency through 0.56 and 70 kHz 15 per cent filters.
In addition to the above narrow-band digital information, the broad-band electric field waveform on one axis of the orthogonal boom-mounted triad is passed through a filter which is Hat between I and 22 kHz; the output is then continuously monitored by a separate special purpose (analog) telemetry sysum, permitting reconstruction of the power spectrum for this one axis. Intense emissions both below I kHz and above 22 kHz can also be detected by this system. These waveform signals are compressed by a unilcvel amplifier and the Automatic Gain Control (AGC) voltage is also telemetered to Earth as one component of the experiment internal subcommutator. The waveform signals (uncorrected lor AGC voltage) are fed into a UA-6 ubiquitous spectrum analyser, and finally, dynamic spectra (frequency-time diagrams) arc recorded on photographic film.
92

The/-r diagrams do not give highly accurate information on the variations in wave amplitude above the effective threshold of the analog system (to be discussed shortly) because film has non-linear response and small dynamic range. However, individual oscilloscope traces of relative electric field amplitude versus frequency, using the analog data, can also be compiled in times as short as about 6 ms.
The sensitivity (in the absence of ambient plasma noise) of the analog system is set by spacecraft interference or by the output of the Goddard Space Flight Center rubidium vapour magnetometer, which shares the analog telemetry system with the plasma wave detector output. Though common mode rejection and boom mounting of the dipoles strongly reduces interference it is not entirely absent. Visual inspection of the dynamic spectra nearly always permits identification of interference; the most prevalent lines arc at 2.641 kHz (and its integral harmonics), due to the spacecraft converter. In addition to interference lines, the GSFC Rb-magnetometer generally puts out an intense line at one-quarter the local electron cyclotron frequency,/c/4, which is mixed with the plasma wave detector output. Non-linearities produce strong odd harmonics (3/c/4,5Jcf4,...) and much weaker even harmonics (fc/2,/c. jfc/2,...) of the basic/c/4 lines. Orien only the odd harmonics offc/4 appear in the dynamic spectra. Of course, the Rb-magnetometer lines never appear in the digital electric field signals.
Wc can empirically estimate the effective sensitivity of the analog system by finding the digital amplitudes when the analog f-t diagrams indicate an emission lying near one of the digital pass bands. The effective threshold sensitivity varies between about 0.1 and 1.0 raV/m, depending upon spacecraft conditions. This variable threshold implies that analog data alone are unsuitable for properly normalised statistical studies of the occurrence of various types of emissions. Weak natural emissions, which must compete with strong emissions as well as with interference and the Rb-magnetometer signals, are not likely to be found in the analog data.
Natural electric field emissions are typically narrow-band. Their centre frequencies only fortuitously fall at the right sequence in the central pass bands of our digital channels. While the digital channels have been calibrated over a wide range of frequencies, our initial digital data reduction programmes have assumed for simplicity that the waves are at the centre frequency of a given digital pass band. For this reason, calibrated digital amplitudes have so far been examined only when the analog data indicate that a narrow-band emission lies near the 15 per cent pass band of one of the digital channels. Therefore, the digital amplitudes are a lower limit to the actual amplitude for a narrow-band emission. Because the natural emissions are narrow-band, and since, moreover, the digital words contain much less information than the analog data, the analog results dominate our discussion.
2.3 DC Magnetic Field Diagnostics
The local dc ̂ magnetic field magnitude, and consequently the local electron cyclotron frequency, has been obtained by one or both of two methods. The GSFC Rb-magnetometer lines serve as convenient markers at intervals at/c/4 oifcfl on t h e / / diagrams, from which the relation of the ambient wave frequency Xofc can be obtained visually. The Rb-magnetometer signal never penetrates the plasma, so that ambient emissions at frequencies near one of its lines cannot be triggered by the magnetometer. Each type of electric field emission has been observed both with and without the appearance of the Rb-Iines. When the Rb-lines do not appear, for one of several reasons, we can consult the digital output of the UCLA triaxial iluxgate magnetometer to find the local electron cyclotron frequency.
93

2.4 Wave Magnetic Field Diagnostics
The TRW narrow-band magnetic channels at 0.56 and 70 kHz are not useful for determining the magnetic amplitudes of those emissions wi th /e : 1-22 kHz. Of somewhat greater usefulness in this regard is the JPL/UCLA triaxial search coil magnetometer, which measures the broad-band Û-1.5 kHz magnetic field waveform. On several occasions the search coil analog measurements have been reduced using the same \JA-6 analyser and format as for the electric field data. By this means, both the electric and magnetic components of magnetospheric whistler noise, with/ < fc, have been simultaneously delected (Brody er a/.B). When we wish to examine ihe magnetic components of higher frequency emissions (f >/c) this technique is ussful only at large distances from the Earth, where fc S 1.5 kHz.
3. COMPLEX EVENT OF IS AUGUST 1968
Figure I shows the location of OGO-5 duiing the event under consideration; the data wc show were
obtained between 0730 and 0800 UT, when OGO-5 was inbound near the geomagnetic equator between
6.5 î L i 8, with local time somewhat past midnight.
Q60D 0630 0700 0730
UNIVERSAL TIME
0050 0100 0110 0120 0130 LOCAL TIME
Figure I.- OGO-5 equator crossing, 15 August 1968 K=4.

OGO - 5 EQUATORIAL El£CTRIC FIELD MISSIONS. AUGUST 15. 1968
i 1 1 i 1 i r 0727KX) 072tfl0 0728:30
TIME(UT)
Figure Z- OOO-S equatorial electric field emissions, 15 August 1968.
Figure 2 gives three simultaneous/-/ diagrams, beginning near 0727 UT, with different bandwidth ranges: O>10,0-5, and 0-2.5 kHz. The Rb-magnetometer output is identifiable as a lattice of narrow, almost horizontal, lines in each/-/ diagram; several cf these have been labelled at the right of Fig. 2. The 2.46 kHz spacecraft converter line is also identified here. Note that the local magnetic field varied with time, since the Rb-magnetometer lines changed frequency with time.
The most prominent feature of the 0-10 kHz spectrogram is the triplet of narrow-band emission lines between 7 and 9 kHz. The elements in the triplet are separated in frequency approximately by the electron cyclotron frequency. This is one characteristic type of emission observed on OGO-5. The noise bands appear well above the cyclotron frequency and they often, but not always, occur in doublets or triplets separated by fe.
Less prominent in the 0-10 kHz spectrogram arc emissions at 3/c/2, 5/c/2, and 7/c/2, which appear more clearly in the 0-5 kHz spectrogram. The structure of the emission near 3 fc/2 may be examined in more detail in the 0-2.5 kHz spectrogram at the foot of Fig. 2. These emissions represent a second common class observed on OGO-5, namely, those with frequencies in-between cyclotron harmonics. Generally, the noise bands are detected with/near, but not precisely equal to, odd half harmonics of/c (3_/t,'2.5/c/2, etc.)
95
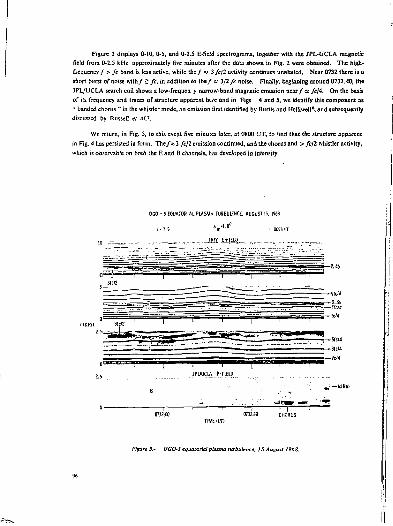
Figure 3 displays (MO, 0-5, and 0-2.5 E-field spectrograms, together with the JPL-UCLA magnetic field from 0-2.5 kHz approximately five minutes after the data shown in Fig. 2 were obtained. The high-frequency/ > fc band is less active, while t h e / « 3/e/2 activity continues unabated. Near 0732 there is a short burst of noise withfZfc, in addition to t h e / a 3/2 fc noise. Finally, beginning around 0732:40, the JPL/UCLA search coil shows a Iow-Frcquen y narrow-band magnetic emission n e a r / = yîr/4. On the basis of its frequency and traces of structure apparent hu'e and in Figs 4 and 5, we identify this component as " banded chorus " in the whistler mode, an emission first identified by Burtis and Hclliwcll8, and subsequently discussed by Russell el af.7.
We return, in Fig. 5, to this event five minutes later, at 0800 UT, to find that the structure apparent in Fig. 4 has persisted in form. The fx 3 fcjl emission continued, and the chorus and > fcjl whistler activity, which is observable on both the E and B channels, has developed in intensity.
OCO - 5 EQUATORIAL PLASM* TUHBUUNCE, AUGUST 15. 1968
L-T.S V - 8 • 0053'
TRW E-FIELD
U l l I JPLAJCW B-flELD
Figure 3.- OGO-5 equatorial plasma turbulence, IS August 1968.
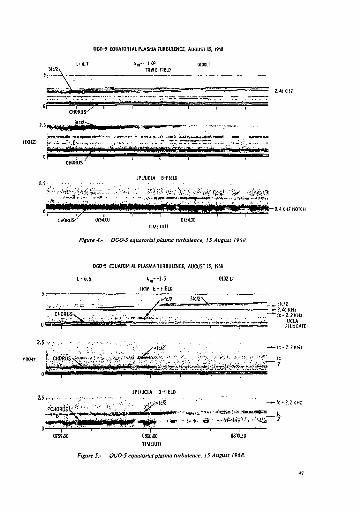
OGO-5 EQUATORIAL PLASMA TURBULENCE. AUGUST 15. I9M
* m - 1-0* 0100LI
CHORUS-'
KKH2) i - ,~ i « : • . £ ' - , - ,
r • •. i • !jtfn j -i ^ |i i 11 ii v - iiifir r i> itiwwfrvny . v . . * • r.i ,»»> n* i},f •!. ' -»—>«*
CHORUS
JPL/UCLA B-FIELD . 5 - • , - " • - - . .
CKORU 0754:00 075430
TIMEIUT)
Figure 4.~ OGO-5 equatorial plasma turbulence. 15 August 1968.
OGO-5 EQUATORIAL PLASMA TURBULENCE. AUGUST 15. 1968
L-6 .6 " " n " - 1 - 5 0 l K L T
2 . 5 . - • . - - . - • . • ; - • • . . • - - • - . . • • .
MKHZJ £ C H O R U S ^ 7 7 , ^ K * - , ^ .y.-'.--- ; . " " V f *"•'" --.-•-••'': :r<;'_^<s
of j " I • WÊÊt^^^^àÊ^^^^m^mi* ii-ii iiiiinaiiii
JPL/UCLA B-FIELD
;>fc/2 —- f c - Ï . ÏKHz
K l ' . i l l |'| i i W i M l i n » r i f f " « i ' ' m » . j > - ' * ' - - * t g ) a ; - a n « « » » w _ | c
, _ - - , , • • - , : ^ - ^ . . , !
0300:00 0800:30
TIMEIUT)
FigureS.- OGO-5 equatorial plasma turbulence. 15 August 1968.
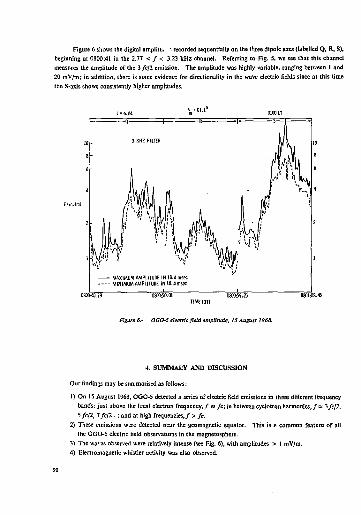
Figure 6 shows the digital omplitu, ; recorded sequentially on the three dipole axes (labelled Q, R, S), beginning at 0800:41 in the 2.77 < / < 3.23 kHz channel. Referring to Fig. 5, we see that this channel measures the amplitude of the 3/c/2 emission. The amplitude was highly variable, ranging between 1 and 20 raV/m; in addition, there is some evidence for directionality in the wave electric fields since at this time the S-axis shows consistently higher amplitudes.
Figure 6.- OGO-5 electric field amplitude. 15 August 1968.
4. SUMMARY AND DISCUSSION
Our findings may be summarised as follows:
1) On 13 August 1968, OGO-5 detected a series of electric field emissions in three different frequency bands: just above the local electron frequency,/ & fc; in between cyclotron harmonics,/ss 3/e/2, 5/c/2, 7/c/2...; and at high frequencies,/ > fc.
2) These emissions w;re detected near the geomagnetic equator. This is s common feature of all the OGO-5 electric field observations in the magnetosphere.
3) The wa'-:s observed were relatively intense (see Fig. 6), with amplitudes > I mV/m. 4) Electromagnetic whistler activity was also observed.
Geostationary satellites provide ideal platforms for the continuous study of those electric fie] J ei which, because they are localised near the geomagnetic equator, OGO-5 only encountered on that small portion of each orbit when it crossed the geomagnetic equator. The large amplitudes of the emissions suggest that they play an important role in the acceleration and loss of electrons on auroral lines of force.
ACKNOWLEDGEMENTS
We are pleased to thank J.P. Heppner and the GSFC Rb-magnetometcr Group for permission to display their measurements; CT. Russell and P j . Coleman, Jr. of UCLA for the use of fluxgatc magnetometer drta; and C.T. Russell, R.E. Holzer, and EJ. Smith for permission to display search coil magnetometer data. Our experimental task has been made lighter by their help and cooperation. Thi work was supported by NASA under Contracts NGR 05-007-190 and NAS 5-9278.
REFERENCES
/ . Geophys. Res., 71, p. 1 (1966).
2. Cornwafl.J.M.
3. Crook, G.M. Scarf, F.L. Fredricks, R.W. Green. I.M. Lukas. P.
4. Scarf, F.L. Kennel, CF. Fredricks, R.W. Green. I.M. Crook, G.M.
5. Brody, K.I. Russell, C.T. Holzer, R.E. Kennel, C F . Fredrtcks, R.VV. Scarf, F.L.
6. Burtis,W.J. HelKweH, R.A.
Olson, J.V. Holzer, R.E. Smith, E.J.
J. Geophys. Res.. 71, p. 2185 (1966).
IEE Trans. Geoscience Electronics, GE-7, p. 120 (1969).
in Particles and Fields in the Magnetosphere, <fl.M. McConnac, éd.), p. 275. D. Reidel Publ. Co., Dordrecht-Holland, 1970.
Am. Geophys. Un. Trans.. 50. (abstract) p. 291 (1969).
J. Geophys. Res.. 74, p. 3002 (1969).
An. Otophyj. V». T ' W , « (abstract) r.. 291 (1969).
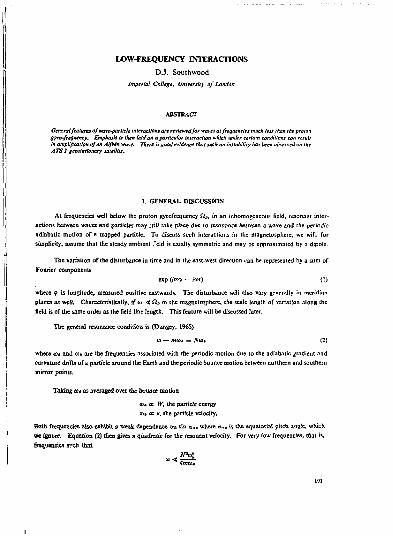
LOW-FREQUENCY INTERACTIONS
D.J. Southwood imperial College. University of London
ABSTRACT
Gérantfeatures ofwave-particte interactions are reviewed far waves at frequencies much lets than the proton gyro-frequency. Emphasis Is then laid on a particular interaction which under certain conditions can result in amplification ûf an Alfvin wave. There is goad evidence that such an instability has been observed on the ATS1 geostationary satellite.
J. GENERAL DISCUSSION
At frequencies well below the proton gyrofrequency (lp, in an inhomogeneous field, resonant interactions between waves and particles may still take place due to resonance between a wave and the periodic adiabatic motion of a trapped particle. To discuss such interactions in the magnetosphere. we will, for simplicity, assume that the steady ambient .'eld is axially symmetric and may be approximated by a dipolc.
The variation of the disturbance in time and in the east-west direction can be represented by a sum of Fourier components
exp (imp — /toi) (I)
where 9 is longitude, measured positive eastwards. The disturbance will also vary generally in meridian planes as well. Characteristically, if to < Cl9 m the magnetosphere, the scale length of variation along the field is of the same order as the Meld line length. This feature will be discussed later.
The general resonance condition is (Dungey, 1965)
o) — M I D I = /Vw» (2)
where 04 and u» are the frequencies associated with the periodic motion due to the adiabatic gradient and curvature drifts of a particle around the Earth and the periodic bounce motion between northern and southern mirror points.
Taking da as averaged over the bounce motion
(at <x W, the partiels energy co» Œ v, the particle velocity.
Both frequencies also exhibit a weak dependence on sin a,< where a . ( is the equatorial pitch angle, which
we ignore. Equation (2) then gives a quadratic for the resonant velocity. Far very low frequencies, that is,
frequencies a;<ch that
101
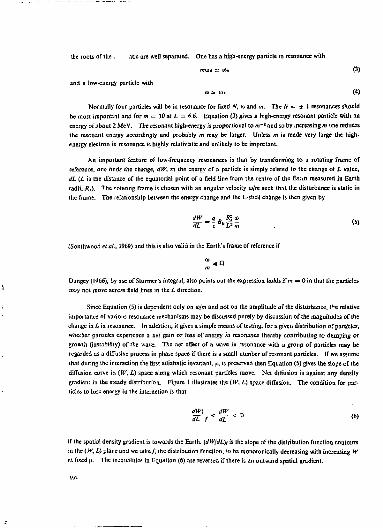
ihe roots of the i ,itic are well separated. One has a high-energy particle in resonance with
mojd s: to» (3)
and a low-energy particle with « » a» (4)
Normally four particles will be in resonance for fixed A', (a and m. The /V = ± 1 resonances should 6c most important and for m = 30 At L = 6.6. Equation (3) gives a high-energy resonant particle with an energy of about 2 MeV. The resonant high-energy is proportional to m - 1 and so by increasing m one reduces the resonant energy accordingly and probably m may be larger. Unless m is made very large the high-energy electron in resonance is highly relativistic and unlikely to be important.
An important feature of low-frequency resonances is that by transforming to a rotating frame of reference, one finds the change, dW, m the energy of a particle is simply related to the change oF L value, dL (L is the distance of the equatorial point of a field line from the centre of the Earth measured in Eanh radii, JÎ.). The -otating frame is chosen with an angular velocity v/m such that the disturbance is static in the frame. The relationship between the energy change and the L-sliell change is then given by
dW _ q D JP. a)
(Southwood et ai, J969) and this is also valid in the Earth's frame of reference if
Dungey (1966), by use of Stormer's integral, also points out the expression holds if m = Oin that the particles may not move across field lines in the L direction.
Since Equation (5) is dependent only on w/m and not on the amplitude of the disturbance, t'-e relative importance of various resonance mechanisms may be discussed purely by discussion of the magnitudes of the change in L in resonance. In addition, it gives a simple means of testing, for a given distribution of particles, whether particles experience a net gain or loss of energy in resonance thereby contributing tc damping or growth (instability) of the wave. The net effect of a wave in resonance with a group or particle.1; may be regarded as a diffusive process in phase space if there is a small number of resonant particles. If we assume that during ihe interaction the first adiabatic invariant, m is preserved then Equation (5) gives the slope of the diffusion curve in {W, L) space along which resonant particles move. Net diffusion is against any density gradient in the steady distribution. Figure 1 illustrates the (W. L) space diffusion. The condition for particles to lose energy in the interaction is that
dW\ dW -dr\f<dL<0 < 6 >
if the spatial density gradient is towards the Earth. (dWjdVit is the slope of the distribution function contours in the {W, L) plane and wc take/, the distribution function, '.<i bz monotonically decreasing with increasing W .it fixed u. The inequalities in Equation (6) are reversed if there is an outward spatial gradient.

w
V »
Resonant particle motion in (W,L> space, on the assumption that the fust Invariant b preserved. The diffusion curves C,, C4 are liable; C3. C3 contribute to Instability; / , and f3 are distribution function contours where f, > f3.
We can roughly estimate (dF//dL)r by assuming that the steady distribution is maintained adiabaticalty (Dungey, 1966) i.e.
dW\ SR'I dLh
Equations (7) and (5) substituted in (6) give
SL
1 > - - > 0
(7>
(8)
O r ; can deduce from Equations (3) and (4) that only the high-energy resonant proton satisfies Equation (S) and then only for westward travelling waves. The low-energy resonant particles would appear to be in a position to damp the waves.
The next stage is to discuss the resonant drifts in the L direction. Thtss are listed by Ducgcy (1965). If the east-west wavelength is much greater than the resonant particle's Larmorrados the two most important drifts are due to an cast-wKt electric field in the Disturbance, E„ and a transverse magnetic perturbation, b», in a mendias plane. The two drifts are
c£- M« m whtre B is the ambient field and V., is the parallel velocity of the particle 'along the field.
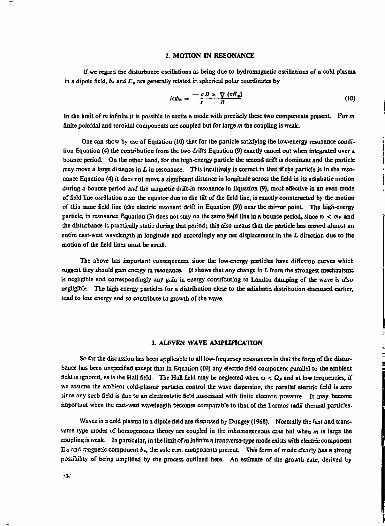
2, MOTION IN RESONANCE
[f we regard the disturbance oscillations as being due to hydro magnetic oscillations of a cold plasma in a dipole field, b. and £"„ are generally related in spherical polar coordinates by
to». _ - f ' *7 f rgJ < l 0 )
In the limit of m infinite it is possible to excite a mode with precisely these two components present For m
finite poloidal and toroidal components are coupled but for large m the coupling is weak.
One can show by use of Equation (10) that for the particle satisfying the low-energy resonance condition Equation (4) the contribution from the two drifts Equation (9) exactly cancel out when integrated over a bounce period. On the other hand, for the high-energy particle the second drift is dominant and the particle may move a large distance in L in resonance. This intuitively is correct in that if the particle is in the resonance Equation (4) it does not move a significant distance in longitude across the field in its adiabatic motion during a bounce period and the magnetic drift-in resonance in Equation (9), most effective in an even mode of field line oscillation osai the equator due to the tilt of the field line, is exactly counteracted by the motion of this same field line (the electric resonant drift in Equation (9)) near the mirror point The high-energy particle, in resonance Equation (31 does not stay on the same field line in a bounce period, since o> < to» and the disturbance is practically static during that period; this also means that the particle has moved almost an entire east-west wavelength in longitude and accordingly any net displacement.in the X, direction due to the motion of the field lines must be small.
The above has important consequences since the low-energy particles have diffusion curves which suggest they should gain energy in resonance. It shows that any change in L from the strongest mechanisms is negligible and correspondingly any gain in energy contributing to Landau damping of the wave is also negligible. The high-energy particles for a distribution close to the adiabatic. distribution discussed earlier, tend to lose energy and so contribute to growth of the wave.
3. ALFVEN WAVE AMPLIFICATION
So far the discussion has been applicable to all low-frequency resonances in that the form of the disturbance has been unspecified except that in Equation (10) any electric field component parallel to the ambient field is ignored, as is the Hall field. The Hall field may be neglected when m < Q„ and at low frequencies, if we assume the ambient toM-plasma particles control the wave dispersion, the parallel electric field is zero since any such field is due to an electrostatic field assodaied with finite electron pressure. It may become important when the east-west wavelength becomes comparable to that of the Larmor radii thermal particles.
Waves ia a cold plasma in a dipole field arc discussed by Duogey (1968). Normally the fast and transverse type modes of homogeneous theory are coupled in the inhamogeneaus ca« but when m is large the coupling is weak. In particular, in the limit of m infinite a transverse-type mode exists with electric component Eç and magnetic component b., ihe sole e.m. components present This form of mode clearly has a strong possibility of being amplified by the process outlined here. An estimate of the growth rate, derived by
J IK

equating the particle loss of energy in the resonant diffusion process to :he gain of energy of the wave, gives (Southwood et al., 1969)
Bft | res. particles
M = proton mass
/ = number density of resonant particles in phase space V = particle velocity B., = ambient Geld at the equator on the resonant field line A = AlfvÊn speed
}R, — scale of the spatial density gradient of the resonant protons assumed to be driving the instability.
f may be quite larg; and in addition various features of this mode and the amplification mechanism fit well with observations on the geostationary satellite ATS I (Cummings el a/., 1969). These are remarkably sinusoida] oscillations predominantly in the radial direction. Theory suggests that the group velocity in the east-west direction decreases as m increases and so the disturbance stays reasonably stationary in local time. Since the energy exchange takes place through the Vnb.{B drift the strongest effect (from the N — ± I resonances) requires that b. be an even function of latitude and so the excited field line oscillation is north-south anti-symmetric with a component b, at the equator. Since ATS 1 is at the equator the observed oscillations must be even harmonics of field oscillations. The particle instability outlined here fits naturally with the observations, whereas to get such sinusoidal anti-symmetric oscillations from a macroscopic fluid instability would be difficult
where
where

REFERENCES
Cummings, W.D. O'Sullivan, R.J. Coleman, F.J., Jr.
J. Geophys. Res,, 74, p. 778 (1969).
Dungey, J.W.
Dungey, J.W.
Space Sci. Rev., 4, p. 199 (1965).
in Radiation Trapped in the Earth's Magnetic Field (B, McConaaa éd.). p. 389, Reidel Dordrecht-Holland, 1966.
Dungey, J.W. in Physics of Geomagnetic Phenomena (S. Matsushita and W.H. Campfell, eds.), p. 913, Academic Press, 1968.
Southwood, D.J. Dungcy, J.W. Etherington, R J .
Pltmet. Space Sci., 17, p. 349 (1969).
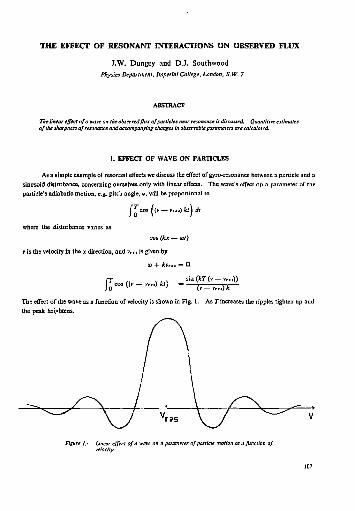
THE EFFECT OF RESONANT INTERACTIONS ON OBSERVED FLUX
J.W. Dungey and D.J. Southwood Physics Department, Imperial College. London, S.W. 7
ABSTRACT
The linear effect of a wave on the observed flux of particles near resonance is discussed, Quantitive estimates of the sharpness of resonance and accompanying changes in observable parameters are calculated.
1. EFFECT OF WAVE ON PARTICLES
Asa simple example of resonant effects we discuss the effect of gyro-resonance between a particle and a sinusoid disturbance, concerning ourselves only with linear effects. The wave's effect on a parameter of the particle's adiabatic motion, e.g. pitch angle, a, will be proportional to
JJ"COS((V-P„ .)*')*
where the disturbance varies as
cos (kx — at)
v is the velocity in the x direction, and v,«, is given by
at + kv„. = Q
j o c o s ( ( v - v r , . ) f t , , = — ( — — w -
The effect of the wave as a function of velocity is shown in Fig. 1. As T increases the ripples tighten up and the peak h=ipbtens.
Figure I.- Linear effect of a wave on a parameter of particle motion as a function of velocity.
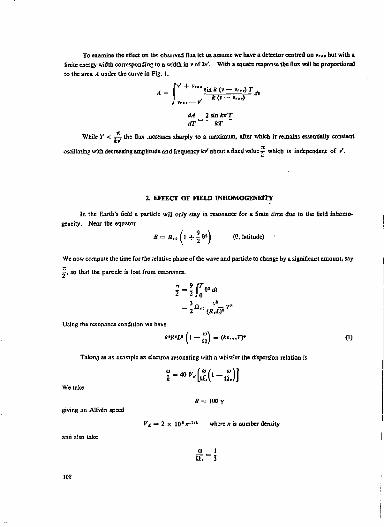
To eiamine the effect on tip; observed G u let us assume we have a detector centred on v „ , but with a finite energy width corresponding to a width in P of 2 / . With a square response the flux will be proportional to the area A under the curve in Fig. 1.
dA _ 2 sin taT dT~ kT
While r < ~ the flux .ncreases sharply to a maximum, after which ir remains essentially constant
oscillating with decreasing amplitude and frequency kv' about a fixed value -r. which is independent of S.
2. EFFECT OF HELD TNHOMOGENFJTY
In the Earth's field a particle will only stay ia resonance for a finite time due to tlte field mhomo»
geneity. Near the equator
B = Btt ( l -!-1 6»\ (6, latitude)
We now compute Lbs time for the relative phase of the wave and particle to change by a significant amount, say
'^, so that the particle is lost from resonance.
2 2 J 0
3 v a
2Li"{R.L)*J
Using the resonance condition we have
* " J P L " ( l - g ) =(kVr..Tr (1)
Taking as an example an electron resonating with a whistler the dispersion relation is
ï-«"<|£('-â)]
giving an Alfvén sp:ed ff= 100 r
Y A = 2 x 10 s rrlri where n is aumber density
J±- 1 Q. ~3

and so r = 4 x I0 1 irl" cm sec"'
Then v r „ = 8 x (0* n-"» cm sec"*
W,„ ->20n- 'kcV Q, = 2 x 11* red sec- 1
Using (I) we then have
and also
k = 1.7 x lO- ' f l 1 " rad cm- 1
« .X = 4 X 10» cm kRJb = 7 X 10 s / ! 1 ' 3
j fcr„ ,7-=300n 1 ' 3
Q r « 450 n1'»
This means the interaction time 7* is such that the resonance is quite sharp. The pitch angle change for particles strictly in resonance (Le. the height of the peak in Fig. 1) may also be simply estimated.
Set = 4.5 n"* b rad = 2 6 0 n " a A o
where the disturbance amplitude b is measured in gammas.
Correspondingly for protons in resonance with a bydromagnetic wave.
l . . . ~ P, = 2 x 10" rr1'
w,.. = 20 n~' keV = 3 rad s e c 1
k = 1.5 x 10-«/i kRJ. = 6 0 n 1 , a
kt—T - 13 n>" OT = 2 0 n 1 »
So resonance is far less sharp. Again the pitch angle change may be computed
8« = 0.2 nU> 6 rad = 11 «"i" 4"
3. LOWER FREQUENCY INTERACTIONS
For lov-frequency interactions the process may again be looked at in a similar way, although estimates are more inaccurate due to the departure of the adiabatic motion from pure sinusoid behaviour (Hamlin et al, 196I1
VT» = ALR, (1.30 — 0.56 sin a.,)
where xb is the bounce period. For strictly resonant high-energy particles the change in L in a bounce period is of the order
where ^ i s a mean field tilt seen by the particle, and the process is that already described by Southwood.
One may dearly get substantial changes in L even if the resonance is not very sharp.
REFERENCES
Hamlin, D.A. Karpltu, R. Vik, R.C. Watson, K.M.
/. Geophys. Res., 66, p. 1 (1961).
Southwood, D.J, See present volume.

THE PLASMAPAUSE J.O. Thomas
Physics Department, Imperial College Unfrershy of London
ABSTRACT
The main purpose o]this note is to summarise the facts about the plasmapaus* andits behavi ,<o-as tkey are known at the present time. As a preliminary step, the experimental techniques for in situ measurements of the plasmapause profile are assessed criticallyand some ofthe difficulties encountered in low-density, thermal-plasma diagnostics are outlined. Experiments based on electrostatic wave propagation seem to have some obvious advantages.
I. INTRODUCTION
In situ probes of one kind or another have been extensively used in recent years to study the sudden decrease in electron density which occurs at a geocentric distance of a few Earth radii and is known as the plasmapause (or Carpenter's knee). Basically, the results can be said to have confirmed the observations or Carpenter and bis co-workers ' relating to the location of the plasmapause in the equatorial plane as deduced from whistler observations. Satellite studies have confirmed its existence in other than the equatorial planes and have thus essentially established its world-wide nature.
Bauer'has recently reviewed in situ techniques for measurements of the thenru! plasma in the magne-tosphere. It is clear that there are severe difficulties associated with some of the techniques about which I shall not go into details but will mention some of the sources of error. Probably the best results w far are those of Sharp and his colleagues 3 , < in the Lockheed Group taken on the OGO-5 satellite, though they themselves also draw attention to possible sources of error in their data.
2. IN SITU TECHNIQUES
The methods that have been used in plasma density measurements include electron and ion (raps and retarding potential analysers. The latter use Langrauir theory, which normally only applies to situation where the Debye length, 1 D , is small in comparison with the probe dimensions. In the magnetosphcr lp is considerably greater than the typical probe dimensions used to (feite, being of the order of several mettes at a geostationary orbit. In addition, secondary emission may be important due either to photo emission or to energetic particles. In ion mass spectrometers it is possible for errors to arise from the acquisition by the satellites of (unknown) positive potentials. Bauer (ibid.) points out that ion mass spectrometers are more sensitive than ion traps and that the secondary emission problem is more severe for electron traps (or Langmuir probes) than the ion trap measurements. However, ion traps are much less sensitive than electron (raps.
It appears likely that techniques involving electrostatic waves offer distinct advantages JL the magnc-tosphere a in that plasmasheath effects can be eliminated, since the experiments fan bedesigned to be basically concerned with plasma wave propagation characteristics. Resonance effects over large volumes of the plasma and involving fundamentally a frequency measurement may also be used. There also seems to be scope for investigating experiments to test the feasibility of employing relative'/ large probes (compared with the Dcbye length) And also movable antenna components.
I l l
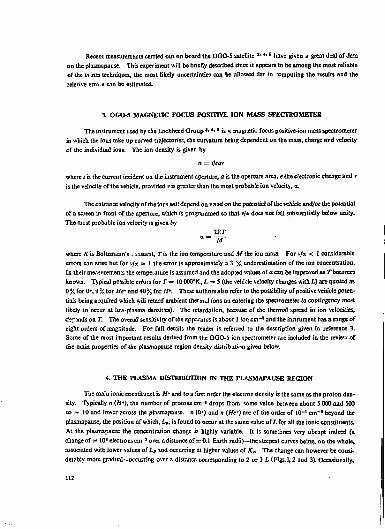
Recent measurements carried out on board the OGO-5 satellite a > * ' s have given a great deal of data on the plasmapause. This experiment will be briefly described since it appears to be among the most reliable of the in situ techniques, the most likely uncertainties can be allowed for in imputing the results and the relative erro.a can be estimated.
3. OGO-5 MAGNETIC FOCUS POSITIVE ION MASS SPECTROMETER
The instrument used by the Lockheed Group >> •• ' is i magnetic focus positive-ion mass spectrometer in which the ions take up curved trajectories, the curvature being dependent on the mass, charge ard velocity of the individual ions. The ion density is given by
n = iftav
where ( is the current incident on the instrument aperture, a is the aperture area, e the electronic change and v
is the velocity of the vehicle, provided v is greater than the most probable ion velocity, %,
The entrance velocity of the ions will depend on r and on the potential of the vehicle and/or the potential of a screen in front of the aperture, which is programmed so that V/K does not fall substantially below unity. The mast probable ion velocity is given by
1ÏLT a ~ M
where K is Boltzmann's . jiistant, T is the ion temperature and M the ion mass. For v/a < 1 considerable errors can arise but for v/a =; I the error is approximately a 3 % underestimation of the ion concentration. In their measurements the temperature is assumed and the adopted values of a can be improved as T becomes known. Typical possible errors for T = 10000°K,£,=: S(thevehiclc velocity changes with L) are quoted as 0% for 0*. 9% for He* and 40% for H*. These authors also refer to the possibility of positive vehicle potentials being acquired which will retard ambient therm J ions on entering the spectrometer (a contingency most likely to occur at low-plasma densities). The retardation, because of the thermal spread in ion velocities, dcr^nds on T. The overall sensitivity of the apparatus Is about I ton c m - 3 and the instrument has a range of eight orders of magnitude. For full details the reader is referred to the description given in reference 3. Some of the most important results derived from the OGO-5 ion spectrometer are included in the review of the main properties of the plasmapause region density distribution given below.
4. THE PLASMA DISTRIBUTION IN THE PLASMAPAUSE REGION
The main ionic constituent is H' and to a first order the electron density is the same as the proton density. Typically n (ff *), the number of protons cm- 5 drops from some value between about 5 000 and 500 to ~ 10 and lower across the plasmapause. H (0*) and n {He") are of the order or 10"1 c m - 8 beyond the plasmapause, the position of which, Lp, is found tc occur at the same value of L for all the tonic constituents. At the plasmapause the concentration change is highly variable. It is sometimes very abrupt indeed (a change of c* 10* electrons cm- 3 ovcradistanceof a: 0.1 Earth radii)—the steepest curves being, on the whole, associated with lower values of Ls 'ind occurring at higher values of Kp. .The change can however be considerably more gradual—occurring over a distance corresponding to 2 or 3 L (Figs.l, 2 and 3). Occasionally,
112

E Ko
.<r' L
LOCAL TIME
v>-X.
^ ^SST \
0/3 OUTBOUND 3/9/66
KT -T7
2 3 4 5 6 7 8 9 02.00 03:20 04.10 04:45 05:1Z 05:35 05:54 06:09
I0 a
I0 4
I ID3
< LU
u 8 to1
io-'
ri^
H*
*fc tf!»,»!! fegfcï,
' 0 /5 0UTB0UND-3/15/68
_L
^ ^ f ^
2 3 4 5 6 7 B 9
01:18 02:42 03.33 04.12 04:42 05:05 05:24 05:40
OGO V (HARRIS.SHARP and CHAPPELL(!«69))
Flrut: t.- 7he plastnapause In H* ion concentration on P and IS March 1968 from the OGO-S ion man spectrometer (after Harris el at.*}.

4/l2/SC-K|>< 1* 4/4/68-Kp = 2 4/22/68-K p=3 3/25/68-K P =4-5
0 0 0 V RESULTS (CHAPPEU. HARDIS and SHARP 1969)
Fliure 2.- The plasmapame In H* ton concentration based on groups of obsenallons from OGO~S In the range 00004400 LTal different leveli of magnetic activity 'after Choppell el aL* ).

PLASMAPAUSE POSITION (FROM CARPENTER (1966))
Figure J.- The diurnal variation of L (after Carpenter1 ) .
quite persistait " plateaux " occur in which the abrupt descent is interrupted by a constant value of ,V over a distance of about 0.5 RB. As stated above, an increase in K, causes a decrease in L, and then beyond the plasmapausc there is a greater variability in the electron density with on increase in scatter of the observations but N increases by a factor of about ten over quiet trough values. Harris ei a/.* also draw attention to the regular " wavclike " structure (Fig. I) around L = 6 to 7 (It frequently extends beyond this region (o smaller or larger L values). It appears at the same location as a wave structure observed in the magnetic held measurements made on OGO-5*. It has been observed to occur inside the ptasmasphere also when L, > - 6.
The diurual variation in L, has been given by Carpenter7 and is reproduced in Fig. 3. Some of the main features can be described as follows8:
1) There is t dusk "bulge" in which A» increases by 0-5 -2.5 Re within 15 - 20° longitude. 2) L9 decreases from quiet day values in the range 5-10 r% to lower values of 2 to 4 RB during the main
phase of a magnetic storm. 3) During quiet periods the dusk " bulge " moves slowly in the direction of the Earth's rotation and
during substonns, sunward " surges " of the " bulge " occur. 4) The results of Chappell el al.& based on a study of 20 passes in the W range 0000 - 0400 (after
allowing for LT effects misusing the data corresponding to Fig. 3) confirm that I, decreases with
US
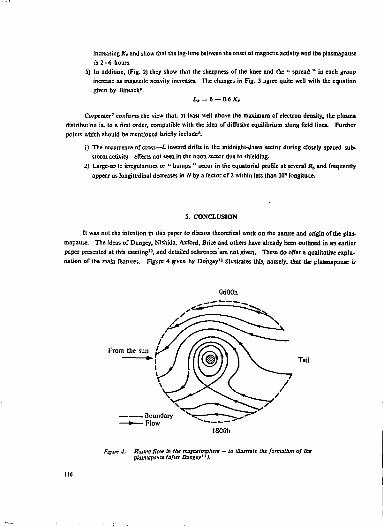
increasing A:P and show that the lag-time between the onset of magnetic activity and the plasmapause is 2-6 hours.
5) In addition, (Fig. 2) they show that the sharpness of the knee and the " spread " in each group increase as magnetic activity increases. The changes in Fig. 3 agree quite well with the equation given by Binsaclt».
L, = 6 — 0.6 K,
Carpenter' confirms the view that, at least well above the maximum of electron density, the plasma distribution is, to a first order, compatible with (he idea of diffusive equilibrium along field lines. Further points which should be mentioned briefly include8.
1) The occurrence of cross—L inward drifts in the midnight-d,iwn sector during closely spaced sub-storm activity—effects not seen in (he noon sector due to shielding.
2) Large-s» le irregularities or •* humps " occur in the equatorial profile at several Rt and frequently appear as longitudinal decreases in iV by a factor of 2 within less than 10* longitude.
5. CONCLUSION
It was not the intention in this paper to discuss theoretical work on the nature and origin of the plasmapause. The ideas of Dungey, Nishida, Axford, Brice and others have already been outlined in an earlier paper presented at this meeting10, and detailed references are not given. These do offer a qualitative explanation of the raain features. Figure 4 given by Dungey11 illustrates this, namely, that the plasmapause is
From the sun L
Boundary N ' — * — Flow
Figure 4. • Flastna flow In the imsnctoipkere - to Otustrate the fomatton of the plasmajmise (after Dungey ' ' /
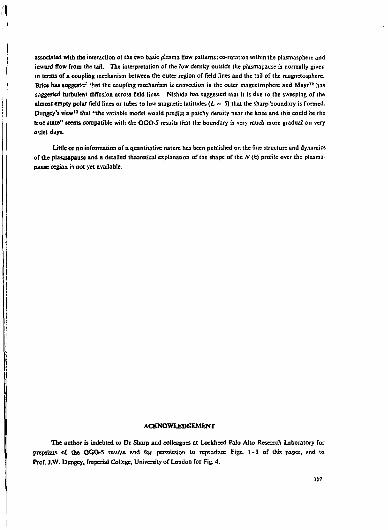
associated with the interaction of the two basic plasma How patterns: co-rotation within the plasmaspherc and inward flow from the uif. The interpretation of the low density outside the ptasmapause is normally given in terms of a coupling mechanism between the outer region of field lines and the tail of the magnetosphere. Brice has suggest'-/ Uiat the coupling mechantsm is convection in the outer magnetosphcre and Mayr 1 B has suggested turbulent diffusion across field lines. Nishida has suggested that it is due to the sweeping of the almost empty polar field lines or tubes to low magnetic latitudes (L <~ 5) that the sharp boundary is formed. Dungey's view11 that "the variable model would predict a patchy density near the knee and this could be the true state" seems compatible with the OCO-5 results (hat the boundary is very much more gradual on very o'jiet days.
Little or no information or a quantitative nature has been published on the fine structure and dynamics of the pLasmapaosc and a detailed theoretical explanation of the shape of the N (h) profile over the plasma-pause region is not yet available.
ACKNOWLEDGEMENT
The author is indebted to Dr Sharp and colleagues at Lockheed Palo Alto Research Laboratory for preprints of the OGO-5 results and for permission to reproduce Figs. 1-3 of this paper, and to Prof. J.W. Dungey, Imperial College, University of London for Fig. 4.
117

REFERENCES
1. Carpenter, D.L. Whistler Evidence of a " Knee " in th-, Magnetosphere Ionization Density Profile, J. Geophys. Res.. 68, p. 1675 (1963).
Invited Paper (Abstract), XVIth URSI General Assembly, Ottawa, 1969.
3. Harris, K.K. Sharp. G.W.
OGO- V Ion Spectrometer, lEETraa. Geosdence Electronics. GE-7, p. 93 (1969).
4. Harris, K.K. Sharp, G.W. Chappell, C.R.
Observations of the Plasmapause from OGO-5 (Lockheed Palo Alto Research Laboratory preprint 1969) J. Geophys. Res., 75, p. 219 (1970).
5. Chappell.C.R. Harris, K.K. Sharp, G.W.
A Study of the Influence of Magnetic Activity on the Location of the Plasmapause as Measured by OGO-5. J. C'eophys. Res., 75, p. 50 (1970).
6. Cole^^n, P.J.,Jr. Farrey, T.A.
Private communication to authors of ref. 5.
7. Carpenter, D.L Whistler Studies ofthePlamapause in the Magnetosphere, 1. Temporal Variations in (he Position of the Knee and some Evidence on Plasma Motions near the Knee, J. Geophys. Res.' 71, p. 693 (1966).
8. Carpenter, D.L.
9. Binsack,J.H.
Invited Paper (Abstract), XVith URSI General Assembly, Ottawa, 1969.
Plasmapause Observation with tne MIT Experiment on IMP-2, J. Geapkys. Res.. 72. p. 5231 {.Xtb'l}.
10. Axford, I.
11. Dungey.J.W.
See present volume.
The Theory of the Quiet Magnetosphere, in Solar Terrestrial Physics, (J.W. King and W.S. Newman, eds.) pp. 91-106, Academic Press, 1967.
The Plasmapause and its Relation to the Ion Composition in the Topside Ionosphere, preprint, 1969. NA5A-X-621^7-570.

MAGNETIC FT2LD VARIATIONS AT ATS I
Robert L. McPherron and Paul J. Coleman, Jr.
Department of Planetary and Space Science and Institute of Geophysics and Planetary Physics University of California, Los Angeles, California 90024
ABSTRACT
Magnetic field variations observed with the magnetometer on the ATS I satellite are briefly described. These variations are classified according to whether they are macroscopic field changes or fluctuations and also whether they occur during quiet, disturbed (substorms), or very disturbed (storms) limes. It is concluded that a complete understanding of these complex, interrelated phenomena still requires much detailed study.
I. INTRODUCTION
The purpose of this paper is to describe th-. magnetic field variations observed with the magnetometer on the ATS 1 satellite Iccawd in a geostationary equatorial orbit at a geographic longitude of 152.3°W. These variations have been divided into a number of distinct types covering a very broad range of time-scales from one second to one week. Before examining these variations we shall consider some of the advantages of the geostationary orbit.
The most important advantage for a magnetometer experiment is that the satellite is fixed in the Earth's main field. Consequently, the usual problem of separating effects of satellite motion through the main field from temporal variations is eliminated. Equally important is that successive orbits ore nearly duplicates of eacb other and this allows one to draw conclusions of a statistical nature about the phenomena encountered in each orbit. Furthermore, the orbit is coincideotally at a radial distance such that magnetic field lines intersecting the auroral zone pass through the equatorial plane near the geostationary orbit. Finally, the location of the satellite is very close ".o the intersection of the geographic and geomagnetic equators.
These advantages of a geostationary satellite invite a number of interesting scientific questions. Foremost among these is the nature and cause of the midnight auroral disturbances that apparently originate in the equatorial plane near the geostationary orbit. Similarly, it appears that the plasmapause and the inner edge of the ring current are located at this distance during quiet times. During very disturbed times the niagne-topause on the dayside occasionally crosses the orbit, while on the mghtside the inner edge of the plasma sheet and tail current may also cross. Finally, we should note that ground observations of magnetic micro-pulsations show the largest amplitude and greatest variety in the auroral zone. If the origin of these is magnetospherio, as seems likely, then it appears that many micropulsation sources must also be located near the geostationary orbit.
These questions fall into two broad categories: the first is macroscopic field variations, presumably arising in large-scale carrent systems; the second is magnetic fieldfiuciuaiioas or waves, probably generated, by plasma instabilities. These two categories help form a convenient outline for presenting our experimental observations. To complete the outline, we note that distinctly durèrent phenomena occur during quiet, moderately disturbed (magnetospheric substorms) and very disturbed (magnetic storms) times.
119
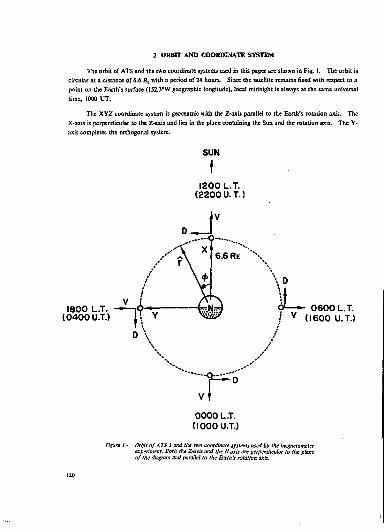
2. ORBIT AND COORDINATE SYSTEM
The orbit of ATS and the two coordinate systems used in this paper are shown in Fig. 1. The orbit is circular at a distance of 6.6 RE with a period of 24 hours. Si ace the satellite remains fixed with respect to a point on the Earth's surface (152.3°W geographic longilude), local midnight is always at the same universal time, 1000 UT.
The XYZ coordinate system is geocentric with the Z-axis parallel to the Earth's rotation axis. The X-axis is perpendicular to the Z-axis and lies in the plane containing the Sun and the rotation axis. The Y-axis completes the orthogonal system.
SUN
• 1200 L.T.
(2200 U.T.)
6.6 RE
1800 L (0400 U.T.) H
\ D
0 6 0 0 L.T. / V (1600 U.T.)
D \
0000 L.T. (1000 U.T.)
figure J.- Orbit of ATS 1 and the two coordinate systems used by the magnetometer experiment. Both the Z-axis and the H~axls are perpendicular to the plane of the diagram and parallel to ihe Earth's rotation axis.
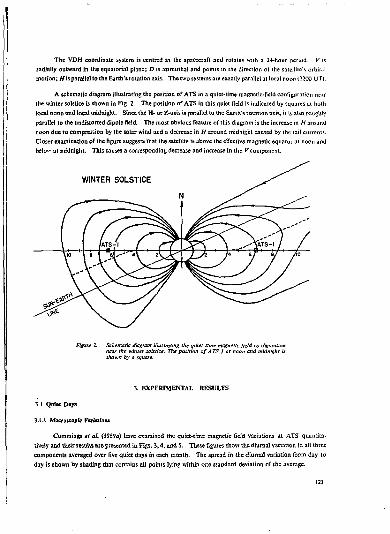
The VDH coordinate system is centred in the spacecraft and rouies with a 34-hour period. V is radially outward in the equatorial plane; D is azimuths! and points in the direction of the satellite's orbiml motion; Wis parallel to the Earth's rotation axis. The two systems are exactly parallel al local noon (2200 UT).
A schematic diagram illustrating the position of ATS in a quiet-lime magnetic-field configuration near the winter solstice is shown in Fig. 2. The position of ATS in this quiet field is indicated by squares m both local noon and local midnight. Since the H- or Z-axis is parallel to the Earth's rotation axis, it is also roughly parallel to the undrstorted di pole field. The most obvious feature of this diagram is the increase in //around noon due to compression by the solar wind and a decrease in H around midnight caused by the tail currents. Closer examination of the figure suggests that the satellite is above the effective magnetic equator at noon and bcloi" al midnight. This causes a corresponding decrease and increase in the V component.
Figure 2. Schematic: diagram Illustrating Me quiet time magnetic field coifiguration near the winter solstice. The position of ATS I at noon and mldni&ht is shown by a square.
3. EXPERIMENTAL RESULTS
3.1 Quiet Dxys
3.1.1 Macroscopic Variations
Cummings « al. (I969o) have examined the quiet-time magnetic field variations at ATS quantitatively and their results arc presented ID Figs. 3,4, and 5. These figures show the diurnal variation in all three components averaged over five quiet days in each month. The spread in the diumai variation from day to day is shown by shading that contains all points lying within one standard deviation or the average.
121
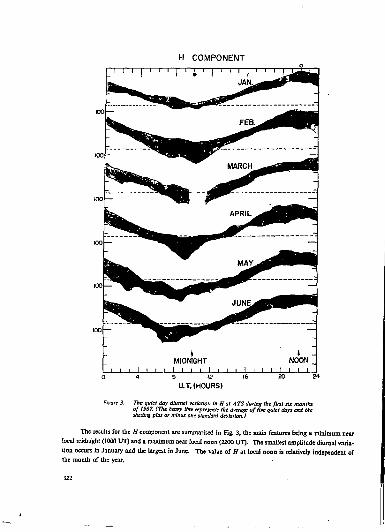
" MIDNIGHT NOON ~ i i i 1 i i i I i i i I i i i I i i i I i i i
0 4 G 12 16 20 24 U.T. (HOURS)
Ftptre 3- The quiet day diurnal variation in H at ATS during the first six months of196?. (The heavy line reprrienti the average of five quiet days and the shading plus or minus one standard deviation.)
The results for the H component are summarised in Fig. 3, the main features being a minimum near local roirfnight (1000 UT) and a maximum near local noon (2200 UT). The smallest amplitude diurnal variation occurs in January and the largest in June. The value of H at local noon is relatively independent of the month of the year.
122
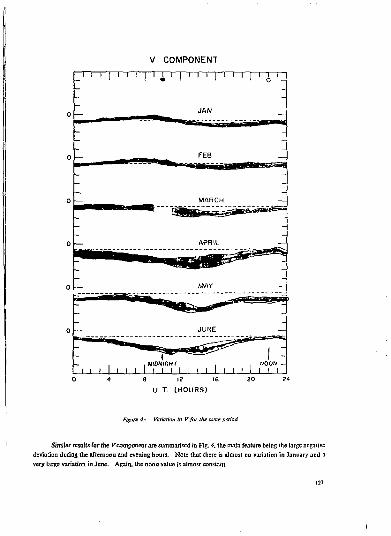
V COMPONENT
U. T. (HOURS)
Figure 4.- Variation in V for the n
Similar results Tor the P component are summarised in Fig. 4, the main feature being the large negative deviadan during the afternoon and evening hours. Note that there is almost no variation in January and a very large variation in June. Again, the noon value is almost constant.
123
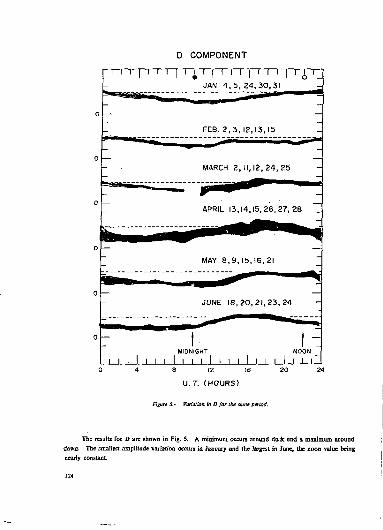
D COMPONENT 1 ' I ' ' ' I ' i ' M ' i I ' ' ' I ' A
JAN. 4 , 5 , 24,30,31
FEB. 2 , 3 , 12,13,15
MARCH 2,11,12,24,25
APRIL 13,14,15,26,27, 28
MAY 8,9,15,16,21
JUNE 18,20,21,23,24
MIDNIGHT NOON I I ' I I I I I I I I I I 1 I I I I I I I I I
(2 16 20 24
U.T. (HOURS)
Figure 5.- Variation In D for Ike same period.
The results for D are shown in Fig. 5. A minimum occurs around dcik and a maximum around dawn. The smallest amplitude variation occurs in January and the largest in June, the noon value being nearly constant.
124
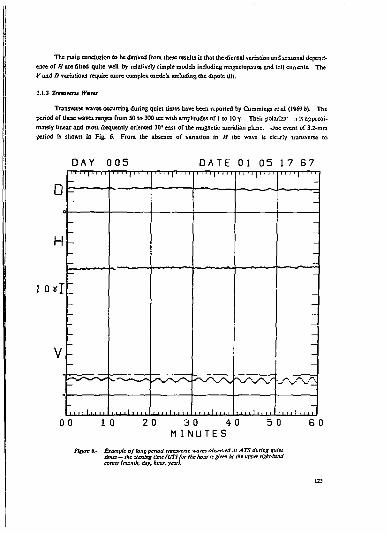
The main conclusion to be derived from these results is that the diurnal variation and seasonal dependence of H are fitted quite well by relatively simple models including magneiopause and tail currents. The f a o d D variations require more complex models including the dipole lilt
3.1.2 Tramsrmt IVMKI
Transverse waves occurring during quiet times have been reported by Cummings « ai. (1969 b). The period of these waves ranges from 50 to 300 sec with amplitudes of 1 to 10 Y- Their polariza* n is approximately linear and most frequently oriented 30* east of the magnetic meridian plane. Jtie event of 3.2-min period is shown in Fig. 6. From the absence of variation in H the wave is cicely transverse to
DAY 0 0 5 DATE 0 1 05 17 6 7
D
H
0*1
rj-rr ~
1 • ' ' • • ' ' ' ' • • 1 1
"
- •^ 'N^ 'X. '
m i l
0 0 1 0 2 0 3 0 4 0 M I N U T E S
5 0 G 0
Figure 6.' Example of long-period transverse waves observed ai ATS during quiet tùna — the starting time (UTJfor the hour to given In the upper rig/U-hand comer (month, day, hour, year).

the DC magnetic field. Furthermore, because the variation in D is small the wave is linearly polarized roughly in a magnetic meridian plane. A similar event or 1.4-min period, with essentially the same properties, is shown in Fig. 7.
D A Y 0 1 0 DATE 01 1 0 1 6 6 7
D
H
1 0 * 1
V
M ( ( | I I M | 1 M F| M I 1~| M 11 j I I I I
1 1 1 1 1 11 M 1 1 1 I i i r i I r t ( i ) r ( n I I i n ) t t t t l ( i i i I i n i I i i t t t i t
TTTTTTTTT
0 0 10 20 30 40 50 M I NUTES
60
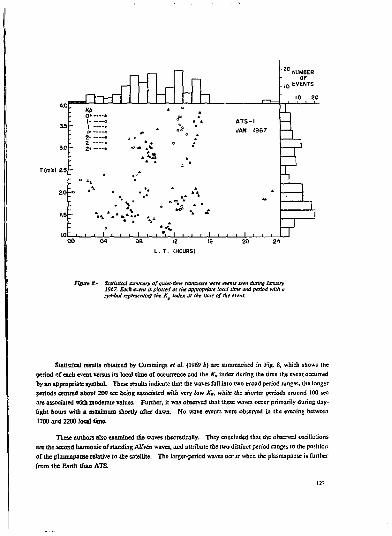
Kl . Q ̂ diuMfk
L . T . (HOURS)
Figure 8.- Siathctcal summary of quiet-time mruvene wore evtntz seen during January 1967. Each event ù plotted at the appropriate load time and period with a symbol rtpraenting the K Index at Vie lime of she event.
Statistical results obtained by Cumtnings et al. (1969 6} are summarised in Fig. 8, which shows the period of each event versus its local time of occurrence and the Kr index during the time die event occurred by an appropriate symbol. These results indicate that the waves fall into two broad period ranges, the longer periods centred about 200 sec being associated with very low Kr. white the shorter periods around IÛ0 sec are associated with moderate values. Further, it was observed that these waves occur primarily during daylight hours with a maximum shortly after dawn. No wave events were observed in the evening between 1700 and 2200 local time.
These authors also examined the waves theoretically. They concluded that the observed oscillations
are the second harmonic of standing AlfVén waves, and attribute the two distinct period ranges Co the positron
of the plasmapause relative to the satellite. The larger-period waves ocr jr when the plasmapause is further
from the Earth than ATS.
3.2 Moderately Disturbed Days (Substonns)
3.2.1 Macroscopic Vatkaioia
A number of distinct variations in the magnetic field have been reported at ATS during substorms (Cumming* et at,, 1968; Coleman and McPherron, 1970). Some of these are summarised in Fig. 9. The figure shows the D, H, and f components of the field for a full 24 hours. Data for a quiet day are shown by dashed lines and for a moderately disturbed day by heavy lines.
The signature of a magnetospheric substonn at ATS is most evident in the H component consisting of a gradual depression in H followed by a rapid recovery. When ATS is clos: to local midnight this recovery is coincident with the expansion phase of a polar magnetic substorm in the auroral zone. Three magneto-spheric substorms are recorded in the data of Fig. 9. The times at which the polar substorm expansions began were detcnained from auroral zone magnetograms and are shown by vertical dashed lines.
In a number cf substorms that occurred near the Spring equinox it,was found that the H depressions occurred between 0800 and 0400 local time. Of these depressions, those which occurred prior to 2300 local time were found to reach a minimum some time after the start of the expansion phase. In contrast, those from 2300 to 0400 local time had a minimum simultaneous with the start of the expansion.
A characteristic variation in the D component is sometimes seen at ATS during substcrim. For example, in Fig. 9 a large negative spike occurred in conjunction with the recovery of the H component. These spikes have only been observed when ATS was in the morning sector and only near the equinoxes.
Significant changes occur in the ATS substorm signature as a function of season. For example, Cummings et at. (1968), using data near the winter solstice, reported a large asymmetry around local midnight and noted that very few depressions occ" -red in the morning sector. Further, while ihe I) component had no distinct variation, the V component alternately increased and decreased, suggesting the growth and decay of tail-like fields.
From such data as those in Fig. 9, it appears likely that the large depressions in H at ATS during substorms are mainly due to the diamagnetic effect of a partial ring current from midnight towards dusk. Supcriraj -sed on the effects of this partial ring current are effects due to enhanced tail currents. The rapid recovery in // is probably due to the simultaneous loss of ring current particles, collapse of the tail-like fields, and perhaps growth of field-aligned currents. The entire problem is confused by the complex local-time dependence, seasonal dependence, and variability associated with the strength of successive substorms.
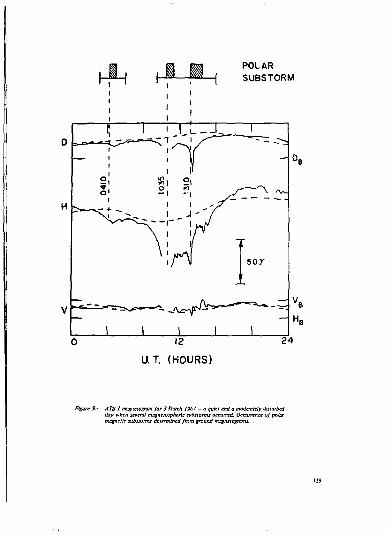
12
UT. (HOURS)
ATS I mag,ietOpam far $ March 1967 - a quiet and a moderately disturbed day when several magnttospheric substorms occurred Occurrence of polar magnetic substorms determined from ground msgnetograms.
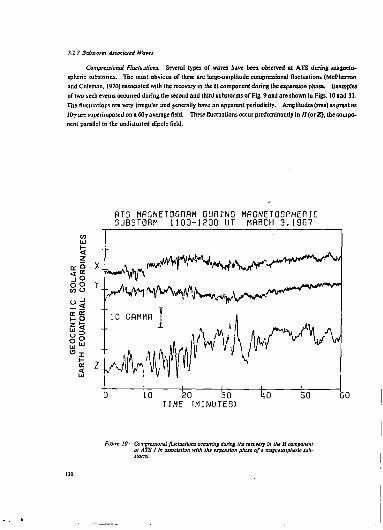
3.2.2 Saba or m Associated Watci
Compressionoi FlucluJthns. Several types of waves have been observed at ATS during magneto-spheric substorms. The most obvious of these are large-amplitude compressional fluctuations (McPherron and Coleman, 1970) associated with the recovery in the H component during the expansion phase. Examples of two such events occurred during the second and thini Eubstorms of Fig. 9 and are shown in Figs. 10 aad 11. The fluctuations ore very irregular and generally have no apparent periodicity. Amplitudes (rms) as greatas \0y are superimposed on a 60y average field. These fluctuations occur predominantly in H (or Z), the component parallel to the undistoned dîpole Held.
-JO o o
ATS MflGNETOGRflM DURING MRGNETGSPHERIC SUBST0RM 1100-1200 UT MRRCH 3.1967
• * v ^ " ^f^^f^^
"I 10 GRMMR
^ ' ' A / ^ 10 2"Ô -K) fro IBÔ" SO
T I M E ( M I N U T E S )
Figure 10.- Compressions! fluctuations occurring during the recovery in the H component at ATS 1 in aisoctaiton wtih the expansion phase of a magnetospheric sub-storm.
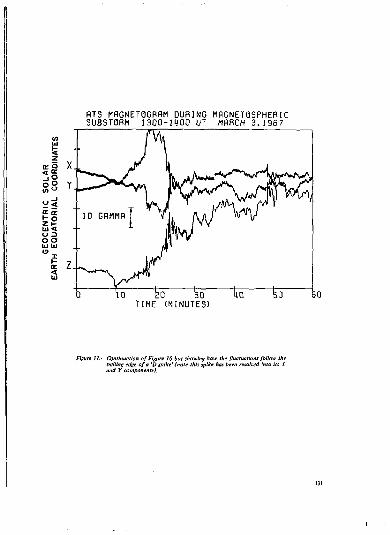
RTS MflGNETOGRfiM DURING MfiGNETOSPHERIC SUBST3RM 1300-1M00 UT MARCH 3 .1967
"To TIME (MINUTES)
Figure 11.- Continuation of Figure 10 but showing how the fluctuations follow the trailing edge of a 'D spike' (note this spike has been resolved into its X and Y components).

Power spectra of these fluctuations ore generally steep with no characteristic peaks, as illustrated in Figs. 12 and 13 for the above events. At lower frequencies the power of the H (or Z) component is usually about an order of magnitude greater than (hat of either of the transverse components.
The fluctuations can occur throughout the night sector in assouation with the expansion phase of magnetospheric substorms. When the satellite is near local midnignt the events always begin after the start of the recovery of the //component. However, near dusk the fluctuations may begin before the minimum of the depression in H. During substorms when negative D spikes are observed the waves always begin after the trailing edge of the D spike.
The origin of these lluciuations has net been determined, one possibility being that they are generated by an instability associated with a partial ring current. Alterna livery, they may be turbulence associated with the collapse of toil-like fields.
POWER SPECTRA 0F MfiG FIELD HT ATS DURING SUBSTORM MARCH 3.1967 1040-1207 UT
FREQUENCY (HERTZ)
Figure 12.- Auto spectra far the three components of the magnetic fletd fluctuations illustrated in figure 10.

POWER SPECTRA OF MHG FIELD HT ATS DURING SUBSTORM MARCH 3.1967 1334-1501 UT
FREQUENCr (HERTZ)
Figure 13.- Auto spectra for the data g.'vert in Figure II.
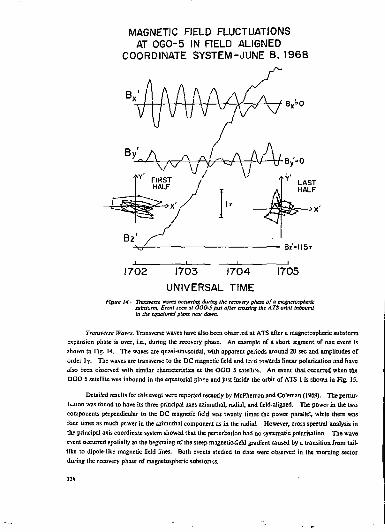
MAGNETIC FIELD FLUCTUATIONS AT OGO-5 IN FIELD ALIGNED
COORDINATE SYSTEM-JUNE 8, 1968
Bx' l\J\l\!\iwj<s\/* J
1702 1703 1704 UNIVERSAL TIME
1705
figure 14.- Thntsversc *&res occurring during the recovery phase of a magnetosp/iertc substorm. Event seen at QGO-S hat after crossing the ATS orbit inbound In the equatorial plane near dawn.
Transverse WOVPS, Transverse waves have also been observed at ATS after a magnetospheric substorm expansion phase is over, i.e., during the recovery phase. An example of a short segment of one event is shown in Fig. 14. The waves are quasi-sinusoidal, with apparent periods around 20 sec and amplitudes of order 1 y. The waves are transverse to the DC magnetic field and te^d towards linear polarization and have also been observed with similar characteristics at (he OGO 5 satelu'c. An even! that occurred when the OGO 5 satellite was inbound in the equatorial plane and just inside the orbit of ATS 1 is shown in Fig. 15.
Detailed results for this event were reported recently by McPherron and Coleman (1969). The pertux-U.uon was found to have its three principal axes azimuthal, radial, and field-aligned. The power in the two components perpendicular to the DC magnetic field wai twenty times the power parallel, while there was four times as much pewer in the azimuthal component as in the radial. However, cross spectral analysis in the principal axis coordinate system showed that the perturbation had no systematic polarisation. The wave event occurred spatially at the beginning of ihe steep magnetic-field gradient caused by a transition from taillike to dipole-like magnetic field lines. Both events studied to date were observed in the morning sector during the recovery phase of magnetospheric substonvj.
134
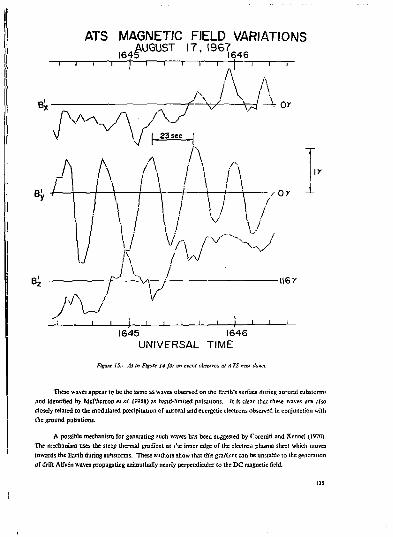
ATS MAGNETIC FIELD VARIATIONS ^ U G U S T I 7 . I 9 6 7 6 4 6
~i 1 1 1 1 1 1 1 r
A:
r^Afii
i ' '
1645 1646 UNIVERSAL TIME
Figure / 5 . - As In Figure J4 for an event observée at ATS near dawn.
These waves appear to be the same as waves observed on the Earth's surface during auroral substorms and identified by McPhcrroo et al. (J968J as band-limited pulsations. It is clear that these waves are also closely related to the modulated precipitauon of auroral and energetic electrons observed in conjunclion with the ground pulsations.
A possible mechanism for generating such waves has been suggested by Coroniti and Kennel (1970). The mechanism uses the steep thermal gradient at t^e inner edge of the electron plasma sheet which moves towards the Earth during substorms. These authors show that this gradient can be unstable to the generation of drift Alfvén waves propagating azimuthally nearly perpendicular to the DC magnetic field.
135
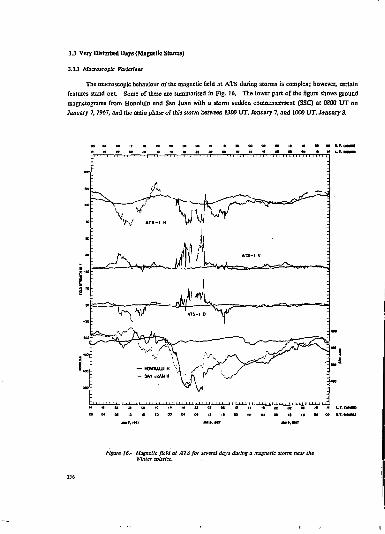
3.3 Very Disturbed Days {Magnetic Storas)
3.3.1 Macroscopic Variations
The macroscopic behaviour of the magnetic field at ATS during storms is complex; however, certain features stand out. Some of these ore summarised in Fig. 16. The lower part of the figure shows ground magaetograms from Honolulu and San Juan with a storm sudden commencement (SSQ at OSOO UT on January 7,1967, and the main phase of this storm between 1300 UT, January 7, and 1000 UT, January 8.
figure 16.- Magnetic fiel I at ATS for several days during a magnetic storm near the Winter solstice.
136
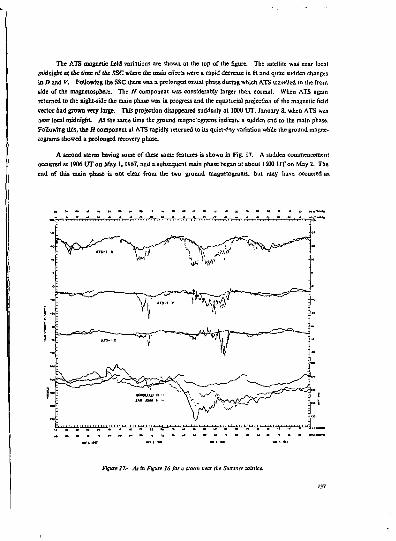
The ATS magnetic field variations are shown at the top of the figure. The satellite was near local midnight at the time of the SSC where (he main effects were a rapid decrease in H and quite sudden changes is D and V. Following the SSC there was a prolonged initial phase during which ATS travelled lo the front side of the magnetospbere. The H component was considerably larger than normal. When ATS again returned to the night-side the main phase was in progress and the equatorial projection of the magnetic field vector had grown very large. This projection disappeared suddenly at 1000 UT, January 8, when ATS was near local midnight At the same time the ground magne* cgmms indicate a sudden end to the main phase. Following this, the H component at ATS rapidly returned to its quiet-^iy variation while the ground magne-tograms showed a prolonged recovery phase.
A second storm having some of these same features is shown in Fig. 17. A sudden commencement occurred at 1906 UTonMay 1.1967, and a subsequent main phase began at about 1500 UTon May 2. The end of this main phase is not clear from the two ground magnetograms, but may have occurred as
Figure ]7.- As in Figure 16 for a storm near the Summer mbtlce-
m
late as 17Û0 UT on May 3. A large equatorial projection of the magnetic field also accompanied this main phase. The most important point to note, however, is that the direction of this projection in May is opposite to that for the storm in January. Again, the recovery phase of the storm at ATS is short while quite prolonged ID the ground magnetograms.
Tentative conclusions based on the analysis of these and several other storms in the first half of 1967 are the following. A sudden commencement causes a moderate increase as well as compression in the strength of the tail current. This situation persists throughout the initial phase, the main phase being a time of very strong, rapidly fluctuating, tail-like fields when a ring current is obviously growing. It is also a time of complex overlapping substorms in the auroral zone, and generally ends quite suddenly with the disappearance of the tail-like fields of ATS.
It seems likely that what happens during magnetic storms is that the plasma sheet moves up the tai! towards the Earth and connects Q>ecUy to the region of the ring current. Because of this direct connection, plasma is injected so rapidly that successive substorms cannot eliminate the plasma completely from the midnight sector wilh the result that the remnant plasma begins to drift, forming the ring current The sudden disappearance of the tail-like fields apparently indicates a retreat of the plasma sheet, a slowing of plasma injection, and the beginning of the recovery phase.
3.3.2 Storm-Associated Waves
Meridional Fluctuations. Several distinct wave phenomena appear to be closely associated with magnetic storms (Bariidd and Coleman, 1970). The most obvious type is the meridional fluctuations shown in Fig. 18. These waves have periods between 2 and 15 min and amplitudes as large as 30y peak-to-peak, the perturbation lying mainly in the H-V or magnetic meridian plane. Their polarization is approximately linear but wilh components both transverse and parallel to the ambient magnetic field. Four similar wave events have been observed in six magnetic storms. They all occurred at or just following the minimum of the main phase, both energetic electron and proton fluxes being modulated during the wave event. Electrons were ia-phase and protons out-of-phase with the H variations. Barfield and Coleman (1970) have concluded that *he characteristics of these waves ate consistent with the drift mirror instability of Hasegawa (1469).
138
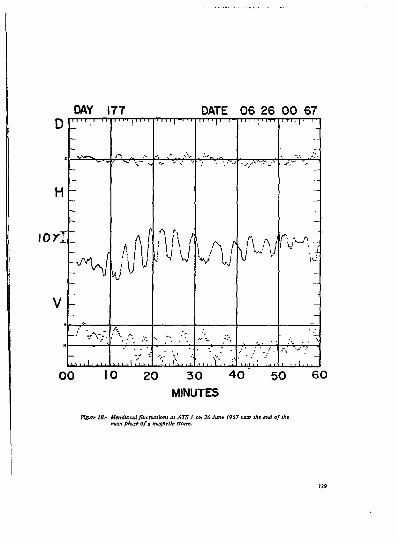
DAY 177 DATE 06 26 00 67
u - ' " ' " " " " ' " " " " ' " " ' " " 1 ,1 | . ! l
. " • A 0 ,r ' f ' : •.,-.-"~'V -'•' ' _
H - -
lOX l
^W Jit m \Af X^J ivl
V _
-•"' Vv.'. '\;-. ... - r- •'••
• , ' •-
" . : ' .' ' ••'- „ " . •«•*• • '
.,.,!,.,. I l h l n i ,'\ ,r..., , , , . ' f . ;'• l i . i l n i i
00 10 20 30 40 50 60 MINUTES
figure I&- Méridional fluctuations at ATS I on 26 June 1967near the end ofthe main phase of a magnetic starm.

Transverse Wases. A second type of wave seen during magnetic storms is transverse waves in the Pc 1 band, as shown in Fig, 19. These waves had five-second periods and 1 to 2f amplitudes. The one event studied was left elliptically polarized roughly transverse to the ambient field. Three such events, all in the afternoon sector at ATS, occurred during magnetic storms. Each of these Pc 1 events occurred at times of unusually high fluxes of 100 to 1000 keV solar flare protons, while two of them occurred during the long-period meridional fluctuation events discussed above and seemed to be amplitude-modulated by them. The most likely origin for these waves is a cyclotron instability of some component of the trapped-proton population.
UCLA M/OCT0METER EXPERECNT ATS-I
Figure 19.- Transverse waves in Pc I band occurring In conjunction with méridional fluctuations on 26 June 196? daring main phase of a magnetic storm.

Other Waves. In addition to the above wave phenomena, at least two other distinct types occur during magnetic storms, both of which were observed during the recovery phase of magnetic storms. One type with fluctuations ID all three components is shown in Fig. 20. A second type with unusual wave form is given in Fig. 21. Neither of these has, however, been studied in detail at the present time.
DAY 0 0 8 D A T E 01 08 19 G7
D
H
V-
I I I I I I I I I I I I I I I I I I I I I I I I I I I I I I I I I I I I I I I I I I M I I I I I I I I I I I I U I
1 0* I E v/v../wu J-vyvJ'
I • • I " • ' I " ' • I • • • ' ' * I ' ' I • • ' • I ' • ' ' I • • " ' " • • * " • • ' • • " 1 • •
00 10 20 30 40 50 GO M I N U T E S
Figure 20-' Magnetic field fluctuations observed at ATS on 8 January 1967 during the recovery phase of a magnetic storm.

DAY 0 14 D A T E 0 1 14 1 3 6 7
D
H
i o*I
V
• ^ ^ / V
I I I I I I I I M I I I I I I I I I I I I I I I I
• ' ' • I • ' • ' 1 " • >> • • • ' I • ' • • 1 • • • • I • " • I " • ' I • • • ' ' " • 11 • • ' i
00 10 20 30 40 50 MINUTES
6 0
Figure 21.- Another type ofmagnetic field fluctuation observed at ATS on 14 January 1967 during the recovery phase of a magnetic storm.
4. CONCLUSIONS
We have described several types of magnetic field variati ns recorded at the ATS 1 satellite. These variations have been classified according to whether they are quiet, sobstorm, or storm-time phenomena, and subdivided into macroscopic vacations and fluctuations (waves).
142
This broad range of phenomena appears to be strongly interrelated. For the most pan the physics of this remarkable inter-relationship remains to be worked out. As a result it is useful to develop phenome-nological models which emphasise this inter-relationship. Our version of such a model, a highly speculative one, is described below.
During quiet times ATS 1 rotates around the Earth measuring magnetic effects of two major current systems. On the sunward side it measures a magnetic field enhancement caused by magnetopause currents, while on the night-side it measure? a depression caused by the tail currents. As the solar wind pressure increases, the effects of these two current systems become more pronounced at ATS and substorm activity begins to occur.
Throughout the dusk-to-midnight sector large depressions in the H component are measured by magnetometers at mtd-latitude stations as well as at ATS 1. These are apparently due to large westward currents in the equatorial plane close to and beyond the ATS orbit
Near midnight sudden recoveries in the H component occur simultaneously at ATS 1 and at the mid-latitude ground stations. These recoveries suggest that most of the particles causing the currents are lost, probably to the auroral ionosphere, by precipitation. This recovery is not a smooth process at the satellite—large-amplitude compressional fluctuations in the magnetic field suggest that it is quite turbulent. In addition to the compressional fluctuations, large spikes in the D component indicate that coaxial, field-aligned sheet currents flow down magnetic field lines during the recovery.
Loss mechanisms other than precipitation are also involved in the recovery. Some electrons are energised at this time and drift towards dawn. As they drift through the pre-dawn sector a plasma instability occurs, possibly driven by the drifting electrons. This instability generates transverse, band-limited pulsations which then interact with the electrons to cause pulsating electron precipitation.
In addition to the electrons some protons are injected, which then drift towards dusk. These panicles cause an enhancement of any pre-existing depressions near the dusk meridian.
When solar wind conditions are appropriate, as they are after a large solar flare, magnetic storms develop, during which the effects of magnetopause and tail currents are even more pronounced at ATS than during typical substorms and individual substorms are frequent and strong. It seems likely that the protons injected by an individual substorm are not completely eliminated before more are injected by a subsequent substorm. The net result is the formation of a large ring current This ring current is in its initial stages apparently quite unstable to certain types of drift waves. Thus, long-period, large-amplitude fluctuations in the meridian plane are a common occurrence during the early main phases of storms. Further, these instabilities may affect the anisotropy of the proton pitch-angle distribution. The net result could be a cyclotron instability producing the five-second transverse waves which appear to be amplitude-modulated by the long-period fluctuations.
Finally, during the recovery phase of the storm, which begins after substorms have essentially stopped, the ring current becomes unstable to the generation of other types of drift waves. Eventually, the ring current decays and quiet conditions again prevail.
143
It seems appropriate to end this discussion with the observation that a synchronous satellite is ideally situated to study these exceedingly complex and interrelated phenomena. While ATS I has been extraordinarily successful in discovering new phenomena, the need for simultaneous measurements of particles and fields at several points in the synchronous equatorial orbit is apparent. Thus the planned ESRO geostationary satellite should contribute greatly to the progress of raagnetospheric physics.
ACKNOWLEDGEMENTS
This work was supported in part by the National Aeronautics and Space Administration under research grant NGR 05-007-004.
REFERENCES
Barfield, J.N. Coleman, P.J., Jr.
Storm-related Wave Phenomena Observed at the Synchronous, Equatorial Orbit, J. Geophys. Res.. 75, p. 1943 (1970).
Coroniti, F.V. Kennd, C.F.
Auroral Mieropulsation Instability, J. Geophys. Ret.. 75, p. 1863 (1970).
Coleman, PJ., Jr. McPnerron, R.L.
Fluctuations in the Distant Geomagnetic Field During Siibsforms: ATS-I, in Particles and Fields in the Magnetosphere (B.M- McCormac, éd.), p. 171, D. Rcidel Publ. Co., Dordrecht-Holland, 1970.
Cummings, W.D. Barfield, J.N. Coleman, P.J., Jr.
Magnetospheroc Substorms Observed at the Synchronous Orbit, J. Geophys. Res.. 73. p. 6687 (1968).
Cummings, W.D. Coleman, PJ., Jr. Siscoe, G.L.
The Quiet Day Magnetic Field at ATS-1, Publication No. 752, Institute of Geophysics and Planetary Physics, University of California, Los Angeles (1969a).
Cummings, W.D. O'SuIlivan, R.J. Coleman, PJ., Jr.
Standing Alfvén Waves in the Magnetosphere, J. Geophys. Res., 74, p. 778(1969*).
Drift Mirror Instability in the Magnetosphere, Phys. Fluids, 12, p. 2642 (1969).
McPherrori,R.L. Parks, G.K. Coroniti, F.V. Ward, S.H.
Studies of the Magnetospheric Substorm, II - Correlated Magnetic Micropulsations and Electron Precipitation During Auroral Substorms, / . Geophys. Res., 72, p. 1697, (1968).
McFherron, RX. Coleman, P.J., Jr.
Magnetic Fluctuations During Magnetospheric Substorms, I - Expansion Phase, J. Geophys. Res., 75. p. 3927.(1970).
McPherron, RX. Coleman, PJ., Jr.
Band-Limited Micropulsations at 6 to 8 Earth Radii in the Equatorial Plane (Abstract) Am. Geophys. Un. Trans., 50, p. 565 (1969).
GEOSTATIONARY S A T E L U T E STUDIES
OF MAGNETOSPHERIC SUBSTORMS
P. Rothwell University of Souihampion. England
ABSTRACT
In addition to geostationary satellite experiments for substorm investigations, other simultaneous experiments in the Ionosphere, magnetosphere and nearby interplanetary space are required. Magnetospheric electric fields, electron acceleration mechanisms in the magnetosphere and plasma sheet, ware-particle interactions daring substorms and ike origin of the magnetospkeric plasma are discussed and the rapid dissémination of some geostationary satellite data is proposed.
An extensive review of information on the magnctospheric substorm already available from geostationary and other satellites, rocket and ground-rased measurements has already been given by Axford at this meeting, and by Akasofu (1968).
In studying the substorm we are trying to deduce, from small-scale measurements made at different points I'D the magnetosphere, ionosphere, and interplanetary space, the large-scale processes occurring when the solar wind (a magnetic plasma with variable density, velocity, and magnetic field direction) interacts with the magnetosphere (a rotating magnetic dipole containing hot trapped plasma with an insulating atmospheric layer just above the solid earth). There are considerable difficulties in identifying spatial and temporal variations in the development of the substorm and, when we cannot observe the large-scale phenomena directly, in deciding which of the wealth of phenomena observed during the substorm arc causally related and which have their origin in a common cause. Since many of the processes of interest occur close to 6.5 Re. the geostationary orbit is certainly a very good location from which to study the substorm, and it is easier to attempt to sort out spatial and temporal variations from a satellite at a axed radial distance from the Earth than from a satellite whose radial distance from the Earth varies. However, it is difficult for the substorm to be properly studied from this orbit alone; if we are to understand what is going on we also need information at the same time from other locations in the magnetosphere, both near and far from the equatori?! plane, at différent radial distances from the Earth, from the ionosphere at a variety of latitudes and longitudes as well as from nearby interplanetary space.
The " life history " of a substorm apparently starts with a large-scale electric field building up across the magnetosphere and under its influence there are inward motions of whistler ducts (Carpenter, 1963) and plasmapause and plasma sheet (Vasyliunas, 1968).
It is clearly important to measure these large-scale magnetospheric electric fields. They can be estimated from observations of the positions of the plasmapause and the boundary between the drift orbits and " trapped " orbits of more energetic particles. Nishida (1966) and flrice (1967) suggest that the plasmapause boundary lies at the radial distance at which the co-rotational velocity and the conveclive velocity of magne-tospheric plasma (under the influence of the magnetospheric electric field) become equal. For more energetic particles, the boundary between " drift " orbits and trapped orbits is at the radial distance at which the magnetic
145
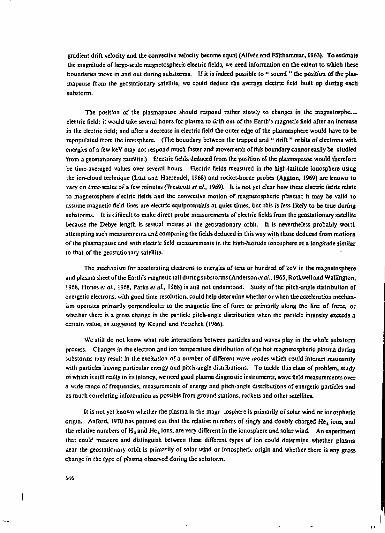
gradient drift velocily and the convective velocily become equal (AlfvcnandFàlthammar, I963). To estimate the magnitude of large-scale magnetospheric electric fields, we need information on the extent to which these boundaries move in and out during substorms. If it is indeed possible to " sound " the position of the plasmapause from the geostationary satellite, we could deduce the average electric field built up during each substorm.
The position of the plasmapause should respond rather slowly to changes in the magnetosphe... eleciric field : it would take several hours for plasma to drift out of the Earth's magnetic field after an increase in the electric field; and after a decrease in electric field the outer edge of the plasmasphere would have to be «populated from the ionosphere. (The boundary between the trapped and " drift " orbits of electrons with energies of a few keV may not respond much faster and movements of this boundary cannot easily be studied from a geostationary satellite.) Electric fields deduced from the position of the plasmapause would therefore be time-averaged values over several hours. Electric fields measured in the high-latitude ionosphere using the ion-cloud technique (Lust and Haerendel, 1968) and rocket-borne probes (Aggson, 1969) are known to vary on time-scales of a few minutes (Westcolt et al., 1969). It is not yet clear how these electric fields relaie to magnetospherc electric fields and the convective motion of magnetospheric plasma; it may be valid to assume magnetic field lines are electric equipotentiats at quiet times, but this is less likely to be true during substorms. It is c'imcult to make direct probe measurements of electric fields from the geostationary satellite because the Debye length is several metres at the geostationary orbit. It is nevertheless probably worth attempting such measurements and comparing the fields deduced in this way with those deduced from motions of the plasmapause and with electric field measurements in the high-latitude ionosphere at a longitude similar to that of the geostationary satellite.
The mechanism for accelerating electrons to energies of lens or hundred of keV in the magnetosphere and plasma sheet of the Earth's magnetic tail during substorms (Anderson et at., 1965, Rothwell and Wellington, 196$, Hones et al, 1968, Parks et al, 1968) is still not understood. Study of the pitch-angle distribution of energetic electrons, with good time resolution, could help determine whether or when the acceleration mechanism operates primarily perpendicular to the magnetic line of force or primarily along the line of force, or whether there is a gross change in the particle pitch-angle distribution when ihe panicle Intensity exceeds a certain value, as suggested by Kennel and Petschek (1966).
We still do not know what role interactions between particles and waves play in the whole substorm process. Changes in the electron and ion temperature distribution of the hot magnetospheric plasma during subsiorms may result in the excitation of a number of different wave modes which could interact resonantly with particles having particular energy and pitch-angle distributions. To tackle this class of problem, study of which is still really in its infancy, we need good plasma diagnostic instruments, wave field measurements over a wide range of frequencies, measurements of energy and pitch-angle distributions of energetic particles and as much correlating information as possible from ground stations, rockets and other satellites.
It is not yet known whether the plasma in the magr .osphereis primarily of solar wind or ionospheric origin. Axford, 1970 has pointed out that the relative numbers of singly and doubly charged He 4 ions, and the relative numbers of H 9 and He, ions, are very different in the ionosphere and solar wind. An experiment that coulr1 measure and distinguish between these different types of ion could determine whether plasma near the geostationary orbit is primarily of solar wind or ionospheric origin and whether there is any gross change in the type of plasma observed during the substorm.
146

It is still not c!:ar whether special conditions arc necessary in interplanetary space for subiiorms to occur. For example, there is some statistical evidence that substorms occur more frequently when the interplanetary rWd is south-pointing (Fairfield and Cahill, 1966, Rostoker and Fâlthammar. 1967) but many individual examples can be found of substorras occurring while the interplanetary field is north-pointing— and has been north-pointing for some hours before the subslorm. This problem requires information from an eccentric-orbit satellite in nearby interplanetary space, but the " beginning ** and subsequent development of a substorm can be determined more readily from magnelo-neters and other instruments carried on a geostationary satellite than from ground-based instruments (Cummings and Coleman, 1968)
If we are to make the best use of the geostationary satellite in the study of the magnetosphcric substorm we must try to. arrange that information from at least some of the instruments it carries is made rapidly and
easily available (o the scientific community. This may mean including some rather simple well-tried detectors in the payload, the information from which can be readily understood and processed quickly.
It might be appropriate for the ESRO laboratories themselves to assume responsibility for building the monitoring experiments (for example, a three-component magnetometer and some simple particle detectors), reducing the information from them to a convenient for.= and making this information generally available to all interested space groups.
It would also be useful if analogue information from the monitoring instruments could appear as real-time information on paper charts at the Kiruna rocket range, along with the riometer and ground-based magnetometer information already available there. In this way experimenters ciuld, on the basis of instant information from the geostationary satellite, choose the moment to fire their rockets.
[f further satellites are planned for launch during the lifetime or GEO.1) a higher priority should be
put on eccentric orbit satellites than on further geostationary satellites for sîudy of ihu substonn. Infor
mation on processes occur*"'; during the substonn at different radial distances from the Earth cannot be
obtained from the geostationary orbit, but local time variations can—at U ast statistically.
It is inevitable that some of the questions we are now asking will have been answered by the time CEOS is launched. Experiments planned now to investigate the Harth's nviro.iment at the geostationary orbit should be designed to have as much flexibility of operation as possible, so that they may still be of use in solving some of the new problems that will have arisen by 1975-1976.
REFERENCES
Aggson, T.L. in Atmospheric Emissions (B.M. McCjrmac and A. Omholt, eds.), p. 305, Van Nostrand Remhold, New York, 1969.
Aiasofu, S.-I. Polar and Mapteiospheric Substorms, D. Reidel Publ. Co., Dordrccht-HoUand, Ï968.
Alfvén, H. Cosmical Electrodynamics, p. 60, Oxford University Press, I^M. Fâlthammer, C-G.
147
Anderson, K.A-Harris, H.K. Paoli, RJ .
Brice, R M .
Carpenter, D.L.
Cummings, W.D. Coleman, PJ., Jr.
Fairfield, D.H. Cahill, l_J., Jr.
Hones, E.W., Jr. Bame, S J . Singer, S. Brown, R.R.
J. Geaphys. Res.. 70. p. 1039 (1965).
in Particles and Fields in the Magnetosph ereXB. M. MeCormaced.), p. 46, D. Rcidel Puhl. Co., Dordrecht-Holland, 1970.
J. Geophys. Res., 72, p. 5193 (1967).
Radio Science 3. p. 719 (1968).
Ibid., p. 758 (1968).
/ . Geophys. Res.. 71. p. 155 (1966).
J. Geophys. Res., 73, p. 61S9 (1968).
Kennel, C F . Petschek, H.E.
/ . Geophys. Res.. 71. p. 1 (1966).
Lûst, R. Haerendel, G.
in Earth'!, Particles and Fields (B.M. McCormac, éd.), p. 271, Rejnhold Book Corp., 1968.
Parks, G.K., Araoldy, R.L. Lezniak, T.W. Winckler, J.R.
Rosloker, G. Fâlthammer, C-G.
Vasyliunas, V.M.
Westcott, E.M. Stolarik, J.D. Hoppner, J.P.
J. Geophys. Res.. 71. p. 5669 (1966).
Radio Science 3, p. 715 (1968).
J. Geophys. Res., 72, 5B53 (1967).
Planet. Space Set.. 16, p. 1441 (1968).
J. Geophys. Res.. 73, p. 2839 (1968).
X Geophys. Res., 74. p. 3469 (1969).
RESULTS F R O M THE ESRO I LOW-ENERGY PARTICLE EXPERIMENT AND THEIR RELATION T O A GEOSTATIONARY SATELLITE PROJECT»
R. Riedler
Technical Unirersliy Cruz. Dept of Communications and Wave Propagation Graz, Austria
ABSTRACT
The résolu from the S. 71B law-energy particle spectre experiment on board the ESRO I satellite are dls-cussed and conclusions drawn concerning the possibility of mounting a similar experiment on a geauationary satellite.
1. INTRODUCTION
One of the eight experiments on board the ESRO I satellite, S.7I B, was designed to measure the spectra of low-energy particles (electrons and protons) in two directions, - I0 8 and ~ 80°, relative to the Earth geomagnetic field vector, the exact values depending on the accuracy of the held alignment of the satellite axis. The energy range involved was I —13 keV and the measuring method comprised electrostatic analysers and Mullard channel multipliers. Similar instruments were Sown on both versions, ËSRO 1 A (Aurorae), launched on 3 October 1968 and still in orbit, and ESRO I B (Boreas), launched on 1 October 1969". Two observations concerning the geostationaiy satellite project which result from the experience, gained from S.71 B, are made below.
2. ELECTRON AND PROTON PRECIPITATION PHENOMENA
The first concerns a scientific question. Data from S.71 B are usually obtained on a routine basis during posses over Redo (Belgium), Tromsd and Spitsbergen (Norway), and Fairbanks (Alaska), u: % a high-speed, real-time telemetry system. The inclination of the satellites (93.8* and 85.1*, respectif , together with the long lifetime of ESRO I A, has resulted in good real-time (and aurora! lime) coverage being obtained, thus enabling the latitude and local time structure of low-energy electron and proton precipitation characteristics to be investigated.
• The work %as carried out et the Kir una Geophysical Observatory. Kinmt. Sweden.
** Poreas stayed m orbit until 2i November 1969,
!4»

Figure ].• Electron precipitation zones observed during the period 23 February to 2 March 1969. showing zones with hard and soft electron spectra.
Figure 1 shows the results for the period 23 February-2 March, 1969, whfchserveas a suitable example (Riedler, 1970). The electron precipitation is shown as a function of eccentric dipole time (EDT) and invariant latitude A. Different zones can be distinguished according to the shape of the electron spectra observed. Over the polar region there is a " high intensity soft " zone (SEj) adjacent to a " low intensity soft " zone (SEJ. In addition, two " hard " zones can be seen, which seem tc 'xiincide quite well with the auroral zone and the auroral oval respectively. Similar zone characteristics and some regular anisotropics were observed for the proton précipitation. A more detailed investigation of these matters is under way.
Not very much is known about the origin of the observed phenomena but the geostationary satellite project is well suited to shed light on such complicated questions. It follows from the geostationary altitude of L = 6.6, correspoadinr »o A = 67 s, that the " hard " electron zone boundaries will be sampled and statistically monitored as functions of local time, geomagnetic activity, etc. {cf. Fig. 1). It would then be of special importance to have simultaneous measurements at the geostationary altitude, at lower satellite heights (as in the case of ESRO I), at rocket altitudes, and at balloon levels. As has already been pointed out by Prof. Trefall at this Colloquium , there is a great interest in Europe concerning balloon work (SPARMO). It is a fortunate coincidence that the X-rays, which can easily be monitored from balloons, stem from the " hard " electrons mentioned above and thus are well suited for comparison with the measurements at the geostationary altitude. It is to be hoped that this relatively inexpensive method, together wita other investigations including ground-based work, and in conjunction with the geostationary satellite measurements,
ISO
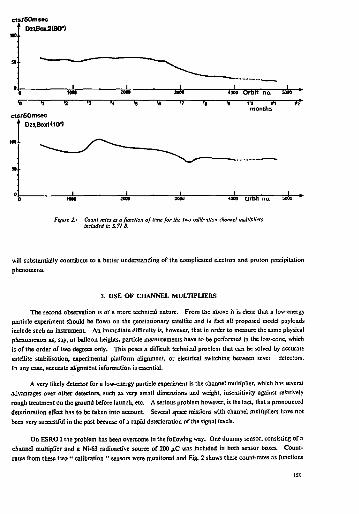
cta/50ms«c D2lBox2(80°)
4D0O Orbit no. 5ÔM
cts/SCmsec DZ^BoxldOO
will substantially contribute to a better understanding of the complicated electron and proton precipitation phenomena.
3. USE OF CHANNEL MULTIPLIERS
The second observation is of a more technical nature. From the above it is clear that a low-energy particle experiment should be flown on the geostationary satellite and in fact all proposed model payloads include such an instrument. An immediate difficulty is. however, that in order to measure the same physical phenomenon as, say, at balloon heights, particle measurements have to be performed in the loss-cone, which is of the order of two degrees only. This poses a difficult technical problem that can be solved by accurate satellite stabilisation, experimental platform alignment, or electrical switching between sevei " detectors. In any case, accurate alignment information is essential.
A very likely detector for a low-energy particle experiment is the channel multiplier, which has several advantages over other detectors, such as very small dimensions and weight, insensitivity against relatively rough treatment on the ground before launch, etc. A serious problem however, is the fact, that a pronounced deterioration effect has to be taken into account. Several space missions with channel multipliers have not been very successful in the past because of a rapid deterioration of the signal levels.
On ESRO I the problem has been overcome in the following way. One dummy sensor, consisting of a channel multiplier and a Nt-63 radioactive source of 200 u.C was included in both sensor boxes. Count-rates from these two " calibration " sensors were monitored and Fig. 2 shows these count-rates as functions
of time. It can be -«en that the deterioration effect is very modest indeed, the main reason being that experiment S.7I B v. operated on a low duty cycle. Only real-time telemetry is used in connection with the read-out stations mentioned above so the duty cycle is approximately 10 minutes on / 90 minutes off. This provides sufficient time for the channel multipliers to recover. In addition, it is possible to avoid switching on S.71 B, by means of daily messages to ESOC, depending on the state of the experiment (i.e. count-rate levels) and the necessity for switch-on (geomagnetic utivity, local time, etc.)*. In the early lifetime of the satellite the count-rales were almost constant. This ha^. been foreseen as the satellite was then entering the sunlit-orbit phase. An increase in the instrument's mean temperature resulted ta a change of the amplifier characteristics in the proper way. The opposite effect later in the satellite's lifetime could not be avoided, but was compensated by careful choice of the switch-on times. It occasionally happened that S.71 B was left in the " on " position for one orbit because of unsuccessful " off" commands. During these times the count-rates decreased markedly, but afterwards recovered almost to normal provided sufficient time was allowed.
For the geostationary satellite low-energy particle experiment this deterioration problem might cause some difficulties. The proposed lifetime of the satellite is two years, and according to the experience with ESRO I/S.71 B it is not impossible to meet such a requirement with channel multipliers"", but a carefut switching policy must be adopted. One would like to monitor individual channel multipliers, and it should be possible to switch the instrument on and off according to the decision:, taken on the ground. These decisions should then be based—at least after half a year—on the physical state of the instrument (count-rate level), judging this against the geomagnetic activity, i.e. the necessity o. aaving the experiment switched on for interesting measurement periods. Although it would be ideal to monitor the low-energy electron and proton Muxes continuously, experience from S.7I B shows that it is hardly possible to aim for a continuously operating instrument using channel multipliers.
* The cooperation of ESOC in these matters is very much appreciated.
*• Note added after ike Colloquium : On February I. 1970, sixteen months after launch, S.71 B was Still working satisfactorily and showed no sign of disastrous effects.
REFERENCES
Riedler, W. in Intercorrelated Satellite Observations Related to Solar Events (Proceedings of the 3rd ESLAB/ESR1N Symposium, Noordwijk. September 1969), p. 557, D. Rei'del Publ. Co., Dordrecht-Holland, 1970.
LS2
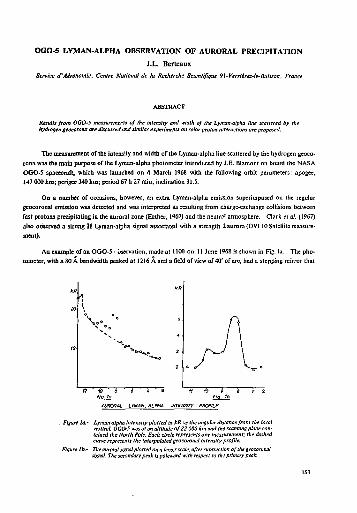
OGO-5 LYMAN-ALPHA OBSERVATION OF AURORAL PRECIPITATION
J.L. Berteaux
Service d'Aéronomle. Centre National de la Recherche Scientifique 9\-Verrières-le-Buisson, France
Results from OGO-5 measuremerts of the intensity and width of the Lyman-alpha line scattered by the hydrogen geocorona are discussed and similar experiments on solar proton interactions are proposed.
The measurement of the intensity and width of the Lyman-alpha line scattered by the hydrogen geocorona was tfie mam pui^ose of tie Lyman-alpha photometer introduced by J.E. Blamont on board Ihe NASA OGO-5 spacecraft, which was launched on 4 March 1968 with the following orbit parameters: apogee, 147 000 km; perigee 340 km; period 67 h 27 miu; inclination 31.5.
On a number of occasions, however, an extra Lyman-alpha emission superimposed on the regular geocoronal emission was detected and was interpreted as resulting from charge-exchange collisions between fast protons precipitating in the auroral zone(Eather, 1967) and the neutral atmosphere. Clark et al. (I967) also observed a strong H Lyman-alpha signal associated with a strength 2 aurora (OVI10 Satellite measurement).
An example of an OGO-5 ' ûservation, made at 1100 on II June 1968 is shown in Fïg. la. The photometer, with a 80 A bandwidth peaked at 1216 A and a field of view of 40' of arc, had a stepping mirror that
Ho la fig. 1b
AURORAL LTMAN. ALPHA ItiTENSlTr PROFILE
. Figure la.- Lyman-alpha intensity plotted in kR vs the angular distance from the local vertical OGO-5 was at an altitude of 22 000 km and the scanning plane contained the North Pole. Each circle represents one measurement; the dashed curve represents the interpolated geocomnal intensity profile.
Figure lb.- Tlie auroral signal plotted on a larger scale, after subtraction of the geocoronal signal. The secondary peak is poleward with respect to the primary peak.

provided a distribution of the Lyman-alpha intensity in a vertical plane by steps of 0.5* ar.d was maintained
in a fixed position for 0.5 sec
In fig. )b the geocoronal intensity has been subtracted and shows that the auroral emission in this case had an intensity of 6 kR, compared to a typical 100 RofH 9 auroral emission (Eather, 1967) and a calculated Lv-a/// e ratio of 7.5 (Rccs, 1961). Some spatial structure is visible, the secondary peak beingsituated pole-ward of the maximum intensity peak; at the location of the aurora the geocorona was lit by the Sun.
This observation would seem lo be correlated with the strong solar proton emission observed by Explorer 34 on 9,10 and 11 June 1968 and indicates that monitoring of the spectrum and intensity of Lyman-alpha aurorae could be a new tool in explaining further the mechanisms of interaction between solar protons and the Earth's magnetosphere. It could be employed both day and night, especially if coupled with a hydrogen absorption cell, in removing the major par. of ihe geocoronal Lyman-alpha emission.
REFERENCES
Clark, M.A. The Observation of a Proton Aurora in the Visible and at Lyman-Elliott, D.D. alpha, Trans. Am. Ceophys. Union, 48, p. 151 (1967). LaValle, S.R. Metzger, D.H.
Eaincr, R.H. Auroral Proton Precipitation and Hydrogen Emissions, Rev. Ceophys., 5. p. 207 (1967).
Rces, M.H. The Aurorally Associated Lyraan-aipha Radiation, Mem. Soc. R. ScL Liège, Ser. 5, 4. pp. 609-619 (1961).
MAGNETOSPHERIC SUBSTORMS : GEOSTATIONARY SATELLITE INVESTIGATIONS
IN RELATION TO GROUND-BASED OBSERVATIONS Bengt Hultqvist
Kinma Geophysical Observatory, Kinma, Sweden
ABSTRACT
It is suggested that became satellite particle measurements relate to a smaller volume of space they should have higher priority over magnetic and electric field measurements. The need for ground-based substorm measurements from N. Scandinavia, Spitsbergen, Bear Island, Iceland, Greenland, Jan Moyen, as veil as from Soviet and N. American sites is messed. Data processing requirements are also discussed.
INTRODUCTION
A substorm is a transient phenomenon and in order to study it in a synoptic manner a dense net of observation points is needed. A few such observation nets on the Earth's surface have ted lo the discovery of subst orras and have been the basis for most of what we now know and understand about (hem. However, the net should be three-dimensional. Although there is little hope of acquiring a large number of simultaneous observation paints in space around the Earth, including the distant magnetosphere, it is certainly important for substorm investigation to have as many as possible. What is considered here is the case of the geostationary satellite in addition to ground-based observation stations.
Europe has some advantages over the USA as far as the ground aspect of (he geostationary satellite project is concerned. This is perhaps most pronounced in the launching of sounding rockets but is also to some extent true for ordinary ground-based measurements. It is highly desirable for all possible means of improving tie scientific value to be exploited and this has been stated many times before in the planning and preparation of this satellite project.
Two obvious questions to be asked are the following:
1) In what way can measurements at a geostationary satellite supplement ground observations of substorms?
2} How to arrange the ground-based observation network in order to supplement as far as possible the geostationary satellite measurements during substorms?
1. IMPORTANCE OF PARTICLE MEASUREMENTS
Let us consider for 3 moment the Ërst question. It is obvious that the energetic particles at the satellite are of special interest in this respect, as they are the cause of most of the ionospheric effects observed from the ground. I personally doubt ibal the simplest kino's of correlation studies between the ground observation cf various energetic particle «Sects, such as aurora, radio wave absorption, VLF emissions, etc and rough
155

integral flux measurements with little or no pitch angle information on the satellite, will provide very much new information in 1974 and 1975. It is important for the geostationary satellite to provide us with detailed measurements of the energy spectrum for electrons us well as for protons, and perhaps a-particles, over a wide energy range (say, from a small fraction of a keV to MeV energies) as a function of pitch angle. The loss cone is of special interest for relating measurements at the geostationary satellite with those on the ground.
Particle measurements at the geostationary satellite are particularly important because it is only measurements in the equatorial plane that can tell us anything about the total trapped particle and particle energy content in a field tube and they are therefore necessary for answering such questions as:
a) Is the observed particle precipitation in the atmosphere consistent with the measurements in the equatorial plane, or is acceleration outside the equatorial region important?
b) Does the trapped particle energy content in a field tube increase or decrease—far separate energy intervals as well as totally—when particles of different energies are precipitated; i.e. can the precipitation be considered as the dumping of existing old particles, or not?
c) Is the time delay observed at local times away from the starting point of the subslorm consistent with the drift of the particles (of measured energy) causing the phenomenon from that sector, or is local acceleration needed?
d) How do the pitch angle distribution and energy spectrum change in the equatorial plane when there is an auroral break-up in the atmosphere?
e) Is it at all possible to understand the pitch angle distributions peaked along the magnetic held lines seen in the atmosphere, in terms of the intensification of flux solely in the loss cone in the equatorial plane but not z: larger pitch angles ? If not, the effect must be due to low-altitude processes.
f) Is there any modulation of the particle ilux in the atmosphere which definitely cannot be seen in the equatorial plane?
There are many more fundamental questions to which the answers are unknown. They must be answered in order to understand the plasma properties in the Earth's environment and many of them cannot be answered on the basis of geostationary satellite measurements alone or ground measurements alone. Some muy have been answered before the geostationary satellite is in orbit but certainly not all. Most of these questions have one thing in common: quite complete and detailed particte measurements are needed to provide the answers.
In addition, the magnetic and electric field measurements at the geostationary satellite will certainly support corresponding types of measurements on the Earth's surface in maDy important ways. However, both the magnetic and the electric field measurements on the ground,* as well as at the satellite, integrate effects over much larger regions or space than the particle measurements, and therefore do not permit such exact deductions to be made about the relations between phenomena in the atmosphere and at the geostationary satellite as do particle measurements. This is the main reason, from the ground-based aspect or the operation, for placing a higher priority on good and complete particle measurements at the satellite than on magnetic and electric field measurements.
156
2. RANGE OF GROUND OBSERVATION NETWORK
With regard to the second question, the entire region where the field line at which the satellite is located reaches the atmosphere should be covered. However, for substorm investigations ground observations are needed over all the aurora) and polar cap tegions.
I firmly believe that if considerable improvements are made in our ground synaptic observations it will be possible for important new contributions to the understanding of these substorm phenomena to be made. However, some new hardware or software must be introduced. By software is meant the way of organising the study, density of the net, cooperation in handling data reduction, etc. The most important new dement in Uw substorm studies under discussion is the geostationary satellite, but substantial improvements can also certainly be made on the ground. Balloons, sounding rockets and low-orbit satellites also need to be employed, but Ihcy are discussed elsewhere at this meeting-
Let us then consider auroral observations in a little more detail. All-sky cameras (colour if possible) at maximum intervals of 400-500 km, should cover northern Scandinavia, i.e. Norway, Finland and Sweden, north of approximately 60" to 62" geomagnetic latitude. The distance should, however, be a good deal less than SCO km in order to obtain useful information when the sky is partly covered by cloud.
It is also extremely important for measurements to be made at Bear Island, as well as in southern, central and nortbem Spitzbergen, thus giving a good geomagnetic latitude coverage. The longitudinal coverage is likewise very important for substorm studies and the Greenland stations, where there is an additional latitude chtin, are of particular importance. In northern Europe, where there is sa much sea area, ft is important for measurements to be made in Iceland and on Jan Mayen. Another obvious need is to seek the cooperation of Soviet observatories on the Kola peninsula and along the Siberian coast. Measurements from Canada and Alaska would of course, also be needed.
3. CONCLUSIONS
Consequently, as soon as the question of substorm investigations arises th ground observation aspect becomes an important operation. For it to be successful—
a) The groups carrying out the ground observations should participate in the substorm aspect of the project on an equal footing with those groups concerned with the satellite experiments. This means that all relevant data, obtained from the geostationary satellite, other satellites, rockets, balloons, as well as on the ground, should go into a common substorm da;a pool available to all contributing groups.
b) ESRO, or more precisely, ESOC should undertake the task of collecting and organising ad the data.
c) A special committee should be set up by the scientific community and ESRO, to be responsible for making detailed plans and recommendations for ground-based measurements as well as for organising the analysis data, ESRO to supply the secretarial and other administrative assistance. This committee should of course, also contain representatives from non-ESRO countries such as Norway, Finland, Iceland, USSR, Canada and the USA (Alaska^.
157
I think it would be of great value if steps were to be taken at this present meeting for establishing such a committee.
I will not go into furtlu.. details here concerning the various measurements necJcd, but I would like to emphasise once again that something more must be done concenung improved ground measurements than was done during the IGY in the limited sphere we are discussing; improved methods of measurement must be introduced where possible as well as greater cooperation in the use and analysis of the data than occurred after the IGY.
15B

COORDINATED GROUND AND SATELLITE OBSEÏÏVATTONS
O. Holt
Aurora Observatory, Tromsô, Norway
I agree with Dr. Hultqvist that it is very important to begin planning coordinated ground-based and satellite experiments. However, I think we should consider all aspects of an experiment rather than just concentrating on a particular instrument.
I would like to support Dr RothwelTs pica for the early availability of all standard satellite data. However, I disagree with those who consider such arrangements as being of value only at the time of launching a rocket or a balloon. The rapid availability of satellite data is also important for standard ground-based operations and 1 would like to describe some work carried out at Tromsô during the recent visit of Professor Keikkila of the University of Texas at Dallas. With a soft particle spectrometer on board the Iris-A satellite and with the aid of a computer programme an analog recording was made of his data in real time at our station. With this arrangement we were able to vary the mode of his experiment according to the measurements made by our ground-based instruments. For example, if a pulsating aurora WLS detected with our photometer his experiment would be arranged to cover a few distinct particle energies rather than sweeping a spectrum to study time variations. On the other hand, if his instruments detected strong proton fluxes our spectrometer would be used for studying H-alpha emissions.
[ consider this type of relation between the satellite and ground-based experiments to be very important.

Flgurt / .- Locations Of Firuifih &ophys!cct staltora.
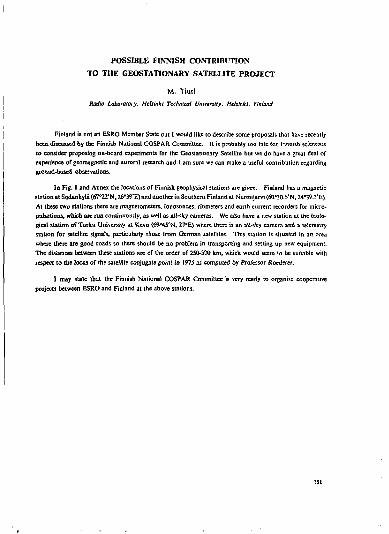
POSSIBLE FINNISH CONTRIBUTION
TO THE GEOSTATIONARY SATELLITE PROJECT
M. Tiuri
Radio Laboratofj, Helsinki Technical University, Helsinki, Finland
Finland is not an ESRO Member Stale out I would like to describe some proposals that have recently been discussed by the Finnish National COSPAR Committee. It is probably too late for Finnish scientists to consider proposing on-board experiments Tor the Geostationary Satellite but we do have a great deal of experience of geomagnetic and aurora) research and I am sure we can make a useful contribution regarding ground-based observations.
In Fig. I and Annex the locations of Finnish geophysical stations are given. Finland has a magnetic stetion at Sodankylâ (67°22'N. 26'39'E) and another in Southern Finland at Nurmijârvi (60*30.5'N, 24°3°.3'E). At these two stations there are magnetometers, ionosondes, riometers and earth current recorders Tor micro-pulsations, which are run continuously, as well as all-sky cameras. We also have a new station at the biological station of Turku University at Kevo (69"45'N, 278E) where there is an all-sky camera and a telemetry station for satellite signals, particularly those from German satellites. This station is situated in an area where there are good roads so there should be no problem in transporting and setting up new equipment. The distances between these stations are of the order of 250-300 km, which would seem to be suitable with respect to the locus of the satellite conjugate point in 1975 as computed by Proièssor Rocderer.
I may state that the Finnish National COSPAR Committee is very ready to organise cooperative
projects between ESRO and Finland at the above stations.
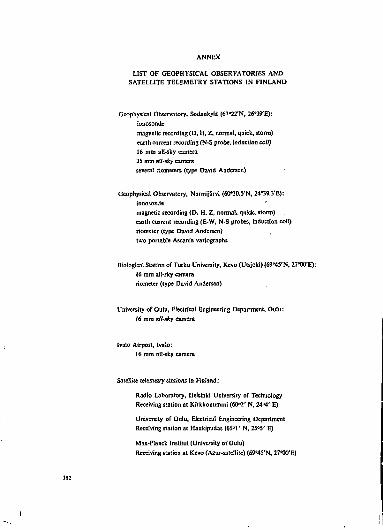
ANNEX
LIST OF GEOPHYSICAL OBSERVATORIES AND SATELLITE TELEMETRY STATIONS IN FINLAND
Geophysical Observatory, Sodankylâ (67"22'N, IfTWE): io nos on de magnetic recording (D, H, Z, normal, quick, storm) earth current recording (N-S probe, induction coil) 16 mm all-sky camera 35 mm alt-sky camera several riometers (type David Andersen)
Geophysical Observatory, NurmijStvi (60*30.5'N, 24*39.3'E): ionosonde magnetic recording <D, H, Z, normal, quick, storm) earth current recording (E-W, N-S probes, induction coil) riomster (type David Andersen) two portable Ascania variographs
Biological Station of Turku University. Kevo (Utsjoki) (69°45'N, 27B00'E): Id mm alt-sky camera riometer (type David Andersen)
University of Oulu, Electrical Engineering Department, Oulu: 16 mm all-sky camera
Ivalo Airport, Ivalo: 16 mm all-sky camera
Satellite telemetry stations in Finland :
Radio Laboratory, Helsinki University of Technology Receiving station at Kirkkonummi (60°2' N, 24°4' E)
University of Oulu, Electrical Engineering Department Receiving station at Haukipudas (65°1 ' N, 25 a5' E)
Max-Planck Institut (University of Oulu) Receiving station at Kevo (Azur-satellite) (o9°45'N, 27aO0'E)

PERIODIC VARIATIONS OF ELECTRON FLUXES
OBSERVED AT SYNCHRONOUS ALTITUDES
George K. Parks*
Université de Toulouse
Centre d'Étude Spatiale des Rayonnements BP n" 4057, 31 - Tou louse
ABSTRACT
Temporal analysis of electron fluxes dtiected at synchronous altitudes indicates that the commonly observed periodic variations -At the precipitated fluxes also persist in the equatorial electrons with large pilch-angles. The dynamic spectral analysis of twenty consecutive days of electron data indicates that the subslarm-correlattd increases of electrons observed in the equatorial plane have a recurrence period of about 2.5 hours. faster fluctuations are also observed within the substarm period. These include variations of a few minutes period and the more rapid S to 4Q*econdperiods.
1. I N T R O D U C T I O N
I t is well k n o w n f rom pas t satellite observat ions tha t t he o u t e r z o n e electron fluxes unde rgo large
var ia t ions in bo th space and time ( F r a n k , 1965). It is a lso known tha t these var ia t ions are associated with
magne tosphcr ic acceleration a n d precipi tat ion phenomena . Unt i l recently, detailed information concerning
such va r i a t ions i n t he o u t e r magne tosphere w a s difficult t o ob ta in owing t o the rapid mot ion of the satellites.
However , detectors car r ied o n geos ta t ionary satellites have m a d e it possibl- to car ry o u t such studies. T h e
local magne t i c field measurements at the geosta t ionary orbit provide information on the relative mot ion of
L-shells d u e t o t he d is tor t ion o f the magne tosphere . Therefore , e lectron flux var ia t ions o n a fixed shell c a n
n o w be separated (in principle) from var ia t ions caused by L-shells moving by the satellite, and temporal
var ia t ions of energet ic electrons in t he equator ia l p lane can be examined ID detail .
ReccDt par t ic le experiments o n the geosta t ionary satellite, A T S I, a n d the corre la ted high-alt i tude bal
loon flights have s h o w n t h a t the ou te r zone energetic electron fluxes of energies £ 5 0 k e V undergo la r je inten
sity var ia t ions dur ing magne tospher ic subs to rms (Pa rks a n d Winckler , 1968). Simul taneously with these
large increases o f e lectron fluxes observed in t he equator ia l p lane, ba l loons a t t he au ro ra l conjugate bave
detected intense precipi tated fluxes. These large increases a r e non-adiaba t ic changes of electron fluxes and
represent n e w addi t ions o f freshly accelerated particles to the radia t ion belts, ft rs becoming more evident
t ha t part icles accelerated dur ing subs to rms const i tu te t he p r edominan t source of energetic electrons for the
o u t e r rad ia t ion bel ts .
T h e character is t ic pe r iod c f part icle accelera t ion observed i n t h e equa tor ia l p lane is between 1-3 h o u r s
(Pa rks a n d Winckler, 1968). However , it is well k n o w n f rom precipi ta t ion measurements that fluctuations
of a quasi -per iodic n a t u r e exist f rom tens of milliseconds !o several hundred seconds . These rapid variat ions
• Formerly of the Physics Department, University of Minnesota
163

are superposed within the characteristic substorm period and may possibly arise from complex wave-particle interactions and instabilities associated with the acceleration processes. Consequently, important clues may be derived concealing (he acceleration, precipitation, and modulation mechanisms operating in the magne-toplasma medium.
Examination of the extensive ATS I energetic electron data file Etas shown that numerous fluctuating phenomena common to precipitated fluxes also exist in the equatorial electron fluxes. The purpose of the present paper is to present some of the temporal properties of the different types of fluctuating particle phenomena that have been observed in the equatorial plane at synchronous altitudes. When possible, data will be interpreted in terms of pertinent theories.
2. INSTRUMENT
The University of Minnesota electron spectrometer on board the ATS 1 geostationary satellite is a narrow aperture detector (full view angle 11s) fixed perpendicular to the.satellite spin axis. Nominally, electrons of pitch-angles about €0-90" are detected. The electrons are detected in three energy ranges: 50-150 keV, 150-500 keV, and 500-1000 keV. Ths counts/sample multiplied by 4 J x 10* gives electron fluxes in (cmfl-sec-ster-ke V)- 1 in the 50-150 keV channel. The factors in the other two channels are 7.79 x I0 1
and 4.05 x 101, respectively. The three energy channels and the background are sampled sequentially, and the maximum time resolution for a given energy channel is 160 milliseconds.
3. RESULTS
Table 1 lists the most common types of particle flux variations deduced from both balloon and rocket data during substorms. The different types of fluctuations are fisted according to their temporal characteristics. Table I alsoincludesthelccaltimeswtorwheretJiespecinctypeoffluctuationsaremostccmmoniy observed, including their characteristic e-folding energies and spatial extent (referred to 100 km altitude in the ionosphere). With the exception of the " millisecond " structures and microbursts, the numerous variations have been observed in tbe equatorial fluxes at synchronous altitudes. Below, the properties of these variations as deduced from the ATS 1 measurements and the correlated balloon flights are given.
(a) 1-3 hours: This period is associated with the fundamental mode of particle acceleration in the magnetosphere. The increases of particles observed in the equatorial plane have the characteristic period of and occur during auroral substonns (Akasofu, 1964). The periodic nature of these electron increases in the equatorial plane has been examined in detail and the results arc discussed below.
Figure 1 is a statistical study of twenty consecutive days of electron data obtained at synchronous altitudes ihat included many days of substorm activity. The top curve shows the three-hour averages of the flur-time profile. The bottom curve shows the frequency characteristics of the electron flux variations associated with substorms, shown here os a function of time. Six levels of power contours are shown. The darkest shade represents the largest amplitude, and the successive levels correspond tu oscillation amplitudes half as large. Tbe power spectrum derived from the dynamic spectrum is shown on the right The large
164
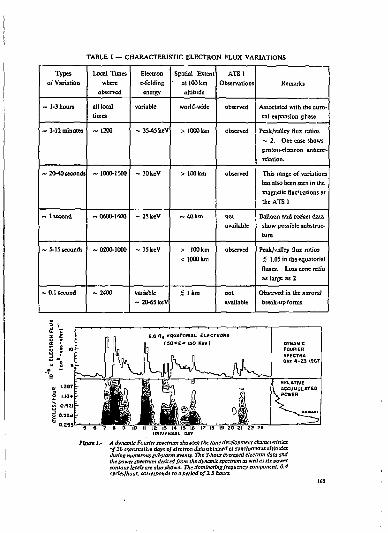
TABLE I — CHARACTERISTIC ELECTRON FLUX VARIATIONS
Types 01 Variation
Local Times where
observed III Spatial Extent
at 100 km altitude
ATS1 Observations Remarks
- 1-3 hours all local times
variable world-wide observed Associated with the auroral expansion phase
- 3-12 minutes ~ 120C ~ 35-45 keV > 1000 tan observed Peak/valley flux ratios ~ 2- One case shows proton-electron anticor-rclation.
- 20-40 seconds - 1000-1500 ~30kcV > 100 km observed This range of variations has also been seen i n the magnetic fluctuations at the ATS I
~ ! second -0600-1400 ~ 25 keV ~ 4 0 k m not available
Balloon and rocket data show possible substructure
~ 5-15 seconds ~ 0200-1000 - 15keV > 100 km < 1000 km
observed Peak/valley flux ratios S 1.05 in l is equatorial fluxes. Loss cone ratio as large as 2
~ 0.1 second - 2 4 0 0 variable ~ 20-65 keV
< Jkm not available
Observed in the auroral break-up forms
K '-387
g 1.104
<fl O.IZI
£> 0.33d
° 0.253
6.6 R« EQUATORIAL ELECTRONS (SO<E<!50 K«V|
^NL^jA-^, OrHAMIC FOURIER SPECTRA DAY 4-23 I96T
19 20 21 22 23
A dynamic Fourier spectrum showing the time development characteristics i / 20 consecutive days of electron data obtained at synchronous altitudes during numerous substorm events. The 3-hour averaged electron data and the power spectrum derived from the dynamic spectrum as wetliu six po-^er contour levels are also shown. The dominating frequency component. 0.4 cycles/hour, corresponds to a period of Z5 hours.

increases of electron fluxes observed in the outer zone shown by the 3-hour averages are due to substorm-correlated increases. It is apparent that the overaii electron Sus ievd m the radiation belt is enhanced by the periodic recurrence of substorms. The periodic nature of substonns is indicated by the presence of a single peak in the power spectrum at 2.5 hours. It is also worthy of note that the high electron flux level at synchronous altitudes remained above the quiet time flux level for several days. Typical e-folding decay times for the twenty days studied varied between one and four days. This decay rate either represents loss rate of these electrons into the Earth's atmosphere or diffusion rate onto other magnetic shells. Note that the fluxes decayed to a value that corresponds closely to the critical flux limit, ~ 3 x I0 T (cm1 sec) - 1 (Kennel and Petschek, 1966).
The relationship between the trapped electron Mux increases and the precipitated auroral fluxes has been studied in detail by Parks (1970). These are summarised as follows:
I) Increases of electron fluxes in the equatorial plane during substonns are"always accompanied by precipitated fluxes in the auroral zone. The excellent correlation is observed from about local midnight to local noon, indicating that the precipitation and acceleration are strongly coupled.
2} The energy spectra between precipitated auroral and trapped equatorial electron fluxes are similar.
3) The equatorial pitch-angle distributions during subsEorms are always anisotropic and peaked toward 90° pitches. The pitch-angle distribution appears to depend on the electron flux and, therefore, changes during a substorm.
4) The acceleration phenomena is energy dependent in that > 95 % of electron fluxes observed are in the energy range 50-150 keV (for the Minnesota particle detector system).
5) The lifetimes of the substgrm-correlated accelerated particles varied between 200 seconds to 2000 seconds, with electrons in a typical event having a lifetime of about 1000 seconds.
Our observations indicate that the lifetimes of the substorm-corrclated electrons are short compared to their drift periods, and that the time profile; within and outside the loss cone are extremely well correlated even past local noon. Consequently, we have concluded that the acceleration mechanism affects particles n all pitch-angles at the some time during substorms, including the loss cone from which particles are precipitated. There is a strong suggestion that the dynamic processes responsible for magnetospberic substonns are large-scale disturbances capable of acting synchronously over large distances in both longitude and latitude.
Although there is at present no complete theory that car; explain in their entirety the magnetospheric or auroral acceleration processes, we have recently suggested that energy diffusion accompanying strong pitch-angle diffusion in cyclotron resonant interaction in the whistler mode is probably an important particle acceleration mechanism in the raagnetosphcra. It has been possible to interpret our observations in a consistent manner using the strong diffusion model (Kennel, 1969). Figure 2 illustrates the energy diffusion path required to explain the strong coupling between precipitated and trapped particles. The original article by Parks (1970) should be consulted for details.

VELOCITY SPACE DIFFUSION
Figure 2.- Election diffusion oaths rtouircd to cxnkin the correlation between precipitated and trapped electron Increases.
(b) j-12 minutes: This type of variation is most commonly observed around local noon. Earlier satellites have also reported seeing this type of variation iu the distant radiation zones, especially near the partide Uapplog boundary (Un and Anderson, 1966). These modulated structures may arise from the betatron-modulation of electron fluxes by the presence of hydromagnetic waves in the regions (Judge and Coleman, 1962). However, as will be shown below, particle fluctuations of three periods at synchronous altitudes are more characteristic of plasma instabilities.
167
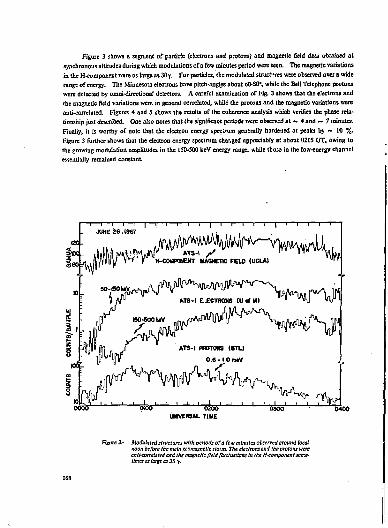
Figure 3 shows a segment of particle (electrons and protons) and magnetic field data obtained at synchronous altitudes during which modulations of a few minutes period were seen. The magnetic variations in the H-component were as large as My. For particles, the modulated struct"res were observed over a wide range of energy. The Minnesota electrons have pitch-angles about 60-80", while the Bell Telephone protons were detected by omni-directionaï detectors. A careful examination of Fig. 3 shows that the electrons and the magnetic field variations wero in general correlated, while the protons and the magnetic variations were anti-correlated. Figures 4 and 5 shows the results of the coherence analysis which verifies the phase relationship just described. One also notes that the significant periods were observed at ** 4 and ~ 7 minutes. Finahy, it is worthy of note that the electron energy spectrum generally hardened at peaks by ~ 10 %. Figure 3 further shows that the electron energy spectrum changed appreciably at about 0215 UT, owing to the growing modulation amplitudes in the 150-500 keV energy range, while those in the low-energy channel essentially remained constant
I T~ n — i — i — p - 1 — i — i — i — I — I — i — i — i — i — I — | — r — T — r — T — r
UKVER9AL TIME
Figure 3.- Modulated structures with periods of a few minutes observed around local noon before the main geomagnetic stoim. The electrons and the protons were cntl-correktedand themagnetic fieldfluctuations hi the H-componentsometimes as targe as 30 7.
168
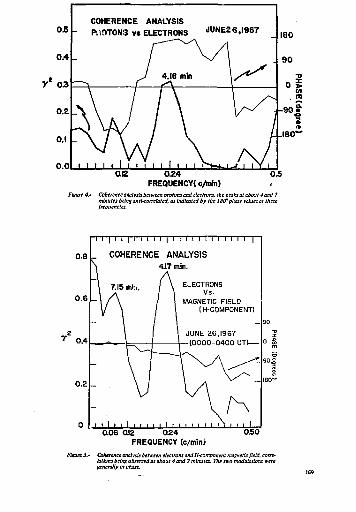
OS COHERENCE ANALYSIS
- PVtOTONiî v* ELECTRONS JUNE26.I967 i
0.4 c
y* os J 4.16 mln r
0.2 -\\A/ A W^i -0.1
v / / J
0.0 1 1 1 1 1 1 1 1 1 1 1 1 1 1 1 -br+j.-f i i / i
_ 180
. 90
0 > 01 l"l
90 J 1
» .180"
O.E 0.24 FREQUENCY(c/Mn)
0.5
Figure 4.' Coherence analysis between protons and electrons, the peaks at about 4 and 7 minutes being anH-corretated, as Indicated by the ISO'phase values at these freauencles.
0.8
T '| 1 1 I T ! 1 1 1 | 1 M 1 1 1 1 1 1 1 1 1 |
COHERENCE ANALYSIS 4.17 min.
0.6 -7.15 ml„ / \ ELECTRONS
/ \ / 1 MAGNETIC FIELD / \ / \ ( H-COMPONENT)
0 4 \ 1 1 JUNE 26,1967
0.2
-
V s
0 J _ 1 ' ' 1 ' ' ' ' ' 1 ' \ i i i .!.._ 0.06 012 024 0.50
FREQUENCY (c/mini Figure 5.- Coherence analysis between electrons and H-component magnetic field, coi
latlons being observed at about 4 and Tmmuta. The two modulations w. generally In phase.
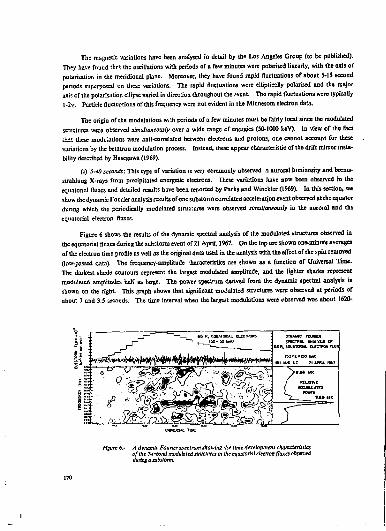
The magnetic variations have been analysed in detail by th« Los Angeles Group {to be published). They have found thrt the oscillations with periods of a few minutes were polarised linearly, with the axis of polarisation in the meridional plane. Moreover, they have found rapid fluctuations of about S-15 second periods superposed on these variations. The rapid fluctuations were elliptically polarised and the major axis of the polarisation ellipse varied in direction throughout the ,-vent. The rapid fluctuations were typically 1-2Y- Particle fluctuerions of this frequency were not evident in the Minnesota electron data.
The origin of the modulations w,:h periods of a few minutes must be fairly local since the modulated
structures were observed simultaneously over a wide range of energies {50-1000 keV). In view of the fact
thai these modulations were anti-correlated between electrons and protons, one cannot account for these
variations by the betatron modulation process. Instead, these appear characteristic of the drift mirror insta
bility described by Hasegawa (1969).
(c) 5-40 seconds: This type of variation is very commonly observed a auroral luminosity and brems-
strahlODg X-rays from precipitated energetic electrons. These variations have now been observed m the
equatorial fluxes and detailed results have been rer/orted by Parks and Winckler (1969). la this section, we
show the dynamic Fourier analysis resultsof one substorm correlated acceleration evint observed at the equator
during which the periodically modulated structures were observed simultaneously in the Buroral and the
equatorial electron fluxes.
Figure 6 shows the results of the dynamic spectral analysis of the modulated structures observed in the equatorial fluxes during the substorm event of 7,1 April, 1967. On the top are shown one-minute averages of the electron time profile as well as the original data used in the analysis with the effect of the spin removed (low-passed data). The frequency-amplitude -Jiaracteristics are shown as a function of Universal Time. The darkest shade contours represent the largest modulated amplitude, and the lighter shades represent modulated amplitudes half as large. The power spectrin) derived from the dynamic spectral analysis is shown on the right This graph shows that significant modulated structures were observed at periods of about 7 and 3.5 seconds. The time interval when the largest modulations were observed was about 1620-
hlgure 6.- A dynamic Fourier spectrum showing *A* lime 'teveîopmerU ckamcterùttcs of the 7-i'tond modulated structures In the equatorial electron fluxes observed during a sabitorm.
170
1639 UT. These modulated structures on the equatorial plane were observed simultaneously with those in predpitaiuJ electrons. The modulations J the precipitated electrons had periods of about 4 and 8 seconds (not shown).
A comparison of the modulated structures in the equatorial and auroral electrons shows that the modulations in precipitated fluxes were considerably larger. The peak-to-valley flux ratios in the precipitated fluxes attained values as large as 2, while such ratios in the equatorial plane were ~ 1 OS. This indicates that the mechanism responsible for these modulated structures is more efibetive for partides in ue loss-cone than those in the equatorial plane with large pitch-angles. We believe that the modulated structures are not directly Associated with the primary acceleration process responsible for substann-correlated electron increases but rather the modulations represent the effects of microscopic plasma instabilities subsequent to the energisation process. The loss-cone modulation mechanism described recently by Coroniti and Kennel (1970) appears to good agreement with our observations (for details of these modulated structures, see Parks and Winckler, 1969).
4. SUMMARY AND CONCLUSION
This article has shown that the structures often seen in precipitated fluxes also persist in the equatorial electrons with large pitch-angles. The longest period observed was about 2.5 hours, and this period was associated with the fundamental acceleration process during magnetospheric substorms. Examples have been given of well-defined structures with periods of about four minutes observed in electrons, protons, and the local magnetic field. These modulated structures could not be accounted for by the betatron process, in view of the fact that the electrons and the protons were out of phase by about 180*. Consequently, it is concluded that the structures were associated with some form of plasma instability. Finally, by use of Fourier analysis, it has been shown that the equatorial fluxes were sometimes modulated with 5-40 second periods. The modulation levels in tbs equatorial fluxes were considerably smaller than those in the loss cone, indicating that the mechanism responsible for these structures was more effective for particles in the loss-cone than for those with large pitch-angles. Previously, it was suggested that if particles with large pitch-angles were initially betatron-modulated by micropulsations of the same periods at the equator, the observed structures at the equator could simply represent the wave periods. However, because betatron modulation enhances pitch-angle onisotropy, whistlers will be generated and electrons scattered into the loss-cone and precipitated. Consequently, particles in the loss cone should also show the wave periods. Coleman and Mc Pherroa (1970) recently indicated their findings of such micropulsations in the equatorial plane. The waves had periods of about 20 seconds and the RMS values were about l-2y. These were found in the 17 August, 1967 substorro events during which similar structures in electron fluxes were observed (Parks and Winckler, 1969).
With the exception of the 1-3 hour period, the various temporal structures are interpreted to represent a modulation process that takes place after the electrons have been accelerated by some other means. These rapid structures cao arise from microcospic plasma instabilities. On the other hand, the characteristic times of 1-3 hours are believed to be associated with the magnetospheric substorm. The substorm process must be macroscopic in nature since the substorm is large-scaled and the duration involved is of the order of an hour. Although we are ignorant of the detailed process, it is interesting to r.ole that both the geomagnetic field reconnection model (Dungey, 1963, Levy et a/., 1964, Axford et at., 1965) and the flapping tail model ol Obayashi (1967) call for time-scales of about [-3 hours.
171
The data presented here has been primarily electron measurements of energies * 50 keV with large pitch-angles. Information on low-energy electrons and protons was not available. Finally, although the time resolution of the apparatus permitted measurement of " microburstlike " structures, this information was lost because of the spin of the ATS 1 satellite (spin period ~ 0.6 seconds). Future experiments on geostationary satellites can easily provide such information.
ACKNOWLEDGEMENT
This text was written at the Faculté des Sciences, Université de Toulouse, and the research carried out while the author was at the School of Physics and Astronomy, University of Minnesota. Tbe ATS satellite programme wa: supported by National Aeronautics and Space Administration contract NAS 5 - 9542. The high-altitude balloon project was supported by the National Science Foundation Grant NSF GA-487,

REFERENCES
The Development of Auroral Substorms, Planet. Space Sci.. 12. p. 273 (1964).
Axford, W.I. Petschek, H.E. Siscoe, G.L.
Tail of the Magnetosphere, J. Geophys. Res.. 70, p. 1231 (1965).
Coleman. PJ . Jr. McPherron, R.L.
Fluctuations in the Distant Geomagnetic Field during Subs terms: ATS 1, in Particles and Fields in the Magnetosphere (B.M. McCormac, éd.), p. 171, Rcidel Publ., Dordrecht-Holland. 1970.
Coroniti, F.V. Kennel, C.F.
Electron Precipitation Pulsations, / . Geophys. Res.. 75, p. 1279 (1970).
Dungey, J.W.
Frank, L.A.
Interactions of Solar Plasma with the Geomagnetic Field, Planet. Space Sci.. 10, p. 233 (1963).
A Survey of Electrons E > 40 keV Beyond 5 Earth Radii with Explorer 14, / . Geophys. Res., 70. p. 1593 (1965).
Hasegawa, A. Drift Mirror Instability in the Magnetosphere, Phys. Fluids, 12. p. 2642 (1969).
Judge, D.L. Coleman, PJ . Jr.
Observations of Low-Frequency Hydromagnelic Waves in the Distant Geomagnetic Field: Explorer 6, J. Geophys. Res.. 67, p. 5071 (1962).
Consequences of a Magneiosphcric Plasma, Rev. Geophys., 7. p. 379 (1969).
Kennel, C F . Petschek, H.E.
Limit on Stably Trapped Particle Fluxes, / . Geophys. Res., 71, p. 1 (1966).
Levy,R.H. Petschek, H.E. Siscoe, G.L.
Aerodynamic Aspects of the Magnetospberic Flow, AIAA Journal, 2. p. 2065 (1964).
Lin, R.P. Anderson, K.A.
Periodic Modulations of the Energie Electron Fluxes in the Distant Radiation Zone, J. Geophys. Res., 71, p. 1827 (1966).
Obayashi, T. Flapping Motions of the Magnetospheric Tail, Report of Ionosphere and Space Research in Japan, vol. 21, p. 137,1967 (Conference on Conjugate-Point Phenomena, Boulder, Colorado, June 1967).
Parks, G.K. Wincklcr, J.R.
Acceleration of Energetic Electrons Observed at the Synchronous Altitude during Magnetospheric Substonns, J. Geophys. Res., 73, p. 5786 (1968).
Parks, G.K. Simultaneous Observationsof5-to IS-second Period Modulate Energetic Winckler, J.R. Election Fluxes at the Synchronous Altitude and the Auroral Zone,
J. Ceophys. Res., 74, p. 4003 (1969).
Parks, O.K. The Acceleration and Precipiution of Van Allen Outer Zone Energetic Electrons, J. Geophys. Res., 75, p. 3802 (1970).

COORDINATED STUDIES OF PRECIPITATED ELECTRONS BY GEOSTATIONARY SATELLITE AND BALLOONS
Harald Trefall Department of Physics, University of Bergen, Bergen, Norway
ABSTRACT
Examples of the local time variations of the spatial character of electron précipitation events over Northern Scandinavia are discussed. Conjugate points may move around by several hundred kilometres a day and useful simultaneous balloon and satellite measurements are only likely when the conjugate point Is within about 100 km of the balloon. Balloon /cachings from a north-south chain of stations across the auroral zone to determine the latitude, and possibly (M longitude, of the point conjugate to the satellite are proposed New balloon and satellite Instruments are also proposed.
Simultaneous balloon observations of X-ray bremsstrahlung carried out by member groups of SPARMO from several locations in Northern Scandinavia since 1962 have shown that not only the temporal but also the spatial character of electron precipitation events varies greatly with local time. Examples of different types of precipitation events discussed are the following:
a) Impulsive precipitation events in the early evening associated with the onset of substorms around midnight, having probably a very limited north-south extension, and showing rapid south-north motions.
b) Midnight events associated with magnetic substorms, which have extensions of less than 100 km in the north-south direction but more than 1 000 km in the east-west direction and move with the auroral dcctrojeL
c) Slowly varying absorption events in the early morning, not associated with local geomagnetic disturbances, having large extensions in both north-south and east-west directions and showing a clear north-to-south movement of their well-defined southern boundaries.
d) Moving pulsating events around local dawn, which progress from cast to west and have large spatial extensions.
e) Late-moming to noon events of large cxteusion in all directions and coherent time-variations over large aureas.
f) Rapid pulsations with rather limited spatial extension. g) Microbursts with extensions of about 100 km or less in all directions.
Considering that the field of view of an unshielded X-ray detector at balloon altitudes is also of the order of 100 km, it is obvious that in most cases good correlation between simultaneous balloon and satellite measurements can be expected only when the geomagnetic field line through the satellite comes down, at [east in latitude, to within about 100 km of the balloon position. On the other band, it should also be possible to determine experimentally where the field line through the satellite actually falls by performing correlated
175
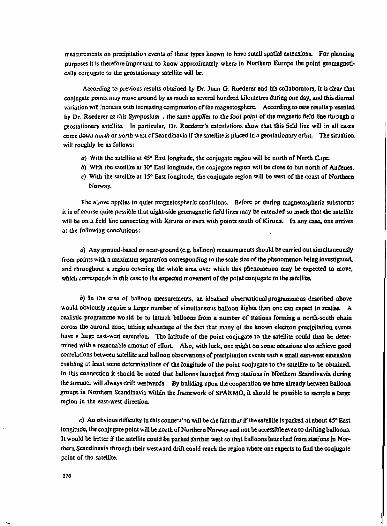
measurements on precipitation events of those types known to have small spatial extensions. For planning purposes it is therefore important to know approximately whero in Northern Europe the point geomagneti-cally conjugate to the geostationary satellite will be.
According to previous results obtained by Dr. Juan G. Roederer and his collaborators, it ta clear that conjugate points may move around by as much as several hundred kilometres during one day, and this diurnal variation will ,'ncrease with increasing compression of the magnctospherc. According to new results p/esented by Dr- Roederer at this Symposium , the same applies to the foot point of the magnetic field line through a geostationary satellite. In particular, Dr. Roedcrer's calculutions show that this field line will in all cases come doiw» north or north-west of Scandinavia if the satellite is placed in a geostationary orbit. The situation will roughly be as follows;
a) With the satellite at 45" East longitude, the conjugate region will be north of North Ope . o) With the satellite at 30" East longitude, the conjugate region will be close to but north of Andenes. c) With the satellite at 15 s East longitude, the conjugate region will be west of the coast of Northern
Norway.
1 he above applies to quiet magnetospheric conditions. Before or during magnetospheric substorms it is of course quite possible that night-side geomagnetic field lines may be extended so much that the satellite will be on a Meld line connecting with Kiruna or even with points south of Kiruna. In any case, one arrives at the following conclusions;
a) Any ground-based or near-ground (e.g. balloon) measurements should be carried out simultaneously from points with a maximum separation corresponding to the scale size of the phenomenon being investigated, and throughout a region covering the whole area over which this phenomenon may be expected to move, which corresponds in this case to the expected movement of the point conjugate to the satellite.
b) In the case of balloon measurements, an idealised observational programme as described above would obviously require a larger number of simultaneous ballooa flights than one can expect to realise. A realistic programme would be to launch balloons from a number of stations forming a north-south chain across the auroral zone, taking advantage of the fact that many of the known electron precipitation events have a large east-west extension. The latitude of the point conjugate to the satellite could then be determined with a reasonable amount of effort. Also, with luck, one might on some occasions also achieve good correlations between satellite and balloon observations of precipitation events with a small east-west extension enabling at least some determinations of the longitude of the point conjugate to the satellite to be obtained. In this connection it should be noted that balloons launched from stations in Northern Scandinavia during the summer will always drift westwards. By building upon the cooperation we have already between balloon groups in Northern Scandinavia within the framework of SPARMO, it should be possible to sample a large region in the east-west direction.
c) An obvious difficulty in this conned: in will be the fact that if the satellite is parked at about 45" East longitude, the conjugate point will be north of Northern Norway and not be accessible even to drifting balloons. It would be better if the satellite could be parked farther west so that balloons launched from stations in Northern Scandinavia through their westward drift could reach the region where one expects to 6nd the conjugate point of the satellite.
176

Another very desirable development would be to have inexpensive light-weight magnetometers that could be carried with the balloons, so as to get a better picture of the magnetic aspects of substorms along with X-ray recordings. This would be especially important if the balloons had to drift out over the sea to reach the region where it was expected to find the point conjugate to the satellite.
To facilitate the comparison between satellite and balloon measurements it would be highly desirable if the satellite could contain an electron detector that only responded to electrons within the loss cone, or predominantly to such particles. If the detector mainly responds to trapped particles, it is possible that time variations within the loss cone, which are those which must be related to balloon observations of X-rays from precipitated particles, may be masked by unrelated time variations of the trapped particle flux. The aim should therefore be to have one satellite instrument to detect, as far as practically possible, the particles within the loss cone.
The advantage of having the satellite in an elliptical geosynchronous rather than a geostationary orbit, so that the satellite would move from say S.6 R B to 7.6 RH during a day, being closer in around midnight and further out around noon, should be seriously considered. The associated diurnal variation in longitude would probably not be unreasonably largj. This might facilitate correlations between gound-bosed and satellite measurements, in that the conjugate point of the satellite might then be placed closer to the mast active latitude region (auroral oval) at all local times.
In any case, the Bergen group would be very interested in cooperating with other European balloon groups and the groups having suitable experiments on board ths ESRO geostationary satellite, in order to utilise the unique observational possibilities that will be created through this satellite project.
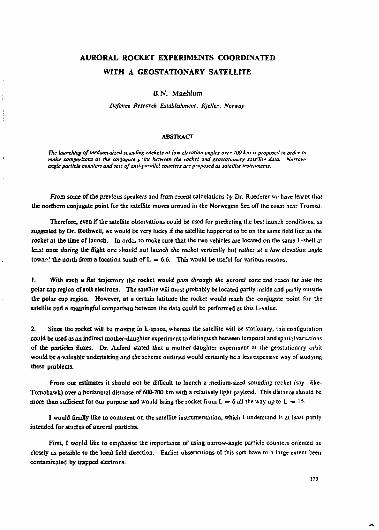
AURORAL ROCKET EXPERIMENTS COORDINATED
WITH A GEOSTATIONARY SATELLITE
B.N. Maehlum Defence Research Establishment. Kjeller, Norway
ABSTRACT
The launching of medium-sized sounding rackets at low elevation angles over 700 km is proposed in order to make comparisons at the conjugate j . •>/«/ bcween the rocket and geostationary satellite data. Narrow-angle particle counters and sets of anti-parallel counters are proposed as satellite instruments.
From some of the previous speakers and from recent calculations by Dr. Roederer wv have learnt that the northern conjugate point for the satellite moves around in the Norwegian Sea off [he coast near Tromso.
Therefore, even if the satellite observations couid be used Tor predicting the best launch conditions, as suggested by Dr. Rothwell, we would be very lucky if die satellite happered to be on the same field line as the rocket at the time of launch. In ordc. to make sure that the two vehicles are located on the same L-shell at feast once daring toe flight one should not launch the rocket vertically out rather at a low elevation angle towa.-.' the north from a location south of L = 6.6. This would be useful for various reasons :
(• With s-JCb a flat trajectory the rocket would pass through the auroral zone and reach Jar into (he polar cap region of soft electrons. The satellite will most probably be located partly inside and partly outside the polar cap region. However, at a certain latitude the rocket would reach the conjugate point for the satellite and a meaningful comparison between the data could be performed at this L-value.
2. Since the rocket will be moving in L-space, whereas the satellite will be stationary, this configura lion could be used as an indirect mother-daughter experiment to distinguish between temporal and spatial variations of the particles fluxes. Dr. Axford stated that a mother-daughter experiment at the geostationary orbit would be a valuable undertaking and the scheme outlined would certainly be a less expensive way of studying these problems.
From our estimates it should not be difficult to launch a medium-sized sounding rocket (say i like-Tomahawk) over a horizontal distance of 600-700 km with a relatively light paylor.d. This distance should be more than sufficient for our purpose and would bring the rocket from L = 6 all the way up to L = 15.
I would finally like to comment on the satellite instrumentation, which I understand ir, at least partly intended for studies of auroral particles.
First, I would like to emphasise the importance of using narrow-angle particle counteis oriented as closely as possible to the local field direction. Earlier observations of this sort have to a large extent been contaminated by trapped electrons.
179
Secondly, 1 think it would be very wise to use sets of two anti-parallel counters. To my knowledge nobody tins yet proved that there is complete north-south symmetry in the Muxes or1 field-aligned (ie. precipitated) particles near the equatorial plane. Ic fact, low-altitude particle observations indicate that significant asymmetries oust when the goemagnetic axis is not oriented in a direction normal to the solar wind. Such studies may prove important for the understanding of particle dynamics in the magnetosphere.
THE GEOSTATIONARY SATELLITE AS A DETECTOR OF ULTRAVIOLET SUNRISE AND SUNSET
RJ. Armstrong
Defence Research Establishment, Kjeller, Norway
ABSTRACT
A proposal for using a geostothnary satellite for observing ultraviolet sunrise and sunset Is presented. The Instrument would detect macroscopic changes In ozone absorption and ozone content.
I. INTRODUCTION
The detection of ultraviolet sunrise and sunset has been used in rocket and satellite studies for the determination oof zone profiles in the mésosphère and stratosphere "' .
There is an advantage in-using large zenith angles as this increases the length of the absorbing layers and gives better altitude discrimination. The finite size of the Sun introduces some smearing into the ozone profiles and the satellite position uncertainties also introduce errors. The angle subtended by the point of closest approach of the Sun's rays to the Earth and by the detector at the centre of the Earth is another factor determining the sensitivity of the method.
It is proposed that a stable geostationary satellite would offer advantages for long-verm measurements of the ozone screening layer over equatorial regions up to latitudes ± 23°. If stellar ultraviolet sources other than the Sun were used other regions of the Earth's surface could be investigated provided the sensitivity was increased.
2. PRINCIPLE OF METHOD
The basis of the proposal is to use an ultraviolet detector (for example 2600 A) to observe sunrise and
sunset from the geostationary satellite. The sensor could also be combined with housekeeping functions such
as solar aspect during sunlit periods.
It is unlikely that ozone profiles could be obtained, due to the distance of t ie geostationary orbit from the Earth. However, since effective screening heights for ozone are believed to vary by at least 10 km, the detector could be used to follow such macroscopic changes in ozone absorption and therefore of ozone content (see Figure).
181
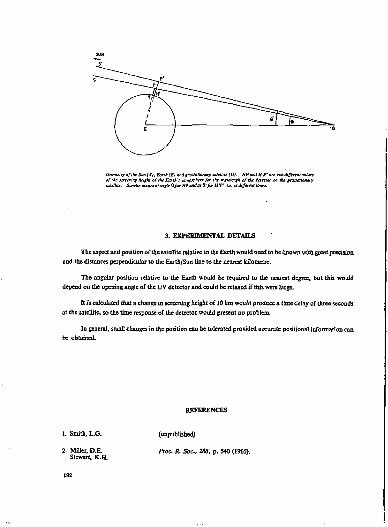
CromtiryoTihtSim ISj, EanhiE) and gnOtalhmrjr inrdlila (C). HPend HVare two different rnhtt eftkr strmlrf Atigkl of the Ectth'i elnasp/xre for the nwwlrnjd of tkc ituçur on the f alelliu. Suxrlst otcanat&ttleQfyr HP andet 0' far H'P', (*.a different OnKi.
3. EXPERIMENTAI. DETAILS
The aspect and position of the satellite relative to the Earth would need to be fcno wn with great precision and the distances perpendicular to the Earth/Sun line to the nearest kilometre.
The angular position relative to the Earth would be required to the nearest degree, but this would depend on the opening angle of the UV detector and could be relaxed if this were large.
It is calculated that a change in screening height of 10 Ian would produce a time belay of three seconds at the satellite, so the time response of the detector would present no problem.
In general, smal! changes in the position can be tolerated provided accurate positional information can be obtained.
REFERENCES
1. Smith, L.G.
2. Miller, D.E. Stewart, K.H.
(unpublished).
Proc. R. Soc. 283, p. 540 (1965).
CHARGED PARTICLE EMISSION FROM A GEOSTATIONARY SATELLITE Peter Stauning
Ionosphere Laboratory, Lyngby. Denmark
ABSTRACT
A quantitative model is derived for the interaction of a satellite emitting charged particles with an ionize-f medium characterized by satellite radius < Debyelength < electron gyro radius. In a numerical evaluation of the I-Vcharacteristic for the Ideallsei representation of a geostationary satellite, realistic values for the outer magnetosphere plasmi tensities, temperature and magnetic fields have been used. It is shown that t/ie emission of rather smaS urrents of energetic particles can cause considerable changes in the satellite equilibrium potential. Changes of several hundred volts are found for electron or Ion currents of about 1 mA. It is suggested that such a capability should be included in the pay load of the ESRO geostationary satellite to optimise the operational conditions for plasma and electric field experiments and—together with these experiments—to Investigate plasma parameters, resonances and instabilities and to study the precise interaction of a spacecraft with a dilute, ionized medium.
1. INTRODUCTION
The controlled emission of charged particles from a space vehicle is an interesting new tool in space research. Some possible applications of this technique are listed below.
1) Quiescent control of spacecraft potential
a) Adjustment of space charge sheath.
ft) Control of photocmission and photoelectron cloud.
c) Acceleration of ambient low-energy, charged particles.
2) Modulated changes of spacecraft potential
a) Measurement of satellite I-V characteristic.
b) Generation of electrostatic oscillations.
3) Beam effects
a) Generation of VLF noise.
b) Production of artificial auroras; Geld line tracing.
c) Modification of radiation belt particle population.
The first satellite experiment using controlled charged-particle emission was—to my knowledge—the VLF experiment on board the FR-I satellite, where the VLF antennas were provided with "hot cathode" electron emitters (Blanquart and Ramond, 1966). The forced displacement of the antenna potential produced by the emitted electron current was intended to reduce the antenna impedance. Similar "hot-cathode" techniques have been used in a number of rocket experiments. The most recent Wallops Island electron accelerator rocket experiment (Hess, 1967) was a most ambitious cnarged-particle ejection experiment The
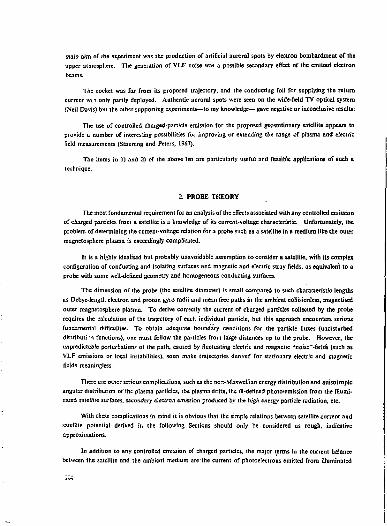
main aim of the experiment was the production of artificial auroral spots by electron bombardment of the
upper atmosphere. The generation of VLF noise was a possible secondary effect of the emitted electron
beams.
The rocket was far from its proposed trajectory, and the conducting foil for supplying the return current wi< only partly deployed. Authentic auroral spots were seen on the wide-field TV optical system (Neil Davis) but the other supporting experiments—to my knowledge— gave negative or inconclusive results:
The use of controlled charged-particle emission for the proposed geostationary satellite appears to provide a number of interesting possibilities for improving or extending the range of plasma and electric field measurements (Stauning and Peters, 19Û7).
The items in 1) and 2) or Ihe above list are particularly useful and feasible applications of such a technique.
2. PROBE THEORY
The most fundamental requirement for an analysis of Ihc effects associated with any controlled emission of charged particles from a satellite is a knowledge of its current-voltage characteristic Unfortunately, the problem of determining the current-voltage relation for a probe such as a satellite in a medium like the outer magnetosphere plasma is exceedingly complicated.
It is a highly idealised but probably unavoidable assumption to consider a satellite, with its complex configuration or conducting and isolating surfaces and magnetic and electric stray fields, as equivalent to a probe with some well-defined geometry and homogeneous conducting surfaces.
The dimension of the probe (the satellite diameter) is small compared to such characteristic lengths as De bye-length electron and proton gyro radii and mean free paths in the ambient coliisionless, magnetised outer magnetosphere plasma. To derive correctly the current of charged particles collected by the probe requires the calculation of the trajectory of each individual particle, but this approach encounters serious fundamental diflïculties. To obtain adequate boundary conditions for the particle fluxes (undisturbed distributi -i functions), one must follow the particles from large distances up to the probe. However, the unpredictable perturbations of the path, caused by fluctuating electric and magnetic "noisc"-fieIds (such as VLF emissions or local instabilities), soon make trajectories derived for stationary electric and magnetic fields meaningless,
There are other serious complications, such as the no-i-MaxwclIian energy distribution and anisotropic angular distribution or the plasma particles, the plasma drifts, the ill-defined pholo^emission from the illuminated satellite surfaces, secondary electron emission produced by the high energy particle radiation, etc.
With these complications in mind it is obvious (hat the simple relations between satellite current and satellite potenlial derived in the following Sections should only be considered as rough, indicative approximations.
In addition to any controlled emission of charged particles, the major terms in the current balance between the satellite and the ambient medium are the current of photoeleclrons emitted from illuminated
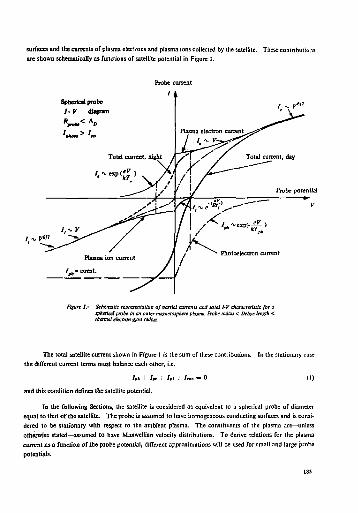
surfaces and the currents of plasma elec'/ons and plasma ions collected by the satellite. These contributions are shown schematically as functions of satellite potential in Figure 1.
Probe current
Figure I.- Schematic représentation of partial current! and total I-V characteristic for a spherical probe In an outer magnetospkere pbimo. Probe radha < Debye length < thermal electron gyro radius.
The total satellite current shown in Figure I is the sum of these contributions. In the stationary case the different current terms must balance each other, i.e.
/»* + / „ + hi 4- /«» = 0 (1)
and this condition defines the satellite potential.
In the following Sections, the satellite is considered as equivalent to a spherical probe of diameter equal to that of the satellite. The probe is assumed to have homogeneous conducting surfaces and is considered to be stationary with respect to the ambient plasma. The constituents of the plasma are—unless otherwise stated—assumed to have Maxwellian velocity distributions. To derive relations for the plasma current as a function of the probe potential, different approximations will be used for small and large probe potentials.
185
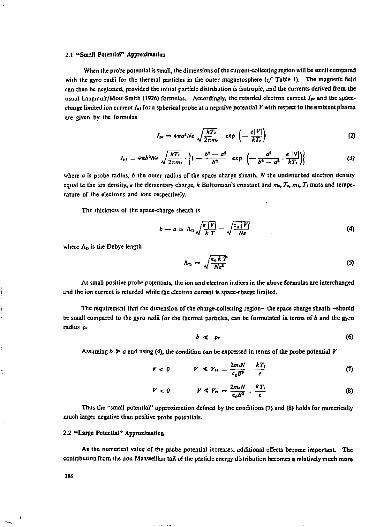
2.1 "Small Potential" Approximation
When the probe potential is small, the dimensions of the current-collecting region will be small compared with the gyro radii for the thermal particles in the outer magnctosphere (cf. Table I). The magnetic field can then be neglected, provided the initial particle distribution is isotropic, and the currents derived from Ibe usual Langmuir/Mott-Smith (1926) formulas. Accordingly, the retarded electron current A» and the space-charge limited ion current I,< Tor a spherical probe at a negative potential V with respect 1o the ambient plasma are given by the formulas
A UW f1^ I, * B - ° * ( flS e\V\\\
(2)
(3)
where a is probe radius, b the outer radius of the space charge sheath, N the undisturbed electron density
equal to the ion density, e the elementary charge, k Boltzmann's constant and m<, 7V, mi, T< mass and tempe
rature of the electrons and ions respectively.
The thickness or the space-charge sheath is
where A D is ILe Dcbye length
At small positive probe potentials, the ion and electron indices in the above formulas ore interchanged and the ion current is retarded while the electron current is space-charge limited.
The requirement that the dimension of the charge-collecting region—the space charge sheath—should
be small compared to the gyro radii for the thermal particles, can be formulated in terms of b and the gy.-o
radius p.
b < p . (6)
Assuming b > a and using (4), the condition can be expressed in terms of the probe potential V
V<0 y<y„ = ™L.ÏIl ( ! ) CçU e
Thus the "small potential" approximation defined by the conditions (7) and (8) holds for numerically much larger negative than positive probe potentials.
22 "Large Potential" AppnudnurJoii
As ihe numerical value of the probe potential increases, additional effects become important. The contribution from the non-Maxwcllian tail of the particle energy distribution becomes a relatively much more

TABLE 1 Possible plasma parameters at the geostationary orbit.
W.-JV (cm-*!
kr.=kr, (eV)
Aj)
(m)
V.
(m sec-1)
V,
(m sec-1) P..
<m)
P.i
(m) J..
(Am-*)
1
100
30
10
73
40
23
5.9 x 10'
3.2 x 10 e
1.9 X 10'
1.9 x 10»
1.1 x 10*
6.1 X 10'
255
140
81
1.5 x 10'
8.4 X 10'
4.9 X 10'
2.7 X 10-'
1.5 X 10- 7
8.5 X 10-'
3
30
10
3
23
13.4
7.3
3.2 X 10'
1.9 x 10'
1.0 X 10»
1.1 x 10*
6.1 x 10*
3.3 x 10*
140
81
44
8.4 x 10»
4.9 X 10*
2.7 X 10*
4.4 x 10-'
25 x 10-'
1.4 x I0-'
10
10
3
1
7.3
4.0
23
1.9 X 10*
1.0 X 10'
5.9 X 10 s
6.1 x 10*
3.3 x 10'
1.9 X 10'
SI
44
26
4.9 x 10'
2.7 X 10'
1.5 X 10'
8.5 x 10-T
4.7 X 10-'
2.7 X 10-'
30
3
1
0J
2.3
1.3
0.7
1.0 X 10'
5.9 X 10'
sa x io'
3.3 X 10'
1.9 X 10*
I.I X 10'
44
26
[4
27 x 10*
1.5 X Iff1
8.4 x 10'
1.4 X I0-'
8.0 X 10-'
4.4 X 10-'
B K 130 T •»„ =* 2.3 X 10* sec- 1 ra,, =: 12.5 sec- 1 / „ = 3.6 * „z ftl = 2.0,Hz
important part or the retarded current and exceeds the conrribution from the thermal particles at large retarding
potentials.
The magnetic field must be taken into account for the space-charge limited current, when the dimension
of the space-charge region around Ihe probe—within which the probe electric field is confined—approaches
or exceeds the gyro radii of the attracted particles.
One could consider the current of plasma parades collected by the probe as being extracted from the plasma at the outer boundary of the space-charge sheath. In the unperturbed medium at larger distances from the satellite, the gyro centres of the charged particles are constrained to move along the magnetic field lines. Thus, when the sheath dimension considerably exceeds the particle gyro radii, all the particles collected by the probe must previously have been gyrating around field lines passing through the space-charge region. An upper limit to the collected current is therefore set by the parallel flow of particles within the tube of force that just encompasses the space-charge region. This approach was used by Beard and Johnson (1961) with the important correction by Beard (1966).
The current parallel to the magnetic field of the charged particles confined within a tube of force of
cross-section TÛP (b > p*) is found to be the plasma current density j \ = eNvJA multiplied by twice the
cross-sectional area of the tube of force, i.e.
h = ~ JT A* Nev0 = A* Ne J ^ ^ (9)
1B7
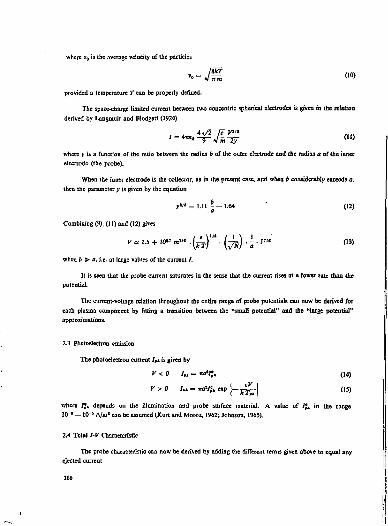
where F 0 is the average velocity of the particles
provided a temperature T can be properly denned.
The space-charge limited current between two concentric spherical electrodes is given in the relatioa derived by Langmuir and Blodgett (1924)
_ . 4 y/2 (ë V*" 7 = 4 ^ -%- J- - ^ 01)
where y is a function of the ratio between the radius b of the outer electrode and the radius a of (he inner electrode (the probe).
When the inner electrode is the collector, as in the present case, and when b considerably exceeds a, then the parameter v is given by the equation
>>*<«= 1.11 -—1.64 ' (12)
Combining (9), (11) and (12) gives
^ l . i + W . » » . ( i i ) " ' . ( J j ) . i . I » . (13)
when b >. a, i.e. at large values of the current / .
It is seen that the probe current saturates in the sense that the current rises at a lower rate than the potential.
The current-voltage relation throughout the entire range of probe potentials can now be derived for each plasma component by fitting a transition between the «small potential" and the "large potential" approximations.
2.3 Photoelectroo emission
The photoelectron current I,t is given by
V < 0 / „ = IM*J;» (14)
V>0 '« = ™V*.«<PJ-^5 05)
where I*k depends on the illumination and probe surface mateiial. A value of /*» in the range 10-' — 10-* A/ro* can be assumed (Kurt and Moroz, 1962; Johnson, 1965).
2.4 Total 1~V Characteristic
The probe characteristic can now be derived by adding the different terms given above to equal any ejected current
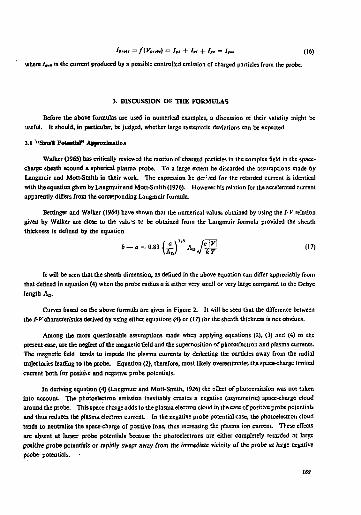
W =f{Vfn*.) = / P* + / „ + / , . = / , . . (16)
where / „ . is the current produced by a possible controlled emission of charged particles from the probe.
3. DISCUSSION OF THE FORMULAS
Before the above formulas are used in numerical examples, a discussion of their validity might be useful. It should, in particular, be judged, whether large systematic deviations can be expected.
3.1 "Small Potential" Approxlmitloj
Walker (1965) has critically reviewed the motion of charged particles in the complex field in the space-charge sheath around a spherical plasma probe. To a large extent he discarded the assumptions made by Langmuir and Mott-Smith in their work. The expression he der : /ed for the retarded current is identical with the equation given by Langmuir and Mott-Smith (1926).. However his relation for the accelerated current apparently differs from the corresponding Langmuir formula.
Bettinger and Walker (1964) have shown that the numerical values obtained by using the I-V relation given by Walker are close to the values to be obtained from the Langmuir formula provided the sheath thickness is defined by the equation
It will be seen that the sheath dimension, as defined in the above equation can differ appreciably from that defined in equation (4) when the probe radius a is either very small or very large compared to the Debye length A D .
Curves based on the above formula are given in Figure 2. It will be seen that the difference between the I-V characteristics derived by using either equations (4) or (17) for the sheath thickness is not obvious.
Among the more questionable assumptions made when applying equations (2), (3) and (4) to the present case, are the neglect of the magnetic field and the supernosition of photoelectron and plasma currents. The magnetic field tends to impede the plasma currents by deflecting the particles away from the radial trajectories leading to the probe. Equation (2), therefore, most likely overestimates the space-charge limited current both for positive and negative probe potentials.
In deriving equation (4) (Langmuir and Mott-Smith, 1926) the effect of photoemission was not taken into account The photoelectron emission inevitably creates a negative (asymmetric) space-charge cloud around the probe. This space charge adds to the plasma electron cloud in the case of positive probe potentials and thus reduces the plasma electron current. In the negative probe potential case, the photoelectron cloud tends to neutralise the space-charge of positive ions, thus increasing the plasma ion current These effects are absent at larger probe potentials because the photoelectrons are either completely retarded at large positive probe potentials or rapidly swept away from the immediate vicinity of the probe at large negative probe- potentials.
1S9
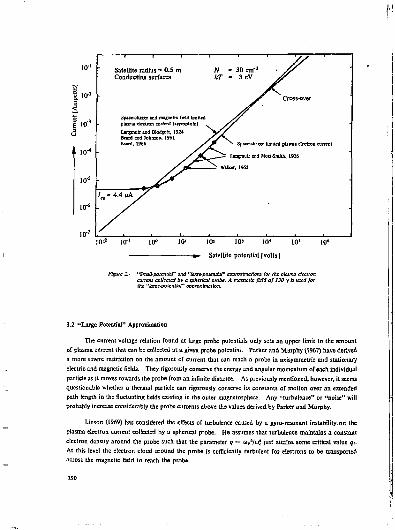
Satellite radius = 0.5 m N - 30 cm*3 • ^ r Conducting surfaces kT = 3 eV y ^
jT Cross-over
Spice-chngc acd magnetic field [fcnitai yy' plixni election cuitent (iiyroptacel ^ ^ r
Lingmuii and Bladgett, 1924 J V J : Bend and Johnson, J961 V ^ ^ ^ ^ s . Beard, 196C s^£L Space-chugt limited plaçai ckction cunent
^ / J C _ ^ - ^ UrjpmifrandMott-SmlUj, 19Ï6
/ j £ — Walker, 1965
7 w = 4.4 » A /
I I U 1 1 1—. L - I
io* icr1 io° 10* l e îo* io« to1 io* ^> Satellite potential [ volts ]
Figure 2.- "SrnalhpolentlaT' and "ionre-polentlaT approxtmatlans for the plasma electron current collected by a spherical probe. A maxnettc field of 130 y ù used for Ike "LrKcvoientlaT' approximation.
3.2 "Large Potential" Approximation
The current-voltage relation found at large probe potentials only sets an upper limit to the amount of plasma current that can be collected at a given probe potential. Parker and Murphy (1967) have derived a more severe restriction on the amount of current that can reach a probe in axisymmetric and stationary electric and magnetic fields. They rigorously conserve the energy and angular momentum of each individual particle as it moves towards the probe from an infinite distance. As previously mentioned, however, it seems questionable whether a thermal particle can rigorously conserve its constants or motion over an extended path length in the fluctuating fields existing in the outer magnetosphere. Any "turbulence" or "noise" will probably increase considerably the probe currents above the values derived by Parker and Murphy.
Linson (1969) has considered the effects of turbulence caused by a gyro-resonant instability .on the plasma electron current collected by a spherical probe. He assumes that turbulence maintains a constant electron density around the probe such that the parameter q = iùr~la\ J u s t attains some critical value qt.
At this level the e'.ectron cloud around the probe is sufficiently turbulent for electrons to be transported across the magnetic field to reach the probe.
190
10''
I lo-' s
i IOJ
iff4
1 0 !
Id*
Iff'
Theoretically (Buneman, 1961, Buneman et al., 1966) such an instability is generated by unneutraiised electron clouds in crossed electric and magnetic gelds, when q exceeds a sizeable Traction of unily. The instability is evident in magnetrons and has also been demonstrated in laboratory plasma experiments (Janes, 1965).
It is important to note, that the space-charge limited current-voltage relation (13) constitutes an upper limit to the amount of current that can be collected by the probe even in the presence of turbulence.
3.3 Combined probe characteristic
Partial current-voltage characteristics for a spherical probe can be obtained Tor each oT the collected plasma components by fitting "smooth" transitions between the "small potential'.' and the "large potential" relations. The accuracies of such fitted transitions are of course questionable. A typical example is shown in Figure 2 for the plasma electron current.
The approximate relations derived above should only be considered as upper limits for the plasma current collected by the probe. The deviations down to the actual current levels probably depend on the intensity of the "noise-fields" present.
If the probe potential is steadily increased (numerically), discontinuous transitions from low-current modes to modes of high probe currents might appear at the onset of possible turbulent instabilities.
4. NUMERICAL EVALUATION OF THE I-V CHARACTERISTICS OF A GEOSTATIONARY SATELLITE
For the numerical evaluation of the I-V characteristics of a geostationary satellite, the sets of plasma
parameters shown in Table 1 have been selected to represent the medium in the outer magnetosphere at
geostationary distances (6.6 j y .
The value B = 130 y for the magnetic field intensity is based on measurements made with the geostationary ATS-1 satellite (Coleman, 1967). The ranges of plasma densities and temperatures arc based on various measurements reported in the literature. These are indirect measurements such as ground-based measurements of structured micropulsations (Kenney et al., 196'.'), whistler measurements from Alouette I and 2 and from OGO 3 (Angenuri and Carpenter, 1966; Carpenter and Stone, 1968; Carpenter et al., 1969) and in situ measurements such as the OGO 1 spherical analyser and mass spectrometer measurements (Tayloreio/., 1965; SagalynandSmiddy, 1966)and the IMP landZretarding-potentialanalysermeasurements (Serbu and Maier, 1967). The temperatures have been set to lower values at higher plasma densities, in agreement with Vasylïunas (I968).
The variability at geostationary distances is no doubt large enough for any value of density and tem
perature to occur within the selected ranges. The ranges shown «"ould even be considerably exceeded, parti
cularly tu periods of enhanced activity.
Some of the sets of plasma parameters from Table 1 have been used to compute the current-voltage
characteristics of a 1 m diameter satellite assumed to have conducting surfaces.
191
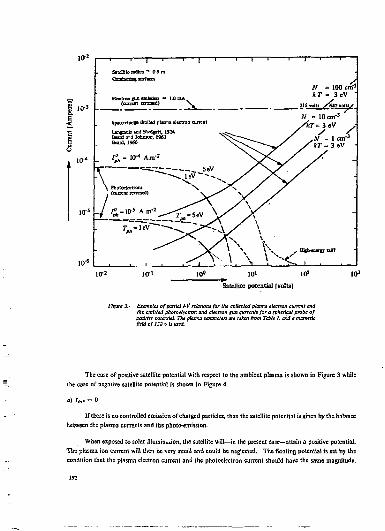
Iff1
SittOilc itdiui = 0-5 m
Ekcbon j t n emtakn -
^ N = 100 C M 3
* r - 3 cV 215_rdU
Satellite potential [volts]
flniwi- Examples of partial I-V relations for the collected plasma electron current and the emitted nhotoekctron and electron tun currents fora spherical probe of positive soter.tisl. The plasma oanmetets are taken from Table I. and a magnetic field of IJ3 y Is used. '
The case of positive satellite potential with respect to the ambient plasma is shown in Figure 3 while the case of negative satellite potential is shown in Figure 4.
If there is no controlled emission of charged particles, then the satellite potential is gr/en by the balance between the plasma currents and the photo-emission.
When exposed to solar illumin-aon, the satellite will—in the present case—attain a positive potential. The plasma ion current will then be very small and could be neglected. The floating potential is set by the condition that the plasma electron current ana the photoelectron current should have the same magnitude.
192
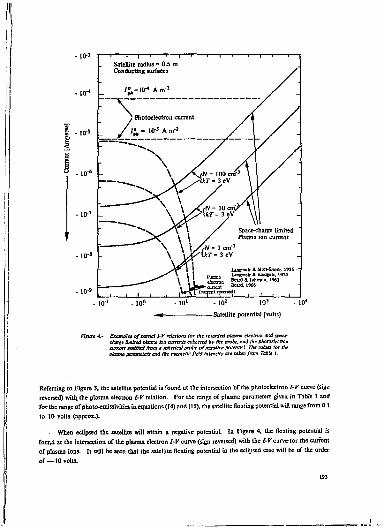
Flxure 4.- Exameia of partial t-Y rthttons for the retarded plasma electron and space-charge limited plasma too currents collected by the probe, end the pkotoeletrran aman emitted fient a snhtrical probe ofntjtatlve polentlrl The ratio for the plasma parameter! and the magnetic fietd Inteivity are taken from Table 1.
Referring to Figure 3, the satellite potential is found at the intersection of the pholoeleclron I-V curve (sign reversed) with, the plasma electron I-V relation. For the range of plasma parameters given in Table 1 and for the range of photo-emissivities in equations (14) and (15), the satellite floating potential will range from 0.1 to 10 volts (appro*-).
When eclipsed the satellite will attain a negative potential. In Figure 4, the floating potential is foutd at the intersection of the plasma electron I-V curve (sign reversed) with the /-Kcurvelor the current of plasma ions. It will be seen that the satellite floating potential in the eclipsed case will be of the order of —10 volts.
U3

b) /„ . + 0
It is assumed throughout thai the energies of the ejected particles are large enough to allow/ them safe escape from the saiellitc.
If an electron current is emitted (hen the satellite potential will increase. At the larger electron gun current the dominant terms in the current balance Tor the satellite are the gun current together with the plasma electron current. The photo-emission and the plasma ion current will vanish.
From Figure 3 the satellite potential can be found by the intersection of the line showing the (constant) electron gun current (sign reversed) and the plasma electron /-K curve. It may be noted that very large potentials of several hundred volts can be produced by an electron-gun current as small as 1 mA.
The emission of an ion current makes the satellite potential decrease but the equilibrium potential is still denned through the current balance shown in equation (1). The individual tenru of the equation are visualised in Figure 3 (positive satellite potential) or Figure 4 (negative potential).
If illuminated the satellite remains at a positive potential for ion gun, currents increasing almost up to the level where the ejected current equals the "Saturation" photoemission (see Figure 4). From this "knee" level at about 10~G to l(H A, the satellite potential rapidly decreases towards large negative values if the ion gun current is further increased. This rather abrupt transition is absent when the satellite is eclipsed. In this case, the satellite potential decreases steadily for increasing ion gun current.
One may note from Figure 4 (hat the satellite in both the illuminated and in the eclipsed cases attains negative potentials of several thousand volts for ion gun currents as small as a few hundred (*A-
5. APPLICATIONS OF CONTROLLED CHARGED PARTICLE EJECTION
It is obvious from the above numerical examples—however approximate— that even very small electron or ion gun currents are likely to produce considerable changes in the potential of a geostationary satellite. The possible applications (see Introduction) of such controlled potential changes will now be briefly considered.
5.1 Quiescent Control of Satellite Potential
A number of experiments considered desirable for a geostationary satellite depend to a great extent on the satellite potential, either directly or via its influence on the plasma properties in the immediate vicinity or the satellite, e.g. DC electric field, VLF electric field, plasma resonance and plasma density experiments, temperature and composition probes, plasma particle detectors, etc. These experiments are complicated and the results obtained could be ambiguous.
By continuously emitting selected electron or ion gun currents one can shift the satellite potential in controlled steps and maintain it at levels differing from Ihc floating potential. Such an active control of the satellite potential has two features that are important for ensuring the reliability of results from such experiments, i ^ ,
194
i) selection of the optimum working conditions for any specific plasma or electric held experiment,
/i) provision of a tool for investigating factors having possible perturbing effects on such experiments.
For each of the points listed in the Introduction one should note:
a) The satellite space-charge sheath with its unneutraliscd electron or ion cloud, and within which —roughly speaking—most of the electric field from the satellite 13 confined, is a disturbing factor for most of the above measurements. The dimension of the sheath depends on the satellite potential (see Equation (4)}. For experiments that are boom-mounted to carry them out to the unperturbed plasma, it seems highly desirable to hold the satellite at plasma potential. At zero potential the satellite space-charge sheath probably shrinks to minimum size.
b) The photoemission from the satellite—when illuminated— ma? ùiisr&re to a considerable extent with the plasma and electric field measurements by producing an enhanced electron density in the immediate vicinity of the satellite. The photoelectrons have, tn addition, an energy distribution that probably differs from the energy distribution of the electrons in the ambient plasma.
The density enhancement near the satellite can be estimated from the fact that the photoelectron current approximately equals the plasma electron current, i.e.
Iff* e v„ = itfp,<?vp. (18)
or
*. = * „ / £ <»)
Thus a relatively small flux of high-energy plasma electrons could produce a dense cloud or low-energy photoelectrons at the satellite.
The cloud of photoelectrons is sun-oriented. This asymmetry will produce a spin modulation on the
plasma and electric field measurements, which, no doubt, will complicate investigations of "natural" asymme
tries such as large-scale electric fields and the associated plasma drift.
The photoemission could be completely suppressed by increasing the satellite potential (see Fig. 3)
above the floating potential by a few volts.
c) Measurement of the plasma parameters from a geostationary satellite is no easy task. The density of the dilute plasma at synchronous distances (cf. Table I) is probably below the detection threshold for most plasma experiments. The space-charge cloud around the satellite consisting of plasma particles mixed with photoelectrons produced by solar illumination and secondary electrons produced by high-energy particle radiation, is a rather serious perturbation. Furthermore, the electric field from a satellite at floating potential could prevent a considerable part of the plasma particle population from reaching a sensor located in the vicinity of the satellite—even in cases where the sensor is boom-mounted and separately biased.
In addition to the effects previously discussed an active control of the satellite potential seems desirable in order to ensure that all particles of either sign reach the plasma sensors. One could even think of producing a satellite potential of several hundred volts whereby thermal particles of the appropriate sign, when accelerated
1»
towards the satellite, could attain enough energy to become detectable by the standard low-energy particle detectors.
5.2 Modulated Potential Changes
The emission of charged particles might be used as a controlled current source in active plasma experiments. Modulation of the ejected current would produce a corresponding modulation in the satellite potential and its environment. Such potential changes might be detectable by vnrious other experiments such as plasma probes, low-energy particle detectors and eleuric field antennas.
a) The current-voltage characteristic for the satellite might be obtained if the ejected current were varied Jowly enough to enable the satellite to attain a stationary and measurable potential at each current level. P'asma densities and temperatures could be derived from such an /-P characteristic. The results are not expected to be precise because a satellite, having a complex geometry and inhomogeneous surfaces, is probably a rather poor plasma probe. However, important data on the precise in te rrxtion of a satellite with an ionized medium might be obtained.
b) Modulation of the ejected current over a frequency range seems quite feasible using electron and ion gun techniques. The satellite might therefore be used as a monopole transmitting antenna to generate electrostatic waves in the ambient medium. To receive such waves would probably require some kind of electric field antenna.
Using the satellite itself as a transmitting antenna together with single or multiple boom-mounted electric field antennas, might prove an efficient arrangement for the study of plasma resonances. A similar experiment has been discussed by Storey et al. (1968) in their investigation of a quadrupole probe intended for studies of ionospheric plasma resonances. The investigation of plasma resonances has proved an accurate and reliable method of measuring plasma parameters such as density and temperature. A resonance experiment on board the geostationary satellite might furthermore provide important information on the nature of the instabilities and other disturbances in the outer magnctospherc plasma.
3.3 Beam effects
It does not appear likely that measurable effects could be produced away from the geostationary satellite by emission of a beam of charged particles.
To emit currents of the required intensities for producing the beam effects listed in the Introduction requires either an extremely large conducting area connected to the satellite to supply the return current, or the emission of a compensating current of equal magnitude but opposite sign. Neither of these methods seems feasible with present techniques.
196
6. CONCLUSIONS
Plasma probe theory is not capable of providing an accurate conclusive model of the interaction between a current-emitting satellite and a dilute, ionized medium.
The present approach combines a "small-potential" approximation used for the space-charge limited plasma current when the dimension of the satellite space-charge sheath is smaller than the panicle gyro radii, with a "large-potential" approximation used for the space-charge and magnetic field limited plasma current when the dimension of the sheath considerably exceeds the gyro radii of the collected plasma particles.
It is believed that this model definitely pivides an upper limit for the collected plasma current for any value of the satellite potential. The actual degree of over-estimation depends in particular on the exterior configuration of the satellite, on the intensity of the natural electric and magnetic noise fields and on the possible generation of instabilities in the ambient plasma.
Using realistic values for the magnetic field and the plasma parameters at the geostationary orbit, it has been shown that small currents emitted from electron or ion guns can produce very large changes in the satellite potential. Emitted electron or ion currents of the order of 1 mA may thus alter the satellite potential from the normal floating potential by several hundred volts. The above uncertainty in the numerical evaluation implies that the actual potential change corresponding to a given value of the emitted current might be even larger.
The inclusion of small electron and ion guns in the payload for a geostationary satellite therefore provides a most powerful tool for producing substantial stationary or time-varying changes in the satellite potential. The use of such a facility offers substantial improvements and extensions in the capability of performing reliable plasma and electric field measurements with a geostationary satellite.
The use of controlled charged-particle emission is also considered to be very important for investigating the exact interaction of a satellite with a medium such as the dilute, outer magnetosphere plasma.
A charged-particle emission experiment should preferably include electron and ion guns capable of delivering currents up to approximately 1 mA of electrons and 200 yA of ions with energies of approximately 1 keV. These currents should be produced in a controlled sequence e.g. from approximately I pA to 1 mA electron current and 1 to 200 pA ion current.
Electron guns of a type considered suitable for a satellite experiment (rugged construction, long-life filament) are now available, having an effeciency of approximately 10 % (i.e. power consumption = 10 X emitted power).
Solid-state ion guns (Lithium -f surface layer of Al sO s , 2 SiOj, LiaO) have been constructed for laboratory purposes to deliver currents of some tens of mA over several hours (200 - 300 mA hours). A type suitable for a satellite experiment does not—to my knowledge— yet exist.
A system of electron and ion guns is not in the ordinary sense a scientific experiment as no output data (except knowledge of the amount of emitted current) are produced. Such a device should rather be considered as a common facility for plasma, low-energy particle and electric field experimenters.
197
REFERENCES
Angerami, J.J. Carpenter, D.L.
Whistler Studies of the Plasmapausc in the Magnetosphere, J. Geophys. Res., 71, p. 711 (1966).
Beard, D.B. Johnson, F.S.
Ionospheric Limitations on Attainable Satellite Potential, / . Geophys. Res., 66, p. 4113(1961).
J. Geophys. Res., 71, p. 4707 (1966). (Correction to paper by D.B- Beard and P.S. Johnson, 1961.)
Bettinger, R.T. Walker, E.H.
A Relationship for Plasma Sheaths about Langmuir Probes, University of Maryland Tech. Report 350 (1964).
La Prise d'Espace, L'Echo des Recherches. 45. p. 56 (1966).
The RF Theory of Crosscd-Field Devices, in Crossed-Field Microwave Devices, vol. I (E. Okress, éd.). Academic Press, New York, 1961.
B u cerna n, O. Levy, R.H. Linson, L.M.
Stability of Crossed-Field Electron Beams, J. AppL Phys., 37. p. 3203 (1966).
Recent Research on the Magnetospheric Plasmapausc (paper presented at the Conjugate Point Symposium, Boulder, 1967), Radio Sci., 3. p. 719 (1968).
Carpenter, D.L. Park, C.G. Taylor, H.A., Jr. Brinton, H.C.
Multi-Experiment Detection of the Plasmapause from EOGO Satellites and Antarctic Ground Stations, / . Geophys. Res., 74, p. 1837 (1969).
Coleman, P.J., Jr. Periodic Progress Report, Oct. 1967. in ATS Technical Data Reports val, 4. GSFC (1967).
The Wallops Island Electron Accelerator Rocket Experiment, GSFC Report preprint (1967).
Experiments on Magnetically Produced and Confined Electron Clouds, Phys. Rev. Lett., 15, p. 135 (1965).
Satellite Environment Handbook, Stanford University Press, 1965.
Kenney, J.F, Knaflich, H.B. Lîcmohn, H.B.
Magnetospheric Parameters De. 'nnined from Structured Micropulsa-tions, / . Geophys. Res., 73. p. 673, M968).
Kurt, P.G. Moroz, V.I.
The Potential of a Metal Sphere in Interplanetary Space, Planet. Space Sci.. 9. p. 259 (1962).
Langmuir, I. Blcdgcn, K.B.
Current Limited by Space Charge Between Concentric Spheres, Pkys. Rev.. 24. p. 49 (1924).
Langmuir I. Mott-Sroith, H.M.
The Theory of Collectors in Gaseous Discharges, Phys. Rev., 28, p. 727 (1926).
Current-Voltage Characteristics of an Electron-Emitting Satellite in the Ionosphere, J. Geophys. Res., 74. p. 2368 (1969).
Parker-, L.W. Murphy, B.L.
Potential Build-up on an Electron-Emitting Ionospheric Satellite, J. Geophys. Res.. 72. p. 1631 (1967).
Sagalyn, R.C. Sroiddy, M.
Results of Charged Particle Measurements in the Energy Range 0 -1000 Electron Volts, OGO-A in Space Research VI. (R.L. Smith-Rose, éd.), p. 477, Spartan Books, Washington, 1966.
Serbu, G.P. Maier, EJ.R.
Thermal Plasma Measurements within the Magnetosphere, in Space Research VII (R.L Smith-Rose, éd.), p. 527, North Holland Publ. Co., 1967.
Stauning, P. Peters, B.
Electron Gun Experiment for a Geosynchronous Satellite, ESRO Proposal S-146, 1967.
Storey, L.R.O. Aubry, M.P. Meyer, P.
A Quadrupole Probe for the Study or Ionospheric Plasma Resonances, Note Technique GRl/NTP/SI, 1968.
Taylor, H.E. Brinton, H.C. Smith, CR.
Positive Ion Composition in the Magneto-Ionosphere Obtained from the OGO-A Satellite, J. Geophys. Res.. W. p. 5769 (1965).
A Survey of Low-Energy Electrons in the Evening Sector of the Magnetosphere with OGO 1 and OGO 3, J. Geophys. Res.. 73. p. 2839 (1968).
Plasma Sheath and Screening Around a Stationary Charged Sphere and a Rapidly Moving Charged Body, in Interactions of Space Vehicles with an Ionized Atmosphere (S.F. Singer, éd.), Pergamon Press, 1965.
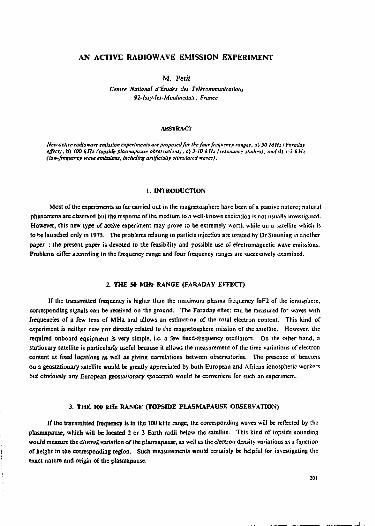
AN ACTIVE RADIOWAVE EMISSION EXPERIMENT
M. Petit Centre National d'Études des Télécommunications
92-lssy-les-Moulineaux, France
ABSTRACT
New active radiowave emission experiments are proposedfor the four frequency ranges, a) JO MHz I Faraday effect), b) 100 kHz (topsideplasmapause observations), c) 3-10 kHz (resonance studies), and A) l-i kHz ((OKhfrequency trove emissions, including artificially stimulated wares).
1. INTRODUCTION
Most of the experiments so far carried out in the magnetosphcre have been of a passive nature; natural phenomena are observed but the response of the medium to a well-known excitation is not usually investigated. However, this new type of active experiment may prove to be extremely worth while on a satellite which is to be launched only in 1975. The problems relating to particle injection are treated by Or Stauning in another paper ; the present paper is devoted lo the feasibility and possible use ol eh-ctromagnctic wave emissions. Problems differ according to the frequency range and four frequency ranges arc successively examined.
2. THE 50 MHz RANGE (FARADAY EFFECT)
If the transmitted frequency is higher than Ihe maximum plasma frequency foF2 of the ionosphere, corresponding signals can be received on the ground. The Faraday efTec: can be measured for waves with frequencies of a few tens of MHz and allows an estimation of the total electron content. This kind of experiment is neither new nor directly related to the magnetosphere mission of the satellite. However, the required onboard equipment is very simple, i.e. a few fixed-frequency oscillators. On the other hand, a stationary satellite is particularly useful because it allows the measurement of the time variations of electron content at fixed locations as well as giving correlations between observatories. The presence of beacons on a geostationary satellite would be greatly appreciated by both European and African ionospheric workers but obviously any European geostationary spacecraft would be convenient for such an experiment.
3. THE 100 kHz RANGE (TOPSIDE PLASMAPAUSE OBSERVATION)
If the transmitted frequency is in the 100 kHz range, the corresponding waves will be reflected by the plasmapause, which will be located 2 or 3 Earth radii below the satellite. This kind of topside sounding would measure the diurnal variation or the plasmapause, as well as the electron density variations as a function of height in the corresponding region. Such measurements would certainly be helpful for investigating the exact nature and origin of the plasmapause.
201
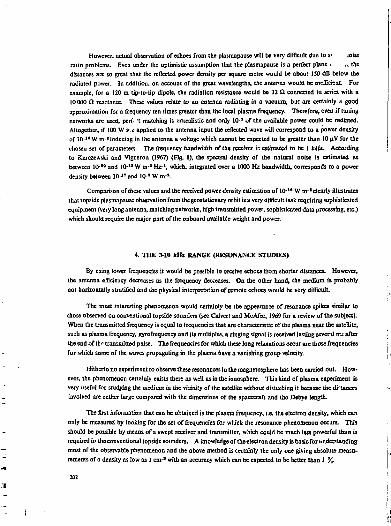
However, actual observation of echoes from the plasmapause will be very difficult due to s- loisc ratio problems. Even under the optimistic assumption that the plasmapause is a perfect plane L. ., the distances are so great that the reflected power density per square metre would be about 150 dB below the radiated power. In addition, on account of the great wavelengths, the antenna would be inefficient. For example, for a 120 m tip-to-Up dipole, the radiation resistance would be 32 Q connected in series with a 10 000 fl reactance. These values relate to an antenna radiating in a vacuum, but are certainly a. good approximation for a frequency ten times greater than the local plasma frequency. Therefore, even if tuning networks are used, perf t matching is unrealistic and only 10-a of the available power could be radiated. Altogether, ir 100 W » c applied to the antenna input the reflected wave will correspond to a power density of 10-" Wm-*inducing in the antenna a voltage which cannot be expected to be greater than IOuVfor the chosen set of parameters. The frequency bandwidth of the receiver is estimated to be I kHz. According to Karczewski and Vigneron (1967) (Fig. 1), the spectral density of the natural noise is estimated as between 10-" and 10-" W nr* Hz-1, which, integrated over a 1000 Hz bandwidth, corresponds to a power density between 10-" and 10-* W nr a .
Comparison of these values and the received power density estimation of 10-" W n r 1 clearly illustrates that topside plasmapause observation from the geostationary orbit isa very difficult task requiring sophisticated equipment (very long antenna, matching networks, high transmitted power, sophisticated data processing, etc) which should require the major part of the onboard available weight and power.
4. THE 3-10 kHz RANGE (RESONANCE STUDIES)
By using lower frequencies it would be possible to receive echoes from shorter distances. However, the anlenna efficiency decreases as the frequency decreases. On the other hand, the medium is probably not horizontally stratified and the physical interpretation of remote echoes would be very difficult.
The most interesting phenomenon would certainly be lbe appearance of rcsorance spikes similar to those observed on conventional topside sounders (see Calvert and McAfee, 1969 for a review of the subject). When the transmitted frequency is equal to frequencies that are characteristic of the plasma near the satellite, such as plasma frequency, gyrofrcquency and its multiples, a ringing signal is received lasting sevenl nu after the end of tb-' transmitted pulse. The frequencies for which these long relaxations occur are those frequencies for which some of the waves propagating in the plasma have a vanishing group velocity.
Hitherto no experiment to observe these resonances in the magnetosphere has been carried out. However, the phenomenon certainly exists there as well as in the ionosphere. This kind of plasma experiment is very useful for studying the medium in the vicinity of the satellite without disturbing it because the distances involved are rather large compared with the dimensions of the spacecraft and the Debye length.
The first information that can be obtained is the plasma frequency, i.e. the electron density, which can only be measured by looking for (be set of frequencies for which the resonance phenomenon occurs. This should be passible by means of a swept receiver and transmitter, which could be much less powerful than is required ir» die conventional topside sounders. A knowledge of the electron density is basitfor understanding most of the observable phenomenon and the above method is certainly the only one giving absolute measurements of a density as low as 1 cm-' with an accuracy which can be expected to be better than 1 %-
102
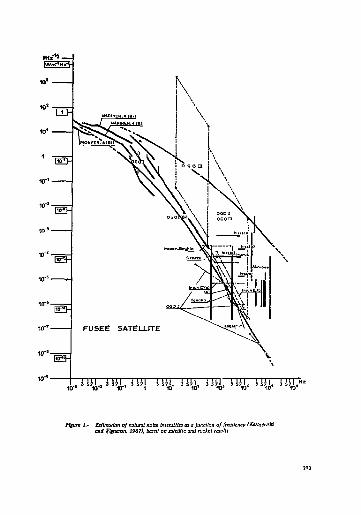
Q >
&
\
FUSEE SATELLITE
Jr> * Hi-> ! HA- U i i S " i - S H i ' " U - U ' l i< i l J l i>
f ï jure / .- Estimation ofnatural noise Intensities as a function of frequency (Karaewski and Vigneron, 1967), based on satellite and racket results.

Simply looking for the set of resonance frequencies could also provide on accurate measurement of the electron gyrofrequcacy. Theoretically, a magnetometer gives more accurate measurements of the magnetic field, but it would be useful to check the magnetometer results. Some significant discrepancies might result from the fact that the magnetometer data concern a well-defined point, while the resonances involve some integration aver space in the vicinity of the satellite.
At present the other characteristics of the relaxation signals (amplitude variation versus time and frequency spectrum which is probably time dependent) are not well known experimentally. Several theoretical studies have been devoted to the problem. The last one by McAfee takes the density gradients into account and was applied to the plasma frequency and upper hybrid frequency resonances. The results of that theory, even if they have not yet been experimentally proved to be correct, illustrate the wide range of possibilities of the resonance studies.
McAfee (1968,1969) interprets the resonances in terms of oblique echoes (Fig. 2) and shows that at a given time two waves with different frequencies and different orientations or the wave propagation vector can be received as the result of two different ray paths. Therefore, the received signal should be mainly composed of two waves, the frequencies of which vary with time (Fig. 3). . The observed fringes could thus
Figure 2.- Types of ray path. The figures near the curves correspond to the angles between the electron density gradient directions and the magnetic fields. Note that fir a given value of the angle several paths are possible (McAfee, 1969}.
204
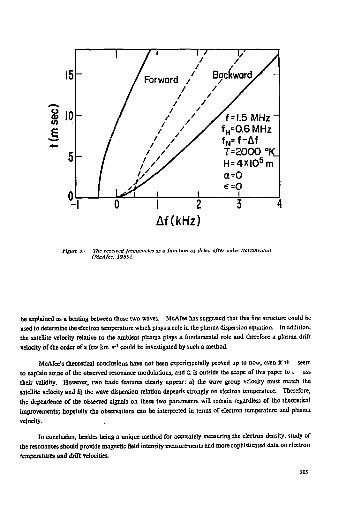
o <u m E S'»
- / y / / /Forward / Backward/-
/ / / / f = 1.5 MHz ~ / / ' / fH=0.6MHz
/ f / S f N = f _ A f
/ / / / T=2000°K_ / / / H=4x|05m
\^\ i i i I 2 3 Af(kHz)
be explained as a beating between those two waves. McAfee has suggested that this fine structure could be used to determine the electron temperature which plays a role in the plasma dispersion equation. In addition, the satellite velocity relative to the ambient plasma plays a fundamental role and therefore a plasma drift velocity of the order of a few km s _ 1 could be investigated by such a method.
McAfee's theoretical conclusions have not been experimentally proved up to now, even if th seem to explain some of the observed resonance modulations, and it is outside the scope of this paper to » uss their validity. However, two basic features clearly appear: a) the wave group velocity must match the satellite velocity and b) the wave dispersion relation depends strongly on electron temperature. Therefore, the dependence of the observed signals on these two parameters will remain regardless of the theoretical improvements; hopefully the observations can be interpreted in terms of electron temperature and plasma velocity.
In conclusion, besides being a unique method for accurately measuring the electron density, study of the resonances should provide magnetic Geld intensity measurements and more sophisticated data on electron températures and drift velocities.
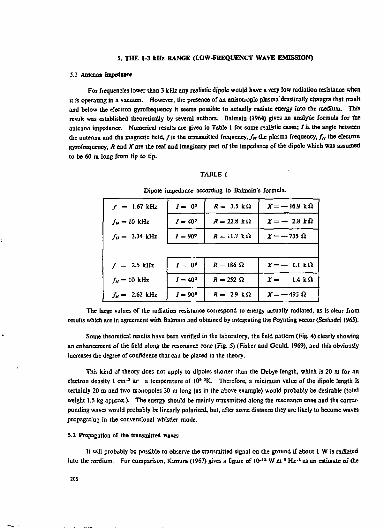
5. THE 1-3 kHz RANGE (LOW-FREQUENCY WAVE EMISSION)
5.1 Antenna impeduce
For frequencies lower than 3 kHz any realistic djpole would have a very low radiation resistance when it is operating in a vacuum. However, the presence of an anisotropic plasma' drastically changes that result and below the electron gyrofrequency ft seems possible to actually radiate energy into the medium. This result was established theoretically by several authors. Balmain (1964) gives an analytic formula for the antenna impedance. Numerical results are given in Table 1 for some realistic cases; / i s the angle between the antenna and the magnetic field,/is the transmitted frequency, fa the plasma frequency, fH the electron gyrofrequency, R and AT arc the real and imaginary part of the impedance of the dipole which was assumed to be 60 m long from tip to tip.
TABLE I
Dipole impedance according to Balmain's formula.
/ = 1.67 kHz
h = 10 kHz
f„ = 3.34 kHz
/ - 0» « = 3.S kQ X = — 16.9 k û / = 1.67 kHz
h = 10 kHz
f„ = 3.34 kHz
J-40" * = 22.8 k!2 X = — 2.8 kfl
/ = 1.67 kHz
h = 10 kHz
f„ = 3.34 kHz / = 90" H = il.7 k Q X- — 735 Q.
/ = 2.5 kHz
/ « = 10 kHz
!„ - 2.62 kHz
/ - 0» R - 1 8 6 Q X=— 1.1 krt / = 2.5 kHz
/ « = 10 kHz
!„ - 2.62 kHz
7 = 40» S - 252 a X=— 1.4 kfl
/ = 2.5 kHz
/ « = 10 kHz
!„ - 2.62 kHz / = 9 0 " Jï = 2.9 k l i X = — 49: Q
The large values of the radiation resistance correspond to energy actually radiated, as is clear from
results which are in agreement with Balmain and obtained by integrating the Poynting vector (Seshadri 1965).
Some theoretical results have been verified in the laboratory, the field pattern (Fig. 4) clearly showing
an enhancement of the field along the resonance cone (Fig. 5) (Fisher and Gould, 1969), and this obviously
increases the degree of confidence that can be placed in the theory.
This kind of theory does not apply to dipoles shorter than the Debye length, which is 20 m for an
electron density 1 cm- 3 ar a temperature of 10s °K. Therefore, a minimum value of the dipole length is
certainly 20 m and two monopoles 30 m long (as in the above example) would probably be desirable (total
weight 1.5 kg appro*-). The energy should be mainly transmitted along the resonance cone and the corres
ponding waves would probably be linearly polarized, but, after some distance they are likely to become waves
propagating in the conventional whistler mode.
5.2 Propagation or the transmitted waves
It will probably be possible to observe the transmitted signal on the ground if about 1 W is radiated into the medium. For comparison, Kimura (1967) gives a figure of 10- 1 1 W n r ' Hz- 1 as an estimate of the
206
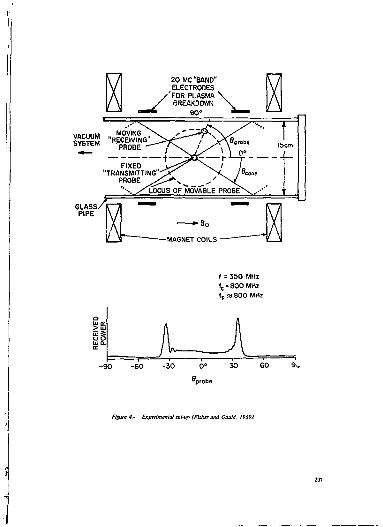
CLASS PIPE
I = 350 MHz
f c = 800MHz
K ra 800 MHz
Figure 4- Expérimental set-up IFlitter and G^ttld. 19691
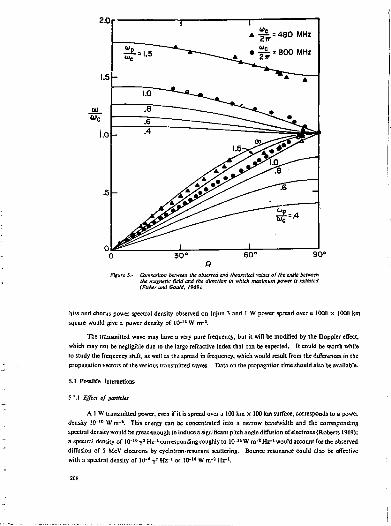
2.0r -, 1
A -Si =480 MHl
0 30° 60° 90° a
Figure J- Comparison between the observed and theoretical values of the anale between the magnetic field and the direction in which maximum power It radiated (Fisher and Gould, 1969).
hiss and chorus power spectral density observed on Injun 3 and I W power spread over a 1000 x 1000 km
square would give a power density of 10"" W rrr s.
The transmitted wave may have a very pure frequency, but it will be modified by the Doppler effect, which may not be negligible due to the large refractive index that can be expected. It could be worth while to study the frequency shift, as well as th.; spread in frequency, which would result from the differences in the propagation vectors of the various transmitted waves. Data on the propagation time should also be available.
5.3 Possible interactions
S-". I Effect of particles
A 1 W transmitted power, even if it is spread over a 100 km x 100 km surface, corresponds to a power density I0"" 1 Wnr*. This energy can be concentra ted into a narrow bandwidth and the corresponding spectral density would be great enough to induce a significant pitch angle diffusion of electrons (Roberts 1969); a spectral density of lO- 1 0Y a Hz-1 corresponding roughly to 10-" W n r ' Hz-' would account for the observed diffusion of 5 MeV electrons by cycla Iron-resonant scattering. Bounce resonance could also be effective with a spectral density of 1Û-* v' H r l or 10"1 0 W n r a Hz"1.
208

06 JUN 63
ELT CNS)
Figure 6.- Triggered emissions a) upper panel sJtows multlpath nose whistlers and ruing tones trixzered
by NAA at 14.7 kHz: lower panel shows discrete emissions triggered by nose whistlers at their upper cut-off frequencies (f J2). Eights Station, 6 June 1963. 0751 VT.
b) artificially stimulated émisions (ASE's) from the Morse code dashes transmitted by station NAA; Hies connect the direct wave observed near the transmitter with Us wnistiewnode echo observed near the conjugate point (Helliweli, 1969).
The particles that may be artificially precipitated will be difficult to observe on the ground because they will be mixed with naturally precipitated panicles from all regions. It would probably be easier to observe pitch angle diffusion on the satellite itself.
5.3.2 Artificially stimtlatei ware
As is well known, discrete emissions have a tendency to be triggered by other signals (Helliwell 1969), as illustrated by Fig. 6. These triggering signals can either be whistlers or man-made signals provided by ground-based VLF transmitters of high power (10fl W) (Hel'iwell, 1965), or even of low-power (100 W)

(Kimura, 1968). The likelihood of such a phénomène- increases with the duration of the triggering signal and is far greater with Morse-code dashes (approximately 150 ms) than with Morse dots (approximately 50 ms). Furthermore, the onset of the triggered emission is delayed with respect to the onset or the triggering signal by times of the order of 100 ms. As is shown in Tabic 2 (Carpenter and Lasch, 1969). the likelihood of the phenomenon decreases as the transmitter frequency increases; this is an aspect of the experimental law, that triggering is most common when the triggering frequency is equal to one-holfthe minimum gyrofrequency on the path. This can be interpreted (Helliwell 1969) as a maximum ray focusing which occurs at that particular frequency because the rate of change of curvature of the refractive index surface a zero for zero wave normal angle.
TABLE 2
Occurrence data indicating ihe decrease in observed artificial triggering of VLF magnetospheric noise associated with an increase in NAA transmitter frequency.
(The observations of triggered noise were made at Eights, Antarctica.)
Period
number A u
Observing
period
% o f observing intervals
with some ase activity
1 14.7 kHz 1963
71 days
May-July
14.5 %
Mor
se c
ode
I I 14.7 kHz 1963
10 days
May l-IO
11.7 %
Mor
se c
ode
HI 18.6 kHz 1963
IS days
August 5-22
1-3 %
Mor
se c
ode
IV 17.8 kHz 1965
27 days
June-August
2.0 % 0.7 % IV 17.8 kHz
1965
27 days
June-August Morse code FSK
Some interesting phenomena also seem to occur near one-quarter or the gyrofrequency: experimental observations of the noise band (Russell, Holzer and Smith 1969) and theoretical studies (Knox 1969) show the influence of the group velocity minimum occurring at that frequency. Even if these phenomena are not related ;o artihcally stimulated emissions, it would be useful to transmit waves in that frequency range.
Such triggered emissions will certainiy be induced by a 1 W power inpuL Very wcnhwbile experi
mental data could be collected by changing the frequency and the duration of the transmitted signals. The
triggered emissions could be received on the ground or at the satellite,
210
6. CONCLUSION
A transmitter and a receiver tunable between SOO Hz and 100 kHz could be used in connection with a 30 m dipole. Such an experiment is probably the only way to measure accurately electron densities as low as 1 cm-*. Electron temperature and plasma motion could hopefully also be evaluated. In addition, very worthwhile studies of the interaction phenomena could result from wave emission into the magnelosphcric medium.
REFERENCES
Impedance or E. Short Dipoie Antenna in a Magnetoplastna, IEEE Tram. ÂP-l2rp. 605 (1964).
Calvert, W. McAfee, J.R.
Topside-Sounder Resonances, Proc. IEEE, 37, p. 1080 (1969).
Carpenter, D.L. lasch, S.
An Effect of a Transmitter Frequency Increase on the Occurrence of VLF Noise Triggered near L=3 in the Magnetosphere, / . Ceophys. Res., 74, p. 1859 (1969).
Fisher, R.K. Gould, R.W.
Resonance Cones in the Field Pattern of a Short Antenna in an Anisotropic Plasma, Phys. Rev. Lett., 22, p. (093 (IP59).
Whistlers and Related Ionospheric Phenomena, Stanford University Press, Stanford, California, 1965.
Low-Frequency Waves in the Magnetosphere, Proc. International Symposium on the Physics of the Magnetosphere, Washington, D.C., Sept., 1968 in Magnetosphere Physics (Rev. Geophys., 7) (DJ. Williams and G.D. Mead, eds.), p. 281, (969.
Karcsewski, FJ . Vigneron, J.
Estimation des densités de puissances, spectrales dans la gamme de frequences 10-a à 10s H2 des phénomènes naturels détectés au sol, en fusée et satellite. Note technique G.R.I., Paris, septembre, 1967.
On Observations and Theories of the VLF Emissions, Planet. Space St., IS. p. 1427 (1967).
Triggering of VLF Magnetosphere Noise by a Low-Power (~ 100 W) Transmitter, J. Geophys. Res., 73. p. 445 (1968).
Growth of a Packet of Finite Amplitude Very-Low-Frequency Waves, with Special Reference to the Magnetosphere, Planet. Space Sa'.. 17, p. 13 (1969).
McAfee, J.R. Ray Trajectories in an Anisotropic Plasma Resonance, / . Geophys. Res., 73, p. 5577 (1968).
Topside Resonances as Oblique Echoes, J. Geophys. Res., 74, p. 802 (1969).
Pitch-Angle Diffusion of Electrons in the Magnetosphere, Proc. International Symposium on the Physics of the Magnetosphere, Washington,
- D.C., Sept., 1968 in Magnetosphere Physics (Rev. Geophys., 7) (D.J. Williams and G.D. Mead, eds.) p. 305, 1969.
Russell, C.S. Holzer, R.E. Smith, E.J.
OGO 5 Search Coil Magnetometer Observations in the Magnetosphere, presented at the American Geophysical Union Meeting, April, J969.
Radiation Resistance of Elementary Electric Current Sources in a Magnetoionic Medium, Proc. IEE. 112, p. 1856 (1965).

PRELIMINARY PROPOSAL FOR EXPERIMENTS ON THE ESRO GEOSTATIONARY SATELLITE (GEOS)
G. Martelli and J. Troughton Plasma Physics Group, University of Sussex, U.K.
ABSTRACT
Proposed geostationary satellite experiments concerning a) the magnetosphtric "knee", b) plasma resonances and e) plasma wave noise are discussed.
I. INTRODUCTION
Until fairly recent times the main effort in space physics has been concentrated on the collection of data regarding distributions of high-energy particles, magnetic fields, particle fluxes in various parts of the magnetosphere and a study of the quasi-static picture of the magnetosphere. Problems concerning the dynamics of the magnetosphere and wave-particle interactions have been discussed mainly in terms of Alfvén waves and gyroresonant interactions in the cold plasma approximation only.
However, it has become increasingly dear from recent experimental and theoretical developments that ideas such as instabilities and the interactions between particle distribution functions and electrostatic (as well as electromagnetic) waves generated in hot magnetised plasmas are equally important. It is generally realised that a reasonably complete picture of the magnetosphere can only be built up from a knowledge of the particle velocity distribution functions combined with measurements of the wave amplitudes of the many modes of oscillation possible in a hot plasma. The resulting information concerning the significance of various kinds of instabilities and wave-particle interactions (obtained by monitoring the level of electrostatic and electromagnetic plasma wave noise levels over a wide frequency band) would be of great importance for the understanding of the plasma physics of the magnetosphere. Information jnceming the plasma parameters such as plasma density, magnetic field, temperature and possibly bulk mution of the plasma, may also be obtained from plasma wave measurements1, but these would involve the transmission of waves over a swept-frequency band and the reception of the resulting echoes and plasma resonances.
2. PROPOSALS IN BRIEF WITH SCIENTIFIC OBJECTIVES
2.1 The Knee Project
Among the important magnetospheric features available for study from a geostationary satellite is the "knee" feature1 discovered by analysis of whistler propagation and confirmed later by satellite observations. This feature is essentially a fall of at least an order of magnitude in the plasma density at L values lying between 4 and 6, combined with an increase in plasma temperature sadi that the plasma pressure remains constant We propose using a swept-frequency transmitter and wave echo receiver to monitor the
213
electron density and position of the knee, to determine its stai. during magnetic storms and to determine its role in the general structure of the magnetosphere. The n,ethod proposed is essentially the same as that used in the successful Alouette3 series and in Explorer XX4, i.e. it is based on the techniques of ionosonde probing.
2.2 Plasma Resonances Project
Resonances in the reception of waves transmitted by a satellite occur when the relative velocity between satellite and plasma equals the group velocity for the propagation of the waves6. If the waves are not Landau-damped, the wave energy remains in the vicinity of the satellite, giving rise to a large signal at the receiver. From a knowledge of the dispersion relation and the frequency at which resonance occurs, plasma parameters such as density, magnetic field, temperature, and possibly the bulk motion of the plasma, may be deduced.
2.3 Plasma Wave Noise Projet!
The problem of plasma diffusion across lines of force in the magnetosphere has not been completely solved. Pitch-angle scattering of gyroresonant electrons or protons with circularly-polarised electromagnetic radiation and bounce-resonant infractions, while being important processes, cannot completely account for the observed diffusion rates. In laboratory studies of plasma confinement, enhanced diffusion takes place when electrostatic noise levels in the plasma rise above a certain critical limit8-*. It is proposed that the antennas used for the reception of plasma echoes and plasma resonances should also monitor the elec'.-ostatie noise levels in various frequency bands, especially those corresponding to the lower hybrid resonance noise band and ion acoustic waves.
3. DISCUSSION
3.1 î l e Knee Project
The electron density and magnetic fields at distances far from the satellite can be found from observations of the time delays or wave pulses travelling at the group velocity and propagating in either O-, X- or Z-mode propagation. Reflection of the X-wave occurs when the upper cut-off frequency
becomes locally higher than the transmitter frequency. The upper cut-ofF frequency is shown as a function of lvalues in Figure t, where the data for the density distribution has been taken from Figure 2. Reflection of the Z-modc occurs at the lower cut-off frequency.
ar j reflection of the O-wave at the plasma frequency,/,,. It can be seen that a frequency sv. - .p from 10 kHz -* 500 kHz should provide information on the structure of the knee feature. Delay times may be estimated to a first approximation using cold-plasma theory. The theory of ionosondc probing has been well documented and there is no essential differerce here except for the frequency range an-1 riistancc of propagation involved.
214
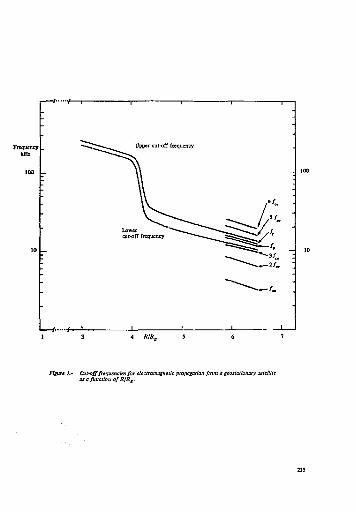
•f—1— 1 1 —\ r ;
• » * ^ , ^ Upper cut-off frequency •
ft. .
^ If. _
Lower ^ ^ * ^ ^ ^ ^ ^ " — ^ , cut-off frequency ^^^—~^^^
-
. L _ l 1 1 i i
"
4 RIRB S
Figure h- Cut-off frequencies for electromagnetic propagation from a geostationary satellite ai a function of R/Rs.
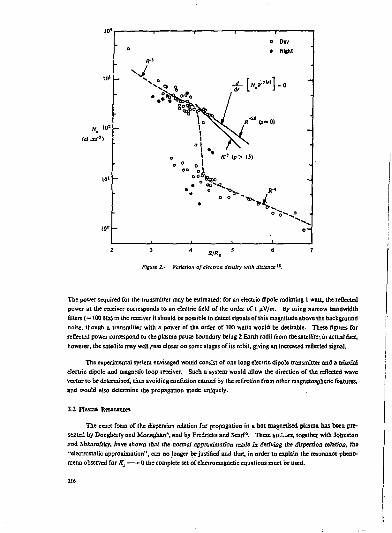
lu- 1 • 1 • " " l 1
o Day
«•> • Night
10" S / — "\ *-[*>'«]" "
• • ^ S,/ I . ^ W *""»-<»
N, 10» i X s i (el cm') K \ ° i / \ O ••
> «• ' (p > 15) 0 °
10" c ° \ « oo^«_ • •
10°
u o—
1 1
Figure 2.- Variation of electron density with distance1*
Tns power required for the transmitter may be estimated: for an electric dîpole radiating I watt, the reflected power at the receiver corresponds to an elcciric field of the order of I fiV/m. By using narrow bandwidth alters (~ tOO Hz) in the receiver it should be possible to detect signals of this magnitude above the background noise, though a transmitter with a power of the order of 100 watts would be desirable. These figures for reflected power correspond to the plasma pause boundary being 2 Earth radii from the satellite-, in actual fact, however, the satellite may well rasa closer on some stages of its orbit, giving an increased reflected signal.
The experimental system envisaged would consist of one long electric dipolc transmitter and a triaxial electric dipole and magnetic loop receiver. Such a system would allow the direction or the reflected wave vector to bn determined, thus avoiding confusion caused by the reflection from other magaetospheric features, and would also determine the propagation mode uniquely.
3.2 Plusna Resonances
The exact form of the dispersion relation far propagation in a hot magnetised plasma has been presented by Dougherty and Monaghan8, and by Fredricks and Scarf*. These &u.l~i3, together with Johnston sod Shkorofblcy, have shown that the normal approximation made in deriving the dispersion relation, the "electrostatic approximation", can no longer be justified and that, in order to explain the resonance phenomena observed for Kx *• 0 the complete set of electromagnetic equations must be used.
216

It has been generally concluded 1 0 ' 1 1 that the Alouette satellite resonances and the frequency deviations of the resonances form the exact harmonics of the electron gyrofrcqucncy can only be satisfactorily explained when
a) the relative motion between the satellite and the ambient plasma is taken into account, and A) the full set of electromagnetic equations is used in the derivation of the dispersion relation.
The dispersion relations for the magnetosphcric situation arc shown in Figs. 3 and A. The local electron density can be observed from the local cut-off frequencies of the O, X or Z traces. At these frequencies the corresponding wave modes experience a zero refractive index for the plasma parameters around the satellite.
Figure 3.- Dispersion of the EerruteUi modes in the electrostatic approximation.
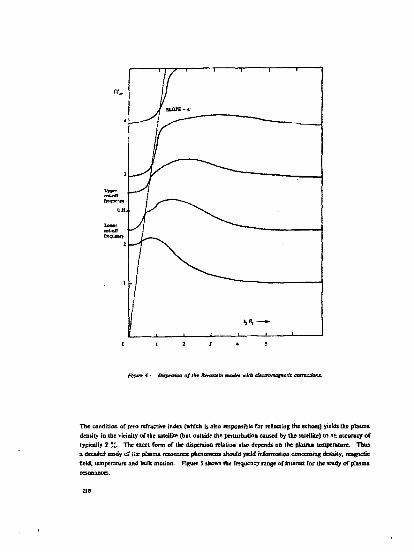
Flgttrt 4.- Dispersion of the Striatum moda w&S deemma^eUt eorrtctiam.
The condition of zero refractive index (which is also responsible for reflecting the «hoes) yield* the plasma density in the vicinity of the satellite (but outside the perturbation caused by the satellite) to »R accuracy of typically 2 %. The exact form of the dispersios relation also depends on the plasma temperature. Thus a detailed satdy of &c plasma restmattee pfcesciaKra should ytdd iaforrcatwfl coaccRttsg density, rnapietk field, temperature and bulk motion. Figure S shows the frequency range of interest for trie study of plasma resonances.
213
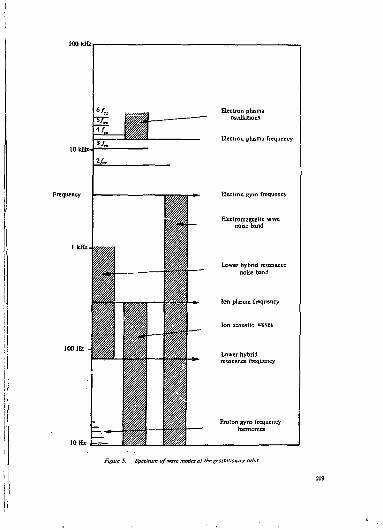
IS 3/«
Electron plasma osciiiabans
Electron plasma frequency
t.
Electron gyro frequency
Electromagnetic v noise band
Lower hybrid resonance noise band
Ion plasma frequency
Ion acoustic waves
Lower hybrid : frequency
Proton gyro frequency harmonics
Figure 5.- Spectrum of wave modes at the geostaiionzry orbit.
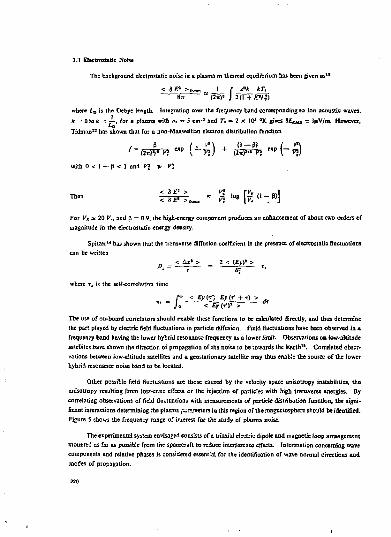
3.3 Electrostatic Nobe
The background electrostatic noise in a. plasma in thermal equilibrium has been given as 1*
8* " (2«)' J 2(\+X*L$
where L& is the Debye length. Integrating over the frequency band corresponding to ion acoustic waves,
k = B l o i = j - , for a plasma with n, = 5 em-* and F. = 2 x 10* BK gives $£«£5 « i(tV/m. However, La
Tidman" has shown that for n non-Maxwellian electron distribution function
with 0 < 1 — p < ] and V\ * V*
«P ( - ^ ) + gjgss^ « P ( - ^
EJ •eg [go-»]
For VE ~ 20 K, and p" = 0.9, the high-energy component produces an enhancement of about two orders of magnitude in the electrostatic energy density.
Spitzer" has shown that the transverse diffusion coefficient in the presence of electrostatic fluctuations
can be written
r> - < *** > = 2 < t^»1 >
where T, is the self-correlation time
/ - < £y (-Q £>• (T1 + T) > ^ Jo < £y{T-)* > **
Hie use of on-board correlators should enable these functions to be calculated directly, and thus determine the part played by electric field fluctuations in particle diffusion. Field fluctuations have been observed in a frequency band having the lower hybrid resonance frequency as a lower limit Observations on low-altitode satellites have shown the direction of propagation of the noise to be towards the Earth". Correlated observations between low-altitude satellites and a geostationary satellite may thus enable the source of the lower hybrid resonance noise band to be located.
Other possible field fluctuations are those caused by the velocity space anisotrapy instabilities, the anisoUopy resulting from loss-ccfle effects or the injection of parlicles with high transverse energies. By correlating observations of field fluctuations with measurements of particle distribution function, the significant interactions determining the plasma ^rameters in this region of the magnetosphere should be identified. Figure 5 shows the frequency range of ir.ierest for the study of plasma noise.
The expérimental system envisaged consists of a triaxiaJ electric dipole and magnetic loop arraogemsM mouoied as far as possible from the spacecraft to reduce interference effects. Information concerning wave components and relative phases is considered essential for the identification of wave normal directions and modes of propagation.
4. ELATION TO OTHER EKPEACMENTS
The experiments proposed will contribute with the other on-board experiments to form a complète picture of thit region of the magsetosphere asd also, in the case of the knee project, of an important feature of the magnetospherc which may play a significant role in the generation of instabilities. The proposed experiments will be both dependent on, and complementary to, the results obtained by the particle detottors and the magnetometer, Frank1* has shown that the panicle velocity distribution functions, when seen in their eatiredes, exhibit sudden fluctuations asd changes, with high-energy spikes moving generally from high energy to low energy. These high-energy spikes should be accompanied by increases in the background electrostatic noise. The plasma noise results should thus correlate with the results of the particle detectors.
The ratiîu of the experiments proposed here should also be correlated with ground-based observations of precipitating electrons, VLF radiation and magnetic field variations made at the auroral zone observatories. This wcu!d be particularly important for the understanding of magnctospheric substorm events and electron acceleration processes.
Since some or these experiments involve the transmission of radiation, the question of interference with other experiments arises. Until the final number and type of Experiments are decided, however, we feel that considerations of this nature are premature. A more serious problem is likely to be interference with the pioyosed experiments from other spacecraft components, but again this effect is difficult <c estimate until prototype tests have been made. Since the OGO-5 1 7 experiments have been flown successfully we see so reason why these problems should not be overcome.
5. CONCLUSIONS
The proposals may be briefly summarised as follows:
A. The knee project: application of established tonosonde techniques to the study ûf the position
s*cbffity and density of this feature.
B. Plasma resonances: observation of the plasma resonances to determine the macroscopic plasma
parameters.
C. Plasma wave noise observations: to determine the ievel of held fluctuations with special regard
to particle diffusion.
We feel that the proposed experiments -mil contribute to an understanding of the structure and stability of the magnetosphere. Further studies with these experiments should also throw some light on many basic features of microscopic plasma physics. Just as spacecraft studies with magnetic antennas nlone have already yielded basic information on electromagnetic plasma instabilities associated with velocity space anisotropics asd on electromagnetic mode coupling, it is îikeîy that studies of the nature proposed will yield significant answers to present general questions concerning loss-cone instabilities, confinement and fast diffusion, stochastic acceleration and plasma turbulence.
121
1. Crawford, F.W. Harp, R.A. Mantei, T.D.
2. Carpemer, D.L.
3. Jackson, J.B.
4. Calvert, W. VanZandt, T.E.
5. Shfcarofsky, LP. Johnslon, T.W.
REFERENCES
J. Geophys. Res.. 72. p. 57 ((967).
J. Gsophys. Res.. 71. p. 693 (1966).
in Electron Density Distribution in the Ionosphere (E. Thranc, cd.) p. 325. North Holland, Amsterdam. 1964.
/ Geophys. Res.. 71. p. 1799 (1966).
Pkys. Rev. Lett. 15. p. 51 (1965).
Plasma Instabilities and Anomalous Transport (W.B. Pardo and H.S. Robertson, eds.). University of Micmi Press, 1566.
7. Kadomtsev, B.B.
8. Dougherty, J.P. Monaghan, J.J.
Plasma Turbulence. Academic Press, 1965.
Proc. R. Soc, Ser. A 289, p. 214 (1965).
9. Fredricks, R.W. Scarf, FX.
in Plasma Waves in Space and Laboratory, Vol. I (J.O. Thomas and BJ. Landmark, eds.) p. 97, Edinburgh University Press, 196*».
10 Benson, R.F. An Analysis of Aloueiie I Plasma Resonance Observations, NASA Report No. X-6L2-68-116 (1968).
11. Calvert, W.
12. Rostoker, N.
13. Tidman, DA.
14. Spjtzer, L.Jr.
15. Gumett, D.A. Pfciffer, G.W. Anderson, R.R. Mosîer, R.R. Cauffman. D.P.
16. Frank, LA.
Resonances in the Ionosphere, in Plasma Waves in Space and Laboratory, Vol. I. p. 41, Edinburgh University Press, 1969.
Nucl, Fusion, 1. p. 101 (1961).
University of Maryland Tech. Note BN-426 (1965).
Phys. Fluids, 3. p. 659 (1960).
J. Geophys. Res.. 74, p. 4631 (1969).
On the Distributions or Low-Energy Protons and Electrons in the Earth's Magnetosphree, in Earth's Particles and Fields (B.M. McCormac, ed.) p. 67, Reinhold Book Corp., New York, 1968.
17. Scarf, FX. Crook, G.M. Fredricks, R.W. Green, I.M. Kennel, C F .
16. Scarf, F.L. Bernstein, W. Fredricks, R.W.
Observations of Plasma Waves in Space, in Plasma Waves in Space end Laboratory. Val 1. p. 379, Edinburgh University Press, 1969.
Am. Geophys. Un. Trans., p. 139 (1966).
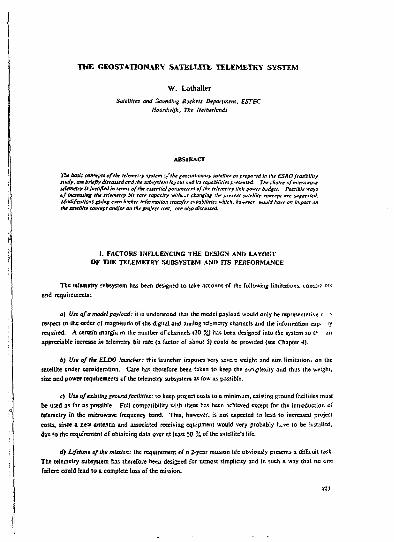
THE GEOSTATIONARY SATELLITE TELEMETRY SYSTEM
W. Lothalier
Satellites and Sounding Rockets Department, ESTEC Noordtvijk, Tlte Netherlands
ABSïîtACT
The basic aattpts of'the lelemelry tyitem •>/'the geostationary satellite as proposedin the ESRO feasibility study, are briefly discussed and the subsystem layout and Us capabilities presented The choice of microwave telemetry is Justified in terms ofthe essential parameters ofthe telemetry link power budget. Possible ways of increasing the telemetry bit rate aipatliy witht,~i changing thr présent satellite concept are suggested. Modificationsgirinf even higher information transfer capabilities which, horerer, would hare on impact on the satellite concepttrndfer on the project cost, ore also discussed.
I. F A C T O R S INFLUENCING T H E DESIGN A N D LAYOUT
O F T H E TELEMETRY S U B S Y S T E M A N D ITS P E R F O R M A N C E
Tîie telemetry subsystem has be^n designed 10 tokc account of ihe following limitations, comir? nts
and requirements:
a) Vie of a model pay load: it is understood thai the model payload would only be representative v i respect to the order of magnitude of the digiul and analog telemetry channels and ihe information cap; iy required. A certain margin in the number of channels <30 %) nas ban designed into (he system so tr an appreciable Increase in telemetry bit rate <a farter of about S} couîd be provided <see Chapter 4j.
b) Use of the ELDO !auncher: this launcher imposes very sevece weight and sia limitation* on the satellite under consideration. Care has therefore been taken to keep the complexity and thus the weight, size and power requirements of the telemetry subsystem as iow as possibfe.
c) Use of existing growid facilities: 10 keep project costs to a minimum, existing ground facilities must
be used as far as possible. Foil compatibility with these has been achieved except for the introduction of
telemetry in the microwave frequency band. This, however, is not expected to tead to increased project
costs, since a sew antenna and associated receiving equipment would very probably fuve to be installed,
due to the requirement of obtaining data over at least 50 % of the satellite's life.
d) Lifetime of the mission: ihe requirement of & 2-year mission life obviously presents a difficult tasV.
The telemetry subsystem has tncrefo.« h**n designed for utmost simplicity and in such a way that no arc
failure could lead to a complete loss of the mission.
222
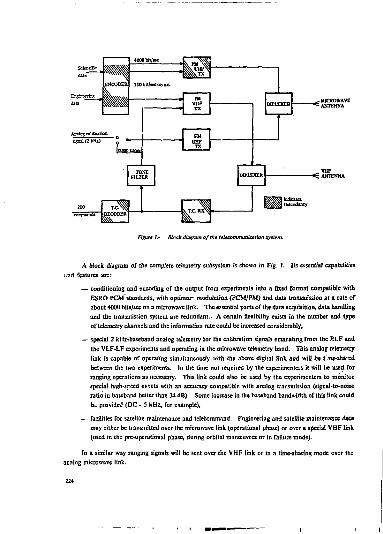
Figure l.- Sleek diagram of the telecommunication syiitm.
A block diagram of the complete telemetry subsystem is shown in Fig. 1. Its essential capabilities
und features are:
— conditioning and encoding of the output from experiments into a fixed format compatible with ESRO PCM standards, with optimur modulation (PCM/PM) and data transmission at a rate of about 4000 bits/sec on a microwave link. The essential parts of the data acquisition, data handling and the transmission system are redundant.- A certain flexibility exists in the number and type or telemetry channels and the information rate could be increased considerably,
— special 2 kHz-baseband analog telemetry for the calibration signals emanating from the ELF and the VLF-LF experiments and operating in the microwave telemetry band. This analog telemetry link is capable of operating simultaneously with the above digital link and will be ijne-sbarsd between the two experiments. In the time not required by the experimenters it will IK used for ranging operations as necessary. This link could also be used by the experimenters to monitor special high-spaed events with an accuracy compat.'blf with analog transmission (signal-to-noise ratio in baseband better than 34 dB). Some increase in the baseband bandwidth of this link could bi provided (DC - 5 kHz, for example),
— facilities for satellite maintenance and telecommand. Engineering and satellite maintenance data may either be transmitted over the microwave link (operational phase) or over a special VHF link (used in the pre-aperational phase, during orbital manœuvres or in failure mode).
In a similar way ranging signals will be sent over the VHF link or in a time-sharing mode over the
analog microwave link.
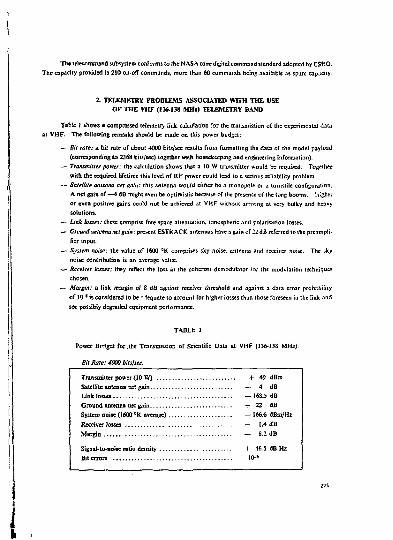
The telecommand subsystem conforms to the NASA tone digital command standard adopted by ESRO. The capacity provided is 210 on-off commands, more than 60 commands being available as spare capacity.
2. TELEMETRY PROBLEMS ASSOCIATED WFffi THE USE OF THE VHF (136-138 MHz) TELEMETRY BAND
Table I shows B compressed telemetry link calculation for the transmission of the experimental data t VHF. The following remarks should be made os this power budget:
— Bit rate: a bit rale of about 4000 bits/sec results from formatting the data of the model payload {cerrespondtflg to 2368 bits/sec) together with housekeeping aod engineering information!-
— Transmitter power: the calculation shows that a 10 W transmitter would be required. Togelher with the required lifetime this level cf RF power could lead to t. serious reliability problem.
— Satellite antenna net gain: this antenna waufd either be a monopole or a turnstile configuration. A net gain of —4 dB might even be optimistic because or ihe presence of the long booms, '.ilgher or even positive gains could not be achieved at VHF without arriving at very bulky and heavy solutions.
— Link losses: these comprise free space attenuation, ionospheric and polarisation losses.
— Ground antenna net gain: present ÊSTRACK antennas have 3 gain of 22 dB referred to the preamplifier input.
— System noise: the value of 1600 °K comprises sky noise, antenna and receiver noise. The sky noise contribution is an average value.
— Receiver losses: they reflect the loss in the coherent demodulator for the modulation techniques chosen.
— Margin: a link margin of 8 dB against receiver threshold and against a data error prcbs&iîity of 10-" is considered to be - lequate to account for higher losses than [hose foreseen in the link and tor possibly degraded equipment performance.
TABLE J
Power Bi'Hget for.the TransmissioD of Scientific Data at VHF (136-138 MHz).
Bit Rate: 4000 bits/sec.
Tntssisitler power {10 W) -f 40 dBm
Satellite antenna net gain — 4 dB Link losses — 168.5 dB Ground Antenna net gain + 22 dB System noisî (1600 °K. average) — 166.6 dBm/H2
Receiver losses — 1.4 dB Margin — 8.2 dB
Stgnal-to-noise ratio density , 4- 46.5 dB-Hz
Bit errors 10-*
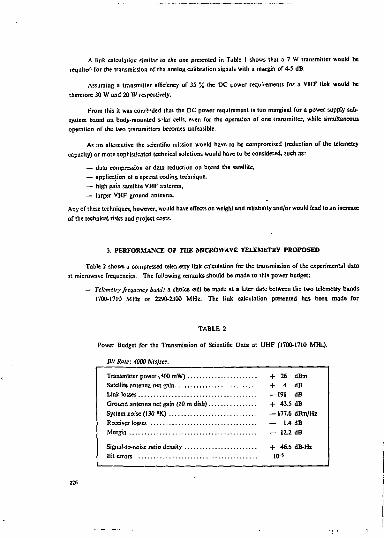
A link calculation similar to the one presented in Table I shows that a 7 W transmitter would be required for the transmission of the analog calibration signals with a margin of 4-5 dB.
Assuming a transmitter efficiency of 35 % (he DC power requirements for a VHF link would be theretore 30 W and 20 W respectively.
From this it was cond-ded that the DC power requirement is too marginal for a power supply subsystem based on body-mounted s.-lar ceils, even for the operation of one cransmitter, while simultaneous operation of the two transmitters becomes unfeasible.
As an alternative the scientific mission would have to be compromised (reduction of the telemetry capacity) or more sophisticated technical solutions would have to be considered, such as:
— data compression or daia reduction on board the satellite, — application of a special coding technique, — high gain satellite VHF antenna, — larger VHF ground antenna.
Any of these techniques, however, would have effects on weight and reliability and/or would lead to an increase of the technical risks and project costs.
3. PERFORMANCE OF THE MICROWAVE TELEMETRY PROPOSED
Table 2 shows a compressed telen.etry link calculation for the transmission of the experimental data at microwave frequencies. The following remarks should be made to this power budget:
— Telemetry frequency band: a choice i"ill be made at a later date between the two telemetry bands 1700-17)0 MHz or 2290-2300 MHz. The link calculation presented has been made for
TABLE 2
Power Budget for the Transmission of Scientific Data at UHF (1700-1710 MHi).
Bit Rate: 4000 bitsjsec.
Transmitter power \W0mW) + 26 dBm Satellite antenna net gain + 4 dB Link losses — 191 dB Ground antenna net gain (10 m dish) + 43.5 dB System noise (130 °K) — 177.6 dBrn/Hz Receiver losses — 1.4 dB Margin — 12.2 dB
Stgnal-to-noise ratio density + 46.5 dB-Hz Bit errors 10-8
226

the 1700 MHz band. No significant changes will, however, result in link performance if the final choice were the 2300 MHz band.
— Bit rate; the same format would fee ased as is the case of VHF transmission, resulting in about «X» bits/sec
— Transmitter power: a 400 raW transmitter is proposed. Solid state UHF transmitters working at this level of RF power are well within European development capabilities.
— Satellite arteiaxf net gain: the satellite antenna consists of a linear s'oited waveguide producing a toroidal pattern around the spin axis of the satellite wivh a beamwïdth of ab-n« B° . Its minimum directive gain in the direction of Redu will be S dB above isotropic.
— Link tosses: these comprise free space attenuation and polarisation losses. — Graosdantenna net gam: the gain quoted {43.5 d8) corresponds loan antenna size of about 10 m.
— System noise: the value of 130 °K quoted comprises receiver noise <70 °K for an uncoaled parametric amplifier) and antenna noise (sly noise, noise due to antenna sidelobcs and transmission line noise).
— Receiver tosses: the same modulation technique would be used as Tor transmission in the VHF telemetry band, with the same receiver losses.
— Margin: a link margin of 12 dB as proposed may be regarded as satisfactory for a geostationary satellite.
4. WAYS OF INCREASING THE TELEMETRY BIT RATE WITHOUT AFFECTING SATELLITE DESIGN OR PROJECT COST
[f so required it appears feasible to increase the telemetry bit rate from WOO bits/sec to
about 20ÛÛG bits/sec This codd be achieved by (cf. Table 2):
a) An increase of transmitter power from 400 mW to 800 mW. This can be realised at the expense of an additional 2 W to be delivered by trie power* supply subsystem, ft snouîd be noted in this contest that the power supply subsystem has be-wi designed for a contingency of 13 W unregulated power from the solar array and with s coatingeiicy of i I watt-hours to be supplied by the battery during eclipse. Transmitter technology itself would remain essentially unchanged. The semiconductors to be used in the transmitter power stage, however, would be less derated than initially foreseen, and a slightly higher effort to qualify these components might therefore be indicated.
6) A decrease in the telemetry link margin from 12 dB to 8 dB. This decrease would lead to a still
acceptable safety asargm against receiver threshold and 3gainst a bit error probability of Î0-*.
Assuming conservatively an efficiency of formatting in the telemetry encoder of 60 %. an information rate of about 12 kbit/sec could therefore be made available to the scientific payload. Similarly the transmission capacity of the analog telemetry link could be increased from 1 kHz to a S kHz-wid= channel. In this case, however, the transmitter output Only would be increased from 300 raW to SOO mW.
22?
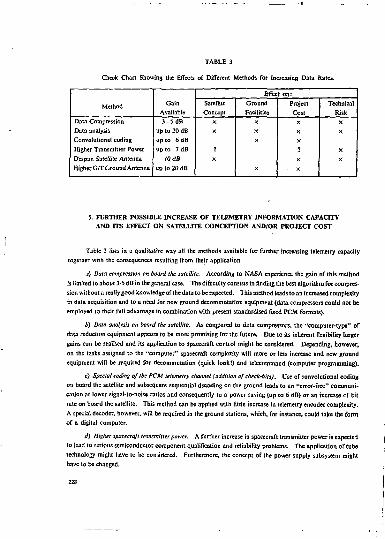
TABLE 3
Check Chart Showing the Effects of Different Methods far Increasing Data. Rates.
Method Gain Available
Effect on:
Method Gain Available
Satellite Concept
Ground Facilities
Project Cost
Technical Risk
Data Compression Data analysis Convolutional coding Higher Transmitter Power Despun Satellite Antenna Higher G/TCround Antenna
3 - 5 dB up to 20 dB up to 6 dB up to 7dB
10 dB up to 20 dB
X
X
? X
X
X
X
X
X
X
? X
- X
XX
XX
5. FURTHER POSSIBLE INCREASE OF TELEMETRY INFORMATION CAPACITY AND ITS EFFECT ON SATELLITE CONCEPTION AND/OR PROJECT COST
Table 3 lists in a qualitative way all the methods available for further increasing telemetry capacity together with the consequences resulting from their application.
j) Data compression on board the satellite. According to NASA experience the gain of this method is limited to about 3-5 dB in the general case. The difficulty consists in finding the best algorithm for compression without a really good knowledge or the data to be txpected. This method leads toan increased complexity in data acquisition and to a need for new ground decommutatîon equipment (data compressors could not be employed to their full advantage in combination with present standardised fixed PCM formats).
b) Data analysis on board the satellite. As compared to data compressors, the "computer-type" of data reduction equipment appears Jo be more promising Tor the future. Due to its inherent flexibility larger gains can be realised and its application to spacecraft control might be considered. Depending, however, on the tasks assigned to the "computer" spacecraft complexity will more or less increase and new ground equipment will be required for decommutatîon (quick look!) and telecommand (computer programming).
c) Special coding of the PCM telemetry channel (addition of check-bits). Use of convolutional coding on board the satellite and subsequent sequential decoding on the ground leads to an "error-free" communication at lower signal-to-noise ratios and consequently to a power saving (up to 6 dB) or an increase of bit rate on board the satellite. This method can be applied with little increase in telemetry encoder complexity. A special decoder, however, will be required in the ground stations, which, for instance, could take the form of a digital computer.
d) Higher spacecraft transmitter power. A further increase in spacecraft transmitter power is expected to lead to serious semiconductor component qualification and reliability problems. The application of tube technology might have to be considered. Furthermore, the concept of the power supply subsystem might have to be changed.
223
<*) Application ofadespun satellite antenna. Despinning the saiellite antenna (mechanical or electrical) would allow for an increase of antenna gain of roughly 10 dB. This method, however, would very seriously affect the satellite concept and inevitably lead to an appreciable increase in complexity and weight of the spacecraft.
f) Higher figure of merit (GfT) of the receiving ground station. Appreciable gains in telemetry link capacity can be realised at the expense of larger antenna installations. In fact, the gain increases as a function of the square of the antenna diameter. The impact on the cost of the installation, however, is great : as a rule of thumb oee may consider the cost of the antenna installation to increase with about the third power of ils size. Some extra gain can also be achieved when applying cooled preamplifiers. In practice the most economical compromise between antenna size and preamplifier temperature is aimed at a desired figure of merit of the receiving antenna.
IÎ9

THE SCIENTIFIC VALUE OF COMPUTING FACILITIES FOR ESRO SATELLITE MISSIONS
F. Du Castel Centre National d'Études des Télécommunications, Issy-les-Moulineaux. France
Reference to the Roseau and FR-l satellite projects shows that onboard computers need not be restricted lo mcnagement of the satellite equipment but can become an integral part of the scientific experiments. The ways In which a stored, instead of a wired, programme could increase the scientific significance of an experiment are considered and applied to proposed geostationary satellite experiments. It is not possible to adapt the conrenilonal satellite measurements to unexpected aspetts of a phenomenon or to refine the analysis during special events. If the data aialysis can be made on board, particularly with a révisable stored programme, then the characteristics of the ••ensors can be continuously adjusted to the actual phenomenon. The following successive steps need to be taken before introducing computers on board a satellite: a) a precise study of the scientific requirements, entailing a good comprehension of /he physical processes, b) a proper study of the relevant problems of logic, c) a feasibility study cf the onboard computer itself and of the consequences ofIts Inclusion In the satellite, andd) a related study of the required transmission capacities between the Earth stations and the satellite.
1. INTRODUCTION
A working group to discuss the problem arising from the use of onboard computers for the next generation of scientific satellites has recently been set up by ESRO. It b Ihercrore of interest at this stage to consider the scientific possibilities of computing facilities for the GEOS mission.
The history of the problem begins with the limitations of previous conventional satellites and the case of the French FR-l satellite, which has been studied by Storey, shows that:
a) The limitations of an experiment by the constraints of a wired programme become evident during the analysis of the satellite data.
b) Definite restrictions arise when an unexpected phenomenon is studied in expected conditions, and vice-versa, when one studies an expected phenomenon in unexpected conditions, e.g. launching failures, variations in ambient conditions, etc.
c) It is also impossible to change the focus of the experiment during the lifetime of the satellite and lo go beyond the descriptive level and analyse a physical process.
The evolution in the approach to an onboard computer thus appears as follows;
r) The first and obvious idea is to manage the satellite by controlling the equipment, either by handling the data or by processing if for the TM link;
ii) The new idea is to use the computer in defining the experiment itself in the hope of increasing the scientific capability of (he equipment.
Examples will be given by reference to missions already suggested for the GEOS satellite, some of which concern one experiment while others concern the coordination or several experiments. The general aim is to stimulate the imagination nf scientists regarding GEOS or other future satellites.
231

2. THE ROLE OF AN ONBOARD COMPUTER IN ONE EXPERIMENT
2.1 Example of an active experiment on plasma diagnostics
A resonance probe, suggested for GEOS, had been previously studied for a self-adaptable version of ihe late Franco-Soviet ROSEAU orojeci This is an active experiment in which the medium is excited by a radio pulse at a sweeping frequency. The plasma response must be Fourier-analysed in order to detect the characteristic plasma frequencies at which non-pro pa gating waves induce signals of long duration in the receiver. One interesting application is the possible measurement of low-plasma decsitv values.
The simplest aspect of the resonance detection suggests an immediate possibility. Useful information being limited to the frequencies for which long signals exist and by the duration of those signals, it is obviously of some interest Tor the available information tc be restricted to its useful part in order to'obtain a better de 6 nit ion of the received signal. Moreover, as the amplitude of the signal varies it is of some interest to adapt the receiving a. d transmitting characteristics to the received signal. Onboard computers would certainly facilitate the processes of selection and adaptation, although this could likewise be done with a wired programme.
New factors arise, however, from a more detailed analysis of the phenomenon. The received signal usually presents a complex modulation pattern and a theoretical treatment of the propagation of the waves in a hot plasma and in the vicinity of a resonance suggests an explanation of the pattern by computing a ray path back to the satellite. As such a path does not exist in cold plasma it may be possible to measure a new parameter, the plasma temperature, with the same equipment. The following procedure is suggested: a resonance frequency is selected and the signal is integrated to obtain a fine analysis of its spectrum. Unfortunately, the selection of the exact resonance frequency required by the procedure is not straightforward as it implies a preliminary spectral analysis. With the existing fast Fourier transform programme, however, this analysis can be realised even with an onboard computer of small capacity. It will, of course, be important to be able to reprogramme the computer in the event of any unforeseen theoretical developments.
Another aspect of the problem is choosing between two modes of using the equipment, one devoted to the detection of resonance frequencies, the other to the analysis of the signal at a résonance frequency, the criteria obviously depending on the measurements themselves. Therefore, the ability to select either of the modes at any instant calls for a rapid analysis of the data, which it is also possible to carry out on the onboard computer.
2.2 Other examples involving one sensor
Let us now consider the cose of a particle detector. In a conventional system the correspondence between the applied voltage and the energy range is rigid and the distribution of the energy channels fixed. However, with a computer it become', possible to realise any required distribution of the energy channels or to adapt the detector range to the measured particle flux, and the criteria may be established by a preliminary measurement. Interpretation of this measurement may involve a deconvolution of the signal in order to enable the characteristics for the subsequent use or the computer to be selected. This procedure is also a task for the computer even if the process is not straightforward and involves some statistical analysis.
232
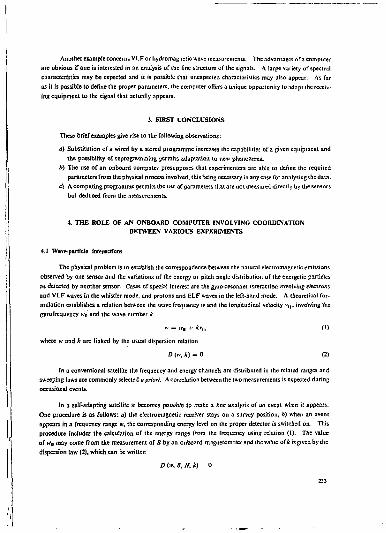
Another example concerns VLFor hydromagnetic wave measurements. The advantages ofa computer are obvious if one is interested in an analysis of the fine structure of the signals. A large variety of spectral characteristics may be expected and it is possible that unexpected characteristics may also appear. As far as it is possible to define the proper parameters, the computer offers a unique opportunity to adapt the receiving equipment to the signal that actually appears.
3. FIRST CONCLUSIONS
These brief examples give rise to the following observations;
a) Substitution of a wired by a stored programme increases the capabilities of a given equipment and the possibility of reprogrammtng permits adaptation to new phenomena.
b) The use of an onboard computer presupposes that experimenters are able to define the required parameters from the physical process involved, this being necessary in any case for analysing the data.
c) A computing programme permits the use of parameters that are not measured directly by the sensors but deduced from the measurements.
4. THE ROLE OF AN ONBOARD COMPUTER INVOLVING COORDINATION BETWEEN VARIOUS EXPERIMENTS
4.1 Wave-particle interactions
The physical problem is to establish the correspondence between the natural electromagnetic emissions observed by one sensor and the variations of the energy or pitch angle distribution of the energetic particles as detected by another sensor. Cases of special inleresl are the gyrc-resonani interaction involving electrons and VLF waves in the whistler mode, and protons and ELF waves in the left-hand mode. A theoretical formulation establishes a relation between the wave frequency ii'and the longitudinal velocity i 'M, involving the gyro frequency »•» and the wave number k
» '= >vB + kv„ 0)
where w and k are linked by the usual dispersion relation
D (», k) = 0 (2)
In a conventional satellite the frequency and energy channels are distributed in the related ranges and sweeping laws are commonly selected a priori, A correlation between the two measurements is expected during occasional events.
In a self-adapting satellite it becomes possible to make a fine analysis of an event when it appears. One procedure is as follows: a) the electromagnetic receiver stays on a survey position, b) when an event appears in a frequency range w, the corresponding energy level on the proper detector is switched on. This procedure includes the calculation of the energy range from the frequency using relation (I). The value of wB may come from the measurement of B by an onboard magnetometer and the value of k is given by the dispersion law (2), which can be written
D (if, B, N,k) = 0
233
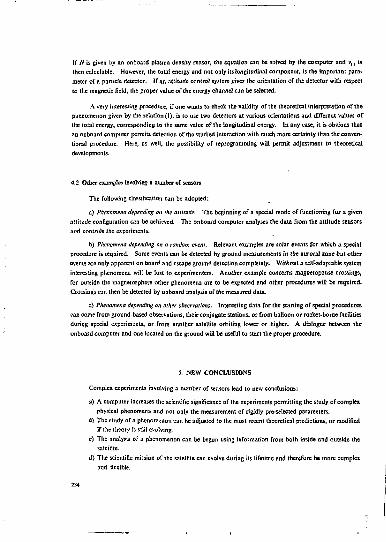
If iV is given by an onboard plasma density sensor, the equation can be solved by the computer and v,, is then calculable. However, the total energy and not only its longitudinal component, is the importan; para* meter of a particle detector. If an attitude control system gives the orientation of the detector with respect to the magnetic field, the proper value of the energy channel can be selected.
A very interesting procedure, if one wants to check the validity of the theoretical interpretation of the phenomenon given by the relation (1), is to use two detectors at various orientations and different values of the total energy, corresponding to the same value of the longitudinal energy. In any case, it is obvious that an onboard computer permits detection of the studied interaction with much more certainty than the conventional procedure. Here, as well, the possibility of «programming will permit adjustment to theoretical developments.
4.2 Other examples involving a number of sensors
The following classification can be adopted:
a) Phenomena depending on the attitude. The beginning of a special mode of functioning for a given attitude configuration can be acbkved. The onboard computer analyses the data from the attitude sensors and controls the experiments.
b) Phenomena depending on a random event. Relevant examples arc solar events for which a special procedure is required. Some events can be detected by ground measurements in the auroral zone but other events are only apparent on board and escape ground detection completely. Without a self-adaptable system interesting phenomena will be lost to experimenters. Another example concerns raagnetopause crossings, for outside the magnetosphere other phenomena are to be expected and other procedures will be required. Crossings can then be detected by onboard analysis of the measured data.
c) Phenomena depending on other observations. Interesting data for the starting of special procedures can come from ground-based observations, their conjugate stations, or from balloon or rocket-borne facilities during special experiments, or from another satellite orbiting lower or higher. A dialogue between the onboard computer and one located on the ground will be useful to start the proper procedure.
5. NEW CONCLUSIONS
Complex experiments involving a number of sensors lead to new conclusions:
a) A computer increases the scientific significance of the experiments permitting the study of complex physical phenomena and not only the measurement of rigidly pre-sclec:ed parameters.
b) The study of a phenomenon can be adjusted to the most recent theoretical predictions, or modified if the theory is sîiîi evolving.
c) The analysis of a phenomenon can be begun using information from both inside and outside the satellite.
d) The scientific mission of the satellite can evolve during its lifetime and therefore be more complex and flexible.
234

6. GENERAL CONCLUSIONS
Il seems viral to consider self-adaptable versions of ESRO satellites if. order to increase ilie sciemilic value of their missions. The study of such a satellite-type has to folio* the successive steps
— Definition ofcfcpcrimemaJ needs. Starting from 'he Studied phenomena with no a priori constraints. — Analysis of the corresponding problems of logic, in terms of compilers (logical operations,
computing programmes). — A feasibility study of the computer and its effect on the saieUitc siruciure. — Adaptation of scientific needs to technical constraints. — Study of the effects of the competing system on the telemetry and telecommand î*«fcs between the
satellite and the ground (programming capacity) and on the ground eqtupmer" (ground-Kiicd computer).
In some cases it will appear that an onboard computer is the best solution; in others that a grounu-&=sed computer (special-purpose or general) and a large capacity satellite/ground link «'Il serve a better function. In any case, the use of more computing facilities will cvrtai«ly bring progress to the scientific aim of the satellites, in the new age of space research where the definition of ti.. physical processes of space lakes tfie place of the limited measurements (hat were possible ir the first age.
BIBLIOGRAPHY
Cliff, R.A. A Stored Program Computer for Small Scientific Spacecraft, NASA TN D-3640, October 1966.
Storey, L.R.O.
Arnould, J.
L'emploi d'un calculateur universel a bord d'un satellite scientifique, Note interne ORI, CNET, octobre 1966.
Perspectives offertes par l'emploi d'un calculateur à bord d'un satellite scientifique. Note interne, CNET, octobre 1966.
Stabler, E.P. Spacecraft Computers for Scientific Information Systems, Proceedings, I.E.E.E., Vol. 54, p. 1734, December 1966.
Varloot, D. Tarama2zo, J.
Programme Roseau - fonctions assurées par un calculateur embarque, Note interne CNET 979/TDS, féviier !9;7.
Cliff, R.A.
Cliff, R.A.
Space for Small Computers. Electronics, 40, p. 127 (1967).
Application of the Stored Program Computer to Small Scientific Spacecraft, NASA TN D-3988, June 1967.
Fimmel, R.O. Egger, A. Bellow, L.M.
Central Data System Concepts for Spacecraft Data Management, Proceedings Inter national Telemetry Data Conference, Washington, DC. October 1967. Vol. 3, p. Ill (1967).
Williams, DJ. Hoffman, R.A. Lonsanecker, G.W.
The Small Scientific Satellite (S3) Program and its First Payload, NASA TM X-âi2-6ft-118, November I96S.
Colloque sur les calculateurs embarqués (CNES), Paris, décembre 1 L'Onde Electrique, mars 1969.
Cliff, R.A. Paull, S.
The IMP I Computer Experiment, NASA TM X-71 i-69-9], March 1969.
The SDP-3 A Computer Designed for Data Systems of Small Scientific Spacecraft, NASA TM X-711-69-43, February 1969
Glcncross, W.M. Penny, R.W. Rain, W.J.
The Use of Computers On Board Small Scientific Spacecraft, Mullard Space Science Lab. MS/90, Jan. 1970 and ESRO SN-109, March 1970.

CALCULATEURS EMBARQUES
QUELQUES CONSIDÉRATIONS TECHNIQUES
J. Cazernajou Centre National d'Études Spatiales
RESUME
Après un are/ rappel des principalis notions concernant la structure et te fonctionnement d'un ordinateur, l'auteur souligne l'importance du rôle que Jouent certains paramétrer purement techniques dans fa conception d'un ordinateur embarqué. Ces paramètres (poids, consommation, Jtabititi) ûeiermimnt à lew lour le choix des solutions techniques que l'on adoptera pour réaliser les principaux soas-systimes de l'ordinateur (entrée-sortie, mémoire, bloc de commande, etc.). Le document se termine per un tableau comparatif de quelques calculateurs ejnbarquis actuellement en service ou sur le point de S'être, et sur un bilan de t'arentrasenf dei travaux du CNESsur tut petit calculateur de bord originellement destiné au projet Eole.
î. INTRODUCTION
Au cours des dix dernières années les importants progris dans ia conception et, surtout. la technologie des ordinateurs ûnt permis une large diffusion de ces remarquables outils de travail.
La microminiaturisation , j c s fonctions logiques à faible consommation a abouii à la réalisation de
petites unités relativement performames.
Toutefois les impératifs de fiabilité font que deux a trois ans s'écoulent entre l'avènement d'un nouveau eojspe-sani et son appiieatisa aux matériels spatiaux, ii es! en effet nécessaire de bien connaître ce composant pour pc-'voir garantir son comportement a long terme.
Mais à l'heure actuelle, il semble bien que toutes les conditions soient réalisées pour pcrmcltir de construire de petits calculateurs embanjuablcs à bord de satellites de faible faille; on peut constater dans la littérature que de nombreux pays travaillent dans ce sens.
11 est incontestable que l'utilisation d'un calculateur à bord offre d'énormes avantages :
— augmentation des performances d'une expérience, car le calculateur gère son exploitation de manière adaptative; de plus il peut permettre des communications entre expériences, rendant ainsi possibles des corrélations intéressantes.
— gain en souplesse parce que, au cours de ta mission, la manière d'exploiter les capteurs peut être modifiée soit par ordre de télécommande émis du sol et interprété par le calculateur, soil, surtout, par repfogrammatioa totaîe ou partielle.
— gain erj temps, parce qu'avec un équipement câblé, la fonction a réaliser doit Sire définie et figée dew à trois ans avant le lancement; alors qu'avec un calculateur h programme peut être éi"dié et modifié jusqu'au lancement; il peut même être changé au cours du vol.
— gain financier, car uc calculateur est un équipement universel qui ne nécessite des frais d'études qu'une seule fois.
237

- enfin un calculateur permettra de diminuer la puissance absorbée par l'émetteur de télémesure en éliminant les données redondantes et en assurant une surveillance autonome du satellite.
Ayant de dégager les paramétres importants dans la définition d'tm petit calculateur embarquable. is en rappeler brièvement la structure et le principe de fonctionnement
2. STRUCTURE ET PRINCIPE DE FONCTIONNEMENT D'UN CALCULATEUR
Un calculateur est essentiel te ment composé de trois parties fondamentales (voir Figure 1) :
— la mémoire, — l'unité centrale,
— les organes d'entrées-sorties.
d~k383ctiral in r
Figure 1.' Schéma déstructure d'un ordinateur.
2.1 La mémoire
La mémoire est un ensemble d'éléments mémoires digitaux, généralement découpé en mots.
Chaque mot possède un numéro, c*est son adresse.
La mémoire pennet de conserver les programmes de traitement et assure le stockage provisoire des données.
Un programme est constitué par une séquence de codes binaires rangés dans des mots d'adresses successives; chacun de ces codes s'appelle une instruction.
L'écriture en mémoire des instructions s'appelle la programmation; les données, elles, sont le plus couramment introduites en mémoire, par l'intermédiaire des organes d'entréc-sortic, sous contrôle du programme,
2.2 L'unité centrale
C'est la partie active du calculateur; composée de circuits logiques, elle comporte deux sous-ensembles :
— le bloc de &. amande
— le bloc de calcul.
2.2.1 Le bloc de commande
II assure l'exécution séquentielle, c'est-à-dire instruction par instruction, du programme.
Un compteur ordinal, ou compteur d'instructions comporte l'adresse de l'instruction à exécuter;
cette instruction est transférée de la mémoire dans un registre appelé registre d'instruction.
Un décodeur identifie la nature de l'instruction (instruction d'entrée, d'addilion, etc.) et génère les ordres logiques nécessaires à son exécution; pendant ce temps, le compteur ordinal est avancé d'une unité de façon à pointer sur la prochaine instruction.
Nota : tout calculateur est muni d'une instruction de branchement conditionnel qui permet de modifier, ou non, le contenu du compteur ordinal, en fonction d'un test (par exemple signe du résultat d'une soustraction); ceci permet de sauter à une autre partie du programme et donne un air d'intelligence au comportement du calculateur.
2.2.2 Le bloc de calcul
tl est constitué de deux ou plusieurs registres interconnectés par un opérateur arithmétique et logique.
Les registres contiennent les opérandes (placés au préalable par une instruction antérieure) et l'un d'eux reçoit
le résultai; c'est l'accumulateur.
2.3 Les orgues d'entrée-sortie
Assurant les transferts d'information entre le calculateur et son environnement, ils sont souvent appelés
canaux; j'en distinguerai deux types :
2,3.1 Canal simple
Le plus souvent, pour le type de calculateurs auquel nous nous intéressons, il assure l'échange d'Info,
mations entre l'extérieur et les registres du bloc de calcul; ces échanges se font sous le contrôle d'instructions
d'entrée-sortîe.
239
En général l'information ainsi introduite est stockée en mémoire par l'instruction suivante; il est donc nécessaire de dérouler un petit programme pour acquérir de l'information de cette façon; il en résulte deux
conséquences ;
— si la cadence de transfert est très lente, l'unité centrale travaille lentement et le rendement du système est mauvais,
— si, par contre, la cadence est très rapide, i) devient impossible de dérouler le programme de gestion du transfert.
Ces inconvénients seront levés par l'utilisation d'un canal d'accès direct
2.3.2 Catsd d'accès direct
Il s'agit d'une voie d'entrée-sortie qui possède ses propres accis à la mémoire; il écrit ou lit en mémoire, à des mots d'adresses successives.
Son fonctionnement est déclenché par une instruction de l'unité centrale qui lui fournit l'adresse et le volume de la zone mémoire à explorer. A partir de ce moment, le fonctionnement du canal devient autonome et l'unité centrale peut aller exécuter d'autres programmes; simplement, les accès à la mémoire du canal sont prioritaires sur ceux de l'unité centrale.
Si les cadences sont lentes, l'unité centrale n'est pas bloquée et peut exécuter d'autres tâches; si les cadences sont très élevées, l'unité centrale sera en attente et seul le iemps d'accès à la mémoire limitera les performances.
13-3 Les iattrraptioru
La notion d'interruption revêt une importance toute particulière pour un calculateur embarqué,
destiné à fonctionner en temps réel, en communication avec de nombreux équipements extérieurs.
Un système d'interruptions permet de prendre en compte des événements dont l'apparition ou les instants d'apparition sont imprévisibles; si ces instants étaient connus, un tel système ne serait pas nécessaire,
H est important de noter que la nature de ces événements est répertoriée à l'avance et que seuls les instants d'occurrence sont inconnus.
La présence d'une interruption est matérialisée par l'apparition sur un fil, appelé ligne d'interruption,
d'un signal logique; l'unité centrale va alors arrêter l'exécution du programme en cours et se dérouter vers un so us-programme de gestion de l'interruption; après exécution de ce sous-programme, elle reprendra le programme interrompu; il est donc indispensable que, lors de la prise en compte de l'interruption, l'adresse de l'instruction interrompue et le contenu des registres arithmétiques soient rangés en mémoire pour assurer la reprise correcte du travail par la suite.
Il existe généralement plusieurs lignes d'interruption associées & diverses sources :
— externes : périphériques qui désirent utiliser les services du calculateur,
— internes : détection de fonctionnements anormaux (débordements en addition, protection de la
mémoire, parité, etc.).
240
Ces événements ne possMent pas tous le même degré d'urgence; aussi afiecle-t-on des degrés de priorité aux diverses lignes d'inUrruption de façon à ce que, si deux interruptions sont présentes en même temps, la plus urgente soit traitée en premier.
Cependant, il est possible que pendant le déroulement d'un programme il soit nécessaire de ne pas être interrompu par certaines interruptions; dans ce cas un registre programmable, appelé masque d'inter
ruption, filtrera les lignes indésirables.
2.4 Aspect Doirersel d'un ctlcnlatenr
Il peut être dégagé grâce à une analogie; en effet, lorsqu'un électronicien doit construire un équipement remplissant une fonction particulière (filtre, corrélateur, transcodeur, etc.), il dispose d'un ensemble de composants (résistances, capacités, transistors, fonctions logiques, etc.) qu'il assemble et interconnecte de façon à réaliser la fonction souhaitée.
Il existe une autre manière de réaliser ces fonctions, c'est d'utiliser un calculateur; le constructeur qui
devient un programmeur, dispose également de composants : ce sont les instructions de la machine (addition,
multiplication, entrée, sortie, mise en mémoire, décalages, etc.); it les assemble et les interconnecte de façon
à constituer un programme qui réalise un filtrage, une fonction de corrélation, un transcodage, etc.
L'avantage est évident : le corrélateur se transforme tris vite en transcodeur, par «programmation;
l'inconvénient fondamental réside dans le fait que les fonctions câblées sont beaucoup pios performanres que
les fonctions programmées.
Néanmoins pour le cas de3 matériels spatiaux où les frais d'études sont très élevés, l'intérêt écono
mique d'un type de calculateur standard est frappant
3. LES PARAMÈTRES IMPORTANTS DANS LA DÉFINITION D'UN CALCULATEUR
3.1 Paramétres techniques
Bien qu'en toute logique les aspects fonctionnels devraient passer en premier, il est bien connu que, pour les matériels spatiaux, les contraintes techniques entraînent une limitation des performances fonctionnelles; nous commencerons donc par les contraintes fondamentales.
3.1.1 Poids - Consommation
Nous pensons que, dans l'état actuel de la technique, il est possible de réaliser plusieurs séries de
calculateurs embarquables sur des satellites de tailles diverses; à titre purement indicatif, il semble homogène
d'embarquer des calculateurs :
5-6 W, 5-6 kg pour des satellites jusqu'à 100 kg, 10-15 W, 10-15 kg pour des satellites de 3 à 400 kg.
Il est à noter que le chiffre de consommation sera moyenne par la charge du calculateur car ce dernier
doit se mettre en état de veille chaque fois qu'aucun programme n'est exécuté.
241
L'on doit également remarquer que la mémoire intervient grosso modo pour les 2/3 dans le bilan de
consommation et ''avantage dans le bilan de poids; ceci est dû au fait que les mémoires à tores de ferrites, les
plus couramment utilisées, mettent en jeu des puissances importantes et emploient beaucoup de composants
discrets.
Actuellement deux types de mémoires semblent devoir concurrencer sérieusement les tores :
— les mémoires a MOSFET avec intégration à large échelle, — les mémoires à fils.
Les premières, si elles semblent devoir résoudre le problème du poids, offrent par contre l'inconvénient de devoir être alimentées en permanence pour conberver leur contenu; en conséquence, dès que la capacité est importante, le bilan de consommation devient assez lourd; d'autre part, pendant le ré-chargement des batteries, les programmes seront détruits, à moins qu'un dispositif d'alimentation de secours ne soit mis en place.
Pour les secondes, le bilan de poids semble être sensiblement équivalent à celui des tores; par contre le
bilan de puissance peut être divisé par un facteur compris entre 5 et 10.
3.1.2 FiaàUîté
C'est également un critère de choix très important.
S'il faut être 1res prudent dans le crédit que l'on accorde aux chiffres de taux de panne annoncés, parce que les méthodes de calcul sont très diverses, il n'en est pas moins vrai que l'organisation fonctionnelle doit être optimisée de façon à assurer le maximum de longévité au matériel (redondances des éléments critiques, possibilité de fonctionnement en mode dégradé, etc ).
Deux optiques peuvent être envisagées pour accroître la fiabilité :
— extrême simplicité
— configurations complexes autodépannables.
Pour ce qui nous concerne, nous préférons la première solution car on s'aperçoit très vite que les ensembles complexes (redondances triples par exemple) coûtent 1res cher en poids et en volume.
Enfin il est indispensable qu'un minimum de mémoire soit indestructible; celte partie de la mémoire contiendra au moins le programme assurant la reprogrammation du système à partir du sol.
3.2 Paramètres fonctionnels
3.2.1 Repr/seanaioa da nombres
C'est en généra! la première caractéristique que l'on fait apparaître dans les specifications d'un calculateur; on sait que trois représenta tiens sont possibles :
— virgule fixe,
— virgule flottante,
~ décimal codé binaire (DCB).
242
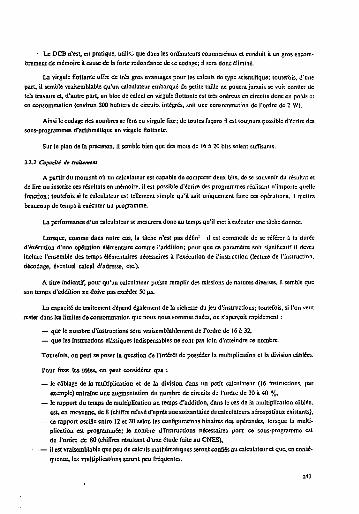
- Le PCB n'est, en pratique, utili*- que dans les ordinateurs commerciaux et conduit à un gros encom
brement de mémoire à cause de la forte redondance de ce codage; il sera donc éliminé.
La virgule flottante offre de très gros avantages pour les calculs de type scientifique; toutefois, d'une part, il semble vraisemblable qu'un calculateur embarqué de petite taille ne pourra jamais se voir confier de tels travaux et, d'autre part, un bloc de calcul en virgule flottante est très onéreux en circuits donc en poids et en consommation (environ 300 boîtiers de circuits intégrés, soit une consommation de l'ordre de 2 W).
Ainsi le codage des nombres se fera en virgule fixe; de toutes façons il est toujours possible d'écrire des sous-programmes d'arithmétique en virgule flottante.
Sur le plan de la précision, il semble bien que des mots de 16 à 20 bits soient suffisants.
3.2.2 Capacité de traitement
A partir du moment où un calculateur est capable de comparer deux bits, de se souvenir du résultat et de lire ou inscrire ces résultats en mémoire, il est possible d'écrire des programmes réalisant n'importe quelle fonction; toutefois st le calculateur est tellement simple qu'il sait uniquement faire ces opérations, il mettra beaucoup de temps à exécuter un programme.
La performance d'un calculateur se mesurera donc au temps qu'il met à exécuter une tâche donnée.
Lorsque, comme dans notre cas, la tâche n'est pas défùr il est commode de se référer à la durée d'exécution d'une opération élémentaire comme l'addition; pour que ce paramètre soit significatif il devra inclure l'ensemble des temps élémentaires nécessaires à l'exécution de l'instruction (lecture de l'instruction, décodage, éventuel calcul d'adresse, etc.).
A titre indicatif, pour qu'un calculateur puisse remplir des missions de natures diverses, il semble que
son temps d'addition ne doive pas excéder 50 \is.
La capacité de traitement dépend également de la richesse du jeu d'instructions; toutefois, si l'on veut
rester dans les limites de consommation que nous nous sommes fixées, on s'aperçoit rapidement :
— que le nombre d'instructions sera vraisemblablement de l'ordre de 16 à 32,
— que les instructions classiques indispensables ne sont pas loin d'atteindre ce nombre.
Toutefois, on peut se poser la question de l'intérêt de posséder la multiplication et la division câblées.
Pour fixer les idées, on peut considérer que :
— le câblage de la multiplication et de la division dans un petit calculateur (16 instructions, par exemple) entraîne une augmentation du nombre de circuits de l'ordre de 30 à 40 %,
— le rapport du temps de multiplication au temps d'addition, dans le cas de la multiplication câblée, est, en moyenne, de 8 (chiffre relevé d'après une soixantaine de calculateurs aérospatiaux existants},
— ce rapport oscille entre 12 et 30 selon les configurations binaires des opérandes, lorsque la multiplication est programmée; le nombre d'instructions nécessaires pour ce sous-programme est de l'ordre de 80 (chiffres résultant d'une étude faite au CNES),
— il est vraisemblable que peu de calculs mathématiques seront confiés au calculateur et que, en conséquence, les multiplications seront peu fréquentes.
243

Ainsi, à notre avis il n'est pas indispensable de disposer de ces opérations câblées; il nous paraît plus
intéressant de reporter ces circuits sur les organes d'entrée-sortie.
En liaison avec le choix du jeu d'instructions, se présente le problème de la méthode d'adressage; en Effet pour des calculateurs de petite taille, l'augmentation du nombre de codes opératoires entraîne la diminution des positions binaires imparties à t'adresse; si l'on désire disposer d'une capacité d'adressage supérieure, il faut introduire un artifice qui consiste le plus souvent à ajoutera l'adresse partielle contenue dans l'instruction une adresse complémentaire contenue dans un registre auxiliaire; cette opération peut se faire de deux façons:
— par addition arithmétique (registre de base, index), — par juxtaposition, la valeur de Tort poids de l'adresse étant contenue dans un registre appelé
compteur de pages.
Les inconvénients de ces solutions sont essentiellement :
— pour la premiere, augmentation du nombre de circuits puisqu'il faut réaliser une addition, — pour la seconde, difficultés lors de l'exploitation, car la gestion du compteur de pages'pose
toujours un certain nombre de problèmes, plus particulièrement en présence d'interruptions (il
faut sauvegarder la valeur du compteur de page3 dans une autre page...).
En contrepartie, ces méthodes permettent l'extension de la mémoire jusqu'à de très fortes capacités (64 à 128 K par exemple); il ne faut cependant pas perdre de vue que, si la taille du satellite est faible, on n'aura guère la possibilité d'utiliser des mémoires de capacité supérieure à 16 K environ, pour des raisons de poids.
Pour ce qui concerne l'adressage indexé, il est certain qu'il permet une bonne souplesse dans la programmation; on notera que le registre d'index devra être sauvegardé en mémoire lors de la prise en compte d'une interruption et que cette opération diminue la rapidité de réponse du calculateur.
3.2.3 Les taries-sorties, ta Interruption!
L'expérience du CNES, à propos du projet ROSEAU, a montré que c'était là un point fondamental dans la définition du calculateur; en effet, à bord, le calculateur se présente comme un coordinateur entre le sol, les expériences et le satellite lui-même; iî sera donc connecté à de nombreux équipements dont il recevra des informations et auxquels il donnera des directives.
Le facteur important pour les organes d'entrée-sortie sera la dynamique de la cadence des échanges
d'information; il existe en effet deux aspects cattf'adictoires ;
— forte cadence pour l'échantillonnage d'un signal a large bande; on sait en effet faire des convertisseurs analogiques/numériques capables d'échantillonner un signal à 122 kHz (8 bîtsà I MH2) et il serait extrêmement dommage que le calculateur ne puisse pas suivre;
— faible cadence régulière pour piloter l'émetteur de télémesure.
Nous avons vu {au paragraphe 2.3.2) les avantages d'un canal d'accès direct pour résoudre ces
problèmes. Toutefois, il reste intéressant de disposer de voies d'entrée-sortie par les registres de l'unité
centrale afin d'échanger des informations de faible volume (mots de commande, de contrôle, etc.).
244
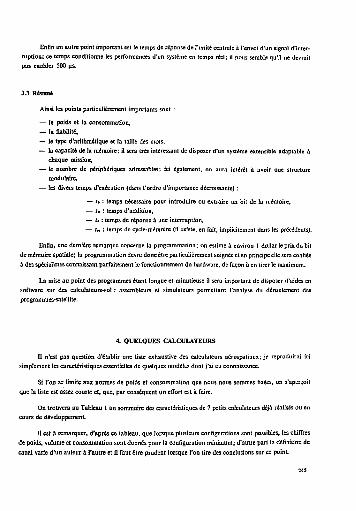
Enfin un autre point important est le temps de réponse de l'unité centrale à l'envoi d'un signal d'interruption; ce temps conditionne les performances d'un système en temps réel; il nous semble qu'il ne devrait pas excéder 500 ws.
Ainsi les points particulièrement importants sont :
— le poids et la consommation, — la fiabilité,
— le type d'arithmétique et la taille des mots,
— la capacité de la mémoire; il sera très intéressant de disposer d'un système extensible adaptable a chaque mission,
— le nombre de périphériques adressables; ici également, on aura intérêt a avoir une structure modulaire,
— les divers temps d'exécution (dans l'ordre d'importance décroissante) :
— H : temps nécessaire pour introduire ou extraire un bit de la mémoire, — la : temps d'addition, — U : temps de réponse à une interruption, — tw> : temps de cycle-mémoire (il existe, en fait, implicitement dans les précédents).
Enfin, une dernière remarque concerne la programmation ; on estime à environ 1 dollar le prix du bit
de mémoire spatiale; la programmation devra donc être particulièrement soignée et en principe elle sera confiée
à des spécialistes connaissant parfaitement îc fonctionnement du hardware, de façon à en tirer le maximum.
La mise au point des programmes étant longue et minutieuse il sera important de disposer d'aides en software sur des calculateurs-sol : assembleurs et simulateurs permettant l'analyse du déroulement des programmes-satellite.
4. QUELQUES CALCULATEURS
U n'est pas question d'établir une liste exhaustive des calculateurs aérospatiaux; je reproduirai ici simplement les caractéristiques essentielles de quelques modèles dont j'ai eu connaissance.
Si l'on se limite aux normes de poids et consommation que nous nous sommes fixées, on s'aperçoit
que la liste est assez courte et, que, par conséquent un effort est à faire.
On trouvera au Tableau 1 lin sommaire des caractéristiques de 7 petits calculateurs déjà réalisés ou en cours de développement
Il est à remarquer, d'après ce tableau, que lorsque plusieurs configurations sont possibles, les chiffres
de poids, volume et consommation sont donnés pour la configuration minimum; d'autre part la définition de
canal varie d'un auteur à l'autre et il faut être prudent lorsque l'on tire des conclusions sur ce point.
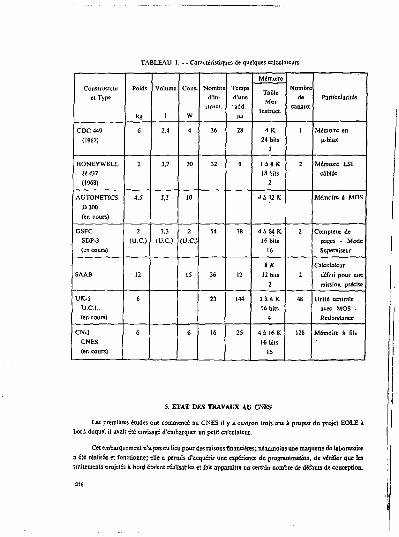
TABLEAU 1. — Caractéristiques de quelques calculateurs
Constructeur et Type
Poids Volume
1
Cons.
W
Nombre d'in-
struet.
Temps d'une add. lis
Mémoire Nombre
de canaux
Particularités Constructeur
et Type Poids Volume
1
Cons.
W
Nombre d'in-
struet.
Temps d'une add. lis
Taille Mot
Instruct.
Nombre de
canaux Particularités
CDC449
(1967)
6 2,4 4 36 28 4 K
24 bits
1
I Mémoire en u.-biax
HONEYWELL H « 7 (1968)
2 3.7 20 32 9 M 8 K
18 bits
2
2 Mémoire LSI câblée
AUTONETICS D200 (en cours)
4.5 3,3 10 4 à 3 2 K Mémoire à MOS
GSFC SDP-3 (en cours)
2
(U.C.) 3,3
(U.C.) 2
(U.C.)
54 78 4 à 5 4 K 16 bits
16
2 Compteur de pages - Mode Superviseur
SAAB 12 15 36 12 12 bits
2
2
Calculateur
défini pour une
mission précise
UK-5 U.C.L. (en cours)
6 23 144 2 à 4 K 16 bits
4
48 Unité centrale avec MOS -Redondance
CN.l
CNES
(en cours)
6 6 16 25 4 à 16 K
16 bits
16
128 Mémoire à fils
5. ETAT DES TRAVAUX AU CNES
Les premières études ont commencé au CNES il y a environ trois ans à propos du projet EOLE à bord duquel il avait été envisagé d'embarquer un petit calculateur.
Cet embarquement n'a pas eu lieu pour des raisons financières; néanmoins une maquette de laboratoire a été réalisée et fonctionne; elle a permis d'acquérir une expérience de programmation, de vérifier que les traitements projetés à bord étaient réalisables et fait apparaître un certain nombre de défauts de conception.
246
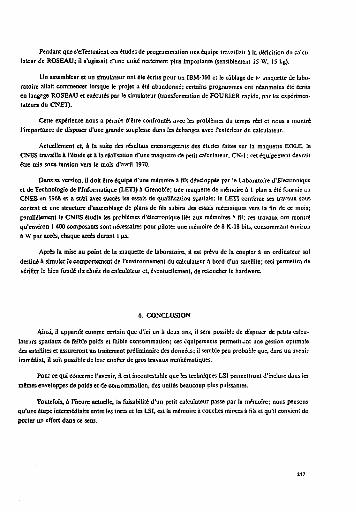
Pendant que s'effectuaient ces éludes de programmation une équipe travaillait à la définition du calcu
lateur de ROSEAU; il s'agissait d'une unité nettement plus importante (sensiblement 15 W, 15 kg).
Un assembleur et un simulateur ont été écrits pour un IBM-360 et le câblage de I" .naquelte de laboratoire allait commencer lorsque le projet a été abandonné; certains programmes ont néanmoins été écrits en langage ROSEAU et exécutés par le simulateur (transformation de FOURIER rapide, par les expérimentateurs du CNET).
Cette expérience nous a permis d'être confrontés avec les problêmes du temps réel et nous a montré l'importance de disposer d'une grande souplesse dans les échanges avec l'extérieur du calculateur.
Actuellement et, à la suite des résultats encourageants des étides faites sur la maquette EOLE, le CNES travaille à l'étude et à la réalisation d'une maquette de petit calculateur, CN-I ; cet équipement devrai! être mis sous tension vers le mois d'avril 1970.
Dans sa version, El doit être équipé d'une mémoire à fils développée par le Laboratoire d'Electronique et de Technologie de l'Informatique (LET!) à Grenoble; une maquette de mémoire a 1 plan a été fournie au CNES en 1968 et a subi avec succès les essais de qualification spatiale; le LETI continue ses travaux sous contrat et une structure d'assemblage de plans de fils subira des essais mécaniques vers la fin de ce mois; parallèlement le CNES étudie les problèmes d'électronique liés aux mémoires à fil; ces travaux ont montré qu'environ 1 400 composants sont nécessaires pour piloter une mémoire de 8 K-18 bits, consommant environ 6 W par accès, chaque accès durant 1 ps.
Apres la mise au point de la maquette de laboratoire, il est prévu de la coupler à un ordinateur sol
destiné à simuler le comportement de l'environnement du calculateur a bord d'un satellite; ceci permettra de
vérifier le bien fondé du choLt du calculateur et, éventuellement, de retoucher le hardware.
6. CONCLUSION
Ainsi, il apparaît comme certain que d'ici un à deux ans, il sera possible de disposer de petits calculateurs spatiaux de faible poids et faible consommation; ces équipements permettant une gestion optimale des satellites et assureront un traitement préliminaire des données; il semble peu probable que, dans un avenir immédiat, il soit possible de leur confier de gros travaux mathématiques.
Pour ce qui concerne l'avenir, il est incontestable que les techniques LSI permettront d'inclure dans les
mêmes enveloppes de poids et de consommation, des unités beaucoup plus puissantes.
Toutefois, à l'heure actuelle, la faisabilité d'un petit calculateur passe par la mémoire; nous pensons qu'une étape intermédiaire entre les tores et les LSI, est la mémoire à couches minces à fils et qu'il convient de porter un effort dans ce sens.
BIBLIOGRAPHIE
1. Rapports présentés au colloque «.Calculateurs embarqués sur fusées et satellites», Paris, 3-6 décembre I!
Baechïer, D.O.
Gautier, Y. Ben Sarooun, A.
Jiewertz, B.
Grunberg, G. et al.
cm, R.A.
Culhane, J.L.
Trends in the Design of Aerospace Digital Computers.
Critères de choix de l'architecture d'un calculateur embarqué sur satellite et de son langage de programmation en fonction des besoins particuliers.
Data Processor for the Swedish Satellite Project.
Etude et réalisation d'une mémoire à fils spatiale.
The SDP-3. A Computer Designed for Data Syslcms of Small ScicntiSc Spacecraft.
The Use of a General-Purpose Digital Computer for Data Handling On Board the UK-5 Spacecraft (in press).
PROBLEMS OF DC ELECTRIC FIELD MEASUREMENTS FROM A GEOSTATIONARY SATELLTTE
U. Fa h I «on
Department of Plasma Physics The Royoi Institute of Tectet/Hegy Stockholm 70, Sweden
ABSTRACT
The dttSgit md epenstkm of on eiearit-fjM detector cfske tSsÊ&Se-peobe type em a tesstef&xaty mttllite is discussed. Meier &£ieulti£* art expected, dm respecstrefy to eiecvicfitkl distortion and pè&toetttitont from the lasetiitt, and also to pheioemissSrtty ruriatkuts on the probe surfaces. Nrctssor? precautions to krrp errors arising from these and other effects at a harmless tetet en imesiigattd.
I. tPCTRODUCnON
It has Jong been realised that (be electric field is an importait! parameter m rnagrsetospheric physics (AJfvés 1950, 1967; Dunge». 196!; AafonJ & Hines, I960 Knowledge of the electric geld mil greatly improve our understanding of many magnecospheric processes.
Successful direct measurements of the electric field in the ionosphere have been made (tarn rockets (Mazer & Breston. 1967; Aggson. 19&9: Kefley. Mozer and Fahiesott. 1969: Potier and Caybilt. 1969} 2nd
recently from tateUiies in the upper ionosphere fOnraeu & Cauffman, 1969; Maycurd & Hcppner. 1970). In the outer magnetosphcre, however, direct measurements are considerably more difficult, and no successful measurements have yet been reporte*! Theoretical arguments (Block, 1966; Hciws, (968; Vasyiiunas, 1968; Obayashi &. Nîsteda, 196$), projection of the ionospheric Se!d as measured directly or indirectly (FflppU/o/-, 1968; Wescott « <r/., 1969; Mour andScrlin, 1969) and a few indirect measurements (Carpenter and Stone, 1967; Freeman» 1968) have given rough knowledge of [he electric field in certain regions of (fee outer magnetosphere. la other regions, however, where the indirect methods have soi been applicable asd theoretical arguments are incoadtisive, the field is virtasl.y tmicnowit.
A geostationary satellite offers in excellent opportunity for an attempt to measure the electric field in a very interesting part of the magnetosphere. However, as wilt be seen below, it is evident that a considerable amount of tEeorxtkai analysis and laboratory work wff be necessary to guarantee a reasonably accurate Beasuremeot. Oa the other hand, the difficulties seen today are definitely not insurmountable and the qurs-tioa h not whether the measurement is possible, but how it should be made with reasonably small technical and économie efforts.
This article will mainly discuss electric-Held measurements by the double probe method, which seems
to be the most suitable one.
The paper concentrates oa the problems of dc . ekrtne-Setd expermseBls. However, the ekctric-rtdd probes of a d.c experiment wfli be useful also for a.c electric-field measurements, and the most favourable arrangement seems to be lo combine the d.c and a-c measurements inio one single experiment- The a.c aspects of dectric-fiefd measurements are covered in an article by Storey .
24»

2. PHYSICAL PARAMETERS
The properties jf the magne to spheric plasma, and especially of the tow-temperature plasma, are incompletely known, and vary also from time to time. Even when considering the special case of electric-field measurements from a geostationary satellite, it is evident that the electric-field experiment will meet widely varying conditions. An ideal electric-field detector should of course be capable of giving accurate measurements in all imaginable situations. It should, however, be remembered that even an experiment giving useful data only during certain, not too unlikely, conditions, may give very important information. Although an almost perfect experiment can be constructed, economic and technical considerations may reveal a less ambitious experiment to be the best compromise.
Table l gives estimates of typical values of some quantities of importance for an electric-field experiment from a geostationary orbit. It should be pointed out that practically all the figures in the tabic arc uncertain or may fluctuate within about a power of 10 from the values given. In connection with geomagnetic disturbances the magnetopause may be pushed inside the satellite orbit. In other situations the plasmapause (or fragments from the plasmasphere) may reach out to the satellite. For such periods, generally of short duration, very drastic variations in fields and particle fluxes can be expected.
TABLE 1. Physical properties of plasma near a geostationary orbit, and current densities expected to a probe surface at plasma potential.
Species Current density
A/m«
Thermal electrons 3.1Q- 8
1/cm* I eV
Energetic elections
lOMOVcm* sec ster
MOkoV 5-10- 7 -S .10- a
Pbotoelectross 10-6 - 10-»
Thermal ions 10-»
Energetic ions lu - "» - I0 -"
The magnetic field strength will usually be çif \hç order of IQÛgamniafl, producing gyro n>dii for thermal electrons of a few hundred metres. The Debye length will typically be around 10, possible up to 100 m and the ion plasma frequency a few hundred Hz.
Present estimates indicate that the electric field ù generally of the order of 0.1-IO œV/m. Technical
difficulties with long booms on a rotating satellite (the rotation necessary for reasons presented below) make
2Î0
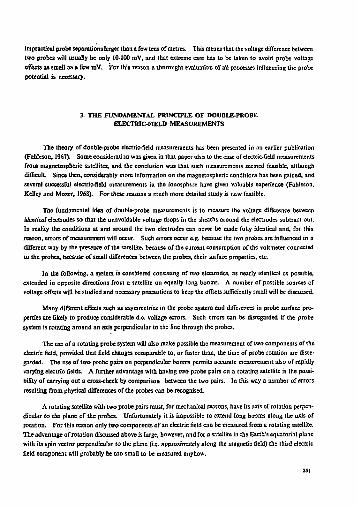
impractical probe separations larger than afew tens of metres. This means that the voltage difference between two probes will usually be only 10-100 mV, and that extreme care has to be taken to avoid probe voltage offsets as small as a few mV. For this reason a thorough! evaluation of all processes influencing the probe potential is necessary.
3. THE FUNDAMENTAL PRINCIPLE OF DOUBLE-PROBE ELECTRIC-FIELD MEASUREMENTS
The theory of double-probe electric-field measurements has been presented in an earlier publication (Fahleson, 1967). Some consideration was given in thai paper also to the case of electric-field measurements from magnetospheric satellites, and the conclusion was that such measurements seemed feasible, although difficult. Since then, considerably more information on the magnetospheric conditions has been gained, and several successful electric-field measurements in the ionosphtre have given valuable experience (Fahleson, Kelley and Mozer, 196S). For these reasons a much more detailed study is now feasible.
The fundamental idea of double-probe measurements is to measure the voltage difference between Identical electrodes so that the unavoidable voltage drops in the sheaths around the electrodes subtract oui. In reality the conditions at and around the two electrodes can never be made fully identical and, for this reason, errors of measurement will occur. Such errors occur e.g. because the two probes are influenced in a different way by the presence of tbe satellite, because of the current consumption of the voltmeter connected to tbe probes, because of small differences between the probes, their surface properties, etc.
In the following, a system is considered consisting of two electrodes, as nearly identical as possible, extended in apposite directions from a satellite on equally long booms. A number of possible sources of voltage offsets will be studied and necessary precautions to keep the offsets sufficiently small will be discussed.
Many different effects such as asymmetries in the probe system and differences in probe surface properties are likely to produce considerable d.c. voltage errors. Such errors can be disregarded if the probe system is rotating around an axis perpendicular to the line through the probes.
The use of a rotating probe system will also make possible the measurement of two components of the electric field, provided that field changes comparable to, or faster than, the time of probe rotation are disregarded. The use of two probe pairs on perpendicular booms permits accurate measurement also or rapidly varying electric fields. A further advantage with having two probe pairs on a rotating satellite is the possibility of carrying out a cross-check by comparison between the two pairs. In this way a number of errors resulting from physical differences of the probes can be recognised.
: A rotating satellite with two probe pairs must, for mechanical reasons, have its axis of rotation perpendicular to the plane of the probes. Unfortunately it is impossible to extend long booms along the axis of rotation. For this reason only two components of an electric field can be measured from a rotating satellite. The advantage of rotation discussed above is large, however, and for a satellite in the Earth's equatorial plane with its spin vector perpendicular to the plane (i.e. approximately along the magnetic field) the third electric field component will probably be too small to be measured anyhow.
251

4. THE EQUILIBRIUM POTENTIAL OF A PROBE
A number of different processes determine the potential of a probe in the magnetospheric plasma. The most important of them are.
0 The pkoioemissiort of the illuminated probe surface. The current brought to the probe by photo-emission will be approximately
/ , . = lPx • A,,., (1)
where is* is the pholoemissiwty in sunlight of the probe surface and At^> is the area projected to the solar radiation. If the probe has a positive potential, V, relative to its surroundings, part of the photoelectroa flux is kept back and the current will be
/,» = » • Awf
where/is the fraction of photoelectrons emitted with sufficient energy to overcome the potential V. Little accurate information is available on the spectrum and angular distribution of photoelectrons, as it depends very much on surface properties, contaminating gas layers, etc. If the electrons can be ascribed a typical temperature Tut (corresponding to a few eV) the photoemîssîon current can be written
/»» = t„k • Ap,» • exp ( — g j r j . (2)
If the probe has a negative potential the photoemission current is uninhibited, given by (1).
ii) The thermal electron flux from the plasma. The current flowing to a probe due to thermal plasma electrons has been calculated by Langmuir and is, for a negative probe
>($
and A is the probe area, n, TV, m. and e being respectively the electron density, temperature, mass and charge, and k being the Boltzmann constant
If the probe is positive relative to the plasma, the current will be given, instead, by
provided the probe is spherical and small compared to the Dcbye length.
iii) High-energy electron fiux. The current /» . . due to the population of high-energy electrons that is usually present will be practically independent of the probe voltage
Only whea (he probe has a. negative potential comparable to the characteristic energy of these electrons will the current decrease.

jv) Secondary-electron emission. Hie secondary-electron flux will be roughly proportional to the St» of energetic electrons. Usually it is considerably smaller than t ie high-energy electron flux, but Tor special probe materials it can be comparable to, or eves larger than, tie primary flux. In the rest of this article t ie secondary emission is neglected compared to the primary electron and the photoelectron fluxes. If K> desired, a correction for secondary emission can be made by mulliplyittg the primary flux by a suitable factor.
v) Thermal-fail fia /ram the plasma. The tsermai-ios flux will be highly anisotropic, in view of the motion of the satellite relative to the plasma. It will be small compared to the electron fluxes from the plasma and tile photoelectron Bus. The current brought to a spherical probe at zero potential will be approximately
V Té 2itm.
where Tt is the ion temperature, mi the ion (proton) mass, and v the velocity of the probe relative 10 the plasma. If the probe has a potential V < 0, the current will increase roughly proportional lo V. Only when the probe passes the Earth's shadow wiB the ioa current be of any importance.
vi) High-energy km fiux. This 8ux is approximately independent of the probe voltage and always considerably smaller than die high-energy electron flux and. accordingly, of («lie importance for (he probe potential.
vii) Flux ofphotoeteetronsfrom the satellite. This flux will in general depend on the orientation of the probe relative to the satellite and the solar direction. It can be decreased by increasing the probe separation and by suitable adjustment of probe and satellite potentials. Due to practical (imitations, however, it can never be fully eliminated. It wiJ] be discussed in more detail below.
viii) Current fiowtng to the probe through its electrical connection This current, /, can be varied wiihin wide limits by the «se of suitable bias arrangements on the satellite. A certain current will also flow through the insulation and along the surface of the boom that supports the probe. By choosing suitable materials this leakage current can be kept sufficiently small to be disregarded.
Disregarding the contributions from ions, secondary electrons and electrons of satellite origin, the equilibrium voltage of the probe will be given by the condition
/ . + / . « + / , . + / - 0 (6)
Assuming the paoloelcctrcn current lo dominate so (he probe becomes positive, its potential will be kT. givenbycombinatioaofEqs.(2),(3),(S)atid<6). For V •< -—, V is given by the explicit expression
If the probe surface has a wry low pnotoemission or if the influx of electrons from the plasma is very high, the probe may become négative. This case has been discussed in much detail by Bettinger (1965). tt the Dux of high-energy electrons, then, is considerable compared to the flu* of thermal electrons (which seems to
2S3
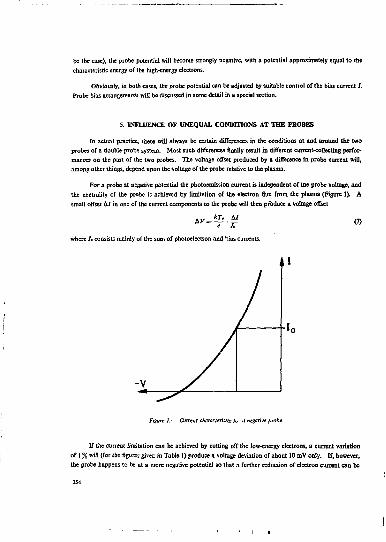
be the case), the probe potential will become strongly negative, with a potential approximately equal to the characteristic energy of the high-energy electrons.
Obviously, in both cases, the probe potential can be adjusted by suitable control of the bias current /. Probe bias arrangements will be discussed in some detail in a special section.
5. INFLUENCE OF UNEQUAL CONDITIONS AT THE PROBES
In actual practice, there will always be certain differences in the conditions at and around the two probes of a double-probe system. Most such differences finally result in different current-collecting performances on the part of the two probes. The voltage offset produced by a difference in probe current will, among other things, depend upon the voltage of the probe relative to the plasma.
For a probe at negative potential the photoemission current is independent of the probe voltage, and the neutrality of the probe is achieved by limitation of the electron flux from the plasma (Figure 1). A small offset &/ in one of the current components to the probe will then produce a voltage offset
^-£.£ (7) where / . consists mainly of the sum of photoelectron and bias currents.
I
!o
Figure ].- Current characteristic JV. - a negative probe.
U the current limitation can be achieved by cutting off the low-energy electrons, a current variation of I % will (for the figures giver in Table 1) produce a voltage deviation of about 10 mV only. If, however, the probe happens to b : at a more negative potential so that a further reduction of electron current can bo
254
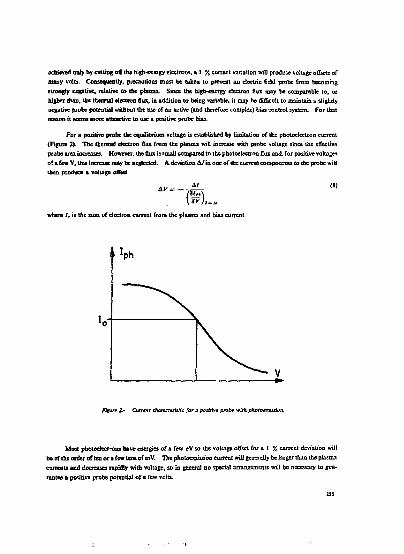
achieved only by catling off the high-energy electrons, a 1 % current variation will produce voltage offsets of many volts. Consequently, precautions msst be takes to prevent an electric field probe from becoming strongly negative, relative to the pissa*. Since the high-energy electron flux may be comparable to, or higher than, the thermal election f ux, ia addition to being variable, it may be difficult to maintain a slightly negative probe potential without the use of an active (and therefore complex) bias control system. For that reason it seems more attractive to use a positive probe bias.
For s positive probe the equilibrium voltage is established by limitation of the pfaotoeiectron current (Figure 2). The thermal electron flux from the plasma will increase with probe voltage since the effective probe area increases. However, the flux is small compared to the photoelecrron Sux and, for positive voltage* of a few V, this increase may be neglected. A deviation 4 / in one of the current composent* to the probe wtii then produce a voltage offset
d.K =
"(#),. (8)
where U is the sum of electron current from the plasma and bias current
Figure 2- Qtrrtnt chaneitristtc for a positive probe wtifi phototmiuioa.
Most p&otoeiectrons have energies of a few eV so the voltage offset for a 1 % current deviation will beoftheordtroftcsorafewlesaofmV. The photoeim^sionauTent will generally be larger than the plasma currents and decreases rapidly with voltage, so in general no special arrangements wfl] be necessary to guarantee e positive probe potential of a few volts.
us
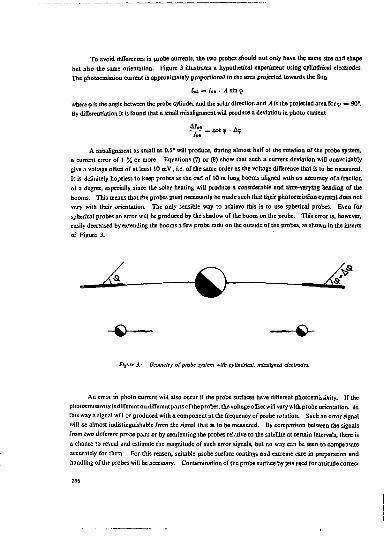
To avoid differences in probe currents, the two probes should not only have the same size and shape
but also the same orientation. Figure 3 illustrates a hypothetical experiment using cylindrical electrodes.
The photoemission current is approximately proportional to the area projected towards the Sua
/j.» = i»* • A sin q>
where 9 is the angle between the probe cylinder and the solar direction and A is the projected area far tp = 90°. By differentiation it is found that a small misalignment will produce a deviation in photo current
A/*» . A
~j— = COt 9 • Up
A misalignment as small as 0.5* will produce, during almost half of the rotation of the probe system, a current error of 1 % or more. Equations (7) or (8) show that such a current deviation will unavoidably give a voltage offset of at least 10 mV.i.e. of the same order as the voltage difference that is to be measured. It is definitely hopeless to keep probes at the end of 10 m long booms aligned with an accuracy of a fraction of a degree, especially since the solar healing will produce a considerable snd time-varying bending of the booms. This means that the probes must necessarily be made such that th,eir photoemissioa current does not vary with their orientation. The only sensible way to achieve this is to use spherical probes. Even for spherical probes an error will be produced by the shadow of the boom on the probe. This error is, however, easily decreased by extending the booms a few probe radii on the outside of the probes, as shown in the inserts of Figure 3.
o-Figure 3.- Geometry of probe system with cylindrical, misaligned electrodes.
An error in photo current wiil also occur if the probe surfaces have different photoemissivity. If the photoemissivityisdiiïercnt on different parts oftheprobes.the voltage ofTset will vary with probe orientation, la
this way a signal will be produced with a component at the frequency of probe rotation. Such an error signal will be almost indisiinguishable from the signal that is to be measured. By comparison between the signals from two different probe pairs or by reorienting the probes relative to the satellite at certain intervals, there is a chance lo reveal and estimate the magnitude of such error signals, but no way can be seen to compensate accurately for them. For this reason, suitable probe surface coatings and extreme care in preparation and handling of the probes will be necessary. Contamination of the probe surface by jets used for attitude correo-
2S6

tion may be a serious problem. No probe material used at present seems able to fulfil the severe requirements of surface homogeneity resulting in pbotoemissmty variations of less than one percent Laboratory investigations indicate large variations in pRatoemissivtty evert for «cry ewefuSy prepared surfaces, and cUScaltics with reproducibility of measurements Some of these dirBmliies which depend on contaminating ga* layers have been avoided in more recent measurements in ultra-high vacuum. There is some hope, therefore, that some of rite variations seen in laboratory will disappear after a probe has been in space for some time. New types of probe material are now being developed and tested in many laboratories asd preliminary results indicate that radically improved surface materials wiH be available for experimenters within the next few years.
At present photoemissivity variations seem to be the factor that determines the minimum possible probe separation. It seems likely thai (at least within a few years) a probe separation of 20 or 43 m will be sufficient for a good experiment.
What has been stated here regarding the choice missivity of * probe surface is vaiïd also for the work
function- However, work function variations seem to be the less serious problem of the two, especially ÎT
the plasma electrons have a rather isotropi. velocity distribution.
Another difference in conditions at the probes ef a profr* ^air is p-odt-Ced by ine current through the voltmeter which is Sowing in at one probe and et» at the Oifter. By a sertaWe choice of probe sax ami voltmeter input resistance, R. this error cart be made negligibly small. For probes at negative potential the design criterion reads (FaMeson, 196?)
For positive probes the same condition will be
Probes of 10 cm diameter will require a voltmeter impedance of about 1QM010 iX Smaller probes
can be used if the impédance is further increased, but the disturbance of the probe from the boom wiH be
relatively more important.
6. EIXCTKIC FIELD DISTURBANCE ABOUND THE SATELLITE
The satellite will in general have a potential different from that of the plasma and will then also disturb the potential hi its surroundings. Due to the large Dcbye length the disturbed region wiS reach far from the satellite and may envelop the eJectrie-Sekl probes. If the (symmetric) satellite is situated in an isotropic plasma (in the plane of the booms) without a macroscopic electric field and the two probes are equally far from the satellite they will gel identical voltages.
If t ie pUsma is amsotropk in the frame of the satellite {e.g. because of aa eJectric feeM aad associated
partide drifts), the symmetry breaksdewn and the potential of the two probes will become différent. Contrary
to what may first be believed then seems to be no a priori reason to assume that the potential difference bet-
237
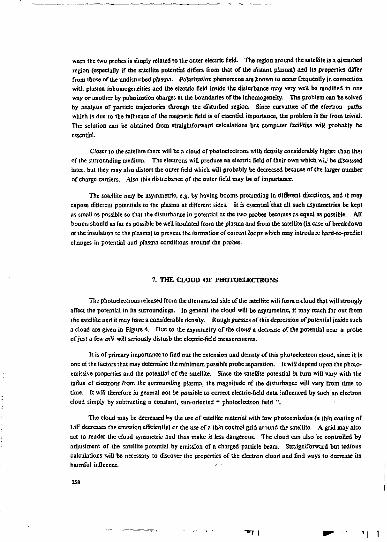
ween the two probes is simply related to the outer electric field. The region around the satellite is a disturbed region (especially if the satellite potential differs from that of the distant plasma) &aà its properties differ from those of ihe undisturbed plasma. Polarization phenomena are known to occur frequently in connection with plasma mhamogcneilies and the electric field inside the disturbance may very well be modified in one way or another by polarization charges at the boundaries of the inhomogeneity. The problem can be solved by analysis of particle trajectories through the disturbed region. Since curvature of the electron paths which is due to the influence of the magnetic field is of essential importance, the problem is far from trivial. Ths solution can be obtained from straightforward calculations but computer facilities will probably be essential.
Closer to the satellite there will be a cloud of photoeleclrons with density considerably higlar: than ttv.t of the surrounding medium. The electrons will produce an electric field of their own which '*u.; be discussed later, but they may also distort the outer field which will probably be decreased because of the larger number of charge carriers. Also this disturbance of the outer Geld may be of importance.
The satellite may be asymmetric, e.g. by having booms protruding in different directions, and it may expose different potentials to the plasma at different sides. It is essential that all such asymmetries be kept as small as possible so that the disturbance in potential at the two probes becomes as equal as possible. All booms should as far as possible be well insulated from the plasma and from the satellite (in cose of breakdown of the insulation to the plasma) to prevent the formation of current loops which may introduce hard-to-predict changes in potential and plasma conditions around the probes.
7. THE CLOUD OF PHOTOELECTRONS
The photoeleclrons released from the illuminated side of the satellite will form a cloud that will strongly affect the potential in its surroundings. In general the cloud will be asymmetric, it may reach far out from the satellite and it may bave a considerable density. Rough guesses of this depression of potential inside such a cloud arc given in Figure 4. Due to the asymmetry of the cloud a decrease of the potential near a probe of just a few mV will seriously disturb the electric-field measurements.
It is of primary importance to find out the extension and density of this photoelectron cloud, since it is one of the factors that may determine the minimum possible probe separation. It will depend upon the phoio-emissive properties and the potential of the satellite. Since the satellite potential in turn will vary with the influx of electrons from ths surrounding plasma, Ihe magnitude of the disturbance will vary from time to time. It will therefore in general not be possible tc correct electric-field data influenced by such an electron cloud simply by subtracting a constant, sun-oriented " photoelectron field ".
The cloud may be decreased by the use of satellite material with low photoemission (a thin coating of LiF decreases the emission efficiently) or the use of a thin control grid ar-iund the satellite. A. grid may also act to render the cloud symmetric and thus make it less dangerous. The cloud can also be controlled by adjustment of the satellite potential by emission of a charged particle beam. Straightforward but tedious calculations will be necessary to discover the properties of ;he electron cloud and find ways to decrease its harmful influence.
258
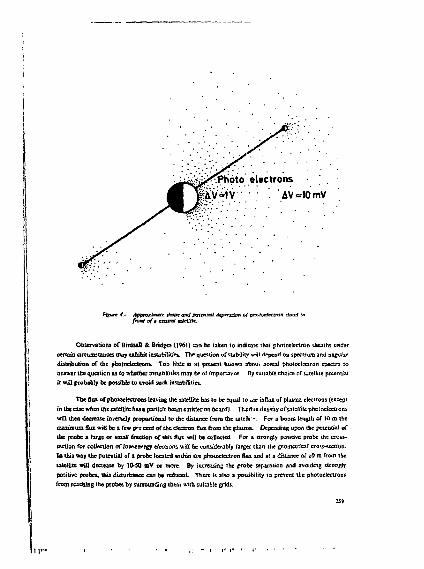
electrons • . 4V=10mV
Figure 4- Approximate shape and pasenissl deprrs&m of ps^sweâKswi dead i* front of a xsxmi sxtrMtc
\ Observations of BtrdsaO &. Bridges (1961) a n be takes to indicate thai phoioeleetron sheaths under certain arcutnstaBOes may exhibit instabilities. The question of «ability win depend oa speciruns acd angolar distribution of the photocieciçons. Too little is at present known abou. actual photoeicctron spectra to answer the question as to whether instabilities may br of importance. By suitable choice of satellite potential it will probably be possible to avoid such insubiiiues.
Tbe fiux of pbotoetetfons leaving the satellite bas to be equal to Jie infiax of plasma electrons (except in the case when the satellite has » particle beam emitter on board). The flux density of satellite photoelectrons will then decrease inversely proportional to the distance front the sateEIi -, For a boom length of 10 as the maiimata Sux will be a few gri cent of the electron 8ux from the p&snm. Depending upon the potential of the probe a large or small friction of this flux will be collected. For a strongly positive probe the cross-section for collection of low-energy electrons will be considerably larger than the geometrical cross-section. In this way the potential of a probe located wilbia ûx photoelectroa Box and" at a distance of iO m froai the satsiiite wia decrease by 10-50 mV or more. By icaessiag !he probe separation and avoiding stroogly positive probes, this disturbance can be reduced. There is also a possibility to prevent the photoelectrons from reaching the probes by surrounding them with suitable grids.
lis
| | » - . • • ! . . . - t i r t " » »•

If precautions are not taken, disturbances produced by photoelectrons from the satellite will be one of the most severe obstacles to the electric-field measurements. By rigorous theoretical analysis it will be possible to determine a minimum possible probe separation for an electric-field experiment. The probe separation found in this way can probably be decreased considerably by suitable design, possibly involving control grids or some kind of •• photoeleciron deflectors " around the satellite and/or the probes. It is hard *i preclude the result of such an analysis but methods seem to exist to reduce the photo electron disturbances to a harmless level even for quite moderate probe separations.
8. PROBE BIAS ARRANGEMENTS
The desirability of keeping the probes at a certain potential und the absolute need to avoid high negative probe potentials hive been stressed above. It is likely that the probes will automatically adjust to a positive potential of a few volts which would be favourable for measurements. However, conditions in themagnetospbere are highly variable and the probe potential may sometimes become less suitable for electric-field measurements. For in and post-flight analysis of the operation of the field detector, deliberate variation of the probe bias within wide limits would also be of great help to separate different effects from each other.
A simple arrangement to create a probe bias is shown in Figure 5. The theory of probe bias arrangements is presented elsewhere (Fahteson, 1967; Fan!eson, BostriJm & Fâllhammar, 1967). Attention need only be drawn here to the fact that in order to bias the probes, the satellite must have a sufficiently large conducting area so that it can collect the bias return current from the plasma. For negative probes biased to the plasma potential, tiie necessary satellite area A, is
V 2TOM,
/ 2rcmi ' 4ne
where A is the total area af the probes. For the biasing of originally positive probes to plasma potential, the corresponding relation reads
/ 0 » A. p- A • 4ne
•V 2ron,
Figure 5.- Arrangement to create probe bias.
In this last expression, the ton current has been neglected. A bias system of the type described here, a " passive " bias system, can be designed to give suitable probe bias in spite of considerable variation* of the plasma environment.
If a very accurate probe bias is desired an " active " bias control system will be necessary. Such a system utilises an arrangement to measure the plasma potential (e.g. by the method of Boyd and Willmorc, 1963) and regulates, through a feedback loop, the bias voltage source Va (Figure 5). The weak point of such a system is the plasma potential sensor which may get confused if the plasma has an unusual velocity distribution. Flights with active bias systems have, as far as the author is informed, not yet been reported.
A suitable compromise for the experiment discussed here may be a passive bias system with a few different bias source voltages which can be connected on command from the ground.
Methods exist (Stauning, 1969) to control the potential of the satellite by the emission of a suitable current from an ioa- or electron gun on the satellite. With such a control, the potential of the satellite can be brought close lo ihe plasma potential, so that the disturbed region around the satellite becomes small. Another possibility is to emit a beam of electrons, thereby making the sateUile positive so that the phoioeleclron flux will be cut off,
A beam of charged panicles emitted info a plasma may become unstable. Such instabilities are interesting objects to study, but they may also ruin measurements or naturally-occurring plasma waves. For that reason, an emitter bias system, if provided, should also have a back-up bias system of the internal-battery type, so that measurements with desired probe bias can proceed, even if the emitter has to be turned off.
For the thorough understanding of the in-flight operation of ihe electric-field detector, it is essential that as many " diagnostic " experiments as possible can be performed. Charged-particie emitwrs on the satellite w31 increase considerably the number of possible diagnostic experiments.
Another diagnostic experiment which could easily be done, now and then, is a measurement of the probe-plasma impedance. This has been done in rockct-bome electric-field experiments (Mozer & Bruston, 1967) by shunting a suitable resistor across the voltmeter input.
9. OTHER METHODS OF MEASUREMENT
Numerous other, more indirect, methods to measure the electric field from a satellite exist. A careful analysis of all such methods is outside the scope of the present publication, but some of the alternative methods, which either have been discussed already or may turn out to be of special inlcest. deserve to be described here briefly.
Since the magnetic field at the location of Use satellite is well known, the electric held can be deduced from measurements of particle motions. The particles can be the naturally-occurring plasma or particles ejected from the satellite,
261
*
Freeman (1°68> has measured the angular distribution of very low-energy protons and observed anisotropics indicating a drift motion of the plasma, and consequently an electric field. The measurements reported seem to be correct, but for sensitivity reasons he has been able to do measurements only at special instances when the plasma density was anomalously high. Judging from what has been stated above on potential deviations due to the photoelectron cloud, it is somewhat doubtful that the method will work also in a thinner plasma (provided the instrument sensitivity can be increased) where the photoeleclrons will be relatively more important. The same doubts can be raised against measurements of the anisotropy of particles of higher energy since a given outer electric field will give a correspondingly smaller anisotropy. On the other hand, anisotropy raeasurements may succeed to give the electric field along the magnetic field direction, where the double-probe method meets with great difficulties.
Artificial ion clouds may give some information on the electric field. The main problem is that the time necessary to accelerate the cloud to its final velocity is comparable to the time it lakes for the cloud to diffuse sufficiently that it can no longer be observed from the ground, it is unknown to the author to what extent the techniques of such experiments can be improved. A serious drawback is also the one-time character of such an experiment.
A study of the motion ofan emitted beam of particles from a particle emitter to a collector on the same satellite suffers from the fact that the particles move in the strongly distorted electric field prevailing near the satellite. Modifications are possible where the particles are shot out far from the satellite and returned by the magnetic field, but intensity problems arc likely to appear instead. Intensity problems will also have to be faced in experiments based on observation of the point of intersection of a particle beam with the ionosphere.
A study or wake effects close to the satellite with Langmuir probe technique is likely to fail because of the potential variations due to photoelectron s, which will tend to hide those produced by the proton flow.
Schemes to measure the outer wflxrjc field by comparison of measurements of the field (e.g. by field mills) at diametrically opposite surfaces of a satellite seem unrealistic. There exist certain methods to compensate for the plasma influence on a field mill but the method itself rests on a loose throretical ground. It is also very sensitive to all kinds of errors of measurements, since the outer field is found as the difference of two large, almost equal quantities.
A study of the propagation or plasma waves excited from a wave transmitter on the satellite, or on a boom, to one or several receivers may give indication of the plasma drift. If the receivers are also stationed at the satellite, the main problems will be that the wave will propagate through a disturbed medium and that the distance of propagation will in general not be large compared to the Debye length. Having the receivers on the ground creaf J power supply problems, having them on other spate vehicles creates technical and coordination problems, if two, or more, closely-situated geostationary or geosynchronous satellites are available, the method may be very useful and also relatively inexpensive.
10. SUMMARY
A number of serious difficulties will be encountered by an electric field experiment on a geostationary satellite. However, it is believed that the difficulties can be rather well predicted and that precautions can be taken to keep the error of measurement sufficiently small.
2$2
The author imagines a Successful experiment to consist of two (or, if possible, four) identical probes extended on long, insulated booms in the plane perpendicular to the axis of rotation of a spinning satellite. The probe diameter may be of the order of 10 cm. and extreme care has to be devoted to the preparation and maintenance of very homogeneous probe surfaces.
The probe separation should be as large as is technically possible, in order to give a voilage difference between the probe» larger than the voltage errors thai can be expected. The minimum separation is probably determined by the photo-eiaissivity variations of the probe surfaces. With probe materials ai present under development in surface physics laboratories, probe separations of a few tens of metres seem sufficient. For many different reasons the probe separation can not be decreased very much further even if still better probe material» become available.
It is likely that some good indirect method for measurement of the electric field can be developed. However, considerable difficulties also seem to be present for such experiments.
REFERENCES
Aggson, T.L. Probe Measurements of Electric Fields in Space, in Atmospheric Entte* sions. {B.M. McCormac and A. Omholt, eds.), p- 305, Van Nostrand Reinhold, Ne-./ York, I969.
Alfvcn, H.
Aiïvén, H.
Cosmic Electrodynamics, Clarendon Press, Oxford, 1950.
On the Importance of Electrical Fields in the Magnetosphere and Interplanetary Space, Space Sa. Rev., 7. p. 140 (1967).
Axford, W.I. Hines, CO.
A Unifying Theory of High-Latitude Geophysical Phenomena and Geomagnetic Storms, Can. J. Phys., 39. p. 1433 (1961).
Bettinger, R.T. An In Situ Probe System for Measurement of Ionospheric Parameters, in Interactions of Space Vehicles with an Ionized Atmosphere (S.F. Singer, éd.), p- 163, Pcrgamon Press, New York, 1965.
Birdsall, C.K. Bridges, W.R.
Space-Charge Instabilities in Electr«-j Diodes and Plasma Converters, J. Appl.Phys.,32. p. 2661 (1961).
On the Distribution of Electric Fields in the Magnetosphere, J. Geophys. Res., 71, p. 855(1966).
Boyd, R.L.F. Willmorc, A.P.
A Method of Studying the Energy Distributions of Ionospheric Ions and Electrons, in Space Research III. (W. Priester, ed.) p. 1168, North-Holland Publ. Co., 1963.
Carpenter, D.L. Stone, K.
Direct Detection by a Whistler Method of the Magnetospheric Electric Field Associated with a Polar Substorm, Plan. Space Set., 15, p. 395 (1967).
Interplanetary Magnetic Field and the Auroral Zones, Phys. Rev. Lett., 6. p. 47 (1961).
Theory of Electric Field Measurements Conducted in the Magnetosphere with Electric Probes, Space Set. Rev.. 7, p. 238 (1967).
Fahleson, U. Bostrom, U. Fâlthammar, C.-G.
Problems of Rocket-Borne Electric Field Measurements in the Ionosphere, Royal Inst. ofTechn., Stockholm, Div. Plasma Physics, Report No. 67-24 (1967).
Fahleson, U.V. Kclley, M.C. Mozcr, F.S.
Investigation of the Operation of a DC Electric Field Detector, Univ. of California, Berkeley Report, Sept. 1968.
Preliminary Results of Electric Field Measurements in the Auroral Zcne, J. Geophys. Res.. 73, p. 21 (1968),
Observation of Flow oî Low-Energy Ions at Synchronous Altitude and Implications for Magnetospheric Co.ivection, / . Geophys. Res., 73. p. 4151(1968).
Gurnett, D.A. Cauffraan, D.P-
Doubte Probe Measure menu or DC Electric Fields with ihe Injun S Satellite, Univ. oflowa Report 69-45 (1969).
Hones, E.W. Jr. Electric Fields and Plasma Convection in the Magnetosphere, in Earths Particles and Fields. <B.M. McCormac, ed). p. 403. Rcuihold. Boot. Corp., 1968.
Keliey, M.C. Mozer, F.S. FaMeson, U.V.
Measurements of the Electric Field Component of Wairs in ihe Auroral ionosphere, Univ. of California. Berkeley Report. August 1969.
Maytiard, N.C. Heppser, J.P.
Variations in Electric Fields from Polar Orbiting Satellites in f-articks andFields in the Magnetosphere. (B.M. McCormac.ed), p. 2J7.D. Reidel Ptibi. Co., Dordrecht-Hoiiaad. 1970.
Electric Field Measurements in the Auroral Ionosphere. J. Graph Res.. 72, p. 1109(1967).
Mozer, F.S. Scrîài, R.
Magnetosphere Electric Field Measurements with Balloons. J. Geophrs Res., 74. p. 4739 < 1969).
Obayashi, T. Nisbida, A.
Large-scale Electric Fields in the Magnetosphere. Space Sri. Rev.. S. p. 1 (1968).
Potter, W.E. Cayhill, L.J. Jr.
Electric and Magnetic Field Measurements Near an Auroral EiecUfljci. J. Ceophys. Res.. 74. p. 5159 (1969).
Statming, P. Charged Particle Emission from a Geostationary Satellite (see p. of ihe present volume).
Storey, L.R.O.
Vasyliunas, V.M-
Electric Field Experiments • Alternating Fields (sec present volume).
A Crude Estimate of the Relation Be.wecn the Solar Wind Speed and Ihe Magnetospheric Electric Field, J. Ceophys. Res.. 73, p. 2529 (196S).
Wesicott, EM. Stotarik, J.D. Htppner. J.P.
Eteetrie Fselds in the Vicinity of Auroraf Forms from Motions of Barium Vapor Releases, Trans. Am. Ceophys. Un., 49. p. 155096$) and J. Ceapkys. Res.. 74, p. «69(1969).

ELECTRIC FIELD EXPERIMENTS - ALTERNATING FIELDS
L.R.O. Storey Groupe de Recherches lonosphériques du C.N.R.S.
94-Saint-Maur-des-Fossês. France
ABSTRACT
The characteristic frequencies of the ambient plasma and the properties of the electromagnetic and electrostatic waves propagating through it org described. The difficulties of using three different kinds of antenna are listed and the joint problems of field measurement and interpretation for simple plane waves us well as complex random wave fields are discussed for both electromagnetic and electrostatic waves, and recommendations for future theoretical and experimental studies ore made.
I. E N V I R O N M E N T
1.1 Introduction
The environment of a geostationary satellite comprises both particles and fields.
The particles can be divided into energetic particles and thermal plasma. The former arc important as one source of the fields, through the instabilities that they provoke in the plasma, and also as affecting the electrostatic equilibrium of the antennas; this topic is considered in the companion paper by Fahlcson1. For a given static antenna potential, the antenna impedance depends mainly on the properties of the thermal plasma, and only these wili je considered here.
The alternating fields can also be divided into two classes: ihe natural fields of waves in the ambieni
plasma, and the artificial quasi-electrostatic fields of the various sources of interference on board the satellite.
1.2 Partides
1.2.'. Remote plasma
Typically the ambient plasma has an electron density of about I cm *, and icmperatures -.uch thai
KT/e a 1 cV for both the electrons and the ions. Under these conditions, the Dcbye length is about 7.5 m.
The electron density, N, probably varies by a factor of 10 each way with respect lo the above figure. For ,V = 10 cm-3, the Debye length wouj be 2.3 m, white for .V = 0.1 cm 3 it would be 23 m The corresponding values of the various characteristic frequencies of the plasma are given in Table 1 ; note that they ail lie below 30 kHz.
Little is yet known about variations of the temperature T. The ion temperature may exceed the electron temperature2.
2fi7
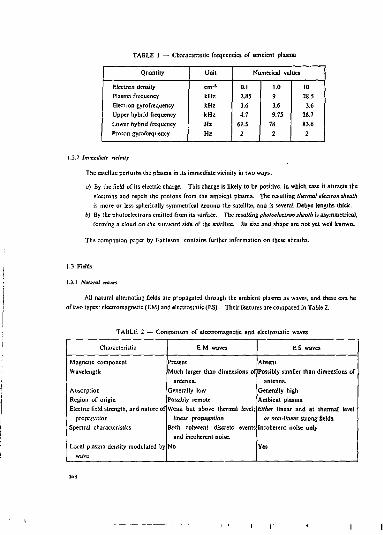
TABLE 1 — Characteristic frequencies of ambient plasma
Quantity Unit Numerical values
Electron density cur» 0.1 1.0 10 Plasma frequency kHz 2.85 9 28.5 Electron gyroFrequcncy kHz 3.6 3.6 3.6 Upper hybrid frequency kHz 4.7 9.75 28.7 Lower hybrid frequency Hz 61.5 78 83.6 Proton gyrofrcquency Hz 2 2 2
1.2.2 Immediate tieinity
The satellile perturbs the plasma in its immediate vicinity in two ways:
a) By the field of its electric charge. This charge is likely to be positive, in which case it attracts the electrons and repels the protons from the ambient plasma. The resulting thermal electron sheath is more or less spherically symmetrical around the satellite, and is several Debye lengths thick.
b) By the photoeicctrons emitted from its -urface. The resulting photoetectron sheath is asymmetrical, forming a cloud on the sunward side of the satellite. Jts size and shape are not yet well known.
The companion paper by Fahleson1 contains further information on these sheaths.
1.3 Fîdds
1.3.1 Natural HUTCS
All natural alternating fields are propagated through the ambieni plasma as waves, and these can be of iwo types: electromagnetic (EM} and electrostatic (E3). Their features are compared in Table 2.
TABLE 2 — Comparison of electromagnetic and electrostatic waves
Characteristic E M waves ES waves
Magnetic component Present Absent Wavelength Much larger than dimensions ol Possibly smaller than dimensions of
antenna. antenna. Absorption Generally low Generally high Region of origin Possibly remote Ambient plasma Electric field strength, and nature of Weak but above thermal level; Either linear and at thermal level
propagation linear propagation or non-linear strong fields. Spectral characteristics Both coherent discrete events
and incoherent noise. Incoherent noise only
Local plasma density modulated by No Yes wave
263
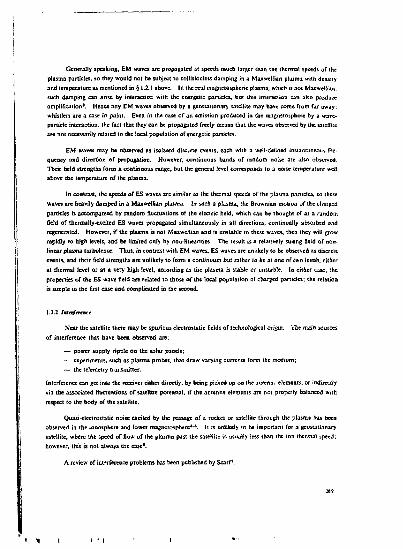
Generally speaking, EM waves are propagated at speeds much larger than the thermal speeds of the plasma particles, so they would not be subject to collisionleis damping in a Maxwclliart plasma with deosity and temperature as mentioned in § 1.2.1 above. In the real magnetospberie plasma, which is not Maxwdlian, such damping can arise by interaction with the energetic particles, but this interaction can also produce amplification'. Hence any EM waves observed by a geostationary satellite may have come from far away: whistlers are a case in point. Even in the case of an emission produced in the magnetosphcre by a wave-particle interaction, the fact that they can be propagated freely means that the waves observed by the satellite are not necessarily related to the local population of energetic panicles.
EM waves may be observed as isolated discrete events, each with a well-defined instantaneous frequency and direct ion of propagation. However, continuous bands of random noise are also observed. Their field strengths form a continuous range, but the general level corresponds to a noise temperature wer! above the temperature of the plasma.
In contrast, the speeds of ES waves are similar to the thermal speeds of the plasma particles, so these waves arc heavily damped in a Maxwellian plasma. In such a plasma, the Brownian motion of the charged panicles is accompanied by random fluctuations of the electric field, which can be thought of as a random field of thermally-excited ES waves propagated simultaneously in all directions, continually absorbed and regenerated. However, if the plasma is not Maxweflian and is unstable to these waves, then they will crow rapidly to high levels, and be limited only by non-linearities. The result is a relatively strong held of nort-linear plasma turbulence. Thus, in contrast with EM waves, ES waves are unlikely to be observed as discrete events, and their field strengths are unlikely to form a continuum but rather lo lie at one of two levels, cither at thermal level or at a very high level, according as the plasma is stable or unstable. In either case, the properties of the ES wave field are related to those of the local population of charged panicles; the relation is simple in the first case and complicated in the second.
1.3.2 Itaofattttt
Near the satellite there may be spurious electrostatic fields of technological origin, ine main sources of interference that bave been observed are;
— power supply ripple oo the solar panels; — experiments, such as plasma probes, that draw varying currents form the medium; — the telemetry transmitter.
Interference can get into the receiver either directly, by being picked up on the anienn;. elements, or indirectly via the associated fluctuations of satellite potential, if the antenna elements are not properly balanced with respect to the body of the satellite.
Quasi-electrostatic noise excited by the passage of a rocket or satellite through the plasma has been observed in the ionosphere and lower magnetosphere*-*. It is unlikely to be important for a geostationary satellite, where the speed of flow of the plasma past the satellite is usually less than the ion thermal speed; however, this is not always the case*.
A review of tcL'rfereece problems has been published by Scarf.
269
2. MEASUREMENT HNIQUES
2.1 Introduction
In the study or magnetospheric electric fields, the problems of measurement and interpretation are inseparable. There h no unique best method for measuring these fields. The way that one should measure them is determined by the subsequent use that one wishes to make of the measurements, and this depends in turn on the hypotheses that can be made about the structure of the fields.
For initial exploratory observations, where nothing is known about the field structure, it may suffice to have a rough measure of electric field strength, or the frequency/time spectrum of the field, or both. Here one need measure only a single field component, and the choice oi antenna type is not critical; the range of types available for a geostationary satellite is presented in Section 2.2 below. The important point is to avoid spurious interference, and the appropriate precautions are described in Section 2.3. Of course, this point also applies io piecisu measurements.
Precise measurements are called for if one wishes to have detailed information on the wave field under study. For instance, if it is legitimate to suppose that the observed field is that of a single plane wave, then one may wish to interpret the measurements for any or all of the following wave properties:
— wave mode — accurate total £ field strength — direction of propagation — energy flux vector — polarization — wave admittance.
Again, the field may be random, in which case one would be interested in the wave distribution function that describes the statistical structure of the field (see Section 2.4). In either case, at least 2 and probably all 3
components of £ must be measured simultaneously. The interpretation of the measurements involves comparing these various components, which means that their relative values must be accurate, and this is only possible if the individual values are accurate. For some purposes, such as calculating the polarisation of a single plane wave, one could tolerate uncertainly in a scale factor common to all components, but even this would be unacceptable if one wished to determine the total field strength accurately. Hence the need for precise electric field measurements arises.
The joint problems of field measurement and interpretation, both for simple plane waves and complex random wave fields, are discussed below in Sections 2.4 and 2.5 for EM and ES waves respectively. On the basis or this discussion, various recommendations are formulated in the final Chapter 3.
2.2 Antenna types
2.2.1 Generalities
The siiuation of a geostationary satellite is interesting because it offers the widest possible choice of antenna types. The reason is that the Debye length ta aX the ambient plasma is comparable to the dimensions
270
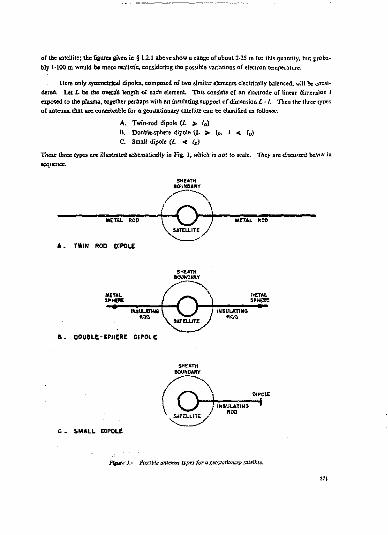
or the satellite; the figures given in § 1.2.1 above show a range or about 2-25 m for this quantity, but probably 1-100 m would be more realistic, considering the possible variations of electron temperature.
Here only symmetrical dipoles, composed of two similar elements electrically balanced, will be considered. Let L be the overall length ot each element. This consists of an electrode of linear dimension / exposed to the plasma, together perhaps with on insulating support of dimension L - /. Then the three types of antenna, that are conceivable for a geostationary satellite can be classified as follows:
A. Twin-rod dipole (L > tD) U. Double-sphere dipole (£ > l0, 1 < lD) C. Small dipole (L < lD)
These three types are illustrated schematically in Fig. 1, which is not to scale. They ere discussed below m sequence.
04 y
UETAL ROD
A. TWIN ROD DIPOLE
B . DOUBLE-SPHERE DIPOLE
C . SMALL DIPOLE
Ftffjn J,- fa&ble antenm typafor a geostationary satellite
2.22 Ttrln-rûd tûpo'.t
Antennas of this type have been used on satellites of the Alouette/rsis series, and also on the NASA Radio Astronomy Explorer satellite. They have the technical merit of being easy to deploy, using the STEM concept or a preformed metallic ribbon that is wound up on a reel for the launch but bends around to form a tube when it is unwound in orbiL Overall antenna lengths of several tens or even hundreds of metres can be attained in this way.
They also have some good electrical properties: thus they provide plenty of signal for a given field, and have a low impedance. These properties are consequences of their great length and large surface area. Moreover they can be used for diagnostic purposes, for instance by measuring the self-impedance of a single antenna, or the mutual impedance of two antennas, as a function of frequency. If a pair of crossed dipole antennas, normally connected to separate receivers as in Fig. 2A, is used for the mutual impedance measurement, a higher mutual impedance is obtained if the four antenna elements are connected asymmetrically to the signal source and receiver, as in Fig. 2B.
These long antennas have the disadvantage of a diminished response to E5 waves of wavelength less than the physical leagtli L of the antenna. Also, in order to make precise measurements without interference, it is necessary that the antenna elements be shielded along that part of their length that ties within the per* turned region near the satellite; this requirement makes these antennas less simple to construct.
2.2.3 Double-sphere dipole
An antenna of this type has been proposed for quasi-static F field measurements oathcGEOS satellite*. Each element of the dipole consists of a conducting sphere supported ca the end of an insulating rod, which should be sufficiently long to hold the sphere outside the perturbed région near the satellite.
The use of a double-sphere dipole to measure alternating rather than static fields is easier in some respects and more difficult in others. On the one hand, there is no need to worry about inequality or variation in the contact potentials between the two spheres and the plasma. On the other band, steps must be taken to prevent natural noise or artificial interference from being picked up capacitatively on the insulated connections that run from the spheres through the perturbed sheath region to the receivers in the body of the satellite. Here two remedies arc available: either one can screen the connecting wire with a coaxial sheath, using an active feedback system to reduce the capacitance between the wire and the sheath, as on the FR-I satellite», or one can place the preamplifier inside the sphere itself, as on the Injun-5 satellite5. Such remedies, though complex, are effective and are easier to apply to a double-sphere dipole than to a twin-rod dipole.
In comparison with the twin-rod dipole, the double-sphere dipoie has an effective length that is better defined and more nearly equal to the overall geometric length. However, the effective length is generally less than for a twin-rod dipole, for practical reasons. Also the impedance is higher, because the surface area of the electrodes is smaller. The double-sphere dipole responds to ES waves of all wavelengths, hut the response is difficult to interpret when the wavelength is smaller than the distance between the spheres.
2.2.4 Small dipole
Electric dipole antennas with overall dimensions much smaller than the Debye length have been used by Crook el a!.10 on the satellite OGO-5. In order to avoid perturbations caused by the body of the satellite,
272

MEASURING TWO COMPONENTS OF ELECTRIC FIELD
SIGNAL SOURCE
PLASMA DIAGNOSTICS BY MUTUAL IMPEDANCE
C . INTERFERENCE DETECTION USING PARALLEL D1POLES
Figurv 2.' Possible uses far a pair of crossed dlpole
the entire antenna with its preamplifier must be held well away from the body on the end of a long boom.
If the thermal plasma was the on'y feature of the emironinrat such antennas would behave as in Tree space. Then their dements could have any convenient shape; for instance, they could be simple rods. However, in view of the presence of energetic charged particles, Crook et aJ.ia used rods top-loaded with spherical wire cages that increased their electrical capacity without much increasing their collecting area for

energetic particles. Another difficulty is that even though the antenna is small and even though it is outside the sheaths created by the body of the satellite; it may create its own thermal electron sheath and phctoshcath and these may perturb the received fields11. Possibly these sheaths and the perturbations they cause could be eliminated by biasing the antenna suitably with respect to the body.
Naturally these small dipoles offer even smaller signals and higher impedances than the two previous types, but this disadvantage is offset by the fact that the preamplifiers can be placed close to the electrodes. They have the advantage of responding uniformly to electrostatic waves of all wavelengths.
2.3 Avoiding interference
Interference can be avoided both by prevention at the source, and by making the antennas insensitive to it.
Methods of prevention include the following:
— insulatiDg the surfaces of the solar cells and placing electrical filtefs between them and the rest of the power supply system
— replacing electrically noisy experiments by quieter ones that achieve the same results, c • arranging that they do not have to be operated at the same time as the electric field measurements
— insulating the telemetry antennas from the body of the satellite.
Among the precautions to be taken in designing the antennas, one of the most important is to use symmetrical dipoles, electrically balanced with respect to the body, so that any fluctuations of the potential différence between the body and the plasma do not enter the antenna. The need to keep the electrodes as far from the body as possible has been mentioned already. Finally, stubs can be used to prevent any telemetry signals picked up on the electrodes from entering the associated receivers.
In practice interference may get into the receivers in spite of all precautions, and then one needs to be able to distinguish it from natural noise. Usually two of its features are helpful in this respect:
— the regularity of its frequency/time spectrum — the non-uniformity of its distribution in the space around the satellite.
fn order to exploit the first feature, the complete noise waveform must be returned to ground by telemetry. If the noise is filtered on board into several bands, and only the smoothed noise level in each band is telemetered, then much useful information is lost.
The second feature implies that two similar antennas with their axes parallel :o each other, placed at different points around the body, will pick up different amounts of noise if this is artiScta), whereas a natural noise field will excite them equally. At least, natural EM noise will excite closely correlated signals in the two antennas, but with natural ES noise the correlation .nay be less close because the waves may be absorbed appreciably over the distance separating the two antennas ; even then, the statistics of the two signals should be the same. If the antenna system includes a pair of crossed dipoles, their four c jJients can be reconnected to form n pair of parallel dipoles for the purpose of detecting interference (Fig. 2 C).
274
2.4 Stody ofefectnmagtcflc ware fields
As mentioned previously, natural EM waves may occur os discret events, in which the field can be
regarded locally and insianteneously as that or a single plane wave, characterized by a unique angular fre
quency <ù and .a unique angular wave number vector k. Of course, this is true even more frequently of
artificial VLF transmissions from the ground, propagated through the magnctosphere in the whistler mode.
If one wishes to obtain full information about afield of this type, while measuring only the properties
of tie- field and not those of the ambient plasma, then one must equip the satellite with loop antennas to
measure the induction B of the magnetic field of the wave, as well ta with dipoles for its electric field E.
In fact, Shawhan1* bas pointed out that full information about the wave can be had by measuring
only 5 out of the 6 components of its field. That is, one must measure either 3 components of £ and 2 compo
nents of .ff, or 3 components of 3 and 2 off. The latter arrangement was adopted far the FR-I satellite11.
The missing field component can be reconstructed using Maxwell's equations alone, without any further
assumptions about the wave or the plasma. The method for doing this was developed by Grard ! l. Alterna
tively, of course, this component can be measured with a sixth antenna, as on the OOO-S satellite10. Proce
dures for (be subsequent interpretation of the amplitudes and phases of the 6 fieid components, in t:rms of
the properties of the wave as listed at the head of this Chapter, have been described both by Grard1* and
by Shawhan".
Some of these basic properties are related to the physical state cf the plasma. For instance, the wave admittance is proportional to the refractive index of the plasma for the observed direction of wave propagation, and this index depends in turn on the local magnetic field strength and electron density. If the static magnetic field strength is known, either by measurement or from a model, then the electron density can be calculated".
On the other band, on? may prefer to measure tfte electron density with a probe, in which case one
can infer the prr. i. des of the wave from measurements of fewer field components, for instance just the 3
components of B.
Now the situation where the field is that of a single plane wave is very special and probably rare. Natural noise fields arc more likely to be composed, even instantaneously and locally, of a continuum of waves of different frequencies going in different directions. Rather than having a definite frequency to and
wave number k, the mise covers a frequency band A<u and a range AAr of wave numbers. Such a random
wave field can be described only statistically, and the proper description is provided by a function P (w, k)
that specifies, for each of the wave modes that may coexist, how the wave energy flux is distributed with
respect to the variables a» and it. This wave distribution function is analogous to the particle distribution
function for a gas. In fact, the following analogies mcy be drawn:
Particles Waves
Particle type Wave mode Energy Frequency
Momentum vector Wave number vector

When the wave field is random, it is not possible to reconstruct a mining field component from measu
rements of the 5 others, so all 6 components must be measured. Then the interpretation problem is how to
obtain the maximum information about P (w, k) from these 6 measurements. My attention was first drawn
to this problem by Gurncti", and I do not know what progress he or others have made towards solving it.
However, it is evident that the first step in interpreting the data is to perform on analysis in frequency, so that
the problem becomes that of finding the distribution p{k) over wave number vectors for tbe waves whose frequencies lie in some narrow band of width So centred on a known frequency ea. It is also evident that even when only one wave mode is present, measurements of the 6 field components in the frequency range Sto
do not suffice to determine p(k), which is a continuous function. Nevertheless they do provide a lot of information about this function. To be exact, tbe available data comprise the following 36 independent parameters:
— the mean square values of each of the 6 field components — the amplitudes and phases of the cross-correlations between each of the 1S pairs of iield components.
To these one might add further data obtained by measuring tbe ambient elec&on density and static magnetic
field strength, which fix the dispersion equation for the w^ve mode in question. Clearly, even if p(k) cannot
be determined completely, one should be able to get fairly detailed information about it, finch as the values
of some of its moments. To begin with, one could détermine the mean Poyntiag vector, which is propor
tional to the zerolh moment oîp[k). The question of what other information is available, and how it can t e
got out of the data, is important and needs to be studied urgently.
2.5 Study of electrostatic waves
The experimental study of ES waves in the magsetosphere is liable to be more difficult than that of EM waves, for two main reasons: firstly, the fields are most unlikely to be those of single plane waves, but instead they will almost always be random andfrcquently non-linear; secondly, the fields have no magnetic components, so less data are available for interpretation.
In fact, from measurements of the 3 components of £ in a narrow frequency band, one can derive the mean square value of each of them, together with the amplitudes and phases of the correlations between the 3 possible pairs. The total is only 9 items of data, or a quarter of the number available in the case of EM wave fields. Even if the local electron density, electron temperature, and stalk magnetic field strength are measured so that one can fill in all the unknowns in the dispersion equation for the ES waves, it is obvious that more field variables must be measured if one is to be able to pin down tht wave distribution function to the same extent as for EM field*.
One possible source of further data would be a fast pfasma probe, capable of responding to tbe variations of plasma density that are an integral part of the field of ES waves. However, this does not appear to be a very good possibility for experiments e* geostationary altitude, where the plasma is so tenuous that it is difficult to make probe measurements of its mean density, let alone observe rapid variations.
A more hopeful source would be the use of spaced pairs of electric d/pole antennas, with their axes parallel. The two dipoles yield partly independent information, since the wavelengths of the E5 waves are
276
not necessarily large compared to practicable spacings. In fact, the information provided by a spaced pair of dipoles in m ES wave field is similar to that provided by a loop in an EM wave field; both devices measure spatial variations of the electric field.
In a recent rocket experiment in the auroral ionosphere, Mozer and Kelley" have demonstrated the e^-tencc of a time delay between signals received on two parallel antennas, and have shown that it is consistent with excitation by ES ion waves propagated at about 1 km r 1 .
The theory for (he interpretation of these and other measurements of ES wave fields needs to be developed.
3. RECOMMENDATIONS
In the light of the foregoing discussion, a number of recommendations can be made concerning an eventual alternating electric field experiment on the ESRO geostationary satellite. These concern both preparatory theoretics! work, and practical details of the experiment itself.
3.1 Theory
a) There is need for a theoretical study of the environment of the satellite in order to evaluate the sizes and shapes of the thermal electron sheath and the photosheath. Possibly this work could be supported by experiments in laboratory plasmas.
6) In order to estimate their A.C. impedance, a study should be made of the interaction between the antennas and the ambient plasma, including the effects of photo-emission from their electrodes.
c) The structure of the wave fields generated by natural processes in the magnetosphere should be studied, with the object of seeing whether this structure can be predicted in sufficient detail to justify making precise measurements of more that» one field component
d) Tha theory must be developed for interpreting simultaneous measurements of all components of the natural EH and ES wave fields, in order to extract as much information as possible about their wave distribution functions.
3.2 Expcrimeat
a) If in fact it is decided tn measure several field components simultaneously, then the mean square values of these components and the cross-correlations between pairs of components should be computed on board the satellite by analogue methods, in order to reduce the amount of data to be seat back to ground by telemetry.
ft) The local magnetic field strength, electron density, and electron temperature should be measured, so B3 to provide knowledge of the dispersion equations for EM and ES waves.
DISCUSSION
C.R Kennel and J.W. Dungey both remarked that a knowledge of tbc electron temperature was not sufficient to fix the duper ion equation for ES waves, since the plasma at geostationary altitude is not y ax-wcllian. The complete velocity distribution function for the low-energy particles would have to be measured.
27?
REFERENCES
I- Fahleson, U.V. Problems of DC Electric Field Measurements from a Geostationary Satellite (see present volume).
Heating of the Magnetospheric Plasma by Electromagnetic Waves Generated in the Mag ne to sheath J. Geophys. Res., 74, pp. 1763*1771 (1969).
i. Kennel, CF. Thome, R.M.
Unstable Growth of Unducted Whistlers Propagating at an Angle to the Geomagnetic Field, J. Geophys. Res., 72, pp. 871-878 (1967).
4. Gurnett, D.A. Mosicr, ii.R.
VLF Electric and Magnetic Fields Observed in the Auroral Zone with the Javelin S.46 Sounding Rocket, / . Geophys. fies., 74. pp. 3979-3991 (1969).
S. Gurnetl, G.W. Anderson, R.R. Mosier, S.R. Cauffman, O.P.
Initial Observations or VLF Electric and Magnetic Fields with the Injun 5 Satellite, J. Geophys. Res.. 74. pp. 4631-4648 (1969).
6. Freeman, J.W. Young, D.T.
Magnetospheric Plasma Phenomena at the Geostationary Orbit (see present volume).
7. Scarf. F.L. In-orbit Interference Problems, J.PX. Technical Memorandum 33-402, pp. 149-162.
8. ESRO Feasibility Study No. 2 on the Scientific Geostationary Satellite, April, 1969.
9. Storey, L.R.O. Antenne électrique dipole pour reception TBF dans ['ionosphere, L'Onde Eke, 45, pp. 1427-1435 (1965).
10. Crook, G.M. Scarf, FX. Fredricks, R.W. Green, I.M. Lukos, P.
The OGO-V Plasma Wave Detector : lastrumentation and ïn-FUght Operation, ŒEE Trans. Geosci. Electronics, 7, pp. 120-135 (1969).
11. Fahleson, U.V.
12. Shawhan, S.D.
Private communication (October 1969).
The Use of Multiple Rrceivers to Measure the Wave Characteristics of Very-Low-Frequency Noise in Space, Royal Institute of Technology, Stockholm, Report No. 69-19 (June 1969).
13. Storey, L.R.O. Résultats préliminaires sur la propagation TBF dans la basse magnéto-sphère, obtenus par le satellite FR-I, in Space Research K//(R.L. Smith.-Rose, éd.) pp. 5S8-602, North Holland Publ. Co., Amsterdam. 1967.
14. Grard, R.J.L. Interprétation de mesures de champ électromagnétique TBF dans la magnétosphère, Ann. Géophys.. 24, pp. 955-971 (1968). (An English translation is obtainable from the author or from the secretariat of the G.R.I.)

15. Storey, LR.O. A Method for Measuring Local Electron Deuity from an Artificial
Satellite, J. Rej. No!, Bur. Stand., 63D, pp. 325040(1950).
16. Gurnett, D.A. Private communication (December 1965).
[7. Kelfcy, M.C. Piivats communieaïion (July (969).
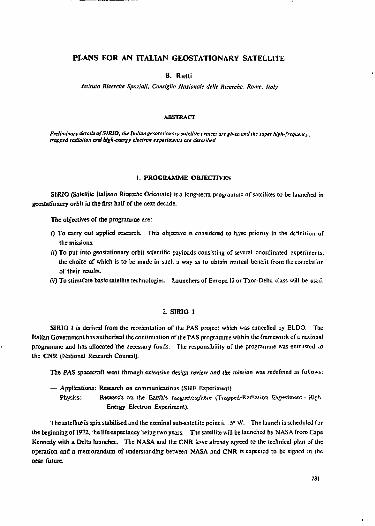
PLANS FOR AN ITALIAN GEOSTATIONARY SATELLITE
B. Ratti htituto Ricerche Spaziali, Consiglio Nazionale delle Ricerche, Rome, Italy
ABSIRACT
Preliminary details ofSlRIO, the Itallangaotationay satellite project are given and ike super high-frequency. trapped radiation and k&ft-cnergy électron experiments aie described.
1. PROGRAMME OBJECTIVES
StRIO (Satellite Italians Ricerche Orientate) is a long-term programme of satellites to be launched in geostationary orbit in the first half of the next decade.
The objectives of the programme are :
0 To carry out applied research. This abjective is considered to have priority in the definition of the missions.
ii) To put into geostationary orbit scientific payloads consisting of several coordinated experiments, the choice of which is to be made in such a way as to obtain mutual benefit from the correlation of their results.
J'/I) To stimulate basic satellite technologies. Launchers of Europa II orThor-Delta class will be us«d.
2. S1RIO 1
SIRIO I is derived from the reorientation of the PAS project which was cancelled by ELDO. The Italian Government has authorised the continuation of the PAS programme within the framework of a national programme and has allocated the necessary funds. The responsibility of the programme was entrusted .o the CNR (National Research Council).
The PAS spacecraft went through extensive design review and the mission was redefined as follows:
— Applications: Research on communications (SHF Experiment). — Physics: Research on the Earth's magnetosphere (Trapped-Radiation Experiment - High-
Energy Electron Experiment).
The satellite is spin stabilised and the nominal sub-satellite point k .5" W. The launch is scheduled far the beginning of 1972, -he life expectancy being two years. The satellite will be launched by NASA from Cape Kennedy with a Delta launcher. The NASA and the CNR !~>?ve already agreed to the technical plan of the operation and a memorandum of understanding between NASA and CNR is expected to be signed in the near future.
281

3. SHF EXPERIMENT
This experiment has been proposed by (he Communication Institute of Milan Polytechnic University. The experiment offers the possibility of acquiring data on the propagation of the Super High Frequencies over 10 GHz, which must be used in future space systems because of the gradual saturation of the frequency bauA in use today.
These frequencies make avaihblc great bandwidth» but are affected by atmospheric conditions, particularly rain. It is, therefore, necessary to conduct synoptic observations of these phenomena, since knowledge of the influence of rain variations in space and time is very scarce. S1R10 1 could thus become one of the first satellites capable of carrying out such experiments.
These circumstances have prompted many agencies and research groups to consider the possibility of joining the Polytechnic University fn the experiment by providing earth stations which would be constructed by the participating agencies. Interest has been shown from the follow ng countries: Denmark, Canada, France, Germany, the Netherlands, Norway, Sweden, U.5.A., and the U.K.
The on-board transponder operates in the 18 GHz band for the up-link'and in the 12 GHz band for the down-link. The on-board antenna is a mechanical despun antenna with a beam which permits coverage of Europe, the Atlantic Ocean and North America from the geostationary altitude. The system allows systematic measurements of the attenuation of the link, (absolute or differential) within the limits of a band of approximately 800 MHz for the up-link and approximately 550 MHz for the down-link. It is also possible to determine the linear component of the variation of the group delay in the bands but only for the down-link. In addition, the system will permit narrow-band communication experiments with signals codified to the rate of 200-500 bits/sec. Under the best conditions the system will permit propagation experiments with, a band sufficient to transmit one television channel. The transponder can assume three different configurations selectable by telecommand:
f) propagation mode, M) narrow band communication mode. Hi) television mode.
The transponder can also transmit the digital telemetry of the satellite.
The txperiraent also offers the possibility of establishing communications within the framework of the inter-university liaison scheme sponsored by the Polytechnic University. This scheme envisages communications both via telephone and television for the exchange of information between European universities. At present one university in Danemark, one in the Netherlands and two in the U.K. have shown interest.
4. TRAPPED RADIATION EXPERIMENT
The object of this experiment is to gain a better understanding of the physics of the magnetosphere and, in particular, to contribute to the study of the trapping mechanism.
A proposal for magnetospheric measurements by means of geostationary satellite was presented to the C.N.R. in 1965 by the Physics Department of Rome University. At that stage the possibility of Italy
252
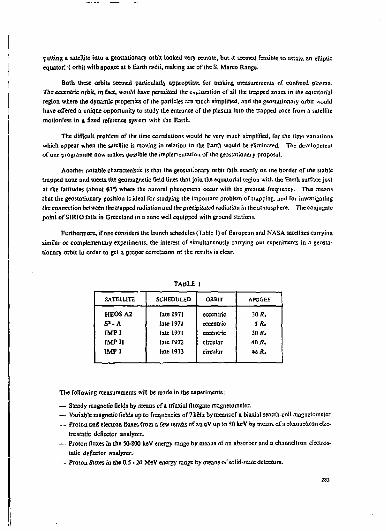
putting a satellite into a geostationary orbit looked very remote, but it seemed feasible to attain an elliptic equator 1 orbit with apogee at 6 Earth radii, making use of the S. Marco Range.
Both these orbits seemed particularly appropriate for making measurements of confined plasma. The eccentric orbit, in fact, would have permitted the cAj.;oratton of ail the trapped zones in the equatorial region where the dynamic properties of the particles are much simplified, and the geostationary orbit would have offered a unique opportunity to study tie entrance of the plasma into the trapped zone from a satellite motionless in a fixed refeieace sysem with the Earth.
The difficult problem of the time correlations would be very much simplified, for the time variations which appear when the satellite is moving in relation to the Earth would be oliminated. The development of our programme now makes possible the imptenentation or the geostationary proposal.
Another notable characteristic is that the geostationary orbit falls exactly on the border of the stable trapped zone and meets the geomagnetic field lines that join the equatorial region with ihe Earth surface just at the latitudes (about 67°) where the auroral phenomena occur with the greatest frequency. This means that the geostationary position is ideal for studying the important problem of trapping, and Tor investigating the connection between the trapped radiation and the precipitated radiation in the atmosphere. The conjugate point of SIRK) falls in Greenland in a zone well equipped with ground stations.
Furthermore, if one considers the launch schedules (Table I) of European and NASA satellites carrying
similar or complementary experiments, the interest of simultaneously carrying out experiments in a geosta
tionary orbit in order to get a proper correlation of the results is clear.
TABLE 1
SATELLITE SCHEDULED ORBTT APOGEE
HEOSA2 late 1971 eccentric 30 # , S»-A late 1971 eccentric 5R.
IMP I late 1971 eccentric 30 R.
IMP H late 1972 circular 4ÙR.
IMP J late 1973 circular 40 R.
The following measurements will be made in the experiments:
— Steady magnetic fields by means cf a triaxial fluxgate magnetometer. — Variable magnetic fields up to frequencies of 7 kHz by meansof a biaxial search-coil magnetometer. — Proton and electron Muxes from a few tenths of an eV up to 50 kcV by means of a channeltf on elec
trostatic deflector analyzer.
— • Proton fluxes in the 50-800 keV energy range by means of an absorber and a channeltion electros
tatic deflector analyzer. — Proton fluxes ia the 0.5 - 20 MeV energy range by means of solid-rtate detectors.
233
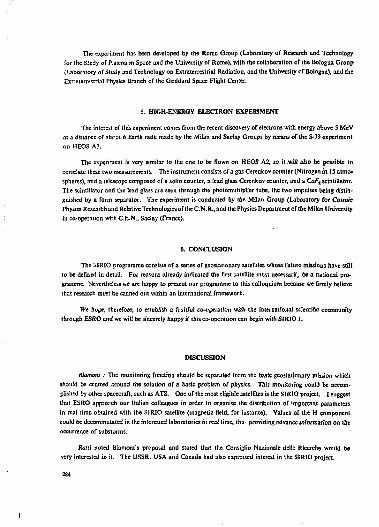
The experiment has been developed by the Rome Group (Laboratory of Research and Technology for Ihe Sludy of Plasma in Space and the University of Rome), with the collaboration of the Bologna Group (laboratory of Study and Technology on Extraterrestrial Radiation, and the University of Bologna), and the Extraterrestrial Physics Branch of the Goddard Space Flight Center.
5. HIGH-ENERGY ELECTRON EXPERIMENT
The interest of this experiment comes from the recent discovery of electrons with energy above S KeV at a distance of abrai 6 Earth radii made by the Milan and Sa clay Groups by means of the S-79 experiment on HEOS Al.
The experiment is very simitar to the one to be flown on HEOS A2, so it .will also be possible to correlate these two measurements. The instrument consists of a gas Ccrenkov counter (Nitrogen at 15 atmospheres), and a telescope composed of a solid counter, a lead glass Cerenkov counter, and a CoFt scintillator. The scintillator and the lead glass are seen through the photomultiplier tube, the two impulses being distinguished by a form separator. The experiment is conducted by the Milan Group (Laboratory for Cosmic Physics Research and Relative Technologies of the C.N. R., and the Physics Department of the Milan University in co-operation with C.E.N., Saclay (France).
6. CONCLUSION
The ilRIO programme consists of a series of geostationary satellites whose future missions have still to be defined in detail. For reasons already indicated the first satellite must necessari!,, be a national programme. Nevertheless we are happy to present our programme to this colloquium because we firmly believe that research must be carried out within an international framework.
We hope, therefore, to establish a fruitful co-operation with the International scientific community through ESRO and we will be sincerely happy if this co-operation can begin with SIRIO 1.
DISCUSSION
Blamont : The monitoring function should be separated from the basic geostationary mission which should be centred around the solution of a basic problem of physics. This monitoring could be accoro-pliiJied by other spacecraft, such as ATS. One of the most eligible satellites is the SIRIO project. I suggest that ESRO approach our Italian colleagues in order to organise the distribution of important parameters in real time obtained with the SIRIO satellite (magnetic field, for instance). Values of the H component could be decommutaced in the interested laboratories in real time, thu- providing advance information on t ie occurrence of subslorms.
Batti noted Blamont's proposal and stated that the Consiglio Nazionale delle Ricerche would be very interested in it. The USSR, USA and Canada had also expressed interest in the SIRIO project.
2to
Aparicio, B.
Axford, W.i.
Axîsa, F.
Bahnsen, A.
Batogn, A.
Berteaux, J.L.
B la mont, J. E.
Block, ' . P .
Bondi, H.
Bryant, D.
Bullough, K.
Cambou, F.
Cazemajou, J.
Christophersen, P-
Collot, G.
Dalael, R.
D'Angcfo, N.
D:nkespiler, J.A.
Du Caste], F.
Dumbs, A.
Dungey, J.W.
FahlesoD. U.
PARTTOPANTS
Kiruna Geophysical Observatory, Sweden.
Dept of Applied Physics and Information Science, University of California, La Jolla. U.S.A.
Centre d'Études Nucléaires de Saclay, France.
Danish Space Research Institute, Lyngby, Denmark.
Physics Department, Imperial College London, U.K.
Service d'Aéronomîe, Centre National de la Recherche Scientifique, Verrières-Ie-BuissoQ, France.
Service d'Aéronomie, Centre National de la Recherche Scientifique, Verrières-! e-Buisson, France.
Royal Institute of Technology, Stockholm, Sweden.
ESRO, Neuilly-sur-Seine, France.
Radio and Space Research Station, Slough, U.K.
Physics Department, University of Sheffield, U.K.
Centre d'Études Spatiale des Rayonnements, Toulouse, France.
Techniques Électroniques/Traitement de rinformaiino, Centre Nationar d'Études Spatiales, Brétigny, France.
Kiruna Geophysical Observatory, Sweden.
Chairman, Scientific Satellite Committee, EUROSPACE.
Radio and Space Research Station, Slough, U.K.
ESRIN, Frascati, Italy.
ESRO, Neuilly-sur-Seine, France.
Centre National d'Études des Télécom m un tcaiions, Issy-les-Moulineaux, France.
Arteilsgruppe fur Physikalische Weltraumforschung, Freibarg, Germany.
Physics Department, Imperial College London, U.K.
Royal Institute of Technology, Stockholm, Sweden.

Fâlthàmmar, G.C. Royal Institute of Technology, Stockholm, Sweden.
Fooks,G.F. ESOC, Darmstadt, Germany.
Friis-Christensen, E. Danish Meteorological Institute, Copenhagen, Denmark.
Freeman, J.W. Department of Space Science, Rice University, Houston, U.S.A.
Punch, O. Danish Space Research Jnsiilule, Lyngby, Denmark.
Gciss, S. Physikalisches Institut, Universitât Bern, Switzerland.
Gcndrin, R. Groupe de Recherches ïonosphériqt^s, Saînl-Maur, France.
Giesc, R.H. Ruhr-Universîtât Bochum, Germany.
Grabowski, R. Arbeitsgruppe fQrPhysikalischc Wcltraumlbrschung, Freiburg, Germany.
Grard, R.J.L. ESTEC, Noordwijk, Netherlands.
Green, C. ESTEC, Noordwijk, Netherlands.
Green, T.S. ESRIN, Frascati, Italy.
Greening, W.D.B. Science Research Council, London, U.K..
Hirt, P. Physikalisches Institut, Universifât Bcnt, Switzerland.
Holback, B. Uppsala Ionospheric Observatory, Sweden.
Holt, O. Auroral Observatory, Tromsô, Norway.
Hultqvist, B. Kiruna Geophysical Observatory, Sweden.
Hutchinson, O.W. Physical Laboratory, University of Soul ha m pi on, U.K.
Iversen, B. Danish Space Research Institute, Lyngby, Denmark.
J^eschke, R. ESTEC, NoordwijX Netherlands.
Jonasson, P. Danish Space Research Institute, Lyngby, Denmark.
Jordan, H.L. ESRIN, Frascati, Italy.
Jr/rgensen, T.S. Danish Mcteoiologtcal Institute, Copenhagen, Denmark.
Kaiser, T.R. Physics Department, University of Sheffield, U.K.
Karszewski. J.F. Groupe de Recherches lonosphériques, Issy-les-Moulineaux, France.
245
Kennel, C F .
King, J.W.
Klcen, W.
landmark, B.
Lassen, K.
Ledercq, M,
Ler.han, K.
Lothaller. W.E.
Lund. N.
Lundbak, A.D.
Lust, R.
Maehlum, B.N.
Malleus, G.
Mariani, F.
Martelli, G.
McPherron, R.
Mikkelsen, I.K.
Moore, A.F.
Mulltoger, D.E.
Neubauer, F.M.
Norman, K.
Occhifllint-Dilworth, C
Ortner, J.
Pacault, R.
Department of Physics, University of California, Los Angeles, U.S.A.
Radio and Space Research Station. Slough, U.K.
ESTEC, Noordwijk, Netherlands.
Norwegian Defence Research Establishment, Kjcl'cr, Norway.
Danish Meteorological institute, Copenhagen, Denmark.
Groupe de Recherches Jonosphériqucs. Issy-les-Moulineaux, France.
ESOC, Darmstadt. Germany.
ESTfc^, Noordwijk, NelherJands.
Danish Spanish Research institute. Lyngby. Denmark.
Danish Meteorological Institute, Copenhagen, Denmark.
MaA-Planck-Institut fur Extraterrcstrische Physik, Garching. Germany.
Norwegian Defence Research Establishment, Kjcller, Norway.
Groupe de Recherches lonosphéricjues, Issy-les-Moulineaux. France.
Institute of Physics. University of Rome, Italy.
Plasma Physics Group. University of Susse*. U.K.
Space Science Center. University of California, Los Angeles. U.S.A.
Danish Meteorological Institute, Copenhagen. Denmark.
ESRO, Neuilly-sur-Seine. France.
ESTEC, Noordwijk, Netherlands.
Institut fur Geophysik und Météorologie, Universitàï Braunschweig, Germany.
Milliard Space Science Laboratory. University College London. Holm-bury Si. Mary, U.K.
Institute of Physics, University of Milan, Italy.
ESRO, Neuilly-sur-Seine, France.
ESRO, Neuilly-sur-Seine, France.
Parks, G.
Pedersen, A.
Peters, B.
Petit, M.
Pfolzcr, G.
Pinkau, K.
Quenby, J.J.
Ratti, B.
Riedler, W.
Roederer, J.G.
Rothwell, P.
ROUK, A.
Schindler, K.
Schmidt, J.
Schniewind, J.F.
Sheppard, P.A.
Sine, K.
Southwood, DJ.
Stauning, P.
Steen Mikkelsen, J.
Stofiregen, W.
Storey, L.R.O.
Stro'mgrcn, B.
Thomas, J.O.
Centre d'Étude Spatiale des Rayonnements, Toulouse, France.
ESTEC, Noordwijk, Netherlands.
Danish Space Research Institute, Lyngby, Denmark.
Centre National d'Études des Télécommunications, Issy-les-Moulineaux, France.
MaK-Planck-Institut fur Aeronomie, Lindau, Germany.
Max-Planck-Institut fur Extraterrestrische Phystk, Garchiag, Germany.
Physics Department, Imperial College London, U.K.
Istimto Nazionale di Ricerche Spaziali, Consiglio Nazîonale dellc Riccrchc, Rome, Italy.
Technische Hochschule, Graz, Austria.
Department of Physics, University of Denver, U.S.A.
Department of Physics, University of Southampton, U.K.
Groupe de Recherches lonospbfriques, Issy-les-Moulineaux, France.
ESRIN, Frascati, Italy.
Kimna Geophysical Observatory, Sweden.
ESTEC, Noordwijk, Netherlands.
Department of Meteoro. igy. Imperial College London, U.K,
Physikalisches Institut, Universîtât Freiburg, Germany.
Physics Department, Imperial College London, U.K.
Ionosphere Laboratory, Lyngby, Denmark.
Danish Meteorological Institute, Copenhagen, Denmark.
Uppsala Ionospheric Observatory, Sweden.
Groupe de Recherches [onosphériques, Saint-Maur, France.
University Observatory, Copenhagen, Denmark.
Physics Department, Imperial College London, U.K.
288

Tïtiri, M.
Trefall, H.
Trendelenburg, E.A.
Ungstrup, E.
Velut, P.M.
Wibbereoz, G.
Wilhelm, K.
Wilhjetro. J.
Technical University of Finland, Olaniemi-Helsinki, Finland.
Department of Physics, University of Bergen, Norway.
ESTEC, Noordwyk, Netherlands.
Danish Space Research Institute, Lyngby, Denmark.
Division des Programmes Scientifiques, Centre National d'Etudes Spatiales, Brétigny, France.
Institut fflr Keraphysik, UnrversiuSi Kiel, Germany.
ESRO, Neuilly-sur-Seine, France.
Danish Meteorological Institute, Copenhagen, Denmark.
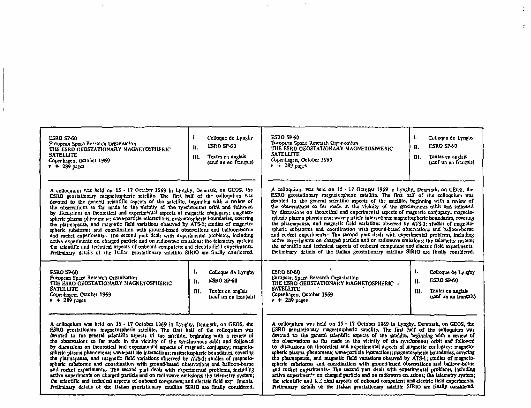
ESRO SP-60 European Space Research Organisation T I E ESRO GEOSTATIONARY MACNETOSPHERIC SATELLITE Copenhagen, October 1369 v + 289 pages
I. Colloque de Lyngby
H. ESRO SP-60
III. Textes en anglais (sauf un en français)
ESRO SP60 European Space Research Oipnitation TI1E ESRO GEOSTATIONARY MAGNET05PHERIC SATELLITE Copenhagen, October 1969 v + 289 pages
I. Colloque de Lyngby
H. E5RO SP^O
III. Textes en anglais (sauf un en français)
A colloquium was held on IS - 17 Ocisbw 1969 In Lyngby, Denmsik, on GEOS, the ESRO geostationary magnetospheric satellite. The fini half of (he colloquium w u devoted to Ibo general identifie aspects of the satellite, beginnum with a review of the observations so far mads in the vicinity of the synchronous orbit and followed by discussions on theoretical and experimental aspects of magnetic conjugacy; magneto-spheric- plasma phenomena; wave-panicle interactions; magnetospheric boundaries, covering the plasmapause, and magnetic field variations observed by ATS-l; studies of magneto-sptterlc tubstorms end coordination with ground-based observations uid balloon-bamc and racket experiments.- The second p u t deals with experimental problems, including active experiments on charged paitlcle and on radiowave emlsjionj; the telemetry system; the Eclentlilc end technical aspects of onboard computers; and electric field experiments. Preliminary details of the 1'alian geostationary satellite SIRIO ere finally considered.
A colloquium was held on IS - 17 October 1969 in Lyngby, Denmark, on GEOS, the ESRO eeostationaiy mognc to spheric satellite. The first half of (he colloquium was devoted to the genera] scientific aspects of the satellite, beginning with a review of the observations so far maje in the vicinity of the synchronous orbit and followed by discussions on theoretical and experimental aspects of magnetic conjugacy; magneto-spheric plasma phenomena; wave-particle interactions; magne to ipheric boundaries, covering the plasmapause, and magnetic field variations observed by ATS-]; studies of ra^ncto-tphcrlc tubstcrms and coordination with pound-based observations and balloon-borne and rocket experiments- The second pan deals with experimental problems, including active «pertinents on charged particle and on radiowave emissions: the telemetry system; the scientific and technical aspects of onboard computers; and electric field experiments. Preliminary details of the Italian geostationary satellite SIRIO ore finally considered.
ESRO SMO European Space Research Organisation THE ESRO GEOSTATIONARY MAGNETOSPHERIC SATELLITE Copenhagen, October 1969 v + 289 pages
I- Colloque de Lyngby
H. ÉSRO SP-60
III. Textes en anglais (muf un on français)
ESRO SP-6Q European Space Research Organisation THE ESRO GEOSTATIONARY JiAGNETOSPHERIC • SATELLITE Copenhagen, October 1969 v + 289 pages
L Colloque do Lyngby
| j . ESRO SMO
III, Textes en anglais (un i un en français)
A colloquium was held on IS - 17 October 1969 to Lyngby, Denmark, on GEOS, «he ESRO geostationary magnetospheric satellite. The first half of the colloquium was devoted to the general scientific aspects of the satellite, beginning with a review of the observationt so far made 1» the vicinity of the synchronous orbit and followed try discussions on theoretical and expérimenta] aspects of magnetic cenjugacy; magneto-Spheric plasma phenomena; wave-puticle interactions; maBrietospherlc boundaries, covering the plasmapause, and magnetic field variations observed by ATS-l; studies of magneto-Spheric substorms and coordination with ground-based observations and balloon-borne and rocket experiments.- The second part deals with expérimenta] problems, Including active experiments on charged particle and on ndlowave emissions; the telemetry system; the scientific and technical aspects of onboard computers; and electric field exj - iments. FreUmlnary details of the Italian gwststionary satellite S [RIO are finally considered.
A colloquium was held on IS - 17 October 1969 In Lyngby, Denmark, on GEOS, the ESRO geostationary magnetospheric satellite. The first half of the colloquium was devoted to the general scientific aspects of the satellite, beginning with a review of the observation» so fat made In the vicinity of the synchronous orbit and followed by discussions on theoretical and experimental aspects of magnetic eofljugacy; magneto-spheric pluma phenomena; wave-particle Interactions; magnetospheric boundaries, covering the platmapause, and magnetic field variations observed by ATS-l; studies of magneto-spheric tubstorms and coordination with ground-based observations and baliw-bome and rocket experiments.- The second part deals with experimental problems, Including •dive «périmer:*" on charged particle and on radlowzve en.JSions; thi telemetry system; the scientific and kJ'nIca] aspects of onboard compote»; and electric field expérimenta. Prclimirtïry details of the Italian geostationary satellite SIRIO are Anally considered.