physics - International Nuclear Information System (INIS)
566
PROCEEDINGS OF A SYMPOSIUM, KARLSRUHE, 30 OCTORER 3 NOVEMRER 1967 FAST REACTO PHYSICS,
-
Upload
khangminh22 -
Category
Documents
-
view
4 -
download
0
Transcript of physics - International Nuclear Information System (INIS)

P R O C E E D I N G S O F A S Y M P O S I U M ,
K A R L S R U H E , 3 0 O C T O R E R 3 N O V E M R E R
1967 FAST REACTO PHYSICS,


FAST REACTOR PHYSICS
VOL.1

The following States are Members of the International Atomic Energy Agency:
AFGHANISTAN ALBANIA
ALGERIA ARGENTINA
AUSTRALIA
AUSTRIA
BELGIUM
BOLIVIA
BRAZIL
BULGARIA BURMA
BYELORUSSIAN SOVIET
SOCIALIST REPUBLIC CAMBODIA CAMEROON CANADA CEYLON CHILE CHINA COLOMBIA CONGO, DEMOCRATIC
REPUBLIC OF COSTA RICA CUBA CYPRUS CZECHOSLOVAK SOCIALIST
REPUBLIC DENMARK DOMINICAN REPUBLIC ECUADOR EL SALVADOR ETHIOPIA FINLAND FRANCE GABON
GERMANY, FEDERAL
REPUBLIC OF GHANA GREECE GUATEMALA HAITI HOLY SEE HUNGARY ICELAND INDIA INDONESIA IRAN IRAQ ISRAEL ITALY
IVORY COAST JAMAICA JAPAN JORDAN KENYA KOREA, REPUBLIC OF KUWAIT LEBANON LIBERIA LIBYA
LUXEMBOURG MADAGASCAR MALI MEXICO MONACO MOROCCO NETHERLANDS NEW ZEALAND NICARAGUA NIGERIA
NORWAY PAKISTAN PANAMA
PARAGUAY PERU
PHILIPPINES
POLAND
PORTUGAL
ROMANIA SAUDI ARABIA
SENEGAL SIERRA LEONE
SINGAPORE SOUTH AFRICA SPAIN SUDAN SWEDEN SWITZERLAND SYRIAN ARAB REPUBLIC THAILAND TUNISIA
TURKEY UGANDA UKRAINIAN SOVIET SOCIALIST
REPUBLIC UNION OF SOVIET SOCIALIST
REPUBLICS UNITED ARAB REPUBLIC UNITED KINGDOM OF GREAT
BRITAIN AND NORTHERN IRELAND
UNITED STATES OF AMERICA URUGUAY VENEZUELA VIET-NAM YUGOSLAVIA
The Agency's Statute was approved on 23 October 1956 by the Conference on the Statute of the
IAEA held at United Nations Headquarters, New York; it entered into force on 29 July 1957. The
Headquarters of the Agency are situated in Vienna. Its principal objective is "to accelerate and enlarge
the contribution of atomic energy to peace, health and prosperity throughout the world".
Printed by the IAEA in Austria
April 1968

PROCEEDINGS SERIES
FAST REACTOR PHYSICS
PROCEEDINGS OF A SYMPOSIUM ON FAST REACTOR PHYSICS AND RELATED
SAFETY PROBLEMS HELD BY THE
INTERNATIONAL ATOMIC ENERGY AGENCY IN KARLSRUHE, 30 OCTOBER - 3 NOVEMBER, 1967
In two volumes
VOL.1
INTERNATIONAL ATOMIC ENERGY AGENCY VIENNA, 1968

FAST REACTOR PHYSICS (Proceedings Series)
ABSTRACT. Proceedings of a Symposium organized by the IAEA and held in Karlsruhe, 30 October -3 November 1967. The meeting was attended by 183 scientists from 23 countries and three international organizations.
Contents: (Vol.1) Review of national programmes (5 papers); Nuclear data for fast reactors (12 papers); Experimental methods (3 papers); Zoned systems (7 papers); Kinetics (7 papers). (Vol.11) Fast critical experiments (8 papers); Heterogeneity in fast critical experiments (5 papers); Fast power reactors (13papers); Fast pulsed reactors (3 papers); Panel discussion.
Each paper is in its original language (50 English, 11 French and 3 Russian) and is preceded by an abstract in English with a second one in the original language if this is not English. Discussions are in English.
(Vol.1: 5 5 1 p p . , Vol . I I : approx. 600 pp . , 16 X 24 cm, paper-bound, 434 figures) Price: Vol .1 : U S $ 1 1 . 0 0 ; £ 4 . 1 1 . 8
Vol.11: Approx. US $12.00; £ 5 . 5 . 0
FAST REACTOR PHYSICS IAEA, VIENNA, 1968
STI/PUB/165

FOREWORD
The Symposium on Fast Reactor Physics and Related Safety Problems, arranged by the International Atomic Energy Agency, was held at Karlsruhe from 30 October to 3 November, 1967. One hundred and eighty-three scientists, representing 23 different countries and three international organizations, attended. Sixty-three papers were presented.
It became clear that participants were confident that the fast reactor would become a major source of nuclear power and it was to be expected that the papers would show determined progress towards that goal. Three separate trends can be discerned.
First , much attention is being given to the heterogeneity problem and several different methods of calculation are being developed. Such techniques must be effective before it is possible to validate a cross-section set with the results of critical experiments and then to use it to do calculations, for, say, a power reactor with fuel in an entirely different physical form.
Second, several laboratories are using zone techniques to do effective fast-reactor experiments in thermal reac tors . Although this calls for a high level of theoretical and experimental competence, it is well worthwhile, in view of the high cost of all-fast systems.
Third, much work, both theoretical and experimental, has been done in recent years on steam-cooled fast reactors, particularly in Europe. However, despite the apparent advantage of using heavy steam to reduce troublesome coolant void effects, very little attention appears to have been given to this point over the same period.
One of the most significant features of the meeting was the accumulating evidence that the parameter a (o"capture/<7 fission) for 239Pu in the 1-keV region was substantially higher than had hitherto been thought. This shift has serious economic implications for many fast-reactor designs at present under consideration, particularly those cooled by steam and those using oxide fuel. In fact, any plutonium-burning reactor might be less effective than previous calculations had led one to believe.
In view of the interest shown in this point, an impromptu panel discussion was organized on the last day of the symposium to discuss the hew information. The group of experts considered three aspects of the problem: the best a values to use; implications of the increased a value; and ways of improving the existing knowledge. A record of this panel discussion is printed at the end of this book, which contains the full proceedings of the symposium.
For the success of the meeting thanks are due in large measure to the staff of the Kernforschungszentrum Karlsruhe, whose hospitality and help were greatly appreciated by all participants.

EDITORIAL NOTE
The papers and discussions incorporated in the proceedings published by the International Atomic Energy Agency are edited by the Agency's editorial staff to the extent considered necessary for the reader's assistance. The views expressed and the general style adopted remain, however, the responsibility of the named authors or participants.
For the sake of speed of publication the present Proceedings have been printed by composition typing and photo-offset lithography. Within the limitations imposed by this method, every effort has been made to maintain a high editorial standard; in particular, the units and symbols employed are to the fullest practicable extent those standardized or recommended by the competent international scientific bodies.
The affiliations of authors are those given at the time of nomination. The use in these Proceedings of particular designations of countries or
territories does not imply any judgement by the Agency as to the legal status of such countries or territories, of their authorities and institutions or of the delimitation of their boundaries.
The mention of specific companies or of their products or brand-names does not imply any endorsement or recommendation on the part of the International Atomic Energy Agency.

CONTENTS OF VOL. I
REVIEW OF NATIONAL PROGRAMMES (Session I)
Federal German fast breeder programme (SM- 101/5) 3 W. Hafele Discussion . . .' 14
Fast reactor research and development programme in Japan (SM-101/65) 15 H. Ishikawa, S. An and Y. Mishima
Le programme francais sur la physique des reacteurs a neutrons rapides (SM-101/66) 27 F. Storrer, O. Tretiakoff et G. Vendrybs Discussion 34
United Kingdom programme in fast reactor physics (SM-101/48) 37 C. G. Campbell Discussion 46
Fast reactor physics programme of the United States Atomic Energy Commission (SM-101/60) 49 W. B. Loewenstein and I. F. Zartman
General Discussion 61
NUCLEAR DATA FOR FAST REACTORS (Session II and (Session III, Part 1)
Neutron capture and fission cross-section data in the keV energy range: some new measurements and renormalizations (SM-101/9) . . 67 K. H. Beckurts, D. Kompe, H. O. Menlove and W. P. Ponitz Discussion 76
Energy- and temperature-dependent capture measurements below 30 keV supporting Doppler effect calculations (SM-101/17) . 77 H. Seufert and D. Stegemann
Prediction of neutron cross-sections in the energy range 1.0 to 10.0 MeV (SM-101/34) 95 S. B. Garg and B. P. Rastogi Discussion I l l
Self-shielding factors for uranium and plutonium (SM- 101/22) . 113 M. Segev, S. Yiftah and M. Caner Discussion 121
Basic nuclear data for the higher plutonium isotopes (SM-101/21) 123 S. Yiftah, J. J: Schmidt, M. Caner and M. Segev Discussion 149

Calculation of temperature-dependent effective neutron cross-sections (SM-101/32) 151 A. Müller Discussion 166
The group cross-section set KFK-SNEAK: preparation and results (SM-101/12) 167 H. Küsters, H. Bachmann, H. Huschke, E. Kiefhaber, B. Krieg, M. Metzenroth, I. Siep, K. Wagner and D. Woll Discussion 187
Modèle continu pour le ralentissement inélastique des neutrons rapides (SM-101/55) 189 M. Cadilhac et Martine Pujol Discussion . 203
Imprécisions des paramètres caractéristiques d1 un réacteur rapide de puissance dues aux incertitudes actuelles concernant les données neutroniques: leur évaluation, et leur diminution à partir des expériences critiques (SM-101/58) 205 J. Y. Barré et J. Ravier Discussion 223
The data required for fast reactor safety assessment by probability methods (SM-101/50) , 225 J.R. Crickmer and L. Cave Discussion 239
Sensitivity study of fast reactors using generalized perturbation techniques (SM- 101/30) 241 A. Gandini, M. Salvatores and I. Dal Bono Discussion 253
A re-evaluation of 235U, 238 U and 23ЭPu cross-sections based on microscopic and integral data (SM-101/67) 255 G. Rakavy, Y. Reiss, D. Samoucha and Y. Yeivin Discussion 264
EXPERIMENTAL METHODS (Session III, Part 2)
A modified least-squares method to unscramble proton recoil spectra (SM-101/53) 269 J. Kockum, L.G. Larsson and I. Ebbsjö Discussion 276
Mesure en pile de réponses en énergie de tritons obtenus par la réaction 6Li(n,t)4He et détectés au moyen de détecteurs à semi-conducteurs (SM- 101/45) 277 Ghislaine De Leeuw et S. De Leeuw Discussion 288
A new method of measuring alpha (E) for 239Pu (SM-101/41) 289 M. G. Schomberg, M. G. Sowerby and F. W. Evans Discussion 300
General Discussion 303

ZONED SYSTEMS (Session IV)
Etude experimental des caracteristiques neutroniques des milieux multiplicateurs rapides dans 1'assemblage critique thermique-rapide Ermine (SM-101/56) .309 J. Bouchard, R. Vidal et J. C. Mougniot Discussion 324
Analyse des possibilites d'une irradiation massive de combustible pour reacteurs rapides dans BR2, reacteur d 'essai de materiaux (SM-101/24) 327 G. Minsart et F. Motte
Fast-thermal coupled system for integral measurements of fission-product cross-sections (SM-101/35) 349 M. Bustraan Discussion 365
Analysis of integral experiments on the ZPR VI critical facility (SM-101/31) 367 G. Cecchini and A. Gandini Discussion 375
Theoretical and experimental analysis of fast neutron spectra (SM-101/4) 377 H. van Dam andH.R. Kleijn Discussion 387
Generation of intermediate standard neutron spectra and their application in fast reactor physics (SM-101/25) 389 A. Fabry and P. Vandeplas Discussion 411
Techniques de determination des caracteristiques nucleaires.de la boucle refroidie au sodium utilisee dans BR2 pour des essais de combustibles de reacteurs rapides (SM-101/26) 413 J. Debrue, M. De Coster, Ch. De Raedt et A. Fabry
KINETICS (Session V)
Alpha determination from transfer function, obtained by pulsed neutron analysis (SM-101/28) 435 W. Rotter Discussion 451
Time-dependent SN calculations describing pulsed source experiments at the FRO reactor (SM-101/54) 453 A. Bergstrom, J. Kockum and S. Soderberg Discussion 465
Probability distribution of neutron counts for the p-method in reactor noise analysis: a numerical calculation (SM-101/38) . . . . . . .467 E. Tiirkcan and J.B. Dragt Discussion 475

Modal effects in the triple-correlation reactor-noise experiment (SM-101/36) 477 J.B. Dragt Discussion 491
Analyse des techniques de mesure de la reactivite d1 ensembles multiplicateurs fortement sous-critiques (SM-101/27) 493 P. Vandeplas
A stochastic calculation of fast reactor generation times (SM-101/64) 513 T.J. Williamson and R.W. Albrecht Discussion 526
Influence of time-dependent coupling coefficients and delay times on the kinetics of a modular fast reactor core (SM-101/51) 529 W.H. Kohler, C.Y. Ho, H. Plaza and N. B. Poulsen Discussion 546
General Discussion 547
Chairmen of sessions and secretariat of the Symposium 551
REVIEW OF NATIONAL PROGRAMMES
(Session I)

Chairman: B.I. SPINRAD

FEDERAL GERMAN FAST BREEDER PROGRAMME
W HAFELE INSTITUT FUR ANGEWANDTE REAKTORPHYSIK, KERNFORSCHUNGSZENTRUM KARLSRUHE, KARLSRUHE, FEDERAL REPUBLIC OF GERMANY
Abstract
FEDERAL GERMAN FAST BREEDER PROGRAMME. The Federal German Fast Breeder Programme started in 1960 at the Kernforschungszentrum Karlsruhe. The first approach was clearly scientific and concentrated on physics, safety and principal engineering studies. In particular, four major steps were taken in the experimental area: SUAK, STARK, SNEAK, and SEFOR.
After 6 years of hard and intensive work both sodium and steam were considered promising coolants of roughly the same overall potential. This led to the decision to pursue major engineering developments with these two coolants.
About 1969/1970 two prototypes of 300 MW(e), one for each coolant, will be built with the objective of demonstrating the breeding and electricity producing potential on a large and significant scale. The sodium prototype will be built by the Konsortium Siemens-Interatom, possibly together with Belgonucl6aire of Belgium and the Dutch Neratoom. The steam-cooled prototype will be built by the group AEG/MAN/GHH. Thereafter it is intended to order two demonstration plants of 1000 MW(e) to meet the ultimate objective: to have 1000 MW(e) fast oxide breeder reactors "available on a commercial and competitive basis by the end of the 1970s.
1. THE GENERAL PROGRAMME
The Federal German fast breeder programme started in 1960, when the reactor physics group finished the design work for the Karlsruhe research reactor FR 2. The original approach was characterized by the idea to have not only a fast breeder but also a commercially competitive nuclear power station. This led us immediately into the more detailed examination of the fuel cycle, and our point of departure was then to study the oxide-fuel fast breeder concept. The physics of such a reactor is notably different from that of a metal-fuelled breeder. It was in particular the determination of power coefficients and, in this connection, the investigation of the safety features of such a reactor, which was of prime importance. In reflecting on the title of this meeting, we feel that it is still of prime importance. It was quite natural, therefore, that the first thing in Karlsruhe was the planning of a fairly large physics programme. From this evolved constantly increasing engineering studies. It was the choice of coolant that was the overriding problem. Attached to this was an experimental engineering programme. Alongside that we started a fuel-element development programme, which included the construction and operation of the necessary facilities, that is, apart from the FR 2, a number of hot cells and Pu fabrication facilities and others. At a somewhat later stage we emphasized even more strongly R & D work on facilities related to the fuel cycle. Euratom has been associated with this work since 1963. The present association will last until the end of
* Work performed within the association in the field of fast reactors between the European Atomic Energy Community and Gesellschaft ftlr Kernforschung mbH., Karlsruhe.
3

4 HXFELE
1967. In the course of the work it was possible to determine more specifically the target of the project: the Federal Republic of Germany wants to have lOOO-MW(e) fast breeder power stations by 1980. These fast breeder power stations shall be competitive with the available light-water reactors. The target for the fuel-cycle costs is 1 mill/kWh or less, and for the capital cost the target is $US 100/kW.
To arrive at this goal it is necessary to have fast breeder prototype reactors. This class of reactor must be under construction by 1970 and be in operation by 1974. This gives enough time for one or even two parallel 1000-MW(e) demonstration plants. The successful operation of these plants will be the basis for the commercial phase of fast breeder reactors.
Detailed studies in Karlsruhe led to the conclusion that sodium and steam have the same industrial potential. But the quality of the potential differs. Sodium has the potential of a high gain breeder with the associated fuel cost benefit, and high gain breeding is ultimately, say beyond the year 2000, an absolute necessity. We still feel that capital cost is a problem, the industrial and commercial solution of which can be demonstrated only at a later date. On the other hand, steam-cooled breeder technology will directly evolve from present-day light-water technology with all the greatly increasing operating experience to come. Two 600-MW(e) light-water reactor stations were ordered in the Federal Republic of Germany early in 1967 on a purely competitive basis without any subsidies whatsoever. A somewhat lower breeding ratio is associated with steam cooling, which partly compensates the capital cost advantage with respect to sodium plants.
In 1965/66 the important decision was taken to prepare the early construction of one sodium and one steam-cooled fast breeder 300-MW(e) prototype in the Federal Republic of Germany. At the same time it was decided that, instead of the national laboratory, industry must take the lead and the responsibility for these prototypes, because it is industry and not the government which shall handle the expected fast breeder market after 1980. Therefore, the Konsortium Siemens-Interatom will establish the sodium prototype, and the AEG/MAN/GHH group the steam-cooled prototype. The Kernforschungszentrum Karlsruhe, as a National Laboratory, will have a double function: On one hand it will actively support the industrial work and accept certain tasks in the framework-of the direct prototype work. On the other hand it will pursue a basic programme under its own responsibility that will broaden and strengthen the project work more generally. Therefore, the Fast Breeder Project is no longer a Karlsruhe affair, but a national effort to arrive independently at the competitive stage of reactors of the second generation i. e. the fast breeders.
Looking ahead, one realizes that the market for fast breeder reactors will be tremendous and at the same time it is clear that the Federal German national basis is somewhat narrow. During the last couple of years there has been an intensive contact with both Belgium and the Netherlands, as a result of which there will be a three-level or ultimately even a four-level, joint fast breeder venture. Belgian and Netherlands industrial groups, BelgoNuqleaire and Neratoom, join the Siemens-Interatom Group, and the national laboratories of these countries, i. e. Mol and Petter, join Karlsruhe, and the three governments have a

SM-101/5 5
corresponding agreement which also provides the funds. There is hope that, at a later stage, the electrical ultilities of these countries will also come to a similar understanding. There is a good chance that Luxemburg will also join the group. A similar arrangement with other partners is under way for the steam-cooled breeder.
The Fast Breeder Project, which originated at Karlsruhe, is therefore a fairly large joint venture. The involved partners agreed to a fair partition of work. In so doing, the larger physics efforts remain at Karlsruhe, in co-operation with Mol and Petten. Bearing in mind that this meeting is concentrating more specifically on physics and safety this report concentrates on these topics.
2. EXPERIMENTAL PHYSICS
As has been mentioned before, it was the investigation of the physics of an oxide-fuelled fast breeder with its low-energy neutron tail that attracted attention from the very beginning. In 1961 a four-step experimental programme was envisaged as is now described.
2 .1 . SUAK
At Karlsruhe pulsed subcritical assembly SUAK makes use of the accumulated experience with 14-MeV pulsed neutrons. The fast assembly allows for decay measurements and spectrum determinations by the time-of-flight technique. For an easier interpretation of measurements only bare assemblies are constructed, which also contain as few materials as possible. So far three assemblies have been investigated. The first assembly consisted of pure uranium (20% enrichment) only. In the other assemblies different amounts of hydrogen-containing material were added to shift the neutrons to lower energies and to study the anisotropic scattering effect of hydrogen in greater detail. At the present stage of physics in Kar l s ruhe we a r e concentra t ing on, among o ther things, the effect of the interface between core and blanket. The spectrum in the core is fairly constant with respect to the radius, but in the blanket there are rapid changes of the spectrum with the radius (or z axis). The large mean free path lets this effect penetrate also into the core. The clean geometry of SUAK and the ease of experimental access will enable us to investigate these interface effects at SUAK in the near future. At present we have a joint French-German venture at SUAK, to compare exponential and pulsed experiments, also by using SUAK. This is the programme HEUREKA of the Cadarache project. It should be kept in mind that SUAK is not designed for the use of plutonium.
2.2. STARK I
The fast-thermal Argonaut reactor was the first critical assembly with fast neutrons on the European continent. The graphite column of the original Argonaut has been replaced by a fast core. Only enriched uranium can be used, but not plutonium. STARK was a very great help in developing the fast neutron experimental techniques at an early stage, in particular the spectrum measurement techniques; A pile

6 HXFELE
oscillator for heated samples and a heated foil furnace for studies of the Doppler effect were also installed. Further, an investigation on pulsed sources, with particular s t ress on noise analysis techniques, was made. Noise analysis is a great help for determining the neutron lifetime and the reactivity features during shut-down including the approach to criticality. Alongside this, an analysis of coupled systems was carried out. STARK will continue to be important for preparing experiments of the larger and more complicated SNEAK machine.
2 .3 . SNEAK
The fast zero power assembly is a full-scale critical facility designed in particular to perform large-scale Pu fuel experiments. It went critical on 15 December, 1966, the same date when the Cadarache facility MASURCA became critical. SNEAK is comparable not only with MASURCA, but with the United Kingdom zero power reactor ZEBRA, and the United States ZPPR in Idaho. Physics-oriented experiments are being conducted in the present phase with great emphasis on steam and the involved reactivity coefficients, and the mock-up of the two Federal German prototypes will come later. The measurements in SNEAK will ultimately give the physics reference points for the whole German-Belgian-Netherlands fast reactor project.
2.4. SEFOR
The South-West Experimental Fast Oxide Reactor is a joint venture of General Electric and Karlsruhe together with Euratom, the South West Atomic Energy Associates, and the USAEC. As is well known, it is a 20-MW(th) experimental dynamic test reactor, the construction of which is fairly advanced. First criticality is expected for the early summer of 1968. The objective of this reactor experiment is to obtain information on the dynamic behaviour of oxide-fuelled fast breeders, particularly the Doppler coefficient, under operating conditions. At the same time engineering experience is acquired on a significant scale. The experimental programme provides for four distinct steps:
(a) Static tests (c) Oscillator and balanced oscillator tests (c) Sub-prompt critical excursions (d) Prompt critical excursions.
At the recent Cadarache meeting there was a comprehensive paper on SEFOR that reported the latest stage of the work.
2.5. KRITO
KRITO is at present a thermal critical facility at the Netherlands nuclear research centre at Petten. In the framework of the joint Karlsruhe-Mol-Petten programme Petten will transfer this facility into a coupled facility to investigate the reactivity influence of the fission products. More data on this will be reported by the Petten group at this symposium.
The reactor physics of fission products has been neglected for some time. This stems from the early days of a very hard spectrum and

SM-101/5 7
comparatively low burn^ups. But fast ceramic reactors of a high burn-up do have a considerable fission product poisoning, which decreases not only reactivity but also breeding with the result that fuel costs are again increased beyond a certain amount of burn-up as is the case with thermal reactors. Thermal reactors have their optimum around 30 000 MWd/t; large fast oxide reactors seem to have their optimum somewhere near 100 000 MWd/t. More precise information on fission product cross-sections is necessary to give more accurate evaluations.
2.6. Van de Graaff Accelerator
In Karlsruhe a 3-MeV Van de Graaff accelerator with a bunching facility is used for cross-section measurements in the fast breeder project. The experimental programme is concerned with the measurement of capture cross-sections of structural material and fission products in the energy range of 10 - 200 keV. Also fission cross-sections of the isotopes -239PU, 240Pu, and 241Pu are measured. Further effort is under way for absolute measurements of cross-sections and neutron fluxes as well as for self-shielding factors and resonances in the keV energy region. It may be mentioned in this connection that cross-sections of shielding materials are studied in the MeV-range by the use of the Karlsruhe cyclotron.
3. REACTOR THEORY
Reactor theory has always been of special interest at Karlsruhe. It was through reactor theory that Karlsruhe entered the field of fast reactors. Looking back one can recognize a number of phases in the development of fast reactor theory. Originally, one-dimensional diffusion theory with 11 or 13 groups was applied for calculating critical masses or enrichments, the spectra in core and blanket, and breeding ratios. Very soon the emphasis on the lower end of the spectrum led to a larger number of groups and the evaluation of energy self-shielding effects. There are only about 10% of all fissions below 10 keV where most power coefficients originate. SN versions and other transport techniques were introduced somewhat later in the multigroup procedures.
The next stage was to concentrate on the calculation of the Doppler and coolant void effects. For this more extended perturbation codes had to be developed, and a detailed examination of the resonances of the neutron cross-sections was necessary. The more realistic evaluation of the sodium void coefficient necessitated two-dimensional calculations. In addition to the diffusion and SN codes in two dimensions, group-collapsing procedures had to be developed for this two-dimensional procedure. Multizone arrangements in core and blanket also required two-dimensional procedures. The preparation of self-shielded cross-sections, including heterogenity-effects, one-dimensional calculations with numerous groups (say 26, 60 or more), group condensation in different regions of the reactor, two-dimensional calculations with a few-group (6 or so) perturbation theory, the calculation of reaction rates, the calculation of power coefficients and neutron lifetime, and the one-dimensional burn-up code, have all been put together into one super-code,

H£FELE
the Karlsruhe NUSYS system. This code has been the basis for all design work at Karlsruhe and the Federal German industrial groups during the past two years. Emphasis is now being put on the transport effects in the region of scattering resonances. Besides applying the well-known ELMOE code, a new technique using about 200 groups is being developed.
In a third stage attention is being concentrated on the non-idealized actual power reactor. The influence of fission products is being studied in detail. In addition, the influence and burn-up of control rods, two-dimensional power distributions with control rods, the proper distribution of control rods, the influence of burn-up on the reactor behaviour, the change of the sodium void coefficient and breeding ratio with control-rod insertion and fuel burn-up, the change of power distribution with plutonium build-up in the blanket, the calculation of the different temperature coefficients in different regions of the reactor, and more engineering details, are being studied. We also envisage the large-scale application of Monte Carlo techniques in order, for example, to calculate streaming effects. These more elaborate and partially cumbersome procedures are mandatory for a responsible prototype design and describe to some extent the present stage of development at Karlsruhe. Fast reactor theory and calculation may arrive at its asymptotic stage if all these steps are combined into an even larger code, and ultimately we must look for three-dimensional calculations, when power stretching is required to reach full competitiveness. Explicit three-dimensional calculations are not available at Karlsruhe for more direct design of the prototype reactors, but they will be there in time to calculate best core-blanket management schemes and control-rod operation programmes. We are aware that an IBM 360/91 computer will be necessary for this, whereas for the prototype calculations described above,an IBM 360/65 computer can handle the supercodes exceeding NUSYS. Such machines will be installed at Karlsruhe next year.
4. REACTOR SAFETY
Concern about reactor safety is as old as reactor theory and it is intimately related to it. Fast reactor safety is particularly challenging, because the configuration of an actual fast reactor is not that with the highest reactivity, contrary to the situation with thermal reactors. In the old days it was the melt-down accident which attracted the greatest attention. Loss of sodium reduced the reactivity of the original core configuration, and it was the slow core melt-down without additional neutrons, which destroyed the core and could have led to a second configuration of much higher reactivity and therefore to an extreme power excursion with subsequent production of large amounts of mechanical energy.
Large fast ceramic power reactors have a region with a positive coolant void coefficient in the inner part of the core. If the coolant is lost the production of neutrons is enhanced, and the destruction of the core is combined with the power excursion and the subsequent production of mechanical energy. Parallel to that one must now consider the large inventories of plutonium of these fast breeders, together with the previously unusual sizes of 1000 MW(e). This leads to new levels of

SM-101/5- 9
radiological concern. We conclude that these hypothetical disasters produce mechanical energies of not much more than 1000 MWs, even if extreme measures to obtain a small sodium void reactivity effect like pancaking are not taken. The figure of 1000 MWs is a limit, because of the Doppler coefficient. In fact this seems to be the most important benefit arising from the Doppler coefficient. Rather sophisticated versions of the Bethe-Tait technique are now available at Karlsruhe, taking into account the cylindrical geometry and the axial structure of sub-assemblies; also considerable work is going on to determine the equation of state for the mixed oxide fuel.
It seems to be possible to contain 1000 MWs in a reactor building. Benefiting from the experience of SEFOR safety and licensing procedures, we arrived at the two-containment concept. There is an inner concrete containment around the reactor and the primary circuit; this is nitrogen filled and designed to withstand the 1000-MWs event, but has only a 10% tightness. Therefore a second containment, which is of high tightness and houses the rest of the reactor installation, is being planned.
The 1000-MWs incident can happen more or less only if the safety system fails completely. Measures of diversity and redundancy can avoid such a malfunction almost completely. There are a limited number of events like sodium voiding after a break in the primary circuit and subsequent melt-down, which cannot be affected by a functioning safety system. Therefore, a safe and reliable design of the primary circuit turns out to be as important as the design of the safety system itself. But we hope to arrive ultimately at a situation of engineered safeguards including that of the primary circuit. In such a case no reactor containment but an ordinary building is necessary. We are not yet confident enough to design such all-out engineered safeguards for the Na and steam-cooled prototypes. Much more work on engineering components testing is required for that. To prepare this we started some time ago to work on the mathematics and statistics of reliability and availability, which is an exciting new area. In so doing we hope to identify the schemes and fields of excessive engineering testing thus ultimately arriving at the concept of engineered safeguards to be eventually applied to our 1000-MW(e) demonstration plants of about 1975/6.
In-addition we will pursue several more obvious tasks connected with reactor safety like aerosol research, the radiochemistry of primary circuit contamination in the case of steam-cooled breeders, iodine filtering etc.
Fast reactor physics and safety is becoming an increasingly mature affair, which requires imaginative ventures with all the features of large-scale scientific enterprise. But this will enable us to have a responsible prototype design by 1970.
B I B L I O G R A P H Y
DOSCH, P . , Leistungsschwingungen eines Reaktors im prompt-kritischen Gebiet bei rampenfflrmigen ReaktivitStsstOrungen, Nukleonik 4 6 (1962) 258-263.
ENGELMANN, P . , "Fission gas pressure build-up and fast breeder economy", Physics of Fast and Intermediate Reactors (Proc. Symp. Vienna, 1961) 3, IAEA, Vienna (1962) 229-45.
HAFELE, W., WIRTZ, K., "Approaches to the Development of a Fast Breeder Reactor", Proc. FORATOM Conf., Paris (1962).

10 HXFELE
HAFELE, W., "The effective lifetime and temperature coefficient in a coupled fast-thermal reactor", Physics of Fast and Intermediate Reactors (Proc. Symp. Vienna, 1961)3, IAEA, Vienna (1962) 19-32.
HAFELE, W., WIRTZ, K., AnsStze zur Entwicklung eines Schnellen Brutreaktors, Atom. Wirtsch. 1_ (1962) 557.
HAFELE, W., Die Bedeutung kernphysikalischer Grundlagen bei der Auslegung schneller Brutreaktoren, Phys. Verh. VDPG 2 9 (1962); KFK-118.
OTT, K., JANSEN, A. , "Long-time behaviour of fast breeders", Physics of Fast and Intermediate Reactors (Proc. Symp. Vienna, 1961) 2, IAEA, Vienna (1962) 213-228.
SCHMIDT, J . J . , "Nuclear data requirements for fast and intermediate reactor calculations", Physics of Fast and Intermediate Reactors (Proc. Symp. Vienna 1961) 1., IAEA, Vienna (1962) 3-20.
SCHMIDT, J . J . , Neutron Cross Sections for Fast Reactor Materials, Part I: Theory and Compilation, Part II: Tables, Part III: Graphs KFK-Report 120 and EANDC-E 35 (U) (1962).
BOHM, H. , "Parameter dependence of the after-meltdown accidents" Proc. Conf. on Breeding, Economics, and Safety in Large Fast Power Reactors, ANL-6802, Argonne (1963).
BORGWALDT, H. , Bestimmung der Extrapolationslange schneller Reaktoren in der Mehrgruppen-Pj -NSherung, Nukleonik J5 1 (1963), 27-31.
BORGWALDT, H. , SANITZ, D . , Die Impulskorrelation zweier Neutronendetektoren im stationaren Reaktor, Nukleonik 5 6 (1963) 239.
DOSCH, P . , Regelung und Instrumentierung von schnellen Reaktoren, ATM Marz 1963, R 25-26, Lieferung 326, KFK-146.
DOSCH, P . , KRAUS, H.J . , UHRIG, H. , "Design and experimental evaluation of an electromagnetic acceleration system for fast safety rods", Physics and Material Problems of Reactor Control Rods, (Proc. Symp. Vienna 1963) IAEA, Vienna (1964) 571.
FRAUDE, A. , Ober den Einfluss eines prompten negativen Temperaturkoeffizienten auf das Verhalten eines schnellen Reaktors nach einem Reaktivitatssprung, Nukleonik 5_ 7 (1963) 290-93; KFK-186 (1963).
FRAUDE, A. , Ober eine Lflsung der kinetischen Gleichungen bei periodischen ReaktivitatsSnderungen,
Nukleonik 5(1963) 62; KFK-144 (1963).
FROHLICH, R. , OTT, K., SCHMIDT, J . J . , Dependence of Fast Reactor Doppler-Coefficients on Nuclear Data Uncertainties, Proc. Conf. on Breeding Economics and Safety in Large Fast Power Reactors,, ANL-6802 Argonne (1963).
FROHLICH, R., OTT, K., SCHMIDT, J . J . , Calculations of Doppler-coefficients of dilute fast reactors, ANL-6792(1963) 777.
HAFE, E. W., Das Projekt Schneller Brilter, Atom Wirtsch. 8 4 (1963) 206.
HAFELE, W., Prompt ilberkritische Leistungsexkursionen in schnellen Reaktoren, Nukleonik 5 5 (1963) 201; KFK-175.
HAFELE, W., Principles and problems of the development of a fast reactor fuel element, ANL-6792, Argonne (1963).
KUNZE, H. , On the theory of space-dependent neutron spectra in heterogeneous reactors, KFK-137.
OTT, K., "Theoretical methods available for calculation of neutron spectra", EAES-Symp. on Fast and Epithermal Neutron Spectra in Reactors, Harwell (December 1963).
OTT, K. , SCHROETER, K.E. , Comparison of Doppler and Na-void-coefficients of dilute fast reactors, ANL-6792, Argonne (1963).
OTT, K., Theorie verzBgerter flberkritischer Exkursionen zur Messung der Doppler-Koeffizienten schneller Reaktoren, Nukleonik 5 7 (1963), 285-290; English: KFK-153 (1963).
SCHMIDT, J . J . , Nuclear physics work at Karlsruhe related to the fast breeder reactor project, Rep. EANDC, ECSG(1963) 17.
SCHMIDT, J . J . , OTT, K., FR0HLICH, R., I. Dependence of fast reactor Doppler coefficients on nuclear data uncertainties. II. Calculation of Doppler coefficients of dilute fast reactors, Proc. Conf. on Breeding, Economics and Safety in Large, Fast Power Reactors, Argonne, ANL-6802 (Oct.1963).

SM-101/5 11
SMIDT, D . , Optimization and safety of helium cooled fast breeders, Argonne Conf. ANL-6792 (1963).
SMIDT, D . , Parameterstudien an gasgekCihlten schnellen Reaktoren, Nukleonik 5 8 (1963) 353.
BECKURTS, K.H. et a l . , The Karlsruhe Fast-Thermal Argonaut Reactor Concept, KFK-217.
CALDAROLA, L. , A new type of oscillator experiment. The balanced oscillator experiment to measure Doppler reactivity coefficients and thermal parameters of fuel rod in fast reactors, Nukleonik, 7 3 (1965) 120; KFK-253.
CALDAROLA, L. , SCHLECHTENDAHL, G.: Reactor Temperature Transients with Spatial Variables -First Part: Radial Analysis, KFK-223.
CALDAROLA, L. , HAFELE, W., SCHIKARSKI, W.: Experiments to evaluate reactivity coefficients with reactor operating at steady state conditions (Static experiment), KFK-260.
FROHLICH, R., Eine verallgemeinerte Galerkin-Methode zur numerischen LOsung der Neutronentransport-gleichung, Nukleonik 6 4 (1964) 211.
HAFELE, W., et a l . , "The Karlsruhe Fast Breeder Project", Int. Conf. peaceful Uses atom. Energy (Proc. Conf. Geneva, 1964) 6, UN, New York (1964) 72.
HAFELE, W., ENGELMANN, P. : Fast Reactor Programs - Ein Bericht Ober die Arbeiten auf dem Gebiet der Schnellen Reaktoren - 3 . Genfer Konferenz, ANS nucl. News, 7 10 (1964); Atom. Wirtsch. 11 (1964) 541.
HAFELE, W. et a l . , "Static and dynamic measurements on the Doppler effect in an experimental fast reactor", Int. Conf. peaceful Uses atom. Energy (Proc. Conf. Geneva 1964) j3 UN, New York(1964) 200.
SMIDT, D . , MOLLER, A . , Reaktortechnik auf der 3 . UN International Conference on the Peaceful Uses of Atomic Energy, Atom. Wirtsch. 11(1964) 545.
SMIDT, D . , et a l . , 1000 MWe Na-gekUhlter Schneller Brtlter (Na-1), KFK-299.
BORGWALDT, H. , STEGEMANN, D . , A common theory for neutronic noise analysis experiments in nuclear reactors, Nukleonik 1_ 6 (1965) 313; KFK-363.
CALDAROLA, L. , The balanced oscillator experiment, Nukleonik 7 3 (1965) 120.
ENGELMANN, P . , Das Verhalten Schneller Nulleistungsreaktoren bei ReaktivitStsstOrungen, KFK-332.
FISCHER, M. , HA*FELE, W., Shock front conditions in two-phase flow including the case of desuperheat, Argonne-Conf. (1965).
FROLICH, R.: Theorie der Dopplerkoeffizienten schneller Reaktoren unter Berflcksichtigung der gegenseitigen Abschirmung der Resonanzen, KFK-367.
FROLICH, R., OTT, K., About the influence of resonance overlapping on calculated Doppler-coefficients of fast reactors, Nucl. Sci. Engng 22 (1965) 490.
FR5LICH, R., OTT, K., Results of Doppler coefficient calculations for fast reactors and comparison of different methods, Argonne Conf., ANL 7120 (1965).
HAFELE, SMIDT, D . , WIRTZ, K., The Karlsruhe reference design of a 1000 MWe sodium cooled fast breeder reactor, Argonne Conf. (1965) KFK-369.
MOLLER, U. , Monte-Carlo-Methoden, Wiss. Z . Univ. Rostock 14, Math. -Nat. Reihe, No.3/4 (1965) 329.
MILLER, U. , Lflsung der Transportgleichung mit Hilfe der Monte-Carlo-Methode, KFK-297.
MSLLER, U. , Unterprogramme zur LOsung neutronenphysikalischer Probleme mit Hilfe der Monte-Carlo-Methode, KFK-298.
KIEFHABER, E. , SCHROETER, K.E. , Calculation for Tntercomparison to be made at Conference on Safety, Fuels and Core Design in Large Fast Power Reactors (see lecture by D. Okrent, Argonne Conf., ANL 7120 (1965).
KIEFHABER, E. , OTT, K., Survey parameter study of large steam-cooled fast power reactors, Argonne Conf. ANL 7120(1965).
KIEFHABER, E. , OTT, K., Interpolationsformel fdr Selbstabschirmfaktoren, KFK-384.

12 HAFELE
KUSTERS. H. , METZENROTH, M. , The influence of some important group-constants on integral fast reactor quantities, Argonne Conf., ANL 7120 (1965).
KUSTERS, H., Theorie der Neutronenthermalisierung in einer zylindersymmetrischen Zwei-Zonen-Reaktorzelle, Nukleonik 7 3 (1965) 130.
KUNZE, H., Eigenwertprobleme der Reaktortheorie und Raumgruppen, Nukleonik 1_ 8 (1965) 429.
OTT, K., Theoretical methods available for calculation of fast and epithermal neutron spectra, Nukleonik 7 3(1965)161.
SMIDT, D . , et al . , Safety and cost analyses of a 1000 MWe sodium cooled fast power reactor, Argonne Conf. (1965).
SMIDT, D . , SOMMER, W., Application of the vented fuel concept to a sodium cooled power breeder with 1000 MWe, Argonne Conf. (1965).
AUDOUX, M. et a l . , The balanced oscillator tests in SEFOR, Int. Conf. Fast Critical Experiments and their Analysis, Argonne (1966).
BRAESS, D. et a l . , The Calculation of Large Fast Reactors, London Conf. on Fast Breeder Reactors (1966).
CALDAROLA, L., HAFELE, W., SCHIKARSKI, W., Experiments to evaluate reactivity coefficients with reactor operating at steady state conditions (Static-experiments), KFK-260 (1966).
CALDAROLA, L., TAVOSANIS, M. , Design Criteria and Preliminary Calculations of SEFOR Second and Third Core", KFK Rep.
DALLE DONNE, M. , A new and simple method of estimating the liquid superheat due to surface conditions in nucleate boiling and its application to sodium, Nukleonik .8 3 (1966) 133.
DALLE DONNE, M., Comparison of He, C 0 2 , and steam as coolants of a 1000 MWe fast reactor, KFK-447.
ENGELMANN, P . , Untersuchungen Uber das inhflrente dynamische Verhalten schneller Nulleistungsreaktoren bei ReaktivitatsstOrungen, Nukleonik £ 3 (1966) 152.
ENGELMANN, P . , et a l . , Initial experiments in the Karlsruhe fast critical facility, SNEAK, Int. Conf. Fast Critical Experiments and their Analysis, Argonne (1966) KFK-472.
FISCHER, E.A. , Interpretation of Doppler coefficient measurements in fast critical assemblies, Int. Conf. Fast Critical Experiments and their Analysis, Argonne (1966) KFK-473.
FISCHER, E.A. , The overlap effect of resonances of different fuel isotopes in Doppler-coefficient calculations for fast reactors, Nukleonik 8 3 (1966) 146.
FISCHER, E.A. , KELLER, K. , Einfluss der Entmischung von oxydischem Brennstoff auf den Verlauf von Leistungsexkursionen in schnellen Reaktoren, die durch den Dopplerkoeffizienten abgefangen werden, Nukleonik 8 8 (1966) 471.
FROLICH, R., OTT, K., Einfluss von FestkOrpereigenschaften auf die Berechnung des Dopplerkoeffizienten, Nukleonik £ 3 (1966) 137.
GRASS, G. , KOTTOWSKI, H. , MILLIOT, B., Beitrag zur Untersuchung des Siedens von Fltissigmetallen bei erzwungener Korrektion, Nukleonik 8 5 (1966) 273.
HAFELE, W., Schnelle Brutreaktoren, ihr Prinzip, ihre Entwicklung und ihre Rolle in einer Kernenergiewirtschaft, KFK-480.
HAFELE, W., Safety of large fast reactors - a round-table discussion, Nucleonics 24 (Feb. 1966) 62.
HAFELE, W., Das Prinzip des Brtltens, und Das Projekt Schneller BrOter Karlsruhe, Atom. Wirtsch. 11 6(1966) 290-93.
HAFELE, W., Zur Entwicklung der Schnellen Brutreaktoren, Brennstoff-W3rme-Kraft 18 (1966) 6.
KOHLER, W.H. , Variational Method for Prompt Neutron Kinetics, Nukleonik £ 4(1966) 203.
KUSTERS, H. , Bericht Uber die London Conference on Fast Breeder Reactors, Mai 1966, Atom. Wirtsch. 11(1966) 6.
KUSTERS, H. , Bericht flber die Argonne Konferenz Uber Sicherheit, nukleare Auslegung und Wirtschaftlichkeit schneller Reaktoren Argonne 1965, Atom. Wirtsch. 11 (1966) 3 .

SM-101/5 13
MATTHES, W., Theory of fluctuations in neutron fields, Nukleonik 8_ 2 (1966) 87.
MULLER, A. e t a l . , Referenzstudie filr einen dampfgektlhlten Schnellen Brutreaktor (D- l ) , KFK-392 (1966).
PONITZ, W., Bestimmung von s- und p-Wellen-StSrkefunktionen aus dem Isomerenverhaltnis nach dem Einfang mittelschwerer Neutronen, Physikertagung Freudenstadt (1966).
SCHMIDT, J . J . , "Principles and problems in neutron nuclear data evaluation", Nuclear Data for Reactors (Proc. Conf. Paris 1966) 2 IAEA, Vienna (1967) 279; KFK-457.
SMIDT, D . , Die Londoner Konferenz fiber Schnelle Brutreaktoren, Atom. Wirtsch. 11 6 (1966) 308.
BICKEL, W., et a l . , Safety considerations for the Karlsruhe fast critical facility SNEAK, Int. Conf. on Safety of Fast Breeders, Aix-en-Provence (1967).
BRAESS, D . , et a l . , Safety features of a sodium cooled fast breeder reactor of 300 MWe (Na-2), Int. Conf. on Safety of Fast Breeders, Aix-en-Provence (1967).
BRAESS, D . , et a l . , Improvement in second excursion calculations, Int. Conf. on Safety of Fast Breeders,
Aix-en-Provence (1967).
CALDAROLA, L. , RUSSELL, C . , The second balanced oscillator experiment, Nukleonik £ 7 (1967) 323.
CALDAROLA, L., Analysis of reactor power excursion by means of solutions with asymptotic expansion, Nukleonik 9 3 (1967) 129.
EDELMANN, M. , MURLEY, T .E . , STEGEMANN, D . , Investigation of prompt neutron kinetics in the fast -thermal argonaut-reactor STARK by noise analysis, KFK-522 (1967).
ENGELMANN, P . , Physikalische Aufgaben fflr SNEAK, Atom. Wirtsch. 12 4(1967).
ERBACHER, F.J . , et a l . , Influence of the design and arrangement of the components in various cycles on the safety of steam cooled reactors, Aix-en-Provence (1967).
FISCHER, E.A. , Bemerkungen zur Bedeutung des adjungierten Flusses in der Reaktortechnik, Nukleonik 9 7(1967)332.
FISCHER, M. , et a l . , Safety aspects of steam cooled fast breeder reactors, Int. Conf. on Safety of Fast Breeders, Aix-en-Provence (1967).
GAST, K., SCHIKARSKI, W., Containment of a large sodium-cooled fast breeder reactor, KFK-547.
GAST. K., et a l . , Na-2 design (300 MW German FCR), ANS Conf. on Fast Reactors, San Francisco (1967).
GUPTA, D . , et a l . , Third Foratom Congress London, German Contributions to Sessions I, II, III, IV, VI, KFK-546(1967).
HELLER, F . , HAFELE, W., SCHIKARSKI, W., The principles of double containment and the behaviour of aerosols in relation to the safety of reactors with a high plutonium inventory, Int. Conf. Safety of Fast Breeders, Aix-en-Provence (1967).
PEPPLER, W., et a l . , Sodium boiling and fast reactor safety, Int. Conf. Safety on Fast Breeders, Aix-en-Provence (1967).
SCHIKARSKI, W., Oberlegungen zu schweren Reaktorunfailen, KFK-530.
SCHLECHTENDAHL, E.G. , Sicherkeitsaspekte schneller Reaktoren, VDI-Nachr. 21/21(1967).
SCHRODER,, R., Zur Simultation von Spaltprodukten in schnellen, kritischen Anordnungen, Nukleonik 10 1(1967)18. ~
SEIFRITZ, W., STEGEMANN, D . , Ein Zwei-Detektor-Kreuzkorrelationsexperiment zur Bestimmung von Reaktorparametern aus dem Neutronenrauschen, Nukieonik 9 4 (1967) 169.
SEIFRITZ, W., STEGEMANN, D . , An on-line reactivity meter using the two-detector cross-correlation technique for shutdown reactivity measurements, Trans. Am. nucl. Soc. 1JD 1 (1967) 283.
SMIDT, D . , 3rd Foratom-Kongress in London, Industrielle Aspekte eines Programms fUr schnelle Brutreaktoren, Atom. Wirtsch (1967).
SMIDT, D . , et a l . , Na-2. Entwurfsstudie filr einen 300 MWe Na-KFK-660 (in press).

14 HXFELE
DISCUSSION
M. F. TROYANOV: In this paper Mr. HSfele quite rightly stressed the need to know the fission product cross-sections in order to determine their effect on the neutron balance. He also mentioned the existence of an optimal value for the burn-up: what is this value, as obtained in these calculations?
H.W. KUSTERS: As regards a lOOO-MW(e) sodium-cooled reactor I can tell you that, on comparing the neutron and economic properties of the system, we arrived at a figure of about 70 000 MWd/t.

FAST REACTOR RESEARCH AND DEVELOPMENT PROGRAMME IN JAPAN
H. ISHIKAWA, S. AN*AND Y.MISHIMA* SPECIAL COMMITTEE FOR POWER REACTOR DEVELOPMENT PROJECT, JAPAN ATOMIC ENERGY RESEARCH INSTITUTE, TOKYO, JAPAN
Abstract
FAST REACTOR RESEARCH AND DEVELOPMENT PROGRAMME IN JAPAN. The present paper reviews the fast reactor research and development programme, with the stress on fast reactor physics and related safety problems.
The first part of the paper deals with the research and development programme, which was prepared by a Special Committee for Power Reactor Development Project in compliance with the request of the Japan Atomic Energy Commission. The 100-MW(th) fast experimental reactor and fast prototype reactor are to be sodium-cooled. The former is scheduled to be critical in 1972, and some of the related R&D activities have already commenced. The prototype is to be developed at the latest by the early 1980s. A prototype advanced converter project is also now under way in Japan, and a new organization was established in October 1967 to develop both the fast reactor and the advanced converter.
The second part of the paper describes the research and development programme connected with fast reactor physics and safety problems related to the fast reactor project, and also outlines the present state of activities in Japan. The JAERI fast critical assembly, which attained criticality at the end of April 1967, is scheduled to play an important role in obtaining information on the reactivity effects in large fast reactors, and will be used to check designs of the experimental fast reactor and the prototype fast reactor. Also, other establishments plan to prepare additional experimental facilities for research on this subject. In many establishments theoretical research is increasing on the following topics: nuclear data for fast reactors, fast neutron energy spectrum, reactivity coefficients, design study of large fast reactors, analysis of fast reactor kinetics and accidents. The study of fast reactor safety in Japan is so far mainly confined to the theoretical approach;' however, the experimental research programme is also being prepared on such subjects as containment system design studies, sodium technology and fuel development.
The annual rate of increase of energy consumption has become very great in Japan in recent years . However, our energy resources such as coal, oil and fissile materials are far from sufficient. For this reason, we are very interested in nuclear power generation, especially in efficient breeder power reactors. It is expected that sodium-cooled fast breeder reactors will be in use earlier than breeder reactors of other types.
The Japan Atomic Energy Commission (JAEC) has held, since 1964, the Power Reactor Development Conference where various specialists have participated to establish a power reactor development programme to establish an energy supply and to promote science and engineering in Japan. After the report was presented by the Power Reactor Development Conference in March 1966, the JAEC decided to establish a Special Committee for Power Reactor Development Project, June 1966. The Special Committee has been planning the national development programme for the fast breeder reactor and the advanced converter reactor, with the
* Department of Nuclear Engineering, University of Tokyo.
15

16 ISHIKAWA et al.
assistance of many subcommittees and working groups. A new organization, the Power Reactor and Nuclear Fuel Development Corporation will be established on 1 October, 1967, to promote the power reactor development programme with the aim of realizing the JAEC policies with regard to the fast breeder reactor and the advanced converter reactor on a wider basis. The organization will include the Japan Atomic Energy-Research Institute (JAERI), the Atomic Fuel Corporation (AFC), manufacturing industries, electrical utility industries and universities.
To develop fast breeder reactors, the Special Committee recommends the construction of an experimental sodium-cooled prototype reactor in the near future. A s a necessary step in this development, sodium technology has been studied since 1957.
The construction of the fast experimental reactor (JFER) is necessary in order to acquire experience in design, construction and operation of the reactor type by utilizing our research and development efforts and industrial technology. This experience will contribute to the design and construction of both the prototype fast reactor and larger reactors. The JFER will facilitate various irradiation studies with fast neutron flux.
The conceptual design of the JFER is almost completed. The prototype breeder reactor (about 200 MW(e)) will become critical around 1975 under the supervision of the new organization. The fast critical facility (FCA) will be used to carry out a mock-up experiment of the reactor core. The necessary theoretical study for the FCA and the reactor is also proceeding. A second design study of the 1000-MW(e) sodium-cooled fast reactor was completed recently.
With regard to the development of plutonium fuel, the main work has been done by the Plutonium Fuel Development Laboratory of the AFC. Close co-operation between JAERI and the new organization (including AFC) are to be maintained in the design, fabrication, construction and operation of these fast reactors.
1. DEVELOPMENT PROGRAMME OF FAST REACTORS IN JAPAN
1.1. Design of the Fast Experimental Reactor (JFER)
The 100-MW(th) fast experimental reactor (JFER) is scheduled to be under construction in 1969, and to go critical in 1972. The conceptual design is nearly completed including details of sodium coolant circuits and the various mechanisms of the components [1]. On the basis of the conceptual design, the kinetic behaviour of the reactor at normal operation and transient state are also being analysed. The necessary amount of 239Pu investment is considered to be about 220 kg. It is expected to load mixed-oxide fuel of plutonium and uranium for the first fuel investment. Depending upon the availability of sufficient plutonium, uranium-oxide fuel can be loaded instead of mixed-oxide fuel. The cladding material of the mixed-oxide fuel pin will be AISI-316. The main parameters of the reactor are shown in Table I.
The 100-MW heat will be cooled by air at the first stage of reactor operation. After steady operation of the JFER is achieved, it can be used for testing the steam generator, if reliable technology for a steam generator is developed by then. The future installation of an in-core loop is being considered.

SM-101/65 17
T A B L E I. DESIGN P A R A M E T E R S OF lOO-MW(th) J F E R
Plant performance
Reactor power (MW(th)) 100
Core power (MW(th)) 92
Reactor inlet temperature (°Q 350
Reactor outlet temperature (°Q 500
Core region coolant velocity (m/s) 6
Primary system total pressure drop (kg/cm2) 6
Dimensions
Core volume (including control rods) (litre) 200
Pitch of fuel assemblies (triangular) (mm) 80
Pitch of fuel pins (mm) 7.7
Clad outer diam.(mm) 6.3
Clad thickness (mm) 0.35
Fuel diam. (mm) 5.5
Core height (mm) 600
Axial blanket height (mm) 400 x 2
Radial blanket height (mm) 1400
Gas reservoir height (mm) 200
Core performance
Core average power density (MW/1) 0.46
Core material (enrichment) Pu02 - UOz (0.30)
Core volume fraction (unit fuel assembly) Fuel/Na/5US = 38/38/23
Core fuel density (g/cm3) 10
No. of core fuel assemblies 55
No. of control rods 12
No. of radial blanket assemblies 257
No. of fuel pins per core assembly 88
Max. fuel-pin linear heat flux (W/cm) 500
Peak-to-average power ratio in core 1.6
Max. heat flux (W/cmz) 250
Max. clad surface temperature (°Q 580
Max. fuel temperature (°C) 2300
Max. burn-up (at. <#>) 5

18 ISHIKAWA et al.
The reactor power will be obtained with the following considerations in mind:
(a) Core height should be at least 600 mm in order to irradiate fuel elements for the prototype reactor in the JFER.
(b) The best cylindrical geometry of the reactor core is desired in relation to an economic inventory of fissile fuel. The core volume is approximately 200 l i t res.
(c) A moderate power density (0. 5 MW/litre) in the core is required to obtain results of irradiation tests for fuel elements at shorter periods. Thus a moderate linear heat flux for fuel pin and neutron flux level is obtained, bearing in mind present fuel technology and future development.
The design principles of the JFER are generally conservative, since this is the first experience with fast reactors in Japan, and the safety considerations are paramount especially in Japan because of earthquakes and public concern. One of the features of the JFER is that the reactor is highly ^flexible for fuel testing. Since the reactor is not very large, the peak-to-average ratio of power rating in the core is inevitably not very low; however, the sodium coefficient is negative enough and the reactor is inherently safe. Long burn-up capability of the fuel is not necessarily required for the first inventory, and the minimum requirement is to provide stable irradiation conditions at the designed power level and thus to provide suitable fast neutron flux for fuel testing. Specially designed in-core monitoring systems are to be installed; also, an alpha-gamma monitoring cave capable of some non-destructive testing and the mechanical handling of fuel assemblies — e.g. the measurement of pressure drop along the fuel element by means of inert gas flow, and minor repairing of fuel assemblies removed from the reactor — will be constructed near the reactor. Periodic inspections of fuel assemblies at • each stage will enable estimates of burn-up capability and safety for further irradiation to be made.
1.2. lOOO-MW(e) fast reactor and protype fast reactor
The construction of a prototype reactor will begin in 1972, and become critical in 1975. The 1000-MW(e) commercial reactor will have a 4- to 6-loop cooling system. If we choose a prototype with a 1- to 3-loop cooling system, the capacity of the prototype reactor should not be less than 200 MW(e), and 200 to 300 MW(e) is considered appropriate.
Design studies of the 1000-MW(e) fast breeder have been carried out by JAERI and will be followed up by the new organization. The first conceptual design study on the 1000-MW(e) fast breeder was completed in April 1966 [2]. The second conceptual design study was finished recently and will be published by JAERI. The results obtained by these design studies are reflected in the detail design of the JFER and in the design philosophy of the prototype breeder.
Two kinds of design study on the 1000-MW(e) breeder reactor were done by JAERI, based on the sodium-cooled, and mixed-oxide fuel systems. Safety, economy and breeding gain are three factors to be considered for such a commercial power reactor plant. Difficulties concerning the safety problems of the fast reactor increase as the reactor size becomes larger. The first design of the 1000-MW(e) breeder has a flat cylindrical
2*

SM-lOi/65 19
(H/D= 2.15) core geometry in order to obtain a higher breeding gain (1.44). Two-zone loading of different enrichment (10. 5% and 14. 8% P11O2) is applied to get flat power distribution. The calculated sodium coefficient in the worst case is more than +3 dollars, while it could be less than + 1 dollar for sodium loss in the central 19 channels.
A ring core geometry was selected in the second design study and safety aspects are emphasized because of the following points:
(a) Maximum sodium coefficient is reduced so as to have a greater nuclear safety margin
(b) Power density in the core is reduced so as to have a greater thermal safety margin
(c) Clad thickness is increased so as to have greater mechanical strength.
1.3. Fuel development
The detailed design of the fuel element for the JFER, hydraulic flow studies and mechanical assessments of the fuel assembly, are being carried out at JAERI. A JFER fuel assembly is being manufactured to study the coolant flow condition of the assembly in the water loop. Experimental data of flow pattern, pressure drop, velocity distribution and vibration are obtained, and the results are found to be in agreement with the expected values.
The development and studies of fuel material are mainly done by the Plutonium Fuel Development Laboratory in AFC [3]. Studies on cladding materials and on mixed carbide and nitride and some on mixed oxide are to be done by the metallurgy group in JAERI. Inspection techniques have been developed and are being applied in the Inspection Laboratory of AFC.
An irradiation test of fuel pins in the Enrico Fermi Reactor is planned in collaboration with JAERI, AFC and the Japan Central Research Institute of Electric Power Industry (CRIEPI). The fuel test assembly contains 24 fuel pins sub-assembled in four thimbles. The combination of sample pins is planned so as to obtain as much information as possible from the single test assembly irradiation.
Other series of irradiation tests are being planned in the Dounreay Fast Reactor. The first programme is to be performed with the main emphasis on the investigation into the cladding material. AISI 316 stainless-steel pipes of different grain size, cold drawn and solution treated, will be irradiated at a higher temperature in the reactor. Mixed-oxide fuel pins, the same as those designed for the first loading of JFER, are to be irradiated during the second stage of the programme.
Studies on mixed carbide and nitride are not yet started. However, JAERI is modifying research facilities for this purpose. Uranium carbide and nitride have been investigated during recent years by both JAERI and private companies. Interest is shown in the nitrocarbide.
1.4. Sodium technology
Studies on sodium technology were started by Hitachi, Ltd., and JAERI participated a little later by sending staff. Several sodium loops with 1- to 3-in. piping and with heat generation up to 200 kW, were con-

20 ISHIKAWA et al.
structed by Hitachi, Ltd., and these were operated jointly by the two organizations during, various studies on corrosion, impurity control, heat transfer and small-scale sodium component tests [4], One of the loops was transferred to the JAERI site in 1965, and it has been operated to study sodium technology [5]. A sodium flow test of the JFER fuel assembly is also planned in this loop.
To establish the sodium technology for the development and construction of sodium-cooled fast reactors, a fairly large out-of-pile sodium test loop is now planned, based on experience to date. The heating capacity of the main heater, at the maximum temperature of the loop, is about 2 MW; the loop is therefore known as the 2-MW loop.
The primary purpose of this loop is to aid in examining various characteristics of the components for the experimental fast reactor that is to be built in the near future. It is also expected to supply valuable engineering data for the cooling systems of future large-scale fast breeder reactors . Domestic equipment and other facilities will be used for most of the loop system. Tests of the JFER fuel assemblies' characteristics are also to be performed by the loop.
Before the construction of the JFER, a mock-up of the main large components of the reactor will be fabricated and tested. Shielding plug, fuel-changing machine, control and safety rods, reactor vessel, dummy fuel assemblies and support plates will be assembled and tested in high-temperature sodium. The data will be used to improve the design, decide the accuracy in fabrication, and to prevent troubles during reactor operation.
1.5. Reactor physics
The fast critical facility (FCA) is now completed at JAERI, which makes it possible to study the reactor physics of large fast cores for an extended period [6,7].
The machine is the split-table type of horizontal matrix structure. The matrix consists of 35 rows by 35 columns, but it is designed so as to be easily extended to 51 rows by 51 columns in which large cores up to 3000 litres with a 50-cm-thick blanket can be built. The facility is provided with a pulsed neutron source of 200 keV Cockcroft-Walton type accelerator, which generates neutron bursts from 0. 05 to 10 JUS width at the centre of the assembly. The facility is housed in a double container with a 25-m diam. and height of 21 m. The facility became critical on 29 April 1967, with 20% enriched uranium. The experiment programme will be mainly concerned with the sodium void effect and the Doppler effect in large fast reactors. Accordingly, the heterogeneity effect in the sodium void experiment is now being theoretically studied. Regarding the Doppler experiment, an intermediate energy system, suitably moderated to enhance the Doppler effect, is proposed. The nuclear characteristics of the JFER core will be studied by the facility using plutonium fuel.
In the Atomic Energy Society of Japan, a Fast Reactor Committee was organized in 1964. Theoretical researches on fast reactor physics and feasibility studies on large fast reactors have been carried out,not only in JAERI but also in universities and in industries. The fast reactor safety analysis group of the Japan Nuclear Code Committee has developed several codes for the evaluation of fast reactor safety problems. Methods for measuring the various power coefficients of reactivity have

SM-101/6 5 21
been invest igated. Other p rob lems of in t e re s t a r e the improvement of exper imenta l techniques , especia l ly for spec t rum m e a s u r e m e n t s , and the development of noise techniques for the investigation into space-dependent k ine t ics . These techniques will be incorpora ted into the fast c r i t i ca l exper iment .
6. F a s t r e a c t o r safety
With r ega rd to safeguards in connection with the J F E R , a 90-m-high meteorologica l tower will shor t ly be built at the proposed si te and the observat ion of meteorologica l and diffusion p a r a m e t e r s will commence . At p resen t , emphas i s i s placed on developing diffusion and dilution ana lyses in ca lm condit ions.
F o r the design of the p r i m a r y containment of the J F E R , a s e r i e s of model exper iments i s scheduled in the near future to t es t b las t r e s i s t ance s t r u c t u r e , top plug, blas t shield, e tc . As for the secondary containment, a study of the effect of sodium fire and a compar i son between s tee l , r e in forced concre te and p r e - s t r e s s e d concre te will be pe r fo rmed . An exp-pe r imen t on sod ium-a i r reac t ion i s included in the p r o g r a m m e for the nea r future. The a s e i s m a t i c design of the containment sys t em and r e a c t o r vesse l and the study of shielding concre te a r e a l so impor tant m a t t e r s .
F o r r e s e a r c h on the effect of sodium boiling at a t r ans i en t condition on fast r e a c t o r safety, exper imen t s using a water loop or a sodium boiling loop a r e now being planned. The fuel a s sembly plugging and melt ing accident and the counter methods against them a r e a l so to be invest igated. In view of the impor tance of s t eam gene ra to r safety re la ted to the prototype fast r e a c t o r , the exper iment on wa te r - sod ium reac t ion will be s t a r t ed in the next f iscal y e a r .
The theore t i ca l safety ana lyses of the JFER a r e now under way; s tabi l i ty study, c red ib le acc idents , design and evaluation of control s y s t em, co re meltdown accident and sodium a i r reac t ion .
2. REVIEWS OF FAST REACTOR PHYSICS AND RELATED SAFETY PROBLEMS
2. 1. F a s t r e a c t o r phys ics
Studies on fast r e a c t o r physics have recent ly been in p r o g r e s s in Japan and the main r e s u l t s of the theore t ica l and exper imenta l works were repor ted at the BNES London Conference in May 1966 [6]. Group constants , numer i ca l methods , nuclear c h a r a c t e r i s t i c s of fast s y s t e m s , r e a c t o r k inet ics , exper imenta l techniques, pulsed neutron exper iments and the fast c r i t i ca l facility (FCA), were reviewed with a l i s t of r e f e r ences on work done since 1962 [7].
The co re configuration of the FCA, which became c r i t i ca l 29 Apr i l , 1967 [8], is cy l indr ica l . The core uses 20% enriched uranium and has a 30-cm blanket of na tura l u ran ium. The cri t ical m a s s i s es t imated to be 96. 7 kg (235U), after an adjustment of excess reac t iv i ty of l e s s than 0 .1% Ak/k to the loading amount of 96. 88 kg (2 3 5U). The FCA was brought up to the maximum output of 100 W on 18 May, and the radia t ion dose-r a t e of the leakage from the FCA building was m e a s u r e d . The p resen t

22 ISHIKAWA et al.
core, slightly modified from the initial one, contains 97. 62 kg, and the critical mass is estimated to be 96.3 kg. The calculated critical mass was 96 to 102 kg using the one-dimensional and two-dimensional diffusion codes and ANL-635 group constants.
An intermediate energy spectrum core programme has been proposed and will be carried out soon, particularly to obtain information on the group constants in the resonance energy region [9], The intermediate core will be composed of 20% enriched uranium metal plates and a suitable amount of hydro-carbon compound or beryllium. As far as the resonance energy region is concerned, the intermediate core is expected to give the most sensitive experimental results. The experimental results obtained in such a system are not exactly the same as those obtained in a fast reactor system. However, useful information may be obtained on the cross-section set in the resonance region from the measured results of criticality, neutron spectrum, Doppler effect and other reactivity measurement-s.
The nuclear calculations of the JFER were made using the following codes: EXPANDA (one-dimensional multi-group diffusion) [10,11], TWENTY GRAND (two-dimensional few-group diffusion), TORCH (one-dimensional burn-up), KPARAM (kinetics parameter) [12] ESELEM (neutron spectra, effective cross-sections, 1500 fine groups) [13]. These calculations for the criticality, reactivity coefficients, burn-up characteristics, control-rod worths and kinetics, etc. are contained in the progress report [1].
The sodium-loss reactivity effects of large Pu-U and Pu-Th fast reactors were studied [14]. Using the one-dimensional multi-group calculation, the maximum volume fraction of fuel for both fast systems were determined on the assumption that a positive reactivity effect is not caused by the total loss of sodium. It was found that the Pu-Th system has a much more negative reactivity effect than the Pu-U system upon the total loss of core sodium. The maximum fuel volume fraction is found to be about 5 vol.% larger for the Pu-Th system than for the Pu-U system.
The effect of fuel burn-up upon the breeding ratio, effective multiplication factor and sodium-void reactivity effect of large Pu-U fast reactors were investigated [15]. The initial breeding ratio may be a measure of the breeding ability of the fast reactor throughout its operational life. The variation of sodium-void reactivity owing to fuel burn-up of the above system is small.
A simple and quick method was proposed for one-dimensional multi-group calculations of multi-region fast reactors [16]. This method is based on the condition of neutron-balance in each of the regions or sub-regions. Neutron flux distributions are represented by the simplest functions. The accuracy is comparable with the ordinary diffusion theory calculations, while the computing time is saved by a factor of ten. The code using this method is called RNB (Regional Neutron Balance).
2.2. Fast reactor safety
As part of the programme to develop the JFER, some research and development work on fast reactor safety has already started at JAERI. The following paragraphs outline the results obtained so far.

SM-101/65 23
An attempt has been made to derive a mathematical model by which the transfer function of fast reactors could be predicted accurately. A detailed distributed-parameter model was introduced, in which the temperatures of the fuel and coolant are evaluated as continuous radial-axial and axial functions, and also it was assumed that the expansion and deformation of the core structure depend not only on the temperature gradient of the coolant in its subassembly but also on the deformation of the upper structure. Being analysed with this model, the JFER does not show instability under credible conditions, and the increase of power and the decrease of coolant flow-rate tend to increase instability. Accidents such as various types of reactivity insertion, coolant coast-down and channel blockage are analysed using the code, EXCURS, which is somewhat modified from the original one developed at the University of Tokyo.
Dynamic analysis of the overall plant which contains the reactor, primary and secondary cooling systems and air cooler, the design and evaluation of the control system, and the determination of the operational method, have been made with an analogue computer. The control and operation system keeps the reactor inlet at constant temperature. For this purpose, the reactor inlet temperature is controlled by the control rod at constant power operation and at power-up the temperature is kept constant by decreasing the outlet sodium temperature of the air cooler as power increases [17]. To make a more detailed analysis, a hybrid system, which consists of an analogue computer, digital computer Pb 250 (Memory 8. 9K) and independent simulaters of IHX (Intermediate Heat Exchanger) and the air cooler, is in the process of being formed.
In the field of hypothetical accidents, an analysis was made of the meltdown accident and the sodium-air reaction accident of the JFER. The AX-1 code was modified to calculate the explosion energy in the hypothetical melt-down accident more realistically. The main modifications are as follows:
(a) It is modified to be able to take into account the Doppler feedback effect.
(b) The insertion of the reactivity is given by the following equation:
kex =At3 + Bt2 + Ct + D + E exp(Ft)
(c) The pressure distribution of the core is given by the threshold-type equation of state or by the saturation pressure-law equation of state.
The equation of state of the core materials is very important in calculating the explosion energy. However, the experimental data for the equation of state of uranium dioxide at high temperature are very poor. So it is calculated from the table of Hougen, Watson and Ragatz using the principle of the corresponding state. The code, EXPLO, with the above-mentioned modifications has contributed considerably in estimating the explosion energy and consequently in designing the primary reactor container.
A code was developed to analyse the sodium-air reaction. The main characteristics of the code are as follows:
(a) The gas temperature is spatially uniform in the container; (b) The wall temperature is independent of place;

24 ISHIKAWA et al.
(c) The heat generation rate by the sodium-air reaction is proportional to the concentration of the reactants and square root of the absolute gas temperature in the container;
(d) Fission-product decay heat is taken into account. The calculated results using the code have been applied to the design of the secondary reactor container.
The design and study of the containment for a fast breeder reactor system have also been made. Valuable experience was obtained through the construction of the containment system for the FCA at JAERI [18]. The necessary functions of the FCA containment were obtained by a double containment concept. The primary containment is to withstand the dynamic load due to the detonation. Apart from making a theoretical study, an experimental test was made, using the small-scale models and TNT explosives,to find empirical data for reinforced concrete for the primary containment. The secondary containment is a cylinder of reinforced concrete with a hemisphere cap. For the secondary containment, a comparative study was made for vessels of steel, reinforced concrete and pre-stressed concrete, from the economic and structural aspects. The aseismatic design is also an important problem because the foundation of the FCA building is on a surface sand layer far above shale rock. Much effort was centred on how the acceleration to the structure induced by earthquakes could be reduced to a minimum.
The fast reactor safety analysis group of the Japan Nuclear Code Committee at the Atomic Energy Society of Japan is developing fast reactor safety codes. This group is now preparing the computer code for the study of reactor transient due to coolant sodium boiling. The code is composed of two parts: thermohydrodynamics including coolant boiling, and reactor kinetics including the effect of various feed-back reactivity. In the thermohydrodynamics, a homogeneous two-phase flow model was used. The coding is almost finished and the transient induced by reactor power increase or plugging of coolant channel has been successfully traced for purposes concerned with reactor safety. In the case of a very rapid power increase, however, there still remains some difficulty in agreeing on the numerical solutions.
At the University of Tokyo, a study was made of the analysis of stability, accident and core meltdown of large fast reactors . For analysing the dynamic behaviour as a function of time, the code EXCURS was made [19.]. The characteristics of this code are as follows:
(a) The dynamic behaviour of the reactor is spatially independent and the energy group is treated as one group;
(b) The thermal representation of the reactor is made by channel approximation. Two channels, hot channel and average, are taken in this code;
(c) It is possible to vary coolant flow-rate and to take account of decay heat;
(d) The Doppler effects, effects of fuel axial expansion, sodium expansion and structure expansion are included as feedback effect;
(e) It is impossible to analyse after fuel melting or sodium boiling. An energy release during a core meltdown accident was examined for
a typical large fast breeder reactor using the code FASTAC [20]. The FASTAC code is composed of a one-dimensional few-group diffusion equation and hydrodynamic equations, which govern the movement of the

SM-101/65 25
core material. Axial movement of core material is represented by the change of axial buckling and the effective fuel density. The meltdown phenomenon is represented by the change of core height due to gravitational force and the corresponding change of core fuel density. These treatments are approximations of the original equations, but the calculated energy releases have shown good agreement with values previously calculated by other workers. The dependence of released energy upon the core volume was investigated and it was found that the linear relation exists between them when the change of the prompt neutron lifetime and the power-peaking factor are taken into consideration. The partial meltdown phenomenon was also analysed varying the spatial distribution of the initial temperature of fuel material. The available energy does not show a marked decrease irrespective of the initial meltdown area. On the other hand, when the Doppler effect exists properly the available energy is nearly proportional to the initial meltdown area and the meltdown is limited to the local part of the core according to the initial condition. No dangerous autocatalytic behaviour is found even in the case of the compaction of the fuel in the annular region of the core.
A C K N O W L E D G E M E N T S
The authors wish to thank the members of the Special Committee for Power Reactor Development Project and the Subcommittees, for the numerous helpful discussions that took place when preparing this report.
R E F E R E N C E S
[1] NOZAWA, M. et a l . , Fast experimental reactor progress report 1, the first conceptual design, JAERI Memo 2696 (1967) (Japanese).
[2] NOZAWA, M., Sodium-cooled 1000 MW(e) fast breeder reactor design study, J. Atom. Energy Soc. Japan 9 (1967) 16 (Japanese).
[3] NAKAMURA, Y., Central station fast breeder reactor, plutonium fuel requirement, Japanese experience, Nuclear Metallurgy Symposium on Pu Fuel Technology, Phoenix (Oct. 1967).
[4] KAWAHARA, S., FURUKAWA, K., SAKO, K.. Sodium technology in Japan, BNES London Conf. Fast Breeder Reactors 5B/2 (1966).
[5] FURUKAWA, K. et a l . , Liquid sodium technology development (I), test loops, purification methods and corrosion tests, J. nucl. Sci. Technol. ^3(1966) 501.
[6] HIROTA, J., KATSURAGI, S., NOZAWA, M., NISHIHARA, H., Theoretical and experimental works on fast reactor physics in Japan, BNES London Conf. Fast Breeder Reactors, 5A/3 (1966).
[7] HIROTA, J. et a l . , The JAERI fast critical facility, Int. Conf. Fast Critical Experiments and their Analysis, ANL (Oct. 1966).
[8] HIROTA, J. , Critical experiment of the FC A, J. atom. Energy Soc. Japan 9 (1967) 354 (Japanese). [9] KUROI, H. et a l . , Heterogeneity study for intermediate energy core programme, these Proceedings,
SM-101/29. [10] KATSURAGI, S. et a l . , EXPANDA, the one-dimensional diffusion equation code for fast reactors,
JAERI Rep. JAERI-1091 (1965) (Japanese). [11] SUZUKI, T. et a l . , Improvement of EXPANDA, the one-dimensional diffusion equation code for
fast reactor, JAERI Rep. JAERI-1118 (1966) 14 (Japanese). [ 12] MORIGUCHI, K., SUZUKI, T . , Multigroup calculations of kinetics parameters in fast reactors,
(KPARAM-code) JAERI-1082 (1965) 41. [13] KATSURAGI, S. et a l . , Group constants for a fast reactor and sodium void effects, JAERI Rep.
JAERI-1109 (1965) 27. [14] OHTA, M., The comparative study of the sodium loss reactivity effect of large Pu-U and Pu-Th
fast reactors, J. nucl. Sci. Technol. 2(1965)340.

26 ISHIKAWA et al.
[15] NISHIHARA, H., OHTA, M., On the burn-up characteristics of large Pu-U fast reactors, J. nucl. Sci. Technol. 2(1965) 525.
[16] NISHIHARA, H., OHTA, M., A regional neutron-balance method for multi-group calculation of multi-region fast reactors, J. nucl. Sci, Technol. 3 (1966) 409.
[17] SAITO, S., unpublished paper. [18] UCHIDA, T . , ISO, Y., "Containment design and study for the Fast Critical Assembly of JAERI",
Containment and Siting of Nuclear Power Plants, (Proc. Symp. Vienna, 1967) IAEA, Vienna (1967) 473.
[19] OYAMA, A., AN, S., SAITO, S., Dynamic analysis of large fast reactor, J. nucl. Sci. Technol. (to be published).
[20] OYAMA, A., AN, S., KONDO, S., Analysis of fast reactor core meltdown accidents, Int. Conf. Fast Reactor Safety, Aix-en-Provence (Sept. 1967).
LE PROGRAMME FRANCAIS SUR LA PHYSIQUE DES REACTEURS A NEUTRONS RAPIDES
F. STORRER, 0 . TRETIAKOFF, G. VENDRYES ASSOCIATION EURATOM-CEA, CENTRE D'ETUDES NUCLEAIRES DE CADARACHE,
FRANCE
Abstract — R6sum6
THE FRENCH FAST REACTOR PHYSICS PROGRAMME. The paper reviews the work done by the Euratom-CEA Association in the field of fast reactor physics and discusses its place in the general programme.
Although RAPSODIE was not designed as a tool to be used in reactor physics, neutron measurements made with this reactor since it first went critical have shed considerable light on fast reactor physics in general and on the operation of this reactor in particular. To date, RAPSODIE has completed the equivalent of 70 operational days at the rated power of 20 MW(th).; burn-up in the reactor core has now reached 9000 MWdA. Particular attention is being given to the problem of critical mass and to reactivity build-up, which can be an extremely valuable source of information on the processes taking place within the fuel.
Neutron studies in preparation for PHENIX, begun over two years ago, are now an integral part of the physics programme. They serve as the guiding thread for the Association's theoretical and experimental work.
The authors have access to the MASURCA critical assembly, the HARMONIE reactor, and the ERMINE fast-thermal critical assembly mounted within the MINERVE swimming-pool reactor. By kind permission of the Karlsruhe authorities, the authors can also participate in work on the SUAK sub-critical assembly.
The authors show how these four facilities where experiments are currently being performed on identical media of simple composition complement one another. The paper ends with an outline of current theoretical work and an indication of the underlying objectives.
LE PROGRAMME FRANCAIS SUR LA PHYSIQUE DES REACTEURS A NEUTRONS RAPIDES. Les activitfis menfies par 1'Association Euratom-CEA dans le domaine de la physique des rSacteurs a neutrons rapides sont r6sum€es, en les situant dans le cadre general du programme.
Bien que RAPSODIE n' ait pas £t£ conju comme un outil pour faire de la physique, les mesures d'ordre neutronique, faites sur RAPSODIE depuis la premiere divergence, ont apporte de nombreux et utiles enseignements aussi bien pour la connaissance de la physique des r€acteurs rapides que pour la comprehension du fonctionnement de ce r€acteur. RAPSODIE a accumule- a ce jour 1' Equivalent de 70 jours de marche a la puissance nominale de 20 MW(th), et le taux de combustion au centre du r€acteur atteint maintenant 9000 MWj/t. On aborde particulierement le probleme de la masse critique et celui de 1' evolution de la rfiactivite, qui constitue une source extrSmement pr£cieuse d'informations sur le comportement du combustible.
Les etudes neutroniques prfiparatoires a PHENIX ont commence1 il y a plus de deux ans et elles constituent actuellement une activity essentielle dans le domaine de la physique. Elles constituent le fil conducteur des travaux exp6rimentaux et theoriques de 1'Association.
Les moyens exp£rimentaux dont les auteurs disposent sont: 1'assemblage critique MASURCA, le rSacteur source HARMONIE et 1'assemblage critique rapide-thermique ERMINE realise dans la pile piscine MINERVE. Grtce a l 'obligeance de leurs collegues allemands, les auteurs effectuent figalement une experience commune dans 1'assemblage sous-critique SUAK de Karlsruhe.
On souligne la compl€mentarit€ de ces quatre installations dans lesquelles sont actuellement conduites des experiences sur un mgme milieu de composition simple. Enfin on indique les objectifs et les grandes lignes des etudes theoriques en cours.
Nous resumons ici nos activities dans le domaine de la physique avec l'intention de les situer dans le cadre general de notre programme sur les reacteurs a neutrons rapides.
27

28 STORRERet al.
Comme on peut l'imaginer, notre objectif prioritaire consiste pour l'heure a faire fonctionner le reacteur RAPSODIE. Aussi commencerons-nous par parler des aspects les plus saillants de son comportement neu-tronique, et si nous insistons sur cette question, c'est parce qu'elle ne fera pas l'objet d'autres communications a. ce colloque.
Bien que RAPSODIE n'ait pas ete congu comme un outil pour faire de la physique, il existe de profondes interactions entre ce reacteur et cette branche de la science; nous avons presque ete surpris du nombre et de l'interet des enseignements que nous ont apportes les mesures d'ordre neutronique faites sur RAPSODIE depuis sa premiere divergence, ceci aussi bien pour la connaissance de la physique des reacteurs rapides que pour la comprehension du fonctionnement de ce reacteur. Signalons en passant que RAPSODIE fonctionne de fagon tres satisfaisante. Nous avons aujourd'hui accumule 1"equivalent de 70 jours de marche a. la puissance nominale de 20 MW(th), dont 50 depuis le ler septembre, debut de la premiere periode de marche en regime continu, et le taux de combustion au centre du reacteur atteint maintenant 9000 MWj/t.
Le premier resultat que nous avons obtenu est la valeur de la masse critique, toutes barres en haut, a une temperature du sodium uniforme de 150° C. Nous avons constate par l'experience une masse critique, ou encore un volume critique, inferieurs de pres de 10% a ce qui etait prevu. Sur le moment, cette difference nous a etonnes car les calculs avaient ete faits en utilisant les resultats d'une experience critique effectuee il y a trois ans sur l'assemblage critique ZPR-III d'Idaho. Les calculs ont ensuite ete repris et l 'ecart entre la valeur prevue et la valeur me-suree a pu etre explique, par une analyse t res minutieuse des differences existant entre la maquette critique et le reacteur, chacun avec sa comple-xite propre. Nous en avons conclu qu ' i les t assez illusoire de pretendre simuler un reacteur par une maquette fidele et que, d'une maniere gene-rale, il est preferable de realiser des experiences plus fondamentales, dans des configurations plus pures et plus simples, conduisant a. une interpretation plus facile et plus sure, meme si elles s'ecartent delibere-ment de la structure du reacteur reel. Nous en avons egalement conclu que les physiciens auxquels incombe la tache de prevoir la masse critique d'un reacteur n'ont pas seulement besoin de bonnes connaissances en physique des reacteurs; ils doivent aussi posseder les qualites de minutie qui font la force des comptables.
Passons sur les mesures relatives aux taux de reaction, aux indices de spectres, a la valeur des barres de controle, et insistons par contre sur celles qui concernent revolution de la reactivite et des coefficients de temperature et de puissance. La determination de ces grandeurs, effectuee a. plusieurs reprises depuis la premiere mont^e en puissance, constitue une source extremement precieuse d'informations sur le comportement du combustible au fur et a. mesure que progresse son irradiation. Nous presenterons ici les resultats obtenus a. ce jour, bien qu'ils soient encore preliminaires.
Tout d'abord, nous avons constate, au cours des periodes de marche continue, que la reactivite diminue de fagon tout a fait reguliere et l i-neaire avec l'irradiation, a raison de -0, 94 • 10"4 Ak/k par JEPN(jour equivalent a puissance nominale) la ou le calcul avait predit -10"4 Ak/k.
Lorsque, a. l'occasion des arrets , on mesure la variation de la reactivite du reacteur a puissance nulle, on constate qu'elle evolue sans a-coup et diminue selon la meme loi a. raison de -0, 94* 10"4Ak/k par JEPN.

SM-101/66 29
2 0 ЗО АО SO**« 6 0 \ J E P N 7 0
FIG.l. RAPSODIE - Evolution de la réactivité.
p c m Uoo
5 0 0
Uoo
ТО О А
кзоо
h200
100
Ю 2 0 3 0 4 0 5 0 6 0 7 0 JEPN
FIG.2. RAPSODIE - Evolution du coefficient de puissance (integré de 0 à 20 MW).
Par contre, l'observation de l'évolution de la réactivité du réacteur a 20 MW(th) a fait apparaître un phénomène inattendu. Lorsque, après un arrêt , le réacteur est amené à nouveau à 20 MW(th), nous avons jusqu'ici constaté chaque fois un gain de l 'ordre de 10~4Дк/к, toutes choses égales par ailleurs, par rapport à la situation du réacteur à 20 MW(th) juste avant l 'arrêt .

30 STORRER et al.
Cela appara l t plus c l a i r ement su r la figure 1. Ces gains apparen ts de reac t iv i te ne sont que la manifestat ion de la diminution du coefficient de pu i s sance . Cette diminution etait a t tendue, m a i s pas de cet te facon-la.; el le se produit en fait pa r sauts a l 'occas ion des cyclages t he rmiques du combust ible , et el le ne semble pas affecter la reac t iv i te a pu issance nul le .
Les m e s u r e s du coefficient de puissance , q u i o n t e t e faites au debut du fonctionnement a pleine pu issance (en juin 1967) et ont ete r epe t ee s au c o u r s de l ' i r r ad ia t ion , en octobre , mont ren t que le coefficient de pu issance a, dans son ensemble , diminue de p r e s de moit ie jusqu 'a ce jour (fig. 2). Comme le mont re le tableau, la composante l iee au sodium et aux s t r u c t u r e s es t r e s t e e pra t iquement constante , a l o r s que la composante l iee au combust ible a diminue de p resque un facteur 3. Nous n 'avons pas encore d 'explicat ion cer ta ine des observa t ions fai tes, qui t raduisent une diminution p r o g r e s s i v e de l 'a l longement du combust ible a. chaque montee en pu i s sance . P a r m i l e s causes envisagees , c i tons:
a) le combust ible oxyde se r ed i s t r ibue et se colle a. la gaine qui, etant plus froide, freine la dilatation de la colonne;
b) la diminution du jeu en t re gaine et oxyde diminue leur difference de t e m p e r a t u r e ;
T A B L E A U . RAPSODIE - C O E F F I C I E N T S DE PUISSANCE ( p c m / M W pour un debi t de 800 m 3 / h )
VALEURS CALCULEES
Combustible se dilatant suivant la fibre la plus chaude
Combustible li€ & la gaine
Coefficient total
22,5
15,5
Combustible
14
7
Structure + sodium
8,5
8,5
VALEURS MESUREES
Juin 1967
Octobre 1967
30,5
17,5
22
8
8.5
9.5

SM-101/66 31
c) la disparition de la structure en pastilles entraine que le combustible ne se dilate plus suivant la fibre la plus chaude, mais selon la temperature moyenne.
Nous nlinsisterons pas davantage sur cette question, qui n'est pas encore completement elucidee. Cela etant, nous nous attendons a. ce que le coefficient de puissance diminue encore quelque peu jusqu'a une valeur analogue a. celle qui a ete calculee dans le cas d'un combustible lie a. la gaine (soit environ - 1 , 5 • 10"4 Ak/k/MW) et qu'il ne descendra en tout cas pas au-dessous de la valeur, de l 'ordre de 0, 9 • 10"4 Ak/k/MW, qui correspond a la composante liee au sodium et aux structures. De toute facon il est clair que la mesure reguliere de la reactivite et des coefficients de puissance et de temperature est de nature a apporter des renseignements extremement utiles sur le comportement moyen des 2300 aiguilles fissiles que contient le cceur au fur et a mesure que pro-gresse l 'irradiation.
Les resultats de ces mesures d'ordre neutronique seront ulterieure-ment confrontes avec ceux des examens faits sur le combustible irradie lui-meme • Nous mettons au point en ce moment les methodes d'analyse chimique et isotopique du combustible irradie, afin de comparer revolution reelle de sa composition a celle qui a ete calculee.
L'analyse de devolution constatee sur RAPSODIE n'est evidemment pas directement transposable a. des reacteurs de plus grande taille, dont la composition et le spectre sont notablement differents. II est neanmoins certain que des effets analogues se produiront et nous en tenons compte d'ores et deja dans nos etudes de PHENIX.
Les etudes neutroniques preparatoires a PHENIX ont commence il y a plus de deux ans et elles constituent actuellement notre activite essen-tielle dans le domaine de la physique. Leur echelonnement est conditionne par deux dates cles: printemps 1968, ou doit etre etabli l'avant-projet, et fin 1969, ou doivent etre fixees les specifications pour la fabrication du combustible.
Pour nous guider dans ces etudes nous n'avons que t res peu de references experimentales car il n'a ete effectue a ce jour dans le monde que t res peu d'experiences integrales au plutonium sur des milieux dont les compositions, les spectres, les.teneurs en plutonium-240 soient voisins de ceux qui correspondent aux futurs prototypes. Nous devrons done faire des experiences par nous-memes, et les moyens dont nous disposons a cet effet sont: l'assemblage critique MASURCA, le reacteur source HARMONIE et l'experience critique rapide-thermique ERMINE.
Le reacteur source HARMONIE, d'une puissance de 2, 5 kW, fonctionne depuis bientot deux ans. II est consacre, pour la moitie de son temps, aux etudes de protection, l 'autre moitie etant partagee entre la mise au point de techniques experimentales et l'alimentation en neutrons d'assem-blages exponentiels.
L'experience critique rapide-thermique ERMINE, plus particuliere-ment destinee a la mesure de coefficients de reactivite, a demarr§ voici un an dans la pile piscine MINERVE situee a Fontenay. Les premiers resultats obtenus et les caracteristiques de cette experience feront l'objet d'une communication a ce colloque1.
1 BOUCHARD, J . , VIDAL, R., MOUGNIOT, J . C . , «Etude expdrimentale des caractgristiques neutroniques de milieux multiplicateurs rapides dans l'assemblage critique thermique-rapide ERMINE», ces comptes rendus, SM-101/56.

32 STORRER et al.
Notre outil essen t ie l , l ' a s semblage cr i t ique MASURCA, est en se rv ice depuis 10 moi s . Ses p r inc ipa les c a r a c t e r i s t i q u e s a ins i que quelques-uns des p r e m i e r s r e su l t a t s obtenus seront egalement p r e s e n t e s .
Le choix de nos methodes de t r ava i l et du r61e devolu a. chacune des ins ta l la t ions repose sur les r e m a r q u e s su ivantes :
1) De nombreuses r a i sons s 'opposent a une simulat ion aus s i fidele que poss ib le du cceur de PHENIX. La plus evidente est la l imitat ion de no t re stock de plutonium - 180 kg environ, soit moins du quart de la quanti te contenue dans PHENIX. La plus contraignante est sans doute la grande heterogenei te des ma te r i aux de s imulat ion: vouloir r e s p e c t e r l ' exac te propor t ion des noyaux const i tuants conduirai t a des mi l ieux t r e s he te rogenes et n 'ayant m e m e pas un min imum de r egu la r i t e .
2) La consti tuante d'un a s semblage cr i t ique dans MASURCA demande p lu s i eu r s semaines ou m e m e p lus i eu r s mois , le cout de fonctionnement d'une te l le instal lat ion est t r e s eleve.
En conclusion, nous n ' e tud ie rons dans MASURCA, en vue de l 'e tape PHENIX, qu'un petit nombre d ' a s semblages c r i t iques , dont les c a r a c t e r i s t iques seront chois ies de facon a e t r e a i sement ca lculables , c ' e s t - a - d i r e des ce l lu les de composit ion simple et de pet i tes d imens ions .
Afin d 'a l leger au maximum la charge de MASURCA, les exper iences qui y seront effectu^es, et qui immobi l i se ron t une grande quantite de m a t i e r e f iss i le , seront consac ree s a des evaluations p r e c i s e s du bilan de neut rons et a l 'etude de la distr ibution spat iale de p a r a m e t r e s impor -tan t s , t e l s que le coefficient sodium. La plus grande par t ie des etudes r e l a t ives aux p ropr i e t e s « asymptot iques» des milieux chois is — indices de spec t r e , coefficients de reac t iv i te , facteur de conversion, e tc . — seront menees , soit dans les a s semblages sous -c r i t i ques a s soc i e s a HARMONIE, soit dans ERMINE. On e c a r t e r a egalement de MASURCA les m i s e s au point de methodes e x p e r i m e n t a l s .
Une tel le repar t i t ion du t r ava i l n ' e s t possible que si les r e su l t a t s obtenus sur HARMONIE ou ERMINE sont parfai tement coheren ts avec ceux qu 'aura i t donnes une exper ience analogue effectuee dans MASURCA. Un reca lage prealable etai t done indispensable .
La p r e m i e r e par t ie de no t re p r o g r a m m e a done ete consac ree , d'une par t a evaluer les poss ibi l i tes des differentes ins ta l la t ions , d 'au t re par t a effectuer ce r eca l age .
Nous avons choisi pour cela un mil ieu de composit ion pa r t i cu l i e rement s imple , le cceur 1 -Bde MASURCA, dont chaque cellule e l ementa i re es t cons t i tu te par un b a r r e a u d 'uranium enr ich i a 30% et t r o i s r eg le t t e s de g raph i te . Outre son ex t r eme s impl ic i te , ce milieu mult ipJicateur possede de nombreuses c a r a c t e r i s t i q u e s i n t e r e s s a n t e s : - i l p re sen te un spec t r e suffisamment degrade ; - s a m a s s e cr i t ique est faible, ce qui a p e r m i s , dans sa vers ion 1-A
ou chaque ba r r eau d 'uranium enr ichi es t r emplace par un b a r r e a u d 'uranium na tu re l contenant 25% de plutonium, de r e a l i s e r au plutonium le.cceur de d e m a r r a g e de MASURCA;
- i l pe rme t une etude approfondie des effets d 'heterogenei te , g race a la p r e sence du graphi te .
Conformement aux idees d i r e c t r i c e s que nous venons de rappe le r , l e s p rop r i e t e s du mil ieu 1-B de MASURCA seront etudiees dans quatre ins ta l la t ions : l ' a s semblage cr i t ique MASURCA, 1'experience couplee r ap ide - the rmique ERMINE, 1'experience exponentielle su r HARMONIE

SM-101/66 33
et des exper iences pu l sees dans l ' a s semblage sous -c r i t ique SUAK de K a r l s r u h e . Nous s o m m e s heureux de pouvoir souligner, a cet te occas ion , l ' excel lente cooperat ion qui a pu s ' e t ab l i r a insi en t re physiciens du KFK et du CEN de Cada rache . Cette p r e m i e r e exper ience commune a par exemple p e r m i s une confrontation fondamentale de ce r t a ine s techniques en s p e c t r o m e t r i e de neut rons r ap ide s .
A MASURCA, ce p r o g r a m m e se poursui t ac tuel lement avec le r e m -placement p rogress i f du cceur 1-A par le cceur 1-B. Les configurations i n t e r m e d i a i r e s sont des t inees a nous donner le plus tot poss ible une idee exacte des difficultes r e n c o n t r e e s l o r s de la rea l i sa t ion d ' exper iences a p lus i eu r s zones en uran ium et plutonium et dans l ' analyse des r e su l t a t s obtenus.
Ce p r o g r a m m e p re l imina i r e se poursu ivra jusque v e r s le mil ieu de l 'annee 1968. Durant cet te p£riode nous p r e p a r e r o n s la suite en etudiant sys temat iquement , pa r le calcul , les c a r a c t e r i s t i q u e s des a s s e m b l a g e s c r i t iques a ven i r . Selon nos idees ac tue l les , ces a s s e m b l a g e s c r i t iques comprendront :
1) Deux mil ieux au plutonium, Z - l et Z - 2 , des t ines a l 'e tude des deux zones du cceur de PHENIX ( Z - l cor respondan t a la zone cen t r a l e la moins r eac t ive ) . Pour definir ces deux mil ieux on r e c h e r c h e r a le me i l l eu r c o m p r o m i s en t re le d e s i r de se r app roche r de la composi t ion exacte de PHENIX et le souci de la s impl ic i te de rea l i sa t ion a l 'a ide des ma te r i aux de s imulat ion de MASURCA.
2) Deux mil ieux a l 'uranium-235^ R - l et R - 2 . Ces mil ieux, di ts de r e f e rence , s ' in t roduisent dans no t re p r o g r a m m e pour la r a i son suivante : le s tock de plutonium disponible ne pe rme t pas de r e n d r e Z-2 - et a for t io r i Z - l — cr i t ique . Les montages c r i t iques des t ines a l 'e tude des mil ieux Z - l et Z-2 comprendront done n e c e s s a i r e m e n t chacun une zone n o u r r i c i e r e a l , u r a n i u m - 2 3 5 . Les mil ieux R - l et R-2 const i tuant ces zones n o u r r i c i e r e s se ron t chois i s afin d ' e t r e compat ib les — selon des c r i -t e r e s ac tuel lement a l 'e tude - r e spec t ivement avec Z - l et Z - 2 .
L 'e tude d'un r eca lage des specif icat ions de fabricat ion du combust ib le de PHENIX est envisagee p a r subst i tut ion d 'une p r e - s e r i e de combust ible dans MASURCA. L'etude macroscop ique de ces differents mi l ieux dans MASURCA s e r a p recedee et p r e p a r e e pa r leur etude dans ERMINE ou HARMONIE selon le p r o c e s s u s deja employe pour les cceurs 1-A et 1-B.
L'exploitat ion des r e s u l t a t s de ce p r o g r a m m e ne s e r a pas une tache a i s ee , en pa r t i cu l i e r pa r suite de no t re faible stock de plutonium. Neanmoins i l n ' e s t pas ce r t a in que ee soit forcement une mauva ise chose que de manquer de plutonium pour c e s exper iences , c a r cela oblige a un g r o s effort de reflexion pour les concevoir et les i n t e r p r e t e r . Nous aur ions tous ra i son d ' e t r e sa t i s fa i t s s ' i l s ' ave ra i t possible de p r e d i r e avec une bonne p rec i s ion l es c a r a c t e r i s t i q u e s d'un grand r e a c t e u r - et nous pensons ici sur tout aux r e a c t e u r s de 1000 MW(e) - sans avoir r e a l i s e une m a -quette en v ra i e g randeur .
Pa r a l l e l emen t aux etudes menees specifiquement pour PHENIX nous poursuivons un p r o g r a m m e d 'e tudes a plus long t e r m e dont le but es t d ' a m 6 l i o r e r nos f o r m u l a i r e s de calcul des r ^ a c t e u r s a neu t rons r a p i d e s .
Nous nous conten terons de quelques t r e s b reves r e m a r q u e s a l eur sujet . Une p r e m i e r e ca t6gor ie d 'e tudes v ise a mieux ca lcu le r les d i v e r s e s c a r a c t e r i s t i q u e s d'un r e a c t e u r a p a r t i r des donnees de b a s e . Les sec t ions efficaces dont nous disposons nous incitent a employer un t r e s grand nombre
3
34 STORRERet al.
de groupes; la complexite geometrique des reacteurs nous incite a decouper l'espace en un tres grand nombre de mailles. II y a done une tendance naturelle a augmenter la precision des calculs par l'emploi de codes de diffusion ou de transport de plus en plus complexes et faisant appel a toutes les memoires que nous apporte chaque nouvel ordinateur. On peut se demaftder si de tels codes de calcul ne seront pas peu a peu supplantes par des codes de Monte-Carlo. D'autre part, il nous semble que dans bien des cas il y aurait interet a ne pas vouloir traiter le probleme en une fois (en utilisant des codes qui pretendent tout faire), mais plutot a essayer de developper des techniques de calcul qui permettent de calculer certains problemes particuliers. Nous pensons ici specialement aux bilans de neutrons en milieu infini, aux interfaces entre deux milieux, a l 'hetero-geneite, aux barres de controle, etc. Nous savons que de nombreuses etudes oht deja 6te poussees dans ce sens mais nous croyons qu'un effort supplementaire devrait etre fourni. Nous ne savons pas encore t res bien comment les interfaces affectent la reactivite et les flux, et nous ne pouvons pas encore bien calculer le flux et le flux adjoint aux basses energies; par consequent nous ne savons pas encore bien calculer l'effet Doppler, ainsiqueles coefficients de reactivite des divers materiaux.
L'etude separee de certains problemes particuliers permet beaucoup mieux qu'un calcul d'ensemble de bien comprendre la physique de certains phenomenes.
D'autres methodes theoriques sont destinees a mieux exploiter les resultats des experiences integrates. II s'agira par exemple de determiner la masse critique d'un reacteur de puissance sans pour autant recourir a une maquette critique fidele et en vraie grandeur. Cet objectif ne peut etre atteint que si nous parvenons a developper de bonnes techniques d'ex-trapolation. Nous savons tous que la theorie multigroupe, qui constitue une methode de calcul universelle, n'est pas un bon outil d'extrapolation, et le devient de moins en moins au fur et a mesure qu'elle se developpe en complexite et en precision. Nous ressentons tous le besoin de pouvoir representer certaines caracteristiques essentielles de nos experiences et de nos reacteurs au moyen d'un nombre limite de parametres sans pour autant sacrifier excessivement la precision.
Des efforts en ce sens sont poursuivis en France, mais la place nous manque pour en parler ici.
Nous voudrions seulement, en terminant, souligner que ce sont les imperatifs du projet PHENIX qui guident et canalisent notre programme actuel sur la physique des reacteurs rapides, apres que les etudes de conception de RAPSODIE eurent joue ce role pendant de nombreuses annees.
On ne saurait trop insister sur 1'interet, pour un programme consacre a la physique, de disposer d'un tel fil conducteur pour eviter que les etudes ne se dispersent et ne s'ecartent trop des imperatifs concrets.
D I S C U S S I O N
J. L. ROWLANDS: Could we be told more about the error in the prediction of the critical size of RAPSODIE on the basis of the ZPR-III mock-up experiments?

SM-101/66 35
What are the major differences in composition and geometry between the mock-up and RAPSODIE, and what are the problems of bookkeeping? Are there uncertainties arising from manufacturing tolerances?
F . STORRER: The basic differences between RAPSODIE and the critical experiment carried out several years previously on ZPR-III are as follows: Whereas RAPSODIE has an oxide blanket, the simulated blanket was metallic; sodium in the RAPSODIE core was simulated largely by aluminium; furthermore, there were appreciable fabrication differences between the pre-ser ies and series assemblies and between these and the specifications. Thorough investigation showed that the details of geometry and composition had to be taken into account, particularly in the interface region between core and blanket.
In fact, since RAPSODIE has a k^of close on 2, 50% of the neutrons produced in the core escape, and an error of 1% in evaluating these leakages gives rise to an e r ror of 1% in the reactivity. These leaks should cause fewer problems for reactors now planned.


UNITED KINGDOM PROGRAMME IN FAST REACTOR PHYSICS
C. G. CAMPBELL FAST REACTOR PHYSICS DIVISION, UKAEA REACTOR GROUP, ATOMIC ENERGY ESTABLISHMENT WINFRITH WINFRITH, UNITED KINGDOM
Abstract
UNITED KINGDOM PROGRAMME IN FAST REACTOR PHYSICS. The paper contains a review of the fast reactor physics programme being undertaken in the United Kingdom and describes the organization that directs the work.
1. Introduction
There is a continuing programme of work directed towards the understanding of the physios of the Prototype Fast Beaotor (P.F.B.) [1] and subsequent fast reactors. The data and methods used for making performance predictions are being revised to take account of new differential measurements and integral checks on sero-power reactors. This will produoe more accurate predictions and, ultimately, will reduce the reliance on detailed mook-ups for the large fast reaotors that will follow P.F.B.
The design calculations for P.F.B. have been performed using the data set, FD2 [2], derived from the U.K.I.E.A. Data Library. These predictions have been adjusted after comparison of experiments on the P.F.B. mook-up in Zebra with calculations using the methods used for reaotor design. A new data set, FD3, is now being prepared from the current version of the Data Library, which inoludes the latest evaluated data. This set will be used to reinterpret a wide range of integral data obtained from the sero-power reaotors, Zebra and Vera, and other reactors abroad. A considerable effort has been devoted to acourate measurements of neutron spectra so that such measurements oan be inoluded in a systematic attempt to adjust FD3 to suit the integral data within the limits of aoouraoy of the differential data.
This paper briefly surveys all aspects of the work in fast reaotor physios in the U.K. It also describes the organisation within the U.K.A.E.A. which directs the work.
2. Requirements of reaotor design
In order to establish some of the main features of P.F.B., a parameter survey programme [3] was used. Additional exploratory calculations [ 4] were performed to decide other important features such as the optimum designs for the breeder blanket and the inner shield surrounding it. The likely features of subsequent, probably larger, reactors were also considered at an early stage so that as many as possible of these could be inoluded in the P.F.B.
37
38 CAMPBELL
When making predictions for the detailed design of the P.P.E., target aoouraoies were set for oertain features. The value of k _-for a fresh charge of fuel (with the reactor at inlet temperature; was to he predioted within limits of HK 2#, in order to ease the problem of adjusting a fixed sise of core to ezaot oritioality. The power coefficient, predioted within limits of ± 30^, was sufficient to determine the kinetic response. Control rod worths, predicted within limits of +_ 10$, were sufficient to decide the mass of absorber required per rod. Power distributions were to be predicted within +_ 5$ for a quite complex oore and blanket configuration. The neutron and gamma fluxes at the nucleonio deteotors [3] had to be predicted within suoh limits as would allow three ranges of instruments to cover the full range from shut-down to full power. The inner shield had to be designed to give acceptable levels of radioactivity in the sodium in the secondary coolant cirouit.
A series of computer calculations was made to study various problems of fuel management for the operating reactor. The problems considered inoluded several versions of the equilibrium fuel cycle and the approaoh to equilibrium.
The kinetio response of the reactor was studied for a range of flow and reactivity transients. A range of values for the individual contributions to the power coefficient was assumed, to allow for the uncertainty in predictions. It was then necessary to 8how that all events leading to damage to the reaotor were extremely unlikely and that those leading to a district hasard were negligible. An analogue computer study of the whole power plant was also undertaken in order to facilitate the design of the control system.
Studies are being made of what happens in a sub-assembly in the event of total or partial blockage [6]• Possible ways of early deteotion of suoh events are being examined for example, by means of aooustic noise or electrical noise in thermocouples. In addition, idealised models of gross melt-down of the core are being considered to obtain an indication of the ultimate accident to guide the design of containment structures [7].
3. Organisation and responsibilities
The engineering design of the P.F.B. is being undertaken by the Fast Reactor Design Office of The Reactor Group (T.R.O.) at Risley. Central Technical Services, T.R.G., Risley, deal with the immediate physios problems of the design office. They deal with performance calculations, fuel oyoles, kinetics and acoidents. They do the parameter surveys and eoonomic studies using the "present worth" method [8 ]• Some theoretical methods are developed in C.T.S. and programmed for the computer.
Vinfrith (T.R.G.) has the main responsibility for the development of physios design methods and the data to be used with them. The accuracy requirements for nuolear physios measurements are specified and the resulting differential data evaluated and converted into data sets suitable for the usual methods of calculation. Data and methods are oheoked and revised as a result of integral measurements made on Zebra and other

SM-101/48 39
zero-power reactors elsewhere. Theoretical assessment studies of advanced fast reactors with alternative fuels and coolants are undertaken. Research and development is also in progress on nuclear detectors, nuoleonio instruments and oontrol systems. The Winfrith shielding group is based at Harwell in order to make use of the reactor, Lido. This group recommends methods and
data for shielding calculations, after oheoking them against experiments on Lido and Zebra.
At Aldermaston (Weapons Group), differential nuolear physics measurements are performed that yield nuclear data for fast reactor calculations. Many of the evaluations of the data are also oarried out there. Integral experiments, including measurements of neutron spectra to oheck data and methods, are performed on the sero-power reactor Vera. The new reactor, Viper [9» 10] , "built for radiation experiments, gives information on the Soppier effect and prompt-oritioal kinetics. At Harwell (Research Group), differential nuclear physios measurements are performed that yield nuolear data. Neutron spectra have been measured in sub-oritioal systems by time-of-flight spectrometry [11 ].
Dounreay (T.R.G.) is the site of the P.F.R. and so is specially concerned with the specification of experimental facilities and with operational problems. The Authority Health and Safety Branch at Risley, vets the safety aspects of the P.F.R. and is also developing Monte Carlo methods for use in safety assessments which are applicable to fast reactors. Some fast reaotor calculations have also been performed by nuolear industry on oontraot to the Authority.
4* Data and methods
The early oaloulations for the P.F.R. were performed using the data set produced by Tiftah, Okrent and Moldauer extended to 0.4eV by adding further groups. This 33-group set was called FD1 [12]. The long term aim was to use data whose origin and evaluation was better understood. The U.K.A.E.A. Data Library stores evaluated data at as many energy points as is justified. The computer programme, GALAXT [13], reduoes the library to any chosen group arrangement. The set, FD2 [2], was the first produoed in this way, in 1965, and has been used, for all the detailed design oaloulations for P.F.R. This set is now known to lead to important errors in predictions [14] &nd new evaluated data are now available. A new set, FD3, is being tested.
For some years, there has been in existence a request list [15] that specifies the aoouraoies required in order to achieve, using differential nuolear data only, k ff for fast reactors to a standard deviation of 1$} breeding gain to a standard deviation of 0.03} and other properties needed in reactor design and in the interpretation of experiments. The measurement programme has gone some way toward meeting the objectives. Because of the difficulty of many of the outstanding measurements on the request list, it is expeoted that a successor to FD3 will ultimately be produced by adjustment of FD3 to suit integral data from sero-power reaotors.

40 CAMPBELL
Core calculations for the P.P.E. are usually performed with the multigroup diffusion theory code, CRAM [16], whioh is available in one-dimensional form in slab, cylindrical and spherical geometries and in two-dimensional form in RZ, R9 and XT co-ordinate systems. A two-dimensional triangular mesh version and a three-dimensional version are under consideration. For one-dimensional calculations, the full group structure of FD2 can be used but, for two-dimensional cases, some compromise in groups and mesh is necessary. For example, the P.F.R. hexagonal sub-assemblies may be represented by rectangular zones with 4 nosh points per rectangle giving 1300 mesh points in a typical XT problem. This is solved with 6 energy groups to accuracy of convergence 0.0005 in k f in l£ hours on the IBM 7090.
The self-shielding of resonanoe reactions in heavy elements in homogeneous media is allowed for by methods used by Abagyan et al [17]« Heterogeneous media are dealt with by equivalence relations. The effect on k f f of the fine structure in the flux in sero-power reaotors is calculated with the oode, CELFERT [18], whioh solves the equations of integral transport theory in slab geometry. Both heterogeneity corrections are more important in the interpretation of experiments in zero-power reactors than for the more nearly homogeneous power reactors because of the thiok fuel and diluent components used in the experiments, for economy reasons.
The worth of control rods is obtained by successive oriticality oaloulations using CRAM, with the absorber in place and removed. This oan only be done rigorously, with a two-dimensional computer oode, at the oore oentre line. Semi-empirical extrapolations are used to yield the worth of off-centre rods.
First order multigroup perturbation theory is used for many oaloulations of temperature and power coefficients.
The accuracy of these methods has been tested by general studies and also for specific problems. In some oases, a oorreotion has been applied to the result of the basic method. The studies made include 1 the effeot of mesh sise; the effeot of number of groups in the group condensation) a comparison of diffusion theory with the % method of transport theory to various orders of H) and a comparison of first order and exaot perturbation theory.
The approximate methods and equivalence relations used when treating the resonance region have been tested and revised as a result of mors exact calculations using the codes GENEX and SDR [19]* The code, GENEX, produces data for heavy elements at close enough energy intervals to reproduoe the resonances. The oode, SDR, solves the slowing down equation in the resonanoe region exactly for a homogeneous medium and approximately, using collision probability methods, for multi-region systems. Up to 120,000 energy points may be used in the range below 25 keV and up to 8 regions.
In order to get reliable prediotions for oertain properties suoh as the sodium temperature coefficient, it is necessary to

SM-101/48 41
use a better group-averaging procedure than is normally used when deriving a data set like FD2. A development of the code, ELMOE [20], is being used for this purpose. It solves the fundamental mode equations in about 1500 fine energy groups. It is being developed as the regular intermediate step when producing a new data set from the Data Library.
A Monte Carlo code, OEM [21] , developed for critioality problems, has been tested in exploratory calculations for the P.P.E. Speoial Monte Carlo methods [221 are being examined to oaloulate control rod worths in realistic three-dimensional geometry in acceptable computing times.
The calculations for the inner shield of P.F.E. were performed with a two-dimensional diffusion theory oode, ATTOW [23], A Monte Carlo oode. MOB, was developed to treat the heterogeneity of this shield [24J. The theoretioal methods were checked against experiments on Lido and Zebra [23, 24, 25]. Thetransport theory code, BIOBE [26], was used for calculations of the outer concrete biologioal shield for whioh diffusion theory is inadequate. Cross-seotion data reduoed from the U.K.A.E.A. Data Library were used for most calculations.
5. Integral ohecks-on aero-power reaotorsi data adjustment
Fast oritical assemblies are built on two sero-power reactors, Zebra at Winfrith, and Vera at Aldermaston. In both oases, the cores and blankets of interest are constructed of square plates, 3 mm thick, stacked in vertical steel tubes. This makes it possible to study a wide range of reactors with the same set of components. When a blanket about 30 cm thiok is required, these reactors can aooommodate cores of volumes up to 4000 and 200 1, respectively. The larger siae of Zebra makes it more suitable for project work direoted towards a partioular power reactor) both can be used to yield integral ohecks of data or methods. Sub-critical assemblies at Harwell [11] and Aldermaston [27] have also been used for measurements of neutron spectra by the time-of-flight method.
Examples of the project work undertaken on Zebra are the studies on assembly 4 of possible moderating blankets for the P.F.E. [28]1 on assembly 5 of the Doppler effect in the so-called Doppler loop [29]) a n d on assembly 7, the full-sise P.F.E. mook-up. The work on Zebra 7 includes studies of k -- , breeding gain, control rod worths, detector sensitivities ana reaotion rates in the core, blanket and inner shield. This work is complementary to more extensive studies of the inner shield on Lido [ 23]. The reactor, Dimple, has also been used in a thermal-fast soned critioal arrangement to assist the conceptual design of a superoritical-steam-cooled fast reaotor [30]. The reactor, Vera, has been used to study the effect of replaoing the natural uranium blanket of the Dounreay Fast Beactor by niokel [31].
Experimental results from several reaotors have been used to check the predictions using the FD2 set [14]* Some of the success of FD2 (and other sets) is due to compensation of errors

42 CAMPBELL
in Pu239 or U235 data that over-estimate k ._ by errors in U238 that under-estimate it* An adequate test or a new set must cover a vide range of oritioal experiments, inoluding plutonium-fuelled assemblies, few of which have been built to date.
Zebra is currently being used to extend the range of information on plutonium-fuelled systems. The value of a (capture-to-fission ratio) for Pu239 is being measured by the method used on Dimple [30]. A 15 HeY electron linac and 200 m flight path have recently been completed with which core and blanket spectra up to about 200 keV will be measured on the same systems by the time-of-flight method. The remaining parts of the spectra will be measured with hydrogen-filled proportional counters and Li6 spectrometers.
The programme for Vera is mainly concerned with measurements of simple assemblies for oheoking methods and data. A range of systems containing Pu239» U235* U238 and various diluents is being studied [32]. Recent work has inoluded a homogeneous oxide assembly and further measurements on one of the earlier assemblies, 5A, in an attempt to improve the accuracy of the techniques of neutron spectrometry [27].
The new data set, FD3, is being produoed from evaluated differential data) a successor to FD3 will be produced later, adjusted to force agreement between calculation and experiment* for integral experiments. Work is in progress on the DOHDEE-PEHICUIX system of computer codes [33] which may be used for this purpose. The work oan be divided into three phasest
(1) Optimisation of neutron oross-seotion data adjustments to fit experimental oritioal sizes with no resonanoe self-shielding or heterogeneity effects (oompleted),
(2) Optimisation of neutron oross-seotion data adjustments to fit experimental oritioal sices and spectra and spectral indices at the oentre of systems with no resonanoe self-shielding or heterogeneity effects (well advanoed),
(3) As (2) but with resonanoe self-shielding and heterogeneity effects taken into account (planned).
As an alternative to the KUHDEE-PEHICUIK system, it may be possible to use empirical adjustment methods whioh oan take into acoount a wider range of integral data.
6. Integral checks on operating power reactors suoh as P.P.B.
The operation of the Lounreay Fast Eeaotor was reviewed in 1966 [34] vhen both physics and engineering aspeots were considered. Because of its use as a fast flux test reaotor, there is a requirement for aoourate estimates of reaction rates inoluding damage rates in graphite, steel and other materials. The methods used are similar to those used for the P.P.E. [31].
A simple analogue reactivity meter is proving itself a valuable operational tool in control rod calibrations, in worth measurements for monitoring kinetic stability and for exploring

SM-101/48 43
any suggestion of anomalous behaviour [35]• The reactivity noise is typically a tenth of a oent and step changes of a oent oan be measured, for example, during worth measurements.
Noise measurement and correlation techniques have also been used in exploring reaotor behaviour by recording on magnetic tape and extracting cross-and auto-correlations using off-line analogue equipment. The most interesting feature of this work has been the discovery of a flux oscillation at about 6 o/s whose frequency is proportional to reactor flow and whose relative amplitude is approximately independent of reaotor power. This independence of power makes it unlikely that the oscillation oould be due to a resonanoe in the power-induced feedback. The fluctuation has no operational interest but is being studied in case it should prove to be larger in a different design.
The general level of noise in a thermocouple has been monitored by an experimental piece of safety equipment. Typically, the part of the thermocouple noise signal, fluctuating at a frequency of about 0.15 o/s, is reotified and integrated for 5 min. It may be shown that, for a thermocouple underneath a sub-assembly (that is, downstream) the noise signal is a more sensitive indication of subassembly blookage than the steady signal.
The experience on D.F.E. has been used when specifying the experimental equipment and facilities for P.F.R. Study of the P.F.B. itself will be an important check on the design methods for subsequent reactors, especially for aspects like kinetics that cannot be studied on zero-power reactors.
7. Discussion
There is a comprehensive programme of fast reactor physios in the U.K. Nuclear data is continually being measured, evaluated and incorporated into the data sets used for reactor calculations. Background knowledge, especially of plutonium-fuelled systems, will be extended by experiments on zero-power reactors. The integral data obtained will be used to adjust cross-section sets. Experiments will also be performed to study specifio features of future reactor designs. Fast reactors are designed using multigroup methods which are now becoming well tried and tested against integral ' experiments and whose limitations are reasonably well understood. Work in progress will elucidate some of the remaining problems concerned with three-dimensional geometry, resonance shielding and heterogeneity. Studies are being made of fuel management problems and the optimising of future designs. Existing data and methods are adequate to design P.F.R. Work in progress will narrow the design uncertainties in subsequent reactors.
REFERENCES
[ 1] FRAME, A. 0., et al., Design of the Prototype Fast Reactor, B.N.E.S. Conf. on Fast Breeder Reaotors, London (1966), P 3/3.

44 CAMPBELL
[ 2] SMITH, H. W.f ROWLANDS, J. L., WARDLEWORTH, D., The FD2 group-averaged cross-section set for fast reactor calculations, UKAEA Rep. AEEW-R491 (1966)
[ 3] SMITH, R. D., et al., Fast reactor physios, including results from U.K. zero-power reaotors, Proc. 3rd UN Int. Conf. PUAE 6. (1964)90.
[ 4] SMITH, D. C. 0., MANN, J.E., WHEELER, R. C , Some physics studies in support of P.P.R. design, B.N.E.S. Conf. on Fast Breeder Reaotors, London (1966), P5A/2.
[ 5] EVANS, P. B. F., et al., Control and instrumentation of the Prototype Fast Reactor. B.N.E.S. Conf. on Fast Breeder Reactors, London (1966), P5A/5.
[ 6] JUDD, A. M., Loss-of-ooolant aooidents in a large sodium-oooled fast reaotor, Proo. Conf. on Safety, Fuels, and Core Design in Large Fast Reactors, ANL-7120(1965)67.
[ 7 ] LORD, R. M., Effeot of oore configuration on the explosive yields for large sodium-cooled fast reaotors, Conf. on Safety of Fast Reactors, Cadaraohe (1967), P Hi/4.
[ 8 ] ILIFFE, C. E., Economics of plutonium breeding, plutonium inventory and uranium conversion, UKAEA TRG Report 1207(H), (1966).
[9] WEALE, J. W., et al., A new fast pulsed reactor, Viper, This conference, SM-IOl/39.
[10] MoTAOQART, M. H., et al., Measurements of the physics characteristics of the fast pulsed reaotor Viper, This oonferenoe, SM-IOl/44.
[11 ] COATES, M. S., et al., UKAEA Rep. AERE R5330 (to he published)
[12] ROWLANDS, J. L., WARDLEWORTH, D., A nineteen-group extension of the Tiftah, Okrent and Moldauer cross-seotion set, UKAEA Rep. AEEW-M472 (1964).
[13 ] BELL, V. J., et al., A users' guide to GALAXY 3, UKAEA Rep. AEEW-R379 (1964).
[14 ] BAKER, A. R., A systematic study of the aoouraoy of multigroup oritioality calculations for fast critical assemblies, J. Brit. Nuol. En. Soc. £ (1967) 247.
[15 ] Compilation of EANDC requests, EANDC 55 (1966).
[16] HASSITT, A., A oomputer programme to solve the multigroup diffusion equations, UKAEA TRG Report 229(H), (1962).
[17] ABAGTAN, L. P., et al., Group Constants for the Calculation of Nuclear Reaotors, Moscow (1964)*

SM-101/48 45
[18] JAMES, M. P., MATTHEWS, J. D., A perturbation method for nultigroup neutron transport calculations in plane lattices, UKAEA Rep. AEEW-R2190962).
[19] BRISSENDEN, R. J., DURSTON, C., Calculation of neutron speotra, Proo. Conf. on Applications of Computing Methods to Reactor Problems, ANL 7050 (1965)23.
[20] RAGO, A. L., HUMMEL, H. H., ELMOE, an IBM-704 programme treating elastio scattering resonanoes in fast reactors, ANL-6805 (1964).
[21] HEMMIHOS, P. J., The OEM code, UKAEA Rep. AHSB(S)R105 (1967)*
[22] GUBBINS, M. E., Reaotor perturbation calculations by Monte Carlo methods, UKAEA Rep. AEEW-M581 (1966).
[23] AVERT, A. F, et al., Neutron attenuation studies in fast reactor shielding, B.N.E.S. Conf. on physios problems of reaotor shielding (1967), P 1.3/2.
[24] BROUGHTON, J., et al., Methods of calculation for the treatment of shield heterogeneities in the Prototype Fast, Reaotor, B.N.E.S. Conf. on physios problems of reaotor shielding (19^7)» P 2.2/6.
[25] GRIMSTQNE, M., et al., Comparison of measurements and calculations of the neutron spectrum in Lido experimental shields, B.N.E.S. Conf. on physics problems of reactor shielding (1967), P 1.3/7.
[ 26] PREISER, S., et al., ARL Teoh. Report 60-314 0960).
[ 27] PATERSON, W. J., et al., Neutron spectrum measurements in the fast reaotor assembly Vera 19A and tests of the time-of-flight spectrometry method in Vera 5A and Viper 1, This conference, SM-101/40.
[ 28] SMITH, R. D., BAKER, A. R., ROWLANDS, J. L., B.N.E.S. Conf. on Fast Breeder Reactors, London (1966), P 4A/5.
[ 29] BAKER, A. R, WHEELER, R. C., Doppler coefficient measurements in Zebra Core 5, UKAEA Rep. AEEW-R465 (1966).
[ 30] ARNOLD, M.J., et al., Variation of k-inf with coolant density for a
plutonium-fuelled steam-cooled fast reactor lattice: comparison of
experiment with prediction, This conference, SM-lOl/43.
[31 ] SMITH, J. C , ATKINSON, H., McTAGGART, M. H., Theoretical and experimental analysis of reaction rate distributions in the Dounreay Fast Reaotor, Proc. Conf. on fast critical experiments and their analysis, ANL-7320 (1966) 590.
[32 ] MoTAGGART, M. H., et al., Interim report on uranium-fuelled Vera reactor experiments, UKAEA Rep. AWRE R5/66.
46 CAMPBELL
[33 ] HEMMENT, P. C. E, PENDLEBURY, E. D., The optimisation of neutron cross-section data adjustments to give agreement with experimental critical sizes, Proo. Conf. on fast oritioal experiments and their analysis, AITL-7320 (19^6) 88.
[34 ] HEHRY, K. J., EDWARDS, A. G., A review of the operation of the Dounreay Fast Reactor, Proo. B.N.B.S. Conf. on Fast Breeder Reaotors, London (1966), P 2/2.
[35 ] JAMES, P. R., TAIT, D. Dounreay Fast Reactort kinetic computer analogue, Nuol. Eng. 11 (1966) 611.
DISCUSSION
S. YIFTAH: You mentioned that integral measurements would be used to adjust the 35-multigroup cross-section set obtained by your group. Whenever a similar adjustment was made in the past using one set of integral experiments the results were good for similar systems but very poor whenever new, possibly bigger, systems had to be calculated and measurements compared. Supposing you adjust your 35-group set using integral measurements pertaining to the 250-MW(e) prototype, can you be sure that the adjusted system will be adequate for 1000 MW(e) or bigger reactors, or for predicting systems other than those used in the adjustment?
C.G. CAMPBELL: We shall adjust the new FD3 set to fit the results of integral experiments, but the integral experiments chosen will be those made in simple cell geometry under well-defined conditions. Integral experiments made on mock-ups may not be suitable. Consider, for example, the present knowledge of 238U capture; there is a 15% uncertainty in the differential data. With present integral techniques the 238U capture to 239pu fission ratio can be determined to 3% and may well be improved to li%, but it is, of course, particularly important to examine all possible sources of systematic error in these integral measurements. It will be a long time before the accuracy of the differential measurement can approach that of the integral measurement for 238U capture. Provided that data are fitted to integral quantities measured with care in clean, well-defined lattices, and that allowance is made for the small spectral difference between systems, it should be valid to use these data in other situations.
H. W. KUSTERS: As regards data fitting, our procedure was to take a group constant set and introduce certain changes, thereby producing corresponding changes in the integral quantities, which we then analysed in a similar, but simpler, way to that used by Mr. Pendlebury (Ref.[33] of the paper) so as to revert to the original set. The attempt failed. Would Mr. Campbell or Mr. Pendlebury care to comment on this?
C. G. CAMPBELL: One reason for your failure to return to the original data may be that you omitted to take account of the inevitable effect of the postulated change in data on the spectrum.
E. D. PENDLEBURY: In our optimization of group cross-section adjustments to fit experimental critical sizes we find that generally the data adjustments are in the direction implied by measurements taken more recently than those incorporated in the basic evaluations. This would indicate that the adjustments tend towards the physically correct cross-sections.

SM-101/48 47
We have done calculations similar to those mentioned by Mr.Kiisters and found the same effect, but this is readily understandable if one studies the mechanism of the adjustment procedure. For example, if the fission cross-section of 235 U, say, is the only quantity artificially changed, and then in the adjustment procedure all cross-sections are allowed to change, the adjustments will be spread over all the cross-sections and will not be concentrated on the 235u fission cross-section alone, which means that the 235U fission cross-section will in general not be adjusted to the same extent that it was artificially changed. It will, however, almost certainly be adjusted in the direction of the value from which it was changed. In other words, in the adjustment procedure, the group cross-sections are effectively assumed to be normally distributed about the starting values and hence the adjusted values depend to some extent on the starting values. Despite this effect, I firmly believe that cross-sections which have been adjusted to fit integral quantities are better than cross-sections which have not been so adjusted, provided the adjustments are reasonable in relation to cross-section measurements and their uncertainties.
R. VIDAL: I note that in the United Kingdom fast reactor physics programme a special effort is to be made to replace fission chambers by detectors. Has Mr. Campbell's group made comparisons of fission rates as measured by these two means?
C.G. CAMPBELL: Fission rate ratios are measured at Winfrith with foils of fissile materials placed in the appropriate plates of the lattice cell. After a standard irradiation, the induced fission product gamma-activity is measured and separate calibration experiments then relate the fission rate to the fission product gamma-activity. The calibration experiment uses absolute fission chambers in a back-to-back arrangement with a dummy chamber of the same geometry. A foil of composition appropriate to the chamber deposit is irradiated in the dummy chamber during measurement of the fission rate, then removed and the fission product gamma-activity counted. The spectrum is that of the lattice being tested although the same calibration factors are found (to within ± 2%) even when 235U and 239Pu foils are irradiated in a thermal flux in which the fission cross-sections are known. We have found that the fission rate in the 238U chamber differs by 9% from that measured in the 238u fuel plates; this is why we use foils rather than chambers for this measurement.


FAST REACTOR PHYSICS PROGRAMME OF THE UNITED STATES ATOMIC ENERGY COMMISSION
W.B. LOEWENSTEIN LMFBR PROGRAM OFFICE ARGONNE NATIONAL LABORATORY
ARGONNE, ILL.
AND I.F. ZARTMAN UNITED STATES ATOMIC ENERGY COMMISSION, WASHINGTON, D. C. , UNITED STATES OF AMERICA
Abstract
FAST REACTOR PHYSICS PROGRAMME OF THE UNITED STATES ATOMIC ENERGY COMMISSION. The United States of America fast reactor physics programme is a broadly based research and development effort that is focused on the major neutronics problems of fast reactor design and operation and aims at providing a sound basis for the large-scale commercial exploitation of fast power breeder reactors. These include the optimization of reactor performance to gain maximum economic advantages from fuel without sacrificing safety and reliability requirements. The major emphasis is on the physics of sodium-cooled systems with lesser effort currently on steam and gas-cooled systems.
The refinement of nuclear data for use in reactor calculations is a major high priority item. Such refinement will come from further specific differential cross-section measurements as well as correlations and/or adjustments via integral data and theory. The availability of large amounts of differential and integral data places severe requirements on automatic data processing techniques. These must be used both in the procurement and the compilation of the data to provide it in a form which is routinely useful for the reactor designer.
The continued operation of the fast critical facilities ZPR-m, VI, and XI, as well as the projected operation of the ZPPR, is planned. Much of the work on these facilities is in support of nuclear data verification of nuclear design methods. These facilities will also be used in support of engineering design of fast test and power reactors.
The development of reliable and relatively sophisticated nuclear design methods is extremely important so that the qualitative interpretive aspects of nuclear design can be minimized. The development of these methods requires that certain aspects of nuclear theory, in particular space-time kinetics, three-dimensional techniques, and/or variational methods must be applied to fast reactor systems. The safety analysis requirements include major accident and kinetics codes which provide for system transients.
Experimentally, the development of improved neutron spectrometry for fast reactors will provide a necessary basis for verifying theory and data for nuclear design. The full exploitation of the critical assemblies will give consideration to the use of automated data accumulation and processing, as well as improved techniques for reactivity measurements.
The Physics Programme is sensitive to the requirements of other disciplines in the liquid Metal Fast Breeder Reactor (LMFBR) Programme. These include the application of nuclear design methods to conceptual studies and safety analyses. Related quantitative studies and evaluation of the reactor fuel cycle are major -' considerations throughout the operating history of both conceptual and currently operating reactors. Such studies will provide feedback and specifications for the basic research and development programme.
I. INTRODUCTION
The fast reactor physics programme of the United States Atomic Energy Commission is a broadly based research and development effort that con-
49

50 LOEWENSTEIN and ZARTMAR
c e n t r a t e s on the major neut ronics p r o b l e m s of fast r e a c t o r design and opera t ion with the a im of providing a sound b a s i s for the l a r g e - s c a l e c o m m e r c i a l exploitation of fast power b r e e d e r r e a c t o r s . These p r o b l e m s include the optimizat ion of r e a c t o r design to gain maximum economic advantages without sacr i f ic ing safety and re l iabi l i ty r e q u i r e m e n t s . With the se lect ion of the Liquid Metal Fas t B r e e d e r Reac to r (LMFBR) sy s t em by the Commiss ion and the i r decis ion to concent ra te the i r major r e s o u r c e s on the development of th is concept, the main emphas i s of the phys ics p r o g r a m m e is in this a r e a with l e s s e r effort cu r r en t ly on s t e a m -and gas -coo led fast r e a c t o r s y s t e m s .
The or ig ins of the fast r e a c t o r phys ics p r o g r a m m e in the United States of Amer i ca date back to the ve ry ea r ly days of nuclear energy and a r e int imately connected with ea r ly fast r e a c t o r feasibil i ty expe r imen t s and demons t ra t ions . The cons t ruc t ion and opera t ion of the Clementine fast r e a c t o r at Los Alamos in 1946 was an ea r ly effort to demons t ra t e some technica l a spec t s of fast r e a c t o r technology. The complet ion and o p e r a tion in 1951 of the f irs t expe r imen ta l b r e e d e r r e a c t o r , EBR-I , demons t r a t ed the feasibil i ty of opera t ing a fast r e a c t o r sys t em with a net breeding gain, and provided important information on operat ing s tabi l i ty and cont ro l . E B R - I opera t ion s t a r t ed with 235U-fuelled c o r e s and culminated with a co re of plutonium fuel. The in te res t in fast b r e e d e r r e a c t o r s for power product ion led d i rec t ly to r e s e a r c h and development in support of the second exper imenta l b r e e d e r r e a c t o r , EBR-1T. Having demons t ra t ed the technica l feasibil i ty of breeding under power producing condit ions, EBR-II is now being used p r i m a r i l y as a fast flux i r r ad ia t ion facility in support of our fuel development p r o g r a m m e .
The Enr ico F e r m i Fas t B r e e d e r Reac to r (FERMI) cons t ruc ted at Monroe, Michigan, by Atomic Power Development Assoc ia tes (APDA) and opera ted by the Power Reac to r Development Company (PRDC) has l ikewise made significant contr ibut ions to es tabl ishing fast power r e a c t o r technology. The Los Alamos Molten Plutonium Reac tor (LAMPRE) has contr ibuted to the feasibil i ty of opera t ing fast r e a c t o r s y s t e m s with molten plutonium fuels.
Many of the exper imenta l techniques and analyt ical methods now in use in fast r e a c t o r physics applicat ions were developed and tes ted as pa r t of the or ig inal Manhattan P ro jec t . The t h e r m a l r e a c t o r development p r o g r a m m e s and the in te rmedia te spec t rum r e a c t o r work have made s ig nificant contr ibut ions. F o r example , the SN method used for t r anspo r t calculat ions was one of s e v e r a l explored and developed at the Los Alamos Scientific Labora tory (LASL) long before the study and design of l a rge fast b r e e d e r r e a c t o r s , as we know them today, began. Simultaneously, the work leading to the routine application of mult igroup methods was developed at the Knolls Atomic Power Labora tory . Many publications on th is important method date back to the ea r ly 1950s. Similar ly , ea r ly work on fast c r i t i ca l exper iments was c a r r i e d out at Los Alamos with the Topsy, Popsy, Jezebe l , Godiva and re la ted a s s e m b l i e s and provided data on the bas ic p r o p e r t i e s of r e a c t o r s with ve ry fast neutron spec t r a .
The ea r ly contr ibut ions to fast r e a c t o r physics from these fast r e a c t o r expe r imen t s , as well as o ther r e s e a r c h and development not pa r t of an in tegrated fast r e a c t o r p r o g r a m m e , provided a valuable and substant ia l background upon which to base a future p r o g r a m m e .
With the growth of the t h e r m a l power r e a c t o r indust ry and i ts potential of economic compet i t iveness with fossi l fuels, the Atomic Energy Com-

SM-101/60 51
mission (AEC) directed its attention to advanced concepts including fast breeder reactors as the next step in the utilization of the country's energy resources. The report "Civilian Nuclear Power - A Report to the President-1962" gave strong impetus to the organization of a national fast breeder reactor development programme in which fast reactor physics is an important basic ingredient.
Considerable study and effort was devoted to a survey of the status of the fast reactor physics work in the United States of America and other countries, and to identifying and analysing the technical problems that must be solved in support of the national fast breeder reactor programme. Also included in the survey were studies on how best to utilize the technical and industrial resources in the United States in accomplishing this work and in identifying the facilities which would be needed to serve as the "tools. "
The studies resulted in a report which identified a number of areas requiring the initiation of new work or the augmentation of existing efforts, and formed the basis for the AEC-supported research and development work during the past several years.
The aim of the research and development programme in reactor physics is to provide a sound basis for the large-scale commercial exploitation of fast breeder power reactors, beginning in the 1980s. The achievement of power at low cost requires large plant sizes (about 1000 MW(e) and optimum performance of all components. This will be approached by way of demonstration plants of lower power (about 300 MW(e)). These will be built and operated with less stringent technical requirements in the 1970s.
This two-step objective, defined by time, plant size, and graduated technical sophistication permits division of the research work into short-term and long-term categories. The short-term objectives are characterized by requirements that ensure the development of a core design technology adequate for demonstration reactors in the early 1970s; and long-term objectives by the capability to produce, by the early 1980s, the high degree of economic optimization of reactor cores demanded for commercial applications without sacrificing safety requirements.
The LMFBR Program has already resulted in authorization to build or modify a number of facilities in support of programme objectives. These include the Oak Ridge Linear Accelerator (ORELA), the Argonne Fast Neutron Generator (FNG), the Zero Power Plutonium Reactor (ZPPR), the modifications to the Zero Power Reactors VI and IX (ZPR-VI and IX), and conversion of EBR-II to a fast flux irradiation facility.
The first reactor project arising out of the fast reactor programme is the design and construction of the Fast Flux Test Facility (FFTF) by the Pacific Northwest Laboratory (PNL). Committment to the design of the first demonstration power plant will probably be made by 1970. Readjustments to the physics programme to provide physics support to these projects will be made as needed.
The recognition of the need for planning for the extensive and difficult technical problems, which must be solved to achieve the goal of safe, economical and reliable fast breeder reactor power plants, led to the establishment of the LMFBR Program Office at Argonne National Laboratory (ANL). This office is staffed with technical experts in the various
1 Reactor Physics Efforts Required in Support of the Fast Breeder Development Program, WASH-1066.
52 LOEWENSTEIN and ZARTMAN
discipl ines for the purpose of giving technical advice and a s s i s t ance to the Division of Reactor Development and Technology of the USAEC in the planning, co-ordinat ion and evaluation of technical ac t iv i t ies of the LMFBR P r o g r a m . The P r o g r a m Office is continuing the e a r l i e r physics review by incorporat ing the output of the var ious l abo ra to r i e s in the United States and abroad and by factoring in the technical input and r equ i r emen t s from United States industry . The P r o g r a m Office is also developing the in terac t ions between physics and o ther discipl ines such as safety, cont ro l and ins t rumenta t ion, plant s y s t e m s , fuel cyc les , fuels and m a t e r i a l s , and core design. A rev i sed and updated Fas t B r e e d e r Reactor Phys ic s P r o g r a m Plan will be i s s u r e d during 1968.
II. MAJOR FAST REACTOR DESIGN PROBLEMS
The major objective of the fast r e a c t o r physics p r o g r a m m e is to develop re l iab le methods for nuc lear design and to fully unders tand the neutronic behaviour of the r e a c t o r co re under al l operat ing condit ions. The neutronic and re la ted p a r a m e t e r s of an LMFBR or other fast b r e e d e r r e a c t o r in e i ther fu l l -scale or demonst ra t ion s y s t e m s cannot now be p r e dicted within l imi ts sufficiently well defined for opt imum economical p e r formance . Therefore , cu r r en t and near - fu ture r e a c t o r designs mus t be flexible enough to accommodate some degree of uncer ta in ty even though a fairly detailed engineering mock-up is per formed. Providing for such flexibility, and at the same t ime ensur ing safe, re l iab le r e a c t o r p e r formance , will prevent the at tainment of the des i red economical fuel ut i l izat ion in the ea r ly designs. Ult imately, however, as be t t e r nuc lear data and verif ied analyt ical techniques become avai lable , i nc reased confidence in predic t ive methods used for nuc lear design should c o r r e c t th is deficiency.
The major physics p rob lem a r e a s and the objectives for r e a c t o r s such as the Fas t Flux Tes t Faci l i ty , an ea r ly demonst ra t ion plant, and a l a r g e r e l ec t r i ca l capaci ty fast b r e e d e r r e a c t o r sys t em a r e somewhat different.
The major p rob lems for. the Fas t Flux Tes t Faci l i ty a r e p r i m a r i l y those assoc ia ted with the design for maximum fast flux, the maintenance of constancy of neutron flux throughout r e a c t o r operat ing cyc les , and the provis ion of flexibility to accommodate a wide var ie ty of tes t i r r ad ia t ions . Some unique neutronic design p rob lems a r e associa ted with the split conical core concept of the re fe rence design. These will r equ i re extensive c r i t i ca l exper iments for confirmation.
The demonstra t ion and l a r g e - s c a l e power r e a c t o r s have p rob lems assoc ia ted with the management of fuel and with the la rge s ize of the c o r e s . F o r the ea r ly r e a c t o r s , reasonable predict ion of cr i t ica l i ty , the power dis tr ibut ion and changes of power dis tr ibut ion with fuel burn-up a r e needed. As one designs l a r g e r r e a c t o r s , dynamics p rob lems dealing with spat ia l effects and the potential influence of coolant react iv i ty in an abnormal si tuation become m o r e pronounced than they a r e for the ea r ly p lants . The abil i ty to predic t confidently the t ime-dependent react iv i ty of core configurations that might resu l t from abnormal operat ions or malfunctions is r equ i red for safety ana lyses .
The understanding of the dynamic behaviour of l a rge LMFBR r e a c t o r s r e q u i r e s improved methods to desc r ibe the kinetics of such s y s t e m s , p a r -

SM-101/60 53
ticularly those systems having relatively weak neutronic coupling from one side of the core to the other. Also needed is a more accurate knowledge of the various feedback mechanisms and their effect upon the reactor operation. Similarly, the change in the interaction of relatively separate modular cores as a function of changes in the reactor core and blanket of each module with operation requires detailed study.
In the design of reactor control systems a number of problems arise, such as the specification of reactivity requirements, control rod mechanisms, composition, and the monitoring of the reactor flux. Self-shielding of control rods, while conceptually understood, needs to be explored for routine design considerations. The development of a reliable criticality meter for on-line computer control is needed. These are technical problem areas for physics and other design disciplines.
The design of optimum shielding has been and continues to be a problem for fast reactor designers. Shielding is not generally a question of 'conceptual feasibility; it is technically possible to shield practically any configuration. However, the economic optimization required for commercial plants makes it necessary to improve the accuracy of shielding calculations. Quantitative data on neutron and gamma interactions with structural components and clad materials in the reactor are needed to provide information on the ultimate component and clad lifetimes.
The burn-up of the fissile and fertile materials in the core and blanket, with the accompanying transmutations and fission products, produces changes in the interactions between the core and blanket. These changes result in altered criticality requirements, reactivity coefficients and power distributions which must be understood and be predictable. It should be noted that the approach to a routine or equilibrium operating fuel cycle will be strongly influenced by the isotopic content of the initial loading. Improved fuel burn-up codes for the precise prediction of reactor performance during core lifetime are needed.
The solution of major fast reactor design problems can be obtained in a number of ways; one is by demonstration in a high-flux high-temperature environment. The Southwest Experimental Fast Oxide Reactor (SEFOR), currently under construction by the General Electric Company, is an example of such a reactor experiment. This project is an example of international co-operation in the physics programme; it is also a major technical undertaking in the fast reactor programme as a precursor to a larger power reactor. The physics measurements that will follow reactor start-up and operation at power are expected to provide valuable demonstrations of steady state and transient feedback parameters, particularly the effective Doppler reactivity, and contribute substantially to the confidence with which the physics problems are understood and solved in the design.
III. THE FAST REACTOR PHYSICS PROGRAMME
The major parts of the current and future fast reactor physics programme include: (1) Cross-section measurements, sensitivity studies, compilations, and evaluations, (2) neutron spectrum measurements, (3) critical experiments mainly on the Zero Power Reactors (ZPR-III, VI, IX, and ZPPR), (4) development of theoretical methods for nuclear design,

54 LOEWENSTEIN and ZARTMAN
and (5) in te rd isc ip l inary work including that to help guide subsequent phys ics r e s e a r c h and development.
A. C r o s s - s e c t i o n m e a s u r e m e n t s
A significant pa r t of the United States fast b r e e d e r phys ics p r o g r a m m e is devoted to bas ic neutron c r o s s - s e c t i o n m e a s u r e m e n t s . The re a r e t h r ee major efforts in th is p r o g r a m m e devoted p r i m a r i l y to meet ing LMFBR c r o s s - s e c t i o n r e q u i r e m e n t s . The faci l i t ies uti l ized or to be u t i l ized by these efforts a r e : (1) The R e n s s e l a e r Polytechnic Insti tute (RPI) Linac; (2) the Oak Ridge National Labora to ry (ORNL) 3.0- , 5 .5- , and 7.5-MeV Van de Graaff g e n e r a t o r s and e lec t ron l inear a c c e l e r a t o r (ORELA); and (3) the ANL 3.0-MeV Van de Graaff gene ra to r and 8-MeV Fas t Neutron Genera to r (FNG). In addition to these efforts , t he re a r e s e v e r a l o ther United States m e a s u r e m e n t p r o g r a m m e s , not p r i m a r i l y devoted to meet ing LMFBR r e q u i r e m e n t s , that have provided significant amounts of data u s e ful to r e a c t o r des igners in the pas t and a r e expected to provide fur ther contr ibut ions of th is type to r e a c t o r technology in the future. These include, among o the r s , the work of LASL using l a rge , underground, single pulse sou rce s ; work at un ive r s i t i e s such as Columbia and Duke; work by indus t r i a l groups such as Genera l Atomic and Texas Nuclear Corpora t ions ; and also work in other physics p r o g r a m m e s at ORNL, Brookhaven National Labora to ry (BNL), ANL, and L i v e r m o r e Radiation Labora to ry (LRL).
The work under way at RPI at p r e sen t is concentra ted on capture c r o s s - s e c t i o n m e a s u r e m e n t s on a wide va r ie ty of m a t e r i a l s , including sepa ra t ed isotopes of Fe , Ni, W, Pb , Al and Na. M e a s u r e m e n t s under way by ORNL, in co-opera t ion with RPI , include the Pu cap tu re / f i s s ion ra t io (alpha at l e s s than 1 keV). ORNL is a lso per forming m e a s u r e m e n t s of the ra t io of 238U capture 2 3 5U fission in the energy range 0.1-1 MeV, and the e las t ic and inelast ic sca t t e r ing c r o s s - s e c t i o n s for Fe and Na in the energy range > 4 MeV. At ANL e las t ic and inelast ic c r o s s - s e c t i o n m e a s u r e m e n t s a r e being made on a wide va r ie ty of s t r u c t u r a l and cont ro l m a t e r i a l s , in the energy range 0.3-1.5 MeV.
A.t p resen t a significant effort is devoted to the complet ion of the ORELA and FNG faci l i t ies and the development of spec ia l data-handl ing and ana lys is s y s t e m s . The ORELA, for example , is scheduled for routine opera t ion in September 1968 and the ANL Fas t Neutron Genera to r (FNG) for operat ion in September 1969. A data acquisi t ion sys tem for ORELA is being assembled and efforts a r e under way to complete the specif icat ions of an on-l ine immedia te analys is sys t em with light pen and display capabi l i t ies for use with the ORELA. An immedia te da ta -ana lys i s sys t em complete with l ight-pen capabi l i t ies has recent ly been developed for use with the ORNL Van de Graaff g e n e r a t o r s and has g rea t ly reduced the t ime requ i red for the analys is of e las t ic and inelast ic sca t te r ing data obtained with these faci l i t ies . A data link was recent ly completed and tes ted between RPI and the New York Universi ty (NYU) CDC-6600 computer . This is expected to grea t ly speed the ana lys is of the capture c r o s s - s e c t i o n data at RPI and enable e a r l i e r uti l ization of these data by the r e a c t o r de s igne r s .
With r e g a r d to future plans , a t tempts will be made to obtain much higher resolut ion and accuracy in the energy range below 300 keV. Simultaneous m e a s u r e m e n t s of more than one p a r a m e t e r will be emphasized, e . g . , total cap ture , sca t te r ing , f ission. In the 2-10-MeV energy range ,

SM-101/60 55
elastic and inelastic cross-sections will extend the work at lower energies on fast reactor materials. The plans are best summarized by stating that they are based upon making those measurements, which can be made with the listed facilities, to meet those fast breeder requests listed in EANDC 103 "U", the Compilation of Requests for Nuclear Cross-Section Measurements (June 1967). The highest priority measurements will generally receive the earliest emphasis. In the next five years, an intensive cross-section measurement effort is envisioned.
B. Sensitivity studies
It is difficult to determine precisely what the value is of any single measurement to the development of a fast breeder economy, since definitive answers to this question can easily cost more than making the measurements themselves. Nonetheless, the question is often asked by the measurers . Some attempts have been made to answer this question in terms of available information, experience with various "evaluated" cross-section l ibraries, via analyses of the anticipated FBR design problems, and in terms of the alternative methods which would rely more heavily upon critical experiments and integral methods. Some studies of this type were reported at the Neutron Cross-Section Technology Conference in March 1966 (See USAEC CONF-660303, Books 1 and 2). Other studies will be completed in time for the forthcoming conference on Neutron Cross-Section Technology (Washington, March 1968). Information in this area also will be generated in the data testing programme of the CSEWG, discussed below.
C. Compilation and evaluation
The large quantities of cross-section data points being generated by the various groups mentioned above have produced a host of problems for the reactor physicists who utilize these data. They have been forced to develop automated methods for data storage, retrieval, evaluation, and the production of multigroup l ibraries. A. few years ago, the Sigma Center Information Storage and Retrieval System I (SCISRS-I) format was developed by BNL for storage of experimental neutron cross-section data. The SCISRS-I tape now contains about a million data points.
A cross-section evaluation programme was developed utilizing experienced and capable personnel available at a variety of United States reactor organizations. This programme, co-ordinated by the AEC and the Cross-Section Evaluation Center (CSEC) at BNL, has culminated in the release of the Evaluated Nuclear Data File-B (ENDF/B) library, which was developed by the Cross-Section Evaluation Working Group (CSEWG). Similar efforts will be a continuing part of the future programme and will be effectively carried out through the National Neutron Cross-Section Center recently established at BNL.
Some 50 isotopes are included in the ENDF/B library, which will now undergo extensive testing via calculations of the characteristics of critical assemblies and relatively simple configurations for which reliable integral data are available. Codes have also been developed for operations upon ENDF/B and for converting ENDF/B to multigroup formats for use in the design and analysis codes of the various United States reactor organizations. Write-ups on the evaluations now in ENDF/B and the associated codes are also nearly complete.

56 LOEWENSTEIN and ZARTMAN
Plans include the development of a SCISRS-II data s to rage sys tem which will e l iminate some of the shor tcomings of SCISRS-I and pe rmi t wider use of it. The ENDF/B tapes will be r ev i sed to form a second ve r s ion (after pe rhaps a yea r of test ing) and an evaluated c r o s s - s e c t i o n l i b r a r y for s h i e l ding will be developed which will be compatible with the E N D F / B sys t em now avai lable .
Significant p r o g r e s s has been made in the a r e a of automated evaluat ions . A p r o g r a m m e called SCORE has been developed by Atomics Internat ional (AI), using IBM facil i t ies at Palo Alto, to display data from SCISRS-I or o ther fi les, such as E N D F / B , util izing a l a rge computer on a t i m e - s h a r i n g b a s i s . This p e r m i t s a ve ry efficient in teract ion between an evaluator and the g rea t m a s s of c r o s s - s e c t i o n data, which is s to red on magnet ic t apes . Analysis via l ight-pen over lay techniques and curve-f i t t ing rout ines is thus g rea t ly aided. Vers ion I of the SCORE p r o g r a m m e is completed and is being p r e p a r e d for gene ra l r e l e a s e . P lans in this a r e a include fur ther development of curve fitting techniques and the incorporat ion of mul t i level fitting p r o c e d u r e s into the SCORE sys tem.
D. Neutron spec t rum m e a s u r e m e n t s
Efforts at ANL continue to improve the proton reco i l s p e c t r o m e t e r desc r ibed at the 1966 ANL conference. Measu remen t s a r e made rout inely in the ZPR cri ' t icals using this proton reco i l s p e c t r o m e t e r . S imi la r m e a s u r e m e n t s a r e now being made by AI in the Ep i the rma l Cr i t i ca l Expe r imen t Labora tory (ECEL) to a s s i s t in the analys is of the Doppler m e a s u r e m e n t s made at th is facility.
The use of t ime-of-f l ight techniques for spec t rum m e a s u r e m e n t s is being c a r r i e d out at Genera l Atomic (GA) and RPI using re la t ive ly s imple a s s e m b l i e s of those m a t e r i a l s expected to be uti l ized in b r e e d e r r e a c t o r s . The e lec t ron Linacs at these s i tes a r e used to genera te fast neutron pu l ses within these a s s e m b l i e s . The ea r ly emphas i s in these p r o g r a m m e s has been on the development and cal ibrat ion of de tec to rs and the development of suitable data-handling and da ta -ana lys i s s y s t e m s . Recent m e a s u r e men t s of fast neutron spec t r a from l a r g e a s s e m b l i e s of Fe and 238u have been repor t ed by RPI. Measu remen t s on smal l , sphe r i ca l a s s e m b l i e s of 2 3 5U'and 238U have been repor t ed by GA.
Time-of-f l ight s tudies with s imple sys t ems , in addition to fur ther developing the exper imenta l technique, will also a s s i s t in the ana lys is of bas ic c r o s s - s e c t i o n s and calculat ional techniques . Compara t ive m e a s u r e ment s using the proton reco i l s p e c t r o m e t e r and the t ime-of-f l ight method, especia l ly in the lower energy over lap region a r e planned during the next yea r . P rov i s ion is a lso being made for a t ime-of-f l ight capabil i ty at the ZPR-VI and IX facil i t ies using the ANL Fas t Neutron Genera tor to provide the n e c e s s a r y pulsed neutron source .
E. Cr i t i ca l a s sembl i e s
The l a rges t exper imenta l effort in the United States fast b r e e d e r r e a c t o r physics p r o g r a m m e re l a t e s to p rocur ing in tegra l data using fast c r i t i c a l a s s e m b l i e s . These data a r e needed not only to help develop and check analyt ical methods , but to verify actual core designs through the pe r fo rmance of mock-up c r i t i c a l s . Fo r these purposes , the AEC has

SM-101/60 57
four major facilities at its disposal, utilizes or supports other industrial-owned facilities, and has under review the question concerning whether additional facilities may be needed.
The bulk of the fast reactor physics critical experiment programme has been and will continue to be performed in the four governmentrowned facilities ZPR-III, ZPR-VI, ZPR-IX and the latest and largest ZPPR. The many experiments and mock-up criticals that have been performed in the past on these critical assemblies are well described in the literature. The Proceedings of the International Conference on Fast Critical Experiments and Their Analysis held at ANL in October 1966 include a good summary of the results up to that date. Some of the current and future activities will be described below.
First, in support of our efforts to develop analytical methods and techniques, ZPR-III is engaged in a series of basic, clean plutonium criticals with a broad range of spectra intended to bracket the spectrum range of interest to fast power breeders. These criticals are deliberately made simple to facilitate analytical correlation. During these experiments, the standard critical data are being procured including neutron spectra (using both proton-recoil spectrometry and foil activation techniques), critical mass, flux mapping, fuel and material worths, Doppler effects, sodium void effects, and heterogeneity studies. This series will be interrupted this autumn to permit an extensive programme of criticals to be performed in support of the Fast Flux Test Reactor (FTR) design. The recent basic investigations, identified as Assemblies 48, 48B, 49, and 50, developed general data for plutonium fuelled systems with differing spectra by substituting coolant in the reference configuration (48), with void (49), and with graphite (50). Assembly 48B was used to explore 24(>Pu effects.
ZPR-VI has recently been engaged in extensive studies of the characteristics of a large-scale (2500-litre core) uranium carbide fuelled system. These studies are important not only in themselves for the information they provide on the properties and characteristics of carbide-fuelled fast r e a c t o r c o r e s , but in pa r t i cu l a r because they a r e an in tegra l part of a programme conducted in both ZPR-VI and ZPR-IX designed to test the validity of using zone techniques to reproduce the characteristics of much larger reactor cores. Early results indicate that meaningful measurements can be made in reasonably small zones. The importance of verifying the validity and limitations of zoned-core measurements is obvious in optimizing the utilization of our limited and expensive plutonium critical fuel supplies.
ZPR-VI will soon be used to study an oxide fuelled simulation with ~ 3700-litre core volume. The zoned loadings in ZPR-IX have been used for Doppler reactivity investigations with a variety of neutron spectra. These were adjusted by varying the ratio of 238U to carbon from ~ 0 to 1.4 in a reference composition (Coolant/structure/uranium/carbon =35, 15, 25, 16 vol. %, respectively). Other recent data include importance measurements with californium sources to aid in the interpretation of zoned configurations.
As the planning of our integrated fast reactor physics programme developed it became obvious that insufficient plutonium critical facilities existed to carry out the programme. Accordingly, it was decided to modify the ZPR-VI and ZPR-IX facilities to permit them to conduct ex-

58 LOEWENSTEIN and ZARTMAN
p e r i m e n t s with plutonium loadings up to 1000 kg in s ize . It is expected that these two c r i t i ca l a s s e m b l i e s will be available for plutonium expe r i men t s by this t ime next y e a r .
As the concepts for the l a r g e - s c a l e LMFBR designs developed, it b e c a m e obvious that none of the exist ing faci l i t ies would be capable of handling the l a rge mock-ups n e c e s s a r y for the l a r g e - s c a l e power r e a c t o r s . After cons iderable evaluation and review it was decided that a l a rge wafer - type c r i t i ca l of bas ica l ly the s a m e design as ZPR-III , VI, and IX would bes t s e rve our needs and give us both the s ize r equ i r ed and the flexibility for interchanging our l imi ted plutonium fuel supply between the four faci l i t ies and would pe rmi t i n t e rcompar i son of r e s u l t s , not only with our own c r i t i c a l s , but with those of o ther coun t r i e s . Accordingly, the Zero Power Plutonium Reactor (ZPPR) has been author ized and is under cons t ruc t ion . This facility will be avai lable for plutonium exper imen t s by mid-1968 . It is planned f irst to pe r fo rm some l a r g e - s c a l e bas ic exp e r i m e n t s to check out techniques on l a rge c o r e s where the spec t rum is soft and the s ignals achieved from per tu rba t ion methods a r e expected to be much reduced.
The magnitude of the fuel p r o g r a m m e involved in "s tocking" th is r e a c t o r with fuel and non-f iss i le m a t e r i a l s may be of some in t e r e s t . In o r d e r to be able to analyse with some degree of p rec i s ion the in tegra l data developed from our plutonium c r i t i c a l s , we have ins is ted that a l l the fuel of a given plutonium composit ion be blended to c lose uniformity. The bulk of the fuel (2900 kg) will contain 11.5% 2*0Pu, but a few hundred ki log r a m s of 30% 2 4 0Pu fuel will also be produced to invest igate higher isotope effects and s eve ra l hundred k i lograms of rodded fuel will be produced so that rodded zones can be studied.
As the fast b r e e d e r r e a c t o r s become l a r g e r and the neutron s p e c t r a become softer, it is e s sen t i a l that al l a spec t s of the he terogeneous diffe rences between wafer- type c r i t i c a l s and rodded-type r e a c t o r s be tho r oughly unders tood. Extensive heterogenei ty s tudies will be conducted to insure that the c r i t i c a l exper iments pe r fo rmed in the wafer- type c r i t i c a l s can be in te rpre ted p rope r ly for the p in- type hot sodium r e a c t o r s that will be buil t . Included in these s tudies will be exper iments uti l izing zones of plutonium pins both at ambient and elevated t e m p e r a t u r e s init ially in ZPR-VI / IX facility. Many other s tudies involving va r ious geomet r ic groupings and d rawer a l ignments of f i ss i le , fer t i le , s t r u c t u r a l and coolant m a t e r i a l s , will be pe r fo rmed .
F o r s e v e r a l y e a r s Doppler m e a s u r e m e n t s have been made at Atomics Internat ional (AI) using the E C E L on a wide va r ie ty of fuels and s t r u c t u r a l m a t e r i a l s in spec t r a ranging from a few k i lo -e lec t ron vol ts to s e v e r a l hundred k i lo -e lec t ron vol ts median fission e n e r g i e s . Recent m e a s u r e m e n t s have been completed using Pu samples having va r ious isotopic r a t i o s . Also under study by AI is the effect upon Doppler m e a s u r e m e n t s of samples of m a t e r i a l s which a r e placed in fuelled zones whose t e m p e r a t u r e can be va r i ed .
BNL is gradual ly shifting the emphas i s of i ts work from t h e r m a l r e a c t o r s tudies to fast r e a c t o r s . A Fas t Source (FS) Reac tor has recent ly been completed and will be used for the development of exper imenta l t ech niques and specia l s tudies , such as the effects of heterogenei ty and neutron s t r eaming upon the in te rpre ta t ion and application of plate-type c r i t i c a l m e a s u r e m e n t s .

SM-101/60 59
F. Theory and computational methods
A major United States effort in this area is the development of the Argonne Reactor Computation, the ARC, system, which is being developed on the IBM System 360 Model 50-75 computer complex. This system links a wide variety of computational modules and control programmes so they can operate in a unified manner without human intervention. For a detailed description of this system reference is made to USAEC Report ANL-7332, which will be issued in the near future. In recent months progress has been made in the development of: burn-up and depletion modules, codes to study heterogeneity effects, codes to compute effective fission and capture cross-sections in the resonance region, codes to interpret Doppler measurements, cross-section modules based on the Multigroup Constants Code (MC2), and certain transport and diffusion modules.
Additional computational efforts include: the development of burn-up codes at LASL and Babcock and Wilcox (B & W), space-time dependent kinetics studies at Massachusetts Institute of Technology (MIT), LASL, ANL, and BNL, development of Monte Carlo methods at AI and ANL, and sodium void analyses at APDA. The codes ETOE, ETOM, GAND, ETOG, and ENDRUN have been developed for utilizing ENDF/B data in the various industrial design codes.
Several analytical areas are receiving increasing attention in the United States of America by a number of organizations. These include proper averaging of differential data to produce multigroup parameters, flux synthesis methods and problems related to core melting patterns during large power transients. The BISYN code recently developed at GE is an early attempt to apply synthesis methods to fast reactor analysis and early results are encouraging. Included in the cross-section averaging efforts are those to rapidly and routinely adjust multigroup parameters for energy and spatial self-shielding by expanding upon the work of Bondarenko.
It is anticipated that future efforts will be devoted to the improvement of numerical and statistical methods for handling the transport of neutrons. With the new genera t ion of compu te r s , it is planned to exploit Monte Car lo techniques, for example, in the calculation of reactivity changes caused by changes in temperature or localized removal of coolants. The further development of two- and three-dimensional codes based on transport, diffusion and Monte Carlo methods is anticipated for the solution of burnup, control, and space-time kinetics problems.
G. Interdisciplinary activities
Many applied aspects of the physics research and development require involvement with other disciplines in the LMFBR Program. The 1000-MW(e) LMFBR study programme, commonly referred to as the "1000 MW(e) Follow-Ons, " is being pursued by the Atomics International, Babcock and Wilcox, Combustion Engineering, General Electric and Westinghouse Electric Corporations in co-operation with Argonne National Laboratory. These studies require an evaluation of the physics methods used to define the characteristic neutronic behaviour of various LMFBR concepts. The results of these studies will provide useful guidance to physics research and development.

60 LOEWENSTEIN and ZARTMAN
Another aspect of in te rd isc ip l inary act iv i t ies is the development of codes that couple the va r ious d isc ip l ines . Recent developments include the coupled neut ronics , heat t r ans fe r , and hydraul ics code, FORE-II , by Genera l E lec t r i c and the quas i - s t a t i c excurs ion code, QX-I, by Argonne National Labora to ry . Related code development is being c a r r i e d out by Atomics Internat ional and Pacif ic Northwest Labora to ry . PNL, in conjunction with APDA, is refining some major accident codes based on AX-I, RAC and the Weak Explosion Codes for safety ana lyses . Related to these is development of codes to account for fuel slumping during excurs ions a s input to the major accident codes .
SUMMARY
While at va r ious p laces in this paper r e fe rences a r e made to technica l accompl i shments , these a r e not p resen ted in detai l and a r e given m o r e in the nature of p r o g r a m m e p r o g r e s s repor t ing .
The technical accompl i shments of the United States fast r e a c t o r phys ics p r o g r a m m e a r e r a t h e r widely published. In addition to r e p o r t s and p a p e r s in the technical and profess ional society journa ls , b road dis t r ibut ions is made throughout the world by the AEC Technical Information s e r v i c e s . The Proceed ings of the Internat ional Conference on Fas t Cr i t i ca l E x p e r i men t s and The i r Analysis (October, 1966, Argonne National Labora to ry) , and the Proceed ings of the Br i t i sh Nuclear Energy Society (BNES) (May 1966) a r e compilat ions containing s u m m a r i e s of the United States fast r e a c t o r physics r e s u l t s . The Proceed ings of the Conference on Neutron C r o s s - s e c t i o n Technology (CONF-660303, Book 1 and 2, Washington, D. C . , March 1966), and the Topical Meetings of the American Nuclear Society (Fast Reac tor Technology, San F r a n c i s c o , 1967; Coupled Reactor Kinet ics , College Station, 196 7; and Mathemat ics and Computation, Mexico City, 1967) a r e further s o u r c e s of recent developments .
In the p repara t ion of th is paper we have d iscussed the r e a c t o r physics p r o g r a m m e as though it were l imited to the act ivi t ies and efforts of United States s c i en t i s t s . We have not r e f e r r e d direct ly or indirect ly to the c o n t r i butions from sc ien t i s t s in o ther count r ies . We al l know that much technica l information and many ideas per t inent to fast b r e e d e r r e a c t o r phys ics have c r o s s e d the b o r d e r s of the originat ing coun t r i e s . The United States a p p r e c i a t e s the cons iderable information it has rece ived from the p r o g r a m m e s of o ther count r ies . Indeed we believe that the a r e a of r e a c t o r phys ics i s an appropr ia te one in which the exper ience developed in the va r ious count r ies should be freely exchanged. We look forward to continued co-opera t ion and exchanges of information.

GENERAL DISCUSSION
Review of the USSR fast reactor programme1
N.V.KRASNOYAROV: I propose to give a brief review of the USSR programme for fast sodium reactors. You will of course know that, on the basis of experience acquired with the fast sodium reactor BR-5 and in designing larger reactors, we have begun to develop the BN-350 atomic power station employing a fast neutron reactor of 1000 MW(th) capacity. Since the characteristics of this reactor are given in the literature, I will not dwell on them here.
The various components of the reactor are still at the trial stage, but construction of the reactor building at Shevchenko is nearing completion and assembly of the equipment has begun. The physical characteristics of the full-scale reactor model with a loading of approximately 1100 kg of 235U were tested in the BFS critical assembly.
The subsequent development of higher-pressure reactors with sodium temperatures capable of supplying steam to modern turbines, high burn-up and long intervals between shut-downs for refuelling, has given rise to a number of problems. It is intended that the BOR-60 reactor, now under construction, will clarify and solve some of them. Its characteristics are well known:
(i) Power 60 MW(th) (up to 1100 kW/1); (ii) Sodium outlet temperature up to 580°C; and (iii) Uranium dioxide fuel.
Building and assembly work is now going on in Melekess, and the reactor is due to come into operation in 1968. The Melekess Atomic Reactor Institute is .becoming increasingly involved in work on the use of fast reactors for nuclear power generation.
In our view, the successful introduction of the BN-350 and BOR-60 reactors are the most important objectives for the immediate future in the fast reactor field.
The BR-5 reactor continues to work at its full capacity of 5 MW, using monocarbide fuel. Burn-up in the monocarbide has exceeded 2%. The first core elements with plutonium oxide reached a burn-up of 6-7%. Many test elements are at present also being irradiated. Some of the core elements have developed leaks. Experiments are being carried out to determine that part of the fission product output which differs from the output obtained with oxide fuel. Changes were also observed in the power coefficients. All these problems require further investigation.
The BR-1 reactor was used as neutron source in experiments carried out on the Doppler effect in 238U with sample temperatures up to 2000°K, and the results of these experiments are reported in paper SM-101/63. The reactor is now being re-equipped for carrying out similar Doppler effect measurements, with heating of the medium surrounding the sample..
Measurements of the Doppler effect in the harder spectrum in the BFS core are also under way.
This critical assembly was used to investigate physics problems of reactors with absorbing control rods. Methods were meanwhile developed
1 This presentation and the ensuing discussion took place at the beginning of Session III but is reproduced here because of the nature of the subject matter.
61

62 GENERAL DISCUSSION
for calculating heterogeneous s y s t e m s . Two r e p o r t s p resen ted at th is symposium (SM-101/61 and 62) have dealt with methods of calculat ing the heat r e l e a s e dis t r ibut ion and he terogeneous effects and with a compar i son of the calculated and exper imenta l r e s u l t s .
The purpose of r ecen t work on the BFS has been to clarify the r e a s o n s for d i sc repanc ies between calculated and exper imenta l r e s u l t s on neutron l i fe t ime. In future the BFS will be operated in conjunction with an e lec t ron cyclotron in o rde r to c a r r y out var ious t ime-of-f l ight exper iments and to m e a s u r e the spec t ra of fast r e a c t o r s of varying composit ion. Sodium blocks have been developed for measur ing the sodium void effect. It should be noted that the nuc lear constants , originally accepted on the bas i s of m a c r o - e x p e r i m e n t s on a number of e l ementa ry c h a r a c t e r i s t i c s , a r e showing themse lves more and m o r e open to c r i t i c i s m . A new set of constants is being drawn up, incorporat ing the la tes t developments in nuc lear data. It i s fu r the rmore proposed to define the degree of accuracy needed in establ ishing the group constants , so that the r e a c t o r c h a r a c t e r i s t i c s may be de termined to the requ i red accuracy .
The re is a constantly growing need for effective and economical methods of r e a c t o r calculation in r ea l geomet ry . A cons iderable con t r i bution to methodology has been made by the P h y s i c s Insti tute of Moscow Univers i ty . The genera l ized method of conditional separa t ion of spat ial va r i ab les makes it poss ib le to de te rmine the in tegra l c h a r a c t e r i s t i c s of the neutron field in two-dimensional r e a c t o r s . On the bas i s of synthetic methods , mult igroup p rob lems can be converted into p rob lems involving few groups . F u r t h e r m o r e , a method for solving the kinetic equation in plane mul t i - l aye r geomet ry has been worked out, making it poss ib le to solve the heterogenei ty problem in BFS-type c r i t i ca l a s s e m b l i e s . The development of new economical synthetic methods makes it poss ible to draw up severa l comprehens ive , optimized p r o g r a m m e s .
W . B . LOEWENSTEIN: Could Mr . Krasnoyarov p lease e labora te on the changes in power coefficient observed during operat ion of BR-5?
N . V . KRASNOYAROV: The p re l imina ry information to date is as follows: (i) The fast region of the power effect is found to be nonl inear ; (ii) The reac t iv i ty effects observed for the posi t ive and negative power jumps a r e different.
These phenomena had not previously been noted during invest igat ion of a r e a c t o r with f resh monocarbide fuel.
A. FERRARI: Severa l speake r s have made re fe rence to a t t empts at wri t ing th ree -d imens iona l diffusion codes . I wonder whether such an unwieldy code is r ea l ly n e c e s s a r y , and whether synthesis methods alone would not be sufficient in dealing with the th ree -d imens iona l p rob l ems which a r i s e in p r a c t i c e .
B . I . SPINRAD (Chairman) : Three -d imens iona l synthes is codes have been successful ly used for a var ie ty of p rob l ems , but one must be careful to prove the method for each sys tem to which synthes is i s applied. Such a method depends on minimizing a var ia t ional functional, but a t t empts to find a theore t ica l functional which min imizes var ia t ions in flux shape have met with no s u c c e s s . A reac t iv i ty c r i t e r ion is there fore usual ly employed, and it i s n e c e s s a r y to verify for each r e a c t o r that the minimizat ion of reac t iv i ty e r r o r gives a p roper flux shape. This is done by comparing

GENERAL DISCUSSION 63
the r e s u l t s of synthes is calculat ions with a number of c r i t i ca l exper i men t s , or exact t h ree -d imens iona l ca lcula t ions , on s y s t e m s of sufficient geomet r i ca l complexity to cover the r equ i red r ange .
F.-STORRER: We used an energy synthes is code to deal with the in ter face between two core reg ions with s i m i l a r spec t r a , a s r epor ted to the Argonne National Labora to ry (ANL) Conference of October 1966, and the reac t iv i ty we found was in perfect ag reement with that calculated by an a l te rna t ive method both m o r e exact and m o r e cost ly in computer t i m e . I should be in te res ted to hear which synthes is codes — be they space or energy methods — a r e being studied at p resen t in the USSR.
M . F . TROYANOV: Synthetic methods and var ious appl icat ions thereof a r e cur ren t ly under study in the Engineer ing and P h y s i c s Insti tute of the USSR. A neutron-f ield synthes is in two-dimensional r , z geomet ry has been worked out, enabling the in tegra l c h a r a c t e r i s t i c s and neutron balance in a mul t i -zone r e a c t o r to be re l iably predic ted . This method of calculat ion saves substant ia l ly on the t ime needed for the accu ra t e two-dimensional calculat ion, without adverse ly affecting the de te rmina t ion of the in tegra l c h a r a c t e r i s t i c s . A neutron field synthes is in two-dimensional x, n geomet ry (a solution of the kinetic equation) has a lso been c a r r i e d out; we used this var ian t of the method in calculating he terogeneous effects in BFS- type c r i t i ca l a s s e m b l i e s . Final ly , methods of space-energy synthes is have been developed for dealing with two-dimensional p rob lems with a smal l number of g roups . These methods have been published in the collected pape r s of the Engineer ing and P h y s i c s Inst i tute for 1965 and 1966.


NUCLEAR DATA FOR FAST REACTORS
(Session II and Session III, P a r t 1)

Chairmen: S. YFTAH and K.E.J. WIRTZ

NEUTRON CAPTURE AND FISSION CROSS-SECTION DATA IN THE keV ENERGY RANGE Some new measuremen t s and renormal iza t ions*
K.H. BECKURTS, D. KOMPE, H.O. MENLOVE. AND W.P. PONITZ INSTITUT FtfR ANGEWANDTE KERNPHYSIK, KERNFORSCHUNGSZENTRUM KARLSRUHE, KARLSRUHE, FEDERAL REPUBLIC OF GERMANY
Abstract
NEUTRON CAPTURE AND FISSION CROSS-SECTION DATA IN THE keV ENERGY RANGE: SOME NEW MEASUREMENTS AND RENORMALIZATIONS. Some new measurements of capture cross-section have been performed using the 3-MeV Karlsruhe pulsed Van de Graaff accelerator. A major effort was undertaken to measure the absolute gold capture cross-section as a function of energy between 25 and 500 keV in order to establish a reliable standard for capture and fission cross-section renormalizations. To do this, a well-collimated pulsed beam of monoenergetic neutrons produced in a thin Lithium target at 80° to the proton beam direction was used to irradiate a 0.1-cm thick sample in the centre of a large liquid scintillator which detects the prompt capture y-rays. The relative neutron flux was measured with a ' grey neutron detector' which is relatively insensitive to neutron energy variations in the energy range of these measurements. The gold cross-section shape was normalized at 30 keV to an absolute value fitted from various recent experiments.
By a similar technique, the capture cross-section of z®{] in the energy range 25 - 500 keV was determined. Furthermore, cross-sections of several medium and heavy weight nuclei which may be of some interest to reactor design (Nb, Mo, Cs, Hf, Ta, W, Re) were determined by a time-of-flight method, using our gold value as a standard. The data are presented and some implications of the new data on reactor calculations, are reviewed.
1. INTRODUCTION
Radiative neutron capture is one of the most important nuclear processes relevant to the neutron balance in fast reactors. There has thus been a great effort in many laboratories to measure capture cross-sections, particularly in the keV energy range. Nevertheless, the situation is still far from satisfactory. The main regions where data are incomplete, as discussed recently within international data committees, are the following:
(a) Although cross-section ratios can be measured with sufficient accuracy in many cases, the deduction of absolute cross-section values has in most cases not been carried out consistently owing to the lack of a proper and internationally recognized standard cross-section.1 This holds particularly in the energy range 10 - 100 keV where flux measurements (and thus standard cross-section determinations) are difficult to carry out.
* Work performed within the association in the field of fast reactors between the European Atomic Energy Community and Gesellschaft fflr Kernforschung m.b.H., Karlsruhe.
1 This is also true for fission cross-sections.
67

68 BECKURTS et al .
(b) For some of the most important reactor materials, especially the fertile and fissile nuclei, a very high accuracy — in some cases down to ± 1% - is required. Even if standard cross-sections were known to this accuracy, these requests could not always be fulfilled since the cross-section ratio measurement methods are not that accurate.
(c) Cross-section ratio measurements on very small samples or on highly radioactive materials are difficult to perform and require the development of special techniques. Similarly, accurate measurements on nuclei with small capture cross-sections, e.g. lighter structural materials like Fe, cannot be carried out easily.
(d) There is finally a number of nuclei for which adequate measuring methods as well as samples are available but which hitherto have just escaped attention. To these belong many stable fission products and control materials.
It is obvious that these problems, whose solution might require a total effort of several hundred man-years, can only be tackled by close international co-operation between many laboratories. Some first steps in this direction have recently been taken by the European-American Nuclear Data Committee.
To contribute to some of the above problems, a programme has been launched at the Karlsruhe 3-MeV pulsed Van-de-Graaff accelerator which will be briefly reviewed in this paper. So far, a large part of our effort has been spent on the standardization problem where we have remeasured the absolute capture cross-section of gold between 25 and 500 keV to an accuracy of about ± 5%. We propose to use this cross-section cur,ve as a standard for further renormalizations of capture and fission cross-sections. The results of this experiment are described in section 2. Our method for determining the gold cross-section is rather tedious and time-consuming, yet we believe that some cross-sections like 238U capture and 235U fission are so fundamental to fast reactor calculations that they warrant a direct determination by essentially the same method to avoid additional er rors due to a cross-section ratio measurement. As a first step along these lines, we have redetermined the 238U capture cross-section in the energy range 25 - 500 keV (section 3). The standard time-of-flight technique using a large liquid scintillator tank for capture cross-section measurements has also been further developed in our laboratory; some results on heavy structural materials are given in section 4.
In conclusion, section 5 contains some of the implications of these new data for reactor calculations and some general comments on future capture cross-section work.
2. ABSOLUTE CAPTURE CROSS-SECTION OF GOLD
This experiment was performed in two steps. First, the shape of the cross-section curve between 25 and 500 keV was measured by a new technique. Then, this relative cross-section curve was normalized at 30-keV neutron energy, using results from several independent absolute measurements.

SM-101/9 69
The experimental set-up for the shape measurement is shown in Fig. 1. A thin gold foil was irradiated by a collimated beam of nearly monoenergetic neutrons, obtained at an angle of 80° from the 7Li(p, n)7Be reaction (target thickness: 12-18 keV for low energies, 12-40 keV in the middle energy region and 40-100 keV for high energies). The gold sample was located within a 1.1-m-diam. large liquid scintillator tank [1, 2] which was used to determine the relative capture rate. The pulsed-beam - time-of-flight method was used for background discrimination. The neutrons transmitted through the gold foil were thermalized and totally absorbed in a 'grey neutron detector1 [3]. This is a paraffin pile, size 60 X 60 X 60 cm, with a 10 X 10 X 30 cm beam entrance hole, located at the end of the neutron path. Capture of thermalized neutrons by hydrogen leads to the well-known 2.2-MeVy-ray; since y-ray absorption in paraffin at this energy is small, the photopeak counting rate of a Nal (Tl) detector located near the pile is very nearly proportional to the capture rate and thus to the impinging neutron current. This detector has to a first approximation an efficiency curve which is independent of neutron energy; to a higher approximation small deviations from the flat efficiency curve exist which can, however, be calculated [3].
Lead Shield Large Liquid Scintillator
FIG. 1. Experimental arrangement for cross-section shape determination.
The relative capture cross-section follows directly from the counting rate of the large liquid scintillator tank and from the corrected counting rate of the grey detector. However, some slight corrections have to be applied in addition: relation between average cross-section and cross-section at an average energy; resonance self-shielding and multiple scattering within the gold foil; efficiency change of the large liquid scintillator whose bias was set at about 3.6-MeV photon energy with neutron energy; air scattering of neutrons between the gold foil and the grey detector; appearance of the second neutron group from the 7Li(p, n) 7Be reaction above ~ 380-keV neutron energy. These corrections, together with a detailed discussion of the experimental approach, will be published elsewhere [4].
The absolute normalization of the relative cross-section curve was performed at 30-keV neutron energy. Table I lists the results of several

70 BECKURTS et al.
TABLE I. GOLD CAPTURE CROSS-SECTION VALUES AT 30 keV
Method
Flux det .
Associated activity
Integral (MnSC>4-bath)
Relative (23s u-fission)
Relative (1 0B-n,a)
Shell transmission
Capture rate det .
Activity
Activity
Activity
Prompt capture y-rays
Reference
[8,18]
[18 - 20]
[21]
[22 - 24]
[25 - 28]
Average value
(mb)
598 ± 30
596 ± 20
608 ± 40
587 ± 21
614 ± 37
more recent determinations at this energy from five independent methods. The table includes data taken with Sb-Be sources which were transformed to 30 keV assuming En = 22.8 keV [5] for Sb-Be and a cross-section ratio of 0.915 ± 0.040 [2]. The fitted best value from all these results is
on y(Au) (En = 30 keV) = 0.596 ± 0.012 barn.
The gold capture cross-section as a function of energy, normalized with the above value, is shown in Fig. 2.
£ 030
K k
+ >+ r •k^
^
,97Au(av) ^Au
l ^ ^ i - k j H^ N MN
^ \
30 40 50 60 70 60 90 100 150 200 300 400 500 600
Neutron Energy [keV] * -
FIG.2. Gold capture cross-section as a function of neutron energy.
We have carried out a further independent determination of the gold capture cross-section shape in the energy range 10 - 150 keV. A time-of-flight method with neutrons from a thick 7Li target was used. The capture rate in a gold foil was measured with the large liquid scintillator tank, while the relative neutron flux was simultaneously determined with

SM-101/9 71
a thin boron-10 slab viewed by Nal (Tl) scintillators or, in a different run, by a Li glass detector. Both detectors were placed at the exit of the large liquid scintillator tank. The boron-10 n, ay cross-section as recommended by Spaepen [6] and the 6Li n, a cross-section from the Breit-Wigner fit of Bergstr5m et al. [7] were used for the calculation of the neutron detector efficiencies. In these calculations, corrections for multiple scattering of neutrons within the detector were applied. The measurement yielded however only the relative shape of the gold cross-section since no effort was made to determine the absolute efficiency of the neutron detectors. The shape curves were again normalized to a value of 596 millibarns at 30 keV. The resulting curves are compared to the grey detector results in Fig. 3. Note that the values found relative to boron and to lithium agree very well among themselves. Since they were taken with higher resolution than the grey detector data they show some structure. On the average, they agree very well with the grey detector data, at least below 80 keV. The deviations above 80 keV are small and well within the limits of experimental error .
V H I '"***-,
*•**( V
*», 6B
" * ^ lr
90 SO 70 80 90 100 400 500 600
Neutron Energy CkeVl
FIG. 3. Comparison of gold cross-section shape as measured with grey detector (-scintillator (O) and 10B slab (A).
-), 6Li glass
A detailed comparison of our new standard cross-section as shown in Fig. 2 with the results of previous experiments is given in Ref. [4]. Briefly speaking, there is good agreement of the shape with most of the recent determinations by various methods. There is also good agreement in the absolute values over the whole energy range with a recent experiment by Harris et al. [8 ] which was performed by an absolute method and is, like ours, independent of reference cross-sections. On the other hand, there is a striking disagreement in the absolute cross-section values above 100 keV with several other experiments which are based essentially on a measurement of the ratio tfniy
Au/crn>f u. This holds in particular for the recent experiments of Barry [9] and of Vaughn et al. [10] which are in themselves consistent but yield, when evaluated with White's [11] 235U fission cross-section, a gold capture cross-section which is always about 15% higher than our results.

72 BECKURTS et al.
3. 238U CAPTURE CROSS-SECTION
The 238U n, y cross-section could be determined by measuring the value relative to gold and subsequent normalization, using the data of Fig. 2. Since this would introduce several errors , i .e . the errors in the
u 4) </> I
(A M O O
09 08 Q7 06 05 0.4
03
02
01 Q09 008 007 006
20 40 60 80 100 200
Neutron Energy CkeVJ—
400 600
FIG.4. 238U capture cross-section as a function of neutron energy.
1 t 1 c k-o X I
c o "o 0>
</>
to 09 08 07 06 05
04
03
Q2
009 008 Q07 0.06
"-• - . .b""^ c '—
N
!%^*v
'*N
,
"N
v.
Stehn et ol.ri5] Parker 1131 Schmidt [14]
v v V
V , "T ' i
20 40 60 80 100 200
Neutron Energy [keVJ -400 600
FIG. 5. Comparison of experimental values of 2MU capture cross-section with compiled values.
standard cross-section and in the ratio measurement would combine, we have determined it by the same method as described for gold in the previous section. The normalization of the shape curve which had been found by the grey detector - large scintillator tank method was again done at 30 keV. Therefore, an absolute cross-section measurement was performed at the 7Li(p, n)7Be threshold [12], using an activation method and a neutron flux determination by the associated 7Be activity method.

SM-101/9 73
The induced 239Np activity (Tj - 2.346 d) was determined by two independent methods (y-ray counting with a 30 cm3 Ge(Li) detector; 106-keV y-X-ray coincidence counting method), the detectors being calibrated by using an absolutely calibrated ^ A m source. The result at 30 keV (i .e. for a beam with an average energy of 30 keV and a distribution with a half-width of 15 keV) is oa>y
mi] (En = 30 keV) = 0.479 ± O.OHbarn. The mXJ capture cross-section as normalized with this value is shown in Fig.4. The error is about 5% at the lower energy limit and increases to 9% at the upper end.
In Fig. 5 we compare our results with evaluated data as taken from recent compilations of Parker [13], Schmidt [14] and Stehn [15]. The agreement with Stehn1 s data below 100 keV is quite satisfactory; our data are distinctly lower than those of all three compilers in the energy region above 100 keV. The implication of this deviation for some reactor calculations will be discussed in section 5.
4. SOME RENORMALIZATIONS OF CAPTURE CROSS-SECTION DATA
Using a time-of-flight method and the large liquid scintillator tank, we measured the capture cross-section, relative to gold, for a number of medium-weight and heavy nuclides in the energy range 10 keV - 150 keV. Preliminary data for Ta, W, Mo, In, Re, Hf, Cd, Ag, Pd, Nb and Cs were presented at the 1966 IAEA nuclear data conference [2]. These data have now been re-evaluated, using the new gold capture cross-section data.2 Re-evaluated data for those nuclei which may be of some interest for reactor calculations are shown in Fig. 6. The data are corrected for resonance self-shielding and multiple scattering. Their accuracy (including the standard cross-section error) is about 10% over the whole energy range.
Preparations for further measurements of relative cross-sections, especially for stable fission products and for lighter structural materials like iron are being made at our laboratory.
5. SOME IMPLICATIONS OF THE NEW DATA FOR FAST REACTOR CALCULATIONS.
To check the influence of the new 238U capture cross-section on reactor parameters, the new data were converted into group constants and included on a trial basis into the KFK-SNEAK-26-group cross-section set [16], This set is based on Schmidt's cross-section curves [14], As can be seen from Fig. 5, the Schmidt data are distinctly higher than ours above 100 keV; there is a corresponding decrease of the group cross-sections in this energy range.
The modified set was used for calculations of the SNEAK 3A-1 critical assembly [17], a 670 litre steam-cooled 235u/238u system. Whereas the
2 Strictly speaking, the measured cross-section ratios were evaluated using a gold cross-section curve intermediate between the two sets of curves in Fig.3; the difference between this and the grey detector result of Fig. 2 is, however, unimportant.

74 BECKURTS et a l .
Q7
06
05
QA
03
02
01
. •.
. a
*<*,
* "« *<
1
S
*•. *•<
Nb
* • • •
••
•••#
• . . > *S.
V • • ^
* * * • - • «
Hf
'•.. *•
03
02
0)
007
006
•
.. «;
"VA *•*%
'• *•• \ •f
Mo
***• *m
*v' *s
•i
- « . „ \ t
*•_ , ••(
Ta
" " • • .
•. * -' *%
V V •%# »•
-• ».
Cs
'"'..
. • • ' *v-
—. '.. ••
„
w
"•.
30 40 50 60 706090100 200 10
Energy IkeV]
30 40 50 60 70 8090100
t .
ion
V. (0 SS
OJ
10 09 08 07
06 05 04
Re —r— .
20 30 40 50 60 70 8090100
Energy[keVl • —
FIG.6. Capture cross-sections for Nb, Hf, M o . T a , Cs, W and Re.

SM-101/9 75
unmodified KFK-SNEAK-set slightly underestimates reactivity (keff= 0.997 for a system of critical size), the modified data increase the multiplication factor by about 1%. At the same time, they lead to a reduction of the conversion ratio by about 5%. It is possible that the increase in reactivity would be partly compensated if the 235U fission cross-section were reduced by normalizing measured gold capture to 235U fission cross-section ratios by using our new gold cross-section standard. Such investigations are at present under way but it seems premature to draw any conclusions.
In any case, we feel that it is highly desirable to discuss the problems of keV capture and fission cross-section normalizations in close connection with criticality calculations. In particular, interpretations of measurements on pulsed subcritical systems where the ratio of absorption to leakage can be arbitrarily shifted, may be helpful.
A C K N O W L E D G E M E N T
The authors would like to thank Dr. H. Kttsters for performing the calculations mentioned in section 5 and for helpful discussions.
R E F E R E N C E S
KOMPE, D . , to be published.
KOMPE, D . , in Nuclear Data for Reactors (Proc. Conf. Paris, 1966) 1, IAEA, Vienna (1967) 513. PONITZ, W.P. , Nucl. Instrum. Meth. (In press).
PONITZ, W.P. , KOMPE, D . , MENLOVE, H.O. , submitted for publication J. nucl. Energy. RYVES, T .B. , BEALE, D.W., Int. J. appl. Radiat. Isotopes 18 (1967) 204.
SPAEPEN, J . , in Nuclear Data for Reactors (Proc. Conf. Paris, 1966) 1, IAEA, Vienna (1967) 241.
BERGSTROM, A. , et a l . , CCDN-NW 3 (1966) 7.
HARRIS, K.H. , et a l . , Nucl. Phys. 69(1965) 37. BARRY, J .F . , J. nucl. Energy A/B 18 (1964) 49. VAUGHN, F.J . , COPP, K.L. , GRENCH, H.A. , MENLOVE, H.O. , Bull. Am. Phys. Soc. 11. (1966) 753. WHITE, P .H. , J. nucl. Energy A/B 19(1965) 325. MENLOVE, H.O. , PONITZ, W.P . , submitted for publication Nucl. Sci. Engng. PARKER, K., AWRE 0-79/63 (1964). SCHMIDT, J . J . , KFK-120 part I (1967). STEHNJ.R., e t a l . , BNL-325, 2nded . , Suppl. 2, Vol.Ill (1965). KUSTERS, H. , et a l . , these Proceedings, paper SM-101/12. STEGEMANN, D . , e t a l . , these Proceedings, paper SM-101/11. PONITZ, W.P . , J. nucl. Energy A/B 20 (1966) 825. PONITZ. W.P . , in Nuclear Data for Reactors (Proc. Conf. Paris, 1966)1., IAEA, Vienna (1967) 277.
RYVES, T .B . , e t a l . , J. nucl. Energy A/B 20 (1966) 249.
KNOLL, G.P. , PONITZ. W.P. , J. nucl. Energy A/B 21 (1967) 643.
MOXON, M . C . , RAE, E.R., Nucl. Instrum. Meth. 24(1963) 445.
KONKS, V.A. , et a l . , Soviet Phys. JETP 1^(1964) 59.
HADDAD, E., et a l . , EANDC 33 U (1963). BOGART, D . , SEMLER, T . T . . Report NASA TM X-52 173 (1966).
SCHMITT, H.W., COOK, C.W., Nucl. Phys. 20(1966) 202.
BOGART, D . , in Nuclear Data for Reactors (Proc. Conf. Paris, 1966)1, IAEA, Vienna (1967) 503.
FROEHNER, F.H. , ANS-Meeting San Diego, June 1967, Abstr. 9.
76 BECKURTS et al.
DISCUSSION
W. HART: Peter White's fission cross-section measurements for 235U in the 100-keV energy region are quoted as being accurate to about 2 or 3%. What is the corresponding accuracy associated with the 235U fission cross-sections obtained from your measured gold capture cross-sections and reported o{ 235u/ac
Au ratios? K.H. BECKURTS: The accuracy of our gold measurements in that
energy range is about 4-5%. However, if they are compared indirectly, in the manner you indicate, with White's values, the discrepancy between the two is 12%, which is definitely outside the limits of mutual error.
J .L . ROWLANDS: I note that you find that reduction of the 238U capture cross-section results in a 5% reduction in the conversion ratio. We find that a reduction in the 238U capture cross-section causing a 1% reduction in reactivity changes the breeding ratio by less than 1%, in fact.
K.H. BECKURTS: I shall refer this question to Dr. Kusters, who carried out these calculations. I might add, however, that after we changed the 235U fission and capture data using our gold renormalization, the total change in conversion ratio was very small.
H. W. KUSTERS: Our method of handling the replacement of the low PSnitz-Menlove 238U capture data was to introduce them into the SNEAK set, and then to perform a fundamental mode calculation, achieving criticality by buckling iteration. In this case there is definitely reduction of the conversion ratio. Dr. Rowlands is, I think, referring to the case where criticality is achieved by altering the enrichment. The change in conversion ratio is then certainly negligibly small.
T. A. PITTERLE: In the reported calculated 239Pu/235u a n d 238u/235u fission ratios, were the 239Pu and 238U fission cross-sections used renormalized to your new 235U cross-sections?
K.H. BECKURTS: No, they were not. T.A. PITTERLE: Most of the reported change in these fission ratios
would then be due solely to lowering of the 235U fission cross-section and would not really indicate an improvement in the calculated spectrum obtained with the KFK-SNEAK set.
Consistent use of 239pu/235u and 238u/235u fission ratios would probably reduce the difference between the calculated fussion ratios of the cross-section sets.
K.H. BECKURTS: Quite likely so, but one should note that on our results the agreement for <jc
238u/o-fZ35uis also improved and that in this case both cross-sections were re-adjusted.

ENERGY- AND TEMPERATURE-DEPENDENT CAPTURE MEASUREMENTS BELOW 30 keV SUPPORTING DOPPLER EFFECT CALCULATIONS*
H. SEUFERT AND D. STEGEMANN INSTITUT FOR NEUTRONENPHYSIK UND REAKTORTECHNIK, KERNFORSCHUNGSZENTRUM KARLSRUHE,
KARLSRUHE, FEDERAL REPUBLIC OF GERMANY
Abstract
ENERGY- AND TEMPERATURE-DEPENDENT CAPTURE MEASUREMENTS BELOW 30 keV SUPPORTING DOPPLER EFFECT CALCULATIONS. Energy- and temperature-dependent capture measurements below 30-keV neutron energy were performed in natural uranium, tungsten, and tantalum using the slowing-down time spectrometer technique. The experimental set-up used for the experiments consists of a lead block of . 1.3 m side length containing two experimental channels of 10 xlO cm2 cross-section. Into the first channel the target of a 14-MeV neutron generator is introduced, whereas the second channel is used for insertion of the heated samples. Pulses of 14-MeV neutrons, having a pulse width of about 1 ys, are used. The neutron energy is degraded first by inelastic collisions; afterwards only elastic collisions take place so that a specific relationship holds between mean neutron energy in the lead pile and the time after occurrence of the neutron pulse. Because of this time-energy relation a time analysis procedure for the detector counts is applied. Because the energy range below 30-keV neutron energy is most interesting for Doppler-effect investigations the slowing-down time spectrometer is used to measure the capture ratios of hot-to-cold samples of natural uranium, tungsten, and tantalum. Thin samples were heated to different temperatures for this purpose, and the capture y-rays were detected by proportional counters. Because hot-to-cold capture ratios are measured a knowledge of the neutron flux is not necessary; therefore, a direct comparison of calculated and measured temperature-dependent cross-sections is possible. A theoretical analysis of the experimental data for uranium is given.
1. INTRODUCTION
The idea of measuring temperature- and energy-dependent reaction rates was considered necessary to support the analysis of integral Doppler experiments performed in fast critical assemblies. This support concerns only the neutron and nuclear physics aspects of Doppler-effect analysis. The additional reactor physics complications are avoided and thus the problems for a detailed comparison of experiment with theory are reduced. Besides the Doppler-effect of fissile and fertile reactor materials, the study of high-temperature metals like tungsten and tantalum is also of interest in advanced high-temperature reactors .
The aim of this experiment was the measurement of energy-dependent reaction rates below 30 keV at different sample temperatures. For this purpose the neutron slowing-downtime spectrometer [1, 2] was used. This operates as follows: fast monoenergetic neutron bursts of short
* Work performed within the association in the field of fast reactors between the European Atomic Energy Community and Gesellschaft fUr Kernforschung m.b.H., Karlsruhe.
77

78 SEUFERT and STEGEMANN
duration are slowed down in a material of high mass number in which they maintain a relatively narrow energy distribution. Therefore, a relation holds between slowing-down time and average neutron energy. The moderator, a lead cube, contains an experimental channel into which the sample under investigation is positioned. Neutron captures in the sample result in spontaneous 7-rays from the decaying nuclei. These capture 7*s are measured time-dependent by proportional counters. By this procedure hot-to-cold reaction rate ratios between 0.2 and 30 keV were measured in similar time-dependent neutron spectra. Because of this the neutron flux cancels almost completely in the hot-to-cold ratio formed, which is an important advantage of this experiment. Apart from this the resonance energy region of interest for Doppler experiments coincides with the energy range covered by the slowing-down time spectrometer, so obtaining an optimum energy-dependent signal of the Doppler-effect at different temperatures.
This type of experiment is well suited to check theoretical analysis regarding uncertainties in nuclear data and to correct calculation of temperature-dependent cross-sections in the statistical region of resonances. This treatment includes resonance interference and overlap effects of different isotopes present in one mixture. The results from these experiments are a helpful tool for the analysis of energy-integrated foil activation measurements or other Doppler experiments in fast reactors .
2. EXPERIMENTS AND RESULTS
2 . 1 . Description of experimental set-up
A sketch of the experimental set-up is shown in F i g . l . The main components are the neutron generator and the lead cube of 1. 3 m side length. Highly purified lead (99.99%) was used for the slowing-down time spectrometer. Two channels of 10X 10 cm2 cross-section were cut out of the lead cube, one for the target and one for the sample under investigation. The lead cube was surrounded by a 1-mm-thick Cd sheet to prevent re-entrance of slow neutrons. Short neutron bursts were generated by the reaction T(d, n)a with a pulsed Cockroft-Walton type accelerator. The titanium-tritium target placed in the centre of the lead cube was bombarded by the deuterons accelerated up to 150 keV. The ions from a Penning-type source were accelerated in d.c. operation and the ion pulses of 0.4 to 1.5 /us duration were formed by deflection plates as indicated in F i g . l . The pulse repetition rate was 2 kc/s for nearly all experiments.
2.2. Detectors, furnaces and electronics
Three experimental runs, two at different sample temperatures and one background measurement, are necessary to evaluate the hot-to-cold capture ratio. To make intercomparison between the three runs the

SM-101/17 79
neutron source strength had been monitored by a BF3 proportional counter shielded with Cd against slow neutrons. Its position is indicated in F i g . l .
Figure 2 shows the cross-sections of the two different furnaces used in these experiments. In assembly A the sample is surrounded by the detector in contrast to assembly B. The detectors were proportional counters of 30 cm sensitive length and 10 mm diam. at 1 mm wall thickness. They were filled with argon at a pressure of 760 mmHg. Two assemblies A and B were constructed because different aspects had to be taken into account. One aspect is the optimum detector efficiency obtained by maximum solid angle in order to have reasonable counting t imes. Another aspect concerns a maximum signal-to-background ratio, which is of utmost importance if the sample cross-section is low. Assembly A is best suited for large cross-section samples because it has approximately 4ir geometry. Assembly B, on the other hand, offers maximum signal-to-background ratio. The disadvantage, however, is the reduced detector efficiency. For the geometries shown in Fig. 2 the background is reduced by a factor of 10 from assembly A to B. The corresponding efficiency (solid angle) is only reduced by a factor of about 4 from A to B. This has been found from calculations. Therefore, assembly B had to be used to measure capture in 238U.
PENNING ION-SOURCE CROSS-SECTION OF TARGET TRITIUM TARGET CROSS-SECTION OF SAMPLE
FIG. 1. Set-up of neutron slowing-down time spectrometer.
For the furnace constructions in Fig. 2 some additional information is given: all furnace material including the electrical feed-throughs and proportional counter tubes were fabricated from AlMg3, an alloy (97% Al, 3% Mg) having an extremely low capture cross-section. The volume between the inner and outer furnace wall was evacuated up to 10"4 Torr by a diffusion pump to avoid heat convection. The sample is heated by 1-mm Thermocoax wires. The heating power necessary to achieve a

80 SEUFERT and STEGEMANN
sample temperature of 700°K was 12 W for assembly A and 70 W for assembly B. Temperature was measured by NiCr-Ni thermocouples. All inner surfaces were polished in order to have high reflection of heat radiation.
NiCr-Ni THERMOCOUPLE
THERMOCOAX HEATING ELEMENTS
AljOjDISTANCE
HOLDERS
FURNACE WALL
OUTER SAMPLE HOLOER WALL
SAMPLES To OR W
INNER SAMPLE HOLDER WALL
10 PROPORTIONAL
COUNTERS
SCALE
FIG.2A. Profile of furnace assembly A.
NiCr-Ni THERMOCOUPLE
PROPORTIONAL COUNTER
SHIELDING
THERMOCOAX HEATING ELEMENTS
INNER FURNACE WALL
OUTER FURNACE
WALL
OUTER SAMPLE HOLDER WALL
SCALE
FIG.2B. Profile of furnace assembly B.
The electronic circuitry is shown in Fig. 3. The monitor channel is conventional electronics. . The special kind of signal channel will be explained in more detail. Actually two detectors feed one linear channel with pulses. The signals of the five channels are mixed and afterwards time-analysed. These five channels were found to be necessary because during and shortly after the neutron bursts high y-flux impinges onto the detectors. Using five channels instead of one results in a considerable reduction of pulse pile-up. Conventional non-overload amplifiers have -for these high-amplitude input pulses - long recovery times and base line shifts. The mixer of the five-channel circuitry delivered fast output signals of 100-ns pulse width and had a time resolution of the same order.

SM-101/17 81
The pulses were finally analysed by a fast shift register1 [3] . The maximum counting speed together with the multiscaler storage system was 5X 10⁶ pulses/s in every channel. Because of deadtimes of the order of 10 /us, conventional time analysers could not be used for these measurements as they cannot handle the counting rates of about 2X 10⁵ pulses/s during and shortly after the neutron bursts. In this set-up the limiting factors concerning deadtime were the amplifiers and discriminators used in the counting channels having about 2 to 3 JUS deadtime, so in this respect the set-up was not optimum.
In addition to the need for extremely short deadtimes, the total drift in count rate should be better than 0.5% per 10 hours, since measuring times of several hours are possible only in this way. Long measuring times, however, are necessary to achieve good statistics. The main instabilities result from drifts of discriminator levels and less from gain variations of amplifiers. In Fig.4 the gamma pulse height spectrum of a proportional counter is shown. The discriminator level has been set according to the indication in Fig. 4. The necessary long time behaviour was even better than 0. 5% in our arrangement.
2 .3 . Energy calibration of slowing-down time spectrometer
The relation between average neutron energy and slowing-down time for an elastic scattering medium is given by:
(2.1)
or t = A - - t (2.2)
with
t,(Z)
t
C
t o
A 2 % 2
mNA \
2 (t
- v r - - . A 2 * 2
2
A A. s V
o
1
A L 2 v 0
The symbols are explained in the nomenclature given at the end of the paper. To calibrate the spectrometer in the energy range under investigation two different materials with resonances of known energies were measured. A plot of slowing-down time versus l/-s/If, shown in Fig. 5, is best suited to compare the constant C with earlier calibrations [2]. The result is C = 185 keV jus2 compared to 179 keV us2 in Ref. [2] . The resonance energies were taken from BNL-325.
1 Manufactured by BORER and C o . , Solothurn, Switzerland.

82 SEUFERT and STEGEMANN
•HV5-CZ3—
UJ
6
o o
(-BE, -COUNTER 4JJ
dD-SHIELDING
•
41-
HI—
HI-
HI—
HI-
HI—
PI ATF9 m
PREAMP.
ORTEC103
5 C
HA
RG
E
SE
NS
ITIV
E
PR
EA
MP
S.
IN O
NE
CA
BIN
ET
II II
II
II
HV PULSING
ASSEMBLY
-
MONITOR CHANNEL
MAIN AMP..INT.-
DISCR.
HAM NER N302
1NER
N
<
DIS
CR
. H
in
N
AM
PS
.
< in
PRESET COUNT
SCALER
"T
•JAL
CH
AN
N
O
FAST MULTISCALER MEMORY
1/1 1 a.
_ 2 1 1
FAST SHIFT
REGISTER
1 —
STA
RT
1
AN
AL
YS
ER
TIME MARK GENERATOR
1 I 1 1 1
J
READOUT CONTROL UNIT
1 TAPE
PUNCHER
1 TYPE
WRITER
FIG. 3. Block diagram of electronic circuitry.
1500 COUNTS (N)
REL.UNITS MEASURED AT 150kV
ACCELERATOR VOLTAGE
0.5/isec NEUTRON PULSE WIDTH
100t>
500
-EXTRAPOLATED CHANNEL NOISE
/ DISCRIMINATOR LEVEL SETTING
50 100
CHANNELS
150
FIG.4: Gamma spectrum of a proportional counter.

SM-101/17 83
To avoid the influence of higher harmonics of the spatial neutron distribution on energy calibration the y-detectors were positioned at zero crossing of the third harmonic as indicated in Fig. 1.
FIG. 5. Dependence of slowing-down time t on 1/VfT.
2.4. Resolution of slowing-down time spectrometer
The energy resolution is determined on the one hand by the slowing-down phenomena, on the other hand by uncertainties in the time measurement and the extended neutron pulse width. The following three slowing-down phases are mainly responsible for the energy resolution of the spectrometer:
(1) Inelastic scattering above 0.5 MeV (2) Asymptotic energy distribution resulting from the statistics of
scattering below the first excited level (3) Thermal motion of lead atoms at eV energies.
The calculated energy resolution as function of slowing-down time is plotted in Fig. 6, taking into account all effects mentioned above (neutron pulse width 1. 5 us).
The resolution of the spectrometer is appropriate for measuring the energy-dependent resonance integral in the statistical energy region from 0.2 to 30 keV. As is more fully explained in section 3 the following condition must hold:
r s , r « DS « *E « E (2.3)
It can be seen from Fig. 6 that condition (2.3) is satisfied.

84 SEUFERT and STEGEMANN
10* 103 104
FIG. 6. Slowing-down time spectrometer resolution curve.
2 . 5 . Deadtime effects and tes t m e a s u r e m e n t s
The high counting r a t e s during and short ly after the neutron burs ts (the reasons for this effect a re summar ized in Ref. [2]) could not be r eg i s t e red without counting l o s se s owing to the deadtime limit explained in sect ion 2 . 2 . To invest igate the influence of deadtime effects on the hot - to-cold 7 - r ay rat io the following exper iment was ca r r i ed out. The basic idea of this exper iment is to s imulate the increased counting ra te from the Doppler-effect by higher neutron intensi ty. The procedure is explained by the following formula:
S I l ( t ) - B u ( t )
S I 2( t ) " B l 2 ( t )
(2.4)
where S is the signal plus background at I j and t, B the background at I± and t, Ij the neutron intensity i, and t the slowing-down t ime . This ratio i s ve ry s i m i l a r to the hot- to-cold 7 - r ay rat io of a rea l experiment defined by:
R = H(t) - B(t) C(t) - B(t)
(2.5)
where H is the signal plus background of hot sample at t, C the signal plus background of cold sample at t, and B the background at t .

SM-101/17 85
The only difference between Eq.(2.4) and Eq.(2.5) is that the background depends on neutron intensity in Eq.(2.4). However, Eqs (2.4) and (2.5) are almost equal in our case and a measurement approximates the deadtime effect closely. In Fig. 7 the result of a deadtime experiment is shown in which tantalum has been measured at two neutron intensities differing by 9. 5%. Up to the fifth channel the deadtime loss is large and affects the accuracy of hot-to-cold 7-ray ratios appreciably. Consequently we reduced the deadtime effects in the first five channels by running the neutron generator at reduced power,which means 110 kV accelerating voltage and 2 mA target ion current for nearly all measurements.
1.2-
0,8-
V-RAY RATIO
/
X
/ X
/ /
: * x x x *
NEUTRON INTEh 1095
X
. " x x - x
JSITY RATIO
x X x ex x X
t(/Jsec)
0 8 16 24 32
FIG. 7. Ratio of gamma rays at different neutron intensities.
1.2-
V-RAY RATIO RATIO OF EMPTY TO LOADED FURNACE (0.2mm LEAD FOIL)
1.0- x x * " * * " :r
0.9-
08
t (psec)
0 8 16 24
FIG. 8. Gamma ratio of a shielding experiment.
32
Another effect which was investigated concerns the 7-shielding of the detectors by the samples to be measured. Very thick samples absorb -7-rays from the lead and, therefore, change background. Figure 8 shows the result of such a shielding experiment where the sample was replaced by a 0. 2-mm-thick lead foil. The thickness of.this foil was sufficient to simulate the 7-absorption effect of the samples investigated. The measurement shows that the absorption effect on background can be neglected.

86 SEUFERT and STEGEMANN
Finally, it was n e c e s s a r y to m e a s u r e the rat io of heated-to-cold empty furnace to make sure that the heating itself does not contribute to the hot- to-cold rat io of a sample measu remen t . F o r a t empera tu re change of 400 degCthe resu l t is plotted in F ig . 9. This includes the influence of furnace dislocations by heating. This , too, does not affect the r e su l t s .
1.2-
H0T-T0-C0LD Y-RAY RATIO
700* K 300»K
1.0- » K X :i * ! * "
09"
08 t (psec)
0 8 16 24 32
FIG. 9. Hot-to-cold background y-ray ratio versus slowing-down time.
2 . 6 . Measurements with 238U
For ' 238U the rat io of the 7-counting ra t e s obtained with the heated sample to the 7-counting ra te with the sample at room tempera tu re , after subtract ion of background(hot- to-cold 7 - r ay rat io) , is shown as a function of average energy o r slowing-down t ime in Figs 10 and 11, respectively. The exper imenta l conditions - also used for the theoret ical calculations according to section 3 - a re given in Table I. The experimental resul t s a r e shown by crosspoints and the theore t ica l calculation is presented by the dashed curve . The e r r o r marg ins given a r e based only on s ta t is t ics at 68% confidence level . They a re evaluated from the formula
R (H-BXC-B) "y(c-B)V (H-C)2B +(H-B2)C (2.6)
which is derived from E q . ( 2 . 5) with the e r r o r propagation law. To reduce the e r r o r marg ins of the experiment , a fas ter electronic c i rcui t ry for the l inear channels is nece s sa ry and now under construction for future exper iments . A s ta t i s t i ca l e r r o r in R - l of about 5 to 10% is aimed for. In spite of the l imited accuracy the exper imental data seem to indicate the possibil i ty of in terpre t ing the capture ra te increase (see section 3) by s ta t i s t ica l theory down to s eve ra l hundred eV.
238U is of special in te res t in Doppler investigations in fast reac tors and justifies further efforts-to improve accuracy . In this context, however , a number of difficulties have to be mentioned which a re par t icular to 238U. The main difficulty a r i s e s from the low signal-to-background ra t io , which means that gammas from lead contribute to the counting ra t e a lmost as much as the capture gammas of the sample itself. The

SM-101/17 87
o i I.K n — i i i i i
1.12-
xxx\
\ -V
I 1 1—I—I I I I
DASHED LINE:THEORY
750"K 300 °K
6 1J»
\ - r -L \
\ N
X X \
m-
\ <\
\ X X X X
1J00-
V
_ l I 1 I I I I
V
-J I I I I I
Q 4
i 1.16-
1.12
6 108-
1.06
1.00
E ( e V )
FIG. 10. Hot-to-cold 238U capture y -ray ratio versus E.
X X X X
20 t ( p s e c ) 30
SLOWING DOWN TIME
FIG. 11. Hot-to-cold 238U capture y-ray ratio versus t.
disadvantage from this effect follows di rect ly from the first t e r m of E q . ( 2 . 6 ) . To min imize the background the 7 - r ays result ing from the decays of 238U and impur i t i e s had been almost eliminated by shielding the de tec tors with 300-jum lead as indicated in F i g . 2 B . Another difficulty
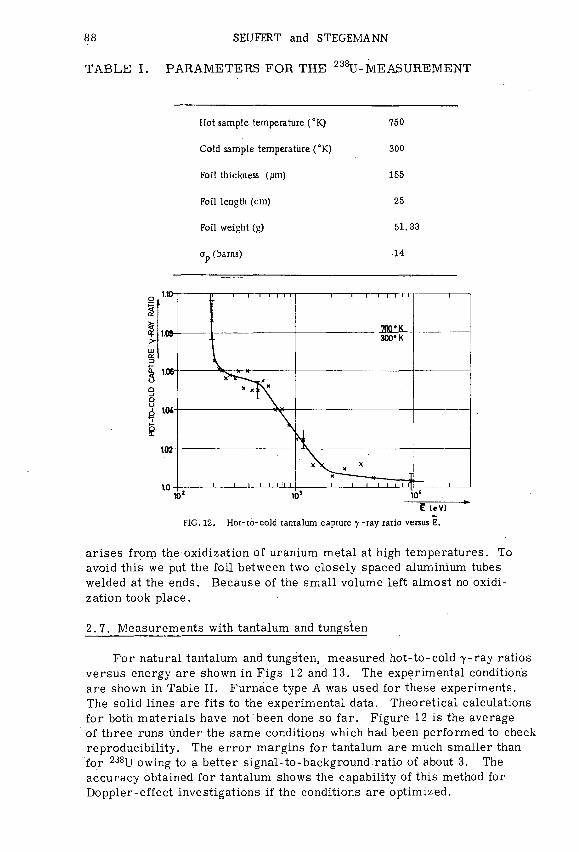
88 SEUFERT and STEGEMANN
TABLE I. PARAMETERS FOR THE 238U-MEASUREMENT
?AY
RA
TIO
1-7-
'TU
RE
-C
OL
D C
AF
1.10-]
HO
T-TO
H
Hot sample temperature (CK)
Cold sample temperature (°K)
Foil thickness (um)
Foil length (cm)
Foil weight (g)
o p (barns)
i r i i i i i
X f \
a2 1
i i
* \ x
Q3
750
300
155
25
51.33
•14
i i i i i i
700'K 300° K
X
l | l | 1 IT
1
1
0' —= fc-E (eV)
FIG. 12. Hot-to-cold tantalum capture y-ray ratio versus E.
arises from the oxidization of uranium metal at high temperatures. To avoid this we put the foil between two closely spaced aluminium tubes welded at the ends. Because of the small volume left almost no oxidization took place.
2.7. Measurements with tantalum and tungsten
For natural tantalum and tungsten, measured hot-to-cold y-ray ratios versus energy are shown in Figs 12 and 13. The experimental conditions are shown in Table II. Furnace type A was used for these experiments. The solid lines are fits to the experimental data. Theoretical calculations for both materials have not been done so far. Figure 12 is the average of three runs under the same conditions which had been performed to check reproducibility. The error margins for tantalum are much smaller than for 238U owing to a better signal-to-background ratio of about 3. The accuracy obtained for tantalum shows the capability of this method for Doppler-effect investigations if the conditions are optimized.

SM-101/17 89
E(eV)
FIG. 13. Hot-to-cold tungsten capture y-ray ratio versus E.
T A B L E II . P A R A M E T E R S FOR THE TANTALUM AND TUNGSTEN MEASUREMENTS
Tantalum Tungsten
Hot sample temperature (°K)
Cold sample temperature (°K)
Foil thickness ()um)
Foil length (cm)
Foil weight (g)
700
300
150
30
35.19
700
3.00
350
25
68.75
3. CALCULATION OF CAPTURE RESONANCE INTEGRALS AT DIFFERENT ENERGIES
3 . 1 . The analytic model of the heterogeneous resonance integral
We used the following exper imental a r rangement . The absorber , an isotope of high m a s s number, is surrounded totally by the slowing-down m a t e r i a l lead . Because the energy width of an abso rbe r resonance is sma l l compared with the energy loss of neutrons by elast ic collisions in both the abso rbe r and surrounding modera to r , heterogeneous resonance in tegra l theory in na r row resonance approximation can be applied for

90 SEUFERT and. STEGEMANN
this s i tuat ion. We follow the derivat ion of Dre sne r [4] for the he te rogeneous resonance in tegra l . It is defined in our case as the energy- , in tegrated absorption c r o s s - s e c t i o n which, when multiplied by the flux0 that would exist in the absence of the resonance , gives the t rue absorption r a t e :
J H j l p V
with
N I 0 V = / N cr vp V dE (3.1)
AE
1 / E a 1 / (E - I )ff
&E &E
Equation (3.2) can be rewr i t ten with Wigner ' s rational approximation for P0(E t)
1 = 3 / *a(T) STY^) dE < 3 - 3 > &E
with S = \ .
This formula used for our exper iments is identical to the self-absorption t e r m of the theore t ica l t r ea tmen t of Doppler foil activation measuremen t s as performed by Reynolds [5] .
3 . 2 . Calculation of the 2 3 8U-resonance in tegra l from nuclear data
In this section the method of calculating E q . ( 3 . 3) is specified. The range of calculation has been l imited to the s ta t i s t ica l energy region because th is mainly contr ibutes to the Doppler effect in fast r e a c t o r s . To show the re la t ionship with the 238U foil activation exper iments which were also c a r r i e d out at the STARK-reac tor [6] , we have res t r i c ted ourse lves to capture p r o c e s s e s in 238U. Capture in monoisotopic nuclides like 181Ta a r e t r ea ted s imi la r ly .
F o r 238U the t h ree resonance s e r i e s a r e as follows:
1
j
s
0
1/2
1
1
1/2
2
1
3/2
3

SM-101/17 91
The r e sonances a r e descr ibed in the mul t i -channel one- level approximat ion by:
fft(x) = f f o c ( r 1 2 c o s 2 6 i + r L 2 s i n 2 5 i ) +a
P (3-4)
\ l + x 1+x /
a (x) = a a oa 1
2 (3.5) 1+x
with x = j | ( E - E R ) .
At low energ ies the a s y m m e t r i c t e r m in Eq . (3 .4 ) d i sappears because of sma l l 6j and will be neglected in the following t r e a t m e n t .
Conventional methods [4] have been used to calculate the t empera tu re dependent Doppler-effect , i . e . the t empera tu re -dependen t resonance in tegra l (3 .3 ) . Using the abbreviat ions
NV * V = Vs
N «y = v = rt + s we get
with
I
e8
6S
=
=
5 • s
s a oc
<V ry AE COS 2 6 i
V cos 2 6 ,
J ( e 8 , *s> (3.6)
Because the nuc lear r e sonances a r e ve ry nar row the energy dependence of 0s and /3s a r e ignored over the range of integrat ion. Besides this , it has to be summed over the different resonance s e r i e s (index s ) .
In the s ta t i s t i ca l resonance region the resonance in tegral (3.6) has to be averaged over the P o r t e r - T h o m a s s ta t i s t i ca l ch i - square Tn d i s t r i bution of one degree of f reedom. The radiat ive capture width E, is taken to be constant . We did th is averaging by following a method descr ibed in Ref. [ 7 ] .
Final ly, the energy range of integrat ion AE must be chosen. So far we have assumed only one resonance in AE. In rea l i ty we had n8 r e s o nances in AE owing to the l imited energy resolut ion of the neutron s p e c t r o m e t e r .
With the aid of
A E Is - = D ( 3 . 7 )
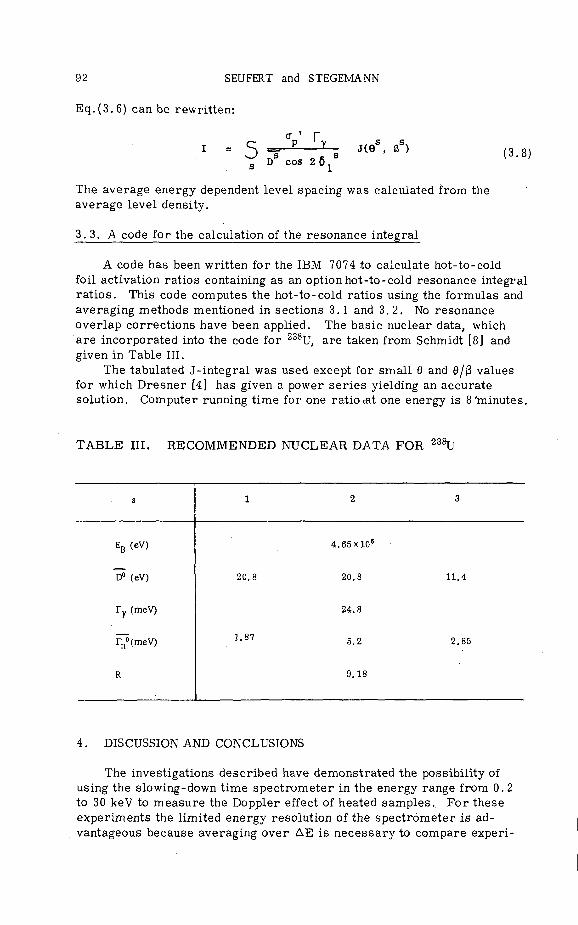
92 SEUFERT and STEGEMANN
Eq . (3 .6 ) can be rewr i t t en :
1 - 5 = r ~ f i «*". »s> (3.a: s D cos 2 0 .
The average energy dependent level spacing was calculated from the average level densi ty.
3 . 3 . A code for the calculation of the resonance integral
A code has been wri t ten for the IBM 7074 to calculate hot- to-cold foil activation ra t ios containing as an option hot- to-cold resonance integral r a t i o s . This code computes the hot- to-cold ra t ios using the formulas and averaging methods mentioned in sect ions 3.1 and 3 .2 . No resonance over lap cor rec t ions have been applied. The bas ic nuclear data, which a r e incorporated into the code for 238U, a r e taken from Schmidt [8] and given in Table III.
The tabulated J - i n t eg ra l was used except for smal l 6 and 0/j3 values for which D r e s n e r [4] has given a power s e r i e s yielding an accura te solution. Computer running t ime for one ra t io cat one energy is 8 'minutes.
TABLE III. RECOMMENDED NUCLEAR DATA FOR 238U
s
EB (eV)
D° (eV)
r y (meV)
V(meV)
R
1
20.8
1.87
2
4.65X10⁶
20.8
24.8
5.2
9.18
3
11.4
2.85
4. DISCUSSION AND CONCLUSIONS
The invest igat ions descr ibed have demonst ra ted the possibil i ty of using the slowing-down t ime s p e c t r o m e t e r in the energy range from 0. 2 to 30 keV to m e a s u r e the Doppler effect of heated s a m p l e s . F o r these exper iments the l imited energy resolut ion of the spec t rome te r i s advantageous because averaging over AE is n e c e s s a r y to compare exper i -

SM-101/17 93
ment with theory in the s ta t i s t i ca l energy region. The exper iments descr ibed have to be taken as a f i rs t s tep in examining the capabil i t ies of the slowing-down t ime s p e c t r o m e t e r for th is type of invest igat ions. Although sufficiently sma l l e r r o r ma rg in s have been obtained, for instance, for tantalum, an improvement is. n e c e s s a r y for m a t e r i a l s with low signal-to-background ra t ios , e . g . 238U. This improvement can cer ta in ly be achieved by using fas te r e lec t ron ics to d e c r e a s e deadt ime effects. From the r e su l t s for 238U obtained so far, it can be concluded that an accuracy of the measu red ra t io of about 5 to 10% s e e m s poss ib le .
F u r t h e r , it can be concluded from the exper ience gained so far that o ther in te res t ing aspec ts of the Doppler effect can be investigated by this technique. These aspec ts a r e : over lap and in ter ference effects of different resonance s e r i e s and different nuclides; the low energy extension to which the s ta t i s t i ca l resonance theory holds; and the sa tura t ion range of the Doppler effect at high t e m p e r a t u r e .
A C K N O W L E D G E M E N T S
The authors acknowledge the nuclear data recommendat ions of J . J . Schmidt. F u r t h e r , we thank H. Helmke for his help in setting up the expe r imen t s .
R E F E R E N C E S
[1] BERGMAN, A. A. et a l . , A neutron spectrometer based on measuring the slowing-down time of neutrons in lead, Int. Conf. peaceful Uses atom. Energy (Pioc. Conf. Geneva, 1955) 4, UN, New York (1956) 135.
[2] MITZEL, F., PLENDL, H .S . , Messungen von (n, y)-Wirkungsquerschnitten und Resonanzintegralen mit dem Bleispektrometer, Nukleonik 6 8 (1964) 371.
[3] EDELMANN, M. et a l . , Investigation of Prompt Neutron Kinetics in the Fast-Thermal Argonaut-Reactor STARK by Noise Analysis, Kernforschungszentrum Karlsruhe Rep. KFK 522.
[4] DRESNER, L., Resonance Absorption in Nuclear Reactors, Pergamon Press, New York (1960).
[5] REYNOLDS, A. B., Resonance integral for the Doppler measurement in fast reactors by the foil-activation technique, Nucl. Sci. Engng 22 (1965) 487.
[6] SEUFERT, H., to be published.
[7] FERZIGER, J.H. et a l . , Resonance Integral Calculations for Evaluation of Doppler Coefficients (The Rapture Code), USAEC Rep. GEAP 3923.
[8] SCHMIDT, ].]., Neutron Cross Sections for Fast Reactor Materials, Part I: Evaluation, Kernforschungszentrum Karlsruhe Rep.KFK 120.
NOMENCLATURE
A - Atomic m a s s (mass units)
6j - Phase shift for neutrons with quantum number 1
Ds - Mean level spacing of s e r i e s s (eV)
A - Doppler width (eV)
E - Energy (eV)

94 SEUFERT and STEGEMANN
AE - Energy range (eV)
E - Mean energy (eV)
E R - Resonance energy (eV)
T - Total width (eV)
r - 7-width (eV)
r ^ - Neutron width of s e r i e s s (eV)
I - Effective resonance in tegra l (barns)
J - J - i n t e g r a l
j - Spin quantum number of compound nucleus
S. - Mean chord length (cm)
Xs - Scat ter ing mean free path (cm)
1 - Angular momentum quantum number of compound nucleus
mN - Neutron m a s s (mass units)
N - Density of sample m a t e r i a l ( c m - 3 )
P 0 - Escape probabil i ty
R - Hot- to-cold 7 - r a y ra t io
s - Number of resonance s e r i e s
a a - Microscopic absorpt ion c r o s s - s e c t i o n (barns)
a - Potential cross-section (barns) P
at - Total cross-section (barns)
a Q C - Compound nucleus cross-section at E = ER (barns)
CToa - Absorption cross-section at E = ER(barns)
£ - Macroscopic potential cross-section (cm-1)
£t - Macroscopic total cross-section (cm-1)
S - Summation symbol
t - Slowing-down time (JUS)
T - Temperature (°K)
V - Volume (cm3)
<f> - Flux in AE (ernes'1)
cp - Flux per energy unit (cm"2s_1eV"1).

PREDICTION OF NEUTRON CROSS-SECTIONS IN THE ENERGY RANGE 1. 0 TO 10. 0 MeV
S.B. GARG AND B.P. RASTOGI BHABHA ATOMIC RESEARCH CENTRE, TROMBAY, BOMBAY, INDIA
Abstract
PREDICTION OF NEUTRON CROSS-SECTIONS IN THE ENERGY RANGE 1.0 TO 10.0 MeV. Neutron cross-sections, total, ' shape elastic' and ' reaction' , in the energy range 1.0 to 10.0 MeV have been calculated for niobium, lead, uranium-235 and plutonium-239 — which are extensively used in fast nuclear reactors as structural, shielding and fissile materials - by means of the local spherical optical model. It is concluded that highly deformed nuclides like uranium-235 and plutonium-239 can be represented fairly well with a suitable local spherical optical potential and the cumbersome approach of the non-local deformed optical model can be avoided in the first approximation. The real part (U) of the neutron-nucleus potential is represented by the Woods-Saxon form and the imaginary part(W) by the Gaussian form. The whole range of 1.0 to 10.0 MeV has been split up into slabs over which the average values of U, W, a (surface diffuseness), b (Gaussian width) andy0 have been determined which give good fits to the measured total cross-sections. The maximum deviation from the measured value is found to be 15% but in general the agreement is reasonably good. For niobium no measurements are available beyond 3.0 MeV and so these calculations serve to fill in the gap. For the doubly magic nuclide lead the imaginary part of the potential is small as expected. The reaction cross-section has been split up into compound elastic and inelastic parts by using the Hauser-Feshbach statistical theory.
INTRODUCTION
The phenomenological approach to the optical model [1,2] is being widely used to understand the nucleon-nucleus interactions for heavy and medium-weight nuclei both in the intermediate and high energy regions. It has met with great success in describing the neutron-nucleus interactions which are important in the design of nuclear power reactors and has provided a mechanism of interpolating or extrapolating the data from the measure'd quantities like total and elastic scattering cross-sections. The optical model is an intermediate between the continuum model and the shell model of the nucleus. If the imaginary part of the potential becomes zero, the nuclear shell model is obtained. If the ratio between the imaginary and real part of the potential tends to infinity, the continuum model results. It determines the 'shape elastic1 and 'reaction1
cross-sections. The latter is split up into compound elastic and inelastic components using the Hauser-Feshbach statistical theory [3]. Thus:
ot =ffse + ar (optical model) (1)
ar =CT
ce+CTinel (statistical theory) (2)
To calculate inelastic scattering cross-sections precise knowledge of the energy levels of the target nucleus, their spins and parities is desired. Any gap in the knowledge of levels or any uncertainty in their spins and parities would mar the calculations. Angular distributions.of
95
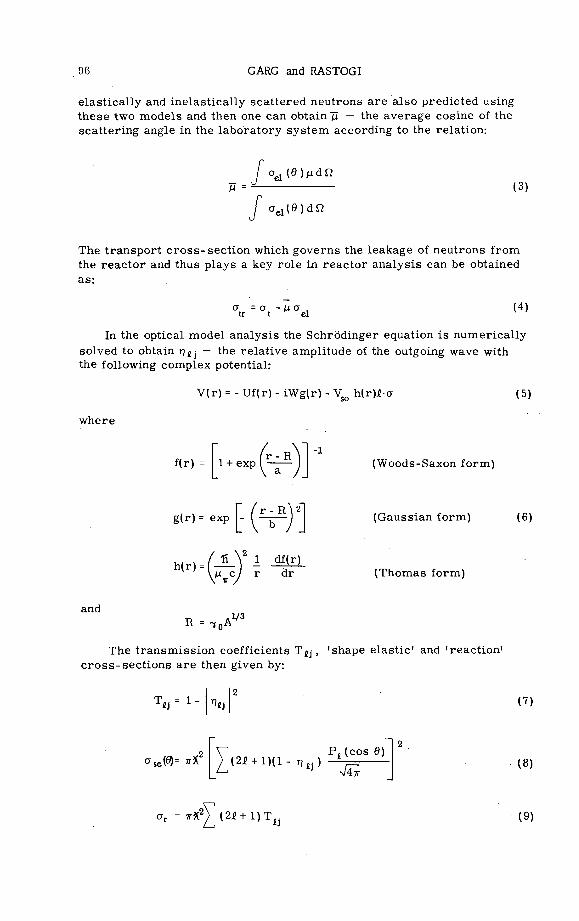
96 GARG and RASTOGI
e las t ica l ly and inelas t ica l ly sca t t e red neut rons a r e a lso predic ted using t h e s e two models and then one can obtain "p. — the ave rage cosine of the sca t te r ing angle in the l abora to ry sys tem according to the re la t ion:
(3)
The t r a n s p o r t c r o s s - s e c t i o n which governs the leakage of neu t rons f rom the r e a c t o r and thus plays a key ro le in r e a c t o r analys is can be obtained a s :
tr t ^ el (4)
In the optical model ana lys is the Schrodinger equation is numer ica l ly solved to obtain r)£j — the re la t ive ampli tude of the outgoing wave with the following complex potential:
where
V(r) = - Uf(r) - iWg(r) - V h(r)4-cr (5)
f(r) 1 + exp r - R -1 (Woods-Saxon form)
g(r) = exp r - R \ 2
(Gaussian form) (6)
h(r) = ft \ 1 df(r)
H c / r dr (Thomas form)
and R = -,0A 1/3
The t r a n s m i s s i o n coefficients T 4 j , ' shape e las t ic 1 and ' r eac t ion ' c r o s s - s e c t i o n s a r e then given by:
T*j = 1 ~ "l«j (7)
CTse(0= » * I P , (cos 9) (2i + l ) ( l - r j j .) - * - = (8)
ar = jrX2) (2i + l ) T H (9)
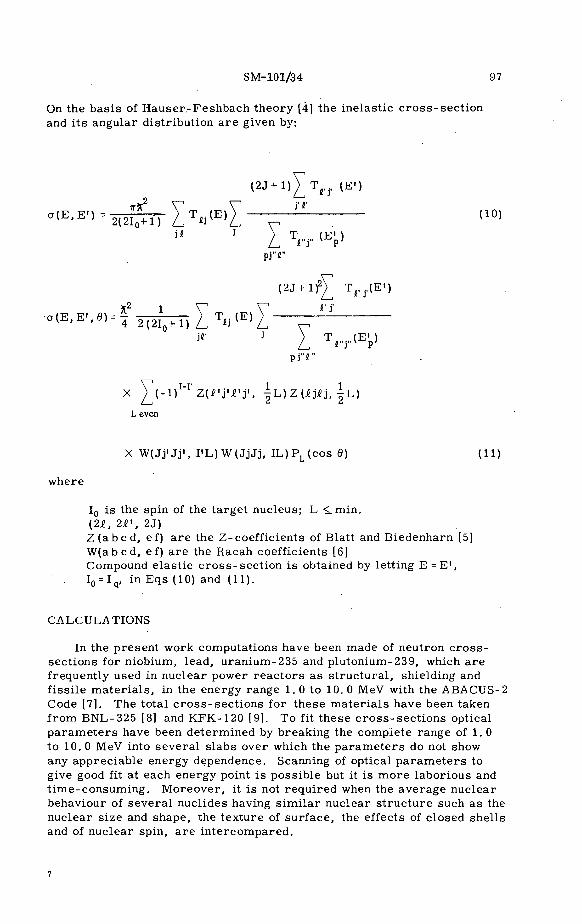
SM-101/34 97
On the basis of Hauser.-Feshbach theory [4] the inelastic cross-section and its angular distribution are given by:
( 2 J + l ) ^ T | t f (E')
^^-^0TVIT^E)I-^ (10)
W (EP]
pj'T
CT^E,'^ = |2y(2i-rT)IT^(E)I
( 2 J + l f ^ Tfilj,(E')
i'j'
I ) T r j . (E.p) pj"je"
X ^ V l ) M , Z ( j e ' ; j ' i ' j ' , | L ) Z ( i j i j , - | L ) L even
X W(Jj'Jj', I 'L)W(JjJj, IL)R (cos 0) (11)
where
I0 is the spin of the target nucleus; L <_min. (2i, 2V, 2J) Z ( a b c d , ef) are the Z-coefficients of Blatt and Biedenharn [5] W(abcd, ef) are the Racah coefficients [6] Compound elastic cross-section is obtained by letting E = E*, I0 = Iq , in Eqs (10) and (11).
CALCULATIONS
In the present work computations have been made of neutron cross-sections for niobium, lead, uranium-235 and plutonium-239, which are frequently used in nuclear power reactors as structural, shielding and fissile materials, in the energy range 1. 0 to 10. 0 MeV with the ABACUS-2 Code [7], The total cross-sections for these materials have been taken from BNL-325 [8] and KFK-120 [9]. To fit these cross-sections optical parameters have been determined by breaking the complete range of 1. 0 to 10.0 MeV into several slabs over which the parameters do not show any appreciable energy dependence. Scanning of optical parameters to give good fit at each energy point is possible but it is more laborious and time-consuming. Moreover, it is not required when the average nuclear behaviour of several nuclides having similar nuclear structure such as the nuclear size and shape, the texture of surface, the effects of closed shells and of nuclear spin, are intercompared.

r-fl
X MEASURED C^f
> O to S3
H O O
<>2
ENERGY ( M e V ) —*~
1
FIG. 1. Total cross-sections for niobium.

SM-101/34 99
The cross-section predictions contained in this paper have been done with the local spherical optical model with the Woods-Saxon form for the real part of the optical potential. To allow for the surface absorption of neutrons the Gaussian form of the imaginary potential is included. This form of potential could give reasonable estimates for the total cross-sections and thus no need was felt to include mixed volume and surface interactions or volume interactions alone. Moreover, the projectile neutron meets a sufficient number of nucleons on the surface of the nuclides included in this work and thus the probability of its interacting with these nucleons is greater than with those contained in the inner core.
The spin-orbit term has been dropped since no attempt was made to fit the differential elastic cross-sections and polarization, the data being very meagre, especially for Nb, 235U and 239Pu; although for reasonably good estimates of local parameters the data on angular distributions, polarization, inelastic scattering and total cross-sections should, as far as possible, be fitted simultaneously. Nevertheless the transmission coefficients obtained with the local optical parameters scanned here and used in the predictions of inelastic scattering cross-sections on the basis of the Hauser-Feshbach theory do provide orders of magnitude. These orders of magnitude may be of some use in reactor calculations since data on inelastic cross-section measurements for these materials are not available throughout the whole energy range considered here.
NIOBIUM
Here the advantage has been taken of an earlier work [10] in which optical parameters for zirconium were scanned in the energy range 1. 0 to 10.0 MeV. Zirconium contains 40 protons and 50 neutrons while niobium consists of 41 protons and 52 neutrons. Their average nuclear behaviour is expected to be similar since they are of the same size and shape. The optical potential parameters which have been used in the predictions are:
(1) 1.0^E< 2.0 MeV; U = 40 MeV; W=10MeV; a = b=0 .5 fm
7 = 1.555 f m.
(2) 2. 0 ^ E ^ 10.0 MeV; U = 40 MeV; W=10MeV; a = b=0 .6 fm
70= 1.25 fm.
Between 1 and 2 MeV the value of the cut-off radius is noted to be more than is required for the rest of the incident neutron energies. This is justified since the increased cut-off radius would include even those compound nuclear levels which have T ~ D and thus the average of total cross-section taken over all these levels is improved. If the number of compound nuclear levels is inadequate, the measured total cross-section and the calculated one wouid show disagreement. A comparison of the measured and the calculated data is shown in Fig. 1. The maximum deviation of -16% is noted at a neutron incident energy of 2. 0 MeV but beyond 2. 0 MeV the agreement is complete. No measured data are

TABLE I. TOTAL, iSHAPE ELASTIC AND REACTION CROSS-SECTIONS (BARNS) OF NIOBIUM o
-, ; - O
E(MeV) o t (measured) o t (calculated) og e or
1.0
2 . 0
2 . 5
y 3 .0
3 . 5
4-0
4 . 5
5 .0
5 . 5
6 .0
6 . 5
7 .0
7 .5
8 .0
8 .5
9 .0
9 . 5
10.0
7.10
5.10
4 .60
4 .30
-
-
-
-
-
-
-
-
-
-
-
--
7.25
4 .35
4 .46
4 .42
4 .29
4 .14
3.98
3 .83
3.68
3 .53
3.40
3.29
3 .21
3 .16
3 .12
3 .07
2 .97
2 .86
5.32
2 .67
2 .99
3 .19
3.27
3.29
3 .25
3 .18
3.09
2 .97
2 .85
2 .72
2 .59
2 .47
2 .36
2 .26
2 .15
2 .06
1.93
1.67
1.47
1.23
1.02
0 .85
0 .73
0 .65
0.59
0 .56
0 .55
0.57
0 .62
0 .69
0 .76
0 . 8 1
0 .82
0.80

SM-101/34 101
avai lable beyond 3. 0 MeV (BNL-325), so these calculat ions s e rve to extend it up to 10. 0 MeV. The total , shape e las t ic and reac t ion c r o s s - s e c t i o n s a r e given in Table I.
To b reak the reac t ion c r o s s - s e c t i o n into compound e las t ic and ine las t ic components the following energy leve ls with the i r spins and p a r i t i e s have been used:-
Energy level (MeV) J*
0.0 0 .029 0.741 0.809 0.958 1.08
Compound e las t ic and inelas t ic c r o s s - s e c t i o n s have been calculated at 2 . 0 , 4 . 0 , 6 .0 , 8. 0 and 10. 0 MeV with the NEARREX Code [11], which accounts for level width fluctuation cor rec t ion , and a r e r ecorded in Table II. Any excitation of leve ls due to d i rec t in teract ion is not accounted for. Angular d is t r ibut ions of e las t ical ly sca t t e red neutrons at 4 . 0 and 5.0 MeV were a lso calculated with the ABACUS-2 code to compare them with those measu red by Thomson [12] at 90°. The compar i son i s as follows:
E(MeV) Thomson ' s data Calculated data
4 . 0 83±16 m b / s r 72 m b / s r 5.0 72+14 m b / s r 82 m b / s r
The calculated quant i t ies a r e within the exper imenta l e r r o r s .
LEAD-208
Lead-208 contains 82 protons and 126 neu t rons . Thus it i s a doubly magic nuclide with closed she l l s . This p roper ty should r e su l t in low values of the imaginary potent ial , as has been found.
The total c r o s s - s e c t i o n s a r e taken from BNL-325 and they a r e the total c r o s s - s e c t i o n s for na tura l lead. Since na tura l lead cons i s t s most ly of 2 0 8Pb, the total c r o s s - s e c t i o n s calculated for this isotope a r e compared with those of na tura l lead in F ig . 2.
The surface diffuseness p a r a m e t e r a and the Gauss ian width p a r a m e t e r b a r e fixed at 0. 5 fm and 0. 8 fm respec t ive ly throughout the whole energy range . The value of Y0 has been taken to be 1. 25 fm. The r e a l and imaginary p a r t s of the potential va ry a s follows:
(1) 1.0<£E< 2.0 MeV; U = 4 0 M e V ; W - 3 MeV
(2) 2 . 0 < E £ 3.5 MeV; U = 45 MeV; W = 3 M e V
(3) 3 . 5 < E < 5.5 MeV; U = 55MeV; W = 3 MeV
(4) 5 .5< E < 1 0 . 0 M e V ; U = 55 MeV; W = 5 MeV
9/2+
1 / 2 ; 7 / 2 +
5/2 +
9/2 +
5/2 +

o CO
TABLE II. CALCULATED CROSS-SECTIONS (BARNS) FOR NEUTRON EXCITATIONS OF NIOBIUM
E(MeV)
2 .0
4 . 0
6 .0
8 .0
10.0
Compound elastic
0.822
0.241
0.169
0.238
0.213
Total inelastic
0.819
0.595
0.377
0.440
0.562
0.029
0.004
0.007
0.017
0.031
0.031
0.741
0.277
1.156
0.079
0.116
0.144
Excited levels (MeV)
0.809
0.141
0.086
0.055
0.072
0.097
0.958
0.312
0.259
0.154
0.157
0.198
1.08
0.085
0.087
0.054
0.064
0.092

.-9
X MEASURED <J"£
- 7
-5
CO
CO"
«3
ENERGY CMeV -)
IO - I
FIG. 2. Total cross-sections for lead.
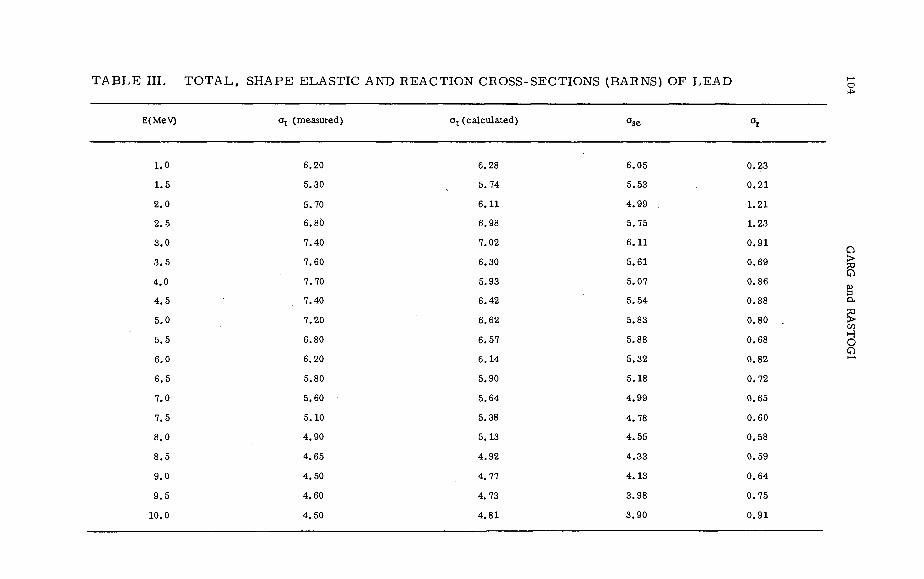
TABLE III. TOTAL, SHAPE ELASTIC AND REACTION CROSS-SECTIONS (BARNS) OF LEAD £
E(MeV) o t (measured) o t (calculated) o s e or
1.0
1.5
2 . 0
2 . 5
3 .0
3 . 5
4 . 0
4 . 5
5 .0
5 .5
6 .0
6 .5
7.0
7 .5
8 .0
8 .5
9 .0
9 . 5
10.0
6.20
5.30
5.70
6.80
7.40
7.60
7.70
7.40
7.20
6.80
6.20
5.80
5.60
5.10
4.90
4.65
4.50
4.60
4.50
6.28
5. 74
6.11
6.98
7.02
6.30
5.93
6.42
6.62
6.57
6.14
5.90
5.64
5.38
5.13
4.92
4.77
4.73
4.81
6.05
5.53
4.99
5.75
6.11
5.61
5.07
5.54
5.83
5.88
5.32
5.18
4.99
4.78
4.55
4.33
4.13
3.98
3.90
0.23
0.21
1.21
1.23
0.91
0.69
0.86
0.88
0.80
0.68
0.82
0.72
0.65
0.60
0.58
0.59
0.64
0.75
0.91

SM-101/34 105
From Fig. 2 it may be inferred that the measured and total cross-sections agree fairly well except for the region 3. 5 MeV to 4. 5 MeV. The maximum deviation is observed to be -25% at 4. 0 MeV but it falls to -16% at 3. 5 MeV and -11% at 4.5 MeV. To obtain better agreement U and W were changed but no success was achieved. However, no scan was made on all the optical parameters to explain this local effect although it is felt that an agreement can be struck with suitably chosen parameters. The calculated total, shape elastic and reaction cross-sections are given in Table III.
The energy levels used in the computations of compound elastic and inelastic cross-sections are as follows:
Energy level (MeV)
0.0 2.615 3. 198 3.475 3.709 3.750 3.960 4.300
Both the Hauser-Feshbach statistical theory and Moldauer's statistical theory of nuclear collision cross-sections [13] have been used in predicting the compound elastic and inelastic cross-sections. It has been observed that with Porter-Thomas distribution assumed for the partial widths the inelastic cross-sections obtained with Moldauer's theory show reductions as much as a factor of two from those calculated with the Hauser-Feshbach theory — a situation which has been explained by Dresner [14] and Moldauer [15]. It also indicates the uncertainties that may be present in the transmission coefficients and consequently in the optical model parameters which ought to be obtained with the inelastic scattering data taken into account, since the imaginary potential is closely related to neutron absorption.
In obtaining the optical parameters the data on inelastic scattering measured by Towle and Gilboy [16] were not considered but only the total cross-sections were fitted. The inelastic cross-sections calculated by us are, therefore, not registered here.
URANIUM-235 AND PLUTONIUM-239
The two fissile materials 235U and 239Pu are the backbone of nuclear industry and as such their study needs great care. All the available information on their nuclear structure has to be carefully examined before applying a model to calculate their interactions with neutrons. It is well known that these two nuclides are highly deformed ones and they must be studied with the non-local deformed optical model of Perey and Buck [17]. But to avoid the cumbersome approach of this model the spherical local optical model has been used to calculate their total cross-sections. The measured and calculated total cross-sections represented in Figs 3 and 4
i l 0+ 3" 5" 4" 5" 3 -6" 4 +

•7
t ^ 1
12 a <
t* -5
°3
/ v
2 i
X X
4 1
X
ENERGY ( M e V ) —
X
" " " 6 1
X MEASURED (J-£
X
y
8 1
* X
i
>
a.
</) H O O
FIG.3. Total cross-sections for uranium-235.

x X X MEASURED G\
- 7
-sg
<>3 ENERGY ( M e V ) IO
FIG.4. Total cross-sections for plutonium-239.

TABLE IV. TOTAL, SHAPE ELASTIC AND REACTION CROSS-SECTIONS (BARNS) OF URANIUM-235
E(MeV) o t (measured) o t (calculated) or
1.0
1.5
2.0
2.5
3.0
3.5
4.0
4.5
5.0
5.5
6.0
6.5
7.0
7.5
8.0
8.5
9.0
9.5
10.0
6.55
6.67
7.10
7.57
7.78
7.82
7.72
7.57
7.39
7.17
6.93
6.72
6.54
6.39
6.28
6.17
6.08
6.01
5.96
6.33
7.78
8.08
7.62
7.08
7.18
7.02
6.85
6.67
6.48
6.28
6.08
5.93
6.16
6.29
6.32
6.28
6.19
6.09
5.12
5.77
6.24
6.21
6.33
5.77
5.94
5.99
5.96
5.87
5.73
5.55
5.36
5.34
5.54
5.64
5.66
5.62
5.54
1.41
2.01
1.84
1.41
0,75
1.41
1.08
0.86
0.71
0.61
0.55
0.53
0.57
0.82
0.75
0.68
0.62
0.57
0.55
>
P
s H O

SM-101/34 109
r evea l that, th is kind of approach is sui table at l eas t in the f i r s t approxi mat ion so long as one does not t r y to explain ine las t ic sca t t e r ing data where ro ta t ional and vibrat ional exci tat ions a r e impor tant ; although local potent ia ls s o m e t i m e s r ep roduce the ine las t ic data complete ly .
The max imum deviation from the m e a s u r e d data for both 235U and 239pu ^ g been found to be 15%. The contr ibut ions of pa r t i a l neutron waves up to H = 9 have been taken into account . The optical p a r a m e t e r s for these m a t e r i a l s a r e a s follows.
Uranium-235
The values of W, a, b and 70 have been fixed at 6. 0 MeV, 0. 5 fm,0. 5 fm and 1. 25 fm respec t ive ly throughout the whole energy r ange . The values of U a r e :
(1) 1 . 0 < E £ 2 . 0 M e V ; U = 41 .2 MeV
(2) 2.0 < E £ 3.0 MeV; U = 42. 5 MeV
(3) 3 . 0 < E < 7. 5 MeV; U = 52.5 MeV
(4) 7.5 < E < 10.0 MeV; U = 60 MeV
Plutonium-239
The values of W, a, b and y0 a r e fixed at 6. 0 MeV, 0. 5 fm, 0. 5 fm and 1. 25 fm respec t ive ly . The values of U a r e :
(1) 1.0 < E < 1.5 MeV; U = 4 1 . 2 MeV
(2) 1 . 5 £ E < 2 .0 MeV; U = 43 . 5 MeV
(3) 2 .0 < E < 3.0 MeV; U = 42. 5 MeV
(4) 3. 0 < E < 6.5 MeV; U = 51 MeV
(5) 6.5-< E £ l O j 0 MeV; U = 60 MeV
These p a r a m e t e r s a r e p re l imina ry and a r e to be modified in the light of ine las t ic sca t te r ing and angular dis t r ibut ion data.
Exci tat ion c r o s s - s e c t i o n s for 22 energy levels in the case of 235U and for 24 energy levels in the case of 239Pu a s suggested by Schmidt [9] were calculated. The compound e las t ic c r o s s - s e c t i o n was found to d e c r e a s e a s the energy of the incident neutron i nc r ea sed .
The calculated c r o s s - s e c t i o n s for 235U and 2 3 9Pu-are shown in Tab les IV and V respec t ive ly .

TABLE V. TOTAL, SHAPE ELASTIC AND REACTION CROSS-SECTIONS (BARNS) OF PLUTONIUM-239 £ o
E(MeV) o t (measured) a t (calculated) og e of
1.0
1.5
2 .0
2 . 5
3 .0
3 .5
4 . 0
4 . 5
5 .0
5 .5
6.0
6 .5
7.0
7 .5
8.0
8 .5
9 .0
9 .5
10.0
7.11
6.75
6.91
7.63
8.0
8.0
7.96
7.91
7.86
7.76
7.62
7.35
7.10
6.85
6.60
6.44
6.33
6.25
6.15
7.22
7.06
7.09
7.57
6.98
7.33
7.46
7.32
7.08
6.80
6.51
6.22
6.31
6.43
6.45
6.41
6.33
6.23
6.14
5.18
5.78
6.25
6.71
6.33
5.82
6.20
6.31
6.25
6.11
5.90
5.66
5.41
5.63
5.74
5.76
5.74
5.67
5.58
2.04
1.28
0.84
0.86
0.65
1.51
1.26
1.01
0.83
0.69
0.61
0.56
0.90
0.80
0.71
0.65
0.59
0.56
0.56

SM-101/34 111
REFERENCES
[1] FESHBACH. H. , PORTER, C . , WEISSKOPF, V., Phys. Rev. 96 (1952) 448. [2] HODGSON, P. E., The Optical Model of Elastic Scattering, Clarendon Press, Oxford (1963). [3] HAUSER, W., FESHBACH, H. , Phys. Rev. 87(1952) 366. [4] AUERBACH, E.H., MOORE, S.O. , Phys. Rev. 135(1964) B895. [5] BLATT, J. , BIEDENHARN, L., Rev. mod. Phys. 24(1952) 258. [6] RACAH, G., Phys. Rev. 62(1942) 438. [7] AUERBACH, E.H., BNL-6562. [8] HUGHES, D. , SCHWARTZ, R., BNL-325 (1958) and the revised version (1965). [9] SCHMIDT, J .J . , KFK-120.
[10] GARG, S.B., Proc. Nuclear Physics Symposium held at Indian Institute of Technology, Kanpur, India (1967).
[11] MOLDAUER, P . , ENGELBRECHT, C. , DUFFY, G.. ANL-6978. [12] THOMSON, D.B., Phys. Rev. 129 (1963) 1649. [13] MOLDAUER, P. A., Phys. Rev. 135 (1964) B642. [14] DRESNER, L., Proc. Int. Conf. Neutron Interaction with the Nucleus, Columbia University (1957), [15] MOLDAUER, P.A., Phys. Rev. 123 (1961) 968. [16] TOWLE, J., GILBOY, W., Nucl. Phys. 44 (1963) 256. [17] PEREY, F .G. , BUCK. B., Nucl. Phys. 32(1962)353.
DISCUSSION
T.D. BEYNON: I would be interested to hear from Mr.Rastogi whether the oscillations in the calculated at curves in his paper, as exemplified by Fig. 2 for lead, are due to the energy limits in the averaging procedure used for the optical model calculations or to the target-level scheme that he applied? Also, could we please have some idea of the errors on the experimental points used for the comparison?
B . P . RASTOGI: We tried to remove the oscillations by changing U and W but were unsuccessful. No scan was made on any other parameters to explain this effect but it is felt that agreement could be achieved with suitably chosen parameters. Furthermore, in our potential there is no spin-orbit term; if this were introduced it might well lead to enhanced agreement with the experimental points.


SELF-SHIELDING FACTORS FOR URANIUM AND PLUTONIUM
M. SEGEV, S. YIFTAH AND M. CANER SOREQ NUCLEAR RESEARCH CENTRE, YAVNE, ISRAEL
Abstract
SELF-SHIELDING FACTORS FOR URANIUM AND PLUTONIUM. Self-shielding factors for 238U, 239Pu, ^Pu , M1Pu' and Ul?u axe presented for several energies and temperatures as functions of dilution. They were calculated by the 'ladder' method, in a variant which was especially developed to gain high accuracy in short computer time. A brief description of the method is given.
The temperature-dilution dependence of the cross-sections displayed by these shielding factors is thus free from the assumptions of either small fluctuations or isolated resonances.
INTRODUCTION
In the calculation of the Doppler effect in fast reactors it is useful to introduce the concept of effective cross-sections. An effective cross-section for the energy E is the weighted average of the resonance cross-section in a small energy range AE about E, the flux-being the weight function. A microscopic effective cross-section for an element of the mixture depends on the mixture characteristics, which, in a common approximation [1], are the background cross-section a and the mixture temperature T. If the range AE is narrow enough to permit the collision density F(u) to be considered a constant, and if, further, AE < E , so that the factor 1/E can be neglected in the averaging process, the effective cross-section is of the following form:
E-E.
J d E —> TIST AE a + HiK-ir-*)
< a > ( E , c r , T ) = ± -^— (1) x
AE dE
\ < ^ ' " ) cr +
In Eq.( l ) , x is the type of reaction, i the resonance index, a the cross-section at the resonance peak, ip the line shape, and T the total resonance width. a£,i depends further on the neutron width r j ^ , and on the width Tx j for the reaction x. The summation over i includes, strictly, every resonance in the range from 0 to some cut-off energy Ec
where the resonance structure disappears. In the range of low energies, however, the average width or Doppler width of the resonance is much smaller than the average resonance spacing, so that each <(<7X y (E, a ,T)
113

114 SEGEV et al.
TABLE I. THE KNOWN PART OP THE RESONANCE LADDER AS OF JANUARY 1967
Isotope
U-238
Pu-239
Pu-240
Pu-241
Pu-242
Last resolved
resonance (eV)
4000
300
680
63
390
Number of
resonances
239
87
43
61
20
Reference
\ SCHMIDT [10]
J
paper SM-101/21 (these Proceedings)
is determined in practice by one resonance, namely the one closest to E. The number of i terms will increase as the energy increases due to increased overlapping between resonances.
The evaluation of an effective cross-section is straightforward so long as the energy and widths of each of the resonances in the summation in Eq.(l) are known. However, considering that the Doppler range is from 100 eV to 100 keV, Table I shows that only a small fraction of the resonances concerned are actually known.
To calculate the necessary effective cross-sections one has, therefore, to rely heavily on approximate methods. In doing so three assumptions have been made: firstly, that the level spacing and the resonance parameters are statistically distributed about mean values; secondly, that the level spacing has a Wigner distribution and the widths a x 2 _ t yP e distribution with an a priori unspecified number v of degrees of freedom [2, 3]; and thirdly, that the mean parameters and their energy dependence are known.
Until recently, two analytic methods were known for the evaluation of effective cross-sections in the range of unresolved resonances [2, 3]. In the one, applicable to the low energy range, it is assumed that the cross-section (Eq.(l)) is determined everywhere by one resonance — the nearest. In the other, applicable to the high energy range, it is assumed that resonance overlapping makes the cross-section fluctuations small. There exists, however, an intermediate range, approximately from 500 eV to 10 000 eV, where neither method is sufficiently reliable since the resonances are neither spaced enough for the overlapping to be negligible nor close enough for the overlapping to be strong.
In an attempt to avoid assumptions concerning the extent of resonance overlapping, a statistical-numeric method has lately been devised for the evaluation of Eq.(l) [4-6]. The essence of the method is the construction of an artificial distribution for each resonance parameter Zi in the range AE. This distribution, called a "ladder", is constructed by repeated sampling of a random number between 0 and 1. Each random number
SM-101/22 115
determines a value of zi from the corresponding statistical distribution y^zj). Values of z4 obtained in consecutive random samplings are assigned to consecutive resonances. The use of the random distribution creates a population of effective cross-sections <CCT)>£J each obtained by a different ladder 2., and the mean <( <(a \ )> will be a good estimate of the cross-section built on the real ladder, ^cr)^*, to the extent that the distribution of the population is narrow.
One question that arises is how many ladders should be sampled out in order to get a good estimate of the cross-section and its standard deviation. As Kelber and Kier found, and as is also our practice, some 10 to 15 ladders suffice. This has a practical importance since machine-time is proportional to the number of ladders used to evaluate a cross-section.
The second question is how many resonances.to include in a ladder such that the statistical error be as low as required. The practice of Dyos and Stevens was that large ladders of up to a thousand resonances should be considered in order to get a few percent accuracy in the cross-section and that for problems requiring high accuracy the ladders should be much larger. These findings render the procedure very time-consuming or even unfit as a standard efficient method for the evaluation of effective cross-sections. A further difficulty in this respect is the fact that the ranges AE for the calculation of the effective cross-sections should be small enough to ensure a constant collision density and will not, in general, contain enough resonances as to obtain a sufficiently low statistical e r ror .
A LADDER METHOD BY DISCRETE SAMPLING
To render the ladder method an efficient computer routine, one has to find a way of achieving high accuracies with ladders of a comparatively small number of resonances. If we look into the reason for the statistical dispersion we find it to have two sources. One source of statistical error is the different order in which the parameters are distributed among the resonances, in different ladders. This sort of randomness cannot be repaired; it is the immediate result of the method — the random sampling. Another source for statistical error is the fact that in sampling parameters for a ladder we pick a finite number of values out of a continuous distribution and therefore one ladder will differ from the other not only in the order of the parameters but also in the values of the parameters. If each ladder contained the same parameter values one source for statistical inaccuracy would be removed.
Let y(z) be the distribution of the width or the level spacing, where the range of z is 0 S z oo . Divide this range into N equi-probability subranges defined by the sequence of points 0 = z0< z1< z2< . . . < zN =oo, such that the following holds:
n / y(z)dz
- ^ • i = I (for each n) (2)
I y(z)dz o

116 SEGEVetal.
Define "pa r t i a l " moments of the dis t r ibut ion as follows:
n
/ zmy(z)d: z ..
< zm > = —2^ (for each n) (3) n z pn / y(z)dz
z n- l
According to Eqs (2) and (3)
00
/ zm y(z)dz N
" N A. < z ^n r n=i
/ y(z)dz
(4)
Thus the moments of y(z), and par t i cu la r ly the average , a r e ent i re ly defined by the par t ia l moments <(z X . Under what conditions can we calculate effective c r o s s - s e c t i o n s if the continuous dis t r ibut ions y(z) a r e replaced by the d i sc re te dis t r ibut ions y(<(z^>n)? It is obvious that the calculation will become more re l iab le as N i n c r e a s e s . F ig . 1 shows that for values higher than N = 6 all the calculat ions yield prac t ica l ly the same re su l t . The figure i l lus t r a t e s the influence of N on the calculation of the capture c r o s s - s e c t i o n of 2 4 0 Pu at 1 keV. A s i m i l a r p ic ture was obtained in calculating capture and fission c r o s s - s e c t i o n s at other energ ies and for other i so topes . As r e g a r d s accuracy , we get a s tandard deviation of 2% for a ladder of 300 r e sonances , compared with 4.4% obtained by Dyos. By using d i sc re te dis t r ibut ions it is possible to obtain high accuracy a lso in r anges AE where t he re a r e not many re sonances (as for example in the higher isotopes of Pu, where resonances have not been resolved up to as high energ ies a s in 2 3 8U); this is because I r esonances can be des cr ibed by a distr ibution of I values and a ladder of IX J s tages where J can be taken as la rge as des i red .
Average c r o s s - s e c t i o n s , which a r e effective c r o s s - s e c t i o n s for infinite dilution, have been measu red for many m o r e cases than t e m p e r a ture-dependent finite-dilution effective c r o s s - s e c t i o n s . There fore an efficient method of calculation is needed par t i cu la r ly for the l a t t e r . Separate the effective c r o s s - s e c t i o n into two p a r t s as follows:
< ax > (a,T) =Jfx(cr,T) < ^ > (5)

SM-101/22 117
4.6
4.2
* 3 . 8
< CD
3.4
3.0,
•
-
CALCULATION BY 10 LADDERS
CTy(Pu-240 ;lkeV)
1 ! m 111 1 , 1 , 1 1 1 , 1
0 2 4 6 8 10 NUMBER OF DISCRETE VALUES FOR DESCRIBING THE STATISTICAL DISTRIBUTION
3.5 _ CALCULATION BY 10 DISCRETE VALUES
CTy(Pu-240;l keV)
NUMBER OF LADDERS FOR CALCULATING
THE CROSS-SECTION
FIG.l. Calculation of a capture cross-section by a ladder of 120 resonances.
where <(crx )> is the ave rage c r o s s - s e c t i o n . Eq.(5) is the definition of the self-shielding factor fx(cr ,T). To calculate the t e m p e r a t u r e effect in the r e a c t o r one needs the differences '\crx)> (a, T 2 ) — " x ^ ^ ia>^i)-According to Eq.(5)
A < ax > (CT,AT) = Af x (a ,£T) < CTX > (6)
If <\crx)> is known, a s for example by measu remen t , one has to evaluate f x (a , T) in o r d e r to de te rmine the effective c r o s s - s e c t i o n . Since the ave rage c r o s s - s e c t i o n <(crx^ is the effective c r o s s - s e c t i o n in infinite dilution at any t e m p e r a t u r e , we get, according to (5), for each ladder i ,
< a x > (CT,T) J
f x ( a ' T ) i = < ax > («,T) (7)
The self-shielding factor (fx)j i s the ra t io of two effective c r o s s - s e c t i o n s calculated by the same ladder . Both these effective c r o s s - s e c t i o n s {obtained from E q . ( l ) ) deviate from the t rue c r o s s - s e c t i o n s in the same a lgebra ic di rect ion, and we may thus expect the dependence of (fx)^ on i to be l e s s than that of the effective c r o s s - s e c t i o n s t hemse lves . F ig . 2 shows that the s ta t i s t i ca l re l iabi l i ty of f r (100b, 300°K) and fy(100b, 900°K), calculated for 2 4 0Pu at 1 keV with a ladder of 120 r e sonances , is be t te r

118 SEGEV et al.
Af(900o-300°K)
STANDARD DEVIATION
8 12 16 20
f(900°K)
4 8 12 16 20 4 8 12 16 20
NUMBER OF LADDERS FOR CALCULATING THE SELF-SHIELDING FACTOR
FIG.2. Calculation of a self-shielding factor by a ladder of 120 resonances.
than that of <(ay )> calculated for the same conditions, as shown in Fig. 1. Furthermore the statistical reliability of Afy between the two temperatures is even higher.
Figs 1 and 2 show also that the evaluations of < <^ax ^ £X <(fx>£^ and the standard deviations require a rather small number of ladders.
THE COMPUTER CODE SELF
The computer code SELF computes self-shielding factors as functions of energy, temperature and background cross-section. The input data are average resonance parameters as functions of energy and the number v of degrees of freedom in the distributions of the partial widths and level spacings. The self-shielding factors are calculated from Eq.(l) (including the antisymmetric line shape for elastic scattering) according to the ladder method as described in the previous section. In each region AE a decision is made at the start as to which resonances to include in the sum E in
i Eq.( l ) . The criterion for deciding to include a particular resonance is that its contribution relative to that of the nearest resonance is greater than a predetermined e (usually e = 0.001). The relative contribution is evaluated from average V and D values for the line shape at zero and at infinite temperature, taking the greater of the two. The line shape is calculated by the WANL routine, developed at Argonne [8]. It is a rapid and exact routine. Its accuracy was checked by comparison with other exact routines which are more time-consuming [9]. In the present version of the ladder method the value of AE is unimportant and is determined by the number of resonances in the ladder and their average spacing. The number of resonances in the ladder is determined by the requirements for statistical accuracy. The integration over E is carried out by dividing AE into sub-regions and performing a 48-point Gaussian integration within each. The number of sub-regions is determined by the requirement that its aug-

TABLE II. SELF-SHIELDING FACTORS FOR URANIUM-238 AND PLUTONIUM-239
E
(keV)
0.1
0.3
1.0
3-0
10
40
T
(°K)
300 900
1500 2100
300 900
1500 2100
300 900
1500 2100
300 900
1500 2100
300 900
1500 2100
300 900
1500 2100
u -238 capture
1000 .
.462
.546 •590 .620
.663
.745
.782
.805
• 902 •937 • 950 •957
•973 .984 .988 .990
• 993 • 997 .998 • 998
• 999 • 999
1.000 1.000
cr LOO
157 194 218 237
282 352 392 422
616 702 742 768
842 894 915 928
950 972 980 984
991 996 997 998
10
.066
.077
.085
.091
.124 • 153 • 173 .188
.361
.438
.481
.511
.629
.716 • 757 .784
.827 • 895 • 921 • 935
• 957 .980 .986 .989
u-238 elastic
1000
.574
.624 • 653 .674
•727 .783 .810 .828
• 920 .945 .956 .962
•974 .984 .987 .989
• 993 .996 • 997 .998
• 999 1.000 1.000 1.000
cr 100
.402
.416
.427
.435
.499
.530 • 550 • 565
• 729 • 775 • 799 .815
.867
.903
.919
.929
• 951 • 970 • 977 .980
.992 • 996 • 997 • 997
10
.347 •351 •355 • 358
.414
.426
.436
.443
• 599 .632 .651 .665
•739 .781 .803 .819
.865
.903
.921 • 932
.966
H
VO
CO
C
O C
O C
O
ON
ON
ON
1000
.801
.862
.887
.902
.906
.942
.955
.962
.981
.990
.992
.994
.993
.996
.997
.997
.998
.999
.999
.999
PU-239 capture
<y
100
.425 •513 .564
• 599
• 598 .700 .747 .776
.871 • 924 .941 • 950
.945
.967 • 974 .978
.986 • 992 •993 • 995
10
.213
.269
.308
.338
.322
.419
.473
.510
.653
.761
.803
.827
.808
.874
.898
.911
.939
.963
.971
.976
Pu -239 fission
1000
.884 •915 .928 •937
• 940 .960 .968 • 972
.986 • 992 .994 • 994
• 994 • 996 • 997 • 998
• 998 • 999 .999 • 999
a 100
.618
.667
.696
.718
.721
.782
.811
.829
.904 •938 .949 .956
• 953 .970 .976 .980
.987
.992 •994 • 995
10
.403 • 437 .462 .482
• 479 • 541 .576 .602
.728 •799 .828 .845
.834
.885
.906
.918
.944
.966 • 974 .978
Pu -239 elastic
1000
.940 •957 .965 •970
• 972 .982 .986 .989
• 995 • 997 •998 • 998
.998 • 999 .999 .999
.999 1.000 1.000 1.000
cr 100
.841
.862
.875
.885
.889 • 915 .928 • 937
.965 • 979 .983 .986
.985
.991 • 993 .994
.996 • 997 • 998 • 998
10
• 792 .806 .815 .823
.824
.848
.862
.872
.913 • 937 • 947 • 954
.948
.966
.972
.976
.982
.988 • 991 • 992

CO
o
TABLE III. SELF-SHIELDING FACTORS FOR PLUTONIUM-240, -241 AND -242
E
(keV)
0.1
0-3
1 0
3-0
10
T
(°K)
300 900
1500 2100
300 900 1500 2100
300 900 1500 2100
300 900 1500 2100
300 900 1500 2100
Pu-240 capture
3000
.665 •7^3 .780 .803
.837
.889 •909 .921
.961
.976
.982 •985
.990 •994 •996 •997
•998 •999 • 999 • 999
J
300
.266
.329
.367 •395
• 453 .544 .592 .625
.765
.836 ,866 .885
.920
• 953 .964 .971
.980 • 990 .993 • 995
Pu -240 fission
3000
.663
. 74l •777 .800
.844
.894 • 914 .925
• 959 • 975 .981 .984
.991 • 995 • 997 • 997
•998 .999 •999 • 999
a 300
.268
.331
.369
.397
.467
.560
.607
.639
• 759 .830 ,860 .879
.928
•959 .970 •975
•978 • 989 • 992 • 99^
Pu-240 elastic
3000
.684 • 748 .780 .800
.846
.890
.908
.920
.963 •977 .982 «984
• 990 .994 • 995 • 996
• 997 • 998 • 999 • 999
a 300
.396
.430
.452
.470
•55^ .609 .641 .663
.798
.850
.874
.889
.924
•951 .961 .967
• 975 .986 .989 • 991
Pu-241 capture
t
10000 .
.987 • 992 • 993 •99^
• 995 • 997 • 998 • 998
• 999 • 999 • 999
1.000
T
L000
.892
.927
.941 •949
•953 •972 •978 .982
.988
•993 • 995 • 996
Pu-241 fission
10000
•992 •994 •995 .996
.996 •997 •998 •998
•999 •999
1.000 1.000
(T
1000
.93^
.951
.958
.963
.965
.975
.979
.982
.992
.995
.996
.996
Pu-241 elastic
10000
• 997 .998 .998 •999
•999 •999 •999
1.000
1.000 1.000 1.000 1.000
a 1000
.976
.984
.987
.989
.989 • 993 • 995 .996
• 997 .998 .999 • 999
Pu-242 capture
or 10000
.856
.901
.918
.928
•937 •959 .967 •972
•978 .987 .989 •991
1000
.476
.563
.606 •635
.665
.745
.782
.805
.839
.891
.912 • 924
Pu-24£ > elastic
<T 10000
.872 •909 • 924
•933
.944
• 963 .970 .97^
.982
.988 • 991 • 992
1000
.601
.651
.678
.697
.731
.785 ,812 .829
.872
.909
.925
.934

SM-101/22 121
mentation should not result in a relative change larger than 0. 001 in the computed quantity. The number of sub-regions needed at low energies (100-1000 eV) is equal to or somewhat greater than the number of resonances in the ladder. For higher energies the number of sub-regions decreases, owing to the increase in resonance overlapping. The code is written for the Philco-2000.
DISCUSSION AND RESULTS
Since average cross-sections are usually measured, or at least are much more measurable than effective cross-sections, and since self-shielding factors or differences of self-shielding factors can be calculated to satisfactory accuracy in reasonable computer-time, we find the notion of the self-shielding factor more effective and useful to Doppler calculations than effective cross-sections. As an example we present in the paper self-shielding factors for 238U, 239Pu, 240Pu, 241Pu and 242Pu in several energies, dilutions and temperatures. The values in Tables II and III are with three figures, meaning that differences constructed out of them are significant to the last figure. These tables are part of much more detailed ones calculated as preliminary to the evaluation of group self-shielding factors, for the 30-group set we have constructed. The code written for the Philco-2000 has computed some 6000 self-shielding factors, for energies in the range 100 eV - 50 keV, in 10 hours.
REFERENCES
[1] ABAGYAN, P,L. et a l . , "Group Constants for Nuclear Reactor Calculations", Consultants Bureau (1964).
[2] NICHOLSON, R. B„ Doppler Effect in Fast Reactors, APDA-139 (1960). [3] SHAVIV, G., Doppler Effect in Fast Reactors, Thesis. [4] KELBER, C.N. , KIER, P .H. , Nucl. Sci. Engng 24 (1966) 389. [5] KELBER, C.N. , KIER. P. H., Nucl. Sci. Engng 26 (1966) 67. [6] DYOS, M.W., STEVENS, C.A., Nucl. Sci. Engng 2_5 (1966) 294. [7] SEGEV, M., Cross-Section Sets for Fast Reactor Calculations, Thesis. [8] ROTHENSTEIN, W., (Dept of Nuclear Sciences, Technion, Haifa, Israel), private communication. [9] ARAD, B., (Soreq Nuclear Research Centre, Yavne, Israel), private communication.
[10] SCHMIDT, J .J . , KFK 120A (1966).
DISCUSSION
H.W. KUSTERS: Was a comparison made of the self-shielding of 238U, as calculated by the ladder method, and the values given by Bondarenko et a l . , and if so, how large were the deviations in the keV range?
M. SEGEV: Yes, we did do this comparison and found only small deviations, probably due to discrepancies in the resonance parameter data and not to the method of calculation.
H.W. KUSTERS: Certainly, the Russian set may include other microscopic data, but it is nevertheless of interest to know the deviations.
J .L . ROWLANDS: Could Mr.Segev explain whether he thinks it worthwhile averaging over a number of ladders, when in fact there is only

122 SEGEV et al.
one real ladder? Should we not rather aim at obtaining improved measured data?
M. SEGEV: Naturally, a direct experimental determination of the resonance parameters is preferable, but, failing this, there is no alternative to averaging over a number of ladders. The population of all possible ladders has some standard deviation which indicates the degree of confidence with which we can say that the cross-section value evaluated in this way, as an average, approximates to the actual value.

BASIC NUCLEAR DATA FOR THE HIGHER PLUTONIUM ISOTOPES
S. YIFTAH, J.J. SCHMIDT*, M. CANER AND M. SEGEV SOREQ NUCLEAR RESEARCH CENTRE, YAVNE, ISRAEL
Abstract
BASIC NUCLEAR DATA FOR THE HIGHER PLUTONIUM ISOTOPES. Fast reactor fuel may have an appreciable content of high Pu isotopes, the amount varying according to the source. Therefore, in calculations of static and dynamic reactor characteristics, reliable basic nuclear data are needed not only for 239Pu but for the higher isotopes as well. Reactor computations depend on cross-sections as functions of energy, dilution and temperature. Basic nuclear data for a fuel isotope consists therefore of average cross-sections and resonance parameters. Experiment alone does not furnish such data in a final complete form. In fact, the experimental information needs interpretation, weighting, evaluation and often also interpolation on theoretical grounds. Within the framework of contracted research with the Association EURATOM-Karlsruhe on fast reactors, an evaluation was made of basic nuclear data for the high Pu isotopes. This paper summarizes some pertinent parts and aspects of the evaluation. Resonance parameters and cross-sections are presented for 240Pu, ul Pu and 242Pu in the form of experimental and recommended data. Complete sets of parameters include the first 43, 61 and 20 resonances of these isotopes respectively. Average parameters are derived from these.sets, to be used at higher energies where either the para-metrization is incomplete or the resonances unresolved. Although the samples.are, as a rule, too poor for a direct derivation of statistical distributions, there is enough general knowledge on the subject today to fix these distributions within narrow limits.
1. INTRODUCTION
Since the plutonium produced as a by-product in thermal reactors is to serve as fuel for fast reactors, it is necessary to have accurate nuclear data for all its isotopes present. The composition of Pu fuel from thermal reactors may be in the following range [1] : 239Pu, 55-60%; 240Pu, 20-25%; 241Pu, 10-15%; 242 Pu, 5-10%. That means that if a typical 1000-MW(e) reactor is fuelled with, say, 3 tonnes of plutonium, it will have about 1700 kg 239Pu, 600 kg2 4 0Pu, 400 kg 241 Pu and 300 kg 242Pu. In other words, about half or l i tonnes of the plutonium will be of the higher isotopes variety. It is thus advisable to know as much as possible about the nuclear and other properties of half the fuel loading.
Nuclear data for 239pu have been evaluated recently [2, 3] . The purpose of this paper is to give a recommended complete set of nuclear data for the higher isotopes 240Pu, 241 Pu and 242Pu.
Only limited experimental data are available, and it was thus necessary to rely heavily on nuclear systematics and theory to cover the whole range of interest (0.01 eV to 15 MeV). The systematic literature search covers the period up to the Paris Conference on Nuclear Data (October 1966), but later available data are also included. The results are presented below according to three energy regions: the thermal region (0.01 to 1 eV approx.), the resonance region, and the fast neutron region (above 1 keV).
* Kernforschungszentrum Karlsruhe, Federal Republic of Germany.
123
124 YIFTAH et al.
The data evaluated has been punched on ca rd s in the KEDAK (Kar ls ruhe) format and, l ike the r e s t of the Ka r l s ruhe nuc lear data file, will be t r a n s fe r red to the neutron data compilat ion cen t re at Saclay where it will then become available upon r eques t .
2. THERMAL ENERGY RANGE
In this sect ion we give recommended values for the following c r o s s -sec t ions at t he rma l energy (0.0253 eV): total (a T ) , sca t t e r ing (a ), f ission (af) and capture (a ). A d iscuss ion and graphs depicting the c r o s s - s e c t i o n s in the range from 0. 01 eV to the vicinity of the f i r s t resonance will be given e l sewhere [4] .
2 . 1 . Plutonium-240
crT. We recommend the value a T = crn + a{ + a - 281 b . A m e a s u r e d value of 273 ± 8 b has been repor ted [5] .
aR, a f . F r o m a Bre i t -Wigner calculation using the p a r a m e t e r s of the f i rs t resonance we obtained the values an - 2.26 b , af - 0. 052 b .
a . Ten sou rces mentioned by Drake and Dyos [6] were used to obtain the weighted average a = 279 b . To obtain agreement with this value a sma l l change was made in r of the f i rs t resonance (from 31 + 3 to 32 .3 ± 3 meV).
2 . 2 . Plutonium-241
a T . We recommend a T = 1385 ± 20 b , as in BNL-325 (1965) [7] ; this value is based on the m e a s u r e m e n t s of Craig and Westcot t [8, 9] and Simpson and Schuman [10] .
ffn. This was taken from the mult i level calculation of Drake and Dyos [6] : crn = 12.6 b .
Of. A recen t evaluation by Westcott [11] and m e a s u r e m e n t s by J a m e s [12] and White et a l . [13] point to values in the range 1012-1022 b; BNL 325 (1965) gives a best value of 950 ± 30 b a r n s , based on older data. We recommend the value of White et a l . : crf = 1022 ± 29b .
or . This value was calculated as a - ar - {an + a{) = 350 ± 38 b . The only d i rec t m e a s u r e m e n t available is a r e a c t o r spec t rum average by F ie lds [14] : 390 ± 80 b .
2 . 3 . Plutonium-242
Table I p r e sen t s the 0.0253 eV data. F o r aT we adopt the weighted average of the m e a s u r e m e n t s of Auchampaugh et a l . [18] and Young et a l . [19] . It can be seen that the f i rs t posit ive resonance can account for only one third of a T . In fact, Young s ta tes [20] that he found it n e c e s s a r y to postulate two negative r e s o n a n c e s : one at - 0 . 02 eV and another much

SM-101/21 125
fur ther away. In the p resen t work we made an approximate fit to aT with one negative r e sonance . The p a r a m e t e r s we a r r i v e d at a r e : T"= 30 meV; r ° " = 0.13 meV; E~ = - 1 . 1 eV. F r o m these p a r a m e t e r s we calculated an, and we took a = a T - or , obtaining finally: a T = 39.5 ± 0. 8 b; c r n = 9 . 0 b ; a = 30.5 b . 7
3. RESONANCE ENERGY RANGE
The re has been a g rea t i nc r ea se in the volume of exper imenta l data in this region during the l a s t two y e a r s . If we take as a s t a r t ing point for the p resen t evaluation Supplement No. 2 to BNL-325 dated F e b r u a r y 1965 [7] , we see that the number of reso lved recommended resonance p a r a m e t e r s was 9 for 2 4 0 Pu, 23 for 2 4 1Pu and one for 2 4 2 P u . In the p resen t r e p o r t r ecommended re sonance p a r a m e t e r s a r e given for £3 24° Pu r e sonances , 61 2 4 1 Pu re sonances and 20 2 4 2Pu r e s o n a n c e s .
F o r compar i son the following table s u m m a r i z e s the knowledge of resolved resonance p a r a m e t e r s for these as well as o ther nucl ides , as of January 1967:
Isotope Las t reso lved resonance Number of r e sonances Reference (eV)
235
239p u 3 0 0 „ , I (Feb. 1966)
240 Pu 680 241 Pu 63 P r e s e n t 242p u 3 9 0 on I r ep o r t
Most of the recen t data in this region have been obtained from two s o u r c e s :
(1) Time-of-f l ight techniques using the l inear e lec t ron a c c e l e r a t o r s of Eura tom (Geel, Belgium), Harwel l , the R e n s s e l a e r Polytechnic Insti tute and L i v e r m o r e .
(2) A v e r y important source of new data has become available from t ime-of-f l ight m e a s u r e m e n t s preformed using the 1.2 kt nuclear explosion • P e t r e l 1 in Nevada in June 1965 as a neutron source with a neutron yield of 1.8 X 10²³ neutrons with a duration of 0 .1 /usee. The nuc lear device was located at a depth of 185 m from which a 35-cm d iamete r pipe provided a flight path for neut rons with s a m p l e s , so l id - s t a te de t ec to r s , f ission foils and other n e c e s s a r y ins t rumenta t ion a r r anged above the sur face . In this exper iment fission c r o s s - s e c t i o n s of 2 4 0Pu, 241 Pu, 2 4 1Am, 2 4 2 Am as well as 233U, 235 U and 2 3 9 Pu were m e a s u r e d and analysed.
In the analys is of both recen t and old data th ree kinds of tables were cons t ruc ted: (a) tables of exper imenta l and recommended resonance p a r a m e t e r s (giving all the available and a s sumed data; (b) tables of resonance p a r a m e t e r s for neut ronics calculat ions (giving only those r e sonances for which al l the significant par t i a l widths can be presen ted) ;

126 YIFTAH et al.
TABLE I. Pu-242 THERMAL DATA
Reference
Studier et al. [15]
Butler et al. [16]
BNL 325 (1958) [17]
Auchampaugh et al. [18]
Young et al. [19]
This report
av
30 + 10
18.6 + 0.8
30 + 2
30 + 2
30.5
Barns
ffn
8.9 + 2.6
9.0
ffT
38.9 + 1.6
39.8 + 1.0
39.5 + 0.8
Remarks
pile neutrons
measured
(?) wrongly assigned to Butler
a measured; ay from BNL 325 (1958) an " aT " <\
measured
recommended
and (c) tables of average resonance parameters. The tables of type (a) (experimental data) have to be presented elsewhere [4] due to their excessive length.
To compute the recommended resonance parameters from the experimental values, we calculated weighted averages and e r ro r s . If the error bars did not overlap, a root mean square error was calculated instead. In cases of large discrepancies, some of the measurements had to be rejected.
3 .1 . Plutonium-240
3 .1 .1 . Resonance parameters: values for neutronics calculations (Table II)
Some comments about the source data follow. The best data are those from the transmission experiment of Bockhoff
et al. [21] . The experiments, which used time-of-flight techniques, were performed with the 60-MeV electron linear accelerator of Euratom, which is operated by the Central Bureau for Nuclear Measurements (CNBM), Geel, Belgium. The 240Pu samples used in the experiment were supplied by the USAEC. Three samples with a total thickness of 0. 0675 g/cm2 were used. The resolution was 6 to 1 nsec/m. In this experiment 158 resonances were found between 20 eV and 5 keV. Between 20 eV and 800 eV T°for 36 out of 42 resonances have been determined by shape analysis. The data of Byers et al. [22] were obtained from a nuclear detonation as neutron source. The resolution was 17 to 6 nsec/m. The shape analysis of the data has not yet been published.
Brooks and Jolly [23] investigated the fission cross-section in the 20 to 120 eV range. Their measurements were relative to 235U; fissions were detected by liquid scintillators. Their r f are recommended although they are for the most part upper limits. Short descriptions of the measurements from 1963 back to 1955 are included in BNL-325 (1965) [7] .
To complete the table of values for neutronics calculations, when rf values were missing, it was assumed that rf = \ r f / = 0.23 meV (see section 4. 1.1).

SM-101/21 127
TABLE II. Pu-240 RESONANCE PARAMETERS: VALUES FOR NEUTRONICS CALCULATIONS
i = 0, J = \ for all r e sonances
r
1 2 3 4 5 6 7 8 9 10 11 12 13 14 15 16 17 18 19 20 21 22 23 24 25 26 27 28 29 30 31 32 33 34 35 36 37 38 39 40 41 42 43
Er (eV)
1.056 20.46 38.33 41.64 66.63 72.82 90.77 92.50 105.03 121.65 135.22 151.72 162.9 170.3 186.1 199.6 239.3 260.7 287.3 305.1 318.5 320.9 338.7 346.2 364.0 372.3 405.0 419.0 450.2 466.4 473.2 494.2 499.6 514.6 546.8 553.5 566.6 597.2 608.4 632.6 637.8 665.5 678.9
r (meV) n
2.30 2.3 18 16.1 48.0 21.8 13.3 2.9 44.2 13.9 17.8 13.6 8.6 13.4 16.0 0 11.3 25 125.1 7.0 6.0 18.6 5.7 16.2 30.9 13.3 102.5 8.1 16.8 0 0 5.1 18.6 20.4 29.9 16.7 30.0 53.0 20.5 12.3 0
183 24.0
r (meV) Y
32.3 21 26 33 47 22 29 32 32 35 38 32 43 37 41 32 32 32 65 32 32 77 32 51 43 32 71 32 102 32 32 32 32 32 32 32 32 32 32 32 32 96 32
Tf (meV)
0.006 0.55 0.14 0.13 0.38 0.49 0.23 1.07 0.75 1.6 0.23 0.23 0.23 0.23 0.23 0.23 0.23 0.23 0.23 0.23 0.23 0.23 0.23 0.23 0.23 0.23 0.23 0.23 0.23 0.23 0.23 0.23 0.23 0.23 0.23 0.23 0.23 0.23 0.23 0.23 0.23 0.23 0.23
r o ImeV) n
2.24 0.51 2.91 2.50 5.88 2.56 1.39 0.30 4.31 1.26 1.53 1.10 0.67 1.03 1.17 0 0.73 1.55 7.38 0.40 0.336 1.04 0.31 0.87 1.62 0.69 5.09 0.396 0.79 0 0 0.23 0.83 0.90 1.28 0.71 1.26 2.17 0.83 0.49 0 7.11 0.92
3 . 1 . 2 . Average resonance p a r a m e t e r s below 1 keV (Table III)
The nuc lear momentum and par i ty of 2 4 0 Pu is In - 0 +; s-wave neutrons lead to s t a tes with total angular momentum J = \, while p-wave neutrons lead to J = £, f.

128 YIFTAH et al.
TABLE III. Pu-240 AVERAGE RESONANCE PARAMETERS BELOW 1 keV
<D>'_= i0 , 1 = 13.2 + 1.7 eV
< D > _3 = 7.26 eV J 2
/ (K l = ° < r ° > i = 1.81 ± 0 .24 meV
n J = 7
/ Ox { = 1
< r n > . 1 = 3 - 3 0 m e V 1 ~2
< T ° > 3 = 1.82 meV 1 2
1
'1=0 ' ' 0 S * =€„ = ( ! . 3 7 ± 0 . 5 1 ) X io-4
J = V ? 2 2 = ?, = 2 . 5 X 10" i = l J
4 = 0 < T f > _ i = 0 .23 meV
]•
i = o < Tv> i = 3 2 + 1 meV
' ' ! =
<T Y > "1 3 = 32 meV y-2 2
i/„ = 1; i/f = l ; v =oo
a = 1 0 . 6 b a r n s pot
Average p a r a m e t e r s for s-wave neu t rons . The in tegra l plot of the resonance levels shows that they begin to be mis sed at an increas ing ra t e beyond 200 eV. Consequently, the calculation of the average level spacing
<D> was based on 15 r e sonances . We obtained <D> = (E 1 5 - E ^ / 1 4 = 13.2 ± 1 . 7 eV. The average reduced neutron width was calculated to
36
be < r ° > = (1/36) \ rn°r = 1.81 ± 0.24 meV. The capture width Fy was
r = l
assumed to have a delta function dis t r ibut ion. A weighted average was calculated from the m e a s u r e d r y r ( r = 1, . . . , 21), namely < r > = 32 + 1 meV. The s t rength function is 5 0 =<rn°>/<D> = ( 1 . 3 7 ± 0 . 5 1 ) X 1 0 - 4 . This value may be compared with C0 = (2. 3 ± 0. 7) X 10"4 r epor t ed by Simpson and F luhar ty [24] . <T f> was calculated by fitting <(af ^ = 0.16 b (using the code SELF [25]) with ff = 1 and the p resen t average p a r a m e t e r s . The r e su l t (which we r ecommend for the whole 1-1000 eV range) is <Crf )> = 0.23 meV at E = 200 eV. The <C<Jf)> was calculated from the resonance curve of Bye r s et a l . [22] in the range 0-1000 eV.

SM-101/21 129
Average parameters for p-wave neutrons. We follow the recommenda-tions of Schmidt for 238U [2] . <,D^>is assumed to depend on J and not on J£, according to the Fermi gas model:
/ r . N , T. const. J ( J+1) < D > ( J ) = 2 T T T e x p - 2 ^
with the spin cut offer = 4. It follows that:
<D> * = 0, l = 13.2 ± 1.7 eV; <D> J = * = 7.26± 0.94 eV J = 1/2 J = 3/2
?! is assumed to be independent of J and equal to 2. 5 X 10⁻⁴ ( as in 238 U).
It follows that <r°> ]l\/2= 2.24 meV, and O ^ J j ^ 1.23 meV. <r y>
is assumed to be independent of J and i . The potential scattering cross-section is taken as that for 238U[2] , namely CT = 10. 6 b.
E r ro r s . The calculated er rors are statistical. For a sample [xv . . . xn) from a X2-distribution with v degrees of freedom, the standard deviation is
CT = (2/ni/)1/2<x>
Statistical distributions. It is accepted at present that D follows a Wigner distribution, while r^follows a X2-distribution with un - 1. The distribution of r is commonly assumed to be a delta function. The distribution of rf is open to question and, moreover, may depend on the isotope considered. We adopted a X2 -distribution with v, - 1.
3.2. Plutonium-241
3.2. 1. Resonance parameters for neutronics calculations (Table IV)
Plutonium-241 presents the problem of level interference. To re produce the fission cross-section between resonances satisfactorily, it is necessary to use a multilevel multichannel formalism, such as that of Reich and Moore [26] . This has been done by most experimenters. But at present, nuclear codes for Doppler calculations are based on the use of the Breit-Wigner line shapes and therefore the data for neutronics calculations must be presented as B-W parameters. In computing r e commended values we did not differentiate between single and multilevel resonance parameters.
The best data for the range 4 to 20 eV. come from the fission measurements of Moore et al. [27] . The resolution was 75-100 nsec/m. The best data in the range 20 to 60 eV come from the fission measurements of Simpson et al. [28] who made use of a nuclear detonation as a neutron source; the resolution was 20 nsec/m, and there was also an improvement in the statistical accuracy. Short descriptions of the measurements from 1964 back to 1956 are included in BNL-325 (1965) [7]
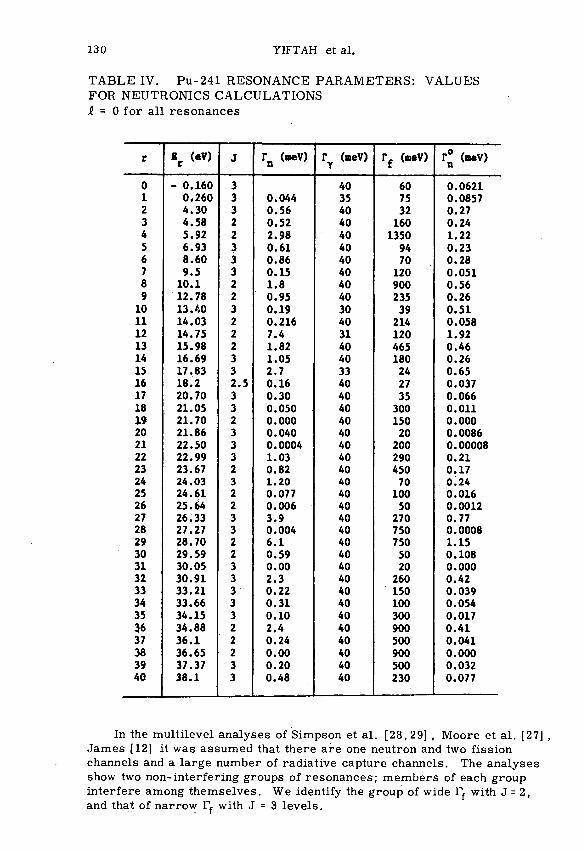
130 YIFTAH et al.
TABLE IV. Pu-241 RESONANCE PARAMETERS: VALUES FOR NEUTRONICS CALCULATIONS i = 0 for all resonances
r
0 1 2 3 4 5 6 7 8 9 10 11 12 13 14 15 16 17 18 1* 20 21 22 23 24 25 26 27 28 29 30 31 32 33 34 35 36 37 38 39 40
Er (eV)
- 0.160 0.260 4.30 4.58 5.92 6.93 8.60 9.5 10.1 12.78 13.40 14.03 14.75 15.98 16.69 17.83 18.2 20.70 21.05 21.70 21.86 22.50 22.99 23.67 24.03 24.61 25.64 26.33 27.27 28.70 29.59 30.05 30.91 33.21 33.66 34.15 34.88 36.1 36.65 37.37 38.1
•->
3 3 3 2 2 3 3 3 2 2 3 2 2 2 3 3 2.5 3 3 2 3 3 3 2 3 2 2 3 3 2 2 3 3 3 3 3 2 2 2 3 3
r (meV) n
0.044 0.56 0.52 2.98 0.61 0.86 0.15 1.8 0.95 0.19 0.216 7.4 1.82 1.05 2.7 0.16 0.30 0.050 0.000 0.040 0.0004 1.03 0.82 1.20 0.077 0.006 3.9 0.004 6.1 0.59 0.00 2.3 0.22 0.31 0.10 2.4 0.24 0.00 0.20 0.48
r (meV) Y
40 35 40 40 40 40 40 40 40 40 30 40 31 40 40 33 40 40 40 40 40 40 40 40 40 40 40 40 40 40 40 40 40 40 40 40 40 40 40 40 40
Tf (meV)
60 75 32 160 1350 94 70 120 900 235 39 214 120 465 180 24 27 35 300 150 20 200 290 450 70 100 50 270 750 750 50 20 260 150 100 300 900 500 900 500 230
T° (meV) n
0.0621 0.0857 0.27 0.24 1.22 0.23 0.28 0.051 0.56 0.26 0.51 0.058 1.92 0.46 0.26 0.65 0.037 0.066 0.011 0.000 0.0086 0.00008 0.21 0.17 0.24 0.016 0.0012 0.77 0.0008 1.15 0.108 0.000 0.42 0.039 0.054 0.017 0.41 0.041 0.000 0.032 0.077
In the multilevel analyses of Simpson et al. [28, 29] , Moore et al. [27] , James [12] it was assumed that there are one neutron and two fission channels and a large number of radiative capture channels. The analyses show two non-interfering groups of resonances; members of each group interfere among themselves. We identify the group of wide rf with J = 2, and that of narrow rf with J = 3 levels.

SM-101/21 131
TABLE IV (cont . )
r
41 42 43 44 45 46 47 48 49 50 51 52 53 54 55 56 57 58 59 60 61
K <eV> r
38.4 38.5 39.2 39.9 40.3 40.83 42.66 43.3 43.85 46.5 48.1 50.3 50.9 51.9 52.6 53.4 58.02 59.18 60.26 61.30 62.08
J
3 2 3 3 3 2 3 3 3 2 3 2 2 2 2 3 2 2 3 2 2
r (meV) n
0.105 0.087 1.20 1.5 0.005 2.9 0.30 0.19 0.00 2.2 6.2 0.77 0.043 0.043 0.007 0.00 2.90 2.69 4.81 0.094 8.12
r (meV) Y
40 40 40 40 40 40 40 40 40 40 40 40 40 40 40 40 40 40 40 40 40
r, (meV) f
10 400 160 50 50
1200 250 50 20 280 480 300 300 50 200 300 700 550 160 50 650
T° (meV) n
0.017 0.014 0.20 0.24 0.0008 0.46 0.045 0.028 0.000 0.31 0.90 0.106 0.006 0.006 0.001 0.000 0.38 0.35 0.62 0.012 1.03
The " r ° " va lues of Simpson et a l . [28] a r e thought to be c lo se r to values for 2 g j r ° , as in Moore et a l . [27] , and a r e t r ea ted a s much. In
Table IV, r ^ i s calculated from S impson ' s data using the appropr ia t e s t a t i s t i ca l factor gj .
3 . 2 . 2 . Average resonance p a r a m e t e r s below 1 keV (Table V)
The nuc lear momentum and par i ty of 2 4 iPu is In = - | +; s-wave neutrons lead to s t a tes with J = 2 ,3 while p-wave neut rons lead to J = 1, 2, 3, 4. The recommended < r y > is taken to be 40 meV [27-29] .
The level spacings for the two s-wave sequences w e r e computed and added "in pa ra l l e l " to obtain the observed ave rage spacing. If we adopt
<D >obs and the express ion for <D)>jf a s in 240pUj w e g e t the following " theo re t i ca l " va lues : <D>f=1 = 2 . 9 8 eV; <D>j = 2 = 2.04 eV; <D>*=3 =1 .76 eV = < D > J = 4 : The "expe r imen ta l " va lues , which we obtain for i = 0, a r e : <D>«=2 = 2.33 ± 0.26 eV (19 resonances ) ; and < D > / = 3 = 1.59 + 0.14 eV (calculated from 31 r e s o n a n c e s ) . F o r J = 2 ,3 we r ecommend the expe r i menta l va lues .
?/=p was f i rs t computed for the J = 2 ,3 sequences sepa ra t e ly , but s ince the difference between the two quanti t ies obtained was s m a l l e r than the e r r o r s , the s t a t i s t i ca l average was adopted ins tead.
? r = 2 o 3 s ? o = ( L 3 0 ± 0 . 7 5 ) X 10-4

132 YIFTAH et al.
TABLE V. Pu-241 AVERAGE RESONANCE PARAMETERS BELOW 1 keV
< D > o b j = 0 .945 ± 0 . 0 9 3 eV
< D > { = ° = 2 . 3 3 ± 0 . 2 6 eV N / J =2
< D > 4 = 0 = 1 . 5 9 ± 0 . 1 4 eV
< D> j " j = 2 .98 eV
< D > ; ; J = 2.33 eV
< D > ^ 3 = 1.59 eV
< D > ; : ; = i . ? 6 e v
< r ° > ^ ° = 0 . 3 4 2 ± 0 . 1 0 9 meV
< r 0 ) ' r 0 = 0 . 1 8 8 ± 0 . 0 4 7 meV N " J=3 < r ° > f \ 1 = 0.745 meV N n ' J =1
< r ° > J : J = 0.582 meV
< r n > J l 5 = 0.398 meV
<r°>' = 1 = 0.440 meV
?1=S'3 =?o =d .30±0 .75)X10- 4
?J=j.2.3.4 = f i = 2 . 5 X 1 0 - 4
<r f>*"° = ,443±120meV
< r f > s = 0 = 171 ±43 meV 1 = 3
<r f> l~\\ = 443 meV
<ri>)?3 = 171 meV
< P f > J = 1.4 = 2 8 4 m e V
< r r > J = l!2.3.4 = 4 0 m e V
vD = 1 for {£, J) = (0, 2), (0, 3), (1 ,1 ) , (1 , 4)
vB = 2 for ( i , J ) = (1 ,2 ) , (1 ,3)
V{ = 1; vy = oo
^uot = 10. 3 b a r n s

SM-101/21 133
This value may be compared with that of Craig et al. [8] , namely €o = (1.9 ± 0.8)X 10"4. The value of Vl=1 was taken as for 239Pu [2] and assumed to be independent of J.
The (r{y j~° were computed from Table IV. No information is available on p-wave fission; for the sake of computation we took <(rf )>* to be independent of i . For the J = 1, 4, series we took the statistical average of the s-wave fission widths.
The capture width ^ r O was assumed to be independent of J and A. The potential scattering cross-section was taken to be 10.3 b, as
for 239Pu [2] .
Statistical distributions. <(D > is considered to follow a Wigner distribution, rfjis assumed to follow a X2-distribution, with the number of degrees of freedom vn equal to the number of neutron channels: yn = 1 for (4 = 0, J = 2,3) and (i = 1, J = 1,4); vn = 2 for (i = 1, J - 2 , 3). The distribution of r is assumed to be a delta function. Simpson et al.[28] found that for the two s-wave sequences Tf has a X2 -distribution with
3 .3 . Plutonium-242
3 . 3 . 1 . Resonance parameters: values for neutronics calculations (Table VI)
Most of the information available comes from two recent experiments. Auchampaugh et al. [18] made transmission measurements below 400 eV
TABLE VI. Pu-242 RESONANCE PARAMETERS: VALUES FOR NEUTRONICS CALCULATIONS & = 0* J = 2 for all resonances
r
1 2 3 4 5 6 7 8 9 10 11 12 13 14 15 16 17 18 19 20
E r (eV)
2.64 14.60 22.48 40.96 53.7 68.2 89.1 106.0 108.0 132.7 151.1 166 205.6 217.4 235.4 276 311 324 336 388
Tn (meV)
1.92 0.061 0.28 0.48 52 3.0 0.80 0.6 14.8 5.9 17.7 1.0 31.0 4.6 7.8 10.1 11.0 229 94.5 47.3
r (meV) Y
25.5 30 30 30 18 30 30 30 30 30 30 30 30 30 30 30 30 30 30 30
T° (meV)
1.19 0.016 0.060 0.075 7.1 0.36 0.085 0.06 1.42 0.51 1.44 0.08 2.2 0.31 0.51 0.61 0.63 12.7 5.2 2.40

134 YIFTAH et al.
with a resolu t ion of 10-90 n s e c / m using 97-99% 242pu t a r g e t s . The data were a r e a and shape analysed. Pat tenden [30] made a s i m i l a r m e a s u r e ment below 850 eV (a rea ana lys is below 320 eV) with a bes t resolut ion of 15 n s e c / m using 91% 2 4 2Pu t a r g e t s . F o r m e a s u r e m e n t s between 1961 and 1958, see BNL-325 (1965).
The only value for the fission width is Tf (2. 64 eV) < 0. 02 meV (BNL-325 (1965)). We took r f = 0. 0 meV throughout. F o r most of the r e sonances it is a s sumed that T = 30 meV.
3 . 3 . 2 . Average resonance p a r a m e t e r s below 1 keV (Table VII)
F o r 2 4 2 Pu (Iff = 0 +) the J - sequences a r e : s -wave, J = \; p -wave , J = \, - | . F o r (X^)1 we took the value a s sumed by the e x p e r i m e n t e r s , i . e . 30 meV. The observed level spacing is < D ) bs = 18. 5 ± 2. 0 eV (calculated from 19 r e sonances ) . Pat tenden [30] gives \ D > o b s = 18.1 + 4 .5 eV. We as sumed the same express ion for <(D)>J as in the case of 2 4 ° . 2 4 1 Pu . We
TABLE VII. Pu-242 AVERAGE RESONANCE PARAMETERS BELOW 1 keV
{ =0.1
2 < D > j = 2 =<D>obs = 1 8 . 5 + 2 .0 eV
i = l < D > 3 = 1 0 . 2 eV
t = o < r ° > i = 1.85 ± 0 .60 meV
n J =-
1 = 1 < rn°> i = 4 .62 meV
j = -
i = l <T°> 3 = 2 . 5 5 meV
? t = o = ? o = U - 0 0 ± 0 .42)X 10"4
? = C, = 2 . 5 X 10" t = i 1
i = o.i <T f > _ i 3 = 0 . 0 meV
i = o.i I 1 2 ' 2
* = 0.1 1 3 2" 2
<T y> _i*3 = 30 meV
i/„ = 1; v, - \; i / = o o n ' i * y
CT„„. = 10. 6 b a r n s pot

SM-101/21 135
TABLE VIII. AVERAGE CROSS-SECTIONS BELOW 1 keV
Pu isotope
240
241
242
eV
E
600
1000
60
100
300
1000
350
1000
<o > Y
7.1 + 0.5
4.6 + 0.3
22.1
16.1 + 1.3
9.14
4.5 + 0.4
7.17 + 0.5
3.18 + 0 . 2 2
barns
<v 0.16
0.16
43.4
33.5 + 0.7
20.6
10.5 + 0.6
0.01
0.01
<ffj>
33.9 + 1.0
28.5 + 0.8
77.7
62.0 + 1 . 8
42.1
26.9 + 0.5
32.3 + 1 . 0
23.2 + 0.7
«r > - <OL> - <a > - <a,> n T y f
g e t ? 0 = (1 .00 ± 0. 42) X 10-4; Auchampaugh et a l . [18] obtained So = (0 .95 ± 0.40) X 10-4. F o r <r f> we took <T f >= 0.0 meV. ^ is expected to change only l i t t le from one isotope to the next; we therefore take the same value as for plutonium-240, 241, namely 2 .5 X 10"4 . The s ta t i s t i ca l d is t r ibut ions a r e taken to be the same as for 2 40pu.
3 . 4 . Las t reso lved resonance up to. 1 keV
By " l a s t r eso lved re sonance" we mean the las t one for which a complete se t of p a r a m e t e r s is available ( 2 4 0p u , 679 eV; 24i Pu, 62 eV; 2 4 2 Pu, 388 eV).
Average c r o s s - s e c t i o n s were calculated with the computer code SELF [25]. These ( recommended) r e s u l t s a r e displayed in Table VIII. The calculated points a r e to be joined smoothly . The quoted e r r o r s a re of a s t a t i s t i ca l n a t u r e . F o r the fer t i le i so topes , <(CTT)> and ^ay)> were a lso calculated using the fluctuation factors evaluated by Schmidt [2] ; they agree with the r ecommended values within the s tated e r r o r s . Throughout the range we a s sume the values <crf > (2 4 0Pu) = 0.16 b; and <a f > (2 4 2Pu) = 0.01 b (these a r e the 1 keV va lues) .
4. FAS.T NEUTRON ENERGY RANGE
We include under this heading data from 1 keV to 15 MeV. The following c r o s s - s e c t i o n s a r e presen ted in graphica l form: total (a T ) , nonelas t ic ( a x ) , f ission (a f ) , capture (cr), ine las t ic (an , ) , pa r t i a l ine las t ic (<*„{ ), (n, 2n) = a2n, and (n, 3n) =cr 3 n .
F o r the Pu isotopes in quest ion, the only fast neutron m e a s u r e m e n t s available a r e those of Of, and even these do not cover the whole r a n g e .

136 YIFTAH et al.
As a ru l e , we have taken the <rf evaluated by Davey [31] , who r enorma l i zed previous re la t ive m e a s u r e m e n t s using new absolute m e a s u r e m e n t s of the 235U and 2 3 9 Pu fission c r o s s - s e c t i o n s ; the new a f values a r e up to 10% lower than previous ly . Davey covered m e a s u r e m e n t s up to July 1965.
As shown by the exper imenta l data and the optical model , CTT is s i m i l a r for nuclei of close m a s s n u m b e r s . It is a lso expected that there a re s i m i l a r i t i e s between fer t i le nuclei among t h e m s e l v e s , and fissi le nuclei among ' themse lves . Thus above 0 . 1 - 0 . 2 MeV, crT of 2 4 0 Pu and 2 4 2Pu was taken as for 238U, and crT of 2 4 1 Pu as that of 2 3 9 P u . Below 0 . 1 - 0 . 2 MeV, CTT can be accounted for by s- and p-wave neutrons only; s ince the s t rength function C0 of the Pu isotopes differs by as much as 40% from the U i so topes , Oj. in this region was calculated for each isotope from i ts average resonance p a r a m e t e r s .
In the MeV range the compound e las t ic sca t te r ing becomes negligible; as a r e su l t , the non-e las t ic c r o s s - s e c t i o n becomes identical with the absorpt ion c r o s s - s e c t i o n , which according to the optical model is s i m i l a r for nuclei of close m a s s n u m b e r s . The re fo re , in the MeV range ax is taken as equal to that of an appropr ia te 239 Pu or 2 3 8 U isotope (as for a J). ay was calculated in the range 1-800 keV for 2 4 0Pu and 2 4 2 Pu , and in the range 1-50 keV for 2 4 1 P u . Unless otherwise indicated, nuclear data for 2 3 9 Pu and 238U were taken from the compilation of Schmidt [2] .
The following quanti t ies were also included in the evaluation: average p a r a m e t e r s above 1 keV (which were used in the p resen t calculat ions of average c r o s s - s e c t i o n s ) ; the average number of prompt neutrons per fission (P); the average sca t te r ing cosine in the lab sys tem (£L); the energy spec t rum of secondary neutrons from fission (X(E*)).
4 . 1 . Plutonium-240
4 . 1 . 1 . Average p a r a m e t e r s above 1 keV
The energy dependence of < \D/ ' can be r ep re sen t ed by (B + E) 2 exp[ -2s / a (B + E)] , where B is the neutron binding energy and a is the level density p a r a m e t e r [32] . Values for a a re ve ry uncer ta in in the m a s s region of 240, but the value 38 MeV"1 is p re fe r r ed [33] at p resen t since it has been shown to improve the calculated ZPR-II I c r i t i ca l m a s s e s as compared with those obtained using the value 22 MeV' 1 in YOM [34]. The neutron separa t ion energy for (2 4 0Pu + n) is B = 5.39 MeV [35] .
The values of ? j ( 235 U, 238 U, 2 3 9 Pu) were recent ly found to be around 2 .5 X 10"4 . Since ?x is an in t r ins ic p roper ty of the nucleus we do not expect ve ry different ^ - v a l u e s for the higher Pu i so topes .
Since the s t rength functions a r e , by definition, independent of energy (over smal l energy ranges) we may a s sume that in the Doppler range ( i . e . up to some 50 keV) they a r e constant .
The energy var ia t ion of <(rf )> of 2 4 0Pu was determined by finding the values which give a fit of *\af ^ (E) above 1 keV, when the above r e c o m mended p a r a m e t e r s a re used and assuming a Wigner distr ibution for D and an X 2 -dis t r ibut ion for Tn and Tf{va = i/f = 1). The code SELF [25] was used for the calculat ion.

SM-101/21
We s u m m a r i z e the r ecommended p a r a m e t e r s ;
<D>(E) = <D>o b s X (B + E)2 exp[-2N/a(B + E)]
a = 38 M e V 1
B = 5.39 MeV
5 0 (E) = 1.37X 10⁻⁴
?X(E) = 2 . 5 X IO-4
137
E(keV)
1 J = 1/2, 3/2
1
0.23
10
2.0
25
3.0
50
5.0
100
8.0
200
20.0
500
65.0
900
630
4 . 1 . 2 . C r o s s - s e c t i o n s
(7T(Figs 1,2). CTT was calculated from the average resonance p a r a m e t e r s above 1 keV. In the lower energy region the high-valued ?0 makes aT h igher for 24° Pu than for 2 3 8 Pu. Above 100 keV the two cu rves p rac t i ca l ly coincide. F r o m 200 keV to 15 MeV we a s sume CTT(240PU) = a T ( 2 3 8 U). <rT
for 238U was taken from the evaluat ion of Schmidt up to 10 MeV and from that of P a r k e r [36] in the range 10-15 MeV.
CT (Figs 1,2). In the range 1 to 60 keV the non-e las t i c curve is the sum of Of and ay. In the range 60 to 1000 keV, cxn(E) was calculated with the r ecommended resonance p a r a m e t e r s and s t a t i s t i ca l d i s t r ibu t ions . The
10 100 1000
E(keV)
FIG.l. 24° Pu: Total, non-elastic, capture, inelastic cross-sections; keV range.
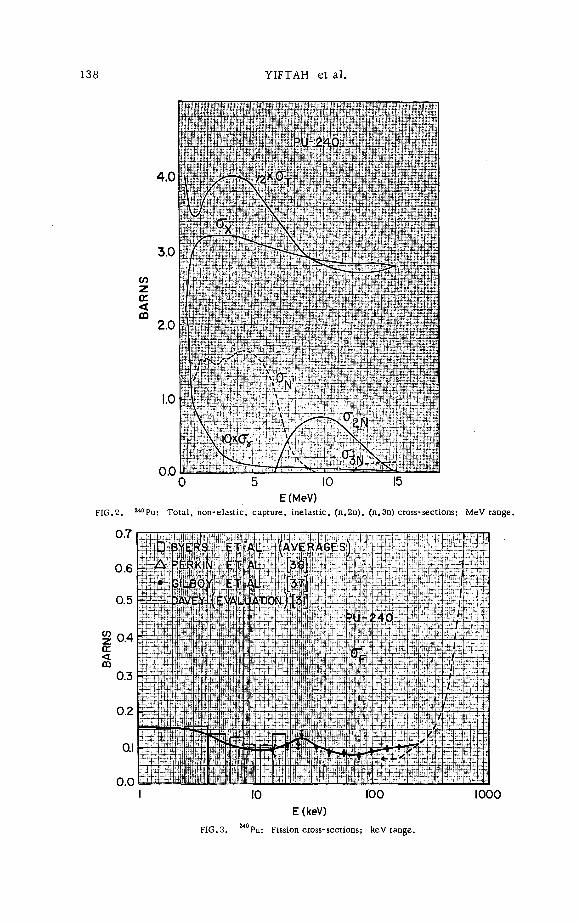
138 YIFTAH et al.
<n z a: < CD
2J'JW4.J| ! ' 1 V
A>524Q:
:? i >t
XZGZT •
ytrq: J ILX
5 10 E(MeV)
FIG.2. 240Pu: Total, non-elastic, capture, inelastic, (n,2n), (n,3n) cross-sections; MeV range.
10 100 E(keV)
FIG.3. M0Pu: Fission cross-sections; keV range.
1000

SM-101/21 139
fall of CTn(E) towards a is more rapid than in 238U mainly because the compound e las t i c s t a r t s to d e c r e a s e apprec iably a l ready at 500 keV, where the sha rp r i s e in r f (2 4 0Pu) s e t s in, while in 2 3 8U this s i tuat ion does not occur below 900-1100 keV. Thus CTX , obtained as the difference <xT-an, r e a c h e s the value of 3 b a r n s a l r eady at 1 MeV, as compared with 2 MeV for 2 3 8U. Between 1 and 2 MeV, ax (2 4 0Pu) was in terpola ted smoothly . Above 2 MeV, where the compound e las t i c i s negl igible , a n ( 2 4 0 Pu) was a s sumed to be equal to that of 238U; the re fo re , a x ( 2 4 0 Pu) = <rx (
2 3 8U).
FIG.4. ^ P u : Fission cross-sections; MeV range.
a f (Figs 3 ,4) . In the range 1-18 keV pa r t i a l ave r ages were calculated from the nuc lear detonation data of Byers et a l . [22] . In the range 15-170 keV our curve goes through the va lues of Gilboy et a l . [37] and the 24-keV point of P e r k i n et a l . [38] . The data of Gilboy et a l . give the c r o s s - s e c t i o n r a t i o s 240p u : 235|j m e a s u r e d by the t ime-of-f l ight method; we normal i zed these values to the crf (
235U) recommended by Davey. F r o m 250 keV to 4 MeV we followed the r ecommenda t ions of Davey [31] . Between 4 and 15 MeV we adopted the exper imenta l values of Henkel et a l . [39] r e n o r m a l i z e d to CTf(235U) a s given by Davey, and the values of Kazar inova et a l . [40] and Nes te rov and Smirenkin [41] .
a (F igs 1,2). In the range 1-1000 keV, a {E) was calcula ted with the code SELF [25] using the r ecommended average p a r a m e t e r s and s t a t i s t i ca l d i s t r ibu t ions . F r o m 1 to 400 keV, a is 1 . 8 - 2 . 1 t imes the a (2 3 8U); this can be compared with r ecommenda t ions of or(2 4 0Pu) = 1. 75 X oy( 238u) based on a few m e a s u r e m e n t s of a (2 4 0Pu) [34] # Between 1 and 2 MeV, a y( 2 4 0Pu) was in terpolated smoothly . Above 2 MeV we took a (2 4 0Pu) = a y ( 2 3 8U).

140 YIFTAH et al.
an. (Figs 1,2). After the de terminat ion of the other pa r t i a l c r o s s -sect ions and CTX, the inelas t ic c r o s s - s e c t i o n was calculated as crn. = o-x- (a f + ay + o2n + a 3 n ) . The threshold for this reac t ion is 43 keV.
0 200 400 600 800 1000 1200
E(keV)
FIG. 5. ^oPu: Partial inelastic cross-sections; keV range.
<jE] (F ig . 5). The re is no exper imenta l information on the exci tat ion cu rves for 240 p u ; the re la t ive excitat ion cu rves (ano /a n t ) for 2 3 8U were therefore used . The a s sumed level scheme for 2 4 0 Pu (Table IX(a)) was cons t ruc ted as follows: the five lower excited leve ls of 240Pu, which agree (approximately) in energy and pa r i ty with the cor responding leve ls of 2 3 8U, were used as such; for higher e n e r g i e s , where the re is no c o r r e s p o n dence between the 2 4 0 Pu and 238U l e v e l s , we took the 2 3 8 U l e v e l s . The 2 4 0 Pu levels were taken from Douglas [42 ] .
°2n > CT3n(Fig.2). The a2n curve was const ructed as follows. The <rn M c r o s s - s e c t i o n for neutron emiss ion was calculated as an M = a x - (af +a ). The ra t io (a2n/
CTn M w a s * n e n calculated from the theore t ica l work of P e a r l s t e i n [43] ; a2n is then given by <rn,M
x (°2n/CTn,M)' ^ h e c r o s s - s e c t i o n for the (n, 3n) p r o c e s s was calculated in a s i m i l a r way. Threshold ene rg ies were taken from Douglas [42] .

SM-101/21
TABLE IX. ASSUMED LEVEL SCHEMES
141
(a) Pu-240
E t (keV)
0
43
142
292
597
640
(838)
(939)
* f <968> [(1006)
"• *»•'•'... a..-.
I»_
0+
2+
4+
6+
1-
3-
(5-)
(0+)
(2+)
<°tL . ,-:L..>:,n.^~!i-
(b) Pu-241
E i (key>
0
33
95
(155)
(229)
* J(313)
[(315)
(342)
(400)
(417)
I* -
2
1+ 2
1+ 2
Ui+) 2 (il+) 2
(I-) 2
CiS»
(c) Pu-242
E± (keV)
0
45
(148)
(310)
(680)
(732)
(838)
(939)
* f W 8 >
1(1006)
Iir
0+
2+
(4+)
(6+)
(1-)
(3-)
(5-)
(0+)
(2+)
(0+)
The brackets indicate that the levels were taken from U-238 (a,c) or U-233 (b) * Taken as one level.
4 . 1 . 3 . Other nuc lear data
v. A l inea r fit was made to recen t m e a s u r e m e n t s of the average number of (prompt) neut rons per fission [44 ,45 ,46] . The r ecommended curve is v = 3.00 +0.101 E(MeV).
juL. The average e las t ic sca t t e r ing cosine for 24°.24l,242pu i g t a j^n equal to ju L( 2 3 8U).
X(E*). The energy spec t rum of secondary neut rons from fission is taken to be equal to the Watt spec t rum, as r ecommended for 2 3 8U by Schmidt:
X(E') = 0.45270 e x p ( - E » / 0 . 9 6 5 ) s i nh (2 .29 E« ) 1 / 2
where E1 is the secondary neutron energy . <(E' )> = 1.98 MeV.
4 . 2 . Plutonium-241
4 . 2 . 1 . Average p a r a m e t e r s above 1 keV
See the d iscuss ion for 2 4 0 Pu. The separa t ion energy for (2 4 1Pu + n) is B = 6, 26 MeV [35] . The average fission widths a r e taken to be constant up to 50 keV:
4 = 0 , 1 4 = 0 , 1 <rf>jl2' = 4 4 3 m e V ; <Tf >JC3" = 171 meV

142 YIFTAH et al.
FIG. 6.
10 100 1000
E(keV)
241Pu: Total (keV and MeV range), and fission (keV range) cross-sections.
10 100 1000
E (keV)
FIG.7. M 1 Pu: Non-elastic, capture, inelastic cross-sections; keV range.
4 . 2 . 2 . C r o s s - s e c t i o n s
a T ( F i g . 6). The curve for a T (E) in the range 1 to 200 keV was calcula ted from the recommended s t rength functions. Po ten t i a l - r e sonance in te r fe rence was included. Up to 10 keV, cxT(241Pu) is somewhat higher than aT(239 p u ) ,
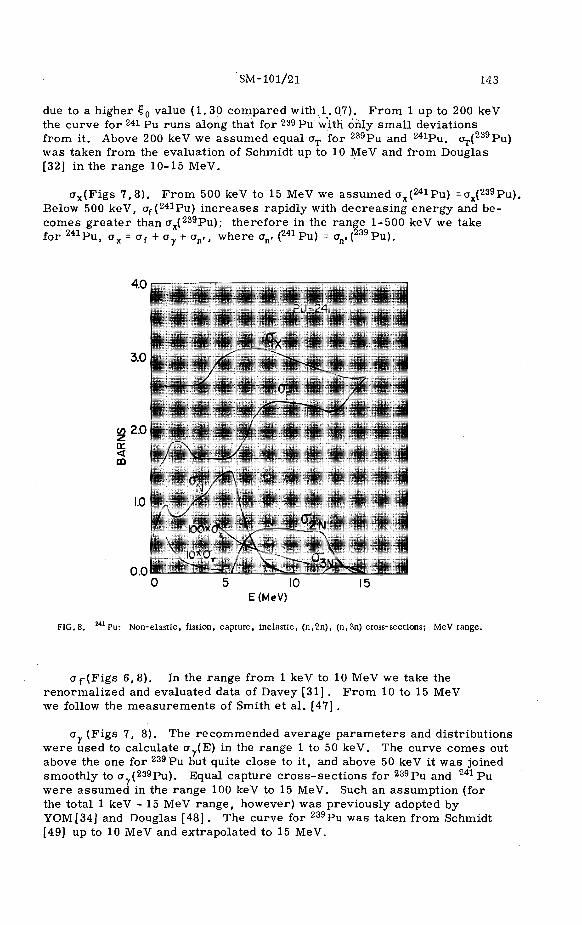
SM-101/21 143
due to a higher ? 0 value (1 .30 compared w i t h . l . 07). F r o m 1 up to 200 keV the curve for 2 4 1 Pu runs along that for 239 Pu with only sma l l deviat ions from it . Above 200 keV we a s sumed equal CTT for 2 3 9Pu and 2 4 1Pu. was taken from the evaluation of Schmidt up to 10 MeV and from Douglas [32] in the range 10-15 MeV.
o,.(239Pu)
a x ( F i g s 7 ,8 ) . F r o m 500 keV to 15 MeV we as sumed a x ( 2 4 1 Pu) =a x ( 2 3 9 Pu) . Below 500 keV, af (
2 4 1Pu) i n c r e a s e s rapidly with dec reas ing ene rgy and be comes g r e a t e r than a x ( 2 3 9Pu); the re fore in the range 1-500 keV we take for 2 4 1 Pu , a v = Of + a v + an,, where CT_. (241 Pu) = o_. (239 Pu) . + a y + ar
5 10 E (MeV)
FIG. 8. Pu: Non-elastic, fission, capture, inelastic, (n,2n), (n,3n) cross-sections; MeV range.
CTf(Figs 6 ,8) . In the range from 1 keV to 10 MeV we take the r eno rma l i zed and evaluated data of Davey [31] . F r o m 10 to 15 MeV we follow the m e a s u r e m e n t s of Smith et a l . [47] .
a (Figs 7, 8). The recommended average p a r a m e t e r s and dis t r ibut ions were used to calculate a (E) in the range 1 to 50 keV. The curve comes out above the one for 2 3 9 Pu but quite close to i t , and above 50 keV it was joined smoothly to cry(2 3 9Pu). Equal capture c r o s s - s e c t i o n s for 2 3 9 Pu and 2 4 1 Pu were a s sumed in the range 100 keV to 15 MeV. Such an assumpt ion (for the total 1 keV - 15 MeV range , however) was previously adopted by YOM[34] and Douglas [48] . The curve for 2 3 9 Pu was taken from Schmidt [49] up to 10 MeV and extrapola ted to 15 MeV.
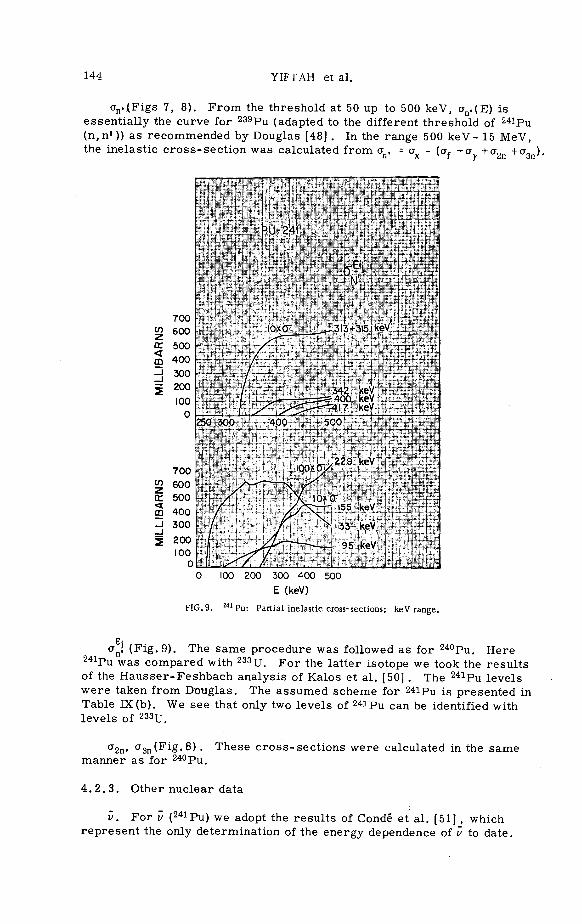
144 YIFTAH et al.
an.j(Figs 7, 8). F r o m the threshold at 50 up to 500 keV, an. (E) is essen t ia l ly the curve for 239pu (adapted to the different threshold of 241Pu (n, n ' ) ) as recommended by Douglas [48] . In the range 500 k e V - 15 MeV, the inelast ic c r o s s - s e c t i o n was calculated from or , = a - iac +a +an +a„ ).
n x x t y 2n 3n'
E (keV)
FIG. 9. 241 Pu: Partial inelastic cross-sections; keV range.
<V ( F i g - 9 ) . The same procedure was followed as for 2 4 0 Pu. Here 2 4 1Pu was compared with 2 3 3 U. F o r the l a t t e r isotope we took the r e su l t s of the H a u s s e r - F e s h b a c h analys is of Kalos et a l . [50] . The 2 4 1Pu levels were taken from Douglas . The assumed scheme for 2 4 iPu is p resen ted in Table DC(b). We see that only two levels of 2 4 1 Pu can be identified with leve ls of 2 3 3U.
°2n' CT3n(FiS-0) • These c r o s s - s e c t i o n s were calculated in the same manner as for 2 4 0 Pu.
4 . 2 . 3 . Other nuclear data
v. Fo r v (2 4 1Pu) we adopt the r e s u l t s of Conde et a l . [51] , which r e p r e s e n t the only determinat ion of the energy dependence of v to date .

SM-101/21 145
The l ea s t s q u a r e s fit to the i r data i s ? = 2. 905 + 0.146 E(MeV). At t h e r m a l energy the re is a d i sc repancy between Conde ' s value and that r ecommended in BNL-325 (1965); but four of the m o r e r ecen t values l i s ted there agree with Conde.
^ L . The same as for 2 4 0 Pu.
X(E ' ) . This is taken to be equal to the Watt spec t rum recommended for 2 3 9Pu by Schmidt:
X(E») = 0.48395 exp( -E») s i n h ( 2 E ' ) 1 / 2
<E* > = 2 . 0 0 MeV
4 . 3 . Plutonium-242
4 . 3 . 1 . Average p a r a m e t e r s above 1 keV
See d iscuss ion for 2 4 0 Pu.
a = 38 MeV-1
B =5.03 MeV
?0(E) = 1.00X10'4
?1(E) = 2.5X IO-4
4 . 3 . 2 . C r o s s - s e c t i o n s
a T (Figs 10, 11). In the range 1 to 100 keV, CTT was calculated from the recommended resonance p a r a m e t e r s . Start ing from 1 keV the CTT(242PU) curve is somewhat higher than the CTT( 2 3 8U) cu rve , but at 20 keV it a l ready prac t ica l ly joins the l a t t e r . F r o m 100 keV to 15 MeV we as sumed a T ( 2 4 2 Pu) = crT(238U). The l a t t e r curve was taken from Schmidt up to 10 MeV and from P a r k e r [36] in the range 10-15 MeV.
crx(Figs 10, 11). Up to 2 MeV, ax was calculated as the sum of a f , ay and crn. . Between 3 and 15 MeV we assumed a x ( 2 4 2 Pu) = crx (
2 3 8U). Between 2 and 3 MeV the curve was interpolated.
CTf (Figs 10,11) . The a f curve in the range 1 keV to 1. 7 MeV was taken from Davey [31] ; it follows the ( renormal ized) m e a s u r e m e n t s of But le r [52] in the range 140 keV to 1.7 MeV. Since this curve r e s e m b l e s the one for 2 4 0Pu in this r ange , i ts continuation above 2 MeV and up to 15 MeV was taken equal to cxf (
2 4 0Pu) .
ay (Figs 10, 11). a was calculated from the resonance p a r a m e t e r s between 1 keV and 1 MeV. Below 100 keV it is about 30% higher than cry(238U); this difference can be accounted for by the higher C0 and ( r y X At about 1 MeV the two curves have approximately the s ame value . Between 1 and 15 MeV we a s sume a (2 4 2Pu) = a (2 3 8U).

146 YIFTAH et al.
10 100 1000 E (keV)
FIG. 10. 242 Pu: Total, non-elastic, fission, capture, inelastic cross-sections; keV range.
4.0
3.0
z < CO
2.0 -
0.0
•
V
•
.. 1
PU-
r~NK°'T
'.- °5i^-\.
"i - *
1 V* \io»ov V '
• — i —
242 -
- -
-
yS _ . .
— r - • ^
15 5 10 E (MeV)
FIG. 11. M2Pu: Total, non-elastic, fission, capture, inelastic, (n,2n), (n,3n) cross-sections; MeV range.

SM-101/21 147
200 400 600 800 1000 1200
E (keV)
FIG. 12. 242Pu: Partial inelastic cross-sections; keV range.
a n . (F igs 10,11) . F r o m threshold (45 keV) up to 2 MeV we a s sumed crn.(242Pu) = <7n.(238U). Above 2 MeV, where cxx i s taken as that of 2 3 8U, we calculated <rn. = ax - (af + a + o"2n+ CT3n^-
E-an
J. (F ig . 12). Only the f i r s t excited s ta te has been observed . We followed the same p rocedure as with 2 4 0 Pu. The a s sumed level scheme is p resen ted in Table IX (c).
a2n , a3n (F ig . 11). These were const ructed as for 2 4 0 P u .
4 . 3 . 3 . Other nuclear data
v. No data a r e avai lable , and we therefore take i /(2 4 2Pu) = i/(240Pu) = 3.00 +0.101 E(MeV) neut rons / f i s s ion .
ML :X(E«). S e e 2 4 0 P u .
A C K N O W L E D G E M E N T
The r e s e a r c h r epor t ed he re was supported in par t by the KBB (Kar ls ruhe) — Eura tom Associat ion on F a s t R e a c t o r s , Kernforschungs-zen t rum, K a r l s r u h e .

148 YIFTAH et al.
R E F E R E N C E S
[1] HXFELE, W., Fast breeders, their principle, development and place in the utilisation of nuclear energy (lecture in German), Karlsruhe Rep. KFK 480 (1966). SCHMIDT, J . J . , Karlsruhe rep. KFK 120/1 (1966). GREEBLER, P . , ALINE, P . , HUTCHINS, B. , US Rep. GEAP-5272 (1966). YIFTAH, S. , SCHMIDT, J.J., CANER.M., SEGEV, M. , Basic nuclear data for the higher plutonium isotopes, Israel AEC Rep. IA-(to be published). PATTENDEN, N.J . , RAINEY, V . S . , J. nucl. Energy H. (1959) 14. DRAKE, M.K. , DYOS, M.W., US Rep. GA- 6576 (1965). STEHN, J.R., GOLDBERG, M . D . , WIENER-CHASMAN, R., MUGHABGHAB, S.F. , MAGURNO, B.A. MAY, V.M. , USAEC Rep. BNL-325, 2nd ed. Suppl. No.2 (1965). CRAIG, D .S . , WESTCOTT, C .H . , Can. J. Phys. 42 (1964)2384. CRAIG, D .S . , WESTCOTT, C .H . , Can. AEC Rep. AECL-1948 (1964). SIMPSON, O.D. , SCHUMAN. R.P. , Nucl. Sci. Engngl l (1961) 111.
WESTCOTT. C.H. et a l . , Atom. Energy Rev. 3 2 (1965) 3. JAMES, G.D. , Nucl. Phys. 65 (1965) 353. WHITE. P .H. , REICHELT. J .M.A. , WARNER, G.P . , Nuclear Data for Reactors 2 (Proc. Conf. Paris, 1966), IAEA, Vienna (1967) 29. FIELDS. P.R. et a l . , Nucl. Sci. Engng 1 (1956) 62. STUDIER, M.H. et a l . , Phys. Rev. 93 (1954) 1433. BUTLER, J . P . , LOUNSBURY. M. , MERRITT, J . S . , Can. J. Phys. 35 (1957) 147. HUGHES, D.J . , SCHWARTZ, R.B., USAEC Rep. BNL-325. 2nd ed. (1958). AUCHAMPAUGH, J . F . . BOWMAN, C D . , COOPS, M . S . , FULTZ, S.C. , Phys. Rev. 146 (1966) 840. YOUNG, T .E . , REEDER, S. D. , Bull. Am. phys. Soc. 11. (Apr. 1966)334. YOUNG, T .E . , private communication (March 1967). B S C K H O F F , K.H. et a l . , Nuclear Data for Reactors 2 (Proc. Conf. Paris, 1966), IAEA, Vienna (1967) 135. BYERS, D.H. , DIVEN, B .C. , SILBERT, M.G. , Conf-660303 (Washington), Book II. p. 903. BROOKS, F .D . , JOLLY, J .E . , IAEA Rep. INDSWG-63 (1964) 13. SIMPSON, O.D, , FLUHARTY, R.G., Bull. Am. phys. Soc. 2 (1957)219. SEGEV, M. , YIFTAH, S. , CANER, M. , these Proceedings, paper SM-101/22. REICH, C.W., MOORE-, M . S . , Phys. Rev. i n (1938) 929. MOORE, M . S . , SIMPSON, O.D. , WATANABE, T. et a l . , Phys. Rev. 235 (1964) B945. SIMPSON, O.D. , FLUHARTY, R.G., MOORE. M.S. et a l . , CONF-660303 (Washington) Book II. p.910. SIMPSON, O.D. , MOORE, M . S . , Phys. Rev. 123 (1961)559. PATTENDEN, N.J . , in Study of Nuclear Structure with Neutrons, (Proc. Int. Conf. Antwerp, 1965), EANDC Rep. 44U, paper 93. DAVEY, W.G. , Nucl. Sci. Eng. 26 (1966) 149. DOUGLAS, A . C . , BARRY, J . F . . UKAEA Rep. AWRE 0-79/64 (1965). SZWARCBAUM, G. , SIEGER (SEGEV), M. , YIFTAH, S. , Israel AEC Rep. IA-899 (1964). YIFTAH, S. , OKRENT, D. , MOLDAUER, P .A. , Fast Reactor Cross Sections, Pergamon Press, New York (1960). HYDE, E. K., PERLMAN, I . , SEABORG, G. T . , The Nuclear Properties of the Heavy Elements I, Prentice-Hall Inc . , Englewood Cliffs, N.J. (1964). PARKER, K., UKAEA Rep. AWRE 0-79/63 (1964). GILBOY, W.B., KNOLL, G., Nuclear Data for Reactors 1 (Proc. Conf. Paris, 1966), IAEA, Vienna (1967) 295. PERKIN, J.L. et a l . , J. nucl. Energy A/B 19 (1965) 423. HENKEL, R.L., NOBLES. R. A . , SMITH, R.K.. USAEC Rep. AECD 4256 (1957). KAZARINOVA, M . I . , ZAMYATIN, Yu.S . , GORBACHEV, V.M. , Soviet J. atom. Energy 8 (1961) 125.. NESTEROV, V.G.. SMIRENKIN, G.N. , Soviet Phys. JETP 8 (1959) 367. DOUGLAS, A . C . , UKAEA Rep. AWRE 0-91/64 (1965). PEARLSTEIN, S. , USAEC Rep. BNL-897 (1964). DE VROEY, M. , FERGUSON, A . T . G . , STARFELT, N. , J. nucl. Energy A/B 20 (1966) 191. KUZMINOV, B.D. , USAEC trans. Rep. AEC-tr-4710 (1962).

SM-101/21 149
[46] BARTON, D .M. , BARNARD, W., HANSEN, G.E., US Rep. LAMS-2489 (1960). [47] SMITH, H. L., SMITH, R.K., HENKEL, R.L., Phys. Rev. 125 (1962)1329. [48] DOUGLAS, A . C . , UKAEA Rep. AWRE 0-101/64 (1965). [49] SCHMIDT, J . J . , Karlsruhe Rep. KFK 120/III (1962). [50] KALOS, M.H. , TROUBETZKOY, E .S . , US Rep. NDA-2134-2 (1960). [51] CONDE", H . , HANSEN, J . , HOLMBERG, M. , Nuclear Data for Reactors 2 (Proc. Conf. Paris,
1966), IAEA, Vienna (1967) 51. [52] BUTLER, D.K. , Phys. Rev. 117 (1960)1305. [53] DOROFEEV. G.A. , . DOBRYNIN. Y . P . . J. nucl. Energy 5 (1957) 217 (transl. from Russian).
D I S C U S S I O N
W.B. LOEWENSTEIN: Were your recommended 240Pu cross-sections checked against available integral data?
S. YIFTAH: No, they were not, but we do intend to carry out this check.
W.B. LOEWENSTEIN: Does the trend of your new data indicate an improvement on the results presented at the International Conference on Fast Critical Experiments and their Analysis, organized by Argonne National Laboratory from 10 to 13 October 1966?
S. YIFTAH: I am afraid I cannot comment on current trends before performing the calculations.
K.H. BECKURTS: Your paper states that the capture cross-section of 240Pu in the energy range 1-400 keV comes out to be 1.8 to 2.1 times larger than the capture cross-section of 238U; does this refer to the experimental 2 3 8u capture cross-section or to a calculated one, and have you tested the SELF code calculations against experimental az values?
M. SEGEV: As co-author of this paper I can tell you that as a check on the SELF code we compared the calculated at curve for 238U with the curve recommended by J . J . Schmidt, from Karlsruhe, and found very good agreement.


CALCULATION OF TEMPERATURE-DEPENDENT EFFECTIVE NEUTRON CROSS-SECTIONS
A. MULLER ABTEILUNG FUR REAKTORENTWICKLUNG,
SIEMENS AG, ERLANGEN, FEDERAL REPUBLIC OF GERMANY
Abstract
CALCULATION OF TEMPERATURE-DEPENDENT EFFECTIVE NEUTRON CROSS-SECTIONS. The reliability of the Doppler coefficient, which is of decisive importance for the safety of fast reactors, depends strongly on the error margins for the temperature derivatives of the effective neutron cross- sections used in multi-group perturbation theory. Because in the energy region relevant for the Doppler effect most resonances of the fertile and all resonances of the fissile material are still unresolved, the evaluation of cross-sections must start with statistical parameters extrapolated from resolved resonances and subject to large errors. This paper attempts to clarify quantitatively the interdependence between the most important statistical resonance parameters and the temperature derivatives of the effective cross-sections. After an outline of the method chosen for the evaluation of these temperature derivatives, some improvements are discussed. As the well-known J-function and its derivatives with respect to both variables play an important part in the calculation, efficient sub-routines for these functions are .required. The tabulations published until now are not well suited for this purpose and therefore we have performed a new tabulation, interpolation and approximation with higher accuracy and less expense of storage capacity. Asymmetric interference scattering is included by generalizing the J-function and approximating the correction term. The contribution to the temperature derivatives resulting from overlapping between resonances of the same sequence depends on the choice of the resonance distribution law. We compared a xz distribution with degree of freedom v = 10 and the Wigner distribution.
The improved method is applied to a typical fast reactor with different sets of input data. The interdependence between statistical parameters and the resulting temperature derivatives is studied by calculations with 10°Jo change in one parameter only. Given error margins for the statistical resonance parameters lead to the desired error estimates for the temperature derivatives of the effective cross-sections. Comparison with the equivalent changes in cross-sections for infinite dilution offers the possibility of checking these error margins.
1. Introduction
The calculation of a fast-reactor Doppler coefficient
by multi-group perturbation theory requires the temperature
derivatives of effective reaction cross-sections. Because
the accuracy of the Doppler coefficient is of decisive
importance for the safety of the reactor, the error margins
of these temperature derivatives must be known.
In the energy region relevant for the Doppler effect
most resonances of the fertile and all resonances of the
fissile material are still unresolved. The evaluation of
cross-sections must, therefore, start with statistical para
meters, extrapolated from resolved resonances and subject
151

152 MULLER
to large errors. The aim of this work is to clarify quanti
tatively the interdependence between the most important
statistical resonance parameters and the temperature deri
vatives of the effective cross-sections.
For the calculation of effective cross-sections several
more or less accurate methods have been proposed /~"1_7 - Z~5_7»
We chose the method of Proelich /~5_7> because it seems to
combine high accuracy and relative simplicity. After an out
line of this method we discuss some improvements, concerning
the J-function and the overlap correction. Then we apply this
method to the reactor investigated by Froelich and calculate
the relative changes in the temperature derivatives of the
capture and fission cross-sections caused by 10# changes in
some statistical parameters. The results are compared with
the equivalent changes in the corresponding cross-sections
for infinite dilution.
2. Outline of method used
In multi-channel one-level theory the resonances of a
nuclide are divided into sequences specified by the quantum
numbers 1 and J. In each sequence s the distance D = D^,
between successive resonance energies E, and E, , is distri
buted about a mean level spacing 15_ (see chapter 3.2).
E_ is dependent on energy according to
where E,, is the binding energy and a is a constant. The neu-r-> r~i
tron widths /^ s and the fission widths 1} s are distri
buted about average values f s and Cf 5 , respectively, ac
cording to X -distribution laws with degrees of freedom V. <K and Vt . The energy dependence of f s is given by
(2)
with strength function S-, and penetration factor v-, (v = 1;
Y 1 = R2/(R2 + * 2 ) , where R2^6-/(4TT) and ft2= A? /E)!
7 5 (E) must be taken from graphs. The distribution of the
SM-101/32 153
y- -widths l /S is neglected, Prs is assumed constant. The
sequence parameters l,J,Ej, S,, vnlv, / l~f > '"f,s together with 2 A 2 Ex,, a, R , j \ and the atomic number densities N_ are the
o a
input parameters for cross-section calculations in the statis
tical energy region.
We consider an energy group with width A E so small that
the average resonance parameters can be taken as constant in
it. In the narrow resonance approximation the group average
effective macroscopic cross-sections for resonant reaction
(n,z) (z= fl% f, c =#'+ f+n) of sequence s are given by
<W-<-%•>/<-£-> where the total cross-section /U± is the sum of the constant
total potential scattering cross-section fip and all resonant
cross-sections ucs dependent on energy and temperature.
h = ?? + £ fc,s (4)
Instead of calculating the temperature derivative of (( 2,5)
Proelich calculates only the temperature derivative of a
fictitious cross-section defined by
Proelich and Ott /"~6_7 have shown that this derivative gives
in first-order perturbation theory the same result for the
overall Doppler coefficient of a fast reactor as the deriva
tive of eq. (3)-, if le"akage and changes in elastic removal
can be neglected. Since tlie correct splitting of the net effect
into contributions of the individual sequences normally is not
of interest, we adopt this method.
Proelich considers a homogeneous reactor composed of
U and •* Pu oxide fuel with non-resonant coolant and struc
ture material. He takes into account all 1 = 0 and 1 = 1 238 239
sequences, 3 for y U and 5 for ^Pu. As the resonances of the 1 = 0 sequence of U (s = 1) are much higher than all

154 MULLER
other resonances in the relevant energy region, they are treated separately.
In the calculation of \~p~) interference with other sequences is neglected, i.e. £ ^c,s in the denominator is replaced by its average value £ (/uc A giving
S M
/_Ai\ « / £±A \ ^ / £L*A \ (6 )
with
ft'"" fr*l<?<.>) (7)
Similarly one gets
%}~~fc'\ ?? +t>v) ~ ~ki1~(tf«c^J (8)
Because in sequence 1 the mean level spacing XL is large compared with the effective line widths, interaction between neighbouring resonances can be approximated by series expansion, Introducing the cross-sections for resonance k in E
ft,* " /"ot,u • Vk / \ (9)
where If/ and % are the usual symmetrical and asymmetrical line shape functions and V) = tan (j)0 , with phase shift
<po = R/* we get
n< \ = / ? Prik \ ^ r?+rvl V /" + fa * zk ?<,*> I (10)
y 1/ fr.k \ - y / <"r,fc •/"'."' \
Neglecting " the first term can be expressed by the well-^
known J-function (see chapter 3.1). The secondterm is simpli
fied further. The denominator is replaced by its average value
vfw = ( (*t + ^ (/Vs)/ • APProxiroation of the "y/-function by

SM-101/32 155
a Gaussian according to Dresner £~lj finally leads to
The bar designates averaging over f^ A . / = £*p I Pot,* i ) i m ~X~ with Doppler width A and e^ is an abbreviation for E(K/A) with
£(f)-2-/«p(-g--|f)-fiW.rfJr <«>
where ii2 (x)»dx is the number of resonances k'^ k which lie in the interval dx about the relative distance x = D/D" from resonance k (see chapter 3.2). With the similar abbreviation
e(fj=2.f(S-4-P(-|.^M.dx (,„ the temperature derivative of eq.(1l) may be written in the form
The positive first term gives the main Doppler effect. It is somewhat reduced by the negative second overlap term.
The resonances of all sequences s >1 are treated as a whole. Because they are low compared with f*p the following expansion is allowed (z = y {)
iM-l^/at-**'*&£$«» 5>1
y A, \ . /_J \ /S.ftL.-frv-rt*&*>)\

156 MULLER
The second term vanishes, if we choose
(16)
- <"'"+ ,? < (<A»-A.>-K.>-M/ I ! :>*.> The average product (ftts-Pcs) can he calculated similar to the
overlap term in eq. (10), but in the sum k' = k is included.
With
z s (17)
the bars denoting averaging over lv s and C $ , we get
tf . ?f + &M'<r^$-IE*,*£*)-&] (18)
and
T J A " &«"»•*>• fo,)-§-(E..,-e,)
Transforming eq. (15) similar to eq. (8) yields finally
T
The first term is positive and corresponds to eq.(H). The
second term is negative and takes into account the inter
action between sequences s >1 and sequence s = 1.
3. Improvements
3.1 The J-function
Evaluation of eqs. (H) and (20) requires the J-f unction
and its derivatives with respect to ft and I . 4--digit-
tabulations of this function have been published by several
authors. Dresner's table [7 J is restricted to O.U t < 1 and
0£k£31 with p = 2k.10~5. Extensions to smaller f by Adler

SM-101/32 157
et al. Z""8_7 and by Nather et al. /~9_7 have errors that amount
to about 1.5 i> for $ = 0.05 and p » 0.1. This would cause
large errors in the derivatives. The best and most extensive
table with about 10 000 function values is that of Bell et al.
/""10_7» hut it has some drawbacks, too. For large & the
\ -dependence of J is so weak that the last digit will change
by one unit only after many steps. Besides waste in storage
capacity this fact causes jumps in ^J/°§ which may disturb
comparison of results for only slightly varied input data.
Another drawback is the spacing of the ^ -scale, which is
linear in several sub-intervals. This causes excess informa
tion at the upper and interpolation errors at the lower end
of each sub-interval.
For these reasons we performed a new tabulation correct
to 6 digits with an approximately logarithmic spacing of the
§-scale. In order to get as continuous and smoothly varying
derivatives as possible, we use a 4 times 4 point interpola
tion routine. Thus we reach an accuracy in J better than
2.10"* with only 24 £ -points between 0.005 and 1 and 32
(i -points between k = 1 and k = 16.5 that are in all 776 func
tion values. For k > 16 we get the same accuracy with the fol
lowing rational expression.
-1 + a3« £ + a
(21) with a1 = 0.0013129-/? "
1 + 0.9818294-/T2
a2 = 0.35504947-/*~2 + 0.17116913-/J"5 - 0.023305-/* "4
a3 = 1.H86697 + 0.8985628-/S ~1 - 0.0319557-/* ~2
Similar but simpler approximations are applied for k < 1.5
and for J < 0.005 or J > 1 with 1.5 <k £ 16, because these
regions are practically never used. Altogether this new ap
proximation /~11_7 gives higher accuracy in the J-function
and its derivatives than any other method known to us and all
this with drastically reduced expense of storage requirement
compared with Bell's tabulation.

158 MULLER
The neglect of r[ in eq. (9) does not introduce serious error, but it always causes somewhat too large temperature
derivatives, because the generalized J-function
Jtf f %) . f +W*
with (22)
2-$i^-M-*)<m.<LHm<L)'£f
varies less with $ than J(/>, I , 0). In order to be on the safe side without wasting machine time we made the following ap
proximation
J(AU)~ J(M»MJ(A-^-J(A».4f(M] (23
With a rational expression for f(/*, f ) an accuracy of few per
cent can be reached, if %-*L <& y f which is valid for normal
dilution. This correction decreases the total d(pf)ldT for the
reactor discussed in chapter 4 by somewhat more than 1% for
energies between about 3 and 50 keV.
3.2. Resonance overlapping
The distribution function i2 (X) used in eqs. (12) and
(13) is given by the sum
fiM = I £W (24)
where P (x).dx is the probability that the n-th neighbour of
resonance k lies in dx about the relative distance x = D/I)
from Efc and 2n(x) obeys the recurrence relation
x
PnM • j ^ W - P * . , i*-t)-Jt (*>,; (25, o
Proelich /"~5_7 assumed a % -distribution with degree of
freedom p = 10 for P^x). Hence he could describe Q> (x) in

SM-101/32 159
analytical form. Schmidt £~ 12j, however, showed that new ex
perimental results are better represented by the Wigner-distri-
bution
< V * ) = f-X-exp(-S:-X2) (26)
Therefore we calculated numerically the corresponding Q, w (x)
and the functions Sw(y) and ew(y) defined by eqs. (12) and
(13). The results are compared with Proelich's functions in
fig. 1. As with the Wigner-distribution small x-values are 2.
more probable than with the %-distribution, ew(y) is consi
derably larger than e1Q(y) for y 2/ 5. That takes effect
especially on the widely spaced resonances of sequence 1
which supply the main part of the Doppler effect. For the
reactor discussed in the next chapter replacing of the
X-distribution by the Wigner-distribution reduced d(/^^)/ciT
for energies below about 10 keV by some per cent and slightly
increased it for higher energies.
4. Discussion of results
The reactor considered by Froelich /~5_7 was composed of
25 vol-* 2 3 8U0 2, 5 vol-# 239Pu02, 40 vol-# Na and 30 vol-#
structure material. Hence follow <%*s0.35 cm" and the atomic -1 -1 -1
number densities Ny = 0.005575 cm -barn , Np = 0.001125 cm . barn" for an assumed fuel density of 10 g.cm"~3 (not given in /~5_7)« The effective temperature was 900 °K.
In a first calculation we used the same statistical para
meters as Proelich did. They are for 258U£_SQ=Sl=10"*4'(eV)"1/'2,
D"l/2 = 18.5 eV, E° / 2 = 10.08 eV, PQ = 1 , 1} = 24.6 meV, R2 =
0.8515 barn, E B = 4.7 MeV, a = 22.43/MeV,A2 = 2.0895 barn.eV;
and for 259Pu : SQ = S1 = 10"4 (eV)"1/2, D° = 10.12 eV
D° = 3.57 eV, D£ = 2.4 eV, y = Vf = 1, C independent of sequence
taken from C^Jy C* = 38.7 meV, R2 = 0.8356 barn, EB = 6.4 MeV,
a = 22.43/MeV, A 2 = 2.0894 barn • eV.
In a second calculation we took the new parameters given
with error margins by Schmidt /~12_7. They are for U:
SQ =(0.9 + 0.1).10"4(eV)"1/2, S1 = (2.5 ± 0.5).^""^(eV)"
1/2,
f t r tn 73
Lirhtufli: !'- -iiu.-: l i ' *_Li* Azi^iM FIG. 1. Functions f210(x), e10(y). e10(y) f o r X2-distribution with degree of freedom v - 10 and fiw(x), e ^ y ) , ew(y) for Wigner distribution.

SM-101/32 161
5J/2=(20.8 + 2.0) eV, 3J°/2=(11 .4 ±1.1) eV, V n = 1 ,
Vt =(24.8 + 5.6) meV, R* = (0.8427 + 0.02406) barn,
E £ = 4.76 MeV, a = 22.834/MeV; and for 239Pu :
S0 =(1.07+0.1).10~4(eV)~1/2, 8^(2.5+0.5).10"4" (eV)~1/2'
E£ = 8.78 eV, E° = 3.12 eV, E° = 2« 1 2 e V» vn= 2 f o r (1,J) =
(1,1), Vn =_1 otherwise, Vf = 2 for (1,J) = (0,0), Vf = 1
otherwise, T f = 2.8 eV for (1, J) = (0,0), f " = 0.057 eV for
(1,J) = (0,1) and low energies, energy dependence given
by graph (for 1 = 1 sequences assumed similar to (1,J) =
0,1)), R2=(0.819+0.020) barn, E B = 6.382 MeV, a = 22.898/MeV.
FIG.2. Temperature derivatives of fictitious cross-sections versus energy: d <jjy>/dT|p and d<jjf>/dT| for Froelich's data; d<£ >/dT Is and d</L>/dT| s for Schmidt's data.
The results, shown in fig. 2, are not split into shares
for U and Pu, because introduction of the fictitious cross-A
section pj and mixing up of U and Pu-effects in a unique
a

4 ' S 6 7 6 7 io: A 5 4 / 8 9 m4
FIG. 3. Relative change in d<p > /dT caused by relative change in parameter v versus energy.
SM-101/32 163
eff ^ z makes this partition insignificant. We only separated the y- and f-components, because they are rather independent of each other and often used separately in perturbation calculations. We see that the newer input data raise d ^ ^ / d T appreciably for E >. 10 eV and lower it by about 8 $> for E » 1 keV. d<^f)>/dT, on the contrary, is practically unaffected despite large changes in H,, S1 and I) , except at high energies where its absolute value is negligible. Because
A A d<^f>/ d T is s m a 1 1 compared with d <^>/dT for E £, 500 eV, we will confine our further discussion to the latter function.
In order to find those statistical parameters which influence strongest d^^O/dT, we repeated the secondcalcu-lation with one parameter raised by 10 # and all the others unchanged. The resulting changes in d AV) /dT are shown in fig. 3 for the most important parameters of U: S , S1,
^1/2' ^3/2 and ^t ' We see *nat ^or -*-ow and intermediate energies the errors in U^y2 and [Z. and for high energies the errors in fj- , S^ and E,/p are most serious. If all the error margins given in /"~12_/ were independent of one another, maximum error margins for d (£*ry/&T of about 20 # near 1 keV, 30 i» near 10 keV and 40 $> near 100 keV would result. Approximately half of this error is contributed by the 20 # uncertainty in
/"L . Because this error margin is concluded from only a few resolved resonances and because the probable value of f was used in the analysis of the other resonances so that the strength function values S and S1 depend on it, we suppose that the total error margins might be safely reduced to 10 # near 1 keV, 15 # near 10 keV and 20 # near 100 keV.
If we compare with the corresponding relative changes in the microscopic capture cross-section of TJ for infinite dilution (&} ) caused by changes of one parameter V (see fig. 4), we find qualitative and quantitative analogies. The maximum relative errors of <6"y / should, therefore, be comparable with those of d^/Uj^/dT. This corresponds to some values recommended by Schmidt in/~12_7, but it is inconsistent with some experimental results. More exact measurements of (.^ ) for the region of unresolved resonances would help much in assuring the error margins given above.

10W t 5 8 ? 8 9 !<T
FIG. 4. Relative change in <o?,> of 238U caused by relative change in parameter v versus energy.
SM-101/32 165
The curves in fig. 3 are certainly dependent on reactor
composition and temperature but they will he good enough for
error estimation of similar reactors. Uncertainty in ftp may
he taken into account hy means of the dashed curve added for
this purpose.
5. Conclusive remarks
We tried further improvements of the calculational method hut
did not yet include them into our standard program. For in
stance, we studied the Gaussian approximation to the Y~^ u n c~
tion. It effects mainly on the statistical averages E of eo Z j S
eq. (17), but because the error in f($)= i "V/2(?, xj» dx is less
than 0.4 fi for ] < 0.005, less than 1.6 # for ^ 0.02 and
less than 4 $> for \ £ 0.05, the overestimation of d < "a-> /dT caused by the low resonances of sequences s > 1 cannot be
large. Nevertheless we will try to include this correction,
because it can easily be done with a polynomial expansion
of f (f) . Judging of the corresponding effect on the functions
e(y) and £(y) is more difficult, but it seems to be small
compared with that caused by the change from %- to Wigner-distribution. The errors coming from narrow-resonance approxi
mation were investigated recently in detail by Hwang /~~14__7
and found to be negligible. Summing up,we can suppose that
further efforts in improving the methods of calculation do
not pay until the error margins of the statistical resonance
parameters can be reduced drastically.
R E F E R E N C E S
[1] NICHOLSON, R.B., Atomic Power Development Associates Inc. Rep. APDA-139 (1960). [2] CODD, J . . COLLINS, P.J . , USAEC Rep. ANL-6792 (1963) 711. [3] HWANG, R.N. . Nucl. Sci. Engng^l 4(1965) 523. [4] FISCHER, E.A. , Nukleonik_8 3 (1966) 146. [5] FROELICH. R., Rep. KFK 367 (1965). [6] FROELICH,'R., OTT, K., Nucl. Sci. Engng 22 (1965) 490. [7] DRESNER, L. , Int. Series of Monographs on Nuclear Energy, Pergamon Press, vol.4 (1960). [8] ADLER, F .T . et a l . , Int. Conf. peaceful Uses atom. Energy (Proc. Conf. Geneva, 1958), \§, UN,
New York (1958) 142. [9] NATHER, V.W. , NORDHEIM, L.W., General Dynamics Corp. Rep. GA-2460 (1961).
[10] BELL, V.J . , BUCKLER, P . A . C . , PULL, I . C . , UKAEA Rep. AEEW-R 266 (1963). [11] MULLER, A., Zentrale Entwicklung und Forschung der Siemens AG, Erlangen, unpubl. Rep. No.26
(1967) (in German). [12] SCHMIDT, J . J . . Rep. KFK 120/1(1967). [13] SCHMIDT, J . J . , Rep. EANDC(E)-46 "L" (1963). [14] HWANG, R.N., Proc. of Nat. Topical Meeting of ANS, San Diego, vol.2 (1966) 319.

166 MULLER
D I S C U S S I O N
H. W. KUSTERS: I should f i rs t like to point out that in the paper by Froe l ich (Ref. [5] of your paper) the t empe ra tu r e der ivat ion of the denominator is in fact taken into account — albeit approximately and your method cer ta in ly r e p r e s e n t s an improvement in this r e spec t .
Did you per form Doppler effect calculat ions and how do these compare with data obtained by the s imp le r method?
A. MULLER: In the paper to which I made re fe rence (KFK 367) F roe l i ch and co -worke r s neglected the t e m p e r a t u r e der ivat ive of the denominator of the effective c ro s s - s ec t i on , corresponding to a flux change which vanishes in f i r s t - o r d e r per turba t ion theory when in tegrated over the r eac to r . Pe rhaps you had in mind some other in ternal work of Dr . F roe l i ch .
So far our calculat ions have been confined to c r o s s - s e c t i o n s and the i r t e m p e r a t u r e de r iva t ives .
J . L. ROWLANDS: I should like to know from Dr . Muller whether he took into account the effect of s ta t i s t i ca l sampling in a s s e s s i n g the accuracy of Doppler coefficient calcula t ions . I notice that in his paper (SM-lOl /22) Dr. Segev quotes a somewhat l a r g e r s tandard deviation of 100% or m o r e , depending on the pa r t i cu la r select ion of r e sonances , for the Doppler change in 239pu c r o s s - s e c t i o n s between 700 and 900 eV.
A. MULLER: The effect of s ta t i s t i ca l sampling was taken into account by numer ica l in tegrat ion over all dis tr ibution functions of pa r t i a l l ine widths and resonance dis tances us ing Gaussian quadra ture formulas .
The difference between the s tandard deviations given by Dr . Segev and by myself may be explained as follows: Dr . Segev1 s data re la te only to the 239pu c r o s s - s e c t i o n s between 700 and 900 eV, whereas my data a re valid for a r e a c t o r composed of 25% 238{jo2 and only 5% 2 3 9 P u 0 2 . The influence of the 238U resonances (s-wave) far exceeds the effect of the 239pu r e sonances in this energy region.
M. SEGEV: I would just point out that the 100% standard deviation in 2 3 9Pu c r o s s - s e c t i o n change with t empe ra tu r e is quoted in my paper as a resu l t obtained by Kel le r and Kie r .

THE GROUP CROSS-SECTION SET KFK-SNEAK Prepara t ion and resu l t s *
H. KDSTERS, H. BACHMANN, H. HUSCHKE, E. KIEFHABER,
B. KRIEG, M. METZENROTH, I. SIEP, K. WAGNER AND D. WOLL INSTITUT FUR NEUTRONENPHYSIK UND REAKTORTECHNIK, KERNFORSCHUNGSZENTRUM KARLSRUHE, KARLSRUHE, FEDERAL REPUBLIC OF GERMANY
Abstract
THE GROUP CROSS- SECTION SET KFK-SNEAK: PREPARATION AND RESULTS. For the calculation of integral quantities, measured in the Fast Zero-Power Assembly SNEAK, a new group cross-section set was prepared directly from microscopic data. These data are based on the latest evaluation of cross-section and resonance parameters tabulated on the Karlsruhe Nuclear Data File KEDAK. Special attention is paid to the calculation of the elastic moderation.
This group set is partially organized in a manner similar to the Russian ABN-set. This means a tabulation of isotope-dependent group cross-sections for infinite dilution and energetic .self-shielding factors, tabulated for the parameters OQ, describing the dependence on the mixture, and for the temperature. The neutron-spectrum 0(E) is replaced by 0(E) = F(E)/Et(E) , where F(E) is the collision density referred to below as ' macroscopic weighting-function' and Et(E), the total cross-section of the mixture. A macroscopic weighting-function has been obtained by calculations with the ABN-set, and the Karlsruhe KFK-group set, smoothing the step-function for the collision density.
The elastic scattering matrix is calculated from experimental cross-sections on KEDAK for all light- and medium-weight isotopes at the beginning of every diffusion calculation. The dependence on the mixture is taken into account exactly. For heavy-weight materials a similar representation is used.
Inelastic scattering and the transport cross-section are treated in a similar way as in the ABN-set. For the calculation of the group cross-sections and self-shielding factors a fully automated code-
system has been established. During the preparation of the SNEAK-set the influence of the new material-dependent group cross-
sections on various integral reactor parameters was studied. The basic material composition for the calculations is the core composition of SNEAK-3A-2, with
an equivalent steam densitiy of 0.07 g/cm3, which is different from that of SNEAK-3A-1. The procedure was as follows: starting with the ABN-set, the cross-sections of 238U, O, Fe, Cr, C,
Ni, Al, 235U were successively replaced. For the ABN-set and then after each material substitution the following quantities were determined by fundamental mode calculations: the critical buckling B*, k , forBc the neutron-flux, A BQ against the preceding material replacement, the migration area, the conversion ratio, the Doppler coefficient and the neutron-generation time, for the critical buckling of the ABN-set (B? J^-^,) the neutron- flux, Ak for coolant loss and the steam-density coefficient of reactivity.
To get a more detailed insight into the effect of microscopic data on neutron balance and the spectrum, the authors calculated in each case, for all core materials and for 239Pu, ^Pu, M1Pu (both for Bc and Be ABN)> shielded and unshielded microscopic one-group constants by condensing with the corresponding 26 group spectrum.
Furthermore, the effect of the more accurate method in calculating the elastic removal cross-section on k£ff, B£, spectrum and reaction rates was studied.
A precise investigation of the influence of the change in group-cross-sections and a comparison with some integral experiments in SNEAK-3A-1 are given.
* Work performed within the association in the field of fast reactor between the European Atomic Energy Community and Gesellschaft fur Kernforschung m. b. H., Karlsruhe.
167
168 KUSTERS et al.
1. INTRODUCTION
The lack of accuracy in some essential cross-section types gives r ise to considerable fluctuations in some important quantities used in the design of large fast reactors. As long as only concepts are considered and trends of main integral nuclear parameters are of interest, the theoretical methods and basic data used today are able to give satisfactory answers. But in calculating the nuclear properties of a fast reactor, already built or under construction, with the feedback on thermodynamic and economic properties, safety and long-time characteristics one obtains remarkable differences with different basic data recommended by various authors. Looking at integral reactor quantities shown in the intercomparisons at the Argonne Conferences in 1965 and 1966 the accuracy in the calculation of fast reactors is improving with time, but convergence of the results has not yet been reached.
In Karlsruhe the fast critical assembly SNEAK has been operating since December 1966. The theoretical analysis of the experiments clearly should be done on the basis of the latest and best cross-section data and method. Up to 1965 we calculated fast reactors with the Russian group constant set ABN from Bondarenko et al. [1].
In 1965 Schmidt revised his first cross-section evaluation [2], and on this basis we prepared new infinite dilute group constants, with a weighting spectrum of a typical lOOO-MW(e) sodium-cooled reactor, for the most important materials used in fast breeders. The resonance self-shielding factors were taken from the Russian set with only slight modifications in the shielding of elastic moderation in certain groups. Preparation of this group constant set KFK 26-10 and results for large power reactors and critical assemblies are given in Ref. [3],
In 1966 a second revision of microscopic data has been published by Schmidt [4], The recommended cross-sections and statistical parameters are available on the Karlsruhe Nuclear Data File KEDAK. From these data we prepared the group cross-section set KFK-SNEAK in 26 groups with resonance self-shielding factors calculated by ourselves. It should be noted that no adjustment to the special assembly has been made. The term ' SNEAK' in the group set arises from the fact that as a weighting spectrum for averaging the cross-sections a smoothed 26-group collision density spectrum has been used which was calculated with KFK 26-10 for the assembly SNEAK 3A-2. The hydrogen density used in this core is also typical for a large steam-cooled fast reactor (0. 07 g/cm3) . This is twice the hydrogen density of the assembly SNEAK-1, which has been analysed experimentally during the last months [5].
This paper will give a short survey of the methods used in calculating the group constants. A comparison of the main differences in the basic data is shown. During the preparation of the group constant set the influence of the new data on interesting integral quantities for SNEAK 3A-2 is studied. For the assembly SNEAK 3A-1 under experimental investigation now the essential results and a first conclusion about the quality of the set is given. In a further section some results of cal-

SM-101/12 169
culations with the SNEAK-set for ZPRIII/48 and for large sodium-and steam-cooled reactors will be discussed.
2. MICROSCOPIC GROUP CONSTANTS
2 .1 . Theoretical aspects
The main calculational techniques are described in this section. In addition to the determination of the elastic removal group constants, the effective microscopic group cross-section of type z in group g for isotope k is calculated by
k,..s u ° z
/ i (g)
(g)
\ (E) kat (E) + ,
F(E) ka t (E) +
OO
Q
«i
F(E)dE
dE
(1)
The collision density F(E) is a slowly varying function with respect to energy and composition. In the broad structural resonances F(E) is proportional to the effective logarithmic energy decrement of the mixture. A correction can, therefore, be applied to F(E), but it is not yet included in the group set presented here.
Correctly the denominators in Eq. (1) should contain in NR approximation the total macroscopic cross-section of the mixture under consideration. For practical purposes it is convenient to replace the cross-section of the rest materials by an appropriate average in group g. Usually one takes the infinite dilute total group cross-sections in group g for this average, but it is very unrealistic to take the average total cross-section of 238U with a resonance level spacing of 18 eV as a background for the shielding of U or Pu resonances with level spacings of roughly one order of magnitude less . Therefore, we defined kcr|j = (l/Nk)mEkNm
mcrg, with 2 3 8a 8 replaced by the potential scattering
cross-section. The effective group cross-section is split into two parts:
kol-k,l , "ft (T,a«) (2)
a8 is the group constant for infinite dilution for T = 0 and T is the average temperature of the fuel. Both factors are tabulated on the Karlsruhe GROUCO file. This splitting procedure is very useful in the statistical resonance region, because there ka8 is then calculated by integration over pointwise tabulated microscopic cross-sections, while the self-shielding factor is determined by statistical resonance parameters. By this procedure the influence of uncertainties in statistical parameters is reduced.

170 KUSTERS et al.
The evaluation of the self-shielding factors is based on the single-level Bre i t -Wigner formula . In ter ference of potential and resonance sca t te r ing and resonance over lap is taken into account. The detailed descr ip t ion of the calculat ional technique will be given in the full documentation of the SNEAK set .
F o r the descr ipt ion of e las t ic moderat ion the CT0 concept has been abandoned; the dependence on the mix ture is taken into account in NR approximation exactly in each r eac to r calculation. Fo r high-energy anisotropic sca t te r ing in the CMS sys tem the known experimental angular d is t r ibut ions a r e d i rect ly inse r t ed and integrated over the degradation in te rva l . Fo r the e s sen t i a l energy region of the important resonances the exper imenta l data provided a r e sufficient; they a r e continually being brought up to date . The automatic calculation of the macroscopic e las t ic r emova l group c r o s s - s e c t i o n in every diffusion run necessi tated a reorganiza t ion of the KEDAK file, which resu l ted in a new ERDAK file which is used in these calcula t ions .
The t r an spo r t c r o s s - s e c t i o n is defined by
<jg = crS - E crj-»8.K]'"-g (3) tr t j<g
where a]~*gis the sca t t e r ing ma t r ix (calculated with the appropriate weighting F(E)) and juJ~^g a r e the e lements of the mat r ix for the average sca t te r ing cosine. Equation (3) is based on the assumption that the neutron cu r ren t i s only weakly dependent on energy, at leas t within the mos t important neighbouring groups to group g. In the SNEAK set up to now only hydrogen is t rea ted by Eq. (3), because for isotopes with higher atomic weight than 10 the second t e r m on the right-hand side of Eq. (3) can be approximated by a § . /i§.
The inelas t ic sca t t e r ing ma t r ix i s calculated by taking the same t r ans fe r function as in ABN but normal iz ing the mat r ix elements to the re -eva lua ted total inelas t ic c r o s s - s e c t i o n . The (n, 2n) p rocesses are included in the inelas t ic ma t r i x .
The var ious codes for calculating the group constants a re combined in the code sys tem MIGROS. The organizat ion is given in Fig. 1. Two different methods can be used in calculating the elast ic moderation: method A is based on the a0 concept, method B calculates directly the shielded macroscopic e las t ic removal from the ERDAK file. The code sys tem is fully automized, which is important especial ly for the determinat ion of shielding factors in the different energy regions of resolved, s ta t i s t i ca l and strongly overlapping resonances .
2 . 2 . Comparison of group constants
The SNEAK se t contains new group constants , based on a re-evaluation by Schmidt, for the following e lements or isotopes: H, C, O, Na, Al, Cr, Fe , Ni, 235U, 238U, 2 3 9 Pu. The c ros s - sec t i ons for other isotopes a r e , up to now, identical with those given in the ABN set . New group constants will be provided also for fission products [6] and the higher plutonium isotopes [7], but these data had not yet been included on the KEDAK and GROUCO files during the analysis discussed in this paper.

SM-101/12 171
As mentioned above, all new effective group cross-sections are weighted with the collision density F(E) which was obtained by smoothing the core averaged F(E) of a diffusion calculation with KFK 26-10 for SNEAK 3A-2 with the hydrogen density of 0. 07 g/cm3. Only the main differences in the group constants of the SNEAK set compared to KFK 26-10 and the ABN set are shown here.
Energetic self-shielding factors for resolved resonances from resonance parameters
Energetic self-shielding factors for resolved resonances from measured cross-sections
Energetic self-shielding factors for unresolved resonances from statistical resonance parameters
X
Group-cross-sections for infinite dilution
Superposition and tabulation of all microscopic group constants on GROUCO file
Elastic and inelastic scattering matrix (method A)
1/v cross-sections
Calculation of macroscopic group constants for all mixtures from Grouco file
Diffusion calculation
Calculation of the elastic scattering matrix for a given mixture (method B)
Replacement of the elastic scattering matrix
FIG. 1. The code system MIGROS and the preparation of macroscopic effective group constants.
Figure 2 shows the fission and capture group cross-sections for 235U. SNEAK data for capture between 10 and 500 keV are smaller
by 10-20% than the KFK data; the fission values, based on White' s measurements, show^he same behaviour, the deviations are, however, somewhat smaller. The low orc values result from lower a data in this energy range.
Capture and fission group cross-sections for 239Pu are given in Fig. 3. Between 10 and 100 keV the fission data are taken from White1 s measurements (in Ref. [4] these values had not yet been recommended), and the low capture values result also from smaller a data. The new data are smaller by 10-20% compared to the previous KFK data.
The capture cross-sections for Cr, Fe, and Ni are practically the same as in the KFK 26-10 set. The large differences in the region 10-100 keV, where the values used in Karlsruhe for <jc (Fe) (Moxon measurements) are about a factor 2-3 times larger than the Russian constants should again be noted; for crc (Ni) there is a factor of 4, especially between 10-20 keV.
The Al capture group constants in the SNEAK set are larger than the ABN values in the essential energy region between 10 - 500 keV by 20% up to a factor of 2. We also have larger capture values in the low-energy region. The microscopic data for Al are taken from AEEW M445 with only slight modifications.
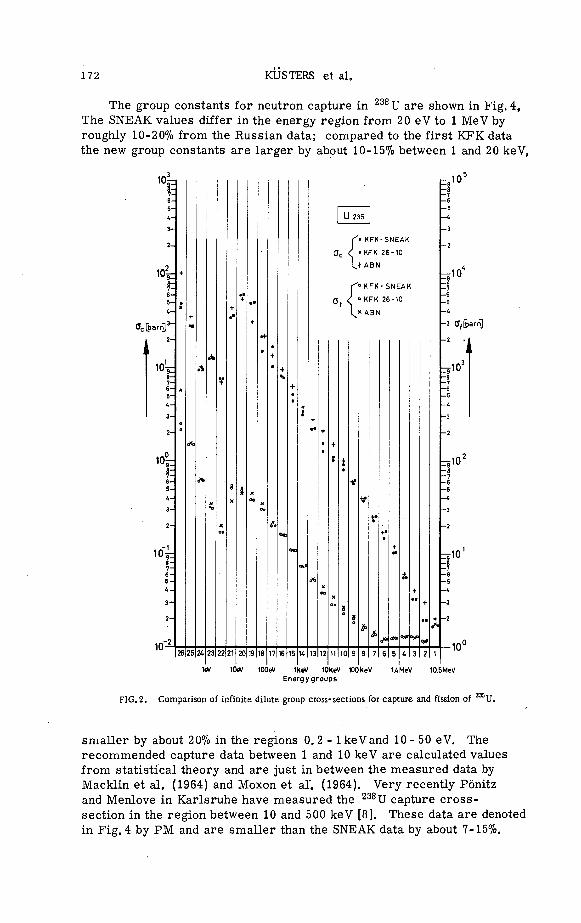
172 KUSTERS et al.
The group constants for neutron capture in 238U are shown in Fig. 4, The SNEAK values differ in the energy region from 20 eV to 1 MeV by roughly 10-20% from the Russian data; compared to the first KFK data the new group constants are larger by about 10-15% between 1 and 20 keV,
10^-i
Crc[bam]3
1 io°d
10^-
10"-26 25 24 23 22 21 20| 19 18 17
W 1 0 * 100eV
U 235
>KFK-SNEAK
Oc < 'KFK 26-10
H - A B N
KFK-SNEAK
KFK 26-10
r-^ICT
-8 -7 -6 •5 -4
•3 Gf[barn]
-2
I I
bio3
- 8 - 7
c *
r10-
:10'
-10v
15 K 13 12 11 10 9 8 7 6 5 4 3 2 1
IkeV 10keV 100 keV UMeV 10.5MeV Energygroups
FIG. 2. Comparison of infinite dilute group cross-sections for capture and fission of U.
smaller by about 20% in the regions 0. 2 - 1 keVand 10 - 50 eV. The recommended capture data between 1 and 10 keV are calculated values from statistical theory and are just in between the measured data by Macklin et al. (1964) and Moxon et al*. (1964). Very recently Ponitz and Menlove in Karlsruhe have measured the 238U capture cross-section in the region between 10 and 500 keV [8], These data are denoted in Fig. 4 by PM and are smaller than the SNEAK data by about 7-15%.

SM-101/12 173
In Fig. 5 the self-shielding factors for cr0 = 100 barn and T = 900°K calculated with the recommended resonance parameters are compared with the equivalent ABN data. Between 10 eV and 1 keV the SNEAK values are larger by 10-30%.
r!Cf
ioy t 6-
<j[bam]
1 ^
10°H
107
10-
P u 239
'• KFK-SNEAK
• KFK 26-10
+ ABN
•"<• KFK-SNEAK
»KFK 26-10
XABN
=^ioJ
*
- 3 Cff[barn]
i i
rs102
- 8 - 7 - 6 - 5
rs/IO1
- 5 - 4
10"
10' 26 25 24 23] 22 21 20(19 18 17 16 15 H 13 12 11 10 9 8 7 6 5 A 3 2 1
1eV lOeV lOOeV IkeV lOkeV lOOkeV 1fMeV 105MeV Energy groups
FIG. 3. Comparison of infinite dilute group cross-sections for capture and fission of 239Pu.
To see the influence of the different methods in calculating the macroscopic elastic removal cross-section, the results for the SNEAK set are plotted in Fig. 6. Method A is based on the CTQ concept; method B calculates the macroscopic group constant directly from microscopic data in each reactor calculation. Because the escape probability for a neutron scattered out of a group varies strongly within the degradation interval, and this interval for all isotopes except the very light ones is small against the group width and comparable to resonance widths of,

174 KUSTERS et al.
e. g., iron or oxygen, the removal cross-section of any isotope except the very light ones is strongly influenced by the resonance structure of the macroscopic total cross-section of the mixture. For the SNEAK assembly in two groups this influence is remarkable. In the group from
10£i
q.[barn] H
I I
1 0 >
10"-
1)238
K F K - S N E A K
KFK 2 6 - 1 0
* ABN
26 25 V, 23 22 21 20 19 18 17 16 15 V, 13 12 11 10 9 8 7 6 5 A 3 2 1
1eV 10eV lOOeV 1keV 10keV lOOkeV I.AMeW 10.5MeV Energy groups
& 1 0 '
3
-3 0.[barn]
r10 i
- 7 - 6 - 5
- 3
- 2
=•10"
=o10
-10"'
FIG. 4. Comparison of infinite dilute group cross-sections for capture and fission of mU.
400 to 800 keV the oxygen resonance at 442 keV reduces the removal cross-section of all isotopes except hydrogen in method B, because the escape probability, weighted by the ascending wing of the total cross-section of oxygen in method B, is smaller than in method A, where only an average total cross-section is used. In the group from 21. 5 to 46. 5 keV the descending wing of the asymmetric resonance dip of iron at 25 keV causes a larger escape probability for all isotopes except hydrogen by method B than by method A. Therefore, the removal cross-section

SM-101/12 175
is enlarged by method B. These effects can plainly be seen in the corresponding neutron spectra, shown in Fig. 11. The differences from the Russian removal cross-sections are quite large in the resonance region of structural materials, because besides the different weighting spectrum the infinite dilute value of the elastic scattering group constants as well as the corresponding shielding factor which enter the elastic removal cross-section are calculated for the total energy group and not for the degradation interval only.
1.0 —
" 0 . 8 -
0.6—
0.4 —
0 .2—
•
22
• +
21
10
• +
20
sV
• +
19
• +
18
100
• +•
17
eV
• +
16
• 4-
15
+ •
14
eV
• +
13
• +
o T
• + • +
U238
•
, = 100 barn
= 900°K
•
• KFK-SNEAK
+ ABN
12
10
11 10 9
100
8
<eV
_ .
-
-
Energy groups
FIG.5. Comparison of energetic self-shielding factors for capture (o = 100 barns, T = 900°K) of 2 U.
0.04 - 1
0.03 -
1 0.02 -
+
o
§ ° o o+o* o
+ • +
• KFK-SNEAK (METHOD A )
+ ABN
O K F K - S N E A K (METHOD B )
11 10 9
1keV 10keV
8
o+
100 keV
Energygroups
10.5 MeV
FIG. 6. Comparison of different procedures in calculating macroscopic elastic scattering matrix (see text).
Formula (3) yields a higher transport cross-section down to the keV region for hydrogen, and as a consequence the leakage of fast neutrons out of the system will be reduced. The previously used CT^ data are calculated by aft - as (1- U) + cra where the average cosine of scattering is given by 2/3. Figure 7 shows the differences.

176 KUSTERS et al.
10.0—
5.0—
i
0.5—
15
Xo
a 0{J. (SNEAK)
X O"(ABN)
14 13 12 11 10 9 7 6 5
1keV 10keV 100 keV Energygroups
4 3 2 1
1.4 MeV IQBMeV
FIG. 7. Comparison of the transport cross-section of hydrogen.
3. RESULTS
3 .1 . Results obtained during preparation of KFK-SNEAK
The new constant set was prepared in a similar way as the first set KFK 26-10. As a basis we have taken the Russian ABN set and have replaced the group constants of the elements and isotopes mentioned above by new ones. After each replacement a fundamental mode diffusion calculation for the homogenized core using method A for elastic removal was performed to determine the influence of the new data on integral reactor quantities. The core composition is that of the assembly SNEAK 3A-2 with a hydrogen density similar to a larger steam-cooled fast reactor. The atomic number densities of the core materials are (the factor 1024 has been omitted): N(A1) = 1.289 X10"2, N(C) = 8. 62 X1CT4, N(Cr)= 3.42 X10"3, N(Fe) = 1. 27 X10"2, N(H) = 1. 64 X10"3, N(Ni) = 1. 86 X10"3, N(0) = 1.446 X1(T2, N(235U) = 2.03 XIO"3, N( 238U) = 8. 108 X10"3.
The fundamental mode caluclations were performed in two different ways: (1) achieving criticality by iteration of the buckling; (2) taking the critical buckling from a calculation with the ABN set and looking for the difference in criticality produced by the special replacement considered. The new group cross-sections for the various isotopes were replaced in the following sequence: (1) 238U, (2) 1 6 0, (3) Fe, (4) Cr,
239 PU, (10) (Tp ( 238 U)+a« (5)12C, (6) Ni, (7) Al, (8) H, (9) 235U + (11) Na.
In Figs 8-10 this sequence is numbered from 1 to 10; 1 corresponds to the replacement of 238U, 2 to the additional replacement of oxygen, replacement 10 introduces the potential scattering cross-section of 238U for a0 determination and the afr according to Eq. (3). With replacement 10 all materials which build up the core composition of the SNEAK assembly
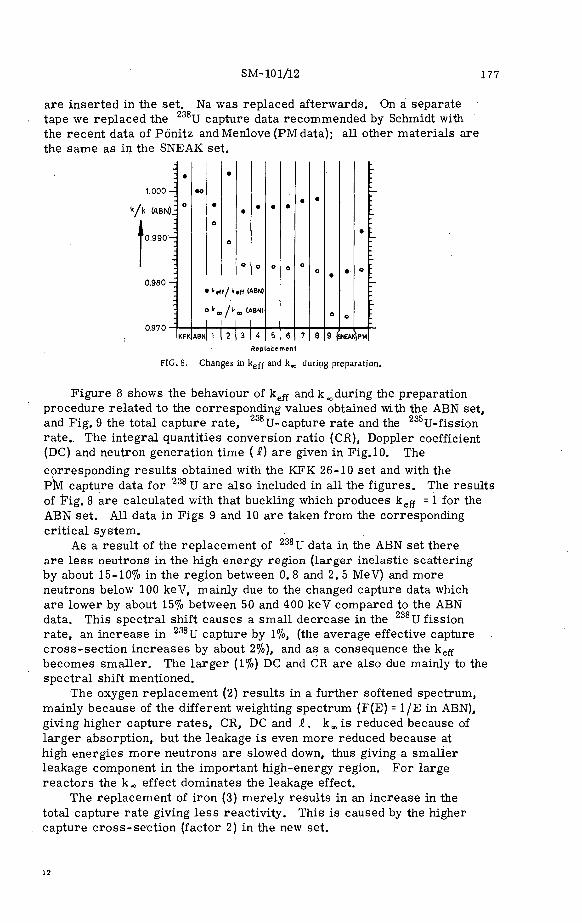
SM-101/12 177
are inserted in the set. Na was replaced afterwards. On a separate 238 tape we replaced the U capture data recommended by Schmidt with
the recent data of Ponitz andMenlove (PMdata); all other materials are the same as in the SNEAK set.
1.000 ^
k/k (ABN)i
* 0 . 9 9 0 - |
0.980 -
0.970
• • -e f t / l -e f f (ABN)
ABN 1 2 3 4
•
0
5
•
0
6
•
0
7
•
0
8
•
0
•
0
•
0
9 (SNEAKVM
Replacement
FIG. 8. Changes in keff and k„ during preparation.
Figure 8 shows the behaviour of keff and kw during the preparation procedure related to the corresponding values obtained with the ABN set, and Fig. 9 the total capture rate, 238U-capture rate and the 235U-fission rate.. The integral quantities conversion ratio (CR), Doppler coefficient (DC) and neutron generation time ( i) are given in Fig. 10. The corresponding results obtained with the KFK 26-10 set and with the PM capture data for 238 U are also included in all the figures. The results of Fig. 8 are calculated with that buckling which produces keff = 1 for the ABN set. All data in Figs 9 and 10 are taken from the corresponding critical system.
As a result of the replacement of 238U data in the ABN set there are less neutrons in the high energy region (larger inelastic scattering by about 15-10% in the region between 0. 8 and 2. 5 MeV) and more neutrons below 100 keV, mainly due to the changed capture data which are lower by about 15% between 50 and 400 keV compared to the ABN data. This spectral shift causes a small decrease in the 238U fission rate, an increase in 238U capture by 1%, (the average effective capture cross-section increases by about 2%), and as a consequence the keff becomes smaller. The larger (1%) DC and CR are also due mainly to the spectral shift mentioned.
The oxygen replacement (2) results in a further softened spectrum, mainly because of the different weighting spectrum (F(E) = 1/E in ABN), giving higher capture rates, CR, DC and i . k w i s reduced because of larger absorption, but the leakage is even more reduced because at high energies more neutrons are slowed down, thus giving a smaller leakage component in the important high-energy region. For large reactors the kM effect dominates the leakage effect.
The replacement of iron (3) merely results in an increase in the total capture rate giving less reactivity. This is caused by the higher capture cross-section (factor 2) in the new set.

-1.15-
_
1.10-
-
1.05-
1.00-
—
* R C 2 3 8 / R C 2 3 8 ( A B N )
• R C t o t / R C t o t ( A B N )
° R f 2 3 5 / R f 2 3 5 ( A B N )
•
•
o
KFK
• • o
ABN
• • O
1
•
• o
2
•
o
•
3
•
o
•
4
•
o
•
5
•
o
•
6
•
o
•
7
•
o
•
8
•
•
o
9fc
•
•
o
>NEAX
• .
•
o -
" IPMI
REPLACEMENT
FIG. 9. Changes in reaction rates during preparation.
1.15 -
1.10 -
1.05 -
1.00 -
0.9 5 KFK ABN
A CR/CR(ABN)
A DC/DC(ABN)
• L / L(ABN)
8
&
fSNEAKl 9|SNEAK|PM
REPLACEMENT
FIG. 10. Changes in integral quantities during preparation.

SM-101/12 179
As the volume percentage of Cr, C, Ni is small in the SNEAK core, the effects of the replacements 4-6 are small.
Because of the better down scattering at high energies (weighting function) the Al replacement (7) gives less neutrons above 200 keV, more neutrons between 200 and 20 keV, and again less neutrons below 10 keV. Thus, the leakage is reduced, showing a larger keff because k^ is unchanged. The smaller number of neutrons below 10 keV is responsible for the remarkable decrease in DC. Hydrogen (case 8) scatters down more neutrons above 200 keV and less neutrons below because of the different weighting spectrum. This gives higher total
• capture rates and especially a remarkable increase in DC and S.. The decrease in k,*, is just compensated by the simultaneous decrease of the leakage rate. One should note, however, that in the ABN set we used Eq. (3) for calculating the transport cross-section, and in replacement 8 we had to take the usual o^ definition for organizational reasons. Thus, in this case the hydrogen is somewhat more transparent than in the other calculations, 1-7. The correction for atr(H) is performed in replacement 10. The ninth replacement of 235U gives by far the largest effects. The spectrum is softer because of a larger reduction of capture at lower than at higher energies. Thus, in particular the capture in 238U becomes considerably larger by 10%, the fission and absorption become smaller because of the lower cross-sections despite the softer spectrum. In consequence, kw becomes smaller (1%) and, as the leakage rate is also greater, keff changes by about 1. 7%. The larger capture in 238 U (spectrum effect) and the lower absorption in 235U (effect of cross-sections) produce a 10% higher CR than in case 8. DC and JP are also enlarged by roughly 10% (spectrum).
Case 10 contains the replacement of the hydrogen transport cross-section according to Eq. (3) (see also Fig. 7). Together with the new o^ the potential scattering cross-section of 238U crp = 10. 6bhas been introduced for the calculation of a0 for the reasons mentioned in section 2 .1 . The leakage is somewhat decreased and overcompensates the decrease in k«, on account of the slightly softer spectrum.
Case 10 now is identical with the KFK-SNEAK group set. (The sodium replacement was done later because SNEAK 3A does not contain Na.) With this set calculations have been performed for the core composition SNEAK 3A-1. The results of these calculations are compared with experimental results in the paper of Stegemann et al. [5]. Before we draw the essential conclusions, we will discuss the effects of another cross-section replacement based on the recent measurements of the capture cross-section by Ponitz and Menlove (PM data). We obtained these data at a time when the calculations with the SNEAK set were almost complete and for consistency they were not included in the theoretical results of Ref. [5]. For the reference core composition discussed in this section (SNEAK assembly 3A-2) the lowered 238U capture results in an increase of keff by 0. 9% and the CR is lowered by 0. 5%.
In Figs 11 and 12 the neutron spectra and adjoint spectra of the SNEAK 3A-2 core are shown for different sets and methods related to the values of the ABN set. In Fig. 11 the spectra calculated by method

oo o
TABLE I. CHANGES IN LOSS OF COOLANT REACTIVITY AND REDUCED STEAM DENSITY COEFFICIENT DURING PREPARATION
AkL
(AkL>ABN
dk/k dp/p
( d k / k \ Vdp/py v yABN
KFK 26-10
1.119
1.076
1
0.9325
0.9478
2
0.8918
0.914
3
0.868
0.911
4
0.862
0.907
5
0.862
0.907
6
0.858
0.904
7
0.8198
0 .883
8
0.8249
0.892
9
1.181
1.096
SNEAK
1.2008
1.107
PM
1.180
1.077

SM-101/12 181
A and method B are given (for discussion see section 2. 2). The sharp dip in the sodium resonance group 13 in the KFK 26-10 arises from the elastic removal cross-section (method A) of 1 6 0, which follows the Na resonance shape because of the weighting spectrum of a sodium-cooled reactor used in KFK 26-10. The changes in neutron importance can easily
o o o OQ^
be understood by considering the changes in the U capture and U fission and capture group cross-sections given in Figs 2 and 4.
1.4-1
1.3-
1.2-
1.1-
1.0-
0.9-
0.8-
• o
15
•
• o
14
• o
•
13
•
o
•
12
a
o
11
o
a
a
10
o •a
9
o
a a
8
<DKFK 0ABN
$(SNEAK/Method A)
$ ABN
<t>(SNEAK/Method B) <t> ABN
a
o a
iT l
a
a O
6
a •ft
• O
IT 4
• • 0
3
•S
2
0
1
IkeV 10keV 100 keV
Energy Groups 1.4 MeV 105 MeV
FIG. 11. Comparison of neutron spectra.
1.06-
1.04-
1 0 2 -
100-
0.98-
BO
a
15
»° •
14
eV
a
B°
13
a
»°
12
10
a
©
O
11
keV
©
0 10
a
a 0
9
10C
a
© 0
8
keV
a
O
IjlKFK 9 ABN
0(SNEAK/Method A) $ ABN
4>PM
<(>ABN
a e 0
17
Sa O
6
a
5
1.4
8 ,0
4
MeV
»"°
3
B'°
2
s a
1
10.5
Energy Groups
FIG. 12. Comparison of the adjoint functions.
Table I lists the changes in the loss of coolant reactivity AkL and the reduced steam density coefficient of reactivity (dk/k)/(dp/p), both related to ABN values. The results can plainly be understood by
182 KUSTERS et ah
following the discussion given earlier. Again the largest differences are obtained in the 235U replacement in case 9. One should note the 20% decrease in AkL and 11% increase in the reduced steam density-coefficient compared to ABN. The KFK 26-10 set gives results in between the ABN and SNEAK set, because a large part of microscopic data are similar to those incorporated in the SNEAK set. As we performed fundamental mode calculations using the critical ABN buckling, only the trends should be given precisely; clearly the absolute values must be obtained in 1- and 2-dimensional calculations.
3. 2. Main results for the SNEAK 3A-1 assembly obtained with the KFK-SNEAK set
The detailed comparison of experimental and theoretical results obtained with the KFK-SNEAK set (method B) for the assembly 3A-1 is given in Ref. [5]. Here we will quote the main results to give an impression of the quality of data and methods used.
3.2.1.- Criticality
Homogeneous two-dimensional diffusion theory, method B:
, hom keff
Ak(S4)
Ak(het)
k^f (SNEAK)
k^fm (ABN)
khom (KFK 26-10
= 0.9895
= +0.0027
= + 0.0025
= 0.995
= 1.019
) = 1.018
S4 -correction:
Heterogeneity correction: (calculated)
So we have
For comparison:
Accuracy of half a per cent in keff is the target of reactor calculations and this is achieved with the group set KFK-SNEAK. It should be noted again that no adjustments to measured reactor quantities have been made. Both KFK-26-10 and ABN give higher keff values by about 3%J
3.2.2. Spectrum and spectral indices
In Fig. 13 the spectra calculated with the SNEAK set (method A and method B) and with the KFK 25-10 set are compared with experimental results . Again we have satisfactory agreement between theory and experiment for method B and the SNEAK set. The less accurate method A gives 20% deviations in the most important groups for elastic scattering (oxygen and iron resonances). Inserting the PM data into the SNEAK set leaves the spectrum practically unchanged. The result can be improved by one iteration step for the collision density. From the spectrum, calculated by SNEAK-method B, a new collision density can be obtained

SM-101/12 183
which is used for calculation of new removal cross-section in another SNEAK method B calculation. This has not yet been done here, but the effects should not be large.
In Table II the most important fission and capture to fission ratios for the centre of SNEAK 3A-1 are compared with experiment. There is very good agreement in the 238U capture to 235U fission ratio, the other ratios do not fit as well to the experimental data. A check has been made in using the measured spectrum in the calculation of 07 (238U)/af (235U), giving no improvement. This effect is not yet understood and needs further investigation, especially with respect to the experimental technique used.
1.3 -
1.2 -
1.0 -
0 .9 -
• •
O
11
o
•
•
10
o
• •
9
O
• •
e
•
0
•
7
•
•
O
6
. •' :
•
O
5
<|>KFK OEXP
4>SNEAK/Melhod A <|>EXP
<>> SNEAK/Method B
<t>EXP
lOkeV 100 keV 1.4 MeV
ENERGY GROUPS
10.5 MeV
FIG. 13. Comparison of theoretical and experimental neutron spectra for assembly SNEAK 3A-1.
Table II also gives the corresponding ratios using the low 238U capture data of Ponitz and Menlove. The drastic reduction in CTC (
238U)/orf(235U) is just within the experimental error line. With respect
to criticality we obtain kjj/ (PM) = 1. 008 with the PM data, applying the same corrections for S4 and heterogeneity given above. There is a strong indication that, because of normalization corrections, the fission and capture cross-sections of 235U should be even smaller than the low White data included in the SNEAK set [10]. This would result in better agreement of the PM data with experiment. The influence of these renormalization effects on the important integral nuclear quantities is being investigated.

184 KUSTERS et al.
TABLE II. SPECTRAL INDICES IN THE CENTRE OF SNEAK 3A-1
o f(U238)
o f(U235)
oc(U238)
of(U235)
o f(Pu239)
a f(U235)
Experiment
0.0336± 3°lo
0.142± 0.008
1.03± SPjo
SNEAK
SET
0.0301
0.143
0.96
KFK
26-10
0.0301
0.129
0.971
ABN
0.0316
0.127
1.001
PM
oc(U238)
0. 0297
0.136
0.952
3.2 .3 . Heterogeneity corrections
The SNEAK set gives far better agreement with the experimental results than both KFK 26-10 and the ABN set [5, 9]. The theory results in about 10% higher Akhet than the measured results in the bunching experiments, while the ABN data are too small by a factor of two in Akhet. Also the detailed cell fine structure gives much better results if the SNEAK set is used instead of the ABN or KFK 26-10 sets.
3 .2.4. Void calculations
The sequence of void measurements in the central zone of SNEAK 3A-1 is fairly well represented by calculations with the SNEAK set [5]. Including heterogeneity corrections, there are deviations from experiment by about 5%. Results obtained with the ABN set are 30-40% too low (see also Ref. [9]).
3 .2 .5 . Breeding ratio
Bearing in mind the theoretical and experimental results for the 238U capture to 235U fission ratio (Table II), the breeding ratio of SNEAK 3A-1 is also in much better agreement with experiment than results obtained with KFK 26-10 or ABN, see also Ref. [5].
3. 3. Results for the ZPRIII/48 critical assembly
To check in particular the plutonium data incorporated in the SNEAK set, we performed a calculation for the ZPRIII/48 assembly and compared the results with those formerly obtained with the KFK 26-10 set [11]. This first calculation for the homogenized core was done with that core radius for which the KFK 26-10 set produces ke
h#m = 1. 0. With the

SM-101/12 185
SNEAK set we obtained then kgfm (SNEAK) = 0. 963. The following
corrections have to be made:
correction 0.003 Heterogeneity correction (as given in the ANL intercomparison) 0. 014 KFK 26-10 to experiment (as given in the ANL intercomparison) 0. 011
Thus, on the basis of the ANL intercomparison we obtain with the SNEAK set
k ^ (SNEAK) = 0.991 •
Some spectral indices are shown in Table III. Again, as in the case of SNEAK 3A-1, the agreement is not too good. A more precise calculation for the real geometry of ZPRIII/48 with redetermined heterogeneity corrections is under way.
3.4. Results for large fast power breeders
For completeness some calculations have been done with the SNEAK set for a steam-cooled large power reactor, the Karlsruhe Dl design [12], A separate group set for the Karlsruhe prototype Na2 with sodium as a coolant was established with the appropriate core weighting spectrum and an additional blanket weighting spectrum. This set is named KFK-NAP [13]. The most important feature is an expected reduction in keff by about 2-3% for both types compared to results obtained with KFK 26-10. This means a difference in keff by about 6% compared to ABN calculations. For the steam-cooled reactor both coolant loss reactivity change Akj, and the absolute value of the steam density coefficient are increased remarkably, changing the stability characteristics of this reactor for the worse. These investigations are not yet complete.
TABLE III. SPECTRAL INDICES IN THE CENTRE OF ZPRIII/48
Of(U238)
of(U235)
oc(U238)
o f(U235)
of(Pu239)
o f(U235)
Experiment
0.0307
0.138
0.976
SNEAK
SET
0.0301
0.145
0 .91
KFK 26-10
0.031
0.131
0.938
ABN
0.0328
0.130
0.958

186 KUSTERS et al.
4. CONCLUSION
The comparison of the theoretical results, obtained with the new group constant set KFK-SNEAK, with the measured results for the fast critical assembly SNEAK 3A-1 show a remarkable and encouraging step forward in the field of fast reactor calculation. Compared to the previous KFK 26-10 set, the main reasons for the better agreement of experiment and theory are the low fission and capture data of 235U included in the SNEAK set and an improved description of elastic moderation (method B). The remaining differences have to be analysed very carefully to get an idea of what has to be improved in microscopic cross-section evaluation and in the methods of establishing macroscopic self-shielding group constants. On the theoretical side, for instance, we are dealing with the problem of space-dependent resonance self-shielding (core-blanket interface), and in the near future we will have a code in consistent PI approximation for 200 groups, so that the investigation of the space-dependent fine structure of the spectrum will, it is hoped, give further insight into the complex situation of fast reactor analysis.
A C K N O W L E D G E M E N T
We are very grateful to Dr. D. Stegemann for giving us continuous access to experimental results.
REFERENCES
[1] bONDARENKO, I . I . et a l . , Gruppenkonstanten schneller und intermedi3rer Neutronen fllr die Berechnung von Kernreaktoren, KFK-tr-144.
[2] SCHMIDT, J .J . , Neutron Cross-sections for Fast Reactor Materials, KFK 120, Parts I and II. [3] KUSTERS, H., METZENROTH, M., The Influence of some Important Group Constants on
Integral Fast Reactor Quantities, ANL 7120 (1965) 432. [4] SCHMIDT, J .J . , Neutron Cross-sections for Fast Reactor Materials, KFK 120, part I. [5] STEGEMANN, D. et a l . , Physics investigations of a 670-& steam-cooled fast reactor system in
SNEAK, assembly 3A-1, KFK 672, these Proceedings, SM-lOlAl. ' [6] HAKANSON, R., 26-group Cross-sections for the Fission Products in a Fast Reactor, internal
KFK Rep. [7] YIFTAH, S. et a l . , Basic nuclear data for the higher plutonium isotopes, these Proceedings,
SM-101/Sl. [8] PONITZ, W., MENLOVE, H.O. , Absolute radiative capture cross-sections for fast neutrons
in238U, submitted for publication to Nucl. Sci. Engng. [9] WINTZER, D. , Heterogeneity calculations including space-dependent resonance self-shielding,
these Proceedings, SM 101/13. [10] BECKURTS, K.H. , private communication. [11] LIEBER, K., METZENROTH, M., Contribution to the intercomparison on ZPRIII/48, Conf. Fast
Critical Experiments and their Analysis, Argonne, 1966. [12] KIEFHABER, E., Reactivity coefficients of steam-cooled fast breeders, KFK 629, these Proceedings,
SM 101A5. [13] BACHMANN, H., METZENROTH, M., SCHROETER, K.E. , WOLL, D. , Der KFK-NAP
Gruppenkonstantensatz, Erstellung und Ergebnisse, to be published.

SM-101/12 187
DISCUSSION
M. SEGEV: In defining atr you assumed a weak dependence of the current on the energy. Is this a valid assumption throughout the range of resonant cross-sections?
H.W. KUSTERS: We redefined the transport cross-section for hydrogen only, and included the neutron current in a first iteration step, but this gave no further improvement. In order, inter alia, to eliminate simplifying assumptions, we decided to maintain a consistent Pj approach in multi-group (200) as well as in fewer-group calculations. In fact, it is not the current itself which is a weakly dependent function of the energy in the resonance region, but E2 J. Having once defined the corresponding group constants, one could clearly apply this to resonant cross-sections as well.
H. F . TROYANOV: Was a correction made for the form of the intra-group spectrum in the first KFK set of group constants? In the system of constants used by Bondarenko et al. this is allowed for by making successively more precise determinations of the spectrum.
H.W. KUSTERS: As I mention in the Introduction, in calculating the group constants we used as a weighting spectrum a collision density spectrum with roughly 200 energy points, obtained by smoothing out the spectrum calculated for the SNEAK composition with our first KFK group set. This KFK set has a typical weighting spectrum for a 1000 MW(e) sodium-cooled reactor. We also iterated the SNEAK weighting spectrum sets but this gave no further improvement. With regard to elastic moderation, it was not the weighting spectrum alone which worried us, but rather the aQ concept, which we therefore abandoned in favour of calculating the elastic slowing-down.
H.F . TROYANOV: Do you propose to make a detailed determination of the structure of the spectrum to obtain the cross-section of elastic transfer from one group to the next each time you do the reactor calculation?
H.W. KUSTERS: In each reactor calculation we calculated the elastic removal cross-section for 1000 energy points directly form the KEDAK file using the fine-structure weighting l/E t(E), according to the narrow resonance approximation. The macroscopic F(E) weighting, which is a smoothly varying function of energy and composition, is changed only to allow for calculation of quite different systems, such as steam- or sodium-cooled reactors, or special fast facilities, e.g. STARK, SUAK or SNEAK.
Closing remarks by Session Chairman
S. YIFTAH (Chairman): We have devoted this session to the discussion of various measured, calculated, evaluated and multigroup cross-sections, so before we end I should like to draw attention to cross-sections which we have not considered. I have in mind the potential importance of investigating the cross-sections and nuclear data of other less-common heavy nuclides, such as 232U, the plutonium isotopes 236pu and238Pu, and certain isotopes of americium, curium and californium.

188 KUSTERS et al.
T A B L E A. ANNUAL PRODUCTION O F ACTINIDE ISOTOPES
Fission
236u ( i n :
237 Np
238 p u
239 Pu
2 4 0 ^
241pu
241 Am
242 ^
M2Cm
243 Am
w C m
products
!35U and 238U)
US (tonnes/yr)
160
22
2 .3
0.6
40
13
6.7
0.9
1.5
0 .03
0.6
0 .1
World (tonnes/yr)
430
60
6.3
1.6
110
36
18
2 .5
4 . 1
0.08
1.7
0 .3
As r e g a r d s the nuclear data r equ i r emen t s of the nuclear power industry , emphas is may well shift to new fields, at l eas t in the United States of Amer i ca . Whereas up ti l l now efforts have been largely directed towards study of c r o s s - s e c t i o n s for analysis and optimization of reac tor design, safety and init ial r e a c t o r operat ion, it seems that present t rends look towards the nuclear data needs of power r e a c t o r s operating for a re la t ive ly long t ime and producing la rge quantit ies of isotopic by-products from spent and recycled fuel. In this connection, problems of fuel burn-up, prolonged exposure of sensi t ive components to neutron radiation and so on will be of p r ime impor tance . A full and detailed knowledge of the nuclear c ha r a c t e r i s t i c s of all the nuclei p resent in a r eac to r at all t imes will enable it to be operated with g r e a t e r rel iabi l i ty, at higher powers , to higher bu rn -ups , and with optimized isotope production.
According to an es t imate by Snyder 1 , the annual production of the actinide isotopes in 1987 will be as shown in Table A.
C r o s s - s e c t i o n s of such isotopes as 2 3 6Pu, half-life 2. 85 y r , which is formed from 238U after two (n, 2n) react ions or from 235U after two (n,T) and one (n, 2n) reac t ion (in both cases via 2 3 7Np), may assume great impor tance . 236Pu i s , in fact, at the head of a ser ious contamination chain, the 236pu-> 232U-> 2 2 8 Th chain, in which all member s following 1. 91-yr 228 Th a r e shor t - l ived i so topes , including many powerful gamma emi t t e r s .
F u r t h e r m o r e , the use of s t rongly a lpha-act ive 238Pu and 244Cm in isotopic power sources for space and other applications calls for detailed nuclear data on thei r formation and fission p roper t i e s . This type of information is also needed for detailed burn-up calculations and will inevitably contribute to a genera l knowledge and understanding of the act inides and thei r fission p r o c e s s e s .
1 SNYDER, T.M., CONF-660303, Book 2, Washington D. C. (Mar. 1966) 1034.

MODELE CONTINU POUR LE RALENTISSEMENT INELASTIQUE DES NEUTRONS RAPIDES
M. CADILHAC FACULTE DES SCIENCES DE MARSEILLE,
ET MARTINE PUJOL CEA, CENTRE D'ETUDES NUCLEAIRES DE SACLAY,
FRANCE
Abstract — R6sum£
CONTINUOUS MODEL FOR THE INELASTIC SLOWING^DOWN OF FAST NEUTRONS. Following up the preliminary studies on the approximate operator for inelastic scattering, presented at the Karlsruhe symposium in June 1966 organized by the European Atomic Energy Society, the authors study its application to treatment of the inelastic slowing-down of 239Pu, either alone or associated with the elastic slowing-down of oxygen. 239Pu and oxygen are represented by their detailed microscopic cross-sections. For pure 239 Pu, the errors introduced by using the continuous model are assessed from some significant parameters (direct spectra, slowing-down density, keff, etc.) and compared with the errors caused by transition to the classic multigroup convention. For the Pu/0 2 mixture, the authors study the validity of a joint model for the inelastic scattering of 239Pu and the elastic scattering of oxygen in the inelastic slowing-down range. In the same range, they check the conservation of the fine structure of the flux produced by oxygen scatter resonances.
MODELE CONTINU POUR LE RALENTISSEMENT INELASTIQUE DES NEUTRONS RAPIDES. A la suite des etudes preliminaires sur l'operateur approche de diffusion inelastique, presentees a Karlsruhe lors du colloque de juin 1966 organise par la Societe europeenne d'energie atomique, les auteurs ont etudie son application au traitement du ralentissement inelastique du 239Pu, soit seul, soit associe au ralentissement elastique de l'oxygene. Le 239Pu et l'oxygene sont represented par leurs sections efficaces microscopiques detaillees. Pour le 239Pu pur, on a evalue sur certaines grandeurs significatives (spectres directs, densite de ralentissement, keff, e tc .) les erreurs introduces par l'utilisation du modele continu et on les a com-parees aux erreurs introduces par le passage au formalisme multigroupe classique. Pour le melange Pu-0 2 , on a etudie la validite d'un modele commun de diffusion inelastique du 239Pu et de diffusion elastique de l'oxygene dans le domaine de ralentissement inelastique. Dans ce meme domaine, on a verifie la conservation de la structure fine du flux provoquee par les resonances de diffusion de l'oxygene.
INTRODUCTION
Les calculs des milieux a neutrons rapides sont en general tr ibu-taires de la formulation multigroupe, principalement a. cause de la s t ructure complexe de l 'operateur exprimant la diffusion inelastique. Cette methode a 1' inconvenient de dissimuler les faits physiques preponderants sous une masse de donnees numeriques.
C'est pourquoi nous avons propose [1] un modele simplifie permettant de trai ter l 'energie commeune variable continue et susceptible done de conduire a une meilleure comprehension des milieux multiplicateurs a neutrons rapides. Nous avons consider! des milieux homogenes ou la dependance vis-a-vis de l 'espace est representee par un mode fonda-mental (laplacien), mais le modele propose pourrait etre etendu au t ra i tement de problemes plus complexes.
189

190 CADILHAC et PUJOL
1. ETUDE DU MODELE CHOISI POUR LA DIFFUSION INELASTIQUE
Considérons le bilan neutronique dans un mil ieu infini avec une dis t r ibut ion homogène de s o u r c e s :
/ P ( E ' - E) ES(E» ) Ф(Е» ) dE» - Et (E) Ф(Е) +S(E) = 0 E
P ( E ' -*• E) r e p r é s e n t e la probabi l i té é l émen ta i r e de t r ans i t ion . Le modèle est défini p a r un noyau synthétique de la fo rme :
P ( E » - E ) = f ( E ' ) g ( E ) s i E ' ^ E
= 0 si E ' < E (1)
Pour obtenir ces fonctions nous avons imposé les deux conditions su ivan tes :
1) conservat ion de la sect ion to ta le de diffusion iné las t ique :
E' E'
/ P(E» -• E) dE = f(E« ) / g ( E ) dE = 1 (2)
о о
2) égali té de 1' action des o p é r a t e u r s exact et approché su r un ce r t a in s p e c t r e de ré fé rence Фо(Е):
/ P ( E ' - > E ) E s ( E ' ) 3 > 0 ( E ' ) d E ' = / P ( E ' - * E ) E s ( E ' ) í > 0 ( E ' ) d E ' = p ( E ) (3)
E E
P a r suite de la normal i sa t ion (2), on a r r i v e à c a r a c t é r i s e r un corps par une seule fonction de l ' é n e r g i e , soit h(E) = l / f (E) , te l le que:
Р , Е . . Е , , Ь ! Щ , 4 ,
h(E) es t une fonction posi t ive , par tan t de la va leur 0 pour E = 0 et c ro i s san t avec l ' é n e r g i e .
L ' e x p r e s s i o n analytique de h(E) obtenue par l e s équations (2) et (3) e s t :
avec
u)(E')= Е5(Е')Ф0(Е«) (5)
h(E) = C . e x p f P ( E " > d E " (6) E / [ u ( E ' ) - p ( E ' ) ] d E «
E"
h(E) es t définie à une constante mult ipl icat ive p r è s , h(oo) es t donc fixée a r b i t r a i r e m e n t .

SM-101/55 191
Pour obtenir une fonction continue de l1 éne rg ie , il e s t n é c e s s a i r e de posséde r des sect ions efficaces et des probabi l i tés de t r an s f e r t pour toute va leur de l ' é n e r g i e . Actuel lement , l e s conna i ssances disponibles sont des va l eu r s numér iques p r i s e s par l e s quant i tés c i - d e s s u s , en un nombre d i s c r e t N d ' é n e r g i e s données . (Nous avons employé l es sec t ions efficaces mic roscop iques et l e s probabi l i tés de t r an s f e r t ang la i ses [2, 3] . )
Nous devons donc t r a n s p o s e r l e s équations continues pour obtenir un nouveau fo rma l i sme ut i l i sable à p a r t i r d ' un nombre fini de données n u m é r i q u e s .
Les données consis tent en: 1) une échel le d ' é n e r g i e s de dépar t , so i t Ej une de ces é n e r g i e s , 2) la va leur numér ique de la sect ion efficace inélas t ique pour chacune
de ces é n e r g i e s , soit <7j = a ( E j ) , 3) la va leu r numér ique (calculée à pa r t i r des données) de la p roba
bili té de t r an s f e r t d ' une énerg ie Ej de dépar t à une énerg ie E ¡ d ' a r r i v é e , soit
De p lus , soit cpj =Oo(Ej ) la va leu r numér ique p r i s e p a r le flux d' a jus tement à 1' énerg ie E ,•.
Soit Mj le coefficient d ' i n t ég ra t ion à l ' é n e r g i e Ej appa ra i s san t dans 1 ' express ion numér ique des i n t é g r a l e s .
Nous nous s o m m e s fixé une échel le d ' é n e r g i e s d ' a r r i v é e identique à l ' é c h e l l e donnée d ' é n e r g i e s de dépar t et, dans ce nouveau f o r m a l i s m e , p(E) es t donc calculé pour chaque énergie de l ' é c h e l l e , soit pj = p(Ej).
La probabi l i té approchée qui, en continu, s ' é c r i v a i t :
P ( E ' - E ) = f ( E ' ) g ( E )
devient
P i E j - E ^ P j . - f j g i
P. . = f, g. s 'ob t ien t p a r la résolu t ion du sys tème suivant :
¿ Mifjgi =
I ^ J
14 14
¿ M j fj gi^j <Pj = ¿ Mj Pj.i Oj <Pi = Pj
(7)
(8) j = i j = i
Pour des commodi tés de calcul , on introduit là fonction h j = l / f i ; la re la t ion (7) donnant a lo r s Migi = hj - h j - i , l e s h¡ sont obtenus pa r r é -
La conservation des neutrons doit être respectée; ces coefficients sont donc définis par la relation: E fiiPj,i = l .
i s j

192 CADILHAC et PUJOL
hi =h I + i - Pi+iMi + i A ^ ^ц/Щ) • E n Posant hN = 1 et
Wj = Gj <pj, P j f i s ' é c r i t :
c u r r e n c e avec j >i +1
Б - h i ~ h i - l P i . i " fi.h.
On re t rouve bien l1 équivalence dans le nouveau fo rma l i sme adopté .de l ' e x p r e s s i o n théor ique P(E'->E) = h ' ( E ) / h ( E ' ) .
Les é léments indiqués c i - d e s s u s nous pe rmet ten t d' effectuer à p a r t i r des données mic roscop iques , soit un calcul «exact», qui s e r v i r a de r é f é r e n c e , avec l es R ¡ , soit un calcul approché avec l es P j f i .
2. COMPARAISON AVEC LE FORMALISME MULTIGROUPE CLASSIQUE
Les calculs actuels de neutronique se font à l ' a i d e du fo rma l i sme mult igroupe; l e s sect ions mul t igroupes s 'obt iennent en effectuant des moyennes su r des sect ions microscop iques dé ta i l l ées .
Nous avons fait un calcul exact avec des données microscop iques ; nous allons maintenant c r é e r à p a r t i r de ces données un fo rma l i sme mult igroupe et c o m p a r e r , p a r r appor t aux r é su l t a t s exacts obtenus avec l e s sect ions microscopiques , l e s e r r e u r s introduites par l ' u t i l i s a t ion du fo rma l i sme mult igroupe à ce l les int rodui tes par l ' u t i l i s a t ion du modèle .
Pour que 1' ensemble des études soit cohérent , il faut conse rve r pour la c réa t ion des données mul t ig roupes :
1) le flux d ' a jus tement u t i l i sé pour la fabrication du modèle , 2) l e s coefficients d' in tégrat ion jUj . Les données mul t igroupes dans le groupe [i] s 'obt iennent a lo r s par
l e s équations su ivantes :
i,., : flux d ' a jus t emen t pour le groupe [i]
* ° [ i ] = / ^ ( E , ) d E ' = Z *i<pi
[ i ] : [ i ]
£[.•,: section efficace pour le g roupe [i]
^ а ( Е ' ) Ф 0 ( Е ' ^ Е ' Y ^ с т 1 ?i _ Ш 1 E [ 1 ]
/ Ф0(Е')(1Е'
[i] t e [ i ] I^i
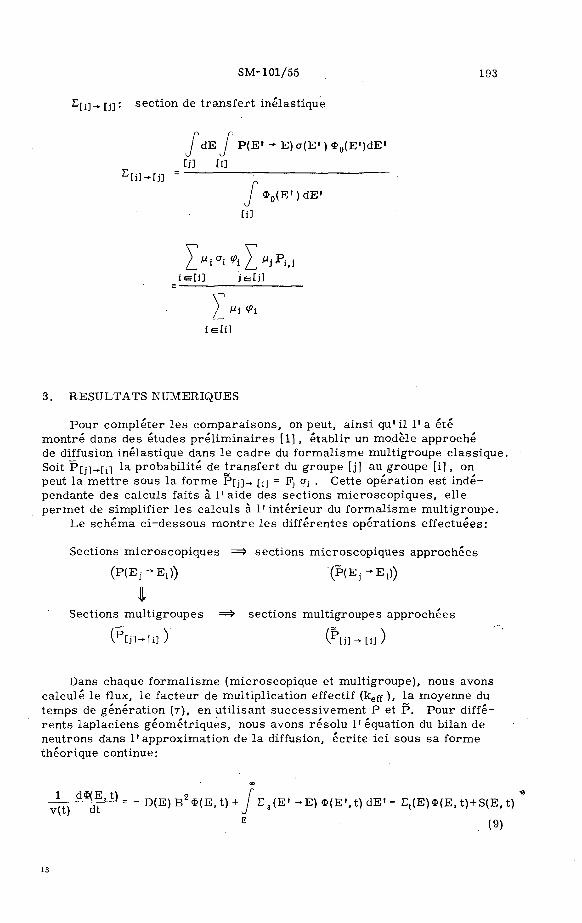
SM-101/55 193
^[i]-»-[j]: sect ion de t r ans fe r t inélas t ique
Е Ш - Ш
/ dE / Р(Е» - Е )а (Е ' )Ф 0 (Е»^Е» [j] [i]
/ $ 0 (E ' )dE» [i]
X^i a i^iIMJp iJ i e f i ] JeU]
¿ i i i e t i ]
3. RESULTATS NUMERIQUES
Pour complé te r l e s compara i sons , on peut, a ins i q u ' i l l ' a été mont ré dans des études p r é l i m i n a i r e s [1] > é tabl i r un modèle approché de diffusion inélas t ique dans le cad re du fo rma l i sme mul t igroupe c la s s ique . Soit P[j]->[i] la probabi l i té de t r a n s f e r t du groupe [j] au groupe [ i ] , on peut l a m e t t r e sous la forme P[j]-> [i] = Fj a¿ . Cette opéra t ion es t i ndé pendante des calculs faits à l ' a i d e des sect ions mic roscop iques , el le p e r m e t de s impli f ier l e s calculs à l ' i n t é r i e u r du fo rma l i sme mul t igroupe .
Le schéma c i -de s sous mon t re l e s différentes opéra t ions effectuées:
Sections mic roscop iques = ^ sec t ions mic roscop iques approchées
( P Í E J - E Í ) ) - ( P Í E j - E , ) )
I Sections mul t igroupe s =^> sect ions mult igroupe s approchées
Dans chaque fo rma l i sme (microscopique et mul t igroupe) , nous avons calculé le flux, le facteur de mult ipl icat ion effectif (keff ), l a moyenne du t emps de généra t ion (т), en ut i l i sant success ivement P et P . Pour différ e n t s lap lac iens géomé t r i ques , nous avons r é so lu l ' équa t ion du bilan de neutrons dans l ' app rox ima t ion de la diffusion, éc r i t e ici sous sa forme théor ique continue:
— d $ ( E , t ) " - D ( E ) B ^ ( E , t ) + / ES(E« - E ) $ ( E ' , t ) d E ' - Е{(Е)Ф(Е, t) + S(E, t) v(t) dt
E (9)

194 CADILHAC et PUJOL
h(E)
0.4 •
E (MeV)
FIG.l . Valeur de h(E).
11
150O-
1000--
5 0 0 -
100-•
0,5 1 1,5
FIG.2. Ajustement sur fission: erreurs relatives sur kc(Pu).

SM-101/55 195
Si 1* on prend comme source S(E, t) = x(E) ó(t), x(E) étant le î'lux de fission, keff et T sont obtenus par l e s in tégra les [1]
keff = J v(E)Ef (E) dE J Ф (E, t) dt о о
(10) OO 0 0
T = / v (E)Ef (E) dE / t Ф(Е, t) dt о о
Ces équations doivent ê t r e t r a n s p o s é e s dans l e s deux f o r m a l i s m e s et ca lcu lées chaque fois avec l e s probabi l i tés de t r a n s f e r t exac tes et a p p r o c h é e s .
Les r é s u l t a t s numér iques obtenus pour un bloc de plutonium pur sont exposés sous forme de f igures .
3 . 1 . Ajustement su r le flux de fission
La figure 1 donne la courbe h(E) interpolée pa r r appor t aux points d i s c r e t s h j .
Dans l es deux f igures suivantes (fig. 2 et 3), on a calculé les va l eu r s de keff et de т pour différents laplaciens géomé t r iques :
B 2 (m-2) = 0 , 3 0 ,25 0,2 0 ,15 0 ,1 0 ,05
keff =0 ,34306 0,40051 0,48119 0,60287 0,80785 1,22920
108 T (sec) = 0, 20929 0,23891 0,27868 0,33517 0,42255 0,57929
Soient
k c et тс l e s va l eu r s de keff et de т ca lculées d i rec tement à p a r t i r des données mic roscop iques ,
kc et т с l e s va l eu r s de keff et de т ca lculées p a r le modèle à p a r t i r des
m ê m e s données,
km et r m l e s va l eu r s de keff et de т en mul t igroupe,
Цп et r m l es va l eu r s de k e f f et de т en mult igroupe approché p a r le modè le .
On a (fig. 2):
Дк с _ k g - k ç kc
дк т с k c
Акт
kc
_ k m - . kc k c
_ Д к т с km • - k m

196 CADILHAC et PUJOL
0,1 0,2 op o,4 Q5 qe o,7 Zc 10-
FIG. 3. Ajustement sur fission: erreurs relatives sur T (PU).
$IE) X (E) A
0,01
E(MeV)
FIG. 4. Ajustement sur flux de fission: flux directs exact et approche (Pu).
X(E) flux de fission
*(E) *(E).

SM-101/55 197
FIG.5. Ajustement sur flux exact, В2 = 0,1 m"2: erreur relative sur kc(Pu).
et (f ig.3).
Д Т ( Тс " T e
Д т me _ 'm
Атг A T , Tm Tm
La figure 4 donne l e s courbes Ф(Е), flux exact c a r a c t é r i s t i q u e du mil ieu pour B2 = 0, 1 m" 2 , Ф(Е), flux approché c a r a c t é r i s t i q u e du mil ieu pour B 2 = 0 , 1 m"2 et x (E) , flux de f iss ion.
3 . 2 . Ajustement su r flux c a r a c t é r i s t i q u e du mil ieu obtenu pour В 2 = 0 Л m"2
Ce flux est ca lculé d i rec tement avec (9) a p a r t i r des données m i c r o s copiques . Les ca lculs suivants sont faits pa r la méthode «continue» p r o posée (fig. 5 et 6): Д к с / к с = (Rc - k c ) / k c ; Дт с / т с = (тс - т с ) / т с .
On a calculé l e s flux exact et approché c a r a c t é r i s t i q u e s du mil ieu pour l e s différents lap lac iens et r e p r é s e n t é l e s e r r e u r s r e l a t i ve s sur l e s flux exacts pour B 2 = 0, 05, 0, 15, 0, 20 m" 2 .
Pour B 2 = 0 ,1 , ДФ(Е)/Ф(Е) = 0 puisque 1' a justement est fait su r ce flux m ê m e . La figure 7 donne l es courbes ДФ(Е)/Ф(Е) = (ф(Е) - Ф(Е))/Ф(Е) pour В 2 = 0 ,05 , 0 ,15 et 0 ,20 m"" ,-2

198 CADILHAC et PUJOL
600--
5 0 0 -
400
300--
200
100
w 0,1 0,2 0,3 0,4 0,5 0,6 g tf
FIG.6. Ajustement sur flux exact, В2 = 0,1 nr 2 : erreur relative sur т (Pu).
*• В --0,05m-
E(MeV)
FIG. 7. Erreurs relatives sur les flux directs (Pu).
4. MELANGE Ри-Ог
Nous savons que, pour des noyaux lourds, la diffusion élastique peut être représentée de manière satisfaisante par un modèle factorisé [4]. Nous allons voir, dans le domaine d' énergies supérieures à 10 keV où le ralentissement inélastique est associé au ralentissement élastique, si un

SM-101/55 199
•T? 10_S
300 •
200-
100
0,5 15 kf
FIG. 8. Ajustement sur x(E) et constante: erreur relative sur k (Pu-O).
$(EJ . X (E)
E(MeV)
FIG. 9. Ajustement sur flux de fission: flux directs exact et approche (Pu-02).
flux de fission *(E)
*(E).

200 CADILHAC et PUJOL
0 0 5 1 kc
FIG. 10. Ajustement sur flux exact, B2 = 0,05 m"2: erreur relative surk c(Pu-02) .
A<£(E)j
<t> ' 30 •
2 0 •
1 0 -
-10 •
- 20 .
. 3 0 •
JO"1
,
N 4
^y
i i
'"!! J!
1 v\ 1
V ¥
J i ! I W \ 1/
«. .r\.. <?
0,01 0,1 1 10
E (MeV)
FIG. 11. Ajustement sur flux exact: erreurs relatives sur les flux directs (Pu-02).
-X—*— B 2 = 0 , 0 5 m " B2= 0,07 m"
— B2 = 0,08 m" B2= 0 ,10m"

SM-101/55 201
modele unique permet une bonne représentation de l'ensemble des phénomènes de diffusion. Le ralentissement élastique engendré par le plutonium est négligeable par rapport à son ralentissement inélastique, nous étudions donc un modèle représentant la diffusion inélastique du plutonium et la diffusion élastique de l'oxygène.
Nous adoptons: 1) une échelle d' énergies commune aux deux corps; les résultats
numériques portant sur des bilans neutroniques, nous avons pu lisser les courbes représentant les résonances de l'oxygène et conserver 1' échelle moins détaillée du plutonium;
2)' le formalisme employé pour le plutonium seul; nous utilisons des notations équivalentes à celles qui ont été définies précédemment, les indices supplémentaires e correspondant à la diffusion élastique (par ex. crei) et i correspondant à la diffusion inélastique (par ex. aj.).
Pj i = fjëi e s t solution du système
N
^ j f j g i ^ e j + a i j ]<Pj
j = i
En résolvant 1' équation du bilan neutronique écrite pour le mélange PU-O2 et transposée dans le nouveau formalisme, nous avons calculé le flux et le facteur de multiplication effectif (keff ).
Le ralentissement est, dans 1' équation, successivement représenté par:
1) les matrices exactes:
N
I»i<Ve j . 1+ < " i
P ' i . I "'i
2) la matrice approchée:
N
j = i
Les calculs sont effectués avec les données microscopiques; nous n'avons pas fait le calcul des sections multigroupes correspondantes.
Les keff et les flux ont été calculés pour différentes valeurs du laplacien:
B2 (m-2) 0,05 0,07 0,08 0,10 0,12 0,15
keff 0,91772 0,72684 0,65840 0,55411 0,47843 0,39719
M i S i = 1
i=£J
(H )

202
£|E1
0.09
0.08
0.07
0.06
0,05.
0.04-
0.03-
0.02-
0.01.
0.01 6^ 1 i5 •""
E (MeV)
FIG. 12. Ajustement sur flux de fission: flux directs exact et approche (O).
*(E) *(E)
4 . 1 . Ajustement sur flux de fission pour E a 1 MeV et constante pour E < 1 MeV
La figure 8 donne A k c / k c = ( k c - k c ) / k c avec l es m e m e s notations que p recedemmen t . La figure 9 donne $(E) (flux exact c a r a c t e r i s t i q u e du mil ieu pour B 2 =0 ,05 m" 2) , <i?(E) (flux approche ca rac t e r i s t i que du mil ieu pour B 2 =0 ,05 m"2) et x(E) (flux d ' a jus t emen t ) .
4 . 2 . Ajustement sur flux ca r ac t e r i s t i que du milieu pour B 2 =0 ,05 m"2
La figure 10 donne A k c / k c = (Kc - k c ) / k c et la figure 11 la r e p r e s e n tation des e r r e u r s r e l a t ives obtenues su r le flux exact pour differents l ap lac iens : A $ ( E ) / $ ( E ) = ($(E) - * (E) ) /$ (E) pour B 2 = 0, 07, 0,08 et 0 , 1 m ' 2 , et A $ ( E ) / $ ( E ) = 0 pour B2 =0 ,05 m" 2 .
5. DIFFUSION ELASTIQUE
Dans un melange PU-O2, pour des energ ies e levees appara i t une s t ruc tu re fine du flux provoquee par les r e sonances de diffusion de 1' oxy-gene .
P renan t s implement de l ' oxygene en p re sence d 'un corps d ' abso rp t ion constante , nous avons calcule le flux ca rac t e r i s t i que de ce mil ieu en employant success ivement l e s probabi l i tes de t r ans fe r t exacte et a p p r o -chee de l ' oxygene . {P- . " (h j — hi_1)/A<i hj , h{ calcule pa r la methode indiquee pour le plutonium en prenant comme flux de r e fe rence le flux de f i ss ion . )
CADILHAC et PUJOL

SM-101/55 203
Nous avons pu vérifier une conservation satisfaisante de cette s t ructure fine. Le flux exact (Ф(Е)) et le flux approché (Ф(Е)) en milieu infini sont reproduits à la figure 12.
CONCLUSIONS - ACTIVITES FUTURES
Les résultats obtenus montrent que le modèle étudié peut constituer un outil commode pour 1' étude de nombreux problèmes où une connaissance détaillée du spectre de neutrons est nécessaire.
Parmi les applications intéressantes que nous envisageons maintenant nous citerons: - Etude de bilan de neutrons en milieu infini, comparaison de milieux
235U et Pu, comparaison avec des calculs classiques (multigroupes et Elmoe) sur des compositions représentatives des milieux «Phénix»;
- Etude de la dépendance spatiale de la structure fine énergétique du spectre: milieux hétérogènes, problèmes d'interface;
- Etude de problèmes multizones, soit directement, soit par utilisation conjointe du modèle continu et du formalisme multigroupe classique.
REFERENCES
[1] CADILHAC, M. , PUJOL, M. , A simple model for the inelastic scattering of fast neutrons, J. Nucl. Energy 21 1 (1967) 58; «Modèle simple pour la diffusion inélastique des neutrons rapides^ Colloque SEEA, Karlsruhe, juin 1966.
[2] PARKER, К. , Aldermaston Nuclear Data Library, AWRE, Report No. 070/63 (May 1963). [3] BARRINGTON, E.P. , POPE, A.L . , STORY, J . S . , Winfrith Nuclear Data Library (May 1963). [4] DRESNER, L., Resonance Absorption in Nuclear Reactors, Pergamon Press, London, New York, Paris
(1960).
DISCUSSION
T.D. BEYNON: This is a very interesting technique. Looking at the physics of it, one is reminded of the Weisskopf evaporation formula for inelastic scattering, where the inelastic kernel is regarded as degenerate. It is well known that the evaporation model gives quite good results for heavy-mass isotopes, where there is a dense target structure, but for light isotopes the kernel is, of course, not so good. Have you tried out your method on slowing down in a medium moderator like iron?
M. PUJOL: No, we have only done calculations for plutonium and plutonium oxide.
T.D. BEYNON: Referring to the evaporation model once more, I suspect that, in fact, you are finding effective evaporation temperatures by using what you call a reference spectrum. I would hazard a guess that the method described in your paper would not be so effective for an isotope of medium mass.


IMPRECISIONS DES PARAMETRES CARACTERISTIQUES D'UN REACTEUR RAPIDE DÉ PUISSANCE DUES AUX INCERTITUDES ACTUELLES CONCERNANT LES DONNEES NEUTRONIQUES Leur évaluation, et leur diminution à pa r t i r des expér iences cr i t iques
J. Y. BARRE ET J. RAVIER
CEA, CENTRE D'ETUDES NUCLEAIRES DE CADARACHE,
FRANCE
Abstract — Résumé
INACCURACIES IN THE CHARACTERISTIC PARAMETERS OF A FAST TOWER REACTOR DUE TO THE PREVAILING UNCERTAINTIES IN THE BASIC NEUTRON DATA: THEIR EVALUATION AND THE EXTENT TO WHICH THEY CAN BE REDUCED BY CRITICAL EXPERIMENTS. The authors first determined the inaccuracies in the characteristic parameters of a fast, reactor due to uncertainties in the basic neutron data, using a generalized perturbation method. The magnitude of these uncertainties then led them, as a second step, to use the results of critical experiments to improve the accuracy of the calculated forecasts and thereby possibly improve the cross-sections themselves.
The first method, described by Baker, simply provides an empirical formula for correcting the calculated critical mass and has been directly applied to the Cadarache data. By the second method (the BARRAKA code) one obtains a set of corrections to the cross-sections considered to be of major importance, after making adjustments as between the experimental values and those calculated from the Cadarache data for several parameters measured in a large number of critical fast assemblies.
IMPRECISIONS DES PARAMETRES CARACTERISTIQUES D'UN REACTEUR RAPIDE DE PUISSANCE DUES AUX INCERTITUDES ACTUELLES CONCERNANT LES DONNEES NEUTRONIQUES: LEUR EVALUATION, ET LEUR DIMINUTION A PARTIR DES EXPERIENCES CRITIQUES. Dans une première étape, les auteurs ont déterminé les imprécisions des paramètres caractéristiques d'un réacteur rapide dues aux incertitudes concernant les données neutroniques de base à l 'aide d'une méthode de perturbation généralisée. L'importance de ces imprécisions les a conduits, dans une seconde étape, à utiliser les résultats des expériences critiques pour améliorer la précision des prévisions par calcul et éventuellement les sections efficaces elles-mêmes.
La première méthode (celle de Baker) fournit simplement une formule empirique pour corriger la masse critique calculée et a été directement appliquée au formulaire Cadarache. La seconde méthode (code BARRAKA) donne au contraire un ensemble de corrections pour les sections efficaces jugées prépondérantes après ajustement entre les valeurs expérimentales et celles calculées par le formulaire Cadarache de plusieurs paramètres mesurés dans un grand nombre d'assemblages rapides critiques.
INTRODUCTION
Le premier but de cette étude est de déterminer l'influence des incertitudes actuelles concernant les données neutroniques de base sur les paramètres caractéristiques (masse critique, taux de surgénération, temps de vie . . . ) d'un grand réacteur rapide de puissance.
En utilisant la méthode de perturbation généralisée décrite par Usachev [1-3],.nous avons pu localiser parmi l'ensemble des sections efficaces les sources d 'erreurs les plus importantes et estimer une erreur globale maximale par élément pour chaque paramètre (par exemple ± 4% pour la réactivité due au 239Pu).
205

206 BARRE et RAVIER
En plus de leur in térê t p rop re , ces r é su l t a t s nous pe rmet ten t de formuler pour les expér imen ta teu r s un ensemble cohérent de demandes de m e s u r e , avec les p réc i s ions souhai tées et les degrés d 'urgence .
Les impréc i s ions impor tan tes cons ta tées su r les p a r a m è t r e s ca r ac t é r i s t i ques nous ont conduits à e s s a y e r de ten i r compte des r é su l t a t s des expér iences c r i t iques pour a m é l i o r e r la p réc i s ion des p rév is ions p a r calcul et éventuel lement a m é l i o r e r les sect ions efficaces e l l e s - m ê m e s . Dans ce but, deux méthodes sont envisagées :
La méthode décr i t e pa r Baker [4] fournit une formule empir ique fonction de la composit ion pe rmet tan t de c o r r i g e r la m a s s e cr i t ique calculée p a r un jeu de constantes donné. Les coefficients de r é g r e s s i o n qui i n t e r viennent dans cette formule sont c a r ac t é r i s t i ques du jeu et dé t e rminés p a r ajustement par moindres c a r r é s en t re les va l eu r s ca lcu lées par le jeu et m e s u r é e s du coefficient de mult ipl icat ion d'un grand nombre d 'expér iences c r i t iques . Cette méthode a s implement été p r o g r a m m é e dans le code BARBAK et appliquée au «jeu C a d a r a c h e » [5] su r 34 a s semblages . Nous es t imons avoir réduit l ' é ca r t - t ype sur la réac t iv i té de 1,6% a 0,3%.
Une seconde méthode (code BARRAKA) consis te à a jus ter les sect ions efficaces de façon à obtenir le mei l l eur accord en t re tous les p a r a m è t r e s ca lcu lés p a r un jeu donné et m e s u r é s dans les expér iences c r i t i ques . Des r e c h e r c h e s dans cet te direct ion ont déjà été e n t r e p r i s e s p a r Pendlebury et a l . [6], Pazy et a l . [7 ] , et également par Gandini et a l . [8]. Toutes re l ient la var ia t ion d'un p a r a m è t r e d'un assemblage à la var ia t ion d'une sect ion efficace pa r une méthode de per turba t ion géné ra l i s ée .
Dans ce m é m o i r e , les sect ions efficaces chois ies sont ce l les dont l ' influence a été jugée prépondérante d ' ap rès l 'étude p récéden te ; e l les ne peuvent v a r i e r que dans l es l imi tes des incer t i tudes ac tue l les e s t i m é e s dans cette étude. Nous avons imposé que le nombre de p a r a m è t r e s m e s u r é s soit net tement supér ieur au nombre de sect ions efficaces à a jus te r . L ' impréc i s ion su r un p a r a m è t r e m e s u r é es t s implement p r i s e en compte pa r l ' i n t e r m é d i a i r e d'un poids . Le fait d 'u t i l i se r un sy s t ème surabondant p e r m e t de s ' abs t en i r de toute condition supplémenta i re a r b i t r a i r e sur les var ia t ions des sect ions efficaces à l ' i n t é r i eu r des con t ra in tes cho i s i e s .
Les tendances qui se dégagent des r é su l t a t s p r é l i m i n a i r e s ( tendances indépendantes des poids a t t r ibués aux différents p a r a m è t r e s ) conduiraient , pour le jeu Cadarache , à augmenter la capture du 239pu e t ¿u 235и е\ à. d iminuer la fission et le v de ces deux é léments et la capture du 238U.
Il n ' es t pas quest ion d 'u t i l i se r cet te méthode comme moyen d 'évaluat ion automatique, ni de modif ier actuel lement l e s données mic roscop iques de b a s e . Toutefois, la méthode nous p e r m e t dans l ' immédia t d ' a m é l i o r e r la p r éc i s ion de beaucoup de p a r a m è t r e s ca lculés et p o u r r a p e u t - ê t r e , une fois au point, faci l i ter la tâche des éva lua t eu r s .
1. IMPRECISIONS DES PARAMETRES CARACTERISTIQUES D'UN REACTEUR RAPIDE DE PUISSANCE DUES AUX INCERTITUDES ACTUELLES CONCERNANT LES DONNEES NEUTRONIQUES
Les incer t i tudes su r les p a r a m è t r e s c a r a c t é r i s t i q u e s d'un r é a c t e u r rapide proviennent de deux s o u r c e s : l e s e r r e u r s dues aux méthodes de calcul , et les e r r e u r s dues aux impréc i s ions dans l es données neutroniques

SM-101/58 207
multigroupes. Notre but est uniquement de déterminer les incertitudes dues aux er reurs du second type, dont l'amplitude est à notre avis prépondérante.
1.1. Incertitudes actuelles dans les données neutroniques
Deux types essentiels d'incertitudes peuvent intervenir sur les sections efficaces effectives des éléments entrant dans la composition d'un réacteur:
- Les e r reurs dues aux données microscopiques provenant, soit des er reurs mentionnées par un expérimentateur (erreur statistique), soit des e r reurs systématiques entre les valeurs mesurées par différents expérimentateurs, soit des imprécisions des sections efficaces calculées par différents modèles théoriques dans les domaines où les mesures n'existent pas;
- Les e r reurs dues aux méthodes de passage des données microscopiques aux sections efficaces multigroupes.
Seules les premières er reurs ont été évaluées, en distinguant trois catégories d'éléments:
Eléments lourds : 238Ü, 239Pu, 24°Pu Eléments intermédiaires: Fe, Ni, Na Elément léger : O. Etant donné la faible importance de la diffusion élastique par les
éléments lourds dans le ralentissement, cette section efficace n'a pas été'étudiée. De même, la diffusion inélastique par l'oxygène n'est pas considérée.
Les incertitudes maximales sur toutes les sections efficaces et le paramètre v ont été établies dans le découpage en énergie du jeu russe [9]. S'il existe une part d'arbitraire dans le choix de ces incertitudes maximales, elles donnent cependant une bonne représentation des e r reurs dont sont entachées actuellement les données neutroniques de base. Pour les sept éléments cités, le détail de ces incertitudes est donné dans les rapports de Barré [10,11].
1. 2. Relation entre incertitudes sur les données de base d'une part et sur les paramètres d'un réacteur d'autre part
1.2.1. Méthode
Dans des études similaires, Moorhead [12] et Greebler et al. [13] ont utilisé des calculs directs. Nous employons une méthode de perturbation généralisée décrite par Usachev [1-3].
En effet, l'influence des incertitudes sur les sections efficaces étant faible, une méthode directe qui donne la variation d'un paramètre à partir de la différence de deux résultats nécessite une grande précision de calcul. Une méthode de perturbation apporte pour la même précision un gain de temps et une meilleure compréhension des phénomènes physiques en définissant une expression analytique de cette variation. La méthode d'Usachev donne la variation de tout paramètre caractéristique qui s'exprime sous forme d'un rapport de deux fonctionnelles bilinéaires du flux et du flux adjoint, variation due à toute perturbation d'une donnée neutronique dans le réacteur, par exemple une section efficace. Le réacteur est ramené à l'état critique après la perturbation par variation de

208 BARRE et RAVIER
l ' en r i ch i s semen t . Cette méthode a été appliquée dans l ' approximat ion de la diffusion et à zé ro dimension dans le code PERTUS.
1 .2 .2 . Résul ta ts
Les six p a r a m è t r e s c a r a c t é r i s t i q u e s étudiés sont le coefficient de mult ipl icat ion (k), le taux de surgénéra t ion interne (TRI), le t emps de vie {$.), le spec t r e c a r a c t é r i s é pa r le rappor t du flux a u - d e s s u s de 1,4 MeV su r le flux total (R4), le coefficient sodium décomposé en effet dégrada tion (CNAD) et effet capture (CNAC).
FIG. 1. Imprécisions sur к dues aux incertitudes des sections efficaces, dk/k = f(E), en pcm.
Comme modèle d'un grand réacteur rapide de puissance, nous avons choisi un réacteur à combustible mixte PUO2-UQ2;1 le volume critique du coeur est de 1200 l i t res. A titre d'exemple, l'a variation en fonction de l'énergie de l'imprécision sur le coefficient de multiplication due^aux incertitudes concernant les sections efficaces dont l'influence est prépondérante est représentée dans la figure 1. Ces imprécisions sur les paramètres caractéristiques, calculées initialement à 24 groupes, sont condensées pour la clarté des résultats en quatre bandes d'énergie. Le tableau I donne par exemple cette présentation condensée pour le paramètre k.
Compositions atomiques en 1024 at. cm"3: acier:0,225-10"1; 0:0,164- 10"l; Na: 0,617- 10"
9Pu : 0,112 • 10"2; ш Pu : 0,295 -10"3; 238U: 0,672- 10"

SM-101/58 209
TABLEAU I. VARIATIONS DE LA REACTIVITE DUES AUX INCERTITUDES SUR LES SECTIONS E F F I C A C E S : dk /k = f (+Дст/ст) en pcm
Elément
238 и
239 p u
240 p u
Fe
Ni
Na
0
Energie
1,4 - 1 0 . 5 MeV
0 ,0465 - 1,4 MeV
0 ,215 - 4 6 , 5 keV
Therm. - 215 eV
1,4 - 1 0 , 5 MeV
0 ,0465 - 1,4 MeV
0 ,215 - 4 6 , 5 keV
T h e r m . - 215 eV
1.4 - 1 0 , 5 MeV
0 ,0465 - 1,4 MeV
0 ,215 - 4 6 , 5 keV
Therm. - 215 eV
1,4 - 1 0 , 5 MeV
0 .0465 - 1,4 MeV
0 ,215 - 4 6 , 5 keV
Therm. - 215 eV
1,4 - 10 ,5 MeV
0 ,0465 - 1,4 MeV
0 ,215 - 4 6 . 5 keV
Therm. - 215 eV
1.4 - 10 ,5 MeV
0 ,0465 - 1,4 MeV
0 ,215 - 4 6 , 5 keV
Therm. - 215 eV
1 . 4 - 1 0 . 5 MeV
0 ,0465 - 1,4 MeV
0 ,215 - 4 6 , 5 keV
T h e r m . - 215 eV-
Fission
+ 719
+ 408
+ 2612
+ 2933
+ 108
+ 104
+ 208
+ 5
-
-
-
-
Capture
- 34
-2120
-2186
- 36
- 31
- 654
-1447
- 104
6
- 313
- 417
- 18
- 17
- 226
- 355
3
- 35
- 94
- 47
0
3
4
5 •
0
- 129
Transport
+ 209
+ 526
+ 46
+ 0 '
+ 33
+ 110
+ 26
+ 0
+ 13
+ 33
+ 6
+ 0
+ 350
+ 449
+ 79
+ 0
+ 28
+ 90
+ 38
+ °
+ 162
+ 151
+ 18
+ 0
+ 174
+ 739
+ 89
0
V
+ 351
+ 210
+ 827
+ 292
+ 13
+ 85
+ 132
+ 3
-
-
-
-
Diffusion élast ique
-
-
- 23
- 45
+ 20
+ 0
- 5
- 11
+ 3
+ 0
- 23
- 41
+ 14
0
- 52
- 265
- 12
0
Diffusion
inélast ique
- 694
- 146
- 142
- 68
- 48
- 16
- 587
- 67
- 128
- 35
- 13
-
Les principales conclusions se résument en quatre points: a) Les données neutroniques dont les incertitudes sont jugées pré
pondérantes pour tous les paramètres sur la majeure partie du spectre d'énergie sont la capture et la fission du ^ P u , et la capture du 238U.
b) Si ces conclusions étaient prévisibles qualitativement, nous avons par contre chiffré l'importance relative des incertitudes de toutes ces sections sur chaque paramètre suivant l 'énergie. Nous avons estimé l'imprécision globale sur chaque paramètre due aux er reurs sur toutes
14

210 BARRE et RAVIER
les sect ions dans tout le domaine d 'énergie pour les t r o i s é léments p r é pondérants (tableau II). Ces va l eu r s dépassent l a rgement les m a r g e s souhai tées pour un projet .
c) L'influence des incertitudes sur les sections efficaces de tous les éléments, entre l'énergie thermique et 200 eV, puis entre 1,5 et 10 MeV, sur les paramètres étudiés est faible pour ce type de réacteur, à quelques exceptions près (diffusion inélastique dans le 238u p a r exemple).
d) Pour ces p a r a m è t r e s , l e s p réc i s ions souhai tables pour un projet étant supposées de ± 0,6% sur к (soit 1% sur la m a s s e cr i t ique pa r var ia t ion de
l ' en r i ch i s semen t ) , ± 1% sur le taux de su rgénéra t ion in te rne , ± 5% sur le t emps de vie et le coefficient sodium, pour les sect ions efficaces dont l ' influence dans un domaine d 'énerg ie es t supé r i eu re à l 'une de ces l imi t e s , nous avons fait des demandes de m e s u r e de p r io r i t é I dans la «Reques t L i s t » de 196 7 de l 'EANDC. Les p réc i s ions demandées sont obtenues pa r s imple propor t ionnal i té .
Il s e ra i t souhaitable que ces demandes de m e s u r e s puissent ê t r e sa t i s fa i tes , ca r les incer t i tudes exis tant su r des p a r a m è t r e s ca lculés au s s i impor tan ts pour un projet de r é a c t e u r rapide que la m a s s e cr i t ique ou le taux de surgénéra t ion doivent pouvoir ê t r e cons idérablement r édu i t e s .
2. UTILISATION DES RESULTATS DES EXPERIENCES CRITIQUES POUR DIMINUER LES IMPRECISIONS SUR LES PARAMETRES CALCULES DE REACTEUR
Il appara î t , d ' ap rès les r é su l t a t s p récéden t s , que la seule ut i l isat ion des données microscopiques m e s u r é e s ne nous p e r m e t pas de r é a l i s e r des ca lculs de r é a c t e u r s rap ides avec une p réc i s ion suffisante pour un proje t . Il nous semble a l o r s utile de ten i r compte des p a r a m è t r e s m e s u r é s dans les expér iences c r i t i ques . Les buts des deux méthodes que nous employons dans ce sens sont opposés : la p r e m i è r e méthode (décri te p a r
T A B L E A U II. INCERTITUDES GLOBALES E S T I M E E S DES P A R A M E T R E S CARACTERISTIQUES POUR LES TROIS E L E M E N T S P R E P O N D E R A N T S (%)
Elément
238 y
239pu
Fer
dk
к
±4,6
±4
±2
dTRI TRI
±12
±13
± 3
dR4 R4
±10
± 2
± 7
d £ £
±17
± 8
± 4
dCNAD CNAD
±50
±40
±15
14*

SM-101/58 211
Baker [4]) fournit simplement une formule empirique qui permet de corriger la masse critique calculée par un jeu donné; la seconde méthode donne au contraire un ensemble de corrections pour les sections efficaces jugées prépondérantes, après ajustement sur tous les paramètres mesurés dans les assemblages.
2. 1. Méthode de Baker
2. 1. 1. Principe
La base de cette méthode, directement appliquée à Cadarache dans le programme BARBAK, est l'ensemble des coefficients de multiplication k c obtenus par un jeu donné des modèles calculables d'un grand nombre M d'assemblages critiques rapides.
On suppose que l 'écart entre la valeur calculée kc et le coefficient de multiplication expérimental k ^ = 1 peut se développer sous forme linéaire des compositions atomiques de N éléments présents dans le cœur des assemblages (239Pu, 235U, 238U, etc.)
N
ï kC - 1 =
i = l
Les compositions atomiques sont normalisées comme suit:
c i , concentration en 239Pu, = 0,6 C2, concentration en 235 ц^ = 1,0.
Les N coefficients de régression a i , caractéristiques du jeu, sont ceux qui minimisent la somme des carrés des résidus E2 suivant la méthode habituelle des moindres carrés :
M
B * - I ( k 0 i - i - y j = i
La méthode implique que le nombre M d'assemblages soit supérieur au nombre N d'inconnues a^ Le fait que la régression obtenue soit significative est vérifié par un test en F de Student-Fisher, le seuil étant choisi à 1%. Le gain apporté par cette méthode peut être chiffré en comparant l 'écart-type initial o"j du coefficient de multiplication autour de sa valeur moyenne ïï et l 'écart-type après ajustement <rF:
M
)>v 2
a I
2 a F
3 = 1
M
M -
E 2
- N -
1
1

to I—1
to
TABLEAU III. COEFFICIENTS DE REGRESSION ET ECARTS-TYPES POUR LE JEU CADARACHE - METHODE BARBAK
Element
Coefficient de regression at x 104
Nombre d'assemblages ou l 'e-lement est present
Ecart-type
Analyse des variances
2S9pu
+ 406 ± 70
4
235 u
+ 183 . ± 19
30
a\ = 1, 6°/o
Rapport des variances
Seuil a l°lo
238 u
- 37 ± 2
33
: F = 81, 7
: F = 3, l r
Acier
+ 15 ± 2
34
Aluminium
- 3 ± 3
14
Sodium
+ 8 ±12
5
Oxygene
+ 14 ± 6
3
Carbone
- 2 ±2
13
op= 0,3%
Degres de liberte vx = 10
i/2 = 23
Hydrogene
- 77 ±25
4
Cuivre
- 241 ± 63
3

SM-101/58 213
2. 1. 2. Application au jeu Cadarache
Base expérimentale. Les 34 assemblages calculés par ce jeu, choisis parmi les ZPR III, ZEBRA et VERA, comprennent 30 assemblages au 235U et quatre au 239Pu. Le calcul d'un assemblage se fait dans l'approximation de la diffusion sur un modèle homogène sphérique avec réflecteur. Le passage de l'assemblage critique expérimental au modèle critique simplifié pour le calcul nécessite plusieurs corrections de la masse critique expérimentale: correction expérimentale (barres, contour. . . ), hétérogénéité, facteur de forme. Nous tenons compte des différences entre l'approximation de la diffusion et celle du transport (S4) en utilisant l 'écart moyen donné par Baker [4] pour chaque assemblage. L'écart entre la masse critique calculée par le jeu et la masse critique expérimentale du modèle simplifié est alors traduit en variation de к par l 'intermédiaire du facteur (dM/M)/(dk/k).
Résultats. Les coefficients de régression obtenus (tableau III) démontrent que les éléments 239pu et 235U sont surréactifs et que le 238U est sous-réactif comme dans la plupart des jeux [4].
Un ajustement important est réalisé pour l'ensemble des compositions (fig. 2): l 'écart-type sur к passe de 1,6% à 0,3% après ajustement (pour le jeu FD2, l 'écart-type final est de 0,45% [4]).
2. 1. 3. Validité des résultats
Nous souhaitons utiliser cette méthode pour corriger la masse cr i tique d'un grand réacteur rapide au 239pu comprenant 20% de 240Pu. Or, seuls quatre assemblages au 239Pu sont utilisés; de plus, le combustible ne comprend en moyenne que 6% de 240Pu. Un ajustement effectué avec le 240Pu a donné un coefficient de régression positif, mais l 'écart-type extrêmement important sur ce résultat lui ote tout sens. D'après l'étude précédente (tableau I), pour un réacteur de ce type l'incertitude maximale sur к due aux 20% de 240Pu pourrait atteindre ± 1,5%.
Pour obtenir la valeur du paramètre к calculé qui se compare à la valeur expérimentale, il est nécessaire d'effectuer plusieurs corrections qui sont elles-mêmes entachées d 'erreurs:
Hétérogénéité : ± 0,2% sur к [14] Facteur de forme : ± 0,5% sur к [14] Correction expérimentale : ± 0,1% sur к [14] Passage diffusion - S4 : ± 0,2% sur к
Pour le modèle homogène sphérique d'un même assemblage critique, il existe des désaccords qui peuvent atteindre ±1000 pcm entre les valeurs globales de ces corrections évaluées par différents auteurs, Davey [14] et Meneghetti et al. [15] par exemple.
Les résultats obtenus avec les normalisations 0,5, 0,6 et 0,7 pour la composition du 239pu (tout en conservant C2 = 1,0) sont t rès voisins: ceci confirme également la conclusion de Baker.
Cette méthode, extrêmement attirante par sa simplicité, a été utilisée pour essayer de corriger la masse critique de l'assemblage

214 BARRE et RAVIER
MASURCA 1-A au 239P u [1 6] ca lculée pa r le jeu Cadarache :
Masse cr i t ique expé r imen ta l e 2 170± 0,6 kg Masse cr i t ique calculée pa r le jeu 3 141 ± 5 kg Masse cr i t ique co r r i gée p a r BARBAK 156 ± 7 kg
Malgré le gain apporté pa r l ' a jus tement , le désaccord avec l ' expé r i ence demeure important . Une va leur plus faible de l 'hé té rogénéi té en d iminuera i t l ' ampl i tude .
Cet éca r t pour ra i t ê t r e a t t r ibué au petit nombre de r é a c t e u r s au 239pu
ut i l i sés dans l ' a jus tement . En effet, p a r m i les 34 r é a c t e u r s ana lysés ini t ia lement , suppr imons un des 30 r é a c t e u r s à 235u le plus ma l calculé p a r le jeu (ZPR 111-32).
La m a s s e cr i t ique de cet a s semblage c o r r i g é pa r ce nouvel a jus te ment es t en accord avec l ' expé r i ence :
Masse cr i t ique expér imenta le 213 kg Masse cr i t ique calculée pa r le jeu 180 kg Masse cr i t ique co r r i gée BARBAK 217 ± 5 kg
Il s e r a i t important de pouvoir d i sposer d'un plus grand nombre d ' expér iences c r i t iques au plutonium pour c o r r i g e r avec plus de garan t ie la m a s s e cr i t ique calculée d'un r é a c t e u r rapide ut i l isant ce combust ib le .
2 .2 . Méthode BARRAKA
2 . 2 . 1 . Pr inc ipe
A l 'opposé de la méthode p récéden te , qui co r r ige la m a s s e cr i t ique a p r è s le calcul , cette seconde méthode r e c h e r c h e , par ajustement en t re tous l e s p a r a m è t r e s ca lculés p a r un jeu donné et m e s u r é s dans les exp é r i e n c e s c r i t iques , l ' ensemble des var ia t ions des sect ions efficaces qui donne le mei l l eur accord en t re le ca lcul et l ' expér ience .
D'une par t , nous disposons de A a s semblages rap ides c r i t i ques . Dans chaque as semblage a, P p a r a m è t r e s X m (a, p) sont m e s u r é s . Soient X e (a, p) les va leu r s de ces p a r a m è t r e s ca lculées pa r un jeu donné.
D 'au t re pa r t , nous souhaitons a jus ter des sect ions efficaces c o r r e s pondant à R réac t ions , E é léments dans un découpage en énergie à G groupes . Cette méthode est c a r a c t é r i s é e par les deux impéra t i f s su i van t s : les var ia t ions des sect ions efficaces données pa r l ' a jus tement doivent ê t r e c o m p r i s e s en t re l e s l imi t e s des incer t i tudes max ima le s ac tue l les e s t i m é e s dans l 'é tude précédente (section 1); le nombre de p a r a m è t r e s m e s u r é s doit ê t r e net tement supér ieur au nombre de sec t ions efficaces a jus tées .
La var ia t ion re la t ive dX/X d'un p a r a m è t r e p m e s u r é dans un a s s e m blage a est r e l i ée à la var ia t ion re la t ive dcr/ст d'une sect ion efficace d'une
2 Masse critique équivalente en plutonium comprenant 8t5<7ode 240Pu. 3 L'effet d'hétérogénéité est évalué actuellement à 2,5 ±0,5% sur к (KHAIRALLAH, A., ces comptes
rendus, SM-101/57).

SM-101/58 215
réaction r, un élément e et un groupe g par la méthode de perturbation généralisée au premier ordre déjà utilisée (1. 2):
dXc . . . . da . . -rgcr (a, p) = a(a., p, e, r, g) — (e, r, g)
(1)
Cette méthode de perturbation est également employée par d'autres auteurs (Gandini et al. [8]). Nous retenons les variations relatives des sections efficaces qui minimisent la somme des carrés des résidus E2 :
A,P
•ï E = > W(a,p) Xm( a ,p)-X aJ(a ,p)
Xm (a,p) a.P
(2)
Xaj (a,p) = Xe (a, p)
E, R, G
1+ \ <v (a, p, e, r, g) — (e, r, g)
W(a, p) représente le poids attribué à la mesure d'un paramètre dans un assemblage.
Le problème se ramène à une minimisation avec contraintes. La résolution se fait par une méthode t rès simple de cheminement avec pas de variation variable pour chaque inconnue et éventuellement division de pas. En aucun cas la variation d'une section efficace ne peut dépasser en valeur absolue la borne évaluée, mais si elle l'atteint en cours d'ajustement, elle ne demeure pas nécessairement fixée à cette valeur.
Le fait d'imposer un système surabondant permet de s'abstenir de toute condition supplémentaire arbitraire sur les variations des sections efficaces à l 'intérieur des contraintes choisies. Choisir parmi plusieurs solutions celle qui donne la somme minimale de variations pour l'ensemble des sections efficaces supprimerait la possibilité de tenir compte d 'erreurs systématiques qui, à notre avis, peuvent encore exister ( a du 239pu p a r exemple). Le formalisme que nous utilisons ne donne aucune préférence aux valeurs de départ.
Le poids attribué à un paramètre mesuré se décompose en deux facteurs:
W(a,p) K(p) :2(a,p) (3)
x(a, p) représente l 'erreur sur un paramètre mesuré dans un assemblage, soit donnée par l'expérimentateur, soit évaluée. K(p) permet de faire évoluer arbitrairement l'importance relative des différents paramètres dans l'ajustement. Un des points délicats de la méthode est certainement le choix de ces poids. Cette méthode n'est valable que dans la mesure où les variations obtenues des sections efficaces sont indépendantes des poids relatifs choisis dans une gamme suffisamment étendue.

216 BARRE et RAVIER
2. 2. 2. Application au jeu Cadarache
P a r a m e t r e s m e s u r e s . Les cinq p a r a m e t r e s re tenus dans cet te p r e m i e r e etude sont: - l e coefficient de mul t ip l ica t ion : k - l e s taux de fission du 238u et du 2 39pu r appor t e s a la fission du 2 3 5U: afU238/crfU235' CTf Pu239 /CTf U235 - le rappor t des coefficients de danger: DKu235/t)Kpu239 - le t emps de vie : S..
Les taux de fission et les coefficients de danger sont ceux m e s u r e s au cen t re des a s semb lages . Les 151 m e s u r e s sont chois ies p a r m i 36 a s semblages ; en plus des 34 a s semblages u t i l i ses dans BARBAK (2. 1.2), nous t ra i tons RAPSODIE et sa maquet te ZPR III-44.
Les p a r a m e t r e s theor iques c o m p a r e s aux va l eu r s expe r imen ta l e s sont ca lcules dans 1'approximation de la diffusion en geomet r i e spher ique a 25 groupes pour des a s s e m b l a g e s homogenes c r i t iques avec re f lec teur . En pa r t i cu l i e r , les coefficients de mult ipl icat ion sont ceux deja u t i l i ses dans BARBAK.
Sections efficaces. Dans cet te p r e m i e r e etape, les va r ia t ions affectent les sect ions efficaces dont l ' influence a ete jugee p r e p o n d e r a t e dans l 'e tude precedente (section 1), soit : 235U: cap ture , f ission et v 238U: cap ture , fission, diffusion inelast ique et v 239pu: cap ture , fission et v.
Nous faisons l 'hypothese que l e s fac teurs d 'autoprotect ion sont exac t s , Les va r ia t ions ne concernent que les sec t ions efficaces a dilution infinie et sont l imi t ees aux quat re p r e m i e r s groupes d'un decoupage en energ ie a cinq grands groupes :
MeV MeV keV keV eV
Pour chacun de ces quatre p r e m i e r s groupes les coefficients a (equation 1) sont ca lcules dans l ' approximat ion de la diffusion a ze ro dimension (code PERTUS) avec le decoupage la rge precedent .
Les sect ions efficaces a cinq groupes sont obtenues pa r ponderat ion su r le spec t re au cen t re de chaque as semblage des sect ions efficaces a 25 g roupes . Cette l imitat ion du nombre de groupes ou les var ia t ions peuvent avoir lieu est n e c e s s a i r e puisque nous imposons un sys teme surabondant . Ce p r e m i e r a justement por te sur 33 sect ions efficaces; 151 m e s u r e s sont u t i l i sees .
Po ids . Actuellement, nous supposons que l ' e r r e u r x sur un p a r a -m e t r e m e s u r e est constante quel que soit l ' a s semblage :
k : x = ± 1% i : x = ± 10%
^ ^ : x=±2,5% g | ^ - 5 : x = ± 2% °f U235 D K Pu239
^ 2 3 _ 9 : x = ± l % a f U235
1. 2. 3. 4. 5.
0,821 0,111 9,12 0,275 T h e r m .
- 14,5 - 0,821 - I l l - 9,12 - 275
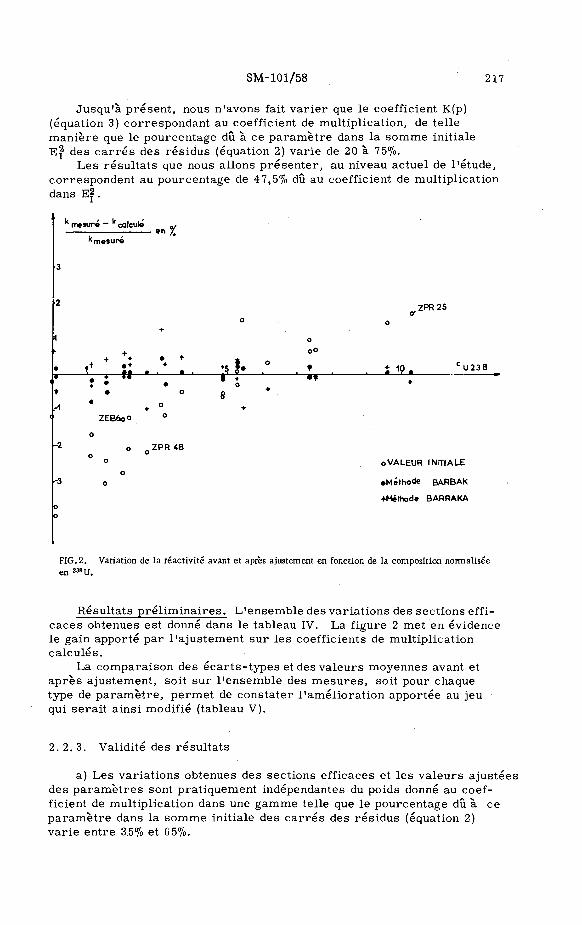
SM-101/58 217
Jusqu'à présent, nous n'avons fait varier que le coefficient K(p) (équation 3) correspondant au coefficient de multiplication, de telle manière que le pourcentage dû à ce paramètre dans la somme initiale E^ des carrés des résidus (équation 2) varie de 20 à 75%.
Les résultats que nous allons présenter, au niveau actuel de l'étude, correspondent au pourcentage de 47,5% dû au coefficient de multiplication dans E2.
'• к
•3
2
1 •к
• •
.-1 1
-2
-3
о О
mesure — * calculé
к mesuré
•f
1 +
• •
+ • * m» m T I
• ZEB60O
О
о о
О
0 о
о
«z
+
• t +
• О
о о
2PR «8
о
• 5 * . 1 t
о 8
+
о
•
о оо
t ' **
ZPR25 о*
о
+ 10 . C U 2 3 8 •
о VALEUR INITIALE
•Méthode BARBAK
-fMéthode BARRAKA
FIG. 2. Variation de la réactivité avant et après ajustement en fonction de la composition normalisée en 238U.
Résultats préliminaires. L'ensemble des variations des sections efficaces obtenues est donné dans le tableau IV. La figure 2 met en évidence le gain apporté par l'ajustement sur les coefficients de multiplication calculés.
La comparaison des écarts-types et des valeurs moyennes avant et après ajustement, soit sur l'ensemble des mesures, soit pour chaque type de paramètre, permet de constater l'amélioration apportée au jeu qui serait ainsi modifié (tableau V).
2. 2. 3. Validité des résultats
a) Les variations obtenues des sections efficaces et les valeurs ajustées des paramètres sont pratiquement indépendantes du poids donné au coefficient de multiplication dans une gamme telle que le pourcentage dû à ce paramètre dans la somme initiale des carrés des résidus (équation 2) varie entre 3.5% et 65%.

218 BARRE et RAVIER
T A B L E A U IV. VARIATIONS DES SECTIONS E F F I C A C E S O B T E N U E S PAR LA METHODE BARRAKA
Réaction
Capture
Fission
v Л
Energie
0, 821 - 14, 5 MeV
0,111 - 0, 821 MeV
9,12 - 111 keV
0,275 - 9,12 keV
0,821 - 14, 5 MeV
0,111 - 0,821 MeV
9,12 - 111 keV
0,275 - 9,12 keV
0, 821 - 14, 5 MeV
0,111 - 0, 821 MeV
9,12 - 111 keV
0,275 - 9,12 keV
23SU
20
17
20
-30
6
-4
-6
- 2 , 5
+ 4 ,3
- 3,8
- 0 ,1
-2 ,0
Variations (%)
239pu
-80
45 '
- 3
60
- 7
8 ,3
-18
15,5
5,2
-3
-2
-2
238 и
-15
- 4 , 8
-15
- 4 , 9
- 6
+ 4
Diffusion inélastique
238U — (1 ->2) = -22% — ( 1 -»3) = -23% — (2 -*3) = + 1 % a a a
b) Considérons pour chacun des t r o i s é léments étudiés l ' ensemble des var ia t ions des sect ions efficaces re tenues (tableau IV). Nous avons vér i f ié , en pa r t i cu l i e r sur l ' a s semblage MASURCA 1-A, que, d ' ap rè s ces va r i a t ions , pour le jeu Cadarache , le 239pu e t le 235 и sont s u r r é a c t i f s , et le 238u est sous-réact i f . Ces r é su l t a t s sont en parfai t accord avec ceux de la méthode BARBAK (2. 1. 2). Quali tat ivement, ceci est évident pour le 235U: dans le domaine d 'énergie où le flux neutronique es t max i m a l pour un grand r é a c t e u r rapide (10 keV - 1 MeV), la méthode propose d 'augmenter la capture et de diminuer la fission et le p a r a m è t r e v de cet é lément .
c) L ' é ca r t - t ype final du coefficient de mult ipl icat ion ajusté donné pa r la ve r s ion actuel le de BARRAKA, soit 0,7%, doit se c o m p a r e r à l ' é c a r t -

TABLEAU V. MOYENNES ET EC ARTS-TYPES AVANT ET APRES AJUSTEMENT
Parametre
k
St
°f U238 °fU235
°f Pu239 °f U235
DK U235
DK p u 239
Total
Nombre de mesures
35
25
33
32
26
151
Moyenne ini t iale
X C / X m
1,012
0,980
0,967
0,978
1,039
0 ,994
Moyenne finale x a j / x m
1,000
0, 951
0,995
0,999
1,005
0,992
Ecart- type
ini t ial
(%)
2 , 0
8 ,4
10 ,0
3 , 4
6,7
6 ,6
Ecar t - type
final
(%)
0,7
9,7
8,3
2 ,5
4 , 3
5,7
CO

220 BARRE et RAVIER
type final donné par BARBAK dans un ajustement portant uniquement sur l e s t r o i s é léments 235U, 238 U, 2 3 9 Pu, soit 1% (et non à la va leur 0,3% du tableau III). Augmenter le nombre d ' é léments dont les sect ions efficaces sont a jus tées dans BARRAKA, tout en conservant un sys tème la rgement surabondant , p e r m e t t r a donc de diminuer l ' é c a r t - t y p e final sur le coefficient de mult ipl icat ion, m a i s auss i les é c a r t s - t y p e s des au t r e s p a r a m è t r e s a jus tés .
d) Bien que ces r é s u l t a t s soient p r é l i m i n a i r e s (tableau IV), nous avons voulu s i tue r pa r rappor t aux m e s u r e s expér imenta les les va l eu r s des sec t ions efficaces modifiées pa r BARRAKA, ma i s il ne s 'agit que de t endances :
^ F i s s ion - 2 3 5 U
E > 1 MeV : Evaluation de P a r k e r [17]
10 keV < E < 1 MeV : L imi tes in fé r ieures des points expér imentaux de White [18] et Knoll et Ponitz [19]
E < 10 keV : Résul ta ts de l ' expér ience P E T R E L [20].
F i s s ion - 2 3 9 P u
Plutôt que Q-f nous p rend rons le r appor t cr^p^g/afU235, qui es t m e s u r é le plus souvent.
E > 1 MeV : Mesu re s de Allen et Ferguson [21]
0,1 MeV < E < 1 MeV : Le rappor t ajusté est toujours supér ieur de 10% aux l imi t e s s u p é r i e u r e s des points e x p é r i mentaux de White [18]
10 keV < E < 100 keV : Résul ta t s de White [18].
Capture - 235U
Seul le rappor t a = crc/<7f est m e s u r é , comme pour le 2 3 9Pu. La va leu r ajustée de a s e r a i t sys témat iquement supé r i eu re de 10% aux m e s u r e s de Lottin et Weston [22] ou de Saussure [23].
Capture - 2 3 9 Pu
Le rappor t a a justé es t également supé r i eu r de 15% aux m e s u r e s de Lottin et Weston [22], sans cependant a t te indre les va l eu r s de Uttley et J a m e s [24] en dessous de 10 keV.
Capture - 2 3 3 U
M e s u r e s de Hanna et Rose [25], Lyon et Macklin [26], Belanova [27], Moxon et Chaffey [28] dans le domaine d 'énergie compr i s en t re 1 MeV et 20 keV.

SM-101/58 221
Paramètre v
E > 1 MeV : Pour tous les éléments, le v doit être augmenté; 235U, 238U: évaluation du BNL [29]; 239Pu: mesures de Mather et al. [30]
E < 1 MeV : Pour tous les éléments, la diminution proposée du v nous rapproche des mesures de Sowerby et al. [31] pour l'étalon 252Cf.
e) Il n'est pas question actuellement de modifier les données de base, ni d'utiliser cette méthode comme moyen d'évaluation automatique. Si le sens de ces variations correspond à la réalité, leur amplitude n'est sans doute pas rigoureusement exacte: la limitation du nombre d'éléments peut entraîner un ajustement forcé sur une section efficace de l'un d'entre eux, alors que la source d'erreur provient d'un autre corps non ajusté (fer par exemple). Rappelons également que nous supposons initialement que les e r reurs dues aux méthodes de calcul sont nettement inférieures aux er reurs dues aux incertitudes sur les données de base. Cependant, les éléments dont nous ajustons les sections efficaces dans la version actuelle sont ceux dont l'influence est prépondérante. Cette méthode nous permet dans l'immédiat, pour de nombreux paramètres mesurés dans-les assemblages critiques, d'améliorer la précision des prévisions par calcul.
CONCLUSION
Les incertitudes actuelles sur les données de base sont telles que les paramètres d'un grand réacteur rapide ne peuvent être calculés avec une précision suffisante pour un projet. Nous souhaitons que les demandes de mesures de données fondamentales que nous avons pu formuler avec leur précision soient rapidement satisfaites.
L'utilisation des paramètres mesurés dans les expériences rapides critiques nous a permis d'améliorer la précision de plusieurs paramètres calculés à partir du jeu Cadarache:
-Sans modifier le jeu, la méthode BARBAK prédit le coefficient de multiplication d'un nouvel assemblage avec un écart-type de 0,3%;
-Au contraire, la méthode BARRAKA permet d'ajuster les données multigroupes les plus importantes du jeu initial, donc de mieux calculer, non seulement le coefficient de multiplication, mais aussi tous les paramètres d'un réacteur.
Cette seconde méthode, plus attirante pour le physicien car elle s'attaque à la source des e r reurs , est actuellement développée a Cadarache. Les extensions prévues comprennent l'étude systématique des poids, l 'ajustement des sections efficaces d'autres éléments (par exemple le fer), l'analyse de nouveaux paramètres et assemblages. Une amélioration importante pourrait être envisagée si nous disposions de résultats expérimentaux provenant d'un plus grand nombre d'assemblages au 239pu et de paramètres mesurés plus sensibles aux réactions de capture (â = ffc/crf).

222 BARRE e t RAVIER
REFERENCES
[1] USACHEV, L. N. . Théorie des perturbations appliquée aux calculs du facteur de régénération et d'autres grandeurs caractéristiques des processus dans un réacteur nucléaire, Energie atom. 15 (décembre 1963) 35-47.
[2] ABAGYAN A. A. et al. «Nouveaux aspects de l'application des fonctions adjointes et de la théorie des perturbations aux calculs des réacteurs et des protections», 2 e Conf. int. util. éner. atom, fins pacif. (Actes Conf. Genève, 1958) 4, Nations Unies, New York (1958) 359.
[3] USACHEV, L. N. é t a l . , Bulletin d'information du centre des données nucléaires 1 Atomizdat (1965) 242 (en russe).
[4] BAKER, A. R., "Comparative studies of the criticality of fast critical assemblies", Proc. Int. Conf. on Fast Critical Experiments and their Analysis, ANL-7320 (1966) 116.
[5] RAVIER, J. , Présentation du jeu de sections efficaces multigroupes préparé à Cadarache, ANL-7320 (1966) 47.
[6] PENDLEBURY, E.D. et a l . , The Optimization of Neutron Cross Section Data Adjustments to give
Agreement with Experimental Critical Sizes, ANL-7320 (1966) 88. [7] PAZY, A., RAKAVY, G., REISS, Y., YEIVIN, Y., "Integral measurements as supplementary data in
neutron cross-section evaluation", Nuclear Data for Reactors (Proc. Conf. Paris, 1966) П, IAEA, Vienna (1967) 309.
[8] GANDINI, A. et a l . , Comparison between Experimental and Theoretical Integral Data on Fast Critical Facilities, ANL-7320 (1966) 107.
[9] ABAGIAN, L. P. et a l . , Group Constants for Nuclear Reactor Calculations, Consultants Bureau, New York (1964).
[10] BARRE, J. Y., Influence des incertitudes dans les données neutroniques sur un certain nombre de paramètres caractéristiques d'un réacteur rapide - Premiers résultats - Cas du Pu239 PNR/SETR R. 011 (1967).
[11] BARRE, J. Y., Influence des incertitudes dans les données neutroniques de base sur les paramètres caractéristiques d'un réacteur rapide (à paraître).
[12] MOORHEAD, T. P. , "The effects of errors in cross-section data on calculations for a large dilute fast reactor", Physics of Fast and Intermediate Reactors (Proc.Symp. Vienna,1961) П, IAEA, Vienna (1962) 111.
[13] GREEBLER, P. et a l . , User Requirements for Cross-Sections in the Energy Range from 100 eV to 100 keV, GEAP-4472 (1966).
[14] DAVEY, W. G., An Analysis of 23 ZPR Ш Fast Reactor Critical Experiments,. NSE-19 (1964) 259-73.
[15] MENEGHETTI, D. et a l . , Calculations of ZPR 1П Fast Assemblies using a 26 Group Argonne Cross-section Set, ANL-7133 (1966).
[16] KREMSER, J. e t a l . , «MASURCA 1 -A et 1-B -Résultatspréliminaires», ces comptes rendus, SM-101/59.
[17] PARKER, K., Neutron Cross-sections of U 235 and U 238 in the Energy Range 1 keV - 15 MeV, UKAEA Rep. AWRE-O-82/63 (1963).
[18] WHITE, P. H., J. Nucl. Energ. 19 (1965) 325. [19] KNOLL, G. F . , PONITZ, W. P . , A measurement of the U 235 fission cross section at 30 and 64 keV,
J. Nucl. Energ. 21 (1967) 643. [20] DIVEN, В. С , inEANDC(US)-96L (1967). [21] ALLEN, W. D. , FERGUSON, A. T. G., Proc. phys. Soc. 70A (1957) 573. [22] LOTTIN, A., WESTON, L.W., ANL-7320 (1966) 22. [23] SAUSSURE, G. de, in EANDC(US)-96L (1967). [24] UTTLEY , С H., JAMES, G.D., in AHSB(S)R-125 (1967). [25] HANNA, R. С , ROSE, В., J. Nucl. Ener. 8 (1959) 197. [26] LYON, W. S., MACKLIN, R. L., Phys. Rev. 114 (1959) 1619. [27] BELANOVA, T. S., VANKOV, A. A., MKHAILUS, F. F . , STAVISSKY, Yu. Ya., Nuclear
Data for Reactors (Proc. Conf. Paris, 1966) I, IAEA, Vienna (1967) 455. [28] MOXON, M. С , CHAFFEY, L.M., in BNL-325, 2nd Ed., Suppl. 2, Ш (1965). [29J STEHN, J.R. e t a l . , in BNL-325, 2nd Ed., Suppl. 2, Ш(1965). [30] MATHER, D. S. et a l . , Nucl. Phys. 6£ (1965) 149. [31] COL VIN, D. W., SOWERBY, M. G., MACDONALD, R. I . , "Confirmatory experimental data on the
Harwell boron pile v values", Nuclear Data for Reactors (Proc. Conf. Paris, 1966) I, IAEA, Vienna (1967) 307.

SM-101/58 223
D I S C U S S I O N
J. L. ROWLANDS: In studying the extent to which a parameter like breeding is sensitive to cross-section changes, one can either allow the keff to vary or adjust the enrichment so as to maintain criticality. The second procedure is the more appropriate when arriving at the cross-section measurement requirements for reactor design. With regard to the first part of your paper, which method did you use?
J. Y. BARRE: Firstly, we were not studying the sensitivity of a parameter with respect to a cross-section, but rather the margin of er ror in a parameter arising from the estimated uncertainty in regard to a cross-section.
Secondly, the reactor has in point of fact to be brought back to criticality again after the initial perturbation. I would go so far as to say that these secondary perturbations, if I may so term them, have a major effect on the internal breeding rate; for instance, as regards the effect of uncertainties in the 239pu fission cross-section, the primary and secondary perturbation effects tend to cancel each other out.


THE DATA REQUIRED FOR FAST REACTOR SAFETY ASSESSMENT BY PROBABILITY METHODS
J.R. CRICKMER AND L. CAVE ATOMIC POWER CONSTRUCTIONS LTD., SUTTON, SURREY, UNITED KINGDOM
Abstract
THE DATA REQUIRED FOR FAST REACTOR SAFETY ASSESSMENT BY PROBABILITY METHODS. Probability methods for the assessment of reactor safety have been developed in the UK to the point where it is possible to make some quantitative comparisons of the safety of differing reactor types measured against acceptable criteria for a given site. One particular method for rapid assessment of preliminary designs has been used to show those areas of fast reactor physics and kinetics where further work could materially assist the designer by allowing relaxation of the standards required of reactor shut-down and emergency systems without impairing reactor safety.
1. INTRODUCTION
A considerable amount of work has been devoted recently in the UK to developing probability methods for the assessment of reactor safety. They are based on associating the consequences of any given reactor or plant failure in terms of the radioactivity subsequently released, with the probability of such an event taking place. Two possible sets of criteria to be used in assessing reactor safety have been described by Farmer [1] and by Adams and Stone [2] .
A simplified method of analysis has been developed by Atomic Power Constructions Ltd. (APC) and its application to Advanced Gas-cooled Reactors (AGRs), pressure-tube water reactors and sodium-cooled fast reactors has been outlined in Refs [3], [4] and [5] respectively.
One of the major contributions of the method is to provide a means of comparing the relative contributions to safety made by plant items such as protective systems, emergency heat-removal systems and containment systems. In addition the worth of increased accuracy in basic data can be assessed in terms of the effect on the accuracy of the prediction of events subsequent to a primary plant failure.
This paper seeks to establish for large sodium-cooled fast reactors those physical and engineering data where increased accuracy or reliability would make a significant contribution to reactor safety. It is shown how such contributions could conceivably have economic benefits by allowing reductions in reliability standards required of some plant items.
2. OUTLINE OF THE METHOD OF ANALYSIS
The APC method of analysis has been described by Cave and Holmes [3] and only a brief outline is presented here. The method involves
15
225

226 CRICKMER and CAVE
•writing down all conceivable fault sequences and examining in more detail those which could lead to la rge (103 - 107 Ci 131I) f ission-product r e l e a se s . The probabil i ty of each stage of the sequence taking place is assessed and the total probabili ty calculated. The resu l t is compared with the target defined by the safety c r i t e r i a descr ibed in the next sect ion. If the target probabili ty for a r e l ea se of the magnitude envisaged is not achieved, the improvement requi red in the re l iabi l i ty of the shut-down system, emergency sys tem, containment, e t c . , is apparent . The simplici ty of the method, which entai ls only s imple hand calculat ions, also makes it easy to examine the effects of l a rge per turba t ions in the or iginal assumpt ions . The method is descr ibed in m o r e detai l in Appendix I .
3 . CHOICE OF NUMERICAL SAFETY CRITERIA
In the absence of firm c r i t e r i a to be used for l icensing procedures in the UK and to provide a compar ison of fast r e ac to r s with AGR, the p resen t paper uses the c r i t e r i a developed in Ref. [3] . These follow F a r m e r ' s proposa ls [ l ] as far as l a rge r e l e a s e s a re concerned and a re based on a considerat ion of the effects of a single r eac to r during a 30-year l i fe - t ime and do not take into account the complexit ies of a national reactor p r o g r a m m e . Again it has been considered that if the probability attributed to any single p r i m a r y fault does not exceed 1/10 of the acceptable total probabil i ty for the corresponding iodine-131 r e l ease , then summing over all the faults does not violate the acceptable total probability c r i te r ion .
At the lower end of the r e l e a s e spec t rum, an economic cr i te r ion has been imposed such that the probabil i ty of individual p r imary faults leading, to r e l e a s e s of 1000 Ci of iodine-131 should not exceed 10 - 4 per reac tor yea r o r 3X 10~3 in the r e a c t o r l i fe. This c r i te r ion is based on a simple evaluation of the commerc i a l r i sk to the opera to r ar is ing from the prolonged outage which would be associa ted with faults leading to r e l eases of l e s s than 1000 Ci 1 3 1 I .
The proposed c r i t e r i a for this paper a r e presented in F i g . l .
4 . SALIENT FEATURES OF THE 1000 MW(e) CIVIL FAST REACTOR (CFR)
The salient fea tures of the 1000 ME(e) CFR a re descr ibed in Appendix II.
5. QUALITATIVE ANALYSIS OF CONCEIVABLE FAULTS IN CFR
A paper to the Internat ional Conference on the Safety of Fas t Breeder Reac tors [8] has descr ibed, in some detail , possible accident mechanisms which could lead to the r e l ea se of significant quantities of radioactive fission products and plutonium from a fast r e a c t o r such as the Prototype Fas t Reactor (PFR) o r the CFR developed from it . Some of these mechanisms
15*

SM-101/50 227
are shown in Fig. 2. A significant release can occur only if the primary containment is breached in some way, since the reactor vault roof is designed to contain the active gas blanket appropriate to the use of vented fuel in normal operation. The breach could occur in three ways:
(i) Lifting or cracking of the vault roof following an explosion or the formation of high pressure within the vault
(ii) Melting through the reactor tank and leak jacket by molten fuel (iii) Failure of the gas blanket clean-up plant components or pipework.
Level of acceptable probabi l i ty on economic grounds . 1 . Summated over a l l faults { ) • 2 . Individual faults ( )
Limit of acceptable probabi l i ty on publ ic safety grounds
1 . Summated over a l l faults ( ) 2 . Individual faults ( )
Release (Curies I 1 3 ' )
FIG. 1. Proposed safety and economic criteria.
It should be noted that the secondary containment would normally control releases through breach (iii) above and also small leakages under (i). Therefore a serious release can occur only if widespread fuel melting takes place or if sodium boiling produces a high enough pressure in the vault to produce significant leakage through the vault roof from an active gas blanket. This itself is unlikely unless accompanied by fuel melting.
Widespread fuel melting in the reactor core would occur only in one of the following sets of circumstances:
(a) The reactor fails to shut down prompty in the event of a severe primary fault, such as sub-assembly blockage, fuel pin failure, or loss of coolant flow.
(b) The reactor shuts down correctly after a primary fault but the removal of fission product decay heat is inadequate.

228 CRICKMER and CAVE
THIRD
FIG. 2. Probability analysis for C. F. R.

SM-101/50 229
ANGLE PROJECTION
MOLTEN FUEL REACHES REACTOR,VESSEL 4
BURNS THROUGH
:,®
NOTE . THERE EXIST ADDITIONAL
AND THE BOX
HES OF THE DIAGRAM BETWEEN EACH BOX .
TURBINE DISINTEGRATES
CtO'3)
SECONDARY SODIUM SYSTEM FIRE
do-3)
EMERGENCY FUNCTIONS CORRECTLY
NO RELEASE

230 CRICKMER and CAVE
Melting of one sub-as sembly could also occur due to e r r o r s in the fuel handling p rocedures after the sub-assembly leaves the p r imary sodium.
6. THE UPPER LIMITS TO FISSION PRODUCT RELEASES IN FAULT CONDITIONS
Iodine has a s t rong affinity for sodium at r eac to r t e m p e r a t u r e s . Exper iments involving injecting iodine o r sodium iodide into sodium have given somewhat var iab le r e su l t s , but it would appear that a decontamination factor (DF) of at leas t 1000 can be justified where the escaping fission products pass through a significant depth of liquid sodium. Some F rench work [9] has shown that even when the escaping iodine from molten fuel i s accompanied by sodium vapour, the DF in passing through liquid sodium was as much as 100 000. F o r the purpose of this report a DF of 1000 has been assumed for iodine re leased under liquid sodium, including iodine r e l eased as methyl iodide. It has been further assumed that when sodium burns in a i r 10% of i ts iodine content is re leased .
The total inventor ies of fission products for a 1000 ME(e) CFR in continuous operat ion with unvented fuel a re approximately:
5X10 8 Ci
6X 10⁷Ci
8X 10⁴Ci
Rare gases (Kr and Xe) 9X 10⁸ Ci
The CFR core as designed also contains some 2400 kg of plutonium in the form of plutonium oxide.
The upper l imit to iodine r e l e a s e s i s , however, r a the r l e s s than the f igures quoted above since it is difficult to see how the iodine could be re leased without t ravel l ing through at leas t some sodium o r sodium vapour, and even if the sodium burned l a t e r on contact with the atmosphere, only about 10% of the available iodine would be re leased, say 6X 10⁶Ci 1 3 1I. This r e l ea se could only occur if the r eac to r failed to shut down co r rec t ly and the resul t ing nuclear excurs ion had sufficient energy to disrupt the p r i m a r y containment to the point where the secondary con^ ta inment was also breached by m i s s i l e s o r the p r e s s u r e generated by burning sodium. It is also conceivable that, if the reac tor were shut down but fission product heat removal were inadequate, fuel melting could lead to a c r i t i ca l a s sembly and a chain of events s imi la r to that descr ibed above.
The upper l imit r e l e a s e of r a r e gases has been taken as the total inventory (9X 10⁸Ci), although the re is evidence of significant retention in both fuel and sodium under some condit ions. Within one o r two k i lomet re s of the s i te this would be equivalent, in t e r m s of whole-body effects, to some 107 Ci 131I; at g r e a t e r dis tances i ts re lat ive importance diminishes rapidly .
Total iodine
1 3 1 T
137Cs

SM-101/50 231
The possible upper limit release of plutonium is a little uncertain but has been pessimistically assumed to be 10% or 240 kg (which is equivalent in the more important radio toxic effects to about 2.4X 10⁶ Ci 13lI [3] . Thus taking into account the pessimistic nature of the APC method [3], it is sufficient to evaluate the hazards in terms of the iodine release alone; taking 107 Ci 131I as equivalent to the release of 6X 10⁶ Ci 131I and the shorter-lived iodines.
7. FREQUENCY OF PRIMARY AND SEQUENTIAL FAULTS
Those primary faults which could lead to upper limit releases are summarized in Table I together with some estimates of the possible sequential faults. The frequencies quoted have been estimated by reference to a wide range of sources and are generally in close agreement with those previously quoted in Ref.[3] .
It will be seen that there are several chains of events which could conceivably lead to a release of about 6X 10⁶ Ci 131I. All these chains involve postulating an energy release in the reactor vault roof leading to breaching of the secondary containment. They derive from failure of the reactor to shut down on demand following flow failure or from heat removal failure in the core, rather than from failure of structural components, which is much less likely to occur.
Detailed calculations [10] have shown that an energy release of the magnitude required to collapse the PFR vault roof is most unlikely. However, some small finite possibility of its occurrence does exist and this has been put at 10~3 per incident in Ref. [8]. It is expected that similar probabilities would pertain to the chance of exceeding design limits for the CFR vault roof.
Since spent reactor fuel is handled only one sub-assembly at a time, the maximum release in a fuel handling accident is some 1.5X 10⁴Ci 131I for a 30-day cooled sub-assembly.
8. PHYSICS DATA REQUIRED FOR PREDICTION OF REACTOR BEHAVIOUR UNDER FAULT CONDITIONS
It will be seen from Table I that with the exception of fuel handling accidents, major releases from a CFR of the deisgn considered would always be associated with a nuclear explosion of some magnitude. The probability ascribed to such an explosion therefore always features as a part of the overall probability of large-scale fission-product releases.
For the purposes of Table I a simple distinction has been made between what are termed 'small' and 'large' explosions based on the ability of the primary and secondary containments to fulfil their functions afterwards. In the absence of detailed information values of 10"1 and 10 -4
have been assigned to the possibility of a 'small' or ' large' explosion respectively. These are the probabilities of such an event occurring per occasion on which all or most of the fuel melts.

T A B L E I. PROBABILITIES FOR ACTIVITY RELEASES TO ATMOSPHERE (1000 MW(e) CFR)
Primary fault
1 . Loss of coolant faults
Self-failure of primary tank
2 . Loss of coolant flow faults
Loss of power to primary pumps
Failure of primary pump outlet duct
Spurious operation of flow controller
Failure of diagrid causing flow failure
3 . Reactivity faults
Rod withdrawal at power
Rod withdrawal during start-up
Rod withdrawal during shut-down (Operator error)
4 . Loss of secondary coolant faults
Loss of power to secondary pumps
(Operator error)
Turbine trip
Secondary sodium fire
Spurious operation o f flow controller
Frequency (per reactor life)
10"5
10
lO"4
1
10" 5
1
10" 2
i o - 3
10-3
100
10" 3
1
Secondary fault
Failure of leak jacket
Failure to trip
Failure to trip
Failure to trip
Failure of rods to enter core
Failure to trip
Failure to trip
Failure to trip
Failure to trip
Failure to trip
Affecting al l circuits
Failure to trip
Frequency
(per primary fault)
10"5
10"6
10" 6
10" 6
l O ' 1
10" 6
10" 6
io - •
10" 6
10" 6
i o - 5 *
10" 6
Subsequent events
(a) Small explosion
(b) Large explosion causing failure of primary and secondary containment
(a) (b) <a)
(b) (a) (b)
(a)
(b)
(a) (b) (a) (b)
(a)
(b)
(a)
(b)
(a)
(b)
Frequency
1 0 - '
1 0 - 4
10-1
10"* IO-1
io-" l O " 1
i o -
IO-1
l o - 4
10" 1
io - 4
IO- 1
10 - 4
10" 1
10"4
io-» IO- 4
lO"1
10"4
Overall probability
1 0 - 1 0
10" s
io-»
1 0 - "
1 0 " " 1 0 - ' l o - " i o - ' io- 1 0
1 0 - '
i o - " io - 9
10-12
i o - i ° i o - "
10 - 1 0
1 0 - "
10"5
10"'
l o - '
10-T
1 0 - i o
Release (Ci 181I)
10 4
<100
1 0 '
<100 1 0 '
<100 10 '
<100 1 0 '
<100
1 0 7
<100 1 0 1 7
<100 101
<100 10 7
<100 107
10'
<100
10 7
n o
?o
> < ra

TABLE I (cont.)
Primary fault
5. Failure of emergency heat removal
systems
Reactor trip for reasons in 1-4
Spurious reactor trip
Turbine disintegrates
6. Fuel handling faults
Fuel handling accident outside the reactor vessel involving burning of 1 S/A
Frequency (per reactor life)
100
100
10 "3
10 "4
Secondary fault
Failure to supply cooling within a few hours
Failure to supply cooling within a few hours
Debris causes loss of all secondary sodium systems
Containment intact clean up plant working
Containment open
Frequency (per primary fault)
lO"6
10"6
10"=**
1
lO"2
Subsequent events
(a) (b)
(a) (b)
Frequency
lO' 1
10 "4
10-1 io-<
Overall probability
10"5
10-"
10 "5
io->
10"»
io-4
10"6
Release (Ci 1S1I)
<100 107
<100 10T
10'
<100
2 x l 0 4
* This figure could be achieved by careful attention to secondary sodium pipework layout and the overall probability for this accident could be greatly reduced by containing the system in an inert atmosphere.
** This figure could readily be achieved by siting the steam generators away from the turbine, by placing the turbine end-on to the generators and by providing blast walls.

234 CRICKMER and CAVE
Another r equ i rement for many of the fault conditions leading to major activity r e l e a s e s is failure of the r eac to r to t r i p . By this is meant failure of the shut-down sys tem to inject sufficient negative react ivi ty in t ime to prevent sodium boiling and /o r widespread fuel fa i lure .
The third factor which mus t be considered in relat ion to large activity r e l e a s e s i s the rel iabi l i ty of the post incident heat removal sys tems , since fai lure of these sy s t ems to opera te on demand could lead to fuel failure and the possibi l i ty of a nuclear explosion.
Of these th ree aspec ts of r e a c t o r technology the las t is largely a question of careful engineering, layout and provision of adequate equipment to give the requi red redundancy.
Reactor physics plays a m o r e important role in the calculation of the appropr ia te re l iabi l i ty f igures for the other two aspec t s . Fo r example, Hicks [10] and o the r s have shown that the magnitude of any possible nuclear explosion is highly dependent on the value of the Doppler coefficient of react iv i ty and to a l e s s e r extent on the p a r a m e t e r s involved in the equation of s t a t e . The t ime available to t r i p the r eac to r for various fault conditions also depends on the Doppler coefficient, and on the factors affecting the formation of superheat conditions in the sodium.
In addition the re a r e many other non-nuclear physical proper t ies and engineering considerat ions for the core components which influence the course of major core inc idents . However, mos t of these are now known with sufficient accuracy o r a re p a r a m e t e r s which a re not in general amenable to a l tera t ion for safety r e a s o n s .
9. RELIABILITY OF REACTOR SHUT-DOWN AND EMERGENCY SYSTEMS
In Ref. [5] it has been shown that for a 1000 MW(e) civil fast reac tor suitable for urban siting the failure r a t e s typically required of the reac tor shut-down and emergency sys t ems a r e 10 - 6 and 5X 10 - 7 per demand, respec t ive ly . These figures a r e calculated on the assumption that in the event of a core melt-down the re is a 1 in 10 chance of a prompt cr i t ical a s sembly occur r ing and a fur ther 1 in 1000 chance that such an assembly would lead to an explosion of such a magnitude that both p r imary and secondary containments were breached .
Obviously if these f igures could be reduced ( i . e . the events made l e s s likely), the table shows that the performance s tandards required of the shut-down and emergency sys t ems could be re laxed. Fo r example, for any given design the vault and roof may be designed to withstand the effects of a cer ta in s ize of explosion, typically they might be calculated using the mos t pess imis t i c es t imate cur ren t ly available for the Doppler coefficient. This s ize of explosion could then be taken as the dividing line between ' s m a l l ' and ' l a r g e ' explosions. F u r t h e r refinement of the calculations o r exper imenta l evidence might show that the chance of explosion exceeding the dividing line was 100 t imes l e s s likely than previously thought. This would enable the cost of the double shut-down sys tem to be saved as the requi red re l iabi l i ty would now be 1 failure per 104 demands.

SM-101/50 235
10. THE DATA REQUIRED
To carry out a complete analysis for a fast reactor of the type outlined above and in Ref. [5], it will be necessary to assemble a considerable volume of information.
Some of this data falls in the category of plant performance and reliability and some, of more interest to this Symposium, in the field of reactor physics. Most of this data is not available at the present time. The engineering data could probably be assembled from the records of manufacturers, electricity supply companies, etc. , but the physics data has yet to be produced.
It should be noted that what is required is not merely the maximum expected size of an explosion, but the chance of the maximum expected size being exceeded. Similarly, considerably more information is needed to assess the reliability required from the reactor shut-down system, and the prospects of obtaining this from any proposed design. The way in which the progress of the fault affects the quickness of response of the sensing devices is particularly important in this context. Thus the physics data required can be listed and the cost of obtaining it for any given reactor design can be weighed against the cost of providing more reliable shutdown systems or stronger containments.
Taking a factor of 10 in probability as a minimum standard of accuracy, we can see that some data are already available with sufficient accuracy. Doppler coefficient, for example, and the equations of state for UO2 are probably known to this accuracy, but the rate of reactivity addition for various types of fuel melt-down for any given reactor design is not nearly so well known. Other areas where further accuracy is required are the question of the relevance of the simple geometries and models used in the calculations to the complex core geometries of real reactors.
To assess trip reliability considerably more data than at present exist are required to trace the course of sub-assembly incidents and to show that for all possible types and degree of faults there exist sensing devices with sufficient speed of operation and sensitivity to detect the faults in time. In particular the factors affecting superheating of sodium under reactor conditions and the effects of sodium coefficient require close attention. In this connection the sodium coefficient is now known with more than sufficient accuracy.
11. CONCLUSIONS
Reference [5] used a simple method of probability analysis to demonstrate the suitability of a large sodium-cooled fast reactor for urban siting. This paper has extended these ideas to show that increased accuracy in certain areas of basic physics data could lead to a relaxation of the1 requirements for some reactor safety systems laid down in Ref. [5]. It remains for the individual designer to weigh the relative cost of obtaining this accuracy against the saving in plant costs, for his particular design.

236 CRICKMER and CAVE
APPENDIX I
MORE DETAILS OF THE APC METHOD
A . l . INTRODUCTION
The object of this Appendix is to set down in more detail certain aspects of the APC method of probability analysis. The following topics are considered:
Method of summation of risks The pessimistic nature of the APC method.
A. 2. METHOD FOR SUMMATION OF RISKS
This is most conveniently illustrated initially by consideration of a criterion based on economic considerations, thus:
Let Pj denote the probability of some fault i which leads to an outage during the life of the reactor. Denote the cost of the enforced outage due to fault i by £ Q . Then the operator's expectation of loss due to this fault is fpjCj and clearly his total expectation of loss due to all primary faults which lead to outages during the life of the reactor is EEpjCj.
Similarly, the 'expectation of damage to the public' due to faults which lead to the release to atmosphere of fission products can be denoted by EpjRjk. where Ri denotes the release, which may, in general, be taken as the *31I release, and kj is a factor relating release, in curies of 131I, to number of casualties. If a linear relation between release and casualties is assumed, kj is a constant.
In the course of the analysis the probabilities of the various faults are estimated, together with the corresponding releases of 131I. In establishing the safety criteria it is convenient, in practice, to specify the maximum acceptable probability corresponding to some fixed value of 131I release, e .g. Farmer [1] has suggested that the probability of a release of 106 Ci 131I should not exceed 1 per 107 reactor years, making the assumption that only one such release need be considered. Thus to establish whether the risk, summed over all faults, is acceptable it is permissible to compute E(p.C.kk/Crkr) where Cr is some specific size of release used for reference purposes, in order to arrive at a mean probability to compare with the proposed criterion. In the APC method it is convenient to use the practical upper limit for the 131I release for reference purposes.
A. 3. THE PESSIMISTIC NATURE OF THE APC METHOD
The frequencies assumed for primary faults (see Table I of this paper) are best estimates rather than upper limits; they could therefore contain some degree of optimism.

SM-101/50 237
The reliability assumed for the reactor shut-down system and emergency cooling system is treated pessimistically. It is assumed that the stated failure rate applies to operation of the system within the maximum time assumed in the design. In the event of failure to operate within this time it is quite likely that they would still operate in time to prevent core melt down. However, no credit is taken for this possibility.
Thus for each primary fault which necessitates operation of these systems it is assumed that either the reactor shuts down correctly, or the fault is uncorrected and leads to core melt down and the practical upper limit release.
In mathematical terms, in the event of a primary fault of probability p. which necessitates shut-down, it is assumed that there is a probability of q of failure to shut down correctly and a probability (1-q) of shutting down correctly. Thus the probability of the release of 1 X 10⁷ curies of 131I is qpj, and the probability of zero release is ( l -qjpj . In some instances two alternative paths following a primary fault can readily be identified which may lead to different shut-down requirements. The two paths, which must have a combined probability of unit, are each treated in the way described above.
APPENDIX II
SALIENT FEATURES OF THE 1000 MW(e) CFR DESIGN
The design chosen for this paper is the 1000 MW(e) CFR described by representatives of the three British Consortia at the BNES Conference in May 1966 [12] . It is a direct development of the Prototype Fast Reactor being built at Dounreay for the UKAEA which has been fully described in Refs [6, 7 and 13] . Brief details only are given below of the CFR design, which differs essentially from PFR in being four times as large in output, and in that PFR is situated on an isolated site.
1. CORE DESIGN
The CFR core consists of 295 hexagonal sub-assemblies each comprising 325 stainless steel clad, mixed uranium/plutonium oxide fuel pins. The pins are supported by grids within a stainless steel hexagonal wrapper. Eight tantalum rods are used for control and 10 more rods are used to maintain sub-criticality during fuel handling and to assist reactor shut-down.
2. PRIMARY CIRCUIT
The entire primary circuit is contained within a cylindrical primary tank of stainless steel, surrounded by a separate steel leak jacket. The leak jacket is contained within a reinforced concrete vault below ground

238 CRICKMER and CAVE
leve l . P r i m a r y sodium is circulated through the core and 18 intermediate heat exchangers by 6 mechanica l pumps in pa ra l l e l . These pumps a re total ly i m m e r s e d in the p r i m a r y sodium and a r e driven by e lect r ic motors si tuated above the vault roof. The argon gas blanket covering the p r imary sodium is held at about 1 lb / in 2 above a tmospher ic p r e s s u r e .
3 . SECONDARY CIRCUIT AND STEAM GENERATORS
The secondary sodium circui t is in the form of 6 separa te loops each connected to an in te rmedia te heat exchanger . Each loop has its own c i rcu la to ry pump and 3-stage s team genera to r . The s team genera tors a r e provided with burs t ing d iscs to re l ieve p r e s s u r e and vent waste products in the event of a sod ium/water react ion following a tube fai lure.
4 . FUEL HANDLING
Replacement of spent fuel in the core with fresh fuel from the rotary s to re within the r e a c t o r ve s se l is ca r r i ed out with the r eac to r shutdown. Movement of fuel to and from the s to re and the fuel handling caves ex te rna l to the r e a c t o r vault can, however, be ca r r i ed out with the r e a c t o r on load.
The r e a c t o r vault i s covered by a reinforced concrete roof fitted with a rotat ing shield concentr ic with the co re . Refuelling entails rotating th is shield and the re fore r equ i r e s that the control and shut-off rods a re disconnected from the i r mechan i sms and must therefore remain in the core throughout r e a c t o r refuelling opera t ions . The charge machine can handle only one sub -as sembly at a t ime and can only unlatch it in the lowered posi t ion. The sub-as sembly is handled ent i re ly immersed in sodium.
Spent fuel from the s torage ro tor is handled ent irely in sodium-filled buckets which can be t r a n s f e r r e d one at a t ime in an argon atmosphere to the buffer s to re and hence to the argon-fil led examination and decontamination caves .
R E F E R E N C E S
[1] FARMER, F.R., "Siting criteria - A new approach", Containment and Siting of Nuclear Power Reactors.
(Proc. Symp. Vienna, 1967), IAEA, Vienna (1967) 303.
[2] ADAMS, C.A., STONE, C. N., "Safety and siting of nuclear power stations in the United Kingdom",
Containment and Siting of Nuclear Power Reactors. (Proc. Symp. Vienna, 1967), IAEA, Vienna
(1967) 129.
[3] CAVE, L., HOLMES, R. E., "Suitability of the advanced gas-cooled reactor for urban siting", Con
tainment and Siting of Nuclear Power Reactors. (Proc. Symp. Vienna, 1967), IAEA, Vienna
(1967) 273.
[4] CAVE, L., WILLIAMS, T .F . , "Safety assessment of pressure tube heavy water reactors by probability
methods", Heavy Water Power Reactors (Proc. Symp. Vienna, 1967), IAEA, Vienna (1968)
Paper SM-99/19.
[5] CAVE, L., CRICKMER, J.R., "Safety assessment of fast reactors by probability methods", CEA
Int. Conf. Safety of Fast Reactors, Aix-en-Provence, Sep. 1967, Paper 6/6.

SM-101/50 239
[6] EVANS, P.B.F. et a l . , "Control and instrumentation of prototype fast reactors", BNES Conf. Fast Breeder Reactors, London, 17-19 May 1966, Paper 5A/5.
[7] BISHOP, J. F. W. et a l . , "Design and development of fuel and fuel elements for prototype fast reactors", BNES Conf. Fast Breeder Reactors, London, 17-19 May 1966, Paper 4B/1.
[8] FARMER, F.R., GILBY, E.V., "A method of assessing fast reactor safety", CEA Int. Conf. Safety of Fast Breeder Reactors, Aix-en-Provence, Sep. 1967.
[9] BARTHOUX, A., SAROUL, J., "Comportement des produits de fission dans le sodium liquide", Alkali Metal Coolants (Proc. Symp. Vienna, 1966), IAEA, Vienna (1967) 743.
[10] HICKS, E.P. , MENZIES, D .C . , "Theoretical studies on the fast reactor maximum accident", Int. Conf. Safety, Fuels and Core Design in Large Fast Power Reactors, Argonne, 11-14 Oct. 1965, ANL-7120, 654-70.
[11] GREEN, A.E., BOURNE, A.J. , Reliability Considerations for Automatic Protective Systems, UKAEA
Rep. AHSB(S) R91. [12] TATTERSALL, J .O. , BELL, P.R.P., EMERSON, E., "Large commercial sodium cooled fast reactors",
BNES Conf. Fast Breeder Reactors, London, 17-19 May 1966, Paper 3/6. [13] FRAME, A.G. et al., "Design of the prototype fast reactor", BNES Conf. Fast Breeder Reactors,
London, 17-19 May 1966, Paper 3/3.
DISCUSSION
D. STEGEMANN: Would you indicate how you arrived at the figures quoted in the example you mentioned in your oral presentation, for primary failure consisting in loss of power to primary pumps an estimated frequency of 10 per reactor life-time and for associated secondary failure 10"4?
L. CAVE: The assumed incidence of primary pump failure is based on the experience of the United Kingdom electrical supply system, on the assumption that the primary pumps are driven by electric motors taking their supply from the grid via transformers. The data available suggest that the figure of 10 failures per reactor lifetime (i .e. once in 3 years) is reasonable. In practice it might vary from 1 to 30. Other figures might be appropriate for other arrangements of pump drives or electrical supplies.
As far as secondary failures are concerned, the incidence of failures on demand of reactor shut-down systems has been investigated closely in the United Kingdom for our Magnox and advanced gas-cooled reactors. It is considered that with a single shut-down system (based on two effective trip parameters for each fault condition and with "2 out of 3" logic in each of the trip channels) a failure rate of 1 in 104 demands is reasonable. For fast reactors the time available to detect some faults and to shut the reactor down is less . The adequacy of the trip sensor time-response must therefore be viewed with some reservation for the time being, and it would be desirable to have function data on, for example, sodium superheating. However, if function data are not forthcoming, it should be possible, by ingenuity in design, to devise alternative sensors with time constants which would be fully acceptable.
K .E . J . WIRTZ (Chairman): How does British industry feel about the wish of the Central Electricity Generating Board to have the safety report based on the probability analysis? The task might be formidable.

240 CRICKMER and CAVE
L. CAVE: I agree that the preparation of a safety report based on probability analysis would involve considerable work. However, we have prepared such reports for recent AGR tenders, using the APC method of analysis described in the paper. I feel that the additional work has been well worth while because of the much greater appreciation one reaches of those features in the design which are most important to safety.

SENSITIVITY STUDY OF FAST REACTORS USING GENERALIZED PERTURBATION TECHNIQUES
A. GANDINI, M. SALVATORES •
CNEN, CENTRO DI STUDI NUCLEARI, CASACCIA, ROME AND I. DAL BONO CNEN, CENTRO DI CALCOLO, BOLOGNA, ITALY
Abstract
SENSITIVITY STUDY. OF FAST REACTORS USING GENERALIZED PERTURBATION TECHNIQUES. A broad sensitivity study is presented relative to integral quantities of interest for fast reactor evaluation, namely sodium effects, Doppler coefficients, prompt neutron lifetimes, using generalized perturbation techniques. Deviations roughly typical of present uncertainties are assumed for differential nuclear data, and therefore the results obtained are fairly indicative of the inaccuracies to be associated with theoretical predictions.
1. INTRODUCTION
The present work aims to analyse the influence of the different nuclear parameters on the assessment of integral quantities relevant to the reactor safety of typical fast ceramic reactor systems; namely, the sodium void coefficient, the Doppler coefficient and the prompt neutron life-time. For this purpose generalized perturbation techniques have been used which take into account the influence on the integral quantities consequent on changes of both the real and adjoint neutron flux. It is shown that the influence of changes of the adjoint flux on such quantities may be relevant in some cases. In this respect the present paper is an improvement on a previous paper [1], where only the effects relevant to real flux changes were considered.
The variations of the differential nuclear parameters correspond roughly to assumed uncertainties of data available at present and therefore the results obtained are fairly indicative of the inaccuracies to be associated with theoretical predictions. On the basis of this analysis it is then possible to indicate which data, at different energies, are most inaccurate and how much improvement in the integral quantities considered could be obtained by reducing some of the assumed uncertainties.
In the analytical study the multigroup diffusion theory has been adopted and the cross-section library by Abagyan [2] .
2. THE PERTURBATION METHOD ADOPTED
Let us consider a ratio Pbu of two bilinear functionals of the real and adjoint neutron fluxes cp and <j?*:
_ / f f*H?dr _ Qi Pbil " /^*F<?dr ~ Q 2
( 1 )
241

242 GANDINI et a l .
In pa r t i cu l a r pb i l may r e p r e s e n t r eac t iv i ty values and prompt neutron l i f e t imes . In the fo rmer case H r e p r e s e n t s a change A P of the Boltzmann opera to r whereas in the l a t t e r case it r e p r e s e n t s the i nve r se diagonal m a t r i x v" 1 . F is the f ission production m a t r i x . If now a per tu rba t ion 6 P is introduced into the s y s t e m without affecting the c r i t ica l i ty , pbn
will genera l ly change by an amount 6 p^^ . Using genera l ized per tu rba t ion methods [1 , 3], the following equation may be wr i t ten :
Pbil
where
^ ^ = / ^ * 6 G ^ d r + / <£*6P^dr + / ^ * 6 P ^ d r (2)
6 G = 6 H _ 6 F _ Qi Q2
and <p *, ip a r e respec t ive ly the over -a l l impor tance and flux density functions corresponding to the ra t io pb i l cons idered . The f i rs t t e r m at the r ight hand side of Eq.(2) r e p r e s e n t s the change of pb i l due to d i rec t effects, i . e. changes of the opera tor AP, if any. The second and th i rd t e r m s r e p r e s e n t indirect effects, the second being connected to r e a l flux changes, the third to adjoint flux changes . The formulation of these in tegra l t e r m s s e e m s to be equivalent to that which appears as the numera to r of conventional per turba t ion express ions as r ep re sen t ed by E q . ( l ) . Functions 0* and (// a r e given by the following equat ions:
£ * = £ ? ? (4) i = l
1
-I i = l
* i (5)
where <p* and ^j a r e solutions of the i t e ra t ive sys t ems
1 - < 6 > I - A * # * = F*tjj* (i = 2, 3 . . . ) *• 1 1 - 1 '
- A ^ j = G^ (7)
{ - A ^ = F ^ . j (i = 2, 3 . . . )
Opera to r A (and the adjoint A*) a r e re la ted to the lo s s (capture and leakage) and down-sca t te r ing p r o c e s s e s . Since functions $* and ^ t converge to ze ro for i-» 00, I and P a r e decided by the convergence c r i t e r i on chosen. It should be noted that s y s t e m s (6) and (7) cor respond to i t e ra t ive equations normal ly used for calculating the adjoint and r e a l f luxes.
The CIAP ID code solves sys t ems (6) and /o r (7) in mult igroup diffusion theory and one dimension. The GLOBPERT ID code ca lcula tes 6Pbil/Pbil va lues .

SM-101/30 243
TABLE I. COMPOSITIONS (in nucle i /cm 3 X.10"24) AND DIMENSIONS OF THE TWO REFERENCE FAST SYSTEMS
R(cm)
H (cm)
NPu-239
NU-238
N Fe
N Cr
NNi
,N N a
NBe
N° Nc
Pancake oxide system
Core
-
63.56
0.000851
0.004253
0.01134
0. 00326
0.00152
0.01012
0.00462
0.014828
-
Blanket
-
45.72
0.000199
0.010008
0.01015
0.00292
0.00136
0.00704
-0.020416
-
Carbide system
Core
102.95
-0.00075
0.006272
0.004718
0.001355
0.000032
0.01463
-
0.007022
Blanket
148.67
-0.000206
0.012142
0.007166
0.00206
0.00096
0.00946
-
0.012348
3. FAST REACTORS STUDIED
The reactors considered in the present analysis are two plutonium-fuelled sodium-cooled breeders. They have been chosen according to present trends in fast reactor design. The first system is a pancake oxide reactor, the second system consists of a carbide cylindrical reactor with an L/D ratio close to one. The calculations, have been performed in slab geometry for the pancake case, using a radial buckling B? =0.000164 to allow for the finite radial size, whereas for the carbide system the spherical geometry has been adopted. Compositions and dimensions of the two reference systems are illustrated in Table I.
4. SODIUM VOID EFFECT
The integral parameter Pbn chosen to study the sodium void effect is the reactivity value associated with the removal of 10% vol. of sodium from the system. The sensitivity analysis consists in the evaluation of the sodium effect changes consequent on assigned;percentage variations of the group nuclear constants of the component elements. For the oxide pancake system the net sodium void reactivity effect is -0..928X 10"3 6k/k whereas for the carbide system it is -2.459X 10"^ 6k/k. The results of the calculations are shown in Table II. For the clarity of exposition the 26 groups of the Abayan library have been condensed into four, as shown in Table III. The interpretation of the results requires that four different

TABLE II. SENSITIVITY VALUES RELATIVE TO THE SODIUM VOID E F F E C T (in percent 6p b i l /p b i l ) £
Material
239 p u
238 u
Na
Fe
c o Be
Param. a
V
°f
°c
°in
°el
V
°f
°c
°in
°el
°in
°el
°c
°in
°el
°el
°el
°el
System
^ \ Gr. 6o/o ^ * \ ^
0.02
0.03
0.05
0.10
0.10
0.02
0.03
0.05
0.10
0.10
0.10
0.10
0.10
0.10
o.io 0.10
0.10
0.10
Carbide
1
- 19.73
- 20.25
0.38
4.38
0.20
- 25.09
- 22.41
7.11
77.66 ;
- 3.71
- 40.78
- 11.98
0.45
16.93
0.81
6.65
-
-
2
- 44.82
- 54.19
0.99
1.82
27.73
1 1
0.27 i
- 3.99
1.15
6.81
45.05
-
-
3
46.49
45.16
- 25.88
1.19
- 75.33
9.82
82.09
- 3.34
6.93
15.89
-
-
4
39.55
35.20
- 26.19
0.15
- 28.94
1.90
3.67
- 1.23
2.17
2.03
-
-
Oxide
1
- 2.73
- 2.79
0.05
0.45
0.03
- 2.86
- 2.63
0.69
5.43
- 0.56
1.62
- 0.82
0.14
3.56
0.11
-1.02
0.90
2
- 7.86
- 8.85
0.57
0.21
5.58
- 1.18
- 0.26
0.50
1.26
-5.51
2.66
3
2.84
2.06
- 2.42
0.11
- 2.57
0.76
6.62
- 0.64
1.22
-0.85
0.68
4
8.00
8.45
- 6.63
0.02
- 5.63
0.29
0.13
- 0.64
0.66
-0.41
0.16

TABLE III. FINE AND COARSE GROUP STRUCTURE
Coarse groups
Fine groups
Ei (keV)
1
6500
2
4000
1
3
2500
4
1400
5
800
6
400
7
200
2
8
100
9
4 6 . 5
10
2 1 . 5
11
10 .0
12
4 .65
3
13
2 .15
14
1.00
15
0.465
Coarse groups
Fine groups
E x (keV)
16
0 .215
17
0.100
18
0.0465
19
0.0215
20
0.010
4
21
0.00465
22
0.00215
23
0.0010
24
0.000465
25
0.000215
T
0.0000252
CO
en
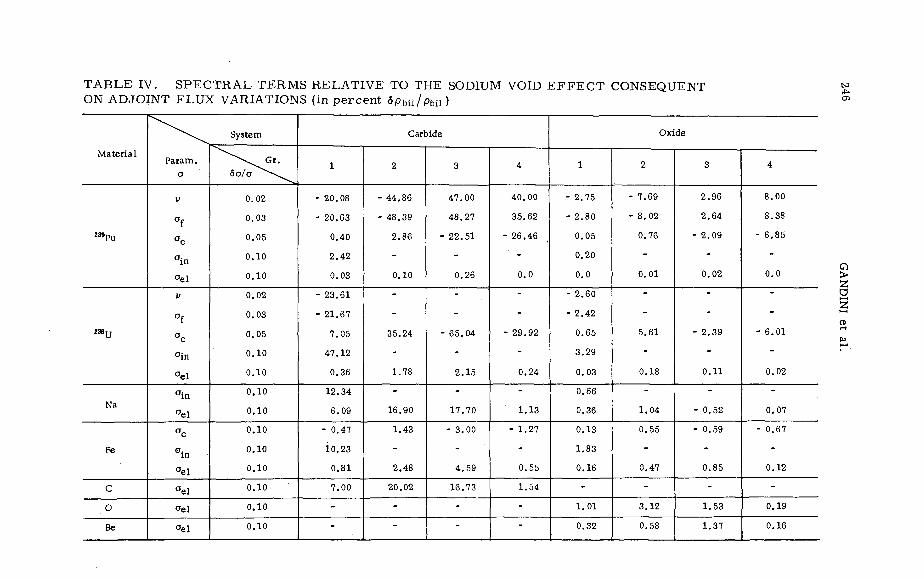
T A B L E IV. S P E C T R A L T E R M S R E L A T I V E TO THE SODIUM VOID E F F E C T CONSEQUENT £ ON A D J O I N T F L U X VARIATIONS (in p e r c e n t 6 p b i l / p b i l ) °>
Material
239p u
2 3 8 u
Na
Fe
C
O
Be
Param. a
V
°f
°c
°in
°el V
°f
°c
°in
°el
°in
°el
°c
°in
°el
°el
oel
o e l
System
6a/a ^ ^ ^
0.02
0.03
0.05
0.10
0.10
0.02
0.03
0.05
0.10
0.10
0.10
0.10
0.10
0.10
0.10
0.10
0.10
0.10
Carbide
1
- 20.08
- 20.63
0.40
2.42
0.03
- 23.61
- 21.67
7.05
47.12
0.36
12.34
6.09
- 0.47
10.23
0.81
7.00
--
2
- 44.86
- 48.39
2.86
0.10
35.24
1.78
16.90
1.43
2.48
20.02
--
3
47.00
48.27
- 22.51
0.26
- 65.04
2.15
17.70
- 3.00
4.59
16.73
--
4
40.00
35.62
- 26.46
0.0
- 29.92
0.24
1.13
- 1.27
0.55
1.54
--
Oxide
1
- 2.75
- 2.80
0.05
0.20
0.0
- 2.60
- 2.42
0.65
3.29
0.03
0.66
0.36
0.13
1.83
0.16
-1.01
0.32
2
- 7.69
- 8.02
0.76
0.01
5.61
0.18
1.04
0.55
0.47
-3.12
0.58
3
2.96
2.64
- 2.09
0.02
- 2.39
0.11
- 0.52
- 0.59
0.85
-1.53
1.37
4
8.00
8.38
- 6.85
0.0
- 6.01
0.02
0.07
- 0.67
0.12
-0.19
0.16

TABLE V. LEAKAGE TERMS RELATIVE TO THE SODIUM VOID E F F E C T (in p e r c e n t 6/0^ / p b i l )
Material
239 p u
2 3 8 u
Na
Fe
C
O
Be
Param. a
V
°f
°c
°in
°el V
°f
°c
°in
"e l
°in
o*
in
°el
< * 1
°in
"el
Oel
"el
°el
System
60/0 ^"~"- -^
0.02
0.03
0.05
0.10
0.10
0.02
0.03
0.05
0.10"
0.10
0.10
0.10
0.10
0.10
0.10
0.10
0.10
0.10
0.10
0.10
Carbide
1
. 0.0
0.05
0.0
0.10
0.15
0.0
- .0 .28
- 0.07
- 5.42
- 4.32
- 0.01
- 61.89
- 0.01
- 22.38
0.0
- 1.02
- 1.20
- 5.17
--
2
0.0
0.10
0.03
1.47
- 0.06
- 4.59
6.86
- 47.93
0.0
- 0.44
4.98
--
3
0.0
0.10
0.10
0.97
0.31
8.17
7.52
65.69
0.0
3.58
2.80
--
4
0.0
0.08
0.09
0.10
0.14
1.72
1.28
1.47
0.0
1.74
---
Oxide
1
0.0
0.01
0.0
0.01
0.03
0.0
- 0.04
- 0.01
- 0.76
- 0.61
- 0.02
0.30
- 0.06
- 1.50
0.0
- 0.13
- 0.22
-- 0.94
0.19
2
0.0
0.01
0.0
0.18
- 0.02
- 1.54
0.25
- 2.63
0.0
0.05
-- 1.14
0.24
3
0.0
0.01
0.01
0.11
0.04
0.76
0.27
- 4.04
0.0
1.00
-0.67
0.26
4
0.0
0.01
0.01
0.02
0.03
0.28
0.13
- 0.04
0.0
0.60
-0.32
0.07
* Direct effect
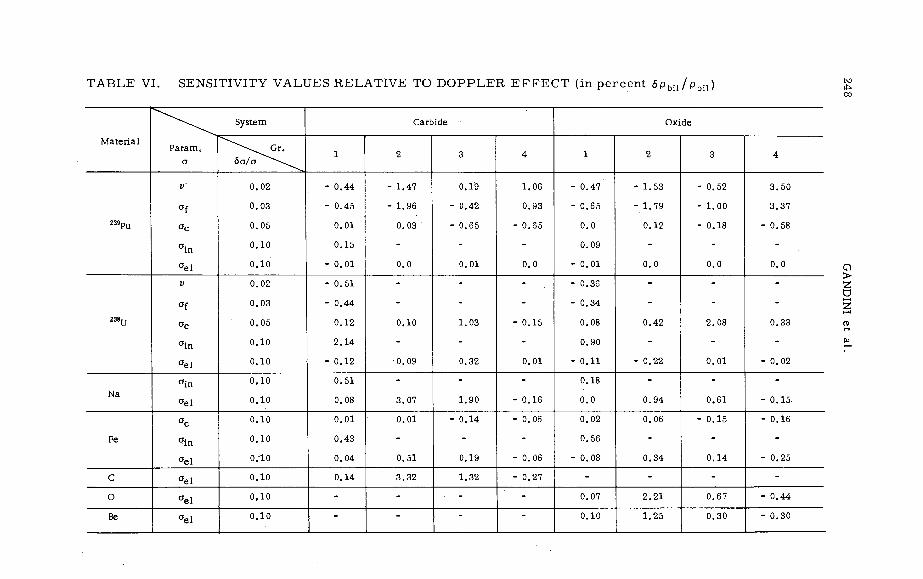
TABLE VI. SENSITIVITY VALUES RELATIVE TO DOPPLER E F F E C T (in percent 5p b i l /p b i l ) £ 00
Material
239pu
2 3 8 u
Na
Fe
C
O
Be
Param. a
V
°f
o c
°in
°el V
Of
°c
°in
°el
°in
°el
°c
Oin
°el
°el
°el
°el
System
6 o / o ^ ^ ^ ^
0.02
0 .03
0.05
0.10
0.10
0.02
0 .03
0 .05
0.10
0.10
0.10
0.10
0.10
0.10
o.-io
0.10
0.10
0 .10
Carbide
1
- 0.44
- 0.45
0.01
0.15
- 0 .01
- 0 .51
- 0.44
0.12
2 .14
- 0.12
0.51
0.08
0 .01
0.43
0.04
0.14
-
-
2
- 1.47
- 1.96
0.03
0.0
0.10
0.09
3.07
0.01
0.51
3.32
-
-
3
0.19
- 0.42
- 0.65
0.01
1.03
0.32
1.90
- 0.14
0.19
1.32
• -
-
4
1.06
0.93
- 0 .65
0.0
- 0.15
0.01
- 0.16
- 0.06
- 0.06
- 0.27
-
-
Oxide
1
- 0.47
- 0 .65
0.0
0.09
- 0.01
- 0.36
- 0.34
0.08
0.90
- 0 .11
0.18
0.0
0.02
0.56
- 0.08
-
0.07
0.10
2
- 1.53
- 1.79
0.12
0 .0
0.42
- 0.22
0 .94
0.06
0 .34
-
2 .21
1.25
3
- 0.52
- 1.00
- 0.18
0.0
2 .08
0 .01
0 .61
- 0 .15
0.14
-
0.67
0.30
4
3 .50
3.37
- 0.58
0.0
0.33
- 0.02
- 0 .15
- 0.16
- 0.25
-
- 0 .44
- 0 .30

SM-101/30 249
effects should be distinguished, corresponding to the influence of the real and adjoint flux variations on the spectral and leakage terms into which the perturbation 6P of Eq. (2) may be subdivided. In general it should be noted that there is a large contribution to the spectral terms due to the adjoint flux variation consequent on changes of the fission and capture properties of the fissile and fertile materials, as shown in Table IV. The inelastic and elastic scattering effect on the adjoint flux, and consequently on the spectral term, is comparable with that due to the real flux variation. As far as the leakage terms are concerned, their values are much smaller than the spectral ones, as may be seen in Table V, where also the direct effects of sodium cross-section changes, corresponding to the first term on the right-hand side of Eq. (2), are included. The variation of the real and adjoint fluxes due to the elastic scattering changes is also important in this connection.
It is interesting to notice that the direct effects consequent on sodium cross-section changes are of the same order of magnitude as many indirect changes consequent on flux variations. This shows in particular that when computing the sodium void effect one should take into consideration the rigorous formulation of the reactivity
6k /y*APff'dr k J$* F?» dr ( '
where <p* represents the real flux after the sodium is removed. This may be evaluated by a good approximation using the generalized perturbation techniques adopted here [3].
5. DOPPLER EFFECT
As far as the Doppler effect is concerned, the reactivity associated with a temperature r ise in the core from 900 to 2100°K has been considered. For the oxide pancake system the value has been calculated as -1.547X10"2 6k/k, and for the carbide system -1.391X10"2 6k/k. The results of the calculations are shown in Table VI. It is interesting to note the role of the adjoint flux variation caused by changes of the v and <7f of plutonium. This is shown in Table VII where also the direct contributions to allow a more detailed analysis are indicated . As expected, the adjoint flux variations consequent on changes of the CTC of 238U show an opposite trend. Real flux changes relevant to the Doppler effects are attributable particularly to the change in CTC of 238U in the third coarse group, and in general to the change in oe\ and ain , respectively, in the first and in the second and third groups. This is expected, as these cross-sections are directly involved in the softness of the spectrum to which the Doppler effect is related. Also here it seems of relevance that, with the rough uncertainties assumed, the main cause of the inaccuracy of Doppler effect evaluations appears to be cross-sections that are different from those involved directly in the Doppler effect itself.
6. PROMPT NEUTRON LIFETIME
The prompt neutron lifetime for the pancake oxide and for the carbide system has been calculated as 0. 794 X 10-6 s and 0. 571 X 10"6 s. The

CO en
T A B L E VII. S P E C T R A L TERMS RELATIVE TO DOPPLER E F F E C T CONSEQUENT ON ADJOINT FLUX VARIATIONS ° (in p e r c e n t 6 pbu / Pbil)
Mate r i a l
»9 PU
238 u
Na
Fe
C
O
Be
P a r a m .
a
V
°f
'?
°i °in
"el V
°f a*
°c
°c*
°in
°el
°in
°el
°c
°in
°el
° e l
° e l
° e l
System
0.02
0.03
0.03
0.05
0.05
0.10
0.10
0.02
0.03
0.03
0.05
0.05
0.10
0.10
0.10
0.10
0.10
0.10
0.10
0.10
0.10
0.10
Carbide
1
- 0.41
- 0.42
0.01
0.04
- 0.01 - 0.49
- 0.45
0.0
0.12
0.71
- 0.10
0.18
- 0.05
0.01
0.15
0.02
- 0.01
--
2
- 1.37
- 1.49
0.15
- 0.03
1.11
- 0.42
- 0.12
0.04
- 0.11
0.0
--
3
0.58
0.58
- 0.37
- 0.33
0.22
0.0
- 0.96
4.48
0.03
0.26
- 0.05
0.10
0.31
--
4
1.57
1.45
- 0.45
- 1.02
0.44
0.0
- 1.28
1.27
0.04
0.06
- 0.05
0.05
0.07
--
Oxide
1
- 0.44
- 0.44
0.0
0.03
- 0.01 - 0.36
- 0.35
0.08
0.26
- 0.09 0.05
- 0.05
0.02
0.18
- 0.09
-- 0.10
0.02
2
- 1.45
- 1.50
0.19
- 0.03
0.93
- 0.41
- 0.16
0.10
- 0.23
-- 0.19
0 .0
3
- 0.06
- 0.09
- 0.41
- 0.04
0.27
- 0.01
- 0.07
3.81
- 0.09
- 0.08
- 0.02
- 0.01
-0.03
0.01
4
2.02
1.92
1.48
- 1.52
0.94
0.0
- 1.54
1.97
0.02
0.02
- 0.16
0.04
-0.04
0.01
* Direct effect

T A B L E VIII. SENSITIVITY VALUES R E L A T I V E TO P R O M P T N E U T R O N L I F E T I M E (in p e r c e n t 5 p b i l / p b i l )
Material
239pu
2 3 8 u
Na
Fe
C
O
Be
Param. a
V
°f
°c
°in
°el V
°f
°c
°in
°el
°in
°el
°c
°in
°el
°el
°el
°el
System
&a/a ^ ^ ^
0.02
0.03
0.05
0.10
0.10
0.02
0.03
0.05
0.10
0.10
0.10
0.10
0.10
0.10
0.10
0.10
0.10
0.10
Carbide
1
- 0.26
- 0.27
0.0
0.11
0.0
- 0.32
- 0.26
0.07
1.86
- 0.07
0.46
0.14
0.01
0.36
0.05
0.17
--
2
- 0.59
- 0.90
- 0.04
0.01
- 0.29
0.15
1.65
0.0
0.28
1.67
--
3
0.50
0.09
- 0.55
0.01
- 2.12
0.25
1.29
- 0.07
0.24
0.95
--
4
0.66
0.44
- 0.60
0.0
- 0.78
0.04
0.06
- 0.03
0.06
0.08
--
Oxide
1
- 0.24
- 0.25
0.0
0.08
0.0
- 0.20
- 0.17
0.05
0.78
- 0.05
0.16
0.05
0.01
0.50
- 0.01
-0.16
0.11
2
- 0.65
- 0.86
0.02
0.0
0.03
- 0.02
0.63
0.01
0.27
-1.40
0.83
3
0.19
- 0.12
- 0.40
0.01
- 1.24
0.11
0.53
- 0.11
0.28
-0.65
0.40
4
0.80
0.56
- 0.87
0.0
- 0.93
0.02
0.04
- 0.10
0.10
-0.14
0.07

TABLE IX. SENSITIVITY VALUES RELATIVE TO PROMPT NEUTRON LIFETIME CONSEQUENT ON REAL FLUX VARIATIONS (in percent 6pbil/pm)
Material
239 p u
238 . .
Na
Fe
C
O
Be
Param. o
V
°f
o c
°in
°el
V
°f
°c
°in
°el
°in
°el
°c
°in
°el
° e l
° e l
oe l
System
^ ^ \ G r . 5o/o ^"~\^^
0.02
0.03
0.05
0.10
0.10
0.02
0.03
0.05
0.10
0.10
0.10
0.10
0.10
0.10
0.10
0.10
0.10
0.10
Carbide
1
0.0
0.0
0.0
0.08
0.0
0.01
0.04
- 0.01
1.26
0.0
0.33
0.16
0.0
0.25
0.06
0.17
-
-
2
- 0.01
- 0.28
- 0.09
0.02
- 0.71
0.33
1.69
- 0.02
0.32
1.66
-
3
0.0
- 0.33
- 0.31
0.02
- 1.32
0.18
1.02
- 0.04
0.17
0.74
-
-
4
0.0
- 0.16
- 0.17
0.0
- 0.24
0.02
0.03
- 0.01
0.03
0.05
-
-
Oxide
1
0.0
0.0
0.0
0.06
0.0
0.01
0.02
0.0
0.61
- 0.01
0.13
0.07
0.0
0.38
0.03
-0.20
0.09
2
0.0
- 0.19
- 0.06
0.01
- 0.38
0.15
0.69
- 0.03
0.37
-1.46
0.82
3
0.0
- 0.30
- 0.28
0.01
- 0.95
0.10
0.48
- 0.08
0.22
-0.56
0.34
4
0.0
- 0.23
- 0.25
0.0
- 0.31
0.02
0.03
- 0.03
0.07
-0.11
0.06
SM-101/30 253
results of the sensitivity study are shown in Table VIII. The major effects lie, as expected, in the real flux spectrum variations, as indicated in Table IX, where the real flux change effects are presented. For this reason the aei of light elements and ain and ac of the fertile material are particularly involved. As far as the adjoint flux variations are concerned, the major role is played by the change of v, <3{ and ac of the fissile and fertile materials.
7. CONCLUSION
The generalized perturbation techniques used in this paper seem to represent a powerful tool for analysing integral parameters of interest in the study of fast reactor safety, insofar as they permit a considerable improvement in specific differential data. In this particular analysis, the final values of Tables II, VI and VIII, which summarize the whole work, have not been interpreted in terms of standard deviations of the integral parameters themselves as this would have involved assessing some sort of correlation among different groups, which is beyond the scope of the paper. These results, however, clearly indicate that, among those considered, the integral parameter most sensitive to the assumed uncertainties of cross-sections appears to be the sodium void effect. To reduce its uncertainty as much as possible, a noticeable improvement should be made in our knowledge of the fission and capture parameters of the fissile and fertile materials, and of the elastic and inelastic parameters . An improvement here would have a beneficial effect also on the other integral quantities considered.
REFERENCES
[1] DAL BONO, I. et a l . , Perturbation analysis of fast reactors by the CIAP and GLOBPERT codes using improved perturbation methods, Proceedings of Argonne Conference on Fast Criticality Experiments, Oct. 1966, Rep.ANL-7320 (1967).
[2] ABAGYAN, L. P. et al . , Group Constants for Calculation of Fast Reactors, Gosatomizdat, Moscow (1964).
[3] GANDINI, A . , A generalized perturbation method for bilinear functionals of the real and adjoint neutron fluxes, J. nucl. Energy (in press).
DISCUSSION
H. W. KUSTERS: I am not quite clear about your generalized perturbation method. Your paper states that you have some procedure for accounting for changes in real and adjoint fluxes; now, in trying to improve first-order perturbation it seems better to do two successive keff calculations. With your method, can you really save computer time on calculating second-order effects?
M. SALVATORES: Yes, in fact we need do only one keff caculation. As I indicated, the solution of the iterative system gives functions <//* and ip which enable us to evaluate (by means of Eq.(2) in the paper) the changes in real and adjoint fluxes corresponding to every required parameter variation, without direct calculation of any of these variations. In this way we can save computing time and obtain more information about the effects under investigation.


A RE-EVALUATION OF **°U, ^ 8 U AND ^ y P u CROSS-SECTIONS BASED ON MICROSCOPIC AND INTEGRAL DATA
G. RAKAVY, Y. REISS, D. SAMOUCHA AND Y. YEIVIN DEPARTMENT OF THEORETICAL PHYSICS, THE HEBREW UNIVERSITY OF JERUSALEM, ISRAEL
Abstract
A RE-EVALUATION OF 235U. 238U AND 239Pu CROSS-SECTIONS BASED ON MICROSCOPIC AND INTEGRAL DATA. A generalized least-squares method to improve microscopic cross-section evaluations by means of integral data, has been applied to re-evaluate the cross-sections of 235U, 238U and 239Pu, using critical-mass data of 24 simple metallic systems, composed of these isotopes.
It has been found that, after some minor modifications of the original cross-section set, most of the experimental integral data could be reproduced. The cross-section modifications, as a rule, were of the order of a few per cent and well within the uncertainties in the cross-sections. The exception to the rule was the 239Pu fission cross-section in the energy range up to about 150 keV, which had to be decreased by 15 - 20%. This result independently confirms the recent measurements of White et al.
INTRODUCTION
The modification of cross-sections based on results of integral experiments has recently been the subject of several papers [1-5] . These papers, however, only discuss the adjustment of the so-called group constants, these constants having been previously derived in one way or another from a basic set of microscopic cross-sections. But sets of group constants, by their very nature, are usually useful only f o r w e l l - d e f i n e d f a m i l i e s of m u l t i p l y i n g s y s t e m s and t h e i r a p p l i c a t i o n is thus rather limited. The notion of universal group constants a priori seems to be self-contradictory. The more fundamental problem in this context should therefore be the adjustment, or rather the improvement of the basic cross-section set itself.
In this note we report the first results obtained by a generalized least-squares procedure to improve microscopic cross-section sets by integral data, proposed by our group [6] .
This method essentially reduces to minimizing the form
Here the first summation refers to all cross-sections pertinent to the systems considered, and the second to all integral quantities taken into account. The a, y, etc. are the measured values of the relevant quantities, from which we start, the a are the modified, unknown cross-sections, and the y[a] are the calculated values of the integral quantities.
255

256 RAKAVY et al.
All explicit formulas are derived in Ref.[6], except for a more recent improvement incorporated in the procedure [7] taking account of the total cross-section data, which are generally more reliable than those of partial cross-sections.
DESCRIPTION OF INPUT DATA AND RESULTS
As a first practical test of the method, we have applied it to simple spherical critical systems. We had gathered data on critical uranium and plutonium spheres, bare or reflected by natural uranium, and also on bare or reflected systems with an inner plutonium core surrounded by a uranium shell. Thus, except for minor 240Pu and gallium impurities, these systems are comprised of three isotopes only, namely 235U, 238U and 239Pu. We have so far considered 24 such systems, the details of which are collected in Table I.
As our basic microscopic cross-section set, the one which we set out to improve by means of the above critical-mass data, we have chosen the 1962 Karlsruhe set [8] . The relative error of the various partial and total cross-sections have been taken from Schmidt [9] .
TABLE I. DESCRIPTION OF THE 24 CRITICAL SYSTEMS THE DATA OF WHICH WAS USED TO IMPROVE THE MICROSCOPIC CROSS-SECTION EVALUATION
Plutonium masses quoted include all impurities. 6-phase plutonium includes 1 wt % of gallium. Uranium masses are the 235U masses. All data have been taken from Paxton [16], except those for systems UR 2, 4, 5, 6 and' 9 which were taken from Templin [17] . The last two columns give the values of the parameters y, calculated with the 1962 Karlsruhe cross-section set (a) and with the modified set (a).
System
Symbol
p
PR1
PH2
»PKJ
• P R 4
PU1
PU2
«fUJ
*PU4
*PU5
FORI
PUR2
UR1
UR2
UR3
UR4
UR5
UR6
UR7
UR8
UR9
»UR10
Ul
U2
Mass (kg)
16.28
8.39
6.22
5.91
5.73
8.39
5.72
2.527
2.022
2.024
1.615
1.610
Pu-239
Density (gr /em')
15.66
15.62
15.58
15.36
15.63
15.62
15.56
19.22
15.60
15.62
19.48
19.42
Fiss ionable
Pu-240 (*>) 4.5
4 .9
1.35
4 .8
1.5
4 .9
1.5
4 .7
4 .7
1.5
2.34
4.73
Core
Mass (kg)
12.64
18.80
26.80
36.70
36.35
8.87
9.09
34.0
30.86
24.9
24.5
23.75
23.56
19.2
18.55
18.42
16.65
48 .8
48.7
U-235
Density (gr/cm')
18.80
18
18
18
18
18
18
18
18
18
18
18
18
18
18
18
18
18
18
80
80
80
80
80
80
75
80
75
75
75
80
75
75
80
62
75
75
U-238 (<*)
6.83
6.82
6.83
6.83
6.83
6.8
6.8
6 .1
6.5
6 .1
6.5
6.5
6.5
6 .1
6 .1
6.5
6.8
6.2
6 .1
Ref lec to r Nat. Uranium
Thickness (cm)
4.128
11.684
19.609
24.130
18.923
18.872
1.765
2.54
4.470
4.75
5.08
5.08
8.941
9.957
10.16
18.009
Density (gr/cm3)
18.92
19.00
19.00
19.00
19.00
19.00
19.00
19.00
19.00
18.80
18.80
19.00
19.00
19.00
19.00
19.00
Tf [S] - i (ilOOO)
6.783
10.488
9.608
4.885
2.938
1.326
1.115
-7 .018
-4 .385
-3.466
-3.676
-3.900
-3.546
-3 .147
-3 .351
-3.440
-10.044
-10.154
Yt°] - 1 (xlOOO)
- .761
.180
.353
.214
.377
.446
.299
- . 378
1.378
.898
.514
.108
.469
- .427
- .787
- . 9 2 3
- . 9 1 3
-1 .011

SM-101/67 257
The integral quantities that we consider, the 7's of our problem, are obviously the reactivities, or the multiplication constants, of the above-mentioned systems. We find it more convenient, however, to employ other, closely related quantities, namely the eigenvalues of the equation
7
The y[o] of the critical systems have been calculated in a 25-group Sg
approximation. The experimental values, by definition, are all 7 = 1. As for the er rors A 7, these are often (but not always) given along with the other experimental results, but the values quoted vary rather suspiciously from system to system. We have therefore, somewhat arbitrarily, assumed that A7=0.001 for all the systems. This is equivalent to 50- 100 g plutonium in the Pu-core systems, and to 250 - 500 g uranium in the U-core systems.
TABLE II. CORRECTION FACTORS FOR U.
The second column gives upper bounds of energy intervals over which the factors are constant. In the original set the relation 7(E) = 2. 25+0. 132 E was used.
No.
1
2
3
4
5
6
7
8
9
10
11
12
13
14
15
16
17
18
19
20
21
22
23
24
25
Energy HeV
.020
.040
.070
.090
.120
.160
.200
.250
.300
.375
.450
.550
.650
.750
.900
1.100
1.300
1.450
1.550
1.650
2.0
2.4
3.0
4.0
14.0
Fission
.5
2.4
3.3
3.3
3.4
3.5
3.7
3.9
4.0
4.1
4.0
3.9
4.3
4.0
3.7
3.4
3.0
2.8
2.6
2.5
2.2
1.8
.6
.4
.0
Capture
-1.2
-2.5
-2.6
-2.1
-1.8
-1.5
-1.3
-4.8
-4.1
-3.5
-3.0
-2.7
-2.5
-2.2
-1.7
-1.3
-.9
-.7
-.6
-.5
-.4
-.3
-.1
-.1
-.0
P (xlOO)
Inelastic Scattering
.0
.0
.1
.4
.8
1.3
1.9
2.5
3.1
3.7
4.0
3.9
3.7
3.4
2.9
2.1
1.5
1.2
1.2
1.2
1.1
.9
.9
.6
.1
Elastic Scattering
.1
1.1
1.9
2.6
2.9
3.0
2.9
2.7
2.2
1.6
1.1
.7
.3
.1
-.1
-.2
-.3
-.3
-•3
-.3
-.4
-.3
-.2
-.1
-.0
•v
.0
.5
.6
.6
.5
.5
.5
.6
.6
.5
.5
.5
.5
.4
.4
.4
.4
.3
.3
.3
.2
.2
.3
.2
.0

258 RAKAVY et al.
TABLE III. CORRECTION FACTORS FOR 238U.
The second column gives upper bounds of energy intervals over which the factors are constant. In the original set the relation "y(E) = 2.48+0.132 E was used.
NO.
1
2
3
4
5
6
7
8
9
10
11
12
13
14
15
16
17
18
19
20
21
22
23
24
25
Energy
HeV
.02
.04
.07
.09
.12
.16
.20
.25
.30
.375
.450
.550
.650
.750
.90
1.1
1.3
1.45
1.55
1.65
2.0
2.4
3.
4.
14.
Fission
.0
.0
.0
.0
.0
.0-
.0
.0
.0
.0
.0
.0
.0
•0
-.0
-.1
-.1
-.3
-.6
-.7
-.8
-1.9
-1.4
-.9
-.0
P
Capture
.5
.3
1.1
3.4
4.5
5.2
5.3
.8
.7
.6
.5
.5
.5
.4
.4
.4
.2
.1
.1
.1
.1
.0
.0
.0
.0
Uioo) Inelastic
Scattering
,0
.0
-.1
-.6
-1.8
-3.6
-2.9
-3.8
-4.6
-5.3
-5.7
-5.9
-7.5
-6.2
-4.9
-4.3
-2.9
-2.5
-2.0
-2.6
-2.3
-1.5
-1.2
-.9
-.1
Elastic Scattering
-.6
-1.4
-2.5
-3.4
-6.8
-9.9
-10.0
-9.4
-8.5
-7.3
-6.1
-5.0
-3.9
-2.5
-1.1
-.7
-.6
-.5
-.5
-.2
-.1
.1
.2
.2
.0
V
.0
.0
.0
.0
.0
.0
.0
.0
.0
.0
.0
.0
-.0
-.0
-.0
-.0
~.o ~.o -.1
-.1
-.1
-.1
-.0
-.0
-.0
The neutron angular fluxes and adjoint angular fluxes have also been calculated in the above-mentioned approximation and have then been used as input to a multigroup perturbation code to obtain the derivatives dy/do which are necessary for our analysis.
Finally, by the explicit formulas of Ref. [6] (slightly modified as already mentioned), the relative correction factors defined by
CT = (l+p)o-
obtained for each partial cross-section and for v. The p's are given in Tables II, III and IV. The original and modified microscopic cross-sections are given in Figs 1, 2 and 3.
As will be explained below, only 18 systems were used to obtain the modified cross-section set. The values of the 18 corresponding Y*S, calculated with the original (1962 Karlsruhe) and modified sets of cross-sections, are also given in Table I.

SM-101/67 259
TABLE IV. CORRECTION FACTORS FOR ^P.u . .
The second column gives upper bounds of energy intervals over which the factors are constant. In the original set the relation 7(E) = 2. 89+0.123 E was used.
So.
1
2
3
4
5
6
7
8
9
10
11
12
13
14
15
16
17
18
19
20
21
22
23
24
25
Endrgy HaV
.02
.04
.07
.09
.12
.16
.20
.25
.30
.375
.45
.55
.65
.75
.90
1.10
1.30
1.45
1.55
1.65
2.0
2.4
3.0
4.0
14.0
Fission
•5.7
-15.9
-22.5
-23.6
-14.6
-3.5
-3.1
-2.8
-2.4
-2.0
-1.7
-1.4
-1.2
-1.0
-.9
-.7
-1.2
-1.0
-.8
-.7
-.5
-.4
-.3
-.2
-.0
Capture
10.9
22.2
16.9
14.8
9.5
3.0
2.6
1.9
1.4
1.1
.8
.6
.4
.3
.2
.1
.2
.1
.1
.1
.1
.0
.0
.0
.0
P (xlOO)
Inelastic Scattering
.2
.6
1.2
1.1
.4
-.4
-.5
-.7.
-1.0
-1.2
-.9
-.5
-.0
.0
.1
.3
.6
.7
.9
1.0
1.1
1.0
.8
.6
.0
Elastic Scattering
.5
2.4
4.5
5.7
4.7
3.3
3.2
3.0
2.8
2.6
2.3
2.0
1.8
1.7
1.5
1.3
1.3
1.1
.9
.8
.6
.4
.2
.0
.0
V
-.6
-1.6
-2.3
-2.4
-2.3
-2.1
-1.9
-1.6
-1.4
-1.2
-1.0
-.8
-.7
-.6
-.5
-.4
-.3
-.3
-.3
-.2
-.2
-.1
-.1
-.1
-.0
DISCUSSION
It should be clear from the tables and figures that the cross-section modifications are generally very small indeed. This actually implies that the experts who analysed the multitude of direct cross-section measurements and theoretical information and derived the 'best' cross-section set have done a pretty good job. With some more luck they could just as well have derived most of the modified set, which seems to be almost as consistent with the primary data as the original set i s . Since the integral quantities are often extremely sensitive to variations in the cross-sections, rather slight changes in the cross-section curves might greatly improve the agreement between the calculated and experimental values of the Y 'S . In other words, the experimental cross-section and integral data are, in fact, consistent with each other. Yet, because of the enormous scatter of the former and the extreme sensitivity of the latter, it is practically impossible at present to derive satisfactory cross-section curves from the cross-section data alone. The direct

0.01
barns
0.10 -i L
100 MeV
barns
ISO
w-
50-
0
' 1 ' 1
(Sel (U-235)
^*^^S_
1 1 1 1
1
-
s
-
I
001 1.0 10.0 MeV
TO > > <
FIG. 1. Microscopic cross-sections of 2*U. 1962 Karlsruhe set (5) ; • modified cross-.sections (a) resulting from the least-squares analysis including critical-mass data of 18 systems.

barns
barns
barns
150
100
50
' I ' i
Cfei (U-238)
i , I
-
> 0.01 Q1 10 10.0
MeV
barns
3.0
2.0
10
0
1 ' 1
Ojn (U-238)
S i
1 1
/ II
Jl
/y jy
1
\
\ -
Q01 0.1 1.0 100 MeV
FIG.2. Microscopic cross-sections of 2MU. 1962 Karlsruhe set (5); modified cross-sections (o) resulting from the least-squares analysis including critical-mass data of 18 systems.

FIG. 3 . Microscopic cross-sections of Pu. 1962 Karlsruhe set (6); modified cross-sections (o) resulting from the least-squares analysis including critical-mass data of 18 systems; HJ-« measurements of White et al . [ 1 2 ] .

SM-101/67 263
cross-section measurements do supply an excellent 'spine' for the curves, but an additional guide is essential for obtaining their finer structure. The integral measurements, by their superior accuracy, supply this guide for drawing the 'ripples' superposed on the 'spine' .
In some cases, however, the cross-section modifications are neither small nor lie within the experimental uncertainties in the original curves. The case in point in the present analysis is the fission cross-section of 239Pu. This exception, however, is quite remarkable. It is now generally accepted [10,11] that the earlier evaluations of this cross-section up to about 150 keV should be substantially modified in view of the new measurements of White et al [12] given in Fig. 3. This is exactly what is indicated by our results. Had our results been obtained before the publication of these measurements, we would have suggested that the original fission cross-section in this energy range should be re-checked. The fact that the only real deviation of a modification cross-section from the original curve had already been discovered by direct measurements seems to fully vindicate the re-evaluation procedure. In the few other cases where the modifications are not really small, amounting to about 10% or more, the uncertainties in the original cross-sections are rather large, and the modifications always lie within limits.
In the final analysis, the modified cross-section set is based on 18 systems only. Their y 's, calculated with the modified set, nicely agree with their experimental values: they are all equal to unity within l%o or less . It turned out that, as soon as part or all of the other six systems, marked by an asterisk in Table I, were included, many of the resulting correction factors started to 'jump' and more often than not reached values far exceeding the input uncertainties. At the same time, while the nice fit of the first 18 y's was not appreciably affected, the y's of the additional systems persistently refused to fall into line. This seems to indicate that, while the 18 measurements are consistent with the direct cross-section data and with each other, the other six are definitely neither consistent with the 'differential' nor with the rest of the integral data.
We have also applied the least-square procedure to different combinations of parts of the 18 consistent systems. The cross-section sets obtained in each case, even when only as few as three systems (P, PR1 and UR4) were considered, practically coincided with the set obtained by using all 18 systems. It is therefore evident that additional critical-mass data on fast plutonium and uranium systems of the kind considered in this analysis will be adequately reproduced by the present modified cross-section set. Moreover, the inclusion of additional critical-mass data of such systems will not contribute much to further improvement of the cross-sections.
An interesting coincidence is worth mentioning. All the systems excluded from the final analysis, except PR4 (POPSY), are" quoted as 'private communications' only, which fact might imply that the measurements quoted were not final. As for POPSY, this is of course not really a spherical system and our analysis may indicate that the quoted dimension of its equivalent spherical reflector is in e r ro r .
We would also like to remark that in some cases we could not use published data [13-15] for lack of information as to the isotopic composition of the systems.

264 RAKAVY et al.
R E F E R E N C E S
[1] EDWARDS, A.G. , The Assessment of Plutonium Cross-Section Data by Fast Integral Experiments, UKAEA Rep. TRG-439(D) (1063).
[2] CECCHINI, G. et a l . , "Analyse des donnges globales pour revaluation des rfiacteurs rapides par des parametres a peu de groupes", 3rd Int. Conf. peaceful Uses atom. Energy (Proc. Conf. Geneva, 1964) 2, UN, New York (1964)388.
[3] HEMMENT, Pamela C.E., PENDLEBURY, E.D., "The optimisation of neutron cross-section data adjustments to give agreement with experimental critical sizes", Proc. Int. Conf. Fast Critical Experiments and their Analysis, USAEC Rep.ANL-7320 (1966) 88.
[4] CECCHINI, G. et a l . , "Comparison between experimental and theoretical integral data on fast critical facilities", Proc. Int. Conf. Fast Critical Experiments and their Analysis, USAEC Rep. ANL-7320 (1966) 107.
[5] USACHEV, L. N., ZARITSKY, S. M., "The accuracy of calculations of reactor parameters as a function of the accuracy of elementary constants", Nuclear Data for Reactors (Proc. Conf. Paris, 1966) 2, IAEA, Vienna (1967) 321.
[6] PAZY, A,, RAKAVY, G., REISS, Y., YEIVIN, Y., "Integral measurements as supplementary data in neutron cross-section evaluation", Nuclear Data for Reactors (Proc. Conf. Paris, 1966) 2, IAEA, Vienna (1967) 309.
[7] PAZY, A. et a l . , Theory and practice of neutron cross-section evaluation, to be published. [8] SCHMIDT, J .J . , Neutron Cross-Sections for Fast Reactor Materials, Karlsruhe Rep. KFK-120, Pts II
and III (1962). [9] SCHMIDT, J .J . , ibid, Pt I (1966) K13.
[10] GREEBLER, P. et a l . , Evaluation and Compilation of Pu-239 Cross-Section Data for the ENDF/B Files, USAEC Rep. GEAP-5272 (1966).
[11] SCHMIDT, J .J . , private communication. [12] WHITE, P.H., HODGKINSON, J. C. , WALL, G.C. , "Measurement of fission cross-sections for neutrons
of energies in the range 40 - 500 keV", Physics and Chemistry of Fission (Proc. Symp. Salzburg, 1965) 1, IAEA, Vienna (1965) 219.
[13] KLOVERSTROM, F. A., Spherical and Cylindrical Plutonium Critical Masses, USAEC Rep. UCRL-4957 (1957).
[14] McENHILL, J.J. , WEALE, J. W., "Integral experiments on fast systems of plutonium, uranium and thorium", Physics of Fast and Intermediate Reactors (Proc. Semin. Vienna, 1961) 1, IAEA, Vienna (1962) 253.
[15] BOURGEOIS, P., CLAIR, C. , COMTE, R., LONG, J.J . , "Description de 1'assemblage critique RACHEL", Physics of Fast and Intermediate Reactors (Proc. Semin. Vienna, 1961) 1, IAEA, Vienna (1962) 313.
[16] PAXTON, H .C . , Los Alamos Critical-Mass Data, USAEC Rep. LAMS-3067 (1964). [17] TEMPLIN, L.J. et a l . , Reactor Physics Constants, USAEC Rep. ANL-5800 (2nd ed. 1963).
D I S C U S S I O N
B . I . SPINRAD: I notice that you s ta r t ed with two quite different c r o s s - s e c t i o n s e t s , the P a r k e r and Schmidt s e t s , and that your r e su l t s indicate co r rec t ions to the Schmidt s e t . When you do the s ame to the P a r k e r set , do the co r r ec t ed r e su l t s show any convergence?
Y. YEIVIN: As I s t r e s s e d in my talk, the modifications of the c r o s s - s e c t i o n curves a r e usual ly in the form of ' r i p p l e s ' , superposed on a bas ica l ly c o r r e c t ' s p i n e ' . Since the two c r o s s - s e c t i o n se t s s o m e t i m e s differ quite marked ly we cannot expect the respec t ive modified se t s to coincide. However, F ig . A shows what we may achieve by modifying the c r o s s - s e c t i o n s : the solid line joins the points denoting the reac t iv i t i e s of the 18 s y s t e m s , calculated with Schmidt ' s c r o s s -

SM-101/67 265
section set; and the dashed line refers to Parker ' s 1 set. Once this procedure has been applied to each set, the reactivities calculated with the modified sets agree with the experimental values to within ±2.5%o; it becomes clear that the German plutonium cross-sections are 'over-reactive', while the British ones are 'under-reactive1 . You will recall
AKC/oo)
30
25
20
15
10
-10
-15
-20
-25
/PARKER
/ J I I I I I i i i
1 2 1 2 1 2 9 8 7 6 5 4 3 2 1 2 1 t _ r _ . t _ r _ . i _ r _ . t , » ____,
P PR PUR PU UR U FIG. A. Comparison of calculations using Schmidt's cross-section set with Parker's 1960 set.
that the German fission cross-section was decreased appreciably (in agreement with the measurements of White et al .) , thereby bringing down the reactivities of the plutonium systems. One might expect furthermore that the British fission cross-section would increase, where-
1 BUCKINGHAM, B.R.S. e t a l . , UKAEA Rep. AWRE 0-28/60 (1960).

266 RAKAVY et al.
as in fact it also decreased when the modification procedure was applied to the British set. It seems, therefore, that whereas significantly different cross-section sets will not really converge upon modification by our procedure, the indicated trends will still apply.
J. Y. BARRE: How many multiplying systems containing 239Pu did you use in your modification? How many of these systems have an energy spectrum sufficiently degraded to permit correction of the 239Pu fission cross-section in the 10-keV region?
Y. YEIVIN: Of the 18 systems used to modify the cross-sections (details of which are given in Table I of paper SM-101/21), one was a bare Pu sphere (JEZEBEL), two were Pu spheres reflected by natural uranium, two were bare systems with an inner Pu core surrounded by a 235U shell, and two were mixed systems with a natural uranium reflector. The other 11 systems had a uranium core. Obviously, all of these are hard-spectrum systems, not very sensitive to the cross-section values at 10 keVor below. You are right in implying that softer-spectrum systems should be included in the analysis, in order to improve the cross-sections in the low-energy region, and it is our intention to include such systems in future analyses.
E. D. PENDLEBURY: What standard deviations did you assume for the different keff.values?
Y. YEIVIN: The er rors in the critical masses are not always quoted in the literature, and even when they are we find that the quoted values vary over a wide range for the various systems. We therefore assumed, somewhat arbitrarily, that the uncertainties of the measured reactivities were 2.5%o throughout, which is equivalent to 50 - 100 g plutonium, or to 250- 500 g uranium for the respective systems. These limits are also marked on Fig. A.

EXPERIMENTAL METHODS
(Session III, P a r t 2)

Chairman: K.E.J. WIRTZ
A MODIFIED LEAST-SQUARES METHOD TO UNSCRAMBLE PROTON RECOIL SPECTRA
J. KOCKUM AND L.G. LARSSON
RESEARCH INSTITUTE OF SWEDISH NATIONAL DEFENCE, STOCKHOLM, AND I. EBBSJO
AB ATOMENERGI,
STUDSVIK, NYKOPING, SWEDEN
Abstract
A MODIFIED LEAST-SQUARES METHOD TO UNSCRAMBLE PROTON RECOIL SPECTRA. A computer program to UNFOLD proton recoil spectra has been written for the IBM/360-30 computer. By a least-squares technique it determines the neutron spectrum as weights in the sum of theoretically derived response functions when fitted to the measured recoil spectrum. Physically unreasonable oscillations, which easily result from this type of analysis, are depressed by adding a term y S2 to the usual sum (Sj) of squared deviations before minimizing. Here S2 is a measure of how well the points in the neutron spectrum fit polynomials of the k:th degree drawn through k + 2 points, k equals 2 or 3 has been used. The relative weights of the two sums are adjusted by means of y.
The program has been tested on pulse-height distributions obtained by calculations from a typical fast reactor neutron spectrum. The response functions used apply to a spherical proportional counter and take into account wall effects and counter resolution. It turns out to be possible to reproduce a neutron spectrum with the high cut-off neutron energy corresponding to proton ranges of the order of the counter radius. The program is also capable of correcting for proton pulses due to neutrons above the cut-off energy, provided that the shape of the neutron energy spectrum is known for these neutrons. In regions where the spectral variations are rapid compared to the counter resolution a smoothed result is obtained.
It is found that the best reproduction of the original neutron spectrum is obtained for the y-value which gives Sx equal to the number of points in the recoil spectrum. An estimate of the statistical errors in the neutron spectrum thus obtained is given. A typical computing time for one y-value is about 2. 5 min when 53 neutron energy and 71 proton energy points are used.
1. Introduction
Hydrogen-filled proportional counters have proved to be suitable for measuring neutron spectra in fast reactors in the energy region between a few keV and a few MeV [l, 2], These detectors, however, show a deviation from the ideal rectangular response function due to wall effects in the high energy region and to the limited energy resolution (about 10 % ) .
Several methods have been used for unscrambling measured pulse-height distributions once the response function of the experimental apparatus is known. In the case when the response has the ideal rectangular shape, the neutron spectrum is easily obtained by differentiation. The most direct way to take the actual shape of the response function into account is perhaps to make an inversion of the response matrix, but the solution thus obtained often exhibits physically unrealistic oscillations. Brunfelter et al. [3] have shown how these can be reduced by using a special form of the matrix. Burrus et al. [4] have described a way of overcoming the oscillations by accepting only non-negative solutions and Yates [5] has given a method including minimization of a function, depending both on the goodness of fit and on the smoothness of the solution. A similar method has been suggested
269

270 K O C K U M et al.
by Grissom et al. [6] under the assumption of Gaussian response. Our investigation shows how the latter method can be extended and applied to pulse-height distributions from proton recoils in a spherical proportional counter when both wall effects and resolution are taken into account.
2. Presentation of the method
When the spectrometer is irradiated in a neutron spectrum <J>(En) the corresponding pulse-height distribution, P(E )dE_, defined as the number of pulses with pulse-heights between E and E + dE , will be
P P p' E nmax
P(E )dE P P
<|>(E )Z(E ) G (E .E )dE ttt (1) n n n p p n
where
E » neutron energy
E =» maximum neutron energy in the actual neutron field nmax "•' I(E ) «= total efficiency of the spectrometer at energy E
G(E ,E )dE •» probability that a neutron of energy EJJ will give a n- p p pulse in the spectrometer with pulse-height between
E and E + dE P P P
The integral in (1) is approximated with a Simpson's rule numerical quadrature. In order to get appropriate spacing in the summation, the energy variable is expressed in lethargy units. Thus Eq, (1) will be
n P. - I 4. Z. G.. C. A. (2) l .". I l lj l l J 1=1 J
where
C • weights used in the numerical quadrature
A. » step-lengths in lethargy units in the numerical quadrature
and the rest of the abbreviations are obvious.
If we now want to fit a measured pulse-height spectrum P:(l j j« m) in the least squares sense to Eq. (2), this is equivalent to minimizing the sum
m . n ;. - y —^—* (p . - y •. E . G . . c . A . ) ' 1 .•*•, ,.» x 2 j . L . l l lj l l
j»l (AP.) J i«l J (3)
where AP. is the statistical uncertainty in P. . J J
The solution {<)ȣ} thus obtained will usually exhibit physically unrealistic oscillations, due to the badly conditioned matrix.

SM-101/53 271
In order to damp these oscillations, a term y*S2 is in the present method added to S. before minimizing. S2 is here defined as
n-1 2
£ R, . where R. . is the rest term in an approximate Taylor series ex-i-k+1 pansion of the solution <t>£+i in the k previous <f»£:s (see Ref. [6]). If k » 2, for example, this means that one is looking for a solution where the 4£:s four by four closely follow parabolas when they at the same time satisfy Eq.(l). y is a parameter that adjusts the relative weights put on S- and S- , respectively.
The set {$.} will be obtained by the n linear equations
3 ( S 1 ^ S 2 ) n . ,
0 1 = 1 . . . n 1
(4)
The sum S, ought to be of the order of the number of measured points (m) when a physically realistic solution to the problem is found since the terms are weighted with their statistical uncertainties. A search is therefore made in the program by varying the parameter y until S.. = m .
The statistical uncertainties in the solution are obtained from the formula
«« m 3 <J>. -(A*.)2 - I (—i)2(AP ) Z (5)
j-1 j J
These uncertainties are easily obtained from the same matrix that gives the solution to Eq. (4).
3. Response functions
Snidow [7] has shown that it is possible to calculate a response of spherical counters which takes wall effects into account and which well reproduces measured response functions. We have used his method on a spheri-ical counter 3.94 cm in diameter, filled with 7 atm CH4, and determined the response functions G^En.Ep) for neutron energies in the region between 66 keV and 10 MeV. The finite resolution of the counters can be taken into account by assuming Gaussian resolution function and defining the final response function as
E <E-y2
n - r — j G(E ,E ) - f dE e 2 ( o ( E ) )
G. (E ,E) (6) n P I o(E)/2T l *' o
(The low integration limit E has to be > 0 in order to avoid singularities.)
In order to speed up the numerical calculations and facilitate interpolations, two approximations to Eq. (6) have been made. The first is to approximate Gi(En,E_) with a parabola, the second to take the resolution effects into account only close to the step in Gi(En,Ep) at E = E .

272 KOCKUM et al.
The fo l lowing modified form of Eq. (6) has been used;
i - [A(E )+B(E )«E +C(E )«E 2 - G_(E ,E ) • E L v n n p n' p 1 n* n
/27 dx] 0 < E < E
- p - n E -E
G(En ,Ep) - < (6a)
n E -E _P n
1 2 ,« —— e dx •5T
E > E P n
The coefficients A, B and C are determined by a least squares fit to the response functions calculated according to Snidow with the further restriction that the total area should remain unchanged. The resolution function o(E) is for the time being assumed to be proportional to the energy, but it is easy to include an energy dependence, caused for instance by electronic noise. Fig. 1 shows G(En,Ep) according to Eq. (6) and the difference between the results obtained with Eq. (6) and Eq. (6a) for the neutron energies 0.63 and 3 MeV. The latter is the highest energy used in the unscrambling procedure, and here the approximations made are largest,
4. Test spectrum
In lack of an experimental pulse-height spectrum and in order to make it possible to control the different factors affecting the result of the unfolding procedure a test pulse-height spectrum has been constructed using Eq. (1). A theoretical neutron spectrum (Fig. 2) calculated for core 7 of the FRO reactor (cf. Table I) with the SPENG program [8] was used as input together with response functions calculated with a = 0.0423 E according to Sect. 2.2, which corresponds to FWHM of 10 % for a Gaussian peak. Since it is essential that no numerical uncertainties introduced when evaluating Eq. (1) will affect the conclusions drawn from the calculations, the number of neutron energy and pulse-height points has been much larger during the construction of the test spectrum than in the unscrambling procedure. Statistical uncertainties to the pulse-height spectrum have been added with the aid of a set of normally distributed random numbers.
5. Results and discussion
The result of an application of the unscrambling program (UNFOLD) [9] to the test spectrum is shown in Fig, 2. The lethargy step in the pulse-height
E. spectrum was taken as 0.03 (• " = 1.03) and in the final neutron spectrum
E. Vl 0.04 (- » 1.04). This corresponds to 129 Eqs. of type (2) with 97 un-
Ei-1 knowns $i in the energy region investigated (66 keV to 3 MeV), Since these

SM-101/53 273
~ 1.0 o
0.5
-10""
0.2 0.3 0.4 0.5 0.6
PULSE - HEIGH T(En)
0.7 MeV
1.5
1.0-Hi
0.5.
• 10-3 \ / ' N \ \ / I /
PULSE-HEIGHT (E„)
0.5 1.0 1.5 2.0 2.5 3.0 3.5 MeV
FIG. l . Computed response functions G(En,Ep) of a spherical proportional counter (diameter 3.94 cm) filled with 7 atm CH4 . In the upper figure En = 0. 63 MeV, in the lower ER = 3 MeV. The dashed-dotted curves give the results according to Snidow [7], the full line the results according to Eq. (6) and the dashed curve the difference between the results according to Eq. (6a) and Eq. (6). The parameters used in Eq. (6a) were in the two cases:
A = 1.068, B =-0.217 M e V 1 and | C| < 2 xlO"3 MeV"2
A =2.088, B = -0.88 MeV 1 and C = 7.74 X 10"2MeV"z.
numbers exceed the memory capacity of the computer used (IBM 360/30), the unscrambling was divided into two parts. Moreover, pulses due to neutrons above 3 MeV have to be taken into account. At these energies the wall effects are so large that the counter cannot be used to obtain detailed spectral information. Instead the shape of the neutron spectrum at these energies is assumed to be known and attached to the solution below 3 MeV, The pulses due to the neutrons are included when a fit is made in the region between 400 keV and 3 MeV as described in Sect. 2, The pulse-height spectrum below 500 keV due to neutrons above this energy is then calculated from Eq.(l) and subtracted from the original pulse-height spectrum and an unscrambling' in the low energy region is started. Uncertainties in the result are introduced at both ends of the energy region investigated since the information here is incomplete due to the finite resolution. For that reason the two parts of the unfolding are made to overlap.

274 KOCKUM et al.
60 80 100 200 400 600 800 103 2x10* NEUTRON ENERGY (keV)
FIG. 2. Comparison between input neutron spectrum (full line) and resulting neutron spectrum (crosses) obtained with the UNFOLD program. The points above 450 keV were obtained directly, the points below this energy after subtracting of pulses due to higher energy neutrons as discussed in the text.
TABLE I : Atomic D e n s i t i e s in FRO Core 7
Isotope
in22 w 3 10 at/cm
u 2 3 5
0.354
u 2 3 8
1.395
Ni
2.044
Cr
0.096
Fe
0.406
H
0.599
G
2.150
F
0,006
60 ao 100 600 800 W 2x10* NEUTRON ENERGY (keV)
FIG. 3. Comparison between input neutron spectrum (full line) and resulting neutron spectrum obtained by differentiation. The crosses apply to the case when pulses due to neutrons above 3 MeV were included, the points to the case where they were excluded.

SM-101/53 275
UNFOLD has been applied to the same pulse-height spectrum both with and without statistical uncertainties added. The results shown in Fig. 2 correspond to a total number of counts of about 3 • 10^, In the present application the pulse-height spectrum was regarded as a point-spectrum, but a run in which each point represented an integration over a narrow interval did not change the results appreciably.
The result of a direct differentiation of the same pulse-height spectrum is shown for comparison in Fig. 3. Since only two adjacent pulse-height points are at present used to obtain each point in the neutron flux the scattering due to statistical uncertainties will be large. Because of this we only show the case where no uncertainties have been added. We show both the case with and without pulses due to neutrons above 3 MeV added. As is to be expected the differentiation fail to reproduce the high energy part of the neutron spectrum where the wall effects in the counter are appreciable. Below about 600 keV (A » 1,06 in the Eq, (6a)) the obtained spectrum follows the input spectrum better but is still somewhat high and fine details are smeared out.
The result of UNFOLD given in Fig. 2 shows quite satisfactory agreement in the high energy region indicating that it would be possible to extend the usable range of the counter to even higher energies. In the low energy region, however, the spectral details are completely smeared out. When no statistical uncertainties were included a result similar to that obtained by differentiation was obtained. In this case the yvalue that gave a minimum in Y S2/S1 was used since this criterion empirically has been shown to give approximately the same y as the statistical one. If a lower value of y than that giving Si = m was used when uncertainties were added, oscillations in the obtained spectrum with a period of about 6 energy points start to appear. The results shown apply to k = 2 in the Taylor series expansion, but similar effects were obtained for k = 3. Attempts were made to get better spectral resolution by using more energy points but still without success. The failure of UNFOLD to reproduce the spectral details of the test spectrum is probably due to the fact that peaks and valleys follow each other within one resolution width of the counter. In the errors shown in Fig, 2 and calculated according to Eq. (5) the smoothing effect of the method is included explaining the small errors obtained in the low energy region.
6. Conclusions
In the preceding section it is shown that the proposed method to unscramble pulse-height spectra obtained with spherical proportional counters is capable of extending the useful range of these counters to high energy regions where the wall effects are appreciable. The smoothing condition used to damp unwanted oscillations in the result is too rigorous to allow wanted details in the neutron spectrum to be obtained. Further work to loosen this condition and thus find ways to include known information about the counter resolution is planned. For the time being the best combination seems to be the use of the UNFOLD program in the high energy region and a differentiation scheme in the low energy part,
REFERENCES
[lj BENJAMIN, P.W., KEMSHALL, CD., REDFEARN, J., Report AWRENR2/64 (1964)
[2] BENNET, E.F., Nucl. Sci. Eng. T7_ (1967) 16

276 KOCKUM et al.
[3] BRUNFELTER, В. , KOCKUM8 J . 0 ZETTERSTRÖM, Ho-0.0 Nucí. I n s t r . Meth„ j»0 (1966) 84
[A] VERBINSKI, V.V,9 BURRUSt, WoR.0 FREESTONE, R.M., TEXTOR, R„ „ Report ORNL-P-2471 (1966)
[5] YATES, MoJeL.p Proc«, EANDC Conf„ Automatic Acquisition and Reduction of Nuclear Datae Karlsruhe (1964) 533
[б] GRISSOM, JoY.9 K0EHLERe D„R„8 GIBBS0 B.G., Nucí, Ins t r n Meth. 45 (1966) 190
[7] SNIDOW, N.L., WARRENp H0D0() Nucl„ Instr„ Meth. _51 (1967) 109
[8] NYMAN, K., I n t . Report AE-RFN-279 (1967)
[9] EBBSJÖ, I . , KOCKUM, J . and LARSSONs LoG.s I n t . AE Report to be published
D I S C U S S I O N
D. STEGEMANN: Have you compared your unsc rambl ing technique with the techniques applied to date using Monte Car lo techniques , so as to c o r r e c t for wall and end effects?
J . KOCKUM: No, apar t from calculat ions of the response- funct ions t h e m s e l v e s , .which have been compared by Snidow and found to give ve ry good ag reemen t .
D. STEGEMANN: What i s your a s s e s s m e n t of the accu racy obtainable between 1 and 3 MeV with your unsc rambl ing method for smooth and resonance-conta in ing neutron s p e c t r a ?
J . KOCKUM: The accuracy is very good for a smooth spec t rum, as shown in F ig . 3. Well s epa ra t ed r e sonances can probably be r e so lved , but if two r e sonances l ie within the reso lu t ion of the counter they will be smoothed out.
J . W . WEALE: I should like to draw the at tention of par t ic ipants to a r e p o r t dealing with unsc rambl ing techniques , r e fe rence No. AWRE 07 /67 , which will be available from Aldermas ton in about one month ' s t i m e .

MESURE EN PILE DE REPONSES EN ENERGIE DE TRITONS OBTENUS PAR LA REACTION 6 Li(n , t ) 4 He ET DETECTES AU MOYEN DE DETECTEURS A SEMI-CONDUCTEURS*
GHISLAINE DE LEEUW ET S. DE LEEUW CENTRE D'ETUDE DE L'ENERGIE NUCLEAIRE, MOL-DONK, BELGIQUE
Abstract — Resume
IN-PILE MEASUREMENTS OF THE ENERGY RESPONSES OF TRITONS OBTAINED BY THE 6Li(n,t)4He . REACTION AND DETECTED WITH SEMI-CONDUCTING DETECTORS. Neutron spectrum measurements by the 6Li(n, t)4He reaction, using either the parameter Et or the parameter E a + Et, call for knowledge of the distributions - characteristic for the spectrometer and the measurement medium - of the triton energies for monoenergetic neutrons.
These distributions usually have to be calculated from the differential angular cross-sections for triton emission at the neutron energies considered, when the angular distribution of the incidental flux is known. By determining these distributions experimentally in an isotropic neutron flux, one can check or complete the data for the differential angular cross-sections for triton emission.
The paper also shows that by making measurements with collimated detection geometry and comparing the results with those applicable to isotropic conditions, it is similarly possible, in the general case, to obtain an indication of the angular neutron-flux distribution, and to use this information for more precise interpretation of the spectra deduced from the parameters E a + Et and Et.
The energy distributions of tritons for neutrons with energies of about 250 keV was measured in the leakage spectrum of the HARMONIE reactor. This was done by using a single channel analyser to select a narrow-energy band in the E a + Et distribution measured, and measuring the energy distribution of tritons coinciding with pulses from the single channel analyser.
The resolution of the neutron energy selected depends on the half-height width of the E a + Et response for thermal neutrons (90 keV for 30/zg of lithium fluoride) and the width of the single channel (40 keV).
MESURE EN PILE DE REPONSES EN ENERGIE DE TRITONS OBTENUS PAR LA REACTION 6Li(n, t)4He ET DETECTES AU MOYEN DE DETECTEURS A SEMI-CONDUCTEURS. La mesure de spectres de neutrons au moyen de la reaction 6Li(n,t)4He, soit par le parametre E t , soit par le parametre E a + Et> necessite la connaissance des distributions, caracteristiques pour le spectrometre et le milieu de mesure, des energies des tritons pour des neutrons monoenergetiques. Ces distributions doivent normalement etre calculees sur la base des sections efficaces angulaires differentielles d'emission des tritons aux.energies neutroniques considerees, lorsque la distribution angulaire du flux incident est connue. La determination experimentale de ces distributions dans un flux neutronique isotrope permet de verifier ou de completer les donnees relatives aux sections efficaces angulaires differentielles d'emission des tritons. On montre egalement que, par mesure en geometrie de detection collimatee et comparaison au cas isotrope, on peut de meme obtenir dans le cas general des indications sur la distribution angulaire du flux de neutrons et les utiliser ensuite pour une interpretation plus precise des spectres deduits a partie des parametres E a + Et et E t . On a mesure la distribution des energies de tritons pour des neutrons d'energie voisine de 250 keV, dans le spectre de fuite du reacteur HARMONIE. Pour ce faire, on selectionne a l 'aide d'un monocanal, dans la distribution E a + E t mesuree, une bande etroite en energie et on mesure la distribution des energies de tritons en coincidence avec les impulsions provenant du monocanal. La definition sur l'energie des neutrons choisie est determinee a partir de la largeur a mi-hauteur de la reponse E a + Et obtenue aux neutrons thermiques (90 keV pour 30/ig de fluorure de lithium) et de la largeur du monocanal (40 keV).
* Travail effectue au Centre d'etudes nucleaires de Cadarache (CEA), dans le cadre du contrat Euratom «Projet Neutrons Rapides».
277

278 DE LEEUW et DE LEEUW
1. INTRODUCTION
La détermination d'un spectre neutronique à l'aide de la réaction 6Li(n, t)4He peut être fondée sur la mesure, à l'aide de semi-conducteurs, de la distribution des particules alpha et des tritons émis en coincidence (paramètre E a + E t) ou sur la mesure de la distribution en énergie des tritons émis (paramètre E t ) , principalement pour des énergies neutro-niques inférieures à 500 keV [1].
L'interprétation de la réponse en fonction de E a + E tnécessite la connaissance de la section efficace totale de la réaction et, comme élément de correction, de la section efficace différentielle d'émission des tritons pour déterminer le rendement du spectromètre en fonction de l 'énergie.
Pour la réponse en fonction de Et , la section efficace angulaire différentielle constitue l'élément essentiel pour calculer les distributions en énergie des tritons en réponse à des neutrons monoénergétiques.
Le rendement et les distributions en énergie des tritons sont caractéristiques du spectromètre et du milieu de mesure; si, lors de leur détection, les particules alpha et les tritons émis font l'objet d'une collimation, ce rendement et cette distribution dépendent essentiellement de la distribution angulaire des neutrons.
La distribution angulaire étant généralement mal connue nous proposons une méthode de mesure permettant de déterminer expérimentalement , pour un spectromètre et un milieu de mesure donnés, les distributions en énergie des tritons pour des neutrons monoénergétiques, d'où peut être déduit le rendement dans le cas de la méthode E a + E t .
Dans l'hypothèse où la distribution angulaire des neutrons ne varie pas en fonction de l'énergie des neutrons, il suffit de mesurer la distribution en énergie des tritons correspondant à une seule énergie iieutronique pour pouvoir calculer les autres distributions.
Pour une collimation parfaite des particules alpha et des tritons on peut déduire, par la même méthode, la distribution angulaire des neutrons en fonction de l'angle entre le neutron et l'axe de collimation des particules alpha et des tritons.
2. PRINCIPE DE LA METHODE
Le spectromètre consiste en un sandwich de détecteurs à semi-conducteurs avec un dépôt de 6LiF monté entre les deux. Suivant le but recherché la détection des particules alpha et des tritons est collimatée ou non.
La technique combine la mesure du spectre E t et E a + E t . Nous sélectionnons à l'aide d'un monocanal dans le spectre E a + Et une bande étroite en énergie et mesurons la distribution Et en coïncidence avec les impulsions provenant du monocanal.
Le schéma électronique de base est donné dans la figure 1. Il peut être complété avec un circuit de coïncidence rapide dans la chaîne de sommation pour réduire le bruit de fond y. La connection 2 du schéma permet de mesurer la bande d'énergie effectivement sélectionnée par le monocanal.
Le degré de collimation, l 'épaisseur du dépôt de 6LiF et la largeur en keV du monocanal sont fixés en tenant compte de la valeur du flux neutronique instantané et du temps de comptage tout en essayant de conserver à l'ensemble des performances optimales.

SM-101/45 279
1>-сй Monocanal
н> Porte АООсх
Converties
FIG. 1. Schéma électronique.
Plomb W'///•'/•''Л- Tête du spectromètre Coeur d'harmonie
en position haute
FIG. 2. Dispositif expérimental.
TABLEAU I. LARGEURS A MI-HAUTEUR, EXPERIMENTALES ET THEORIQUES, DES DISTRIBUTIONS E a + E t , E t ET E a POUR UN DEPOT DE 6 LiF D'EPAISSEUR NOMINALE EGALE A 3G>g/cm2
Détection 2 ÎT Détection collimatée
(keV)
Exp. Théor.
135 57 95 49
Et
(keV)
Exp. Théor.
55 41 40 40
E a + E t
(keV)
Exp. Théor.
95 61
MESURES
3 .1 . Montage
Nous avons mesuré le spectre de fuite contre le cœur d'HARMONIE en position haute et fonctionnant à 35 W. Le spectromètre était monté de telle façon que l'axe de collimation était perpendiculaire à la face de la pile (fig. 2).
Le spectromètre est constitué de trois parties: - la tête du spectromètre contenant les détecteurs à semi-conducteurs, type Ortec; elle était placée approximativement à 50 cm de la face de la pile et entourée de plomb (~10 cm); - une canne sous vide de 2 m dans laquelle étaient tendus trois fils conducteurs reliant les sorties signal et la masse des détecteurs à la boîte de connexion; - la boîte de connexion.

280 DE LEEUW et DE LEEUW
3 10-
-
-2
10-
-
1 m-
N(cps) •'•
r-o< — - t
':"-«-, t.
4 . v . •
. .
^
.4 •*_«o<+t
,. '130 keV
•' ,
\ ^
150 200 250 300 №CANAL
FIG. 3. Spectre E a+E t sans coïncidences.
2.1 OH
ЮН
2.10-
N(cps)
Л ¡ r '
¿OlkeV «
I У 1 1 /• 1
x ETALONNAGE DU
« MONOCANAL
\
4 Af-- i—i—г 0 100 500 En(KeV)
FIG. 4. Spectre E + Et lissé et étalonnage du monocanal.
3.2. Etalonnage du spectromètre dans la colonne thermique d'HARMONIE
Nous avons étalonné préalablement le spectromètre avec la chaîne électronique associée dans la colonne thermique d'HARMONIE. Le degré de collimation était de 0, 15. Les largeurs à mi-hauteur pour le dépôt de 6LiF de SOjUg/cm2, évaporé sur un des détecteurs, sont résumées dans le tableau I.
Les différences entre les résultats expérimentaux et les calculs théoriques sont également observées pour d'autres épaisseurs de dépôt de 6LiF [2]. Dans le calcul théorique on a pris comme largeur à mi-

SM-101/45 281
2 10-
10
N(cps)
%
110 160 210 260 № CANAL 360
1.8 2 2.2 2A 2,6 2,8 3 3,2 3,4 Q' Gt+0,230 E(MeV)
FIG. 5. Réponses expérimentales pour En = 230 + 40 keV (spectre de fuite).
hauteur du bruit électronique 40 keV et comme parcours des particules alpha et des tritons dans LiF respectivement 5 et 27, 3jum.
3 .3 . Mesure du spectre Ea + Et sans coïncidences
Les spectres E a + E t ont été mesurés sans coincidences ou avec coïncidences sur une seule voie, la chaîne de spectrométrie étant incomplète à cette-date pour des mesures en somme.
La première mesure E a + E t a été faite sans coïncidences pour connaître l'importance du bruit de fond dans la distribution obtenue à la sortie du monocanal. Le spectre obtenu est dessiné à la figure 3 et repris après lissage à la figure 4. Nous notons un élargissement du pic, dû aux neut rons lents , de 95 à 130 keV. Malgré la couver ture de plomb, le brui t de fond est encore t rès important. Pour En = 0 keV le rapport du nombre d'impulsions sur le bruit de fond est de 27; à 250 keV il est trois fois plus faible.
3.4. Etalonnage du monocanal
Nous branchons la connexion n° 2 (voir fig. 2). Cet étalonnage a été fait avant chaque mesure de la distribution E a et E t monoénergétique.
Nous avons remarqué une faible instabilité du monocanal en cours de mesure. La largeur de la fenêtre du monocanal était de 40 keV, la largeur à mi-hauteur de la distribution finale était de 80 keV avec comme énergie moyenne 230 keV.
3. 5. Mesure des distributions E a et Et
La somme des trois distributions mesurées est représentée à la figure 5. Elle comporte trois parties: - la distribution E a allant de 1, 6 MeV à approximativement 2, 5 MeV; nous pouvons facilement éliminer cette contribution dans un montage

282 DE LEEUW et DE LEEUW
3 10-
5-
2-
2
5-
keV(cps)
/ / / /
/ /
h • i ' i
/ !
' Г w
Détecteur sansLiF
- Détecteur avec Li F
*x*~-x-—w
\ \ \ \ \ -4 \ \ \ »
2,33 2,53 2,73 2,93 3,13 3.33 Et(Mev)
FIG. 6. Comparaison des spectres Et obtenus dans les deux détecteurs après soustraction du bruit de fond.
collimaté sans détériorer la résolution; - la distribution E t de 2, 5 à 3, 4 MeV; - une distribution coïncidant avec la distribution du monocanal.
Elle contient les impulsions dues aux particules alpha et aux tritons tombant dans le même détecteur et, pour la plus grande partie, le bruit de fond. En effet, la probabilité pour que ces impulsions de bruit de fond soient formées de deux impulsions proches de 2 MeV est t rès faible. On le constate d'ailleurs dans la distribution mesurée par l'absence totale d'impulsions en dessous dé 1, 6 MeV et au-dessus de 3, 4 MeV.
La figure 6 représente le spectre E t en coïncidence avec les impulsions dues aux particules alpha dans chaque détecteur, après soustraction du bruit de fond et normalisation sur E t = 3 MeV. Elle met nettement en évidence la nécessité d'une correction pour une mesure de spectre par le paramètre E t dans le cas d'une distribution angulaire anisotrope de neutrons.
3.6. Mesure du spectre E a + E t avec des coïncidences sur une voie
A la fin des mesures nous avons remesuré la distribution E a + E t
en faisant des coïncidences sur la voie du détecteur ne comportant pas de dépôt. Notant un nouvel élargissement du pic dû aux neutrons lents (les détecteurs avaient déjà servi dans d'autres mesures) nous avons fait une deuxième mesure pour vérifier la stabilité des détecteurs. Les résultats sont reproduits à la figure 7.

SM-101/45 283
,o3-
2 10-
10
Nfcps)
^ « * &
i
&
/ •
»190keV
A .
1
x 1 - r e Heure de mesure • 2^ e Heure de mesure
1 Canal = 21,2keV
•»• • ' . "~~~
i 150 200 250 N° Canal
FIG.7. Spectre Ea + E£ en coincidences.
TABLEAU II. RAPPORT, APRES SOUSTRACTION DU BRUIT DE FOND, DU NOMBRE D'IMPULSIONS DES SPECTRES E a + E t
OBTENUS AVEC ET SANS COINCIDENCES A DES ENERGIES DISCRETES DE NEUTRONS
En
(keV)
100
150
200
250
300
300
400
450
500
600
700
Rapport du nombre
d'impulsions
22,6
20,8
22, 9
22,9
21,2
23,9
21,4
24,6
27,5
22,7
23

284 DE LEEUW et DE LEEUW
Le tableau II donne le r appo r t du nombre d ' impuls ions des s p e c t r e s , avec et sans coincidences , a des ene rg i e s d i s c r e t e s de neu t rons et a p r e s sous t rac t ion du brui t de fond, suppose exponentiel .
L ' accord obse rve , dans l es l imi tes des e r r e u r s s t a t i s t iques , confi rme la val idi te des hypotheses fai tes pour la sous t rac t ion du brui t de fond.
4. INTERPRETATION DES RESULTATS
4 . 1 . Genera l i t es
Cinq buts peuvent e t r e r e c h e r c h e s dans la technique d e c r i t e .
1) De te rmine r le facteur de co r rec t ion a appliquer au spec t r e E t ou E a + E t m e s u r e , dG a l ' an iso t ropie de la dis t r ibut ion angula i re des neut r o n s .
Dans ce cas la source p r imord ia l e d ' e r r e u r s e r a liee a la definition su r l ' energ ie neutronique se lec t ionnee .
Dans l 'hypothese d'une var ia t ion lente de la dis t r ibut ion angula i re et du flux de neut rons en fonction de l ' ene rg ie , le facteur de co r rec t ion s e r a obtenu en divisant la dis t r ibut ion m e s u r e e par la dis t r ibut ion theor ique . La dis t r ibut ion th£orique es t calculee , pour la bande d '6nergie neu t ron i que analysee , su r la base des sect ions efficaces different iel les d ' emiss ion des t r i tons dans le cas d'une dis t r ibut ion angulaire i so t rope des neu t rons .
2) De t e rmine r la d is t r ibut ion angulai re des neu t rons . La prec i s ion su r la m e s u r e s e r a en plus l iee dans ce cas a la va leur
de l 'angle de col l imation et a la resolut ion en E t et E a + E t . En negligeant 1'influence de la resolut ion finie et dans l 'hypothese d'une
col l imation parfai te des pa r t i cu les e m i s e s et d'une definition parfai te de l ' ene rg ie du neutron, nous pouvons e c r i r e :
a v e c S [ E t ( 0 , E n ) / E n ] * W
S(E t /E n ) = reponse a un flux i so t rope de neut rons mono§nerget iques d ' e n e r -gie En (deduite de la sect ion efficace differentielle d ' emiss ion des t r i tons)
R ( E t ) = reponse a des neut rons mono^nerget iques d 'energ ie E n avec une dis t r ibut ion angulai re quelconque du flux
$ (0) = dis t r ibut ion angula i re 6 = angle en t re le neutron et le t r i ton emis (lab).
La re la t ion E t = E t (0 , E n ) es t donnee par la c inemat ique de la reac t ion . Si la dis t r ibut ion angula i re des neut rons es t cylindrique et si l 'axe de col l imation concorde avec l 'axe de s y m e t r i e , nous obtenons la dis t r ibut ion angula i re $ (0, <p). Dans le cas d'une dis t r ibut ion angula i re quelconque, il e s t n e c e s s a i r e de faire t ou rne r l 'axe de col l imation pour obtenir i>(6, cp).
3) Ver i f ie r ou comple te r les donnees su r l e s sect ions efficaces different i e l l e s dans un flux i so t rope de neu t rons .
En effet si <t>(0) = Cte nous obtenons S [ E t / E n ] , qui es t r e l i ee d i r ec temen t a la section efficace differentiel le angula i re pa r la re la t ion
S ( E t / E n ) = 2 i rA(E n )on&i(E t ) ,E n ]

SM-101/45 285
FIG. 8. Comparaison de la réponse théorique et expérimentale en énergie de tritons.
2 -I RexP-" isotr
2 H
-1 iO
2Л
г-РтЯЧЙ
l¿ 2,6 23 3,2
Distribution isotrope pour En= 225 keV
E t (MeV)
55Í 129 i til I 95 I 79 I 62 I 42 I °0 в POUR En = 225keV UP 120 103" 8 7 71 53 29
53 129 112 "96 82 66 «8 22*0 в POUR E n = 250 ke V
FIG. 9. Terme de correction dûà la distribution angulaire des neutrons.
avec A(En) = 2/ÍE^. - E t 1 8 0 J ar = section efficace différentielle angulaire dans le système du centre
de masse M = cos© = A(En)E t - B(En) © = angle d'émission du triton dans le système de centre de masse B(En) = ( E v + E t i 8 0 J / ( E v - E t l 8 0 „ ) .
Par suite de la résolution finie sur la distribution E a + E t cette technique n'est applicable que pour des énergies neutroniques supérieures à 500 keV.

286 DE LEEUW et DE LEEUW
T A B L E A U III. CORRECTIONS A A P P O R T E R AUX S P E C T R E S Ea + E t MESURES, PAR SUITE DE L 'ANISOTROPIE D E LA DISTRIBUTION ANGULAIRE DES NEUTRONS DANS TROIS CAS P R E C I S
(MeV)
0,100
0,150
0,20
0,25
0,3
0,35
0,4
0,5
0,55
0,6
1
2
К (1 e r cas)
0,97
1,02
1,05
1,07
1,06
1,05
0,83
0,93
К (2 е cas)
1,11
0,90
0,93
1,03
1,13
1,10
0,82
0,98
К (3 e cas)
1,22
0,91
1,04
1,01
1.14
0,59
1,19
1,04
0,72
1,16
Dans les t r o i s cas un ana lyseur b ipa ramét r ique pe rme t de mul t ip l ie r le nombre de réponses s imul tanées selon la n é c e s s i t é .
4) Dé t e rmine r en fonction de l ' énerg ie du neutron, dans le cas d'une dis t r ibut ion i so t rope de neu t rons et d'une détection 47Г, le pourcentage de pa r t i cu le s seconda i res é m i s e s faisant en t re e l les un angle infér ieur à 180°.
5) P a r une technique semblable , é l imine r l ' appor t de neut rons a u - d e s s u s d'un ce r t a in seui l d ' éne rg i e . Ceci es t impor tant par exemple dans le cas d'un spec t r e t r è s dur où les hautes éne rg ie s peuvent, par le fait que la s p e c t r o m é t r i e E t es t une technique ind i rec te , noyer la réponse aux neut rons de plus faible énerg ie dans la dis t r ibut ion en énerg ie des t r i t ons .
4 . 2 . In terpré ta t ion de la dis t r ibut ion E t m e s u r é e
Dans la figure 8 nous avons r e p r i s la dis t r ibut ion E t m e s u r é e en la comparan t à la réponse théor ique calculée , dans le c a s d'un flux i so t rope de neu t rons , pour un groupe d ' énerg ie r ec tangu la i re de neut rons de 200 à 270 keV.
La figure 9 donne le t e r m e de co r r ec t ion obtenu par division des deux d i s t r ibu t ions .
En négligeant l ' e r r e u r due à la réso lu t ion finie su r E t et E a + E t nous pouvons déduire de la dis t r ibut ion m e s u r é e Ф (в) en passant de la var iab le E t à la var iab le 0. Ceci a été fait pour En = 225 keV et 250 keV. Les nouvel les a b s c i s s e s sont r e p r i s e s dans la figure 9.

SM-101/45 287
Nous r e m a r q u o n s que la dis t r ibut ion es t proche de l ' i so t rop ie pour O°<0<8O°, qu 'e l le p r e sen t e un maximum autour de 100°, du probablement a la diffusion dans le plomb, et tombe rap idement v e r s ze ro pour des angles plus g r a n d s .
Dans le tableau III nous donnons le t e r m e de c o r r e c t i o n K a. appl iquer au s p e c t r e E a + E t m e s u r e dans les t r o i s cas s implif ies su ivants :
1) <&(©) = 0 pour 110° < 0 < 180° = 1, 5 8O°<0<11O° = 1 0 ° < 6 < 80°
exemple r ep resen ta t i f de la m e s u r e p resen te
2) <J>(0)=O pour 8O°<0<18O° = 1 O°<0< 80°
3) $(0) = 1 pour 0= 0° = o ej o°
L' impor tance du facteur de co r rec t ion dans le cas du p a r a m e t r e E t
es t m i s e en evidence par les m e s u r e s de la figure 6.
4 . 3 . Sources d ' e r r e u r s
La m e s u r e met en evidence que les e r r e u r s sont l i ees a quat re p a r a -m e t r e s fondamentaux: - l ' e p a i s s e u r du depot de 6 L i F , qui, avec la chaine e lect ronique, definit la resolu t ion que nous pouvons obtenir pour E t et E a + E t
- le degre de col l imatiqn, qui s e r a , selon le but r e c h e r c h e , celui de la m e s u r e du spec t r e E t ou E a + E t ou le pius faible possible pour la m e s u r e de la dis t r ibut ion angula i re des neut rons ' - la l a r g e u r de la bande d 'energ ie chois ie , l iee a la resolut ion de E a + E t , a la definition de l '6nergie moyenne dans le spec t r e Ea + E t , done a la s ta t i s t ique , et a la s tabi l i te du monocanal meme - la p rec i s ion s ta t i s t ique .
Le rendement et l e s conditions exper imenta les de te rmineron t le choix opt imal de chaque p a r a m e t r e , et le but r e che rche d e t e r m i n e r a l ' impor tance re la t ive donnee a chacun d 'eux.
5. CONCLUSIONS
Nous avons developpe une nouvelle technique de m e s u r e pe rmet tan t d ' in terpr&ter d'une faQon plus exacte les s p e c t r e s E t ou E a + E t m e s u r e s en pile et pe rmet t an t de donner des informations su r la d is t r ibut ion angula i re des neu t rons , en l ' i l l u s t r an t par un exemple . Nous avons ega le -ment souligne les a u t r e s poss ib i l i t es de la technique dans la m e s u r e des s p e c t r e s et de donn6es fondamentales de la reac t ion 6Li(n, t ) 4 He.
REMERCIEMENTS
Les au t eu r s r e m e r c i e n t vivement Mess i eu r s A. Schmitt et C. Beets qui leur ont p e r m i s de r e a l i s e r ce t r ava i l .

288 DE LEEUW et DE LEEUW
REFERENCES
[1] DE LEEUW. G., DE LEEUW, S., Rapport CEA-R 3038 (1966). [2] DE LEEUW, G., DE LEEUW, S., a paraftre.
DISCUSSION
D. STEGEMANN: I have two questions; firstly, what is your total spectrometer efficiency for triton collimation, as opposed to the detection of alpha particles and tritons? Secondly, what is your estimate of the accuracy obtainable with currently available 6Li (n, a) cross-section data?
G. de LEEUW: Where the purpose of the measurement is to correct a measured spectrum, no modification is made to the spectrometer. The total yield is then the measured yield multiplied by a factor which depends on the size of the mono-channel window. For measuring the angular distribution of neutrons, the yield depends on the definition it is desired to obtain with regard to neutron energy and the angle between neutron and triton, hence on the degree of collimation.
Adequate statistics can usually be obtained within the maximum integrated flux tolerable for the detector in question.
With regard to your second question, greater accuracy regarding total cross-sections is desirable. The data on the differential c ross-sections for emission of tritons are plainly inadequate, particularly for neutron energies below 200 keV. The experimental spectrum E e for very low energies can only be interpreted on the basis of extrapolations.
Where the sum of particle energies is being measured, the differential cross-section comes into the calculations only in a correction term, and lesser accuracy is therefore required. For the measurements which we are proposing to undertake the degree of accuracy will vary directly with the neutron energy.

A NEW METHOD OF MEASURING ALPHA (E) FOR 2 3 9 Pu
M . G . SCHOMBERG, M . G . SOWERBY AND F. W. EVANS
ATOMIC ENERGY RESEARCH ESTABLISHMENT,
HARWELL, DIDCOT, BERKSHIRE,
UNITED KINGDOM
Abstract
A NEW METHOD OF MEASURING ALPHA(E) FOR 239Pu. A special liquid scintillator detector has been developed for the purpose of measuring alpha(E) for 239Pu in the energy range 10 eV to 30 keV using
the Harwell Linear Accelerator time-of-flight spectrometer. (Alpha(E) is the ratio of capture to fission cross-sections as a function of incident neutron energy.) The detector has two outputs, one responding to gamma-ray interactions and the other to fast neutrons. The efficiency of the detector for gamma rays is arranged to be proportional to the gamma-ray energy. This property is achieved by utilizing an improved Moxon-Rae design and ensures that the efficiency of the detector for radiative capture events is constant irrespective of the nature of the gamma-ray cascade. The fast neutrons are also detected in the liquid scintillator and pulse shape discrimination is used to reject events produced by gamma rays. As a gamma-ray detector the device is sensitive to both radiative capture events and to the prompt gamma rays produced in fission. However, a correction for this latter component is made using the information from the fast neutron output which is essentially only sensitive to fission events. For each of the time-of-flight timing channels the ratio of the corrected counts from the gamma detector to the number of fission events detected is equal to K x alpha(E), where K is a constant determined by normalization. The technique of measuring both capture and fission simultaneously ensures that incident neutron energy spectrum charges and resolution effects are unimportant and also reduces the multiple scattering corrections. The detector system is described and some of the data obtained are shown.
1 . INTRODUCTION
239 The value of the capture cross-section (O^Y(E)) of Pu in the
energy range 100 eV to 15 keV is one of the major uncertainties in the nuclear data required to calculate the properties of large dilute fast reactors. At the present time the errors in Ohy{%) in this energy range vary between +1l°/o and 80°/o but if these can be reduced to +5°/o then it should be possible to calculate the breeding gain to _+0.03. Smith [1] has stated that an error in breeding gain of _+0.1 for a typical large sodium cooled fast reactor may result in a range of fuel doubling time of 10-20 years which could lead to variations of over 10°/o in the estimated cost of electricity generation. Therefore there are cogent reasons for making improved measurements.
In this paper a new method to measure the value of Ony{E) or a(E) (the ratio of the capture to fission cross-sections) for 239Pu will be described and some provisional results presented. Before this is done, however, the data available below 10 keV will be briefly reviewed and the basic techniques of making a measurements will he discussed.
2. REVIEW OF DATA AVAILABLE AND POSSIBLE METHODS OF MEASUREMENT
At the present time uncertainties in the values of o"nY(E) and a(E) for 239Pu in the energy range 100 eV to 15 keV are large, the errors varying between 17°/o at 100 eV to - f80°/o at 10 keV [2], Only two differential measurements of a(E) have been performed in this energy
289

290 SCHOMBERG et al.
region. Ignatev and Kirpiohnikov [3] obtained data in the energy range 7 eV to 210 eV by detecting fission neutrons with fast neutron detectors and the gamma rays from both capture and fission events with sodium iodide detectors. Data below 205 ©V have been obtained by Wang Yung-Chang et al. [if] using the pulsed reactor at Dubna. Their detector was a large cadmium loaded liquid scintillator in which fission events were distinguished from capture events by the technique of delayed coincidences.
The only other experiments which give direct information on a(E) are integral measurements. Examples of these are the KAPL data partially reported by Kanne et al. [5] and subsequently summarised by Sampson and Molirio [6] and the experiments of Fox et al. [7]. However the integral measurements are made in broad neutron spectra and therefore can only be considered to give some indication of a in the energy region of interest. Above 20 keV, where mono-energetic neutron sources are available, good data exist for 239Pu.
There are basically three methods of determining C%Y(E) and a(E) for fissile material (neglecting chemical techniques used at thermal energies).
(a) ohy(E) is derived from the measured total (o~nT) and fission cross-sections (ohf) using the formula
where OL^CE) is the scattering cross-section.
(*>) OnY^) is derived from measurements of the fission cross-section and a linear combination of the capture and fission cross-sections. This method is basically a measurement of K + Ra(E) where 0^K$1 and R % 1. •
(c) 0"hY(E) and ohf(E) are measured directly.
239 The most reliable data for Pu in the energy range 200eV to
10 keV have been obtained by the first method but the accuracy is poor because of uncertainties in the values of ohn. ohn in the energy range below 10 keV can be assumed to be the sum of the shape elastic and compound elastic cross-sections. For 239PU the shape elastic cross-section is accurately known [11 ] and the errors in o"nn aTe
predominantly due to uncertainties in the compound elastic cross-section. For 235g the ratio of the compound elastic to the shape elastic cross-sections is much smaller so that the uncertainties in the compound elastic cross-section are not so significant. Hence the capture cross-sections for 235u determined using this method by Brooks et al. [10] and Uttley [11] are reasonably accurate.
239 Therefore in order to measure ohY(E) and a(E) for Pu it is
necessary to use the second or third methods. The third method is only possible if the fission events can be detected with 100°/o efficiency so that the capture gamma rays can be distinguished from those due to fission. In practice it is not possible to achieve 100°/o efficiency and so all measurements are essentially determinations of K + Ra(E).
Most previous measurements [12,8,4] made use of a large liquid scintillator and detected fissions by looking for the delayed pulses due to the fission neutrons which are slowed down and captured in the scintillator. This system is relatively uncomplicated above a few keV
19*

SM-101/41 291
where mono-energetic neutron sources are available. For lower neutron energies the measurements must be made using a "white" spectrum neutron source with time-of-flight techniques and this greatly increases the complexity of the electronic equipment required to do the analysis. Therefore the only practicable methods of detecting fission events are either to use a fission chamber or to detect the fast neutrons emitted in fission. In the present experiment the latter method is used in conjunction with a Y-ray detector which detects the prompt fission and capture Y-rays. The experiment measures K + Ra(E) and is in principle similar to that of Ignatev and Kirpichnikov [3].
3. THE NEW ALPHA DETECTOR
It has been seen in the previous section that the detector system adopted in the present experiment to measure <x(E) in the energy range below 20 keV consists of a gamma-ray detector and a neutron detector.
In order to perform any measurement of capture cross-section correctly the detector must have a constant efficiency irrespective of the form of the gamma ray cascade which follows neutron capture. This can be obtained by three methods:
(a) using a large liquid scintillator which has an efficiency of almost 100°/o for any capture event.
(b) using the system proposed by Maier-Leibnits and described by Hacklin and Gibbons [13].
(c) using a Moxon-Rae detector [14] whose efficiency is proportional to the gamma-ray energy.
It is not easy to use the first two methods in the present experiment since it would be necessary either to construct a new type of large liquid scintillator if neutrons and gamma-rays are to be detected simultaneously or to use two dimensional recording of time-of-flight and pulse height with the Haier-Leibnitz system. Therefore a detector based on the Moxon-Rae principle has been used in the present experiment.
The best method of detecting fast neutrons with good time resolution is probably to use a liquid scintillator with pulse shape discrimination to reject the pulses due to Y-rays. However when plutonium samples are used there is the added complication that the ^39pu has a decay rate of ~2.3 x 10⁹ nuclei per second per gram and 0.06°/o of these disintegrations give gamma rays of energy greater than 100 keV. Furthermore, since the light output can be up to four times as great for an electron as for a proton of the same energy, the near simultaneous occurrence of two of these low energy gamma rays can easily be mistaken by the pulse shape discrimination system for a proton pulse. The classical way to eliminate this effect, which was used by Patrick et al. [15], is to put approximately 1 inch of lead between the scintillator and the sample. However it is necessary in the present experiment to detect fission and capture events simultaneously so that the corrections for multiple scattering are minimised and incident neutron spectrum changes and resolution effects are then unimportant. Therefore the presence of large amounts of lead is undesirable.
White [16] of the Electronics and Applied Physics Division at Harwell has developed a new pulse shape discrimination system which is based upon a fast linear gate and integrator. The current pulse from the anode of the-detector photomultiplier is split equally between two linear

PULSED NEUTRON BEAM F80 I -B00STERI35N FROM SAMPLE)
C O O ac o
FIG. 1. Sectional view of the detector used to measure alpha (E).

SM-101/41 293
gates and a. threshold discriminator detects the start of the pulse and opens the gates for 50 hs and 500 ns respectively. The pulses due to protons and electrons are then distinguished by checking whether or not the ratio of the integrated currents is greater than a predetermined value. The total time for analysing a pulse is approximately 1|is and during this period the gates are inhibited. The system is able to analyse pulses at over 100 kc/s because the integrators are restored before the inhibit is removed and the neutron output is inhibited if the fast discriminator sees a second pulse during the period when the gates are open. This system is a great improvement over the original methods of pulse shape discrimination. The system of Brooks [17]» and the cross-over method, for instance, are typically limited to 3 kc/s and 20 kc/s respectively.
These developments in pulse shape discrimination techniques mean that it is now possible to combine the fission neutron and gamma ray detectors because large quantities of lead are not required. At the same time it is possible to take advantage of an improved type of Moxon-Rae detector of higher efficiency which has been developed by Weigmann et al. [18].
The new detector for the measurement of a(E^ is shown diagrammatically in Pig. 1. It consists of a tank of NE 213 liquid scintillator 14 inches long, 6 inches deep and 6 inches wide. In the centre 6 inches of the tank there is a 0.036 inch aluminium separator which essentially divides this region into 8 sections, these 8 sections being viewed alternately by two photomultipliers (A and B) at the ends of the tank. Gamma rays are detected by demanding a coincidence between the photomultipliers A and Bj the efficiency is proportional to the gamma ray energy for effectively the same reasons as in a conventional Moxon-Rae detector. Past neutrons are detected by separately applying pulse shape discrimination techniques to the signals occurring in the photomultipliers A and B. The proton recoils resulting from fast neutron interactions do not result in coincidences since the aluminium separator is opaque to protons with energies less than - 6 MeV; in comparison a 1 MeV electron loses ~200 keV in the aluminium. In principle errors can arise if two gamma rays are detected simultaneously in the two halves of the detector. However the efficiency of the detector for gamma rays is sufficiently small that this is not a serious effect. It is necessary of course to have relatively low efficiency detectors otherwise there would be an appreciable probability that the neutrons and gamma rays from fission would be detected in coincidence and hence cause ambiguity in the pulse shape discrimination system.
In the experimental arrangement shown in Fig. 1 a /4" thick lead screen between the plutonium sample and the detector is not shown. This small amount of lead proved to be desirable to reduce the large number of small pulses in the detector due to the natural radioactivity of the sample which the pulse shape discrimination equipment has to analyse. In order to verify that the efficiency characteristics of the capture detector were not affected by the lead the detector was checked using the "black" resonance technique [14] with Ag, Pt, Au, Ta and 2 3 % a na also with a Monte-Carlo computer code.
4. THE EXPERIMENTAL ARRANGEMENT
The new detector was assembled on one of the flight paths of the Harwell time-of-flight neutron spectrometer based on the 45 MeV Electron Linear Accelerator with its neutron 'Booster' target [19]. The main experimental details for the measurements covering the incident neutron

294 SCHOMBERG et al.
TABLE I. EXPERIMENTAL DETAILS
Energy range
Flight path length
Neutron burst width (unmoderated)
Timing channel width
Nominal resolution
Resonance filters for background measurement
Permanent 'black' filter
Incident spectrum measurement
10 eV - 30 keV
34.9 m
220 ns
125 ns
7.2 ns/m
Mn, Mo, Ta, Al
Al
l/£" thick 6Li glass scintillator
energy range 10 eV to 30 keV are given in Table I. Three 2 inch diameter 239Pu samples with low (0.7°/o) 24°Pu content and thickness of 0.00120, 0.000579 and 0.00029 atoms/barn respectively are used. The energy spectrum of the incident neutron flux is also measured with the same resolution by replacing the sample with a V ^ inch thick °Li glass scintillator (NE 905). The glass, which is 2V2 inches in diameter and is mounted 2'/''6 inches away from the photomultiplier to reduce the effect of multiple scattering, has a known efficiency as a function of neutron energy.
5. ANALYSIS OF DATA AND RESULTS
The number of counts from the gamma ray detector, Ny, and from the fission neutron detector, Nn» in a given time-of-flight channel is related to the number of capture, nc, and fission, nf, events by the equations
N Y= €,nf + £ 2n c
N n = t 5n f + e 4n c
(2)
(3)
where ^1, e2> fe3 and 6 4 are the efficiencies of the two detectors for fission and capture events respectively. The values of nc and nf depend upon the capture and fission cross-sections through the following relationships
l nT nT nT ' J
[ nT nT N °nT j
(4)
(5)
where 4 is the incident neutron flux, ohT> °"nY» °hf and °hn &re *ne
total, capture, fission and scattering cross-sections and T is the transmission of the sample. The triangular brackets denote averages and represent the probability of a scattered neutron causing a further

SM-101/41 295
reaction; the primed quantities are the values of the cross-sections etc. after scattering.
The equations are simplifications because they do not allow for the 0.005" aluminium can round the sample or the small (1,07°/o) fraction of aluminium in the sample. The more complete equations will be used in the final analysis of the data but these simplified equations can be used to demonstrate that in an alpha measurement of this type the multiple scattering corrections are not very significant. If equation (4) is divided by equation (5) and the result simplified we obtain
(1+o- <^1 al 5 £ > ' - . . . \ (6)
nf , (1-T»)
where a = °nV and a1 = °nV
°nf °nf' nc
Hence if a' = a then —- = a. In practice a is a function of neutron energy but in general * the variations are much smaller than the variations in cross-sections. Therefore, since the samples are thin,
the ratio __£ is expected to be nearly equal to a. n»
Hence the value of a can be obtained by simplifying equations (2)
(7)
and (3) to give A N Y
n c
n f = aS =
Nn
B - C N Y N n
where S is the multiple scattering correction and
B = Vt,, C = Vt. ^ r w- ' °r In this experiment it is being assumed that all the efficiencies
(•1 ,^2>t3>^4) a r e independent of incident neutron energy. This assumption is undoubtedly correct for fc2 because of the properties of a Moxon-Rae detector and because the total energy of capture gamma-rays (~6 MeV") is large compared with the incident neutron energy. £-4 is small and so any changes in the capture gamma-ray spectrum as a function of incident neutron energy can be neglected.
However, the values of -3 and ^-j, which are the efficiencies of the neutron and gamma-ray detectors for fission, could change be6ause the fission mass distribution and the fission fragment kinetic energy have been observed to change from resonance to resonance. Since the detector system only gives one pulse per fission event the efficiency ^3 is given by
S= % (1 ~(1 " S ^ P(V) < 8 )

O 40
:
. 74
95
65 7
1
: :
• * •
^
52
60
50
08
s ; 5'5
*u
(M
>
•O
22
29
S
^ m
- 17
66
»- l4
68
14 3
1
: i ' y ^
68 II
. . . /
A
u 2400 3600 4Q00 4400
CHANNEL NUMBER
4800 5200 5600 6000
CO O
o
tn
FIG.2. Neutron yield from 0.00058 atoms/barn 239Pu sample.

2 5 0 o O
• •
A i
74
95
•4*4
65
-71
.
\
(
¥
52
-60
50
-08
WW
5 5
»
* *.
*U w ^
41
-42
••
26
-2
;
flfrA* £ & & » * ^visfcJ i».' V ? * "~. *»•
22
29
•
t
17
-66
4
_Mgg£Sjj&££~£.:£ ^&£<&<< *?.
14
-68
t
14-3
1
11-8
9
i
K~J
B
* t
2000 2400 2800 3200 3 600 4000 4400
CHANNEL NUMBER
4800 5 200 5 600 6000
CO
^
FIG. 3 . Gamma-ray yield from 0.00058 atoms/barn 239Pu sample.

298 SCHOMBERG et al.
5-OOr
4-SO -
4 0 0 -
3-50 -
2 -SO
FIG. 4. Ny/Nn as a function of a .
*U)
2-Or
l-O at
' I
o PROVISIONAL RESULTS PRESENT EXPERIMENT (NO MULTIPLE SCATTERING CORRECTION )
* CALCULATION FROM CTnt A 0"nf
• DE SAUSSURE ET AL . 1966
• HOPKINS & DIVEN 1962
A IGNATEV & KIRPICHNIKOV 1965
V WANG YUNG -CHANG ET AL . 1966
••U I I I 11 _ l _ _ l I I I I 1 l _ i l ' ' ' • '
IO< IO J lO1 io3
NEUTRON ENERGY ( « v )
FIG. 5. cx(E) for239Pu.

SM-101/41 299
where P(V) is the probability of emitting V neutrons per fission and £ n is the efficiency of neutron detector for neutrons. Bollinger et al. [20] have made a deliberate attempt to examine 239pj for variations in the average number of neutrons per fission (v) from resonance to resonance. They found that within the statistical accuracy of 3-4 /o there was no perceptible variation. Recently Cao et al. [21] have measured the fission cross-section of 235u using simultaneously the fragment and neutron detection methods. They conclude that the data obtained agree within a few per cent, any deviations being readily explicable as due to statistics and self absorption and multiple scattering effects_. These two pieces of information support the assumption that V and £-3 are constant from resonance to resonance.
The changes in the relative fission gamma ray yield as a function of fragment mass have been measured [22] and it is found that these variations are about 50°/o of those occurring in v> [23]. Therefore, since v> can be taken to be constant, it can be assumed that the relative Y-ray yield and hence €1 are constant.
At the present time measurements of the neutron and Y-ray yield have been made for the two thickest 239PU
samples, the incident neutron flux has been measured and the runs on Ag, Ft, Au, Ta and 23°U required to check the performance of the Y-ray detector have been made. Figs. 2 and 3 show the observed neutron and gamma yields in the energy range 11 eV to 100 eV from the sample of medium thickness. The data are untreated except for background subtraction and the figures on the graphs give the resonance energies.
The experiment is normalised by assuming the values of a for 13 well resolved low energy resonances in the energy region below 80 eV. Fig. 4 shows the values of a and the corresponding values of Ny/^n ^ o r *^e
medium sample. The curve is the best line fitted to the data which assuming that the multiple scattering correction S is unity leads to values of A = 0.930, B = 0.390 and C = 0.00683. The values of a for the resonances were obtained from the data of Derrien et al. [24].
The reactor physicist requires the ratio of the average capture cross-section to the average fission cross-section (<OnY>/<°nf>) rather than the average value of a (<a>). In order to get the average value of these cross-sections it is necessary to make multiple scattering corrections and the present experiment is not far enough advanced for this to be done. However, in order to see whether or not the value of <0nY>/<crn^,> *-s k -S*1 in the energy range from a few hundred eV to 10 keV the neutron and Y-ray counts have been integrated over 100 eV intervals below 1 keV, 1 keV intervals between 1 and 10 keV, 5 keV intervals from 10 to 30 keV and 10 keV intervals from 50 to 70 keV. Then, using equation (7) an estimate of <o"nY>/<Onf> can be made. The results are shown in Fig. 5 and it can be seen that the results are in reasonable agreement with the values obtained from o~nT and ohf. At the high energy end between 10 and 30 keV the results are higher than expected from the data of De Saussure et al. but this discrepancy is not considered to be significant at this stage. The errors shown in Fig. 5 have been arbitrarily assumed to be +33°/o because systematic errors, which have not been assessed, predominate in this experiment. The procedure used to obtain some indication of the value of «%Y>/<o"nf> is only valid if the multiple scattering corrections are small and the variation of the incident neutron flux over the energy interval used is negligible. In addition corrections are required for the effect of theO. 005"Al can round the samples. Therefore the results shown in Fig. 5 should be viewed with extreme caution. However, the results do show, particularly
300 SCHOMBERG et al.
in the energy range above 1 keV where the assumptions are not too unreasonable, that the value of a is probably of the order of unity and not of the order of 0.5 as suggested by the KAPL data [6],
6. ACKNOWLEDGMENTS
The authors are particularly indebted to Mr. G. White for his co-operation and development of the pulse shape discrimination equipment, to Mr. M. J. Hopper for converting his Y-ray Monte Carlo programme for use with the present detector system and to Mr. M. C. Moxon for advice and discussions on capture cross-section measurements. The advice and encouragement of Dr. E. R. Rae is gratefully acknowledged.
7. REFERENCES
[1] SMITH, R.D., Nuclear Data for Reactors 1_ IAEA Vienna (1967) 27. [2] PATRICK, B.H., SOWERBY, M.G., Private communication. [3] IGNATEV, K.H., KIRPICHNIKOV, I.V., Euronuclear 2 (1965) 77. [4] WANG YUNG-CHANG, DERMENDZHIEV, E., RYABOV, Yu. V., CHANG PEI SHU,
Preprint P-2713 J.I.N.R. Dubna (1966). [5] KANNE, W.R., STEWART, H.B., WHITE, P.A., Proc. 1st U.N. Int. Conf.
PUAE jt (1956) 315. [61 SAMPSON, J.B., M0LIN0, D.F., (1957) KAPL 1793. [7J POX, W.N., RICHMOND, R., SKILLINGS, D.J., WHEELER, R.C., J. Brit.
Nucl. Energy Soc. 6 (1967) 63. [8] DE SAUSSURE, G., WESTON, L.W., GWIN, R., INGLE, R.W., TODD, J.H.,
HOCKENBURY, R.W., PULLW00D, R.R. and LOTTDJ, A., Nuclear Data for Reactors 2 IAEA Vienna (1967) 233.
[9] UTILEY, CTA., EANDC(UK) ifO'L' (1964). [10] BROOKS, P.D., JOLLY, J.E., SCHOMBERG, M.G., SO'flERBY, M.G., UKAEA
Rep. AERE - M 1670 (1966). 11] UTTLEY, C.A., UKAEA Rep. AERE - M 1272 (1963). 12' HOPKINS, J.C., DIVEN, B.C., Nucl. Sci. and Eng. 12 (1962) 169. 13] MACKLIN, R.L., and GIBBONS, J.H., Phys. Rev. 159"Tl967) 1007. 14^ MOXON, M.C., RAE, E.R., Nucl. Inst, and Meth. 24, (1963) 445. ;15J PATRICK, B.H., SCHOMBERG, M.G., SOWERBY, M.G.. and JOLLY, J.E.,
Nuclear Data for Reactors 2 IAEA Vienna (1967) 117. [16] WHITE, G., Private Communication. [17J BROOKS, P.D., Nucl. Inst. 4. (1959) 151. [18] WEIGMANN, H., CARRARO, G., BOCKHOFF, K.H., Nucl. Inst, and Meth.
50 (1967) 265. [19] POOLE, M.J., WIBLIN, E.R., Proc. 2nd U.N. Int. Conf. PUAE 14 (1958)
226. [20] BOLLINGER, L.M., COTE, R.E., THOMAS, G.E., Proc. 2nd U.N. Int. Conf.
PUAE 1^ (1958) [21] CAO, M.G., MIGNECO, E., THEOBALD, J.P., WARTENA, J.A., WINTER, J.
To be published. [22] MAIER-LEIBNITZ, H., ARBRUSTER, P., SPECHT, H.J., Physics and
Chemistry of Fission 2 IAEA Vienna (1965) 113. [23] TERRELL, J., Physics and Chemistry of Fission 2 IAEA Vienna (1965) 3. [24] DERRIEN, H., BLONS, J., EGGERMANN, C., MICHAUD'ON, A., PAYA, D.,
RIBON, P., Nuclear Data for Reactors 2 IAEA Vienna (1967) 195.
D I S C U S S I O N
H.W. KUSTERS: The a curve for 2 3 9 Pu used in evaluating the capture data in the SNEAK set p resen ted in paper SM-101/12 is based on ex t ra polated Hopkins-Diven data below 20 keV, following the KAPL foil

SM-101/41 301
measurements. This a curve is in good agreement with the Douglas-Barry evaluation, but it turns out both from experiment and theoretical investigations that the a values below 20 keV are higher than those we used by up to 30%. This is bound to have a considerable influence on the neutron characteristics of large plutonium-fuelled fast reactors, especially for steam-cooled systems, where the breeding gain will be even lower than it is now.
Have your data been included in a group cross-section set and have the effects referred to already been calculated?
M.G. SCHOMBERG: These data are not included in the FD2 cross-section set but the effect has been tested in modified versions of this set. The new FD3 set will contain high a values in line with these recent values obtained at Harwell.
The data at present are provisional and it is difficult to recommend the best a values to use, particularly in the 1-15 keV range. The values quoted in my paper would result in a reduction in the breeding gain for a typical large sodium-cooled fast reactor of about 0 .1 , as compared to the value calculated with FD2; however, with suitable design a good doubling time may still be achieved. The effect on the steam-cooled reactor has not been studied in detail but it is expected to be more serious, especially in view of the low breeding gain calculated using the older data.
J. Y. BARRE: I should like to mention that with the fitting method described in paper SM-101/58 we expect to increase the value of the pa ramete r s for 239Pu between 10 and 100 keV by about 15%. This would tally with your latest measurements.
K.H. BECKURTS: What is the sensitivity E of your system for capture and fission events? Also, what is the time resolution of your system, and do you plan- to use it for • fast timing1 ?
M.G. SCHOMBERG: The measured efficiency for one detector, as used in the system described, is of the order of 5% for both capture and fission events.
The timing accuracy of both the neutron and gamma detectors depends mainly on the choice of photomultipliers. With fast photomultipliers a timing resolution of less than 2 nsec has been obtained and the system has been used for ' fast ' time-of-flight measurements.

GENERAL DISCUSSION
F. EBERSOLDT: I should like to make a few remarks on our method of determining neutron spectra from reaction rates and a hypothetical spectrum.
The general equation relating the neutron flux 0(E) to the response function of a detection system R(E) is an integral Fredholm equation of the first kind. The kernel of this equation contains essentially the cross-sections of the reactions considered.
When measuring reaction rates (spectral indices, for instance) to determine neutron spectra, one no longer obtains a response function continuously dependent on a parameter E (as in proton recoil spectrometry, for example), but only a few discrete values. Their number N, which is equal to the number of detectors, is unfortunately not very high. Furthermore, the measure points rk are affected by statistical errors c k(k=l f . . . . N )
(k= l , 2 , . . .N)
One could try a direct inversion of Eqs(l) using a multigroup technique, for instance. But the cross-section matrix appearing in these equations would often be unfavourable because of the similarity of some cross-sections. This would produce solutions which are very sensitive to e r rors in the reaction rates or cross-sections and, as stated by several authors, show unwanted and non-physical oscillations. All this excludes a direct inversion of the fundamental equations (1).
There have been two different methods used mainly up to now to solve the equations under consideration. The first one assumes a priori a special shape of the spectrum. In a parametric representation of the spectrum the parameter values are determined from the measured reaction rates. The difficulty of this method consists in choosing good approximation functions and their domain of definition.
Another way to solve the problem is to develop the function <j> (E) on a basis of orthogonal functions and to determine the coefficients of the development from the measured reaction rates. This method has the disadvantage of giving solutions which may oscillate because of the limited number of terms in the development.
The method presented here uses the fact that, besides the experimental quantities rk , one generally has a rough idea of the spectrum sought. This can be gained from calculations or similar experiments made previously. The principle of the technique is to start with this hypothetical spectral function <p0 (E) and to add a correction function <&(E) which is to be determined from the measure points
0(E)=x- (pQ(E) + cp1(E) (2)
303

304 GENERAL DISCUSSION
The quantity x is an amplitude factor which is unknown at the beginning. It will be chosen so as to minimize the total correction, i. e.
^ ( E ) dE -» minimum (3)
As one assumes that (p0[E) is a 'physical' function, i .e . a continuous one with first derivative also continuous, one should require these properties to hold for the correction function cp (E) too.
It seems even realistic to require that ^ ( E ) should be a 'smooth' curve, in particular without strong oscillations. This can be realized by minimization of the curvature, i . e .
/Yd2<pi\2
/ ( JT^2 J dE -» minimum (4) 0
These physical requirements lead, of course, to an approximate solution of the equations (1), with some contributions to the error functions ek. But one should keep in mind that the exact solution generally would not have any physical meaning because of its undesirable oscillations.
Introducing the multigroup formalism to solve the problem, one can use the technique of Lagrange's multiplier to combine Eq. (4) with the condition that the total e r ror is a constant
I el = c2 (c = const) (5)
k = i
N 2 ' 2 „2
i = l i = l
c -» min (6)
where X is the inverse of the Lagrange multiplier. As opposed to the classical theory where Xis calculated, it seems
better to attribute a non-negative value to X and to omit the constant term -c2 which is often unknown and can be calculated later by Eq. (5).
From the Lagrange equations (6) and the multigroup form of equations (1), one obtains the final results
e =
with
X A ^ j ^ ^ F + X A ) " 1 ( ? - x 0 . 1 ) (7)
( (F+XA^IUF+XA)- 1 /?) ( (F + XA)-1 s, (F+XA)-1 s) v ;
The matrices A and F contain only average values of cross-sections. The components of'the vector ~s are obtained by the scalar products of <p0(E) with all the cross-sections CTk(E).
GENERAL DISCUSSION 305
The p a r a m e t e r X contro ls the ra te of smoothing of </>i(E). Starting with X= 0, which gives the d i rec t unfolding of equations (1) without smoothing ( co r r ec t solution), one i n c r e a s e s the amount of smoothing when inc reas ing X.
The bes t X s e e m s to be one that e l iminates undesirable oscil lat ions in the solution to <& (E) and gives at the same t ime an e r r o r | e k | exceeding the exper imenta l e r r o r , which of course is a lower l imit for 1^1 .
The method has been p r o g r a m m e d in FORTRAN IV for the IBM-360 computer , and the code is s t i l l being tes ted . The f i rs t applications to mathemat ica l models , where the theore t ica l solutions were known, have given ve ry sa t i s fac tory r e s u l t s .
The advantages of th is method are the following: (1) The solutions obtained a re 'physical ' functions without e r r o r -
induced osci l la t ions (2) No s p e c t r a l shape is fixed a p r io r i (3) The solut ions s eem to be l i t t le sensi t ive to the choice of the
ini t ial function <P0(E), thus al l the n e c e s s a r y impor tance is given to the m e a s u r e d reac t ion r a t e s .
(4) F u r t h e r m o r e one gets a m e a s u r e of the overal l e r r o r affecting the m e a s u r e p o i n t s . 1
H.W. KUSTERS: As I see it, you a r e t ry ing to adjust the spect rum to in tegra l data. I would have thought that t he re was no difficulty in predic t ing the spec t rum if one rea l ly has the c o r r e c t c ro s s - s ec t i on data. Could you clarify whether in your evaluation you kept constant the effective c r o s s - s e c t i o n s , which a r e the rea l ly uncer ta in data?
F . EBERSOLDT: Spect ra calculated by mult igroup calculat ions, for ins tance , do not n e c e s s a r i l y agree with exper imenta l r e su l t s , essential ly because the c r o s s - s e c t i o n s used a r e not sufficiently good. The method p resen ted h e r e allows us to c o r r e c t these calculated spec t ra by react ion-r a t e m e a s u r e m e n t s ( spec t r a l indices) . E r r o r s in the c ro s s - sec t i ons used for the theore t i ca l de terminat ion of the spec t rum contribute to the e r r o r e affecting the m e a s u r e d reac t ion r a t e s . To prevent these e r r o r s e having too grea t an influence on the calculated spec t rum the mat r ix F descr ibing the c r o s s - s e c t i o n s of all the de tec to rs should not be too s ingular . This could be a r ranged by choosing a good set of de tec tors with d i s s imi l a r c r o s s - s e c t i o n s over appropr ia te ly chosen energy r anges .
The subject of this presentation will be published more completely in a nuclear journal.

20*

ZONED SYSTEMS
(Session IV)

Chairman: M. BOGAARDT

ETUDE EXPERIMENT ALE DES CARACTERISTIQUES NEUTRONIQUES DES MILIEUX MULTIPLICATEURS RAPIDES DANS L ' ASSEMBLAGE CRITIQUE THERMIQUE-RAPIDE ERMINE
J. BOUCHARD ET R. VIDAL CEA, CENTRE D'ETUDES NUCLEAIRES DE FONTENAY-AUX-ROSES
ET
J .C. MOUGNIOT CEA, CENTRE D'ETUDES NUCLEAIRES DE CADARACHE, FRANCE
Abstract — R&um6
EXPERIMENTAL STUDY OF THE NEUTRON CHARACTERISTICS OF FAST CORES IN THE ERMINE THERMAL-FAST CRITICAL ASSEMBLY. A section of fast-reactor lattice was placed in the central hole of the MINERVE reactor, thus forming a coupled "thermal-fast" critical assembly. The authors describe the construction of the first core, composed of the MASURCA 1-B lattice of 30*70 enriched uranium diluted in graphite, together with the experimental techniques used.
Most measurements were carried out by the oscillation method, using an automatic regulating rod, to compensate for reactivity effects. The experiment was conducted with special care, so as to avoid electronic, mechanical and neutron perturbations as much as possible.
The paper shows the results of measurements of spectral indices and of reactivity effects of fissile, fertile and structural materials. It also contains the results of experiments carried out to determine heterogeneity effects, the Doppler effect of 238U and the importance functions.
These experimental values are compared with values calculated from transport theory. The authors analyse sources of error, various causes of perturbations and improvements required in the methods of interpretation.
The authors conclude that the difficulties met in the interpretation of these experiments are due to the fact that the core has two zones and that they are the same, whether the driver zone is thermal or fast, when the asymptotic spectrum is reached. .
ETUDE EXPERIMENTALE DES CARACTERISTIQUES NEUTRONIQUES DES MILIEUX MULTIPLICATEURS RAPIDES DANS L* ASSEMBLAGE CRITIQUE THERMIQUE-RAPIDE ERMINE. Une portion de rgseau de rgacteur a neutrons rapides est place'e dans la cavite de la pile MINERVE, formant ainsi un assemblage critique couple1
«thermique-rapide». La realisation du premier coeur, constitue' par le r£seau MASURCA 1-B en uranium enrichi a 30<7o diluS dans le graphite, est d£crite ainsi que les techniques expgrimentales u t i l i ses .
La majeure partiedes mesures sont effectu£es par la mSthode d'oscillation, les effets en r€activit€ etant compensSs par une barre de pilotage automatique. Un soin particulier est apporte a la realisation explrimentale afin d'Sviter au maximum les perturbations electroniques, m£caniques et neutroniques.
Les auteurs prSsentent les rgsultats des mesuies d'indices de spectre et d'effets en r6activit6 des matgriaux fissiles, fertiles et de structure, ainsi que les r£sultats des experiences effectuSes pour determiner les effets d*h6t6rog6neite,l'effet Doppler de l'uranium-238 et le rapport des importances. Ces valeurs experimentales sont comparees aux valeurs calculees par la th6orie du transport. Les sources d'erreurs, les diff€rentes causes de perturbation et les ameliorations a apporter aux mSthodes d'interpretation sont analyses.
Les auteurs concluent enfin que les difficultes rencontrees dans 1'interpretation de ces experiences sont dues au fait que le cceur est a deux zones et qu' elles sont les mSmes, que la zone nourriciere soit thermique ou tapide, loisque le spectre asymptotique est atteint.
309

310 BOUCHARD et al.
INTRODUCTION
Le développement des études su r les r é a c t e u r s rap ides a ent ra îné la construct ion d' ensembles c r i t iques de grandes dimensions qui immobi l i sent des quanti tés impor tan tes de m a t i è r e s f i ss i les et qui souvent ne sont pas a s sez souples pour s ' a d a p t e r aux conditions expér imen ta les pa r t i cu l i è r e s néces s i t ée s par la m i se en oeuvre de techniques expér imen ta les p r é c i s e s .
Les coeurs à deux zones se sont développés r é c e m m e n t pour effectuer l e s m e s u r e s sur une par t ie seulement du r é seau , afin de diminuer la quantité de combustible a é tudier ; cependant, le grand volume de la zone n o u r r i c i è r e rapide r e s t e un inves t i s sement impor tant en combust ible et rend 1' exploitation du r é a c t e u r plus complexe.
L ' e x p é r i e n c e ERMINE es t un a s semblage cr i t ique a deux zones . La zone n o u r r i c i è r e es t the rmique , ce qui p e r m e t de r e n d r e 1' ensemble cr i t ique avec une faible quantité de 235 U et, tout en maintenant la sû re t é de fonctionnement des a s semblages the rmiques , d1 a t te indre au cen t re de la zone rapide un spec t r e ca rac t é r i s t i que du mil ieu à é tudier .
Ces expér iences sont effectuées dans le cadre des études e n t r e p r i s e s en F r a n c e pour complé te r l e s informations obtenues su r l ' a s s e m b l a g e cr i t ique MASURCA [1] auquel sont a s s o c i é s , d 'une par t , 1' expér ience exponentielle HUG montée sur le r é a c t e u r HARMONIE, d ' a u t r e pa r t , l ' a s s e m b l a g e t he rmique - r ap ide ERMINE ins ta l lé dans le cœur de MINERVE. Deux r é seaux de base se ron t étudiés sur l e s t r o i s ensembles afin d' a s s u r e r les recoupements n é c e s s a i r e s .
Dans ce m é m o i r e on développe l es expér iences effectuées sur le p r e m i e r r é seau ERMINE, l e s techniques expér imenta les u t i l i sées ainsi que l es r é su l t a t s obtenus. Les conclusions sur l ' i n t e r p r é t a t i o n des m e s u r e s sur les a s semblages à deux zones t he rmique - r ap ide sont comparée s à ce l les déduites des expér iences é t r angè re s su r l e s coeurs a deux zones r a p i d e s .
1. DESCRIPTION DE L'ASSEMBLAGE
L" as semblage t he rmique - r ap ide ERMINE se t rouve dans la pile MINERVE si tuée au Centre d ' é tudes nuc léa i res de Fon tenay -aux-Roses . Il s ' agit d 'une pile piscine dont le combust ible es t de l ' u r a n i u m enr ich i a 90%. Elle possède une cavité cen t ra le de sect ion c a r r é e dont le côté peut v a r i e r de façon continue, dans laquelle on a placé la pa r t i e rap ide de 1' a ssemblage ainsi que la zone d' adaptation et l e s r é f l ec t eu r s axiaux suivant une configuration r e p r é s e n t é e sur l e s f igures 1 et 2.
Un cube de graphite de 310 mm d1 a r ê t e es t pe r cé de 108 t rous contenant les é léments de m a t i è r e f i ss i le const i tués de b a r r e a u x cyl indr iques d ' u r a n i u m métal l ique enr ich i a 30% de 305 m m de longueur et de 12, 7 mm de d i amè t r e , gainés d' ac i e r inoxydable. Le vide cor respondant a la composit ion normale du c œ u r MASURCA 1-B es t ménagé en t re la gaine et le graphi te . Au cen t re du bloc de graphi te on dispose d 'un canal de m e s u r e s de sect ion c a r r é e dont l e s d imensions i n t é r i e u r e s (28, IX 28, 1 mm) sont identiques a ce l les d 'une cel lule no rmale du r é s e a u (fig. 3). La m a s s e de 2 3 5U dans la zone rapide es t de 22 kg environ.
SM-101/66 311
Afin d'obtenir au centre de l 'assemblage le spectre caractéristique du réseau étudié avec un volume minimal, on a placé contre les faces de la zone rapide un filtre convertisseur en uranium naturel métallique, de 4 cm d'épaisseur sur les faces latérales et de 8 cm plus 7 cm d' acier inoxydable sur les faces supérieures et inférieures.
La zone nourricière thermique est formée par les éléments combustibles de MINERVE entourés des réflecteurs latéraux en graphite de 50 cm d'épaisseur, l 'ensemble étant plongé dans l 'eau. La masse de 235U dans cette zone est de 5, 1 kg.
L'assemblage ainsi réalisé présente, du point de vue du contrôle, les mêmes caractéristiques qu'un réacteur thermique. Une étude des paramètres de couplage suivant la formulation d'Avery a montré que le coefficient de multiplication de la zone rapide était faible (il ne s 'y produit qu'environ 10% des fissions) et que le temps de vie global était t res proche de celui de la zone nourricière.
La zone rapide a la composition du cœur M ASURCA 1-B qui est résumée dans le tableau I pour les différents milieux.
2. TECHNIQUES EXPERIMENTALES
Les expériences avaient pour but - de vérifier qu' au centre de 1' assemblage ainsi réalisé on obtenait un spectre caractéristique du réseau a étudier, - de développer les techniques expérimentales en vue de leur application sur MASURCA, - enfin d'apporter des résultats en vue de l 'étude de ce premier réseau.
Pour contrôler ia validité des résultats, il faut s' assurer de l 'identité des effets en réactivité normalisés et des spectres directs avec ceux mesurés au centre d'un cœur critique de même composition. Au stade actuel de ces études, le recoupement complet n' est pas encore possible avec MASURCA, qui est chargé avec un cœur au plutonium, aussi la comparaison n' a-t-elle porté que sur les spectres directs mesurés a 1' aide de taux de réaction sur l 'empilement exponentiel HUG dont le volume dépasse la moitié du volume critique.
2 . 1 . Mesures de taux de réaction
On peut distinguer - les mesures relatives pour contrôler le domaine de stabilité du spectre au centre de 1' assemblage et son identité avec le centre du massif exponentiel HUG, - les distributions radiales des taux de fission dans la cellule centrale pour mettre en évidence les effets d'hétérogénéité,' - les mesures absolues pour comparer un certain nombre d'indices de spectre aux résultats des calculs correspondants.
Si les deux premiers types de mesures présentent peu de difficultés, le dernier pose des problèmes d'étalonnage qui ne sont pas encore entièrement résolus dans la mesure où l 'on désire atteindre une t res bonne précision. On a utilisé deux techniques: les chambres a fission et l1 activation de détecteurs.

C h c w b * * A . ptlotoqC
FIG. 1. Coupe horizontale du cceur.
FIG. 3. Canal d'oscillation.
O a o re
£
FIG. 2. Coupe verticale du coeur.
U cnr<.V>i

SM-101/56 313
TABLEAU I. COMPOSITION DE LA ZONE RAPIDE (1024 atomes/cm3)
Corps
Uranium-235
Uranium-238
Acier
Aluminium
Graphite
Eau
Cœur rapide
0,232 • 10"2
0, 536 * 10""z
0, 624 ' 10"2
-0,0542
-
Zone de transition
0,303 ' 10~3
0,0419
0,961 ' 10~2
---
Zone nourricière
0,134 • Ю - 3
0,147 • 10"4
-0,0235
-0,0196
Réflecteurs
---
0,406 * 10"2
0,077
0,100 • 10"2
2. 1. 1. Chambres a fission
L' amélioration des techniques dans ce domaine a permis d'utiliser des chambres cylindriques de 4 mm et de 1, 5 mm de diamètre, ces dernières étant réalisées pour des mesures de distribution fine de taux de fission dans la cellule. L'épaisseur des dépôts varie de 100 a 1000ng suivant les dimensions de la chambre et la nature des corps fissiles, qui sont les suivants: 235U, 238U,Unat., 239Pu,232Th^et 237Np. Les impulsions délivrées par ces chambres sont amplifiées et analysées par un sélecteur d'amplitudes.
Actuellement, les seules mesures absolues concernent le rapport ^ f ii238/^f U235 • Elles sont effectuées a l 'aide de deux chambres à fission possédant, l 'une un dépôt de 235U, l 'autre un dépôt d'uranium naturel. L'étalonnage est effectué dans un spectre thermique qui permet d'atteindre le rapport des masses de 235U dans les deux chambres. Cette méthode sera étendue aux autres couples suivants: 24° Pu - 239Pu; 237 N p _ 239 p u . 2 3 8 T J . 2 3 9 p u ; 238 y _ 233 u # д f & u t d a n g c e g c a s < e n p l u g
de l'étalonnage dans un spectre thermique, effectuer une analyse isotopique ou un dosage spectrométrique précis pour déterminer la quantité relative du corps fissile à basse énergie par rapport au corps dont la réaction de fission présente un seuil.
2 .1.2. Détecteurs
Les taux de fission dans le 238 U et le 235U sont mesurés avec des détecteurs pour déterminer - leurs valeurs relatives dans l 'uranium et le graphite, - la valeur absolue du rapport ст f U238 /<?fu235 dans l 'uranium et le graphite pour la comparaison entre ERMINE et 1'empilement exponentiel HUG.
Pour ce dernier cas, des précautions particulières quant aux choix des temps d'irradiation et de décroissance, des seuils de discrimination et des activités des détecteurs doivent être prises pour s'affranchir des erreurs systématiques. Le bon accord avec le même indice mesuré avec les chambres à fission montre que la technique adoptée est satisfaisante.

314 BOUCHARD et al.
La déterminat ion de la va leur re la t ive du taux de capture du 2 3 8 u de deux dé tec teurs se fait en mesuran t , soit l1 activité y du pic a 106 keV du 2 3 9Np après cor rec t ion des produits de fission p a r a s i t e s , soit , dans le cas des m e s u r e s de 1' effet Doppler, 1' activité y du pic a 74 keV du 239 TJ
D ' a u t r e s types de dé tec t eu r s , en pa r t i cu l i e r le soufre, le sodium et le manganese , ont été u t i l i sés pour la compara i son en t re ERMINE et HUG et pour des m e s u r e s r e la t ives en t re différents points .
2 . 2 . Mesure des effets en réac t iv i té
Les effets en réac t iv i té sont m e s u r é s par la méthode d 'osc i l l a t ion . Le canal de m e s u r e , si tué au cen t re du r é s e a u , a les dimensions de la cel lule cen t ra le . L 'échant i l lon , de 101,6 mm de longueur, es t placé dans un t r a in continu de graphite et d ' u r a n i u m enr ichi a 30%, de façon a r econs t i tue r la cel lule; sa longueur es t te l le que, pendant le mouvement d' osci l lat ion, le r é s e a u soit toujours complet afin de ne c r é e r que la per turba t ion due a 1' échanti l lon sans modifier 1' environnement (fig. 2 et 3). Cependant, pour ce r t a ins échanti l lons de p lus 'grand volume, le t r a in d 'osc i l l a t ion es t , cha rgé uniquement de graphi te .
L 'osc i l l a t ion es t du type «pseudo-ca r r é» avec une pér iode de 20 s et des temps de t r a n s i t de 1' o r d r e du dixième du temps d' a r r ê t . L ' effet en réac t iv i t é produit pa r le déplacement de 1'échantillon es t compensé par un pilote automatique const i tué d 'une b a r r e ro ta t ive r ecouve r t e de s e c t e u r s de cadmium dont le mouvement es t a s s e r v i aux var ia t ions du signal dél ivré par une chambre d ' ion isa t ion placée dans le ré f lec teur de la zone thermique (fig. 1). Cette b a r r e compense automat iquement l e s va r ia t ions de réac t iv i t é c r é é e s pa r l ' échan t i l lon et son angle de ro ta t ion es t e n r e g i s t r é pa r un ana lyseur en t e m p s , ce qui p e r m e t d' é l iminer l e s pér iodes de t r a n s i t dans le dépouil lement des r é s u l t a t s . La l inéa r i t é de la b a r r e de pilotage a été vérif iée pour la gamme d 'u t i l i sa t ion qui r e p r é s e n t e environ ±10 pcm. La p réc i s ion at teinte avec ce dispositif de m e s u r e es t in fé r ieure a 0, 01 pcm soit 10"7 en r éac t iv i t é .
2 . 3 . Effet Doppler
Une p r e m i è r e s é r i e de m e s u r e s a été e n t r e p r i s e pour a t te indre l ' e f fe t Doppler du 2 3 8U. Deux méthodes ont été u t i l i s ées , l ' u n e pa r l ' o sc i l l a t i on d ' un échanti l lon chauffé, 1' au t re par 1' activation de dé t ec t eu r s p lacés dans l1 échantil lon chauffé.
P o u r l e s m e s u r e s pa r osci l lat ion, l e s échanti l lons p réga inés en ac ie r inoxydable et p lacés a 1' i n t é r i eu r du t r a in d' osci l la t ion (fig. 2) sont chauffés pa r induction a haute fréquence dans le champ d ' induct ion d ' u n solénoide de cuivre s i tué a u - d e s s u s du c œ u r , à une dis tance du mil ieu du c œ u r égale a la course d' osci l la t ion. Pendant chaque pér iode d 'osc i l l a t ion , 1' échanti l lon chaud et un échanti l lon froid identique sé journent a l te rna t ivement pendant une demi -pé r iode de 10 s au mil ieu du c œ u r , le four a induction ne fonctionnant que pendant la demi -pé r iode où 1' échantil lon chaud es t p lacé a 1' i n t é r i eu r . Ce dispositif or ig inal p e r m e t , le r é g i m e d ' équ i l i b re étant é tabl i , d ' ob t en i r des t e m p é r a t u r e s par fa i tement r ep roduc t ib l e s , de changer faci lement l e s d imensions des échanti l lons et de n ' appor te r aucune per tu rba t ion pa r l e dispositif de chauffage dans

SM-101/56 315
le cœur. Les mesures ont été effectuées jusqu'à 500°C sur des échantillons d'uranium naturel métallique et d'oxyde, et sur un échantillon d'uranium métallique enrichi a. 30%.
Pour les mesures par activation, deux détecteurs d'uranium appauvri sont placés respectivement au centre des échantillons chaud et froid du montage précédent. Pendant l'oscillation, ils sont ainsi irradiés pendant des temps égaux, et la comparaison des taux de comptage de la raie y de 74 keV du 239u formé permet d'obtenir la variation relative de la capture du238U.
2.4. Mesures d'importance
Les mesures relatives d'importance a l'aide de sources de neutrons sont effectuées dans les mêmes conditions que les mesures d' effets en réactivité. La source, placée dans un train continu de graphite, est oscillée entre le cœur et l'extérieur. Pour séparer l'effet sur la réactivité des neutrons émis de celui dû aux matériaux constitutifs de la source, on effectue la mesure à différentes puissances. On a aussi vérifié que cette séparation donnait de bons résultats en oscillant une source de Sb-Be vierge identique a la source active. Aucune correction n'est à apporter à la cinétique de la pile, celle-ci étant dans tous les cas maintenue a l'état critique grâce a la barre de pilotage automatique.
3. RESULTATS ET COMPARAISONS AVEC LES CALCULS
3. 1. Indices de spectre
Pour la comparaison entre ERMINE et l'empilement exponentiel HUG, les indices de spectre <ff u23g/tff u 2 3 5 sont mesurés avec des couples de détecteurs de 9 mm de diamètre placés au centre de l'élément combustible de 12, 7 mm de diamètre et dans le graphite au voisinage du barreau. On constate un excellent accord sur cet indice de spectre, qui est aussi confirmé pour des couples de détecteurs Mn-S et Na-S:
Uranium
Graphite
ERMINE
342 ±2,5 • 10"4
288 ±4 • 10'4
HUG
341 ±4,5 • Ю-4
292 ±2, 5 • 10"4
Les mesures effectuées avec des chambres a fission miniatures permettent d'obtenir la distribution radiale des taux de fission Rf u 2 3 5
et Rf U238 du 235U, du 238U et de l'indice de spectre 5f u23s/ f U235 dans le graphite. Les résultats sont présentés sur les figures 4 et 5 et montrent que le taux de fission dans le 238U et l'indice de spectre varient de près de 20% entre le centre du barreau et le point situé dans le graphite a la limite de la cellule.
On caractérise le milieu étudié par l'indice de spectre <?f u238/ f U235 en trois points de la cellule situés respectivement au centre de l'uranium, dans le graphite au voisinage du barreau et dans le graphite à la limite de la cellule. Ils sont mesurés avec des couples de détecteurs, sauf pour le dernier point pour lequel on utilise des chambres a fission, les

Ua 307.
Graphite
- _
090.
6.35 18.2 VIf\ mm
FIG. 4 . Repartition radiale des taux de fission du 235U et du 23 U .
Dctactcurs
C h a m b r t ©* f i s s i o n
D3 O a o
FIG. 5. Repartition radiale des indices de spectre 6f U238^ ° f U235-

SM-101/56 317
dé tec t eu r s ayant un d i amè t r e t rop impor tan t pour donner une va leur ponctuel le . Les r é s u l t a t s expér imentaux sont en bon accord avec ceux ca lcu lés pa r un code Monte-Car lo [2]:.
Calcul
340- 10"4
294 • 10 -4
Les var ia t ions de différents indices de s p e c t r e ont auss i été m e s u r é e s en t r o i s points de la cellule cen t ra le r é p a r t i s su r l e s 10 cm qui c o r r e s p o n dent à la hauteur de l ' échan t i l lon . On constate une s tabi l i té sa t i s fa i san te , compte tenu de la p réc i s ion , dans la zone de m e s u r e des effets en r éac t i v i t é :
- 5 cm 0 + 5 cm
1,000 0,992
1,000 0,996
1,000 1,015
3 .2 . Effets en r é act ivi té
Pour c o m p a r e r l e s va l eu r s expér imen ta les a. ce l les ca l cu lées , i l e s t n é c e s s a i r e de ten i r compte de l ' h é t é rogéné i t é du mil ieu dans lequel sont effectuées l e s m e s u r e s . Un calcul de cellule en Monte-Car lo [2] nous a p e r m i s de c o m p a r e r l e s coefficients de réac t iv i t é ca lculés en supposant la cel lule composée d ' un mil ieu homogène à ceux obtenus en tenant compte de l ' h é t é rogéné i t é lo r sque la m e s u r e es t effectuée dans l ' u r a n i u m ou dans le graphi te . Nous donnons dans le tableau II quelques exemples des r é s u l t a t s obtenus; c ' e s t à 1' aide de ces calculs que l ' o n co r r ige l es v a l e u r s expér imen ta les pour l e s c o m p a r e r à ce l les ca lculées en supposant le mil ieu homogène.
TABLEAU II. CORRECTIONS D' HETEROGENEITE SUR LES E F F E T S EN REACTIVITE PAR GRAMME RAPPORTES A L'URANIUM-235
Corps
Uranium-238
Carbone
Fer
Bore naturel
Oxygène
Monte-Carlo,
homogène
-0 ,090
0,229
-0 ,021
- 7 , 0 4
0,112
Monte
Uranium
-0,088
0,228
-0 ,021
-7 ,38
0,112
•Carlo, hétérogène
Graphite
- 0,102
0,222
- 0, 020
- 8 , 4 3
0,109
Expér ience
Uranium 342 ± 2, 5 • 1 0 ' 4
Valeur moyenne 288 ±4 • 10"4
Graphite L i m i t e d e - l a c e U u l e 276 ± 3 • 10"4
238 XT / 235 j j
239 P u / 2 3 5 U
T h / 235U
0,998
0,998
1, 003

318 BOUCHARD et al.
TABLEAU i n . CARACTERISTIQUES DES ECHANTILLONS
Corps
Uranium-238
Plutonium-239
Thorium
Carbone
Fer
Nickel
Aluminium
Zirconium
Bore naturel
Oxygene
Sodium
Hydrogene
Caractgristiques
Uranium naturel: 0=12 ,7 mm; M = 250 g
Uranium 1 20P]o : 0=12,7 mm; M = 250 g
Uranium a 30"7o: 0 =12,7 mm; M=250 g
Fils de plutonium a 6% de "°Pu; M = 10 g
0=12,"7; M=250g ,
Echantillons divers de masse < 120 g
Plaques de 2 mm; M = 150 g
Plaques de 2 mm; M = 150 g
Bloc de 25 X 25 x 100 mm;; M = 150 g
0 = 12,7 mm; M = 80 g
Carbure de bore: gchantillons de 1 et 2 g
Pastilles d'alumine: 0=12 mm; M = 40 g
4 rgglettes de type MASURC A: M = 50 g
Echantillons d'eau et de poly£thyl£ne d'environ 1 g
Les caracteristiques des echantillons sont rassemblees dans le tableau III et 1' ensemble des valeurs mesurees et calculees, correspondant a l1 effet d'un gramme du corps etudie rapporte a 1' effet d'un gramme de 235 U, sont presentees dans le tableau IV.
Pour obtenir les valeurs theoriques presentees, on utilise les constantes d1 Hansen et Roach a 16 groupes et le jeu Cadarache a 26 groupes [3] et des calculs a une et deux dimensions en theorie de la diffusion [4] et en theorie du transport [5],
La comparaison des resultats appelle les constatations suivantes: - La correction d' heterogeneite par le code Monte-Carlo reduit
beaucoup les ecarts, surtout lorsqu'elle est importante. II faudrait dans certains cas effectuer des calculs d'heterogeneite plus detailles pour rendre parfaitement compte des conditions de mesure.
- Dans la plupart des cas, c 'es t le calcul avec le jeu Cadarache qui rend le mieux compte des valeurs experimentales.
- L?,uranium-238, qui correspond a une dilution t res faible, n1 est pas bien calcule. D! ailleurs, les resultats presentes dans le paragraphe suivant montrent de t res fortes variations en fonction du diametre et de 1'enrichissement de 1'echantillon, et des calculs plus complets utilisant un code de perturbation heterogene devraient etre effectues pour obtenir une meilleure interpretation de ces variations.
- Le 239Pu, le carbone et 1'oxygene sont en t res bon accord ainsi que le thorium si l 'on tient compte de la marge d 'e r reur et des importantes variations que ce corps presente en fonction de la dilution.

TABLEAU IV. E F F E T S EN REACTIVITE PAR GRAMME RAPPORTES A L' URANIUM-235
Corps
Uranium-238
Plutonium-239
Thorium-232
Carbone
Fer
Nickel
Aluminium
Zirconium
Bore naturel
Oxygene
Sodium
Hydrogene
Rgsultat experimental
B m t Corrige par Monte-Carlo
-0,098 ± 0,002 -0,098
+ 1,42 ±0,03 +1,42
-0,189± 0,010 -0,177
+ 0,220 ± 0,002 +0,227
-0,029'+0,001 -0,029
-0,052 ± 0,001 -0.053
' -0,005 ± 0,001 -0,005
-0,039 ± 0,001 -0,041
- 8 , 5 ± 0 , 2 - 7 , 1
+ 0,104 ±0,010 +0,107
+ 0,066 ± 0,006 +0,067
+ 73,0 ±2 ,0 +75,0
Code de transport Jeu Hansen et Roach
2 dimensions 1 dimension
-0,084 -0,079
+ 1,40 +1,41
-0,166 -0,162
+ 0,226 +0,232
-0,024 -0,022
-0,136 -0,134
-0,0010 +0,0031
-0,0160 -0,0143
-6,66 -6,66
+ 0,108 +0,114
+ 0,043 +0,049
+ 53,4 +52,6
Code de diffusion a 1 dimension
Jeu Hansen et Roach Jeu Cadarache
-0,084 -0,095
+ 1,41 +1,44
-0,165
+ 0,238 +0,222
-0.023 -0,029
-0,135
+ 0,0025 -0,014
-0,0148 -0,043
-6 ,61
+ 0,117 +0,110
+ 0,049 +0,043
+ 54,5 +63,1

320 BOUCHARD et al.
- Pour le bore, l ' écar t est de l ' o rdre de 6%, mais il faut remarquer que la correction d'hétérogénéité, qui est t res importante, ne rendait pas compte dé sa répartition exacte dans le graphite de la cellule.
- Les différences trouvées sur le fer et 1' aluminium sont certainement dues en majeure partie aux variations de l 'importance en fonction de l 'énergie, t res sensible pour ces corps, et que le calcul ne prend en compte qu'imparfaitement.
- Le nickel et le zirconium donnent des résultats t res différents des valeurs calculées, qui ne peuvent être attribuées qu'aux sections efficaces de capture utilisées.
- L'hydrogène et le sodium présentent de gros écarts qu'on peut attribuer aux constantes utilisées pour le calcul des transferts élastiques ou a la mauvaise connaissance de la fonction d'importance, ce qui est plus improbable si on tient compte des bons résultats obtenus avec le carbone et l'oxygène.
3.3. Hétérogénéité et effet Doppler
3 .3 .1 . Hétérogénéité
238-Pour étudier les effets en ré activité du U en fonction de la dilution, on utilise des fils d'uranium naturel de 4 mm2 de section. On a vérifié avec des fils d'uranium enrichi à 93% que, dans la gamme étudiée, l'effet du 235U était indépendant de la dilution, ce qui confirme les résultats
Ak2 5 8U
FIG. 6. Effet en réactivité du 238U en fonction de la dilution.
20 30 40 50 60 °~U238(b)
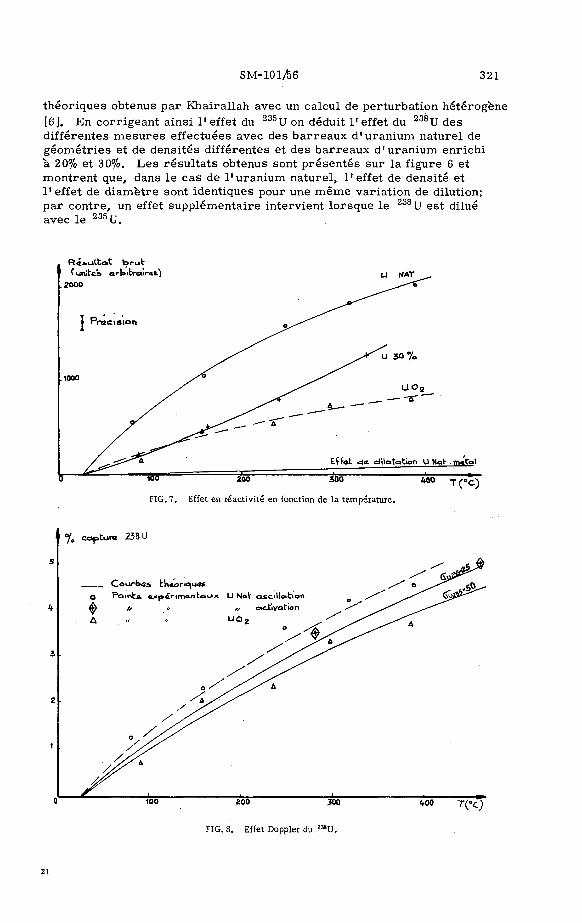
, R é s u l t a t b r u t f \un'it«is> QrUitrc»ir«b) I 2000
U NAT
MOOO
200 300 400 T ( e c Y
FIG. 7. Effet en réactivité en fonction de la température.
J % capturo 238 U
C o u r b e s tkaoriqucs
О Pointa. <i>partrrxxntaux U Nal" osci l lat ion ф // * x, «ctiyation
Л y
л VX 200 300 <*00 T('C)
21
FIG. 8. Effet Doppler du 238U.
SM-101/66 321
théoriques obtenus par Khairallah avec un calcul de perturbation hétérogène [6]. En corrigeant ainsi l1 effet du 235U on déduit l1 effet du 23àU des différentes mesures effectuées avec des barreaux d'uranium naturel de geometries et de densités différentes et des barreaux d'uranium enrichi a 20% et 30%. Les résultats obtenus sont présentés sur la figure 6 et montrent que, dans le cas de l 'uranium naturel, l'effet de densité et 1' effet de diamètre sont identiques pour une même variation de dilution; par contre, un effet supplémentaire intervient lorsque le 2 3 8u est dilué avec le 235U.
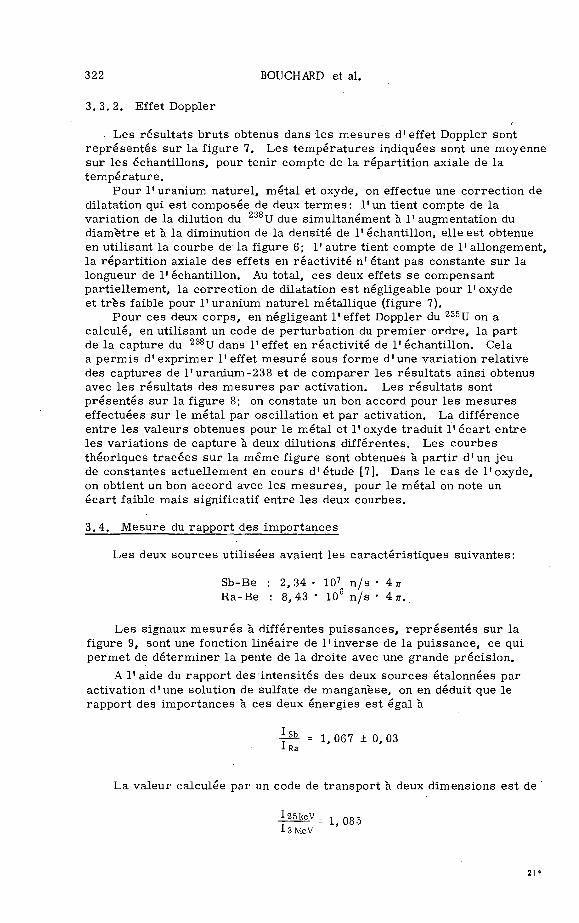
322 BOUCHARD et al.
3 . 3 . 2 . Effet Doppler
Les r é su l t a t s b ru t s obtenus dans l e s m e s u r e s d 'effet Doppler sont r e p r é s e n t é s sur la figure 7. Les t e m p é r a t u r e s indiquées sont une moyenne sur l e s échanti l lons, pour t en i r compte de la répar t i t ion axiale de la t e m p é r a t u r e .
Pour l ' u r a n i u m na ture l , mé ta l et oxyde, on effectue une cor rec t ion de dilatation qui es t composée de deux t e r m e s : l ' u n t ient compte de la var ia t ion de la dilution du 2 3 8 u due s imul tanément a. 1' augmentation du d iamèt re et a la diminution de la densi té de l ' échant i l lon , el le es t obtenue en ut i l isant la courbe de la figure 6; 1' au t re t ient compte de 1' a l longement, la r épar t i t ion axiale des effets en réac t iv i t é n1 étant pas constante su r la longueur de 1' échantil lon. Au tota l , ces deux effets se compensant par t ie l lement , la co r rec t ion de dilatation es t négligeable pour l ' oxyde et t r è s faible pour l ' u r a n i u m na ture l métal l ique (figure 7).
Pour ces deux c o r p s , en négligeant 1' effet Doppler du 235U on a calculé , en ut i l isant un code de per turba t ion du p r e m i e r o r d r e , l a pa r t de la capture du 238U dans l 'effet en réac t iv i té de l ' échan t i l lon . Cela a p e r m i s d ' e x p r i m e r l ' e f fe t m e s u r é sous forme d 'une var ia t ion re la t ive des cap tures de l ' u r a n i u m - 2 3 8 et de c o m p a r e r l e s r é su l t a t s a insi obtenus avec l e s r é su l t a t s des m e s u r e s par activation. Les r é su l t a t s sont p r é s e n t é s su r la figure 8; on constate un bon accord pour l e s m e s u r e s effectuées su r le méta l par osci l lat ion et par activation. La différence en t re les va leu r s obtenues pour le mé ta l et l ' oxyde t radui t l ' é c a r t en t re les var ia t ions de capture à deux dilutions différentes. Les courbes théor iques t r a c é e s su r la m ê m e figure sont obtenues a p a r t i r d ' un jeu de constantes actuel lement en cours d ' é tude [7]. Dans le cas de l ' oxyde , on obtient un bon accord avec l es m e s u r e s , pour le méta l on note un é c a r t faible ma i s significatif en t re l e s deux courbes .
3 . 4 . Mesure du r appor t des impor tances
Les deux sou rces u t i l i sées avaient l e s ca r ac t é r i s t i ques su ivantes :
Sb-Be : 2 ,34 • 107 n / s • 4 тг Ra-Be : 8, 43 • 106 n / s • 4 тт..
Les signaux m e s u r é s à différentes pu i s sances , r e p r é s e n t é s su r la figure 9, sont une fonction l inéa i r e de l ' i n v e r s e de la pu issance , ce qui p e r m e t de dé t e rmine r la pente de la droi te avec une grande p réc i s ion .
A l ' a i d e du r appor t des in tens i tés des deux sources étalonnées par activation d 'une solution de sulfate de manganèse , on en déduit que le r appor t des impor tances à ces deux énerg ies es t égal a
^ - = 1, 067 ± 0, 03 J-Ra
La va leur calculée par un code de t r a n s p o r t à deux dimensions es t de
3MeV
21*

SM-101/56 323
Le bon accord en t re ces deux va l eu r s nous conduira à développer cet te méthode en ut i l i sant comme r é f é r ence une source de 252Cf, c a r la p réc i s ion du résu l t a t expér imenta l n ' e s t l imi tée que par l ' é t a lonnage des sou rces et la va leur calculée s e r a plus significative si les s p e c t r e s d ' é m i s s i o n sont mieux connus.
o j ï o ? e J 5 o/t ojs 5rS or^
FIG. 9. Oscillations de sources.
CONCLUSION
Les résultats des indices de spectre comparés a ceux de l'expérience exponentielle HUG montrent que l'on a bien atteint au centre d'ERMINE le spectre caractéristique du réseau.
Les techniques expérimentales utilisées, aussi bien pour les effets en réactivité que pour 1' effet Doppler, présentent 1' avantage de ne créer aucune perturbation dans le réseau. Les résultats présentés dans ce mémoire montrent que l'on peut ainsi effectuer des mesures précises et interprétables. 1 Les expériences sur le cœur MASURCA de même composition n'étant pas encore effectuées, les coefficients de réactivité n'ont pu être comparés qu'aux valeurs calculées. Cependant, on constate que, si on rend bien compte par le calcul de l'hétérogénéité de la cellule, on obtient un bon accord sur les corps lourds ou tres absorbants. Le désaccord qui apparaît sur certains corps ralentisseurs, en particulier l'hydrogène et le sodium, a déjà été constaté dans plusieurs expériences étrangères [8] et se retrouve également pour le cœur MASURCA 1-A [1].

324 BOUCHARD et al.
Nous ne disposons pas encore de suff isamment de r é s u l t a t s pour savoi r si ce désaccord es t t r e s différent en t re le cas de la maquet te cr i t ique et le cas du c œ u r à deux zones comme cela a été consta té su r ZPR6 [9]. Cependant, il appara î t ac tuel lement que l es difficultés r e n c o n t r é e s dans l ' i n t e r p r é t a t i o n de c e r t a i n s r é s u l t a t s obtenus au cen t r e d' ERMINE proviennent du fait que le c œ u r es t à deux zones , et non du fait que la zone n o u r r i c i è r e es t t he rmique ; on pense m ê m e que l e s difficultés se ra i en t l e s m ê m e s avec un c œ u r cr i t ique réf léchi .
Ces expér iences ont p e r m i s de d é m o n t r e r q u ' i l é tai t poss ib le d ' o b t e n i r des r é s u l t a t s i n t é r e s s a n t s avec une zone rap ide dont le volume r e p r é s e n t e environ 12% du volume du c œ u r c r i t ique ré f léchi . En augmentant l égè remen t ce volume et en amél io ran t la zone de t rans i t ion , on d i sp o se r a dans le prochain a s semblage d ' une zone cen t ra l e plus impor tan te afin d ' é t e n d r e l es poss ib i l i tés expé r imen ta l e s .
On peut ainsi conclure que l ' u t i l i s a t i on des a s semblages t h e r m i q u e -rapide pour étudier l e s c a r a c t é r i s t i q u e s neutroniques de mil ieux mul t ip l ica teurs r ap ides peuvent donner l e s m ê m e s informations que l es c œ u r s rap ides a deux zones , m a i s i l s r e p r é s e n t e n t pa r cont re 1' énorme avantage de n ' u t i l i s e r q u ' u n faible inves t i s sement de m a t i è r e f i s s i l e . Ils const i tuent a insi un complément indispensable aux maquet tes c r i t iques r ap ides pour l e s études de proje t de r é a c t e u r s s u r g é n é r a t e u r s .
REMERCIEMENTS
Nous expr imons not re grat i tude a M. Tretiakoff pour son soutien efficace dans la r éa l i s a t i on de cette p r e m i e r e expér ience ; nous tenons également à r e m e r c i e r MM. Guyader, Meness i e r , Khairal lah, Dar rouze t et C a r r e ainsi que le pe rsonne l de MINERVE de l eur active par t ic ipat ion a ce t r ava i l , et MM. Brunet , Campan et Manent de l eur amica le col laborat ion.
REFERENCES
[1] KREMSER, J. et a l . ,« MASURCA 1-A et 1-B - Résultats préliminaires», ces comptes rendus, SM-101/59.
[2] PARISOT, В. , Communication personnelle. [3] RAVIER, J. , CHAUMONT, J .M. , Présentation du jeu de sections efficaces multigroupes préparé
àCadarache, Congrès d' Argonne, 10-13 octobre 1966, ANL-7320. [4] BORE, C . , DANDEU, Y. , SAINT-AMAND, C . , Code MUDE, Rapport CEA-2923 (1965). [5] CARLSON, В. , LEE, С , WORLTON, J . , The DSN and TDC Neutron Transport Codes, LAMS-2346
(1960). [6] KHAIRALLAH, A., LACAPELLE, T. , STORRER, F. , « Hétérogénéité dans 1* assemblage 1-A de
MASURCA», ces comptes rendus, SM-101/57. [7] NEVIERE, G., Communication personnelle. [8] BARLEON, L. et a l . , Evaluation of Reactor Physics Experiments, KFK-482 (1966). [9] KARAM, R. A., LESAGE, L. G., Zone-core concepts, Trans. Am. nucl. Soc. 1£ 1 (1967) 270.
D I S C U S S I O N
H. SEUFËRT: My question concerns the Doppler activation m e a s u r e m e n t s . Did you m e a s u r e the decay of 239U or 2 3 9Np, and how did you d i sc r imina te against the background from fast f ission?

SM-101/66 325
R. VIDAL: We measured the 74-keV decay gamma of 239U. The detectors placed in the hot and cold samples were irradiated simultaneously by the oscillation method and counted simultaneously; counting started about 15 min after irradiation.
No correction was made for the background; it was not considered necessary since, in the comparison between hot and cold detectors, the fission rate in the two detectors was identical and low compared with the 239U peak. Within the limits of the experimental uncertainty, this finding is supported by the fact that the decay period of the signal corresponds to the half-life of 239U.
E. HELLSTRAND: Your measurements of the importance of neutrons of different energies are very interesting and the accuracy obtained impressive. In connection with the two-dimensional calculations, I should like to know whether the effect of heterogeneity has been taken into account. It should not be negligible, considering the large difference in energy between the Ra-Be neutrons and those from the Sb-Be source.
R. VIDAL: The lattice was only slightly perturbed in this case. The uranium in the central pell was replaced by a graphite channel containing the source. In the interpretation of the results which we have presented, we did not take into account possible differences between the importance of the neutrons in the graphite and that calculated for a homogeneous cell.
W. K. FOELL: Did you, in your analysis of 238U reactivity and Doppler measurements, allow for the core-sample resonance interaction effects — that is to say, the effects due to differences in absorber density in core and sample?
R. VIDAL: No, we did not. We felt that these effects were negligible for 238U in the light of the precision achieved in our experiments.


ANALYSE DES POSSIBILITES D» UNE IRRADIATION MASSIVE DE COMBUSTIBLE POUR REACTEURS RAPIDES DANS BR2, REACTEUR D' ESSAI DE MATERIAUX
G. MINSART ET F. MOTTE CENTRE D'ETUDE DE L'ENERGIE NUCLEAIRE, MOL-DONK, BELGIQUE
Abstract — Resume
ANALYSIS OF THE POSSIBILITY OF LARGE-SCALE IRRADIATION OF FAST REACTOR FUEL IN THE BR2 MATERIALS-TESTING REACTOR. Since September 1965 devices have been used in the BR2 reactor to irradiate fuel pins sodium-cooled under forced circulation, as part of a series of studies on fast reactor fuel designs. The low-energy component of the neutron spectrum incident on these devices is filtered out by boron and cadmium screens. More recently, attempts have been made to design an irradiation device of greater power, which would allow a fast-reactor fuel sub-assembly to be tested to high burn-up rates, under specific spectral and power conditions representative of the next generation of fast reactors. These specifications and the size of the sub-assembly precludes the idea of filtering out the incident spectrum, instead of which this spectrum has to be transformed in a zone at the periphery of the sub-assembly. A device of this type, given the name of SOCRATE, is to be placed in the central experimental cavity (diameter« 200 mm) of the BR2 reactor. It would contain about 380 fuel pins of 6 mm diameter, arranged in a triangular lattice of 7. 9 mm pitch and cooled by circulating sodium. The 61 pins at the centre of this lattice form the sub-assembly. At the enrichment adopted, the maximum specific power in the zone containing the sub-assembly is about 1 MWAitre for a maximum linear power of 530 W/cm. A burn-up of 80 000 MWd/t could, in principle, be attained within a year. The paper deals in particular with comparative analysis of stresses and damage in the sub-assembly pins, as referred to the properties of the Na-2 reactor core, and concludes that irradiation in SOCRATE could be a significant way of testing a fuel sub-assembly designed for a fast reactor.
ANALYSE DES POSSIBILITES D'UNE IRRADIATION MASSIVE DE COMBUSTIBLE POUR REACTEURS RAPIDES DANS BR2, REACTEUR D'ESSAI DE MATERIAUX. Depuis septembre 1965, des dispositifs d'irradiation de quelques crayons combustibles refroidis par une circulation forcfie de sodium sont utilises dans le r6acteur BR2, dans le cadre d'etudes conceptuelles de combustibles pour r£acteurs rapides: la composante de basse 6nergie du spectre neutronique incident a ces dispositifs est filtr£e par des £crans constitufis de bore et de cadmium. On a entrepris plus r€cemment d'analyser la conception d'un dispositif d'irradiation de plus grande capacity, permettant le test d'un sous-assemblage combustible de rfiacteur rapide jusqu' a des taux d'irradiation elevgs, dans des conditions de spectre et de puissance specifique representatives des r£acteurs rapides de la future generation; ces specifications ainsi que la taille du sous-assemblage imposent d' abandonner le procfidS de filtration du spectre incident au profit de la m£thode de conversion dans une zone de couverture disposed a la pdriphfirie du sous-assemblage. Un tel dispositif, d€nomme' SOCRATE, serait localise dans la cavite exp£rimentale (diametre «200 mm) centrale du rSacteur BR2; il contiendrait environ 380 crayons combustibles d'un diametre de 6 mm, disposes suivant un r£seau triangulaire" d' un pas de 7,9 mm et refroidis par une circulation de sodium; les 61 crayons situds au centre de ce r£seau constituent le sous-assemblage. Aux enrichissements adoptes, la puissance splcifique rnaximale dans la region occup£e par le sous-assemblage est d'environ de 1 MW/l. pour une puissance lineique maximale de 530 W/cm; un taux d'irradiation de 80 000 MWj/tonne pourrait en principe y gtre atteint en une annfie. Le m£moire est particulierement orients vers 1' analyse comparative, les proprietis du coeur du rgacteur Na-2 £tant prises comme reference, des contraintes et d£g<lts d'irradiation dans les crayons du sous-assemblage: cette gtude permet de conclure que 1'irradiation dans SOCRATE d'un sous-assemblage combustible concu pour un rgacteur rapide serait un test significatif.
327

328 MINSART et M O T T E
1. INTRODUCTION
Depuis deux années, des dispositifs d'irradiation de crayons combustibles refroidie par une circulation forcée de sodium sont utilisés dans le réacteur a haut flux BR2 [l] ; la majoration de la capacité de ces boucles est en cours d'étude afin de permettre l'irradiation d'un faisceau de sept crayons combustibles. La densité de puissance dans les crayons irradiés dans ces dispositifs peut aisément atteindre et dépasser les niveaux prévus dans les piles rapides : l'enrichissement du combustible et la forme du spectre d'irradiation sont ajustés en conséquence ; la composante à basse énergie de ce spectre peut être plus ou moins éliminée selon que des écrans plus ou moins é-volués sont utilisée (В, В + Cd) ; néanmoins les conditions d'irradiation restent très éloignées des conditions rencontrées dans un réacteur rapide et les sollicitations auxquelles est soumis le crayon combustible sont, à cet égard, peu représentatives. L'usage d'écrans absorbants implique en outre une pénalité réactive appréciable pour le réacteur BR2. L'intérêt de l'irradiation dans ces dispositifs ne réside pas dans un test global de la tenue sous irradiation d'aiguilles combustibles destinées à une pile rapide ; en outre, la capacité de ce type de dispositif ne peut que rester modeste.
La demande en volume d'irradiation de combustible pour réacteur rapide allant en croissant, on s'est dès lors attaché à examiner la possibilité d'une irradiation massive dans BR2 d'aiguilles combustibles dans des conditions aussi représentatives que possible. La notion d'irradiation maesive a été précisée en prenant pour objectif le test sous irradiation d'un sous-assemblage combustible complet considéré comme une entité mécanique, crayons et structure ; la capacité minimale de cet assemblage a été fixée à 37 crayons combustibles disposés suivant un réseau de type classique pour les centrales rapides futures : plus précisément, des caractéristiques proches de celles du projet allemand Na-2 ont été adoptées. L'usage d'écrans absorbants circonscrits à un tel sous-assemblage, outre qu'il impliquerait une pénalité réactive excessive, ne permettrait pas d'obtenir des conditions d'irradiation satisfaisantes.
Adoptant comme hypothèse première de travail que la géométrie de la matrice du réacteur BR2 ne pouvait être modifiée, c'est-à-dire que les cavités d'irradiation devaient être utilisées telles quelles, on s'est tourné vers l'usage de la cavité centrale du réacteur (diamètre utile d'environ 200 mm) en y disposant un réseau régulier de crayons combustibles refroidis par une circulation de sodium ; la partie centrale de ce réseau accueillerait le sous-assemblage à tester, tandis que la zone périphérique serait constituée de crayons combustibles ayant pour r8le d'assurer, dans la partie centrale du dispositif, des conditions d'irradiation représentatives.
Ce rapport résume l'étude neutronique d'avant-projet du dispositif et est axé sur l'analyse comparée des sollicitations auxquelles serait soumis le sous-assemblage ; cet avant-projet neutronique a été développé parallèlement à une étude préliminaire de la conception thermo-hydraulique et mécanique du dispositif ; il est loin d'être complet en ce sens que de nombreux aspects conceptuels liés à la neutronique n'ont pas encore été abordée en détail. L'étude paraît néanmoins être arrivée à un stade suffisant pour en dégager les premières conclusions.
Ce dispositif d'irradiation a été baptisé SOCRATE, ce patronyme mettant plus ou moins heureusement en évidence son objectif principal : SOdium Cooled Reactor Assembly Testing Experiment (test d'assemblage pour réacteur refroidi au sodium).
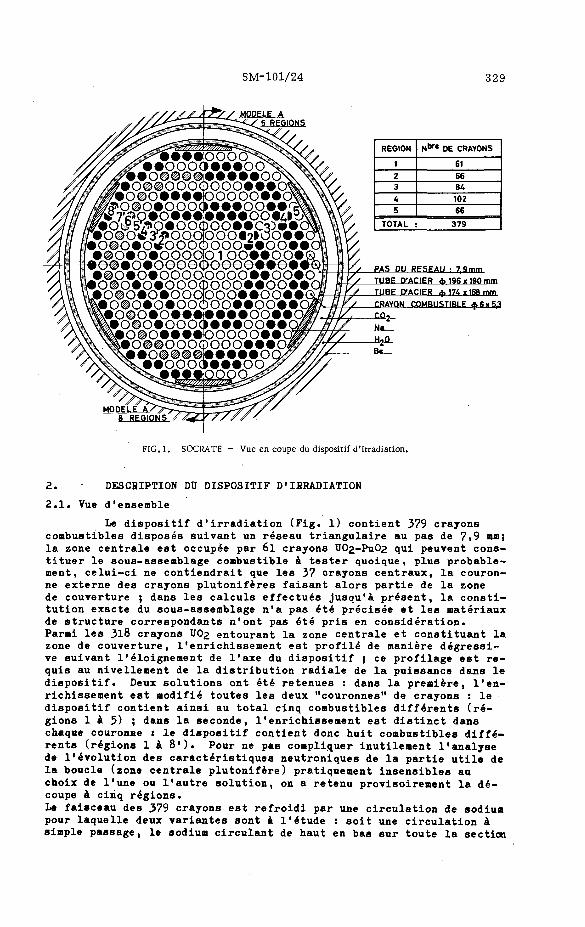
SM-101/24 329
'JLu MODELE A 5 REGIONS
• • • • o o o o ^ „ iooo<i©##oo ^ ^ooooooo«#«o i • • • • p o o o o « « o ^ XDOOO#*#00©#<^
^ P»OOCpOO«*C3D»«OL IO#0^3^00QPOO«2>00««CT O^O^OtfOOOOOOO^OOMC >0O«O«OOOqp1 OOMOOt® *©o«o«oooooooo««oo«c5^
[ •o^o«o«ooocpooo««oo««r iiOQO«o«ooqpoo«#oo«»G
" o^o«o«ooooo«#oo««Oi ' 0®0«0#«©|«###00#«Qr >000«0000«#«00««Qf
^o©o««#«ooooo«#dr
(••ooo6###oo. ••••i&opp^
MODELE k, 6 REGIONS
REGION
1
2 3 4 5
N 1** OE CRAYONS
61
66 84 102 66
TOTAL : 379
PAS DU RESEAU r 7,9 mm
TUBE D'ACIER 4. 196 x 190 mm
TUBE D-ACIER ft 174 »168 mm
CRAYON COMBUSTIBLE $6x5,3
FIG. 1. SOCRATE - Vue en coupe du dispositif d'irradiation.
2. DESCRIPTION DU DISPOSITIF D•IRRADIATION
2.1. Vue d'ensemble
Le dispositif d'irradiation (Fig« 1) contient 379 crayons combustibles disposes suivant un reseau triangulaire au pas de 7,9 mm; la zone centrale est occup£e par 6l crayons UO2-PUO2 qui peuvent cons-tituer le sous-assemblage combustible a tester quoique, plus probable-ment, celui-ci ne contiendrait que les 37 crayons centraux, la couron-ne externe des crayons plutoniferes faisant alors partie de la zone de couverture ; dans les calculs effectues jusqu'a present, la constitution exacte du sous-assemblage n'a pas ete preciaee et les materiaux de structure correspondents n'ont pas ete pris en consideration. Parmi les 3l8 crayons UO2 entourant la zone centrale et constituent la zone de couverture, l'enrichissement est profile de maniere degressive suivant 1'eloignement de l'axe du dispositif ; ce profilage est re-quis au nivellement de la distribution radiale de la puissance dans le dispositif. Deux solutions ont ete retenues : dans la premiere, l'en-richissement est modifie toutes les deux "couronnes" de crayons : le dispositif contient ainsi au total cinq combustibles diffeVents (regions 1 i 5) ; dans la seconde, l'enrichissement est distinct dans chaque couronne : le dispositif contient done huit combustibles diff£-rents (regions 1 a 8'). Pour ne pas compliquer inutilement 1'analyse de Involution des caracte>istiques neutroniques de la partie utile de la boucle (zone centrale plutonifere) pratiquement insensibles au choix de l'une ou 1*autre solution, on a retenu provisoirement la de-coupe a cinq regions.
Le faisceau des 379 crayons est refroidi par une circulation de sodium pour laquelle deux variantes sont a 1'etude : soit une circulation a simple passage, le sodium circulant de haut en bas sur toute la section

330 MINSART et MOTTE
FIG. 2. Vue en coupe de la zone centrale du réacteur BR2.
occupée par le combustible, soit une circulation à double passage : le sodium introduit à la partie supérieure de la zone de couverture parcourt celle-ci de haut en bas pour refluer ensuite dans la zone centrale ; il est prématuré de faire un choix entre ces deux solutions. Il faut remarquer que les résultats présentés sont cependant plus caractéristiques de la version "simple passage" puisqu'il n'a pas été tenu compte dans le calcul de la paroi de séparation des deux sens de circulation du sodium ni de l'irrégularité que cette paroi introduirait nécessairement dans le réseau combustible. Le sodium est contenu dans un premier tube d'enceinte séparé d'un second tube constituant l'enveloppe extérieure du dispositif par un matelas de gaz (C0¿) dont le rôle principal est d'assurer une isolation thermique du tube extérieur ; celui-ci est refroidi extérieurement par la circulation d'eau primaire du réacteur BR2 et est centré dans le chenal expérimental central (diamètre nominal : 203,2 mm) du réacteur. Ce chenal est muni, sur les couvercles supérieur et inférieur de la cuve du réacteur, d'un bouchon d'accès individuel autorisant notamment la solution à simple passage pour la circulation du sodium. La Fig. 2 montre schématiquement la partie intéressante de la matrice en béryllium du réacteur BR2, le dispositif d'irradiation étant en place dans le chenal central ; on a représenté en des positions caractéristiques quelques-uns des éléments combustibles de BR2 qui constitueraient la configuration de chargement du réacteur, disposée en anneau autour du chenal central ; les 6l crayons plutonifères du dispositif d'irradiation sont représentés par des cercles pleins afin d'illustrer, à l'échelle du réseau de BR2, la taille maximale du sous-assemblage testé.
2.2. Constituants 1. Dimensions du crayon combustible. Des dimensions hors tout égales ont été adoptées pour la totalité des crayons combustibles.

SM-101/24 331
Diamètre extérieur : 6,00 шш Epaisseur de la gaine : 0,35 шш Longueur hors tout : l60 cm (couvertures axiales et chambre d'ex
pansion incluses). 2. Matières fissiles. La densité du combustible uniformément distribué dans le volume de la gaine occupé par le combustible (smeared density) a été prise égale à 9,6 soit environ 87 % de la densité théorique.
Zone centrale : U02-Pu02 - environ 15 % en poids de Pu02 dans le mélange
- ÜO2 enrichi à 90 % Composition isotopique (% nombre atomes U + Pu)
U-235 : 76,500 Pu-2^0 : 1,230 U-238 : 8,500 Ри-2^1 : 0,123 Pu-239 : 13,64-1 Pu-2*f2 : 0,006
Zone de couverture : UO2 - enrichissements à optimiser. Le nombre d'enrichissements n'est limité, dans le cadre de l'infrastructure de fabrication considérée, que par la constitution de lots contenant un minimum de 30 crayons de même nature. L'utilisation d'un combustible UO2 classique de même géométrie que les crayons de la zone centrale a été retenue dans cette étude ; cette position pourrait être revue tant au point de vue des dimensions qu'à celui de la nature du combustible (le combustible cermet est notamment prie en considération). 3« Nature du gainage:
Acier inoxydable (densité : 7,8 pour T ~ 600 °C) Composition : Fe : 69,5 % en poids Ni : 13»0 % en poids
Cr : 16,0 Mo : 1,5. k. Réfrigérant :
Sodium (densité : 0,83 pour T = 500 °C). 5. Tubes de force :
AISI 304 L, densité : 8,0. .... 6. Isolation thermique :
C02 (30 ata, T * 180 °C), densité : 0,036.
3. METHODES DE CALCUL
Deux méthodes de calcul ont été utilisées ; la première est basée sur l'approximation de diffusion, l'autre fait appel à la théorie du transport. Les deux codes correspondants font usage d'une représentation multigroupe des énergies des neutrons, mais avec des découpes différentes ; le modèle géométrique est annulaire et suppose la symétrie de révolution autour de l'axe du dispositif d'irradiation.
3.1. Calculs utilisant la théorie de la diffusion. Le code MODIC II [2] a été associé à une librairie de sec
tions efficaces à 28 groupes d'énergie ; les sections efficaces des 27 premiers groupes sont obtenues par une condensation de la librairie GAM [3] ; le groupe thermique couvre les énergies inférieures à 0,683 eV et les sections efficaces correspondantes sont moyennées sur des spectres de Wilkins calculée à partir des paramètres de Westcott et des compositions. La routine de préparation du programme permet de faire intervenir les corrections de structure fine : facteurs de désavantage, atténuation des sections sur la base de l'intégrale de résonance.
A l'actif de ce moyen de calcul, on peut noter : - le grand nombre d'intervalles géométriques d'intégration - la facilité de modifications de données : changement d'une compo
sition, ajustement du buckling axial,...

332 MINSART et MOTTE
- l'enchaînement automatique des diverses séquences de calcul : préparation des constantes, calculs de criticité, calcule de taux de réaction et d'indices de spectre,...
Au passif, il faut remarquer que le modèle à un seul groupe thermique est peu adapté à l'étude de transitions de spectre aussi importantes que le passage d'un coeur thermique à un réseau rapide.
Dans l'ensemble cependant, les calcule MODIC II permettent de dégrossir l'étude d'un système mixte, tel que SOCRATE dans BR2, en fournissant des résultats suffisamment approchés pour orienter les études plue précises à effectuer en théorie du transport.
3.2. Méthode basée sur la théorie du transport Le code QMS [k] est un ensemble intégré de routines de calcul
pouvant être associé à deux librairies de sections efficaces à 'tO groupes d'énergie, dénommées GMS 1 et GMS 2, mises au point à Vinfrith. Le code GMS applique la méthode DSn de Carlson pour le calcul de criticité ; ce code a été adapté au CEN en FORTRAN IV pour son exploitation sur ordinateur IBM 360-40 ; pour cette étude, l'approximation DSif a été adoptée et la librairie GMS 2 a été retenue.
La découpe énergétique de la librairie GMS 2 a été fixée dans le cadre d'études de systèmes rapides : les 32 premiers groupée correspondent à la librairie F.D.2 de Winfrith [5 ] et couvrent lee energies supérieures à 0,683 eV j leur largeur en léthargie est 0,50 sauf pour le premier groupe (Au = 1,00). Maie la gamme dee energies thermiques est détaillée en huit groupes supplémentaires, ce qui permet de représenter fidèlement les spectree à basse énergie et de suivre leur évolution au travers de chaque région ; dee transferte entre groupée sont effectués, tant vers les groupes d'énergie supérieure ("upscattering") que vers les groupée d'énergie inférieure ("downscattering") ; le nombre de groupes intervenant dans ce processus dépend de l'isotope considéré.
Le formalisme utilisé pour la préparation des constantes macroscopiques permet l'introduction de facteurs de structure fine de flux dans chaque groupe pour chaque isotope, ainsi que l'usage de sections efficaces microscopiques atténuées pour tenir compte de l'auto-protection des résonances ; le taux d'atténuation est lié à la valeur de la section efficace macroscopique de diffusion potentielle du réseau divisée par la concentration de l'isotope considéré.
Le code dispose également d'une routine de condensation des sections efficaces en un ensemble à nombre de groupes réduit ; la pondération fait appel pour chaque composition à des spectres préexistants, calculés et mis en mémoire, par exemple lors d'un ou plusieurs problèmes précédents ; l'ensemble est complété par des routines fournissant la distribution des taux de fission et divers taux de réaction, ainsi que par une routine d'épuisement.
Le problème majeur de l'étude d'une boucle rapide localisée dans un réacteur thermique est assurément l'analyse de la transition de spectre entre ces deux parties ; on est en droit d'espérer que la découpe de la librairie GMS 2 adoptée pour cette étude puisse permettre un calcul assez précis de cette transition.
Le calcul est effectué en deux étapes : - calcul de cellule.
On calcule la distribution fine des flux dans une cellule unitaire en milieu radialement infini et on en déduit des facteurs de pondération à appliquer aux constituants pour l'homogénéisation de la région ; ce travail est répété pour chaque région du dispositif.
- calcul d'ensemble. Le calcul de l'ensemble du système S0CRATE-BR2 est ensuite effectué, les différentes régions étant homogénéisées. La carte de

SM-101/24 333
FIG. 3. Distributions radiales de la densité de puissance.
flux obtenue lors de ce calcul GMS est ensuite convertie en distribution de la densité de fission, en spectres normalisés aux différents points et en divers taux de réaction.
k, OPTIMISATION DU CHARGEMENT
Une première étape consiste à optimiser le chargement en combustible du dispositif d'irradiation et d'en calculer lee performances à l'état initial ; l'évolution de ces performances avec le taux d'irradiation constituera une seconde étape du calcul. Cette optimisation vise l'obtention d'une densité de puissance et d'un spectre adéquats dans la zone centrale tout en respectant un critère considéré comme essentiel : les sollicitations maximales doivent rester localisées dans la zone centrale de manière à éviter que l'essai d'irradiation du sous-assemblage ne soit limité par un taux prohibitif de défaillances dans la zone de couverture ; dans les calculs de cet avant-projet, ce critère a été réduit à une expression simple et évidemment insuffisante, imposant que la densité de puissance dans la zone de couverture reste égale ou inférieure à la densité de puissance dans la zone centrale ; l'analyse du critère dans son acceptation complète exige des calculs thermo-hydrauliques couplés à une étude de la structure fine de la distribution de puissance et un examen approfondi des écarts par rapport aux conditions nominales ; cette analyse pourrait conduire, comme cela a été dit au paragraphe ¿.2,, à modifier la géométrie des crayons, voire la nature du combustible, dans la zone de couverture. La densité de puissance dans la zone centrale est portée près du maximum réalisable»
- en adoptant pour cette zone un combustible à enrichissement très élevé (15 % en poids de Pu02 , 85 % de U02 enrichi à 90 % U5),
- en poussant les enrichissements du combustible de la zone de couverture aux limites supérieures qu'autorise le critère évoqué ci-dessus.
En ce qui concerne le combustible de la zone d'irradiation, on reviendra par la suite sur l'influence que peut avoir une forte majoration de l'enrichissement, sur la représentativité de l'expérience d'irradiation.

334 MINSART et MOTTE
Ю° 10° КГ Ю"5 10* 10'
FIG. 4. Repartition énergétique des flux.
Les calculs d'optimisation des enrichissements dans la zone de couverture ont été menés en parallèle pour les deux découpes à cinq et huit régions ; ils ont conduit aux résultats illustrés en traits pleins à la Fig. 3 où on a porté en ordonnée la densité de puissance au niveau du maximum de la répartition axiale, exprimée en kilowatts par litre de mélange, combustible et réfrigérant homogénéisés. Ces niveaux de puissance correspondent à un flux de chaleur maximal de 600 W/cm2 dans la plaque la plus chaude des éléments combustibles du réacteur BR2. Il a été jugé inutile de poursuivre actuellement ces calculs au-delà de ce stade : on a estimé empiriquement les corrections à apporter aux enrichissements pour obtenir un nivellement plus pouseé des maxima de la densité de puissance (courbes en traits interrompus, Fig. 3) s les enrichissements correspondante figurent entre parenthèses ; ces corrections n'affectent pratiquement pas les propriétés de la zone centrale. La suite du calcul a été menée avec la découpe à cinq régions ayant fait l'objet du calcul précis.
La découpe à huit régions permettrait de rendre pratiquement équivalente la densité maximale de puissance dans tous les crayons du dispositif; d'une manière générale, les gradients de puissance dane la zone de couverture s'atténuent quelque peu.
La Fig. k permet de comparer les spectres neutroniques au centre du coeur du réacteur Na-2 [6 J et au centre et à la périphérie de la zone centrale du dispositif SOCRATE ; les spectres sont représentés sous forme différentielle (flux par intervalle unitaire de léthargie vs énergie ou léthargie) et sous forme intégrale (pourcentage du flux dans

SM-101/24 335
Г | . Ф ( и ) , flss. crrr?."!
107 10Ç 105 10A Ю3 lo2 101 eV I I I 1 1 1 1 I 1 1 1 I I I I I L 0 1 2 3 4 5 6 7 8 9 10 12 14 и
FIG. 5. Répartition énergétique des densités de fission.
le domaine des énergies limité inférieurement par l'énergie £, lue en abscisse). On peut constater, comme en témoignait la distribution de puissance, que le spectre dans le sous-assemblage est fort homogène ; par ailleurs, l'écart entre les spectres Na-2 et SOCRATE s'apprécie mieux en se référant aux courbes représentant le spectre dans une aiguille combustible (85 % en poids de UC enrichi à 90 %, 15 % de PuC ; * c o m b : 10,7 mm) irradiée dans BR2 sous écran (B + Cd) et refroidie par une circulation de sodium.
La Fig. 5 est sans doute plus parlante : elle illustre, sous forme différentielle et intégrale, la répartition énergétique de la densité de fission dans les deux milieux Na-2 et SOCSATE. Les deux courbes intégrales sont pratiquement confondues au-dessus d'une énergie de 70 keV : 60 % des fissions dans les deux systèmes sont distribués énergétiquement de la même manière ; elles s'écartent ensuite, la population des fissions induites à basse énergie étant plus élevée dans SOCRATE ; ainsi, la densité de fission en-deçà de ¿f0 eV est nulle dans Na-2 alors que. dans SOCRATE, 7,5 % du total des fissions sont produits sous ce seuil énergétique. On a également représenté la courbe intégrale relative au spectre dans l'aiguille irradiée sous é-cran : l'énergie médiane (50 % des fissions de part et d'autre) est, dans ce cas, égale à ^50 eV environ alors qu'elle se situe au voisinage de l80 keV tant dans Na-2 que dans SOCRATE ; on remarque que l'écran (B • Cd) élimine mieux la composante à très basse énergie du spectre BR2 incident que ne le fait la zone de couverture dans SOCRATE. Sur les représentations différentielles, il est intéressant d'analyser les deux "cornes" qui se présentent, dans le domaine des hautes énergies,

00
TABLEAU I. STRUCTURE FINE DE LA DENSITE DE PUISSANCE E T SECTIONS E F F I C A C E S °*
Parametre
Creusement, P centre
peripheric
Distorsion, P . .- P peri centre , ^
P moyen
Sections efficaces moyennes sur energie
o" 235U , barns
a-f239pu, id.
a" 10B , id. a *
0" 238U, id. E. , cm" (tous les isotopes)
2- , cm"
(idem)
SOCRATE - zone centrale
0,9944
+ 0,56 %
Moyennes sur la zone centrale
2,096
2,421
6,966
1,275 10"1
1,725 10"2
SOCRATE - centre
1,609 lO^2
Reseau infini de
cellules "U naturel"
1,0017
- 0,17 %
Moyennes sur la cellule
2,048
1,893
2,719
5,372 10"2
2,857 10"5
Na-2 - centre
2,270 10"3
Reseau infini de cellules du type "SOCRATE -zone centrale"
1,0050
- 0,50 %
Moyennes sur la cellule
1,406
1,799
0,892
1,320 10"1
1,184 10"2

SM-101/24 337
d'une manière sensiblement différente d'un milieu à l'autre : cette différence témoigne principalement d'une influence beaucoup plus marquée dans Na-2 de la fission rapide dans l'uranium-238 et du ralentissement inélastique induit par cet isotope.
Ces diverses analyses conduisent en finale au jugement global le plus significatif qui porte sur les gradients radiaux de puissance à l'échelle du sous-assemblage et à celle du crayon combustible.
<-» Gradient dans le sous-assemblage combustible : La densité de puissance à la périphérie de la zone occupée par un sous-assemblage de 37 crayons combustibles est supérieure de 7 % environ à la densité de puissance en son centre ; ce gradient mesuré dans la région homogénéisée surestime quelque peu la différence de puissance entre le crayon central et un crayon périphérique.
- Gradient dans le crayon combustible : Afin de pouvoir apprécier l'importance relative du gradient de puissance suivant le rayon des crayons combustibles de la zone d'irradiation, on a comparé les trois cas suivants : 1. SOCRATE - zone centrale 2. Réseau infini de cellules élémentaires de mêmes dimensions et com
position que celles de la zone centrale de SOCRATE, à cela près que l'uranium naturel a été substitué à l'uranium enrichi à 90 % en U-235 I ce cas a été retenu en vertu de sa similitude avec le coeur du réacteur Na-2
3< Réseau infini de cellules élémentaires identiques à celles de la zone centrale de SOCRATE.
s Ces trois cas sont classés dans un ordre de dureté globale croissante du spectre qui les caractérise. Le tableau I indique, dans les trois cas, les valeurs des creusement et distorsion de puissance dans les crayons combustibles : dans les deux réseaux infinis, on constate une légère majoration de la densité de puissance entre la périphérie et le centre du crayon alors qu'une évolution de sens inverse reste apparente dans SOCRATE ; de toute manière l'écart entre ces valeurs est peu significatif : à même densité de puissance périphérique, les puissances centrales extrêmes ne diffèrent que d'un pour-cent. Les sections efficaces microscopiques citées dans le même tableau permettent d'apprécier les différences spectrales entre les trois systèmes:
„ o"f 235U et o-f 239pu déc roissent de façon monotone quand, globalement, la dureté du spectre augmente ; °"a В amplifie fortement les différences spectrales dans le domaine inférieur des énergies épi-thermiques.
- °f 23bu témoigne d'un spectre sensiblement moins dur à haute énergie, dans la cellule à uranium naturel.
Les sections macroscopiques de fission illustrent évidemment en premier lieu les différences d'enrichissement ; on peut y voir en outre l'effet de la contamination en neutrons de basse énergie dans le spectre de SOCRATE, par comparaison avec le spectre d'un réseau infini constitué de cellules identiques ; dans la zone centrale de SOCRATE, la différence entre la section macroscopique moyenne sur la région et la section macroscopique au centre de la même région montre un reliquat de dérive spectrale au travers de la région ; le même effet était également illustré à la Fig. k (courbes intégrales). La comparaison des valeurs de 2f dans la cellule-uranium naturel et au centre du réacteur Na-2 ne permet pas de conclusion simple, les deux systèmes restant trop différents : l'enrichissement (Pu) de Na-2 est quelque peu supérieur mais, par contre, ce réacteur contient sensiblement plus de matériaux de structure ; en tous cas, il est permis de considérer que le spectre de Na-2 est moins dur que le spectre du réseau
22

338 MINSART et MOTTE
TABLEAU II. VALEURS ABSOLUES DES NIVEAUX DE FLUX AUX CENTRES DE SOCRATE ET DE Na-2 (NORMALISEES A 500 W/cm DE CRAYON COMBUSTIBLE)
Seuil énergétique
3,68 MeV
2,025 MeV
100 keV
2 keV *
460 eV *
100 eV
22 eV *
SOCRATE
in.cm .s )
8,31 1012
1k 2,95 l(T
15 1,50 1 0 ^
1,80 1015
1.85 Ю 1 5
1.86 io15
1,88 1015
Na-2 (n.cm .s ;
1,65 1013
7,25 1014
7,86 io15
1,30 10l6
1,3^ 1016
1,3^ 1016
1.3* 1016
* La valeur du seuil est approximative en raison des découpes énergétiques différentes utilisées pour le calcul des deux milieux.
infini de cellules du type SOCRATE : ceci permet de conclure que l'écart des creusement et distorsion de puissance dans les crayons du coeur Na-2 et dans les crayons du centre de SOCRATE est inférieur au pourcent, é-cart maximal apparaissant entre les deux milieux les plus différents au point de vue considéré. Enfin, on peut remarquer, en comparant les valeurs de Sf dans le centre des deux systèmes, Na-2 et SOCRATE, que les "flux totaux" sont, à même densité de puissance, dans le rapport inverse des sections : le flux total est sept fois plus élevé dans Na-2. A cet égard, le tableau II compare les valeurs absolues des flux au-dessus de quelques seuils énergétiques dans Na-2 et SOCRATE, pour une normalisation commune à 500 W/cm de crayon combustible.
SOCRATE. Valeurs caractéristiques. Caractéristiques initiales, déduites du calcul en DS¿+ à kO groupes : (référence : 600 W/cm2 au point chaud BR2). - Densité de puissance, zone centrale, au maximum de la distribution axiale : 975 kW/1
- Puissance linéique maximale, crayons zone centrale : 530 W/cm - Puiseance spécifique maximale, idem : 250 W/gr combustible oxyde ou
2.400 W/cm3 de combustible - Flux calorifique maximal, idem : 280 W/cm2 - Puissance totale approximative dans SOCRATE : 10 MW - Puissance totale BR2 : de l'ordre de 60 MW, suivant chargement -
pour environ 20 assemblages combustibles - Apport de réactivité de SOCRATE : de l'ordre de 1 % Ak/k (état de
référence» obturateur Be dans le chenal central).
5. CALCULS D'EVOLUTION
Le code de transport GMS contient une routine de réduction du nombre de groupes ; cette option a été mise à profit pour condenser en 15 groupes les sections efficaces macroscopiques à kO groupes de chacune des régions de SOCRATE et de BR2, les spectres de condensation étant
22*

SM-101/24 339
-2
-10
-5
<£(uj-JT,
3-
2
Ho .2
Normalisation: oo 4>(u)du= 1
'o /
40 groupes, OMWj/tonne 15 groupes, 0 MWj / tonne
"L.
±=r
107 106 10 • ' I • •
4 3 2 KT 10 10* 10 -I I 1 I
J eV
0 1 2 3 4 5 6 7 8 9 10 12 14 u
FIG. 6. SOCRATE - Spectres neutroniques au centre du dispositif (modeles a 40 et 15 groupes).
les spectres moyens par region du probleme initial a ^0 groupes. La bonne concordance des deux modeles est illustree a la Fig. 6.
BR2 fonctionne par cycles de 2*f jours, avec un arrSt interm4-diaire permettant un remaniement du coeur ; l'intervalle de temps pour la routine d'epuisement a done ete fixe a 12 jours et on a suppose un renouvellement complet du chargement combustible de BR2 tous les Zk jours. Pour les calculs de distribution de flux au debut de chaque e-tape de 12 jours, on impose un laplacien axial rendant le systeme pra-tiquement critique ; les flux moyens qui en resultent pour chaque region sont normalises sur la base du niveau de puissance impose et sont alors utilises pour le calcul d'evolution des concentrations isotopiques pendant la duree impartie. Le code repete automatiquement la procedure en prenant comme nouvelles donnees les teneurs de chacun des isotopes obtenues a la fin de l'etape precedente ; l'hypothese du renouvellement du coeur BR2 a cependant oblige une frequente intervention manuellfi.
On a represente a la Fig. 7 les distributions radiales de la densite de fission a differents stades de 1'irradiation ; la normalisation de ces distributions est basee sur un flux de chaleur maximum egal a 600 W/cm2 dans la plaque combustible la plus chaude du chargement BR2. Une reduction progressive du niveau de puissance est observee dans chaque region ; elle est attribuable a la consommation des atomes fissiles et a la reduction des niveaux de flux : ces influences sont attenuees a des degres divers par une majoration des sections efficaces microscopi-ques de fission induite par les deformations de spectre.

340 MINSART et MOTTE
0 1 2 З А 5 6 7 8 cm FIG. 7. Distributions radiales de la densité de puissance en cours d'irradiation.
1
0,9
0£
0,7
0.6
ZjÜ) 4
If(o)
I f ( o ) MOYENNES PAR REGION
3
1733 К Г 2 e m J
1762 10"* . К З 2 1<Г* . 1374 10" . K 0 8 10" »
|
Région 3
• _ ? -
\ A
\ 5
» —
25 630 MWj /t 49 910 \ 73 000
I I \ i i i i i i i i гч 0 24 48 72 96 144 192 jours
FIG. 8. Évolution des sections macroscopiques de fission.
Les régions périphériques du dispositif subissent un appauvrissement relatif important et jouent de moins en moins leur rSle de convertisseur, permettant ainsi à la contamination par les neutrons de bas-

SM-101/24 341
.фвО.п.ст-2.»-1
NORMAUSE A : / * ( u ) d u « 1
hO,25
О 1 2 3 A 5 6 7 8 9 10 12 14 u
FIG. 9. SOCRATE - Spectres neutroniques au centre. Evolution avec le taux d'irradiation.
ее énergie de pénétrer plus profondément dans le dispositif ; cet effet spectral tend à accélérer la vitesse de consommation des noyaux fissiles mais aussi, dans une certaine mesure, le taux de conversion des noyaux fertiles en isotopes fissiles* En outre, la réduction de la densité de fission entraîne une diminution du flux total ; les calculs montrent que les flux totaux des cinq régions du dispositif sont également réduits, en fin d'irradiation, à environ 90 % de leur valeur initiale ; le taux de réduction moins prononcé du niveau de puissance dans la région 3 est donc une conséquence directe d'une réduction relativement moins marquée du £f de cette région.
Les allures différentes de la variation relative des sections efficaces macroscopiques de fission moyennes par région, représentées à la Fig. 8, résultent de la combinaison des influences diverses citées ci-dessus. On observe, par exemple, pour la région h une chute accélérée du Sf au cours de l'irradiation : relativement aux autres régions, l'augmentation de o"f compense d'une manière moins marquée la réduction de la concentration en atomes fissiles. Les calculs montrent par ailleurs que l'accumulation de 239Pu dans la région 3 est plue marquée que dans les autres régions de la zone de couverture.
La zone de couverture offre dans son ensemble une barrière encore bien suffisante pour que l'accroissement de la contamination de la zone centrale par les neutrons de basse énergie soit indiscernable ; ce phénomène est illustré à la Fig.9 où les spectres sur l'axe du dispositif ont été représentés à l'état initial et en fin d'irradiation; on constate également à la Fig.7 que le profil radial de la distribution de la densi-

342 MINSART et MOTTE
-10
* (u )
. 1 5 _
-5
t = 0 (0MWj/tonn« )
NORMALISE A: 1 FISSION cm-3*-1
t=216j(73000MW|/tonn«) NORMALISE A:0i82 FISSION em-3!
107 106 -. h:—
NT 10' 10° 10' _i i i i
10 _ l L
,1 eV
,0 1 2 3 A 5 6 7 8 9 10 12 14 u
FIG. 10. SOCRATE - Spectres neutroniques au centre, a l'echelle des densites de puissance.
te de puissance n'y est pas sensiblement modifie. La Fig.10 met en evidence la gamine d'energie dans laquelle la reduction du flux total (~ 10 %) au cours de 1'irradiation est la plus marquee ; les deux histogrammes de cette figure ont ete normalises proportionnellement aux densites de puissance en debut et en fin d'irradiation ; on constate que la partie a basse energie est pratiquement non affectee.
Au cours de 2^0 jours effectifs de fonctionnement (c'est-a-di-re en pratique une annee), on pourrait en principe atteindre dans la zone centrale un taux d'irradiation de l'ordre de 80.500 HWj/tonne * au niveau du maximum axial. L'evolution temporelle des taux d*irradiation dans chacune des regions et des pourcentages d'atomes lourds consommes est detaillee dans le tableau III. La Fig. 11 montre Involution en fonction du temps des concentrations des divers isotopes du plutonium et de 1'uranium dans la zone d'irradiation.
II est important de souligner egalement que la derive de r£ac-tivite associle a Involution du dispositif pendant un an n'est que de 1,5 10-2 Ak/k environ.
6. DEGATS D'IRRADIATION
Si les contraintes dans le crayon combustible peuvent Stre considerees comme equivalentes dans les deux systemes compares, SOGRA-TE - zone centrale et Na-2 - coeur, il faut examiner s'il en est de mS-me quant a la resistance que peut leur opposer le gainage au cours de 1'irradiation.
1 Les taux d'irradiation sont rapportes a la tonne de combustible (U + Pu) metal.

SM-101/24 343
Parmi les deux mécanismes de fragilisation du matériau de gainage, déplacements atomiques et formation d'atomes de gaz, il est bien admis que le premier a un effet résultant négligeable aux températures voisines de 600 °C atteintes dans les gaines des milieux considérés. En ce qui concerne la fragilisation induite par l'accumulation de gaz aux joints des grains, on considère que l'hydrogène, produit dans les réactions (n,p), a une influence secondaire vis-à-vis de l'hélium produit par réaction (n,a) ; l'hydrogène formé diffuse en effet plus facilement hors du matériau de gainage. Dans l'acier de gainage adopté (Fe : 69,5 ; Cr : 16,0 ; Ni : 13,0 ; Mo : 1,5 % en poids) on s'est donc attaché à examiner les mécanismes de production d'hélium afin de pouvoir en comparer principalement les taux initiaux de production dans les deux milieux. Trois sources d'hélium ont été traitées séparément :
- réaction (n,a) avec les constituants de l'acier : Fe, Ni et Cr. - réaction (n,a) avec l'azote (0,06 % en poids) inclus dans l'acier. - réaction (n,a) avec le bore présent dans l'acier à l'état d'impureté et apporté principalement à l'alliage par le nickel (50 ppm de bore dans le nickel, soit 6,5 ppm de bore dans l'acier).
La variation énergétique des sections efficaces °~(E) des deux premières réactions a fait l'objet d'une analyse bibliographique : seule la partie à pseudo-seuil de la section efficace dans le domaine des énergies neutroniques les plus élevées vaut d'être prise en considération dans les milieux envisagés. Pour chaque réaction, un seuil effectif, Eeff, et la section efficace effective correspondante, eff, sont déterminés ; cette section a une valeur constante au-dessus du seuil et nulle en-deçà. On recherche, suivant une technique dérivée de la méthode de Grundl et Usner [7 ] , le couple de valeurs (Eeff, eff) qui, tout en satisfaisant l'expression
/
00 /~co
BinhV\[Ë . e~PE . dE = / 4 (E) . sinh V 0 Г . e" P E . Jo
eff
dE
dans laquelle v = u 2 et P = l (spectre de Watt)
est à la fois le plus insensible à des variations du paramètre v et du paramètre p, c'est-à-dire à une distorsion, par rapport au spectre de fission de l'uranium-235, du spectre dans lequel le taux de réaction doit être calculé. On détermine ainsi les valeurs suivantes :
Acier - Eeff : 6,85 HeV { ceff ; 26»5 mb
Azote - Eeff : 2,025 MeV ; o"eff : 223 mb.
Les spectres neutroniques ci-après ont été adoptés : - SOCBATE : axe de la zone centrale homogénéisée (GMS, kO groupes) - Na-2 [6] : axe du coeur de la pile homogénéisé (NUSYS, 26 groupes).
Ces spectres ont été normalisés à 1 fission/стЗ.в puisque aussi bien les deux systèmes peuvent être considérés comme également capables d'une même puissance spécifique. Les neutrons contenus dans le groupe énergétique où venait s'intercaler le seuil effectif de la réaction (n,a) considérée ont été supposés répartis, entre les limites énergétiques de ce groupe seulement, suivant un spectre de fission 235u. Lee précisions avec lesquelles les sections différentielles (n,a) eont connues (de± 20 à 50 % euivant l'isotope) autorisent à considérer ces diversee hypothèses comme satisfaisantes.

TABLEAU III. TAUX D'IRRADIATION MOYENS PAR REGION E T POURCENTAGES DU NOMBRE D 'ATOMES ( U + P u ) * PERDUS PAR FISSION ET CAPTURE
Duree d'irre diation( jours! effectlfs)^
24
MWj/tonne
N(t)
MWj/tonne
N - N(t) -2-B <*>
MWj/tonne
N - H(t) -2-n (*)
MWj/tonne
N - N(t)
N -<*)
MWj/tonne
N - N(t) -(%)
8.690
1,17
8.865
1,26
7.350
1,03
7.240
0,98
7.500
1,00
48
17.220
2,32
17.990
2,50
14.610
2,04
14.285
1,93
14.500
1,90
72
25.630
3,46
26.600
3,73
22.555
3,03
21.145
2,84
21.015
2,73
Plus precisement : 2 3 5U, 2 3 BU, 239Pu,
96
33.860
4,57
35.060
4,93
29.655
4,02
27.810
3,72
27.065
3,50
120
41.930
5,66
43.400
6,11
36.685
4,98
34.280
4,57
32.690
4,18
144
49.910
6,73
51.630
7,27
43.660
5,94
40.550
5,39
37.905
4,82
2it0Pu, 24lPu et **Pu.
168
57.725
7,79
59.770
8,42
50.595
6,88
46.630
6,18
42.745
5,42
192
65.415
8,83
67.830
9,56
57.490
7,83
52.500
6,94
47.250
5,96
216 240
73.000 80.465
9,85 10,86
75.830 83.750
10,69 11,80
64.345 71.160
8,75 9,6.7
58.160 63.6OO
7,66 8,36
51.450 55.390
6,53 6,95
>

SM-101/24 345
(_ in20,. ._. i 10 <
-
-
=
-
-
«. cm
) 242 ^Pu.1000 239
238,. U
235 "°U.0 (1
2A1Pu.K) 2 4 0 P U
-0 24 48 72 96 120 144 168 192 216 240 J°urs
17.220 33.860 49.910 65-415 80.465 MWj/t
FIG. 11. Concentrations isotopiques dans la zone centrale.
TABLEAU IV. TAUX DE REACTION (n, or) DANS SOCRATE ET Na-2
Cons t i tuen t
Acier
Azote
Bore
Tota l
Taux de r e a c t i o n pour 1 f i s s ion /cm .8
en 10 / c m 3 . s (*)
SOCRATE
69 ,3
49,9
21,6
140,8
Na-2
137,3
122,7
75,9
335,9
SOCHATE , nn
Na-2 ' 1 0 ° en %
50 ,5
40,7
28 ,4
41,9
( *) Par cm du milieu homogeneise : seul 1*acier du gainage est pris en compte•
Le taux de reaction dans le bore, £_, ^a*^i» a e* e calcule en utilisant les bibliotheques du bore-10 associees aux codes GMS et NUSYS.
Les taux de reaction initiaux dans l'acier, l1azote et le bore sont donnes au tableau IV : le taux global de reactions (n,a) dans SOCRATE, en debut d*irradiation, represente 42 % du m€me taux de reaction dans le coeur du reacteur Na-2. Ne disposant pas de donnees precises quant a 1'evolution dans Na-2 des spectres et niveaux de flux en fonction du taux d'irradiation, on n'a pu que verifier assez grossierement que ce pourcentage n'etait pas sen-

346 MINSART et M O T T E
siblement modifié en fonction du taux d'irradiation : un effet de compensation entre tendances opposées est d'ailleurs observé. Ce pourcentage peut dès lors également représenter le rapport entre les taux intégrés de réaction (n,a), à un taux d'irradiation donné (pour un taux d'irradiation de 50.000 MWj/tonne, environ 1017 réactions (n,a) par cm^ du milieu homogénéisée
Considérant les incertitudes inhérentes à cette analyse, on ne lui attribuera que le mérite de situer un ordre de grandeur : la production d'hélium dans le gainage des crayons combustibles est le double environ dans le coeur Na-2 de ce qu'elle est dans la zone centrale du dispositif SOCRATE. Dans l'état actuel des connaissances sur les mécanismes de fragilisation, cette différence ne paraît pas significative : on peut donc conclure que les différences des niveaux de flux entre les deux systèmes, mises globalement en évidence par la majoration d'enrichissement requise pour obtenir dans SOCRATE une densité de puissance équivalente à celle du coeur Na-2, ne pénalise guère l'expérience d'irradiation en ce qui concerne la fragilisation du gainage. Il ne manque d'ailleurs pas d'auteurs qui considèrent que les phénomènes de fragilisation envisagés ici sont, dans une très large mesure» uniquement dépendants de la densité de fission.
7. AUGMENTATION DES PERFORMANCES
En parallèle avec les études d'optimisation et d'évolution du dispositif SOCRATE, on a examiné les moyens d'en augmenter les performances, soit par transformations dans le réacteur BR2, soit par modifications de la conception de la zone de couverture. Cette analyse conduit à ne retenir en pratique qu'une solution qui soit peu coûteuse et réalisable sans aucun développement technologique particulier : elle conduit à majorer le niveau de flux incident à la périphérie du dispositif d'irradiation et, par là, la densité de puissance dans le dispositif. Le niveau de flux incident sera plus élevé, pour un même flux calorifique maximal au point chaud du chargement de BR2, si l'enrichissement ou la teneur en combustible dans les plaques des éléments combustibles est réduit ; ces deux options conduisent d'ailleurs à des effets très semblables dans le domaine de variation acceptable. Ce domaine est en effet limité par l'obligation de charger dans le BR2 un plus grand nombre d'éléments combustibles pour atteindre un même investissement de réactivité : la puissance totale du BR2 en est accrue et le plafond de la capacité (80 MW) des échangeurs primaires est rapidement atteint. Compte tenu de cette limitation, une réduction à 70 % 235u de l'enrichissement actuel (90 % 35u) du combustible de BR2 permettrait d'accroître de 15 % environ la densité de puissance dans la zone d'irradiation, sans y modifier sensiblement le spectre neutronique ; la puissance linéique maximale dans les crayons du sous-assemblage central de SOCRATE atteindrait dès lors 600 W/cm environ. On a par ailleurs vérifié que la réduction d'enrichissement dans le coeur BR2 conduit à une modification acceptable de l'effet réactif associé à une réduction de la densité du réfrigérant (coefficient de vide).
8. DISCUSSION
En ce qui concerne les divers aspects sous lesquels le caractère représentatif de l'expérience d'irradiation a été analysé, il reste à examiner les conséquences de la majoration de l'enrichissement du combustible sur le spectre des produits de fission : la dissemblance de ces

SM-101/24 347
spectres requiert un examen comparatif dee situations résultant des affinités chimiques différentes des produits formée vis-à-vis de l'oxygène» Il faut d'ailleurs remarquer que ce problème n'est pas particulier aux irradiations dans SOCRATE : un artifice semblable est également utilisé pour les irradiations dans des réacteurs rapides de combustible destiné aux grands projets actuels.
A l'échelle du crayon combustible, la distribution radiale quasi uniforme de la densité de puissance assure une répartition des températures et des produite de fission similaire à celle qui caractérise les réseaux purement rapides : à ce point de vue, l'évolution métallurgique du combustible dans SOCRATE sera donc représentative.
En ce qui concerne le sous-assemblage combustible, le gradient transversal de puissance est modéré ; les études bidimension-nelles en cours permettront de préciser les distributions axiales de puissance : à cet égard, le déplacement cyclique des barres de contrôle du réacteur BR2 tendra à uniformiser la puissance intégrée sur une tranche appréciable de la hauteur des crayons.
Les conditions de travail des crayons situés dans la zone de couverture doivent être investiguées en détail : à cet égard, la structure fine de la densité de puissance dans la section droite de ces crayons est une donnée fondamentale ; des techniques éprouvées [l ] appliquées à un modèle du dispositif localisé dans BR02 permettraient de déterminer cette caractéristique avec la précision requise. Plus généralement d'ailleurs, la disponibilité de BR02, modèle nucléaire précis du réacteur BR2, est considérée comme un atout essentiel à la réalisation du dispositif d'irradiation : la plupart de ses caractéristiques peuvent y être confirmées.
Sur le plan de l'analyse de la sécurité, les études ont été entamées ; on a ainsi vérifié que SOCRATE localisé au centre de la matrice du réacteur BR2 forme un système très largement sous-critique en l'absence d'éléments combustibles du BR2 ; l'immersion dans l'eau légère du faisceau des 379 crayons combustibles conduit à un facteur de multiplication de l'ordre de 0,80 : cette situation est évidemment due à la forte sous-modération de ce système et à sa géométrie défavorable ; d'autre part, le déchargement du dispositif accompagné d'une introduction massive d'eau dans la cavité centrale du réacteur conduit à un déficit réactif important. D'une manière plus générale, la cinétique du système couplé, SOCRATE-BR2, est dominée par les caractéristiques du BR2 } l'apport réactif du dispositif est en effet très faible. Enfin, l'étude des situations anormales dans la partie rapide du système, telles que la réduction de densité ou la vidange du sodium,est à entreprendre ; il en est de même des effets réactifs associée à la fusion du combustible.
Par ailleurs, la technologie particulière des circuits sodium dans le réacteur BR2 a été éprouvée à l'occasion de la réalisation de plusieurs dispositifs antérieurs [l] ; la présence d'une quantité de sodium sensiblement supérieure dans le système primaire et dans la piscine du réacteur BR2, inhérente à l'évacuation d'une puissance élevée, situe évidemment la complexité du problème à un niveau très différent.
9. CONCLUSION
Cette étude avait pour but d'analyser les conditions d'irradiation dans SOCRATE afin de pouvoir apprécier si l'irradiation d'un sous-assemblage combustible conçu pour un réacteur rapide serait un teet significatif : cette étude apporte une réponse affirmative qui justifie de poursuivre l'analyse des caractéristiques du dispositif afin de pouvoir juger s'il est réalisable dans un délai de deux ans

348 MINSART et M O T T E
et dans dee conditions financieres acceptables. L'etude des contrain-tes thermiques dans les crayons combustibles localises dans lea important s gradients de puissance de la zone de couverture est tres proba-blement 1'element d1appreciation le plus critique. Tant pour ce probleme particulier que, d'une maniere generale, pour 1'ensemble du projet, la realisation d'un modele nucleaire du disposi-tif dans BR02 paralt etre un passage oblige.
REMERCIEMENTS
Les auteurs remercient vivement les differentes personnes qui ont contribue a la preparation de ce rapport ; ils remercient tout particulierement Monsieur M. DANDOY qui 8'est charge de 1'execution des calculs, de la preparation des donnees pour l'ordinateur et du depouillement des resultats, ainsi que Monsieur V. GRAILET qui a assure 1'illustration de ce rapport.
Ils tiennent a souligner la courtoisie de Monsieur E. G. SCHLECHTENDAHL, GfK, qui leur a communique les caracteristiques du reacteur Na-2 requises a ce travail.
Enfin, ils remercient Monsieur J.J. HUET pour les interes-santes discussions touchant au domaine de la metallurgie.
REFERENCES
[l] DEBRUE, J. et al.,"Techniques de determination des caracteristiques nucleaires de la boucle refroidie au sodium utilisee dans BR2 pour des essais de combustibles de reacteurs rapides", ces comptes renduB, SM-lOl/26.
[2] VAN ROOSBROECK, G. et al., MODIC II (rapport interne au CEN).
[3] JOANOU, G.D., DUDEK, J.S., GAM-I - A consistent Pi multigroup code for the calculation of fast neutron spectra and multigroup constants, GA-1850 (l96l).
[h] GRATTON, C.P., SMITH, P.E., GMS 1 - A generalised multigroup system of calculations using the IBM 7030 (STRETCH) computer, UKAEA Rep. AEEW-M ^58 (1965).
[5] SMITH, R.W. et al., The F.D.2 group averaged cross-section set for fast reactor calculations, UKAEA Rep. AEEW-R <*91 (1966).
[6] SCHLECHTENDAHL, E.G., Kernforschungszentrum Karlsruhe, Communication personnelle.
[?] GRUNDL, J., USNER, A., Nucl. Sci. Engng £ 6 (i960) 598.

FAST-THERMAL COUPLED SYSTEM FOR INTEGRAL MEASUREMENTS OF FISSION-PRODUCT CROSS-SECTIONS*
M. BUSTRAAN REACTOR CENTRUM NEDERLAND,
PETTEN, THE NETHERLANDS
Abstract
FAST-THERMAL COUPLED SYSTEM FOR INTEGRAL MEASUREMENTS OF FISSION-PRODUCT CROSS-SECTIONS. In the framework of the co-operation of the West Germans, Belgians and Dutch on fast-breeder research a feasibility study has been initiated on the possibilities for integral measurements of fission-product cross-sections for fast reactor systems. A recent study (Rep. GEAP-4472) suggests that uncertainties may exist regarding, for instance, coolant void coefficients of 10$ for a sodium-cooled and of 20$ for a steam-cooled design. Some of these uncertainties are caused by inaccuracies in cross-sections for fissile and fertile isotopes, and can be reduced considerably by results from critical experiments. The remainder (up to 4$ for sodium and up to 6$ for steam-cooled breeders) is mainly due to inaccuracies in cross-sections of fission products.
Because of the high radioactivity, direct measurements in a critical experiment with actual fission products are impossible. The use of mock-ups of fission products still leaves big uncertainties because of the differences in isotopic compositions of natural elements occurring in fission products. It is therefore proposed to convert the existing, heavily shielded, light-water critical experiment KRITOat the Petten site of the Reactor Centrum Nederland into a coupled fast-thermal system, in the fast zone of which by oscillator methods integral cross-sect ions of actual fission product mixtures, elements and nuclides, are to be measured by oscillator methods. To specify the compositions of the fast zone a number of 26 group diffusion calculations have been performed based on the ABBN set.
Regarding the influence of fission products on the coolant void effect, which is the major effect to be looked at, it appeared that 90% of the influence is caused by neutron absorption in the range of 2 keV to 50 eV for a sodium-cooled 1000-MW(e) breeder and in the range of 6 keV to 10 eV for a steam-cooled 1000-MW(e) breeder. Compositions were therefore sought for the fast zone giving about the same reactivity versus energy response to a sample of fission products introduced in the centre of the fast zone. It was found that compositions consisting of 90% enriched uranium with graphite in atomic ratios varying from 25 to 50 graphite atoms per 235U atom, and with a slight addition of polyethylene (from zero to one H atom per 235U atom) will produce the wanted spectra and energy-reactivity response for the oscillator. For such compositions the sensitivity of the oscillator will be of the order 1 to 3 x 10~65k/k per gram of fission product mixtures for a coupled system which derives 50 to 75% of its reactivity from the fast zone. A design has been made which can accomodate the variable fast zone sizes needed for the various spectra. The programme of the measurements is outlined. At the same time a small heavily shielded facility is being designed for chemical separation of fission product elements from reactor wastes and from 239Pu and 235U irradiations in the high flux reactor at Petten. In addition to the fission product cross-sections, integral cross-sections for other materials and even Doppler coefficients could be measured in the proposed system.
1. INTRODUCTION
In the framework of the co-operation of the West Germans, Belgians and Dutch on fast-breeder reactor research, a study has been undertaken by the RCN on the feasibility of integral measurements of the c ross-sections of actual fission products in neutron spectra of interest for fast reactors.
Work performed under the Euratom-TNO/RCN association, contract number 013-65-1 RAAN.
349

350 BUSTRAAN
Fi s s ion products const i tute one of the sou rces of i naccurac ie s in the predict ion of fast r e a c t o r behaviour, A recen t study [1] sugges ts that , in genera l , uncer ta in t i es may exist , for example , in coolant void coefficients of 10$ for a sodium-cooled fast r e a c t o r and of 20$ for s t eam cooling. P a r t of these uncer ta in t ies can be at t r ibuted to inaccurac ie s in the c r o s s - s e c t i o n s of the f iss i le and fer t i le i so topes . The uncer ta in t i e s due to the inaccurac ies in the knowledge of the f ission product c r o s s -sec t ions may range up to 4 $ or 6 $ for a sodium or a s t eam-coo led b r e e d e r , respec t ive ly .
It i s to be expected that the inaccurac ie s in the c r o s s - s e c t i o n s of fer t i le and f iss i le m a t e r i a l s will be reduced considerably in the coming y e a r s as a resu l t of the differential c r o s s - s e c t i o n m e a s u r i n g p r o g r a m m e s under way at s eve ra l l abo ra to r i e s and by the r e s u l t s of c r i t i ca l expe r imen t s .
The same is t r ue for other core m a t e r i a l s . The si tuation looks l e s s p romis ing for f ission products . For a number of m o r e impor tant f ission product isotopes most or even all exper imenta l information is lacking. Fo r th is r e a s o n one has to r e s o r t to theore t i ca l e s t i m a t e s (see, for example, Ref. [2]). As the number of impor tant fission product i so topes , daughter products and capture products amounts to about 90 it i s un rea l i s t i c to expect r e s u l t s of differential c r o s s - s e c t i o n m e a s u r e ments for all these i sotopes in the foreseeable future. Moreover , the high activity of a number of these i sotopes h a m p e r s d i rec t m e a s u r e m e n t s . Also, a number of these i sotopes a re available only r a r e l y or not at all in enr iched form.
There fore in tegra l m e a s u r e m e n t s on actual f ission products could contr ibute to the reduct ion of exist ing uncer ta in t i e s . Fo r the m e a s u r e m e n t s of, for example , the effect of f ission products on coolant void coefficients, the use of actual f ission products in a c r i t i ca l exper iment i s very difficult because of the radioact ivi ty . Fo r th is purpose mock-up f ission products have been devised. The mos t genera l and e labora te mock-up sys tem is desc r ibed in Ref. [3]. In th is mock-up only 60% of the actual f ission products (with hal f - l ives longer than one yea r ) can be r ep re sen t ed co r rec t ly ; the r e m a i n d e r have to be s imula ted by natural ly occu r r ing and not too expensive m a t e r i a l s . ^As this s imulat ion is based on the previously mentioned theore t ica l e s t i m a t e s of c r o s s - s e c t i o n s a r a t h e r l a rge uncer ta in ty is s t i l l p resen t .
A fur ther exper imenta l study on the react iv i ty effects of actual f ission products s e e m s the re fo re n e c e s s a r y . Because of the high activity (1 kCi per g ram fission products of a few months old) and of the s ca rc i t y of sepa ra ted isotopes only the use of sma l l samples i s feasible . This l eads d i rec t ly to a cen t ra l reac t iv i ty value m e a s u r e m e n t by, for example , pile osc i l l a tor techniques in a r e a c t o r sys tem in which flux and adjoint flux spec t r a have a sufficient cor respondence with the spec t r a in an actual r e a c t o r .
The study made by the RCN on how such m e a s u r e m e n t s could be per formed at Pe t t en has led to a des ign-proposa l for a f a s t - t h e r m a l coupled facility rep lac ing the p resen t t h e r m a l c r i t i ca l facility KRITO [4], located in a heavily shielded bay at the RCN si te at Pe t ten . In the cen t ra l fast zone of th is coupled facility the m e a s u r e m e n t s on bulk f ission product samples , f i ss ion-product e lements and f iss ion-product isotopes will be per formed by a pile osc i l l a to r technique. Some cons idera t ions leading to th is design, some r e s u l t s from the support ing

SM-101/35 351
calculations, and the proposed experimental programme are briefly discussed in the following pages.
2. EFFECTS OF FISSION PRODUCTS IN POWER BREEDER REACTORS
Two types of effects of fission products on the behaviour of a power breeder reactor have to be considered.
2 .1 . Direct effects
The first type is direct effects, e. g. on reactivity and breeding ratio. Here the effects of fission products are directly related to the ratio of the reaction rates (mainly absorption) of the fission products to the reaction rates in the core constituents (especially fuel) at the same energy. In this case the energy range of interest for the knowledge of the fission product cross-sections is that range in which most of the fissioning and breeding takes place.
2. 2. Difference effects
The second type is difference effects, i. e. the effects of fission products on coolant void reactivity coefficients. In this case the differences in the reaction rates of fission products in the non-voided and voided reactor are important. Here a sort of "difference spectrum" is thus the quantity of interest.
As the difference effects were thought to be more important, and as the requirements for measurements concerned with these effects are probably more difficult to meet, they received prime attention.
To obtain some reference data for the magnitude and energy dependence of the fission product influence on void coefficients, a few calculations were made for the reference designs Nal [5] and DI [6]. All calculations referred to in this paper were done in 26 groups with one-dimensional diffusion programmes EDDI and FREDDI written in ALGOL 60 for the Electrologica X8 computer of the RCN. All cross-sections used were taken without modifications from the 26 group library of ABBN [7],
By one-dimensional first-order perturbation calculations the over-all reactivity effects of adding fission products to the non-voided and to the 100% voided core of the Nal reactor has been determined. From this calculation estimates were obtained for the effect of fission products on the void coefficient for each energy and each perturbing phenomena (absorption, scattering, etc. ), separately. In this perturbation calculation 10 pairs of fission products per cm3 were homogeneously added to the core. This corresponds to a homogeneous burn-up of about 12 000 MWd/t. The reactivity loss due to the addition of these fission products to the non-voided core was - 0. 90%, and addition to the 100% voided core produces a loss of only - 0. 56%. The difference, + 0. 34%, can be considered as a measure of the positive contribution of fission products to the void coefficients.
Inspection of the reactivity contributions per energy group as given in the Figs 1 and 2 reveals that nearly 90% of the fission product effect is caused by absorption in the energy region 2 keV to 50 eV. The other

352 BUSTOAAN
\2 -
-6k 10
2 -
n 1 1 1 1 1 1 r
N a l I\
-S
— NORMAL
— VOIDED
JL V 107 \Ob 105 10* 10 \QT W \ 0.025
ENERGY (eV)
FIG. 1. Contribution of each energy group to the reactivity loss due to absorption of fission products added to the normal and voided core of the Nal reactor.
ha
HO
8
6
4
2
0
-2
-A-
n 1 1 r
N a l
— i 1 1 —
— 6/> (TOTAL)
— 6yo (ABS.)
— &/o (OlFF.) -
6/o (SCATT.)
X
1 1 r——i——r— r r 1 r <07 106 10 5 <0 \0 <02 \0 \ 0.025
ENER6Y (eV)
FIG. 2. Breakdown of the contribution of each energy group to the effect of fission products on the void coefficient for the Nal reactor.

SM-101/35 353
contributions comprise leakage and transport effects in the region 2 MeV to 0. 2 MeV, contributing about + 10%; absorption about 10 keV, contributing about + 10%; and absorption in the sodium resonance at 2. 8 keV, contributing about - 10%.
For the steam-cooled reactor DI analogous results are given in Fig. 3. From this it is clear that here most of the effect is due to absorption in the energy region 6 keV to 5 eV.
1 1
DI
-
|"Lr rJ~J
_P
. "V-
i i i i i
NORMAL
— - VOIDED
DIFFERENCE
i - i
~L
L_.
•
J" I k •n 1
I 1 r;—rr 1 1 r~ 1 1 — ' K>7 106 \05 10 «T 102 W1 1 0.025
ENERGY (cV)
FIG. 3. Contribution of each energy group to the reactivity effects due to fission products in the DI reactor.
From these figures, however qualitative they may be, it is clear that for the measurements of absorption cross-sections of fission products most emphasis should be placed on the range from a few keV down to several eV, i. e. the resonance region. It is in just this region where data for most of the fission product cross-sections are lacking, and where reliable predictions based on nuclear theories are hard to make.
3. COMPOSITION STUDIES
In a survey study, using first-order perturbation calculations a large number of compositions of fast systems have been tested on their response of reactivity versus energy to a small sample of mixed fission products introduced in their centre, in order to find compositions that might produce responses as given in the Figs 2 and 3. A high "sensitivity" (6p per gram of fission products introduced in the centre) is wanted
23

TABLE I. SURVEY OF SEVERAL COMPOSITIONS AND THEIR CHARACTERISTICS
1
Composition
number
1 2 3 4
4 . 1 4 , 3 5
6
6, 1
7 7, 0 . 1 7, 0 . 3 8
8, 0 . 1 9
10
11 12
12, 0 . 1 12, 0 . 3
2
C H 2
p = l
36 53 63 74 74 74
80 85 85
94 .4 94 .4
94 .4 98 .2
98 .2
------
3 4
Approximate vol . °]o of ma te r i a l s a
C
p = l . 5
--------------
8 6 . 5 92 .7
95 97
97 97
U-235
64
47 37 26 26
26 20
15 15
5.6 5.6
5.6 1.77
1.77
13 .5 7 . 3
5 3 3
3
5
B-10
----
16.7
50
--
16.7
-1.7
5
-1.7
----1.7 5
6
n di lu t . n U - 2 3 5
1:1 2 : 1 3 :1 5 :1 5 :1
5 :1 7 :1
10 :1 10 :1
3 0 : 1 30 :1
3 0 : 1 1 0 0 t l
100:1
10 :1
2 0 : 1 30 :1
50 :1 50 :1 50 :1
7
R c (cm)
12 .3
12.8 14 15 .3 18
25 1 5 . 5
15 .7 29
14.8 2 2 . 5 31 15 .7
35
34 4 2 . 4
4 7 . 7 57
59 70
8
mass
U-235
(kg)
90
77 80 76
124
332 60
4 6 . 5 284
14 .4 51
134 5 . 1
56
416 432
430 440
490 820
9
<5p/g X 1 0 " 7
- 42 - 195 - 240 - 340
- 125
- 32 - 480 - 597
- 60 -1400 - 354
- 115 -1730
- 151
3 .7 - 13
- 2 0 . 3 - 30 .3 - 22 .9
- 11.2
10
AE
400 keV-4eV
4keV-2eV I k e V - l e V 200 - 2 e V
Many peaks
Many peaks Many peaks
Many peaks
Many peaks Many peaks
Many peaks Many peaks Many peaks Many peaks
l M e V - 2 k e V 100-0 .2 keV
50keV,-50 eV 1 0 - 0 . 0 1 k e V
1 0 - 0 . 0 2 k e V 10-0 . 05 keV
11
E top
4 - 0 . 0 1 k e V l - 0 . 0 1 k e V
l - 0 . 0 1 k e V 50-4 eV
100-2 keV 10-2keV
5 - 0 . 2 k e V 0 . 2 k e V
0 . 2 k e V 0 . 2 k e V
GO
a
> >
B-10 is given in mg elementary B-10 per cm

SM-101/35 355
because, due to the high radioactivity of actual fission products, the amount of sample that can be handled will always be small. Therefore, in the first place most of the reactivity in the measuring system should be derived from the energy region where most of the absorption in the fission products takes place; secondly, the system should contain no or only a limited amount of materials with high resonance capture, such as, for example, 238 U.
This leads to compositions with graphite or hydrogen (or combinations thereof) as slowing-down materials and with highly enriched uranium as fuel.
To cut off a too high epithermal contribution a small amount of boron could be added.
Some results of the calculations are given in Table I, where a number of material compositions are given together with some pertinent data. Columns 7 and 8 give the radius and mass of the bare spherical system with the given composition. Column 9 shows the "sensitivity" of the composition in terms of the central reactivity value due to the introduction of 1 g of a fission product mixture to the bare sphere. Columns 10 and 11 show the energy range of the reactivity response and the location of the top of this response. Some of the responses are also given in the Figs 4 and 5.
The effect of adding some hydrogen in the form of polyethylene has also been studied. Results are given in Figs 6 and 7 and Table II.
On the basis of these results the compositions 1: 30 C, 1: 50 C and 1: 75 C + 1 H have been selected as reference compositions for the design. The spectra produced by these compositions are given in Fig. 8 together with central spectra of the Nal and DI reactors. From this it is clear that the measurements have to be performed in several spectra, i. e. several compositions will have to be employed.
In all these calculations all materials were supposed to be homogeneously mixed, so the results given here have to be corrected for the inevitable heterogeneity that in fact occurs. It appeared from separate calculations that the heterogeneity does not essentially alter the picture given above. However, considerable attention should be paid to self-shielding and mutual shielding effects in and around the sample.
4. COUPLED FAST-THERMAL SYSTEM DESIGN
The facility to be built by the RCN to measure fission product c ross-sections will be a fast-thermal coupled system. The arguments for this are: firstly, lower amounts of enriched fuel are needed for a coupled system compared with an all-fast system; secondly, the longer mean neutron life-times in a coupled system eases the safety problems; and thirdly, this facility will have to replace an existing light-water critical experiment. The feasibility and safety of a coupled fast-thermal system have been clearly demonstrated by the STARK facility [8],
To have the full advantages of the safety characteristics of water reactors, the thermal zone of our facility will be water-moderated. For low thermal fuel inventory and high fast flux-to-power ratio, highly enriched plate-type fuel will be used for the thermal zone, which is a cylindrical annulus surrounding the fast zone. The thickness of this

356 BUSTOAAN
14
12
10
8
6
n i i r i i i r
— 1:5H — T.5H+ 31UB 10C
1 1 1—!—i 1 n -
»06 105 10* \0 102 10 1 0.025
ENERGY (eV)
FIG. 4. Reactivity response versus energy due to fission products introduced in compositions 1: 5 H.
"i 1 r^—i r 10' 106 105 104 10J 10* 10* 1 0.025
ENERGY (eV)
FIG. 5. Reactivity response versus energy due to fission products introduced in compositions 1 : 50 C.
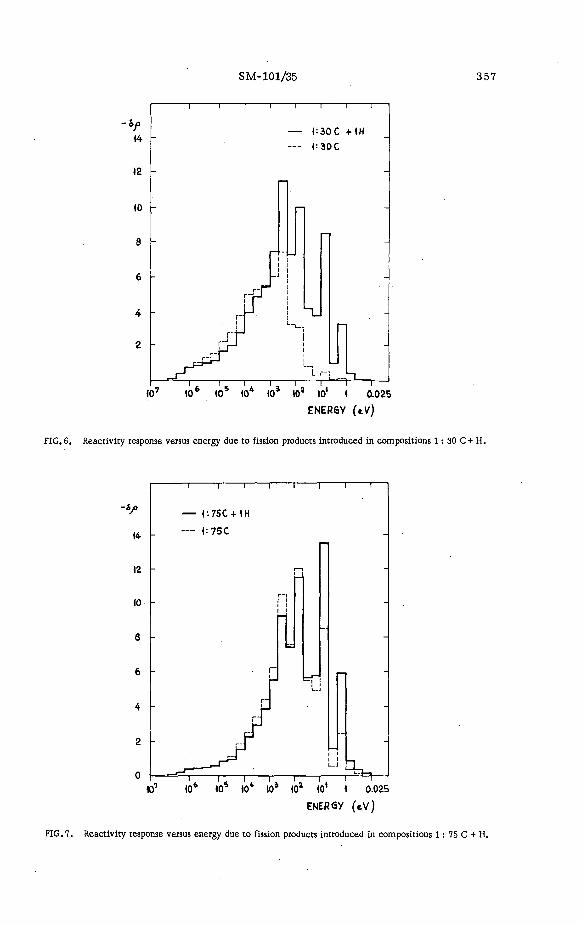
SM-101/35 357
12
10
<07
n 1 1 1 1 1 1 r
— <:30C + 1H
— 1:30C
• c '"K Hi '"a ' I I T 10* 10* 10* «T tO2 lo' 1 0.025
ENER6Y (eV)
FIG. 6. Reactivity response versus energy due to fission products introduced in compositions 1: 30 C+ H.
TT ' ' ' r , 107 10* 106 W*" 10* 10* 10* 1 0.025
ENERGY ( e V )
FIG. 7. Reactivity response versus energy due to fission products introduced in compositions 1: 75 C + H.

TABLE II. SURVEY OF E F F E C T OF ADDING SMALL AMOUNTS OF HYDROGEN TO GRAPHITE URANIUM MIXTURES (All composit ions contain 10% (by volume) aluminium)
Composition
number
11
12
13
14
15
16
17
18
19
20
21
22
23
24
25
26
27
28
29
30
U-235
1
1
1
1
1
1
1
1
1
1
1
1
1
1
1
1
1
1
1
1
Atom ratios
U-238
0 . 1
0 . 1
0 . 1
0 . 1
0 . 1
0 . 1
0 . 1
0 . 1
0 . 1
0 . 1
0 . 1
0 . 1
0 . 1
0 . 1
0 . 1
0 . 1
0 . 1
0 . 1
0 . 1
0 . 1
c
20
20
20
20
30
30
30
30
40
40
40
40
50
50
50
50
75
75
75
75
H
0
0 .1
0.3
1
0
0 .1
0 .3
1
0
0 .1
0 .3
1
0
0 .1
0.3
1
0
0 .1
0.3
1
Crit ical radius
(cm)
45 .7
4 5 . 4
44 .9
4 3 . 4
52.0
51 .7
51.2
49 .6
56.6
55 .5
55 .9
54 .2
59 .3
60 .1
59.6
57 .9
67 .2
66 .9
66 .4
64 .4
Crit ical
mass
(kg U-235)
488
479
462
418
490
482
468
423
481
455
462
422
446
465
453
387
438
430
421
385
6p/g scatt . x 10"7
+ 5 .1
+ 5 .1
+ 5.3
+ 5.6
+ 3.8
+ 3.8
+ 3.9
+ 4 .2
+ 3 .1
+ 3.2
+ 3 .1
+ 3 .4
+ 2 .0
+ 1.8
+ 1.9
+ 2 . 0
+ 1.3
+ 1.3
+ 1.3
+ 2 . 1
Sp/g abs.
x 10"7
- 1 7 . 3
- 1 8 . 9
- 2 2 . 4
- 3 5 . 5
- 2 2 . 2
- 2 3 . 7
- 2 7 . 1
- 3 9 . 6
- 2 7 . 0
- 2 9 . 8
- 3 2 . 0
- 4 4 . 0
- 3 9 . 2
- 3 8 . 3
- 4 1 . 5
- 5 3 . 5
- 4 8 . 2
- 5 0 . 3
- 5 2 . 9
- 6 0 . 1
<5p/g total
x 10 - 7
- 1 2 . 2
- 1 3 . 8
- 1 7 . 1
- 3 0 . 0
- 1 8 . 4
- 2 0 . 0
- 2 3 . 2
- 3 5 . 5
- 2 4 . 0
- 2 6 . 6
- 2 8 . 8
- 4 0 . 7
- 3 7 . 2
- 3 6 . 5
- 3 9 . 7
- 5 1 . 5
- 4 6 . 9
- 4 8 . 9
- 5 1 . 6
- 5 7 . 9

SM-101/35 359
thermal zone is variable from 0 to 15 cm. The outer reflector consists, for ease of construction, also of water. A natural or depleted uranium buffer or filter separates the fast and thermal zones. The thickness of this filter is 5 cm.
<p
< o 4 -
< o 3 -
io 2 -
1 1
1
tl
Y»
fj •A
1 4n6
'^^>S$
i I I m 5 \r& in3
— a — b — c
^^K
w \\ n \
irfi in'
*=30C 1-.50C I--75C + 1H N a l D I
V \ V \ \ \
^ vv \ \\ \ 1 1
i nnoc
ENERGY (eV)
FIG. 8. Spectra of the Nal and DI reactors and spectra compositions 1: 30 C, 1: 50 C and 1: 75 C +1H.
As mentioned earlier, the measurements will have to be performed in several different spectra, thus in more or less diluted compositions of the fast zone. To maintain the fraction of the total reactivity contributed by the fast zone at about the same level (50 to 75%), rather varying dimensions of the fast zone have to be accommodated. To be able to keep the inner radius of the thermal zone at a fixed value when more compact fast zones, which would call for a much smaller radius, are employed, it is suggested that an additional graphite layer of variable thickness should be introduced between the thermal zone and the buffer.
The influence of this additional graphite has been studied in some detail. For a few reference cases the total reactivity is lowered by only 2% when the graphite layer is varied from 0 to 30 cm. This loss in reactivity when compensated by adding fuel to the thermal zone causes a loss in "sensitivity" of 10 to 30%, according to whether a natural or a depleted uranium buffer is being used. For small graphite thicknesses, e. g. 10 cm, even an increase in "sensitivity" is observed. Inspection of the reactivity response versus energy for extreme cases (0 and 25 cm graphite thickness) reveals that over the whole energy range the relative differences are less than 0. 75%. This graphite layer of variable thickness thus provides an agreeable freedom in the design.

360 BUSTRAAN
1 THERMAL ZONE
2 CONTROL PLATES
3 GRAPHITE
4 FAST ZONE
5 OSCILLATOR
6 OVERFLOW
7 DUMP LINE 8 AIR OUTLET
9 CONTROL PLATE DRIVES 10 BUFFER ZONE
A Jo:
FIG. 9. Perspective view of fast-thermal coupled facility design.

&?%&{ GRAPHITE
H J | § | FUEL ELEMENTS (THERMAL ZONE)
ISffiSSJ F U E L ELEMENTS (FAST ZONE)
^ ^ H CONTROL PLATES (BORAL)
FUEL ELEMENTS (BUFFER ZONE)
FIG. 10. Horizontal cross-section of fast-thermal coupled facility design.

362 BUSTRAAN
Control p la tes will be in se r t ed between t h e r m a l zone and buffer. Some modera t ing m a t e r i a l (graphite or water) between pla tes and the t h e r m a l fuel zone enhances the cont ro l plate va lues . The actual values a r e dependent on the reac t iv i ty dis t r ibut ion over the t h e r m a l zone, buffer and fast zone. P l a t e s cover ing a lmost the whole t h e r m a l zone may have a total worth of 4 to 6%.
FIG. 11. Vertical cross-section of fast-thermal coupled facility design.
The present design proposal is illustrated in the Figs 9 - 1 1 . This design foresees a central fast zone in a tank of aluminium with an outer diameter of 104 cm and a height of 100 cm, completely separated from the aluminium tank for the thermal zone, thus excluding accidental leakage of water from the thermal tank into the fast tank.
The fast fuel elements will consist of aluminium boxes (1-mm wall thickness), 2 in X2 in in cross-section, in which the platelets of such materials as enriched uranium and graphite are stacked. The platelets will have the same dimensions as used in other facilities, e. g. SNEAK. In the upper and lower side of the elements a 20-cm column of axial blanket material will be located. This will consist of natural or depleted uranium plates possibly alternating with graphite plates. The fuel boxes will rest in a bottom grid. In this gridplate either fuel elements, graphite filler elements or uranium buffer elements may be placed at any location.
The thermal fuel zone consists of 36 thermal fuel elements. These elements, measuring 7, 5 cm X15 cm in cross-section, consist of boxes

SM-101/35 363
in which a variable number of the highly enriched UA1 alloy Al-clad plates of 7. 5 cm X60 cm can be stacked vertically. The outer section of the thermal tank serves as an outer reflector for the thermal zone. A separation has been made in the bottom part of this outer zone to provide for an air chamber. During the filling of the tank air is trapped in this chamber. The pressure built up can be released by opening magnetic valves. The resulting fast drop of the water level in the thermal zone causes a fast scram in addition to control rod movement.
The existing control rod drive mechanisms of KRITO will be used unaltered. They are located above the system. The oscillator drive system is mounted below the reactor to facilitate the loading of the active samples. In case highly active samples are being oscillated the temperature of the sample will be kept down by a forced circulation of air through the oscillator tube which will remove the decay heat developed by the sample.
A number of gamma-compensated ionization chambers and counters will be located in the outer reflector. From these the neutron flux signals will be derived. For the analysis of the measurements a number of different methods will be used. An experimental auto rod (a small control rod with a servo drive) has been built and is being tested at the Low Flux Reactor at Petten. A direct analysis of the neutron flux signal has already been developed. For reactivity control after loading, extensive use will be made of the pulsed neutron source and reactor noise techniques already developed. The mean neutron life-time will be measured by these. This is a very sensitive safety quantity depending largely on the reactivity contribution of the fast zone. For these purposes a small on-line computer will be installed.
Some data on the three reference compositions in the actual design are given in Tables III and IV.
5. PROGRAMME FOR THE MEASUREMENTS AND FOR THE PROCURING OF SAMPLES
After the normal star-up measurements and necessary calibrations, the programme will start with measurements in several spectra on the mock-up fission product material as used in SNEAK. Thereafter measurements in several spectra will be performed on gross fission-product samples containing up to 10 to 15 g of fission products of 239Pu or 235U, to be produced in the High Flux Reactor at Petten or to be purchased elsewhere. These measurements are intended to produce an over-all figure showing the actual fission product influences compared with the mock-up products. After this a series of more elaborate measurements on chemically separated fission product elements will begin. The amount of sample material needed will vary from a few grams up to 20 g depending on the cross-sections and fission yields of the specific elements or isotopes.
The few fission product elements occurring in nature as a single isotope (as 133Cs, 13i5La, 141 Pr , 103Rh) will not be difficult to obtain. Other elements, such as Sm, Ru, Nd, Pd, Mo, Eu, Zr, will be separated from actual fission product wastes. A quantity of 500 g of thermal reactor waste has already been ordered for separation purposes.

364 BUSTRAAN
TABLE III. SOME CALCULATED DATA ON THREE REFERENCE
COMPOSITIONS IN THE FAST-THERMAL COUPLED FACILITY
Composition:
Radius fast zone (cm)
Filter natural U (cm)
Thickness graphite (cm)
Thickness thermal zone (cm)
Extrapolated height (cm)
Mass U-235 (kg)
Fast zone a
Thermal zone
Fractional contribution to power
Fast zone
Filter
Thermal zone
Fractional contribution to reactivity
Fast zone
Filter
Thermal zone
Mean neutron life-time ((js)
1: 30 C
30
5
15
7.4
81.1
120
7.5
0.39 .
0.10
0.51
0.54
0.11
0.35
32
1: 50 C
40
5
5
5
81.1
150
5
0.57
0.11
0.32
0.75
0.11
0.14
12
1: 75C+1H
40
5
5
9.7
81.1
90
10
0.28
0.11
0.61
0.33
0.12
0.55
37
Central reactivity value in 10"T per gram fission product
Absorption
Scattering
Total
Central reactivity value in 10" T per gram U-235
-16.2
+ 2.5.
-13.7
+ 28
-23
+ 1.2
-21.8
-
-23.6
+ 0.8
-22.8
+ 13
a Assuming a saving for an upper and lower blanket of 15 cm each. b For pure fast assemblies the life-time would be of the order of 10~6 - 10"7s.

SM-101/35 365
TABLE IV. ATOMIC DENSITIES (in 1022 Atoms/cm 3 ) OF THE REFERENCE COMPOSITIONS OF TABLE III.
1: 30 C
1: 50 C
1: 75 C + l H
H
0
0
0.087
C
6.38
6.47
6.53
Al
0.6
0.6
0.6
U-235
0.213
0.162
0.087
U-238
0.0213
0.0162
0.0087
These elements will also be measured in their naturally occurring isotopic composition. Irradiation in the High Flux Reactor of a number of these elements to obtain samples with other isotopic compositions is also being considered. 147Pm, 135Cs-137Cs and99Te will be purchased as sources and purified if necessary. Finally, the purchase or loan of a number of enriched isotopes is being envisaged.
For the chemical operations, a small heavily shielded facility has been designed, in which, by various chemical techniques, for example, ion-exchange methods, the fission products will be separated. In these shielded boxes or in the hot cells of the RCN at the Petten site, the samples will be prepared and mounted for measuring. Sample size and forms will be varied to analyse self-shielding effects.
Besides being used for fission-product cross-section measurements, the system described may be used for measuring cross-sections of other materials or even Doppler coefficients.
According to the present time-schedule we may be able to start the measurements at the end of 1968 or the beginning of 1969. However, negotiations on obtaining and financing the enriched fuel have not yet been concluded. It is estimated that finally up to 200 kg 235 U will be needed in this system. In the preliminary periods the amounts needed will be 100 to 150 kg.
REFERENCES
[1] GREEBLER, P. , HUTCHINS, B. A., Rep. GEAP-4472 (1966). [2] GARRISON, J .D. , ROOS, B. W., Nucl. Sci. Engng 12_(1962) 115. [3] SCHRODER, R., Nukleonik 10(1967) 18. [4] COEHOORN, J. , et al. "The critical facility KRITO", Exponential and Critical Experiments
(Proc. Symp. Amsterdam, 1963)2, IAEA, Vienna (1964) 233. [5] SMIDT, D. , et a l . , Rep. KFK-299 (1964). [6] MULLER, A. , et al., Rep. KFK-392 (1966). [7] BONDARENKO, 1.1., et a l . , Group Constants for Nuclear Reactor Calculations. Consultants
Bureau, New York (1964). [8] MEISTER, H. , et a l . , Rep. KFK-217 (1964).
DISCUSSION
R. VIDAL: The advantage of coupled "thermal-fast" reactors is that the investment in fissile materials can be reduced substantially. Why did you not keep the volume of the fast zone at a minimum?

366 BUSTRAAN
M. BUSTRAAN: F r o m separa te calculat ions for spher ica l sy s t ems it appears that, for smal l m a s s e s , the cen t ra l and adjoint spec t r a a re far removed from the asymptotic ones. To obtain spec t r a sufficiently close to the asymptotic ones, one needs , with our isotopic composi t ions, 235U in amounts of about 100-150 kg for spher ica l geomet r ies and 180-200 kg for cyl indr ical geomet r i e s .
ANALYSIS OF INTEGRAL EXPERIMENTS ON THE ZPR VI CRITICAL FACILITY
G. CECCHINI AND A. GANDINI CNEN, CENTRO DI STUDI NUCLEARI, CASACCIA, ROME, ITALY
Abstract
ANALYSIS OF INTEGRAL EXPERIMENTS ON THE ZPR VI CRITICAL FACILITY. A new approach is presented to integral experiment evaluation, which correlates nuclear group parameters to the integral data. This correlation is applied to the sodium void experiments made on the ZPR VI critical facility. The basic feature of the method consists in the use of generalized perturbation techniques and in the minimization of nuclear parameter corrections.
1. INTRODUCTION
At the present time, much effort is being given in fast reactor physics to the correlation methods between measured and calculated integral quantities, considered as necessary complements to basic data evaluation. The main reason for this interest may be summarized as follows:
(1) A higher degree of accuracy than that existing at present in basic nuclear data seems to become increasingly difficult to achieve, time consuming and expensive, although there is a need for more accurate theoretical predictions.
(2) What reactor designers are most concerned with is not the basic data in themselves, but the integral behaviour of the reactor or, quantitatively, reaction rates, neutron lifetimes, reactivity worths, etc.
(3) A large amount of integral information is becoming increasingly available from fast critical facilities and/or new fast prototypes.
(4) Larger and faster computing facilities are being installed.
Naturally these reasons call for a compromise of efforts between basic and integral data evaluation work. There is no doubt that each of these activities will eventually mutually benefit.
The scope of the present paper is to give a general description of the philosophy of the correlation method adopted, and to show some results relevant to the ZPR VI critical experiments.
2. GENERAL PHILOSOPHY OF THE METHOD
The basic philosophy of the method is simple and may be found in Ref. [1] . It will be described here very briefly together with some recent developments. Let us consider a number I of integral experiments of the most general kind. They may belong to one or more reactor systems
367

368 CECCHINI and GANDINI
and may r ep re sen t in genera l react ion ra t e r a t ios , react iv i ty worths , reac t iv i ty r a t ios , prompt neutron l i fe t imes , and source worth r a t i o s .
We shal l f i rs t reduce the in tegra l quanti t ies according to the s impl i fied calculational models assumed for each exper iment , in o r d e r to account for heterogenei ty , shape, self-shielding and o ther effects. We shal l then assoc ia te with all these exper iments an I-component vec tor (m+m' ) where m r e p r e s e n t s the exper imenta l reduced in tegra l data and m ' r e p r e s e n t s the inaccurac ies connected with them in re la t ion to both the s t a t i s t i c s of the exper iments and the data reduction p rocedure from mic roscop ic to group c r o s s - s e c t i o n s . Let us now a s s u m e by bes t value c r i t e r i a (the bas i s is a f iduciary approach) J -mul t ig roup nuc lear cons tan t s . The mul t igroup approximation is consis tent with the fact that it is widely used for fast r e a c t o r calculat ions , and the re fore it r e p r e s e n t s the form by which the c r o s s - s e c t i o n s a r e r equ i r ed . We fur ther a s sume that the i t e ra t ive method used by Abagyan et a l . [2] i s val id . With this assumpt ion the J -g roup constants will be normal ized to infinite dilution. The self-shielding factors will not be affected by the p resen t method, at l eas t at the s tage it i s intended at p r e s e n t . The J -mul t ig roup constants will r e p r e s e n t in genera l group averages defined in accordance with the theo re t i ca l approximation used . This i s desc r ibed in detai l in Ref .[2] . These constants will r e p r e s e n t genera l ly sca t t e r ing , absorpt ion, f ission c r o s s - s e c t i o n s , number of secondar ie s pe r fission, and fission s p e c t r a . They will be r ep resen ted by a J -component vec to r d*+d*' where cf r e p r e s e n t s the infinite dilution group constants and d*' the inaccurac ies connected with t h e m . The s ame a rguments used for in' a r e applicable h e r e . It i s poss ib le , in pa r t i cu la r , that the group reduct ion of bas ic data in t roduces some degree of uncer ta in ty which may be accounted for by p roper ly adjusting d ' .
If we now calculate the I - in tegra l quanti t ies corresponding to the m e a s u r e d ones , by making use of the J -g roup constants d and adopting given theore t i ca l models we shall genera l ly obse rve d i sc repanc ies Am between the m e a s u r e d and calculated va lues . Let us suppose then that we a r e able to exp re s s Am in t e r m s of c r o s s - s e c t i o n adjustments Ad* in a s imple l i nea r form of the type
Am + e m ^ L A d (1)
where e is an (IX I) diagonal ma t r i x in which the e lements ej a r e unde te rmined p a r a m e t e r s with l imi t s \ei | ^1 and where L is an (IX J) m a t r i x in which the e lements a^ r e p r e s e n t calculable sensi t iv i ty coeff ic ients . This i s allowed for if use is made of genera l ized per turba t ion techniques shown in Refs [3 -5] . At th is point a consis tency approach should be applied in co r rec t ing the group constants by amounts Ad* within t h e i r uncer ta in ty l imi t s d' so that agreement i s obtained between theo re t i ca l and exper imenta l values within the i r uncer ta in ty l imi t s m ' . If the problem has solut ions, s ince we a s s u m e that in genera l I< J, t he re i s an infinite number of constant s e t s consis tent with the exper imenta l v a l u e s . To a r r i v e at a unique set , a l eas t norm condition is applied to co r r ec t i ons Ad. More p rec i se ly the following condition mus t be sat isf ied:
F = Ad A Ad = minimum

SM-101/31 369
where A"1 is the following diagonal matrix:
A - ^ d i a g ^ , ^ , . . . , 4
where a.- is a parameter usually assumed proportional to the absolute error d'.. This assumption stems from the principle of greater correction for those constants which look affected by higher inaccuracies. It may appear that some corrections Ad: result from the bounds represented by their uncertainty limits. In such case, the pertinent upper or lower bounds should be assumed as the proper correction and there should be a new iteration with d'j (and therefore o-j) close to zero. This process may be iteratively applied until, it is hoped, convergence to consistency is reached. If this is the case, we may say that the method adopted, although not strictly based on physical grounds, is, however, operating within the uncertainty area of what can be assumed to be the present knowledge of both the differential and integral parameters and gives "effective" group constants consistent with it.
It may happen, however, that convergence is not obtainable either because the errors assumed for the group constants and/or integral experiments are unreal and/or because the calculational models and approximations are inappropriate. At this point assessment in terms of general good sense is essential, as some sort of judgement on basic and integral data and/or theoretical assumptions will be implied. Some kind of sensitivity test might be used to help this situation, by slightly changing the uncertainty limits m' of the experimental integral data, in order to sort out those data which appear most critical for the convergence to consistency and therefore are worth looking at first.
Mention should be made of the fact that the method outlined here may be used also for checking pieces of information assumed to be reliable with others assumed uncertain. For example, one might want first to force consistency between given group constants and a given set of reliable experimental integral data, and then to check a new set of similar experimental values with the corrected cross-sections. This also represents a possible way of sorting-out those pieces of information which might cause trouble.
A final comment is required in relation to possible intercorrelations among cross-sections. In principle, system (1) can accept different linear equations. Therefore, the system of equations representing these intercorrelations given with obvious notation by the expression
- • - + - »
q+ €1 q1 =LxAd
may be directly incorporated by it. If it happens, which is unlikely, that I > J, a fit procedure may be applied, so that
F1 = (Am - LAcf) B_1(Am - LAd) = minimum
dng diagoi
B"1 = diag
where B"1 is the following diagonal matrix:
1 1 Urn'!)2' (m'2)
2 (m\f

TABLE I. 16-GROUP CROSS-SECTIONS FROM THE SOVIET LIBRARY (barns) -j o
Group
1
2
3
4
5
6
7
8
9
10
11
12
13
14
15
16
Na
a e l
1.62
1.95
2.42
3.32
4.37
4.00
3.80
5.30
4.30
5.00
8.00
100.0
6 .2
3 . 3
3 . 1
3 . 1
a i n
0.65
0.65
0.58
0.48
0.13
0 . 0
2 3 5 U
°c
0.0286
0.04
0.06
0.12
0.17
0.25
0.40
0.60
1.00
1.50
2.10
2.75
3.80
6.30
9.50
15.11
V
3.08
2.79
2.63
2.52
2.46
2.47
2.45
2.44
2.43
2.42
2.42
2.42
2.42
2.42
2.42
2.42
°f
1.234
1.25
1.28
1.25
1.23
1.41
1.70
2.10
2.65
3.40
4.40
5.40
7.30
11.0
16.0
24.31
a i n
1.909
1.91
1.76
1.38
1.20
1.00
0.60
0.18
0.06
0 . 0
2 3 8 U
°c
0.0086
0.02
0.06
0.13
0.13
0.15
0.22
0.35
0.46
0.60
0.78
1.20
2.10
3.60
4.50
17.64
V
3.14
2.87
2.67
2.58
0 . 0
a f
0.629
0.58
0.49
0.02
0 . 0
a in
2.521
2.60
2.25
2.15
1.65
1.05
0.55
0.19
0 . 0
Fe
a e l
2.385
2.37
2.40
2.53
3.78
2.99
3.69
5.29
14.5
3.99
8.40
5.89
7.39
10.0
11.0
11.4
°in
1.352
1. 13
0.90
0.37
0.01
0 . 0
C
a e l
1.297
2.00
1.80
2.55
3.10
4 . 0
4 . 3
4 . 5
4 . 6
4 . 7
4 . 7
4 . 7
4 . 7
4 . 7
4 . 7
4 . 7

SM-101/31 371
The J-conditions 6F1/6d: give the J-equations from which the corrected set may be deduced.
3. CALCULATIONAL PROCEDURE
To solve system (1) the CALI code has been used [6] . The sensitivity coefficients a^. of matrix L are now calculated separately making use of two separate codes, the CIAP-2D and the GLOBPERT-2D. The CIAP-2D [7] calculates in two dimensions and multigroup diffusion theory the global importance and real flux functions used in the generalized perturbation techniques. In input, it requires on tape real and adjoint flux maps from a bi-dimensional diffusion code [8] . The GLOBPERT-2D code [9] uses the fluxes of the CIAP-2D code, and calculates the coefficients a{- using procedures analogous to those adopted in conventional perturbation techniques.
To reduce the experimental data to the homogeneous calculational model adopted, the heterogeneity effects have been evaluated by using a first collision probability method [10] . These effects, however, have been shown to be negligible in the cases considered. As the best set of basic values, the library of Abagyan et al. [2] has been adopted with proper consideration given to the self-shielding factors [11] . To reduce the calculation time, a reduction of the energy groups from 26 to 16 has been made. This has been obtained by collapsing in one group the first two and the last ten energy groups of the Soviet library. With the same aim to save computing time, a pre-selection of nuclear parameters significantly relevant to the integral experiments considered has been made. This pre-selection has been based on a previous sensitivity analysis. The nuclear parameters which have resulted are: v, Of, ac , ain of 235U, v, af, ac , ain of 238U, ael , ain of Na, ael , ain of Fe and aei of C. Their initial values are shown in Table I.
4. APPLICATION OF THE METHOD TO ZPR VI INTEGRAL EXPERIMENTS
As a starting point in using the correlation method outlined above, two sodium removal experiments of Assembly 2 of ZPR VI [12] have been chosen, considering the general relevance of this kind of experiment on the sodium void effect. The material compositions and dimensions of this assembly are shown in Table II. In Table III the regions where the sodium has been voided in integral experiments under study in the present analysis are indicated together with the experimental and calculated values. As they are related to the inner and outer core regions, these experiments should give evidence of the spectral effects and the leakage effects, and therefore should be most significant. As may be seen, there is an excellent agreement, of ~ 1 % , for the central removal experiment and a good agreement, of ~10%, for the eccentric removal experiment. If we consider also the experimental e r rors assumed, there is evidence of the rather good reliability of the Soviet cross-section library adopted, and of the iteration method implied in it for evaluating the self-shielding factors. The use of the CALI code has given, as expected, small variations, of the order of a few percent, in the scattering

TABLE II. DIMENSIONS (cm) OF ASSEMBLY 2 OF ZPR VI AND COMPOSITIONS (nuclei /cm 3 X 10"2*) -a tS3
Core
Blanket
R
46.22
76.72
Ha
45.72
76.22
235JJ
0.002285
0.000081
238u
0.009853
0.03993
C
0.0129
0.0
Na
0.00791
0.0
SS
0.01475
0.00965b
0.006003
From midplane. b The two values refer to the inner and outer part of the blanket.
3 a,
TABLE III. Na VOIDED REGIONS: EXPERIMENTAL AND CALCULATED VALUES (in Ak/kX 10~5) Q
Integral experiment B
Integral experiment I, III
Rin(cm)
0.0
24.468
Rout( c m)
13.592
35.344
Hin(cm)
0.0
35.56
Hout(cm)
15.24
45.72
Reduced exp. value
- 2.62 ±0.13
-137.4 ±7.8
Calculated value
- 2.60
-120.0

TABLE IV. CROSS-SECTION CORRECTIONS (in percentages)
Group
1
2
3
4
5
6
7
8
9
10
11
12
13
14
15
16
Na
° e l
0.198
0.459
1.137
2.196
4.432
2.081
1.078
1.007
0.550
0.414
0.267
1.112
0.115
0.020
0.001
-0.002
° in
0.177
0.152
0.500
0.415
-0.008
0 . 0
**U
°c
0 . 0
0.001
0.001
0.001
0.004
0.012
0.014
0.004
-0.019
-0.035
-0.035
-0.003
-0.055
-0.038
-0.019
-0.018
V
-0.004
-0.002
-0.003
-0. 004
-0.010
-0.004
0.001
0.006
0.012
0.013
0.009
0 . 0
0.011
0.006
0.002
0.001
°f
-0.006
-0.004
-0.006
-0.008
-0.018
-0.007
0.002
0.012
0.023
0.024
0.018
0.001
0.022
0.012
0.004
0.002
° in
0.056
0.078
0.085
-0.045
-0.136
-0.011
-0.003
-0.001
0 . 0
0 . 0
2SSU
°c
0.002
0.006
0.023
0.023
0.014
0.032
0.033
0.011
-0.038
-0,056
-0.048
-0.004
-0.056
-0.029
-0.015
-0.012
V
-0.010
-0.003
-0.004
-0.001
0 . 0
°f
-0.001
-0.005
-0.006
-0.001
0 . 0
° in
0.322
0.466
0.544
-0.009
-0.082
-0.024
0.002
-0.006
0 . 0
Fe
° e l
0.030
0.081
0.223
0.317
0.399
0.196
0.102
0.046
0. 041
0.023
0.049
-0.004
0.021
0.013
0.006
0 . 0
°in
0.019
0.075
0.362
0.285
0.551
0 . 0
C
° e l
0.053
0.144
0.337
0.344
-0.273
-0.034
0.063
-0.021
0.025
0.066
0. 066
0.031
0.035
0.024
0.013
-0.001

- a
TABLE V. EXPERIMENTAL AND CALCULATED VALUES (in Ak/kX 10"5 ) WITH CORRECTED CROSS-SECTIONS
Integral experiment C
Integral experiment I, I
Integral experiment I, II
Integral experiment J, III
R in(cm)
0 .0
24.468
24.468
35.344
Rout (cm)
19.030
35.344
35.344
46.220
Hin(cm)
0.0
0 .0
17.78
35.56
Hout(cm)
20.32
10.16
27.94
45. 72
Reduced exp. value
- 92. 8 ±4. 6
-166.1± 8.3
-153. 6 ±7. 7
-136.3±6.8
Calculated value
- 95.6
-168.5
-150.7
-132.9

SM-101/31 375
cross-sections of sodium for which the eccentric measurement appears by far the most sensible. All these corrections, as assumed, lie well within the cross-section uncertainties, and are shown in Table IV.
To check the validity of the "effective" cross-sections obtained, they have been used to calculate the other sodium void experiments of Assembly 2. The agreement has proved excellent, as shown in Table V.
The next step in this work will be the analysis of the zoned sodium void- experiments of Assembly 4Z of the ZPR VI critical facility. They will first be interpreted in terms of corrected cross-sections (and realistic geometries) and, if there is no agreement, they will be assimilated by the correlation procedure adopted.
A C K N O W L E D G E M E N T
The authors wish to thank Dr. I. Galligani (Euratom, Ispra) for his valuable support and fruitful discussions on the numerical problems.
REFERENCES
[1] CECCHINI, G. et a l . , "Analysis of integral data for few-group parameter evaluation of fast reactors", Int. Conf. peaceful Uses atom. Energy (Proc. Conf. Geneva, 1964)2 UN, Geneva (1964)388.
[2] ABAGYAN, L. P. et a l . , "Group Constants for Calculation of Nuclear Reactors", M. Gosatomizdat, Moscow (1964).
[3] USACHEV, L.N., Atomn. Energ., ^5 (1963) 472. [4] GANDINI, A., "A perturbation method for analysis of neutron source worth experiments in nuclear
reactors", Nucl. Sci. Engng (in press). [5] GANDINI, A., "A generalized perturbation method for bilinear functionals of the real and adjoint
neutron fluxes", J. nucl. Energy (in press). [6] CECCHINI, G. et a l . , "Comparison between experimental and theoretical integral data on fast
critical facilities CALI, a program for generating effective nuclear group constants by a correlation method", Proc. Int. Conf. on Fast Reactors, Argonne, Oct. 1966, Rep. ANL-7320.
[7] CECCHINI, G., "II programme CIAP-2D", Internal CNEN Rep., Doc. Int. LFCR(67)9 (1967). [8] GALLIGANI, I . , the TDDC Code (private communication). [9] CECCHINI, G., "II programme GLOBPERT-2D", Internal CNEN Rep., Doc. Int. LFCR(67)13 (1967).
[10] BITELLI, G. et a l . , "Heterogeneity calculation in fast reactor lattices" (to be published)-[11] GRIFONI, S., CECCHINI, G., "II codice RUSSKI", Internal CNEN Rep., Doc. Int. LFCR(66)17
(1967). [12] RUSCH, G.K. e t a l . . Rep. ANL-7010 (1964) 91.
DISCUSSION
J. Y. BARRE: I do not feel that one is justified in correcting the cross-sections for five elements and 16 energy groups (Table IV) on the basis of two series of measurements (Table III).
G. CECCHINI: That may be so. However the results obtained with the "corrected" cross-sections are very good.
J .Y. BARRE: The small number of measured parameters you use imposes an additional constraint on the cross-sections, so that you have an over-determined system. Like Mr. Pendlebury, with the PENICUIK code, and Mr. Yeivin, with the method he presented in paper SM-101/67, your method requires that the sum of the squares of the cross-section
376 CECCHINI and GANDINI
var ia t ions be minimized . This is equivalent to assuming that your init ial c r o s s - s e c t i o n s a r e exact o r that t h e r e a r e no longer any sys temat ic e r r o r s in the c r o s s - s e c t i o n s .
G. CECCHINI: Our method r equ i r e s that the functional F be minimized, not the sum of the squares of the c r o s s - s e c t i o n va r i a t ions . Suitable values of a, may be selected when considering the sys temat ic e r r o r s .
Y. YEIVIN: With rega rd to Mr. B a r r e ' s r e m a r k , I should like to point out that the re is no s imple di rect re la t ionship between the amount of in tegra l data and the extent to which c r o s s - s e c t i o n s (or group constants) may be modified. The r e su l t s I presented were obtained by employing c r i t i ca l m a s s data for 18 sys t ems ; they could also have been obtained, however , by using as few as th ree s y s t e m s . Adding m o r e sys t ems of the s ame kind does not yield new c r o s s - s e c t i o n information; only the addition of different sy s t ems (different from, say, the spec t rum point of view) will contribute significantly to the c r o s s - s e c t i o n modifying p rocedu re .
J . L . ROWLANDS: It s e e m s to m e that the accuracy of the predic t ions made using adjusted c r o s s - s e c t i o n s i s not so apparent as when a s imple adjustment factor (to be applied to the calculated pa rame te r ) is derived from the expe r imen t s . Have you considered a s se s s ing the accuracy of your adjusted c r o s s - s e c t i o n s o r of the predic t ions made with them?
G. CECCHINI: Yes, and, as I said, we found that the values calculated using the cor rec ted c r o s s - s e c t i o n s a r e in ve ry good agreement with the exper imenta l data.
K . H . J O E S T : If I have understood your paper cor rec t ly , your cor rec t ion of group constants consis ts in a modification of infinitely dilute va lues . However, the self-shielding factors may also be inco r rec t , and this may be of impor tance , for ins tance , in fitting m e a s u r e d Doppler coefficients. Can you also handle such problems with your method?
G. CECCHINI: Yes, we can.

THEORETICAL AND EXPERIMENTAL ANALYSIS OF FAST NEUTRON SPECTRA
H. VAN DAM ANDH.R. KLEIJN REACTOR INSTITUUT, DELFT, NETHERLANDS
Abstract
THEORETICAL AND EXPERIMENTAL ANALYSIS OF FAST NEUTRON SPECTRA. The reactor physics division of the Inter-Academic Reactor Institute at Delft is concentrating its efforts in the field of fast reactor physics on problems of a more fundamental nature. The object of the programme is to determine experimentally a number of microscopic reactor physics parameters such as conversion potentials, fission ratios and Doppler coefficients for simple geometries and material compositions. Because of the extreme importance of knowledge of the neutron spectrum for the interpretation of the results, attention has initially been concentrated on both the measurement and the calculation of fast neutron spectra.
The transport of neutrons in absorbing and non-absorbing heavy atom materials is studied by solving the Boltzmann equation. Both isotropic and anisotropic scattering are considered. Anisotropic scattering is treated by the Pn-approximation, while flux-anisotropy is handled with the S^-method. In the code FAST-DELFT, scattering is treated up to the P4 component, a further extension of which is useless because of the lack of available cross-section data. By using this method, the effect of scattering anisotropy on the spectrum formation has been studied. In addition the influence of group cross-section inaccuracies was determined. The experimental work has been concentrated on methods to determine in-core spectra. Using home-made proportional counters with gamma-ray discrimination provisions fast neutron spectra have been measured in simple geometries. These experiments were complemented by foil measurements in the lower energy region. The results of this work are presented in this paper.
1. INTRODUCTION
The reactor physics division of the Reactor Instituut at Delft is -concentrating on some fundamental problems in fast reactor physics.
The object of the programme is to determine experimentally several microscopic reactor parameters such as conversion potentials, fission ratios and Doppler coefficients for simple geometries and material compositions in order to test the validity of calculation methods and possibly improve them.
We feel that a university laboratory may thus, to a certain extent, contribute to a better understanding of the neutron behaviour in fast reactors, at the same time confronting students, majoring in reactor physics, with current developments.
Because knowledge of the neutron spectrum is essential for interpreting the experimental results, attention has been first focused on both the measurement and the calculation of fast neutron spectra.
Theoretical work involves the analysis of neutron transport in various materials by solving the Boltzmann equation using the diffusion approximation [l] and the more rigorous SN method [2, 3] . In particular the influence of anisotropic scattering on the space and energy distribution of neutrons is being investigated.
Two different transport approximations to correct for anisotropic scattering are compared (diagonal transport approximation and a cor-
377

378 VAN DAM and KLEIJN
rec ted diagonal t r a n s p o r t approximation), which can be used in codes dealing with only i so t ropic sca t t e r ing . The adequacy of these approxi mat ions will be invest igated by compar ing the r e su l t s with those of an anisot ropic ve r s ion of the SN code, based on a Pn t r e a tmen t of anisot ropic s ca t t e r ing .
The exper imenta l work has concentrated on methods to de te rmine incore s p e c t r a . Using foil activation methods and h o m e - m a d e propor t ional coun te r s , fast neutron s p e c t r a a r e being m e a s u r e d in s imple geome t r i e s with re la t ive ly sma l l vo lumes . In addition to r i s e t ime d i sc r imina t ion [4], a well-known method for el iminat ing the counter g a m m a - r e s p o n s e , a technique is being developed for d ras t i ca l ly reducing the gamma s e n s i t ivi ty by applying, inside the counter tube, an ant i -coincidence shield against convers ion e lec t rons or iginat ing from the wall .
In sect ion 2 of th is paper an outline is given of the t r a n s p o r t approxi mat ions while a m o r e detailed presenta t ion of the exper imenta l work appears in sect ion 3 . The calculation r e s u l t s a r e presen ted in sect ion 4.
2. THEORETICAL ANALYSIS
2 . 1 . T ranspo r t approximations for anisot ropic sca t te r ing
A t r a n s p o r t approximation, additional to the commonly used diagonal t r an spo r t approximation (DTA) as descr ibed by Pendlebury and Underhill [5] , was introduced for use in an i so t ropic sca t te r ing ve r s ion of the t r a n s p o r t equation to rep lace a more r igorous calculation model that includes anisotropic sca t t e r ing .
F o r demonst ra t ion purposes a non-multiplying medium with a s lab geomet ry is cons idered . The one-d imens ional t r a n s p o r t equation for th is case r e a d s :
MT-N(x, E,/Lt) + E t(x,E)N(x, E,)u)=S(x, E ,^ ) (1) dx l
where : x = space co-ord ina te ju = cosine of the angle between the a b s c i s s a and the
flight d i rect ion of the neutron N(x, E, n) = flux of neutrons with energy E pe r unit ju-interval
about the di rect ion ju at x S(x, E, n) = source of neutrons with energy E p e r unit ^ - i n t e r v a l
about the d i rec t ion /u at x, containing sca t te r ing sou rces and external , i . e . flux-independent s o u r c e s .
Since external source contributions a r e not essen t ia l for the p resen t d iscuss ion , fur ther r e fe rence to them i s omi t ted .
Expanding fluxes and sca t te r ing c r o s s - s e c t i o n s in L e g e n d r e - s e r i e s , re ta ining t e r m s up to the P1 component and d iscre t iz ing the energy va r i ab le , yields mul t igroup Pj equations for neutron t r a n s p o r t .
£4« +=«*5.£i:rt4£ (2a) g'

SM-101/4 379
I A 0g + E g A g = y Eg'g^g; 3 d x v o t v l /_, 1 v 1
:2b)
where : 08, $g = zero and f i r s t -o rde r , respec t ive ly , Legendre component of the flux in energy group g
E8 t = to ta l c r o s s - s e c t i o n for neutrons in energy group g
E n 8 ' E i 8 8 = ze ro and f i r s t - o r d e r , respec t ive ly , Legendre component of the c r o s s - s e c t i o n for sca t t e r ing of neut rons from group g1 to group g.
As shown by Pendlebury and Underhil l [5], a t r a n s p o r t approximat ion is obtained by introducing the following subst i tut ions in Eqs (2a) and (2b):
Eg'g = j ^ g ' g _ Eg'g ( 3 a )
E S = E g o ' 8 - E i ' 8 <3b>
6 g g = 0 if g! * g, o r 6 s g = 1 if g' = g
As a resu l t the t e r m s with Eg<£8 in Eqs (2a) and (2b) must be replaced by summat ions of g ' -dependent t e r m s . These modificat ions, known as the full t r a n s p o r t approximation, requ i re the calculation of the f i r s t -o r d e r Legendre components of the group fluxes, and the re fore cannot be t r ea t ed with codes based on iso t ropic sca t te r ing s o u r c e s .
When the t r a n s p o r t c r o s s - s e c t i o n s , as given in Eqs (3a) and (3b), a r e used in a code that handles flux anisotropy m o r e r igorous ly than that up to the Pj component ( e . g . S4 o r Ss approximations) it can be shown that the t r a n s p o r t approximation becomes exact in two s i tua t ions : (a) F o r the t r i v i a l case where t h e ^ - t h o r d e r sca t te r ing c r o s s - s e c t i o n Legendre component E | 8 =0 f o r i > 0, i . e . i so t ropic sca t t e r ing . (b) When E8 8 = / j 8 8 E 8 8 for JL > 0, where jug 8 is the mean cosine of the sca t t e r ing angle in the l abora to ry co-ordinate sys tem for sca t te r ing from energy group g1 to g.
In the l a t t e r ca se , where all h igher -order Legendre components of the sca t te r ing c r o s s - s e c t i o n a r e equal, it can eas i ly be shown that the angle-dependent sca t t e r ing c r o s s - s e c t i o n can be wri t ten a s :
Es(Ai) = y - { l - ^ + 2 M - 6 ( l - i u ) } (4)
where 6 is the Dirac delta function. Phys ica l ly th is means that sca t te r ing cons is t s of an i so t rop ic com
ponent plus a purely forwardly d i rec ted component.
However, the r e a l advantage, a d e c r e a s e in machine t ime , will be obtained when t r a n s p o r t approximations can be incorpora ted in codes dealing with i so t ropic sca t t e r ing s o u r c e s .

380 VAN DAM and KLEIJN
A well-known method is to ignore sca t t e r ing anisotropy in the slowing-down c r o s s - s e c t i o n s . This method i s r e f e r r e d to as the diagonal t r a n s p o r t approximation (DTA) [5] . In th is ca se the c r o s s - s e c t i o n s a r e given by:
E j - E f - E f * (5a)
Eg'g^g 'g .Eg 'g . f ig 'g ( 5 b ) str 0 1
When an appreciable par t of the slowing down in h igh-energy regions is due to e las t ic sca t t e r ing - as is the case for sy s t ems containing a ce r t a in amount of l ight- to medium-weight nucl ides - the DTA is expected to give l e s s accura te r e s u l t s . F o r these conditions we use a co r r ec t ed diagonal t r a n s p o r t approximat ion (CDTA). This co r rec t ion is obtained by substi tut ing c r o s s - s e c t i o n s in such a way that the dis t r ibut ion of sca t t e r ing angles for those neut rons that r ema in in the energy group cons idered , is taken into account so that the mean cosine of the to ta l number of sca t t e r ing events equals the actual mean cosine of the angular dis t r ibut ion, i . e . :
I (6a)
Eg'g= £g'g_ 68'gV ESS" (6b) str 0 /_, 1
The DTA and CDTA, as given by Eqs (5) and (6), a r e in fact spec ia l c a s e s of the full t r a n s p o r t approximat ion as can be i l lus t ra ted by consider ing the event where the group width i s such that e las t ic sca t t e r ing of neu t rons can only extend to the n e a r e s t lower energy group. The equations de scr ib ing th is condition a r e :
£f+«!?•$• E f ^ s S X 1 (7a)
^^•f -Ef^+E^f 1 (7b)
where : L^ 0, E ^ j = ze ro and f i r s t - o r d e r , respec t ive ly , Legendre component of the c r o s s - s e c t i o n for e las t i c t r a n s f e r of neut rons from group g-1 to group g. This c r o s s -sect ion is frequently r e f e r r e d to as the e las t ic reduct ion c r o s s - s e c t i o n .
Eq. (7b) can be modified t o :
7 7W\ ~dx" (7c)
r g rgg rg"1 *1

SM -101/4 381
To e l iminate the P j component in the sou rce t e r m of the t r a n s p o r t equation, e i ther of the following two approximat ions can be introduced in E q . ( 7 c ) .
(i) Eg"j # | ~ 1 = 0 , i . e . anisot ropic slowing down is neglected (DTA)
o r s-l e-1 g g
(ii) ^ e r i ^ i = ^ e r i ^ i ' * , e - an iso t ropic sca t t e r ing into the group considered is equal to anisot ropic s ca t t e r ing from the group (CDTA).
Physica l ly th is involves the assumpt ion that , should the second approxi mat ion (CDTA) be used, all anisotropic sca t t e r ing is to be in t ragroup sca t t e r ing , whereas in the DTA case only the in t ragroup contribution to anisot ropic sca t te r ing is accounted for in the t r an spo r t equation.
The net effect of these approaches is that sca t te r ing is l e s s anisot ropic for the CDTA case than for the DTA case , because the forwardly d i rec ted anisot ropy of slowing-down col l is ions is l e s s than that for the in t ragroup col l is ions , owing to l a r g e r energy l o s s e s a s s o c i ated with high angle col l i s ions . Since in both approximat ions s lowing-down sca t t e r ing is t r ea t ed as being i so t rop ic , the total s ca t t e r ing angular d is t r ibut ion ( isotropic + delta forward) is m o r e accura te ly accounted for in the CDTA c a s e .
At p resen t the r e s u l t s of calculat ions based on the CDTA case a r e being compared with those of S^ calculat ions , including anisot ropic sca t t e r ing , to de te rmine the l imi t s of applicabili ty of these approx imat ions .
2 . 2 . Group c r o s s - s e c t i o n s
The ABN-set [6] has been used for calculat ions analysing the expe r i menta l a r r angemen t as desc r ibed in sect ion 3 . In this set a s tandard spec t rum was used for averaging c r o s s - s e c t i o n s ove r ene rgy -g roups consis t ing of the fission spec t rum for t h r e e groups above 2.5 MeV and a F e r m i spec t rum ( l / E ) for all lower e n e r g y - g r o u p s . F o r the s y s t e m s being studied d i sc repanc ie s a r e encountered owing to differences between the s tandard spec t rum and the actual spec t rum: (i) In the case of graphi te , d i s c r epanc i e s a r e expected nea r the fission source where the spec t rum devia tes s t rongly from the F e r m i s p e c t r u m . However, at some dis tance the group c r o s s - s e c t i o n s will be c o r r e c t , (ii) In the case of a luminium it i s n e c e s s a r y to develop a new c r o s s - s e c t i o n set because of the g rea t d i sc repancy between the ABN-spec t rum and the actual spec t rum in all posi t ions of the l a t t i ce .
A computer code for the calculation of c r o s s - s e c t i o n s for groups with r e sonances is being developed. It i s based on the s ame pr inc ip les as ELMOE [7] . An additional problem to be solved is that no asymptot ic spec t rum exis t s in the sys t em so that group c r o s s - s e c t i o n s will be space-dependent . Until now the se l f -shie lding fac tors as l i s ted in the ABN-se t were used .
A p r e l i m i n a r y study has been made of the deviations from ABN c r o s s - s e c t i o n s caused by the d i sc repancy between the actual spec t rum and the F e r m i s p e c t r u m . E las t i c t r a n s f e r c r o s s - s e c t i o n s a r e mos t sens i t ive

382 VAN DAM and KLEIJN
to these devia t ions . Since the actual spec t rum is h a r d e r than the F e r m i spec t rum, e las t ic t r a n s f e r c r o s s - s e c t i o n s will be s m a l l e r than those given by the ABN, resul t ing in h a r d e r spec t r a than obtained with ABN c r o s s - s e c t i o n s . Writing the in t ragroup flux of le thargy u as <f){u) = e"Bu, where B = 0 r e p r e s e n t s a F e r m i spec t rum, the e las t ic reduction c r o s s -sect ion Eer for the group from le thargy Uj to le thargy u2 is given by:
,-Bu -Bu / e'dU du= / E s ( u - u ' > u2) e"DU du (8)
By fur ther assuming the total sca t te r ing c r o s s - s e c t i o n to be constant within the group one finds:
E„ = B \-a gBAu.^
, (l-B)lna 1-e a lA -B in a,
T B — + B " ( 1 " e ) (9)
where : \-a = maximum fractional energy d e c r e a s e per e las t ic coll ision, Au = group width.
F o r B = 0 Eq. (9) gives the express ion used for the ABN-se t :
^e r Au (10)
where £ =mean logar i thmic energy decrement per e las t ic coll is ion. Table I shows the d e c r e a s e of the e las t ic reduction c r o s s - s e c t i o n
as a function of B for the values Au in the ABN-set .
TABLE I. DECREASE OF ELASTIC REDUCTION CROSS-SECTION (%) AS A FUNCTION OF B AND Au RELATIVE TO THE VALUE FOR B = 0
B
0.1
0.2
0.3
0.4
0.5
Au = 0. 57
1.1
2.9
4 .6
6.4
8.5
Lethargy interval
Au=0.69
1.7
4 .1
6.4
8.7
10.9
Au = 0.77
2.1
4.9
7.5
10.2
12.8

SM-101/4 383
For graphite the results of the calculations show that near the fission source B varies between 0. 5 and 0. 1 for the groups 5 to 14 (1.4 MeV to 1 keV). This means that the elastic reduction cross-section may deviate up to 11% from the values given by ABN. The result of a re-evaluation of cross-sections in the region near the source has been investigated (see section 4).
3. EXPERIMENTAL WORK
The experimental programme requires a facility in which various neutron spectra can be created. To compare experimental results with those of calculations this facility should comprise simple material compositions and geometries.
shielding
assembly for spectrum measurements
water graphite
reactor co
FIG. 1. Vertical cross-section of the HOR-university pool reactor thermal column.
In the centre of a graphite block (110X110X110 cm3) on top of the thermal column of the 2-MW HOR-university pool reactor (see Fig. 1) different materials of interest can be stacked together with fission plates to create neutron energy distributions that are strongly affected by anisotropic scattering.
Provisions have been made for the insertion of counter tubes and foils for spectrum measurements at different positions in the lattice. The geometrical arrangement of the materials has been selected so that one-dimensional calculations for a spherical geometry seem to be an acceptable approximation for the system proper.
To calibrate the equipment and to test calculation methods the system was first uniformly filled with graphite. Thus the spectrum was properly defined and no difficulties arose in defining the group constants.
As a material of primary interest aluminium will be used, which exhibits many strong scattering resonances in the 10 keV-1000 keV energy range. In particular, attention will be paid to the spectral

384 VAN DAM and KLEIJN
behaviour nea r the a luminium-graphi te in te r face . To introduce changes in the spec t rum gradient var ious concentra t ions of light nuclei will be mixed with the a luminium. Thereaf te r these m a t e r i a l s will be par t ly replaced with fissionable m a t e r i a l s .
FIG. 2. Radial cross-section of the anti-coincidence counter tube.
The neutron spec t r a a r e being m e a s u r e d by both activation methods and proton recoi l coun te r s . As a possible means of reducing the gamma response of a proton reco i l tube a spec ia l technique was developed for d i scr imina t ion between convers ion e lec t rons from the wall and those genera ted in the gas filling. F igure 2 gives a radia l c r o s s - s e c t i o n of th is counter . It cons is t s of a cent ra l ly located main anode surrounded by 16 cathode wi res dividing the volume into an in ternal and an external zone . Ionizations c rea ted in the ex terna l volume a re detected by eight guard anodes. By means of ant i -coincidence operat ion the contribution of wall conversion e lec t rons is e l iminated. Because the main component of the gamma response is caused by this effect a considerable d e c r e a s e of gamma sensi t ivi ty i s expected to be obtained. A fur ther advantage of this design is that only those protons a r e detected that t r a n s f e r t he i r tota l energy in the cen t ra l region of the tube . This s implif ies co r rec t ion p r o c e d u r e s . A minor disadvantage is a d e c r e a s e in yield. End-effects s t i l l exist but a r e of minor impor tance because the two axial sur faces make up only about 14% of the total surface for a sensi t ive volume 2-in. long and § in. in d i a m . , as is used in our c a s e .
4 . CALCULATIONAL RESULTS
Spectrum calculat ions were performed for a spher ica l geomet ry of the following d imens ions :
r = 0 - 6 cm (cent ra l hole (vacuum)) r = 6 - 7 cm (shell shaped fission source) r = 6 - 3 0 cm (first zone (graphite o r aluminium)) r = 3 0 - 5 5 cm (second zone (graphite)) .

SM-101/4 385
Figure 3 shows spectra in a graphite system, calculated with diffusion and S4 approximations. In the central hole a relatively hard spectrum exists whereas, at a distance of 26 cm from the centre, the spectrum is almost 1/E below 400 keV. A comparison between diffusion and S4 approximations shows that the flux level calculated with diffusion theory is too low, especially near the source, because first-flight neutrons are not accounted for. The influence of this effect is, of course, stronger with increasing removal to the intragroup scattering ratio. For the lower energy groups the discrepancy is smaller because, for these groups, the scattering sources are more spatially distributed.
E0(E) (arbitrary units)
10
10
S4 approximation diffusion approximation
normalized on source strength
F- •F=
r = 6 cm
r=26cm
10 10' 10J 10* E(keV)
FIG. 3. Spectra in a pure graphite system.
Results of a comparison between the two transport approximations developed in section 2 are shown in Fig. 4. The CDTA gives a softer spectrum than DTA owing to the stronger anisotropy that is assumed in the DTA, as was indicated earl ier . The calculations show that group fluxes differ up to 10% in the lower energy range whereas, in the case of DTA, the leakage from the system is approximately 16% higher. As mentioned in the introduction, more specific conclusions about the validity of these transport approximations can be given by comparison with more rigorous calculations.
The influence of a modification of elastic transfer cross-sections, according to section 2, was studied by using modified cross-sections for the region between r = 6 and r = 26 cm and the original ABN-set for the remaining part of the system. The results of these calculations, indicating a hardening of the spectrum, are presented in Fig. 5.

386 VAN DAM and KLEIJN
r = 6 cm
r= 26cm
- group number
E(keV) 1 10 10' 10" 10'
FIG. 4. Relative differences between group fluxes obtained with CDTA and DTA
r : 6 c m
r=26cm
group number
E(keV)
FIG. 5. Relative differences between group fluxes obtained with a modified ABN-set and the original ABN-set; graphite assembly, CDTA.
Spatially dependent spectra for a graphite system with an internal zone of aluminium are shown in Fig. 6'. In the lower energy tail of the spectrum the flux level is almost spatially independent in the aluminium zone as a result of a large supply of moderated neutrons coming from the
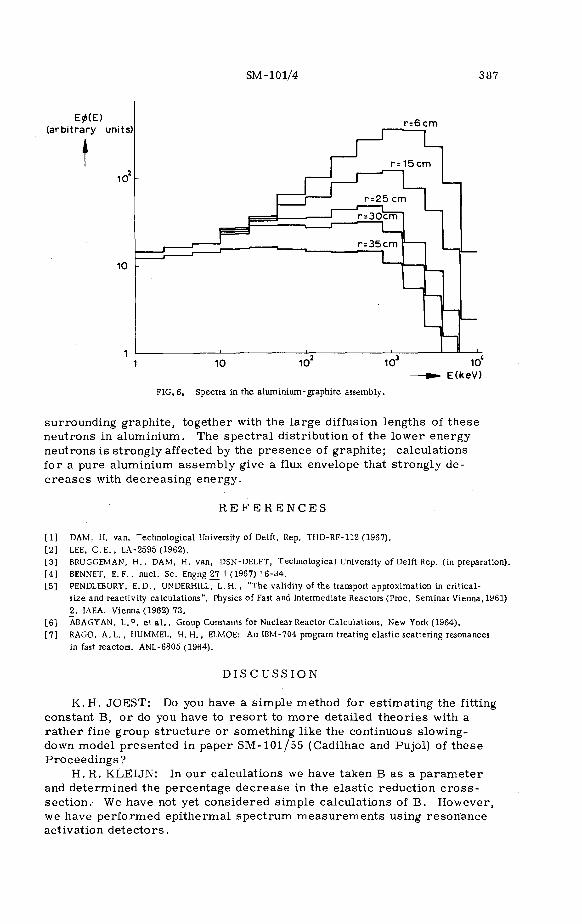
SM-101/4 387
E0(E) (arbitrary units) r=6cm
10 10 10
FIG. 6. Spectra in the aluminium-graphite assembly.
10 E(keV)
surrounding graphite, together with the large diffusion lengths of these neutrons in aluminium. The spectral distribution of the lower energy neutrons is strongly affected by the presence of graphite; calculations for a pure aluminium assembly give a flux envelope that strongly decreases with decreasing energy.
REFERENCES
[1] DAM, H. van, Technological University of Delft, Rep. THD-RF-112 (1967). [2] LEE, C.E. , LA-2595 (1962). [3] BRUGGEMAN, H., DAM, H. van, DSN-DELFT, Technological University of Delft Rep. (in preparation). [4] BENNET, E. F., nucl. Sc. Engng £7 1 (1967) 16-34. [5] PENDLEBURY, E.D., UNDERHILL, L.H. , "The validity of the transport approximation in critical-
size and reactivity calculations", Physics of Fast and Intermediate Reactors (Proc. Seminar Vienna, 1961) 2, IAEA, Vienna (1962) 73.
[6] ABAGYAN, L.P. et a l . , Group Constants for Nuclear Reactor Calculations, New York (1964). [7] RAGO, A.L. , HUMMEL, H. H., ELMOE: An IBM-704 program treating elastic scattering resonances
in fast reactors, ANL-6805 (1964).
DISCUSSION
K.H. JOEST: Do you have a simple method for estimating the fitting constant B, or do you have to resort to more detailed theories with a rather fine group structure or something like the continuous slowing-down model presented in paper SM-101/55 (Cadilhac and Pujol) of these Proceedings?
H. R. KLEIJN: In our calculations we have taken B as a parameter and determined the percentage decrease in the elastic reduction cross-section. We have not yet considered simple calculations of B. However, we have performed epithermal spectrum measurements using resonance activation detectors.


GENERATION OF INTERMEDIATE STANDARD NEUTRON SPECTRA AND THEIR APPLICATION IN FAST REACTOR PHYSICS
A. FABRY AND P. VANDEPLAS
CENTRE D'ETUDE DE L'ENERGIE NUCLEAIRE,
MOL-DONK, BELGIUM
Abstract
GENERATION OF INTERMEDIATE STANDARD NEUTRON SPECTRA AND THEIR APPLICATION IN FAST REACTOR PHYSICS. The possibility of generating intermediate standard neutron spectra through partial moderation of the uranium-235 thermal fission spectrum within a cavity in a conventional thermal column has been investigated. Multigroup transport calculations on simple spherical arrangements of source and moderator have shown that a family of well-predictable neutron spectra can be produced and that fast reactor spectra are sufficiently well simulated, in the useful energy range. A highly flexible mock-up of such a system has been realized in a spherical cavity hollowed out of the protruding end of the graphite thermal column of the BR1 reactor. Preliminary measurements by the activation technique are compared with theory. It is shown that the device can be used as a tool for better assessment of neutron spectrometry techniques and for accurate integral testing of basic nuclear data. Attention is finally drawn to a modified version of the spherical-shell transmission technique, which will tentatively be applied to improve multigroup inelastic and capture cross-section sets for some important materials.
1. INTRODUCTION
1.1. The availability of standard neutron fields has long been recognized as a useful tool in the field of in-pile neutron dosimetry. For instance, the well known "standard pile" [l] [2] p] is widely used in trying to determine absolute thermal neutron fluxes, or epithermal spectra in well moderated thermal reactors. On the high energy side, on the other hand, the thermal fission spectrum has often been taken as a reference for spectral index measurements [4] [5] . It can easily be shown that the propagation of relative errors due to cross section shape uncertainties is greatly reduced with such a comparison procedure, while absolute errors completely cancel out.
Standard neutron spectra also are well suited for accurate integral cross section measurements, which can provide powerful checks or serve as a guide in the evaluation of microscopic differential data [6][7][8][9].
1.2. The need for non -L/E intermediate standard spectra has often been pointed out, for instance at meetings of the EURATOM DOSIMETRY WORKING GROUP. It has been put forward, in the frame of the US fast reactor physics program flO] , that the intercomparison of critical experiment results, integral measurements and neutron spectra require appropriate standards.
The same question also was seriously discussed among Dutch, German and Belgian physicists and the action decided at Mol in this sense was greatly encouraged on such occasions. In the same line, J.A. Grundl from LOS ALAMOS should be especially acknowledged here for exchanges of ideas which constituted a strong support at the start of the present work.
389

390 FABRY and VANDEPLAS
2. SCOPE OF THE INVESTIGATION
2.1. An intermediate standard neutron spectrum could be tentatively defined by the following main requirements :
a) its shape should reasonably well simulate the spectral conditions encountered in fast assemblies
b) its shape should therefore be variable in order to cover a broad range of hardnesses
c) its shape should be as well known as presently possible in the energy range of interest
d) its intensity should be sufficient for practical utilization e) the physical system should be simple enough to be reproducible in other
laboratories.
2.2. Condition b is essential in view of the large range of neutron spectra found in fast reactors, according to the degree of core dilution. It is also evident that integral cross section measurements performed in well known spectra with highly differing mean neutron energies would be of considerable value. It consequently seems quite clear that a genuine family of intermediate standard spectra should in fact be generated, the term "family" meaning that one should be able to shift from one standard to another in a quick and easy way by changing some parameters of the physical assembly, to which the spectrum shape would be particularly sensitive.
2.^. It is imposed by condition c that the materials chosen for construction of the standard assembly have sufficiently well understood nuclear properties. Structure and canning should be reduced to such proportions as to have no practicalinfluence on the spectra. The accuracy in the depiction of standard spectra is believed to be more important than the exactness of simulation : the energy distribution of the most important reaction rates should present the same broad features as in fast assemblies, but a detailed reproduction of spectra is in no wise considered as necessary. It will nevertheless be shown that for special purposes, more conformable "secondary" standard spectra can be generated in the same assembly, although at the expense of the accuracy.
2.4. A possible approach to the generation of intermediate standard spectra lies in the consideration of equilibrium conditions in exponential assemblies. The description of such spectra by theory would be simple and the accuracy satisfying, provided the previous requirement about constitutive materials can be fullfilled. However, flexibility required for the creation of a standard family at first seems difficult to achieve in this way ; the existence of serious flux gradients and associated anisotropics, depending on the observed relaxation lengths, is not ideal for the assessment of so called "differential" neutron spectrometers, like the Li^ (n,c( ) [ll] [12] or proton recoil devices [lj5] [l4] ; finally it is not sure whether or not equilibrium could be guaranteed in practice to a sufficient degree of accuracy nor could the contribution of unwanted low energy neutrons returning to the system after interaction with the environment be predicted with any certainty.
2.5. Past experience at Mol and elsewhere has shown that it is possible to produce a pure thermal fission spectrum of by placing a thin fissile plate inside a cavity in a moderator under such conditions that the unavoidable background neutrons can be controlled. Therefore it has been

SM-101/25 391
felt feasible to generate a family of non-l/E intermediate standard spectra by partial moderation of the 235u thermal fission spectrum in a cavity.
Uncertainties about the 235u fission spectrum itself will not be discussed here. They are treated extensively in a recent LOS ALAMOS paper [16] as well as in a letter accepted for publication in Nukleonik [15] .
The basic idea underlying such an approach is to choose a one-dimensional arrangement and to degrade the fission spectrum into a distribution over the whole neutron energy range from about 10 eV up to 5 MeV, by means of a material for which all pertinent nuclear data are as well known as possible. In this way, sophisticated transport calculations should provide an excellent description of the spectrum ;it is believed that the condition imposed about nuclear data restricts the choice of the material to moderators. Only H and C have been accepted at first.
2.6. In the following items, it will be discussed shortly and illustrated to what extent the five main requirements defined hereabove can be satisfied with such an approach. It will appear how the probable drawbacks noted for exponential systems are avoided.
Some experiments performed in a mock-up of the proposed standard assembly will be described and compared with theory.
Finally, possible applications in fast reactor physics will be outlined.
3. CALCULATION OF STANDARD SPECTRA AND SOURCES OF ERRORS
3.1. Design calculations have been performed by means of the 40 group GMS transport code [if] in the DS4 approximation. The GMS - II cross section library is in fact the British FD2 set [l8J in the energy range of .interest here. It is implicitly assumed in all the further considerations that activation foils or neutron spectrometers used in the standard spectra are covered with cadmium 1 mm in thickness. Spherical geometry was adopted.
3.2. Figure 1 displays the arrangment. It consists of a 50 cm diameter cavity embedded in a large graphite mass. The neutron source is a 1 mm thick fissile spherical shell located at the center of the cavity ; this source was treated as homogeneous, but its composition was chosen to be typical of a 90 % enriched uranium oxide powder compacted by vibration into a thin stainless steel cladding.
The region labelled 2 contains an absorber whose thickness was generally fixed to 2 gr/cmr. The role of this absorber is to prevent the low energy neutrons of the wall return spectrum to reach the inner experimental hole. The radius of the hole, noted X, is variable, depending on the thickness of region 1, which is constituted of the moderator aimed at partially degrading the source and wall return spectra. For some calculations however, other substances than moderators have also been placed in region 1.
Table I summarizes the various compositions considered for regions 1 and 2, together with the corresponding values of the intermediary radius X. Each case is characterized by a conventional number given in the first column and referred to in all subsequent discussions.
The first five cases (number lj5 to 15) are relative to the so-called "polythene family of primary intermediate standard spectra" ; the other ones will be discussed later on in this paper, when dealing with secondary standards or with the applications of the assembly in fast reactor physics.

w CD CO
TABLE I. CHARACTERISTICS OF THE VARIOUS CENTRAL SPHERICAL ARRANGEMENTS CONSIDERED IN THE CALCULATIONS
Reference number
15
25
21
17
15
24
25
20
19
14
Composition of region 1
Air
Polythene
Polythene
Polythene
Polythene
Mo
Fe
U 0,4 % depleted
U 0.4 % depleted
U 0,4 % depleted
Radius of internal hole X (cm)
6.25
5.75
5.25
4.25
2.25
2.25
2.25
2.25
2.25
2.25
Composition of region 2
1CL r, / 2 B 2 gr/cm
10B 2 gr/cm
10., n / 2 B 2 gr/cm
B 2 gr/cm
B 2 gr/cm
p B 2 gr/cra
B 2 gr/cm
U 0.4 £ depleted
B 2 gr/cm
B 2 gr/cm

SM-101/^5 393
U Shell
FIG. 1. Calculation model of the standard spectrum facility.
.10 -2
^—h-a—^^-3-
[V) Group U (1.35 to 0.821 MeV) _(2) Group 9 (111 to 67.4 KeV) (3) Group 13(15 to 9.12 KeV) 0 Group 23(101 to 61.4 eV)
IL AiL b. Polythene
d 2 3 5 U S. Air
I I I radius(cm)
-I—I—I—I—I—I 0 3 6 12 15 18 21 24
FIG.2. Typical radial flux distribution in the standard assembly.
3.3. Figure 2 shows the computed radial flux distributions through the cavity for a few neutron groups in case 17 (table I) and illustrates the physical mechanisms leading to the production of the standard spectra ;
394 FABRY and VANDEPLAS
these phenomena are easily understood if it is noted that the wall return flux in such a cavity does not depend on position, provided there is no absorption within the source.
Figure 3 displays the standard family obtained with polythene in the conditions depicted by figure 1 and table I. On figure 4 is plotted the response function
fg0" fi (E)o-(E) dE
I CEe) = }j£ '• j o M E ) c r ( E ) d E
for the reaction (n,f) in these standard spectra. It must be emphasized that no optimisation of the system has yet been carried out so that these pictures do not really represent the ultimate possibilities. The broad features of the family are nevertheless satisfactory in the sense discussed in § 2.3., the most noticeable difference with respect to actual fast reactor spectra being the absence of inelastic scattering processes so that too high a proportion of virgin fission spectrum neutrons reach the inner hole.
By introducing inelastic scattering, as is done in the secondary standard family discussed in § 6, a more exact simulation results, but at the expense of accuracy.
Graphite has also been tried as the moderator in region 1 under the same conditions : the moderating effects were too small and no family could be generated.
3.4. In all the calculations carried out so far, no effort has yet been made to determine the actual accuracy of the obtained standard spectra. This important step implies much additional work, including at least the following items : - evaluation of the best microscopic differential cross sections and their confidence limits for H, C and B^O, taking into account the most recent experimental results, including those which will be available in the near future (sec § 3.5.)
- increase in the number of energy groups until flux weighting errors become negligibly small when reducing evaluated microscopic data to the final multigroup library
- increased order of the CARLSON method and use of a sufficient number of terms in LEGENDKE polynomial angular approximations to the differential scattering cross sections (graphite mainly) ; it should be noted that only the first term was considered in the present investigation
- detailed study of the propagation of errors due to uncertainties on multigroup cross sections and on the representation of the uranium-235 fission spectrum.
International collaboration seems necessary to reach such objectives, which are not restricted to the scope of the present paper.
3.5. It must be emphasized that the intermediate standard spectra are in fact uranium-235 fission spectra degraded by a limited number of interaction processes of fast neutrons with selected materials : their description relies basically upon a few cross sections which have been chosen just because they are considered as primary standards [19J L2^J ^ o r differential energy cross section measurements.
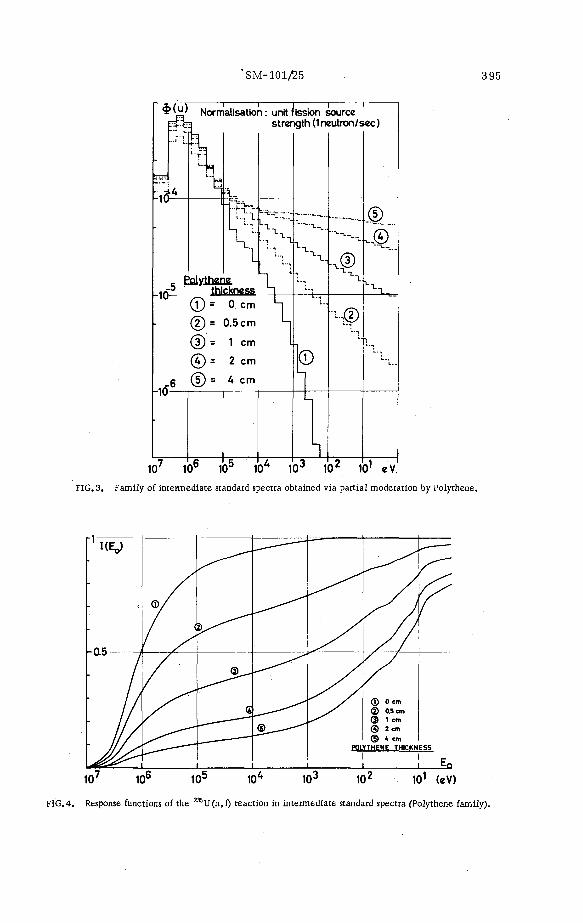
"SM-101/25 395
$(u)
qiii
V
14
-
> i i i i
Normalisation: unit fission source
*•••1
Lf3
>.a
1.. FT,-.-,
stren
- l -T^-V L...
Polythene ^ 1n-5 thickness n
_1Q it T V *
© = Ocm h
© = 0.5cm L i ® = 1 cm L
© = 2 cm
-10" 6 © = 4 cm
gth(1n<
X H
©
'—I
zutron/s
i® \
' # L-
ec)
-©.... 4>...
^ i .
H \ . .
107 106 105 10A 103 102 101 eV
FIG. 3. Family of intermediate standard spectra obtained via partial moderation by Polythene.
FIG.4. Response functions of the 235U(n,f) reaction in intermediate standard spectra (Polythene family).

396 FABRY and VANDEPLAS
3.5.1. Above 1 eV, protons contained in hydrogeneous substances can be regarded as unbound ; the total cross section up to 5 MeV is practically equal to the elastic scattering cross section, which is isotropic in the centre-of-mass reference system and is known to better than 1 % (6] |l9] [21] [22]
3.5*2. Below 5 MeV, elastic scattering is again the unique process to be considered in graphite \6\ (25] , but only below 1 MeV can it be regarded as isotropic within 5 % £24]] ; between 2 and 5 MeV, the elastic scattering angular distribution varies strongly [25] from resonance to resonance or even within one and the same resonance and doubts exist [26] about published multigroup libraries, as for instance the AWRE data file [23) ; the angle-integrated scattering cross section is known to approximately + 5 % from 1 eV up to 5 MeV. The recent HARWELL high resolution measurements [27] are expected to resolve the discrepancies. Some improvements might also result from refined spectrum measurements in simple geometries, as for instance the time-of-flight studies of escape spectra from graphite spheres [28] .
3«5»3» The total cross section of B-10 is mostly composed of the (n,<* ) and elastic scattering contributions, the latter being effective only above 10 KeV. It seems well established [29] that the competing processes (n,t), (n, V ) and (n,p) are practically negligible below 500 KeV, i.e. in the whole of the energy range where they could have influence for the present application. The (n, t* ) reaction is 1/v up to 300 keV to within 5 % Qjo] [3l] and known to + 2 % below 10 keV and it is highly probable that the accuracy will soon~reach the 1 # level in the energy range below 100 KeV. Present calculations and others [32] indicate that scattering in boron-10 has a small influence on the standard spectra j the pertinent cross section becomes sufficiently well known [29J [31] at present for the related uncertainty to be almost negligible. The inelastic scattering effective threshold [33] lies around 4.5 MeV so that again, it is reasonable to expect no influence.
In conclusion, the significant processes involved in the generation of the proposed standard spectra are the reactions ^H (n,n), C (n,n) and 10B (n, < ) ; the differential energy cross sections are all considered as standard ; international requests with priority I and measurements under way in various laboratories will probably result in a 1 % accuracy on these cross sections within a few years.
Each of these three reactions influences the standard spectra in a given energy range only so that,even though some overlapping occurs,fairly accurate theoretical description of such standard spectra should be possible.
4. STATUS OF EXPERIMENTAL WORK
4.1. A mock-up of the proposed standard assembly has been constructed. Preliminary measurements have been performed by the foil activation technique, to check that no unexpected effects could hamper the practical applicability of the basic ideas developed hereabove.
It was also important to gain some technical experience about the operation of such a facility, in order to foresee any future problems and estimate the performances and to define the final configuration in all details.
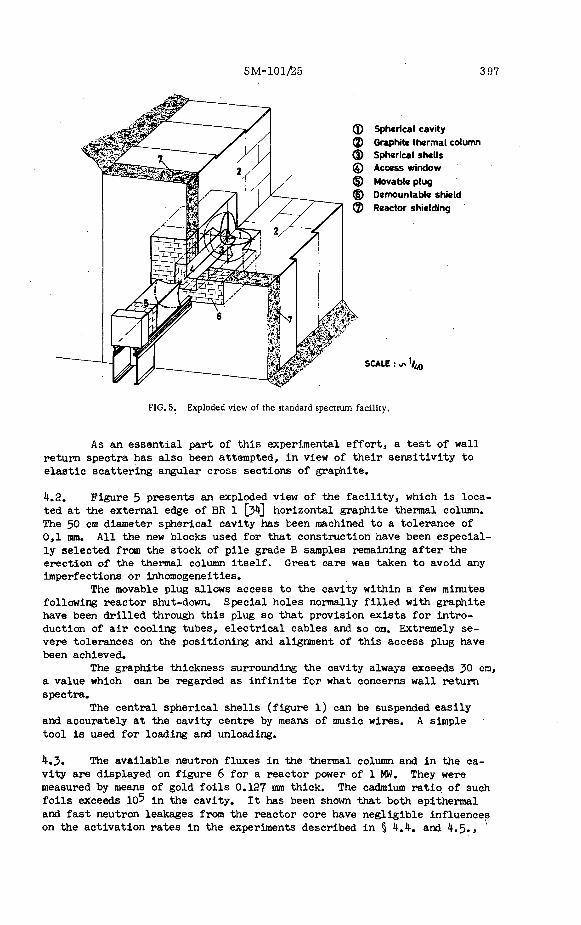
SM-101/25 397
FIG. 5. Exploded view of the standard spectrum facility.
As an essential part of this experimental effort, a test of wall return spectra has also been attempted, in view of their sensitivity to elastic scattering angular cross sections of graphite.
4.2. Figure 5 presents an exploded view of the facility, which is located at the external edge of BR 1 [34] horizontal graphite thermal column. The 50 cm diameter spherical cavity has been machined to a tolerance of 0,1 ram. All the new blocks used for that construction have been especially selected from the stock of pile grade B samples remaining after the erection of the thermal column itself. Great care was taken to avoid any imperfections or inhomogeneities.
The movable plug allows access to the cavity within a few minutes following reactor shut-down. Special holes normally filled with graphite have been drilled through this plug so that provision exists for introduction of air cooling tubes, electrical cables and so on. Extremely severe tolerances on the positioning and alignment of this access plug have been achieved.
The graphite thickness surrounding the cavity always exceeds 30 cm, a value which oan be regarded as infinite for what concerns wall return spectra.
The central spherical shells (figure l) can be suspended easily and accurately at the cavity centre by means of music wires, A simple tool is used for loading and unloading.
4.5. The available neutron fluxes in the thermal column and in the cavity are displayed on figure 6 for a reactor power of 1 MW. They were measured by means of gold foils 0.127 mm thick. The cadmium ratio of such foils exceeds 105 in the cavity. It has been shown that both epithermal and fast neutron leakages from the reactor core have negligible influences on the activation rates in the experiments described in § 4.4. and 4.5.,

398 FABRY and VANDEPLAS
.2„,J
100 200 300 c m
FIG. 6. Available neutron flux in BR1 graphite thermal column with the spherical cavity.
even for the less favourable capture reactions. This demonstrates that background runs (in the absence of the fission source) will probably not be necessary when operating the final standard assembly on a routine scale.
Fine angular distributions of the thermal neutron flux impinging on the central spherical shells have also been determined using copper foils. The ratio between maximum and minimum fluxes is about two and can be entirely assigned to the axial flux gradient in the bulk of the thermal oolumru These measurements show that it is possible to profile the thickness of the uranium shells in such a way that the fast flux in the inner experimental hole be nearly isotropic, a feature which is desirable when dealing with differential neutron spectrometers (§ 2.4.), although it is not essential for the scalar flux spectrum in that region to be identical with the spectrum expected for a uniform and isotropic thermal flux inoident on a uniform source. Nevertheless,since no serious technological difficulty is associated with the realization of a suitably profiled source, calculations have been performed to establish the spectrum distortion due to neutron interactions within the source, for the nominal thickness and composition (§. 3.2.). Such distortions, though present, are found to be small and it is reasonable to hope that the future calculations will reveal a sufficiently weak dependence on the thickness in the range to be considered for complete compensation of the thermal flux gradient, so that no appreciable deviation from the one- dimensional geometry will result from the use of a profiled fission source. Since the ratio between the fission flux produced in a fissile shell and the incident thermal flux increases rapidly with shell thickness up to some maximum value, after which it de-

SM-101/S5 399
<I>(u) NORHAI
10"
f
-10
rH .1
-2
. . - J
ISATION:/
Pv u - l
$(u)di 14 »V
- 1 H
• i
S-i
G \j
-hJ^-L
1
MS rundl
JJH-v X
50 cm diameter cavity in graphite Central point fission source
1 , — i — I •
10' 10° 10* 10" 10" 10' 101 eV
FIG. 7. Wall return spectrum at the centre of a spherical cavity.
creases slowly and If the optimal thickness is used on the less exposed side of the spherical shell, only a slight decrease will be necessary on the opposite side In order to produce equilibrium.
k.k. As an experimental test of the calculations of wall return spectra, radial distributions of absolute activation rates for a few foils have been measured in the cavity in a central, point fission source geometry.
Figure 7 compares the computations performed at Mol with similar DS4 calculations published by GRUNDL £35j , who used the 16-group cross section library of HANSEN and ROACH [56] . Discrepancies of up to 20 % are apparent on the spectrum shapes, but the total return fluxes per unit fission source agree to better than 1 %m Thus, the comments of § 3-5.3. about graphite cross section libraries appear to be well justified.
The fission source used for the measurements was a pellet of uranium oxide enriched to 90 %, having a thickness of 2 ram, and a diameter of approximately 2 cm, cased with a thin stainless steel cladding. The activation foils all had the same diameter as the source, while their thicknesses ranged from 0,2 mm down to 0.05 mm, including dilute alloy foils supplied and assessed to 1 % accuracy by CBNM, Euratom, Geel. The foils were placed in a cadmium tube 1 mm thick and about 25 cm long, mounted on the movable access plug of the cavity, the source being fixed at the center of the opposite end-face of the tube by means of a thin aluminium ring, A special foil holder of minimum mass has been designed to guaran-

400 FABRY and VANDEPLAS
tee an accurate knowledge of source-to-detector distances in these experiments, without introducing perturbations. It was constituted by three very thin steel ribbons graduated and held together at 90° with respect to each other by stainless steel discs located at both extremities ; the foils were slided into the graduation slots.
The activation rates all were determined absolutely by means of a 3n x 3" Nal (Tl) crystal calibrated [27] to an accuracy better than + 2 #.
5 10 15 20RADIUS(cm)
FIG. 8. Test of wall return spectrum for a point fission source at the centre of the 50 cm diameter cavity.
The results were treated as follows : the activation rate per unit fission source for the actual source-detectors geometry was computed analytically £58] in infinite vacuum for the threshold foils, as a function of the distance to the source. Similar curves were obtained for the capture reactions by normalization to the preceding case. In all cases the small perturbations within the source were accounted for ; in deriving these transport corrections, the source was simulated by a small sphere of equivalent mean chord length. Wall return contributions were added, selfshielding corrections were applied when necessary, and allowance was carefully made for the effective cadmium cut off energies in cylindrical geometry Q59] . This procedure yielded the theoretical curves shown on figure 8, which are to be compared with the experimental points. The results obtained with the Z n ^ (n,p) and Fe5° (n,p) reactions are not included because, for the source-to-detector distances at which measurements were possible, no wall return contributions could be noticed, in agreement with theory.
Experimental errors are not expected to exceed a few percent. The theoretical curves are influenced by the choice of microscopic group cross sections for the activation detectors. An extensive evaluation work has been performed in this respect and will be published soon [4QJ*
The theoretical wall return spectra appear to be systematically too soft, especially in the case of GMS calculations.
The discrepancy between theory and experiment is not really significant when GRUNDL's wall return spectrum is accepted. In any case, it is clear that an optimisation of the multigroup cross section library of gra-

SM-101^5 401
phite is necessary, and this could probably be achieved to a sufficient degree of accuracy during next year.
4.5» Figure 9 shows a mock-up of the central spherical arrangement, constructed to test whether true intermediate standard spectra can be produced within the cavity. The absorber is a shell of natural boron carbide with a density of 1.43 gr/cnp and a thickness of 1.7 cm, compacted by vibration within an aluminum cladding. A graphite spherical shell of 4 cm thickness is used as the moderator. The spherical source is approximated by a set of small fissile plates distributed over the outer surface of the boron screen. The complete assembly is suspended at the center of the cavity.
Figure 10 compares the central neutron spectrum in this arrangement with the core spectrum of a large dilute steam-cooled fast reactor, while figure 11 illustrates the corresponding response functions of some activation detectors.
In table II, a few measured spectral indices are compared with theory. A systematic discrepancy clearly appears, which is consistent with the observations made in the point-source geometry arrangement (§ 4.4.) and again shows the need for a better treatment of graphite nuclear data in the GMS data file. However, apart from this expected disagreement, the preliminary measurements strongly support the possibility of generating intermediate standard neutron spectra in the cavity.
Moreover, it also appears that the flux intensities which would be available in the final assembly are sufficient for most applications and that the facility would exhibit enough flexibility for the generation of a complete family of standard spectra.
5. APPLICATIONS IN FAST REACTOR PHYSICS
5.1. Attention will be focused here on a few points which may be considered as the most probable objectives of our future program in connection with the facility..
The following particular applications have been selected : a) Reference system for spectral index measurements and for the sandwich
foil technique [4l] [42] [4?] 6
b) Reference system for checking or improving the reliability of the Li (n,cK) and proton recoil spectrometers
c) Facility for accurate integral measurements of microscopic cross sections d) Test and improvement of non elastic and capture cross sections for struc
tural materials through a modified version of the spherical shell transmission method [44] [45]
e) Doppler effect measurements by the activation technique
Some short comment is presented hereafter about these five items.
5.2. Points a and b have already been referred to in the preceding paragraphs. It must be emphasized that the experimental techniques mentioned earlier are or will be used at MOL in BR02 zero power reactor, in relation with the operation of sodium loops [46] as well as with the future SOCRATE [47] fuel testing experiment in the high flux reactor BR2. It is also worthwhile to outline that the gamma-to-neutron flux ratio in the final standard assembly will be rendered as small as a few percent, to allow proper standardization of the differential neutron spectrometers.
26

Aluminium cladded B^C shel ls
Graphite shells
Fissile plates with various diameters
Support rings tor fissile plates
pa K!
&> p a.
< > 2!
a CTJ t -
>
FIG. 9. Mock-up for test of standard assembly.

SM-101/25 403
<*>( U)NC
-10
r i
r—'
-1i i
- i
1 r-1
I 1
1 1 1 1 1
-,* 1
-2
1 1 1
. J
IRMAUSATt
rh J h L_
_ Snea _ Stan<
mock
ON : / 4(u) du»1
•—-i
1 i i
J]
k-3(St Jard as -up
L 1
1 1
earn) >sembly
i i l i
i ,
u. \
\ i
10' 10c 10= 10H 10° 10' 10' eV
FIG. 10, Comparison of central neutron spectra in a large dilute steam-cooled fast reactor and in the mock-up of standard assembly.
1 KEg (V^
—T
1
1—
-r-
n
U-y // //
J^7^£?
y /
1 © i 38U(n,f) FP
® 115ln(n.m115mln
(D 235U(n.f) FP
© " ,Cu(n.8)Mbi
© " " u t i i . f t ^ U
© 197Au(n.ft198Au
10' 10c 10J 10H 10° 10' 10 ,1 (eV)
FIG. 11. Response functions of activation detectors in the neutron spectrum of the present mock-up.

404 FABRY and VANDEPLAS
TABLE II. SPECTRAL INDICES IN THE MOCK-UP OF THE STANDARD SPECTRUM FACILITY
Spectral index
63Cu (n. X) 64Cu 115ln(n,n')115raln
55Mn (n, fl 56Mn 115ln(n,n')115raln
197Au (n.K) 198Au 115ln(n,n')115raln
Theory
0.64
1.29
7.75
Experiment
0.57
1,00
6.50
It is also planned to reduce this ratio by one decade in the existing assembly by surrounding the uranium spherical source with bismuth shells : transport calculations have shown that the resulting neutron spectrum changes are so weak that negligibly small additional uncertainties on standard spectra would result,
5»3. A systematic work is now being undertaken to redetermine the average fission spectrum cross sections for capture reactions, for it has been shown recently p-5] that HUGHES' previous data [48] are considerably in error ; the purpose is to test [49] the statistical model in the range where competition with inelastic scattering and contribution of high order neutron waves play an important role.
In the softer intermediate standard spectra, it should be possible to determine the radiation width for some individual main resonances, the other parameters being provided by differential total cross section measurements ; information about strength functions could perhaps be deduced from measurements in the harder standard spectra.
Even though these integral cross section measurements cannot be interpreted directly in terms of fundamental parameters characterizing the interactions of neutrons with nuclides, no doubt exists regarding their usefulness : the general opinion is that accurate integral measurements are a necessary complement to high resolution differential studies in order to meet the overall degree of reliability on fast reactor nuclear data required by considerations of safety and economics.
5.4. The spherical shell transmission method [44] [45] associated with threshold detectors has often been used in the past to give reliable information about non elastic cross sections.
Recently, serious arguments have been put forward by DAVEY [50] showing that the application of such a technique in the core of a fast

SM-101/^5
-10"
Normalisaflon: unit fission source strength (1 neutron /s]
© Without Mo (D With 4cm of Mo
io' io° io \o ur xr io' «v
FIG. 12. Illustration of the spherical shell transmission method in the standard assembly.
critical assembly allows the unambiguous choice of the most suitable inelastic cross-section set for a given material,,
The standard spectrum facility is well suited for such measurements : the improvements considered as necessary after DAvEY's exploratory research are achieved in the present system. Shells of any material with thicknesses up to 4 cm can easily be inserted inside the fission source.
The resulting perturbations have been computed in the illustrative cases of molybdenum, iron and depleted uranium with natural boron as the absorber in region 2 (figure 1 and table I, cases.24, 23 and 19). Figure 12 displays the case of molybdenum while table III gives the changes in reaction rates for a few activation detectors in the case of molybdenum and iron. A 4 cm thick depleted uranium shell results in spectrum 2 of figure 1} (see § 6) s the perturbations here are considerable in the energy range where capture is dominant, but the reaction rates are not reported because the fissions in the shell have not been taken into account so far.
For all three materials, the effects are significant at high energy : the perturbations of reaction rates or spectral Indices by insertion of the shells provide a highly sensitive test of inelastic scattering cross sections. Such a test could be made even more powerful by supplementing foil activation measurements by a Li° (n,ot> ) spectrometer. For instance fine multigroup downscattering cross section sets could be derived, by a trial and reject procedure, over the energy range extending above the inelastic scattering thresholds. This is thought to be one of the most inte-

TABLE III. ILLUSTRATION OF THE PERTURBATIONS TO BE E X P E C T E D IN THE APPLICATION OF THE SPHERICAL SHELL TRANSMISSION METHOD
2 5 8 U (n , f )
n 5 i n ( n , n ' ) 1 1 5 i n l n
2 3 7Np (n , f )
2 3 5 U ( n , f )
63Cu ( n , # ^ C u
55Mn (n,&) 56Mn
1 3 9 La (n, * l lK)La
^ A « (n,X) 198Au
Reaction r a t e with she l l
Reaction r a t e without she l l
Shell » Mo (4 cm th ick )
0.642
0.695
0.862
0.991
0.793
0.605
0.794
0.706
Shel l : Fe (4 cm th ick)
0.792
O.858
0.950
1,05
O.989
O.936
O.963
1.03
< > a r->

SM-101/^5 407
*(ljjFt Normalisation:
\
unit fission source strength (1 neutron / sec)
(T) Without screen S) With 2gr/cm2nat.B
10' 1(T 10w 10" 10" 10" 10" «V
FIG. 13. Spectra transmitted through depleted uranium shells in the standard assembly.
resting applications of the standard facility in the field of nuclear data for fast reactors.
At lower energies, using also the proton recoil spectrometer, one could hope to determine systematically in a similar way multigroup capture cross section sets, the corrections for multiple scattering in the shells being defined by comparing the normal transport calculations with similar ones neglecting scattering. Unfortunately, except in the strong low energy resonance peaks or in a few cases such as uranium-238, the shell transmission in the present arrangement is generally too high. No calculations have yet been performed to deduce^the thicknesses required for such purposes. In any case, the sourcevcavity diameters would have to be increased and the cost would perhaps become prohibitive in comparison with the accuracy of the resulting information. Because the transmission is strongly affected in the predominant resonances, suitably chosen activation foils used in the same way as threshold detectors will provide useful information about some parameters of these resonances.
The most interesting application is this line probably is the study of the Doppler effect by the activation technique, heating foils or shells to increasing temperatures for various surface-to-raass ratios in both cases.

408 FABRY and VANDEPLAS
6. SECONDARY STANDARD SPECTRA
Once differential spectrometers or activation foils are carefully assessed (§ 5«2.) in the intermediate standard spectra, they could in turn be used for the standardization of other, less accurately known, although reasonably reliable spectra. Such spectra are called here "secondary standards". The shell transmission technique (§ 5.4. ) could greatly help in this connection.
There are two main reasons for introducing the concept of a secondary standard family : a) improvement of fast reactor spectrum simulation by attenuation of vir
gin fission neutrons via inelastic scattering b) suggestion for an assembly easier to duplicate in other laboratories.
It is felt that degrading the fission spectrum by means of natural uranium shells instead of a moderator should lead to the proper answer. Even the need for an enriched uranium shell as fissile source might be avoided in this way, depending on the applications. However, it is believed that the diameter of the cavity should be increased.
Not many calculations have yet been done in this sense. A few spectra obtained with 0.4 % depleted uranium shells are shown on figure 15 (table I, problems 20, 19 and 14 ; figure l). The detailed composition of these shells is the same as SNEAKfs blanket and has been selected because they are available for shell transmission experiments. The results are encouraging and indicate that, if the cavity diameter is increased, as previously suggested, boron shells could perhaps be suppressed and the thickness of natural uranium shells might then become the pertinent parameter for the flexible generation of a secondary standard family suitable in relation with modern large dilute fast reactors.
7. FUTURE TREND
The performances of the standard spectrum facility could be improved by an increase of the cavity diameter. This would reduce the influence of the uncertainties in the differential angular scattering cross sections of the wall's material, probably extend the usefulness of the system to laboratories where big heavy water thermal columns are available, help generating simpler and cheaper secondary standard spectra and allow a broader application of the spherical shell transmission technique to the determination of capture and non elastic multigroup cross section sets. This would also open the way to the assessment of differential spectrometers with greater sizes as those considered here, an interesting generalization provided it is justified by some interest on the part of external laboratories.
It is not yet clear however to what extent the increased cost would become restrictive.
8. CONCLUSION
It is believed that the present work strongly suggests the possibility of generating a family of non l/E-in'terme<iia'te standard spectra within a spherical cavity in a conventional thermal column and sufficiently stresses the interest of such a new kind of facility for the fundamental progress of fast reactor physics.

SM-101/25 409
ACKNOWLEDGMENTS
Without the constant and encouraging support of Mr. F. MOTTE, head of the CEN-SCK Reactor Study Department, this work would really have been impossible»
We are greatly indebted to Mr. H. DECKERS for the thankless task of adapting the GMS code to the IBM 360 computer. We also would like to put forward the valuable help that we have continuously received from so many collegues of the sections : Reactor Physics, Theoretical Reactor Study and Applied Mathematics as well as of the BR1 staff. Especially, F. CAMPS, F. VAN TURNHOUT, G. BES, F. COPS and J. TISSOT should be acknowledged.
Finally it must be stressed that the vibrocompacted boron shells have been perfectly realized by Mr. G. LUYTEN from BelgoNucleaire.
REFERENCES
[1] HUGHES,D.J.- Pile Neutron Research. Addison - Wesley, Cambridge
(1953).
[2] DEBRUE,J.- CEN report R i860 (1960). [3] GEIGER,K.W.- Radiation Measurements in Nuclear Power - Berkeley
Nuclear Laboratories. Institute of Physics and Physical Society. Conference - series n° 2 p 289 (1966).
[4] GRUNDL,J.A.- Report LAMS - 2883 (1963).
[5] FABRY,A.- Radiation Measurements in Nuclear Power. Berkeley Nuclear Laboratories. Institute of Physics and Physical Society. Conference series n° 2 p y22 (1966).
[6] SCHMIDT,J.J.- Report KFK 120 (1966).
[7] DAV£Y,W.G.- Nucl. Sci. Eng. 26, 149 (I966).
[8] GRUNDL,J.A. and HANSEN,G.E.- Nuclear Data for Reactors vol I p 321 IAEA (1967).
[9] EDWARDS,A.G.- TRG report VJ9 (D) (1963).
[10] ZARTMAN.I.F.- Report ANL-7320 p 740 (1966).
[11] SILK,M.G.- Report AERE - R 51&3 (1966).
[12] DE LEEUW-GIERTS.G. and DE LEEUW,S.- This conference, paper SM-101/45 (1967).
[13] BENNETT,E.F.- Nucl. Sci. Eng. 27, 16-27 (1967).
[14] BENJAMIN,P.W. et al. - Report AWRE - NR 1/64 (1964).
[1 3 FABRY,A.- Accepted for publication in Nukleonik.
[16] GRUNDL,J.A.- Nucl. Sci. Eng. 30, 39-53 (1967).
[17] GRATT0N,C.P., SMITH,P.E.- Report AEEW-M 4 8 (1965).
[18] SMITH,R.W. et al.- Report. AEEW - R 491 (1966).
[19] SPAEPEN,J.- Nuclear Data for Reactors vol I p 241 - IAEA (1967).
[20] IAEA Panel on Nuclear Standards needed for neutron cross section measurements. Brussels, May (1967).
410 FABRY and VANDEPLAS
[21] HORSLEY,A.- Report AWRE 0 - 2 3 / 6 5 ( 1 9 6 5 ) .
[22 ] GAMMEL,J.L.- Chapter V.T p 2185 i n F a s t Neutron P h y s i c s - Part I I
( 1 9 6 3 ) .
[ 2 3 ] PARKER,K.- Report AWRE 0 - 7 1 / 6 0 ( 1 9 6 1 ) .
[ 2 4 ] GOLDBERG,M.D. e t a l . - BNL 400 second e d i t i o n ( 1 9 6 2 ) .
[ 2 5 ] CAMPBELL,R.W. e t a l . - NAA - SR-11980 v o l IV ( 1 9 6 7 ) .
[ 2 6 ] VERBINSKI.V.V. e t a l . - N u c l . I n s t r . Meth. 5 £ , 181 -192 ( 1 9 6 7 ) .
[ 2 7 ] LANGSFORD,A. e t a l . - EANDC c o n f . on Study of N u c l e a r S t r u c t u r e w i t h N e u t r o n s , Antwerp P /81 ( 1 9 6 5 ) .
[ 2 8 ] GAYTHER,D.B. and GOODE.P.D.- Report AERE-PR/NP/10 p 21 ( 1 9 6 6 ) .
[29] MOORING,F.P. e t a l . - N u c l . P h y s . 8 2 , 16 -32 ( 1 9 6 6 ) .
[30 ] C0X,S.A. and PONTET.F.R — J . N u c l . En. A/B 2 2 , 2 7 1 - 2 8 3 ( 1 9 6 7 ) .
[31] UTTLEY.C.A. e t a l . - Report AERE-PR/NP 11 p 3 ( 1 9 6 7 ) .
[32 ] FREESTONE,R.M., Jr - Report ORNL-TM-1816 ( 1 9 6 7 ) .
[33] GRUNDL,J.A. and USNER.A. - N u c l . S c i . Eng. £ , 598 ( i 9 6 0 ) .
[34] STIENNON,G.- Geneva Conference P / 1 6 7 3 ( 1 9 5 8 ) .
[3^~] GRUNDL,J.A. - T r a n s . Am. N u c l . S o c . 5 , 381 ( 1 9 6 2 ) .
[36 ] HANSEN,G.E. and ROACH,W.H.- Report LAMS-25^3 ( 1 9 6 1 ) .
[37] FABRY,A.- Unpubl i shed communication to the Euratom Dosimetry Working Group ( 1 9 6 5 ) .
[38] DEPUYDT.H. and NEVE de MEVERGNIES.M.- J . N u c l . En. A/B 16 , 4 4 7 - 4 5 3 ( 1 9 6 2 ) .
[39 ] BROWN,H.L. Jr and CONNOLLY,J.J.- N u c l . S c i . Eng. 2 4 , 6 ( 1 9 6 6 ) .
[4o ] FABRY,A. and LANGELA,D.- To be p u b l i s h e d .
[41] EHRET.G.- Atompraxis 7 ( 1 1 ) 393 ( 1 9 6 1 ) .
[42] Mc CRACKEN,A.K.- R a d i a t i o n measurements i n n u c l e a r power. I n s t i t u t e of P h y s i c s and P h y s i c a l S o c i e t y . Conference s e r i e s n° 2 p 168 ( 1 9 6 6 ) .
[43 ] WEITZBERG.A.- Report ANL 7320 p 535 ( 1 9 6 6 ) .
[44] BETH£,H.A. e t a l . - J . N u c l . En. 3 , 207 ( 1 9 5 6 ) ; 3 , 273 ( 1 9 5 6 ) ; 4 , 3 ( 1 9 5 7 ) 4 , 147 ( 1 9 5 7 ) .
[45] ALLEN,R.C. e t a l . - Chapter V.H. i n Fas t Neutron P h y s i c s p a r t I I ( 1 9 6 3 ) .
[46 ] DEBRUE,J. e t a l . - This c o n f e r e n c e , paper SM-101/26 ( 1 9 6 7 ) .
[47] MINSART.G. and MOTTE,F.-This c o n f e r e n c e , paper SM-101/24 ( 1 9 6 7 ) .
[48] HUGHES,D.J. e t a l . - P h y s . Rev. 91.. 1 ^ 2 3 ( 1 9 5 3 ) .
[ 4 9 ] BENZI,V. and B0RT0LANI,M.V.- Nuc lear Data f o r R e a c t o r s v o l . I P 537 ( 1 9 6 7 ) .
[50] DAVEY,W.G. and AMUNDSON.P.I.- N u c l . S c i . Eng. 2 8 , 111 -123 ( 1 9 6 7 ) .

SM-101/25 411
D I S C U S S I O N
OQC 2S8
R. VIDAL: Fission rates are measured with U, U and even 239pu detectors by counting the gamma activity above a certain threshold. Can one be sure that the variations in fission product yield as a function
235 238
of energy for nuclides as different as U and U are negligible? Since there is no such difficulty in the case of fission chambers, have your results been compared with fission ratios obtained by fission chamber measurements?
A. FABRY: In view of the variation in fission product yield with neutron energy, we feel that it is better not to employ activation techniques in measuring fission rates in intermediate spectra. For example, the technique based on the detection of traces in mica foils covered with a deposit of fissile material is a useful one.
J. DEBRUE: We have examined this problem in relation to 235U as part of the work described in paper SM-101/26. In measuring the gamma activity of fission products, a 450-860 keV window seems to eliminate the effect of the variation in fission product yield (see paragraph 3. 1 of that paper), the measured activity being due principally to five isotopes with yields that vary little between the thermal energy region and 14 MeV.


TECHNIQUES DE DETERMINATION DES CARACTERISTIQUES NUCLEAIRES DE LA BOUCLE REFROIDIE AU SODIUM UTILISEE DANS BR2 POUR DES ESSAIS DE COMBUSTIBLES DE REACTEURS RAPIDES*
J. DEBRUE, M. DE COSTER, Ch. DE RAEDT ET A. FABRY CENTRE D'ETUDE DE L'ENERGIE NUCLEAIRE, MOL-DONK, BELGIQUE
Abstract — Resume
TECHNIQUES FOR DETERMINING THE NUCLEAR CHARACTERISTICS OF THE SODIUM-COOLED LOOP USED IN BR2 TO TEST FAST-REACTOR FUELS. A loop for testing fast-reactor fuels was designed and installed in the BR2 high-flux reactor. The fuel pins are cooled with sodium, which permits the removal of 130 kW of power. Absorbing screens (B4C and Cd)round the section of the loop inside the reactor stop the low-energy components of the incident neutron spectrum. The intensity and energy distribution of the neutron flux is capable of producing a high mean power density in the test fuel without excessive flux depression, even with high fissionable-material contents. Irradiation conditions in BR2 are based on measurements made in the BR02 reactor, the nuclear model of BR2. These values are used in conjunction with calculations made with diffusion and transport (DSn method) codes. Spectral indices and fission rates are used to check the correctness of the calculated spectrum and the constants used for the fissionable materials. The main problems consist of relating the power density in the fuel pins, as measured in BR02, with the total power of BR2, using this power density value to calibrate the in-loop integrating flux meters, and determining changes in these parameters during irradiation. The authors discuss the problems involved in applying the combined set of measuring and calculating techniques.
TECHNIQUES DE DETERMINATION DES CARACTERISTIQUES NUCLEAIRES DE LA BOUCLE REFROIDIE AU SODIUM UTILISEE DANS BR2 POUR DES ESSAIS DE COMBUSTIBLES DE REACTEURS RAPIDES. Une boucle destinfee a des essais de combustibles pour rfiacteurs rapides a ttt congue et installed dans le rfeacteur a haut flux BR2. Les crayons combustibles sont refroidis par du sodium qui permet d'fevacuer une puissance de 130 kW. Des ecrans absorbants (B4C et Cd), entourant la section en pile de la boucle, arretent les composantes a basse dnergie du spectre neutronique incident. L'intensit6 et la repartition 6nerg6tique du flux neutronique permettent d'obtenir une puissance spdcifique moyenne elevfie dans le combustible d'essai, sans que le creusement dans les crayons soit excessif, meme pour de fortes teneurs en matiere fissile. Les conditions d'irradiation dans BR2 sont ddterminees a partir des mesures effectufees dans le rfeacteur BR02, modele nucldaire de BR2; ces mesures sont couplers a des calculs effectu£s au moyen d'un code de diffusion et d'un code de transport (methode DSn). Des mesures d'indices spectraux et de taux de fission constituent un controle de la validity du spectre calculd et des constantes utilis£es pour les materiaux fissiles. Les problemes majeurs consistent a relier la puissance spfecifique dans les crayons combustibles, mesurfee dans BR02, a la puissance totale de BR2, a Stalonner par rapport a cette meme puissance spfecifique les moniteurs intSgrateurs de flux places dans la boucle et a definir devolution de ces grandeurs au cours de l'irradiation. Les problemes posfes par l'application de l'ensemble des techniques de mesure et de calcul sont discutes.
1. INTRODUCTION
1.1. La boucle refroidie au sodium est l'un des dlspositifs expe>imen-taux utilises dans le r^acteur d'essai de mateViaux BR2 pour les irradiations de crayons combustibles. Cette boucle, mise en service en 1965* a
* Travail effectue dans le cadre de l'Association CEN-Euratom chargee d'exploiter le reacteur BR2 et ses installations connexes (contrat 006/60/5 BRAB).
413

414 DEBRUE et al.
été conçue spécialement pour réaliser des conditions d'irradiation voisines de celles rencontrées dans un réacteur à neutrons rapides, refroidi au sodium :
- les crayons irradiés baignent dans le sodium en circulation ; la température de celui-ci peut atteindre 600 °C
- l'intensité du flux neutronique incident permet de créer, dans les crayons irradiés, une puissance linéique du même ordre de grandeur que celle caractérisant les réseaux de pile rapide
- le variation radiale de la densité de puissance dans ces crayons est minimisée grâce à l'utilisation d'écrans absorbants qui, placés autour de la section en pile de la boucle, arrêtent les neutrons de basse énergie.
1.2. La boucle et son équipement ont fait l'objet d'une description antérieure [ 1]• La section en pile est un doigt de gant cylindrique composé de deux chambres concentriques dans lesquelles circule le sodium ; la cavité centrale contient les crayons à irradier. Ces deux chambres sont entourées d'un écran de carbure de bore gainé ; l'enveloppe extérieure ou tube de force est en contact avec l'eau de refroidissement du réacteur.
L'ensemble est introduit dans le trou central d'un bouchon d'aluminium tapissé intérieurement d'un écran de cadmium gainé. Ce bouchon, d'un diamètre extérieur de 200 mm, occupe le centre de la matrice du réacteur.
Les pompes électromagnétiques et l'échangeur dé chaleur sodium -CO. sont localisés dans une enveloppe de 200 mm de diamètre, située à l'intérieur de la cuve du réacteur, au-dessus du coeur. Le doigt de gant et l'enveloppe forment un ensemble manipulable d'une seule pièce.
Les crayons irradiés peuvent occuper une longueur d'environ 700 mm ; leur nombre peut varier de un à sept. La puissance totale évacuée est limitée à 1J0 KW.
La figure la est une coupe horizontale de la partie en pile de la boucle, dans le cas de l'irradiation d'un simple crayon. Les cotes sont données à titre indicatif. Des variantes de cette disposition sont réalisables, dont la plus importante consiste à supprimer l'écran de carbure de bore ; la figure lb montre une réalisation de ce type. Six éléments combustibles (type SIII) semblables à ceux utilisés habituellement dans BR2, mais d'un diamètre plus réduit (trois tubes combustibles au lieu de six) peuvent être logés dans le bouchon d'aluminium ; ces éléments sont destinés notamment à compenser la perte de réactivité qu'entraîne la présence de la boucle.
1.5. La section en pile de la boucle est exposée au flux incident des neutrons produits par les éléments combustibles (type SVI principalement) disposés autour du trou central de la matrice du réacteur. La configuration de chargement adoptée actuellement est représentée à la figure 2 ; elle est conçue de manière à répondre aux impératifs d'exploitation et aux spécifications du programme d'irradiation dans son ensemble. Une description complète des constituants du réacteur est donnée dans la référence [2 ] .
L'intensité du flux neutronique et sa répartition énergétique sont conditionnées par les caractéristiques du flux dans la couronne de 10 éléments combustibles entourant le trou central, par la présence des constituants séparant ces éléments des écrans absorbants, et évidemment par le pouvoir absorbant de ceux-ci.
L'écran en cadmium de 2,5 mm d'épaisseur absorbe tous les neutrons en dessous de 0,5 eV environ. Il laisse passer une composante épi-

SM-101/26 415
A CRAYON COMBUSTIBLE B.SCRAN B4C ($32x38) C-ECRAN Cd ( $ 5 2 x 5 7 ) D_TUBE DE FORCE ( $ 6 1 . 5 x ^ , 5 ) E_BOUCHON At ( $ 6 3 x 2 0 0 ) F-ELEMENTS COMBUSTIBLES SHI G-MONITEURS DE FLUX
FIG. la . Section en pile de la boucle et du bouchon d'aluminium associe. Dispositif muni de deux ecrans absorbants.
A-CRAYON COMBUSTIBLE B-ECRAN Cd ( $ 4 9 x 52) CTUBE DE FORCE (<j> 35 x 38) D-BOUCHON At ( $ 55 x 200) E-ELEMENTS COMBUSTIBLES SHI F-MONITEURS DE FLUX
FIG. lb . Section en pile de la boucle et du bouchon d'aluminium associe. absorbant.
Dispositif muni d'un ecran
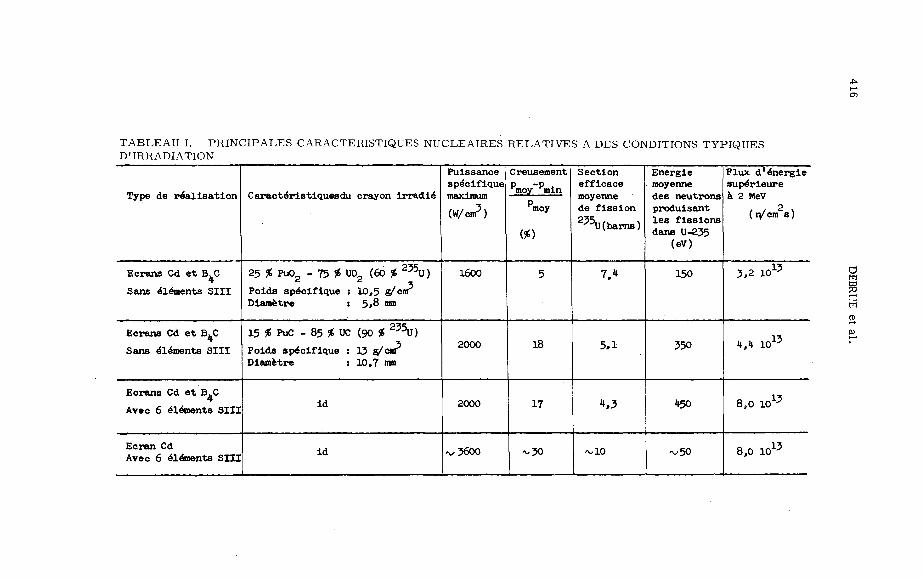
I - 1
OS
T A B L E A U I. P R I N C I P A L E S CARACTERISTIQUES NUCLEAIRES RELATIVES A DES CONDITIONS TYPIQUES D'IRRADIATION
Type de realisation
Ecrans Cd et B.C
Sans elements SIII
Ecrans Cd et B.C
Sans elements SIII
Ecrans Cd et B.C
Avec 6 elements SIII
Ecran Cd Avec 6 Elements SHI
Caracteristiquesdu crayon irradle1
25 % Pu02 - 75 * U02 (60 % 2?5U)
Poids specifique : 10,5 g/cnr Dianetre : 5,8 ran
15 f> PuC - 85 % UC (90 %
Poids specif ique s 13 g/cnr Diametre j 10,7 inn
id
id
Puissance sp^cifique maximum
(W/cnr5)
1600
2000
2000
^5600
Creusement P -P j moy min
p moy
5
18
17
'oJO
Section efficace moyenne de fission 2:?5U( barns)
7.4
5,1
4,3
~10
Energie moyenne des neutrons produisant les fissions dans U-2J5
(eV)
150
350
450
^50
Flux d'^nergie supeVieure a 2 MeV
(n/cm s)
3,2 1015
4,4 1013
8,0 1013
8,0 1015
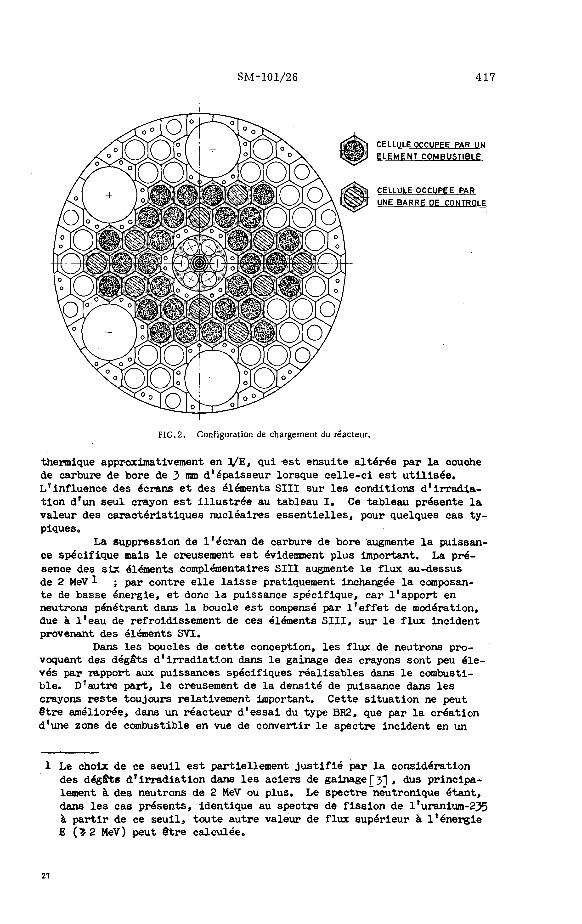
SM-101/26 417
CELLULE OCCUPEE PAR UN
ELEMENT COMBUSTIBLE
CELLULE OCCUPEE PAR
UNE BARRE DE CONTROLE
FIG.2. Configuration de chargement du réacteur.
thermique approximativement en V E » Q u i ^ s t ensuite altérée par la couche de carbure de bore de 2 mm d'épaisseur lorsque celle-ci est utilisée. L'influence des écrans et des éléments SIII sur les conditions d'irradiation d'un seul crayon est illustrée au tableau I. Ce tableau présente la valeur des caractéristiques nucléaires essentielles, pour quelques cas typiques,
La suppression de l'écran de carbure de bore augmente la puissance spécifique mais le creusement est évidemment plus important. La présence des six éléments complémentaires SIII augmente le flux au-dessus de 2 MeV 1 ; par contre elle laisse pratiquement inchangée la composante de basse énergie, et donc la puissance spécifique, car l'apport en neutrons pénétrant dans la boucle est compensé par l'effet de modération, due à l'eau de refroidissement de ces éléments SIII, sur le flux incident provenant des éléments SVT.
Dans les boucles de cette conception, les flux de neutrons provoquant des dégâts d'irradiation dans le gainage des crayons sont peu élevés par rapport aux puissances spécifiques réalisables dans le combustible. D'autre part, le creusement de la densité de puissance dans les crayons reste toujours relativement important. Cette situation ne peut être améliorée, dans un réacteur d'essai du type BR2, que par la création d'une zone de combustible en vue de convertir le spectre incident en un
Le choix de ce seuil est partiellement justifié par la considération des dégâts dsirradiation dans les aciers de gainage [y] , dus principalement à des neutrons de 2 MeV ou plus. Le spectre neutronique étant, dans les cas présents, identique au spectre de fission de l'uranium-235 à partir de ce seuil, toute autre valeur de flux supérieur à l'énergie E (? 2 MeV) peut être calculée.

418 DEBRUE et al.
spectre voisin de celui d'un réacteur rapide. L'étude d'une boucle répondant à cet objectif fait l'objet d'une autre communication à ce symposium [3*1.
1.4. Comme cela a été précisé ci-dessus, différentes variantes analogues à celles présentées à la figure 1 peuvent être réalisées, suivant les spécifications définies par l'expérimentateur.
Sur la base de ces spécifications, des calculs d'orientation sont effectués pour optimiser les conditions d'irradiation. Les paramètre considérés dans ce travail d'optimisation sont, en toute généralité :
- les dimensions des écrans absorbants, avec suppression éventuelle de l'écran de B.C
- la disposition des crayons à irradier, et dans certains cas leur diamètre et leur composition.
Le plus souvent, la teneur en plutonium des combustibles mixtes U-Pu est imposée tandis que l'enrichissement en U-235 peut être ajusté pour obtenir la puissance linéique ou la température de surface désirée.
Les calculs neutroniques sont effectués au moyen de codes de diffusion ou de transport, en géométrie cylindrique.
Les mesures préparatoires à l'irradiation sont réalisées dans le réacteur BR02, à l'aide d'un modèle nucléaire de la section en pile de la boucle. Le réacteur BR02 est une facilité critique dont le coeur est identique à celui du réacteur BR2 [4}j on y conduit les essais nucléaires requis par les irradiations dans BR2.
L'objectif de la campagne de mesure dans BR02 est d'établir une prévision de la puissance spécifique qui sera produite dans les crayons fissiles (voir "5.1«)« On attache toutefois beaucoup d'importance à apprécier la validité des méthodes de calcul et des constantes nucléaires utilisées, en vue d'améliorer la précision des prévisions théoriques lors des projets ultérieurs (voir 4.).
Au cours de l'irradiation dans BR2, des moniteurs de flux sont présents dans la boucle, au voisinage des crayons fissiles ; la mesure de l'activité de ces moniteurs, après leur récupération lors du démantèlement de la boucle, fournit les grandeurs de base pour l'évaluation de l'épuisement des crayons en fin d'irradiation. La calibration des moniteurs est également l'un des objectifs des mesures préparatoires à l'irradiation (voir 3.2.).
Dans les paragraphes suivants, les méthodes de calcul sont décrites ainsi que les techniques expérimentales ; les résultats de leur application à l'irradiation d'un crayon UC-PuC, en présence des deux écrans, sans éléments SIII (second cas du tableau I), sont discutés d'une manière détaillée.
2. METHODES DE CALCUL
2.1. Les calculs effectués lors de l'étude d'optimisation d'une irradiation en boucle fournissent les distributions radiales du flux neutro-nique, en spectre et en intensité, dans le plan du point chaud. On en déduit la puissance spécifique moyenne dans les crayons ainsi que la variation de la densité de fission à l'intérieur de ceux-ci.
Vu la présence d'écrans fortement absorbants dans la boucle, il est indiqué d'employer un code de transport. Dans un grand nombre de cas cependant (voir 2.2.), l'emploi d'un code de diffusion s'avère justifié.
27*

SM-101/26 419
Les deux codes utilisés sont г le code de diffusion MODIC II [ 5] et le code de transport GMSII^6].
Le code MODIC II est un code de diffusion multigroupe à une dimension, écrit pour machine digitale Mercury Ferranti. Vingt-huit groupes d'énergie sont employés : 27 groupes épithermiques et un seul groupe thermique limité supérieurement à 0,683 eV. Les sections efficaces thermiques sont calculées par pondération des sections différentielles au moyen d'un spectre de Wilkins. Les constantes non thermiques proviennent de la bibliothèque GAM à 68 groupes d'énergie [71* réduite à 27 groupes selon la procédure décrite dans [8].
Le code GMSII, écrit en langage Fortran pour IBM 7050 et adapté à IBM 360, résoud l'approximation discrète S de Carlson de l'équation de transport de Boltzmann. Le code est unidimensionnel et comporte quarante groupes d'énergie, dont huit en dessous de l'énergie 0,683 eV. La bibliothèque [9] fournit les constantes nécessaires aux calculs, sauf pour le béryllium et le cadmium. Pour ces deux éléments, des sections efficaces ont été calculées à partir des bibliothèques GAM à 68 groupes et GMSI (bibliothèque à 40 groupes dont 15 en dessous de 0,683 eV).
Tous les calculs ont été effectués en géométrie cylindrique. La boucle occupant le centre de la configuration, le réacteur est représenté par quinze à vingt régions homogènes concentriques. En ce qui concerne la boucle, le crayon fissile et chacun des écrans constituent des régions distinctes, séparées par des régions qui contiennent les différents constituants intermédiaires.
2.2. Par rapport au code de diffusion MODIC II, le code de transport GMSII a l'avantage de traiter plus correctement les écrans absorbants dans le domaine thermique où les sections efficaces de capture sont élevées et de décrire d'une manière plus détaillée le domaine thermique, chose indispensable pour le traitement des régions où le formalisme de Wilkins n'est pas applicable.
Dans les configurations à deux écrans absorbants, le flux thermique au centre de la boucle est totalement négligeable et donc également la contribution du domaine thermique à la puissance dans le crayon. Pour cette raison, un traitement théorique imparfait des écrans à. forte absorption thermique ainsi qu'un calcul approximatif des constantes thermiques sont suffisants pour décrire le spectre neutronique dans la boucle. Le code MODIC II peut donc être utilisé dans ce cas (voir 4.1. à 4.3.).
En absence d'écran de carbure de bore, la contribution de la puissance dans le domaine thermique à la puissance totale n'est plus négligeable. Le code de transport GMSII à plusieurs groupes thermiques est nécessaire dans ce cas.
2.3. La figure 3 donne (traits pleins) la spectre du flux au centre de la boucle à deux écrans sans éléments SIII supplémentaires, en l'absence de crayon, calculé par code MODIC II et normalisé àj^fi (u) du = 1. L'ajout de six éléments SIII supplémentaires modifie la partie rapide du spectre, comme indiqué par les traits interrompus, tandis que la suppression de l'écran de B.C augmente le flux dans les domaines épithermique et thermique (traits en pointillé).
Le fluxj^jô (E) dE au-dessus du seuil E est également représenté. D'autres résultats théoriques sont donnés au paragraphe 4, avec
les résultats expérimentaux correspondants.
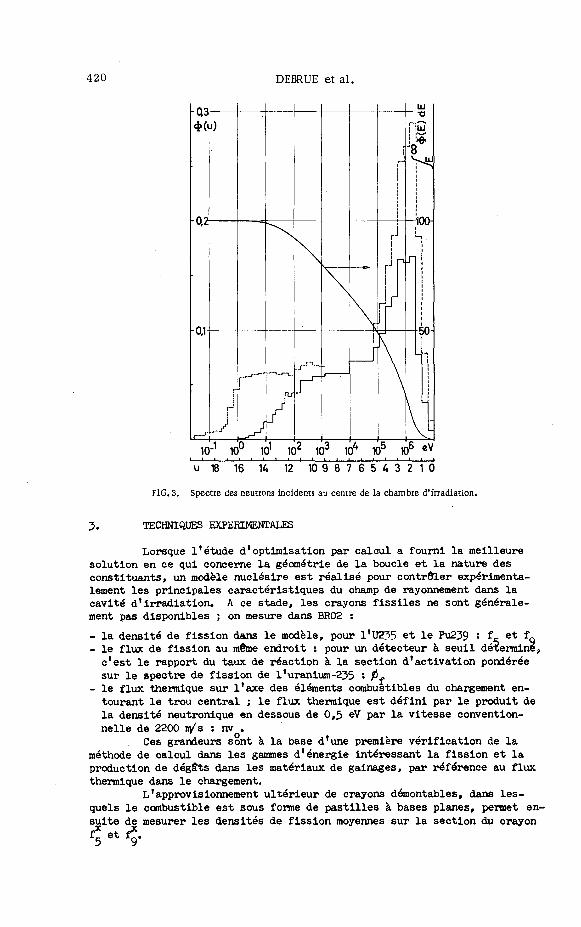
420 DEBRUE et al.
10Л 10° 101 10 103 104 105 106 eV
u ' 18 16 14 12 10 9 8 7 6 5 4 3 2 i 0
FIG. 3. Spectre des neutrons incidents au centre de la chambre d'irradiation.
3. TECHNIQUES EXPERIMENTALES
Lorsque l'étude d'optimisation par calcul a fourni la meilleure solution en ce qui concerne la géométrie de la boucle et la nature des constituants, un modèle nucléaire est réalisé pour contrôler expérimentalement les principales caractéristiques du champ de rayonnement dans la cavité d'irradiation. A ce stade, les crayons fissiles ne sont généralement pas disponibles ; on mesure dans BR02 :
- la densité de fission dans le modèle, pour l'U2?5 et le Pu2^9 Î f et f_ - le flux de fission au même endroit : pour un détecteur à seuil détermine, c'est le rapport du taux de réaction à la section d'activation pondérée sur le spectre de fission de l1 uranium-2J55 î fif
- le flux thermique sur l'axe des éléments combustibles du chargement entourant le trou central ; le flux thermique est défini par le produit de la densité neutronique en dessous de 0,5 eV par la vitesse conventionnelle de 2200 m/s : nv .
Ces grandeurs sont à la base d'une première vérification de la méthode de calcul dans les gammes d'énergie intéressant la fission et la production de dégâts dans les matériaux de gainages, par référence au flux thermique dans le chargement.
L'approvisionnement ultérieur de crayons démontables, dans lesquels le combustible est sous forme de pastilles à bases planes, permet ensuite de mesurer les densités de fission moyennes sur la section du crayon fí et f*

SM-101/26 421
La valeur de différents rapports de taux de réaction (indices spectraux) est enfin déterminée, avec ou sans crayons combustibles. Le creusement dans ces crayons est également mesuré.
J.l. Prévision des conditions d'irradiation dans BR2 déduite des mesures effectuées dans BR02. Cette prévision repose sur des relations du type :
1 * a nv о
í * l L f5 J
л nv norm о
a (1)
Le rapport fq/f,- caractérise la perturbation due au crayon fissile ; fí et f , mesurés au cours de deux irradiations successives, sont nor-5 5 malisés à une même intensité du flux en un point à l'intérieur de la boucle, suffisamment éloigné du crayon dans le sens axial et donc non affecté par la perturbation locale due à celui-ci.
Le flux thermique nv est mesuré dans les éléments combustibles entourant l'expérience. Dans BR2, la valeur maximum, sur l'axe de ces éléments, est liée au flux de chaleur maximum admissible lorsque les éléments sont frais.
Le facteur a_ est un facteur correctif qui tient compte de ce que la normalisation adoptée plus haut pour f^fc est arbitraire : a. est inférieur à l'unité de quelques pourcents. •
Les valeurs des densités de fission sont déterminées par activation de disques U-Al (enrichissement 90 % U235) et Pu-Al (teneur de 97 % Pu239)» à. 20 % en poids de matière fissile. Des disques en uranium pur, enrichi à 90 #, sont également utilisés.
L'activité gamma des produits de fission est mesurée pour l'ura-nium-235» dans une bande d'énergie comprise entre 450 et 860 keV ; une série de mesures effectuées pendant la décroissance, qui suit une loi du type f * , contribue à définir l'activité à un moment bien déterminé après l'irradiation. Pour le plutonium-239* les gamma d'énergie supérieure à 650 keV sont mesurés ; ce seuil est choisi pour minimiser l'importance relative de l'activité naturelle.
La calibration de l'installation de comptage repose sur l'irradiation des disques dans un spectre purement thermique dont l'intensité est déterminée par activation de détecteurs d'or. Le taux de comptage, dans les conditions standardisées, est ainsi mis en relation avec le taux de fission dans les disques U-Al et Pu-Al.
Pour l'uranium-235> l'influence de la variation du rendement des produits de fission avec l'énergie des neutrons E a été examinée ; une telle variation pourrait induire une erreur systématique en calibrant dans une colonne thermique des détecteurs utilisés dans le spectre de la boucle où l'énergie moyenne des neutrons est de l'ordre de 100 eV. Dans l'intervalle des énergies y de 450 à 86O keV, l'activité est principalement due à cinq isotopes dont le rendement ne varie pas de plus de 10 % lorsque E
passe de 0,025 eV à 2 MéV. D'autre part, les spectres gamma sont identiques,
de même que pour un détecteur irradié dans un convertisseur (Ê = 2 MéV),
et les lois de décroissance ne se différencient guère. Ces arguments rendent
peu probable une influence de la variation du rendement des produits de
fission, pour les conditions de mesure précitées. On a pu même vérifier
qu'en adoptant un seuil de discrimination inférieur de 605 keV, sans limi-

422 DEBRUE et al.
tation supérieure, les taux de fission mesurés dans la boucle restaient inchangés. Ces conclusions conduisent finalement à affirmer qu'une variation de E de 0,025 eV à 200 eV environ peut être ignorée dans l'application de ces techniques.
Deux relations du type (1), respectivement pour l'uranium et le plutonium, fournissent une estimation de la puissance spécifique (W/cnr ) moyenne à une cote quelconque du crayon considéré
f* f* W m (n^~ N5 E5 + nf" NQ V x nvo (BR2) W/cnf5 (2)
о о avec N et N : nombre de noyaux d'uranium-235 et de plutonium-239 par
E et E : énergie dissipée, par fission, à l'intérieur du crayon 5 У (produits de fission, rayonnement è) : 0,272.10"
Ws pour l'uranium-235 et 0,284.10 Ws pour le plutonium^^
nv (BR2) s flux thermique maximum, dans les éléments SVT, que l'on compte réaliser dans BR2.
La valeur de cette prévision de la puissance spécifique, sur la base des mesures effectuées dans le réacteur BR02, doit être appréciée en tenant compte des commentaires suivants :
1) Les rapports fp/nv et f^/nv sont indépendants de toute mesure absolue car les valeurs des densités de fission de même que les valeurs du flux thermique reposent sur l'utilisation de détecteurs d'or dont l'activité est mesurée de la même manière dans les deux cas.
2) L'obtention d'un flux thermique maximum déterminé dans BR2 sera assurée, par un essai de courte durée, effectué à basse puissance dans BR2, au cours duquel la valeur du flux thermique maximum, mesurée par activation de détecteurs de cobalt, sera mise en correspondance avec la puissance totale du réacteur et l'indication de l'activité N16 dans l'eau de refroidissement, qui lui est proportionnelle. Cet essai est effectué au niveau de 500 kW environ ; la linéarité des instruments de mesure ont fait l'objet de tests rigoureux à plusieurs reprises, entre 500 kW et 50 MW environ.
3) les éléments combustibles constituant le chargement BR02 sont.des éléments frais ; l'influence de l'épuisement qui caractérise les éléments de BR2 n'est donc pas incluse dans le résultat fourni par la relation (2). Mise à part la possiblité de simuler cet épuisement dans BR02, on peut estimer cet effet en utilisant les informations accumulées dans BR2, relatives aux variations de fi, /nv , où fi est le flux par unité de léthargie, et de fijm en fontion de l'épuisement local, et aux variations des distributions axiales de flux thermique en cours de fonctionnement[4]. La densité de fission dans la boucle est liée aux valeurs de fi et fi dans les éléments les plus proches.
Plus simplement, on peut considérer en première approximation que, lors du fonctionnement de BR2 à puissance constante, la population des neutrons rapides est maintenue constante. La distribution radiale se modifiant peu au cours du temps, le flux rapide moyen sur la longueur active de chaque canal ne varie pas tandis que la distribution axiale s'aplatit par suite du retrait du faisceau des barres de contrôle. La densité de fission dans la boucle suit la même évolution s sa valeur moyenne, calculée sur une longueur de 700 mm environ, reste inchangée tandis que la valeur maximum décroît ; cette décroissance est obtenue par la simple considération des facteurs de forme axiaux pour les neutrons rapides, au début d'un cycle

SM-101/26 423
d'exploitation (barres de contrôle insérées) et à la fin du cycle (barres extraites) ; elle vaut environ 12 %. Ce raisonnement est confirmé par le fait que la puissance extraite de la boucle varie peu au cours d'un cycle de fonctionnement.
En conclusion, la puissance spécifique, calculée par (2) au point le plus chaud, pour un crayon fissile de composition initiale connue devrait être supérieure d'environ 6 % à la puissance spécifique moyenne au cours du cycle ; ceci suppose que les éléments SVT soient frais au début du cycle.
L'expérience a montré toutefois que les prévisions basées sur les seules mesures effectuées dans le réacteur BR02 ne peuvent être obtenues avec une précision meilleure que 10 #.
L'application des relations (l) et (2) à un crayon UC-PuC, irradié dans les conditions décrites au tableau I (second cas), a donné les résultats suivants, au point le plus chaud du crayon
#
#
-24 nv = (4,55 + 0,15) . 10 о
-24 nv = (5,01 + 0,15) . 10 о
où nv est le flux maximum mesuré dans les éléments SVI. La composition du crayon, déjà citée, est 85 % UC - 15 % ÜC en poids ;
l'uranium est enrichi à 90 % en U235. Le diamètre du combustible est de 10,7 mm. La puissance spécifique maximum obtenue est de l8jJ0 + 60 W/cm3.
3.2. Détermination du taux de fission moyen dans les crayons irradiés, par mesures de l'activité des moniteurs placés dans la boucle à BR2.
Comme cela a été mentionné au paragraphe 1.4., des moniteurs sont placés dans la boucle en cours d'irradiation. Ces moniteurs sont des fils de cobalt et de fer de 9 rara de longueur et 0,5 mm de diamètre, introduits dans un microtube en acier fixé sur le tube jô 20/23 séparant les circuits aller et retour du sodium (figure la). - u Les réactions d'activation considérées sont : Co (n,^ ) Co et »c. (**)*< Pe (n,p) Mn54. La majeure partie de la réponse du cobalt est due à la
résonance, située à 1J2 eV ; le fer-5^ est un détecteur à seuil dont le seuil effectif est situé à 2,9 MeV. Les demi-vies sont respectivement de 5,27 années et ¿08 jours. Les propriétés du fer, en tant que détecteur intégrateur, sont satisfaisantes pour des irradiations d'une durée n'excédant pas 100 jours ; pour des irradiations de plus longue durée, d'autres moniteurs doivent être utilisés.
Comme la réponse du cobalt est prépondérante dans une gamme d'énergie neutronique où se produisent la plupart des fissions dans l'uranium et le plutonium (voir 4.1. et figure 4), il est logique de relier l'activité des moniteurs de cobalt au taux de fission moyen, au cours de l'irradiation, dans les crayons. On minimise ainsi l'effet d'une variation éventuelle du spectre dans la boucle au cours du temps. Cette variation, qui pourrait être due à une distorsion du spectre incident en raison de l'épuisement des éléments combustibles SVI, n'a toutefois pas été décelée : la réponse du fer pourrait donc être reliée au taux de fission, de même que le cobalt. La présence des moniteurs de fer se justifie surtout pour la dosimétrie intéressant les dégâts d'irradiation.
On désigne par le symboleH le taux de désintégration par gramme d'un fil de cobalt, ayant les dimensions déjà citées, après une irradiation de 1 seconde. Il s'agit de déterminer les valeurs de fí/'C--, et fî/C, . Les mesures effectuées à cette fin sont résumées au tableau II.

TABLEAU II. SCHEMA DES MESURES EFFECTUEES POUR LE CONTROLE DES CONDITIONS D'IRRADIATION PAR MONITEURS DE FLUX
Reacteur Endroit de mesure
Niveau de puissance
Reactions utilisees pour les me-sures par activation
Grandeurs obtenues
Autres grandeurs mesu-
BR02
Modele nucleaire de la section en pile de la boucle, avec ou sans crayons fissiles
Maximum 500 W
2 3 5u („,,) 239Pu(n,f) 115
31
Sh,
In(n,n') (E
P (n,p) (E
Zn (n, p) (E
seuil
seuil
seuil
1,lMeV)
2,6MeV)
3,^MeV)
f /f 7 5 fy^vln) 0f(In)/0f(Fe)(
a>
f /f V 9 fo/0f(ln).
BR2
Modele nucleaire de la section en pile de la boucle, sans crayons fissiles
500 kW
Co(n,Y) (Er
Fe(n,p) (E seuil
132 eV)
= 299MeV)
0f(Fe)/TCo
f f 5 v >
'Co et, de ni§me,
fX
9 TCo
ft f {In) 0f(Fe) (3)
Flux thermique dans les elements SVI
Flux thermique dans les elements SVI Niveau de puissance
BR2
Boucle refroidie au sodium ; irradiation proprement dite
33 a 60 MW
59Co (n,Y) 5^Fe (n,p)
A (desint/s) 00
fC dt 3
H «
Co
Co
Co
Co
A (desint/s)
Jpf(Fe) dt
Flux thermique integre dans les elements SVI Variation du flux thermique dans un element SVI au moyen d'une sonde calorimetrique a U-235
:(a) 0„(Fe) est deduit de 0_(P) trouve egal a 0 (Zn); les trois valeurs sont done identiques.

SM-101/26 425
FIG. 4." Fonctions de reponse des detecteurs utilises pour la mesure des indices de spectre.
Le schema adopts resulte des considerations pratiques suivantes : - des detecteurs de fer et de cobalt, identiques aux moniteurs utilises dans la boucle, sont impropres aux raesures dans BR02 car leur activite est insuffisante
-les raesures dans BR2 fonctionnant a basse puissance sont effectu^es au moyen du modele nucl^aire de la boucle, mais l'utilisation des crayons fissiles reserves aux mesures est exclue ; deux irradiations a cette puissance sont effectuees, dans les conditions extr&nes d'epuisement des elements SVI.
L'application de la relation (3) (tableau II) a 1'irradiation du crayon UC-PuC dont il est question en 3.1. a donne s
i. = 0,60 + 0,02 P (In) m'&>'° t ^ ' 10 -24
d'ou
J6f(ln) fiti*e) fi (Fe) - 1'^ + 0,03 ; -7- (4,97 + 0,08) . 109
f \Jo
-?- - (1,19 + 0,06) . 10"15 j ^o
d'autre part, y f ^ » 1,10 + 0,03 ; d'ou
- 9—- (1,31 + 0,08) . 10"1-5
*Co

426 DEBRUE et al.
La puissance spécifique moyenne, au cours d'une irradiation à pleine puissance de durée T, au point le plus chaud du crayon est déterminée par
(i[ f£ dt). N5 E5 + Ц i£ dt) . H9 Es
T • ^ 0 -H 5 E 5 + T - ^ N
9E 9 (4)
4 La valeur maximum mesurée de A /T est de 2,00.10 desini/s.g.
pour une irradiation de durée unitaire ; d'où W a 1870 + 100 W/спг .
Remarques : 1) L'influence du rayonnement gamma créé dans l'ensemble du chargement de
BR2 apporte une contribution supplémentaire à la puissance spécifique maximum de 100 W/спГ environ.
2) Les résultats expérimentaux précités ont été rendus indépendants de la perturbation du flux provoqué par les crayons fissiles, à l'endroit où se trouvent les moniteurs ; les facteurs caractérisant cette perturbation sont donnés au paragraphe 4.2.
Les techniques employées pour la mesure des flux de fission, tant dans le réacteur BR02 que dans le réacteur BR2, ont été décrites antérieurement [lO] [il] [12] . Elles reposent sur l'utilisation d'installations (spectrometre $ dans la plupart des cas) calibrées à partir de l'irradiation des détecteurs considérés dans un convertisseur en uranium enrichi à 90 #, alimenté en neutrons thermiques par le réacteur BRI. L'intensité du spectre de fission fourni par ce convertisseur a été déduite de la mesure absolue du taux d*activation d'une série de détecteurs à seuil dont les sections efficaces sont les mieux connues.
Les détecteurs de cobalt sont mesurés par référence à des étalons, au moyen d'une chambre d'ionisation ou d'un compteur à scintillation.
4. TEST DES METHODES DE CALCUL
Les résultats expérimentaux ont été comparés aux prévisions théoriques en considérant séparément les caractéristiques suivantes :
1) le spectre sur l'axe du modèle nucléaire de la section en pile de la boucle, en absence de crayon combustible
2) les perturbations locales du flux neutronique, créées par la présence de ce crayon
3) la variation de la densité de puissance à l'intérieur du crayon 4) la puissance spécifique dans le crayon rapporté au flux thermique dans
les éléments combustibles SVT constituant le chargement du réacteur. La plupart des informations de nature expérimentale ont été obte
nues par les mesures dans le réacteur BR02.

SM-101/26 427
ji.l. Spectre neutronique sur l'axe du modèle nucléaire de la boucle. Le contrôle de la forme du spectre est basé sur la mesure d'une série de rapports de taux de réaction ou indices de spectre ; outre les réactions de fission dans l'uranium-235 et le plutonium-239» on utilise des réactions d'activation sensibles à des gammes d'énergie bien différenciées.
La figure 4 en est une illustration ; elle représente les fonctions de réponse
h (E ) . ( ° OJ- (E) fi (E) <BÂ Cq(Z)fi (E) dE (5) о So
des réactions utilisées, relatives au spectre calculé au moyen du code Mo-dic II (figure 3)# pour la réalisation à deux écrans, sans éléments SIII.
Le tableau III fournit les valeurs expérimentales et théoriques d'une série d'indices de spectre obtenus au moyen de ces mêmes réactions.
La calibration des installations de mesure des taux de fission et des taux d'activation pour les détecteurs résonnants est obtenue en irradiant les détecteurs dans une colonne thermique. Cette calibration repose sur la connaissance des sections efficaces thermiques ou sur des mesures absolues d'activité.
Pour les détecteurs à seuil, les mesures sont effectuées par référence au convertisseur (voir 3.2.) ; chaque taux de réaction est obtenu en multipliant le flux de fission mesuré par la section efficace moyenne, pondérée par un spectre de fission.
Dans la plupart des cas, les détecteurs fissiles ou résonnants se présentent sous forme d'alliage de manière à minimiser les corrections d'auto-protection.
Les valeurs théoriques, indiquées au tableau III, ont été calculées au moyen des sections efficaces ci-après :
235 239 1) Dans la première colonne (A), les sections de U et Pu proviennent
de la bibliothèque GAM [7] [8] ; dans la seconde colonne (B), les mêmes sections sont basées sur la bibliothèque GMS II.
2) Pour les réactions Au (n,$ ) et W (n, V ), on a procédé à l'évaluation des meilleurs paramètres caractérisant chaque résonance, à partir des informations les plus récentes ; ce travail d'évaluation est décrit aux références [13] et [l4]. Un code [15] a été élaboré pour calculer, sous forme multigroupe, les sections et les taux de réaction à partir de ces paramètres de base.
3) Les sections des réactions -*co (n, ^ ) et Mn (n, J ) sont celles de la bibliothèque GAM, sauf, en ce qui concerne le cobalt, pour le groupe contenant la résonance à 132 eV ; l'intégrale de résonance mesurée [lé] a, dans ce cas, été utilisée.
4) Pour les réactions à seuil, les sections de groupe sont calculées en pondérant les sections différentielles par le spectre de fission de l'uranium-235 [il] .
On peut déduire de la comparaison des résultats expérimentaux aux valeurs calculées les conclusions suivantes :
235 1) Les sections efficaces tirées de la bibliothèque GMS II, pour U et
Pu, fournissent une valeur de l'indice Pu/ U en bien meilleur accord avec l'expérience que les sections de la bibliothèque GAM .
2) Mis à part l'indice w/ ^ U , on constate une augmentation systématique du rapport théorie/expérience lorsque l'on considère successivement les

428 DEBRUE et al .
TABLEAU III. COMPARAISON DES VALEURS EXPERIMENTALES ET THEORIQUES DES INDICES DE S P E C T R E
Indice de spectre
2 3 9 ^ / 2 3 5 ^ 1 9 7 A u / 2 3 5 u
186и / 2 3 5 ц
5W2 3 5D 1 1 5 I n / 2 3 5 u
1 0 W 3 1 P 1 1 * b / 3 1 p
5W197Au
Valeur
expérimentale
1,10 + 0 , 0 ?
2 ,12 + 0 , 0 3
1,49 + 0 ,03
0 ,35 + 0 ,02
0,0^92 + 0,0012
( 5 , 8 + 0 , 2 ) . 1 0 - 3
32,8 + 1,3
7,46 • 0 , 2 3
0,0232 + 0 ,0005
(2 ,72 + 0 , 0 5 ) . 1 0 - 3
Valeur th
A*>
0,81
1,71
1,52
0 ,303
0,0462
5 , 8 4 . 1 0 - 3
29 ,8
7,29
0,0270
3 , 4 2 . 1 0 - 3
éorique
В
1,12 2 ,20 1.95 0 ,389 0 ,0593 7 , 5 0 . 1 0 - 3
29 ,8
7,29
0,0270 3 , 4 2 . 1 0 - 3
Valeur théorique Valeur expérimentale
A
0,735
0,81
1,02
0 ,865
0,940
1,01
0,9Ю
0,975
1,16 1,26
В
1,02 1,04 1,31 1,12 1,21 1,29
0 ,910
0 ,975
1,16 1,26
a) Voir t ex te p a r . 4. 1.
197 59 réaction Au, Со, -'-'Мп et In, rapportées à la réaction de réfé-rence U j ceci semble indiquer, étant donnée l'allure des fonctions de réponse, que le spectre calculé est relativement plus riche en neutrons d'énergies élevées que le spectre réel. Les valeurs des deux in
dices ^Rh/-51? et 115In/51P confirment ce effet, pour la partie
supérieure à 900 keV, seuil effectif du rhodium. L'indice ^°Pu/ ^ U , lui, est assez insensible à cette distorsion qui s'étend sur l'ensemble du spectre.
J>) L'écart que présente l'indice U, dans la suite des valeurs croissantes théorie/expérience considérées ci-dessus, peut être interprété par un effet de la résonance étroite que présente le cadmium à 18,5 eV [l7j ; cette résonance coïncide pratiquement avec celle du tungstène à l8,8 eV. Le calcul théorique décrit probablement mal cet effet, très localisé dans le spectre, dû à l'écran de cadmium sur le flux incident.
4) La connaissance des sections des matériaux de détection est évidemment essentielle s les conclusions obtenues quant au spectre calculé en dépendent directement.
Les causes possibles d'une surestimation de la dureté du spectre calculé ont été examinées. La manière de décrire la configuration de chargement du réacteur, en géométrie cylindrique, dans la partie entourant immédiatement la boucle (figure 2) n'est pas sans importance à cet égard. Pour le calcul du spectre examiné dans la présente comparaison, cette partie du chargement a été assimilée à une couronne ne contenant que des cellules chargées de combustible suivie, à l'extérieur, d'une couronne représentant les cellules contenant les pièces d'extension inférieures en béryllium des barres de contrôle. On obtient un spectre moins dur, et donc plus conforme aux mesures, en homogénéisant dans une seule couronne des cellules appartenant aux deux types précités. Ainsi, les valeurs du rapport théorie/ expérience citées dans la dernière colonne du tableau III deviennent s

SM-101/26 429
pour 2 5 9 Pu/ 2 5 5 U
nV235u U V 1 9 7 Au
: 1,02
: 1,19
: 1.12
On conserve l e m§me accord pour l e premier indice tandis que l ' accord e s t ara&Liore pour l e s deux de rn ie r s .
4«2<, Perturbat ion due au crayon combustible On a determine" l 8 inf luence de l a presence du crayon combustible
UC-PuC sur l e taux de r e a c t i o n mesure au moyen de d i f f e r e n t s d e t e c t e u r s , a l ' e n d r o i t ou sont loca l i ses l e s moniteurs de flux (parol exte*rleure du tube $ 20 - 22) . Toutes l e s valeurs sont no rma l i s e s a une mime i n t e n s i t e du flux en un point a. l 9 i n t £ r i e u r du modele nucl^aire (ou de l a boucle) , suffisam-ment eloign^ du crayon dans l e sens axia l e t done non perturb^ par c e l u i - c i .
Ces r£ su l t a t s sont necessaires a 1*application correcte de l a r e l a t i on (j$) du tableau I I (voir 3«2.) ; i l s penaettent d 'appr^cier 6galement l a va l id i ty du calcul Medic I I .
TABLEAU IV. PERTURBATIONS SPECTRALES CREEES LOCALEMENT A L'INTERIEUR DE LA BOUCLE PAR UN CRAYON COMBUSTIBLE UC~PuC
Reaction
59,
5 5 >
115
5^
7Co(nsY)
'Mn(neY)
In(n 8 n ' )
Fe(n,p)
Valeur experimental®
0,90
0,935
1,15
1,22
Valeur theorique
0,88
0,95
1,20
1,2^
Les valeurs exp^rimentales et theoriques sont presentees au tableau TV. Aux basses Energies, on constate une depression du flux tandis qu'aux hautes energies, la source neutronique que constitue le crayon pro-voque une augmentation du flux. Ces effets de variation sont bien d^crits par le calcul th6orique<,
4.3« Variation de la densite de puissance a l8interieur du crayon. La variation radiale de la density de puissance dans un crayon ir-
radie est un Element determinant de la distribution de la temperature. En raison de l1importance de cette caraeteristique, deux techniques expeVimen-tales bashes sur 1'irradiation de disques de mica places entre les pastilles combustibles ont £te mises en oeuvre. Les mesures sont effectuees dans le r^acteur BR02.
Les disques de mica, en contact direct avec le combustible, subis-sent 1*influence des produits de fission qui orient, d'une maniere tres localised, des defauts dont la densite est proportionnelle a la densite de fission [lgj.
L'epaisseur des disques utilises est de 0,045 mm. Apres irradiation, ils sont plonges pendant 40 minutes dans une solution d'acide fluor-hydrique qui agit comme "revelateur" des defauts et les rend propres au d6pouillement ; les deux techniques de d^pouillement sont les suivantes :

430 DEBRUE et al.
a) sur des photographies obtenues au microscope avec un agrandissement x 300, on effectue le comptage des traces ; la densité des traces est d'environ 10 /cm ; la surface des plages examinées individuellement suivant un diamètre est de 0,07 mm . Le parcours moyen des produits de fission dans le mica étant de l'ordre de 10 u , les deux faces peuvent é4re étudiées séparément.
b) on procède à une mesure de la densité optique au moyen d'un microphotomètre [19], d'une manière continue suivant une direction diamétrale du mica ; la plage analysée a une largeur de 2 u et une longueur de 1 mm.
Cette seconde technique a^été appliquée aux micas présentant la densité de traces d'environ 10 /cm , valeur optimum pour la première technique. Une densité plus élevée est toutefois souhaitable pour les mesures au moyen du microphotomètre.
1,6
1,5
1,4
1,3
1,2
1,1
1 :
0 1 2 3 U 5 5,35
FIG. 5. Variation radiale de la densité de puissance dans un crayon combustible UC-PuC.
La figure 5 présente, réunis suivant un rayon, les résultats obtenus par analyse de trois disques irradiés simultanément, à des niveaux différents, dans l'empilement de pastilles UC-PuC. Le comptage des traces a été effectué plusieurs fois au centre et à proximité du bord pour chacun des micas, ainsi que suivant un diamètre ; en microphotométrie, trois diamètres ont été explorés pour chacun des échantillons.
C'est à la périphérie du crayon que les résultats sont le plus su-Jets à des erreurs systématiques. Il est probable que la distribution réelle est encadrée par les deux courbes expérimentales moyennes correspondant à chacune des deux techniques d'analyse.
On peut en conclure que le creusement calculé par voie théorique est légèrement sous-estimé. L'accord est néanmoins très satisfaisant, eu égard à la méthode de calcul utilisée.
4.4. Puissance spécifique moyenne rapportée au flux thermique dans les éléments.
Le calcul M0DIC II, avec la bibliothèque des sections GAM, surestime d'une manière générale les valeurs des flux et des taux de fission à l'intérieur de la boucle. Cette surestimation est de l'ordre de 20 % dans l*exemple considéré. Cette valeur ne peut être déterminée en toute rigueur en raison de la descriptionde la configuration de chargement par un modèle géométrique cylindrique.
C'est en raison de cette surestimation que des contrdles expérimentaux sont effectués, comme indiqué au début du paragraphe 3.
Comptage de traces >—5—. Microphotométrie Courbe calculée
Rayon (mm)

SM-101/26 431
REMERCIEMENTS
Les auteurs remercient toutes les personnes qui ont contribué à la réalisation de ce travail, en particulier les ingénieurs et techniciens du Département Etude des Réacteurs, du Département des Etudes Technologiques et des Services Etudes et Exploitation de BR2.
R E F E R E N C E S
[il SOENSN, M., in Alkali Metal Coolants (Proc. Symp. Vienna, 1966), L J IAEA, Vienna (1967) 297, 391
i 21 Belgian Engineering Test Reactor BR2, Safety and Design, СEN/ L J Hep. BLO 59, May 1, I96I
SCK
3| MINSART, G., MOTTE, P . , "Analyse des p o s s i b i l i t é s d 'une i r r a d i a t i o n massive de combustible pour r é a c t e u r s r ap ides dans BR2, r é a c t e u r d ' e s s a i de matér iaux", ces comptes rendus, SM-lOl/24
M MC 1 J 1'
MOTTE, F. et al, "Etude des caractéristiques nucléaires de BR2 à aide de son modèle nucléaire BR02", 3e Conf int. util. éner. atom,
fins pacif. (Actes Conf. Genève, I964) ¿, Nations Unies, New York (1964) 33
[5] VAN ROOSBROECK, G. et al., MODIC II. Note interne CEN/SCK
[б] GRATTON, C.P., SMITH, P.E., GMS I - A generalized multigroup system of calculations using the IBM 7030 (STRETCH) computer. AEE Winfrith Rep. AEEW-M 458, February I965
[7] JOANOU, G.D. et al., Nuclear data for GAM-I data tape General Atomic Rep. GA-2451, August I96I
[8] JOANOU, G.D., DUDEX, J.S., GAM-I, A consistent P multigroup code for the calculation of fast neutron spectra and multigroup constants General Atomic Rep. GA-1850, June 1961
[9J SMITH, .R.W. et al., The F.D. 2 group averaged cross section set for fast reactor calculations. AEE Winfrith Rep. AEEW-R 491, August I966
[lO] FABRY, A., The Monitoring of Radiation Damage Experiments in high Flux Reactor BR02, Grenoble, November 15-17, I965
[ll] FABRY, A., Neutron Spectrometry in BR2 Reactor by means of Activation Threshold Detectors, Berkeley Castle, Berkeley, Glos, 12-16 September 1966
[12] FABRY, A., Procedure for the Determination of Fast Neutron Spectra in Zero Power Reactor by means of Activation Threshold Detectors, Brussels, 9 February 1966
[13] DAMLE, P.P., FABRY, A., VAN DEN BROECK, H., An evaluation of Nuclear Data for some Activation Detector useful in Thermal and Epithermal Spectral Indices Measurements, BLG 423/67

432 DEBRUE et al.
[l4j FABRY, A„, et LANGELA, D., Evaluation of Multigroup Cross Sections for Activation Detectors,, Rapport interne CEN
[15] DECKERS, H., CROCUS, A Code for the Calculation of Resonance Cross Sections and Resonance Reaction Rates. Rapport Interne CEN
[l6] CARRE, J.C., VIDAL, fi., "Mesures des sections efficaces et des intSgrales de resonance par la methods d'oscillation", Nuclear Data for Reactors (C.r. Conf. Paris, 1966) JI, AIEA, Vienna (1967) 479
fljl BAUMANN, N0P0, Resonance Integral and Self-Shielding Factors for Detector Foils, DP-817 - E.I. du Pont de Nemours & Co, Savannah River Laboratory, Aiken, South Carolina, January 1963
[_l8j MORY, J.j Sur quelques utilisations de l'enregistrement des fragments de fission dans les isolants, CEA - R2846, 1965
[19] TUYN, J.W.N., Solid State Nuclear Track Detectors in Reactor Physics J Experiments, Nucl. Applic. £ (1967) 372

KINETICS
(Session V)

Chairman: F, STORRER
28*

ALPHA DETERMINATION FROM TRANSFER FUNCTION, OBTAINED BY PULSED NEUTRON ANALYSIS*
W. ROTTER CENTRE D'ETUDE DE L'ENERGIE NUCLEAIRE,
MOL-DONK, BELGIUM
Abstract
ALPHA DETERMINATION FROM TRANSFER FUNCTION. OBTAINED BY PULSED NEUTRON ANALYSIS. Measurements in a sub-critical lattice have shown that the spatial dependence of the transfer functions is the same, whether they are determined by modulating a neutron source or by analysing the pulsed neutron response. When defining a transfer function for prompt neutrons, its spatial dependence can be eliminated to a high degree if only the harmonic free part of the pulse response is used for the analysis. The decay constant a can be determined from these 'reduced' prompt transfer functions. The sensitivity of this method on systematic deviations from the pure exponential decay offers some valuable checks in the interpretation of pulsed neutron experiments. Also the constant background, i . e . the delayed neutron tail can be determined with high accuracy. The elimination of the spatial dependence in the transfer functions results in a correction factor for the time integral of the prompt neutron response. When it is applied to Sjostrand's area ratio, the corrected value is in rather good agreement with the extrapolated area ratio (Gozani) and the reactivity obtained by the kB/S method of Garelis-Russell.
1. INTRODUCTION
In a recent, paper Russell et al. [1] have shown that the (total) transfer function (T. F . ) of a reactor for a neutron source can be derived from a pulse measurement, and that this transfer function agrees with the T .F . measured by source modulation. These two transfer functions show the same spatial dependence.
This paper outlines, on the basis of the work cited, how the spatial dependence of the transfer functions can be eliminated. The determination of the prompt decay constants a from these harmonic free transfer functions constitutes one of the practical consequences of the method. By the same procedure the constant delayed neutron tail can be evaluated with high accuracy.
2. SOURCE TRANSFER FUNCTION
A detector at a certain distance from a neutron source has a probability P(t) of detecting one emitted neutron after a time t. If the source has a (time-dependent) intensity S(T), the counting rate of the detector will be
t
D(t) = AS(T) P(t-r)dT (1)
* EURATOM; contract 001-64-1 TRUB between Euratom and Association Centre d'Etude de l'Energie Nucleaire/BelgoNucleaire.
435

436 ROTTER
P(t)
FIG. la. Detection probability P(t) for a single neutron.
FIG. lb. Detector counting rate for periodically pulsed neutrons.
The detection probability P(t) is the sum of two terms Pp(t) and P<j(t), referring to prompt and delayed neutrons respectively (Fig. la). The integrated detector response after a single short neutron pulse (6-function) is
D(t)dt P (r)dr + Pd(r)dr P d
(2)
Pulse experiments are usually performed at a constant repetition rate. If we respect the condition l / a x «. T « l /Xj , where T is the repetition period, at-y is the decay constant of the fundamental mode of prompt neutrons, and A. is the decay constant of the delayed neutron group i, and if we are measuring under steady state conditions, the repetition process does not disturb the time dependence of Pp(t) (Fig. lb). Also the integral
P d ( r )d r=A d

SM-101/28 437
i s re ta ined and has now the form A$ = T B , where B i s the counting ra t e of the constant pa r t of the pulse r e sponse ( i . e . of the delayed neutron ta i l ) . The constant de tec to r answer B for the delayed neut rons now also makes it poss ib le to de t e rmine the ' p rompt ' counting r a t e by a s imple subt rac t ion of B from the total counting r a t e .
2 . 1 . Source t r a n s f e r function for prompt neut rons
Always with the condition T = 2n/ u « 1/ X{, we will now r e s t r i c t our cons idera t ions to prompt neu t rons only.
A s ine-modula ted neut ron sou rce can be r e p r e s e n t e d by
S ( T ) = S + A S e j t J r (3)
During the m e a s u r e m e n t of a l a rge number of complete p e r i o d s , the de tec to r counting r a t e for p rompt neut rons i s
Dp(t) = S / Pp(r)dT + ASe j w t / Pp(r) e-jWTdT (4)
= D + AD e j w t
p P
By analogy with the no rma l i zed total sou rce T . F . for a r e a c t o r [2] we now define a normal i zed t r a n s f e r function for p rompt neut rons
* _ AD p /D p R P ( t 0 ) " A S / 5
which i s independent of the sou rce intensi ty and the number of accumulated p e r i o d s . Where
Dp = S / Pp(r)dT = S A p (4a)
and
ADp = AS / e" j W TPp(T)dT
o
the r e a l pa r t of the prompt T . F . i s
00
AS / P (T) (cos U T - j sinidT) dT (4b)
R p ( u ) = (5)

438 ROTTER
where
G. = / P (T) COS u r d r = in -phase component
G = - / P P ( T ) sin UT dT = out -of-phase component
o
2 . 2 . The total source T . F . for a r e a c t o r
Considering now all neut rons , only the t ime- independent pa r t of Eq. (4) must be completed. We have
D = S ( A p + A d )
and the total t r a n s f e r function is then
[ G 2 ( u ) + G 2 » ] 1 / 2
R(u) = m . ™ = Rp(u)M (6) A p + A d
where M = A p / (A p + Ad). As pointed out in [2] , the amplitude of the to ta l T . F . can be re la ted to the reac t iv i ty for an opt imal frequency u by
_ R(u)
1 - R(u)
The deviation of the r e a l frequency u from u gives only sma l l e r r o r s for shor t neutron l i f e - t imes . F o r s m a l l u we have indeed (Eq.(6)) :
2 2
Gout(u) <JC G in (u) and Rp(u) « 1. In this ca se p = Ap /Ad , which ag ree s with
SjSs t rand 's in te rp re ta t ion [3] .
2 . 3 . T . F . m e a s u r e m e n t s
The normal ized t r a n s f e r function can be m e a s u r e d d i rec t ly , point by point, by a s ine-modula ted source [2, 4 ] , if one u s e s different f requencies for each m e a s u r e m e n t . Equation (4b) shows that it i s also poss ible to calculate the T . F . from pulse m e a s u r e m e n t s , because the t ime behaviour of Pp(t) i s known. With l/a1 <3CT« l / X j we can rep lace the i n t eg ra l s from Eqs (4a) and (4b) by s u m s :
'max
Gin = \ (Cj - B) cos u t At j=l
G = ) (c. - B) sin u t At out / , J
j=l

SM-101/28 439
and Jmax
A P = X (CJ - B > A t
j - 1
where Cj is the dead-time-corrected counting rate in channel number j (counts/sec), j m a x is the total channel number, covering the whole period T, B is the delayed neutron tail of the reactor response (counts/sec), At is the channel width (sec), t is the (j - 0.5) At = time assigned to channel j (sec), and to is the arbitrary frequency (rad/sec).
The arbitrary frequencyu in the weighting functions (cos ut) and (sinut) simulates the source frequency. The range of u is limited for high frequencies on the channel width and on statistical fluctuation. Very low frequencies do not take the influence of delayed neutrons on the T. F . into consideration. But just the interesting part of the transfer function can be derived, and this from only one measurement. Therefore only pulse measurements will be considered in what follows.
3. THE FUNCTION Pp(t)
Till now no assumption was made about the function Pp(t). Experimental values were used for the calculation of the transfer function, found by subtraction of the constant delayed neutron tail from the total counting rates. At this stage we will assume that the time-dependent reactor response to a source pulse can be represented by a single exponential ( i .e . harmonics are neglected or eliminated)
Pp(t) = X i e - a i t (7)
The integrated and normalized detector response is
S J 1 en o l
Relating this to the constant delayed neutron 'background' we find Gozani's extrapolated area ratio [5] :
Xjcn
Substituting Eq.(7) into Eqs (4a) and (4b) gives the amplitude of the prompt T . F . for an exponential response:
V 1 + w2/a J

440 ROTTER
Two impor tant consequences follow from this express ion : (1) the ampl i tude Xj of the single exponential does not appear in the prompt T. F . , and (2) because a1 should not va ry in space , the prompt T . F . should also be spat ial ly invar iab le .
4 . EVALUATION OF THE DECAY CONSTANT a FROM THE MEASUREMENTS
Because of the difference in the decay constants , the ha rmon ic s in the pulse response will genera l ly d i sappea r after a ce r t a in waiting t ime tE . F o r t > t£ the remain ing prompt neutron population will decay in these c a s e s exponentially with a single decay constant a1# The t ime behaviour of th is harmonic free pa r t of the pulse response should be r e p r e s e n t e d by Eq . (7 ) .
Calculating the prompt T . F . , Eq . (5) , from the r e a c t o r response for E
f > t£J Rp(w), we should obtain a unique T . F . at all de tec tor locat ions .
The shape of this T . F . should also ag ree with the theore t i ca l cu rve .
Knowing Rp(u), a1 can be de termined from Eq . (8 ) . A suitable frequency has to be selected for this purpose . By requi r ing that a^ be independent from the delay t ime tE in the region of the exponential decay, the background due to the delayed neutron amplitude can be evaluated quite a c cura te ly . With the resu l t ing value of the delayed neutron ampli tude, it i s now poss ible to check that the shape of the prompt t r ans f e r function for a single exponential sa t i s f ies Eq. (8) over a wide range of f requencies .
5. EXPERIMENTAL INSTALLATION
The procedure descr ibed for analysing the pulse r e sponse was used for the exper imenta l r e s u l t s , obtained on a highly undermodera ted l a t t i ce :
la t t ice pitch 10.8 mm
/ V ( H 2 0 ) \ mode ra to r ra t io ) 1.5
VV(fuel)/
configuration cyl indr ica l and square fuel UOs
externa l d i ame te r of the fuel pins 8.5 mm fuel height in the fuel pins 100 cm enr ichment 7% 235U
The neutron source (Phil ips sealed tube, max .y ie ld :2X 10⁹ n / s e c ) was insta l led in the HgO ref lec tor at midplane, 32 cm from the lat t ice c e n t r e .
Within the la t t ice , a BF3 de tec to r (5 cm active length, 7-in. d iamete r ) was used for the m e a s u r e m e n t s at different locations on the x-ax is (Fig . 2), and at X = - 5 along the y - and z - a x i s . Reflector m e a s u r e m e n t s w e r e made with a 1-in. BF3 de tec tor ; the monitoring was done with a BF 3 de tec tor in the re f lec tor . The de tec tor impulses were s tored in a 400 mult ichannel ana lyse r (Intertechnique); the shor tes t measur ing t ime was 20 /us/channel.

SM-101/28 441
0.5-
0.1
-20 10 n t - 0 5 10 ''' BF3 '' 1/Ain
CORE
^ X 20
SOURCE
REFLECTOR
FIG. 2. Experimental layout.
TRANSFER FUNCTION R(uj)
MODULATED NEUTRON SOURCE
PULSE ANALYSIS
BF3 POSITION
T
N = 488
- CO (S"T) 10"
FIG. 3. Transfer functions in a subcritical cylindrical lattice of N = 488 fuel elements, measured at different detector positions along the x-axis at midplane.
The neutron yield of the source was adapted to the counting rate of the detector in such a manner that the dead-time correction never exceeds a few per cent.
Besides the pulse measurements, sine modulation and step variation (modified source-jerk method) were used as described in Ref. [2].

442 ROTTER
Urns) 1.5
FIG. 4. Prompt counting rates at different detector positions (N = 488).
4500
4000
3500
3000
2500
N = 488
•=(X=+20) V = (X = + 10) +;(X.-±0 ) A=(X=_11 ) (MX =.20)
At = 20/us/channel
20 30 40 50 60 70 80-
FIG. 5. Decay constants a found by starting exponential fitting of measured counting rates at different channel numbers E.
6. EXPERIMENTAL RESULTS
We will first discuss some measurements on a cylindrical lattice of N = 488 fuel elements (critical size: N = 740). The fuel-charged region of the lattice ranged from X = - 1 2 t o X = +12.
For different detector locations on the x-axis the transfer function was measured by modulating the yield of the neutron source sinusoidally.

SM-101/28 443
Rr
0.5
0.1
•^a»j.
o v MODULATED NEUTRON SOURCE
PROMPT T.F RpM(CORE)
PROMPT T.F Rp(uu)(REFLECTOR)
Rp(uu) FOR X< + 10
R ^ ( U J ) FOR X = + 10
N=488
OJ (S1) 104 10°
FIG. 6. Prompt transfer functions (N = 488).
The die-away curves have been measured by pulsed neutrons under the same condition. In Fig. 3 the experimental points of the (total) T . F . measured by the oscillatory neutron source are compared with the transfer functions R(u) obtained by analysis of the total pulse response Eq. (6). We note that both T . F . measurements exhibit the same frequency and spatial dependence.
The usual fitting of the total pulse response by a function f(t) .= X1 exp (-ait) + B gives X^ a1 and B for t >tE . If B is subtracted from the counting rates, the time behaviour of the prompt neutron population remains. Figure 4 shows some experimental results for different detector locations. The prompt neutron decay curves were normalized at t = 1.4 msec. The shape of these curves is typical: near the source the measured points exceed the single exponential term and approach the fundamental mode only after a very long waiting time. On the other side of the reactor the counting rates rise slowly and approach the fundamental mode from below; Between both a nearly exponential decay after a short waiting time is reached: the waiting time tE is a function of the detector location. With a convenient choice of the waiting time tE (corresponding to a channel number E of the multiscaler) the harmonics are eliminated to a great extent.
Starting at different channel numbers E [6], the fitting gives a series of o-(E) from which an asymptotic value aK can generally be derived. A typical set of processed data is shown in Fig. 5. Only the measurements at X = +20 do not define an a^. All other measurements lead to asymptotic values that are, however, still slightly different from each other. The spatial dependence has thus not been eliminated completely.
Deriving the prompt transfer function from the same part (t >tE) of the decay curve provides another check on the presence of any harmonics remaining after tE . Figure 6 compares the prompt transfer function Rp(w) of the complete reactor response (0 ^ t $ T) with the prompt transfer

444 ROTTER
<x(S1)
3000
h:
50
40
30-
20
10
200O1.0-
1000 Q5
*£
i-hk SW
-20 -15
REFLECTOR
1 • 10 -5 0 +5 +10
N=A88
•=<*T.F
"M N
V / / / / / .* / / /
_; / Ds/SJOSTRAND •'/ V S / U R E L I S -v .RUSSELL
A= SxAkj
REFLECTOR
X
-20 -15 -10 -5 0 +5 +10 +15 +20 SOURCE
FIG. 7. Spatial dependence of the decay constant a, the reactivity and the reactivity correction factor S (N = 488).
function Rp(w) computed from the part t > tE of the decay curves. All
transfer functions Rp(w) measured at detector locations X< +10 fall very
closely together, as marked in Fig. 6. The dotted line inside the marked region gives the transfer function corresponding to the characteristic decay constant of this configuration.
A decay constant a™ is now computed with help of the prompt transfer
function Rp(w) for t > t£(Eq.(8)). The employed frequency was w »* 0.1 oe1 as
used throughout the whole computation. Figure 7 compares some of these aTF with those found by fitting {aK ) . The two series of decay constants show nearly the same values for a wide range of detector positions X. In the neighbourhood of the neutron source, the fitting results in a rather pronounced spatial variation of the a 's in the reflector. The standard deviations of the fitted values a , in the reflector (2%) do not differ significantly from those of the core measurements (1%). One could be tempted to assign equal importance to all measurements.
The transfer function can give us some more information. Because of the integration (see section 2.3) of the weighted experimental values, the influence of the statistical fluctuation on the shape of the transfer function is much smaller than in the exponential fitting. Systematic deviations from the single exponential decay can, therefore, be seen more
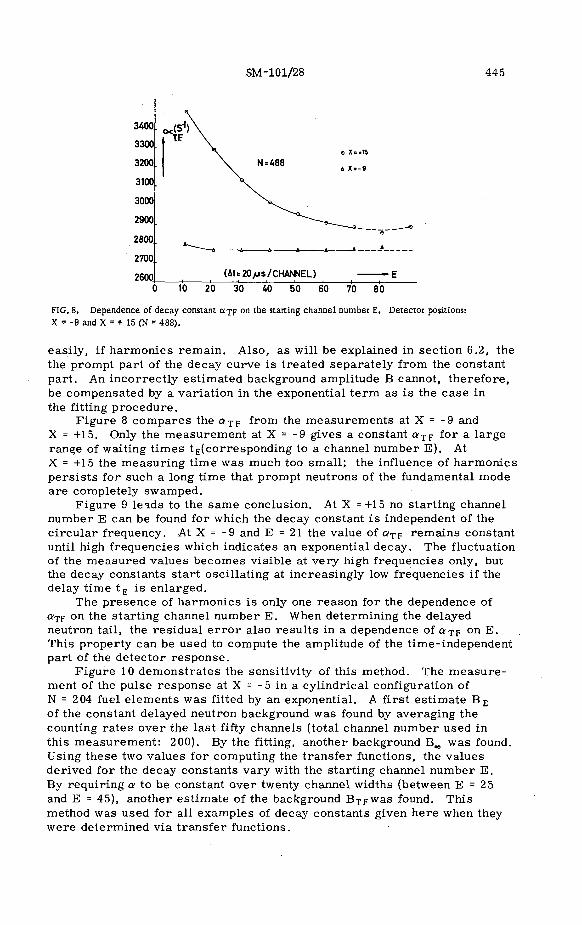
SM-101/28 445
3400
3300
3200
3100
3000
2900
2800
2700
2600 (AU20>us/CHAhNEL)
0 10 20 30 40 50 60 70 80
FIG. 8. Dependence of decay constant ajp on the starting channel number E. Detector positions: X = -9 and X = + 15 (N = 488).
easily, if harmonics remain. Also, as will be explained in section 6.2, the the prompt part of the decay curve is treated separately from the constant part. An incorrectly estimated background amplitude B cannot, therefore, be compensated by a variation in the exponential term as is the case in the fitting procedure.
Figure 8 compares the aT F from the measurements at X = -9 and X = +15. Only the measurement at X = -9 gives a constant aT F for a large range of waiting times tE(corresponding to a channel number E). At X = +15 the measuring time was much too small; the influence of harmonics persists for such a long time that prompt neutrons of the fundamental mode are completely swamped.
Figure 9 leads to the same conclusion. At X =+15 no starting channel number E can be found for which the decay constant is independent of the circular frequency. At X = -9 and E = 21 the value of <*TF remains constant until high frequencies which indicates an exponential decay. The fluctuation of the measured values becomes visible at very high frequencies only, but the decay constants start oscillating at increasingly low frequencies if the delay time tE is enlarged.
The presence of harmonics is only one reason for the dependence of Q-TF on the starting channel number E. When determining the delayed neutron tail, the residual e r ror also results in a dependence of a T F on E. This property can be used to compute the amplitude of the time-independent part of the detector response.
Figure 10 demonstrates the sensitivity of this method. The measurement of the pulse response at X = -5 in a cylindrical configuration of N = 204 fuel elements was fitted by an exponential. A first estimate B £ of the constant delayed neutron background was found by averaging the counting rates over the last fifty channels (total channel number used in this measurement: 200). By the fitting, another background Bw was found. Using these two values for computing the transfer functions, the values derived for the decay constants vary with the starting channel number E. By requiring a to be constant over twenty channel widths (between E = 25 and E = 45), another estimate of the background BT Fwas found. This method was used for all examples of decay constants given here when they were determined via transfer functions.

446 ROTTER
FIG. 9. Variation of decay constants a using different circular frequencies in the prompt transfer functions.
a*. B
o(S1)
5000
4500
4000
N=204
| X= - 5 |
*
o.(E)
1.05
1.00
Q95
0.9
5000
4500
4000
3500
3000
2500
2000,
0 , J 10 20 30 40 50 60-o<(5 )
• TF
WITH BTP= 1.0042 B _
= * s r = ^ — - + F * ^ "~^WITHB«_
-WITH Be
10 20 30 40 50 60 E
FIG. 10. Dependence of decay constants aT F on the subtracted constant amplitude B.
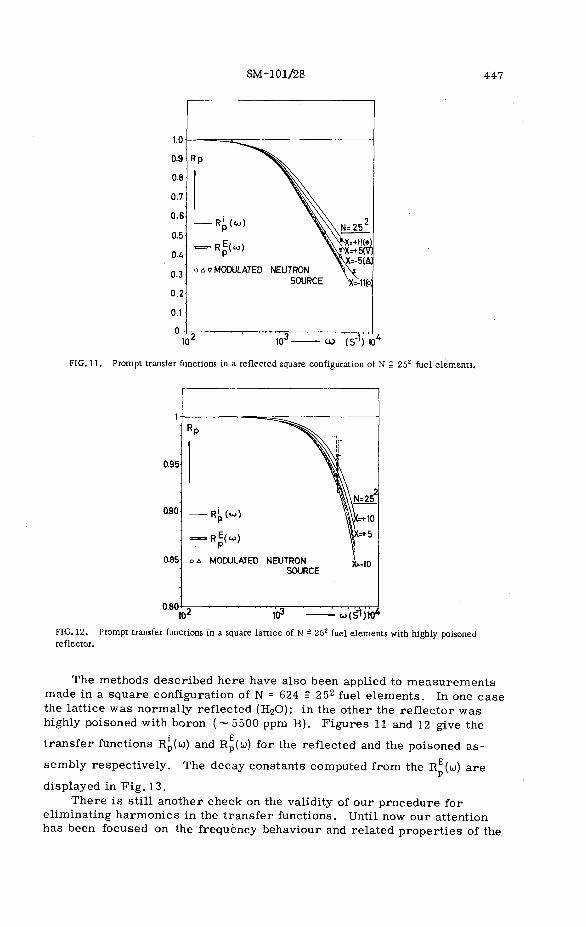
SM-101/28 447
1.0
0.9
0.8
0.7
0.6
0.5
0.4
0.3
0.2
0.1
0
Rp
RE(co)
OAVMODULATED NEUTRON SOURCE
10' CO (S~1) 10
FIG. 11. Prompt transfer functions in a reflected square configuration of N = 25z fuel elements.
0.95
Q90
0.85
0.80 — «(s'iJKr
FIG. 12. Prompt transfer functions in a square lattice of N = 252 fuel elements with highly poisoned reflector.
The methods described here have also been applied to measurements made in a square configuration of N = 624 = 252 fuel elements. In one case the lattice was normally reflected (H20); in the other the reflector was highly poisoned with boron (~5500 ppm B). Figures 11 and 12 give the
transfer functions RJ,(w) and Rp(u) for the reflected and the poisoned as
sembly respectively. The decay constants computed from the RE(w) are
displayed in Fig. 13. There is still another check on the validity of our procedure for
eliminating harmonics in the transfer functions. Until now our attention has been focused on the frequency behaviour and related properties of the

4 4 8 ROTTER
12000
10000]
8000
cx(S-1)
1800
1600
uoa
1200
ifS"1)
I
N=25'
BORON POISONED
REFLECTOR
- 5 0 +5
N=25*
CORE
-~x SOURCE
i REFLECTOR
-20 -15 -10 -5 0 +5 +10 +15 +20 +25 SOURCE
FIG. 13. Decay constants a x F i n t n e square configuration N - 252 with poisoned and unpoisoned reflector.
-20 -15 -10
FIG. 14. Distribution of the 'prompt' area Ap and the 'delayed' area A^ in the cylindrical configuration of N = 488 fuel elements.
normalized prompt transfer function. The consequences on reactivity determination are also worth investigating.
The ratio of the time integrals of the prompt to delayed responses gives the SjSstrand expression for the reactivity PSj = Ap/Ad. This was related in section 2.2 to the.amplitude of the total transfer function if a convenient circular frequency was used:
R 1 ^ -*u t j V * o 1 / ^ AP j ^ ; with R (u) = Rp(u) 1-R l(w) P d

SM-101/28 449
Midplane 10
FIG. 15. Spatial dependence of reactivities and decay constants along the z-axis in the reflected square configuration of N - 252 fuel elements.
As shown in F ig . 7, the values of pSj have a very marked space dependence which is due to the p r e s e n c e of h a r m o n i c s . F igu re 14 i l l u s t r a t e s the well-known fact that these ha rmon ics a r e mainly p resen t in the prompt a r e a . To reduce the influence of these ha rmonics the prompt a r e a has to be adjusted. We look for a co r r ec t ion factor S to convert th is p rompt a rea , which contains all ha rmon ics
(A, 1 X./a.
i = 1, 2, 3
into the prompt a r e a of the fundamental mode Xjoty S can thus be in te r pre ted by S = (X1/a1)/{LXi [ ) and we get a c o r r e c t e d reac t iv i ty
SA r
A, P = RE(<3)
l - R E ( u ) ' with R (u) ^ ' F T 2
P a
The definition of S is given by
P
RP(<3) 1-Rp(c3) A^ i / l -Rp((3)
Rp(u) l-REp(u>) Ap R i ( f i ) V l RE(u)
The impor tan t t e r m for the e l iminat ion of ha rmon ic s i s given by
i - RP(<3)
l - R (t5) P
Computing the S values for each m e a s u r e m e n t in the cyl indr ica l configuration of N = 488, we obtain the r e su l t s p resen ted in F ig . 7. Multiplying the a r e a ra t ios of Sjfistrand with S, we get the co r r ec t ed reac t iv i t i e s p* = S p i . They a r e nea r ly constant over a l a rge pa r t of the r e a c t o r c o r e
29

450 ROTTER
with exception of the regions in the vicinity of the boundar ies . F u r t h e r m o r e they agree quite well with the reac t iv i t i e s calculated by the kj3/i method of Gare l i s and Russe l l [7 ] . This lends some evidence to the conjecture that both methods e l iminate the ha rmonics to the same extent .
Another in te res t ing example is displayed in F ig . 15. It was obtained in the square configuration N = 25 2 (wi th HjO ref lec tor ) . The m e a s u r e m e n t s w e r e made at X = -5 and at different d i s tances of Z from the midplane . We note that pSj = S pS j , i . e . S = 1, in the region where the node of the th i rd harmonic can be expected.
7. CONCLUSION
It has been i l lus t ra ted exper imenta l ly that the spat ia l dependence of the t r a n s f e r functions is re la ted to the t r ans ien t behaviour of the p rompt neut rons immedia te ly after a neutron pulse . Using only the exponential pa r t of the decay curve , a nea r ly spa t ia l independent t r a n s f e r function for p rompt neut rons can be der ived . The decay constants a can be computed from this ' reduced 1 t r a n s f e r function.
The high sensi t ivi ty of the prompt t r ans fe r function on sys temat ic deviations from the exponential law offers a valuable check in the in te r pre ta t ion of the decay curve of the prompt neutrons , which is of g rea t help in the compar i son of a m e a s u r e m e n t s made at different de tec tor locat ions .
In addition,the constant par t of the r e a c t o r r e sponse can be de termined with high accuracy . This leads to a higher p rec i s ion in react iv i ty m e a s u r e ments , especial ly in the p re sence of a high na tura l background, as i s the ca se with plutonium-fuelled a s s e m b l i e s .
The el iminat ion of the spat ia l dependence in the t r a n s f e r function s t i l l has another consequence: knowing the ampli tudes of the t r ans f e r functions with and without ha rmon ics , a co r r ec t ion factor can be found which r e m o v e s the d iscrepancy between the reac t iv i t i e s obtained by using the a r e a ra t io (SjOstrand) on the one hand, and the extrapolated a r e a ra t io (Gozani) o r the k/3/i> method (Gare l i s and Russel l ) on the other hand.
A C K N O W L E D G E M E N T S
The author wishes to acknowledge gratefully Eura tom, the SCK-CEN (Mol) and BelgoNucleaire , more especial ly M e s s r s . P . Kruys, F . Motte and J . Debrue, for the i n t e r e s t shown in the p re sen t work and for the help given in achieving i t .
Thanks a re equally due to the m e m b e r s of the mixed group (SCK-CEN)-BN who have col laborated in the m e a s u r e m e n t s , to M. R. Blyau for e s tabl ishing the n e c e s s a r y computer p r o g r a m m e s and to all the col leagues of the Reac tor Phys ics and Applied Mathemat ics sec t ions who have always kindly ass i s t ed m e . The author also thanks M e s s r s . N. Maene and P . Vandeplas for s t imulat ing d iscuss ions and many helpful sugges t ions .
29*

SM-101/28 451
R E F E R E N C E S
[1] RUSSELL, J.L. , Jr., ROTTER, W., Interrelation of kinetic experiments, to be published in Nucl. Sci. Engng.
[2] ROTTER, W., "Mesures au moyen d'une source pulsee et modulee dans un reacteur" Pulsed Neutron Research £(Proc . Symp. Karlsruhe. 1965), IAEA, Vienna (1965) 775.
[3] SJOSTRAND, N.G. Measurements on a subcritical reactor using a pulsed neutron source, Ark. Fys. 1113(1956).
[4] ELENGA, C.W., REIFENSCHWEILER, O., "The generation of neutron pulses and modulated neutron fluxes with sealed-off neutron tubes", Pulsed Neutron Research 2 (Proc. Symp. Karlsruhe, 1965), IAEA, Vienna (1965) 609.
[5] GOZANI, T. , The Theory of the Modified Pulsed Source Technique, EIR-Bericht Nr. 79 (1965). [6] BACH, D.R., BUNCH, S.I., CERBONE, R.J.. SLOVACEK, R.E., Prompt neutron decay constants in
multiplying hydrogeneous media, Nucl. Sci. Engng 11 (1961) 199-210. [7] GARELIS, E., RUSSELL, J.L. , Jr. , Theory of pulsed neutron source measurements, Nucl. Sci. Engng
lj6 (1963) 263-70.
D I S C U S S I O N
F. EBERSOLDT: You have assumed an exponential decay for the neutron population to be detected, though I believe that the regions studied were highly sub-critical. If this is the case, it no longer seems justifiable to assume single-mode decay. Have you calculated or estimated the e r ror in the detected neutron balance introduced by suppression of the other modes? What were the keff values of the regions investigated?
W. ROTTER: The sub-critical value of the lattice was 9.3 $. The method has also been applied to a lattice of 204 fuel rods (with a sub-critically of ~25 $) with the same success, since we did not 'assume' exponential decay; only that part of the decay curve (after a certain time-lag tE) where the curve appears to be exponential was used. The 'reduced' transfer function Rp(w) then indicates whether the decay curve is in fact a pure exponential or not.


TIME-DEPENDENT SN CALCULATIONS DESCRIBING PULSED SOURCE EXPERIMENTS AT THE FRO REACTOR
A. BERGSTROM, J. KOCKUM AND S. SODERBERG
RESEARCH INSTITUTE OF NATIONAL DEFENCE,
STOCKHOLM*
Abstract
TIME-DEPENDENT SN CALCULATIONS DESCRIBING PULSED SOURCE EXPERIMENTS AT THE FRO REACTOR. In view of the difficulties in describing pulsed source experiments quantitatively in assemblies consisting of a fast core and a light reflector, a time-dependent Sfj code has been applied to this type of assembly. The code, written for the IBM 7090 computer, divides time into short intervals and computes the flux in spherical geometry for each interval using the Carlson S4 scheme. The source term is obtained by extrapolation from two earlier time-intervals. Several problems in connection with the discretization of the time, space and energy dimensions are discussed. For the sub-critical assembly studied the treatment of the lower energy-groups is decisive for the numerical stability. A 22-group cross-section set with a low energy cut-off at 0.04 eV obtained with the SPENG programme has been used. The time intervals are varied continuously and are set proportional to the inverse of the maximum logarithmic time-derivative of the space and energy-dependent flux with the further restriction that they are not allowed to increase above a predetermined value. In a typical case, the intervals vary between 10"9 and 10"8 sec. The memory of the computer is fully exploited when 22 energy groups and 46 radial points are used. The computing time for each time-interval is about 6 sec. The code has been applied to a 3.5% sub-critical assembly consisting of a 20% enriched, spherical uranium metal core with a thick copper reflector and the calculations have been compared to experiments with good agreement. The calculations show that spectral equilibrium below 10 keV is not reached until times long compared to the usual measuring times and that the exponential decay finally reached is entirely determined by reflector properties at almost thermal energies. It is also shown that the simple one- and two-region models are inadequate in this case and that no time-independent prompt neutron life-time can be obtained from the measurements.
1, Introduction
Pulsed source experiments in multiplying systems have usually been analyzed with the point reactor model. In this model it is assumed that spectral equilibrium is attained rapidly throughout the reactor and that the measured decay of the neutron population is given by the same exponential (except for rapidly decaying higher modes) independently of the spectral sensitivity and the position of the detector used. The decay constant is in this model a simple function of the reactivity of the system, the effective delayed neutron fraction and the mean prompt neutron lifetime vhich are all easily defined parameters.
Brunson, Huber [l] and Waltar, Ruby [2], respectively, have reported
experiments on heavily reflected systems characterized by very unequal
neutron life-times in core and reflector, taken separately. In these cases,
the simple point reactor model has turned out to be inadequate, but the ntvo-point model" proposed by Conn [3] seems to be able to explain the
experimental results. In this model, core and reflector neutron popula
tions are treated separately. Besides the core multiplication constant, «
interaction parameters between core and reflector populations and separate
neutron life-times have to be defined. These parameters are supposed to be
time independent. The model predicts a prompt neutron decay characterized
* Experimental work performed at AB Atomenergi, Studsvik, Nykoping, Sweden.
453
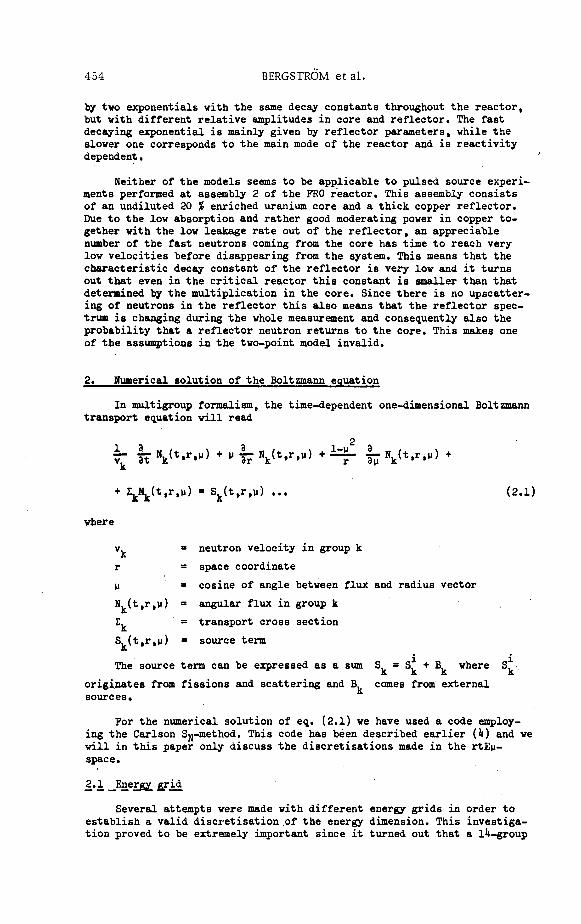
454 BERGSTROM et al.
by two exponentials with the same decay constants throughout the reactor, but with different relative amplitudes in core and reflector. The fast decaying exponential is mainly given by reflector parameters, while the slower one corresponds to the main mode of the reactor and is reactivity dependent.
Neither of the models seems to be applicable to pulsed source experiments performed at assembly 2 of the FRO reactor. This assembly consists of an undiluted 20 % enriched uranium core and a thick copper reflector. Due to the low absorption and rather good moderating power in copper together with the low leakage rate out of the reflector, an appreciable number of the fast neutrons coming from the core has time to reach very low velocities before disappearing from the system. This means that the characteristic decay constant of the reflector is very low and it turns out that even in the critical reactor this constant is smaller than that determined by the multiplication in the core. Since there is no upscatter-ing of neutrons in the reflector this also means that the reflector spectrum is changing during the whole measurement and consequently also the probability that a reflector neutron returns to the core. This makes one of the assumptions in the two-point model invalid.
2. numerical solution of the Boltzmann equation
In multigroup formalism, the time-dependent one-dimensional Boltzmann transport equation will read
* ZkNk(t,r,y) » Sk(t,r,u) ... (2.1)
where
v, = neutron velocity in group k
r = space coordinate
\i = cosine of angle between flux and radius vector
N, (t,r,u) = angular flux in group k
I = transport cross section
S (t,r,u) = source term
The source term can be expressed as a sum S = S, + B, where S
originates from fissions and scattering and B comes from external sources.
For the numerical solution of eq. (2.1) we have used a code employing the Carlson S^-method. This code has been described earlier (k) and we will in this paper only discuss the discretisations made in the rtEy-space.
£»i _%e£Ky. gfid
Several attempts were made with different energy grids in order to establish a valid discretisation of the energy dimension. This investigation proved to be extremely important since it turned out that a lU-group

SM-101/54 455
cross section set was insufficient for the case we had with considerable slowing-down occurring in the reflector. For a lU-group case we even obtained a divergence of the computational process which could not be remedied by changing time or radial discretisation and which occurred after a practically constant number of time-steps regardless of their length* We ascribe this phenomenon to a feed-back via slow fission to the higher energy-groups of errors in the lower groups caused by an improper discretisation there. When using a 22 group cross section set these difficulties disappeared. Different values of (l/v) were used in core and reflector but this proved to give an almost negligible improvement compared to the case when they were set equal in core and reflector.
!•£, J^li^i. grid
Also here several grids were tried in order to establish a valid discretisation. The choice here turned out to be less critical as long as the grid was made finer close to the core-reflector boundary.
£•2 -?*£?-££?•&
For the discretisation of the time dimension we used a method similar to that described in [5] , and varied the time-steps continuously setting them inversely proportional to the largest absolute value of the logarithmic time-derivative of the flux in space and energy, and with the further restriction that the time-step was not allowed to increase above a predetermined value of the order of 10"** sec.
Several computational schemes were then investigated in an attempt to optimize the number of time-steps required. The following three methods were compared in this respect.
1) In the method lt the one previously used in ref. [k], the source term S at time t - 0.5At is determined by extrapolation. In the term
E.N , we set N = 0.5(A+B). Here A is the flux at time t-At, which is
computed in the earlier step and B is the flux at time t .
S* is determined as S^ = S + 0.5(S-S ), where S is the source term 1
at time t-At , and S is the source term at time t-2At.
2) In method 2 we set for N and s£
N. = N (t-At), i.e. the flux at time t-At
S, = S(t-At), i.e. the source term at time t-At.
3) In method 3, a one-step iteration is performed, where the values of N, (t) and S(t) from method 2 are used again in the same time-step.
Nk = 0.5(Nk(t-At) + Nk(t))
S^ • 0.5(S(t-At) + S(t))
Contrary to what might have been expected since they contain no extrapolations, the stability of methods 2 and 3 was decreased compared to method 1, so that a shorter time-step was required. If a shorter time-step was used, however, there is very good agreement between the results obtained from methods 1 and 3 and acceptable agreement with the results from.method 2.

456 BERGSTROM et al.
If At is chosen 0.2'ICT sec in our problem, all three methods vill be stable. The methods 2 and 3 show comparable accuracy. In method 1 ve could use a time-step At = 10""° - 1.5 • 10-° sec. Since method 3 requires twice the computation time of method 1 for each time-step, method 1 will be superior. We will now study why method 1 shows greater stability than the others.
We then analyze the stability behaviour of one of the group equations under some simplified assumptions.
i) We assume the source term s£ not to be critical for the stability since it consists of a sum of integrals.
ii) We assume that for stability considerations we can neglect all derivatives except the time-derivative.
Under these assumptions we obtain the following equation for a perturbation y
vk dt V
For method 2 this gives
y(t) = y(t-At) - AtvkZky(t-At) = (l-Atv^) y(t-At) .
If At v I > 2 the perturbation will grow from step to step and we will have an instability.
Q
Method 2 was unstable for At = 0.5#10~ , which we also can deduce from the above argument. For energy group 1 we have v • 2U«10° cm/sec and E • 0.12 cm-*, which makes At v E * 2.06.
For method 1 we have
y( t ) (l+0.5AtvkEk) » (l-0.5AtvkEk)y(t-At) ,
l-0.5AtvkLk
i > e ' y ( t ) " i+o.;>Atvk y ( t~A t ) •
This factor is < 1 for all At so the type of instability discussed above cannot occur.
Method 3 gives
y(t) - y(t-At) - 0.5 AtvkEk(y(t-At) + (l - AtvkEk)y(t-At))
y(t) » y(t-At) (l-AtvkSk + 0.5 (AtvkEk)2)
This becomes unstable for At v, Z, > 2 .
When the discretisation of the r, t, E dimensions was performed in accordance with the description above, the agreement between Si|-calcula-

SM-101/54 457
tions and experiment turned out to be satisfactory as we shall see later. For this reason and computation time considerations no investigation vas made of variations in the angular discretisation.
3. Cross section set
The group cross sections used were obtained by the SPENG [6] program from cross section tapes currently in use at AB Atomenergi. The cross sections are in the tapes given pointwise, except in the resonance regions, where narrow group cross sections have been calculated using resonance parameters. When the calculations were made only an old set of copper cross sections given pointwise was available. A more modern set gives appreciably lower absorption cross section in some groups below 5 keV. For each region the SPENG program calculates a weighting fine structure spectrum using fundamental mode B^-approximation taking shielding of resonances into account. Since it turns out that very low energy neutrons are of importance, a 22 group set with a lethargy step of 0.9 in most groups and a low energy cut-off at 0.0U eV was constructed (cf. Table I). No up-scattering was included. Since the calculations are to deal with prompt neutrons only, the fractions of fission neutrons in each group were multiplied by (l - 6). Besides the cross sections entering steady state calculations, 1/v and detector cross sections were averaged over the appropriate spectra.
U. Experiment
Since the experimental set-up has been described in [U, 7j only some aspects of it will be discussed here. The most thoroughly investigated assembly (Assy 2) consisted of an approximately spherical undiluted 20 % enriched U 2 3 5 core surrounded by a cylindrical copper reflector, more than 35 cm thick. The assembly was made 3.5 % subcritical by a reduction of the core radius. In order to keep the spherical symmetry the tritium target, producing bursts of 14 MeV neutrons, was introduced to the core center through a 2.7 cm square channel. As neutron detectors we used a He3 filled gas scintillator and a hydrogen filled spherical proportional counter. In both counters it was possible to cut off the gamma pulses with a simple discriminator. The spectral sensitivity of these detectors is given in Table I. When the gas scintillator was used the time resolution of the electronic set-up was given by the channel width of the multichannel analyzer in the actual run (0.2 or 0.U ys), while the time resolution of the proportional counter was about 2 ys. Three detector positions were used, one in the core, one at the core-reflector boundary and one in the reflector. The burst repetition rate was varied so as to keep the ratio between peak intensity and delayed neutron background at about 100.
5. Comparison between theoretical and experimental results
The results of experiments and calculations on the subcritical Assy 2 are given in Figs. 1-3. The calculations were made on a spherical core surrounded by a 35 cm thick spherical reflector. In order to take into account the reactivity effects of target and detector channels, the critical radii with and without channels were determined and the experimental subcritical radius was decreased in the same proportion (to 16.28 cm) in the calculations. In the figures shown, the experimental curves have been normalized to the pertinent theoretical ones at 8 us. Due to an uncertainty in the experimental zero time the curves have been shifted in the time

ел с»
CO m яз О со H PO О:
TABLE I.
Group
1
2
3
4
5
6
7
8
9
10
11
SPECTRAL EFFICIENCY OF DETECTORS
Energy boundary
(MëV)
10.0
2.25
1.25
7.0 X 10"1
3.9 X 10_ 1
2.2 XIO"1
1.2 XIO"1
6.1 X10"2
3.4 XIO"2
1.5 X10~2
5.5 XIO"3
2.2 XIO"3
He3
2.04
1.74
0.847
0.826
1.039
1.48
2.16
3.24
4.84
7.52
13.3
H2
2.09
3.05
3.98
4.83
5.15
3.86
0.37
-
-
-
-
Group
12
13
14
15
16
17
18
19
20
21
22
Energy boundary
(MeV)
8.8 X 1 0 - 4
3.5 X 1 0 - 4
1.4 XIO - 4
5.5 X10~5
2.2 XIO"5
8.8 X10 - 6
3.5 XIO"6
1.4 XIO"6
5.5 XIO"7
2.2 XIO"7
4.0 XIO"8
He3
21.5
34.9
57.0
88.2
146
217
308
505
796
1230
1940
Щ
-
-
-
-
-
-
-
-
-
-
-

SM-101/54 459
10"-fc
0 10 20 30 40 50 60 70 80 /<s
FIG. 1. Decay of the neutron population measured and calculated for a detector position (r = 10.4 cm) in the core of Assy 2 . The slope of the straight lines is obtained by stationary S4 calculations.
106-
103
102-
10
0 10 20 30 40 50 60 70 80/us
FIG. 2. Decay of the neutron population measured and calculated for a detector position (r = 23.5 cm) at the core reflector boundary of Assy 2. The slope of the straight lines is obtained by stationary S4 calculations.

460 BERGSTROM et a l .
10 20 30 A0 50 60 70 80/*s
FIG. 3. Decay of the neutron population measured and calculated for a detector position (r = 44.5 cm) in the reflector of Assy 2. The slope of the straight lines is obtained by stationary S4 calculations.
60/JS
FIG. 4. Decay of the neutron population measured in the reflector of Assy 2 with an He detector at different reactivities (from top: 0.69, 1.29 and 3.59% below critical, respectively).

SM-101/54 461
1 1 i 1 i 1 i i — 0 10 20 30 40 50 60 70 80;us
FIG. 5. Calculated response of an He3 detector in a reflector position in Assy 2 (upmost curve) and the neutron density in different groups as a function of time.
direction to reproduce the peak intensity1(when discernible) or to give the best overall fit.
As is seen the agreement between experiment and time dependent S^ calculations is good. The discrepancy in the slope of the final decay (13 %) for the He3 detector in the reflector position (Fig. 3) might be explained by the fact that the absorption cross section in copper ought to be decreased and that the calculations vere made with a spherical reflector while the experimental reflector was cylindrical and somewhat larger. The slope of the straight lines drawn in the figures is obtained by a stationary S^ calculation, where an exponentially decaying flux was postulated and the slope determined by iteration. In these calculations only 2 instead of 8 groups were used below 100 eV.
6. Discussion
The good agreement between experiment and theory shown in Figs. 1-3 justifies confidence in the results of the time-dependent code even in time regions where no detailed experimental results are available - at least until new phenomena such as thermal up-scattering start to become of importance. Since the model used in the calculations with a group structure in energy and space and a finite low energy cut off implies the existence of a discrete set of eigenvalues to the Boltzmann equation it is of interest to investigate which part of the reactor and which energy group is responsible for the slowest decaying mode calculated and if this mode has a physical significance.
The experimental results shown in Fig. k indicate that the final decay is entirely given by the properties of the reflector. These measure-
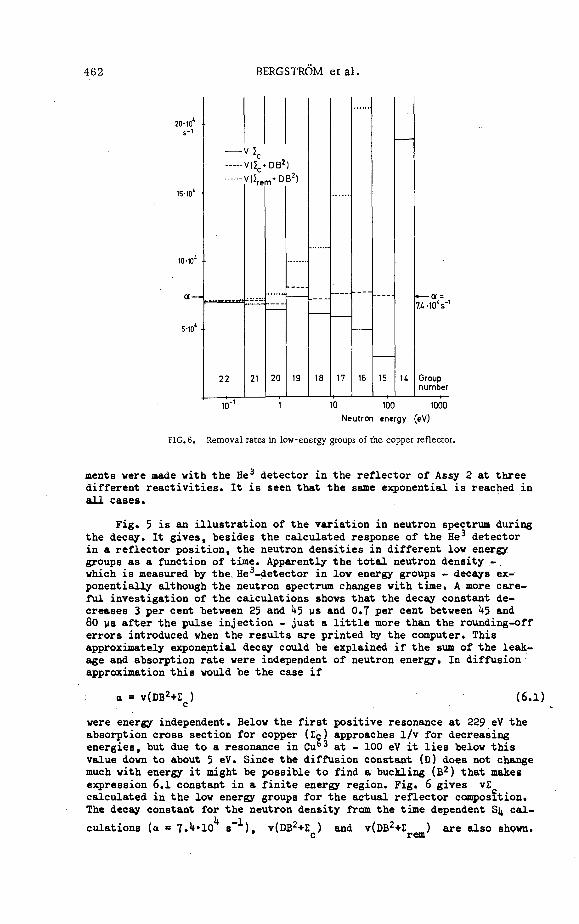
462 BERGSTROM et a l .
20-10
-vac • D B Z
22
DB^)
20
- — a = U -10V
Group number
10 1 10 100 1000 Neutron energy (eVj
FIG. 6. Removal rates in low-energy groups of the copper reflector.
ments were made with the He3 detector in the reflector of Assy 2 at three different reactivities. It is seen that the same exponential is reached in all cases.
Fig* 5 is an illustration of the variation in neutron spectrum during the decay. It gives, besides the calculated response of the He3 detector in a reflector position, the neutron densities in different low energy groups as a function of time. Apparently the total neutron density -which is measured by the. He3-detector in low energy groups - decays exponentially although the neutron spectrum changes with time. A more careful investigation of the calculations shows that the decay constant decreases 3 per cent between 25 and 1+5 us and 0.7 per cent between 1+5 and 80 us after the pulse injection - just a little more than the rounding-off errors introduced when the results are printed by the computer. This approximately exponential decay could be explained if the sum of the leakage and absorption rate were independent of neutron energy. In diffusion approximation this would be the case if
a - v(DB2+E ) c
(6.1)
were energy independent. Below the first positive resonance at 229 eV the absorption cross section for copper (Zc) approaches 1/v for decreasing energies, but due to a resonance in Cu63 at - 100 eV it lies below this value down to about 5 eV. Since the diffusion constant (D) does not change much with energy it might be possible to find a buckling (B2) that makes expression 6.1 constant in a finite energy region. Fig. 6 gives vE calculated in the low energy groups for the actual reflector composition. The decay constant for the neutron density from the time dependent 2>\ calculations (a = T.^'10 s ), v(DB2+E ) and v(DB2+Z )
c v ( D B 2 + Z )
rem are also shown.

SM-101/54 463
5 10 20/JS
FIG. 7. Calculated response of an He3 detector placed in the core (upper curve) and the reflector (lower curve) of a uranium reflected assembly.
—3 —2 B2 in these expressions is taken as 7.9*10" cm- , which is the mean value
obtained if a in Eq. 6.1 is set equal to 7.^*10 in groups 13 to 18. Since expression 6.1 then becomes almost constant in all low energy groups it is reasonable that an approximately exponentially decaying neutron density is obtained. The obtained buckling is equal to that of a 35.3 cm thick slab which is not an unrealistic result compared to the reflector thickness of 33 cm.
Since all volume elements in the rtE-space are coupled to each other through diffusion, fissioning and down-scattering, the slowest decaying group will eventually determine the over all decay of the neutron flux. When this decay is reached spectral equilibrium will develop all over the
system. From the group values of v(E +DB2) plotted in Fig. 6 it is seen
that the slowest rate of removal will occur in group 22. In this energy group both the leakage and the scattering out of the group are almost negligible compared to the absorption. Since this will persist even at lower energies and the capture cross section here is proportional to 1/v, the same decay constant should have been reached if more groups had been added. The expected a is thus a true eigenvalue not dependent on group structure. At these energies thermal up-scattering starts to be of importance but then the absorption dominates the removal even more and the above statement is still valid. The assumption that the lowest energy group eventually determines the decay is supported by the result of a stationary S.-calculation shown as straight lines in Figs. 1-3. The last

464 BERGSTROM et al.
group here reached from 0.2 to 8 eV giving a (vZ +DB2) of 7.6*10 s~
which should be compared to the obtained a of 7 • 1*3*10 s~ .
The determination of the equilibrium spectrum is equivalent to solving the static Boltzmann equation with all absorption cross sections decreased by a/v. This means that the effective removal from the reflector almost vanishes in groups 15-22 and that the spectrum here will be proportional to l/E in contrast to the critical spectrum which decreases rapidly with energy. This decrease in effective absorption explains why the low energy neutrons play a much greater role in the pulsed experiment than in the steady state reactor.
The fact that the core neutrons and the high energy reflector neutrons have not reached an exponential decay even at the end of the studied time interval, although they seem to approach one, also supports the statement that the lowest energy group in the reflector eventually will determine the decay. In the high energy groups spectral equilibrium is reached much earlier. An attempt to fit two exponentials to the calculated core decay has been made without success showing the inadequacy of the two-point model in this case. This is also to be expected since the leakage probability from the reflector to the core is changing as long as the spectrum changes. This is contradictory to the assumption that all parameters entering the model are time independent. It is also evident that no unique neutron life-time can be defined and measured as long as the spectrum changes.
The time-dependent code has also been tested on a more normal reactor -a core with the same composition surrounded by a natural uranium blanket. This assembly was also 3.5 % subcritical. As is seen in Fig. 7 the same exponential decay is rapidly attained throughout the reactor making it possible to use the point reactor model.
7. Conclusions
The discussion in the preceding sections shows that it is possible to describe quantitatively the pulsed source experiments also in systems with light reflectors with the time-dependent S code and with the cross section
set calculated by the SPENG program. The latter part of the decay is dominated by low-energy cross sections not tested in criticality calculations, but also by the perhaps less interesting reflector properties.
It is obvious that no spectrum equilibrium is reached during the time when enough neutrons are left in the system to make measurements possible. This makes the simple one- and two-point models inadequate and parameters such as neutron life-time dependent of time and impossible to measure with the pulsed source method. A difference between critical spectrum and prompt a-mode spectrum will persist even in cases where the point reactor model is applicable giving a possible explanation to the discrepancy between calculated and experimental neutron life-times reported for instance by Brunson et al. [8] .
Acknowledgement
The authors wish to express their gratitude to Prof. H.O. Kreiss for valuable advice and stimulating discussions in connection with the treatment of the numerical stability and to Mr. R. Hakansson for the help with the stationary calculations.

SM-101/54 465
References [l] BRUNSON, G.S. and HUBER, R.J., Proc. Int. Conf. on Fast Critical
Experiments and Their Analysis, Rep. ANL-7320 (19бТ) ТОб Й WALTAR, A.E. and RUBY, L., Nukleonik 10 (19бТ) 70 [3] COHN, C.E., Nucl. Sci. Eng. 13 (1962) 12 (V) BERGSTROM, A., BRUHFELTER, В., KOCKUM, J. and SODERBERG, S.,
Proc. Int. Conf. on Fast Critical Experiments and Their Analysis AHL-7320 (1966) 69U
[5] BRICKSTOCK, A., DAVIES, A.R., SMITH, I.e., Proc. Conf. on the Application of Computing Methods to Reactor Problems, ANL-7050 (1965) 1*13
[6] NYMAN, K., Internal Report AE-RFN-279 (1967) [7] BERGSTROM, A., BRUHFELTER. B. and KOCKUM, J., Proc. Pulsed Neutron
Research, IAEA, Vienna 2 (1965) 357 [8] BRUMSON, G.S., CURRAN, R.H., GASILDO, J.M. and HUBER, R.S.,
Rep. ANL-668I (196З)
DISCUSSION
B.I. SPINRAD: It seems to me that a is determined by the time-scale on which measurements are made. After an appropriate time one sees the decays dominated by delayed neutrons; if one waits a shorter time one sees the reflector-spectrum neutrons, which are a pseudo-thermal group of neutrons acting as a pseudo-delayed group; after an even shorter time, one sees core characteristics. Does this not mean that all these avalúes, in themselves, contain a rather small amount of information?
J. KOCKUM: I agree that we do not get out any parameters that are characteristic of the stationary fundamental mode of the core. On the other hand, I believe the paper demonstrates that we are able to describe this particular experiment.
B.I. SPINRAD: The group of low-energy neutrons in the reflector, acting as a delayed source, introduces only a reflector flux and a small fission peak at the core edges. The shape of this function is very far from the fundamental mode of the reactor, so it is not at all surprising that one does not find it in a calculation which essentially emphasizes the fundamental mode and its decay.
J. KOCKUM: I don't think that one can describe the returning reflector neutrons as a single new group of delayed neutrons, since their energy distribution changes with time. The stationary calculations reported show that it is possible to calculate the final decay without recourse to the time-dependent code. This decay, however, is as you say not a characteristic of the core; on the other hand it should be taken into account since eventually the flux at the core centre slowly follows the same decay - even if this is not measurable.
30


PROBABILITY DISTRIBUTION OF NEUTRON COUNTS FOR THE p-METHOD IN REACTOR NOISE ANALYSIS A numer ica l calculation
E. TURKCAN AND J.B. DRAGT REACTOR CENTRUM-NEDERLAND, PETTEN, THE NETHERLANDS
Abstract *
PROBABILITY DISTRIBUTION OF NEUTRON COUNTS FOR THE p-METHOD IN REACTOR NOISE ANALYSIS: A NUMERICAL CALCULATION. The p-method in reactor noise analysis is the technique, proposed by Zolotukhin and Mogil'ner, of measuring the probabilities pk for detecting k neutrons in a certain time interval. Reactor parameters may be derived from the probability distributions. Because of its simplicity and high speed this method seems to be very attractive for application in fast reactors. It was used by Mogil'ner in the USSR BR-6, and a probability analyser has been built in the framework of the Karlsruhe fast breeder project.
The distribution can be used in different ways, for example by using only p 0 or the variance. It is more attractive, however, to use the complete distribution, and to compare it to a theoretical calculated distribution. Up to now for such a calculation only approximate distributions were available (negative binomial distribution and an asymptotic distribution for long time intervals). The present paper describes a numerical technique for a more exact distribution. It is a calculation for the case for which a probability generating function has been derived by several authors. A point reactor model is assumed, with neglect of delayed neutrons and some very improbable branching processes.
The procedure is presented for obtaining numerically the distribution from the generating function. It is a multiple recurrence calculation that has been programmed in Algol-60 for the E1-X8 computer.
Several examples of the calculated distributions are given. A comparison is made with the approximating distributions, and conclusions are obtained on the range of validity of the approximations. Moreover the calculated distributions are compared to some experimental ones, and the agreement is found to be excellent. The problem of fitting theoretical to experimental distributions is discussed.
1. INTRODUCTION
The p-method in reactor noise analysis is the technique proposed by Mogil'ner and Zolotukhin [1] of measuring the probabilities pk for detecting k neutrons in a time interval T, for different values of T. Reactor parameters may be derived from these probability distributions.
The technique is very promising as a fast measuring method. By means of rather simple electronics one can measure pk (especially p0) at high speed. It thus seems to be very attractive for application in fast reactors .
Experimentally the p-method has been used in the USSR reactors BR-6 (prompt neutron decay constant at critical ac - 5000 s"1) and PF-4 {ac » 200 s-i) [2], in the French reactor ALECTO {ac = 50 s"1) [3], in the Italian ROSPO [4], while in the framework of the Karlsruhe fast breeder project a probability analyser has been built [5] for the experimental determination of pk.
Zolotukhin and Mogil'ner [6] recognized that in first approximation the distribution pk is a negative binomial distribution (or Polya distribution),
467 30

468 TURKCAN and DRAGT
and they have shown exper imenta l ly that a negative binomial dis t r ibut ion i s in good agreement with an exper iment . La te r Pac i l io [4] came to the s ame conclusion, even for l a r g e r de tec tor efficiencies.
Another approximate dis t r ibut ion has been given in [7], which is good for long t ime in t e rva l s . We will r e fe r to th is dis t r ibut ion as the asymptotic dis tr ibut ion. A s u m m a r y of the approximat ions can be found in [8].
P a l [9], Zolotukhin and Mogil1 ne r [7] and Dalfes [10] have der ived a probabil i ty generat ing function for a m o r e exact probabil i ty d is t r ibut ion This r a the r complicated function has not been used up to now for a calculat ion of p^. In th is paper we der ive a numer ica l technique (a mult iple r e c u r r e n c e p rocess ) for such a calculat ion. Resul t s will be compared with the approximate d is t r ibut ions mentioned above.
2. TAYLOR EXPANSION OF THE GENERATING FUNCTION
The generat ing function i s :
,TW - J(l + »)'«-«-*>4- (W)'«-<'»« y * (1)
with: a io-T
2m ffzT
A - ? ? - (2) <b =J1+ 2 z ( l - x )
He re : a = prompt neutron decay constant z - v a r i a n c e - t o - m e a n ra t io minus one, for T-*oo (neglecting delayed
neutrons) m = mean number of counts in the t ime in terva l T
Since the generat ing function is defined by
TTT(X) = £ p k x k (3)
k= 0
the problem is to find the Taylor s e r i e s expansion of the function (1). We make this expansion in the following 8 s teps . Step 1. The expansion coefficients of
<j> = ^ ck x k (4)
k =0
a r e :
z Y ( 2 k - 3 ) ! ! 'k V 1+ 2
s / l+ 2z (5)

SM-101/38 469
They can be calculated by the r e c u r r e n c e re la t ion
_, 2 m - 3 ... z c _ •= c _ i B w i t h B = •nT m-l m 1 + 2z
cQ = N / 1 + 2 Z
Step 2 . F o r the function 1/$ we have the expansion:
1+ 2z k = o
(6)
° k ( 2 k - l ) x k ' (7)
Step 3. Combining s teps 1 and 2:
<t>+l= X S k * k (8)
k = 0
with:
1 - m + z .„.
Step 4, A r e c u r r e n c e re la t ion for the coefficients d^, defined by
OO 00
e a 0 = e x p ( a Y ck x k ) ^ V dk x k (10)
k = 0 k = 0
i s found by differentiating both s ides of the equation:
oo oo oo
a V k ck x*'1 Y dj x1 = V k dk x1*"1 (11)
k = 0 1 = 0 1 = 0
By* wri t ing m =1+ k, and by changing the o rde r of the summat ions , the left-hand side can be wr i t ten :
oo m
MI a ) x«"l-! > k c k d m . k
m = 0 k = 0
F r o m this follows the r e c u r r e n c e re la t ion:
m
dm = ^ V k c k d m . k , w i t h d 0 = e a c o (12)
k= 1

470 TURKCAN and DRAGT
Step 5. In the s ame way:
e"a0 =Y ekxk (13) k = 0
with
in
^ ) k c k e m . k ; e0 = e"aco (14) k = l
Step 6. Define:
oo
( i + O ( e a 0 _ e " a 0 ) = I h k x k (i5) k = 0
By substi tut ing (8), (10) and (13), col lect ing t e r m s with the s ame power x k , one easi ly finds:
h m = ^ ( d k - e k ) g m . k (16)
k = 0
Step 7. The expansion coefficients of:
« £ bkx* d7) {l + <f>fe-^-o) -( l-(ft)2e-a(1 + p)
4(j> k = o
a r e now seen to be given by
e"a
b m = - 5 - { h m + 2 ( d m + e m ) } (18)
(19) wT(x) = Y Pkxk = ( 2 , b k X y k = 0 k = 0
By differentiating both s ides of the equation, one f inds:
V IP iX 1 " 1 ^ b k x k = - A ^ PiX1 ^ k ^ x 1 * ' 1 (20)
1 = 0 k = 0 k = 0 k = 0
Taking k + 1 = m, and changing the o r d e r of the summat ions , l eads to :

SM-101/38 471
m m bkPm-k(m"k) = - A ) ^ kbkPm-k (21)
k = 0 k = 0
which gives the recurrence relation:
m
P m = " ^ X b kP m -k ( m - k + A k ) / b o- (22)
k = 1
together with
Po = ^ A (23) The numerical process defined by the equations (6), (9), (12), (14),
(16), (18) and (22) was programmed in the form of an ALGOL-60 procedure. The text of this procedure is given in the Appendix.
3. RESULTS OF CALCULATIONS AND EXPERIMENTS
A computer programme for the Electrologica EL-X8 computer was made, which calculates the distribution, and compares it with the following distributions:
(i) Poisson distribution; (ii) Polya or negative binomial distribution; and
(iii) The asymptotic distribution; all of them computed for the same set of reactor parameters.
The calculations were made for situations where experimental data were also available. The experimental distributions were measured in the LFR at Petten. The experimental technique and analysis are described in [11].
It was found that, in all cases, the experiments were in close agreement with the calculated distributions. The Poisson distribution always showed large deviations. The Polya and asymptotic distributions sometimes agreed with the "exact" one, sometimes not. This is illustrated in Figs 1 to 4.
In Fig. 1 the two approximations are good, in Fig. 2 only the Polya distribution is a good approximation, while in Fig. 3 only the asymptotic distribution is good. Neither approximation is good in Fig. 4.
4. DISCUSSION
From the results shown in Figs 1-4 the following conclusions are obtained. As was to be expected, the asymptotic distribution is only a good approximation in the case of rather long time intervals. For rather high values of z the Polya distribution becomes a bad approximation. This is especially so for low values of k, most notably for po. Figures 3 and 4 show that one has to be somewhat careful if one wants to use the Polya
I

472 TURKCAN and DRAGT
0.16
0.K
0.12
0.10
o.oe
0.06
0.04
0.02
/
/ /
- /
W l 1 1 1 1
t EXACT-POLYA o ASYMPTOTIC
i i i i i i i i i i i
0 1 2 3 4 5 6 7 6 9 10 11 12 13 14 15 16
FIG.l . Calculated probability distribution for a = 444 s"1, z = 0.601, T = 0.020 s, C = 335 s"
0.22
0.20
0.18
0.16
O.U
0.12
0.10
0.08
0.06
0.04
0.02
- 1
+ 1
Y
1\
\ \ \
\
i i i i i J _
t EXACT • POLYA o ASYMPT
• i i T i ~ Y ~ 9 ~ v 0 1 2 3 4 5 6 7 8 9 10 11 12 13
k
FIG.2. Calculated probability distribution for a = 61. 3 s"1, z = 49.4, T = 0.002 s, C = 186. 8 s"
distribution, as has been strongly recommended in Refs [4, 12]. The technique of this paper gives a means for investigating the limitations.
We have not tried to fit the theoretical "exact" distributions to the experimental ones. The parameters for the calculated distributions have been obtained from other types of analysis of the same measurements. It is possible in principle to make such a fit, for example by the method of least squares. Then, for the usual iterative least-squares analysis, the derivatives dp^/da and 9pk/9z are needed. They can be found by a recursion calculation, similar to that in section 2, for dirT/da and 97TT/3Z, which are rather complicated functions. What is to be expected

SM-101/38 473
x EXACT • POLYA o ASYMPTOTIC
FIG. 3. Calculated probability distribution for a = 450 s"l, z = 6.24, T = 0.038 s, C = 179.2 s"1.
0.16
0.H
0.12
0.10
0.06
0.06
0.04
0.02
-
• i i i i
x EXACT • POLYA o ASYMPTOTIC
i i i i i i i i i i
0 1 2 3 I* 5 6 7 8 9 10 11 12 13 M k
FIG.4. Calculated probability distribution for a = 54.2 s"1, z = 23.7, T = 0.015 s, C = 532 s"1.
from such an analysis? In many cases the distribution is close to a Polya distribution. The parameters a and z are contained in this distribution as only one parameter:
z 1 - ttT (24)
It is to be expected, therefore, that a fit of the theoretical "exact" distribution to the experimental one will yield a reliable value for the parameter (24), but not for a and z separately. For such a determination distributions for at least two values of T are necessary. The least-squares analysis of two or more complete distributions at the same time will be difficult.

474 TURKCAN and DRAGT
APPENDIX
The text of the ALGOL-procedure for the calculation of the probability distribution i s given below. The input quantities of the procedure are: a = prompt neutron decay constant a; z = the parameter defined after (2. 2); C = count-rate; T = length of time interval. The distribution pk i s delivered in the array p[ 1 : max],
procedure EXAGT(a,z,C,T,p,max); valne a;z;C,T; real a,z,C,T; Integer max; array p; begin real x;A,B,D,h,y;
Integer m,k,ml; array c,g,d,e,b[0:max];
real procedure SUM(i,h,k,ti); value k; integer-l;h,k; real TTJ begin real s;
s:« 0; ! : • h; goto t e s t ; next: s : - s + t l ; l : « i + l ; t e s t : I f i<n then goto next;
5UM:« B end SUM;
x:» aXT/2; A:« 2xC/(axz); y : - exp(-ot); B:- z / ( l*2xz);
c[0]:» sqrt(l+2xz); g[0]: - 2x(l+z)/c[0]; d [ 0 ] : - exp(xxc[0]); e[0]:« l / d [ 0 ] ; D:- b[Q]:« yx(g[0]x(d[0]-e[0])+2x(d[0]4e[0]))/U; h:- p [0] : -b[0]^( -A); m:* ml :• 0; C:«CXT; fOr'mt-'m+l whlle(m<C V h > »-6)An < max dTbegln c[mj:- c[m-1 ]XBx(2xm-3)/m;~
g[m]:- 2xc[m]x(l-ntfz)/(l-»2xz); d[ml:- SUM(k,l,m,kx c[k]xd[m-k])xx/m; e[m]:- -€UM(k,1,m,kXc[k]xe[m-k])xx/m; h:- SUM(k,0,m,(d[k]-e[k])xg[m-k]); b[m]:- yx(h+2x(d[m]4e[m]))A; h:- p[mj:» -SUM(k,1,m,(m-k+AXk)xb[k]xp[m-k))/(Dxm); ml :• ml +1 ;
end;
end EXACT; for m:« ml step 1 unt i l max do p[m]:« 0; max:= ml
R E F E R E N C E S
[1] MOGIL'NER, A . L , ZOLOTUKHIN, V.G. , Atomn. Energ. 10(1961)377. [2] MOGIL'NER, A . L . SHVETSON, D.M. , Atbmn. Energ. 20(1966)117. [3] BRUNA, J .G . , et a l . , Etude Preliminaire de la Cinetique d'un Reacteur par la methode des
Probabilites, CEA-R 2454 (1964). [4] PACILIO, N. , Nucl. Sci. Engng 26 (1966) 565.

SM-101/38 475
[5] STEGEMANN, D. H. , Bestimmung teaktorphysikalischer Parameter aus dem Reaktorrauschen durch Analyse von Wahrscheinlichkeitsverteilungen, KFK 542 (1967).
[6] ZOLOTUKHIN, V .G. , MOGIL'NER, A. I . , Atomn. Energ. 10_ (1961) 379. [7] ZOLOTUKHIN, V.G. , MOGIL'NER, A. I . , Atomn. Energ. 1^(1963)11. [8] DRAGT, J .B . , TURKCAN, E., Nukleonik 10 (1967) 67. [9] PAL, L., J. nucl. Energy, Parts А/В Г7 (1963) 395.
[10] DALFES, A. , Nukleonik 8 (1966) 94. [11] TÜRKCAN, E., DRAGT, J .В. , Experimental Study of Different Techniques for Analysing Reactor
Noise Measured by a Neutron Counter, RCN-75 (1967). [12] LMDEMAN, A.J . , RUBY, L., NucL sci. Engng 29 (1967) 308.
DISCUSSION
D. STEGEMANN: I should like to point out that by his method Mr. Türkcan was calculating probability distributions which we measured here in STARK and SNEAK by means of a probability analyser, and that agreement between theory and experiment was found to be very good. We gratefully acknowledge the work done on these calculations and feel that real progress has been made in the application of this method by virtue of Mr. Turkcan's theoretical treatment. What is still lacking, however, is a thorough treatment of statistical e r rors for the calculated probabilities, and we hope that Mr. Türkcan will go on with this encouraging treatment to solve this er ror problem.


MODAL EFFECTS IN THE TRIPLE-CORRELATION REACTOR-NOISE EXPERIMENT
J.B. DRAGT
REACTOR CENTRUM NEDERLAND, PETTEN, NETHERLANDS
Abstract
MODAL EFFECTS IN THE TRIPLE-CORRELATION REACTOR-NOISE EXPERIMENT. Recently the point reactor theory for detection of three correlated counts has been given by the author elsewhere. Two types of family-trees for the three related neutrons have to be distinguished: in one the tree twice branches in two; in the other type there is a threefold splitting. This last effect is most interesting physically, since it depends on a new reactor parameter, which permits the determination of delayed neutron fraction, generation time (separately) and fission rate, without the need for any static experiment. The effect, however, is very weak. It has been shown that the special triple correlation function n(t){n(t) -n( t + r)}n(t+T) (where n(t) = count-rate of a neutron detector) only depends on the threefold splitting effect, at least for point reactor theory. The determination of this quantity is a typical fast reactor experiment, since only then; (a) there are no interfering delayed neutron effects; (b) the measuring time can be kept within reasonable limits. In the present paper the theory is extended to include space dependence. The triple correlation function is generalized to: n(t){n(t+6)-n(t+6'+ T)}n(t+2e+ r ) , permitting better discrimination against higher modes.
The theory uses the Green's function approach that has been used by several authors for the calculation of second order moments. Two main conclusions are obtained: (a) A correction factor is found for the new reactor parameter, mentioned above, containing integrals over multiple products of fission density and neutron importance; (b) The higher modes of the twofold double-splitting tree are found to produce in the triple correlation function a contribution which is no longer zero but may eventually exceed the desired effect. It will be calculated for a few simple cases.
An experiment was performed for measuring the triple correlation functions, by coupling a reactor online to a digital computer. Since a thermal reactor was used, only very rough results could be obtained, in spite of the long measuring t ime. The spatial effect was clearly observed, not the threefold splitting effect.
1. INTRODUCTION
In a recent paper [1] a theory was given on third-order moments and threefold correlations in the neutron noise of a stationary reactor for the point reactor model.
Three neutrons, detected by a neutron counter (or three counters), may be correlated if the fission trees to which they belong, somewhere in the past originate from a common fission. If one traces back these fission trees one may find, of course, (a) No correlation at all; (b) Two correlated and one uncorrelated neutron chain; (c) Three correlated chains. In this paper we will only consider the threefold correlated events. They may belong to two different types of fission tree, shown in Fig. 1.
The fundamental quantity in the theory is the probability for detecting a neutron in dti at t i , another neutron in dt2 at t2 and a third one in dt3
at t3. We will denote this probability for process a of Fig. 1 by Pa ( t2_ t i , 13 ~ t i ) , and for process b by Pt>(t2_ti, t 3 - t i ) . Pb can be split into three
477

478 DRAGT
CASE a CASE b
FIG. 1. Fission trees for threefold correlation. The solid lines (-) represent fission chains, crosses (x) are fission events, and circles (O) detected neutrons.
different contr ibutions Pbi , P b 2 and P ^ , depending on whether the count label led A (see Fig . 1) i s the f i rs t , second or th i rd count.
It has been found in [1], for the point r e a c t o r model , with neglect of delayed neu t rons :
P a (u , v) = - C a 2 Z 2 e •a(u + v) (1)
»b(u, v) = - C ^ Z { e 2G -av (2)
with: C = mean coun t - r a t e of the de tec tor a = prompt neutron decay constant
and with:
Z i = e — = ; v{v-D a2A2
(3)
Z 2 :<1 v(v-\)(v-2)
,3 A 3 (4)
where : e = detector efficiency = ra t io of coun t - ra te C and fission r a t e F; v = number of neut rons pe r fission; A = genera t ion t i m e .
Z j i s the same p a r a m e t e r that can be de termined in the usual twofold co r re la t ion exper iments ( R o s s i - a , Feynman-a , e t c . , see [2]).
The possibi l i ty of measur ing Z 2 is in te res t ing . It p e r m i t s the d e t e r mination of e (and from that the fission r a t e F or the r e a c t o r power) and of aA (= /3 - p = prompt react ivi ty) separa te ly , provided the s t a t i s t i c s of v a r e known with sufficient accu racy . Fo r a r e a c t o r c lose to delayed c r i t i ca l i ty the delayed neutron fraction j3 can be obtained d i rec t ly .
Now, in genera l , it i s much m o r e l ikely that t h r ee detected neut rons belong to a fission t r e e of type b than to type a. Exper imenta l ly the t r e e - a effect will nea r ly always be obscured by the t r e e - b effect. In [1 ] , however , a p romis ing t h i r d - o r d e r moment was found:
n( t ){n( t ) -n( t+T)}n( t+T) (5)

SM-101/36 479
where n(t) r e p r e s e n t s the detector coun t - r a t e . Fo r this p a r t i c u l a r moment can be wr i t ten :
n( t ){n(t) -n( t+T)}n(t+T) = { P a ( 0 , r ) - P a ( T , r ) } + { P b ( 0 , T ) - P b ( r , T)} (6)
By substi tut ing (1) and (2), the t e r m with P b i s seen to cancel , and only the t r e e - a effect is left. Measurement of (5), t he re fo re , might yield Z2. In [1] the effect of delayed neut rons has a lso been ca lcula ted . The delayed neutron contr ibution to P b can d is turb the prompt neutron effect in P a , but this effect i s negligible in fast s y s t e m s . The de te rmina t ion of (5) was concluded to be a typical fast r e a c t o r exper iment for two r e a s o n s : (a) In this case the delayed neut rons a r e not in terfer ing; (b) Since the t ime sca le of the exper iment is de te rmined by a, and a v e r y l a r g e number of in t e rva l s 1/a will be needed, a r easonab le measu r ing t ime i s only to be expected in fast s y s t e m s .
The effects of space and energy dependence have not been taken into account in [1]. This will be the subject of the p re sen t pape r . The need for the evaluation of th is effect will appear in the next sec t ion .
2. EXPERIMENT
Although the exper iment is typical ly suited to fast r e a c t o r s , it was neve r the le s s t r i ed in a t h e r m a l sy s t em, v iz . the Argonaut r e a c t o r LFR at Pet ten , in December 1966. A ve ry long measur ing t ime and poor accu racy were to be expected. Here we will give a brief descr ip t ion and some r e s u l t s of the exper iment , s ince on the one hand the exper iment shows one poss ib le way of obtaining this information, and on the other hand the r e s u l t s have given r i s e to the evaluation of modal effects in th is pape r .
The exper iment was as follows. The counts from a B F 3 - c o u n t e r in the r e a c t o r w e r e fed to a b inary s c a l e r . The s c a l e r was r ead and r e - s e t every 2 ms- ( t ime in te rva l T), and the contents (numbers n t ) w e r e t r a n s f e r r ed d i rec t ly to the Elec t ro logica EL-X8 computer . Here the quantity
N
N Z . n i ( n l " n H ) n H (7> i = l
was calculated, toge ther with the twofold co r re l a t ion function
N
- ^ n i n i + j-"n"2 (8)
It was poss ib le to ca lcula te the functions (7) and (8) in r e a l t ime for at most 24 different va lues of j at the s a m e t i m e . Once in about 7 min the m e a s u r e m e n t was in te r rup ted in o r d e r to pr int i n t e rmed ia t e r e s u l t s . Measu remen t s were taken for about 75 min.

480 DRAGT
TABLE I. SUMMARY OF ON-LINE THIRD-ORDER NOISE EXPERIMENT
Detector position C
(counts/s) (s"1) A/Z>
VN
VC
1100
650
53.7
54.4
42.7
14.2
(2 .79±0.17)xl0~
( 2 . 4 9 ± 0 . 3 0 ) x l 0 '
30 ~. 60
X(ms) FIG. 2. Third-order moment measured in VN.
._,008
+ c
"? 0.06 c 1
c
0.02
r " ]< P*
T 7 J- < i < > « 0
<
N
> <
< >
N
< »
»
<
" / "*" .
< < »
< »
| . . . . J l 30 40
X(ms) FIG. 3. Third-order moment measured in VC.

SM-101/36 481
The results have been analysed by fitting the auto-correlation function (8) to:
$CT2aZ1e~aiT (9)
thus obtaining a and Z 2 . Then (7) was fitted to
CT 3 a 2 Ae* a T ( l -e" a T ) (10)
When the desired effect is observed, A is equal to iZ2, and A/Z 2 is equal to (/3-p)/4.
Results are presented in Table I and Figs 2 and 3. Measurements were made at two different detector positions at the same reactivity (about - 8 cents). If threefold correlations are detected (either from tree-a or tree-b), the quantity A/Z 2 should be independent of the position ( i .e . A proportional to e2). This was in fact observed. However, we know that, for this reactor, | 3 - 0.007. The expected kfz\ then is 0.19X10⁻² . The experimental quantity is larger by a factor of about 14. The most likely explanation is that this is due to the only effect that has been neglected so far: higher modes of t ree-b, which may introduce a contribution that is not distinguishable from the t ree-a effect.
Part of the higher mode effect may be due to the fact that two of the three points in the triple correlation function coincide. This contribution is eliminated by spacing the three points. It can easily be shown that the following generalization of (5):
n(t){ n(t +CT) - n(t +a +.r)}n(t + 2a + T) (11)
possesses the property of only depending on threefold correlated counts, and in the point reactor model on t ree-a only. Also, this quantity was determined in the on-line experiment. The result was roughly the same as for the measurement with a =0, but much more inaccurate. The generalized moment (11) will be used in the subsequent sections.
3. THE MODAL THEORY
3 .1 . Definitions, etc.
Green1 s function approach will be used, as it was used for the first time for space dependent problems by Matthes [3]. We will closely follow the work of Otsuka and Iijima [4].
Space and energy dependence will be taken into account. These coordinates together will be denoted as one phase space co-ordinate x. The reactor is stationary in time. Only prompt neutron multiplication will be considered.
The following Green' s function is needed: TT(XV x0, tj-tg) = neutron density at xj, and at time ti, following one neutron
born at xg and at time t0. Our functions will be expanded in eigenfunctions. We use Wp-modes [5] (prompt neutron production only). The neutron density eigenfunction will be denoted by 0k, the adjoint eigenfunctions by 0^, the eigenvalues by -<*k (the fundamental a0 is our previously defined prompt neutron decay
31

482 DRAGT
constant a). Then:
J r fx i .xo . t j - to ) = ^ k ( X l ^ * ( x 0 ) e " a k ( t l " t o ) (12)
k
where the eigenfunctions are so normalized that:
/4*(x)tfk(x)dx = l (13)
The fission process will be described by the operator & (in general the product of fission cross-section and normalized fission spectrum), which means that a neutron density N(x) produces a fission density in phase space:
F(x) = ^N(x) (14)
Henceforth N(x) and F(x) will be used for the stationary distributions.
We will have three neutron detectors in the reactor. We start by assuming monoenergetic point detectors at Xi in phase space. They have detection probabilities rji (i = 1, 2, 3), which means that a neutron density N(x) produces a count-rate
Ci = niN(Xi) (15)
For more realistic detectors we will have to integrate our later results over some part of the phase space. As far as point detector results will be found to depend only on the stationary Ci, we are permitted to apply them for finite detectors as well.
3.2. Calculation of Pa (u, v)
Pa is found by means of the following list of probabilities:
(i) Probability for fission in dxo at x0 and in dt0 at time t 0 : F(x0)dt0dx0
(ii) Probability for production of v prompt neutrons: pv
(iii) Probability for detection of a descendant at x1( .ti: r\\vit {x\, XQ, t i - t 0 )d t !
(iv) Probability for detecting another descendant at x2 , t 2 : r}2{v ~ 1)7r(x2» x0> t 2 - t 0 )d t 2
(v) Probability for detecting a third descendant at x3 , t 3 : r)3{v -2)7r(x3, x 0 ' t3~t0)dtg
These probabilities are multiplied, Eq.(12) is used, and the integrations over space and time are carried out. We are only interested in a first-order approximation. In the phase space integrals the contributions with (j)0 and 0* appear to be dominating: we only take them into account. Further we assume that the stationary density N(x) is approximately proportional to 0o(x). Then:
F(x) = K ^ 0 o ( x ) (16)
31*

SM-101/36 483
C t = K r j i 0 o ( X i ) " (17)
In t h i s f u n d a m e n t a l m o d e a p p r o x i m a t i o n , t h e p r o b a b i l i t y P a i s i m m e d i a t e l y -s e e n t o b e e q u a l t o :
P a ( u , v ) = r ] 1 r ) 2 r ] 3 0 o ( x 1 ) < / > o ( x 2 ) 0 o ( x 3 ) ^ ( ^ - l ) ( ^ - 2 ) / 0 * ( x o ) 3 F ( x o ) d x o
I1 -"(tj-toJ-aCtj-tjJ-aCtj-t,,) X / e dto
. C1C2C3 r •*3< 2 r , , -a(u+v)
Using the definitions:
Total f iss ion r a t e F = /F(x)dx = K / ^ 0 o d x (19)
Genera t ion t ime A = — r ,A ~. , , (20) v J $* & <j>0 d x
(v = Average number of p rompt plus delayed neut rons per f ission);
Efficiency d = C j / F (21)
one obtains:
P a ( u , v ) =£C1<*2Z2f2e*a<u + v ) (22)
Here Z 2 i s the quantity defined in (4), but now with €263 ins tead of e 2 . The effect of space and energy dependence is expres sed in the factor
f 2 (a c o r r e c t i o n factor with r e s p e c t to the point r e a c t o r model r e su l t ) , given by:
f i<t>f ^4>o dx- {/^4>o dx}2
*2 - { / 0 * ^ o d x } 3 ^6)
3 . 3 . Calculation of P b (u , v)
The l i s t of probabi l i t ies for P b l i s as follows:
(i) Probabi l i ty for f ission at t 0 , x 0 : F ( x 0 ) d t 0 d x 0
(ii) Probabi l i ty for production of v neu t rons : p„ (iii) Probabi l i ty of detecting a descendant at t j with counter 1: r)^vir(xlt
xo» *i ~*o) (iv) Probabi l i ty that another desc-endant gives fission at t 4 , x 4 :
[v - 1) ^ 4 7 r ( x 4 , X 0 , t 4 - t 0 ) ; {&~4 means hat &" ope ra t e s on x 4 ) (v) Probabi l i ty for n neut rons produced at t 4 : p (vi) Probabi l i ty for detecting a descendant at t 2 with counter 2:
• r j 2 j i J r ( x 2 , x 4 * t 2 _ t 4 ) (vii) Probabi l i ty for detecting another descendant at t 3 with counter 3:
> ? 3 & * - 1 ) T ( X 3 , X 4 , t 3 - t 4 )

484 DRAGT
Again we use the expansion (12), but th is t ime not the fundamental mode approximat ion. This r e s u l t s in:
P b l ( u , v ) S T kflmn ktfmn
(24)
M m a
where the t ime factor - exactly as in [1] - is given by:
T 1 ="/ ds / dt e k«mn Q 0
•aks - ojt - a m ( u + s - t) - an(v + s - t)
- ( a c - a n ) u - a n v - a r n u - a n v
(am + a n - a « ) K + Q r « ) iam +an~a l)(a k+at +am)
The phase space factor S,1. is found to be:
SkCmn =n1^k(x1)-r]20m(x2)-r ? 30n(x3)- J / ( i / - l )2-QMRm n {
where the abbrevia t ions :
/ 0*(x) tf>*(x) F(x)dx = Q ke
/ 0 * ( x ) 0 * ( x ) ^ m ( x ) d x = R k6m
(25)
(26)
(27)
have been used. The next p rob lem is to find Pb2(u> v ) - An analogous evaluation as for
P b l - and cor responding to the calculat ion in [1] - yields.*.
P M ( u . v ) I kCmn
kCmn kfimn (28)
with:
and
a m u - a n v
k« mn (a, +a +a )(a +a„) \ k m n M m i '
Skfimn = r ? l ^ k ( x l ) - , l 2 ^ m ( x 2 ) ^ 3 ^ n ( x 3 ) ' , y ^ - 1 ) ' ®mlR knfi
[29)
(30)
Similar ly :
P (u,v) = > S?„ Tf„ b3 /_, kCmn k«mn
kCmn
(31)

SM-101/36 485
with
- a m u-a n v T 3 = (32^
kemn (ak+am+an)(an+ai) { ;
S L n n = > W X 1 > - M m ( x 2 > ' ^3 * n < V ' ^ " ^ * ' Q m l R k m l (33)
3 .4 . Approximat ions in Pb(u, v)
Now we a s s u m e that we a r e in te res ted only in t ime in t e rva l s of the o rde r of magnitude of 1/a. If then the higher modes a r e much m o r e s u b -c r i t i ca l than the fundamental one, we have:
for P I (34)
Then T j ^ m n , T 3{ r n n and the second t e r m of T ^ m n a r e ze ro , un le s s
m = n = 0. The f i r s t t e r m of T ^ m n i s ze ro , un le s s i = n = 0. The non -ze ro t e r m s left in P b l + Pb2 + F >b3 a r e :
P b ( u , v ) - V n 1 0 k ( x 1 ) - r ? 2 ^ ( x 2 ) - r ? 3 0 o ( X 3 ) > I ^ ^ 2 e - - . Q k f ^ '—' mi k 0 ' km
V 2 e"°'(U+V ^-o^u+v)
+ : - - - ' • • • - ' • ' - • • „ )
k«
Qki Root ( 2Qoe Rkoe 1 ( 3 5 . 2a-an a+ai J
The f i r s t t e r m , p ropor t iona l to e" a v , i s the one that cance l s in the moment (11). The dominating t e r m in the sum is the t e r m with k = m = 0. Together with the approximat ions (16) and (17) and the definitions (19) - (21) th is t e r m becomes :
| C i a 2 Z 1 ( e 2 ) Z 1 ( e 3 ) f f e - a v (36)
where now f- i s the space and energy co r rec t ion factor
_ / 0 o 2 ^ - f l o d x J y 0 o d x J i " { /<£*^ 0 dx}2 <d'>
The s a m e factor has been given in [4] for twofold c o r r e l a t i o n s . In the second t e r m of (35) propor t ional to e{ -a (u+v)} , i s the c o n t r i
bution with k = i =0 exactly zero.. Only higher mode contr ibut ions a r e left. The dominating t e r m s a r e for k = 0, i / O o r k / 0, & = 0. The t e r m s k / 0, i = 0 give a factor :
-QkoRooo +QooRkoo ,„„.

486 DRAGT
which will be very s m a l l . In fact, in the approximation that the s ta t ionary dis t r ibut ion is propor t ional to the fundamental mode, we have
Qkd - Rkco ( 3 9 )
(as follows immedia te ly f rom the definitions (27). Then (38) i s exact ly z e r o .
The t e r m s k = 0, £ f 0 in the second t e r m of (35) yield:
2 e ' 0 ^ -[a,-a)
e . i t
= lC 1ar Z^Cg) Z 1 ( e 3 ) f ^e ' a ( u + v ) - a ( 4 0 )
with
2a(at-a) ReooRoofi {at -2a){al +a) R0 0 0
2
> l
(41)
where (39) has been used . The final r e su l t for P b i s :
oc(u+v) P b (u ,v ) = i C 1 o 2 Z 1 ( e 2 ) - Z 1 ( e 3 ) f n e "v + ae ^y> } (42)
This r e su l t i s to be used for the evaluation of the moment (11). Together with (22):
ni( t ){n 2 ( t+cr ) -n2( t+cT+T)}n3( t+2a+T) = P(cr, 2 a + T ) - P ( a + T , 2CT+T)
= C 1 a 2 { i z 2 f 2 + i Z 1 ( e 2 ) Z 1 ( e 3 ) f f a } e " 3 a ° e - a T ( l - eaT ) (43)
3 . 5 . Discuss ion of the r e s u l t s
It is no longer t rue that values of Z j and Z 2 immedia te ly yield e and j3-p: the factors f and f2 must be taken into account. In pa r t i cu l a r , the re la t ion between Z i , Z2 and /3-p [1] now must be expressed in m e a s u r a b l e quanti t ies as follows:
1 . 33Z 2 f 2 /Z? f? = (|3-p)g (44)
with geomet ry and spec t rum factor:
„ - J 2 . - J</>^3^-0odxj0n*^-^odx g - q - {/**2jri0i}2 (45)
This factor i s expected to be not too far from 1. A second.conclusion is that the higher modes of case b in F ig . 1 i n t r o
duce a dis turbing effect in the moment (11). It appears from Eq.(43) that it is not poss ib le to r emove this d is turbance by suitably positioning the

SM-101/36 487
d e t e c t o r s . In the following sec t ions , t he re fo re , only one detec tor will be cons idered .
It follows from the der ivat ion that the effect is caused by the higher modes induced by the t r ans i t ion from the f i r s t to the second f ission in t r e e - b of F ig . 1. It depends completely on the r e a c t o r configuration. Its magnitude is exp res sed in the factor a. F r o m (43) follows that the d is turbance is sma l l if
f f ^ - - 7 J ^ - « l (46) a Z 2 f 2 {P-P)g
In the next sect ion the quantity a will be es t ima ted .
3 .6 . Calculation of the d is turbance a
3 . 6 . 1 . Genera l cons idera t ion
An o rde r -o f -magn i tude es t ima te for the quantity a can be obtained by only consider ing the t e r m A=l. If, moreove r , a\ » a:
2a_ /<ftf 0ff y 0Q dx / ^ 2 ^ - 0 ! dx a ~ « i { / 0 * 2 ^ 0 o d x } 2 ( 4 7 )
For the evaluation of this express ion one needs a computer code that ca lcu la tes the higher u p - m o d e . This is a difficult p rob lem for a fast r e a c t o r . It i s poss ib le to find higher modes by a mult igroup diffusion code with the poss ib i l i ty for a poison s e a r c h . But this p r o c e s s in p r ac t i ce only works for a low number of energy g roups . F o r fast s y s t e m s , however , one is not pe rmi t t ed to reduce the number of energy groups to a low number ; this i s espec ia l ly so for a -ca lcu la t ions [6],
To gain some unders tanding, neve r the l e s s , the calculat ion has been made for two ve ry s imple analytic r e a c t o r mode l s : the b a r e homogeneous monoenerge t ic s lab r e a c t o r , and the ref lec ted r e a c t o r desc r ibed by the two-point Cohn model . At the s a m e t ime the factor g (45) will be calcula ted.
3 . 6 . 2 . B a r e homogeneous one-group s lab
Now x is the one-dimensional space coord ina te . Apart from n o r m a l izat ion fac tors
0o(x) = 0*(x) = cos | | (48)
for a s lab extending from x = - b to x = +b . The fission opera to r i s a constant over the s l ab . The factor g now becomes :
+ir/2 +7T/2
/ c o s 4 y d y / c o s 2 y d y -ir/2 -ir/2 27TT 2 , n A 1
g = - ^ 1 = ^ 5 6 - = 1 - ° 4 1 <49> / cosSydy^
TT/2 J

488 DRAGT
F o r the calculation of a (47) only even higher eigenfunctions must be cons idered (odd functions give no contr ibution). Then
A i x x*t \ 37TX
01 (X) = 0f(x) = C O S ^ " (50)
Taking also the normal iza t ion condition (13) into account, this gives (with in tegrat ions from -n/2 to +7r/2):
2a0 f / cos 3 y • cos2 y • dy] / c o s 2 y dy 2 a>o ^ i_ / c o s 3 y d y J / c o s 2 3 y d y 25 ax
«o and a^ a r e es t imated from
1 +B?L2 - ( l - /3)kco Q, = - 1
k«A with diffusion length L, infinite mult ipl icat ion factor k „ , and geomet r i c bucklings:
.-, I IT
B:
(51)
(52)
"-VSU ^ ' • d s ) - " * [53)
Then for a c r i t i ca l r e a c t o r , s ince kw = 1 + B 2 L 2 :
"o = 0 / A
„ 8(k«, - l ) ru . — —5—— *-
(54)
Then
and the condition (46) becomes
kmA
k«,)3 100(k o o - l )
(55)
0 .02 « 1
(56) k O O - l
or k M - l » 0 .02
The m o r e r eac t ive the c o r e , the s m a l l e r i s the dis turbing effect.
3 . 6 . 3 . The Cohn model
This is a two-point r e a c t o r model : co re and re f lec tor both a r e r e p resen ted by one point. These points will be label led by c and r r e s p e c t ively. Then the kinetic equations for core and re f lec tor dens i t i e s , neglecting delayed neutron mult ipl icat ion, a r e :
_d_ dt
( P c - j 3 ) / A c +K/& N.
A J (57)

SM-101/36 489
where K and ;u a r e coupling p a r a m e t e r s between core and r e f l ec to r , and St i s the l i fe t ime of neut rons in the r e f l ec to r . This formulat ion differs from Cohn1 s or ig inal one [7] in that we p r e f e r to use reac t iv i ty and genera t ion t ime , r a t h e r than 6k and l i fe t ime. The reac t iv i ty of the whole r e a c t o r is exp re s sed in the pa r t i a l co re reac t iv i ty pc :
The total genera t ion t ime is
p = pc +KH
A= Ac+K|Ui
(58)
and that
_2a± {<f>%)Ah)r { (0n)c(4o)c+(<^U<Mr}
"i < W V c {(tfi*)c(<vc+(^)r(W
where the normal iza t ion (13) has been incorpora ted in the formula . Now (-a0) and (-c*i) a r e the eigenvalues of the ma t r i x in (57):
( p c - / 3 ) / A c + * . K/I
M / A c -1/t+oti = 0
<£0 and <f>i a r e the e igenvec to r s , <f>* and </>* a r e the e igenvec tors of the adjoint m a t r i x . They can be wr i t ten
(59)
The in tegra l s in (45) and (47) now become summat ions over two poin t s . Since &r, the f ission ope ra to r , is z e ro in the re f l ec to r , the i n t eg ra l s containing f?' have one non -ze ro t e r m . It follows immedia te ly that
(60)
(61)
(62)
n/Ac
Then Eq.(61) becomes , using (59),
l / i - o r i
K/£
= 2a0 ( a i ^ - 1 ) 2 {A c ( l -^oJg) 2 + A - A J a " ai {l-a0W ' {Ac (<*!* -1 ) 2 +A-A C }
We t r y to approximate this express ion for
(i) Weak coupling, shor t re f lec tor l i fe t ime; and (ii) A sys t em close to c r i t i c a l .
Equation (62) can be r ewr i t t en :
„2 2
l-Okt = fi-p-aiA
(63)
(64)
(65)

490 DRAGT
F o r smal l ai the left-hand side of th is equation is negligible, so :
aQ=(p-p)/A (66)
Since
p-/3
the other a is approximate ly
a^lAc <68V Neglecting a0Jl with r e s p e c t to 1, th is yields
a - 2 - ^ ^ (69,
If the r e a c t o r is c lose to c r i t i ca l
a = 2 ^ (a0A)2 (70)
There fore , the dis turbing effect i s sma l l when the coupling between core and re f lec tor is weak, and when the re f lec tor l i fe t ime is sho r t .
We t r y to e s t ima te the effect for the exper iment of Section 2. The re
an - 54 s -1
F r o m (unpublished) pulsed neutron m e a s u r e m e n t s in the s ame r e a c t o r we have found indicat ions that
- y = 6; JL = 1(T3 s
Then:
a = 0.035
For the ra t io of the two effects in (43) we then find
j Z i f i a „ 0.070 . .
iz2f2 = 0 " 1 0
So the measu red effect is about eleven t i m e s l a r g e r than the expected effect. This i s in agreement with the exper iment (about 14 t i m e s l a r g e r ) , So the modal effect indeed explains the observed d i sc repancy .
4. SUMMARY OF CONCLUSIONS
We s u m m a r i z e the main conclus ions .
(i) When calculating /3-p and e f rom threefold co r re la t ion expe r imen t s , one mus t take into account a space and energy cor rec t ion fac tor .

SM-101/36 491
This factor is expected not to deviate too far from 1. (ii) The moment
n(t){n(t+a) - n(t+a+r)} n(t + 2a+r)
is less sensitive to higher mode contamination than the moment with a = 0 .
(iii) There are higher mode effects that cannot be removed by detector positioning. They depend on the system itself.
(iv) From the results of the two simple calculations in Sections 3.6.2 and 3.6.3 we expect that the disturbance is small for a system consisting of a fairly reactive core, surrounded by a strongly absorbing blanket or reflector.
(v) It is a difficult problem to evaluate the disturbance effect quantitatively for an actual fast system.
A C K N O W L E D G E M E N T
The experiment described in Section 2 was made possible by the help of Mr. E. Tiirkcan, Mr. G.J . Bakkenes and the LFR-staff.
REFERENCES
t l ] DRAGT, J .B . , Nukleonikjj) (1967) 7. [2] THIE, J .A . , "Reactor Noise", AEC Monograph (1963). [3] MATTHES, W., Nukleonik4 (1962) 213. [4] OTSUKA, M . t IIJIMA, T . , Nukleonik J (1965) 488. [5] KAPLAN, S. e t a l . , Proc. 3rd UN Int. Conf. PUAE 4 (1964) 41 . [6] MURLEY, T . E . , The modal analysis of prompt neutron kinetics in fast and fast-thermal coupled systems,
INR-4/66-4, Kernforschungszentrum Karlsruhe (1966). [7] COHN, C.E . , Nucl. sci. Engng 13_ (1962) 12.
DISCUSSION
D. STEGEMANN: You state that the threefold correlation experiment is particularly suited to measuring j3eff in fast reactor systems without any other static experiments. In view of the relatively small detection efficiencies (about 10"5) in fast systems and seeing that Zi is proportional toe and the threefold correlation term Z2 is proportional to e2 ( i .e . about 10"10), I am almost sure that no reasonable results for /3 can be found using this method, especially as in addition one must distinguish between the two types of threefold correlation (which in Fig. 1 you denote as " t rees" a and b). Could you tell us why you believe this experiment to be more advantageous for measuring j3eff than a normal correlation noise experiment together with a static experiment for measuring the absolute reactor power?
J. B. DRAGT: With regard to your first point, I can say that here we have to distinguish between the "tree-b" effect, which is not proportional to Z, but to zf, and the "tree-a" effect, dependent on Z 2 . Hence both effects are proportional to e2 , and the ratio of the two is independent

492 DRAGT
of detector efficiency. This efficiency might give r i s e to p rob lems in a fast r e a c t o r , although it is not c l ea r to what extent this is a l imitat ion, s ince detailed e r r o r evaluations for the t h i r d - o r d e r moments a r e not as yet avai lable . If poor detector efficiency p re sen t s a problem, the number of de tec tors could be inc reased , in which case the prob lem is more of a p rac t i ca l than a fundamental na tu re .
As to your question, I do not believe that the usual co r re l a t ion ex per imen t , together with an absolute r e a c t o r power determinat ion, is any m o r e accura te than the p resen t method, the advantage of which is that it provides a new and independent check on normal p r o c e d u r e . M o r e over , it is in te res t ing from the point of view of at tempting to der ive the max imum poss ib le information from r e a c t o r noise .
G .S . BRUNSON: There is an in teres t ing var ia t ion of the s imple Rossi-Q' co r re la t ion exper iment : One ini t ia tes the t iming cycle with e i ther a 10B or 235U counter , at posi t ions of equal impor tance , and t e r mina tes the cycle in e i ther case with a fur ther counter at the cent re of the c o r e . On compar ing the two cor re la t ion curves one finds that init iation with the 235U counter gives a probabil i ty amplitude a few pe r cent l a r g e r than does the 1 0B counter , due to the v neutrons introduced into the neutron population at t ime t = 0.
The fact that the additional neut rons produce an effect of only a few per cent i s significant. Each neutron chain begins with a single fission, i . e . has an instantaneous population of v. However, the chains normal ly detected in the R o s s i - a exper iment by this compar i son a r e shown to have a population of ~50 neutrons at texp = 0. It is clear then that the chains studied by this method are very much larger than average, having presumably experience some fortuitously large values of v before the first detection. The reason for this is quite clear, namely that a chain must be detected-twice to be counted at all; hence chain detection probability is weighted as (pop.)2 .
R.W. ALBRECHT: The fact that uranium and boron have different absorption cross-sections surely enters into account.
G.S. BRUNSON: The initiating counter merely detects the existence of a neutron chain and the sensitivity of the 10B or 235u counter is immaterial. What is important is to maintain exactly the characteristics of the terminating counter so that a precise comparison of the two experimental results may be made.

ANALYSE DES.TECHNIQUES DE MESURE DE LA REACTIVITE D» ENSEMBLES MULTIPLICATEURS FORTEMENT SOUS-CRITIQUES
P. VANDEPLAS CENTRE D'ETUDE DE L'ENERGIE NUCLEAIRE, MOL-DONK, BELGIQUE
Abstract — R6sum6
ANALYSIS OF THE TECHNIQUES FOR MEASURING THE REACTIVITY OF FAR SUB-CRITICAL MULTIPLYING SYSTEMS. The methods of measuring control-rod worth on the basis of reactor response to a periodic excitation source are analysed and it is shown that the ratio of the integrals of the prompt and delayed neutron densities over one period is independent of the shape of the signal used. This ratio will thus be equal to the ratio of the neutron densities in the presence of a time-independent source. The pulsed source, sinusoidal source and source removed methods therefore give identical worth values. Experimentation and numerical analysis show that the ratio of prompt to delayed neutron density, which is a linear combination of successive eigenvalues of the system, is largely dependent on the position of the source. It is demonstrated analytically that with a suitably chosen volume of integration, the contribution of the space harmonics is drastically reduced in the integrals of both the prompt neutron density and the delayed neutron density. Numerical studies show that the ratio of these two integrals is practically equal to the reactivity corresponding to the fundamental static mode and is almost independent of the position of the source. Integration of the neutron densities over a volume can be reduced to an integration along a straight line by a suitable choice of source location. Such an integration can be performed by means of an integral detector, thereby only requiring one measurement. Optimization of the position of the source and of the limits of integration to give the best value for the reactivity can be achieved on the basis of purely experimental criteria.
ANALYSE DES TECHNIQUES DE MESURE DE LA REACTIVITE D'ENSEMBLES MULTIPLICATEURS FORTEMENT SOUS-CRITIQUES. Les mSthodes de mesure de 1* antirgactivitg a partir de la r€ponse d'un rSacteur a une source d'excitation p£riodique sont analysSes. Cette analyse montre que le rapport des integrates sur une pfiriode des densites neutroniques prompte et retardee est independant de la forme du signal utilise. Ce rapport sera par consequent egal au rapport des densites neutroniques existant en presence d'une source constante. Les m£thodes de la source pulsee, de la source sinusoidale et de re ject ion de source conduisent done a des valeurs identiques d' antireactivite. Le rapport des densites neutroniques prompte et retardee, qui est une combinaison lineaire des valeurs propres successives du systeme, depend fortement de la position: T'experience et 1'analyse numerique le montrent. On montre analytiquement que, lorsque le volume d'integration est convenablement choisi, la contribution des harmoniques spatiales est fortement reduite tant dans 1' integrate de la densite neutronique prompte que dans 1' integrate de la densite retardee. Par une etude numerique, on.montre que le rapport des deux integrates est pratiquement egal a la reactivite correspondant au mode statique fondamental, et quasi independant de la position de la source. L'integrate des densites neutroniques sur un volume peut se reduire a une integrate simple par un choix judicieux de la position de la source: une telle integration peut se realiser au moyen d'un detecteur long et ne requiert qu'une seule mesure. L'optimisation de la position de la source et des limites d'integration conduisant a la meilleure valeur de reactivite peut se faire sur base de criteres purement experimentaux.
1. INTRODUCTION
C'est en raison du complet .disaccord qui a ete constate entre les resultats theoriques et les resultats de mesure, en regime sous-critique, de la reprise de reactivite des barres de controle des que ces
493

494 VANDEPLAS
va leu r s dépassent deux d o l l a r s , que ce t r ava i l a été e n t r e p r i s . Pour expliquer ce désaccord , une des campagnes de m e s u r e de 1' expér ience VENUS a été étudiée en déta i l .
La p résen te étude e s t essen t i e l l ement numér ique , s e s buts étant : - de faire porter la comparaison entre la théorie et l1 expérience sur
des grandeurs directement mesurables et non sur les résultats indirects qui s'en déduisent, et de prouver ainsi la validité des résultats théoriques
- de prouver que, même dans des conditions défavorables, les résultats des méthodes de mesure proposées constituent une excellente approximation de la réactivité à mesurer.
L'intérêt de pouvoir mesurer correctement la réactivité ainsi que la constante de décroissance des neutrons prompts d'un ensemble fortement sous-critique est double. En effet, on peut - mesurer la réactivité d'un réacteur toutes barres de contrôle enfoncées
(caractéristique importante du point de vue de la sécurité) - vérifier les méthodes théoriques sur la base de résultats expérimentaux
obtenus sur des ensembles comportant de faibles quantités de combusjtible.
2. ANALYSE DES METHODES DE MESURE DE REACTIVITE EN REGIME SOUS-CRITIQUE
2.1. Définition de la réactivité statique d'un réacteur sous-critique
La réactivité statique est définie par la relation
ou
P = Pl = vl - 1
vx représente la plus petite des valeurs propres de 1' équation statique de Boltzmann
LNn = i/nMN + RNn (1)
L = opérateur de destruction M = opérateur de production R = opérateur de transfert N = densité neutronique.
La réactivité en dollars s'exprime par
9 /3 /3 Ц/3
(/3 = fraction effective des neutrons retardés) puisque Ц, le facteur effectif de multiplication, est égal à 1/v .
La mesure de la réactivité p.* revient ainsi à mesurer la première valeur propre du système: il faut donc disposer de la fonction propre

SM-101/2 7 495
correspondante, en l 'occurrence de la distribution de la densité neutronique fondamentale.
D'une façon générale, la réactivité statique d'un réacteur sous-critique sur le mode n est défini par
о - v - 1 Hn n
où pr =(vn - iy/3:, avec 1 <v1 . . . < VR^ et donc Рг< Рп^г •
2.2. Réponse d'un réacteur sous-critique à une source d'excitation variable dans le temps
En présence d'une source périodique de période T, suivant [1] , le rapport des densités neutroniques promptes et retardées intégrées sur cette période vaut
/
00 T
Np(7<t)dt L-k nk (V^° g ) J s ° ( t > d t
A 1 \*> - 1 = n = l П 0 A2(r) T T
0 n = l n n
ou Np(r , t) = densité neutronique totale prompte N r(r,t) = densité neutronique totale retardée
avec N = N + Nr = densité neutronique totale.
"^ N est la densité neutronique qui existerait en 1' absence de précurseurs de neutrons retardés, Nr est la densité neutronique due aux seuls précurseurs des neutrons retardés.
Mais
et [1] donne
о о
J \ C n ( t ) d t = )3 knKnJT Tn(t)dt о
T
Nous obtenons après élimination de / XCn(t)dt

496 VANDEPLAS
oo i
Ы£.—?2 1 ,2) A2(?) « T
I^TTTTgy Rn<?)^^/s n ( t )d t n = l 0
—» Dans cette express ion , R n ( r ) es t la fonction p ropre d ' o r d r e n et vn
la va leur p ropre cor respondante de l ' équa t ion stat ique de Boltzmann appliquée au r é a c t e u r envisagé . Les fonctions Sn(t) sont les coefficients du développement en s é r i e de fonctions p r o p r e s de S( r , t )
S( r , t ) = E S n ( t ) R n ( r )
En pra t ique , les différents modes sont exci tés de la même maniè re , de so r t e que
S( r , t ) = E Sn(t) R n ( r ) = S(t)E S n R n ( r ) (3)
où l e s Sn r ep ré sen ten t l e s coefficients du développement de S(r ) en s é r i e de fonctions p r o p r e s du p rob lème .
Il vient donc
00
l i / n - ( i - 3 ) S n R n i )
A ^ B ^ I ( 4 )
A2(r) V 1 s R ( ? )
11=1 u
A 1 ( r ) /A 2 ( r ) es t donc indépendant de la forme du signal ex t é r i eu r et en p ré sence d1 une source fixe
A!( r ) _ Np(?)
A 2 ( r ) N r ( r )
Les méthodes de Sjôstrand, de la modulation et de l ' é j ec t ion de source fourniront donc des va l eu r s identiques Dour le r appor t A j ^ J / A g (r).
Posons , dans l ' e x p r e s s i o n (4)
1 1 „ „ S„ =F„ vn - ( 1 - 3 ) vn - 1 "n -n
et (5)
v - 1 = p

SM-101/27 497
FIG. 1. Réponse d'un réacteur sous-critique à une source neutronique puisée périodique.
Il vient
A , ( 7 ) _n=i —* °°
A2(r)
Fnpn*Rn(r)
F R (r) n n
(6)
n = l
—) Les Fn sont les coefficients du développement de A2(r) en série de
fonctions propres; les Fn pn sont les coefficients du développement correspondant de A-^r).
Lorsque seul Fj est différent de zéro,
2 .3 . Aperçu des méthodes expérimentales
2 .3 . 1. Méthode de la source puisée périodique [1]
La réponse (la variation de la densité neutronique) en un point r du réacteur est illustrée à la figure 1.
La période T doit être telle que
» T » Л
où Л représente le temps de génération des neutrons prompts et Xmax la plus grande des constantes de décroissance des précurseurs des neutrons retardés. _
Le rapport A : /A 2 = EF n p*R n ( r ) /EF n R n ( r ) vaut p* lorsque seul Fj est différent de zéro, c ' es t -à -d i re lorsque les neutrons sont distribués suivant la fondamentale.
2 .3 .2 . Méthode d'extinction de source [2]
La réponse d'un réacteur sous-critique à une extinction de source est représentée à la figure 2. Lorsque la source fonctionne, la densité
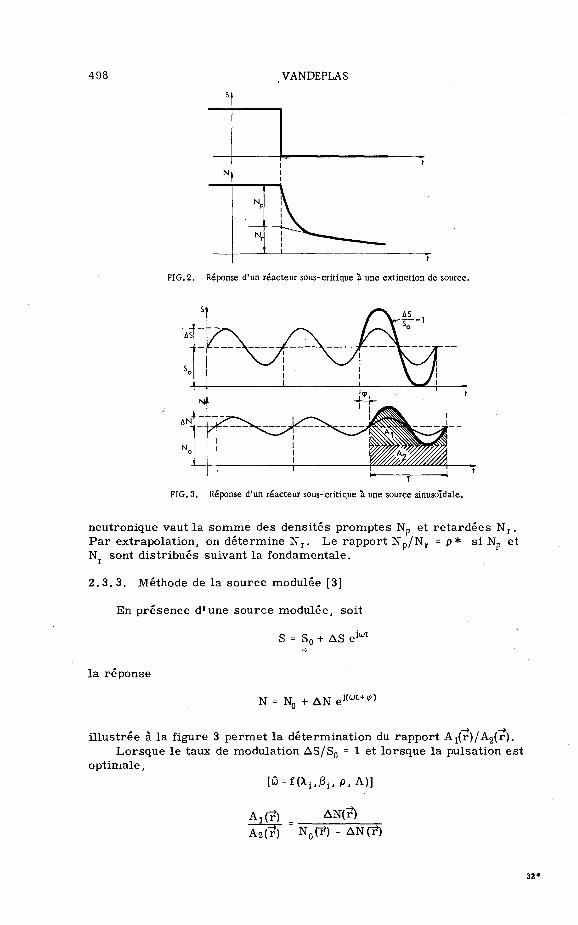
498 VANDEPLAS
FIG. 2. Réponse d'un réacteur sous-critique à une extinction de source.
. J AS
So
5 ^^
! » •
Vv='
i
FIG. 3. Réponse d'un réacteur sous-critique à une source sinusoïdale.
neutronique vaut la somme des dens i tés p romptes Np et r e t a r d é e s N r . P a r extrapolat ion, on dé te rmine N r . Le rappor t N p / N r = p * s i Np et N sont d i s t r ibués suivant la fondamentale.
2 . 3 . 3 . Méthode de la source modulée [3]
En p résence d 'une source modulée , soit
S = Sn + AS e jwt
la réponse
N = N0 + AN ej ( w t + *>
i l lus t rée à la figure 3 pe rme t la déterminat ion du rappor t A 1 ( r ) /A 2 ( r ) . Lorsque le taux de modulation AS/S0 = 1 et lo rsque la pulsation es t
opt imale , [Û = f ( X i f / 3 i f p . A ) ]
A2(?) AN(r) ~te(?) ' N0C^) - AN(?)
32*

SM-101/27 499
E p^r
FIG. 4. Reponse d'uri reacteur sous-critique a une source crenelee periodique.
2.3.4. Methode de la source crenelee periodique
Cette methode se rattache aux methodes des neutrons pulses et de 1'extinction de source. La reponse du reacteur est illustree a la figure 4.
La periode T du signal doit etre telle que (voir 2.3.1)
- » T » A max
T - d » A
d » A
d = duree de fonctionnement de la source pendant une periode A = temps de generation des neutrons prompts Xmax = la plus grande des constantes de decroissance des precurseurs
des neutrons retardes.
Dans ces conditions
Ai(?) Np(F) d_ NT(r) - NR(r) d A 2 ( ? ) " N R ( ? ) T" N R ( ^) T
Les autres methodes presentent, pour la determination de p * . des desavantages par rapport a la methode de la source en crenaux:
r - Methode de la source pulsee: pour une meme valeur de / S(t)dt, les
o corrections de temps mort a introduire lors du compta^e seront plus grandes, car S(t)puls€ » S(t)crgnaux
- Methode d1 ejection de source: outre le faible taux de comptage, elle necessite le calcul de Nr et comporte done les incertitudes liees au modele ponctuel et aux constantes (jSj, Xj)
- Methode de la source modulee: elle necessite le calcul de la pulsation optimale w = l[p,^i, \ i t A) et comporte done les incertitudes liees au modele ponctuel et aux constantes \ i t ^ et A.

500 VANDEPLAS
2 . 4 . Aspect t empore l de la réponse à une source var iab le
Considérons le cas d 'un signal en crénaux, répondant aux conditions spécif iées p récédemment . Après extinction de la sou rce , la réponse prompte peut s ' é c r i r e
Кр(?^)=£гп^Кп(?)е-а"Г
n = l
n An
Lorsque seul F j es t différent de z é r o ,
N p ( r , t ) = F j p Í R ^ r J e " " 1 1
avec
Л
ce qui se r e p r é s e n t e par une droi te en coordonnées semi - loga r i thmiques (fig. 5).
2 . 5 . Conditions de validité des méthodes
Le rappor t Ai("r)/A2("r) ne s e r a égal à la réac t iv i té stat ique p" = p'{ que s i N p ( r , t ) et Nr (r*,t) sont répar t i s - su ivan t la fondamentale RjC?). P ra t iquement , Np et Nr sont r é p a r t i s suivant la fondamentale:
a) Lorsque p es t faible, c ' e s t - à - d i r e pour une si tuation proche de la c r i t i c i t é , c a r , dans ces conditions (voir 2 .2 ) ,
1 x a . - F . "„-<i-0> "„-i n "
soit
1 1 о — S = F Pn + £ Pn П
n r rn
Mais , Pj étant faible et px < pn^1
FlPl >>FntlPntl
F l » Fn¿l

SM-101/27 501
log fondamentale seule
en présence d'harmoniques
FIG. 5. Aspect temporel de la réponse neutronique prompte à une extinction de source.
de sorte que
ï F R p n n rn
A i ( r ) _ n = l_
A 2 ( r ) J] FnRn - P i
n = l
b) Lorsque les neutrons de source (14 MeV), après ralentissement et diffusion, ont une répartition proche de Rjir) . En effet, dans ce cas
s i » sn¿i e t Fi » F ел 1 n^l 1 n f l
2.6. Elimination des harmoniques
2.6. 1. Méthode de Gozani [4]
Nous n1 avons pas analysé cette méthode en détail car, comme Gozani le précise, la méthode n 'es t valable que si les modes fondamentaux statiques et dynamiques (en décroissance exponentielle) sont identiques. Ce n 'es t pas le cas pour un réacteur réfléchi ou, de façon plus générale, pour un ensemble à plusieurs zones dont les caractéristiques d'absorption sont fort différentes [5] .
2 .6 .2 . Méthode d' «intégration pondérée» (IP)
Dans le cas d'un réacteur nu et homogène, dans les limites de validité de la théorie de la diffusion à un groupe les fonctions propres successives sont orthogonales, de sorte que
et le rapport
f R n ( r )R m ( r )d?=C^ 1 | I 6° icteur
f Ritô£ «Rntf^ Ai reacteur n = 1
HP / Ï4(r> Y FnRn^> d ?
réacteur n = 1

502 VANDEPLAS
peut s1 écrire
L A 2
n = i réacteur )¿
F„ / Rn(?) H (?) d? P J " î d r
n = 1 réacteur
p; = P'
En pratique, cette méthode serait lourde à appliquer car elle nécessiterait en tout point du réacteur la mesure de
Aj(r ) = ) P-F R (r) í ¿__, n n n
n = l
et le calcul de
A2(r) = ) F R (r)
n = l
Nx(r) = R2(r)
Comme nous le montrerons plus loin, pour une certaine position de la source l1 intégration de volume peut en pratique se réduire à une intégrale simple.
Notons que l ' intérêt de cette méthode est académique, car elle se limite aux réacteurs non réfléchis et nécessite la connaissance de la fondamentale.
2 .6 .3 . Méthode d'«intégration simple» (IS)
Considérons un réacteur «plan infini», nu et homogène. Nous savons que
Rn(x) = sin П7Г X
a étant l1 épaisseur extrapolée du réacteur. En mesurant, au moyen d'un détecteur intégral de longueur égale
à 2a/3, le rapport 5a/6 «
p*F R (x)dx r n n n ч '
2JIS - a/6 n=l
5a/6 „
/ 1 F»R" (x) dx a/6 n = l

SM-101/27 503
i p l 5 *5 7 * 7 11 ' и 13 *13 17P17" R . El _ Z? + Zn ^13
11 ' 13 F 1 7 17
F l P l* + [EP]IS F i + tE] I S
on voit que les harmoniques d 'ordre 2,3 et leurs multiples sont éliminées et que
A1
* 2 J
n * •1
[ E p ] I S « F 1 p * et [ ^ « F j
Une première objection à cette méthode est que, dans le cas d'un réacteur réfléchi, Rn(x) = Gn(sin птгх/а) + fn(x). Mais fn(x), qui traduit 1' influence du réflecteur sur la distribution neutronique dans le noyau, est négligeable vis-à-vis de Gn(sin птгх/а) dans la majorité des cas pour a/6 s x s 5 a /6 .
2 .6 .4 . Méthode des deux détecteurs (DD)
Pour un réacteur plan, la réponse sommée de deux détecteurs placés en x = a/3 et x = 2a/3 s ' écrit
L A 2 J
Ai(a/3) + Ax(2a/3) DD A2(a/3) + A2(2a/3)
Fift* + F ñ P y F7ft7* + F1lPfi - Fiapft - F, Fj + F5 - F7 + F n 13
F l P l* + [Ep]DD
F, + [E] DD
et ce rapport sera proche de p* lorsque
f E p i D D < < F l ^ e t [ E ] D D< < F 1
Par rapport à la méthode précédente, celle-ci présente l'inconvénient que les coefficients de p*, p* . . . ne comportent pas les facteurs 5, 7, 11 . et qu'elle sera forcément moins précise; en d 'autres termes sa limite d'applicabilité sera plus faible, la limite d'applicabilité étant la valeur maximale de p pour laquelle l'approximation est valable.

504 VANDEPLAS
Source d'excitation
detecteurs ponctuels detecteur integral
FIG. 6. Illustration des conditions pratiques de mesure.
d = distance source-noyau; h = hauteur physique; h ' = hauteur extrapolee.
2 . 6 . 5 . Aspect t empore l de ces methodes
Considerons la reponse prompte a un signal en c renaux. Apres extinction de la sou rce ,
n = °°
N p ( ? , t ) ^ F n p * R n ( 7 ) e " a n t
n = l
Cette reponse devient, dans la methode de 1 ' integrat ion ponderee ,
[Np( t )] I P = F j p j e - ^
dans la methode.de l1 in tegrat ion s imple , pour un r e a c t e u r plan infini,
[Np(t)] IS = Fx p* e «ir - & pf e"0"1 - ^ p^ e"0"1. . .

SM-101/27 505
dans la méthode des deux détecteurs, pour un réacteur plan infini,
[Np(t)]DD = F1 P* e"ait+ F5 p* e'a5 t - F p * e a^ . . .
Il en résulte que la réponse du détecteur intégral et la réponse sommée des deux détecteurs ne comporteront pratiquement plus que la décroissance des neutrons prompts suivant le mode fondamental.
2.7. Conditions pratiques de mesure
Le but poursuivi est l 'élimination de l'influence des harmoniques sur là détermination expérimentale de p* = p* et la simplification maximale des mesures.
Considérons le cas le plus fréquent d'un réacteur cylindrique réfléchi. Si la source d1 excitation est placée sur 1' axe de ce réacteur (fig. 6) à une distance optimisée [6] de façon que la répartition radiale de la densité neutronique soit proche de la fondamentale, le rapport Aj(r, z)/A^(r, z) ne sera plus fonction que de z, les harmoniques radiales étant absentes.
Cela simplifiera considérablement la mesure car, - pour la méthode d'intégration simple, une mesure au moyen d'un
compteur BF3 (situé éventuellement dans le réflecteur radial) de longueur égale aux deux tiers de la hauteur extrapolée du réacteur suffira,
- pour la méthode des deux détecteurs, seule une mesure de la réponse sommée de deux détecteurs situés en z = h ' / 3 et z = 2h ' /3 (h' : hauteur extrapolée) sera nécessaire.
Il va de soi que ces mesures devront être indépendantes de la position radiale des détecteurs.
Ces considérations présupposent que les distributions axiales de densité neutronique sont de la forme sin n^z /h 1 . Si en pratique les distributions suivant z ne sont pas de cette forme (par exemple en raison de l'introduction partielle de barres absorbantes), il n 'es t plus possible de définir analytiquement les conditions favorables à l'élimination des harmoniques.
Il est cependant possible de définir expérimentalement les conditions optimales de mesure comme celles correspondant à log[Np(t)] =f(t), après extinction de la source, se rapprochant le plus d'une droite.
Pour la méthode des deux détecteurs cette optimisation se résume à un déplacement de ces détecteurs.
Pour la méthode d'intégration simple, une modification de la longueur du détecteur est en principe nécessaire. En pratique cependant, l 'optimisation peut se ramener au déplacement d'un détecteur de longueur fixe, étant donné la faible contribution, du point de vue du taux de comptage, de l 'extrémité du détecteur qui est la plus éloignée de la source.
3. VERIFICATION NUMERIQUE DES METHODES PROPOSEES
3 .1 . Introduction
L'étude numérique a été effectuée en rapport avec l 'expérience critique VENUS (fig. 7). Cette situation est complexe en ce sens que

506 VANDEPLAS
source d excitation 1АМеУ
tube modérateur
assemblage combus t ib le
FIG.7. Vue schématique du réacteur VENUS.
le réacteur est réfléchi et essentiellement hétérogène, et les valeurs de réactivité fort élevées: la vérification numérique des méthodes proposées sera d'autant plus probante.
Le premier but poursuivi est le calcul des réponses locales des détecteurs A^^/Ag ("?) et de les comparer aux valeurs mesurées.
La vérification numérique des méthodes de mesure proposées consiste à comparer la valeur de la réactivité calculée par intégration des réponses locales à la réactivité statique calculée de la façon classique. Les calculs sont effectués au moyen du code THREX [7] . Ils consistent à déterminer, en présence d'une source fixe de 14 MeV, les distributions des densités neutroniques promptes et totales.
Dans la suite nous appellerons — improprement d1 ailleurs — réactivité locale p*(r) le rapport
Pi Kn N(7) - N (?) ХГгТ

SM-101/27 507
FIG. 8. Distribution de p*(r) en présence d'une source ponctuelle de 14 MeV située dans le réflecteur (avec quatre barres de contrôle).
3.2. Résultats
Plusieurs cas ont été envisagés, tant au point de vue du nombre de barres insérées qu1 au point de vue de la distribution spatiale et énergétiqu de la source d1 excitation.
3 . 2 . 1 . Cas de quatre barres centrales insérées, la source d'excitation de 14 MeV étant logée dans le réflecteur (fig. 7)
La réactivité p = v1 - 1 = 8,12%, soit 11,04$ (/3eff - 7,35- ÎO'3), constitue la valeur de référence. La distribution de p1(~r) = A (?)/A r(í) est donnée à la figure 8. On remarque la variation très importante de p1{r) en fonction de r . La valeur expérimentale mesurée dans le tube

508 VANDEPLAS
m o d e r a t e u r 1. 60 (fig. 7) vaut 6 , 8 3 $ , contre 6 , 2 2 $ pour le ca lcul . L» accord es t done sa t is fa isant etant donne que le calcul se fait dans un plan et suppose a p r i o r i que la dis t r ibut ion axiale de densi te neutronique cor respond a la dis t r ibut ion fondamentale (introduction de B1 H). L ' a l l u r e de la var ia t ion de Pj(r) theorique a pu e t r e comparee aux va leu r s e x p e r i m e n t a l s . L1 accord e s t excel lent .
Pour la methode d1 integrat ion s imple , l ' a i r e d1 in tegrat ion bidi-mensionnel le co r respond au noyau p rop remen t dit c a r l e s d imensions r ad ia l e s du noyau cor respondent aux deux t i e r s des dimensions r ad i a l e s ex t r apo lee s . Si on compare la va leur t rouvee
A , l = = 1 $
L A 2 J l S p .
/ N r dr
noyau
a p * = 1 1 , 0 4 $ , on voit que l1 accord es t excel lent . La methode des deux de tec teurs fournit
A = 11,53
DD
l e s deux de tec teurs etant supposes d t re p laces su r 1* axe de s y m e t r i e de 1 'ensemble r e a c t e u r - s o u r c e , a une dis tance du cen t re egale a 1/6 de la dimension ex t rapo lee .
3 . 2 . 2 . Cas de dix-huit b a r r e s enfoncees
De facon a definir l e s l im i t e s dans l e sque l l es [Aj/Ag]^ et [Aj /AJpp cor respondent a p = v -y-1, ce cas ex t r§me a ete envisage . Dans ces condit ions, la va leur a m e s u r e r es t
P ^ c 7 ,35-10-3 5 U ' 4 8 $
Differentes conditions, tant au point de vue de la dis tr ibut ion spat ia le qu ' ene rge t ique , de la source d1 excitation ont ete env isagees . Ces conditions ainsi que l es r e s u l t a t s qui y correspondent sont donnes au tableau I.
3 . 3 . Discuss ion des r e s u l t a t s
Le fait que , en p re sence d 'une source d" exci tat ion identique a la source de neut rons de f ission du probleme s ta t ique , la va leur de p, (~r) ne soit pas constante indique que la va leur de j3 a in t roduire dans la re la t ion (4) doit g t re fonction de "? (fig. 11). Cette modification de j3 es t due a la modification du spec t r e rapide aux approches du re f l ec teur . L1 augmentat ion de Pi(iO a 1 'approche du re f lec teur s1 observe exper imenta lement .
Dans un t rava i l u l t e r i eu r , nous envisageons de definir l e s va l eu r s loca les de |3, A, e t c . , et de l e s r e l i e r aux va l eu r s moyennes c l a s s iq u es .

SM-101/27 509
TABLEAU I. CONDITIONS ET RESULTATS
Source d'excitation
Ponctuelle, 14 MeV, dans le re"flecteur
Ponctuelle, 14 MeV, au centre du noyau
14 MeV, uniforme'ment rSpartie
Uniforme'ment re"partie, et distribute en e'nergie suivant le spectre total de fission
14 MeV, distribute suivant la source de fission du probleme statique
Identique, tant du point de vue spatial que du point de vue e'nerge'tique, a la source de fission du probleme statique
Pi (r*
Fig. 9
Fig. 10
-
-
-
-
[ * 1 _A2 J IS
(S)
53,26
44,25
50,5
49,8
50,8
49,5
.A z J DD (8)
37,33
53,9
-
-
49,33
49,10
Cela se justifie d' autant plus pour des reacteurs a deux types de combustible (U, Pu).
Pour une distribution uniforme de la source, que son energie soit de 14 MeV ou distribute suivant le spectre total de fission, la valeur de [Aj/Ag] I s est pratiquement egale a p* = p* .
Lorsque la source d'excitation est situee dans le reflecteur radial, la valeur de [A1/A2]ls est proche de pf mais la valeur de [A1/A2]DD n'est plus satisfaisante.
Comme, pour une valeur de p? = 50 $, les ecarts entre p* et [A1/A2]IS sont au maximum egaux a 5 $, et comme 1'ecart relatif augmente avec p* (importance relative des harmoniques plus grande), l 'erreur commise ne serait pour p* = 30 $ que de 2 $, et pour p=£ = 10 $ de 0, 2 $ . Cela se confirme, 1'ecart entre p* et [Aj/AJjg et [A1/A^DD etant tres faible dans le cas de quatre barres inserees (3.2. 1).
Ces precisions sont tres satisfaisantes etant donne que l1 incertitude sur la mesure experimentale est de 1* ordre de grandeur des ecarts precites.
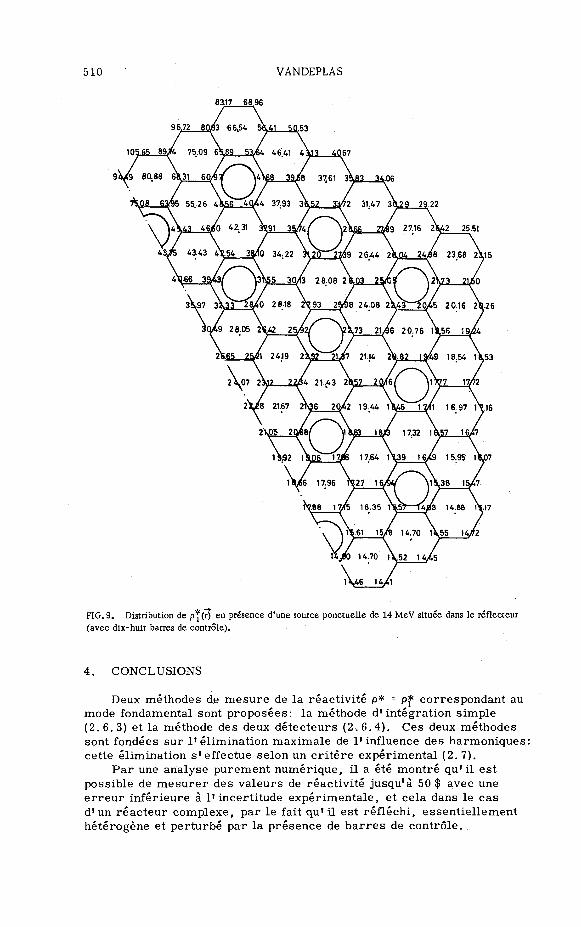
510 VANDEPLAS
FIG. 9. Distribution de p*(r) en présence d'une source ponctuelle de 14 MeV située dans le réflecteur (avec dix-huit barres de contrôle).
4. CONCLUSIONS
Deux méthodes de mesure de la réactivité p* = pf correspondant au mode fondamental sont proposées: la méthode d'intégration simple (2.6.3) et la méthode des deux détecteurs (2.6.4). Ces deux méthodes sont fondées sur l'élimination maximale de 1'influence des harmoniques: cette élimination s'effectue selon un critère expérimental (2. 7).
Par une analyse purement numérique, il a été montré qu'il est possible de mesurer des valeurs de réactivité jusqu'à 50$ avec une erreur inférieure à l'incertitude expérimentale, et cela dans le cas d'un réacteur complexe, par le fait qu ' i l est réfléchi, essentiellement hétérogène et perturbé par la présence de barres de contrôle.

SM-101/27 511
27.64 27.64
2857 2&/з 2793 2IL23 28.57
29.13 29Í2 30,20 г\зб 29,86 30.20 г\§2__2Д13
30.93 з\27 3 4 Щ \&&Ь 33¿7 3Q93 25
153 35ft 39.55 4\68 A1JB8 39.55 35.75 31J
44/65 4447 4 \б5 446б/
49.75 4*73 4 7 ^ 4 975 4Î
5\Э4 55¿3j \ \ б З _ _ 5 3 Д 4
60J8 63,96^62^6 6Q1B
6 \ / 64.87 6í
6 5.91 65/91
6 ^ 2
FIG. 10. Distribution de p*(r) en présence d'une source d'excitation située au centre du noyau.
REFLECTEUR Huh REFLECTEUR
FIG. 11. Profil de p, le long de l'axe de symétrie du réacteur, en présence d'une source d'excitation ayant la distribution fondamentale.
Il serait souhaitable que les méthodes proposées soient vérifiées expérimentalement par une comparaison systématique des valeurs de Pj(r) calculées et mesurées, et des valeurs calculées de p* et expérimentales de [Aj/Ag] et [A /A ]DD pour différents chargements d'un réacteur cylindrique réfléchi. Cette étude permettrait de définir les limites d'applicabilité pratique des méthodes préconisées.
R E M E R C I E M E N T S
L'auteur désire remercier ici M.A. Siebertz de l 'appui et des conseils prodigués au cours de ce travail et M. W. Rotter des discussions fructueuses sur les techniques expérimentales en question.

512 VANDEPLAS
REFERENCES
[1] SJOSTRAND, N. G. , Measurements on a subcritical reactor using a pulsed neutron source, Ark. Fys. 11 13(1956).
[2] JANOWSKI, F .J . , KLEIN, D . , MILLER, T . M . , Calibration of control rods, Nucl. Sci. Engng 2 (1957) 288-302.
[3] ROTTER, W.', «Mesures au moyen d'une source pulsee et m o d u l e dans un reac teur» , Pulsed Neutron Research (C.r. Colloque Karlsruhe, 1965) U_, AIEA, Vienne (1965) 775.
£4] GOZANI, T . , "The Theory of the modified pulsed source technique", EIR-Bericht Nr. 79 (1965). [5] PRESKITT, C .A . , NEPHEW, E.A. , "Interpretation of pulsed source experiments", Pulsed Neutron
Research (Proc. Symp. Karlsruhe, 1965)1^, IAEA, Vienna (1965) 77. [6] LOPEZ, W.M. , BEYSTER, J .R. . Nucl. Sci. Engng 12 (1962) 190-202. [7] DE MEERSMAN, R., Programme THREX, BLG-230 (1963).

A STOCHASTIC CALCULATION OF FAST REACTOR GENERATION TIMES
T.J. WILLIAMSON AND R.W. ALBRECHT UNIVERSITY OF WASHINGTON SEATTLE, WASHINGTON, UNITED STATES OF AMERICA
Abstract
A STOCHASTIC CALCULATION OF FAST REACTOR GENERATION TIMES. Multigroup calculations for fast reactors are basically static in character, based on a representation of the system in which 25 or fewer groups are used to describe 5 or 6 decades in energy. While most of the uncertainty in calculations (as exemplified by generation times which are consistently 10 to 20% too low) is due to errors in cross-sections, errors may also arise in averaging over broad groups; and in the treatment of elastic scattering by means of computed elastic removal cross-sections. Also, the multigroup method does not.permit convenient detailed study of the physics of slowing down in fast reactors.
In this paper a new approach to calculation of fast reactor temporal and integral properties is described. With this method the neutron slowing down process is treated approximately as a discrete time, discrete state Markov process. Starting with an initial condition of a pulse of neutrons distributed with a fission spectrum, the neutron density as a function of energy and time over a large number ( >100) of energy 'states'or 'groups' is evolved at discrete time steps. From this discrete representation of the time-energy dependent neutron density one is able to calculate a finely resolved discrete approximation to the distribution of slowing down times to first generation fission. The first time moment of this function is the generation time. Convolution of this distribution yields a function proportional to the time dependent response of a counter after a burst of fission spectrum neutrons. It is this function which is sampled in the Rossi-a experiment. Compared to the usual multigroup calculations the method has the advantage of not being directly dependent on spectral or adjoint calculations, and of being able to account for elastic scattering very accurately. Further, it is a dynamic calculation which follows the evolution of the neutron slowing down process in detail, as opposed to the usual calculations based on static fluxes. The method is versatile and may be applied to fast spectral and criticality calculations, and the usual spectral indicators such as central core fission ratios. Example calculations using the discrete state Markov method have been performed in systems with simple geometry. These calculational results are compared to those of other methods.
INTRODUCTION
T h e u s u a l , m u l t i g r o u p a p p r o a c h to c a l c u l a t i n g f a s t r e a c t o r
i n t e g r a l p a r a m e t e r s i s b a s i c a l l y s t a t i c in c h a r a c t e r . The m u l t i p l i c a t i o n
c o n s t a n t , k, a n d t h e t i m e c o n s t a n t , a, ( n e g a t i v e by c o n v e n t i o n ) a r e
e s s e n t i a l l y e i g e n v a l u e s of the t i m e s e p a r a b l e m u l t i g r o u p e q u a t i o n s . The
p r o m p t g e n e r a t i o n t i m e i s c o m m o n l y e v a l u a t e d i n d i r e c t l y f r o m the
r e l a t i o n [ 1 ] ,
k - 1 1
A - -£— - T2- (1) p k a k
P P
w h i c h c l e a r l y a m p l i f i e s a n y e r r o r s in the v a l u e of the p r o m p t m u l t i p l i c a
t i o n c o n s t a n t , kp , t h a t i s a s s o c i a t e d w i t h a. lp i s the p r o m p t
" l i f e t i m e " n o r m a l l y r e p o r t e d in the l i t e r a t u r e .
513

514 WILLIAMSON and ALBRECHT
Neutron slowing down is a continuous Markov process [2, 3], that is, a process for which the probability for being in a certain volume element of phase space (space-time-energy) at some future time depends only on the present state of the system and not on the past. In this paper we approximate the process as a discrete time, discrete state Markov process, and construct an array of state transition probabilities from simple probabilistic considerations of the collision physics. This matrix is then applied to evolve the time dependence of a pulse of neutrons on a discrete time-energy mesh. From this the usual integral parameters may be calculated directly but we obtain, in addition, a complete temporal description of the pulse. Space dependence is treated in the transport approximation.
2. REVIEW OF THE MATHEMATICS OF DISCRETE MARKOV PROCESSES
A discrete representation of the neutron density at any time, nAt, is provided by the state vector [4 ] ,
s(nAt) = (Sj, s2> • • • , s., • • •>s N ) , (2)
where s- is the probability that the neutron is in the state bounded by energies E i and E^. i ( E ^ E ^ . \) at time nAt. This presumes some initial state vector, s , at zero time, which is in our case derived from the fission spectrum and for which the elements sum to unity.
Fundamental to the description of a discrete Markov process is the transition probability matrix,
ht- ipi,jH ( 3 )
The element P. . is the probability that a neutron will make a transition from state i to state j in one time step, At. Clearly, if all possible states are included in the set we may write,
SP. . = 1 (4)
The neutron state vector may be stepped forward in time using this matrix,
thus,
s(nAt) = I((n-l)At) • P ^ . (5)
It is a well-known and particularly useful result of the theory of Markov processes that the probability of going from state i to state j in n time steps is given by the i, jth element of the nth power of the 1-step matrix. Thus the n-step transition matrix is,
§> = p n = | | p ( n ) II ( 6) nAt At " i, j » • v '
The power is taken in the usual sense of matrix multiplication.

SM-10.1/64- 515
3. A STOCHASTIC MODEL FOR SLOWING DOWN IN FAST SYSTEMS
The energy continuum is divided into N discrete states of which the first N-1 span the energy region of interest to fast reactors (say Ei = 10 Mev to Eja J = 10 ev). The first state is a 6-function in energy. The N*k state extends to zero energy and is an absorbing state for neutrons which survive to scatter below E-^_ j . Its primary purpose is as a
check to see that all neutrons are accounted for and Eq. (4) is satisfied. Three additional absorbing states are added for neutrons which suffer non-fission capture, leak from the system, or cause a fission. Thus the state vector ha8 N+3 elements and the transition probability matrix is of rank N+3. At very long t imes the value of the N+l st element of the state vector becomes the total probability for non-fission capture in the system. Similarly for elements N+2 and N+3.
For each state we define an expected time to coll ision in the state
Vi Y S J W
The brackets imply an energy average over state i which will be considered shortly.
Now, the off-diagonal transition probabilities may be written as the product of two probabilities,
- Y i At P. . = ( 1 - e )p. . , i < j < N (8)
it J . i.J
The first factor is just the probability that a neutron suffers a coll ision during the time At. The second factor, called the transfer probability, is the probability that a neutron goes from state i to state j in a coll ision.
We must allow for the possibility that a neutron remains in the same state after a col l is ion so that non-absorbing diagonal elements have the form
-YiAt -Yi A t
P. . = e n + (1-e )p. . , i < N (9)
which is an accurate representation if \&t i 8 small . The diagonal elements are unity for the four absorbing states,
P . = p. . = 1 , i=N, N+l, N+2, N+3. (10) i , i i i i
Before defining the transfer probabilities we consider a method for computing expectations for a state ( i . e . expected reaction rates, expected energy at which a coll ision occurs, e t c . ) . Our fundamental assumption is that neutrons enter a state according to a distribution which is uniform in energy across the state. Thus neutrons about to suffer their

516 WILLIAMSON and ALBRECHT
first collision in state i are assumed to be distributed according to,
w i . i ( E > - 5 F ' (E. , ' - E V E i * E * E i - i • <n> 1 1-1 1
If a la rge number of s ta tes is used this will be a good assumpt ion for neutrons which enter the state via inelast ic scat ter ing or fission.
Elas t ic sca t ter ing is a s sumed isotropic in the center of m a s s sys tem to make the above assumpt ion hold. In regions of anisotropic sca t ter ing the scat ter ing c r o s s section is reduced by the factor (1 -u (E))
2g'(E) = ( l - u c ( E ) ) 2 s ( E ) (12)
where (J-C(E) is the average sca t te r ing cosine in the center of m a s s sys tem, and the p r o c e s s is t rea ted as being otherwise isotropic with scatte red neutrons dis t r ibuted according to the familiar relat ion
1
where
/ i xir - <*E < E < E (1-a) E o o o
A + 1
and E is the energy at which sca t te r ing occu r s . For each state we shall compute the appropr ia te average energy at which sca t te r ing o c c u r s .
Should cuE lie between the state boundaries , the physics of the p r o c e s s is adjusted slightly so that the fundamental assumpt ion holds . To do this we multiply the c r o s s section by a scaling factor, a, which is close to unity, and at the same t ime divide the maximum energy loss per collision by a. The scaling factor is chosen so that the sca t te red neut ron dis t r ibut ion extends jus t to the lower l imit of a s ta te . It can be shown that the moderat ing power of the isotope is p r e se rved to high o rde r if a is close to one and A > 10. If the sca t te red neutron dis t r ibut ion spans seve ra l s ta tes scaling is usually unnecessa ry .
Neutrons may survive to suffer m o r e than one coll is ion in a s tate so we define the n*" coll ision survival probabil i ty in state i, r- , as the probabili ty that a neutron survives to suffer at l eas t n col l is ions in state i. Obviously,
ru = ' ( 1 3 » If we a s sume that neutrons about to suffer their n ' " collision in state i a re dis t r ibuted according to a function, w i ,n (E) , which is normal ized to unity over the state, then we may define the normal ized probabil i ty density for coll ision in state i
oo oo
Wi(E) =\I ri,n™i,nH/[I ri,„l < 1 4 > Ln=l J ln=l
If there is a coll is ion in state i, W-(E)dE is the probabili ty that the
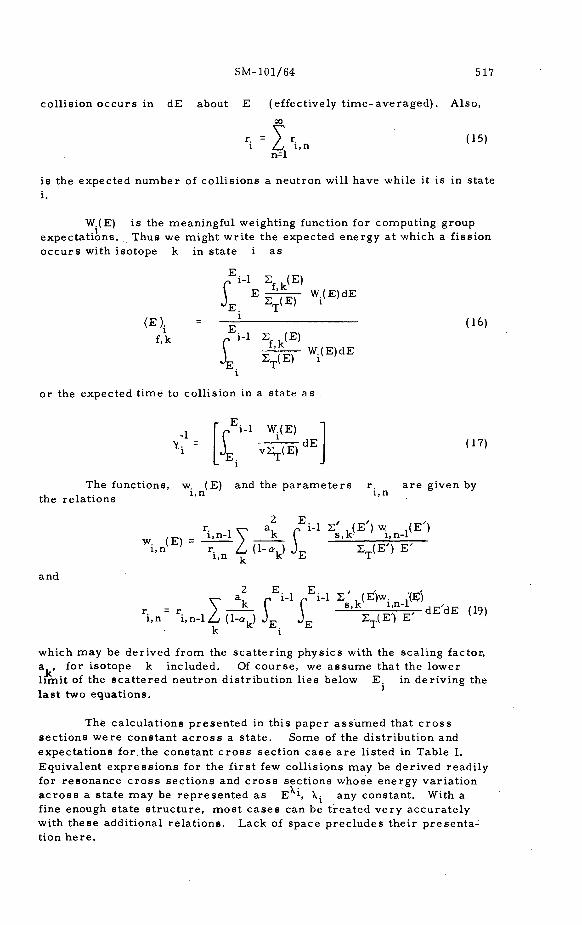
SM-101/64 517
coll ision occurs in dE about E (effectively t ime-ave raged) . Also,
00
,-Jr. l l_j i , n
n=l
(15)
is the expected number of col l is ions a neutron will have while it is in state
W.(E) is the meaningful weighting function for computing group expecta t ions . Thus we might wr i te the expected energy at which a fission occurs with isotope k
< E \ f.k
in s tate
E
£ i-l 2 (E)
E ——— W(E)dE
16)
I i-l
\ k ( E )
ST(E) W.(E)dE
or the expected t ime to coll ision in a state as
Y.
r p E i - l W.(E)
4 . ^ T ^ d E (17)
The functions, w (E) and the p a r a m e t e r s r. a r e given by ., , ... i , n i , n the re la t ions
,m ri.»-iv at r - 1 ss.k(E-) wi.n-i(E''
W''n " 'i.n 4- ( l - V J E ST(E'» E'
a n d
i,n i.n-lLi (1-ar,J J^ JT
E i -1 pE i - l S ' J E W |(E)
s,k ^ - l ^ d E ^ d E ( 1 9 ) 2T(E') E '
which may be der ived from the sca t te r ing physics with the scaling factor, a , for isotope k included. Of course , we assume that the lower l imit of the sca t t e red neutron dis t r ibut ion l ies below E. in deriving the las t two equat ions.
The calculat ions presen ted in this paper a ssumed that c r o s s sect ions were constant a c r o s s a s ta te . Some of the dis t r ibut ion and expectat ions for the constant c r o s s section case a re l isted in Table I. Equivalent express ions for the f i rs t few coll isions may be der ived readi ly for resonance c r o s s sect ions and c r o s s sections whose energy var ia t ion a c r o s s a s tate may be rep resen ted as E i, \^ any constant. With a fine enough state s t ruc tu re , mos t ca ses can be t rea ted very accura te ly with these additional re la t ions . Lack of space prec ludes their p resen ta tion h e r e .
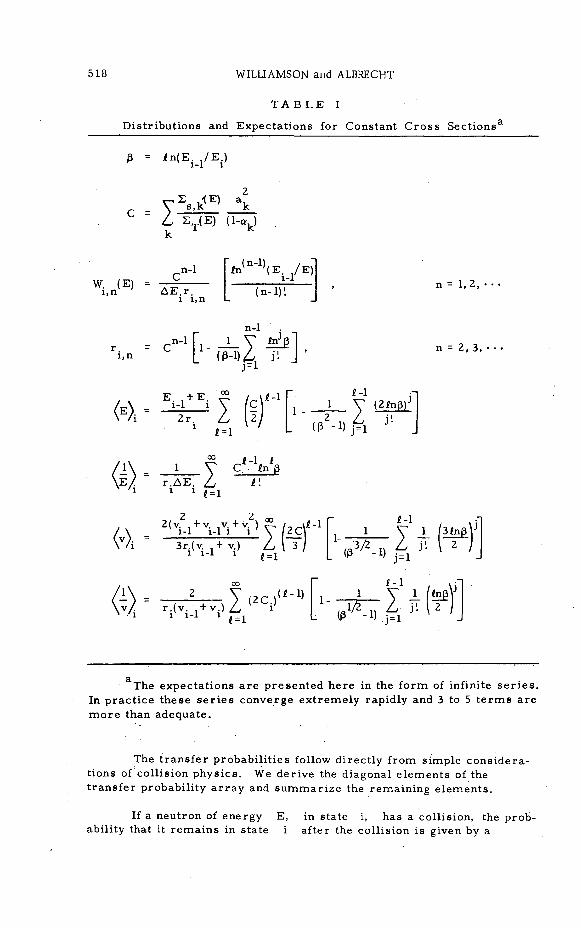
518 WILLIAMSON and ALBRECHT
T A B L E I
Dis t r ibut ions and Expectat ions for Constant C r o s s Sec t ions a
P = !n (E . . /E . ) r l - l 1
Yss,k<E> ak
.n-1 W. (E)
i ,n
i , n
AE.r . I i ,n
(n-1) i n ^ E . ^ E )
(n-l) i
n-1
I j = l
(4 -
c L (MA J'-
E. + E . ^ / \
" I T " Z z) i = l
00 i-1
r.AE. Z *!
n = 1, 2,
n = 2, 3,
1-1. 1 V (2lr
'- n Z jl 2ln[3)J
(P -1) ,~1
' In (3
1 = 1
i - i+yiw Y fief1 r i v1 ± (3~M i /3fapV
®-^2«H'-j*;|*WJ L (P '. - i ) •=!
1-1
The expectat ions a r e p resen ted here in the form of infinite s e r i e s . In p rac t ice these s e r i e s converge ex t remely rapidly and 3 to 5 t e r m s a re m o r e than adequate .
The t ransfe r probabi l i t ies follow direct ly from simple considerations of collision physics . We derive the diagonal e lements of the t ransfer probabili ty a r r a y and summar i ze the remaining e lements .
If a neutron of energy E, in state i, has a collision, the probability that it r emains in state i after the collision is given by a

SM-101/64 519
summation over all the isotopes , of the probabil i ty that the coll is ion is e las t ic and with isotope k,
Kss,k<E» /2VE>
t imes the probabil i ty that the final neutron energy is between E and E., i . e . ,
• a k ^ ( E - E . )
1-a, / E k
for isotropic sca t te r ing ( inelast ic sca t te r ing within a state is insignificant). Pi ^ is computed as the expectation over a l l col l is ions in state i,
I K k(£) /E-E: J E ) I E T » ' / i
i < N (20)
F o r constant c r o s s sect ions in state i we have,
a2 S '
i,i= [ ^ ( E / J Z 2yi-"a (21)
Off-diagonal e lements mus t include both elast ic and inelast ic sca t te r ing and a r e wr i t ten
>• - J x.J- Li
r 4 K k(E) \ A n k(E)\
k I 8 , k R :(E)> + ( ^ — >h j i -* j ) (l-<*k)\ ST(E) i,j k t" ^ k
ST(E) / k%
1< i < N 1 < J < N> (22)
where
H . . ( E )
k
AE.
E
E I a. - •,-.•©;
-CI--
- i / ( i -a ,
a k
s.k
<*k)
(23)
and the h(i-»j) a r e inelast ic sca t te r ing t ransfe r probabi l i t ies which mus t be es t imated from avai lable inelast ic sca t te r ing data . Eq. (23) c a r r i e s the implicat ion that the appropr ia te average energy at which scatter ing occurs in a s ta te is given by /—) •
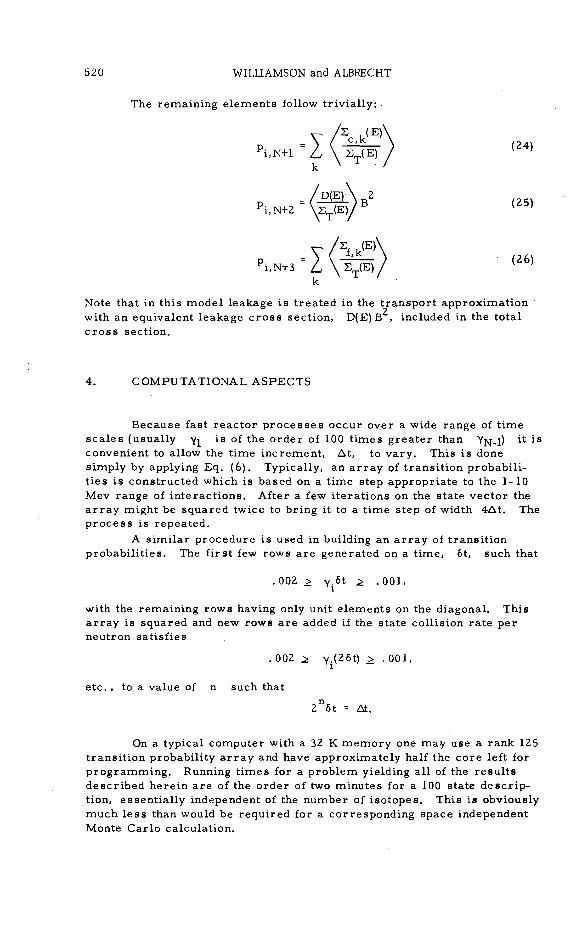
520 WILLIAMSON and ALBRECHT
The remaining e lements follow t r iv ia l ly :
i,N+2 \2T (E)>
(24)
(25)
Ji,N+3 Z • $ )
Note that in this model leakage is t r ea ted in the t r anspo r t approximat ion with an equivalent leakage c r o s s section, D(E)B , included in the total c r o s s sect ion.
COMPUTATIONAL ASPECTS
Because fast r eac to r p r o c e s s e s occur over a wide range of t ime sca les (usually yi ^s °f the o rde r of 100 t imes g rea t e r than Yjvj_i) it is convenient to allow the t ime increment , At, to va ry . This is done simply by applying Eq. (6). Typically, an a r r a y of t rans i t ion probabi l i t ies is const ructed which is based on a t ime step appropr ia te to the 1-10 Mev range of in te rac t ions . After a few i te ra t ions on the state vector the a r r a y might be squared twice to bring it to a t ime step of width 4At. The p r o c e s s is repeated .
A s imi la r procedure is used in building an a r r a y of t rans i t ion probabi l i t ies . The f i rs t few rows a re generated on a t ime, 6t, such that
.002 > Y - 6 t 2 . 0 0 1 , l
with the remaining rows having only unit e lements on the diagonal. This a r r a y is squared and new rows a r e added if the state collision ra te per neutron sat isf ies
002 ^ Y<2 5 t) > -001 ,
e tc . , to a value of n such that
2 n 6t = At.
On a typical computer with a 32 K memory one may use a rank 125 t rans i t ion probabil i ty a r r a y and have approximately half the core left for p rog ramming . Running t imes for a problem yielding all of the r e su l t s desc r ibed here in a r e of the o rder of two minutes for a 100 state desc r ip tion, essent ia l ly independent of the number of i so topes . This is obviously much less than would be requi red for a corresponding space independent Monte Car lo calculat ion.
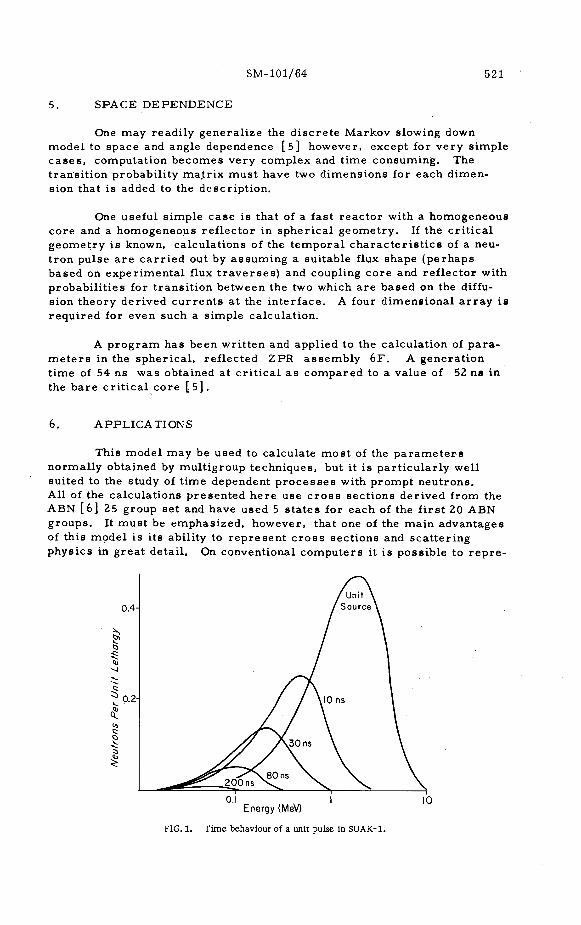
SM-101/64 521
5. SPACE DEPENDENCE
One may readi ly genera l ize the d i s c r e t e Markov slowing down model to space and angle dependence [5] however, except for ve ry s imple c a s e s , computation becomes very complex and t ime consuming. The t rans i t ion probabil i ty majtrix mus t have two dimensions for each dimension that is added to the descr ip t ion .
One useful s imple case is that of a fast r eac to r with a homogeneous core and a homogeneous ref lec tor in spher ica l geometry . If the c r i t i ca l geomet ry is known, calculat ions of the t empora l c h a r a c t e r i s t i c s of a neut ron pulse a r e c a r r i e d out by assuming a suitable flux shape (perhaps based on exper imenta l flux t r a v e r s e s ) and coupling core and ref lec tor with probabi l i t ies for t r ans i t ion between the two which a re based on the diffusion theory der ived c u r r e n t s at the in ter face . A four d imensional a r r a y is r equ i red for even such a simple calculat ion.
A p r o g r a m has been wr i t ten and applied to the calculat ion of pa ra m e t e r s in the spher ica l , reflected ZPR assembly 6 F . A genera t ion t ime of 54 ns was obtained at c r i t i ca l as compared to a value of 52 ns in the ba re c r i t i ca l core [-5],
6. APPLICATIONS
This model may be used to calculate mos t of the p a r a m e t e r s normal ly obtained by mult igroup techniques, but it is pa r t i cu la r ly well suited to the study of t ime dependent p r o c e s s e s with prompt neu t rons . All of the calculat ions p resen ted he re use c r o s s sect ions der ived from the ABN [6] 25 group set and have used 5 s ta tes for each of the f i r s t 20 ABN groups . It mus t be emphasized, however, that one of the main advantages of this model is its ability to r ep re sen t c r o s s sect ions and sca t te r ing physics in grea t detai l . On conventional computers it is possible to r e p r e -
Energy (MeV)
FIG. 1. Time behaviour of a unit pulse in SUAK-1.

522 WILLIAMSON and ALBRECHT
s e n t the s y s t e m w i t h a s m a n y a s 60 s t a t e s p e r d e c a d e in the r a n g e f r o m 100 k e v to 10 M e v , a n d 100 o r m o r e s t a t e s p e r d e c a d e in the r e g i o n b e l o w 100 k e v .
A d e s c r i p t i o n of t h e b e h a v i o r of a p u l s e of f i r s t g e n e r a t i o n p r o m p t n e u t r o n s s l o w i n g down i s o b t a i n e d f r o m . t h e s t a t e v e c t o r s w h i c h , w h e n e a c h s t a t e v a l u e i s d i v i d e d by the l e t h a r g y w i d t h of t h e s t a t e , g i v e s a d i s c r e t e r e p r e s e n t a t i o n of t he n e u t r o n d e n s i t y in l e t h a r g y . F i g u r e s 1 a n d 2 i l l u s t r a t e t he e v o l u t i o n of a un i t p u l s e in two r e p r e s e n t a t i v e s y s t e m s , SUAK-1 [ 7 ] , and the c o r e of Z P R - I I I a s s e m b l y 14 [ 1 , 8 , 9 ] . The d i s p e r s i o n i s due m a i n l y to i n e l a s t i c s c a t t e r i n g .
0.01 0.1 I 10 Energy (MeV)
FIG. 2. Time behaviour of a unit pulse in core of ZPR-III assembly 14.
Note t h a t a t any t i m e m o r e t h a n 99% of the n e u t r o n s a r e d i s t r i b u t e d w i t h i n 1 o r 2 d e c a d e s in e n e r g y . T h i s f a c t m a y be u s e d to e x t e n d the e f f e c t i v e n u m b e r of s t a t e s g r e a t l y s i n c e a t any t i m e the t r a n s i t i o n m a t r i x n e e d on ly e n c o m p a s s t h e e n e r g i e s in w h i c h the n e u t r o n s e x i s t .
A func t ion of c o n s i d e r a b l e i n t e r e s t i s t h e d i s t r i b u t i o n of s l o w i n g down t i m e s to f i r s t f i s s i o n , de f ined in the c o n t i n u u m by [ 1 0 ] ,
K(t) = jV(E) 2 ( E ) N ( E , t ) d E (27)
w h e r e N(E , t) i s the f i r s t g e n e r a t i o n p r o m p t n e u t r o n i m p u l s e r e s p o n s e . If a p u l s e of un i t a r e a i s u s e d the z e r o t h t i m e m o m e n t i s t h e p r o m p t m u l t i p l i c a t i o n c o n s t a n t , k . The f i r s t t i m e m o m e n t of K(t) d i v i d e d by k i s t h e p r o m p t l i f e t i m e , 1 , a n d the p r o m p t g e n e r a t i o n t i m e , A p , i s j u s t l p / k _ . The L a p l a c e t r a n s f o r m of K(t) i s r e l a t e d to the L a p l a c e t r a n s f o r m of the d i s t r i b u t i o n for a l l f i s s i o n s fo l lowing the p u l s e , G(t) , by [ 1 0 , 1 1 ] ,
g(s) _ Ms)
l - k ( s ) (28)
G(t). i s the func t ion s a m p l e d in the R o s s i - a e x p e r i m e n t a n d m a y be c o m p u t e d d i r e c t l y f r o m K(t) by n u m e r i c a l c o n v o l u t i o n .

S M - 1 0 1 / 6 4 523
The a n a l o g to E q . (27) in o u r m o d e l i s g i v e n by,
N - l
j = 1
w h e r e u^ : i s a n a v e r a g e p r o m p t f i s s i o n y i e l d in t h e s t a t e and s; i s t he j " 1 e l e m e n t of the s t a t e v e c t o r a t t i m e nAt . T h i s func t ion i s p lo t t ed in F i g . 3 for four d i f f e r e n t f a s t s y s t e m s , of w h i c h a l l bu t SUAK-2 a r e c r i t i c a l . The e f fec t of t he U-2 38 f i s s i o n t h r e s h o l d i s c l e a r l y v i s i b l e in t h e c u r v e for S U A K - 1 . T a b l e II c o m p a r e s s o m e of o u r g e n e r a t i o n t i m e a n d l i f e t i m e c a l c u l a t i o n s w i t h o t h e r c a l c u l a t i o n s and e x p e r i m e n t s .
FIG. 3. Distribution of slowing down times to first fission in four fast reactor cores.
A n a l o g o u s d i s t r i b u t i o n s to l e a k a g e , L( t ) , c a p t u r e , R( t ) , and n e u t r o n d e a t h in the s y s t e m , T( t ) , m a y be c a l c u l a t e d . F o r e x a m p l e ,
L ( n A t + ^ ) = ^ + 2 ( ( n + l ) A t ) - s ^ l n A t ) (30)
T h e s e f u n c t i o n s a r e i l l u s t r a t e d in F i g s . 4 and 5 for two v e r y d i f f e r e n t s y s t e m s . T h e i r m o m e n t s a r e c o m p a r e d in T a b l e II .
7 . C O N C L U S I O N S
We h a v e p r e s e n t e d a n a p p r o a c h to f a s t r e a c t o r n e u t r o n i c s c a l c u l a t i o n s w h i c h i s b a s e d on a d i r e c t , t i m e d e p e n d e n t , m a t h e m a t i c a l a n a l o g to a s l o w i n g down p u l s e of n e u t r o n s . In p a r t i c u l a r , we a r e a b l e to e v a l u a t e g e n e r a t i o n t i m e s d i r e c t l y a s the f i r s t t i m e m o m e n t of t he d i s t r i b u t i o n to f i r s t f i s s i o n s . E l a s t i c s c a t t e r i n g i s t r e a t e d by a m o r e s t r a i g h t f o r w a r d a p p r o a c h t h a n t h e e l a s t i c r e m o v a l c r o s s s e c t i o n s n o r m a l l y u s e d in m u l t i -g r o u p t h e o r y . Our c a l c u l a t i o n s h a v e u s e d a m a x i m u m of 100 e n e r g y s t a t e s , bu t one m a y p o t e n t i a l l y u s e 300 o r m o r e s t a t e s . S u c h a l a r g e n u m b e r i s m o r e t h a n a d e q u a t e to d e t a i l the c u r r e n t k n o w l e d g e of c r o s s s e c t i o n s a n d s c a t t e r i n g .

524 WILLIAMSON and ALBRECHT
T A B L E I I
P r o p e r t i e s of Four F a s t A s s e m b l i e s 3
Pu-239 Core ZPR3 Core ZPR3 SYSTEM Sphere SUAK-1 Assy. 6F Assy. 14
Composition, -22 Atoms/cc x 10
Carbon —- -— - - - 5.350 Aluminum —- 0.437 1.900 Stainless Steel — - - - 1.050 0.790 U-235 — 0.821 0.672 0.450 U-238 — ' 3.240 0.763 0.034 Pu-239 4.960
Effective Multiplication Constant, keff
Geometric Buckling (cm -2)
Central Core Flux Averaged Energy (Mev)
Bare Core Prompt Generation Time, A p , (ns)
Bare Core Prompt Lifetime,
V (ns)
Calculated Prompt Lifetime (1963 X-sections)
Calculated Prompt Lifetime (1966 X-sections)
Experimental Prompt Lifetime (ns)
Mean Time to Non-fission Capture (ns)
Mean Time to Leakage (ns)
Mean Time to Death by Leakage or Absorption
Percentage of Neutrons Lost bv Capture
Percentage of Neutrons Lost by Leakage
Percentage of Neutrons Causing Fission
1.00
0.15400
1.57
3.38
3.37
7.35
2.84
3.14
1.8
65.0
32.2
0.858
0.01877
0.85
32.6
27.7
27. 25 c
28. 3C
47.2
22.4
28.6
15.9
50.7
33.4
1.00
0.00704
0.92
52.0
51.6
45.0 b
68d
77d
83.6
34.0
47.1
11.1
49.5
39.4
1.00
0.00755
0.86
156.0
154.9
144.0°
153d
187d
268.6
44.2
115.3
11.9
48.0
40.1
Unless otherwise noted, figures are for bare critical cores andjhave been computed with the method of this paper.
Reflected system, data of Davey, 1963 [ 8 ] .
Personal communication, E. Wattecamps of Kernforschungszenstrum Karlsruhe, September, 1967. d r -I
Reflected system, data of Meneghetti and White, 1966 [ l j .
The use of the t r anspo r t approximation is known to be sufficient for many fast sys tems [ 1 2 ] . Multigroup d i sc re te ordinates calculat ions of k seldom differ by more than 2% from values obtained in the t r a n s por t approximation in simple s y s t e m s . This is well within the range for which k may be rel iably es t imated on sys tems for which no in tegra l exper imenta l data is avai lable . Cer ta inly any e r r o r s induced in the generat ion t ime and other t empora l c h a r a c t e r i s t i c s a r e far l e s s than existing e r r o r s due to our ignorance of c r o s s sec t ions .

SM-101/64 525
Computing t i m e s a r e substantial ly l e s s than those requ i red by an a l te rna te method, Monte Carlo, and the r e su l t s a r e free of the s ta t i s t i ca l fluctuations inherent to Monte Car lo .
5 10 Time After Pulse (ns)
FIG. 4. Time distributions in a bare, critical 239Pu sphere.
200 400 Time After Pulse (ns)
600
FIG. 5. Time distributions in core of ZPR-III assembly 14.
C e r t a i n l y the d i s c r e t e M a r k o v m o d e l w i l l no t r e p l a c e t h e t i m e h o n o r e d m u l t i g r o u p t e c h n i q u e s , b u t i t i s e x p e c t e d to p r o v i d e u s e f u l s u p p l e m e n t a r y i n f o r m a t i o n a b o u t the p h y s i c s of s l o w i n g down in f a s t r e a c t o r s
526 WILLIAMSON and ALBRECHT
REFERENCES
1] MENEGHETTI, D. and WHITE, J . R. , Calculations of ZPR-3 fast a s sembl i e s using a 26-group Argonne c r o s s - s e c t i o n set, ANL-7133 (1966).
2] MEDINA, A . , "Stochast ic models for nuclear r e a c t o r s " , P r o c . UN Int. Conf. PUAE, P/1084 (1958) 697.
3] KOSALY, G. , On the Stat is t ical Theory of Neutron Transpor t , Nukleonikj . 6 (1959) 221 .
4] KARLIN, S. , A F i r s t Course in Stochastic P r o c e s s e s , Academic P r e s s , New York (1966)
5] WILLIAMSON, T. J . , A s tochast ic model for neutron modera t ion and regenerat ion, Ph. D. Disser ta t ion, Universi ty of Washington (1967)
6] BONDARENKO, I. I . , (Ed . ) , Group Constants for Nuclear Reactor Calculat ions, Consultants Bureau, New York (1964)
7] BORGWALDT, H. , KUCHLE, M. , MITZEL, F . , and WATTECAMPS, E. , "Suak, a fast subcr i t ica l facility for pulsed neutron m e a s u r e m e n t s , " P r o c . Symp. Pulsed Neutron Research , 2 (1965) 399.
8] DAVEY, W. G. , A compar i son of exper imenta l and calculated prompt neutron l ifet imes and cen t r a l react ivi ty coefficients in ZPR-III a s sembl i e s and their re la t ionship to other r eac to r p a r a m e t e r s , ANL-6682 (1963)
9] BRUNSON, G. S. , CURAN, R. N. , GASIDLO, J . M. , and HUBER, R. J . , A survey of p rompt -neu t ron l ifet imes in fast c r i t i ca l sys tems , ANL-6681 (1963)
10] STORRER, F . , GOVAERTS, P . , EBERSOLDT, F . , and HAMMER, P . , A method for calculating the flux evolution in a fas t -neut ron multiplying medium as a function of t ime, space, and energy, Nucl. Sci. Engng. , 24(1966) 344.
11] CADILHAC, M. , GOVAERTS, P . , HAMMER, P . , MOORE, M. , NICOLAENKO, B. , and STORRER, F . , Contribution to the theory of pulsed and modulated exper iments on fast neutron mult iplying media, P r o c . Symp. Pulsed Neutron Research , ^ (1965) 991 .
12] JOANOU, G. D. , and KAZI, A. H. , The validity of the t r an spo r t approximation in f a s t - r eac to r calculat ions, T r a n s . Am. Nucl. Soc. 6 1 (1963) 17.
D I S C U S S I O N
B . I . SPLNRAD: In the calculat ions you performed on reflected s y s t e m s , how did you t r ea t re f lec tor events? Did you cons ider neut rons absorbed in the ref lec tor as absorpt ion, cap ture o r leakage?
R. W. ALBRECHT: The calculat ions repor ted he re were on equivalent ba re sys t ems and the ref lec tor effect was co r rec t ed for by introduction of an appropr ia te t e r m . In other calcula t ions , not mentioned he re , we used a two-region model with t r ans i t ions between core and ref lec tor calculated by including ar t i f ic ia l t rans i t ion e lements in the Markov t rans i t ion m a t r i x .
B . I . SPINRAD: I see , but if the calculat ions were on equivalent ba re s y s t e m s augmented by ref lec tor savings then it i s not su rp r i s ing that they did not agree ve ry well with the expe r imen t s .

SM-101/64 527
R.W. ALBRECHT: Certainly. The experimental results were adjusted by Davey, who used some core reflector model to get an equivalent bare core lifetime. The equivalent bare core results, as calculated from the experimental measurements on this basis, may well be suspect.
B.I. SPINRAD: I should indeed like to commend the fact that in your paper the kinetic parameters obtained are well defined. The difficulties experienced in correlating theory and experiment are due, I feel, to the fact that we do not know yet what the experiments mean]
D. STEGEMANN: I gather from your paper, Mr. Albrecht, that time -independent spectra, too, can be calculated fairly easily. Is this correct?
R.W. ALBRECHT: Yes, the time-independent spectrum can be directly calculated from the evolution of a generation by integrating N(E, t) over time. This has been done and is one option of the code.
D. STEGEMANN: Was the 14-MeV source spectrum of the neutron generator considered or was a fission neutron spectrum taken instead?
R.W. ALBRECHT: I think this point needs some clarification. Our calculation is hot a simulated pulse neutron experiment, but rather a direct computation of the evolution of a neutron generation in a multiplying medium. Thus no external source enters the calculation. However, we have also used this method to calculate slowing-down parameters of moderators and, in such a case, a 14-MeV source is included; results then show such interesting effects as Plazek wiggles in the first few collisions.
H. RIEF: What is the initial neutron distribution function in space and energy for calculating eigenvalues? Did you iterate this distribution before making a fundamental-mode distribution and what are the criteria for this?
R.W. ALBRECHT: The initial neutron distribution in energy is, of course, the fission spectrum. In space, the distribution is essentially fundamental-mode although this does not have any direct effect since leakage is only calculated from an initial buckling value. Eigenvalues are not calculated since no iteration is done; instead, the reported parameters are calculated directly from the input constants with the multiplication constant given by k = / K(t)dt.


INFLUENCE OF TIME-DEPENDENT COUPLING COEFFICIENTS AND DELAY TIMES ON THE KINETICS OF A MODULAR FAST REACTOR CORE*
W.H. KOHLER, C.Y. HO, H. PLAZA ANDN.B. POULSEN DEPARTMENT OF NUCLEAR ENGINEERING, TEXAS A & M UNIVERSITY, TEXAS, UNITED STATES OF AMERICA
Abstract
INFLUENCE OF TIME-DEPENDENT COUPLING COEFFICIENTS AND DELAY TIMES ON THE KINETICS OF A MODULAR FAST REACTOR CORE. Previous treatments of kinetics problems in modular and toroidal cores in fast breeder reactors have been based on Avery's coupled kinetics equations for partial integral fission sources. Most of these calculations do not take account of the time dependence of the reactivity coupling coefficients caused by possible flux tilting in an excursion. Furthermore, the effect of time delays for neutrons travelling between the modules, which is expected to be small, is not included in the model itself. The present investigation of the behaviour of two coupled modules is based on our recent derivation of coupled reactor kinetics equations from the Boltzmann equation. The distribution functions of delay times for neutrons are approximated by delta functions. It is shown that in three-group theory an analytical expression for the average delay time between two modules can still be derived. The calculation is based on the three-group leakage fluxes. Cross-sections are condensed from a 26-group set. Step changes in fission cross-sections are considered as perturbations. Coupling coefficients are calculated using the critical flux distribution and, to show the effect of time dependence, using the asymptotic flux distribution. Finally, a numerical method for solving coupled reactor kinetics equations is outlined.
Comparing solutions of simple kinetics problems without feed-back but with time-dependent coupling coefficients and delay times to solutions without consideration of these two effects, it is found that the influence of neutron delay times is indeed negligible for the usual transients considered in the safety analysis of fast breeder reactors. However, the inclusion of time-dependent coupling coefficients can markedly alter the module power during an excursion.
1. INTRODUCTION
1.1. Modular core concepts
To overcome problems with the positive sodium void coefficient for large fast breeder reactor cores, modular [1], [2], and annular [3], core designs have been proposed. The modular design, consisting of Pu bearing modules surrounded by U238 breeding blanket regions which are separated from adjacent modules by thin graphite regions allows for building up cores of different sizes using varying numbers of these basic modules. The sodium void coefficient of each module is negative.
Other modular concepts proposed in the past are the molten Plutonium design [4] and, in a quite different connection, modular nuclear rocket designs [5].
This work was sponsored by the TexasA&M University Research Council.
34 529

530 KOHLER et al.
1.2. Previous work and scope of this paper
Previous work on modular fast reactor kinetics and dynamics has been based on AVERY's work in connection with the coupled fast-thermal ZPR III experiments [6]. This model does not include finite delay times for neutron exchange between modules since their influence is expected to be small. It will be shown in this paper that for normal operating behavior and for the most likely type of excursions the delay times can indeed be neglected.
A more important question that has not been investigated in previous work [7], [8] is the possible time dependence of the coupling coefficients caused by a changing flux shape in the system and the influence of these time dependent coupling coefficient* on the temporal behavior of the system.
By considering step changes in cross-sections of a system consisting of two modules we will show that the time dependence of coupling coefficients must be taken into account in the kinetics treatment of modular fast cores.
Finally we will outline a numerical solution method for kinetics problems in modular cores.
2. CALCULATIONAL MODEL
2.1. Kinetics equations
Kinetics equations for a system of M coupled modules as derived from the Boltzmann equation by PLAZA [9], [10] will be used in this paper:
dT dt
(D
i** - If Tj - \u°ji (2)
where
T.(t) amplitude function of neutron flux in module J C^(t) " " of delayed neutron precursors,
module j, group i A, prompt neutron generation time in module j $. effective delayed neutron fraction in module j A'L delayed neutron decay constant, module j, group i y . effective reactivity of j-th isolated module p externally impressed reactivity in module J ejL coupling coefficient for neutron exchange k to j pk
,j(T)dT distribution function of delay times for neutrons going from module k to module j (assumed to be time independent)
We note, that when the system is critical, all y* are negative. The reactivities, prompt neutron lifetimes and the coupling coefficients are rigorously defined in terms of the
34*

SM-101/51 531
system's time dependent flux shape function. In the last term of Eq.(l) the time dependence of the prompt neutron generation time has been assumed to be negligible.
The distribution functions of delay times will be assumed to be delta functions: p,.(T)dT • <S(T -Tk1)dT, where Tk1 is a properly calculated average delay time. (For short time initial transients, as for instance in pulsed neutron experiments with coupled modules, more detailed descriptions of p, ,(T)dT may be required; we refer the reader to the work oFADLER, GAGE and HOPKINS [11].)
With the above substitution Eq. (1) reads
dT d t
= Pjnj-gJ T + Z XjiCji + I |*J T k( t -T k J) (3) i-1 k=lAJ
At criticality, p = 0, and we obtain the criticality condition of the system:
Yl0+e110 e210 'M10
120
'lMo
YJo+ejjo
YMo+eMMo
= 0 (4)
where the subscript zero stands for evaluation of the quantity at criticality. In the special case of two symmetrical modules e110 = e?20 = eR a s w e l 1 a s Y10 = Y20 = Y0
a n d el20=e2lO=eT the criticality condition reads: jality
+ ep + eip = 0 (5)
We wish to call the j-th module strongly coupled if max ek.t 3< ; in this case the module would not retain its
isolated flux shape in the system, reactors are of this type.
Modular fast breeder
Module j will be called weakly coupled if max ek, 6.; k*j J J
here the module would approximately retain its isolated flux shape in the system.
2.2. Model geometry and composition
Case I: We consider a system of two initially symmetrical modules, 6M cm wide, separated by a 32 cm wide breeding blanket and enclosed by 32 cm breeding blankets. The blanket will only be considered at the beginning of life without Pu buildup.
The module and blanket material volume percentages, Intended to be only roughly representative of an actual modular

532 KOHLER et al.
system, are as follows; module: 50* Na, 19-6$ Fe, 30.4? U02-PuOp of 90* theoretical density, and for the blanket: 20% C, 32* Na, 1636 Fe, 32* U23°, The above percent composition
of the fuel is: 79.52*U238 12.90*Pu239, 6.lWu 2 4°, 1.02*Pu2111 and 0.4l*Pu21*2.
Case II: The composition stays as in Case I, however the outside blankets are deleted. To demonstrate effects of weak coupling, the diffusion coefficients have been artificially reduced by a factor 70 in the core modules to reduce the leakage and with it the coupling. The width of the modules is only 16 cm in this case.
2.3. Calculation of coupling parameters
The calculation of the coupling parameters is performed within a one-dimensional, plane geometry, 3-group diffusion theory model. The lower energy limits of the groups are 0.8Mev, O.lkev and 0.025ev„ Cross-sections for the calculation were obtained by condensation of the 26 group set by BONDARENKO et al [12].
6-f 36 /60 CM
FIG. 1. Power density; critical system, 1% change in vLf.
The steady state coupling coefficients y , e^ and e^ are quite difficult to evaluate from their formal definitions [10]. We will use reasonable approximations for them here that satisfy the criticality condition, based on eigenvalues of two multigroup diffusion calculations. The steady state isolated module reactivity is obtained from the eigenvalue k of a multigroup eigenvalue calculation for the isolated module as Y 0 = l~
k0~ '
T o calculate the steady state coupling parameters e.p and e^ the criticality condition for two symmetrical modules is used: y + eT + E R = 0. A fictitious multigroup eigenvalue calculation for the system is performed setting vZf = 0 everywhere except in one module. The resulting eigenvalue kf leads to a negative reactivity p» = 1-kf-l that must exactly be compensated for by the suppressed fissions; thus: pf = -eT. (The relatively small contribution of U23° fissions in the coupling medium is therefore added to the

SM-101/51 533
contribution from the other core in this approximation). Knowing y and Em, we calculate eR from the criticality condition. ° l
The perturbation considered in case I will be a 1% step increase in vZf in module 1 and a simultaneous 1% decrease in vZf in module 2. The resulting tilt in power density P, as obtained from a A-mode calculation, is shown in Fig. 1.
The A-mode fluxes in group g, ij>g, are a good approximation to the asymptotic flux shape for the perturbation considered and are used to calculate the asymptotic, or effective coupling coefficients that should be used in a rigorous kinetics calculation. Thus we have:
Y 4 x Y _ JS 2 ( 6 )
J J O / j Z x1" 4>m+ Z vZSj <J>Sdx
m g
fk * Xm 4>mo Z v z f k * g dx
k J T / j Z Xm <J>mJ Z v Z f ^ d x ( 7 )
m J g
£UA - er
P< =
/ . Z Xm • ? + Z A(vZS ) * « d x '
J m _£_ J ' j Z ^ *?o Z v Z f1 * S d x ( 8 )
m J g J
In equations (6) through (8) /. dx means integration over the j-th module and >m^ is the adjoint flux in group g of the
j-th module when isolated from the critical system.
If vZf, > vEf,0 and vZ~p=vZf2n»
t n e n w e s e e from equation (7) that £.2\ < eT» meaning that neutrons supplied from module 2 to module 1 now contribute less equivalent reactivity in module 1. The coupling coefficients ekj are to be viewed in the sense of equivalent reactivities and not in terms of expectation values for causing fissions.
The reflection coupling coefficients, eR, are assumed to be unchanged by the particular perturbation considered since most reflected neutrons return from the blankets after travelling only a few mean free path and the blankets are not perturbed.
The calculations for Case II are analogous to Case I except that the perturbations of the fission cross section are smaller; in module 1: 0.5$ increase in vZ„ and in module 2: 0.5$ decrease in vZf..
Results of these calculations are summarized in TABLE I, where we note that generally eT <g eR and that in Case I: eT = 5.65 x g(strong coupling) whereas in the fictitious Case II: eT = O.OOMl x 3(weak coupling).

534 KOHLER et al.
TABLE I
Summary of input data
\ Y2 £R e
e 2 1 P
P 2 A
A 2 6
T T T R
Case I
Module 1
Module 2
criticai
-3.9020/-la
-3.9020/-1
3.5971/-1
3.0M.9/-2
3.049/-2
0
0
2.193/-7
2.193/-7
5.40/-3
2.0471/-7
4.6381/-8
1* change vZ„
-156
asymptotic
-3.863V-1 -3.9414/-1
3-5971/-1 3.6358/-2
2.5569/-2
9.9010/-3
-1.0101/-2
2.4338/-7
2.4918/-7
5.40/-3
2.0471/-7 4.6381/-8
Case II (weak coupling)
Module 1
Module 2
critical
-2.8304/-3
-2.8304/-3
2.808/-3
2.240/-5
2.240/-5
0
0
7.923/-8
7.923/-8
5.40/-3
6.990/-8
2.500/-8
0.5% change vEf
-0.5* " "
asymptotic
-2.8163/-3
-2.84U6/-3
2.808/-3
3-7341/-5
1.3437/-5
4.9751/-3
-5.0251/-3 7.9305/-8
8.0103/-8
5.40/-3
6.990/-8
2.500/-8
Q ""X
/-x means 10
The average delay times Tm and Tj reflection respectively are calculatec 3 group delay times by
= £_ E Jg(b,-) T|
2 J+(b,-)
for transmission and from the respective
(9)
TR =
£ j"(o,») T R
2 j!(o,*) g g
(10)
where we consider a one dimensional coupling slab 0 <fc x & b , that is illuminated at t = o+ and x = o with a source of neutrons having the same leakage spectrum as one of the core modules. The other face at x = b is bounded by a black absorber,

SM-101/51 535
such that 4>(b,t) = o. j + (x,t) and j~ (x,t) are the partial group currents in the positive and negative x-direction respectively.
We first define the time integrated transmission neutron group currents at x = b
Qf (b,t) =' ff jg (b,t')df (11)
and the time integrated reflection neutron group currents at x = o
JR (o,t) = (f J" (o,t')df (12)
The combined boundary - initial value problem
(l)ga 4>6(*,t) = Dg^|g(x,t) _ zg(()g(x>t) + zjh-g^h(Xft)
h <j)S (b,t) - o (t > o)
(13) <|>g (x,o) = o (o £ x & b)
is solved for the Laplace transformations q§ (b>s) and qg (0,s) of the time integrated transmission and reflection currents respectively. These last two quantities both have double poles at s = 0 (and also an infinite number of negative simple poles). These double poles at the origin lead asymptotically to a linear time behavior of Qm(b,t) and Q|5(o,t). By extrapolating these asymptotic solutions back to Q = 0, we obtain on the time axis as intercepts the group transmission delay times Tj5 and the group reflection delay times Tg. The method, though straight forward, leads to rather lengthy expressions for the higher group delay times [9], that will not be repeated here.
For the first group we list the following expressions (leaving out the group index 1 for simplicity):
qT(b,s) 2 1 Dot s2(sinh ab+2Da cosh ab) (14)
„ /•« „\ l(l-2Dacothab) qR(o,s) • *- ,_.
s2(i+2Dacothab) K ± 0 >
where a(s) = (t + > /D) and I = lim J (x,t) » const, is
the fraction of the leakage current into the slab in•group one once the omitted subscript is reinserted.
This leads to the asymptotic time behavior
QTA(b,t) = lim §- (s2 qT(b,s)e
st) (16) s-*o

536 KOHLER et al.
(a similar equation holds for QR«(o,t)), which then gives
QTA(b,t) = j + (b,°°) (t - TT) (17)
(o,t) = j"(o,«) (t - Tn) (18)
where
. + , * 2JID J {°tCO> " L ( s i n h b + 2D cosh b) (19)
L L2D 2D L b •p - 1 r b ««•»-*, b (1+b + L tanh L) ,, ,onv TT = 2vT {L C o t h L (1+2D coth b) 1} ( 2 0 )
and 21) b ,-, x £(1-L coth L) j (o,<=°) = — -
1+2D coth b L L
(21)
T - 2T„ + (1-L coth L)/vE (00, XR 1-2D coth b K<LeL>
L L
Here L"1 = lira a(s) = (E/D)^ s->-o
Eqs. (19) to (22) are to be used for the first group in equations (9) and (10) to calculate the average delay times.
Note that for large coupling media,bJ>L, the transmission delay time in group one becomes a linear function of b, while the reflection delay time becomes a constant. Equations (20) and (22) show that T T > TR.
The complete 3 group formalism was applied to the coupling blankets of case I and case II and the results are included in TABLE I. Note that we have neglected the small fission rate in group one in the blanket in this treatment.
SOLUTION OP KINETICS EQUATIONS
3.1. Analytical solution for step changes [9]
Calling the set of modules {1, 2,** j,*M} = S, an approximate analytical solution for step changes in the system (2) and (3) is found for t ^ max (T..+T, , ) .
1 keS For smaller times, which are of no interest here, one would have to solve the system of differential-difference equations paying particular attention to conditions along the initial time lags [13].
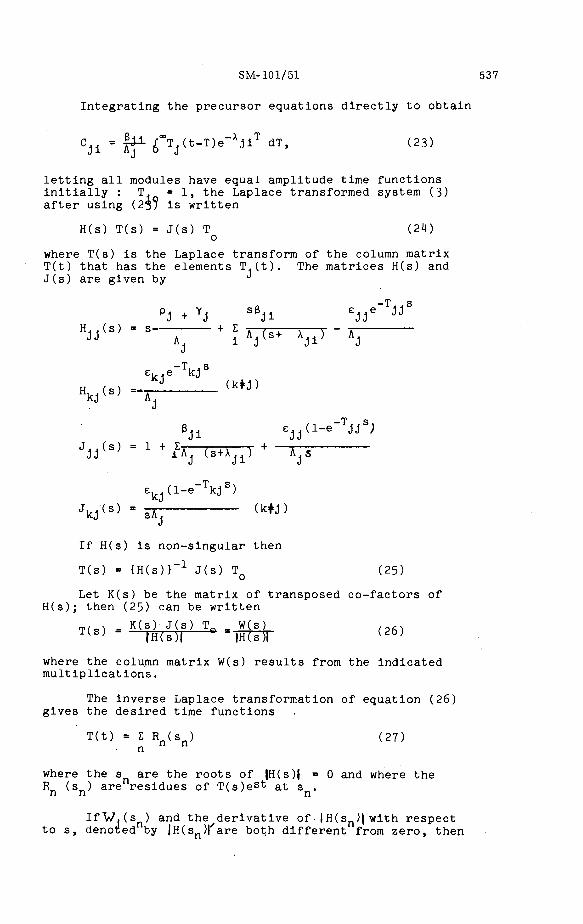
SM-101/51 537
Integrating the precursor equations directly to obtain
- x 5- A\(t-T)e"XjiT dT, (23) -ji - i c f I T j ( t - T ) e J 1 dT>
letting all modules have equal amplitude time functions initially : T. = 1 , the Laplace transformed system (3) after using (2?? is written
H(s) T(s) = J(s) T (24) o
where T ( s ) i s t h e L a p l a c e t r a n s f o r m of t h e column m a t r i x T ( t ) t h a t has t h e e l e m e n t s T , ( t ) . The m a t r i c e s H(s ) and J ( s ) a r e g i v e n by J
PJ + Y j S 6 j i £ J j e " T j j S
H . . ( s ) = S + E -i—7—- \ r - 7— J J Aj i A j ( s + X j i ) A j
e k e - T k j s
H ( 8 ) = - _ < k *J>
5Ji £ J J ( 1 - e " T ^ . , ( S ) = 1 + E 7 7—r? r + 7——
J«J i A , ( s + X . j L ) A . S
e k J ( l - e - T k j S )
J k j ( s ) = i A y - (k*J>
If H(s) is non-singular then
T(s) = (H(s)}"1 J(s) TQ (25)
Let K(s) be the matrix of transposed co-factors of H(s); then (25) can be written
Tf<n - K(s) J(s) T- _ W(s) (0(-, T(s) THltTf ~WJT (26)
where the column matrix W(s) results from the indicated multiplications.
The inverse Laplace transformation of equation (26) gives the desired time functions
T(t) = E Rn(sn) (27) n
where the s are the roots of |H(s)| = 0 and where the Rn ^sn^ a r e r e s i d u e s o f T(s)est at s .
IfV. (s ) and the derivative of |H(sn)| with respect to s, denoted by |H(sn)|
/are both different from zero, then

538 KOHLER et al.
(28)
T(s) has a simple pole at s and the residue of T(s)est at s is given by
WJ(sn)esnt
Rn(sn) = |H(sn)|'
Note that W. and H(s) are analytic at s and that the singularities or T(s) and T(s)est are the sSme since est is an entire function.
Thus, if the above conditions are satisfied, the amplitude function in each module is given by
T (t) = I A.(sn)esnt <29>
J n J
where
Aj(sn) = Wj(sn)/|H(sn)|/ (30)
3.2. Influence of the delay times
Calculations for case I and case II of section 2.3 using the method described in the previous sections have been carried out.
If we assume temporarily that in these perturbations the coupling coefficients e™ and eR are unchanged then we obtain the poles of the Laplace transformed solution, which are also the roots of the inhour equation of two coupled modules from |H(s)| = 0 in the form:
h S U + i r T TI ) = ( pl + Yl + p2 +Y 2)/
2 + ( 3 1 )
+eRe"TRs ± ([(p1+Y1)-(P2+Y2)]
2/1* + ^e~2TTsfA
There are 15 roots of eq. (3D, that are qualitatively sketched by the solid lines in Fig. 2. (We get the same number of poles of the Laplace transformed solution if £12 * ^l')
If one neglects time delays by setting TR and TT equal to zero in (31), then there are lH roots left as indicated by the broken lines in Fig. 2. In particular, the largest negative root disappears and most of the other roots stay relatively unchanged. This indicates that the delay times will only have an influence on the solution in a very short time interval after the perturbation.
To quantify the argument we show in the first 3 columns of TABLE lithe poles of the Laplace transform solution, which are the time eigenvalues of the system for case I unaltered, case I with delay times arbitrarily increased by a factor 10 and case I setting the delay times equal to zero respectively.

SM-101/51 539
DELAY TIMES ZERO
FIG. 2. Roots of inhour equation for two cores (not to scale).
TABLE II
Time eigenvalues case I
asymptotic v
regular
-0.268.7/8a
-0,2691/6
-0.9118/4
-0.3201/1
-0.3020/1
-0.1250/1
-0.1046/1
-0.3225/0
-0.1978/0
-0.1316/0
-0.5240/-1
-0.3038/-1
-0.1355/-1
-0.1285/-1
0.1854/0
alues of coupl.
T'=TX10
-0.1545/7 -0.1988/6
-0.5367/4
-0.3201/1
-0.3020/1
-0.1250/1
-0.1046/1
-0.3225/0
-0.1978/0
-0.1316/0
-0.5240/-1
-0.3038/-1
-0.1355/-1
-0.1285/-1
0.1854/0
coefficients
T = 0
-0.281/6
-0.1027/5 -0.3201/1
-0.3020/1
-0.1250/1
-0.1046/1
-0.3225/0
-0.1978/0
-0.1316/0
-0.5240/-1
-0.3038/-1
-0.1355/-1
-0.1285/-1
0.1854/0
critical values
T = 0
-0.3104/6
-0.1779/5 -0.3201/1
-O.3077/I
-0.1249/1
-0.1106/1
-0.3223/0
-0.2174/0
-0.1315/0
-0.6609/-1
-0.3036/-1
-0.1386/-1
-0.1285/-I
0.4069/-1
V-x means 10~x
First note that the asymptotic system period, vis. the inverse fof the positive time eigenvalue is unaltered within the accuracy of the calculation in the three cases.

540 KOHLER et al.
The main effect of increasing the delay times by a factor 10 is the reduction of the largest negative eigenvalue by about a factor 10. The poles contributed by the delayed neutrons are identical in the three cases. Case II and other examples have shown the same general behavior.
The plotted solutions for case I and case II are in Figures 3 and 4 in solid lines, where the options of using T = 0 and T' = 10T are indistinguishable from the plotted solution.
/.4--
1.2-•
V
FIG. 3. Amplitude functions; time-dependent coupling, - time-independent coupling.
4QO A/SEC
FIG. 4. Amplitude functions: weakly coupled modules.
Thus we conclude that for excursions up to prompt criticality of the system, which are the most likely ones to occur in practice, the delay times may be neglected.

SM-101/51 541
3.3. Influence of time dependent coupling coefficients
The influence of time dependent coupling coefficients will be inferred from a comparison of step input results using the asymptotic values for the coupling coefficients (see sect. 2.3.) referred to as time dependent coupling coefficients, to results using the critical values, referred to as time independent coupling. The input reactivity is the same in both calculations.
For strong coupling (case I) the time eigenvalues for asymptotic and critical values of the coupling coefficients are given in TABLE II, columns 3 and 4. Using the critical (time-independent) values, the asymptotic period of the system is underestimated by about a factor 5.
In Fig. 3 the amplitude functions for case I using the critical (time-independent) coupling coefficients are shown in broken lines. The underestimate of the period is quite obvious. There is also a 5% decrease in the amplitude function tilt.
For weak coupling (case II), which is not the case in proposed modular fast reactor cores, the influence of changing from time dependent to time independent coupling coefficients iSj expectedly, not nearly as great, since the two modules behave more nearly like isolated reactors. Fig. 4 shows in broken lines the effect of time independent coupling again, which is still much more pronounced than any effects of the delay times.
In general the calculations have shown that the solutions for kinetics equations are quite sensitive to small changes in the coupling coefficients, and we conclude that in a more complete treatment, including feedback effects, the time dependence of the coupling coefficients must be considered.
3.4. Algorithm for numerical solution
Since the effect of the delay times has been shown to be negligible for times of interest, a numerical solution for the system (2) and (3) with all T=0 will be presented. It is based on an exponential approximation technique for point reactor kinetics by HANSEN [14]. A similar approach has been used by PLUTA et al [15].
For point reactor kinetics it is well known that conventional numerical techniques lead to exorbitant calculating times since the presence of a root at about -B/A in the inhour equation of the critical reactor requires very small time steps [16]. This problem is aggravated in coupled modular reactors and gets worse, the stronger the coupling, that is, the larger eT. This can be seen by considering the largest negative root of the modular inhour

542 KOHLER et al.
equation (eq.(31)) at criticality: p-^Pp^O, Y1=Y2=Y0 &
nd s * A.; also remember that we consider T=0. This gives a root at about -(2eT+6)/A. In our case I, which is representative of actual modular fast breeders, £rr(= 5.73 (see section 2.3) and hence the most negative root is about a factor 10 larger in absolute value than for a single core fast reactor.
For the numerical solution of system (2) and (3) we define a column matrix $ with the elements T, , T„, C,, •••*CT6» C2l""C26* W e t h e n w r i t e t n e system
(32)
X16 °
with
dl
e12
17 f "
k6
0
d* dt
e21 Al d2
0
0
A2
A$
Xll
0
"hi
o x 2 f - - - x 2 6
•A16 *A
~X21
0 $?(, ' i
hf -X26
and d. = W V £ J J
The matrix A is split into a diagonal matrix D, a lower triangular matrix L and an upper triangular matrix U
A = D + L + U (33)
The system (32) is then integrated over the time step h to
*(t+h) = e-h •(t) +Q/he-( h"n)(L + U)$(t+n)dn (34)
To carry out the integration the column matrix $ in the integrand is approximated exponentially:
• (t+n) - e^ »(t) (35)

SM-101/51 543
where the diagonal matr ix ui i s given by
U),
1 1
'16 '21
w26
For step changes, the integration in eq. (3*0 is then carried out to yield:
where
G =
#(t+h)'» G »(t)
e dl h
£l2(e"ih-ed2h)
A2(w1-d2)
»11(ewlh-e-Xllh)
A1 (V X11 }
Bl6(ewlh-e-Xl6h)
WXl6>
e d2 h
•«12"-8i6
(36)
0 •
o — o g2i.--g26
e-Xllh
e"Xl6h
(ea,2h-e-X21n) "21 A2(a)2+A21)
B26(ea)2h-e-X26h)
A2(a,2+X26)
e"X21h
e~X26h
where e21(e
w2h-edlh)
'lv™2 "1
and X13(e
MlJh-edlh)
hi • a ) i r d 1
X 2 J ( e M 2 J h - e d 2 h )
>2j = » 2 - d 2

544 KOHLER et al.
The elements of the diagonal matrix w are calculated initially from the previous time step
„ . i l n ( ! j i ! L ) (37) j h v*7(t-h7
and are then Iterated upon in the current time step until they satisfy a prescribed convergence criterion.
A numerical solution of this type was obtained for case II and is identical with the solution presented in figure k.
For other than step change problems elements of matrices D, L and U become time dependent, and instead .of eq. (3*0 we get:
h h t+h
*(t+h) = e l m i n $(t) + f e{?f)dt' [L(t+rj) + U(t+rj)]$(t+rj)dn (38)
4. CONCLUSIONS
Based on analytical solutions of modular fast reactor kinetics equations valid for times larger than the delay times for neutron exchange between the modules, we conclude that for the class of transients below prompt critical the effect of the delay times is negligible. They thus do not have to be included into a model for the numerical integration of cpupled module kinetics equations.
Solutions of the modular core kinetics equations are very sensitive to small changes in the coupling coefficients, This sensitivity increases with the size of the coupling coefficients and is quite pronounced for the strong coupling in modular fast breeder cores. Perturbations that produce neutron flux shape function tilts change the coupling coefficients. The time dependence of the coupling coefficients must thus be considered in the solution of modular core kinetics equations.
The computations have been carried out on the IBM 7094 of the Data Processing Center of Texas A&M University.
REFERENCES
[1] WRIGHT, J.H. et al, conceptual design and preliminary accident analysis of sodium-cooled, carbide-fueled, large modular fast reactor, Proc. Conf. on Safety, Fuels and Core Design in Large Fast Power Reactors, ANL 7120 (1965) 205.

SM-101/51 545
[2] EGGEN, D. et al, Enhanced safety characteristics of a sodium-cooled coupled reactor, Proc. Conf. on Safety, Fuels and Core Design in Large Fast Power Reactors, ANL 7120 (1965) 789.
[3] Large fast reactor design study, Allis-Chalmers Manufacturing Company, ACNP - 64503 (1964).
[4] HANNUM, W.H. et al, An application of molten Plutonium fuel to fast breeders, Proc. Conf. on Breeding, Eono-mics and Safety in Large Fast Power Reactors, ANL -6792 (1963) 571.
[5] CHEZEM, C.G. et al, The Los Alamos coupled reactor experience, LA-3494 (1966).
[6] AVERY, R. Theory of coupled reactors, Proc. 2nd UN Int. Conf. PUAE 12. (1958) 182.
[7] GUNSON, W.E. et al, Transient response of coupled fast reactor cores, Proc. Conf. on Safety, Fuels and Core Design in Large Fast Power Reactors,ANL 7120 (1965) 776.
[8] HECK, F.fl. et al, The inherent neutronic safety characteristics of the fast modular reactor concept, in Proc. ANS National Topical Meeting on Coupled Reactor Kinetics, Texas A&M Press (1967) 348.
[9] PLAZA, H. Coupled reactors kinetics equations, Dissertation, Texas A&M University (1966).
[10] KUHLER, W.H., Summary of derivations of coupled point reactor kinetics equations, Proc. ANS National Topical Meeting on Coupled Reactor Kinetics, Texas A&M Press (1967) 192.
[11] ADLER, F.T. et al, Spatial and spectral coupling effects in multicore reactor systems, Proc. ANS National Topical Meeting on Coupled Reactor Kinetics, Texas A&M Press (1967), 521.
[12] BONDARENKO, I.I. et al, Gruppenkonstanten schneller und intermediarer Neutronen fur die Berechnung von Kernreak-toren, KFK-tr-l44, translation from Russian (1964).
[13] BELLMAN, R. COOKE, K.L., Differential Difference Equations, Academic Press, New York (1963).
[14] HANSEN, K.F. et al, Stable numerical solutions of reactor kinetics equations, Nucl. Sci. Engng. 22, 1 (1965) 51.
[15] PLUTA, P.R. et al, Kinetics of coupled thermal-fast spectrum power reactors, Proc. ANS National Topical Meeting on Coupled Reactor Kinetics, Texas A&M Press, (1967) 360.
[16] COHEN, E.R., Some topics in reactor kinetics, Proc. 2nd UN Int. Conf. PUAE II (1958) 302.
35

546 KOHLER et al.
D I S C U S S I O N
H.W. KUSTERS: In applying your method to coupled r e a c t o r s you a s s u m e a s tep-wise per turbat ion in one or both of the modules , whereas some sor t of r a m p - r a t e reac t iv i ty inser t ion would be c l o s e r to rea l i ty . Can your method deal with such r a m p - r a t e inser t ion and what effect would th is have on the t ime dependence of the coupling coefficients, which in turn would considerably influence the excurs ion behaviour?
W. H. KOHLER: The main par t of our paper i s a study of some of the p rob lems involved in modular co re k inet ics . The r a m p problem, or any other problem c lose r to rea l i ty , would have to be dealt with by the n u m e r i ca l solutions a lso outlined in the paper . One important point that we observed on looking at the s imple r p rob lems is the exis tence of a much m o r e negative root than /3/X ; this leads to p rob lems with the numer i ca l solution, but we a r e be t te r equipped to deal with these problems now. Since we have a lso noted the ex t reme sensi t ivi ty of coupling coefficients to changes in the flux shape, in the r a m p problem we shal l calculate coupling coefficients from stat ic calculat ions before undertaking the main calculat ion and then check whether the evolving flux ti l t will justify the use of these coefficients.
B . I . SPINRAD: Am I c o r r e c t in assuming that the ex t ra mode you get is due to the poss ib i l i t ies of s y m m e t r i c and a s y m m e t r i c per turbat ion?
It s tands to reason , heur is t ica l ly , that if one takes an init ial c r i t i ca l sys t em which is a s y m m e t r i c , any per turbat ion can be taken a s a l inear superposi t ion of the s y m m e t r i c and an a s y m m e t r i c per turba t ion .
W.H. KOHLER: We did not use two modes s imultaneously in this calculat ion; instead we calculated the coupling coefficients using the c r i t i c a l flux and the asymptot ic l ambda-mode flux in tu rn . In genera l , with coupled r e a c t o r kinet ics, one exchanges difficulties in the calculat ion of higher mode contr ibutions in a modal t r ea tmen t for difficulties in calculating the t ime-dependent coupling coefficients. P e r h a p s a var ia t iona l combination of two modes might be valuable in this r e spec t .

GENERAL DISCUSSION
F . STORRER (Chairman): I think it would be worthwhile to consider for a moment our motivation - as experimentalists and theoreticians - in doing these kinetic experiments on pulsation, modulation, correlation and what I shall label generally as reactor 'noise1.
Three motives come to mind. Firstly, I think we can readily agree that here theoreticians and experimentalists have come across an immensely important and fascinating field of study. Secondly, from these experiments and related theory we gain a better basic knowledge of the neutron processes occurring in a reactor. It is a fundamental tenet of pure research that it has no exact practical objective, but that it leads almost always to results of practical significance. I believe that in the case of critical experiments this general principle holds. We cannot overestimate the amount we have learned from studies of the techniques referred to in this session about neutron processes described by the Boltzmann equation. We are witnessing a dissection of this equation, together with the revelation of the spectrum of eigenvalues of the transport operator and associated eigenfunctions. There is no doubt that this information is of great practical use. Thirdly, one can think of the short-term practical objectives - what results we can expect from these experiments that will be of direct use in our study of power reactors .
I would suggest that we start our discussion by considering what other objectives are being pursued in the various research centres, leaving aside the work presented at this Symposium. For instance, I wonder whether it is planned to make a systematic comparison of the calculated and measured values of the decay constant of the prompt neutrons in an assembly, and to introduce this comparison into the cross-section modification processes that have been described in Session III.
W. B. LOEWENSTEIN: The fast reactor community generally tends to disagree on the reliability of determinations of the effective delayed neutron fraction. I believe that many of the techniques described in these papers on kinetics might possibly provide a basis for an absolute determination of this parameter, because our current understanding of this is largely based on knowing the delayed neutron yields, as determined primarily from fission spectra, and then inserting them into a calculation. It is very difficult to compare theory and experiment at the present time without knowing the delayed neutron fraction reliably, so perhaps an effort to determine this in an integral fashion would be very productive.
G.S. BRUNSON (Scientific Secretary): The Agency held a small panel in the spring of 1967 on the subject of delayed neutrons, and one of the points it discussed then was the question of whether delayed neutron time curves exhibited growth-decay characteristics. There was one school of thought that felt that current delayed neutron data were really satisfactory, but on the other hand Dr. Tomlinson, from Harwell, stated that on the basis of separations he felt certain that about half of the 55-sec delayed neutron group did come through a growth-decay history; that is, half of it behaved in accordance with the Keepin data and another half of it grew in and then died out. This, therefore, raises the question as to whether the delayed neutron information, not only quantitatively but in time, is good enough for reactors with circulating fuel, or some sort of fast-start rocket reactor.
547
548 GENERAL DISCUSSION
D.STEGEMANN: This i s m o r e re levant to differential data on j3 than to t ime-dependent expe r imen t s . I agree that investigation of /3eff in in tegra l a s s e m b l i e s , by a combination of e i ther pulse source or noise m e a s u r e men t s and s ta t ic m e a s u r e m e n t s of absolute r e a c t o r power, i s of p r ime impor tance . We have ca r r i ed out r e a c t o r m e a s u r e m e n t s on STARK, comparing absolute r e a c t o r power m e a s u r e d by foil activation and fission ra t e t r a v e r s e s with m e a s u r e m e n t s made by noise analys is , and these agreed fairly well, so we plan to continue this work now in fast s y s t e m s although we cannot give any indication of the accuracy with which /3eff can be m e a s u r e d . I also believe that the application of kinetic m e a s u r e m e n t s to noise analysis offers promis ing r e s e a r c h p rospec t s , and kinetic methods could be valuable too, as a diagnostic tool in the opera t ion of power r e a c t o r s .
B . I . SPINRAD: I should like to make two points . F i r s t l y , t h e r e is always the problem of cor re la t ing the denotation of react iv i ty in t e r m s of delayed neutrons (in do l la rs 3eff units) with i ts denotation in t e r m s of absorpt ion units (k uni ts) . In this r ega rd , it is well to r e m e m b e r that the bes t approach is to make a good m e a s u r e m e n t of the flux and mul t ip l i cation, which is a s tandard m e a s u r e m e n t and not so difficult as most k inet ic is ts seem to think. It is not valid to say that we do not know /3eff because we cannot m e a s u r e it by s t r i c t ly dynamic me thods .
Secondly, I notice that mos t of the exper imenta l work is done in t e r m s of negative r eac t iv i t i e s . It is well known, however, that the kinet ics equations a r e not s y m m e t r i c about cr i t ica l i ty , so I think a good deal m o r e investigation into both the exper imenta l and theore t i ca l m e a s u r e m e n t of kinetic p a r a m e t e r s in r i s ing period s y s t e m s would be worthwhile .
A. FABRY: On the bas i s of recent exact in tegra l m e a s u r e m e n t s t h e r e is good reason to believe that the r ea l f ission spec t rum of 235U is h a r d e r than that predicted by differential m e a s u r e m e n t s , based usual ly on the proton reco i l . This in tu rn influences the neutron l ifet ime in ve ry hard fast r e a c t o r s , as has a l ready been shown. I should like to know what, if anything, should be done about th i s , and whether th is type of e r r o r could occur in the f ission spec t r a of m o r e dilute fast r e a c t o r s .
F . STORRER: In fact, we have been wondering whether the fission spec t rum ta i l towards the lower ene rg ies was not actually g r e a t e r than is genera l ly accepted, and whether th is modification of the f ission spec t rum would not reduce the d i sc repancy between calculated and m e a s u r e d neutron s p e c t r a .
R. VIDAL: I should like to add a l i t t le to Mr . S tegemann 's comments to the effect that noise m e a s u r e m e n t s on power r e a c t o r s enable us to deduce the t r ans f e r function at different power l e v e l s . Measu remen t s of this type have been done in F r a n c e on Rapsodie, along with o the r c r i t i ca l m e a s u r e m e n t s to obtain the t r a n s f e r function by making sinusoidal reac t iv i ty per turba t ions at different f requencies and by analysing r e a c t o r r e sponse to react iv i ty j umps .
Y. YEIVIN: Revert ing to the Cha i rman ' s in t roductory r e m a r k s , I wonder whether anyone would c a r e to comment on the accuracy of kinetic m e a s u r e m e n t s used as in tegra l data in c r o s s - s e c t i o n adjustment p rocedu re s , s ince th is will emerge as the mos t impor tant single factor in th is context.
F . STORRER: We have been studying this at Cadarache , but it i s s t i l l too soon to draw quantitative conclus ions . Bes ides the spec t r a l m e a s u r e m e n t s , I think that we could usefully employ the exper imenta l

GENERAL DISCUSSION 549
value of the decay constant a, for a fundamental o r pseudofundamental mode, in a c r i t i ca l o r sub -c r i t i c a l a s sembly . P r e l i m i n a r y calculat ions have shown that a i s often m o r e sensi t ive than the reac t iv i ty o r the m a t e r i a l buckling to c r o s s - s e c t i o n fluctuations at low e n e r g i e s . These r e su l t s have st i l l to be compared with the accuracy of exper imenta l de terminat ion of these p a r a m e t e r s . One should not, of cour se , anticipate the conclusions to be drawn from these s tudies , but it would be a shame not to draw on cer ta in data a l ready available to u s .
On the other hand, while we believe we can make use of the a values of the fundamental o r pseudofundamental mode - which i s an inherent cha rac t e r i s t i c of the sys t em for a ve ry l a r g e range of init ial conditions -it s e e m s that a detailed analys is of the t r ans i en t behaviour would be difficult to c a r r y out, s ince detailed calculation of the ha rmonics ca l ls for an exact knowledge of the source (space, energy, t ime) and Of the de tec tor .
W.H. KOHLER: My question is not re la ted to k ine t ics . I should l ike to hea r whether anyone he re has done calculat ions on the photofission contribution in typical fast b r e e d e r r e a c t o r s . I wonder whether th is i s , say, a \% contribution, o r much l e s s .
K . E . J . WIRTZ: I think much l e s s ; mos t of the capture g a m m a - r a y s will appear as ca scades , and ve ry few g a m m a - r a y s with ene rg ies in excess of 5 MeV will appea r .


SYMPOSIUM ON FAST REACTOR PHYSICS
AND RELATED SAFETY PROBLEMS
HELD AT KARLSRUHE, 30 OCTOBER - 3 NOVEMBER 1967
CHAIRMEN OF SESSIONS
Sess ion I B. I. SPINRAD
Session II S. YIFTAH
Session III K . E . J . WIRTZ
Sess ion IV M. BOGAARDT
Session V F . STORRER
Session VI E . HELLSTRAND
Sess ion VII W. B . LOEWENSTEIN
Session VIII R . D . S M I T H
Session IX M . F . T R O Y A N O V
IAEA
I s r a e l
F e d e r a l Republic of Germany
Nether lands
F r a n c e
Sweden
United States of Amer ica
United Kingdom
Union of Soviet Socialist Republics
SECRETARIAT OF THE SYMPOSIUM
Scientific S e c r e t a r i e s :
Ed i to r :
G. S. BRUNSON D.A. YASHIN
L . A . SELF
R e c o r d s Officer: E . M. PEMBRIDGE
Division of Nuclear Power and R e a c t o r s , IAEA
Division of Scientific and Technical Information, IAEA
Division of Languages, IAEA
Adminis t ra t ive A. GREBENSTCHIKOV Department of Technical S e c r e t a r y : , Opera t ions , IAEA
551

I A E A S A L E S A G E N T S
Orders for Agency publications can be placed with your bookseller or any of our sa
agents l isted below :
A R G E N T I N A Comision Nacional de Energia Atomica Avenida del Libertador General San Martin 8250 Buenos Aires - Sue. 29
A U S T R A L I A Hunter Publications, 23 McKillop Street Melbourne, C.l
A U S T R I A Georg Fromme & Co. Spengergasse 39 A-1050, Vienna V
B E L G I U M Office international de librairie 30, avenue Marnix Brussels 5
B R A Z I L Livraria Kosmos Editora Rua do Rosario, 135-137 Rio de Janeiro
Agenda Expoente Oscar M. Silva Rua Xavier de Toledo, 140-1° Andar (Caixa Postal No. 5.614) Sao Paulo
BYELORUSSIAN SOVIET SOCIALIST REPUBLIC
See under USSR
CANADA The Queen's Printer Ottawa, Ontario
C H I N A (Taiwan) Books and Scientific Supplies Service, Ltd., P.O. Box 83
Taipei
CZECHOSLOVAK SOCIALIST REPUBLIC S.N.T.L. Spolena 51 Nove Mesto Prague 1
D E N M A R K Ejnar Munksgaard Ltd. 6 Nb'rregade Copenhagen K
F I N L A N D Akateeminen Kirjakauppa Keskuskatu 2 Helsinki
F R A N C E
Office international de documentation et librairie 48, rue Gay-Lussac F-75, Paris 5 e
G E R M A N Y , Federal Republic of R. Oldenbourg Rosenheimer Strasse 145 8 Munich 8
H U N G A R Y Kultura Hungarian Trading Co. for Books and Newspapers P.O.B. 149 Budapest 62
I S R A E L Heiliger and Co. 3 Nathan Strauss Street Jerusalem
I T A L Y Agenzia Editoriale Internazionale Organizzazioni Universali (A.E.I.O.U.) Via Meravigli 16 Milan
J A P A N Maruzen Company Ltd. 6, Tori Nichome Nihonbashi (P.O. Box 605) Tokyo Central
M E X I C O Librena Internacional Av. Sonora 206 Mexico 11, D.F .
NETHERLANDS N.V. Martinus Nijhoff Lange Voorhout 9 The Hague
NEW Z E A L A N D Whitcombe & Tombs, Ltd. G.P.O. Box 1894 Wellington, C.l

N O R W A Y Johah Grundt Tanum Karl Johans gate 43 Oslo
P A K I S T A N Karachi Educat ion Society Haroon Chambers South Napier Road . (P.O. Box No. 4866)
Karachi 2
P O L A N D
Osrodek Rozpowszechniana Wydawnictw Naukowych Po l ska Akademia Nauk Pa lac Kultury i Nauki Warsaw
R O M A N I A Cartimex Rue A. Briand 14-18 Bucares t
SOUTH AFRICA Van Schaik 's Bookstore (Pty) Ltd. Libri Building Church Street (P .O. Box 724) Pretoria
S P A I N
Libreria Bosch Ronda de la Universidad 11 Barcelona . '
S W E D E N C.E. Fr i tzes Kungl. Hovbokhandel Fredsgatan 2 Stockholm 16
S W I T Z E R L A N D Librairie Payot Rue Grenus 6 1211-Geneva 11
T U R K E Y Librairie Hachette 469, Is t iklal Caddesi Beyog lu , I s t anbu l
UKRAINIAN SOVIET SOCIALIST
REPUBLIC , See under USSR
UNION OF SOVIET SOCIALIST REPUBLICS
Mezhdunarodnaya Kniga Smolenskaya-Sennaya 32-34 Moscow G^200
UNITED KINGDOM OF GREAT BRITAIN AND NORTHERN IRELAND
Her Majesty 's Stationery Office P .O. Box 569 London, S.E.I
UNITED STATES OF AMERICA National Agency for International Pub l i ca t ions , Inc. 317 Eas t 34th Street New York, N.Y. 10016
V E N E Z U E L A Sr. Braulio Gabriel Chacares Gobernador a Candilito 37 Santa Rosal ia (Apartado Pos ta l 8092) Caracas D ,F ,
Y U G O S L A V I A Jugoslovenska Knjiga Terazi je 27 Belgrade
IAEA publicat ions can also be purchased retai l at the United Nations Bookshop at United Nations Headquarters , New York, a t the news-s tand at the Agency 's Headquar ters , Vienna, and at most conferences , symposia and seminars organized by the Agency. ,
In order to faci l i tate the distr ibution of i ts publ ica t ions , the Agency is prepared to accept payment in UNESCO coupons or in local cur renc ies .
Orders and inquiries from countries where s a l e s agents have not yet been appointed may be sent to :
Distribution and Sales Group, International Atomic Energy Agency, Kamtner Ring 11, A-1010, Vienna I, Austria

INTERNATIONAL ATOMIC ENERGY AGENCY VIENNA, 1968
PRICE: US $11.00 Austr ian Schillings 285,-(£4.11.8; F.Fr. 53 ,90 ; DM 44,- ]