w& - International Nuclear Information System (INIS)
256
fl* Pr. /7?3 w& \ UCRL-52295, Part ,1 AUTOMATION OF THE NATIONAL WATER QUALITY LABORATORIES, U. S. GEOLOGICAL SURVEY i: DESCRIPTION OF LABORATORY FUNCTIONSI AND DEFINITION OF THE AUTOMATION PROJECT iW * W. F. Morris H. S. Ames ^ Jiily 1, 1977 Prepared for U S. D artment of Energy under contract No. V. 405-Eng-48 III •LAWRENCE [ H 5 UVERMORE I k a l LABORATORY UnvtrsttyolCaltormAjvemtore msa ^%,.± -^^ hoar- «-,-:'i-:.- . :'• •- ._« -i»'. available copy to permit U'f> SrOadoStpassible avail™ '^illty. ' •„ •3-' •• .,,>:., h.( ;•;..'•; i ' 1 - • , its Ufi' .UNSffEfi
-
Upload
khangminh22 -
Category
Documents
-
view
4 -
download
0
Transcript of w& - International Nuclear Information System (INIS)
fl* Pr. /7?3 w& \
UCRL-52295, Part ,1
AUTOMATION OF THE NATIONAL WATER QUALITY LABORATORIES, U. S. GEOLOGICAL SURVEY i: DESCRIPTION OF LABORATORY FUNCTIONSI AND DEFINITION OF THE AUTOMATION PROJECT
iW *
W. F. Morris H. S. Ames ^
Jiily 1 , 1977
Prepared for U S. D artment of Energy under contract No. V. 405-Eng-48
III •LAWRENCE [ H 5 UVERMORE I k a l LABORATORY
UnvtrsttyolCaltormAjvemtore
msa ^%,.±
- ^ ^
hoar- «-,-:'i-:.- . :'• •- ._« -i»'. available copy to permit U'f> SrOadoStpassible avail™
' ^ i l l t y . ' •„
•3-' •• . , , > : . , h . ( ;•;..'•; i ' 1 - • , its Ufi' .UNSffEfi
u Distribution Category
UC-11
LAWRENCE UVERMORE LABORATORY UrmenityctiCaktomia/LiverrrK>re,Ca)ilorria/9455Q
UCRL-52295, Part 1
AUTOMATION OF THE NATIONAL WATER QUALITY LABORATORIES,
U. S. GEOLOGICAL SURVEY l. DESCRIPTION OF LABORATORY
FUNCTIONS AND DEFINITION OF THE AUTOMATION PROJECT
W. F. Morris H. S. Ames
MS. date: July 1, 1977
ROIICB
POBTIOKS 07 THIS RSPOFT ARE ItHSOJBLB. It hes been reprcnucr d f ran the best available copy to permit the broadestpossiblg avail-./ ability.
UiSTRiBUF:G;; ;j, ,.,.'. , . ,--, ;:::.;,T£CS,
Vl
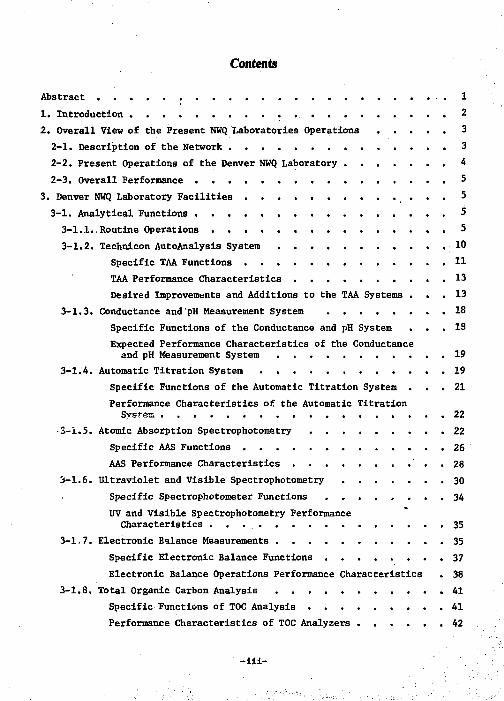
Contents
Abstract 1 1. Introduction 2
2. Overall View of the Present NWQ Laboratories Operations 3 2-1. Description of the Network 3 2-2. Present Operations of the Denver NWQ Laboratory . . 4 2-3. Overall Performance 5
3. Denver NWQ Laboratory Facilities . . . 5 3-1. Analytical Functions 5
3-1.1. Routine Operations 5 3-1.2. Technlcon AutoAnalysis System 10
Specific TAA Functions 11 TAA Performance Characteristics 13 Desired Improvements and Additions to the TAA Systems . . . 13
3-1.3. Conductance and pH Measurement System 18 Specific Functions of the Conductance and pH System . . . IS Expected Performance Characteristics of the Conductance and pH Measurement System 19
3-1.4. Automatic Titration System 19 Specific Functions of the Automatic Titration System . . . 21 Performance Characteristics of the Automatic Titration
Sysf-eja 22 .3-1.5. Atomic Absorption Spectrophotometry 22
Specific AAS Functions 26 AAS Performance Characteristics . . 28
3-1.6. Ultraviolet and Visible Spectrophotometry 30 Specific Spectrophotometer Functions . . 34 UV and Visible Spectrophotometry Performance
Characteristics 35 3-1.7. Electronic Balance Measurements 35
Specific Electronic Balance Functions 37 Electronic Balance Operations Performance Characteristics . 38
3-1.8. Total Organic Carbon Analysis 41 Specific Functions of TOC Analysis 41 Performance Characteristics of TOC Analyzers . 4 2
-ill-
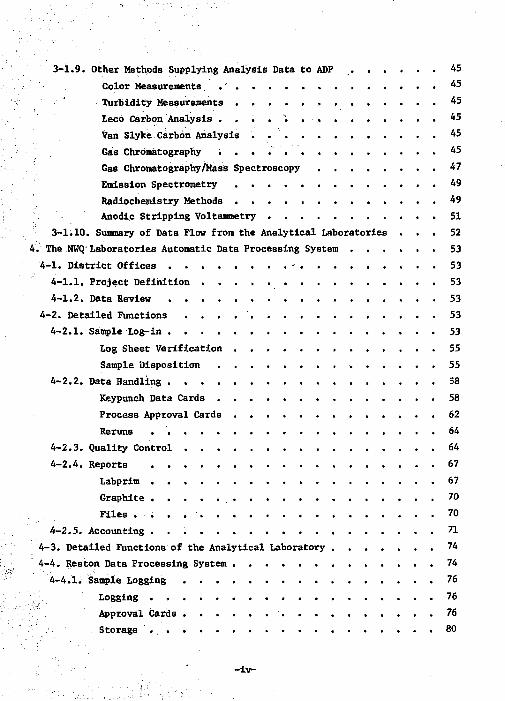
3-1.9. Other Methods Supplying Analysis Data to ADP 45 Color Measurements 45 Turbidity Measurements 45 Leco Carbon Analysis . . . . . . 45 Van SlykeCarbon Analysis 45 Gas Chromatography . . . . . . 45 Gas Chromatography /Mass Spectroscopy 47 Emission Spectrometry . . . . . 49 Radiochemistry Methods 49 Anodic Stripping Voltammetry 51
3-1.10. Summary of Data Flow from the Analytical Laboratories . . . 52 4. The NWQ Laboratories Automatic Data Processing System 53 4-1. District Offices ' 53
4-1.1. Project Definition 53 4-1.2. Data Review 53
4-2. Detailed Functions 53 4-2.1. Sample Log-in 53
Log Sheet Verification . 55 Sample Disposition 55
4-2.2. Data Handling 58 Keypunch Data Cards 58 Process Approval Cards 62 Reruns 64
4-2.3. Quality Control 64 4-2.4. Reports 67
Labprim 67 Graphite 70 Files 70
4-2.5. Accounting . . . 71 4-3. Detailed Functions of the Analytical Laboratory 74 4-4. Reston Data Processing System 74
4-4.1. Sample Logging 76 Logging 76 Approval Cards 76 Storage 80
-iv-
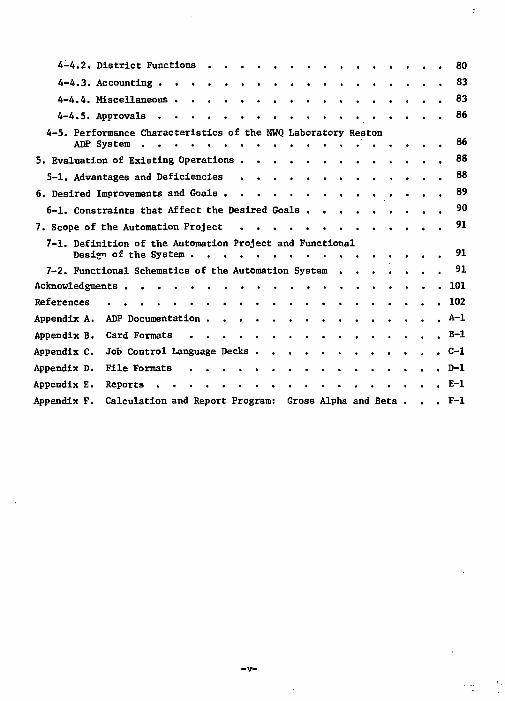
4-4.2. District Functions 80 4-4.3. Accounting 83 4-4.4. Miscellaneous 83 4-4.5. Approvals 86
4-5. Performance Characteristics of the NWQ Laboratory Reston ADF System ' 86
5. Evaluation of Existing Operations 88 5-1. Advantages and Deficiencies 88
6. Desired Improvements and Goals 89 6-1. Constraints that Affect the Desired Goals 9 0
7. Scope of the Automation Project 9 1
7-1. Definition of the Automation Project and Functional Design of the System 91
7-2. Functional Schematics of the Automation System 91 Acknowledgments 101 References 102 Appendix A. ADP Documentation A-l Appendix B. Card Formats B-l Appendix C. Job Control Language Decks , . C-l Appendix D. File Formats D-l Appendix E. Reports E-l Appendix F. Calculation and Report Program: Gross Alpha and Beta . . . F-l
-v-
AUTOMATION OF THE NATIONAL WATER QUALITY LABORATORIES,
U. S. GEOLOGICAL SURVEY l. DESCRIPTION OF LABORATORY
FUNCTIONS AND DEFINITION OF THE AUTOMATION PROJECT
Abstract
In January 1976, the Water Resources Division of the U.S. Geological Survey asked Lawrence Livermore Laboratory to conduct a feasibility study for automation of the National Water Quality (NWQ) Laboratory in Denver, Colorado (formerly Denver Central Laboratory). Results of the study were published in the Feasibil
ity Study for Automation of the Central Laboratories, Lawrence Liver-more Laboratory, Rept. UCRL-52001 (1976). Because the present system for processing water samples was found inadequate to meet the demands of a steadily increasing workload, new automation was recommended. In this document we present details necessary for future implementation of the new system, as well as descriptions of current laboratory automatic data processing and analytical facilities to better define the scope of the project and illustrate what the
new system will accomplish. All pertinent inputs, outputs, and other operations that define the project are shown in functional designs. The new system will accelerate each stage involved in processing a water sample. All sample-related data produced in the laboratory will be acquired either directly on-line, in real time, or by off-line entry mode. The system will also process and store the data and generate reports. Twenty-nine on-line data sources from eight different types of analytical instruments will be interfaced, providing 190 of the approximately 400 different parameters determined each day as well as 70% of the average daily data flow. Although the information presented here pertains specifically to the Denver laboratory, the same renovations will eventually be instituted at the NWQ laboratory in Atlanta, Georgia.
1. Introduction
Water quality analyses throughout the United States are conducted by regional National Water Quality (NWQ) laboratories of the Water Resources Division, U.S. Geological Survey (USGS). The NWQ laboratory in Denver, Colorado (formerly Denver Central Laboratory) services the 16 states that comprise the western region, and currently processes approximately 40,000 samples and 1,000,000 determinations annually. In the past, the KWQ laboratories have been able to meet the dcnands of the heavy workload through systematic operation, incorporation of modern laboratory Instrumentation, and the use of remote data processing facilities in Reston, Virginia. However, the sample load Is increasing, creating large backlogs of outstanding samples. At the same time, the new instruments generate more parameter determinations In less time thereby, increasing the data handling problems.
In an attempt to alleviate these problems, the USGS requested that Lawrence Livermore Laboratory (LLL) examine the overall operations at the Denver facility and recommend a course of action. In January 1976,
LLL conducted a feasibility study for further automating the NWQ laboratories, concluding that they could benefit from increased automation and the acquisition of in-house computer facilities. The USGS has approved plans to comply with the feasibility study recommendations; thi^ document is the next step in that process.
One of our primary purposes is to define the scope of the automation project by presenting an overall view of the NWQ laboratories operations as well as detailed descriptions of the Denver laboratory operations and data processing system. We also include system performance characteristics, advantages and disadvantages of the system, needed improvements, and the goals of the NWQ laboratories. Because of certain constraints, not all the desired improvements and goals can be attained. These constraints and their effect on the automation project will be explained.
The information we present is intended to provide enough details to allow the designer to fully understand the scope of the project and then design the required automation.
-2-
2. Overall View of the Present NWQ Laboratories Operations
2-1. DESCRIPTION OF THE NETWORK
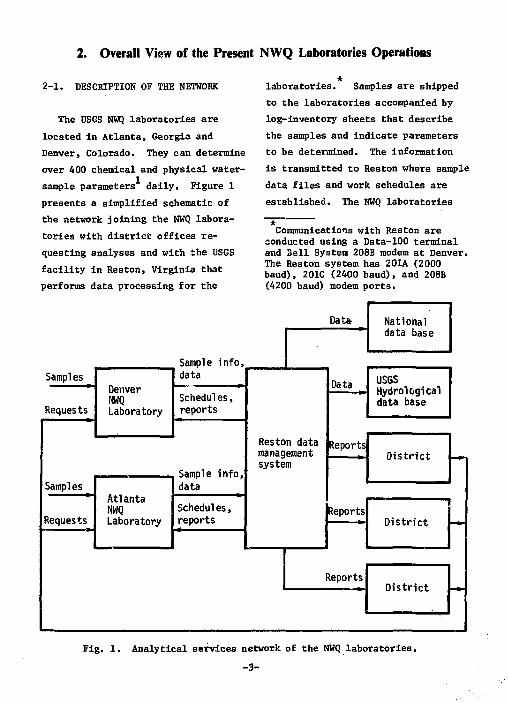
The USGS NWQ laboratories are located in Atlanta, Georgia and Denver, Colorado. They can determine over 400 chemical and physical water-sample parameters daily. Figure 1 presents a simplified schematic of the network joining the NWQ laboratories with district offices requesting analyses and with the USGS facility in Reston, Virginia that performs data processing for the
laboratories. Samples are shipped to the laboratories accompanied by log-inventory sheets that describe the samples and indicate parameters to be determined. The information is transmitted to Reston where sample data files and work schedules are established. The NWQ laboratories
Communications with Reston are conducted using a Data-100 terminal and 3ell System 208B modem at Denver. The Reston system has 201A (2000 baud), 201C (2400 baud), and 208B (4200 baud) modem ports.
Sample info, data
Data- National data base
Sample info, data
National data base
Sample info, data Samples
Denver NWQ Laboratory
Sample info, data
Reston data management system
Data USGS Hydrological data base
Denver NWQ Laboratory
Schedules, reports
Reston data management system
Data USGS Hydrological data base Requests
Denver NWQ Laboratory
Schedules, reports
Reston data management system
Reports
USGS Hydrological data base
Samples
Denver NWQ Laboratory
Sample info, data
Reston data management system
Reports
Samples Sample info, data
Reston data management system
Reports District
Samples Sample info, data
Reston data management system
Reports
District
Samples Atlanta NUQ Laboratory
Sample info, data
Reston data management system
Reports Requests Atlanta NUQ Laboratory
Schedules, reports
Reston data management system
Reports 1
District Requests Atlanta NUQ Laboratory
Schedules, reports
Reston data management system
1
District Atlanta NUQ Laboratory
Reston data management system
1
District
Reports District -District -
Fig. 1. Analytical services network of the NWQ laboratories.
-3-
conduct analyses according to work schedules, and the Reston computer prograas process the data and generate reports. 2-2. PRESENT OPERATIONS OF THE
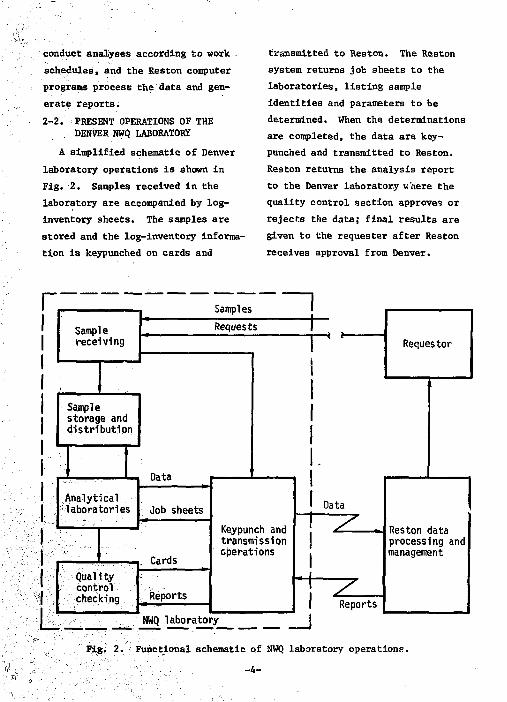
DENVER NWQ LABORATORY A simplified schematic of Denver
laboratory operations is shown in Fig. 2. Samples received in the laboratory are accompanied by log-inventory sheets. The samples are stored and the log-inventory information is keypunched on cards and
transmitted to Reston. The Reston system returns job sheets to the laboratories, listing sample identities and parameters to be determined. When the determinations are completed, the data are keypunched and transmitted to Reston. Reston returns the analysis report to the Denver laboratory where the quality control section approves or rejects the data; final results are given to the requester after Reston receives approval from Denver.
r Sample receiving
Sample storage and distribution
Analytical laboratories
Quality control checking
Samples Requests
Data
Job sheets
Cards
Reports
Keypunch and transmission operations
-J i- Requestor
Data
^ Reports
Reston data processing and management
NWQ laboratory
Fig. 2. Functional schematic of NWQ laboratory operations. _4-
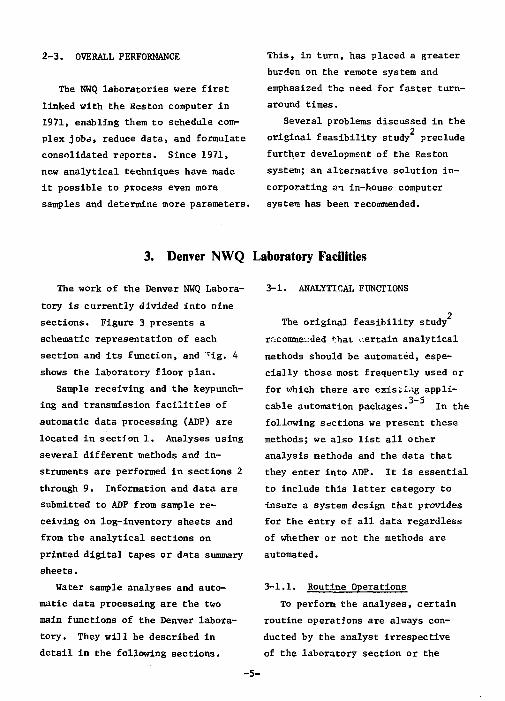
2-3. OVERALL PERFORMANCE
The NWQ laboratories were first linked with the Reston computer in 1971, enabling them to schedule complex jobo, reduce data, and formulate consolidated reports. Since 1971, new analytical techniques have made it possible to process even more samples and determine more parameters.
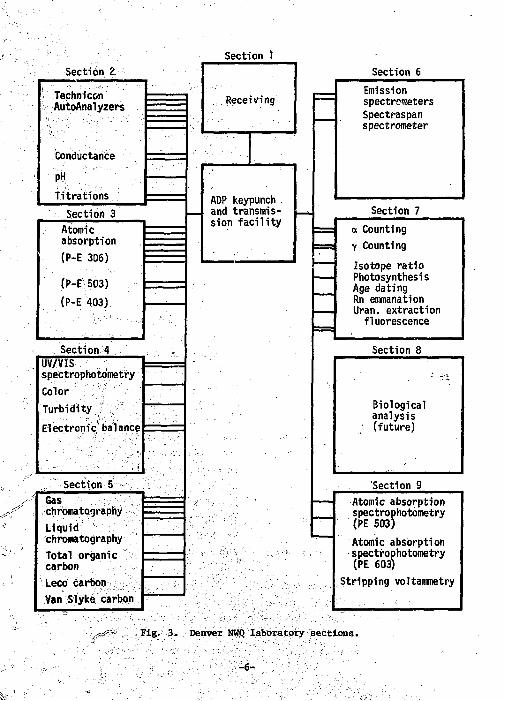
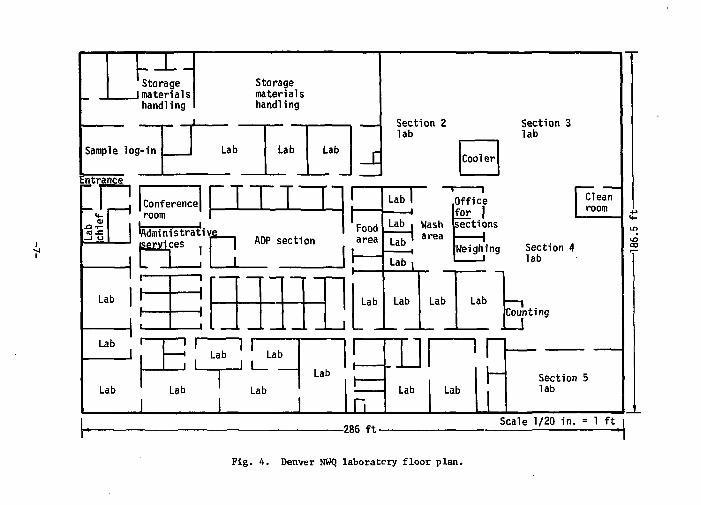
The work of the Denver NWQ Laboratory is currently divided into nine sections. Figure 3 presents a schematic representation of each section and its function, and "ig. 4 shows the laboratory floor plan.
Sample receiving and the keypunching and transmission facilities of automatic data processing (ADP) are located in section 1. Analyses using several different methods and instruments are performed in sections 2 through 9. Information and data are submitted to ADP from sample receiving on log-inventory sheets and from the analytical sections on printed digital tapes or data summary sheets.
Water sample analyses and automatic data processing are the two main functions of the Denver laboratory. They will be described in detail in the following sections.
This, in turn, has placed a greater burden on the remote system and emphasized the need for faster turnaround times.
Several problems discussed in the 2
original feasibility study preclude further development of the Reston system; an alternative solution incorporating an in-house computer system has been recommended.
3-1. ANALYTICAL FUNCTIONS
2 The original feasibility study recommended That certain analytical methods should be automated, especially those most frequently used or for which there are existing appli-
3-5 cable automation packages. In the following sections we present these methods; we also list all other analysis methods and the data that they enter into ADP. It is essential to include this latter category to insure a system design that provides for the entry of all data regardless of whether or not the methods are automated.
3-1.1. Routine Operations To perform the analyses, certain
routine operations are always conducted by the analyst irrespective of the laboratory section or the
3. Denver NWQ Laboratory Facilities
Section 1 Section 2
Technicon AutoAnalyzers
Conductance PH Titrations
Technicon AutoAnalyzers
Conductance PH Titrations
Technicon AutoAnalyzers
Conductance PH Titrations
Technicon AutoAnalyzers
Conductance PH Titrations
Technicon AutoAnalyzers
Conductance PH Titrations
Technicon AutoAnalyzers
Conductance PH Titrations
Technicon AutoAnalyzers
Conductance PH Titrations
Section 3 Atomic absorption (P-E 306)
(P-E 503) (P-E 403)
Atomic absorption (P-E 306)
(P-E 503) (P-E 403)
Atomic absorption (P-E 306)
(P-E 503) (P-E 403)
Atomic absorption (P-E 306)
(P-E 503) (P-E 403)
Atomic absorption (P-E 306)
(P-E 503) (P-E 403)
Atomic absorption (P-E 306)
(P-E 503) (P-E 403)
Atomic absorption (P-E 306)
(P-E 503) (P-E 403)
Atomic absorption (P-E 306)
(P-E 503) (P-E 403)
Atomic absorption (P-E 306)
(P-E 503) (P-E 403)
Atomic absorption (P-E 306)
(P-E 503) (P-E 403)
Section 4 UV/VIS spectrophotometry Color Turbidity Electronic balance
UV/VIS spectrophotometry Color Turbidity Electronic balance
UV/VIS spectrophotometry Color Turbidity Electronic balance
UV/VIS spectrophotometry Color Turbidity Electronic balance
UV/VIS spectrophotometry Color Turbidity Electronic balance
Section 5 Gas chromatography Liquid chromatography Total organic carbon Leco carbon Van Slyke carbon
Gas chromatography Liquid chromatography Total organic carbon Leco carbon Van Slyke carbon
Gas chromatography Liquid chromatography Total organic carbon Leco carbon Van Slyke carbon
Gas chromatography Liquid chromatography Total organic carbon Leco carbon Van Slyke carbon
Gas chromatography Liquid chromatography Total organic carbon Leco carbon Van Slyke carbon
Gas chromatography Liquid chromatography Total organic carbon Leco carbon Van Slyke carbon
Gas chromatography Liquid chromatography Total organic carbon Leco carbon Van Slyke carbon
Gas chromatography Liquid chromatography Total organic carbon Leco carbon Van Slyke carbon
Receiving
Section 6
ADP keypunch and transmission facility
Emission spectrometers Spectraspan spectrometer
Section 7
—
o Counting Y Counting Isotope ratio Photosynthesis Age dating Rn emmanation Uran. extraction fluorescence
Section 8
Biological analysis (future)
'Section 9 Atomic absorption spectrophotometry (PE 503) Atomic absorption spectrophotometry (PE 603)
Stripping voltammetry
Fig. 3. Denver NWQ laboratory sections.
-6-
Entrance
Storage J materials
handling
Storage materials handling
Sample log-in Lab Lab Lab _n
Section 2 lab
Section 3 lab
Cooler
ri 'i irTTT~r _ I | |Conference) 1 1 1 I
<<-1 ' r o o m I
a l l i •Administrative, services J | ADP section
Food area
Lab
~l r
Lab
Lab I
Lab • Wash
uP a r e a
i -\ Office for | sections
Lab
P ro
ean room
Weighing Section 4 _ J lab
Lab Lab Lab Counting
Lab l~
Lab
u r
ZJ L Lab Lab
Lab Lab Lab
Lab Lab Section 5 lab
-286 ft- Scale 1/20 in. = 1 ft
Fig. 4. Denver NWQ laboratory floor plan.
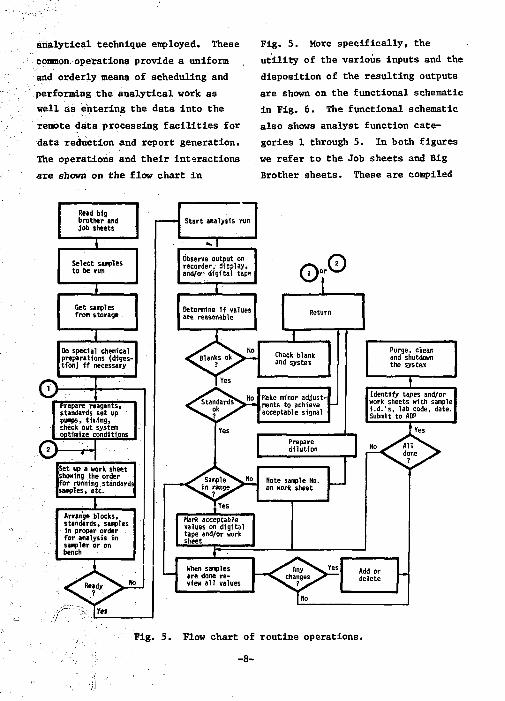
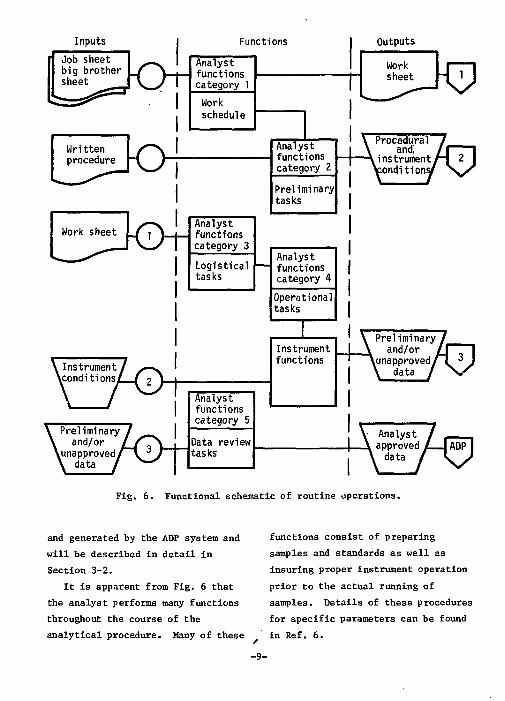
analytical technique employed. These common operations provide a uniform and orderly means of scheduling and performing the analytical vork as well as entering the data into the remote data processing facilities for data reduction and report generation. The operations and their interactions are shown on the flow chart in
Fig. 5. More specifically, the utility of the various inputs and the disposition of the resulting outputs are shown on the functional schematic in Fig. 6. The functional schematic also shows analyst function categories 1 through 5. In both figures we refer to the Job sheets and Big Brother sheets. These are compiled
Renl big brother and job sheets
Select samples to be run
Get samples from storage
Do special chemical preparations (digestion) if necessary
©
©
Trepare^-eagenis, standards set up. pinps» tln.lng, check out system ^gtlglze^ojjditlons
Set up a work sheet showing the order for running standards samples, etc.
T Arrange blocks, standards, samples 1n proper order -for analysis in sampler or on bench
Fig. 5 . Flow chart of routine operations.
- 8 -
Inputs Job sheet big brother sheet
Analyst functions category 1 Work schedule
Functions
Work sheet
Analyst functions category 2
Preliminary tasks
fOrl Analyst functions category 3
Logistical tasks
Analyst functions category 4 Operational tasks
Preliminary and/or
^unapproved data
Analyst functions category 5
Data review tasks
Instrument functions
Outputs
sdural / ind / ] 1 rument / H 2 I i t i ons / \ | /
Procedural and
iinstrument pondi
Preliminary and/or
^unapproved data
r v 7
Analyst / approved L—IADP
data / \ j f
Fig. 6. Functional schematic of routine operations.
and generated by the ADP system and will be described in detail in Section 3-2.
It is apparent from Fig. 6 that the analyst performs many functions throughout the course of the analytical procedure. Many of these
functions consist of preparing samples and standards as well as insuring proper instrument operation prior to the actual running of samples. Details of these procedures for specific parameters can be found in Ref. 6.

la the following sections we describe the major analytical instruments and the procedural steps associated with these operations. Instruments included are those that handle a major portion of the laboratory workload and that are operated routinely in the various sections of the Denver laboratory.
3-1.2. Technicon Autoanalysis System
The Technicon AutoAnalyzer (TAA) performs continuous-flow, simulta
neous chemical analyses. The system aspirates multiple samples in sequence, brings the samples and reagents together for reaction, and continuously moves the sequence of samples through perdetermined analysis steps to produce a colored solution. The analyzer pumps the solution through a colorimeter, where light absorption by the solution is measured. The concentration of the aialyte of interest, which is related to the light absorption, can be displayed on a recorder or a digital printer.
Table 1. Technicon AutoAnalyzer systems and parameters determined. System No.
No. of channels
Parameters determined
Sampling rate Detector
Method3
reference
1 1 Chemical Oxygen Demand (COD)
40/hr Colorimeter Provisional
2 1 Cyanide 20/hr Colorimeter 1-2302-76 3 1 Fluoride (total) 20/hr Ion selective
Electrode (ISE) 1-1327-77 4 1 Nitrogen (Kjeldahl) 60/hr Colorimeter 1-2552-77 5 2 Iron (total) 40 Colorimeter 1-6379-76
Phosphorus (total dissolved)
40 Colorimeter 1-2600-76
6 4 Sulfate (low) 30/hr Colorimeter 1-2822-76 Sulfate (high) 30/hr Colorimeter 1-2822-76 Chloride (low) 30/hr Colorimeter 1-2187-76 Chloride (high) 30/hr Colorimeter
7 6 Nitrogen (N03+N02)
40/hr Colorimeter 1-4545-77
Nitrogen (N02) 40/hr Colorimeter 1-6540-76 Nitrogen (NH4+) 40/hr Colorimeter 1-2523-77 Fluoride (diss.) 40/hr Ion selective
electrode 1-1327-77 Phosphorus (PO,) 40/hr Colorimeter 1-2600-76 Silica (S102) 40/hr Colorimeter 1-2700-77
"See Ref . 6, Ch. A-l.
-10-
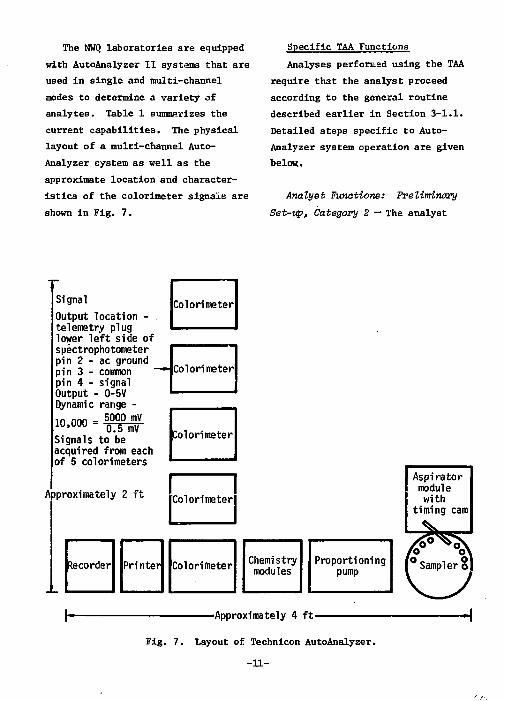
The NWQ laboratories are equipped with AutoAnalyzer II systems that are used In single and multi-channel modes to determine a variety of analytes. Table 1 summarizes the current capabilities. The physical layout of a multi-channel AutoAnalyzer system as well as the approximate location and characteristics of the colorimeter signals are shown in Fig. 7.
Specific TAA Functions Analyses performed using the TAA
require that the analyst proceed according to the general routine described earlier in Section 3-1.1. Detailed steps specific to AutoAnalyzer system operation are given below..
Analyst Funotions: Preliminary
Set-up, Category 2 — The analyst
Signal
Output location - . telemetry plug lower l e f t side of spectrophotometer pin 2 - ac ground pin 3 - common pin 4 - signal Output - 0-5V Dynamic range -
in nnn - 5 0 0 _° m V
1 0 ' 0 0 0 " 0.6 mV Signals to be acquired from each of 5 colorimeters
Approximately 2 ft
Colorimeter
Colorimeter
Colorimeter
Colorimeter
Recorder Printer Colorimeter
Aspi rator module with
timing cam
Chemistry modules
Proportioning pump
-Approximately 4 ft-
Fig. 7. Layout of Technicon AutoAnalyzer.
-11-
performs preliminary chemistry independent of the AutoAnalyzer, e.g., sample digestion required for Kjeldahl nitrogen determination. He prepares reagents needed for the specific parameters to be determined and sets up the appropriate reagent reservoirs, tubing, connections and AutoAnalyzer components. He then inserts the appropriate sample timing cam to establish the number of samples to be sequenced per hour and the relative times for aspiration of sample and wash. Using a known standard or sample, he adjusts the colorimeter amplifif * gain settings, signal span, and damping He then indexes the printer to output the appropriate sequence of indentification numbers.
Instrument Functions — The Auto-Analyzer automatically aspirates the sample and wash, and then pumps the reagents and air segments into the system. It performs the chemistry and pumps the reacted, colored solution through the colorimeter flow-through cell. As the samples pass by the detector system, the signals are automatically read and relayed to the strip chart recorder and printer tape.
Analyst Functions: Data Approval, Category S — The analyst observes the signal on the strip chart to deter
mine its acceptability. If, for example, two sample dilutions are being run in two separate channels as in sulfate determination, the analyst will designate as acceptable one cf the two results that falls in the optimum range of the detection system. He marks the acceptable value on the digital printer tape. If a signal is out-of-range or distorted, he notes the sample identification on the work sheet and digital tape as a required rerun. He conducts the above functions as the results appear. When convenient, he prepares a rerun sample, places it in the next available sample tray position, and notes the position on his work sheet. When every sample 1'as been run, the analyst edits the digital printer tape. He identifies on tape the parameters determined by the laboratory code and enters the sample identification numbers either individually or in sets, depending on whether the samples were run in sequence. The digital printer tape is then submitted to the data processing section.
Calculations — Parameter concentrations are usually determined by referencing sample absorbance values to a standard calibration curve that relates absorbance to concentration. The calibration curves may be stored from a previous run or are generated
from standard data accumulated in the current run. More details regarding the calculations may be found in the method descriptions referenced in Table 1.
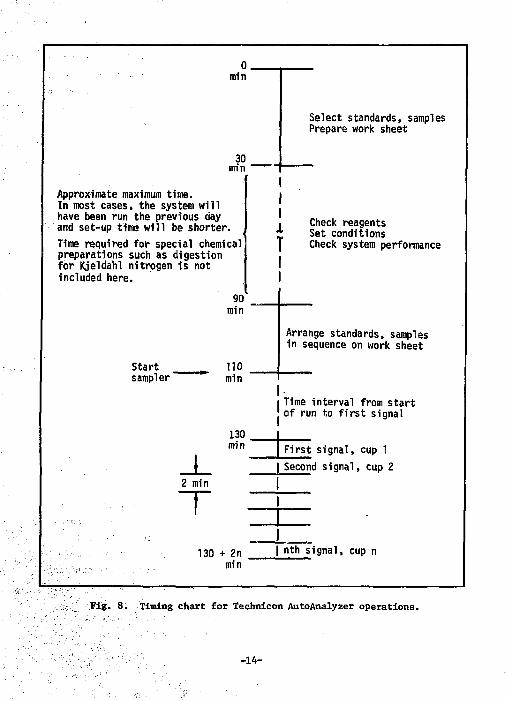
TAA Performance Characteristics A timing chart presented in Fig. 8
shows the sequence of operations and the times required for operating the TAA.
Approximately 70 samples can be processed through a TAA in an 8-hr period, considering the time spent in selecting samples, preparing the system, and running blanks, calibration standards, standard reference samp.'.es, and periodic check standards Checking over the strip charts and data tapes for reasonableness of the data is also taken into account. However, special preparations such as sample digestion for kjeldahl nitrogen are not considered.
Thus, in single-channel operation (see system 1, Table 1) approximately 70 parameters can be determined and as many as 140 in two-channel operation. Multi-channel operation, however, does not necessarily mean that the number of parameters determined is 70 times the number of channels. For example, in system 6, Table 1 (4 channels), although 280 actual determinations are made, only 140 optimum CI and SO, results are selected for the final report to ADP.
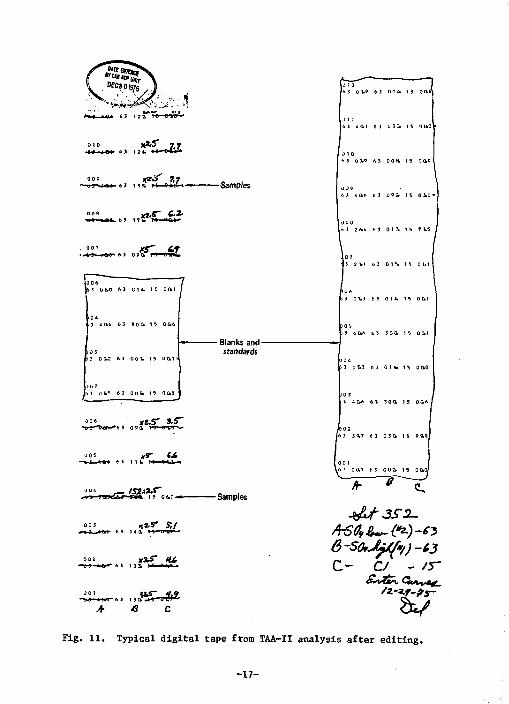
Examples of typical strip chart recordings from the TAA are shown in Figs. 9 and 10. Superimposed on these are several types -f anomalous signals. A typical digital tape, before and after editing, is shown in Fig. 11.
Desired Improvements and Additions to the TAA Systems
To improve the analytical results and make the operation of the TAA system more efficient, it would be advantageous to process standard calibration data as soon ae the standards have been run. In this way, the operator can quickly determine if the standard data is appropriate for use in subsequent analyses.
In addition, more efficient operation is possible if the standard reference sample (SRS) data (indicating the accuracy of the method) are made available as soon as the SRS is run. Thus, corrections can be made immediately and costly errors can be avoided.
In the near future, additional AutoAnalyzer systems will be operative. For example, on Table 1, system 4 (Kjeldahl nitrogen) and system 6 (S0~ and Cl~) are candidates for replication. Also, four channels of system 7 (NOj + N 0 2 > N 0 2 > NH 4
and P) will be replicated with a separate system.
0, min
30 min
Approximate maximum time. In most cases, the system will have been run the previous day and set-up time will be shorter. Time required for special chemical preparations such as digestion for Kjeldahl nitrogen is not included here.
90" min
Select standards, samples Prepare work sheet
I 1 T
Check reagents Set conditions Check system performance
Arrange standards, samples in sequence on work sheet
Start no sampler
_L 2 min
T 130
min
130
•
Time interval from s ta r t of run to f i r s t signal
_L 2 min
T 130
min F i rs t s ignal , cup 1
_L 2 min
T 130
Second s ignal , cup 2 _L 2 min
T 130
_L 2 min
T 130
_L 2 min
T 130
_L 2 min
T 130
_L 2 min
T 130 + 2n
mm nth s ignal , cup n
Fig. 8. Timing chart for Technicon AutoAnalyzer operations.
-14-
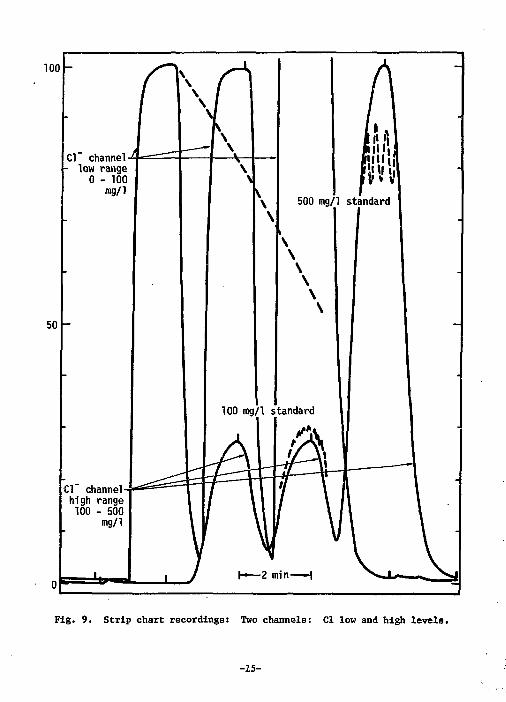
100
Cl~ channel-^ - low range
0 - 100 mg/1
50
CI channel high range 100 - 500
mg/1
Fig. 9. Strip chart recordings: Two channels: CI low and high levels.
-15-
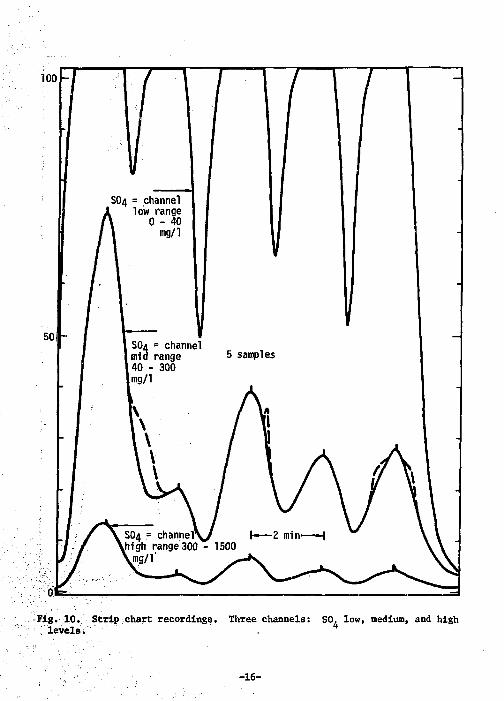
100
50!
SO4 = channel low range
0 - 4 0 mg/1
SO4 = channel I mia range 40 - 300
I mg/1 5 samples
Fig. 10. Strip chart recordings. Three channels: SO, low, medium, and high levels.
-16-
X^S* 7,7 63 124, frfr *3h* '
0 09 rf^ J5» " ^ T V b U - i ! I I S t< 8-M *•
ops _ xt*§7 jc**r
-Samples
i a 0.1 t 3 o 3 i IS f> u.0
15 o i 5 AS ooa i s oo>«
0 0 7 Xf" 6t • 6 3 090. 1 J ' W n L
63 C I * . 15 00.1 /
3 4 0.6 63 3 0 0. t S 0 0.6
j 3 0 0.2 63 0 0 1. 15 00.1
J 0 7 51 G ^ 6J 009. 15 00.3
" 6 XZ^T &S"" •*6 5 0 9 0. " ~" "
0 05 * £ - C.t - « — * * * H 11 b "
**?UiA
*a£*£ J0 1 Jt&J" _ V . »
- » * - * * f l - 6 i 1 3 0. - M 0 UJ r
* tf c
-Blanks and-standards
-Samples
13 3 1.1 6 3 014 M tl1.1
i 3 0 7.3 t 3 0 14. IS 0 0.1
J 4 0.* 0 3 3 0 a 19 0 0,1
>3 U7.J 6 3 0 14 . 1 5 0 0.0
3 4 0.6 6 3 3 0 0. 15 0 0.6 I
63 3*7 63 030. 15 9 9,9
00.1 63 0 0 1 15 0 0.0/
O C/ - /5"
V Fig. 11. Typical digital tape from TAA-II analysis after editing.
-17-
3-1.3. Conductance and pH Measurement System
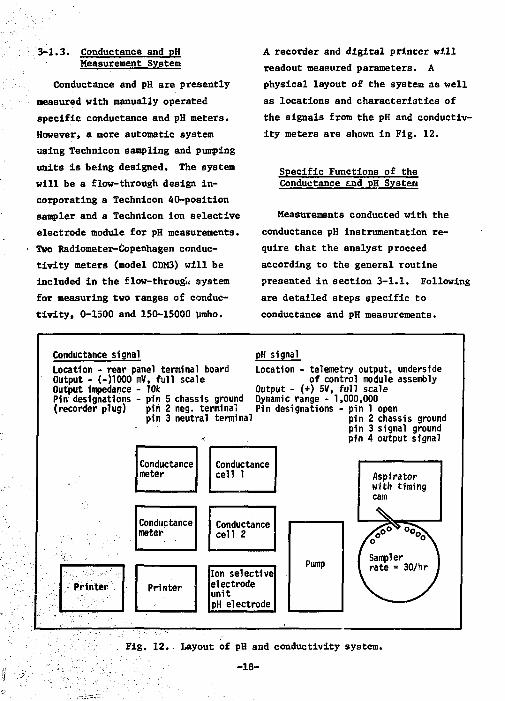
Conductance and pH are presently measured with manually operated specific conductance and pH meters. However, a more automatic system using Technicon sampling and puxrplng units is being designed. The system will be a flow-through design incorporating a Technicon 40-position sampler and a Technicon ion selective electrode module for pH measurements. Two Radiometer-Copenhagen conductivity meters (model CDM3) will be included in the flow-through system for measuring two ranges of conductivity, 0-1500 and 150-15000 limho.
A recorder and digital printer will readout measured parameters. A physical layout of the system as well as locations and characteristics of the signals from the pH and conductivity meters are shown in Fig. 12.
Specific Functions of the Conductance end pH System
Measurements conducted with the conductance pH instrumentation require that the analyst proceed according to the general routine presented in section 3-1.1. Following are detailed steps specific to conductance and pH measurements.
Conductance signal pH signal Location - rear panel terminal board Location - telemel Output - (-)1000 mV, full scale of conl Output impedance - 10k Output - (+) 5V, f Pin designations - pin 5 chassis ground Dynamic range - 1, (recorder plug) pin 2 neg. terminal Pin designations -
pin 3 neutral terminal
ry output, underside rol module assembly ull scale 000,000 pin 1 open pin 2 chassis groun pin 3 signal grounc pin 4 output signal
d
Conductance meter
Conductance cell 1
ry output, underside rol module assembly ull scale 000,000 pin 1 open pin 2 chassis groun pin 3 signal grounc pin 4 output signal
Conductance meter
Conductance cell 1 Aspirator
with timing cam Aspirator with timing cam
Conductance meter Conductance
cell 2
Aspirator with timing cam
Conductance meter Conductance
cell 2
Pump 1 Sampler 1 I rate = 30/hr / Pump 1 Sampler 1 I rate = 30/hr /
Printer Printer Ion selective electrode unit pH electrode
Pump 1 Sampler 1 I rate = 30/hr /
Fig. 12. layout of pH and conductivity system. -18-
Analyst Functions: Preliminary Set-up, Caiegory 2 — Buffer solutions covering the pH range of samples to be measured are made available. A standard kCl solution, 0.01000 normal, is prepared for checking the cell constant of the conductivity meter. No sample preparation is required, and prior to running the unknowns, the system 's checked out with the appropriate buffers and the standard kCl solution, / ,'prc .dilate conductivity meter settings may be found in Kef. 7.
Instrument Functions — The Auto-Analyzer sampler usas dual aspirator tubes to aspirate aliquots of samples into the system. The samples are segmented with air and pumped through the pH and conductiv: ty modules. Conductivity and pH are measured in the flow-through modules and the signals are read out on the strip chart recorder and digital tape.
Analyst Functions: Data Approval, Category S — The analyst observes the strip chart and printed digital tape output looking for unusual signals. He also checks the values of standards included in the series of samples to insure satisfactory system operation. When every sample has been run, the analyst edits the digital tape for submission to ADF. He uses the laboratory code to
identify the parameters measured, and enters the sample numbers that correspond to the data on the tape.
Calculations — Calculations relative to specific conductance measurements can be found in Chapter A-i of Ref. 6 as well as in the 'adiometer-Copenhagen CDM3 Manual.
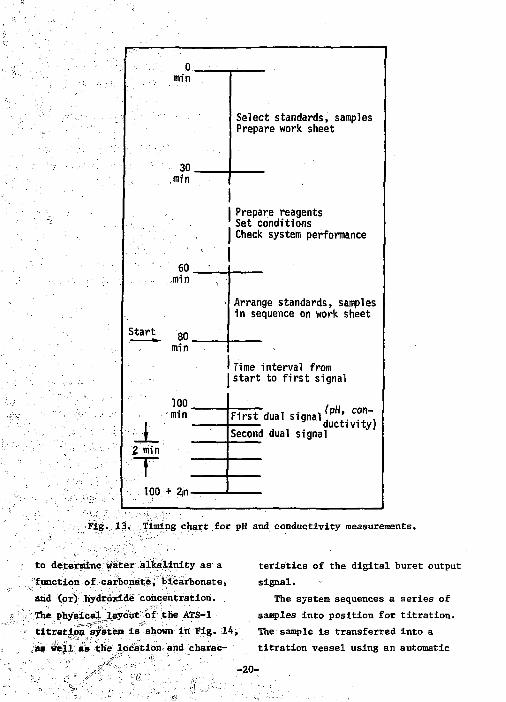
Expected Performance Characteristics of the Conductance and pH Measurement System A timing chart of conductance and
pH measurement operations is shown in Fig. 13.
Although the sampler for this system is expected to sequence 30 samples per hr, the number of actual determinations per 8-hr period will not be a direct multiple because of the time required to perform preliminary tasks such as sample selection, system set-up, standardization, and inclusion of blanks, ...hecks, etc. Time will also be required to review the data. Therefore, it is expected that the conductivity and pH channels will each yield a net of 150 determinations per 8-hr period.
3-1.4 Automatic Titration System
The NWQ Laboratory is equipped with two model ATS-1 Radiometer-Copenhagen automatic titration systems that are most frequently used
-19-
Start
0. min
30. ,min
60. min
80. min
100. min
Z min
T : 100 + 2.n-
Select standards, samples Prepare work sheet
Prepare reagents Set conditions Check system performance
Arrange standards, samples in sequence on work sheet
Time interval from start to first signal
First dual signal fpH, con-Second dual signal ductivity)
Fig. 13. Timing chart for pH and conductivity measurements.
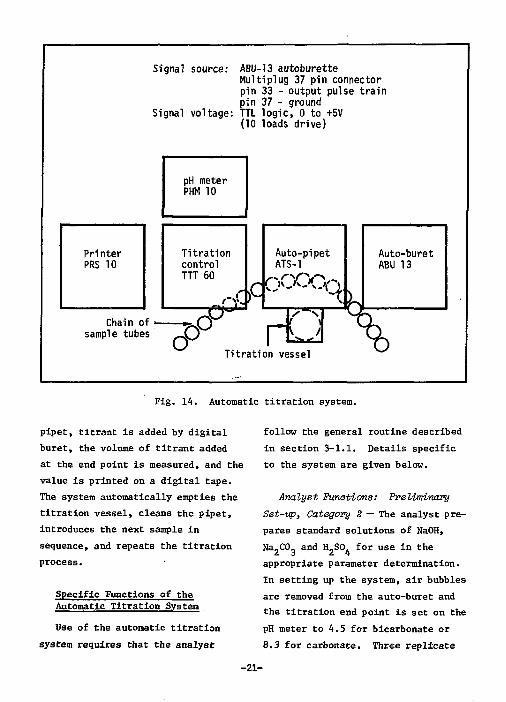
to determine water alkalinity as a function of carbonate, bicarbonate, and (or) hydroxide concentration. The physical layout of the ATS-1 titration aysten is shown in Fig. 14, as well as the location and charac
teristics of the digital buret output signal.
The system sequences a series of samples into position for titration. The sample is transferred into a titration vessel using an automatic
-20-
Printer PRS 10
Signal source:
Signal voltage:
Chain of sample tubes
ABU-13 autoburette Multiplug 37 pin connector pin 33 - output pulse t ra in pin 37 - ground TTL log ic , 0 to +5V (10 loads drive)
pH meter PHM 10
T i t ra t ion control TTT 60
o O a r0
Auto-pipet ATS-1
rL, Titration vessel
Auto-buret ABU 13
Fig. 14. Automatic titration system.
pipet, titrant is added by digital buret, the volume of titrant added at the end point is measured, and the value is printed on a digital tape. The system automatically empties the titration vessel, cleans the pipet, introduces the next sample in sequence, and repeats the titration process.
Specific Functions of the Automatic Titration System
Use of the automatic titration system requires that the analyst
follow the general routine described in section 3-1.1. Details specific to the system are given below.
Analyst Functions: Preliminary Set-ip, Category 2 — The analyst prepares standard solutions of NaOH, Na.CO, and H.SO, for use in the 2 3 2 4 appropriate parameter determination. In setting up the system, air bubbles are removed from the auto-buret and the titration end point is set on the pH meter to 4.5 for bicarbonate or 8.3 for carbonate. Three replicate
-21-
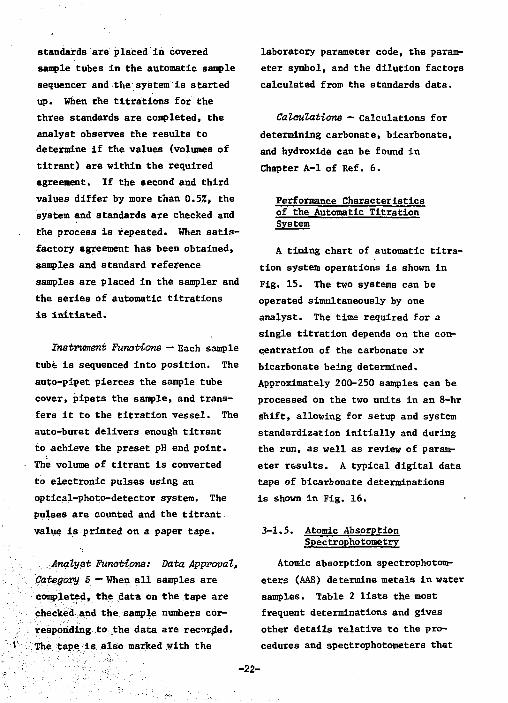
standards are placed In covered sample tubes in the automatic sample sequencer and the system is started up. When the titrations for the three standards are completed, the analyst observes the results to determine if the values (volumes of titrant) are within the required agreement. If the second and third values differ by more than 0.5/5, the system and standards are checked and the process is repeated. When satisfactory agreement has been obtained, samples and standard reference samples are placed in the sampler and the series of automatic titrations is initiated.
Instrument Functions — Each sample tube is sequenced into position. The auto-pipet pierces the sample tube cover, pipets the sample, and transfers it to the titration vessel. The auto-buret delivers enough titrant to achieve the preset pH end point. The volume of titrant is converted to electronic pulses using an optical-photo-detector system. The pulses are counted and the titrant value is printed on a paper tape.
Analyst Functions: Data Approval, Category S — When all samples are completed, the data on the tape are checked and the sample numbers corresponding to the data are recorded. The tape is also marked with the
laboratory parameter code, the parameter symbol, and the dilution factors calculated from the standards data.
Calculations — Calculations for determining carbonate, bicarbonate, and hydroxide can be found in Chapter A-l of Ref. 6.
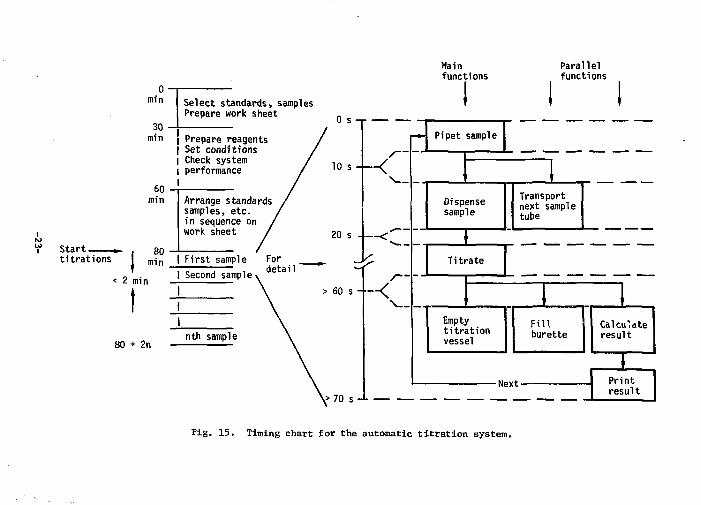
Performance Characteristics of the Automatic Titration System
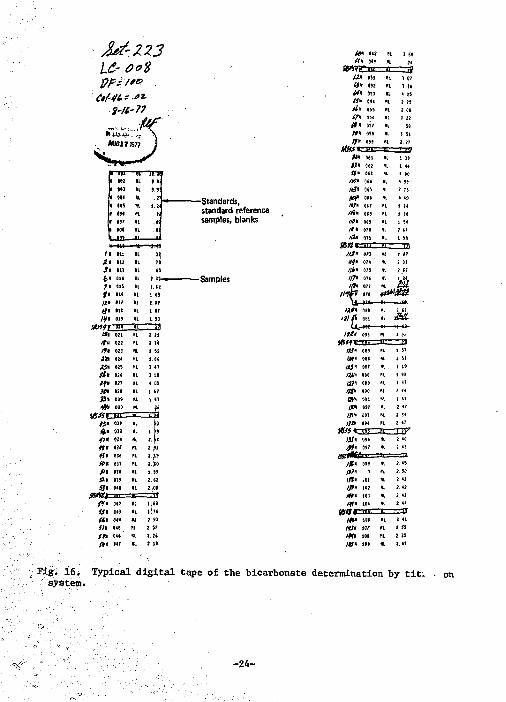
A timing chart of automatic titration system operations is shown in Fig. 15. The two systems can be operated simultaneously by one analyst. The time required for a single titration depends on the concentration of the carbonate or bicarbonate being determined. Approximately 200-250 samples can be processed on the two units in an 8-hr shift, allowing for setup and system standardization initially and during the run, as well as review of parameter results. A typical digital data tape of bicarbonate determinations is shown in Fig. 16.
3-1.5. Atomic Absorption Spectrophotometry
Atomic absorption spectrophotometers (AAS) determine metals in water samples. Table 2 lists the roost frequent determinations and gives other details relative to the procedures and spectrophotometers that
Start , titrations
60 min
80 min
< 2 min
80 + 2n
Main functions
Select standards, samples Prepare work sheet
0 min
30 -J m m | Prepare reagents
I Set conditions I Check system I performance I
Parallel functions
I I 0 s
Arrange standards samples, etc. in sequence on work sheet
I First sample I Second sample *
J nth sample
W O s
- <
— <
-~<
r-» Pi pet sample
Dispense sample
Titrate
Empty titration vessel
Transport next sample tube
Fill burette
-Next-
Calculate result
Print result
Fig. 15. Timing chart for the automatic t i t ra t ion system.
USr.0*$
$-11-7?
r~ *f AU617 87?
In 11: ML 12
/« l i t HL 70
S* i n ML (5
t>* t>* m ML 1.(2
r« OU NL 1 iS
l» HT 11 LIT
n* «U NL 1 07
m 019 XL i n
#>m ML i* IS* on ML 2 21 #11 022 ML 2 lit / f t 023 ML 2 M
»m OH ML i . «
AS* MS ML 1 4T
a* 02* NL 1 IB
»9* 127 111 4_DS
m 81* ML 1 fc7
33* 029 HL 1 47
m OJD U __g # • (33? NL f * • OU ML 1 7J
#»« 014 ML 4< tt* 025 « 8 . «
a* 016 ML 2.JS
a* 017 ML l.j» /i» 018 HL i..S»
* • 039 ML 2. 02
S3* 010 NL 2..0I
#• 042 HL IJCO
is* 043 NL i jw
<*» 04* ffl 2.93 ft* 045 HI . 2 n ft* 04C HL 2.2C
w 147 «!• 2 11
Standards, standard reference samples, blanks
—Samples
1 45
JO.
Fig. 16. Typical digital tape of the bicarbonate determination by titv system.
-24-
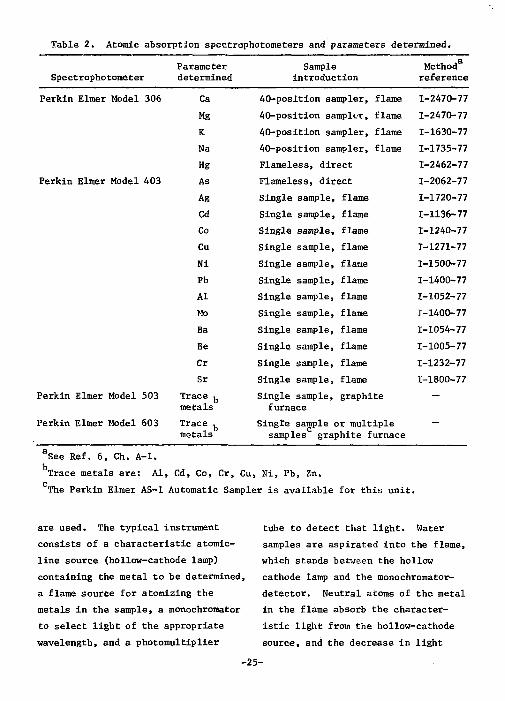
Table 2. Atomic absorption spectrophotometers and parameters determined.
Spectrophotometer Parameter determined
Sample introduction
Method reference
Perkin Elmer Model 306
Perkin Elmer Model 403
Perkin Elmer Model 503
Perkin Elmer Model 603
Ca 40-position sampler, flame 1-2470-77 Mg 40-position sampler, flame 1-2470-77 K 40-position sa impler, flame 1-1630-77 Na 40-position sampler, flame 1-1735-77 Hg Flameless, direct 1-2462-77 As Flameless, direct 1-2062-77 Ag Single sample, flame 1-1720-77 Cd Single sample, flame 1-1136-77 Co Single sample, flame 1-1240-77 Cu Single sample, flame T-1271-77 Ni Single sample, flame 1-1500-77 Pb Single sample, flame 1-1400-77 Al Single sample, flame 1-1052-77 Mo Single sample, flame 1-1400-77 Ba Single sample, flame 1-1054-77 Be Single sample, flame 1-1005-77 Cr Single sample, flame 1-1232-77 Sr Single sample, flame 1-1800-77
Trace b
metals Single sample,
furnace graphite —
Trace , Single sample < or mult iple -metals samples graphite furnace
See Ref. 6, Ch. A-l. Trace metals are: Al, Cd, Co, Cr, Cu, Ni, Pb, Zn. The Perkin Elmer AS-1 Automatic Sampler is available for this unit.
are used. The typical instrument consists of a characteristic atomic-line source (hollow-cathode lamp) containing the metal to be determined, a flame source for atomizing the metals in the sample, a monochromator to select light of the appropriate wavelength, and a photomultiplier
tube to detect that light. Water samples are aspirated into the flame, which stands between the hollow cathode lamp and the monochromator-detector. Neutral atoms of the metal in the flame absorb the characteristic light from the hollow-cathode source, and the decrease in light
-25-
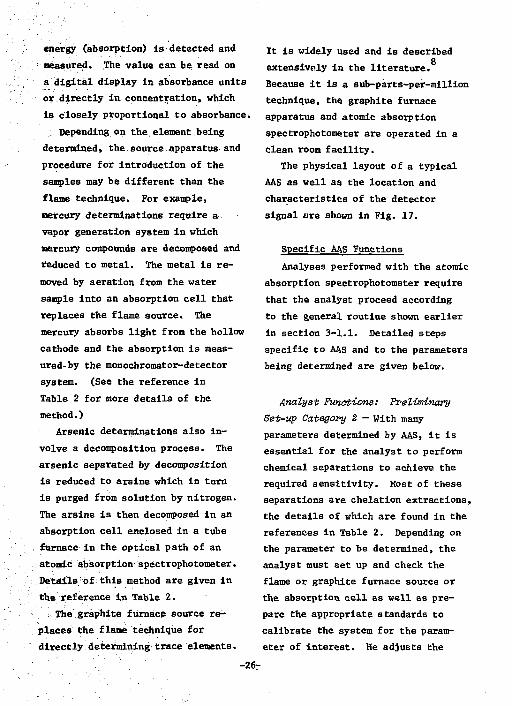
energy (absorption) is detected and measured. The value can be read on a digital display in absorbance units or directly in concentration, which is closely proportional to absorbance.
Depending on the element being determined, the source apparatus and procedure for introduction of the samples may be different than the flame technique. For example, mercury determinations require a vapor generation system in which mercury compounds are decomposed and reduced to metal. The metal is removed by aeration from the water sample into an absorption cell that replaces the flame source. The mercury absorbs light from the hollow cathode and the absorption is measured- by the monochromator-detector system. (See the reference in Table 2 for more details of the method.)
Arsenic determinations also involve a decomposition process. The arsenic separated by decomposition is reduced to arsine which in turn is purged from solution by nitrogen. The arsine is then decomposed in an absorption cell enclosed in a tube furnace in the optical path of an atomic absorption spectrophotometer. Details of this method are given in the reference in Table 2. : The graphite furnace source re
places the flame technique for directly determining trace elements.
It is widely used and is described Q
extensively in the literature. Because it is a sub-parts-per-million technique, the graphite furnace apparatus and atomic absorption spectrophotometer are operated in a clean room facility.
The physical layout of a typical AAS as well as the location and characteristics of the detector signal are shown in Fig. 17.
Specific AAS Functions Analyses performed with the atomic
absorption spectrophotometer require that the analyst proceed according to the general routine shown earlier in section 3-1.1. Detailed steps specific to AAS and to the parameters being determined are given below.
Analyst Functions: Preliminary Set-up Category 2 — With many parameters determined by AAS, it is essential for the analyst to perform chemical separations to achieve the required sensitivity. Most of these separations are chelation extractions, the details of which are found in the references in Table 2. Depending on the parameter to be determined, the analyst must set up and check the flame or graphite furnace source or the absorption cell as well as prepare the appropriate standards to calibrate the system for the parameter of interest. He adjusts the
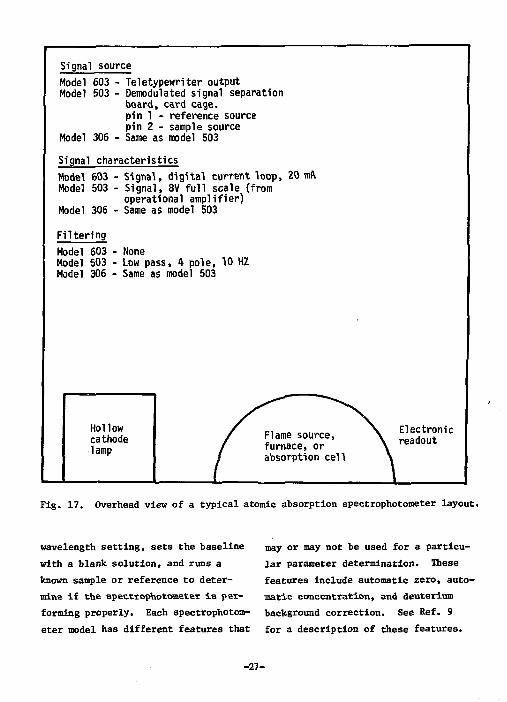
Signal source Model 603 - Teletypewriter output Model 503 - Demodulated signal separation
board, card cage. pin 1 - reference source pin 2 - sample source
Model 306 - Same as model 503 Signal characteristics Model 603 - Signal, d ig i t a l current loop, 20 raft Model 503 - Signal, 8V f u l l scale (from
operational ampli f ier) Model 306 - Same as model 503
F i l te r ing Model 603 - None Model 503 - Low pass, 4 pole, 10 HZ Model 306 - Same as model 503
Hollow cathode lamp
Electronic readout
Fig. 17. Overhead view of a typical atomic absorption spectrophotometer layout.
wavelength setting, sets the baseline with a blank solution, and runs a known sample or reference to determine if the spectrophotometer is performing properly. Each spectrophotometer model has different features that
may or may not be used for a particular parameter determination. These features include automatic zero, automatic concentration, and deuterium background correction. See Ref. 9 for a description of these features.
-27-
Analyst Functions: Sample Line-Vp and Introduction* Categories 3 and 4 — Automatic samplers are used only on the Instruments that determine Ca, Mg, Na, and K. For all other AAS parameter determinations, samples are introduced singly. The analyst usually lines up the samples on the work bench or laboratory cart in the sequence given on his work sheet, manually introduces the sample (to the aspirator, graphite furnace, or mercury generation system), views the absorbance on the digital readout display, and records the value on the work sheet.
Instrument Functions — The instrument reads the absorbance signal and displays it on a four-digit tube display.
sheets are identified by sample numbers, laboratory code, and parameter symbol.
Caloulations — All concentrations are determined by reference to standard calibration curves relating concentration vs absorbance.
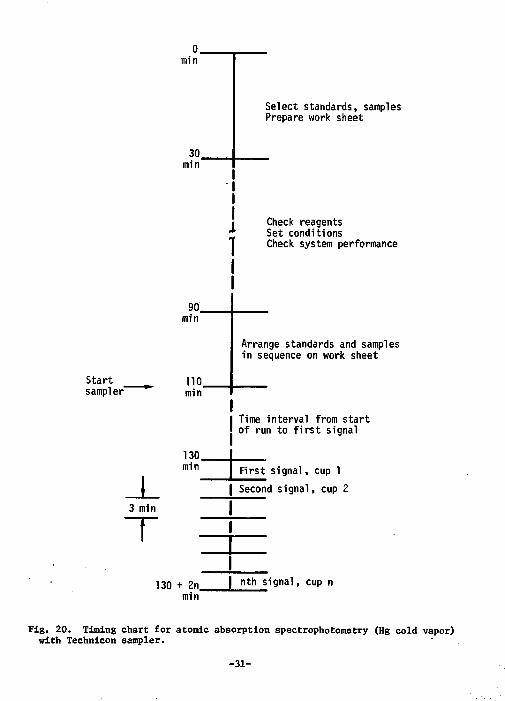
AAS Performance Characteristics
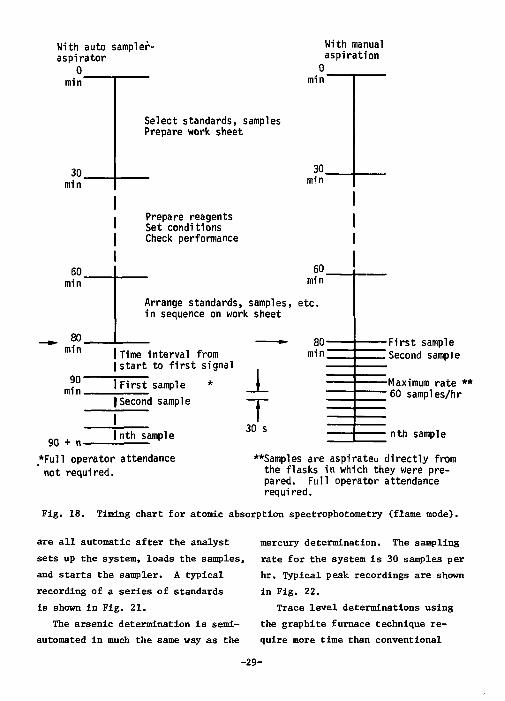
Timing charts that show the operations associated with the various types of atomic absorption spectrophotometers are given in Fig. 18, 19 and 20.
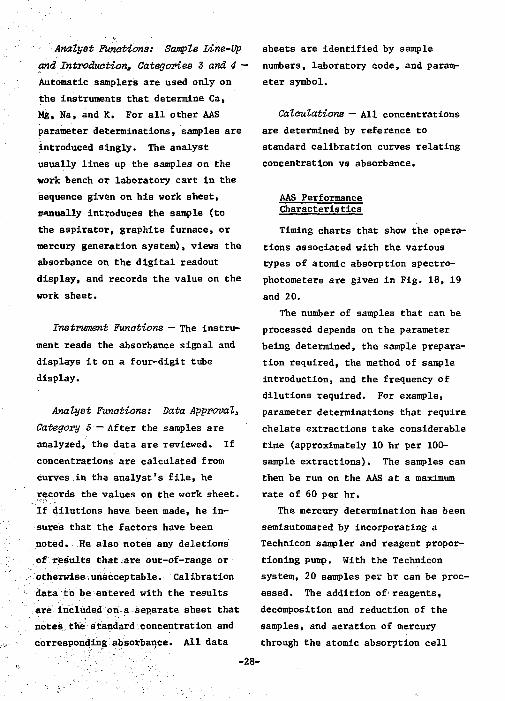
The number of samples that can be processed depends on the parameter being determined, the sample preparation required, the method of sample introduction, and the frequency of dilutions required. For example, parameter determinations that require chelate extractions take considerable time (approximately 10 hr per 100-sample extractions). The samples can then be run on the AAS at a maximum rate of 60 per hr.
The mercury determination has been semiautomated by incorporating a Technicon sampler and reagent proportioning pump. With the Technicon system, 20 samples per hr can be processed. The addition of- reagents, decomposition and reduction of the samples, and aeration of mercury through the atomic absorption cell
Analyst Functions: Data Approval, Category 5—After the samples are analyzed, the data are reviewed. If concentrations are calculated from curves in the analyst's file, he records the values on the work sheet. If dilutions have been made, he insures that the factors have been noted. \R& also notes any deletions of results that are out-of-range or otherwise unacceptable. Calibration data to be entered with the results are included on a separate sheet that notes the standard concentration and corresponding absorbance. All data
-28-
With auto sampler-aspirator
0 min
With manual aspiration
30. min
60. min
80. min
90" min.
90 + n-
0 min'
Select standards, samples Prepare work sheet
30. min
Prepare reagents Set conditions Check performance
60. min
Arrange standards, samples, etc. in sequence on work sheet
Time interval from start to first signal
80-min'
I First sample |Second sample
I nth sample
1 T 30 s
-F i rs t sample '.Second sample
-Maximum rate * * "60 samples/hr
nth sample
•Full operator attendance not required.
**Samples are aspirateu directly from the flasks in which they were prepared. Full operator attendance required.
Fig. 18. Timing chart for atomic absorption spectrophotometry (flame mode).
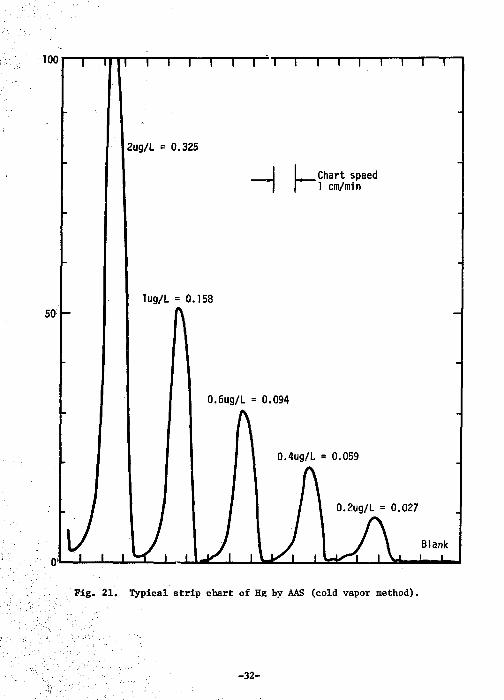
are all automatic after the analyst sets up the system, loads the samples, and starts the sampler. A typical recording of a series of standards is shown in Fig. 21.
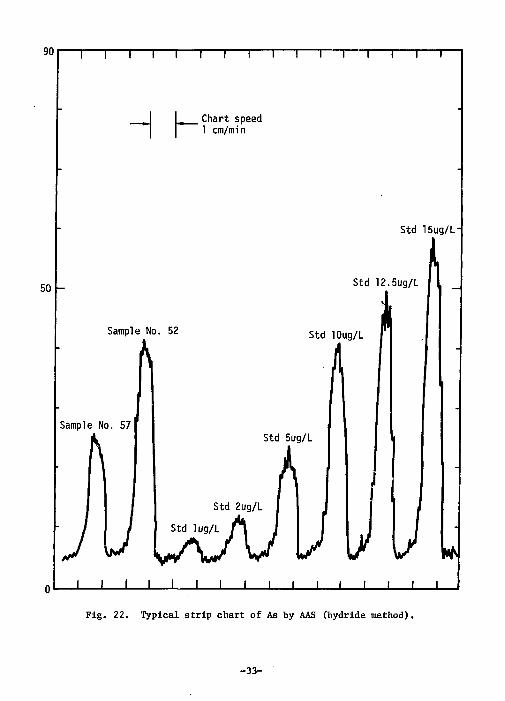
The arsenic determination is semi-automated in much the same way as the
mercury determination. The sampling rate for the system is 30 samples per hr. Typical peak recordings are shown in Fig. 22.
Trace level determinations using the graphite furnace technique require more time than conventional
-29-
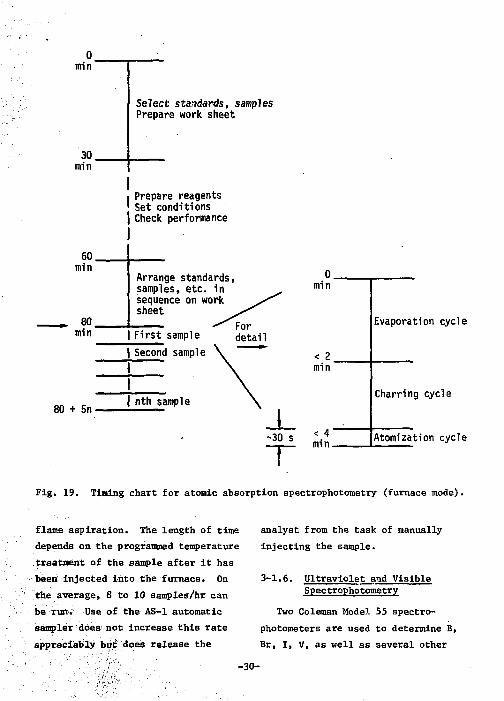
0 min
30, min
Select standards, samples Prepare work sheet
I Prepare reagents ' Set conditions | Check performance
60. min
80. min
80 + 5n •
Arrange standards, samples, etc. in sequence on work sheet
Second sample
nth sample
For First sample detail
0. min
< 2. min
-30 s < 4' min.
Evaporation cycle
Charring cycle
Atomization cycle
Fig. 19. Timing chart for atomic absorption spectrophotometry (furnace mode).
flame aspiration. The length of time depends on the programmed temperature treatment of the sample after it has been injected into the furnace. On the average, 8 to 10 samples/hr can be run. Use of the AS-1 automatic sampler does not increase this rate appreciably but does release the
analyst from the task of manually injecting the sample.
3-1.6. Ultraviolet and Visible Spec trophotometry
Two Coleman Model 55 spectrophotometers are used to determine B, Br, I, V, as well as several other
-30-
0 min
30. min
Select standards, samples Prepare work sheet
90. min
Start 110 samp Ier "" min
130
Time interval from start of run to first signal
_L mm First signal, cup 1
_L Second signal, cup 2 3 min 1 "T 1
i | 1 130 + 2n 1 nth signal, cup n
Check reagents Set conditions Check system performance
Arrange standards and samples in sequence on work sheet
min
Fig. 20. Timing chart for atomic absorption spectrophotometry (Hg cold vapor) with Technicon sampler.
-31-
100 T - T
50;
T—i—i—i—i—r-rn—i—i—i—i—i—i—i—r
2ug/L = 0.325
H h Chart speed 1 cm/rain
lug/L = 0.158
0.2ug/L = 0.027
J I I * T I ' \ - r I i Blank
Immim.
Fig. 21. Typical strip chart of Hg by AAS (cold vapor method).
-32-
1 1 1 1 1 1 1 1 1 1 1 1 1 1 1
L Chart speed \ 1 cm/min
- Std 15ug/L-
1 - Std 12.5ug/L 1 L
JL 1 -
Sample Nc '• 5 2 Std lOug/L r
if A f\ Sample No. 57
h Std 5ug/L 1 fl , h J
1 Std 2ug/L J J /
/ / Std lug/L A J J J -
J 1 1 1 1 i i i i i i
J 1 I
\Jf \jr i i i i
M
Fig. 22. Typical strip chart of As by AAS (hydride method).
-33-
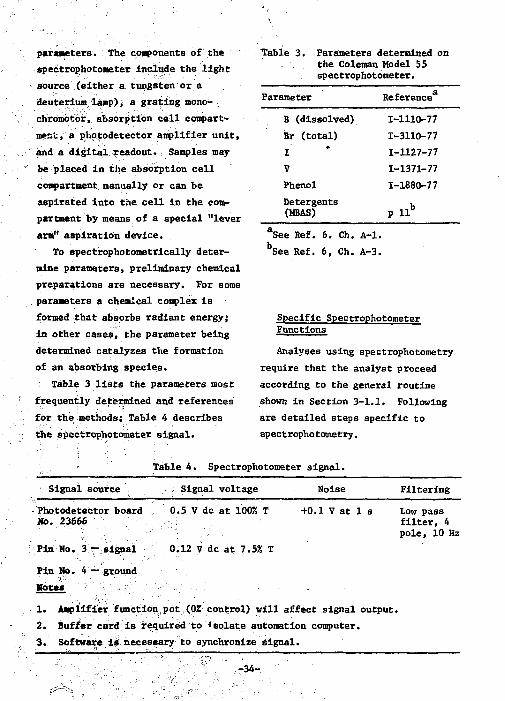
parameters. The components of the spectrophotometer Include the light source (either a tungsten or a deuterium lamp), a grating mono-chromotor, absorption cell compartment,a photodetector amplifier unit, and a digital readout. Samples may be placed in the absorption cell compartment manually or can be aspirated into the cell In the compartment by means of a special "lever arm" aspiration device.
To spectrophotometrically determine parameters, preliminary chemical preparations are necessary. For some . parameters a chemical complex is formed that absorbs radiant energy; in other cases, the parameter being determined catalyzes the formation of an absorbing species.
Table 3 lists the parameters most frequently determined and references' for the methods; Table 4 describes the spectrophotometer signal.
Table 3. Parameters determined on the Coleman Model 55 spectrophotometer.
Parameter Reference B (dissolved) 1-1110-77 Br (total) 1-3110-77 I 1-1127-77 V 1-1371-77 Phenol 1-1880-77 Detergents (MBAS) P l l b
See Ref. 6. Ch. A-l. See Ref. 6, Ch. A-3.
Specific Spectrophotometer Functions
Analyses using spectrophotometry require that the analyst proceed according to the general routine shown In Section 3-1.1. Following are detailed steps specific to spect ropho tometry.
Table 4. Spectrophotometer signal.
Signal source Signal voltage Noise Filtering
0.5 V dc at 100% T +0.1 V at 1
0.12 V dc at 7.5% T
- Photodetector board Mo. 23666
Plri No. 3 — signal
Pin No. 4 — ground Motes ••
1. Amplifier function,pot (0% control) will affect signal output. 2. Buffer cardis required to Isolate automation computer. 3. Software islnecessary to synchronize signal.
Low pass filter, 4 pole, 10 Hz
-34-
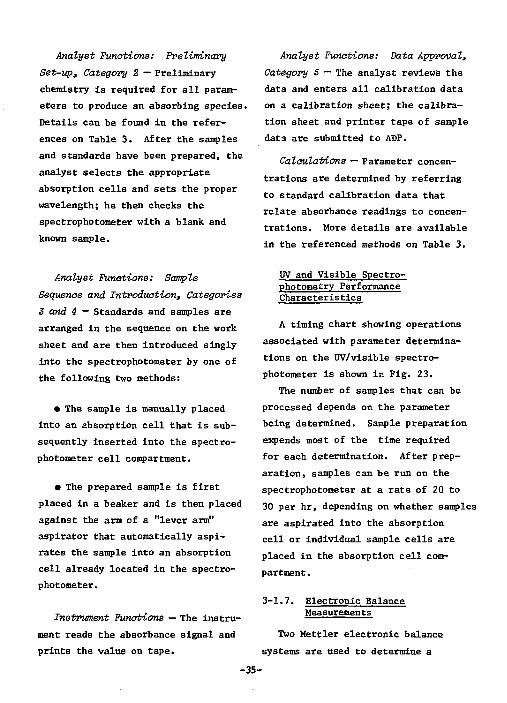
Analyst Functions: Preliminary Set-up, Category 2 — Preliminary chemistry is required for all parameters to produce an absorbing species. Details can be found in the references on Table 3. After the samples and standards have been prepared, the analyst selects the appropriate absorption cells and sets the proper wavelength; he then checks the spectrophotometer with a blank and known sample.
Analyst Functions: Sample Sequence and Introduction, Categories 3 and 4 — Standards and samples are arranged in the sequence on the work sheet and are then introduced singly into the spectrophotometer by one of the following two methods:
• The sample is manually placed into an absorption cell that is subsequently inserted into the spectrophotometer cell compartment.
• The prepared sample is first placed in a beaker and is then placed against the arm of a "lever arm" aspirator that automatically aspirates the sample into an absorption cell already located in the spectrophotometer .
Instrument Functions — The instrument reads the absorbance signal and prints the value on tape.
-35-
Analyst Functions: Data Approval, Category 5 — The analyst reviews the data and enters all calibration data on a calibration sheet; the calibration sheet and printer tape of sample data are submitted to ADF.
Calculations — Parameter concentrations are determined by referring to standard calibration data that relate absorbance readings to concentrations. More details are available in the referenced methods on Table 3.
UV and Visible Spectrophotometry Performance Characteristics
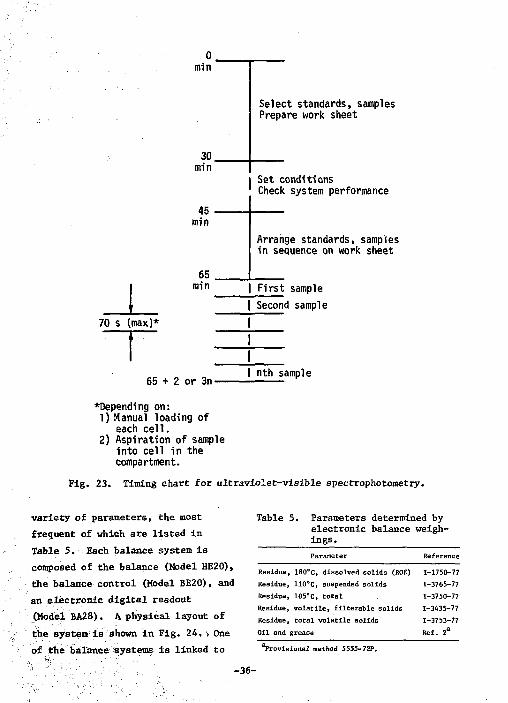
A timing chart showing operations associated with parameter determinations on the UV/visible spectrophotometer is shown in Fig. 23.
The number of samples that can be processed depends on the parameter being determined. Sample preparation expends most of the time required for each determination. After preparation, samples can be run on the spectrophotometer at a rate of 20 to 30 per hr, depending on whether samples are aspirated into the absorption cell or individual sample cells are placed in the absorption cell compartment .
3-1.7. Electronic Balance Measurements
Two Mettler electronic balance systems are used to determine a
0 min
70 s (max)*
30. min
45 min
65 min
65 + 2 or 3n-
Select standards, samples Prepare work sheet
Set conditions Check system performance
Arrange standards, samples in sequence on work sheet
First sample | Second sample
I nth sample
•Depending on: 1) Manual loading of
each cell. 2) Aspiration of sample
into cell in the compartment.
Fig. 23. Timing chart for ultraviolet-visible spectrophotometry.
variety of parameters, the most frequent of which are listed in Table 5. Each balance system is composed of the balance (Model HE20), the balance control (Model BE20), and an electronic digital readout (Model BA28). A physical layout of the system is shown in Fig. 24. •. One of the balance systems is linked to
Table 5. Parameters determined by electronic balance weighings. Parameter Reference
Residue, 180°C, dissolved solids (ROE) 1-1750-77 Residue, 110°C, suspended solids 1-3765-77 Residue, 105°c, total 1-3750-77 Residue, volatile, filterable solids 1-3435-77 Residue, total volatile solids 1-3753-77 Oil and grease Ref. 2
Provisional method 5555-72P.
-36-
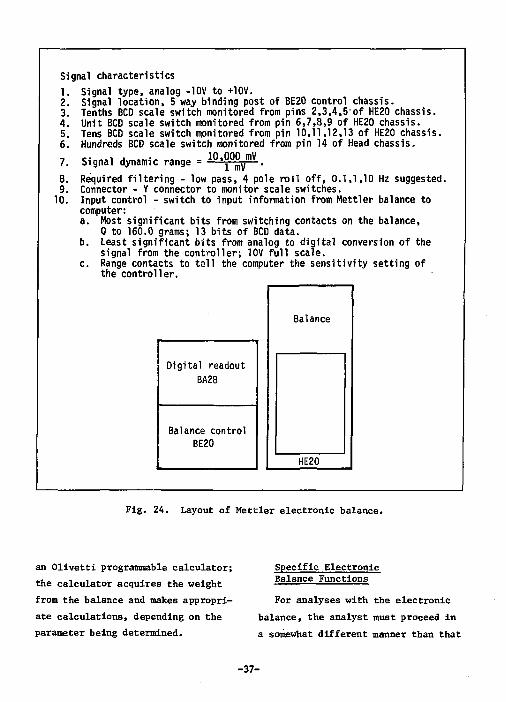
Signal characteristics
8. 9.
10.
Signal type, analog -10V to +10V. Signal location, 5 way binding post of BE20 control chassis. Tenths BCD scale switch monitored from pins 2,3,4,5'of HE20 chassis. Unit BCD scale switch monitored from pin 6,7,8,9 of HE20 chassis. Tens BCD scale switch monitored from pin 10,11,12,13 of HE20 chassis. Hundreds BCD scale switch monitored from pin 14 of Head chassis. Signal dynamic range = 1 0 ' ° y . Required filtering - low pass, 4 pole roll off, 0.1,1,10 Hz suggested. Connector - Y connector to monitor scale switches. Input control - switch to input information from Mettler balance to computer: a. Most signif icant bits from switching contacts on the balance,
0 to 160.0 grams; 13 bits of BCD data. b. Least signif icant bits from analog to d ig i ta l conversion of the
signal from the control ler; 10V f u l l scale. c. Range contacts to t e l l the computer the sensit ivi ty setting of
the controller.
Digital readout BA28
Balance control BE20
Balance
HE20
Fig. 24. Layout of Mettler electronic balance.
an Olivetti programmable calculator; the calculator acquires the weight from the balance and makes appropriate calculations, depending on the parameter being determined.
Specific Electronic Balance Functions
For analyses with the electronic balance, the analyst must proceed in a somewhat different manner than that
- 3 7 -
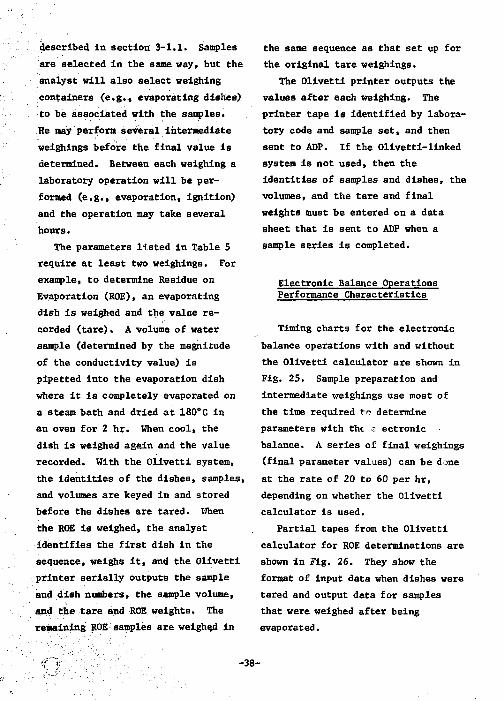
described in section 3-1.1. Samples are selected in the same way, but the analyst will also select weighing containers (e.g., evaporating dishes) to be associated with the samples. He nay perform several intermediate weighings before the final value is determined. Between each weighing a laboratory operation will be performed (e.g., evaporation, ignition) and the operation nay take several hours.
The parameters listed in Table 5 require at least two weighings. For example, to determine Residue on Evaporation (ROE), an evaporating dish is weighed and the value recorded (tare). A volume of water sample (determined by the magnitude of the conductivity value) is pipetted into the evaporation dish where it is completely evaporated on a steam bath and dried at 180°C in an oven for 2 hr. When cool, the dish is weighed again and the value recorded. With the Olivetti system, the identities of the dishes, samples, and volumes are keyed in and stored before the dishes are tared. When the ROE is weighed, the analyst identifies the first dish in the sequence, weighs it, and the Olivetti printer serially outputs the sample and dish numbers, the sample volume, and the tare and ROE weights. The remaining ROE samples are weighed in
the same sequence as that set up for the original tare weighings.
The Olivetti printer outputs the values after each weighing. The printer tape is identified by laboratory code and sample set, and then sent to ADP. If the Olivetti-linked system is not used, then the identities of samples and dishes, the volumes, and the tare and final weights must be entered on a data sheet that is sent to ADP when a sample series is completed.
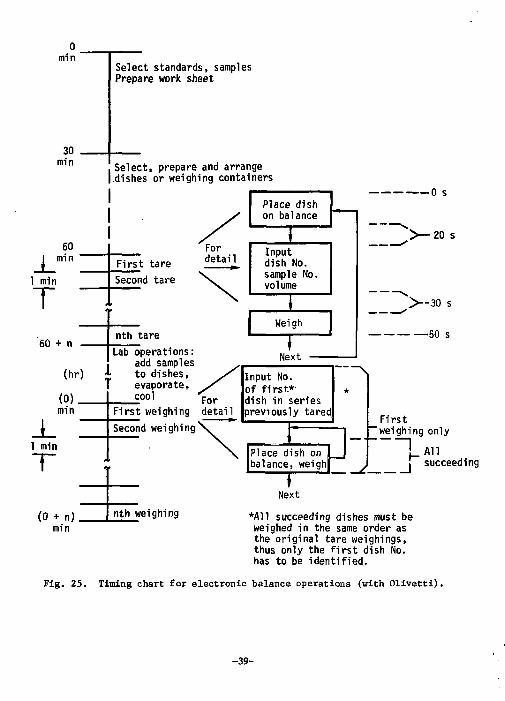
Electronic Balance Operations Performance Characteristics
Timing charts for the electronic balance operations with and without the Olivetti calculator are shown in Fig. 25. Sample preparation and intermediate weighings use most of the time required to determine parameters with the s ectronic balance. A series of final weighings (final parameter values) can be done at the rate of 20 to 60 per hr, depending on whether the Olivetti calculator is used.
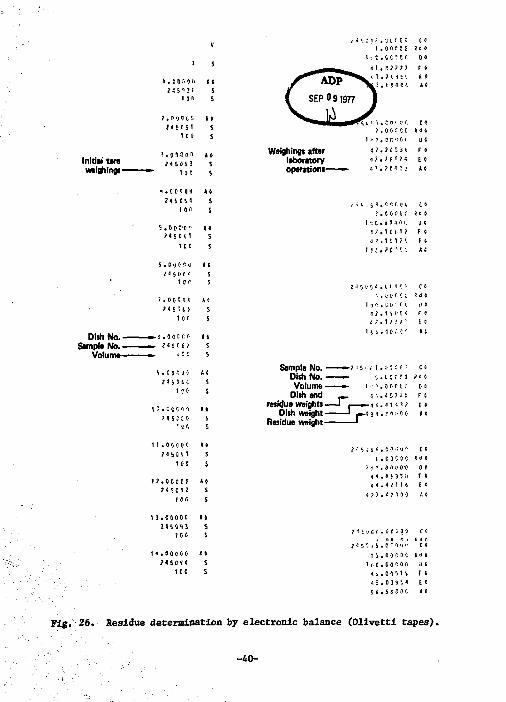
Partial tapes from the Olivetti calculator for ROE determinations are shown in Fig. 26. They show the format of input data when dishes were tared and output data for samples that were weighed after being evaporated.
-38-
30 min
JL 1 min T
60 min
60 + n
_L 1 min
T
(0 ) . min
(0 + n) min
Select standards, samples Prepare work sheet
. Select, prepare and arrange I dishes or weighing containers
(hr) i
First tare Second tare
nth tare Lab operations:
add samples to dishes, evaporate, cool
First weighing For detai1
Second weighing
nth weighing
For detail
Place dish on balance Place dish on balance
* Input dish No. sample No. volume
* Weigh
J Next
-0 s
> — 2 0 s
>--30
50 s
Input No. of first*' dish in series previously tared
t Firs t
"weighing only
L All ^
Place dish on balance, weigh —r
Next *A11 succeeding dishes must be weighed in the same order as the original tare weighings, thus only the first dish No. has to be identified.
succeeding
Fig. 25. Timing chart for electronic balance operations (with Olivetti).
-39-
i . o o P a e R d «
I s I . C 1} fi 0 ti At
2 4 5 1 > l s 1 5 t s
1 . [>9 0 C '•> I t I 4 5 C 5 1 s
l o t . s
Initial tare wtiflhingc—
1 . o n e o n 2 4 S i > S 3
At 5 S
4 . 0 0 0 1) 0 «< J 4 s e n s
t O ' l s
S , 0 t'CB " ? 4 s o s 1
I t s
ICC s
5 . 0 0 t: ? 'J <e I'iHt'
1 0 f s s
/ . 0 d 1 f] <l At 2 « s •: 1 1
1«r-S S
At At
Volume-— s
t . c o - o c At 2 4 5 0 U S
l o t s
1 I . C C C-11 > 4 5 ? : 0
14 S
• c f S
1 1 . 0 0 0 0 0 At ? 4 i .] 1 1 5
1<rC 5
1 2 . 0 C C 0 0 At 2 4 i C 9 2 S
106 5
1 3 . C D DOC At n a i l S
IOC S
1 * . <l 0 0 0 0 At 74S1H4 s
100 s
Weighings after laboratory operat ions-
1 . C 0 ' • <' C C 4 1. 0 0 f £ C K « t
i •• n . o c -i 5 i o t 4 I . 11 I i » F t l ( . / i " ! E t 4 ' . > 0 0 ". * I t
r r. i;
i . 0 0 0 0 C ft 0 6 I •: a . Q o •'' 01". a t
t 7 . 11 (. 1 1 f t 4 7 .1 • 1 > i E t
I I i . >c':• :• At
2 4 £ V V 1 . C f-1 C r- C t 4 . I- 0 r C ;. t 4 t
I :i c . <; ['* f i: 0 e j ? . i •, ••> s < r o 4 ! . 1 / '. / ' ! I
I I i . 1 o;• •;" At
Sample No. Dish N o . Volume
Dish and residue weights
Dish weight Residue weight
i ' s ; 5 ' . ' . ' 0 " 'J '• c t
( , . C 0 C C C 5 4 t
1 ;! * , 0 It >i (1-0 0 t
4 « . 4 i 3 S S F t
4 4 . 4 2 1 1 6 E t
1 ? 7 . i C O C 1 0 A t
M S > K S . 0 C 3 0 C C«
2 4 5 ' , , s ' . o " l l o l i C t
1 1 . 0 0 C U 1 4 1 1 i! 0 . 0 0 1 0 0 II t
4 '. . 0 4 "• 1 S F t 4 5 . 03 V- 4 Et
Fig. 26. Residue determination by electronic balance (Olivetti tapes).
-40-
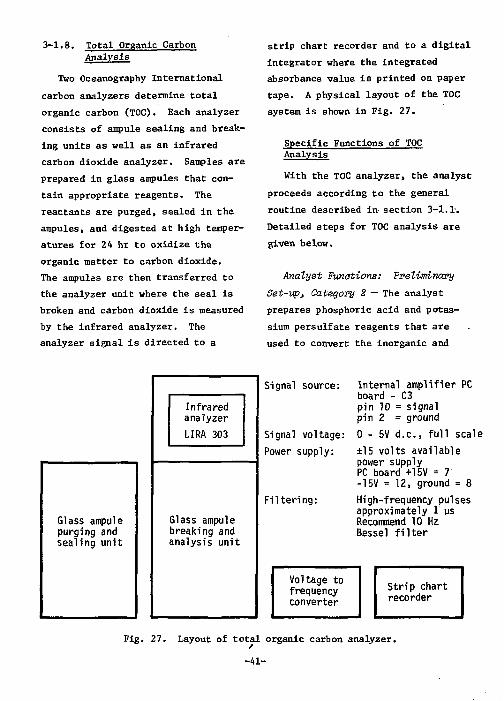
3-1.8. Total Organic Carbon Analysis
Two Oceanography International carbon analyzers determine total organic carbon (TOC). Each analyzer consists of ampule sealing and breaking units as well as an infrared carbon dioxide analyzer. Samples are prepared in glass ampules that contain appropriate reagents. The reactants are purged, sealed in the ampules, and digested at high temperatures for 24 hT to oxidize the organic matter to carbon dioxide. The ampules are then transferred to the analyzer unit where the seal is broken and carbon dioxide is measured by the infrared analyzer. The analyzer signal is directed to a
strip chart recorder and to a digital integrator where the integrated absorbance value is printed on paper tape. A physical layout of the TOC system is shown in Fig. 27.
Specific Functions of TOC Analysis
With the TOC analyzer, the analyst proceeds according to the general routine described in- section 3-1.1. Detailed steps for TOC analysis are given below.
Analyst Functions: Preliminary
Set-up, Category 2 — The analyst prepares phosphoric acid and potassium persulfate reagents that are used to convert the inorganic and
Glass ampule purging and sealing unit
Infrared analyzer LIRA 303
Glass ampule breaking and analysis unit
Signal source:
Signal voltage: Power supply:
Fi1teri ng:
Voltage to frequency converter
Internal amplifier PC board - C3 pin 10 = signal pin 2 = ground 0 - 5V d.c, full scale ±15 volts available power supply PC board +15V = 7 -15V = 12, ground = 8
High-frequency pulses approximately 1 us Recommend 10 Hz Bessel f i l t e r
Str ip chart recorder
Fig. 27 . Layout of t o t a l organic carbon analyzer .
- 4 1 -
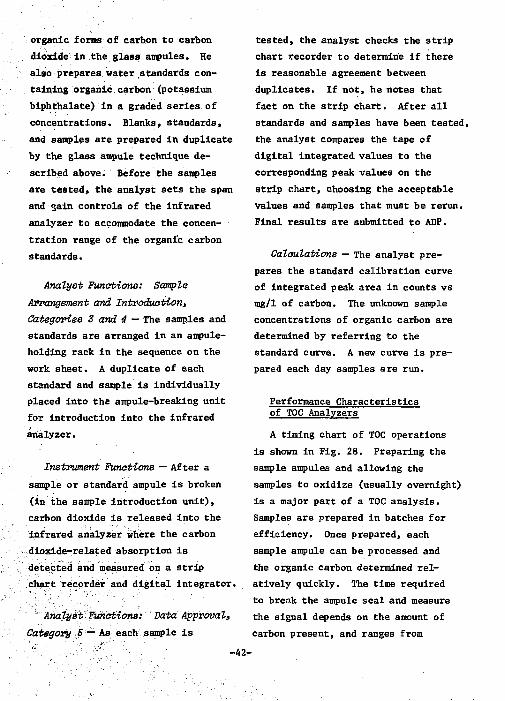
organic forms of carbon to carbon dioxide in the glass ampules. He also prepares water .standards containing organic carbon (potassium biphthalate) in a graded series of concentrations. Blanks, standards, and samples are prepared in duplicate by the glass ampule technique described above. Before the samples are tested, the analyst sets the span and °ain controls of the infrared analyzer to accommodate the concentration range of the organic carbon standards.
Analyst Functions: Sample Arrangement and Introduction, Categories 3 and 4 — The samples and standards are arranged in an ampule-holding rack in the sequence on the work sheet. A duplicate of each standard and sample is individually placed into the ampule-breaking unit for introduction into the infrared analyzer.
Instrument Functions — After a sample or standard ampule is broken (in the sample introduction unit), carbon dioxide is released into the infrared analyzer where the carbon dioxide-related absorption is detected and measured on a strip chart recorder and digital integrator.
Analyst Functions: Data Approval, Category S — As each sample is
tested, the analyst checks the strip chart recorder to determine if there is reasonable agreement between duplicates. If not, he notes that fact on the strip chart. After all standards and samples have been tested, the analyst compares the tape of digital integrated values to the corresponding peak values on the strip chart, choosing the acceptable values and samples that must be rerun. Final results are submitted to ADF.
Calculations — The analyst prepares the standard calibration curve of integrated peak area in counts vs mg/1 of carbon. The unknown sample concentrations of organic carbon are determined by referring to the standard curve. A new curve is prepared each day samples are run.
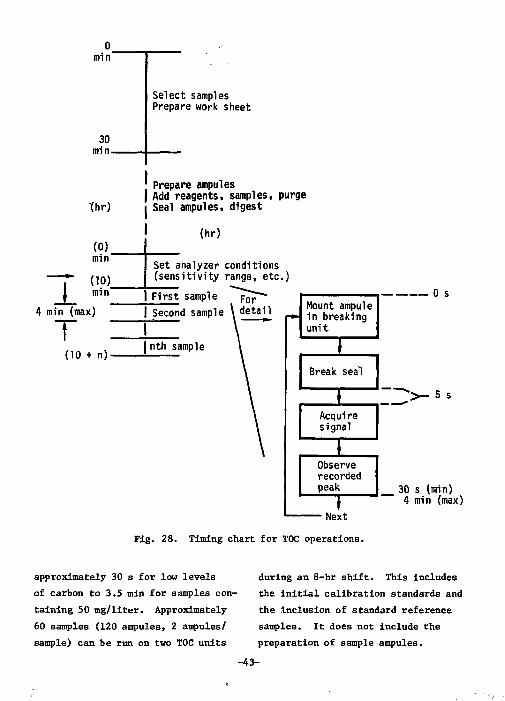
Performance Characteristics of TOC Analyzers
A timing chart of TOC operations is shown in Fig. 28. Preparing the sample ampules and allowing the samples to oxidize (usually overnight) is a major part of a TOC analysis. Samples are prepared in batches for efficiency. Once prepared, each sample ampule can be processed and the organic carbon determined relatively quickly. The time required to break the ampule seal and measure the signal depends on the amount of carbon present, and ranges from
0 min
30 min-
J_
'(hr)
(0) min
(10) min
4 min (max)
T : (10 + n)-
Select samples Prepare work sheet
' Prepare ampules I Add reagents, samples, purge I Seal ampules, digest
(hr)
Set analyzer conditions (sensitivity range, etc.) First sample
I Second sample \ detail
| nth sample
Mount ampule in breaking unit
* Break seal
* ^ > -Acquire signal
* Observe recorded peak 30 s (
* Next 4 min
0 s
5 s
Fig. 28. Timing chart for TOC operations.
approximately 30 s for low levels of carbon to 3.5 min for samples containing 50 mg/liter. Approximately 60 samples (120 ampules, 2 ampules/ sample) can be run on two TOC units
during an 8-hr shift. This includes the initial calibration standards and the inclusion of standard reference samples. It does not include the preparation of sample ampules.
-43-
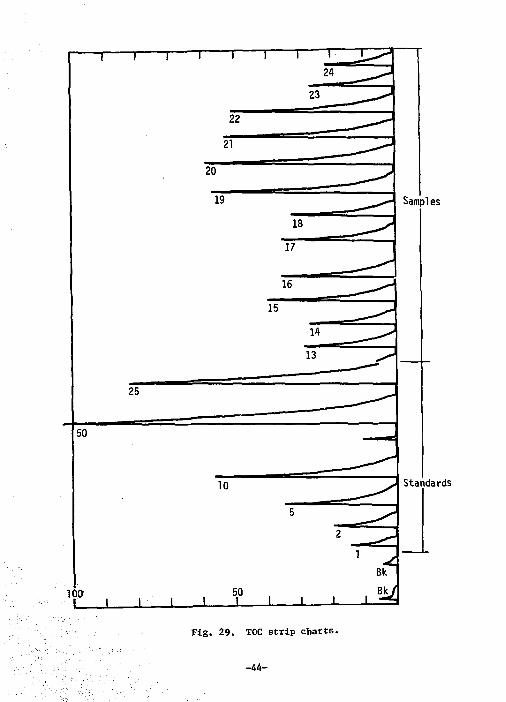
Samples
Standards
Fig. 29. TOC s t r i p c h a r t s .
-44-
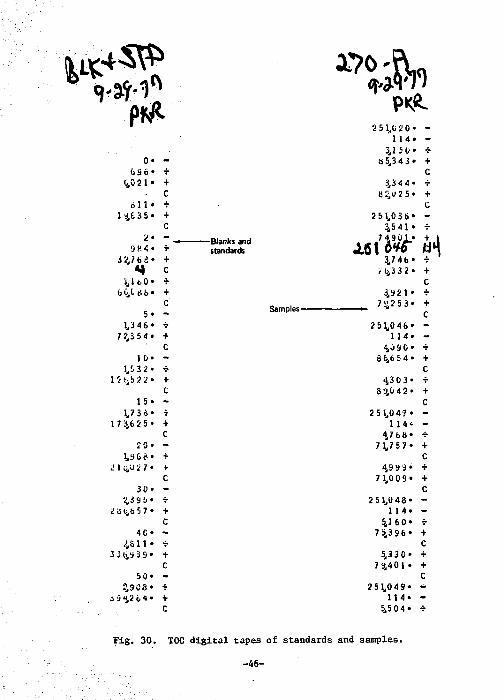
Examples of some typical strip chart recordings and digital tapes from the TOC are shown in Figs. 29 and 30.
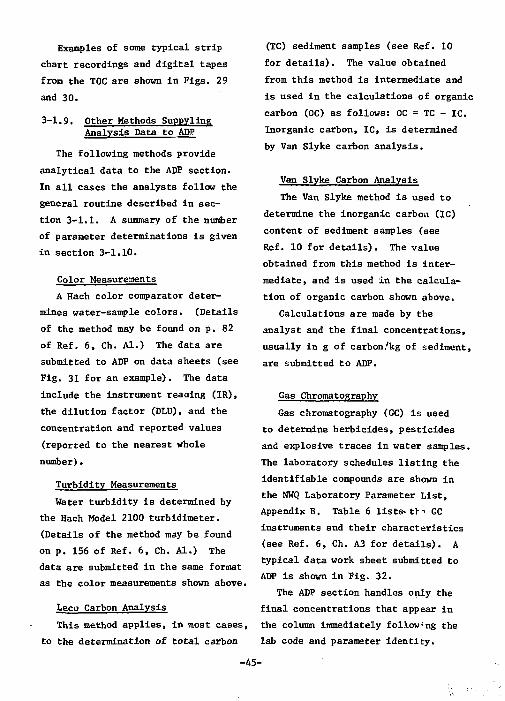
3-1.9. Other Methods Suppyling Analysis Data to ADP
The following methods provide analytical data to the ADP section. In all cases the analysts follow the general routine described in section 3-1.1. A summary of the number of parameter determinations is given in section 3-1.10.
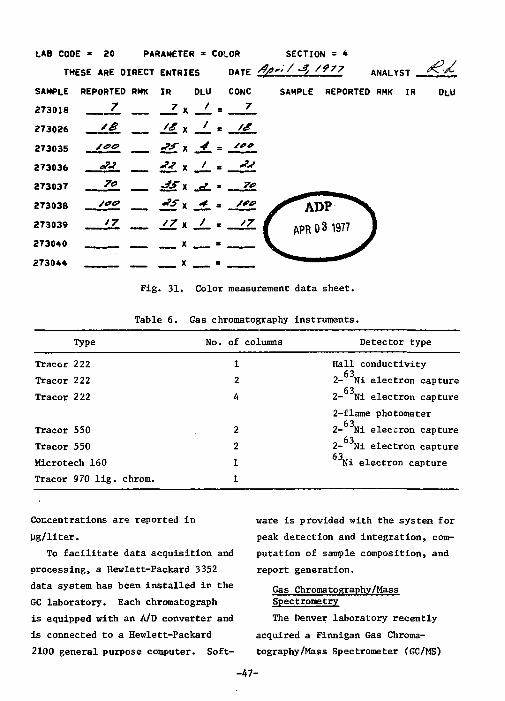
Color Measurements A Hach color comparator deter
mines water-sample colors. (Details of the method may be found on p. 82 of Ref. 6, Ch. Al.) The data are submitted to ADP on data sheets (see Fig. 31 for an example). The data include the instrument reading (IR), the dilution factor (DLU), and the concentration and reported values (reported to the nearest whole number).
Turbidity Measurements Water turbidity is determined by
the Hach Model 2100 turbidimeter. (Details of the method may be found on p. 156 of Ref. 6, Ch. Al.) The data are submitted in the same format as the color measurements shown above.
Leco Carbon Analysis This method applies, in most cases,
to the determination of total carbon
(TC) sediment samples (see Ref. 10 for details). The value obtained from this method is intermediate and is used in the calculations of organic carbon (0C) as follows: OC = TC - IC. Inorganic carbon, IC, is determined by Van Slyke carbon analysis.
Van Slyke Carbon Analysis The Van Slyke method is used to
determine the inorganic carbon (IC) content of sediment samples (see Ref. 10 for details). The value obtained from this method is intermediate, and is used in the calculation of organic carbon shown above.
Calculations are made by the analyst and the final concentrations, usually in g of carbon/kg of sediment, are submitted to ADP.
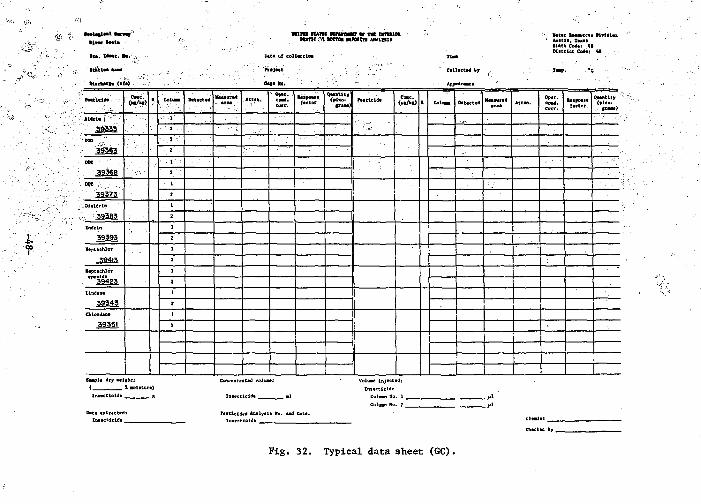
Gas Chromatography Gas chromatography (GC) is used
to determine herbicides, pesticides and explosive traces in water samples. The laboratory schedules listing the identifiable compounds are shown in the NWQ Laboratory Parameter List, Appendix B. Table 6 lists-th-- GC instruments and their characteristics (see Ref. 6, Ch. A3 for details). A typical data work sheet submitted to ADP is shown in Fig. 32.
The ADP section handles only the final concentrations that appear in the column immediately following the lab code and parameter identity.
-45-
ftS-0
feSo 0,02 1 • +
C 6 1 1
1 46 3 5
2
• + C
OH 4 3 2,7 6 6
«*
b C,l ti 6
• + C
• + C
standards
5 1,346
72,3 5 4 + c
10 1,5 3 2
+ c
15 1,7 3 6
17 4 6 2 5 +
20 1,9 6 6
2 1 i»a 2 7 < c
30 3,3 8 5 •
2110, t>57 ' +
4 0 ' 2,5 11 <
3 3 (jS 3 9 • +
50< 2,9 S 8 •
3 i l 2 f e 4 " + c
Samples
X?0^jPL 1 «|*V) 1 PK^
2 5 1,020 • -1 1 4 * -
3,150* •f
8 5 , 3 4 3 * + C
3,34 4* •f 8 2,0 2 5 • +
c 2 5 1,0 3 6 • -
1 5 4 1 • T
7 4.901 •
X6t 6W +
3,7 4 6 * T ,b ,33 2* +
c 49 2 1 • T
7 !12 5 3 • + c
2 51,0 4 6 * -1 1 4 « -
4,09 0 ' •r
8 fc,t> 5 4 • + c
4,303* T
8 9,0 4 2 • + r
2 51 ,047* 1 1 4 ' -
47 6 8 * •r 7 1,7 5 7 • +
c 4,999* •f
7 1,009* + 2 5 1 , 0 4 8 *
1 1 4 * -5,1 6 0 • r
75 ,396* + C
5,330* T
7 9,401* + 2 5 1 , 0 4 9 *
1 1 4 * -5,504* •f
Fig. 30. IOC d i g i t a l tapes of standards and samples.
-46-
LAB CODE * 20 PARAMETER » COLOR SECTION = 4 THESE ARE DIRECT ENTRIES DATE fy-i/-*, /?77
SAMPLE REPORTED RMK IR DLU CONC SAMPLE REPORTED RMK ANALYST .
IR
/xZ'ft
DLU
Fig. 31. Color measurement data sheet.
Table 6. Gas chromatography instruments.
Type No. of columns Detector type
Tracor 222 Tracor 222 Tracor 222
Tracor 550 Tracor 550 Microtech 160 Tracor 970 lig. chrom.
Hall conductivity 2- Ni electron capture 2- Ni electron capture 2-flame photometer 2- Ni electron capture 2- Ni electron capture Ni electron capture
Concentrations are reported in ug/liter.
To facilitate data acquisition and processing, a Hewlett-Packard 3352 data system has been installed in the GC laboratory. Each chromatograph is equipped with an A/D converter and is connected to a Hewlett-Packard 2100 general purpose computer. Soft
ware is provided with the system for peak detection and integration, computation of sample composition, and report generation.
Gas Chromatography/Mass Spectrometry The Denver laboratory recently
acquired a Finnigan Gas Chromatography/Mass Spectrometer (GC/MS)
-47-
• * * l « t l « l tan
U m l M U
• t a t l c * U M
tut* uf col lac t i n
ft*Jatt
c«f» Re.'
Ha tar i H N t c a a H v U l a n Avatln, Tax** ftata ferfat <• D l n r l c t Coaa; W
Colltctrt by
Appaftraaca
h a t l d d * COTC. R COIUH Dttactad Haaaueai Atttn. 0 » « . cowl, corr.
RaapMM factor
(•too- fl Fe i t lc ldt
H • Ce>e.
X C O I I M Dtttctad Haawui4 at«a A t » a .
Opat. cc*d. fact01
Qwntlty
tr«a*>
AMrU i - . -* .aaaaa
DW>
393.63 DW '
J9368 DM:
39373 Maldria
393B3 Endrin
39393 Haptachlor
39413 Htptachlo'i Htptachlo'i
lindane
39343 CUordatia
,39351 3
Saaole dty Might : ( I mwlituT*)
Concent raced volia
Inaectlcid*
Fait lclde* Aaalyala Mo. and Data: Inaccticlde _ _ _ ^ ^ _ ^ ^ _ _ _ _ _
Voluac Injccttd:
Imacttctde
_ / > ! - / * >
Ctieaiat
Checked by _
Fig . 32. Typical data sheet (GC).
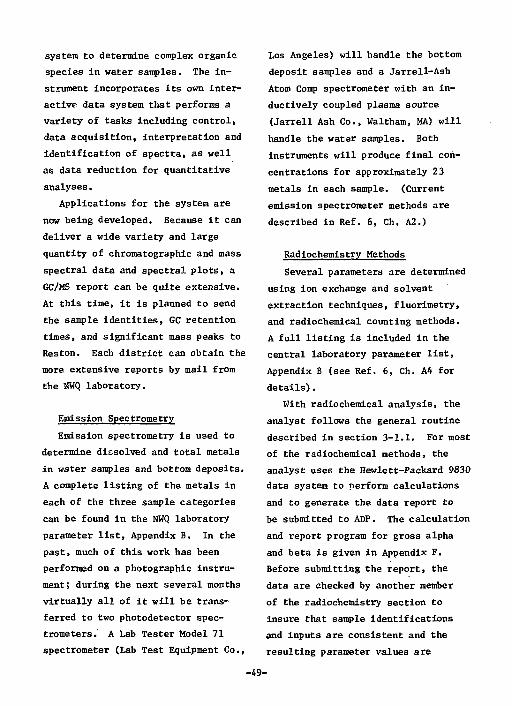
system to determine complex organic species in water samples. The instrument incorporates its own interactive data system that performs a variety of tasks including control, data acquisition, interpretation and identification of spectra, as well as data reduction for quantitative analyses.
Applications for the system are now being developed. Because it can deliver a wide variety and large quantity of chromatographic and mass spectral data and spectral plots, a GC/MS report can be quite extensive. At this time, it is planned to send the sample identities, GC retention times, and significant mass peaks to Reston. Each district can obtain the more extensive reports by mail from the NWQ laboratory.
Emission Spectrometry Emission spectrometry is used to
determine dissolved and total metals in water samples and bottom deposits. A complete listing of the metals in each of the three sample categories can be found in the HWQ laboratory parameter list, Appendix B. In the past, much of this work has been performed on a photographic instrument; during the next several months virtually all of it will be transferred to two photodetector spectrometers. A Lab Tester Model 71 spectrometer (Lab Test Equipment Co.,
Los Angeles) will handle the bottom deposit samples and a Jarrell-Ash Atom Comp spectrometer with an inductively coupled plasma source (Jarrell Ash Co., Waltham, MA) will handle the water samples. Both instruments will produce final concentrations for approximately 23 metals in each sample. (Current emission spectrometer methods are described in Ref. 6, Ch. AZ.)
Kadiochemistry Methods Several parameters are determined
using ion exchange and solvent extraction techniques, fluorimetry, and radiochemical counting methods. A full listing is included in the central laboratory parameter list, Appendix B (see Ref. 6, Ch. AA for details).
With radiochemical analysis, the analyst follows the general routine described in section 3-1.1. For most of the radiochemical methods, the analyst uses the Hewlett-Packard 9830 data system to perform calculations and to generate the data report to be submitted to ADP. The calculation and report program for gross alpha and beta is given in Appendix F. Before submitting the report, the data are checked by another member of the radiochemistry section to insure that sample identifications and inputs are consistent and the resulting parameter values are
-49-
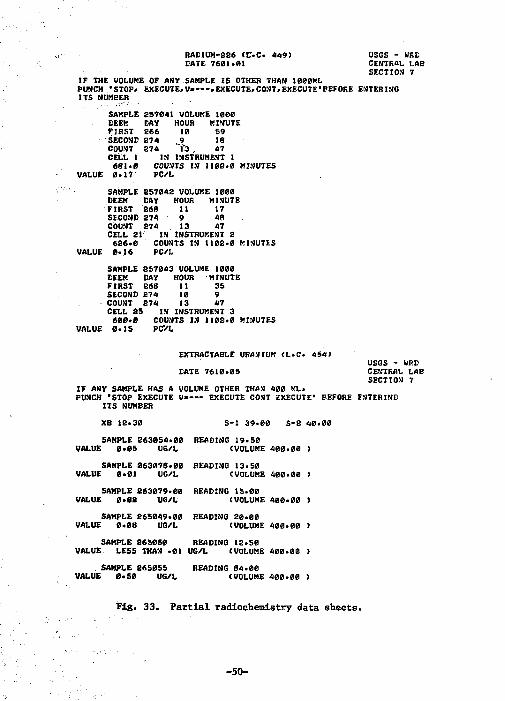
RABIUM-226 (V.C. 449) USGS - UKC DATE 7601.01 CENTRAL LAB
SECTION 7 IF THE VOLUME OF ANY SAMPLE IS OTHER THAN I000ML PUNCH "STOP. EXECUTE>V——.EXECUTE»CONT,EX£CUTE,BEFORE ENTERING ITS NUMEER
SAMPLE 257041 VOLUME 1000 CEEK BAY HOUR MINUTE FIRST E66 10 69 SECOND 274 9 18 COUNT 274 "C3 ., 47 CELL 1 IN INSTRUMENT 1 6S1.0 COUNTS IN 1102.0 MINUTES
VALUE 0.17 PC/L SAMPLE £57048 VOLUME 1000 DEEM CAY HOUR MINUTE FIRST £68 11 17 SECOND £71 9 48 COUNT 874 13 47 CELL 21 IN INSTRUMENT 2 626.0 COUNTS IN 1102.0 MINUTES
VALUE 0.16 PC/L SAMPLE SS7043 VOLUME 1000 DEEM DAY HOUR MINUTE FIRST 268 11 35 SECOND 274 10 9 COUNT 274 13 47 CELL 25 IN INSTRUMENT 3 600.0 COUNTS IN 1102.0 MINUTES
VALUE 0.15 PCVL
EXTRACTABLE URANIUM <L.C. 454> USGS - WRD
GATE 7610.05 CENTRAL LAB SECTION 7
IF ANY SAKPLE HAS A VOLUME OTHER THAN 400 «<L» PUNCH 'STOP EXECUTE V » — EXECUTE CONT EXECUTE' BEFORE ENTERINC
ITS NUMBER XB 12.30 S-l 39.00 S-2 40.00 SAMPLE 263054.00 READING 19.50
VALUE 0.05 UG/L CVOLUME 400.00 > SAMPLE 263078.00 READING 13.50
VALUE 0.01 UG/L (VOLUME 400.00 > SAMPLE 263079.00 READING 15.00
VALUE 0.02 UG/L CVOLUME 400.00 > SAMPLE 265049.00 READING 20.00
VALUE 0.08 UG/L (VOLUME 400.00 > SAMPLE 265050 READING 12.50
VALUE LESS THAN .01 UG/L (VOLUME 400.00 > SAMPLE 2650SS READING 84.00
VALUE 0.50 UG/L (VOLUME 400.00 >
Fig. 33. Partial radiochemistry data sheets.
-50-
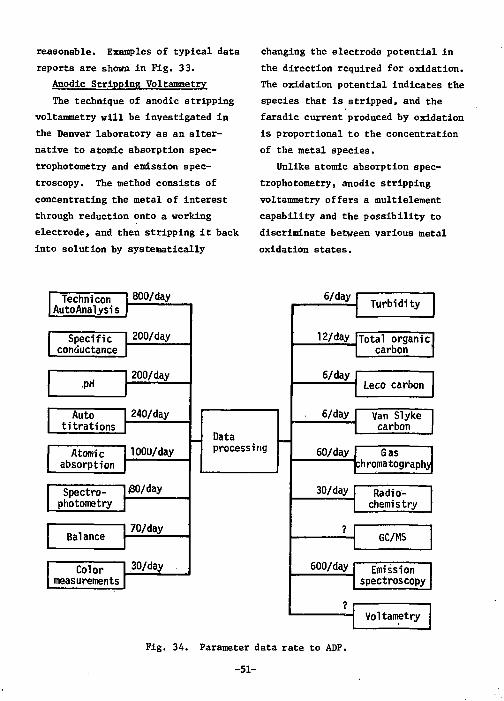
reasonable. Examples of typical data reports are shown in Fig. 33.
Anodic Stripping Voltammetry The technique of anodic stripping
voltammetry will be investigated in the Denver laboratory as an alternative to atomic absorption spectrophotometry and emission spectroscopy. The method consists of concentrating the metal of interest through reduction onto a working electrode, and then stripping it back into solution by systematically
changing the electrode potential in the direction required for oxidation. The oxidation potential indicates the species that is stripped, and the faradic current produced by oxidation is proportional to the concentration of the metal species.
Unlike atomic absorption spectrophotometry, anodic stripping voltammetry offers a multielement capability and the possibility to discriminate between various metal oxidation states.
Technicon AutoAnalysis
800/day Technicon AutoAnalysis
200/day 200/day Specific conductance
200/day Specific conductance
200/day 200/day •PH 200/day •PH
240/day 240/day Auto titrations
240/day Auto titrations
1000/day 1000/day Atomic absorption
1000/day Atomic absorption
i80/day i80/day Spectrophotometry
i80/day Spectrophotometry
70/day 70/day Balance 70/day Balance
30/day 30/day Color measurements
30/day Color measurements
U Data processing
6/day Turbidity Turbidity
12/day Total organic carbon !
Total organic carbon !
6/day Leco carbon Leco carbon
6/day Van Slyke carbon
Van Slyke carbon
60/day Gas :hromatography
Gas :hromatography
30/day Radio-chemistry Radio-chemistry
? GC/MS GC/MS
600/day Emission spectroscopy
Emission spectroscopy
Voltametry
Fig. 34. Parameter data rate to ADP.
-51-
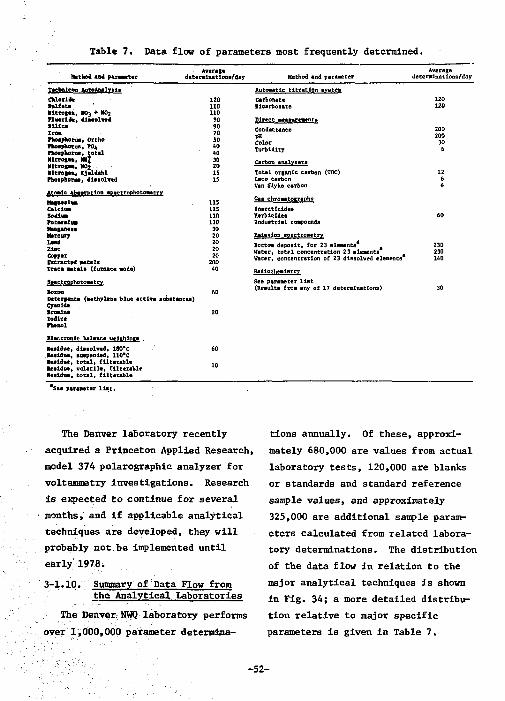
Table 7. Data flow of parameters most frequently determined. Average Average
Netho* and parameter date rmlnatIons/day Method and parameter dete rolnat ions/day
Tecfceicon AutoAnalvaiB Automatic t itration system ChXoTi.it 120 Carbonate 120 f a l f a t * • • '• 110 Bicarbonate 220 Hitrotaa, WOj + H02 110 Flueriea, dissolved ?0 Direct measurements S l l i ea Iron Phoepaorus, Ortho
90 70 50
Conductance pH Color Turbidity
200 200 30
Phoepaotus, PO4 Phoapaorua, to ta l
40 40
Conductance pH Color Turbidity 6
nitrogen, MJ 30 Carbon analvzera •Utroge*,. VO2 20
Carbon analvzera
Nitrogen, Kjalaahl IS Total organic carbon (TOC) 12 Phosphorue, dissolved IS Leco carbon
Van Slyke carbon 6 6
Atomic absorption apectrophotoMtrv MegaeaiwB 11s Gas chromatography Calclua. 11s Insecticides Sodiue. 110 Herbicides 60 FetaaaitM 110 Induatrlal compounds Manganese 30 Mercury 20 Emission spectrometry Lead Zlac
20 20 20
200
Bottom depoait, for 23 elements* a 230 Lead Zlac
20 20 20
200 Water, total concentration 23 elements 230
Copper Exeracted metals
20 20 20
200 Hater, concentration oC 23 dissolved elements 140 Traea metals (furnace mode) 40 Radiochemlatry Spec tr ©photometry See parameter l i s t Boron 60 (Results from any of 17 determinations) 30 Detergents (methylene blue active substances) Cyanide Broalne 20 Iodlut Phenol
Electronic balance trelthlau . Residue, dissolved. 180*C .Residue, suspended, 110*C Residue, to ta l , f i l terable Residue, vo la t i l e , f l l tersble Residue, to ta l , f i l terable
*Ses paraseter l i s t .
The Denver laboratory recently acquired a Princeton Applied Research, model 374 polarographic analyzer for voltammetry investigations. Research is expected to continue for several months, and if applicable analytical techniques are developed, they will probably not be implemented until early 1978.
3-1.10. Summary of Data Flow from the Analytical Laboratories
The Denver, NWQ laboratory performs over 1,000,000 parameter determina
tions annually. Of these, approximately 680,000 are values from actual laboratory tests, 120,000 are blanks or standards and standard reference sample values, and approximately 325,000 are additional sample parameters calculated from related laboratory determinations. The distribution of the data flow in relation to the major analytical techniques is shown in Fig. 34; a more detailed distribution relative to major specific parameters is given in Table 7.
-52-
4. The NWQ Laboratories Automatic Data Processing System
In this section we describe the automatic data processing (ADP) system and its performance characteristics. Examples of the various data sheets, report sheets and keypunch cards and their formats are compiled in Appendices A through E; they are all used or generated by the ADF system.
The system shown in Fig. 35 consists of the ADP and analytical sections of the NWQ Laboratory, the management codes and computer system (IBM 370/155) in Reston, Virginia and the district offices.
In the figures that accompany the following text, the relationships of the ADF systems components and their inputs, outputs, and functions are illustrated. The key to understanding the figures and the relationships is shown in Fig. 36.
4-1. DISTRICT OFFICES
As shown in Fig. 35, the district offices perform project definition and data review.
4-1.1. Project Definition In Fig. 37 the inputs and outputs
required for project definition are shown. As part of the project definition function, the district offices can request chemistry
supplies from the NWQ laboratory, and request creation of new parameters or schedules.
4-1.2. Data Review To review data, the district
offices can use the Reston computer codes LABPRIM (Appendix A-2) and LABUDG (Appendix A-4) to retrieve data. After reviewing the data the district can either request that samples be rerun (Appendix E-30), request that the data base be checked, or request that specific analysis values be changed (Appendix E-41).
4-2. DETAILED FUNCTIONS
The ADP operations (see Appendix A-1) of the Denver laboratory can be divided into five sections as shown in Fig. 35. These are sample log-in, data handling, quality control reports, and accounting. The functions of these sections are described below.
4-2.1. Sample Log-in In Fig. 38, the detailed inputs
and outputs for sample log-in are shown. In addition, it is observed that the sample log-in involves verification of the log sheet (Fig. 39) and sample disposition (Fig. 40).
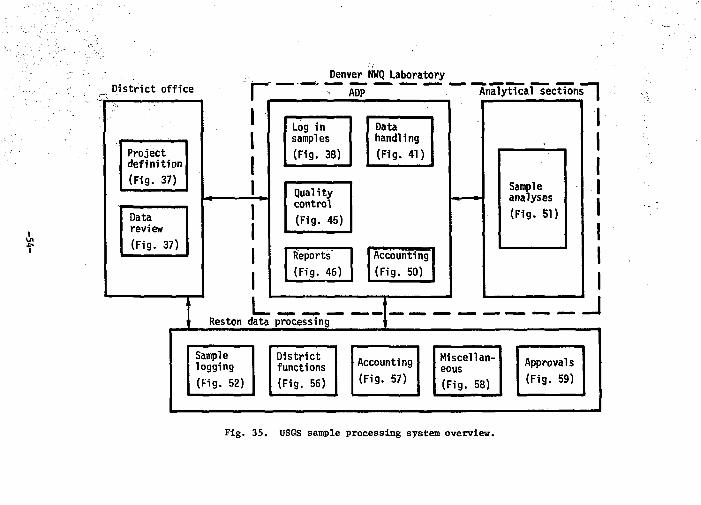
Dis t r i c t of f ice T Denver NWQ Laboratory
"~ " ~ " " ~ " ADp" Analytical sections"~|
Log in samples (Fig. 38)
Data handling (Fig. 41) Project
de f in i t ion (Fig. 37)
Log in samples (Fig. 38)
Data handling (Fig. 41) Project
de f in i t ion (Fig. 37)
Log in samples (Fig. 38)
Data handling (Fig. 41)
Sample analyses (Fig. 51)
Project de f in i t ion (Fig. 37) Sample
analyses (Fig. 51)
Project de f in i t ion (Fig. 37)
Quality control (Fig. 45)
Sample analyses (Fig. 51)
Quality control (Fig. 45)
Sample analyses (Fig. 51)
Quality control (Fig. 45)
Sample analyses (Fig. 51) Data
review (Fig. 37)
Quality control (Fig. 45)
Sample analyses (Fig. 51) Data
review (Fig. 37)
Sample analyses (Fig. 51)
Reports (Fig. 46)
Accounting (Fig. 50)
L Reston data processing
J Sample logging (Fig. 52)
D is t r i c t functions (Fig. 56)
Accounting (Fig. 57)
Miscellaneous (Fig. 58)
Approvals (Fig. 59)
Fig. 35. USGS sample processing system overview.
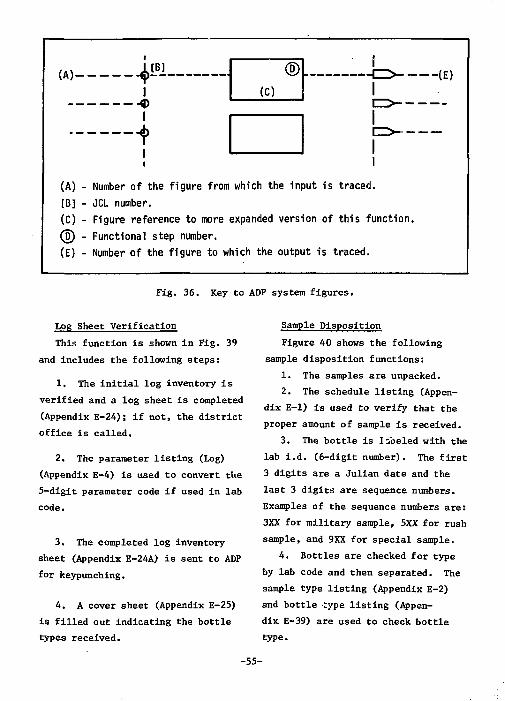
w 4L»I 4)
H> I
® (E) (C)
I (A) - Number of the figure from which the input is traced. (B) - JCL number. (C) - Figure reference to more expanded version of this function. (5) - Functional step number. (E) - Number of the figure to which the output is traced.
Fig. 36. Key to ADP system figures.
Log Sheet Verification This function is shown in Fig. 39
and includes the following steps:
1. The initial log inventory is verified and a log sheet is completed (Appendix E-24); if not, the district office is called.
2. The parameter listing (Log) (Appendix E-4) is used to convert the 5-digit parameter code if used in lab code.
3. The completed log inventory sheet (Appendix E-24A) is sent to ADP for keypunching.
4. A cover sheet (Appendix E-25) is filled out indicating the bottle types received.
Sample Disposition Figure 40 shows the following
sample disposition functions: 1. The samples are unpacked. 2. The schedule listing (Appen
dix E-l) is used to verify that the proper amount of sample is received.
3. The bottle is labeled with the lab i.d. (6-digit number). The first 3 digits are a Julian date and the last 3 digits are sequence numbers. Examples of the sequence numbers are: 3XX for military sample, 5XX for rush sample, and 9XX for special sample.
4. Bottles are checked for type by lab code and then separated. The sample type listing (Appendix E-2) and bottle type listing (Appendix E-39) are used to check bottle type.
-55-
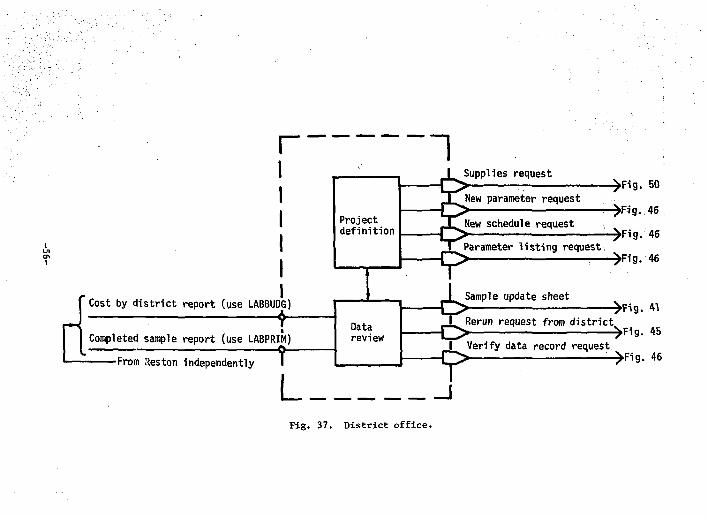
r
Cost by district report (use LABBUDG)
i Completed sample report (use LABPRIM) -From Reston independently
L
Project definition
Data review
Supplies request
New parameter request New schedule request Parameter listing request
->Fig. 50
->Fig. 46 ->Fig. 46 ->Fig. 46
Sample update sheet ->Fig. 41
_. Rerun request from district -|2> —- >Fi9- « I Verify data record request.
^ •>Fig. 46
_J Fig. 37. District office.
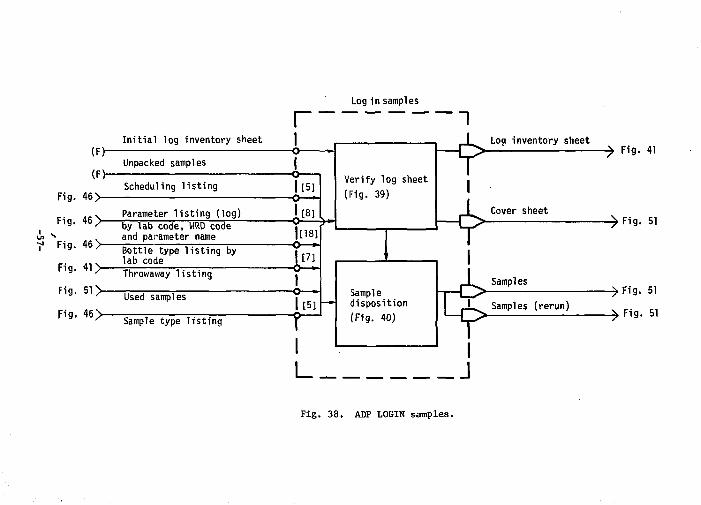
(F)"
(F)" Fig. 46>-
Fig. 46 >-
Fig. 46 >-
Fig. 41 >-
Fig. 51 >-
Fig. 4 6 >
Initial log inventory sheet
Unpacked samples
Scheduling listing
Parameter listing (log) by lab code, WRD code and parameter name Bottle type listing by lab cede Throwaway listing
Used samples
Sample type listing
r Log in samples
I - O -
j [ 5 ] -O—-
l [ 8 ] - O —
| [18] - O — -
I [7]
r-
I —o-| [ 5 ]
T L
Verify log sheet (Fig. 39)
Sample disposition (Fig. 40)
Log inventory sheet
Cover sheet
Samples
Samples (rerun)
-> Fig. 41
-> Fig. 51
->Fig. 51
-> Fig. 51
Fig. 38. ADP LOGIN samples.
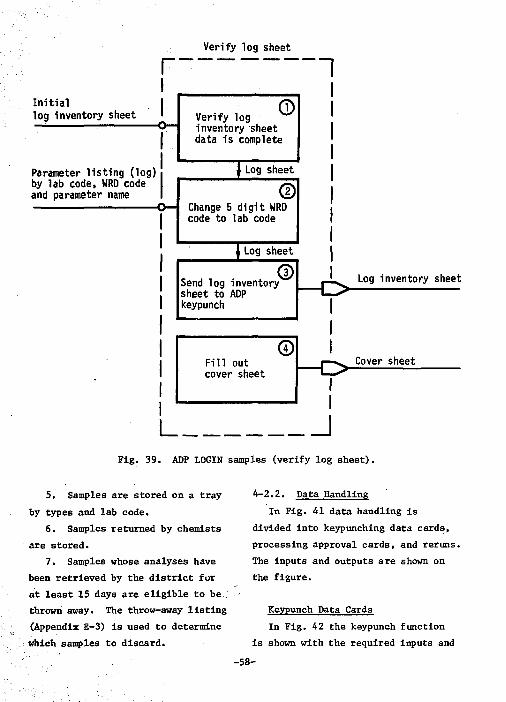
Verify log sheet r Initial log inventory sheet
Parameter listing (log) by lab code, WRD code and parameter name
I
Verify log inventory sheet data is complete
0
1 Log sheet
© Change 5 digit WRD code to lab code
| Log sheet
Send log inventory sheet to ADP keypunch
©
Fill out cover sheet
©
l_.
""I
Log inventory sheet
Cover sheet
J Fig. 39. ADP LOGIN samples (verify log sheet).
5. Samples are stored on a tray by types and lab code.
6. Samples returned by chemists are stored.
7. Samples whose analyses have been retrieved by the district for at least 15 days are eligible to be thrown away. The throw-away listing (Appendix E-3) is used to determine which samples to discard.
4-2.2. Data Handling In Fig. 41 data handling is
divided into keypunching data cards, processing approval cards, and reruns. The inputs and outputs are shown on the figure.
Keypunch Data Cards In Fig. 42 the keypunch function
is shown with the required inputs and
-58-
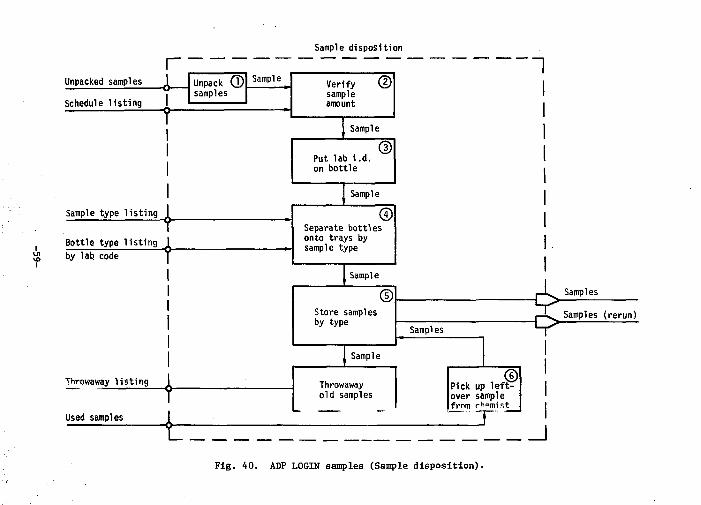
Sample disposition
r Unpacked samples I Schedule listing I
Unpack © samples
T
Sample type listing
Bottle type by lab code
listing I
Throwaway listing
Used samples t
Sampl e Verify (D sample amount
Sample
Put lab i . d . on bot t le
© Sample
© Separate bottles onto trays by sample type
Sample
© Store samples by type
Samples
Sample
Throwaway old samples
1
© Pick up leftover sample frnm ch°mist
—r ~
4> Samples
I
Samples (rerun)
_1 Fig. 40. ADP LOGIN samples (Sample disposition).
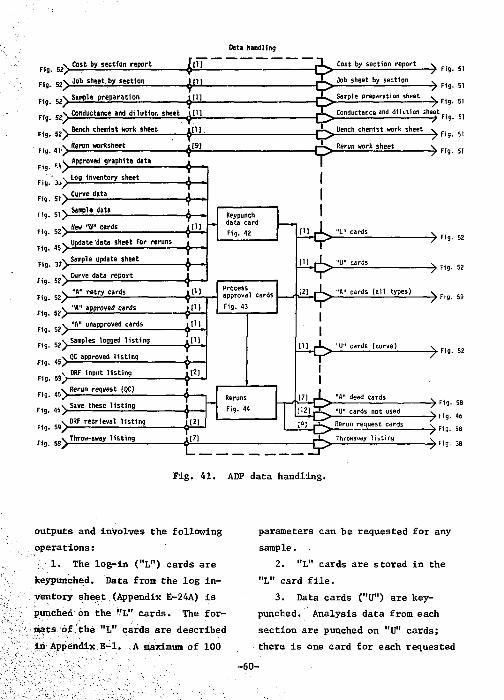
Dati handling
Fig-Fig.
Fig. Ffg. Ffg. Fig. F1g. F1g. Fig.
fig-
Fig-F1g. Fig. Fig-Fig-Fig-Fig. Fig. F1g.
Fig. Fig-Fig-Fig.
Fig-
Cost by section report
Job sheet by section „ v Simple preparation
^Conductance and dilution sheet . Bench chemist work sheet
4„>
«> «> «> «> "> 5 2 >
Rerun worksheet Approved graphite data Log Inventory sheet Curve data Sample data
New U U U cards Update "data sheet for reruns
Sample update sheet Curve data report "A" retry cards
=> "A" approved cards "A" unapproved cards Samples logged listing QC approved listing «>
% ORF input listinq 5 v -v Rerun request (QC)
Save these llstini
t DRF retrieval listing
L Throw-away listing
(U 111
[11 [11
m
m Keypunch
-J data card Fig. 42
in Pi
111
in
121
Process approval cards Fig. 43
[2!
Reruns Fig. 44
[71 • f
Cost by section report Job sheet by section
- > Fig. 61
- ^ Fig. 51 J L Sample preparation sheet v
- T ^ > - 7 F1g. 51 • » Conductance and d i lu t ion sheet.. _ i ^ Conductance and d i lu t ion sheet
-0» — ? " 9 - 5> «*^_ Bench chemist work sheet v _,
1 l
Rerun work sheet
'A" cards ( a l l types)
I I
,£LfJ>X [121 3 C »U"
cards (curve}
cards not used
Throwavjay l i s t i ng
- ^ Fig. 51
- > Fig. 52
- > F1 9 - 52
- ^ Fig. 59
- ^ . Fig. 52
- ^ Fig. 58
Rerun request cards - ^ F i g . 46
- ^ F i g . 58
- ^ F i g . 38
Fig. 41. ADP data handling.
outputs and involves the following operations:
1. The log-in ("L") cards are keypunched. Data from the log inventory sheet (Appendix E-24A) is punched on the "L" cards. The formats of the "L" cards are described in Appendix B-l. A maximum of 100
parameters can be requested for any sample.
2. "L" cards are stored in the "L" card file.
3. Data cards ("U") are keypunched. Analysis data from each section are punched on "D" cards; there is one card for each requested
-60-
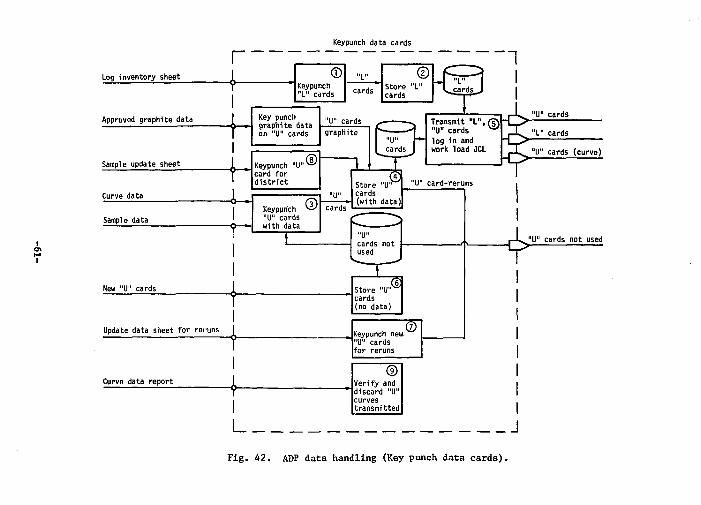
Log inventory sheet
Approved graphite data
Sample update sheet
Curve data
Sample data
New "U" cards
r Keypunch data cards
© Keypunch "L" cards
"L-cards
© Store "L" cards
Key punch graphite data on "U" cards
"U" cards graphite
Keypunch "U" v- /
card for district
G) Keypunch ^-^ "U" cards with data
"U"
"1 "L"
.cards.
1 , ,_L "U" cards ansmtt "l",(|\ - t > — :
" " r d s H L "L" cards Transmit
log in and work load JCL -9^ 5 cards (curve)
"U" card-reruns
Update data sheet for reruns Keypunch new. "U" cards for reruns
Curve data report
®~
^ cards not used
® Verify and discard "U" curves transmitted
L J Fig. 42. ADP data handling (Key punch data cards).
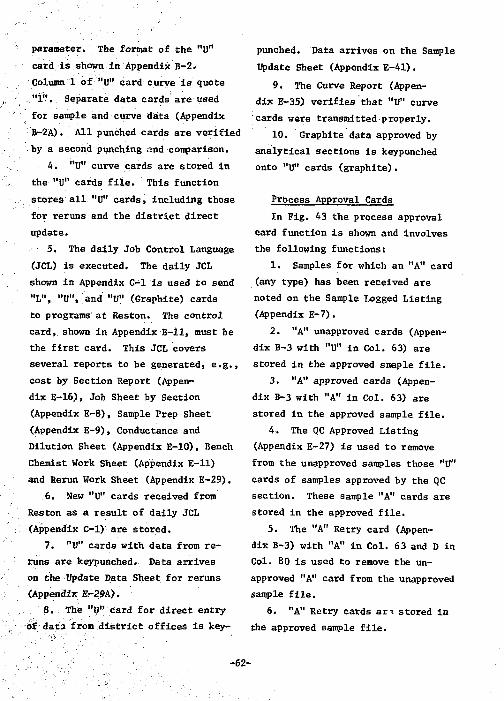
parameter. The format of the "U" card is shown in Appendix B-2; Column 1 of "U" card curve Is quote "1". Separate data cards are used for sample and curve data (Appendix B-2A). All punched cards are verified by a second punching and comparison.
4. "U" curve cards are stored in the "U" cards file. This function stores all "U" cards, including those for reruns and the district direct update.
5. The daily Job Control Language (JCL) is executed. The dally JCL shown in Appendix C-l is used to send "L", "U", and "U" (Graphite) cards to programs at Reston. The control card, shown in Appendix B-ll, must be the first card. This JCL covers several reports to be generated, e.g., cost by Section Report (Appendix E-16), Job Sheet by Section (Appendix E-8), Sample Prep Sheet (Appendix E-9), Conductance and Dilution Sheet (Appendix E-10), Bench Chemist Work Sheet (Appendix E-ll) and Rerun Work Sheet (Appendix E-29).
6. New "U" cards received from Reston as a result of daily JCL (Appendix C-l) are stored.
7. "V" cards with data from reruns are keypunched. Data arrives on the Update Data Sheet for reruns (Appendix E-29A).
8. The "U" card for direct entry of data from district offices is key
punched. Data arrives on the Sample Update Sheet (Appendix E-41).
9. The Curve Report (Appendix E-35) verifies that "U" curve cards were transmitted properly.
10. Graphite data approved by analytical sections is keypunched onto "V cards (graphite).
Process Approval Cards In Fig. 43 the process approval
card function is shown and involves the following functions:
1. Samples for which an "A" card (any type) has been received are noted on the Sample Logged Listing (Appendix E-7).
2. "A" unapproved cards (Appendix B-3 with "U" in Col. 63) are stored in the approved smaple file.
3. "A" approved cards (Appendix B-3 with "A" in Col. 63) are stored in the approved sample file.
4. The QC Approved Listing (Appendix E-27) is used to remove from the unapproved samples those "U" cards of samples approved by the QC section. These sample "A" cards are stored in the approved file.
5. The "A" Retry card (Appendix B-3) with "A" in Col. 63 and D in Col. 80 is used to remove the unapproved "A" card from the unapproved sample file.
6. "A" Retry cards ar». stored in the approved sample file.
-62-
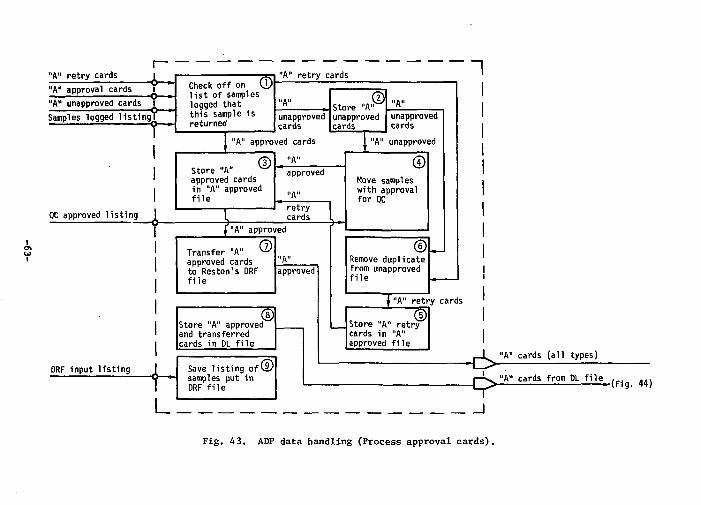
"A" retry cards "A" approval cards "A" unapproved cards
l -o-I o-Samples logged listing^
Check off on list of samples logged that this sample is returned
QC approved listing
"A" retry cards 1 "A"
"A'
unapproved cards
approved cards "A"
© Store "A" unapproved cards
Store "A" approved cards in "A" approved file
©
f - ^ approved
"A" retry cards
approved
Transfer "A approved cards to Reston's DRF file
© •A" approved
Store "A" approved and transferred cards in DL file
©
DRF input listing
L
Save listing of © samples put in DRF file
"A" unapproved cards
"A" unapproved
© Move samples with approval for QC
© Remove duplicate from unapproved file
Store "A" retry cards in "A" approved file
I"A" retry cards
(51
i
-9* _]
'A" cards (all types)
"A" cards from DL file (Fig. 44)
Fig. 43. ADP data handling (Process approval cards).
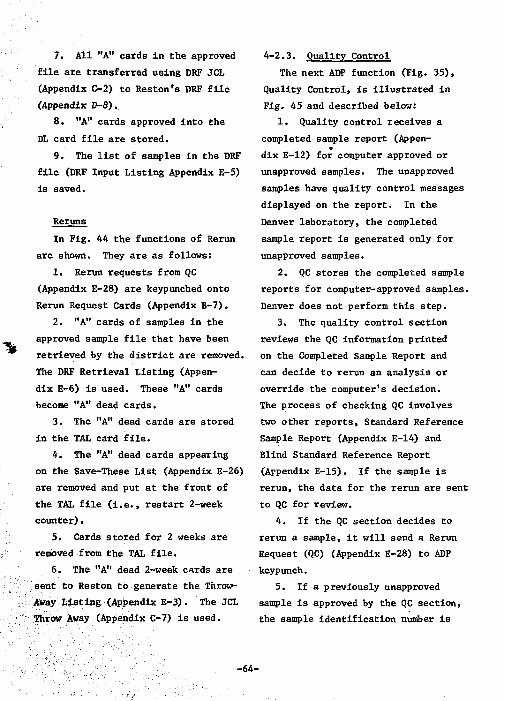
7. All "A" cards in the approved file are transferred using DBF JCL (Appendix C-2) to Reston's DRF file (Appendix D-8).
8. "A" cards approved into the DL card file are stored.
9. The list of samples in the DRF file (DRF Input Listing Appendix E-5) is saved.
Reruns In Fig. 44 the functions of Rerun
are shown. They are as follows: 1. Rerun requests from QC
(Appendix E-28) are keypunched onto Rerun Request Cards (Appendix B-7).
2. "A" cards of samples in the approved sample file that have been retrieved by the district are removed. The DRF Retrieval Listing (Appendix E-6) is used. These "A" cards become "A" dead cards.
3. The "A" dead cards are stored in the TAL card file.
4. The "A" dead cards appearing on the Save-These List (Appendix E-26) are removed and put at the front of the TAL file (i.e., restart 2-week counter).
5. Cards stored for 2 weeks are removed from the TAL file.
6. The "A" dead 2-week cards are sent to Reston to generate the Throw-Away Listing (Appendix E-3). The JCL Throw Away (Appendix C-7) is used.
4-2.3. Quality Control The next ADP function (Fig. 35),
Quality Control, is illustrated in Fig. 45 and described below:
1. Quality control receives a completed sample report (Appendix E-12) for computer approved or unapproved samples. The unapproved samples have quality control messages displayed on the report. In the Denver laboratory, the completed sample report is generated only for unapproved samples.
2. QC stores the completed sample reports for computer-approved samples. Denver does not perform this step.
3. The quality control section reviews the QC information printed on the Completed Sample Report and can decide to rerun an analysis or override the computer's decision. The process of checking QC involves two other reports, Standard Reference Sample Report (Appendix E-14) and Blind Standard Reference Report (Appendix E-15). If the sample is rerun, the data for the rerun are sent to QC for review.
4. If the QC section decides to rerun a sample, it will send a Rerun Request (QC) (Appendix E-28) to ADP keypunch.
5. If a previously unapproved sample is approved by the QC section, the sample identification number is
-64-
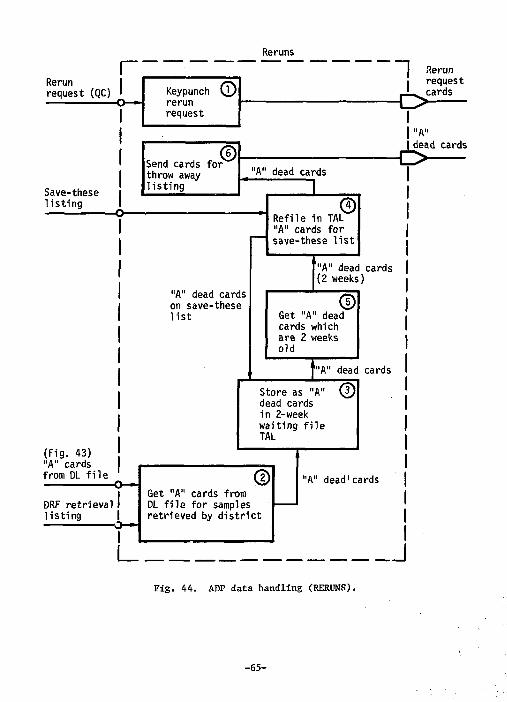
Reruns r [ Rerun Rerun 1 request (QC) 1 Keypunch CD
rerun request
• request pL^cards
O—•" Keypunch CD rerun request t^*
j "A"
© Send cards for throw away l i s t i n g
|dead cards © Send cards for throw away l i s t i n g
C^1
"A" dead cards |
© Send cards for throw away l i s t i n g
l i s t i n g 1 © Refile in TAL "A" cards for save-these l i s t
© Refile in TAL "A" cards for save-these l i s t
'"A" dead cards | (2 weeks) •
1 "A" dead cards j on save-these 1 l ist
© Get "A" dead cards which are 2 weeks old
"A" dead cards 1
Store as "A" © dead cards in 2-week waiting f i l e TAL
(Fig. 43) "A" cards 1 from DL f i l e ©
Get "A" cards from DL f i l e for samples retrieved by d i s t r i c t
"A" dead1cards |
DRF retr ieval 1 l i s t i ng |
© Get "A" cards from DL f i l e for samples retrieved by d i s t r i c t
© Get "A" cards from DL f i l e for samples retrieved by d i s t r i c t
l_ J Fig. 44. ADP data handling (RERUNS).
-65-
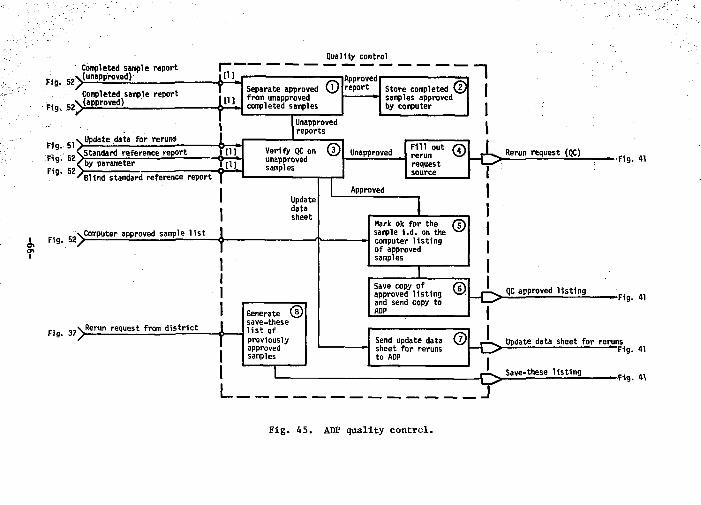
Fig. 52^! (
Fig. 52>!
Completed sample report (unapproved) Completed sample report (approved)
Fig. 51" Fig. 52 Fig. 52
Update data for reruns ^Standard reference report
Separate approved from unapproved completed samples
Quality control
Approved report
1 Unapproved reports
by parameter 4a Blind standard reference report J
Verify QC on ® unapproved samples
Fig. 5 2 > Computer approved sample 1 i s t L
Update data sheet
Fig. 37^! Rerun request from distr ict
Generate (5 / save-these l i s t of previously approved samples
L.
1 Store completed (£/ I samples approved by computer
Unapproved Fill out (7) rerun V ^ request source
Approved
Hark ok for the (5) sample I .d . on the ^ ^ computer l ist ing of approved samples
I I
I I I
Rerun request (QC) •Fig
Save copy of approved listing and send copy to AOP
Send update data (jj sheet for reruns to ADP
QC approved listing -Fig
Update data sheet for reruns 1 -Fig
.J Save-these l isting
- F ^
Fig. 45. ADP quality control.
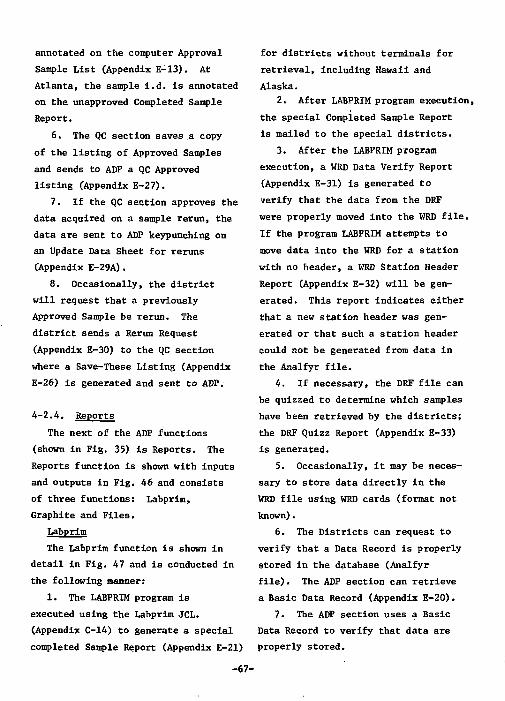
annotated on the computer Approval Sample List (Appendix E-13). At Atlanta, the sample i.d. is annotated on the unapproved Completed Sample Report.
6. The QC section saves a copy of the listing of Approved Samples and sends to ADP a QC Approved listing (Appendix E-27).
7. If the QC section approves the data acquired on a sample rerun, the data are sent to ADP keypunching on an Update Data Sheet for reruns (Appendix E-29A).
8. Occasionally, the district will request that a previously Approved Sample be rerun. The district sends a Rerun Request (Appendix E-30) to the QC section where a Save-These Listing (Appendix E-26) is generated and sent to ADP.
4-2.4. Reports The next of the ADP functions
(shown in Fig. 35) is Reports. The Reports function is shown with inputs and outputs in Fig. 46 and consists of three functions: Labprim, Graphite and Files.
Labprim The Labprim function is shown in
detail in Fig. 47 and is conducted in the following manner:
1. The LABPRIM program is executed using the Labprim JCL. (Appendix C-14) to generate a special completed Sample Report (Appendix E-21)
-67-
for districts without terminals for retrieval, including Hawaii and Alaska.
2. After LABPRIM program execution, the special Completed Sample Report is mailed to the special districts.
3. After the LABPRIM program execution, a WRD Data Verify Report (Appendix E-31) is generated to verify that the data from the DRF were properly moved into the WRD file. If the program LABPRIM attempts to move data into the WRD for a station with no header, a WRD Station Header Report (Appendix E-32) will be generated. This report indicates either that a new station header was generated or that such a station header could not be generated from data in the Analfyr file.
4. If necessary, the DRF file can be quizzed to determine which samples have been retrieved by the districts; the DRF Quizz Report (Appendix E-33) is generated.
5. Occasionally, it may be necessary to store data directly in the WRD file using WRD cards (format not known).
6. The Districts can request to verify that a Data Record is properly stored in the database (Analfyr file). The ADP section can retrieve a Basic Data Record (Appendix E-20).
7. The ADP section uses a Basic Data Record to verify that data are properly stored.
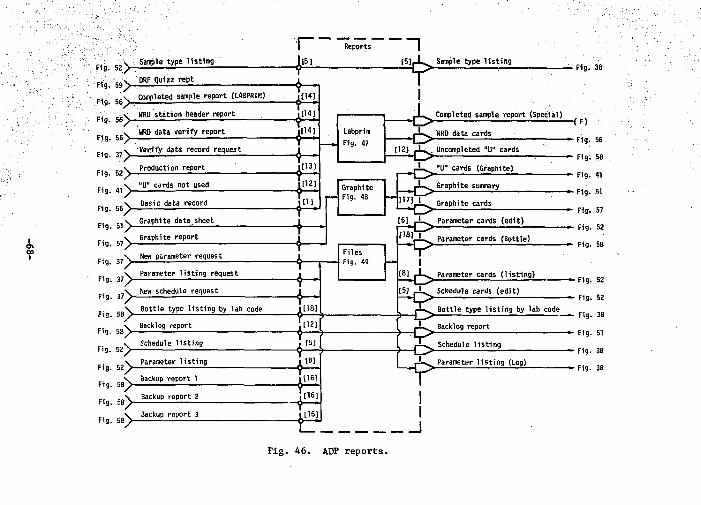
Fig.
Fig.
Fig.
Fig.
Fig.
F1g.
Fig.
Fig.
Fig.
Fig.
Fig.
Fig.
Fig.
f i g .
Fig.
Fig.
Fig.
Fig.
Fig.
Fig.
Fig.
Sample type l i s t i ng
DRF Quizz rept
Completed sample report (LABPRIH)
URD .station header report
WRD data verify report
•Verify data record request
Production report
"U" cards not used
Basic data record
'> Graphite data sheet Graphite report
New parameter request
Parameter listing request
New schedule request
Bottle type listing by lab code
Backlog report
Schedule listing
Parameter listing
Backup report 1
Backup report 2
;s> dackup report 3
[5]
[141
[14]
[14]
[13]
[12]
[1]
Labprim Fig. 47
Graphi te Fig. 48
[18]
Files Fig. 49
[12]
[5]
[B]
116]
[16]
| [16]
F i g . 4 6 . ADP r e p o r t s
[Sir Sample type l i s t i ng - Fig. 38
Completed sample report (Special)
URD data cards
[12] , !< , , , Uncompleted "U" cards
P U ^ "U" cards (Graphite)
p j ^ ^ Graphite summary
I 1 7 J J L ^ Graphite cards
[6] J L ^ ^ Parameter cards (edit)
Parameter cards (Bottle)
[8] fX^^ Parameter cards ( l i s t ing)
(5) , J ^ Schedule cards (edit)
Backlog report
Schedule l i s t i ng
-(F)
- F1g. 56
" F1gi 58
• F1g. 41
- Fig. SI
• Fig. 57
- F1g. 52
• Fig. 58
Bottle type listing by lab code
Parameter listing (log)
-Fig. 52
• F1g. 52
• Fig. 38
• Fig. 51
• Fig. 38
• Fig. 38
J
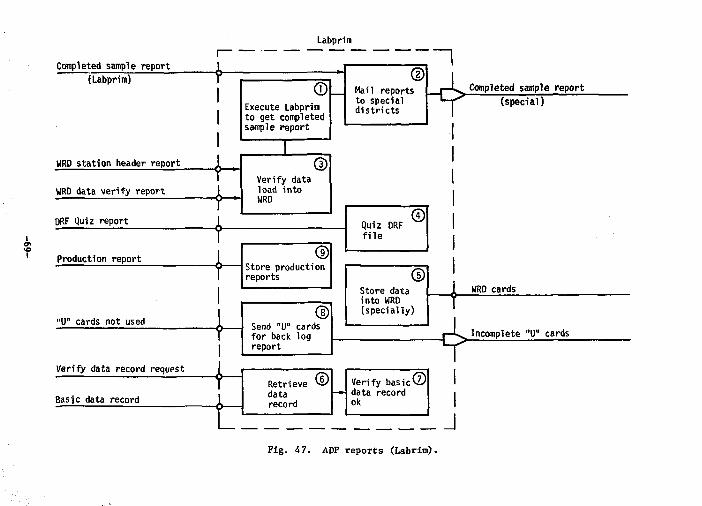
Labprim
Completed sample report 1 I
1
Completed sample report 1
_ © Hail reports to special districts
I
1
(Labprim) Y 1 1 1 1
© Hail reports to special districts
I
1
(Labprim) Y 1 1 1 1
© Execute Labprim to get completed sample report
— ©
Hail reports to special districts
I
1
Completed sample report (special)
Y 1 1 1 1
© Execute Labprim to get completed sample report
I
1
Y 1 1 1 1
I
1
WRD station header report
Y 1 1 1 1 ©
Verify data load into WRD
I
1
WRD data verify report ? 4 ,
© Verify data load into WRD
I
1
7 4
© Verify data load into WRD
I
1
7 4
© Verify data load into WRD ©
Quiz DRF file
I
1
DRF Quiz report 7 4
© Quiz DRF file
I
1
i t 4
© Quiz DRF file
I
1
t 4 ©
Store production reports
© Quiz DRF file
I
1 1 Production report
t 4 ©
Store production reports
I
1 f 1 1
© Store production reports ©
Store data into WRD (specially)
I
1 WRD cards f 1 1
© Store data into WRD (specially)
I
1 WRD cards f 1 1
© Store data into WRD (specially) t
"U" cards not used
f 1 1 ©
Send "U" cards for back log report
© Store data into WRD (specially) t
t 1 4
© Send "U" cards for back log report
t Incomplete "U" cards t
1 4
© Send "U" cards for back log report T
i i i
Verify data record requpst
t 1 4 T
i i i
Verify data record requpst
t 1 4
Retrieve data record
Verify basic © data record ok
T i i i
Basic data record 4 Retrieve data record
Verify basic © data record ok
T i i i f
Retrieve data record
Verify basic © data record ok
T i i i f
T i i i
Fig. 47. ADP repor t s (Labrim).
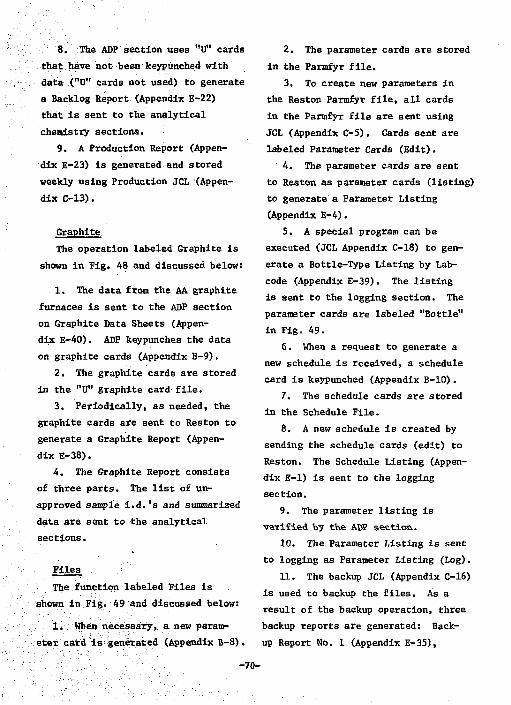
: 8. The ADP section uses "U" cards that have not been keypunched with data ("U" cards not used) to generate a Backlog Report (Appendix E-22) that is sent to the analytical chemistry sections.
9. A Production Report (Appendix E-23) is generated and stored weekly using Production JCL (Appendix C-13).
Graphite The operation labeled Graphite is
shown in Fig. 48 and discussed below:
1. The data from the AA graphite furnaces is sent to the ADP section on Graphite Data Sheets (Appendix E-40). ADP keypunches the data on graphite cards (Appendix B-9).
2. The graphite cards are stored in the "U" graphite card file.
3. Periodically, as needed, the graphite cards are sent to Reston to generate a Graphite Report (Appendix E-38).
4. The Graphite Report consists of three parts. The list of unapproved sample i.d.'s and summarized data are sent to the analytical sections.
Files The function labeled Files Is
shown in Fig. 49 and discussed below:
1. When necessary, a new parameter card is generated (Appendix B-8).
2. The parameter cards are stored in the Parmfyr file.
3. To create new parameters in the Reston Parmfyr file, all cards in the Parmfyr file are sent using JCL (Appendix C-5). Cards sent are labeled Parameter Cards (Edit).
4. The parameter cards are sent to Reston as parameter cards (listing) to generate a Parameter Listing (Appendix E-4).
5. A special program can be executed (JCL Appendix C-18) to generate a Bottle-Type Listing by Lab-code (Appendix E-39). The listing is sent to the logging section. The parameter cards are labeled "Bottle" in Fig. 49.
6. When a request to generate a new schedule is received, a schedule card is keypunched (Appendix B-10).
7. The schedule cards are stored in the Schedule File.
8. A new schedule is created by sending the schedule cards (edit) to Reston. The Schedule Listing (Appendix E-l) is sent to the logging section.
9. The parameter listing is verified by the ADP section.
10. The Parameter Listing is sent to logging as Parameter Listing (Log).
11. The backup JCL (Appendix C-16) is used to backup the files. As a result of the backup operation, three backup reports are generated: Backup Report No. 1 (Appendix E-35),
-70-
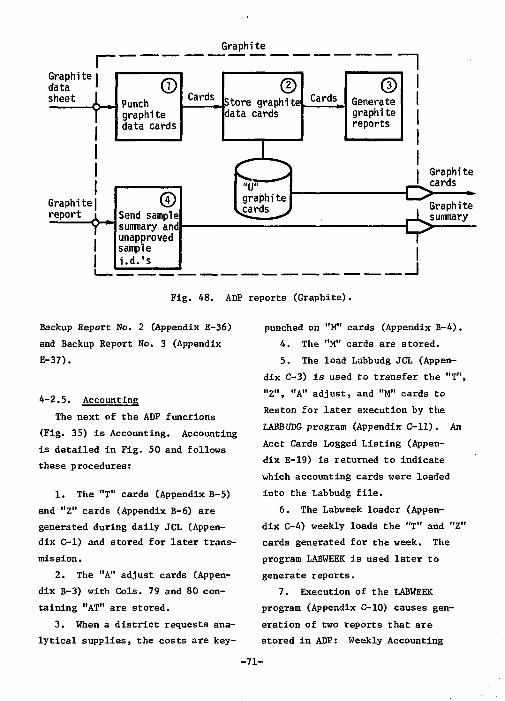
Graphite I data ' sheet
Graphite| report
f
f
© Punch graphite data cards
© Send sample summary and unapproved sample i . d . ' s
Graphite
~1 Cards ©
^. Store graphite data cards
Cards
"U" graphite cards
© Generate graphite reports
Fig. 48. ADP repor t s (Graphite) .
•o Graphite cards
^
._l
Graphite summary
Backup Report Ho. 2 (Appendix E-36) and Backup Report No. 3 (Appendix E-37).
4-2.5. Accounting The next of the ADP functions
(Fig. 35) is Accounting. Accounting is detailed in Fig. 50 and follows these procedures:
1. The "T" cards (Appendix B-5) and "Z" cards (Appendix B-6) are generated during daily JCL (Appendix C-l) and stored for later transmission.
2. The "A" adjust cards (Appendix B-3) with Cols. 79 and 80 containing "AT" are stored.
3. When a district requests analytical supplies, the costs are key
punched on "M" cards (Appendix B-4). 4. The "M" cards are stored. 5. The load Labbudg JCL (Appen
dix C-3) is used to transfer the "T", "Z", "A" adjust, and "M" cards to Reston for later execution by the LABBUDG program (Appendix C-11). An Acct Cards Logged Listing (Appendix E-19) is returned to indicate which accounting cards were loaded into the Labbudg file.
6. The Labweek loader (Appendix C-4) weekly loads the "T" and "Z" cards generated for the week. The program LABWEEK is used later to generate reports.
7. Execution of the LABWEEK program (Appendix C-10) causes generation of two reports that are stored in ADP: Weekly Accounting
-71-
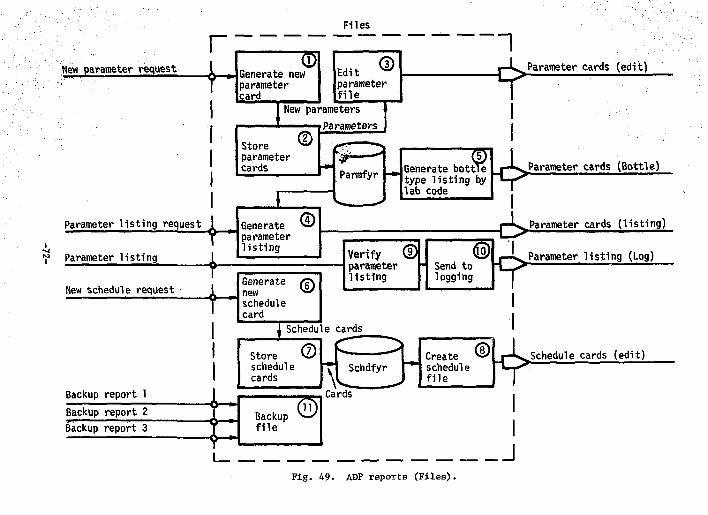
Files r New parameter request I Generate new
parameter card
New parameters Parameters
Store parameter cards
<D
1 Parameter cards (edit)
Parmfyr ®
Generate bottle type listing by lab code
fr Parameter cards (Bottle) Parameter listing request
i f Parameter listing f
Generate >*/ parameter listing
New schedule request + Generate new schedule card
© Verify < D parameter listing
Send to logging
i-^Parameter cards (listing) I
Parameter listing (Log) r? TSchedule cards
" © I f Schdfyr
Backup report 1 Backup report 2 Backup report 3
Schedule cards (edit)
Fig. 49. ADP reports (Files).
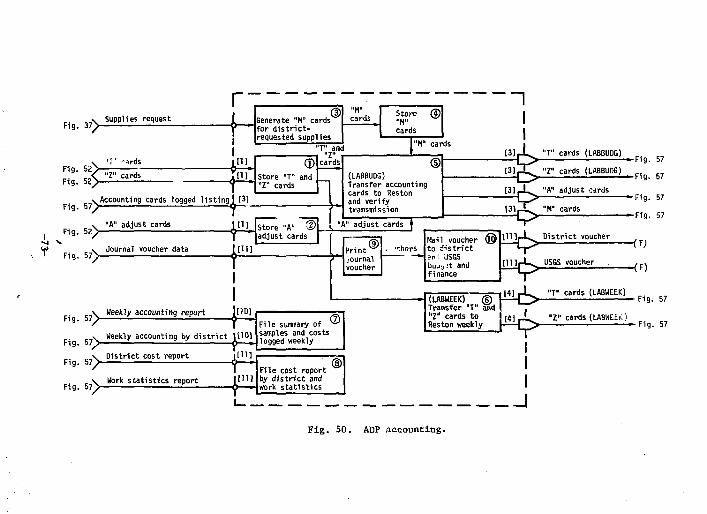
r Fig. 37^-
Supplies request Generate "M" cards for d i s t r i c t -requested supplies
© "M" cards Store
"M" cards
"9- "VrTT Fig. 52^—— cards
I
Fig. 57> Accounting cards logged 1 i s t i ng I
•f" ©
Store "T" and "Z" cards
T" and "Z"
[31 u. u I
Fig. 52^-"A" adjust cards
Fig. 57 >-Journal voucher data
illjJsloTe "A" ~®1_ \ ^adjus t cards |
~i
"H" cards
© (LABBUDG) Transfer accounting cards to Reston and verify transmission
"A" adjust cards \
j a i i ^ r r 3 i l "7»
cards (LABBUDG) — Fig. 57
[ 3 ) J L "Z" cards (LABBUDG) r . „ 1 ; > • Fig, b/
[31,-U^ "A" adjust cards
I 13] ,-L "H» cards
—q>-^—--F i g . 57
- F i g . 57
Fig. 57)>-
Fig. 57>
Fig. 57^>
Fig. 5 7 \
Weekly accounting report
Jim i I
Print ^ journal voucher
chers Mai 1 voucher (ft to district an USGS but >,3t and f1 nance
[THpL Distri ct voucher -if)
USGS voucher
Weekly accounting by dis t r ic t 1110]
District cost report i [ H l
File summary of samples and costs logged weekly
© (LABWEEK) © Transfer "T" and I "Z" cards to Reston weekly
"T" cards (LABWEEK)
-<F)
"Z" cards (LABWEEK)
Fig. 57
Fig. 57
Work stat is t ics report f EH] File cost report by dis tr ic t and work stat is t ics
Fig. 50. ADP accounting.
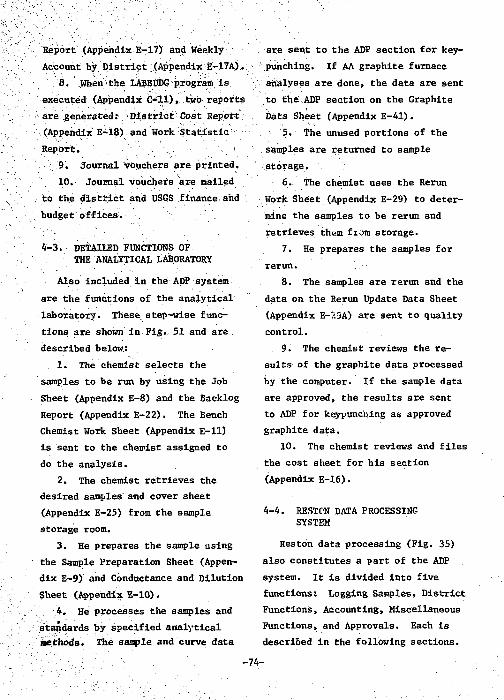
TJeport (Appendix E-17) and Weekly Account by District (Appendix E-17A).
8. ..When the LABBDDG program is executed (Appendix C-11), two reports are generated: District Cost Report (Appendix E-18) and Work Statistic Report.
9. Journal vouchers are printed. 10. Journal vouchers are mailed
to the district and USGS finance and budget offices.
4-3. DETAILED FUNCTIONS OF THE ANALYTICAL LABORATORY
Also included in the ADP system are the functions of the analytical laboratory. These, step-^wise functions are shown in Fig. 51 and are described below,:
1. The chemist selects the samples to be run by using the Job Sheet (Appendix E-8) and the Backlog Report (Appendix E-22). The Bench Chemist Work Sheet (Appendix E-ll) is sent to the chemist assigned to do the analysis.
2. The chemist retrieves the desired samples' and cover sheet (Appendix E-25) from the sample storage room.
3. He prepares the sample using the Sample Preparation Sheet (Appendix E-9) and Conductance and Dilution Sheet (Appendix E-10).
4. He processes the samples and standards by specified analytical methods. The sample and curve data
are sent to the ADP section for keypunching. If AA graphite furnace analyses are done, the data are sent to the ADP section on the Graphite Data Sheet (Appendix E-41).
5. The unused portions of the samples are returned to sample storage.
6. The chemist uses the Rerun Work Sheet (Appendix E-29) to determine, the samples to be rerun and retrieves them f10m storage.
7. He prepares the samples for rerun.
8. The samples are rerun and the data on the Rerun Update Data Sheet (Appendix E-?.3A) are sent to quality control.
9. The chemist reviews the results of the graphite data processed by the computer. If the sample data are approved, the results are sent to ADP for keypunching as approved graphite data.
10. The chemist reviews and files the cost sheet for his section (Appendix E-16).
4-4. RESTCN DATA PROCESSING SYSTEM
Reston data processing (Fig. 35) also constitutes a part of the ADP system. It is divided into five functions: Logging Samples, District Functions, Accounting, Miscellaneous Functions, and Approvals. Each is described in the following sections.
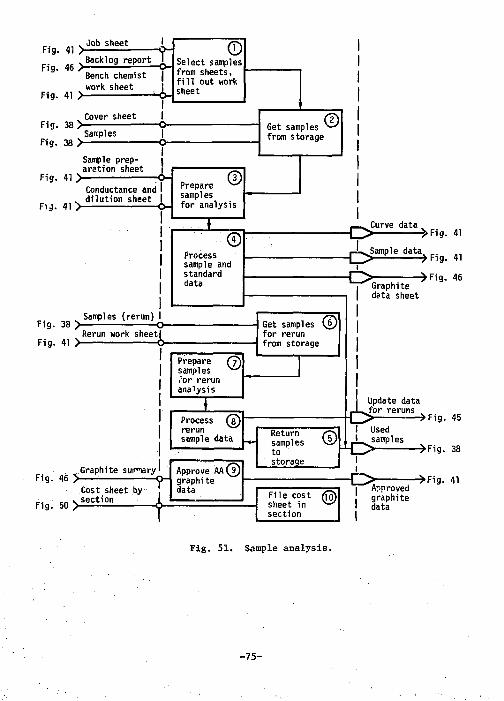
Job sheet Fig. 41 > „ Backlog report I Fig. 46 > — - Q-\ Bench chemist work sheet Fig. 41 > l-Q-{
© Select samples from sheets, fill out work sheet
Fig. 38 >-Fig. 38 y
Cover sheet Samples
I -O-I
Fig. 41 > Sample preparation sheet
Fij. 41 >
I I - O Conductance and I dilution sheet I
® Prepare v ^ samples for analysis 1 Process sample and standard data
Samples (rerun) Fig. 38 > o-Rerun work sheetl
Fig. 41 > O-Prepare samples 'or rerun analysis
©
© Process rerun sample data
Graphite sugary ' Fig. 46 >——• O-
Fig. 50 > Cost sheet by section
Approve A A © graphite data
Get samples from storage ©
Get samples \§) for rerun from storage
Return samples to storage
©
_ . Curve data „ - 0 - — > Fig. 41
jX^Sample data - T > — ! - » F i g . 41
o Graphite data sheet
- > F i g . 46
Update data —_ for reruns „ O — »Fig. 45
I Used !_ samples
1C> - > F i g . 38
Fi le cost sheet in section
00
I -o I Approved
graphite I data
-»F ig . 41
Fig. 51 . Sample a n a l y s i s .
- 7 5 -
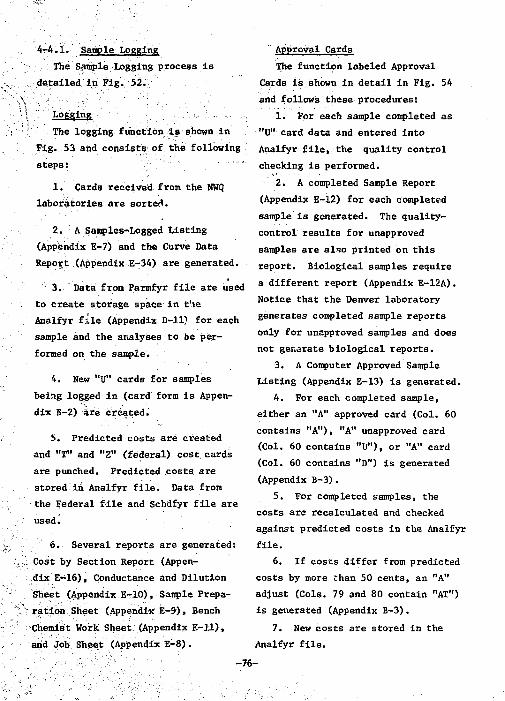
4-4.1. Sample Logging The Sample Logging process is
detailed in Fig. 52.
L.°SS l nS The logging function is shown in
Fig. 53 and consists of the following steps: ........
1. Cards received from the NWQ laboratories are sorter*.
2. A Samples-Logged Listing (Appendix E-7) and the Curve Data Report (Appendix E-34) are generated.
3. Data from Parmfyr file are used to create storage space in t'.te Analfyr file (Appendix D-ll) for each sample and the analyses to be performed on the sample.
4. New "U" cards for samples being logged in (card form is Appendix B-2) are created.
5. Predicted costs are created and "T" and "2" (federal) cost, cards are punched. Predicted costs are stored in Analfyr file. Data from the Federal file and Schdfyr file are used.
6. Several reports are generated: Cost by Section Report (Appendix E-16), Conductance and Dilution Sheet (Appendix E T I O ) , Sample Preparation Sheet (Appendix E-9), Bench Chemist Work Sheet (Appendix E-ll), and Job Sheet (Appendix E-8).
Approval Cards The function labeled Approval
Cards is shown in detail in Fig. 54 and follows these procedures:
1. For each sample completed as "U" card data and entered into Analfyr file, the quality control checking is performed.
2. A completed Sample Report (Appendix E-12) for each completed sample is generated. The quality-control results for unapproved samples are also printed on this report. Biological samples require a different report (Appendix E-12A). Notice that the Denver laboratory generates completed sample reports only for unapproved samples and does not generate biological reports.
3. A Computer Approved Sample Listing (Appendix E-13) is generated.
4. For each completed sample, either an "A" approved card (Col. 60 contains "A"), "A" unapproved card (Col. 60 contains "U"), or "A" card (Col. 60 contains "D") is generated (Appendix B-3).
5. For completed samples, the costs are recalculated and checked against predicted costs in the Analfyr file.
6. If costs differ from predicted costs by more than 50 cents, an "A" adjust (Cols. 79 and 80 contain "AT") is generated (Appendix B-3).
7. New costs are stored in the Analfyr file.
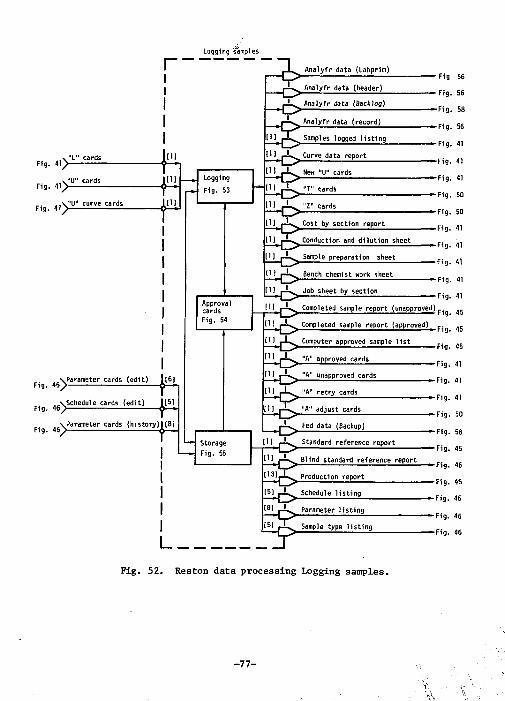
Ftg. 41>-
F1g. 4 1 ^
Fig. 4 1 ^ U" curve cards
Fig. 4 6 ^
v '
Fig. 4 6 ^
Fig. 4 6 ^
Parameter cards (ed
Schedule cards (ed
r Logging samples
to
I I I ]
l [ l l
i t) |[6]
i t ) I[5]
Parameter cards (history)![8]
Logging
r H F 19- 5 3
Approval cards Fig. 54
Storage Fig. 55
L
Analyfr data (Lahprim)
Analyfr data (header)
^ Analyfr data (Backlog)
Analyfr data (record)
Samples logged listing
^ Curve data report
New "U" cards
Cost by section report
Conduction and dilution sheet
Sample preparation sheet
Bench chemist work sheet
-Fig 56
-Fig. 56
-Fig. 58
-F1g. 56
-Fig. 41
-Fig. 41
-Fig. 41
-Fig. 50
-Fig. 50
-F1g. 41
-F1g. 41
-Fig. 41
-Fig. 41
-Fig. 41 i-i-s J° D sheet by section
,-ls^ Completed sample report (unapproved) _. - 5
[1! f—s^ Completed sample report (approved)
H ) — L ^ Computer approved sample list
^ I r-U^ "A" approved cards
Ml A "A" unapproved cards
"A" retry cards
11 ] | - i ^ "ft" adjust cards
Fed data (Backup)
Standard reference report
Blind standard reference report
Production report
Schedule listing
Parameter listing
Sample type listing
•Fig. 45
Fig. 45
Fig. 41
Fig. 41
Fig. 41
Fig. 50
Fig. 58
Fig. 45
Fig. 46
Fig. 46
Fig. 46
Fig. 46
Fig. 46
Fig. 52. Reston data processing Logging samples.
-77-
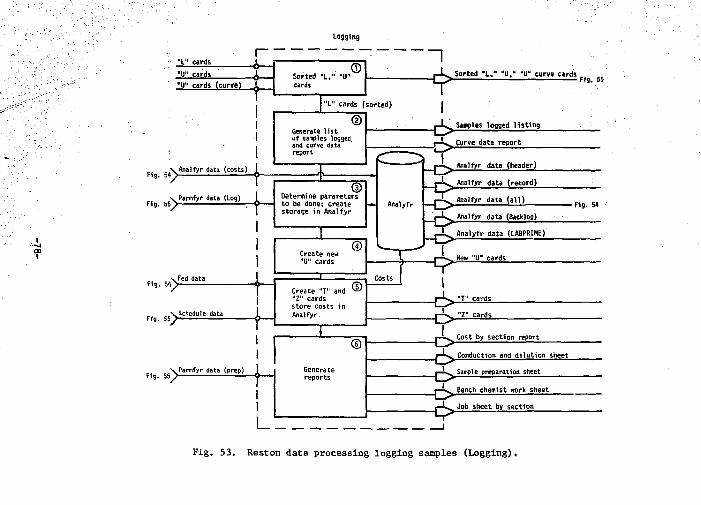
Logging
"L" cards
"U" cards (curve) 1 Sorted "L,' cards
©
"L" cards (sorted)
© Generate l i s t of samples logged, and curve data report
Fig. "> Analfyr data (costs)
•
Parmfyr data (Log)
Fig. 5 0 ~
• Schedule data
Fig. 5 5 ^
4
Parmfyr data (prep)
Determine parameters to be done; create \-~ storage in Analfyr
* Sorted " l . " "U," U U U curve cards
SawpUs logged l i s t i n g
Curve data report
Analfyr data (header)
Analfyr data (record)
Analfyr data ( a l l )
Fig* 55 .
Analfyr data (Backlog)
Analyfr data (LABPRIME)
New "U" cards
-F1g- 54
Cost by section report
Conduction and d i lut ion sheet
Sample preparation sheet
Bench chemist work sheet
Job sheet by section
Fig. 53 . Reston data processing logging samples (Logging).
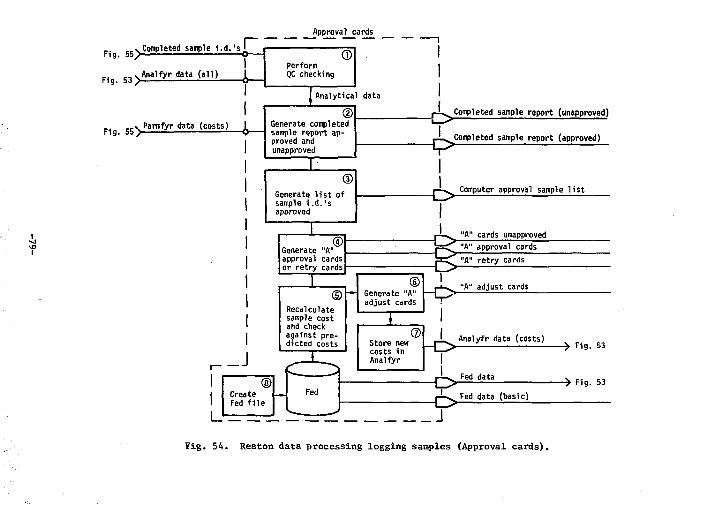
„vCompleted sample L d . ' s l Fig. 55^ — O —
Fig. 53 > Analfyr data (all)
Fig. 5 5 > Parmfyr data (costs)
Approval cards
Perform QC checking
© Analytical data
® Generate completed sample report approved and unapproved
I -o
I
Generate list of sample i.d.'s approved
Completed sample report (unapproved)
Completed sample report (approved)
Computer approval sample list
© I Generate "A" I approval cards I or retry cards
• O r "A" cards unapproved 'A" approval cards "A" retry cards
"A" adjust cards
Analyfr data (costs)
Fed data
- > F1g. 53
- > Fig. 53
Fed data (basic)
Fig . 54. Reston da ta processing logging samples (Approval c a r d s ) .

8, The Federal file is created or modified.
Storage The Reston data processing storage
functions are shown in Fig. 55 and described below:
1. If necessary, incoming data "U" cards are used to generate a Standard Reference Report (Appendix E-14).
2. Standard reference data are stored in a Standard Reference File (Appendix D-5).
3. If necessary, incoming data "U" cards are used to generate the Blind Sample Report (Appendix E-15).
4. Blind sample reference data are stored in a Blind Standard Reference File (Appendix D-4).
5. Incoming cards are counted and work statistics performed.
6. Statistical data are stored in the Production File (Appendix D-6).
7. Data reduction is performed on incoming "U" card data.
8. Analytical results are stored in the Analfyr file (Appendix D-9).
9. A Production Report (Appendix E-23) is generated.
10. New parameters are added to the Parmfyr file (Appendix D-l).
11. A new schedule is added to the Schdfyr file (Appendix T>-2) and the Schedule Listing (Appendix E-l) and Sample-Type Listing (Appendix E-2) are generated.
12. A Parameter Listing (Appendix E-4) is generated.
4-4.2. District Functions The district functions shown in
Fig. 35 as part of Reston data processing are illustrated and described in more detail in Fig. 56 and in the following text:
1. When the LABPRIM program is executed (JCL Appendix C-14), the DRF file (Appendix D-8) is searched for completed samples. LABPRIM is executed by the districts to retrieve data and by the NWQ laboratories for special districts.
2. For each sample in the DRF file, the sample data are retrieved from the Analfyr file.
3. The sample data are used to generate a Completed Sample Report.
4. If the sample data are to be put in the WRD file (Appendix D-12), the Station Header file (Appendix D-5) is checked for a header.
5. If no header exists, LABPRIM attempts to generate one from the data in the Analfyr file. A WRD Station Header Report (Appendix E-32) is generated to indicate no header or that the new header was created.
6. When the header exists, the analytical sample data are loaded into the Analfyr file.
7. A WRD Data Verify Report is generated when the data are loaded
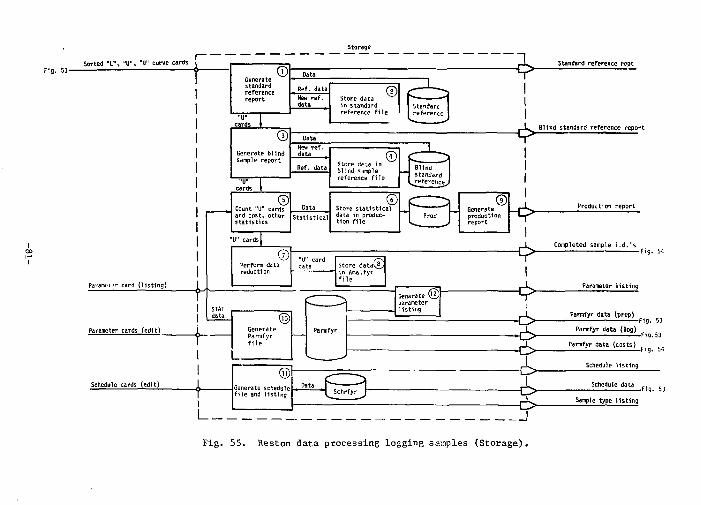
Sorted "L " , "U ' \ "U" curve cards
Parameur card (Usting)
Parameter cards (edit)
Schedule cards (edit)
Standard reference ropt
Blind standard reference report
Production report
Completed sample i . d . ' s - F i g . 54
Parameter listing
Parmfyr data (prep)
Parmfyr data (log) - F i g . 53
Parmfyr data (costs) .Fig. 54
Schedule l i s t ing
Schedule data .Fig. 53
Sample type l i s t ing
Fig. 55. Reston da ta processing logging samples (Storage) ,
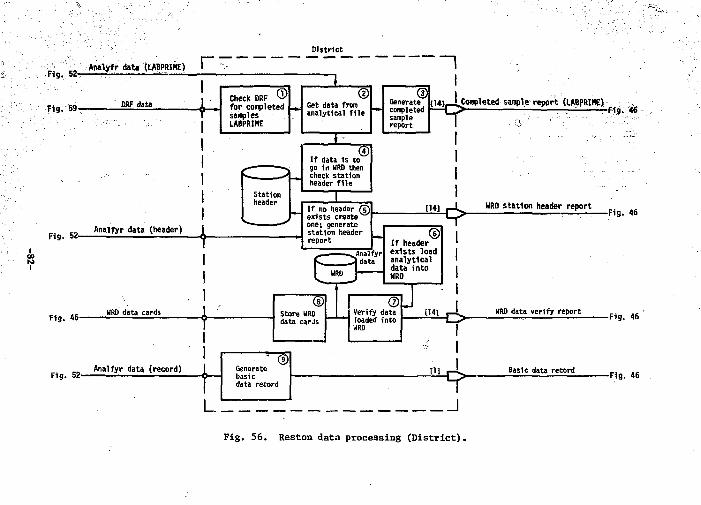
Fig. 52-
Flg. 59-
Analyfr date (UBPRIME) r District
DRF data +- Check DRF © for completed |_ . samples LABPRIME
®| Get data from analytical f i le
Generate completed sample report
i Couple ted sample report (UBPRIHE)
I Fig. 46
F1g. 52-
Flg. 46-
Flg. 52-
Analfyr data (header)
WRD data cards
Analfyr data (record)
L
Station header
©1 I f data Is to go In MRD then check station header f i l e
I f no header (5) exists create one; generate station header report
tH]
Analfyr 'data
® Store WRD data cards
©1 I f header exists load analytical data into WRD
<Z> Verify data loaded into WRD
u
^
[141
® Generate basic data record
I I
j
MRD station header report
HRD data verify report
Basic data record
-Fig. 46
-Fig. 46
-F1g. 46
Fig. 56. Reston data processing (District).
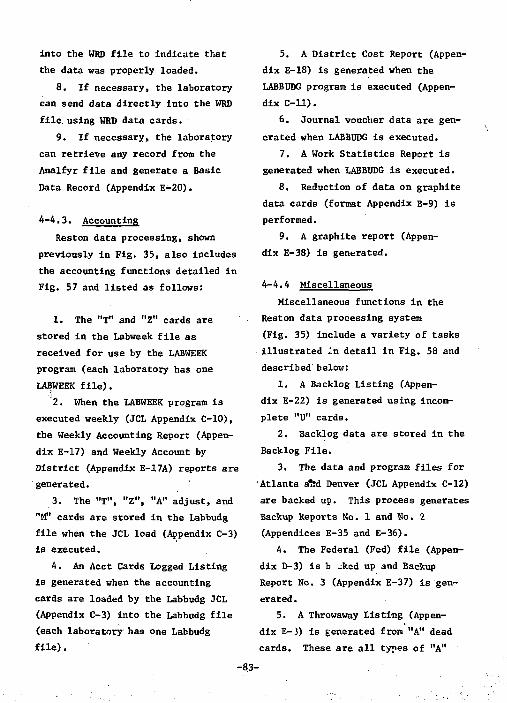
into the WRD file to indicate that the data was properly loaded.
8. If necessary, the laboratory can send data directly into the WRD file, using WRD data cards.
9. If necessary, the laboratory can retrieve any record from the Analfyr file and generate a Basic Data Record (Appendix E-20).
4-4.3. Accounting Reston data processing, shown
previously in Fig. 35, also includes the accounting functions detailed in Fig. 57 and listed as follows:
5. A District Cost Report (Appendix E-18) is generated when the LABBUDG program is executed (Appendix C-ll).
6. Journal voucher data are generated when LABBUDG is executed.
7. A Work Statistics Report is generated when LABBUDG is executed.
8. Reduction of data on graphite data cards (format Appendix B-9) is performed.
9. A graphite report (Appendix E-38) is generated.
4-4.4 Miscellaneous Miscellaneous functions in the
Reston data processing system (Fig. 35) include a variety of tasks illustrated in detail in Fig. 58 and described below:
1. A Backlog Listing (Appendix E-22) is generated using incomplete "U" cards.
2. Backlog data are stored in the Backlog File.
3. The data and program files for Atlanta at!d Denver (JCL Appendix C-12) are backed up. This process generates Backup Reports No. 1 and No. 2 (Appendices E-35 and E-36).
4. The Federal (Fed) file (Appendix D-3) is b jked up and Backup Report No. 3 (Appendix E-37) is generated .
5. A Throwaway Listing (Appendix E-.3) is generated from "A" dead cards. These are all types of "A"
1. The "T" and "Z" cards are stored in the Labweek file as received for use by the LABWEEK program (each laboratory has one LABWEEK file).
2. When the LABWEEK program is executed weekly (JCL Appendix C-10), the Weekly Accounting Report (Appendix E-17) and Weekly Account by District (Appendix E-17A) reports are generated.
3. The "T", "Z", "A" adjust, and "M" cards are stored in the Labbudg file when the JCL load (Appendix C-3) is executed.
4. An Acct Cards Logged Listing is generated when the accounting cards are loaded by the Labbudg JCL (Appendix C-3) into the Labbudg file (each laboratory has one Labbudg file).
-83-
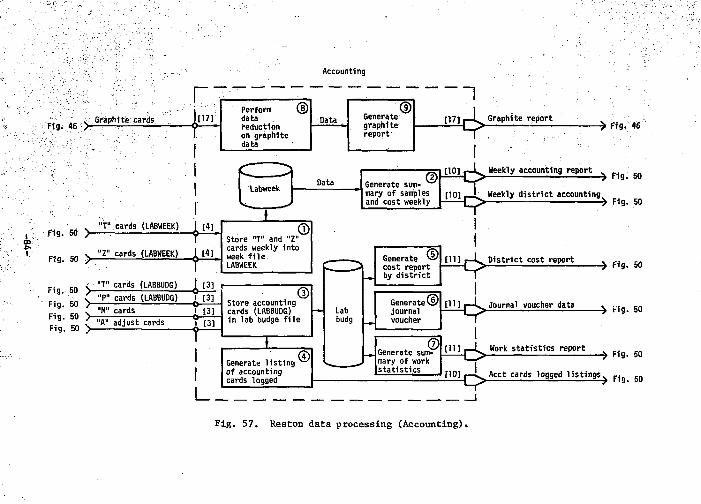
Accounting
Fig. 46 > Graphite cards
r; inn Perform
data . reduction on graphite data .
© Data
Data
Fig. 50 >- "T" cards (LABWEEK) [4]
Fig. 50 > "Z" cards (LABWEEK) [4]
F i g. 50 "T" cards (t-ABBUDG) ^ [3] Fig. 50 >-j Fig. 50 >-^ Fig. 50 >-
© Store "T" and "Z" cards weekly into week file LABWEEK
P" cards (LABBUDG) M" cards A" adjust cards
JJ3] -O i [3] — O - 5 — I [3]
© Store accounting cards (LABBUDG) in lab budge file
1_
T ©
Generate l ist ing w
of accounting cards logged
Lab budg
Generate graphite report
© 1 Graphite report -> Fig. 46
© Generate sum-mary of samples and cost weekly
[101 d> Weekly accounting report ^ Fig. 50
[10] _ L Weekly district accounting i — 4 Z > ^— ^ Fig. 50
Generate
© cost report by distr ict
Generate © journal voucher
I
District cost report -> Fig. 50
Journal voucher data -4 Hg. 50
Generate sum-mary of work statistics
© I
[11] p - 1 ^ Work statistics report
I -» Fig. 50
flO] •—L Acct cards logged l ist ings. ,i„ c 0
Fig . 57. Reston data processing (Accounting).
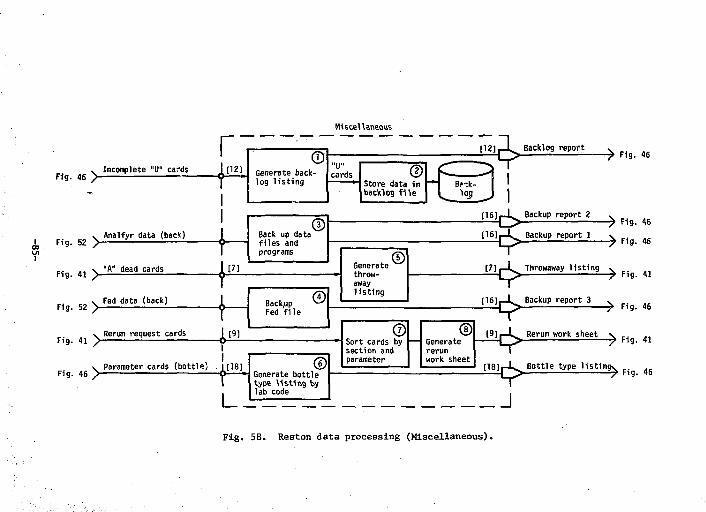
Fig. 52 >-Analfyr data (back)
Fig. 41 > "A" dead cards
Fig. 52 >-
Fig. 41 y
Fed data (back)
Rerun request cards
r Miscellaneous
. Incomplete "U" cards I [1 Fig. 46 > ?^± P1-2] 0
Generate backlog l is t ing
"U" cards
Fig. 46 y Parameter cards (bottle)
Back up data files and programs ©
[71
[91
Backup Fed file ©
[18]
l_
© Generate bottle type l is t ing by lab code
© Store data in backlog f i l e
3> sarS """" ""•"—> ,„. 4.
>d> [ 1 6 ] | - L Backup report 2
Generate throw-away l is t ing
© i^> Backup report 1
~y Fig. 46 -^ Fig. 46
[7],-L Throwaway listing '<>
• y Fig. 41
© Sort cards by |— section and parameter Generate rerun work sheet
[161.—L Backup report 3 v 1~> — : 7 F 19- 4 6
Rerun work sheet v _. L> — ? Fig. 41
jltilj-k^ Bottle type listing^ ^ ^
J Fig. 58. Reston data processing (Miscellaneous).
cards for which approved data has been moved to the DRF file (Appendix D-8) for more than 15 days.
6. A Bottle-Type Listing by Labcode (Appendix E-39) is generated using parameter cards.:
7. Rerun Request cards (Appendix B-7) are sorted by section and parameter..
8. A Rerun Work Sheet (Appendix E-29) is generated.
4-4.5J Approvals The approvals functions of the
Reston data processing system are shown in Fig. 59 and include the following steps:
1. The "A" cards (all types) are used to store completed sample identifications in the DRF file (Appendix D-8) for retrieval by the districts from their terminals (each laboratory haB one DRF file).
2. As the samples are flagged as completed in the DRF file, a DRF Input Listing (Appendix E-5) is generated to indicate which samples are available to the districts.
3. The DRF file is used to generate a DRF Retrieval Listing (Appendix E-6) to indicate which samples have been retrieved by the districts.
4. When necessary, the status of the DRF file can be quizzed and a DRF Quizz Report is generated (Appen^ dix E-33).
4-5. PERFORMANCE CHARACTERISTICS OF THE NWQ LABORATORY RESTON ADP SYSTEM
In this section the more important performance characteristics of the system are specified.
The response time of the entire system depends heavily on data processing operations at Reston. The ADP system is currently remote-batch. Therefore each function performed at the laboratory is limited by the availability of the IBM 370 at Reston and the amount of money available for communications time. To reduce CPU charges, much of the processing is performed overnight.
Some functions performed at Reston are critical to continuing operations in the NWQ laboratories. If the Reston system goes down, operations in the laboratories are essentially halted. Downtime of the Reston system has been estimated at approximately 5 hr per mo.
The total number of parameters for one sample cannot exceed 100. The sample must be split if the number of parameters requested exceeds 100. Samples normally are available for analysis approximately 24 hr after being received in the NWQ laborar
tory. They can be processed without a job sheet. A Sample Preparation or Work Assignment Sheet is usually generated about one day after the sample is received.
-86-
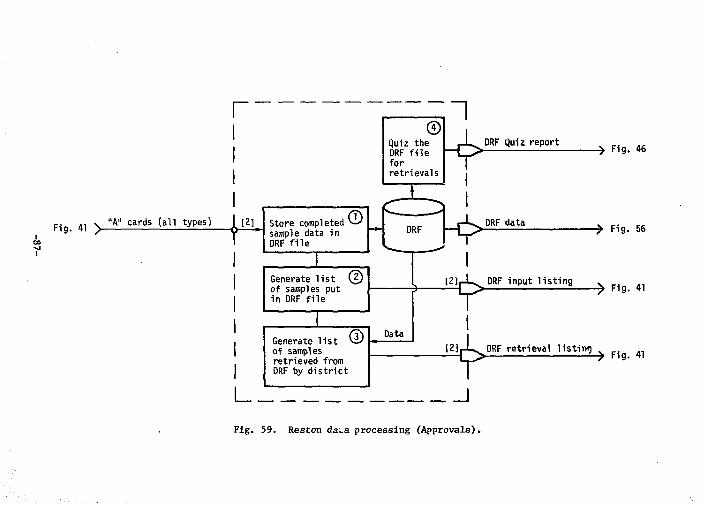
r ©
Quiz the DRF file for retrievals
1 DRF Quiz report -> Fig. 46
Fig. 41 > "A" cards (all types) I [2] Store completed sample data in DRF f i l e
© DRF k> DRF tiata -» Fig. 56
Generate list (2) of samples put in DRF file
L
Generate list W of samples retrieved from DRF by district
Data
[2 ]_L DRF input l is t ing
[2]|J_S^DRF retrieval l ist ing
- > Fig. 41
• ^ > Fig. 41
I
Fig. 59. Reston da^a processing (Approvals).
Once storage has been allocated for a requested parameter, the allocation cannot be enlarged. Parameters are stored in records three times as long as that of the parameter. Deleting a parameter does not free the space for additions. The transcription of data from log-inventory sheets or instrument output tapes is limited by the availability of keypunch operators and the backlog of data to be transcribed.
The minimum turnaround time to process data for a sample is about
three days (rush); normal turnaround time without reruns is 20 days.
It requires about three additional days if a sample has to be rerun for quality control checks, and quality control results are not available for approval for at least one day. After the sample is completed the summary report is normally available in one day.
Accounting data is currently sent weekly frors "T" and "Z" card files, and billing is currently performed monthly at Reston from data updated by "T" and "Z" cards.
5. Evaluation of Existing Operations
5-1. ADVANTAGES AND DEFICIENCIES
Because the Denver laboratory is divided into sections, samples can be analyzed for several parameters simultaneously thereby reducing the overall sample analysis time. The use of Reston computer facilities has given the laboratory the ability to conduct complex work scheduling, data reduction, collation, and report generation. However, some deficiencies must be pointed out with regard to use of the Reston system. They are as follows:
• Transcribing analytical data to forms and keypunching it on
cards is time-consuming and error-prone.
• Card-file maintenance is time-consuming. (Key-to-disc systems can replace the card system to alleviate this problem.)
• Sample parameter results and quality control data are available in a minimum time of one overnight cycle after transmission of the analytical data to Reston. Thus, malfunctions or other errors go undetected leading to the possible compounding of errors and a greater incidence of sample reruns.
-88-
• To insure an acceptable ansrfer in one overnight cycle, many samples are diluted to two or more concentrations to insure that at least one dilution will fall within the range of the method. This increases the sample load of the laboratory.
• Samples are backlogged if the Reston system goes down.
• Sample analyses cannot be started urtil a job sheet is obtained from Reston.
• Output from the remote system takes a minimum of one overnight cycle.
• The NWQ laboratories depend on the Reston computer system over which they have no direct control.
6. Desired Improvements and Goals
The evaluation of the existing operations in the Denver laboratory has shown advantages and deficiencies of the system. Elimination of these deficiencies will lead to improved performance. A summary of the desired goals follows, and are presented as a guide to the further design of the automation system. They are not intended to limit the design to any particular hardware. The desired goals are:
• To decrease the time required for logging in samples and compiling files of parameters to be determined, both at the NWQ laboratories and at Reston.
• To make available probable values for the parameters to be determined, thus minimizing reruns resulting from out-of-raage analyses.
• To incorporate on-line automated analysis methods capable of real-time data acquisition, data processing, and quality control screening.
• To eliminate punched cards as a method of computer communication and provide, at the same time, efficient techniques for the off-line entry of data from low-use methods and instruments, nonautomated instruments, and instrument systems containing computers.
• To provide a means of introducing and processing rerun samples quickly.
• To incorporate automated sample-changer and dilution systems that can be applied to a variety of instrumental methods.
-89-
• To establish an effective automated method for distributing samples.
• To maintain data backup so laboratory operations will not be interrupted, and accumulated data will not be lost in the event of a component malfunction within the system.
• lo provide methods for promptly assessing laboratory performance, examining the status of an analysis, and reporting routine analytical data.
6-1. . CONSTRAINTS THAT AFFECT THE DESIRED GOALS
We have stated the desired goals that are expected to improve the performance of the NWQ Laboratory. Several constraints will affect attainment of these goals. They are: applicable technology, available funds, and time. A limited area of computer technology including both software and hardware is applicable to NWQ laboratory heeds. In the initial feasibility study, specific hardware and software were recommended because they were known to apply and would yield substantial cost benefits. The software includes BASIC language programs and the required assembly language routines applicable in whole
or in part to NWQ laboratory instruments (e.g., ultraviolet and atomic absorption spectrometers, Technicon AutoAnalyzers, the total organic carbon analyzer, and the Mettler electronic balance). The hardware includes interface designs for linking the above instruments to a computer system. It is important to remember that software and hardware interfaces are designed fcr use with a specific computer system (Data General) employing a specific operating system (MRDOS). If the NWQ laboratories choose to gain the cost benefits and development time savings from the above software and hardware designs, they are then constrained to use a specific computer system or acquire a system th;:t provides comparable hardware interfaces and software at no additional cost.
We choose not to pursue certain goals at this time or until preliminary investigations have been completed. For example, a sample distribution system will not be defined until laboratory automation is completed. Automatic sample changing and dilution will be pursued as a separate development project, and complete elimination of the need for Data 100 terminal will not be realized immediately.
-90-
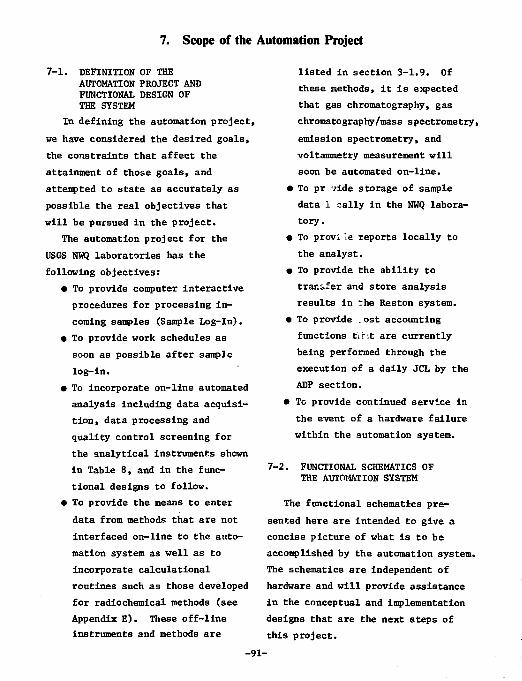
7. Scope of the Automation Project
7-1. DEFINITION OF THE AUTOMATION PROJECT AND FUNCTIONAL DESIGN OF THE SYSTEM
In defining the automation project, we have considered the desired goals, the constraints that affect the attainment of those goals, and attempted to state as accurately as possible the real objectives that will be pursued in the project.
The automation project for the USGS NHQ laboratories has the following objectives:
• To provide computer interactive procedures for processing incoming samples (Sample Log-In).
• To provide work schedules as soon as possible after sample log-in.
• To incorporate on-line automated analysis including data acquisition, data processing and quality control screening for the analytical instruments shown in Table 8, and in the functional designs to follow.
• To provide the means to enter data from methods that are not interfaced on-line to the automation system as well as to incorporate calculational routines such as those developed for radiochemical methods (see Appendix E). These off-line instruments and methods are
listed in section 3-1.9. Of these methods, it is expected that gas chromatography, gas chromatography/mass spectrometry, emission spectrometry, and voltammetry measurement will soon be automated on-line.
• To pr vide storage of sample data 1 cally in the NHQ laboratory.
• To provi Je reports locally to the analyst.
• To provide the ability to transfer and store analysis results in the Reston system.
• To provide -. ost accounting functions t'ir:t are currently being performed through the execution of a daily JCL by the ADP section.
• To provide continued service in the event of a hardware failure within the automation system.
7-2. FUNCTIONAL SCHEMATICS OF THE AUTOMATION SYSTEM
The functional schematics presented here are intended to give a concise picture of what is to be accomplished by the automation system. The schematics are independent of hardware and will provide assistance in the conceptual and implementation designs that are the next steps of this project.
-91-
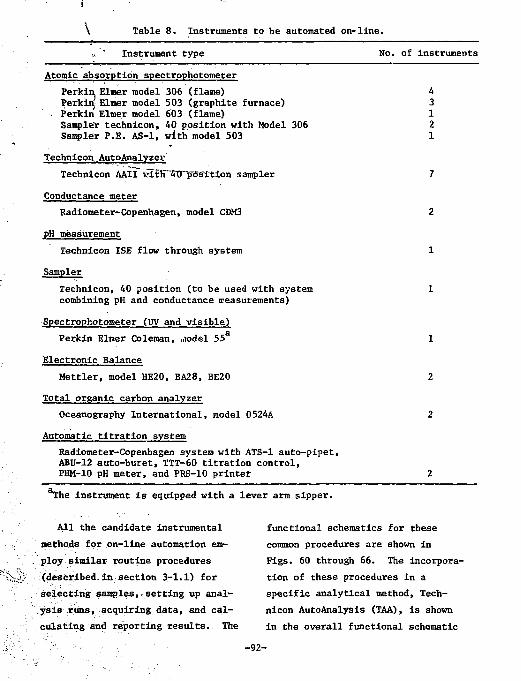
Table 8. Instruments to be automated on-line.
v. ' Instrument type No. of instruments
Atomic absorption spectrophotometer Perkin. Elmer model 306 (flame) 4 Perkin Elmer model 503 (graphite furnace) 3 Perkin' Elmer model 603 (flame) 1 Sampler technicon, 40 position with Model 306 2 Sampler P.E. AS-1, with model 503 1
Technicon AutoAnalyzer Technicon AAlT w!tK~4trpT5aTtion sampler 7
Conductance meter Radiometer-Copenhagen, model COM3 2
pH measurement Technicon ISE flow through system 1
Sampler Technicon, 40 position (to be used with system 1 combining pH and conductance measurements)
Spectrophotometer (UV and visible) Perkin Elmer Coleman, uiodel 55 1
Electronic Balance Mettler, model HE20, BA28, BE20 2
Total organic carbon analyzer Oceanography International, model 0524A 2
Automatic titration system Radiometer-Copenhagen system with ATS-1 auto-pipet, ABU-12 auto-buret, TTT-60 titration control, PHM-10 pH meter, and PRS-10 printer 2
The instrument is equipped with a lever arm sipper.
All the candidate instrumental functional schematics for these methods for on-line automation em- common procedures are shown in ploy similar routine procedures Figs. 60 through 66. The incorpora-(described.in section 3-1.1) for tion of these procedures in a selecting samples, setting up anal>- specific analytical method, Tech-ysis runs, acquiring data, and cal- nicon AutoAnalysis (TAA), is shown culating and reporting results. The in the overall functional schematic
-92-
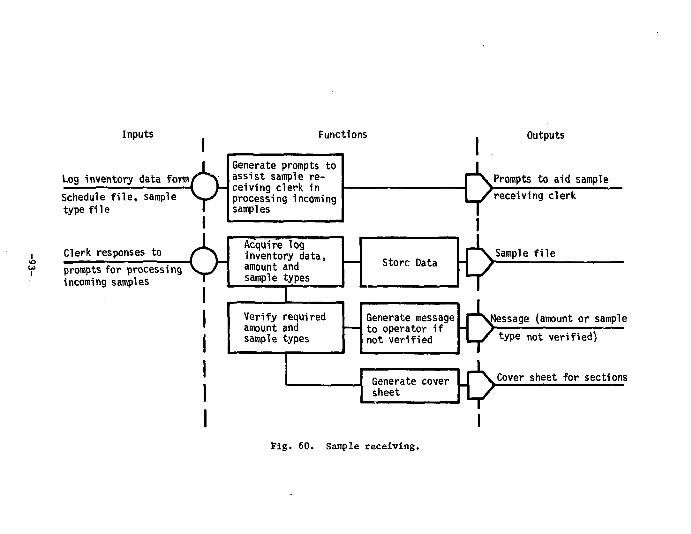
Inputs Functions
Log inventory data form Schedule file, sample type file
Clerk responses prompts for processi incoming samples
I
assing V _ /
Generate prompts to assist sample receiving clerk in processing incoming samples
Acquire log inventory data, amount and sample types
Store Data
Verify required amount and sample types
Generate cover sheet
Fig. 60. Sample receiving.
Outputs
aid sample |""\Prompts to aid s I /receiving clerk
| \Sample f i le
Generate message P ^Ul — to operator if -J /•
not verified L - S
Message (amount or sample type not verified)
Cover sheet for sections
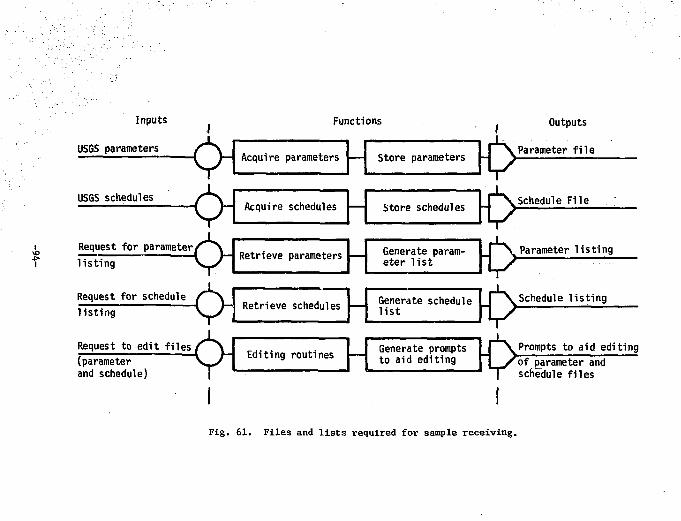
I VO I
Inputs
USGS parameters
USGS schedules
Functions
Request for parameter l i s t i n g
Request for schedule l i s t i n g
Request (parameter and schedul
Acquire parameters Store parameters
Acquire schedules — Store schedules
Retrieve parameters Generate parameter l i s t
Retrieve schedules
to edi t f i l es f \ | ~ T ~ " • 1 J— Edit i er \^s
dule) [ •
H> Outputs
Parameter f i l e
Schedule Fi le
Parameter l i s t i n g
Generate schedule I \Schedule l i s t i n g l i s t
;ing routines Generate to aid
e prompts f ^ \ P r o m p t s to aid edi edit ing | / o f parameter and — - — — ^ ^ schedule f i l e s
ting
Fig. 61. Files and lists required for sample receiving.
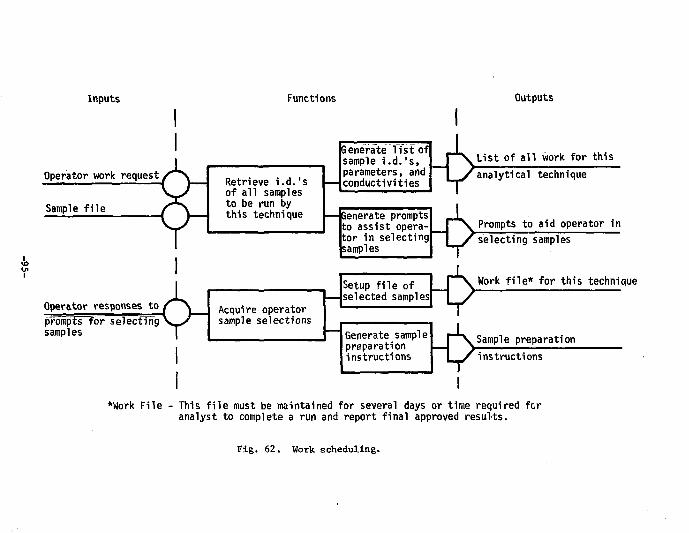
Inputs
Operator work request
Sample file
Functions
Operator responses to prompts for selecting samples
Retrieve i.d.'s of all samples to be run by this technique
Senerate list of sample i.d.'s, parameters, and conductivities
— Senerate prompts to assist operator in selecting samples
Acquire operator sample selections
Generate sample preparation instructions
Outputs
List of all work for this analytical technique
Prompts to aid operator in selecting samples
Setup file of _ _ P \ — selected samples | /
K> Work file* for this technique
Sample preparation instructions
i I *Work File - This file must be maintained for several days or time required fcr
analyst to complete a run and report final approved results.
Fig. 62. Work scheduling.
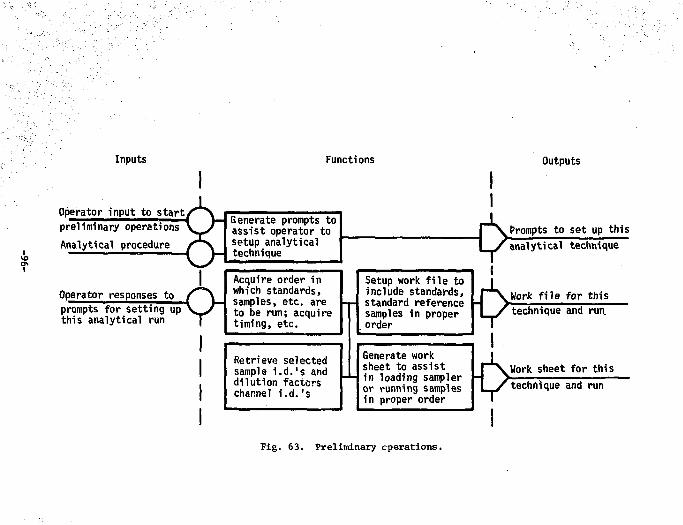
Inputs Functions Outputs
Operator input to start preliminary operations Analytical procedure
Operator responses prompts for setting this analytical run
Generate prompts to assist operator to setup analytical technique
Acquire order in which standards, samples, etc. are to be run; acquire timing, etc.
Retrieve selected sample i.d.'s and dilution factors channel i.d.'s
Setup work file to include standards, standard reference samples in proper order
Generate work sheet to assist in loading sampler or running samples in proper order
I
Prompts to set up this analytical technique
Work file for this technique and run.
Work sheet for this technique and run
Fig. 63. Preliminary operations.
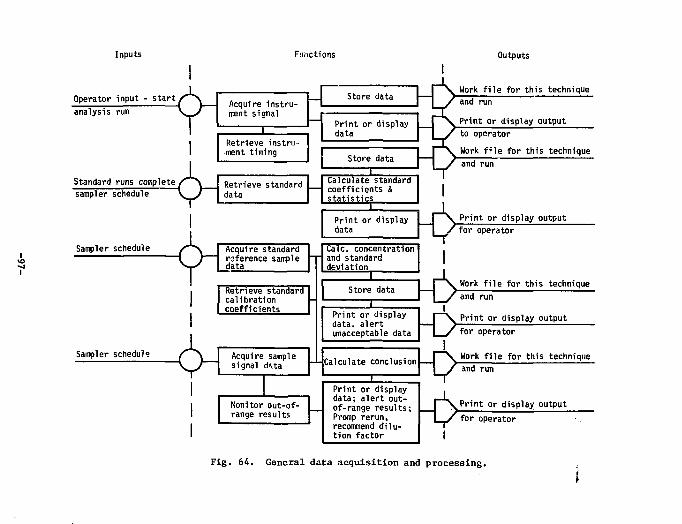
Inputs Functions Outputs
Operator input - start analysis run
Standard runs complete sampler schedule
Sampler schedule
Sampler schedule
Acquire instrument signal
Store data
Retrieve instrument timing
Print or display data
Store data
Retrieve standard data
Calculate standard coefficients & stat is t ics
Print or display data
Acquire standard reference sample data
Retrieve standard calibration coefficients
Acquire sample signal dota
Calc. concentration and standard deviation
I Store data
I
Work file for this technique and run Print or display output to operator Work f i l e for this technique and run
Print or display output
Print or display data, a ler t unacceptable data
Calculate conclusi
Print or display data; a ler t out-
Mom tor out-of- _ of-range results; range results
X
Promp rerun, recommend dilution factor
for operator
Work file for this technique and run
or display output operator
Work f i l e for this technique and run
or display output operator
Fig. 64. General data acquisition and processing.
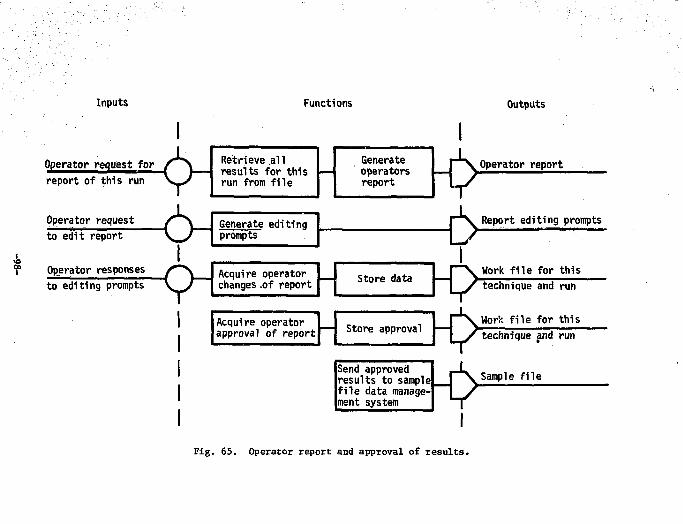
Inputs Functions Outputs
*
Operator request for report of this run
Operator request to edit report
Operator responses to editing prompts
I
Retrieve all results for this |— run from file
Generate editing prompts
Acquire operator changes .of report
Acquire operator .. , approval of report ~\ s t o r e aPP™va1
Generate operators report
-6 Operator report
— I Store data — I \
K> K>
Report editing prompts
Work file for this technique and run
Work file for this technique and run
Send approved results to sample file data manage ment system
Sample file
Fig. 65. Operator report and approval of results.
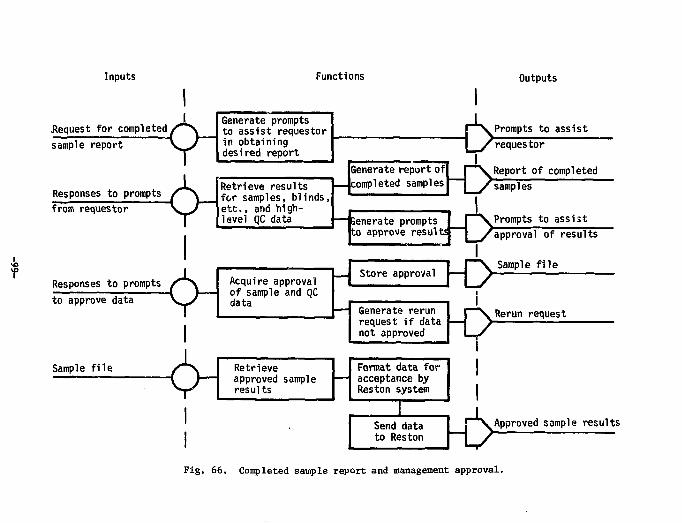
Inputs Functions Outputs
.Request for completed sample report
Responses to prompts from requestor
Responses to prompts
Generate prompts to assist requestor in obtaining desired report
Retrieve results for samples, blinds, etc., and high-level qC data
to approve data /**"v Acqui
4 ) of sa V--/ data ire approval 5ample and QC
Sample f i l e SH Retrieve approved sample results
Generate report of completed samples 1-6
Prompts to assist requestor Report of completed
Senerate prompts to approve result;
_ Store approval I
samples
Prompts to assist approval of results
Sample file
Generate rerun reques not approved
te rerun j—v t if data — y proved L _ /
Rerun request
Format data for acceptance by Reston system
Send data to Reston H> Approved sample results
Fig. 66. Completed sample report and management approval.
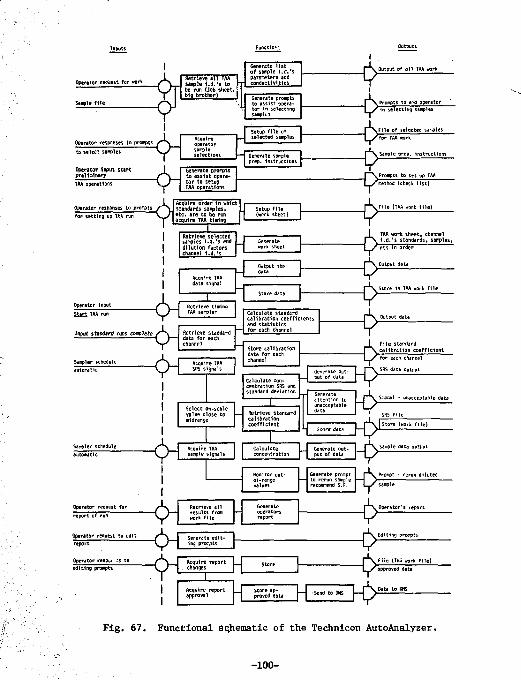
Operator reves t for work
Operator responses to prompts i
fletrieve i l l TAA I sample i . d . ' s to f n , be run (job sheet, • big brother)
Generate l i s t of saaple l . d . ' s parameters and conductivi t ies
Generate prompts to assist opera* tor In selecting sampits
to select samples
Acquire operator sample selections
Generate prompts to assist operato r to setup TAA operations
Operator responses to prompts , for sett ing up TAA run
Acquire order i n which standards samples (
etc . are to be run acquire TAA timing
Retrieve selected samples i . d . 's and d i l u t i on factors channel l . d . ' s
Operator Input
SSf i i TAA run
input standard rmi complete
Sampler schedule
Retrieve standard data for each channel
Calculate standard ca l ib ra t ion coef f ic ients and s ta t i s t i cs for each channel
Store ca l ib ra t ion data for each channel
Calculate concentration SRS and standard deviation
Sampler schedule
Generate attention to unacceptaDle
f \ Acquire Ti V j / ^ sample si i
Hon1 tor out-ol -range values
General to ren rec oilmen d
| " * ^Ou tpu t of a l l
I
Prompts to aid operator in selecting samplei
L _ / f o r TAA selected samples
Sample prep, instructions
Prompts to set up TAA 'method (chetk l i s t )
T / r t c In
le {TAA Kork f i l e )
order
Output data
f ^ S t o r e 1n T
p \ Output d
\__/ for
j " " ^ SHS data
f ^ \ Sample d
each channel
output
Signal - unacceptable data
Store (work f i l e )
te prompt f ~ \ un sample — > iend D.F. L—r
Prompt - rerun diluted
Operator request for
Operator request report
Operator respv. ;s to
to ed i t X * N
Retrieve a l l results from work f i l e
Generate —i operators
report
r ^ " \Opera tor 's report
Editing prompts
Fi le |TAA work f i l e )
Acquire report _ Store ap-approval • * — — ' -"
-P rS^Oati to D
Fig. 67. Functional gqhematic of the Technicon AutoAnalyzer.
-100-
In Fig. 67. Because all other candidate instrumental methods are similar to the TAA in theii functional steps, only the TAA schematic
This automation project is a cooperative effort of many people. We especially wish to acknowledge the helpful advice of G. W. Barton, Jr., W. G. Boyle, E. W.
is shown. Specific functional innovations for the other on-line instruments can be deduced from the specifications text.
Crawford, E. R. Fisher, and A. M. Kray of Lawrence Livermore Laboratory and R. L. McAvoy and his staff of the USGS National Water Quality Laboratory.
Acknowledgments
-101-
References
1. national Water Quality Parameter List, Water Resources Division, U.S. Geological Survey (1976).
2. W. F, Morris, E. S. Peck, E. R. Fisher, and G. W. Barton, Jr., Feasibility Study for Automation of the Central Laboratories, Water Resources Division! U.S. Geological Survey, Lawrence Livermore Laboratory, Rept. UCKL-52001 (1976).
3. S. I. Bystroff, W. G. Boyle, and G. W. Barton, Jr., Atomic Absorption Itistrument Functional Description, Lawrence Livermoi l Laboratory, Rept. UCRL-52065 (1976).
4. R. W. Crawford and G. W. Barton, Jr., Technioon AutoAnalyais: Functional Description, Lawrence Livermore Laboratory, Rept. UCRL-52046 (1976).
5. R. W. Crawford and L. P. Rigdon, Total Organic Carbon Analyzer: Functional Description, Lawrence Livermore Laboratory, Rept. UCRL-52045 (19.5).
6. Techniques of Water Resources Investigations of the United States Geological Survey, Book 5.
7. Operation Manual, Specific Conductance Meter, CDM-3, Radiometer-Copenhagen Manual 982-653, 5090.
8. W. B. Barnett and J. D. Kerber, Instrumental Electronics for Use with Flameless Atomic Absorption Sampling Device, American Laboratory 7_, 43 (1975).
9. Operations Manual, Atomic Absorption Spectrophotometer, Models 306, 403, 503, and 603, Perkin-Elmer Corporation.
10. NWQ Laboratory Methods Manual, U.S. Geological Survey.
MLD/lc/jcn/vt f '' . -102-
Appendix A ADP Documentation
1. NWQ Laboratories ADP OPERATIONS
Introduction:
Ruben E. Gust Computer programe? Denver Central Laboratory FTS 234-4992
Subject: CENTRAL LABS ADP OPERATIONS
During this period of discussion I will cover the Central Labora
tories ADP operations, primarily those areas from the time a sample
reaches the laboratory until the analyses are complete, and the results
of the sample are returned to the requestor. To do this I plan to start
with the Log-Inv Information sheet and how the sample is established in
our files, and then follow the sample through to completion. I will
also discuss the weekly Log-Inv Information report (LABWEEK), the
analytical retrieval programs (LABPRIM), and with Harry'P help, the
budget (LABBUDG). When a sample is sent to the lab it has to be
accompanied by a Log-Inv Information sheet as shown here.
Insert 1.—near here
A-2
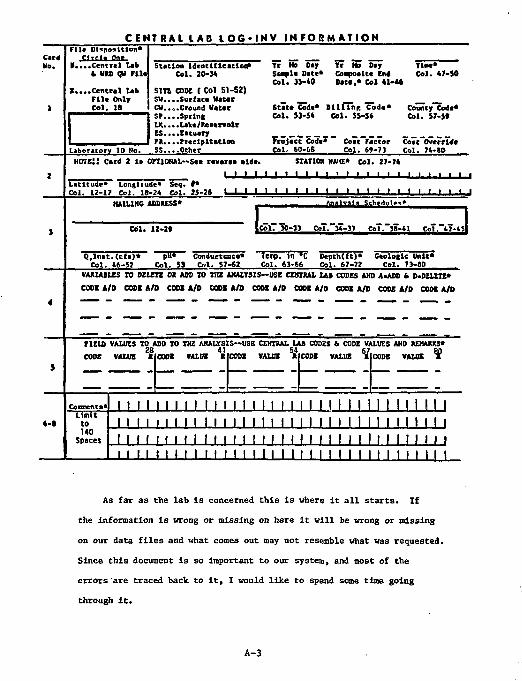
CENTRAL I A D I Q G - I N V I N F O R M A T I O N File ot*no*ltlon*
r « r < - l . On» H*.••Central tab
t mo qu Flit J....Central lab
Til* Only Col. IB
Station Identification* Col. 20-M
s m CODE ( Col 51-52) SU.
Tr Mo Day Tr Ha Day TIM*
Laboratory ID Ho.
Surface Water ..Ground Water ..Spring . .Lake/Keaerolr ..Eatuary ..rredpltatloa ..Other
Saapla Date* Coapoelt* En* Col. 47-50 Col. JJ-40 Date." Col • ! - • *
Stat* Code* s l l l l n r . Cod** County Cod** Col. 51-5* Col. J5-S* Col. 57-5*
Frojecc Code* Coat Factor Coat Override Col. 60-C6 Col. 69-73 Col. 74-EO
HCTE!! Card 2 la OKIONAL--Se • re * elde. STATION MICE* Col. 17-74 I I I I I I t I I t l i I • • • i i i
Latitude* Longitude* Seq. #* Col. 12-1? Col. 18-14 Col. 85-26 I I I I I ' • ' ' ' ' • I I I I I ' • ' ' ' ' J
MAILING ADDRESS*
Col. 11-2* UITM-» CoT."jZ-3» COT.~1D"-41 CoT.-ti-til
Q.lnat.(cfa)* Col. 4t-52
Condueteaca* C;t. 57-62
Temp, in *C Col. 63-66
D t p t h ( f t ) * C o l . 6 7 - 7 2
G e o l o g i c U n i t * C o l . 73-HO
VAXZAKZS TO DELETE OH ABB TO 1 7 3 ANALYSIS—USE CEKTJIAL U l CODES AND A-ADD fc D.DELETE*
CODI A / 0 CODI A / 0 CODI A / 0 CODE A / 0 CODE A/D CODE A/D CODI A/D CODE A/D COSE A / 0
FIELD VALUES TO ADD TO THE ANALYSIS—USE CENTRAL LAD COSES * CODE VALUES AND REHAMS* 2 8 41 54 67 «n
CODE VALUE « CODI VALUE I CODI VALUE I CODI VALUE IE CODI VALUE
11 n M 111 ii i n i n 11111111 in i in ii i i i 11 ' i i 11 11 i i i i n i i 11 i 11 i l 11 i n i 11 " n n i i I I i i • i I i I I I I I I I I I I I I I I I I I i " I I " 1 1 1 1 1 1 1 1 1 1 1 1 1 1 1 1 1 1 1 1 1 1 1 1 1 1 1 1
As far as the lab is concerned this is where it all starts. If
the information is wrong or missing on here it will be wrong or missing
on our data files and what comes out may not resemble what was requested.
Since this document is so important to our system, and most of the
errors are traced back to it, I would like to spend some time going
through it.
A-3
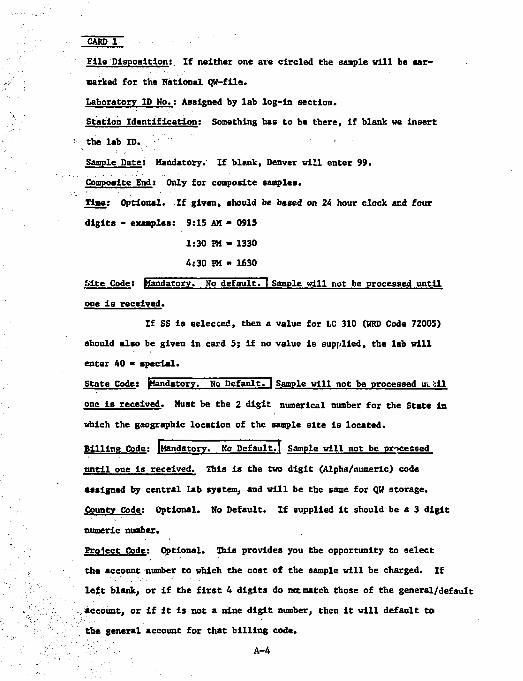
CARD 1
File Disposition: If neither one are circled the sample will be ear
marked for the National QW-file.
Laboratory ID No.: Assigned by lab log-in section.
Station Identification: Something has to be there, if blank we Insert
the lab ID.
Sample Date: Mandatory. If blank, Denver will enter 99.
Composite End: Only for composite samples.
Time: Optional. If given, should be based on 24 hour clock acd four
digits - examples: 9:15 AM - 0915
1:30 PM - 1330
4:30 PM - 1630
Site Code: Mandatory. No default.~l Sample will not be processed until
one is received.
If SS is selected, then a value for LC 310 (WSD Code 72005)
should also be given in card 5; if no value is supplied, the lab will
enter 40 " special.
State Code: Mandatory. No Default. I Sample will not be processed m ell
one is received. Must be the 2 digit numerical number for the State in
which the geographic location of the sample site is located.
Billing Code: iMandatory. No Default.I Sample will not be processed
until one is received. This is the two digit (Alpha/numeric) code
assigned by central lab system, and will be the same for QH storage.
County Code: Optional. No Default. If supplied it should be a 3 digit
numeric number.
Project Code: Optional. This provides you the opportunity to select
the account number to which the cost of the sample will be charged. If
left blank, or if the first 4 digits do net match those of the general/default
account, or if it is not a nine digit number, then it will default to
the general account for that billing code.
A-4
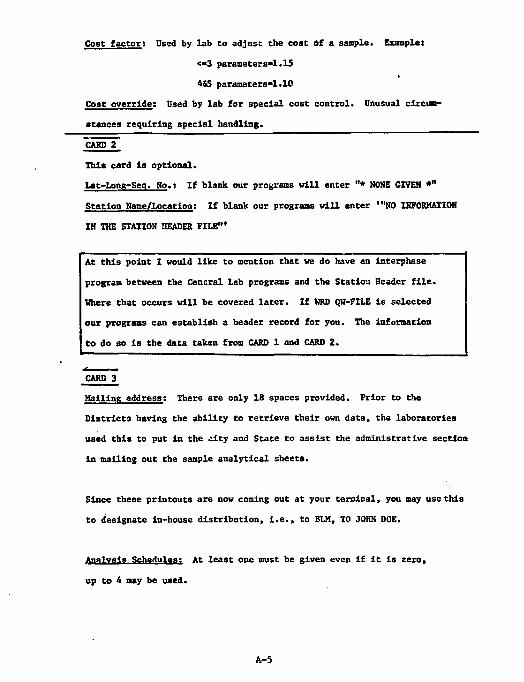
Cost factor: Used by lab to adjust the cost of a sample. Example:
<-3 parameters*l.15
4S6 parameters"1.10
Cost override; Used by lab for special cost control. Unusual circum
stances requiring special handling.
"CARD 2
This card is optional.
Lat-Lons-Seq. No.: If blank our programs will enter "* NOSE GIVEN *"
Station Name/location! If blank our programs will enter '"NO INFORMATION
IN THE STATION HEADER FILE"'
At this point I would like to mention that we do have an interphase
program between the Central Lab programs and the Station Header file.
Where that occurs will be covered later. If WRD QW-FILE is selected
our programs can establish a header record for you. The information
to do so is the data taken from CARD 1 and CARD 2.
CARD 3
Mailing address; There are only 18 spaces provided. Prior to the
Districts having the ability to retrieve their own data, the laboratories
used this to put in the £ity and State to assist the administrative section
in mailing out the sample analytical sheets.
Since these printouts are now coming out at your terminal, you may use this
to designate in-house distribution, i.e., to BLM, TO JOHN DOE.
Analysis Schedules; At least one must be given even if it is zero,
up to 4 may be used.
A-5
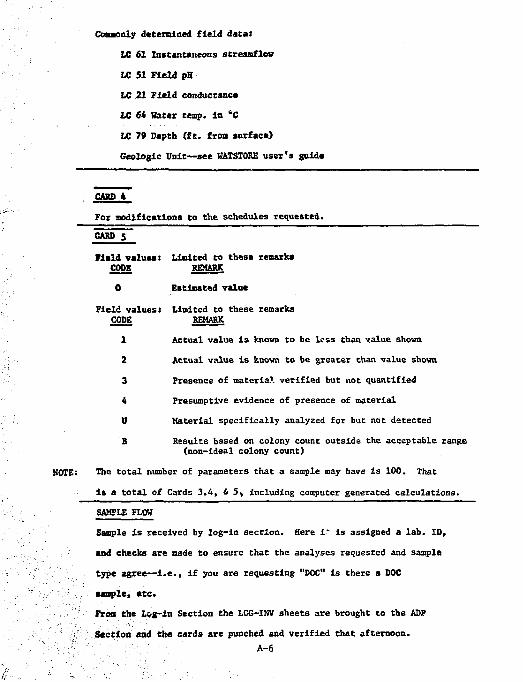
Commonly determined field data:
LC 61 Instantaneous streamflov
LC 51 Field pH
LC 21 Field conductance
LC 64 Water temp, la "C
LC 79 Depth (ft. from surface)
Geologic Unit—see WATSTORE user's guide
CAM *
For modifications to the schedules requested.
CAM) 5
Field values: Limited to these remark* CODE REMARK
0 Estimated value
Field values: Limited to these remarks CODE REMARK
1 Actual value is known to be less than value shown
2 Actual value is known to be greater than value shown
3 Presence of material verified but not quantified
4 Presumptive evidence of presence of material
U Material specifically analyzed for but not detected
B Results based on colony count outside the acceptable range (non-ideal colony count)
The total number of parameters that a sample may have is 100. That
is a total of Cards 3,4, & 5, including computer generated calculations.
SAMPLE FLOW
Sample is received by log-in section. Here i" is assigned a lab. ID,
and checks are made to ensure that the analyses requested and sample
type agree—i.e., if you are requesting "DOC" is there a DOC
sample, etc.
From the Log-in Section the LCG-INV sheets are brought to the ADP
Section and the cards are punched and verified that afternoon. A-6
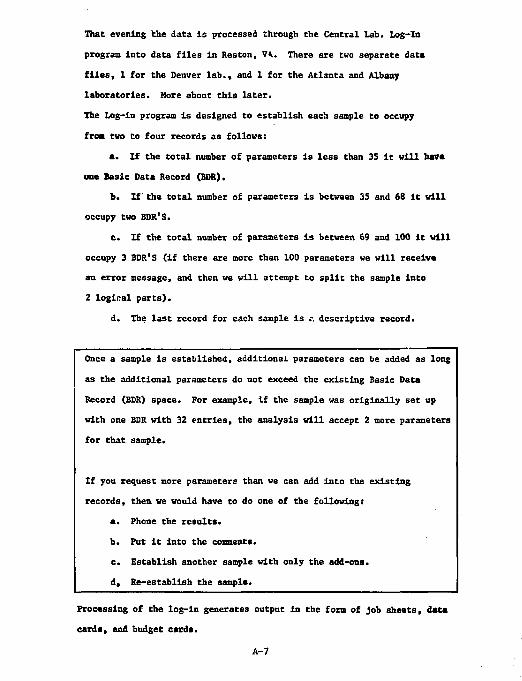
That evening the data is processed through the Central Lab. Log-In
program into data files in Reston, VA. There are two separate data
files, 1 for the Denver lab., and 1 for the Atlanta and Albany
laboratories. More about this later.
The Log-in program is designed to establish each sample to occupy
from two Co four records as follows:
a. If the total number of parameters is less than 35 it will have
one Basic Data Record (BDR).
b. If the total number of parameters is between 35 and 68 it will
occupy two BDR'S.
c. If the total number of parameters is between 69 and 100 it will
occupy 3 BDR'S (if there are more than 100 parameters we will receive
an error message, and then we will attempt to split the sample into
2 logical parts).
d. The last record for each sample is ?, descriptive record.
Once a sample is established, additional parameters can be added as long
as the additional parameters do not exceed the existing Basic Data
Record (BDR) space. For example, if the sample was originally set up
with one BDR with 32 entries, the analysis will accept 2 more parameters
for that sample.
If you request more parameters than we can add into the existing
records, then we would have to do one of the following:
a. Phone the results.
b. Put it into the comments.
c. Establish another sample with only the add-ons.
d. Re-establish the sample.
Processing of the log-in generates output in the form of job sheets, data
cards, and budget cards.
A-7
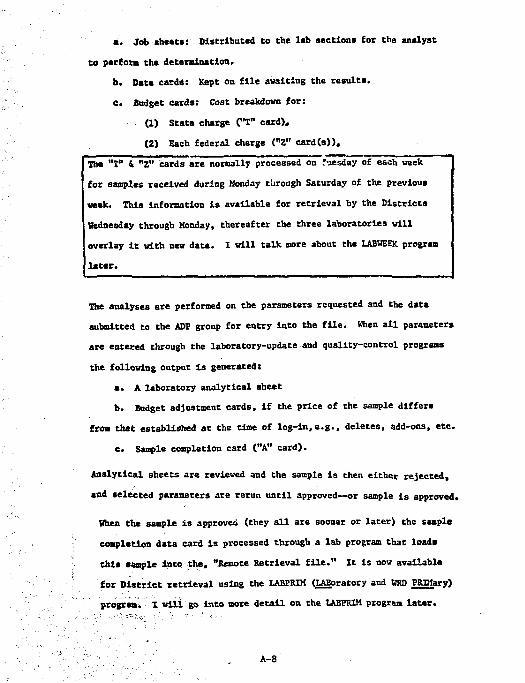
a. Job sheets: Distributed to the lab sections for the analyse
to perform the determination.
b. Data cards: Kept on file awaiting the results.
e. Budget cards: Cost breakdown for:
(1) State charge ("T" card).
(2) Each federal charge ("Z" card(s)).
The "I" & ''Z" cards are normally processed on Tuesday of each week
for samples received during Monday through Saturday of the previous
week. This information is available for retrieval by the Districts
Wednesday through Monday, thereafter the three laboratories will
overlay it with new data. 1 will talk more about the LABWEEK program
later.
The analyses are performed on the parameters requested and the data
submitted to the ADP group for entry into the file. When all parameters
are entered through the laboratory-update and quality-control programs
the following output is generated:
a. A laboratory analytical sheet
b. Budget adjustment cards, if the price of the sample differs
from that established at the time of log-in,e.g., deletes, add-ons, etc.
c. Sample completion card ("A" card).
Analytical sheets are reviewed and the sample is then either rejected,
and selected parameters are rerun until approved—or sample is approved.
When the sample is approved (they all are sooner or later) the sample
completion data card is processed through a lab program that load*
this sample into the, "Remote Retrieval file." It is now available
for District retrieval using the LABPRIM (LABoratory and WRD PRElary)
program. I will go into more detail on the LABPRIM program later.
A-8
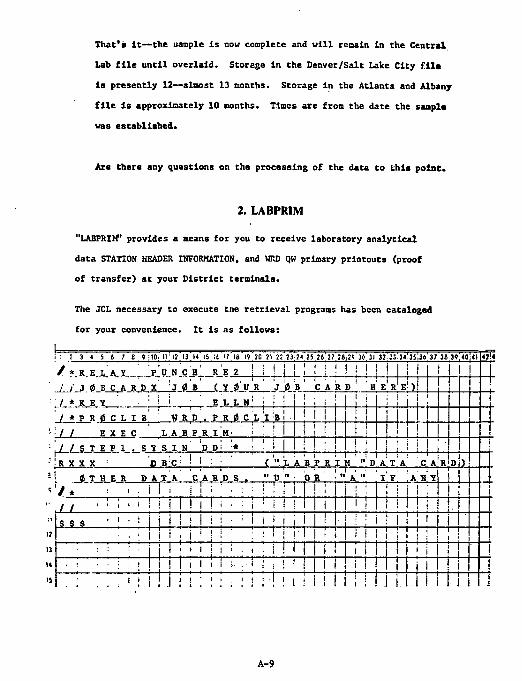
That's It—the sample Is now complete and will remain In the Central
Lab file until overlaid. Storage in the Denver/Salt Lake City file
is presently 12—almost 13 months. Storage in the Atlanta and Albany
file is approximately 10 months. Times are from the date the sample
was established.
Are there any questions on the processing of the data to this point.
2. LABPRIM "LABPRIM" provides a aeans for you to receive laboratory analytical
data STATION HEADER INFORMATION, and WRD QW primary printouts (proof
of transfer) at your District terminals.
The JCL necessary to execute tne retrieval programs has been cataloged
for your convenience. It is as follows:
: ! 3 4 S 6 7 8 » :10i II 12 13 14 IS :t U 18 19 2C 21 22 23 24 25 2 6 2 7 28[2? 30 31 32:33'34!3S|3637 38 3 9 > 0 41 42'4
/ * R E L A Y ' p ' u H C ' H ' R E 2 ! i ! i I ! ! i • I ! ! ! 1 i i / / J 0 B C A R D X
. i ' i i . i l • i : i : ! i J O B ( Y 0 U R J 0 B C A R D H E R E ! ) l
I
9
/ * K E Y . • i i • • E L L H ' ! . ! ! i i ! i
I
9
• ! ' •• : 1 . i / * P R 0 C L I B W R D . P R 0 C L I ' B i 1 i I i
i
I
9
/ / E X E C L A B P R I H ' ; ' ! ! 1 ! i i t !
I
9
/ / s i E P i . s s s n DDi :* ! ' ! 1 ! ! : ! ! ; i i |
I
9
R X X X : £ B ' C ' ! 1 : { " . L A B P R I M " D A T A C A'R D ) I
9
« T H E R D A T
/ * i • 1 1 A C A R D S . " D " 0 R " A " I F A N Y I I
9
« T H E R D A T
/ * i • 1 1 . : : : : i i l 1 ; i i i { ! 1
I » !
I
9
/ / '• I 1 ! 1 i • : i ' 1 1 i i 1 ! i i ! i j ; i S S S ' | : ; j i j 1 1 i • ; i i 1 i i i i
i M i l l j ! i 12
• : : i : i i i i • ! : 1 i !! • i M i i | 1 ! 1 !
1 1 !
13 i • • i i i ; . . : i ! i | i i ! • i ! i i I 1 I i 1 ! It • • : ! i i ! i i 1 i :• i i 1 i ! I ! i i i ! 1 ! 1 1 i ! IS . ; . . . • ; i i ! ' i ' . i I i - 1 i' 1 I j i 1 . J
A-9
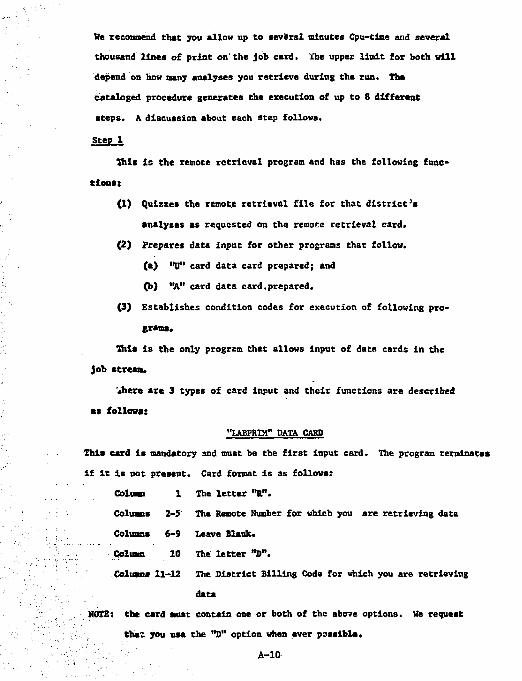
We recommend that you allow up to several minutes Cpu-time and several
thousand lines of print on' the job card. I'he upper limit for both will
depend on how many analyses you retrieve during the run. The
cataloged procedure generates the execution of up to 8 different
steps. A discussion about each step follows.
Step 1
this is the remote retrieval program and has the following func
tions:
(1) Quizzes the remote retrieval file for that district's
analyses as requested on the remote retrieval card.
(2) Prepares data input for other programs that follow.
(a) "U" card data card prepared; and
(b) "A" card data card.prepared.
(3) Establishes condition codes for execution of following pro
grams.
this is the only program that allows input of data cards in the
job stream.
'there are 3 types of card input and their functions are described
•s follows:
"IABPRIM" DATA CAM)
This card Is mandatory and must be the first input card. The program terminates
if it is not present. Card format is as follows:
Column 1 The letter "R".
Columns 2-5' The Remote Number for which you are retrieving data
Columns 6-9 Leave Blank.
Column 10 The letter "D".
Columns 11-12 The District Billing Code for which you are retrieving
data
HOIE: the card must contain one or both of the above options. We request
that you usa the "D" option when ever possible.
A-10
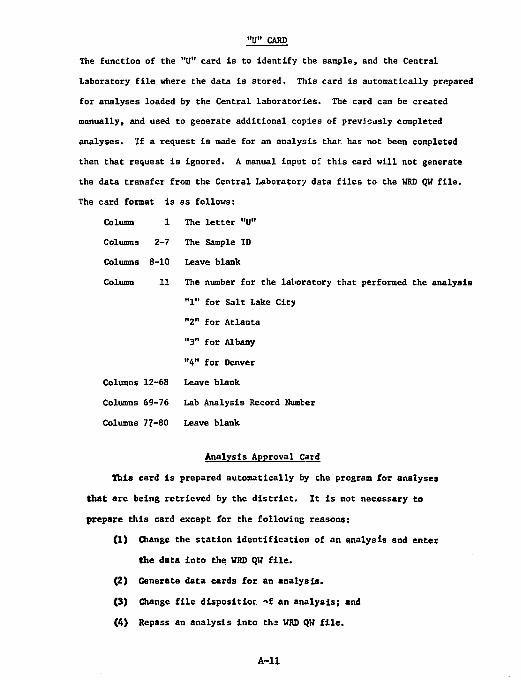
"U" CARD
The function of the "U" card is to identify the sample, and the Central
Laboratory file where the data is stored. This card is automatically prepared
for analyses loaded by the Central laboratories. The card can be created
manually, and used to generate additional copies of previously completed
analyses. If a request is made for an analysis that has not been completed
then that request is ignored. A manual input oi this card will not generate
the data transfer from the Central Laboratory data files to the WRD QH file.
The card format is as follows:
Column 1 The letter "U"
Columns 2-7 The Sample ID
Columns 8-10 Leave blank
Column 11 The number for the laboratory that performed the analysis
"1" for Salt Lake City
"2" for Atlanta
"3" for Albany
"4" for Denver
Columns 12-68 Leave blank
Columns 69-76 Lab Analysis Record Number
Columns 77-80 Leave blank
Analysis Approval Card
This card Is prepared automatically by the program for analyses
that are being retrieved by the district. It is not necessary to
prepare this card except for the following reasons:
(1) Change the station identification of an analysis and enter
the data into the WRD QH file.
(2) Generate data cards for an analysis.
(3) Change file disposition ->£ an analysis; and
(4) Repass an analysis into the WRD QH file.
A-ll
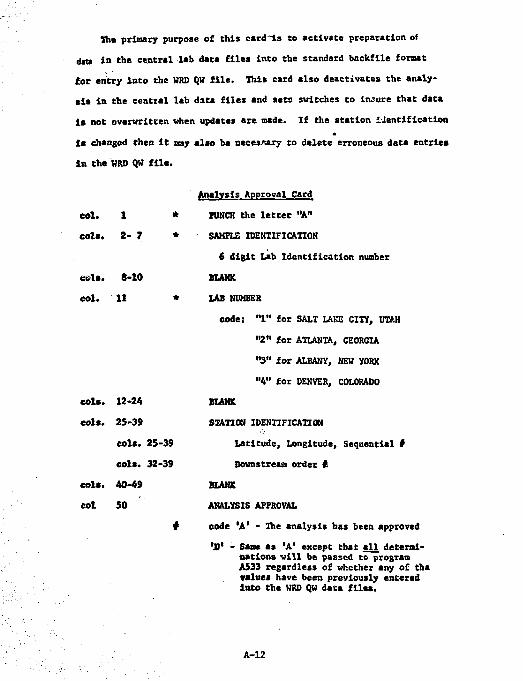
The primary purpose of this card-is to activate preparation of
data in the central lab data files into the standard backfile format
for entry into the WRD QW file. This card also deactivates the analy
sis in the central lab data files and sets switches to injure that data
is not overwritten when updates are made. If the station UentifIcation
fs changed then it nay also be necessary to delete erroneous data entries
In the WRD QW file.
Analysis Approval Card col. 1 * PUNCH the letter "A" cole. *' 7 * SAMPLE IDENTIFICATION
6 digit Lab Identification number eels. 8-10 HANK col. 11 * LAB NUMBER
code: "1" for SALT LAKE CITY, UTAH
"2" for ATLANTA, GEORGIA
"3" for ALBANY, NEW YORK
"4" for DENVER, COLORADO
cols. 12-24 BLANK
cols. 25-39 STATION IDENTIFICATION
cols. 25-39 Latitude, Longitude, Sequential #
cols. 32-39 Downstream order #.
cols. 40-49 BLANK
COl 50 ANALYSIS APPROVAL
# code 'A' • The analysis has been approved
'II' - Same as 'A' except that all determinations will be passed to program A533 regardless of whether any of the values have been previously entered into the WRD QW data files.
A-12
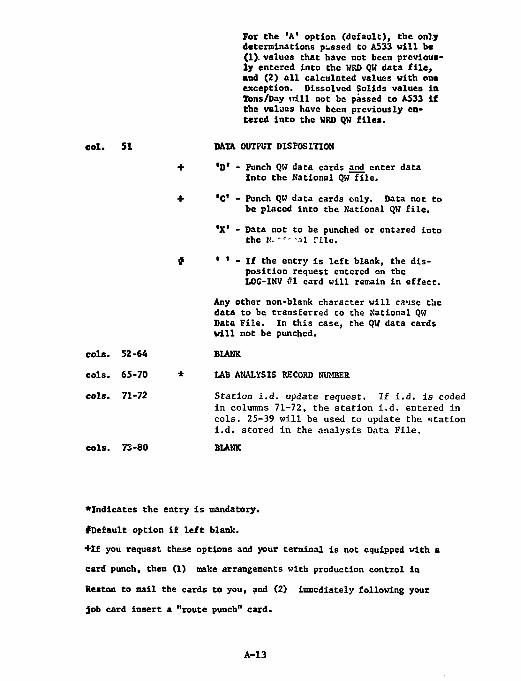
For the 'A' option (default), the only determinations passed to A533 will be (1). values that have not been previously entered into the WRD QH data file, and (2) all calculated values with one exception. Dissolved Solids values in Tons/Day will not be passed to AS33 If the values have been previously entered into the WRD QH files.
col. 51 DATA OUTPUT DISPOSITION
+ 'D' - Punch QW data cards and enter data into the National QH file.
+ 'C' - Punch QH data cards only. Data not to be placed into the National QH file.
'X' - Data not to be punched or entered into the N. -•- -il rile.
# • * - If the entry is left blank, the disposition request entered on the LOG-INV ill card will remain in effect.
Any other non-blank character will cause the data to be transferred to the National QH Data File. In this case, the QU data cards will not be punched.
cols. 52-64 BLANK
cols. 65-70 * LAB ANALYSIS RECORD NUMBER
cols. 71-72 Station i.d. update request. If i.d. Is coded in columns 71-72, the station i.d. entered in cols. 25-39 will be used to update the station i.d. stored in the analysis Data File.
cols. 73-80 BUNK
•Indicates the entry is mandatory.
{Default option if left blank.
+If you request these options and your terminal is not equipped with a
card punch, then (1) make arrangements with production control In
Reston to mail the cards to you, and (2) immediately following your
job card insert a "route punch" card.
A-13
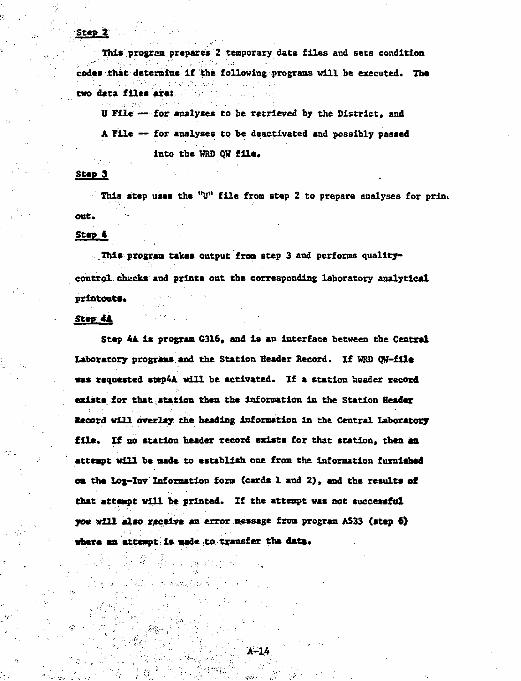
Step 2
This program prepares 2 temporary data files and sets condition
codes that determine:if the following programs vill be executed. The
two data files are:
U File — for analyses to be retrieved by the District, and
A File — for analyses to be deactivated and possibly passed
into the WRD QH file.
Step 3
This step uses the "U" file from step 2 to prepare analyses for print.
out.
Step *
.This program takes output from step 3 and performs quality-
control checks and prints out the corresponding laboratory analytical
printouts.
Step *A
Step 4a, is program G316, and is an interface between the Central
Laboratory programs and the Station Header Record. If WRD QH-file
was requested stsp4A will be activated. If a station header record
exists for that.station then the information in the Station Header
Kecord will overlay the heading information in the Central Laboratory
file. If no station header record exists for that station, then an
attempt will be made to establish one from the information furnished
on the Log-Inv Information form (cards 1 and 2), and the results of
that attempt will be printed. If the attempt was not successful
you will also receive an error message from program A533 (step 6)
where an attempt is made to transfer the data.
A-14
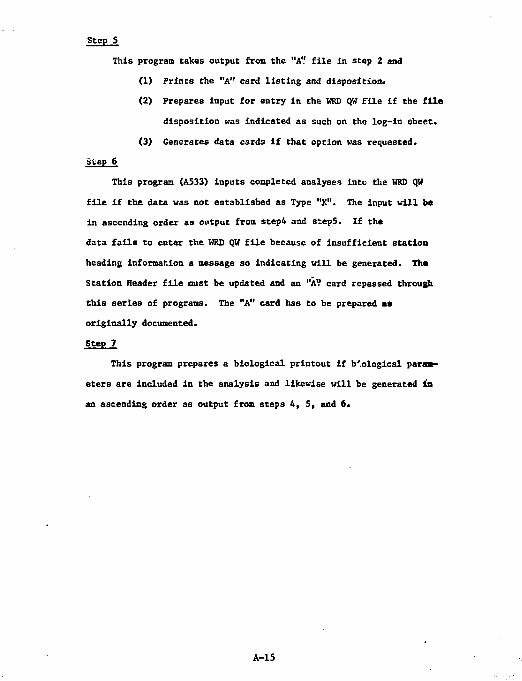
Step 5
This program takes output from the "A" file in step 2 and
(1) Prints the "A" card listing and disposition.
(2) Prepares input for entry in the WRD QW File if the file
disposition was indicated as such on the log-in sheet.
(3) Generates data cards if that option was requested.
Step 6
This program (AS33) inputs completed analyses into the HRD QW
file if the data was not established as Type "X". The input will be
in ascending order as output from step4 and step5. If the
data fails to enter the HRD QU file because of insufficient station
heading information a message so indicating will be generated• The
Station Header file must be updated and an "AV card repassed through
this series of programs. The "A" card has to be prepared •»
originally documented.
Step 7
This program prepares a biological printout if b'.ological param
eters are included in the analysis and likewise will be generated in
an ascending order as output from steps 4, 5, and 6.
A-15
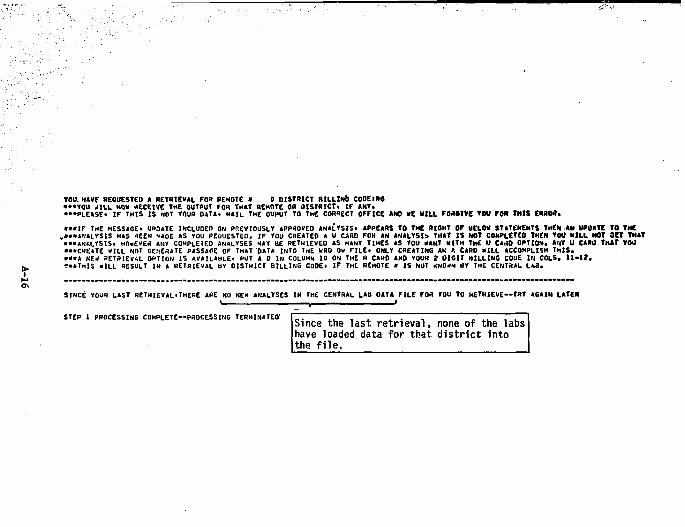
YOU. HAVE REQUESTED A RETRIEVAL FOR REMOTE • 0 DISTRICT BILLING C00EIP9 •••YOU JILL NOV RECEIVE THE OUTPUT FOR THAT REMOTE OR OtSTRICT. IF ANY. •••PLEASE* IF THIS IS NOT YOUR DATAi HAIL THE OUPUT TO THE CORRECT OFFICE AND "E HILL FORMVE YOU FOR THIS ERROR. •••IF TriE MESSAGE. UPDATE INCLUDED ON PREVIOUSLY APPROVED ANALYSIS. APPEARS TO THE RIOHT OF UELOH STATEMENTS THEN AN UPDATE TO THE ,<«»AUAlYSIS HAS SEEN MAOE AS YOU REQUESTED, IF You CREATED A U CARD FOH AN ANALYSIS THAT IS NOT COMPLETED THEN YOU HILL NOT SET THAT •••ANALYSIS. HO«EVER ANY COMPLETED ANALYSES HAY BE RETRIEVED AS HANY TIMES AS YOU NANT HITH THE U CAriD OPTION. ANY U CARU THAT YOU •••CREATE HILL NOT GENERATE PASSAGE OF THAT DATA INTO TriE KRD OW FILE. ONLY CREATING AN A CARD HILL ACCOMPLISH THIS. •••A KE4 RETRIEVAL OPTION IS AVAILAHLE. PUT A 0 IN COLUMN 10 ON THE R CARD AND YOUR 2 DIGIT HILLING COUE HI COLS. 11-12. -••TnlS aILL RESULT IN A RETRIEVAL BY OISTHICT BILLING CODE) IF THE REMOTE ' IS NUT KNOWN BY THE CENTRAL L«a.
SINCE YOUR LAST RETRIEVAL'TNERE ARE NO NEK ANALYSES IN THE CENTRAL LAB DATA FILE FOR YOU TO RETRIEVE—TRY AGAIN LATER
STEP 1 PROCESSING COMPLETE—PROCESSING TERMINATED1
Since the last retrieval, none of the labs have loaded data for that district into the file.
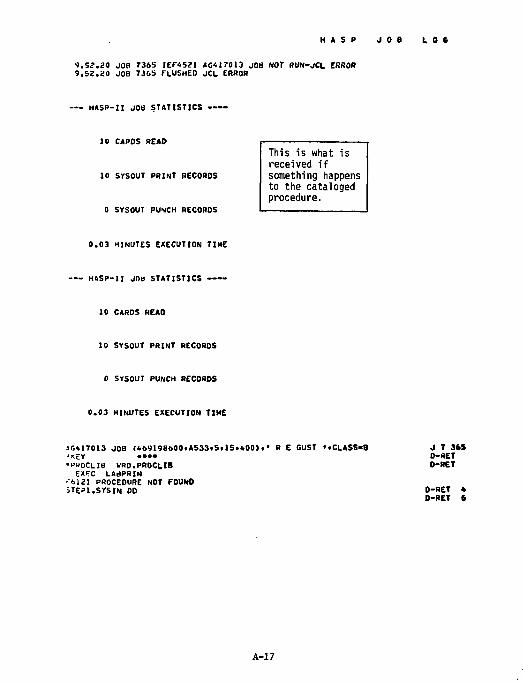
H A S P J 0 8 L O G
9.52.20 JOB 7365 I£F«52I KG*17013 JOB NOT RUN-JCL ERROR 9.52.20 JOB 7J6S FLUSHED JCL ERROR
— HASP-1I JOB STATISTICS
10 CAPOS READ
10 SYSOUT PRINT RECORDS
0 SYSOUT PUNCH RECOROS
This is what is received if something happens to the cataloged procedure.
0.03 MINUTES EXECUTION TIME
H6SP-II JOB STATISTICS
10 CARDS READ
10 SYSOUT PRINT RECORDS
0 SYSOUT PUNCH RECORDS
0.03 HINUTES EXECUTION TIME
ar.*170I3 JOB <*69198bOO.AS33.S.lS.<.00>>' R E GUST ••CLASS'S JxEY •••• •PHOCLIB WRD.PROCLlB
EXPC LAdPRIN •'6121 PROCEDURE NOT FOUND STEP1.SYS1N DD
J 7 36S O-RET O-RET
D-RET * D-RET 6
A-17
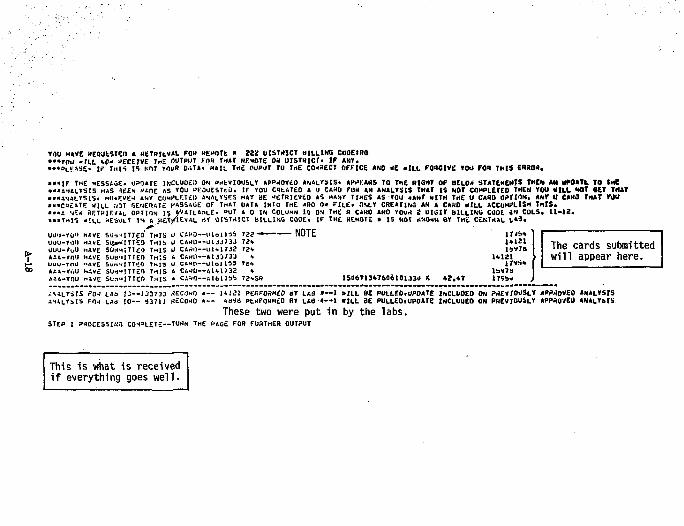
YOU HAVE REOUfcSTED A HETRIeVAL FOR REMOTE • 222 DISTRICT HILLING CUOEIRO •••Yfid -ILL N O RECEIVE T«E OUTPUT FOB THAT REMOTE OR DISTRICT. IF ANY. •••PLt-ISE. IF T M I S IS WIT YOUR D.-.TA. M A I L T H E OUPJT To TdE CORRECT OFFICE AND dE «ILL FORGIVE »OU FOR THIS ERROR.
•••IF THE MESSAGE. UPDATE INCLUDE;! ON PKtVIOUSLY APPROVdO ANALYSIS. APPEARS TO THE RIGHT OF HELOd STATEMENTS THEW M UPDATE. TO ft* •••ANALYSIS MAS 1EEN MADE AS YOU PfOUESTtD. IF YOU CRtATED A U CAPO FUR AN ANALYSIS THAT IS NOT COMPLETED THEM YOU «ILL SOT GET TlUT • ••ANALYSIS. MI1.EVEH ANY CtlMPLFjLD ANALYSES MAY aE RETRIEVcO AS MANY TIMES AS YOU aANT alTH THE O C«RO OPTION. ANT U CAMS Tirtt VOtf •••CREATE KILL :OT GENERATE PASSAGE OF THAT OATA INTO THE aRO 0« FILE. ONLY CREATING AN A CARD HILL ACCUHFLISri T H I S . • ••A NEa RETRIEVAL OPTION IS AVAILABLE. °UT A 0 IN COLUMN ltj ON THE fl CARD AND YOUR 2 UIGIT BILLING CODE 4r* COLS. 11-12. • • • M S . . I U RESULT IN A K£t/lEvAL dY DISTRICT blLLING CODE. IF THE REMOTE > IS NOT KNOlN BY T M E CENTRAL LA3.
UU'J-YO't HAVE SiJ^-.ITJED THIS UUU-YOU HAVE SUBMITTED THIS UUU-VuU HAVE SUHMITltO T H I S AA&.fnu HAVE subHiTiEo T H I S UUU-TOU "AVE 5un-.ITTi;0 T M I S A A A - Y I I U HAVE SUl- ITTEO THIS AAA-YOU .-AVE SUrvITTEO TrtIS
CAPO—tl l o l l 3S 722 — CARO—U13J733 72*. CARD--U141732 724 CAMl)—A133 733 * C 6 « 0 — u l o l l 5 S T24 CARO--AU1732 4 CARD—AlAllbb 72<.SR
NOTE
15G6713A760M01J31I X 4 2 . * ?
IU5.4 1*121 ISV7B.
14121 17*34
179b.
The cards submitted will appear here.
;\JLYSIS FOR LAb 13—1J3733 REClWO • — 1*!21 PERFORMED <JY LAS » — 1 »ILL BE PULLEO.UPOATE INCLUDED ON PREVIOUSLY APPROVED ANALYSIS ANAL'blS FOR LAd I D — S3711 RECORD «-- <.«J6 PERFORMED BY LAB •««• I RILL BE PULLEO.UPOATE INCLUDED ON PREVIOUSLY APPROVED ANALYSIS
These two were put in by the labs. STEP 1 PROCESSING COMPLETE—TURN THE PAGE FOR FURTHER OUTPUT
This is what is received if everything goes well.
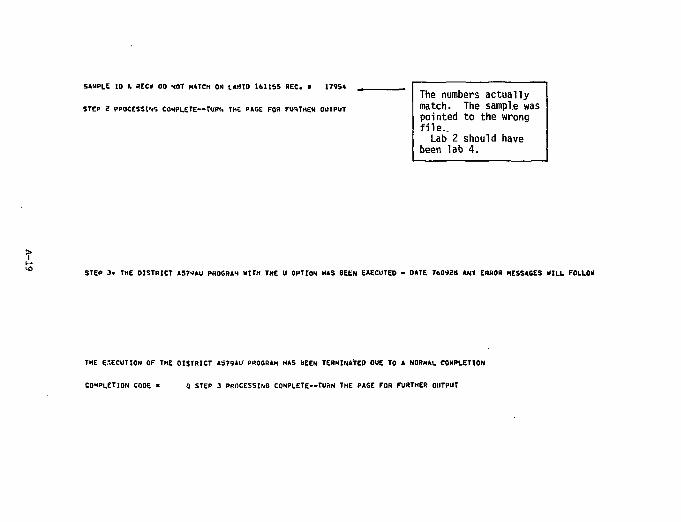
SAMPLE ID k REC> 00 NOT MATCH ON LArilO 1611S5 REC. • 17954
STEP I PROCESSING COMPLETE—TUPh THE PAGE FOR FURTHER OUTPUT The numbers actually match. The sample was pointed to the wrong file..
Lab 2 should have been lab 4.
STEP 3. THE OISTRICT AST4AU PROGRAM KITH THE U OPTION HAS BEEN EXECUTED - DATE 760*28 ANT ERROR MESSAGES KILL FOLLO*
THE EXECUTION OF THE OISTRICT AS79AU PROGRAM HAS BEEN TERMINATED OUE TO A NORMAL COMPLETION
COMPLETION COOE « 0 STEP 3 PROCESSING COMPLETE—TURN THE PAGE FOR FURTHER OUTPUT
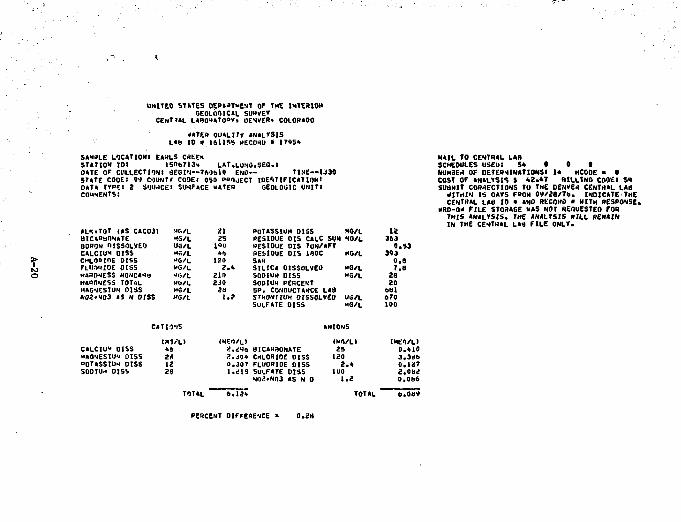
UNITEO ST»TES OEPA4TMENT OF THE INTERIOR GEOLOGICAL SURVEY
CENTJAL LABORATORY, DENVER" COLORADO «TF.R DUALITY ANALYSIS
L*D ID » 16US5 RECORD • 1795* SIMPLE LOCATION! EARLS CREEK STATION 101 1S<I6713» LAT.LUNG.SEO.: 0«TE OF COLLECTION! 8EGIM--769610 ENO— TIME—1330 STATE COOEl 94 COUNT' CODE: 050 PROJECT IDENTIFICATION! DATA TVPF! J SOURCE! SURFACE MATER GEOLOGIC UNIT! COMMENTS:
•LKiTOT <>S CAC03) BICARBONATE BORON nisSOLVEO C«LCIUM DISS CMLO°IOE OISS FLUORIDE OISS HARDNESS NONCARe HARDNESS TOTAL MAGNESIUM OISS KO2.N03 AS H OISS
Mft/L MG/L UG/L MG/L MG/L MG/L MG/L Mb/L WG/L MG/L
21 2S l»0 46 ISO 210 2J0 28 1.?
POTASSIUM DtSS RESIDUE DIS CALC SUM RESIDUE DIS TUN/AFT RESIOUE DIS 1S0C SAR SILICA DISSOLVES SODIUM DISS SODIUM PERCENT SP. CONDUCTANCE LA9 STRONTIUM DISSOLVED SULFATE DISS
MO/L MO/L MG/L MG/L MG/L
UG/L MG/L
CALCIU" OISS MAGNESIUM DISS POTASSIUM OISS SODIUM DISS
laVLI (ME'l/L) <MG/Lt 46 2.<No BICARBONATE 25 2A 2.304 CHLORIDE OISS 120 12 0.J07 FLUORIDE OISS 2.4 29 l.c!19 SULFATE DISS 100
NI12.N03 AS N 0 1.2 TOTAL 6.124 TO
PERCENT DIFFERENCE « 0.28
U 363
0.4J 393 O.S 7.8
26 20 681 670 100
IMEQ/L) 0.410 3.306 0.127 2.082 0.086 6.089
HAIL TO CENTRAL LAB SCHEDULES USEU! 54 0 0 t NUMBER OF DETERMINATIONS! 14 HCODE » • COST OF ANALYSIS i 42.47 HILLING COOCs SO SUBMIT CORRECTIONS TO THE DENVER CENTRAL LA8
4ITHIN 15 DAYS FROM 09/26/76. INDICATE THE CENTRAL LA8 10 • AND RECORD • WITH RESPONSE.
MRD-0* FILE STORAGE MAS NOT REQUESTED FOR THIS ANALYSIS. THE ANALYSIS HILL REMAIN IN THE CENTRAL LAM FILE ONLY.
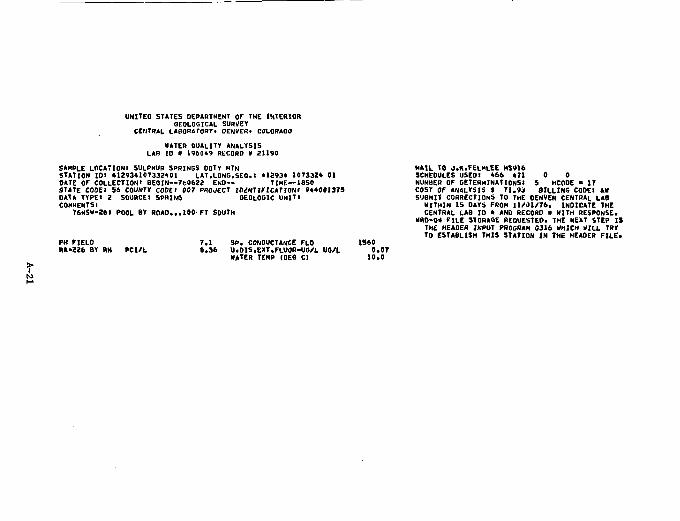
UNITEO STATES DEPARTMENT OF THE INTERIOR GEOLOGICAL SURVEY
CENTRAL LABORATORY DENVER* COLORADO HATER DUALITY ANALYSIS
LAB ID » 1960*9 RECORD • 21190 SAMPLE LOCATIONI SULPHUR SPRINGS OOTY MTN STATION ID: 41293A107332A01 LAT.LONG.SEO.I A1293A 107332* 01 OATE OF COLLECTION" BEGIN—760622 END-- TIME—1850 STATE CODEI 56 COUN7V COOEl 007 PROJECT IOcNTIFICATIONl 9**001375 DATA TYPE« 2 SOURCEI SPRING GEOLOGIC UNIT I COMMENTS!
76HSW-26I POOL BY ROAD...100- FT SOUTH
PH FIELD 7.1 SP. CONDUCTANCE FLO RA-J26 BY P.N PCt/L 0.36 U.DIS.EXT.FLUOR-UG/L U8/L
MATER TEMP IDEG C)
MAIL TO J.K.FELMLEE HS916 SCHEDULES USED: *66 ATI 0 0 NUMBER OF DETERMINATIONS! S HCODE • 17 COST OF ANALYSIS S 71.93 SILLING COOEl M SUBMIT CORRECTIONS TO THE DENVER CENTRAL LAS MITHIN IS DAYS FROM 11/01/76. INDICATE THE CENTRAL LAB ID A AND RECORD < MITH RESPONSE.
HRD-O* FILE STORAGE REQUESTED. THE NEXT STEP IS THE HEADER INPUT PROGRAM 0316 WHICH KILL TRY TO ESTABLISH THIS STATION IN THE HEADER FILE.
1S60 0.07 10.0
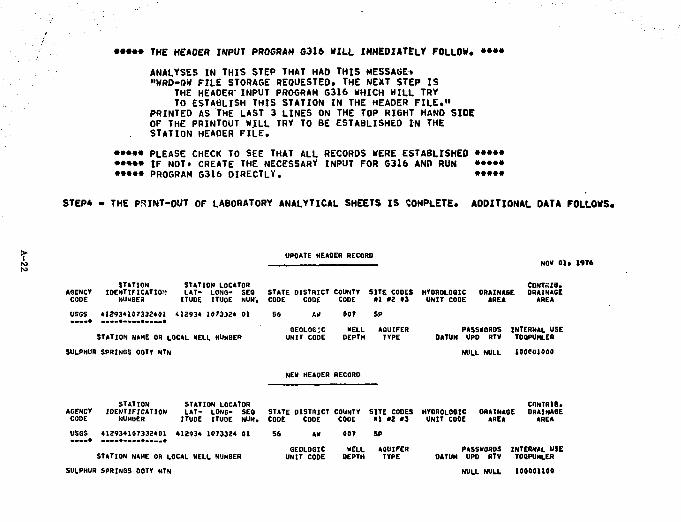
••••• THE HEAOER INPUT PROGRAM 6316 HILL IMMEDIATELY FOLLOW. •••• ANALYSES IN THIS STEP THAT HAD THIS MESSAGE* "WRD-OW FILE STORAGE REOUESTEO. THE NEXT STEP IS
THE HEADER- INPUT PROGRAM G316 WHICH WILL TRY TO ESTABLISH THIS STATION IN THE HEAOER FILE."
PRINTED AS THE LAST 3 LINES ON THE TOP RIGHT HAND SIOE OF THE PRINTOUT WILL TRY TO BE ESTABLISHED IN THE STATION HEAOER FILE.
••••• PLEASE CHECK TO SEE THAT ALL RECOROS WERE ESTABLISHEO •*••• ••*•• IF N0T» CREATE THE NECESSARY INPUT FOR G3I6 AND RUN ••••• ••••• PROGRAM G316 DIRECTLY. •••••
STEP* - THE P3INT-0UT OF LABORATORY ANALYTICAL SHEETS IS COMPLETE. ADDITIONAL DATA FOLLOWS.
UPDATE HEAOER RECORD NOV 01f 1*76
STATION STATION LOCATOR CONTSIS. AGENCY IDENTIFICATION LAT- LONG- SEQ STATE DISTRICT COUNTY SITE CODES HYOROLOOIC ORAINASE DRAINAGE CODE NUMBER ITUOE ITUDE NUM/. CODE CODE CODE HI «2 »3 UNIT CODE AREA AREA USOS 412934107332401 412934 1073324 01 56 JW 007 SP
STATION NAME OR LOCAL HELL NUMBER SULPHUR SPRINGS OOTY MT N
GEOLOG:C UNIT CODE
"ELL DEPTH
AOUIFER TYPE
PASSWORDS INTERNAL USE DATUH UPD RTV TDQPUHLEA
NULL NULL 100001000
NEU HEADER RECORO
AGENCY CODE
STATION IDENTIFICATION
NUMBER STATION LOCATOR LAT- LONG- SEO ITUDE ITUDE NUM.
USGS 412934107332401 412934 1073324 01
STATION NAME OR LOCAL NELL NUMBER SULPHUR SPRINGS DOTY MTN
STATE DISTRICT CODE CODE
COUNTY SITE CODES CODE al .2 »3
CONTR1B. HYDR0L06IC DRAINAGE DRAINAGE UNIT CODE AREA AREA
56 AM 007 SP GEOLOGIC UNIT CODE
HELL AQUIFER DEPTH TYPE
PASSWORDS INTERNAL USE DATUM UPD RTV TOQPUHLER
NULL NULL 100001100
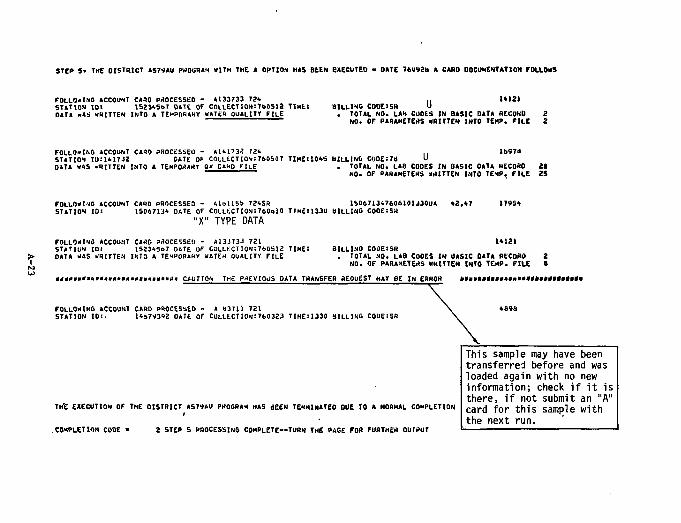
STEP «• THE 0ISTR1CT AS74AU PROGRAM WITH THE A OPTION HAS 8EEN BAECUTEO • OATE 76UV2D A CARD DOCUMENTATION FOLLOWS
FOLLOWING ACCOUNT CARO PROCESSED - A133733 72* STATION IS". lS23".SoT DATE OF C0LLECTI0N1760SJ2 TlHEl DATA WAS WRITTEN INTO A TEMPORARY WATER DUALITY FILE
II U l Z * BILLING CODE1SR U . TOTAL NO. LAM CODES IN BASIC DATA RECORD
NO. OF PARAMETERS WRITTEN INTO TEMP. FILE
FOLLOWING ACCOUNT CARD PROCESSED - AHl'32 724 .. lb*7d STATION IU:1417J2 DATE OF COLLECTION:760507 TIMEI10A3 BILLING COD£:7d U OATA WAS WRITTEN INTO A TEMPORARY QW CARD FILE . TOTAL NO. LAS CODES IN BASIC DATA RECORD 21
NO. OF PARAMETERS WRITTEN INTO TEMP, FILE 2S
FOLLOW IJG ACCOUNT CARD PROCESSED - AloUSi 724SR 1S0671347606101J30UA *2.<7 179SA STATION ID: 1S067134 DATE OF COLLtCTIO.N:760t>10 TJM£:1330 HILLING CODESSR
"X" TYPE DATA FOLLOWING ACCOUNT CARD PROCESSED - A13J733 721 STATION ID! 15234567 OnTE OF COLLtCT10N:760512 TIME: DATA WAS WRITTEN INTO A TEMPORARY WATER QUALITY FILE
1*121 BILLING COUEISR . TOTAL NO. LAB CODES IN BASIC DATA RECORD 2
NO. OF PARAMETERS WRITTEN INTO TEMP. FILE * TION THE PREVIOUS DATA TRANSFER REQUEST MAY BE IN ERROR
FOLLOWING ACCOUNT CARD PROCESSED - A B3711 721 STATION ID: 1467*392 DATE OF COLLtCTION:760323 TIME:1330 SILLING C0UE:SR
TH'E EXECUTION OF THE DISTRICT AS79AU PHOGRAM HAS dEEN TERMINATED DUE TO A NORMAL COMPLETION i
COMPLETION CODE - 2 STEP 5 PROCESSING COMPLETE—TURN THE PAGE FOR FURTHER OUTPUT
This sample may have been transferred before and was loaded again with no new information; check if it is there, if not submit an "A" card for this sample with the next run.
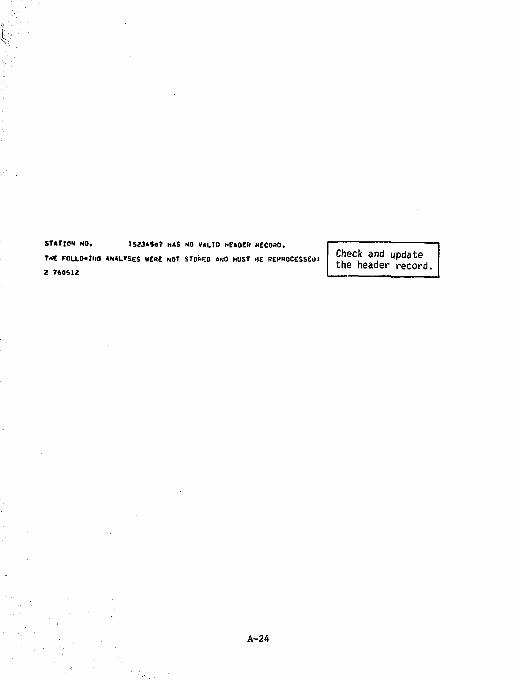
STATION NO. I5234SST HAS NO VALID N E A O E R RECORD.
TXC FOULO.IIIO ANALYSES HERE NOT STORED AND MUST 4E REPROCESSED!
2 760312
Check and update the header record.
A-24
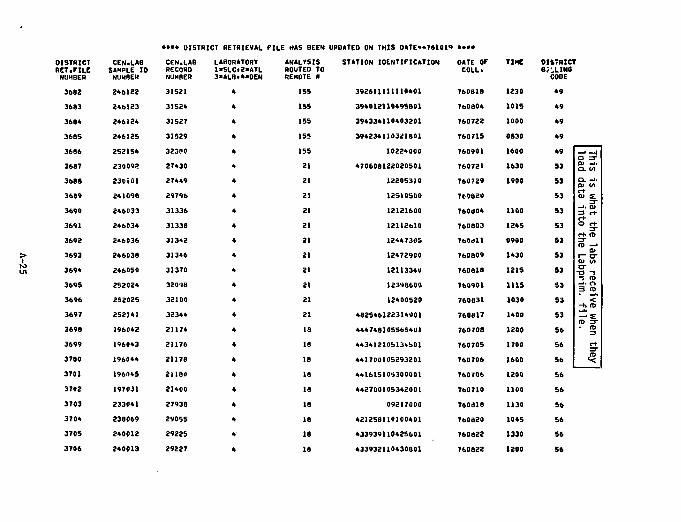
•••• DISTRICT RETRIEVAL FILE HAS BEEN DISTRICT RET.FILE NUMBER
CEN.LAB SAMPLE ID NUMBER
CEN.LAB RECORD NUMBER
LABORATORY l«SLCi2>ATL 3>ALBi4aOEN
ANALYSIS ROUTED TO REMOTE »
3682 246122 31521 155 3663 246123 31S24 155 3684 246124 31527 155 3685 246125 31529 155 3686 252154 32380 155 3687 230092 27430 21 3688 230101 27449 21 36B9 241096 29T96 21 3690 246033 31336 21 3691 246034 31338 21 3692 246036 31342 21
<? 3693 246038 31346 21 3694 246050 31370 21 369S 252024 32098 21 3696 252025 32100 21 3697 252141 32344 21 369B 196042 21174 IB 3699 196043 21176 IB 3700 196044 21178 18 3701 196045 21180 18 3702 197031 21400 18 3703 233041 2T938 18 3704 238069 29055 18 3705 240012 29225 18 3706 240013 29227 IS
UPDATED ON THIS 04TE--761019 STATION IDENTIFICATION
392611111110401 394012110495B01 394334110403201 394234110321801
10224000 470608122020501
12205310 12510500 12121600 12112610 12447305 12472900 12113340 1239B600 12400520
482546122314901 444748105S654O1 443412105134501 441700105293201 44161S105300O01 442700105342001
09217000 421258110100401 43393911042S601 433932110430801
DATE OF COLL.
TIME DISTRICT BiUINO CODE
76081B 1230 49 760804 1015 49 760722 1000 49 760715 0B30
1600 1630
49 49 S3
760901 760721
0B30 1600 1630
49 49 S3
This load
760729 1900 S3 at (/> 760820 S3 3" 760004 760803
1100 1245
S3 53
at th into
760O11 0900 S3 rti ID ID —•
760809 1430 53 0> r- er 0) (/)
760818 760901
1215 111S
S3 S3
rece bpri IT
760831 1030 53 -b n> 760817 76070S
1400 1200
S3 56
when ile.
760705 1700 56 S 760706 1600
1200 56 56
•? 760706
1600 1200
56 56
760710 1100 56 760818 1130 56 760820 1045 56 760822 1330 56 760822 1200 56
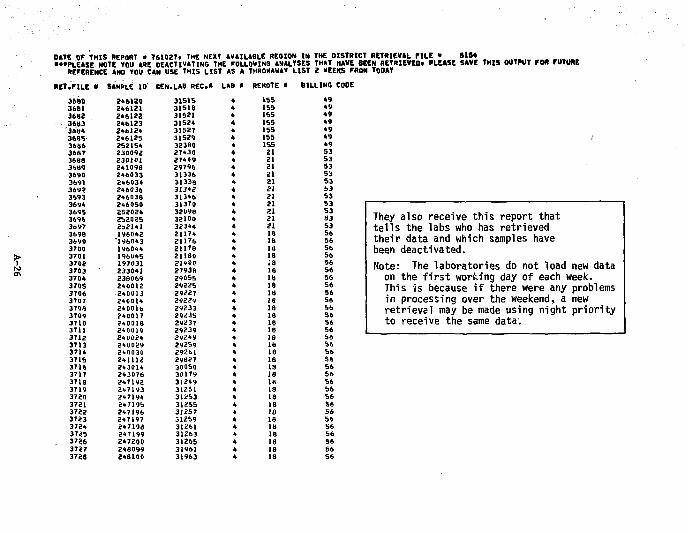
DATE OF THIS REPORT * 761027. THE NEXT AVAILABLE REGION IN THE DISTRICT RETRIEVAL FILE • SIS* •••PLEASE NOTE YOU ARE DEACTIVATING THE FOLLOWING ANALYSES THAT HAVE BEEN RETRIEVEOt PLEASE SAVE THIS OUTPUT FOR FUTURE
REFERENCE AND YOU CAN USE THIS LIST AS A THROHAMAY LIST 2 KEEKS FROM TODAY RET.FJLE • SAMPLE ID CEN.LAS REC.» LAG • REMOTE » BILLING CODE
3680 246120 31515 4 155 49 3681 246121 31518 4 155 49 368? 246122 31521 4 tss 49 3683 246123 31524 4 155 49 36a* 246124 31527 4 15S 49 3685- 246125 31529 4 155 49 3686 252154 32380 « 155 49 3687 230092 27430 4 21 S3 3688 230101 27449 1 21 53 3689 241098 29796 4 21 S3 3690 246033 31336 < 21 S3 3691 246034 31338 « 21 S3 369? 246036 31342 4 21 !>3 3693 246038 31346 < 21 53 3694 246050 31370 4 21 53 3693 252024 32098 < . 21 53 3696 252025 32100 < 21 53 3697 232U1 32344 < 21 53 3698 196042 21174 < . 18 56 3699 '196043 21176 ' » 18 56 3700 196044 21178 < 18 56
> 3701 196045 21180 < . 18 56 T 370? 197031 21»00 ' 18 56 a* 3703 233041 2793B k 18 56 a* 3706 238069 29055 ' 1 18 56
370S 240012 29225 ' i 18 56 3706 240013 29227 k IB 56 3707 240014 29229 ' 18 56 3708 240016 29233 k 18 56 3709 240017 29235 k 18 56 3710 240018 29237 k 18 56 3711 240019 29239 k 18 56 3712 240024 29249 < 1 18 56 3713 240029 29259 k 18 56 3714 240030 29261 k 18 56 3715 241112 29827 k 18 S6 3716 243014 30050 k IS 56 3717 243076 30179 k 18 56 3718 247192 31249 k 18 56 3719 247193 31251 k 18 S6 3720 247194 31253 k IS 56 3721 247195 31255 k 18 56 3722 247196 31257 t IB 56 3723 247197 31259 k 18 56 372* 247198 31261 t 18 56 3725 247199 31263 4 18 56 3726 247200 31265 k 18 56 37S7 248099 3196] k 18 56 3728 248100 31963 4 18 56
They also receive this report that tells the labs who has retrieved their data and which samples have been deactivated. Note: The laboratories do not load new data on the first working day of each week. This is because if there were any problems in processing over the weekend, a new retrieval may be made using night priority to receive the same data:
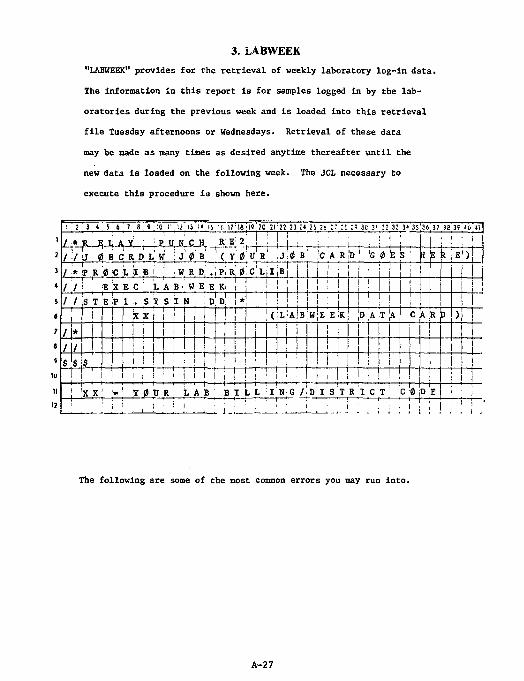
3. LABWEEK "LABWEEK" provides for the retrieval of weekly laboratory log-in data.
The information in this report is for samples logged in by the lab
oratories during the previous week and is loaded into this retrieval
file Tuesday afternoons or Wednesdays. Retrieval of these data
may be made as many times as desired anytime thereafter until the
new data is loaded on the following week. The JCL necessary to
execute this procedure is shown here.
i ' 2 3 « 5 6 7 8 » ;:o r ;J is i» is 'i u i s j w 20 2122 2! n 2S 2! :: :s :« 3C'3' 32 33 3J 3S'3(. 37 ! ! 3 ! «ii »l
1 Z.T*jiL-E,Jt.JUL; .i P| U, KSJ*r - p \ i ? / ."/ SJ 0 B C R D L W ' J 0 B (' y' 0
i ' i : I ' 1 : i '
• j i ; I i : ! : i
2 Z.T*jiL-E,Jt.JUL; .i P| U, KSJ*r - p \ i ? / ."/ SJ 0 B C R D L W ' J 0 B (' y' 0
1 ! . • 1 . 1
V R , J ; 0 B ,C A RiD « 0 k !s : |« E k\E<)\ 3 / * !p R 0 C k, I B 1 : • W R D, . i PJ R 0, Cl Lj I jB j i l l !
1 ! 1 1 1 j i ' i I « / / i 8 : X l C L A J ' H E I R 1 ! ! ! 1 i ! i 1 i l
j i i 1
5 / 7 is T E ip 1 . s i s m D!D 1 ' 1 i i ' 1 . 1 ! • !
1 ' ! 1 t
1 I ; 1 XX l | 1 i j ! ; ' ( ; L ; A ! B ; W ] E E ; K D A ,T 'A ;C A R E ) 1
1 T Li* ! ! 1 1 i i !
1 1 i e L, / r 1 11 1
| 1 i i w $ $, 1 ! ' M i ! j J !
ll) ^r . 1 1 1 | i • 1 ! 1 i | 1 1 ! ' 1 ' ! 1 i | 1 i ! II 1 X X | ; - ! Y 0 V R L A B 1 B I L L ''' I N G /'•$' I S T R I C I C !0 D E 1 i
12 1 '
The following are some of the most common errors you may run into.
A-27
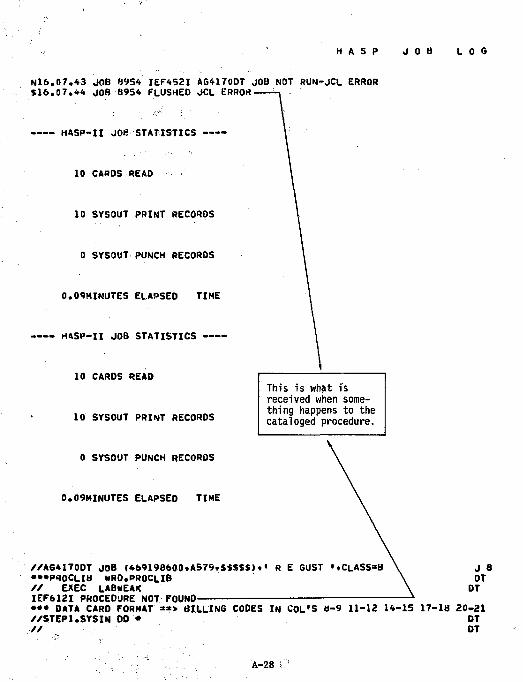
H A S P J O B L O G
N16.07.43 JOB 8954 IEF452I AG41700T JOB NOT RUN-JCL ERROR 516.07.44 JOB 8954 FLUSHED JCL ERROR —
HASP-II JOfi STATISTICS —
10 CARDS READ
10 SYSOUT PRINT RECORDS
0 SYSOUT PUNCH RECORDS
0.09MINUTES ELAPSED TIME
H4SP-II JOB STATISTICS
10 CARDS READ
10 SYSOUT PRINT RECORDS
This is what is received when something happens to the cataloged procedure.
0 SYSOUT PUNCH RECORDS
0.09HINUTES ELAPSED TIME
//AG41T0DT JOB (4b9198600«A579t$SSS$).• R E GUST ».CLASS=B \ J 8 •••PROCLIB KRO.PROCLIB \ DT // EXEC LABdEAK \ DT IEF612I PROCEDURE NOT FOUND— — ••• DATA CARD FORMAT " > BILLING CODES IN COL'S 8-9 11-12 14-15 17-18 20-21 //STEP1.SVSIN DO * DT // DT
A-28 I
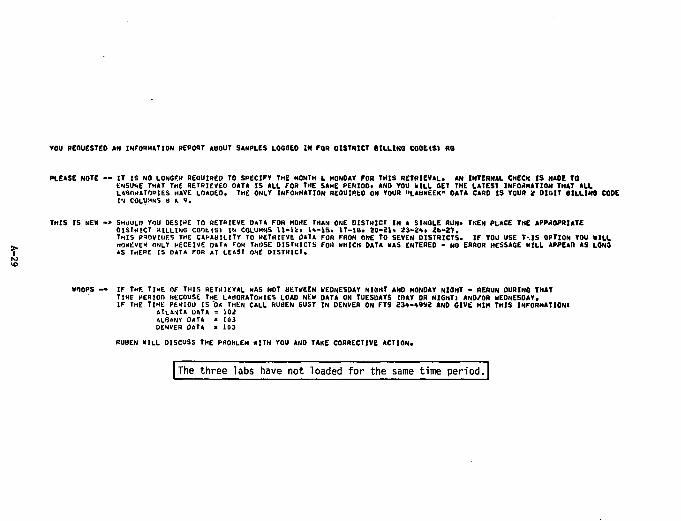
YOU REQUESTED AN INFORMATION REPORT ABOUT SAMPLES LOGGEO IN FOR DISTRICT BILLING COOE(S) US
PLEASE NOTE — IT IS NO LONGER REOUIRED TO SPECIFY THE MONTH I MONDAY FOR THIS RETRIEVAL. «N INTERNAL CHECK IS MADE TO ENSURE THAT THE RETRIEVED OATA IS ALL FOR THE SAME PERIOD* AND YOU WILL GET THE LATEST INFORMATION THAT ALL LABORATORIES HAVE LOADED* THE ONLY INFORMATION REOUIREO ON YOUR "LABWEEK" DATA CARD IS YOUR 2 DIGIT BILLING CODE IN COLUMNS d A 9.
THIS IS NEW -> SHOULO YOU DESIRE TO RETRIEVE DATA FOR MORE THAN ONE DISTRICT IN A SINGLE RUN* THEN PLACE THE APPROPRIATE DISTRICT HILLING COOt(SI IN COLUMNS H-li* U-15* 17-16* 20-21* 23-2*. 26-27. THIS PROVIIIF.S THE CAPABILITY TO RETRIEVE OATA FOR FROM ONE TO SEVEN OlSTRICTS. IF YOU USE T-.IS OPTION YOU WILL
,_ HOWEVER ONLY RECEIVE DATA FOR ThOSE DISTRICTS FOR WHICH DATA WAS ENTERED - NO ERROR HESSAGE WILL APPEAR AS LONG T AS THERE IS DATA FOR AT LEAST ONE OISTHICT. to to
WOOPS -- IF THE TIME OF THIS RETRIEVAL WAS NOT BETWEEN WEDNESDAY NIGHT AND MONDAY NIGHT - RERUN OURING THAT TIME PERIOD BECOUSE THE LABORATORIES LOAD NEW DATA ON TUESDAYS CDAY OR NIGHTI AND/OR WEDNESDAY. IF THE TIME PERIOD IS O* THEN CALL RUBEN GUST IN OENVER ON FTS 23»-A9»2 AND GIVE HIM THIS INFORMATION!
ATLANTA DATA = 104 ALBANY DATA * 103 DENVER OATA * 103
RUBEN WILL DISCUSS THE PROBLEM WITH YOU AND TAKE CORRECTIVE ACTION.
The three labs have not loaded for the same time period.
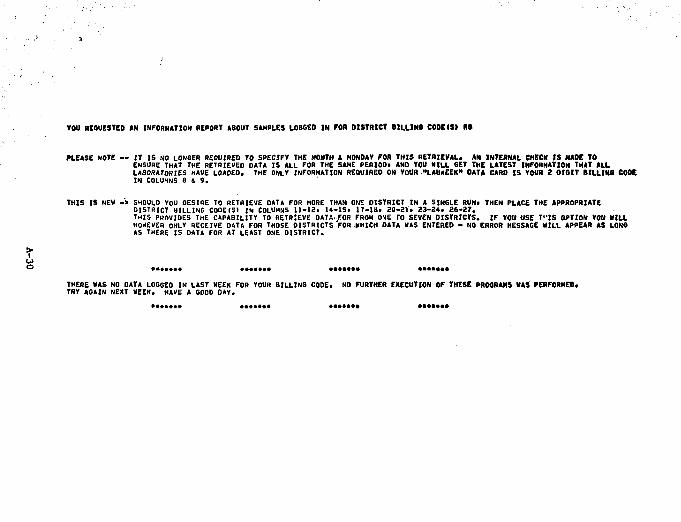
VOU REOUESTEO AN INFORMATION REPORT ABOUT SAMPLES LOSGED IN FOR DISTRICT BILLINS COOE(S> R»
PLEASE NOTE — IT IS NO LONGER REOUIRED TO SPECIFY THE MONTH I MONDAY FOR THIS RETRIEVAL* AN INTERNAL CHECK IS HADE TO ENSURE THAT THE RETRIEVED DATA IS ALL FOR THE SAME PERIOD? AND YOU MILL GET THE LATEST INFORMATION THAT ALL LABORATORIES HAVE LOAOEO. THE ONLY INFORMATION REQUIRED ON YOUR "LAB«EEK" DATA CARD IS YOUR 2 OIOIT BILLING CODE IN COLUMNS 8 «, 9.
THIS IS NEW -> SHOULD YOU DESIRE TO RETRIEVE DATA FOR MORE THAN ONE DISTRICT IN A SINGLE RUN. THEN PLACE THE APPROPRIATE DISTRICT BILLING C0DEC51 IN COLUMNS 11-12. 14-1S. 17-18. 20-21. 23-24, 26-27. THIS PROVIDES THE CAPABILITY TO RETRIEVE DATA.FOR FROM ONE TO SEVEN DISTRICTS. IF YOU USE TVJS OPTION YOU KILL HOWEVER ONLY RECEIVE DATA FOR THOSE DISTRICTS FOR HHICH DATA WAS ENTERED - NO ERROR MESSAGE WILL APPEAR AS LONG AS THERE IS OATA FOR AT LEAST ONE DISTRICT.
T THERE WAS NO DATA LOGGED IN LAST WEEK FOR YOUR BILLING CODE. NO FURTHER EXECUTION OF THESE PROGRAMS WAS PERFORHEO. TRY AGAIN NEXT WEEK. HAVE A GOOD DAY.
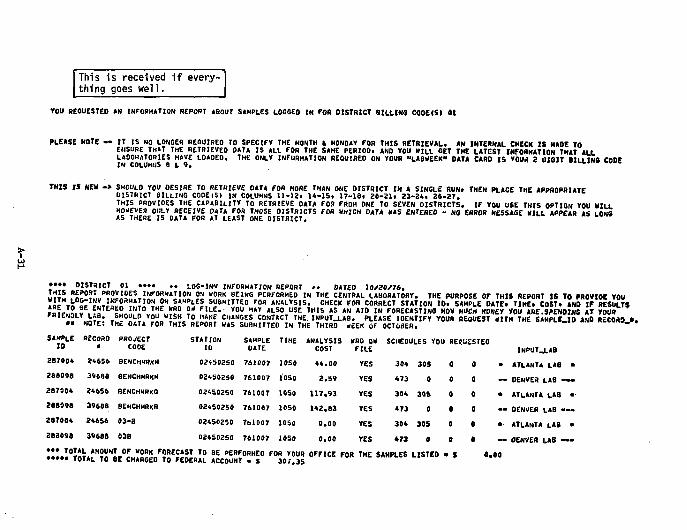
This is received i f everything goes well.
YOU REOUESTEO AN INFORMATION REPORT ABOUT SAMPLES LOGGED IN FOR DISTRICT BtLLtNG CO0E(SI 01
PLEASE NOTE — IT IS NO LONGER BEOUIRED TO SPECIFY THE MONTH I MONDAY FOR THIS RETRIEVAL. AN INTERNAL CHECK IS HADE TO ENSURE TH»T THE RETRIEVED DATA IS ALL FOR THE SAME PERIOD. ANO YOU WILL GET THE LATEST INFORMATION THAT ALL LABORATORIES HAVE LOADEO. THE ONLY INFURHATION REOUIREO ON YOUR "LABWEEK" DATA CARD IS YOUH 2 DIGIT BILLING CODE IN COLUMNS fi I 9i
THIS IS NEW -» SHOULD YOU DESIRE TO RETRIEVE DATA FOR HORE THAN ONE DISTRICT IN A SINGLE RUN. THEN PLACE THE APPROPRIATE DISTRICT BILLING CODElS) IN COLUMNS 11-12. 14-15. 17-18. 20-21. 23-24. 26-27. THIS PROVIDES THE CAPABILITY TO RETRIEVE DATA FOR FROM ONE TO SEVEN DISTRICTS. IF YOU USE THIS OPTION YOU MILL HOWEVER ONLY RECEIVE DATA FOR THOSE 0ISTR1CTS FOR WHICH DATA WAS ENTERED - NO ERROR MESSAGE WILL APPEAR AS LONG AS THERE IS DATA FOR AT LEAST ONE OISTRICT.
•••» DISTRICT THIS REPOS •••• .. LOG-INV INFORMATION REPORT .» DATED 10/20/76.
Ill "«? 0? 7 P R o y , I O E S INFORMATION ON WORK BEING PERFORMED IN THE CENTRAL LABORATORY. THE PURPOSE OF THIS REPORT IS TO PROVIOE TOU ARE ik llT«rl^1tll,0V\lnM^H,Scamllf.0 ™ * N 4 L V S I S: C H E C K F 0 B C 0 , , R E C T S T A T , 0 N «»• * « « « DA«. T,HE. COS?. ANb I?"Is!™* raitSi? I?S wn.'. IMu'y^S ^ f.M", Y ? ^ * I «!;S° U S E , H I S *s *N *"> '" FORECASTING HOW MUCH MONEY YOU ARE.SrENDlNG AT YOUR « MOT?: T»- n«. SA. T S « 2 ™ J S £M*"£.E! C; N T* C T T 2 E »NPUT-'-*e. PLEASE IOENTIFY YOUR REQUEST WXTM THE SAHPLE_IO AND RECORD.*. «« NOTE: THc DATA FOR THIS REPORT WAS SUBMITTED IN THE THIRO WEEK OF OCTOBER. SAMPLE
ID RECORD PROJECT
COOE STATION
ID SAMPLE DATE TIME ANALYSIS
COST WRD QW FILE
SCHEDULES YOU REQUESTED INPUT.J.AB
287004 2*656 BENCHHRKH 02450250 761007 1050 44.00 YES 304 30S 0 0 • ATLANTA LAB 268098 39688 8ENCHMRKH 024802S0 761007 1050 2.59 YES 473 0 0 0 .. DENVER LAB — 287004 24656 BENCHMRKQ 02450250 761007 1050 117.93 YES 304 SOS 0 0 • ATLANTA LAS 288098 39688 BENCHMRKR 02*50250 761007 1050 142.83 YES 473 0 0 0 .. DENVER LAB •• 287004 246S6 03-3 02450250 761007 1050 0.00 YES 304 305 0 0 • • ATLANTA LAB < 283098 39688 03B 02450250 761007 1050 0.00 YES 473 0 0 0 -. DENVER LAB — !«.I°T«VA.*H?nNIr0Jul!2?J/?2E«oLTO B E P E B P. 0 R H E D ">« YOUR OFFICE FOB THE SAMPLES LISTED • s 0. 00
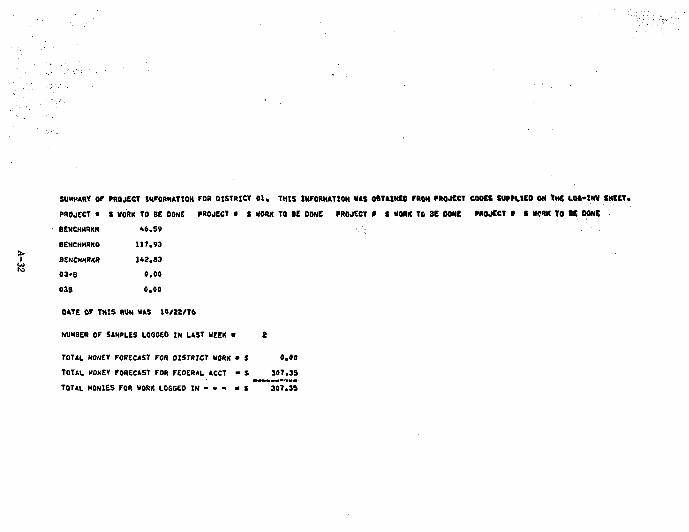
SUMMARY OF PROJECT INFORMATION FOR DISTRICT Ol, THIS INFORMATION HAS OBTAINED FROM PROJECT COOES SUPPV.IEO ON tMC LO«-tHV SHEET. PROJECT • S WORK TO BE OONE PROJECT * S MORK TO BE DONE PROJECT * S KORK TO 3E OONE PROJECT » S VCRK TO K OONC BENCHMRKH A6.S9 BENCMMRKQ 117.93
I SENCHHRKR 1*2.83 M 03-B 0.00
038 0.00
DATE OF THIS RUN WAS 10/22/76
NUMBER OF SAMPLES LOGGED IN LAST WEEK • 2
TOTAL MONEY FORECAST FOR DISTRICT WORK • S 0.00 TOTAL MONEY FORECAST FOR FEDERAL ACCT - S 30T.3S TOTAL MONIES FOR WORK LOGGED IN - - - « S 307.35
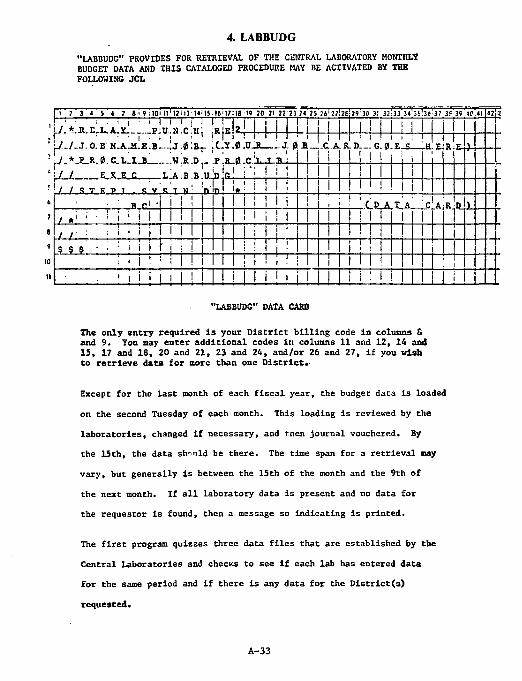
4. LABBUDG "LABBUDG" PROVIDES FOR RETRIEVAL OF THE CENTRAL LABORATORY MONTHLY BUDGET DATA ADD THIS CATALOGED PROCEDURE MAY BE ACTIVATED BY THE FOLLOWING JCL
1 2 3 4 5 * 7 » ' 9 :IOi II'12i13'14'Is:i6'l7118 19 20 21 22 23 24 25 26'27i26 2 9 3 0 31 32l33 34'35 3 6 3 ? 35 35 SC 41 42J41 1 ! 1 ' : . i , • i 1 1 1 I 1 1 1 J . * . H . E . L . A . Y - _ _ . P ; U . N . C . H : :RiE ,\ 1 i l I 1 1 j i | 1 1 I I 1 1 1 i 1 r • • • i , i . . i ! ! i JJ.J. o. B N.A.JI.£.B..-.'J .0:B_ .:C.Y , 7 . * E.R.0.C.L.IJB .-_.H.R.D.^ P R-
! 1 1 I I ! l 1 1 I 1 ! 1 I I I I 0 H R , .7 fi -R r: 4 R n r. a v o u r n u )
r • • • i , i . . i ! ! i JJ.J. o. B N.A.JI.£.B..-.'J .0:B_ .:C.Y , 7 . * E.R.0.C.L.IJB .-_.H.R.D.^ P R-
' • i
! ! i i i i
/ / E X E C LJl.B.B.OJ) r. r; ! ! ! I 1 1 1 I
/ / S T P p J „ , s ,y S T H ' n n V i l l i M i l I *,ci '
i i 1 i I i i I I I • . 1 i • . • • ; '
( D A T A C A R D > / *' '' • U 1 i 1 1
1 1 i i i I i I 1 ! 1 1 >
M - ^ ' i ! ! ! 1 I I • i | | i ' ' : i ;
$ S S • • • I I I i •• ' ; ! 1 I I ! \ 1 ; . i ! ! i i 1 ! 1 1 ! 1 1 1 1 ! 1 ! i
. i , i i | , I ! ! i ! I i ! i i T\ ! i : I 1 M i "LABBUDG" DATA CARD
The only entry required Is your District billing code in columns S and 9. You may enter additional codes in columns 11 and 12, 14 and 15, 17 and 18, 20 and 21, 23 and 24, and/or 26 and 27, if you visb. to retrieve data for more than one District.
Except for the last month of each fiscal year, the budget data is loaded
on the second Tuesday of each month. This loading is reviewed by the
laboratories, changed if necessary, and r.nen journal vouchered. By
the 15th, the data should be there. The time span for a retrieval may
vary, but generally is between the 15th of the month and the 9th of
the next month. If all laboratory data is present and no data for
the requestor is found, then a message so indicating is printed.
The first program quizzes three data files that are established by the
Central Laboratories and chectcs to see if each lab has entered data
for the same period and if there is any data for the District(s)
requested.
A-33
The second program sorts the data for the District(s) or special
project(a) requested. It sorts first by account numbers, and then,
by ascending laboratory identification numbers. The second program
and also the third prograa only execute if the first program found
that each laboratory had loaded its data, and that there was some data
for at least one of the District* requested.
The third prograa print* or.t the individual sample cost documentation,
a cost summary of account* for the month, a cost summary of account*
to date for the fiscal year, and a cost breakdown of monies spent at
each Central Laboratory.
A-34
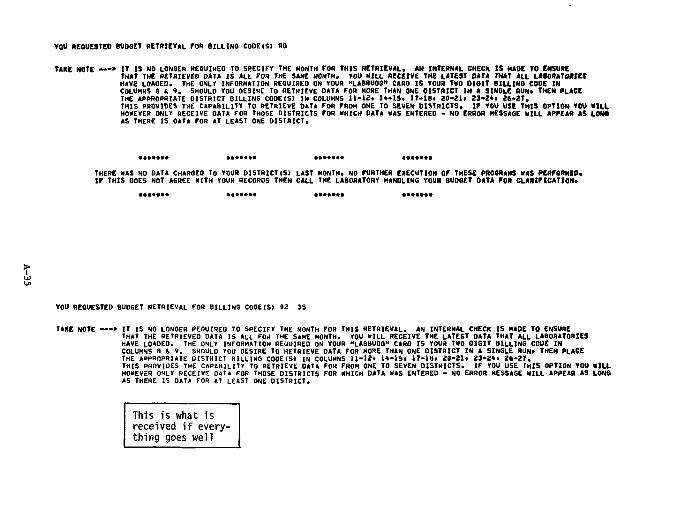
YOU REQUESTED BUDGET RETRIEVAL FOR BILLING COOE(S) RO
TAKE NOTE — > IT IS NO LONGER REQUIREO TO SPECIFY THE MONTH FOR THIS RETRIEVAL. AN INTERNAL CHECK IS MADE TO ENSURE THAT THE RETRIEVED DATA IS ALL FDR THE SAME MONTH. YOU MILL RECEIVE THE LATEST DATA THAT ALL LABORATORIES HAVE LOADED. THE ONLY INFORMATION REQUIRED ON YOUR "LABBU03" CARD IS YOUR TWO DIGIT BILLING CODE IN COLUMNS l i t , SHOULD YOU DESIRC To RETRIEVE DATA FOR MORE THAN ONE OISTRICT IN A SINGLE RUN. THEN PLACE THE APPROPRIATE DISTRICT BILLING COOEIS) IN COLUMNS 11-12. U-IS. 17-lBi 20-21. 23-24t 26-27, THIS PROVIDES THE CAPABILITY TO RETRIEVE DATA FOR FROM ONE TO SEVEN DISTRICTS. IF YOU USE THIS OPTION YOU MILL HOWEVER ONLY RECEIVE OATA FOR THOSE DISTRICTS FOR WHICH DATA MAS ENTERED - NO ERROR MESSAGE WILL APPEAR AS LOW AS THERE IS OATA FOR AT LEAST ONE DISTRICT,
THERE MAS NO DATA CHARGEO TO YOUR OISTRICT IS) LAST MONTH. NO FURTHER EXECUTION OF THESE PROGRAMS WAS PERFORMED. IF THIS DOES NOT AGREE WITH YOUR RECORDS THEN CALL THE LABORATORY HANDLING YOUR BUDGET DATA FOR CLARIFICATION.
YOU REOUESTED BUDGET RETRIEVAL FOR BILLING CODEIS) 02 35
TAKE NOTE — > IT IS NO LONGER REQUIRED TO SPECIFY THE MONTH FOR THIS RETRIEVAL. AN INTERNAL CHECK IS HADE TO ENSURE THAT THE RETRIEVED DATA IS ALL FOR THE SAME MONTH. YOU WILL RECEIVE THE LATEST DATA THAT ALL LABORATORIES HAVE LOADED. THE ONLY INFORMATION REQUIRED ON YOUR "LA8BUDG" CARD IS YOUR TWO OIGIT BILLING CODE IN COLUMNS 8 (. 9. SHOULD YOU DESIRE To RETRIEVE OATA FOR MORE THAN ONE DISTRICT IN A SINGLE RUN. THEN PLACE IHE APPROPRIATE DISTHICT BILLING CODECS) IN COLUMNS 11-12* I*->S. 17-18. 20-21. 23-2*. 26-27. THIS PROVIDES THE CAPABILITY TO RETRIEVE DATA FOR FROM ONE TO SEVEN DISTRICTS. IF YOU USE THIS OPTION YOU WILL HOWEVER ONLY RECEIVE DATA FOR THOSE DISTRICTS FOR WHICH OATA WAS ENTERED - NO ERROR MESSAGE WILL APPEAR AS LONG AS THERE IS DATA FOR AT LEAST ONE DISTRICT.
This is what is received if everything goes well
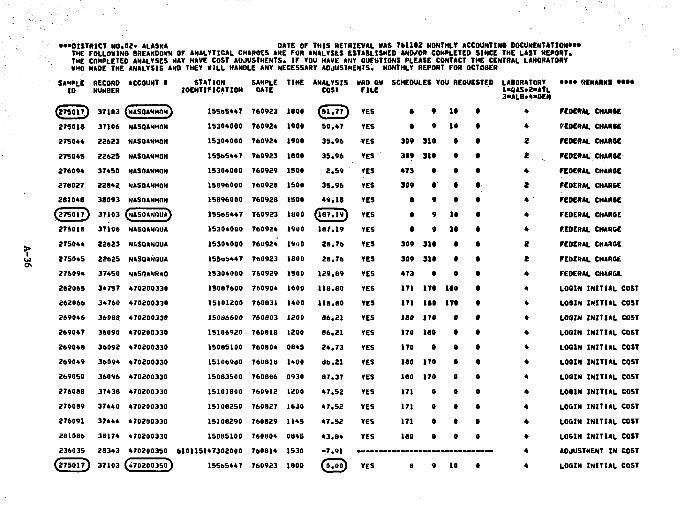
•••DISTRICT NO.OJ. ALASKA DATE OF THIS RETRIEVAL HAS 701182 MONTHLY ACCOUNTING DOCUMENTATION*** THE FOLLOHINO BREAKDOWN OF ANALYTICAL CHARGES ARE FOR ANALYSES ESTABLISHED AND/OR COMPLETED SINCE THE LAST REPORT. THE COHPLETEO ANALYSES MAY HAVE COST ADJUSTMENTS. IF YOU HAVE ANY QUESTIONS PLEASE CONTACT THE CENTRAL LABORATORY HHO MADE THE ANALYSIS ANO THEY HILL HANDLE ANY NECESSARY ADJUSTMENTS. MONTHLY REPORT FOR OCTOBER
SAMPLE ID
RECORD NUMBER
37103
ACCOUNT • STATION IDENTIFICATION
15505447
SAMPLE OATE
760923
TIME
1800
ANALYSIS COST
NRD OH FILE
YES
SCHEOULES YOU REQUESTED
8 * 18 8
LABORATORY l-BASi2'ATL 3-ALB.4.DEN
gTSOIT]
RECORD NUMBER
37103 (NASQANMON)
STATION IDENTIFICATION
15505447
SAMPLE OATE
760923
TIME
1800
ANALYSIS COST
NRD OH FILE
YES
SCHEOULES YOU REQUESTED
8 * 18 8 4
275018 37106 NASOANHON 1530*000 T6092* 1900 50.47 YES 8 9 la a 4
27S044 22623 NASOANMON 1530*000 76092* 1900 35.96 YES 309 310 2
2750*5 22625 NASQANMON 1S505447 760923 1B00 35.96 YES 389 318 2 27609* 37*50 NASQANMON 1530*000 760929 1500 2.S9 YES 473 a 4
2711027 228*2 NASQANHON 15896000 760928 1S00 35.96 YES 309 a 2
2010*8 38093
37103
NASOANMON 15896000
15565**7
760928
760923
1500
1800
49,18
(187.19)
YES
YES
a a
9
9 18 8
* ~ ? T 5°»0
38093
37103 (NASOANOMA)
15896000
15565**7
760928
760923
1500
1800
49,18
(187.19)
YES
YES
a a
9
9 18 8 4
275018 37106 NASQANQUA 1530*000 76092* 1900 187.19 YES a 9 18 8 4
27S0«t 22623 NASOANOUA 1530*000 76092* IVilO 28.7b YES 309 319 2
2750*5 22625 NASQAHQUA 155bb**7 760923 1800 28.76 YES 389 318 2
27609* 37*50 NASQANRAO 1530*000 760929 1500 129.B9 YES 473 8
262065 3*757 470200330 15087600 76090* 1600 118.80 YES 1T1 178 iao a 262066 3*760 •70200330 15101200 760831 1*00 118.80 YES 171 188 170 8
2690*6 36088. 470200330 15086600 760803 1200 06.21 YES 180 170
2690*7 36090 470200330 15106920 760818 1200 86.21 YES 170 180
2690*8 36092 470200330 15085100 76080* 0845 24.73 YES 170 0
2690*9 3609* 470200330 15106980 760818 1400 86.21 YES 180 170
269050 36096 470200330 15083500 760806 0930 87.37 YES 180 170
276088 37*38 470200330 15101800 760912 1200 47.52 YES 171 0
276089 37**0 470200330 15108250 760827 16J0 4 7.52 YES 171 0
276091 37*«« 470200330 15108290 760829 1145 47.52 YES 171 0 2810B6
236035
3817*
283*3
37103
470200330
470200350
1508S100
6101151*7302000
15505*47
76080*
76081*
760923
0845
1530
1800
43.84
-7.91
Q.00)
YES 180 0 2810B6
236035
3817*
283*3
37103
470200330
470200350
1508S100
6101151*7302000
15505*47
76080*
76081*
760923
0845
1530
1800
43.84
-7.91
Q.00) YES a 9 10 8 t275017 j
3817*
283*3
37103 (*70200350)
1508S100
6101151*7302000
15505*47
76080*
76081*
760923
0845
1530
1800
43.84
-7.91
Q.00) YES a 9 10 8
•••• REMARKS ••»
FfOERAL CHAR8E
FEDERAL CHAR8E
FEDERAL CHARSE
FEDERAL CHARSE
FEDERAL CHARSE
FEDERAL CHARGE
FEDERAL CHAR6E
FEDERAL CHARGE
FEOERAL CHARGE
FEDERAL CHARGE
FEDERAL CHARGE
FEOERAL CHARGL
LOGIN INITIAL COST
LOGIN INITIAL COST
LOGIN INITIAL COST
L001N INITIAL COST
LOGIN INITIAL COST
LOGIN INITIAL COST
LOGIN INITIAL COST
LOGIN INITIAL COST
LOGIN INITIAL COST
LOGIN INITIAL COST
L06IN INITIAL COST
ADJUSTMENT IN COST
LOGIN INITIAL COST
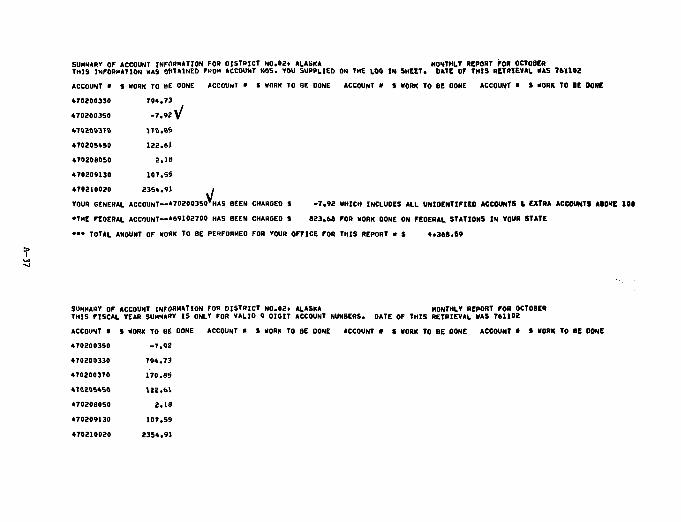
SUMMARY OF ACCOUNT INFORMATION FOR OISTRICT NO.02. ALASKA MONTHLY REPORT FOR OCTOBER THIS INFORMATION dAS OBTAINED FROM ACCOUNT NOS. YOU SUPPLIED ON THE LOO IN SHEET. DATE OF THIS RETRIEVAL HAS 761102
I WORK TO BE DONE ACCOUNT « S WORK TO BE DONE ACCOUNT • S dORK TO BE DONE ACCOUNT • S WORK TO BE DONE ACCOUNT « 470200330 4702003SO
794.73 -7.9«V
".10ZOM10 no.es A70205«50 122.61 47020B0S0 2.18 470209130 107.5S 470210020 2354.91 YOUR GENERAL ACCOUNT—470200350»H»S BEEN CHARGED S -7.92 HHICH INCLUDES ALL UNIDENTIFIED ACCOUNTS I EXTRA ACCOUNTS ABOVE 101 •THE FEOERAL ACCOUNT—»69102700 HAS BEEN CHARGED $ 823.68 FOR WORK DONE ON FEOERAL STATIONS IN YOUR STATE ••• TOTAL AMOUNT OF dORK TO BE PERFORMED FOR YOUR OFFICE FOR THIS REPORT • S 4.368.59
SUMMARY OF ACCOUNT INFORMATION FOR DISTRICT NO.03. ALASKA MONTHLY REPORT FOR OCTOBER THIS FISCAL YEAR SUMMARY IS ONLY FOR VALID 9 DIGIT ACCOUNT NUMBERS. DATE OF THIS RETRIEVAL MAS 761102 ACCOUNT • % dORK TO 86 OONE ACCOUNT • S dORK TO BE DONE ACCOUNT • S VORK TO BE DONE ACCOUNT • S dORK TO BE DONE 470200350 -7.92 470200330 794.73 470200370 170.89 4IMOS4SO \EE.fel 470208050 2.18 470209130 107.55 470210020 2354.91
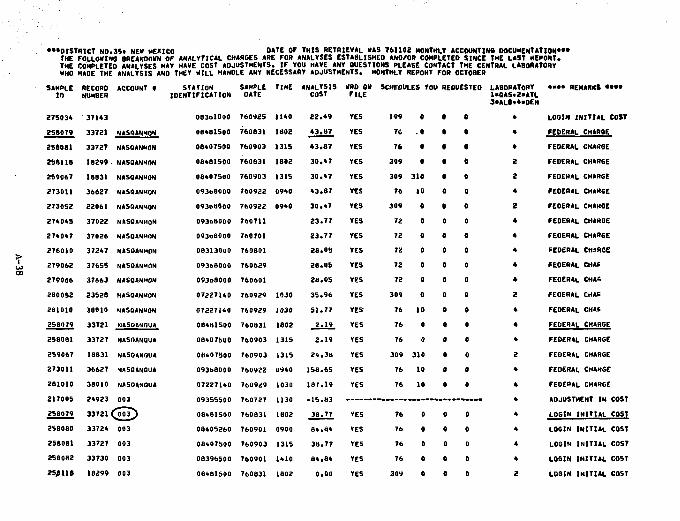
•••DISTRICT NO.35. NEW MEXICO DATE OF THIS RETRIEVAL MAS 761102 MONTHLY ACCOUNTIHB DOCUMENTATION"* THE FOLLOMING BREAKOOVN OF ANALYTICAL CHARGES ARE FOR ANALYSES ESTABLISHED AND/OR COMPLETED SINCE THE LAST REPORT. THE COMPLETED ANALYSES MAY HAVE COST ADJUSTMENTS. IF YOU HAVE ANY OUESTIONS PLEASE CONTACT THE CENTRAL LABORATORY MHO MADE THE ANALYSIS ANO THEY MILL HANDLE ANY NECESSARY ADJUSTMENTS. MONTHLY REPORT FOR OCTOBER
STATION SAMPLE TIME ANALYSIS WRD ON SCHEDULES YOU REGUESTED LABORATORY •••• REMARKS ••••
LOOJN INITIAL COST FEDERAL CHARGE FEDERAL CHANGE FEOERAL CHARGE FEOERAL CHARSE FEDERAL CHARGE FEOERAL CHARGE FEDERAL CHARGE FEOERAL CHARGE FEDERAL CHARGE FEOERAL CHAF FEOERAL CHAR FEOERAL CHAR FEDERAL CHAF FEDERAL CHARGE FEOERAL CHARGE FEOERAL CHARGE FEOERAL CHANGE FEDERAL CHARGE ADJUSTMENT IN COST LOGIN INITIAL COST LOGIN INITIAL COST LOGIN INITIAL COST LOGIN INITIAL COST LOGIN INITIAL COST
SAMPLE 10 RECORD NUMBER
ACCOUNT •
27503* 371*3 258079 33721
3372T NASQANHON
256081 33721 3372T NASQANMON
2S8HB 18299 NASOANMON 259067 18831 NASOANMON 273011 36627 NASQANMON 273052 22061 NASQANMON 2740*5 37022 NASQANMON 27*047 37026 NASOANMON
!i> 2760)0 372*7 NASQANMON L-38
279062 279066
37655 37663
NASQANMON NASQtNMQN
2B0052 23528 NASOANMON 281010 38010 NASQANMON 258079 33721 NASQANQUA 258081 33727 NASQANQUA 259067 18831 NASQANQUA 273011 36627 NA5QANQUA 281010 38010 NASOANQUA 217005 2*923 003 258079 33721 CS5 2SB080 3372* 003 258081 33727 003 258082 33730 003 238118 18299 003
FICATION OATE COST FILE l*QASt2«ATL 3«ALB.*»DEN
08361000 76092S 1140 22.49 YES 199 S 0 * 08*81500 760831 1802 43. B7 YES 7t .0 » * 08*07500 760903 1315 43.87 YES 76 0 0 4 08*81500 760831 1802 30.47 YES 309 0 0 2 08*07500 760903 1315 30.*7 YES 309 310 0 2 09368000 760922 0940 43.87 YES 76 10 0 4 093OB000 760922 0940 30.47 YES 309 0 0 2 09368000 760711 23.77 YES 72 0 0 093O8000 760701 23.77 YES 72 0 0 08313000 760801 28.05 YES 72 0 0 09368000 760629 28.05 YES 72 0 0 093D8000 760601 28.05 YES 72 0 0 072271*0 760929 1030 35.96 YES 309 0 0 0 07227140 760929 1030 51.77 YES 76 10 0 0 08481500 760831 1802 2.19 YES 76 0 0 0 08*07500 760903 1315 2.19 YES 76 0 s 0 08*07500 760903 1315 24.38 YES 309 310 0 0 09368000 760922 0940 158.65 YES 76 10 0 0 07227140 09355500 08*81500
760929 760727 760831
1030 1130 1802
187.19 -15.83 38.77
YES 76 10 0 0 07227140 09355500 08*81500
760929 760727 760831
1030 1130 1802
187.19 -15.83 38.77 YES 76 0 0 0
08405260 760901 0900 8*.8* YES 76 0 0 0 08407500 760903 1315 38.77 YES 76 0 0 0 08396500 760901 1410 8*.8* YES 76 0 0 0 08*81500 760831 1802 0.00 YES 309 0 0 0 2
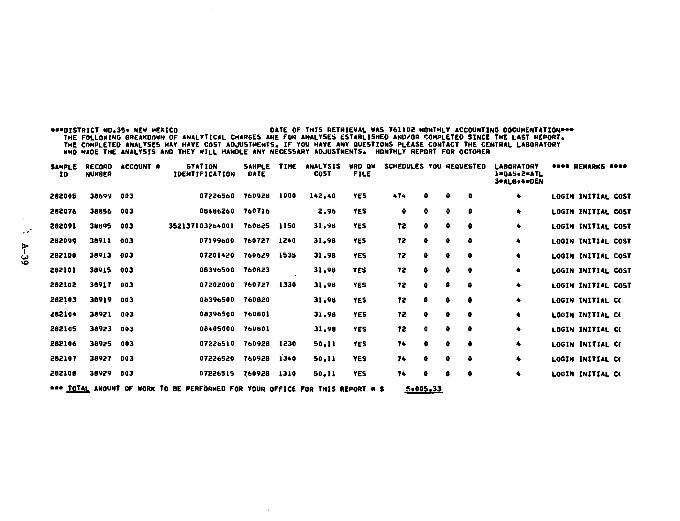
•••OISTRICT NO.35. NEW MEXICO DATE OF THIS RETRIEVAL HAS 761102 MONTHLY ACCOUNTING DOCUMENTATION"* THE FOLLOWING BREAKOOWN OF ANALYTICAL CHARGES ARE FOR ANALYSES ESTABLISHED AND/OR COMPLETED SINCE THE LAST REPORT, THE COHPLETEO ANALYSES MAY HAVE COST ADJUSTMENTS, IF VOU HAVE ANY QUESTIONS PLEASE CONTACT THE CENTRAL LABORATORY •HO MADE THE ANALYSIS AND THEY WILL HANDLE ANY NECESSARY ADJUSTMENTS. MONTHLY REPORT FOR OCTOBER
SAMPLE ID
RECORO NUMBER
ACCOUNT » STATION IDENTIFICATION
SAMPLE DATE
TIME ANALYSIS COST
WHO ON FILE
SCHEDULES YOU REQUESTED LABORATORY 1*0AS.2>ATL 3-ALB.4.0EN
282005 38699 003 07226560 760928 1000 142.40 YES 474 0 0 0 4 282076 38856 003 00*86260 760716 2.96 YES 0 0 0 0 4 282091 38895 003 352137103264001 760825 1150 31.98 YES 72 0 0 0 *
s- 282099 38911 003 07199600 760727 1240 31.98 YES 72 0 0 0 4 -39 282100 38913 003 07201420 760629 1535 31.98 YES 72 0 0 0 4
-39
282101 38915 003 08396500 760823 31.98 YES 72 0 0 0 4 282102 38917 003 07202000 760 727 1330 31.98 YES 72 0 0 0 4 282103 30919 003 08396500 760820 31.98 YES 72 0 0 0 4 28210* 38921 003 08396500 760801 31.98 YES 72 0 0 0 4 28210S 38923 003 oetosooo 760801 31.98 YES 72 0 0 0 4 282106 38925 003 07226510 760928 1230 50.11 YES 7* 0 0 t 4 282107 38927 003 07226S20 760928 1340 50.11 YES 74 0 0 0 4 282108 38929 003 07226515 760928 1310 50.11 YES 74 0 0 0 4 ••• TOT AL_ AMOUNT OF WORK TO BE PERFORMED FOR YOUR OFFICE FOR THIS REPORT • t Si •005.33
•••• REMARKS ••••
LOGIN INITIAL COST LOGIN INITIAL COST LOGIN INITIAL COST LOGIN INITIAL COST LOGIN INITIAL COST LOGIN INITIAL COST LOGIN INITIAL COST LOGIN INITIAL CC LOGIN INITIAL C( LOGIN INITIAL C( LOGIN INITIAL CI LOGIN INITIAL CC LOGIN INITIAL CI
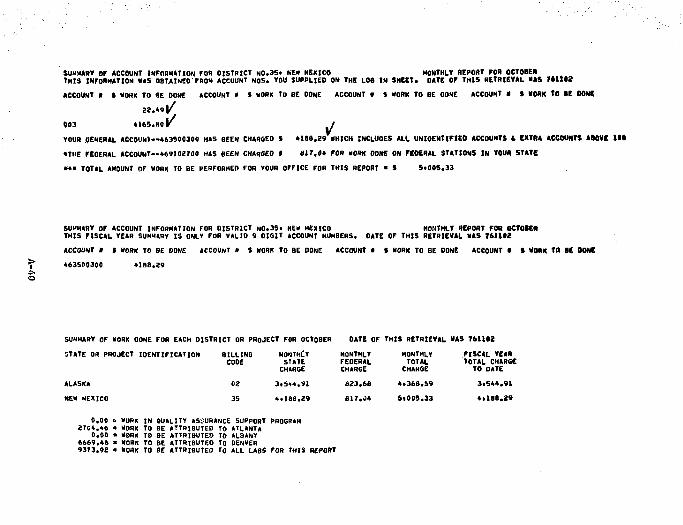
SUKMARY OF ACCOUNT INFORMATION FOR OISTRICT NO.35. NEV HEX ICO MONTHLY REPORT FOR OCTOBER THIS INFORMATION HAS OBTAINED FROM ACCOUNT NOS. YOU SUPPLIED OH THE LOO IN SHEET. DATE OF THIS RETRIEVAL HAS 7*1102 ACCOUNT • $ WORK TO BE DONE ACCOUNT • » WORK To BE DONE ACCOUNT • S WORK TO BE DONE ACCOUNT « $ WORK To IE DONE
22.49V
003 4165.BoK / YOUR GENERAL ACCOUNT—463500300 HAS BEEN CHARGED S 4188.29 HHICH INCLUDES ALL UNIDENTIFIED ACCOUNTS I EXTRA ACCOUNTS ABOVE 1 M •THE FEDERAL ACCOUNT—469102700 HAS SEEN CHARGED 1 «17.0» FOR VORK DONE ON FEDERAL STATIONS IN YOUR STATE ••• TOTAL AMOUNT OF WORK TO BE PERFORMED FOR YOUR OFFICE FOR THIS REPORT • S 5.005.33
SUMMARY OF ACCOUNT INFORMATION FOR DISTRICT N0.3S. NErl MEXICO MONTHLY REPORT FOR OCT08ER THIS FISCAL YEAR SUMMARY IS ONLY FOR VALID 9 DIGIT ACCOUNT NUMBERS. DATE OF THIS RETRIEVAL MAS 761U2 ACCOUNT * 463500300
> WORK TO BE DONE 4188.29
ACCOUNT • » MORK To BE DONE ACCOUNT • S DORK TO BE DONE ACCOUNT • S VORK TO K OONC
SUMMARY OF VORK DONE FOR EACH DISTRICT OR PROJECT FOR OCTOBER STATE OR PROJECT IDENTIFICATION
ALASKA NEV MEXICO
DATE OF THIS RETRIEVAL MAS 761102 BILLING CODE
MONTHllY STATE CHANGE
MONTHLY FEDERAL CHARGE
MONTHLY TOTAL CHANGE
FISCAL YEAR TOTAL CHARGE TO DATE
02 3.544.92 823.68 4.366.59 3.544.91 35 4.188,29 617.04 5.005.33 4.18S.29
0.00 u VORK IN DUALITY ASSURANCE SUPPORT PROGRAM 2704.46 » VORK TO BE ATTRIBUTED TO ATLANTA
0.00 « VORK TO BE ATTRIBUTED TO ALBANY 6669.46 * VORK TO BE ATTRIBUTED TO DENVER 9373.92 • VORK TO BE ATTRIBUTED TO ALL LA8S FOR THIS REPORT

Appendix B Card Formats
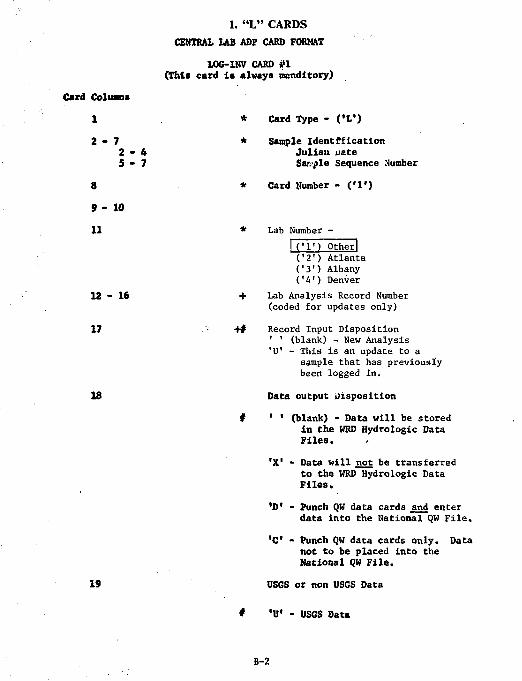
1. "L" CARDS CENTRAL LAB ADP CARD FORMAT
LOC-INV CARD #1 CThls card is alwaya manditory)
* Card Type - ('L') * Sample Identfficatlon
4 Julian uate 7 Sar.ple Sequence Number
* Card Number - ('l')
Lab Number -1('!') Otherl ('2') Atlanta ('3') Albany ('4') Denver
Lab Analysis Record Number (coded for updates only)
Record Input Disposition ' ' (blank) - New Analysis 'U' - This is an update to a
sample that has previously been logged in.
Data output disposition
' * (blank) - Data will be stored in the WRD Hydrologic Data Files.
'X* - Data will not be transferred to the WRD Hydrologic Data Files.
'D' - Punch QW data cards and enter data into the National QW File.
'C - Punch QW data cards only. Data not to be placed into the National QW File.
USGS or non USGS Data
V - USGS Data
B-2
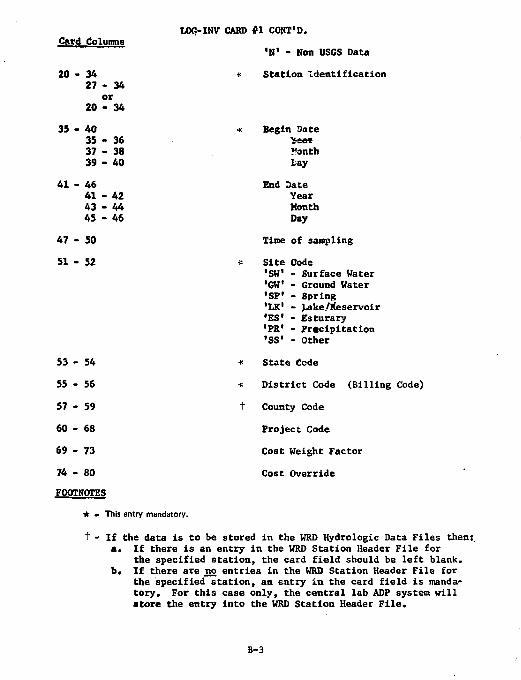
Card Columns
2 0 - 3 4 2 7 - 3 4
or 2 0 - 3 4
35 - 40 35 - 36 37 - 38 39 - 40
41 - 46 41 - 42 4 3 - 4 4 45 - 46
47 - 50
51 - 52
tOCJ-INV CARD #1 CONT'D.
•N' - Non USGS Data * Station Identification
53 - 54 55 - 56 57 - 59 60 - 68 69 - 73 74 - 80 FOOTNOTES
Begi n Date Yeoc Month lay
End Date Year Month Day
Time of sampling Site Code •SH' - Surface Hater •GW' - Ground Hater •SP' - Spring •LK' - Lake/R'eservoir •ES' - Esturary •PR' - Precipitation 'SS' - Other
* State Code * District Code (Billing Code) t County Code
Project Code Cost Height Factor Cost Override
* - This entry mandatory.
+ - If the data is to be stored in the WRD Hydrologic Data Files then: a. If there is an entry in the WRD Station Header File for
the specified station, the card field should be left blank. b. If there are no entries in the WRD Station Header File for
the specified station, an entry in the card field is mandatory. For this case only, the central lab ADP system will •tore the entry into the WRD Station Header File.
B-3
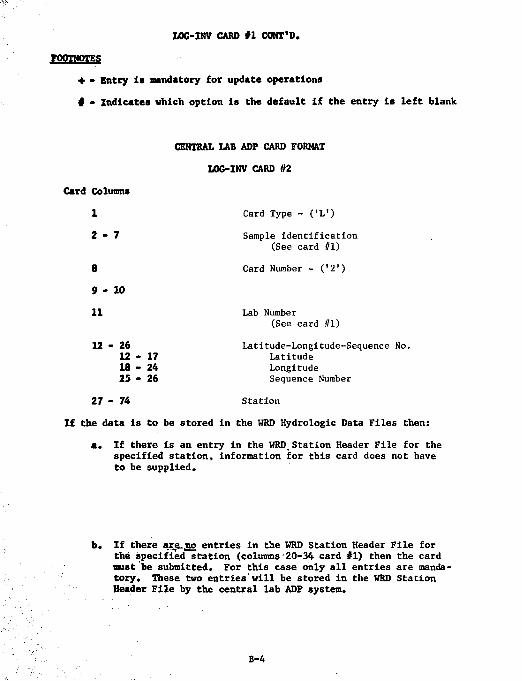
LOG-INV CARD #1 CONT'D. FOOTNOTES
+ - Entry Is mandatory for update operations # - Indicates which option is the default If the entry is left blank
CENTRAL LAB ADP CARD FORMAT LOG-1NV CARD #2
Card Columns
1 Card Type - ('L')
2 - 7 Sample identification (See card #1)
8 Card Number - ('2') 9-10 11 Lab Number
(See card #1) 12 - 26 Latitude-Longitude-Sequence No.
12 - 17 Latitude 18 - 24 Longitude 25 * 26 Sequence Number
27 - 74 Station If the data is to be stored in the WRD Hydrologic Data Files then:
a. If there is an entry in the WRD.Station Header File for the specified station, information for this card does not have to be supplied.
b. If there are-,no entries in the WRD Station Header File for the specified station (columns•20-34 card #1) then the card must be submitted. For this case only all entries are mandatory. These two entries'will be stored in the WRD Station Header File by the central lab ADF system.
B-4
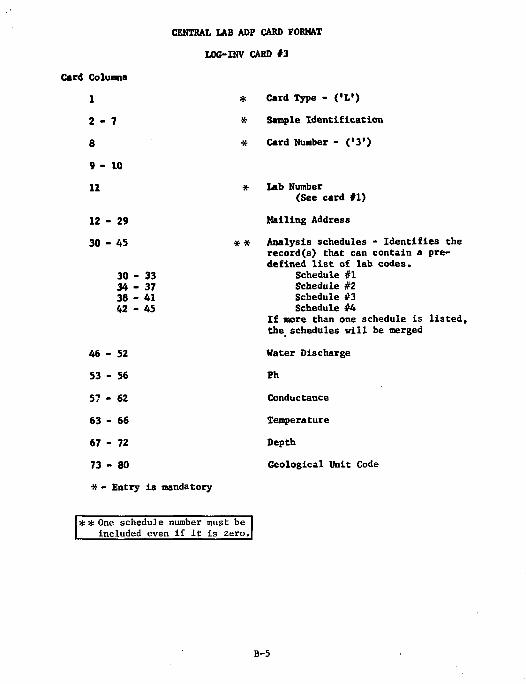
CENTRAL LAB ADP CARD FORMAT LOG-INV CARD #3
Card Columns
1 *
2 - 7 * 8 *
9-10 11 *
12 - 29 30-45 * *
30 - 33 34-37 38 - 41 42 - 45
46 - 52 53 - 56
57 - 62 63 - 66
67 - 72 73 - 80 * - Entry is mandatory
* * One schedule number must be included even if it is zero.
Card Type - ('L') Sample Identification Card Number - ('3')
Lab Number (See card #1)
Hailing Address Analysis schedules - Identifies the record(s) that can contain a predefined list of lab codes.
Schedule #1 Schedule #2 Schedule #3 Schedule #4
If more than one schedule is listed, the schedules will be merged
Water Discharge Ph
Conductance
Temperature
Depth
Geological Unit Code
B-5
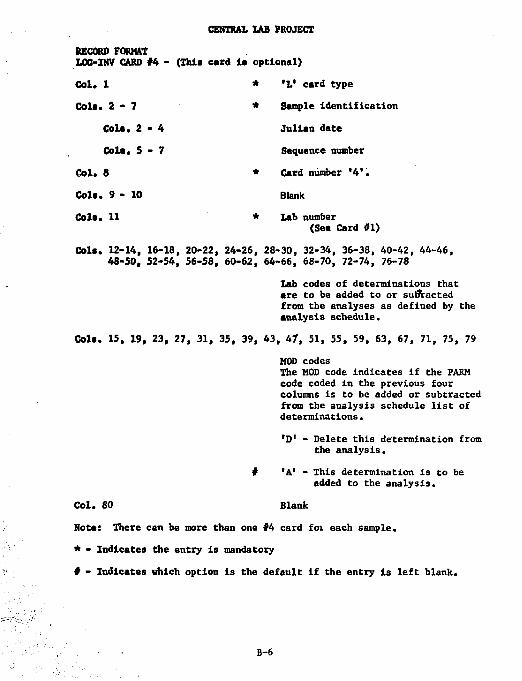
* 'L1 card type * Sample identification
Julian date Sequence number
* Card number '4'.
Blank * lab number
(See Card #1)
CENTRA!. IAB PROJECT
RECORD FORMAT LOG-INV CARD #4 - (This card la optional) Col. 1 Cola. 2 - 7
Cola. 2 - 4 Cola. 5 - 7
Col. 8 Col*. 9-10 Col*. 11
Col*. 12-14, 16-18, 20-22, 24-26, 28-30, 32-34, 36-38, 40-42, 44-46, 48-50, 52-54, 56-58, 60-62, 64-66, 68-70, 72-74, 76-78
lab codes of determinations that are to be added to or subtracted from the analyses as defined by the analysis schedule.
Col*. 15, 19, 23, 27, 31, 35, 39, 43, 47, 51, 55, 59, 63, 67, 71, 75, 79 MOD codes The MOD code indicates if the FARM code coded in the previous four columns is to be added or subtracted from the analysis schedule list of determinations.
'D* - Delete this determination from the analysis.
# *A' - This determination is to be added to the analysis.
Col. 80 Blank
Note: There can be more than one #4 card foi each sample. * - Indicates the entry is mandatory
# - Indicates which option is the default if the entry is left blank.
B-6
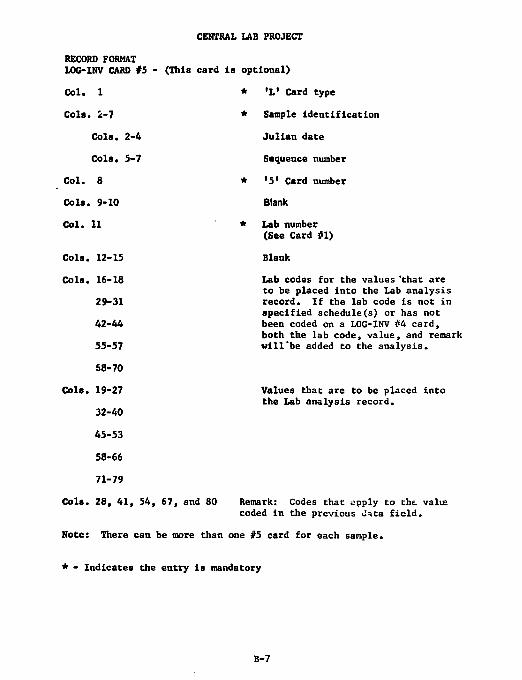
CENTRAL LAB PROJECT
RECORD FORMAT
LOG-INV CARD #5 - (This card Is optional)
Col. 1 * 'L' Card type
Cols. 2-7 * Sample identification
Cols. 2-4 Julian date
Cols. 5-7 Sequence number
Col. 8 * '5' Card number
Cols. 9-10 Blank
Col. 11 * Lab number
(See Card #1)
Cols. 12-15 Blank
Cols. 16-18 Lab codes for the values 'that are to be placed into the Lab analysis
29-31 record. If the lab code is not in specified schedule(s) or has not
42-44 been coded on a LOG-INV #4 card, both the lab code, value, and remark
55-57 will'be added to the analysis. 68-70
Cols. 19-27 Values that are to be placed into the Lab analysis record.
32-40
45-53
58-66
71-79
Cols. 28, 41, 54, 67, and 80 Remark: Codes that apply to the. value coded in the previous Ctta field.
Note: There can be more than one #5 card for each sample.
* - Indicates the entry is mandatory
B-7
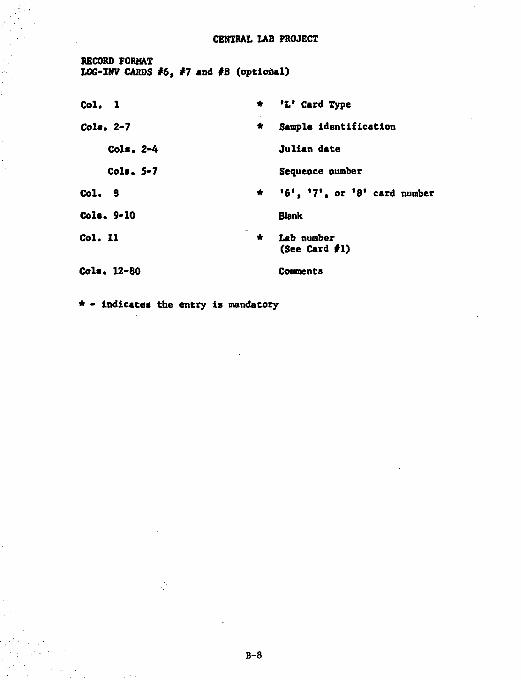
CENTRAL LAB PROJECT RECORD FORMAT LOG-IHV CARDS #6, #7 and #8 (optional)
Col. 1 * »L» Card Type
Cola. 2-7 * Sample identification Cols. 2-4 Julian date Cols. 5-7 Sequence number
Col. 3 * '6 1, '7', or '8' card number
Cols. 9-10 Blank Col. 11 * Lab number
(See Card #1) Cols. 12-80 Comments
* - indicates the entry is mandatory
B-8
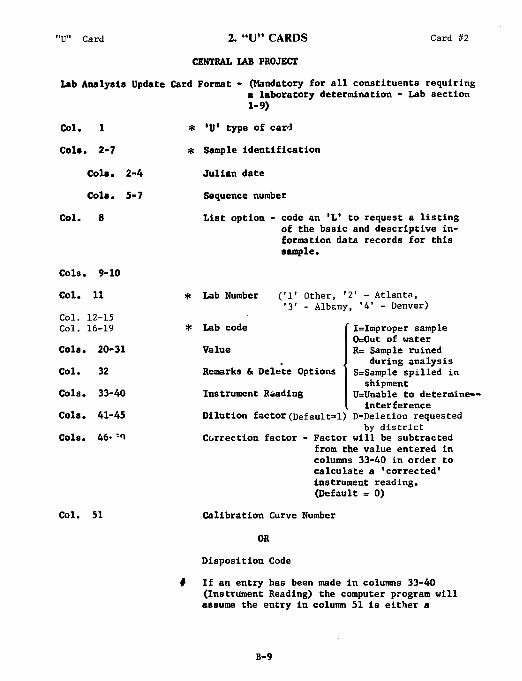
"U" Card 2. "U" CARDS Card #2
CENTRAL LAB PROJECT
Lab Analysis Update Card Format - (Mandatory for all constituents requiring a laboratory determination - Lab section 1-9)
Col. 1
Cola. 2-7
Cols. 2-4
Cols. 5-7
Col. 8
Cols. 9-10
Col. 11
Col. 12-15 Col. 16-19
Cols. 20-31
Col. 32
Cols. 33-40
Cols. 41-45
Cols. 46-'1
Col. 51
* 'U' type of card * Sample identification
Julian date
Sequence number
List option - code an 'L' to request a listing of the basic and descriptive information data records for this sample.
* Lab Number ('1* Other, '2' - Atlanta, '3' - Albany, '4' - Denver)
Lab code
Value
Remarks & Delete Options
Instrument Reading
I=Improper sample 0=0ut of water R= Sample ruined
during analysis S=Sample spilled in shipment
U=Unable to determine-interference
Dilution factor (Default=l) D=Deletion requested by district
Correction factor • Factor will be subtracted from the value entered in columns 33-40 in order to calculate a 'corrected' instrument reading. (Default = 0)
Calibration Curve Number
OR
Disposition Code
If an entry has been made in columns 33-40 (Instrument Reading) the computer program will assume the entry in column 51 is either a
B-9
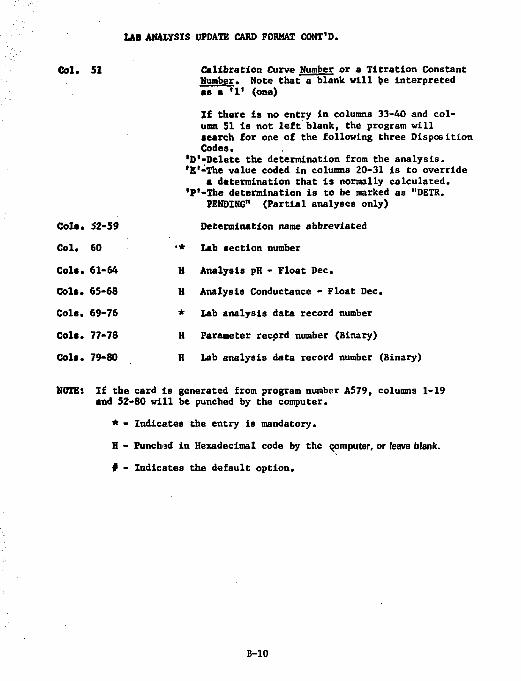
LAB ANALYSIS UPDATE CARD FORMAT CONT'D.
Col. 51 Calibration Curve Number or a Titration Constant Number. Note that a blank will be interpreted •a a '1' (one) If there is no entry in columns 33-40 and column 51 is not left blank, the program will search for one of the following three Disposition Codes.
'D'-Delete the determination from the analysis. 'E'-The value coded in columns 20-31 is to override
• determination that is normally calculated. 'P*-The determination is to be marked as "DETR.
FENDING" (Partial analyses only)
Col*. 52-59 Determination name abbreviated Col. 60 •* Lab section number
Cols. 61-64 H Analysis pH - Float Dec. Cols. 65-68 H Analysis Conductance - Float Dec. Cols. 69-76 * Lab analysis data record number Cols. 77-78 H Parameter record number (Binary) Cola. 79-80 H Lab analysis data record number (Binary)
NOTE: If the card is generated from program number A579, columns 1-19 and 52-80 will be punched by the computer.
* - Indicates the entry is mandatory.
H - Punched in Hexadecimal code by the computer, or leave blank. # - Indicates the default option.
B-10
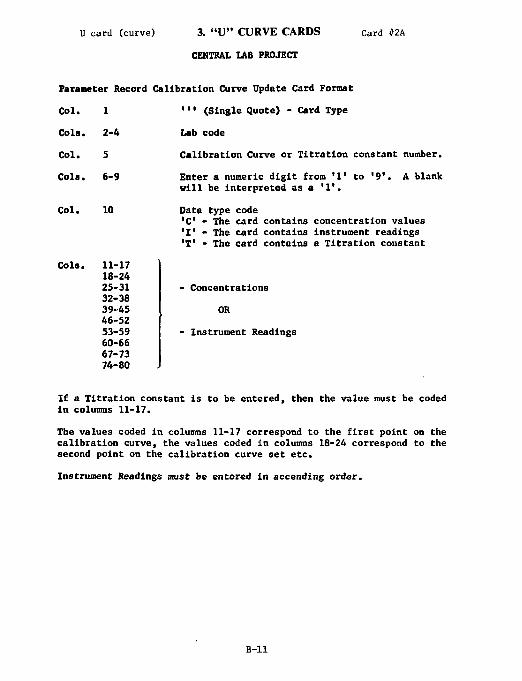
U card (curve) 3. " U " CURVE CARDS Card #2A
CENTRAL LAB PROJECT
Parameter Record Calibration Curve Update Card Format
''' (Single Quote) - Card Type
Lab code
Calibration Curve or Titration constant number.
A blank
Col. 1
Cola. 2-4
Col. 5
Cols. 6-9
Col.
Cols.
10
11-17 18-24 25-31 32-38 39-45 46-52 53-59 60-66 67-73 74-80
Enter a numeric digit from '1' to '9'. will be interpreted as a '1'.
Data type code 'C' - The card contains concentration values 'I* - The card contains instrument readings 'T' - The card contains a Titration constant
- Concentrations
OR
- Instrument Readings
If a Titration constant is to be entered, then the value must be coded in columns 11-17.
The values coded in columns 11-17 correspond to the first point on the calibration curve, the values coded in columns 18-24 correspond to the second point on the calibration curve set etc.
Instrument Readings must be entered in accending order.
B-ll
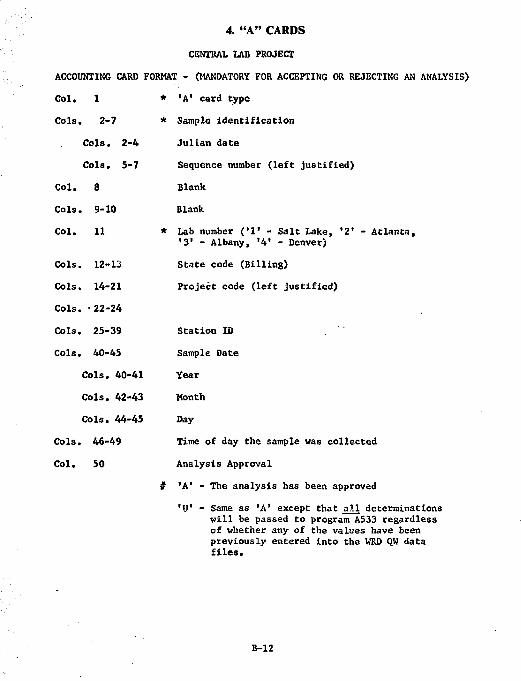
4. "A" CARDS CENTRAL LAB PROJECT
ACCOUNTING CARD FORMAT - (MANDATORY FOR ACCEPTING OR REJECTING AN ANALYSIS)
Col. X * 'A' card type
Cols. 2-7 * Sample identification
Cols, 2-4 Julian date
Cols. 5-7 Sequence number (left justified)
Col. 8 Blank
Cols. 9-10 Blank
Col. 11 * Lab number ('1' - Salt Lake, '2' - Atlanta, '3' - Albany, '4' - Denver)
Cols. 12-13 State code (Billing)
Cols. 14-21 Project code (left justified)
Cols. • 22-24
Cols. 25-39 Station ID
Cols. 40-45 Sample Date
Cols. 40-41 Year
Cols. 42-43 Month
Cols. 44-45 Day
Cols. 46-49 Time of day the sample was collected
Col. 50 Analysis Approval
# 'A' - The analysis has been approved
'U' - Same as 'A' except that all determinations will be passed to program A533 regardless of whether any of the values have been previously entered into the HRD QW data files.
B-12
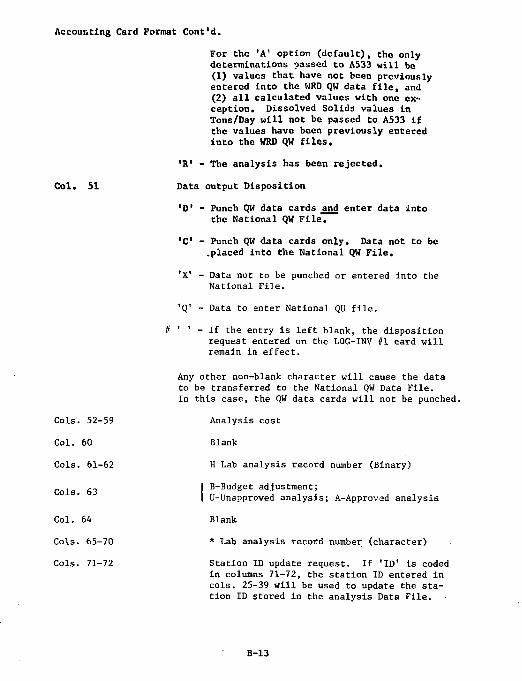
Accounting Card Format Cont'd.
For the 'A' option (default), the only determinations passed to A533 will be (1) values that have not been previously entered into the WRD QW data file, and (2) all calculated values with one exception. Dissolved Solids values in Tons/Day will not be passed to A533 if the values have been previously entered into the WRD QW files.
'R' - The analysis has been rejected.
Col. SI Data output Disposition
'D' - Punch QW data cards and enter data into the National QW File.
'C' - Punch QW data cards only. Data not to be .placed into the National QW File.
'X' - Data not to be punched or entered into the National File.
'Q' - Data to enter National QU file.
t ' ' - If the entry is left blank, the disposition request entered on the LOG-INV #1 card will remain in effect.
Any other non-blank character will cause the data to be transferred to the National QW Data File. In this case, the QW data cards will not be punched.
Cols. 52-59 Analysis cost
Col. 60 Blank
Cols. 61-62 H Lab analysis record number (Binary)
,., j B-Budget adjustment;
I U-Unapproved analysis; A-Approved analysis
Col. 64 Blank
Cols. 65-70 * Lab analysis record number (character) Cols. 71-72 Station ID update request. If 'ID' is coded
in columns 71-72, the station ID entered in cols. 25-39 will be used to update the station ID stored in the analysis Data File.
B-13
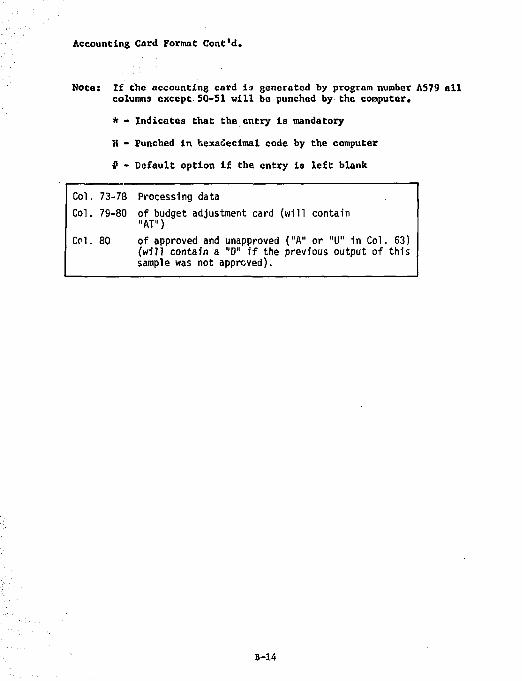
Accounting Card Format Cont'd.
Note: If the accounting card is generated by program number AS79 all columns except 50-51 will be punched by the computer.
* » Indicates that the entry la mandatory H - Punched in hexadecimal code by the computer
$ - Default option if the entry is left blank
Col. 73-78 Processing data Col. 79-80 of budget adjustment card (will
"AT") contain
Col. 80 of approved and unapproved ("A" or (will contain a "D" if the previous sample was not approved).
•U" in output
Col. 63) of this
B-14
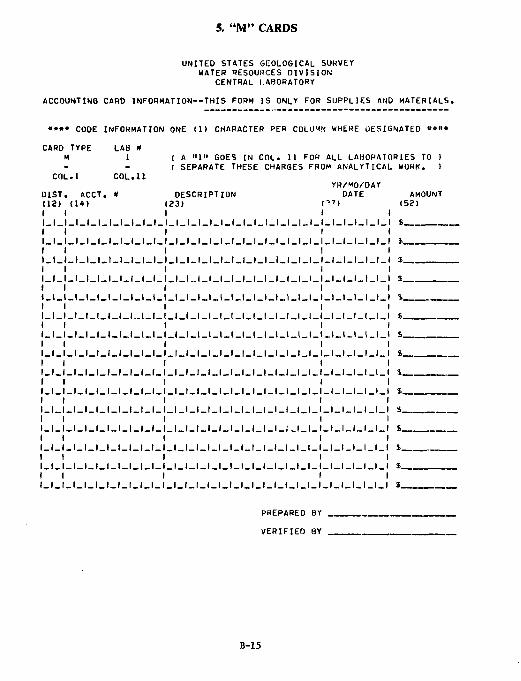
5. "M" CARDS
UNITED STATES GEOLOGICAL SURVEY WATER RESOURCES DIVISION
CENTRAL LABORATORY ACCOUNTING CARD INFORMATION—THIS FORM IS ONLY FOR SUPPLIES AND MATERIALS.
•••• CODE INFORMATION ONE <1> CHAPACTER PER COLUMN WHERE DESIGNATED ••»• CARD TYPE LAB #
M 1 ( A "1" GOES IN COL. 11 FOR ALL LAHORATORIES TO I ( 5EPARATE THESE CHARGES FROM ANALYTICAL WORK. )
AMOUNT (52)
COL.l COL.11 YR/MO/DAY
DIST. ACCT. » DESCRIPTION DATE (12) (1*) (23) P 7 )
i $ $
PREPAREO BY VERIFIEO BY
B-15
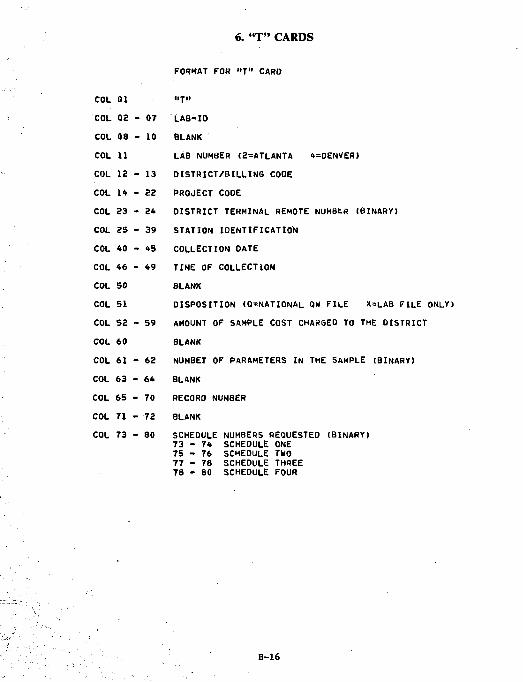
6. "T" CARDS
FORMAT FOR "T" CARD
COL 01 »T» COL 02 - 07 LAB-IO COL 08 - 10 BLANK COL 11 LAB NUMBER (2=ATLANTA 4=DENVER) COL 12 - 13 DISTRICT/BILLING CODE COL I* - 22 PROJECT CODE COL 23 - 2* DISTRICT TERMINAL REMOTE NUMBtR (BINARY) COL 25 - 39 STATION IDENTIFICATION COL 40 - 45 COLLECTION DATE COL 46 - 49 TIME OF COLLECTION COL 50 BLANK COL 51 DISPOSITION (Q=NATIONAL QW FILE X=LAB FILE ONLY) COL 52 - 59 AMOUNT OF SAMPLE COST CHARGED TO THE DISTRICT COL 60 BLANK COL 61 - 62 NUMBET OF PARAMETERS IN THE SAMPLE (BINARY) COL 63 - 64 BLANK COL 65 - 70 RECORD NUMBER COL 71 - 72 BLANK COL 73 - 80 SCHEOULE NUMBERS REQUESTED (BINARY)
73 - 74 SCHEDULE ONE 75 - 76 SCHEDULE TWO 77 - 78 SCHEDULE THREE 78 - 80 SCHEOULE FOUR
B-16
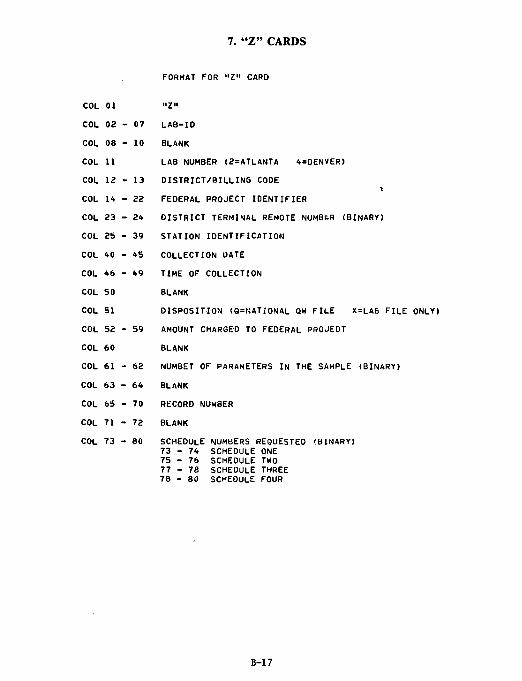
7. "Z" CARDS
FORMAT FOR "Z" CARD
COL 01 "Z» COL 02 - 07 LAB-IO COL 08 - 10 BLANK COL 11 LAB NUMBER <2=ATLANTA 4=DENVER> COL 12 - 13 DISTRICT/BILLINS CODE
l COL 1* - 22 FEOERAL PROJECT IDENTIFIER COL 23 - 20 OISTRICT TERMINAL REMOTE NUMBtR (8INARY) COL 25 - 39 STATION IDENTIFICATION COL 40 - 45 COLLECTION DATE COL 46 - 49 TIME OF COLLECTION COL 50 BLANK COL 51 DISPOSITION <Q=NATIONAL QW FILE X=LA6 FILE ONLY) COL 52 - 59 AMOUNT CHARGED TO FEDERAL PROJEDT COL 60 BLANK COL 61 - 62 NUMBET OF PARAMETERS IN THE SAMPLE (BINARY) COL 63 - 64 BLANK COL 65 - 70 RECORO NUMBER COL 71 - 72 BLANK COL 73 - 80 SCHEDULE NUMBERS REQUESTED (BINARY)
73 - 74 SCHEDULE ONE 75 - 76 SCHEDULE TWO 77 - 78 SCHEDULE THREE 78 - 80 SCHEDULE FOUR
B-17
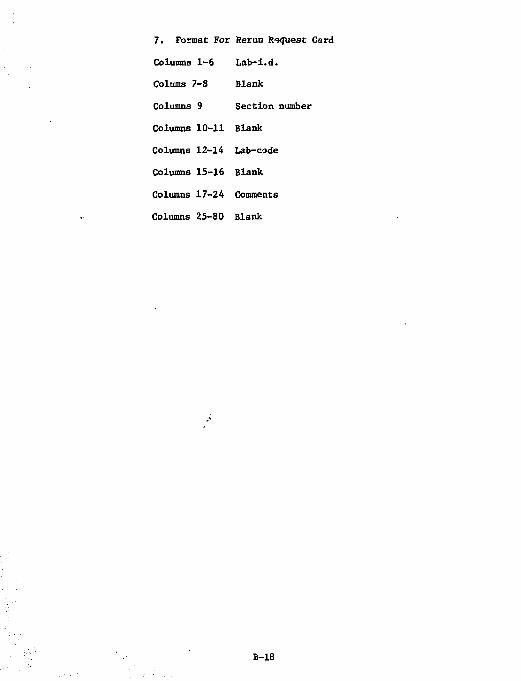
7. Format For Rerun Request Card Columns 1-6 Lab-i.d. Colums 7-8 Blank
Columns 9 Section number Columns 10-11 Blank
Columns 12-14 Lab-code Columns 15-16 Blank Columns 17-24 Comments Columns 25-80 Blank
B-18
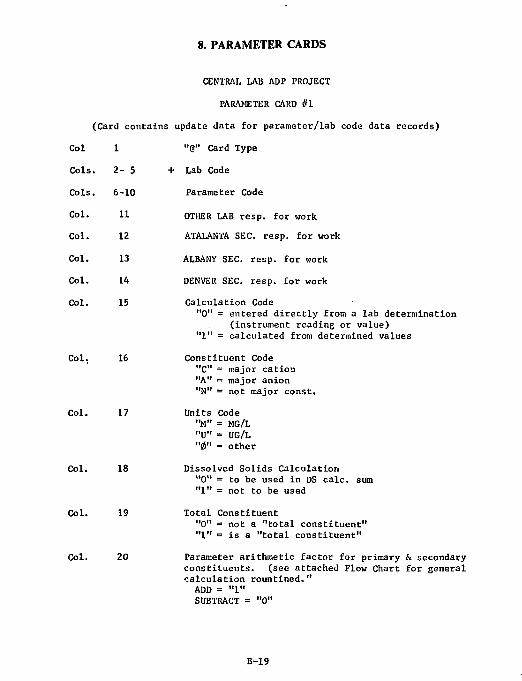
8. PARAMETER CARDS
Col 1
Cols. 2- 5
Cols. 6-10
Col. 11
Col. 12
Col. 13
Col. 14
Col. 15
CENTRAL LAB ADP PROJECT
PARAMETER CARD #1
(Card contains update data for parameter/ lab code data records)
"@" Card Type
+ Lab Code
Parameter Code
OTHER LAB resp . for work
ATALANTA SEC. resp. for work
ALBANY SEC. resp. for work
DENVER SEC. resp. for work
Calculation Code "0" = entered directly from a lab determination
(instrument reading or value) "1" = calculated from determined values
Col. 16 Constituent Code "C" = major cation "A" = major anion "N" = not major const.
Col. 17 Units Code "M" = MG/L "U" = UG/L "0" = other
Col. 18 Dissolved Solids Calculation "0" = to be used in DS calc. sum "1" = not to be used
Col. 19 Total Constituent "0" = not a "total constituent" "1" = is a "total constituent"
Col. 20 Parameter arithmetic factor for primary & secondary constituents. (see attached Flow Chart for general calculation rountined." ADD = "1" SUBTRACT = "0"
B-19
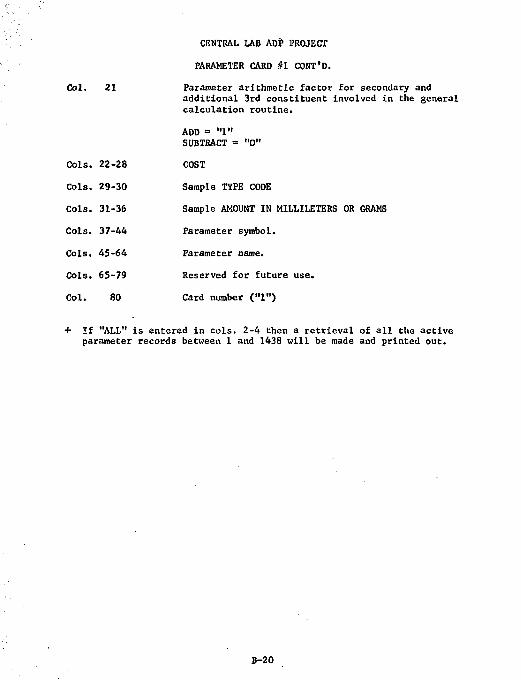
CENTRAL LAB ADP PROJECT
PARAMETER CARD #1 CONT'D.
Col. 21 Parameter arithmetic factor for secondary and additional 3rd constituent involved in the general calculation routine.
ADD = "1" SUBTRACT = "0"
Cols. 22-28 COST
Cols. 29-30 Sample TYPE CODE
Cols. 31-36 Sample AMOUNT IN MILLILETERS OR GRAMS
Cols. 37-44 Parameter symbol.
Cols. 45-64 Parameter name.
Cols. 65-79 Reserved for future use.
Col. 80 Card number ("1")
+ If "ALL" is entered in cols. 2-4 then a retrieval of all the active parameter records between 1 and 1438 will be made and printed out.
B-20
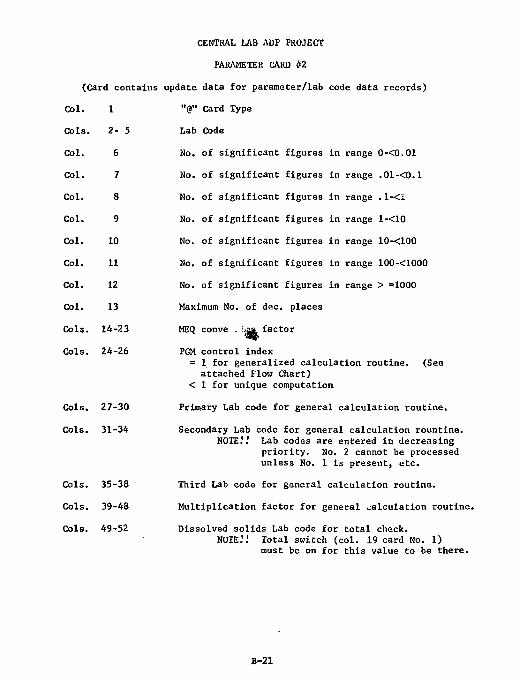
CENTRAL LAB ADP PROJECT
PARAMETER CARD #2
(Card contains update data for parameter/lab code data records)
"@" card Type
Lab Code
No. of significant figures in range 0-<0.01
No. of significant figures in range .01-<0.1
No. of significant figures in range .1-<1
No. of significant figures in range 1-<10
No. of significant figures in range 10-<100
No. of significant figures in range 100-<1000
No. of significant figures in range > =1000
Maximum No. of dec. places
HEQ conve . !;Mi factor
PGM control index = 1 for generalized calculation routine. (See
attached Flow Chart) < 1 for unique computation
Cols. 27-30 Primary Lab code for general calculation routine.
Cols. 31-34 Secondary Lab code for general calculation rountine. NOTE.'.' Lab codes are entered in decreasing
priority. No. 2 cannot be processed unless No. 1 is present, etc.
Cols. 35-38 Third Lab code for general calculation routine.
Cols. 39-48 Multiplication factor for general calculation routine.
Cols. 49-52 Dissolved solids Lab code for total check. NOTE.'.' Total switch (col. 19 card No. 1)
must be on for this value to be there.
Col. 1
Cols. 2- 5
Col. 6
Col. 7
Col. 8
Col. 9
Col. 10
Col. 11
Col. 12
Col. 13
Cols. 14-23
Cols. 24-26
B-21
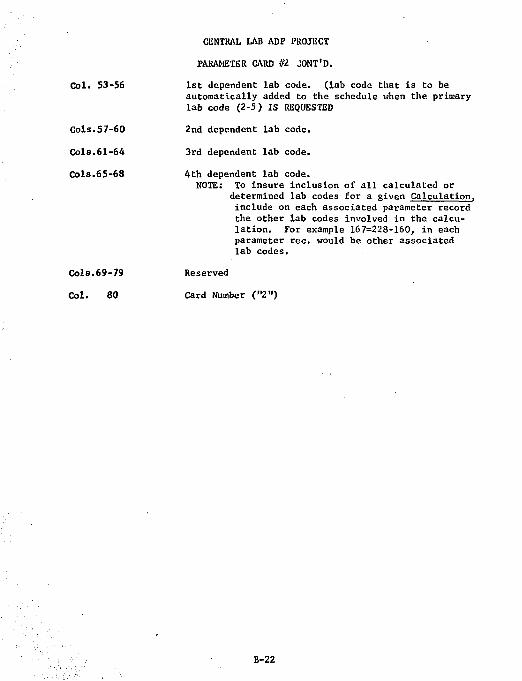
CENTRAL LAB ADP PROJECT
PARAMETER CARD #2 JONT'D.
Col. 53-56 1st dependent lab code. (lab code that is to be automatically added to the schedule when the primary lab code (2-5) IS REQUESTED
Cols.57-60 2nd dependent lab code.
Cols.61-64 3rd dependent lab code.
Cols.65-68 4th dependent lab code. NOTE: To insure inclusion of all calculated or
determined lab codes for a given Calculation. include on each associated parameter record the other lab codes involved in the calculation. For example 167=228-160, in each parameter rec. would be other associated lab codes.
Cols.69-79 Reserved
Col. 80 Card Number ("2")
B-22
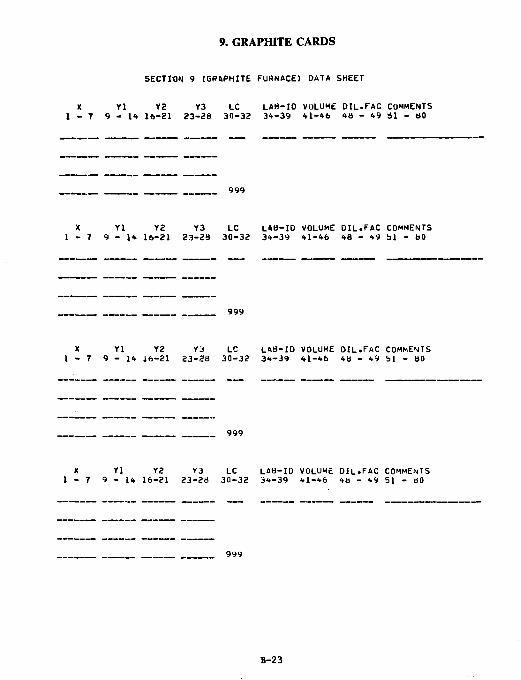
9. GRAPHITE CARDS
SECTION 9 (GRAPHITE FURNACE) DATA SHEET
X Yl Y2 Y3 LC LAH-IO VOLUME DIL.EAC COMMENTS 1 _ 7 9 - 1 * 16-21 23-28 30-32 34-39 41-46 48 - 49 SI - 80
999
X Yl Y2 Y3 LC LAB-ID VOLUME DIL.FAC COMMENTS 1 - 7 9 - 1 4 16-21 23-28 30-32 34-39 41-46 48 - 49 bl - bO
999
X Yl Y2 Y3 LC LA8-ID VOLUME DIL.FAC COMMENTS 1 - 7 9 - 1 4 16-21 23-28 30-32 34-39 41-46 48 - 49 SI - 80
999
X Yl Y2 Y3 LC LAB-ID VOLUME DIL.FAC COMMENTS 1 - 7 9 - 1 4 16-21 23-28 30-32 34-39 41-46 48 - 49 51 - 80
B-23
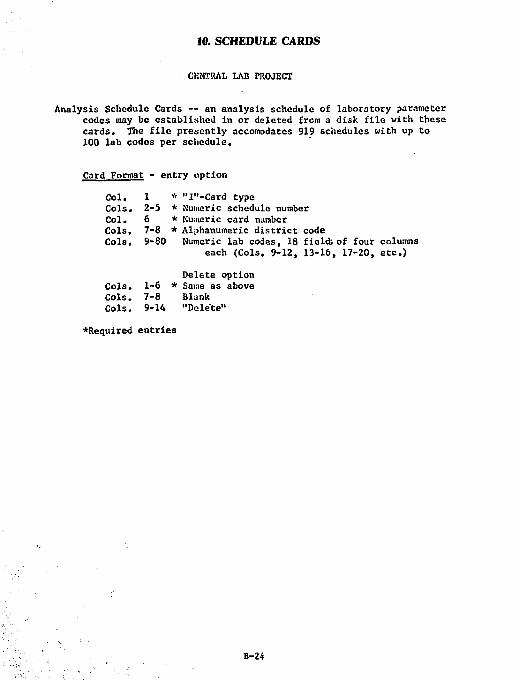
10. SCHEDULE CARDS
CKNXBAL LAB PROJECT
Analysis Schedule Cards — an analysis schedule of laboratory parameter codes may be established in or deleted from a disk file with these cards. The file presently accomodates 919 schedules with up to 100 lab codes per schedule.
Card Format - entry option
Col. 1 * "I"-Card type Cols, 2-5 * Numeric schedule number Col. 6 * Numeric card number Cols. 7-8 * Alphanumeric district code Cols. 9-SO Numeric lab codes, 18 field; of four columns
each (Cols. 9-12, 13-16, 17-20, etc.)
Delete option Cols, 1-6 * Same as above Cols. 7-8 Blank Cols, 9-14 "Delete"
•Required entries
B-24
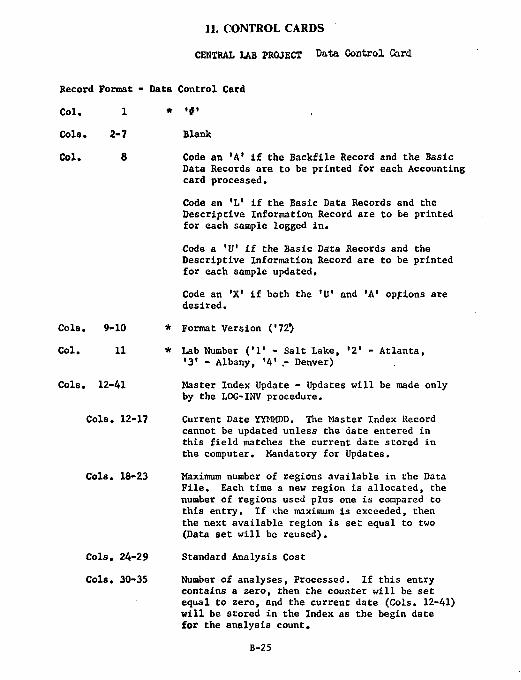
11. CONTROL CARDS
CENTRAL LAB PROJECT Vata. Control Card
Record Format - Data Control Card
Col. X * '#'
Cols. 2-7 Blank
Col. 8 Code an 'A' if the Backfile Record and the Basic Data Records are to be printed for each Accounting card processed. Code an 'V if the Basic Data Records and the Descriptive Information Record are to be printed for each sample logged in.
Code a 'U' if the Basic Data Records and the Descriptive Information Record are to be printed for each sample updated.
Code an 'X' if both the 'U* and 'A* options are desired.
Cols. 9-10 * Format Version ('72} Col. 11 * Lab Number ('1' - Salt Lake, '2' - Atlanta,
'3' - Albany, '4' - Denver)
Cols. 12-41 Master Index Update - Updates will be made only by the LOG-INV procedure.
Cols. 12-•17 Current Date YYMMDD. The Master Index Record cannot be updated unless the date entered in this field matches the current date stored in the computer. Mandatory for Updates.
Cols. 18-23 Maximum number of regions available in the Data File. Each time a new region is allocated, the number of regions used plus one is compared to this entry. If the maximum is exceeded, then the next available region is set equal to two (Data set will be reused).
Cols. 24-29 Standard Analysis Cost
Cols. 30-35 Number of analyses, Processed. If this entry contains a zero, then the counter will be set equal to zero, and the current date (Cols. 12-41) will be stored in the Index as the begin date for the analysis count.
B-25
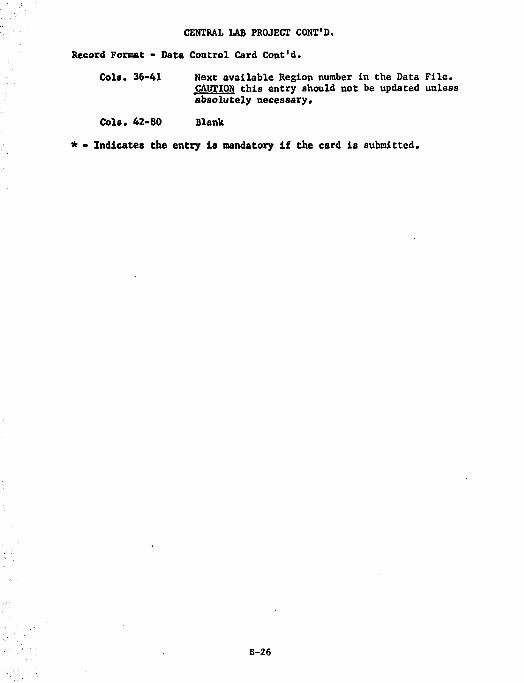
CENTRAL LAB PROJECT CONT'D,
Record Format - Data Control Card Cont'd. Cols. 36-41 Next available Region number In the Data File.
CAUTION this entry should not be updated unless absolutely necessary.
Cols. 42-80 Blank
* - Indicates the entry is mandatory if the card is submitted.
B-26
Appendix C Job Control Language Decks
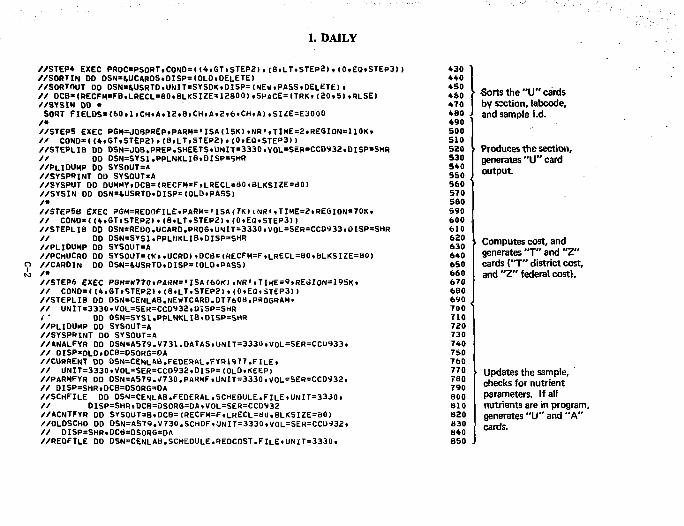
•1. DAILY
//STEP* EXEC PR0C=PSORT.C0ND=(<4,GT.STEP2>.(8.LT.STEP2).(0.EO.STEP3)) //SORTIN OD DSN=iUCAROS,DISP=<OLO.DELETE) //SORTOUT DD DSNxfcUSRTO,UNIT=SYSDK.DISP=<NEil,PASS.DELETE) . // OCB*<RECFM=FB.LRECL=80.8LKSIZEsl2800>,SPACE*(TRK.<20»5),RLSE) //SYSIN OO • SORT FIELDS«<60.1.CH«A.12.8.CHtA.2.6»CH.A>.SIZE=E3000 /* //STEPS EXEC PGM=JOBPREP.PARM=,ISA(15K>.NR,.TIME=2.REGION=110K. // CONO*<(*t6T.STEP2)»(8.LT.5TEP2)»(0.EQ.STEP3)( //STEPLIB OO DSN=JOB.PREP.SHEETS.UNIT=3330,VOL=SER=CCD932.0ISP=SHR // OD DSN=SYS1.PPLNKLI8.DISP=SHR //PLIDUMP OD SYSOUT=* //SYSPRINT DD SYSOUT*A //SYSPUT OD DUMMYtDCB=<RECFM*F.LRECL=80«8LKSIZE=aO) //SYSIN OD DSN=lUSRTD.OISP=(OLD.PASS) /* //STEP5B EXEC P6M=REDOFILE.PARM='ISA(7KltNR<.TIME=2.REGION=70K. // COND*((4.GT.STEP2).(8.LT.STEP2).(0.EQ.STEP3)) //STEPLIB DD DSN=REDO.UCARD.PROG»UNIT=3330.VOL=SER=CC0933.0ISP=5HR // OD OSN=SYS1.PPLNKLIB»OISP=SHR //PLIDUHP DD SYSOUT=A //PCHUCRD OD SYSOUT=(K..UCR0).DCa=(RECFM=F.LR£CL=80.8LKSIZE=80)
n //CAROIN OO DSN=&USRTD.DISP=<OLO.PASS) ro /*
//STEP6 EXEC PSM=W770«PARM='ISA<60K).NR'.TlME=9.REdION=195K. // COND=((4.GT.STEP2).(8.LT.STEP2)•(0.EB.STEP3)) //STEPLIB OD DSN=CENLAB.NEWTCARD.OT7608.PROGRAM. // UNIT»3330.\/OL=SER=CCD932,OtSP=SHR / ' DO DSN=SYS1.PPLNKLIB,DISP=SHR //PLIOUMP DO SYSOUT=A //SYSPRINT DO SYSOUT=A //ANALFYR DD DSN=A579.V731.0ATAS.UNIT=3330,VOL=SER=CCU933. // DISP*OLD.DCB=OSORG=DA //CURRENT OO OSN=CENLAS.FEDERAL.FYR1977.FILE. // UNIT=3330.VOL=SER=CCD932.DISP=(OLD.KEEP) //PARMFYR DD DSN=AS79. i/730.PARMF.UNlT=3330, V0L=SER=CCD932. // OISP=SHR.DCB=DSORG=OA //SCHFILE DD DSN=CENLAB.FEDERAL.SCHEDULE.FILE.UNIT=33iO. // DISP=SHR.0CB=DSORG=DA.VOL=SER=CCD932 //ACNTFYR OD SYSOUT=B.DCB=(RECFM=F.LRECL=8U,8LKSIZE=aO) //OLDSCHD DD DSN=A579.V730.SCHDF.UNIT=3330.VOL=SER=CCD932. // DISP=SHR.DCB=DSORG=DA //REOFILE OO OSN=CENLAB.SCHEDULE.REDCOST.FILE.UNJT=3330.
•30 **0 450 480 470 480 490 500 510 520 530 540 550 560 570 580 590 600 610 620 630 640 650 660 670 680 690 700 710 720 730 740 750 760 770 780 790 800 810 820 830 840 850
• Sorts the " U " cards by section, labcode, and sample i.d.
Produces the section, generates " U " card output.
Computes cost, and generates "T" and "Z" cards ("T" district cost, and "Z" federal cost).
Updates the sample, checks for nutrient parameters. If all nutrients are in program, generates " U " and "A" cards.
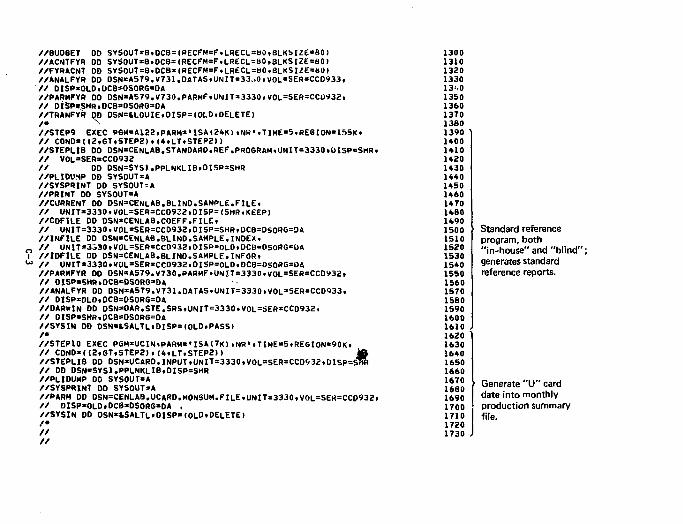
//BUOGET 00 SYSOUT*B.DCB=(RECFM=F.LRECL=BO,8LKSIZE=BO) //ACNTFYR DO SYS0UTsB.OCB=<RECFM=F,LRECL=B0.BLKSIZE=80> //FYRACNT DO SYSOUT*B.DCB*(RECFM=F.LR£CL=B0.8LK$IZE=dO) //ANALFYR 00 DSN«A579.V731 .DATAS.UNIT=33..0.VOLSSER=CCD933. '// DISP*OLD.DCB*OSORG*OA //PARMFYR 00 DSN*A579.V730.PARMF.UNIT=3330.VOL=SER=CCD932, // Dl5l*JsSHR.DCB*DS0RG=DA //TRANFYR 00 DSN=&LOUIE.DISP=(OLD.DELETE) /• //STEP9 EXEC P6M=A122»P»RM«*ISAt24K>tNR'.TIME=5,REGI0N=155K. // COND=<(2.GT.STEP2).(4.LT.STEP2)) //STEPLI8 00 DSN=CENLAB.STANDARD.REF.PROGRAM.UNIT=3330.DISP=SHR. // V0L=SER*CCD932 // 00 DSN=SYS1.PPLNKLIB.DISP=SHR //PLIDl'MP DO SYSOUTsA //SYSPRINT OD SYS0UT=A //PRINT 00 SYS0UT=A //CURRENT DD DSN=CENLAB.BLIND.SAMPLE.FILE. // UNIT«3330.V0L=SER=CCD932.DISP=(5HR.KEEP> //COFILE OD DSN*CENLAB.COEFF.FILE. // UNIT=3330.VOL=SER=CCD932,0ISP=SHR»DCB=DSOR6=DA //INFILE 00 OSN*CTNLAB.BLLNO.SAMPLE.INOEX.
_, // UNIT*3;»30TV0L=S£R=CCO932,DISP=OLD«DCB=DSORG«DA I //IOFILE DO OSN=CENLAB.BLIND.SAMPLE.INFOR. " // UNIT*3330.VOL=SER=CCD932.0ISP=OLD.DCB=DSORG=DA
//PARMFYR DD DSN*A579.V730.PARMF.UN!T=3330.VOL=SER=CCD932. // 0ISP=SHR.DCB»0S0RG=DA //ANALFYR DD DSN*A5T9.V731.DATAS.UNIT=3330.V0L=SER=CC0933, // DISP=OLD.DCB=DSORG=DA //DARHIN DD DSN=OAR.STE.SRS.UNIT=3330.VOL=SER*CCD932. / / DISP«SHR,OCB=DSORG=DA / / S Y S I N 0 0 DSN»FCSALTL»DISP=(OLD.PASS) /• //STEP10 EXEC P6M=UCIN.PARM««ISA(7K>.NR«»TIME*5.REGION=90K. // C0ND*((2.GT.STEP2).(4<LT.5TEP2>> tft //STEPLIB DD DSN«UCARO.INPUT.UNIT=3330.«OL=SER=CCD93Z.OISP=s1« // DD DSN«SYS1.PPLNKLIB.DISP=SHR //PLIOUMP DO SYSOUT=A //SYSPRINT 00 SYSOUT*A //PARM DD 0SN=CENLAS.UCARO.M0NSUM.FILE.UNIT=3330,VOL=SER=CCD932 // DISP*OLOtDCB>0S0RG*DA , //SYSIN 00 OSN-iSALTL.DISP«(OLD.DELETE! /• // //
1300 1310 1320 1330 13'.0 1350 1360 1370 1380 1390 1*00 1410 1420 1430 1440 1450 1460 1470 14B0 1490 1500 1510 1520 1530 1540 1SS0 1560 1570 1580 1590 1600 1610 1620 1630 1640 1650 1660 1670 1680 1690 1700 1710 1720 1730
Standard reference program, both "in-house" and "blind" generates standard reference reports.
Generate " U " card date into monthly production summary file.
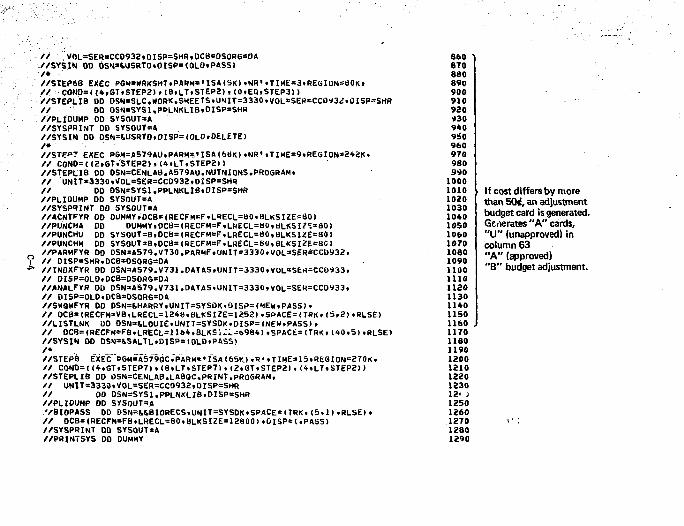
•// . VOL=SER=CCD932.OISP=SHR.0CB=DS0RG=OA .//SYSIN OD DSN»«.USRTO»OISP*(OLD.PASS>
, • • / • • < ' "
//STEP6S EXEC PGM=WRKSHT.PARM='ISA(SK>»NR'«TIME=3.REGION=d0K. // COND=U*,GT.STEP2>»(B.LT»STEP2).(0.EQ.STEP3>> //STEPLIB DD OSN=SLC.WORK.SHEETS.UNIT=3330.VOL=SER=CC093<J.OISP=SHR // 00 0SN=SYS1.PPLNKLIB.DISP=SHR //PLIDUMP 00 SYSOUT=A //SYSPRINT DO SYSOUT=A //SYSIN OD OSN=&USRTO.0ISP=(OLD.DELETE) /• //STFP7 EXEC PGM=A579AU.PARM='ISA(<>B!O.NR'.TIME=9»REGI0N*242K» // C0ND=((2.GT.STEP2)»(4.LT.STEP2)> //STEPLIB OD DSN=CENLAB.A579AU.NUTNI0NS.PROGRAM. // UNIT«3330.V0L=SER=CC0932.DISP=SHR // DD DSN=SYS1.PPLNKLI8.DISP=SHR //PLIDUHP 00 SYSOUT=A //SYSPRINT 00 SYSOUT»A //ACNTFYR 00 DUMMYiOCB=(RECFH=F.LRECL=80.BLKSIZE=80) //PUNCHA DD DUMMY.OCB=<RECFM=F,LWECL=BO,BLKSI/'-*80> //PUNCHU DD SYSOUT=B.0CB=(RECFM=F,LRECL=80.BLKSI/£=80l //PUNCHM DO SYSOUT*B.DCa=<RECFM=F,LRECL=80,8LKSI2E=80> //PARMFYR DO DSN=A579.V730,PARMF»UNIT=3330.VOL=S£R=CCD932,
I // DISP»SHR.DCB=0S0R6=DA ** //INDXFYR 00 0SN=A579.V731.DATAS,UNIT=3330.VOL=SEH=CCD933.
// DISP=OLD.DCB=DS0RG=DA //ANALFYR DD DSN=A579.V731.0ATAS.UNIT=3330»V0L=SER=CCD933. // DISP=OLD.DCB=DSORG=DA //SWQWFYR 00 DSN=iHARRY.UNIT=SYSDK.DISP=(NEW.PASS)• // DCB»<RECFH»VB.LRECL=12*8«BL!tSIZE=1252).SPACE=<TRK.IS,2)»RLSE) //LISTLNK DO DSN=&LOUIE»UNIT=SYSDK.DISP=(NEW,PASS). // DCB=(R£CFM=FB.LRECL=116*.BLKSi^-t>9S*).SPACE=(TRK»(40.51.RLSE) //SYSIN DD OSN=&SALTL.DISP=(OLD.PASS) /• //STEPS EXEC" PGM=A579QC»PARM='ISA(65K) .R'.TIME=15.REGI0N=270K, // COND=((4.GT.STEP7).(8.LT.STEP7).(2.GT.STEP2),(4.LT.STEP2)> //STEPLIB 00 DSN=CENLAB.LABQC.PRINT.PROGRAM, // UNlT=3330.VOL=SER=CC0932.0ISP=SHR // OD DSN=SYS1.PPLNKLI8.DISP=SHR //PLIOUMP DD SYSOUT=A VBIOPASS DD DSN=i&BI0RECS.UNIT=SYS0K.SPACE=(TRK.(5.1).RLSE). // DCB=(RECFM=FB.LRECL=80.BLKSIZE=12800).OISP=(.PASS) //SYSPRINT OD SYSOUT*A //PRINTSYS DD DUMMY
860 870 880 B90 900 910 920 930 9*0 9S0 960 970 980 990 1000 1010 1020 1030 1040 1050 1060 1070 1080 1090 1100 1110 1120 1130 1140 1150 1160 1170 1180 1190 1200 1210 1220 1230 12' J 1250 1260 1270 1280 1290
If cost differs by more than 504, an adjustment budget card is generated. Generates "A" cards, " U " (unapproved) in column 63 "A" (approved) "B" budget adjustment.
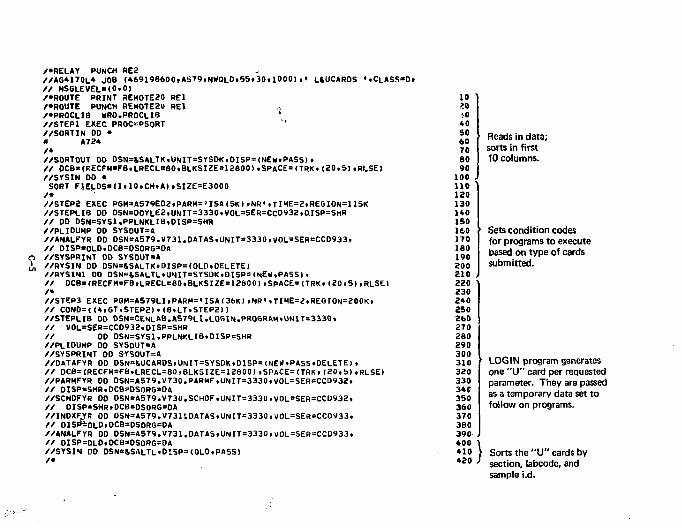
/•RELAY PUNCH RE2 //AG4170L4 JOB (469198600.AST9.NWQLD.55.30.1000)»• L4UCARDS '.ClASS»D. // MS6LEVEL»<0.0) /•ROUTE PRINT REMOTE20 RE1 /•ROUTE PUNCH REM0TE20 RE1 /•PROCLIB WRO.PROCLIB ' //STEPI EXEC PROC'OSORT //SORTIN DD • * A724 /• //SORTOUT DO OSN=iSALTK.UNIT=SYSDK.OISP=(NEW.PASS). // OCB=(F:CCFH=F8,LRECL=80.BLKSIZE=12800) .SPACE=(TRK. (Z0.5) ,RLSE) //SYSIN DD • SORT F1ELDS*(1.10.CH.A).SIZE=E3000 /• //STEP2 EXEC PGM=A579E02,PARM=°ISA(5K),NR'.TIME=2.REG10N=115K //STEPLI8 DD DSN=DOYLE2.UNIT=3330»VOL=SER=CCD932,D.ISP=SHR // DD DSN=SYS1.PPLNKLIB,0ISP=SHR //PLIDUHP OD SYSOUT=A //ANALFYR DD DSN=A579.V731.0ATAS,UNIT=3330,VOL=SER=CCD933, // DISPsOLD.DCB=DSORG=DA
O //SYSPRINT OD SYSOUT=A ' //RYSIN DD DSN=&SALTK.DISP=(OLD.DELETE)
//RYSIN1 DD DSN=&SALTL.UNIT=SYSDK.DISP=MNE*,PASS>. // DCB»(RECFM=FB.LRECL=80.BLKSIZE=12600),SPACE=(TRK.<20.5),RLSE) /• //STEP3 EXEC PGM=A579LI.PARM='ISA(36K>»NR».TIME=2,REGI0N=200K. // CONO=((4.GT.STEP2).(8.LT.STEP2)) //STEPLIB DD 0SN=CENLAB.AS79LI.LOGIN.PROGRAM»UNIT=3330» // V0L=SER=CC0932.DISP=SHR // OD DSN=SYS1.PPLNKLIB.0ISP=SHR //PLIDUMP DO SYSOUT=A //SYSPRINT 00 S'YSOUT=A //DATAFYR OD DSN=&UCARDS»UNIT=SY5DK.0ISP= (NEW.PA5S.DELETE) • // DC8=(RECFM=FB.LRECL=80.BLKSIZE=12800>.SPACE=<TRK.(20,5).RLSE) //PARMFYR DD OSN=A579.V730.PARMF.UNIT=3330.V0L=SER=CCD932. // OISP»SHR,OCB=DSORG=DA //SCHDFYR DO DSN=A579.V730.SCHDF.UNIT=3330»VOL=SER=CCD932. // DISP=SHR.DCB=OSORG=OA //INDXF.YR OD DSN=A579.V731'.DATAS.UNIT=3330.V0L=SER=CCO933, // DISPiOLD.DCB=DSORG=DA //ANALFYR DD 0SN=A579.V731 ,DATAS.UNIT=3330. V0L=SER=CCD933, // DISP=OLO,DCB=DSORG=DA //SYSIN DO OSN=&SALTL«OISP=(OLD,PASS) /•
10 .?0 i-0 40 | J • Reads in data; 70 sorts in first 80 10 columns. 90
100 110 ' 120 130 1*0 ISO 160 > Sets condition codes J70 for programs to execute
based on type of cards 200 submitted. 210 220 230 240 250 260 270 280 290 300 310 f LOGIN program generates 320 one " U " card per requested 3 3 0 parameter. They are passed »gp as a temporary data set to 3^0 follow on programs. 370 380 390 400 *10 > Sorts the " U " cards by * 2 0 ' section, labcode, and
sample i.d.
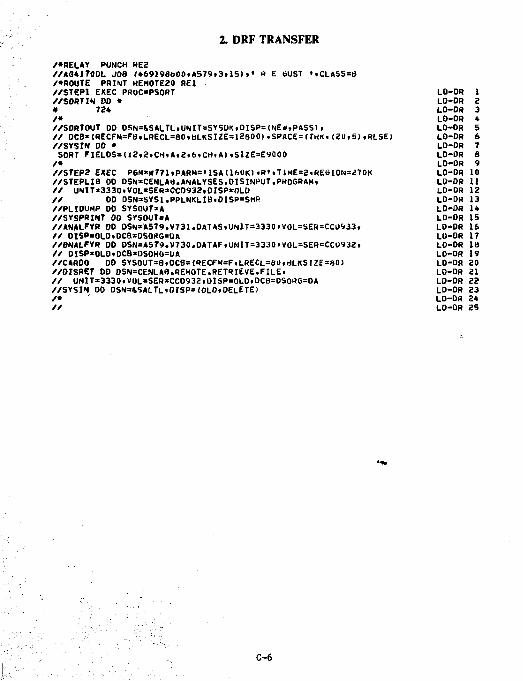
2. DRF TRANSFER /•RELAY PUNCH HE2 //AS4J7SDL J08 <«69198bOO.AS79.3.15>•• » E GUST >.CLASS=6 /•ROUTE PRINT KEMOTE20 RE1 //STEP1 EXEC PROC=PSORT LO-DR 1 //SORTIN OD • LO-OR 2 # 72* LO-DR 3 /• LO-OR * //SORTOUT OD OSN=iSALTL»UNIT=SYSOK.OISP=<NE*»PASS>i LO-OR 5 // DCB*(RECFM=FB»LRECL=80«BLKSIZE=12800).SPACE=(TKK.(2U.51.RLSE) LO-DR 6 //SYS IN DO • LO-OR 7 SORT FIELOS=U2.2iC4.A,2.6.CH.A>.SlZE=E9000 LO-OR 8
/• LD-OR 9 //STEP? EXEC P6***771»PARM=«ISA<160K>tR'>TlME=2.REG10N=270K LO-OR 10 //STEPLIB 00 OSN»CENLAB.ANALYSES.DISINPUT,PROGRAM. LO-OR 11 // UNIT»3330.VOL*SER=CC0932.0ISP*OLD LO-DR 12 // DO DSN»SYS1.PPLNKLIB.0ISP=SHR LO-DR 13 //PLIOUMP 00 SYSOUT*A LD-DR 14 //SYSPRINT 00 SYS0UT»A LD-DR 15 //ANALFYR OD DSN*A579.V731.OATAS.UNIT=3330>VOL=SER=CCD933, LD-DR 16 // DISP»01D.DCB=DS0HG*0A LO-OR 17 //BNALPYR DO OSN=AS79.V730.DATAF.UNlT=3330»VOL=SER=CCO932. LO-OR 18 // DlSP*0LD<DCB*0S0HG=UA LO-OR 19 //CARDO DO SYS0UT=B»0CB=<RECFM=F,LRECL=8i>.«LKSIZE*80) LO-OR 20 //OISRET DO DSN=CENLA*.REMOTE.RETRIEVE.FILE. LD-DR 21 // UNIT=3330.VOL=SER=CCD932.DISP=OLD.DC8=DSO«G=DA LO-DR 22 //SYSIN 00 DSN=&SALTL.0ISP=<OLD.DELETE) LD-DR 23 /• LD-DR 2* // LD-DR 25
C-6
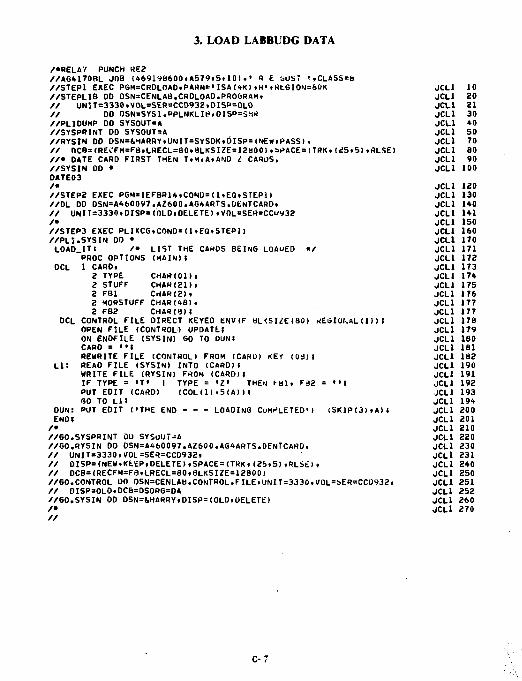
3. LOAD LABBUDG DATA /•RELAY PUNCH RE2 //AG4170BL JOB (469198600.A579.5.10>»' R E 'JUST '.CLASS=b //STEP1 EXEC PGM=CRDLOAD.PARM='ISA(»K>.H'«tftGION=60K JCLl 10 //STEPLIB 00 DSN=CENLAB.CRDLOAD.PROGRAM. JCLl 20 // UNIT=3330.VOL=SER=CCD932.DISP=OLO JCLl 21 // DD OSN=SYSl.PPLNKLIt>.DISP=SMR JCLl 30 //PLIDUMP DO SYSOUT=A JCLl 40 //SYSPRINT OD SYSOUT=A JCLl 50 //RYSIN OD OSN=&HARRY.UNIT=SYSDKtblSP=(NE«iPASS). JCLl 70 // OCB=<RECFM=F8.LRECL=80.BLKSIZE=12a00>»SPACE=(TRK.(2S.S)»RLSE> JCLl 80 //• DATE CARD FIRST THEN T.M.A.AND I CAROS. JCLl 90 //SYSIN DD • JCLl 100 OATE03 /• JCLl 120 //STEP2 EXEC PGM=IEFBR14.C0ND=(1.EQ.STEPU JCLl 130 //DL OD DSN=A460097.AZ600.AG4ARTS.UENTCARD. JCLl 140 // UNIT=3330.DISP=<OLD.OELETE).VOL=SER=CCU¥32 JCLl 1*1 /• JCLl ISO //STEPS EXEC PLIXCG.COND*(l.EO.STEPl> JCLl 160 //PLI.SYSIN OD • JCLl 170 LOAD_IT: /• LIST THE CARDS BEING LOAuEO •/ JCLl 171
PROC OPTIONS (MAIN)I JCLl 172 OCL 1 CARD. JCLl 173
2 TYPE CHAR(01). JCLl 174 2 STUFF CHAR(21). JCLl 175 2 FBI CHAR(2). JCLl 176 2 MORSTUFF CHAR(48). JCLl 177 2 FB2 CHAR(8)I JCLl 177
DCL CONTROL FILE OIRECT KEYED ENVIF aLKSIZE(BO) rtEGIOKAL (1) ) ; JCLl 178 OPEN FILE (CONTROL) UPDATE; JCLl 179 ON ENDFILE (SYSIN) GO TO OUNJ JCLl 180 CARD = "I JCLl 181 REWRITE FILE (CONTROL) FROM (CARD) KEY <l)d)l JCLl 182
LI! READ FILE (SYSIN) INTO (CARD)I JCLl 190 WRITE FILE (RYSIN) FROM (CAROM JCLl 191 IF TYPE = "T« I TYPE = 'Z< THEN fBl. FS2 = "I JCLl 192 PUT EDIT (CARO) (COL(l).5(A))I JCLl 193 GO TO Ll» JCLl 194
DUN: OUT EDIT ('THE END LOADING COMHLETED') (SKIP(3).A)I JCLl 200 END! JCLl 201 /• JCLl 210 //GO.SYSPRINT OD SYSlWT-A JCLl 220 //GO.RYSIN DO DSN=A460097.AZ600.AG4ARTS.DENTCARD. JCLl 230 // UNIT=3330.VOL=SER=CCD932. JCLl 231 // OISP=(NEW.KEi£P.DELETE)»SPACE=(TRKi (2S.5) .RLSEI. JCLl 240 // OCB=(RECFM=FB.LRECL=80.8LKSIZE=12800) JCLl 250 //GO.CONTROL DO OSN=CENLAB.CONTROL.FILE.UNIT=3330.VOL=iER=CCD932. JCLl 251 // 0ISP=OLD.0CB=DSORG=DA JCLl 252 //GO.SYSIN OD DSN=&HARRY.DISP=(OLD.DELETE) JCLl 260 /* JCLl 270 //
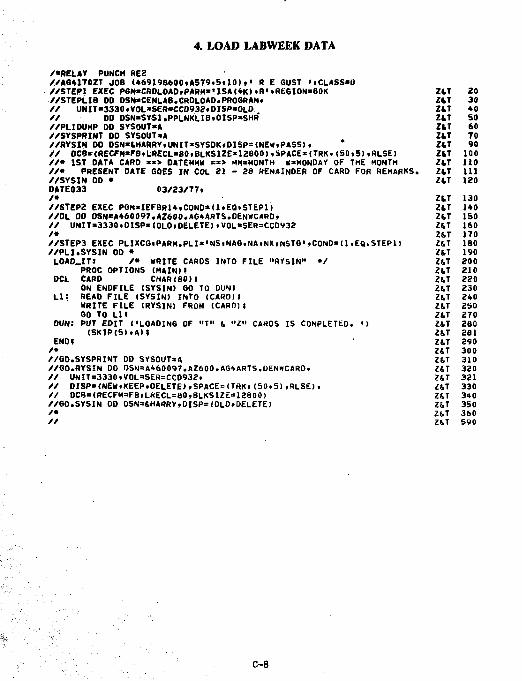
4. LOAD LABWEEK DATA /•RELAY PUNCH RE2 //A64170ZT JOB (469198600.AS79.5.10).• R E OUST '.CLASSED //STEP1 EXEC PGM*CRDLOAD.PARM**ISA(4K>.R'.REGION»e0K //STEPLIB DD OSN*CENLAB.CROLOAD.PROGRAM. // UNIT*3330.VOL*SER*CCD932.DISP*OLD // OD DSN«SYS1.PPLNKLIB.DISP*SHR" //PLIOUHP OD SYSOUT*A //SYSPRINT OD SYSOUT.A //RY5IN OD OSN«fcHARRY,UNIT*SYSDK.DISP=(NEw»PASS). // OCB*<RECFM*FB»LRECL«80»BLKSIZE*12800).SPACE»(TRK.(SO,5)tRLSE) //• 1ST DATA CARD « > OATEMMW «•> MM*M0NTH W»M0NDAY OF THE MONTH //• PRESENT DATE GOES IN COL 21 - 28 REMAINDER OF CARD FOR REMARKS. //SYSIN DD • DATE033 03/23/77. /• //STEP2 EXEC PGM»IEFBR14.C0ND*(1»EQ»STEP1) //OL 00 OSN*A460097.AZ600.AG4ARTS.DENWCARD. // UNIT*3330.DISP*(OLO.OELETE)>VOL*SER=CCD932 /• //STEPS EXEC PLIXCG«PARM.PLI*,NS.NAG.NA.NX.NSTG'.COND»(l.EQsSTEPl> //PLI.SYSIN OD * LOADJtTJ /• WRITE CARDS INTO FILE "RYSIN" •/
PROC OPTIONS (MAIN)I DCL CARD CHAR (80) I
ON ENDFILE (SYSIN) GO TO DUN) Lli READ FILE (SYSIN) INTO (CARD);
WRITE FILE (RYSIN) FROM (CARD); SO TO LlI
DUN: PUT EDIT ('LOADING OF "T" fc "Z" CARDS IS COMPLETED. ') (SKIP(S).A);
ENOl /• //GO.SYSPRINT DO SYSOUT=A //GO.RYSIN DD DSN=A460097.AZ600.AG4ARTS.DEN<ICARD» // UNIT=3330«V0L=SER=CCD932. // DISP=(NEW.KEEP.DELETE),SPACE=(TRK.(50.5).RLSE). // DCB«(RECFM=FB»LKECL=80.BLKSIZE=12800) //GO.SYSIN 00 0SN=&HARRY.DISP=(OLD.DELETE) /• //
ZfcT 20 ZfcT 30 ZfcT 40 ZfcT SO ZfcT 60 ZfcT 70 Z4T 90 ZIT 100 ZkT no ZfcT 111 ZfcT 120 ZfcT 130 ZfcT 140 ZfcT 150 Z&T 160 ZfcT 170 ZfcT 180 ZfcT 190 ZfcT 200 ZfcT 210 ZfcT 220 ZfcT 230 ZfcT 240 ZfcT 2S0 ZfcT 270 ZfcT 280 Z&T 281 ZfcT 290 ZfcT 300 ZfcT 310 ZfcT 320 Z&T 321 Z&T 330 Z&T 340 Z&T 3S0 ZfcT 360 ZfcT 590
C-8
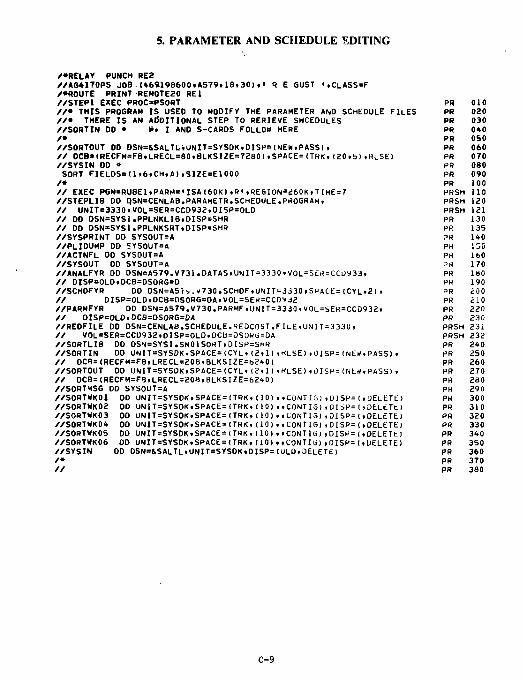
5. PARAMETER AND SCHEDULE EDITING
/•RELAY PUNCH RE2 //»6*170PS JOB (469198600.»579.18.30).' R E OUST >,CLASS=F /•ROUTE PRINT REM0TE20 REI //STEPl EXEC PROC'PSORT //• THIS PROGRAM IS USED TO MODIFY THE PARAMETER AND SCHEDULE FILES //• THERE IS AN ADDITIONAL STEP TO RERIEVE SHCEDULES //SORTIN DO • S« I AND S-CAROS FOLLOW HERE /• //SORTOUT 00 OSN=&SALTLiUNIT=SYSDK.DISP=(NEW.PASSI. // DCB»<RECFM=FB.LRECL=80.8LKSIZE=72B0)»SPACE=(TRK.(20.5).HLSE) //SYSIN DD • SORT FIELDS=(1.6.CH,A),SIZE=E1000 /• // EXEC PGH=RUB£l.PARrt=iISAI60K> »R'>REGION=i!60K, TIME = 7 //STEPLIB OD PSN=CENLAB.PARAMETR.SCHEDULE.PROGRAM, // UNIT=3330>VOL=SER=CCD932,DISP=OLD // OD 0SN=SYS1.PPLNKLIB.0ISP=SHR // DD 0SN=SYS1.PPLNKSRT.DISP=SHR //SYSPRINT DD SYSOUT=A //PLIDUMP DD SYSOUT=A //ACTNFL DO SYSOUT=A //SYSOUT OD SYSOUT=A //ANALFYR DD DSN=A579.V731 .DATAS.UNIT = 3330. V0L = S£R = CCL>933, // DISP=OLD.DCB=DSORG=0 //SCHDFYR DO DSN=A57'> . *730 ,SCHDF.UNIT=3J30 .SPACE= (CYL.2) > // DISP=0LD.DCB=0S0RG=OA.VOL=SER=CCO9J2 //PARMFYR DD DSN=A579.1/730.PARMF.UN1T = 3330 . V0L=SEH = CCD932. // DISP=OLD.DCB=DSORG=DA //REOFILE DD DSN=CENLAB.SCHEDULE.REDCQST.FILE.UNIT=3330, // V0L=SER=CCD932»0ISP=0LD.DCfcl=DS0Hli=DA //SORTLI8 DD DSN=SYS1 .SM01SORT .0ISP=SHR //SORTIN OD UNIT=SYSDK.SPACE=(CYL.(2.11.KLSE),OISP=(NErf.PASS). // DCB=<RECFM=F8.LRECL=20B,BLKSIZE=6240) //SORTOUT OD UNIT=SYSDK.SPACE=(CYL. (2,1) .«LSE) ,L)ISP=(NLW. PASS) . // DCB=(RECFM=F8.LRECL=208.BLKSIZE=62oO> //SORTMSG DD SYSOUT=A //SORTWK01 DD UNIT=SYSDK.SPACE=(TRK,(10)..CONTIG).DISP=(.DELETE)
DD UNIT=SYSDK.SPACE=(TRK.(10)..C0NTI3),DISP = I .DELETE) DO UNIT=SYSDK.SPACE=<TRK»(10)..C0NTI3),DISP=(.DELETE) DD UNIT=SYSDK.SPACE=(TRK,(10)..C0NTI6),DISP=(.DELETE) OD UNIT=SYSDKtSPACE=(TRK,(10)ttCONTIG),DISP=(.DELETE) DD UNIT=SYSDK.SPACE=<TRK,(10)..CONTIU).DISP=(.DELETE) DD DSN=iSALTL«UNIT=SYSDK.DISP=(ULO.DELETE)
//SORTWK02 //SOPTWK03 //SORTWK04 //SORTWKOS //SORTWK06 //SYSIN /• //
PR 010 PR 020 PR 030 PR 040 PR OSO PR 060 PR 070 PR 080 PR 090 PR 100 PRSH 110 PRSH 120 PRSH 121 PR 130 PR 13S PR 140 PR 130 PR 160 PR 170 PR 180 PR 190 PR 200 PR 210 PR 220 PR 230 PRSH 231 PRSH 232 PR 240 PR 250 PR 260 PR 270 PR 280 PR 290 PR 300 PR 310 PR 320 PR 330 PR 340 PR 350 PR 360 PR 370 PR 380
C-9
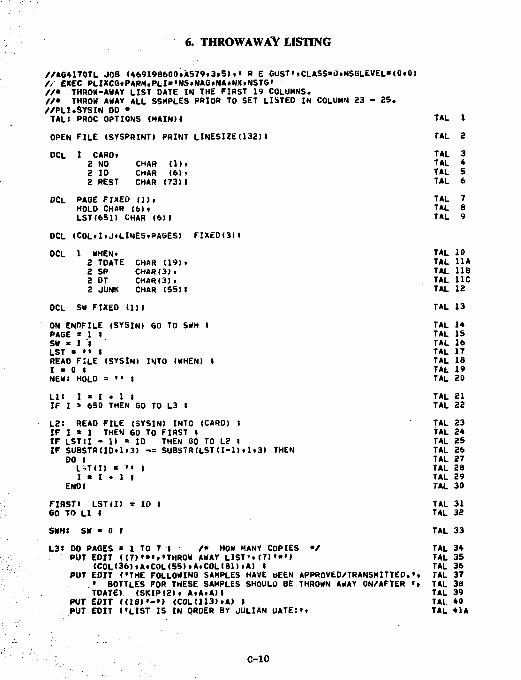
6. THROWAWAY LISTING
//AG41T0TL JOB (469198600iA579t3tS)•• R E GUST'(CLASS*OtHSGLEVEL*(0t0> // EXEC PLIXCG«PARM.PLI»'NS»NAG.NA»NX.NSTG> //• THROW-AWAY LIST DATE IN THE FIRST 19 COLUMNS. //• THROW AWAY ALL SSMPLES PRIOR TO SET LISTEO IN COLUMN 23 - 25. //PLI.SYSIN DD * TAL: PROC OPTIONS (MAIN)1 OPEN FILE (SYSPRINT) PRINT LINESIZEI132)I
TAL 1 TAL 2
OCL
DCL
I CAROi 2 NO 2 ID 2 REST
CHAR CHAR CHAR
(II. 16)»
(73)1 PAGE FIXED (]). HOLO CHAR (6). LSTI6S1) CHAR (6)1
DCL CCOLiI»J<LlNES«PAGES) FIXED(3lt DCL 1 WHEN.
2 TDATE CHAR (19). 2 SP CHAR(3)f 2 DT CHAR(3). 2 JUNK CHAR (55)I
DCL SW FIXED (1)1 ON ENDFILE (SYSIN) GO TO SWH I PAGE * 1 I SW * 1 I LST » •• I READ FILE (SYSIN) INTO (WHEN) • 1 = 0 1 NEW: HOLD = •• I Lll I * .1 • 1 I IF I > 650 THEN GO TO L3 I L2: READ FILE (SYSIN) INTO (CARD) ; IF I * 1 THEN GO TO FIRST I IF LST(I - 1) * ID THEN 60 TO L2 I IF SUBSTRUD.1.3) -.= SUBSTR(LST(1-1).1.3) THEN
DO I L?T(I) « '•• I I * I • 1 I
END I FIRSTl LST(I) GO TO LI I SWHI SW * 0 »
* ID I
L3S DO PAGES = 1 TO 7 I /• HOW MANY COPIES •/ PUT EDIT ((7)•••••THROW AWAY LIST'.(7)••')
(COL(36),A.COL(55).».COL(81).A) I PUT EDIT ('THE FOLLOWING SAMPLES HAVE BEEN APPROVED/TRANSMITTEO.*.
• BOTTLES FOR THESE SAMPLES SHOULO BE THROWN AWAY ON/AFTER '• TDATE) (SKIP<2)« A.A.A)I
PUT EDIT <<16)«-') (C0L(113)»A) » PUT EDIT ('LIST IS IN ORDER BY JULIAN UATE:'.
TAL 3 TAL 4 TAL 5 TAL 6 TAL 7 TAL 8 TAL 9
TAL 10 TAL 11A TAL 118 TAL 11C TAL 12 TAL 13 TAL 1* TAL 15 TAL 16 TAL 17 TAL 18 TAL 19 TAL 20 TAL 21 TAL 22 TAL 23 TAL 24 TAL 25 TAL 26 TAL 27 TAL 28 TAL 29 TAL 30 TAL 31 TAL 32 TAL 33 TAL 34 TAL 35 TAL 36 TAL 37 TAL 38 TAL 39 TAl 40 TAL 41A
C-10
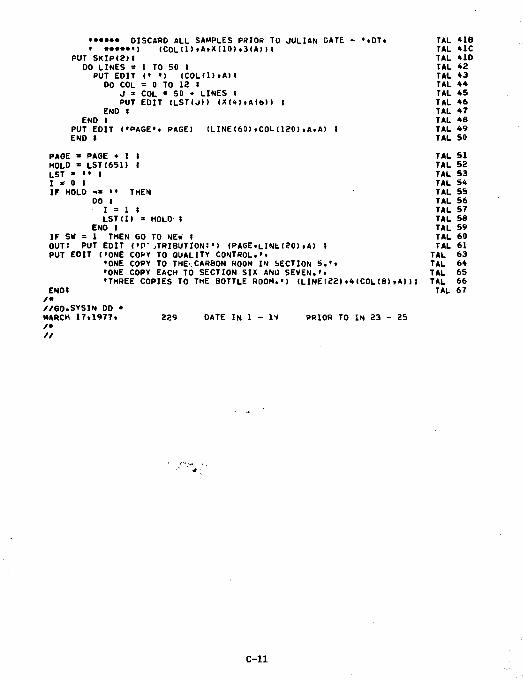
•••••• DISCARD ALL SAMPLES PRIOR To JULIAN GATE - ••DT. TAL *1B i ••••••) (COL(1>,A»X(10).3(A)M TAL *1C
PUT SKIP(?M TAL 410 DO LINES = 1 TO 50 « TAL *2 PUT EDIT <• •) (COL(l).AM TAL *3 DO COL - 0 TO 12 » TAL **
J » COL • 50 • LINES ; TAL 45 PUT EDIT ILST<J>> (X(4)»A<6>) : TAL *6
END « TAL *7 END I TAL *B
PUT EDIT (*PAGE*t PAGE) (LINE(60)•COL(120)tAt A) * TAL *9 END » TAL 50
PAGE * PAGE • 1 I TAL 51 HOLD * LST(6S1) I TAL 52 LST » •• I TAL 53 1 * 0 1 TAL 54 IF HOLD -' •• THEN TAL 55
DO I TAL 56 I = 1 t TAL 57 LST(I) * HOLD ; TAL 58
END • TAL 59 IF SW * 1 THEN GO TO NEW I TAL 60 OUTS PUT EDIT <»P"jTRIBUTIONS") (PAGE.LINE(20).A) « TAL 61 PUT EDIT ("ONE COPY TO QUALITY CONTROL.•• TAL 63
•ONE COPY TO THE' CARBON ROOM IN SECTION 5.«» TAL 6* •ONE COPY EACH TO SECTION SIX AND SEVEN.'» TAL 65 •THREE COPIES TO THE BOTTLE ROOM.') (LINE(22)•*(COL(8)>A))1 TAL 66
ENDI TAL 67 /• //GO.SYSIN DD * MARCH 17,1977. 229 DATE IN 1 - IV PRIOR TO IN 23 - 25 /• //
C-ll
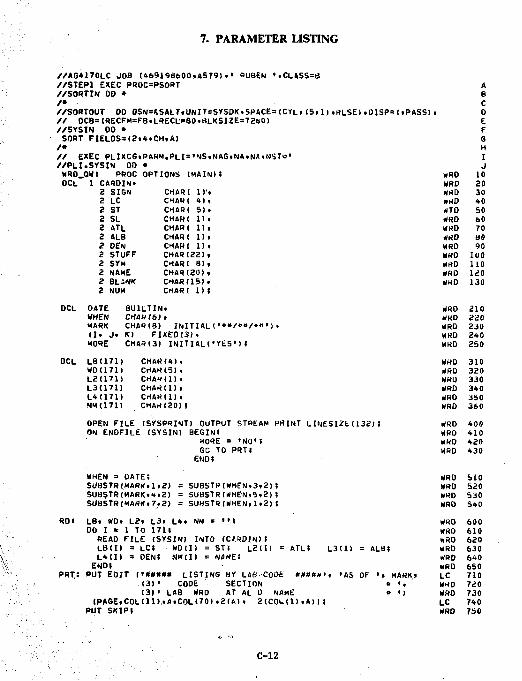
7. PARAMETER LISTING
2 SIGN 2 LC 2 ST 2 SL 2 ATL 2 ALB 2 OEM 2 STUFF 2 SYM 2 NAME 2 BLiNK 2 NUM
//AG4170LC JOB (+69198600.AS79).' RUBEN '.CLASS=8 //STEP1 EXEC PROC=PSORT //SORTIN 00 * /• //SORTOUT 00 DSN=*SALT.UNIT=SYSDK.SPACE=(CrL.(5.1).rtLSE>.DISP=(.PASS>. // 0CB=(RECFM=FB.LR£CL*80»BLKSIZE=72<i0) //SYSIN 00 • SORT FIELDSs(2.4.CH.A) /• // EXEC PLIXCG.PARM.PLI^NS.NAG.NA.NX.NSTo' //PLI.SYSIN 00 • WR0_QW: PROC OPTIONS (MAIN)! OCL 1 CARDIN.
CHAR( 1C. CHAR< 4). CHAR< 5). CHARI lit CHAR( 1). CHAR( lit CHAR( 1). CHAR(22). CHAR( 8). CHARI20). CHAR(15). CHAR( 1) ;
OCL OATE SU1LTIN. WHEN CHAR(6). MARK CHA«(8) INITIAL(>••/•«/•»•). (I. J. Kl FIXED(3). MORE CHARI3) INITIALISES') ;
DCL L8(171> CHAH(4>. WDU71) CHAR(5>. L2I171) CHAK(l). L3(17I) CHAR(l), L4(171) CHAHU). NM(171) CHARI20)) OPEN FILE (SYSPRINT) OUTPUT STREAM PRINT LINESIZfc(132)( ON ENDFILE (SYSIN) BEGIN!
MORE = •NO'; GC TO PRTI
END;
WHEN = OATE; SUBSTR(MARK.1.2) = SUBSTP(WHEN.3.2); SUBSTR(MARK.4.2> = SUBSTR (WHEN.5.2M SUBSTR(MARK.7,2) = SUBSTR(WHEN.1.2);
RDS LB. WO. L2« L3« L4» NM = " I DO I « 1 TO 17H
REAO FILE (SYSIN) INTO (C'.SDIN) 1 LB(I) = LC; WO(I) = STI L2(I) = A T H L311) = ALB; L4(I) = OEN; NM(I) = NAME!
END; PRT.S PUT EDIT (•##### LISTING BR LA8-CO0E ###»*•. IAS OF '. MARK.
(3)' CODE SECTION • •, (3)' LAB WRD AT AL D NAME » <)
(PAGE. COL(U)..A.COL(70) .2(A) . 2 (COud ) . A) ) I PUT SKIP;
A 8 C 0 E F G H I J
WRO 10 WHO 20 WRD 30 »RD 40 WTO 50 WRO bO WRO 70 WKO 80 WRO 90 WHO 100 WRD 110 WRO 120 WRO 130
WRD 210 WRD 220 WRO 230 WRD 240 WRD 250 WRD 310 WRD 320 WRD 330 WRO 340 WRO 3S0 WRO 360 WRO 400 WRO 410 WRO 420 WRO 430
WRD 510 WRD 520 WRO 530 WRO 540 WRD 600 WRO 610 WRO 620 WRD 630 WRO 640 WRO 650 LC 710 WRD 720 WRD 730 LC 740 WRO 750
C-12
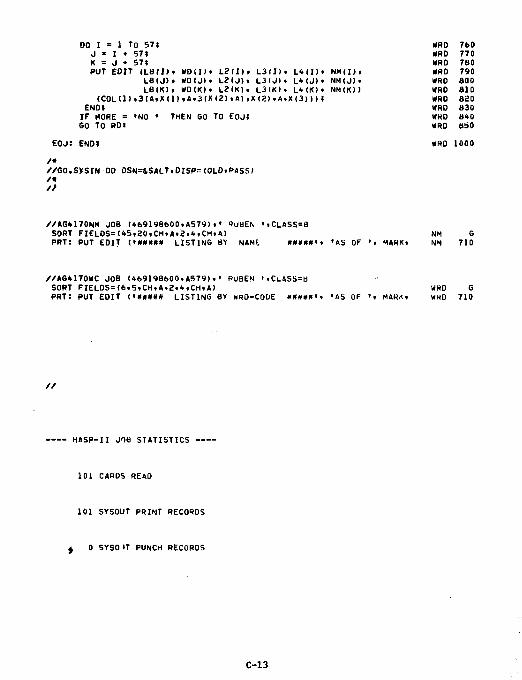
WRD 760 WRD 770 WRD 780 WAD 790 WRD 800 WRD 810 WRO 820 WRD 830 WHD 8<t0 WRD 850 NRO 1000
DO I = 1 To 57; J ' I • 57; K = J • 57; PUT EDIT (LBtl)r WD(I>» L2II)> L3(I). L*(I)* NMII).
LB(J). WO(J). L2(J). L3(J). L*(J>» NM(J). LB(K)t WD<K)« L2IK). L3IK). L»(K). NM(K))
(COL(l) .3<4»XU> .A.3IXI2) .«) .X<a> ,A,X<3> ) It END;
IF MORE = >NO • THEN GO TO EOJ; GO TO RDI
EOJ: ENDI
/• //60.SXSIN DO OSN=&SALT.OISP*<OLO.PASSI /« //
//AG4170NM JOB <469198600.A579> 1» RUBEN '.CLASS=B SORT FIELOS=(4S,20.CH.A.2.*.CH.A> NM G PRT! PUT EDIT (•»***# LISTING BY NAME »*#**•» 'AS OF •> MARK« NM 710
//AG+1T0WC JOB U69198600.AS79).• RUBEN ' . C L A S 5 = H SORT FIELDS=(6.5.CM.A»a.<nCH.A) WRD G PRT: PUT EDIT (•##### LISTING BY WRO-CODE *»#»*•» 'AS OF •» MARKt WHD 710
HASP-II JOB STATISTICS
101 CARDS READ
101 SYSOUT PRINT RECORDS
0 SYSO IT PUNCH RECORDS
C-13
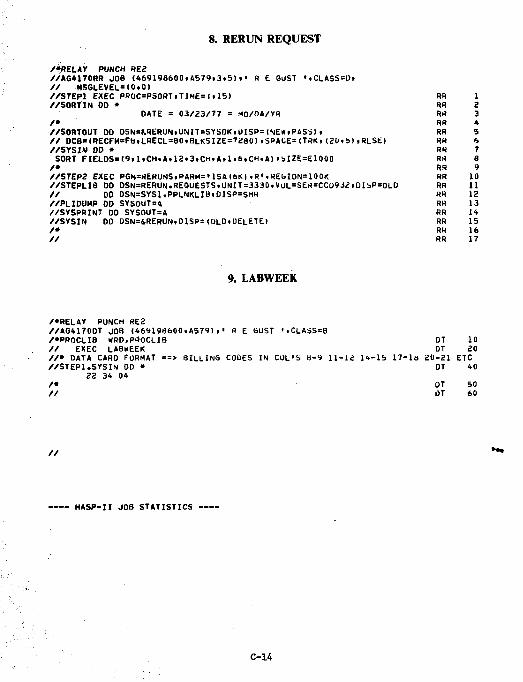
8. RERUN REQUEST
/•RELAY PUNCH HEZ //AG4170RR JOB (469198600.A579.3.5) . • R £ GUST «.CLASS=0. // MSGLEVEL=(0.0) //STEP1 EXEC PR0C=PS0RT.TIME=(.1S) //SORTIN DD •
DATE = 03/23/77 = MO/OA/YR /• //SORTOUT 00 DSN=HRERUN.UNIT=SYSDK.UISP=(NEW»PASS>. // DCB*(RECFH=Ffa.LRECL=80.BLKSIZE=7280).SPACE=(T«K.(20.S)iRLSE) //SYSIN OD • SORT FIELDS»<9.1.CH.Atl2«3.CH.A»1.6,CH«A)»SIZE=E1000 /* //STEP2 EXEC PGM=rtERUNS«PARM=MSA(6K).R>.HEGION=100K //STEPLIB DO DSN=RERUN.REQUESTS.UNIT=3330.VuL=S£R=CCD9J2fDISP=0LD // DD DSN=SYS1.PPLNKLIB.DISP=SHR //PLIDUMP DD SYSOUT=A //SYSPRINT DO SYSOUT=A //SYSIN 00 DSN=&RERUN.DISP=(OLD.DELETE) /• //
9. LABWEEK
/•RELAY PUNCH RE2 //AG4170DT JOB (46V198600.A579). • » E GUST '.CLASS=B /•PROCLIB WRD.PPOCLIB DT 10 // EXEC LABWEEK DT 20 //• DATA CARD FORMAT ==> BILLING CODES IN COL'S 8-9 11-12 14-15. 17-18 20-21 ETC //STEP1.SYSIN DD • DT 40
22 34 04 /• OT 50 // DT 60
RR 1 RR 2 Rrt 3 RR 4 RR 5 RR 6 RR 7 RR 8 RR 9 RR 10 RR 11 RR 12 RR 13 RR 14 RR 15 RR 16 RR 17
HASP-II JOB STATISTICS
C-14
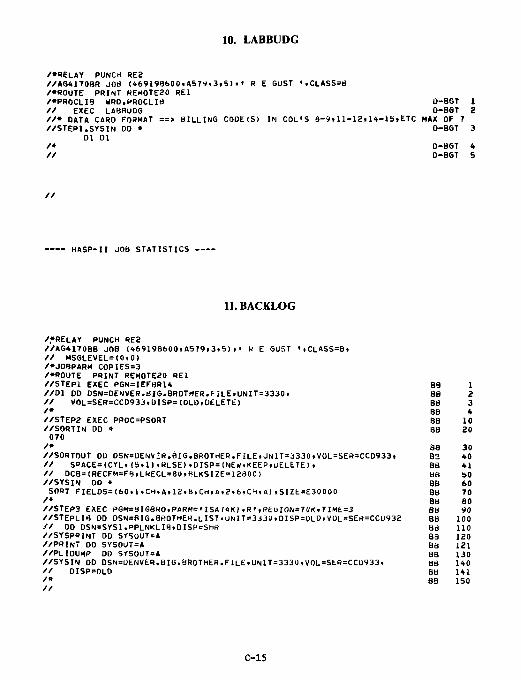
10. LABBUDG
/•RELAY PUNCH RE2 //AG41708R JOB (469198600.A579.3.5)«• R E GUST '.CLASS=B /•ROUTE PRINT REMOTE20 RE1 /•PROCLIB WRD.PROCLIB D-BGT 1 // EXEC LABRUDG D-BGT 2 //• DATA CARD FORMAT ==> BILLING CODE(S) IN COL'S 8-9.11-12.14-16.ETC MAX OF 7 //STEP1.SYSIN DO • D-BGT 3
Dl Dl /• O-BGT * // D-BGT 5
HASP-II JOB STATISTICS
11. BACKLOG
/•RELAY PUNCH RE2 //AG4170BB JOB (469198600.A579.3.5).> H E GUST '.CLASS=B. // MSGLEVEL=(0.0) /•JOBPARM C0PIES=3 /•ROUTE PRINT REMOTE20 RE1 //STEP1 EXEC PGM=IEF8R14 //Dl DD DSN=DENVER.BIG.BROTHER.FILE.UNIT=3330. // V0L=SER=CCD933.DISP=(OLD.DELETE) /• //STEP2 EXEC PROC=PSORT //SORTIN DD • 070 /•
//SORTOUT OD OSN=DENV£R.BIG.BROTHER.FILE.UNIT=3330.VOL=SER=CCD933. // SOACE=(CYL. (5.1) .RLSE>.OISP=(NE«I.KEEP«UELETE> . // DCB=(RECFM=Ft).LRECL=8U.eLKSIZE = 1280 0) //SYSIN DO • SORT FIELDS=(60.1.CH.A.12.6.CH.A.2.6»CH,A).SIZt=E30000 /•
//STEM EXEC PGM=BIGBR0.PARMs'ISA(4KI.R'.REuION=70K.TlME=3 //STEPLIH DD DSN=BIG.BROTHER. LI ST. UN IT = 33311.01 SP=OLD.V0L=SER=CCU932 // DD DSN=SYS1.DPLNKLI8«DISP=SHR //SYSPRINT DD SYSOUT=A //PRINT DD SYSOUT=A //PLIDUMP DO SYSOUT=A //SYSIN DD DSN=UENVER.BIG.BROTHER.FILE.UNIT=3330.VOL=StR=CCD933. // DISP=OLO /• //
BB 1 BB 2 BB 3 BB 4 BB 10 BB 20 88 30 63 40 BB 41 B6 SO BB 60 BB 70 BB 80 SB 90 BB 100 BB 110 B8 120 BB 121 BB 1J0 BB 140 BB 141 BB 150
C-15
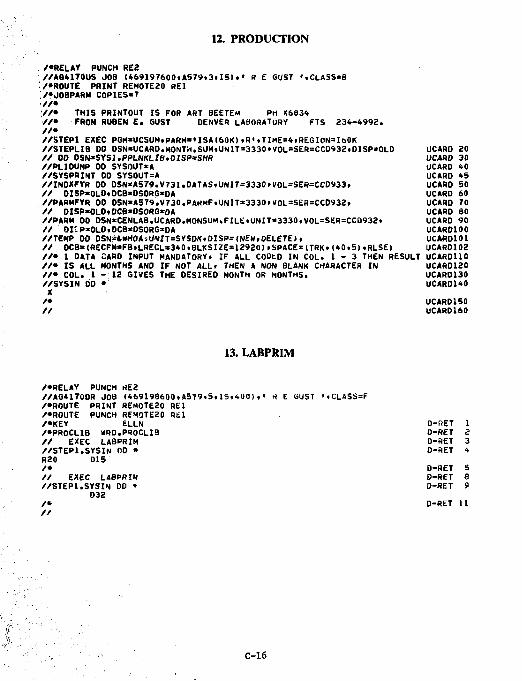
12. PRODUCTION
/•RELAY PUNCH RE2 //AG4170US JOB (469197600.AS79.3.15).' R E GUST t,CLASS=B /•ROUTE PRINT REM0TE20 RE1 /•UOBPARH C0PIES*7 //• //• THIS PRINTOUT IS FOR ART BEETEM PH X6834 //• FROM RUBEN E. GUST OENVER LABORATORY FTS 234-4992. //• //STEPI EXEC PGM»UCSUM,PARM*'ISA<60K)»R<»TIME=4.REGION=160K //STEPLIB DO OSN'UCARO.MONTH.SUM«UNIT=3330.VOL=SER=CCD932.DISP=OLD UCARO 20 // 00 0SN»SYS1.PPLNKLIB.0ISP*SHR UCARO 30 //PLIDUHP DO SYSOUT'A UCARO 40 //SYSPRINT DD SYSOUTsA UCARO 45 //INOXFYR 00 DSN*A579.V731.DATAS.UNIT=3330»VOL=SER=CCD»33f UCARD 50 // DISP>OLD.DCB'DSORG*DA UCARD 60 //PARMFYR DD DSN*A579.V730.PARMF.UNIT»3330.V0L=SEH=CCD932. UCARD 70 // DISP«OLD.OCB«OSORG*DA UCARD 80 //PARM DD DSN*CENLAB.UCARO.MONSUM.FILE.UNIT=3330.VOL=SER=CCD932. UCARO 90 // OUP*OLD.OCB»DS0RG=D» UCARO10O //TEMP 00 DSN?«.*HOA»UNIT=SYSDK.DISP=<NEW.DELETE*. UCAfiOlOl // DCB*(RECFM*FB.LRECL*340.BLKSIi!E=12920) .SPACE* ITRK. (40.5) .RLSE) UCAR0102 //• 1 DATA CARD INPUT MANDATORY. IF ALL COOtO IN COL. 1 - 3 THEN RESULT UCARD110 //• IS ALL MONTHS AND IF NOT ALL. THEN A NON BLANK CHARACTER IN UCARD120 //• COL. 1 - 1 2 GIVES THE DESIRED MONTH OR MONTHS. UCAR0130 //SYSIN DD * UCARD140 X /• UCARD150 // UCARD1&0
13. LABPRIM
/•RELAY PUNCH RE2 //AG41700R JOB (469198600.A579.5.15.400).' H E (SUST .CLASS=F /•ROUTE PRINT REM0TE20 RE1 /•ROUTE PUNCH REMOTE20 RE1 /•KEY ELLN D-RET 1 /•PROCLIB WRD.PSOCLia O-RET 2 // EXEC LABPRIM D-RET 3 //STEPI.SYSIN DO • D-RET 4 R20 D15 /• D-RET 5 // EXEC LABPRIM D-RET e //STEPI.SYSIN DD • D-RET 9
032 /• D-RET 11 //
C-16
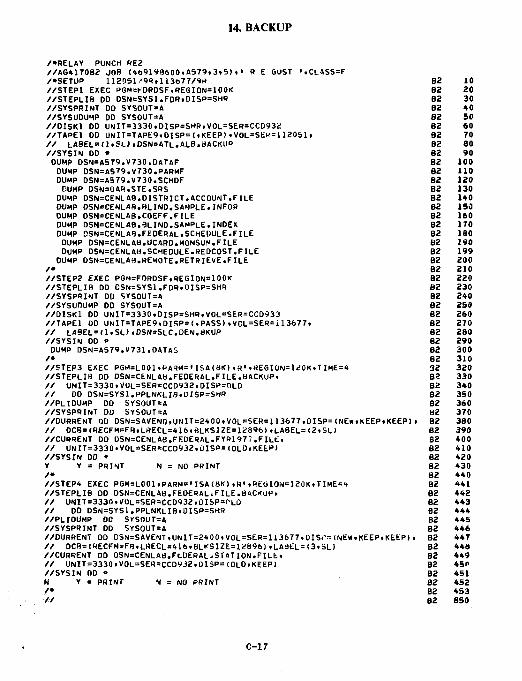
14. BACKUP
/•RELAY PUNCH RE2 //AG4170B2 JOB (469198600.A579.3.5).> R E GUST '.CLASSsF /•SETUP 1120Sl,'9R,H3t>77/»* //STEP1 EXEC PGM=KDRDSF,REGION=100K //STEPLIB OD DSN=SYS1.FDR»DISP=SHR //SYSPRINT DO SYSOUT=A //SYSUDUMP DO SYSOUT=A //DISKl 00 UNIT=3330.0ISP=SHR,VOL=SER=CCD932 //TAPE1 OD UNIT=TAPE9,DISP=(.KEEP).VOL=SER=112051. // LABEL=(1«5L).DSN=ATL.ALB.BACKUP //SYSIN DD • DUMP DSN=A579.V730.DATAF DUMP DSN=AS79.V730.PARMF DUMP DSN=A579.V730.SCHDF DUMP 0SN=OAR.STE.SRS DUMP DSN=CENIA8.DISTRICT.ACCOUNT.FILE DUMP DSN=CENLAB.BLIND.SAMPLE.INFOR DUMP OSN=CENLAB.COEFF.FILE OUMP DSN=CENLAB.BLIND.SAMPLE.INDEX DUMP PSN=CENLAB.FEDERAL.SCHEDULE.FILE DUMP DSN=CENLAB.UCARD.MONSUM.FILE DUMP DSN=CENLAB.SCHEDULE.REDCOST.FILE DUMP DSN=CENLAB.REMOTE.RETRIEVE.FILE /•
//STEP? EXEC PGM=FDRDSF,REGI0N=100K //STEPLIB DD 0SN=SYS1.FDR»0ISP=SHR //SYSPRINT DO SYS0UT=A //SYSUOUMP OD SYSOUT=A //DISKl OD UNIT=3330,DISP=SHR,VOL=SER=CCD933 //TAPE1 OD UNlT=TAPE9.DISP=(.PASS>»V0L=SER=il3677. // LA8EL=(1.SL>«DSN=SLC.DEN.BKUP //SYSIN DO • OUMP DSN=AS79.V731.DATAS /• //STEP3 EXEC PGM=L001.PARM='ISA(8K).R'.KEGION=120K.TIME=4 //STEPLIB DO DSN=CENLAB.FEDERAL.FILE.BACKUP. // UNIT=3330»VOL=SER=CCD932.DISP=OLD // 00 DSN=SYS1.PPLNKLIB.DISP=SHR //PLIDUMP DD SYSOUT=A //SYSPRINT DO SYSOUT=A //CURRENT 00 DSN=SAVENO.UNIT=2400.VOL=SER=113677,DISP=(NEll.KEEP.KEEP). // 0CB=(RECFM=FB,LRECL=416.BLKSIZE=12896> .LABEL=(2.SL) //CURRENT OD DSN=CENLAB.FEDERAL.FYB197?.FILEi // UNIT=3330.VOL=SER=CCD932»OISP=(OLD.KEEP) //SYSIN OD * Y Y = PRINT N = NO PRINT /• //STEP* EXEC PGM=L001.PARM=<ISA(8K>,Ri,REGION=120K.TIME=4 //STEPLIB DO DSN=CENLA6.FEDERAL.FILE.BACKUP. // UNIT=3330.V0L=SER=CCD932.DISP=f>LD // DO DSN=SYS1.PPLNKLIB»UISP=SHR //PLIOUMP OD SYSf)UT=A //SYSPRINT DD 5YS0UT=A //DURRENT DD DSN=SAVENT.UNIT=2400.VOL=SER=U3677.DISi,= (NEW.KEEP«KEEP). // DCB=(RECFM=F8.LRECL=416.BLKSIZE=12SJ9tp).LABEL=(3.SL) //CURRENT OD OSN=CENLAB.FtDERAL.STATION.FILE. // UNIT=3330.VOL=SER=CCD932.DISP=(OLD.KEEP) //SYSIN OD • N Y = PRINT N = NO PRINT /• //
B2 10 B2 20 B2 30 B2 40 82 50 82 60 82 70 82 80 82 90 82 100 B2 110 82 120 B2 130 B2 140 B2 ISO B2 160 82 170 B2 180 82 190 82 199 82 200 82 210 82 220 B2 230 82 240 82 250 82 260 82 270 82 280 B2 290 B2 300 B2 310 32 320 B2 330 B2 340 B2 350 B2 360 82 370 82 380 B2 390 82 400 82 410 B2 420 82 430 82 440 82 441 B2 442 B2 443 82 444 B2 445 82 446 82 447 82 448 B2 449 82 4SI> B2 451 82 452 B2 453 82 850
C-17
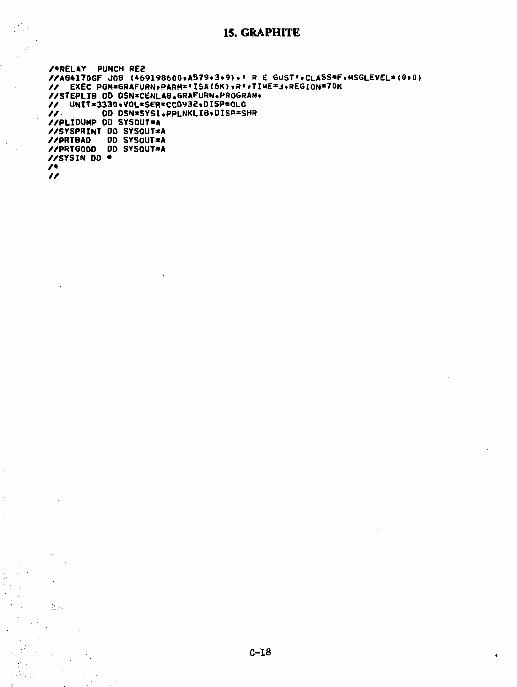
15. GRAPHITE
/•RELAY PUNCH RE2 //AG4170GF JOB (*69198600tAS79.3.9) . • R £ GUST• tCLASS=K,MS6(_EVEL= <0• 01 // EXEC PGM*GRAFURN»PARM«,J,SA(6K>tR'»TJ.ME»JtREGXON*70K //STEPLIB OD OSN*CENLAB.GRAFURN.PROGRAM« // UNIT»3330•V0L*SER«CC0932.0ISP=OLO // OD DSN*SYSl.PPLNKLIBtDISP=SHR //PLIDUMP OD SYSOUT«A //SYSPRINT DO SYSOUT»A //PRTBAD DO SYSOUT*A //PRTGOOO DO SYSOUT*A //SYSIN 00 • /* //
C-18
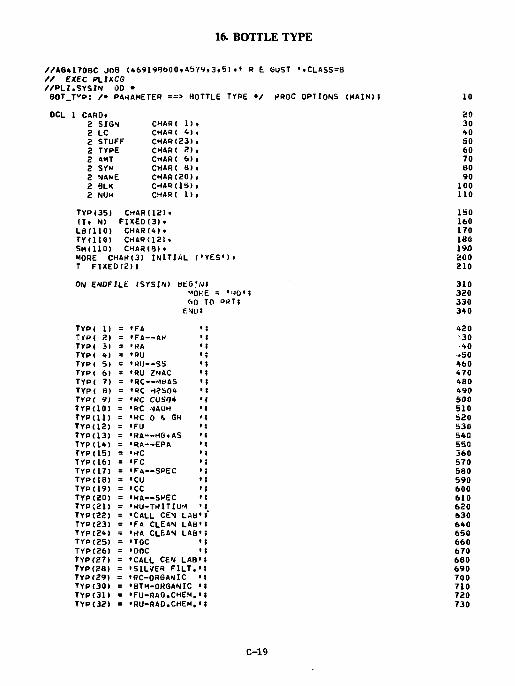
16. BOTTLE TYPE
//AG4170BC JOB (469199600»4S79.3»5)•' R E GUST '.CLASS=B // EXEC PLIXCG //PLI.SYSIN 00 • BOT TVR: /» PARAMETER ==> BOTTLE TYPE •/ PROC OPTIONS (MAIN)I 10 OCL 1 CARD.
2 SIGN CHAR( lit 2 LC CHAR( 4), 2 STUFF CHAR(23), 2 TYPE CHAR! 2). 2 4MT CrIARt 6), 2 SYM CHARt 8). 2 NAME CHAR(20). 2 BLK CHARI15), 2 NUM CHARI lit
TYP(35) :HARU2>. (I. N) FIXEDI3). LB(llO) CHARI4). TY(HO) CHARU21. SM(llO) CHARI8)t MORE CHAK<3) INITIAL (» ITES'l • T FIXED(2M ON ENOFILi' (SYSIN) HtG'/v
•'ORE a >')0>t 60
CNUI ro ORT;
TYP( 1) = •FA • T*P( 2) = •FA--AH • TYPI 31 = •RA ' TYP( 4) = •RU > TYP< 5> = •RU—SS • TYP( 6) = •RU ZNAC • TYPI 7) = IRC—.vttJAS • TYP( 8) = •RC HJS04 • TYP( 9) = 'RC CUS04 • TYP(IO) = •RC NAOH • TYP(ll) = •RC 0 *• GH > TYPU2) = • FU ' TYP(13) = •RA—HG.AS ' TYPI14) = •RA—EPA ' TYPU5) = •RC • TYP<I6) = • FC • TYPU7) = •FA—SPEC • TYP(IB) s •CU • TYP(19) = •CC • TYP(20) = •RA—SPEC • TYPJ21) = •RU-TRITIUM • TYPI22) = •CALL CEN LAB' TYP(23) = •FA CLEAN LAB' TYPI24) = •HA CLEAN LAB' TYR(25) = •TOC « TYP(26) = •DOC • TYPC27) = •CALL CEN LAB' TYP(28) = •SILVER FILT.') TYPI29) = •RC-ORGANIC '1 TYP(30) = •BTM-OHGANIC • TYP(31I = •FU-RAO.CHEM.M TYP(32) = •RU-RAD.CHEM.M
20 30 40 SO 60 70 80 90
100 110
150 160 170 160 194) 200 210
310 320 330 340
420 '30 •40 »S0 460 470 480 490 500 510 520 530 540 550 360 570 580 590 600 610 620 630 640 690 660 670 680 690 700 710 720 730
C-19
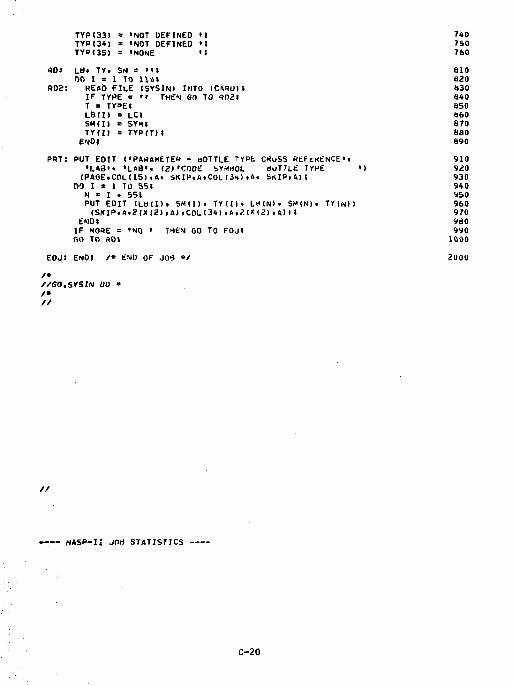
TYPI33) = 'NOT DEFINED 'I 740 TYP(3*) • iNOT DEFINED M 7S0 TYO«35) = 'NONE 'I 760
*D: L«» TY, S» - ••! 610 00 I = 1 TO 111)) 820
RDa: HEAD FILE (SYSINI INTO (CASO)i 830 IF TYPE = '« THEN GO TO "?(«» 8*0 T = TYOEJ 850 LB(I) = LC« 860 SMd> = SYM; 870 IVIII = TYP(TM 880
END* 890 PUT: PUT EDIT («PA«AMETE» - BOTTLE TYPE CrtuSS WtFtKENCE'. 910
•L»3'« 'LAS'. (2) 'CODE SYMBOL duTTLIi TYPE ') 920 (PAGE.COL(IS).A. SKIP.A.COL (3M .A, SKIP,AM 930
00 I = 1 TO S5I 940 M « I t S5I 950 PUT EDIT (Lad), SMdli TYdl, L*(N)« SMINt, TY((4>> 960 <SKIP.A.2(X<2),A)>C0L(34>.A.?(X(2).All» 970
EMD* 980 IF MORE = 'NO • THEN GO TO FOJI 990 GO TO ADI 1000
EOJ: END! /• EMD OF J06 •/ 2000 /* •/GO.SYSrN 00 * /• //
HASP-I: JOd STATISTICS
C-20

Appendix D File Formats
D-l
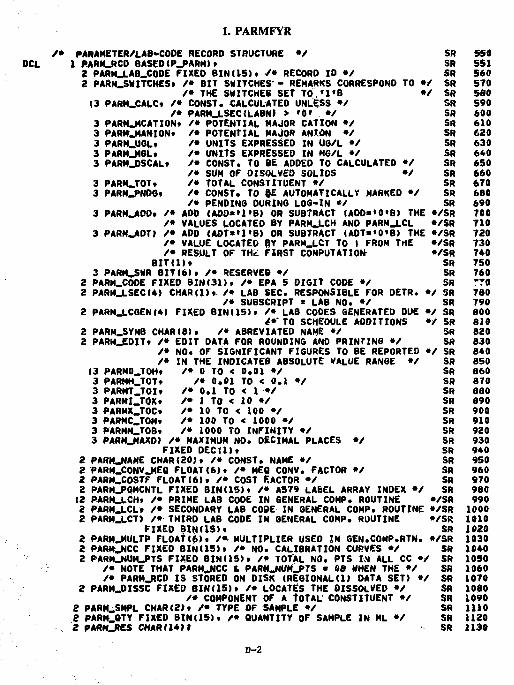
1. PARMFVR /• PARAMETER/LAB-CODE RECORD STRUCTURE •/ SR 550
DCL 1 PARH_RCD BASED(P_PARM>» SR 551 2 PARM_LAB_CODE FIXED BINU5>« /• RECORD ID •/ SR 560 2 PARH.SWITCHES* /• BIT SWITCHES- REMARKS CORRESPOND TO •/ SR 570
/• THE SWITCHES SET TO «1*B •/ SR 580 (3 PARM_CALCt /• CONST. CALCULATED UNLESS •/ SR 590
/• PARM_LSEC(LABNI > '0* •/ SR 600 3 PARM_MCATION« /• POTENTIAL WAJOR CATION •/ SR 610 3 PARM.J4ANI0N? /• POTENTIAL MAJOR ANION •/ SR 620 3 PARHJJSLf /• UNITS EXPRESSED IN U6/L */ SR 630 3 PARM_MGLt /• UNITS EXPRESSED IN NG/L *• SR 640 3 PARM_DSCAL« /• CONST. TO BE ADOED TO CALCULATED */ SR 650
/• SUM OF OISOLVED SOLIDS •/ SR 660 3 PARM.TOT. /• TOTAL CONSTITUENT •/ SR 670 3 PARM_PNOG« /• CONST. TO gE AUTOMATICALLY MARKED */ SR 680
/• PENDING DURING LOG-IN */ SR 690 3 PARM_AOD, /• ADD (ADD«»1'B) OR SUBTRACT (ADD*<0*B> THE */SR 700
/• VALUES LOCATED BY PARMJ.CH AND PARM_LCL »/SR 710 3 PARM_ADT) /• ADD (ADT»»1«B) OR SUBTRACT (ADT**0*B) THE */SR 720
/• VALUE LOCATED BY PARM_LCT TO I FROM THE »/SR 730 /• RESULT OF THc FIRST COMPUTATION */SR 7*0
BITlDt SR 750 3 PARH.SWR BIT (6). /• RESERVED •/ SR 760
2 PARM.COOE FIXED BIN(31>. /• EPA 5 DIGIT CODE */ SR T70 2 PARM_LSEC<4> CHAR(l). /• LAB SEC. RESPONSIBLE FOR DETR. •/ SR 780
/• SUBSCRIPT * LAB NO. •/ SR 790 2 PARM_LCGEN(4) FIXED BINU5). /• LAB CODES GENERATED DUE •/ SR BOO
4»" TO SCHEDULE ADDITIONS •/ SR 810 2 PARM.SYMB CHAR(8), /• ABREVIATED NAME •/ SR S20 2 PARM_EDITt /• EDIT OATA FOR ROUNDING AND PRINTING •/ SR 830
/• NO. OF SIGNIFICANT FIGURES TO BE REPORTED •/ SR 840 /•IN THE INDICATED ABSOLUTE VALUE RANGE */ SR 850
(3 PARMO.TOHt /* 0 TO < 0.01 »/ SR 860 3 PARMH_TOTt /• 0.01 TO < 0.1 */ SR 870 3 PARMT.TOI* /* 0.1 TO < 1 */ SR 880 3 PARMI.TOXt /• 1 TO < 10 •/ SR 890 3 PARMX.TOCt /• 10 TO < 100 •/ SR 900 3 PARMC.TOMt /* 100 TO < 1000 •/ SR 910 3 PARMM_T08. /• 1000 TO INFINITY •/ SR 920 3 PARM_MAXD> /• MAXIMUM NO. DECIMAL PLACES •/ SR 930
FIXED OEC(l). SR 940 2 PARMJNAME CHAR(20), /• CONST. NAME •/ SR 950 2 PARM_CONV_MEQ FLOAT(6)t /• MEO CONV. FACTOR •/ SR 960 2 PARM.COSTF FLOAT 16)• /• COST EACTOR •/ SR 970 2 PARM_P6MCNTL FIXED BIN(15)t /• A579 LABEL ARRAY INDEX •/ SR 980 (2 PARMJ.CH. /• PRIME LAB CODE IN GENERAL COMP. ROUTINE »/SR 990 2 PARM_LCL» /• SECONDARY LAB C09E IN GENERAL COMP. ROUTINE «/SR 1000 2 PARH_LCT) /• THIRD LAB CODE IN GENERAL COMP. ROUTINE */SR 1010
FIXED BIN<15>« SR 1020 2 PARM.MULTP FLOAT (611 /•- MULTIPLIER USED IN GEN.COMP.RTN. */SR 1030 2 PARM_NCC FIXED BINI15). /• NO. CALIBRATION CURVES »/ SR 1040 2 PARM_NUH_PTS FIXED BIN(15>. /• TOTAL NO. PTS IN ALL CC •/ SR 1050
/• NOTE THAT PARM_NCC fc PARM_NUH_PTS • OS WHEN THE •/ SR 1060 /• PARM_RCD IS STORED ON DISK (REGIONAL(l) DATA SET) •/ SR 1070
2 PARMJHSSC FIXED BIN(15)t /* LOCATES THE DISSOLVED */ SR 1080 /• COMPONENT OF A TOTAL CONSTITUENT •/ SR 1090
2 PARM.SMPL CHAR(2>. /• TYPE OF SAMPLE •/ SR 1110 2 PARM.OTY FIXED BIN(15)t /* QUANTITY OF SAMPLE IN ML •/ SR 1120 2 PARM_RCS CMARU4M SR 1130
D-2
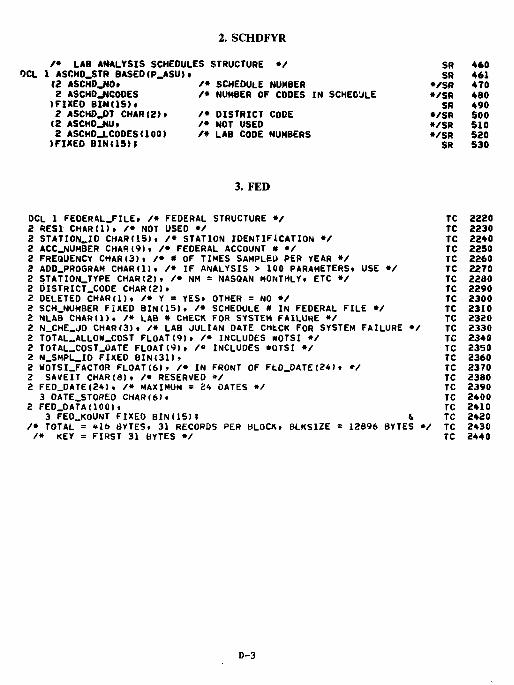
2. SCHDFYR
/ • LAB ANALYSIS SCHEDULES STRUCTURE OCL i ASCHD.STR BASED(P_ASU>t
(2 ASCHD_NO» 2 ASCHD_NCODES
)FIXED BINU5>« 2 ASCHD.DT CHAR(2)t
(2 ASCHD_NUt 2 ASCHD_LCODES(100)
)FIXED B I N t l S M
•/ /• SCHEDULE NUMBER /* NUMBER OF CODES IN SCHEDULE /• DISTRICT CODE /• NOT USED /• LAB CODE NUMBERS
SR 460 SR 461
•/SR 470 •/SR 480 SR 490
•/SR SOO •/SR S10 •/SR S20 SR 530
3. FED
DCL 1 FEOERAL_FILE» /• FEDERAL STRUCTURE */ TC 2220 2 RES1 CHAR(l), /• NOT USED •/ TC 2230 2 STATION_ID CHAR(IS). /• STATION IDENTIFICATION •/ TC 2240 2 ACC_NUMBER CHAR(9). /• FEDERAL ACCOUNT * •/ TC 2250 2 FREQUENCY CHAR(3)i /• # OF TIMES SAMPLED PER YEAR •/ TC 2260 2 ADD_PR06RAM CHAR(l), /• IF ANALYSIS > 100 PARAMETERSt USE •/ TC 2270 2 STATION_TYPE CHAR(2)t /• NM = NASOAN MONTHLY, ETC */ TC 2280 2 DISTRICT.CODE CHAR(2)• TC 2290 2 DELETED CHAR(l), /• Y = YES, OTHER = NO •/ TC 2300 2 SCH.NUMBER FIXED 8INU5), /* SCHEDULE # IN FEDERAL FILE •/ TC 2310 2 NLA8 CHAR(l). /• LAB # CHECK FOR SYSTEM FAILURE •/ TC 2320 2 N_CHE_JD CHARO), /• LAB JULIAN DATE CHtCK FOR SYSTEM FAILURE •/ TC 2330 2 TOTAL_ALLOK_COST FL0AT<9)» /• INCLUOES KOTSI •/ TC 23*0 2 TOTAL_COST_DATE FL0AT<9), /» INCLUDES »0TSI •/ TC 2350 2 N_SMPL_ID FIXED BIN(31>« TC 2360 2 WOTSI_FACTOR FLOAT(61• /• IN FRONT OF FtD_DATE(24)« •/ TC 2370 2 SAVEIT CHAR(8)» /* RESERVED */ TC 2380 2 FED_DATE(24>, /• MAXIMUM = 84 DATES •/ TC 2390 3 OATE_STOREO CHAR(6)» TC 2400
2 FED_DATA(100), TC 2410 3 FED_KOUNT FIXED 8IN(15>; & TC 2420
/• TOTAL = tlb BYTES, 31 RECORDS PER BLOCK, BLKSI2E = 12896 BYTES •/ TC 2430 /• KEY = FIRST 31 BYTES •/ TC 2440
D-3
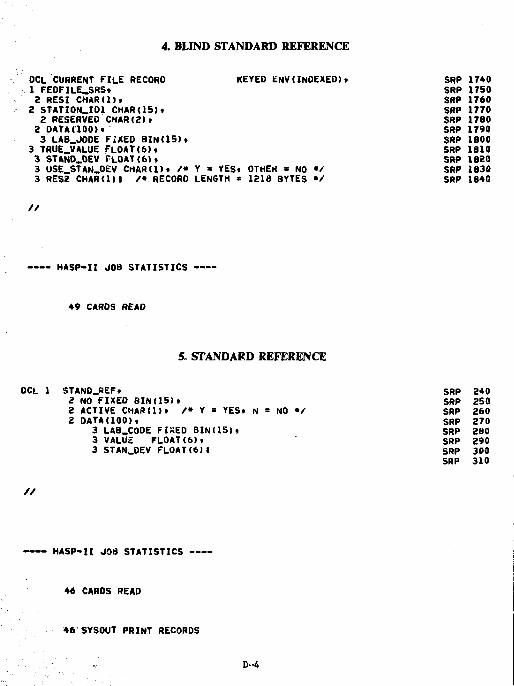
4. BLIND STANDARD REFERENCE
DCL CURRENT FILE RECORD KEYED £NV<INDEXED)• SRP 1740 1 FEDFILE_SRS» SRP 1750 2 RESI CHARIDt SRP 1760 2 STATI0N.ID1 CHAR(15). SRP 1770 2 RESERVED CHAR(21. SRP 1780 2 DATA(1001. SRP 1790 3 LAB.JODE FiXED BIN(15>< SRP 1800
3 TRUE.VALUE FLOAT(6). SRP 1810 3 STAND.0EV FLOAT(6), SRP 1820 3 USE_STAN_DEV CHAR(l). /• Y x YES. OTHEK x NO */ SRP 1830 3 RES2 CHARdll /* RECORD LENGTH x 1218 BYTES •/ SRP 1840
//
HASP-II JOB STATISTICS --
49 CARDS READ
5. STANDARD REFERENCE
DCL 1 STAND_REF. SRP 240 2 NO FIXEO 8IM15). SRP 250 2 ACTIVE CHAR(l). /• Y = YES. N = NO •/ SRP 260 2 DATA(IOO). SRP 270
3 LAB.CODE FIXED BIN(IS). SRP 280 3 VALUc FLOAT(6). SRP 290 3 STAN.0EV FLOAT(6)I SRP 300
SRP 310
//
HASP-II JOB STATISTICS
46 CARDS READ
46 SYSOUT PRINT RECORDS
D-4
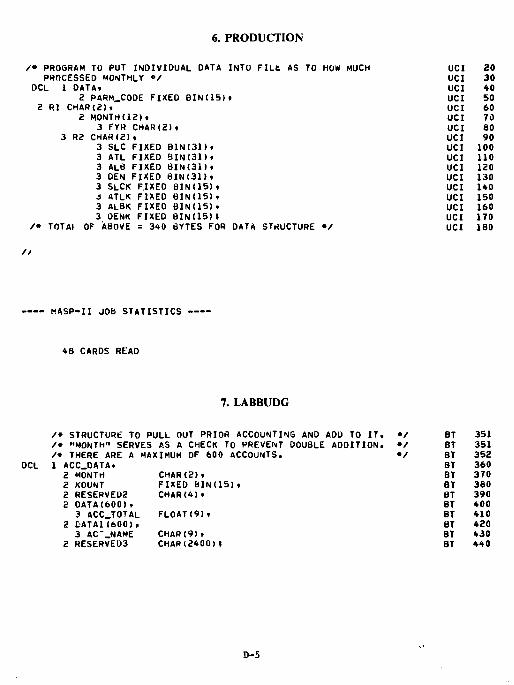
6. PRODUCTION
/• PROSRAM TO PUT INDIVIDUAL DATA INTO FILt AS TO HOW MUCH PROCESSED MONTHLY */
DCL I DATA. 2 PARM_CODE FIXED BI N U 5 ) .
2 RI CHAR(2)< 2 M0NTHU2).
3 FYR CHARI2)t 3 R2 CHAR(2),
3 SLC FIXED BI N O l ) . 3 ATL FIXED 8IN(31>» 3 AL8 FIXED BIN(31)< 3 DEN FIXED BI N O l ) . 3 SLCK FIXEO BINU5)t 3 ATLK FIXEO BINI15). 3 ALBK FIXEO BIN(15). 3 OENK FIXED BINI15M
/• TOTAI OF ABOVE = 340 BYTES FOR DATA STRUCTURE •/
//
HASP-II JOB STATISTICS
48 CARDS READ
7. LABBUDG
/* STRUCTURE TO PULL OUT PRIOR ACCOUNTING AND ADD TO IT. /* "MONTH" SERVES AS A CHECK TO PREVENT DOUBLE ADDITION. /* THERE ARE A MAXIMUM OF 600 ACCOUNTS.
DCL 1 ACC_DATA. 2 MONTH CHAR(2)» 2 KOUNT FIXED BINC15). 2 RESERVE02 CHAR(4)• 2 DATAC600).
3 ACC_TOTAL FLOAT(9). 2 DATA1(600),
3 AC"_NAME CHAR(9). 2 RESERVED3 CHAR(2400)t
UCI 20 UCI 30 UCI 40 UCI 50 UCI 60 UCI 70 UCI 80 UCI 90 UCI 100 UCI 110 UCI 120 UCI 130 UCI 140 UCI 150 UCI 160 UCI 170 UCI 180
•/ BT 351 */ BT 351 */ BT 352
BT 360 BT 370 BT 380 BT 390 BT 400 BT 410 BT 420 BT 430 BT 440
D-5
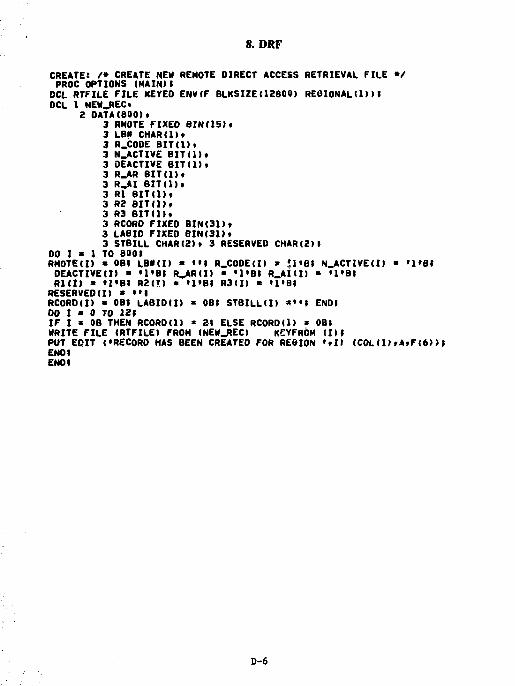
8. DRF
CREATE: /• CREATE NEW REMOTE DIRECT ACCESS RETRIEVAL FILE •/ PROC OPTIONS (MAIN)I DCL RTFILE FILE KEYED ENV(F BLKSIZEt12800) REGIONAL(1)>I DCL 1 NEW_RECt
2 DATA(800I. 3 RNOTE FIXED 8IN(15). 3 LB* CHAR(l). 3 R.CODE BIT(1). 3 N_ACTIVE BIT(l)t 3 DEACTIVE BITU)t 3 R_AR BIT(l)t 3 R_AI 8IT(1), 3 Rl BIT(1>. 3 R2 BITUJf 3 R3 BIT(I>f 3 RCORD FIXED BINOl)» 3 LABIO FIXEO BINOl)t 3 STBILL CHAR(2). 3 RESERVED CHAR(2)I
DO I * 1 TO 8001 RMOTE(I) « OBt LB#(I) • ••» R_CODE(I> « U'BI N_ACTIVE(I) * »l'Bt DEACTIVE(I) « «1«BI RJkRII) « «1»BI R.AIH) * '1»BJ R1II) » »l»Bt R2(!) * »1»B» R3(I) « «I»BI
RESERVED(I) * ••! RCORD(I) • OBJ LABID(I) - OBt STBILL(I) *••! END I 00 I • 0 TO 12t IF I • OB THEN RCORD(l) » 21 ELSE RCORD(l) * OBI WRITE FILE (RTFILE) FROM (NEW.REC) KEYFROM (1)1 PUT EDIT <•RECORD HAS BEEN CREATED FOR REGION '.I) (COL(l)»4tF<6>)I ENDt ENDt
D-6
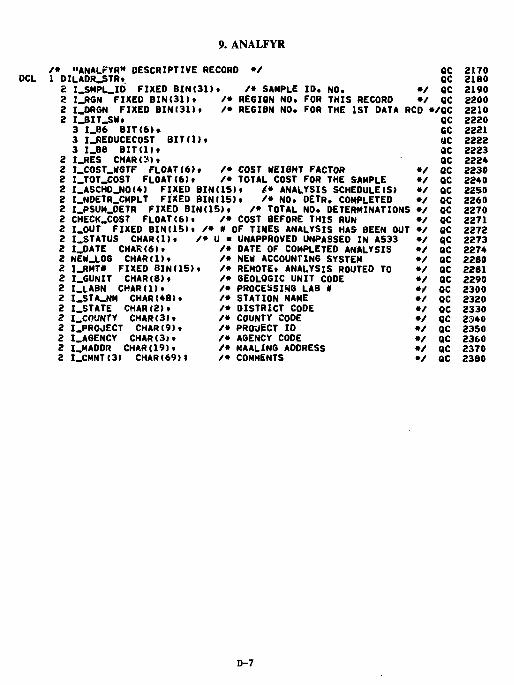
9. ANALFYR
/ • "ANALFVR" DESCRIPTIVE RECORD • / DCL 1 DILADR_STRt
2 I .SMPL.ID FIXED B I N U l l i 2 I_RGN FIXED B IN(31 ) t 2 I_ORGN FIXED BIN 131)• 2 I_BIT_SW»
3 I_86 B I T ( 6 ) . 3 I.REOUCECOST BIT(lit 3 I_B8 BIT(1>» I.RES CHAR(3). I_COST_WGTF FLOAT(6). I_T0T_C0ST FLOAT(6). I_ASCHO_NO!*l FIXED BIN(15). I.NDETR.CMPLT FIXED BIN(IS).
/• SAMPLE ID. NO. QC OC
•/ OC /• REGION NO. FOR THIS RECORD */ QC /• REGION NO. FOR THE 1ST DATA RCD */QC
QC
/# COST WEIGHT FACTOR •/ /• TOTAL COST FOR THE SAMPLE •/
(• ANALYSIS SCHEOULEIS) •/ /• NO. DETR. COMPLETED •/
/• TOTAL NO. I.PSUM_DETR FIXED BINU5). CHECK_COST FLOAT(6)• /• COST BEFORE THIS RUN I.OUT FIXED BINI15). /• # OF TINES ANALYSIS HAS BEEN OUT I.STATUS CHAR(1>« /• U • UNAPPROVED UNPASSED IN A533
DETERMINATIONS •/ •/
I.DATE CHAR(6I. NEW_LOG CHARU). I_RMT# FIXED BINU5). I.GUNIT CHAR(8). I.LABN CHARU). I_STA_NM CHAR(+8). I_STATE CHAR(2). I_COUNTY CHAR(3). I.PROJECT CHAR(9), I.AGENCY CHAR(3). I.MADDR CHAR(19).
2 I_CMNT(3) CHAR(69)I
/• DATE OF COMPLETED ANALYSIS /• NEW ACCOUNTING SYSTEM /• REMOTE. ANALYSIS ROUTED TO /• GEOLOGIC UNIT CODE /• PROCESSING LAB * /• STATION NAME /• DISTRICT CODE /• COUNTY CODE /• PROJECT ID /• AGENCY COOE /• MAALING ADDRESS /* COMMENTS
•• •/ •/ •/ */ •/ •/ •/ •/ *• */ •/ •/
CC ac QC QC QC QC QC QC QC QC QC ac QC QC QC QC QC QC QC QC QC QC QC QC
2170 2180 2190 2200 2210 2220 2221 2222 2223 222* 2230 2240 2250 2260 2270 2271 2272 2273 227* 2280 2281 2290 2300 2320 2330 2340 2350 2360 2370 2380
D-7
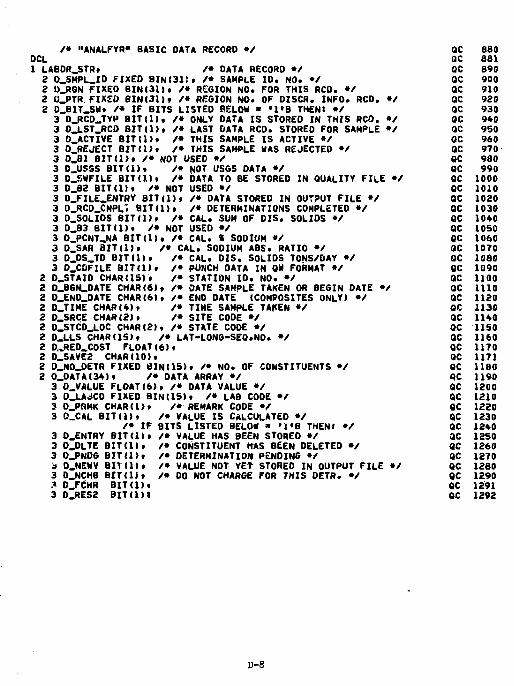
/• "ANALFYR" BASIC DATA RECORD •/ DCL 1 LABOR.STR. /• DATA RECORD «/ 2 0_SMPL_ID FIXED BlN(31)» /• SAMPLE ID. NO. */ 2 D_RGN FIXED BIN(31), /* REGION NO. FOR THIS RCD. •/ 2 0_PTR FIXED BINOl), /• REGION NO. OF DISCR. INFO. RCD. •/ 2 D_BIT_SW» /• IF BITS LISTED BELOW • «1»B THENJ •/ 3 D_RCD_TYP BIT(l), /* ONLY OATA IS STORED IN THIS RCD. •/ 3 D_LST_RCD BIT(l), /• LAST DATA RCD. STORED FOR SAMPLE •/ 3 D_ACTIVE BIT(l), /• THIS SAMPLE IS ACTIVE •/ 3 0_REJECT BIT(l). /» THIS SAMPLE WAS REJECTED */ 3 D_B1 BIT(l), /• NOT USED •/ 3 D.USSS BIT(i), /• NOT USGS DATA •/ 3 D.SWFILE BIT(l). /• DATA TO BE STORED IN QUALITY FILE •/ 3 D_82 BITUI, /• NOT USED •/ 3 D_FILE«ENTRY BIT(l), /• DATA STORED IN OUTPUT FILE */ 3 D_RCD_CMPL7 BIT(l). /* DETERMINATIONS COMPLETED •/ 3 0_SOLIOS BIT(l), /• CAL. SUM OF DIS. SOLIDS •/ 3 D_B3 BIT(l), /• NOT USED •/ 3 D_PCNT_NA BIT(l), /• CAL. * SOOIUN •/ 3 D.SAR BIT(l). /• CAL. SODIUM ABS. RATIO •/ 3 D.DS.TD BIT(l), /• CAL. DIS. SOLIDS TONS/DAY •/ 3 O.COFILE BIT(l). /• PUNCH DATA IN QW FORMAT •/
2 D_STAID CHAR(15). /• STATION ID. NO. •/ 2 D_BGN_DATE CHAR(6), /• DATE SAMPLE TAKEN OR BEGIN DATE •/ 2 D_END_DATE CHAR(6), /• END DATE (COMPOSITES ONLY) •/ 2 D.TIME CHAR I*)» /• TIME SAMPLE TAKEN */ 2 D.SRCE CHAR(2)» /• SITE CODE •/ 2 D_STCD_LOC CHAR(2), /• STATE CODE •/ 2 D.LLS CHAR(15), /• LAT-LONG-SEO.NO. •/ 2 D..RED.COST FLOAT (6), 2 D.SAVE2 CHAR(10), 2 D_NO_OETR FIXED BIN(IS), /• NO. OF CONSTITUENTS •/ 2 D_DATA(34)« /• DATA ARRAY •/ 3 D.VALUE FLOAT(6), /• DATA VALUE •/ 3 D_LAJCD FIXED BINU5I, /• LAB CODE •/ 3 D_PHMK CHAR(l), /'REMARK CODE »/ 3 D_CAL BIT(l), /• VALUE IS CALCULATED •/
/• IF BITS LISTED BELOW * »»«B THEN« •/ 3 D.ENTRY BIT(l), /• VALUE HAS BEEN STORED •/ 3 D.OLTE SITU). /• CONSTITUENT HAS BEEN DELETED •/ 3 O.PNDG BTT(1>, /* DETERMINATION PENDING •/ J 0_NEWV BIV(l), /• VALUE NOT YET STORED IN OUTPUT FILE •/ 3 D_NCHG BITtl), /• DO NOT CHARGE FOR THIS DETR. */ 3 D.FCHR BIT(II, 3 D.RES2 BIT(1)1
QC 880 QC 881 QC 890 OC 900 QC 910 QC 920 QC 930 QC 940 QC 950 QC 960 QC 970 QC 980 QC 990 QC 1000 QC 1010 QC 1020 QC 1030 QC 1040 QC 10S0 QC 1060 QC 1070 QC loao QC 1090 QC 1100 QC mo QC 1120 QC 1130 QC 1140 QC 1150 QC 1160 QC 1170 QC 1171 QC 1180 QC 1190 QC 1200 QC 1210 QC 1220 QC 1230 QC 1240 QC 1250 QC 1260 QC 1270 QC 1280 QC 1290 QC 1291 QC 1292
D-8
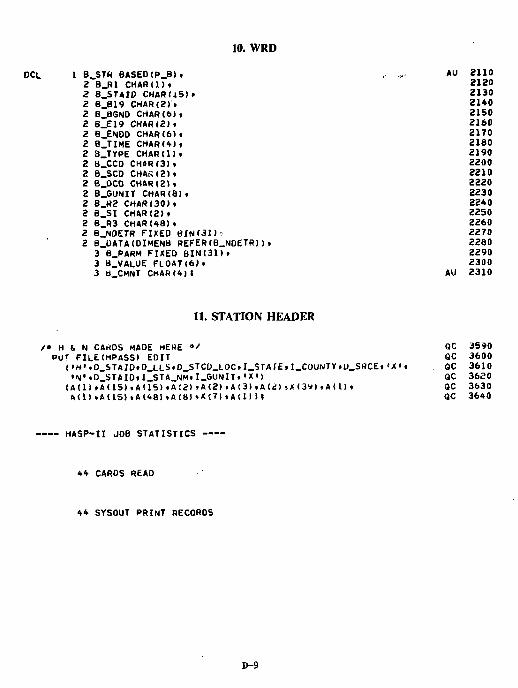
10. WRD
B_STR BASED(P_Bt. AU 2110 2 B_R1 CHAR(l)f 2120 2 B_STAID CHARU5>» 2130 2 B_B19 CHAR(2)t 2140 2 B_B6ND CHAR(6). 21S0 2 B_E19 CHAR(2)« 2160 2 B_ENDD CHAR(6)i 2170 2 B_TIME CHAR(4) t 2180 2 3_TYPE CHARtDf 2190 2 B.CCD CHAR(3)t 2200 2 B_SCD CHAR(2). 2210 2 B.DC0 CHAR(2)i 2220 2 B_6UNIT CHAR(8)t 2230 2 8_H2 CHAR(30)» 2240 2 8_SI CHAR(2)t 2250 2 B_R3 CHAR(48)• 2260 2 B_NDETR FIXED BIN(31): 2270 2 8_0ATA(DIMENB REFER(B_NDETR))t 2280
3 B.PARM FIXEO BINI31). 2290 3 B_VALUE FLOAT<6>» 2300 3 d_CMNT CHAR(4)i AU 2310
II. STATION HEADER
/• H S, N CArtOS MADE HERE •/ QC 3590 PUT FILE(HPASS) EDIT QC 3600
I'H'iD_STAID»D_LLS.D_STCD_LOC»I_STArE»I_COUNTY»D_S«CE»»X<. QC 3610 •N'.O.STAIDiI.STA.Nml.GUNIT.'X'l QC 3620 (A(l)tA(15>«A(15> tA{2)tA{2> t A <3> »A <<!) ?X < 3*> » A < 1 > » OC 3630 A(l).A(15)tA(48)«A(8)«X(7).A(1))? QC 3640
HASP-II JOB STATISTICS
44 CARDS READ
44 SYSOUT PRINT RECORDS
D-9

Appendix E Reports
E-l
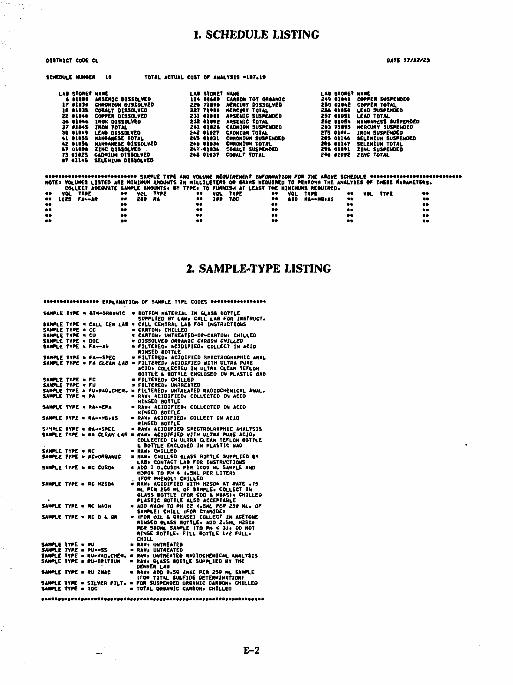
1. SCHEDULE LISTING
DISTRICT CODE CL BATE 77/12/23
SCHEDULE HUNK* TOTAL ACTUAL COST OF ANALYSIS •UT.l*
LAI STORET * inn i r t i M t I I I I US 22 111** M Oil** 37 I I MS 31 1114* 41 l l » 5 S 42 l l t S * »T O H M 73 11125 • 7 I114S
ARSENIC DISSOLVED CHROHIUH OISSOLVED COBALT OISSOLVEO COPPER DISSOLVEO IROK DISSOLVED IRON TOTAL LEAO DISSOLVEO HAMtANESE TOTAL MANBAHCSE OISSOLVED ZINC DISSOLVED . CADMIUM OISSOLVED SELENIUM DISSOLVED
LAI STORET I I * I I M l 2 2 * T l l f t 227 71«lft 231 • t i l l 232 01012 2 *1 H I 2 * £42 I I 0 2 7 2*3 B1031 2 *1 0103* 2 * Y - 0 1 I 3 * 2 * 1 0103T
CARBON TOT OROANIC MERCURY DISSOLVED MERCURY TOTAL ARSENIC SUSPENDED ARSENIC TOTAL CADMIUM SUSPENDED CADMIUM TOTAL CHROMIUM SUSPENDED CHROMIUM TOTAL COBALT SUSPENDED COIALT TOTAL
LAI STORET 24V 011*1 250 011*2 2 M I I I H 217 010S1 2*2 01OS* 2*3 71005 275 0IOA-, 213 01146 2 1 * t l H T 205 010*1 29* I I » 2
COPPER SUSPENDEO COPPER TOTAL LEAO SUSPENDED LEAD TOTAL MANBANE5I SUSPENDED MERCURY 5USP2N0ED IRON SUSPCNOCD SELENIUM 5USPENDEO SELENIUM TOTAL 21NC SUSPENDED ZINC TOTAL
• • • • • * • • • • • • • • • • • • • • > • • > • • • • • • SRNPLC 7YPE AND VOLUME REaOIReNENT INFORMATION FOR THE AlOVE SCHEDULE « • • • • • • • » • * • • • • • • • • I NOTEl VOLUMES LISTED ARE MINIMUM AMOUNTS IN MlLLILCTCRS OR MAMS REQUIRED TO PERFORM THE ANALYSES OF THESE PARAMETERS.
COLLECT ADEOUATE SAMPLE AMOUNTSt IY TYPE. TO FURNISH AT LEAST THE MINIMUMS REWIRED. • • VOL TYPE • • VOL TYPE • • VOL TYPE • • VOL TYPE • * VOL TYPE • • • «» 1125 FA—AR • * 211 RA • • J l * T0C • • AID R A — M i AS • • * •
2. SAMPLE-TYPE LISTING
IATIOH OF SAMPLE TYPL CODES *
SAMPLE TYPE * 8TM-0RGANIC
5AHPLE TYPE • CALL CEN LAI SIMPLE TYPE * CC SAMPLE TYPE * CU SAMPLE TYPE a DOC SAMPLE TYPE * FA—AR
SAMPLE TYPE * FC SAMPLE TYPE * FU SAMPLE TYPE * FU-RAD.CHEN. • SAMPLE TYPE * RA >
SAMPLE TTPE » RA—EPA -
SAMPLE TYPE * RA—H6*AS •>
SAMPLE TYPE •
RC-0R8AMIC
RC CUSO*
SAMPLE TYPE a RC H2SO*
SAMPLE TYPE <
SAMPLE TYPE «
SAMPLE tVPE i SAMPLE TYPE < SAMPLE TYPE i SAMPLE TYPE •
RC NAOH
RC O L 61
PU--SS RU-RAD.CHEH. RU-TRITIUM
SAMPLE TYPE • *U ZNAC
• I0TTOM MATERIAL IN GLASS BOTTLE SUPPLIED BY LAM* CALL LAB FOR INSTRUCT.
• CALL CENTRAL LAB FOR INSTRUCTIONS • CANTONt CHILLED « CARTONt UNTREATEO-OR-CARTON* CHILLED * DISSOLVED OR6ANIC CARSON CMJiLED > FILTEREOt ACIDIFIED, COLLECT IN ACID
RINSED BOTTLE > FILTERED! AC1OIFIE0 SPECTROGRAPHS ANAL > FILTERED* ACIDIFIED WITH ULTRA PURE
ACID* COLLECTED IN ULTRA CLEAN TEFLON BOTTLE & BOTTLE ENCLOSEO IN PLASTIC BA6
- FILTERED* CMILLEO a FILTEREOt UNTREATED FILTERED* UNTREATED RADIOCHEMICAL ANAL* RAW* ACIDIFIED* COLLECTED IN ACIO RINSED BOTTLE RAW* ACIDIFIES* COLLECTED IN ACIO RINSEO BOTTLE RAH* ACIDIFIED* COLLECT IN ACID RINSED BOTTLE RAM* ACIDIFIED SPECTROGRAPHIC ANALYSIS RAW. ACIDIFIED tflTH ULTRA PURE ACID* COLLECTED IN ULTRA CLEAN TEFLON BOTTLE 1 BOTTLE ENCLOSED IN PLASTIC SAG RAM* CHILLED RAM* CHILLED GLASS BOTTLE SUPPLIED IV LAB* CONTACT LAB FOR INSTRUCTIONS ADO 1 O.CUSO* PER 1U00 NL SAMPLE AND H3PD4 TO PH 4 uSNL PER LITER) (FOR PHENOL! CHILLED RAM* ACIDIFIED WITH HZS04 AT RATE .75 ML PER 251 ML OF SAMPLE* COLLECT IN CLASS BOTTLE (FOR COO 1 NBAS)* CHILLED PLASTIC BOTTLE AL50 ACCEPTABLE ADO NAOH TO PH 12 <.SNL PER 251 ML- OF SAMPLEI CHILL IFOR CYANIDEl IFOR OIL 4 CREASE) COLLECT IN ACETONE RINSED SLA5S BOTTLE* ADD 2.SML H2SC4 PER 590ML SAMPLE (TO PH < 3 l< DO NOT RINSE BOTTLE* FILL BOTTLE 1 / 2 FULL* CHILL RAW* UNTREATED RAW* UNTREATED RAW* UNTREATED RADIOCHEMICAL ANALYSIS RAM* BLASS BOTTLE SUPPLIEO BY THE DENVER LAB RAW* ADD 0*50 ZNAC PER 251 ML SAMPLE (fOR TOTAL SULFIDE DETERMINATION) FOR SUSPENDED ORBANIC CARBON* CHILLED TOTAL ORBANIC CARION* CHILLED
E-2
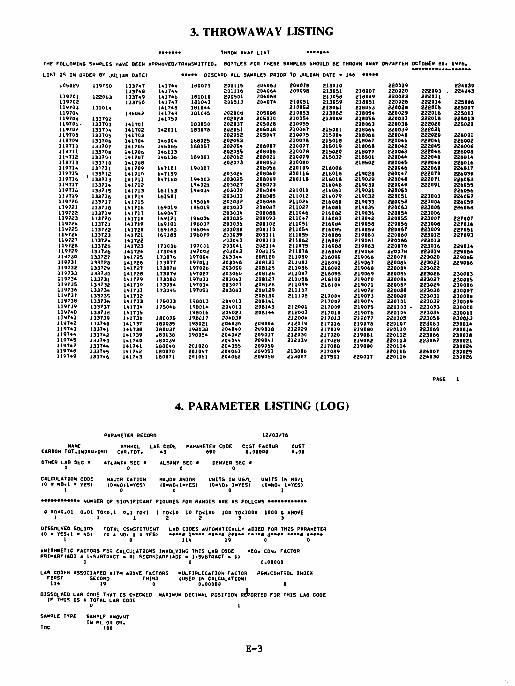
3. THROWAWAY LISTING ••*•••• THROU AWAY LIST •••••••
THE! FOLLOWING SAMPLES HAVE BEEN APPROVED/TRANSMITTED. BOTTLES FOR THESE SAMPLES SHOULD BE THROWN AtUY ON/AFTER OCTOBER 30. 1976.
LIST IS IN ORDER BY JULIAN DATE: «•••• OISCARD ALL SAMPLES PRIOR TO JULIAN DATE - 1*6 •••••
105024 119TS0 1337*7 1*17** 180079 201115 20*063 209078 213010 220019 224039 1337*6 1*17*5 201116 20*06* 20909B 213051 218007 220020 222003 . 224043
119701 1220t>3 1337*9 t*17*b 161010 201501 20*068 213058 218049 220023 222011 119702 133750 1*17*7 1610*3 201513 20*074 210051 213059 218051 220026 22201* 225006 119703 13101* 1*17*8 1610** 210052 213061 218053 220O2B 222015 22500T 11970*, 13b0*2 1*17*9 1810*5 202008 205D0B 210053 213062 2180S* 220029 222016 2250 U 119705 133702 1*1750 202023 205010 210054 213069 218056 220037 222018 225013 11970b' 133703 1*1701 1B3050 202037 20S028 210055 218063 220036 222020 225021 119707 133704 1*1702 1*2011 1B307B 202051 205038 210067 215001 21806* 220039 222021 11970S 133705 1*1T03 202052 205047 210075 215004 218066 220040 222029 226001 119709 133706 1*170* l*t>00* 168025 202053 210076 215018 218067 220041 2220*1 226002 119710 133707 1*1705 l*t>0bb 188057 20205* 208007 210077 215019 218068 220042 2220*5 226006 119711 133708 1*1706 1*1)113 202055 208016 210078 215020 218077 220043 2220*6 226008 11*712 13371. J 1*1707 1*613b 189001 202062 20B021 210079 215032 218501 220044 222048 226014 119713 133710 1*1708 202073 20B053 210080 218502 220045 222049 226016 119714 13*711 1*1709 1*7101 190007 20B056 210109 216006 2200*6 222069 226017 119715 133712 1*1710 1«T1S9 20302* 20B060 210116 216016 219028 220047 222070 226030 11971b 133713 1*1711 1*7160 19*003 203025 20BO69 210118 216016 219029 220048 222071 226053 119T1T 13371* 1*1712 19*021 203027 20B073 2160*6 219030 220049 222091 226055 11971b 13371s 1*1713 161153 19*03* 203030 20808* 211011 216061 219031 220050 226056 i:m* 133716 1*171* 161501 203031 208085 211012 216079 219032 220051 223003 226057 119720 13371T 1*1715 195009 203032 208086 21102* 216080 219033 220052 22300* 226059 119721 13371B 1*1716 169019 195019 203033 208087 211027 216081 219035 220053 22300S 226068 119722 133719 1*1717 1690*7 20303* 2080B6 211046 216082 219036 220054 223006 119723 133720 141718 169121 196006 203035 208093 2110*7 216083 219042 22005S 223007 227007 11972* 133T2] 1*1719 169181 196007 203036 206102 211051 21608* 219058 220056 223008 227016 11*725 133722 1*1720 169183 1960*4 203038 208110 211054 216085 219059 220057 223009 227051 119726 133723 1*1721 169185 196079 203039 208111 211055 216086 219060 220060 223016 227093 119727 13372* 1*1722 2030*0 208113 211062 216087 219061 220066 223013 119728 133725 1*1723 173036 197001 203041 208114 211075 216088 219063 220076 223016 22901* 119729 13372fc 1*172* 17304B 197002 2030*3 208115 211076 216089 219064 220078 223019 229064 119730 133727 1*1725 1730TQ 19700* 2U304* 208120 211080 216090 219066 220079 223020 229065 119731 133T2S 1*1726 173077 1970L1 2030*6 208121 2110S1 216091 219067 220081 223021 229066 119732 133729 1*1T27 173070 197026 203050 208125 211086 216092 219066 220OB* 223022 119733 133730 1*1726 173079 197027 203060 208126 211087 216095 219069 2200B5 223026 230003 11973* 133731 1*1729 173060 197031 203061 208127 2110BB 216102 219070 220086 223027 230005 ]19735 133732 1*1730 17309* 197034 203O7T 208128 211089 21610* 219071 2200B7 223029 230006 119736 13373* 1*1731 173095 197051 203081 208129 211107 219072 220088 223030 230007 119T3T 133735 1*1732 208130 21110B 21700* 219073 220089 223031 230008 119T3B 13373b 1*1733 175033 198013 20*011 2081*1 217007 219074 220101 223032 230009 119T39 133737 1*173* 1750*6 198014 20*013 2061*3 212001 217009 219075 220103 - 223033 230010 1197*0 13373a 1*1735 198016 20*023 2061** 212003 217010 219076 220104 22303* 230011 1197*1 133739 l*t73b 180005 19B017 20*030 212004 217013 219077 220105 223056 230013 1197*2 1337*0 1*1737 180035 198021 20*036 20900* 212019 217016 2190TB 22010T 223063 230014 1197*3 1337*1 1*1738 180037 198038 20*0*0 209018 212029 217019 219080 220110 223065 230016 11974* 1337*2 1*1739 1BDU3B 198054 20*0*2 209037 212030 217020 2190B1 220112 22306b 230018 1197*5 1337*3 1*17*0 160039 20*0** 2090*1 212039 217028 219082 220113 223067 230021 U9T*7 1337** 1*17*1 1600*0 201020 20*055 209050 217086 219090 220114 230024 1197*6 133T*5 1*17*2 180070 2010*7 20*061 20905] 213006 217089 220115 224007 230025 1197*9 1337*6 1*17*3 1B0071 201061 20*062 20906B 213007 217501 22O017 22011b 224030 230026
PAGE 1
4. PARAMETER LISTING (LOG)
PARAMETER RECORD 12/03/76
NAME SYMBOL LAB C O D E PARAMETER CODE COST FACTOR COST CARBON TOT,IN0RG.ORG C A R . T D T . 4 3 6 9 0 0.00000 0.00
OTHER LAB S E C • ATLANTA S E C • ALBANY S E C * DENVER S E C " 0 0 0 0
CALCULATION CODE MAJOR CATION MAJOR ANION UNITS IN U6/L UNITS IN MB/L tO • NOtl > YES) (0«NOtl»YES> )0"NOtl«YESl (0-NO. 1"YES) (0«NOt 1-YES)
1 0 0 0 1
• • • • • • • • • • • • igUMBER OF SIGNIFICANT FIGURES FOR RANGES ARE AS FOLLOW • • • • • • • • • • • •
0 TOCO.01 0 . 0 1 TO<0.1 0 . 1 TOO 1 TO<10 10 To<100 100 TOdOOO 1000 I ABOVE 1 1 1 2 2 3 3
DISSOLVED S0L105 TOTAL CONSTITUENT LAB CODES AUTOMATICALLY ADDED FOR THIS PARAMETER (0 • rES . l * NO) (0 « NO. 1 • YESI • • • • • ! • • • • • » • • • 2«»»» « . « | 3 . . * . • • • • ! * > • * .
1 0 114 19 0 0
ARITHMETIC FACTORS FOR CALCULATIONS INVOLVING THIS LAB CODE MEQ. CON. FACTOR PRIMARY1ADD • 1.SJBTRACT = 01 SECONDARY (ADD • 1.SUBTRACT « (J)
1 0 0.00000
LAB CODES ASSOCIATED H1TH ABOVE FACTORS MULTIPLICATION FACTOR P6M.C0NTR0L INDEX FIRST SECOND THIRD <USED IN CALCULATION) 11* 19 0 0.00000 0
DISSOLVED LAS CODE THAT IS CHECKED MAXIMUM DECIMAL POSITION REPORTEO FDR THIS LAB CODE IF THIS IS A TOTAL LAB CODE
SAMPLE TYPE SAMPLE AMOUNT IN ML OR OR.
TOC too
E-3
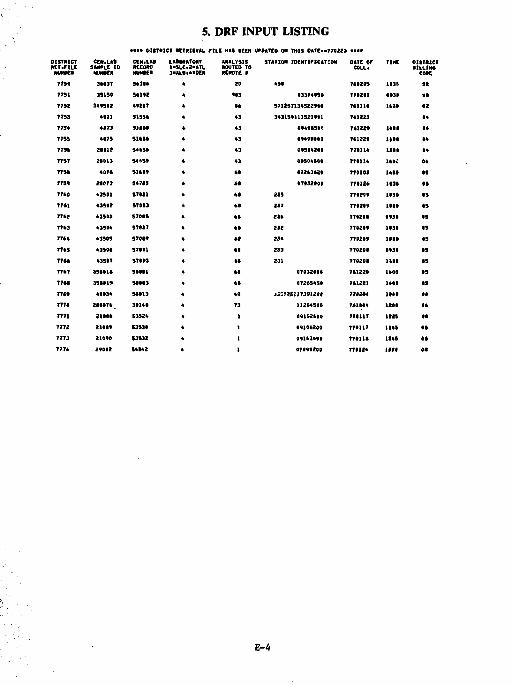
5. DRF INPUT LISTING •••• DItTKICT RETRIEVAL FILE HAS BEEN UFDATEO ON THIS DATE—770223 ••••
DISTRICT RET.FILE M W K »
CEH.LAt SANFLE ID mmzn
CEH.LAt KCOM NUMKR
7750 3**37 5 * 3 0 *
7751 3 5 1 5 * 5*1*2
7752 3*9512 4*217
7 7 5 3 •an 5 1 5 5 *
7754 4 0 7 3 5 1 * M
7 7 5 5 4175 5 1 * * *
7 7 5 * 2*»12 5 4 * 5 *
7757 2*013 5 * * 5 *
7751 *0T» 5 1 t » *
T75t 21973 547*5
77*0 43501 57011
77*1 43512 570*3
77*2 43593 5 7 0 * 5
7 7 * 3 43504 57*17
7 7 * 4 435*5 5 7 0 * 9
77*5 4350* S7091
7 7 * * 435*7 570*3
77*7 35**1» S***l
7 7 * * 3 S M 1 9 5 0 M 3
77*9 40*34 5**13
777* 2***7* 3 9 1 4 *
7771 2 1 * * * 53524
T7T2 2 1 * * * 53530
7773 210*6 53532
777* 29012 54*42
ANALYSIS ROUTED TO RENOTE *
STATION IDENTIFICATION DATE OF COLL.
TINE OlSTftlCT • I L L I N *
cote 20 45* 7*0205 1030 SR
9*3 03374*50 T70201 093* «• •* 57125713452290* 7 *111* 1*30 02
43 3431591115219*1 7*1223 04
43 0949BSOC 7*122* 1**0 04
43 09499*00 7*122* I t M 04
43 095042** 77*114 1100 0*
43 0*50**90 770114 1*»C 0*
** • 7 2 * 3 * 2 * 770103 1*0* 05
*• •7*32*00 77012* 1*3* • 5
6 * 235 770209 1130 • 5
*B 237 770209 100* «5
*» 2 3 * 77020* 0*30 Ot
*» 232 7702*9 1*30 05
** 234 77*209 1 * 1 * 08
•a 233 77020* 0*3* 05
*s 231 77020* no* •5
*• 0703200* 7*1220 1*00 •5
6 * 07265*5* 7*1221 14*0 • t 49 3J593511739120* 77*2*4 1*4* •• 73 112**500 7*10*4 1100 0 *
1 09152*0* 77*117 1*25 •• 1 0910*200 770117 1145 •• 1 091*3490 7 7 * 1 1 * 1145 Ot
1 07*99200 77*124 t m 0 *
E-4
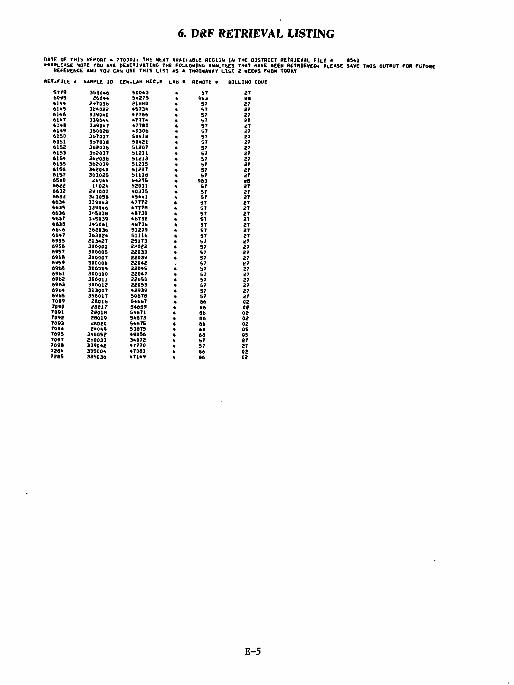
6. D«F RETRIEVAL LISTING
DATE OF THIS HEf>ORT s 770301. THE Ht*1 , '•••LEASE NOTE TOU ARE DEACTIVATING THE
REFERENCE Af*U TOU CAN USE TrtIS LIST
RET.FILE * SAMPLE 10 CENiLAU KEC.» LI 5779 6045 614* 61*5 6146 61*7 61*8 6149 6150 6151 6152 6153 6154 615% 6154 6157 65 BO 6622 6632 6633 6634 6635 6636 663T 6638 66". 6 664T 6955 6956 69ST 69511 695* 6960 6961 6962 6963 6964 6965 TO 69 T090 7091 7092 7093 7094 7095 7097 709ft 7284 7285
353D46 26044
2*»036 324022 339040 339044 339047 350028 3&T01T 3»T018 362035 3o2037 362038 362039 362040 363025 «!6'J44 H 02*
291007 3(3058 339043 339046 3>-5038 3*5039 3*5041 362036 36302* 213*27 300001 300005 300007 300008 300009 300010 300011 300012 313007 35S01T 28016 i&on 2B01B 28019 £8020 24049
346052 260033 339042 335004 335036
50043 5*275 21680 45734 47766 4T7T4 47780 *9306 50418 50421 51207 S1211 51213 51215 41217 51118 54275 52031 40375 45*41 47772 4777B 48730 46T32 48T36 51209 51116 25173 22022 22033 22039 22042 22045 22047 2205C 22053 42939 50878 54667 5*669 5*671 54673 54675 53875 49056 34072 47770 47081 471*9
AILABLE REGION IN ThE DISTRICT RETRIEVAL FILE * 8541 OLLOtflNG ANALTSES THAT rfAVE BEEN RETRIEVED* PLEASE SAVE THIS OUTPUT FOR FUTURE ' A. TMUMMAY LIST 2 «E£«S FHOH TODAY
" REMOTE • BILLING COUE
E-5
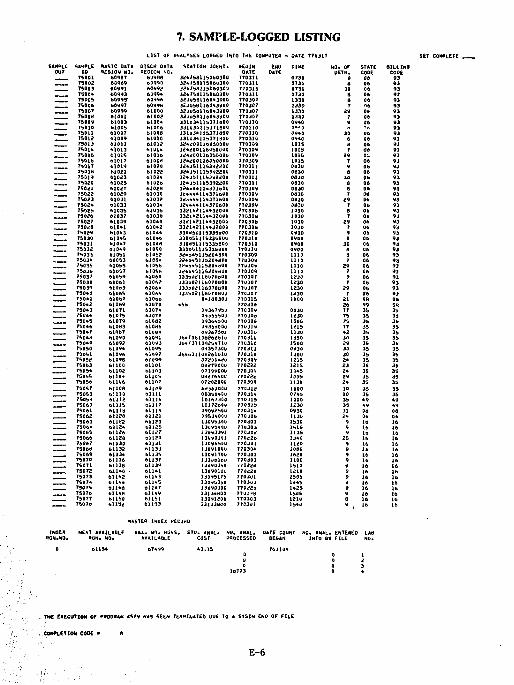
7. SAMPLE-LOGGED LISTING LIST OF •N»L»SE5 LOGGED IN TO Trit COMPUTER - OAT£ T7UJIT SET COMPLETE
S*MI»|.L SAMPLE 1AS1C OAT* DtSCR DATA STATION lUENT. BEGIN END TIME NO. OF STATE BILLING our to 1E&IOU NO. REGION NO* OATE DATE DETR. CODE CODE
75001 60987 eovftfl 32*758115060300 7703 I I 0730 9 06 93 75002 60989 60990 32*158115060300 770311 0730 « 06 93 75003 60991 60V9? 32*750115060300 770311 0730 30 06 93 7500* 60993 6099* 32*758115060300 770311 0730 8 06 93 7S0C5 60995* 60496 32Jtl5BI. 160*3900 770307 1330 B 06 93 75006 60997 60998 3 £ J I > 5 8 1 160*3900 770307 1330 7 06 93 75007 60999 61000 32JU5811b0*3900 770307 1330 29 06 93 75008 6100! 61002 32JUS8)lb043900 770307 1330 7 06 93 75009 61003 6100* 331U3*U33M600 770310 09*0 06 93 75010 61005 blQOb 331u3*l l !s3?lB0Q 770310 93 750 U 61007 61008 3 3 I u 3 * I t i J 7 i a C 0 770310 09*0 30 06 93 75012 61009 6 l 0 | 0 J31U3* l l 337U l lU 77031Q 0940 6 06 93 7501J 610)1 61012 32*2001160aOOOU 770309 1015 8 06 93 7501* 61013 61U1* 32*COOil6050OUO 770309 1015 7 06 93 75015 61015 61016 j2*200t ib0t>oooo 770309 1015 29 01 93 7501b 61017 61010 32*200116050000 770309 1015 7 06 93 75017 61019 b l020 32*351115392200 770311 0830 9 06 93 75Q]« 61021 61022 324J5U153V220U T70311 0830 8 06 93 7501'* 61023 6102* 32*J5 l l l 539220u T703IJ OflJO 30 Ob 93 75020 61025 61026 3E*J5 l l l539220U 770311 0830 8 06 93. 75021 61027 6102ft 3 ? * * * * 11*3716011 770309 0830 8 06 93 75022 61029 61030 J * * * * * l l * 3 7 l 6 O 0 7T0309 0830 7 06 93 75023 6 I0J1 6103? 3<*-.»** l l *3Tl60l l 770309 0830 29 06 93 7502* 61033 6103* 32****11*371600 770309 0030 7 06 93 7502b 61035 61036 3321*211**3200(1 770300 1030 B 06 93 7502* 61037 6)03H 3321421l**3200ft 77030b 1030 7 06 93 75027 61039 610*0 3321*211**32001) T7030H 1030 29 06 93 760*8 610*1 610*2 3321*211**32000 770308 1030 7 06 93 75029 610*3 610* * 330«61II5335«00 770310 0900 9 06 93 7503O 610*5 610*6 330O5U15335BU0 770J10 0900 8 06 93 75031 610*7 bl04A 330851115336800 T70310 0900 30 06 93 75032 610*9 61050 330o5lll5336<»U0 770310 OVOO 8 06 93 75033 61051 61U52 32*3*511520*800 770309 1110 8 06 93 7503* 61053 6105* 32*9*511920*800 770309 1110 7 06 93 75035 61055 61056 3S<»b*511520*8011 7TU30* 1110 29 06 93 75036 61057 6105H 32*3*5)1520*801] 770309 1110 7 06 93 75037 61059 61060 33330211607UaOa 7T0307 1230 9 06 93 75038 6106] 610ft? J336021l6070t)OD 770307 1230 T 06 93 75039 11063 6106* 3333U2116070BOD 7T03O7 1230 29 Ob 93 T50*Q «1U65 ttlOhh J33902116070UUU 77030 7 1230 7 06 93 750*1 61067 blObU 0*la030l) 770315 1000 21 OB OB 750*2 61Qt>9 61DT0 *5s 770J16 26 99 SR 750*3 61071 6107* 0936793U 770309 0830 77 35 3b 750*4 61075 61078 0*3bS3Qu T70J0d 1230 75 35 35 750»5 61079 61082 093t>*s00 770308 1505 75 35 35 750*6 61083 6101b U936CID0U 770J19 1215 77 35 35 750*7 61087 b i l l a1* 0V367361 770J1U 1130 *2 35 35 750*8 61090 61091 Jb* '0b lUU2626lb JTOJlU 1350 30 35 35 750*9 61092 61093 Jb* '3T10125*TU 770310 1500 29 35 3b 75050 6109* 61095 09357300 770311 0930 30 35 35 75051 61096 61097 36*o3110626l0 l0 77031U 1300 30 35 35 75052 6I09Q 61099 0 7201*10 770309 12)5 2 * 35 35 75053 61100 61101 Qd27900ll 7702B2 1215 23 35 35 7505* 61102 61103 07149000 770309 10*S 2* 35 35 75055 6110* 61105 082765OU T70222 1035 29 35 35
- 75056 61106 61107 07202000 770309 U 3 0 2 * 35 35 . „ . 750 57 611 OS 61(09 1/0361011U T7D312 II I DO 10 35 35
75059 6*110 b l l l l 08338*00 770J1* 0 7*6 10 35 35 7505* 61112 6111* 10167JOO 770315 looo 35 * 9 49 75060 61115 61117 1017260U 770316 1230 35 *9 49 75061 6111B 6L119 09092500 77031* 0930 31 0(J 08 7S062 61120 M 1 2 1 0953*000 7TOJ08 1130 2 * 0* 0* 75063 6112? 61123 13095300 770303 1530 9 16 16 7506* 6112* M12S 13UVS.Au 77U303 1515 9 16 16 7S065 61126 61127 J30V33V) 770J02 1135 9 16 l b 75066 61128 6)129 130901H1 *7U22tt 13*0 25 16 16 75067 61130 61)31 1309*5DU 770301 1120 9 16 16 75068 61132 6113J 130910D0 77030* 1000 9 16 16 75069 6113* b l l 3 5 13091700 770303 lb20 9 16 16 75070 61136 6(137 IJ lUOlb l l 770303 1100 9 16 16 75071 61138 61134 13U90350 7 70228 1510 9 16 16 75072 611*0 • 611*1 130901DU 7T0C28 1210 9 16 16 75073 611*2 611*3 13095175 770JOI 1505 9 16 16 7507* 6 1 1 * * 611*5 13095350 770303 1**5 9 16 16 7S075 6 K « « 6 ) 1 * 7 13U903D0 770226 1*25 9 16 16 75076 611*8 611*9 1313*800 7TUi2B 1505 9 16 16 75077 61150 6115) 13091200 770303 1210 B 16 16
— 7507« 61152 61153 131338(10 770301 15*0 9 16 16
FASTER INDEX K ECOnD
IMOEX NEKT AVAILABLE MAX. NO. HGNS. STO. *«* ( . • NO , ANAL. OATE COUNT NO. ANAL. ENTERED LA8 R G N . N O . RON • NO. AVAILABLE COS>T PROCESSED BEGAN I N T Q QM FILE NO.
. THE EXECUTIOM OF PROGRAM A579 HAS SEEM TERMINATED DUE TO A STSIN END OF FILE
.COMPLETION CODE • R
E-6
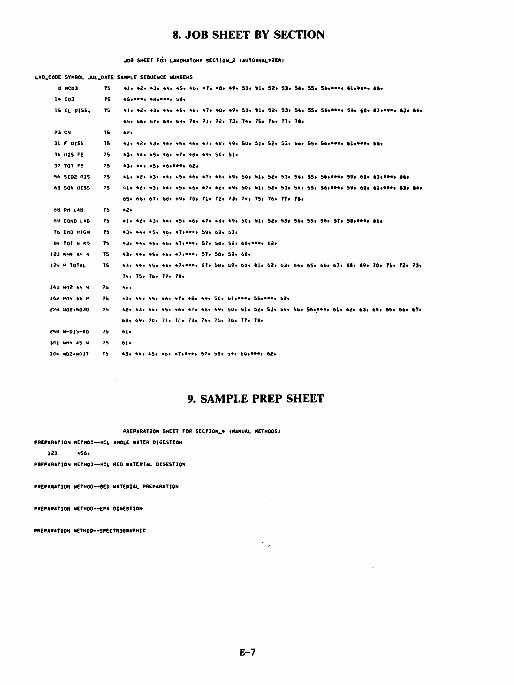
8. JOB SHEET BY SECTION
J08 SHEET FOR LAUORATORV 5ECTI0N_2 IAUTOANALVZER1
LAB.COOE SYMBOL JUL.OATE SAMPLE SEQUENCE NUMBERS
B MC03 75 4 ] . 4 2 . 43* 4 4 . *S t 46 . 47* 4Bt 49* 50* felt 5 2 * S3* 54* 55* 5 » t * " « 61 t»«»* t t t
14 C03 75 4 5 » « » i 4a*»«». 50*
15 CL DISS. 75 4 1 * 42* 43* 4 4 . * 5 . 46* * 7 * 4 6 . 49* 50* h i * 5 2 . S3* 54* 55* 5 » * « * * * 59* *Qi t l t * t * * «3* * • •
6 5 . b6* bT» 6B. b9« 70* 7 1 * 72* 73* 74* 75* 76* 77* 7«*
23 CN 75 62 .
31 F DISS 75 4 1 * 42* 43* 44* 45 . 46* 47* 4tr, 49* 50* 5 1 * 52* 53* S*r 55* 56***>a* 61t»«»* 66*
3d U1S FE 75 43* 44* 45* 4 b . 47 . 46* 49* 50* S i *
37 TOT FE 75 43* 44* 45* 4 6 , « * « . 62*
56 SI02 HIS 75 4 1 * 42* 43* 44< vS . Kb. 4 7 . 4(1. 49 . SO* S i t 52* S3* 5 4 . 55* 5»*«4«* 5 9 . 60* 61.*4*>t 66*
63 SO* DISS 75 o l< 4 2 . 4 3 . * * . 45* 4 6 . 47* 40 . 49* 50* 5 1 * 52* S3* 54* SSt 56* *»«* 59* 6S* * ! * • • • * »3* * • •
b5* b b . 67t b d . 6 9 . 70* 7 1 . 72. 73 . 7 * . 75* 76 . 7T. 7B*
6(1 PH L«B 75 42 .
69 COND LAB 7b 4 ) . 42 . 43 . 44* 45 . 4 6 . 4 7 . 4d* 49* bOt b i t 52* 53* 5 4 . 55 . 5 6 . 57* 5 » « * « * 6 1 *
7b COD HIGH 75 43* 44* i 5 i 46* • ? . • • • . 5V* bO* b i t
a* TOT H «0 75 43 . 44* * b . 4 6 . - , ? » • • • . 57* SB* 59* 6 0 * * * « * 62*
123 NH4 *s \ 75 4 3 . 4 * . 4 5 . 4 b . »7»»»«. 57* 5 6 . 5 9 . 60 .
129 P TOTAL 75 4 3 . 44 . 4 5 . 4b* 47**>*>* 57* 5(9* 5 9 . bO* 6 1 * 62* 63* 64 . 6 5 . 66* 6 7 . 68* 49* 70* 7 1 * T2* 73*
T4. 75 . 7b . 77. 78.
160 N02 AS i| 75 42*
162 P04 A5 P 75 - .3. 44* 45* 46* 47* 48* 49* 50* b l . « « * 55t»»«» 62*
2?B [.02.1030 75 4 2 . 4 3 . 4 4 . 4S< 4 6 . 4 7 . 4tjt 49* SO. 5 1 . 52* S3* 54 . 55* S 6 t » * t 6 1 . 62* 63* 6 4 . 65* 66* 67*
ba* 6 9 . 70. 7 1 . 7,'* 73* 74. 75* 76 . 7T. 76.
268 N-DIS-RD 75 6 1 .
311 NM4 »S H TS b i t
304 N02*NQ3T T5 4 3 . 4 4 . 45 . 46 . » T . * * » . 57* 3 d . 3 4 . b O . * » * 62 .
9. SAMPLE PREP SHEET
PREPARATION SHEET FOR SECTION.,* (MANUAL METHODS! PREPARATION METHOD—HCL WHOLE HATER DIGESTION
123 456. PREPARATION METHOD--KCL BED MATERIAL DIGESTION
PREPARATION METHOD—BEO MATERIAL PREPARATION
PREPARATION METHOD—EPA 0IGE5TI0N
PREPARATION METHOD--SPECTRDQRAPHIC
E-7
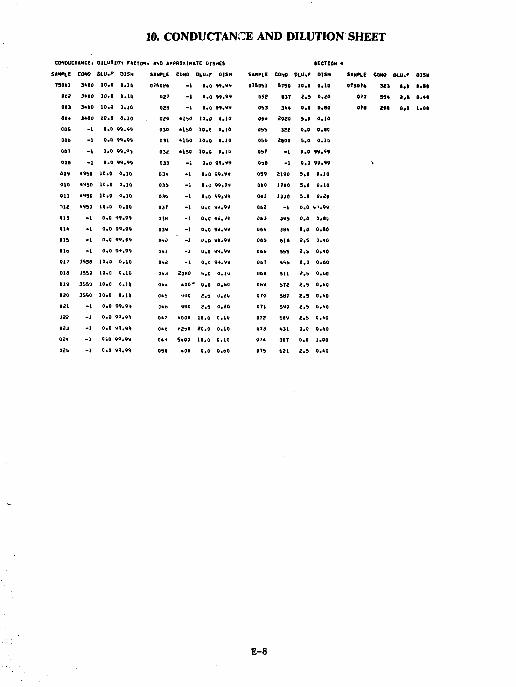
10. CONDUCTANCE AND DILUTION SHEET
CONDUCTANCE* OILUTIAN FACTOR AXO APPROXIMATE DISHES
SANPte COW OLU.F 01 $H SAMPLE COND OLU.F DISH
TS001 3*00 10.0 0.10 075026 - 1 0.0 99.99
002 3*00 10.0 0,11) 027 - 1 0.0 99,99
003 3*00 10.0 0.10 02B - 1 0.0 99.49
00 * 3*00 10.0 0.10 029 MbO 10.0 0.10
005 - 1 0.0 90.99 030 *L50 10.0 0.10
00b - 1 0.0 04.09 031 *150 10.0 0.10
OOT - I 0.0 OO.oj 032 *150 10.0 0.10
00B - 1 0.0 99,0% 033 - 1 0.0 99.44
009 *950 10.0 o.io 03* • 1 a.o 99.94
010 *950 10.0 D.10 03b - 1 o.c 99,9V
O i l »150 10.0 O.IO 03b - 1 0.0 99.99
312 •950 10.0 0.10 037 - 1 u.o 44.99
013 - I 0 .0 40.99 • 30 - 1 0*0 99. it
0 1 * - 1 0.0 94.9% 039 - 1 0,0 94.94
01S - I 0 .0 0 9 . 9 * a»o - 1 0.0 99,99
01b - 1 0.0 9-1,99 0*1 • 1 0,0 99.99
017 3S50 10.0 0,10 0*2 - I a.o 9 9 . 4 *
oia 3SS0 LO.O 0.10 0*3 20t)0 5.0 0.10
0)9 35S0 10.0 O.10 0 * * * o o - 0.0 0.6Q
020 3550 10.0 0.10 0*5 490 2 .5 U.2b
021 - I 0.0 99.99 0*b 990 2 .5 a.20
022 - 1 0.0 99 .99 0*7 *000 10.0 0.10
02J - 1 0.0 99 ,99 o*e 02SU 20.0 0.10
02* - 1 o-.o 99 .94 0*9 5*00 10.0 0.10
02b - 1 a.o 99.99 050 *00 0.0 0.00
SAMPLE CONO DLU.F OISH
OT5051 5TS0 1 0 , 0 0 . 1 0
052 B3T 2 . 5 0 . 2 0
053 3 * * 0 . 0 0 , 8 0
005
060
2920 5 . 0 0 . 1 0
322 0 . 0 o.«a 2000 5 . 0 0 . 1 0
- I 0 . 0 9 9 . 9 9
- 1 0 . 0 9 9 , 9 9
2190 5 . 0 0 . 1 0
1TH0 5 . 0 0 . 1 0
1330 5 . 0 0 . 2 0
- I 0 . 0 S't.OO
395 0 . 0 O.St
38* 0 , 0 0 . 0 0
»L» 2 . 5 0 .*0
555 2 . 5 0 , * 0
*56 0 , 0 0 . 6 0
511 2 . 5 0 . 6 0
t»T2 2 . 5 O.*0
5«? 2 . 5 O.*0
590 2 . 5 o.*o 589 2 . 5 O.*0
*31 0 . 0 0 . 0 0
30T 0 . 0 1 .00
021 2 . 5 0 . 4 0
SAMPLE COMD OLU.f DISH OTSOH 323, 0.1 ».••
077 559 2,5 0.41 019 29« 0,0 l.OI
E-8
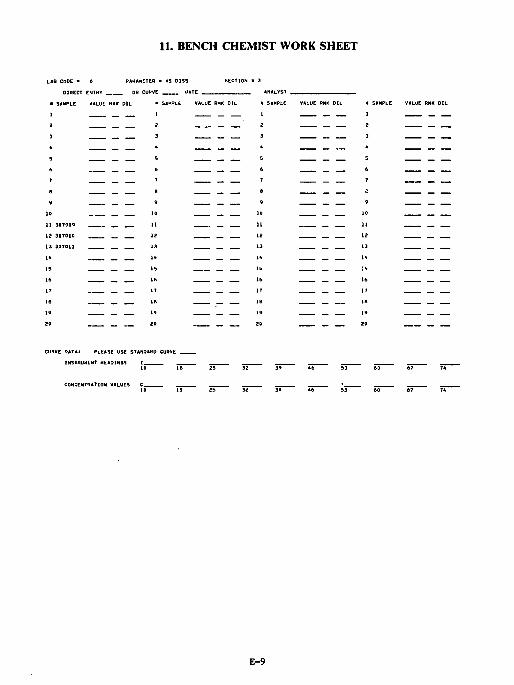
11. BENCH CHEMIST WORK SHEET
LAB CODE * 6 PARAMETER • AS DISS SECTION • 3
DIRECT ENTRY OR CURVE i»ATE ANALTST
• SAMPLE VALUE RMK OIL • SAMPLE VALUE RMK OIL * SAMPLE VALUE RMK OIL * SAMPLE VALUE RMK OIL
2 _ 2
3 _ 3
CURVE OATAt PLEASE USE STANOARO CURVE INSTRUMENT HEADINGS I _ ^ _ __
10 IB 25 32 39 »6 S3 60 AT 74
CONCENTRATION VALUES C • LD IB 35 32 39 *6 53 60 67 7*
E-9
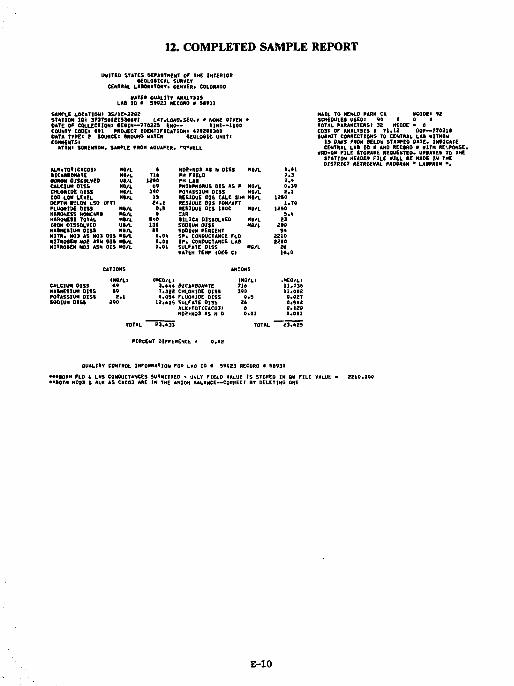
12. COMPLETED SAMPLE REPORT
UNITED STATES DEPARTMENT OF THE INTERIOR KOLOfttCAL SURVEY
CENTRAL L«IM*TORY. DENVER* COLORADO
SAMPLE LOCATIONi 3S/1C-3202 STATION 101 3 r 3 r 5 * I 2 t S » 6 « I LAT.LOWS.SEtf.l • WWE MVEN * OATE OF COLLECTION I IE I IN - -7T0225 END-- TINE—1100 COUNTY CODE* 001 M O ^ C T IDENTIFICATION* 4TB2OO30O DATA TYPE! 2 SOURCE I MOUND HATER SEQLOOIC UNIT! C0MMENT5I
ATTN I SORENSDN. SAMPLE FROM AOUAFER. "^"HELL
ALK*T0TICACO3> BICARBONATE • W O N DISSOLVED CALCIUM OX5S CHLORIDE DISS COD LOW LEVEL DEPTH IEL0W LSO (FTI FLUORIDE DISS HARDNESS HONCARI HARDNESS TOTAL IRON DISSOLVED MA0NES1UM OIS5 NITR, N03 AS NO3 DIS NlTftOtEN N02 ASM DIS NITROSEN N03 ASN DIS
NB/L » NB/L m U»/L 12*0 Nft/L 69 NB/L 340 MB/L 15
24.1 NB/L O.S MB/L 0 Hl/L 9»0 UB/L 130 MB/L Sf MB/L 0,0* MB/L 0,00 MO/L 0,01
N02*N03 AS N DISS PH FIELD PM LAS PHOSPHORUS DIS AS P NB/L POTASSIUM DISS MO/L RESIDUE OIS CALC SUM HB/L RESIDUE OIS TON/AFT RESIDUE DIS H O C SAR SILICA DISSOLVED SODIUM OISS SODIUM PERCENT SP. CONDUCTANCE FLD SP* CONDUCTANCE LAI SULFATE DISS NATEH TEMP (DEO C)
NB/L
MB/L
HO/L
S
MAIL TO MENLO PARK CA BCODEl 92 SCHEDULES USEOt 90 0 0 0 TOTAL PARAMETERSt 32 HCODE > 0 COST OF ANALYSIS S T l . 1 2 OOP--77031B SUBMIT CORRECTIONS TO CENTRAL LAB HlTMIN
15 04*5 FROM KLOO STAMPED OATC. IHtlCATE CENTRAL LAB ID • AND RECtflD B KITH RESPONSE,
HRD-QH FILE STDRA8E REQUESTED. UPDATES TO THE STATION HEAOER FILE * I L L I E MADE IN THE DISTRICT RE.7KUVAL PROfiRAN H LABPJtlN " .
CALCIUM OISS MABNESIUM DISS POTASSIUM OISS SODIUM DISS
(MEQ/L) 3.444 BIC4HB0NATE T.322 CHLOMIDE DISS 0.054 FLUOHIDE DISS
12.615 SULFATE OISS ALK»TOT(CitC03f N02*N03 AS N D
23.433
iHEQ/L> 11.736 11.002
0.02T 0.542 0.120 0.OB1
"*Z3.«5
PERCENT DIFFERENCE '
QUALITY CONTROL INFORMATION FOtt L*9 10 « 59023 RECORD i 58931
E-10
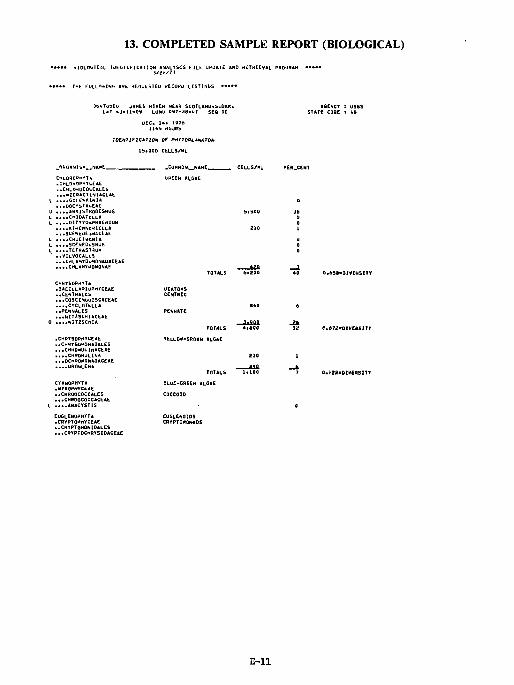
13. COMPLETED SAMPLE REPORT (BIOLOGICAL)
<• • • • Tut Km.L'WN! not -lEqutSTEl) rtECOrtU LISTINGS
IOEM IF I CAT IDH Of PrirTDPLtSKTOto
lb .000 CtLLS/ML
Ofar.iMTsu titrnf.
CILOROPHYTA .CniOKi)PrtTi.EAt ..CMLOX(jCO<.CALEd . . .MlOACTlNlACtAL ....GULE*<lUHI» ...00CVSTAt.EAE
1 . . . . A N K I S T K O D E S M U S ....CHtlDATtLLA ....DICTYOaPHAErtlUM .... lUMCMUfHCLLA ...SCENtOEvJACtAE . . . .CtfUCIutNlA . . . . S C C N E O L S H U S ....TETRAST^UH ..VOLVOCALtS ...ClLAHTDoMONAUACEAE . . . .CHLAMVI^OHONAS
CHMYSOPHYTA .dAClLLARIUPrtYCEAE ..CENTRALti ...COSCINUUISCICEAE ....CYCLOTtLLA ..PENNALES ...NITZSCMiACEAE
NiTZSCnIA
•CHRYSOPHYCEAE ..CHRTSOMOKADALES ...CHHOMULlNACtAE •••.CHRDHULINA .••OCHHOMONADACCAE ....UROGLEhA
CYANOPHYTA .MYKOPHfCttE ..CHHOOCOCCALES ...CHROOCOCCACEAE
. ....ANACYSTIS
EUGLENOPHYTA .CRVPTO»HYCEAE . .CRYPTOMONIOALES ...CRYPTOCnRYSIDACEAE
.COHMON^J^AHE™
OREEN ALGAE
TOTALS 6*200
ror*LS *.#cc VELLOH-BR0UN ALGAE
TOTALS
BLUE-GREEN ALGAE
C0CCO1O
O.ftSi-tHVEKSITY
C.67£-0 IV£«Sir r
0.122-DIVERSIT*
E - l l
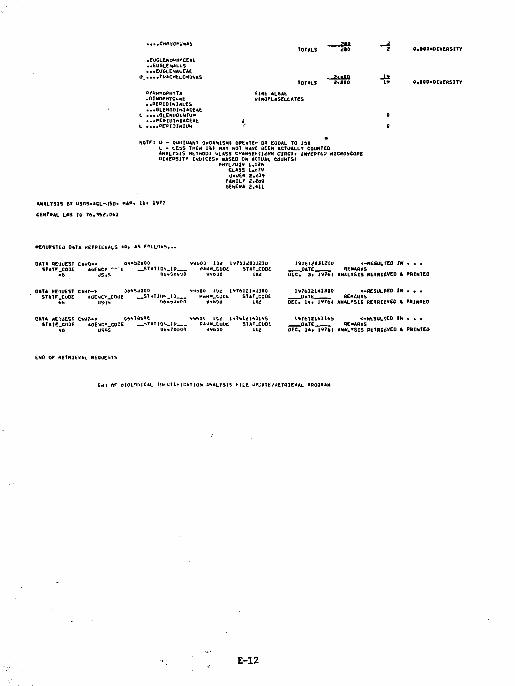
TOTALS 210
TOTALS 2<a00
..CM»«OfUi»*i
.EUGLENOPHTCEAt «.EUGLEN*Lt5 ...EUGLENALEAS «...Th«CMtLOHUh»S
PYttKMOPHVT* .D INOPMYCXAE ..PERIOIN1ALES ...GLENOBIfilACEAt
G L E N U O I N I U M . . .PERIUMlACEAt
. . . . .PE»rOIi*IUM
NOTE) l> - OUrMUANT OXCANISMI GREATE* 00 EQUAL TO 14* L - LEsS THEN l * t HAY NOT HAVE tlEEN ACTUALLY COUNTED «N»L"bJS HtTnDOl OLASS CmMtitti(IdH* CIRC1* [MtrERTEO HICffOSCOPE 0IVE»SITV INDICES* HASEO ON ACTUAL COUNTS!
PhYL/UlV 1.^26 CLASS LaTV OKdEfl 2.^39
FAMlL? i,2nl GENERA 2 . « U
O.MD«DIVERSITY
O.OOO-OIWESSITT
ANALYSIS BY USr-S-ACL-JSD. MAR.
CENTRAL LAB tO 76 .16?.0*1
•ElUESTEil DATA KETRIEVALS «»* A% Ff>LLO"S.,,
OATA RC'IUEST CA«l)-> STATE_COD£ AbE*C» "
Oo*!>?UOO t _STATION_It>
VSbOO 102 l*7bl20JJ2lQ firfM.CUDE STAT.CODE
VMbUO IPd
19T6I2DJ12I0 c-flESULTCO IM • . . DATE REMARKS
DEC. 3 . 14TAI ANALYSIS RETRIEVED I PAINTED
OATA REQUEST CIHO-> Dfi*5J(IOO ST*TF_Ct)DE »GE-JC*_tOuE „ 5 1 »Tin»._iD_
kft US'fS 06»3Jul :^K"™ i v T 6 i £ i * l 3 o o «-H£Sin.reo I N • • • DATE REMARKS
OEC. U t 19T6I ANALYSIS REtRIEVEO t PRINTEO
OATA xEOUEST C»rt£i-> OpWAblo v%r>00 102 l * 7 t > U l i l l * S STlT€_COOE «GE^CV_CUDE ITATION.ID PA^M_CO0t STAT.CODE
46 USr,S UO-7O300 4VbtlO 1(12
1<*76121»1US <-H£SULteO IN > . . DATE REMARKS
OEC, 14, 197*1 ANALYSIS BETRlbWEO I PRINTED
E*D OF RETRlEwil. SEOJESTS
£*r) HF dltlLl&lCAL IDtNl l r ICdT ION ANALYSIS U L E UPDATE/RETRIEVAL PROORAM
E-12
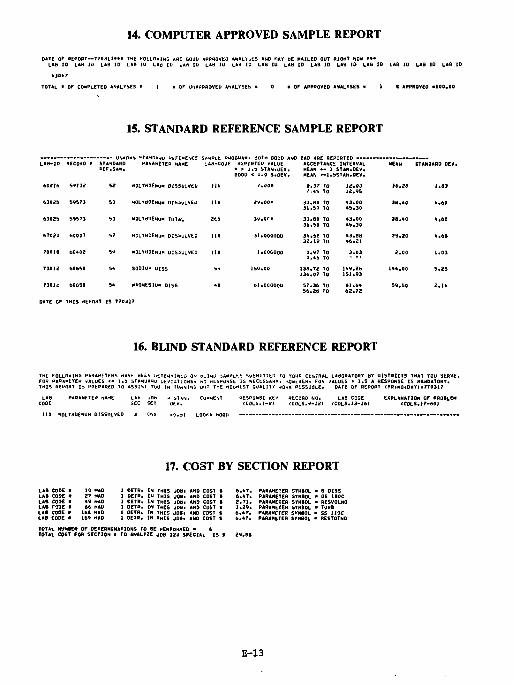
14. COMPUTER APPROVED SAMPLE REPORT
+30*7
TOTAL * OF COMPLETED ANAL*SE5 • 1 a OF UNAPPROVED ANALYSE!) • • OF APPROVEO ANALYSES • 1 * APPR0VEO «100.00
15. STANDARD REFERENCE SAMPLE REPORT
too it s?ij?
63025 59573
63025 59573
6T02D 60007
70019 60*02
73012 60650
T301C 60650
mOLVitOEtofit OISSULVLO I I
lOLXtiOtNy DIS3ULVEU 11
MOL*<JDENUM TOTAL
MOLTBDEMjM DIS3ULVE.D
KOLTBDENUM UI53ULWE0
SOD1U" UISS
MAGNESIUM DISS
DATE GF THIS HEPOHT IS T70317
2fcS
110
Sv
*D
r.Qo* «.J7 ».*5
TO TO
12.03 12.95
2*.00» 33.80 31.50
TO TO
A3.00 AS.3D
3i».0f» 33.60 31.SO
TO TO
A3.00 4S.3Q
3T.00GOQD 3*.62 32.19
TO 70
Ai.ea 46.21
].006000 o.y? o.*b
TO TO
3.D3
l*>0.00 130.72 136.07
TO TO
1*9.20 151.93
61.00G0OD 57,36 56.26
TO TO
61.6* 62.72
MEAN STANDARD DEV.
10.50 1.03
39 . *0 4 .60
3B.*0 4 ,60
39,20 4.6ft
2.00
1** .00
59.50
1.03
5 .29
2.1A
16. BLIND STANDARD REFERENCE REPORT
I FOLLOWING PAOAutTEKS • . OttH ttTE^MlNtiJ OH OLlNI aAHPLti SUUMlTTbD TQ l"0UR Ctr.:RAL LABORATORY t»T DISTRICTS THAT TOU SERVE.
PARAMETER NAME
110 MOLTBOENUM DI5SOLVEO
#£5PONSb KEY
17. COST BY SECTION REPORT
LAB CODE • 10 MAD LAB CODE • 27 HAD LAB CODE • *9 HAD LAS CODE • 66 HAP LAS CODE • 168 MAO LAS CODE • 169 MAD
1 OETR. IN THIS JOB. AND COST ft 6 .4T . 1 DETR. IN THIS JOUi AND COST ft 6 . 4 7 . 1 OETR. IN THIS JOB. AND COST ft 2 . 7 1 . 1 OETW. IN THIS JOB. AND COST t 1 .29 . 1 OETR. TW THtS JOB. AND COST ft 6 . 4T . 1 OETR. IN THIS JOB* AND COST ft 6.AT.
PARAMETER SYM10L - B DISS PARAMETER SYMBOL • D5 1B0C PARAMETER STHSDL - RESVOLNO PARAMETER STHBOL • TURB PARAMFTER SVMOL - SS HOC PARAMETER SYMBOL - RESTOTND
E-13
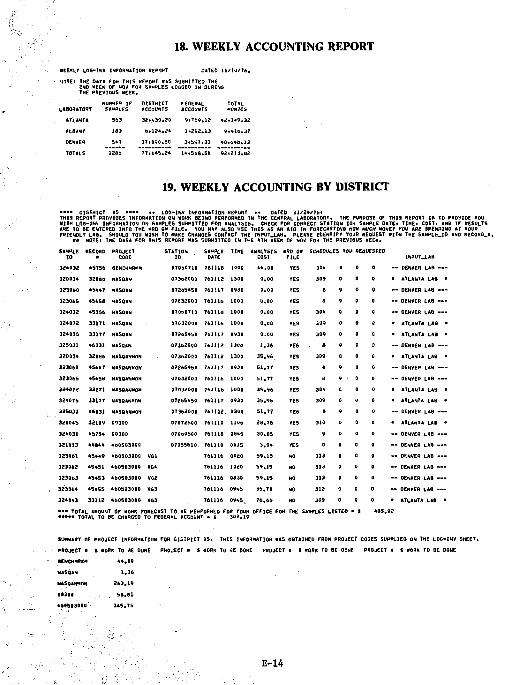
18. WEEKLY ACCOUNTING REPORT
MEEKLY LOG-lNV INFORMATION REPORT DATED 11/10/T6. •nTEi THE OAT* FOR T H I S REPORT MAS SUBMITTED THE
2ND MEEK OF MOV F04 SAMPLES LOGGED IN DURING THE PREVIOUS MEEK.
LABORATORY
ATLANTA
A L M M Y
DENVF.R
TOTALS
5*0
1286
32..* 3 0 . 20
fc.124.24
37.090.BO
7 7 . 6 * 5 . 2 *
9 .719,12
1.292.13
3 .557,33
14.SbS.56
42 .1 *9 .32
9 . * l b . 3 7
40.646.13
92*213.112
19. WEEKLY ACCOUNTING BY DISTRICT
• • • • 01STHICT 05 • • • • . * LOO-lNV INFORMATION REPORT * . DATED U / 2 * / T 6 « THIS REPORT PROVIDES INFORMATION ON WORK BEING PERFORMED IN THE CENTRAL LABORATORY* THE PURPOSE OF THIS REPORT IS TO PROVIDE YOU WITH LOB-INV INFORMATION ON SIMPLE5 SUBMITTED FOR ANALYSIS. CHECK FOR CORRECT STATION [D* SAMPLE DATE* TIME* COST. AND IF RESULTS ARE TO BE ENTCRED INTO THE «HD OK F I L E . YOU MAY ALSO USE THIS AS AN AID [N FOIIECASTfNQ HQ* MUCH MONEY YOU ARE SPENDING AT YOUR FRIENDLY LAD. SHOULD YOU M]SH TO MAKE CHANGES CONTACT THE I N P U T . L A B . PLEASE IDENTIFY YOUR REQUE5T MITH THE SAMPLK_IO AND RECORD.*.
M NOTEl THE DATA FOR THIS REPORT MAS SUBMITTED IN THE 4TN MEEK OF NOV FOH THE PREVIOUS MEEK.
SAMPLE 10
RECORD •
PROJECT CODE
STATION ID
SA«PLE DATE
Tr«E ANALYSIS COST
«RD 0W FILE
32*032 45T56 BENCHkRKM 070607)0 761110 1000 44,00 YES
320034 320(16 NASOAW 07362000 761112 1300 0,00 YES
323060 45447 NASQAN 0T265450 761UT 0930 0,00 YES
323065 4545S NASQAN 07032000 76111b 1000 0,00 YES
324032 45756 NASQAN OTOfO'lO 761UU 1000 0,00 YES
324072 331T1 NASQAN 07032000 T61H6 1000 0,00 YES
32*076 331T7 NASBAN 072o5*b0 T61117 0930 0.00 YES
325031 46031 NA5QAN 073o2000 T«lli2 U<10 1,36 YES
320034 32066 NASOANMC1N 073n2000 761112 1300 35,96 YES
323060 45*4 7 NASQANMOW 07265450 7»1117 09JO 51.77 YES
32306S 45456 NASOANMON 07032000 761116 1000 51.T7 YES
32+073 33171 VASOANNDN 07032DO0 761116 1000 35.96 YES
32407b 33177 NASBANHON 07265*50 T41UT 0930 35.96 YES
325031 46031 NASOANMON 07362000 761112. 1300 51,77 YES
320045 32109 00300 070T2500 761110 UOtf 2D.7b YES
324031 45754 00300 070&0500 761116 0845 30.05 YES
321013 4*9*4 400503000 07055610. 761110 0915 5,94 YES
323061 •5*49 *60503000 V61 761116 0920 59.15 NO
323062 45451 460503000 VGA 761116 luso 59.15 NO
323063 4S453 460503000 VG2 761116 0840 S9.1S NO 323064 45455 460503000 VG3 761116 09<vb 05.70 NO
3240*3 33112 460503000 VG3 761116 09*5, 76,66 NO
SCHEDULES rou REQUESTED INPUTJ.AB
0 — DENVER LAB - - -
0 * ATLANTA LAS •
0 — DENVER LAB —
0 - - OENVEH LA8 —
0 - - DENVER LAB
a • ATLANTA LAS • 0 • ATLANTA LAB • 0 — DENVER LAB — 0 • ATLANTA LAB • 0 — DENVER LAB 0 — DENVER LAB — 0 * ATLANTA LAS • 0 • ATLANTA LAB • 0 -- DENVER LAB — 0 • ATLANTA LAB • 0 — DENVER LAB 0 — DENVER LA9 —— 0 — OENVER LAB 0 -- DENVER LAB — 0 -- DENVER LAB ™ 0 — OENVER LAS 0 • ATLANTA LAB •
405.92
SUMMARY OF PROJECT INFORMATION FQR lilSlRICT 05 . THIS INFORMATION *AS OBTAINED FROM PROJECT CODES SUPPLIED ON THE LOG-INV SHEET.
PROJECT « S MORK TO K ODNE
SENCHMffKM 44.00
NASUAN 1.36
u430AN>"i*i 263.1«
0*301 58 .01
4M5 I3000 345.75
S MORK TO BE DONE PROJECT « S MORK TO BE DONE PROJECT * S MORK TO BE DONE
E-14
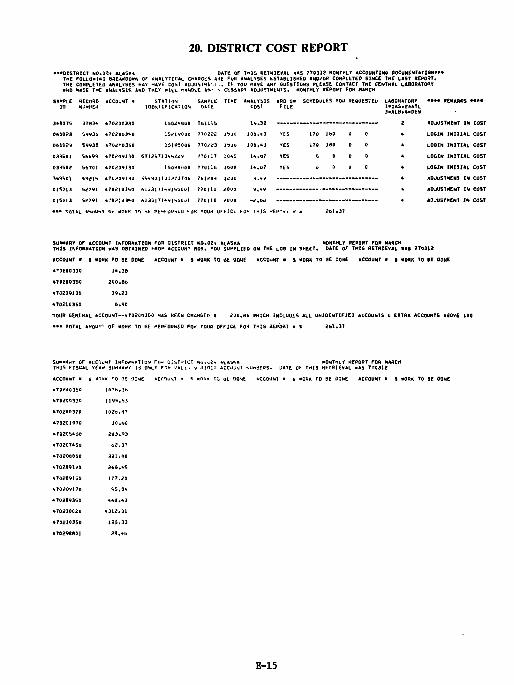
20. DISTRICT COST REPORT
•••DISTRICT NQ.Q2« ALASKA DATE OF I M S RETRIEVAL «AS 7703J2 MONTHLY ACCOUNTING 0OCUM£NTArl0N**» THE FOLLOWING BREAKDOWN OF ANALYTICAL CHARGES ARE FU» ANALYSES ESTABLISHED AND/OR COMPLETED SINCE THE LAST REPORT. THE COMPLETED ANALYSES "AY HAVE COST ailJuSTMfc f , IF- YOU HAVE ANY OUE5TIONS PLEASE CONTACT THE CENTHAL LABORATORY WHO MADE THE ANALYSIS AND TMEY M I L L H»itDt.E I
SAMPLE 10
RECORD NUHHEI*
ACCOUNT « STATION IDENTIFICATION
SAMPLE GATE
TlHE
3»fl075 3783* A70200330 lb0i»«OO Ttolllb
066028 5993t •7O20OJS0 1SPIVO0O 770222 lbJO
D6b02V 5993B • 7D*r>0350 1519S0O0 7 7Q2«f3 lb jo
039501 56699 •70209130 5712b7U»b2*<* /TOUT I0«S
039502 5 b TO] *70209t30 IbOVOi'OO 77Ullb J tiott
i*>V,T,\ »<»?l% *?<|209130 •>S»9311 JUTJ70U 7612U4 I< ;JO
01SD13 M 7 « l *7DflOJSO bi33171«ylbS0Ql T70I10 *QUU
015013 52791 »ro2: i )3*o *13J l7 ] + vl3SU(Jl F7UU0 2ituu
• • • TOTAL »*)U»1 OF *OV* 1 1 f t Pt - fOUltD Fi) « YOU-* 0 FKlCt
i CESSARY AOJU'THbNTS. MONTHLY REPORT FOR MARCH
blS »RO 0» SCHEDULES YOU RE 00 EST El*
1*.B7 YES 0 0 (
-2.*>tt — — - • — —
i° TMJS *tv«i i * 2bl,37
LABORATORY 1"QAS.2»ATL 3>ALB**aDEN
•••• REMARKS •••«
ADJUSTMENT IN
LOGIN INITIAL
LOGIN INITIAL
LOGIN INITIAL
LOGIN INITIAL
ADJUSTMENT IN
ADJUSTMENT IN
ADJUSTMENT IN
COST
COST
COST
COST
C05T
COST
COST
COST
ACCOUNT • S MDRK TO BE DONE ACCOUNT • 1 riORK TO 6E DONE ACCOUNT * S MORK TD OE DONE ACCOUNT * f VORK TO IE DONE
**0200330 1A.3B
•70200350 200.8b
AT0209130 39.23
AT021035Q 6.90
YOUR GENERAL ACCOUNT—470200350 HAS BEEN CHaHGEU t 200.(96 UHlCH INCLUDES ALL UNIDENTIFIED ACCOUNTS I EATRA ACCOUNTS ABOVE 100
••• TOTAL AHOU1'1 OF HORK TO BE PEOF0R«ED FO« YOUR OFFICE FOR THIS REPORT » S 261.IT
SUMMiAT OF THIS FISCAL
ACCOUNT INFORMATION Y£»rt SUMHArtV IS OM
FOJ UIST"ICT MU<12> (>LAbtvA _Y FRf VALiu t DlfilT ACCJUMl tl UHBEBS. !
ACCOUNT • A mnmt TO ME OONE A C O U - H • *. nn«- TO a t DONE SCCO'JMT
4702(10350 in7b,3H
fc702M)330 1195.<i3
A7020037D 102b.*7
A7O20197O JO.60
*T020W.bO 2d3.93
470207*50 &2.3T
470206050 221.OD
*7QZQ9UQ 2b&.*5
470209150 177.20
A70209170 9 5 . 0 *
A70204350 • * 0 . * 3
*70210020 •312 .31
A7D2103SO 195.33
A7029B8D1 2S.*o
k «ORK TO BE DONE ACCOUNT N I «0RK To BE DONE
E-15
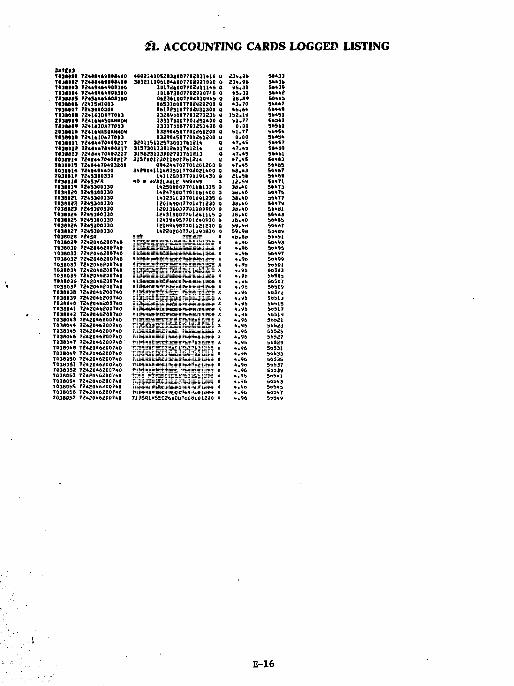
21. ACCOUNTING CARDS LOGGED LISTING
MTE03 TI38I01 T « j a i i 2 T I38 I83 rasaoo* T t M t a s T t3 i»e« TI3II0T TI38008 zasaao* rnui* 203111* T83B01* 703*111 7*38012 7*3*013 tasaiii 703*013 TQ3B016 Tasaai' Toiatia Tosatit T03B020 T038I21 T03B0Z2 7038123 T038D24 T038I25 TO38926 T038027 T«380ZS T0380Z9 T038030 TD3B031 T03B032 T03B033 T03BD3* T03B035 T03B035 T03B037 T03B03B T038039 70380*0 T03B0*1 T0380*2 70380*3 7038044 7038045 7038046 TQ3B047 7038048 T03B049 703BOSO T036051 7038052 T038053 TO 3605* T038Q5S TO3B056 7038057
T24ia*6«aeaM0 7 2 * * a * * 9 B * s * i o 724494*4*00300 72*49***901300 7 2 * M * * 6 * 0 * 3 I 0 7Z415HI003 7243000300 7Z4161D477003 72416*4 SQlMMOit 72*1*10*7 70 03 T2*UN»Sa»HW« 7241*10477*03 7Z404470480Z17 72404478400217 724044704*0217 72404470400217 72*04*70*03200 72*0*0**00 724S300330 72433f5 72*5300130 72*5300330 72*5300330 72*5300330 7245309330 72*5300330 72*5310330 72*5300330 7245300330 724 SB 72420*02007*0 72*20**2007*0 72420*0200740 72420*0200740 72420*6200740 7242046200740 7242046200740 72*20462007*0 72*2046200740 72*20*6200740 72420*6200740 72*20*62007*0 72*20*62007*0 72*2046200740 72*20462007*0 72*20*62007*0 • 72*20462007*0 72420*62007*0 72*20*62007*0 72*20*62007*0 72*20462007*0 72*20*62007*0 72*20*62007*0 72420*6200?40 72420<.b2007*0 72420*62007*0 72420*62007*0 72*ZO*b2007aQ 72*20*6200740
4002141052838007702031410 < 383211106104*007702021000 (
lD17Z»0*770ZuU145 ( 1016730077020)07'0 < 0*23*100770*010945 ( 1*5310007702021200 C 061723107702031300 ( 132690007701271230 4 133170007701251*00 C 133170007701251400 ( 132904507701261200 < 132904507701261200 t
3201151125730017(>1Z14 C 315730113012*017*121* ii 315623133002701761213 t 315700U3D116.017M214 G
0942*4707701201200 0 34290*111*835017704021400 C
141125007701191*30 i 4)0 * *V*llt»lE 999999 J
1*2509007701181315 a 142475001701181*00 Q l*l23!iE!0770U9t235 0 lZ01b90a770U7l230 0 12013500770*11)0900 0 12*3190077U12*IH5 Q 1241949577012*0930 U 121B9*9B770U21230 3 l422020077i>W9D819 r,
77M07 X 7135*lESEC?*DDC7bOS121200 * T135aieSEC3*«OD7bO«0*12bO x T13SMESEC35DCr>7b080*12Q0 * T13S*HSEC16DCC76Q»051200 * ri3S«J«SEC23SCS760«U5]£09 A T13S»l*SECl7CflB761UB]20n A T13$ftlE5EC2bPDD7b09l61200 X tl3SRlESEC26CCC760aoM200 * T13SPl£SECi«C«&7bQ81212O0 * TI3S»USEC*0CC 760(1131200 X T13$nieSEC23D4t)7b0fli21200 * T13SR2-5EC32CC»7b08161200 X T13SR2H5EC3bO0D7bO»1312O0 x Tl3SR2*SEC3boaB7b08lM200 X T13SR2«S£C33n0C7608lbI200 X T13SRl«5EC3SD0b7b0SO51200 x 713SBl«SEC7>AO 7bOH0bl2O0 X T13SRl«SEC19ACD7b09151200 X T13SRlEbEC230ilB7bu7i3i2D0 A Tl3SRlESEC20ACA7b071.11cO0 X T13S»l€SECl*UC87bOTl£l200 X T13SBlESEC23CBC7t>07121200 X 7l3SRlESECl7dBB7bQ7l£1200 X T13St)laSeC9UaC 760bll2120Q X T1*S H3llSEClODA7blOQbl2O0 * 713SR3KSeC310Ci'7alOObl20D X T13SRt»SEC35SSC7tf|T^7li;oo X T13S«*l'»SEC17OCC7b07jol2OU X Tl3SRli>SEC2blDU7oUUl0l2<10 X
455
23* .3b 5*433 234.96 54*34
95 .31 5*439 95 .31 5*442 38.89 5*44^ 43.70 54447 46.64 5*449
152.19 5*451 i l l . 77 5*5*1
0.00 565*1 51.77 5*454
0.00 5*454 * 7 . »S 5*457 4 7 . *3 5**59 47.45 5***1 47 .45 54*63 *7 .45 56*65 58.4 J 56*67 2 1 . 5 * 5*469 12.59 50471 38.40 5**73 36.40 5*475 38.40 5*477 38.40 56479 38.40 56*81 3B.40 5**HJ 4B**0 5**85 59.9« S***7 59.9D 5D4UV *b .8« 5b*i . l
».Vb Sb*93 * . 9 b 5b*9S * . 9 b 5b«97 4 .9b 5b*99 4.9sr Se50t -.9(1 St»503 ».9t> 56503 ••.9b 5650 7 • .96 5650& * . 9 b boSli * . 9 b 5bbU * . 4 b bbt>15 4.9b 56517 * . 9 b 56519 4 .96 56921 * . 9 6 56523 * . 9 b 56525 * , 9 6 5*527 * . 9 b 56529 * . 9 b 50531 * . 9 b 56533 • .96 S6535 * . 9 b 56537 4 .96 S»539 * . 9 b 5o5»l * , 9 6 563*3 *.<*o 5ob*3 4.9b 5ba*T ».9b 5bS*<#
E-16
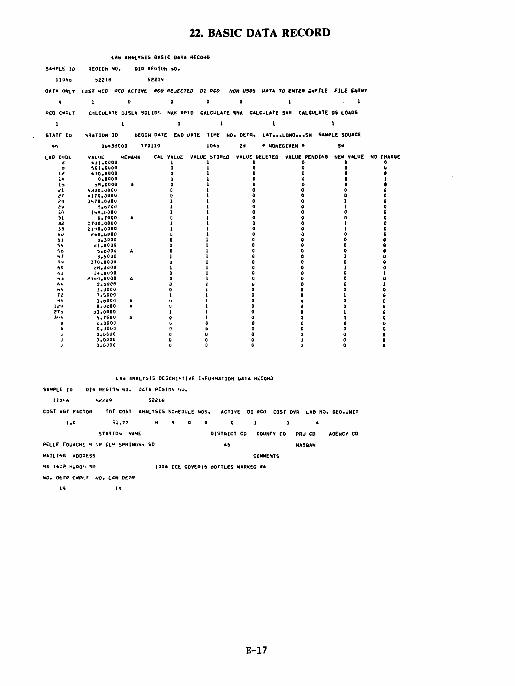
22. BASIC DATA RECORD
L*b ANALVSI5 6*S]C DATA RECORD
REGION MO. DIR REGION NO.
S221B 5221S
LAST aCO HCO ACTIVE fiCO REJECTED 01 OCO
1 0 0 0
NON USCS DATA TO ENTER CVFlLE FILE ENTRy
CALCULATE OISLV SOLIDS NAK RP1D CALCULATE *NA CALCULATE SAR CALCULATE OS LOADS
I O i l 1
SAMPLE SOURCE STATION 10
06*30000
BEGIN DATE
T70110
•bOUQbOO
°s::;s siiiHS
0.TO0O lrao.oooo 2 1 ' J O . O O O O
CAL VALUE VALUE
[ME NO. DETfl,
0*S 24
STORtO
..LONG..
29 • NONEGIVEN • S*
ALUE DELETED VALUE PENDING NEH VALUE 0 0 1
LAd ANALYSIS 0E5CRIMWE INFORMATION DATA RECORD
SAMPLE ID DI« REIilOl* NO. OATA PEGION UU,
lt«'ft S22t"» 52216
COST WGT FACTOR TOT COST ANALYSIS 5CHEDULE NOS. ACTIVE 01 BCD COST OVR LAB NO. GEO.UNIT
1.0 TI.TT « O 0 0 0 1 0 *
STATION *A«E DISThlCT CD COUNT* CO PHJ CD AGENCY CO
PELLE FOUHCHE » NR EL" SPRINGS. SD *b NASOAN
MAILING ADDRESS COMMENTS
RX 1*12 HURON *D 100« ICE COVER 16 dOTTLES HARKED •%
NO. QETR C«W.I M O . L*(* OcTfi
1<» 19
E-17
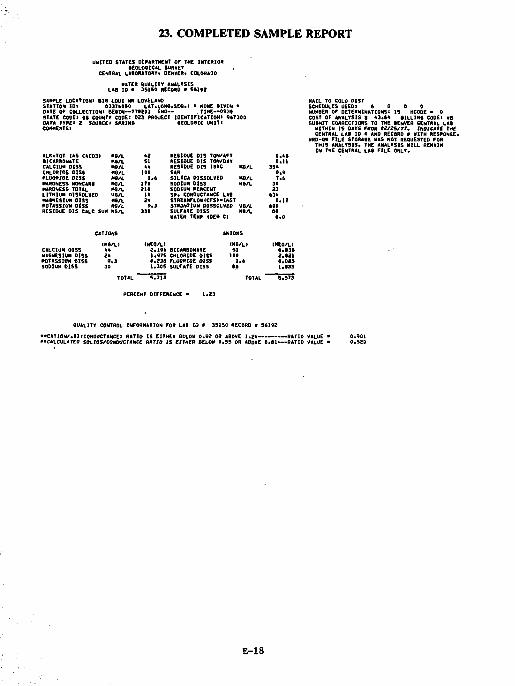
23. COMPLETED SAMPLE REPORT
UNtTEO STATES DEPARTMENT OF THE INTERIOR GEOLOGICAL SUAMET
CENTRAL LABORATORY* OENVEftf COLORADO
SAMPLE LOCATIONi BIG LOUI NR LOVELAW) STATION ID i 0337*050 LAT.LONB.SEQ.I • NONE fttVEN • OATE OF COLLECT I ON l 6EBIN--7TI201 END— . TIME—0930 STATE C00E1 « • COUNTY COOE: 023 PROJECT IDENTIFICATION! 96T300 OAT* 7YP£i a SOURCE1 S M I N 6 GEOLOBIC UNITi COMMENTS!
ALKtTOT IAS CAC03I BICARBONATE CALCIUM DISS CHLORIOE OISS FLUORIOE OISS HARDNESS NONCARB HARDNESS TOTAL LITHIUM O1SS0LVED MABNCSIUM DISS POTASSIUM OISS RESIDUE OIS CALC SUM
N8/L M8/L M6/L MG/L MO/L MO/L HB/L UO/L MO/L m/t MO/L
RESIDUE DIS TON/AFT O.AB RESIDUE OIS TON/DAY 0 4 ) 1 RESIDUE OIS IBOC MB/L 35* SAR 0 .9 SILICA DISSOLVED MS/L T.b SODIUM DISS MB/L 90 SODIUM PERCENT 23 SP. CONDUCTANCE LAB * 3 * STflEAMFLOH<CF5>-tNST 0*12 STRONTIUM DISSOLVED UO/L too SULFATE DISS M«/L as HATER TEMP (DEB C) • .0
MAIL TO COLO OIST SCHEDULES USEOi 6 0 0 0 NUMBER OF DETERMINATIONS* IS HCODE - 0 COST OF ANALYSIS S *3.** BILLINB CODEi RB SUBMIT CORRECTIONS TO THE BENVER CENTRAL LAB
KITHIN IS OIYS FROM 02/25/77. INDICATE THE CENTRAL LAB ID « AND RECORD » MITH RESPONSE*
MRD-BH FILE STORASE MAS NOT REQUESTEO FOR THIS ANALYSIS. THE ANALTS1S MILL REMAIN IN THE CENTRAL LAB FILE ONLY.
CALCIUM DISS MAGNESIUM OISS POTASSIUM OISS SODIUM OISS
(HEO/LI 2.lOfe BICARBONATE ..975 CHLORIDE DISS 0.23S FLUORIDE DISS 1.30S SULFATE DI5S 5.713
(MEO/L) 0.B3B 2 .B21 0 . 0 B 5 1.B33
STSTS
PERCENT DIFFERENCE •
QUALITY CONTROL INFORMATION FOR LAB 10 • 3S150 RECORD C 56192
E-18
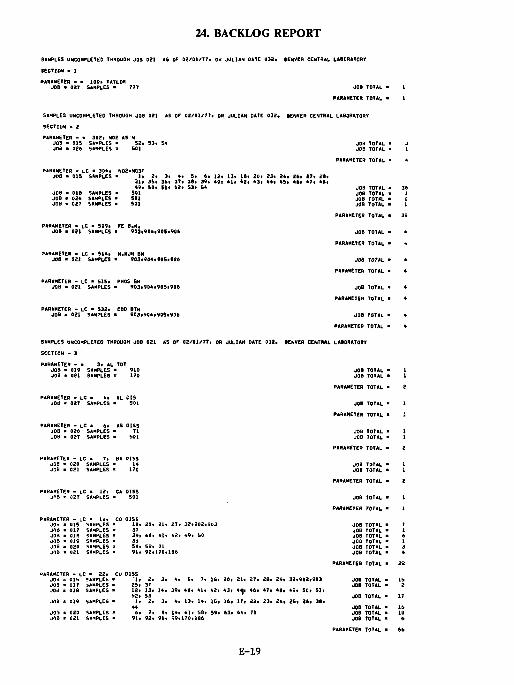
24. BACKLOG REPORT SAMPLES UNCOMPLETED THROUGH JOB 021 AS OF 02/01/77* OR JULIAN OATE 033* DENVER CENTRAL LABORATORY
SECTION - ]
PARAMETER - * 100* TAYLOR JOB * 027 SAMPLES • T7T JOB TOTAL - 1
PARAMETER TOTAL • 1
SAMPLES UNCOMPLETED THROUGH JOB 021 AS OF 02/01/7T> OR JULIAN OATE 032. iENVER CENTRAL LABORATORY
SECTION - 2
PARAMETER - a 302. N02 AS N JOB > 015 SAMPLES • S2, 53, 5* JOB TOTAL • J JOB • 026 SAMPLES » 501 JOB TOTAL • 1
PARAMETER TOTAL • *
PARAMETER - LC • 304, N02*N03T JOB - 015 SAMPLES » It 2* 3« A* 5. 6* 12, 13* IB, 20* 23* 84i 26. 17* 2Bt
31* 35. 36. 37. 3B» 39* 40; 41. 42, 43* 44* AS. 4t* 47. 4«. 49. 50* 51* 62t 53* 54 JOB TOTAL - 36
JOB TOTAL • ] JOB TOTAL * I JOB TOTAL - 1
PARAMETER TOTAL • 39
JOB TOTAL • 4
PARAMETER TOTAL • *
JOB TOTAL • •
PARAMETER TOTAL • 4
JOB TOTAL • 4
PARAMETER TOTAL • 4
JOB TOTAL « •
PARAMETER TOTAL • 4
SA M P L E S UNCOMPLETED THROUGH JOB 0 2 1 AS OF 02/01/77, OR JULIAN OATE 033. IENVER CENTRAL LABORATORY
SECTION - 3
JOS JOB JOB
> 01B • 026 - 02T
SAMPLES SAMPLES SAMPLES "
501 501 SOI
PARAMETER - LC • 509. JOB - 021 SAMPLES
FE 8.M. 903, 904! I905I »9Q6
PARAMETER - LC - SI4* JOS - 021 SAMPLES
N* KJN Bh 963 «
1 «04*«l5i .906
PARAMETER - - 3* AL TDT JOB • 019 SAMPLES 910 JOB • 021 SAMPLES " 170
PARAMETER - LC - 4, AL CIS JOB « 027 SAMPLES " 501
PARAMETER - L C « 6, AS DISS JOB - 020 SAMPLES 71 JOB a 027 SAMPLES " 501
PARAMETER - LC - 7* SA 0IS5 JOB x 020 SAMPLES 14 J?B • 021 SAMPLES 170
PARAMETER - LC • 12, CA OISS jns * 02T SAMPLES * SOI
PARAMETER - LC • 10* CO OISS JOo • 015 SAMPLES IB. 20. 21* 27. 32, 902* 903 JOiJ • 017 SAMPLES 37 JOB • oia SAMPLES 39, 40, 41, 42, 49i < 50 JOS > 019 SAMPLES 30 JOB • 020 SAMPLES SB. 59, 71 joa • 021 SAMPLES • 91* 92. 170. 1B6
OAflAMETER - LC « 22. CU OISS JOb » 015 SAMPLES "1, 2* 3* 4* S, 7* IB, joa a 017 SAMPLES 25, 37 JOd • oia SAMPLES • 12.
52. 13. S3
14* 39* 40, 41* 42,
Jflb « 019 SAMPLES • 44
2. 3* 4, 13, 14, 15<
jo'i • 020 SAMPLES 7, S, 14. 4]p 58, 59i JOB c 021 SAMPLES • 91. 92, 9B, 99* 170, 186
PARAMETER TOTAL "
JOB TOTAL *
PARAMETER TOTAL '
PARAMETER TOTAL •
PARAMETER TOTAL >
JOB TOTAL •
PARAMETER TOTAL »
JOS TOTAL • T JOB TOTAL • 1 JOB TOTAL > 6 JOB TOTAL • 1 JOB TOTAL • 3 JOB TOTAL • 4
PARAMETER TOTAL • 22
20, 21* 27. 28, 29* 32*912.903 JOB TOTAL < JOB TOTAL •
43* 4«, 46* 47* 48, 49* 50. SI, JOB TOTAL •
IB* 17* 22* 23. 24* 25* 26* 36. JOB TOTAL '
63* 64* 71 JOB TOTAL ' JOB TOTAL •
PARAMETER TOTAL - 6»
E-19
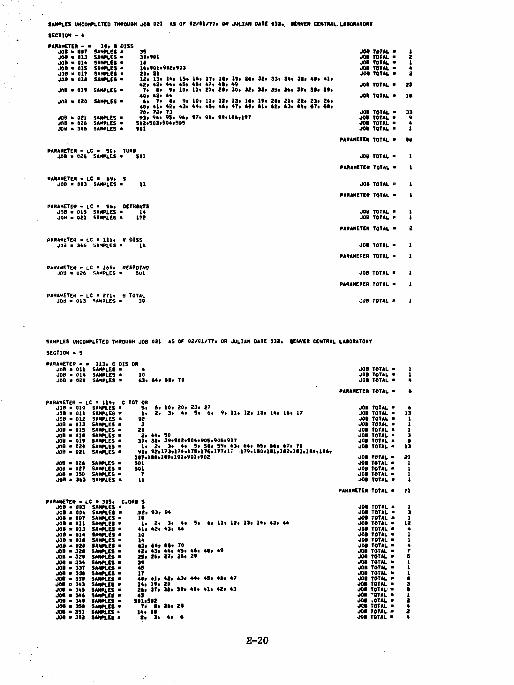
SANIES UNCOMPLETED THROUSH JOI 021 AS OF IZ/61/77* M JULIAN DATE 632. K N V » CENTRAL. UOOBATOM
JOI « BIT SAMPLES • JOI a 013 SAHPLCS • JOB * 014 SAMPLES • JOB « 015 SAMPLES • JOB a 017 SAMPLES • JOB * 01S SAMPLES • JOB s 019 SAMPLES •
JOS > 020 SAMPLES •
JOB « 021 SAMPLES • JOB « 026 SAMPLES • JOB « 3*6 SAMPLES •
39»*0t IB 16*901*902*903 20* 21 12* 13* 14* I S * 16* IT * IB* 19* 26* 3 2 . 42* 43* 44* 45* 46* 47* 4B* 49
7* B* 9* 10* II* 27* 2B» 30* 32* 33* 40* 43* 44
6* 7* «* 9* 10* 1 1 * 1Z* 13* IB* 19* 40* 4 1 * 42* 43* 44* 45* 46* * T * 6 1 * 6 1 * 70* 72* 73 93* 94* 95. 9b* 97* 96* 99*166*197
592*503*504.505 901
33* 34* 3 * . 46* 4 1 *
39. 36* 37. 3B* 39*
JOB TOTAL JOB TOTAL JOB TOTAL JOB TOTAL JOB TOTAL
JOB TOTAL
JOB TOTAL
JOB TOTAL JOB TOTAL JOB TOTAL JOB TOTAL
PARAMETER TOTAL
PARAMETER - lC • 96* OCTRBNTS JOB » 015 SAMPLES > 14 JOB M 021 SAMPLES > 1T2
JOB TOTAL
PARAMETER TOTAL
JOB TOTAL
PARAMETER TOTAL
PARAMETER TOTAL
JOB TOTAL
PARAMETER TOTAL
JOB TOTAL
PARAMETER TOTAL
SAMPLES UNCOMPLETED THROUGH JOB 021 AS OF 02 /01 /77* OR JULIAN DATE 032. IENVER CENTRAL LABORATORY
PARAMETER • > 113* C DIS Off JOB » O i l SAMPLES • 4 JOB * 014 SAMPLES • 10 JOB * O20 SAMPLES - 63* 44* 4B* TO
PARAMETER - LC • 114* JOB • 010 SAMPLES • JOB > O i l SAMPLES * JOB a 012 SAMPLES • JOB • 013 SAMPLES • JOB - 015 SAMPLES « JOB - 01S SAMPLES • JOB > 019 SAMPLES • JOB B 021 SAMPLES • JOB B 0Z1 SAMPLES •
JOB B 026 SAMPLES • JOS a 027 SAMPLES a JOB a 350 SAMPLES a JOB a 3*3 SAMPLES •
PARAMETER - LC * 305. JOB a 003 SAMPLES • JOB a 004 SAMPLES • JOB a 007 SAMPLES • JOB a t i l SAMPLES • JOB a 013 SAMPLES • JOB a 014 SAMPLES • JOB a 416 SAMPLES • JOB a 621 SAMPLES • JOB > 326 SAMPLES • JOB a 329 SAMPLES • JOB * 334 SAMPLES • JOB a 337 SAMPLES • JOB a 338 SAMPLES • JOB • 33* SAMPLES • JOB B 343 SAMPLES • JOB a 349 SAMPLES • JOB a 346 SAMPLES • JOB a 3*9 SAMPLES • JOS a 356 SAMPLES • JOB a 331 SAMPLES * JOB • 352 SAMPLES •
6* 10* 20. 23* 27 9* 1 1 * 12 . 13* 14* 16* 17
20 2* 44* SO
37* 3B* 39*902*904*905*906*907 1 * 2 . 3* 4* 5* SB* 5 9 . 63* 64* 65* 66* 67* 71
9 1 * 9 2 . 1 7 3 * 1 7 4 * 1 7 5 . 1 7 4 . 1 7 7 . I I 179*1B0*1B1*162*1B3*1S4*166» 1S7*1BS*169*1«1*901*902 501 501
6* 11* 12* 13* 14* 43* •
63* 64* 46* TO 42* 43* 44* 4S* 46* 4B* 49 2 5 . 26* 27* 2 1 * 29
* • • 4 2 * 42 * 43* 44* 45* 46* 47 14* 19* 20 26* 3 7 . 3B* 3 t . 40* 4 1 * 42* 43
511 .S I2 7 . B* 96* ZB
14* ia
JOB TOTAL JOB TOTAL JOB TOTAL
PARAMETER TOTAL
JOB TOTAL JOB TOTAL JOB TOTAL JOB TOTAL JOB TOTAL JOB TOTAL JOB TOTAL JOB TOTAL
JOB TOTAL JOB TOTAL JOB TOTAL JOB TOTAL JOB TOTAL
PARAMETER TOTAL
JOB TOTAL JOB TOTAL JOB TOTAL JOB TOTAL JOB TOTAL JOB TOTAL JOB TOTAL JOB TOTAL JOB TOTAL JOB TOTAL JOB TOTAL JOB TOTAL JOB TOTAL JOB TOTAL JOB TOTAL JOB TOTAL JOB TOTAL JOB .OTAL JOB TOTAL JOB TOTAL JOB TOTAL
E-20
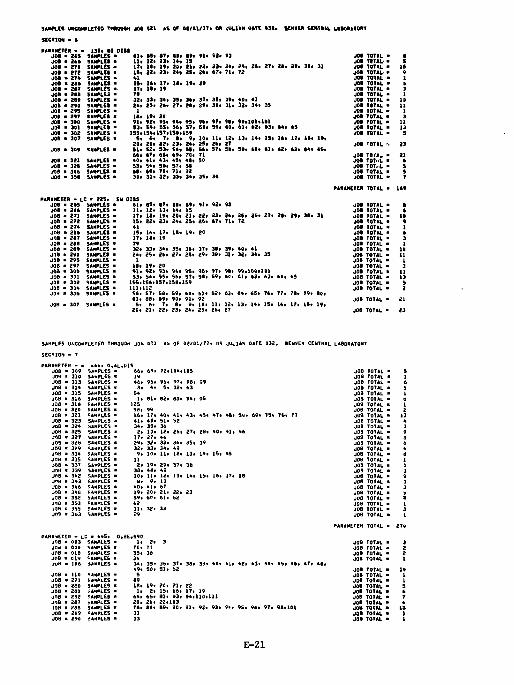
SAMPLES UMCQMPlETCO THRQWH JO* 021 AS OF 02/41/7T* « JULIAN Q « E 131. tEtlVCft CEH1KAL LllWATWlT SECTION - * PARAMETER - • JOB • 265 JOB. • 266 JOI • 271 JOB • 272 JO* • 27* JOi * 2IA JOB • 217 JOB • 2BB JOB * 20* JOB • 290 JOB • 295 JOB • 2»T JOB • 310 JOB • 301 JOS - 302 JOB a 307
139* BI [ SAMPLES • SAMPLES a SAMPLES -SAMPLES > SAMPLES > SAMPLES > SAMPLES • SAMPLE3 -SAMPLES a SAMPLES -SAMPLES > SAMPLES > SAMPLES a SAMPLES > SAMPLES • SAMPLES a
JOB a 30* SAMPLES •
JOB a 321 JOB > 32« JOB a 346 JOB • 3SI
SAMPLES * SAMPLES i SAMPLES • SAMPLES •
. BSt BT* SB* • • * * 1 * 92* 93 i 12* 13* 14* IS i IB* 1 * . 20 * 2 1 * 22* 22 * 24* 25 . 2«* 27* 2 1 * i 22* 23* 24* 25* 24* 67* 7 1 * 72
9 1 * 92* 93* 94* «S* 9 S3* 54* 55* 5 6 . 57* S
155*156*157*151.15* 5* 4* 7* • » 9* 10* 1 1 * 12*
20* 2 1 * 22* 23* 24* 25* 24* 27 5 1 * 52* 5 3 . 54* 59* 5 * . 57* SB* 66* 6 7 . 6B* 69* 70* 71 * 0 * 4 1 . 43* 45* 4B* 90 53* «.*• 56* 57* 5S 6B< • * » 70* 7 1 * 72 30* 3 1 * 32* 33* 34* 35 . 36
1 3 . 14* 15. 16 . 17* IB* 1 * .
5** 60* 6 1 . 4 2 . 43* 64* 65*
JOB TOTAL a • JOB TOTAL- a 5 JOB TOTAL > 15 JOB TOTAL' a 9 JOB TOTAL a ] JOB TOTAL a 6 JOB TOTAL a 3 JOB TOTAL > 1 JOB TOTAL a IB JOB TOTAL a U JOB TOTAL • I JOB TOTAL a J JOB TOTAL a U JOB TOTAL a 13 JOB TOTAL a 5
JOB TOTAL '- 23
JOB TCl'A. a 21 JOS TOTi>L a 6 JOB TOT.L a 5 JOB TOTAL a 5 JOB TOTAL • 7
PARAMETER TOTAL » 169
> B5» 07* BI. 99. 91* 92* 93 JOS • 266 SAMPLES • 11. 12. 13. 14* 15 JOS a 271 SAMPLES 17. IS* 19* 20* 21. 22i JOB a 272 SAMPLES 15. 22* 23. 24* 25. 26. JOB a 27* SAMPLES 41 JOB > 206 SAMPLES 15* 16* IT. IB. 19* 20 JOB • 2S7 SAMPLES 17. 1«* 19 JOB • 2SB SAMPLES 7* JOB > 289 SAMPLES 32* 33* 34. 35. 34. 37. JOB • 290 5AMPLES 24* 29* 26* 27* 29* 291 JOB • 295 SAMPLES I JOB • 297 SAMPLES IB* 19. 2D JOS a 300 SAMPLES 91. 92. lit 94* 95. 96i JOB • 301 SAMPLES S3. 5*. 55* 56. 57. 56i JOB a 302 SAMPLES 155. 156. 157* 158. 159 JOB • 304 SAMPLES Hit 112 JOB a 306 SAMPLE5 • 56> 57. 58* 59. 60. «!•
, 26. 27* 2t* 29* 31* 31
36. 39. 40* 41 30* 31. 32* 34* 35
97. 99* 99*100.101 59. 60. 61. 62. 63* 6*. 65
• 307 SAMPLES • 81. 80. B9* 90* 91. 92 62* 63* 64. 65. 74* 77* 70. 79. 80*
20. 21. 22* 23* 24* 29* 26* 27 10. 11* 12* 13. 1*. 15. 16* 17. IB* 19*
JOB TOTAL • JOB TOTAL • JOB TOTAL • JOB TOTAL < JOB TOTAL • JOB TOTAL • JOB TOTAL • JOB TOTAL • JOB TOTAL • JOB TOTAL • JOB TOTAL • JOB TOTAL • JOB TOTAL • JOB TOTAL • JOI TOTAL • JOB TOTAL • JOB TOTAL • JOB TOTAL •
SAMPLES UNCOMPLETED THROUGH JOB Q?l AS OF 02/01/77. 0« JULIAN DATE 032. BENVER CENTRAL LABORATORY
PARAMETER - - ***» G.AL' • 01S JOB 309 SAMPLES > 6ft. 68* 10*. 105 JOB 310 SAMPLES > 19 JOB 313 SAMPLES • *6. 95. 9b. 97. 98* 99 JOB 314 SAMPLES • 3. *. 5. 32* 63 JOS 315 SAMPLES > 5* JDS 316 SAMPLES « 81. 83* 9*. 95 J3d 318 SAMPLES • JOb 320 SAMPLES • 99 JOB 321 CAMPLES • 17* *Q* 41. *3« *5» *T. *fti JOB 323 SAMPLES > *fl. 51* 52 JOB 32* SAMPLES * 35. 36 JOB 325 SAMPLES • 10. 12. 2bt 27. 28* *0» 411 JOB 327 SAMPLES * 27. •6 JOB 32b SAMPLES • 32* 33. 3*. 35. 39 JOB 329 SAMPLES • 33* 3*. *9 JOB 33* SAMPLES • 10* 11. 12. 13* 1*. 15* *5 JOd 335 SAMPLES • a JOB 331 SAMPLES » 2* 19* 20. 37. 3fi JOH 339 SAMPLES > 38. *8» *9 Jf»B 3*2 SAMPLES • 10. 11. 12* 13. 1*. 15. 16* 17. J"B 3*3 SAMPLES - 8* 9. 10 JOB 346 SAMPLES * 40. * ] • 67 JOB 3*8 SAMPLES a 19. 20. 21. 22. 23 JOB 352 SAMPLES > 59. 60. 61. 62 jia 353 SAMPLES * 62 JOB 355 SAMPLES » 31. 32* 3i JOB * 3t>3 SAMPLES • 29
PARAMETER - LC • 4*5. G, .BE.S90 jia 003 SAMPLES > It 2. 3 jno 00* SAMPLES s TO. 71 JOB 01B SAMPLES • 35. 3b JOB 019 SAMPLES a 3* Jttfl " 106 SAMPLES a 3*. 351
50. IV. 37. 52 38. 39. *0. *li
JOB 110 SAMPLES • JOB 271 SAMPLES • JOS 260 SAMPLES a 19. 20. 21. 22 JOB 281 SAMPLES a 2. 15. 16. 17. 19 JOB 282 SAMPLES a 65. BI. 93. 9*. 110. 111 JOB 287 SAMPLES > 21. 22. 103 JOB 288 SAMPLES a BO. B9. 90. 91. 92* 93. 9*. JOB 269 CAMPLES a 31 JOB • 290 SAMPLES a 33
5«» 60. 75* 76. 77
*2t *3. 44* 45* 46. *7. *B*
95* 96* 97. 91.101
JOB TOTAL a 5 JOB TOTAL a 1 JOB TOTAL • 6 JOB TOTAL a 5 JOB TOTAL a 1 JOB TOTAL a 6 J08 TOTAL a 1 JOB TOTAL a 2 JOS TOTAL • 13 JOB TOTAL a 4 JOB TOTAL a 3 JOB TOTAL a 9 JOB TOTAL • 3 JOB TOTAL a 6 JOB TOTAL a s JOB TOTAL a d JOB TOTAL > 1 JOB TOTAL • 5 JOB TOTAL a 3 JOB TOTAL a 9 JOB TOTAL a 3 JOB TOTAL a 3 JOB TOTAL a > JOB TOTAL a % JOS TOTAL a 1 JOB TOTAL a 3 JOB TOTAL a 1
PARAMETER TOTAL • 270
JOB TOTAL • JOB TOTAL • JOB TOTAL • JOB TOTAL • JOB TOTAL • JOB TOTAL • JO* TOTAL • JOB TOTAL • JOB TOTAL • JOB TOTAL • JOB TOTAL • JOB TOTAL a JOB TOTAL • JOB TOTAL •
E-21
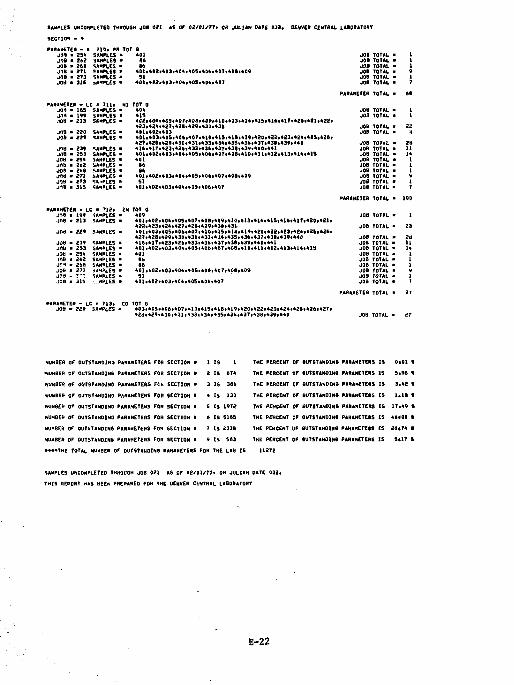
SA-PLES UNCOMPLETED THHOUGH JOB 021 AS OF 02 /01 /77* OR JULIAN PATE 03». DENVER CENTRAL LABORATORY
SECTION - 9
PARAMETER - • TIQ* PB TOT G JOB a 25* SAMPLES • 401 JOB > 262 SAMPLES • 86 JOB * 26B SAMPLES • S6 J(1B • 2T1 SAMPLES * 401.412*403*404.405*4Q6**QT.40»»409 JOB • 273 SAMPLES • SI JO* • 315 SAMPLES • 401«*»2»403»40*»405»*06»407
PARAMETER - LC « 7 1 1 , J0» - 185 SAMPLES J.1rt a 199 SAMPLES JOB > 213 5AMPLES
JIB • 239 SAMPLES JOB a 253 SAMPLES JOB a 25* SAMPLES JOB > 2o2 SAMPLES JOB > 2AB SAMPLES JIM m 271 SAMPLES JOB a 273 SABLES J1« a 315 SAMPLES
NI TOT 0 i 404 > *1S
402*4a4,4C5**07*408*40»»41p,4]3*414*415t416*41T*42B.4t l *4Z2« 423*424,427,428*429,430*431 401,402*403 4D1,403*405,404,407,410.415.4 l l»419»420»*Z2.423»424,415*426* 42?,42ft ,429,*30*«31*433,434*435»43b*43r.*3B*439«4«a 4l<t*41T,423,42ft,433*43a,437>43B»43«t440,441 401.402**»3*404»*05*406.407»*QB»*10*411,412,413,414,415 401
• 6 • 6
•01*402i403,404*405*404*407,40B,409
401*402*403*404*435*406*407
PARAMETER - LC - T12* IH TOT 0 199 •SAMPLES » 409 213 SAMPLES a 4 0 1 ,
422, 229 SAMPLES a 4 0 1 ,
427, 239 SAMPLES • 414, 253 SAMPLES • 4 0 1 , 254 SAMPLES • 401 262 SAMPLES a B6 2t>8 SAMPLES a 06 271 SAMPLES " 4 0 1 ,
SAMPLES > 51 314 -...HOLES • 4 0 1 .
i402*404,405*407*408*409*410,413*414«415,41B*41T,420*421, i423.424»427*428*429»43l»431 i403,40S.406*407,410,415*41**419,420,422,423»424**2B,42t» i*28,429*430**31*433*4J4*435*43**437<43B,439*440 i *17,423,42b,*33*436*497*43B,439i440<*41 ,402.403,404,405,40b,4D7*40B*4lO*411,412,413*414*41*
.402*403,404,405*406*407,400,409
>402*403*40**405»40bt*07
PARAMETER - LC • 713* CD TOT G JOB > 229 SAMPLES * 403,4O5»*O6**O7**lQ,415t4lB,419»42O*422*423*424*«2B*426,42T*
428* *29 ,430 .431 , t33 ,434 ,435 ,436*437 ,438 ,439*440
JOB TOTAL • 1 JOB TOTAL • 1 JOB TOTAL a 1 JOB TOTAL a 9 JOB TOTAL a 1 JOB TOTAL a T
PARAMETER TOTAL a El
JOB TOTAL « 2» JOB TOTAL a 11 JOB TOTAL a 1 * JOB TOTAL • I JOB TOTAL • I JOB TOTAL a I JOB TOTAL - V JOB TOTAL > i JOB TOTAL a 1
PARAMETER TOTAL • 100
JOB TOTAL •
JOB TOTAL •
JOB TOTAL • JOB TOTAL • JOB TOTAL • JOB TOTAL • JOB TOTAL • JOB TOTAL > JOB TOTAL • JOB TOTAL ' JOB TOTAL •
PARAMETER TOTAL '
JOB TOTAL a 27
NUMBER OF OUTSTANDING PARAMETERS FOR SECTION • 1 IS 1 THE PERCENT OF BUTSTANDlNB
•NUMBER OF OUTSTANDING PARAMETERS FOR SECTION • 2 IS 6T4 THE PERCENT OF BUTSTAHOINO
HUHB& OF OUTSTANDING PARAMETERS Ftih SECTION • 3 IS 386 THE PERCENT OF OUTSTANDING
NUMBER OF OUTSTANDING PARAMETERS FOR SECTION * 4 Is 133 THE PERCENT OF BUTSTANOlNB
NUMBER OF OUTSTANDING PARAMETERS FOR SECTION • S IS 1972 THE PERCENT OF 0UT5TAN0JND
NUMBER OF OUTSTANDING PARAMETERS FOR SECTION • 6 IS 5185 THE PERCENT OF GUTSTANOlNB
NUMBED OF OUTSTANDING PARAMETERS FOR SECTION > 7 15 2338 THE PERCENT OF OUTSTANDING
WM8ER OF OUTSTANDING PAHAHETERS FOR SECTION • 9 IS 583 THE PERCENT OF BUTSTANOlNB
11272
PARAMETERS IS 0<01 ft
PARAMETERS IS 5*98 *
PARAMETERS IS 3,42 «
PARAMETERS IS 1.1* f
PARAMETERS IS 17*49 ft
PARAMETERS IS 46400 ft
PARAHETEBS IS 20*74 B
PARAMETERS IS 5tlT ft
••••THE TOTAL NUMBER OF OUTSTANDING PARAMETERS FOR THE LAS IS
SAMPLES UNCOMPLETED THROUGH JOB 021 AS OF 02/01/77* OR JULIAN DATE 032.
THIS DEPORT HAS BEEN PREPARED FOR THE OENVER CENTRAL LABORATORT
E-22
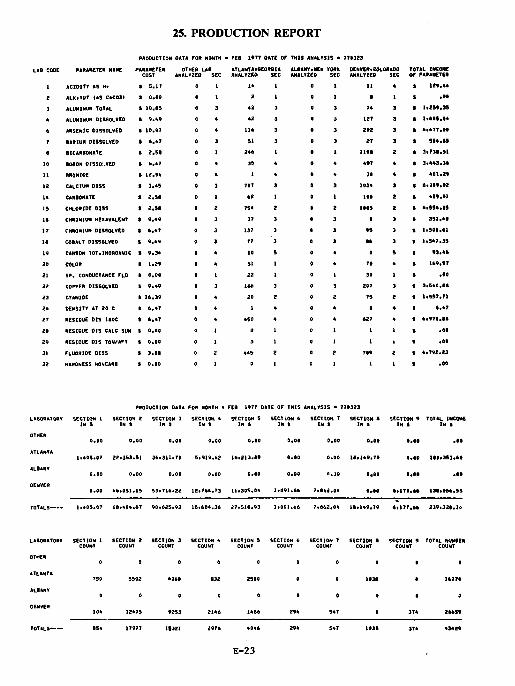
25. PRODUCTION REPORT
PRODUCTION OATA FOR HON TH - FEB 1 *77 DATE OF THIS ANALYSIS • T7B323
PARAMETER NAME PARAMETER COST
OTHER LAB ANALYZED S
ATLANTXtBEORQIA ALBANYiNEW TOR EC ANALYZED SEC ANALYZED SE
OENVERtCOLORADO ANALYZED SEC
TOTAL INCOME OF PARAMETER
ACIDITY A5 H* 5 5 . IT 0 14 11 S 129 .4*
ALK.TQT U S CAC03) 8 O.OB 0 1 2 8 S . # 1
ALUMINUM TOTAL S 10 . 85 0 3 42 74 B 1 i259 .35
ALUMINUM DISSOLVED 8 9 .49 0 • 42 12T 8 1*605 .8*
ARSENIC OISSOLVED 5 10.97 0 . 116 292 S * ( * T T . * B
BARIUM DISSOLVED I 6 .47 0 J 51 27 S 51*.BS
BICARBONATE B 2 .58 0 246 1198 8 3*738.51
BORON DISSOLVED B 6.47 0 » 35 4*7 8 3 * * 4 3 . 3 *
BROMIDE B 12.94 0 . 1 3B S 401.29
CALCIUM DISS B 3.45 0 » 70T 1034 8 6*009.»2
CARBONATE S 2 ,58 0 62 100 B 419.41
CHLORIDE D ISS S 2.5B 0 754 1005 B 4 .554 .05
CHROMIUM HEXAVALENT % 9 ,49 0 37 t B 351.48
CHROMIUM DISSOLVED % * . * 7 0 137 *s • 1.S01.B1
COBALT DISSOLVED % 9 .49 0 7T B6 B 1*5*7.35
CARBON TOT.INORGANIC B 9.34 0 10 a S 93 .46
COLOR B 1.29 0 61 TO 8 169.57
SR, CONDUCTANCE FLD B 0.00 a 22 30 8 .BO
COPPER DISSOLVED B 9.49 0 1*6 207 1 3 .540 .68
CYANIDE B 16.39 a 20 75 « 1*557.71
DENSITY AT 20 C B 6.47 a 1 0 1 6 .47
RESIDUE D I S 1B0C B 6.47 0 450 627 8 6 .970 .88
REStOUE OIS CALC SUM S 0.00 0 0 I S .00
REStOUE OIS TON/AFT B 0.00 0 3 1 8 .00
FLUORIDE D I 5 5 S 3.BB 0 < 445 2 0 2 7B9 2 8 4 .792 .23
HARDNESS NONCARB B o.oo 0 0 1 0 1 1 1 8 .00
OTHER
ATLANTA
ALBANY
DENVER
PRODUCTION DATA FOR MONTH - FEB I9T7 DATE OF THIS ANALYSIS > 77*323 IN 2 SECTION 3 SECTION 4 SECTION 5
t IN 8 IN 8 IN 5
0.00 O.OO 0.00 0.00 0,00
1.405.07 22*353.51 36.311.70 5.919.62 16.213.*9
0.00 0.00 0.00 0.00 O.OO
0.00 46.051.15 53*71* .22 12*7*4 .73 11.305.04 1.091.4b 7 .862.04 0*00 6 * 1 7 1 . 6 * 138*956.53
I .405.0T 68 .404 .67 90*025.93 l f l .6B4.36 27 .518 .93 1.091.66 7.862.04 IB .149 .79 6*177 .66 239.326.16
0.00 0.00 O.OB t . 0 6 .80
0.00 0.00 IB .149 ,79 0.00 18t.353.66
0.00 n , jo 0,00 • ••• . 86
OTHER
ATLANTA
ALBANY
DENVER
E-23
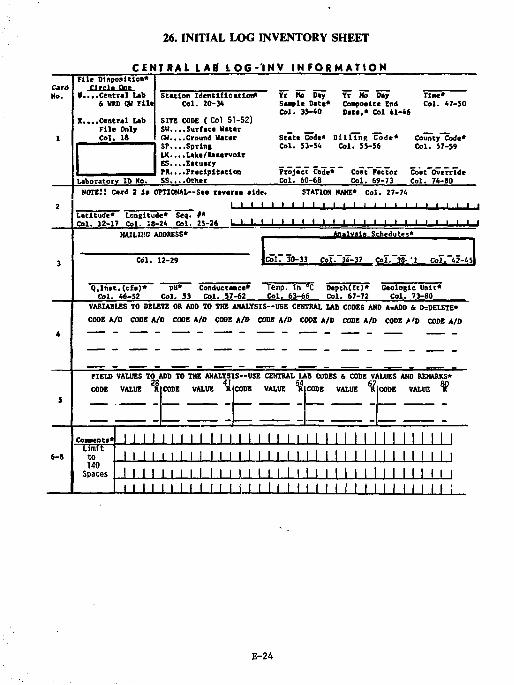
26. INITIAL LOG INVENTORY SHEET
CENTRAL LAB I Q G - ' I N V I N F O R M A T I O N File Disposition*
c i r c l e One K. . . .Central Lab
& URD QW F i l l
X.*. .Central Lab Fi le Only Col. U
Laboratory ID Mo.
Station Identi f icat ion* Col. 20-34
SITE CODE ( Col 51-52) SW....Surface Water GW....Ground Water SP....Spring LK....Lake/Reaervolr ES....Eatuery FR. . . .Prec ip i ta t ion S S . . . .Other
Yr Ho Day Yr Ho Day Tlae* Saaple Date* Composite End Col. 67-50 Col. 35-40 Date,* Col 41-46
State Code* B i l l i n g Code* Col. 53-54 Col. 55-56
Project Code* Col. 60-68
Cost Factor Col. 69-73
County Code* Col. 57-59
Cost Override Col. 74-80
NOTE.'.' Card 2 la OPTIOMAL—See reverae aide.
I I I I Latitude* Longitude* Seq. f* Col. 12-17 Col. 18-24 Col. 25-26 I I l . , l
STATION NAME* Col. 27-74 I l l i l l • • • i i • .
1 ' ' • ' ' I I I I I I I I I -L_l_ MAILING ADDRESS*
Col. 12-29
Analysis Schedules*
ColT 30-33 CoI.~34"-3? CoT.^S"-'! CoT. 42-45
Q,Inet . (cCs)* Col. 46-52
pH* Col. 53
Conductance* Col. 57-62
Temp. 1n °C Col. 63-66
Depth(ft)* Col. 67-72
Geologic Unit* Col. 73-80
VARUILES TO DELETE OR ADD TO THE ANALYSIS—USE CENTRAL LAB CODES AMD A*ADD & D=DELETE*
CODE A/D CODE A/D CODE A/D CODE A/D CODE A/D CODE A/D CODE A/D CODE a'D CODE A/D
FIELD VALUES TO ADD TO THE ANALYSIS—USE CENTRAL U S CODES & CODE VALUES AND REMARKS* 28 _ 4J 54 „ _ 67
R C
E-24
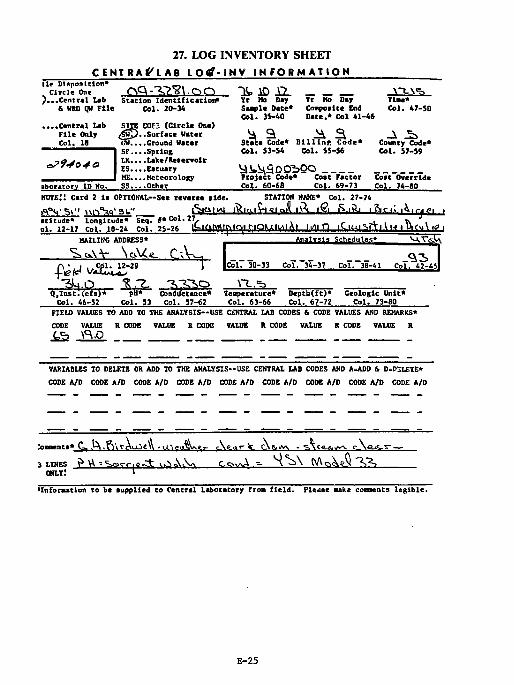
27. LOG INVENTORY SHEET C E N T R A f L A B t O t f - I N V I N F O R M A T I O N
l i e Disposit ion* _ ^ _ . . Circle On. < ^ Q - 7 s ? Y l C ^ O f...Central Lab Station Ident i f icat ion*
& WRD CM F i l e Col. 20-34
. . .Centra l Lab F i l e Only Col. 18
CS9404O
aboratorv ID No.
SITE
CM.. SP.. LK.. ES.. ME.. SS..
C0t~ (Circle On*) ..Surface Water , .Ground Water , .Spring . .Lake/Reaervolr , .Eatuary ..Meteorology ..Other
"it AD XL \~IV^ Yr Mo Day Yr Ho Day Tie** Saaple Date* Conpoalte End Col. 47-SO Col. 35-40 Date,* Col 41-46
Stat* Code* D l l l i n p . Code* County Code* Col. 53-54. Col. 5S-56 Col. 57-59
^li.HSDObQO Project Code* Coat Factor Coat Override Col. 60-6B Col. 69-73 Col. 74-80
NOTE!! Card 2 la OPTIONAL—See rcverae aide. STATION NAME* Col. 27-74 »^°M' 5 > - ' U I V M ' B U " ISK»I»VI foifn£ig|QiV l A i @ K.iftj i & n l i ^ r j f i , atitude* Longitude* Seq. #«Col .27 t. J
o l . 12-17 Col. 18-24 Col. 25-26 M t l t P l l p t ^ l f l Q m y H f t l M i l iQlWI ^ F ' > '•> • P " ^ >0 ' HAILING ADDRESS* Analysis Schedules* V-sT<sV\
^cvW W * . c-.V .
Q , I n s t . ( c f s ) * pH* Conductance*
Col. 30-33 Col. 34-37 Col. 3B-41 _^3 Col. 42-45
Col. S3 Col. 57-62 Tenperature*
Col. 63-66 Depth(ft)* Geologic Unit* Col. 67-72 Col. 73-80
FIELD VALUES TO ADD TO THE ANALYSIS—USE CENTRAL LAB CODES & CODE VALUES AND REMARKS* CODE VALUE R CODE VALUE R CODE VALUE R CODE VALUE R CODE VALUE R Ub \<\D
VARIABLES TO DELETE OR ADD TO THE ANALYSIS—USE CENTRAL LAB CODES AMD A=ADD & D=DSLETE* CODE A/D CODE A/D CODE A/D CODE A/D CODE A/D CODE A/D CODE A/D CODE A/D CODE A/D
3 LINES ft VV -S>o»c- < - | e .3 : tv.'NAXs C o ^ . -V
'Information to be aupplied to Central Laboratory from f i e l d . Pleaae u k e contents l e g i b l e .
E-25
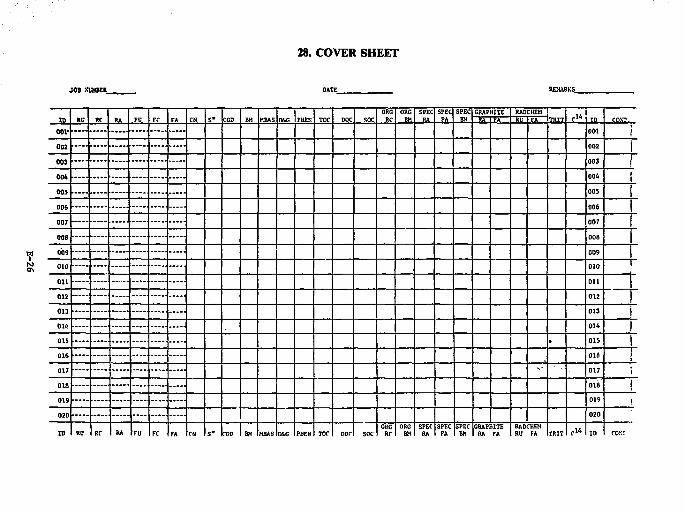
28. COVER SHEET
RI; RC RA FB FC FA rN S" COD BH HRAS C*G EHEN TOC DOC soc ORG
RC ORG SPEC
RA SPEC
f* SPEC
JH GRAPHITE RADCHEH
TWF C 1 4 ID ID RI; RC RA FB FC FA rN S" COD BH HRAS C*G EHEN TOC DOC soc ORG
RC ORG SPEC
RA SPEC
f* SPEC
JH '"RA - FA W FA TWF C 1 4 ID COST.
001- 001 t
i 002 002 1 003 003 1 004 004
005 005
006 006 006 006
007 007 007 007
008 008 008 008
009 009 009 009
010 010 010 010
Oil Oil Oil Oil
012 012 012 012
013 013 013 013
014 014 014 014
015 » 015 015 » 015
016 016 } 016 016 1
017 ^> 017 J
017 ^> 017 1
018 018 1 018 018 1
019 019 019 019
' 020 020 020 020
ID RU RC L F„ FC FA CN S=* :OD m NBAS DM; PHEN ror Dor soc ORG
Rr ORG
BH SPEC
RA SPEC
FA SPEC
BH GRAPHITE
RA FA RADCHEH RU FA TRIT c 1 4 ID cos:
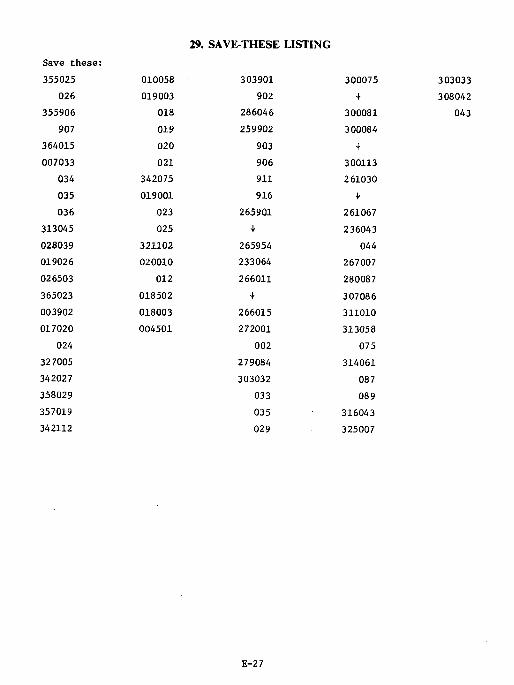
Save these: 355025
026 355906
907 364015 007033
034 035 036
313045 028039 019026 026503 365023 003902 017020
024 327005 342027 358029 357019 342112
010058 019003
018 019 020 021
342075 019001
023 025
321102 020010
012 018502 018003 004501
». SAVE-THESE
303901 902
286046 259902
903 906 911 916
265901 +
265954 233064 266011
+ 266015 272001
002 279084 303032
033 035 029
300075 +
300081 300084
+ 300113 261030
+ 261067 236043
044 267007 280087 307086 311010 313058
075 314061
087 089
316043 325007
303033
308042
043
E-27
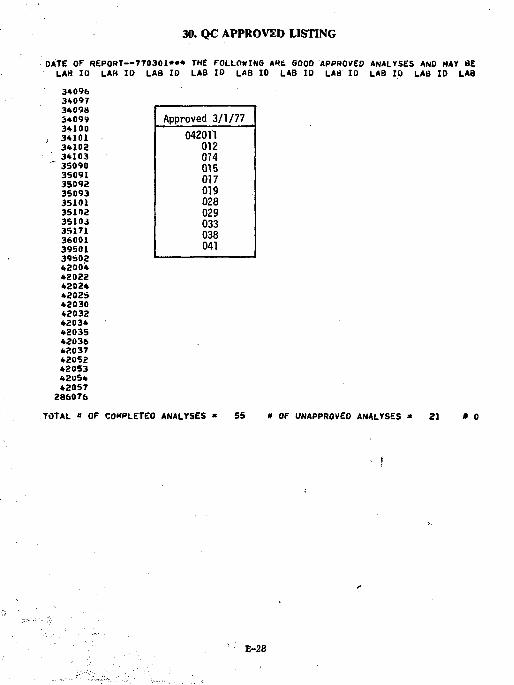
30. QC APPROVED LISTING
DATE OF REPOFJT--77030I"* THE FOLLOWING A«£ SOOO APPROVED ANALYSES AND MAY BE LAB 10 LAFt ID LAB ID LAB ID LAB ID LAB ID LAB ID LAB 10 LAB ID LAB 34096 34097 3409B 34099 Approved 3/1/77 34100 34101 042011 34102 012 34103 014 35090 015 35091 35092 017 35093 019 35101 028 35102 029 35103 033 35171 038 36001 038 39501 041 39502 42004 42022 42024 42025 42030 42032 42034 42035 42036 42037 42052 42053 42054 42057
TOTAL « OF C0MPLETE0 ANALYSES * 55 * OF UNAPPROVED ANALYSES 21 » 0
E-28
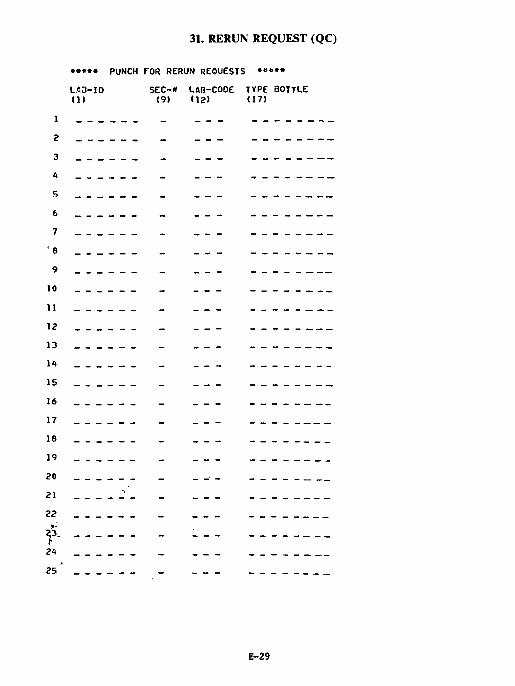
31. RERUN REQUEST (QC)
• • * • • PUNCH FOR RERUN REQUESTS • • • • •
LAD-ID SEC-* LAB-CODE TVPE BOTTLE I I ) (9) (12) (17)
1
2
3
4
5
6
7
' 8
9
10
11
12
13
U
15
16
17
18
19
20
21
22
f 24 25 '
E-29
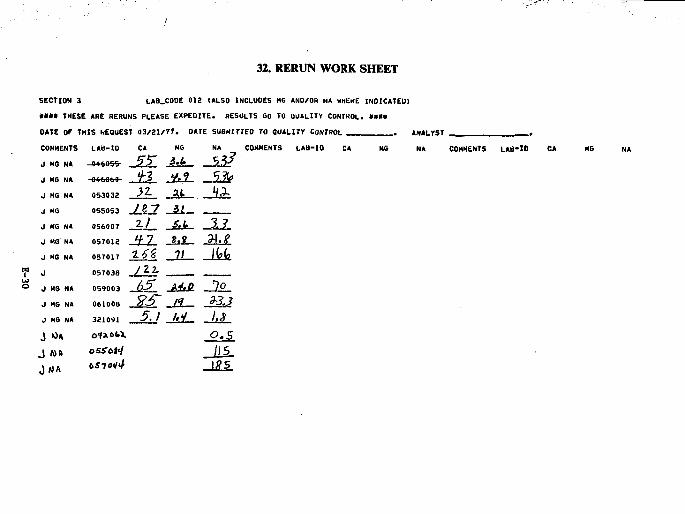
32. RERUN WORK SHEET
SECTION 3 LAB.CODE 012 (ALSO INCLUDES HO AND/OR NA MHEHE INDICATED) *»»• THESE ARE RERUNS PLEASE EXPEDITE. RESULTS GO TO QUALITY CONTROL. »»»« DATE OF THIS KEOUEST 03/21/77. DATE SUBMITTEO TO aUALITV CONTROL . ANALYST
LAB-ID CA MS NA COMMENTS LAB- IO CA MG NA COMMENTS
J M6 NA - 0 * * » S 5 - 5? s.t. _ S 3 / -J MG NA V^UuCJ U JtL f-1. _SJ> J MG NA 053032 yz at HZ J MG OSS0S3 J.83 _£i_ „ ,
J MG N* 0S6O07 J=L. . ikk. \3 J MG NA 0S7012 J£2- .».» di.g J MG NA 0S7017 z££ 11 .Mi J 05703B
059003
y z i 0 MG NA
05703B
059003 J& MJL ?o J MG NA 061008 ?& J3- JM J MG NA 3 8 1 0 9 1 5.1 M 1.3 J OA ofaoM. o.s J Nft oSSbt<1 _ /15. JA»A asno<i4 -as.
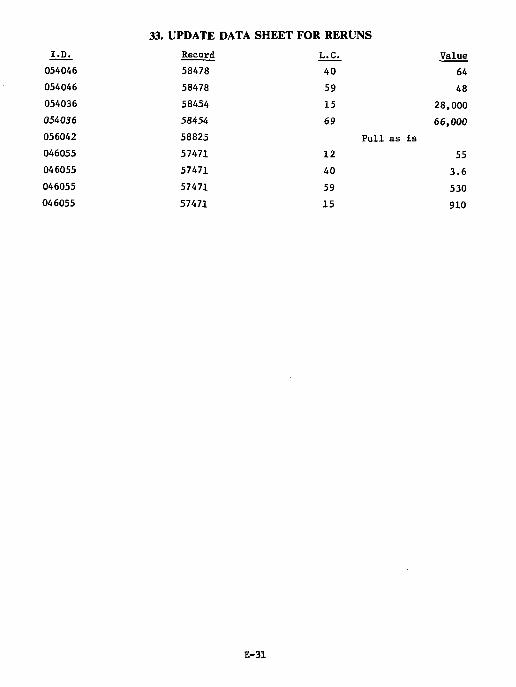
33. UPDATE DATA SHEET FOR RERUNS I.p. Record L.C.
054046 58478 40 054046 58478 59 054036 58454 15 054036 58454 69 056042 58825 046055 57471 12 046055 57471 40 046055 57471 59 046055 57471 15
E-31
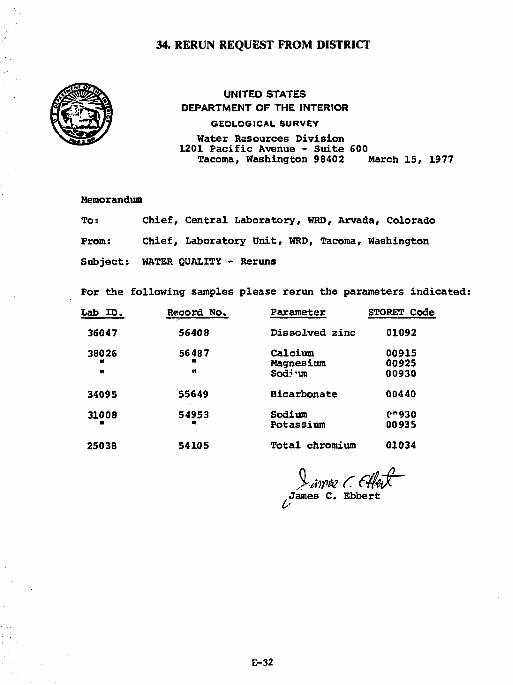
34. RERUN REQUEST FROM DISTRICT
UNITED STATES DEPARTMENT OF THE INTERIOR
GEOLOGICAL SURVEY Hater Resources Division
1201 Pacific Avenue - Suite 600 Tacoma, Washington 98402 March 15, 1977
Memorandum To: Chief, Central Laboratory, WRD, Arvada, Colorado From: Chief, Laboratory Unit, WRD, Tacoma, Washington Subject: WATER QUALITY - Reruns
For the following samples please rerun the parameters indicated: Lab ID. Record No. Parameter STORET Code 36047 56408 Dissolved zinc 01092 38026
If It
56487 m n
Calcium Magnesium Sodi'im
00915 00925 00930
34095 55649 Bicarbonate 00440 31008
M 54953 Sodium
Potassium 0*930 00935
25038 54105 Total chromium 01034
% .James C. Ebbert
E-32

35. WRD DATA VERIFY REPORT
PROCESSING D A t t i 17/01/22
STATION NUH«t»: Ob*3*301> - IM.ET C».*AL " « UtLLt FOUrtCM£.S.D»R. «AT£H YEAH - WT7
TYPE OF STAT|t.'*I ST9EA- l_'I ITuOt-LONwl TuiJt i »»*2J* U)3**d3.0» STATE: *b COuwfrl Oi« U I S T H K T I 44
S«t - O lb -UIS- D I5 - CIFIC S3LVED t ) IS - U1S-
VEO SOLVED CON- SOLIDS SOLVED SOLVEC L- C»M- CMLO- DUCT- IW OF sot IDS SOLIDS U" ttDNATt -J IDE ANCE CONST I - ( I U N S ITONS
- . _ . - . _ . . . . . . _ftl (CU3I (CD (MICRO- TuENfSI •'in PER filTE ("G/L1 (Hfi/L) (Uu/LI (HG/LI 1MU/LI <Mli/Ll HHOS) IMG/L! tC-FTI UAV)
D I S L I 1 I T * SOLVE.
DONATE HOrfON ltiC03»
( - G / L ) 0 0 . 1 0 J0*»? UOYAO O0u«» T0JO1
FCR.
CAU-FLUO- H4VATE
RIUE HARD NESS NESS (CA.«fi l
DATE (Nft /LI IMd/L I IMG/Ll 00902 00100
PER.
D I S A U - D I S INSTAN- D I S SOLVED S C W - SOLVED TANtOUS SOLVED SILICA T10N SODIUM PERCENT 0 1 S - SULFATE ISlQif l RATIO INA) SODIUM CHAROE ISO*) 1 MO/LI IHG/L1 (CFS> (MG/LI 0Q-»55 00931 00V30 009J2 00061 009*5
O IS - 1'IS- D I S U I S -SOLVED SDL- SOLVED SQLVEO OUT no TOTAL OMInO. N ITRITE PHOS PHD5- P l I lS - PLUS CAKUON
TENPE*- ! PHATE P M O " U S PfOrtuS (.URATE OlOMOE ATIJRE I IPO*) [ P I ( N l I C W I
(DEG CI H G / L 1 IMG/LI IMG/L1 IMG/LI IMG/LI IMG/LJ 00010 OObhO 0066b OdbbS OOnfl O0b31 00*05
Ob*aiS10»» l»V1i'J l«0a - fuQU |M OiTE OR TIME
36. WRD STATION HEADER REPORT
UPDATE HEADER RECORD MAR 26i
STATION STATION LOCATOR CONTRIB. AGENCY IDENTIFICATION LAT- LONG- SEO STATE DISTRICT COUNTY SITE COOES HYORQLOGIC DRAINAGE DRAINAGE CODE NUMBER ITUDE ITUDE NUM. CODE CODE CODE ll »2 «3 UNIT CODE AREA AREA
USGS 0*160300 • NONE GIVEN * 36 MB SH
GEOLO STATION NAME OR LOCAL *ELL NUMBER UNIT C
ROARING FALLS flfiOOK AT HERMAN STILL NT NULL NULL 100001000
HU005 THE FOLLOWING DATA FIELDS FOR THE KtAOER RECORD LISTED AtJOVEt HERE FOUND TO CONTAIN ONE OR MORE ERRORS
STATION LOCATOR
DISTRICT CODE
HU006 •••••••••»••*••••••••••••••••••••••••••••• NO UPDATES MADE ••••••••••••••••••••••••"•••••••••••••••••»»»i
E-33
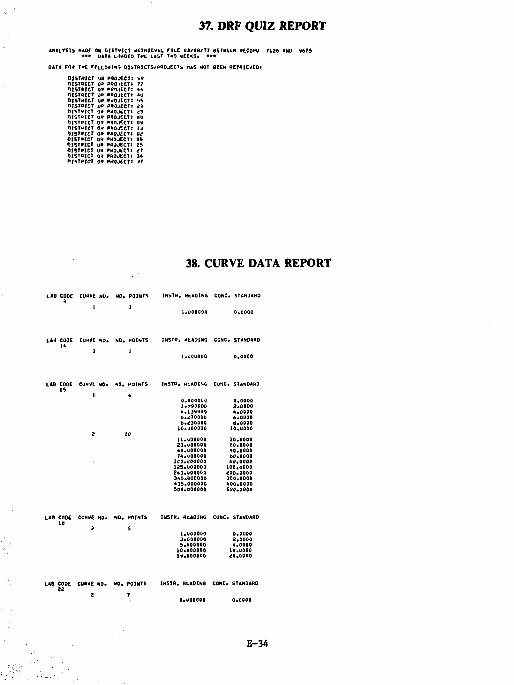
37. DRF QUIZ REPORT
DATA FIR T*E F O L L O - I N I QliTRICTS/PROjECT:* n*S NOT BEEN RETRIEVED*
DJSTfflCT msiarcT lISTfclCT HISTRICT oisiMtcr nisTfficr DISTRICT tllSTQICT DISTRICT iisToicr *>1ST»ICT oisimcr DISTRICT n is iRicT 1ISTRICT
>JB PROJECT: sR 09 MOlECTt 7? 0* PftTfECT: *b OR PROJfcCTt AU g» PROJECT: -aS Iff) PBIJECI: * * •J* PrtOJdCTt c3 gff PROJECT: • « 0» "WJECTI 0<* 09 P R O J E C T : u off • W O J E C T ; o? OR »nnjecTi 0^ U* PROJECT! 2b OR PBOJtCTl *T 0 1 PROJECTI 3ft
38. CURVE DATA REPORT
i * 9 CODE CURVE MO. NO, POINTS [NSTR. HEADING CONC. STANDARD 8
1 1 1.000000 0.0000
LAB CODE CURVE NO* NO. POINTS 1N5TH. rttADlNG CONC. STANDARD
l.uOUOOQ 0.0000
LAB COOE OIRVfc HO. NO. POINTS INSTR, MtADING CONC. STANDARD
O.UOOOOQ 1**90000 4.134999 ft.lTOOOO b.£30000 10.UO00O0
U.UOOOOO 23.000000 •B.uOOOHO 74.UQQ0OO
ICO.OQQOQQ 125.000000 a*3.u0Q00Q 345.000000 *35.000000 500*000000
0.0000 2.0000 4.0000 6.0000 tf.O000 10.0000
10.0000 20.0000 ftO.0000 bQ.0000 as.oooo 100,0000 200.0000 300.0000 400.0000 500.0000
LAB CODE CURVE NO. NO. POINT* INSTR. HtAOING CONC. . STAMP*) Id * 5
1.000000 3.OO000O 5.HO0000 10.000000 lV.UOOOOQ
0.0000 2.0000 t.0000 10.0000 40.0000
LAB CODE CURVE NO. NO. POINTS INSTR, RLADINQ CONC. STANDARD
O.UOODOO 0.0000
E-34
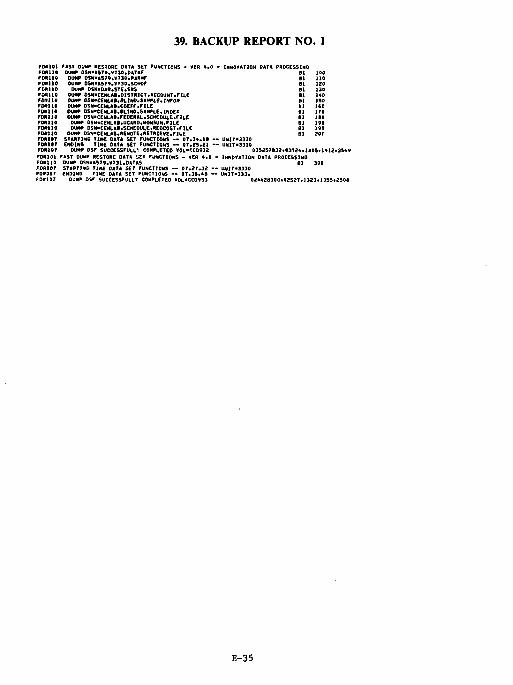
39. BACKUP REPORT NO. 1
FORI 01 FIST DUMP RESTORE DATA SET FUNCTIONS - VER 4 .0 - INNOVATION DAT* PROCESSING FORI10 DUMP 0SN»A579.VT30.DATAF Bt ISO FDRltO DUMP OSN>a579.VT30.paRNF 01 110 FDPtllO DUMP DSN»A57».V730.5CMDF 81 120 FDR11D DUHP 0SN«DAR.STE.SRS Bl 130 FORI 10 DUMP DSN-CEW.At.DlSTRICT.aCCOUNT.FILE Bl 1*0 F0RJ10 OVHP OS«»C£iW.A».»LXt*.Sa*»lC»I«FO* SI ISO FORI 10 DUMP D$N-CENLA**COCFF.FILE Bl 1«0 FOR110 DUMP OSN'CENLAB.tLINO.SAMPLE,INDEX 81 170 FORI10 OUMP OSN«CENLAi.FEOER«L.SCHEDULE.FILE 01 110 FDR110 OUHP DSN>CENLAB.UCARD.MONSUN.F ILE Bl 190 FORUO DUMP DSN-CENLAt.SCHEDULE.REOCOST.FILE SI 199 FDR110 DUHP 05N-CENLAB.REHDTE.RETRICVE.FILE Bl ZOO FOROIT STARTING TIME DATA SET FUNCTIONS - - 0 T . l 4 . I B — U N I T - 3 3 3 0 FOR00T ENDING T I H E DATA SET FUNCTIONS — OT.25.21 - - U N I T - 3 3 3 0 FORIOT DUMP DSF SUCCESSFULLY COMPLETED V0L>CCD932 03525TB32t03724,1805*1412.3549 FOR101 FAST DUMP RESTORE DATA SET FUNCTIONS - VCR 4.0 - INNOVATION DATA PROCESSING FORI10 DUMP DSN-A5T9.VT31.0ATA5 Bl 300 FOR0O7 STARTJN& T I « DAM SET FUNCTIONS « 0 7 . 2 7 . 3 2 " U W T O 3 3 0 FOR007 ENDING TINE DATA SET FUNCTIONS — 0T.38.4B — UNlT'333t> FORIOT OUMP OSF SUCCESSFULLY COMPLETED ¥OL"CC0933 024428300*02527.1323.1055.250B
E-35
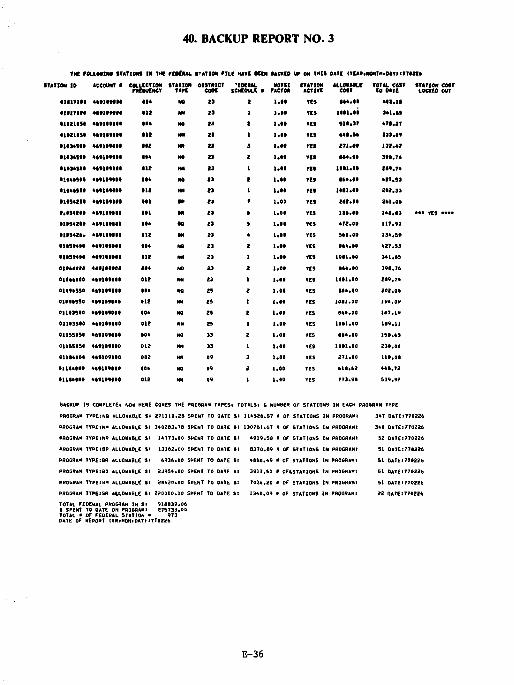
40. BACKUP REPORT NO. 3
THt roLLWIN* STATIONS IN THE fUtMH. STATION M I C HAVE KCN
NN 23
•101T1M 4491090IO •04
•lointo « « t l * H f * 912
•1021*5* 4A910900* •04
0102105* A t t l t t l H • 12
•1«345*0 4«91*90M 0*2
•1*341*0 4 *91 *90M •04
•1*34500 4 * 9 1 * 9 1 • * • 12
0 1 * 4 * 5 * • 4*91*9000 • 04
• t » 4 * S I * 4 * 9 1 * * 0 * * • 12
ttfstzia 4*91*9 | *0 • • 1
».*S42BB 4 A 9 1 I 9 I I I • • 1
• 1 * 3 4 2 * * 4*91**098 • • 4
•1*542* . . 4 *91**1*0 • 12
• IOSOAOO 4 * 9 1 * 9 M » • 04
•1039409 4 * 9 I * 9 M * • 12
O l t i A f f l * 4*91 M M t • • 4
oio**too 4*919910I 012
0109*55* 4*91 M M * •04
01*9*550 4*919910• B12
011*3500 4*91990*1 D04
01113510 4*91*9010 012
01155050 4»91«90*» 004
01155050 4*9109000 012
«11*4*0* 4*9109000 002
011*4101 4*91090*0 004
0 1 M 4 0 M 4*91*9110 012
•ACRED UP ON THIS DATE <TEAR•MONTHtDAYHT70ZZt
M0TSI FACTM
STATION ACTIVE
ALLOMStC COST
TOTAL COST STATION COST J O o*Te LOCKED OUT
1.00 TES M 4 . 0 * 4 U . I S
l . M res 10B1.00 3 4 1 . * *
!.«• res 511.37 4 M . 2 T
!*•• vcs « 4 I . S * 333 , *9
!.#• res «».•• 1 M . 4 7
1.00 YES * * 4 . 0 0 3 9 * . T *
l . a a res 1 M 1 . M 2*9 .74
1.00 res l * 4 . « * 427.93
1.00 res tiai.io 292.33
1.00 res 2 t 2 . * 0 2 * 1 * 0 *
1.01 TES 13* .00 142.03 • • • TES « • • •
1.01 res 4T2.00 117.93
1 .0* res 5*0 .00 134.59
!.•• res 0*4.00 427.53
1.00 TES 10*1.00 341.65
1.00 res •44 .00 3 9 0 . 7 *
L O t TES 10*1.00 219.74
1.00 VES •64 .00 202.06
1 .0 * res 1001.09 194.09
1 .0 * TES 6*4.00 107,19
l . 0 » VES 1011.00 119.11
1*00 res •64 .00 15B.45
1.00 YES 10*1.00 23*.OB
1.00 YES 271,00 11* .0«
1.00 YES * ! • • 6 2 44B.72
1.00 YES TT3.9* 539.97
BACKUP 15 COMPLETE* NOW HERE COHES THE PROGRAM TYPES.
PROGRAM TYPElNO ALLOWABLE SI 271110.26 SPENT TO DATE
PROGRAM TYPE INK ALLOWABLE SI 3*0283.7B SPENT TO DATE
14773.00 SPENT TO DATE
13362.00 SPENT TO DATE
6936.00 SPENT TO DATE
2J954.00 SPENT TO DATE
PROGRAM TYPEINR ALLOWABLE S
PROGRAM TYPEIflP ALLOWABLE %'•
PROGRAM TYPE!BR ALLOWABLE Si
PROGRAM TYPEIBQ ALLOWABLE f
PROGRAM TYPElBN ALLOWABLE Si 28420.00 SPENT TO DATE
PROGRAM TYPEiSR ALLOWABLE tl 220000.00 SPENT TO DATE
TOTAL FEDERAL PROGRAM IN St 918039.06 » SPENT TO OATE ON PROGRAM! 275733.00 TOTAL • OF FEDERAL STATION - 973 OATE OF REPORT IVR.MONtDAT)1770226
TOTALS< * NUMBER Of STATIONS
SI 11*588.57 A OF STATIONS IN
II 130761.67 • OF STATIONS IN
SI 4919.50 • OF STATIONS IN
SI B3T0.89 • OF STATIONS IN
SI 4B60.49 • OF STATIONS IN
SI 3917.51 • OFASTATIONS IN
St 7034.20 • OF STATIONS IN
SI 1340.09 • OF STATIONS IN
IN EACH PROGRAM TYPE
PROGRAMI 347 0ATEI770226
PROGRAM! 3*8 0ATEI770226
PROGRAMI 52 DATE1770226
PROGRAM! 51 OATEJ 77*226
PROGRAMt 51 DATE 177*226
PROGRAMS 51 DATE 1770226
PROGRAMI 51 DATEIT70226
PROGRAMI 22 OATE1770226
E-36
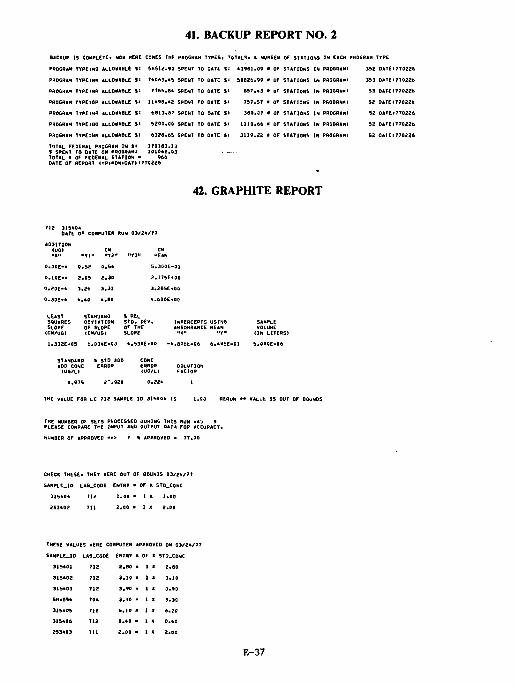
41. BACKUP REPORT NO. 2 BACKUP tS COMPLETE* NOW HERE COMES THE PROGRAM TYPES*
PROGRAM TYPE)NO ALLOCABLE tl PROGRAM TYPElNN ALLOWABLE >> PROGRAM TYPEINR ALLOWABLE SI PROGRAM TVPEI8P ALLOWABLE Si PROGRAM TVPEItJR ALLOWABLE $3 PROGRAM TVPEISO ALLOWABLE St PROGRAM TYPESBN ALLOWABLE SI
5851?.90 SPENT TO OATE I: 7*063.*S SPENT TO OAK f 7T65.8* SPENT TO DATE Si
ll*98.*2 SPENT TO DATE Si 6813.BT SPENT TO DATE Si 5200.00 SPENT TO DATE Si 6328.65 SPENT TO DATE Si
rCT*LS* t NUMBER OF STATIONS IN EACH (
43961.09 • OF STATIONS IN PHOGRAMI 50626.99 * OF STATIONS IN PROGRAM!
BST.*3 • OF STATIONS [N PROGRAM! 757.57 • OF STATIONS IN PROGRAHI 389.OT • OF STATIONS IN PROGRAM!
1110.66 I OF STATIONS IN PROGRAM! 3119.22 • OF STATIONS IN PROGRAM!
TOTAL FEDERAL PH06RAH IN Si 17018; S SPENT TO DATE ON PROGRAM! 1010*. TOTAL • OF FEDERAL STATION • 96t DATE OF REPORT irRtMONaOAT)ITT0226
ROGRAM TYPE
352 OATEI7T0226
353 DATE 1770226
S3 DAT£i?70226
52 DATEIT70226
S2 DATEt770226
52 DATEIT70226
52 OAIEI770226
42. GRAPHITE REPORT
ADDITION IUG) "A" »Y1"
CN CM »V3« «EAN
O.O0E-* 0 .52 0.54 5.300E-Q1
0.10E-* 2 .05 2.30 2.175E*00
0.20E-* 3 >26 3.31 3.285E«0Q
0.30E-* * .*0 4.80 *.600E*00
LEAST SQUARES SLOPE (CH/UG)
STANDARD DEVIATION OF SLOPE (CN/UGI
I REL STD. DEV. INTERCEPTS USING OF THE AHSOKBANCE MEAN SLOPE •'*" »T"
SAMPLE VOLUME (IN LITERS!
1,332E+Q5 6, 03*E*03 *.530E»00 -».876t-06 6.495E-01 S.OUOE-Ob
STANDARD ADD CONC IUG/LI
ft STD II ERROR
DD CONC ERROR DILUTION (UG/LJ FACTOR
0.975 2~.928 0.22*
THE VALUE FOR LC 712 SAMPLE 10 315*0* ' VALUfc 15 OUT OF BOUNDS
NUMBER OF APPROVED • 7 ft APPROVED >
CHECK THESE* THEY MERE OUT OF BOUNDS 03/2A/7T
SANPi£_JO LA6_CODE ENTRY • OF X STD.CONC
315*0* 712 1.00 • 1 X 1.00
253*02 7]1 2,00 • 1 X 2.00
THESE VALUES WERE COMPUTER APPROVED ON 03 /24 /77
SAMPLE.ID LA9_CODE ENTRY • OF X STD.CONC
315*01 712 2.BO > 1 X 2.60 315*02 712 3.10 * 1 X 3.10 315*03 T12 3.90 - 1 X 3. 90 SRHS56 TO* 3.30 > 1 X 3.30 315*05 712 6.10 > 1 X a.10 315*06 712 0.40 - 1 X 0.40 253*03 Til 2.00 > 1 X 2.00
E-37
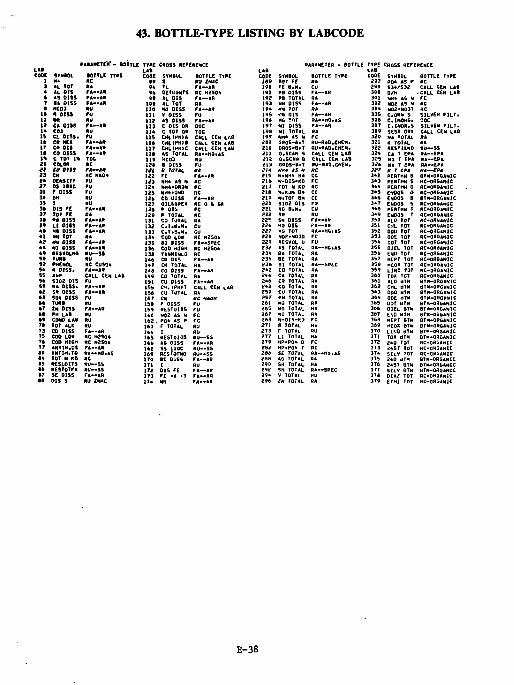
43. BOTTLE-TYPE LISTING BY LABCODE
i PARAMETER' - MTTiC TYPE CROSS REFERENCE PARAMETER - 60TTLE TYPE CROSS REFERENCE LAI LAft LAB LAB CODE SYMBOL •DTTLE TYPE CODE SYMBOL BOTTLE TYPE CODE SYMBOL BOTTLE TYPE CODE SYMSUL BOTTLE TYPE
1 RC 0* S RU ZM*C I « » TOT FE RA 297 PO* AS P RC 3 AL TOT ft* 94 TL FA—AR 190 FE 8 .M. CU 298 S34/S32 CALL CEH LAB
* Al CIS FA--AR H OETRWTS RC H2S04 191 P8 01S5 FA--AR 300 D/H •CALL CEH LAB m as oiss FA—AR Of *L DI5 FA—AR 1«2 PS TOTAL RA 301 MK* AS M FC T •A OISS FA—AR too AL TOT RA 193 MN OISS FA—AR 302 NO? AS N HC
• NC03 RU no HO orss M—AH 19* HH 707 ft* 30* N02»N03T RC 1 * n DISS FU t i l V OISS FU 195 y-.H OIS FA--AR 305 C.OHb S SILVER F I L T . U M RU 112 AS DISS FA—AR 106 HO TOT RA—HG.AS 306 C.INORS. DOC 12 CA OISS FA—AR 113 C OIS OR DOC 197 NI DISS FA—AR 30T C.INOR.S SILVER F ILT . 1 * C03 RU 114 C TOT OR TOC L98 NI TOTAL RA 309 SEST CRT CALL CEH LAB 15 CL OISS. FU 115 CHltPH)* CALL CEN LAfl 199 •Of* AS W FC 320 NA TOTAL RA t* CR HEX FA—AR 1 1 * CHLIPMH CALL CEN LAO 209 GROS-AtT RU-RAD.CHEM. 321 K TOTAL RA IT CR ois FA—A* 117 CriLCPHlC CALL CEN LAB 210 GHOS-B.T RU-»AD,CHEH. 322 RESF1RN0 HU—SS 11 CO OISS FA—AR 110 AS TOTAL RA—HOtAS 211 G.SCAN S CALL CEN LAS 32* CA T EPA HA—EPA 1 * C TOT I N TOC no HC03 RU 212 G.SCAN B CALL CEN LAB 325 MG T EPA RA—EPA 20 C 0 U * RC 120 1 OISS FU 213 GflOS-B.T RU-RAO,CHEN. 326 NA 7 EPA AA—EPA
« CU « 5 J M~i» tet B WTtL ft* it* *M4 *$ *t *C 3e? K T tPM Kt—EP* 23 CN RC HAOH 122 FE FA—AR 215 NtNH* BM CC 3*2 PERTHH B STM-OflGANlC 2 * DENSITY FU 123 NH* AS H RC 216 N-OIS-KD FC 3*3 PERTHH S RC-ORGANlC 27 OS I M C FU 124 NH4*OR0H PC 217 TOT N KO RC 3«* PERTHH 0 HC-ORGANIC 31 9 OISS FU 125 NH40ND nc 216 N.KJN BH CC 3*5 e«oos o HC'cmotmc 3» OH RU 124 CD OISS FA—AR 219 NiTOT 8H CC 3*6 ENDOS B BTM-ORGANIC n 1 RU 12T 0IL4GREA RC 0 * GA 220 S102 DIS FU 3»T ENOOS S RC-ORGANIC 3* OIS ft FA—AH 128 P 01b FC 221 AG B.M. CU 3*8 PERTHN T RC-ORGAHIC 37 TOT « fi* 129 R TOTAL RC 222 BR RU 3*9 ENOOS T RC-ORGANIC 31 P* OISS FA—AR 111 CO TUTAL RA 221 SN DISS FA—AR 3S0 ALO TOT HC-0R6ANIC 3 * L I OISS FA—AR 132 C . I . H . N . CU 226 HO DIS FA—AR 351 CHL TOT RC-QRGANIC 40 Ml OISS FA—AR 133 C .T . t l .H . CU 227 MO TOT RA—HGiAS 352 DDD TOT RC-QRGANIC 41 m TOT HA 134 COD LOH RC M2SO* 221 N02*N03D FC 353 DDE TOT RC-ORGANIC * 2 m oiss FA—AR 135 81 OISS FA—5P£C 220 RESVOL U FU 35* DDT TOT RC-ORGANIC 4 * HI OISS FA—AR 136 COD HIOH AC H2S0* 232 AS TOTAL RA--H6»«S 355 01EL TOT HC-0R6ANIC 4 * RESVOLNO RU—SS 138 TANNING RC 23* 8A TOTAL RA 356 END TOT flC-ORGANlC 50 TURB RU 146 CR DIS FA—AR 236 BE TOTAL RA 357 HEPT TOT RC-ORGANIC 92 PHENOL RC CUS04 1*7 CR TOTAL HA 23B Bl TOTAL RA—SPEC 35 B H£0* TOT RC-ORGANIC 5* « OISS. FA—AR I *« CO OiSS FA—Aft 2*2 CD TOTAL RA 3S9 LlND TOT RC-ORGANIC 55 A6P CALL CEN LAO 1*9 CO TOTAL RA 2 * * CA TOTAL RA 360 TOU TOT HC-OHGANTC 5* S102 OIS FU 151 CU DISS FA—Aft 2*6 CR TOTAL RA 301 ALD dTH BTM-ORGANIC 5* MA DISS. FA—AR 155 CHI(PHIT CALL CEH LAB 2*8 CO TOTAL RA 362 CML dTH BTN-ORGANIC 42 Sit DISS FA—AR 156 CU TOTAL RA 250 CU TOTAL RA 363 QDO dTH BTM-ORGANIC * 3 SO* OISS FO 157 C« AC H*OH 257 PB TOTAL RA 3b* DDE dTH 8TH-ORGANIC 44 TIMS RU 158 F DISS FU 261 Md TOTAL RA 365 DDT HTH BTH-ORGANIC *T 2 N OISS FA—AR 150 RESTO105 FU 265 HO TOTAL RA 366 01EL BTM BTH-ORGAH1C
*• PM LAI RU 160 NO2 AS N FC 267 HI TOTAL RA 367 ENO dTH BTH-ORGANlC 4 * CDNO LAV RU 162. PO* AS P FC 268 N-DIS-KD FC 368 HEPT BTM BTH-OBQANK 7* TOT ALK RU 163 F TOTAL HU 271 B TOTAL Ra 369 HEOX BTH BTH-0RGAN1C 73 CD DISS FA—1R 16* I RU 2T3 F TOTAL. 370 LIND BTH BTM-ORGANIC 75 COD LOM RC M2S04 165 REST0105 RU—SS 2T7 L I TOTAL RA 371 10* UTH BTM-ORGANIC 74 COO HIGH RC H2S0* 146 AG OISS FA--AR 2T9 HP.PO* D FC 372 2*0 TOT RC-QRGANIC 77 INTIM.OS FA—AR 1*8 SS HOC RU--SS 282 HP.PO* T HC 373 2*5T TOT RC-ORGANIC 10 ANTlM.TQ RA—H0.AS 169 RESTOTNO HU--SS 286 5E TOTAL RA—MGMS 37* SILV TOT RC-ORGANIC 1 * TOT H KD RC 170 BE OiSS FA--AR 288 AG TOTAL RA 375 2*0 dTH BTH-ORGANIC •5 tESLOITS RU—SS 171 I RU 290 SR TOTAL RA 376 2*5T BTH aTM-ORbAMIC 14 RESTOTFA RU—SS 172 DIS FE FA—AR 292 SN TOTAL RA—SPEC 377 SILV BTH EITH-OAGANtC 07 SE DISS FA—AH 173 FE •£ «3 FA—AR 29* V TOTAL. RU 378 DIAZ TOT AC-ORGANIC •a DIS S RU 2NAC 17* NN FA—AR 296 ZN TOTAL RA 379 ETMI TDT RC-ORGANlC
E-38
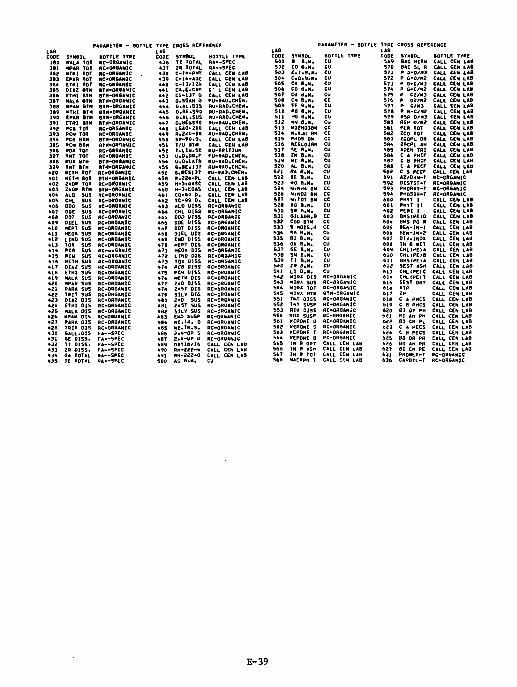
SYMBOL HAL* TOT MPAR TOT MTRI TOT CPAR TOT ETRI TOT DIAZ BTH ETHI BTM MALA BTM MPAR BTM MTfcl BTM CPAR BTM ETRI BTM PCB TOT PCM TOT PC8 BTM PCM BTM RDX TOT TMT TOT RDX «TM TNT BTM METH TOT METH 6oT 240P TOT 240P BTM ALO SUS CML SUS ODD SUS ODE SUS DOT SUS DIEL SUS MEPT SUS HEOA SUS LIND SUS TOX SUS PCB SUS PCH SUS METH SUS DIAZ SUS ETHI SUS MALA SUS HPAR SUS PARA SU5 TRIT SUS DIAZ OlS ETHI OIS MALA OIS MPAR OIS PARA DIS TRIT OIS GALL.OIS GE OISS. TI OISS. ZH OISS. GA TOTAL BE TOTAL
PARAMETER - BOTTLE TYPE CROSS REFERENCE LAB CODE •36
BOTTLE TYPE RC-QRGANIC RC-ORGANlC RC-OROANlC RC-ORGANIC RC-ORGANlC BTM-ORGANIC BTM-ORGANIC BTM-ORGANIC BTH-ORGAN1C 8TN-0R0ANIC 8TN-0RGANIC BTM-ORGANIC RC-ORGANIC RC-ORGANIC BTM-ORGANIC BTH-ORr.lNIC RC-ORSANIC RC-OROAMIC BTM-ORBANIC BTM-DRCANIC RC-MQKNIC BTM-DRGANIC RC-OROANlC BTM-ORGAN1C RC-ORGANIC RC-ORGANlC RC-ORGANK RC-ORGANIC RC-ORSANIC RC-ORGANIC RC-ORGANIC RC-ORGANIC RC-ORGANIC RC-ORGANIC RC-uxGANIC RC-pRGANIC RC-ORGANIC RC-ORGANIC RC-ORGANIC RC-ORGAHIC RC-ORGANIC RC-ORGANIC RC-ORGANIC RC-ORGANIC RC-ORGANIC RC-ORGANIC RC-ORGANIC RC-ORGANIC RC-ORGANIC FA—SPEC FA—SPEC FA—SPEC FA—SPEC RA—SPEC HA—SPEC
SYMBOL T I TOTAL ZR TOTAL
438 C - I « - P * r •39 C-14-AGE 440 C-13/12R 441 CA.E.CAP •42 CS-137 0 •43 G.SCAN 0 •44 G.AL.OIS 44S G.BE.S90 • • 6 G.AL.SUS
458 459 460 461 462 463 464
466 4t»7 *08
*TB 479 4S0
485 486 48T 469
O.BC!»S90 LEAD-210 R.2*t>-BH SR-»0»0, T/U BTM T.LlU.SC U.D.Dfl.F U.DitXTR G.BE.13T G.8CSI37 R.226-PL H-3»GASC H-J.tGAS CO-60 0 . TC-99 0 . ALO OISS CHL OISS 000 UISS ODE OISS DDT OISS OIEL OIS END DISS HEPT DIS HEOX DIS LIND DIS TO* OISS PCS OISS PCN OISS MCTH DIS 240 DJSS 245 T DIS SILV DI.S 240 SUS 24ST SUS SILV SUS END SUSP ME.TH. 0 H E . ' H . S . 2.4-OP S 2.4-DP 0 OXYle/ lb RN-222-B RK-222-G
AS a .M .
BOTTLE TYPE RA—SPEC RA--SPEC CALL CEN L*6 CALL CEN LAB CALL CEN LAB C L CEN LAB CALL CEN LAS FU-RAD.CHEM. RU-RAD.CHEM. RU-RAO.CHEM* RU-RAO.CHCM. RU-RAD.CHEM. CALL CEN LAB RU-RAD.CHEM. CALL CEN LAB CALL CEN LAB RU-TR1TIUM FU-RAD.CMEM. RU-RAD.CHEH. RU-RAO.CH:M. RU-RAD.CHEM. CALL CEN LAB CALL CEN LAB CALL CEN LAB CALL CEN LAB CALL CtH LAS RC-ORBANIC RC-OROANlC RC-ORGAMK RC-ORSANIC nC-ONGANIC AC-ORGANIC AC-ORGANIC RC-ORGANIC RC-ORBANIC RC-GRGAMIC RC-ORGANIC HC-OROANlC RC-ORGANlC RC-ORGANIC RC-ORGANIC RC-ORGANIC RC-ORQANIC RC-ORGANIC RC-ORGANIC RC-ORGANIC RC-ORGANlC RC-ORbANK RC-ORGANIC RC-ORGANIC RC-ORGANIC CALL CEN LAB CALL CEN LAB CALL CEN LAB CU
E
LAB CODE STMBOL BOTTLE TYPE 501 B B.M. CU 502 CO B.H. CU 503 C.I.B.M. CU 50* C.O.B.M. CU 505 CH B.M. CU SO* CO B.M. CU 507 CU B.N. CU 508 CN B.M. CC 509 FE B.M. CU 510 PB B.H. CU SI I MO a.N. CU 512 MM tt.M. CU 513 N02N03BM CC 514 N.KJH AN CC 5IS PHOS BM CC 516 RESLOIBM CU 517 SE B.M. CU 51S 2N B.M. CU 519 NI B.M. CU 520 AL B.N. CU 521 (?A B.M. CU 522 BE B.M. CU 523 MO B.M. CU 524 NtNH* BM CC 526 N.N02 BM CC 527 NtTOT BM CC 521 AO B.M, CU 530 SR B.M. CU 531 OILLGR.a CC 532 COO BTM CC 533 % HOIS.a CC 534 SB B.M. CU 535 BI B.M. CU 536 GA B.M. CU 53T GE B.M, Cu 536 SN B.M. CU 539 TI B.H. CU 5*0 ZR B.M, Cil 5*1 LI B.M. CU 5*2 MIRX DIS RC-ORGANIC 543 MIRK SUS RC-ORGANIC 5*4 "IRA TOT RC-ORGANIC 545 MIRK BTM 8TM-0RGANIC 551 TNT OISS RC-ORGANlC 5S2 TttT SUSP RC-ORGANlC 553 RDX OISS RC-ORGANiC 554 nox SUSP RC-ORGANIC 561 KEPONE 0 RC-ORGANIC 562 KEPONE S RC-ORGANlC 563 KEPONE T RC-ORGANIC 564 KEPONE fl RC-ORCANIC S65 IH B DRY CALL CEN LAB 566 IN 8 ASH CALL CEN LAB 567 IN 8 TOT CALL CEN LAB 56B MACRPH T CALL CEN LAB
TYPE CROSS REFERENCE LAB CODE SYMBOL BOTTLE TYPE 569 BAC NITR CALL CEN LAM 570 BAC SL R CALL CEN LAB 571 f> G-0/N3 CALL CEN LAB 572 P G-0/M2 CALL CEN LAB 573 P G-C/M3 CALL CEN LAB ST* P G-C/N2 CALL CEN LAB 5TS P C2/M3 CALL CEN LAS 576 P 02/M2 CALL CEN LAS 577 P C/M3 CALL CEN LAB 5T8 P N-C/M2 CALL CEN LAB 5T9 RSP 0/M3 CALL CEN LAB 580 RSP Q/mZ CALL CCN LAB 581 PER TOT CALL CEtt LAB 5B2 ZOO TOT CALL CEN LAB 5B3 ZOQPL OR CALL CEtt LAB 56* ZOCPL AH CALL CEN LAB 5B5 ADEN TRI CALL CEN LAB SB6 C A PHCr CALL CEN LAB SB7 C B PHCF CALL CEN LAB 5(11 C A PECF CALL CCN LAB 584 C B PCCF CALL CCN LAB 591 AZ/OHN-T RC-CRGANIC 592 DISTST-T RC-ORGANlC 593 PHORAT-T RC-&RGANIC 594 PHOSDH-T RC-ORGANIC 600 PHVT I CALL CEN LAB 601 PHYT I I CALL CEN LAB 602 PERI I CALL CEN LAB 603 BHS(PE)0 CALL CEN LAB 60* BH5 PG R CALL CEN LAB 605 BEN-1N-1 CALL CEN LAB 606 BEN-lN-2 CALL CEN LAB 60f DtVdNDX CALL CEN LAB 600 IN B MET CALL CEN LAB 609 CML(PE1A CALL CEN LAB 610 CHLlPEIB CALL CEN LAB 611 BMSIPEtA CALL CEN LAS 612 SEST ASH CALL CEN L*B 613 CHLIPElC CALL CEN LAB 6 1 * C H L I P E I T CALL CEN LAB 615 SEST DRY CALL CEN LAd 616 ATP CALL CEN LAB 617 ZP CALL CEN LAB 616 C A PHCS CALL CEN LAB 619 C B PHCS CALL CEN LAB 620 B] Or PH CALL CEN LAB 621 81 AH PH CALL CEN LAB 6£2 Bl CH PL CALL CEN LAB 6*3 C A PECS CALL CEN LAB 62* C B PECS CALL CEN LAB 625 BO OR PR CALL CEN LAB 626 BO AH PR CALL CCN LAB 627 61 CH PE CALL CEN LAB 631 PRONET-T RC-ORGAN[C 636 CAR8YL-T RC-ORGANIC
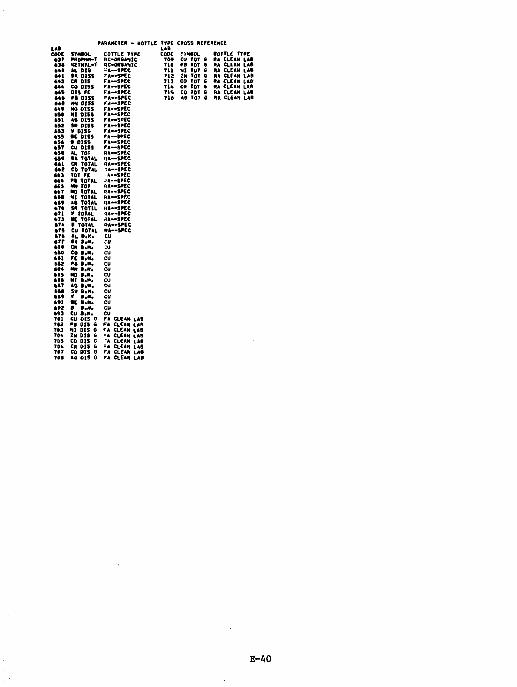
PARAHETCR - MOTTLE TrpE CROSS REFERENCE LAB LAB COM STN0OL COTTLE TW£ CODE EVMBOL t o m e rrpc
• 3 7 MOPMM-T RC-OP.6ANIC 70« CU TOT 6 RA CLEAN LAB •3B ttWL-T HC-ORMNtC 7 HI PB TOT 0 RA CLEAN LAB •*• »L DIS ~A—SPEC 711 NI TOT « RA CLEAN LAB • * 1 BA DISS ?A—SPEC 712 ZN 101 0 RA CLEAN LAB 4*3 C* DIS FA—SPEC 713 CO TOT 6 RA CLEAN LAf
•*» CO DISS FA—SPEC 7 1 * CR TOT 6 RA CLEAN LAB M S DIS re FA—SPEC T15 CO JOT B RA CLEAN LAB
•*• Pi DISS FA—SPEC 7 1 * A6 TOT 6 RA CLEAN LAB M m oiss FA—s«e
•*» HO OISS FA—SPEC »5» Nl OISS FA—SPEC H I At DISS FA—SPEC •52 Sft OISS FA—SPEC • 5 3 V DJ55 FA—SPEC 455 • E DISS FA—SPEC • 5 * • OISS F A « SPEC •57 CU OISS FA—SPEC •SB *L TOT HA—SPEC * 5 » BA TOTAL nA—SPEC
«•! CM TOTAL 0 A—SPEC • • * CO TOTAL T A—SPEC 113 TOT FE ; A—SPEC • 4 * P i TOTAL .1 A—SPEC
«» W» TOT BA—SPEC H T HO TOTAL nA—SPEC • t B N I TOTAL RA—SPEC • • f A« TOTAL RA—SPEC • T t SB TOTIL n A—SPEC • 7 1 V TOTAL M « S P E C • 7 3 BE TOTAL a A—SPEC • 7 * B TOTAL t» A—SPEC • 7 5 CU TOTAL RA—SPEC •Tfc *L i . K . CU *TT ** ».*. CO • T * CR t . M . :u •to CO O.H. CU ••1 FE B.N. CU 6tS PB O.K. CU At * Mtt t . M , C« • I S HO B.H. CU »•• HI B.M. CU • t 7 AB B.M. CU M B Sft B.H. CU • 1 * V « . M . CU • • 1 • E B.H. CU * K B 0.M. CU •43 cu a*H. CU 7 t l CU DIS 0 FA CLCAM LAS 712 »• oi5 e FA CLEAN LAS 7*3 H I 015 6 «-A CLEAN LAB 70* ZH 015 G ?A CLEAN LAB 705 CO OIS G 'A CLEAN LAB 70fc CR DIS 0 FA CLEAN LAB 7B7 co OIS a FA CLEAN LAB 70t AH OIS C FA CLEAN LAB
E-40
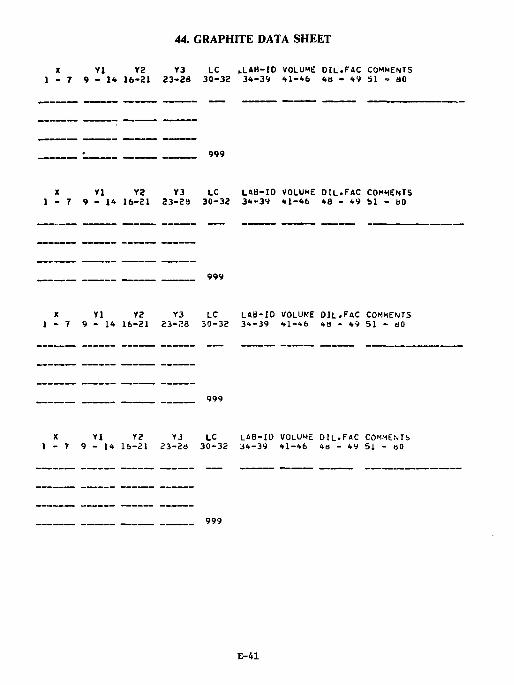
44. GRAPHITE DATA SHEET
X Yl Y2 Y3 LC „LAH-rO VOLUME OIL.FAC COMMENTS 1 - 7 9 - 1 4 16-21 23-28 30-32 34-39 41-46 4B - 49 51 - 80
.
999
X Yl Y2 1 - 7 9 - 1 4 16-21
Y3 LC 23-2B 30-32
999
LAB-ID VOLUME DIL.FAC COMMENTS 3*-39 41-46 48 - 49 51 - 80
X Yl Y2 Y3 LC LAH-1D VOLUME OIL.FAC COMMENTS 1 - 7 9 - 1 4 16-21 23-28 30-32 34-39 41-46 4U - 49 51 - 80
999
X Yl Y2 Yj LC LAB-ID VOLUME DlL.FAC COMMENTS 1 - 7 9 - 1 4 16-21 23-28 30-32 34-39 41-46 4B - 49 51 - 80
999
E-41
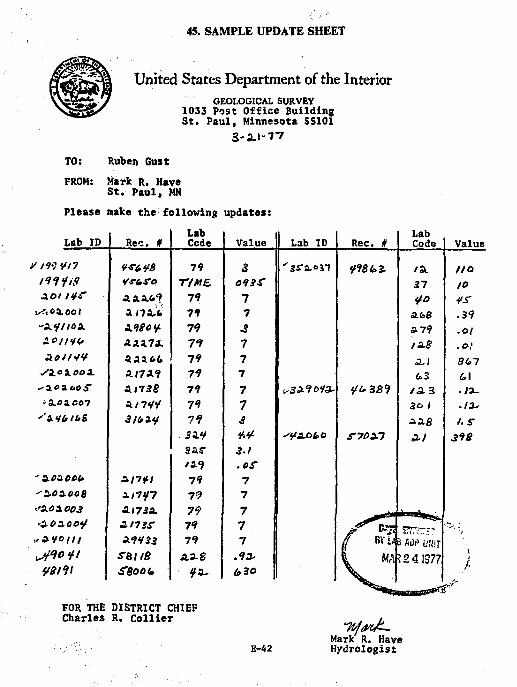
45. SAMPLE UPDATE SHEET
United States Department of the Interior GEOLOGICAL SURVEY
1033 Post Office Building St. Paul, Minnesota SS101
3-a.i-77
TO: FROM:
Ruben Gust Mark R. Have St. Paul, MN
Please make t h e f o l l o w i n g updates:
Lab Lab Lab ID Rec. 9 Cede Value Lab ID Rec. # Code Value
V ill 9/7 ¥*•&¥$ 79 3 • ' s r a . o jT ?9S . i3 . /a. II o tii as Vsr&ro TIME. 013S 3 7 to XOI Iff .a a_a.fr 9 71 7 <<<!> 4S-
iX<0100l 4 ITS,!. 71 7 HbS . 3 9 -SL^tlOX AlSotf. 71 J a- 79 • oi S.oi/if(„ 4 4 4 7 4 . 71 7 12.8 .<=>, ' Aott-tV aaaot 71 7 2,1 8C7
sa.oxooa. A / 7 4 ? 71 7 0,3 Ci ^ l o a t o i * 0.1738 71 7 ^3^-1'0V3- ^£•3 .8? /a. 2 - J 3 -
'SL04C07 Al7¥¥ 79 7 SO / . / 3 -''&*0lb6 i/*ay 71 J A i f i /. 5"
31V 3as-
*4< -^A-Ofco ST 702.7 A / 3 9 8
- 2.0200U A/7f / 7 9 7 •'2.02.00$ A / 7 f 7 7 9 7 S3.C3.003 417 3 A. 79 7 JJ0&*
!», , ,1 -i.02.ootf £ / 7 * T 79 7 jTVSZ 5^t»;—r^ -,:
,'AfOfn Aft 33 71 7 ff BV u B AOP UN.T sJQO ft S8I/8 AX g .12, 1 MA ? 2 41977 /. ye i1\ £8oo & fa- 0,30 /.
FOR THE DISTRICT CHIEF Charles R. Collier
E-42 "ftfotcA-
Mark R. Have Hydrologist
Appendix F Calculation and Report Program: Gross Alpha and Beta
F - l

AN INTRODUCTION TO THE PROGRAMS ON THIS TAPE 0. J. Feist
GENERAL In general, the calculator talks to you by the display, you talk to it
by the keyboard, and the results of this discussion appear on the printout. In some cases, a message is of continuing importance or too long to fit on the display (or both) in which case It is printed and the display says, "See printed message".
I'o use any program on this tape, first find which file it is in by checking the card in the box. Press the "load" key (located near the casette), followed by the number of the file, then "execute". When the casette stops running, press "run" then "execute".
For some of these programs, tables of data are needed from the auxiliary tape unit so it is a good idea to keep that unit turned on.
All of these programs are set up to use the "star date" system, the year and month then decimal and the day of the month (for example Jan 2, 1976 would be 7601.02).
If more than one number is asked for at one time, the requests will be separated by commas. All of the requested numbers should be entered at once, in the order listed, and separated by commas. Each time you make an entry in response to a program request, you must press "execute" to continue.
I have attempted to make all of these programs self-explantory. However, discussions of each program are available here and you can choose whether or not to have each explained. You will be asked whether you want an explanation of each program in turn. In every case a "1" indicates a "yes" and a "0" means "no" (the display will remind you of this each time). As mentioned above, each time you make an entry in response to a program request, you must press "execute" to continue.
Do you want a discussion of the RA-226 program?
F-2
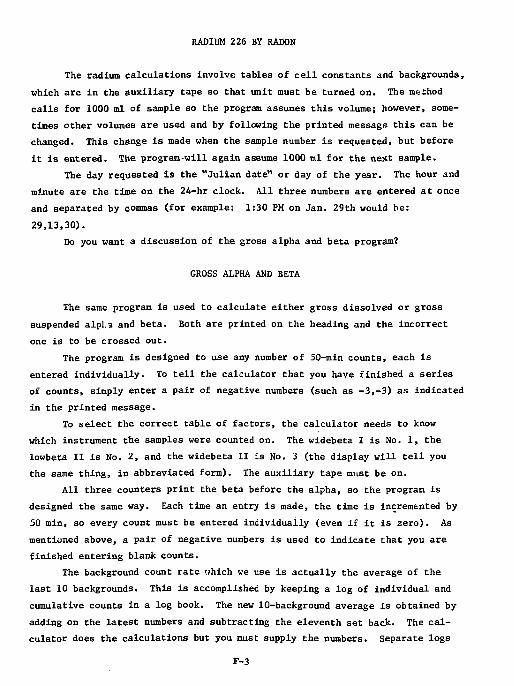
RADIUM 226 BY RADON
The radium calculations involve tables of cell constants and backgrounds, which are in the auxiliary tape so that unit must be turned on. The method calls for 1000 ml of sample so the program assumes this volume; however, sometimes other volumes are used and by following the printed message this can be changed. This change is made when the sample number is requested, but before it is entered. The program-will again assume 1000 ml for the next sample.
The day requested is the "Julian date" or day of the year. The hour and minute are the time on the 24-hr clock. All three numbers are entered at once and separated by commas (for example: 1:30 PM on Jan. 29th would be: 29,13,30).
Do you want a discussion of the gross alpha and beta program?
GROSS ALPHA AND BETA
The same program is used to calculate either gross dissolved or gross suspended alpla and beta. Both are printed on the heading and the incorrect one is to be crossed out.
The program is designed to use any number of 50-min counts, each is entered individually. To tell the calculator that you have finished a series of counts, simply enter a pair of negative numbers (such as -3,-3) as indicated in the printed message.
To select the correct table of factors, the calculator needs to know which instrument the samples were counted on. The widebeta I is No. 1, the lowbeta II is No. 2, and the widebeta II is No. 3 (the display will tell you the same thing, in abbreviated form). The auxiliary tape must be on.
All three counters print the beta before the alpha, so the program is designed the same way. Each time an entry is made, the time is incremented by 50 min, so every count must be entered individually (even if it is zero). As mentioned above, a pair of negative numbers is used to indicate that you are finished entering blank counts.
The background count rate which we use is actually the average of the last 10 backgrounds. This is accomplished by keeping a log of individual and cumulative counts In a log book. The new 10-background average is obtained by adding on the latest numbers and subtracting the eleventh set back. The calculator does the calculations but you must supply the numbers. Separate logs
F-3
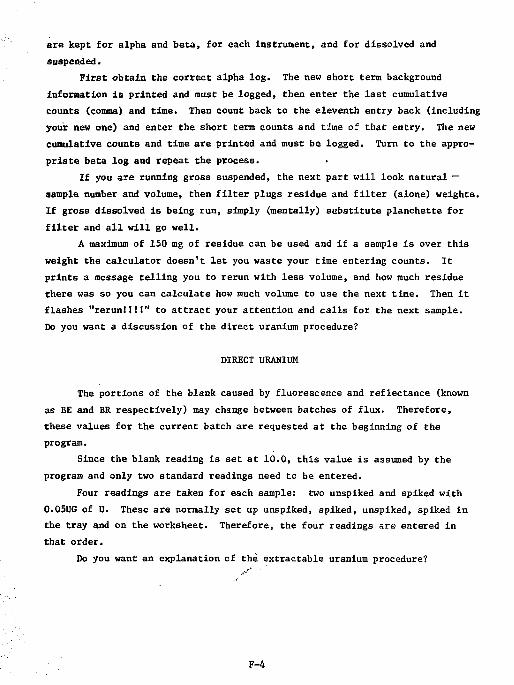
are kept for alpha and beta, for each Instrument, and for dissolved and suspended.
First obtain the correct alpha log. The new short term background information is printed and must be logged, then enter the last cumulative counts (comma) and time. Then count back to the eleventh entry back (including your new one) and enter the short term counts and time of that entry. The new cumulative counts and time are printed and must be logged. Turn to the appropriate beta log and repeat the process.
If you are running gross suspended, the next part will look natural — sample number and volume, then filter plugs residue and filter (alone) weights. If gross dissolved is being run, simply (mentally) substitute planchette for filter and all will go well.
A maximum of 150 rag of residue can be used and if a sample is over this weight the calculator doesn't let you waste your time entering counts. It prints a message telling you to rerun with less volume, and how much residue there was so you can calculate how much volume to use the next time. Then it flashes "rerun!I!!" to attract your attention and calls for the next sample. Do you want a discussion of the direct uranium procedure?
DIRECT URANIUM
The portions of the blank caused by fluorescence and reflectance (known as BE and BR respectively) may change between batches of flux. Therefore, these values for the current batch are requested at the beginning of the program.
Since the blank reading is set at 10.0, this value is assumed by the program and only two standard readings need to be entered.
Four readings are taken for each sample: two unspiked and spiked with 0.05UG of U. These are normally set up unspiked, spiked, unspiked, spiked in the tray and on the worksheet. Therefore, the four readings are entered in that order.
Do you want an explanation of the extractable uranium procedure?
F-4
EXTRACTABLE URANIUM
Since the method normally calls for 400 ml, the program assumes this volume; however, this can be changed by following the printed message before entering the sample number and reading. A volume of 400 ml will again be assumed for the next sample. Do .ou want a discussion of the SR-90 or CS-137 programs?
STRONTIUM-90
Since the method normally calls for 1000 ml, the program assumes this value. If any other volume is used, this can be changed by following the printed message. A volume of 1000 ml will be assumed for the next sample. This program can use any number of 50-min counts. As a signal that you have finished a series, enter any negative number.
Although there are two standards, the results are to be averaged so enter all of the standard counts in one series. In order to correct for incomplete recovery in the separation steps, the original concentration of strontium in the sample must be known and entered when called for.
For cesium-137 the above discussion applies, except that the volume is 500 ml and there is no cesium concentration to be entered. Do you want a discussion of the potassium-40 program?
POTASSIUM-40
This is based on the assumption of normal isotopic ratio. Potassium is determined by atomic absorption spectrophotome:ry. The sample number and potassium concentration are entered and the activity of potassium-40 is printed out. Do you want a discussion of the radium cell constant program?
RADIUM CELL CONSTANT CALCULATION PROGRAM
Each cell's calibration is followed through all five instruments. The day, hour, and minute follow the same conventions used in the RA-226 program. It is assumed that the counting takes place on the same day as the deemanation so only hour and minute are needed for the starting times. The background for
F-5
each cell-instrument combination is needed for the calculation and is entered along with the counts and counting time. Do you want a discussion of the radium data storage program?
RADIUM DATA STORAGE
This program takes the background and cell constant data from the cell log and makes up tabids (on the auxiliary tape and a "hard copy") to be used for RA-226 calculations. Since the log has all the backgrounds for a cell on one page and the constants on another, the program calls for all of the backgrounds for a cell, then the constants, then goes on to the next cell.
After entering the last cell constant, entering a negative number tells the calculator that you are finished. The tables are then stored on the auxiliary tape (it must be on) then a copy is printed. If any errors are found, they can be corrected by following the instructions on the display.
It is important to "relist" after making corrections as this is the only way to get the corrected values on the auxiliary tape. A corrected table will also be printed. Do you want a discussion of the gross alpha and beta factor storage?
GROSS ALPHA AND BETA FACTOR STORAGE
For the calculator to know which instrument is being calibrated, the same numbers are used as in the gross alpha and beta program and are indicated on the display.
Calibration factors are needed for every milligram of residue from 0 to 150 (the calculator keeps track of where you are). Three factors are needed: alpha, beta as SR/Y-90, and beta as CS-137, and must be entered in this order. Example: the display reads "factors for weight 0?" You might punch 0.35,943,1003 "execute". The display would then go on to weight one. After all the factors have been entered, the table is stored on the auxiliary tape and a listing is made. If any errors are found, enter the weight when the "edit: weight (200=relist)" is displayed. At that time, all three factors must be entered. The above display then returns.
It is very important that, if any corrections are made, a relist be executed entering a 200) so that the correct values will be on the auxiliary tape.
F-6
I hope these explanations have helped, and good luck with my programs. The program for this is infile 10, but I am not listing it out since
this run gives the necessary information.
F-7
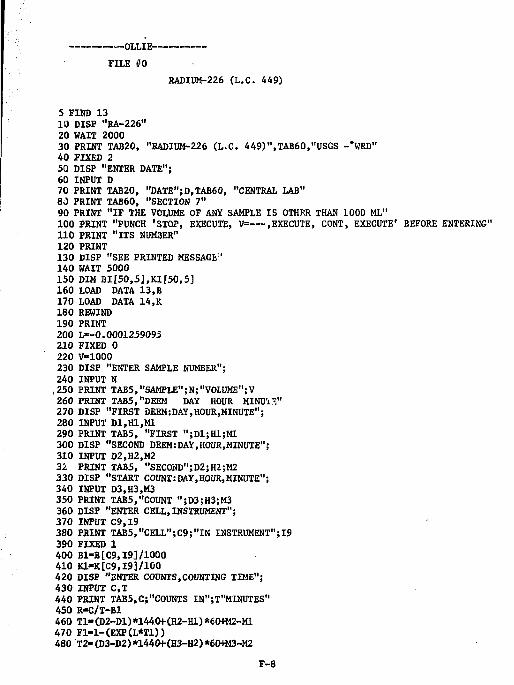
OLLIE FILE #0
RADIUM-226 (L.C. 449)
5 FIND 13 10 DISP "RA-226" 20 WAIT 2000 30 PRINT TAB20, "RADIUM-226 (L.C. 449)",TAB60,"USGS -*WRD" 40 FIXED 2 50 DISP "ENTER DATE"; 60 INPUT D 70 PRINT TAB20, "DATE";D,TAB60, "CENTRAL LAB" 80 PRINT TAB60, "SECTION 7" 90 PRINT "IF THE VOLUME OF ANY SAMPLE IS OTHER THAN 1000 ML" 100 PRINT "PUNCH 'STOP, EXECUTE, V= .EXECUTE, CONT, EXECUTE' BEFORE ENTERING" 110 PRINT "ITS NUM3ER" 120 PRINT 130 DISP "SEE PRINTED MESSAGE" 140 WAIT 5000 150 DIM BI[50,5],KII50,5] 160 LOAD DATA 13,B 170 LOAD DATA 14,K 180 REWIND 190 PRINT 200 L=-0.0001259095 210 FIXED 0 220 V-1000 230 DISP "ENTER SAMPLE NUMBER"; 240 INPUT N ,250 PRINT TAB5,"SAMPLE";N;"VOLUME";V 260 PRINT TAB5,"DEEM DAY HOUR M I N U W 270 DISP "FIRST DEEM:DAY,HOUR,MINUTE"; 280 INPUT D1,H1,M1 290 PRINT TAB5, "FIRST ";D1;H1;M1 300 DISP "SECOND DEEM:DAY,HOUR,MINUTE"; 310 INPUT D2,H2,M2 32 PRINT TAB5, "SECOND";D2;H2;M2 330 DISP "START COUNT:DAY,HOUR,MINUTE"; 340 INPUT D3.H3.M3 350 PRINT TAB5,"COUNT ";D3;H3;M3 360 DISP "ENTER CELL,INSTRUMENT"; 370 INPUT C9.I9 380 PRINT TAB5,"CELL";C9;"IN INSTRUMENT";19 390 FIXED 1 400 B1-B[C9,I9J/1000 410 K1-K[C9,I9J/100 420 DISP "ENTER COUNTS,COUNTING TIME"; 430 INPUT C,T 440 PRINT TAB5,C;"C0UNTS IN";T"MINUTES" 450 R-C/T-Bl 460 T1-(D2-D1)*144C+(H2-H1)*60+M2-M1 470 F1-1-(EXP(L*T1)) 480 T2-(D3-D2)*144OKH3-H2)*60«i3-M2
F-8
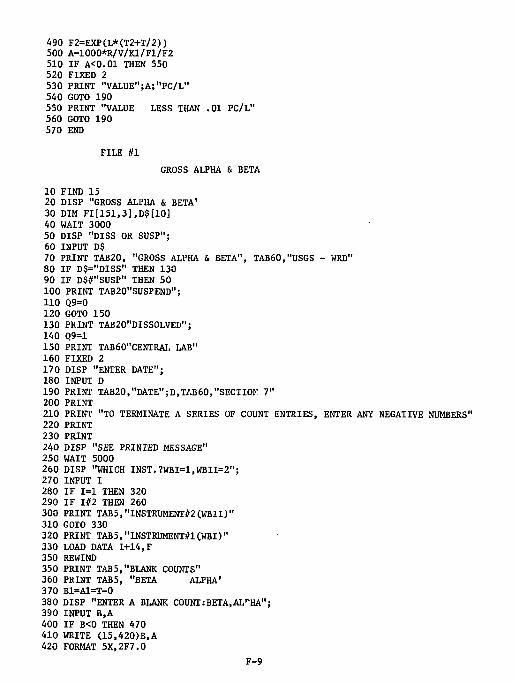
490 F2=EXP(L*(T2+T/2)) 500 A=1000*R/V/K1/F1/F2 510 IF A<0.01 THEN 550 520 FIXED 2 530 PRINT "VALUE";A;"PC/L" 540 GOTO 190 550 PRINT "VALUE LESS THAN .01 PC/L" 560 GOTO 190 570 END
FILE #1 GROSS ALPHA & BETA
10 FIND 15 20 DISP "GROSS ALPHA & BETA' 30 DIM FI[151,3],D$[10] 40 WAIT 3000 50 DISP "DISS OR SUSP"; 60 INPUT D$ 70 PRINT TAB20, "GROSS ALPHA & BETA", TAB60,"USGS - WRD" 80 IF D$="DISS" THEN 130 90 IF D$#"SUSP" THEN 50 100 PRINT TAB20"SUSPEND"; 110 Q9=0 120 GOTO 150 130 PRINT TAB20"DISSOLVED"; 140 Q9=l 150 PRINT TAB60"CENTRAL LAB" 160 FIXED 2 170 DISP "ENTER DATE"; 180 INPUT D 190 PRINT TAB20,"DATE";D,TAB60,"SECTION 7" 200 PRINT 210 PRINT "TO TERMINATE A SERIES OF COUNT ENTRIES, ENTER ANY NEGATIVE NUMBERS" 220 PRINT 230 PRINT 240 DISP "SEE PRINTED MESSAGE" 250 WAIT 5000 260 DISP "WHICH INST.?WBI=1,WBII=2"; 270 INPUT I 280 IF 1=1 THEN 320 290 IF I#2 THEN 260 300 PRINT TAB5,"INSTRUMENT#2(WBII)" 310 GOTO 330 320 PRINT TAB5,"INSTRUMENT#1(WBI)" 330 LOAD DATA 1+14,F 350 REWIND 350 PRINT TAB5,"BLANK COUNTS" 360 PRINT TAB5, "BETA ALPHA' 370 Bl=Al=T-0 380 DISP "ENTER A BLANK COUNT:BETA,AL^HA"; 390 INPUT B.A 400 IF B<0 THEN 470 410 WRITE (15,420)B,A 420 FORMAT 5X.2F7.0
F-9
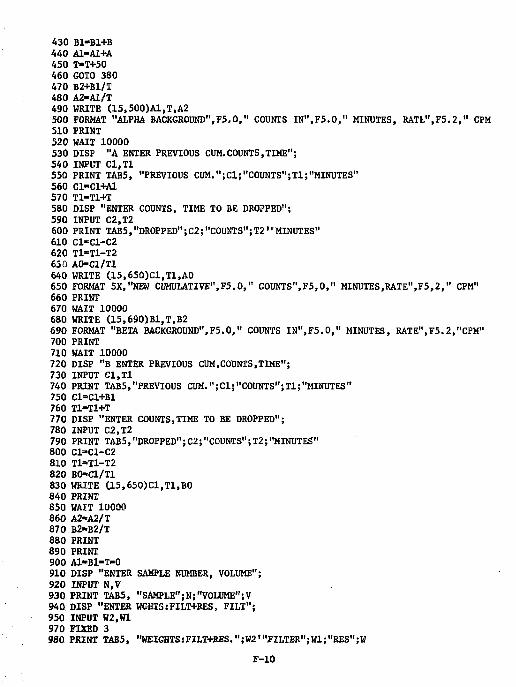
430 Bl-Bl+B 440 Al-Al+A 450 T-T+50 460 GOTO 380 470 B2+B1/T 480 A2-A1/T 490 WRITE (15,500)A1,T,A2 500 FORMAT "ALPHA BACKGROUND",F5.0," COUNTS IN",F5.0," MINUTES, RATt",F5.2," CPM 510 PRINT 520 WAIT 10000 530 DISP "A ENTER PREVIOUS CUM.COUNTS,TIME"; 540 INPUT Cl.Tl 550 PRINT TAB5, "PREVIOUS CUM.";C1;"C0UNTS";T1;"MINUTES" 560 C1-C1+A1 570 Tl-Tl+T 580 DISP "ENTER COUNTS, TIME TO BE DROPPED": 590 INPUT C2.T2 600 PRINT TAB5,"DROPPED";C2;"COUNTS";T2" MINUTES" 610 C1-C1-C2 620 T1=T1-T2 630 A0=C1/T1 640 WRITE a5,650)Cl,Tl,AO 650 FORMAT 5X,"NEW CUMUUTIVE",F5,0," C0UNTS",F5,0," MINUTES,RATE",F5,2," CPM" 660 PRINT 670 WAIT 10000 680 WRITE U5,690)B1,T,B2 690 FORMAT "BETA BACKGROUND",F5.0," COUNTS IN",F5.0," MINUTES, RATE",F5.2,"CPM" 700 PRINT 710 WAIT 10000 720 DISP "B ENTER PREVIOUS CUM,COUNTS,TIME"; 730 INPUT C1.T1 740 PRINT TAB5,"PREVIOUS CUM.";C1;"C0UNTS";T1;"MINUTES" 750 C1=C1+B1 760 Tl-Tl+T 770 DISP "ENTER COUNTS,TIME TO BE DROPPED"; 780 INPUT C2.T2 790 PRINT TAB5,"DROPPED";C2;"COUNTS";T2;"MINUTES" 800 C1=C1-C2 810 T1=T1-T2 820 B0=C1/T1 830 WRITE C15,650)C1,T1,B0 840 PRINT 850 WAIT 10000 860 A2=A2/T 870 B2»B2/T 880 PRINT 890 PRINT 900 A1-B1-T-0 910 DISP "ENTER SAMPLE NUMBER, VOLUME"; 920 INPUT N,V 930 PRINT TABS, "SAMPLE";N;"VOLUME";V 940 DISP "ENTER WGHTS:FILT+RES, FILT"; 950 INPUT W2.W1 970 FIXED 3 980 PRINT TABS, "WEIGHTS:FILT+RES.";W2"'FILTER";W1;"RES";W
F-10
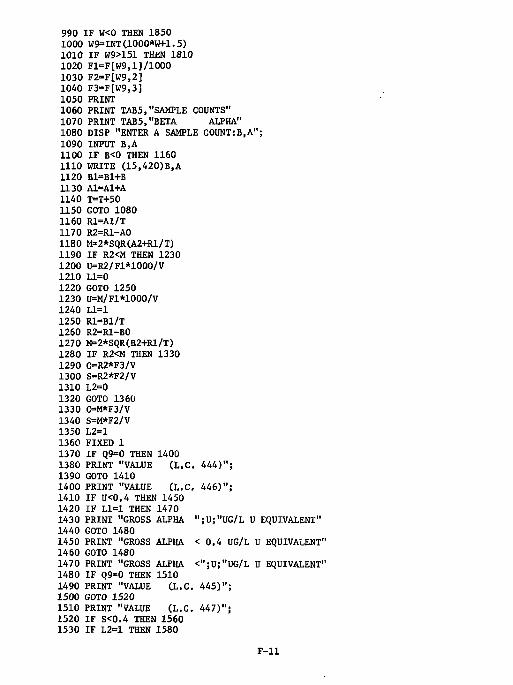
990 IF W<0 THEN 1850 1000 W9=INT(1000*W+1.5) 1010 IF W9>151 THEN 1810 1020 F1=F[W9,lJ/1000 1030 F2=FIW9,2] 1040 F3=F[W9,3] 1050 PRINT 1060 PRINT TAB5,"SAMPLE COUNTS" 1070 PRINT TAB5,"BETA ALPHA" 1080 DISP "ENTER A SAMPLE C0UNT:B,A"; 1090 INPUT B,A 1100 IF B<0 THEN 1160 1110 WRITE (15,420)B,A 1120 B1=B1+B 1130 A1=A1+A 1140 T=T+50 1150 GOTO 1080 1160 R1=A1/T 1170 R2=R1-A0 1180 M*2*SQR(A2+R1/T) 1190 IF R2<M THEN 1230 1200 U=R2/F1*1000/V 1210 L1=0 1220 GOTO 1250 1230 U=M/F1*1000/V 1240 Ll=l 1250 R1=B1/T 1260 R2=R1-B0 1270 M=2*SQR(B2+R1/T) 1280 IF R2<M THEN 1330 1290 C=R2*F3/V 1300 S=R2*F2/V 1310 L2=0 1320 GOTO 1360 1330 C=M*F3/V 1340 S=M*F2/V 1350 L2=l 1360 FIXED 1 1370 IF Q9=0 THEN 1400 1380 PRINT "VALUE (L.C. 444)"; 1390 GOTO 1410 1400 PRINT "VALUE CL.C. 446)"; 1410 IF U<0,4 THEN 1450 1420 IF Ll=l THEN 1470 1430 PRINT "GROSS ALPHA ";U;"UG/L U EQUIVALENT" 1440 GOTO 1480 1450 PRINT "GROSS ALPHA < 0.4 UG/L U EQUIVALENT" 1460 GOTO 1480 1470 PRINT "GROSS ALPHA <";U;"UG/L U EQUIVALENT" 1480 IF Q9-0 THEN 1510 1490 PRINT "VALUE (L.C. 445)"; 1500 GOTO 1520 1510 PRINT 'VALUE (L.C. 447)"; 1520 IF S<0.4 THEN 1560 1530 IF L2=l THEN 1580
F-ll
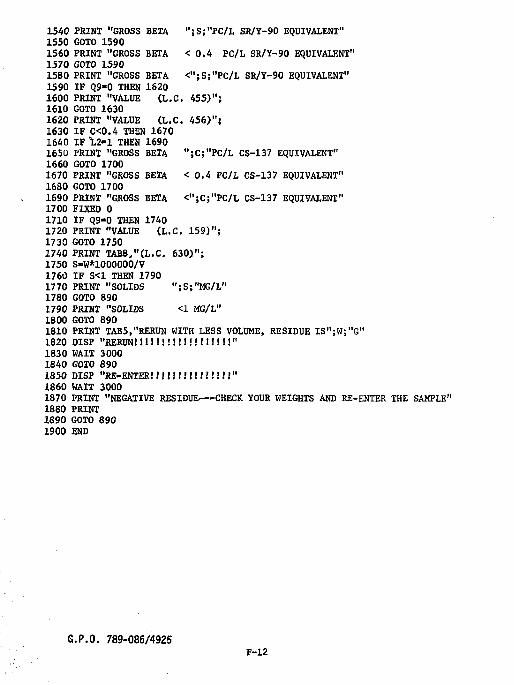
1540 PRINT "GROSS BETA ";S;"PC/L SR/Y-90 EQUIVALENT" 1550 GOTO 1590 1560 PRINT "GROSS BETA < 0.4 PC/L SR/Y-90 EQUIVALENT" 1570 GOTO 1590 1580 PRINT "GROSS BETA <";S;"PC/L SR/Y-90 EQUIVALENT" 1590 IF Q9-0 THEN 1620 1600 PRINT "VALUE (L.C. 455)"; 1610 GOTO 1630 1620 PRINT "VALUE tt.C. 456)"j 1630 IF C<0.4 THEN 1670 1640 IF *L2=1 THEN 1690 1650 PRINT "GROSS BETA ";C;"PC/L CS-137 EQUIVALENT" 1660 GOTO 1700 1670 PRINT "GROSS BETA < 0.4 PC/L CS-137 EQUIVALENT" 1630 GOTO 1700 1690 PRINT "GROSS BETA <";C;"PC/L CS-137 EQUIVALENT" 1700 FIXED 0 1710 IF Q9-0 THEN 1740 1720 PRINT "VALUE (L.C. 159)"; 1730 GOTO 1750 1740 PRINT TAB8,"(L.C. 630)"; 1750 S-W*1000000/V 1760 IF S<1 THEN 1790 1770 PRINT "SOLIDS ";S;"MG/L" 1780 GOTO 890 1790 PRINT "SOLIDS <1 MG/L" 1800 GOTO 890 1810 PRINT TAB5,"RERUN WITH LESS VOLUME, RESIDUE IS";W;"G" 1820 DISP "RERUN!!!!!!!!!!!!!!!!!!" 1830 WAIT 3000 1840 GOTO 890 1850 DISP "RE-ENTER! I'll UH'.lllil" 1860 WAIT 3000 1870 PRINT "NEGATIVE RESIDUE CHECK YOUR WEIGHTS AND RE-ENTER THE SAMPLE" 1880 PRINT 1890 GOTO 890 1900 END
G.P.O. 789-086/4925 F-12