
6 - International Nuclear Information System (INIS)
223
tO r- (N en 6- IGC-126 1991 RADIOCHEMISTRY PROGRAMME /BIENNIAL PROGRESS REPORT ( 1988 - 1989) GOVERNMENT OF INDIA. DEPARTMENT OF ATOMC ENERGY WOIRA GANDHI CENTRE FOR ATOMIC RESEARCH KALRAKKAM
-
Upload
khangminh22 -
Category
Documents
-
view
1 -
download
0
Transcript of 6 - International Nuclear Information System (INIS)

tO r-(N en
6 -IGC-126
1991
RADIOCHEMISTRY PROGRAMME
/BIENNIAL PROGRESS REPORT
( 1988 - 1989)
GOVERNMENT OF INDIA. DEPARTMENT OF ATOMC ENERGY
WOIRA GANDHI CENTRE FOR ATOMIC RESEARCH KALRAKKAM

IGC-126
GOVERNMENT OF INDIADEPARTMENT OF ATOMIC ENERGY
RADIOCHEMISTRY PROGRAMME
BIENNIAL PROGRESS REPORT
[ 1988 - 1989 ]
INDIRA GANDHI CENTRE FOR ATOMIC RESEARCHKALPAKKAM, TAMIL NADU, INDIA

FOREWORD
The %adiochemistry 'Programme has been bringing out biennial progress reports on itsactivities since the inception of the H(adiochemistry Laboratory in 1980. The present report, which coversthe calendar years 1988 and1989, thus marks the completion of the first decade.
The laboratory was set up primarily to provide %&'D support to the development of fastbreeder reactor technology. Thus, the work,programme is directly concerned with the development of<T'B%fuels, chemistry of liquid alkali metals and analytical characterisation of materials. To carry outthis task.and to understand the basic processes, it is necessary to buildup competence in the relevantscientific disciplines. Competence building was, therefore, promoted in the %adiochemistry Programmeand internationally known schools now exist here in the chemistry of alkali metals, thermodynamics,solid state chemistry, materials characterisation etc. This is reflected in the organisation of this report.
In alkali metal chemistry the thrust has been on developing on- line meters as welias theirapplication, corrosion mechanisms, activity transport and sodium batteries. Sufficient attention has beengiven to the underlying science: for example, the thermodynamics of the 9{a-9ti-Q systems. Mightemperature chemistry covers the preparation and characterisation of fuel materials, measurement ofthermophysicaC properties and high temperature mass spectrometry. In the area of fuel reprocessing, thechemistry behind aqueous reprocessing has received the most attention. Some recent studies initiated for

the development of pywchemical reprocessing are aiso described, 'facilities and techniques developed forstudies on irradiatedfuelandradioactive sodium are describedin the section on Tost- irradiation Analysisand9{uclear Chemistry. Our studies on coldfusion are also includedin this section. The various analyticaltechniques developed and standardised for the characterisation of materials are outlined in the sectionon Analytical Characterisation of Materials. The last two sections deal with Analytical Services andInstrumentation and Mechanical Services.
The significant progress made by the 2(adiochemistry (Programme in the last two years isreflected in the number of items covered in this report and the list of publications given at the. end.Though the individual activities are only briefly presented, it is hoped that the report would give anoverview of the worf^of the %adiochemistry Trogramme over the last two years.
I thank, the 'Editorial Committee consisting of %V.Q, "Kutty, S. Vana Varamban,S. Anthonysamy and(D. %arunasagar for editing this report efficiently.
C.K. MATHEWS
Head, Radiochemistry Programme.IGCAR -Kalpakkam.

CONTENTS
FOREWORD i
CONTENTS ///
1.0 CHEMISTRY OF LIQUID ALKALI METALS
1.0.1 Introduction 1
1.1.0 Thermodynamics of Na-M-0 systems
1.1.1 Studies on Na-Fe-0 and Na-Mo-0 systems 3
1.1.2 Reaction of WO3 with liquid sodium and standard Gibbs energies of 4formation of Na2WO4 and Na3\VO4
1.1.3 Reaction of MoO3 with liquid sodium and standard Gibbs energy of 6formation of Na4MoO5
1.1.4 Reaction of Nb2Os with liquid sodium and standard Gibbs energy of 7formation of Na3NbO4
1.1.5 Studies on sodium rust reaction 8
1.1.6 A special DTA set up for studying reactions in alkali metal media 9
1.2.0 Development and applications of sensors
1.2.1.0 Carbon meter
1.2.1.1 Some studies on the decarburisation of Fe - 2 1/4 wt % Cr - 1 wt % 11Mo steel and measurement of carbon activity using an electrochemicalcarbon meter
1.2.1.2 Studies on the measurement of carbon activity and the carbide equi- 12libria in AISI 316 LN stainless steel
1.2.1.3 Studies on the decomposition of sodium carbonate in sodium 14
1.2.2.0 Hydrogen meter
1.2.2.1 Diffusion type hydrogen meter for use in FBTR cover gas 15
1.2.2.2 Studies on reactions of hydrocarbon oils with sodium 16
1.2.2.3 Reaction of molten sodium hydroxide with structural steels 17
1.2.3.0 Studies using p" alumina
1.2.3.1 A novel method for the production of high purity sodium 17
1.2.3.2 Studies on sodium bismuth alloys 18
1.2.4.0 Oxygen meter
1.2.4.1 Measurement of Lower Electrolytic Domain Boundaries of zirconia 20electrolytes
1.2.4.2 Development of coated zirconia sensor for oxygen in sodium 21
111

1.3.0 Batteries
1.3.1 Sodium - metal chloride batteries 23
1.3.2 Studies on sodium (3" alumina interface in sodium batteries 24
1.4.0 Radioactive sodium chemistry loop and activity transport
1.4.1 Radioactive sodium chemistry loop 26137
1.4.2 Studies on the development of radionuclide trap for Cs 26
1.4.3 Overflow type sodium sampler for secondary circuits of FBTR 27
1.4.4 Studies related to activity transport in sodium systems 28
2.0 HIGH TEMPERATURE CHEMISTRY OF ADVANCED MATERIALS
2.0.1 Introduction 31
2. ] .0 Preparation and characterisation of fuel material
2.1.1 Calculation of vapour pressures in the U-Pu-C-0 system for optimisa- 33tion of the preparation of carbides by carbothermic reduction
2.1.2 Commissioning of the preparation laboratory 34
2.1.3 Measurement of the carbon potential of the uranium - plutonium 34mixed carbide fuel by gas equilibration
2.1.4 Measurement of the carbon potential of the mixed uranium - 35plutonium carbide by electrochemical carbon meter
2.2.0 High temperature calorimetry
2.2.1 Thermodynamic properties of ternary oxides of fission products by 39calorimetric measurements
2.2.2 Free energies of formation and relative stabilities of strontium com- 39pounds
2.2.3 Calorimetric investigations on uranium - aluminium alloys 41
2.2.4 Calorimetric investigations on cerium - magnesium liquid alloys 42
2.2.5 Calorimetric studies of cerium - copper and cerium - copper - mag- 44nesium liquid alloys
2.3.0 High temperature mass spectrometry
2.3.1 A study of chromium-tellurium system using high temperature mass 46spectrometry
2.3.2 A mass spectrometric study of the homogeneity range and ther- 47modynamic properties of molybdenum tellurides
2.3.3 High temperature mass spectrometric study of nickel - aluminium - 48hafnium system
IV

2.3.4 Vapour density measurements of some technically important metal 49halides
2.4.0 Thermal analysis and thermal conductivity
2.4.1 A thermogravimetric study of the oxidation behaviour of uranium 51monocarbide
2.4.2 Reaction behaviour of the intermetallic UPd3 in oxidising environment 52
2.4.3 Study of the electrical conductivity of U3O8 53
2.4.4 Study of the thermal conductivity of the zirconates of barium and 53strontium
2.4.5 Development of rare earth borides for control rod applications 54
2.4.6 Differential thermal analysis studies of Ni-Al-X (X=Hf,B) systems 55
2.5.0 Thermal expansion measurements
2.5.1 Thermal expansion studies on some rare earth pyrohafnates by high 57temperature x-ray powder diffractometry
2.6.0 Studies on oxide superconductors
2.6.1 Effect of iron doping and oxygen stoichiometrv on infrared absorption 58in YBa2Cu3O7-x
2.6.2 Experimental study of the decomposition of YBa2Cu3O7- 59
3.0 CHEMISTRY OF NUCLEAR FUEL REPROCESSING
3.0.1 Introduction 61
3.1.0 Aqueous reprocessing
3.1.1 Dissolution of plutonium dioxide in HC1 medium 63
3.1.2 Photochemical dissolution of PuO2 in HC1 medium near ambient 64temperatures
3.1.3 Reprocessing of carbide fuels : conversion of carbide to nitride as a 65head-end step
3.1.4 Chemical head - end steps for aqueous reprocessing of carbide fuels 66
3.1.5 Empirical correlation of the effect of diluents on third phase formation 67
3.1.6 Solubility of uranyl nitrate trihydrate in HCI-H2CI2O4 mixtures 68
3.1.7 Direct photochemical destruction of oxalic acid in nitric acid medium 69
3.1.8 Photochemical generation of uranium (IV) in hydrochloric acid 70
3.1.9 Third phase formation in the extraction ov Th (IV) by mixtures of 71TLA and TBP in n-dodecane
3.1.10 A gas thromatographic study of degradation of paraffin diluents 72

3.1.11 Determination of carbon and hydrogen in liquid hydrocarbons by x- 73ray fluorescence spectrometry
3.1.12 Infra-red spectral studies on thorium nitrate - TBP complexes 74
3.1.13 Estimation of MBP and DBP in TBP using infra-red spectroscopy 75
3.2.0 Non-aqueous reprocessing
3.2.1 Studies on pyrochemical reprocessing 783.2.2 Studies on the separation of uranium from advanced fuel materials by 78
electrorefining
4.0 POST-IRRADIATION ANALYSIS AND NUCLEAR CHEMISTRY
4.0.1 Introduction 81
4.1.0 Hot ceils 83
4.2.0 Out-of-pile simulation experiments 85
4.3.0 In-house development of a retained fission gas analyser 86
4.4.0 Commissioning of lead cells 88
4.5.0 Development of a micro-gamma scanner 89
4.6.0 Studies on fuel-clad chemical interaction (FCCI)
4.6.1 Development of an experimental facility to study the effects of radia- 90tion on FCCI
4.7.0 Nuclear chemistry
4.7.1 Non-destructive analysis of plutonium 92A.I.2 Analysis of primary sodium 934.7.3 Cold fusion 944.7.4 Development of a nuclear microprobe 95
5.0 ANALYTICAL CHARACTERISATION OF MATERIALS
5.0.1 Introduction 97
5.1.0 Inductively coupled plasma mass spectrometry (ICP-MS)
5.1.1 Determination of trace metals in uranium oxide by using ICP-MS 99
VI

5.1.2 Detennination of toxic elements in ground water by hydride genera- 100tion ICP-MS
5.1.3 Determination of zirconium in TBP/n-dodecane by ICP-MS 102
5.1.4 Analysis of steels by ICP-MS 102
5.2.0 Optical emission spectrography
5.2.1 Glow discharge lamp as light source for optical emission spectrography 105
5.2.2 Determination of trace metals in U by optical emission spectrog- 106raphy
5.3.0 Atomic absorption spectrophotometry (AAS)
5.3.1 Detennination of trace metals in uranium oxide by electrothermal AAS 108
5.4.0 High performance liquid chromatography (HPLC)5.4.1 Separation of rare earths by HPLC on reversed phase column modified 110
by camphor-iO-sulphonic acid
5.4.2 Separation of uranium from thorium by HPLC 110
5.4.3 On-line gamma monitor for HPLC 111
5.4.4 Simultaneous detennination of alkaline earth metal ions in reactor 112grade sodium using HPLC
5.4.5 Detennination of weak acid anions by single column ion chromatog- 113raphy
5.4.6 Detennination of DBP and MBP in TBP by ion chromatography 114
5.4.7 Estimation of alkali metals using non - suppressed ion chromatography 115
5.5.0 Miscellaneous analyses and software development
5.5.1 Estimation of hydrazine in high purity water samples 116
5.5.2 Estimation of TiC»2 in ia an ilmenite sample 116
5.5.3 Determination of iron in presence of uranium 117
5.5.4 Automation of XRD and XRF instruments and software development 118
6.0 ANALYTICAL SERVICES 119
7 0 INSTRUMENTATION AND MECHANICAL SERVICES
7.0.1 Introduction 125
Vll

7.1.0 Instrumentation
7.1.1 Augmentation of the radioactive sodium chemistry loop 127
7.1.2 Instrumentation for the hot cell facility 127
7.1.3 Data acquisition system for cold fusion research 129
7.1.4 Data collection module for the thermal analyser 130
7.!.5 Instrumentation for the lead cells and special in-ceil experiments 130
7.2.0 Mechanical engineering services 132
CHEMISTRY COLLOQUIA 135
PUBLICATIONS 137
VUI

1.0
CHEMISTRY OF LIQUID ALKALI METALS
1.0.1
Introduction
The interaction between liquid sodium with the impurities present therein andthe structural material can lead to corrosion problems in reactor circuits. Some of the corrosionproducts are radioactive and their deposition in the cooler regions of the coolant circuit can createoperational problems in the reactor. Since iron is the major component of steel and oxygen themajor impurity, reactions between sodium, iron and oxygen were studied and Na-Fe-0 phasediagram was established in this laboratory. The threshold oxygen potentials for the formation ofternary oxides of sodium or potassium with chromium, niobium, tungsten, molybdenum and ironhave been established using a variety of techniques such as EMF cells, solubility measurementsand isopiestic equilibrations. A new liquid metal differential thermal analysis set up was developedand used to study the reactions of v.irious oxides with sodium and potassium.
Development of or-line meters for oxygen, hydrogen and carbon is an importantaspect of our work programme. Monitoring the sodium coolant for hydrogen and oxygen will helpto detect steam generator leaks at the very inception. The electrochemical hydrogen meterdeveloped in this laboratory has been put into use at FBTR secondary circuits. This meter wasused in capsule experiments also for studying kinetics of the the reaction of sodium with oil andrust. The kinetics of caustic attack or. different steam generator materials was studied barometri-cally. These data will help to c dculate how fast the leaks can expand. In order to detect steamleaks during FBTR start up a new cover gas meter has also been designed and is being fabricated.

2 Alkali Metals
Monitoring sodium for its carbon activity is important because the prevailingcarbon potential in sodium is responsible forcarburisation - decarburisation problems. 7?ie electrochemical carbon meter developed here was used for measuring the carbon potential of differentsteels and their carburisation kinetics. This meter was also used for the measurement of the carbonpotential of the FBTR fuel.
A substitute for the expensive thoria electrolyte used in oxygen meter has beenworked out. LEDB of CSZ and YSZ were measured at low temperatures for the first time andshown to be adequate for use in sodium if operated at low temperatures. A new coated zirconiaoxygen sensor was developed and used in place of YDT.
The process of formation of radioactive corrosion products and their transportin sodium circuits is not well understood. The radioactive sodium chemistry loop, designed andconstructed at this laboratory to generate data and develop models for the transport of radioactivityin reactor loops, was commissioned and operated . Capsule experiments to measure diffusivityand distribution coefficient of " Mn in steel were performed. Studies on the capacity of graphitefor the uptake of 'Cs and the kinetics of the process were carried out to develop traps for " Csin primary sodium. A new overflow sampler for sampling FBTR secondary sodium was alsodesigned and fabricated.
There is a strong interest in sodium-bonded metallic fuels for use in future fastreactors. Thus there is a need to study the interaction between various Fission product metals andsodium. Relevant binaries and ternaries of sodium are being studied in EMF cells based onbeta-alumina. The results of these expriments are also described. A new method to producenuclear and battery grade sodium using beta-alumina is also being developed.
Deteriorating environment and depleting petroleum reserves point to need forelectric vehicles in future. Sodium batteries are strong candidates for use in these vehicles andin load levelling. Studies on sodium electrodes of these batteries resulted in the identification ofthe problems at the anode and in devising means of improving electrolyte performance. This workincludes the development of Na-FeCl2 batteries also.

Alkali Metals 3
1.1.0THERMODYNAMICS OF Na-M-0 SYSTEMS
l.l.l
Studies on Na-Fe-0 and Na-Nb-0 systems
Studies on Na-Fe-0 system :
The interactions between iron and sodium which contains dissolved oxygen play adecisive role in the corrosion and mass transfer of structural steels in high temperature sodium-steel systems. Thermodynamic investigation on Na-Fe-0 system was started in order to understandthese phenomena. To elucidate the equilibrium phase fields, various experiments such as in-sodiuinequilibrations, pseudo-isopiestic equilibrations, DTA and solid state reactions between oxides ofiron and sodium of varying compositions were carried out. Oxygen potentials in phase fieldinvolving liquid sodium were obtained by measuring the equilibrium oxygen concentrations inliquid sodium refluxed with iron oxide [1].
The results of the pseudo-isopiestic equilibrations indicated that the compoundNa4FeO3(s) and Fe(s) are the only products when different iron oxides were equilibrated at 923 Kwith sodium at vapour pressures of 1408 and 880 Pa. The experiment in which the sodium vapourpressure was 4.76 Pa and the equilibration temperature was 773 K, also gave the same results.
The results of pseudo-isopiestic equilibration studies in conjunction with the results ofin-sodium equilibrations [2] carried out earlier indicate that Na4FeO3 (s) is the ternary compoundthat coexists with Fe(s) and Na(l) at temperatures above atleast 773 K and that Na2O(s) and Fe(s)co-exist with liquid sodium upto 623 K. This is in agreement with measurements of oxygenconcentration in liquid sodium containing iron which showed a slope change at 626 K. The oxygenconcentration measured below 626 K corresponded to the saturated solubility of oxygen in sodiumindicating the presence of the phase field Na(l)-Na2O(s)-Fe(s) upto 626 K.
DTA runs carried out earlier have recorded the presence of a reversible process at760 + 6 K which is corroborated by the recent in-sodium oxygen potential measurements usingan EMF technique reported in ref.3. These results in conjunction with the in-sodium and thepseudo- isopiestic equilibration results indicate the existence of the phase field Na(l)-Fe(s)-Na4FeO3(s) above 760 K.
Reactions between oxides of iron (FeO ,Fe2O3) and oxides of sodium (Na2O, Na2O2)in different molar ratios were carried out in sealed vessels at 923 K and at 873 K for durationsexceeding 300 hours. The equilibrium products observed in solid-state reactions indicate theco-existence of the two phase fields at 923 K:
i) Na4FeO3(s) - Na2FeO2(s) - Fe(s) and
ii) Na2FeO.2(s) - NaFeO2(s) - Fe(s)
The XRD pattern obtained for Na2FeO2 (s) formed from Na2O (s) and FeO(s) takenin 1:1 ratio as well as from Na2O2 (s) and Fe(s) in 1:1 ratio differs from the one reportedby Wu et. al.[4j who also adopted a similar procedure for the preparation of this compound.

.4 Alkali Metals
From the above results, the isothermal cross section of the partial phase diagram of Na-Fe-Osystem at 923 K was deduced and reported [5].
Studies on Na-Nb-0 system :
In-sodium equilibration studies were carried out at several temperatures in the range623 K to 923 K, by adding a few gms of Nb2Os in liquid sodium, equilibrating it for more than48 hours and then characterising the products after distilling off excess sodium. The resultsindicated that the ternary compound Na3NbO4 is formed in liquid sodium above 623 K. Niobiummetal was present along with Na3NbO4 as equilibrium products at 923 K and at 623 K. Pseudo-isopiestic equilibration of Nb20s with sodium of vapour pressure 880 Pa at 923 K gave Na3NbO4as the equilibrium product. Further work is in progress.
References:/ / / R. Sridharan, D.Krishnamurthy and C.K.Mathews,J.Nucl. Mater. 167(1989)265.
[2] V.Ganesan, R. Sridharan, T. Gnanasekaran and C.K. Mathews, "Studies on Na-M-0 (M= Fe, Ni)systems and measurements of thermodynamic properties", in Proc. Fourth Int. C.onf. on Liquid MetalEngineering and Technology, Avignon, France, volume 3 (1988) p.533
[3j N.P. Bhat and H.U. Borgstcdt, J. Nucl. Mater. 158 (1988) 7.
[4]P.C.S. Wu. P. Chiotti. andJ.T.Mason,Proc. Int. Conf. onLiquidMctal Technology inEnergyProduction,Champion, Pennsylvania, USA, CONF-760503-P2 (1976) P.638.
[5J R. Sridharan, T. Gnanasekaran, G. Periaswami, G.V. Subbc Rao and C.K. Mathews, " Studies onequilibrium phase fields in Na-Fe-0 system", paper presented at the Int. Symp. on Thermochemistry andChemical Processing, November 20-22, 1989, Kalpakkam.
Contributors:Ft. Sridharan, T. Gnanasekaran and C.K. Mathews
1.1.2
Reaction of WO3 with liquid sodium and standard Gibbs energies of forma-tion of Na2WO4 and Na3WO4
Unlike most of the transition metals like Fe, Cr, Mo, Nb and Ta which form only oneternary oxide in liquid sodium[l],tungsten forms two ternary oxides depending upon tempe ratureand oxygen concentration of the liquid metal[2]. Consequently there should exist three-phasefields, a) Na + W + Na2O, b) Na + W + Na2\VO4 and c) Na + W + Na3WO4 in liquid sodiumat distinct temperature ranges. In order to confirm this, WO3 was equilibrated in liquid sodiumat different temperatures (473 to 808 K). The reaction products identified by XRD (table 1.1.2.1)confirmed the existence of the above three phase fields.
Oxygen potentials of the equilibrated mixture (Na + WO3) at different temperatures(503 to 873 K) were measured by estimating the oxygen concentration of the liquid metal at

Alkali Metals 5
equilibrium by the vacuum distillation method[3]. The results (fig. 1.1.2.1) show three distinctregions corresponding to the above three- phase fields. The transformation of (a) to (b) and (b)to (c) takes place at 540 K and 635 K respectively.
The oxygen potential for the latter two phase fields (b) and (c) were fitted into linearequations:
AG(O:) (Na + W + Na2WO4)/(J mol"1) = -786696 + 178.87(T/K) (1)
AG(O2) (Na + W + Na3WO4)/(J mo!'1) = -765512 + 145.37(T/K) (2)
Standard Gibbs energies of formation derived for the two ternary oxides are comparedin table 1.1.2.2 with the literature values measured by using solid electrolyte galvanic cells [4,5].
Table 1.1.2.1Equilibration of WO3 with liquid sodium
Temp.
(K)
473608708808
time
(h)
24482424
products
WW i
WH
WH
+ Na2Oh Na2WO4h Na3WO4
f- Na3WO4
Table 1.1.2.2Gibbs energies of formation of Na2W()4 and Na3WO4
AG°f(J mol"1) = A + B(T/K) AG°f (kJ mol"1)-A B 500 K 600 K
Na:WO4 1573392 357.74 -1394.5 -1358.7 This study1498041 196.22 -1399.9 -1380.3 Ref[5]
700 K 900 KNa3WO4 1531024 290.74 -1327.5 -1269.4 This work
1497260 209.20 -1350.8 -1309.0 Ref[4]1680973 446.48 -1368.4 -1279.1 Ref[5]
References :/ / / N.P. Bhat andH.U. Borgstedt, WerkstojfundKorrosion 39 (1988) 115.
[2] M.G. Barker, Rev. Int. Hautes Temp. Refract. 16 (1979) 237.
[3] D. Krishnamurthy, N.P.Bhat and C.K. Mathews, Int. Conf. Thermochemistry and Chemical Processing.Nov.20 - 22(1989),Kalpakkam.
[4] SA. Frankham, PhD Thesis,Nottingham University,UK,(1982).

I—
, L —
2.1
2. 0
1.9
I. 1.8-
o
CP
80 CT /
7 0 °K
O'Ju
c \
1.6-\
1.0 1.2 1.61G3K/ T
\°v J.
2.0
1.1.2.1. Oxygen concentration of the equilibrated mixture ( Na + WO3 ) as a function oftemperature

6 Alkali Metals
[5j N.P. Bhat andH.U. Borgstedt, Thermodynamic stabilities ofNaiWOn and NQIWOA in liquid sodium (thisreport).
Contributors:D. Krishnamurthy, N.P. Bhat and C.K. Mathews
1.1.3
Reaction of M003 with liquid sodium and standard Gibbs energy of formation of
Gibbs energies of formation of ternary oxides can be calculated by measuring theoxygen concentration in liquid sodium under the conditions of three phase equilibrium. In orderto find the suitability of the present technique, a well established (Na + Mo + Na4MoOs) systemwas taken and studied.
The experiment involves the measurement of oxygen potentials of the equilibratedmixture (Na + MoO3) at different temperatures (705 to 931 K) by this novel technique in whichequilibrium oxygen concenrration(C) of the liquid metal is measured and oxygen potentialcalculated by the equation
AG(O2) = 2 AG°f(Na2O) + RTlr. [C/C(sat)] (1)
The measured oxygen concentrations as shown in fig. 1.1.3.1 represent Na + Mo +Na2O phase field at lower three temperatures and Na + Mo + Na4MoOs phase field athigher temperatures. A least square fit of the data for the latter phase field yielded
AG(O2)(Na + Mo + Na4MoOs)/(J mol"1) = -786116 + 202.05(T/K) (2)
This is in very good agreement with the literature data measured by using solidelectrolyte galvanic cells [1] as seen in equation 3.
AG(O2)(Na + Mo + Na4MoO5)/(J mol'1) = -762889 + 174.45(T/K) (3)
In the temperature range 681.1 to 931 K AG(O2) from the two measurements agreewith each other to within + 4kJ. It is known that above 681.1 K the system is in the phase fieldNa + Mo + Na4MoOs [2]. The equilibrium reaction can be represented as:
4Na(l) + Mo(s) + 5[O]dissolved = Na4MoOs(s) (4)
Using the above equation as well as equation 2, the standard Gibbs energy of formationof Na4MoO5 is obtained as
AfG°m (Na4MoO5,s)/(J mol'1) = -1965290 + 505.13(T/K) (5)
In-sodium emf measurement gave the free energy of formation of this compound as

Ea.a.
eno
3-10
2 - 9 0
2-7QI
2.50
2.30H
2 . 1 0 -
1.90 U
1 .70
1-50 J i i i I I i i i L
1.10 1.26 1.42
103 K/T
L I I i i I i i
1.58 1.74
1.1.3.1. Oxygen concentration in liquid sodium after equilibrating with MoO3 as afunction of temperature

Alkali Metals 7
A<G°m (Na4MoO5,s)/(J mol'1) = -1907223 + 436.12(T/K) Ref.2 (6)
AfG°m (Na4MoO5,s)/(J mol'1) = -1981935 + 527.5O(T/K) Ref.3 (7)
It can be seen that this data compares well with the one reported in this work.
References:/ / / T. Gnanasekaran,K.H. Mahendran, G. Periaswami, C.K. Mathews andH.U. Borgstedt, J. Nucl.Mater.,
150(1987)113.
[2] T.Gnanasekaranfh.D. Thesis (1987), University of Madras, India.
[3] N.P. Bhat, Private communication.
Contributors :
D. Krishnamurthy and C.K. Mathews
1.1.4
Reaction of Nb2Os with liquid sodium and standard Gibbs energy of formationof Na3Nb04
Gibbs energies of formation data reported in literature for NbO and Na3NbO4 indicateihe existence of Na + NbO + Na3NbO4 phase field in Na - Nb - O system [1] contrary to thereported [2,3] existence of Na + Nb + Na3NbO4 phase field. In order to confirm this, Nb2Oswas equilibrated with liquid sodium at different temperatures (600 to 800 K) and the reactionproducts were identified by XRD. At all temperatures the reaction products were NbO andNa3NbO4 confirming the existence of Na + NbO + Na3NbO4 phase field.
In separate experiments oxygen potentials of the equilibrated mixture at differenttemperatures (423 to 874 K) were measured by a novel technique [4] in which equilibrium oxygenconcentration (C) in the liquid metal is measured and oxygen potential calculated by the equation,
AG(O2) = 2 A G°KNa2O) + 2RTln [C/C(sat)| (1)
The measured oxygen concentrations as shown in fig. 1.1.4.1 represent Na + Nb + Na2Ophase field at lower two temperatures and Na + NbO + Na3NbO4 phase field at higher temperatures.A least square fit of the data for the latter phase field yielded,
AG(O2)/(J mol"1) = -766117 + 128.86(T/K) (2)
This is in fair agreement with the literature data measured by using solid electrolytegalvanic cells [3].
AG(O2)/(J mol"1) = -752333 + 90.56(T/K) (3)

n / o I\J • if V I—
1.3 1.5 1.71 0 3 K / T
1.9
\
\ :
2.1 2.3
1.1.4.1. Oxygen concentration of the equilibrated mixture ( Na + Nb2Os ) as a function oftemperature

8 Alkali Metals
Standard Gibbs energy of formation of \a3NbO4 was calculated from the measuredoxygen potentials by the equation,
AG(O:)(Na + NbO + Na3N'bO4) = 2/3 | A G°i(Na3NbO4) - A G°f(NbO)] (4)
The results are presented in table 1.1.4.1. In ref.[3] the oxygen potetnials measured forthe equilibration mixture (Na + Nb2O.s) is assumed to be for the phase fit-Id Na + Nb + Na3NbO4and the standard Gibbs energy of formation of Na3NbO4 calculated. Our results of equilibrationexperiments have confirmed the phase field Na + NbO + Na.iNbO4 for the reaction of Nb2Oswith liquid sodium. Hence the oxygen potential values measured in ref.j3] should correspond toNa + NbO + Na3NbO4 phase field. The corrected standard Gibbs energy of formation based onabove assumption is also given in table 1.1.4.1.
Table 1.1.4.1Gibhs energy of formation of Na3iS'b()4
AG°f(J mol"1) = A + B(T/K) AGor(kJ mol'1)-A B 500 K 900 K Ref
1557661 275.17 1420.0 1310.0 This study1504666 181.12 1414.1 1341.6 Ref|311536985 218 62 1427.7 1340.2 Ref|3]
References:
/ / / /V.P. RhdtandH.li. Borystedt. WerkstoffundKorrosion J9 (1988) 115.
12j M.G. Barker. A.J. Hooper andDJ. Wood, J. Chem. Soc. Dalton Trans. (1974) 55.
[31 S.A. Frankham, PhD Thcsis.Nomnghtim University.UK,(1982).
/4J D. Krisiitiamunhy, N.P.Bhiit and C.K. Mathcws. Int. Conf. Thermochemistry and Chemical Processing,Nov.20 - 22 <1989),Kalpakkam.
Contributors :D. Krishnamurthy, N.P. Bhat and C.K. Mathews
1.1.5
Studies on sodium-rust reactions
Ferritic steels such as 2 1/4 Cr-1 Mo steel find application in the construction of steamgenerator and sodium storage tanks. These components, upon storge, are prone to atmosphericcorrosion leading to the formation of rust. The nisi thus formed can react with sodium at elevatedtemperatures, releasing hydrogen which will have deleterious effect on the mechanical propertiesof such components. Hence reactions between rust and liquid sodium at various temperatureswere carried out to understand such reactions.

; 'C i
/• \ - 7 23 K- c:: • \ . x
7 2 3 K '.'-' f ? n - R u n )
•"iO .-'\ -.683 K
623 \-\^
•••-. :0 16 2C 22 2/ . 2 6
Time ( mnjicj) £v
1.1.5.1. Results of sodium-rust reactions at various temperatures

Alkali Metals 9
Reactions between rust ( y - FeOOH) and liquid sodium were carried out in a static-system described elsewhere [ 1 ], in the temperature range of 623 to 723 K. The hydrogen releasedwas measured using an electrochemical hydrogen meter employing CuCl2- 5% CaH2 as thehydrogen ion conducting solid electrolyte and Li(l)/LiH(s) as the reference electrode. The detailsof construction of this meter are described elsewhere [2]. The variation of hydrogen meter outputwith the addition of rust samples at various experimental temperatures are showen in fig. 1.1.5.1.It can be seen from the plots that at 723 K, the increase in the hydrogen potential of the systemis very rapid and the reaction attains 95% completion in 1.2 min as against the results at 623 Kwhere the increase in hydrogen potential is gradual and the reaction attains 95% completion in11.5 min. Considering the relative stabilities of the binary compounds of sodium in Na-O-Hsystem and from the knowledge of the thermodynamic properties of Na-Fe-0 system, it can bededuced that at temperatures below 693 K and above 760 K, the hydrogen potential of the systemcould correspond to that of Nai'l)-NaH(s) equilibrium and in the intermediate temperatures, thehydrogen potential could be dictated by Na(l)-NaOH(l) equilibrium. The experiments thus showthat reactions between sodium and rust could give rise to sudden increase in the hydrogen potentialin sodium which could lead to hydrogen embrittlement of steels.
References:[1 i V. Cane sun, IJ. Muralidaran.G. Periaswami andC.K. Mathews, in: Proc. Nad. Symp. on Electrochemical
Techn<>logy & Instrumentation, Kalpakkam, India, Dec. 1988, p.153.
[2} V. Gancsan, T. Gnanasckaran, R. Sridharan, G. Periaswami and C.K. Mathews, in: Proc. Third Int.Conf. on Liquid Metal Engineering & Technology, Oxford, April 1988, w!.l ,p.369.
Contributors :V. Ganesan, P. Muralidaran, G. Periaswami and C.K. Mathews
A special DTA set up for studying reactions in alkali metal media
Study of reactions between oxides and alkali metals is of interest in understandingwetting phenomena and constructing phase diagrams. Differential Thermal Analysis (DTA) isa convenient technique to study the reactions. However, alkali metals have high vapour pressuresand are very reactive. Commercially available DTA instruments are hence not easily adaptablefor this purpose. A special DTA equipment was therefore designed and put to use.
The >chematics of the DTA assembly and the capsule fabricated are shown in fig. 1.1.6.1.The sample holder was made of pyrophillite and enclosed in a metallic chamber. Inconel sheathedehromel- alumel thermocouples were used to measure the temperatures. A nichroine resistancefurnace closed at one end was used for heating the assembly.
The capsules made of stainless steel / nickel were prepared and closed hermetically bypulsed TIG welding after filling them with reaction constituents. The sample crucible consistedof '.he alkali metal and the oxide of interest whereas the reference crucible consisted of only the

A TEMPERATURE MEASUREMENT (SAMPLE)
B PARC 113 PREAMPLIFIER
1,2 REFERENCE AND SAMPLE CAPSULES3 CERAMIC SUPPORT
U DIFFERENTIAL THERMOCOUPLE5 CONTROL THERMOCOUPLE
6,7 PYROPHYLLITE SAMPLE HOLDER AND LID
8,9 METALLIC CHAMBER AND LID
10 QUARTZ TUBE11 FURNACEC RECORDER
1.1.6.1. Special DTA setup to hai.Jv alkMli samples

10 Alkali Metals
alkali metal. The differential output from the thermocouples were recorded through a PARC 113Pre-amplifier Reaction patterns of fourteen different oxides of transition metals such as Fe, Cr,Ni etc. wit'i liquid sodium and potassium were studied using this set up [1|. The reactiontemperatures of liquid potassium with the oxides '.vere lower compared to those obtained withliquid sodium indicating that wetting of structural materials by these two liquid metals wouldfollow \\\c same order. A reversible transformation observed at 760 + 6 K during the DTA runswith iron ox:t!es and sodium could be used to deduce the partial phase diagTam of Na- Fe-O system
References :I JIT. Gnanasekaran. K.H.Mahendran, R.Sridhiran G. Periaswami andC.K. Mathews, "Study of reactions
involving liquid alkali metals using a specially -node DTA set-up", in Proc. Fourth Int. Conf. on LiquidMetal Engineering and Technology, Avignon, France, volume 2, (1988)p. 521.
12j R. Sridharan, T. Gnanasekaran, G. Pcria-wami, G.V. Suhba Rao and C.K. Maihews, " Studies onequilibrium phase fields in Na-Fe- 0 system", paper presented at the Int. Symp. on Thermochemistryand Chemical Processing, November 20-22.1989, Kalpakkam.
Contributors:T. Gnanasekaran, ft Sridharan, K.H. Mahendran and G. Periaswami

Alkali Metals 11
1.2.0
DEVELOPMENT AND APPLICATIONS OF SENSORS
1.2.1.0
CARBON METER
1.2.1.1
Some studies on the decarburization and measurement of carbon activity of Fe-2 1/4 wt.% Cr-1 wt.% Mo steel using an electrochemical carbon meter
Ferritic steels with a composition of Fe-2 1/4 wt.% Cr - 1 wt.% Mo are beingemployed as steam generator materials in last reactors. The present studies are aimed at measuringthe carbon activity and understanding the decarburization behaviour of this material.
The specimen, in the form of foils (200 |J.m thickness) were annealed (to redissolveany precipitated carbide phases, present initially) by heating at 1223 K in vacuum for 7 ks.
In order to measure the carbon activity, the annealed foils were immersed in distilledsodium. The probe of the electrochemical carbon meter [ 11 was kept dipping into the sodium.The system was heated to the desired experimental temperature in a furnace. The equilibriumvalue of the EMF was measured and from this the carbon activity of the specimen was calculated.The carbon content in the equilibrated specimen was determined by chemical analysis. Thus arelation between carbon activity and carbon content was established. This experiment was repeatedat different temperatures and the results are given in Table 1.2.1.1.1.
Table 1.2.1.1.1Measurement of carbon activity of ferritic steel
Specimen Duratioi: of Equilibrium Temp. Final Carbonnumber exposure EMF K carbon activity
ks (mV) contentwt.%
1
34567
766.8464.4522.0568.8630.0558.0547.2
52.932.434.019.664.040.889.0
934959908866864880895
O.Oi580.00750.00610.00630.00670.00910.0075
0.0720.2090.1760.350.0320.1160.0099
A large scatter in the value is attributed to the complexity of the carbide phasetransformation in the fcrritic steel|2],
Studies were also conducted to understand the kinetics of decarbnrizalion of thissteel in sodium. The specimens (8 numbers) were exposed to liquid sodium and the systemwas heated to a temperature of 878 K. One of the specimens was withdrawn at periodic intervals

12 Alkali Metals
(-75 ks) and analysed for the carbon content. The data obtained are shown in Table 1.2.1.1.2.The results indicated that the specimen decarburized to a carbon content of 0.0075 wt.% by a fastprocess. Further decarburization occurs very slowly, probably controlled by the equilibriumestablished by the precipitated carbides.
Table 1.2.1.1.2Results on the studies on the rate of decarburization of ferritic steel in sodium
Specimennumber
12345678
Durationof Exposure (ks)
72147.6230.4309.6385.2468.0547.2630.0
Carbon contentafter exposure
wt.%
001130.00960.00860.00980.00860.00670.00750.0067
Reference:/ / / S. Rajendran Pillai and C.K. Mathews, J. Nucl. Mater. 137(1986) 107
[2] K. Natesan, O.K. Chopra and T.F. Kassner, Nucl. Tech. 28(1976) 441
Contributors:S. Rajendran Pillai, ft. Ranganathan and C.K. Mathews
1.2.1.2
Studies on the measurement of carbon activity and the carbide equilibria in AISI316 LN stainless steel
The carbon activity of 316 LN SS has been measured at a temperature of 925 K atdifferent carbon contents, by the method of equilibration in liquid sodium in conjunction withthe measurement of carbon activity using the electrochemical carbon meter. The equilibriumcarbide phase formed in the steel was extracted from the foil and characterised.
The method employed to measure the carbon activity is same as that reported for 304SS [1]. The specimens required for the equilibration were prepared from 25 \im thick foil whosechemical composition is given in Table 1.2.1.2.1.

SOLUTION ANNEAL THE
SPECIMEN AT 13 73 K FOR
3.Ek s IN VACUUM
DRY THE POWDER AT
333 K
0
CHARACTERISE PHASES
BY X R D
EQUILIBRATE !N SODIUM
AT 925 K FOR 3 Ms
CH 3 OHTREAT WITH 5%
FOR 3.6 ks. CENTRIFUGE
AND WASH 3 - i TIMES
WiTH CH3 OH
EXTRACT CARBIDE ,10% HCi*
CKjOH MEDIUM, Pt. CA1HO.
DE, SPECIMEN.ANODE
ANALVSE C AND N BY
RESPECTIVE ANALYSERS
DISSOLVE IN 1 -U
ANALYSE FOR Fe
AND Mo BY AAS
1.2.1.2.1 Schematic of the carbide extraction characterisation

0.05 "
O.Oi -
- 0.0 3
o
Z 0.02oCOa:
o0.01
o
o
0.04 0.08 0.12 0-16 0-20 0-24
CARBON CONTENT / Wt %
1.2.1.2 2 Carbon activities at different carbon contents in AISI-316 LN SS

Alkali Metals 13
Table 1.2.1.2. J Chemical composition of the specimen (wt.%)
Element Cr Ni Mo Mn Si P C N Fe
Composition 17.7 11.2 2.5 1.4 0.8 0.03 0.023 0.11 rest
These foils were annealed in vacuum at 1273 K to redissolve precipitated carbides.These specimens were subsequently immersed in distilled sodium and the carbon activity wasmeasured using the electrochemical carbon meter[2], at a temperature of 925 K. After equilibriumwas attained (indicated by a constant EMF value) the foils were retrieved and analysed for carbon,and other constituents, thus establishing the relation between carbon activity and composition ofthe alloy. Based on present results, the most widely employed equation of Natesan et al.[3] wasmodified for application to 316LN SS. The modified expression is given by
In ac - In (0.048%C) + (0.525 - 300/T)% C -1.845 +5100A"
- (0.021 - 72.4/T)%(Ni + Mn) +(0.248 - 404AT)%(Cr+Mo)
-(0.0102 - 9.422/T)%(Cr + Mo)2 + 0.033% (Cr+Mo)2
The above relation is represented in Fig. 1.2.1.2.2 along with the results obtained inthe experiment.
The carbide equlibrium in this steel was also studied. After measuring the carbon activityin a specimen of the steel, the precipitated carbide phase was extracted by employing a procedurereported by Ciill et al.(4j. The procedure is shown schematically in Fig.1.2.1.2.1. Analysis of thecarbide by XRD revealed a structure similar to that of Crj3C6- Chemical analysis has revealedthe composition to he Fe13Cr7Ni2.5Moo.5C-6; similar 10 compositions reported in literature.
The chromium content in the carbide is found to be lower than the amount reported inliterature. There is no clear explanation for this observation. We believe that the high content ofnitrogen in the steel might have resulted in the formation of nitrides of chromium, thereby causinga chromium- depleted zone at the grain boundary. This depletion would have caused the formationof carbides iyi' lower chromium contents.
Reference :
/ // S. Rcijcnilnin Filial and C.K. Mathers, J. Nucl. Mater. !50(19S7) 31
(21 S. Rajeruiran Pillai and C.K. Mathcws,./. Nucl. Mater. 137(1986) 107
13/ K NatfMin aiul T.F. Kussncr. Mel. Trans. 4 (1973) 2557
l-iI T.P.S.Cnll aruU.K. (inanamoonhy../. Mater. Sci. !7 (1982)132
Contributors:S. Rajendran Pillai, ft. Ranganathan and C.K. Mathews

14 Alkali Metals
1.2.1.3Studies on the decomposition of sodium carbonate in sodium
Sodium carbonate is an important precursor for generating highly carburizing conditionsin high-temperature sodium through its decomposition. The decomposition of sodium carbonatein sodium is reported to proceed by the reactions[l],
Na2CO3 + 4Na ===== 3Na2O + (CJ (1)
Na2CO3 + 5 Na ===== 1/2 Na2C2 + 3Na2O (2)
The sodium acetylide, generated in the second reaction, would further decompose toliberate free carbon into sodium. In the present study, the increase of carbon activity, resultingby the decomposition of sodium carbonate was monitored using an electrochemical carbon meterf2].
Appropriate amounts of sodium carbonate (by evaporating a known aliquot of a solutionof sodium carbonate to dryness in a steel planchette) was added to distilled sodium, contained ina high purity iron crucible. The electrochemical carbon meter was kept immersed in this sodium.The decomposition of sodium carbonate was monitored by making carbon activity measurementsin sodium before and after the addition of sodium carbonate. In the first set of experiments, 530lig of sodium carbonate (corresponding to 60 u.g of carbon) was added to 0.035 kg of sodium.The system was heated to different temperatures. The decomposition of sodium carbonate wasfound to commence after attaining a temperature of 946 K (Fig. 1.2.1.3.1). The total time requiredfor the completion of decomposition (indicated by a constant value of EMF) at this temperaturewas 3 Ms.
In the second set of experiments (after adding 350 u.g of sodium carbonate), the minimumtemperature for the onset of decomposition was scrutinised even more carefully. In this case, itwas found that the decomposition had commenced even at a temperature as low as 814 K(Fig. 1.2.1.3.2) and was completed in 5 Ms. On increasing the temperature the EMF also increasedbecause of the reduced activity (commensurate with the increased solubility of carbon in sodium).An attempt to carry out a similar experiment at temperatures lower than 814 K was not successful,this being the lower limit of operation of the meter.
A third set of experiments (530 ug of sodium carbonate) was carried out to understandthe kinetics of decomposition. In this case the temperature of the sodium was maintained at 871K. The decomposition was found to be complete in 3.5 Ms (Fig. 1.2.1.3.3) compared to 5 Ms at814 K.
These experiments have clearly indicated the consequence of the presence of sodiumcarbonate as an impurity in reactor grade sodium. Hence, it is necessary to remove this impurityfrom sodium before it is used as a coolant in the reactor.
Reference :/ / / J.P. Mauprc, Report CEA-R-4905, Centre d Etudes Nucleaire de Foutenayaux-Roscs, France, 1977
[2) S. Rajcndran Pillai and CK. Mathers. J.NucI. Water. 137(1986)107

200 r-
40;-
20 L t. L__0 0.4
o AFTER ADDING 530^9 SODIUMCARBONATE [60 jug C]
• E M F CHANGE IN DISTILLED SODIUM
0.8 1.2 1.6 2.0
TIME/SECONDSxiO5
2.4 2.8
1.2.1.3.1 Decomposition of sodium carbonate in sodium ( I set) points 1 to 5 in distilledsodium. The points with corresponding temperatures ( K ) in brackets are
1 ( 8 4 0 ) 2 ( 8 1 8 ) 3 ( 8 7 8 ) 4 ( 9 1 5 )5 ( 9 3 9 ) 6 ( 8 0 0 ) 7 ( 8 2 4 ) 8 ( 8 2 1 )9 ( 8 4 0 ) 1 0 ( 8 6 6 ) 1 1 ( 8 6 4 ) 1 2 ( 8 8 9 )
1 3 ( 8 8 9 ) 1 4 ( 9 4 3 ) 1 5 ( 9 2 0 ) 16 to 22 ( 946 )

o EMF CHANGE IN DISTILLED SODIUMI
° EMF AFTER ADDING 3/.9.8M9SODIUM CARBONATE [40 jug C]
8-0T!ME/SECONDSx10
1.2.1.3.2 Decomposition sodium carbonate in sodium ( 11 set );Points I to 7 are in distilledsodium . The points with corresponding temperatures ( K ) in brackets are :
1 to 4 (821 ) , 5 ( 852 ) , 6 ( 880 ) , 7 (991 )8 to 22 ( 814 ) , 23 to 25 ( 849 ) , 26, 27 ( 878)28 (906)

100r -
10 h
, I i
530jug SODIUM CARBONATE(60/igC)ADDED TO SODIUM
1.0 2.0 3.0 4.0TiME/SECONDS x 10
5.0,-5
S.O 7.0
1.2.1.3.3 Decomposition of sodium carbonate in sodium ( III set ) points withcorresponding temperatures ( K ) in brackets are : 1 to 13 ( 871 ) 14 , 15 (901 )

Alkali Metals 15
Contributors:
S. Rajendran Pillai, R. Ranganathan and C.K. Mathews
1.2.2.0
HYDROGEN METER
1.2.2.1
Diffusion - type hydrogen meter for use in FBTR cover gas
Ingress of water/steam into sodium systems at low temperatures (approx. 200°C) resultin the production of hydrogen all of which is not absorbed by sodium. A good amount of hydrogenbubbles out into the cover gas and this is due to the slow dissolution of hydrogen gas in sodiumat these temperatures. This phenomenon would have a significant bearing on the leak detectionof water/steam into sodium during the start up phase or low power operation of a fast reactor. In-sodium hydrogen meters may not respond to small hydrogen level changes in sodium that occurduring these events. It would, therefore, be desirable to install hydrogen monitors in cover gas.Various options of hydrogen meters for use in the cover gas of FBTR were considered and it wasdecided to incorporate a carrier-gas type hydrogen meter equipped with a thermal conductivitydetector (TCD)| 1 ]. Operating on the principle of hydrogen gas saturation by diffusion through asuitable membrane, this meter would not require a very precise control of the operating temperature.On the otherhand, the electrochemical and flux based diffusion meters require a temperaturestability of+1°C[2]. As the meter operates in the gas phase, attaining this temperature stabilityis difficult due to poor heat transfer characteristics of the gas phase. Further, the detector, namelyTCD, of this diffusion type meter can be stationed well away from the probe unlike the flux- baseddiffusion meter where this is not possible. Moreover, the instrumentation involved is simple andmuch cheaper.
Design of the gas phase hydrogen meter to be incorporated in FBTR was completedtaking into account the space and available location in FBTR secondary circuit. The probe of themeter would be in the form of a coiled nickel tube of 2.5 mm dia, 0.25 mm wall thickeness and5000 mm length and is to be maintained at temperatures above 500°C. Hi^h purity argon gaspasses through the probe and then through TCD. The TCD output can be related to the hydrogencontent in cover gas.
This work was carried out in collaboration with T. R. Sundarainurthy, B. Rajendranand S.C. Chetal of Fast Reactor Group JGCAR Kalpakkam.
References :/ / / R.A. Davies, J.L. Drummond, D.W. Aduway, in: Proc. Int. Conf. on Liquid.~,ikali Metals, BS'ES. 1974,
p.93.

16 Alkali Metals
(2j T. Gnanasekaran, R. Sridharan, G. Periatwami, C.K. MathewsM. Rajan andR.D. Kale, in: Proc. FourthInt. Symp. Liquid Metal Technology in Energy Production. UMET-88, Avignon, France! 1988), paperno. 604
Contributors:T. Gnanasekaran, K.H. Mahendran, R. Sridharan, G. Periaswami and C.K. Mathews
1.2.2.2Studies on reactions of hydrocarbon oils with sodium
The electrochemical hydrogen meter based on CaCl2-CaH2 electrolyte [1] was usedfor studying the reaction between hydrocarbon oils and liquid sodium in the temperature rangeof 623 to 748 K. The experimental set up was equipped with provisions to install the electrtochemi-cal hydrogen meter and to add oil samples to sodium at the desired reaction temperature. The oilused was Teresso grade 32 hydrocarbon oil (M/s Esso, France) which is used as the shaft coolantin the centrifugal sodium pumps in FBTR. The meter responded instantaneously to the ingressof oil at all temperatures of the experiment as seen in fig. 1.2.2.2.1. The emf outputs also indicatedthat the reaction rate was slow at 623 K whereas it became rapid as temperature increased. Theargon cover gas over the sodium was also analysed for hydrocarbons as a function of time afterihe addition of oil, using a Shimadzu-9A GC equipped with an on line FID detector. The reactionproduct formed was mainly methane in confirmity with earlier investigations [2,3]- Smallerquantities of hexane and heptane were also noticed. The FID output for methane fraction varieslinearly with the square root of time indicating that the release of methane during the reaction isa diffusion controlled process.
References :/ / / V. Gnnesan, T. Gnanasekaran, R Sridharan, G. Periaswami and C.K. Mathews in : Proc. Second Int.
Conf. on Liquid Metal Engineering and Technology, BNES,Oxford! 1984)vol.I, p.369.
[2] M.R. Hobdell, E.A. Trevillion and A.C. Wittingham, in: Proc. Second Int. Conf. on Liquid MetalEngineering and Technology. Richland, 1979, p. 47.
/3I AM'. Thorlcy, A. Blundcll, J. Prescott and J. Hilditch, in : Proc. Fourth Int. Conf. on Liquid MetalEngineering and Technology, CEA, Avignon. 1988, Vol. 2, paper nn.507.
Contributors:T. Gnanasekaran, K.H. Mahendran, R. Sridharan, G. Periaswami and C.K. Mathews

0
-0.05
o 623 KA 646 Kv 673 K• 723 Ko 748 K
I-0.2025 50
TIME (MIN.)75
1.2.2.2.1 Variation of EMF after addition of oil

COy.—
z
or.
QTi_
\RtiV
QLt—Z)O
4x10⁵
3x10⁵
2X10⁵
o 673A 723• 748
KKK
•
Q
10/t/min
15i
20
1.2.2.2.2 FID output corresponding to methane fraction Vs/tirne

Alkali Metals 17
1 2.2.3
Reaction of molten sodium hydroxide with structural steels
Reaction rate between molten sodium hydroxide and structural steel is the importantparameter that determines the caustic wastage rate of ferritic steels in the event of a water leak inthe steam generator of a fast reactor. Reliable data on the reaction kinetics between caustic meltand clad material is required to estimate how long one can take for shutting down the reactor ondetecting a leak in steam generator. These data will also help in material selection in the designof future steam generators. Experiments have been carried out in the past to study this phenomenaat temperatures above 1073 K [1J. As a leak in the steam generator generally starts at a microlevel, the temperature at the leak site may not always be in this range. Hence, experiments to studythe reaction rate of pure iron, 2.25Cr-lMo steel and 9Cr-lMo steel with molten sodium hydroxidewere carried out in the temperature range of 773- 873 K. The experiments were carried out bycontaining the molten hydroxide in a nickel container and measuring the pressure of hydrogenevolved after dropping the sample into the molten mass. A mercury filled U-tube manometer wasused for this purpose. The results obtained with 2.25Cr-lMo steel is shown in fig. 1.2.2.3.1. Theresults indicated that the reaction rates of Fe and 2.25Cr-1 Mo steel are essentially the same whereasthat of 9Cr-lMo is higher.
Reference :/ / / R.N. Newman. J.F.B. Payne, A.R. Pugh, PA. Simm, C.A. Smith and RJ. Smith, in : Proc. Int. Conf. on
Ferritic Steels for Fast Reactor Steam Generators, BNES, London (1978), pJ15.
Contributors:T. Gnanasekaran, K.H. Mahendran, R. Sridharan, G. Periaswami and C.K. Mathews
i.2.3.0
STUDIES BASED ON (3"-ALUMINA
1.2.3.1
A novel method for the production of high-purity sodium
Development of a new method for the sodium production is taken up in view of thelarge scale, requirement of nuclear grade sodium at a low cost for the future Prototype Fast BreederReactors and the need for battery grade sodium for sodium batteries.
The method involves the low temperature electrolysis of a molten salt of sodium chloridein sodium tetrachloroaluminate via a sodium ion conducting solid-electrolyte, viz., 3- alumina,p -alumina acts as physical separator (diaphragm) between the anode and the cathode compartmentsof the electrolytic cell, at the same time maintaining the electrochemical contact between the twocompartments. A graphite rod immersed in the molten electrolyte melt at one side of the (5- aluminaforms the anode and pure sodium at the other side of the separator forms the cathode. Under the

460
ICO 200T ( M I N )
838 K!
808 K
300J
1.2.2.3.1 Hydrogen pressure 'mild up as a function of time with 2.25 Cr - 1 Mo sample

18 Alkali Metals
influence of a suitable electric potential, (5-alumina selectively transports sodium ions to the cathodecompartment.
This method has several advantages over the currently adopted Down's process for themanufacture of sodium and these are listed below.
1) The cell can be operated at a low temperature (200-250°C) and low voltage ( 4volts). This makes the process highly energy efficient. Low temperature operation reduces corrosionproblems to the structural materials and hence cell life is enhanced. As the temperature of operationis below the ignition point of sodium, design and operation of the cell becomes easy and simple.
2) Since the sodium is not in contact with the liquid electrolyte, the recombinationreactions encountered in normal cells are nearly non- existent. So the current efficiency of thisprocess is close to 100%.
3) Sodium produced in this method is exceptionally pure. Hence cumbersome andcostly procedures for purification of commercial sodium is avoided. This sodium can directly beused in LMFBR and sodium batteries.
An electrolysis cell has been designed for carrying out laboratory-scale experiments.Fabrication of the cell is completed and trial production is to be commenced shortly. A programmehas also been initiated for setting up a miniscale pilot plant in order to demonstrate the commercialviability of this process.
Contributors :
K.S.Mohan Das, R.Ranganathan, S.R. Pillai, G.Periaswami and C.K.Mathews
1.2.3.2
Studies on sodium - bismuth ailoys
Alloys of liquid alkali metals with Group IV A and V A metals exhibit quasi-ionicbehaviour. At the compositions corresponding to compound formation, thermodynamic propertiesdf these alloys show deviations from normal behaviour that is expected in common metallic alloys.Sodium potentials of sodium- bismuth alloys with 0-12 atom% sodium were electrochemicallymeasured in the temperature range of 571-678 Kfl]. An EMF cell with (3"- alumina as the solidelectrolyte and liquid sodium as the reference electrode was used for this purpose. The EMFvalues were fitted into an equation of the form:
E - A + B T + CTInT
where E is EMF in volts and T h temperature in K. The coefficients A, B and C for\arious compositions employed are given in Table 1.2.3.2.1. These EMF values were used toderive various other thermodynamic quantities such as activity coefficient of sodium, YNa, excessstability and activity coeffcient of '3i,mmh,Y Bi (by Gibb's-Duhem integration) . The values

Alkali Metals 19
obtained at 623 K are listed in Table 1.2.3.2.2. The experimental results have shown thatpronounced ordering due to compound formation in the liquid alloys does not occur within theconcentration range studied.
References:[1] R. Krishnaji Reddy, T. Gnanasekaran and C.K. Mathews, paper presented in Int. Symp. on Ther-
mochemistry and Chemical Processing, November 20-22,1989, Kalpakkam. (To be published in Trans.Indian Inst. Metals).
Table 1.2.3.2.1Coefficients for the expression E(V) = A + BT + CT In T for the interval 571 • 678 K
XNa
0.020.040.060.080.100.12
A
1.60490.74040.96460.82510.88750.8090
B
-0.0008300-0.0002469-0.0029685-0.0013591-0.0020879-0.0012089
C
7.725 x7.253 x
42.463 x20.193 x29.426 x17.332 x
io-5
10*10*10*10"b
10*
Table 1.2.3.2.2yalaes of EMF,(with respect to pure Na reference) and derived thermodynamic properties ofJSa-Biliquid alloys at blTK v
XNa
0.020.040.060.080.100.12
100000
EMF(V)
.39767
.87750
.81718
.78791
.76629
.75057
In Na
-22.1240-13.1274-12.4092-12.1516-11.9720-11.8615
In Bi(calculated)
-0.1406-0.4138-0.44ft 1-0.4510-0.4743-0.4978
ESfkJ/mol)
2929.231276.64199.57
-264.44-74.52813.92
G Na(kJ/moJ)
-134.8569-84.6673-78.8472-76.0231-73.9370-72.4202
Contributors :
R. Krishnaji Reddy, T. Gnanasekaran and C.K. Mathews

20 Alkali Metals
1.2.4.0
OXYGEN METER
1.2.4.1
Measurement of lower electrolytic domain boundaries of zirconia electrolytes
Solid oxide eletrolytes can be used as oxygen sensors in liquid metals. Calcia stabilizedzirconia (CSZ) and yttria stabilized zirconia (YSZ) are the two most commonly used solidelectrolytes. In some of their applications these electrolytes operate near or below their LowerElectrolytic Domain Boundary (LEDB) eg., oxygen sensor in sodium. This calls for accurate dataon LEDB over the range of temperatures of operation. Data on the LEDB of CSZ are availableonly down to a temperature of 823 K. But, CSZ based oxygen sensor for sodium operates at 500K. Since log POzfLEDB) vs 1/T can be non-linear at low temperatures, extrapolation of hightemperature data to low temperatures may introduce significant error [1]. Hence the need foractually measured data. The commonly used maximum EMF technique for LEDB determination[2] involves the setting up a galvanic cell with one electrode as air and the other having a PO2much below the expected P- of the electrolyte. Under such conditions when P+ > PO 2 > P-> PO 2 the open circuit potential of the cell is given by the equation
E(o.c) = (RT/4F)ln [PO2 (ref)/P-]
The cell used by Schmalzried [2] for measuring LEDB of CSZ was modified since Caand Pt elelctrodes used by him do not function well below 823 K. The new cell designed can begiven as.
\V,Air, R11O2 I Electrolyte i (In + Mg), W
Indium metal was chemically deoxidised using magnesium turnings to get low PO2.RuO; film/air was chosen as the other electrode since RuOz/electrolyte interface has low resistanceand the electrode can function well down to 473 K [3]. The cell thus constructed generated stableEMF down to 473 K and made LEDB measurements possible below 823 K for the first time.
The results for CSZ can be given by the equation :
log [PO2 (LEDB)/atm| = 16.154 - 43937.3AT(K) (433-1173 K)
In fig. 1.2.4.1.1 the LEDB of CSZ is compared with the literature data [4]. The dataobtained for LEDB in log PO2 vs 1/T space show that the extrapolation of this line to lowlemepratuies is valid.
The LEDB of YSZ can be given by the equation
log |PO2 (LEDB)/atmJ = 6.4949 - 38886/T(K) (460-941 K)
This is compared with Swinkel's data [5] in fig. 1.2.4.1.2
An attempt has also been made to correlate the LEDB of oxide solid electrolytes totheir thermodynamic stability.

L E D B OF C S Z
-20
-30
-40 r
-50 L
o -60U
e n I-2 -70 i-
-80
O SCHMALZRIED
e TRETYAKOV
O PATTERSON \RAPP
BOGREN \RAPP
THIS WORK
i j . ^
6.0 8.0 10.0 12.0 U.O 16.0 18.0 20.0 22.0
1.2.4.1.1 LEDBofCSZ

0
-20
-40
o L
5WINKEL
THIS WORK
en - 6 0o
-80.
100 L • - • • — i - — J —
2 4 6 8 o" 12 "U 16 18~20~22 24
10 V T
1.2.4.1.2 LEDB of YSZ

Alkali Metals 21
The measured LEDB values of CSZ and YSZ show a linear behaviour down to 473 Kin log PO2 vs 1/T space.
References:fl] U. Nafe, Solid State Ionics (1982)
[2] H.Schmalzried, Z.Phys. Chem., Neu Folge, 38 (1963) 87
[31 G.Periaswami,S.Var.i Varamban,S.RajanBabu and CKMathews, Solid State Ionics, 26 (1988) 311
[4j J. \V.Patterson in " The physics of electronic ceramics" (Eds) L.LHench andD.B.Dove, MercelDekkerlnc,NewYork(1971)pl31
15] DAJSwinkelx, JElectroChem.Soc, 117 (1970) 1267
Contributors :
G. Periaswami, S. Vana Varamban andC.K. Mathews
1.2.4.2
Development of coated zirconia sensors for oxygen in sodium
Yttria Doped Thoria (YDT) solid electrolyte used in oxygen meters for liquid sodiumcoolant are very expensive and have unpredictable life-times. Early attempts to use the easilyavailable Calcia Stabilized Zirconia (CSZ) in these meters failed because:
(1) sodium reacts with Zirconia and (2) Lower Electrolytic Domain Boundary (LEDB)of zirconia is not sufficient for this purpose. Recent measurements on the LEDB of CSZ showthat it can meet the requirements if operated at low temperatures (-500K) [1].
Operation at low temperatures is made difficult by the increased cell resistance. Sincethe main contribution for this comes from interfacial resistance, a reference electrode with lowimpedance, namely K/K2O? was designed and used in the low temperature oxygen sensorsdeveloped in this laboratory. These sensors were tested for their performance in sodium loops.The cell output when plotted against cold trap temperature showed a theoretical slope but had azero error (fig. 1.2.4.2.1).
An analysis showed that the zero error or assymmetric potential was due to the formationof a reaction product layer at the electrolyte surface however small it was. This also led to varyingoutput with time. The life time of the tube was also limited to a few months.
CSZ gave a better performance than YSZ. This was attributed to the partially neutralizednature of CSZ towards the formation of a ternary oxide. It was immediately realized that conversionof the surface into a ternary oxide that ii stabler than sodium zirconate which at the same timedoes not interfere in emf development can help avoid sodium attack on the electrolyte. CaZrO?

390
L , I J I
LJJ
1000/KK)
1.2.4.2.1 Output from Na( O ) I CSZ I K. K2O cell

OXYGEN ppm( log scale)
22.1 12.6 7.2 4.1 2-3 1.3
890 I
COATEDYSZ j
In.In2O3
21 221 I K V I O '
23
Nu(O)x
560
540
- 5 2 0
500
ZUJ
oI—UJCO
oUJX
25
TCT
1.2.4.2.2 Cell output for CaZrO3 coated meter

22 Alkali Metals
wax identified a>, a possible coating material since it has a perovskite structure which permits oxideion condution.
The CSZ tube was coated with a CaZrO3 layer by reacting it with CaO dissolved inCaCb at 1273K. Sensors were constructed using this electrolyte and the cells when tested in asodium loop gave much stabler outputs than the uncoated sensor (Fig. 1.2.4.2.2). Life timesobserved were aiso longer. The slope observed was in accordance with theory. Thus a way ofusing zirconia electrolytes in oxygen sensors has been worked out [2].
However, there is still a large asymmetric potential. This may be due to significantaca corresponding to Ou or the porosity of the CaZrO3 layer which permits sodium movementacross it. The failure rate of the tubes while coating was also high. New methods to generateuniform layers of doped CaZrCh with higher o 0 w'ere attempted. The sol-gel route has beenidentified as the most suitable technique. Efforts are under way to prepare the eletrolyte coatingusing this technique.
References:///' G. PerUiswumi, Ph. D. Thesis. University of Madras, 19S8
[2! G. PcridSMami, S. Rauin Babu and C K. Mathews, Proceedings of the Fourth Int. conf. on Liquid.MetalEngineering and Technology. Avignon.Francc. October I98S. paper no. 6G7
Contributors :G. Periaswami, S. Rajan Babu and C.K. Mathews

Alkali Metals 23
1.3.0
BATTERIES
1.3.1
Sodium - Metal chloride batteries
Fast depletion of fossil fuel reserves and deterioration of the environment as a resultof hydrocarbon burning call for increased use of electric vehicles in future. Sodium batieries withtheir high specific power and high specific energy are the most suitable ones for this purpose.Sodium-sulfur batteries have been under development for well over two decades. Though theproblems related to electrolyte life have been overcome in recent years, problems arising out ofthe suifur electrode still remain. During charging, a non-conducting sulfur layer forms around thecurrent collector leading to difficulties. The highly corrosive nature of the sulfide melt leads tothe transfer of metal ions from the container to [}" AI2O3 thus affecting electrolyte life. MetalChloride/N'aAlCU cathodes have been proposed as a substitute for the sulfur cathode as they arefree from such problems [1|. Sodium-metal chloride batteries were constructed at our laboratoryand tested for their performance to optimize their design. The configuration of the cell is
Na I (5" Alumina II NaAlCU I NaCl , FeCl2, Fe
The cell reaction when the cell operates in the galvanic mode is
2 Na + FeCl2 > 2 NaCl + Fe
The open circuit voltage at 513 K is 2.3 V.
The charging reaction is
Fe + 2 NaCl > FeCl2 + Na
By incorporating Ni in the cathode an overcharge protection can be provided as below
Ni + 2 NaCl - > N1CI2 + 2 Na .... OCV = 2.7 V
There is also an over discharge indicator when NaAICU reacts with Na to givealuminium. The OCV corresponding to this reaction is 1.55 V. The eel! is assembled in dischargedcondition. The schematics of the cell is given in fig. 1.3.1.1. The cathode is contained within thesolid electrolyte while anode material is contained in outer MS container. 'Grafoil" gaskets havebeen employed for sealing the two compartments.
Charge discharge curve at 22 mA current is shown in fig.!.3.1.2. The charging endpoint achieved in a typical charging of a cell of 0.16 Ah is shown in fig. 1.3.1.3.
Reference :/ / / RJ Bones. I Coci.'.er,RC GalUway andD.A Teazle. J Ekctrochcm. Soc ,134 i!<)S7),23?9

ELECTRICAL.LEADS
COUPLING
.«< ALUMINA"COLLAR
-GRAFOIL GASKET
-MICA INSULATION
S E TUBE
CATHODE MATERIAL
•ANODE MATERIAL
1.3.1.1 Schematic diagram of metal chloride sodium cell

^,:-; 2 ; < • • : .
• DS
1.3.1.2 Charge-discharge behaviour at 25 % capacity utilisation at 573 K

zUJ
E O , C 2 . 3 0 0 7CHARGING CURRENT
30
Q l
UJ i
a.<
3 }-
1000 2000 3000T I M E / S E C O N D S
1.3.1.3 Charging curve for 0.16 Ah cell at 573 K

24 Alkali Metals
Contributors :
S. Rajan Babu, G. Periaswami, T. Gnanasekaran and C.K.Mathews
1.3.2
STUDIES ON SODIUM - p" AI2O3 INTERFACE IN SODIUM BATTERIES
The resistance at the sodium - P" alumina interface in sodium batteries can affect theirperformance. Early experiments at our laboratory on the performance of NPL-produced P" aluminain sodium-electrolyte-sodium cells showed that the interfacial resistance in these cells was sig-nificant. The cell resistance also increased with the passage of current. The cycle life observedfor the tubes was also low ( cycles). An analysis of the results pointed to the following reasonsfor the short life time.
1) Presence of surface micro cracks and crevices.
2) Formation of high resistance layers on the electrolyte surface.
3) Polarization of the interface possibly due to moisture and calcium present in theelectrolyte.
4) Insufficient wetting of the electrolyte by sodium.
Since the fabrication process adopted by NPL could not be modified to reduce thesurface crevices, a chemical method to polish the surface was worked out in our laboratory. Thisinvolved dissolving the surface layer in boiling phosphoric acid. The tubes thus polished showeda smooth finish. This method had another benefit in that any high resistance layer present wasalso removed.
In order to reduce the polarization at the interface the tubes were heated at 900Kovernight against the normal practice of heating it at 473K.
For promoting wetting of the tube by sodium the use of a wetting promoter was thoughtof. A coating of lead acetate on 3" alumina was identified as a suitable solution. Finally thepolished tubes were coated with an ethanolic solution of lead acetate before carrying out the hightemperature drying.
Since oxygen present in sodium can precipitate calcium leached out of the tube ascalcium oxide and lead to inierfacial resistance build up, an oxygen scavenger was added to sodium.
The P" alumina tubes thus treated were assembled in sodium /p" alumina/ sodiumcells and tested for their performance. The IR drop observed in these cells was much lower andthis corresponded to the resistance of the electrolyte. There was also no build up of resistancewith time. The cells could operate for much longer periods and the charge that could be passedthrough the electrolytes corresponded to cycle life greater than 3000. These data are given intable 1.3.2.1 for some of the treated tubes.

Alkali Metals 25
Table 1,3.2.1
no. Electrolyte no. Charge passed Current density(NPL) (Ah) (mA/cm2)
1. 69(1 )-2 6734 4502. 51-1-4 3500 15003. 74-2-2 15396 704. 64-1 20160 700
Thus a procedure to improve the performance of p" alumina tubes has been workedoutflj. The results showed that the tubes thus treated can meet the quality requirements for usein sodium batteries.
Reference:
[lj S. Rcijan Babu, T. Gnamsekaran, G. Periaswami and C.K. Mathews, Bull. Electrochem., 5 (1989) 563
Contributors:S. Rajan Babu, T. Gnanasekaran, G. Periaswami and C.K. Mathews

26 Alkali Metals
1.4
RADIOACTIVE SODIUM CHEMISTRY LOOP
1.4.1
Radioactive sodium chemistry loop
The Radioactive Sodium Chemistry Loop (RSCL) built for studying the problems ofactivity transport in fast reactor coolant circuits, was put into operation. A schematic representationof the loop is shown in fig. 1.4.1.1. The initial stage of operation was restricted to the operationof the main loop comprising the electromagnetic pump, heat exchanger and test section. Sodiumfilling and dumping operations were standardised and the necessary clearance for operation of theloop was obtained from the safety committee, IGCAR.
The main loop was operated in an isothermal condition of 473 K. The temperaturewas slowly raised to 573 K and sodium pumping was started using the electromagnetic pump.The cold trap and the plugging indicator sections were subsequently commissioned by filling withsodium and establishing the required flow rate through them. The temperature of the cold trapwas maintained at 473 K and the same was brought down gradually to 398 K in steps of 25 K.Plugging runs were taken at periodic intervals and a plugging temperature of 403 K was observed.
The safety interlock was incorporated to trip the sodium immersion heater in the mainloop, and the electromagnetic pump, in the event of a low flow signal . The operating temperatureof the test section was gradually increased to 773 K with a sodium flow of 6CX) lh" while the coldleg temperature was maintained at 623 K. A demountable heater assembly was fabricated for theoverflow sampler section of the loop. Arrangements are being made to incorporate the CaCl2-CaH2based electrochemical hydrogen meter in one of the by-pass sections of the loop to study thecorrelations between the outputs of the hydrogen meter and the plugging indicator with varyingcold trap temperature.
Contributors:
P. Muralidaran, V. Ganesan, K. Chandran, K.C.Srinivas and C.K.Mathews
1.4.2
Studies on the development of radionuclide trap for 137Cs
Release of radionuclides such as Mn and Cs occur in the core region of operatingfast reactors on account of fuel pin failure and activation of corrosion products. Transport of thenuclides through sodium could lead to high radiation fields at various components of the primarysystems that may require periodic inspection and servicing. This results in long down times andprohibitively high cost of maintenance. In order to confine the released nuclides to specific locationsin the primary circuits, suitable radionuclide traps are required to be developed.

/ u:"
| I t. M -J J M V
I
• V-:i t T
.:. ..JI i-
r- , i-
f i f f •
- < Q)
p 1
C T
S PJ f
i r
CA = =
^-. L'
A- ; J -
• ; * . • . ' •
?C-t*V '-••; ' ; "
i "-'S ."•jir
:F£.P
>i ^ , -
. i•:
" - r '
- ' i •'
1.4.1.1 The schematics of Radioactive sodium chemistry loop

150 -
1001-
C
o50
o
o Graphite sample 1
A Graphite sample 2
60[Time(min)]
1.4.2.1 Resultsof caesiumup-take by graphite samples of differing densities

200 A00 600
TIME (min)800 1000 1200
1.4.2.2 Results of caesium up-take by graphite as a function of time

Alkali Metals 27
The development of a suitable radionuclide trap for Cs is based on the fact thatcaesium forms a series of intercalation compounds with graphite [ 1]. Graphite samples of differingdensities were tested in our laboratory as sorption material and were equilibrated with Cscontained in sodium at 433 K. The uptake of Cs by graphite was measured as a function oftime using a Nal(Tl) detector. The experimental details are described elsewhere [2] and the resultsare shown in fig. 1.4.2.1. It is seen from the figure that the rate of uptake of Cs depends stronglyon the density of the graphite samples used.
137The effect of temperature on the sorption characteristics of graphite for Cs wasstudied by carrying out experiments in the temperature range of 433 to 493 K, the results of whichare given in fig. 1.4.2.2. It can be seen from the figure that the rate of absorption of caesium bygraphite increases with increase in temperature, the saturation time at 433 K being 600 min andthat at 493 K being 310 min. The efficiency calculations show that the graphite samples werefound to take approximately 1.3 x 10⁴ Bq at a temperatures of 453 K and above.
References:/ / / W. Ruedorff, Angew. chem., 71 (1959) 487.
[2] V. Ganesan, P. Muralidaran, T. Gnanasekaran, G. Periaswami and C.K. Mathews, in: Proc. Int. Conf.on Liquid Metal Engineering and Technology, Avignon, France, October 1988, vol.3, paper 634.
Contributors :
V. Ganesan, P. Muralidaran, K. Chandran, G. Periaswami and C. K. Mathews
1A3
Overflow type sodium sampler for secondary circuits of FBTR
Monitoring and control of impurities in sodium circuits of LMFBRs are important fortrouble-free operation of the system from the point of view of plugging of lines, corrosion of structural materials and release of radioactive materials to various components in the coolant circuits.Presence of non-metallic and certain metallic impurities is responsible for the plugging of linesand enhanced corrosion rates. By proper choice of a sampling technique, followed by suitableanalytical techniques, it is possible to have close monitoring of impurities in sodium. Obtainingsouium sample which is representative of the bulk is difficult owing to problems of impuritysegregation during cooling, selective sorption on surfaces and accumulation at interfaces. Sincethe flow through the sampler used in the secondary circuit of FBTR can not take care of errorsfrom the above processes, it was decided 10 design and incorporate an overflow sampler. Samplesobtained from an overflow sampler can be analysed in their entirety thus avoiding problems dueto segregation. Different crucibles can be used for getting samples for different impurities.
The overflow type sampler for secondary circuits of FBTR is based on the TNO designw herein the crucibles for collecting the sodium are stacked one over another as shown in fig. 1.4.3.1.Sodium enters from the top, flows over the crucibles and leaves the sampler through the outlet at

FlIfiNG Male
, DiAICOKNiFE EDGE
*~:T DT — t -JoTTl rLAfiGE
tube
12-7 CG,\'Q SEAL
Firr;>iC ,•>•<••'.!.£
] 8D_ NB_P[PE
SC~H i0'~
-4.3.1 Schematics of overflow iVpe sodium stype sodium sampler

28 Alkali Metals
the bottom. After flushing the crucibles for a sufficient length of time, the sodium flow throughthe sampler is stopped by turning off the appropriate valves. The excess sodium in the sampler isthen transferred to the collection vessel by application of vacuum, leaving behind the crucibleswith the sodium samples in the sampler vessel.
The sampler vessel is fabricated from 40 NB-SCH 40 stainless steel type 304 pipe.The crucible holder, containing five nickel crucibles of 5 ml capacity each, can be introducedfrom the top and secured leak-tight using knife-edge flanges employing annealed nickel platedcopper ring as gasket material. The fabrication of the sampler has been completed and the finalleak checking has been carried out by helium mass spectrometric technique. The sampler alongwith the vacuum system is ready for incorporation in the secondary circuits of FBTR. Based onthe experience gained, a similar sampler for the primary circuits of FBTR is being designed.
Contributors :
V. Ganesan, P. Muralidaran and G. Periaswami
1.4.4
Studies related to modelling of activity transport in sodium systems
The modelling of activity transport in the primary circuits of LMFBRs requires dataon the diffusivity of manganese in stainless steel and the distribution coefficient of manganesebetween sodium and stainless steel. Diffusivity daia is also required for determining the extent towhich decontamination of the components of primary systems need to be carried out. Towardsthis, experiments were carried out to determine these parameters.
Diffusion of manganese in stainless steel:
The diffusion coefficient for ^Mn in stainless steel was determined by a tracer technique.Annealed stainless steel type 304 samples were diffusion annealed in sodium containing a knownamount of Mn. After diffusion annealing, the samples were cleaned free of sodium and theactivity of Mn was measured using a well-type Nal(Tl) detector. Successive layers of the sampleswere removed by the electropolishing technique and the residual activity in each case was measured.The logarithm of the residual activity it various layers was plotted as a function of the square ofthe thickness removed from surface. From the slope the diffusion coefficient of Mn in stainlesssteel was calculated. The diffusion coefficients obtained at temperatures 773 and 823 K are2.18 x 10"14 and 3.38 x 10'13 cm2 s'1 respectively.
Distribution coefficient of manganese between sodium and stainless steel:
Thin stainless steel foils of type 304 were equilibrated in liquid sodium, getteredpreviously with vanadium, for sufficient length of time. At the end of equilibration run, thestainless steel foils were removed, cleaned free of sodium and analysed for manganese content byA AS technique. The manganese content of the sodium samples was measured by ICPMS technique.From these values, the distribution coefficient of manganese between sodium and stainless steel

LU
C3LL.L LLUO
10
CO i
1.1
- " i—
550
1.2
- T / C
500 /•50
1.3 U
1 / ( T / K ) 10
...L -
1.5
.4.4.1 Temperature dependance of distribution coefficient of manganese betweensodium and stainless steel

Alkali Metals 29
was calculated. Fig. 1.4.4.1. shows the variation of distribution coefficient as a function ofreciprocal temperature.
Contributors:V.Ganesan, P.Muralidaran, K.Chandran andG.Periaswami
2.0
HIGH TEMPERATURE CHEMISTRY OF ADVANCED MATERIALS
2.0.1
Introduction
This section includes our studies on the method of carbothemiic reduction for thepraparation of carbide fuels, the electrochemical carbon meter and the commissioning of thepreparation laboratory. Calorimetric investigations on the ternary oxides of fission products andon potential fuel materials like the uranium-aluminium alloys are also described. A high temperaturemass spectrometer was used to conduct vapourisation studies on the tellurides of chromium andmolybdenum (components of the stainless steel clad) in order to derive the thermodynamicproperties of these tellurides and thus to compute the tellurium potentials required for theirformation. Thermonalytical techniques have been used to study the oxidation behaviour of uraniumcarbide and the reaction of the intermetallic compound UPd3 in an oxidising environment. Usinga laser flash technique, the thermal conductivity of the zirconates of barium and strontium hasbeen studied. The thermal expansion behaviour of some rare earth pyrohafnates, which are candidatematerials for control rod applications, has been studied by using high temperature x-ray powderdiffractometry. Some experimental studies have also been carried out on high Tc oxide supercon-ductors in collaboration with the Materials Science Division.

Advanced Materials 33
2.1.0
PREPARATION AND CHARACTERISATION OF FUEL MATERIALS
2.1.1
Calculation of vapour pressures in the U-Pu-C-0 system for optimisation of thepreparation of carbides by carbothermic reduction
The preparation of UC and (U,Pu)C is conventionally carried out by the carbothermicreduction of the oxide, at about 1700-1900 K. The carbothermic reduction reaction proceedsthrough many intermediate stages and the last phase region encountered in the course of preparationis the region MCi-xOx + MC1.5.
In this study, the vapour pressures of CO, U and Pu over the phase field MCi-xOx +M2C3 have been calculated for Pu/(U+Pu) ratios varying from 0.2 to 0.7, temperatures rangingfrom 1500 to 2000 K, and MC1.5/MC phase ratio at 0.1 and 0.2. The data generated are discussedfrom the point of view of optimisation of the preparation temperature.
The results of the calculations indicate that the uranium vapour pressure over the phasefield MCi-xOx + MC1.5 is very small even at 1900 K. The situation was found to be similar forall the values of x, Pu/fU+Pu) ratio and temperature. Hence, it is clear that CO and Pu are theonly vapour species likely to be important from the point of view of carbide preparation.
Figures 2.1.1.1 to 2.1.1.3 give the data on the vapour pressures at 1500 K and 2000K, Tor sesquicarbide content of 10 % and 20 %, and for Pu/(U+Pu) ratio varying from 0.30 to0.70. The data lead to the following observations:
a. The figures show that for both the temperature values, the pressure of plutoniumover the phase field increases with decreasing value of x, while that of CO decreases. For valuesof x below a "cross over" value, the plutonium vapour pressure is higher than that of CO. It isclear that continued heating of the two phase carbide sample to achieve values of x lower thanthe "cross over "value will only result in further loss of piutonium without reduction in oxygenimpurity level. The crossover value of x is lower at 2000 K compared to the value at 1600 K. Asimilar trend was seen for all the compositions and temperatures studied. It is thus clear that theuse of higher temperatures should in general assist in achieving lower values of x.
b. The slopes of the curves for the CO and Pu vapour pressures increase as thePu/(U+Pu) ratio increases. For example, the increase of Pu pressure below the crossover point issteeper for higher values of Pu/(U+Pu).
c. The crossover point is generally at a lower value of x for higher sesquicarbidecontent. However, the difference in the value of x for the crossover point for carbide compositionscorresponding to 10 % sesquicarbide content and 20 % sesquicarbide content narrows down athigher Pu/(U+Pu) values. Fig.2.1.1.4. summarises the data on the value of x at the crossover pointfor various temperatures and Pu/(U+Pu) ratios.
Using the data on the vapour pressures obtained, the optimum temperature for thecarbothermic reduction could he decided.

0.
0.
16
12
- \ 70 <
-
~ _ 60
A
\
V
Pu
o PU
0.08coO
0.01
10Vo Sc
50 V.
J5 00
FIG. 2. 1.1 4Temperature —
0 Q-W 0-20 0-30 O'iO 0-S0OXY Content -
FIG. 2 . 1 . 1 . 1
ioJ
10
£ _ 5
a. -C
s ; o9
Cco 2000K 20VoScPCO 20COK 10 Vo ScPCO I50QK 20V, Sct to /500K1 i on sc
/0 Vc Se\>pu IS00K 20 V, Sc
fro ISOOJt lOV,Sc
209.Sc'
2000K 10'/, Sc
SO " , P ( j
' 3 | , i i , ^j L u i , L__L 10C 0.02 O.Oi 0.06 0 . 0 8 0-10
OXY Content *-
FIG. 2.1 1 2
0.002 0-00L 0-005
OXY
FIG. 2.1 1.3
2.1.1.1,2,3 Vapour pressures of CO and Pu over MC+MC1.5 region
2.1.1.4 The value of x at the crossover point for various temperatures and Pu/(U+Pu)ratios

34 Advanced Materials
Contributors:
S.Anthonysamy, P.R.Vasudeva Rao and C.K.Mathews
2.1.2
Commissioning of the preparation laboratory
An inert atmosphere recircuiation type glove box train facility for the preparation ofadvanced fuel materials has been commissioned. Equipment such as electronic balance, planetaryball mill, 10 ton capacity electrically operated hydraulic pellet press and molybdenum wire- woundhigh temperature furnace have been installed. Necessary modifications of glove boxes have beencarried out to accommodate these instruments inside. Design and fabrication of press toolingsrequired for making 14 mm dia and 10 mm dia pellets were completed. Special pressure controlsystems for the glove boxes have been designed, fabricated and installed in collabration with theTechnical Services Section of RCL. Fabrication and erection of a secondary enclosure facility wascompleted. The entire glove box system was leak tested and the leak rate in each glove box wasfound to be less than 0.02 box volume/h. The in-situ efficiency of the outlet HEPA filter assemblyin all the glove boxes were tested and the efficiency was found to be 99.8 %. The glove box trainhousing the facilities is ready for preparing plutonium bearing compounds and some experimentalruns for the preparation of UC were carried out using this new system.
A special high purity glove box enclosing a gas equilibration set up was commissionedfor the measurement of the carbon potential of uranium - plutonium mixed carbide. The resultsof the studies are reported elsewhere [1]. The high leak tightness of the glove box enabled us tooperate a sodium bath which in turn ensured the high purity of the argon atmosphere required forequilibration experiments.
Reference:[JJ. P.K.Prakashan, KAnanthasivan, LKaliappan, SAnthonysamy, P.R.Vasudeva Rao and C.K.Mathews,
Presented at the International Symposium 'Actinides 89' at Tashkent, USSR (Sept. 1989)
Contributors :
S.Anthonysamy, P.K.Prakashan, K.Ananthasivan, I.Kaliappan and P.R.Vasudeva Rao
2.1.3
Measurement of the carbon potential of uranium - plutonium mixed carbidefuel by gas equilibration
The FBTR at Kalpakkam uses a plutonium-rich mixed carbide of uranium and plutoniumclad in SS 316 tubes. Fuel-clad compatibility depends on the relative carbon potential values of

oI CD
40
50
60
70
80
CLad (
Fuel
0 >
1 1
1 1
S.RGaig ei al
A ^
CD
-
i i . . . . - . . . - i
800 900 1000 1100 1200
Temperaiure( K
2.1.3.1 Carbon potential of the FBTR fuel

Advanced Materials 35
the fuel and the clad. In the present work the carbon potential of the FBTR fuel in the temperaturerange 986-1168 K was measured by methane / hydrogen gas equilibration technique.
The carbide samples were allowed to react with purified hydrogen at the desiredtemperature and the methane generated was monitored at different time intervals using a flameionisation detector. Equilibrium was assumed to have been attained when the amount of methanein the reaction chamber remained unchanged for at least 4h.The temperature was controlled within± 2 K using a proportional temperature controller.
The values of the carbon potential of the FBTR fuel (composition Pu : 66.72 wt % ;U : 27.48 wt % ; O : 3900 ppm ; N : 728 ppm) measured by this technique are given in fig 2.1.3.1along with the results obtained ty Garg et.al.fl'j by an isopiestic technique and by Rajendran Pillaiet.a!.[2] by an emf method.
References:[lj. S. P. Garg, G.L.Goswami, R .Prasad and D.DSood, in Proc. Seminar on Fast Reactor Fuel Cycle, Indira
Gandhi Centre for Atomic Research, Kalpakkam, India, Feb. 1986, Vol.1,p.6]
12] .S .Rajcndran Pillai,SAnthonysamy ,P .K .Prakashan.R .Ranganathan. P .R.VasudevaRao andC .K Math-cws. J. Nud. Mater. 167 (1989) 105
Contributors:
P.K.Prakashan,K.Ananthasivan,I.Kaliappan,S.Anthonysamy, P.R.Vasudeva Rao andC.K.Mathews
2.1.4
Measurement of the carbon potential of the mixed uranium - plutonium carbideby electrochemical carbon meter
The carbon activity of nuclear fuel material is an important data to understand car-burization behaviour of the fuel clad under conditions of irradiation in a nuclear reactor. Tn thepresent investigation, the carbon potentials of uranium monocarbide. (containing oxygen impurity)and the FBTR fuel (a mixed carbide of uranium and plutonium) have been measured. The methodof equilibration in liquid sodium in conjunction with the measurement of carbon activity in sodiumusing the electrochemical carbon meter was used for this purpose.
The details of the carbon meter and the theoretical basis of the equilibration methodhas been reported elsewhere[ll.
a) Experiment with uranium monocarbide
A uranium monocarbide pellet was added to distilled sodium and heated to the desiredexperimental temperature. The carbon activity was measured using the carbon meter.

36 Advanced Materials
Initial experiments were carried out (set I, Table 2.1.4.1) at 953 K and the carbonpotential was found to be very high. This behaviour is attributed to the presence of uraniumdicarbide. Hence, subsequent experiments were planned after removing this phase.
In the second set of experiments fresh lot of sodium and fuel pellet were employed.Foils of 304 L SS were added to getter the excess carbon. Here again, highly carburizing conditionsprevailed and on analysis the foils were found to be highly carburized (carbon content = 0.759 wt%). Hence, two more sets of gettering operations were carried out (sets III and IV) for a totalperiod of 2.59 Ms.
In the subsequent experiment (set V), the SS foils were removed and the system washeated to temperatures in the range of 859 to 953 K and the carbon potential of the fuel wasmeasured. The consequence of further removal of carbon from the system was also studied. Afresh quantity of 304 L SS foils were added to the sodium, and the system heated to 953 K andmaintained at this temperature for 0.34 Ms (set VI). After removing the SS foils the equilibriumcarbon potential was measured at different temperatures (set VII) and the results are given in Table2.1.4.1.
One more cycle of gertering and measurement of carbon potential was carried out (setVIII and IX) and the results included in Table 2.1.4.1. The results on the measurement of carbonpotential of this fuel is also illustrated in Fig. 1.
The residue was recovered after the equilibration and XRD analysis revealed thepresence of UCi-xOx and UO2 phases. The UO2 phase might have formed due to the continuousremoval of carbon and the incidental addition of oxygen. Carbon potential of the two phase fieldUCixOx/UO2 was calculated from the data reported in literature at various values of V and isgiven in Table 2.1.4.2. These data are in very good agreement with results obtained by experimentassuming x = 0.1.
Table 2.1.4.1Gettering of carbon and measurement of the carbon potential in UC(containing UC2 and 2000 ppm oxygen in the monocarbide phase)
Set No.and
duration(Ms)
I (0.72)II (1.55)
111(1.72)
IV (0.86)
Systemdetails
UC (600 mg)UC+1500mg
304 L SSUC from 11
+946.1 mg304 L SS
UC from HI+ 1652 mg
304 L SS
EquilibriumTemp (K)
953953
953
953
Total carboncarbon poten-tials (kJ/moi C)
-10.92-5.56
- 4.863
-11.81
gettered (mg)
3.6607
1.899
0.4312

{ TEMPERATURES900
1.02 1.04 1.06 1.08 1.10 1.12 114 1-16 1.18 1.2
CARBON POTENTIAL IN THE PHASE REGION UC1.x0x + U0 2
2.1.4.1 Carbon potential in the phase region UCi-xOx+UOl

Advanced Materials 37
V (1.13) UC from IV
VI (0.34) UCfromVwithout SS+1913 mg
304 L SSVII (1.206) UC from VI
VIII (0.306) UC from VII+925 mg
304 L SSIX (1.1) UC from VIII
859882920953953
861882911939960899
845868892918944962
-26.55-24.51-14.67- 7.796-5.87
-20.26-15.90-13.20-7.80-4.79-13.70
-22.62-18.53-14.32-9.800- 5.520- 4.520
0.3116
0.1277
Table 2.1.4.2Calculated carbon potential of the two phase field region UCi-xOx + UO2 as afunction of x (estimated interaction energy for UCi- XOX is -89.9 kj)
Temp. (K)
800
1000
Table 2.1.4.3
Value of x
0.10.20.30.10.20.3
Composition of FBTR fuel
Element
PlutoniumUraniumCarbonOxygenNitrogen
Carbon potential(kJ/mol)
-23.86-67.16
-104.93-19.65-65.43-104.76
Cotnposition,wt.%
66.7227.484.723900 ppm728 ppm

38 Advanced Materials
Table 2.1.4.4Carbon potential of the FBTR fuel
Temperature (K) Carbon potential (kJ/mol)
847854878913
-76.03-72.74-72.29-69.28
I)) Measurement of carbon potential of FBTR fuel
The composition of the FBTR fuel is given in Table 2.1.4.3. The procedure employedfor carbon potential measurement is same as the one mentioned above. Initial equilibrationexperiments indicated the presence of trace quantities of free carbon in the pellet. Therefore, thecarbon was removed by gettering with stainless steel as in the case of experiments with uraniumcarbide. The carbon potential was subsequently measured at different temperatures and the resultsare given in Table 2.1.4.4. These results are in good agreement with data reported by other workers12].
Reference:/ / / S. Rajendran Pillai, S. Anthonysamy, P.K. Prakashan, R.Ranganathan, P.R. Vasudeva Rao and C.K.
MathewsJ. Nucl. Mater. 167(1989) 105.
]2] S.P. Garg, G.L. Goswami. R. Prasad and D.D. Sood, in ProcSeminar on Fast Reactor Fuel Cycle,1GCAR. Kalpakkam, lndia.1986, Vol. I p. 61.
Contributors:S.Rajendran Piliai, S. Anthonysamy, P. K.Prakashan, R.Ranganathan, P.R. Vasudeva RaoandC.K. Mathews.

Advanced Materials 39
2.2.0
HIGH TEMPERATURE CALORIMETRY
2.2.1
Thermodynamic properties of ternary oxides of fission products by calorimetricmeasurements
The alkaline earth elements Ba and Sr can combine with other fission products suchas Zr, Mo and Ce to form ternary oxides in an irradiated fuel. As a part of our programme toinvestigate the thermodynamic properties of these fission product compounds, we have measuredthe enthalpy increments of SrCeO3, SrMoO4 and CaMoO4 by a high temperature differentialcalorimeter. The measurements on the other alkaline earth compounds have been reported earlier[1,2,3]. The enthalpy increment measurements covered a temperature range of 1051-1643 K,1042-1636 K and 1034-1637 K respectively. From the least square fit of the enthalpy valuesother thermodynamic parameters like Cp, S°T, (G°T-H°298)/T have been derived.
Fig.2.2.1.1 shows the Cp vs T curves for the three alkaline earth molybdates whichincludes the low temperature data of King et al [4J for CaMoO4. Fig.2.2.1.2 shows the Cp vs Tcurve for SrCeO3. It can be seen from Fig.2.2.1.1 that CaMoO4 has the lowest slope. However,among the zirconates of alkaline earth elements CaZrO3 has the highest slope [3). The differencesin the trends of the slopes among the cubic perovskite zirconates and tetragonal molybdates couldpossibly be related to the differences in the degrees of anharmonicity in their lattice vibrationswhich in turn would be related to the differences in structures.
References :
/ / / . K. Nagarajan. R. Saha, R. Babu and C.K. Maihcws, Thermochim. Acta 90 (1985) 297.
[2j.R. F.aha, R. Babu.K. NagarajanandCK. Mathews, Thermochim. Acta 120 (1987) 29.
13]. R. Saha, R. Babu, K. Nagarajan and C.K. Mathews, J.NucLMater. 167 (1989) 271.
]4]. E.G. King and W.W. Weller, US Bur. Mines. Rep. Invest. 6147 (1963) 6pp.
Contributers:R. Babu, Rita Saha, K. Nagarajan andC.K. Mathews
2.2.2
Free energies of formation and relative stabilities of strontium compounds
Free energies of formation of SrZrO3, SrMoCH, and SrCeO3 at 1000 K and theequilibrium strontium partial pressures for the formation reactions have been computed in thetemperature ranee of 500 to 2000 K and in the oxygen potential range of-376.56 kJ mol" to-502.08 kJ mol Using the free energy functions of SrZrO3(s), SrMoO4(s) and SrCeO3(s) fromour calorimetric study [1,2,3] and the free energy functions of SrO(s), MoC«3(s), CeO2(s), BaO(s)

250
200 -
i
oE
CLU
0 400 800 1200 1500 2000Temperature ( K)
2.2.1.1 Heat capacities of alkaline earth molybdates

0 400 800 1200 1600Temperature (K)
2000
2.2.1.2 Heat capacities of strontium cerate

40 Advanced Materials
and Z1O2 from ihe literature [4], the change in the free energy functions - A (G°T-H°298)/T werecalculated for the following reactions:
SrO(s) + ZrO2(s) === SrZrO3(s) (1)
SrO(s) + MoO3(s) === SrMoO4(s) (2)
SrO(s) + CeO2(s) === SrCeO3(s) (3)
Then, substituting A H°298 of reaction (1) and (2) from the literature [5,6] and estimatedheats of formation values of SrCeO3(s) by the method of Aronson [7], the A G ° T values havebeen calculated. Table 2.2.2.1 shows these A G ° T values at 1000 K along with that of(Ba,Sr)ZrO3[8].
Table 2.2.2.1Free energies of formation of strontium compounds at 1000 K
Compound - A G ° T (klmol )
SrZrO3SrMoO4SrCeO3(Ba,Sr)ZrO3
86.9±210.5±72.6±93.4±
12.815.413.1
8.0
It can be seen from Table 2.2.2.1 that SrMoO4 is the most stable compound provided\loO3 is the starting oxide which has a high oxygen content.
Equilibrium strontium partial pressures were calculated for the strontium compoundsformed by the following reactions
(l/2)O2(g) === SrZrO3(s) (4)
+ (l/2)O2(g) === SrCeG"3(s) (5)
Sr(g) 4 MoO2(s) + O2(g) = SrMoO4(s) (6)
0.5Sr(g) + 0.5BaO(s) + ZrO2(s) +0.25O2(g) = = (Sr,Ba)ZrO3(s) (7)
From Fig.2.2.2.1. it can be deduced that (Sr,Ba)ZrO3 is more stable than all other Srcompounds throughout the temperature range. Below ~ 1000 K, SrMoO4 is more stable than thezirconate and cerate whereas above 1000 K it becomes less stable.
References :/ / / . K. Nagarajan, R. Saha, R. Babu and C.K. Mathews, Thermochim. Acta 90 (1985) 297.
[2 j . R. Saha, R. Babu, K. Nagarajan and C.K. Mathews. J.NucLMater. 167 (1989).
[3]. R. Saha, R. Babu, K. Na^arajan and C.K. Mathews, ThcrmochimActa 120 (1987) 29.
[4[. I. Barin, and O. Knackc, Thermochemical Properties of Inorganic Substances (Springer-Verlag, Berlin,1973).

0
-10
20
D
L?1J-5O
-60
-70
eno
— SrZrO3
SrCcO3
SrMoO*(BaSr)ZrO3
800 1200 1600Temperature( K)
2000
2.2.2.1 Equilibrium strontium partial pressures at an ox>6en potential of - 418.4 kJ mol-1

Advanced Materials 41
(5j. AS. V Vova and N.N. Feodosev, Russ. J. Pky:. Chcm. 38 (1964) 14.
16}. T.N. Rezukhina, and V.A. Levitskii. Izv. Akad. Nauk. SSSRA'eorg. Mater. 3 (1967) 138.
[7]. S. Aronsnn, J. Nucl. Mater. 107 (1932) 343.
(8J. R. Saha, R. Babu, K. Nagarajan and C.K MatheHsjRadiochemistry programme Biennial Report.IGC-105 (1988)40
Contributors:Rita Saha, R. Babu, K. Nagarajan and C.K. Mathews
2.2.3
Calorimetric investigations on U-AI alloys
The thermodynamic properties of U-Al alloys arc of interest since these alloys are usedas fuels in many research reactors. The integral enthalpies of formation of U-Al alloys weremeasured using a high temperature differential calorimeter at 1078, 1094, and 978 K. At 1078and 1094 K, the measurements covered the single phase region {U-Al} and the two phase regionAl3+{U-Al} whereas at 978 Kthe single phase region {U-Al} and the two phase region AU+fU-Al}were covered.
In a typical experiment, Al was taken in the sample crucible of the calorimeter andheated to the experimental temperature above the melting point of Al. Calibration was done bydropping Al samples which were initially at 298 K, into {Al}. Then, U samples were droppedinto the {Al}. From the measured heat effects and the enthalpy data of U from literature [I], theintegral enthalpies of formation can be derived [2].
Fig.2.2.3.1 shows the measured integral enthalpy values of U-Al alloys as a functionof composition at 1078 K and 978 K. The present enthalpies of formation of AU and AI3 arecompared in Table 2.2.3.1 with the literature data f3,4]. The present values are in good agreementwith the literature values within experimental uncertainties. Since the present values pertain to theexperimental temperature, their agreement with the literature values at 298 K indicates the validityof Kopp's law for these compounds.

Limits of (he (wophase region
Single phase U-Alliquid alloy
bJAI ( l ) fUAI 3 (s )
1078 K
\ \\
Limits of the twophase region
( a)-Single phase U-AIliquid alloy
2.2.3.1 Integral enthalpies of U-Al alloys

42 Advanced Materials
Table 2.2.3.1Standard enthalpy of formation of U-Al compounds
Compound
UA14
UAI3
-AH°f(298K)(kJ.mor1)
[U(S) + nAl(s) - > UAlnJ
Present work
l27.0± 7.5
119.7± 8.8
Literature
124.7± 8.4130.5 ± 13108.4± 8.4105.4 ± 9.2
(ReQ
(4).0 (3)
(4)(3)
References:
flj. I.Barin and O.Knacke, Thermochemical Properties of Inorganic Substances (Springer-Verlag, Berlin,1973).
12]. K. Nagarajan, R. Babu and C.K. Mathcws, International Symposium on Thermochemistry andChemical Processing, Nov.1989, Kalpakkam, India.
13 j . M.I .Ivanov, VA. Tubakov and N.S.Podoskia, Atomna Energia 5 (1958) 166 in Russian; Translated SovietJAt.Energy 4 (1958) 1007.
Ml. P. Chiotti andJA. KateleyJ. Nucl. Mater. 32 (1969) 135.
Contributors:
K. Nagarajan, Ft. Babu, and O.K. Mathews
2.2.4
Calorimetric Investigations on Ce-Mg liquid alloys
Salt transport is one of the pyrochemical methods of nuclear fuel reprocessing [1].Copper-magnesium alloys have been used as donor alloys in the salt transport method. Sincecerium is an important fission product and its separation from the fuel materials viz., uranium andplutonium, is dependent on its activity in the donor alloys of copper-magnesium, the thermodynamicproperties of Ce-Cu-Mg system is of importance. As a part of the programme to study theCe-Cu-Mgsystem, calorimetric measurements on the Ce-Mg liquid alloys were carried out.
Work carried out at Max Planck Institut fur Meiallforschung, Stuttgart

oe
i
en*
LJ i n i. L i I : I I I i U..J-U. i i l.-Lj_L.t-
-10 +-
- 1 5 - -
L e
2.2.4.1 Enthalpy, entropy and Gibbs free enthalpy of mixing Ce-Mg liquid alloys

Advanced Materials 43
The integral enthalpies of mixing of Ce-Mg liquid alloys were measured in the tempera-ture range 988-1086K using a calorimeter [2J. The enthalpies of solutior at infinite dilution ofcerium and of the intermetallic compound CeMg3 in liquid magnesium were also calorimetricallymeasured at 95OK. From these enthalpies of solution the enthalpy of formation of CeMg3 at298.15 K was calculated. The enthalpy of melting of CeMg3 was measured u >ing a high temperaturecalorimeter [3].
As shown in Fig.2.2.4.1 the obs3rved concentration dependence of the enthalpies ofmixing could be described in terms of an association model [4] assuming CeMg3 associates to bepresent in the liquid alloy.
Table 2.2.4.1Enthalpy of formation of CeMg3
Authors A H°f• (kJ mol'1)
Present workPhalman and SmithBiltz and Piper
-14.911.7-18.87±1.38-17.97
Table 2.2.4.1 shows that the present value of the enthalpy of formation of CeMg3 islower than the literature values [5,6]. Since calorimetric measurements have been used in thepresent work and since they are more suitable than vapour pressure measjrement [5] as well asacid solution calorimetry [6] for measurements of the enthalpy of formation,the present value isconsidered more reliable. This value is also consistent with the enthalpy of mixing of the liquidalloy of composition CeMg3.
References:/ / /. R.K. Stcunenberg, R.D.Pierce and I. Johnson, Nuclear Metallurgy 15 (1969) 325.
12}. F. Sommcr, in: Materials and Physical Chemistry in Liquid Metal Systems, ed. HM.Borgstcdt (PlenumPress, New York, 1982) p. 387
13]. F.Sommcr J. Scott andB. Predel, Z. Metallkdc. 76 (J985) 369.
[4}. F. Sommcr, Z.Metallkde. 73 (1982) 72,77.
[51. J.E. Phalman andJ.F. Smith, Metall. Trans. 3 (1972) 2423.
I6j. W.Biltz andH. Piper, Z. Anorg. Alleg. Chem., 134 (1924) 13.
Contributors:K.Nagarajan and F.Sommer

44 Advanced Materials
2.2.5Calorimetric Studies of Ce-Cu and Ce-Cu-Mg liquid alloys*
As a part of our study on Ce-Cu-Mg system, calorimetric measurements of the integralenthalpies of mixing of Ce-Cu liquid alloys were carried out 11] in the temperature range of 1095-1473K. The intermetallic compound CeCu2 was prepared, characterised and its enthalpy of solutionat infinite dilution in liquid cerium was calorimetrically measured at 1123 K. Using this value andthe enthalpy of solution at infinite dilution of copper in liquid cerium computed from the integralenthalpy values, the enthalpy of formation of CeCu2 at 298.15 K was calculated to be -18.7 kJmol" . The enthalpy increments of solid and liquid CeCu2 were measured in the temperature rangeof 1039-1190K using a drop calorimeter (1 ]. The enthalpy of me!ling of CeCu2 was also measuredusing a high tempera ure calorimeter [2] and the results are in agreement with the value from dropcalorimetry.
The observed concentration and temperature dependence of the measured integralenthalpies of mixing are explained on the basis of an association model [3] assuming the presenceof CeCu3 associates in the liquid alloy. Fig.2.2.5.1 shows the calculated enthalpy, entropy andGibbs free enthalpy values along with the measured values. The excess specific heats of the alloysat 1850 K calculated using the model are in very good agreement with the values of Dokko et al.14] obtained by levitiition calorimetric measurements as shown in Fig. 2.2.5.2.
The integral enthalpies of mixing of Ce-Cu-Mg ternary alloys were measured using acalorimeter [1] in the following concentration sections:
i) (Cu67-Mg33)x Ce(i-x)
ii) (Cu40Mg60)x Ce(i-x)
iii) (Cu80Mg20)x Ce(i-x)
iv) (Ce33Cu67)x Mg(i-*)
v) (Ce72Cu28)x Mg(i-X)
The measurements covered a temperature range of 945 to 1130K.
Using the association model parameters of Ce-Mg [5] and Cu-Mg [1] binary systems,the enthalpy, entropy and the Gibbs free enthalpies of mixing of the ternary alloys were computedand compared with tho measured values. As in the case of (Ce33di67)x Mg(i-X) shown in Fig.2.2.5.3(a)., the agreement between the measured and the experimental values was good in all cases except(Cu67Mg33)x Ce(i-x) (Fig.3 (b)) and (Cu40Mg60)x Ce(i-x) where deviations were observed. Thedeviations could be aitributed to the ternary interaction between the Cu2Mg associates and ceriumwhich are not taken i ito account in the computations. The measured enthalpies of mixing for the
Work carried o Jt at Max Planck Institut fur Metallforschung, Stuttgart

' • • )
. AS«V
L\
1LS
°7o/ /
o 7 /c '
^v ^ ^
^
0
J__U-!...-l . \
8 1 0
L t'
10 -
t.0
ro
A .,-
J J i—--1—4 '--.i—i—i—--i i - i
•1 6 e
Y
2.2.5.1 Enthalpy, entropy and Gibbs free enthalpy of mixing Ce-Cu liquid alloys

U
6 -
4 -
2 -
.u
.2 . b
A ,Le
8 1.0
Ce
2.2.5.2 Excess specific heat at 1850 K

CC0.33 C U0.67
2.2.5.3a Enthalpy, entropy and Gibbs free enthalpy of mixing of (Ce33Cu67)x Mgi-X

I I I , . , I , . , • ( . . . , I I I , • I
-25 -
0 .1 .2C U0S7 M 9 0 .33
2.2.5.3b Enthalpy, entropy and Gibbs free enthalpy of mixing of (Cu67Mg33)x Cei-x

Advanced Materials 45
ternary alloys of the same composition but obtained from concentration sections are also foundto be in agreement as shown in Fig. 2.2.5.3 (a) and (b).
References :
/ / / . K. Nagarajan andF. Sommer, J.Less-Common Met.,146 (1989) 89[2}.F.Sommer,J.ScottandB. Predel,Z. Metallkde., 76 (1985) 369[3]. F. Sommer, Z. Metallkde., 73 (1981) 72,77
l2j.F.SommerJ. Scott and B. Predel, Z. Metallkde., 76 (1985) 369
13].F'.Sommer, Z. Metallkde., 73 (1985) 72,77
[4]. W. Dokko and R.G. Bautista, Metall. Trans., Bll (1980) 511.
15]. K. Nagarajan andF. Sommer, J.Less-Common Met., 142 (1988) 319
Contributors:K. Nagarajan and F. Sommer
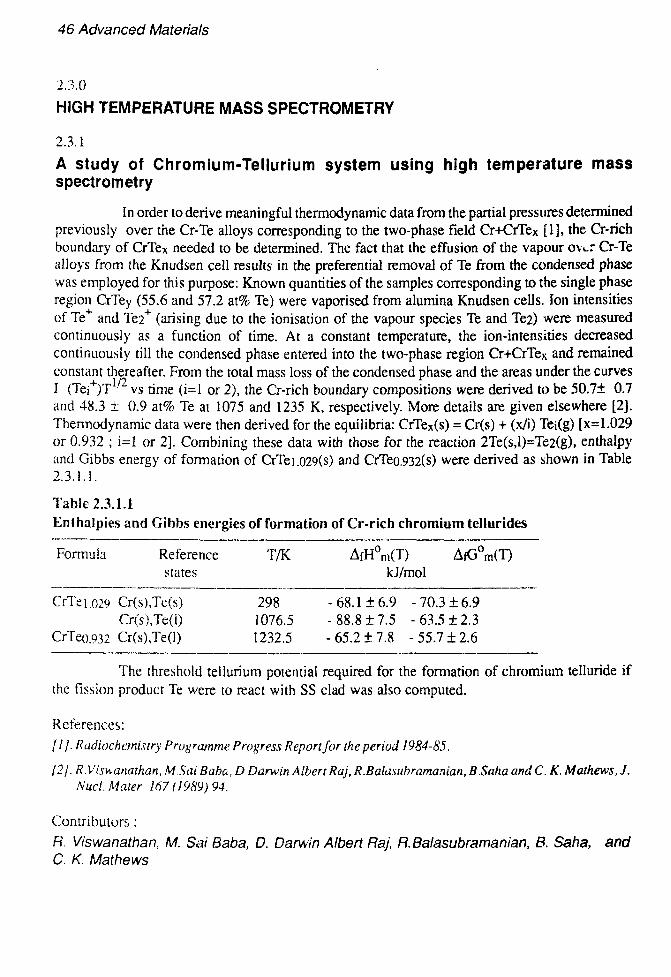
46 Advanced Materials
2.3.0
HIGH TEMPERATURE MASS SPECTROMETRY
2.3.1
A study of Chromium-Tellurium system using high temperature massspectrometry
In order lo derive meaningful thermodynamic data from the partial pressures determinedpreviously over the Cr-Te alloys corresponding to the two-phase field Cr+CrTex [1], the Cr-richboundary of CrTex needed to be determined. The fact that the effusion of the vapour ovtr Cr-Tealloys from the Knudsen cell results in the preferential removal of Te from the condensed phasewas employed for this purpose: Known quantities of the samples corresponding to the single phaseregion CrTey (55.6 and 57.2 at% Te) were vaporised from alumina Knudsen cells. Ion intensitiesof Te+ and Te2+ (arising due to the ionisation of the vapour species Te and Te2) were measuredcontinuously as a function of time. At a constant temperature, the ion-intensities decreasedcontinuously till the condensed phase entered into the two-phase region Cr+CrTex and remainedconstant thereafter. From the total mass loss of the condensed phase and the areas under the curvesI (Tei )T " vs time (i=l or 2), the Cr-rich boundary compositions were derived to be 50.7± 0.7and 48.3 ± 0.9 at% Te at 1075 and 1235 K, respectively. More details are given elsewhere [2].Thermodynamic data were then derived for the equilibria: CrTex(s) = Cr(s) + (x/i) Tei(g) [x=1.029or 0.932 ; i=l or 2]. Combining these data with those for the reaction 2Te(s,l)=Te2(g), enthalpyand Gibbs energy of formation of CrTe].029(s) and CrTeo.932(s) were derived as shown in Table2.3.1.1.
Table 2.3.1.1Enthalpies and Gibbs energies of formation of Cr-rich chromium tellurides
Formula Reference T/K AfH°m(T) AfG°m(T)states kJ/mol
CrTei .029 Cr(s),Te(s) 298 - 68.1 ± 6.9 - 70.3 ± 6.9Cr(s),Te(l) 1076.5 -88.8 ±7.5 -63.5 ±2.3
CrTeo.932 Cr(s),Te(l) 1232.5 -65.2 ±7.8 -55.7 ±2.6
The threshold tellurium potential required for the formation of chromium telluride ifthe fission product Te were to react with SS clad was also computed.
References:
/ / / . Radiochcmistry Programme Progress Report for the period 1984-85.
[2]. R.Viswanathan, MSai Babe, D.Darwin Albert Raj, R.Balasubramanian, B.Saha and C. K. Mathews, J.Nuci Mater 167(1989)94.
Contributors:
R. Viswanathan, M. Sai Baba, D. Darwin Albert Raj, R.Balasubramanian, B. Sana, andC. K. Mathews

Advanced Materials 47
2.3.2
A mass spectrometric study of homogeneity range and thermodynamic proper-ties of molybdenum tellurides
Vaporisation of molybdenum-tellurium alloys corresponding to the two-phase fieldsMo+Mo3Te4 [1] and Mo3Te4+MoTe2 [2] were studied by using Knudsen-effusion massspectrometry for the first time. Partial pressures of the vapor species over Mo+Mo3Te4 weredetermined in the temperature range 960 to 1110 K to be
log[p(Te2)/PaJ = -13631(K/T) + 12.999 and
log[p(Te)/PaJ = -13238(K/T) + 11.674.
p - T relations in the temperature range 820 to 950 K over
Mo3Tc4+MoTe2 were derived as
log[p(Te2)/Pa) = -14979(KyT) + 15.722 and
logfp(Te)/Pa] =-14120(K/T)+ 13.014.
Since vaporisation of Mo-Te alloys involves the preferential removal of Te from thecondensed phase (as in the case of Cr-Te system), a sample originally in the two-phase region ofMo3Te4+MoTe2 could be pushed to another two-phase region Mo+Mo3Te4 through the singlephase region Mo3Te4 and this move meat could be monitored by measuring the ion-intensities asa function of time. The homogeneity range of Mo3Te4 ( 52.4 to 56.5 at% Te) and the activity oftellurium as a function of composition within this single phase could thus be determined. By aGibbs-Duhem integration, the activity of molybdenum and finally the Gibbs energy of formationacross the homogeneity range of Mo3Te4 were derived. Enthalpy of formation at 298K correspond-ing to Mo-and Te-rich boundaries of Mo3Te4 phase (-63.5± 3.1 and-67.0± 0.3 U/mol) andthat corresponding to Mo rich boundary of MoTc2 (-103.51 9.5 kJ/mol) were derived.
References:/ / / . R. Viswanuthan, Ft. Balasubramanian, andC. K. Mathews.J.Chem. Thermodynamics, 21 (19S9) 1183
[2j. R. Viswanathan, R. Balasubramanian, T. S. Lakshmi Narasimhan, and C. K. Maihews., presented inthe Int. symp.on thermochemistry and chemical processing, Nov 20-22,1989, Kalpakkam, India.
Contributors:R. Viswanathan, R. Balasubramanian, T. S. Lakshmi Narasimhan and C. K. Mathews

48 Advanced Materials
2.3.3High Temperature Massspectrometric study of Ni-AI-Hf system*
Nickel aluminides are prospective structural materials for high temperature applications,especially for use as gas turbine and aircraft engine materials [ 1 ]. Minor additions of boron improvesthe ductility, while the addition of hafnium improves high temperature oxidation resistance as wellas high temperature creep resistance. Hence thermodynamic and phase diagram studies on theternary system Ni-Al-X (X = Hf,B) are of basic interest.
Alloys with the composition (Ni.75A1.25)l-xHfx (x=0,0.01,0.03,0.035,0.04,0.045,0.052,0.07,0.09,0.1 and 0.12) were prepared by levitation melting [2\. A substantially modifiedmass spectrometric system of Varian Mat CH-5 type with computer controlled ion-source wasused for the measurements [3],
Alloys were studied in the temperature range 1375-1750K which includes both solidand liquid phases. Calcia stabilised zirconia Knudsen cells were used to contain the alloys. OnlyNi and Al ions could be detected in the temperature range of measurement. Pure Ni(s) was usedfor obtaining the instrument calibration constant required for relating the ion-intensities to thepartial pressures. The ion-intensity ratio of Ni+ and Al+ as a function of temperature could bemade use of to delineate the phase boundaries. Least square fitted pressure-temperature relationswere arrived at for all the alloy compositions studied both in the solid state as well as in the liquidstate.
Table 2.3.3.1 gives partial pressure values at two temperatures 1460K(temperature atwhich all alloys are present in solid state) and at 1650K(temperature at which all alloys are presentin the liquid state). It can be seen from the table that ternary additions of Hf to Ni.75Al.25 reducesthe Ni-activity where as that of Al is increased. The present study is the only thermodynamicinvestigation reported so far on this system.
Table 2.3.3.1Partial pressures of Ni(g) and Al(g) over (Ni.75AI.25)i-x Hfx
0.0.0.0.0.
.000010030052070
T=1460K
PNi(Pa)X 10"3
1.120.960.690.610.59
PAK'Pa)X 10"5
5.296.488.6112.3916.86
T=165OK
PNi(Pa)X 10"~
7.016.073.904.694.54
PAl(Pa)X 10"3
3.583.204.386.819.10
Work carried out at Institute for Reactor Materials, KFA, Julich, FRG.

Advanced Materials 49
0.089 0.63 15.63 3.64 11.210.100 0.57 14.95 3.48 9.22
References:[1]. C.T. Liu, Mi Con 86: Optimization of ProcessingJProperties and Service Performance Through
Microstructural Control, ASTMSTP 979, Eds. B.L. Bramfitt, R.C. Benn, C.R. Brinkman andCF.Vandervoort, ASTM, Philadelphia 1988, pg 222-237.
[2J. K. Hilpert, D. Kobertz, V. Venugopal, M. Miller, H. Gerads, F.T. Bremer andtl. Nickel, Z. Naturforsch.42a (1987) 1327.
13]. K. Hilpert andK. Ruthardt, Ber. Bunsenges. Phys. Chem. 91 (1987) 724.
Contributors :
M. Sat Baba and K. Hilpert
2.3.4
Vapour density measurements of some technically important metal halides
Quasi-binary and quaternary systems of metal halides are important for metal halidelamps due to the possible enhancement of element concentrations in the arc column (of metalhalide lamp). For this purpose a new vapour isolation method has been used to obtain vapourdensities in the temperature and pressure range where Knudsen cell mass spectrometric studiescannot be performed. The measurements were carried out at a constant temperature of 1078 K. Atwin quartz bulb system connected by a small capillary which can be sealed at the high temperatureof the experiment (to isolate the vapur phase from the condensed phase) for keeping the sampleand a sodium heat pipe furnace for obtaining the uniform zone of temperature were used in theinvestigations. More details can be found elsewhere [1].
The following systems were studied:
a) Dyl3, [ x Nal + (1-x) Dyl3 j (x = 0.25,0.75)
b) Scl3, [ x Nal + (1-x) Scl3 ] (x = 0.25,0.50,0.75 ai.d 0.96)
c) [ x Nal + (1-x) GaCl3 ] (x = 0.43,0.67,0.76,0.82 and 0.92)
d) a | x Nal + (1-x) Gal3 ) + (1-a) I x NaCl + (1-x) GaCl3 ]
Work carried out at Institute for Reactor Materials, KFA, Julich, FRG.

50 Advanced Materials
x = 0.54, a = 0.1,0.25,0.50 and 0.75
Enhancement factors (defined by the ratio of the vapour density over the mixture tothat of pure substance) of Na,Sc and Dy in the gas phase were deduced from the vapour densitymeasurements. The vapour density data was also made use of to obtain the gas phase dissociationconstant of the reaction
Nal(g) +Xl3(g) =NaXl4(g) (X = ScandDy)
and compared with the extrapolated high temperature mass spectrometric data. Theagreement was found to be excellent in the case of Nal-Scl3 system [2]
References:[ljK. Hilpert, proceedings of the symposium on High Temperature Lamp chemistry II, ed. E.G. Zubler.p
36- 69, The electrochemical society , proceedings volume 88-4.
12}. K. Hilpert, M. Miller and M. Sai Baba, proceedings of "Sixth International Conference on HighTemperature Chemistry oflnorganic Materials" held at National Institute ofStandards and Technology,Gaithersbrug, Maryland, USA, April3-7,1989.
Contributors:M. Sai Baba and K. Hilpert

Advanced Materials 51
2.4.0
THERMAL ANALYSIS AND THERMAL CONDUCTIVITY
2.4.1
A thermogravimetric study of the oxidation behaviour of uranium monocarbide
Studies on the oxidation and ignition behaviour of carbide fuels are of interest fromvarious considerations which include application in the head end step of reprocessing, conversionof the fabrication waste in refabrication of the fuel, safe intermediate storage of the irradiatedfuel and proper handling of the carbides in nuclear industry and research [1]. While considerableinformation exists on the kinetics of the oxidation of UC at low oxygen pressures and over a widerange of temperatures [2] the corresponding information related to the oxidation behaviour in airor oxygen is quite meagre and often misleading due to the effects of the accompanying ignitionprocess. Thus in order to understand and delineate the mechanistic aspects of oxidation it isimperative to have a detailed knowledge of the ignition also. The uranium monocarbide necessaryfor the present work was prepared by the carbothermic reduction process .In order to measure theignition temperature a new sample holder in the TG mode has been used, the details of which canbe found elsewhere [3]. As the heating rate ( p ) is decreased covering the range from 20K/min to 0.5 K/min the ignition temperature showed a gradual increase from 440 to 490 K.When the heating rate was further reduced to a value of 0.2 K/min no ignition could be noticedindicating that at sufficiently slow heating rates ignition can be altogether prevented. A linearcorrelation was noticed between the reciprocal of the ignition temperature and log ( P ). Oxidationbehaviour of UC was studied employing the thermogravimetric technique with heating rates from0.1 to ] K/min in the nonisothermal mode. The thermogravimerric runs were carried out in air ata How rate of 75 ml/min and utilising wide silica crucibles. Weight changes corresponding to thevarious stages of carbide oxidation were continuously monitored. Further, the reaction productsat the intermediate stages of oxidation were cooled to room temperature and characterised.Fig.2.4.1.1 shows the effect of the heating rate on the oxidation thermogram, illustrating thevariation of the maximum weight gain, weight plateau and inception temperature. It was foundthat the air oxidation of the carbide proceeds through the intermediacy of uranyl carbonate adductand a - UO3, the latter decomposing initially to UO2.9 and finally to U3O8.
References:
/ / / . U Benedict. K. Rtchtcr undJ. Tuerlinx, Trans. Amer. Nucl. Soc. 31 (1979) 512.
121. //. Matzke, Science ofl.MFBR Fuels (North Holland, Amsterdam, 19X6).
I?]. 11.P. Nwada, P. Srinuna Murti, G.Seenivasan and S.Anthonysamy, Thermochim. Acta 144 (19S9) 357.
Contributors :
H.P. Nawada, P. Srirama Murti, G. Seenivasan and S. Anthonysamy

373 573 773
0 IrC/rn,nA 0 5 C/!i)inO 1 "C-'inin
673 973TEMP K
2.4.1.1 Thermograms showing the effect of heating rate on the oxidation of uraniummonocarbide in nonthennal mode

52 Advanced Materials
2.4.2Reaction behaviour of the intermetallic UPd3 in oxidising environment
Studies on the actinide (U, Pu) - noble metal (Ru, Rh, Pd) intermetallics are presentlyof considerable interest as they have been found to be present as inclusions in irradiated fast reactorfuels [1J. These noble metal based intermetallics are also noticed as residues from the dissolutionof fast breeder mixed carbide fuels in concentrated nitric acid [2]. The yield of the noble metalsis fairly high and thus these intermetallics can tie up considerable amounts of actinide elementsas insoluble residues. For the dissolution of the insoluble residues it is possible to have separateschemes among which the oxidation of the fuel as an integrated step or oxidation of the insolubles10 a fairly soluble oxide form is an interesting possibility. While Wijbenga [3] referred to theproblems related to the combustion of U-Pd alloy no systematic information is available on theoxidation behaviour of UPd3.
In the present work the mechanistic and kinetic aspects of the oxidation of UPd3 werestudied by thermogravimetry. UPd3 was obtained as an arc melted button and was annealed in aquartz capsule at 1073 - 1123 K for 15 days. The oxidation behaviour of UPd3 was studiedemploying a thermal analyser and using heating rates ranging from 0.2 to 20 K/min in thenonisothennal mode. The thermogravimetric nins were taken in air at a flow rate of 75 ml/minand utilising wide alumina crucibles. From a separate examination of the oxidation of UPd3 atlow oxygen pressures (-10" ppm O2 in argon) it was noticed that the oxidation is a diffusioncontrolled reaction.
In order to understand the reaction behaviour of palladium in the air oxidation of UPd3,oxidation of pure palladium powder in air was studied in isothermal mode covering a temperaturerange from 873 to 1073 K and also in the nonisothennal mode employing heating rates from 0.2to 5 K/min. As noticed in the Fig.2.4.2.1 the study revealed that the palladium oxidation proceedsthrough the following steps : inception at 806 K, attainment of maximum weight gain at 1039 -105 3 K and a sharp weight loss step with inception around 1063 K corresponding to the decom-posiiion of PdO. The reaction was also seen to be diffusion controlled. As shown in the samefigure the air oxidation of UPd3 proceeds by inception at 593 K and a maximum weight gainaround 1029 K corresponding to the oxidation of U and Pd. As the temperature is slowly raised,a sharp weight loss occurs incepting at 1057 K. This lower temperature of decomposition of PdOin this case is considered to be due to the catalysing influence of U3O8. It also appears that thepalladium present can form a protective covering over the unreacted alloy as well as PdO thuscausing a decelerating influence on the overall progress of the reaction. Thermograms correspondingto the oxidation of UPd3 under various heating rates are shown in Fig.2.4.2.2. As the heating ratewas reduced from 5 to 0.2 K/min the percentage of UPd3 oxidised increased from 50% to 90%.For achieving a complete oxidation of UPd3 it is better to oxidise at a heating rate of < 0.2 K/minupto 973 K and continue to hold the temperature for a very long time.
References:
/ / / . J.I. Bramman, R.M. Shampie, D. Thorn andC. YatesJ. Nucl. Mater. 25 (196S) 201.
121. H KlcykampandR. Pcjsa.J. Nucl.Mater. 124(1984)56.
/.?/. G. Wijbenga, J. Chcm. Thermodyn. 14 (19X2) 4X3.

I 2 r
2
== !£-i
A Pd
373
o-o-o
1073 1173 '273
2.4.2.1 Thermogram for the oxidation of U-Pd alloy and of Pd at a heating rate of0.2 K/min.

16 r — 1
12
10 f-
. 8 -
2\
473 773 873 973TEMP K <=£>
A 0. 2 deg/minA 0-5 •'o 20 '• 5.0 '
• 20 deg./min
1073. !
1173 1273
2.4.2.2 Thermograms for the oxidation of U-Pd alloy under various heating rate

Advanced Materials 53
Contributors:H.P. Nawada, P. Srirama Murti, G. Seenivasan and I. Katiappan
2.4.3
Study of the electrical conductivity of U3O8
Electrical conductivity of U3O8 was studied using D.C. four probe method as afunction of temperature covering the temperature range from 550 to 975 K in air. The sampleused for the measurements was of dimensions 22.7 x 0.28 x 3.58 mm and had a density of 91 %theoretical. The oxygen-to-uranium ratio was determined by spectrophotometry [1] to be 2.661.As shown in Fig. 2.4.3.1 a sharp break which was noticed in the log o~ (where a indicateselectrical conductivity) vs reciprocal temperature plot at 823 K was indicative of a phasetransition. U3O8 is known to undergo a phase transition from orthorhombic to hexagonalstructure and the phase transition temperature which depends on O/U ratio of the sample variesfrom 658 K (O/U ratio 2.667) to about 923 K (O/U ratio 2.558 to 2.65) I2,3j. In the present case,below a temperature of 823 K the In G vs 1/T plot had shown a linear relationship and yieldeda value of 6.496 K cal/mol (0.282 ev) as the activation energy for conduction. This value wasfound to agree well with the value of 0.24 ev reported earlier by Djerassi et atl [4].
References:
/ / / . MX. Ahmed andN.L. Sreenivasan, Anal. Chem. 58 (1986) 2479.
\2}. K. Nairn, T. TsujiandF. OhyaJ. Nud. Mater. 114 (1983) 136.
13/. H. Djerassi and A.P. Somiamt.J. Appl. Phys. 43 (1976) 1275.
14}. T. Ishi, K. Naito andK.OshimaJ. Nud. Mater. 35 (1970) 335.
Contributors :H.P. Nawada, G. Seenivasan and P. Srirama Murti
2.4.4
Study of the thermal conductivity of zirconates of barium and calcium
A study of the thermophysical properties of barium zirconate is of interest in fueltechnology as barium and zirconium are important fission products and are known to be presentin the fuel in the form of barium zirconate f 1J. In addition, the zirconates of barium and calciumare also important as high temperature ceramic coating materials. In the present work thermalconductivities of barium and calcium zirconates were measured as a function of temperature bylaser flash technique. For the preparation of these materials, barium or calcium carbonate was

-20 •
-2L-
-26 -
cr
-2 3 -
-30;
i- . - . . _ . . _; . . . . ! . . . . - ; : . . . . . . ; _ J
10 1.1 12 13 W, 15 1.6 17
2.4.3.1 Electrical conductivity of U3O8 by the four probe method
18

600 700 800 900 1000 1100 1200 1300 1400
Temperature ( K )
2.4.4.1 Thermal diffusivity of barium and calcium zirconates as a fun ction oftemperature

en
co
o£
JC _L600 700
o BaZrOj
^ CaZrO3
j . j_
800 900 1000 1100
Tsmperature (K )
1200 1300 MOO
2.4.4.2 Thermal conductivity of barium and calcium zirconates as a fun ction oftemperature

54 Advanced Materials
mixed with zirconium dioxide in the appropriate proportion, ground thoroughly, pelletised and thepellets were heated for 15 hrs at 1373 K. The pellets were then crushed, ground thoroughly,repelltised and finally sintered at 1773 K for 20 hrs. Formation of the zirconates was verified byx-ray diffraction. The front and rear surfaces of the samples were coated with a thin layer ofplatinum. The coating on the front surface prevents the transmission of 'he laser beam throughthe sample and the coating on the rear surface ensures uniform emission characteristics. In themeasurement of thermal diffusivity by the laser flash method sampling rates of 0.5 to 2 kHz weregenerally employed. Radiative heat losses from the. samples were taken into account and necessarycorrections were applied for the same employing Cowan's method [2j. Thermal conductivitieswere obtained from the thermal diffusivity data making use of the heat capacity data alreadyreported from our laboratory by Nagarajan et al [3j. Figs. 2.4.4.1 and 2.4.4.2 show the thermaldiffusivity and thermal conductivity data as a function of temperature in the range 600 to 1400K. It is noted that the thermal conductivities are generally in the range of i to 3 W/m. deg K,characteristic of low thermal conductivity oxide ceramics [4j.
References :
/ / / C.E. Johnson, I. Johnson, P.E. Blackburn and C.E.Crouthamci, Reactor Tcchnol. 15 11972) 303.
(21 R.D. Cowan, J. Appl. Phys. 34 (1963) 926.
131. K. Na^arajan, R. Saha. R. Balm and C.K. Mathews. Thrrmoi hem. Ada 90(19X5) 2<>>7.
Ml- W.D. Kingery. Introduction to Ceramics, (Wiley. Nev.-York,(1960).
Contributors:Ml / . Krishnaiah, P. Srirama Murti and C.K. Mathews
2.4.5
Development of rare earth borides for control rod applications
Rare earths occupy an important place in nuclear technology. In addition to beingfission products, they are also of importance as control rod materials, flux suppressors and fueldiluents [ 1 ]. Various compounds of rare earths with hafnium as well as boron also are of interestin this context. Studies carried out on rare earth pyrohafnates, which constitute a new family ofrare earth compounds, for neutron absorption applications were reported earlier from our laboratory[2|. As a part of the development of rare earth borides for control rod application, studies werecarried out and a method was standardised for the formation of rare earth borides. Two methodswere investigated for this purpose. In the first method a reaction of LazO3, boric acid and carbonmixed in the desired proportion was carried out at a temperature of 1573 K. In the second methodLa2O3 was mixed with boron carbide and carbon in the desired proportion and the reaction wascarried out for 15 hrs at 1573 K. It was seen that the first method was not suitable for the formationof the boride. The second method however was found to be quite satisfactory. The lanthanumhexaboridc obtained from this method was found ro be very good and the. x-ray diffraction

Advanced Materials 55
examination confirmed the formation of crystalline single phase LaB6- Work related to theformation and thermal diffusivity study of rare earth borides is in progress.
References:/// . W.KAnderson, in : The Rare Earths, eds. F.HSpedding andA.H.Daane Krieger, (Huntington, New
York.l971.)p.522.
{2j. M.V.Krishniah,P.Srirama Muni and CKMathews. Report IGCAR-W5 (1988).
Contributors:M. V. Krishnaiah and P. Srirama Murti
2.4.6
Differential Thermai Analysis studies of Ni-AI-X(X=Hf,B)systems
Ni-Al-X(X=Hf,B) alloys were studied in the temperature range 1275-1800 K. Differntialthennograms were recorded using alumina crucibles. The experiments were performed in acompletely computer-controlled DTA apparatus (NETZSCH). The details of the instrument andthe mehtod of obtaining the data and interpretation are given elsewhere [1]. The studies wereperformed to obtain the effect of ternary additions of Hf and B on the solvus,eutectic and liquidustemperatures of the binary Ni-AI as well as to detennine the ternary section of the phase diagram.
a . Ni-AI-Hfsystem:
Alloys with the composition (Ni.75A1.25)l-x Hfx (x=0,0.01,0.03,0.035,0.04,0.045,0.052,0.07,0.09,0.10 and 0.12) were prepared by levitation melting [2]. For all the alloys differentialthennograms were recorded using different heating and cooling rates . Apart from those alloysprepared by levitation melting, the alloys with x=0.02,0.055,0.06 and 0.08 were prepared insituin the DTA apparatus. Solvus (coresponding to y --> y +P ), solidus and liquidus temperatureswere deduced for all the alloys.
From the results it could be seen that ternary additons of Hf reduces the solvus,eutecticand liquidus temperatures. Also the solubility of Hf in y -phase was found to be above the valueof x=O.O52 and less than x = 0.055.
Work carried out at Institute for Reactor Materials, KFA, Julich, FRG.

56 Advanced Materials
b. Ni-AI-B system :
Alloys with composition (Ni 75AJ.25)l-x Bx (x=0,8.82 X 10"4 ,2.34 X 10'3 ,4.68 X 10'3
,9.79 X 10"3,1.49 X 10"2 ,1.92 X 1(T and 2.31 X 10'2 ) were prepared by levitation melting.The preparation procedure as well as the method of obtaining the data is similar to that describedfor Ni-Al-Hf alloys. Apart from the alloys prepared by levitation melting alloys with x=1.10 X10"" and 1.22 X 10'2 were prepared insitu in the DTA apparatus. From the results it could be seenthat as in the case of Hf, boron addition to Ni.75Al.25 results in the reduction of the solvus ,eutecticand liquidus temperatures . The solubility limit of boron in the -phase was found to lie betweenx=l.l X 10'2and 1.22 X 10'2
References:/ / / . S.R. Dhamadkar, K. Hilpert, D. Kobertz, V. Venugopal and H.Nickel, Proceedings of "Sixth Interna-
tional Conference on High Temperature Chemistry of Inorganic Materials" held at National Instituteof Standards and Technology, Gailhersbrug, Maryland, USA, April 3-7,19S9.
12 j . K. Hilpcrt, D. Kobertz, V. Venugopal. M. Miller, H.Gerads, FT. BremerandH. Nickel, Z. Naturforsch.42a (1987) 1327.
Contributors :M.Sai Baba and K. Hilpert

Advanced Materials 57
2.5.0
THERMAL EXPANSION MEASUREMENTS
2.5.1
Thermal expansion studies on some rare earth pyrohafnates by high temperatureX-ray powder diffractometry
Pyrohafnates of rare eath elements R2Hf2O7 where R represents the rare earth elements,are candidate materials for control rod applications in nuclear technology [1]. Thermophysicalproperties like thermal expansion coefficients of these compounds are not readily available inliterature. Therefore, a programme was undertaken to generate thermal expansion data on lan-thanum, europium and gadolinium pyrohafnates by the absolute method of x- ray powder diffrac-tometry.
The compounds were prepared by heating stoichiometric mixtures of the respectiverare earth sesquioxide and hafnium dioxide at 1773 K for 6 hrs. in a superkanthal furnace. La2Hf2O7crystallised in pyrochlore structure whereas Eu2Hf2O7 and Gd2Hf2O7 exhibited the partiallydisordered pyrochlore structure as revealed by x-ray diffraction analysis, owing to the differencein the ionic radii of the rare earth ions 12]. Our high temperature XRD system and the method ofthermal expansion measurement have been described elsewhere [3]. Angular measurements wererestricted to the (12 4 0), (10 6 6) and (12 4 4) planes of La2Hf2<>7 and the (8 4 0), (8 4 4) and(6 6 6) planes of the other two compounds. The observed variation of the percent expansion ofthe three compounds is presented in Fig.2.5.1.1. The values have also been fitted to equations ofthe form a + bT + cT" and they are shown below:(temperature in K)
La2Hf2O7 : -0.2609+0.7875xl0~3T+0.1064xl0~6T2
Eu2Hf2O7 : -O.O435+O.K)59xlO'3T+O.3878xlO"6T2
Gd2Hf2O7 : -0.3976+1.1822xl0"3T+0.0444xl0"6T2
References :[I]. D.R. Spink andJ.H. Schemel, J. Nucl. Mater. 49(1972173)1
[21.DJM.Bevan and E. Summerville, in: Handbook on the Physics and Chemistry of Rare Earths, eds. K.A.Gschncidner, Jr. and L. Eyring (North Holland, Amstardam, 1979) p.496
131S. Rajagopalan, K.V.G. Kutty, H.K. Jajoo, S.K. Ananthakrishnan and R. Asuvathraman, IGC - 96(1988)
Contributors:K. V.G. Kutty, S Rajagopalan and R. Asuvathraman

coincaa.X
UJ
1 . JU U
1.170
1.040
0.910
0.780
0.650
0.520
0.390
0-260
0.130
0.000
• 6d2
• La2
* Eu2-
-
: J- /
Hf2O? >
Hf2O7 JWV J
Hf2°7 / / A
iffi f fIf///
if
. . . 1. . . . i . .,.1
0 600 900 1200 1500Temperature! K)
2.5.1.1 Variation of the % thermal expansion of lanthanum, europium and gadoliniumpyrohafnates with temperature

58 Advanced Materials
2.6.0
STUDIES ON OXIDE SUPERCONDUCTORS
2.6.12.6.1Effect of iron doping and oxygen stoichiometry on infrared absorption inYiBa2Cu3O7x
The high temperature superconductivity of YiBa2Cu3O7-x (YBCO) is extensivelystudied by IRand Raman spectroscopy among a number of other experimental techniques. Thesespectroscopic techniques help in elucidating the nature of the phonons and the role of electron-phonon interaction in the superconductivty of these systems. There are two distinct sites for Cu;one labelled Cu(l) is between the two Ba planes and forms one dimensional Cu(l)-O(l) chainsin the orthorhombic phase. The other site Cu(2) situated between the Y and Ba planes forms apuckered two dimensional Cu(2)-O(2,3) planes [I]- As a step towards understanding the mechanismof superconductivity with particular reference to the role of Cu-O chains and layers the effects ofoxygen stoichiometry and the impurity elements substituted for Cu have been studied.
Samples of YiBa2Cu3O7-x with different x values were prepared at MSL [2J. 1Rspectra were recorded on a Digilab FTIR Spectrometer Model FTS 15/90 by the standard KBrpellet technique. The weight percentage of the sample in KBr was 2.5%.
IR spectra for various x values are shown in Fig.2.6.1.1 & 2.6.1.2. From this it isclear that the orthorhombic phase is characterised by a band centered around 575 cm and thetetragonal phase by bands positioned at 590 and 640 cm"'. From the IR pattern of the iron-dopedYBCO and from x-ray studies the various modes are assigned as follows:
1. Mode at 575 cm' to Cu(l; - O(4) antisymmetric stretch.
2. Mode at 621 cm"1 to CuU) - O(2,3) stretch.
3. Mode at 590 cm"1 to Cu(l) - 0(1) stretch.
Details of the assignments are given elsewhere [3J.
References///.N.A Beno,L.Soderholm,D.W. Capone.D.G.Hinks.J.DJorgensen.IK.Schuller,C.U.Segre.K.Zhang
and J.D.Grace, Appl. Phys. Lett. 51 (1987) 57.
{2j. Y. Hariharan, M.P. Janawadkar. V.S. Sastry andTS.Radhakrishnan , Pramana-J.Phys. 31 (1988) I.
13 j . A.K. Sood. K. Sankaran, Y. Hariharan, S. Vijayalakshmi, V. Sankara Sastry, S. KalavolhiandJ. Janaki,PramanaJ.Phys. 31 (I98S) 389.
Contributors:
K. Sankaran, S. Vijayalakshmi and A.K. Sood

FIG. 2.6.1.1FIG. 2 . 6 . 1 . 2
WAVtNUMBtRS (cm
700 650 600 550 500 £50
WAVg NUMBERS (cm"1)
2.6.1.1 Infrared absorption spectra of YBa2Cu3O7-5 with different oxygen stoichiometry= (1)0.12,(2)0.17,(3)0.22,(4)0.43,
(5) 0.52, (6) 0.62, (7) 0.67, (8) 0.75.
2.6.1.2 Absorption spectra after subtracting the constant slope electronic absorptionbackground. The curve numbers are the same for Fig. 2.6.1.1. The verticaldotted lines are drawn at 575, 590 and 640 cm to facilitate comparison of mainband positions

Advanced Materials 59
2.6.2
Experimental study of the decomposition of YiBa2Cu3O7-x into tetragonal andorthorhombic phases
It is now well established that the high temperature superconductor YiBa2Cu3O7-x(YBCO) has two reference structures; an orthorhombic (0) structure stoichiometric at X = 0 anda tetragonal (T) structure with the stoichiometric composition YiBa2Cu3O6 (X=l) [1]. The twostructures are different in terms of the oxygen occupancy in the basal plane situated between theBa atoms. Recently it has been suggested that non-stoichiometric YiBa2Cu3O7-x is inherentlyunstable towards decompositon into a mixture of a T phase of composition of O6 and an O phaseof composition in the vicinity of O7. A phase diagram, calculated by the mean field approximation,suggested that if the orthorhombic YBCO is quenched into the two phase region it will decomposeinto a mixture of orthorhombic and tetrogonal phases [2]. We have studied the decomposition ofYBCO into two phase region using infrared absorption and x-ray diffraction measurements. Thedecomposition was studied at 473 K. Oxygen deficient samples of YBCO for IR studies wereprepared in the Materials Science Laboratory.
Fig.2.6.2.1 gives the IR absorption of the orthorhombic and tetragonal YBCO phases.It is seen here that the O phase is characterised by the strong band centered around 575 cm andthe T phase is identified by two strong bands positioned at 590 and 640 cm" [3]. Fig.2.6.2.2gives IR absorption of sample (X = 0.27) after ageing at 473 K for different periods upto 100hours. It can be seen that as the ageing time is increased, there is a remarkable growth of theIR band at -590 cm" charac teristic of the T phase. Similar results are also obtained for X = 0.16[4|. X-ray pattern also gave similar results which support the formation of Tphase. Hence x-rayand IR results show unambiguously that the decomposition reaction in YBCO at 473 K doestake place in qualitative agreement with the phase diagram calculated by Khachaturyan [2].
References:/ / / . MA Benu, L. Soderholm. D.W. Capone, DO. Hints, J.D. Jorgensen. IK. Schuller, C.U. Segre. K.
Zhang. J.D. Grace. Appl.Phys.Lett. 5(1987} 57.
121. ,4.6". Khachaturyan andJ.W. Morris , Phys.Rev.Lett. 59 (1987) 2776.
[31. A K. Sood, K. Sankaran, Y. Hariharan, S. Vijayalakshmi, V. Sankara Sastry, S. Kalavathy andJ. Janaki, Pramana, J.Phy. 31 (1988) 389.
14 j . A.K. Sood, K. Sankaran, V.S Sastry , M.P. Janawadkar, C.S. Sunder, J. Janaki, S. Vijayalakshmi andY.Harifiaran. Physica C156 (1988) 727.
Contributors :K. Sankaran, S. Vijayalakshmi and A. K. Sood'
** Material Science Laboratory , KiCAR

B8
531 1.1 ! :_!- .i700 650 SO-:) 550 5CJG 660
VVAVENUMBER5 t c m- l '
605 550
2.6.2.1 Typical IR absorption spectia of superconducting YBa2Cu3O6.9 andnon-superconducting YBa2Cu3O6.25 prepared by the ceramic route. A constantslope electronic background included in (a) has been subtracted in (b). Thevertical lines are drawn at 640, 590 and 570 cm"1

WAVENUMBERS ( c m
2.6.2.2 IR absorption spectra for YBa2Cu3O6.73 prepared by the ceramic route andannealed at 200°C for periods indicated in the curve. The constant slopeelectronic background has been subtracted in (b) Note the gradual building up of
-lthe 590 cm" mode which is characteristic of the T phase (see also Fig. 2.6.2.1)

3.0
CHEMISTRY OF NUCLEAR FUEL REPROCESSING
3.0.1
Introduction
The chemical aspects of fuel reprocessing that are being studied in the RadiochemistryProgramme can be broadly classified as : (1) studies on PuO2 dissolution, (2) applications ofphotochemistry, (3) studies on the solvent extraction of actinides with special emphasis on thephenomenon of third phase formation and (4) studies on solvent and diluent degradation.
The dissolution of PuO2 in acids is a challenging task because drastic treatment suchas HF addition is needed to dissolve PuO2 even at high temperatures in HNO3. Studies in ourlaboratory are aimed to show that the dissolution in HC1 medium can be effected in the presenceof reducing agents without employing HF. In a significant development, it has been shown thatthe dissolution can be performed photochemically even at room temperature. This observationhas important practical applications.
The use of excited uranyl ion as an oxidising agent in various steps of the reprocessingcampaign has been investigated and methods developed for the destruction of oxalic acid in oxalateprecipitation supernates.
The phenomenon of third phase formation has special relevance to fast factor fuelreprocessing and is a very interesting subject which has not received due attention. In our laboratory,detailed studies have been conducted on this topic with a view to understanding the role of variousfactors such as the diluent, solvent concentration, presence of modifiers etc. The empirical cor-

62 Fuel Reprocessing
reunion that has been developed to predict the effect of the diluent structure is the first of its kindiind promises to provide a reliable way of predicting the limits of loading in the organic phase.
The species formed in the extraction of Th (IV) nitrate by TBP has been a matter ofcontroversy. The infra-red absorption studies carried out by us have clearly proved that the onlyspecies formed in the system is Th(NO3).2TBP.
The degradation of solvents and diluents in reprocessing has been a subject of numerousinvestigations, but there are gaps in the understanding of the process of degradation and the identityof the degradation products. Using infra-red specttoscopy, a new method has been developed forthe estimation of DBP and MBP in TBP solutions. A gas chromatographic study of the degradationof different paraffin diluents has indicated the correlation between the carbon number of the diluentand the extent of degradation.
The reprocessing of carbide fuels poses special problems mainly caused by the for-mation of many organic compounds during the dissolution of the fuel in nitric acid. Since theFBTR uses mixed carbide fuel, it has become necessary to investigate the methods for the destructionof these compounds which would otherwise interfere in the reprocessing steps. Chemical as wellas photochemical methods have been developed for this purpose. A method of convening thecarbide to nitride has also been developed to altogether avoid the formation of the organiccompounds. The efficacy of these methods will be guaged when the irradiated fuel from FBTRis reprocessed.
The economics of power generation by fast breeder reactors dictate that the out-of-reactor rime of the fuel be the minimum. This calls for the development of faster methods ofreprocessing. Non-aqueous routes involving pyrochemical processes have been proposed for thispurpose. We have undertaken a project to study these processes, and our initial results are alsoincluded in this section.

Fuel Reprocessing 63
3.3.0
AQUEOUS REPROCESSING
3.1.1
Dissolution of plutonium dioxide in HCI medium
Detailed studies on dissolution of plutonium dioxide (PuO2) in HNO3 medium havebeen carried out by a large number of workersfl], in view of its importance in nuclear fuelreprocessing and scrap recovery. An attempt has been made in our laboratory to study thedissolution behaviour of PuO2 in HC1 medium, in the presence and absence of a reducing agents,viz., hydrazine and Fe(II).
The data on the dissolution of PuO2 in HCI in the absence of hydrazine are given inFig.3.1.1.1. HCI medium itself being reducing in nature, quite high dissolution is observed. Anincrease in the HCI concentration is seen to increase the solubility. Dissolution of PuO2 in initialacidities of 3M, 5M and 7M HCI in the presence of 0.65 M hydrazine, is shown in fig. 3.1.1.2.Data on the dissolution in 5 M HCI in the presence of varying concentrations of hydrazine aregiven in Table 3.1.1.1. As can be seen from fig. 3.1.1.2, the presence of hydrazine results inconsiderable increase in the dissolution. In 7M HCI, the dissolution rate is not significantly higherthan that in 5 M HCI. This could be mainly due to the limited solubility of N2H4.2HCI in HCI,even at high temperatures. Fig. 3.1.1.3 gives the plot of dissolution vs time, which includes theeffect of Fe(II) and hydrazine on the dissolution of PuO2 in 7M HCI.
Use of hydrazine enhances the dissolution of PuO2 in HCI medium and upto 95%dissolution has been observed in 5M HCI. Hence PuC»2 dissolution in HCI medium can be carriedout to completion , without the use of additives such as Ce(IV), HF etc, as is required in HNO3medium.
Table 3.1J.1Percentage of Pu dissolved in 5M HC!(initial acidity) at 373 K
Time(mm)
15304560120180300
[N2H4] 0.0 M
5.556.827.778.34
11.0712.6213.54
Percentage Pu dissolved
0.14M
8.0712.2616.1420.4033.3943.5262.43
0.27 M
6.4610.8515.2819.0827.1845.8866.03
0.40 M
12.3916.87
—27.2137.0045.2064.62
0.53 M
9.8116.0321.8229.7347.7460.5472.07
0.65M
9.8815.7221.6327.6148.5265.3294.84
References :tlj.J.L. Ryan and LA.I Bray, "Dissolution of Plutonium Dioxide - A Critical Review", Actinide Separations,
p 499. J.D.Navradl ami W.W. Schulz, Eds. American Chemical Soc (1980)

£.3 M HC1
0b M HCI
O 7 M HCt
100 15G 200TIME(min)
2B0 300
3.1.1.1 Dissolution of PuO2 as a function of time in various acidities

20
50
M HCl
0 5 M HCl
• 7 M HCl
100 150 200TIME(min)
250 300
3.1.1.2 Dissolution of P11O2 as a function of time at various acidities with 0.65 M N2H4

100
a 7 M HCI
A 7 M HCI • 0 .65 2 c
Al M HCI • 0 0 2 M Fe(ll)
O 7 W H C U 0 02 W Fe(ll) *- 0 .27 M N 2 HA
7 M HCI + 0.1 M Fe(ll)
~]
Q f- • • • • < » M ! • • • * i . . . i i m ( ) , i j j i • • • . > i • . • • M • * 1 •
0 50 100 150 200 250 300TIME(min)
3.1.1.3 Dissolution of P11O2 as a function of time in the presence of various reducingagents

64 Fuel Reprocessing
Contributors :
A.M. Shakila, T.G.Smivasan and K.N.Sabharwal
3.1.2
Photochemical dissolution of P11O2 in hydrochloric acid medium at near ambienttemperatures
The solubility of PuO2 in HC1 of low concentrations is thermodynamically unfavourable, and thedissolution is very slow. It was noted in our earlier studies on PuO2 dissolution in HC1 [1] thatthe dissolution could be carried out without employing HF, by using reducing agents such as Fe(II)and N2H4.
Recently, Inoue [2] demonstrated the enhancement of the dissolution of PuO2 in HNO3 at 363 K,using uranous nitrate. The present study was aimed at investigating the use of photochemica Uygenerated U(IV) to enhance the dissolution of PuO2 in HC1.
The data on the dissolution of PuO2 in 5 hrs in HC1 solutions of different concentrations are givenin Table 3.1.2.1. A remarkable increase is seen in the dissolution even at room temperature, onirradiating the solution. In fact, when the acid concentration was 5 M, nearly quantitative dissolutionwas observed in about 5 hrs.
From the data given in Table 3.1.2.2, it is seen that the presence of U(IV) during irradiationincreases the rate of hydrazine in the absence of light did not enhance the dissolu tion. Thephotochemical enhancement could probably be due to the following reaction schemes:
A. PuO2*(solid) + U(IV) > Pu(III)aq + U(VTl
PuO2*(solid) + N2H4 —> Pu(III)aq + N2
B. PuO2(solid) + U(IV)* —> Pu(lll)aq + U(VI)
The data available at present seem to indicate that both the schemes are possible. More studieswould be needed to establish the actual mechanism of photochemical dissolution.
Table 3.1.2.1Dissolution of P11O2 as a function cf HCI concentration(IJ(VI)] = 0.015 M; [N2H4] = 0.2 M
S.No.
1234
[HCI]
1 M3M5M7 M
% Dissolutiiwithout light
0.81.42.43.9
mwith light
14.669.095.618.3

Fuel Reprocessing 65
Table 3.1.2.2Photochemical dissolution of P11O2 in HCI at room temperature[HC1] = 3 M ; [U(IV)] = 0.015 M ; [U(VI)] = 0.015 M ; [N2H4] = 0.2 M
S.No
1234 15 16
additives % Dissolutionwithout light
U(VI)N2H4
LJ(VI), N2H4U(IV), N2H4
U(IV)
2.21.81.61.46.3
-
with light
5.06.413.869.070.362.0
References:[lj.AM.Shakila, T.GSrinivasan andK.N.Sabharwal, Nuclear Technology, 88,290 (1989).
12]. Akihiko Inoue, J.ChemSoc. Faraday Trans. 1,84,1195 (1988)
Contributors :
B. S.Panigrahi, T. G. Srinivasan and P. R. Vasudeva Rao
3.1.3
Reprocessing of carbide fuels: conversion of carbide to nitride as a head endstep
The conversion of carbide to nitride seems to be the simplest head-end step in thereprocessing of carbide fuels by the PUREX process. The nitride formed is easy to dissolve, andthe carbon in the carbide is precipitated as free carbon, which can be removed by filtration afterthe dissolution step.
In all the experiments with UC pellets, the conversion to nitride was found to completelydisintegrate the pellets. The surface area of the converted samples was determined, and the resultsare included in Table 3.1.3.1. The surface area of the powders is seen to be very high; it is furtherseen that the use of lower temperatures results in higher surface area powders.
The nitride samples were found to dissolve rapidly in 1:1 HNO3 yielding a clear yellowsolution, indicative of absence of colored organic compounds. The determination of the residualcarbon content of the solution obtained on dissolution showed that when the conversion is carriedout at a temperature above 873 K, no detectable amount of carbonaceous material remains insolution as can be seen from Table 3.1.3.2.
Due to the limited availability of mixed carbide samples, only one experiment couldbe carried out with mixed carbide . The reaction was carried out at 973 K for 8 h. The radiomertic

66 Fuel Reprocessing
analysis indicated that Pu was completely brought into solution. Carbon analysis established thatabout 6.5 % of the carbide carbon was present in solution. This amount, however, is sufficientlylow for likely interference in the solvent extraction steps.
TabJe 3.1.3.1Specific surface area of the products of conversion of the UC into nitride
Sample Reaction Reaction Specific surfaceNo. temperature (K) time (h) area (m /g)
1.2.3.4.
92397310731173
4448
790.1833.6572.8466.9
Table 3.1.3.2Results on the conversion of uranium carbide to nitride by reaction with nitrogen
S. No. Sample Time of Temperature Amount of carbonReaction, (K) in solution
(h) (ug/mL)
1.2.3.4.
5.6.
UCUCUCUC
(sintered)do
(U,Pu)C
4446
68
97310731173973
10731073
20202020
20150
Contributors :K.Ananthasivan, V.Chandramouli,I.Kaliappan,S.Anthonysamy, R.B. Yadav, P.R. VasudevaRao and C.K.Mathews
3.1.4
Chemical head-end steps for aqueous reprocessing of carbide fuels
The organic compounds formed during the dissolution of the carbide fuels in nitricacid adversely affect the extraction of plutonium by TBP. This work was undertaken to studyprimarily the effect of refluxing the dissolver solutions obtained by the dissolution of the uraniumcarbide in 13M nitric acid, on the subsequent solvent extraction steps. The extraction of plutonium,from carbide dissolver solutions, by 30% TBP in n- dodecane and the subsequent stripping andpartitioning of Pu from the organic phase loaded with uranium and plutonium were studied. Theresults obtained were compared with those obtained with control solutions containing uranyl nitrate

Fuel Reprocessing 67
and pliuonium (IV) nitrate having concentrations of uranium, plutonium and nitric acid similar tothat of the dissolver solutions. The distribution ratios obtained with the dissolver solution and thecontrol solution were comparable indicating that the dissolver solution obtained after refluxingfor 20h may give a feed solution suitable for PUREX process. Similarly, extraction and partitioningexperiments were carried out with (U,Pu)C dissolver solutions and the results were similar tothe results obtained with uranium carbide dissolver solutions.
As an alternative chemical route for the destruction of carbonaceous materials in theUC dissolver solution, the effect iveness of sodium dichromate as an oxidising agent was alsoinvestigated in terms of the percentage carbon remaining after treatment of the dissolver solutionwith sodium dichromate . The treatment resulted in the destruction of nearly 97 % of carbon.
Contributors:
V. Chandramouli, N. L Sreenivasan and R. B. Yadav
3.1.5
Empirical correlation of the effect of diluents on third phase formation
It is well known that the LOC values for third phase formation are influenced by thenature of the diluents[l]. The LOC values are known to decrease linearly with increase in thecarbon number of the hydrocarbon diluent. It has aiso been observed [I] that branched aliphaticand aromatic diluents permit higher loadings in the organic phase. However, there has been nosystematic effort to correlate any physical property, or any other parameter to the tendency forthird phase formation.
The relation between molecular topology and the properties of hydrocarbons has beenrecognised for a long time. For example, the retention indices for the gas chromatography ofhydrocarbons have been correlated with many topological indices[2,3]. The connectivity index[2]concept for the hydrocarbons is one such index which can be applied both to straight chain andbranched hydrocarbons. This index takes into account the presence of tertiary and quarternarycarbon atoms in branched systems.
The data on LOC for third phase formation in Th(NO3)4-TBP system for a number ofbranched and straight chain aliphatic diluents are plotted against the connectivity index(CI) in Fig3.1.5.1. The values of CI for the hydrocarbons were calculated as suggested by Randic[2]. It isclear from the figure that the LOC value varies linearly with CI for both straight chain as well asbranched diluents. The only branched hydrocarbon which does not follow the trend is 2,2,4,6,6-pentamethyl heptane, in which case the LOC value is much higher than predicted. It has alreadybeen observed[2] that systems with multiple branching deviate from the simple connectivity indexconcept, and some additional factors may have to be considered.

en
oo
100
90
80
70
60
50
4*0
30
20
2
O NORMAL HYDROCARBON• BRANCHED HYDROCARBON
_ L i i_
CONNECTIVITY INDEX
3.1.5.1 Variation of the limiting organic phase concentration (LOC) with connectivityindex (I) of the diluent in Th (NO3)4 - 30% TBP/Diluent system

68 Fuel Reprocessing
The thorium nitrate system is found to be ideal for studies on diluent effect because ofthe possibility of carrying out extraction from neutral systems which avoids additional factors thatcould be introduced due to extraction of acids by TBP, and difficulty in comparing data at differentacidities. However, the conclusion reached above could as well be applied to other systems suchas the Pu(IV) - NO3 - TBP system and HCIO4 - TBP system.
References:/ / / . Z.Kolarik, Proc. int.Solvent Extraction Conference, Toronto (1977), Ed.B.H.Lucas, QMRitcey and
H.W.Smith, Vol.1, p.178 (1979) C1M special volume 21.
[2j. Milan Randic, Journal ofChromatography, 161,1 (1978).
13j. J.Burda, M.Kuras, J.Kriz andL.Vodicka, Fresenius Z. Anal. Chan., 321,549 (1985).
Contributors:R. Dhamodaran, T.G.Srinivasan and P.R. Vasudeva Rao
3.1.6
Solubility of uranyi oxalate trihydrate in HNO3-H2C2O4 mixtures
Oxalate precipitation of tetravalent actinide ions such as Th(IV) and Pu(IV) is a commonprocess for the preparation of their oxides from nitrate solutions. To examine the possibility ofseparation of the tetravalent actinides from macro amounts of uranium, the solubility of uranyioxalate in mixtures of varying nitric acid concentrations with 0.1M oxalic acid has been measured.
Table 3.1.6.1 gives the results on the measurements of solubility of uranyi oxalate inacid mixtures. Also given for comparison (in paranthesis) are the previous data [1] on thesolubility obtained in nitric acid alone. It is seen that the. presence of oxalic acid decreases thesolubility at all acidities as expected. At any given concentration of nitric acid, the solubi lity valuealso increases with temperature. The concentration of oxalic acid chosen in the present study wasbased on the reported flowsheets for plutonium oxalate precipitation. It is reported that the optimumprecipitation temperature is around 323 K. With 0.1 M oxalic acid, at nitric acid concentration inthe range of 3 to 5 M, the solubility of uranyi oxalate at 323 K is seen to be as high as 20 g/1.This makes it possible to develop procedures for the separation of Th(IV) and Pu(IV) from U(VI)in macro- concentrations also by employing the oxalate precipitation method.

Fuel Reprocessing 69
Table 3.1.6.1.Solubility of Uranyl Oxalate Trihydrate
[HN03]
M
1.0
2.0
3.0
4.0
5.0
Solubility as [U(VI)],
303 K
5.15(9.33)8.46
(12.63)8.6
(15.23)12.36(16.77)12.05(18.55)
313K
7.62(11.15)12.32(15.06)
11.40(17.97)
15.31
15.72
323 K
9.05(13.46)12.64(18.12)15.30
16.38
20.77
* Values in paranthesis are data reported previously [Ref.l].
Reference// / . T.GSrinivasan, S.KNayak, R.Damodharan and P.R.Vasudeva Rao, Proc. of Radiochem. and
Radn.Chem. Symp., BARC, Bombay (1988), paper no. CT-09.
Contributors:B.S.Panigrahi, T.G.Srinivasan and P.R.Vasudeva Rao
3.1.7
Direct photochemical destruction of oxalic acid in nitric acid medium
The reconversion of plutonium nitrate solutions to plutonium dioxide at the tail endsteps of fuel reprocessing is carried out by the oxalate precipitation route. In this process, largevolumes of oxalic acid supernatant solution are generated. The plutonium in this supernatant isrecovered usually after the destruciion of the oxalic acid. Conventionally, the destruction is carriedout by addition of permanganate . As an alternative procedure, we have reported the possibilityof the photochemical destruction of the oxalic acid in the presence of small amounts ofuranium(VI)[l]. A direct photochemical destruction of the oxalic acid in mixtuies of oxalic acidand nitric acid has been studied and the results are reported.
The experimental procedure consists of irradiation of nitric acid-oxalic acid mixturesof varying composition at ambient temperature, in a quartz reactor vessel employing a 400 Wmedium pressure mercury vapour lamp.

70 Fuel Reprocessing
The results of the irradiation of oxalic acid- nitric acid matures of various compositionare provided in Table 3.1.7.1. It is seen that the destruction of oxalic acid is complete in 2 hrswhen nitric acid concentration is 0.5 M. At other concentrations, both higher and lower than 0.5M, the destruction is slower. It is however clear from the data that the complete destruction ofoxalic acid could be achieved in a similar period by using light source of higher intensity. Thetime required for complete destruction even at higher acidities is lowered further if small con-centrations of U(VI) could be added [1]. Under the present conditions of irradiation, it has beenobserved that the oxalic acid concentration is brought down to 0.004M in one hour, when U(VI)is present at a concentration level of 10 mg/ml.
The trend in the destruction rates observed as a function of nitric acid concentration isdifficult to explain. One possible explanation is the difference in the susceptibility for photochemicaldestruction of the dissociated oxalic acid species.
Conventionally, 2 to 4M acidity is used for Pu(IV) oxalate precipitation, and 0.5 to 3Macidity is used for Pu(III) oxalate precipitation. It can be concluded that direct destruction is morerelevant to supernatants obtained in Pu(III) oxalate precipitation.
Table 3.1.7.1
|HNO?1, M
3.01.00.50.040.020.008
% Oxalic Acid Remaining30 min
64.1----
66.0-
60 min
79.239.22.3
55.845.676.3
120 min
69.315.20.0
11.625.159.7
* Initial Oxalic Acid Concentration = 0.1 M
Reference :11 j . T.GSrinivasan,S K.N'ayak, R.Dhamodaran and P R.Vaaudeva Rao, Radiochem. and Radiation Chem.
Symposium, Feb 19RR, BARC, Bombay, paper no. CT- 09.
Contributors:B. S.Panigrahi, T. G. Srinivasan and P. R. Vasudeva Rao
3.1.8
Photochemical generation of uranium(IV) In hydrochloric acid
The use of uranium(IV) as a reductant in the partitioning step of Purex process is wellknown. The conventional method of preparation of U(PV) is by the electrolytic reduction of U(VI),but there have been some studies on the photochemical generation of U(IV) in nitric acid solutions

30
\
*20
zS 15-—•
10u.'
z ^ou
n (
PHOTOCHEMICAL
_*—-—*-—
I///
/ 0 1 M U(VI)
/ 6 0 M HCl/ 0.3 M N 2 H 4
) 1 2 3 4 5TIME HRS
FIG. 3 1.8.1
GENERATION OF U (IV)
30E•^25
?20
C 15Z)
fewo iw
uZ c,o 3o
n6 0
HCL MOLARITY1 2 3
/ o
/
01 02 03HYDRAZINE
FIG. 3.1
4 5 6
[U(VI)]. 01 M
0 3M N 2 H t
3HRS IRRON
6 0 M HClU HRS IRRON
04 05 0.6MOLARITY
.8 2
3.1.8.1,2 Data on the photochemical generation of U (IV) in HCl media as a function oftime and hydrazine concentration

Fuel Reprocessing 71
[ 1,2}. The photochemical generation of U(IV) in hydrochloric acid medium has not, however, beenstudied in detail. In the present work, the photochemical genaration of U(IV) in HCl media hasbeen studied.
The experimental assembly consisted of a 400 watt medium pressure mercury- vapourlamp, placed in a quartz enclosure, which was kept in a well-type reaction vessel. The reactionvessel was double walled, with provision for circulating cool water through the jacket. Solutionsof 0.1 M U(VI) containing varying compositions of HCl and hydrazine were prepared, and 120ml lots of the solutions were irradiated in the reaction vessel. The generated U(IV) was estimatedby measuring the absorbance at 648 nm in 6 M HCl.
The data on the generation of U(IV) in HCl media are given in fig.3.1.8.1 and 3.1.8.2as a function of time and hydrazine concentration. From fig.3.1.8.1, it is clear that the reductionis completed in a period of about 3 to 4 hrs. Fig.3.1.8.2 indicates that for the uranium concentrationsemployed, hydrazine concentrations of 0.3 M or higher result in the complete conversion to LJ(IV).The photochemical reduction can be represented as:
UO22+ + 2 N2H5+ + 2H+ —> U4+ + 2 NH4+ + N2 + 2 H2O ...(1)
Our observations on the effect of hydiazine concentration are in confirmity with thisreaction mechanism.
The data on the effect of HCl concentration on the generation of U(IV) are includedin Fig.3.1.8.2. In solutions of HCl concentration less than 3 M, the reduction of U(VI) to U(IV)is not completed in 3 hrs; the conversion is however complete at higher acidities. At aciditieshigher than 6 M, the solubility of hydrazine hydrochloride in HC! is limited, and hence it can beexpected that the reaction period cannot be reduced further by employing higher HCl concentrations.
References:/ / / . J.L.Carroll. R.E.Burns and HI) Warren, USAEC Report No.HW-70543 (1961).
\2}. M.Goldstein, JJ.Barker and T.Gangwer. BNL - 22443 (1976).
Contributors:B.S.Panigrahi, T.G.Srinivasan and P.F1. Vasudeva Rao
3.1.9
Third phase formation in the extraction of Th(IV) by mixtures of TLA and TBP inn-dodecane
Tetravalent actinides form a second organic phase under certain conditions duringextraction by Tri-n-Butyl Phosphate (TBP). This problem is much more severe in the extractionbv amines such as tiilaurviamine (TLA).
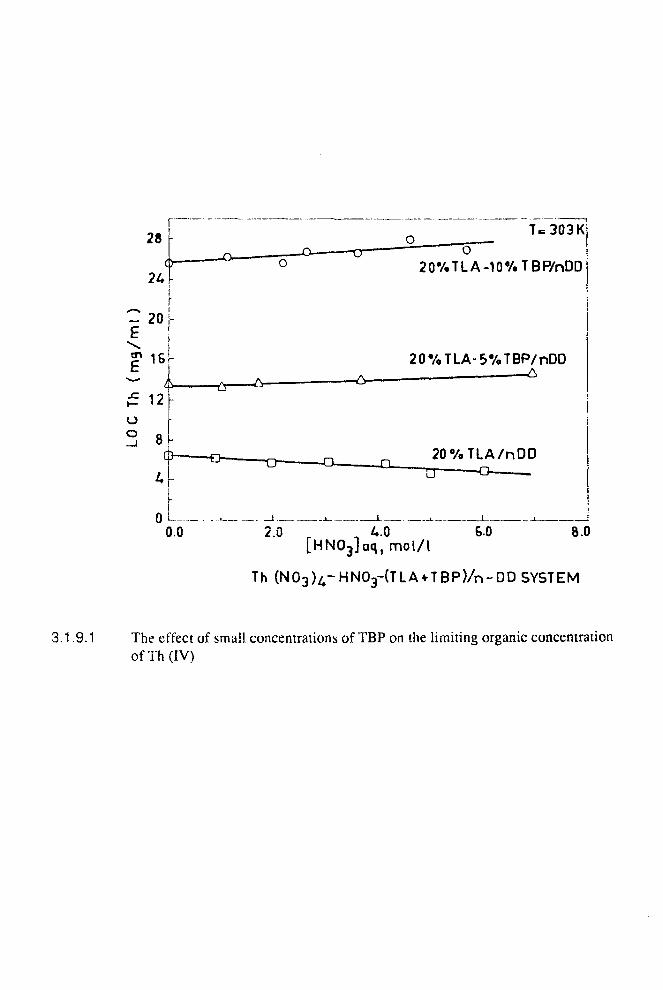
I S .
oo
12
8
• A -
"O-
i
T-303K
20V.TLA-10°/.TBP/nDD
20V«TLA-5%TBP/nDO
-Q. -Q.20%TLA/nDD
TT
0.0_i j j i , j
2.0 „ 4.0 6.0[HNO3]aq, mol/l
8.0
Th (N03)4-HN03- SYSTEM
3.1.9.1 The effect of small concentrations of TBP on the limiting organic concentrationofTh(IV)

T-303K
30%TBP-5%TLA/nDD
2.0 A.O 6.0
[HNO 3 Jaq ,mo l / l
Th (NO3)A-HNO3-(T BP«-TLA)/n.DD SYSTEM
8.0
3.1.9.2 The effect of the addition of small amounts of TLA to TBP on the LOC of Th(IV;

72 Fuel Reprocessing
The limiting organic concentration (LOC) of Th(IV) for third phase formation wasmeasured as a function of aqueous acidity and the data are plotted in Figures 3.1.9.1 and 3.1.9.2.Fig.3.1.9.1 shows the effect of small concentrations of TBP in TLA. Independent determinationof LOC for extraction from neutral solutions into 5 and 10 % TBP in n-dodecane gave values of8.3 g/1 and 19.45 g/1 respectively. From this data, it can be concluded that in the case of extractionfrom neutral solutions into TLA solutions containing small concentrations of TBP, the LOC valuesare almost equal to what would be expected if the solvents functioned independently. The LOCfor extraction by 5 % TBP is expected to decrease at higher acidities. However, in the case ofmixtures, the slope is in the opposite direction. The data in Fig.3.1.9.1. can therefore be taken toindicate some synergistic effect in the extraction by the mixtures.
From Fig,3.1.9.2, it is seen that the addition of small amounts of TLA to TBP increasesthe LOC by about 25 % at all acidities. Extrapolating from the values given for 20 % TLA inFig.3.1.9.1, it can be seen that this increase is well above what would be expected if the solventsfunctioned independently. Thus while the synergistic effect appears to be much more prominentat all acidities in the system with TLA as the minor constituent, this effect is of a much smallermagnitude and is prevalent only at higher acidities when TBP is the minor constituent.
Contributors:
T.G. Srinivasan, R.DhamodaranandP.R.VasudevaRao
3.1.10
A gas chromatographic study of degradation of paraffin diluents
Saturated paraffin hydrocarbons are used as diluents for the solvent Tri-n-Butyl Phos-phate (TBP) in the Purex process for the reprocessing of irradiated nuclear fuel elements. Thechemical and radiation stability of the diluent is an important property that is used in deciding thesuitability of the diluent. In the present work, a comparative study was carried out on the degradationof n-dodecane presently used in IGC and a locally available mixture of n-paraffins ( containingCIO, Cl l , C12 and C13) (designated NPH) using gas chromatographic technique.
Chemical Degradation of NDD:
100 ml of respective diluent was re fluxed with equal volume of 1:1 nitric acid andsamples were removed periodically. The samples were washed with distilled water and analysedby GC. The peak area corresponding to rt-dodecane was found to decrease linearly with the timeof degradation. This linear degradation behaviour provides a possibility of comparing the stabilityof the diluents by simply determining the 9r decrease in peak area of the parent hydrocarboncomponent. The chromatograms of samples of n-dodecane degraded for 7, 14 and 21 hours aregiven in Fig.3.1.10.1. It is seen that the major degradation products fall into two groups, the peakarea uf one group showing a continuous increa?.e. whereas the peak area for the other increasesfirst and then decreases. This might mean that the products in group II are further degraded or are

DEGRADED FOR7 HRS
GROUP 1 I GROUP?.
DEGRADED FORKHRS
GROUP2
GROUP1
DEGRADED FOR21 HRS
GROUP2
j , j i
3.1.10.1 Chromatograms of degraded n - dodicane samples

QUJQ
QJQ
o00
oDCD
7 14 21 28 35 42 49 56
DEGRADATION TIME (HRS)
3.1.10.2 Degradation of NPH constituents as a function of time

Fuel Reprocessing 73
hydrolysed and converted into other products. Washing of the degraded diluent did not removeany of the products.
Chemical Degradation of NPH:
The GC analysis of degraded NPH clearly indicated (Fig 3.1.10.2) that the differentcomponents in the NPH undergo degradation to different extent. The degradation of the C 10component was found to be the minimum. This means that the average carbon no. of such a'mixed" diluent is likely to change during use due to degradation.
The GC analysis of irradiated samples of the diluents indicated that none of themsuffered any significant degradation up to a dose level of 12 Wh/1. This is most likely to be dueto the absence of any nitric acid in the organic phase. (It is known that NO2 radicals are mainlyreponsible for the primary degradation processes.) Studies are therefore being continued with TBPsolutions in the diluents.
Contributors :
S.Anthonysamy, A.M.Shakila, T.G.Srinivasar.. P.R.Vasudeva Rao and C.K.Mathews
3.1.11
Determination of carbon and hydrogen in liquid hydrocarbons by x-rayspectrometry
Conventional x-ray spectrometrie methods are not easily applied in the determinationof very light elements like carbon and hydrogen. However, a method based on the intensity ratioof Ray lei gh to Compton scattering of x-rays can be used for this purpose with an x-ray fluorescencespectrometer [ 1]. Elements of ver>' low atomic number give rise to intense Compton scattering.Therefore the intensity ratio R.scat of the Raleigh to Compton scattering should be sensitive tosmall changes in the compositor) of hydrocarbons, and the intensity ratio can be correlated to thecarbon content especially if it is above 80%. Apart from carbon and hydrogen if sulphur andnitrogen are present at low levels, suitable corrections can be made to account for scattering bythese atoms. This has become an attractive method for the chara cterisation of process streams inpetroleum refining industries. We have used this method to determine the cabon content of somecommercial hydrocarbon solvents viz., Shellsol T and n-paraffin used in nuclear fuel reprocessing.
A Siemens SRS 200 >:-ray fluorescence spectrometer was used for this purpose. TheL a; radiation of the gold target of the x-ray tube was employed for the scattering studies. Theexperimental settings arc given in Table 3.1.11.1.
A calibration curve (Fig.3.1.11.1) between the scattered intensity ratio and weightpercent of carbon was established using pure samples of some saturated and unsaturated hydrocar-

1,10 -
ouin
0.95
90 92Wt%C
3.1.11.1 Correlation between the scattered intensity ratio and wt% C in liquidhydrocarbons

74 Fuel Reprocessing
bons (n-hexane, n-tridecane, mesitylene, xylene and benzene). The carbon content calculated forthe test solvents indicate them to belong to the C12 - Ci8 saturated hydrocarbon range.
Table 3.1.11.1Experimental conditions in the x-ray spectrometricdetermination of carbon in liquid hydrocarbons:
X-ray target : GoldRadiation : Au L a iTube power : 40 kV, 30 mACollimator : 0.4° Soller slitCrystal : LiF (220)Medium : AirDetector : Ar flow proportionalPulse height selection : AutomaticSpecimen presentation : 10 ml in mylar - based liq. cupCounting strategy : Fixed count (10 )Measuring angles : Rayleigh Compton Background
(26-deg.) 53.16 54.57 52.00
References :/7/. C.W.Dwiggins, Jr., Anal. Chem. 33(1961)67
Contributors:
K.V.G. Kutty, S. Rajagopalan and R. Asuvathraman
3.1.12
Infra-red spectra! studies on thorium nitrate - TBP complexes
Actinide(IV) nitrates are in general extracted by trin-butyl phosphate (TBP) in the formof the species M(NO3)4.2TBP. Uranyl nitrate is also extracted with the same stoichiometry withrespect to TBP. In the case of Th(IV), species with TBP/Th(IV) ratios of 2,3 and even 4 have beenproposed. Such speculations have been based on the extraction behaviour of trace levels of Th(IV)[1] as well as data on the limiting organic concentration of Th(lV) for third phase formation [2].We have examined the formation of thorium-beaiing species in the TBP phase by using infraredspectral data.
A saturated solution of the metal nitrate in TBP was first prepared. Aliquots of thiswere taken and mixed with known amounts of pure TBP and allowed to stand. IR spectra wererecorded using a Digilab FTIR spectrometer Model FTS 15/90. The sample was taken as a thinfilm sandwiched between two ZnSe windows.

FIG. 3-1.12.1 FIG. 3.1 12.2
1650 15'oCT 1450 1350 1Z50 1150NUMBERS
1650 1550 1450 I35O USO H50
3.1.12.1 IR spectra of various uranyl nitrate - TBP ratios(A) TBP saturated with uranyl nitrate(B) Solution (A) + equal volume of TBP(C) Solution (A) + twice the volume of TBP(D) Solution (A) + thrice the volume of TBP
3.1.12.2 IR spectra for various thorium nitrate - TBP ratios(A) TBP saturated with thorium nitrate(B) Solution (A) + equal volume of TBP(C) Solution (A) + twice the volume of TBP(D) Solution (A) + thrice the volume of TBP

Fuel Reprocessing 75
Fig.3.1.12.1 and 3.1.12.2 show the IR spectra for various TBP/metal nitrate ratios inthe region 1650-1100 cm"1. The peak at 1280 cm"1 corresponds to the P-O stretch in free TBP.When the metal nitrate-TBP complex is formed the P-0 stretch in the complex shifts to lowerwavenumber: 1180 cm'1 in the case of Th(NO3)4-TBP and 1192 cm'1 in the case of UO2(NO3)2-TBP. The (U4 ) frequency for the mera! nitrate appears at about 1525 cm" .
Ratios of the intensities of the P-0 stretch in the complex and the ( U4 ) peak of thenitrate were calculated for the spectra shown in Fig. 3.1.12.1 and 3.1.12.2. For both U and Th,this ratio was found to be a constant for all the metal nitrate-TBP ratios studied. This indicatesthat the metal nitrate-TBP complex formed when TBP is saturated with the metal nitrate remainsintaci and no further TBP is incorporated into the complex with the addition of TBP. Further,incorporation of additional TBP in the complex would have shifted the P-0 stretch in the complextowards higher wave numbers. Our spectra clearly show no such shifts, nor any new peaks formedwhen additional TBP is added to the saturated TBP-nitrate solution. This shows that the TBPadded remains only as free TBP, indicated by the monotonic increase in the ratio of the P-0stretch band of free TBP to the ( v>4 ) peak of nitrate.
References:I//. D.F. Pcppard, G.W. Mason and JL. Maier, J. Inorg. Chem. .? (1956) 215.
[2\. AS. Kcrtes ,in: Proc. Int. Conf. on Solvent Extraction of Metals, Harwell, eds. HA.C. Mckay , T.V.Mealy J.L. Jenkins and A. S'aylor, (Mannillan, 1965 ip. 377.
Contributors :
K.Sankaran, K.S. Viswanathan, T.R. Mahalingam, T.G. SrinivasanandP.R.V. Rao
3.1.13
Estimation of MBP and DBP in TBP using infrared spectroscopy
The degradation products of TBP such as MBP and DBP cause difficulties in the TBPextraction of plutonium in the processing of irradiated nuclear fuel. The estimation of MBP andDBP in TBP is. therefore, necessary to have a control on the solvent extraction process. By usingFTIR, we have estimated low concentrations of MBP and DBP in TBP in a dodecane medium.
The least squares technique of decomposing unresolved multicomponent spectra [1|has been applied in the estimation of small concentrations of dibutylphosphate (DBP) andmonobutylphosphate (MBP) (5% to 0.5%) in triburylphosphate (TBP).
Pure MBP and DBP samples were prepared from a commercial mixture of MBP andDBP using carbon tetrachloride extraction. Various synthetic mixtures of MBP and DBP in TBP,ranging from 5% of DBP (or MBP) to 0.5% of DBP (or MBP) in TBP were prepared by accuratelyweighing out the organic phosphates. IR spectra of the pure components, which served as standards,and the synthetic mixtures were recorded on a Digilab FTIR Model FTS 15/90 spectrometer. Thesamples were taken in a liquid cell with KBr windows.

76 Fuel Reprocessing
The region of the spectrum used in this investigation was 1350 to 925 cm" , whichcorresponds to the P=O and P-O-C vibrations of the organic phosphates. The P=O stretch frequencyof MBP, DBP and TBP occur at 1150 ,1240 and 1280 cm"1 respectively and the P-O-C vibrationfor all the three phosphates appears near 1030 era"1. A mixture of these phosphates yields onlya broad peak. Hence a direct measurement of the peak area or the peak height to get the concentrationof the components was not possible. A least squares technique to decompose this mixed spectruminto its individual constituents was, therefore, used to estimate the individual phosphate concentra-tions in the mixture.
For two component mixtures, the relative errors in the estimates were about 10% orless for the DBP concentrations used in these experiments (5% to 0.5% DBP in TBP) (Table3.1.13.1). Similar results were obtained for mixtures containing MBP in TBP.
For three component mixtures containing MBP and DBP in TBP, the relative errorsin the estimates were above 20% when the concentrations of the minor components were below57c. In these cases, the standard addition technique was used and the estimates were found to bemore accurate, with the relative errors dropping to about 8% in the worst case. The results areshown in Table 3.1.13.2, where the estimates of MBP by the standard addition technique havebeen compared with the values obtained by direcdy estimating MBP as before. In all theseexperiments, the concentration of DBP was kept below 1.5% by weight.
Table 3.1.13.1Analysis of two component mixtures containingTBP and MBP by IR spectroscopy
SampleNo.
]
3
4
5
6
7
Components
TBPDBPTBPDBPTBPDBPTBPDBPTBPDBPTBPDBPTBPDBP
% Compos(Wt. per
itioncent)
Actual Estimated
94.965.04
95.644.36
96.093.91
96.673.33
97.912.09
98.891.11
99.510.49
95.204.80
95.914.09
96.253.75
96.723.28
97.842.16
98.821.18
99.490.51
Relativeerrors
(%)
1.26.01.57.91.6
10.41.73.21.71.81.35.50.13.7

Fuel Reprocessing 77
Table 3.1.13.2Analysis of three component mixtures containingMBP, DBP and TBP by IR spectroscopy
Expt. Amount of Estimated value of MBPNo. MBP taken
Direct relative with std. relativeestimate error addition error
(Wt.%) (Wt. %) (%) (Wt. %) (%)
1
3
111
.524
.271
.197
0.9440.6761.509
38.0646.8126.07
1.5931.3631.203
4.537.230.50
Relative error is ((actual-estimated)/actuai) x 100
Reference :/1}. D.M.Haaland and R.G.Easterling, Applied Spectroscopy 36 (1982) 665
Contributors:K. Sankaran and K. S. Viswanathan

78 Fuel Reprocessing
3.2.0
NON - AQUEOUS REPROCESSING
3.2.1
Studies on Pyrochemical Reprocessing
Pyrochemical reprocessing methods, especially the one based on electrorefining, arefound to be very attractive in the context of the renewed interest in metallic fuels for the futureFBRs. In order to take the best possible advantage of the recent developments in this line, a projecthas been taken up to set up a lab-scale facility to study the techniques.
The facility mainly comprises four argon-atmosphere glove boxes which are intercon-nected and have the required support facilities like argon recirculation, purification and automaticpressure regulatory systems incorporating the necessary safety features. The schematic of thefacility is shown in Fig.3.2.1.1. The first box will have facilities to prepare molten salt compositions.The second will house the electrorefining cell coupled with an electrochemical system. The thirdwill have an induction heater facility which will be used for the separation of electrolytic metaldeposit from the salt. The fourth box will have a vacuum furnace which will be used for thepreparation of alloys.
Designs of the argon recirculation, supply and exhaust piping, secondary enclosure,selection of suitable blower systems, furnace facilties, purity monitors for the argon atmosphere,electrochemical system, vacuum furnace etc., have been finalised. Procurement of these basicequipment and accessories is in progress. Preliminary leak checking of the glove-boxes was doneand the required modifications are being carrried out. Paralelly, experimental studies were conductedon electrorefining of U- 10% Zr alloy and UC pellets utilising the argon-box set up earlier.
It is planned to conduct further studies on the pyrochemical methods especially thedirect electrorefining technique which will be ideal for the metallic fuels and can also be adaptedfor the mixed carbide.
Contributors:
T. Subramanian, B. Prabhakara Reddy, K. Nagarajan and C. K. Mathews
3.2.2
Studies on the Separation of Uranium from Advanced Fuel Materials byElectrorefining
Mixed carbide and metallic fuels are important candidate fuels for the PFBR.Flt-ctrorefining is the basic technique chosen by ANL for reprocessing the metallic fuel of theproposed Integral Fast Reactor. In this method of reprocessing, the spent fuel is made as anodeand the fissile elements are deposited electrolytically on the cathode from molten salt bath.

Fuel Reprocessing 79
Preliminary studies on the separation of U from U- 10% Zr alloy and UC pellets were undertakenby us using this technique.
The experiments were conducted in an argon atmosphere glove-box with a furnacefacility. The moiten salt electrolyte is a mixture of BaCl2, CaCl2, LiCl, NaCl loaded with UCI3.The schematic of the electrorefining cell is shown in Fig.3.2.2.1. U-10% Zr alloy was preparedby arc melting and was taken in the anode crucible with the molten salt and electrolysed at 773K. The cathode deposit was collected in a ceramic crucible during the electrolysis at 1 Volt. Thedeposits were dissolved and analysed for uranium by potentiometry and for zirconium byICP-MS. The zirconium content in the deposit was found to be between 0.03% and 0.3%. Furtherrefining is possible by optimising the conditions. Thus, zirconium as a fission product aswell as an alloying element can be separated using this electrorefining technique.
Experiments on UC pelets were also conducted using the same facility. The pelletswere taken in the graphite anode crucible and were subjected to electrolysis at 1.5 V. Uraniumdeposited on the cathode was collected and separated from the occluding salt by melting underargon atmosphere with salt cover at 1573 K. Further studies are in progress.
Contributors:
B. PrabhakaraReddy, T. Subramanian, K. Nagarajan and C. K. Mathews

I SAL 7\REP
ELECTROCHEMICAL]SYSTEM J
INDUCTIONHEATER
\VACUUM~*\{FURNACE]
r
3.2.1.1 Schematic of the proposed facility for studies on pyrochemical reprocessing

ARGON
GAS
-v-ve
>h
t=J
7~~~7./ /zzA
*
5vv
SS
S-ve
J
sss
Je i
7ZZZZZZZ.gTt
5 ^
3
<D—- -®_ (i\
1. 7W£-/?M0 WELL
2.JNSULA10R3. COOLING FIN
.THERMAL SHiELD
6-STIRRER
7.CATHODE CONTAINER8-GRAPHITE CRUCIBLE9-PRIMARY VESSEL
.SECONDARY CONTAINER 10.CATHODE ROD
3.2.2.1 Schematic of the elecrorefining cell

4.0
POST-IRRADIATION ANALYSIS AND NUCLEAR CHEMISTRY
4.0.1
Introduction
The hot cells of the Radiochemistry Programme have been designed to include suchspecial features as replaceable inert atmosphere boxes in order to handle irradiated carbide fuelswith maximum experimental flexibility and efficient containment. The hot cells are in the finalstages of completion. The lead cells have been commissioned. Parallely, in-cell equipment like aretained fission gas analyser based on a quadrupole mass spectrometer and a micro-gamma scannerfor studying fission product distribution in irradiated fuel have been developed. In order to studythe diffusion of fuel and fission product species in a thermal gradient, an out-of-pile simulationfacility has been set up. An experimental assembly is being developed to investigate the effect ofradiation on fuel-clad chemical interaction. The above aspects are discussed in this section.
Work on cold fusion was started in our laboratory immediately after newspaper reportsappeared on this topic, and positive results were obtained. An account of our cold fusion reserachis given in this section. A nuclear microprobe is being set up, which would facilitate measurementsusing nuclear reaction analysis and particle-induced x-ray emission. The nuclear methods developedfor the non-destructive analysis of plutonium and for the analysis of primary sodium are alsodescribed here.

Nuclear Chemistry 83
4.1.0
HOT CELLS
The construction work of the concrete ceils and ;he auxiliary facilities [ 1,2] is completedexcept for some minor changes suggested by the Safety Committee.
The argon recirculation system has been commissioned. Two stainless steel diaphragmcompressors are used for recirculating argon in cells 2, 3 and 4. Argon does not come in contactwith any moving part of these compressors. This ensures that the purity of gas is maintained andany spread of contamination is avoided. HEPA filters are provided at the inlet and outlet of thecontainment boxes. Gas is purified to remove oxygen and moisture by passing it through apurification tower filled with molecular sieves 5A and 13X and a de-oxo copper based catalyst.A stand-by purification tower is provided so that when one tower is loaded with moisture andoxygen, the gas flow can be directed through the standby tower. The pressure of each box ismonitored by photohelic guages which sense the pressure and actuate solenoid valves when thebox pressure deviates from the set values. These solenoid valves remove the gas if there is abuild up of pressure or open a gas feed system if the pressure goes down below the set value. Avacuum pump and electropneumatic butterfly valves are used in the gas bleed line. A liquid sealis connected to cell 2, 3 and 4 to take care of any over- pressurisation of the boxes in the eventof a failure of the pressure control systems.
A fast transfer system based on polypropylene rabbit has been designed and built forthe speedy transfer of smail quantities of inactive and low active materials like film bits, chemicalsetc from one ceil to another, and from outside to any of the cells, and vice versa. A junction boxis located in the isolation area. The rabbit coining from one cell will be directed to other cellsfrom this junction box. The opening and closing of the posting cum receiving station in cells 1and 5 are done pneumatically.
Two numbers of external transfer port sleeves were fabricated, machined and installedin cells 1 and 3. These two sleeves were aligned with the La Calhane doors in cells 1 and 5 withan accuracy of 0.01 mm concentricity using a paragon tilting level.
A trolley was designed, fabricated and installed in order to interface the cask whichbrings fuel from the reactor and the La Calhane external transfer port door of the hot cells.Movement in X and Y direction and height adjustment are possible so that precise alignment couldbe achieved.
The decontamination facility was commissioned. Frames to install the filters areinstalled in the wall. Glove port rings and lead spheres with remote tongs have been fixed forcarrying out the decontamination job from the service area. High pressure water jet, high pressuresteam jet, radioactive vacuum cleaner and ultrasonic cleaner are commissioned and these will beused for decontamination of activity.
Co-seals were developed to seal the intercell transport doors and foamed type gasketsto get leak tightness in the cells. These have resulted in the high degree of integrity achieved inthe cells for containing radioactivity.

84 Nuclear Chemistry
References:[1] M.P. Antony, G. Ravishankar, S. Subramaniam, R. Manivannan. K.C. Srinivas and C.K. Mathews
proceedings of the Remote Systems Technology, 1989, (to be published), American Nuclear Society,USA.
[2\ M.P. Antony, G. Ravishankar, S. Subramaniam, R. Manivannan, t'.C. Srinivas, S. Raman, ArunKumarand C.K. Mathews Proc. Symp. Post Irradiation Examination in Nuclear Programme, Vol 2. BARC(1989).
Contributors :M.P. Antony, G. Ravishankar, S. Subramaniam, R. Manivannan, K.C. Srinivas andC.K. Mathews

Nuclear Chemistry 85
4.2.0
OUT OF PILE SIMULATION EXPERIMENTS
A new specimen chamber was designed and fabricated for simulating the radial heatingconditions encountered in carbide fuels under irradiation in the reactor. The difficulties in loadingthe fuel pellet , alignment of the electrode and the pellet associated with the existing specimenchamber are eliminated in this new design.
The argon recirculation system of the two glove boxes were completely changed usingstainless steel pipes and ball valves. A purification tower was fabricated and installed in this line.The oxygen level in the glove box was monitored using an oxygen meter. As part of this activity,the oxygen meter (RML) was calibrated.
Alpha autoradiographic technique has been used to find out the distribution of plutoniumin (Uo.3 - Puo.7) C fuel used for FBTR [1 ]. Small strips of cellulose nitrate films, LR 115 obtainedfrom Kodak, France were kept in contact with a 5 mm diameter fuel pellet for duration rangingfrom one to ten seconds. All the operations were carried out in an argon atmosphere glove box.The films were taken out and decontaminated by washing with dil. HNO3 several times and finallycleaned in an ultrasonic cleaner. All the films were etched for 10 minutes in 2.5 M NaOH solution.The track densities were obtained by scanning the detector under an optical microscope. It isfound that the distribution of plutonium in the mixed carbide fuel is in general homogeneous withsome localised plutonium segregation.
References :
[1) M.P. Antony, J. Daniel C.G. and B. Saha. Proc. Symposium on Radiochem. andRadiation Chem. , RA-36-I (1988).
Contributors :
M.P. Antony, J. Daniel and C.K, Mathews

86 Nuclear Chemistry
4.3.0IN-HOUSE DEVELOPMENT OF A RETAINED FISSION GAS ANALYSER
Qualitative and quantitative determination of gases retained in solid matrices is necessaryfor the characterisation of materials used as fuels and structural components in a nuclear reactor.The influence of the retained gases on the physical and metallurgical properties of the fuel canbe significant and hence it is important to determine the retained fractions of fission gases xenonand krypton in test fuel materials after their discharge from reactor. These data will be useful inevaluating swelling during irradiation.
The prototype apparatus built for this purpose was successfully utilised to determineoccluded gases in inactive materials. The application included determination of trapped heliumcontent in ion implanted metallic glass and polycrystalline materialsLI]. In this apparatus gasesare thermally desorbed and subsequently monitored by quadrupole mass spectrometry.
Based on the above approach a remotely operable fission gas analyser suitable forinstallation inside a mini cell has been designed and fabricated in-house. Its special design featuresand current status are given in the following paragraphs.
All necessary components of the analyser are configured around an all-metal ultra-highvacuum chamber. Figure 4.3.1 depicts the schematic of the UHV apparatus and various vacuummetrological devices incorporated into it. The L'HV chamber is evacuated down to 10 " mbar bya diffusion pump using polyphenyl ether as the pumping fluid. In order to facilitate remoteoperation, the vacuum system is equipped with electro-magnetically and electro- pneumaticallyoperable valves. A motor-operated remote sample transfer device has been fabricated for sampleinsertion and removal. All controls for the vacuum system are from outside the cell. The RFpoucr from a 12 kW, 350 kHz induction generator will be transmitted in a co-axial manner to theinductor coil located around the sample holder inside the 1'IIV chamber. The rapidly changingtemperature of the target (approx.KX) K/sec) will be monitored by a fast recording IR radiationpyrometer. The light beam from the heated target is transmitted from the containment box to thedetection system located outside through fibre-optics- based light guides.
A quadrupolc mass spectrometer (2 - 200 amu range, Spectramass, U.K.) has beenprovided in order to measure partial pressures of the desorbing fission gas isotopes. The serialcommunication interfaces (RS232C) of the quadrupole mass spectrometer and the radiationpyrometer will be used for obtaining the real time desorption data through a signal multiplexerlinked to a personal computer.
For the calibration of the quadnipole mass spectrometer and for the measurement oftotal gas pressure under static vacuum conditions, a capacitance manometer and a spinning rotorviscosity gauge have been provided. These two absolute pressure gauges together cover a widepressure regime, from 2000 mbar to 1()"7 mbar.
All ihe necessary components of the UHV apparatus have been assembled. Heliumleak tests and vacuum integrity tests have been completed. A 12 kW RF induction generator hasbeen commissioned at site. After the LiRV apparatus is interfaced with the RF induction generator,the gas analyser will become operational.

I
Ti1 i'!". r-L f, Ti ir
ri i f^L
i UHV CHAMBER
2. IHKUCTDR COIL';. Sni'PLE IRAN5F;:R DE4 SP1MHING ROTOR GAUSE5. niiRuPTIC RALUA7IDM FVRDHE1CR6. THC'ria^CCH^HICML LEAK VALVE7. CAPACITANCE HANnf'ETER3. BA irJM GftULiE
10. UHV RT FQvrJV V VCXi
4.3.1 The retained fission gas analyser

Nuclear Chemistry 87
Reference:fl] Sitaram Dash and B. Saha , P roc. Fourth National Symp. Mass Spectrometry, Bangalore, 1988, p
NT-4/1.
Contributors:
Sitaram Dash, G.Panneer Selvam, K.Manivannan and B.Saha

88 Nuclear Chemistry
4.4.0COMMISIONING OF LEAD CELLS
The lead cell facility for conducting special post-irradiation experiments on FBTR spentfuel materials is in the advanced stage of commissioning. Major work like argon recirculationsystem piping, process instrumentation piping, electric power wiring and glass panel installationin containment boxes have been completed. A brief outline of works carried out during last twoyears is given below.
Stainless steel and mild steel frames necessary for fixing the viewing panel weredesigned, machined and installed. Ordinary glass panels were positioned and containment integritywas found to be satisfactory with the leak rate less than 0.05 % of box volume per hour. Forimproving the performance of the recirculation system by way of enhancing the gas flow, certaincomponents were identified for replacement. These included isolation valves, quick release cou-plings, feed and bleed line valves. These components were installed after leak testing.
A process instrumentation piping net work for catering to various in-cell services likecompressed air supply, inert gas purging, valve and pump exhausts was designed and erectedthrough a contract. Many service components like swagelok double ferrule compression tubefittings, high pressue-high vacuum "O"seal fittings, projection-recess flanges were procurred fromindigenous suppliers and installed after testing.
Various components required for in-cell service like inter cell transfer port carriage,external transfer port flange, lighting fixtures and co-seal ring have been designed and are inadvanced stages of fabrication.
All electrical power and control requirements for these facilities have been concep-tualised under an integrated instrumentation scheme. Electrical and electronic controllers requiredfofthe operation of the purification towers, actuation of shielding door, switching of in-cell lights,power points, manipulator etc. are being fabricated. Major electrical wiring has been completed.
A micro-processor based process controller for recording various cell systemparameters is being designed. Procurement of transmitters for this puipose is under way.
Contributors:
Sitaram Dash, M. Kamruddin, K. Manivannan, G. Ravisankar.R. Manivannan,G. Paneer Selvam and C.K. Mathews

Nuclear Chemistry 89
4.5.0
DEVELOPMENT OF A MICRO GAMMA SCANNER
Experimental determination of the concentration profiles of fuel constituents and fissionproducts across the fuel sections is required for understanding fuel behaviour during reactoroperation [1]. Radial micro gamma scanning can be used as a complementary technique in orderto obtain the profiles of gamma emitting fission products as a function of precise radial positions[2J.
The experimental system being setup (Fig.4.5.1) consists of 1) a scanning nw.hanismto impart four degrees of precise movement to the sample, 2) a collimator system, made up ofhigh density material, for selective viewing of segments across the fuel sections, 3) a detectorassembly comprising of a HPGe detector in anti-coincidence with a plastic scintillator split annulardetector around it, and 4) a data acquisition and reduction system. A guide assembly requiredfor precise and reproducible alignment of the sample with the collimator and to provide the lateralmovement to facilitate loading/unloading of the sample and for maintenance of scanning machanismhas also been designed.
A software "SCAN" developed earlier [3] for unfolding the gamma scanning data andto calculate the two dimensional distribution of specific activity across the cross section of thefuel specimen, has been tested. A typical radial distribution was assumed and experimental data,as measured through the collimator slit traversing along the radius of the fuel pin, was simulatedusing "GENSCAN' programme. This data was fed to "SCAN" and the regenarated profile wascompared with the original ( Figs. 4.5.2 & 4.5.3 ). The results were satisfactory.
As a prerun to scanning of irradiated fuel section, a mockup table top experiment *ascarried out. A plutonium planchet was scanned for alpha particles using a Si surface barrier detectorafter suitable collimation. Further experiments are in progress.
References:/ / / S.D.Epstein, General Atomic Project Report, GA-A13423 (1975).
[21 J.R. Phillips, Nuc. Tech. 28 (1976) 71.
(31 M. KamruddinJ.B.Doshi, and B. Salia, Symp. Radiochcm. and Radiation Chem. Kalpakkam, (1989)P.N1.02.
Contributors:M. Kamruddin, J.B. Doshi* and B. Saha
Present Address : Dept. of Mech. Engg., IIT. Bombay

Scanningmechanism
Colhrnaljrsystem
U 300mm
Detector
—- onnuius_ - lov; activity
lead
S'cun f:ontrolier
j Translator |TL )7 \L
T
Data acquisition &reduction system
| Signal Signal! G e - - ,-; t t
\"IP 28 !l lir;.'_ ,' Computer j "j*
Nuclear 'Instrument L
Modules i—! Anti—coin.—I unit
MCA
4.5.1 The gamma scanning system

'. rJw\1.
\
i
••} •'• O S 0 ! .? '._i. I
l.G 1 8 2 0 7 2
4.5.2 Comparison of assumed and regenerated data

L V:: I::)-*.
'> :-lr.:r-.
^ 'JB"" J
4.5.3 Isometric projection of activity distribution

90 Nuclear Chemistry
STUDIES ON FUEL-CLAD CHEMICAL INTERACTION
4.6.1
Development of an experimental facility to study the effects of radiation
Non - oxidative t>pe of fuel - clad chemical interactions (FCCI) induced by fissionproducts and believed to be influenced by the intense radiation field present at the fuel-clad interfacehave been proposed to explain the transport of clad constituents into the fuel matrix in LMFBRfuels [1,2]. Therniochemical data alone are not sufficient to make an assesment on the fuel-cladcornpatibilty because the steady state concentrations of some of the reactive vapour species arealtered by the radiation, especially by that due to the fission fragments.
On the experimental side work has been undertaken to develop a facility for conductinginitial experiments similar to the one reported [2] for studies on the effect of the radiolysis of Cslvapour using electron irradiation.
The effects caused by the irradiation due to fission fragments can, to some extent, besimulated by electron beam having energy of the order of a few hundred electron volts with ahigh beam current ( 10 mA or better). The experimental facility consists essentially of (1) a facilityfor preparation and characterizat ion of high efficiency electron emitters (oxide coated cathode ),(2) electron irradiation reaction chamber, (3) high vacuum assembly with appropriate feed-throughs,and (4) power supply/control units, arrangements for heating, temperature control etc.
The facility for preparation and characterization of oxide cathode filaments is nearingcompletion. In order to enhance the electron emission, high purity metal wires such as Ni and Ir,arc coated with an isomolecular mixture of SrO and BaO. Electrical and induction heating facilitieswith high vacuum apparatus required for this purpose have been made ready.
A power supply-cum-beam current measurement/control unit is being developed. Thiswill enable (a) studies on emission characteris tics of the eletron emitter filaments, (b) maintenanceof approp nate voltages for acceleration of the electrons to a suitable energy (c) maintenance ofMo-foil substrate (which simulates the fuel surface) at required temperatures.
A stainless steel vacuum chamber with necessary feed-throughs and gauges has beenmade and leak-tesied. A quartz reaction chamber with arrangements for keeping the species ataccurately maintained temperatures forms an integral part of the s.s. vacuum chamber assembly.This chamber houses the facility for electron irradiation of the vapour species. A resistance furnacewhich is to be used with a proportional-integral (PI) temperature controller, was made and testedfor temperatures up to 1173 K. Molybdenum foils of required thickness were prepared by slowchemical dissolution of thicker strips.
Laboratory- made oxide coated filaments will first be tested in the above facility. Actualexperiments will commence thereafter.
References :[II K. Kimashi, T.Yau> andH.Kane.ko, J.Nucl.Matcr. 116 (1983) 86.

Nuclear Chemistry 91
[2] M.Yamawaki, M.Hirai, T.Yoneoka, KKonashi andMKanno, J.Nud. Sci. Technol. 20 (1983) 852.
Contributors:Arun Kumar, K. Manivannan and B. Saha

92 Nuclear Chemistry
4.7.0
NUCLEAR CHEMISTRY
4.7.1
Non - Destructive Analysis of Pu
During this period a project "Non-destructive assay and on-line monitoring for Pu ina reprocessing plant" was taken up. The responsibility of the Nuclear Chemistry group in thiswork was the installation of on-line monitors based on nuclear techniques.This involved the design, fabrication and testing of neutron collars for the on-line estimation of Pu rich streams, on-linealpha monitors(OLAM) for estimation of Pu in waste streams and monitoring of the leached hulls.
The design of neutron collars has been completed. The collar is being built in twoseparate halves to enable it to encircle the pipeline of interest. Each half will use four neutrondetectors connected to a common preamplifier. The outputs of the two halves will be combinedand fed after amplification to a shift register coincidence counter to detect the number of coincidentneutron counts which will be correlated to the 240Pu effective of the solution. The prototype unitis being fabricated and is expected to be available for testing shortly.
For the on line monitoring of waste streams for Pu two different types of units havebeen considered. Tiie first is a flow type OLAM in which the flowing stream is diverted to a unitwhich has a thin mica/mylar window and a Silicon surface barrier detector is kept on the otherside of the window. The alpha particles from the solution after penentrating the window willimpinge on the detector and will be proportional to the amount of alpha emitting nuclides in thestream. The prototype unit is fabricated and is presently being tested. The design of the drum typeOLAM has been completed and fabrication will be taken up shortly.
The monitoring of leached hulls can be carried out by a number of techniques. Thepresent work proposes three different techniques for this : Gamma spectrometry, Passive total-neutron counting and active neutron interrogation coupled with delayed neutron counting.
Preliminary design calculations to establish the feasibility of gamma spectrometry iscomplete. Design calculations for the other two techniques are in progress. These calculations areassuming a burn up of 25000 MWD/Tonnne and a cooling period of 300 days and the presentisotopic composition of Plutonium. Assistance in these calculations has been obtained from theReactor Physics Division.
The procurement of material and equipment for the above work is almost complete.
Contributors:
C.R. Venkata Subramani and R.Kumar

Nuclear Chemistry 93
4.7.2
Analysis of Primary Sodium
In continuation of the work already reported, standardisation of the procedure for thechemical separation of Co from primary sodium was completed. The problems encountered inthe hydroxide precipitation step , reported earlier , were circumvented by adding a small amountof Co carrier before carrying out the distillation. Quantitative recovery was obtained using thismodification.
Gamma spectromeiry of the primary sodium sample will be a major analytical techniqueto estimate the radioactive impurities in the sample. For this purpose an efficiency calibration ofthe detector was carried out using solution samples obtained from the Radiochemical Cenfe,Amersham. As a first step , point sources were prepared on perspex plates and the variation of thephotopeak area as a function of the incident gamma energy obtained for different distances fromthe detector front end . For each shelf the data was fitted to a regression equation of the form (for energies above 200 KeV ) :
Ln(efficiency) = const * Ln(Energy) + const
The efficiency calibration curve for the Tastena was carried out using aqueous solutionsin a glass vial kept inside the Tastena.
The analysis of a couple of primary sodium samples for Na revealed a considerablediscrepancy between the experimental values and the calculated values. To ensure that this wasnot due to any error in the calibration, the entire system was recalibrated using standard sourcesobtained from other laboratories. In addition the available standard point sources were counterchecked at the Radiochemistry Division , BARC. All these experiments showed that the calibrationused was correct and any discrepancy is not due to experimental error.
The procedure standardised for the analysis of Pu in primary sodium uses the extractionof Pu by TOPO and counting of an aliquot of the organic phase. This gives a minimum detectionlimit of 2pCi/gm sodium. In a bid to improve this, a series of experiments have been conductedto study the optimum conditions for the back extraction of Pu from TOPO and electrodepositionof the Pu in the aqueous phase. The experiments are almost complete and it is expected that theminimum detection limit will be lowered to about lpg/gm sodium.
Contributors:
C.R.Venkata Subramani,N.P.Seshadreesan,K.Swaminathan and N.P.Bhat

94 Nuclear Chemistry
4.7.3
Cold Fusion
Cold fusion was declared observed during the last week of March [1,2]. Recognisingthe scientific and economic significance of the discovery, efforts were made to reproduce the samein our laboratory during the first week of April, 1989 [ 3 ]. The work was started based on newspaper reports, but the two papers cited [ 1,2] became available during the course of the investigation.
Heavy water containing palladium chloride .nickel sulfate and lithium chloride waselectrolysed using Ti as cathode and Pt as anode. Neutrons were looked for and counts well abovethe background were observed. Electrolysis was also carried out using Pd as cathode and Pt asanode with LiOD as electrolyte. An enhancement in temperature was observed on cathode surfacewhen heavy water was used and compared with a control experiment using light water. Furtherexperiments were carried out to identify the parameters controlling the cold fusion phenomenon.Electrode preparation in different dimensions were carried out in vacuum and also in varyingatmosphere like helium, argon etc.. Besides the surface roughness, impurity content was alsocontrolled. The electrolyte concentration was varied and its influence on fusion phenomenonlooked for. The electrode surface was characterised at intervals. The data acquisition system hasbeen automated to the possible extent using a Personal Computer. After prolonged electrolysisneutron signal has been observed with some of the electrolytic cells (Fig.4.7.3.1). Tritium contentin heavy water after electrolysis was also looked for after distillation. Tritium was observed inheavy water after electrolysis well above that in blank heavy water in one cell (table 4.7.3.1).Quantitative measurement of heat output is being tried in a newly designed closed calorimeter.
TABLE 4.7.3.1Results of tritium activity measurements
Concentration of LIODElectrolysis currentElectrolysis TimeActivity before electrolysisActivity after electrolysisActivity produced
: 0.5 M: 2A: 315 hours: 0.03 micro Ci: 0.2 micro Ci
: 0.17 micro Ci
References :/ / / M. Fleischmann and S. Pons : Ekcirochemically Induced Nuclear Fusion of Deuterium.
J.Elertroanal.Chem., 261.301(1989).
121 S.E. Jones et al.. Observation of Cold Nuclear Fusion in Condensed Matter., Nature.388,27,737(1989).
I3j C.K. Mathews, G. Periaswami, K.C. Srimvas, T. Gnanasekaran.S. Rajan Babu, C. Remash and B.Thiyagarajan. On the possibility of nuclear fusion by the electrolysis of heavy water. Ind. Jl. of Tech.vol.27,1989.
Contributors:
B.Thiyagarajan, C. Remash,G. Penaswamy and C.K.Mathews

10 r
O1
ooo
in
c
ouco
Ci)
9 -
8 -
7 -
6 -
U -
3 -
2 -
0 d a CD (s tfl o CD a-1
10 15 20Tri al No
a f t e r 168 hours of e l e c t r o l y s i s )
35
4.7.3.1 Emission of neutrons during the electrolysis of heavy water

Nuclear Chemistry 95
4.7.4
Development of Nuclear Microprobe
Development of nuclear microprobe was initiated in 1985 as a project in the SeventhPlan [ 1,2]. The tandem Van de Graaf accelerator at the centre was planned to be made use of. Thebeam from the accelerator is focussed to a microbearr ' f less than five microns diameter by afocussing system consisting of a micron slit and a quadruplet of four magnetic quadrupoles.Charged panicles emitted due to nuclear reaction with elements on the sample surface are detectedwith surface barrier detector. X-rays emitted are detected by a Si(Li) X-ray detector. The sampleis moved with an X-Y positioner with a spatial resolution of a micron to yield spatial profile ofboth light and heavy elements to ppm sensitivity.
The basic objectives of micro probe development is to profile light elements likecarbon in stainless steel clad of FBTR by nuclear reaction analysis. Micro PIXE yields spatialprofile of medium atomic number elements. By Rutherford back scattering we get profile of highatomic number elements.
A target chamber has been designed and fabricated for micro probe. The chamber hasprovision for containing the micro positioner, sample holder, an SSB detector, Si(Li) detector etc..The chamber is a high vacuum one with provision for viewing the sample through retractableports. Additionally there exists f;'Hlity for automatic sample transfer.
We were successful in designing and fabricating quadrupole lens to stringent tolerancein collaboration with Material Science LaboratoryJGCAR, Kalpakkam. The micron slit, thepositioning table etc. for focusing system are in an advanced stage of design/fabrication at CMTI,Bangalore. These efforts on indigenisation of critical components of the focusing system provedto be successful.
All components of microprobe have to be mounted on a vibration free surface. Avibration isolation platform was designed by I IT Madras and the same has been executed.Development of data handling system including the controller for the positioner has progressedsatisfactorily. Testing of the controller has been carried out.
The system when operational yields a method of surface analysis in a variety of modeshelpful to fast reactor program.

96 Nuclear Chemistry
References:[I] JA.Cookson and F.D.Pilling, Harwell Rept. AERE R6300.1970.
[2] C. Remash. K.GM.Nair fl.S.Thampi, B.Saha and C.K. Mathews. Development of Nuclear micro probeat IGCAR, Seminar on the physics and technology of particle accelerators and their applications,Calcutta, Jan-1987.
Contributors:C. Remash, K.G.M. Nair, N.S. Thampi andC.K. Mathews
Materials Sciences Division

5.0
ANALYTICAL CHARACTERISATION OF MATERIALS
5.0.1
Introduction
Analytical characterisation of technological materials forms an essential ingradient ofmodern materials research. The characterisation of high purity nuclear grade materials calls forsophisticated techniques. The analytical techniques used in this laboratory include: (1) inductivelycoupled plasma mass spec trometry (ICP-MS), (2) optical emission spectrography (OES), (3)atomic absorption spectrophotomeiry (AAS), (4) high performance liquid chromatography (HPLC),(5) x-ray fluorescence spectrometry (XRF) and (6) Fourier transform infra-red spectroscopy(FT-IR). The various analytical methods developed and standardised for a variety of materialssuch as uranium, sodium, steels, rare earths and water samples are described in this section. Aglow dis charge optical emission source, designed and fabricated in-house, is expected to enableus do depth profile analysis of corrosion samples. ICP-iMS is a new technique for elemental andisotopic analysis. The excellent detection limits (below ng/ml) and the multi-element coveragemake this technique a good choice for the analysis of radioactive materials where it is desirabletc keep the sample size to the minimum. Using HPLC, techniques have been standardisedfor the fast separation of rare earth elements from their mixture, and this constitutes a possi blemethod for burn-up determination in irradiated fuel.

Analytical Characterisation 99
5.1.0
INDUCTIVELY COUPLED PLASMA MASS SPECTROMETRY
5.1.1
Determination of trace metals in uranium oxide
The analysis of uranium oxide is generally carried out by using optical emissionspectrometry. Apart from intrinsically low sensitivity, the technique suffers from severe spectralinterference caused by the complex spectrum of uranium. To overcome this problem, either thecarrier distillation technique [1] or matrix separation using solvent extraction [2] or ion exchangeare widely adopted. In contrast, the uranium spectrum obtained in ICP-MS [3] is quite simple.Only the elemental isotopic peaks (234,235,238) and the corresponding oxide peaks are obtained.The oxide peaks do not interfere with any of the impurity elements. Hence, there is practicallyno spectral interference from uranium.
In the method developed in our laboratory, uranium oxide was dissolved in nitric acidthe uranyl nitrate was directly aspirated into the ICR The effect of uranium on the various analytesignals was studied and it was found that uranium has a suppression effect. A concentration ofO-OSft of uranium was chosen as the optimum concentration to work with. Ga, Sb, and Tl wereused as internal standards for the low, medium and high mass elements respectively, to take careof the instrumental drift and to improve the precision. To check the accuracy of the method, anIAEA sample of uranium oxide (SR-64) was also analysed. Our results were found to comparereasonably well with the certified values given by IAEA. The detection limits were found to bein the range 0.1 to 4 ppm. Results are given in Table 5.1.1.1. Matrix separation by solvent extractionwas done with 60% TBP in CCI4. After solvent extraction, excellent detection limits in the range1 co 30 ppb were obtained.Thesc results are given in the Table 5.1.1.2.
Table 5.1.1.1Determination of trace metals in uranium oxide by ICP-MS (Direct method)
Element Concn
AgCdCrCoCuInMgMnMoNi
SrTi
in IAEAsample(ppm)
<0.9<0.1
5.94.38.6
<0.5<4.914.311.413.8
< 0.4< 1.9
RSD'
-126
13--735--
7c IAEACertifiedrange(ppm)
-3.1 -5.04.0 4.34.3 - 6.7
--
14.0- 18.09.5- 16.88.4- 14.1
--
Det.limit(ppm)
0.91.12.40.53.60.54.90.61.03.10.41.9
FBR Speci-fication
limits (ppm)
201
300200100-150200200500150100
Element
CeErDyLaNdGdPrSmHoYbEu
Det.limits(ppm)
0.30.60.70.50.61.80.10.20.41.50.3

100 Analytical Characterisation
Table 5.1.1.2.Determination of trace metals in uranium oxide by ICP-MS(After solvent extraction)
Element Concn
BaCdCrCoCuMnMoMgNiPbVZn
in IAEAsample(ppm)
0.20.325.54.95.8
14.111.63.7
13.82.20.74.2
RSD%
612533
12115.55667
IAEAoverallmedian(ppm)
_-
3.64.25.0
15.312.8
-11.40.95--
IAEAcertifiedrange(ppm)
_-
3.1 - 54.0- 4.34.3 - 6.7
14.0- 18.09.5 - 16.8
-8.4- 14.10.32-2.15
--
Det.limits(ppm)
0.0070.0020.0080.00040.0190.00090.0030.0280.0020.0040.0130.032
Element
LaCePrNdSmGdDyHoErYb
Detectionlimits(ppm)
0.0010.0020.00050.0050.0030.0020.0020.00020.00090.002
References:/ / / A.G. Page,S.V. Gudbolc,S.B. Deshkar and B.D. Joshi, Estima tion of metallic impurities in uranium by
carrier distilla tion method, BARC-862 (1976).
/? / M.D.Palmieri. J.S. Frit:, JJ. Thompson andR.S. HoukAnaly tica Chimica Ada 184 (1986) 187.
I3j A.R. Date andA.L. Gray (ed.), Applications of Inductively Coupled Plasma Mass Spectrometry(Cfiap-mann and Hall. New York, 1989).
Contributors:S. Vijayalakshmi,R. Krishna PrabhuJ.R. Mahalingam and C.K. Mathews
5.1.2
Determination of toxic elements in ground water by ICP-MS
Determination of toxic elements such as As,Bi,Sb,Se,Te,Sn etc. in trace levels in wateris important from the point of view of environmental monitoring. Ail the ground water samplesthat were to be monitored contained high amounts of Na,Mg,Ca and chloride. High amounts ofalkali anu alkaline earths in these waters cause signal suppression of the analytes in ICP-MS. Inaddition, ArCl formed because of high amounts of chloride interferes in the determination ofarsenic which is monoisotopic. These difficulties were overcome by resorting to the hydridegeneration technique [1,2].

Analytical Characterisation 101
Sodium borohydride was used as the reducing agent for the formation of volatilehydrides. Acidified sample solution and NaBH4 solution were pumped into the mixing chamberwhere they react and form the hydrides. These hydrides have to be separated from the solution.This was done by a simple modification of the nebuliser. ICP-MS uses a Meinhard nebuliser andScott spray chamber. The diameter of the capillary tube and the annular space between the capillarytube and the outer concentric lube were increased to 2 mm. In this arrangement there is nopneumatic nebulisation, so that only bigger droplets are produced which get effectively drainedoff the spray chamber. Only the gaseous hydrides and excess hydrogen reach the plasma. Thus,the modified nebuliser in combination with the spray chamber acts as an efficient gas liquidseparator enabling selective continuous introduction of hydrides to the plasma. Acidity, concentra-tion of NaBH4, power,nebulisei gas flow rates are all adjusted to get the optimum conditions(Table 5.1.2.1). An NBS water standard was analysed to check the accuracy of our method. Theresults are given in Table 5.1.2.2. The concentration of toxic metals in some ground water samplesare given in Table 5.1.2.3.
Table 5.1.2.1.Optimum experimental conditions for thedetermination of toxic elements in water
Elements HC1molarity
As,B:,SeSnSb
Table 5.1
1CP-MS
Element
AsBiSe
,Te 30.3
1
%NaBH4 inO.lNNaOH
212
Power 'Nebuliser' gas(KW) flow rate( 1/min)
1.3 1.251.3 1.251.2 1.15
.2.2.analysis of NBS water standard 1643b
Concentration RSDmeasured(ng/ml) %
48.511.29.0
214
Certifiedvalue(ng/ml)
49.011.09.7
Table 5.1.2.3.ICP-MS analysis of ground water samples for toxic elements
Element
AsBiSeTeSnSb
Sample 1(ng/ml)
0.81(3%)< 0.15< 0.21<0.13<0.211.0(591)
Sample2(ng/ml)
0.81(5%)1.0(6%)1.0(7%)2.5(7%)
< 0.21<0.11
Sample3 Sample4(ng/ml) t ng/ml)
< 0.13 1.9(6%)< 0.15 <0.15< 0.21 <0.216.1(7%) <0.13
< 0.21 0.21< 0.11 < 0.11
Detectionlimits(ng/ml)
0.130.150.210.130.210.11

102 Analytical Characterisation
The values given in brackets are RSD values.
References:/ / / T.Nakahara, Prog. Anal. At. Spectrosc.6 (1983) 163.
[21 MJ. Powell, D.W. Boomer andRJ. Mcvicaes , Anal.Chem. 58 (1986) 2867.
Contributors :
S. Vijayalakshmi, Ft. Krishna Prabhu, T.R. Mahalingam and C.K. Mathews
5.1.3
Determination of Zirconium in TBP/n-Dodecane by ICP-MS
Zirconium complexes effectively with the degradation products of both the TBP andthe diluents used in reprocessing and that the zirconium number (no. of moles of Zr in 10 litresof the solvent) serves as a useful index of the extent of degradation of the TBP and diluents.Chemical and radiolytic degradation studies were carried out by the process chemistry section. In(his connection, a method was standardised for the determination of Zr in these degraded organicsamples using flow injection technique.
When organics are introduced into the ICP-MS, soot deposition occurs on the samplertip which clogs the orifice. Addition of a small amount of oxygen was found to remove the sootbut it was found to erode the nickel sampler. So, various solvents such as TBP.CCU, Xylene,dodecane, ethanol and methanol were tried as sample introduction medium in the flow injectionmode without introducing oxygen. Except methanol and ethanol, all other solvents was found todeposit soot even in the FI mode. Among methanol and ethanol, sensitivity obtained with ethanolwas better. So, ethanol was chosen as the sample introduction medium and a dilution factor of25 was found to be optimum. Detection limit was found to be 50 ng/ml for 30%TBP/dodecane.Thermally and photolytically degraded TBP/diluent samples were analysed and the results aregiven elsewhere in this biennial report.
Contributors:
S. Vijayalakshmi, R. Krishna Prabhu and T.R. Mahalingam
5.1.4
Analysis of steels by ICP-MS
Stainless steels are used as structural and cladding material in fast reactors. Titaniumand niobium steels arc the candidate materials for use as fuel. For the characterisation of minorand trace constituents in these types of steels, an analytical procedure was standardised by

Analytical Characterisation 103
using ICP-MS. Steels can be dissolved either in H2SO4 - HNO3 mixture or HCI-HNO3 mixture.The choice of acid for the dissolution of steels is dictated by the possible interfering species. Fordetermining Ti, HC1 - HNO3 was chosen, as sulphuric acid gives rise to isobaric interfering species
S16O and 34S14N. For the determination of V and As, H2SO4 - HNO3 mixture has been used,as hydrochloric acid gives rise to 35C116O+ and 40Ar35Cl+ which interfere with V and Asrespectively.
The effect of matrix on the analytes' signal intensity was studied upto 0.2%. It wasfound that concentrations upto 0.1% steel matrix causes no signal suppression of the analytes.Concentration calibration was done for the various elements in the range 20 to 100 ng/ml by takingRu as the internal standard. The following constituents were determined viz., Cu,Co,Ti,Mn,Mo,As,Nb,Zr,Ce and Al. Also, Cr and Ni in some low alloy steels were determined. Because ofhigh sensitivity, introduction of 100 ppm of steel matrix itself was found to be adequate in mostof the cases. To check the accuracy of the method, different steel standards were analysed andthe values were found to agree well with the certified values. The values are given in Table 5.1.4.1.
Table 5.1.4.1Analysis of steel standards by ICP-MS
SAMPLECODE
BCS-465
BCS-466
M-5
M-12
ELEMENT
CoCuTiVMn
MnMoAsNb
MnNiCrMoVCuZrCe
MnNiCrMo
CERTIFIEDVALUE %
0.0220.0300.3000.0400.900
0.6602.2100.0100.050
0.3901.5600.5100.3500.1600.0900.1500.275
0.7202.0600 7600.730
OBSERVEDVALUE %
0.0220.0300.2400.0460.879
0.6882.4000.0! 10.047
0.3401.9000.4800.3300.1900.0900.1500.300
0.7202.2800.8200.690
RSD%
4.95.43.93.6
11.5
1.786.803.401.63
1.884.099.772.657.471.946.323.64
9.796.8010.0112.93

104 Analytical Characterisation
VCuZrCe
BCS-261 MnMoNbCuCoAs
BCS-459 MnAlCuNbVZr
0.7000.2000.0500.068
0.8300.1100.9100.1200.0500.016
0.9700.0280.1090.0140.0800.072
1.0000.2000.0500.066
0.6800.1100.8800.1220.0500.016
1.0000.0240.1200.0120.0780.072
10.3012.344.762.79
1.782.872.073.452.831.66
7.55.974.301.71.946.67
Contributors:
S. Vijayalakshmi, R. Krishna Prabhu and T. R. Mahalingam

Analytical Characterisation 105
5.2.0
OPTICAL EMISSION SPECTROGRAPHY
5.2.1
Glow Discharge Lamp as Hqht source for OES
A Grimm type [1] glow discharge lamp (GDL) has been designed and fabricated in thelaboratory with a view to studying the diffusion zones of corrosion samples (depth profiling) andusing it as an analytical tool to characterise various metal and alloy samples. In a glow dischargedevice, a low pressure inert gas d.c. discharge takes place causing the surface of the analyte formingthe cathode to be sputtered, atomised and excited to give its characteristic emission. This emissionis then dispersed and analysed by optical emission spectrographic technique [2].
The GDL [3,4] consists of a cone shaped ring anode mounted on a hollow cylindricalbody made of Cu-Be alloy. The anode body has a gas inlet port, a quartz window to couple lightonto a spectrograph and a terminal for power supply. The sample itself (which should be electricallyconducting) acts as a cathode and is mounted on a holder which moves through a stainless steelflange on a fine pitch screw thread. This enables accurate adjustment of the cathode-anode spacing.The entire cathode assembly is housed in a perspex chamber which in turn is mounted on theanode body (Fig.5.2.1.1). Cooling is effected by water circulating through the sample holder andthe anode body. The entire system is evacuated by a rotary pump. The operating pressure of thelamp (typically 6-10 torr) is measured by an oil manometer.
The lamp is operated by first evacuating to a base pressure of -100 microns. Argonis then let in and the flow rate is adjusted to obtain the desired operating pressure in the lamp.The lamp is then connected through a resistance of 1 k ohm in series to a d.c.power supply capableof providing a maximum current of 200 mA and 1 kV.
The current-voltage relations for various pressures of Ar were studied and the resultsindicate that under our operating conditions the discharge is in the abnormal glow region(Fig.5.2.1.2).
A copper sample was then taken to study the sputtering characterisics. In a typicalexperiment the discharage was operated continuously for a period of 30 minutes at 8 torr with anoperating voltage of 680 V and a current of 190 mA. From the weight loss of the copper discthe depth of the crater was estimated using the formula D = W/d.A, where W is the weight loss,d is the density of the material sputtered, and A is the sputtered area. The sputtering rate (D/t)obtained by the experiment was found to be typically 1 micron/min. Similar experiments withother materials like stainless steel are also being performed to arrive at their sputtering charac-teristics, which is required for a depth profile analysis.
Work is in progress to standardise the glow discharge technique as an analytical tool.
References:
/ / / . W.Grimm, Spcvtrochimica Ada 23R (1968) 443.

QjA.1T?
,j /,• n . , .'?:• J > ' -
IF? "
' •'" J! • : ^
1 " I
•.VL-" !-'.'-f..
\/
"7' ]* i
*-'m *-A ^t
• r * '1
— : : • $
X. J• . 1 ; ' . '
ii : >
l.-t J
••3
u
Pl | j.iii
/
5/•«•": -•
• • ' '
5.2.1.1 Schematic of the glow discharge lamp

-40 6::
CURRENTC mA )
5.2.1.2 Current - voltage characteristics of the glow discharge lamp

106 Analytical Characterisation
\2J. A.C.Broekaert, JAnul. Atomic Spectrometry 2 (1987) 537
/jy. Rudu Mavrodineanu, J. Research ofNBS 89 (1984) 143.
[41. D.Fang & R.KMarcus,SpectwchmicaActa43B (1988) 1451.
Contributors:K.S.Viswanaihan, V.Srinivasan, S.NaliniandT.R.Mahalingam
5.2.2
Determination of trace metals in U233 by OES
Analysis of alpha active materials by optical emission spectrography requires glove-boxconditions for sample preparation and excitation. The sample preparation glove-box set up forthis purpose houses a nickel muffle furnace, an analytical balance, an I.R.lamp and other materialsrequired for the preparation of sample for O.E.S analysis. In the modified design of the glove-box,one of the glass panels has been replaced with a 10mm thick aluminium panel and a nickel mufflehas been attached to it with its body projecting outside the glove-box. This facilitates the heatingof the furnace to be carried out from outside and also easy maintenance.
The second glove-box houses the excitation unit (arc-stand) designed in our lab, mountedon (he optical path of the spectrograph. The x,y,z translation facility of this system helps inmaintaining the anode-cathode spacing continuously when the arc is on and focussing the lightonto the .spectrograph slit. This glove-box is provided with necessary power supply for d.c.arc, aquartz window to couple the light on to the spectrograph and a controlled atmosphere chamberwith water cooling. A storage box for storing contaminated waste materials, is connected betweenthe sample preparation and the glove-box containing the arc stand. It has the facility to bag outthe active waste.
It has been made sure that the. whole system is leak tight and meets the safetyrequirements for handling alpha active materials. Using this facility the uranium (IT" ) samplesobtained from RDL after separation from irradiated thorium rods (J rod) have been analysed fortheir purity. The powder samples were first ignited in the furnace at 1123 K for one hour toconvert it to U3O8 completely and then analysed by carrier distillation technique, standardisedearlier in our laboratory [1]. The results are presented in Table 5.2.2.1.

Analytical Characterisation 107
Table 5.2.2.1233Results of spectrographic analysis of uranium oxide (U )
CONCENTRATION IN PPMLOT1 LOT 2 LOT 3 PURE LOT
ELEMENT 13.1.89 23.1.89 23.1.89 20.2.89
BORONBERYLLIUMCADMIUMCOBALTCHROMIUMCOPPERINDIUMMAGNESIUMMANGANESENICKELLEADANTIMONYTINIRONTITANIUMVANADIUMTUNGSTENZINC
2.6<0.1<0.25
20100
<5.0<1.0<10.0
19035
130<5.0
653.2%
<10.0<].()< 100<25
<0.5<0.1<0.25
570.45%
<5.0<1.0<10.0
28040050
<5.00.1%5.0%
<10.0<1.0< 100<25
<0.5<0.1<0.25
450.2%
<5.0<1.0<10.0
880400100
<5.00.1%5.0%
< 10.0<1.0<100<25
12<0.1<0.25<10.0<5.0<5.0<1.0
<10.0<5.0
36140
<5.0< 10.0
0.28%<10.0<1.0< 100<25
Reference :/ / / Bienniai Report 1984-85, Radiochemistry programme.
Contributors:
V.Srinivasan, S.Nalini and T.R.Mahalingam
108 Analytical Characterisation
5.3.0
ATOMIC ABSORPTION SPECTROMETRY
5.3.1
Determination of trace metals in Uranium oxide by electrothermal AAS
Electrothermal atomic absorption spectronietry (ET-AAS) offers advantages such ashigh sensitivity (10"n-10 g) and small sample size. These features make this technique veryattractive for the determination of trace metals in radioiactive materials such as uranium. Methodswere earlier developed in our laboratory for the direct determination of trace metals in sodiumand lithium using ET-AAS [1, 2],
A sensitive method has now been standardised for the direct determination of traces ofcadmium,nickel.chromium and manganesejn uranium oxide (U3O8) by using this technique. Astock solution of uranium (5mg U/ml) was prepared in nitric acid and diluted suitably.Using adeuterium hollow cathode lamp, and uranyl nitrate solution (2mg U/ml),charring temperatureswere optimised to get the best sensitivities and the least non- specific absorption due to the uraniummatrix. Using pure standards of the respective elements,atomisation temperatures were also op-timised. A sample volume of 25 (.il was used and peak absorbance measured.Standard additionswere carried out on uranyl nitrate solution to study matrix effect.In the case of cadmium.increasingthe atomisation temperature to 2273 K as against 1273 K recommended by the manufacturer.helpedovercome interference clue to uranium.thereby giving rise to 100% recovery.Manganese andchromium showed 100% recovery in standard additions indicating no chemical interference fromuranium matrix. In the determination of nickel, serious chemical interference was noticed, whichwas overcome by the addition of an equivalent amount of zirconium to the uranyl nitrate solution.The interference may be due to the formation of U-Ni intennetaliic compound. Zirconium addedto the uranyl nitrate solution acts as a releasing agent due to its stronger affinity for uranium.Since the sample of U3O8 was not very pure, uranium concentrations of 2.5 jig U/25 (i.1 for Mnand Cr,12.5 jig U/25 u.1 for Ni were used to study matrix effect. In the case of Cd, the uraniumconcentration used was 50 |ug U725 {0.1 . The method thus standardised was subsequently usedto determine the above elements in a sample SR-64, received from IAEA. The values obtainedby the present experiment for the different elements were in good agreement with the valuesreported by IAEA, compiled in an intcr-laboratory exercise.This confirms the accuracy of thepresent method. Table 5.3.1.1 gives the concentrations of different elements in SR-64, thesensivitity, detection limit etc.

Analytical Characterisation 109
Table 5.3.1.1Analysis of an IAEA reference sample of uranium oxide by electro thermal AAS
SI.no.
1234
Element
CadmiumManganeseChromiumNickel
References:
Mean Recovery+ SD
%
98 ± 3.594.8 ±7.2
100.2 ±3.896.5 ± 3.5
44
8.51.6
Sensiti-vitvg
X 10"13
X 10"12
X 10"13
XIO'1 1
Detn.limitppm
0.035.21.44.3
Measu-red
concn
ppm
0.1112.05.4
12.0
Valuereportedby IAEA
ppm
0.1014.0-18.03.1-5.08.4- 14.1
/ / / T.R. Mahalingam, R. Geetha, A. Thiruvengadasami and CKMathews , Anal. Chim. Acta 142 (198?)189.
[2] R. Gcetha, A. Thiruvengadasami and T.R. Mahalingam . J. Anal. At. Spectrometry 4 (1989) 447.
Contributors :R. Geetha, A. Thiruvengadasami and T.R.Mahalingam

110 Analytical Characterisation
5.4.0
HIGH PERFORMANCE LIQUID CHROMATOGRAPHY
5.4.1
Separation Ot Rare Earths
Modern high performance liquid chromatographs (HPLC) can separate rare earthsrapidly and with high resolution and sensitive detection, as was shown by Knight et al [1J. Theyhave also demonstrated the advantages of converting a reversed phase column to an ion-exchangerby the addition of a suitable modifier. These columns give even faster separation with betterresolution. By a suitable change in the concentration of the modifier the capacity of the columncan be modified.
We made use of a previously untried modifier, 10-camphorsulfonic acid as the modifierand all the lanthanides were successfully separated.
The eluted metal ions were monitored after a post-column reaction with 4-(2 -pyridylazo) resorcinol (P.AR) or 3,6- bis lo- arsenophenyl)azoj- 4,5-dihydroxy- 2,7-naph-ihalenedisulfonic acid ( Arsenazo - III ). The concentration of PAR was 2x10 M in ammonia(2.M) and ammonium acetate (1M). Arsenazo-Ill (1.5x10" M) was an aqueous solution. Thewavelengths used for detection were 535 nm and 653 nm respectively.
A 5 \±m Supelcosil LC-18, 4.6 x 150 mm, reversed phase column, (Supeclo Inc.,Bellefonte, PA) was used.
The optimum conditions finally arrived at were a concentration of 0.05 M of the modifierand varying the concentration of a- HIBA from 0.05 M to 0.2 M in steps over a period of 35 min.Ali the ianthanides could thus be separated in gradient mode. Fig. 5.4.1.1 shows the chromatogramobtained under these conditions .
Reference :/ / / CM. Knight, R.M. Cassidy, B.M. Recoskie, andL.W. Green , Anal.Chem. 56(1984)474.
Contributors:
D. Karunasagar, M. Joseph and B. Saha
5.4.2
Separation of Uranium from Thorium by HPLC
Isolopic composition and concentration of uranium in irradiated thorium has to bedetermined by mass spectrometry. The. separated uranium has to be free from traces of thorium toavoid isobaric interference due to 'Th in the measurement of "" "U which is a minor isotopeproduced along with "' Y? and 234U. The desirable level of purity is difficult to achieve by the

SEPARATION OF ALKALINE EARTH METALS
COLUMN ION. 2 00
ELUENT • 2 0m.M Ethylene DiamineCitric acid (PH~50)
DETECTOR. Variable wave lengthPost column Reaction withArsenazo-I ot Pjj 10
SAMPLE VOL. 10G/UI containing110 ng Mg270 ng Ca**and4 60ng Sr**
T!ME(MIN.)
>.4.1.1 Separation of lanthanides by HPLC

Analytical Characterisation 111
conventional ion exchange or solvent extraction techniques. HPLC has been developed in ourlaboratory f 1,2 ] for the separation of individual rare earths, transition metals and alkaline earthsfrom a mixture in the respective groups. The same technique was applied for the separation ofuranium from thorium.
The column used for the separation was of reverse phase Ci8 bonded material (Supelcosil, 10 micron, 150 mm x 4.6 mm ID ). The mobile phase contained hydroxyisobutyricacid as the complexing agent. The elution was monitored at 653nm after post column reactionwith arsenazo-III.
Thorium was about thousand times that of U in the starting solution. Prior to loadingon the HPLC column the Th content was reduced by solvent extraction in TOPO/xylene mediumto a level comparable to that of uranium.
Highly resolved separations were obtained in less than ten minutes. The U fraction wassubjected to thermal ionisation mass spectrometry to determine relative intensity at mass 232. Themeasured ion current ( I232) at this mass is negligibly small as reflected in the measured ionintensity ratio, I232/J238, as given in table 5.4.2.1. It is evident that the contribution due to ihis less than 0.003 %.
Table 5.4.2.1Mass spectromctrically measured ion intensity ratio I232/I238-
Sample no. 1232/1238
1 2.86x10"'2 2.91xlO"5
References :/ / / D.Karunasasur, MJoseph. B.Saha and C.K.Mathcws : Rapid determination of burn up of nuclear
fuel - A possible approach: Sepn. Sci. and Technol. 23 (12& 13), (in press).
\2] M.Joseph. D.Karunasd%ar, B.Saha and CKMathews : Estimation of fuel burn up by HPLC : I'roc.Radtochan. & Radiation diem. symp. ( J9S8 ),p-Ra.'29.
Contributors :
M.Joseph, D.Karunasagarand B.Saha
5.4.3
On-line Gamma monitor for HPLC
An on-l.:ne gamma-detector was set up for detecting gamma - active samples elutingfrom the HPLC column. The sei up consisted mainly of a 3" dia. and 3" long Nal(Tl) crystal witha 1 cm dia. and 5cm deep well. The photomultiplier signal after proper amplifica tion was fed

I I
i <->'•
! .
• 1Mn
-i
£ i.
[5 iiT. I
Mn
[
'iME
• a
i O •• CJ :
oo
-'v'^'iV-'i
. I• • ' • • 1.
„ / w ^ , i - •'.
TIME ( rnin )
( b)
5.4.3.1 Separation of manganese and cobalt (a) PAR detection (b) On-line gammadetection

/12 Analytical Characterisation
to a ratemeter ( Tcnnelec , TC 593) and a timer- sealer (PLA ,PTS-461). The ratemeter wasconnected to a chart recorder. Appropriate lead shielding was provided for the crystal to minimisethe background activity.
The stainless steel capillary at the outlet of the HPLC column was coiled and insertedinto the well of the crystal. The length of the capillary inside the well was 20 cm. A capillary of0.5 mm dia resulting in a cell volume of 39 (il was found to give the best response.
In order to test this detection system Co and Mn were separated from their mixture.A dynamic ion exchange method was used for this purpose. A reversed phase column , (SupelcosilLC-18) was used as the stationary phase and the mobile phase consisted of the complexing agenttartaric acid ( 0.04 M ) and the modifier n-octane sulfonate (1.5 X 10" M).The pH was adjustedto 3.5 with ammonia.The HPLC system used is described elsewhere [1].
Initially inactive samples were separated and Mn and Co were detected by complexingthem with pyridylazoresorcinol (PAR) and monitoring the absorption at 535 nm. Thechromatogram is shown in fig . 5.4.3.1 (a). Detection limits were 5 ng and 8 ng for Co and Mnrespectively .
Now the spectrophotometric detector was replaced by the y-detector . The singlechannel analyser monitored all the incoming signals above 3 V in integral mode. The active samplemixture was injected . The chromatogram is shown in fig.5.4.3. l(b). The activity of each elementin the injected volume ranged from 20 nci to 150 nci.
Experiments were carried out to check for any enhancement in retention when carrierfree samples of " Mn were injected. No significant increase was obtained. This method lead todetection limits of 2.6 pg for Mn when carrier free samples were injected.
Reference :
/ / / D.KunuuimgarM Joseph,B.Saha and C.KMathews , Sep. Sri. andTechnol. ,23(19?"; 1949.
Contributors :D. Karunasagar, N.Sivaraman and B.Saha
5.4.4
Simultaneous determination of alkaline earths in reactor grade sodium by HPLC
Alkaline earth cations present in reactor grade sodium samples were separated byconventional liquid chromatographic method and detected using post-column derivatisation tech-nique. Sodium was sampled in tantalum crucible and distilled under high vacuum to remove thematrix. The residue in the crucible was leached with acid.dried and redissolved in the eluent.Suitable aliquot of the aqueous solution was then injected in the sample injection valve of theliquid chromaiograph. The determination of magnesium and calcium were made spectrophotometri-cally after a post column reaction with Arsenazo-1 at pH 10.0. The sensitivity was found to be

SEPARATION OF THE LANTHANIDES: SUPELCO LC 18 COLUMN,
MOOIFiER, CAMPHOR-IO-SULFONIC ACID ; 0C-HI6A VARIED
FROM C-0 5M TO C. 2 M OVER A PEROIO OF 35 M!N.: PH 3.8
DETECTION AT 653nm.AFTER POST COLUMN REACTION
vVtTh ARSENAZO I I I
5.4.4.1 Separation of alkaline earth metals

Analytical Characterisation 113
much superior to the conductometric method of detection. Linear calibration graphs were obtainedfor magnesium and calcium in the 50-500 ug/1 range. Standard addition experiments were carriedout with known amounts of magnesium and calcium to the crucible containing sodium followedby distillation of sodium. The recoveries obtained confirmed that there was no loss of the analytesduring the distillation step. Due to the high sensitivity of post-column detection, it was possibleto estimate very low amounts of alkaline earth metal impurities in sodium in nanogram level. Asample chromatogram showing the separation of alkaline earth metals in a synthetic standard underoptimum conditions is presented in Fig.5.4.4.1. Representative results are given in Table 5.4.4.1.
Table 5.4.4.1Results on the determination of alkaline earths in sodium by HPLC
Wtof
3.0(in all)
MeanSD
Magnesium
HPLC
( g/g)
0.56, 0.580.50, 0.520.60, 0.54
0.550.04
AAS
(g/g)
0.51
Calcium
HPLC
( g/g)
0.72,0.640.54,0.680.60,0.62
0.630.06
AAS
( g/'g)
0.65
Contributors :
S. Sahasranaman, D. Karunasagar and M.Joseph
5.4.5
Determination of weak acid anions by single column ion chromatography
Polymeric resin based anion exchange columns are highly suitable for use with highpH eluents for analysis of weakly dissociated anions. The use of a high pH buffer ensures thatsample species are ionised and provides good sensitivity by conductivity detection. Anions ofweak inorganic acids like fluoride, sulphide,borate and silicate were separated using single columnion chromatograph for their determination in trace levels. An eluent containing 1.5mM sodiumhydroxide and 0. !mM sodium benzoate was used for separating the weak acid anions through aIon-100 union exchange resin of low capacity. The peaks were made to appear po.ilive on therecorder by changing the polarity of the conductance monitor and the chromalogranis were recorded.This method can estimate borate and silicate in microgram levels in aqueous solutions with goodaccuracy.

114 Analytical Characterisation
Contributors:
S.Sahasranaman and N.P.Bhat
5.4.6
Determination of DBP and MBP in TBP by ion chromatography
TBP is widely used in nuclear fuel reprocessing as an extractant for the recovery ofuranium. In strog acid media, TBP undergoes degradation yielding mainly DBP and small amountsof MBP. A rapid and reliable method was developed for estimating DBP and MBP in a mixtureof the two by ion chromatotgraphy. An eluent containing a mixture of sodium carbonate (3mM)and sodium hydroxide (lmM), pH 11.0 was used and anion column (ION-100) of InteractionChemicals employed for separating DBP and MBP. Synthetic standards containing DBP and MBPin trace levels were injected and separated chromatograms were recorded in a thermal printer -plotter. Typical results are shown in Table 5.4.6.1.
Table 5.4.6.1Results on the ion chromatographic determination ofMBP and DBP in TBP (synthetic standard)
12345
Concntaken
DBP
Concnfound
( g/ml)
20015012510075
Contributors:
19415512110377
S.Sahasranaman and
Recovery(%)
97.0103.396.8
103.0102.7
N.P.Bhat
Concntaken
( 1
10015075
200125
MBP
Concnfound
g/ml)
9715478
194122
Recovery(%)
97.0102.7104.097.097.6

•4—'
c
—
—
J i
a
+-•
en
XT
a
Column:- Anion
Eluent -J3mM A/o-Coj
1/mM/VoOH
F/ovv : - ;20 m///irDetect or-ConductivityConcn.of }20mg/lDBP { MBP} 25mg/tVol. taken •.- 100pi
Injection
DBP
0
11
V
11
i20 " 3C
Retention Time ( min )
5.4.6.1 Chroir.atogram of DBP & MBP

Analytical Characterisation 115
5.4.7
Estimation of alkali metals using non suppressed ion chromatography
A method to estimate simultaneously all the alkali metals and ammonium ion in aqueoussolutions was standardised using the liquid chromatograph. A low capacity polymeric cationexchanger from M/s Benson Co., USA was used for the separation of the alkali metal ions and anLDC conductance monitor was used as a detector. Dilute nitric acid (pH 2.5) was used as eluent.The peaks were made to appear positive on the recorder by changing the polarity of the conductancemonitor. Synthetic standards containing all the alkali metals in known quantities were injected inthe liquid chromatograph and the separated chromatograms were recorded. A sample chromatogramis shown in Fig. 5.4.7.1.
Contributors:
S.Sahasranaman and N.P.Bhat

SL'PARtnON OF ALKALI METALS
EL UENT Oil. Nitfcacid PH 2 5
COLUMN • Benson IC Polymeric
DETECTOR Conductivity
SAMPLE V0L.:20/u!contg
1. Lithium (OS fjg)
2 Sodium \2.0jug)
3. Amr:onium(2.0/ijg)
4 Potassium (2 0,/ug)
5 Rubidium (i.O/ug)
6. Caesiurr,(4.0/jg>
5.4.7.1 Separation of alkali metals

116 Analytical Characterisation
5.5.0
MISCELLANEOUS ANALYSES AND SOFTWARE DEVELOPMENT
5.5.1
Estimation of hydrazine in high purity water samples
The determination of hydrazine in high purity water samples in submicrogram levelwas standardised using the highly sensitive ferrospectral reagent. This method is based on thereduction of ferric ion TO ferrous by hydrazine present in the sample and further complexation withferrospectral reagent in a suitable buffer medium. The intensity of the colour produced is propor-tional to the hydrazine present in the sample. A standard calibration graph was drawn using freshsynthetic standards. This method could estimate hydrazine in ppb levels with a precision of 10%.
Contributors :
S. Sahasranaman, V. G. Kulkarni and R. Umamaheswari
5.5.2
Estimation of titanium dioxide in ilmenite sample
Ilmenite is generally regarded as ferrous titanate corresponding to the chemical formulaFeTiO3. A rapid and reliable analytical method was developed for the estimation of titanium dioxidein naturally occuring iimenite sample. The ilmenite ore, after proper sampling was brought intosolution by fusion with a mixof sodium carbonate and sodium borate and the molten ma.ss extractedwith 1:1 Sulphuric acid. A suitable aliquot of the extracted solution was then electrolysed using amercury cathode electrolysis set-up to remove iron completely as amalgam with mercury. Thismethod provides a complete separation of titanium, aluminium and vanadium from the majorinterfering element iron and helps in preconcentrating aluminium and vanadium present in smallamounts. In the supernatant solution titanium was estimated gravimetrically by using approvedanalytical methods. Synthetic standard solutions containing titanium dioxide andferrous and ferriciron analysed using the above separation method gave good recover}' for titanium dioxide therebyconfirming the validity of the present procedure. This method could estimate titanium dioxide inilmenite samples with a standard deviation of 0.4%. Results on a synthetic standard containing300 mg Of TiO2, 125 mg of ferric iron and 75 mg ferrous iron in a volume of 250 ml yieldedalmost 100 % recovery ( 25 ml aliquot taken for estimation ). Results on the actual sample areshown in Table 5.5.2.1.

Analytical Characterisation 117
Table 5.5.2.1Results on T1O2 estimation in an ilmenite sample
No
1234567
Sample wt ( g )
500
i t
t t
t*
*'
MeanSD
% TiO2
49.649.449.048.648.449.248.8
49.00.4
Contributors:S.Sahasranaman, V. G.Kulkarni and R. Umamaheswari
5.5.3Determination of Iron in the presence of uranium
A titrimetric method for the determination of iron in the presenc; of uranium has beenstandardised. This work was taken up in connection with the analysis of iron impurity in U-233samples. As the iron content was found to be in percentage levels (up to 10 %), the emissionspectrographic method could not be used. In the present procedure, advantage was taken of thefact that in the presence of complexing thiocyanate ions, the reduction of Fe(III) ions by mercurousions becomes possible. Uranium does not interfere in this procedure.
In our studies, synthetic mixtures of iron and (natural) uranium were prepared in whichthe uranium to iron ratio was maintained in the range 10 to 50. The titration end point was markedby the disappearance of the blood red colour of the ferric thiocyanate complex. The results ofanalysis of 10 synthetic samples are given in Table 5.5.3.1. The recovery of iron (100.5 ± 0.4 %)is seen to be positively biased, probably due to the air oxidation of the ferrous ion during thecourse of the titration.

118 Analytical Characterisation
Table 5.5.3.1Fe determination in uranium-irun mixtures
Uraniummg
24.2025.3320.4026.7724.4724.9957.8940.1634.225.04
Iron takenmg
1.4022.1292.1602.1292.5812.7381.4591.5261.2361.523
Iron foundmg
1.4132.1372.1812.1342.5972.7461.4551.5331.2481.534
Mean recovery
Recovery%
100.6100.4101.0100.2100.6100.399.7
100.5101.0100.8
: 100.5 ±0.4%
Contributors:
R. B. Yadav and N. L Sreenivasan
5.5.4
Automation of XRD & XRF instruments and software development
An IBM PC has been interfaced with the x-ray analysis system consisting of SiemensD500 diffractometer and SRS 200 spectrometer after necessary modifications of the instrumentcontrol software. Several data reduction software packages for XRD and XRF analysis wereincorporated, which include programs for step scan, peak search, graphics display, indexing anddeconvolving overlapping peaks in XRD and instrument calibration and matrix effect correctionin XRF analysis.
Contributors:
R. Asuvathraman, R. Parthasarathy, S. RajagopalanandK.V.G. Kutty

6.0
ANALYTICAL SERVICES
Analytical support to the various programmes of IGCAR and sometimes to MAPS hasbeen one of the tasks of the Radiochemistry Programme. Samples of different kinds of steels,primary and secondary sodium, argon and nitrogen samples including those from the cover gasof the FBTR, heavy water, transformer oils, flaw- check materials used in quality control etc., areroutinely analysed for major, minor and trace constitutents and specific impurities depending uponthe requirements. Analytical methods were developed and standardised in some cases in theabsence of regular standardised procedures. Instrumental techniques such as inductively coupledplasma mass spectrometry, atomic absorption spectrometry, optical emission spectrogrphy, massspectrometry, spectrophotometry, x-ray fluorescence, gas chromatrography, high pressure liquidchromatography, and electro-analytical methods were used in addition to wet chemical methodsin analysing the samples. Some of the major analytical campaigns are briefly described below.

Analytical Services 121
6.1
lsotopic composition and concentration of uranium and trace metals in ir-radiated thorium :
The isotopic composition and uranium concentration in irradiated thorium rods weredetermined by thermal ionisation mass spectrometry in conjunction with alpha spectrometry.Uranium was assayed in the dissolver solution as well as in̂ the pure fractions separated at theReprocessing Development Laboratory. The isotopes U, U, and U were determined bymass spectrometry while the isotope U was determined by alpha spectrometry afterelectrodeposition. A small portion of the residue was subjected to optical emission spectrographyin order to determine the trace metallic impurities. As the dose due to this sample was fairly high,a gamma spectrometric analysis was carried out; the major activity was found to be " Sb.
6.2
Analysis of sodium :
Carbon content of the sodium samples received from FBTR and the engineeringDevelopment Division are analysed by the distillation-combustion-low pressure method. Tracemetals in the secondary sodium samples of FBTR are determined by ICP-MS. AAS is routinelyemployed for the determination of oxygen, calcium and magnesium. Wet chemical methods areapplied for determining traces of some metallic and non-metailic impurities.
A few radioactive sodium samples from FBTR were analysed for fission products andother gamma emitters, and a sample was further analysed for plutonium. In all cases, the activityof " \'a was detected. No other radioactive nuclide was found to be present in these samples; theplutonium content was also below the detection limit.
6.3
Spectrometric analysis of various materials :
Using ICP-MS, the following samples were analysed, viz., water samples from thesteam generator system of FBTR for copper at ppb levels, weld metal samples for traces of copper,tantalam, titanium, niobium, and cobalt, aluminium brass for arsenic, superconducting Cu6Mo6Sesfor boron, acetic acid for boron, high purity nickel for ultra-trace impurities, zinc-aluminium alloyfor arsenic, Ni-Ti alloy for titanium, samples from the electrorefining experiments on U-Zr alloyfor zirconium, and samples of some organometallics for copper and zirconium.
AAS was routinely employed for the analysis of a variety of samples including thedeposits collected from the rotary plug of FBTR for tin, bismuth and iron, a sample of the headsection of a dummy subassembiy of FBTR for cobalt, stainless steels for manganese, aluminiumbronze for tin and zinc, aluminium iron alloys for iron, Cu-Li alloys for lithium, Cu-Cr alloys forchromium, superconducting samples for their composition, and some blood serum samples foriron and copper.
Optical emission .spectrography was applied for the analysis of Al-Hf alloys for hafniumand for the purity determination of silver, palladium and tin.

122 Analytical Services
Using Fourier transform infra-red spectroscopy, synthetic magnetite samples and cor-rosion products were analysed for ihe presence of Fe-0-O-H groups. Several alumina sampleswere checked for the presence of orgi'nics and many corrosion samples were analysed for thepresence of nhkel oxide. Polystyrene suspensions were also characterised by the infra-red ab-sorption method.
Wavelength dispersive x-ray fluorescence spectrometry was extensively employed forthe compositional analysis of steels, especially titanium-modified steel samples from the Metallurgyand Materials Programme.
64
Determination of carbon, sulphur, oxygen and nitrogen in metals and alloys :
Carbon and sulphur in metal and alloy samples received from the various laboratoriesare determined by using a Lebold Hereaus CS A-2002 analyser. Oxygen and nitrogen are determinedby the inert gas fusion method by means of a Leco oxygen-nitrogen determinator.
6.5
Gas analysis :
Cover gas samples from FBTR are regularly analysed by mass spectrometry. Nitrogenin argon cover gas and helium in nitrogen samples from the reactor are determined by this method.
An electrochemical method employing the CSZ solid electrolyte is used for the deter-mination of oxygen impurity in argon. This is being done on a routine basis for FBTR in orderu> ensure the quality of the cover gas used in the reactor.
The secondary cover gas samples are analysed for the hydrogen and methane contentsby using gas chromatography with thermal conductivity and flame ionisation detectors. Carbondioxide and methane are determined using a low pressure system in conjunction with cryogenicseparation.
Argon samples from the reactor are also regularly analysed for the moisture contentby means of a duPont moisture analyser.
6.6
Wet chemical analysis :
A variety of steel samples consisting of carbon steels, stainless steels, special alloysteels and non-ferrous materials are routinely analysed by wet chemical methods following thestandard ASTM procedure. Oil samples from the various electrical transformers located in thisCentre are also regularly analysed in order to check the total acidity content and moisture.

Analytical Services 123 •
6.7
Summary:
A total of 345 samples requiring 1010 determinations were anslysed in suppon of theactivities of this Centre and MAPS and of some other national laboratories and universities. Thebreak- up of analyses carried out during 1988 and 89 is given in Table 6.1. This does not includethe analytical assistance rendered to the various groups of our own laboratory; the effort involvedin which has approx. been of the same magnitude as reflected in the above table.
Table 6.1Break-up of the analytical service during 1988 and '89
SI.No.
1.
2
3.
+
5.
6.
Facility
Fast Reactor Group(FBTR, EDD &CTS)Metallurgy Programme(MDL, RML, NSF, QCI& MSD)Engineering Services(CWS.CWCP&CEG)Reprocessing Programme(RDL & KARP)MSL, WSCL, MAPS &CWMFOthers(NPL, DelhiMadras Univ.etc.)
Total
No. of samples
81
115
56
11
19
63
345
No. of determinations
314
319
110
67
34
166
1010
Contributors :
S.Sahasranaman, V.G.Kulkami, Uma Maheswari, T.R. Mahalingam, S. Vijayalakshmi,R.K. Prabhu, R. Geetha, A. Thiruvengadasami, V. Srinivasan, S. Nalini, K.S. Viswanathan,K. Sankaran, K.V.G. Kutty, R. Asuvathraman, S. Rajagopalan, D. Krishnamurthy,T. Subramanian, B. Prabhakara Reddy. C.R. Venkata Subramani, N.P. Seshadreesan,K. Swaminathan, S. Rajenderan Pillai, R. Ranganathan, V. Chandramouli,S. Anthonysamy, R. Viswanathan, D. Darwin Albert Raj, T.S. Lakshmi Narasimhan.R. Balasubramanian, M. Saibaba, B. Saha and N.P. Bhat.

7.0
INSTRUMENTATION AND MECHANICAL SERVICES
7.0.1
Introduction :
The Technical Services Section provides engineering support by way of instrumentationand mechanical services to the various R&D activities of the programme. This encompasses themaintenance of existing facilities as well as the related design for new facilities.

Engineering Services 127
7.1.0
INSTRUMENTATION
7.1.1
Augmentation Of The Radioactive Sodium Chemistry Loop
The Sodium Ix>op was commissioned in noven.ber 1987. After ascertaining that theinstrumentation was functioning as conceived during ihe design and test runs, the loop was shutdown for a period ot two months to re-do some sections of (he field wiring, to improve main-tainability. Subsequently, the loop was run for a substantially long period during which valuableoperating experience was gained. The system hardware proved lo be quite reliable. The applicationsoftware was continuously appended and modified to attain a level of comprehensive operationand enhanced user friendliness.
At that stage a strong need was felt for rewriting the User/IO interface software in. amore compact form to function with more reliability. This became all the more necessary as theprevious version became error prone due to the presence of several branch instructions which wereadded to bring in new features. A new version was then evolved (in BASIC) compacting all thesubroutines in the most efficient sequence. A virtual- di.sk mode of access was set up, therebycombining speed with file-handling facility. Vast areas of ihe program were moved on to randomfiles, thereby drastically reducing the main program size.
The commissioning of the in-sodium heaters was taken up next. The field wiring forthe 440 volt operation of the heaters was taken up and completed. A data aquisition moduleconfigured as plug in PCB's to the PC was commissioned for the operation of these heaters. OnePCB is dedicated to the reading of the various flow meters. The flow meter reading is comparedwith the corresponding lower limit set for that channel and the concerned heater is tripped if aminimum required flow is not set up. Extensive use is made of opto-isolated solid state relays toensure adequate isolation of the logic controller. The other PCB was employed for the temperaturecontrol of the in-sodium heaters in an off-on mode. Sustained operation with all these features isto be checked.
Contributors:
V.Shanthamoorthy, K.Manivannan, K.Venugopai and K.C.Srinivas
7.1.2
Instrumentation for the hot-cell facility
The instrumentation for the hot-cell facility was completed and tested. The cells arenow ready for operation. The operations on the hot-cells are largely performed from the operatingpanel provided in the operating area. The control panel is designed as a standard 19-inch widthinstrumentation cubicle. The various controls are distributed on a functional basis to differentMibracks vertically integrated in the panel. The different sub-systems air detailed below :

126 Engineering Services
Three cells are designed for operation in an inert atmosphere of argon. Make-up argongas is let into these cells from a header through individual solenoid valves. Excess argon can bebled to the evacuation system again through solenoid valves. Each cell is provided with a photohelicgauge with high and low set-points. If the pressure traverses beyond these limits, the photohelicgauge will energise the corresponding solenoid valve through relays in the control cubicle, tomaintain the pressure within limits.
The on-line purification system consists of heaters around a resin bed. Whenever theexhausted column is to be regenerated, these heaters will be energised. The heaters are maintainedat the desired temperatures(around 473 K) using a commercial on/off controller.
A diaphragm compressor forces the argon through the cells and the purification bed.The electrical supply to the compressor is interlocked to trip whenever there is an occurence ofdiaphragm failure or overpressurisation or a failure of the cooling water.
After any exposure of the cell box to air and prior to commencement of redrculation.it is necessary to purge the cell with argon. This is accomplished from the control panel by selectingthe concerned cell. The right set of solenoids is energised to admit argon to the cell and release itto the annular gap after filling the cell.
The temperature within each cell can lie monitored from the control panel. Each cellK equipped with an RTD sensor. The selected sensor is connected into the measuring circuit andthe temperature is read-out on a DPM and also on to a data aquisition module plugged into a PC.The box pressures are also logged by the PC and hence a continuous data supply as well as archivalinformation is available.
Pneumatically operated lead-shielding doors are provided for inter-cell transfers. Theselected door can be operated from the control panel by proper switch selection. Solenoid valvesoperated by relays steer the air flow direction suitably to operate the doors.
An electro-pneumatic system is available for the rapid transfer of capsules betweencells,using a rabbit.By operation of self-explanatory switches on the paneljt is possible to postthe rabbit from a eel! on to a common junction and then on to the destination cell.
For in-cell operations, master slave manipulates are provided. The electrical controlsfor these arc distributed in various local control boxes. The controls originally supplied were ofdetromechanical design and proved to be highly unreliable. These controls were replaced withstatic electronic logic modules configured with digital ICs.
Contributors :
V.Shanthamoorthy, R.Parthasarathy, B.Suhasini, K.ManivannanandK.C.Srinivas

Engineering Services 129
7.1.3Data aquisition system for the cold fusion research
A PC-based data acquisition system has been designed and commissioned for the ColdFusion Experiment. This has been done in an effort lo auionifiie the data collection procedureof the experiment which, if done manually, would be time consuming and tedious. The neutroncount rate from the cold fusion cell, the temperature of the cell and the voltage applied to the cellai any set current are the parameters being acquired and processed by the PC. The present designhas additional channel for accommodating more cells if needed.
The system comprises of two standard plug-in cards - one configured to function as aneutron counting module and the other as an analog voltag:; measuring module to acquire celloperating parameters.
Counting module:
The neutron pulses coining out of the cell are piocessed and shaped into standard TTI.pulses by external hardware and are then counted in the counting module. The standard p!ug-in-cardhas been structured to function basically as a programmable timer - sealer. The timer has a rangeof 1 s to 16 ks and the sealer has a counting capacity of 2' ~-l counts. The module also providesa monitoring timer which controls the sealer acquisition precisely for the preset time. Along withthe monitoring timer the PC starts an interrupting timer as well and that interrupts the PC afterthe lapse of the preset time and enables it to retrieve the counts from the sealer. The monitoringtimer is introduced to circumvent the interrupt latency time. Thus the module turns out to be aversatile counting system with programmable timer and sealer.
Voltage measuring module :
The other functional plug-in-card is the voltage measuring card that measure thetemperature of the cell and the voltage applied to the cell. The temperature is sensed by a transducerwhich outputs proportional voltage to the card. Trie cell voltage is directly read by the card. Thecard has an ADC which measures these parameters periodically.
The operational software was developed in the high level !anguage,QBASIC. Theprogram collects a few relevant experimental input variables and sets up the modules accordingly.This program then stores acquired/measured data for the entire nm in a file while providing accessto the user to break the acquisition whenever desired. The system is now in regular use in thelaboratory.
Contributors :
R. Parthasarathy, K. Venugopal, R. Karpagam and K. C. Shnivas

130 Engineering Services
7.1.4
Data collection module for thermal analyser
A microprocessor-based data collection module has been developed as an essentialaccessory for die Thermal Analyser in our lab. The module is developed to collect output data andprint them in the required format.
The interfacing unit of the instrument has an ADC which converts the analog signaland outputs them in time multiplexed BCD format with synchronising control signals. Theinterfacing unit signals the availability of the data with a flag. In the module the flag is used asan interrupt and on the occurrence of this interrupt the data is collected through ports and storedin memory. Finally they are serialed out to a printer in a prescribed format. Thus the modulecollects sequentially all the. four parameters available from the interfacing unit of the instrument.The software had been developed in machine level language and an 8085 based trainer level kithas been adapted for this application. The system is being put into continuous use in the laboratory.
Contributors:
R.Karpagam R.Parthasarathy and K.C.Srinivas
7.1.5
Instrumentation for the lead cells and special in-cell experiments
An integrated instrumentation scheme is under execution for the lead cell facility ofthe Radiochemistry Programme. Instrumentation required for in-cell post irradiation experimentsie.,micro gamma scanning and retained gas analysis, have also been planned and is being carriedout.
Instrumentation scheme for lead cell system has been worked out with a view to ensureuser's convenience and operational safety of dedicated automatic process control. The system isclassified into various subsystems like argon recirculation, purification tower regeneration, purgingoperation solenoid valve controller, power supply system for manipulators, incell power pointrequired for in-cell lights, motorisation of 10 ton shielding door etc. Electrical and electroniccontrollers required for above operations are in various stages of fabrication and testing. Majorpower wiring requirements for the cell system have been completed.
A microprocessor based process controller having serial communication interface forcontrolling and recording various recirculation system parameters like flow rate, pressure drop,moisture level, oxygen level, equipment integrity and system containment (door status reading) isbeing fabricated. The process controller is basically configured around an 8085 microprocessorand is capable of handling multi channel analog signal scanning with simultaneous visual displayof data through an IBM PC for user convenience. This system is capable of further expansionwith inclusion of appropriate hardware.

Engineering Services 131
Instrumentation requirements for special post irradiation experiments in the lead cellsrange from construction of modular power supplies and designing the data logger capable ofhandling a large amount of post irradiation experimental data as in the case with microgammascanning experiment, and transient data as in the case of retained fission gas analysis experiments.Work on the micro positioner for gamma scanning system interlocking with the PC is in progressand the mass spectrometer for retained fission gas analysis set up has been tested through RS 232Ccommunication interface. Other electronic testing for these experiments is in progress.
Contributors:
K.Manivannan, Sitaram Dash, M.Kamruddin and K.C.Srinivas

132 Engineering Services
7.2.0MECHANICAL ENGINEERING SERVICES
Mechanical engineering services like design, fabrication and erection of various com-ponents, equipment and piping services required for the experimental facilities planned inRadiochemistry Programme are provided by this group.
7.2.1
Hot cell and minicell
The hot cell external transfer ports were provided with a stainless steel tunnel of size340 mm ID and 1500 mm long. The tunnel was fabricated and bored to the accuracy of 0.01 mmconcentricity. The tunnel was then aligned and installed in line with Lacalhene flange to facilitatesmooth material transfer into the hot cells.
A remotely operable rabbit loading system was designed and installed in the hot cells.Standard pneumatically operated wrenches were modified to suit the above system.
A new filter changing facility was designed for the cell exhaust filter bank system. Thenew system will facilitate removal of contaminated filters with complete safety.
A portable electrically operated cask trolley of 10 ton capacity was designed andfabricated for the movement of fuel cask between the hot cells and the min;cells.
Process piping for minicell containment boxes were executed through a work contract.
7.2.2
Pyrochemical reprocessing
To carrry out research and development work on pyrochemical reprocessing techniques,the following systems were designed and the execution is in progress.
An inert atmosphere glove box train and associated piping for argon recirculation withpurification system is designed and the tender drawings are prepared.
A secondary containment for radiation safety, enclosing the glove box train has alsobeen designed.
Process water piping work for the above facility is in progress.

Engineering Services 133 v
7.2.3
Nuclear microprobe
In the development of nuclear microprobe, we have taken part in designing the highprecision components like target chamber, object slit and magnetic quadrupole.
In addition to the above, all the components which were required for the various smallerexperimental facilities were fabricated and machined to suit the users' requirements.
Contributors:
G.Ravisankar,P.M.Subramanian, R.Manivannan.A. Veerapandian and K.A.S.Kutty
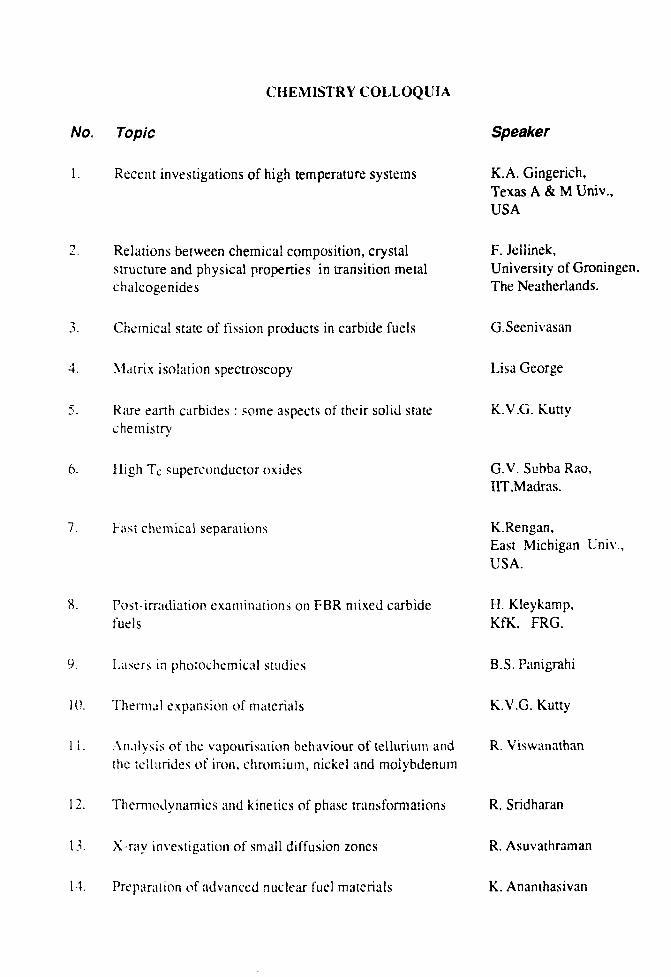
CHEMISTRY COLLOQUIA
No. Topic
1. Recent investigations of high temperature systems
2. Relations between chemical composition, crystalstructure and physical properties in transition metalchalcogenides
3. Chemical state of fission products in carbide fuels
4. Matrix isolation spectroscopy
5. Rare earth carbides : some aspects of their solid statechemistry
6. High Tc superconductor oxides
7. Fast chemical separations
8. Post-irradiation examinations on FBR mixed carbidefuels
9. Lasers in photochemical studies
10. Thermal expansion of materials
1 i. Analysis of the vapourisation behaviour of tellurium andthe tellurides of iron, chromium, nickel and molybdenum
12. Thermodynamics and kinetics of phase transformations
13. X-ray investigation of small diffusion zones
14. Preparation of advanced nuclear fuel materials
Speaker
K.A. Gingerich,Texas A & M Univ.,USA
F. Jellinek,University of Groningen,
The Neatherlands.
G.Seenivasan
Lisa George
K.V.G. Kutty
G.V. Subba Rao,IIT,Madras.
K.Rengan,East Michigan Univ.,USA.
H. Kleykamp,KfK. FRG.
B.S. Panigrahi
K.V.G. Kutty
R. Viswanathan
R. Sridharan
R. Asuvathraman
K. Anamhasivan

136 Publications
15. Partitioning of metals between liquid alloys and molten B. Prabhakara Reddysalts
16. N4iedema's model for the heats of formation of alloys K. Nagarajan
17. Neutron fluence monitoring based on change in theisotopic ratio of clad components using massspectrometry
D. Darwin Albert Raj
18. Electronic structure of uranium intermetallics fromelectron spectroscopy
D. Das Sharma,I.I.Sc, Bangalore
19. Thermodynamic studies of Ce-Mg-Cu alloys K. Nagarajan
20. Studies on the ternary oxygen compounds of sodium and V. Ganesanpotassium
21. Vapourisation thermodynamics: application of massspectrometry
R. Viswanathan
22. Chemical dynamics of rare gas - halogen van der Waals N. Sivakumarmolecules
The TRUEX process P.R. Vasudeva Rao
24. Recent developments in in-line analytical techniques H.J. Ache,KfK, FRG.
2r>. Inductively coupled plasma mass spectrometry S. Vijayalakshmi

Publications 137
JOURNALS
1. K.V.G.Kutty, S.Rajagopalan and C.K.Mathews. X-ray Fluorescence Analyses ofZinc-Aluminium Binary' Alloys by Mathematical Correc lion of Matrix Effects, X-raySpectrometry, 17 (1988) 239.
2 . K. Nagarajan and F Sommer, Calorimetric Investigations of Ce-Mg Liquid Alloys, J.Less-Common Metals, 142 (1988) 319.
3. B. Saha. R. Viswanathan, M. Sai Baba and C.K. Mathews, Thermo chemistry andPhase Relationships in M-Te (M-Fe,Cr and Ni) Sys ferns of Relevance to Fuel CladInteraction in Fast Breeder Nuc lear Reactors - A High Temperature MassSpectrometric Study. High Temp, and High Press., 20 (1988) 47.
4. D.Karunasagar,M.Joseph.B.Saha and C.K.Mathews, Rapid Determina tion of Burn-upof Nuclear Fuel - A Possible Approach, Separation Science and Technology, 23 (1988)1949
5^. N.P.Bhat and H.t'.Borgstedt, Corrosion Behaviour of Structural MaterialsinSodiumInfluenced by Formation of TernaryOxides, Werkstoff und Korrosion, 39 (1988) 115.
6@. N.P.Bhat and H.U.Borgstedt, Thermodynamic Stability of Na4FeOi and ThresholdOxygen Levels in Sodium for the Formation of this Compound on ALSI 316 Steel.J. Nucl. Mater., 158(1988)7.
7. G.Periaswami, S.Vana Varamban, S.Rajanbabu and C.K.Mathews. Low TemperatureZirconia Oxygen Gauges Based on RuO2 Electrode, Solid State Ionics. 26 (1988) 311.
8. R.Viswanathan.M.Sai Baba,D.Darwin Albert Raj. R.Balasubramanian. B.Saha andC.K.Mathews, Vaporisation Thermodynamics of the Fe-Te System - A HighTemperature Mass Spectrometric StudyJ.Chem. Thermodyn., 20 (1988) 1157.
9. A.K.Sood.K.Sankaran, V.S.Sasrry, M.P.Janawadkar, C.Sundar, J.Janaki, S.Vijalakshmiand Y. Hariharan, Experimental Study of the Decomposition of YiBa2ds3O?-x intoTetragonal ami Orthorhom bic Phases, Physica C, 156 (1988) 720.
10. Rita Saha.R. Babu, K.Nagarajan and C.K. Mathews, Thermodynamic Functions ofAlkaline Earth Monouranates from Calo rimetric Mea surements. ThermochimicaActa, 131 (1988) 1 S3.

138 Publications
11. S.Rajendrati Pillai and C.K. Mathews, Carbon Potential of 18/8 Austenitic Steels andthe Free Energy of Formation of Relevant Metal Carbides, High Temp. High Press.. 20(1988)263.
12. T.G.Srinivasan, R Dhamodaran, P.R. Vasudeva Rao and C.K.Mathews, Effect ofUranium on Third Phase Formation in the PuHV) - HNO3 - TBP - Dodecane System,Separation Science and Technology, 23 (1988"! 1401.
13. S.K.Nayak, T.G Srinivasan,P.R.Vasudeva Rao and C.K. Mathews, PhotochemicalDestruction of Organic Compounds Formed During Dissolution of UC in HNO3,Separation Science and Technology. 23 (1988) 1551.
14. D.S.Suryanarayana, R.B. Yadav, P.R.Vasudeva Rao and C.K.Mathews, Trace Analysisof Mercury by a Radiochemieal Displacement Method Using Co(lll)Diethyldithiocarbamate, J. Radioanalytical and Nuclear Chemistry. 120(1988) 155
15. M.Joseph, CK.Mdthcws and P.Bhaskar Rao.Studies on the Equation of State of MixedCarbide Fuel, J. Nucl. Mater., 168 (1989) 220.
16. P.Srirama Murti,R.B. Yadav. H.P.Nawada, P.R.Vasudeva Rao and C.K.Mathews, AStudy of Non-stoichiometry in U3O8, Thermoc himica Acta., 140 (1989) 299.
17. M.V.Krishnaiah, P.SriramaMurti and C.K.Mathews, Thermal Diffusivity and ThermalConductivity Studies on Europium, Gado linium and Uanthanum Pyrohafnates,ThermochimicaActa., 140(1989) 103.
18. S. Rajendran Pillai, S. Anthonysamy, P.K. Prakashan, R. Ranganat han, P.R. VasudevaRao and C.K. Mathews, Carburisation of Stain less Stec! Clad by Uranium-PlutoniumCarbide Fuel, J. Nucl. Mater., 167 (1989) 105.
14. 11.P.Nawada,P.Srirama Murti,G.Sreenivasan, S. Anthonysamy and C.K.Mathews,AThermoanalytical Study of the Ignition Beha viour of Uranium dicarbide,Thermochimica Acta, 144 (1989) 357.
20. H.P. Nawada, P. Srirama Murti, G. Sreenivasan, S. Anthonysamy and C.K.Mathews,Thermogravimetric Study of the Oxidation Behaviour of Uranium dicarbide, J.Thermal Analysis, 35 (1989) 1145.
21. A.M. Shakila, T.G. Srinivasan and K.N. Sabharwal, Dissolution of PuO2 inHydrochloric Acid Medium - Effect of Reducing Agents. Nuclear Technology, 88(1989)293.

Publications 139
22. R.Geetha, A.Thiruvengadasami and T.R. Mahalingam, Determina tion of Trace Metalsin Lithium by Electrothermal Atomisation Atomic Absorption Spectrometry,J.Analytical Atomic Spectromet ry, 4 (1989) 447.
23. R.Saha, R.Babu, K.Nagarajan and C.K. Mathews.Thermodynamic Properties ofTernary Oxides of Fission Products from Calorimetric Measurements, J. Nucl. Mater.,167(1989)271.
2 4 . K.Nagarajan and F.Sommer, Calorimetric Studies of Ce-Cu and Ce-Mg-Cu Alloys,J.Less-Common Metals, 146 (1989) 89.
25. R.Viswanathan, M. Sai Baba, D. Darwin Albert Raj,R. Balasubrama nian, B.Saha andC.K.Mathews, Thermochemistry of Metal-rich Chromium telluride and its Role inFuel-Clad Chemical Interac tions, J. Nucl. Mater., 167 (1989) 94.
26. R. Viswanathan, R. Balasubramanian and C.K. Mathews, VaporisationThermodynamics of the Metal-rich Molybdenum tellurides, Mo3Te4 - A HighTemperature Mass Spectrometric Study, J. Chem. Thermodyn., 21 (1989) 1183.
27. T.Gnanasekaran, K.H.Mahendran,K.V.G.Kutty and C.K.Mathews, Phase DiagramStudies on Na-Mo-0 System, J.Nucl.Mater., 165 (1989) 210.
28. D. Krishnamurthy, S. Vana Varamban, A. Thiruvengadasami and C.K. Mathews,Solubility of Oxygen in Sodium-Potassium Alloys, J. Less-Common Metals, 153(1989)363.
29. R. Sridharan,D. Krishnamurthy and C.K. Mathews, Thermodynamic Properties ofTernary Oxides of Alkali Metals from Oxygen Poten tial Measurements, J. Nucl.Mater., 167 (1989)265.
30 T. Gnanasekaran, K.H. Mahendran, R. Sridharan, V. Ganesan, G. Periaswami andC.K. Mathews, An Electrochemical Hydrogen Meter for Measurement of DissolvedHydrogen in Liquid Sodium, Accepted for publication in Nuclear Technology.
31. T. Gnanasekaran, V. Ganesan, G. Periaswami, C.K. Mathews and H.U. Borgsiedt,Application of Electrochemical Hydrogen Meter for Studying Reactions in LiquidSodium, Accepted for publication in J. Nucl. Mater.
32. V. Chandnimouli, N.L. Sreenivasan and R.B. Yadav, Chemical Head- end Steps forAqueous Reprocessing of Carbide Fuels, Communicated to Radiochimica Acta.

140 Publications
35. D. Krishnamurthy, N.P. Bhat and C.K. Mathews, Reaction of Nb2Os with LiquidSodium and Gibbs Energy of Formation of Na3NbO4, Communicated to J. Chem.Thennodyn.
34^. H.U. Borgstedt and N.P. Bhat, Corrosion Reactions of Liquid Sodium with Platinum,Accepted for publication in J. Less-Common Metals.
35. K.V.G. Kutty, S. Rajagopalan and R. Asuvathraman, Thermal Expan sion Studies onSome Rare Earth Pyrohafnates by High Temperature X-ray Powder Diffratometry,Communicated to Thermochimica Acta.
36. S. Rajendran Pillai, R. Ranganathan and C.K. Mathews, Some Studies on theDecomposition of Sodium carbonate in High Tempera ture Sodium, Accepted forpublication in Nuclear Technology.
37. S.Sahasranaman and N.P.Bhat, Simultaneous Determination of Multiple Anions andCations, Trans. SAEST 23 (1988) 13.
38. A.K.. Sood, K. Sankaran, Y. Hariharan, S. Vijayalakshmi, V. Sankara Sastry, S.Kalavathi and J. Janaki, Effect of Iron Doping and Oxygen Stoichiometry on InfraredAbsorption in YiBa2Cu3O7-x, Pramana-J. Phys., 31 (1988) 389.
39. G.Periaswami, S.Rajan Babu and C.K.Mathews, Potentioslatic Technique forMeasuring Diffusivity of Hydrogen Through Metals, Trans. SAEST, 23 (1988) 51.
10. T.Gnanasekaran, K.H.Mahendran, H.U. Borgstedt and C.K. Mathews, Study of PhaseEquilibria in Na-Mo-0 System Using Solid Electro lyte Galvanic Cells, Trans. SAEST,23(1988)55.
41. C. Ramesh, K.G.M. Nair, N.S. Thampi, B.Saha and C.K. Mathews, Development ofNuclear Microprobe at IGCAR, Indian J. Physics, 62A (1988) 659.
42. S.Rajan Babu, T. Gnanasekaran, G. Periaswami and C.K. Maihews, InterfacialProblems in Sodium- Alumina Half Cells, Bull. Elec trochem., 5 (1989) 563.
43. C.K.Mathews, G.Periaswami,K.C. Srinivas, T. Gnanasekaran, S.Rajan Babu,C.Rameshand B.Thyiagarajan, On the Possibility of Nuclear Fusion by the Electrolysis of HeavyWater, Indian J. Technology, 27 (1989) 229.
44 C.K.Mathews and T.R.Mahalingam, Application of Mass Spectrometry in MonitoringToxic Substances in the Environment, Indian J. Environmental Protection, 9 (1989)272.

Publications 141
45. M.P.Antony, G.Ravisankar, S. Subramanian, R. Manivannan, K.C. Srinivas and C.K.Mathews, A New Radiochemicaj Hot Cell Facility for the Study of Advanced Fuels,Trans. Amer.Nucl. Soc. 60 (1989) 663.

142 Publications
SYMPOSIA/ CONFERENCES/ WORKSHOPS (INTERNATIONAL)
1. Rita Saha, R. Babu, K. Nagarajan and C.K. Mathews, Thermodynamic Properties ofTernary Oxides of Fission Products from Calorimet ric Measurements, SeventhInternational Symposium on thermodyna mics ofNuclearMaterials,Chicago, 1988.
2. S.Rajendran Piliai, S.Anthonysamy, P.K.Prakashan, R.Ranganathan, P.R. VasudevaRao and C.K. Mathews, Carburisation of Stainless Steel by Uranium-PlutoniumCarbide Fuel, ibid.
3. D. Krishnamurthy, R.Sridharan and C.K.Mathews, Thermodynamics Properties ofTernary Oxides of Alkali Metals from Oxygen Poten tial Measurements, ibid.
4. R.Viswanathan.M.Sai Baba, D.Darwin Albert Raj, R.Balasubramanian, B. Saha andC.K. Mathews, Thermochemistry of Metal-Rich Chromium telluride and its Role inFuel-Clad Chemical Interaction, ibid.
5. R.Viswanathan, M.Sai Baba, D.Darwin Albert Raj, R. Balasubramanian,B.Sahaand C.K.Mathews, A Study of Chromium - Tellurium System Using HighTemperature Mass Spectrometry, Eleventh International Mass spectrometryConference. Bordeaux, 1988.
6' . N.P. Bhat, Ch. Adelhelm and H.U. Borgstedt, Oxygen Measurements in Liquid Pb-17Li Eutectic, Fourth International Conference on Liquid Metal Technology in EnergyProduction, Avignon. France, 1988.
7. G. Periaswami, S. Rajan Babu and C.K. Mathews, Development of a Zirconia BasedOxygen Monitor for Sodium Coolant, ibid.
8. T.Gnanasekaran, R.Sridharan, G. Periaswami and C.K. Mathews and M. Rajanand R.D. Kale, Experience with On-line Meters for Measuring Hydrogen in SodimCoolant, Fourth International Confe rence on Liquid Metal Engineering andTechnology, Avignon, Fran ce, 1988.
9. T.Gnanasekaran, K.H.Mahendran, R.Sridharan, G.Periaswami and C.K.Mathews,Study of Reactions Involving Liquid Alkali Metals Using a Specially Made DTASetup, ibid.
1(1 V. Ganesan. R. SridharanX Gnanasekaran and C.K. Mathews, Studies on Na-M-0(VI = Fe, Ni) Systems and Measurements of Thermodynamic Properties, ibid.

Publications 143
11. S. Rajendran Pillai, R. Ranganathan and C.K. Mathews, Measuement of CarbonActivity in Sodium and the Nature of the Carbon-bearing Species, ibid.
12. V. Ganesan, P. Muralidharan, T. Gnanasekaran, G. Periaswami and C.K. Mathews.Studies on Activity Transport in Sodium Systems, ibid.
13. T. Gnanasekaran,V. Ganesan,G. Periaswami, C.K. Mathews and H.U. Borgsiedt,Application of Electrochemical Hydrogen Meter for Studying Reaction in LiquidSodium, Second Karlsruhe Internatio nal Conference on Analytical Chemistry inNuclear Technology, Karlsruhe, FRG, 1989.
14. S. Vijayalakshmi.R. Krishna Prabhu.T.R. Mahaiingam and C.K. Mat hews,Detennination of Trace Metals in Uranium Oxide by ICP-MS, ibid.
15. R.Krishnaji Reddy,T.Gnanasekaran and C.K.Mathews, Studies on Sodium-BismuthAlloys, International Symposium or. Thermochemistry and Chemical Processing,IGCAR.Kalpakkam, 1989.
16. S. Anthonysamy, P.R.Vasudeva Rao and C.K.Mathews, Calculation of VapourPressures in U-Pu-C-0 System for Optimisation of Prepara tion of Carbides byCarbotherniic Reduction, ibid.
17. K. Nagarajan, R.Babu and C.K.Mathews, Calorimetric Investigations on U-Al Alloys,ibid.
18. R. Viswanathan, R.Balasubramanian, T.S.Lakshminarasimhan and C.K.Mathews, AMass Spectrometric Study of Homogeneity Range and Thermodynamic Properties ofMolybdenum tellurides, ibid.
19. D. Krishnamurthy, N.P.Bhat and C.K.Mathews, Gibbs Energy of For mation ofNa3NbO4 by Oxygen Potential Measurements in Liquid Sodium, ibid.
20. S.Rajendran Pillai, R.Ranganathan and C.K.Mathews, Measurement of Free Energy ofFormation of WC and Cr23C6 Using a EMF Method, ibid.
21. R. Sridharan, T.Gnanasekaran, G. Periaswami, G.V.Subba Rao andC.K.Mathews.Studieson Equilibrium Phase Fields inNa-Fe-0 System, ibid.
22. G. Periaswami, S. Vana Varamban and C.K.Mathews, Measurement of LEDB ofZirconta Electrolyte, International Conference on Fron tiers of Electrochemistry,Madras, 1989.

144 Publications
23. S. Rajendran Pillai, R. Ranganathan and C.K. Mathews, Some Studies on theMeasurement of Carbon Activity and Carbide Equili brium in AISI 316 LN StainlessSteel, ibid.
24. M.P.Antony, G.Ravishankar, S.Subramanian, R.Manivannan, K.C.Sri nivas andC.K.Mathews, A New Radiochemical Hot Cell Facility for the Study of AdvancedFuels, American Nuclear Society Winter Meeting, San Fransisco, USA, 1989.
25. P.K.Prakashan, K.AnanthasivanJ.Kaliappan, S.Anthonysamy.P.R.Va sudeva Rao andC.K. Mathews, Measurement of Carbon Potential of U-Pu Mixed Carbide Fuel by GasEquilibration, International Sym posium on Actinides, Tashkent, USSR, 1989.
26 . K. Hilpert, M.Miller and M.Sai Baba, Chemical Vapour Transport and Complexationin the Nal-Scl3 System, Fourth International Conference on High TemperatureChemistry of Inorganic Materials, Gaithersbrug, Maryland, USA, 1989.
27#. K. Hilpert, M.Miller and M.Sai Baba, Nal-Scl3 System - Complexa tion and ChemicalVapour Deposition, Fifth International Sympo sium on the Science and Technology ofLight Sources, York, En gland, 1989.

Publications 145
SYMPOSIA/ CONFERENCES/WORKSHOPS (NATIONAL)
1. S. Vijayalakshmi, R.Krishna Prabhu, T.R.Mahalingam and C.K. Mat hews,Determination of Trace Metals in Sodium by Inductively Coupled Plasma - MassSpectrometry, Fourth National Symposium on Mass Spectrometry, IISc, Bangalore,1988.
2. K.V.G. Kutty, S. Rajagopalan and R. Asuvatharaman, Wavelength Dispersive X-rayFluorescence Analysis of Titanium Stabilised Steels, National Workshop on X-rayEmission Speclrometry, IGCAR, Kalpakkam, 1988.
3. C.K. Mathews, XRP in Comparison with Other Multielement Techni ques, Invitedtalk, ibid.
4. R.Geetha, A.Thiruvengadasami and T.R.Mahalingam, Determination of Titanium inTitanium Stabilised Steels by Flame Atomic Absorption Spectrometry, Fifth ISASNational Symposium on Analytical Spec troscopy and Hyfenated Techniques,Hyderabad, 1988.
5. V. Srinivasan, R. Krishna Prabhu and T.R. Mahalingam, Determina tion of Yttria inYttria Doped Thoria and Yttria Stabilised Zirconia, ibid.
6. N.P.Bhat and H.U.Borgstedt, Electrochemical Sensors for Measure ment of OxygenPotentials in Pb-17 Li Eutectic, National Sympo shim on Electrochemical Techniquesand Instrumentation, IGCAR, Kalpakkam, 1988.
7. T.Gnanasekaran, R. Sridharan, K.H. Mahendran, V. Ganesan, G.Periaswami andC.K.Mathews, Electrochemical Meter for On-line Monitoring of Hydrogen in LiquidSodium, National Seminar on Electrodes, CECRI, Karaikudi, 1988.
8. InterfacialProblemsinSodium - AluminaHalf Cells, ibid.
9. R. Viswanathan, M. Sai Baba, D. Darwin Albert Raj, R. Balasubra manian, B. Sahaand C.K. Mathews, Characterisation of Non-stoic hiometric Iron Telluride by HighTemperature Mass Spectrometry, Fourth National Symposium on Mass spectrometry,Bangalore, 1988.
10. C.K. Mathews, High Temperature Mass Spectrometric Studies of Inorganic Systems,ibid.

146 Publications
11. M. Sai Baba, R. Viswanathan, D. Darwin Albert Raj, R. Balasubra manian, B. Sahaand C.K. Mathews, Determination of Dissociation Constant of Diatomic TelluriumMolecule, ibid.
12. T.Gnanasekaran, R. Viswanathan, M. Sai Baba, D. Darwin Albert Raj,R.Balasubramanian and C.K.Mathews, Gibbs Energy of Formation of NaCrO2 byHigh Temperature Mass Spectrometry, ibid.
13. D.Darwin Albert Raj, R.Balasubramanian, D.Karunasagar, B.Saha and C.K.Mathews,A Possible Neutron Fluence Monitor Based on Shift in Isotopic Abundance of TraceBoron in Stainless Steel Clad, ibid.
14. Sitaram Dash and B. Saha, A Quadrupole Mass Spectrometer Based Residual GasAnalyser, ibid.
15. M. Joseph,D. Karunasagar, B. Saha and C.K. Mathews, Estimation of Fuel Burn up byHPLC, Radiochemistry and Radiation Chemistry Symposium, BARC, Bombay, 1988.
16. K.Swaminathan N.P.Seshadreesan, C.R.Venkata Subramani and N.P.Bhat, Estimationof 54Mn and ' lGmAg in Sodium Metal, ibid.
17. T.G.Srinivasan,S.K. Nayak.R.Dhamodaran and P.R.Vasudeva Rao, PhotochemicalDestruction of Oxalate in Simulated Reconversion Supernatant, ibid.
18. G. Periaswami, Radionuclide Transport in Fast Reactor Coolant Circuits, ibid.
19. V. Chandramouli and R.B. Yadav, Chemical Oxidative Destruction of OrganicCompounds Formed During Dissolution of Uranium Carbide in Nitric Acid, ibid.
20. P. Muralidharan, K.H. Mahendran,T. Gnanasekaran, G. Periaswami and C.K.Mathews, Estimation of Cyanide in Sodium by Differen tial Pulse Polarography,Proc. National Symposium on Electroche mical Techniques and Instrumentation,IGCAR, Kalpakkam, 1988.
21. G. Periaswami,S. Vanavaramban and C.K.Mathews.Measurement of LEDB of ZirconiaElectrolyte at Low Temperatures, ibid.
22. G. Periaswami, S. Vana Varamban and C.K. Mathews, Electrochemical Determinationof Free Energy of Formation of Indium sesquioxide at Low Temperatures, ibid.

Publications 147
23. S.Rajendran Pillai, R.Ranganathan and C.K.Mathews, Some Studies on theDecarburisation and the Measurement of Carbon Activity of Fe - 2.25 wt.% Cr -1 wt.% Mo Steel Using a High Temperature Electrochemical Carbon Meter, ibid.
24. R. Sridharan, K.H. Mahendran.T. Gnanasekaran, G. Periaswarm" and C.K. Mathews,Study of Sodium - Oil Reaction Using Electrochemi cal Hydrogen Meter, ibid.
25. V. Ganesan,P. Muralidharan, G. Periaswami and C.K. Mathews, Stu dies on Sodium -Rust Reactions, ibid.
26. S. Sahasranaman, V.G.Kulkarni and R.Umamaheswary, Eslimation of Titaniumdioxide in Iimenite Samples, Sixth ISAS Symposium on Earth Sciences, Shillong,1988.
27. K.Sankaran, K.S.Viswanathan, T.R.Mahalingam, T.G.Srinivasan and P.R. VasudevaRao Infrared Spectral Studies on Thorium nitrate- TBP Complexes, Radiochemistryand Radiation Chemistry Symposium, IGCAR, Kalpakkam, 1989.
28. T.G.Srinivasan, R.Dhamodaran and P.R.Vasudeva Rao, Third Phase Formation in theExtraction of Thorium(IV) by Mixtures of TLA and TBP in n-Dodecane, ibid.
29. A.M.Shakila, T.G.Srinivasan and K.N.Sabharwal, Dissolution of Plutonium dioxide inHC1 Medium, ibid.
30. B.S.Panigrahi,T.G.Srinivasan and P.R.Vasudeva Rao, Solubility of Uranyl oxalatetrihydrate in HNO3-H2C2O4 Mixtures, ibid.
31. M.K.Ahmed, PotentiometricDeterminationof HNO3 inTBP Phase Loaded with Pu(IV),ibid.
32. M.K.Ahmed, Spectrometric Determination of Non-stoichiometry in Uranium trioxide,ibid.
33. H.P.Nawada, P. Srirama Murti, G. Seenivasan, S. Anthony samy and C.K. Mathews,Investigations on the Reaction Beha viour of Uranium Carbides in OxidisingEnvironments, ibid.
34. S.Vijayalakshmi,R. Krishna Prabhu,T.R. Mahalingam and C.K.Mat hews, TraceCharacterisation of Uranium Oxide by Inductively Coupled Plasma - MassSpectrometry, ibid.

148 Publications
35. M.Joseph, D.Karunasagar and B.Saha, Separation of Uranium from Thorium byHPLC, ibid.
36. M.Kamruddin, J.B.Doshi and B.Saha, Micro Gamma Scanning - An Algorithm forUnfolding Data Measured Through Rectangular Slit, ibid.
37. M.P.Antony, J.Daniel C.G and B.Saha, Determination of Pu Distri bution U-Pu MixedCarbide by Alpha Autoradiography, ibid.
38. N.P. Seshadreesan, K. Swaminathan, C.R. Venkata Subramani and N.P. Bhat,Estimation of Co in Sodium, ibid.
39. V. Ganesan, P. Muralidharan, T. Gnanasekaran, G. Periaswami and C.K. Mathews,Studies Related to Activity Transport in Sodium Systems, ibid.
40. M.P. Antony, J. Daniel C.G. and B. Saha, Determination of Pluto nium Dstribution inU-Pu Mixed Carbide by Alpha Auto radiograp hy, ibid.
41. M.P.Antony, G. Ravishankar, Arun Kumar, S. Raman, K.C. Srinivas, R.Parthasarathy, S. Subramanian, R. Manivannan and C.K. Mathews, A NewRadiochemicai Hot Cell Facility at Kalpak kam, Symposium on Post IrradiationExamination in Nuclear Progra mme, BARC, Bombay, 1989.
42. M. Kamruddin, J.B. Doshi and B. Saha, Development of Micro-Gamma Scanner forIrradiated Fuel Pin Sections, ibid.
43. Sitaram Dash,V. Santhamurthy.K. Manivannan, G. Panneerselvam and B. Saha,In-house Development of an Occluded Fission Gas Analy ser, ibid.
44. S. Anthonysamy, A.M. Shakila.R. Dhamodharan.T.G. Srinivasan, P.R. Vasudeva Raoand C.K. Mathews, A Gas Chromatographic Study of Degradation of ParaffinDiluents, ISAS National Symposium on Recent Trends in ChromatographicTechniques, Madras, 1989.
45. D. Karunasagar, S. Sahasranaman, N. Sivaraman, B. Saha and N.P. Bhat, IonChromatographic Determination of Anions Using Dynami cally Coated Columns, ibid.
46. S. Vijayalakshmi, R. Krishna Prabhu. T.R. Mahalingam and C.K. Mathews,Monitoring of Toxic Metals in Water by Hydride Genera tion ICP-MS, NationalSymposium on Recent Trends in Instrumental Methods of Analysis, Roorkee, 1989.

Publications 149
47. S. Sahasranaman, D. Karunasagar and M. Joseph, Simultaneous Dete rmination ofAlkaline Earth Metal Ions in Reactor Grade Sodium L'sing HPLC, NationalSymposium on Chromatographic Techniques, Seventh ISAS Symposium, Madras,1989.
48. R. Sridharan and T. Gnanasekaran, Investigations on Sodium-Iron- Oxygen System,XIII Annual Symposium in Chemistry, IIT, Madras, 1988.
49. S. Rajendran Pillai aiid R. Ranganathan, Measurement of total carbon, carbonactivity and method for the removal of carbon from sodium, ibid.
50. M.V. Krishnaiah and P. Srirama Murti, Thermal Diffusivity and ThermalConductivity Studies on Europium and Lanthanum Pyrohaf nates, ibid.
51. R. Sridharan, K.H. Mahendran and T. Gnanasekaran, Study of Reactions InvolvingLiquid Alkali Metals Using a Specially Made DTA Set-up, XIV Annual Symposiumin Chemistry, IIT, Madras, 1989.
52. T. Gnanasekaran and K.H. Mahendran, Phase diagram of Na-Mo-0 system, ibid.

750 Publications
REPORTS
1. V. Chandramouli and P.R. Vasudeva Rao, Determination of Oxygen in Some Oxidesand Uranium Carbide by Iner Gas Fusion, IGC - 102, 1988.
2. M. Joseph and C.K. Mathews, Calculation of Vapour Pressures Over Mixed CarbideFuels, IGC- 101, 1988.
3 . N.P. Bhat and H.U. Borgstedt, Thermodynamic Stability of Na4MoOs and ThresholdOxygen Levels in Sodium for the Formation of this Compound on AISI-316 Steel,Primarbericht 01.01.14 P 28 C, Kernforschungszentrum, Karlsruhe, F.R.G, 1988.
4W. N.P. Bhat and H.U. Borgstedt, Korrosion von stahl AISI 304 in Natrium -Natriumhydroxidegemische bei 500 C , Z. Peric, Piamar bericht 010114P28EKernforschungszentrum, Karlsruhe. FRG, 1988.

Publications 151
Ph.D THESES
1. Electrochemical Studies Related to the Development of On-line Meters for Use inLiquid Sodium,G. Periaswami,University of Madras, 1988.
2. Thennal Diffusivity and Thermal Conductivity Studies in Some Thorium-Based MixedOxide Systems by Laser Flash Technique,P. Srirama Murti,University of Madras, 1989.
3. Some Thermodynamic Studies on Alkali Metal - Transition Metal - Oxygen TernarySystems of Relevance in Energy Technology,V. Ganesan,University of Madras, 1989.
PROCEEDINGS
1. X ray Emission Spectrometry - proceedings of a national workshop, C.K. Mathews,V.S. Raghunathan, K.V.G. Kutty and S. Rajagopalan (Ed.), 1989, (in press].
Work carried out at Max Planck Institut fur Metallforschung, Stuttgart, FRG, ondeputation.
® Work carried out at KfK, Karlsruhe, FRG, on extraordinary leave.
Work carried out at KfA, Juelich, FRG, on deputation.