2016 - International Nuclear Information System (INIS)
253
2016 for
-
Upload
khangminh22 -
Category
Documents
-
view
4 -
download
0
Transcript of 2016 - International Nuclear Information System (INIS)
2016for
SCIENCE AND TECHNICS PUBLISHING HOUSE

The VINATOM Annual Report for 2016 has been prepared as an account of
works carried out at VINATOM for the period 2016. Many results presented in
the report have been obtained in collaboration with scientists from national and
overseas universities and research institutions.
The ANNUAL REPORT for 2016
Edited by
Vietnam Atomic Energy Institute
59 Ly Thuong Kiet, Ha Noi, Vietnam
President: Dr. Tran Chi Thanh
Tel: +84-4-39423434
Fax: +84-4-39424133
This report is available from:
Training and Information Division
Dept. of Planning and R&D Management
Vietnam Atomic Energy Institute
59 Ly Thuong Kiet, Ha Noi,Vietnam
Tel: +84-4-39423591
Fax: +84-4-39424133
E-mail: [email protected]

Preface
The research activities of the Vietnam Atomic Energy Institute (VINATOM) during
the period from 1 January to 31 December 2016 are presented in this Report. The research
activities are focused on the following fields:
1. Nuclear Physics, Reactor Physics;
2. Research Reactor, Nuclear Power Technology, Nuclear Safety, Nuclear Power
Economy;
3. Instrumentation, Nuclear Electronics;
4. Industrial Applications;
5. Applications in Ecology, Environment and Geology;
6. Applications in Biology, Agriculture and Medicine;
7. Radiation Protection and Radioactive Waste Management;
8. Radiation Technology;
9. Radiochemistry and Materials Science;
10. Computation and Other Related Topics.
The total number of permanent staff working at the VINATOM as December 31,
2016 is 745 (570 permanent personnel +175 contractual staff). The VINATOM was funded
from the Government with the total amount to 160.951 billion VN Dong for FY 2016. The
international support of about 200,000 USD for the VINATOM activities is committed to
the operating projects including equipment, staff training and expert services.
Highlights of the VINATOM’s R&D activities in 2016 express in areas: research on
reactor physics; capacity development to support safety, security and environment
protection; application of radiation and isotopes in medicine, biology, industry and material
processing; management of radioactive waste.
Main results of fundamental and applied research implemented in the year were
presented in 175 scientific articles, reports and contributions published in many journals,
proceedings of conferences, etc.
During the time of year 2016, in the VINATOM there were 7 to be graduated in
Ph.D. courses; many people have been trained and upgraded knowledge and skill in home
and abroad in the fields of nuclear science and technology.
Dr. Tran Chi Thanh
President, VINATOM
7
CONTENTS
Page
Preface 5
CONTENTS 7
1. CONTRIBUTIONS 11
1.1- NUCLEAR PHYSICS, REACTOR PHYSICS 13
Research on Loading Pattern Optimization for VVER Reactor 15
Tran Viet Phu, Tran Hoai Nam, Nguyen Thi Mai Huong, Nguyen Huu Tiep, Ta Duy Long, Tran Vinh
Thanh, Nguyen Thi Dung, Phan Quoc Vuong, Hoang Van Khanh and Le Tran Chung
Developing the Core Loading Pattern for the VVER-1200/V491 23
Tran Vinh Thanh, Tran Viet Phu, Ta Duy Long and Nguyen Thi Dung
1.2- RESEARCH REACTOR, NUCLEAR POWER TECHNOLOGY, NUCLEAR SAFETY,
NUCLEAR POWER ECONOMY
31
Development of New Techniques and Enhancement of Automatic Capability of Neutron
Activation Analysis at the Dalat Research Reactor
33
Ho Manh Dung, Ho Van Doanh, Tran Quang Thien, Pham Ngoc Tuan, Pham Ngoc Son, Tran Quoc
Duong, Nguyen Van Cuong, Nguyen Minh Tuan, Nguyen Giang and Nguyen Thi Sy
Study on Safety Analysis of VVER-1200/V491 in Scenario of Loss of Coolant Accidents Along
With Partly Failure of ECCS Using RELAP5 Code
40
Hoang Minh Giang, Ha Thi Anh Đao, Hoang Tan Hung, Bui Thi Hoa, Nguyen Thi Tu Oanh, Dinh
Anh Tuan and Pham Tuan Nam
Studying the Possibility of Using Modelica Language to Build a Model Object Library for the
Control System of Dalat Research Reactor
46
Huynh Dong Phuong, Cao Thanh Long and Vo Tan Tai
1.3- INSTRUMENTATION, NUCLEAR ELECTRONICS 55
Research and Design of the Moving System for the Cobalt-60 Industrial Irradiator Vinaga2 57
Le Minh Tuan, Tran Khac An, Nguyen Ngoc Phuong, Tran Van Hung, Cao Van Chung, Phan Phuoc
Thang, Ha Thanh Viet, Nguyen Thanh Cuong and Nguyen Duc Hoa
Manufacture Research of the Test Equipment to Measure the Dose Rate in High Radiation
Medium
65
Phan Luong Tuan, Nguyen Van Sy, Nguyen Xuan Vinh, Dang Quang Bao, Nguyen Thanh Hung,
Pham Minh Duc and Nguyen Xuan Truong
1.4- INDUSTRIAL APPLICATIONS 71
Developing Program and Training Materials for Visual Testing Method 73
Dang Thi Thu Hong, Dao Duy Dung, Le Tuan Anh, Le Duc Thinh, Nguyen The Man, Nguyen Van
Duy and Ha Thi Hong Thu
Development of a Prototype for Investigation of Moisture In Insulation of Oil Pipelines Based
on Neutron Backscattering Method
79
Tran Thanh Minh, Vuong Duc Phung, Mai Cong Thanh and Le Van Loc
8
1.5 - APPLICATIONS IN ECOLOGY, ENVIRONMENT AND GEOLOGY 87
Set up 18
O and 2H Stable Isotope Analysis Procedure for Laser Spectrometry and Application
to Evaluate the Relationship between Surface Water and Groundwater in the Southern Hanoi
89
Vo Thi Anh, Ha Lan Anh, Nguyen Thuy Binh, Nguyen Hong Thinh, Tran Khanh Minh, Nguyen Thi
Thu Ha, Nguyen Manh Hung, Trieu Duc Huy and Nguyen Thanh Binh
Research on the Use of Natural Radium Radionuclides as Tracers for Determination of
Diffusion Factors and Resident Time of Coastal Sea Water
Phase I: Development of the Method for Determination of Diffusion Factors and Resident
Time of Coastal Sea Water
99
Phan Son Hai, Nguyen Thanh Binh, Nguyen Minh Dao, Nguyen Thi Huong Lan, Le Xuan Thang,
Phan Quang Trung, Nguyen Van Phuc, Vo Thi Mong Tham, Pham Ngoc Tuan, Truong Van Dat and
Tuong Thi Thu Huong
Determination of Radium Activity in Some Natural Mineral Waters Using Radioactive
Chemical Extraction Method and Alpha Spectrometry
110
Nguyen Thi Oanh, Duong Van Thang, Duong Duc Thang, Nguyen Van Khanh, Doan Thuy Hau and
Pham Bao Ngoc
1.6 - APPLICATIONS IN BIOLOGY, AGRICULTURE AND MEDICINE 117
Study on the Production of Radioisotopes and Radiopharmaceuticals for Medical Purposes at
the Dalat Research Reactor
119
Nguyen Ngoc Tuan, Duong Van Dong, Nguyen Thi Thu, Bui Van Cuong, Pham Thanh Minh, Nguyen
Thi Hang, Mai Phuoc Tho, Nguyen Thanh Bình, Nguyen Dinh Lam, Nguyen Thị Khanh Giang,
Nguyen Thi Ngoc, Bui Dieu Hang and Dao Tien Manh
Method Development and Determination of Neonicotinoid and Carbamate Pesticide Residues
in Vegetable and Fruit Matrix by HPLC-MS
136
Nguyen Tien Dat, Duong Van Dong, Ta Thi Tuyet Nhung, Nguyen Thanh Nhan, Nguyen Thi Hong
Tham and Dang Trung Tin
1.7- RADIATION PROTECTION AND RADIOACTIVE WASTE MANAGEMENT 141
Establishing Personal Dosimetry Procedure Using Optically Stimulated Luminescence
Dosimeters in Photon and Mixed Photon – Neutron Radiation Fields
143
Le Ngoc Thiem, Bui Duc Ky, Trinh Van Giap, Nguyen Huu Quyet, Ho Quang Tuan, Vu Manh Khoi
and Chu Vu Long
Establishing the Patient Dose Estimation Procedure in Computed Tomography Examination. 150
Bui Duc Ky, Duong Van Trieu, Ho Quang Tuan, Tran Thanh Ha and Bui Thi Anh Duong
Study of Waterproof Capabilities of the Engineered Barrier Containing Bentonite in Near
Surface Radioactive Waste Repositories
158
Lưu Cao Nguyen, Nguyen Ba Tien, Đoan Thi Thu Hien, Nguyen Van Chinh and Vuong Huu Anh
Study on Dose Distribution in the Heterogeneous Density Products Irradiated by Electron
Beam Accelerator UELR-10-15S2
165
Nguyen Anh Tuan, Tran Van Hung, Cao Van Chung and Nguyen Thanh Duoc
1.8 - RADIATION TECHNOLOGY 171
Study on Enhancement Protease-Producing of Bacillus Subtilis by Combining Ribosome
Engineering and Gamma Irradiation
173

9
Tran Bang Diep, Nguyen Thi Thom, Hoang Dang Sang, Nguyen Van Binh, Tran Xuan An, Hoang
Phuong Thao, Pham Duy Duong, Tran Minh Quynh, Ta Bich Thuan and Vo Thi Thuong Lan
Using Gamma Radiation to Inactivate Bacillus Thuringiensis Spores in Biopesticide 183
Nguyen Thi Thom, Nguyen Van Binh, Tran Bang Diep, Hoang Dang Sang, Hoang Phuong Thao,
Pham Duy Duong, Tran Xuan An and Tran Minh Quynh
1.9 - RADIOCHEMISTRY AND MATERIALS SCIENCE 189
Study on Preparing The Absorbent of Potassium Nickel Hexacyanoferrate (II) Loaded Zeolite
for Removal of Cesium from Radioactive Waste Solutions and Followed Method for Stable
Solidification of Spent Composites
191
Pham Quynh Luong, Nguyen Hoang Lan, Nguyen Van Chinh, Nguyen Thu Trang, Vuong Huu Anh,
Le Xuan Huu, Nguyen Thi Xuan and Le Van Duong
Study on Some Experimental Conditions That Affect Corrosion of Some Structural Steel
Materials Using in Nuclear Power Plant
203
Hoang Nhuan, Nguyen Thi Kim Dung, Nguyen Duc Thang, Hoang Xuan Thi, Nguyen Thi Thuc
Phuong, Ngo Xuan Hung, Nguyen Thanh Chung, Tran Xuan Vinh, Hoang Van Duc and Hoang Thi
Tuyen
Using FRAPCON and FRAPTRAN Software Evaluation to Characterize Fuel Rods in Nuclear
Reactors
212
Nguyen Trong Hung, Nguyen Van Tung, Cao Duy Minh, Dang Ngoc Thang and Bui Cong Trinh.
Study on Preparation of 166
Ho-Chitosan Oriented in the Treatment of Liver Cancer 219
Dang Ho Hong Quang, Duong Van Dong, Bui Van Cuong, Nguyen Thanh Binh, Nguyen Thanh
Nhan, Nguyen Dinh Lam and Nguyễn Thi Thu
1.10- COMPUTATION AND OTHER RELATED TOPICS 225
Upgrade the Website of Nuclear Training Center for Online Training 227
Nguyen Minh Duc, Nguyen Thuy Hang, Nguyen Thi Lien, Luu Thi Thu Hoa and Pham Thi Thu Trang
Study for Action Plan Proposal on Some Issues of the National Nuclear Infrastructure for the
New Research Reactor Project in Phase 1&2
235
Cao Hong Lan, Nguyen Nhi Dien, Bui Dang Hanh, Vu Quang Linh, Tran Thi Kim Oanh, Tran Ngoc
Hoan, Nguyen Bach Viet, Nguyen Thuan Yen, Vu Thi Lieu and Pham Thanh Huong
2. IAEA TC PROJECTS AND RESEARCH CONTRACTS 241
2.1 - List of VIE Projects 2016 243
2.2 - List of FNCA Projects 2016 244
2.3 - List of RCA Projects 2016 245
2.4 - List of Research Contract 2016 247
2.5 - List of INT Projects and NON-RCA Projects 2016 248
2.6 - List of National Coordinator and Topical Group Member, Asian Nuclear Safety Network
(Ansn) 2016
249


1. CONTRIBUTIONS


1.1- Nuclear Physics,Reactor Physics

VINATOM-AR 16--01
The Annual Report for 2016, VINATOM 15
RESEARCH ON LOADING PATTERN OPTIMIZATION
FOR VVER REACTOR
Tran Viet Phu1, Tran Hoai Nam
2, Nguyen Thi Mai Huong
1, Nguyen Huu Tiep
1, Ta Duy Long
1,
Tran Vinh Thanh1, Nguyen Thi Dung
1, Phan Quoc Vuong
1, Hoang Van Khanh
1 and Le Tran Chung
1
1Institute for Nuclear Science and Technology
179 - Hoang Quoc Viet, Nghia Do, Cau Giay, Hanoi, Vietnam 2Duy Tan University
254 - Nguyen Van Linh, Da Nang city, Vietnam
Abstract: A study on fuel loading pattern optimization of a VVER reactor was performed. In this
study, a core physics simulator was developed based on a multi-group diffusion theory for the use in
the problem of fuel loading optimization of VVER reactors. The core simulator could handle the
triangular meshes of the core and the computational speed is fast. Verification of the core simulator
was confirmed against a benchmark problem of a VVER-1000 reactor. Several optimization methods
such as DS, SA, TS and a combination of them were investigated and implemented in coupling with
the core simulator. Calculations was performed for optimizing the fuel loading pattern of the core
using these methods based on a benchmark core model in comparison with the reference core.
Comparison among these methods have shown that a combination of SA+TS is the most effective for
Project information:
- Code: ĐTCB.13/15/VKHKTHN
- Managerial Level: Ministry
- Allocated Fund: 600,000,000 VND
- Implementation time: 24 months (Jan 2015- Dec 2016)
- Contact email: [email protected]
- Paper published in related to the project:
1. Tran Viet Phu, Tran Hoai Nam, Akio Yamamoto; Loading pattern optimization for VVER-
1000 reactor using simulated annealing method and Tabu search method; The 4th Regional
Conference on Nuclear Science and Technology for young researcher, 2016, 12 pages (in
Vietnamese).
2. Nguyen Thi Dung, Pham Thuy An, Tran Viet Phu; Research on burnup calculation of VVER-
1000 reactor with critical boron; The 4th Regional Conference on Nuclear Science and
Technology for young researcher, 2016, 13 pages (in Vietnamese).
3. Nguyen Huy Hiep, Nguyen Huu Tiep, Tran Viet Phu, Nguyen Tuan Khai; Development of an
MCNP5-ORIGEN2 coupling scheme for burnup calculation of VVER-1000 fuel assemblies;
The 4th Regional Conference on Nuclear Science and Technology for young researcher, 2016,
10 pages.
4. Tran Viet Phu, Tran Hoai Nam, Akio Yamamoto; Fuel loading pattern optimization for VVER
nuclear reactor; NHEP, 2016, only presentation (in Vietnamese).
5. Tran Viet Phu, Tran Hoai Nam, Akio Yamamoto; Fuel loading pattern optimization of a
VVER-1000 reactor using Simulated Annealing and Tabu Search; Program of Vietnam/Japan
Ressearch/HRD Forum on Nuclear Technology-VII, 2016, 1 page of poster.
6. Nguyen Huy Hiep, Nguyen Huu Tiep, Tran Viet Phu, Nguyen Tuan Khai; Development of an
MCNP5-ORIGEN2 coupling scheme for burnup calculation of VVER-1000 fuel assemblies;
Nuclear Science and Technology, Vol.6, No. 3 (2016), pp. 16-30.
7. Tran Viet Phu, Tran Hoai Nam, Akio Yamamoto, Tomohiro Endo; Automated Generation of
Burnup Chain for Reactor Analysis Applications; Kerntechnik, Vol. 82, No. 2 (2017), pp.
196-205.

VINATOM-AR 16--01
The Annual Report for 2016, VINATOM 16
the problem of fuel loading pattern optimization. Advanced methods are being researched
continuously.
Keywords: optimization method, diffusion theory, VVER-1000, SRAC, peaking factor,
multiplication factor.
I. INTRODUCTION
In pressurized water reactor, the fuel reloading is performed annually. In-core fuel
management is an important problem of nuclear engineering which involves the optimal
arrangement of hundreds of fuel assemblies in the core. The optimal arrangement can be defined as
a configuration which has the maximum cycle length or maximum effective multiplication factor
(K_eff) for the given fuel inventory while satisfying safety constraints such as limitation on power
peaking factor. This problem has been considered since the first nuclear reactors were constructed.
Recently, there are many programs developed to find out optimal Loading Patterns (LP) of reactor
cores. Besides, there are many optimization methods such as Simulated annealing (SA), Genetic
Algorithm (GA), Tabu Search (TS), Evolution Algorithms (EA)… are investigated and applied to
solve the LP optimization problem.
In this research, a fuel loading pattern optimization code (LPO-V code) is developed to find
out optimal LPs for VVER which was one of the candidates for the nuclear power plant in Vietnam.
This code is combined by a Static Core Simulator module (SCS) and a Core Optimization Search
module (COS). A benchmark problem of VVER is used to verify the code.
II. METHODOLOGIES
2.1. Finite difference method and simulator module
A finite difference method (FDM) proceeds by replacing the derivatives in the differential
equations by finite difference approximations. This gives a large algebraic system of equations to be
solved in place of the differential equation, something that is easily solved on a computer. In many
reactor analysis codes, FDM is used to solve diffusion equation of reactor core to find out K_eff,
power distribution… Equation (1) is normal form of the diffusion equation.
(
(1)
Using FDM, equation (1) is transformed to a linear equation system which has matrix form as
equation (2):
(2)
In 1D and 2D models, the form of A matrixes is shown in Figure 1, which most of the
elements except three or fire diagonals are zero.

VINATOM-AR 16--01
The Annual Report for 2016, VINATOM 17
Figure 1: Forms of A matrixes
The simulator module (SCS) was developed based on finite difference method. This module
can calculate K_eff and Peaking factor of VVER used for LP optimization problem. The accuracy
of SCS was verified by comparing with module CITATION of SRAC code [1] and benchmark
results (section 3). Besides, the module calculates only K_eff and power distribution for triangular
model. Therefore, the calculation rate is faster than module CITATION which can calculate 12
geometry types and many neutronic characteristic.
2.2. Hybrid method of Simulated Annealing and Tabu Search methods
The simulated annealing (SA) bases on the simulation of the crystal vibration in annealing
metal [2]. When a melting metal is annealed slowly, the energy state of a crystal in the solid metal
becomes lower than that of quickly annealed metal. Though the basic concept of SA is the hill
climb method which only accepts a better solution than the current one, a probability acceptance of
worse solution is allowed to escape from local optima.
The diagram of SA method is shown in Figure 2 and divided into steps as follows:
(1) Assume an initial LP.
(2) Execute the core burnup calculation using a core calculation code and evaluate the fitness
of LP.
(3) Generate a candidate LP from the initial (or base) LP by random shuffles of the fuel
assemblies. Shuffles of binary or ternary assemblies are performed once, twice or three times.
(4) Estimate the fitness value of a candidate LP generated through the core burnup
calculation.
(5) When the fitness of a candidate LP is higher than that of the base LP, the candidate LP is
adopted as the base LP.
(6) When the fitness of a candidate LP is lower than that of the base LP, the candidate LP is
accepted with a probability of e-δC/T
.
(7) Repeat the procedures from (3) to (6). The number of repetitions is called the Malkov
length.
(8) The system temperature is decreased according to:
Tn+1
= αTn
(3)
where n represents the number of stages or generations and α is the annealing factor, which is
smaller than 1.0. When α is chosen to be closer to 1.0, the system temperature decreases more
slowly.
(9) Return to (3) until the system temperature reaches low enough and the frequency of
change in the base LP is less than a certain value.

VINATOM-AR 16--01
The Annual Report for 2016, VINATOM 18
Figure 2: Diagram of SA method
The advantage of SA is escaping local optima ability. Therefore, the solutions can reach
global optimum. However, drawback of this method is low efficiency so that many more LPs need
to be calculated to reach a given fitness value.
Because of the above reasons, we proposed a hybrid of SA and Tabu Search (TS) method to
enhance the efficiency of the original methods. Tabu search method is primarily used for solving
combinatorial optimization problems [3]-[5]. The suitable strategies of TS method were combined
with SA in the SA+TS hybrid method. These strategies include:
- Tabu list: that is used to store the most recently visited LPs, and these are not allowed to be
revisited.
- Neighborhood sub-space: that include all LPs between the two successive acceptances of
worse LP. Then the best LP of the neighborhood sub-space is chosen as new base LP.
- Intensification: that is used to more thoroughly explore the search space close to the
locations of the best LPs found. When intensification is performed, the search is returned to the best
determined LP and search parameters can be adjusted.
The SA+TS hybrid method was used as the main method in COS module. Besides, the
original SA and TS also were applied in this module to evaluate and compare the methods.
III. RESULTS AND DISCUSSION
3.1. Loading pattern optimization for VVER code
After SCS and COS modules were developed, they were combined to create a loading pattern
optimization for VVER code (LPO-V). This code was programed by FORTRAN language and its
diagram is presented in Figure 3. The LPO-V code can be used to find out optimal LP for reactors
which have hexagonal fuel assembly such as VVER reactors and Dalat Nuclear Research Reactor.
VINATOM-AR 16--01
The Annual Report for 2016, VINATOM 19
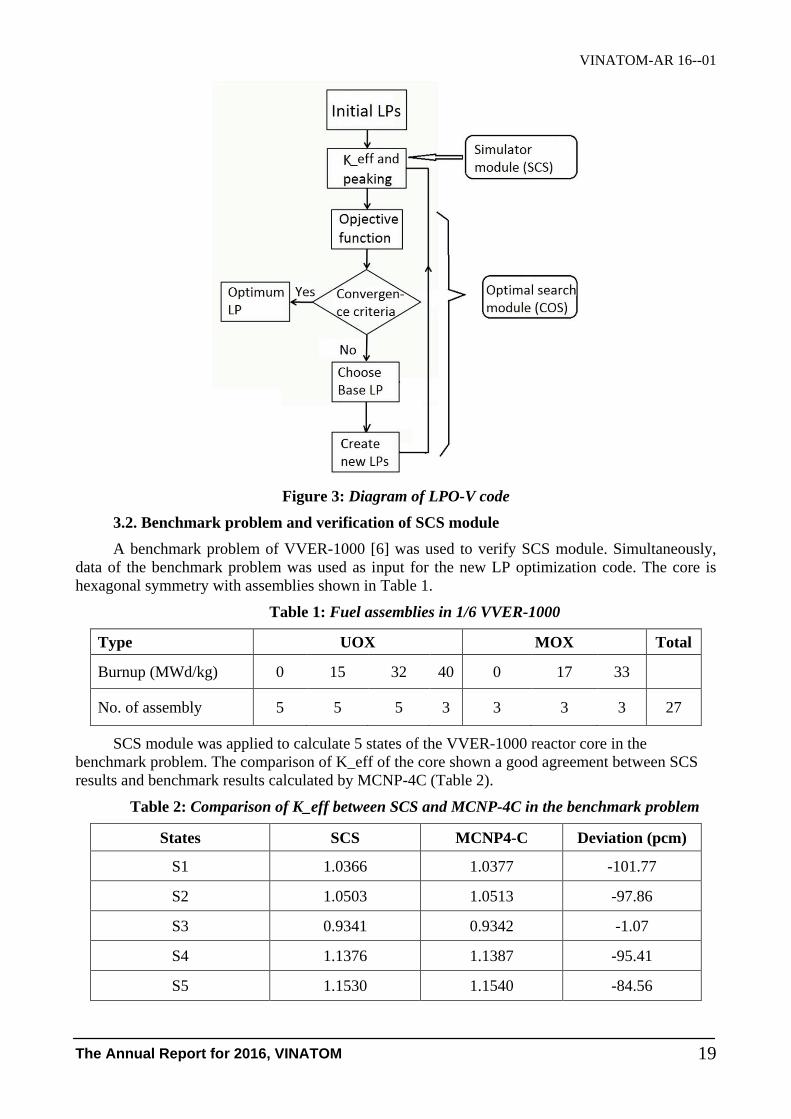
Figure 3: Diagram of LPO-V code
3.2. Benchmark problem and verification of SCS module
A benchmark problem of VVER-1000 [6] was used to verify SCS module. Simultaneously,
data of the benchmark problem was used as input for the new LP optimization code. The core is
hexagonal symmetry with assemblies shown in Table 1.
Table 1: Fuel assemblies in 1/6 VVER-1000
Type UOX MOX Total
Burnup (MWd/kg) 0 15 32 40 0 17 33
No. of assembly 5 5 5 3 3 3 3 27
SCS module was applied to calculate 5 states of the VVER-1000 reactor core in the
benchmark problem. The comparison of K_eff of the core shown a good agreement between SCS
results and benchmark results calculated by MCNP-4C (Table 2).
Table 2: Comparison of K_eff between SCS and MCNP-4C in the benchmark problem
States SCS MCNP4-C Deviation (pcm)
S1 1.0366 1.0377 -101.77
S2 1.0503 1.0513 -97.86
S3 0.9341 0.9342 -1.07
S4 1.1376 1.1387 -95.41
S5 1.1530 1.1540 -84.56

VINATOM-AR 16--01
The Annual Report for 2016, VINATOM 20
Besides, a calculation rate test was also performed. SCS module and CITATION (the fastest
core calculation module that we have had) were applied to calculate 2000 LPs of VVER-1000
simultaneously and the calculation times were compared (Table 3).
Table 3: Time comparison between SCS and CITATION
Code Time (second)
Cygwin Ubuntu
CITATION 3190 3177
SCS 501 320
Increase (times) 6.37 9.93
The comparison results show that calculation rate of SCS is faster than CITATION about 6 to
10 times. The reason is SCS only calculate K_eff and power distribution for triangular geometry,
while CITATION can calculate much more neutronic characteristic for 12 geometry types.
Therefore, SCS module is more suitable for optimization problem of VVER.
3.3. Loading pattern optimization for VVER-1000
The data of the benchmark problem was used as input for the LPO-V code to find out new
optimal LPs. In this research, some conditions were assumed:
- Calculation for 40 random initial LPs
- The core is hexagonal symmetry
- Objective function:
F = K_eff – Wp*max(0, Ppeaking – Cpeaking) – Wl*max(0,Clowest - Plowest) (4)
where: Cpeaking = 1.45: safety margin of peaking factor
Clowest = 0.42: margin of lowest relative power distribution factor
Ppeaking: peaking factor
Plowest: lowest relative power distribution factor (lowest factor)
Wp, Wl: Constant factors
Three methods were applied to find out optimal LP of VVER-1000. The average results of
K_eff and objective function are shown in table 4. The comparison shows that objective function
values of SA+TS hybrid method are largest with equivalent number of calculated LPs. In addition,
the standard deviations of the hybrid method are smallest. Therefore, the hybrid method is the most
efficiency and stable in the three methods.
Table 4: Optimization results of three methods
Method Results
n K_eff peaking factor Lowest factor F
α=0.85
SA 6160 1.15079 1.440 0.427 1.15079
TS 5661 1.15314 1.434 0.427 1.15314
SA+TS 5661 1.15349 1.435 0.425 1.15349
α=0.95
SA 18087 1.15411 1.436 0.425 1.15411
TS 15121 1.15403 1.439 0.424 1.15403
SA+TS 15119 1.15560 1.437 0.424 1.15560
VINATOM-AR 16--01
The Annual Report for 2016, VINATOM 21
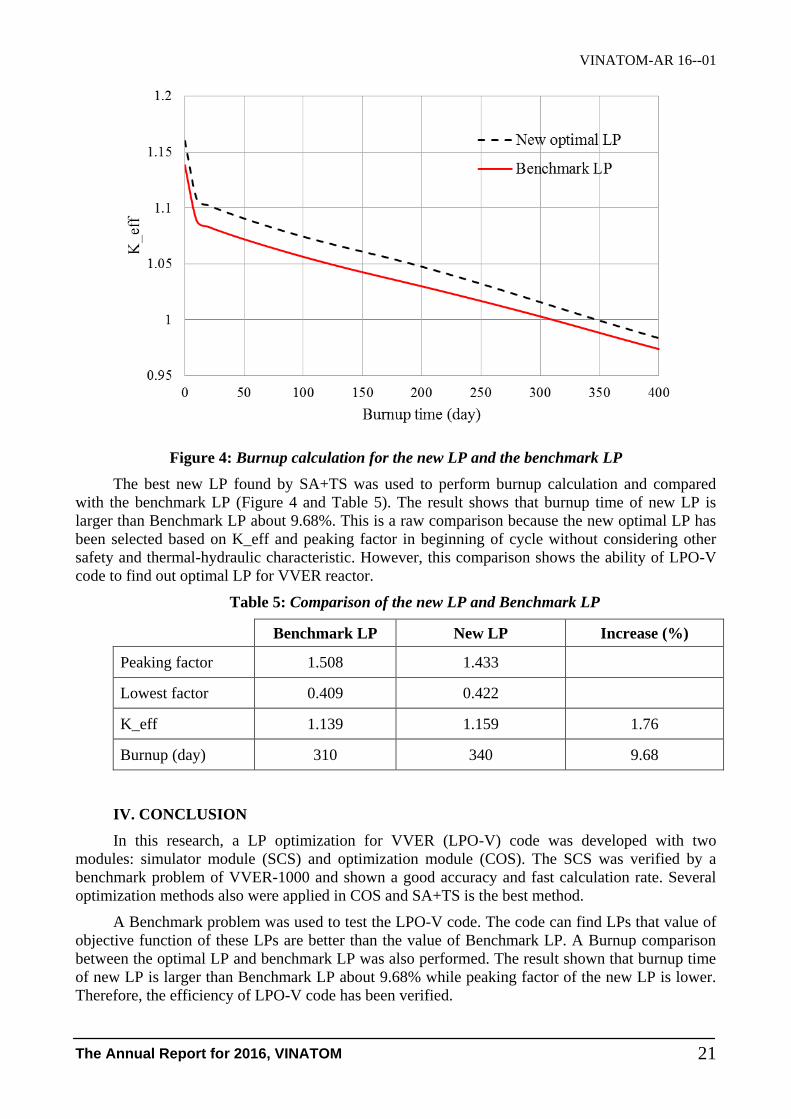
Figure 4: Burnup calculation for the new LP and the benchmark LP
The best new LP found by SA+TS was used to perform burnup calculation and compared
with the benchmark LP (Figure 4 and Table 5). The result shows that burnup time of new LP is
larger than Benchmark LP about 9.68%. This is a raw comparison because the new optimal LP has
been selected based on K_eff and peaking factor in beginning of cycle without considering other
safety and thermal-hydraulic characteristic. However, this comparison shows the ability of LPO-V
code to find out optimal LP for VVER reactor.
Table 5: Comparison of the new LP and Benchmark LP
Benchmark LP New LP Increase (%)
Peaking factor 1.508 1.433
Lowest factor 0.409 0.422
K_eff 1.139 1.159 1.76
Burnup (day) 310 340 9.68
IV. CONCLUSION
In this research, a LP optimization for VVER (LPO-V) code was developed with two
modules: simulator module (SCS) and optimization module (COS). The SCS was verified by a
benchmark problem of VVER-1000 and shown a good accuracy and fast calculation rate. Several
optimization methods also were applied in COS and SA+TS is the best method.
A Benchmark problem was used to test the LPO-V code. The code can find LPs that value of
objective function of these LPs are better than the value of Benchmark LP. A Burnup comparison
between the optimal LP and benchmark LP was also performed. The result shown that burnup time
of new LP is larger than Benchmark LP about 9.68% while peaking factor of the new LP is lower.
Therefore, the efficiency of LPO-V code has been verified.
VINATOM-AR 16--01
The Annual Report for 2016, VINATOM 22
However, this research also has some drawback such as using simple optimization methods,
objective function with only 3 parameters (K_eff, peaking factor and lowest factor). Therefore, we
plan to investigate modern optimization methods, multi-cycle problem and constructing methods of
objective function in the future.
REFERENCES
[1] Keisuke Okumura, Teruhiko Kugo, Kunio Kaneko, Keichro Tsuchhashi, “SRAC2006: A
Comprehensive Neutronics Calculation Code System”, Japan Atomic Energy Agency,
February 2007.
[2] A. Yamamoto, “A quantitative comparison of loading pattern optimization methods for in-
core fuel management of PWR”, Journal of Nucl. Sci. and Technol., 34, 339-347, 1997.
[3] F. Glover and M. Laguna, “Tabu Search” Modern Heuristic Techniques for Combinatorial
Problems, C. R. REEVES, Ed., Blackwell Scientific Publications, Oxford, United Kingdom,
1993.
[4] C. Lin et al., “Pressurized water reactor loading pattern design using the simple tabu search”,
Nucl. Sci. Eng. 129, 61-71, 1998.
[5] J. H. Natasha, T. P. Geoffrey, “Pressurized water reactor in-core nuclear fuel management by
tabu search”, Annals of Nuclear Energy, 75, 64-71, 2015.
[6] Eugeny Gomin, Mikhail Kalugin, Dmitry Oleynik, “VVER – 1000 MOX core computation
benchmark”, OECD, 2006.
VINATOM-AR 16--02
The Annual Report for 2016, VINATOM 23
DEVELOPING THE CORE LOADING PATTERN
FOR THE VVER-1200/V491
Tran Vinh Thanh, Tran Viet Phu, Ta Duy Long and Nguyen Thi Dung
Institute for Nuclear Science and Techonology
179 Hoang Quoc Viet str. - Hanoi
Abstract: In this report we present the results of an investigation in developing the core loading
pattern of the VVER-1200/V491. The loading pattern was developed in two ways: (1) Based on the
core configuration of the VVER-1000/V392 and (2) Selected by the optimized method using in the
LPO-V code. To estimate the developed core, several parameters such as the keff, power distribution,
delayed neutron fraction, fuel and moderator temperature reactivity feedbacks are calculated by SRAC
code.
Keywords: Core configuration, Optimized method, VVER-1200/V491, VVER-1000/V392, LPO-V,
SRAC.
I. INTRODUCTION
The VVER-1200/V491 reactor was considered to be nomanee for the First Vietnam’s Nuclear
Power Plant (NPP) – NinhThuan I. Beacause of that reason, studying characteristics of these
reactors is necessary. In order to understand the neutronic and thermal-hydraulic (TH)
characteristics of these reactors, several studies have been performed in Nuclear Energy Center
(NEC) in the Institute for Nuclear Science and Technology (INST) [1][2]. For the VVER-
1000/V392, the team in NEC has finished the Ministerial Project and had good agreement results
with the parameters in VVER-1000/V392’s ISAR [2].
On the other hand, in the situation of the VVER-1200/V491, the Russian Vendor has provided
specifications through the Fesibility Study Safety Analysis Report (FS-SAR). However, those
parameters are not specified. In case of neutronic calculations, they lack of the core loading
configurations for fuel cycles. To predict the tendencies of the VVER-1200’s core, finding the fuel
loading pattern is necessary.
Project information:
- Code: CS/16/04-02
- Managerial Level: Institute
- Allocated Fund: 60,000,000 VND
- Implementation time: 12 months (Jan 2016- Dec 2016)
- Contact email:[email protected]
- Paper published in related to the project:
1. Tran Vinh Thanh, Tran Viet Phu; Preliminary study on the core loading pattern of VVER-
1200/V491, Nuclear Science and Technology Conference for Young Researchers, 10/2016 (in
Vietnamese).
2. Nguyen HuuTiep, Tran Viet Phu, Nguyen Tuan Khai, Tran Vinh Thanh and Nguyen Minh
Tuan; Representative neutronic characteristics calculations for the VVER-1000 reactors using
SRAC and MCNP5; Nuclear Science and Technology journal; Vol.6, No.2, 2016.
3. Tran Vinh Thanh, Tran Viet Phu; A study on the core loading pattern of VVER-1200/V491;
Accepted to be published in Nuclear Science and Technology journal.
VINATOM-AR 16--02
The Annual Report for 2016, VINATOM 24
According to the FS-SAR, there is only difference between the VVER-1200’s fuel assemblies
(FAs) and the VVER-1000’s. That is, the VVER-1200’s FAs are 20cm higher than the VVER-
1000’s [3][4].Thus we can conjecture that, if the arrangement of fuel rods in each VVER-1000’s FA
is the same as the VVER-1200’s, the core loading pattern of the VVER-1000 can be applied for the
VVER-1200.
On the other hand, using the criteria of effective multiplication factor (keff) and power peaking
factor also lead us to use optimization algorithm to find out the core configuration of the VVER-
1200.
II. CONTENTS
In this report, to find the fuel loading pattern of the VVER-1200 core, we did the following
steps:
Calculated the keff of fuel assemblies (FAs) of the VVER-1200 by SRAC code [4] and
made the comparisions with the VVER-1000 FAs. Then the core configuration of the VVER-1000
was applied to the core loading pattern of the VVER-1200
Used the optimized core loading pattern (LPO-V) to seek the applicable configurations of
the VVER-1200
Used SRAC code to calculate and compare the characteristics of configurations. After
doing these calculations, we calculated the Fuel Temperature Coefficient (FTC) and the Moderator
Temperature Coefficient (MTC) of the VVER-1200
II.1. The SRAC code and the LPO-V program
The SRAC code was developed by Japan Atomic Energy Agency (JAEA). This is the
deterministic code which consists of 107 neutron energy groups. In this report we used two modules
of the SRAC code:(i) The first one is PIJ module which uses the collision probability method
(CPM). This module is usually used to calculate for fuel rod, fuel assembly and prepare the group
constants. Then these constants are used in the second module: (ii) The CITATION module which
import the Finite Difference Method (FDM) for core calculations [4]
The LPO-V program was developed by members of Nuclear Energy Center (NEC) – Institute
for Nuclear Science and Technology (INST). This program consists of two parts:
- The neutronic core calculation part: In this part, LPO-V uses the FDM to solve the neutron
transport equation. On the other hand, to decrease the calculation time, LPO-V skips several
neutronic parameters. The results of LPO-V are keff and power peaking factor in reactor core.
- The optimized loading pattern part: the LPO-V uses the Simulated Annealing method (SA)
in combine with the Tabu Search method (TS) to find the applicable loading pattern. The optimized
core configuration has to satisfy two conditions: (a) the keff is highest and (b)the power peaking
factor is under 1.5.
II.2. The FAs of the VVER-1200/V491
According to the FS-SAR, there are three types of FAs in the first loading cycle of the VVER-
1200/V491. The detail parameters of these FAs were listed in Table 1 [5].
When doing this report, we had to look for several type of VVER-1000 to find the similar of
the VVER-1000’s FA and the VVER-1200’s FA. Fortunately the VVER-1000/V446 used in the
Iranian Bushere NPP has the same parameters of FA type with the VVER-1200/V491. Therefore
we used the 1st cycle core loading pattern of the VVER-1000/V446 to reference to the VVER-
1200/V491 core.[6][7].
VINATOM-AR 16--02
The Annual Report for 2016, VINATOM 25
Table 1: The FAs in 1st loading cycle of the VVER-1200/V491
First loading cycle
FA type
(Avarage Enrichment)
No. of FAs
in core
The fuel rods
(enrichment) FA pitch
(cm)
FA length
(cm) Type I Type II
1.6 54 311 (1.6) - 23.6 368
2.4 67 311 (2.4) - 23.6 368
3.62 42 247 (3.7) 66 (3.3) 23.6 368
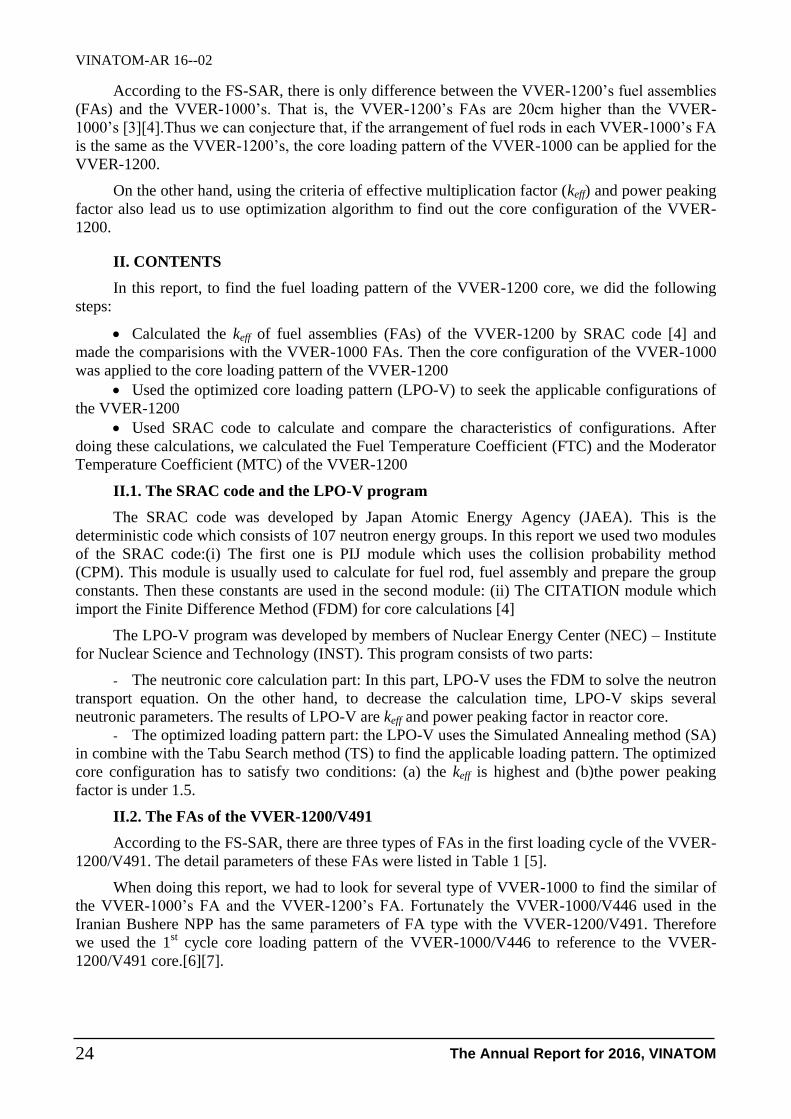
In Figure 1 we can easily find the similarities the two VVER’s FA.
Figure1: The FA of VVER-1200/V491 (left) and the VVER-1000/V446 (right)
The Figure 1 presented two FAs used in VVER-1200/V491 (left) and VVER-1000/V446
(right). In these FAs, there are 312 rods, they are: 247 fuel rods type 1 and 66 fuel rods type 2. In
each FA there are 18 guide tubes, 1 center tube filled by water and 1 tube for testing instrument.
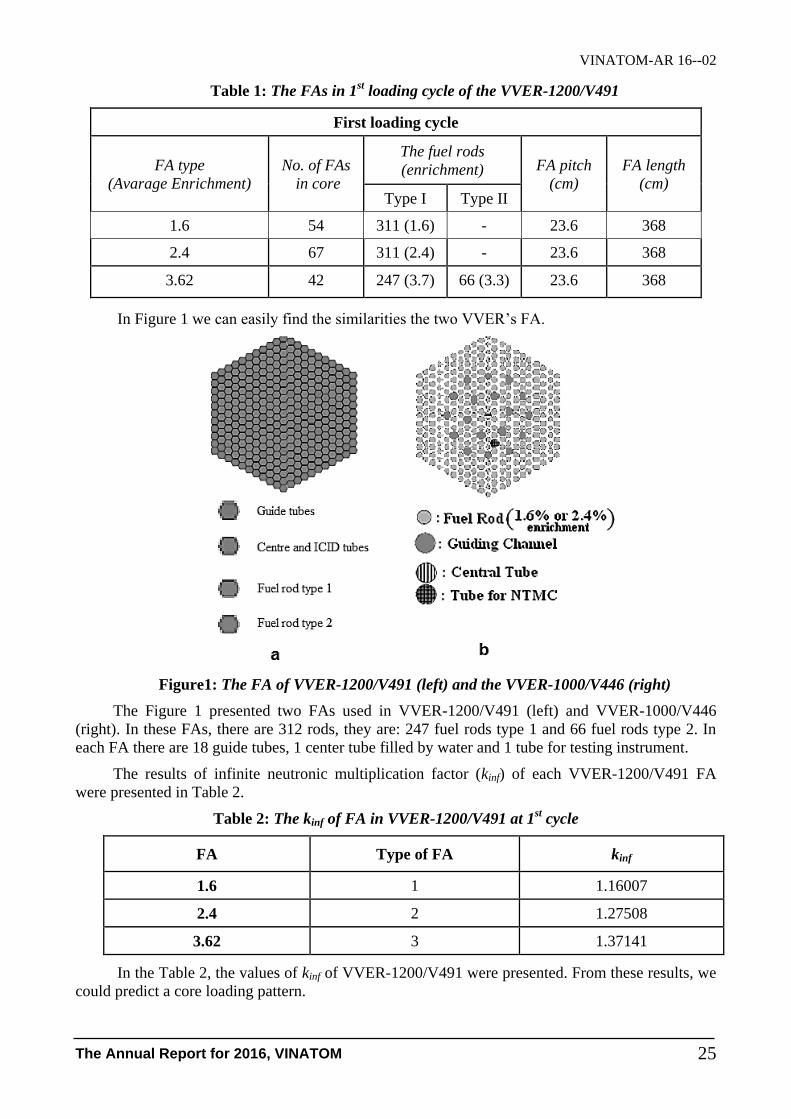
The results of infinite neutronic multiplication factor (kinf) of each VVER-1200/V491 FA
were presented in Table 2.
Table 2: The kinf of FA in VVER-1200/V491 at 1st cycle
FA Type of FA kinf
1.6 1 1.16007
2.4 2 1.27508
3.62 3 1.37141
In the Table 2, the values of kinf of VVER-1200/V491 were presented. From these results, we
could predict a core loading pattern.

VINATOM-AR 16--02
The Annual Report for 2016, VINATOM 26
Normally in a reactor, the FA with higher enrichment will be arranged at the outside of the
core and the lower enrichment FA inside. From the results above, we made an assumption that the
3.62% w/o FAs were outside the core, and the 1.6% w/o and 2.4% w/o FAs were inside.
II.3. The core loading pattern of VVER-1200/V491
Figure 2: The number of each FA in 1/6 VVER-1200’s core
Figure 3 presented the number of 28 FAs in 1/6 VVER-1200’s core. From the assumption,
the reference from VVER-1000/V446 and calculation by LPO-V, we suggested 6 configurations of
VVER-1200/V491’s core. The arrangements of 6 loading patterns were presented in Table 3.
Table 3: The keffs and core configurations of 6 loading patterns
Core VVER-
1000/V392
VVER-
1000/V446 LPO-V1 LPO-V2 LPO-V3 LPO-V4
keff 1.213683 1.213262 1.25572 1.25603 1.25571 1.25652
No. of FA Type Type Type Type Type Type
1 2 2 2 2 2 2
2 1 1 1 1 1 1
3 2 2 1 1 1 2
4 1 1 2 2 2 2
5 1 2 2 2 2 2
6 2 1 3 3 3 1
7 3 3 1 1 1 1
8 2 2 1 3 1 2
9 1 1 2 2 2 2
10 2 2 2 2 2 2
11 1 1 2 2 2 3
12 2 2 3 3 3 1
13 3 3 1 1 1 1
14 1 1 3 2 3 2
VINATOM-AR 16--02
The Annual Report for 2016, VINATOM 27
Core VVER-
1000/V392
VVER-
1000/V446 LPO-V1 LPO-V2 LPO-V3 LPO-V4
15 2 2 2 2 2 2
16 1 1 2 2 2 2
17 2 2 3 3 3 3
18 3 3 1 1 1 1
19 2 2 2 2 2 2
20 1 1 2 2 2 2
21 2 2 3 3 3 3
22 3 3 1 1 2 3
23 1 1 2 2 2 3
24 2 2 3 3 3 3
25 3 3 2 1 1 3
26 2 2 3 3 3 1
27 3 3 1 1 1 1
28 3 3 1 1 1 1
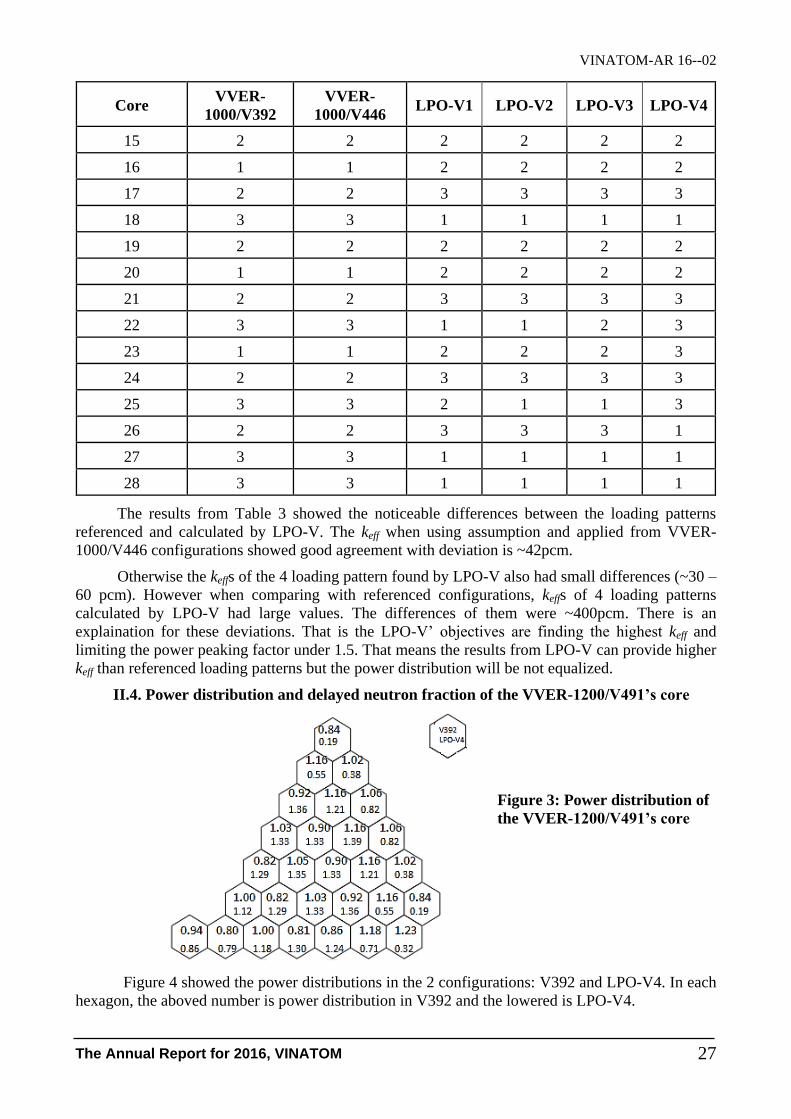
The results from Table 3 showed the noticeable differences between the loading patterns
referenced and calculated by LPO-V. The keff when using assumption and applied from VVER-
1000/V446 configurations showed good agreement with deviation is ~42pcm.
Otherwise the keffs of the 4 loading pattern found by LPO-V also had small differences (~30 –
60 pcm). However when comparing with referenced configurations, keffs of 4 loading patterns
calculated by LPO-V had large values. The differences of them were ~400pcm. There is an
explaination for these deviations. That is the LPO-V’ objectives are finding the highest keff and
limiting the power peaking factor under 1.5. That means the results from LPO-V can provide higher
keff than referenced loading patterns but the power distribution will be not equalized.
II.4. Power distribution and delayed neutron fraction of the VVER-1200/V491’s core
Figure 3: Power distribution of
the VVER-1200/V491’s core
Figure 4 showed the power distributions in the 2 configurations: V392 and LPO-V4. In each
hexagon, the aboved number is power distribution in V392 and the lowered is LPO-V4.
VINATOM-AR 16--02
The Annual Report for 2016, VINATOM 28
From the results in Table 3 and Figure 4, it is easily to relize that in the 2 cases there were
considerable differences of the power distributions. For the V392, the power distribution was
almost stable, the fluctuation from 1.0 in each position was around 0.2. The power peaking factor is
1.23 at FA no.7, the lowest power distribution is 0.80 at position no.2.
In case of the LPO-V4 configuration, there were large differences between FAs’ position, the
outside-core FAs at positions: 7, 12, 13, 18, 26, 27, 28 had low value, high power distribution
positions were FAs no.10, 11, 15, 16, 19, 20, 21. The power peaking factor at FA no.21 is 1.39 and
the lowest power distribution is 0.19 at FAs no.13 and no.28. In this loading pattern, the maximum
difference between the higest and lowest power distribution is 1.2.
The results described above let us to an implementation that the LPO-V’s objectives are
searching for the cores which have high keffand power peaking factor limit under 1.4, so the cores
found by LPO-V may have non-uniform power distribution. This means that the LPO-V is still in
developing and it needs to be verified and improved.
From the results presented in Table 3 and Figure 4, thisis not easy to affirm which
configuration is better. The LPO-V4 showed higherkeff but the V392 had more stable power
distribution.
To estimate the operation period of the reactor, the neutronic – TH coupling and burn-up
calculating are needed. However, in the scope of this paper, those calculations were not carried out.
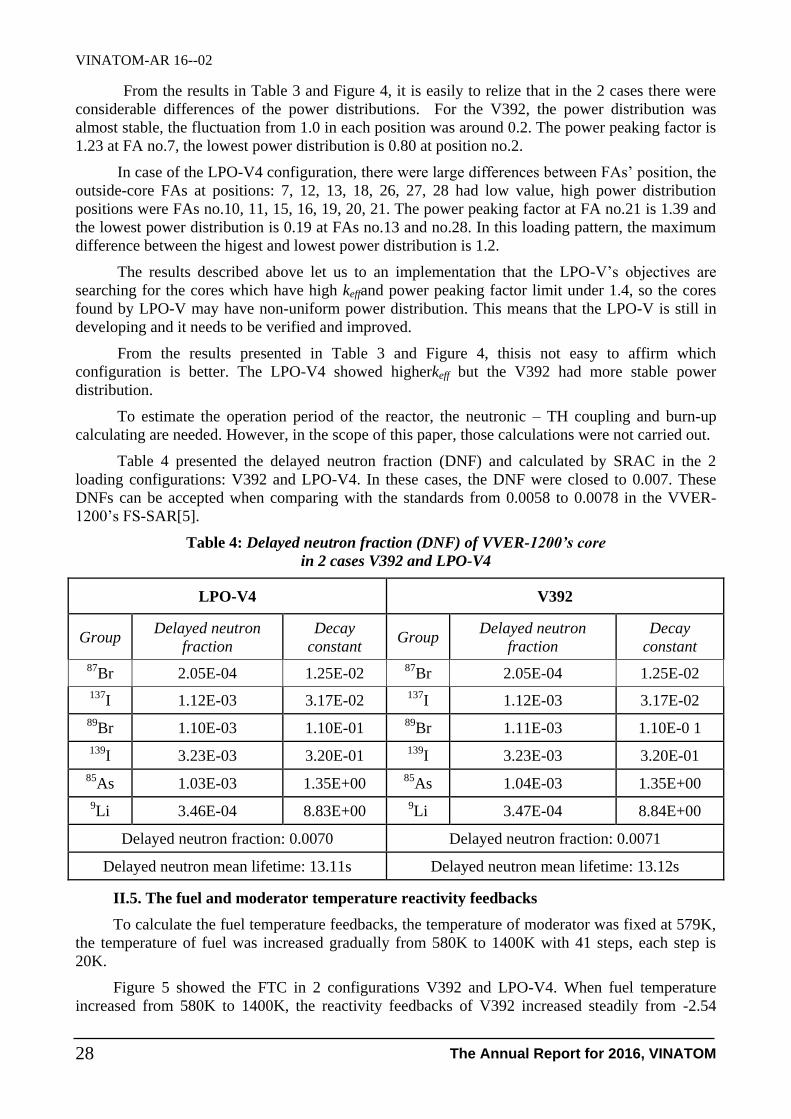
Table 4 presented the delayed neutron fraction (DNF) and calculated by SRAC in the 2
loading configurations: V392 and LPO-V4. In these cases, the DNF were closed to 0.007. These
DNFs can be accepted when comparing with the standards from 0.0058 to 0.0078 in the VVER-
1200’s FS-SAR[5].
Table 4: Delayed neutron fraction (DNF) of VVER-1200’s core
in 2 cases V392 and LPO-V4
LPO-V4 V392
Group Delayed neutron
fraction
Decay
constant Group
Delayed neutron
fraction
Decay
constant
87Br 2.05E-04 1.25E-02
87Br 2.05E-04 1.25E-02
137I 1.12E-03 3.17E-02
137I 1.12E-03 3.17E-02
89Br 1.10E-03 1.10E-01
89Br 1.11E-03 1.10E-0 1
139I 3.23E-03 3.20E-01
139I 3.23E-03 3.20E-01
85As 1.03E-03 1.35E+00
85As 1.04E-03 1.35E+00
9Li 3.46E-04 8.83E+00
9Li 3.47E-04 8.84E+00
Delayed neutron fraction: 0.0070 Delayed neutron fraction: 0.0071
Delayed neutron mean lifetime: 13.11s Delayed neutron mean lifetime: 13.12s
II.5. The fuel and moderator temperature reactivity feedbacks
To calculate the fuel temperature feedbacks, the temperature of moderator was fixed at 579K,
the temperature of fuel was increased gradually from 580K to 1400K with 41 steps, each step is
20K.
Figure 5 showed the FTC in 2 configurations V392 and LPO-V4. When fuel temperature
increased from 580K to 1400K, the reactivity feedbacks of V392 increased steadily from -2.54

VINATOM-AR 16--02
The Annual Report for 2016, VINATOM 29
pcm/K to -1.8pcm/K, the feedbacks of LP3 were from -2.44 pcm/K to -1.73pcm/K. The average
difference between the 2 curves is 0.2 pcm/K and can be neglected.
Because of the VVER-1200/V491’s FS-SAR does not provide information on criteria of the
FTC, the results in this study had been to compare with standards in the VVER-1000/V392 ISAR.
In the ISAR, the limits for FTC vary from -3.3 pcm/K to -1.7 pcm/K at the Beginning Of
Cycle (BOC) .Thus when comparing with standards in the ISAR, the FTC in the 2 configurations
V392 and LPO-V4 were satisfied.
Figure 3: Fuel temperature feedbacks
Figure 4: Moderator temperature feedback
Figure 6 presented the dependence of reactivity of the V392 and LPO-V4 loading pattern on
moderator temperature. In this calculation, the fuel temperature was fixed at 580K when moderator
temperature was devided to 37 steps from 564K to 600K. It is not difficult to relize that the MTC of
V392 and LPO-V4 had the agreement. Figure 6 also showed that when increasing the moderator
temperature, the reactivity curves tent to move down from -29 pcm/K to -45pcm/K. This outcome
confirms the key influence of the moderator temperature reactivity feedback.
The results of MTCs in this report were also compared with the criteria in the FS-SAR of
VVER-1200/V491 and can be regarded as acceptable when the standards in FS-SAR range from -
54.8 pcm/K to -26.7 pcm/K.[5]
VINATOM-AR 16--02
The Annual Report for 2016, VINATOM 30
III. CONCLUSION
In this study, 6 fuel loading configurations were suggested for the VVER-1200/V491’s core:
the applied from the VVER-1000/V446 in the Iranian Bushehr NPP,the assumption and the 4
calculated by core optimization code LPO-V. Several neutronic characteristics in those loading
patterns were performed, they are: the keff, power distribution, delayed neutron fraction, fuel and
moderator temperature coefficient.
For the V392 configuration, the keff was 1.21326, the power distribution was almost uniform
with fluctuation from 1.0 is 0.2; the peaking factor was 1.23; the delayed neutron fraction was
0.0071; the fuel temperature coefficient raised from -2.54 pcm/K to -1.8 pcm/K; the moderator
temperature coefficientmoved down from -29.03 pcm/K to -43.96 pcm/K.
In case of the LPO-V4 loading pattern, keff was 1.25652, the power distribution was not
uneven with the lowest was 0.19 and the highest was 1.39; the delayed neutron fraction was 0.0070;
the fuel temperature coefficientvariedfrom -2.44 pcm/K to -1.73 pcm/K; the moderator temperature
coefficientdecreased from -28.85 pcm/K to -44.43 pcm/K.
Basically, that can be found that the configurations had power distribution, delayed neutron
fraction, the fuel temperature coefficientandmoderator temperature coefficientsatisfied the criteria
in the VVER-1000’s ISAR and the VVER-1200’s FS-SAR. However, there are still some points to
note, they are: (a) the power distribution in the loading pattern calculated by LPO-V was not
uniform and (b) the fuel cycle operation needs to be estimated by burn-up and neutronic – TH
coupling calculations. That is also our next objectives: verify the LPO-V and do those mentioned
calculations.
REFERENCES
[1] Tran Viet Phu and colleagues, “Calculate several neutronic characteristics of the VVER-1000
reactor core”, Ministerial Project (2014-2015).
[2] Risk Engineering LTD., Belene ISAR - Training course provided for Vietnam Atomic Energy
Institute VINATOM, Sofia, Bungari, (15 Jan – 9 March 2012).
[3] Tran Viet Phu and colleagues, “Study on the VVER core optimization loading”, Ministerial
Project (2015-2016).
[4] K. Kumura, T. Kugo, K. Kaneko and K. Tsuchihashi, “SRAC2006: A comprehensive
neutronics calculation code system”, JAEA-Data/Code (2007).
[5] NinhThuan 1 Nuclear Power Plant Project Feasibility Study, NT1.0-3.101-FS-01.03.01.06.02-
rev02 (2015).
[6] S.SafaeiArshi, S.M.Mirvakili, F.Faghini, “Modified COBRA-EN code to investigate thermal-
hydraulic analysis of the Iranian VVER-1000 core”, Progress in Nuclear Energy 52, pp.589-
595, 2010.
[7] YasharRahmani, Ali Pazirandeh, Mohammad B. Ghofrani, Mostafa Sadighi, “Calculation of
the deterministic optimum loading pattern of the BUSHEHR VVER-1000 reactor using the
weighting factor method”, Annals of Nuclear Energy 49, pp.170-181, 2012.

1. 2- Research Reactor,Nuclear Power Technology,Nuclear Safety,Nuclear Power Economy

VINATOM-AR 16--03
The Annual Report for 2016, VINATOM 33
DEVELOPMENT OF NEW TECHNIQUES AND ENHANCEMENT
OF AUTOMATIC CAPABILITY OF NEUTRON ACTIVATION ANALYSIS
AT THE DALAT RESEARCH REACTOR
Ho Manh Dung, Ho Van Doanh, Tran Quang Thien, Pham Ngoc Tuan, Pham Ngoc Son,
Tran Quoc Duong, Nguyen Van Cuong, Nguyen Minh Tuan, Nguyen Giang and Nguyen Thi Sy
Nuclear Research Institute, Vietnam Atomic Energy Institute
01 Nguyen Tu Luc Street, Ward 8, Dalat, Vietnam
Abstract: The techniques of neutron activation analysis (NAA) including cyclic, epithermal and
prompt-gamma (CNAA, ENAA and PGNAA, respectively) have been developed at the Dalat research
reactor (DRR). In addition, the efforts has been spent to improve the automatic capability of
irradiation, measurement and data processing of NAA. The renewal of necessary devices/tools for
sample preparation have also been done. Eventually, the performance and the utility in terms of
sensitivity, accuracy and stability of the analytical results generated by NAA at DRR have
significantly been improved. The main results of the project are: 1) Upgrading of the fast irradiation
system on Channel 13-2/TC to allow the cyclic irradiations; 2) Development of CNAA; 3)
Development of ENAA; 4) Application of k0-method for PGNAA; 5) Investigation of the automatic
sample changer (ASC2); 6) Upgrading of “Ko-DALAT” software for ENAA and modification of “k0-
IAEA” software for CNAA and PGNAA; and 7) Optimization of irradiation and measurement
facilities as well as sample preparation devices/tools. A set of procedures of relevant developed
techniques in the project were established. The procedures have been evaluated by analysis of the
Project information:
- Code: ĐTCB.04/15/VNCHN
- Managerial Level: Ministry
- Allocated Fund: 780,000,000 VND
- Implementation time: 24 months (Jan 2015- Dec 2016)
- Contact e-mail: [email protected]
- Papers published in related to the project:
1. Quality evaluation of k0-standardized neutron activation analysis at the Dalat research reactor;
Ho Manh Dung, Tran Quang Thien, Ho Van Doanh, Cao Dong Vu, Nguyen Thi Sy; J
Radioanal Nucl Chem 309 (2016) 135-143.
2. Determination of multi-element composition of Vietnamese marine sediment and tuna fish by
k0-standardized neutron activation analysis; Ho Manh Dung, Tran Quang Thien, Ho Van
Doanh, Nguyen Thi Sy; J Radioanal Nucl Chem 309 (2016) 235-241.
3. Combination and optimization of the cyclic neutron activation analysis modes at the Dalat
research reactor for determination of selenium in biological materials using 77mSe; Ho Van
Doanh, Ho Manh Dung, Tran Quang Thien, Nguyen Thi Sy, Nguyen Nhi Dien; J Radioanal
Nucl Chem 309 (2016) 185-188.
4. Determination of trace elements in some fruits collected in Vietnam and Korea by NAA at
Dalat and HANARO research reactors; Nguyen Thi Sy, Ho Manh Dung, Yong Sam Chung, Ho
Van Doanh, Tran Quang Thien; J. Nuclear Science and Technology, Vol. 5, No. 4 (2015) 23-
29.
5. Development of epithermal neutron activation analysis (ENAA) at the Dalat research reactor;
Tran Quang Thien, Ho Manh Dung, Ho Van Doanh, Nguyen Thi Sy; Proceedings of the 4th
Young Researcher Conference on Nuclear Science and Technology, Hanoi, 6-7 October 2016.
VINATOM-AR 16--03
The Annual Report for 2016, VINATOM 34
reference materials for which they are meeting the requirements of multi-element analysis for the
intended applications.
Keywords: Neutron activation analysis (NAA); k0-standardization method; Cyclic NAA; Epithermal
NAA; Prompt-gamma NAA; k0-IAEA software.
1. INTRODUCTION
Neutron Activation Analysis (NAA) is a sensitive nuclear analytical technique used to
determine the concentration of elements in a sample [1,2]. The development of new techniques of
this method has been started together with developments of powerful sources of neutrons such as
research reactors, precise and fast gamma semiconductor detectors, high speed electronics,
increased processing ability of the computers and growing demands for the automation of NAA
stages for irradiation, measurement and data processing [3].
This project aims to develop three main techniques of NAA at the Dalat research reactor
(DRR) [4], i.e. cyclic, epithermal and prompt-gamma NAA. Firstly, the cyclic neutron activation
analysis (CNAA) in which a sample is irradiated, decayed, counted, then irradiated again, and this
process is repeated for a number of cycles, the spectra from each counting being summed to give a
final total spectrum. By this process, the counts of a nuclide of interest are considerably increased
and the analytical sensitivity of elements is significantly improved [5,6,7]. Secondly, the epithermal
neutron activation analysis (ENAA) in which the samples are activated not with the whole spectrum
of reactor neutrons but rather after passing through filters (Cd or B) to remove the thermal neutrons.
The use of the filters for the thermal neutrons will lead to relative enhancement of the activity due
to the other elements [8]. Thirdly, the prompt gamma neutron activation analysis (PGNAA) in
which the prompt gamma-rays are counted during irradiating the sample. PGNAA at DRR has been
developed in the recent years, however, it has only been used with the relative standardization
method. In this project, the aim is to apply the k0-standardized method for PGNAA by which it
doesn’t need a standard or reference material [9].
The efforts have also been spent to improve the automatic capability of the irradiation, the
measurement and the data processing stages of NAA. The sample preparation for NAA has also
been paid attention in which several important devices and tools were renewed. Hence, the
performance and the utility in terms of sensitivity, accuracy and stability of the analytical results
generated by NAA at DRR have significantly been improved. The investigation of an automatic
sample changer (ORTEC model ASC2) was also done in the project. The development of “Ko-
DALAT” software for the data processing of ENAA has also been completed. Moreover, through
the IAEA’s assistance the “k0-IAEA” software for the data processing of CNAA and PGNAA have
also been modified for use at DRR.
The development of CNAA, ENAA and PGNAA techniques as well as the enhancement of
automatic capability for NAA at DRR was performed by which the relevant experimental
procedures were established in the project.
2. EXPERIMENTAL
Upgrading of the fast irradiation facility using pneumatic transfer system (PTS) at Channel
13-2/TC for cyclic irradiations was done including hardware and software. Development of CNAA
based on the upgraded irradiation facility together with the necessary corrections have been planned
and carried out.
ENAA was performed by using Cd-box to cover the samples to which they were irradiated at
the Channel 7-1 and Rotary Rack for medium and long-lived nuclides, respectively. The Cd boxes
VINATOM-AR 16--03
The Annual Report for 2016, VINATOM 35
were made or purchased in the project. The MCNP program was applied to evaluate the turbulence
of neutron field when inserting the Cd into reactor. The ENAA’s data processing has been
performed by Ko-DALAT software. Advantage factors for ENAA were measured for the interested
elements.
The k0-standardization method for PGNAA was performed using k0-IAEA software for the
data processing by which the horizontal neutron beam port #2 was characterized and the associated
gamma-ray spectrometer was calibrated following the k0-PGNAA methodology.
The ASC2 system was investigated to identify the technical issues making the system failed.
The MCB-919E module was checked. A new PC was replaced and the controlling software was re-
installed for the system. Wires and cables were checked by ORTEC’s experts and the project
members.
The upgrading of Ko-DALAT software was completed to which it is able to allow for data
processing of ENAA, while k0-IAEA software was modified with the IAEA’s assistance for data
processing of CNAA and PGNAA.
Other works related to the improvement and/or the optimization of the sample preparation,
irradiation and measurement for NAA were also carried out.
3. RESULTS AND DISCUSSIONS
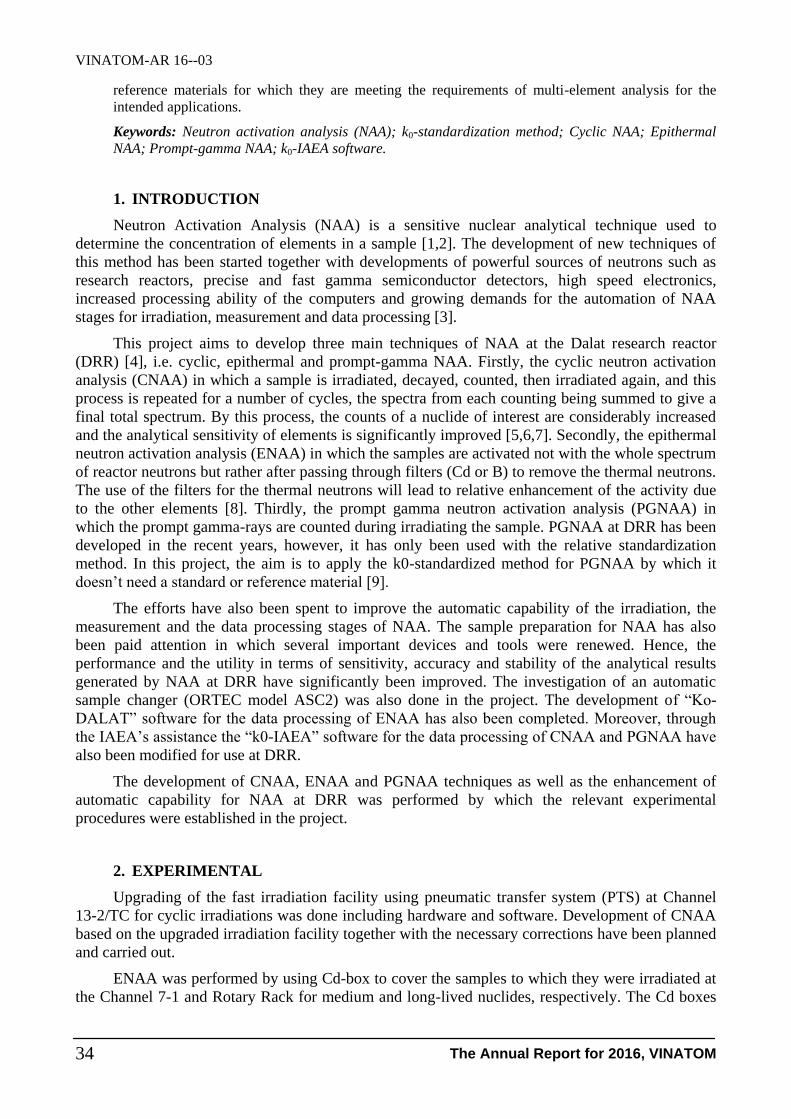
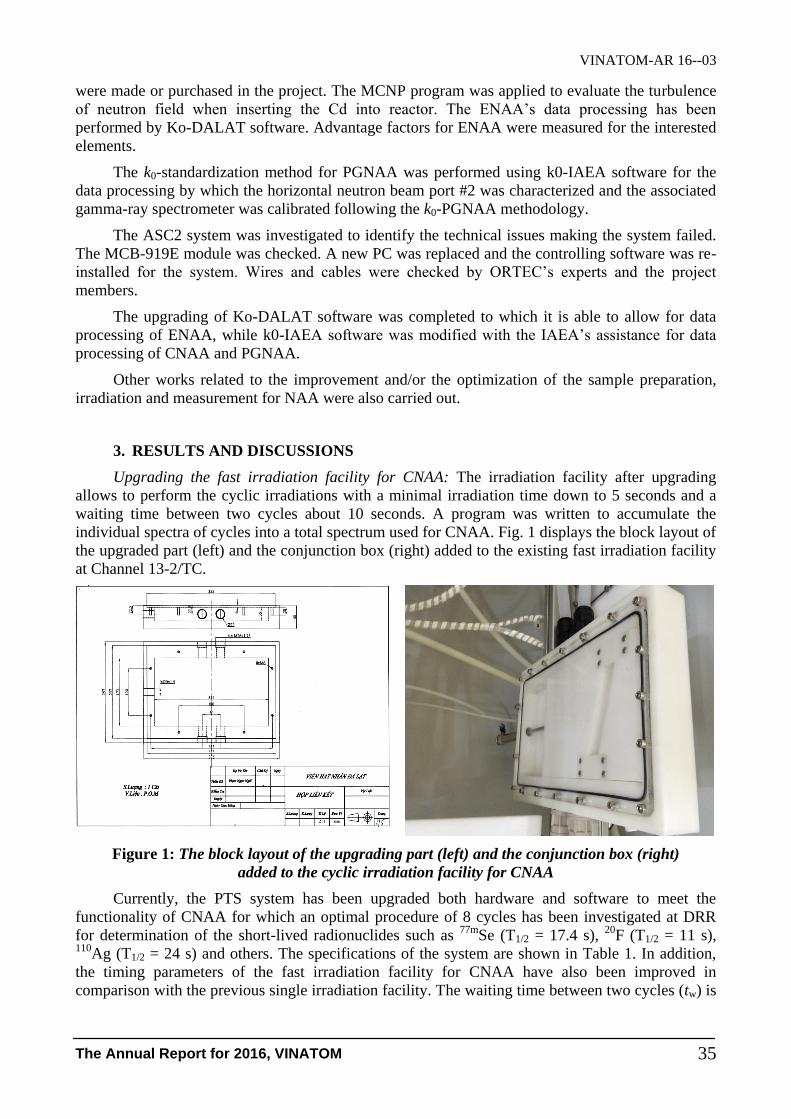
Upgrading the fast irradiation facility for CNAA: The irradiation facility after upgrading
allows to perform the cyclic irradiations with a minimal irradiation time down to 5 seconds and a
waiting time between two cycles about 10 seconds. A program was written to accumulate the
individual spectra of cycles into a total spectrum used for CNAA. Fig. 1 displays the block layout of
the upgraded part (left) and the conjunction box (right) added to the existing fast irradiation facility
at Channel 13-2/TC.
Figure 1: The block layout of the upgrading part (left) and the conjunction box (right)
added to the cyclic irradiation facility for CNAA
Currently, the PTS system has been upgraded both hardware and software to meet the
functionality of CNAA for which an optimal procedure of 8 cycles has been investigated at DRR
for determination of the short-lived radionuclides such as 77m
Se (T1/2 = 17.4 s), 20
F (T1/2 = 11 s), 110
Ag (T1/2 = 24 s) and others. The specifications of the system are shown in Table 1. In addition,
the timing parameters of the fast irradiation facility for CNAA have also been improved in
comparison with the previous single irradiation facility. The waiting time between two cycles (tw) is
VINATOM-AR 16--03
The Annual Report for 2016, VINATOM 36
10 ± 1.0 seconds. The minimal time or decay time (td) in order to transport the sample to the
counting position is now 3.5 ± 0.5 seconds.
Table 1: The specifications of the PTS at Channel 13-2/TC before and after upgrading
No. Timing parameters (s) Before ugrading (s) After upgrading (s)
1 Waiting time (tw) 60 10
2 Decay time (td) 3.2 3.2
3 Minimum irradiation time at Ch. 13-2 5 3
4 Minimum irradiation time at TC 10 5
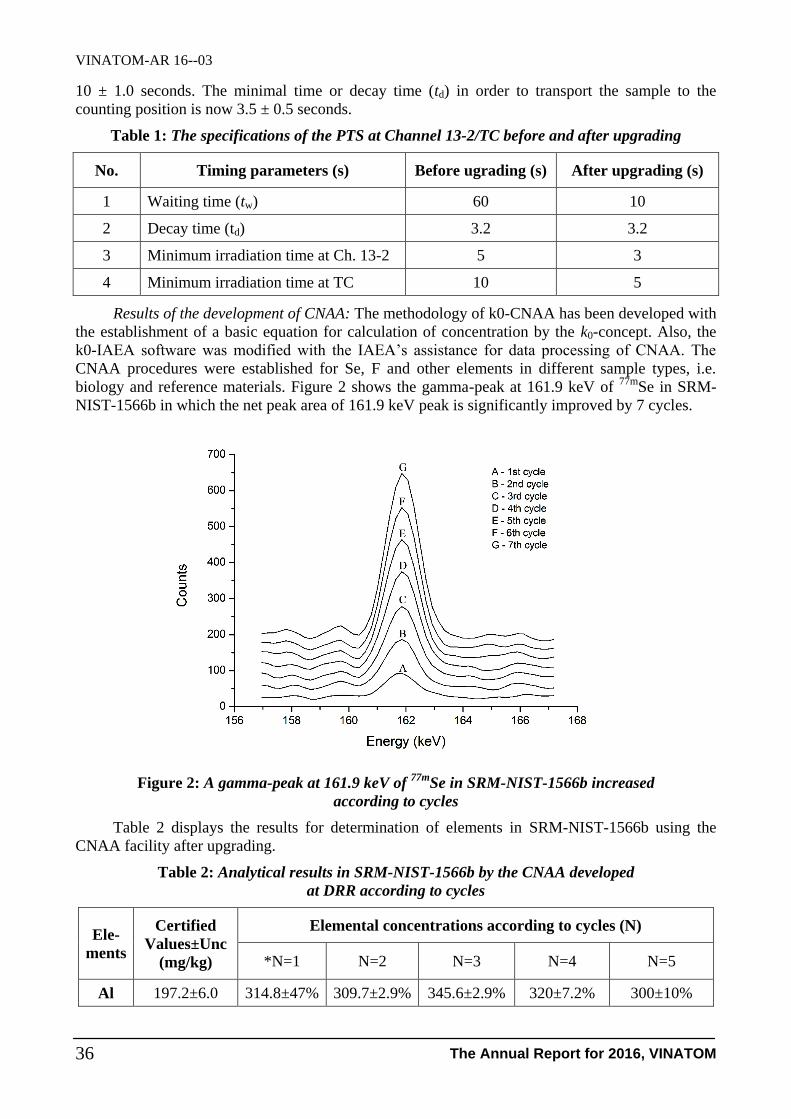
Results of the development of CNAA: The methodology of k0-CNAA has been developed with
the establishment of a basic equation for calculation of concentration by the k0-concept. Also, the
k0-IAEA software was modified with the IAEA’s assistance for data processing of CNAA. The
CNAA procedures were established for Se, F and other elements in different sample types, i.e.
biology and reference materials. Figure 2 shows the gamma-peak at 161.9 keV of 77m
Se in SRM-
NIST-1566b in which the net peak area of 161.9 keV peak is significantly improved by 7 cycles.
Figure 2: A gamma-peak at 161.9 keV of 77m
Se in SRM-NIST-1566b increased
according to cycles
Table 2 displays the results for determination of elements in SRM-NIST-1566b using the
CNAA facility after upgrading.
Table 2: Analytical results in SRM-NIST-1566b by the CNAA developed
at DRR according to cycles
Ele-
ments
Certified
Values±Unc
(mg/kg)
Elemental concentrations according to cycles (N)
*N=1 N=2 N=3 N=4 N=5
Al 197.2±6.0 314.8±47% 309.7±2.9% 345.6±2.9% 320±7.2% 300±10%

VINATOM-AR 16--03
The Annual Report for 2016, VINATOM 37
Ele-
ments
Certified
Values±Unc
(mg/kg)
Elemental concentrations according to cycles (N)
*N=1 N=2 N=3 N=4 N=5
LOD 6.9 2.7 1.9 0.64 0.54
Cl 5140±100 5595±7.2% 5691±5.6% 5796±4.5% 6939±3.1% 5809±3.2%
LOD 800 260 200 59 39
V 0.577±0.023 - - 0.4271±75% 0.431±15% 0.4274±20%
LOD 1.083 0.415 0.29 0.11 0.086
Mn 18.5±0.2 23.38±38% 23.31±12% 19.59±26% 20.40±8.4% 21.76±7.3%
LOD 11.0 3.9 2.7 1.4 1.1
Se 2.06±0.15 1.323±12% 1.49±9.9% 1.379±8% 1.425±6.9% 1.33±5.7%
LOD 0.31 0.17 0.15 0.11 0.071
Ag 0.666±0.010 0.676±26% 0.644±29% 0.770±18% 0.673±24% 0.628±24%
LOD 0.27 0.12 0.11 0.067 0.058
*N = 1: Single irradiation.
Results of the development of ENAA: Using MCNP for evaluating the safety when inserting
Cd-box into the reactor’s irradiation positions as well as the changes of neutron field in pile was
performed. Advantage factors of the interested elements for ENAA were measured and the
procedures for ENAA were established. The elemental concentrations and the limits of detection
(LODs) analyzed by ENAA for geological reference samples are showing that ENAA is able to
detect more radionuclides than the conventional NAA. A number of elements were determined by
ENAA with the LODs are much lower than the conventional NAA.
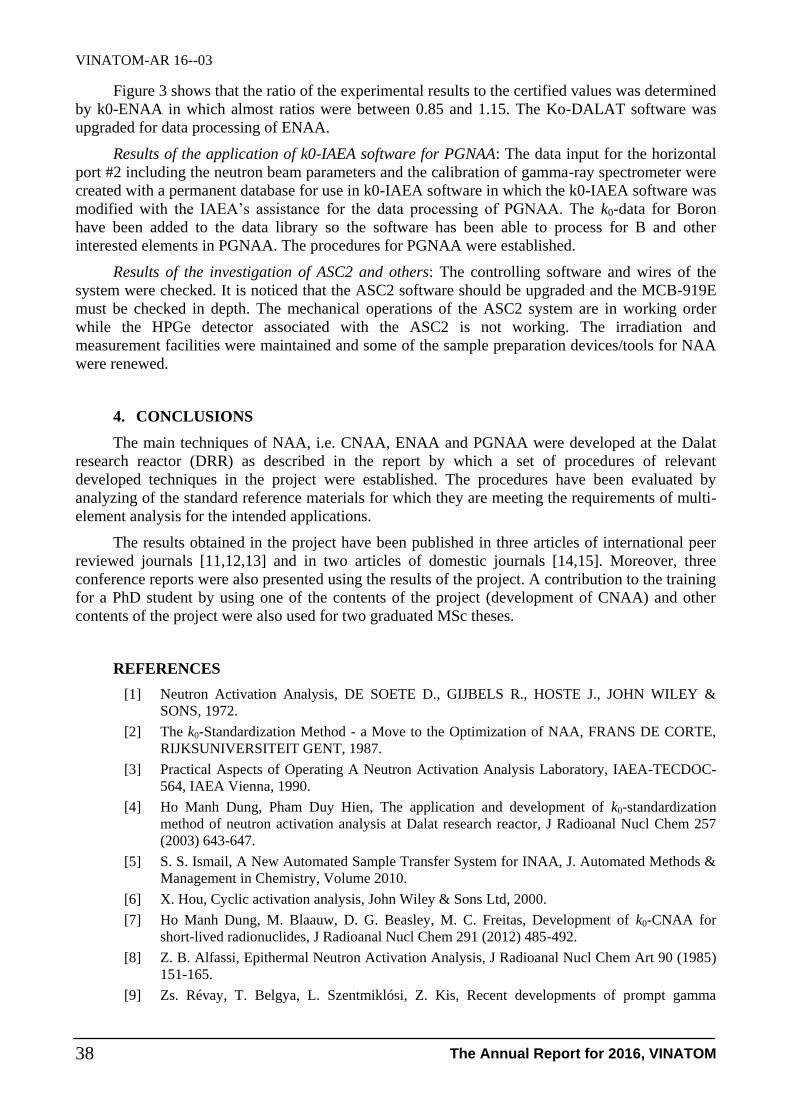
Figure 3: Ratios of the results/certified values association with Z-scores using SRM-
NIST-1633b analyzed by ENAA
VINATOM-AR 16--03
The Annual Report for 2016, VINATOM 38
Figure 3 shows that the ratio of the experimental results to the certified values was determined
by k0-ENAA in which almost ratios were between 0.85 and 1.15. The Ko-DALAT software was
upgraded for data processing of ENAA.
Results of the application of k0-IAEA software for PGNAA: The data input for the horizontal
port #2 including the neutron beam parameters and the calibration of gamma-ray spectrometer were
created with a permanent database for use in k0-IAEA software in which the k0-IAEA software was
modified with the IAEA’s assistance for the data processing of PGNAA. The k0-data for Boron
have been added to the data library so the software has been able to process for B and other
interested elements in PGNAA. The procedures for PGNAA were established.
Results of the investigation of ASC2 and others: The controlling software and wires of the
system were checked. It is noticed that the ASC2 software should be upgraded and the MCB-919E
must be checked in depth. The mechanical operations of the ASC2 system are in working order
while the HPGe detector associated with the ASC2 is not working. The irradiation and
measurement facilities were maintained and some of the sample preparation devices/tools for NAA
were renewed.
4. CONCLUSIONS
The main techniques of NAA, i.e. CNAA, ENAA and PGNAA were developed at the Dalat
research reactor (DRR) as described in the report by which a set of procedures of relevant
developed techniques in the project were established. The procedures have been evaluated by
analyzing of the standard reference materials for which they are meeting the requirements of multi-
element analysis for the intended applications.
The results obtained in the project have been published in three articles of international peer
reviewed journals [11,12,13] and in two articles of domestic journals [14,15]. Moreover, three
conference reports were also presented using the results of the project. A contribution to the training
for a PhD student by using one of the contents of the project (development of CNAA) and other
contents of the project were also used for two graduated MSc theses.
REFERENCES
[1] Neutron Activation Analysis, DE SOETE D., GIJBELS R., HOSTE J., JOHN WILEY &
SONS, 1972.
[2] The k0-Standardization Method - a Move to the Optimization of NAA, FRANS DE CORTE,
RIJKSUNIVERSITEIT GENT, 1987.
[3] Practical Aspects of Operating A Neutron Activation Analysis Laboratory, IAEA-TECDOC-
564, IAEA Vienna, 1990.
[4] Ho Manh Dung, Pham Duy Hien, The application and development of k0-standardization
method of neutron activation analysis at Dalat research reactor, J Radioanal Nucl Chem 257
(2003) 643-647.
[5] S. S. Ismail, A New Automated Sample Transfer System for INAA, J. Automated Methods &
Management in Chemistry, Volume 2010.
[6] X. Hou, Cyclic activation analysis, John Wiley & Sons Ltd, 2000.
[7] Ho Manh Dung, M. Blaauw, D. G. Beasley, M. C. Freitas, Development of k0-CNAA for
short-lived radionuclides, J Radioanal Nucl Chem 291 (2012) 485-492.
[8] Z. B. Alfassi, Epithermal Neutron Activation Analysis, J Radioanal Nucl Chem Art 90 (1985)
151-165.
[9] Zs. Révay, T. Belgya, L. Szentmiklósi, Z. Kis, Recent developments of prompt gamma

VINATOM-AR 16--03
The Annual Report for 2016, VINATOM 39
activation analysis at Budapest, J Radioanal Nucl Chem 278 (2008) 643-646.
[10] M. Rossbach, M. Blaauw, M. A. Bacchi, Xilei Lin, The k0-IAEA program, J Radioanal Nucl
Chem 274 (2007) 657-662.
[11] Ho Manh Dung, Tran Quang Thien, Ho Van Doanh, Cao Dong Vu, Nguyen Thi Sy, Quality
evaluation of the k0-NAA at the Dalat research reactor, J Radioanal Nucl Chem 309 (2016)
135-143.
[12] Ho Manh Dung, Tran Quang Thien, Ho Van Doanh, Nguyen Thi Sy, Determination of multi-
element composition of Vietnamese marine sediment and tuna fish by k0-NAA, J Radioanal
Nucl Chem 309 (2016) 235-241.
[13] Ho Van Doanh, Ho Manh Dung, Tran Quang Thien, Nguyen Thi Sy, Nguyen Nhi Dien,
Combination and optimization of the cyclic NAA modes at the Dalat research reactor for
determination of Se in biological materials using 77mSe, J Radioanal Nucl Chem 309 (2016)
185-188.
[14] Nguyen Thi Sy, Ho Manh Dung, Yong Sam Chung, Ho Van Doanh, Tran Quang Thien,
Determination of trace elements in some fruits collected in Vietnam and Korea by NAA at
Dalat and HANARO research reactors, J. Nuclear Science and Technology, Vol.5, No. 4
(2015) 23-29.
[15] Tran Quang Thien, Ho Manh Dung, Ho Van Doanh, Nguyen Thi Sy, Development of
epithermal neutron activation analysis (ENAA) at the Dalat research reactor, Proceedings of
the 4th conference for nuclear science and technology for young researchers, 6-7/10/2016,
Hanoi, Vietnam.

VINATOM-AR 16--04
The Annual Report for 2016, VINATOM 40
STUDY ON SAFETY ANALYSIS OF VVER-1200/V491 IN SCENARIO OF
LOSS OF COOLANT ACCIDENTS ALONG WITH PARTLY FAILURE OF
ECCS USING RELAP5 CODE
Hoang Minh Giang, Ha Thi Anh Đao, Hoang Tan Hung, Bui Thi Hoa,
Nguyen Thi Tu Oanh, Dinh Anh Tuan and Pham Tuan Nam
Institute for Nuclear Science and Technology, Hanoi, Vietnam
Abstract: The advanced VVER-1200/V491 reactor designed with passive safety systems to deal with
design extension conditions is primarily selected as priority candidate for Ninh Thuan 1 nuclear power
plant project. So that, in order to enhance competence of nuclear safety and toward participation on
review Safety Analysis Report (SAR) of Ninh Thuan nuclear Power project the study on safety
analysis of VVER-1200/V491in scenario of Loss of Coolant Accidents along with partly failure of
ECCS is implemented. As requirement of the study, the input deck file of VVER-1200/V491 for
RELAP5 and analysis report for some special case of LOCAs along with partly failure of ECCS are
issued.
Keywords: VVER, SAR, LOCAs, ECCS, RELAP5…
1. INTRODUCTION
The study on “Safety analysis of VVER-1200/V491in scenario of Loss of Coolant Accidents
along with partly failure of ECCS, using RELAP5 code” is implemented as a specific effort to
understand safety features of VVER-1200/V491 reactor based on the Safety Analysis Report (SAR)
for Ninh Thuan 1 nuclear power project. As reported, the advanced VVER’s reactors are designed
with passive safety systems to deal with design extension conditions such as SBO for core cooling
during at least 24 hours, small break of LOCAs (SBLOCAs) along with failure of high pressure
injection pumps of ECCS and large break LOCAs along with failure of low pressure injection
pumps of ECCS, so that an independent analysis for above issues using RELAP5 code is
appropriate investigation to confirm safety features of VVER-1200/V491 reactor. The requirement
of the study includes following contents:
- Establishment of VVER-1200/V491 reactor input deck with deviation between design
parameters and calculation results for several main parameters below 10%;
- Analysis of several scenario belong to Design Extension Conditions (DEC) such as
LOCAs along with partly failure of ECCS;
- Comparison results from above analysis with those from SAR.
Project information:
- Code: ĐTCB.03/16/VKHKTHN
- Managerial Level: Ministry
- Allocated Fund: 380,000,000 VND
- Implementation time: 12 months (Jan 2016- Dec 2016)
- Contact email: [email protected]
- Paper published in related to the project:
1. Bui Thi Hoa, Hoang Tan Hung, Hoang Minh Giang; Safety Analyses of VVER-1200/V491
reactor for long term station blackout along with small LOCAs; J. Nuclear Science and
Technology, Vol.6, No 4, pp. 8-17, 2016.
2. Hoang Minh Giang, Hoang Tan Hung; A study on improvement of void Fraction Prediction in
saturated region for PSBT sub channel benchmark using ANSYS CFX 14.5; J.Science and
Technology, Hanoi University of Industry, No.40, pp. 28 -33, 2017.
VINATOM-AR 16--04
The Annual Report for 2016, VINATOM 41
2. APPROACH METHODOLOGY OF THE STUDY
The numerical simulation method is used to analyze performances of VVER-1200/V491
during hypothetic condition by using RELAP5 code. Simulation models in such case include steady
state operation of VVER-1200/V491 with full power condition and transient behavior of the reactor
in accident conditions. Simulation models are developed from VVER-1200/V491 input deck file for
RELAP5 code. To develop input deck, it requires specific data sources gathered and processed from
reliable documentations such as (a) Safety Analysis Report of Ninh Thuan 1 nuclear power plant
project at feasibility study stage (called FSSAR), (b) International Report of VVER-1000
benchmarks (Kozloduy VVER-1000/V320 [1], Kalinin VVER-1000/V338 [2]) and (c) VVER-
1000/V392 of Belene project. Based on these data sources, following issues are implemented:
- Understanding and analysis of desired specific data for input deck form FSSAR of Ninh
Thuan 1. Then, with reference to more detail data mentioned in chapters 7, chapter 7 of FSSAR, it
is established nodalization schemes and calculated that geometry characteristics, thermal hydraulics
properties for the elements of primary system (Reactor Coolant System), secondary system and
related safety system. It is noted that the RELAP5 input deck for VVER-1200/V491 (simulation
models) compose of several sub models such as (a) Hydro dynamics systems, (b) Heat structure
system, (c) Reactor kinetics input and (d) reactor control system. Desired data for development of
RELAP5 input deck are provided from corresponding chapters of FSSAR. However, several
specific data cannot be found in these chapters, then corresponding reference data will be used that
taken from other documents of VVERs[3];
- Performance of RELAP5 calculation of simulation models for steady state and transient
behavior according to selected scenario as mentioned above. Interesting results for steady state and
transient are extracted for safety analysis;
- Comparisons between calculated results and those from FSSAR for assessment of studied
simulation in steady state and also transient conditions. These comparisons are useful to verify
appropriateness of simulation given by the study.
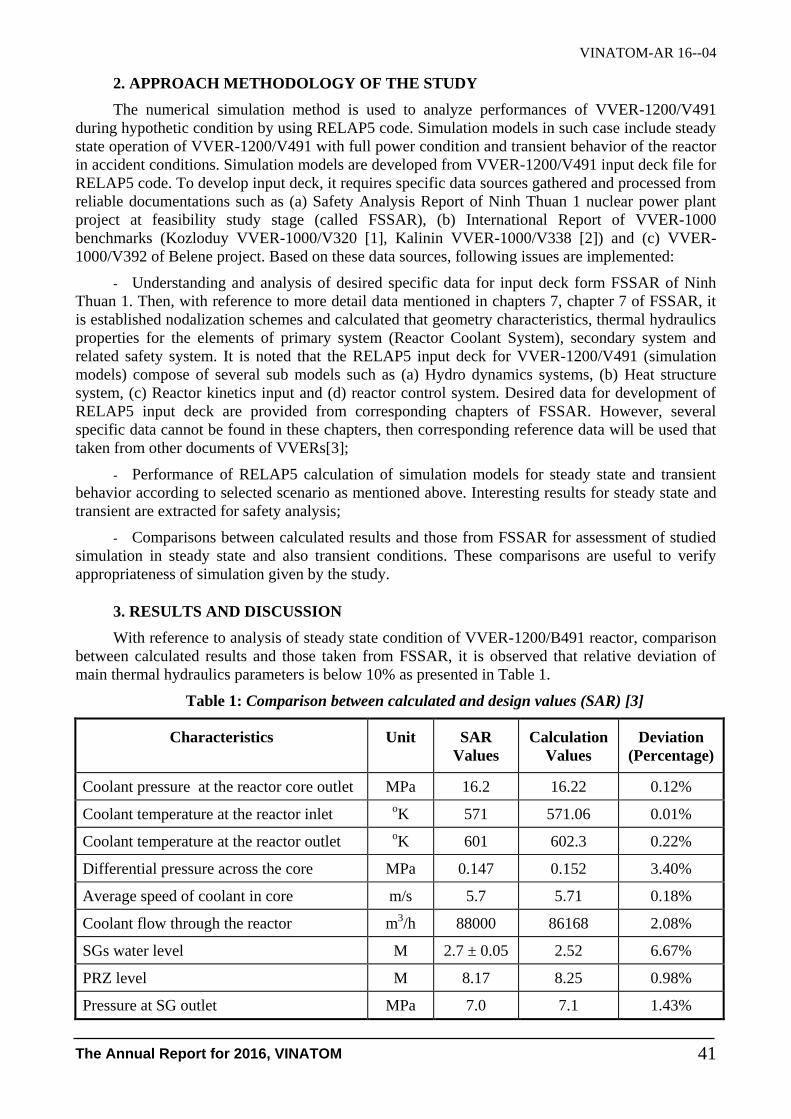
3. RESULTS AND DISCUSSION
With reference to analysis of steady state condition of VVER-1200/B491 reactor, comparison
between calculated results and those taken from FSSAR, it is observed that relative deviation of
main thermal hydraulics parameters is below 10% as presented in Table 1.
Table 1: Comparison between calculated and design values (SAR) [3]
Characteristics Unit SAR
Values
Calculation
Values
Deviation
(Percentage)
Coolant pressure at the reactor core outlet MPa 16.2
16.22 0.12%
Coolant temperature at the reactor inlet oK 571
571.06 0.01%
Coolant temperature at the reactor outlet oK 601
602.3 0.22%
Differential pressure across the core MPa 0.147 0.152 3.40%
Average speed of coolant in core m/s 5.7 5.71 0.18%
Coolant flow through the reactor m3/h 88000
86168 2.08%
SGs water level M 2.7 ± 0.05
2.52 6.67%
PRZ level M 8.17
8.25 0.98%
Pressure at SG outlet MPa 7.0
7.1 1.43%
VINATOM-AR 16--04
The Annual Report for 2016, VINATOM 42
For studying on LOCAs, several scenarios are analyzed with Design Base and Beyond Design
Base Conditions. As illustration, it is presented two scenarios belonging to LOCAs in Beyond
Design Base Condition which are considered more severe than LOCAs in Design Base Conditions.
These scenarios include small break of LOCAs along with failure of High Pressure Injection
System of ECCS and larger break of LOCAs along with failure of Low Pressure Injection System.
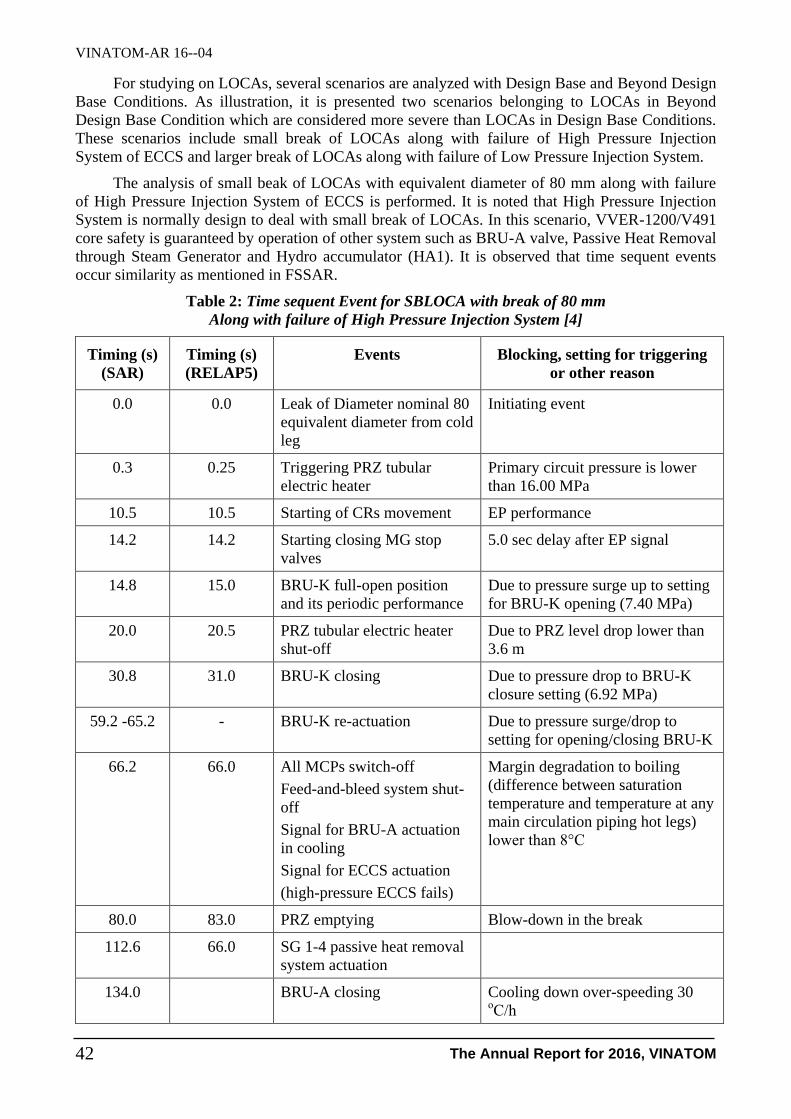
The analysis of small beak of LOCAs with equivalent diameter of 80 mm along with failure
of High Pressure Injection System of ECCS is performed. It is noted that High Pressure Injection
System is normally design to deal with small break of LOCAs. In this scenario, VVER-1200/V491
core safety is guaranteed by operation of other system such as BRU-A valve, Passive Heat Removal
through Steam Generator and Hydro accumulator (HA1). It is observed that time sequent events
occur similarity as mentioned in FSSAR.
Table 2: Time sequent Event for SBLOCA with break of 80 mm
Along with failure of High Pressure Injection System [4]
Timing (s)
(SAR)
Timing (s)
(RELAP5)
Events Blocking, setting for triggering
or other reason
0.0 0.0 Leak of Diameter nominal 80
equivalent diameter from cold
leg
Initiating event
0.3 0.25 Triggering PRZ tubular
electric heater
Primary circuit pressure is lower
than 16.00 MPa
10.5 10.5 Starting of CRs movement EP performance
14.2 14.2 Starting closing MG stop
valves
5.0 sec delay after EP signal
14.8 15.0 BRU-K full-open position
and its periodic performance
Due to pressure surge up to setting
for BRU-K opening (7.40 MPa)
20.0 20.5 PRZ tubular electric heater
shut-off
Due to PRZ level drop lower than
3.6 m
30.8 31.0 BRU-K closing Due to pressure drop to BRU-K
closure setting (6.92 MPa)
59.2 -65.2 - BRU-K re-actuation Due to pressure surge/drop to
setting for opening/closing BRU-K
66.2 66.0 All MCPs switch-off
Feed-and-bleed system shut-
off
Signal for BRU-A actuation
in cooling
Signal for ECCS actuation
(high-pressure ECCS fails)
Margin degradation to boiling
(difference between saturation
temperature and temperature at any
main circulation piping hot legs)
lower than 8°С
80.0 83.0 PRZ emptying Blow-down in the break
112.6 66.0 SG 1-4 passive heat removal
system actuation
134.0 BRU-A closing Cooling down over-speeding 30 оС/h
VINATOM-AR 16--04
The Annual Report for 2016, VINATOM 43
Timing (s)
(SAR)
Timing (s)
(RELAP5)
Events Blocking, setting for triggering
or other reason
151.2 300.0 MCP excursion completion
153.1 106.0 SG 1-4 passive heat removal
system reaching full power
In 40.0 sec after actuation
422.0 -
1550.0
433.0 ECCS tanks performance Primary circuit pressure drop lower
than 5.90 MPa
1168.0 1103.0 Starting boric solution supply
by ECCS low-pressure pumps
Primary circuit pressure drop by
2.50 MPa
1260.0 1383.0 Reactor pressure chamber
filling-up
Exceeding ECCS make-up flow
over break flow
1422.0 1403.0 Reactor collection chamber
filling-up
Exceeding ECCS make-up flow
over break flow
1543.0 2163.0 PRZ filling-up Exceeding make-up flow over
break flow
4000 4000 End of calculation
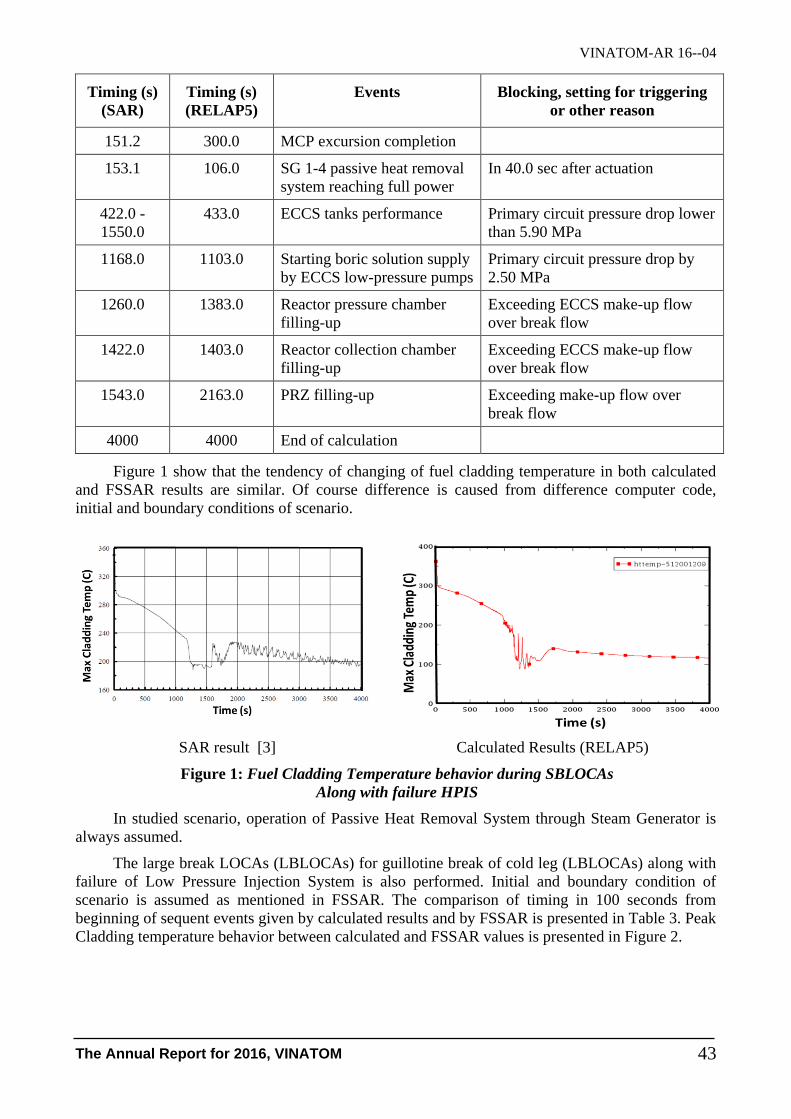
Figure 1 show that the tendency of changing of fuel cladding temperature in both calculated
and FSSAR results are similar. Of course difference is caused from difference computer code,
initial and boundary conditions of scenario.
SAR result [3] Calculated Results (RELAP5)
Figure 1: Fuel Cladding Temperature behavior during SBLOCAs
Along with failure HPIS
In studied scenario, operation of Passive Heat Removal System through Steam Generator is
always assumed.
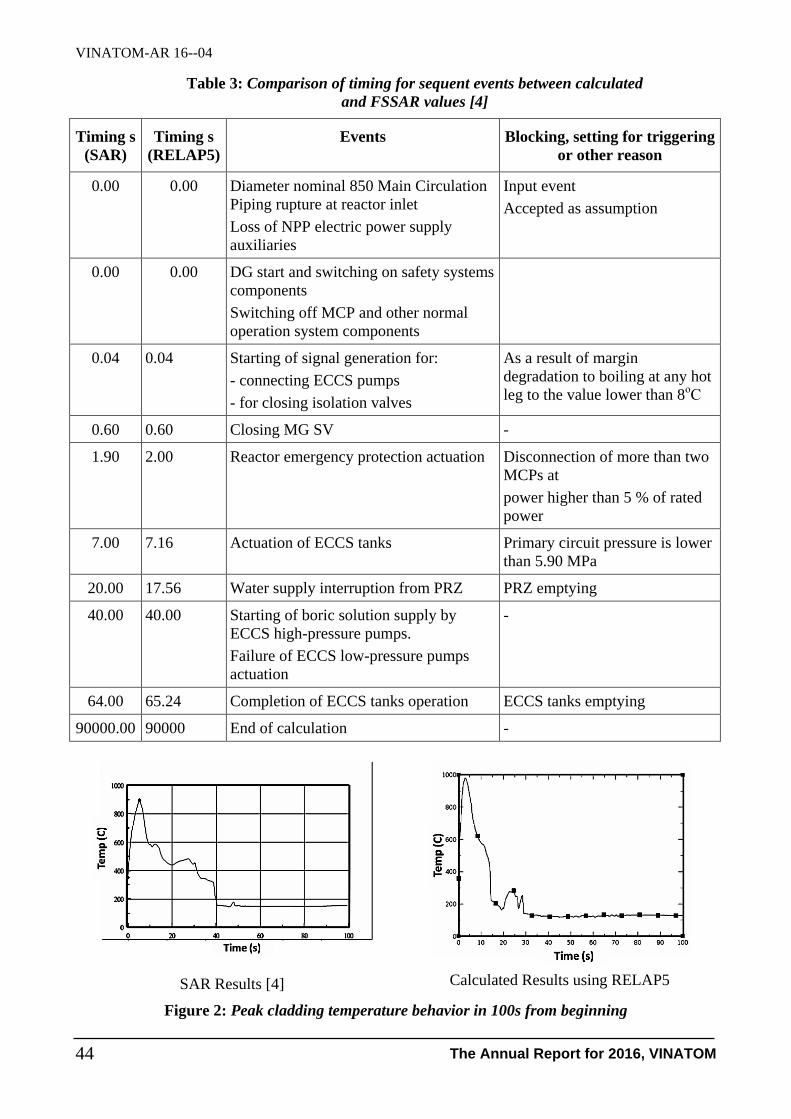
The large break LOCAs (LBLOCAs) for guillotine break of cold leg (LBLOCAs) along with
failure of Low Pressure Injection System is also performed. Initial and boundary condition of
scenario is assumed as mentioned in FSSAR. The comparison of timing in 100 seconds from
beginning of sequent events given by calculated results and by FSSAR is presented in Table 3. Peak
Cladding temperature behavior between calculated and FSSAR values is presented in Figure 2.
VINATOM-AR 16--04
The Annual Report for 2016, VINATOM 44
Table 3: Comparison of timing for sequent events between calculated
and FSSAR values [4]
Timing s
(SAR)
Timing s
(RELAP5)
Events Blocking, setting for triggering
or other reason
0.00 0.00 Diameter nominal 850 Main Circulation
Piping rupture at reactor inlet
Loss of NPP electric power supply
auxiliaries
Input event
Accepted as assumption
0.00 0.00 DG start and switching on safety systems
components
Switching off MCP and other normal
operation system components
0.04 0.04 Starting of signal generation for:
- connecting ECCS pumps
- for closing isolation valves
As a result of margin
degradation to boiling at any hot
leg to the value lower than 8оС
0.60 0.60 Closing MG SV -
1.90 2.00 Reactor emergency protection actuation Disconnection of more than two
MCPs at
power higher than 5 % of rated
power
7.00 7.16 Actuation of ECCS tanks Primary circuit pressure is lower
than 5.90 MPa
20.00 17.56 Water supply interruption from PRZ PRZ emptying
40.00 40.00 Starting of boric solution supply by
ECCS high-pressure pumps.
Failure of ECCS low-pressure pumps
actuation
-
64.00 65.24 Completion of ECCS tanks operation ECCS tanks emptying
90000.00 90000 End of calculation -
SAR Results [4] Calculated Results using RELAP5
Figure 2: Peak cladding temperature behavior in 100s from beginning
VINATOM-AR 16--04
The Annual Report for 2016, VINATOM 45
It is observed that, analysis of LOCAs given by RELAP5 in this study is similar to results
presented in FSSAR for VVER-1200/V491. For example, peak cladding temperature behavior in
both Figure 1 and Figure 2 show similar in both tendency behavior and values. So that simulation
models developed by this study through input deck file for RELAP5 is appropriate as desired.
Analysis also show that acceptance criteria for LACAs are satisfied such as maximum of peaking
cladding temperature is below 1200oC. Thus VVER-1200/V491 reactor core is confirmed safety in
such scenario of LOCAs with given assumptions as mentioned in FSSAR.
4. CONCLUSIONS AND FUTURE WORKS
It is concluded from results of the study that all requirements for this study are well reached
which include following issues:
- Development of VVER-1200/V491 simulation models (input deck file) for RELAP5 code;
- Analysis several scenario of LOCAs along with partly failure of ECCS for VVER-
1200/V491 reactor.
As mentioned above, it is observed that approach methodology is appropriate. Comparison of
calculation results and those given by FSSAR shows acceptable simulation models of this study.
Although the Ninh Thuan nuclear power project is stopped, the study on nuclear safety such
as safety analysis of thermal hydraulics in both design base and design extension conditions is also
benefit to understand severe accident management for any nuclear power plant built near Vietnam
boundary border.
REFERENCES
[1] NEA/NSC/DOC(2002)6, VVER-1000 Coolant Transient Benchmark, PHASE 1 (V1000CT-
1). Vol. I: Main Coolant Pump (MCP) switching On – Final. (June, 2002).
[2] NUREG/IA-0167 Assessment Study of RELAP5/MOD3.2 Based on the Kalinin NPP Unit-1
Stop of Feedwater Supply to the Steam Generator No. 4. (October,1999).
[3] Ninh Thuan Nuclear Power Project Management Board, NINH THUAN 1 NUCLEAR
POWER PLANT PROJECT, Feasibility Study, PART 1, Feasibility Study Description,
VOLUME 3, Specialized reports, Report 1, Feasibility Study Safety Analysis, Chapter 6
Description and conformance to the design of plant systems. Section 6.3 Reactor coolant and
associated systems. NT1.0-3.101-FS-01.03.01.06.02-rev02. (2015).
[4] Ninh Thuan Nuclear Power Project Management Board, NINH THUAN 1 NUCLEAR
POWER PLANT PROJECT, Feasibility Study, PART 1, Feasibility Study Description,
VOLUME 3, Specialized reports, Report 1, Feasibility Study Safety Analysis, Chapter 7
Safety analysis Section 7.5 Deterministic analysis Subsection 7.5.7 Consideration of design
capability for beyond design basis accidents. NT1.0-3.101-FS 01.03.01.07.05.07.00. (2015).
VINATOM-AR 16--05
The Annual Report for 2016, VINATOM 46
STUDYING THE POSSIBILITY OF USING MODELICA LANGUAGE TO
BUILD A MODEL OBJECT LIBRARY FOR THE CONTROL SYSTEM OF
DALAT RESEARCH REACTOR
Huynh Dong Phuong1, Cao Thanh Long
1 and Vo Tan Tai
2
1Center for Nuclear Techniques, Nguyen Trai - District 1 - Ho Chi Minh City 2Dalat Nuclear Research Institute, Nguyen Tu Luc – Dalat - Lamdong
Abstract: Modelica is an object – oriented programming language which has been being developed
for nearly twenty years and widely used in the solution of the modeling and simulation problems for
large and complex dynamic systems. Our project focused on studying the Modelica modeling
language, understanding the control system of Dalat Research Reactor and using Modelica to build an
experimental object model library for modeling and simulation of some typical modules in the control
system of the reactor. The project results have demonstrated that Modelica is a very good and efficient
tool for modeling and simulation problems of Dalat reactor control system.
Keywords: Modelica, Modeling, Simulation, Point Kinetics Equations, Control System, Dalat
Research Reactor, Object Model Library.
1. INTRODUCTION
The Dalat Research Reactor (DRR) which was reconstructed from the old Triga Mark-II
reactor and put into operation in 1984, has been in operation for more than 30 years. Its control
system had been upgraded twice in 1993 and 2007. In the second upgrade, the control system had
been changed from analog to digital. The reactor operation with the upgraded control system has
shown that it has been working quite well. However, after ten years of using the system, although
the DRR operational staff has gained much experience and been able to solve many problems
related to the operation of the system we still have not come to the state of fully understanding the
system. The digital design has made the control system more modular and helped to simplify the
data acquisition, operator interface, system diagnosis and fault analysis but it has also made it more
difficult to understand and troubleshoot because a great deal of system functions has now been
covered by the software codes built into the microcontrollers or microprocessors used in almost all
modules of the control system. The DRR staff has also realized that while the upgraded control
system has some advantages over the original analog system it has also revealed certain weakness
especially in exhibiting the instability during the start-up stage from shutdown of the reactor. A
possible explanation for that behavior is that in the new control system only two neutron flux
monitoring ranges have been implemented and the Source Range now has to cover a much wider
scale of neutron flux (from 3.0x10⁻⁸
– 3.0x10⁻¹
% of nominal power, Pnom) and as the consequence
Project information:
- Code: CS/16/02-01
- Managerial Level: Institute
- Allocated Fund: 100,000,000 VND
- Implementation time: 18 months (Jan 2016- Jun 2017)
- Contact email: [email protected]
- Paper published in related to the project:
Huynh Dong Phuong, Cao Thanh Long; Application of Modelica language for the accurate
solution of the reactor point kinetic equations; 12thNational Conference on Nuclear Science
and Technology, Nha Trang City, August 2017, 9 p.
VINATOM-AR 16--05
The Annual Report for 2016, VINATOM 47
at very low power the neutron density measured by the detectors would fluctuate very much.
Because the software program of the microcontrollers is used to calculate the flux data that in turn
the calculated data will be used to determine reactor power and period, very natural questions are
how the program was designed and if the best data processing algorithm had been used to reduce
the fluctuations of neutron density. Because the control system has been designed, built and
installed completely by a Russian company with very limited involvement of DRR staff, those
questions will never have an answer unless a very special agreement is reached with the Russian
supplier. With a reality that it will be not possible to have such an agreement, if the DRR’s life will
be extended for many years more or if a new research reactor will be built we need to find another
approach to understand the system. Because the system has been being under continuous operation
and we do not have enough spare modules to setup a separate prototype of the system for our study,
the only possible approach is trying to model and simulate the system using computer modeling and
simulation tools. This led to a requirement of finding and acquiring an effective and good tool set
for modeling and simulation problem. After extensive documents and software reviews we have
come up with the selection of Modelica as a modeling language and OpenModelica as modeling
and simulation tool set for the experiment with the problem. The language has been used
extensively and effectively in modeling many types of dynamic systems, especially in aviation and
automobile industries. In this report we will briefly present what we have done to understand the
language, study the functionalities of DRR control system modules and demonstrate that the
language and tool set we have chosen are very suitable for the modeling and simulation of the
control system modules.
2. METHOD
Modelica is a new modeling language which is very different from other conventional
programming languages. It has been designed specifically for modeling and simulation problems.
Being the so-called equation based modeling language, with Modelica, the modeler will be mainly
focusing on the physics equations that govern the dynamic systems without worrying much about
how the equations will be solved. We have studied the language from scratch using an open source
modeling tool called OpenModelica from Open Source Modelica Consortium. The first thing we
had to do to confirm that Modelica could be used for modeling modules of reactor control systems
was to verify if it could solve the Reactor Point Kinetic Equations (PKE) accurately. This was very
essential because if Modelica was not able to do this job well, its use for modeling the reactor
control system which has been designed based on the point model of the reactor would be very
limited. We have built models in Modelica to solve the PKE and tested the models with many well
documented PKE benchmark problems. The models could be used to solve the PKE in many
different cases of reactivity insertion to several types of thermal and fast reactors, with and without
temperature feedback. From the comparison between our simulation results and the benchmark data
it has been concluded that PKE Modelica models we have built could solve the PKE very accurately
for all the benchmark problems.
We have been working intensively with the DRR Instrumentation and Control (I&C) group to
gain understanding about the current control system of the reactor. The control system has been
designed and built by a Russian company and functioning like a digital control system. With the
effective help of the DRR group we have dug deeply into many kinds of technical documents,
operation reports, spent much time with direct discussions and finally we have been able to
understand the design and functionalities of the modules in the control system and how they have
been combined to form the complete control system. The flow of information/data within the
system and between the system and other related systems of the reactor has also been well
understood.

VINATOM-AR 16--05
The Annual Report for 2016, VINATOM 48
Based on what we have learnt about the Dalat reactor control system we have been able to
build a first technical database for the modules of the system. The data in the database have been
used directly in our work of building model object library for some typical modules of the reactor
control system. As mentioned in our final project report, because of the heavy work which needed
to be done, the job to build the complete library for all modules in the control system would require
a project much larger than the project we have just finished. What we have been trying to do with
this project was to show that Modelica was very suitable for application in modeling and simulation
of the reactor control system. We have done our best to select some typical modules of the control
system and used Modelica to build the object model library for them. As we have demonstrated in
our final report, the results obtained from our experiments with the experimental object library were
satisfactory. Detailed discussions about Modelica language, DRR control system, application of
Modelica language in building experimental modeling object library for typical modules of DRR
control system can be found in the final Project Report [25].
3. RESULTS AND DISCUSSION
We have been able to build PKE Modelica models to solve the PKE and successfully tested
the models with many benchmark problems given in the references. The detailed comparisons have
showed excellent agreement between our simulated results and benchmark data. We were able to
reproduce the benchmark results for all of the benchmark cases with the accuracy up to ninth digit
after the decimal point. In some very rare cases the exact matching can still extend to eighth digit.
We believe that PKE models are very good to use in the modeling problem of the control system as
they will provide very accurate reactor power variation in the reactor as the results of reactivity
insertion of various forms. As an example, we are showing in the following the comparison
between benchmark data [10] and results of our PKE model calculation for a thermal reactor with
step reactivity insertion of 1.0$, 1.5$ and 2.0$ with temperature coefficient of 2.5E-6. The
comparison shows that the results of PKE models and benchmark cases are in excellent agreement,
up to 9th
digit after the decimal point.
Table 1: Comparison between Modelica PKE model calculation and benchmark results
Time(s) Neut. Density, = 1.0$ with TF, TR3 Neut. Density, = 1.5$ with TF, TR3
Benchmark Calculation Benchmark Calculation
0.0 1.000000000E+00 1.000000000E+00 1.000000000E+00 1.000000000E+00
10.0 1.320385964E+02 1.320385964E+02 1.079116832E+02 1.079116832E+02
20.0 5.169986095E+01 5.169986095E+01 4.160428128E+01 4.160428128E+01
30.0 2.817468536E+01 2.817468536E+01 2.329893150E+01 2.329893150E+01
40.0 1.814633000E+01 1.814633000E+01 1.530342749E+01 1.530342749E+01
50.0 1.277957703E+01 1.277957703E+01 1.089014315E+01 1.089014315E+01
60.0 9.474932501E+00 9.474932501E+00 8.101031859E+00 8.101031859E+00
70.0 7.244477494E+00 7.244477494E+00 6.182690459E+00 6.182690459E+00
80.0 5.646289700E+00 5.646289700E+00 4.793307820E+00 4.793307820E+00
90.0 4.456834255E+00 4.456834255E+00 3.755614629E+00 3.755614629E+00
100.0 3.550102766E+00 3.550102766E+00 2.966074952E+00 2.966074952E+00

VINATOM-AR 16--05
The Annual Report for 2016, VINATOM 49
Time(s) Neut. Density, = 2.0$ with TF, TR3
Benchmark Calculation
0.0 1.000000000E+00 1.000000000E+00
10.0 1.033808535E+02 1.033808535E+02
20.0 3.913886903E+01 3.913886903E+01
30.0 2.200377721E+01 2.200377721E+01
40.0 1.449367193E+01 1.449367193E+01
0.0 1.031861108E+01 1.031861108E+01
60.0 7.663319203E+00 7.663319203E+00
70.0 5.829395378E+00 5.829395378E+00
80.0 4.499427073E+00 4.499427073E+00
90.0 3.507422663E+00 3.507422663E+00
100.0 2.755126886E+00 2.755126886E+00
Figure 1: Modelica PKE calculation results
A technical database for the main modules of the control system of DRR has been built. The
database contains data for all modules of the control system including UDPN-27R1 module for
detection and measurement of neutron flux; BPM-107R1 module for neutron signal processing,
calculating reactor power and period, generating warning/emergency signals about reactor power
and period; BPM-108R1 module for technological systems signal processing, generating of warning
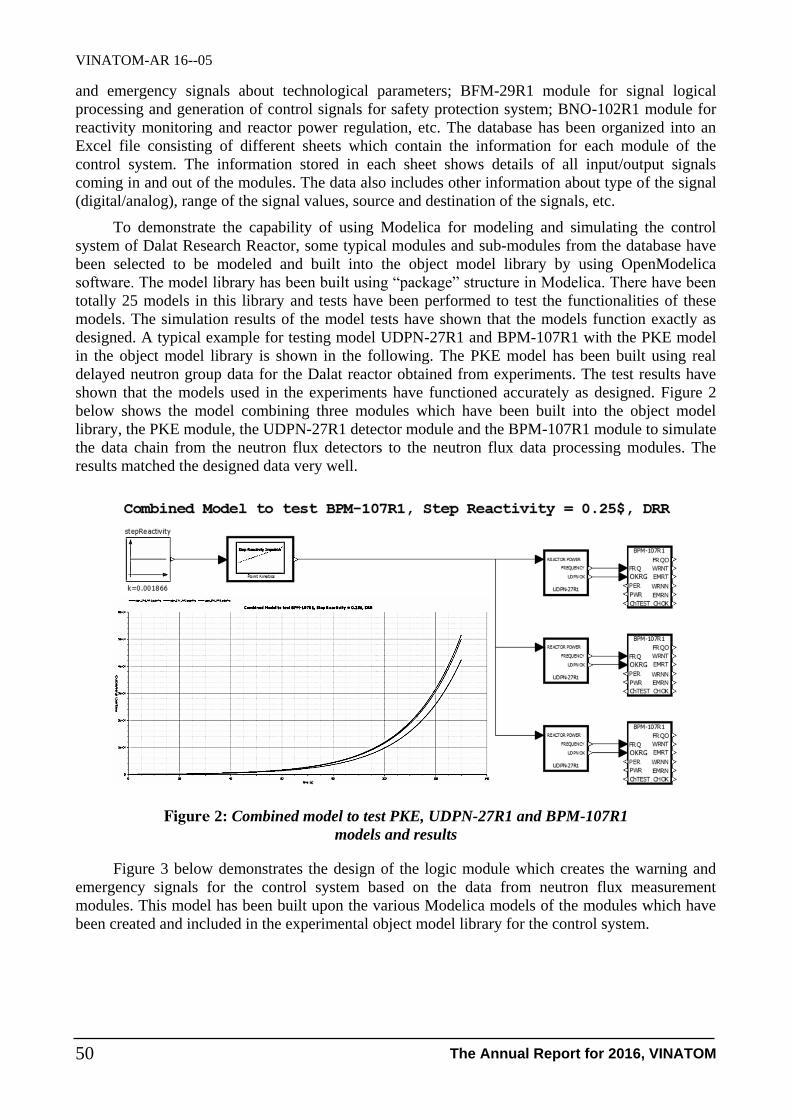
VINATOM-AR 16--05
The Annual Report for 2016, VINATOM 50
and emergency signals about technological parameters; BFM-29R1 module for signal logical
processing and generation of control signals for safety protection system; BNO-102R1 module for
reactivity monitoring and reactor power regulation, etc. The database has been organized into an
Excel file consisting of different sheets which contain the information for each module of the
control system. The information stored in each sheet shows details of all input/output signals
coming in and out of the modules. The data also includes other information about type of the signal
(digital/analog), range of the signal values, source and destination of the signals, etc.
To demonstrate the capability of using Modelica for modeling and simulating the control
system of Dalat Research Reactor, some typical modules and sub-modules from the database have
been selected to be modeled and built into the object model library by using OpenModelica
software. The model library has been built using “package” structure in Modelica. There have been
totally 25 models in this library and tests have been performed to test the functionalities of these
models. The simulation results of the model tests have shown that the models function exactly as
designed. A typical example for testing model UDPN-27R1 and BPM-107R1 with the PKE model
in the object model library is shown in the following. The PKE model has been built using real
delayed neutron group data for the Dalat reactor obtained from experiments. The test results have
shown that the models used in the experiments have functioned accurately as designed. Figure 2
below shows the model combining three modules which have been built into the object model
library, the PKE module, the UDPN-27R1 detector module and the BPM-107R1 module to simulate
the data chain from the neutron flux detectors to the neutron flux data processing modules. The
results matched the designed data very well.
Figure 2: Combined model to test PKE, UDPN-27R1 and BPM-107R1
models and results
Figure 3 below demonstrates the design of the logic module which creates the warning and
emergency signals for the control system based on the data from neutron flux measurement
modules. This model has been built upon the various Modelica models of the modules which have
been created and included in the experimental object model library for the control system.
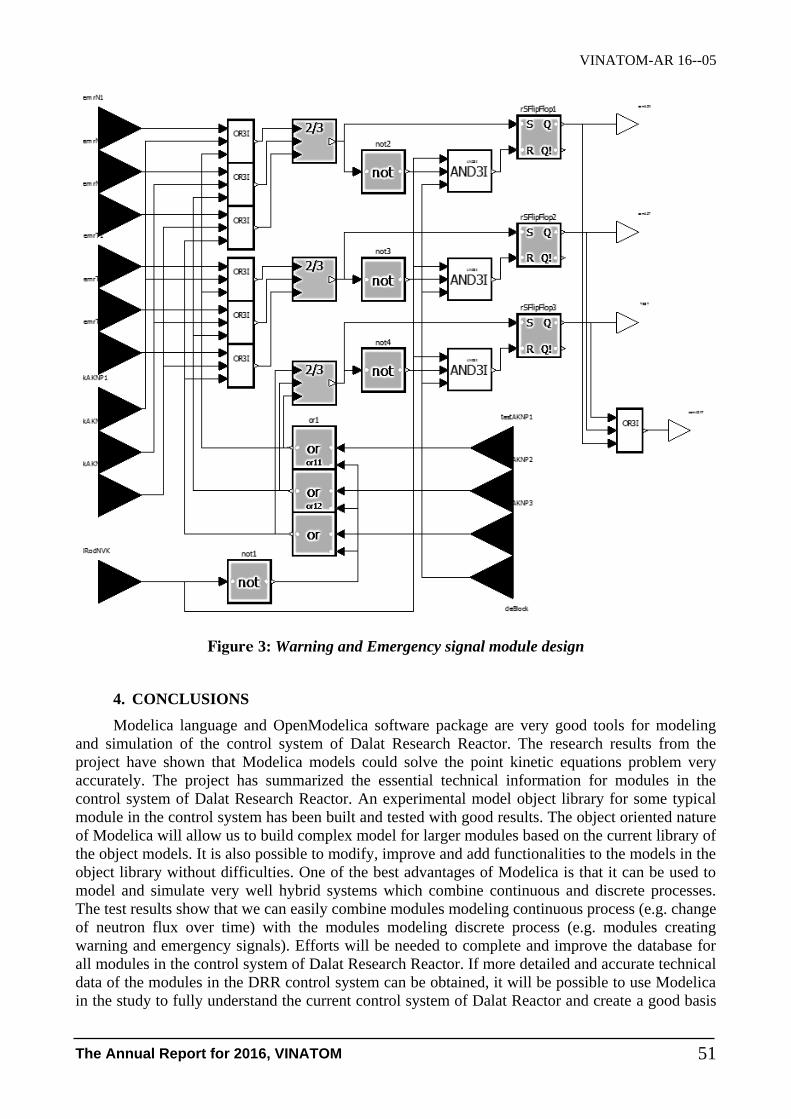
VINATOM-AR 16--05
The Annual Report for 2016, VINATOM 51
Figure 3: Warning and Emergency signal module design
4. CONCLUSIONS
Modelica language and OpenModelica software package are very good tools for modeling
and simulation of the control system of Dalat Research Reactor. The research results from the
project have shown that Modelica models could solve the point kinetic equations problem very
accurately. The project has summarized the essential technical information for modules in the
control system of Dalat Research Reactor. An experimental model object library for some typical
module in the control system has been built and tested with good results. The object oriented nature
of Modelica will allow us to build complex model for larger modules based on the current library of
the object models. It is also possible to modify, improve and add functionalities to the models in the
object library without difficulties. One of the best advantages of Modelica is that it can be used to
model and simulate very well hybrid systems which combine continuous and discrete processes.
The test results show that we can easily combine modules modeling continuous process (e.g. change
of neutron flux over time) with the modules modeling discrete process (e.g. modules creating
warning and emergency signals). Efforts will be needed to complete and improve the database for
all modules in the control system of Dalat Research Reactor. If more detailed and accurate technical
data of the modules in the DRR control system can be obtained, it will be possible to use Modelica
in the study to fully understand the current control system of Dalat Reactor and create a good basis

VINATOM-AR 16--05
The Annual Report for 2016, VINATOM 52
for the design of I&C system for the new research reactor. Future research should also include the
study on the capability of using Modelica and its associated libraries like ThermoPower and
ThermoSysPro to model and simulate the thermal hydraulics problem for the reactor and the
coupling between neutron PKE model and thermal hydraulics problem.
REFERENCES
[1] Peter Fritzson, “Principles of Object-Oriented Modeling and Simulation with Modelica 3.3: A
Cyber Physical Approach”, IEEE Press, Wiley, 2015.
[2] https://www.modelica.org/
[3] “Modelica Language Specification, Version 3.3”, Modelica Association, 2012.
[4] M. Tiller. “Modelica by Example”, Internet book, 2015.
[5] “OpenModelica User’s Guide”, Open Source Modelica Consortium, 2016.
[6] https://www.openmodelica.org/
[7] Peter Fritzson, F. Pazdera, “Introduction to Modeling and Simulation of Technical and
Physical Systems with Modelica”, A John Wiley & Sons, Inc., Publication, 2011.
[8] J.A.W. da Nóbrega, “A New Solution of the Point Kinetics Equations”, Nuclear Science and
Engineering, 46, 1971, 366-375.
[9] A. A. Nahla. “Fundamental Matrix Method for the Reactor Kinetics equations of multi-group
of delayed neutron”, Proceeding of 2nd International Conference on Mathematics and
Information Sciences, 9-13 Nov. 2011, Sohag, Egypt.
[10] B.D. Ganapol. “A highly accurate algorithm for the solution of the point kinetics equations”,
Annals of Nuclear Energy, 62, 2013,564-571.
[11] B. Ganapol, P. Picca, A. Previti, D. Mostacci, “The Solution of the point kinetics equations via
Converged Accelerated Taylor Series (CATS)”, Conference Paper, PHYSOR 2012 –
Advances in Reactor Physics – Linking Research, Industry and Education, 2012,19 pages.
[12] X. Yang, T. Jevremovic, “Revisiting The Rosenbrock Numerical Solutions of the Reactor
Point Kinetics Equation with Numerous Examples”, Nuclear Technology & Radiation
Protection, 24, 2009,3-12.
[13] A. E. Aboanber, A. A. Nahla, “On Padé Approximations to the Exponential Function and
Application to the Point Kinetics Equations”, Progress in Nuclear Energy, 44(4), 2004,347-
368.
[14] S. Q. Bogado Leite et al., “Solution of the point reactor kinetics equations with temperature
feedback by the ITS2 method”, Progress in Nuclear Energy, 91, 2016, 240-249.
[15] Sudhansu S. SINGH, Dinakrushna MOHAPATRA, “Solution of the Reactor Kinetics
Equations by MATLAB Computing”, Nuclear Technology & Radiation Protection, 30(1),
2015, 11-17.
[16] Sara Boarin et al., “Object-Oriented Modeling and simulation of a TRIGA reactor plant with
Dymola”, Energy Pocedia, 101, 2016,42-49.
[17] Oak Ridge National Laboratory, “Update on Small Modular Reactors Dynamic System
Modeling Tool – Molten-Salt-Cooled Architecture”, ORNL/TM-2014/332,2014.
[18] A. C. Cammi et al., “New Modeling Strategy for IRIS Dynamic Response Simulation”,
Conference paper, 5th International Conference on Nuclear Option in Countries with Small
and Medium Electricity Grids, Dubrovnik, Croatia, May 16-20, 2004.
[19] A. Cammi et al., “Control System Design for SMRs and New Generation Reactors”, Technical
Meeting on “Instrumentation and Control in Advanced Small and medium-sized Reactors
(SMRs)”, Vienna, 2013.

VINATOM-AR 16--05
The Annual Report for 2016, VINATOM 53
[20] R. Hale et al., “Dynamic Modeling of Small Modular Nuclear Reactors using MODSIM”,
Proceedings of the 10th International Modelica Conference, 989-998, March 10-12, 2014,
Lund, Sweden.
[21] SNIIP – Systematom Co., “Complex of Equipment for Control and Protection System ASUZ-
14R”, Operating Manual RUNK.506319.004 RE-E, 2006.
[22] Nguyen Nhi Dien, “Safety Analysis Report for Dalat Nuclear Reactor”, Nuclear Research
Institute, VINATOM, Dalat, 2007.
[23] Trinh Dinh Hai, “Mastering the new control system of Dalat Nuclear Reactor” (in
Vietnamese), Final 2008 institutional project report. Nuclear Research Institute, Dalat,
VINATOM, 2011.
[24] Trinh Dinh Hai, “Understanding the new control system of Dalat Nuclear Reactor (part of
reactor operation and maintenance assignments, 2011)” (in Vietnamese), Final task report,
Nuclear Research Institute, Dalat, VINATOM, 2012.
[25] Huynh Dong Phuong, Cao Thanh Long, Final Research Project Report(in Vietnamese, project
code CS/16/02 – 01), Center for Nuclear Techniques, VINATOM, Ho Chi Minh City, 2017.


1. 3- Instrumentation,Nuclear Electronics


VINATOM-AR 16--06
The Annual Report for 2016, VINATOM
57
RESEARCH AND DESIGN OF THE MOVING SYSTEM FOR THE
COBALT-60 INDUSTRIAL IRRADIATOR VINAGA2
Le Minh Tuan, Tran Khac An, Nguyen Ngoc Phuong, Tran Van Hung, Cao Van Chung,
Phan Phuoc Thang, Ha Thanh Viet, Nguyen Thanh Cuong and Nguyen Duc Hoa
Research and Development Center for Radiation Technology
Abstract: On the way of localization of Cobalt-60 industrial irradiators, Research and Development
Center for Radiation Technology (VINAGAMMA) has successfully designed and manufactured the
first version of Co-60 industrial irradiator, VINAGA1. The second version of Co-60 industrial
irradiator has been studied and designed by VINAGAMMA in the frame of the scientific project No.
ĐTCB.02/15/TTNCTK. The main system of a Co-60 industrial irradiator is a mechanical system
inside an irradiation room namely a tote box moving system. This report presents the tote box moving
system of VINAGA2 designed by VINAGAMMA. The tote box moving system contains 52 tote
boxes with the dimensions of 50 cm (w) × 70 cm (l) × 150 cm (h) that are moving around the source
racks in the manner of 4 passes and 2 levels. The irradiator VINAGA2 with this tote box moving
system has good specifications: The minimum time of an irradiation cycle is 1h 20 min. and the dose
uniformity ratio (DUR) at the product densities of 0.1 g/cm3 and 0.5 g/cm
3 is 1.4 and 1.8, respectively.
Radiation energy utilization efficiency at the product densities of 0.1 g/cm3 and 0.5 g/cm
3 is 19.7% and
48.8%, respectively. These specifications meet the requirements for a multi-purpose Co-60 industrial
irradiator and the present irradiation requirements in Vietnam.
Keyword: Tote box moving system, irradiator, cobalt-60, density, dose uniformity ratio (DUR).
1. INTRODUCTION
The first Cobalt-60 semi-industrial irradiator in Vietnam has been put into operation in 1991.
Nowadays, Vietnam has 9 industrial irradiators: 2 accelerators and 7 Co-60 irradiators. These Co-60
industrial irradiators are supplied by Hungary (5), by the Russia (1) and by China (1) [1]. With the
development of the national economics, the demand of sterilization of medical products and food
processing is increased. The localization of Co-60 industrial irradiator is a market requirement for
the development of irradiation processing technology in the country.
In order to develop the applications of radiation technology in the national economics,
VINAGAMMA has the orientation of design and manufacture of multi-purpose cobalt-60 industrial
irradiators. In this development way, VINAGAMMA has designed and constructed the first version
of multi-purpose Co-60 industrial irradiator, VINAGA1. This irradiator has some advanced
features over imported Co-60 industrial irradiators. VINAGA1 will be installed at Da Nang
irradiation center of Vietnam Atomic Energy Institute (VAEI).
Project information:
- Code: ĐTCB.02/15/TTNCTK
- Managerial Level: Ministry
- Allocated Fund: 470,000,000 VND
- Implementation time: 24 months (Jan 2015- Dec 2016)
- Contact email: [email protected]
- Paper published in related to the project:
Le Minh Tuan, Tran Khac An, Cao Van Chung, Phan Phuoc Thang; Research and design of the
moving system for the cobalt-60 industrial irradiator; Nuclear Science and Technology, Vol.6,
No.3, pp. 31-39, 2016.
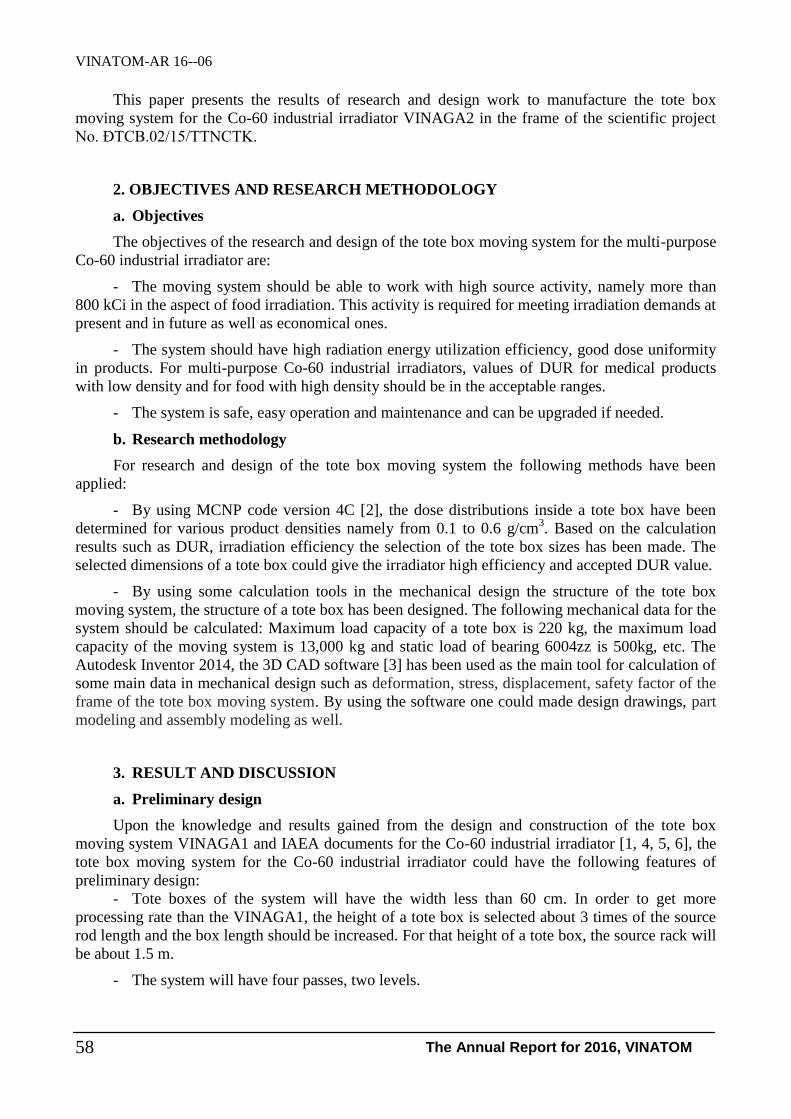
VINATOM-AR 16--06
The Annual Report for 2016, VINATOM
58
This paper presents the results of research and design work to manufacture the tote box
moving system for the Co-60 industrial irradiator VINAGA2 in the frame of the scientific project
No. ĐTCB.02/15/TTNCTK.
2. OBJECTIVES AND RESEARCH METHODOLOGY
a. Objectives
The objectives of the research and design of the tote box moving system for the multi-purpose
Co-60 industrial irradiator are:
- The moving system should be able to work with high source activity, namely more than
800 kCi in the aspect of food irradiation. This activity is required for meeting irradiation demands at
present and in future as well as economical ones.
- The system should have high radiation energy utilization efficiency, good dose uniformity
in products. For multi-purpose Co-60 industrial irradiators, values of DUR for medical products
with low density and for food with high density should be in the acceptable ranges.
- The system is safe, easy operation and maintenance and can be upgraded if needed.
b. Research methodology
For research and design of the tote box moving system the following methods have been
applied:
- By using MCNP code version 4C [2], the dose distributions inside a tote box have been
determined for various product densities namely from 0.1 to 0.6 g/cm3. Based on the calculation
results such as DUR, irradiation efficiency the selection of the tote box sizes has been made. The
selected dimensions of a tote box could give the irradiator high efficiency and accepted DUR value.
- By using some calculation tools in the mechanical design the structure of the tote box
moving system, the structure of a tote box has been designed. The following mechanical data for the
system should be calculated: Maximum load capacity of a tote box is 220 kg, the maximum load
capacity of the moving system is 13,000 kg and static load of bearing 6004zz is 500kg, etc. The
Autodesk Inventor 2014, the 3D CAD software [3] has been used as the main tool for calculation of
some main data in mechanical design such as deformation, stress, displacement, safety factor of the
frame of the tote box moving system. By using the software one could made design drawings, part
modeling and assembly modeling as well.
3. RESULT AND DISCUSSION
a. Preliminary design
Upon the knowledge and results gained from the design and construction of the tote box
moving system VINAGA1 and IAEA documents for the Co-60 industrial irradiator [1, 4, 5, 6], the
tote box moving system for the Co-60 industrial irradiator could have the following features of
preliminary design:
- Tote boxes of the system will have the width less than 60 cm. In order to get more
processing rate than the VINAGA1, the height of a tote box is selected about 3 times of the source
rod length and the box length should be increased. For that height of a tote box, the source rack will
be about 1.5 m.
- The system will have four passes, two levels.
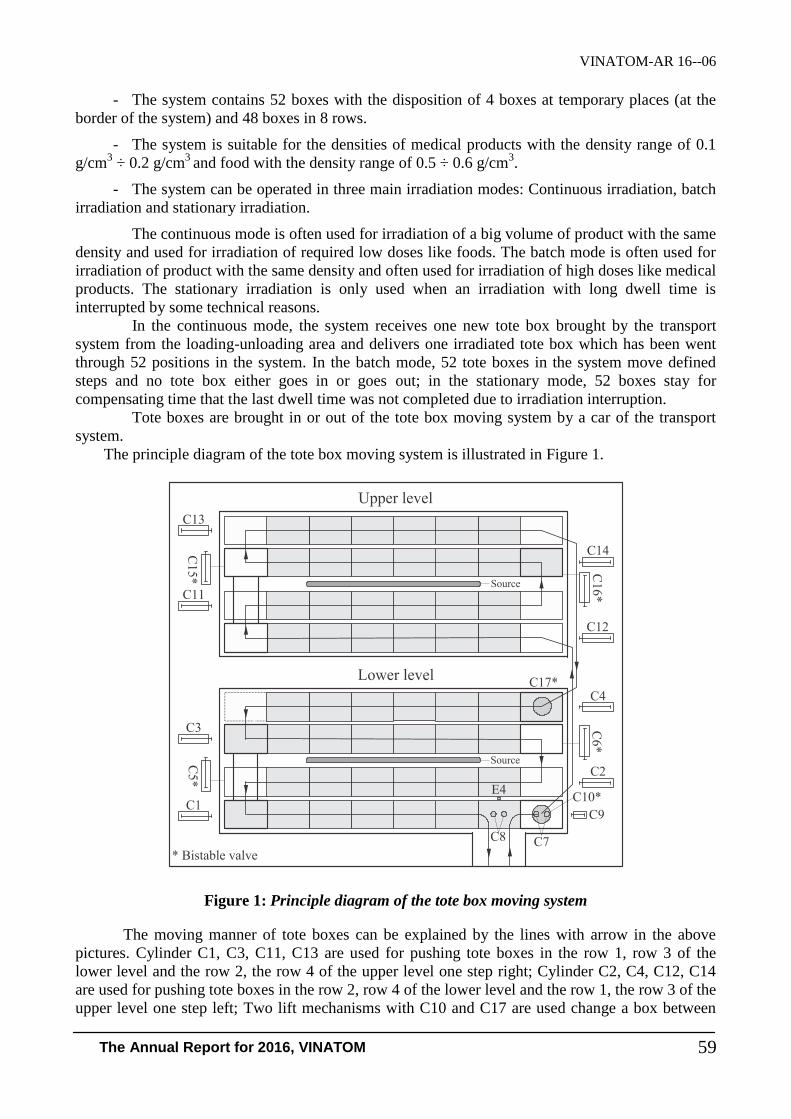
VINATOM-AR 16--06
The Annual Report for 2016, VINATOM
59
- The system contains 52 boxes with the disposition of 4 boxes at temporary places (at the
border of the system) and 48 boxes in 8 rows.
- The system is suitable for the densities of medical products with the density range of 0.1
g/cm3 ÷ 0.2 g/cm
3 and food with the density range of 0.5 ÷ 0.6 g/cm
3.
- The system can be operated in three main irradiation modes: Continuous irradiation, batch
irradiation and stationary irradiation.
The continuous mode is often used for irradiation of a big volume of product with the same
density and used for irradiation of required low doses like foods. The batch mode is often used for
irradiation of product with the same density and often used for irradiation of high doses like medical
products. The stationary irradiation is only used when an irradiation with long dwell time is
interrupted by some technical reasons.
In the continuous mode, the system receives one new tote box brought by the transport
system from the loading-unloading area and delivers one irradiated tote box which has been went
through 52 positions in the system. In the batch mode, 52 tote boxes in the system move defined
steps and no tote box either goes in or goes out; in the stationary mode, 52 boxes stay for
compensating time that the last dwell time was not completed due to irradiation interruption.
Tote boxes are brought in or out of the tote box moving system by a car of the transport
system.
The principle diagram of the tote box moving system is illustrated in Figure 1.
Figure 1: Principle diagram of the tote box moving system
The moving manner of tote boxes can be explained by the lines with arrow in the above
pictures. Cylinder C1, C3, C11, C13 are used for pushing tote boxes in the row 1, row 3 of the
lower level and the row 2, the row 4 of the upper level one step right; Cylinder C2, C4, C12, C14
are used for pushing tote boxes in the row 2, row 4 of the lower level and the row 1, the row 3 of the
upper level one step left; Two lift mechanisms with C10 and C17 are used change a box between
VINATOM-AR 16--06
The Annual Report for 2016, VINATOM
60
two levels; C5, C15, C6, C16 are used to change a box between rows; C8 is used for unlock a box
on the car; C9 is used to prevent a box moving over right in the lift C10 when C1 pushes boxes in
the first row one step right [7].
In order to increase the processing rate of the irradiator using the tote box moving system, it
is predetermined that the height of a tote box is 150 cm with the useful height of 140 cm, the length
of a tote box is 70 cm with the useful length of 66 cm and the width of a tote box should be chosen
among three assuming values, namely 45, 50 and 55 cm with the useful widths of 41, 46 and 51 cm,
respectively.
b. Calculation of physical parameters of the tote box moving system
For a multi-purpose Co-60 industrial irradiator two main physical parameters should be
determined, namely dose uniformity ratio (DUR) and radiation energy utilization efficiency
(hereinafter called efficiency) for various densities of product.
These parameters can be calculated if dose mapping data for various densities of product are
known. The dose mapping data inside a tote box can be known by experimental measurement or by
theoretical calculation. In our case the calculation is carried out by using MCNP code version 4C
[2].
Absorbed doses of 63 cells of MCNP code inside a tote box with different dimensions and
different densities of product have been calculated. There are three cases of tote box dimensions,
namely (45 cm × 70 cm × 150 cm) (Case 1), (50 cm × 70 cm × 150 cm) (Case 2), (55 cm × 70 cm ×
150 cm) (Case 3). The densities of product loaded in tote boxes are 0.1, 0.2, 0.3, 0.4, 0.5 and 0.6
g/cm3.
Dose calculations are carried out for the source activity of 800 kCi. It takes 1 hour of
computer running time for dose calculation of a point. Figure 2 presents the dose calculation points
inside a tote box.
Figure 2: Dose calculation points inside a tote box
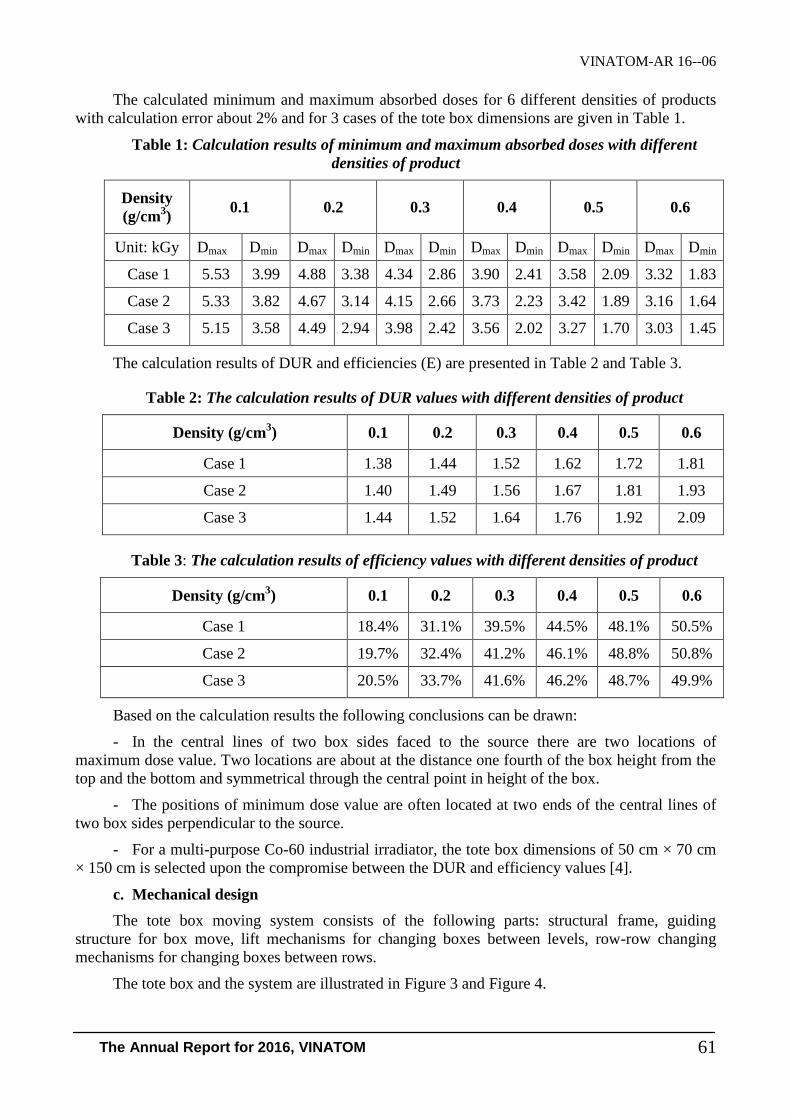
VINATOM-AR 16--06
The Annual Report for 2016, VINATOM
61
The calculated minimum and maximum absorbed doses for 6 different densities of products
with calculation error about 2% and for 3 cases of the tote box dimensions are given in Table 1.
Table 1: Calculation results of minimum and maximum absorbed doses with different
densities of product
Density
(g/cm3)
0.1 0.2 0.3 0.4 0.5 0.6
Unit: kGy Dmax Dmin Dmax Dmin Dmax Dmin Dmax Dmin Dmax Dmin Dmax Dmin
Case 1 5.53 3.99 4.88 3.38 4.34 2.86 3.90 2.41 3.58 2.09 3.32 1.83
Case 2 5.33 3.82 4.67 3.14 4.15 2.66 3.73 2.23 3.42 1.89 3.16 1.64
Case 3 5.15 3.58 4.49 2.94 3.98 2.42 3.56 2.02 3.27 1.70 3.03 1.45
The calculation results of DUR and efficiencies (E) are presented in Table 2 and Table 3.
Table 2: The calculation results of DUR values with different densities of product
Density (g/cm3) 0.1 0.2 0.3 0.4 0.5 0.6
Case 1 1.38 1.44 1.52 1.62 1.72 1.81
Case 2 1.40 1.49 1.56 1.67 1.81 1.93
Case 3 1.44 1.52 1.64 1.76 1.92 2.09
Table 3: The calculation results of efficiency values with different densities of product
Density (g/cm3) 0.1 0.2 0.3 0.4 0.5 0.6
Case 1 18.4% 31.1% 39.5% 44.5% 48.1% 50.5%
Case 2 19.7% 32.4% 41.2% 46.1% 48.8% 50.8%
Case 3 20.5% 33.7% 41.6% 46.2% 48.7% 49.9%
Based on the calculation results the following conclusions can be drawn:
- In the central lines of two box sides faced to the source there are two locations of
maximum dose value. Two locations are about at the distance one fourth of the box height from the
top and the bottom and symmetrical through the central point in height of the box.
- The positions of minimum dose value are often located at two ends of the central lines of
two box sides perpendicular to the source.
- For a multi-purpose Co-60 industrial irradiator, the tote box dimensions of 50 cm × 70 cm
× 150 cm is selected upon the compromise between the DUR and efficiency values [4].
c. Mechanical design
The tote box moving system consists of the following parts: structural frame, guiding
structure for box move, lift mechanisms for changing boxes between levels, row-row changing
mechanisms for changing boxes between rows.
The tote box and the system are illustrated in Figure 3 and Figure 4.

VINATOM-AR 16--06
The Annual Report for 2016, VINATOM
62
Figure 3: A tote box of the moving system
Figure 4: The tote box moving system

VINATOM-AR 16--06
The Annual Report for 2016, VINATOM
63
A tote box consists of a base, a rectangular frame, box covers and 4 bearings. The box base is
made of 304 stainless steel, rectangular frame is made of box stainless steel with the sizes of 50 cm
(w) × 70 cm (l) × 150 cm (h), the box covers are made of aluminum plate with the thickness of 2
mm, 4 couples of bearing 6004ZZ. The tote box has been designed to carry products with the
maximum weight of 220 kg.
The tote box moving system is made of CT3 steel. The structural frame is also made of CT3
(σbk = 345 MPa) [8], box steel with a length of 6 m, a width of 2.692 m and a height of 3.510 m.
The lift mechanisms consist of a box container, guiding part for a box and 12 bearings 6004ZZ. The
row-row changing mechanisms are located at two outside parts of the system.
The system contains 48 boxes in 8 rows and 4 boxes at temporary places. The tote box carries
products with the maximum weight of 220 kg (net weight of a box is 30 kg). The total weight of 48
boxes with the maximum load is 12,000 kg (48 × 250 kg) and the total weight of 4 temporary
positions is 1,000 kg (4 × 250 kg). Therefore, the total load of the tote box moving system is 13,000
kg.
The tote box moving system with 52 tote boxes having dimensions of 50 cm × 70 cm × 150
cm has been designed for the multi-purpose Co-60 industrial irradiator. Its specifications are
suitable for both sterilization of medical products and food irradiation. This tote box moving system
version is timely for the present irradiation demands. Table 4 presents the parameters of the tote box
moving system.
Table 4: Parameters of the tote box moving system
No. Parameters Value
1 Tote box quantity 52
2 Tote box sizes 50 cm × 70 cm × 150 cm
3 Useful box sizes 46 cm × 66 cm × 140 cm
4 DUR at the densities of
- 0.1 g/cm3
- 0.5 g/cm3
1.4
1.8
5 Radiation energy utilization efficiency at the
density of
- 0.1 g/cm3
- 0.5 g/cm3
19.7%
48.8%
6 Minimum time of an irradiation cycle, min. 80
7 Maximum Co-60 activity could be used for food
irradiation with the minimum absorbed dose of
3.2kGy, kCi
1,000
8 Maximum throughput of food irradiation with the
density of 0.5 g/cm3 and the required minimum
absorbed dose of 3.2 kGy, tons.(h.100 kCi)-1
0.83
4. CONCLUSIONS
The second version of tote box moving system for the Co-60 industrial irradiator has been
designed. The tote box moving systems has high performances for multi-purpose utilization namely
VINATOM-AR 16--06
The Annual Report for 2016, VINATOM
64
for food irradiation and radiation sterilization of medical products in comparison with VINAGA1.
In addition, the second version of tote box moving systems favorably meets the requirements for a
multi-purpose Co-60 industrial irradiator and the present irradiation requirements in Vietnam.
Based on pre-estimated price, the designed tote box moving system was lower price compared to
imported one with the equivalent irradiation capacity.
REFERENCES
[1] Le Minh Tuan, et al, Summary report of the scientific project of Ministry of Industry and Trade,
“Research, design and pilot manufacture of the moving system for a Co-60 industrial
irradiator”, Code 04/HĐ-ĐT 2010, 2013.
[2] J.F. Briesmeister, MCNP- A General Monte Carlo N-Particle Transport Code, LA 1265-M,
Version 4C Los Alamos National Laboratory, Los Alamos, 2000.
[3] Nguyen Huu Loc, Manual of Autodesk Inventor, Ho Chi Minh City Publisher, 2008.
[4] Radiation safety of Gamma and Electron Irradiation facilities, IAEA, Safety series No. 107,
1992.
[5] Safe design and use of Panoramic, wet source storage gamma irradiators (Category IV),
American National Standard N43.10, July 1984.
[6] Gamma Irradiators for Radiation Processing, IAEA, Vienna, Austria, 2005.
[7] Operation and Maintenance Manual for SVST-Co60/B type irradiator, Institute of Isotopes Co.
Ltd., 2nd
Edition, Vol. 1, 2, 3, May 1999.
[8] Nguyen Thi Yen, Lectures on mechanical materials, Hanoi Publisher, 2005.
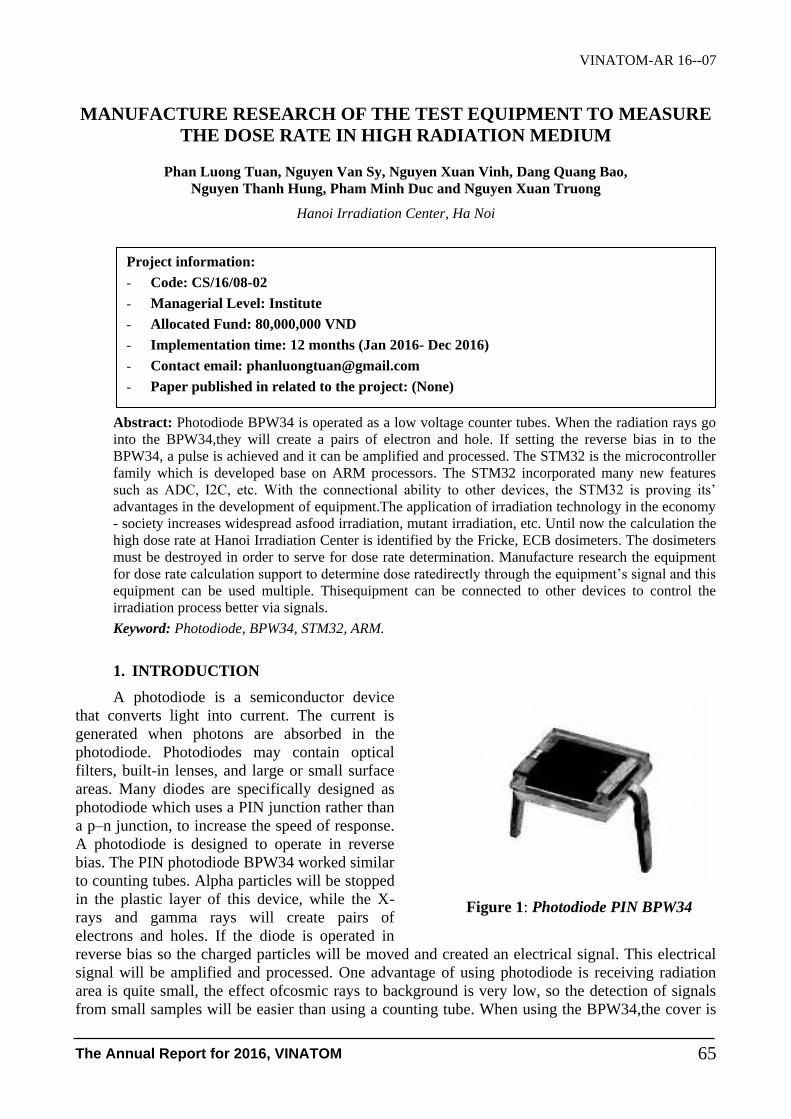
VINATOM-AR 16--07
The Annual Report for 2016, VINATOM 65
Figure 1: Photodiode PIN BPW34
MANUFACTURE RESEARCH OF THE TEST EQUIPMENT TO MEASURE
THE DOSE RATE IN HIGH RADIATION MEDIUM
Phan Luong Tuan, Nguyen Van Sy, Nguyen Xuan Vinh, Dang Quang Bao,
Nguyen Thanh Hung, Pham Minh Duc and Nguyen Xuan Truong
Hanoi Irradiation Center, Ha Noi
Abstract: Photodiode BPW34 is operated as a low voltage counter tubes. When the radiation rays go
into the BPW34,they will create a pairs of electron and hole. If setting the reverse bias in to the
BPW34, a pulse is achieved and it can be amplified and processed. The STM32 is the microcontroller
family which is developed base on ARM processors. The STM32 incorporated many new features
such as ADC, I2C, etc. With the connectional ability to other devices, the STM32 is proving its’
advantages in the development of equipment.The application of irradiation technology in the economy
- society increases widespread asfood irradiation, mutant irradiation, etc. Until now the calculation the
high dose rate at Hanoi Irradiation Center is identified by the Fricke, ECB dosimeters. The dosimeters
must be destroyed in order to serve for dose rate determination. Manufacture research the equipment
for dose rate calculation support to determine dose ratedirectly through the equipment’s signal and this
equipment can be used multiple. Thisequipment can be connected to other devices to control the
irradiation process better via signals.
Keyword: Photodiode, BPW34, STM32, ARM.
1. INTRODUCTION
A photodiode is a semiconductor device
that converts light into current. The current is
generated when photons are absorbed in the
photodiode. Photodiodes may contain optical
filters, built-in lenses, and large or small surface
areas. Many diodes are specifically designed as
photodiode which uses a PIN junction rather than
a p–n junction, to increase the speed of response.
A photodiode is designed to operate in reverse
bias. The PIN photodiode BPW34 worked similar
to counting tubes. Alpha particles will be stopped
in the plastic layer of this device, while the X-
rays and gamma rays will create pairs of
electrons and holes. If the diode is operated in
reverse bias so the charged particles will be moved and created an electrical signal. This electrical
signal will be amplified and processed. One advantage of using photodiode is receiving radiation
area is quite small, the effect ofcosmic rays to background is very low, so the detection of signals
from small samples will be easier than using a counting tube. When using the BPW34,the cover is
Project information:
- Code: CS/16/08-02
- Managerial Level: Institute
- Allocated Fund: 80,000,000 VND
- Implementation time: 12 months (Jan 2016- Dec 2016)
- Contact email: [email protected]
- Paper published in related to the project: (None)
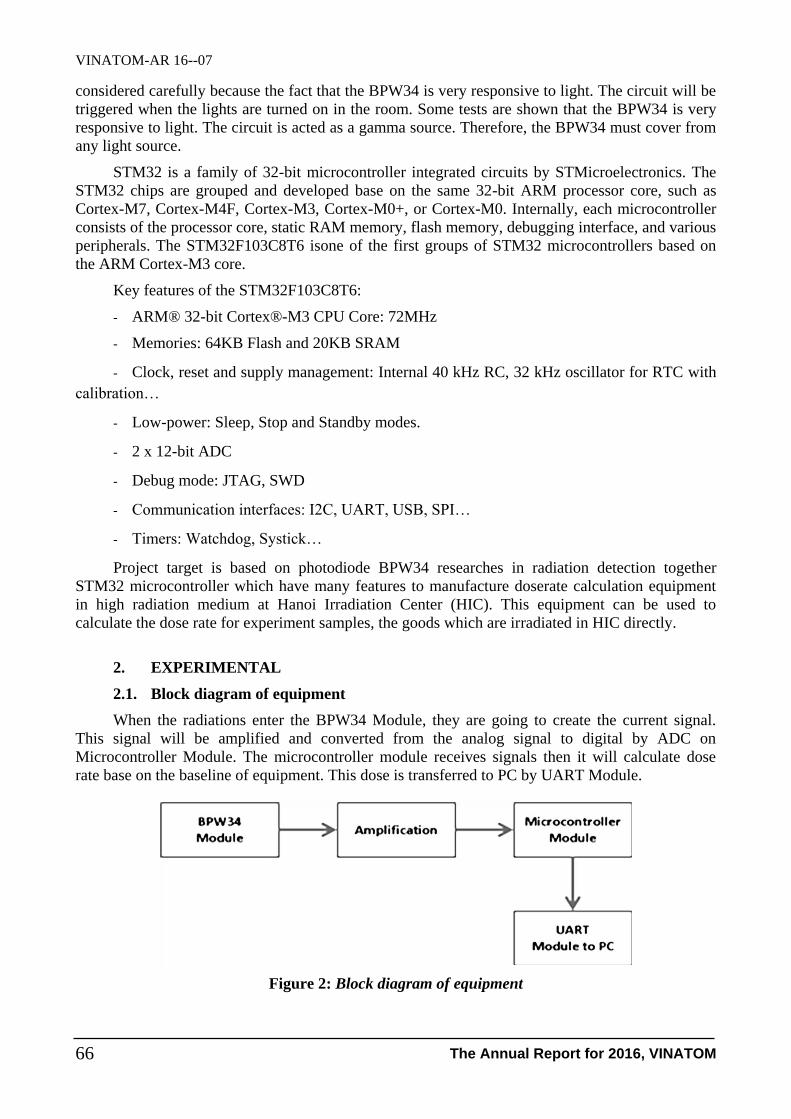
VINATOM-AR 16--07
The Annual Report for 2016, VINATOM 66
considered carefully because the fact that the BPW34 is very responsive to light. The circuit will be
triggered when the lights are turned on in the room. Some tests are shown that the BPW34 is very
responsive to light. The circuit is acted as a gamma source. Therefore, the BPW34 must cover from
any light source.
STM32 is a family of 32-bit microcontroller integrated circuits by STMicroelectronics. The
STM32 chips are grouped and developed base on the same 32-bit ARM processor core, such as
Cortex-M7, Cortex-M4F, Cortex-M3, Cortex-M0+, or Cortex-M0. Internally, each microcontroller
consists of the processor core, static RAM memory, flash memory, debugging interface, and various
peripherals. The STM32F103C8T6 isone of the first groups of STM32 microcontrollers based on
the ARM Cortex-M3 core.
Key features of the STM32F103C8T6:
- ARM® 32-bit Cortex®-M3 CPU Core: 72MHz
- Memories: 64KB Flash and 20KB SRAM
- Clock, reset and supply management: Internal 40 kHz RC, 32 kHz oscillator for RTC with
calibration…
- Low-power: Sleep, Stop and Standby modes.
- 2 x 12-bit ADC
- Debug mode: JTAG, SWD
- Communication interfaces: I2C, UART, USB, SPI…
- Timers: Watchdog, Systick…
Project target is based on photodiode BPW34 researches in radiation detection together
STM32 microcontroller which have many features to manufacture doserate calculation equipment
in high radiation medium at Hanoi Irradiation Center (HIC). This equipment can be used to
calculate the dose rate for experiment samples, the goods which are irradiated in HIC directly.
2. EXPERIMENTAL
2.1. Block diagram of equipment
When the radiations enter the BPW34 Module, they are going to create the current signal.
This signal will be amplified and converted from the analog signal to digital by ADC on
Microcontroller Module. The microcontroller module receives signals then it will calculate dose
rate base on the baseline of equipment. This dose is transferred to PC by UART Module.
Figure 2: Block diagram of equipment
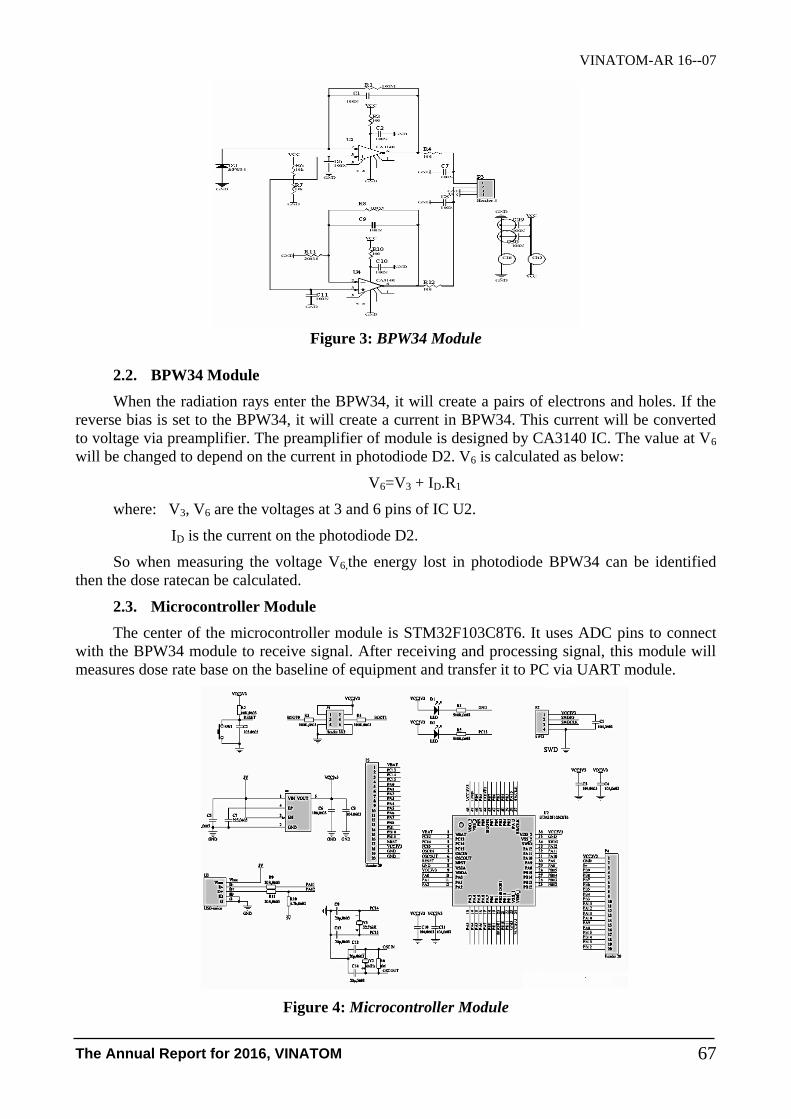
VINATOM-AR 16--07
The Annual Report for 2016, VINATOM 67
Figure 3: BPW34 Module
2.2. BPW34 Module
When the radiation rays enter the BPW34, it will create a pairs of electrons and holes. If the
reverse bias is set to the BPW34, it will create a current in BPW34. This current will be converted
to voltage via preamplifier. The preamplifier of module is designed by CA3140 IC. The value at V6
will be changed to depend on the current in photodiode D2. V6 is calculated as below:
V6=V3 + ID.R1
where: V3, V6 are the voltages at 3 and 6 pins of IC U2.
ID is the current on the photodiode D2.
So when measuring the voltage V6,the energy lost in photodiode BPW34 can be identified
then the dose ratecan be calculated.
2.3. Microcontroller Module
The center of the microcontroller module is STM32F103C8T6. It uses ADC pins to connect
with the BPW34 module to receive signal. After receiving and processing signal, this module will
measures dose rate base on the baseline of equipment and transfer it to PC via UART module.
Figure 4: Microcontroller Module
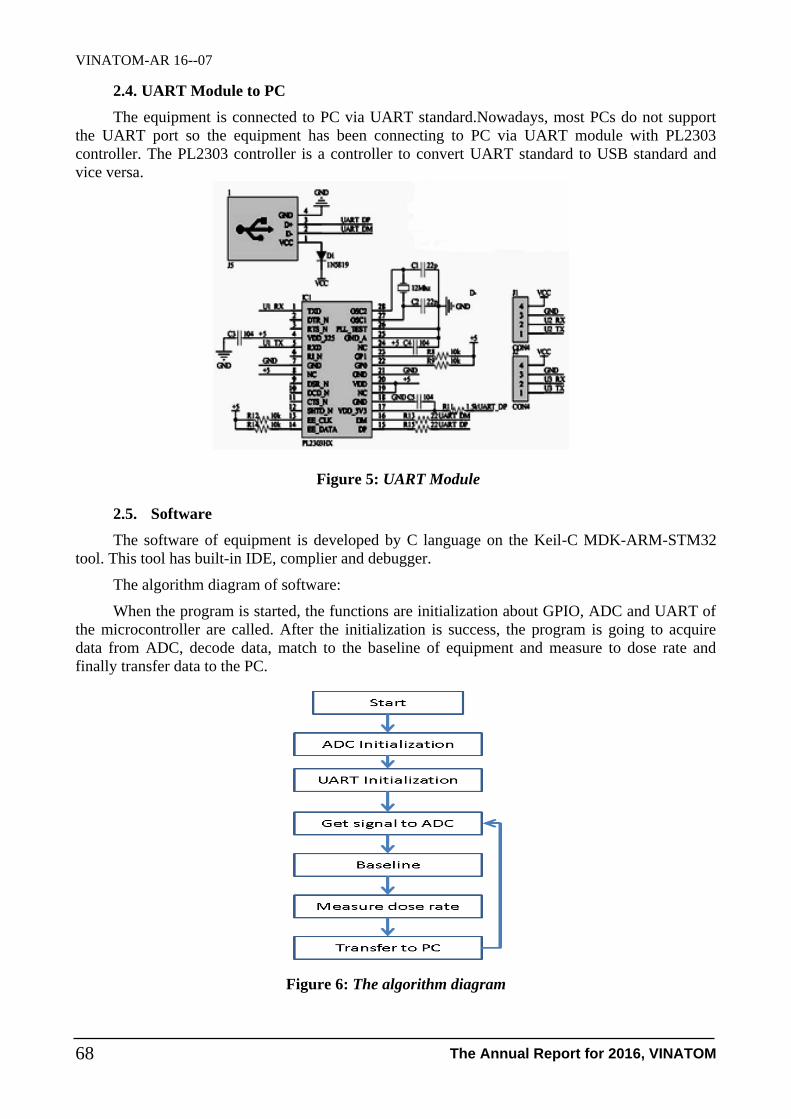
VINATOM-AR 16--07
The Annual Report for 2016, VINATOM 68
2.4. UART Module to PC
The equipment is connected to PC via UART standard.Nowadays, most PCs do not support
the UART port so the equipment has been connecting to PC via UART module with PL2303
controller. The PL2303 controller is a controller to convert UART standard to USB standard and
vice versa.
2.5. Software
The software of equipment is developed by C language on the Keil-C MDK-ARM-STM32
tool. This tool has built-in IDE, complier and debugger.
The algorithm diagram of software:
When the program is started, the functions are initialization about GPIO, ADC and UART of
the microcontroller are called. After the initialization is success, the program is going to acquire
data from ADC, decode data, match to the baseline of equipment and measure to dose rate and
finally transfer data to the PC.
Figure 5: UART Module
Figure 6: The algorithm diagram

VINATOM-AR 16--07
The Annual Report for 2016, VINATOM 69
3. RESULT AND DISCUSSION
3.1. Baseline
Baseline of equipment is built on the theoretical simulation calculations at Hanoi Irradiation
Center. After obtaining the simulation calculations, the equipment is placed at the positions which
were calculated with different dose rate to test voltage values.The baseline of equipment is built
from obtained values.
Table 1: The theoretical simulation calculation
Table 2: Results to test
Dose rate (kGy/h) Voltage (mV) Voltage after
backgroundsubtraction(mV)
0 1580 0
0.1 1753 173
0.3 1827 247
0.5 1913 333
0.7 2002 422
1.0 2075 495
1.5 2160 580
The baseline of equipment:
Figure 7: Baseline
y = 133.28x2 + 235.76x + 163.17 R² = 0.9958
0
500
1000
1500
0 0.10.20.30.40.50.60.70.80.9 1 1.11.21.31.41.51.61.71.81.9 2 2.12.22.32.42.52.62.72.82.9 3
Điệ
n t
hế
(m
V)
Suất liều (kGy/h)
Dose rate
(kGy/h)
Coordinates (cm)
X Y Z
0.1 180 12 85
0.3 145 12 85
0.5 120 0 85
0.7 100 0 85
1.0 85 0 85
1.5 80 0 85
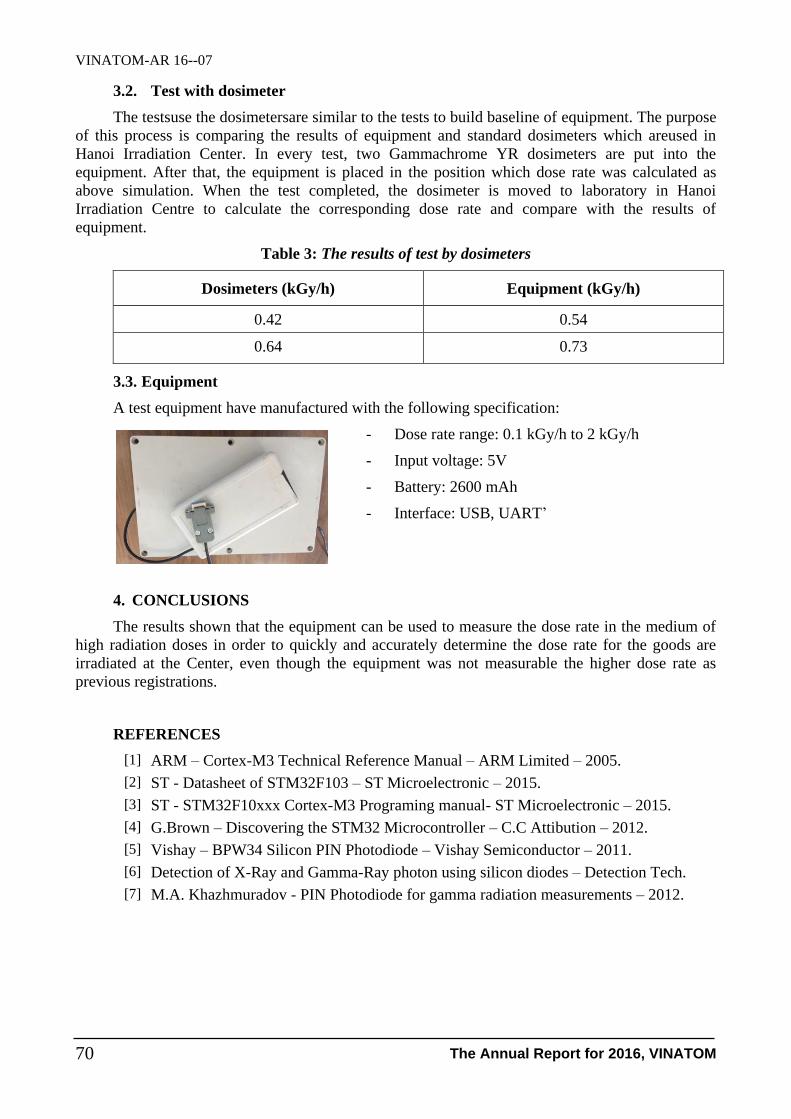
VINATOM-AR 16--07
The Annual Report for 2016, VINATOM 70
3.2. Test with dosimeter
The testsuse the dosimetersare similar to the tests to build baseline of equipment. The purpose
of this process is comparing the results of equipment and standard dosimeters which areused in
Hanoi Irradiation Center. In every test, two Gammachrome YR dosimeters are put into the
equipment. After that, the equipment is placed in the position which dose rate was calculated as
above simulation. When the test completed, the dosimeter is moved to laboratory in Hanoi
Irradiation Centre to calculate the corresponding dose rate and compare with the results of
equipment.
Table 3: The results of test by dosimeters
Dosimeters (kGy/h) Equipment (kGy/h)
0.42 0.54
0.64 0.73
3.3. Equipment
A test equipment have manufactured with the following specification:
Dose rate range: 0.1 kGy/h to 2 kGy/h
Input voltage: 5V
Battery: 2600 mAh
Interface: USB, UART’
4. CONCLUSIONS
The results shown that the equipment can be used to measure the dose rate in the medium of
high radiation doses in order to quickly and accurately determine the dose rate for the goods are
irradiated at the Center, even though the equipment was not measurable the higher dose rate as
previous registrations.
REFERENCES
[1] ARM – Cortex-M3 Technical Reference Manual – ARM Limited – 2005.
[2] ST - Datasheet of STM32F103 – ST Microelectronic – 2015.
[3] ST - STM32F10xxx Cortex-M3 Programing manual- ST Microelectronic – 2015.
[4] G.Brown – Discovering the STM32 Microcontroller – C.C Attibution – 2012.
[5] Vishay – BPW34 Silicon PIN Photodiode – Vishay Semiconductor – 2011.
[6] Detection of X-Ray and Gamma-Ray photon using silicon diodes – Detection Tech.
[7] M.A. Khazhmuradov - PIN Photodiode for gamma radiation measurements – 2012.

1. 4- Industrial Applications


VINATOM-AR 16--08
The Annual Report for 2016, VINATOM 73
DEVELOPING PROGRAM AND TRAINING MATERIALS
FOR VISUAL TESTING METHOD
Dang Thi Thu Hong, Dao Duy Dung, Le Tuan Anh, Le Duc Thinh, Nguyen The Man,
Nguyen Van Duy and Ha Thi Hong Thu
Center for Non-Destructive Evaluation, 140 Nguyen Tuan, Thanh Xuan, Hanoi
Abstract: Visual testing (VT) is recognized as the most common and effective method among
various non-destructive testing (NDT) ones. With the capability of detecting surface defects and
conditions, verifying the integrity of items in various materials, VT is widely used to examina the
quality of products, equipments in many industries. Through implement of the project, research group
have made recommended programs for personnel training on visual testing method. The program is
based on and complies with requirements of international standards such as IAEA Techdoc 628, ISO
9712, SNT-TC-1A. The program also includes a lot of training materials as the set of presentations,
the bank of questions and answers, the notesbook for student, criteria for grading qualification
examinations that focus on welding process. Project‘s results are demonstrated by effective
applications of the program for a nummber of manufacturers in industries such as Phu My Fertilizer,
Fomosa Steel Coperation, Peb Steel Company, etc.
Keywords: Visual testing (VT), NDT, training program, training materials.
1. INTRODUCTION
Visual testing (VT) is the most common and effective examination method that is employed
in many quality assurance programs in industry. Up to now in Vietnam, due to historical conditions,
there are still no standardized Vietnamese VT documents used for NDT quality assurance as well as
weld quality monitoring. Therefore, we are using most of foreign materials and most VT personnel
training and qualification are conducted by foreign organizations.
Moreover, Vietnamese candidates are often lack of adequate skill and experience for
qualification in according to international programs. Hence, establishing of training program and
training materials which is suitable for conditions in Vietnam and to meet international standards is
needful.
NDE Center is the organization in NDT technology transfer and NDT training consultation
with operation ranged over the country. By experiences, we recognize that it is essential to develop
and standardize a Personnel Training and Qualification Program that is suitable Vietnamese
candidates in VT method.
By the 2010’s years, the Center has conducted some training courses on Visual Testing of
Welds in accordance with international programs for industrial manufacturers in power generation,
shipbuilding, petroleum, such as UBI Tower Company, Tien Giang PV Steel Pipe Corporation,
Project information:
- Code: CS/16/09-01
- Managerial Level: Institute
- Allocated Fund: 80,000,000 VND
- Implementation time: 12 months (Jan 2016- Dec 2016)
- Contact email: [email protected], [email protected]
- Paper published in related to the project: (None)

VINATOM-AR 16--08
The Annual Report for 2016, VINATOM 74
Dung Quat Shipyard. Beside active reflection from partners, Center has accumulated the initial
experiences.
Accordingly, the research group has submitted the proposal and obtained the approval to
implement the project "Developing the program and training materials for Visual Testing method”.
The project’s overarching goal is to build up a training program which unifies presentations,
references and criteria for evaluating candidates’ qualification, ensures integrating human
knowledge and the practical needs and requirements in Vietnam. Thus, the research findings are
expected to meet the demands of a large number of VT technicians in the various industries.
NDT applications in the world as well as in Vietnam show that VT is most commonly
employed, with full extent inspection on critical items in industries. It’s well known that, human
factors always play a essential role to control quality of any activity, especially in the NDT
inspection. Those who conduct VT inspection must be trained, qualified and certified according to
an appropriate program.
2. MAIN WORKS
The research group have systematically conducted the surveys and evaluation of the situation
and need on training and cetification of applicant for VT methods. The works are performed by
information collection and analysis from a number typical industrial facilities, such as Power
Generator Corporation EVNGENCO 3; AES Mong Duong 2 Power Company, Formosa Ha Tinh
Steel Company, Phu My Fertilizer Plant, PEB Steel Buildings Co.Ltd., IDICO Machinery Erection
Construction Investment JSC.
Various reputable sources of relevant programs and materials from IAEA, ISO, ASNT are
referenced to develop the VT training program, including topical outlines, presentations, the
question banks, criteria for grading examinations (level I and II).
The resulted program firstly is applied for the staff of NDE Centre and then for some
industrial facilities, such as Formosa Ha Tinh Steel Company, Phu My Fertilizer Plant, PEB Steel
Buildings Co.Ltd., Zamil Steel Buildings Vietnam Co.,
Ltd, IDICO Machinery Erection
Construction Investment JSC. The active reflection from the partners demontrates effectiveness and
reliability of the program.
3. RESULTS
3.1. Training programs for VT Level I & Level II
Table 1: Visual Testing Level I Topical Outline
Contents
Hours of training
Hours Note
1. General knowledge 4
2. Fundamentals 2
3. Visual perception 2
4. Equipments 8
5. Parameters and examination conditions 2
6. Image recording methods 2

VINATOM-AR 16--08
The Annual Report for 2016, VINATOM 75
7. Codes, standards, procedures 1
8. Safety and health 1
9. Applications 4
Total 26
Table 2: Visual Testing Level II Topical Outline
Contents
Hours of training
Hours Note
10. General knowledge 8
11. Fundamentals 4
12. Visual perception 2
13. Equipments 12
14. Parameters and examination conditions 4
15. Image recording methods 5
16. Codes, standards, procedures 3
17. Safety and health 1
18. Applications 4
Total 43
3.2. Training Materials
- Visual Testing training notesbooks (presented by documents, including 9 chapters)
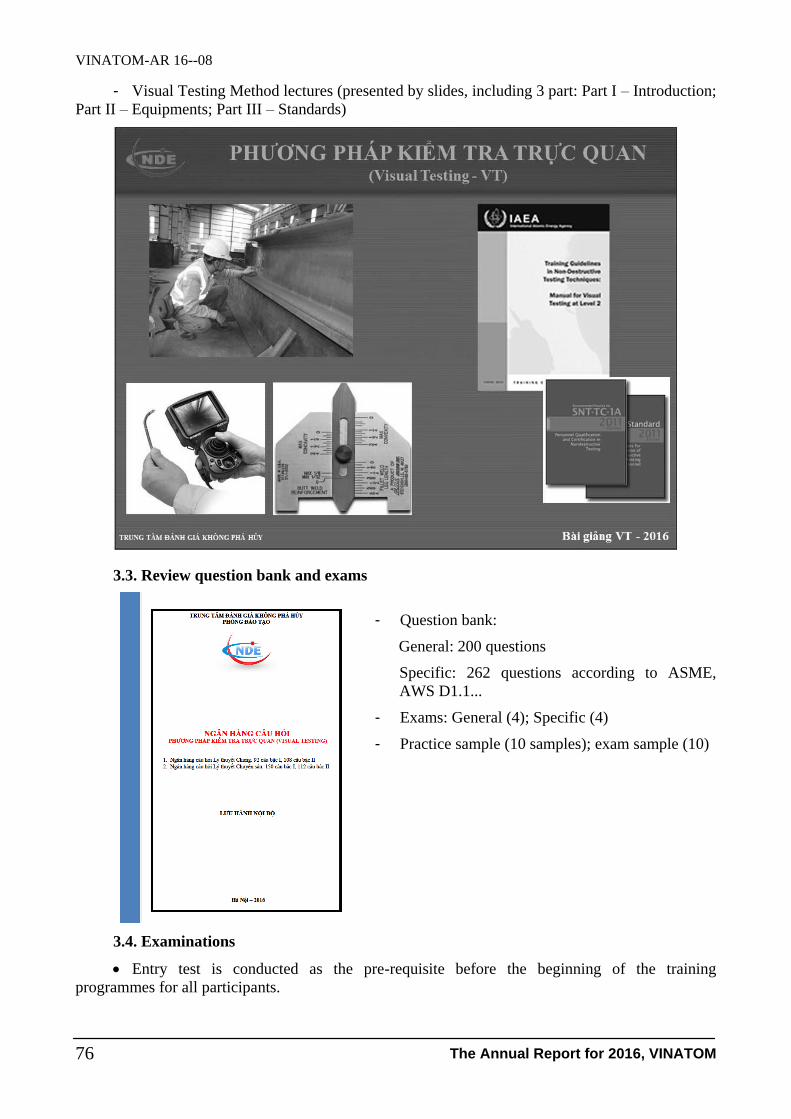
VINATOM-AR 16--08
The Annual Report for 2016, VINATOM 76
- Visual Testing Method lectures (presented by slides, including 3 part: Part I – Introduction;
Part II – Equipments; Part III – Standards)
3.3. Review question bank and exams
- Question bank:
General: 200 questions
Specific: 262 questions according to ASME,
AWS D1.1...
- Exams: General (4); Specific (4)
- Practice sample (10 samples); exam sample (10)
3.4. Examinations
Entry test is conducted as the pre-requisite before the beginning of the training
programmes for all participants.

VINATOM-AR 16--08
The Annual Report for 2016, VINATOM 77
Evaluation criteria are developed in compliance with the proficiency levels: Level I and
Level II, including three tests:
- General
- Specific
- Practical
Examinations administered by the employer for qualification should result in a passing
composite grade of at least 80 percent, with no individual examination having a passing grade less
than 70 percent.
3.5. Training courses
No. Organization Training Period
1. Formosa Hatinh Steel Corporation 1/2016
2. PEB Steel Building Co., Ltd 7-8/2016
3. Lama Idico 11/2016
4. Apave Da Nang 11/2016
5. NDE Center 8/2016
4. CONCLUSION
Throughout the implementation of the project, the research group has achieved certain
findings as follows:
1. Develop training programs and materials for VT technicians in accordance with the
requirements of Vietnam, IAEA and ASNT SNT-TC-1A
2. Develop criteria for evaluating the theory and practice of level I, II
3. Apply successfully the research products for the units in the industrial sector
Figure 1: Visual Testing Certificate

VINATOM-AR 16--08
The Annual Report for 2016, VINATOM 78
With the results above, the project " DEVELOP PROGRAM & TRAINING MATERIALS
FOR VISUAL TESTING METHOD" has successfully obtained and experimental results are
encouraging. And with this idea, the researchers at the Center for Non-Destructive Evaluation NDE
will continue to improve to products could be applications into practical in highly efficient.
With the results above, the project " DEVELOP PROGRAM & TRAINING MATERIALS
FOR VISUAL TESTING METHOD" has successfully obtained and experimental results are
encouraging. And with this idea, the NDE Center‘s researchers will continue to improve products
so that they could be applied more effectively.
REFERENCES
[1] ISO 9712:2012 Non-destructive testing- Qualification and certification of NDT personnel -
General principles
[2] ISO TR 25107:2011 Non-destructive testing - Guidelines for NDT training syllabuses
[3] IAEA - Training Guidelines in Non-Destructive Testing Techniques: Manual for Visual
Testing at Level 2; Training Course Series No. 54, 2013 & Techdoc 628, 2013
[4] ASNT Recommended Practice No. SNT-TC-1A, 2011 Personnel Qualification and
Certification in Nondestructive Testing
[5] ANSI/ASNT CP-105:2011 Training Outlines for Qualification of Nondestructive Personnel
[6] ANSI/ASNT CP-189:2011 Standard for Qualification and Certification of Nondestructive
Testing Personnel
[7] AWS QC-1:2007 Standard for AWS Certification of Welding Inspectors
[8] TWI CSWIP: Certification Scheme for Welding & Inspection Personnel
[9] TCVN 5879:2009 (ISO 3058:1998)
VINATOM-AR 16--09
The Annual Report for 2016, VINATOM 79
DEVELOPMENT OF A PROTOTYPE FOR INVESTIGATION OF
MOISTURE IN INSULATION OF OIL PIPELINES BASED ON NEUTRON
BACKSCATTERING METHOD
Tran Thanh Minh, Vuong Duc Phung, Mai Cong Thanh and Le Van Loc
Centre for Applications of Nuclear Technique in Industry-CANTI, 01 DT 723,
ward 12, Dalat city, Lamdong province
Abstract: The moisture in the insulations is the main reason causing the corrosion on the surfaces of
pipeline systems in the petrochemical and fertilizer plants. Therefore, the moisture inspection is one of
high demands as operation procedure of the plants. Based on the essential demand on the moisture
inspection in insulation, a portable moisture detection system including a He-3 proportion detector and
a Am-Be neutron source has been researched and developed at CANTI in the national project. The
system can detect the moisture in insulation with Limit of Detection-LOD about 32%, 48%, 63%,
76%, 86%, 90%, 93%, 94% at the oil level 0 cm, 2 cm, 4 cm, 6 cm, 8 cm, 10 cm, 12 cm, 14 cm
respectively.
Keywords: neutron backscattering, insulation moisture, corrosion under insulation
I. INTRODUCTION
The pipeline systems in the petrochemical or fertilizer plants need to be maintained at
designated temperatures as a requirement of operation regime by utilization of insulation. However,
the insulation may be moistened during operation by some cases causing the corrosion on the
surfaces of pipelines called Corrosion under Insulation-CUI. The investigation of moisture in
insulation to prevent CUI is an essential demand in the operational procedure of petrochemical or
fertilizer plants.
There are some techniques which can be applied for investigation of moisture in the insulation
such as insulation removal, infrared technique, resistance testing or neutron backscattering
technique in which the neutron backscattering technique is one of popular techniques because of its
sensitivity, portable and online detection.
The neutron backscattering technique includes a radioactive source emitting high-energy
neutrons into the insulation and a thermal neutron detector. Neutrons emitted from radioisotope
sources are energetic particles, with energies up to several MeV. Collectively, such energetic
neutrons are referred to as fast neutrons do not interact with the electric fields of atoms and
molecules. In addition, because of large mass of neutron compared with that of the electron,
Project information:
- Code: CS/16/06-01
- Managerial Level: Institute
- Allocated Fund: 100,000,000 VND
- Implementation time: 18 months (Jan 2016- Jun 2017)
- Contact email: [email protected]
- Paper published in related to the project:
Tran Thanh Minh, Vuong Duc Phung, Mai Cong Thanh, Le Van Loc; Development of a
prototype for investigation of moisture in insulation of oil pipelines based on neutron
backscattering method; Bulletin of Nuclear Science and Technology, Vietnam Atomic Energy
Institute, No.3, pp. 8-13, 2017. (in Vietnamese)
VINATOM-AR 16--09
The Annual Report for 2016, VINATOM 80
neutrons are insignificant affected by electron collision. The only way in which a fat neutron
passing through material can lose its energy is by direct collision with an atomic nucleus. For fast
neutron, in the range 0.5-11 MeV, it is scattering processes which are responsible for energy loss
and slowing down of the neutrons. Scattering process falls in two categories, inelastic and elastic.
Inelastic scattering could be regarded as a special type of absorption process in which the neutron is
captured by nuclear and reemitted with reduced energy. The energy transferred to the nucleus is
usually emitted as gamma-radiation. For light nuclei, inelastic scattering is far less probable that
elastic scattering. Elastic scattering occurs when total kinetic energy of the nuclear and colliding
neutron remains constant. The neutron is slowed down in the collision and its direction of motion is
changed.
If the neutron energy before collision is denoted by E1 and after collision by E2 it is possible
to show that in a head-on collision, the energy transferred to the nucleus is:
E2/E1= [(A-1)/(A+1)]2 (1)
where:
A is the mass of the nucleus.
From Equation 1, it can be seen that it is possible for a neutron to lose all its kinetic energy in
a head-on collision with a hydrogen nucleus. It is clear that, for reason, the presence of hydrogen is
a major factor in the slowing down of fast neutrons.
If there’s moisture in the insulation, the hydrogen nuclei attenuate the energy of the emitted
neutrons. The inspection instrument’s gauge detector displays a low-energy neutrons count
proportional to the amount of water in the insulation. High counts per time period indicate more
moisture and a higher probability of the present of CUI.
The main contents of the project:
- Development of an electronic system to record the signals from the He-3 detector;
- Conduction of experiments for evaluation of characteristics of developed moisture
detection system.
II. DEVELOPMENT OF AN ELECTRONIC SYSTEM TO RECEIVE THE SIGNALS
FROM THE He-3 DETECTOR
The signals from He-3 detector, model LND 252, manufactured by LND INC is about 5
millivolt. To receive the signals of thermal neutrons, a suitable preamplifier has been developed by
using the transistors and capacities. The preamplifier developed in this project can multiply the
signals to 10 times and reduce the noises from high voltage platform and noises from detector.
The signals from the preamplifier are magnified afterward by amplifier platform which has
been developed mainly for amplifying the signals. The amplifier has been designed in two parts.
The fist part has been assigned for reducing the noises produced by temperature during operation.
The signals from preamplifier have been magnified to 5 Volt at the second part of amplifier
platform.

VINATOM-AR 16--09
The Annual Report for 2016, VINATOM 81
Figure 1: The signals from the preamplifier Figure 2: The signals from the amplifier
The signals from amplifier will be discriminated by the threshold block and transformed into
5 Volt TTL signals afterward. The TTL signals will be counted at the counting block which is
designed based on the Arduino Mega 2560.
Figure 3: The signals from threshold block
The counter, data processer, displayer and controller have been developed based on the
Arduino Mega 2560. The digital signals can be processed and displayed on the LCD displayer by a
code developed in the Arduino. The operator can get the information of backscattered neutron,
amount of moisture in insulation on the displayer by operating the controller.
Figure 4: The Arduino Mega 2560, displayer and controller.
III. CONDUCTION OF EXPERIMENTS FOR EVALUATION OF HARACTERISTICS
OF MOISTURE DETECTION SYSTEM
The Rockwool which is used widely as insulation in the petrochemical and fertilizer plants
has a main component of Na2O, CaO, MgO, BaO and polyethylene. Its density is about 1.25 g/cm3. The
Rockwool insulation was cut to size of 25 x 40 x 25 (cm) and moistened by submersion in the water.
The percent of moisture in the Rockwool insulation is calculated by following formula:

VINATOM-AR 16--09
The Annual Report for 2016, VINATOM 82
(2)
where:
%ma: Percent of moisture in the insulation;
m0: Amount of dry insulation (g);
m1: Amount of wet insualtion (g).
The insulation was wetted with the range of wet from 50%-650% with step 50%.
Figure 5: The dry insualtion Figure 6: The wet insulation
The portable neutron backscattering system for investigation of moisture in the insulation includes a
He-3 detector and 1 Ci Am-Be neutron source. The signals from thermal neutron in the He-3 will be
recorded by electrical system developed in the project.
Figure 7: The portable neutron backscattering system Figure 8: Neutron source
The experiment for evaluation of the saturation values and LOD of moisture in the insulation was
conducted at oil level 0-14 cm. At each oil level, the count of neutron backscattered was recorded at
different percent of moisture in the insulation.
The count of backscattered neutron versus percent of moisture in the insulation can be fitted by the
following formula:
I = I0*(1 − e-µ*x
) (3)
where:
I0: Incident neutron (cps);
I: Backscattered neutron at detector (cps);
x: percent of moisture in insulation (%);
µ: attenuation coefficient.

VINATOM-AR 16--09
The Annual Report for 2016, VINATOM 83
Figure 9: The backscattered thermal
neutron versus moisture percent at 0 cm
of oil level
Figure 10: The backscattered thermal
neutron versus moisture percent at 2 cm
of oil level
Figure 11: The backscattered thermal
neutron versus moisture percent at 4 cm
of oil level
Figure 12: The backscattered thermal
neutron versus moisture percent at 6 cm
of oil level
Figure 13: The backscattered thermal
neutron versus moisture percent at 8 cm
of oil level
Figure 14: The backscattered thermal
neutron versus moisture percent at 10 cm
of oil level

VINATOM-AR 16--09
The Annual Report for 2016, VINATOM 84
Figure 15: The backscattered thermal
neutron versus moisture percent at 12 cm
of oil level
Figure 16: The backscattered thermal
neutron versus moisture percent at 14 cm
of oil level
The parameters of function of backscattered neutron count versus percent of moisture in the
insulation fitted by Eq. 3 for each level of oil are shown in the Table 1 below.
Table 1: The parameters of the function of neutron backscattered
versus moisture percent at each oil level
Oil level (cm) I0 Error µ Error Background Error
0 30709.01 ±16699.71 0.16 ±0.01 1302.56 ±52.10
2 44865.02 ±1068.91 0.33 ±0.02 6107.34 ±305.37
4 49333.07 ±654.56 0.47 ±0.02 11905.67 ±476.23
6 50933.04 ±583.20 0.57 ±0.02 16976.98 ±848.85
8 51295.08 ±388.97 0.60 ±0.01 19622.83 ±981.14
10 51972.00 ±328.98 0.63 ±0.01 21616.64 ±864.67
12 52070.09 ±378.61 0.63 ±0.02 22168.12 ±1108.41
14 52115.07 ±314.78 0.64 ±0.01 22565.93 ±1128.30
From the function of backscattered neutron versus percent of moisture in the insulation, the
saturation values and LOD at each level of oil can be determined and shown in the Table 2 below:
Table 2: Saturation values and LOD at each oil level
Oil level (cm) Saturation
values (100%)
Error of saturation
value (100%)
LOD (100%) Error of LOD
(100%)
0 25.48 ±1.53 0.32 ±0.02
2 12.92 ±1.03 0.48 ±0.02
4 9.17 ±0.55 0.63 ±0.03
6 7.65 ±0.38 0.76 ±0.04
8 7.23 ±0.36 0.86 ±0.03

VINATOM-AR 16--09
The Annual Report for 2016, VINATOM 85
10 6.87 ±0.41 0.90 ±0.04
12 6.86 ±0.48 0.93 ±0.05
14 6.80 ±0.54 0.94 ±0.03
COMMENTS:
- The saturation values of moisture at oil levels 0 cm, 2 cm, 4 cm, 6 cm, 8 cm, 10 cm, 12 cm, 14
cm are 2548%, 1292%, 917%, 765%, 723%, 687%, 686%, 680% respectively;
- The LOD at the oil levels 0 cm, 2 cm, 4 cm, 6 cm, 8 cm, 10 cm, 12 cm, 14 cm are 32%, 48%,
63%, 76%, 86%, 90%, 93%, 94% respectively.
IV. CONCLUSIONS
- Based on the function of count of backscattered neutron versus moisture percent, the moisture
percent in the insulation in the real cases can be estimated;
- The saturation values for each oil level were estimated. This value belong to the oil level such as
2548%, 1292%, 917%, 765%, 723%, 687%, 686%, 680% for oil level at 0 cm, 2 cm, 4 cm, 6 cm, 8 cm,
10 cm, 12 cm, 14 cm respectively;
- The LOD for each oil level can be determined such as 32%, 48%, 63%, 76%, 86%, 90%, 93%,
94% for oil level at 0 cm, 2 cm, 4 cm, 6 cm, 8 cm, 10 cm, 12 cm, 14 cm respectively.
REFERENCES
[1] Glenn F. Knoll; Radiation Detection and Measurement; John Wiley & Sons, Inc, USA, 2000.
[2] E. Bardal; Corrosion and Protection (Engineering materials and process), Springer, 2003.
[3] Delahunt, J. F; Corrosion Control under Thermal Insulation and Fireproofing; Proceedings:
Exxon Research & Engineering Co. Internal Conference on Corrosion under Insulation, p.
554, 1984.
[4] Butler, G., and H. C. Iron; Corrosion and Its Prevention in Waters; Melbourne, FL: Robert E.
Krieger, Ch. VI, p 102, 1976.
[5] Midwest Insulation Contractors Association; Commercial and Industrial Insulation
Standards; Omaha, NE.: Plate No. 1-50, 1983.
[6] National Board Inspection Code, NB-23, Rev. 6; Columbus, OH: The National Board of
Boiler and Pressure Vessel Inspectors, 1987.


1. 5- Applications in Ecology,Environment and Geology

VINATOM-AR 16--10
The Annual Report for 2016, VINATOM 89
SET UP 18
O AND 2H STABLE ISOTOPE ANALYSIS PROCEDURE
FOR LASER SPECTROMETRY AND APPLICATION TO EVALUATE
THE RELATIONSHIP BETWEEN SURFACE WATER AND
GROUNDWATER IN THE SOUTHERN HANOI
Vo Thi Anh, Ha Lan Anh, Nguyen Thuy Binh, Nguyen Hong Thinh,
Tran Khanh Minh, Nguyen Thi Thu Ha, Nguyen Manh Hung,
Trieu Duc Huy and Nguyen Thanh Binh
Institute for Nuclear Science and Technology, Hanoi, Vietnam
Abstract: Isotope techniques have widely applications in Earth sciences and isotope hydrology. So
we set up a standard proceduce for 18O and 2H isotope ratios determination for Laser Spectrometry
in the INST. The results shown that the 18O and 2H stable isotope analysis procedure for Laser
Spectrometry is completely reliable with precision 0.1‰ of 18O and 0.3‰ of 2H, uncertainty
0.42‰ of 2H and 0.14‰ of 18O at 1. From using 18O and 2H isotope ratios results, we study
interaction between surface water and groundwater in the South Hanoi. The stable isotope results of
water sample which collected from wells and surface water showed that the groundwater in South
Hanoi are mainly recharged by Red river water or meteorology water dependence on distance from
Red river to position of wells. We hope that the study results can suggest for environmental managers
who can solve and set up policies to improve the groundwater sources in Hanoi.
Keywords: Isotope hydrology, Laser spectrometry, Groundwater, Recharge.
I. INTRODUCTION
The isotope techniques widely used in studies to evaluate penetration level of wastewater
which influence on the quality of urban water source. The isotope techniques considered as one of
the methods to study the dynamics and the recharging of groundwater which can determine the age
and original groundwater and mixture of water resources. The isotope techniques used early for
mixture researching between surface water and groundwater by independent researchers in the
1970s. Krouse et al., 1971, Behrens et al., 1971 and Mausui et al., 1976 evaluated mixture of rivers
by the 18
O and 2H stable isotope techniques [1].
Hsin-Fu Yeh et al., 2009, Liu Xiangchao et al., 2006 and L. Yang et al., 2012 researched the
interaction between surface water and groundwater by the 18
O and 2H stable isotope techniques.
The results of Hsin-Fu Yeh et al shown that the groundwater in Chih-Pen Creek basin recharged
from the river water is 79% and from rainwater is 21%. With Jin-Lun basin, the groundwater
recharged from the river water is 78% and from rainwater is 22%. To combine between chemical
and isotope techniques, L. Yang et al., could know that the groundwater in Jialu basin recharged
Project information:
- Code: ĐTCB. 09/VKHKTHN
- Managerial Level: Ministry
- Allocated Fund: 500,000,000 VND
- Implementation time: 24 months (Jan 2015- Dec 2016)
- Contact email: [email protected]
- Paper published in related to the project:
Vo Thi Anh, Tran Khanh Minh, Trinh Van Giap, Ha Lan Anh, Nguyen Thanh Cong, Nguyen
Hong Thinh, Vu Hoai; Using Isotope Technology for Surface Water Environment Research in
Southern Hanoi; Journal of Environmental Protection, 2016, 7, 1113-1118.

VINATOM-AR 16--10
The Annual Report for 2016, VINATOM 90
from river water is 60-70%. Beside, Liu Xiangchao et al combined isotope technique with pH and
EC analysis methods for researching relationship between river water, Spring River and shallow
layer of groundwater [2], [3].
Hanoi Capital is located in the Northern Delta centre and is the cultural center of the country.
So that the population density in here is very high and the demand for clean water is extremely
large. Therefore, water quality security and control for human activities is essential. Hanoi capital
has surface water source and ground water source very richly by dense system of rivers, lakes and
the groundwater. However, the quality of surface water and groundwater in Hanoi which studied
recently is being transformed badly and impact people life seriously [4], [5].
The isotope technique is very importance. So that, the Isotope hydrology laboratory has been
equipped the LWIA-24D laser spectroscopy in 2015. This study is set up to 18
O and 2H stable
isotope analysis procedure for Laser Spectrometry. From the results 18
O and 2H isotope of
samples collected surface water and wells in South of Hanoi, we research and evaluate discharged
sources of groundwater.
II. LASER SPECTROMETRY
The stable isotopic determining Technique on the laser spectroscopy was developed in 1999
by Van Trigt and Kerstel, E.R.Th [6]. The researchers used Infrared laser for absorption spectra
determining of water sample which could evaluated 2H/
1H,
17O/
16O, and
18O/
16O isotopic ratios.
The LWIA-24D Laser spectroscopy is similar laser spectrometer at DLT-100 spectroscopic
instrument at the Isotope Hydrology laboratory of IAEA. Behind, the LWIA-24D Laser
spectroscopy has a number of superior features such as: the precision of the method was 0.3 ‰ in
1 with 2H and 0.1 ‰ with
18O; working temperature of oven is nearly 46
0C; sample volume for
analysis is 250nL; it can analyze 150 samples per day with 1080 injections per day.
Principle of Laser Spectrometry: For gas measurements based on conventional laser-
absorption spectroscopy, a laser beam is directed through a sample and the mixing ratio (or mole
fraction) of a gas is determined from the measured absorption using Beer’s Law, which may be
expressed:
(1)
where:
I is the transmitted intensity through the sample at frequency
0I is the (reference) laser intensity prior to entering the cell
S is the absorption line strength of the probed transition
L is the optical path length of the laser beam through the sample
is the mole fraction
P is the gas pressure
is the line-shape function of the transition at frequency
In this case, 1 d ,
dI
I
SLP
0
ln1
(2)

VINATOM-AR 16--10
The Annual Report for 2016, VINATOM 91
III. STUDY AREA
The study area is located in the south of Hanoi capital, include four districts: Hai Ba Trung,
Thanh Tri, Hoang Mai, Thanh Xuan; lying between North latitudes N20o56’13” to N21
o05’415”
and East Longitudes E105o45’07” to E105
o55’15”.
In terms of topography, the study area is located in the Red River Delta (also known as North
Delta) where mainly consists river alluvial Delta. In terms of geomorphology, the study area deeply
reflects tropical inner climatic quality (the monsoon tropics). In terms of climate, the study area in
northern Vietnam is internal climate monsoon tropics.
The average annual temperature is range from 22oCto25
oC per year. The total annual
precipitation is about 1500mm within the rainy season accounts 80to85% of annual precipitation.
Geological section is divided into four parts according to litho-logical composition. Hydro-
geological section includes two main aquifers such as Holocene aquifer and Pleistocene aquifer.
The study area has a dense network of rivers and lakes. Inside, the Red river is the largest and
the most important sense which effects to social life in general and to the formation of groundwater
reserves in particular. Besides, some other small rivers in the study area also need to attend such as
the Nhue river, the Tolich river and the Kimnguu river. The Nhue river is a tributary of the Red
river from the Thuy Phuong water inlet sluice to Dien bridge and Ha Dong bridge. The Tolich river
which flows to the Hanoi west and comes into the Nhue river rises from the West Lake. The
Kimnguu river is drainage-river from Thanh Nhan lake and lakes in the Hanoi southern region to
the Nhue river at Ngu Hiep location.
The samples collected from 20 wells, 3 rivers (The Red river, the Nhue river and the
Kimnguu river) and 3 lakes (the Yen So, the Van Quan and the Thanh Nhan lakes). Inside, the Red
river sample collected from different locations.
Figure 1: Sampling location map of the Ha Noi south

VINATOM-AR 16--10
The Annual Report for 2016, VINATOM 92
IV. SAMPLING AND ANALYTICAL METHOD
Sampling Procedures
Before collected groundwater samples, we cleaned the wells by injecting a water volume from
4 to 6 times of the well volume. With the surface water samples, sample bottles directly immersed
into the rivers or lakes at 25 cm depth.
The pH, DO, EC values would immediately measured at sampling locations. Sampling for
bio-chemical analysis preservated and sampled with TCVN 6663-6 (ISO 5667-6: 2005).
Sampling procedures and preservation for the δ18
O and δ2H stable isotope analysis: Fill a 50
mL, double capped, glass or polyethylene bottle directly from the source or from a secondary
container. During sampling, storage and transportation to the laboratory take care to avoid
evaporation of the sample. Polyethylene or glass bottles with 1L volume were suitable for tritium
sampling collection.
Analytical methods
The determination of the δ18
O and δ2H stable isotope in surface water samples is carried out
on a LWIA-24D Laser mass spectrometer (Liquid Water Isotopes Analyzer) located at Isotopes
Hydrology laboratory, Institute for Nuclear Science and Technology, 179 Hoang Quoc Viet Street,
Vietnam.
Procedures of the δ18
O and δ2H stable isotopes analysis in water samples comply with the
IAEA standard operating procedure for the liquid water isotopes analyzer published in 2009 with a
precision <0.1% for δ18
O and <0.3% for δ2H.
The samples which analyzed tritium activity concentration enriched and measured on Liquid
Scintillation Counter (Tricard 3170).
Electrical conductivity, pH and dissolved oxygen are measured in the field with Seven Multil
and Hana HI 9146 hand-held. The biochemical oxygen demand, chemical oxygen demand, NO3+,
NH+
4 and As are carried out at Isotopes Hydrology laboratory with Vietnam standards.
V. RESULTS AND DISCUSSION
1. Set up 18
O and 2H stable isotope analysis procedure
To treat water sample before analysis
The water sample must to check < 30‰ salinity and < 1000mg/L dissolved solid total before
analysis by Laser Spectrometry
To set up working mode for the laser spectrometry
- To set up vacuum desiccation mode
- To set up pumping mode
- To set up dying chamber mode
Measurement range evaluation for the laser spectrometry
To evaluate the measurement range of equipment for the study of water samples in the
laboratory, we used the standard samples with range from -9.2 ‰ to -154 ‰ with2H and -2.69 to
-19.49 ‰ with . The standard samples measured on laser spectroscopy are compared with
results by firm and are presented in Table 1.

VINATOM-AR 16--10
The Annual Report for 2016, VINATOM 93
Table 1: The 2H and results of the standard samples
Sample
The standard sample results by
firm
The standard sample results by
laboratory
2H ‰
18O ‰
2H ‰
18O ‰
Std1 -154 -19.49 -152.3 -18.2
Std2 -123.7 -16.24 -122.6 -14.07
Std3 -97.3 -13.39 -96.34 -12.08
Std4 -51.6 -7.94 -49.99 -7.09
Std5 -9.2 -2.69 -8.6 -2.65
Figure 2: Relationship between2H and 18
O values by firm and by IHL
It is shown that the isotope values of water samples in the range from from -9.2 ‰ to -154 ‰
with2H and -2.69 ‰ to -19.49 ‰ with
18O are highly reliability.
To set up secondary standard line for analysis
Laboratory set up the secondary standards from Red River sample and Catba sea sample (Hai
Phong, Vietnam). The process of setting up a standard calibration line from two samples must be
carried out continuously and regularly on each batch of samples. The steps are as follows:
- to measure δ18
O and δ2H stable isotopes values stable isotopes of Red River sample and
Catba sea sample; to record values at the measurement time (1 and 2 ).
- set up standard linear:
11 axVSMOW +b (3)
22 axVSMOW +b (4)
where:
21
21
VSMOWVSMOWa (5)
21
2121
VSMOWVSMOWb (6)

VINATOM-AR 16--10
The Annual Report for 2016, VINATOM 94
VSMOW1 , VSMOW2 are values of Red River sample and Catba sea sample compared with
VSMOW standard values.
Standard deviation and bias evaluations of measurements
- The standard deviation of the sample is determined by the formula:
1
1
2
n
xx
u
n
i
i
s (7)
where, ix is value of measured sample at time i, is average value of sample from n measuring
times.
- The bias of sample is determined by the formula:
100%1
21 X
(8)
where, 1 is value of standard sample compared with VSMOW standard sample, 2 is value
of standard sample at measured time. The analytical results are presented in the following tables:
Table 2: Standard deviation and bias of standard samples for 2H isotope
Standard sample: 2H= -97.3 ‰ Standard sample:
2H = -9.2 ‰
Time date Result ‰ Time date Result ‰
1 15/10/2015 -96.38 1 15/10/2015 -8.75
2 15/10/2015 -96.72 2 15/10/2015 -8.79
3 15/10/2015 -96.84 3 15/10/2015 -8.63
4 15/10/2015 -96.23 4 15/10/2015 -8.47
5 15/10/2015 -96.33 5 15/10/2015 -8.60
6 15/10/2015 -95.94 6 15/10/2015 -8.64
7 15/10/2015 -96.04 7 15/10/2015 -8.41
8 15/10/2015 -96.21 8 15/10/2015 -8.51
Average -96.34 Average -8.60
Standard deviation 0.3 Standard deviation 0.1
Bias 1% Bias 7%
Table 3: Standard deviation and bias of standard samples for 18O isotope
Standard sample: 18
O= -13.39 ‰ Standard sample:
18O = -2.69
‰
Time date Result ‰ Time date Result ‰
1 15/10/2015 -12.20 1 15/10/2015 -2.62
2 15/10/2015 -12.08 2 15/10/2015 -2.54
3 15/10/2015 -11.98 3 15/10/2015 -2.60

VINATOM-AR 16--10
The Annual Report for 2016, VINATOM 95
4 15/10/2015 -12.23 4 15/10/2015 -2.72
5 15/10/2015 -12.50 5 15/10/2015 -2.54
6 15/10/2015 -11.81 6 15/10/2015 -2.50
7 15/10/2015 -11.90 7 15/10/2015 -2.75
8 15/10/2015 -11.93 8 15/10/2015 -2.94
Average -12.08 Average -2.65
Standard deviation 0.2 Standard deviation 0.1
Bias 10% Bias 1%
The results are shown that the Laser Spectrometry is working well with precision 0.1‰ of
18
O and 0.3‰ of 2H, bias from 1% to 10%.
Calculation 18
O and 2H stable isotope for water samples
The 18
O and 2H stable isotope value for water samples are determined by the formula:
bax sVSMOWS (9)
where, VSMOWS is 18
O (or 2H) value of standard sample, S is
18O (or
2H) value of
sample and b are determined by (4) and (5) equations.
Uncertainty of sample
Uncertainty of sample is determined by equation:
22
SSTD uuu (10)
where, STDu is Standard deviation of standard sample, Su is Standard deviation of sample.
Conclusion: The18
O and 2H stable isotope analysis procedure for Laser Spectrometry is
completely reliable with precision 0.1‰ of 18
O and 0.3‰ of 2H, uncertainty 0.42‰ of
2H and 0.14‰ of
18O at 1.
2. Interactions between surface water and groundwater in South Hanoi
The groundwater in South Hanoi is recharged by two major contributors: Red River water
and meteorological water. The stable isotope composition of groundwater can be determined by
oxygen and hydrogen isotope composition of river water and precipitation water.
The groundwater in the south Hanoi is recharged from river water and rainwater. The stable
isotope composition of groundwater can be determined by oxygen and hydrogen isotope
composition of river water and rainwater. So that, mixed particularity between two distinct
recharge sources can be quantified by a simple linear algebra equation [2], [3]:
p (Vm+Vs)= m Vm+s Vs (11)
where m is the precipitation stable isotope value, s is the river stable isotope value where
recharges for wells; Vm is the amount of precipitation; Vs is the amount of river water.
ms
sm
ss
sm
mmp aa
VV
V
VV
V 1)1(
(12)

VINATOM-AR 16--10
The Annual Report for 2016, VINATOM 96
mS
mpa
(13)
With a is the recharge proportion of river water and (1-a) is the recharge proportion of
precipitation
Through a comparison of the isotopic compositions and water qualities of river water, well
water and precipitation, the groundwater samples can be delineated as described below:
Group 1: Group of wells nearly located the Red river such as P81A-B, P33A-B: the
evaluation of the contribution percentage of the Red River and meteorological water from the
stable isotope values show that, the wells are mainly recharged from 37% to 100% in dry season
and from 62% to 100% in rainy season by the Red river. The samples collected from the group of
wells were not contaminated by ammonium and biochemical in conformity with the National
technical regulation on water quality.
Table 4: The contribution percentage of the Red River on the wells
which are nearly located the Red river
Well
Dry season in
2015
Dry season in
2016
Rainy season in
2015
Rainy season
in 2016
2H
18O
2H
18O
2H
18O
2H
18O
P33a 94% 92% 72% 74% 61% 50% 82% 75%
P33b 100% 90% - - 59% 38% 90% 86%
P81a 67% 57% 100% 100% 49% 48% 87% 88%
P81b 59% 60% 65% 66% 82% 75% 100% 100%
Group 2: Group of P85A-B, P2A-B, P3A-B, P39A and P61A-B-B wells are at distance of 3
km from the Red River. Calculated stable isotope values are shown that the group of these wells is
recharged from 4% to 100% in dry season and from 6% to 100% in rainy season by the Red river.
The samples collected from the group of wells were contaminated by ammonium and biochemical.
Table 5: The contribution percentage of the Red River on the wells
at distance of 3km from the Red River
Well
Dry season in
2015
Dry season in
2016
Rainy season
in 2015
Rainy season
in 2016
2H
18O
2H
18O
2H
18O
2H
18O
P2a 53% 51% 35% 50% 70% 84% - -
P2b 58% 53% - - 64% 70% - -
P3a 32% 28% 58% 67% 97% 92% - -
P3b 34% 21% - - 64% 65% 100% 94%
P39a 83% 92% - - 73% 64% 100% 98%
P39b 65% 61% - - 99% 87% 100% 100%
P61a 81% 100% - - 81% 68% - -
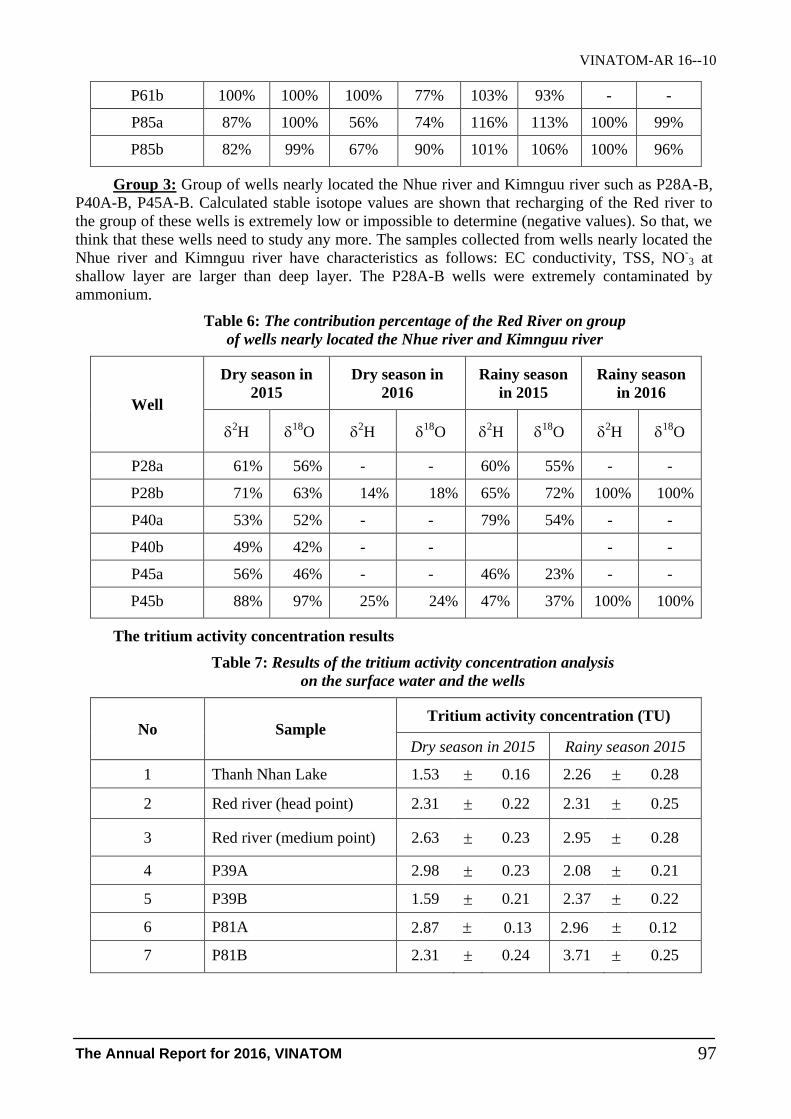
VINATOM-AR 16--10
The Annual Report for 2016, VINATOM 97
P61b 100% 100% 100% 77% 103% 93% - -
P85a 87% 100% 56% 74% 116% 113% 100% 99%
P85b 82% 99% 67% 90% 101% 106% 100% 96%
Group 3: Group of wells nearly located the Nhue river and Kimnguu river such as P28A-B,
P40A-B, P45A-B. Calculated stable isotope values are shown that recharging of the Red river to
the group of these wells is extremely low or impossible to determine (negative values). So that, we
think that these wells need to study any more. The samples collected from wells nearly located the
Nhue river and Kimnguu river have characteristics as follows: EC conductivity, TSS, NO-3 at
shallow layer are larger than deep layer. The P28A-B wells were extremely contaminated by
ammonium.
Table 6: The contribution percentage of the Red River on group
of wells nearly located the Nhue river and Kimnguu river
Well
Dry season in
2015
Dry season in
2016
Rainy season
in 2015
Rainy season
in 2016
2H
18O
2H
18O
2H
18O
2H
18O
P28a 61% 56% - - 60% 55% - -
P28b 71% 63% 14% 18% 65% 72% 100% 100%
P40a 53% 52% - - 79% 54% - -
P40b 49% 42% - - - -
P45a 56% 46% - - 46% 23% - -
P45b 88% 97% 25% 24% 47% 37% 100% 100%
The tritium activity concentration results
Table 7: Results of the tritium activity concentration analysis
on the surface water and the wells
No Sample Tritium activity concentration (TU)
Dry season in 2015 Rainy season 2015
1 Thanh Nhan Lake 1.53 0.16 2.26 0.28
2 Red river (head point) 2.31 0.22 2.31 0.25
3 Red river (medium point) 2.63 0.23 2.95 0.28
4 P39A 2.98 0.23 2.08 0.21
5 P39B 1.59 0.21 2.37 0.22
6 P81A 2.87 0.13 2.96 0.12
7 P81B 2.31 0.24 3.71 0.25

VINATOM-AR 16--10
The Annual Report for 2016, VINATOM 98
The tritium activity concentration values of water samples are no difference in the two
seasons. It is said that the groundwater in the south of Hanoi region is continuously recharged from
meteorological water source after in 1950.
VI. CONCLUSIONS
Major results are as follows.
- The analytical procedures building to determine 18
O and 2H isotope ratio on Liquid Water
Isotope Analyzer with precision 0.1‰ of 18
O and uncertainty 0.3‰ of 2H. uncertainty
0.42‰ of 2H and 0.14‰ of
18O at 1.
- The isotope analytical results showed that the groundwater in South Hanoi is recharged by
two major contributors. They are Red River water and meteorological water: The locations of wells
within 4 km from the Red river are mainly recharged by Red river water. And the locations of wells
are mainly recharged by meteorology water at distance over 4 km from the Red River.
- Tritium analysis results showed that origination of groundwater in the South Hanoi is
continuously recharged by the meteorological water after 1950
We hope that the study results can suggest for environmental managers who can solve and set
up policies to improve the groundwater sources in Hanoi.
REFERENCES
[1] C. W. Fetter; Applied hydrogeology; third edition. Prentice Hall 1993.
Hsin-Fu Yeh. Cheng-Haw Lee. Kuo-Chin Hsu. PoHsun Chang and Chung-ho wang; Using
stable isotopes for assessing the hydrologic characteristics and sources of groundwater recharge;
Environmental Engineering and Management Journal.. 19(4). 185-191, 2009.
[2] L. Yang X. Song. Y. Zhang. D. Han. B. Zhang. and D. Long; Characterizing interactions
between surface water and groundwater in the Jialu River basin using major ion chemistry and
stable isotopes; Hydrol. Earth Syst. Sci.. 16. 4265–4277, 2012.
[3] Liu Xiangchao. Xia Jun;A study of surface water and groundwater using isotopes in Huaishahe
basin in Beijing. China; Sustainability of groundwater resources and its Indicators (Proceedings
of symposium S3 held during the Seventh IAHS Scientific Assembly at Foz do Iguacu. April
2005). IAHS Publ. 302, 2006.
[4] Nguyễn Văn Đản. Status of groundwater contamination in Hanoi. Journal of Geology series A.
No 280/1-2/2004.
[5] Phạm Mạnh Cồn. Nghiên cứu chất lượng nước mặt khu vực nội thành Hà Nội, Tạp chí Khoa
học ĐHQGHN, Khoa học Tự nhiên và Công nghệ, Tập 29, Số 3S, 24-30, 2013.
[6] Van Trigt R., Kerstel E.R.Th., Visser G.H., Meijer H.A.J.; Stable Isotope Ratio Measurements
on Highly Enriched Water Samples by Means of Laser Spectrometry; 2001a. Anal. Chem.. 73.
2445, 2001.
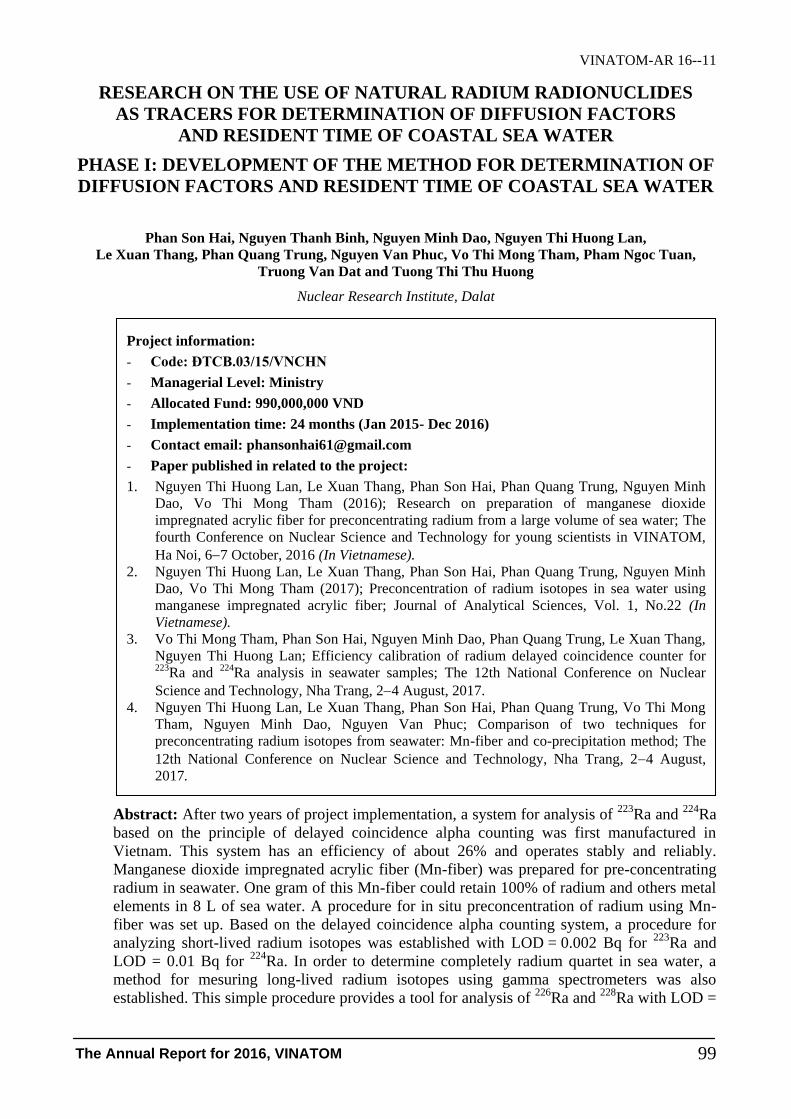
VINATOM-AR 16--11
The Annual Report for 2016, VINATOM 99
RESEARCH ON THE USE OF NATURAL RADIUM RADIONUCLIDES
AS TRACERS FOR DETERMINATION OF DIFFUSION FACTORS
AND RESIDENT TIME OF COASTAL SEA WATER
PHASE I: DEVELOPMENT OF THE METHOD FOR DETERMINATION OF
DIFFUSION FACTORS AND RESIDENT TIME OF COASTAL SEA WATER
Phan Son Hai, Nguyen Thanh Binh, Nguyen Minh Dao, Nguyen Thi Huong Lan,
Le Xuan Thang, Phan Quang Trung, Nguyen Van Phuc, Vo Thi Mong Tham, Pham Ngoc Tuan,
Truong Van Dat and Tuong Thi Thu Huong
Nuclear Research Institute, Dalat
Abstract: After two years of project implementation, a system for analysis of 223
Ra and 224
Ra
based on the principle of delayed coincidence alpha counting was first manufactured in
Vietnam. This system has an efficiency of about 26% and operates stably and reliably.
Manganese dioxide impregnated acrylic fiber (Mn-fiber) was prepared for pre-concentrating
radium in seawater. One gram of this Mn-fiber could retain 100% of radium and others metal
elements in 8 L of sea water. A procedure for in situ preconcentration of radium using Mn-
fiber was set up. Based on the delayed coincidence alpha counting system, a procedure for
analyzing short-lived radium isotopes was established with LOD = 0.002 Bq for 223
Ra and
LOD = 0.01 Bq for 224
Ra. In order to determine completely radium quartet in sea water, a
method for mesuring long-lived radium isotopes using gamma spectrometers was also
established. This simple procedure provides a tool for analysis of 226
Ra and 228
Ra with LOD =
Project information:
- Code: ĐTCB.03/15/VNCHN
- Managerial Level: Ministry
- Allocated Fund: 990,000,000 VND
- Implementation time: 24 months (Jan 2015- Dec 2016)
- Contact email: [email protected]
- Paper published in related to the project:
1. Nguyen Thi Huong Lan, Le Xuan Thang, Phan Son Hai, Phan Quang Trung, Nguyen Minh
Dao, Vo Thi Mong Tham (2016); Research on preparation of manganese dioxide
impregnated acrylic fiber for preconcentrating radium from a large volume of sea water; The
fourth Conference on Nuclear Science and Technology for young scientists in VINATOM,
Ha Noi, 67 October, 2016 (In Vietnamese).
2. Nguyen Thi Huong Lan, Le Xuan Thang, Phan Son Hai, Phan Quang Trung, Nguyen Minh
Dao, Vo Thi Mong Tham (2017); Preconcentration of radium isotopes in sea water using
manganese impregnated acrylic fiber; Journal of Analytical Sciences, Vol. 1, No.22 (In
Vietnamese).
3. Vo Thi Mong Tham, Phan Son Hai, Nguyen Minh Dao, Phan Quang Trung, Le Xuan Thang,
Nguyen Thi Huong Lan; Efficiency calibration of radium delayed coincidence counter for 223Ra and 224Ra analysis in seawater samples; The 12th National Conference on Nuclear
Science and Technology, Nha Trang, 24 August, 2017.
4. Nguyen Thi Huong Lan, Le Xuan Thang, Phan Son Hai, Phan Quang Trung, Vo Thi Mong
Tham, Nguyen Minh Dao, Nguyen Van Phuc; Comparison of two techniques for
preconcentrating radium isotopes from seawater: Mn-fiber and co-precipitation method; The
12th National Conference on Nuclear Science and Technology, Nha Trang, 24 August,
2017.

VINATOM-AR 16--11
The Annual Report for 2016, VINATOM 100
0.05 Bq for 226
Ra and LOD = 0.1 Bq for 228
Ra. These techniques satisfied the demand of
determination of radium quartet in sea water. In this project, methods of determination of
water mass age and diffusion factors of coastal water were also established and tested in a
coastal area of Ninh Thuan province.
Keywords: Radium isotopes, Mn- fiber, coastal sea water, residence time, RaDeCC.
I. INTRODUCTION
The coastal area always receives terrestrially derived materials carried by surface water and
submarine groundwater. After entering the coastal area these materials are mixed with ocean water,
diluted and transported offshore. The existing time of materials coming from land in the coastal area
(it is so called residence time) depends on the exchange rate between coastal water and ocean water.
Rivers are main sources transporting particles and solutes into marine environment. Submarine
groundwater discharge (SGD) is now considered as an important process influencing the coastal
environment and the ocean's chemical budget (Shellenbarger et al., 2006; Breier et al., 2007).
Recent estimates showed that SGD freshwater flux to oceans amounts to 6% of the global river
water flux. SGD often carries relatively high dissolved matter content, thus even a small SGD flux
may have considerable effects on the coastal environment. For instance, outbreaks of harmful algae
blooms have been attributed to the nutrient supply associated with SGD (Scholten et al., 2010).
The exchange of materials between the continental margin and the inside of ocean plays an
important role in global biogeochemical cycles. The quantification of material fluxes through the
coastal ocean is difficult due to the complication of processes occurred within this system. The
management of beach and coastal ocean requires accurately predictive models for tracking the fate
of contaminants and nutrients from the shoreline to the open ocean. However, most models stop at
the 10 m water depth contour, ignoring processes in the surf zone and inner shelf where rivers, tidal
marshes, storm drains and shallow groundwater aquifers discharge (Rapaglia et al., 2010).
Nearshore circulation models are needed to accurately connect theses sources with regional
circulation models. To do this, the nearshore transport of water and solutes must be quantified.
Chemical tracers offer promise but few techniques have been developed to study this complex
region. Radium isotopes are proved to be ideal tracers for quantifying fluxes of dissolved
components across the continental shelf (Moore, 2000). Radium isotopes have been applied to study
residence time of coastal water, the mixing factors of coastal water with ocean (Bourquin, M. et al.,
2008; Beek P. van et al., 2008; Moore W.S. et al., 2008; Rapaglia J. et al., 2010; Souza T.A. et al.,
2010; Hequan Gu et al., 2012). 226
Ra and 228
Ra are suitable for studies in regional level owing to
their long half-lives. Short-lived nuclides 223
Ra (T1/2 = 11.44 d) and 224
Ra (T1/2 = 3.66 d) are
appropriate for investigation of the submarine groundwater discharge and its pathway.
This study is aimed at: (i) Developing procedures for quantification of radium isotopes in sea
water; (ii) Establishing a method of using radium radionuclides as indicators to determine diffusion
coefficients and residence time of coastal water bodies. In order to achieve the goal, the following
research topics were addressed under the frame of this project: (i) To develop in situ radium
preconcentration techniques; (ii) To establish methods for analysis of radium isotopes in sea water
samples; (iii) To set up and apply radium isotopes tracer technique for determination of the
residence time of a coastal water mass at Ninh Thuan to evaluate the ability of the method.

VINATOM-AR 16--11
The Annual Report for 2016, VINATOM 101
II. METHODS OF STUDY
2.1. Development of techniques for in situ preconcentration of radium
2.1.1. Preparing manganese oxide impregnated acrylic fiber
a) Equipment and Reagents: Oven; Water bath; Analytical balance with accuracy 10-5
gram;
100% acrylic fiber; 0.3 MKMnO4 solution; glassware.
b) Preparation of manganese impregnated acrylic fiber: 50 g of acrylic fiber was soaked in
1L of 0.3 M KMnO4 solution for 12 hours at 50-80oC. After the fiber had turned black, it was rinsed
well with deionized water to remove excess KMnO4 as well as MnO2 that did not attach firmly to
the fiber. The fiber then was dried completely in an electric oven at 500C for 48 hours.
2.1.2. Manufacture of device for collecting radium from sea water by Mn-fiber
A device for collecting radium from sea water by Mn-fiber consists of a plastic tank, a
quantitative pump and PVC catridges filled with Mn-fiber. Radium is adsorbed on Mn-fiber when
sea water is passed through these catridges at the flow rate of 3-6 L/ minutes.
2.1.3. Determination of the radium recovery yield of Mn-fiber
a) Investigating radium recovery yield of Mn-fiber by 133
Ba tracer
133Ba tracer is used to study adsorbent capacity of Mn-fiber at laboratory condition. An
amount of tracer 133
Ba with specific activity of 44.879 Bq/gram was blent with sea water. This
solution was passed through 2 grams of Mn-fiber and each volume of 0.5 L solution was collected
over time and then counted on gamma spectrometers to determine 133
Ba activity in the solution.
Based on these data, the amount of 133
Ba absorbed on Mn-fiber was determined.
b) Investigating in situ radium adsorbent capacity of Mn-fiber
Two PVC cartridges were filled with 35g of Mn-fiber and 300 liters of sea water were
sequentially passed through cartridge No.1 and cartridge No.2 at flow rate of 2 - 3 L/minute. Radon
was retained inside the cartridge by turning off two end cap valves. When the radioactivity
equilibrium between 219
Rn and 223
Ra, 220
Rn and 224
Ra was reached, radon isotopes were counted on
delayed coincidence counting system.
2.2. Development of methods for detemination of radium isotopes
2.2.1. Manufacture delayed counting coicidence counting system (RaDeCC)
In the framework of a project at NRI, a 3 chanel counter had designed and set up. In this
project, an alpha scintillation chamber connected to the counter was made to form a completely
delayed coicidence counting system.
a) Manufacture the alpha scintillation chamber
A cylinder chamber was made of plexiglass with a volume of 1.6 L. The inner surface of the
cylinder and a bottom surface were covered with ZnS(Ag) scintillator. The other bottom was
attached to photomultiplier tube. There are an inlet and an outlet on the surface of the chamber
which are connected to a pump in order to transfer radon gas from a Mn-fiber cartridge into the
chamber.
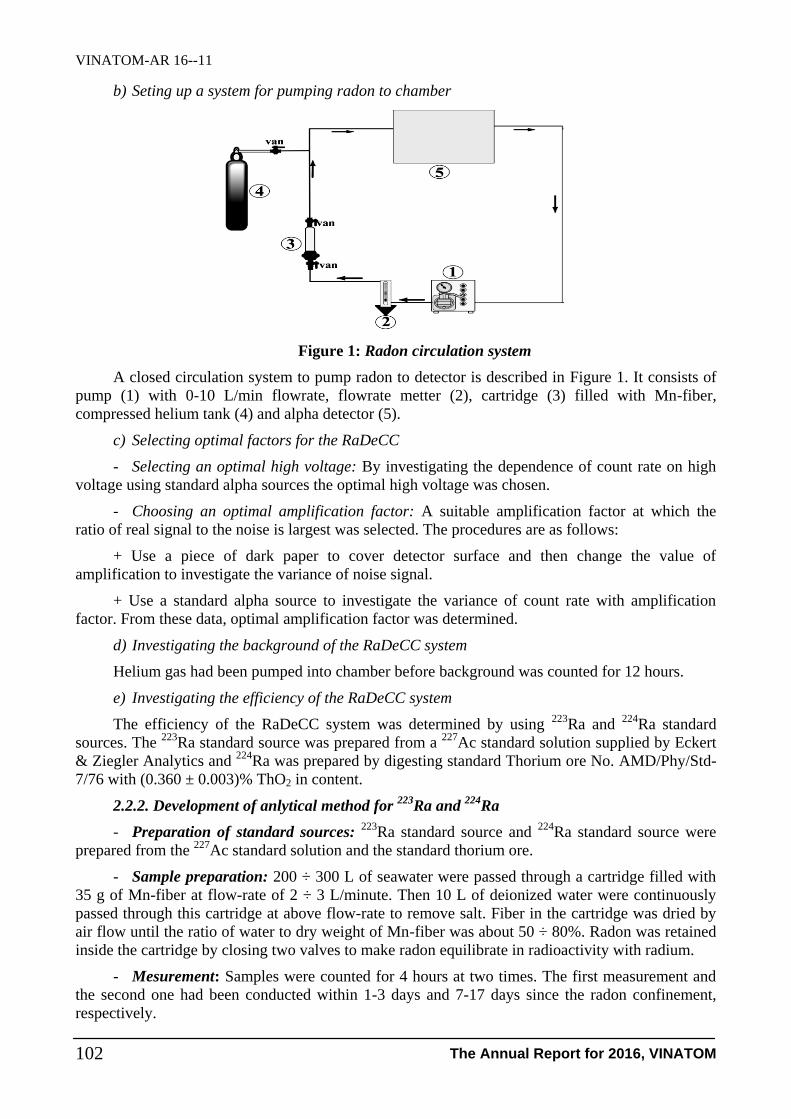
VINATOM-AR 16--11
The Annual Report for 2016, VINATOM 102
b) Seting up a system for pumping radon to chamber
Figure 1: Radon circulation system
A closed circulation system to pump radon to detector is described in Figure 1. It consists of
pump (1) with 0-10 L/min flowrate, flowrate metter (2), cartridge (3) filled with Mn-fiber,
compressed helium tank (4) and alpha detector (5).
c) Selecting optimal factors for the RaDeCC
- Selecting an optimal high voltage: By investigating the dependence of count rate on high
voltage using standard alpha sources the optimal high voltage was chosen.
- Choosing an optimal amplification factor: A suitable amplification factor at which the
ratio of real signal to the noise is largest was selected. The procedures are as follows:
+ Use a piece of dark paper to cover detector surface and then change the value of
amplification to investigate the variance of noise signal.
+ Use a standard alpha source to investigate the variance of count rate with amplification
factor. From these data, optimal amplification factor was determined.
d) Investigating the background of the RaDeCC system
Helium gas had been pumped into chamber before background was counted for 12 hours.
e) Investigating the efficiency of the RaDeCC system
The efficiency of the RaDeCC system was determined by using 223
Ra and 224
Ra standard
sources. The 223
Ra standard source was prepared from a 227
Ac standard solution supplied by Eckert
& Ziegler Analytics and 224
Ra was prepared by digesting standard Thorium ore No. AMD/Phy/Std-
7/76 with (0.360 ± 0.003)% ThO2 in content.
2.2.2. Development of anlytical method for 223
Ra and 224
Ra
- Preparation of standard sources: 223
Ra standard source and 224
Ra standard source were
prepared from the 227
Ac standard solution and the standard thorium ore.
- Sample preparation: 200 ÷ 300 L of seawater were passed through a cartridge filled with
35 g of Mn-fiber at flow-rate of 2 ÷ 3 L/minute. Then 10 L of deionized water were continuously
passed through this cartridge at above flow-rate to remove salt. Fiber in the cartridge was dried by
air flow until the ratio of water to dry weight of Mn-fiber was about 50 ÷ 80%. Radon was retained
inside the cartridge by closing two valves to make radon equilibrate in radioactivity with radium.
- Mesurement: Samples were counted for 4 hours at two times. The first measurement and
the second one had been conducted within 1-3 days and 7-17 days since the radon confinement,
respectively.
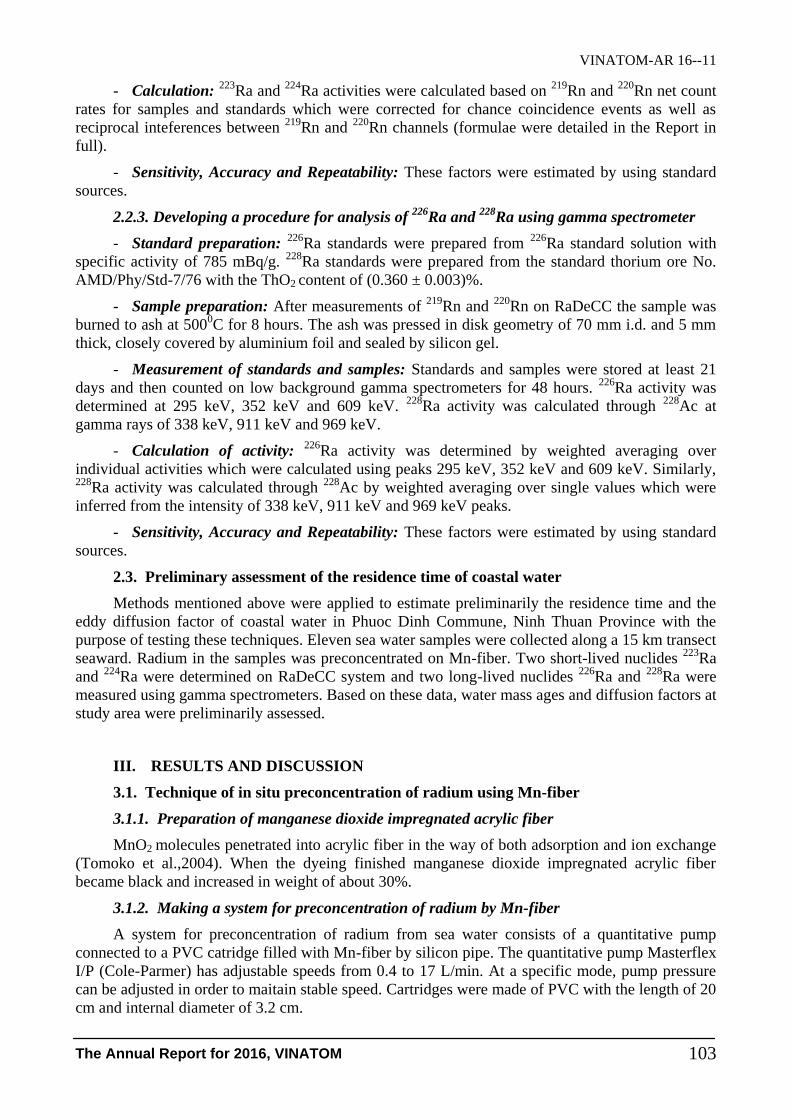
VINATOM-AR 16--11
The Annual Report for 2016, VINATOM 103
- Calculation: 223
Ra and 224
Ra activities were calculated based on 219
Rn and 220
Rn net count
rates for samples and standards which were corrected for chance coincidence events as well as
reciprocal inteferences between 219
Rn and 220
Rn channels (formulae were detailed in the Report in
full).
- Sensitivity, Accuracy and Repeatability: These factors were estimated by using standard
sources.
2.2.3. Developing a procedure for analysis of 226
Ra and 228
Ra using gamma spectrometer
- Standard preparation: 226
Ra standards were prepared from 226
Ra standard solution with
specific activity of 785 mBq/g. 228
Ra standards were prepared from the standard thorium ore No.
AMD/Phy/Std-7/76 with the ThO2 content of (0.360 ± 0.003)%.
- Sample preparation: After measurements of 219
Rn and 220
Rn on RaDeCC the sample was
burned to ash at 5000C for 8 hours. The ash was pressed in disk geometry of 70 mm i.d. and 5 mm
thick, closely covered by aluminium foil and sealed by silicon gel.
- Measurement of standards and samples: Standards and samples were stored at least 21
days and then counted on low background gamma spectrometers for 48 hours. 226
Ra activity was
determined at 295 keV, 352 keV and 609 keV. 228
Ra activity was calculated through 228
Ac at
gamma rays of 338 keV, 911 keV and 969 keV.
- Calculation of activity: 226
Ra activity was determined by weighted averaging over
individual activities which were calculated using peaks 295 keV, 352 keV and 609 keV. Similarly, 228
Ra activity was calculated through 228
Ac by weighted averaging over single values which were
inferred from the intensity of 338 keV, 911 keV and 969 keV peaks.
- Sensitivity, Accuracy and Repeatability: These factors were estimated by using standard
sources.
2.3. Preliminary assessment of the residence time of coastal water
Methods mentioned above were applied to estimate preliminarily the residence time and the
eddy diffusion factor of coastal water in Phuoc Dinh Commune, Ninh Thuan Province with the
purpose of testing these techniques. Eleven sea water samples were collected along a 15 km transect
seaward. Radium in the samples was preconcentrated on Mn-fiber. Two short-lived nuclides 223
Ra
and 224
Ra were determined on RaDeCC system and two long-lived nuclides 226
Ra and 228
Ra were
measured using gamma spectrometers. Based on these data, water mass ages and diffusion factors at
study area were preliminarily assessed.
III. RESULTS AND DISCUSSION
3.1. Technique of in situ preconcentration of radium using Mn-fiber
3.1.1. Preparation of manganese dioxide impregnated acrylic fiber
MnO2 molecules penetrated into acrylic fiber in the way of both adsorption and ion exchange
(Tomoko et al.,2004). When the dyeing finished manganese dioxide impregnated acrylic fiber
became black and increased in weight of about 30%.
3.1.2. Making a system for preconcentration of radium by Mn-fiber
A system for preconcentration of radium from sea water consists of a quantitative pump
connected to a PVC catridge filled with Mn-fiber by silicon pipe. The quantitative pump Masterflex
I/P (Cole-Parmer) has adjustable speeds from 0.4 to 17 L/min. At a specific mode, pump pressure
can be adjusted in order to maitain stable speed. Cartridges were made of PVC with the length of 20
cm and internal diameter of 3.2 cm.
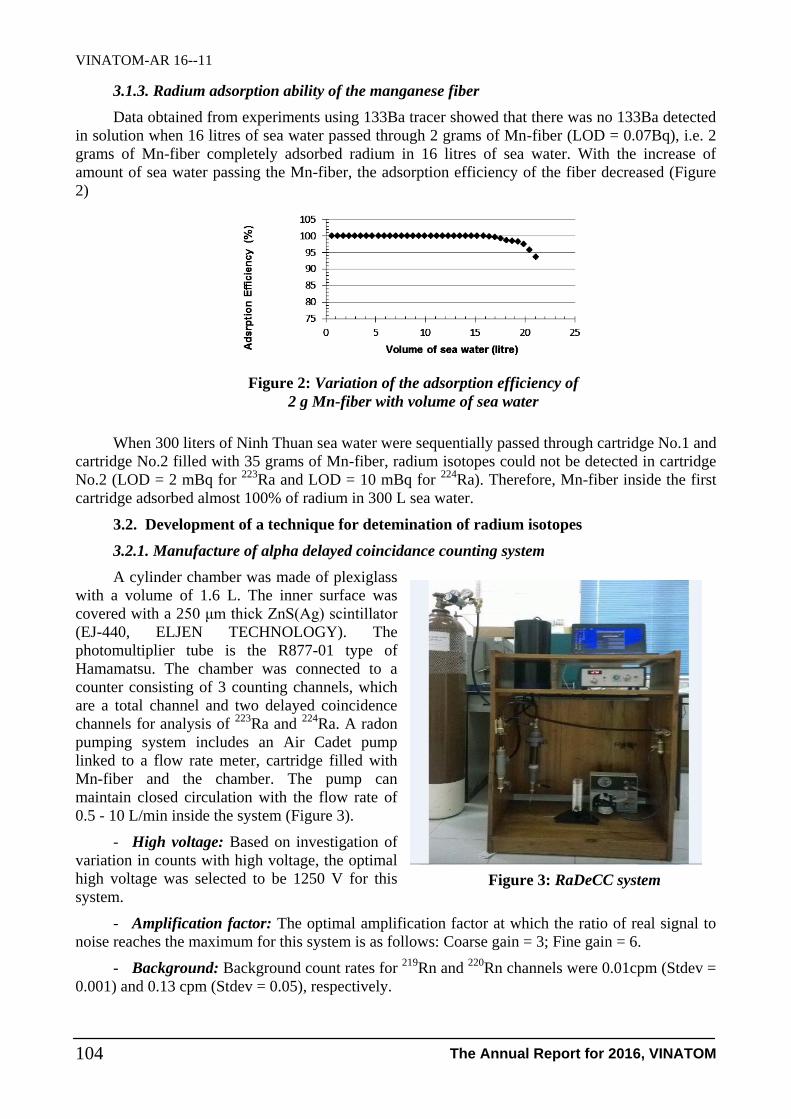
VINATOM-AR 16--11
The Annual Report for 2016, VINATOM 104
3.1.3. Radium adsorption ability of the manganese fiber
Data obtained from experiments using 133Ba tracer showed that there was no 133Ba detected
in solution when 16 litres of sea water passed through 2 grams of Mn-fiber (LOD = 0.07Bq), i.e. 2
grams of Mn-fiber completely adsorbed radium in 16 litres of sea water. With the increase of
amount of sea water passing the Mn-fiber, the adsorption efficiency of the fiber decreased (Figure
2)
When 300 liters of Ninh Thuan sea water were sequentially passed through cartridge No.1 and
cartridge No.2 filled with 35 grams of Mn-fiber, radium isotopes could not be detected in cartridge
No.2 (LOD = 2 mBq for 223
Ra and LOD = 10 mBq for 224
Ra). Therefore, Mn-fiber inside the first
cartridge adsorbed almost 100% of radium in 300 L sea water.
3.2. Development of a technique for detemination of radium isotopes
3.2.1. Manufacture of alpha delayed coincidance counting system
A cylinder chamber was made of plexiglass
with a volume of 1.6 L. The inner surface was
covered with a 250 μm thick ZnS(Ag) scintillator
(EJ-440, ELJEN TECHNOLOGY). The
photomultiplier tube is the R877-01 type of
Hamamatsu. The chamber was connected to a
counter consisting of 3 counting channels, which
are a total channel and two delayed coincidence
channels for analysis of 223
Ra and 224
Ra. A radon
pumping system includes an Air Cadet pump
linked to a flow rate meter, cartridge filled with
Mn-fiber and the chamber. The pump can
maintain closed circulation with the flow rate of
0.5 - 10 L/min inside the system (Figure 3).
- High voltage: Based on investigation of
variation in counts with high voltage, the optimal
high voltage was selected to be 1250 V for this
system.
- Amplification factor: The optimal amplification factor at which the ratio of real signal to
noise reaches the maximum for this system is as follows: Coarse gain = 3; Fine gain = 6.
- Background: Background count rates for 219
Rn and 220
Rn channels were 0.01cpm (Stdev =
0.001) and 0.13 cpm (Stdev = 0.05), respectively.
Figure 3: RaDeCC system
Figure 2: Variation of the adsorption efficiency of
2 g Mn-fiber with volume of sea water
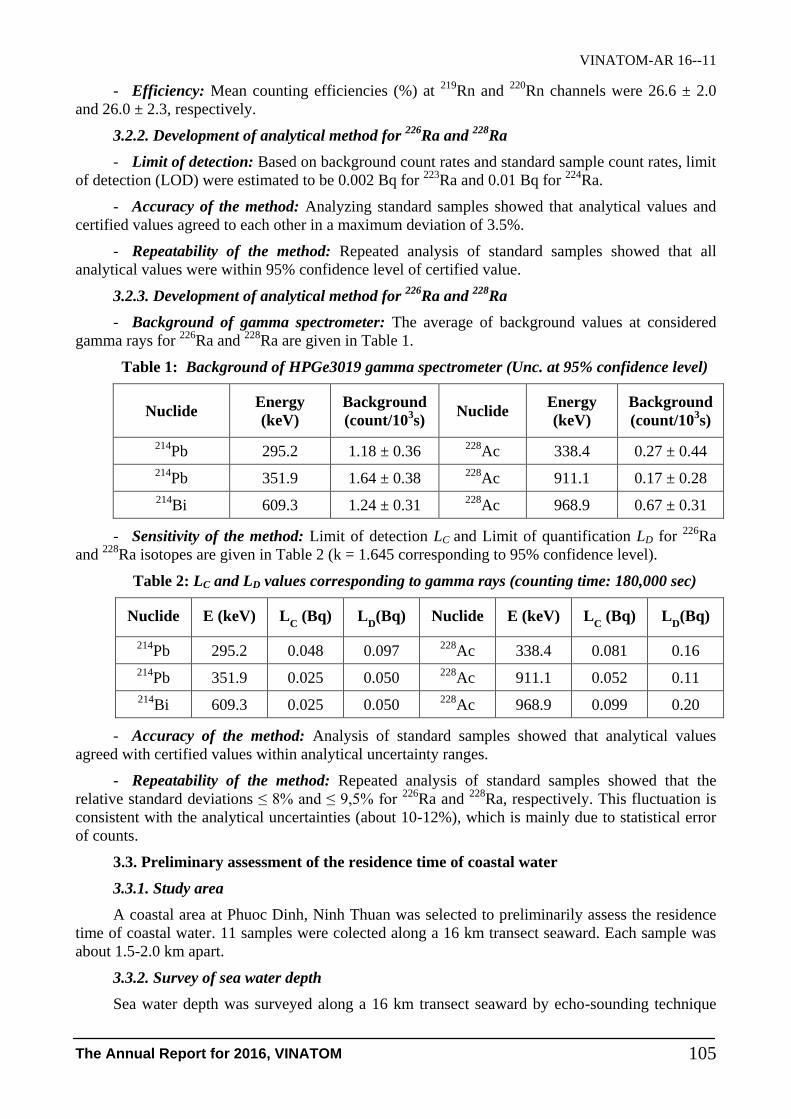
VINATOM-AR 16--11
The Annual Report for 2016, VINATOM 105
- Efficiency: Mean counting efficiencies (%) at 219
Rn and 220
Rn channels were 26.6 ± 2.0
and 26.0 ± 2.3, respectively.
3.2.2. Development of analytical method for 226
Ra and 228
Ra
- Limit of detection: Based on background count rates and standard sample count rates, limit
of detection (LOD) were estimated to be 0.002 Bq for 223
Ra and 0.01 Bq for 224
Ra.
- Accuracy of the method: Analyzing standard samples showed that analytical values and
certified values agreed to each other in a maximum deviation of 3.5%.
- Repeatability of the method: Repeated analysis of standard samples showed that all
analytical values were within 95% confidence level of certified value.
3.2.3. Development of analytical method for 226
Ra and 228
Ra
- Background of gamma spectrometer: The average of background values at considered
gamma rays for 226
Ra and 228
Ra are given in Table 1.
Table 1: Background of HPGe3019 gamma spectrometer (Unc. at 95% confidence level)
Nuclide Energy
(keV)
Background
(count/103s)
Nuclide Energy
(keV)
Background
(count/103s)
214Pb 295.2 1.18 ± 0.36
228Ac 338.4 0.27 ± 0.44
214Pb 351.9 1.64 ± 0.38
228Ac 911.1 0.17 ± 0.28
214Bi 609.3 1.24 ± 0.31
228Ac 968.9 0.67 ± 0.31
- Sensitivity of the method: Limit of detection LC and Limit of quantification LD for 226
Ra
and 228
Ra isotopes are given in Table 2 (k = 1.645 corresponding to 95% confidence level).
Table 2: LC and LD values corresponding to gamma rays (counting time: 180,000 sec)
Nuclide E (keV) LC (Bq) L
D(Bq) Nuclide E (keV) L
C (Bq) L
D(Bq)
214Pb 295.2 0.048 0.097
228Ac 338.4 0.081 0.16
214Pb 351.9 0.025 0.050
228Ac 911.1 0.052 0.11
214Bi 609.3 0.025 0.050
228Ac 968.9 0.099 0.20
- Accuracy of the method: Analysis of standard samples showed that analytical values
agreed with certified values within analytical uncertainty ranges.
- Repeatability of the method: Repeated analysis of standard samples showed that the
relative standard deviations ≤ 8% and ≤ 9,5% for 226
Ra and 228
Ra, respectively. This fluctuation is
consistent with the analytical uncertainties (about 10-12%), which is mainly due to statistical error
of counts.
3.3. Preliminary assessment of the residence time of coastal water
3.3.1. Study area
A coastal area at Phuoc Dinh, Ninh Thuan was selected to preliminarily assess the residence
time of coastal water. 11 samples were colected along a 16 km transect seaward. Each sample was
about 1.5-2.0 km apart.
3.3.2. Survey of sea water depth
Sea water depth was surveyed along a 16 km transect seaward by echo-sounding technique

VINATOM-AR 16--11
The Annual Report for 2016, VINATOM 106
and given in Table 4. The sea depth increases rapidly seawards and reaches the depth of 75 m at 16
km. The slope of sea-floor is high at first five km and decreases gradually with the offshore
distance.
3.3.3. Sample colection, measurement of physicochemical parameter
Eleven surface seawater samples with the volume of 300 L were collected at 3 m depth, 1.5
km apart from each other. The temperature of sea water at sampling points was almost the same.
The pH and salinity values of samples indicated that the study area is not affected by river water.
However, pH and salinity of sea water at first 4 km were slightly higher than that of sea water at
5÷10 km offshore area.
Figure 4: Sea depth at the study area
3.3.4. Radium preconcentration and analysis
Radium in sea water was pre-concentrated by pumping 300 L of sea water through a cartridge
filled with 35 g of Mn-fiber at the flow rate of 2 ÷ 3 L/min. After that, 5 ÷ 10 L of deionized water
were passed through the cartridge at the same flow rate to remove salt on the fiber. The cartridge
was then dried by air pump to make the ratio of water to dry weight fiber reaching 50 ÷ 80%. Short-
lived nuclides 223
Ra and 224
Ra were measured using RaDeCC. Long-lived nuclides 226
Ra and 228
Ra
were analyzed by gamma spectrometers. Analytical values are showed on Figure 5.
Colbert and Hammond (2007) gave out data of radium concentrations in sea water at San
Pedro Bay, USA (223
Ra: 0.02 – 6.57 dpm/100 L; 224
Ra: 0.4 – 72.6 dpm/100 L); Lee et al. (2005)
provided analytical data for 224
Ra (31.2 – 53.8 dpm/100 L), 226
Ra (9.2 – 20.9 dpm/100 L), 228
Ra
(31.5 – 85.2 dpm/100 L) at Ulsan Bay, South Korea; Ghose et al. (2000) published analytical data
for 226
Ra (32.4 – 144.0 dpm/100 L) and 228
Ra (18.0 – 39.6 dpm/100 L) at the Bay of Bengal.
Published radium concetrations in sea water vary in a wide range, depending on the location and
season of sampling. Our analytical data of radium concentration in sea water at Ninh Thuan coastal
area are in the range of published data mentioned above. In our study, all quartet of natural radium
isotpoes in suface sea water were detemined, while above authors just published data of 2 or 3
radium isotopes.
Data obtained from the experiment (Figure 5) show that 226
Ra concentrations are almost stable
along the survey transect. There is a tendency of decrease in 228
Ra concentration offshore. 224
Ra and 223
Ra concentrations tend downwards by distance from shore-line, however there is a certain
fluctuation in the area of 5 – 10 km. This fluctuation might be related to additional radium from
other sources in the area of 5 – 10 km and need to be investigated in detailed.

VINATOM-AR 16--11
The Annual Report for 2016, VINATOM 107
Figure 5: Radium concetrations by the distance from shore-line
(Errors on charts are at 95% confidence level)
3.3.5. Assessing the residence time and diffusion factors of coastal seawater
a) Estimation of seawater mass age: 223
Ra and 224
Ra isotopes were used to estimate seawater
mass age of study area by following fomular (More et al., 2008):
t
t
xe
e
Ra
Ra
Ra
Ra223
224
0
223
224
223
224
(1)
where: (224
Ra/223
Ra)0 is the isotope ratio at the entrence of interested compartment;
(224
Ra/223
Ra)x is the isotope ratio at the distance x; λ223 and λ224 are decay constants of 223
Ra and 224
Ra, repectively.
Residence time was estimated and shown in Table 3. Residence time at sampling positions
varied from 2 to 9 days. Residence time at sampling points of 8,4 km, 11,4 km and 12,9 km
offshore is lower than that at some preceding sampling points. There might be additional radium
sources at these points, resulting in the violation of assumptions in the use of model (1).
Table 3: Residence time of surface sea water calculated from 224
Ra/223
Ra ratios
Distance (km) Residence time (d) Distance (km) Residence time (d)
3.9 2.5 ± 0.2 11.4 0.4 ± 0.1
5.4 2.8 ± 0.2 12.9 3.5 ± 0.2
6.9 4.4 ± 0.3 14.4 8.4 ± 0.6
8.4 1.6 ± 0.1 15.9 8.9 ± 0.8
9.9 5.4 ± 0.4
b) Estimation of diffusion factors:
Diffusion factors were estimated by the following model (More et al., 2008):
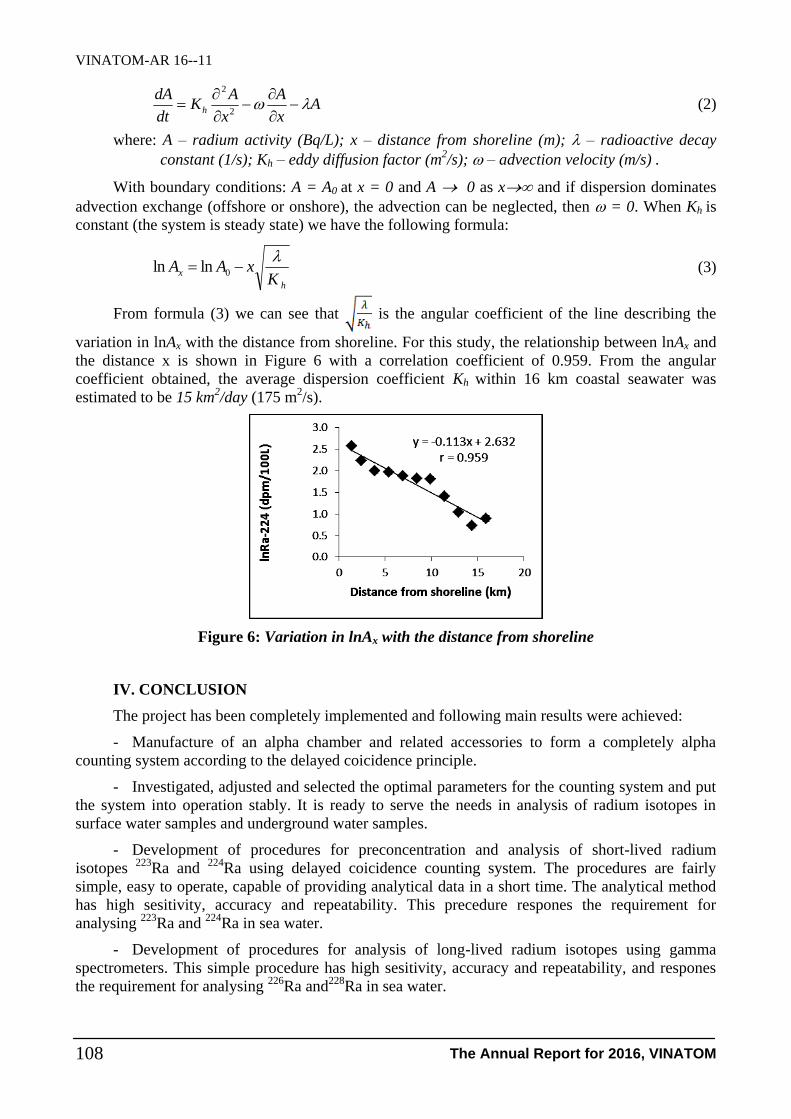
VINATOM-AR 16--11
The Annual Report for 2016, VINATOM 108
Ax
A
x
AK
dt
dAh
2
2
(2)
where: A – radium activity (Bq/L); x – distance from shoreline (m); – radioactive decay
constant (1/s); Kh – eddy diffusion factor (m2/s); – advection velocity (m/s) .
With boundary conditions: A = A0 at x = 0 and A 0 as x and if dispersion dominates
advection exchange (offshore or onshore), the advection can be neglected, then = 0. When Kh is
constant (the system is steady state) we have the following formula:
h
xK
xAA
0lnln (3)
From formula (3) we can see that is the angular coefficient of the line describing the
variation in lnAx with the distance from shoreline. For this study, the relationship between lnAx and
the distance x is shown in Figure 6 with a correlation coefficient of 0.959. From the angular
coefficient obtained, the average dispersion coefficient Kh within 16 km coastal seawater was
estimated to be 15 km2/day (175 m
2/s).
Figure 6: Variation in lnAx with the distance from shoreline
IV. CONCLUSION
The project has been completely implemented and following main results were achieved:
- Manufacture of an alpha chamber and related accessories to form a completely alpha
counting system according to the delayed coicidence principle.
- Investigated, adjusted and selected the optimal parameters for the counting system and put
the system into operation stably. It is ready to serve the needs in analysis of radium isotopes in
surface water samples and underground water samples.
- Development of procedures for preconcentration and analysis of short-lived radium
isotopes 223
Ra and 224
Ra using delayed coicidence counting system. The procedures are fairly
simple, easy to operate, capable of providing analytical data in a short time. The analytical method
has high sesitivity, accuracy and repeatability. This precedure respones the requirement for
analysing 223
Ra and 224
Ra in sea water.
- Development of procedures for analysis of long-lived radium isotopes using gamma
spectrometers. This simple procedure has high sesitivity, accuracy and repeatability, and respones
the requirement for analysing 226
Ra and228
Ra in sea water.

VINATOM-AR 16--11
The Annual Report for 2016, VINATOM 109
- Development of method for determining residence time and diffusion coefficients of
coastal water in Ninh Thuan Province. The preliminary results showed that this new technique is
absolutely applicable for Vietnam coastal area.
REFERENCES
[1] Beek, P. van et al.; Radium isotopes to investigate the water mass pathways on the
Kerguelen Plateau (Southern Ocean); Deep-Sea Research II, 55, pp. 622-637, 2008.
[2] Bourquin, M. et al.; Comparison of techniques for pre-concentrating radium from
seawater; Marine Chemistry 109, pp. 226-237, 2008.
[3] Breier, J.A. and H.N. Edmonds; High 226
Ra and 228
Ra activities in Nueces Bay, Texas
indicate large submarine saline discharges; Marine Chemistry, 103, 131–145, 2007.
[4] Colbert, S. L. et al.; Temporal and spatial variability of radium in coastal ocean and
its impact on computation of nearshore cross-shelf mixing rates; Continental Shelf
Research 27, pp. 1477-1500, 2007.
[5] Ghore, S., M.N. Alam, M.N. Islam; Concentrations of 222
Rn, 226
Ra and 228
Ra in
surface sea water of the Bay of Bangal; Journal of Environmental Radioactivity 47,
pp. 291-300, 2000.
[6] Guogang Jia, Jing Jia; Determination of radium isotopes in environmental samples by
gamma spectrometry, liquid scintilation counting and alpha spectrometry: a review of
analytical methodology; Journal of Environmental Radioactivity 106, pp. 98-119,
2012.
[7] Lee, J.S. et al.; Radium isotopes in the Ulsan Bay; Journal of Environmental
Radioactivity 82, pp. 129-141, 2005.
[8] Moore, W.S. and Ralph Arnold; Measurement of 223
Ra and 224
Ra in coastal waters
using a delayed coincidence counter; Journal of geophysical research, Vol 101, No.
C1, pp. 1321-1329, 1996.
[9] Moore, W. S.; Determining coastal mixing rates using radium isotopes, Continental
Shelf Research 20, pp. 1993-2007, 2000.
[10] Moore, W.S. et al.; Determination of residence time and mixing processes of the
Ubatuba, Brazil, inner shelf waters using natural Ra isotopes; Estuarine, Coastal and
Science 76, pp. 512-521, 2008.
[11] Rapaglia, J. et al.; Investigation of residence time and groundwater flux in Venice
Logoon: Comparing radium isotope and hydrodynamical models; Journal of
Environmental Radioactivity 101, pp. 571-581, 2010.
[12] Scholten, J.C. et al.; Preparation of Mn-fiber standards for the efficiency calibration
of the delayed coincidence counting system (RaDeCC); Marine Chemistry 121, pp.
206-214, 2010.
[13] Shellenbarger et al.; The importance of submarine groundwater discharge to the
nearshore nutrient supply in the Gulf of Aqaba (Israel), Limnol; Oceanogr., 51(4),
1876–1886, 2006.
[14] Souza, T.A. et al.; Use of multitracers for the study of water mixing in the Paraiba do
Sul River estuary; Journal of Environmental Radioactivity 101, pp. 564-570, 2010.

VINATOM-AR 16--12
The Annual Report for 2016, VINATOM 110
DETERMINATION OF RADIUM ACTIVITY IN SOME NATURAL
MINERAL WATERS USING RADIOACTIVE CHEMICAL EXTRACTION
METHOD AND ALPHA SPECTROMETRY
Nguyen Thi Oanh, Duong Van Thang, Duong Duc Thang, Nguyen Van Khanh,
Doan Thuy Hau and Pham Bao Ngoc
Institute for Nuclear Science and Technology, 179 - Hoang Quoc Viet, Hanoi
Abstract: The 226Ra activity concentration in several of mineral water samples of Northern
Vietnam was measured by using alpha spectrometry. Ra adsorption techniques on manganese oxide
were applied to produce thin alpha samples. The efficiency of sample preparation process was
determined by conducting similar procedures for IAEA reference materials. The 226Ra content in
mineral water ranged from (11.33 ± 1.00) mBq/l to (38.00 ± 4.50) mBq/l. The measured maximum
values do not exceed the permissible limit radiation dose for all samples (100 mBq/l - USEPA ). This
study may be useful for assessing impacts of radiation dose from mineral water on human health.
Keywords: radium, mineral water, α-spectrometry, manganese oxide, MnO2 discs.
1. INTRODUCTION
Nowadays, domestic and imported commodities are plentiful and diversified in the
Vietnamese market. Along with the high quality products, we must have measures to prevent the
poor quality ones affecting the health of consumers. It will become more serious if the products are
food and drink that do not meet quality standard requirements because they can cause the
instantaneous and long-term efficiencies. Mineral water is also a product that must be checked and
controlled the food hygiene standards. Especially, radiation levels in mineral water are often higher
than other water sources, so it is necessary to indentify radiation standards before being put into use.
The radioactive isotope such as 226
Ra, 228
Ra, 210
Po, 232
Th, 234
U, and 238
U can be found in the mineral
water, of which 226
Ra is the most important radioactive isotope. 226
Ra is a radioactive decay product
of uranium range and is highly radioactive toxic substance because it has a longer half-life cycle of
1,600 years and alpha emitters that will cause serious biological damage as being infected.
Currently, 226
Ra concentration analysis in the mineral water is one of the market’s demands [1].
In the world, there are many researches about the determination of the 226
Ra in the water but
just a few of them researched into mineral water in detail.
In Viet Nam, survey of radioactivity in mineral water is of practical significance. It is high to
know that the length of the country has hundreds of mineral water sources and in there [2]. Many
establishments have exploited, used, and commercialized other sizes together. Radioactivity in
mineral water is also taken care by some organizations and laboratories Geological scientists of
Project information:
- Code: CS/16/04-01
- Managerial Level: Institute
- Allocated Fund: 80,000,000 VND
- Implementation time: 12 months (Jan 2016- Dec 2016)
- Contact email: [email protected]
- Paper published in related to the project:
Nguyen Thi Oanh, Duong Van Thang, Duong Duc Thang; Determination of 226Ra activity in some
natural mineral waters using radioactive chemical extraction method and alpha spectrometry;
12th Vietnam Conference on Nuclear Science and Technology, Nha Trang, August 2-4, 2017, 8 p.

VINATOM-AR 16--12
The Annual Report for 2016, VINATOM 111
Czechoslovakia, Geology and Viet Nam Atomic Energy Institute also has some data on this issue.
However, a process for determining radioactivity of Ra in the mineral water by alpha
spectroscopy has not been set.
Purpose of topic:
- There are procedures to determine Ra concentrations in natural mineral water.
- There are data on 266
Ra activity concentrations in five natural mineral water mines (Quang
Hanh, Thanh Thuy, Kim Boi, My Lam, Hung Ha).
2. RESEARCH OBJECTS AND ANALYTICAL METHOD
2.1. Research objects
The topic researched mineral water samples at five mines namely Quang Hanh, Thanh Thuy,
Kim Boi, My Lam, and Hung Ha. The mineral water mines which were sampled to analyze 226
Ra
activity concentration in the subject, were founded for a long time in the North of Vietnam and have
famous brands in the market such as Kim Boi mineral water, Quang Hanh mineral water, and Thanh
Thuy mineral water. The study area is located in the south of Hanoi capital
Thanh Thuy Mineral Water – Phu Tho
According to geologists, Thanh Thuy hot spring was formed and led up to the ground from
the Song Da fault intersecting with the northwestern - southeastern fault. The spring covers an area
of over one square kilometers and reserves nearly 20 million cubic meters. Thanh Thuy hot mineral
water’s ingredients are a mixed solution concentrating powerful ionizers, yeasts and most of the
chemical elements that make up the earth’s crust. Thanh Thuy hot spring is a natural hot water
source with many mineral elements such as sulfur. Especially, Vietnam Union of Geological
Sciences recognized the Thanh Thuy hot spring as the first Radon hot spring in the Vietnamese
north. It has very precious Radon used to nurse [2].
My Lam Mineral Water – Tuyen Quang
About 15 kilometers far from Tuyen Quang City along Highway 37, My Lam hot spring,
located at Yen Son commune, is very hot and has high sulfur content. The My Lam hot spring is
Vietnam’s leading hot spring and is suitable to treat arthritis and skin. It has a slightly smell because
of high sulfur content [2].
Hung Ha Mineral Water – Thai Binh
Located at Duyen Hai commune, Hung Ha district in the northern province of Thai Binh, Duy
Hai hot spring was distributed from Northwest to Southeast with the length of 2.250 meters, width
of between 120 meters and 1,000 meters (average width of 600 meters). Duy Hai hot mineral water
is tasteless, calcium bicarbonate or calcium bicarbonate and has total mineralization of 0.47 gram-
0.5 gram per liter. The Duyen Hai hot mineral water is similar in quality to Tien Hai hot mineral
water [2]. It is a potential ware source in terms of scale, water quality, and water depth, so it is
necessary to invest in more detailed research to exploit this precious water source soon.
Kim Boi Mineral Water – Hoa Binh
Located at Ha Bi, Kim Boi district in the northern province of Hoa Binh, it takes about two
hours to go and 75 kilometers far from the center of Hanoi city, Kim Boi hot spring has the lowest
temperature in Vietnam of 34ºC - 36ºC. The mainly mineral compositions of Kim Boi mineral
water are Ca, Mg, Zn, K, Na, HCO3-, SO4
2-, has low solubility (407-412 mg/liter) below the
prescribed level (1000 mg/liter) and meets quality standards for demands such as healing, relax, and
taking care skin [3].
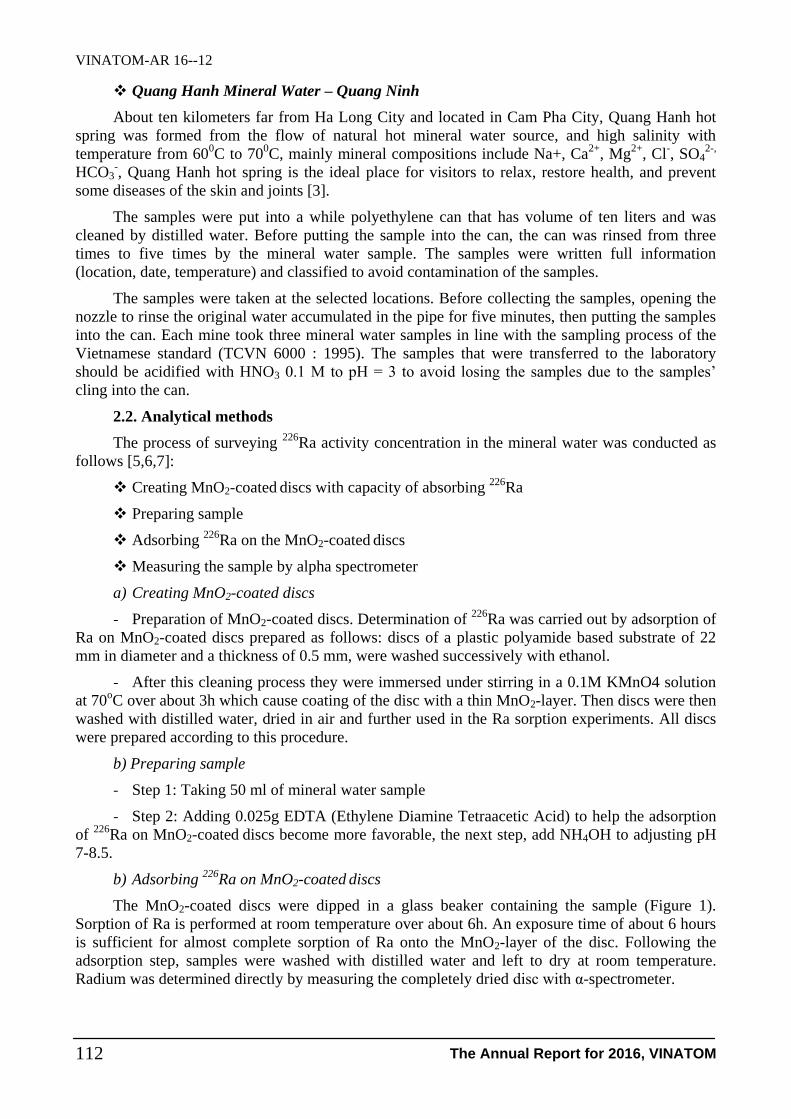
VINATOM-AR 16--12
The Annual Report for 2016, VINATOM 112
Quang Hanh Mineral Water – Quang Ninh
About ten kilometers far from Ha Long City and located in Cam Pha City, Quang Hanh hot
spring was formed from the flow of natural hot mineral water source, and high salinity with
temperature from 600C to 70
0C, mainly mineral compositions include Na+, Ca
2+, Mg
2+, Cl
-, SO4
2-,
HCO3-, Quang Hanh hot spring is the ideal place for visitors to relax, restore health, and prevent
some diseases of the skin and joints [3].
The samples were put into a while polyethylene can that has volume of ten liters and was
cleaned by distilled water. Before putting the sample into the can, the can was rinsed from three
times to five times by the mineral water sample. The samples were written full information
(location, date, temperature) and classified to avoid contamination of the samples.
The samples were taken at the selected locations. Before collecting the samples, opening the
nozzle to rinse the original water accumulated in the pipe for five minutes, then putting the samples
into the can. Each mine took three mineral water samples in line with the sampling process of the
Vietnamese standard (TCVN 6000 : 1995). The samples that were transferred to the laboratory
should be acidified with HNO3 0.1 M to pH = 3 to avoid losing the samples due to the samples’
cling into the can.
2.2. Analytical methods
The process of surveying 226
Ra activity concentration in the mineral water was conducted as
follows [5,6,7]:
Creating MnO2-coated discs with capacity of absorbing 226
Ra
Preparing sample
Adsorbing 226
Ra on the MnO2-coated discs
Measuring the sample by alpha spectrometer
a) Creating MnO2-coated discs
- Preparation of MnO2-coated discs. Determination of 226
Ra was carried out by adsorption of
Ra on MnO2-coated discs prepared as follows: discs of a plastic polyamide based substrate of 22
mm in diameter and a thickness of 0.5 mm, were washed successively with ethanol.
- After this cleaning process they were immersed under stirring in a 0.1M KMnO4 solution
at 70oC over about 3h which cause coating of the disc with a thin MnO2-layer. Then discs were then
washed with distilled water, dried in air and further used in the Ra sorption experiments. All discs
were prepared according to this procedure.
b) Preparing sample
- Step 1: Taking 50 ml of mineral water sample
- Step 2: Adding 0.025g EDTA (Ethylene Diamine Tetraacetic Acid) to help the adsorption
of 226
Ra on MnO2-coated discs become more favorable, the next step, add NH4OH to adjusting pH
7-8.5.
b) Adsorbing 226
Ra on MnO2-coated discs
The MnO2-coated discs were dipped in a glass beaker containing the sample (Figure 1).
Sorption of Ra is performed at room temperature over about 6h. An exposure time of about 6 hours
is sufficient for almost complete sorption of Ra onto the MnO2-layer of the disc. Following the
adsorption step, samples were washed with distilled water and left to dry at room temperature.
Radium was determined directly by measuring the completely dried disc with α-spectrometer.
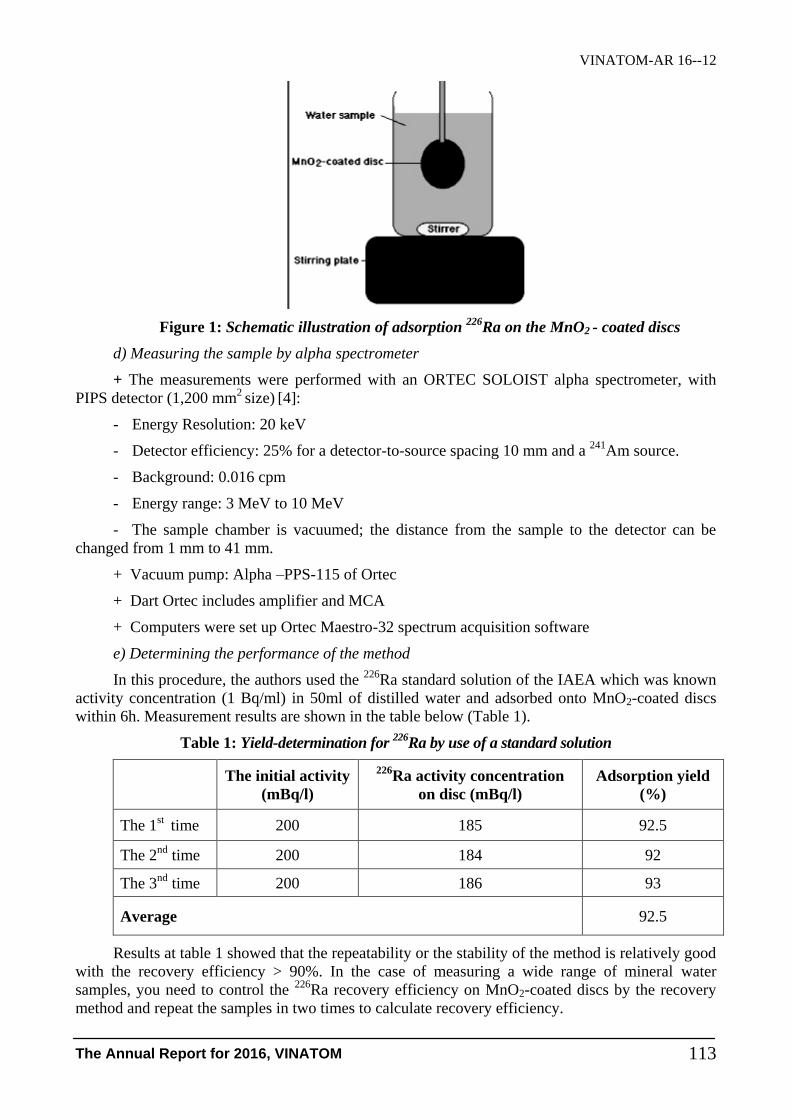
VINATOM-AR 16--12
The Annual Report for 2016, VINATOM 113
Figure 1: Schematic illustration of adsorption 226
Ra on the MnO2 - coated discs
d) Measuring the sample by alpha spectrometer
+ The measurements were performed with an ORTEC SOLOIST alpha spectrometer, with
PIPS detector (1,200 mm2
size) [4]:
- Energy Resolution: 20 keV
- Detector efficiency: 25% for a detector-to-source spacing 10 mm and a 241
Am source.
- Background: 0.016 cpm
- Energy range: 3 MeV to 10 MeV
- The sample chamber is vacuumed; the distance from the sample to the detector can be
changed from 1 mm to 41 mm.
+ Vacuum pump: Alpha –PPS-115 of Ortec
+ Dart Ortec includes amplifier and MCA
+ Computers were set up Ortec Maestro-32 spectrum acquisition software
e) Determining the performance of the method
In this procedure, the authors used the 226
Ra standard solution of the IAEA which was known
activity concentration (1 Bq/ml) in 50ml of distilled water and adsorbed onto MnO2-coated discs
within 6h. Measurement results are shown in the table below (Table 1).
Table 1: Yield-determination for 226
Ra by use of a standard solution
The initial activity
(mBq/l)
226Ra activity concentration
on disc (mBq/l)
Adsorption yield
(%)
The 1st
time 200 185 92.5
The 2nd
time 200 184 92
The 3nd
time 200 186 93
Average 92.5
Results at table 1 showed that the repeatability or the stability of the method is relatively good
with the recovery efficiency > 90%. In the case of measuring a wide range of mineral water
samples, you need to control the 226
Ra recovery efficiency on MnO2-coated discs by the recovery
method and repeat the samples in two times to calculate recovery efficiency.

VINATOM-AR 16--12
The Annual Report for 2016, VINATOM 114
f) Calculating 226
Ra activity concentration in the mineral water sample
The activity concentration of 226
Ra isotopes are calculated according to 4.7 MeV energy peak
and the formula:
1000
TG
o
HHV
CCA (1)
In where
A : Activity concentration 226
Ra (mBq/l)
C : Alpha particle counting rate at 4.7 MeV energy peak (cps)
C0 : Background counting rate (cps)
V : Sample volume (l)
HG: Counting efficiency of alpha system (%)
HT : Chemical recovery efficiency (%)
g) Uncertainty in measurement
Uncertainty in measurement is calculated according to the formula:
(2)
In where
K : Coverage Factor (k = 2 with the desired coverage of 95%)
A : The activity concentration of 226
Ra in the sample (mBq/l)
C : Error of sample rate (cps)
oC : Error of background counting rate (cps)
V : Volume error (l)
GH : Counting efficiency error (%)
TH : Recovery efficiency error (%)
3. RESULTS AND DISCUSSION
Table 2: The activity concentration result of 226
Ra in the mineral water sample by
the adsorbing method on MnO2-coated disc and measuring alpha spectrometry
No. Name of Samples Activity concentration
(mBq/l)
1 Quang Hanh mineral water: the first source 20.00 ± 1.48
2 Quang Hanh mineral water: the second source 16.00 ± 1.34
3 Quang Hanh mineral water: bottled 6.30 ± 1.00
4 Kim Boi mineral water: the first source 19.00 ± 2.00
5 Kim Boi mineral water: the second source 17.10 ± 2.00
2222
0
2
)(
T
T
G
Go
H
H
H
H
V
V
C
C
C
CAkA
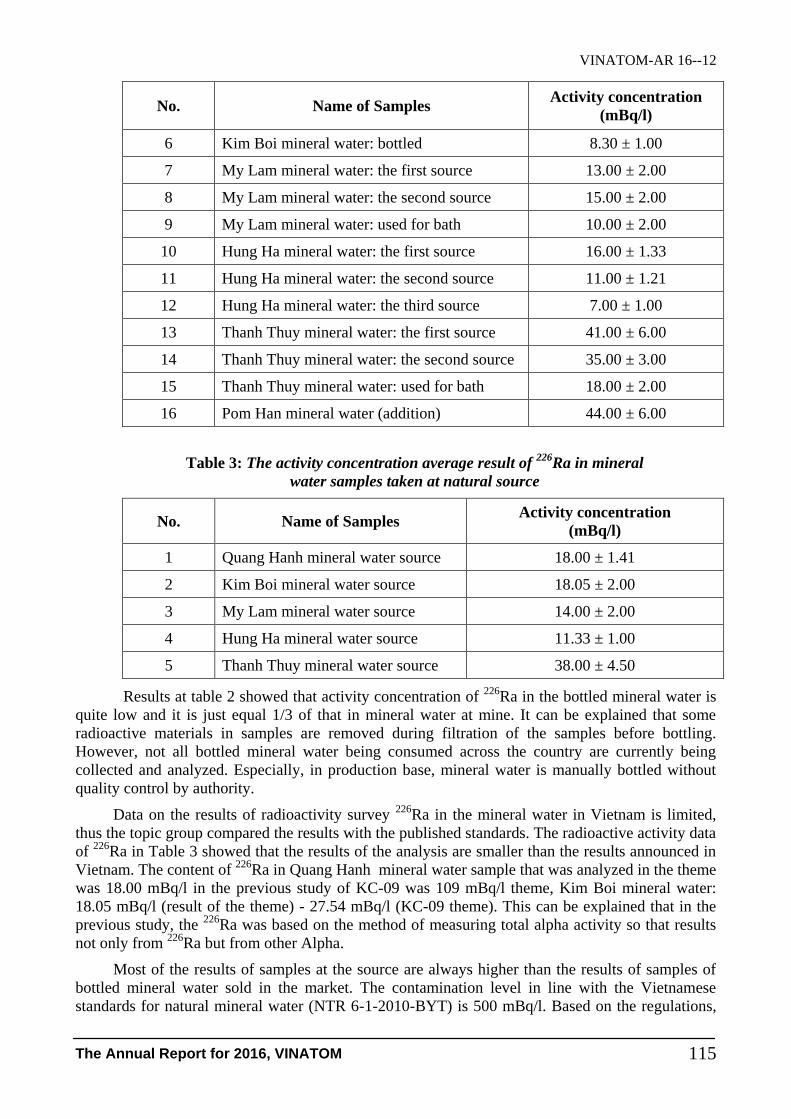
VINATOM-AR 16--12
The Annual Report for 2016, VINATOM 115
No. Name of Samples Activity concentration
(mBq/l)
6 Kim Boi mineral water: bottled 8.30 ± 1.00
7 My Lam mineral water: the first source 13.00 ± 2.00
8 My Lam mineral water: the second source 15.00 ± 2.00
9 My Lam mineral water: used for bath 10.00 ± 2.00
10 Hung Ha mineral water: the first source 16.00 ± 1.33
11 Hung Ha mineral water: the second source 11.00 ± 1.21
12 Hung Ha mineral water: the third source 7.00 ± 1.00
13 Thanh Thuy mineral water: the first source 41.00 ± 6.00
14 Thanh Thuy mineral water: the second source 35.00 ± 3.00
15 Thanh Thuy mineral water: used for bath 18.00 ± 2.00
16 Pom Han mineral water (addition) 44.00 ± 6.00
Table 3: The activity concentration average result of 226
Ra in mineral
water samples taken at natural source
No. Name of Samples Activity concentration
(mBq/l)
1 Quang Hanh mineral water source 18.00 ± 1.41
2 Kim Boi mineral water source 18.05 ± 2.00
3 My Lam mineral water source 14.00 ± 2.00
4 Hung Ha mineral water source 11.33 ± 1.00
5 Thanh Thuy mineral water source 38.00 ± 4.50
Results at table 2 showed that activity concentration of 226
Ra in the bottled mineral water is
quite low and it is just equal 1/3 of that in mineral water at mine. It can be explained that some
radioactive materials in samples are removed during filtration of the samples before bottling.
However, not all bottled mineral water being consumed across the country are currently being
collected and analyzed. Especially, in production base, mineral water is manually bottled without
quality control by authority.
Data on the results of radioactivity survey 226
Ra in the mineral water in Vietnam is limited,
thus the topic group compared the results with the published standards. The radioactive activity data
of 226
Ra in Table 3 showed that the results of the analysis are smaller than the results announced in
Vietnam. The content of 226
Ra in Quang Hanh mineral water sample that was analyzed in the theme
was 18.00 mBq/l in the previous study of KC-09 was 109 mBq/l theme, Kim Boi mineral water:
18.05 mBq/l (result of the theme) - 27.54 mBq/l (KC-09 theme). This can be explained that in the
previous study, the 226
Ra was based on the method of measuring total alpha activity so that results
not only from 226
Ra but from other Alpha.
Most of the results of samples at the source are always higher than the results of samples of
bottled mineral water sold in the market. The contamination level in line with the Vietnamese
standards for natural mineral water (NTR 6-1-2010-BYT) is 500 mBq/l. Based on the regulations,

VINATOM-AR 16--12
The Annual Report for 2016, VINATOM 116
we can conclude that the five mineral water mines in the framework of the researching topic were
small. Moreover, United States Environmental Protection Agency’s (USEPA) has recommended 226
Ra (100 mBq/l), Health Canada (226
Ra) is 500 mBq/l for the quality of water used for daily eating
activities.
4. CONCLUSION
MnO2-coated discs, which was prepared at the laboratory of the Center for Environmental
Radiation Monitoring and Impact assessment, Institute for Nuclear Science and Technology, can
adsorb 226
Ra in mineral water with a efficiency of above 90%.
We has built a process to determine Ra content in the mineral water by means of adsorption
on MnO2-coated discs measuring alpha spectrometry. The process is suitable for laboratory
conditions. Check the stability of the method with an error of less than 20%.
In this study, 226
Ra content in 5 mineral water mines (Quang Hanh, Thanh Thuy, Kim Boi,
My Lam, Hung Ha) has been determined. The results showed that the content of 226
Ra in the
mineral water samples range from 11.33 ± 1.00 mBq/l to 38.00 ± 4.50 mBq/l. Based on standards of
radiation safety in drinking water, it can be concluded that the 226
Ra activity concentration in 5
surveyed mineral water mines was smaller than allowed limits (<100 mBq/l).
REFERENCES
[1] Alexandra Amonette and Brice Smith; The Environmental Transport of Ra and Plutonium;
Institute for Energy and Environmental Research IEER, USA, 2006.
[2] Pham Ngoc Cu, Report on status quo of mineral water exploitation and utilization, state level
project KT01-14 Council of Mineral Reserves, 1993.
[3] https://thanhlamhotspring.com/kien-thuc-tong-hop/.
[4] Nguyen Hai Duong, Nguyen Thanh Nhan, Nguyen Dong Son, Research on the Alpha Ortec
algebra system and put it to use in teaching, Report on the application of physics to the
development of production and life first, Ho Chi Minh 23-24 / 11/2001.
[5] Katell Morvan,Yves Andres, Bandombele Mokili, and Jean-Charles Abbe|, Determination of
Radium-226 in Aqueous Solutionsby r-Spectrometry, Analytical Chemistry, Vol. 73, No. 17,
pp. 4218-4224, September 1, 2001.
[6] Curriculum Vitae Sascha Wisser, Balancing Natural Radionuclides in Drinking Water Supply,
pp.53-156, 2003.
[7] Yonglan Luo, Preparation of MnO2 nanoparticles by directly mixing postassium permanganate
and polyelectrolyte awueous solution, Materials Letters 61, pp. 1893 – 1895, 2007.

1. 6- Applications in Biology, Agriculture and Medicine ;


VINATOM-AR 16--13
The Annual Report for 2016, VINATOM 119
STUDY ON THE PRODUCTION OF RADIOISOTOPES AND
RADIOPHARMACEUTICALS FOR MEDICAL PURPOSES
AT THE DALAT RESEARCH REACTOR
Nguyen Ngoc Tuan1, Duong Van Dong
1, Nguyen Thi Thu
1, Bui Van Cuong
1,
Pham Thanh Minh1, Nguyen Thi Hang
1, Mai Phuoc Tho
1, Nguyen Thanh Bình
1,
Nguyen Dinh Lam1, Nguyen Thi Khanh Giang
1, Nguyen Thi Ngoc
1,
Bui Dieu Hang2 and Dao Tien Manh
3
1 Nuclear Research Institute, No.1 Nguyen Tu Luc, Da Lat City 2 Cho Ray Hospital, Ho Chi Minh City
3 The Army Hospital-175
Project information:
- Code: ĐTĐL.2011-G/81
- Managerial Level: Government
- Allocated Fund: 8,250,000,000 VND
- Implementation time: 48 months (Aug 2011 – Aug 2015)
- Contact email: [email protected]
- Paper published in related to the project:
1. Nguyen Ngoc Tuan*, Duong Van Dong, Bui Van Cuong, Pham Thanh Minh, Nguyen Thi
Hang; Study on the production of 177Lu for medical purposes at the Dalat Research Reactor, Part
1. Study on production of 177Lu at the Dalat Research Reactor; Journal of Nuclear Science and
Technology, Vol.5, No.1, pp. 18-25, 2015.
2. N.N. Tuan, D.V. Dong, M.Ph. Tho, D.H.H. Quang, N.T. Hang, N.D. Lam, B.V. Cuong; Study
on preparation of P-32 to produce applicator for treatment of block tumor and keloid scars;
solution P-32 is taken orally relieving pain of bone cancer metastasis; Journal of Analytical
Sciences; Vol.20, No.4, pp.1-6, 2015 (in Vietnamese).
3. Nguyen Ngoc Tuan, Duong Van Dong, Nguyen Thanh Minh, Nguyen Thi Hang; Study on
production of 177Lu for medical purposes at Dalat Nuclear Research Reactor, Part 2: Study on
distribution and elimination of 177Lu -EDTMP pharmaceutical in animals (white mouse and
rabbit); Journal of Analytical Sciences; Vol.20, No.4, pp.191-197, 2015 (in Vietnamese).
4. Duong Van Dong, Pham Ngoc Dien, Bui Van Cuong, Mai Phuoc Tho, Nguyen Thi Thu, Vo
Cam Hoa; Production of Radioisotopes and Radiopharmaceuticals at the Dalat Nuclear
Research Reactor; J. Nuclear Science and Technology, Vol.4, No.1, pp. 46-56, 2014.
5. Nguyen Thu Thu, Vo Cam Hoa, Nguyen Thi Khanh Giang, Nguyen Thanh Binh, Nguyen Ngoc
Tuan, Nguyen Thi Ngoc; Preparation and Quality Control of Radiolabelled Monoclonal 99mTc-
Lekoscan for Infection and Inflammation Diagnostic Imaging; Journal of 108-Clinical and
Pharmacy T8, pp.198-204, 2013 (in Vietnamese).
6. Nguyen Thi Thu, Vo Thi Cam Hoa, Nguyen Thi Khanh Giang, Nguyen Ngoc Tuan, Nguyen
Thi Hang, Nguyen Thi Ngoc, Bui Dieu Hang; The quality Control and Preclinical Evaluation of
Radioimmunoconjugate 99mTc-NCA90 Monoclonal Antibody in Animals; Journal of 108-
Clinical and Pharmacy, Vol.9, NO1, pp. 47-54, 2014 (in Vietnamese).
7. M. Blaauw1, D. Ridikas2, S. Baytelesov3, P. S. Bedregal Salas4, Y. Chakrova5, Cho Eun-Ha6,
R. Dahalan7, A. H. Fortunato8, R. Jacimovic9, A. Kling10, L. Munoz11, N. M. A. Mohamed12,
D. Párkányi13, T. Singh14, Van Dong Duong15; Estimation of 99Mo production rates from natural
molybdenum in research reactors; Journal of Radioanalytical and Nuclear Chemistry, 2016.
(http://link.springer.com/article/10.1007/s10967-016-5036-6).
VINATOM-AR 16--13
The Annual Report for 2016, VINATOM 120
Abstract: During the years of 2011-2015, the study on the production of radioisotopes and
radiopharmaceuticals for medical purposes at the Dalat Research Reactor has been carried out. The
contents of the this study project are: 1) Improvement of procedure for P-32 production by irradiation
of P2O5 instead of S target due to several S target’s disadvantages. The procedure is simpler and more
efficient. This pharmaceutical is orally used for therapy of bone cancer metastasis; 2) Procedure for
production of Tc-99m generator- The production of 99Mo/99mTc generator by irradiation of MoO3
target at Dalat research reactor with low power. Tc-99m of the same quality as imported Tc-99m is
produced by 99Mo/99mTc generator and initially provided for several hospitals in Ho Chi Minh City
such as Cho Ray Hospital and Tumor Hospital for diagnosis and therapy; 3) Study on production of 177Lu at the Dalat Research Reactor- Irradiation of Lu-176 target to produce Lu-177 labeling with
several organic compounds for diagnosis and therapy. The result asserts that it is possible to produce
Lu-177 from Lu-176 target at Dalat research reactor. However, for irradiation of Yb-176 target, the
amount of Lu-177 formed is too small for medical application due to very low reaction efficiency. 4)
Establishment of procedure for labeling monoclonal antibody DOTA-J591 with 177Lu in
Radioimmunology-Therapy (RIT) for therapy of prostate cancer metastasis. However, testing on
animals is still limited; 5) Procedure for production of 177Lu-labeled EDTMP for therapy of bone
cancer and bone cancer metastasis and 99mTc-labeled sestaMIBI for diagnosis of cardiovascular and
thyroid diseases and breast tumor. The result shows that labeling efficiency is greater than 95% and
nucliditic purity is greater than 99.9%. Experiment on its distribution and safety for animals and
volunteer patients at The army Hospital 175 in Ho Chi Minh City shows satisfactory results 6)
Labeling monoclonal antibody with Tc-99m was successful. SPECT image of inflamed rabbit injected
with 99mTc-labeled NCA90mAb shows the concentration of this radiopharmaceutical in the inflamed
organ.
I. INTRODUCTION
Radioisotopes and radiopharmaceuticals have been researched, developed, and diversified
their applications in diagnosis and therapy. Many compounds labeled with radioisotopes with
suitable energy and half-life is used as target-oriented compounds for cancer therapy. The cancers
such as lymphoma and cancers of intestine, lung, prostate, breast, brain, marrow, liver, kidney, etc
resistant to traditional therapies can be cured with radiopharmaceuticals. Radioisotope therapy is
more effective and specific, reduces duration of therapy and patient recovery.
From 2011 to 2015, within the national project, we conducted research on P-32 production in
the form of Na2H32
PO4 solution as a pain reliever in bone cancer metastasis orally used by patients,
on Lu-177 production to label DOTA-J591mAb for diagnosis and therapy of prostate cancer, on
production of 99
Mo-99m
Tc generator by irradiation of MoO3 to label sectaMIBI with Tc-99m to
produce 99m
Tc-sestaMIBI for diagnosis of heart diseases and research on labeling monoclonal
antibody resistant to NCA90mAb with Tc-99m for diagnosis of osteomyelitis and inflammation.
These radioisotopes are produced at Dalat Nuclear Research Reactor with power of 500 kW and
neutron flux of 2x10¹³
n cm-2
s-1
II. EXPERIMENTS
II.1 Instrumentation and tools
- The nuclear research reactor with 500kW power
- The multichannel gamma spectrometer system with HP Ge(Li) detector, Ortec, USA
- A hood system with electronic stove used to treat the samples
- High Pressure Liquid Chromatography- mass spectrometer (HPLC-MS), Shimadzu, Japan
- ENDOSAFE-PTS100, USA
VINATOM-AR 16--13
The Annual Report for 2016, VINATOM 121
- AAS 6800, Shimadzu, Japan
- UV-VIS 2000, Japan
- Dose Calibrator CAPINTEC CR 127, USA
- Funnels, glasses, graded cylinders, pipettes, micropipettes, centrifuge, etc
II.2 Reagents
- Almost all the reagents used in experiment are P.A. chemicals made by Sigma, USA and
Merck, Germany
- Freshly purified water prepared by a pure water distiller .
III. RESULTS AND DISCUSSION
III.1. Production of P-32 solution; 99m
Tc generator and Lu-177 in Dalat Nuclear
Research Reactor
III.1.1. Improvement of procedure for P-32 production by irradiation of P2O5 instead of S
target due to several S target’s disadvantages: Small neutron capture cross section of S target
results in low efficiency of production and the amount of P-32 produced does not meet the demand
of hospitals nationwide. On the other hand, separation of P-32 from S target is rather complicated
and time-consuming. Thus, that is detrimental to individuals who are involved in the process of
separation in terms of radiation exposure. Using P2O5 target helps to overcome the above
disadvantages.
The procedure is to produce P-32 in the form of Na2H32
PO4 by irradiation of P2O5 target
instead of S target at Dalat research reactor. The radiopharmaceutical Na2H32
PO4 is used as a pain
reliever in therapy of bone cancer metastasis.
After P2O5 target was dried and pulverized, 10 grams of the target equivalent to 4.3 grams of
phosphorus was taken and put into a stoppered quartz ampoule or Purex glass ampoule sealed with
an acetylene torch, then transferred into an 99.9%-purity aluminum container. The container was
loaded into a neutron trap with neutron flux of 2 x 10¹³
n/cm 2.s to be irradiated from 100 to130
hours, and then cooled for 48 hours.
After the reactor was shut down for two days, the container was transferred into a production
box. The ampoule was taken out and cut with specialized tools. The sample was transferred into a
100mL heat-resistant beaker and dissolved with 40 mL of 0.1N HCl. After being cooled, the sample
was added with 8 mL of 30% H2O2 and reflux-heated on a stove for 3 hours. After being cooled, the
sample was taken out, filtered by G-3 porous glass, and passed through a Dowex 50W-X4 ion-
exchange column to remove impure metal cations. After that, activity of P-32 was measured. The
solution obtained in the form of Na2HPO4 was adjusted to pH from 6 to 8 by addition of 1M NaOH.
This pH medium is suitable for oral usage to cure bone cancer metastasis.
The quality of this pharmaceutical was controlled and assured by paper chromatography, thin-
layer chromatography, multichannel gamma spectrometer with Ge(Li) detector and energy of 1.9
keV for the 1332 keV peak of Co-60.
Note: When 4.3 grams of phosphorus (10 grams of P2O5) is irradiated at Dalat research
reactor for 108 hours, 510 mCi of P-32 in the form of Na2H32
PO4 is obtained after the reactor was
shut down for 36 hours. If a patient needs a dose from 7 to 10mCi for each treatment for bone
cancer metastasis, this activity is sufficient for 51 patients. The amount of phosphorus administered
into the body for each treatment is 4.3 grams/51 doses=0.084 gram/dose, equivalent to 84mg/dose.

VINATOM-AR 16--13
The Annual Report for 2016, VINATOM 122
An average amount of phosphorus in a human body is approximately one kilogram, three
fourths of which resides in bone and teeth in the form of apatite. An ordinary adult consumes and
excretes approximately from 1 to 3 grams of phosphorus in the form of phosphate. Therefore, the
total amount of phosphorus entering the body is much smaller than daily demand.
III.1.2. Procedure for production of Tc-99m generator
The procedure is to produce Tc-99m in the form of Na99m
TcO4 (99
Mo-99m
Tc generator) by
irradiation of MoO3 at Dalat research reactor. Tc-99m is used to label organic compounds for
diagnostic imaging of several organs in human body such as thyroid, salivary gland, stomach, brain,
cardiovascular system, etc.
Tc-99m was produced at Center for Radioisotope Research and Production, Dalat Nuclear
Research Institute based on the following reaction
98
Mo (n, γ)99
Mo 99m
Tc
The target to be irradiated in the reactor was MoO3. After irradiation, the target was dissolved
into a solution and transferred into a generator. Tc-99m produced in the generator was extracted for
diagnosis and therapy.
+ Extraction of 99m
Tc from the generator:
This process was conducted by using 99m
Tc generator. The solution of 99m
Tc was extracted
from the generator every 24 hours. For each extraction, a vacuum bottle and a bottle containing 10
mL of sterile physiological saline solution were connected to the generator. The solution was
sucked through the generator column already containing 99
Mo to retain 99m
Tc in the form of
sodiumpertechnate (Na99m
TcO4) in the physilological saline solution and then run into the vacuum
bottle. After the extraction was completed, the bottle containing 99m
Tc was taken out of the
generator.
Figure 1: Diagram of 99m
Tc generator

VINATOM-AR 16--13
The Annual Report for 2016, VINATOM 123
III.1.3. Study on production of 177
Lu at the Dalat Research Reactor
III.1.3.1. Theoretical calculation of 177
Lu activity after the irradiation of 176
Lu và 176
Yb targets
at the Dalat research reactor
a) Calculation of 177
Lu activity after the irradiation of 176
Lu target
The activity of 177
Lu from the activation reaction of 176
Lu will be calculated as
follows:
(1)
where:
- A1(): The activity of 177
Lu to be determined at time
- Φ: neutron flux at sample irradiation position: 2 x 10¹³
ncm-2
s-1
- σac: activation cross section of 176Lu : 2050 barn
- G: isotopic abundance of 176Lu (%): 2.59%
- g: amount of sample to be irradiated (g) 1µg=10-6gram
- M: atomic mass of the isotope to be produced (g): 177g Mole-1
- T1: half-life of the isotope produced (sec): 6.7h x 3600s
- t: irradiation time in seconds
- 6.023x10²³: the Avogadro number
b) Calculation of 177
Lu activity after the irradiation of 176
Yb target
During irradiation, the following reaction occurs : 176
Yb(n,γ)177
Yb (T1 ½=1.911h)177
Lu + β-
(T2 ½=6.7d); After irradiation for a period of time τ, radioactivity of 177
Lu can be calculated as
follows (1):
where:
Φ: neutron flux Φ = 2x10¹³
n.cm-2
.s-1
(for the Dalat reserach reactor);
σac: activation cross section of 176
Yb for the 176
Yb(n, γ)177
Yb reaction, 5,5 barn
G: isotopic abundance of 176
Yb;
g: amount of sample to be irradiated;
M: atomic mass of 176
Yb: 176 g Mole-1
;
T1: half-life of 177
Yb, 6876s
T2: half-life of 177
Lu, 5.788 x10⁵s;
τ : neutron activation time in seconds
1
693.023
1 1.100
....10.023.6)(
Tac eM
gGA
21
1
21
1
2
693.0
2
693.0
1
693.0
1
693.023
2
1
)1()1(.100
....10.023.6(
TT
TxF
TT
TxK
eeFeeKM
gGA
tTT
tTTac

VINATOM-AR 16--13
The Annual Report for 2016, VINATOM 124
t : cooling time. In this case, t=0 because the activity is calculated immediately after
the reactor was shut down. Therefore, the above equation is simplified due to e0=1.
x: 100% (branching ratio of the daughter radioisotope formation) .
Based on the two above-mentioned equation and parameters of 176
Lu và 176
Yb targets, we can
easily calculate the activity of 177
Lu produced after a time period of irradiation. In theory, when 1
gram of 176
Lu with abundance of 2.59% and its neutron capture cross section of 2050barn is
irradiated at the neutron trap with neutron flux of 2x10¹³
n/cm2.sec for 108 hours, the radioactivity
of 177
Lu obtained will be 42Ci/g.
When 1 gram of 176
Yb enriched to 12.76% and its neutron capture cross section of 5.5 barn is
irradiated in the neutron trap with neutron flux of 2.1013
n/cm2.sec for 108 hours, the activity of
177Lu obtained will be 216mCi/g.
When 1 gram of 176
Yb enriched to 95% and neutron capture cross section of 5.5barn is
irradiated in the neutron trap with neutron flux of 2x10¹³
n/cm2.sec until the saturation point, the
activity of 177
Lu obtained will be 1628mCi/g.
The above-mentioned results indicates that when 176
Yb enriched to 12.76% is irradiated at
Dalat research reactor (of low nominal power), the activity of 177
Lu obtained is too low for medical
application. Therefore, we focused on the irradiation of 176
Lu with abundance of 2.59% and 176
Yb
enriched to 97.1 % in our subsequent studies.
III.1.3.2. Production of 177
Lu through the irradiation of 176
Lu with abundance of 2.59% and 176
Yb enriched to 97.1 %.
a) Production of 177
Lu through the irradiation of 176
Lu target with the abundance of
2.59% at Dalat research reactor.
0.3950g of Lu2O3 was put into a quartz glass ampule. The ampule was sealed off then put into
an aluminium container. The target was irradiated at the Dalat research reactor for 108 hours.
Afterwards, the target was cooled for 30 hours so to allow other than 177
Lu radionuclides with short
half-life such as 176m
Lu (T1/2 = 3.7h) to decay completely. After the cooling time, the irradiated
target was transfer into a fume hood with air filter, ventilation sytem, and lead brick and lead glass
shielding for its processing.
The irradiated targets was dissolved by 8mL of 8M HCl and 5mL of 30% H2O2 in a three-
neck flask connected with reflux distillation system and heated on a magnetic stirring stove for 2 to
4 hours. After the target was dissolved completely, it was evaporated until there was only a white
residue and then cooled. After that, it was dissolved by 5ml of 0.05 M HCl and 177
LuCl3 was
obtained. This solution was filtered through a 0.22µm millipour filter and used as a stock solution
for subsequent experiments [1, 2].
100µl of the stock solution was taken by a micropipette and diltued by distilled water to 10ml
(solution I). After that, 100µl of solution I was taken and diluted to 10ml by distilled water (solution
II). 3µl of solution II was taken, absorbed in a piece of filter paper that was then dried at room
temperature. After that, the radioactivity of the sample was measured by using DSPEC ORTEC
multichannel gamma spectrometer with a HPGE detector that has the relative counting efficiency of
58% and energy resolution of 1.9keV at 1332 keV of 60
Co. Figure 2 shows the obtained results .

VINATOM-AR 16--13
The Annual Report for 2016, VINATOM 125
Figure 2: Spectrum of 177Lu
in the sample recorded on
a gamma spectrometer with
HPGe detector (DSPEC
ORTEC)
Table 1: Radioactivity of 177
Lu measured
Lu-177 sample (1) Measuring time of 1min= 60sec
Counts 36480 (113keV)
Activity at the measuring time 2194979 = 2.19E+06 Bq
Counts 53921 (208 keV)
Activity at the measuring time 2440948 =2.44E+06 Bq
Lu-177 sample (2) Measuring time of 1min = 60sec
Counts 37968 (113keV)
Activity at the measuring time 2284511 = 2.28E+06 Bq
Counts 56297 (208keV)
Activity at the measuring time 2548507= 2.55E+06 Bq
Lu-177 sample (3) Measuring time of 1min = 60sec
Counts 41949 (113keV)
Activity at the measuring time 2524045 = 2.52E+06 Bq
Counts 61929 (208 keV)
Activity at the measuring time 2803462 = 2.80E+06 Bq
Radioactivity calculated at the highest peak of 208 keV as follows
- Average activity = 2,5966x10⁶ Bq
- Amount of sample: 3µl of stock solution was diluted to 100 times
- Cooling hours was 67 hours
- Deacy factor of 177
Lu after 67 hours is 0.7481
VINATOM-AR 16--13
The Annual Report for 2016, VINATOM 126
- Real radioactivity:
2.5966x106x10
2x5x10
3 = 15.63 Ci/0.395g Lu = 39.56Ci/g
3 x 0.7481x3.7 x 1010
Based on the above measuring data, the radioactivity of 177
Lu in the sample was calculated to
be 39.56mCi/mg (176
Lu target).
The result in table 1 shows that the radioactivity obtained in experiment is lower than that
calculated theoretically. That is reasonable because the results in theory was obtained from an ideal
condition. Meanwhile, a real production depends on many experimental parameters such as
aluminum containers, glass ampule, target density, temperature..., especially burn-up effect of the
target that reduces the number of atoms participating in the neutron activation reaction.
b) Production of 177
Lu through the irradiation of 176
Yb enriched to 97.1% at the Dalat
research reactor
+ Sample preparation and irradiation
After the sample of Yb2O3 was dried, 50 mg of Yb2O3 (176
Yb is enriched to 97.1%) was
weighed accurately, put in quartz glass ampoule, sealed, then put in a aluminum container, and
irradiated at the Dalat research reactor.
- Irradiation position was neutron trap
- Neutron flux: 2x10¹³
n/cm2.s
- Irradiation time: 108 hours
- Cooling time: 30 hours
+ Sample treatment
After the Yb2O3 target was cooled, it was transferred to a fume hood. The ampoule was
broken and put in a beaker, dissolved with 8ml of 8M HCl, poured into a 250ml three-neck flask
that was connected with reflux distillation system and put on a magnetic stirring stove. The beaker
containing the sample was rinsed with 2 ml of 8M HCl (glass fragments still remained in the
beaker). The stove was turned on. 5ml of 30% H2O2 was added to the beaker slowly and heated
until the target was dissolved completely. The sample was then evaporated until there was only a
white residue. Then the stove was turned off and the residue was cooled. The cooled residue was
dissolved with 5ml of 0.005M HCl and the solution of 177
YbCl3 was obtained as a stock solution for
further dilution as necessary. In order to load the sample to an ion exchange column, the
concentration must be greater than 1µg/µl.
+ Separation of 177
Lu from the target
The column of C18 was rinsed and connected with HPLC system. Make sure that all the
system parameters must be set properly in accordance with the procedure being applied. Before the
sample was loaded into the column of C18, the column was rinsed with acetonitrin. Then 10µl of
sample solution was injected into the column.
Mobile phase was the mixed solution of the complex and ion pair forming agents: 0.25M 2-
HIBA và 0.01M 1-OS.
The experiment was conducted using different volume ratios between 2-HIBA 0.25M and 1-
OS 0.01M: 1:2; 2:1 và 1:1 with pH ranging from 2.2 to 2.4 in the mobile phase.
The mobile phase was let to move through the column with a flow rate of 0.5ml/min. The
pressure in the column C18 ranged from 6-10 bar (1bar=0.9869232667 atmosphere).

VINATOM-AR 16--13
The Annual Report for 2016, VINATOM 127
Because there is no radiation detector on HPLC, at the exit of mobile phase on the column, a
sample changer tray with plastic tubes was used to take each mililiter of sample that had moved
through the column. Each sample taken was measured on CAPRAC radiation counter. Each sample
was numbered and stored for conducting further experiments. The mobile phase moved
continuously and the samples were taken until the total counts of all samples measured was
approximately equal to the total counts of 10µl solution injected into the column. 177
Lu in the
mobile phase was taken separately, adjusted with 6M HCl to less than 1. After that, this solution
was let to move through a glass column (inner diameter of 1.0cm and height of 30cm) had loaded
with Dowex-50x8 resin. The column was pretreated by rinsing with 50 ml solution of 3M NH4Cl,
3M HCl and distilled water twice. After that, the sample was let to move through the column. The
column was then rinsed with 200 ml of 0.1M HCl to remove 2-HIBA and 1-OS .
Pure 177
Lu in the column was eluted with 6M HCl. The solution obtained was poured in a
three-neck flask, prepared and treated as mentioned above, diluted with 0.05M HCl to 5ml, filtered
in a pasteurized way, and measured radioactively.
- The results of separation of 177Lu using the mobile phase of 0.25M 2-HIBA và 0.1M 1-OS with the
ratio of 2:1
Counts 10k/µl;
Figure 3: Diagram
of separation of
177Lu using the
mobile phase
of 0.25M 2-HIBA
and 0.1M 1-OS
with the ratio of
2:1.
The vertical axis represents the counts in each segment of sample while the horizontal axis
represents the number of segments obtained from the mobile phase. 177
Lu was detected from
segment 26 to 43 and 176
Yb was detected in the following segment.
Note: According to the result of the quality assessment of the separated isotope, separation
yield was greater than 70% when using the ratio mentioned above for the mobile phase. However,
the specific activity was not high enough for medical applications (~15mCi/50mg).
Figure 4: Spectrum of 177Lu
obtained after separation of
177Lu from the target
VINATOM-AR 16--13
The Annual Report for 2016, VINATOM 128
Before separation, it was impossible to obtain the above spectrum because different Yb
isotopes emit beta interfering the gamma energy peaks 177
Lu. After separation, the gamma energy
peaks 177
Lu appeared clearly. It shows that 177
Lu was separated from the Yb target. Obviously, the
separation of 177
Lu using the mobile phase of 0.25M 2-HIBA and 0.1M 1-OS with different ratios
has a lower yield and the separation is incomplete.
III.2 Establishment of procedure for labeling monoclonal antibody DOTA-J591 with 177
Lu in Radioimmuno-therapy (RIT) for therapy of prostate cancer metastasis.
III.2.1 Preparation of solution A
Step 1: 35.04mg of DOTA was transferred into a bottom-tip vial with capacity of 5 mL and
diameter of 1 cm. 0.45 mL of distilled water was taken with a micropipette and put into the vial.
Then the vial was shaken gently until complete dissolution.
Step 2: 8.64mg of NHS (N- hydroxysuccinimide) was put into a vial already containing
DOTA. Then the vial was shaken gently until complete dissolution and its medium was adjusted to
pH 7.3 using 1M NaOH solution.
Step 3: 2.4 mg of EDC 1-ethyl-3-(3-dimethylaminopropyl) carbodiimide was transferred into
a vial already containing DOTA and N-hydroxysuccinimide. Then the vial was shaken lightly until
complete dissolution.
Step 4: The mixed solution obtained in step 3 was cooled with ice for one hour.
Step 5: 0.6 mL of J591 was gradually added into the above cooled vial already containing
DOTA. Then the vial was shaken lightly for 10 minutes until the reaction occured completely.
Step 6: 1.2 mL of 0.3M NH4OAc solution was added. Then the vial was centrifuged at a
velocity of 12000 rpm to 15000 rpm for 10 minutes. The solution was decanted with a micropipette
and tranferred into a flask. The residue was added with 1.2 ml of 0.3M NH4OAc solution, rinsed by
shaking lightly, centrifuged at 12000 rpm to 15000 rpm for 10 minutes. The solution was decanted
with a micropipette and tranferred into the above flask. The procedure was repeated for five times.
Step 7: After the residue was rinsed completely, the flask was added with 1 mL of buffer
solution (ammonium acetate 0.3M pH= 7)
III.2.2 Preparation of solution B
- Radioactive solution of 177
LuCl3 (solution B): The stock solution of 177
LuCl3 (the solution
produced at Dalat research reactor with an average activity of 4Ci/ml) was diluted with distilled
water. 0.1 mL of stock solution was added into a vial already containing 3.9ml of distilled water and
adjusted to pH from 4 to 4.5 using 1M NaOH solution. The solution obtained can be diluted to 10-
100mCi/ml for labeling organic compounds.
III.2.3 Labeling DOTA-J591 with 177
Lu
Step 1: 300µl of solution A (3mg J591/ml DOTA-J591) was taken with a micropipette and
transferred into a bottom-tip vial with a diameter of 1 cm and height of 5cm. Then, the vial was put
in a lead container with suitable thickness and the container was put in a sterile box with lead
shielding, lead glass, and ventilation.
Step 2: 250l of 177
Lu3+
solution with an activity of 20mCi (solution B) was taken with a
micropipette and transferred into a vial containing DOTA-J591 (300l of solution A)
Step 3: 1ml of 0.3M ammonium acetate at pH =7 was added into the vial. Then the vial was
shaken gently and let stand for 10 to 20 minutes at room temperature.
Step 4: The mixed solution was passed through a 20ml Biogel-P6 (Polyacrylamide Gel)
column which had been equilibrated with 5 ml of 1% HSA in PBS.
VINATOM-AR 16--13
The Annual Report for 2016, VINATOM 129
Step 5: 3ml of 1% HSA in PBS was taken to elute 177
Lu-DOTA-j591 out of the column.
Step 6: The solution obtained was filtered with a sterile 0.22 µm Millipore filter.
Step 7: Paper chromatography or TLC with a mobile phase of 1% DTPA 1% was used to
assess the labeling efficiency:
- Labeling efficiency >95%
- Radionuclide purity >99%
- Testing on animals: Pharmaceutical distribution in terms of activity was 1.5%/g in prostate,
1.0%/g in liver and 0.05%/g in blood.
III.3. Procedure for production of 177
Lu-labeled EDTMP and 99m
Tc-labeled sestaMIBI
III.3.1. Procedure for production of 177
Lu-labeled EDTMP
III.3.1.1. Preparation of EDTMP (Solution A)
- Preparation of EDTMP solution: 2500mg of EDTMP was put into a stopper flask with capacity of
100mL and added with 17 ml of 2M NaOH. Then the mixed solution was shaken until complete dissolution
and adjusted to pH 8 using 2 ml of 1M HCl solution. The total volume of solution was 19 mL.
- Preparation of L-ascorbic solution: 500 mg of L-ascorbic acid was transferred into a
stopper flask with a capacity of 50 mL, then added with 20mL of oxygen-free double distilled
water, and stirred gently for dissolution.
- Preparation of SnCl2 solution: 100mg SnCl2.2H2O was put into a stopper flask with a
capacity of 50mL, added with 20ml of 0.1M HCl solution with a micropipette, heated gently, stirred
until complete dissolution.
- Preparation of glucose solution: 1 gram of glucose was transferred into a stopper flask with
a capacity of 50 mL, added with 20ml of oxygen-free double distilled water, stirred gently until
complete dissolution.
Step 2: Tin (II) chloride was dropped into EDTMP solution already containing glucose.
Step 3: The solution obtained was adjusted to pH from 7.5 to 8.5 with 2M NaOH and 2M
HCl.
Step 4: The solution obtained was diluted to 100 mL with oxygen-free double distilled water
and concentration of EDTMP was 25mg/mL.
Step 5: The solution obtained was filtered with a sterile 0.22 µm Millipore filter. (Solution A)
III.3.1.2 Labeling EDTMP with 177
Lu
Step 1: 1mL of EDTMP solution (solution A) was transferred into a penicillin vial with a
micropipette, put into a lead container with a suitable thickness. The container was put into a sterile
box with lead shielding, lead glass, and ventilation.
Step 2: 100-500l of 177
Lu3+
solution (solution B) with a suitable activity was transferred into
a penicillin vial already containing EDTMP solution (solution A).
Step 3: The solution obtained was stirred for one minute and let stand for 30 minutes.
Step 4: Paper chromatography or TLC was used to assess the labeling efficiency and quality
of
177Lu-labeled EDTMP. Labeling efficiency of
177Lu-labeled EDTMP was equal or greater
than 95%.

VINATOM-AR 16--13
The Annual Report for 2016, VINATOM 130
III.3.2. Procedure for production of 99m
Tc-labeled sestaMIBI
III.3.2.1. Preparation of sestaMIBI solution (Solution A)
Step 1:
- Preparation of sestaMIBI I solution: 100mg of sestaMIBI was transferred into a stopper
flask with a capacity of 100 mL, dissolved with 80 ml of distilled water for injection, and shaken
gently until complete dissolution.
- Preparation of mannitol solution: 2000 mg of mannitol was put into a flask already
containing 80 ml of sestaMIBI and stirred gently until complete dissolution.
- Preparation of L-Cysteine HCl solution: 100mg of L-Cysteine HCl was put into a flask
already containing sestaMIBI and shaken gently until complete dissolution.
- Preparation of sodium citrate solution: 260 mg of sodium citrate was put into a flask
already containing sestaMIBI and shaken gently until complete dissolution.
- Preparation of SnCl2 solution: 75mg of SnCl2.2H2O was transferred into a stopper flask
with capacity of 50ml, added with 10ml of 0.1M HCl with a pipette, heated gently, stirred until
complete dissolution. Then 1ml of the obtained solution was taken and put into a flask already
containing sestaMIBI.
Step 2: The solution with sestaMIBI was adjusted to pH from 5 to 5.5 with 1N NaOH and 1N
HCl.
Step 3: The solution obtained in step 2 was diluted to 100mL to obtain a necessary
concentration for pharmaceutical preparation.
Step 4: The final solution was filtered with a sterile 0.22 µm Millipore filter (Solution A).
Step 5: 1mL of solution A was put into each penicillin vial with micropipette or pipette. Then
each vial was sealed with a rubber cap, labeled, and preserved at 2 to 8oC in a refrigerator for
tracing and freeze-drying purposes.
III.3.2.2 Preparation of 99m
Tc solution (Solution B)
99mTc in the form of NaTcO4 was extracted from
99Mo-
99mTc generator with an activity from
100mCi to 1000mCi depending on the effective capacity and duration of the generator.
III.3.2.3 Labeling MIBI with 99m
Tc
Labeling process was conducted in a box to ensure safe shielding and sterilized with
ultraviolet light.
Step 1: The temperature of dry block heater was adjusted between 90 and 100oC (dry block
heater was put in a labeling box)
Step 2: A vial containing 1 mL of solution A was opened.
Step 3: 1 mL of solution B was transferred into the vial already containing solution A with a
micropipette.
Step 4: The vial obtained in step 3 was put in dry block heater. The duration of time needed to
raise temperature to a required level was recorded and the vial was let stand for 20 minutes.
Step 5: The vial containing labeled pharmaceuticals was taken out of dry block heater after 20
minutes, put into a container with a lead thickness between 5-10mm and let stand for approximately
15 minutes until the vial was cooled to the room temperature.
Step 6: Paper chromatography or TLC was used to assess the labeling efficiency. Labeling
efficiency was equal or greater than 95%.

VINATOM-AR 16--13
The Annual Report for 2016, VINATOM 131
III.4. Labeling monoclonal antibody with Tc-99m
III.4.1. Conditions and composition for formation of 99m
Tc-NCA90mAb
Research result shows that labeling efficienccy is high when:
+ Molecular ratio between 2-mercaptoethanol and antibody is 1000:1
+ Molecular ratio between dithiothreito and antibody is 500:1
+ Ratio between the amount of tin cloride participating in formation of 99m
Tc and antibody is
1µg (SnCl2): 10 µg of antibody (NCA90mAb)
+ Amount of antibody participating in formation of complex 99m
Tc-labeled antibody is
between 5 and 40 µg.
+ Stabilizers used in the labeling process are buffer solutions such as sodium or potassium
tartrate, sodiumacetate or phosphate.
+ Activity: For the activity between 0.005 mCi and 10 mCi, antibody labeling achieves the
efficiency from 97 % to more than 99 %.
+ Labeling efficiency in terms of specific activity: When specific activity is less than 1
µCi/µg, labeling efficiency is less than 96%. When specific activity is equal or greater 10 µCi/µg,
labeling efficiency is greater than 97%.
+ Reaction duration and temperature: For 5 to 15 minutes, more than 98% of 99m
Tc-labeled
antibody is formed. The result is presented in Figure 5.
Figure 5: Variations of labeling efficiency with temperature; pH medium: Labeling
antibody with 99mTc achieves high efficiency in the medium from 5 to 8.
III.4.2. Assessment of quality of monoclonal 99m
Tc-labeled antibody
- Radioactive purity was assessed by paper chromatography and thin-layer chromatography.
The result shows that concentration of Tc-99m in 99m
Tc-NCA90mAb was greater than 99%.
- Radionuclidic purity was assessed by gamma spectrometer with high pure Ge(Li) detector,
resolution of 1.9 keV for the 1332 keV peak of Co-60. The spectrum obtained shows that Tc-99m
accounted for more than 99.9% in the sample.
- 99m
Tc-labeled antibody meets Vietnamese pharmaceutical standard in terms of bacterial
endotoxin and sterility.
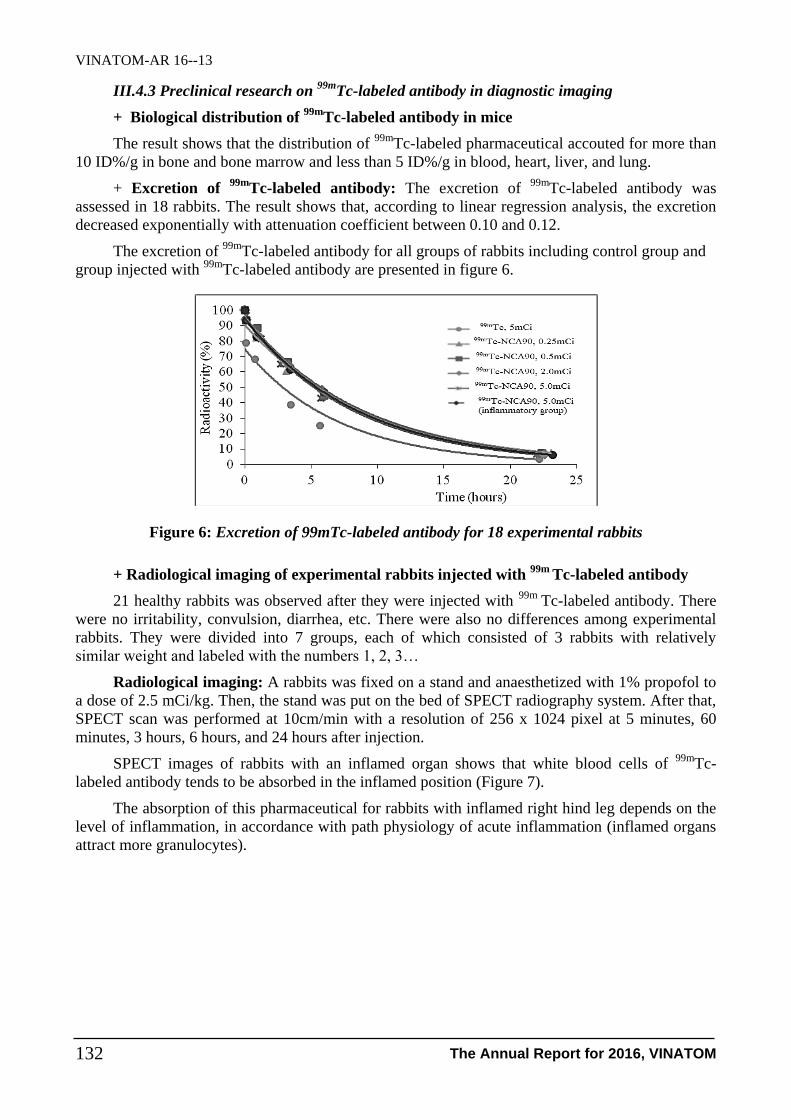
VINATOM-AR 16--13
The Annual Report for 2016, VINATOM 132
III.4.3 Preclinical research on 99m
Tc-labeled antibody in diagnostic imaging
+ Biological distribution of 99m
Tc-labeled antibody in mice
The result shows that the distribution of 99m
Tc-labeled pharmaceutical accouted for more than
10 ID%/g in bone and bone marrow and less than 5 ID%/g in blood, heart, liver, and lung.
+ Excretion of 99m
Tc-labeled antibody: The excretion of 99m
Tc-labeled antibody was
assessed in 18 rabbits. The result shows that, according to linear regression analysis, the excretion
decreased exponentially with attenuation coefficient between 0.10 and 0.12.
The excretion of 99m
Tc-labeled antibody for all groups of rabbits including control group and
group injected with 99m
Tc-labeled antibody are presented in figure 6.
Figure 6: Excretion of 99mTc-labeled antibody for 18 experimental rabbits
+ Radiological imaging of experimental rabbits injected with 99m
Tc-labeled antibody
21 healthy rabbits was observed after they were injected with 99m
Tc-labeled antibody. There
were no irritability, convulsion, diarrhea, etc. There were also no differences among experimental
rabbits. They were divided into 7 groups, each of which consisted of 3 rabbits with relatively
similar weight and labeled with the numbers 1, 2, 3…
Radiological imaging: A rabbits was fixed on a stand and anaesthetized with 1% propofol to
a dose of 2.5 mCi/kg. Then, the stand was put on the bed of SPECT radiography system. After that,
SPECT scan was performed at 10cm/min with a resolution of 256 x 1024 pixel at 5 minutes, 60
minutes, 3 hours, 6 hours, and 24 hours after injection.
SPECT images of rabbits with an inflamed organ shows that white blood cells of 99m
Tc-
labeled antibody tends to be absorbed in the inflamed position (Figure 7).
The absorption of this pharmaceutical for rabbits with inflamed right hind leg depends on the
level of inflammation, in accordance with path physiology of acute inflammation (inflamed organs
attract more granulocytes).

VINATOM-AR 16--13
The Annual Report for 2016, VINATOM 133
Figure 7: SPECT image of an
inflamed rabbit with a dose of
2.5 mCi
IV. CONCLUSION
We have done the project for four years with the following results:
- Improvement of procedure for production of Na2H32
PO4 by irradiation of P2O5 instead of
sulphur target at Dalat research reactor. The procedure is simpler and more efficient. This
pharmaceutical is orally used for therapy of bone cancer metastasis.
- Successful production of 99
Mo/99m
Tc generator by irradiation of MoO3 target at Dalat
research reactor with low power. Tc-99m of the same quality as imported Tc-99m is produced by 99
Mo/99m
Tc generator and initially provided for several hospitals in Ho Chi Minh City such as Cho
Ray Hospital and Tumor Hospital for diagnosis and therapy.
- Successful experiment on irradiation of Lu-176 target to produce Lu-177 for labeling
several organic compounds for diagnosis and therapy. The result asserts that it is possible to
produce Lu-177 from Lu-176 target at Dalat research reactor. When 1 gram of Lu-176 is irradiated
in the neutron trap with neutron flux of 2x10¹³
n/cm2.sec for 108 hours, 39 Ci of Lu-177 is obtained.
However, for irradiation of Yb-176 target, the amount of Lu-177 formed is too small for medical
application due to very low reaction efficiency.
- Successful establishment of procedure for labeling DOTA-J591 with Lu-177 to produce 177
Lu- labeled DOTA-J591 for diagnosis and therapy of prostate cancer. We have synthesized this
pharmaceutical successfully. However, testing on animals is still limited.
- Successful synthesizer of 177
Lu-labeled EDTMP for therapy of bone cancer and bone
cancer metastasis. The result shows that labeling efficiency is greater than 95% and nuclide purity is
greater than 99.9%. Testing on its distribution and safety for animals and volunteer patients at
Military Hospital 175 in Ho Chi Minh City shows satisfactory results.
- Successful synthesizer of 99m
Tc-labeled sestaMIBI for diagnosis of cardiovascular and
thyroid diseases and breast tumor. The result shows that labeling efficiency is greater than 95% and
nuclide purity is greater than 99.9%. Experiment on its distribution and safety for animals and
volunteer patients at The army Hospital 175 in Ho Chi Minh City shows satisfactory results.
- Successful labeling of monoclonal antibody NCA-90 resistant to white blood cells with Tc-
99m to produce 99m
Tc-NCA90mAb for imaging in radioimmunoassay in order to diagnose bone
VINATOM-AR 16--13
The Annual Report for 2016, VINATOM 134
marrow inflammation and infection. SPECT image of inflamed rabbit injected with 99m
Tc-labeled
NCA90mAb shows the concentration of this pharmaceutical in the inflamed organ.
REFERENCES
[1] Ellis, Bobby D.; MacDonald, Charles L. B. “Phosphorus(I) Iodide: A Versatile Metathesis
Reagent for the Synthesis of Low Oxidation State Phosphorus Compounds”. Inorganic
Chemistry 45 (17), 6864, 2006.
[2] Manual for reactor produced radioisotopes, IAEA-TECDOC-1340, January 2003.
[3] E.Bujdoso, I. Feher, G.Kardos. Activation and decay Tables of Radioisotopes. Akademia,
Kiado, Budapest 1973.
[4] Edita Mjekiqi. Estimation of the absorbed dose to patients treated with 177Lu-Dotatate with
regards to the long-term retention and radionuclide impurity in the form of 177mLu. Master's
Thesis, Department of Physics, Lund University, Germany, 2012.
[5] P.S. Balasubramanian. Separation of carrier-free Lutetium-177 from neutron irradiated
natural ytterbium target. Journal of radioanalytical and nuclear chemistry, Articles, Vol.185,
No.2, 305-310, 1994.
[6] Le Van So, N.Morcos, M.Zaw, P.Pellerini, I.Greguric, A. Nevissi. Alternative
chromatographic processes for no carrier added 177Lu radioisotope separation.
Part I. Multi-column chromatographic process for clinically applicable. Journal of
radioanalytical and nuclear chemistry, Vol. 277, No.3, 663-673, 2008.
[7] Le Van So, N.Morcos, M.Zaw, P.Pellerini, I.Greguric, A. Nevissi. Alternative
chromatographic processes for no. carrier added 177Lu radioisotope separation.
Part II. The conventional column chromatographic separation combined with HPLC for high
purity. Journal of radioanalytical and nuclear chemistry, Vol. 277, No.3 675-683, 2008.
[8] Neil H. Bander, Matthew I.Milowsky, David M.Nanus, Lale Kostakoglu, Shankar
Vallabhajosula and Stanley J. Goldsmith. Phase I. Trial of 177Lutetium-labeled J591, a
Monoclonal Antibody to Prostate-Specific membrane Antigen, in Parents with Androgen-
Independent Prostate cancer. Journal of Clinical Oncology; V.23, N0 21, pp 4591-4601,
2005.
[9] Stephanie A.Parker, Ines lopes-Callejia Diaz, Kyle A.Anderson, CarlA. Batt. Design,
Production and Characterization of a single-chain variable fragment (ScFv) derived from the
prostate specific membrane antigen (PSMA) monoclonal antibody J591. Protein Expression
and Purification, 89, pp136-145, Elsevier, 2013.
[10] Anil K Potri, Andrezej Myc, James Beals, Thomemey P.Thomas, Neil H.Bander and James
R Baker. Synthesis and in vitro testing of J591 antibody Dedrimer Conjugates for Targeted
prostate cancer therapy. Journal of Bioconjugate Chem., Vol 15, N06, pp 1174-1181, 2004.
[11] IAEA - TECDOC - 649 Preparation of kits for 177Lu radiopharmaceuticals, IAEA, 1992.
[12] Quality Assurance of Pharmaceuticals. A Compendium of Guidelines and related materials.
Vol. 2. Good Manufacturing Practice and Inspection. WHO, Geneva, 1999.
[13] Chahraborty S, Das T, Sarma HD, Venkatesh M, Banerjee SH. Comparative studies of
177Lu-EDTMP and 177Lu-DOTMP as potential agents for palliative radiotherapy of bone
metastasis. App. Rad & Isot, 66:1196-1205, 2008.
[14] Pillai MRA, Chakeraborty, Das T, Venkatesh M, Ramamoorthy N . Production logistics of
177Lu for radionuclide therapy. Applied Radiation and Isotopes, 59:109-118, 2003.
[15] Delaloye AB and Delaloye B. Radiolabeled monoclonal antibodies in tumor imaging and
therapy, Eur J Nucl Med, 22:571-580, 1995.
[16] Meredith RF, Partridge EE, Alarez RD Intraperitoneal radioimmunotherapy of ovarian
cancer with lutetium-177 -CC49. J Nucl Med, 37:1491-1496, 1996.
[17] Piotr Garnuszeka,*, Dariusz Pawlakb, Iwona Lici !nskaa, Anna Kami!nska, Evaluation of a

VINATOM-AR 16--13
The Annual Report for 2016, VINATOM 135
freeze-dried kit for EDTMP-based bone-seeking radiopharmaceuticals Applied Radiation and
Isotopes 58, p 481–488, 2003.
[18] Yasushi Arano, Recent Advances in 99mTc Radiopharmaceuticals, Journal of Nuclear and
Radiochemical Sciences, Vol. 6, No.3, pp. 177-181, 2005.
[19] International Atomic Energy Agency. Technetium-99m Radiopharmaceuticals: manufacture
of kits technical reports series No. 466. VIENNA, 2008
[20] GABRIEL, M., et al., An intrapatient comparison of 99mTc-EDDA/HYNICTOC with 111In-
DTPA-octreotide for diagnosis of somatostatin receptor expressing tumors, J. Nucl. Med. 44,
p 708–716, 2003.
[21] WACKERS, F.J., et al., Technetium-99m hexakis 2-methoxyisobutyl isonitrile: Human
biodistribution, dosimetry, safety and preliminary comparison to thallium-201 for myocardial
perfusion imaging, J. Nucl. Med. 30, 301–311, 1989.
[22] Kit for the Preparation of Technetium Tc99m SestaMIBI for Injection, Treble Cove Road N.
Billerica, Massachusetts 01862 USA , July 2010.
[23] Blaine Templar Smith R. Ph.; Ph.D. Introduction to diagnostic and therapeutic monoclonal
antibodies, UNM College of Pharmacy, Vol 17, 2012.
[24] Bhargawa, K.K. and Acharya, S.A. Labelling of monoclonal antibodies with radionuclidides.
Semin. Nucl. Med., 19, 187-201, 1989.
[25] Putnam FW, Liu YS, Low TL. "Primary structure of a human IgA1 immunoglobulin. IV.
Streptococcal IgA1 protease, digestion, Fab and Fc fragments, and the complete amino acid
sequence of the alpha 1 heavy chain", 1979.
[26] Lindmo, T., Boven, E., and Cuttita, E., “Determination of the immunoreactive fraction of
radiolabelled monoclonal antibody by linear extrapolation to binding at infinite antigen
excess”, J. Immunol Methods 27, 77-89, 1984.
[27] Zmbova B, Djokic D, Nincovic D, Obradovic V, Kostic K. Chemical and biological
propeties of 2,6-diisopropyl IDA labeled with Tc99m. Int J Rad Appl instrum 38: 35-40,
1987.
[28] Albert E. Ament, Ronald J.Bick, John R. Haaga, Scott D. Wiedenmann, Sclerosing
Cholangitis: Cholescintigraphy with Tc-99m labelled DISIDA. Radiology 151: 197-201,
1984.
[29] .S. Pauwels, L. Piret, A. Schoutens, G. Vandermoten, and C. Beckers, Tc-99m – Diethyl-IDA
imaging: Clinical Evalution in Jaudiced patients. J Nucl 21: 1022-1028, 1980.
[30] Adriana Blazesky, Kenneth M Kozloff, Peter Jh Scott, “Besilesomab for imaging
inflammation and infection in peripheral bone in adults with supected osteomyelitic”, Report
in Medical imaging 2010:3, DOVE PRESS, 2010.

VINATOM-AR 16--14
The Annual Report for 2016, VINATOM 136
METHOD DEVELOPMENT AND DETERMINATION OF NEONICOTINOID
AND CARBAMATE PESTICIDE RESIDUES IN VEGETABLE
AND FRUIT MATRIX BY HPLC-MS
Nguyen Tien Dat, Duong Van Dong, Ta Thi Tuyet Nhung, Nguyen Thanh Nhan,
Nguyen Thi Hong Tham and Dang Trung Tin
The Center for Analytical Techniques, Nuclear Reaserch Institute, Dalat
Abstract: In this work a chemometric approach to positive electrospray ionization (ESI) optimization
for the simultaneous determination of the cyromazine, carbendazim, methomyl, imidacloprid and
thiophanate methyl in vegetable samples by liquid chromatography- mass spectrometry (LC-MS) has
been developed. The effects of the operational parameters such as mobile phase modifier
concentrations, mobile phase flow rate, column temperature, drying gas flow rate, sampling speed,
percentage of formic acid/water at first stage and percentage of formic acid/water at second stage were
evaluated by the 28–3 fractional factorial experimental design using Design Expert software 7.0. The
best experimental conditions observed were 0.06% formic acid/water and 0.13% formic
acid/acetonitril; 0.13 mL/min of mobile phase; 28°C column temperature; 13.6 L/min drying gas flow
rate; 11 µL/sec sampling speed; and 77% v/v of 0.06% formic acid/water at first stage, 5% v/v of
0.06% formic acid/water at second stage. Throughout the last decade many official multiresidue
methods were implemented for pesticide analysis. In this study, the citrate-buffered of QuEChERS
was tested. Primary secondary amine and C18 were studied as the extra sorbent for cleanup step. The
matrices were spinach, onion, egg plant, paprika, ginger, okras and mango. Recoveries ranged from
82.0 – 89.0% except for cyromazine that got 35.1% to 37.2% of recovery values. The method
detection limit (MDL) ranged from 0.01 – 0.03 mg/kg. The values of intra-day and inter-day precision
and accuracy were ≤ 9.8 and ≤ 10.3, respectively. These values were within the acceptable ranges.
Therefore, it was concluded that the method could produce reproducible and accurate results.
Keywords: Chemometric, liquid chromatography- mass spectrometry, design expert, multiresidue,
QuEChERS.
1. INTRODUCTION
Crops are treated with pesticides and against pests and may leave residues in products of
plant. During production, processing, storage, and transport of food a variety of residues and
contaminants may enter the food chain. Thus, determination of pesticide residues in food matrices
has become a necessity in view of the toxicity and stability of these xenobiotics. The application of
multiresidue methods and the multiresidue determination of pesticides in vegetable and fruit matrix
are routinely preferred in most of laboratories due to the simplicity of determining several pesticides
Project information:
- Code: CS/16/01-02
- Managerial Level: Institute
- Allocated Fund: 80,000,000 VND
- Implementation time: 12 months (Jan 2016- Dec 2016)
- Contact email: [email protected]
- Paper published in related to the project:
Nguyen Tien Dat, Duong Van Dong, Ta Thi Tuyet Nhung, Nguyen Thanh Nhan, Nguyen Thi
Hong Tham, Dang Trung Tin. Development of matrix solid phase dispersion (MSPD) method
for the determination of pesticide residues in tea by LC-MS. To be published in the Journal of
Analytical Sciences, Vol. 22 (2017). (in Vietnamese).

VINATOM-AR 16--14
The Annual Report for 2016, VINATOM 137
after a single extraction, facilitating the demands of more efficient and rapid monitoring. The aim of
the present study was to develop a multi-residue method for carbamate and neonicotinoid pesticides
with citrate buffer and dispersive clean-up using combined C18/PSA.
In the past a few years, several literature reports have successfully demonstrated the
applicability of design of experiments (DOE) approach for developing efficient and cost-
efficient LC methods. Attempts were, therefore, made to develop a straight, rapid, sensitive, robust,
effective and economical HPLC method employing DOE. Experimental design was used for
optimization of mobile phase and MS parameters by taking CH3CN, pH, flow rate and drying gas
as variables and their effects.
The proposal method developed on different seven matrices was optimized and validated as
recommended in SANTE/11945/2015. The confirmation of suitability citrate QuEChERS
optimized method was to use for routine testing and assuring the security of farm-produced crops.
2. EXPERIMENTAL
2.1. Chemicals and solvents
Insecticide standards (cyromazine, carbendazim, methomy, imidacloprid and thiophanate
methyl) were purchased from Fluka, Germany. Buffer-salt-mixture for second extraction and
partitioning: 4 g ± 0.2 g of magnesium sulfate anhydrous, 1g ± 0.05g of sodium chloride, 1 g ±
0.05 g of trisodium citrate dihydrate and 0.5g ± 0.03g of disodium hydrogencitrate sesquihydrate.
Bondesil-PSA® 40µm and C-18-sorbent (Octadecyl-silyl-modified silica gel), Bulk material 50µm
were obtained from Agilent. Acetonitrile (HPLC grade, 99.9%) and formic acid were obtained from
Scharlau (Spain) and filtered in 0.45µm membrane. High pure water (18.2 MΩ.cm resistivity, Milli-
Q) was produced with an ElGa water purification system.
2.2. Instrumentation
A Shimadzu LCMS – 2020 system, was used, consisting of a vacuum degasser, a high-
pressure binary solvent delivery system (LC-20AD) and a SIL 20AC autosampler, a column oven,
and a single quadrupole MS analyzer with an electrospray (ESI) interface in the following
conditions: electrospray ionization (ESI) at +4.5 kV (positive) with nebulizer gas at 1.5 L/min, DL
temperature at 2500C, heat block 200
0C. A C18 column (150 mm x 2.1 mm id, 5µm) was used to
perform the separation, with a C18, 40 x 2.1 mm id, security guard column. After the optimization
study, the mobile phase selected was 0.06% formic acid in water (solvent B) and 0.13% formic acid
in acetonitril (solvent A) applied at a flow rate of 0.13ml/min in the following gradient mode (i)
0min (A-B, 23:77, v/v); (ii) 1.8min (A-B, 30:70, v/v); (iii) 7min (A-B, 30:70, v/v); (iv) 18min (A-B,
95:5, v/v); (v) 20min (A-B, 95:5, v/v); (vi) 23 min (A-B, 23:77, v/v) and (vii) 30 min (A-B, 23:77,
v/v). The injection volume and column temperature were set at 5µL and 280C, respectively. The
most abundant ion of each compound was quantified in selected ion monitoring (SIM) mode and a
further two ions were used to confirm the presence of each analyte (Table 1)
Table 1: Quantification and confirmation ions selected for each insecticides
to perform the ESI-MS detection in positive SIM mode
Compounds Ion source SEI (+)
Quantification Confirmation
Cyromazine 167 (100%) 168 (11%)
Carbendazim 192 (100%) 193 (65%)
Methomyl 163 (100%) 164 (82%)
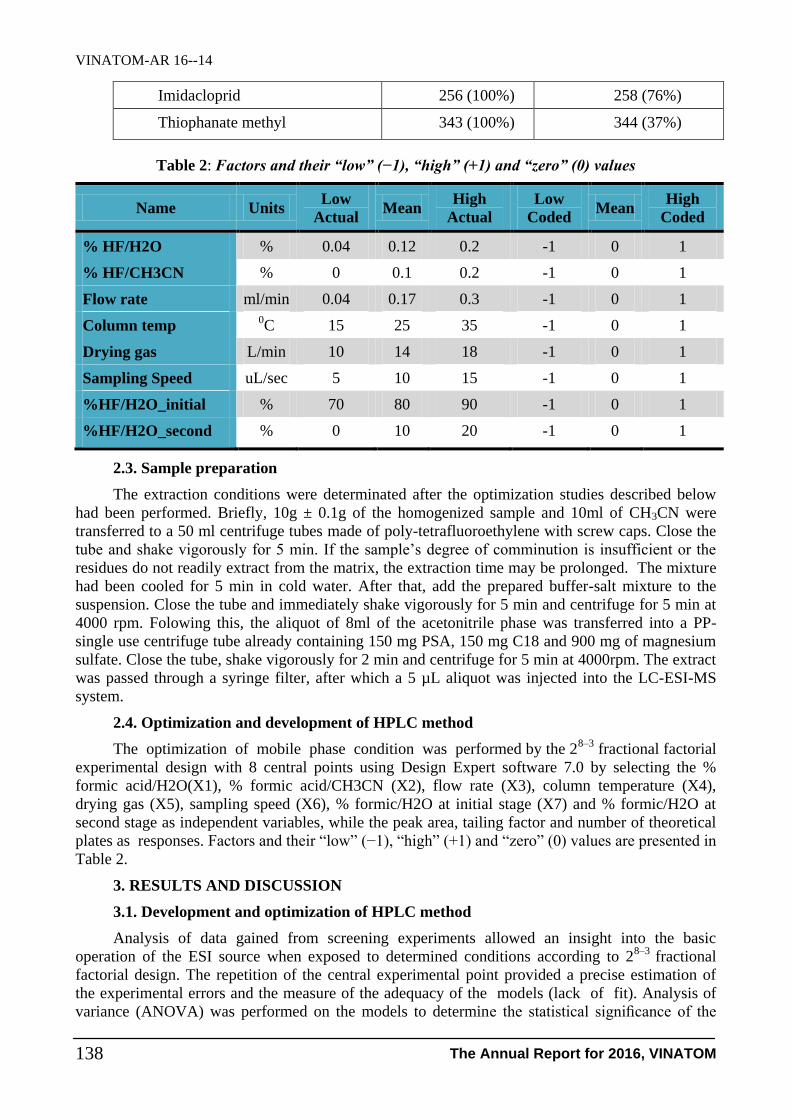
VINATOM-AR 16--14
The Annual Report for 2016, VINATOM 138
Imidacloprid 256 (100%) 258 (76%)
Thiophanate methyl 343 (100%) 344 (37%)
Table 2: Factors and their “low” (−1), “high” (+1) and “zero” (0) values
Name Units Low
Actual Mean
High
Actual
Low
Coded Mean
High
Coded
% HF/H2O % 0.04 0.12 0.2 -1 0 1
% HF/CH3CN % 0 0.1 0.2 -1 0 1
Flow rate ml/min 0.04 0.17 0.3 -1 0 1
Column temp 0C 15 25 35 -1 0 1
Drying gas L/min 10 14 18 -1 0 1
Sampling Speed uL/sec 5 10 15 -1 0 1
%HF/H2O_initial % 70 80 90 -1 0 1
%HF/H2O_second % 0 10 20 -1 0 1
2.3. Sample preparation
The extraction conditions were determinated after the optimization studies described below
had been performed. Briefly, 10g ± 0.1g of the homogenized sample and 10ml of CH3CN were
transferred to a 50 ml centrifuge tubes made of poly-tetrafluoroethylene with screw caps. Close the
tube and shake vigorously for 5 min. If the sample’s degree of comminution is insufficient or the
residues do not readily extract from the matrix, the extraction time may be prolonged. The mixture
had been cooled for 5 min in cold water. After that, add the prepared buffer-salt mixture to the
suspension. Close the tube and immediately shake vigorously for 5 min and centrifuge for 5 min at
4000 rpm. Folowing this, the aliquot of 8ml of the acetonitrile phase was transferred into a PP-
single use centrifuge tube already containing 150 mg PSA, 150 mg C18 and 900 mg of magnesium
sulfate. Close the tube, shake vigorously for 2 min and centrifuge for 5 min at 4000rpm. The extract
was passed through a syringe filter, after which a 5 µL aliquot was injected into the LC-ESI-MS
system.
2.4. Optimization and development of HPLC method
The optimization of mobile phase condition was performed by the 28–3
fractional factorial
experimental design with 8 central points using Design Expert software 7.0 by selecting the %
formic acid/H2O(X1), % formic acid/CH3CN (X2), flow rate (X3), column temperature (X4),
drying gas (X5), sampling speed (X6), % formic/H2O at initial stage (X7) and % formic/H2O at
second stage as independent variables, while the peak area, tailing factor and number of theoretical
plates as responses. Factors and their “low” (−1), “high” (+1) and “zero” (0) values are presented in
Table 2.
3. RESULTS AND DISCUSSION
3.1. Development and optimization of HPLC method
Analysis of data gained from screening experiments allowed an insight into the basic
operation of the ESI source when exposed to determined conditions according to 28–3
fractional
factorial design. The repetition of the central experimental point provided a precise estimation of
the experimental errors and the measure of the adequacy of the models (lack of fit). Analysis of
variance (ANOVA) was performed on the models to determine the statistical significance of the
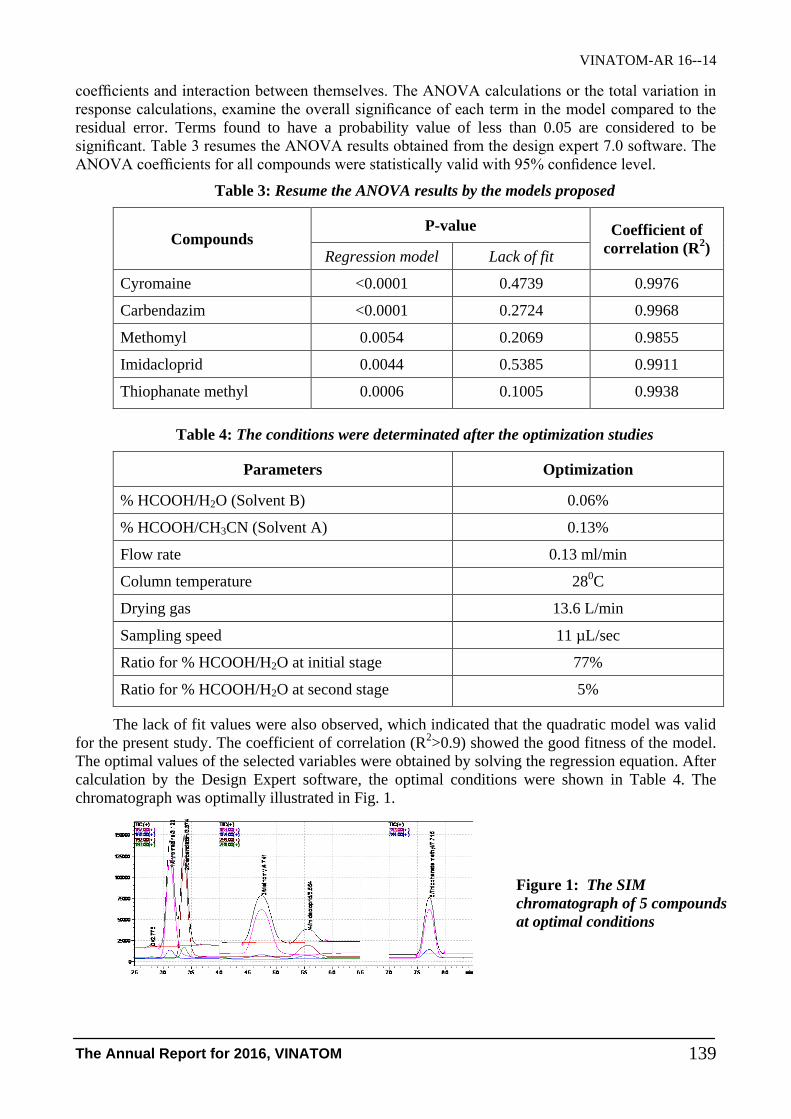
VINATOM-AR 16--14
The Annual Report for 2016, VINATOM 139
coefficients and interaction between themselves. The ANOVA calculations or the total variation in
response calculations, examine the overall significance of each term in the model compared to the
residual error. Terms found to have a probability value of less than 0.05 are considered to be
significant. Table 3 resumes the ANOVA results obtained from the design expert 7.0 software. The
ANOVA coefficients for all compounds were statistically valid with 95% confidence level.
Table 3: Resume the ANOVA results by the models proposed
Compounds P-value Coefficient of
correlation (R2)
Regression model Lack of fit
Cyromaine <0.0001 0.4739 0.9976
Carbendazim <0.0001 0.2724 0.9968
Methomyl 0.0054 0.2069 0.9855
Imidacloprid 0.0044 0.5385 0.9911
Thiophanate methyl 0.0006 0.1005 0.9938
Table 4: The conditions were determinated after the optimization studies
Parameters Optimization
% HCOOH/H2O (Solvent B) 0.06%
% HCOOH/CH3CN (Solvent A) 0.13%
Flow rate 0.13 ml/min
Column temperature 280C
Drying gas 13.6 L/min
Sampling speed 11 µL/sec
Ratio for % HCOOH/H2O at initial stage 77%
Ratio for % HCOOH/H2O at second stage 5%
The lack of fit values were also observed, which indicated that the quadratic model was valid
for the present study. The coefficient of correlation (R2>0.9) showed the good fitness of the model.
The optimal values of the selected variables were obtained by solving the regression equation. After
calculation by the Design Expert software, the optimal conditions were shown in Table 4. The
chromatograph was optimally illustrated in Fig. 1.
Figure 1: The SIM
chromatograph of 5 compounds
at optimal conditions

VINATOM-AR 16--14
The Annual Report for 2016, VINATOM 140
3.2. Validation of the procedure
The method developed was validated for the seven matrices studied in this work: spinach,
onion, egg plant, paprika, ginger, okras and mango. The validation scheme followed was based on
the SANTE guidelines [2]. The specificity of the method was tested by the analysis of blank
samples. The absence of any chromatographic peak in every matrix, at the same retention times as
target pesticides, indicated that there were no matrix compounds that might give a false positive
signal in these blank samples. Recovery of the pesticides from the fortified samples was calculated
relative to that from matrix-matched standard and tested against the 70 – 120% criterion for
evaluation of routine analytical quality-control samples [2]. The accuracy of the method was
estimated by means of recovery experiments at 0.02mg/kg. For all matrices, the results obtained for
most of the compounds were satisfactory, with recoveries between 82.0–89.0% except for
cyromazine that got 35.1% to 37.2% of recovery values. The values of intra-day and inter-day
precision and accuracy were ≤ 9.8 and ≤ 10.3, respectively. The poor recoveries for cyromazine
also illustrate the difficulties of development a unique multiresidue method for the determination of
a number of pesticides with a wide range of polarities. The method detection limit (MDL) ranged
from 0.01 – 0.03 mg/kg.
4. CONCLUSIONS
The method was successfully developed and optimized through DOE using Design expert
version 7.0 software. The significant effect of independent factors was analyzed using ANOVA.
The DOE provides efficient tools for the optimization of variable factors for HPLC method
development. A multiresidue method has been developed for screening in different matrices by
HPLC–MS. The procedure has been validated for representative species from different commodity
groups obtaining satisfactory accuracy and precision for most of analyte/matrix combinations. The
proposed method allows the simultaneous determination of pesticides of very different chemical
families and physico-chemical properties in one single determination step, monitoring the most
sensitive transition for every compound. Confirmation of pesticides detected in samples is
performed by an injection into the HPLC–MS system. The method is stability indicating and it can
be used for the routine analysis of sample.
REFERENCES
[1] BS EN 15662:2008. Foods of plant origin - Determination of pesticide residues using GC-MS
and/or LC-MS/MS following acetonitrile extraction/partitioning and cleanup by dispersive
SPE - QuEChERS-method. European Standard. Approved by CEN on 13 September 2008.
[2] Guidance document on analytical quality control and method validation procedures for
pesticides residues analysis in food and feed. European commission, Directorate-general for
health and food safety, SANTE/11945, 2015.
[3] Ismael Ibrahim Alyaseri, Mukhtar Abdul Sattar Ali, Abdul Karim Jawad Ali and Nadir Kamil
Bahi. Determination of Pesticides Residues in Some Fruits and Vegetables Imported to Iraq.
Journal of Agricultural Science and Technology A 2, pp. 65-70, 2012.
[4] Steven J. Lehotay, Kyung Ae Son, Hyeyoung Kwon, Urairat Koesukwiwat, Wusheng Fu,
Katerina Mastovska, Eunha Hoh, Natchanun Leepipatpiboon. Comparison of QuEChERS
sample preparation methods for the analysis of pesticide residues in fruits and vegetables.
Journal of Chromatography A, 1217, pp. 2548–2560, 2010.

1.7- Radiation Protection andRadioactive Waste Management


VINATOM-AR 16--15
The Annual Report for 2016, VINATOM 143
ESTABLISHING PERSONAL DOSIMETRY PROCEDURE USING
OPTICALLY STIMULATED LUMINESCENCE DOSIMETERS IN PHOTON
AND MIXED PHOTON – NEUTRON RADIATION FIELDS
Le Ngoc Thiem, Bui Duc Ky, Trinh Van Giap, Nguyen Huu Quyet,
Ho Quang Tuan, Vu Manh Khoi and Chu Vu Long
Institute for Nuclear Science and Technology
Abstract: According to Vietnamese Law on Atomic Energy, personal dosimetry (PD) for radiation
workers is required periodically in order to fulfil the national legal requirements on occupational
radiation dose management. Since the radiation applications have become popular in Vietnamese
society, the thermal luminescence dosimeters (TLDs) have been used as passive dosimeters for
occupational monitoring in the nation. Together with the quick increase in radiation applications and
the number of personnel working in radiation fields, the Optically Stimulated Luminescence
Dosimeters (OSLDs) have been first introduced since 2015. This work presents the establishment of
PD measuring procedure using OSLDs which are used for measuring photons and betas known as
Inlight model 2 OSL (OSLDs-p,e) and for measuring mixed radiations of neutrons, photons and betas
known as Inlight LDR model 2 (OSLDs-n,p,e). Such following features of OSLDs are investigated:
detection limit, energy response, linearity, reproducibility, angular dependency and fading with both
types of OSLDs-p,e and OSLDs-n,p,e. The result of an intercomparison in PD using OSLDs is also
presented in the work. The research work also indicates that OSL dosimetry can be an alternative
method applied in PD and possibly become one of the most popular personal dosimetry method in the
future.
Keywords: Personal Dosimetry, Optically Stimulated Luminescence Dosimeters, Microstar
I. INTRODUCTION
The passive dosimetry method is one of most effective approaches used in personal dosimetry
owing to its low cost, simple procedures and reliable. Together with thermoluminescence
dosimeters (TLDs), the optically stimulated luminescence dosimeters (OSLDs) have been widely
applied in personal dosimetry (PD) both in the mixed radiation field of photons and betas (those
dosimeters are hereafter referred as OSLDs-p,e); and in the radiation field of neutrons, photons and
betas (those dosimeters are hereafter referred as OSLDs-n,p,e). Both of these OSLDs (i.e. OSLDs-
p,e and OSLDs-n,p,e) were used in this work for checking their compliance with the corresponding
Project information:
- Code: NVCB.11/15/VKHKTHN
- Managerial Level: Ministry
- Allocated Fund: 480,000,000 VND
- Implementation time: 24 months (Jan 2015- Dec 2016)
- Contact email: [email protected]
- Paper published in related to the project:
1. L. N. Thiem, T. H. Nam, N. T. Khai, T. V. Giap; Neutron Calibration Field of a Bare 252Cf
Source in Vietnam; Nuclear Engineering and Technology, Vol. 49, pp. 277-284, 2017.
2. L.N.Thiem, N.N.Quynh, H.Q.Tuan, T.V.Giap, N.T.Khai, N.H.Quyet; Neutron Calibration
Field at Institute for Nuclear Science and Technology; J. Nuclear Science and Technology;
ISSN 1810-5408; Vol. 6, No. 4, pp. 1-7, 2016.
3. B. D. Ky, V. M. Khoi, T. V. Giap, L. N. Thiem, H. Q. Tuan, T. T. Ha; A study on Personal
Dosimetry for photon using optical stimulated luminescence dosimeters; accepted to be
published in Journal of Nuclear Science and Technology; ISSN 1810-5408.

VINATOM-AR 16--15
The Annual Report for 2016, VINATOM 144
international technical requirements of IEC[0] and ISO[0]. Once the characteristics of both OSLDs
satisfy the international requirements, they were applied in PD experiments through an
intercomparison in order to confirm the reliability of OSLD applications in the practical works of
PD.
OSLDs have been studied since 1950s for radiation dosimetry in archaeological dating and
geological researches. Applications of OSLDs in PD field have been widely applied since 1990 and
recently being used in many countries as USA, France, Canada, Japan, Korea and so on [3,4].
However, Al2O3:C crystal based OSLDs are first time applied in Vietnam at the Institute for
Nuclear Science and Technology (INST) for PD.
In this study, OSLDs structure and operational principle of corresponding Microstar reader
are concerned. Dosimetric characteristics of OSLD used as personal dosimeters such as detection
limit, linearity, reproducibility, energy response, angular response, fading are also presented in this
study accompanying with the uncertainties of PD results.
II. MATERIALS AND METHOD
II.1. Construction of OSLDs
The OSLDs-p,e used in this study consist of three main parts: an outer holder, a XA type case
and one slide holding 4 elements denoted as E1 to E4 which are made by 0.3 mm thick Al2O3:C
crystal with the diameter of 0.5 cm. The elements from E1 to E4 are respectively located at the
positions of different corresponding filters as well as open window polyethylene (thickness of 29
mg/cm2), plastic (thickness of 275 mg/cm
2), aluminum (thickness of 375 mg/cm
2) and copper
(thickness of 545 mg/cm2) for dealing with the personal dose calculation algorithm of (10),
(0.07), (3) caused by photons and betas together with beta dose is separately reported. Figure
1 shows the construction of OSLDs-p,e
The chip elements E1, E3, and E4 of OSLDs-n,p,e have similar construction with those in
OSLDs-p,e. However, the difference is at the element E2 which is Al2O3:C chip coated by 6Li2CO3
for the purpose of neutron dosimetry. The OSLDs-n,p,e construction allows measuring (10),
(0.07), (3) caused by neutrons, photons and betas including neutron dose ( ) separately
reported.
Figure 1: The Landauer Inlight Model 2 personal dosimeter

VINATOM-AR 16--15
The Annual Report for 2016, VINATOM 145
II.2. Microstar reader
Microstar reader is a portable one with the dimensions of 32.7 cm x 23.0 cm x 11.0 cm and
the weight of 15 kg. It is applied by conventional electric power source of 110 – 240 kV, 1.5 Amp,
50 -60 Hz. The reader is connected to an external computer via a USB cable to control the setup
parameters and data analysis/recording. Quality control for the reader is needed at least once a year
or after transport/ repair to ensure the accuracy of personal dose assessment [5]. Figure 2 shows the
Microstar reader connected to a computer.
Figure 2: The Microstar reader connected to a computer
II.3. Experimental method
The OSLDs were irradiated on a tissue equivalent slab phantom at 1.0 m meter under the
controlled conditions of temperature and pressure at the Secondary Standard Dosimetry Laboratory
of INST to the photon doses from 137
Cs-137 and the neutron doses from 241
Am-Be standard sources
to determine their main characteristics as well as detection limit, linearity, reproducibility, energy
response, angular response, fading. The data were analyzed and compared to the requirements from
IEC [0] and ISO [0].
III. EXPERIMENTS AND RESULTS
III.1. Detection limit
The detection limit is the minimum detectable dose of the blank dosimeters which are not
irradiated to any radiation sources. The detection limit is defined as a dose value of 3*δBG [Error!
Reference source not found.,Error! Reference source not found.]. Here, δBG is the experimental
standard deviation of the background and expressed by Eq. (1), where is the background of
dosimeter, is the average background of dosimeters.
The detection limit of both OSLDs-p,e and OSLDs-n,p,e is evaluated as around 0.05 mSv
III.2. Angular dependence
The angular dependence of OSLDs is tested by irradiating OSLDs-p,e and OSLDs-n,p,e to 137
Cs and 241
Am-Be standard sources, respectively at the different angles of 150, 30
0, 45
0 and
600 (0
0 is the angle between the central beam and the normal direction to the phantom). The
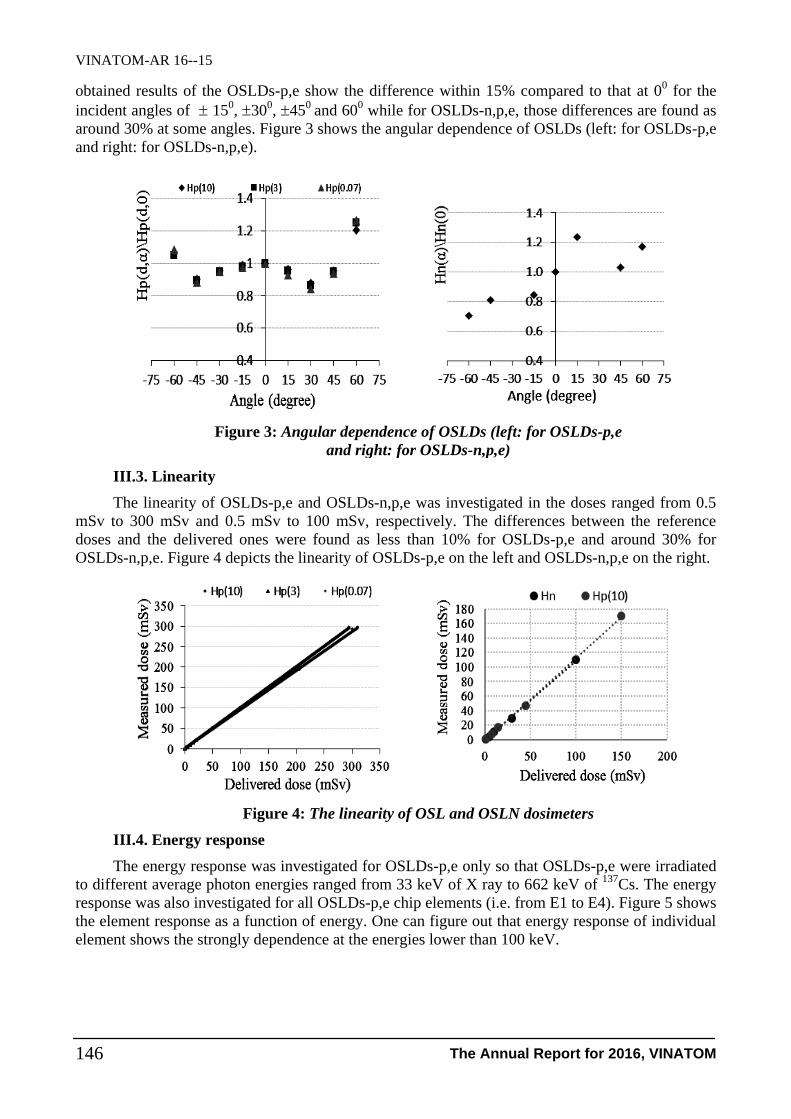
VINATOM-AR 16--15
The Annual Report for 2016, VINATOM 146
obtained results of the OSLDs-p,e show the difference within 15% compared to that at 00 for the
incident angles of 150, 30
0, 45
0 and 60
0 while for OSLDs-n,p,e, those differences are found as
around 30% at some angles. Figure 3 shows the angular dependence of OSLDs (left: for OSLDs-p,e
and right: for OSLDs-n,p,e).
Figure 3: Angular dependence of OSLDs (left: for OSLDs-p,e
and right: for OSLDs-n,p,e)
III.3. Linearity
The linearity of OSLDs-p,e and OSLDs-n,p,e was investigated in the doses ranged from 0.5
mSv to 300 mSv and 0.5 mSv to 100 mSv, respectively. The differences between the reference
doses and the delivered ones were found as less than 10% for OSLDs-p,e and around 30% for
OSLDs-n,p,e. Figure 4 depicts the linearity of OSLDs-p,e on the left and OSLDs-n,p,e on the right.
Figure 4: The linearity of OSL and OSLN dosimeters
III.4. Energy response
The energy response was investigated for OSLDs-p,e only so that OSLDs-p,e were irradiated
to different average photon energies ranged from 33 keV of X ray to 662 keV of 137
Cs. The energy
response was also investigated for all OSLDs-p,e chip elements (i.e. from E1 to E4). Figure 5 shows
the element response as a function of energy. One can figure out that energy response of individual
element shows the strongly dependence at the energies lower than 100 keV.
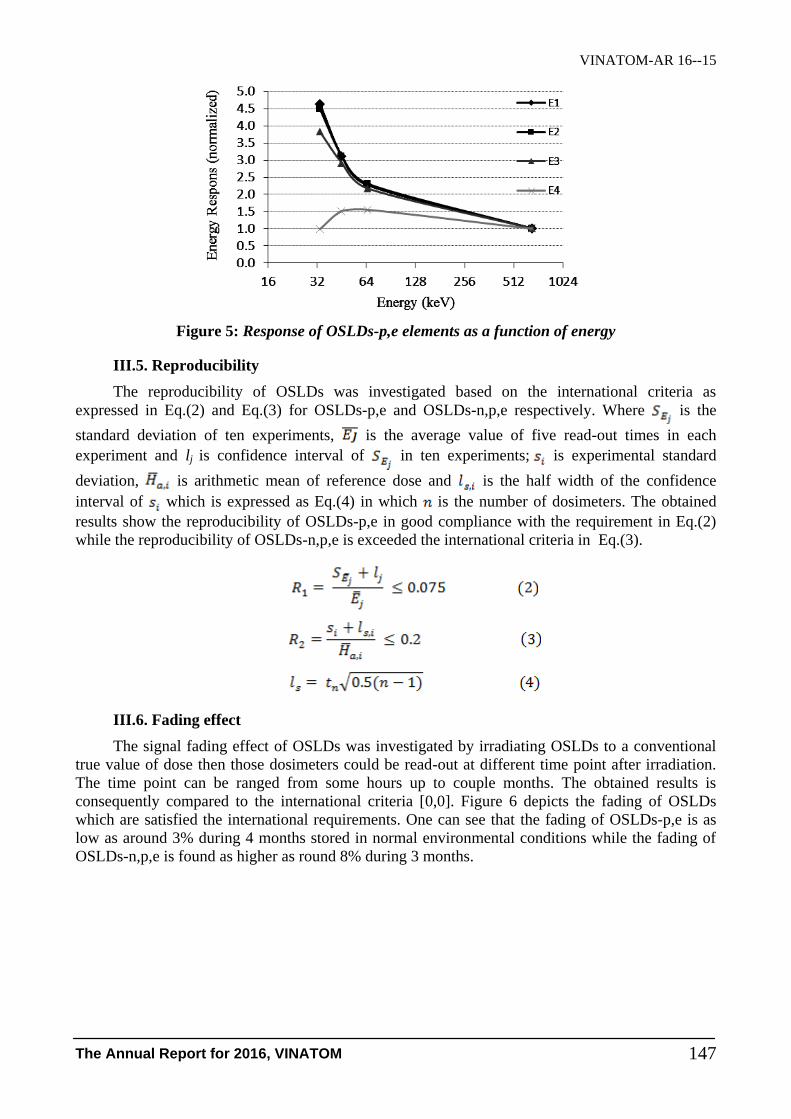
VINATOM-AR 16--15
The Annual Report for 2016, VINATOM 147
Figure 5: Response of OSLDs-p,e elements as a function of energy
III.5. Reproducibility
The reproducibility of OSLDs was investigated based on the international criteria as
expressed in Eq.(2) and Eq.(3) for OSLDs-p,e and OSLDs-n,p,e respectively. Where is the
standard deviation of ten experiments, is the average value of five read-out times in each
experiment and lj is confidence interval of in ten experiments; is experimental standard
deviation, is arithmetic mean of reference dose and is the half width of the confidence
interval of which is expressed as Eq.(4) in which is the number of dosimeters. The obtained
results show the reproducibility of OSLDs-p,e in good compliance with the requirement in Eq.(2)
while the reproducibility of OSLDs-n,p,e is exceeded the international criteria in Eq.(3).
III.6. Fading effect
The signal fading effect of OSLDs was investigated by irradiating OSLDs to a conventional
true value of dose then those dosimeters could be read-out at different time point after irradiation.
The time point can be ranged from some hours up to couple months. The obtained results is
consequently compared to the international criteria [0,0]. Figure 6 depicts the fading of OSLDs
which are satisfied the international requirements. One can see that the fading of OSLDs-p,e is as
low as around 3% during 4 months stored in normal environmental conditions while the fading of
OSLDs-n,p,e is found as higher as round 8% during 3 months.

VINATOM-AR 16--15
The Annual Report for 2016, VINATOM 148
Figure 6: The fading of OSLDs after irradiation (left: for OSLDs-p,e
and right: for OSLDs-n,p,e)
III.7. Intercomparison in personal dosimetry using OSLDs
In this section, an international comparison in personal dosimetry was carried out applying the
procedure established in the work. There were several laboratories in Southern East Asian countries
participated in this intercomparison so that the irradiated OSLDs-p,e were sent between participated
laboratories asking for determining the blind dose and/or asking for delivering a conventional true
value of dose. The personal dosimetry procedure established in this work was applied in the
intercomparison and shown a good agreement around 10% compared to the conventional true value
designated by the pilot laboratory. This implies that the procedure established in the work can be
applied in practical tasks of personal dosimetry. Table 1 shows the measured dose to the true one
ratio obtained from the intercomparison program in terms of (10) and (0.07) quantities in the
mixed radiation field of photons and betas.
Table 1: Ratio between the measured dose and the true one of the intercomparison
program in terms of (10) and (0.07) quantities
Nuclide Quantity True dose
(mSv)
Measured dose
(mSv)
Cs-137 Hp(10)
0.35 0.39 1.11
1.00 0.91 0.91
3.50 3.18 0.91
Sr-90 Hp(0.07)
2.50 2.54 1.02
5.00 4.90 0.98
8.00 7.96 1.00
IV. PERSONAL DOSIMETRY PROCEDURE
This section presents the sequent steps for personal dosimetry procedure using OSLDs
Step 1: Ensure the control nob of the Microstar reader at “H/P” position. Turn on the
Microstar reader and wait at least 30 minutes for the system warm up;
Step 2: Open Microstar software and choose the tab “Configuration” in order to set up
“Dosimeter Type” as “Inlight”; “Accreditation type” as “NVLAP”; “Holder type” as “Landauer
Inlight”; and choose the suitable “XA or BA” in “Default case”;
VINATOM-AR 16--15
The Annual Report for 2016, VINATOM 149
Step 3: Select the “Reading” tab in the software window. Enter the user code in the “User ID”
pane manually if needed (or may be skipped). Disassemble the dosimeter case from the holder and
enter the code of the dosimeter case in the “Process ” pane automatically by the dosimeter code
sensor. Pull out the dosimeter drawer of the Microstar reader to put the dosimeter case into;
Step 4: Push the dosimeter drawer into the fixed position for reading. Turn the control nob
clockwise respectively to the position from E1 to E4; (Note: The indicator light is on during the
reading time and off when ready for another read). When all 4 positions are read out, the software
will automatically calculate , , , beta dose (XA case type) or neutron dose
(BA case type) together with radiation type information.
Step 5: Record the measuring results manually or automatically by the software in an Excel
file which is can be accessed via a computer.
Step 6: Turn the control nob back the “H/P” position. Pull out the dosimeter drawer of the
Microstar reader back the ready position. A new dosimeter can be read by repeating the procedure
from Step 3
V. CONCLUSION
In this work, such following features of the OSLDs were investigated: detection limit,
linearity, reproducibility, energy response, angular response and fading effect. The personal
dosimetry procedures were also established and successfully applied in an intercomparison implies
the reliability of the established procedures which can be applied in the practical works.
REFERENCES
[1] CEI/IEC 1066:1991; Thermoluminescence dosimetry systems for personal and environmental
monitoring, 1991.
[2] ISO 21909 : 2005 (E); Passive Personal Neutron Dosimeters – Performance and Test
Requirements; 2005.
[3] Waraporn Sudjai et al.; Inlight Optically Stimulated Luminescence for Occupational
Monitoring Servive in Thailand.
http://www.aesj.or.jp/publication/pnst003/094.pdf (accessed on Nov.15-2016).
[4] Eduardo G. Yukihara, Stephen W. S. McKeever; Optically Stimulated Luminescence
Dosimetry – Fundamentals and Applications; p. 388, John Wiley and Sons, Ltd., Publication,
2011.
[5] Christopher A Perks, Cliff Yahnke, Marc Million; Medical dosimetry using Optically
Stimulated Luminescence dots and microstar readers;
http://www.landauer.co.uk/documents/LANDAUER_EUROPE_Poster_microstar_in_
medical_dosimetry_octobre08.pdf (accessed on Nov.15-2016).

VINATOM-AR 16--16
The Annual Report for 2016, VINATOM 150
ESTABLISHING THE PATIENT DOSE ESTIMATION PROCEDURE
IN COMPUTED TOMOGRAPHY EXAMINATION
Bui Duc Ky, Duong Van Trieu, Ho Quang Tuan, Tran Thanh Ha and Bui Thi Anh Duong
Institute for Nuclear Science and Technology, 179 - Hoang Quoc Viet, Hanoi
Abstract: Examinations using CT (Computed tomography) scanner are widely applied in medical
facilities. In CT scanning, the patients are normally exposed with much higher doses comparing to
conventional X-ray imaging, so the medical staffs need to control patient doses for optimization
purpose. Estimation of patient dose is also an important step in verifying the performance of CT
scanners. This study presents the patient dose assessment procedure in CT scanners. Firstly, the CT
ion chamber must be calibrated in reference beam qualities established at INST following IAEA TRS
457 documentation. The discrepancy between half value layer(HVL) measured at INST and IAEA
TRS 457 reference values is less than 2%. An example of user CT ion chamber was partially irradiated
in collimated X-ray beams for calibration. Secondly, the chamber was used along with a standard CT
phantom to estimate the CT patient dose then compared to output dose simulated by CT scanner. The
difference between estimation and CT simulation value is less than 17.2%
Keywords: Patient dose, diagnostic radiology measurement.
1. INTRODUCTION
CT scanner is an X-ray imaging technique used for medical diagnostics. It provides more
diagnostic information compared to conventional planar X-ray imaging. However, CT scanner often
gives a significantly higher radiation dose compared with conventional planar X-ray imaging.
Patient dose dosimetry has become an important requirement with the aim to protect the patient and
to optimize procedures for a balance between absorbed dose and image quality in X-ray diagnostic.
The computed tomography dose index (CTDI) includingCa,100and PKL,CT that indicates the amount
of radiation delivered to patients undergoing a single rotation in one CT examination and air-kerma
length product is defined in a phantom for a complete examination, respectively. A CT pencil
chamber 100 mm length is usually used for these dosimetric quantities. To achieve the goal of
radiation protection for patients in diagnostic radiology, dosimetry laboratory has established
patient dose measurement procedure in CT scanner according to the IAEA TRS-457
documentation.
Project information:
- Code: 04 CS/HĐ/NV
- Managerial Level: Institute
- Allocated Fund: 74,000,000 VND
- Implementation time: 12 months (Jan 2016- Dec 2016)
- Contact email: [email protected]
- Paper published in related to the project:
Bui Duc Ky, Duong Van Trieu, Ho Quang Tuan, Vu Manh Khoi, Nguyen Huu Quyet, Tran Thanh
Ha, Bui Thi Anh Duong; Establishing the patient dose estimation procedure in computed
tomography examination; 12th Vietnam Conference on Nuclear Science and Technology, Nha
Trang August 2-4, 2017, 8 p.
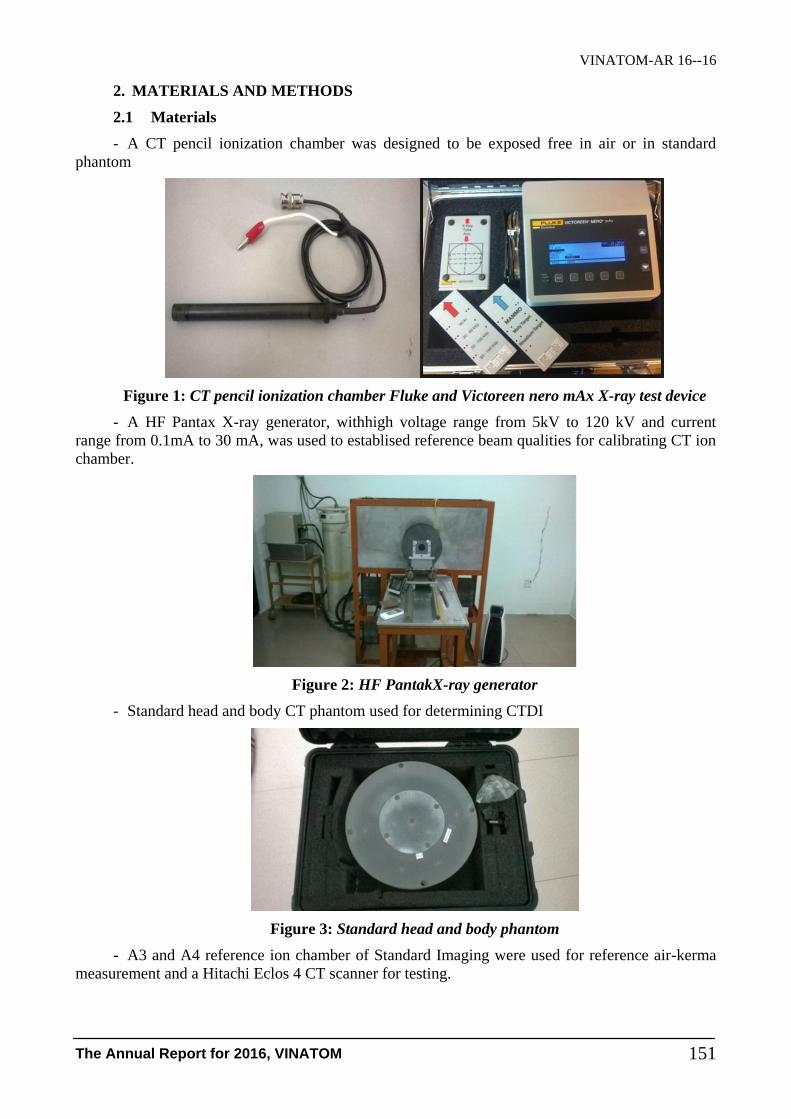
VINATOM-AR 16--16
The Annual Report for 2016, VINATOM 151
2. MATERIALS AND METHODS
2.1 Materials
- A CT pencil ionization chamber was designed to be exposed free in air or in standard
phantom
Figure 1: CT pencil ionization chamber Fluke and Victoreen nero mAx X-ray test device
- A HF Pantax X-ray generator, withhigh voltage range from 5kV to 120 kV and current
range from 0.1mA to 30 mA, was used to establised reference beam qualities for calibrating CT ion
chamber.
Figure 2: HF PantakX-ray generator
- Standard head and body CT phantom used for determining CTDI
Figure 3: Standard head and body phantom
- A3 and A4 reference ion chamber of Standard Imaging were used for reference air-kerma
measurement and a Hitachi Eclos 4 CT scanner for testing.
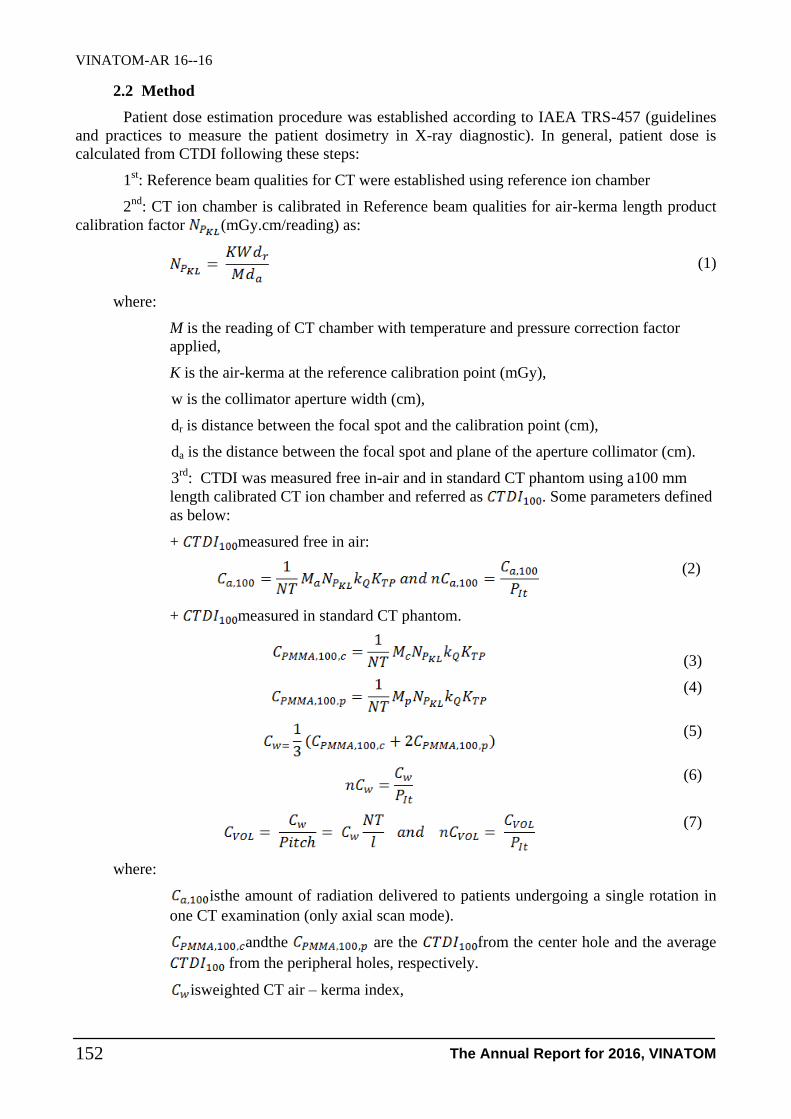
VINATOM-AR 16--16
The Annual Report for 2016, VINATOM 152
2.2 Method
Patient dose estimation procedure was established according to IAEA TRS-457 (guidelines
and practices to measure the patient dosimetry in X-ray diagnostic). In general, patient dose is
calculated from CTDI following these steps:
1st: Reference beam qualities for CT were established using reference ion chamber
2nd
: CT ion chamber is calibrated in Reference beam qualities for air-kerma length product
calibration factor (mGy.cm/reading) as:
(1)
where:
M is the reading of CT chamber with temperature and pressure correction factor
applied,
K is the air-kerma at the reference calibration point (mGy),
w is the collimator aperture width (cm),
dr is distance between the focal spot and the calibration point (cm),
da is the distance between the focal spot and plane of the aperture collimator (cm).
3rd
: CTDI was measured free in-air and in standard CT phantom using a100 mm
length calibrated CT ion chamber and referred as . Some parameters defined
as below:
+ measured free in air:
(2)
+ measured in standard CT phantom.
(3)
(4)
(5)
(6)
(7)
where:
isthe amount of radiation delivered to patients undergoing a single rotation in
one CT examination (only axial scan mode).
andthe are the from the center hole and the average
from the peripheral holes, respectively.
isweighted CT air – kerma index,

VINATOM-AR 16--16
The Annual Report for 2016, VINATOM 153
D1
M
A
D2
F
S
Pb house
Detector
25cm
25cm 50cm
X-ray tube
M is the reading of CT chamber, N is number of slice in one rotation of CT, T is
nominal slice thickness,
is calibration factor of CT chamber,
is factor which corrects for differences in the response of the CT chamber at the
calibration quality and at the quality of the clinical X-ray beam,
is correction factor for temperature and pressure,
PIt is tube loading (mAs) for one complete rotation.
is distance moved by the couch per helical rotation or between consecutive scans for
a series of axial scans.
4th
: Air-kerma length product PKL,CT(mGy.cm) calculated from CTDI from step 3.
ni is rotation number of CT scanner.
5th
(final step): Effective dose E (mSv) calculated from air-kerma length product
K (mSv.mGy-1
.cm-1
) is conversion factor from PKL,CT to effective dose.
3. RESULT AND DISCUSSION
3.1 Establishing reference beam qualities
Reference beam qualities and method of measurement of the first and second HVL used for
calibrations for diagnostic radiology established according to IAEA TRS-457 documentation.
The first HVL (HVL1), is defined as the thickness of the specified material which attenuates
the air-kerma or air-kerma rate in the beam to one half of its original value measured without any
absorber [4, 6].
The second HVL (HVL2) is equal to the difference between the thickness of an absorber
necessary to reduce the air-kerma (air-kerma rate) to one quarter, d1/4, and the value of HVL1:
HVL2 = d1/4 – HVL1. The ratio between HVL1 and HVL2 is termed the homogeneity coefficient, h:
h=HVL1/HVL2[4,6].
Figure 4: An explanatory picture of arrangement for acquiring and measuring the HVL

VINATOM-AR 16--16
The Annual Report for 2016, VINATOM 154
S is the shutter; F is added filtration; A is the HVL absorbers; M is the monitor chamber; D is
the detector.D1, D2 are circular collimators.
Table 1: The result of reference beam qualities established for diagnostic radiology
Beam
quality
High
voltage (kV)
HVL1
(mm Al) h
Ratio of HVL1
(Measured/
IAEA)
Ratio of h
(Measured
/ IAEA)
RQR8
IAEA TRS457 100 3.97 0.68
Measured
(A4 chamber) 100 3.969 0.69 1.000 1.015
Measured
(A3 chamber) 100 3.934 0.68 0.991 1.000
RQT8
IAEA TRS
457 100 6.9 - - -
Measured
(A4 chamber) 100 7.02 - 1.017 -
Measured
(A3 chamber) 100 7.01 - 1.016 -
Table 1 show the discrepancy between the values of homogeneity coefficient h measured and
IEC for RQR8 to be less than 1.5% for both A3 and A4 ionization chamber. The results also
indicate the difference between the values of HVL1 measured and IAEA TRS 457were less than
1.7%. The uncertainty of HVL measured defined approximately 3.4% correspond a coverage factor
k=2.
3.2 Calibration of CT pencil ionization chamber
The following procedure should be followed for calibration of CT pencil ionization chamber.
Air – kerma measurement is first made in the plane of measurement for the RQT radiation qualities
using reference ionization chamber (figure 4). Then the lead rectangular aperture is positioned in
front of the user’s chamber, behind the transmission monitor chamber. The aperture should be
centered about the length of the chamber. The separation of the lead aperture from the point of test
must be known precisely. The width of aperture should be between 20 and 50 mm and be known to
within 0.1 mm. The outer dimensions of the aperture assembly should be large enough to cover the
whole of the CT chamber. The chamber is calibrated in its center, the calibration factor of this
chamber determined by equation 2.1.
Figure 5: A picture of arrangement for calibration of CT ionization chamber

VINATOM-AR 16--16
The Annual Report for 2016, VINATOM 155
a): Circular collimator, b): Monitor chamber, c): Rectangular aperture, d): CT chamber
The reference air-kerma determined in this experiment was 27.47 mGy and the calibration
factors (air-kerma length product calibration factors) of CT chamber combined with Nero mAx
test device was 9.215 mGy.cm.R-1
and 4.572 mGy.cm.R-1
with the width beam 10mm and 5 mm
respectively. The uncertainty of calibration factor estimated approximately 6.8% correspond a
coverage factor k=2.
3.3 Patient dose estimation in clinic
a) Air-kerma CT index free in air
The CT ion chamber is centred of the CT scanner (figure 6), and is situated along the z-axis so
that the beam is centred relatively to the detector length. The CT chamber is scanned with a single
rotation scan, the Ca,100 measurement is made.
Figure 6: A picture of arrangement for measurement of air-kerma CT free in air[3].
Ca,100and nCa,100was calculated from the reading of CT chamber as equation (2.2). Table 2
indicate the results of air-kerma free in air for one rotation of CT scanner.
Table 2: The results of exposure measured free in air
Parameters Slice thickness/
Scan length (mm)
Average exposure
measured (R)
Ca,100
(mGy)
nCa,100
(mGy.A-1
.s-1
)
High voltage: 100 kV
Current: 100 mA
PIt: 100 mAs
FOV: 100
Time: 1s
Temperature: 25.8oC
Pressure:1022.6 mbar
Mode of CT: Axial
5
2.88 27.19 0.27
10 2.63 24.94 0.25
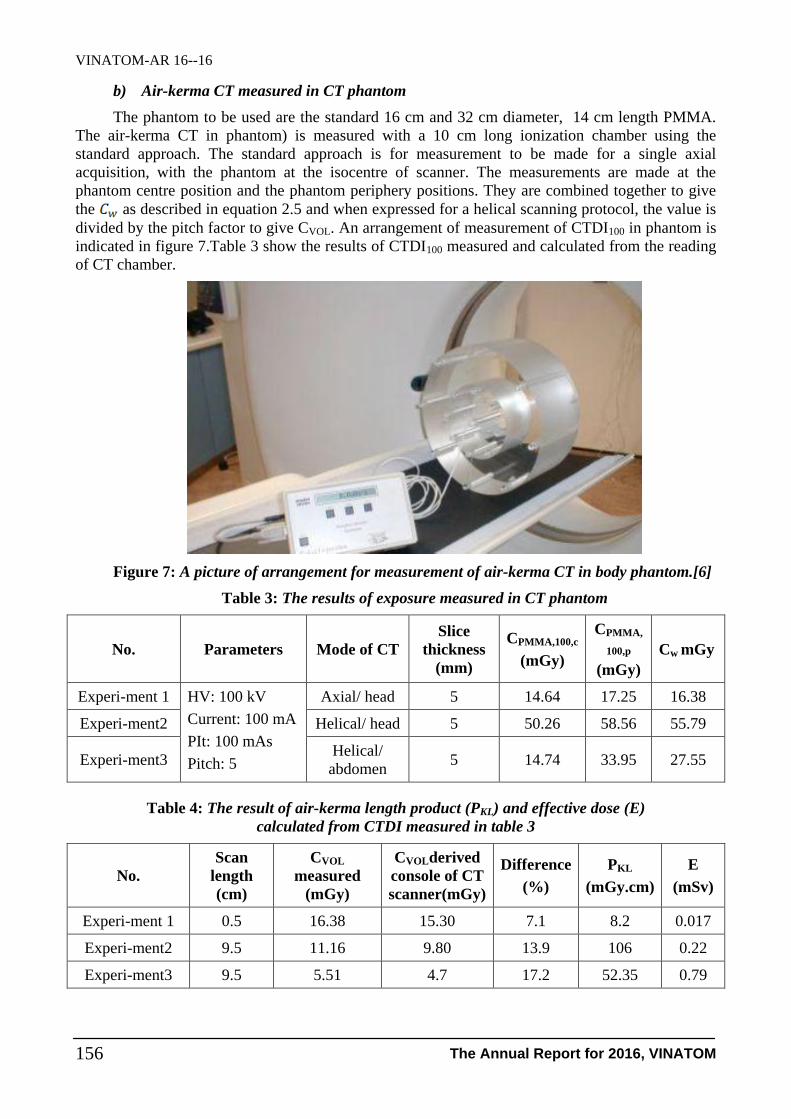
VINATOM-AR 16--16
The Annual Report for 2016, VINATOM 156
b) Air-kerma CT measured in CT phantom
The phantom to be used are the standard 16 cm and 32 cm diameter, 14 cm length PMMA.
The air-kerma CT in phantom) is measured with a 10 cm long ionization chamber using the
standard approach. The standard approach is for measurement to be made for a single axial
acquisition, with the phantom at the isocentre of scanner. The measurements are made at the
phantom centre position and the phantom periphery positions. They are combined together to give
the as described in equation 2.5 and when expressed for a helical scanning protocol, the value is
divided by the pitch factor to give CVOL. An arrangement of measurement of CTDI100 in phantom is
indicated in figure 7.Table 3 show the results of CTDI100 measured and calculated from the reading
of CT chamber.
Figure 7: A picture of arrangement for measurement of air-kerma CT in body phantom.[6]
Table 3: The results of exposure measured in CT phantom
No. Parameters Mode of CT
Slice
thickness
(mm)
CPMMA,100,c
(mGy)
CPMMA,
100,p
(mGy)
Cw mGy
Experi-ment 1 HV: 100 kV
Current: 100 mA
PIt: 100 mAs
Pitch: 5
Axial/ head 5 14.64 17.25 16.38
Experi-ment2 Helical/ head 5 50.26 58.56 55.79
Experi-ment3 Helical/
abdomen 5 14.74 33.95 27.55
Table 4: The result of air-kerma length product (PKL) and effective dose (E)
calculated from CTDI measured in table 3
No.
Scan
length
(cm)
CVOL
measured
(mGy)
CVOLderived
console of CT
scanner(mGy)
Difference
(%)
PKL
(mGy.cm)
E
(mSv)
Experi-ment 1 0.5 16.38 15.30 7.1 8.2 0.017
Experi-ment2 9.5 11.16 9.80 13.9 106 0.22
Experi-ment3 9.5 5.51 4.7 17.2 52.35 0.79

VINATOM-AR 16--16
The Annual Report for 2016, VINATOM 157
Table 4 show the results of CVOL measured in some mode of acquisition of CT scanner. The
CVOL measured differ from CVOL displayed on console of CT scanner from 7.1% to 17.2 %. The
uncertainty of CVOL estimated approximately 9.5% correspond a coverage factor k=2.
4. CONCLUSION
In this work, we have established RQR8, RQT8 reference beam qualities in diagnostic
radiology following IAEA TRS 457. The discrepancy between HVL measured and IAEA TRS 457
values are less than 1.7%. Calibration procedure for detector in CT was established also. Practical
measurements of air-kerma CT index on CT scanner using standard phantom was performed and
compared to outputs of CT scanner. The results showed the difference between CVOL measured and
values displayed on console were less than 20%.
REFERENCES
[1] Computed Tomography - An Increasing Source of Radiation Exposure; David J.
Brenner and Eric J. Hall, New England Journal of Medicine 2007; 357:2277-2284
(2007-11-29).
[2] Comparison of pencil-type ionization chamber calibration results and methods
between dosimetry laboratories; Costas J. Hourdakis, Ludwig Büermann, Olivera
Ciraj-Bjelac, Istvan Csete, Harry Delis, Igor Gomola, Linda Persson, Leos Novak,
IvailoPetkov, Paula Toroi; Physica medica (32), pp. 42-51, 2016.
[3] Status of computed tomography dosimetry for wide cone beam scanner, IAEA
Human Health Report No.5, 2011.
[4] Implementation of the International Code of Practice on Dosimetry in Diagnostic
Radiology (TRS 457); Review of Test Results, IAEA Human health report No.4,
2011.
[5] IAEA Safety Report Series No.16 Calibration of radiation protection monitoring
instruments; 2000.
[6] Technical Reports Series No.457 Dosimetry in Diagnostic Radiology; An
international code of practice, International atomic energy Vienna, 2007.
[7] Clinical dosimetry in diagnostic radiology; Costas J. Hourakis, PPT lessons, 2013.
[8] Estimating patient radiation dose from computed tomography; C. Cagnon, J.
Demarco E. Angel, M. McNitt-Gray, UCLA David Geffen School of medicine,
ACPM 2008.
VINATOM-AR 16--17
The Annual Report for 2016, VINATOM 158
STUDY OF WATERPROOF CAPABILITIES OF THE ENGINEERED
BARRIER CONTAINING BENTONITE IN NEAR SURFACE
RADIOACTIVE WASTE REPOSITORIES
Lưu Cao Nguyen, Nguyen Ba Tien, Đoan Thi Thu Hien,
Nguyen Van Chinh and Vuong Huu Anh
Institute for Technology of Radioactive and Rare Elements (ITRRE)
48, Lang Ha-Dong Da-Hanoi
Abstract: In Vietnam, the study of nuclear fuel cycle is in first steps, such as the exploitation and
uranium processing… These processes generated large amounts of radioactive waste over-timing. The
naturally occurring radioactive material and technologically enhanced radioactive material
(NORM/TENORM) waste, which would be large, needs to be managed and disposed reasonably by
effective methods. These wastes were used to be disposal in the near surface. It was therefore very
important to study the model of radioactive waste repository, where bentonite waterproofing layer
would be applied for the engineered barrier. The aim of this study was to obtain the preliminary
parameters for low-level radioactive waste disposal site being suitable with the conditions of Vietnam.
The investigation of the ratio between soil and bentonite was taken part. The experiments with some
layers of waterproofing material with the ratio of soil and bentonite as 75/25, 50/50 and 25/75 were
carried out to test the moving of uranium nuclide through these waterproofing material layers.
Analyzing the uranium content in each layer (0.1 cm) of pressed soil - bentonite mixture (as a block)
to determine the uranium nuclide adsorption from solution into the materials in the different ratios at
the different times: 1, 2 and 3 months was carried out. The results showed that the calculated average
rate of uranium nuclide migration into the soil - bentonite layer was 5.4.10-10, 5.4.10-10 and 3.85.10-10
m/s corresponding to the waterproofing layer thickness (for 300 years) 4.86 m, 4.86 m and 3.63 m
respectively, which was due on the ratio of soil and bentonite 75/25, 50/50, 25/75 to keep the safety
for the repository. [ 3-5].
Keywords: Bentonite, Ratio of soil and bentonite, Near surface disposal site, radioactive waste
I. INTRODUCTION
The disposal of very low and low radioactive waste in near surface repositories with
engineered barrier were much studied in the world. In this theme, the mix between soil and
Vietnamese bentonite was studied to use as the engineered barrier for the near surface disposal. Soil
and bentonite were mixed with different ratio: 75/25, 50/50 and 25/75 and then these mixture were
pressed in to PVC pipes to investigate the migration of uranium nuclide in the uranium solution
through these materials. The time of migration were changed from 1, 2 and 3 months. Determining
Project Information:
- Code: CS/16/03-02
- Managerial Level: Vietnam Atomic Energy Institute
- Allocated Fund: 80,000,000 VND
- Implementation Time: 12 months (Jan 2016 – Dec 2016)
- Contact Email: [email protected]
- Papers published in relation to the project:
Lưu Cao Nguyen, Nguyen Ba Tien, Doan Thi Thu Hien, Nguyen Van Chinh, Vuong Huu
Anh; A study on waterproof capabilities of the Bentonite-containing engineered barrier used
in near surface disposal for radioactive waste; To be published in J. Nuclear Science and
Technology.
VINATOM-AR 16--17
The Annual Report for 2016, VINATOM 159
the content of uranium in each layer of 0.1 cm of PVC pipes to identify the rate of uranium nuclide
migration through engineered barrier layers was done using XRF technique. From the results of
these rates, the primary calculation of the engineered barrier layers thickness for the near surface
disposal was reported.
II. EXPERIMENT
Preparation of samples and testing conditions: [12,13].
- Samples of soil and bentonite were mixed in different proportions (75/25, 50/50, 25/75
respectively) to get homogeneous material. Each sample were loaded into 03 PVC tubes and
compressed at a pressure of 1.5 tons, to ensure the uniformity at every point, with no gap between
the material and inside wall of the tube.
- For the experiment, the testing conditions were chosen as follows:
o The height of liquid column to soak the sample tubes was 5 cm.
o The sample tubes must be closed during permeability test experiments.
o Determining the infiltration level of uranium into the sample tubes after the period of 1, 2
and 3 months.
o Analyzing the content of uranium in each 0.1 cm layer of the samples tube to determine the
migration of uranium from solution into the materials in different ratios of soil and bentonite.
Test procedure
- For each sample, prepare 500g with the different ratio of soil and bentonite (ratio S/B).
Table 1: The component weight of mixed materials in experiments
Ordinal Name of
amples
Ratio
S/B
Weight of soil
(gram)
Weight of bentonite
(gram)
1 M1 75/25 375 125
2 M2 50/50 250 250
3 M3 25/75 125 375
- PVC pipe with a diameter of 2.7 cm was cut to parts with the length of 10 cm.
- Each mixed material of 100g weight was loaded into a PVC tube then compressed by
CARVER pressure press (USA) at 1.5 tons.
- Use a measuring cylinder to take out 100 ml of uranium containing solution into the cup
for soaked sample.
- Soaking the PVC tube with compressed material into the solution. The solution was
oriented to suck from bottom to top. Check the extent of infiltration after the period of 1 month, 2
months and 3 months.
- When finishing the soaking of PVC tube with experimented materials, cut the PVC tube to
determine uranium content at the each 0.1 cm layer. The uranium content of each sample layer was
measured by X-ray fluorescence (XRF) at the Institute of Technology for Radioactive and Rare
Elements.
- XRF measurement was done as the following:
VINATOM-AR 16--17
The Annual Report for 2016, VINATOM 160
o The sample tube was cut out of the PVC plastic to obtain cylindrical sample and it was
analyzed.
o Surface of the sample was grinded for flat surface (about 0.1 mm of tube height) and kept
on the XRF sample stand for the measurement of the surface. Measurement was performed directly
on the surface of that cylindrical sample.
o For second measurement, it needed to remove the thickness of sample layer by cutting at a
distance of 0.1 cm. Uranium content on this surface layer was measured. This step was repeated
until the uranium content on the surface layer was under the detection limit of XRF method.
- Analyzing the uranium content in each layers of material pipe to determine the amount of
uranium nuclide adsorbed from solution into the material with different ratios of soil/bentonite.
Uranium concentration of solution before and after the experiment was also checked.
III. RESULTS AND DISCUSSION
Examine the movement of uranium nuclide from radioactive waste solution through
engineering barrier layer containing betonite
III.1. Analysis of low - level radioactive waste solution
Solution of low- level radioactive waste has pH = 3 and uranium concentration of 12 mg/g
was used for the present study. The concentration was analyzed using a standard method.
III.2. Analysis of the original Bentonite compositions
Table 2: Compositions of bentonite-Binh Thuan (% concentration)
Composition SiO2 Al2O3 Fe2O3 FeO MgO CaO CO2 K2O Na2O H2O
Bentonit 65.5
-
76.5
6.71 -
11.81
1.44 -
2.27
0.21
-
0.75
1.05 -
2.13
3.29
-
8.32
0.82
-
5.81
0.62
-
1.92
1.35 -
2.40
3.98
-
7.65
Among the original bentonite mines found in our country, Nha Me mine at Binh Thuan
province contains higher alkali content. This is the biggest advantage in applying to make
waterproofing materials for the waste backfill. Therefore, original bentonite of Nha Me mine for
the buffer in this waste backfill was used.
III.3. Examination of the uranium nuclide migration from radioactive waste solution
through layers of the bentonite engineering barrier
The uranium content in samples with different ratio of soil and bentonite (ratio S/B = 75/25,
50/50, 25/75) in mixture before experiments were analyzed. The results showed that in these
samples uranium was not detected (the detection limit of this method was 10 g/g).
Three samples (M1-1, M1-2, M1-3) with the same ratio S/B = 75/25 were soaked in 1, 2, 3
months, respectively. Uranium contents in different layers of materials were determined by the
method described above. The results were presented in Tables 3 and illustrated in Fig. 1.
The similar experiments were carried out with two other series of samples corresponding to
ratios S/B = 50/50 and 25/75, which were denoted as M2 (M2-1, M2-2, M2-3) and M3 (M3-1, M3-
2, M3-3). These results were shown in Tables 4, 5 and plotted in Figs 2, 3, respectively.
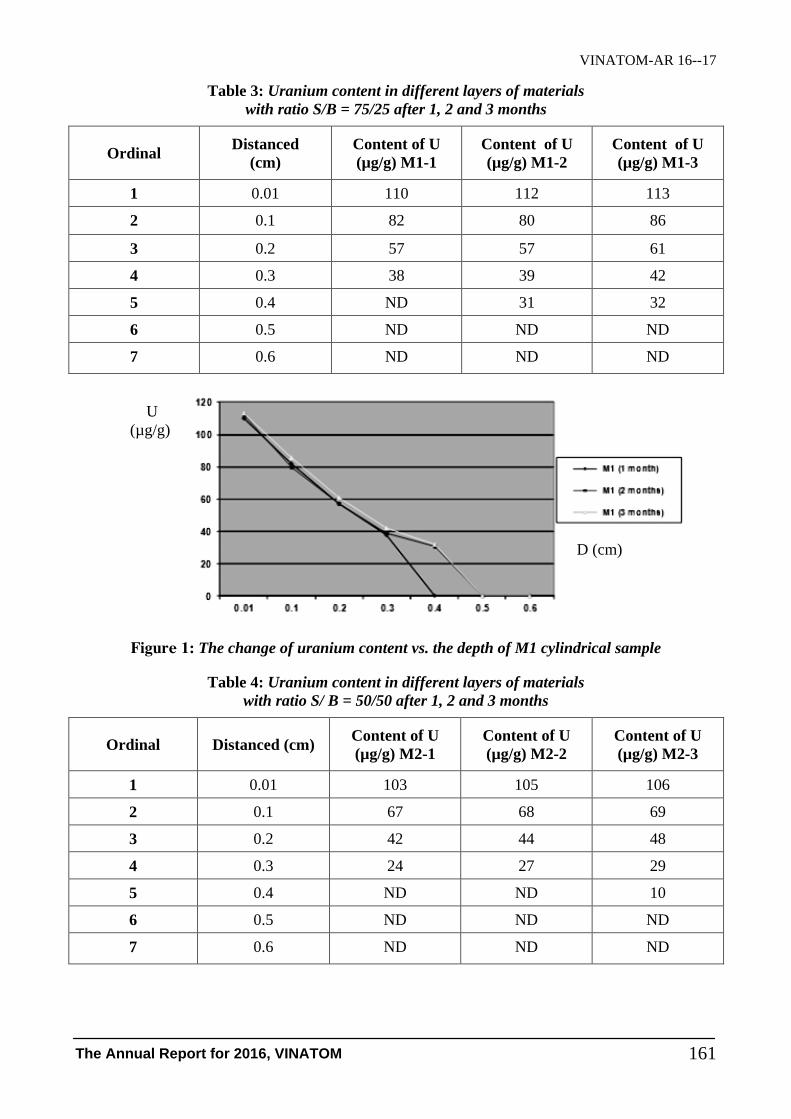
VINATOM-AR 16--17
The Annual Report for 2016, VINATOM 161
Table 3: Uranium content in different layers of materials
with ratio S/B = 75/25 after 1, 2 and 3 months
Ordinal Distanced
(cm)
Content of U
(µg/g) M1-1
Content of U
(µg/g) M1-2
Content of U
(µg/g) M1-3
1 0.01 110 112 113
2 0.1 82 80 86
3 0.2 57 57 61
4 0.3 38 39 42
5 0.4 ND 31 32
6 0.5 ND ND ND
7 0.6 ND ND ND
Figure 1: The change of uranium content vs. the depth of M1 cylindrical sample
Table 4: Uranium content in different layers of materials
with ratio S/ B = 50/50 after 1, 2 and 3 months
Ordinal Distanced (cm) Content of U
(µg/g) M2-1
Content of U
(µg/g) M2-2
Content of U
(µg/g) M2-3
1 0.01 103 105 106
2 0.1 67 68 69
3 0.2 42 44 48
4 0.3 24 27 29
5 0.4 ND ND 10
6 0.5 ND ND ND
7 0.6 ND ND ND
U
(µg/g)
D (cm)

VINATOM-AR 16--17
The Annual Report for 2016, VINATOM 162
Figure 2: The change of uranium content vs. the depth of M2 cylindrical sample
Table 5: Uranium content in different layers of materials
with ratio M3 after 1, 2 and 3 months
Ordinal Distanced
(cm)
Content of U
(µg/g) M3-1
Content of U
(µg/g) M3-2
Content of U
(µg/g) M3-3
1 0.01 98 100 103
2 0.1 60 62 65
3 0.2 20 33 37
4 0.3 ND 18 19
5 0.4 ND ND ND
6 0.5 ND ND ND
7 0.6 ND ND ND
Figure 3: The change of uranium content vs. the depth of M3 cylindrical sample
The results of experiments showed that the rate of uranium adsorption decreased with the
depth of the material layers. According to these results the migration rates and the thickness of
waterproofing layer could be calculated using the following formula [12] if the bentonite layers
were assumed as the constructed soil base.
D (cm)
D (cm)
U (µg/g)
U (µg/g)
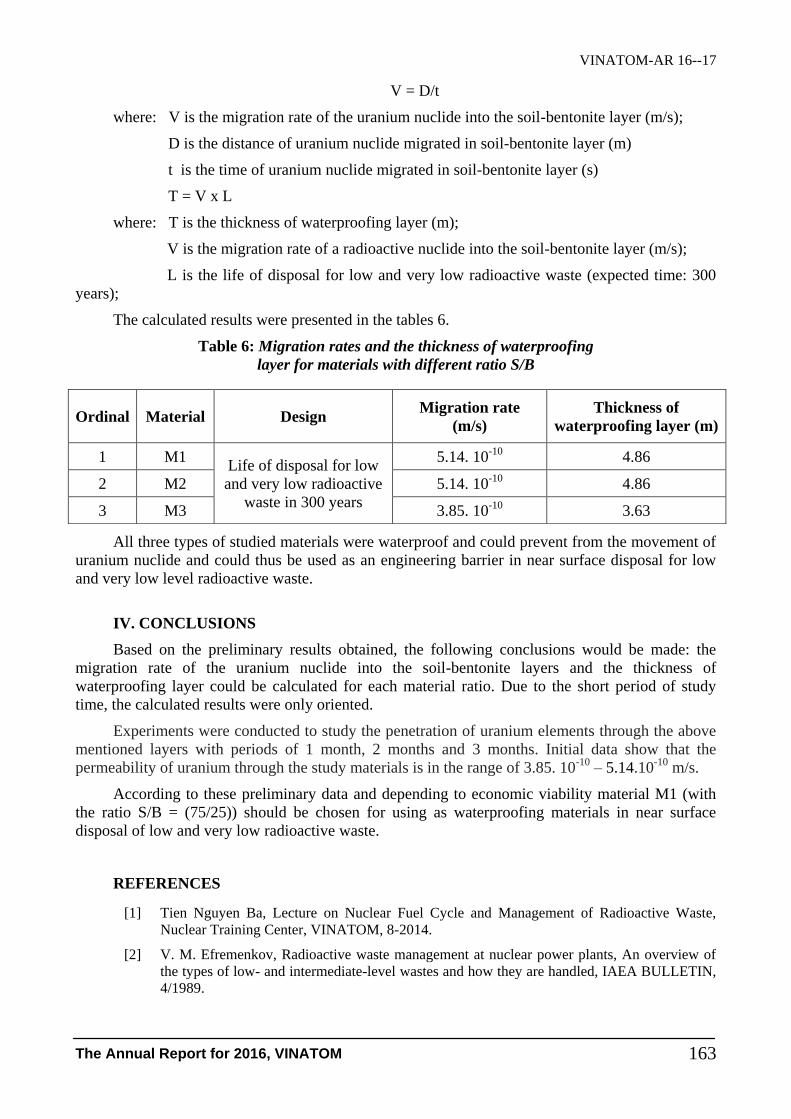
VINATOM-AR 16--17
The Annual Report for 2016, VINATOM 163
V = D/t
where: V is the migration rate of the uranium nuclide into the soil-bentonite layer (m/s);
D is the distance of uranium nuclide migrated in soil-bentonite layer (m)
t is the time of uranium nuclide migrated in soil-bentonite layer (s)
T = V x L
where: T is the thickness of waterproofing layer (m);
V is the migration rate of a radioactive nuclide into the soil-bentonite layer (m/s);
L is the life of disposal for low and very low radioactive waste (expected time: 300
years);
The calculated results were presented in the tables 6.
Table 6: Migration rates and the thickness of waterproofing
layer for materials with different ratio S/B
All three types of studied materials were waterproof and could prevent from the movement of
uranium nuclide and could thus be used as an engineering barrier in near surface disposal for low
and very low level radioactive waste.
IV. CONCLUSIONS
Based on the preliminary results obtained, the following conclusions would be made: the
migration rate of the uranium nuclide into the soil-bentonite layers and the thickness of
waterproofing layer could be calculated for each material ratio. Due to the short period of study
time, the calculated results were only oriented.
Experiments were conducted to study the penetration of uranium elements through the above
mentioned layers with periods of 1 month, 2 months and 3 months. Initial data show that the
permeability of uranium through the study materials is in the range of 3.85. 10-10
– 5.14.10-10
m/s.
According to these preliminary data and depending to economic viability material M1 (with
the ratio S/B = (75/25)) should be chosen for using as waterproofing materials in near surface
disposal of low and very low radioactive waste.
REFERENCES
[1] Tien Nguyen Ba, Lecture on Nuclear Fuel Cycle and Management of Radioactive Waste,
Nuclear Training Center, VINATOM, 8-2014.
[2] V. M. Efremenkov, Radioactive waste management at nuclear power plants, An overview of
the types of low- and intermediate-level wastes and how they are handled, IAEA BULLETIN,
4/1989.
Ordinal Material Design Migration rate
(m/s)
Thickness of
waterproofing layer (m)
1 M1 Life of disposal for low
and very low radioactive
waste in 300 years
5.14. 10-10
4.86
2 M2 5.14. 10-10
4.86
3 M3 3.85. 10-10
3.63

VINATOM-AR 16--17
The Annual Report for 2016, VINATOM 164
[3] Safety series No. 111-G-1.1; Classification of Radioactive Waste, A Safety Guide; A
Publication within the RADWASS Programme, IAEA, Vienna 1994.
[4] Technical design and evaluation of potential repository concepts for long-lived low and
intermediate level waste, Par Grahm, David Luterkort, Per Martensson, Predrik Nisson,(P. 40-
45, 49-54) [2013- Stockholm].
[5] Performance of engineered barrier materials in near surface disposal facilities for radioactive
waste (Chapter 2), [IAEA-2001 Viena].
[6] Bentonite Barriers- New Experiments and State of the Art, GRS-300, (P. 5-19) [2012].
[7] A Review of Non-Traditional Dry Convers MEND 2.21.3b, Dr. M.D.Haug, Ph.D.Gordon
Pauls,(P. 92-95; 104) [2001].
[8] Millet, R.A., Perez, J.-Y., Davision, R. R., “USA practice slurry wall specifications 10 year
later,” Slurry walls: design, contruction and quality control, ASTM STP 1129.
[9] DAY, S., 2003. Envirocon Soil-Bentonit Slurry Wall Design Mix Submittal for Denver Water
Hazeltine, Road Runner’s Rest II and Brinkmann-Woodward Gravel Reservoirs, October, 8 p.
[10] Sandra Sanschez González, The swelling pressure of bentonite and sand mixtures,
[Stockholm, Swenden-2013].
[11] Thai Nguyen Canh, Tu Nguyen Anh, Cuong Bui Quang (2011) "Test construction of trench
wall - Bentonite waterproofing", Journal of Water Resources Engineering and Environmental
Science.
[12] National standard TCVN 8723: 2012 (Land for construction of irrigation works - Method of
determining the coefficient of permeability of soil in the experiment).
[13] Lawrence K. Wang, Jiaping Paul Chen, Membarane and Desalination Technologies, 2011.
VINATOM-AR 16--18
The Annual Report for 2016, VINATOM 165
STUDY ON DOSE DISTRIBUTION IN THE HETEROGENEOUS
DENSITY PRODUCTS IRRADIATED BY ELECTRON BEAM
ACCELERATOR UELR-10-15S2
Nguyen Anh Tuan, Tran Van Hung, Cao Van Chung and Nguyen Thanh Duoc
Research and Development Center for Radiation Technology
Abstract: Accelerator UELR-10-15S2 has been operated since 2012 for irradiating medical products
and foods. The irradiated products have many kinds of size, material and complex distribution so the
dose calculation is difficult and not agree of measured dose. In order to supply offset coefficients to
calculate dose, all irradiated products are surveyed distribution and measured mass and size. After that,
all of them are grouped and designed modeling for each group to calculate dose by MCNP [2] code
and measure dose by film dosimetry. The calculating and measuring results shows that the distribution
dose in side heterogeneous products different from in side the uniform product (from 20% to 50%). So
the offset coefficients for each group of product are fixed for calculating dose on electron beam
accelerator.
Keywords: Electron beam, depth dose profile, distribution dose.
1. INTRODUCTION
In order to supply offset coefficients to calculate dose for irradiated product on electron beam
accelerator UELR-10-15S2 [1], in this article, we calculated distribution dose by MCNP code and
measured dose by film dosimetry for three product groups. MCNP code simulates each of modeling
and calculates dose, after that distribution dose are measured in side three dummies. The calculating
and measuring dose are fixed to depth dose profile standard and offset coefficients calculate to
heterogeneous products irradiated by electron beam accelerator[3].
2. CALCULATION AND MEASUREMENT OF DOSES IN SIDE DUMMIES
2.1. Simulation and calculation of doses by MCNP
The irradiated products by electron beam accelerator are grouped and calculated dose by
MCNP code for every model of groups. There are three main models include:
The first group contains inhomogeneous distribution of surface products:
Project information:
- Code: CS/16/07-01
- Managerial Level: Institute
- Allocated Fund: 70,000,000 VND
- Implementation time: 12 months (Jan 2016- Dec 2016)
- Contact email: [email protected]
- Paper published in related to the project:
Nguyen Anh Tuan, Tran Van Hung, Cao Van Chung and Nguyen Thanh Duoc; Study on dose
distribution in the heterogeneous density products irradiated by electron beam accelerator
UELR-10-15S2; 12th Vietnam Conference on Nuclear Science and Technology, Nha Trang,
August 2-4, 2017, 6 p. (in Vietnamese).

VINATOM-AR 16--18
The Annual Report for 2016, VINATOM 166
Figure 1: Model of inhomogeneous distribution of surface products
The model 1 is calculated by MCNP in case different radius of cylinder cells. The calculation
dose points distribute in the center of each cylinder cell.
The second group contains inhomogeneous distribution of depth products:
Figure 2: Model of inhomogeneous distribution in products
In case products distribute as model 2 (Fig.2), the dose calculation points put on the surface of
each plane cell.
The last group contains inhomogeneous distribution both surface and depth products:
Figure 3: Model of inhomogeneous distribution both surface and depth products
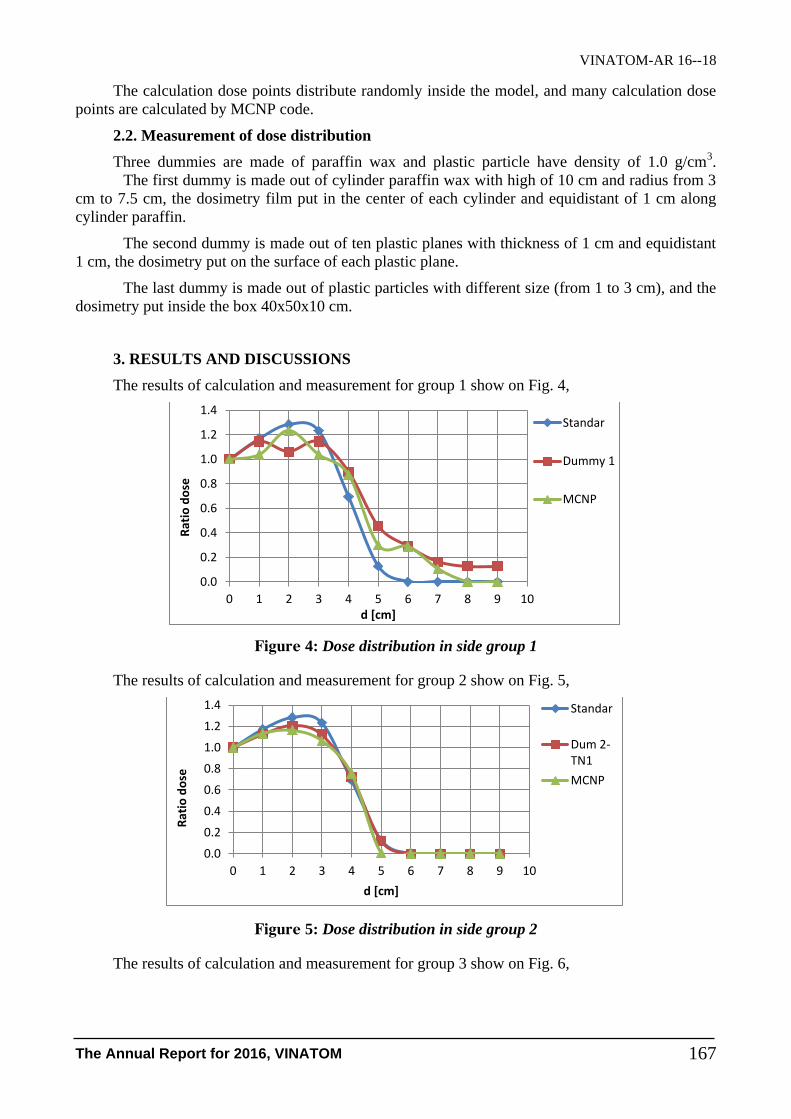
VINATOM-AR 16--18
The Annual Report for 2016, VINATOM 167
The calculation dose points distribute randomly inside the model, and many calculation dose
points are calculated by MCNP code.
2.2. Measurement of dose distribution
Three dummies are made of paraffin wax and plastic particle have density of 1.0 g/cm3.
The first dummy is made out of cylinder paraffin wax with high of 10 cm and radius from 3
cm to 7.5 cm, the dosimetry film put in the center of each cylinder and equidistant of 1 cm along
cylinder paraffin.
The second dummy is made out of ten plastic planes with thickness of 1 cm and equidistant
1 cm, the dosimetry put on the surface of each plastic plane.
The last dummy is made out of plastic particles with different size (from 1 to 3 cm), and the
dosimetry put inside the box 40x50x10 cm.
3. RESULTS AND DISCUSSIONS
The results of calculation and measurement for group 1 show on Fig. 4,
Figure 4: Dose distribution in side group 1
The results of calculation and measurement for group 2 show on Fig. 5,
Figure 5: Dose distribution in side group 2
The results of calculation and measurement for group 3 show on Fig. 6,
0.0
0.2
0.4
0.6
0.8
1.0
1.2
1.4
0 1 2 3 4 5 6 7 8 9 10
Rat
io d
ose
d [cm]
Standar
Dummy 1
MCNP
0.0
0.2
0.4
0.6
0.8
1.0
1.2
1.4
0 1 2 3 4 5 6 7 8 9 10
Rat
io d
ose
d [cm]
Standar
Dum 2-TN1
MCNP
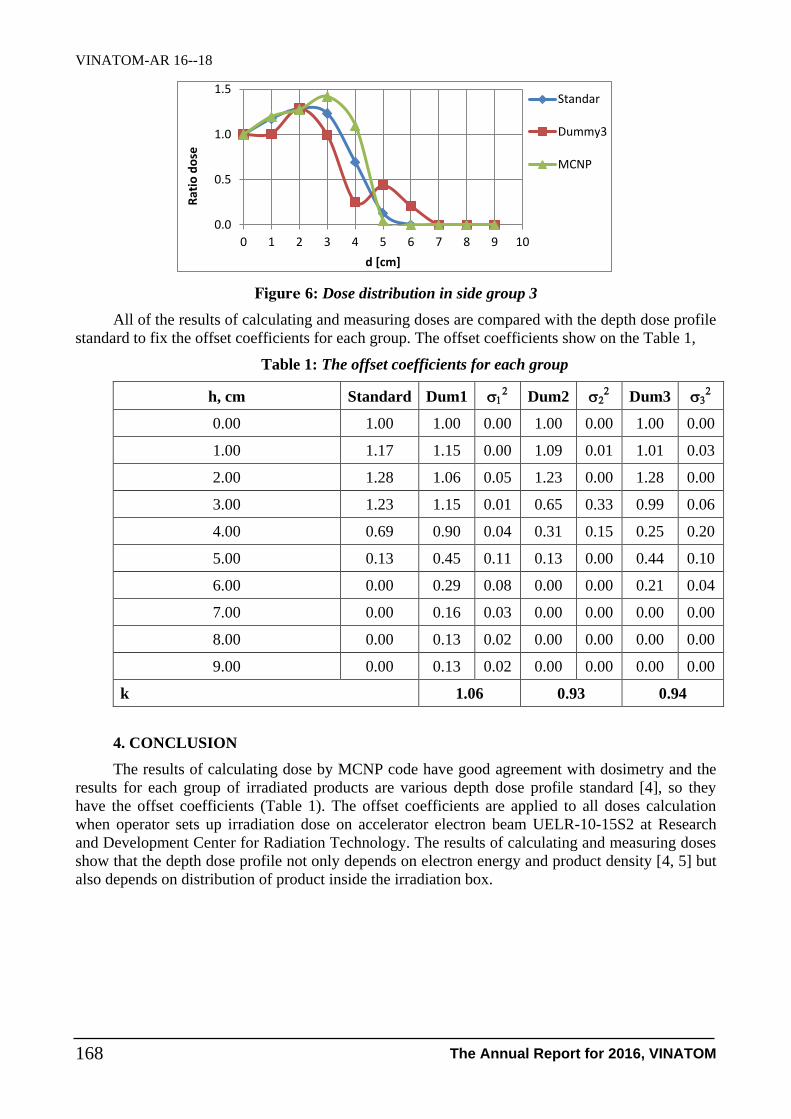
VINATOM-AR 16--18
The Annual Report for 2016, VINATOM 168
Figure 6: Dose distribution in side group 3
All of the results of calculating and measuring doses are compared with the depth dose profile
standard to fix the offset coefficients for each group. The offset coefficients show on the Table 1,
Table 1: The offset coefficients for each group
h, cm Standard Dum1
Dum2 Dum3
0.00 1.00 1.00 0.00 1.00 0.00 1.00 0.00
1.00 1.17 1.15 0.00 1.09 0.01 1.01 0.03
2.00 1.28 1.06 0.05 1.23 0.00 1.28 0.00
3.00 1.23 1.15 0.01 0.65 0.33 0.99 0.06
4.00 0.69 0.90 0.04 0.31 0.15 0.25 0.20
5.00 0.13 0.45 0.11 0.13 0.00 0.44 0.10
6.00 0.00 0.29 0.08 0.00 0.00 0.21 0.04
7.00 0.00 0.16 0.03 0.00 0.00 0.00 0.00
8.00 0.00 0.13 0.02 0.00 0.00 0.00 0.00
9.00 0.00 0.13 0.02 0.00 0.00 0.00 0.00
k 1.06 0.93 0.94
4. CONCLUSION
The results of calculating dose by MCNP code have good agreement with dosimetry and the
results for each group of irradiated products are various depth dose profile standard [4], so they
have the offset coefficients (Table 1). The offset coefficients are applied to all doses calculation
when operator sets up irradiation dose on accelerator electron beam UELR-10-15S2 at Research
and Development Center for Radiation Technology. The results of calculating and measuring doses
show that the depth dose profile not only depends on electron energy and product density [4, 5] but
also depends on distribution of product inside the irradiation box.
0.0
0.5
1.0
1.5
0 1 2 3 4 5 6 7 8 9 10
Rat
io d
ose
d [cm]
Standar
Dummy3
MCNP

VINATOM-AR 16--18
The Annual Report for 2016, VINATOM 169
REFERENCES
[1] Tran Khac An, Tran Van Hung, Cao Van Chung and Nguyen Anh Tuan, Calculation dose
profiles for medical product and food irradiation on accelerator UELR-10-15S2 using MCNP
code and RT-Office software, The 8th national conference on Nuclear science and
Technology, Nha Trang, August 2009.
[2] Los Alamos National Laboratory, Monte Carlo N-Partical Code System, Los Alamos, New
Mexico, 2000.
[3] Introduction to Health Physics, Pergamon International Library of Science, Technology,
Engineering and Social Studies, Publisher: Robert Maxwell, M.C.
[4] R.B. Miller, Electronic Irradiation of Food, Albuquerque, New Mexico, 2005.
[5] Radiation Protection Design Guidelines for 0.1-100 MeV Particle Accelerator Facilities,
National Council on Radiation and Measurements No.51, 1997.


1.8- Radiation Technology


VINATOM-AR 16--19
The Annual Report for 2016, VINATOM 173
STUDY ON ENHANCEMENT PROTEASE-PRODUCING
OF BACILLUS SUBTILIS BY COMBINING RIBOSOME ENGINEERING
AND GAMMA IRRADIATION
Tran Bang Diep1, Nguyen Thi Thom
1, Hoang Dang Sang
1, Nguyen Van Binh
1, Tran Xuan An
1, Hoang
Phuong Thao1, Pham Duy Duong
1, Tran Minh Quynh
1, Ta Bich Thuan
2 and Vo Thi Thuong Lan
2
1Hanoi Irradiation Centre, Minh Khai- Tu Liem- Hanoi
2 Faculty of Biology, VNU University of Science, 334 Nguyen Trai, ThanhXuan, Hanoi
Abstract: Bacillus subtilis B5, Bacillus subtilis H12 and Bacillus subtilis VI are high protease-
producing bacteria selected from various domestic laboratories. The suspensions in logarithmic growth
phase and nutrient agar plates inoculated these bacteria were irradiated at dose ranging 0-3000 Gy
under gamma Cobalt-60 source at Hanoi Irradiation Center. In both cases of irradiation treatment, the
viability of Bacillus subtilis strains was much affected by gamma radiation and the survival rate of
bacteria decreases with the increasing dose. The rate of high protease-producing mutation in three
kinds of Bacillus strains seems to be greater at the dose range of 700-1500 Gy, at which the survival
cells of bacteria was reduced by 3-4 log unit. In this study, the effect of gamma irradiation at different
doses to mutation frequency of antibiotic resistance (rifampicin 0.2 µg/ml and streptomycin 20 µg/ml)
of Bacillus subtilis strains is also investigated. The results show that the mutation frequency of
antibiotic resistance was improved significantly by radiation treatment. The frequency of rifampicin-
resistance reached the highest value at dose of 2000 Gy, 0.93-5.46x10³ times higher than the frequency
of spontaneous mutation. On the other hand, the highest streptomycin mutation frequency was
obtained by irradiation at 1000 Gy. After the first screening, 82 potential 0.2 µg/ml rifampicin-
resistant and 25 potential 20 µg/ml streptomycin-resistant colonies with higher production of protease
than original strain were selected from the irradiated Bacillus subtilis B5 and H12. In the subsequent
Project information:
- Code: ĐTCB 01/15/TTCX
- Managerial Level: Ministry
- Allocated Fund: 870,000,000 VND
- Implementation time: 30 months (Jan 2015- Jun 2017)
- Contact email: [email protected]
- Paper published in related to the project:
1. Diep T. B., Thom N. T., Sang H. D., Thao H. P., Binh N. V., Thuan T. B., Lan V. T. T.,
Quynh T. M. (2016): Screening streptomycin resistant Bacillus subtilis B5 producing high
protease from gamma-radiation mutagenesis. VNU Journal of Science: Natural Science and
Technology, 1S, 32, 170-176.
2. Sang H. D., Thom N. T., Binh N. V., Thao H. P., Quynh T. M., Diep T. B. Effects of gamma
irradiation on streptomycin resistance and protease producing ability of Bacillus subtilis B5.
The 4th Conference on Nuclear Science and Technology for Young Scientists. Hanoi 6-
7/10/2016, 9 p. (in Vietnamese)
3. Diep T. B., Thom N. T., Sang H. D., Binh N. V., An T. X., Thao H. P., Quynh T. M., Lan V.
T. T. Effects of gamma irradiation on the viability and mutant frequency of rifampicin
resistance of some Bacillus subtilis strains having high protease-producing.The 12th National
Conference on Nuclear Science and Technology. Nha Trang 2-4/8/2017, 10 p. (in
Vietnamese)
4. Sang H. D., Thom N. T., Binh N. V., Thao H. P., Quynh T. M., Diep T. B. Screening
streptomycin resistant Bacillus subtilis B5 producing high protease from gamma-radiation
mutagenesis. The 12th National Conference on Nuclear Science and Technology. Nha Trang
2-4/8/2017, 9 p. (in Vietnamese).
VINATOM-AR 16--19
The Annual Report for 2016, VINATOM 174
screening, some mutants having 2-2.5 times higher of protease activity than that of parent strain were
obtained by using the culture medium containing incrementally higher antibiotic concentrations. The
results of PCR, clonning and sequencing techniques proved that the antibiotic-resistance of Bacillus
subtilis due to mutate in rpoB gene involved in these bacteria’s protease synthesis ability.
Keyword: Bacillus subtilis, gamma irradiation, streptomycin, rifampicin, survival, mutation frequency,
protease, rpoB gene.
I. INTRODUCTION
Enzymes are natural catalysts synthesized by living organisms to increase the rate of chemical
reactions required for life. They have been applied in many various fields from food industry to
pharmaceutics and cosmetics. At present, most industrial enzymes are produced by microorganisms
because microbial enzymes are more stable than their corresponding plant and animal enzymes.
Moreover, the activity of the microbial enzyme can be easily modified and their production
is more convenient and safer. It is estimated that there are about 200 microbial original enzymes
are commercialized [1-3]. Proteases are enzymes that hydrolyze proteins into smaller peptides and
free amino acids. And microbial proteases have been widely used in food processing, feed
production and other industrial applications [4]. Bacillus species are the main producers of
various enzymes in industrial scale, and Bacillus subtilisis frequently used for the production of
extracellular proteases [5].
Microbial genome may be modified by physical and chemical mutagenesis such as UV light,
γ-ray, antibiotics… in order to increase their level of enzyme production of the wild-type [6].
Among the physical mutagens, ray, one of the radiation emit from the disintegration of 60
Co
radioisotopes, is the most commonly used mutagen in practice. Gamma radiation induced reactive
oxygen species (ROS) that react with DNA, RNA in the irradiated cell, resulting in damages in
nucleic acids and nucleotides, leading to mutations or even cell death [6-8]. In some cases, it can
create useful mutations at specified locations in genome [9]. Therefore, gamma radiation was
considered as an appropriate method to induce microbial mutants for selecting the strain having
specific characteristics such as radiation sensitivity, radiation or antibiotic resistance [7].
Recently, ribosome engineering has developed for changing the secondary metabolic
function of the wild-type strains and screening potential mutant strains [10]. Streptomycin is an
antibiotic, which acts as a potent inhibitor of prokaryotic transcription initiation, can be used to
study transcription in bacteria. Ochi K. reported that streptomycin likely attacked to ribosome
complexes or RNA polymerase in order to alter the transcription and the translation of
microorganism, thus improving enzyme productivity without modifying the genes of the original
strain [11]. Several streptomycin resistant mutants of Bacillus subtilis have been found to produce
increasing amounts (20–30%) of amylase and protease. In addition, rpoB mutations created by
rifampicin mutagen were effective for the overproduction (1.5- to 2-fold) of these extracellular [12]
In Vietnam, various strains of useful bacteria have been isolated and exploited for agricultural
industrial and medical applications. However, the mutant strains seem not to be used regardless
their advantages in production of primary or secondary products. In recent years, there are some
achievements in radiation-induced mutagenesis technique, which have been applied in practice.
Unfortunately, most radiation-induced mutations are predominantly point mutations, though the
direct action of radiation tends to form larger genetic changes. Combination of radiation and
ribosome engineering can reduce screening time, but produce the broad spectrum of mutations with
increasing mutation rates. Moreover, it found that the mutagenic effects of radiation are the causes
of the development of antibiotic resistance in the exposed colonies [13]. Therefore, gamma
radiation and two kind of antibiotic (rifampicin and streptomycin) have been applied as mutagens in

VINATOM-AR 16--19
The Annual Report for 2016, VINATOM 175
the present study for screening potential antibiotic resistance mutations, which improved protease
production from Bacillus subtilis.
II. EXPERIMENTAL
2.1. Material
A rather high protease-producing strain, Bacillus subtilis B5, Bacillus subtilis H12 and
Bacillus subtilis VI were selected from various domestic laboratories
Nutrient Agar (NA) and nutrient Broth (NB) media were purchased from Difco, USA.
Streptomycin, CH3COOH, amido black, casein at analytical grade were bought from Sigma. Other
chemicals were bought from Wako, Japan and agar from a domestic company.
Chemicals and indicators for molecular biology techniques are purity grade.
2.2. Methods
2.2.1. Preparation of Bacillus subtilis suspension in log growth phase
A loopful of Bacillus subtilis was taken from the NA plate, put in NB medium, cultured and
shaken at 37C for 24 hours. After that, 0.5 ml of this suspension was dispersed in 50 ml NB in a
100 ml Erlenmeyer flask, and incubated at the same condition to reach log growth phase.
2.2.2. Gamma irradiation
The test tubes containing 10 ml of bacteria suspensions in logarithmic growth phase and agar
plates inoculated by 0.1 ml of these suspensions at appropriate concentrations were irradiated in
duplicate. The radiation processing was carried out at the same dose rate with the radiation doses
ranging from 0.1 to 3.0 kGy under gamma ray 60
Co source at Hanoi Irradiation Center. Actual
absorbed doses were measured by Gammachrome YR dosimeters.
2.2.3. Calculation the rate of high protease producing mutation obtained by gamma
irradiation
The irradiated suspensions were coated on the NA plate medium. Single colonies from the
plate were randomly selected (50 colonies for each dose) and inoculated in NB medium for
determining protease activities (the method is described in the 2.2.5). Compared the diameter of
halo zone with the original strains, those with 10% increase were regarded as mutated, while those
less than 10% were not mutated. The mutation rate of each irradiation dose is calculated as
following formula:
Mutation rate (%) = (The number of mutation colonies/Detected colonies) x100%
2.2.4. Screening potential rifampicin/streptomycin resistant mutations
The ten-fold serial dilutions of the irradiated suspensions were prepared in saline pepton, then
0.1 ml of the diluted suspensions were placed on NA plates, incubated at 37C for 24 hours for
determining the effects of gamma radiation on bacterial survival. In parallel, 0.1 ml of these cell
suspensions were put on the plates of NA containing 0.2 µg/ml of rifampicin (or 20 µg/ml of
streptomycin) for screening potential antibiotic resistance mutations. The same volume of non-
irradiation cells was also cultured as negative control.
After incubation period, the survivals were counted as colony forming units (CFU) grown in
the medium with and without 0.2 µg/ml of rifampicin (or 20 µg/ml streptomycin) from the same
irradiated suspension. Mutation frequency was determined as the ratio of the survived colony
number in the medium containing rifampicin (or streptomycin) and those in pure NA medium at
various doses.

VINATOM-AR 16--19
The Annual Report for 2016, VINATOM 176
2.2.5. Isolating extracellular proteases and determining their activities
The potential antibiotic resistance mutations of gamma irradiated Bacillus subtilis were used
for selecting high protease producing strains. Each colony was inoculated into a 700 µl NB in
Eppendorf tubes, incubated at 37°C under shaking condition (120 rpm) for 24 hours. The crude
enzyme was obtained by centrifugation of the cell culture at 10000 rpm, at 4°C for 10 min.
Agar was prepared together with 0.1 % (w/v) casein and poured in petri dishes. The plates
were solidified for 30 min and holes (5 mm diameter) were punched. 30 µl of each crude enzyme
was loaded into a corresponding hole. These plates were incubated at 37°C overnight and amido
black reagent was flooded to all plates for 20-30 min at room temperature. Finally, the clear distinct
zone appeared after dyeing the casein agar plate was observed and photographed. The colony
having larger halo zone, namely high enzyme activity were selected as potential protease producing
mutation for further screening.
In the subsequent screening, potential protease producing colonies were cultured in the NA
medium, which contained incrementally higher antibiotic concentrations to select the greatest
protease producing mutations.
2.2.6. Analysis and identification of mutations
Molecular biology techniques such as PCR, clonning and sequencing for the rpoB and rpsL
genes involved in the protease synthesis of Bacillus subtilis have been used to identify and
analyze the mutations of selected colonies that have the greatest protease producing ability.
III. RESULTS AND DISCUSTION
3.1. Effect of gamma radiation on the growth of Bacillus subtilis
The growth of the irradiated cells was observed to evaluate the radiation effects on viability of
Bacillus subtilis. After irradiation, all irradiated cell suspensions were immediately inoculated on
the same NA plate (5 µl for each), incubated at 37C for 24 hours. The same amount of non-
irradiated suspension was also inoculated on the petri dish for comparison. It was found that there
were obvious differences in the colony density between irradiated and non-irradiated bacteria
samples (Fig. 1- left). The number of colonies seems to depend on irradiation dose. From the dose
higher than 500 Gy the number of colonies quickly reduced, even only 1 or 2 colonies were
observed when the sample was irradiated at 3000 Gy.
0 500 1000 1500 2000 2500 3000
0
1
2
3
4
5
6
7
8
9
Lo
g c
ell s
urv
ival (C
FU
/ml)
Dose (Gy)
A-Bacillus subtilis B5

VINATOM-AR 16--19
The Annual Report for 2016, VINATOM 177
0 500 1000 1500 2000 2500 3000
0
1
2
3
4
5
6
7
8
Lo
g c
ell s
urv
ival
(C
FU
/ml)
Dose (Gy)
B- Bacillus subtilis H12
0 500 1000 1500 2000 2500 3000
0
1
2
3
4
5
6
7
8L
og
cel
l su
rviv
al (
CF
U/m
l)
Dose (Gy)
C-Bacillus subtilis VI
Figure 1: Growth of Bacillus subtilis irradiated with various radiation doses
compared to non-irradiated one (left); Effects of gamma irradiation treatment on
the viability of Bacillus subtilis (right): ●- Cell survival on irradiated NA plates -
line below and ■- Cell survival in irradiated suspensions- line above
It is obviously that bacterial viability was much affected by gamma radiation. In both cases of
irradiation treatment, cell survival was reduced with increase of radiation dose. The effect of
radiation on 3 kind of Bacillus subtilis were expressed as Log cell survival in CFU/ml with
radiation dose (Fig.2-right). The results revealed the dose-dependent viability of the irradiated
bacteria was biphase curve with reduction of radio-sensitivity of the survivors irradiated up to dose
1500 Gy. It may be due to bacterial aggregation during irradiation, resulting in formation of the
larger cell clusters with higher radio-resistant [14].
Study on the viability of Bacillus spore with gamma radiation, Yoon Ki-Hong et al. [15]
indicated that the survival fraction of irradiated spores of Bacillus sp.79-23 exponentially decreased
in the dose ranging from 0.5 to 5 kGy. At 3 and 5 kGy, the number of survival spores was 5% and
1%, respectively.
In other study, Bacillus sp. NMBCC 10023 originally isolated from soil was irradiated with
doses of 1-40 kGy. The survival rate of the bacterial culture decreased exponentially with
increasing irradiation dosage. Guijun et al. [16] reported that lethal rate of Bacillus subtilis NCD-2
increased with irradiation dose, the lethal rate of the bacteria irradiated at 1000 Gy reached 99.50%.
Afsharmaesh et al. also found the reduction of survival fraction of Bacillus subtilis UTB1 by
radiation follows a rather linear model [17].
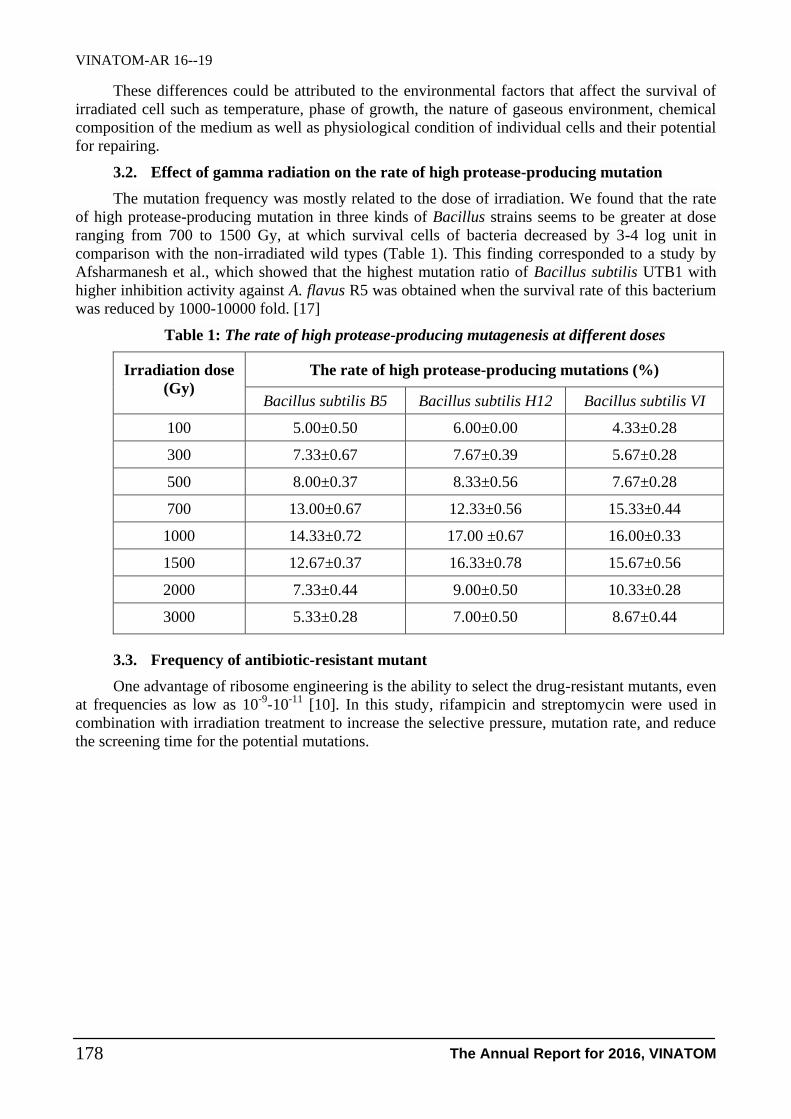
VINATOM-AR 16--19
The Annual Report for 2016, VINATOM 178
These differences could be attributed to the environmental factors that affect the survival of
irradiated cell such as temperature, phase of growth, the nature of gaseous environment, chemical
composition of the medium as well as physiological condition of individual cells and their potential
for repairing.
3.2. Effect of gamma radiation on the rate of high protease-producing mutation
The mutation frequency was mostly related to the dose of irradiation. We found that the rate
of high protease-producing mutation in three kinds of Bacillus strains seems to be greater at dose
ranging from 700 to 1500 Gy, at which survival cells of bacteria decreased by 3-4 log unit in
comparison with the non-irradiated wild types (Table 1). This finding corresponded to a study by
Afsharmanesh et al., which showed that the highest mutation ratio of Bacillus subtilis UTB1 with
higher inhibition activity against A. flavus R5 was obtained when the survival rate of this bacterium
was reduced by 1000-10000 fold. [17]
Table 1: The rate of high protease-producing mutagenesis at different doses
Irradiation dose
(Gy)
The rate of high protease-producing mutations (%)
Bacillus subtilis B5 Bacillus subtilis H12 Bacillus subtilis VI
100 5.00±0.50 6.00±0.00 4.33±0.28
300 7.33±0.67 7.67±0.39 5.67±0.28
500 8.00±0.37 8.33±0.56 7.67±0.28
700 13.00±0.67 12.33±0.56 15.33±0.44
1000 14.33±0.72 17.00 ±0.67 16.00±0.33
1500 12.67±0.37 16.33±0.78 15.67±0.56
2000 7.33±0.44 9.00±0.50 10.33±0.28
3000 5.33±0.28 7.00±0.50 8.67±0.44
3.3. Frequency of antibiotic-resistant mutant
One advantage of ribosome engineering is the ability to select the drug-resistant mutants, even
at frequencies as low as 10-9
-10-11
[10]. In this study, rifampicin and streptomycin were used in
combination with irradiation treatment to increase the selective pressure, mutation rate, and reduce
the screening time for the potential mutations.
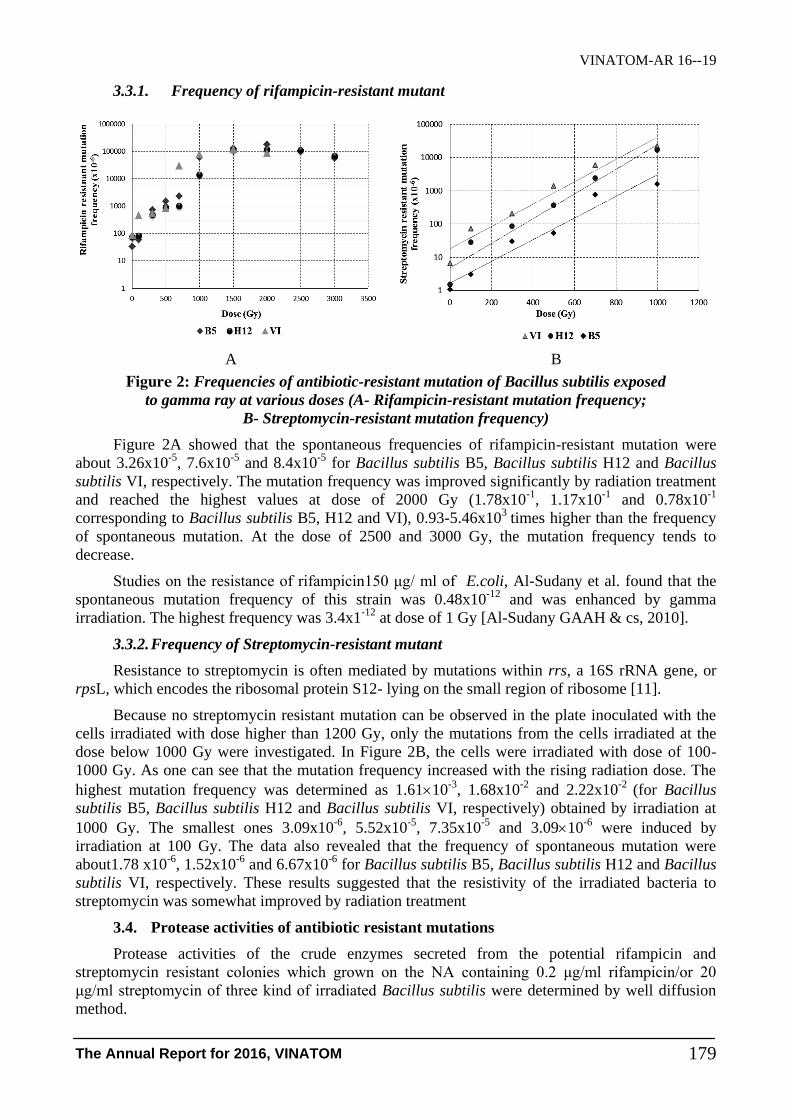
VINATOM-AR 16--19
The Annual Report for 2016, VINATOM 179
3.3.1. Frequency of rifampicin-resistant mutant
A B
Figure 2: Frequencies of antibiotic-resistant mutation of Bacillus subtilis exposed
to gamma ray at various doses (A- Rifampicin-resistant mutation frequency;
B- Streptomycin-resistant mutation frequency)
Figure 2A showed that the spontaneous frequencies of rifampicin-resistant mutation were
about 3.26x10⁻⁵
, 7.6x10⁻⁵
and 8.4x10⁻⁵
for Bacillus subtilis B5, Bacillus subtilis H12 and Bacillus
subtilis VI, respectively. The mutation frequency was improved significantly by radiation treatment
and reached the highest values at dose of 2000 Gy (1.78x10⁻¹
, 1.17x10⁻¹
and 0.78x10⁻¹
corresponding to Bacillus subtilis B5, H12 and VI), 0.93-5.46x10³
times higher than the frequency
of spontaneous mutation. At the dose of 2500 and 3000 Gy, the mutation frequency tends to
decrease.
Studies on the resistance of rifampicin150 μg/ ml of E.coli, Al-Sudany et al. found that the
spontaneous mutation frequency of this strain was 0.48x10⁻¹²
and was enhanced by gamma
irradiation. The highest frequency was 3.4x1-12
at dose of 1 Gy [Al-Sudany GAAH & cs, 2010].
3.3.2. Frequency of Streptomycin-resistant mutant
Resistance to streptomycin is often mediated by mutations within rrs, a 16S rRNA gene, or
rpsL, which encodes the ribosomal protein S12- lying on the small region of ribosome [11].
Because no streptomycin resistant mutation can be observed in the plate inoculated with the
cells irradiated with dose higher than 1200 Gy, only the mutations from the cells irradiated at the
dose below 1000 Gy were investigated. In Figure 2B, the cells were irradiated with dose of 100-
1000 Gy. As one can see that the mutation frequency increased with the rising radiation dose. The
highest mutation frequency was determined as 1.6110-3
, 1.68x10⁻²
and 2.22x10⁻²
(for Bacillus
subtilis B5, Bacillus subtilis H12 and Bacillus subtilis VI, respectively) obtained by irradiation at
1000 Gy. The smallest ones 3.09x10⁻⁶
, 5.52x10⁻⁵
, 7.35x10⁻⁵
and 3.0910-6
were induced by
irradiation at 100 Gy. The data also revealed that the frequency of spontaneous mutation were
about1.78 x10-6
, 1.52x10⁻⁶
and 6.67x10⁻⁶
for Bacillus subtilis B5, Bacillus subtilis H12 and Bacillus
subtilis VI, respectively. These results suggested that the resistivity of the irradiated bacteria to
streptomycin was somewhat improved by radiation treatment
3.4. Protease activities of antibiotic resistant mutations
Protease activities of the crude enzymes secreted from the potential rifampicin and
streptomycin resistant colonies which grown on the NA containing 0.2 μg/ml rifampicin/or 20
μg/ml streptomycin of three kind of irradiated Bacillus subtilis were determined by well diffusion
method.
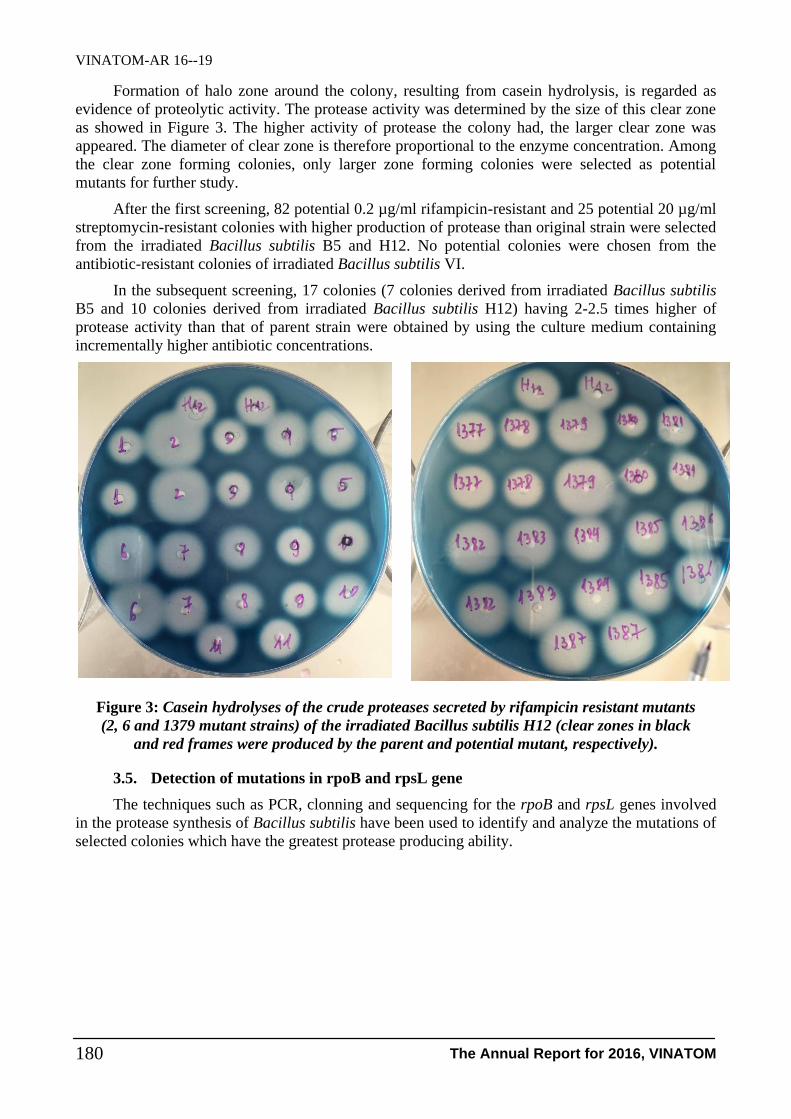
VINATOM-AR 16--19
The Annual Report for 2016, VINATOM 180
Formation of halo zone around the colony, resulting from casein hydrolysis, is regarded as
evidence of proteolytic activity. The protease activity was determined by the size of this clear zone
as showed in Figure 3. The higher activity of protease the colony had, the larger clear zone was
appeared. The diameter of clear zone is therefore proportional to the enzyme concentration. Among
the clear zone forming colonies, only larger zone forming colonies were selected as potential
mutants for further study.
After the first screening, 82 potential 0.2 µg/ml rifampicin-resistant and 25 potential 20 µg/ml
streptomycin-resistant colonies with higher production of protease than original strain were selected
from the irradiated Bacillus subtilis B5 and H12. No potential colonies were chosen from the
antibiotic-resistant colonies of irradiated Bacillus subtilis VI.
In the subsequent screening, 17 colonies (7 colonies derived from irradiated Bacillus subtilis
B5 and 10 colonies derived from irradiated Bacillus subtilis H12) having 2-2.5 times higher of
protease activity than that of parent strain were obtained by using the culture medium containing
incrementally higher antibiotic concentrations.
Figure 3: Casein hydrolyses of the crude proteases secreted by rifampicin resistant mutants
(2, 6 and 1379 mutant strains) of the irradiated Bacillus subtilis H12 (clear zones in black
and red frames were produced by the parent and potential mutant, respectively).
3.5. Detection of mutations in rpoB and rpsL gene
The techniques such as PCR, clonning and sequencing for the rpoB and rpsL genes involved
in the protease synthesis of Bacillus subtilis have been used to identify and analyze the mutations of
selected colonies which have the greatest protease producing ability.
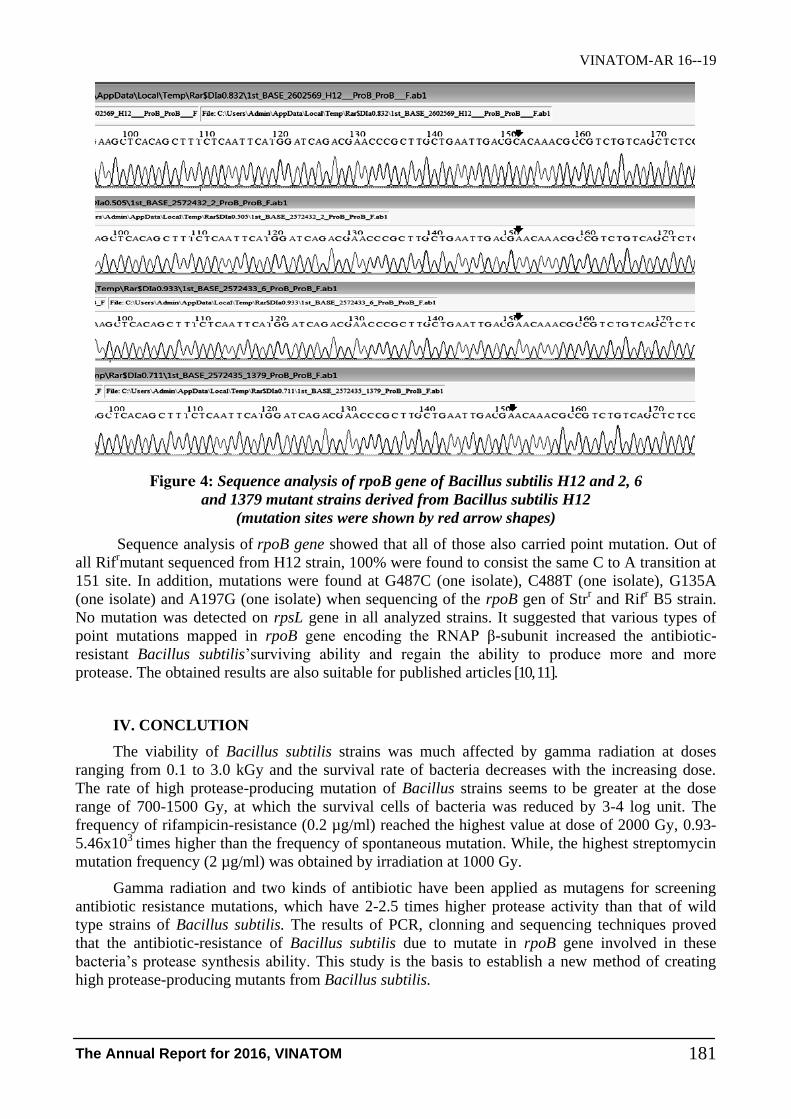
VINATOM-AR 16--19
The Annual Report for 2016, VINATOM 181
Figure 4: Sequence analysis of rpoB gene of Bacillus subtilis H12 and 2, 6
and 1379 mutant strains derived from Bacillus subtilis H12
(mutation sites were shown by red arrow shapes)
Sequence analysis of rpoB gene showed that all of those also carried point mutation. Out of
all Rifrmutant sequenced from H12 strain, 100% were found to consist the same C to A transition at
151 site. In addition, mutations were found at G487C (one isolate), C488T (one isolate), G135A
(one isolate) and A197G (one isolate) when sequencing of the rpoB gen of Strr and Rif
r B5 strain.
No mutation was detected on rpsL gene in all analyzed strains. It suggested that various types of
point mutations mapped in rpoB gene encoding the RNAP β-subunit increased the antibiotic-
resistant Bacillus subtilis’surviving ability and regain the ability to produce more and more
protease. The obtained results are also suitable for published articles [10, 11].
IV. CONCLUTION
The viability of Bacillus subtilis strains was much affected by gamma radiation at doses
ranging from 0.1 to 3.0 kGy and the survival rate of bacteria decreases with the increasing dose.
The rate of high protease-producing mutation of Bacillus strains seems to be greater at the dose
range of 700-1500 Gy, at which the survival cells of bacteria was reduced by 3-4 log unit. The
frequency of rifampicin-resistance (0.2 µg/ml) reached the highest value at dose of 2000 Gy, 0.93-
5.46x10³
times higher than the frequency of spontaneous mutation. While, the highest streptomycin
mutation frequency (2 µg/ml) was obtained by irradiation at 1000 Gy.
Gamma radiation and two kinds of antibiotic have been applied as mutagens for screening
antibiotic resistance mutations, which have 2-2.5 times higher protease activity than that of wild
type strains of Bacillus subtilis. The results of PCR, clonning and sequencing techniques proved
that the antibiotic-resistance of Bacillus subtilis due to mutate in rpoB gene involved in these
bacteria’s protease synthesis ability. This study is the basis to establish a new method of creating
high protease-producing mutants from Bacillus subtilis.
VINATOM-AR 16--19
The Annual Report for 2016, VINATOM 182
REFERENCES
[1] M. B. Rao, A. M. Tanksale, M. S. Ghatge, V. V. Deshpande. Molecular and biotechnological
aspects of microbial proteases. Microbiology and Molecular Rev. 62, 597, 1988.
[2] R. Gupta, Q. K. Beg, P. Lorenz. Bacterial alkaline proteases: molecular approaches and
industrial applications. Appl. Microbiol. Biotechnol. 59, 15, 2002.
[3] S. Li, X. Yang, S. Yang, M. Zhu, X. Wang. Technology prospecting on enzymes: Application,
marketing and engineering. Computational and structural biotechnology journal 2(3), 1, 2012.
[4] W. H. Chu. Optimization of extracellular alkaline protease production from species of
Bacillus. J. Ind. Microbiol. Biotechnol. 34, 241, 2007.
[5] R. Gupta, Q. K. Beg, P. Lorenz. Bacterial alkaline proteases: molecular approaches and
industrial applications. Appl. Microbiol. Biotechnol. 59, 15, 2002.
[6] A. Kodym, R. Afza. Physical and chemical mutagenesis. Methods in Molecular Biology 236,
189, 2003.
[7] C. Von Sonntag. The Chemical Basic of Radiation Biology. Taylor & Francis . New York,
USA, 1987.
[8] A. Y. Kim, D. W. Thayer. Mechanism by which gamma irradiation increases the sensitivity of
Samonella typhimurium ATCC 14028 to heat. Appl. Environ. Microbiol. 62, 1759, 1966.
[9] S. D. Awan, N. Tabbasam, N. Ayub, M. E. Babar, M. Rahman, S. M. Ran, M. I. Rajoka.
Gamma radiation induced mutagenesis in Aspergillus niger to enhance its microbial
fermentation activity for industrial enzyme production. Mol. Biol. Rep. 38, 1367, 2011.
[10] K. Ochi, T. Hosaka. New strategies for drug discovery: activation of silent or weakly
expressed microbial gene clusters. Appl Microbiol Biotechnol. 97, 87, 2013.
[11] K. Ochi. From microbial differentiation to ribosome engineering. Biosci Biotechnol Biochem.
6, 1373, 2007.
[12] K. Kurosawa, T. Hosaka, N. Tamehiro, T. Inaoka, K. Ochi. Improvement of amylase
production by modulating the ribosomal component S12 protein in Bacillus subtilis168. Appl.
Environ. Microbiol. 72, 71, 2006.
[13] Z. S. Tawfik, H. H. Swailam, M. A. Sayed, S. M. EL-Sonbaty. Effect of Gamma Irradiation
and Culture Conditions and Media Composition on Metallothionein Production by Bacillus
pantothenticus. 2nd International Conference on Radiation Sciences and Applications, Marsa
Alam, Egypt. 2010.
[14] S. Yazdi, A. M. Ardekani. Bacterial aggregation and biofilm formation in a vortical flow.
Biomicrofluidics 6, 44, 2012.
[15] K. H. Yoon, S. In-Kyung, H. J. Kyung, P. Seung-Hwan. Hyper-CMCase-producing mutants of
Bacillus sp. 79-23 induced by gamma-radiation. J. Microbiol. Biotechnol. 9(4), 518, 1999.
[16] L. GuiJun, M. You-ting, Y. Su-ling, B. Fang, S. Hong-zhong. Study on γ-ray irradiation
mutation of Bacillus subtilis NCD2. Agricultural Science & Technology. 12(11), 1633, 2011.
[17] H. Afsharmaesh, M. Ahmadzadeh, M. Javan-Nikkhah, K. Behboudi. Improvement in
biocontrol activity of Bacillus subtilis MTB1 against Aspergillus flavus using gamma
irradiation. Crop Protection. 60, 83, 2014.
VINATOM-AR 16--20
The Annual Report for 2016, VINATOM 183
USING GAMMA RADIATION TO INACTIVATE BACILLUS
THURINGIENSIS SPORES IN BIOPESTICIDE
Nguyen Thi Thom, Nguyen Van Binh, Tran Bang Diep, Hoang Dang Sang,
Hoang Phuong Thao, Pham Duy Duong, Tran Xuan An and Tran Minh Quynh
Hanoi Irradiation Center, VINATOM, No.5, Minh Khai, Tu Liem, Hanoi
Abstract: Bacillus thuringiensis (Bt) is one of those safe biological control agents which have
attracted considerable interest as possible replacements for the chemical insecticides. Bt-Bio-pesticide
have been proven to be a suitable tool for controlling pest in agriculture but there are still living bacilli
or free spores in commercial Bt products. After being sprayed outdoor environment, spores can
survive for long periods with little or no nutrients, but is able to regain their vegetative form when
environmental conditions become suitable for their survival. This thing may cause contamination to
the environment and eventually diseases to human and animals. This study evaluates the effect of
gamma radiation based on cobalt-60 on the spore viability, the effect of Bt’s efficiency against
lepidoptera larvae and density of bacillus spore in the soil treated by irradiated Bt products. We
attempted to identify the optimal dose that would inactivate Bt spores but the toxicity of Bt still retain
highly. Although 1 gram of un-irradiated sample contains about 5.2 x 10⁷ spores, spore survive at
radiation dose of 20 kGy could not be detected. In the radiation dose range of 5-20 kGy, the efficiency
of Bt products against Heliothis armigera larvae reduces by 20-30% as toxic as the un-irradiated
sample. In area treated by un-irradiated and irradiated Bt products following the guide of
manufacturing, the spore viability of the soil sprayed by irradiated products reduced by 85% as spores
as the control soil. A radiation dose of 20 kGy fulfills the requirements of killing all spores in Bt
products and maintaining the effectiveness of products.
Keyword: Bacillus thuringiensis, radiation, spore, sterilization, larvicidal activity, Heliothis armigera.
I. INTRODUCTION
Forwarding to a sustainable agriculture, pesticide is gradually replaced by bio-pesticide
because of its strong environmental and human health safety records. 90% of bio-pesticide products
based on Bacillus thuringiensis, are used yearly against lepidoptera pest species in agriculture and
forests [6]. Bacillus thuringiensis has been widely used since 1981 in the world [5] and its effect has
been demonstrated as the statistical figures indicate that its total value has been increased each year.
In 2003, 468 million USA was used for investment to Bt and after 7 years the number reached 1075
million in 2010 [1].
Bt bio-pesticides have been proven to be a suitable tool for controlling insects in agriculture
and is considered to be safe (WHO 1999) but up to now Bt products usually include both toxin
protein and spore free, there for, users concern about the risk of contamination. In some developed
Project information:
- Code: CS/16/08-01
- Managerial Level: Institute
- Allocated Fund: 80,000,000 VND
- Implementation time: 12 months (Jan 2016- Dec 2016)
- Contact email: [email protected]
- Paper published in related to the project:
Nguyen Thi Thom, Nguyen Van Binh, Tran Bang Diep, Hoang Dang Sang, Tran XuanAn, Hoang
Phuong Thao, Tran Minh Quynh, Study on using gamma radiation to inactivate Bacillus
thuringiensis spores in biopesticide; To be published in J. Nuclear Science and Technology, 2017.
VINATOM-AR 16--20
The Annual Report for 2016, VINATOM 184
countries, such as Germany, they only allow Bt products that do not contain living bacilli or their
spores [4]. Since spores are highly resistant to heat, radiation and chemical, the inactivation of
bacterial spores has been a challenge for human health, environmental quality and food safety [2].
There are actually three methods of destroying bacterial spores [8]. The first method is heat
treatment (120-1300C), this method is clean but the temperature is too high to destroy physical and
chemical structure of the toxin protein [10]. Furthermore, the package is required heat resistance;
the time, temperature, pressure factors must be carefully controlled and difficult to storage after
radiation [2]. The second method is using chemical agent - this method is inexpensive, but high
toxicity after treatment, which means it is not friendly and safe with human’s health and
environment [8]. Gamma radiation generated by cobalt-60 effectively inactivates cells via ionizing
radiation. This method is clean, high efficiency, low re-infection and suitable for sterilization Bt
products however gamma irradiation is widely used in pharmaceutical products and in food
preservation [5].
In Vietnam, Bt bio-pesticide which has just stopped at being researched and developed for
over 35 years, has rarely been commercialized, however they are distributed more and more largely
to agriculture [3]. According to the Ministry of Agriculture and Rural Development, the number of
commercialized bio-pesticides which was only 2 in 2009, increased to 334 in 2015 and Bt
accounted 221 products [7]. The development trend of Bt product increases fast day by day,
however, the spore problem is not still focused. Gamma irradiation sterilization is mainly used for
the sterilization of pharmaceuticals and medical devices and using gamma for inactivating spore in
commercial products is not still studied in Vietnam.
In this study, experiments were conducted to evaluate the effect of gamma radiation on
viability of bacillus spores, toxicity of un-irradiated and irradiated products for 4th
-Heliothis
armigera larvae and environmental consequences in laboratory scale.
II. MATERIALS AND METHODS
2.1. Radiation process
Irradiation was accomplished with Cobalt-60 in Hanoi Irradiation Center. The equipment
which has a capacity of 175 kCi, was operated by Irradiation Room. For the continuous irradiation
process, each irradiation carton was registered and labeled with the following information: date of
registration, batch number, desired dose. The units were automatically transferred from a storage
conveyor into the irradiation chamber, where they were circulated on 2 levels, traveling twice
around the Co60
source. The radiation time is carefully calculated in order to achieve the exact dose.
In this study, radiation dose of 5, 10, 15, 20 and 25 kGy were chosen. ECB dosimeters which were
sealed in aluminum foil, were used to check the absorbed radiation dose. The accuracy of the
dosimeters was ± 5%.
VBT USA 16000 IU was distributed by Vietnam Green Garden Company Limited with an
activity of 16000 IU/mg was used for the irradiation. For each radiation dose, 3 carton boxes were
each filled with 18 g of VBT USA. Three boxes remained un-irradiated as controls.
2.2. Assessment of radiation effect on spore viability
To determine the density of spores after irradiation with different dose, three-10 gram-
samples of VBT USA package were transferred into 90 ml of sterile peptone water in flask. After
homogenization by a shaker machine, it is exposed to smaller diluted dose to keep the number of
spores in countable limits. 100 µl of solution was removed from each container and smeared onto
nutrient agar. The agar dishes were prepared with agar and nutrient broth (comprised 3 g of meat
extract, 5 g peptone). Altogether, 17 g of agar and 8 g nutrient broth were measured into each liter
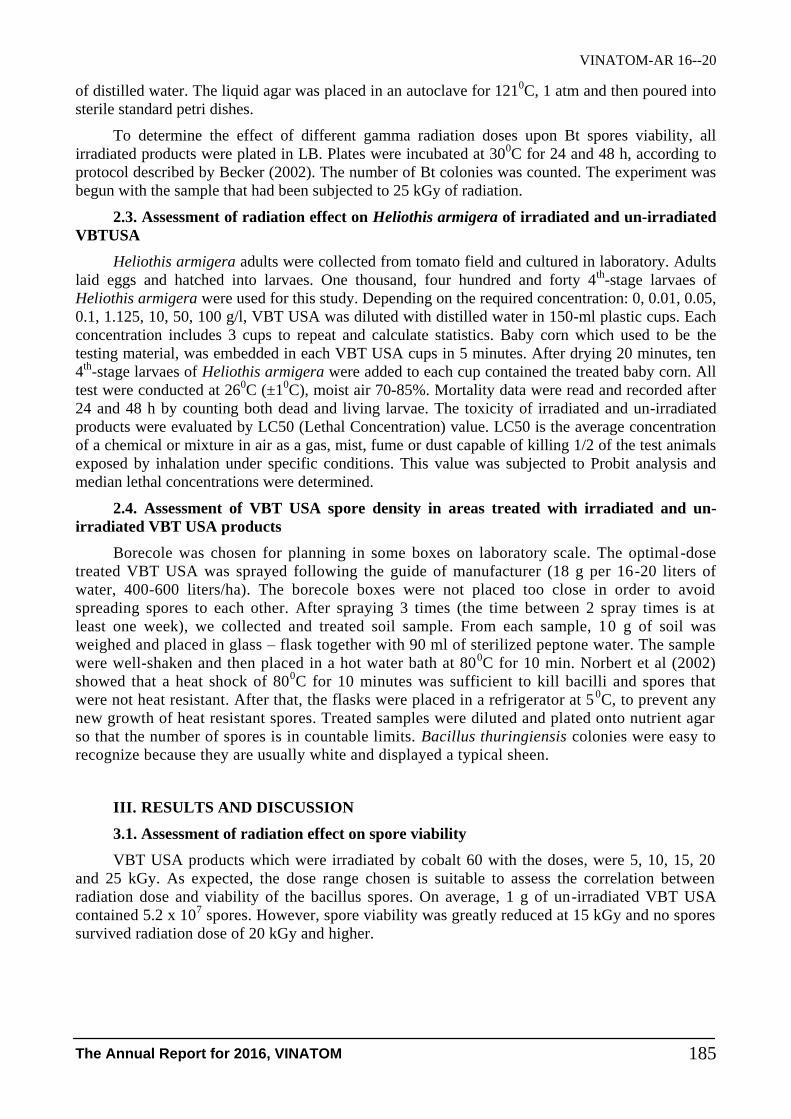
VINATOM-AR 16--20
The Annual Report for 2016, VINATOM 185
of distilled water. The liquid agar was placed in an autoclave for 1210C, 1 atm and then poured into
sterile standard petri dishes.
To determine the effect of different gamma radiation doses upon Bt spores viability, all
irradiated products were plated in LB. Plates were incubated at 300C for 24 and 48 h, according to
protocol described by Becker (2002). The number of Bt colonies was counted. The experiment was
begun with the sample that had been subjected to 25 kGy of radiation.
2.3. Assessment of radiation effect on Heliothis armigera of irradiated and un-irradiated
VBTUSA
Heliothis armigera adults were collected from tomato field and cultured in laboratory. Adults
laid eggs and hatched into larvaes. One thousand, four hundred and forty 4th
-stage larvaes of
Heliothis armigera were used for this study. Depending on the required concentration: 0, 0.01, 0.05,
0.1, 1.125, 10, 50, 100 g/l, VBT USA was diluted with distilled water in 150-ml plastic cups. Each
concentration includes 3 cups to repeat and calculate statistics. Baby corn which used to be the
testing material, was embedded in each VBT USA cups in 5 minutes. After drying 20 minutes, ten
4th
-stage larvaes of Heliothis armigera were added to each cup contained the treated baby corn. All
test were conducted at 260C (±1
0C), moist air 70-85%. Mortality data were read and recorded after
24 and 48 h by counting both dead and living larvae. The toxicity of irradiated and un-irradiated
products were evaluated by LC50 (Lethal Concentration) value. LC50 is the average concentration
of a chemical or mixture in air as a gas, mist, fume or dust capable of killing 1/2 of the test animals
exposed by inhalation under specific conditions. This value was subjected to Probit analysis and
median lethal concentrations were determined.
2.4. Assessment of VBT USA spore density in areas treated with irradiated and un-
irradiated VBT USA products
Borecole was chosen for planning in some boxes on laboratory scale. The optimal-dose
treated VBT USA was sprayed following the guide of manufacturer (18 g per 16-20 liters of
water, 400-600 liters/ha). The borecole boxes were not placed too close in order to avoid
spreading spores to each other. After spraying 3 times (the time between 2 spray times is at
least one week), we collected and treated soil sample. From each sample, 10 g of soil was
weighed and placed in glass – flask together with 90 ml of sterilized peptone water. The sample
were well-shaken and then placed in a hot water bath at 800C for 10 min. Norbert et al (2002)
showed that a heat shock of 800C for 10 minutes was sufficient to kill bacilli and spores that
were not heat resistant. After that, the flasks were placed in a refrigerator at 50C, to prevent any
new growth of heat resistant spores. Treated samples were diluted and plated onto nutrient agar
so that the number of spores is in countable limits. Bacillus thuringiensis colonies were easy to
recognize because they are usually white and displayed a typical sheen.
III. RESULTS AND DISCUSSION
3.1. Assessment of radiation effect on spore viability
VBT USA products which were irradiated by cobalt 60 with the doses, were 5, 10, 15, 20
and 25 kGy. As expected, the dose range chosen is suitable to assess the correlation between
radiation dose and viability of the bacillus spores. On average, 1 g of un-irradiated VBT USA
contained 5.2 x 10⁷ spores. However, spore viability was greatly reduced at 15 kGy and no spores
survived radiation dose of 20 kGy and higher.
VINATOM-AR 16--20
The Annual Report for 2016, VINATOM 186
Figure 1: Number of viable Bacillus thuringiensis var. kurstaki spores
after irradiation with various doses of gamma radiation.
Bt products are only suitable to preserve within 2 years so we examined the density of
bacillus spores in all irradiated and un-irradiated products at 3 and 12 months after radiation. The
result shows that the spores viability of un-irradiated sample after 12 months increases 40 times as
many as before. In irradiated sample, the number of spores also increases but they are still much
smaller than un-irradiated samples with under 20 kGy doses. No viable spore formation was
observed from 20 kGy dose and higher.
Our results is as same as the others research in the world. According to Norbert Becker at al
[4], the minimum dose which sterilizes spores and maintains the effectiveness of products is about
20 kGy. The lethal Shifeng Sun’s research doses in are 10, 12 and 15 kGy for Bt WP, HD-1 and
TnY, separately. The radiation sensitivities among the Bt strains depend on their chemical structure,
physical structure and this abilities to recover from radiation injury [5].
3.2. Insecticidal activities of VBT irradiated at various doses against fourth stage
Heliothis armigera larvae
The bioassays showed that gamma irradiation can cause a reduction in the toxicity of VBT
USA against Heliothis armigera (Tab 2). 80% of toxicity remains after a dose of 10 kGy, increasing
the dose to 20 - 25 kGy lowered the effectiveness by 20 – 30%, which is consistent with the results
published by Norbert Becker et al [4]. The resulting mortality were subjected to log probit analysis
when confidence interval 95%.
Table 1: Effect of gamma irradiation on toxicity of VBT against Heliothis armigera larvae
Dose (kGy) LC50 (range) Toxicity (%)
0 8.987 (5.358 – 15.07) 100
5 11.15 (3.335 – 37.25) 88
10 21.28 (9.103 – 49.73) 95
15 30.59 (16.32 – 57.35) 76
20 19.25 (17.95 – 20.63) 80
25 27.02 (16.62 – 49.90) 71
VINATOM-AR 16--20
The Annual Report for 2016, VINATOM 187
Shifeng Sun et al indicated that irradiation with Co60
did not reduce the effectiveness of Bt
against lepidoptera pest but significantly reduced the toxicity against mosquito [5]. Norbert Becker
et al also found that radiation at a dose of 20-25 kGy caused a 20 – 30% reduction in the
effectiveness of Bt powder against mosquito larvae and the reduction of toxicity of Bt power by
radiation follows a rather linear model [4].
There are many methods for inactivation of Bt spore up to now, such as heat, chemical
agent, radiation. However, these methods do not completely kill spore and significantly reduce
the toxicity of products. Our goal was to attempt to determine the optimal dose for sterilizing Bt
but remaining its toxicity. The results suggest that this dose is about 20 kGy. These differences
in toxicity between our irradiated Bt products and the others are related to the dose required to
affect the insect and the toxin protein’s chemical and physical structure.
3.3. Bacillus thuringiensis density in areas treated with irradiated and un-irradiated
VBT USA products
We identified Bt spore viability by observing their morphological characters on nutrient agar
after treating soil collected from borecole fields. The bioassay showed that viable spore in area
treated with irradiated product reduced as significantly as in area treated with un-irradiated product.
In the control region, which was treated with un-irradiated Bt following the guide of the
manufacture, between 600.000 and 3 million spores were found per gram of soil [4]. The soil
treated by irradiated Bt had a significantly lower viable spore than the control. The density of spore
in soil which treated by irradiated VBT USA, only get 15% as many as soil treated by un-irradiated
VBT USA.
Table 2: Assessment of radiation effect on density in areas treated
with irradiated and un-irradiated VBT USA products
Dose (kGy) The density of spores
in product (%) Toxicity (%)
The density of
spore in soil (%)
Control 100 (0.052 × 10⁹)
100 100
5 0.102 (0.055 × 10⁶)
83.68 23.29±4.9
10 0.021 (0.100 × 10⁴) 81.18 22.60±4.4
15 0.005 (2.700 × 10³) 67.85 15.30±4.3
20 ND 72.50 20.00±2.48
25 ND 73.60 20.30±1.68
ND: not detected
Over the last 20 years, we used hundreds of tons of un-irradiated Bt products every year [5].
The research showed that using un-irradiated Bt products can lead to a significant increase of Bt
spore in soil. KABS found that the soil which was treated by un-irradiated Bt on average twice a
year, containing 700.000 to 44 million spores per gram. In areas treated by irradiated Bt, either no
Bt spore or fewer than 100.000 were found per gram of soil. There for, many developed countries
(such as Germany) ban using Bt products which contain living bacilli or spores [4].
We believed that irradiation is one of the most optimal biological methods to inactivate spore
to be used widely in agriculture. Because the other methods such as UV, chemical treatment, heat
treatment can destroy primary structure of toxin protein. Moreover, gamma irradiation does not
VINATOM-AR 16--20
The Annual Report for 2016, VINATOM 188
increase the temperature of the product even after packing, thus avoiding the recontamination of re-
infection of the sterilized sample.
IV. CONCLUSION
The more dose of radiation increases, the more density of spore reduce. Spore viability was
greatly reduced at 15 kGy and no spores survived at radiation dose of 20 kGy and higher.
Gamma irradiation can cause a reduction in the toxicity of VBT USA against Heliothis
armigera. 80% of toxicity remains after a dose of 10 kGy, increasing the dose to 20-25 kGy
lowered the effectiveness by 20 – 30 %.
The density of spore in soil which treated by irradiated VBT USA, only get 15 % as many as
soil treated by un-irradiated VBT USA.
A radiation dose of 20 kGy fulfills the requirements of killing all spores in VBT and
maintaining the effectiveness of products.
REFERENCES
[1] Market Forecasts: Modest Growth for Synthetic Pesticides, Global Markets for Biopesticides
CHM029F, 2017.
[2] M. P. Silva, Methods of destroying bacterial spores. Microbial pathogens and strategies for
combating them: science, technology and education, 490-49, 2013.
[3] Nguyễn Văn Tuất, Nghiên cứu sản xuất sử dụng thuốc trừ sâu sinh học đa chức năng cho 1 số
loại cây trồng bằng kĩ thuật công nghệ sinh học, đề tài cấp nhà nước, KC.04.12, 2004.
[4] N. Becker, Sterilization of Bacillus thuringiensis israelensis products by gamma radiation.
Journal of the American Mosquito Control Association, 18(1): 57 - 62, 2002.
[5] Shifeng Sun, Jing Fan, Zhongshan Chen, Yi Cai, Guanghong Li, and Yi Pang, The effect of
Gamma Sterilization on the Insecticidal Toxicity of Engineered and Conventional Bacillus
thuringiensis Strains. Journal of Economic Entomology, 106 (1): 36 – 42, 2013.
[6] Suman Gupta, A.K.Dikshit, Bio-pesticides: An ecofriendly approach for pest control. Journal
of Biopesticides, 3(1 Special Issue): 186 – 188, 2010.
[7] Trần Đình Phả, Nguyễn Hồng Sơn, Cù Thị Thanh Phúc, Lê Xuân Cuộc, Đặng Thị Phương
Lan, Bùi Văn Tuấn, Nguyễn Hữu Dũng, Phạm Văn Hiếu, Nghiên cứu thực trạng sử dụng và
khả năng xâm nhập thị trường của các thuốc trừ sâu sinh học trong sản xuất nông nghiệp. Viện
Khoa học Nông nghiệp Việt Nam, 2007.
[8] Setlow P, Spore of Bacillus subtilis: their resistance to and killing by radiation, heat and
chemicals. J Appl Microbiol, 101:514-525, 2006.
[9] Hayashi N, Akiyoshi Y, Kobayashi Y, Kanda K, Ohshima K, Goto M, Inactivation
characteristics of Bacillus thuringiensis spore in liquid using atmospheric torch plasma using
oxygen. Vacuum, 88:173-176, 2013.
[10] Garcia ML, Burgos J, Sanz B, Ordoñez JA, Effect of heat and ultrasonic waves on the survival
of two strains of Bacillus subtilis. J Appl Bacteriol, 67:619-628, 1989.
[11] D. Rabczenko, A. Gliniewicz, B. Kluge, S. Piekarski, An universal tool for the analysis of
effectiveness of insecticides. Pesticydy/Pesticides, 1-4: 57-62, 2011.
[12] De Maagd, R.A., Bacillus thuringiensis - Based Products for Insect Pest Control. Principles of
Plant-Microbe Interactions. Springer International Switzerland, 20: 185-192, 2015.

1.9- Radiochemistryand Materials Science


VINATOM-AR 16--21
The Annual Report for 2016, VINATOM 191
STUDY ON PREPARING THE ABSORBENT OF POTASSIUM NICKEL
HEXACYANOFERRATE (II) LOADED ZEOLITE FOR REMOVAL OF
CESIUM FROM RADIOACTIVE WASTE SOLUTIONS AND FOLLOWED
METHOD FOR STABLE SOLIDIFICATION OF SPENT COMPOSITES
Pham Quynh Luong1, Nguyen Hoang Lan
1, Nguyen Van Chinh
1, Nguyen Thu Trang
1,
Vuong Huu Anh1, Le Xuan Huu
1, Nguyen Thi Xuan
2 and Le Van Duong
2
1Institute for Technology of Radioactive and Rare Elements (ITRRE), VINATOM
48, Lang Ha-Dong Da-Hanoi 2Institute for Chemical Technology, Hanoi University of Science and Technology (HUST)
Abstract: The selective adsorption and stable immobilization of radioactive cesium, K-Ni-
hexacyanoferrate (II) loaded zeolite (FC-zeolite) prepared by impregnation / precipitation method
were studied. The uptake equilibrium of Cs+ for composites FC-zeolite was attained within 8 h and
estimated to be above 97% in Cs+ 100mg/l solution at pH 4-10. Maximum ion exchange capacity of
Cs+ ions (Qmax) for FC-zeoliteX was 112.5 and 69.7 mg/g in pure water and sea water, respectively.
Those values for FC-zeolite A was 85.7 and 42.7 mg/g. Decontamination factor (DF) of FC-zeolite X
for 134Cs was 149.7 và 107.5 in pure water and sea water respectively. Study on synthesized zeolites
(A and X) made of HUST was also conducted in similar manner. The values of Qmax were 98.6 and
39.9 mg/g for zeolite A, and 69.5 and 20.8 mg/g for zeolite X in pure water and sea water,
respectively. Decontamination factor (DF) of zeolite A and X for 134 Cs showed lower values. The
spent CsFC-zeolite was solidificated in optimal experimental conditions: 5% Na2B4O7 additives;
calcination temperature at 900oC for 2h in air. Solid form was determined some of parameters:
immobilization of Cs, compressive strength, volume reduction after calcination (%) and leaching rate
of Cs+ ions in deionization water.
Keywords: Removal of Cs ion, zeolite, treatment of cesium, radioactive waste solutions.
1. INTRODUCTION
Large amounts of high-activity-level aqueous wastes were generated during nuclear fuel cycle
operation, in industry and in nuclear accidents such as in Chernobyl, Fukushima NPP-1. To ensure
the protection of human health and the environment from the hazard of these wastes and hence the
Project Information:
- Code: ĐTCB-07/15/VCNXH
- Managerial Level: Ministry of Science and Technology
- Allocated Fund: 600,000,000 VND
- Implementation Time: 24 months (Jan 2015 – Dec 2016)
- Contact Email: [email protected]
- Papers published in relation to the project:
1. Pham Quynh Luong, Nguyen Hoang Lan, Nguyen Van Chinh, Nguyen Thu Trang, Vuong
Huu Anh, Nguyen Thi Xuan, Le Van Duong; Study the cesium ion absorption ability of some
Viet Nam synthesized zeolite for treatment of radioactive water waste; The 4th National
Conference on Nuclear Science and Technology for Young Researcher, Ha Noi, October,
2016, 6 p. (in Vietnamese).
2. Pham Quynh Luong, Nguyen Hoang Lan, Nguyen Thu Trang, Vuong Huu Anh; The study
on ion exchange of potassium nickel hexacyanoferrate (II) loaded zeolite X for removal of
cesium from radioactive waste solutions and stable solidification method for those spent
exchanger; Vietnam Conference on Nuclear Science and Technology (VINANST - 12) Nha
Trang , August 2-4, 2017, 7 p. (in Vietnamese).
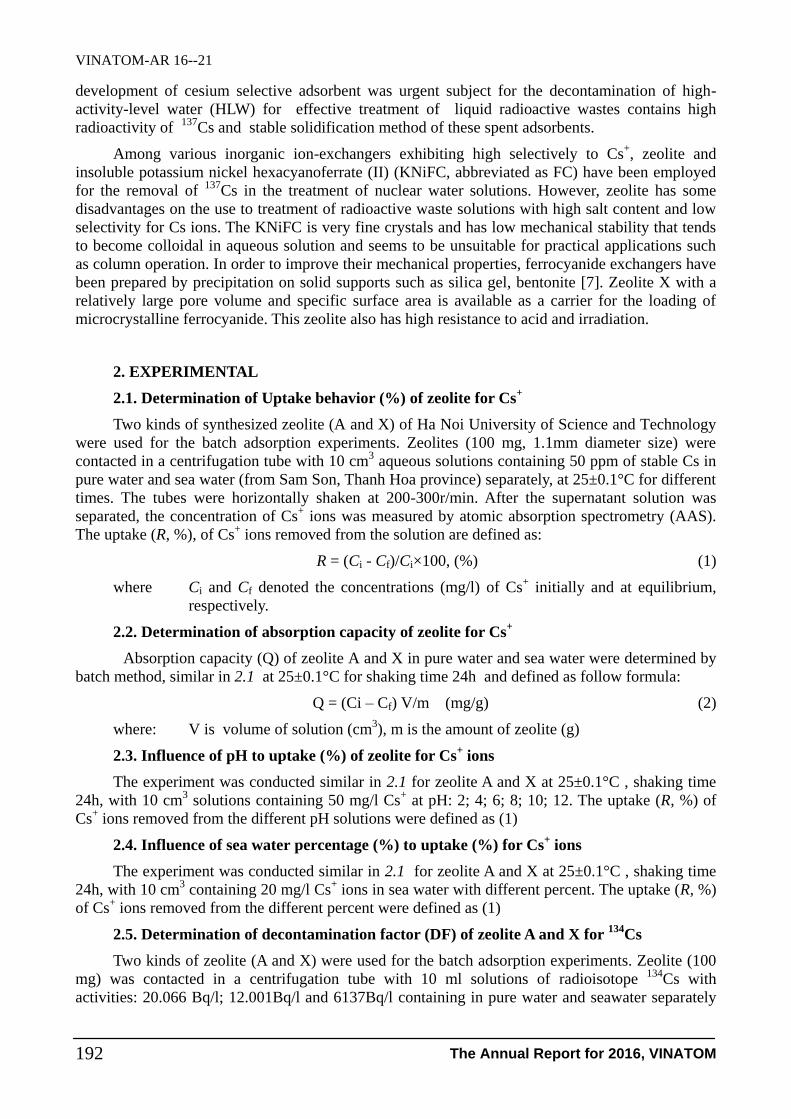
VINATOM-AR 16--21
The Annual Report for 2016, VINATOM 192
development of cesium selective adsorbent was urgent subject for the decontamination of high-
activity-level water (HLW) for effective treatment of liquid radioactive wastes contains high
radioactivity of 137
Cs and stable solidification method of these spent adsorbents.
Among various inorganic ion-exchangers exhibiting high selectively to Cs+, zeolite and
insoluble potassium nickel hexacyanoferrate (II) (KNiFC, abbreviated as FC) have been employed
for the removal of 137
Cs in the treatment of nuclear water solutions. However, zeolite has some
disadvantages on the use to treatment of radioactive waste solutions with high salt content and low
selectivity for Cs ions. The KNiFC is very fine crystals and has low mechanical stability that tends
to become colloidal in aqueous solution and seems to be unsuitable for practical applications such
as column operation. In order to improve their mechanical properties, ferrocyanide exchangers have
been prepared by precipitation on solid supports such as silica gel, bentonite [7]. Zeolite X with a
relatively large pore volume and specific surface area is available as a carrier for the loading of
microcrystalline ferrocyanide. This zeolite also has high resistance to acid and irradiation.
2. EXPERIMENTAL
2.1. Determination of Uptake behavior (%) of zeolite for Cs+
Two kinds of synthesized zeolite (A and X) of Ha Noi University of Science and Technology
were used for the batch adsorption experiments. Zeolites (100 mg, 1.1mm diameter size) were
contacted in a centrifugation tube with 10 cm3 aqueous solutions containing 50 ppm of stable Cs in
pure water and sea water (from Sam Son, Thanh Hoa province) separately, at 25±0.1°C for different
times. The tubes were horizontally shaken at 200-300r/min. After the supernatant solution was
separated, the concentration of Cs+ ions was measured by atomic absorption spectrometry (AAS).
The uptake (R, %), of Cs+ ions removed from the solution are defined as:
R = (Ci - Cf)/Ci×100, (%) (1)
where Ci and Cf denoted the concentrations (mg/l) of Cs+ initially and at equilibrium,
respectively.
2.2. Determination of absorption capacity of zeolite for Cs+
Absorption capacity (Q) of zeolite A and X in pure water and sea water were determined by
batch method, similar in 2.1 at 25±0.1°C for shaking time 24h and defined as follow formula:
Q = (Ci – Cf) V/m (mg/g) (2)
where: V is volume of solution (cm3), m is the amount of zeolite (g)
2.3. Influence of pH to uptake (%) of zeolite for Cs+ ions
The experiment was conducted similar in 2.1 for zeolite A and X at 25±0.1°C , shaking time
24h, with 10 cm3 solutions containing 50 mg/l Cs
+ at pH: 2; 4; 6; 8; 10; 12. The uptake (R, %) of
Cs+ ions removed from the different pH solutions were defined as (1)
2.4. Influence of sea water percentage (%) to uptake (%) for Cs+ ions
The experiment was conducted similar in 2.1 for zeolite A and X at 25±0.1°C , shaking time
24h, with 10 cm3 containing 20 mg/l Cs
+ ions in sea water with different percent. The uptake (R, %)
of Cs+ ions removed from the different percent were defined as (1)
2.5. Determination of decontamination factor (DF) of zeolite A and X for 134
Cs
Two kinds of zeolite (A and X) were used for the batch adsorption experiments. Zeolite (100
mg) was contacted in a centrifugation tube with 10 ml solutions of radioisotope 134
Cs with
activities: 20.066 Bq/l; 12.001Bq/l and 6137Bq/l containing in pure water and seawater separately
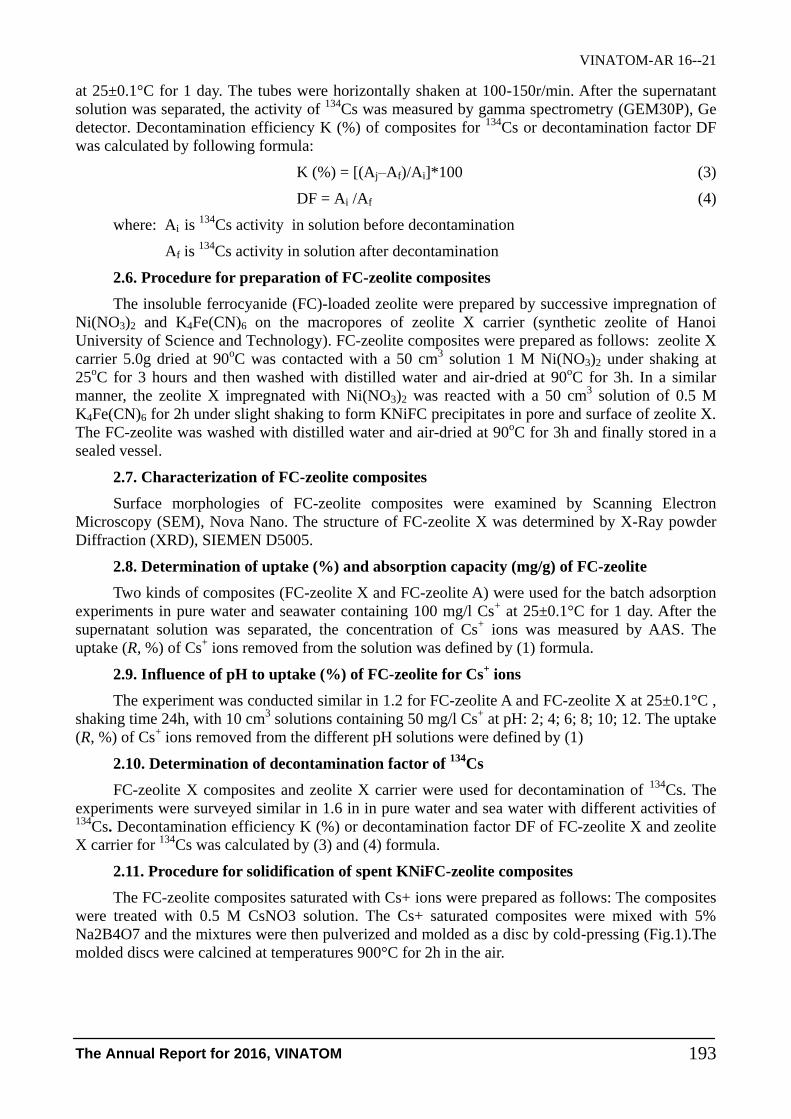
VINATOM-AR 16--21
The Annual Report for 2016, VINATOM 193
at 25±0.1°C for 1 day. The tubes were horizontally shaken at 100-150r/min. After the supernatant
solution was separated, the activity of 134
Cs was measured by gamma spectrometry (GEM30P), Ge
detector. Decontamination efficiency K (%) of composites for 134
Cs or decontamination factor DF
was calculated by following formula:
K (%) = [(Aj–Af)/Ai]*100 (3)
DF = Ai /Af (4)
where: Ai is 134
Cs activity in solution before decontamination
Af is 134
Cs activity in solution after decontamination
2.6. Procedure for preparation of FC-zeolite composites
The insoluble ferrocyanide (FC)-loaded zeolite were prepared by successive impregnation of
Ni(NO3)2 and K4Fe(CN)6 on the macropores of zeolite X carrier (synthetic zeolite of Hanoi
University of Science and Technology). FC-zeolite composites were prepared as follows: zeolite X
carrier 5.0g dried at 90oC was contacted with a 50 cm
3 solution 1 M Ni(NO3)2 under shaking at
25oC for 3 hours and then washed with distilled water and air-dried at 90
oC for 3h. In a similar
manner, the zeolite X impregnated with Ni(NO3)2 was reacted with a 50 cm3 solution of 0.5 M
K4Fe(CN)6 for 2h under slight shaking to form KNiFC precipitates in pore and surface of zeolite X.
The FC-zeolite was washed with distilled water and air-dried at 90oC for 3h and finally stored in a
sealed vessel.
2.7. Characterization of FC-zeolite composites
Surface morphologies of FC-zeolite composites were examined by Scanning Electron
Microscopy (SEM), Nova Nano. The structure of FC-zeolite X was determined by X-Ray powder
Diffraction (XRD), SIEMEN D5005.
2.8. Determination of uptake (%) and absorption capacity (mg/g) of FC-zeolite
Two kinds of composites (FC-zeolite X and FC-zeolite A) were used for the batch adsorption
experiments in pure water and seawater containing 100 mg/l Cs+ at 25±0.1°C for 1 day. After the
supernatant solution was separated, the concentration of Cs+ ions was measured by AAS. The
uptake (R, %) of Cs+ ions removed from the solution was defined by (1) formula.
2.9. Influence of pH to uptake (%) of FC-zeolite for Cs+ ions
The experiment was conducted similar in 1.2 for FC-zeolite A and FC-zeolite X at 25±0.1°C ,
shaking time 24h, with 10 cm3 solutions containing 50 mg/l Cs
+ at pH: 2; 4; 6; 8; 10; 12. The uptake
(R, %) of Cs+ ions removed from the different pH solutions were defined by (1)
2.10. Determination of decontamination factor of 134
Cs
FC-zeolite X composites and zeolite X carrier were used for decontamination of 134
Cs. The
experiments were surveyed similar in 1.6 in in pure water and sea water with different activities of 134
Cs. Decontamination efficiency K (%) or decontamination factor DF of FC-zeolite X and zeolite
X carrier for 134
Cs was calculated by (3) and (4) formula.
2.11. Procedure for solidification of spent KNiFC-zeolite composites
The FC-zeolite composites saturated with Cs+ ions were prepared as follows: The composites
were treated with 0.5 M CsNO3 solution. The Cs+ saturated composites were mixed with 5%
Na2B4O7 and the mixtures were then pulverized and molded as a disc by cold-pressing (Fig.1).The
molded discs were calcined at temperatures 900°C for 2h in the air.

VINATOM-AR 16--21
The Annual Report for 2016, VINATOM 194
Figure 1: Solidification procedure
2.12. Characterization of Cs KNiFC-zeolite solid forms
The composites (KNiFC-zeolite) were treated with 0.5 M CsNO3 solution. The Cs content (wt
%) was measured by EDS (Energy Dispersive Spectrometry). The Cs immobilization ratio (%) was
estimated from the difference of the Cs content in solid form before and after calcination.
Compressive strength of solid forms after calcination was determined by compression test. The
calcined products of the mixture of CsKNiFC-zeolite - Na2B4O7 5% at 900oC for different times
were used for leaching test in deionized water (DW) for period: 1; 7; 14; 21; 28 days, at room
temperature, with solid-leachant ratio: 1/10. Cs+ concentration of the supernatant leaching solution
was measured by AAS.
3. RESULTS AND DISCUSSION
3.1. Uptake behavior (%) of zeolite for Cs+ ions
The uptake rates of zeolite A and zeolite X for Cs+ in pure water (PW) and sea water (SW)
were showed in Fig. 2 at different shaking times up to 24 h. The uptake rate was very high in the
initial stage and attained equilibrium within 8h for zeolite A corresponding to 98.3% and 41.2% in
PW and SW, respectively.
The values for zeolite X was
95.7% and 34.5%, respectively. The
uptake (%) of zeolite A was slight
higher than that of zeolite X. The
uptake (%) of both zeolite types in
PW was great larger than that in SW
due to the competition with Na+
Figure 2: Uptake (%) of zeolite for Cs+ ions for at
different shaking times. [Cs+]: 50ppm
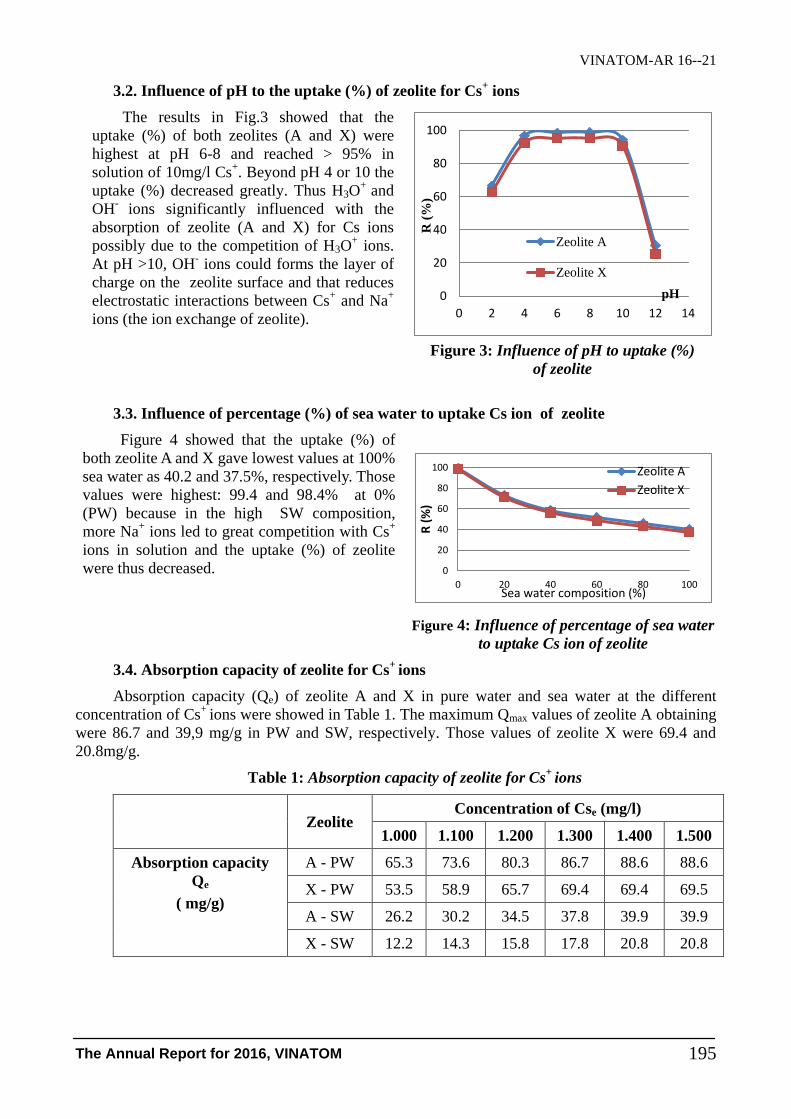
VINATOM-AR 16--21
The Annual Report for 2016, VINATOM 195
3.2. Influence of pH to the uptake (%) of zeolite for Cs+ ions
The results in Fig.3 showed that the
uptake (%) of both zeolites (A and X) were
highest at pH 6-8 and reached > 95% in
solution of 10mg/l Cs+. Beyond pH 4 or 10 the
uptake (%) decreased greatly. Thus H3O+
and
OH-
ions significantly influenced with the
absorption of zeolite (A and X) for Cs ions
possibly due to the competition of H3O+ ions.
At pH >10, OH- ions could forms the layer of
charge on the zeolite surface and that reduces
electrostatic interactions between Cs+ and Na
+
ions (the ion exchange of zeolite).
0
20
40
60
80
100
0 2 4 6 8 10 12 14
R (
%)
pH
Zeolite A
Zeolite X
Figure 3: Influence of pH to uptake (%)
of zeolite
3.3. Influence of percentage (%) of sea water to uptake Cs ion of zeolite
Figure 4 showed that the uptake (%) of
both zeolite A and X gave lowest values at 100%
sea water as 40.2 and 37.5%, respectively. Those
values were highest: 99.4 and 98.4% at 0%
(PW) because in the high SW composition,
more Na+ ions led to great competition with Cs
+
ions in solution and the uptake (%) of zeolite
were thus decreased.
0
20
40
60
80
100
0 20 40 60 80 100
R (
%)
Sea water composition (%)
Zeolite A
Zeolite X
Figure 4: Influence of percentage of sea water
to uptake Cs ion of zeolite
3.4. Absorption capacity of zeolite for Cs+
ions
Absorption capacity (Qe) of zeolite A and X in pure water and sea water at the different
concentration of Cs+
ions were showed in Table 1. The maximum Qmax values of zeolite A obtaining
were 86.7 and 39,9 mg/g in PW and SW, respectively. Those values of zeolite X were 69.4 and
20.8mg/g.
Table 1: Absorption capacity of zeolite for Cs+
ions
Zeolite Concentration of Cse (mg/l)
1.000 1.100 1.200 1.300 1.400 1.500
Absorption capacity
Qe
( mg/g)
A - PW 65.3 73.6 80.3 86.7 88.6 88.6
X - PW 53.5 58.9 65.7 69.4 69.4 69.5
A - SW 26.2 30.2 34.5 37.8 39.9 39.9
X - SW 12.2 14.3 15.8 17.8 20.8 20.8
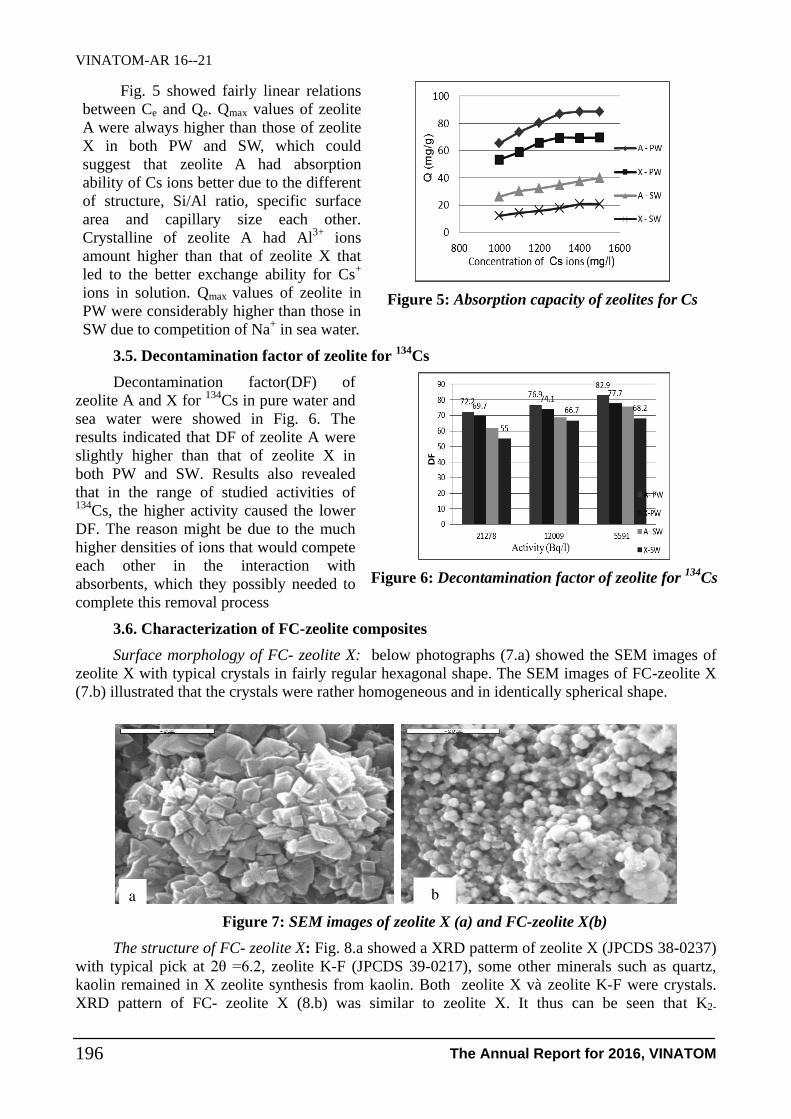
VINATOM-AR 16--21
The Annual Report for 2016, VINATOM 196
Fig. 5 showed fairly linear relations
between Ce and Qe. Qmax values of zeolite
A were always higher than those of zeolite
X in both PW and SW, which could
suggest that zeolite A had absorption
ability of Cs ions better due to the different
of structure, Si/Al ratio, specific surface
area and capillary size each other.
Crystalline of zeolite A had Al3+
ions
amount higher than that of zeolite X that
led to the better exchange ability for Cs+
ions in solution. Qmax values of zeolite in
PW were considerably higher than those in
SW due to competition of Na+ in sea water.
Figure 5: Absorption capacity of zeolites for Cs
3.5. Decontamination factor of zeolite for 134
Cs
Decontamination factor(DF) of
zeolite A and X for 134
Cs in pure water and
sea water were showed in Fig. 6. The
results indicated that DF of zeolite A were
slightly higher than that of zeolite X in
both PW and SW. Results also revealed
that in the range of studied activities of 134
Cs, the higher activity caused the lower
DF. The reason might be due to the much
higher densities of ions that would compete
each other in the interaction with
absorbents, which they possibly needed to
complete this removal process
Figure 6: Decontamination factor of zeolite for 134
Cs
3.6. Characterization of FC-zeolite composites
Surface morphology of FC- zeolite X: below photographs (7.a) showed the SEM images of
zeolite X with typical crystals in fairly regular hexagonal shape. The SEM images of FC-zeolite X
(7.b) illustrated that the crystals were rather homogeneous and in identically spherical shape.
Figure 7: SEM images of zeolite X (a) and FC-zeolite X(b)
The structure of FC- zeolite X: Fig. 8.a showed a XRD patterm of zeolite X (JPCDS 38-0237)
with typical pick at 2θ =6.2, zeolite K-F (JPCDS 39-0217), some other minerals such as quartz,
kaolin remained in X zeolite synthesis from kaolin. Both zeolite X và zeolite K-F were crystals.
XRD pattern of FC- zeolite X (8.b) was similar to zeolite X. It thus can be seen that K2-
a b

VINATOM-AR 16--21
The Annual Report for 2016, VINATOM 197
xNix/2[NiFe(CN)6] precipitated on to the zeolite did not alter the structure of zeolite, which only
made the larger crystal size.
VNU-HN-SIEMENS D5005 - Mau ZM 01
39-0219 (C) - Sodium Aluminum Silicate Hydrate Zeolite P1, (Na) - Na6Al6Si10O32·12H2O - Y: 18.43 % - d x by: 1.000 - WL: 1.54056
38-0237 (*) - Sodium Aluminum Silicate Hydrate Zeolite X, (Na) - Na2Al2Si2.5O9·6.2H2O/Na2O·Al2O3·2.5SiO2·6.2H2O - Y: 91.68 % - d x by: 1.000 - WL: 1.54056
1)
File: Yem-Don-2008-BG-ZM01.raw - Type: 2Th/Th locked - Start: 5.000 ° - End: 50.000 ° - Step: 0.030 ° - Step time: 1.5 s - Temp.: 25.0 °C (Room) - Anode: Cu - Creation: 06/04/08 17:14:20
- Obs. Max: 6.101 ° - FWHM: 0.161 °
Lin
(C
ps)
0
100
200
300
400
500
600
700
800
900
1000
1100
1200
1300
1400
1500
1600
1700
1800
1900
2000
2-Theta - Scale
5 10 20 30 40
d=
14
.47
3
d=
8.8
70
d=
7.5
45
d=
7.1
38
d=
5.7
35
d=
5.0
33
d=
4.8
03
d=
4.4
15
d=
4.2
59
d=
4.1
16
d=
3.9
49
d=
3.8
09
d=
3.4
96
d=
3.3
40
d=
3.2
48
d=
3.1
83
d=
3.0
49
d=
2.9
39
7
d=
2.8
81
0
d=
2.7
88
4
d=
2.7
38
3
d=
2.6
88
8
d=
2.6
59
4
d=
2.6
14
0
d=
2.5
46
5
d=
2.4
00
6
d=
2.2
48
3
d=
2.2
04
3
d=
2.1
79
5
d=
2.1
15
4
d=
2.0
78
1
d=
1.9
74
1
d=
1.9
47
6
d=
1.9
25
5
Figure 8: XRD patterm of zeolite X (a) and FC-zeolite X(b)
3.7. Uptake behavior (%) of FC-zeolite composites for Cs+ ion
The uptake rates of Cs+ for FC-zeolite composites (FC-zeolite X and FC-zeolite A) in pure
water (PW) and seawater (SW) were shown in Fig. 9 at different shaking times up to 24 hrs.
In either case, the uptake rate was
very large in the initial stage and
attained equilibrium within 5 hrs. The
uptake (%) was obtained over 97.5%
for composites in PW and over 65% in
SW. The uptake (%) of FC-zeoliteX
was slightly larger than that for FC-
zeolite A and the uptake (%) of
composites in PW showed larger value
than that in SW due to the competition
with Na+ in sea water.
Figure 9: Uptake (%) of composites for Cs ion in at
different shaking times, 100 ppm Cs+
3.8. Influence of pH to uptake behavior (%) of FC-zeolite composites for Cs+ ions
The results in Fig.10 showed that
the uptake (%) of both FC - zeolite (A
and X) were highest at pH 6-8 and
reached 99% in solution of 100mg/l
Cs+. In a pH range from 4-10, the
uptake (%) also reached more than
97%. Thus H+
and OH-
ions did not
significantly influence with the
absorption of FC-zeolite (A and X) for
Cs ions. This product could be used to
effectively remove Cs ions from the
solutions with different pH.
70.0
75.0
80.0
85.0
90.0
95.0
100.0
0 5 10 15
R (
%)
pH
Cs=100mg/l
KNiFC-
zeolite X
KNiFC-
zeolite A
Figure 10: Influence of pH to uptake (%)
of FC-zeolite for Cs+ ions
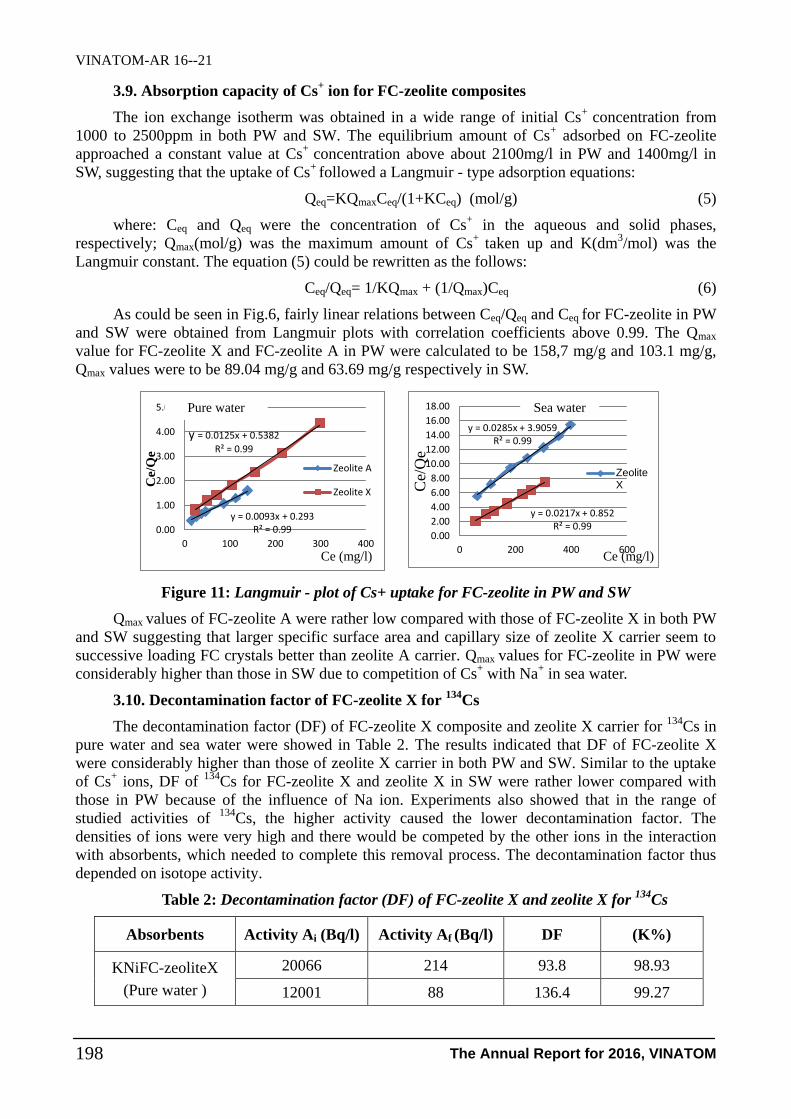
VINATOM-AR 16--21
The Annual Report for 2016, VINATOM 198
3.9. Absorption capacity of Cs+ ion for FC-zeolite composites
The ion exchange isotherm was obtained in a wide range of initial Cs+
concentration from
1000 to 2500ppm in both PW and SW. The equilibrium amount of Cs+ adsorbed on FC-zeolite
approached a constant value at Cs+
concentration above about 2100mg/l in PW and 1400mg/l in
SW, suggesting that the uptake of Cs+
followed a Langmuir - type adsorption equations:
Qeq=KQmaxCeq/(1+KCeq) (mol/g) (5)
where: Ceq and Qeq were the concentration of Cs+ in the aqueous and solid phases,
respectively; Qmax(mol/g) was the maximum amount of Cs+
taken up and K(dm3/mol) was the
Langmuir constant. The equation (5) could be rewritten as the follows:
Ceq/Qeq= 1/KQmax + (1/Qmax)Ceq (6)
As could be seen in Fig.6, fairly linear relations between Ceq/Qeq and Ceq for FC-zeolite in PW
and SW were obtained from Langmuir plots with correlation coefficients above 0.99. The Qmax
value for FC-zeolite X and FC-zeolite A in PW were calculated to be 158,7 mg/g and 103.1 mg/g,
Qmax values were to be 89.04 mg/g and 63.69 mg/g respectively in SW.
y = 0.0093x + 0.293R² = 0.99
y = 0.0125x + 0.5382
R² = 0.99
0.00
1.00
2.00
3.00
4.00
5.00
0 100 200 300 400
Ce/
Qe
Ce (mg/l)
Zeolite A
Zeolite X
y = 0.0285x + 3.9059R² = 0.99
y = 0.0217x + 0.852R² = 0.99
0.00
2.00
4.00
6.00
8.00
10.00
12.00
14.00
16.00
18.00
0 200 400 600
Ce/
Qe
Ce (mg/l)
ZeoliteX
Figure 11: Langmuir - plot of Cs+ uptake for FC-zeolite in PW and SW
Qmax values of FC-zeolite A were rather low compared with those of FC-zeolite X in both PW
and SW suggesting that larger specific surface area and capillary size of zeolite X carrier seem to
successive loading FC crystals better than zeolite A carrier. Qmax values for FC-zeolite in PW were
considerably higher than those in SW due to competition of Cs+ with Na
+ in sea water.
3.10. Decontamination factor of FC-zeolite X for 134
Cs
The decontamination factor (DF) of FC-zeolite X composite and zeolite X carrier for 134
Cs in
pure water and sea water were showed in Table 2. The results indicated that DF of FC-zeolite X
were considerably higher than those of zeolite X carrier in both PW and SW. Similar to the uptake
of Cs+ ions, DF of
134Cs for FC-zeolite X and zeolite X in SW were rather lower compared with
those in PW because of the influence of Na ion. Experiments also showed that in the range of
studied activities of 134
Cs, the higher activity caused the lower decontamination factor. The
densities of ions were very high and there would be competed by the other ions in the interaction
with absorbents, which needed to complete this removal process. The decontamination factor thus
depended on isotope activity.
Table 2: Decontamination factor (DF) of FC-zeolite X and zeolite X for 134
Cs
Absorbents Activity Ai (Bq/l) Activity Af (Bq/l) DF (K%)
KNiFC-zeoliteX
(Pure water )
20066 214 93.8 98.93
12001 88 136.4 99.27
Pure water Sea water
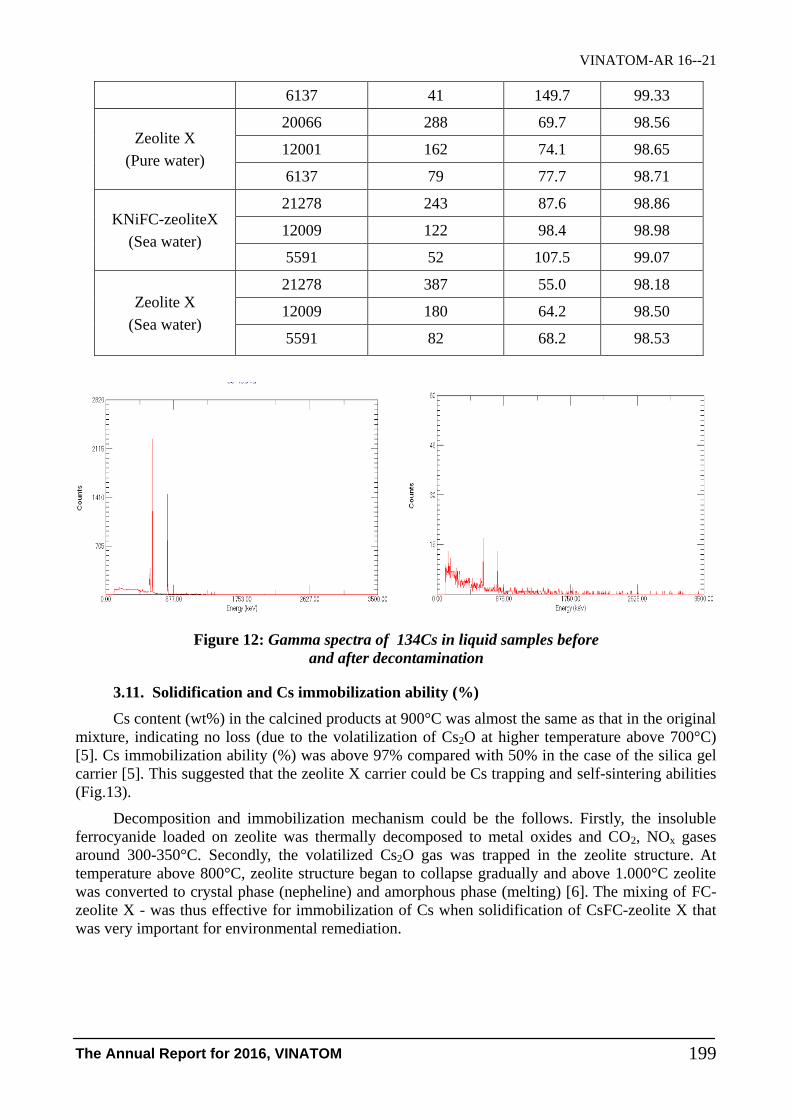
VINATOM-AR 16--21
The Annual Report for 2016, VINATOM 199
6137 41 149.7 99.33
Zeolite X
(Pure water)
20066 288 69.7 98.56
12001 162 74.1 98.65
6137 79 77.7 98.71
KNiFC-zeoliteX
(Sea water)
21278 243 87.6 98.86
12009 122 98.4 98.98
5591 52 107.5 99.07
Zeolite X
(Sea water)
21278 387 55.0 98.18
12009 180 64.2 98.50
5591 82 68.2 98.53
Figure 12: Gamma spectra of 134Cs in liquid samples before
and after decontamination
3.11. Solidification and Cs immobilization ability (%)
Cs content (wt%) in the calcined products at 900°C was almost the same as that in the original
mixture, indicating no loss (due to the volatilization of Cs2O at higher temperature above 700°C)
[5]. Cs immobilization ability (%) was above 97% compared with 50% in the case of the silica gel
carrier [5]. This suggested that the zeolite X carrier could be Cs trapping and self-sintering abilities
(Fig.13).
Decomposition and immobilization mechanism could be the follows. Firstly, the insoluble
ferrocyanide loaded on zeolite was thermally decomposed to metal oxides and CO2, NOx gases
around 300-350°C. Secondly, the volatilized Cs2O gas was trapped in the zeolite structure. At
temperature above 800°C, zeolite structure began to collapse gradually and above 1.000°C zeolite
was converted to crystal phase (nepheline) and amorphous phase (melting) [6]. The mixing of FC-
zeolite X - was thus effective for immobilization of Cs when solidification of CsFC-zeolite X that
was very important for environmental remediation.
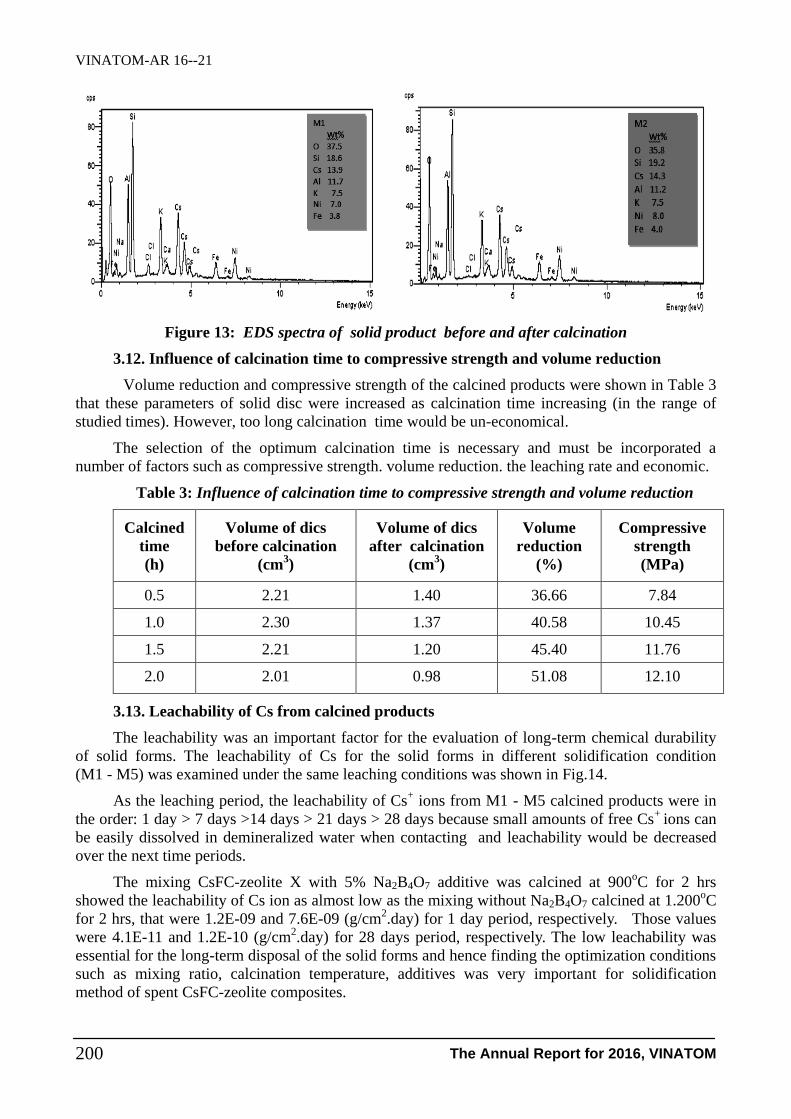
VINATOM-AR 16--21
The Annual Report for 2016, VINATOM 200
Figure 13: EDS spectra of solid product before and after calcination
3.12. Influence of calcination time to compressive strength and volume reduction
Volume reduction and compressive strength of the calcined products were shown in Table 3
that these parameters of solid disc were increased as calcination time increasing (in the range of
studied times). However, too long calcination time would be un-economical.
The selection of the optimum calcination time is necessary and must be incorporated a
number of factors such as compressive strength. volume reduction. the leaching rate and economic.
Table 3: Influence of calcination time to compressive strength and volume reduction
Calcined
time
(h)
Volume of dics
before calcination
(cm3)
Volume of dics
after calcination
(cm3)
Volume
reduction
(%)
Compressive
strength
(MPa)
0.5 2.21 1.40 36.66 7.84
1.0 2.30 1.37 40.58 10.45
1.5 2.21 1.20 45.40 11.76
2.0 2.01 0.98 51.08 12.10
3.13. Leachability of Cs from calcined products
The leachability was an important factor for the evaluation of long-term chemical durability
of solid forms. The leachability of Cs for the solid forms in different solidification condition
(M1 - M5) was examined under the same leaching conditions was shown in Fig.14.
As the leaching period, the leachability of Cs+ ions from M1 - M5 calcined products were in
the order: 1 day > 7 days >14 days > 21 days > 28 days because small amounts of free Cs+
ions can
be easily dissolved in demineralized water when contacting and leachability would be decreased
over the next time periods.
The mixing CsFC-zeolite X with 5% Na2B4O7 additive was calcined at 900oC for 2 hrs
showed the leachability of Cs ion as almost low as the mixing without Na2B4O7 calcined at 1.200oC
for 2 hrs, that were 1.2E-09 and 7.6E-09 (g/cm2.day) for 1 day period, respectively. Those values
were 4.1E-11 and 1.2E-10 (g/cm2.day) for 28 days period, respectively. The low leachability was
essential for the long-term disposal of the solid forms and hence finding the optimization conditions
such as mixing ratio, calcination temperature, additives was very important for solidification
method of spent CsFC-zeolite composites.

VINATOM-AR 16--21
The Annual Report for 2016, VINATOM 201
-5.00E-08
0.00E+00
5.00E-08
1.00E-07
1.50E-07
2.00E-07
2.50E-07
3.00E-07
3.50E-07
0 10 20 30Leaching days
Leac
hin
g ra
te (
g/cm
2.d
ay)
M1
M2
M3
M4
M5
M1: Mixing of CsFC-zeolite X without
Na2B4O7 calcined at 900oC for 2 hrs
M2: Mixing of CsFC-zeolite X with
Na2B4O7 (5%); at 900oC; 0.5 hrs
M3: Mixing of CsFC-zeolite X with
Na2B4O7 (5%); at 900oC for 1.5 hrs
M4: Mixing of CsFC-zeolite X with
Na2B4O7 (5%) at 900oC for 2 hrs
M5. Mixing CsFC-zeolite X without
Na2B4O7 calcined at 1.200oC for 2hrs
Figure 14: Leachability of Cs ion from
calcined products
4. CONCLUSIONS
Absorption capacity of synthesized zeolite A of Hanoi University of Science and Technology
for Cs+ ions were 86.7 and 39.9 mg/g; for zeolite X was 69.5 and 20.8mg/g in pure water and sea
water, respectively. Decontamination factors (DF) of some zeolite A and X for 134
Cs were 82.9 and
77.7 in pure water respectively. In sea water, DF were 75.6 and 68.2 for zeolite X
Potassium nickel hexacyanoferrate II(KNiFC) were loaded on porrous zeolite X (FC-zeolite)
by successive impregnation of Ni(NO3) and K4Fe(CN)6. The loading of KNiFC on zeolite X led to
improvements in both mechanical stability and absorption capacity of Cs+ ions in the large range of
pH (4-10) and reached at over 97% in Cs 100mg/l solution. Maximum ion exchange capacity of
FC-zeolite X for Cs+ ions in pure water was 158.7 mg/g that considerably higher than those in sea
water (98.04 mg/l) due to competition with Na+.
Decontamination factor of FC-zeolite X for 134
Cs was significantly higher than the zeolite X
carrier. These values of decontamination factor depended on initial activity of 134
Cs.
The optimization of solidification method for spent FC-zeolite was as the follows: 5%
Na2B4O7 additives, calcination temperature at 900oC for 2h in air, about 97% of Cs immobilization,
12Mpa compressive strength, 50% volume reduction, leaching rate of Cs+ ions in deionization
water at 4.1E-11g/cm2/day for 28 days. The immobilization of Cs
+ ions
and solidification of the
spent FC-zeolite composites was effective for the safe treatment and disposal of secondary solid
waste.
REFERENCES
[1] H. Mimura. I. Yamagishi. “Characterization and adsorption properties of selective adsorbents
for high decontamination of cesium”. Journal of Ion Exchange. Vol.23. No.1. 6-20 (2012).
[2] H. Mimura. M. Kimura. K. Akiba. Y. Onodera. “Preparation of Insoluble
Ferrocyanide(KNiFC)-Loaded Silica Gels and Adsorption Properties for Cesium”. Bulletin of
the Institute for Advanced Materials Processing. Tohoku University. 54(1/2).1-8(1998).
[3] Hitoshi Mimura. Norihiro. Kenichi. Tohoku University. “Ion exchange properties of potasium
nikel hexacyanoferrate(II) compound” Solvent extraction and ion exchange. 16(4). 1013-1031
(1998).
[4] Si Jung Ye. Shung long Chen. Institu of Nuclear Science. Taiwan. “Treatment of Cs-137 by
zeolite impregnated with various metalic ion and zin- ferrocyanide”.

VINATOM-AR 16--21
The Annual Report for 2016, VINATOM 202
[5] Phạm Thị Quỳnh Lương. Hitoshi Mimura. Yuki Ikarash . Department of Quantum Science and
Energy Engineering. Tohoku University Aramaki-Aza-Aoba 6-6-01-2. Sendai. 980-8579.
JAPAN. Selective Adsorption and Stable Solidification of Radioactive Cesium Ions by Porous
Silica Gels loaded with Insoluble Ferrocyanides. ICEM 2013. Brussels Belgium.
[6] Y. Ikarashi. R. S. Masud. H. Mimura. E. Ishizaki. M. Matsukura. “Development of Stable
Solidification Method for Insoluble Ferrocyanides”. Proc. of WM2013. February 24-28. 2013.
Phoenix. Arizona. USA.
[7] Hitoshi Mimura. Masanori Kimura..Tohoku Uni. „Selective removal of cesium from
radioactive waste solutions using insoluble ferrocyanide-loaded mordenites” WM 99
Conference. March. 1999.
[8] H. Mimura. K. Akiba. M. Ozawa. “Preparation of Ceramic Solid Forms Immobilizing Cesium
and/or Strontium and Evaluation of their Physical and Chemical Properties”. Proc. of
International Conference Nuclear Energy for New Europe 2002. 1105.1-1105.8. Kraniska
Gora. Slobenia. September 9-12 (2002).
VINATOM-AR 16--22
The Annual Report for 2016, VINATOM 203
STUDY ON SOME EXPERIMENTAL CONDITIONS THAT AFFECT
CORROSION OF SOME STRUCTURAL STEEL MATERIALS USING
IN NUCLEAR POWER PLANT
Hoang Nhuan1, Nguyen Thi Kim Dung
2, Nguyen Duc Thang
3, Hoang Xuan Thi
1,
Nguyen Thi Thuc Phuong1, Ngo Xuan Hung
1, Nguyen Thanh Chung
1, Tran Xuan Vinh
1,
Hoang Van Duc1 and Hoang Thi Tuyen
1
1Material Technology Center, Institute for Technology of Radioactive and Rare Elements,
Lang Ha-Dong Da- Hanoi
2Center for Analytical chemistry, Institute for Technology of Radioactive and Rare Elements,
Lang Ha-Dong Da- Hanoi
3NDE center, Nguyen Tuan-Thanh Xuan-Ha Noi.
Abstract: The corrosion cracking of stainless steels is an important degradation phenomenon not only
in nuclear reactors but also in the other industrial factories. In this work, experimental research of
mechanical properties and electro-chemical processes to degradation of carbon steel and SS304 was
carried out. Hardness values, ultimate tensile strength, yield strength, elongation values and impact
energy which are typical for material mechanical properties were measured. When changing heat
treatment conditions, the differences of mechanical properties were not really significant. In electro-
chemical experiments, the OCP results of C45 steel and 304 Stainless Steel in Cl- environment took
initial assessment of corrosion process. The corrosion process of C45 was accelerated over Cl-
concentration. In the case of 304 Stainless Steel, Cl- ions did not significantly affect corrosion process,
only slowed down the formation of the chromium oxide layer on the SS304 surface. In the last section,
experiments were conducted to get a procedure on the determination of 10B/11B isotope ratio in water
samples by isotope dilution – inductively coupled plasma mass spectrometry.
Project Information:
- Code: ĐTCB.12/15/VCNXH
- Managerial Level: Ministry of Science and Technology
- Allocated Fund: 1,000,000,000 VND
- Implementation Time: 30 months (Jan 2015 – June 2017)
- Contact Email: [email protected]
- Papers published in relation to the project:
1. Hoang Nhuan, Hoang Xuan Thi, Nguyen Thi Thuc Phuong, Hoang Thi Tuyen; Study on some
mechanical properties of SS304L under different heat treatment conditions; J. Nuclear Science
and Technology.
2. Nguyen Thi Kim Dung, Nguyen Thi Lien; Study on the determination of 10B/11B isotope ratio
in water samples by isotope dilution-inductively coupled plasma mass spectrometry; The 12th
National Conference on Nuclear Science and Technology, 8/2017, 8 p.
3. Hoang Nhuan, Hoang Xuan Thi, Nguyen Thi Thuc Phuong, Hoang Thi Tuyen. Study on some
mechanical properties of SS304L under different heat treatment conditions. The 12th National
Conference on Nuclear Science and Technology, 8/2017, 9 p. (in Vietnamese)
4. Hoang Xuan Thi, Hoang Nhuan, Tran Xuan Vinh. Study on changing of the open-circuit
potentials (OCPs) by the time of C45 and SS304 in different chloride solutions. The 4th Youth’s
Science Conference, 10/2016, 7 p. (in Vietnamese)
5. Tran Xuan Vinh, Hoang Xuan Thi. Effects of heat treatment conditions on phase structure and
mechanical properties of SS304 austenitic stainless steel. The 4th Youth’s Science Conference,
10/2016, 8 p. (in Vietnamese)
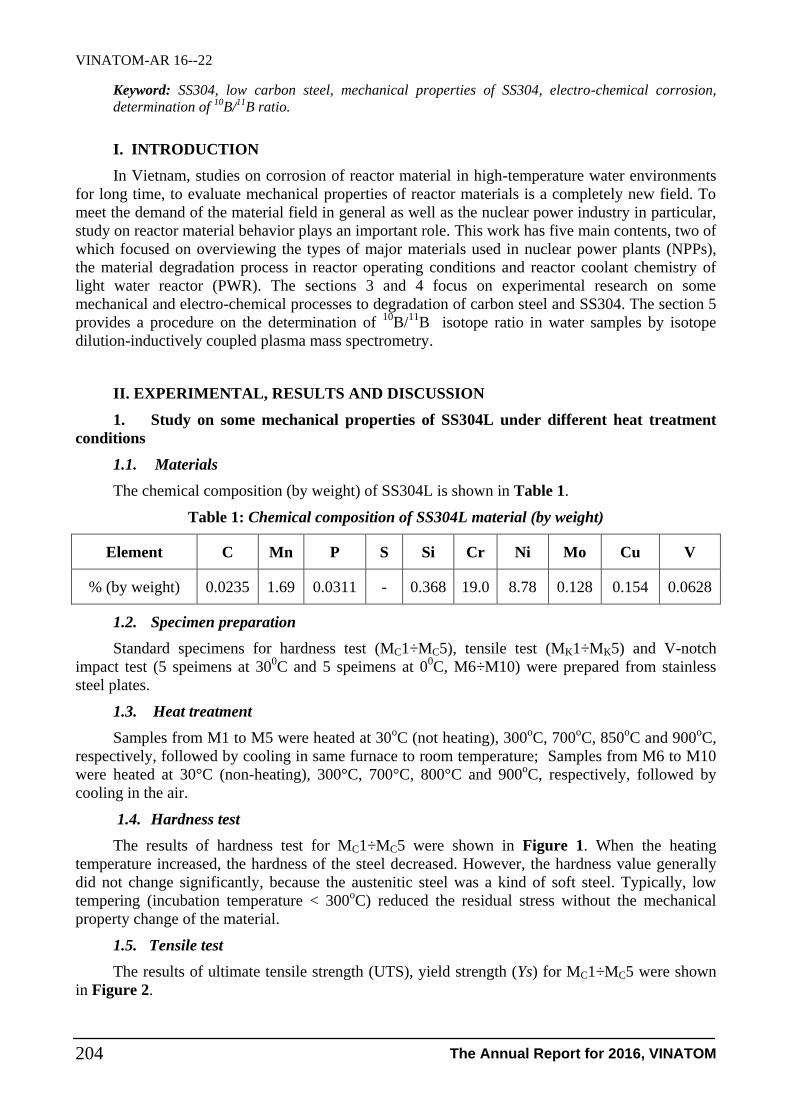
VINATOM-AR 16--22
The Annual Report for 2016, VINATOM 204
Keyword: SS304, low carbon steel, mechanical properties of SS304, electro-chemical corrosion,
determination of 10B/11B ratio.
I. INTRODUCTION
In Vietnam, studies on corrosion of reactor material in high-temperature water environments
for long time, to evaluate mechanical properties of reactor materials is a completely new field. To
meet the demand of the material field in general as well as the nuclear power industry in particular,
study on reactor material behavior plays an important role. This work has five main contents, two of
which focused on overviewing the types of major materials used in nuclear power plants (NPPs),
the material degradation process in reactor operating conditions and reactor coolant chemistry of
light water reactor (PWR). The sections 3 and 4 focus on experimental research on some
mechanical and electro-chemical processes to degradation of carbon steel and SS304. The section 5
provides a procedure on the determination of 10
B/11
B isotope ratio in water samples by isotope
dilution-inductively coupled plasma mass spectrometry.
II. EXPERIMENTAL, RESULTS AND DISCUSSION
1. Study on some mechanical properties of SS304L under different heat treatment
conditions
1.1. Materials
The chemical composition (by weight) of SS304L is shown in Table 1.
Table 1: Chemical composition of SS304L material (by weight)
Element C Mn P S Si Cr Ni Mo Cu V
% (by weight) 0.0235 1.69 0.0311 - 0.368 19.0 8.78 0.128 0.154 0.0628
1.2. Specimen preparation
Standard specimens for hardness test (MC1÷MC5), tensile test (MK1÷MK5) and V-notch
impact test (5 speimens at 300C and 5 speimens at 0
0C, M6÷M10) were prepared from stainless
steel plates.
1.3. Heat treatment
Samples from M1 to M5 were heated at 30oC (not heating), 300
oC, 700
oC, 850
oC and 900
oC,
respectively, followed by cooling in same furnace to room temperature; Samples from M6 to M10
were heated at 30°C (non-heating), 300°C, 700°C, 800°C and 900oC, respectively, followed by
cooling in the air.
1.4. Hardness test
The results of hardness test for MC1÷MC5 were shown in Figure 1. When the heating
temperature increased, the hardness of the steel decreased. However, the hardness value generally
did not change significantly, because the austenitic steel was a kind of soft steel. Typically, low
tempering (incubation temperature < 300oC) reduced the residual stress without the mechanical
property change of the material.
1.5. Tensile test
The results of ultimate tensile strength (UTS), yield strength (Ys) for MC1÷MC5 were shown
in Figure 2.
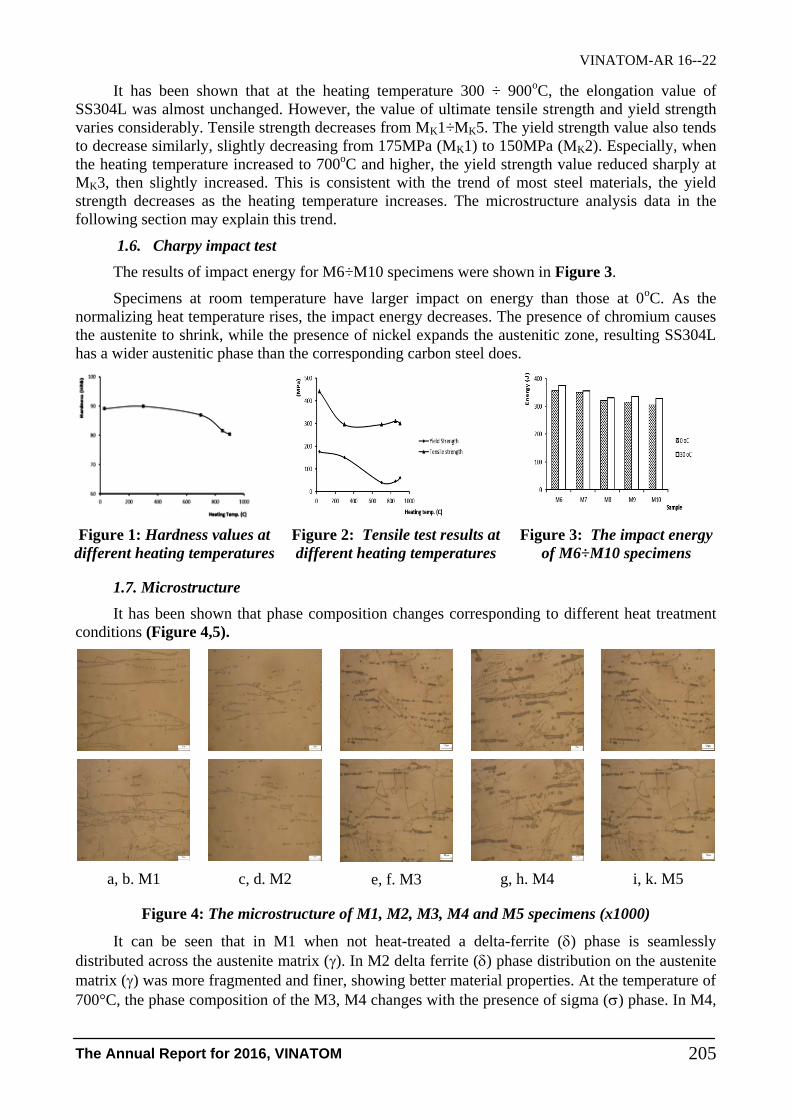
VINATOM-AR 16--22
The Annual Report for 2016, VINATOM 205
It has been shown that at the heating temperature 300 ÷ 900oC, the elongation value of
SS304L was almost unchanged. However, the value of ultimate tensile strength and yield strength
varies considerably. Tensile strength decreases from MK1÷MK5. The yield strength value also tends
to decrease similarly, slightly decreasing from 175MPa (MK1) to 150MPa (MK2). Especially, when
the heating temperature increased to 700oC and higher, the yield strength value reduced sharply at
MK3, then slightly increased. This is consistent with the trend of most steel materials, the yield
strength decreases as the heating temperature increases. The microstructure analysis data in the
following section may explain this trend.
1.6. Charpy impact test
The results of impact energy for M6÷M10 specimens were shown in Figure 3.
Specimens at room temperature have larger impact on energy than those at 0oC. As the
normalizing heat temperature rises, the impact energy decreases. The presence of chromium causes
the austenite to shrink, while the presence of nickel expands the austenitic zone, resulting SS304L
has a wider austenitic phase than the corresponding carbon steel does.
Figure 1: Hardness values at
different heating temperatures
Figure 2: Tensile test results at
different heating temperatures
Figure 3: The impact energy
of M6÷M10 specimens
1.7. Microstructure
It has been shown that phase composition changes corresponding to different heat treatment
conditions (Figure 4,5).
a, b. M1
c, d. M2
e, f. M3
g, h. M4
i, k. M5
Figure 4: The microstructure of M1, M2, M3, M4 and M5 specimens (x1000)
It can be seen that in M1 when not heat-treated a delta-ferrite () phase is seamlessly
distributed across the austenite matrix (). In M2 delta ferrite () phase distribution on the austenite
matrix () was more fragmented and finer, showing better material properties. At the temperature of
700°C, the phase composition of the M3, M4 changes with the presence of sigma () phase. In M4,

VINATOM-AR 16--22
The Annual Report for 2016, VINATOM 206
the more the sigma phase was produced at the grain boundaries, the more negatively mechanical
properties were changed. In M5, the sigma phase () is smaller and more fragmented than in M4
resulting in brittle and poor mechanical properties. When comparing microstructure data and yield
strength, it can be seen that the microstructural results were able to explain for reducing trend of
yield strength. Forming brittle sigma phase are responsible for the reduction of the yield strength. A
slight increase in the yield strength in M5 compared to the M4 sample may be due to less sigma
phase density (Figure 4).
a, b. M7 c, d. M8 e, f. M9 g, h. M10
Figure 5: The microstructure of M7, M8, M9, M10 specimens (x 1000)
In M6(M1)-as-received specimen, delta-ferrite phase exists on austenite matrix phase (Figure
4). After normalizing heat treatment, the sigma phase appears in samples of M7, M8, M9 with
different densities and locations, concentrated mainly in the delta ferrite phase or at the austenite
boundary. It is important that the sigma phase density in the M9 decreases comparing to samples
M7, M8, especially, in the sample M10, the sigma phase no longer appears (Figure 5). As it is
known that the sigma phase is brittle, which reduces the mechanical properties of the material,
eliminating the sigma phase is very important to improve the mechanical properties of the material.
1.8. Discussion
- When increasing the heating temperature in range 30÷900oC followed by incubation, the
difference in hardness data was not really significant.
- When increasing the heating temperature, the ultimate tensile strength and yield strength of
MK1÷MK5 samples decreased while the elongation values were almost unchanged. The cause of
this is the appearance of the brittle sigma.
- When increasing the normalizing heat temperature, the impact energy decreased. The
impact energy of room temperature-samples was higher than that of 0oC specimens.
- For samples at the same normalizing heat temperature, the microstructure images of M6-
M10 showed the presence of sigma phase but successfully eliminated in M10, showing improved
mechanical properties of the material.
2. Investigation of electro-chemical corrosion process of low carbon steel and SS304 in
simulated-PWR secondary coolant conditions
2.1. Sample Composition
The specimen used in this study was C45 steel and 304 Stainless Steel.
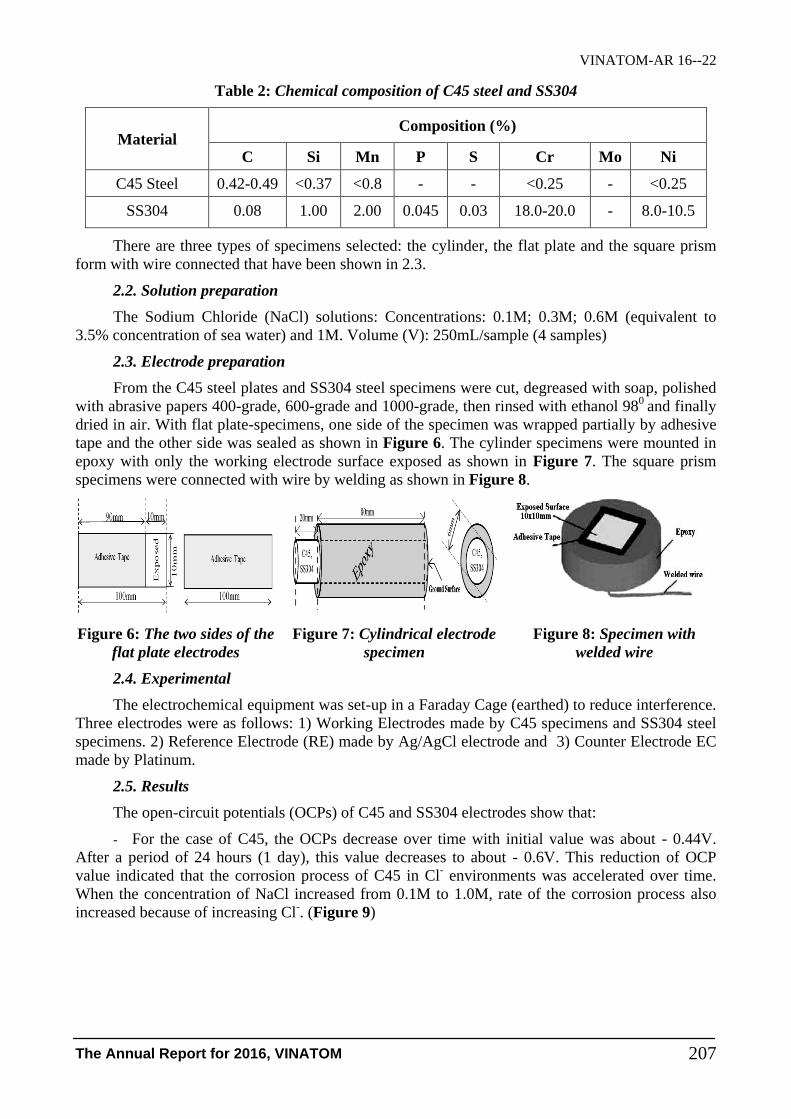
VINATOM-AR 16--22
The Annual Report for 2016, VINATOM 207
Table 2: Chemical composition of C45 steel and SS304
Material Composition (%)
C Si Mn P S Cr Mo Ni
C45 Steel 0.42-0.49 <0.37 <0.8 - - <0.25 - <0.25
SS304 0.08 1.00 2.00 0.045 0.03 18.0-20.0 - 8.0-10.5
There are three types of specimens selected: the cylinder, the flat plate and the square prism
form with wire connected that have been shown in 2.3.
2.2. Solution preparation
The Sodium Chloride (NaCl) solutions: Concentrations: 0.1M; 0.3M; 0.6M (equivalent to
3.5% concentration of sea water) and 1M. Volume (V): 250mL/sample (4 samples)
2.3. Electrode preparation
From the C45 steel plates and SS304 steel specimens were cut, degreased with soap, polished
with abrasive papers 400-grade, 600-grade and 1000-grade, then rinsed with ethanol 980
and finally
dried in air. With flat plate-specimens, one side of the specimen was wrapped partially by adhesive
tape and the other side was sealed as shown in Figure 6. The cylinder specimens were mounted in
epoxy with only the working electrode surface exposed as shown in Figure 7. The square prism
specimens were connected with wire by welding as shown in Figure 8.
Figure 6: The two sides of the
flat plate electrodes
Figure 7: Cylindrical electrode
specimen
Figure 8: Specimen with
welded wire
2.4. Experimental
The electrochemical equipment was set-up in a Faraday Cage (earthed) to reduce interference.
Three electrodes were as follows: 1) Working Electrodes made by C45 specimens and SS304 steel
specimens. 2) Reference Electrode (RE) made by Ag/AgCl electrode and 3) Counter Electrode EC
made by Platinum.
2.5. Results
The open-circuit potentials (OCPs) of C45 and SS304 electrodes show that:
- For the case of C45, the OCPs decrease over time with initial value was about - 0.44V.
After a period of 24 hours (1 day), this value decreases to about - 0.6V. This reduction of OCP
value indicated that the corrosion process of C45 in Cl- environments was accelerated over time.
When the concentration of NaCl increased from 0.1M to 1.0M, rate of the corrosion process also
increased because of increasing Cl-. (Figure 9)

VINATOM-AR 16--22
The Annual Report for 2016, VINATOM 208
Figure 9: The OCP of C45 in NaCl
solutions (0.1 ÷ 1M) for 24 hours
Figure 10: The OCP of SS304 in NaCl
solutions (0.1 ÷ 1M) for 24 hours
- For the case of 304 Stainless Steel, the open circuit electrochemical OCP increase over
time with initial value was about - 0.25V. After a period of 24 hours (1 day), this value increases to
0V → - 0.1V. This increase of OCP value indicates that the corrosion process of 304 Stainless Steel
in Cl- environments did not occur. A passive chromium oxide film which is very stable in the
chlorine environment was created. However, when the concentration of NaCl solution increases to
1M, the Cl- concentration slightly slows down the rate of formation of passive chromium oxide film
(Figure 10).
2.6. Discusion
Due to the experimental conditions at room temperature, the SS304 material used as working
electrodes (WE) were not stressed, the corrosion phenomenon caused by chloride ion on SS304 was
unclear. In subsequent studies, it would be expected using stressed electrodes such as U-bend
specimen with the experimental temperature up to 800C. Other electrochemical techniques such as
EIS and Linear Polarization would also be used to investigate corrosion and erosion processes.
The OCP results of C45 steel and 304 Stainless Steel in Cl- environment took initial
assessment of corrosion process. The corrosion process of C45 was accelerated over Cl-
concentration. In the case of 304 Stainless Steel, Cl- ions did not significantly affect corrosion
process, only slowed down the formation of the chromium oxide layer on the SS304 surface.
3. PROCEDURE ON THE DETERMINATION OF 10
B/11
B ISOTOPE RATIO IN
WATER SAMPLES BY ISOTOPE DILUTION-INDUCTIVELY COUPLED PLASMA
MASS SPECTROMETRY
3.1. Principles
After adjustment of sample medium, the addition of a certain amount of enriched 10
B isotope
into sample, which was then injected to plasma chamber and measured at m/z = 10 and m/z = 11 for 10
B, 11
B, respectively. The isotope ratio 10
B/11
B was determined through correlation of 10
B and 11
B
signals with the addition of 10
B amounts.
3.2. Sample preparation
3.2.1. Water samples
All water samples (mineral water, drinking water, pure water, natural water, etc.) were stored
in polyethylene bottles at 8oC. The volume of 5-7 ml each sample was transferred into five of 10 ml
plastic volumetric flasks. Adding 0.5 ml of 10% HNO3, 0.5 ml of 2.5% D-mannitol solution, and
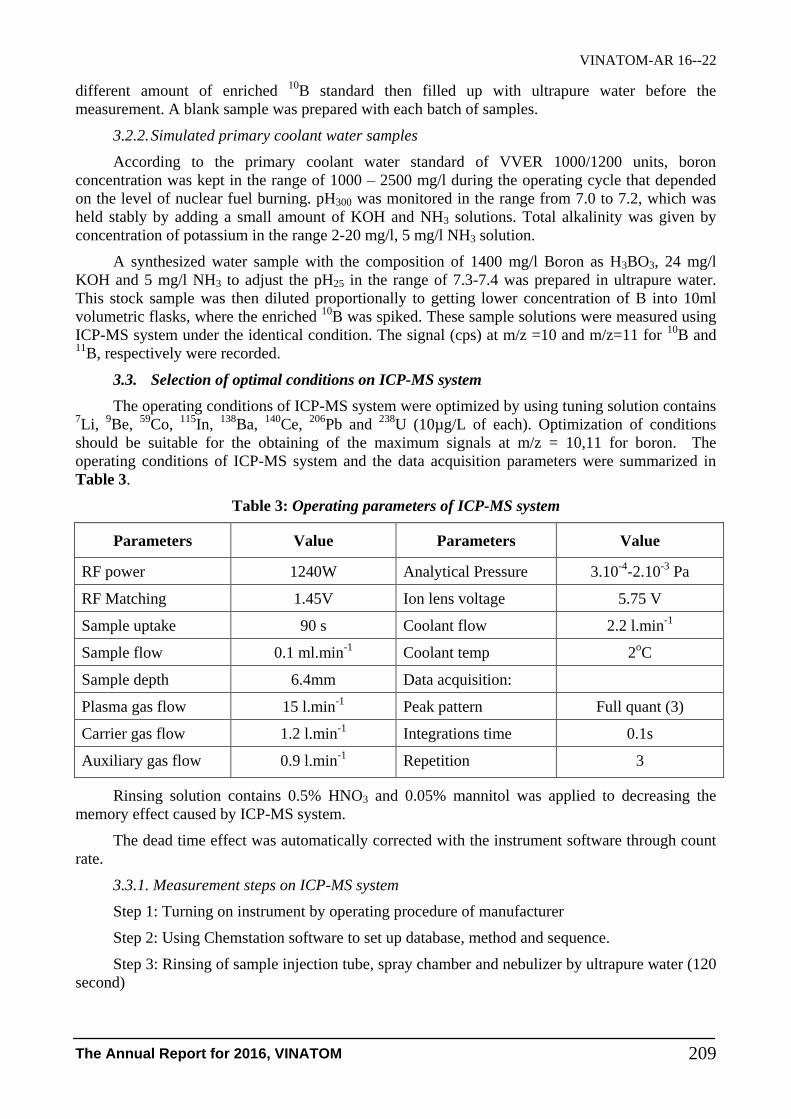
VINATOM-AR 16--22
The Annual Report for 2016, VINATOM 209
different amount of enriched 10
B standard then filled up with ultrapure water before the
measurement. A blank sample was prepared with each batch of samples.
3.2.2. Simulated primary coolant water samples
According to the primary coolant water standard of VVER 1000/1200 units, boron
concentration was kept in the range of 1000 – 2500 mg/l during the operating cycle that depended
on the level of nuclear fuel burning. pH300 was monitored in the range from 7.0 to 7.2, which was
held stably by adding a small amount of KOH and NH3 solutions. Total alkalinity was given by
concentration of potassium in the range 2-20 mg/l, 5 mg/l NH3 solution.
A synthesized water sample with the composition of 1400 mg/l Boron as H3BO3, 24 mg/l
KOH and 5 mg/l NH3 to adjust the pH25 in the range of 7.3-7.4 was prepared in ultrapure water.
This stock sample was then diluted proportionally to getting lower concentration of B into 10ml
volumetric flasks, where the enriched 10
B was spiked. These sample solutions were measured using
ICP-MS system under the identical condition. The signal (cps) at m/z =10 and m/z=11 for 10
B and 11
B, respectively were recorded.
3.3. Selection of optimal conditions on ICP-MS system
The operating conditions of ICP-MS system were optimized by using tuning solution contains 7Li,
9Be,
59Co,
115In,
138Ba,
140Ce,
206Pb and
238U (10µg/L of each). Optimization of conditions
should be suitable for the obtaining of the maximum signals at m/z = 10,11 for boron. The
operating conditions of ICP-MS system and the data acquisition parameters were summarized in
Table 3.
Table 3: Operating parameters of ICP-MS system
Parameters Value Parameters Value
RF power 1240W Analytical Pressure 3.10-4
-2.10-3
Pa
RF Matching 1.45V Ion lens voltage 5.75 V
Sample uptake 90 s Coolant flow 2.2 l.min-1
Sample flow 0.1 ml.min-1
Coolant temp 2oC
Sample depth 6.4mm Data acquisition:
Plasma gas flow 15 l.min-1
Peak pattern Full quant (3)
Carrier gas flow 1.2 l.min-1
Integrations time 0.1s
Auxiliary gas flow 0.9 l.min-1
Repetition 3
Rinsing solution contains 0.5% HNO3 and 0.05% mannitol was applied to decreasing the
memory effect caused by ICP-MS system.
The dead time effect was automatically corrected with the instrument software through count
rate.
3.3.1. Measurement steps on ICP-MS system
Step 1: Turning on instrument by operating procedure of manufacturer
Step 2: Using Chemstation software to set up database, method and sequence.
Step 3: Rinsing of sample injection tube, spray chamber and nebulizer by ultrapure water (120
second)

VINATOM-AR 16--22
The Annual Report for 2016, VINATOM 210
Step 4: Rinsing of sample introduction tube, spray chamber and nebulizer by 0,5% HNO3 +
0,05% mannitol solution (120 second).
Step 5: Measure signal of 10
B and 11
B of blank solution.
Step 6: Measure signal of 10
B and 11
B of sample solution I.
Step 7: Repeating step 3 again.
Step 8: Measure signal of 10
B and 11
B of sample solution II.
The measurement procedure was repeated from blank solution until the last sample.
Data were collected through signals intensity of 10
B and 11
B at m/z=10,11 respectively.
3.3.2. Data processing, calculation and showing the result
Building a plot performed the correlation of 10
B and 11
B signals toward the added amount of
enriched 10
B that would show by an equation Y = A + BX. The 10
B/11
B isotope ratio was calculated
by following formula:
where: A10 denoted the coefficient of the plotted curve on the basic of dependency between 10
B signal and 10
B spike amounts;
A11 denoted the coefficient of the plotted curve on the basic of dependency between 10
B signal and 10
B spike amounts;
Relative standard deviation (%RSD) in this measurement was calculated by following
formula:
Results must display together with standard deviation to show the uncertainty of
measurement. The expanded uncertainty should be calculated via the introduction of a certified
reference sample.
III. CONCLUSIONS
After 2 years of implementation, the project "Study on some experimental conditions that
affect corrosion of some structural steel materials using in nuclear power plant" has completed the
required research contents as follows:
- Investigating the types of major alloy, steel materials used in NPPs and the major material
degradation processes in operating reactor conditions; including 7 topics about steel materials and
alloy materials used in NPPs (carbon steel, stainless steel, Ni-based alloy; welding materials):
composition, physical properties, mechanical properties, used locations; The major material
degradation processes in the primary circuit of PWR (SCC, PWSCC, irradiation embrittlement,
IASCC) and in the secondary circuit of PWR (FAC, fatigue, ...); The methods to evaluate the
mechanical properties of steel materials and alloys; The mechanism of material degradation/aging
and NDT in aging management; Evaluating life expectancy of alloy materials used in NPPs.
- Investigating PWR coolant chemistry, including water treatment technology and water
quality standards used in PWR (VVER type).

VINATOM-AR 16--22
The Annual Report for 2016, VINATOM 211
- Experimentally researching to evaluate mechanical properties of SS304L: specimen
preparation; study on changing hardness, tensile strength and impact energy of SS304L under
different heat treatments;
- Experimentally researching electrochemical corrosion process of SS304 and low carbon
steel in simulated-PWR secondary water conditions and then compare corrosion processes of steel
materials in some corrosion environments.
- Researching to get a procedure on the determination of 10
B/11
B isotope ratio in water
samples by isotope dilution – inductively coupled plasma mass spectrometry.
The initial results of mechanical properties of SS304L under different heat treatments;
electro-chemical experiments about corrosion potentials of SS304, carbon steel and research of
procedure to determine 10
B/11
B isotope ratio by isotope dilution technique (ID-MS) from this work
have shown not only researching and evaluating abilities but also corrosion-controlling ability of
material researching team of Institute for Technology of Radioactive and Rare Elements (ITRRE),
Vietnam Atomic Energy Institute.
REFERENCES
[1] S.A. Tukur, M.S Dambatta, A. Ahmed, N.M. Mu’az. Effect of Heat Treatment Temperature
on Mechanical Properties of the AISI 304 Stainless Steel. IJIRSET 2014.
[2] Honeycombe, R. Bhadeshia, H. “Steels: Microstructure and Properties”. 2nd edition.
London: Edward Arnold. 1995.
[3] Llewellyn, D. Hudd, R. “Steels: Metallurgy and Applications”. 3rd edition. Boston:
Butterworth Heinemann, 1998.
[4] Phan Lương Cầm, Hoàng Thị Bích Thuỷ, Phan Công Thành. “Chống ăn mòn cho cốt thép
trong bê tông bằng phương pháp điện hoá”. Tuyển tập công trình khoa học, Phân ban Công
nghệ hoá học, quyển 1: Hoá vô cơ, Hội nghị khoa học lần thứ XIX, Đại học Bách khoa Hà
nội. tr. 28-34, 10/2001.
[5] Lê Thị Hồng Liên và Nguyễn Thị Thanh Nga. “Nghiên cứu ăn mòn ứng lực của thép không
gỉ 304 trong dung dịch chứa ion clorua”. Tạp chí Khoa học Công nghệ. Tập 51, số 3, tr. 261,
2013.
[6] Szegedi S., Váradi M., Buczkó Cs. M., Várnagy M., Sztaricskai T.; "Determination of boron
in glass by neutron transmission method"; J. of Radioanal. & Nucl. Chem. Letters, 146 (3),
177, 1990.
[7] Dawn Marie McDaniel; “Chemical Analysis for Boron in Nuclear Reactor Coolant Water”;
Master THESIS, Oregon State University, USA, 1984.

VINATOM-AR 16--23
The Annual Report for 2016, VINATOM 212
USING FRAPCON AND FRAPTRAN SOFTWARE EVALUATION TO
CHARACTERIZE FUEL RODS IN NUCLEAR REACTORS
Nguyen Trong Hung, Nguyen Van Tung, Cao Duy Minh, Dang Ngoc Thang and Bui Cong Trinh
Institute for Technology of Radioactive and Rare Elements (ITRRE),
48, Lang Ha-Dong Da-Hanoi
Abstract: An overview of FRAPCON and FRAPTRAN software including the theoretical basis and
computational modeling of the status of the fuel rods in stable operating conditions and the transition
state of the reactor ring were reported. This report also presented the results of evaluation of the
thermal state of the nuclear fuel rod containing ceramic UO2 pellets manufactured by Vietnam was
assumed in stable operating conditions of nuclear power plants. The results obtained showed that the
UO2 pellets achieved certain requirements and technical quality in the operation of nuclear reactors.
Keywords: ceramic pellets, UO2, FRAPCON, FRAPTRAN….
1. INTRODUCTION
In modern nuclear reactors, ceramic fuel, in which uranium dioxide (UO2) is the main
material widely used for the most types of existing reactor. Nuclear fuel for heavy water reactors
are manufactured from natural uranium. For light water reactors fuel, uranium must be enriched (3-
5%).
The quality of UO2 pellets is assessed on the base of ASTM safety standards. In addition,
state of UO2 pellets in operating conditions of the nuclear reactor - one of the important criteria in
the process of researching, designing, manufacturing and safety evaluation of UO2 pellets and
nuclear power plants are assessed by the simulation software. FRAPTRAN and FRAPCON are two
of many programs that are used to assess the current operational status of nuclear fuel in the reactor
at the operational status of nuclear reactors [1-5].
The Fuel Rod Analysis Program CONstan (FRAPCON) is a Fortran 90 computer code that
calculates the steady-state response of light-water reactor fuel rods during long-term burn up. The
code calculates the temperature, pressure, and deformation of a fuel rod as functions of time-
dependent fuel rod power and coolant boundary conditions.
The phenomena modeled by the code include: 1) Heat conduction through the fuel and
cladding to the coolant; 2) Cladding elastic and plastic deformation; 3) Fuel-cladding mechanical
interaction; 4) Fission gas release from the fuel and rod internal pressure; 5) Cladding oxidation.
The latest version of FRAPCON has been changed to modernize the FORTRAN language to
the most recent standards. Other updates include, an update to plenum temperature model, update
to gas properties, the inclusion of the ANS-5.4 (2011) Standard Fission Product Release Model, the
ability to model spent fuel storage using the DATING creep models, the ability to use the ANS-5.1
decay heat model to calculate heating after shutdown, and the ability to specify axial coolant
conditions.
Project Information:
- Code: CS/16/03-01
- Managerial Level: Vietnam Atomic Energy Institute
- Allocated Fund: 80,000,000 VND
- Implementation Time: 12 months (Jan 2016 – Dec 2016)
- Contact Email: [email protected]
- Papers published in relation to the project: (None)

VINATOM-AR 16--23
The Annual Report for 2016, VINATOM 213
The Fuel Rod Analysis Program Transient (FRAPTRAN) is a Fortran language computer
code that calculates the transient performance of light-water reactor fuel rods during reactor
transients and hypothetical accidents such as loss-of-coolant accidents, anticipated transients
without scram, and reactivity-initiated accidents. FRAPTRAN calculates the temperature and
deformation history of a fuel rod as a function of time-dependent fuel rod power and coolant
boundary conditions. Although FRAPTRAN can be used in “standalone” mode, it is often used in
conjunction with, or with input from, other codes.
The phenomena modeled by FRAPTRAN include: 1) Heat conduction; 2) Heat transfer from
cladding to coolant; 3) Elastic-plastic fuel and cladding deformation; 4) Cladding oxidation; 5)
Fission gas release; 6) Fuel rod gas pressure.
The latest version of FRAPTRAN updates material properties, incorporates improvements to
the ballooning model and the high temperature steam oxidation models. New modeling capability
has been added to model axial zoning of gadolinia content. Other new capabilities include increased
time steps and axial nodes, and the inclusion of Optimized ZIRLO cladding.
2. EXPERIMENT
UO2 pellets are prepared from UO2 powder ex-AUC. UO2 pellets were sintered at
1720ºC/6hrs in gas mixture environment H2/N2 with molar ratio of 3/1.
UO2 pellets were identified some characteristics such as size, density, ratio O/U, etc...
The change density of UO2 pellets was calculated based on data re-sintered density of the fuel
pellets. The process of re-sintered UO2 pellets is done at 1750ºC/24hr in the gas mixtures
environment H2/N2 with molar ratio of 3/1.
3. RESULTS AND DISCUSSION
Some characteristics of UO2 pellets
Some characteristics of UO2 pellets obtained are shown in Table 1.
Table 1: Some characteristics of UO2 pellets
Characteristics of pellets (average) Unit Value
Height (length) of pellet mm 10.75
Inner Radius of pellet mm 9
Height (depth) of pellet dish, assumed to be a spherical indentation mm 0.2
Pellet end-dish shoulder width (outer radius of fuel pellet minus
radius of dish) mm 1.36
Ratio O/U 2.001
Weight fraction of gadolinia in urania-gadolinia fuel pellets % 0
Parts per million by weight of moisture in the as-fabricated pellets ppm 0
Parts per million by weight of nitrogen in the as-fabricated pellets ppm 0
As-fabricated apparent fuel density % TD 95.07
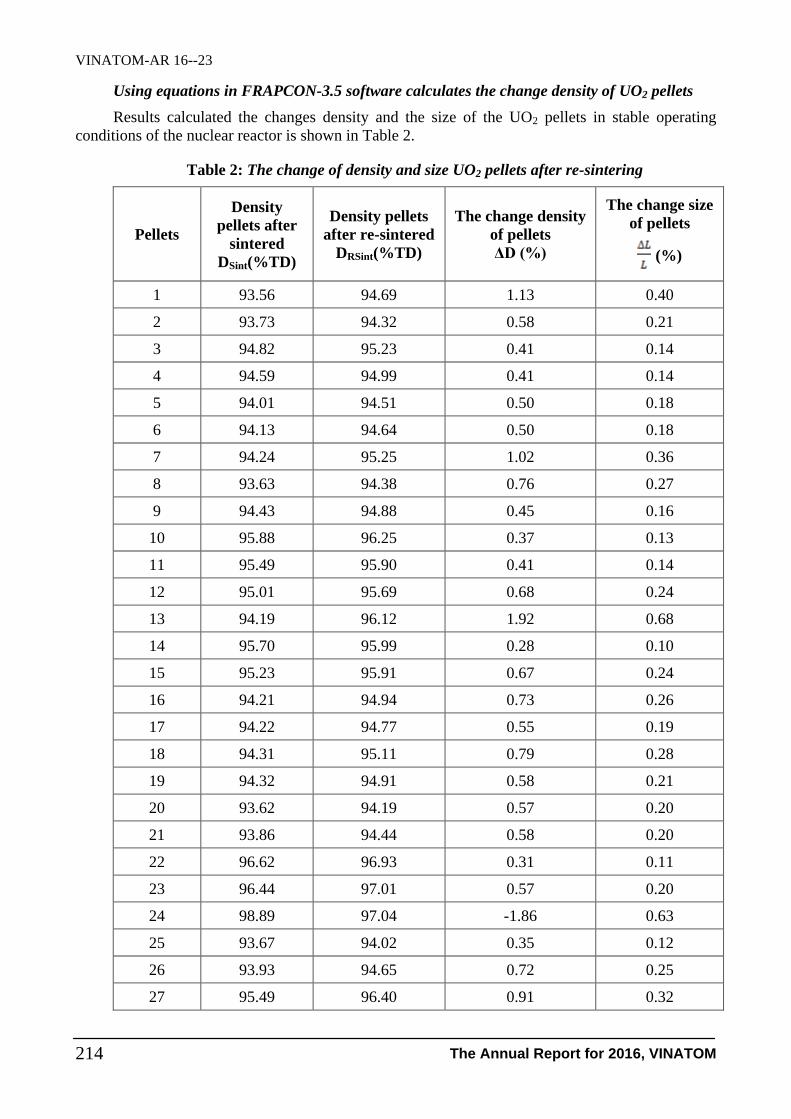
VINATOM-AR 16--23
The Annual Report for 2016, VINATOM 214
Using equations in FRAPCON-3.5 software calculates the change density of UO2 pellets
Results calculated the changes density and the size of the UO2 pellets in stable operating
conditions of the nuclear reactor is shown in Table 2.
Table 2: The change of density and size UO2 pellets after re-sintering
Pellets
Density
pellets after
sintered
DSint(%TD)
Density pellets
after re-sintered
DRSint(%TD)
The change density
of pellets
ΔD (%)
The change size
of pellets
(%)
1 93.56 94.69 1.13 0.40
2 93.73 94.32 0.58 0.21
3 94.82 95.23 0.41 0.14
4 94.59 94.99 0.41 0.14
5 94.01 94.51 0.50 0.18
6 94.13 94.64 0.50 0.18
7 94.24 95.25 1.02 0.36
8 93.63 94.38 0.76 0.27
9 94.43 94.88 0.45 0.16
10 95.88 96.25 0.37 0.13
11 95.49 95.90 0.41 0.14
12 95.01 95.69 0.68 0.24
13 94.19 96.12 1.92 0.68
14 95.70 95.99 0.28 0.10
15 95.23 95.91 0.67 0.24
16 94.21 94.94 0.73 0.26
17 94.22 94.77 0.55 0.19
18 94.31 95.11 0.79 0.28
19 94.32 94.91 0.58 0.21
20 93.62 94.19 0.57 0.20
21 93.86 94.44 0.58 0.20
22 96.62 96.93 0.31 0.11
23 96.44 97.01 0.57 0.20
24 98.89 97.04 -1.86 0.63
25 93.67 94.02 0.35 0.12
26 93.93 94.65 0.72 0.25
27 95.49 96.40 0.91 0.32

VINATOM-AR 16--23
The Annual Report for 2016, VINATOM 215
Pellets
Density
pellets after
sintered
DSint(%TD)
Density pellets
after re-sintered
DRSint(%TD)
The change density
of pellets
ΔD (%)
The change size
of pellets
(%)
28 95.88 96.21 0.33 0.12
29 95.20 95.98 0.78 0.27
30 94.41 95.17 0.76 0.27
31 94.17 94.35 0.18 0.06
32 94.34 94.92 0.58 0.20
33 94.38 94.69 0.31 0.11
34 93.61 94.17 0.57 0.20
35 96.50 97.08 0.58 0.20
36 96.52 97.12 0.59 0.21
37 96.43 96.72 0.29 0.10
38 93.55 94.14 0.59 0.21
39 95.88 96.64 0.76 0.26
40 95.38 95.44 0.05 0.02
41 95.39 95.76 0.37 0.13
42 95.15 95.87 0.72 0.25
43 96.32 96.56 0.23 0.08
44 95.49 95.82 0.33 0.12
45 95.93 96.06 0.13 0.04
46 96.12 96.94 0.81 0.28
47 96.45 96.71 0.26 0.09
48 96.40 97.22 0.82 0.28
49 96.68 97.06 0.38 0.13
50 95.00 94.88 -0.12 0.04
TB 95.07 95.57 0.50 0.20
Using FRAPCON-3.5 software assess the state heat of the fuel rods in stable operating
conditions of the nuclear reactor
Building code calculates with the following input parameters (based on characteristics of UO2
pellets obtained).
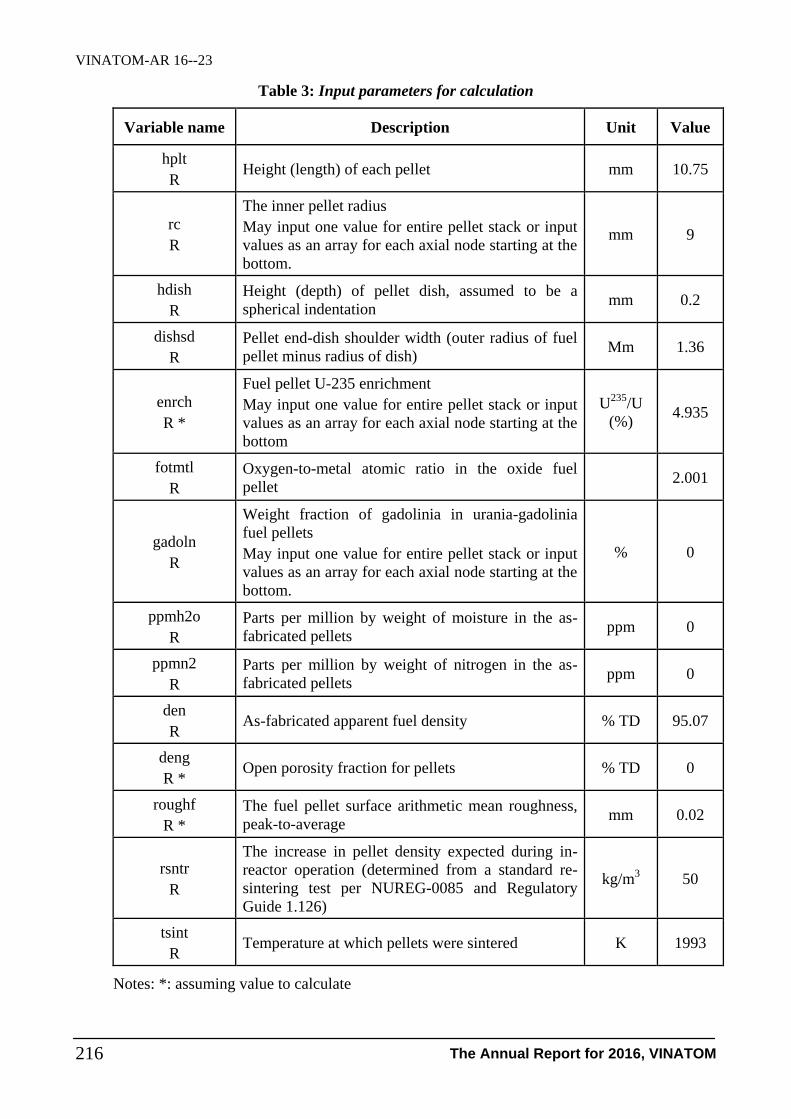
VINATOM-AR 16--23
The Annual Report for 2016, VINATOM 216
Table 3: Input parameters for calculation
Variable name Description Unit Value
hplt
R Height (length) of each pellet mm 10.75
rc
R
The inner pellet radius
May input one value for entire pellet stack or input
values as an array for each axial node starting at the
bottom.
mm 9
hdish
R
Height (depth) of pellet dish, assumed to be a
spherical indentation mm 0.2
dishsd
R
Pellet end-dish shoulder width (outer radius of fuel
pellet minus radius of dish) Mm 1.36
enrch
R *
Fuel pellet U-235 enrichment
May input one value for entire pellet stack or input
values as an array for each axial node starting at the
bottom
U235
/U
(%) 4.935
fotmtl
R
Oxygen-to-metal atomic ratio in the oxide fuel
pellet 2.001
gadoln
R
Weight fraction of gadolinia in urania-gadolinia
fuel pellets
May input one value for entire pellet stack or input
values as an array for each axial node starting at the
bottom.
% 0
ppmh2o
R
Parts per million by weight of moisture in the as-
fabricated pellets ppm 0
ppmn2
R
Parts per million by weight of nitrogen in the as-
fabricated pellets ppm 0
den
R As-fabricated apparent fuel density % TD 95.07
deng
R * Open porosity fraction for pellets % TD 0
roughf
R *
The fuel pellet surface arithmetic mean roughness,
peak-to-average mm 0.02
rsntr
R
The increase in pellet density expected during in-
reactor operation (determined from a standard re-
sintering test per NUREG-0085 and Regulatory
Guide 1.126)
kg/m3
50
tsint
R Temperature at which pellets were sintered K 1993
Notes: *: assuming value to calculate

VINATOM-AR 16--23
The Annual Report for 2016, VINATOM 217
From the results obtained after running the software, we obtained the results show fuel rod
temperatures in graphs.
Figure 1: The pellets
temperature after operation 2
days
The difference temperature from the pellets centerline to the pellets surface was very large,
1035K with 4.5 mm of radius of pellets. There are two reasons leading to this phenomenon. The
first is thermal conductivity will decrease as the temperature rises. The second is change size pellets
due to radiation in nuclear reactor. The increased size of the pellets will leading to porosity in
structure of pellets increasing, leading to potentially reduce the thermal conductivity of pellets.
Figure 2: Pellets surface and
clad inside temperature after 2
days of operation
After 2 days of operation, the results obtained showed that the difference temperature between
the pellets surface and clad inside will be reduced, which may explain as follows: In normal
conditions, the gap between pellets and clad are filled with He gas, however, when burning fuel
rods, the gap will be supplemented by a number of fission product gases (xenon, krypton). As
calculated above, the size of pellets increased 0.2% would make slots altered, along with the
thermal expansion of the fuel and the clad will lead to contact between the fuels and clad inside.
This exposure will reduce the thermal resistance of the gap in the fuel combustion process,
increases the likelihood of heat conduction through the gap and make the surface temperature of the
fuel rods adds up. The temperature difference between the pellets surface and the clad will decrease.

VINATOM-AR 16--23
The Annual Report for 2016, VINATOM 218
Figure 3: Clad outside temperature
after 2 days of operation
With clad outside, due to exposure to heat load water, so that the clad outside temperature is
quite stable, around 507K after 2 days of operation. Thus, the cooling system ensures the stability of
the clad outside temperature, whether the temperature pellets have been increasing.
4. CONCLUSION
The study has reviewed FRAPCON and FRAPTRAN software as the basis of theory and
modeling methods applied in the software to calculate and evaluate the characteristics of the fuel
rods in stable operating conditions and the transition state of the nuclear reactor; all entry
requirements of the program calculates, how to deal with the results obtained from the software.
The study has used the FRAPCON-3.5 software to evaluate thermal state of the fuel rods with
the parameters of manufacturing UO2 pellets reality in Vietnam with a number of other
assumptions. The results obtained showed the change of thermal resistance fuel rods during the
operation of nuclear reactors.
REFERENCES
[1] K. J. Geelhood and W. G. Luscher , “FRAPCON-3.5: A Computer Code for the Calculation of
Steady-State, Thermal-Mechanical Behavior of Oxide Fuel Rods for High Burn up”,
NUREG/CR-7022, Vol. 1, Rev. 1. PNNL-19418, Vol. 1, Rev. 1, Pacific Northwest National
Laboratory, Richland, WA. (2014).
[2] Geelhood, K.J., and W.G. Luscher, “FRAPCON-3.5 Integral Assessment”, NUREG/CR-
7022, Vol. 2 Rev. 1, PNNL-19418 Vol. 2 Rev. 1, Pacific Northwest National Laboratory,
Richland WA. (2014).
[3] Geelhood, K.J., W.G. Luscher, and J.M. Cuta, “ FRAPTRAN-1.5: A Computer Code for the
Transient Analysis of Oxide Fuel Rods”, NUREG/CR-7023 ,Vol. 1 Rev.1, PNNL-19400, Vol.
1 Rev. 1, Pacific Northwest National Laboratory, Richland, WA. (2014).
[4] K. J. Geelhood, W.G. Luscher, J. M. Cuta, “FRAPTRAN-1.5: Integral Assessment”,
NUREG/CR-7023, Vol. 2 Rev.1 PNNL-19400, Vol. 2 Rev.1, Pacific Northwest National
Laboratory, Richland, WA. (2014).
[5] U.S. Nuclear Regulatory Commission, “Standard Review Plan for the Review of Safety
Analysis Reports for Nuclear Power Plants: LWR Edition: Section 4.2: Fuel System Design,
Revision 3”, NUREG-0800, U.S. Nuclear Regulatory Commission, Washington D.C. (2007).
VINATOM-AR 16--24
The Annual Report for 2016, VINATOM 219
STUDY ON PREPARATION OF 166
Ho-CHITOSAN ORIENTED
IN THE TREATMENT OF LIVER CANCER
Dang Ho Hong Quang, Duong Van Dong, Bui Van Cuong, Nguyen Thanh Binh,
Nguyen Thanh Nhan, Nguyen Dinh Lam and Nguyen Thi Thu
Nuclear Research Institute, Dalat
Abstract: This study describes the process for the preparation and quality control of 166Ho-Chitosan
product. The labeling conditions of chitosan with 166Ho radioisotope were carried out such as the
concentration of chitosan, pH, temperature and reaction time to create 166Ho-Chitosan compositions.
Product quality inspection 166Ho-Chitosan on the criteria as nuclide purity, radiochemical purity, tested
for sterility and bacterial endotoxin. The results of survey showed that 166Ho labeled with chitosan
were completed in 1% acetic acid, 3mCi: 30mg ratio at pH = 3, marking time at room temperature for
30 minutes. The results of quality test have shown radionuclide purity ≥ 99%, radiochemical purity ≥
98%, meeting the criteria for the aseptic and bacterial endotoxin according to IV Vietnam
pharmacopoeia. From the above mentioned, 166Ho-Chitosan compositions meet the quality criteria of
the radiopharmaceuticals, therefor, it can be used in pre-clinical research and its application in clinical
treatment.
Keyword: 166Ho-Chitosan, Chitosan, 166Ho, purity, Liver cancer…
1. INTRODUCTION
Nowadays, there is an increasing in the number of people who have to suffer cancers. It
causes the decline of the quality of life. For example, liver cancer may lead to death. According to
the survey in the world, about 500,000 people have liver cancer each year.
The treatment of method uses β-ray emitting isotopes which have a half-life time, energy and
distance running in the appropriate tissue to destroy the cancer cells. This is the most advanced
treatments today. Because it is less affecting the surrounding healthy cells [6].
Among the rare earth elements are being studied for use in diagnostic applications, and treat
cancer. 166
Ho radioisotopes are labelled with Chitosan research to create 166
Ho-Chitosan
compositions. This product is used to treat liver cancer, especially carcinoma of the liver cells to
very good results [7].
This topic describes the process for the preparation and quality control of 166
Ho-Chitosan
products.
Project information:
- Code: CS/16/01-01
- Managerial Level: Institute
- Allocated Fund: 80,000,000 VND
- Implementation time: 12 months (Jan 2016- Dec 2016)
- Contact email: [email protected]
- Paper published in related to the project:
Dang Ho Hong Quang and et al.; Production and quality control of 166Ho radioisotope in Dalat
nuclear reactor; 4th Nuclear technology and science conference for young researchers in the
field of atomic energy, Hanoi 2016, p. 45 (in Vietnamese).

VINATOM-AR 16--24
The Annual Report for 2016, VINATOM 220
2. EXPERIMENTAL
2.1. Materials
166
Ho isotope 6 mCi/ml; Chitosan LMW 10mg/ml; Acetic acid 1%; Ascorbic acid 50mg/ml;
NaOH 1N; HCl 1N; purity water; 0.22µm Filter; Methanol: Amonium axetate 10% (1:1) ;
Methanol: water: acetic acid (4:4:2) pH paper; TLC-SG.
2.2. Equipments
Gamma Spectrum-GMX30190; BioScan-TLC; automatic Pipette; Autoclave; Clean room;
ISOMED 2000; Vortex mixer.
2.3. Preparation
Synthesis of 166
Ho-Chitosan product:
166Ho-Chitosan complex was prepare by dissolving of 30 mg chitosan in 3 ml of 1% acetic
acid solution following the addition of 5mg ascorbic acid, continue add more 3 mCi 166
Ho and then
adjust pH at 3. The solution was stirred thoroughly by a votex mixer for 5 minutes. The reaction
mixture was left standing for 30 minutes at room temperature and then the labeling yield or
radiochemical purity of 166
Ho-Chitosan was determined by TLC-SG (Thin Layer Chromatography-
Silicagen) developing two solvent; Methanol: water: acetic acid (4:4:2) and 10% Ammonium
acetate: Methanol (1:1).
Taking 3 ml Chitosan 10mg/ml concentration (30 mg Chitosan) into glass tubes, adding
more 0.5 ml 166
Ho+3
solution in a 6 mCi / ml concentration (3 mCi 166
Ho+3
), and mix. Using 0.1N
NaOH and HCl 0.1 of the labeling solution adjusted to pH = 3, let stand 30 minutes.
Continue to adding 100 μl (equivalent to 5 mg) of L-ascorbic 50 mg/ml in a solution
containing tubes labeled signs flick. Conducting liquid filtration marked above through a sterile
filter, for penicillin bottles close to the rubber stopper, aluminum button clamp Sterile carried away
Autoclave steamed at 121oC for 15 minutes we obtained preparations
166Ho-Chitosan.
After testing measurements of radioactivity 166
Ho-Chitosan compositions. Product quality
inspection 166
Ho-Chitosan on the criteria as nuclide purity, radiochemical purity, tested for sterility
and bacterial endotoxin.
3. RESULTS AND DISCUSSION
The results of quality test have shown that: 166
Ho nuclide purity ≥ 99%, 166
Ho-Chitosan
radiochemical purity ≥ 98%, meeting the criteria for the aseptic and bacterial endotoxin according
to IV Vietnam pharmacopoeia.
166
Ho-Chitosan was easily repaired by reacting the aqueous 1% acetic acid solution of
Chitosan with 166
Ho isotope at room temperature with high radiochemical yield (>98%) in the
optimized condition (30 mg/3ml of chitosan in %1 AcOH, pH= 3, 30 minutes). The labeling yield
and radiochemical were easily determined by thin layer chromatography (TLC).
Table 1: The characteristics of energy peaks of 166
Ho
Energy (keV) Intensity (%) Type
80.576 5.4 gamma
1379.437 0.9 gamma
48.2211 10.49 X-ray
49.1277 18.6 X-ray
55.7 7.63 X-ray

VINATOM-AR 16--24
The Annual Report for 2016, VINATOM 221
Figure 1a: Gamma ray-Spectrum of
166Ho
Figure 1b: Gamma ray-Spectrum of
166Ho
Table 2: Radiochemical purity of 166Ho-Chitosan in Methanol: water: acetic acid
No Identifier Area Percentage Max
mm
Start
mm
End
mm
Maximum Total
(%)
1 166
Ho-Chitosan 9084.32 100 5 0.5 14.5 1765.65 98.61
Unallocated
Area
128.24 1.39
Total Area 9212.56 100
1 Peak 9084.32 100 98.61
Activity graph, sensor: EMG-TLC
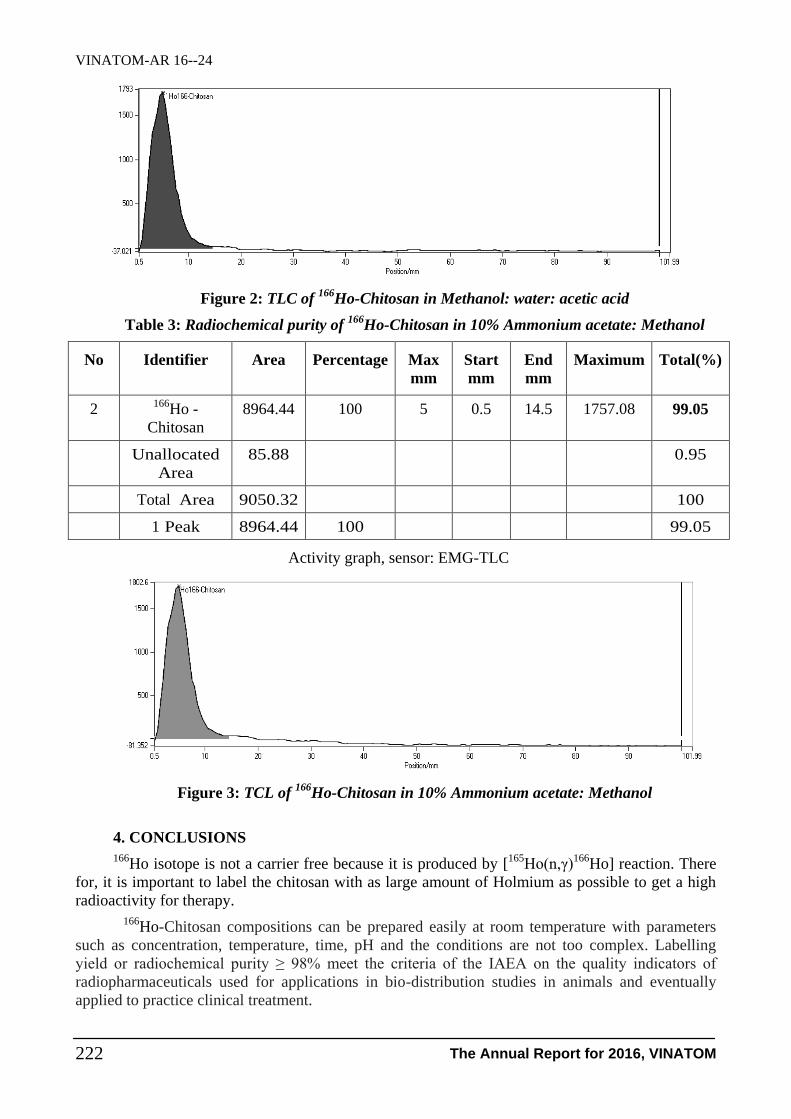
VINATOM-AR 16--24
The Annual Report for 2016, VINATOM 222
Figure 2: TLC of 166
Ho-Chitosan in Methanol: water: acetic acid
Table 3: Radiochemical purity of 166
Ho-Chitosan in 10% Ammonium acetate: Methanol
No Identifier Area Percentage Max
mm
Start
mm
End
mm
Maximum Total(%)
2 166
Ho -
Chitosan
8964.44 100 5 0.5 14.5 1757.08 99.05
Unallocated
Area
85.88 0.95
Total Area 9050.32 100
1 Peak 8964.44 100 99.05
Activity graph, sensor: EMG-TLC
Figure 3: TCL of 166
Ho-Chitosan in 10% Ammonium acetate: Methanol
4. CONCLUSIONS
166Ho isotope is not a carrier free because it is produced by [
165Ho(n,γ)
166Ho] reaction. There
for, it is important to label the chitosan with as large amount of Holmium as possible to get a high
radioactivity for therapy.
166
Ho-Chitosan compositions can be prepared easily at room temperature with parameters
such as concentration, temperature, time, pH and the conditions are not too complex. Labelling
yield or radiochemical purity ≥ 98% meet the criteria of the IAEA on the quality indicators of
radiopharmaceuticals used for applications in bio-distribution studies in animals and eventually
applied to practice clinical treatment.

VINATOM-AR 16--24
The Annual Report for 2016, VINATOM 223
REFERENCES
[1] IAEA-TECDOC-1228, Therapeutic application of radiopharmaceuticals diagnosis and
therapy, June 2011.
[2] IAEA-Technical report series No.458, Comparative evaluation of therapeutics
radiopharmaceuticals, Vienna 2007.
[3] IAEA-TECDOC-1340, Manual for reactor produced radioisotopes, Vienna, IAEA, 2003.
[4] IAEA-TECDOC-1114, September 1999, Optimization of production and quality control of
therapeutic radionuclides and radiopharmaceuticals.
[5] Gopal B. Saha, Fundamentals of Nuclear Pharmacy, Six Edition, Springer, 2012.
[6] Samaneh, Zolghadri, Amir Reza Jalilian, Hassan Yousefnia, Production and Quality Control
of 166Ho-Chitosan for Therapeutic Applications, Iran November 2010.
[7] Yeon Hee Lee, Effect of Holmium-166 Injection into Hepatocellular Carcinomas (SK-
HELP1) Heterotransplated in Mice, Korea 1998.
[8] E. Bujdoso, I. Feher and G. Kardos, Activation and Decay Tables of Radioisotopes, Budapest
1973.


1.10- Computation andOther Related Topics


VINATOM-AR 16--25
The Annual Report for 2016, VINATOM 227
UPGRADE THE WEBSITE OF NUCLEAR TRAINING CENTER
FOR ONLINE TRAINING
Nguyen Minh Duc, Nguyen Thuy Hang, Nguyen Thi Lien,
Luu Thi Thu Hoa and Pham Thi Thu Trang
Nuclear Training Centre, Vietnam Atomic Energy Institute
Abstract: In 2016, Nuclear Training Center (NTC) proposed the task of improving and upgrading
NTC website’s technology for better performance, more attractive interface and more accessible
information to site visitors.. This website will be designed to meet the demand for integrated online
training site, integrated training management page later. For this task, it is expected to build a website
with full modules, English interface of website and especially, the professional website to apply online
training technology and tightly integrated close to the present site of a nuclear training center.
Keyword: website, moodle, e-learning,
1. INTRODUCTION
Since its establishment, one of the first and foremost NTC’s functions is to assist VINATOM
in managing and coordinating PhD programs with specialization authorized by the Ministry of
Education and Training and joint programs with partner universities in providing Master’s degrees,
in the preparation of R& D human resources in atomic energy field. To support the implementation
of the work assigned, www.daotaohatnhan.com.vn site was designed and has been put into
operation since 2010. The website has been an official channel of NTC in providing training
materials, guidelines and scientific knowledge exchange. For the past years, compared to the latest
trends and developments, it is noticed that NTC website has a number of problems which need to be
fixed.
Establishing a website is one of the important tasks for NTC in order to promote and publicize
its activities (in both Vietnamese and English). The active and open relationships with students and
local as well as international organizations help to prepare the human resource for Nuclear power as
well as the other related applications.
The website will be the information source of management plans and contents of Nuclear
Science and Technology training programs. Website will be a good source for students and
professors to find and share the teaching documents as well as references quickly at a low cost
(most of the books, syllabuses and references from the Center will be provided for free).
2. CONTENT
Task 1: Upgrade Vietnamese website of Nuclear Training Center
- Analysis the advantages and disadvantages of the current website
- Design a new interface of the website
Project information:
- Code: 16/CS/HĐ/ĐT
- Managerial Level: Institute
- Allocated Fund: 80,000,000 VND
- Implementation time: 12 months (Jan 2016- Dec 2016)
- Contact email: [email protected]
- Paper published in related to the project: (None)

VINATOM-AR 16--25
The Annual Report for 2016, VINATOM 228
- Edit and unified interface design according to the feedback,
- Programming, website building, transfer data from the old website to the new website
- Update all news, all notifications generated by a nuclear training center in 2016, the agency
referral information, etc.
Task 2: Analysis, design and construction of e-learning page integrated in website with new
technologies at Nuclear Training Center
- Analysis of the transmission request information online at the Nuclear Training Center
- Design and develop user interfaces necessary items in the training modules online.
- Create a test course on a new nuclear training interface website
Task 3: Build English interface website of Nuclear Training Center
- Design English website of Nuclear Training Center
- Edit and unified interface design according to the feedback
- Programming and building the website
- Transfer some news articles, translation agency referral information.
- Post news, updates of Nuclear Training Center in 2016 on the site in English interface.
Completed product
- Vietnamese interface website has been modified and upgraded of the Nuclear Training
Center
- E-learning page of the Nuclear Training Centre has the basic functions of online learning.
- English interface website of the Nuclear Training Center
2.1. Task 1:Vietnamese interface of the Nuclear Training Center’s website
With the assigned tasks in management activities of the Nuclear Training Centre, we have
designed the site www.daotaohatnhan.com.vn and put into operation since 2011. The website has
provided nuclear information in Vietnam and overseas, the website provided document, study
guides and Knowledge Exchange environment.
In the old interface, the site was designed with two main colors, blue and red, based on the
two primary colors in the logo of the nuclear training centre. The main menu contained the
categories: home, about, news, programs, announcements, documentation, books & textbooks, FAQ
and contact.
Statistics of traffic and downloads the information of the site as of the end of the year 2016
were as follows:
Category Quantity Viewed
World news 112 12452
Domestic news 453 169354
Events - Seminars 40 67108
Nuclear technology news 132 89546
Partnership news 4 3266
Statistics of documents, books, textbooks:
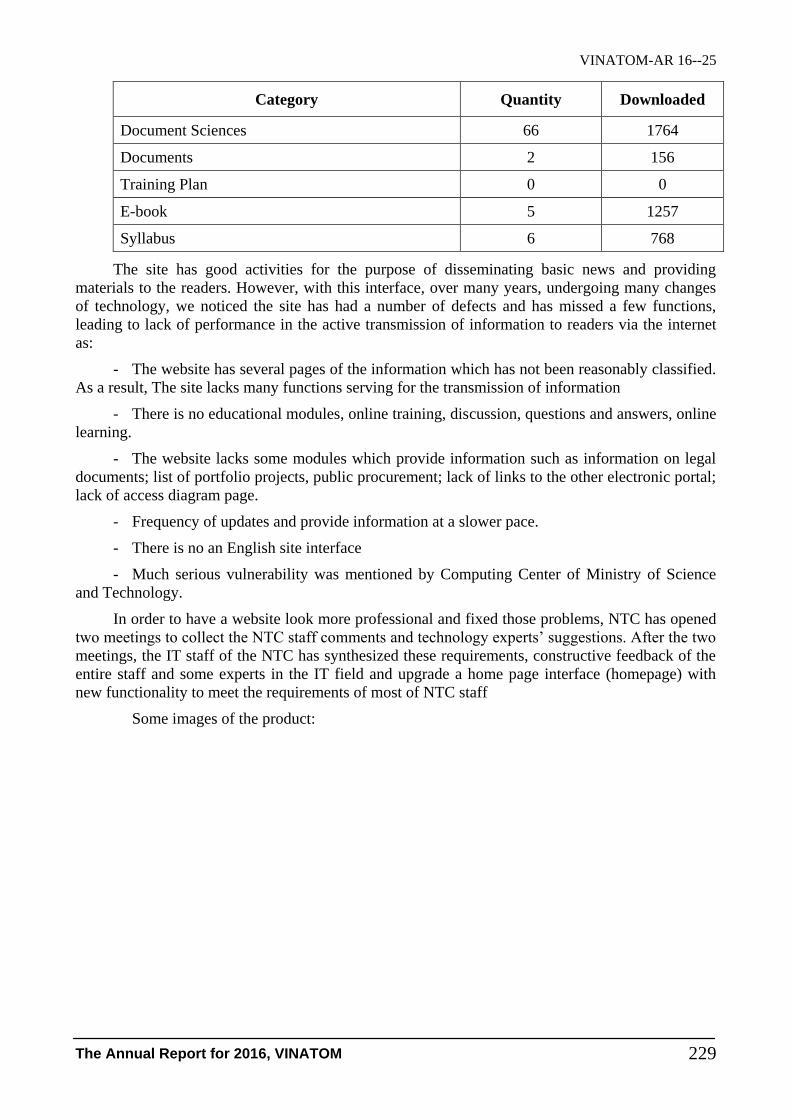
VINATOM-AR 16--25
The Annual Report for 2016, VINATOM 229
Category Quantity Downloaded
Document Sciences 66 1764
Documents 2 156
Training Plan 0 0
E-book 5 1257
Syllabus 6 768
The site has good activities for the purpose of disseminating basic news and providing
materials to the readers. However, with this interface, over many years, undergoing many changes
of technology, we noticed the site has had a number of defects and has missed a few functions,
leading to lack of performance in the active transmission of information to readers via the internet
as:
- The website has several pages of the information which has not been reasonably classified.
As a result, The site lacks many functions serving for the transmission of information
- There is no educational modules, online training, discussion, questions and answers, online
learning.
- The website lacks some modules which provide information such as information on legal
documents; list of portfolio projects, public procurement; lack of links to the other electronic portal;
lack of access diagram page.
- Frequency of updates and provide information at a slower pace.
- There is no an English site interface
- Much serious vulnerability was mentioned by Computing Center of Ministry of Science
and Technology.
In order to have a website look more professional and fixed those problems, NTC has opened
two meetings to collect the NTC staff comments and technology experts’ suggestions. After the two
meetings, the IT staff of the NTC has synthesized these requirements, constructive feedback of the
entire staff and some experts in the IT field and upgrade a home page interface (homepage) with
new functionality to meet the requirements of most of NTC staff
Some images of the product:

VINATOM-AR 16--25
The Annual Report for 2016, VINATOM 230
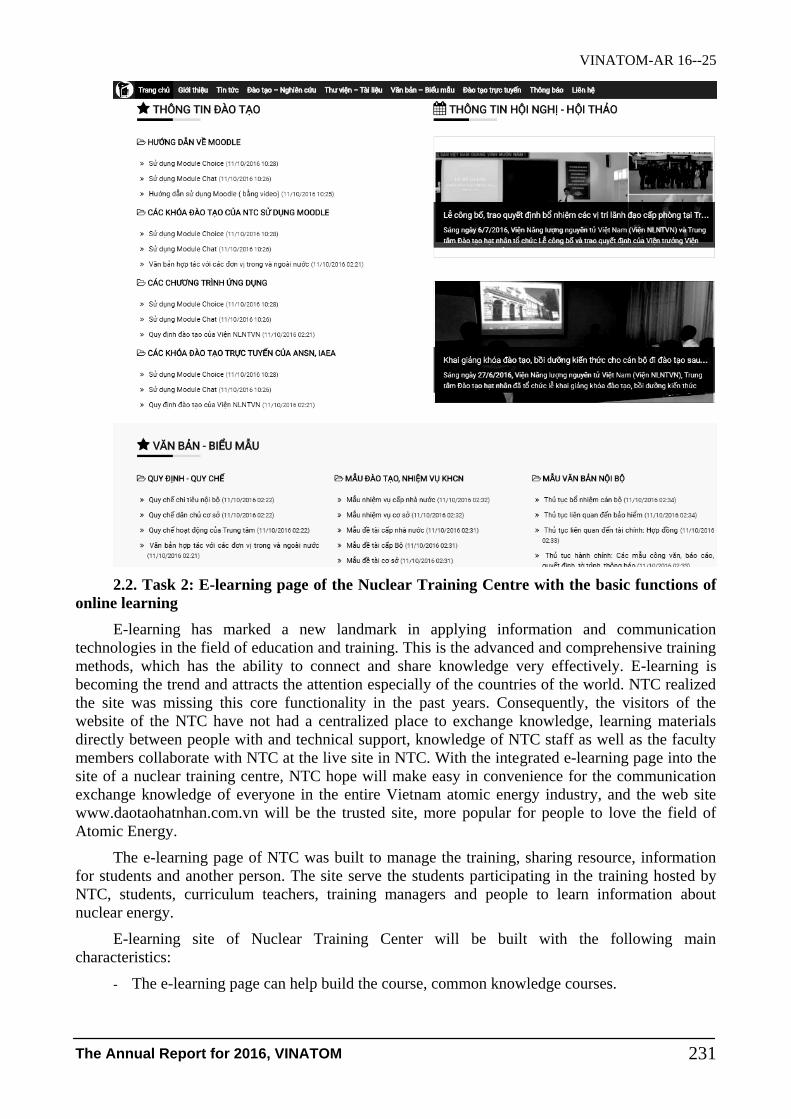
VINATOM-AR 16--25
The Annual Report for 2016, VINATOM 231
2.2. Task 2: E-learning page of the Nuclear Training Centre with the basic functions of
online learning
E-learning has marked a new landmark in applying information and communication
technologies in the field of education and training. This is the advanced and comprehensive training
methods, which has the ability to connect and share knowledge very effectively. E-learning is
becoming the trend and attracts the attention especially of the countries of the world. NTC realized
the site was missing this core functionality in the past years. Consequently, the visitors of the
website of the NTC have not had a centralized place to exchange knowledge, learning materials
directly between people with and technical support, knowledge of NTC staff as well as the faculty
members collaborate with NTC at the live site in NTC. With the integrated e-learning page into the
site of a nuclear training centre, NTC hope will make easy in convenience for the communication
exchange knowledge of everyone in the entire Vietnam atomic energy industry, and the web site
www.daotaohatnhan.com.vn will be the trusted site, more popular for people to love the field of
Atomic Energy.
The e-learning page of NTC was built to manage the training, sharing resource, information
for students and another person. The site serve the students participating in the training hosted by
NTC, students, curriculum teachers, training managers and people to learn information about
nuclear energy.
E-learning site of Nuclear Training Center will be built with the following main
characteristics:
- The e-learning page can help build the course, common knowledge courses.
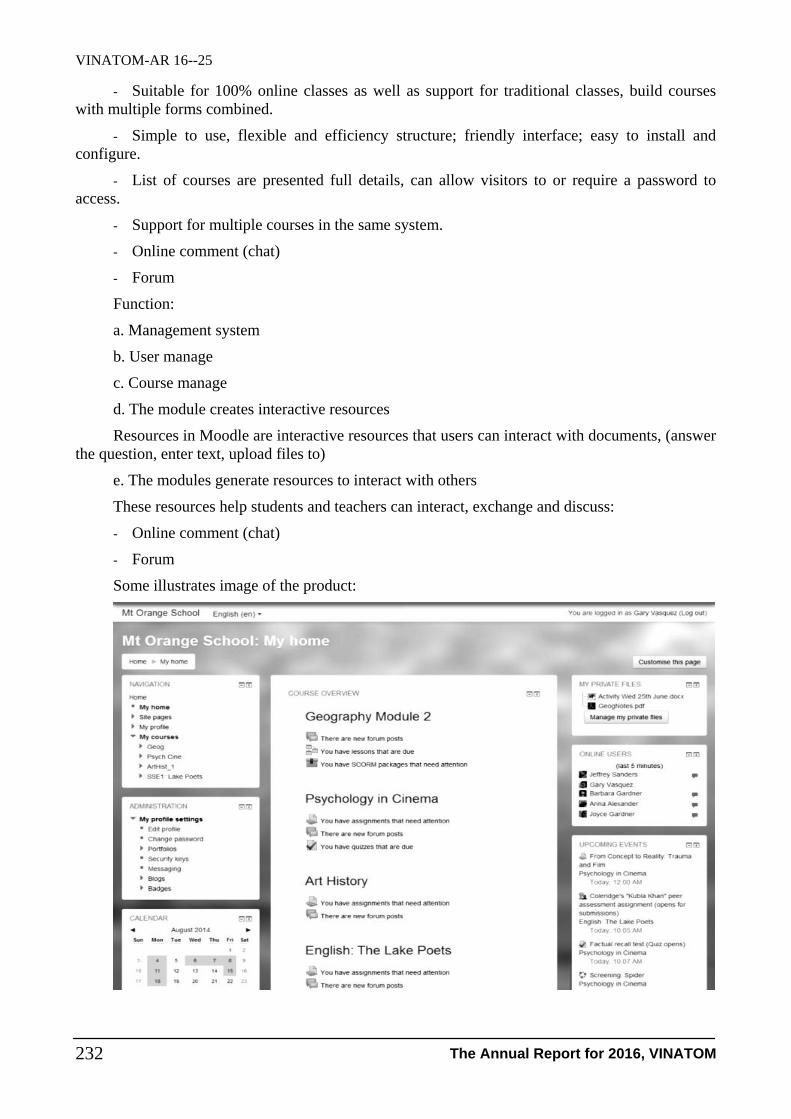
VINATOM-AR 16--25
The Annual Report for 2016, VINATOM 232
- Suitable for 100% online classes as well as support for traditional classes, build courses
with multiple forms combined.
- Simple to use, flexible and efficiency structure; friendly interface; easy to install and
configure.
- List of courses are presented full details, can allow visitors to or require a password to
access.
- Support for multiple courses in the same system.
- Online comment (chat)
- Forum
Function:
a. Management system
b. User manage
c. Course manage
d. The module creates interactive resources
Resources in Moodle are interactive resources that users can interact with documents, (answer
the question, enter text, upload files to)
e. The modules generate resources to interact with others
These resources help students and teachers can interact, exchange and discuss:
- Online comment (chat)
- Forum
Some illustrates image of the product:

VINATOM-AR 16--25
The Annual Report for 2016, VINATOM 233
2.3.Task 3: English interface of the Nuclear Training Center’s website
Nuclear Training Center noticed a great interest from foreign visitor. Therefore, miss an
English interface website operation with Vietnamese interface website that limit the transmission of
information to a global audience interested in the field of nuclear energy in Vietnam in general and
NTC in particular. The information is presented in Vietnamese is not enough to visitors in the
world. So, in the basic task in 2016 year of Nuclear Training Centre, we have proposed to build an
English interface website of NTC as the main content and very important. English interface site of
NTC hopes to become an accurate information channel, rich and useful for reader in English in
global. NTC hopes to provide fully information required of the nuclear energy, in regular news on
the English interface website.
In the process, the NTC has opened many meetings. The NTC’s staff and IT professionals
unite the English interface website as follows:
- Basically, the English interface site will almost the same Vietnamese interface site and
100% of the content will be made by the international language is English.
- This site is designed with separate domain names. The content will be completely
independent of the content of Vietnamese page.
- Some information content as news, important announcements in the operation of NTC and
VINATOM and the nuclear energy industry in the world will be edited, translate and post up to this
site.
Some illustrates image of the product:

VINATOM-AR 16--25
The Annual Report for 2016, VINATOM 234
3. CONCLUSION
Based on the workload and explanations, we believe that our tasks were completed as
registered. All the requirements for a communication channel, a website were brought to the users.
Our website provided information about nuclear physical science news, organizing plans and
contents of nuclear science and technology training courses.The website is stable, easy to use;
interface structure is clear and logical which meet the criteria from Nuclear Training Center.
News module keeps on updating, uploading the internal and corporate news from the center as
well as the fullest and latest news, events, meetings from all the areas related to nuclear issues from
local and international
English interface of the website has presented enough basic information about leadership, and
operational direction of the Nuclear Training Centre.
REFERENCES
[1] About Moodle.https://docs.moodle.org/32/en/About_Moodle.
[2] Editorial Staff, How to Make a Website in 2017 - Step by Step Guide.
http://www.wpbeginner.com/guides/. 2017.
[3] Gavin W. Porter. Free choice of learning management systems: Do student habits override
inherent system quality?Interactive Technology and Smart Education, Vol. 10 Iss: 2, pp.84 –
94.
[4] Moodle Docs. https://docs.moodle.org/32/en/Main_page.
VINATOM-AR 16--26
The Annual Report for 2016, VINATOM 235
STUDY FOR ACTION PLAN PROPOSAL ON SOME ISSUES
OF THE NATIONAL NUCLEAR INFRASTRUCTURE
FOR THE NEW RESEARCH REACTOR PROJECT
IN PHASE 1&2
Cao Hong Lan*, Nguyen Nhi Dien**, Bui Dang Hanh*, Vu Quang Linh*
Tran Thi Kim Oanh*, Tran Ngoc Hoan*, Nguyen Bach Viet*, Nguyen Thuan Yen*
Vu Thi Lieu* and Pham Thanh Huong*.
*Vietnam Atomic Energy Institute
** Nuclear Research Institute
Abstract: The Project on construction for a new research reactor in Vietnam is under preparation. At
the same time, it is necessary to prepare a firm and comprehensive national nuclear infrastructure
which is aimed to implement smoothly and ensure safety and security for the project. How is the status
of the nuclear infrastructure for research reactor project in Vietnam, how can it be assessed, what is the
assessment used for and what are we going to do with that? So, all of these things are the goals set out
to address in this Task. However, due to time constraints and conformity with requirement of project
progress, this Task assessed only 8 critical issues in infrastructure in phase 1&2, including National
position; Management; Legislative framework; Regulatory framework; Human resource development;
Radioactive waste; Site survey, site selection and evaluation; and Environmental protection.
Conditions and criteria in the documents on milestones and assessment of the national nuclear
infrastructure to support a new research reactor project of the International Atomic Energy Agency
(IAEA) were used as bases for assessing the Vietnam's infrastructure status. The results of the Task
are assessment and identification for gaps which need to be addressed and proposing for a plan on
completing the national nuclear infrastructure for the research reactor project on 8 issues in stages
1&2.
1. PREAMBLE
The new research reactor project should be supported by a national nuclear infrastructure.
Most of the infrastructure issues for a research reactor project are similar to that of nuclear power
plants but in a lesser degree. However, the completed national infrastructure needs to have a certain
position to ensure that the risks to nuclear safety as well as nuclear security are adequately dealt
with any incident occurred in operation of the research reactor.
In 2012, the International Atomic Energy Agency (IAEA) has developed and published the
"Specific Considerations and Milestones for a Research Reactor Project". This document identifies
19 issues needed to complete the nuclear infrastructure to ensure the safety and security for the
research reactor project from the start of the project to the commissioning, maintenance and
dismantling of the research reactor. These issues cover the whole of the main things from the
National position, Nuclear safety, Management, Funding and financing, Legislative framework
Project information:
- Code: 13/CS/HĐ/NV
- Managerial Level: Institute
- Allocated Fund: 120,000,000 VND
- Implementation time: 12 months (Jan 2016- Dec 2016)
- Contact email: [email protected]
- Paper published in related to the project: (None)
VINATOM-AR 16--26
The Annual Report for 2016, VINATOM 236
Regulatory framework, Safeguards, Radiation protection, Research reactor utilization, Human
resource development, Stakeholder involvement, Site survey, site selection and evaluation,
Environmental protection, Emergency planning, Nuclear security, Nuclear fuel management,
Radioactive waste, Industrial involvement, Procurement.
By May 2015, the IAEA has drafted the eighth version of Assessment of the National Nuclear
Infrastructure to Support the New Research Reactor Project to guide member countries in the
survey, analyze and assess the nuclear infrastructure of each country.
At present, Vietnam Atomic Energy Institute is directly preparing to implement the project on
construction for the Center of Nuclear Science and Technology in which the key component is a
new research reactor. This is the first research reactor that Vietnam has undertaken from the early
stages of preparation of investment projects to site selection, construction and operation, etc., so that
for safe and smooth implementation of project, the assessment of infrastructure for research reactor
project follows IAEA recommends for 19 issues in three milestones, three phases and conditions to
be met at each milestone is essential to identify the gaps that Vietnam needs to overcome, improve
its infrastructure.
In the short term, in line with the project implementation process in Vietnam, 8 issues of
National position; Management; Legislative framework; Regulatory framework; Human resource
development; Radioactive waste; Site survey, site selection and evaluation; and Environmental
protection in the first two phases need to be early studied and proposed the plan for filling gaps due
to the order of the project work and to timely arrange time for preparation of the capacity building,
overcoming and completion activities.
2. PURPOSE
The purpose of the task is to assess 8 issues of the national nuclear infrastructure for the new
research reactor project at the pre-project and project formulation phases (phase 1&2) to propose an
action plan that the Government, regulatory body, operation organization and related organizations
need to implement to complete the national nuclear infrastructure for the new research reactor
project in Phase 1&2, step by step meet the conditions of project implementation for each phases as
well as meet the requirements of nuclear safety, security and safeguards in accordance with the
international standards.
3. CONTENTS
According to the objectives set out, the Task implemented three following contents:
First, overviewed for 19 issues of national nuclear infrastructure of a research reactor project.
Second, studied and assessed to find out the gaps on eight essential issues of national nuclear
infrastructure for the New Research Reactor Project in Phase 1&2: National position; Management;
Legislative framework; Regulatory framework; Human resource development; Radioactive waste;
Site survey, site selection and evaluation; and Environmental protection.
Third, summarized and proposed action plans to complete the national nuclear infrastructure
on eight essential issues for the New Research Reactor Project in phase 1&2.
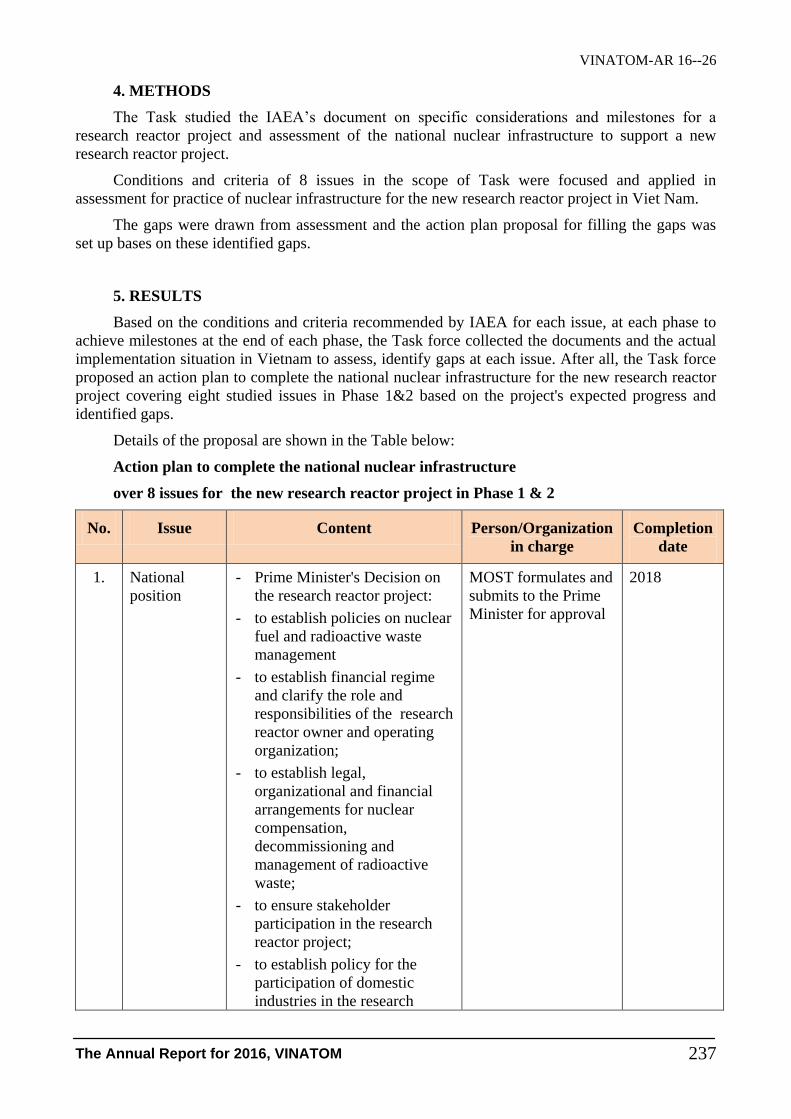
VINATOM-AR 16--26
The Annual Report for 2016, VINATOM 237
4. METHODS
The Task studied the IAEA’s document on specific considerations and milestones for a
research reactor project and assessment of the national nuclear infrastructure to support a new
research reactor project.
Conditions and criteria of 8 issues in the scope of Task were focused and applied in
assessment for practice of nuclear infrastructure for the new research reactor project in Viet Nam.
The gaps were drawn from assessment and the action plan proposal for filling the gaps was
set up bases on these identified gaps.
5. RESULTS
Based on the conditions and criteria recommended by IAEA for each issue, at each phase to
achieve milestones at the end of each phase, the Task force collected the documents and the actual
implementation situation in Vietnam to assess, identify gaps at each issue. After all, the Task force
proposed an action plan to complete the national nuclear infrastructure for the new research reactor
project covering eight studied issues in Phase 1&2 based on the project's expected progress and
identified gaps.
Details of the proposal are shown in the Table below:
Action plan to complete the national nuclear infrastructure
over 8 issues for the new research reactor project in Phase 1 & 2
No. Issue Content Person/Organization
in charge
Completion
date
1. National
position
- Prime Minister's Decision on
the research reactor project:
- to establish policies on nuclear
fuel and radioactive waste
management
- to establish financial regime
and clarify the role and
responsibilities of the research
reactor owner and operating
organization;
- to establish legal,
organizational and financial
arrangements for nuclear
compensation,
decommissioning and
management of radioactive
waste;
- to ensure stakeholder
participation in the research
reactor project;
- to establish policy for the
participation of domestic
industries in the research
MOST formulates and
submits to the Prime
Minister for approval
2018

VINATOM-AR 16--26
The Annual Report for 2016, VINATOM 238
reactor project;
- to ensure the national program
on safety of nuclear fuel and
State System of Accounting
for and Control of (SSAC)
nuclear material are efficiently
developed and implemented
- to ensure the programs for the
nuclear material and nuclear
facilities physical protection
are developed, established and
implemented;
- - to ensure the radiation
protection programs and
emergency response plans are
established and implemented;
2. Management - Strengthen Steeing Comittee
of research reactor project
MOST 8/2017
- Planning on Training and
education for expert, technical
officer, operator, manager and
leader
VINATOM prepares
and submits to MOST
for approval
12/2017
- Establishment for Integrated
Management System
VINATOM 12/2018
3. Legislative
framework
- Continuing with the Project on
revision of Atomic Energy
Law 2008
VARANS 12/2018
- Formulation of Circulars and
Guidelines related to Research
Reactor Project
VARANS 2017-2019
- Study on ability of adherence
to 1997 Vienna Convention,
Convention on Supplementary
Compensation
for Nuclear Damage
VARANS 2019
4. Regulatory
framework
- Setting up a Plan on
strengthening for manpower of
regulatory body
VARANS 2017
5. Human
resource
development
- Setting up a Training program VINATOM 2018
- Setting up a recruitment
program
VINATOM 2018
- Adding manpower demand
into bid requirements
Project Management
Board
2018
6. Site survey,
site selection
- Completing study on site
characteristics
Project Management
Board
2018

VINATOM-AR 16--26
The Annual Report for 2016, VINATOM 239
and
evaluation - Submitting dossier for site
approval
Project Management
Board
2018
7.
Environment-
al protection
- Additional study for the
Environmental Impact
Assessment Report
Nuclear Research
Institute
2017-2018
- Setting up plan and
development for the
environmental monitoring
system at site
Project Management
Board
2017
- Guidance for the content of
Environmental Impact
Assessment Report and
enhance capacity of
environmental regulatory body
VARANS/
VINATOM
coordinate with
Depart. of
Environment of
MONRE
2017
8. Radioactive
waste
- Capacity building for
radioactive waste management
VINATOM 2018-2025
MOST: Ministry of Science and Technology
VINATOM: Vietnam Atomic Energy Institute
VARANS: Vietnam Agency for Radiation and Nuclear Safety
MONRE: Ministry of Natural Resources and Environment
6. CONCLUSIONS
Vietnam's new research reactor project has its own particularity, it is a part of the Project on
Construction of Center for Nuclear Science and Technology. The time-frame for project preparation
is challenged due to the decision of the National Assembly on suspending the nuclear power
project. The site selection is also in trouble by the disagreement of Lam Dong Province Government
on the potential site in Precinct 12, Dalat City. All of these factors slow the progress of the project
and create unique features for the new research reactor project in Vietnam. The signing of the Inter-
governmental Agreement between the Government of Vietnam and the Russian Federation on
construction for the Center of Nuclear Science and Technology on the territory of Vietnam was
supposed to be the Government's commitment to a new research reactor project under which
nuclear infrastructure of Viet Nam has generally reached milestone 1 according to the IAEA criteria
but so far, due to the new situation, more confirmation from the Government is needed.
By studying and evaluating the current situation of nuclear infrastructure for the new research
reactor project in Vietnam on eight issues in phase 1 & 2, it is concluded that:
- Separate assessment for 8 issues of infrastructure shown that the issues management and
human resources are still in Phase 1; and the issues are in Phase 2 including National position;
Legal framework; Regulatory framework; Site survey and site selection; Environmental protection
and radioactive waste.
- To complete the issues in phase 1 and towards the completion of Phase 2 in the national
nuclear infrastructure for the research reactor project, the Task Force recommends considering the
proposals action plan presented above.
VINATOM-AR 16--26
The Annual Report for 2016, VINATOM 240
The assessments resulted from this Task may also be useful references for the Project
Preparation Board/ Project Management Board to carry out the necessary actions for the Center
Construction Project.
In order to provide a comprehensive assessment for nuclear infrastructure issues for the
research reactor project, the Task Force proposes to implement the follow-up task in 2017 on the
remain 11 issues. Thus, a comprehensive and systematic assessments of nuclear infrastructure for
the new research reactor in Vietnam will be used to smoothly carry out a new research reactor
project as well as use as material in coordination with the IAEA in the case of IAEA mission to
Vietnam for national nuclear infrastructure evaluation./.
REFERENCES
[1] Specific Considerations and Milestones for a Research Reactor Project, IAEA Nuclear Energy
Series, No NP-T-5.1, 2012.
[2] Assessment of the National Nuclear Infrastructure to support a new Research Reactor Project,
IAEA Nuclear Energy Series, No NG-T-x.x, 2015
[3] Report on study for proposals on some issues of the national nuclear infrastructure for the
New Research Reactor Project in phase 1&2, 2016, Cao Hong Lan, et al.

2. IAEA TC PROJECTSAND RESEARCH CONTRACTS

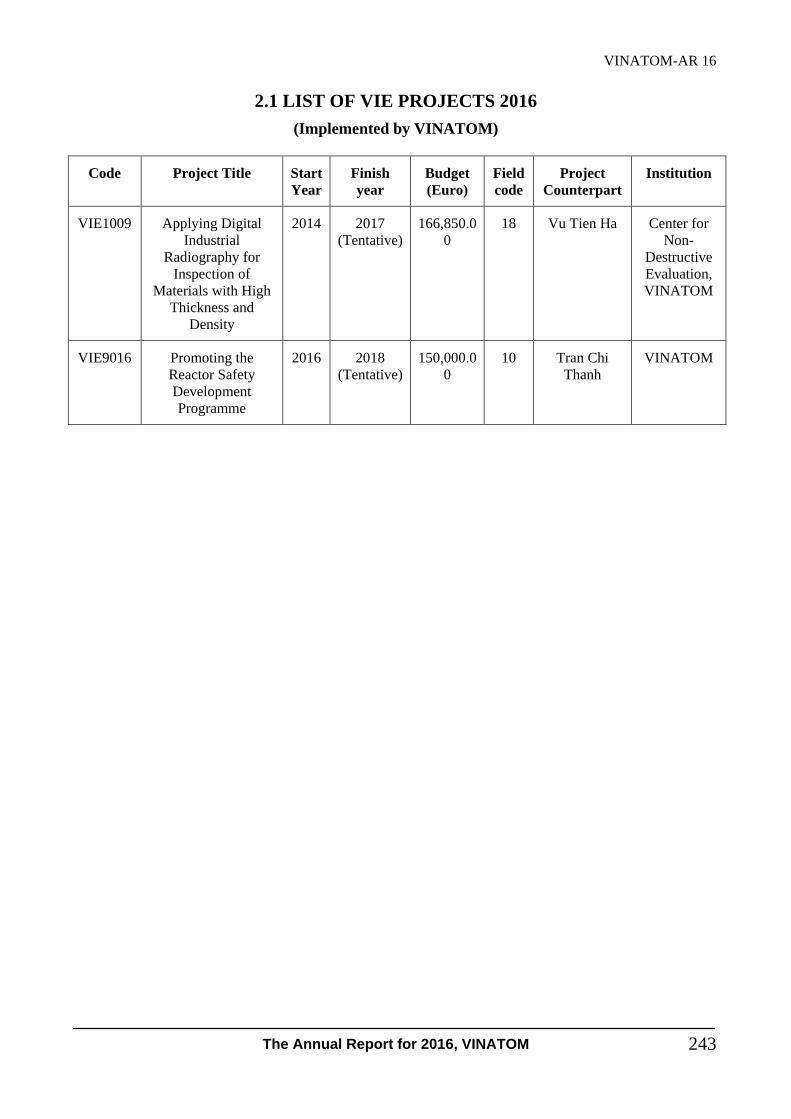
VINATOM-AR 16
The Annual Report for 2016, VINATOM
243
2.1 LIST OF VIE PROJECTS 2016
(Implemented by VINATOM)
Code Project Title Start
Year
Finish
year
Budget
(Euro)
Field
code
Project
Counterpart
Institution
VIE1009 Applying Digital
Industrial
Radiography for
Inspection of
Materials with High
Thickness and
Density
2014 2017
(Tentative)
166,850.0
0
18 Vu Tien Ha Center for
Non-
Destructive
Evaluation,
VINATOM
VIE9016 Promoting the
Reactor Safety
Development
Programme
2016 2018
(Tentative)
150,000.0
0
10 Tran Chi
Thanh
VINATOM
VINATOM-AR 15--

VINATOM-AR 16
The Annual Report for 2016, VINATOM 244
2.2 LIST OF FNCA PROJECTS 2016
(Participated by VINATOM and other Vietnam organizations)
Field Project Title Project Coordinator
Research
Reactor
Utilization
Development
Research Reactor
Network
Dr. Duong Van Dong
Director, Center for Research and Production of
Radioisotope, Nuclear Research Institute
Vietnam Atomic Energy Institute (VINATOM)
Neutron Activation
Analysis
Dr. Ho Manh Dung
Deputy Director, Nuclear Research Institute,
Vietnam Atomic Energy Institute (VINATOM)
Radiation
Utilization
Development
Mutation Breeding Prof. Le Huy Ham
Director General, Agricultural Genetics Institute
Ministry of Agriculture and Rural Development (MARD)
Biofertilizer Dr. Pham Van Toan
Director, Postgraduated Department,
Vietnam Academy of Agriculture Sciences (VAAS)
Ministry of Agriculture and Rural Development (MARD)
Radiation Oncology Dr. Bui Cong Toan
Head of General Radiotherapy Department,
National Cancer Hospital (K Hospital)
Nuclear Safety
Strengthening
Safety Management
Systems for Nuclear
Facilities
Dr. Nguyen Nhi Dien
Nuclear Research Institute
Vietnam Atomic Energy Institute (VINATOM)
Radiation Safety and
Radioactive Waste
Management
Dr. Pham Quang Minh
Director, Department for Planning and R&D Management,
Vietnam Atomic Energy Institute (VINATOM)
Nuclear
Infrastructure
Strengthening
Human Resources
Development
PhD. Nguyen Hao Quang
Vice President,
Vietnam Atomic Energy Institute (VINATOM)
Nuclear Security and
Safeguard
Dr. Nguyen Nu Hoai Vi
Director, Nuclear Control Division,
Vietnam Agency for Radiation and Nuclear Safety
(VARANS)

VINATOM-AR 16
The Annual Report for 2016, VINATOM 245
2.3 LIST OF RCA PROJECTS 2016
(Participated by VINATOM and other Vietnam organizations)
Code Title Year of
approval
Budget
(EUR)
Project
Type
Project
Coordinators
RAS1020
Building Capacity for
Applications of Advanced
Non-Destructive Evaluation
Technologies for Enhancing
Industrial Productivity (RCA)
2014
367,158.02
RCA Vu Tien Ha,
Center for Non-
Destructive
Evaluation,
VINATOM
RAS5057
Implementing Best Practices
of Food Irradiation for
Sanitary and Phytosanitary
Purposes
2012 282,136.66 RCA Tran Minh
Quynh,
Hanoi Irradiation
Center,
VINATOM
RAS5070
Developing Bioenergy Crops
to Optimize Marginal Land
Productivity through Mutation
Breeding and Related
Techniques (RCA)
2014
588,737.48
RCA Le Huy Ham,
Agricultural
Genetics Institute.
RAS5071
Strengthening Adaptive
Climate Change Strategies for
Food Security through the use
of Food Irradiation (RCA)
2014
315,035.15
RCA Tran Minh
Quynh,
Hanoi Irradiation
Center,
VINATOM
RAS6071
Strengthening Radionuclide
Therapy for High Impact
Cancer Treatment Strategy in
Member States of the
Regional Cooperative
Agreement (RCA)
2014 315,481.00 RCA Bui Vinh Quang,
Vietnam National
Cancer Hospital
RAS6072
Strengthening Intensity
Modulated Radiation Therapy
Capability in the Region
(RCA)
2014 470,360.00 RCA Le Van Tinh,
Vietnam National
Cancer Hospital
RAS6076
Improving Cancer
Management Through
Strengthening the Computed
Tomography Cancer Staging
Process (RCA)
2014 390,410.07 RCA Lam Khanh,
Central Military
Hospital 108

VINATOM-AR 16
The Annual Report for 2016, VINATOM 246
RAS6077
Strengthening the
Effectiveness and Extent of
Medical Physics Education
and Training (RCA)
2014
282,949.94
RCA Le Ngoc Ha,
Central Military
Hospital 108
RAS6083
Improving Patient Care and
Enhancing Government
Parties Capacity in Nuclear
Medicine programmes in the
RCA Region (RCA)
2016 359,219.98 RCA Mai Trong
Khoa,
Nuclear Medicine
and Oncology
Center, Bach-Mai
Hospital
RAS6085
Enhancing Stereotactic Body
Radiation Therapy for
Frequent Cancers in the RCA
Region (RCA)
2016 597,500.00 RCA Bui Quang Bieu
Central Military
Hospital 108
RAS7028
Enhancing Regional
Capabilities for Marine
Radioactivity Monitoring and
Assessment of the Potential
Impact of Radioactive
Releases from Nuclear
Facilities in Asia-Pacific
Marine Ecosystems (RCA)
2016 736,222.70 RCA Nguyen Van
Phuc
Nuclear Research
Institute,
VINATOM
RAS7029
Assessing the Impact of
Urban Air Particulate Matter
on Air Quality (RCA)
2016 326,763.79 RCA Vuong Thu Bac,
Institute for
Nuclear Science
and Technology,
VINATOM
RAS7030
Assessing Deep Groundwater
Resources for Sustainable
Management through the
Utilization of Isotopic
Techniques (RCA)
2016
529,059.58
RCA Nguyen Kien
Chinh,
Center for
Nuclear
Techniques,
VINATOM

VINATOM-AR 16
The Annual Report for 2016, VINATOM 247
2.4 LIST OF RESEARCH CONTRACT 2016
(Implemented by VIETNAM)
No Code Project Title Programme Start
Date
Expected
End Date
Completed
Date
Contract
Head
1 D15013 Approaches to
Improvement of Crop
Genotypes with High
Water and Nutrient use
Efficiency for Water
Scarce Environments
Food and
Agriculture
2011-
11-01
2016-11-
01
2017-08-02 (na)
2 D24012 Enhancing the
Efficiency of Induced
Mutagenesis through an
Integrated
Biotechnology Pipeline
Food and
Agriculture
2009-
02-04
2014-05-
20
2016-04-14 (na)
3 E35008 Strengthening of
“Biological dosimetry”
in IAEA Member
States: Improvement of
current techniques and
intensification of
collaboration and
networking among the
different institutes
Human
Health
2012-
02-10
2016-03-
31
2016-11-28 (na)
4 F12024 Utilisation of
Accelerator-Based
Real-time Methods in
the Investigation of
Materials with High
Technological
Importance
Nuclear
Science
2012-
03-28
2016-03-
28
2016-07-01 (na)
5 F22060 Radiometric Methods
for Measuring and
Modelling Multiphase
Systems Towards
Process Management
Radioisotope
Production
and
Radiation
Technology
2012-
07-09
2016-07-
09
2016-10-20 (na)
6 F33019 The Use of
Environmental Isotopes
to Assess Sustainability
of Intensively Exploited
Aquifer Systems
Water
Resources
2012-
07-09
2016-07-
09
2016-03-22 (na)
VINATOM-AR 15--
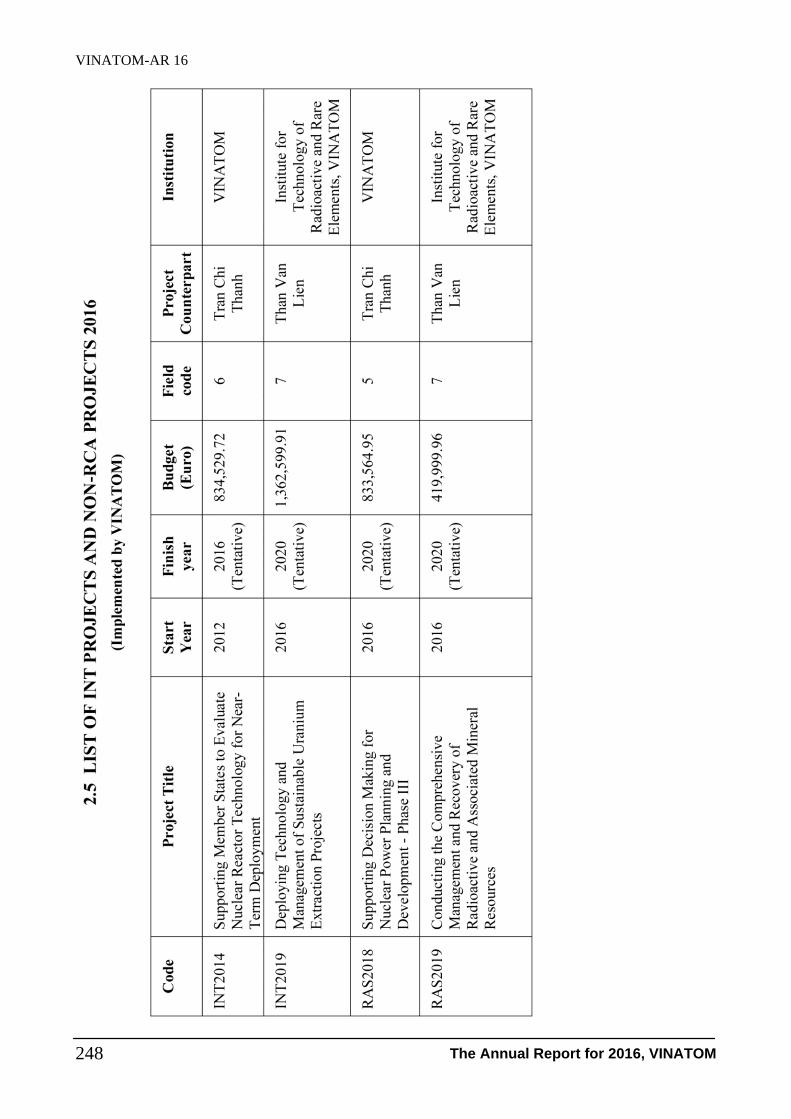
VINATOM-AR 16
The Annual Report for 2016, VINATOM 248
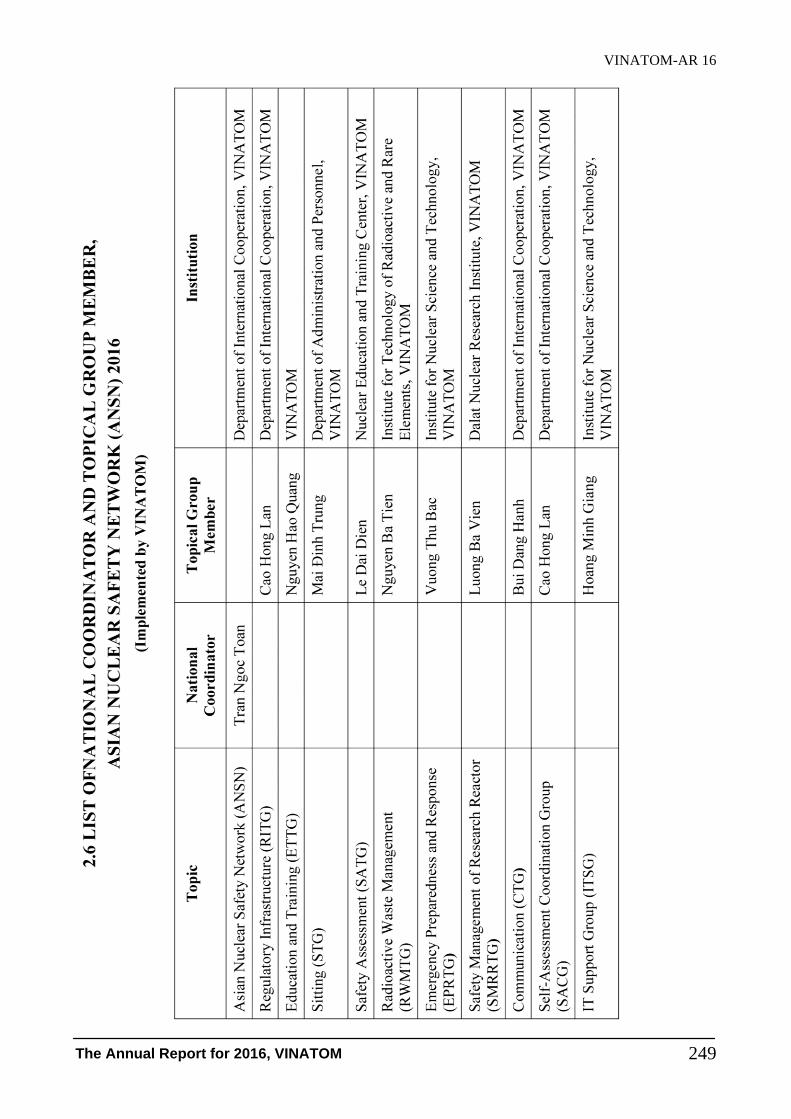
VINATOM-AR 16
The Annual Report for 2016, VINATOM 249

VIỆN NĂNG LƯỢNG NGUYÊN TỬ VIỆT NAM
The ANNUAL REPORT for 2016
Ban biên tập:
TS. Trần Chí Thành, Tổng biên tập
TS. Cao Đình Thanh, Phó tổng biên tập
KS. Nguyễn Hoàng Anh, Ủy viên, Thư ký Ban biên tập
TS. Nguyễn Thị Kim Dung, Ủy viên
ThS. Nguyễn Thị Định, Ủy viên
CN. Nguyễn Thị Phương Lan, Ủy viên.
VIETNAM ATOMIC ENERGY INSTITUTE
The ANNUAL REPORT for 2016
Responsible for publishing: Director and Editor-in-Chief
Pham Ngoc Khoi
Editor and Copy Editor: Nguyen Quynh Anh
Nguyen Minh Chau
Cover Designer: Nguyen Hoang Anh
SCIENCE AND TECHNICS PUBLISHING HOUSE
70 Tran Hung Dao Street, Hoan Kiem District, Hanoi City, Viet Nam
Tel: (+8424) 3942 3172 Fax: (+8424) 3822 0658
Email: [email protected]
Website: http://nxbkhkt.com.vn
BRANCH OFFICE
28 Dong Khoi Street, District 1, Ho Chi Minh City, Viet Nam. Tel: (+8428) 3852 5062
PARTNER LINKS
VIETNAM ATOMIC ENERGY INSTITUTE
59 Ly Thuong Kiet Road, Hoan Kiem District, Ha Noi
Quantity: 100 copies, size 20.5 x 29 cm, at Truong Xuan Printing Co., Ltd
Address: E1, X1 Area, Pham Hung Road, Nam Tu Liem District, Ha Noi City.
Publishing license No: 4315-2017/CXBIPH/3–150/KHKT.
Publishing decision No: 206/QĐ-NXBKHKT, date 11/12/2017.
Printing completed and copies deposited in December 2017.
ISBN: 978-604-67-1023-3