Amorphous iron-chromium oxide nanoparticles prepared by sonochemistry
1
Probing the tribochemical degradation of hydrogenated
amorphous carbon using mechanically stimulated gas
emission spectroscopy
Anton Rusanov a,b, Roman Nevshupa b,c*, Julien Fontaine a, Jean-Michel Martin a, Thierry Le
Mogne a, Vera Elinson d, Andrey Lyamin d, and Elisa Roman e
a Laboratoire de Tribologie et Dynamique des Systèmes, Ecole Centrale de Lyon, UMR 5513,
69134 Ecully Cedex, France
b Bauman Moscow State Technical University, 2-Baumanskaia 5, Moscow 105005, Russia
c IETCC-CSIC, C/ Serrano Galvache 4, Madrid 28033, Spain
d Russian State Technological University MATI, Orshanskaya 3, Moscow 121552, Russia
e Institute of Materials Science of Madrid, ICMM-CSIC, C/ Sor Juana Inés de la Cruz 3,
Madrid 28049, Spain
Abstract
Mechanically Stimulated Gas Emission (MSGE) spectroscopy was used for investigation into
tribochemical reactions and gas emission for four types of amorphous hydrogenated carbon
(a-C:H) coatings, which were obtained by either ion beam deposition (IBD) or plasma
enhanced chemical vapour deposition (PECVD). The results of statistical analysis, which was
employed to identify the components of the emitted gases from the mass-spectrometry data,
argue against the hypothesis that considerable amount of CH3 could be present in the emitted
* Corresponding author. E-mail: [email protected] (Roman Nevshupa)
*ManuscriptClick here to view linked References

2
gases. For the IBD coatings the main components of the emitted gases were methane and/or
argon, whereas for the PECVD coatings they were mainly methane and hydrogen. Noticeable
emission of ethane, propane, carbon mono- and dioxides was also detected under sliding of
PECVD coatings deposited with the lowest ion energy. While frictional heating has been
definitely ruled out as the driving mechanism for MSGE, there are experimental evidences
that MSGE has to be associated with structural degradation of the coating.
1. Introduction
Hydrogenated amorphous carbon (a-C:H) is one of the most promising solid lubricant coating
for ultrahigh vacuum (UHV) and aerospace applications because of its super-low friction,
high wear and chemical resistance in vacuum [1, 2]. The structure of a-C:H film represents a
multiphase heterogeneous saturated/unsaturated twisted network including polymeric carbon
materials and hydrogenated carbon structures with sp, sp2 and sp3 carbon centres and
alternating local order and random local distortions [3-5]. Presently, there is a consensus that
both the ratio of two hybridized forms of carbon sp2 and sp3 and the total content of
incorporated hydrogen are responsible for the large variety of types of hydrogenated
amorphous carbon and its properties [6-9].
Hydrogen is essential for achieving super-low friction (SLF) of a-C:H with friction
coefficient below 0.02 in inert conditions [10-14]. In fact, thermal desorption of hydrogen
usually led to the increase in friction coefficient in vacuum [2, 13, 15]. SLF regime is
associated with a build-up of a transfer film and easy shear between hydrocarbon chains on
the mating surfaces due to coulombic repulsion between positively charged hydrogen atoms
[14, 16-18].
Nevertheless, a-C:H coatings have a serious weak point in that SLF regime is usually
unstable in vacuum: after certain, in many cases quite large, number of friction cycles or
3
sliding distance, it spontaneously switches to solid friction regime with coefficient of friction
much higher than 0.1 [11, 12, 16, 19]. Most of the researchers agree that the instability of SLF
has to be attributed to spontaneous hydrogen desorption from the coating during sliding [1, 2,
15]. Here, a question arises about the molecular mechanisms of this process. Recently Tight-
Binding Quantum Chemical Molecular Dynamics (TB-QCMD) simulation was used to
elucidate the chemical reactions in the sliding interface of a-C:H [18, 20]. These studies have
demonstrated that terminal H atoms can be easily transferred between neighbouring C centres
contributing either to cleavage of C-C bonds or generation of molecular hydrogen. Hayashi et
al. [20] concluded that because of these reactions hydrogen termination cannot lubricate
carbon for contact pressures above 7 GPa. Furthermore, they suggested that the molecular
hydrogen could lubricate because of the steric effect due to larger separation of the mating
surfaces. Bearing in mind that most of molecular hydrogen has to rapidly escape from the
contact zone because of large activation energy for adsorption on both hydrogenated and non-
hydrogenated carbon [21], emission of hydrogen (and other gases) from the sliding interface
must correlate with near-surface chemistry and, therefore, can serve as virtually real-time
probe for a-C:H decomposition in UHV under mechanical loading [22, 23]. Numerous
investigations into chemical mechanisms of thermal decomposition of a-C:H support this
hypothesis [24-26].
So far, only limited studies of mechanically stimulated gas emission (MSGE) from
amorphous carbon coatings were done, while the available literature data is rather
inconsistent. The group of Zaidi [12, 27] was, probably, the first who measured the
composition of the emitted gases during friction of various amorphous carbon coatings in
vacuum (10-4 Pa). They identified ions with mass-to-charge ratios, m/z, 1, 2, 17 and 19, which
were attributed to H+, H2+, OH+, and H3O
+. The reasons for the occurrence of hydroxyl and
hydronium ions were not evident since the coatings contained neither water nor oxygen. Lack

4
of hydrocarbons was also surprising since methane has typically been observed in MSGE
spectra for most technical materials and coatings [22, 28]. Though metals and ceramics may
have no carbon in their chemical compositions, a nanometre-thick surface layer of air-borne
carbon contaminants can act as a precursor for methane emission [22]. Furthermore, the
results in [12, 27] notably contrasted with thermal desorption spectra of various amorphous
carbon films (this subject is discussed in detail in Section 4.1).
Recently, Rusanov et al. [28] reported initial results on the composition of the emitted gases
from highly hydrogenated a-C:H coatings in UHV (10-8 Pa) obtained by cycling the mass-to-
charge ratio of a mass-spectrometer through the range from 1 to 99. The only ions detected in
this study were m/z 2, 12-16. While the ions with m/z 2 were undoubtedly corresponded to
H2+, the origin of a group of ions with m/z 12-16 was ambiguous since these ions can be
assigned to fragments of both methane molecules and methyl radicals. An analysis of thermal
desorption performed in the work [24] suggested a common rate determining step for methane
and methyl formation, i.e., methane was formed in a consecutive recombination step, after
liberation of methyl radical from the a-C:H network. So, analysis of the composition of
emitted hydrocarbons may shed light onto the near-surface chemistry that is extremely
important for the elucidation of friction and wear mechanisms of a-C:H [29]. In view of
mostly qualitative studies of MSGE in the past, obtaining the quantitative data on the MSGE
for both hydrogen and hydrocarbons is another challenging problem.
In the present work mass-spectra of MSGE from four different a-C:H coatings were
analysed in order to understand the effect of the coating chemical composition and structure
on the composition and behaviour of MSGE. On the basis of the experimental findings
possible mechanisms of MSGE from a-C:H are discussed.
2. Experimental technique and procedure
5
2.1. Coatings deposition
The present exploratory study pursue the goal of identification of the main characteristics of
the phenomenon for several coatings, which have different hydrogen content and may have
Ar molecules incorporated in the coatings. For this purpose, four different a-C:H coatings
(D1-D4) were selected. The coatings were deposited on silicon substrates using one of the two
methods: ion beam deposition (IBD) and plasma-enhanced chemical vapour deposition
(PECVD). The parameters of the deposition are shown in Table 1. IBD with higher ion energy
was used to deposit the coatings with relatively low hydrogen content, whereas PECVD was
used to obtain the coatings with higher hydrogen content [25, 30, 31]. Deposition of the
coatings D-2 was assisted by Ar+ bombardment in order to incorporate Ar atoms into the
coating. Acetylene was used as a precursor gas for deposition of the PECVD D-3 coatings and
cyclohexane was used for other three coatings. The coatings D-1, D-2 and D-4 were
developed in this work, whereas D-3, identical to AC8 [1, 28], were provided by IBM.
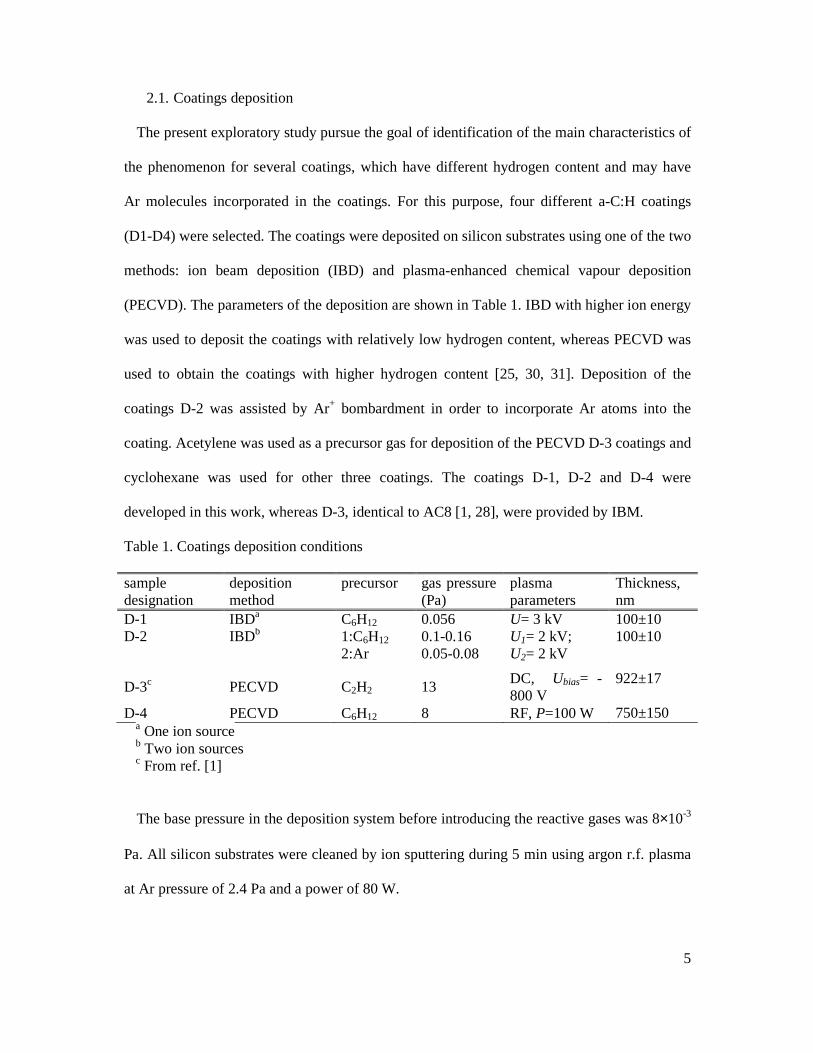
Table 1. Coatings deposition conditions
sample designation
deposition method
precursor gas pressure (Pa)
plasma parameters
Thickness, nm
D-1 IBDa C6H12 0.056 U= 3 kV 100±10 D-2 IBDb 1:C6H12
2:Ar 0.1-0.16 0.05-0.08
U1= 2 kV; U2= 2 kV
100±10
D-3c PECVD C2H2 13 DC, Ubias= -800 V
922±17
D-4 PECVD C6H12 8 RF, P=100 W 750±150 a One ion source b Two ion sources c From ref. [1]
The base pressure in the deposition system before introducing the reactive gases was 8×10⁻³
Pa. All silicon substrates were cleaned by ion sputtering during 5 min using argon r.f. plasma
at Ar pressure of 2.4 Pa and a power of 80 W.
6
2.2. Characterization of hydrogen content
Hydrogen content in the coatings was characterized by Elastic Recoil Detection Analysis
(ERDA) using incident He2+ ions with energy of 2 MeV, ion current in the range between 12
and 15 nA and the total dose between 2.5 and 10 µC. The forward recoiled atoms were
filtered by a 13 µm thick Mylar film.
2.3. Friction test and gas emission measurement
Sliding friction tests were carried out using an original ultrahigh vacuum tribometer with a
“ball-on-flat” configuration and reciprocating motion of the pin. Undesirable and harmful for
desorption measurements outgassing from the mechanical parts was largely avoided by
placing all the motors and guides of the tribometer outside the vacuum chamber. The details
of the experimental system were previously reported [32]. The pins were made of AISI 52100
steel and had a spherical mirror-polished tip with a radius of 8 mm. The pins were
ultrasonically cleaned first with heptane and then with ethanol. Experiments were conducted
at ambient temperature under ultrahigh vacuum in the 10-8 Pa pressure range. The main series
of the tests was carried out with the following sliding conditions: normal load 1 N and sliding
velocity, V, 0.5 mm s-1. Additional tests at severer sliding conditions (normal load 3 to 4 N
and sliding velocity 2 mm s-1) were conducted for the coatings D-3 and D-4 having very
stable SFL regime, in order to study the transition from SLF to solid friction regimes.
Gas emission from the coatings was studied using a quadrupole mass-spectrometer (QMS)
operated in one of two modes: Multiple Ion Determination (MID) or Mass Scanning (MS).
The first mode was used to measure the kinetics of gas desorption for selected gases with
higher time resolution. In this mode, the selected range of m/z was scanned continuously
before, in the course of rubbing and after the sliding test end.
7
The MS mode was used to determine the general composition of desorbed gases. For this
purpose the mass-spectra of residual gases were acquired before and during sliding. At least
15 measurements of each mass-spectrum were acquired to reduce random errors.
Furthermore, to avoid data scattering resulting from intrinsic variation of the MSGE rate, the
mass-spectra were measured in short time intervals, typically in the range of 10 to 20 s. The
time intervals for data acquisition were selected to have the desorption rate most stable
without loss of representativeness of the data samples. After checking the distribution of the
measured data samples for normality using Shapiro-Wilk method [33], the statistical
parameters – mean value and standard error of the mean – were determined for each ion
component of the mass-spectra. Finally, mean differential mass-spectrum (MDMS) was
calculated as a difference between the mean mass-spectrum during sliding and the
corresponding reference mass-spectrum acquired before sliding.
The partial pressures of different gas components emitted during sliding of the a-C:H
coatings were determined from the mass-spectrometry data using the matrix regression
method and the reference fragmentation patterns of gas molecules (see Supplementary
materials SI and Table S1). Though no information on the fragmentation pattern of CH3 was
found in literature, it has been reasonably assumed that the main ion fragments have to be in
the range of m/z from 12 to 15. Bearing in mind natural abundance of heavier isotopes of
hydrogen and carbon, ions with m/z 16 can also be found in the mass-spectrum of CH3, but
their contribution has to be quite small and can be neglected. If the emitted gases contain the
mixture of CH4 and CH3, the resulting MDMS should have an excess of ions with m/z 12-15
as compared with the reference mass-spectrum of pure methane. Thus, the method of analysis
of variances (ANOVA) [34] was applied in this work for statistical comparison of the MDMS
and the standard mass-spectrum of methane. To this end, mean experimental fragmentation
coefficients, , were determined from the MDMS for i=m/z in the range from 12 to 15:
8
/, (1)
where is the mean ion current of the principal component of methane mass-spectrum at
m/z 16.
By assuming that the measurement errors of j i and j16 are independent the standard error (se)
of the mean of can be determined from the Gauss’ formula:
."
, (2)
where #$ and # are the standard errors of and , correspondingly.
The kinetic parameters of MSGE – mean total gas desorption rate of the l-th gas
component, Ql, and the specific amount of the l-th gas component per total mechanically
affected volume, NVW,l, – were determined from the MID mass-spectrometry data using the
following formulae [22, 35, 36]:
( )∫ −−
=kt
tll
k
ll dtptp
tt
SQ
0
00
)( , (3)
w
kllVW V
ttQN
)( 0,
−= , (4)
where Sl is the pumping speed for the l-th gas components, tk – t0 is the period of time during
which the MSGE occurred; pl(t) is the pressure of the l-th gas component, p0l is the
equilibrium pressure for the l-th gas component before sliding, Vw is the total mechanically
affected volume of material.
3. Experimental results
3.1. ERDA
Hydrogen content in the topmost layers of the coatings D-2, D-1, D-3, and D-4 scaled as 15
at.% : 22 at.% : 31 at.% : 46 at.%, correspondingly. These results are consistent with literature
data for a-C:H obtained under similar deposition conditions [31, 37]. For D-3 there is also a
9
satisfactory agreement with the results of Donnet et al. [30] who reported H concentration of
34 at. %. in a coating AC8 identical to D-3. The difference of 3 at. % can be considered rather
insignificant bearing in mind the measurement uncertainty (standard error 1.2 at. %). Our
results suggest that the IBD and PECVD coatings can be classified as moderately
hydrogenated and highly hydrogenated amorphous carbon, correspondingly. The coatings D-4
can probably be considered as transitional between hydrogenated DLC and PLC. Relatively
low hydrogen content in D-1 and D-2 has to be responsible for poor tribological
characteristics of these coatings in vacuum that is consistent with literature [1, 15, 38].
With exception of D-2, the increase in H concentration correlated with the decrease in a
substrate bias during deposition or equivalent impinging ion energy. This tendency was
generally observed in literature [25, 30, 31, 37, 39-41]. Nevertheless, the tendency was
opposite for the IBD coatings: for D-2 both the ion energy and H content were lower than for
D-1. This finding can be related to the effect of Ar+ during deposition due to surface
sputtering and H re-emission from the bulk [31, 42]. Comparing the PECVD coatings, larger
H content in D-4 can, in part, be attributed to the difference in precursor gases: the coatings
grown from linear and cyclic alkanes, i.e. cyclohexane, tend to have more polymer-like
structure with higher content of hydrogen than the coatings obtained from acetylene [30].
3.2. MSGE and friction behaviour
The coatings obtained by IBD and PECVD had very different friction and MSGE
behaviour. In agreement with the previously reported results [28], both the PECVD coatings –
D-3 and D-4 – reached the SLF friction regime. The typical behaviour of friction coefficient
for these coatings was characterized by four stages: I – the initial friction decrease during run-
in, II – the SLF regime, III – the transitional friction increase, and IV – the steady “solid”
friction regime (Figs. 1 and 2). For all the coatings MSGE vanished when the coating had
10
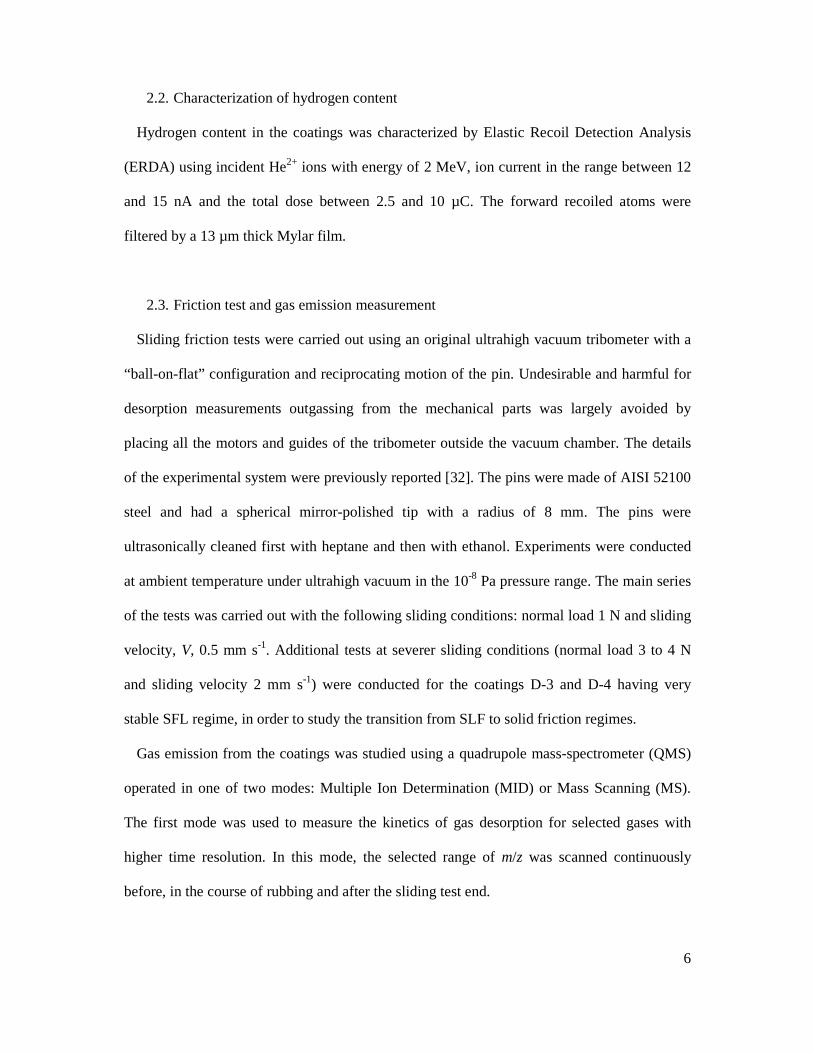
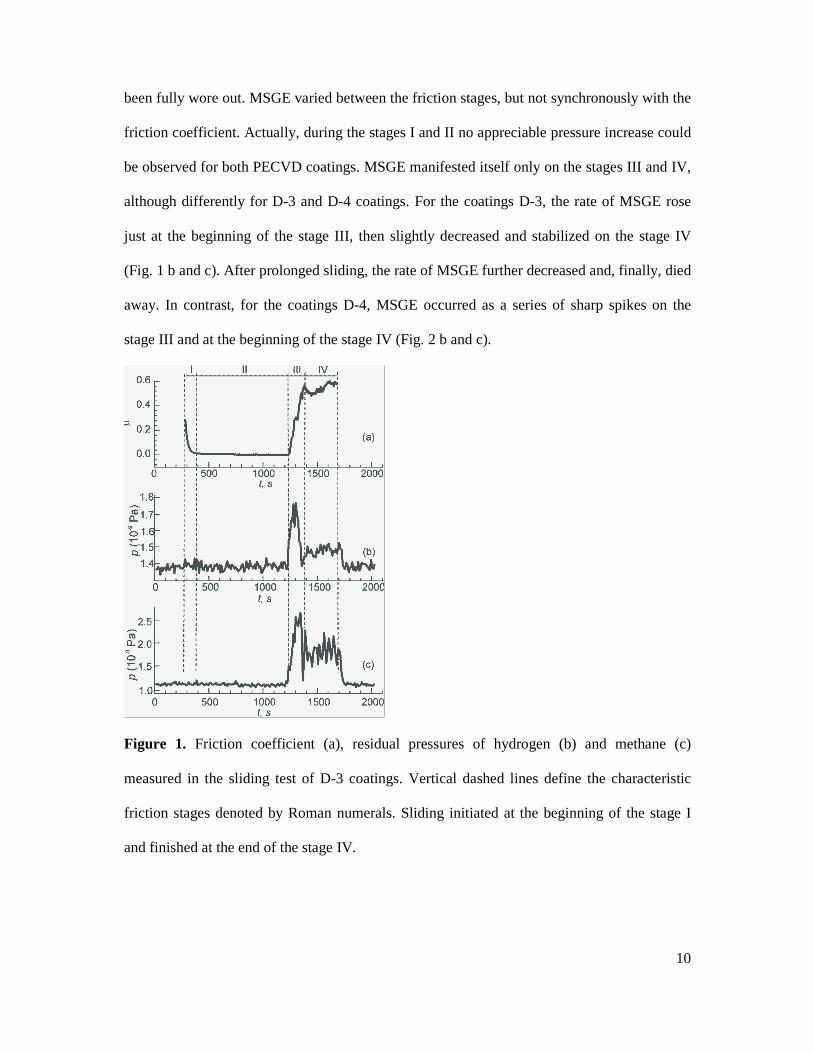
been fully wore out. MSGE varied between the friction stages, but not synchronously with the
friction coefficient. Actually, during the stages I and II no appreciable pressure increase could
be observed for both PECVD coatings. MSGE manifested itself only on the stages III and IV,
although differently for D-3 and D-4 coatings. For the coatings D-3, the rate of MSGE rose
just at the beginning of the stage III, then slightly decreased and stabilized on the stage IV
(Fig. 1 b and c). After prolonged sliding, the rate of MSGE further decreased and, finally, died
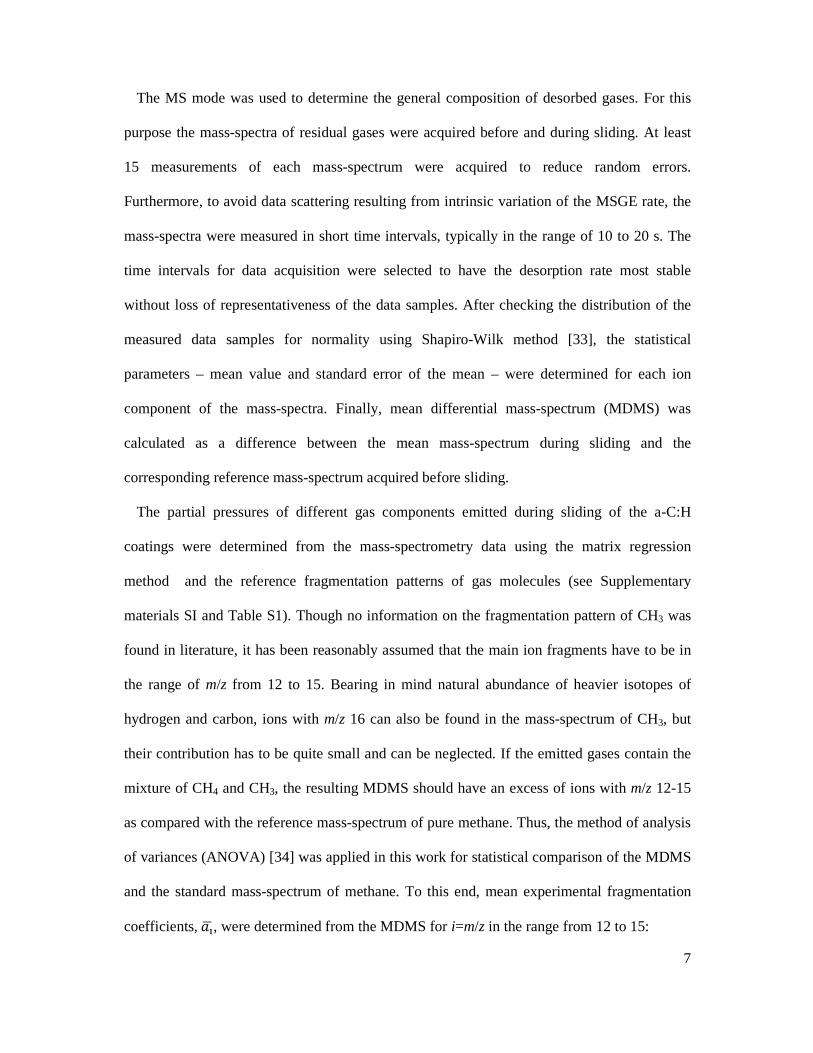
away. In contrast, for the coatings D-4, MSGE occurred as a series of sharp spikes on the
stage III and at the beginning of the stage IV (Fig. 2 b and c).
Figure 1. Friction coefficient (a), residual pressures of hydrogen (b) and methane (c)
measured in the sliding test of D-3 coatings. Vertical dashed lines define the characteristic
friction stages denoted by Roman numerals. Sliding initiated at the beginning of the stage I
and finished at the end of the stage IV.

11
Figure 2. Friction coefficient (a), residual pressures of hydrogen (b) and methane (c)
measured in the sliding test of D-4 coatings. Vertical dashed lines define the characteristic
friction regions denoted by Roman numerals. Sliding initiated at the beginning of the stage I
and finished at the end of the stage IV.
The transient pressure decay on the falling edges of the spikes was much slower than the
pumping process: the time constants were >100 s and 0.94±0.14 s, correspondingly.
Therefore, the pressure decay seems to be an intrinsic property of the MSGE characteristic for
this type of a-C:H. The pressure spikes generally coincided with the peaks of friction
coefficient. Certain correlation in amplitude of the pressure spikes and the friction peaks can
12
also be observed. Similar spike MSGE behaviour was recently reported for the coatings
obtained by PECVD from acetylene gas precursor [28].
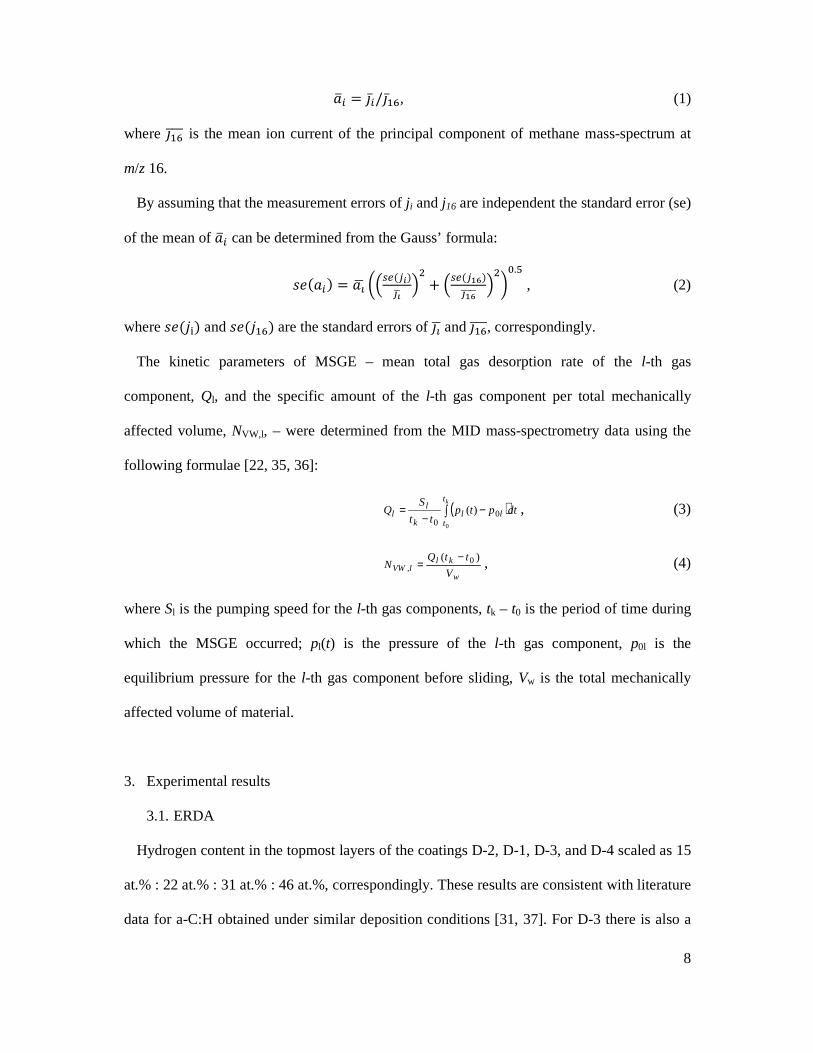
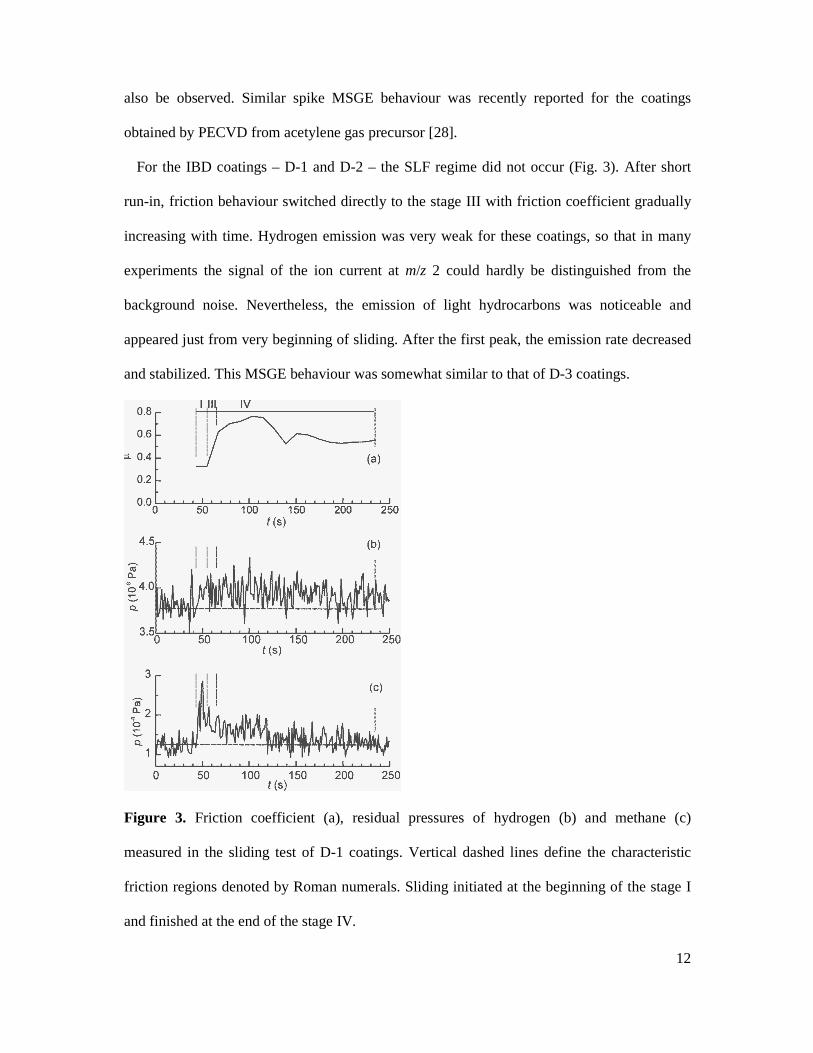
For the IBD coatings – D-1 and D-2 – the SLF regime did not occur (Fig. 3). After short
run-in, friction behaviour switched directly to the stage III with friction coefficient gradually
increasing with time. Hydrogen emission was very weak for these coatings, so that in many
experiments the signal of the ion current at m/z 2 could hardly be distinguished from the
background noise. Nevertheless, the emission of light hydrocarbons was noticeable and
appeared just from very beginning of sliding. After the first peak, the emission rate decreased
and stabilized. This MSGE behaviour was somewhat similar to that of D-3 coatings.
Figure 3. Friction coefficient (a), residual pressures of hydrogen (b) and methane (c)
measured in the sliding test of D-1 coatings. Vertical dashed lines define the characteristic
friction regions denoted by Roman numerals. Sliding initiated at the beginning of the stage I
and finished at the end of the stage IV.

13
3.3. Composition of the emitted gases
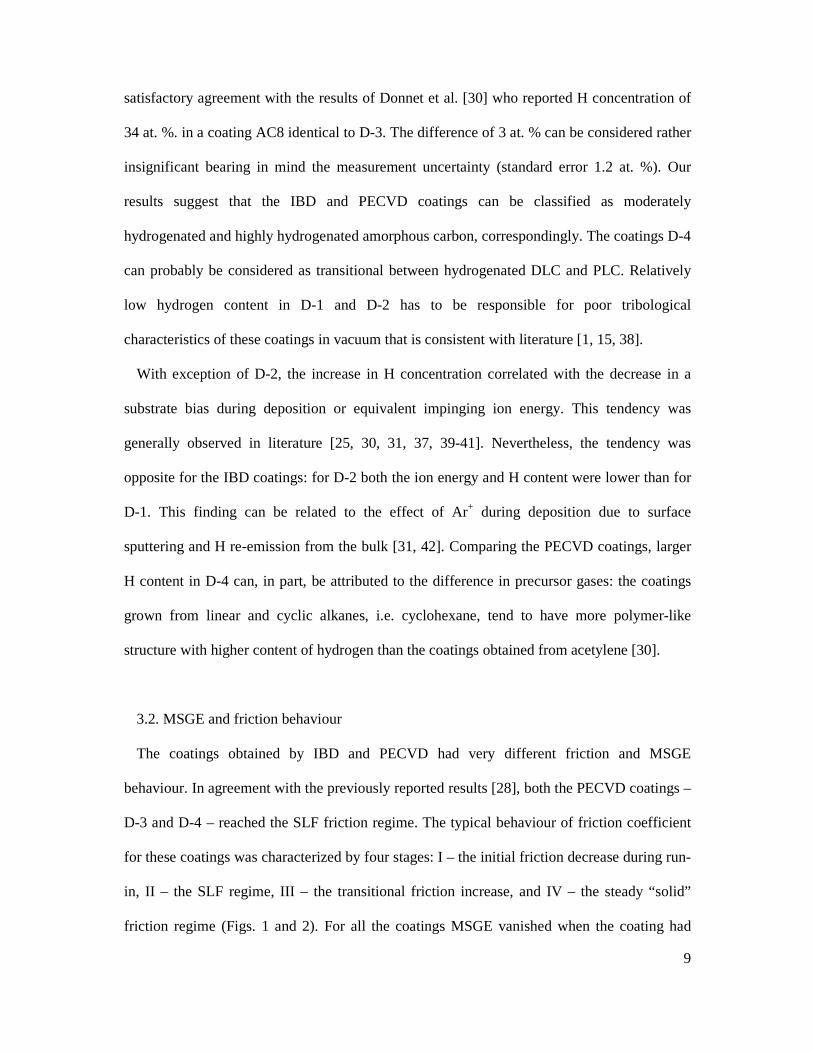
Figure 4 shows the MDMS of the emitted gases for four types of the coatings. For D-3 the
MDMSs were determined on the stage III during the pressure spikes only, whereas for other
coatings they were determined on the stage IV when the MSGE was nearly uniform. Two-fold
standard errors of the mean are shown by vertical error bars.
Figure 4. Mean differential mass-spectra of gases emitted during sliding of the a-C:H
coatings: D-1 (a), D-2 (b), D-3 (c) and D-4 (d). Inset (e) shows the enlarged portion of the
graph (d) in the range of m/z from 24 to 45.

14
The ion components present in all MDMSs were CHn+ with n from 0 to 4. Intensive peaks
of Ar+ and Ar2+ were identified in the MDMSs for D-2. In some tests weak hydrogen
desorption could also be observed, however, the desorption rate had large variation between
different tests even on the same sample. This behaviour was consistent with previous results
and can be related with non-uniform degradation of the coatings under tribological activation
[28].
For the PECVD coatings, H2+ and CHn
+ with n from 0 to 4 were the main components of
the MDMSs. In addition, two groups of ions with m/z from 25 to 29 and from 41 to 45 with
main peaks at m/z 28 and 44 were found for the coatings D-4. Though the main peaks could
be attributed to carbon mono- and dioxide, presence of smaller peaks nearby indicated
possible contribution from ethane, propane, cyclopropane and/or propene. The MDMSs were
fitted by the reference mass-spectra of these possible gas components, using linear regression
method. Then, backward elimination procedure with a sequence of F-tests was employed in
order to discard the gas components which contribution might be statistically insignificant
[33]. Adjusted coefficient of determination, R2, is shown on Table 2 for various combinations
of gas components. From this analysis, cyclopropane and propene were discarded at
significance level of 0.05. When the model included the following gases: H2, CH4, C2H6,
C3H8, CO and CO2, the best regression quality was achieved as indicated by the highest value
of R2, which was very close to unity.
Table 3 shows mean values and standard error of the mean for partial pressures determined
using linear regression analysis of the mass-spectra. In this analysis, standard values of the
ionization probability of each gas, fractional abundance of ion fragments, sensitivity,
transmission and detection factors of the mass-spectrometer were taken in accordance to the
QMS manufacturer’s guide [43]. In terms of pressure, methane was the dominant component
followed by hydrogen. For H2 and CH4 mean partial pressures were statistically significant at
15
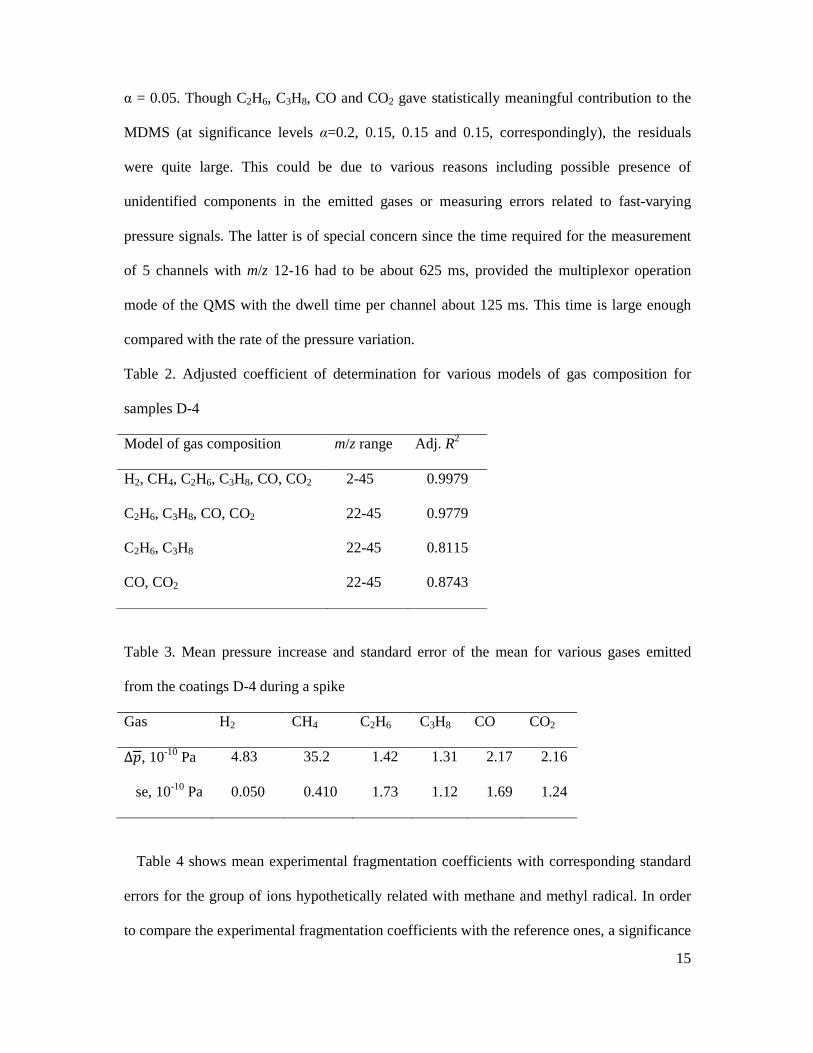
α = 0.05. Though C2H6, C3H8, CO and CO2 gave statistically meaningful contribution to the
MDMS (at significance levels α=0.2, 0.15, 0.15 and 0.15, correspondingly), the residuals
were quite large. This could be due to various reasons including possible presence of
unidentified components in the emitted gases or measuring errors related to fast-varying
pressure signals. The latter is of special concern since the time required for the measurement
of 5 channels with m/z 12-16 had to be about 625 ms, provided the multiplexor operation
mode of the QMS with the dwell time per channel about 125 ms. This time is large enough
compared with the rate of the pressure variation.
Table 2. Adjusted coefficient of determination for various models of gas composition for
samples D-4
Model of gas composition m/z range Adj. R2
H2, CH4, C2H6, C3H8, CO, CO2 2-45 0.9979
C2H6, C3H8, CO, CO2 22-45 0.9779
C2H6, C3H8 22-45 0.8115
CO, CO2 22-45 0.8743
Table 3. Mean pressure increase and standard error of the mean for various gases emitted
from the coatings D-4 during a spike
Gas H2 CH4 C2H6 C3H8 CO CO2
∆&, 10-10 Pa 4.83 35.2 1.42 1.31 2.17 2.16
se, 10-10 Pa 0.050 0.410 1.73 1.12 1.69 1.24
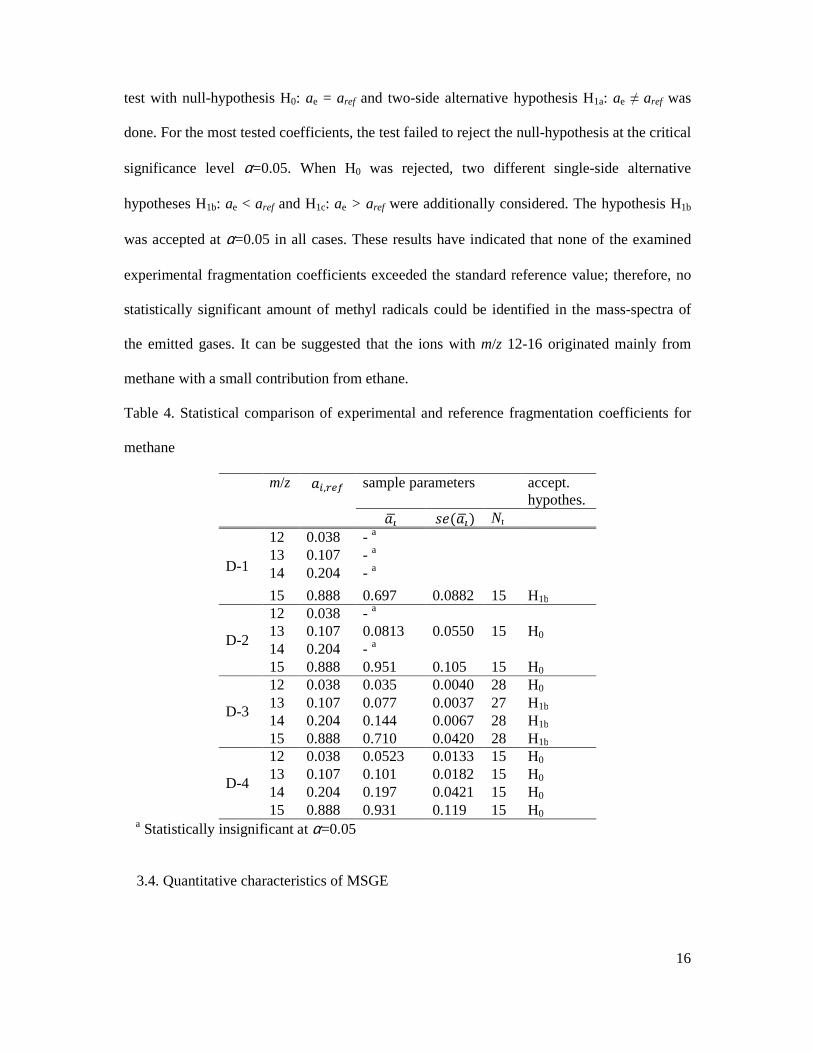
Table 4 shows mean experimental fragmentation coefficients with corresponding standard
errors for the group of ions hypothetically related with methane and methyl radical. In order
to compare the experimental fragmentation coefficients with the reference ones, a significance
16
test with null-hypothesis H0: ae = aref and two-side alternative hypothesis H1a: ae ≠ aref was
done. For the most tested coefficients, the test failed to reject the null-hypothesis at the critical
significance level α=0.05. When H0 was rejected, two different single-side alternative
hypotheses H1b: ae < aref and H1c: ae > aref were additionally considered. The hypothesis H1b
was accepted at α=0.05 in all cases. These results have indicated that none of the examined
experimental fragmentation coefficients exceeded the standard reference value; therefore, no
statistically significant amount of methyl radicals could be identified in the mass-spectra of
the emitted gases. It can be suggested that the ions with m/z 12-16 originated mainly from
methane with a small contribution from ethane.
Table 4. Statistical comparison of experimental and reference fragmentation coefficients for
methane
m/z ,() sample parameters accept. hypothes.
Nr
D-1
12 0.038 - a 13 0.107 - a 14 0.204 - a
15 0.888 0.697 0.0882 15 H1b
D-2
12 0.038 - a 13 0.107 0.0813 0.0550 15 H0 14 0.204 - a 15 0.888 0.951 0.105 15 H0
D-3
12 0.038 0.035 0.0040 28 H0 13 0.107 0.077 0.0037 27 H1b 14 0.204 0.144 0.0067 28 H1b 15 0.888 0.710 0.0420 28 H1b
D-4
12 0.038 0.0523 0.0133 15 H0 13 0.107 0.101 0.0182 15 H0 14 0.204 0.197 0.0421 15 H0 15 0.888 0.931 0.119 15 H0
a Statistically insignificant at α=0.05
3.4. Quantitative characteristics of MSGE

17
Statistical parameters of experimental MSGE rates for hydrogen, methane and argon are
shown in Table 5. In order to reduce the measuring error related with the pressure variation,
the parameters for D-1 – D-3 were determined during the whole stage IV, whereas, for D-4
they were evaluated during the spikes only.
Table 5. Total gas desorption rate, Ql, standard error of the mean, seQl, maximum desorption
rate, maxQl, and specific amount of desorbed gases per unit volume of worn coating for H2,
CH4 and Ar
Ql / seQl / maxQl (10-12 Pa m3 s-1) l H2 CH4 Ar D-1 1.95 / 1.02 / 3.95 D-2 0.73 / 0.17 / 0.94 18.3 / 6.5 / 29.4 D-3 8.95 / 6.01 / 13.2 17.2 / 7.4 /22.4 D-4 48.0 / 21.0 /110.0 31.0 / 14.0 / 59.0 NVW,l (mol cm-3) D-1 1.04×10¹⁹ D-2 1.33×10¹⁸ 9.9×10¹⁹ D-3 7.0×10¹⁷ 1.64×10¹⁸ D-4 1.14×10²⁰ 5.8×10¹⁹
For the IBD coatings the rate of hydrogen emission was statistically insignificant and is not
shown. For D-2 Argon was the dominant species comprising 96% of the total emission yield,
whereas the rate of methane emission was the lowest among all the coatings. With respect to
the methane emission rate, the coatings can be ranged in the following order: D-2 < D-1 < D-
3 < D-4, while the emission rate between D-2 and D-4 increased almost forty-fold. This order
is the same as found for the H concentration in the coatings. Comparing D-3 and D-4, it was
observed that the proportion between methane and hydrogen changed from about 2 for D-3 to
0.65 for D-4. Furthermore, quite surprising was the finding that the instant ratio CH4:H2
considerably varied in course of sliding for the same coating. Figure 5 shows cross-
correlations between the instantaneous values of the emission rates for methane and hydrogen
18
for D-3 (a) and D-4 (b). Solid lines are the linear fits to the experimental data, while the
dashed lines show the upper and the lower bounds. In addition, for the coating D-3, the data
corresponding to the stages III (open dots) and IV (solid dots) were fitted separately (the lines
bIII and bIV). These results show a clear trend of gradual increase in the ratio CH4:H2 along the
stages III and IV. The total span of the ratio was almost one order of magnitude. For the
coating D-4 the ratio also had large dispersion, but without some definite trend. These finding
can conceivably be related with different H content in the PECVD coatings. Indeed, the
depletion of hydrogen in the coating has to be faster when the initial H concentration is lower.
Depletion of H can be the reason for gradual decrease in relative H2 concentration in the
emitted gases. Though under given experimental conditions MSGE is not driven by frictional
heating (see Section 4.2), there is some analogy with thermal effusion experiments [44, 45],
where H2 emission usually slightly anticipated the emission of hydrocarbons. These similarity
may indicate that the same reaction pathways underpin both thermal and mechanochemical
degradation of a-C:H.
Apart from the chemical composition both the coating’s thickness and wear rates could
influence MSGE [46]. In fact, the thicker the coatings the larger should be the total amount of
emitted gases. The same applies for the wear rate. To account for these factors, the total
amount of the emitted gases was divided by the total volume of the material in the
mechanically affected zone. The resulting parameter - specific amount of desorbed gases per
unit volume of worn coating, NVW, – allows comparison of the MSGE for the coatings of
different thickness (Table 5). For methane, NVW increased in the same order as both the H
concentration and the emission rate: D-2<D-1<D-3<D-4. Again, the difference in NVW for
CH4 between D-3 and D-4 is nearly forty-fold. Even higher is the difference in NVW for H2
between D-3 and D-4: more than 160-fold.

19
Figure 5. Cross-correlations between the rates of gas emission for methane and hydrogen for
the coatings D-3 (a) and D-4 (b). Solid lines are linear fits, dashed line are the lower and
upper bounds. Open and solid dots on (a) correspond to the stages III and IV, respectively.
The lines with the slope bm are the linear fits to the total data sample.
4. Modelling and discussion
4.1. Gas composition and rate of MSGE
Though MSGE of hydrogen and methane for a-C:H was previously reported [28], this is the
first time when ethane and propane emission have been observed during sliding of PECVD a-
C:H coatings. Most likely, the hydrocarbons were recombinative products as the coatings
hardly contained free C1 to C3 alkanes. Emission of hydroxyl and hydronium ions has not
been confirmed in our experiments. The gas composition was very different from that
20
reported in [12], but resembled the spectra of thermal decomposition which typically had
hydrogen [2, 24-26, 45, 47-50], methyl radical [24, 26, 45], methane [24, 45, 48, 49],
acetylene [24, 26], ethylene [24, 26, 45, 49], ethane [24, 48, 49], propene [49], propane [25,
49], and higher mostly unsaturated volatile hydrocarbon species [49]. Similar results were
also obtained in thermal desorption studies of graphite subject to atomic hydrogen [13], where
the most important products were hydrocarbons with the general formulae CnH2n and CnH2n+2
and the most abundant species with n=2 and 3.
Argon emission from D-2 has to be a natural consequence of Ar+ bombardment of the
coating during its deposition. Generation of carbon oxides is still puzzling since no oxygen
has to be incorporated into the coatings. Probably, carbon oxides could stem from the
reactions between a-C:H and oxide phases on the steel pin.
An apparent contradiction between, on the one hand, the widespread belief that sliding
leads to hydrogen depletion in a-C:H and, on the other hand, failure to detect any appreciable
H2 desorption during run-in and SLF in these experiments can be plausibly explained if one
considers the detection limit of the QMS and the expected rate of hydrogen desorption. The
smallest emission rate, Qmin, which can be measured by a QMS, is a function of the minimal
statistically significant pressure increase due to MSGE, ∆pmin, and the pumping speed, S,:
*+, ∆-./012 34, (5)
where Na is Avogadro’s number, R is the gas constant, and T is the temperature. On the
reasonable assumptions of the independence of the pressure measurements, ∆pmin can be
determined from the following formula:
∆&+, 5√,√289,,:, (6)
where t2n-2,α is the Student’s statistics at the significance α and 2n-2 degrees of freedom. The
data samples of the pressure must be of the same size, n, and have equal standard deviation,
21
sd. For the typical size of a data sample 10 to 20 and α = 0.05 t2n-2,α is ranged between 1.734
and 1.684 [51]. Then, for given S = 0.159±0.017 m3s-1 and the standard deviation of p(H2)
sd=2.30×10⁻¹¹ Pa we have ∆pmin = 1.50×10⁻¹¹ Pa and Qmin = 5.77×10⁸ mol s-1.
Furthermore, the rate of sweeping of the surface area by the pin is nearly the product of the
contact diameter, d, and the sliding velocity, V. Then, minimal measurable number of H2
emitted from the unit surface area is determined from the following expression:
3;,+, <./=5 . (7)
For V=3 mm s-1 and d=100 µm, NA,min=1.92×10¹¹ mol cm-2 that is approximately 0.01% of
the number of adsorbed atoms in a monolayer. In the hypothesized case that 0.01% of
adsorbed H2 is desorbed from the friction zone during each cycle and that the readsorption of
H2 from the gas phase is negligible, one can assume that the adsorbed layer would be fully
removed in 104 strokes. So, the expected duration of SLF regime, which critically depends on
the saturation of the surface dangling bonds with H, would be much shorter than 104 strokes.
The contrast between this estimation and the experimentally observed duration of the SLF
regime, e.g., 2.5×10⁴ cycles for D-4, implies that the real number of emitted hydrogen
molecules during each cycle has to be at least one order of magnitude smaller than NA,min and,
therefore, could not be detected.
On the other hand, the upper bound of H2 emission rate can be estimated from the results
reported by the group of Kubo who simulated a-C:H sliding interface using TB-QCMD [20].
In a period of time of 6 ps, they observed formation of 1 dihydrogen molecule. This yielded
specific number of emitted H2 per unit surface area 2.0×10¹³ mol cm-2, which value is two
orders of magnitude higher than NA,min. Thus, detection of hydrogen emission during SLF
regime is principally possible under extreme sliding conditions like those used in the
simulation (load pressure 1 GPa and sliding speed 100 m s-1) [20]. However, these results
22
must be interpreted with caution since H2 emission rate was determined from the only
emission event and is conceivably overestimated.
4.2. Effect of frictional heating
When observing appreciable correlation in the position and the amplitude between the
pressure spikes and friction peaks on the stages III and IV (Fig. 2) and certain similarity in the
gas composition between MSGE and thermal decomposition, the by now familiar model of
the gas desorption stimulated by frictional heating comes immediately to mind. This model is
based on the belief that the important increase in temperature, referred to as flash temperature,
is produced on the tops of protruding summits on the contacting rough surfaces due to
significant density of dissipated energy [52]. Drawing on the assumption of severe abrasive
wear of a-C:H various researchers estimated the range of flash temperatures: >600 K [53],
320 K [39], 150 K [27]. Nevertheless, we cannot be confident about the applicability of these
estimations in our case since the condition of severe wear is unrealistic for both run-in and
steady super-low friction (SLF) regimes. More reasonable value of only 15 K was suggested
by Paulmier et al. [27] for low-friction regime and mild wear.
In this work, an approximate solution of the heat problem proposed by Tian and Kennedy
[54] for circular contact zone and homogeneous half-space was used to calculate the lower
bound of flash temperature, ∆Tmax, assuming that the coating is infinitely thin and the upper
bound assuming that the coating is a half-space(the model is given in supplementary materials
SII). The initial parameters used in the calculation were: velocity of the pin V = 2 mm/s,
radius of the contact zone 0.1 mm, flat sample was stationary. The calculation results
(Peclet number, Pe, and ∆Tmax) are shown in Table 6 (for the material characteristics used in
the calculation see Table S2 in supplementary materials). For all regimes ∆Tmax was below 15
K. Such low values are not surprising when low sliding speed and moderate normal load are
23
considered. These results are consistent with the data of Katta et al. [55], who reported the
flash temperature for DLC coatings below 100 K even at the sliding velocity as high as 10
m/s.
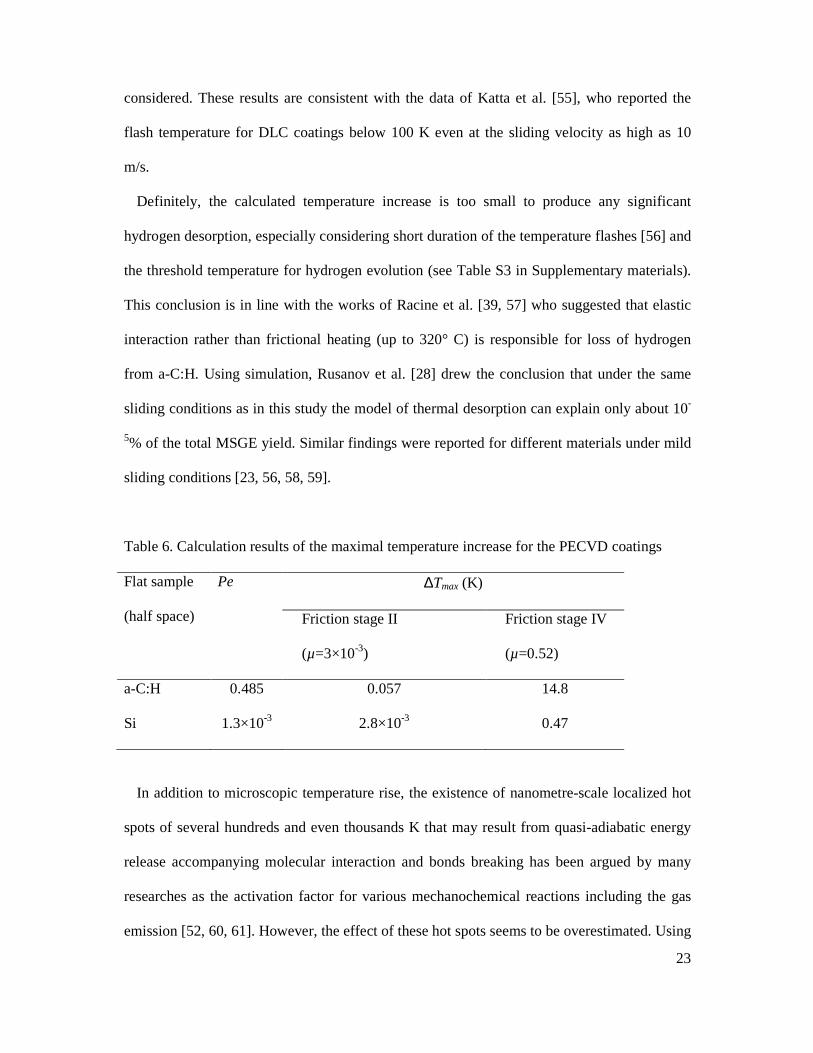
Definitely, the calculated temperature increase is too small to produce any significant
hydrogen desorption, especially considering short duration of the temperature flashes [56] and
the threshold temperature for hydrogen evolution (see Table S3 in Supplementary materials).
This conclusion is in line with the works of Racine et al. [39, 57] who suggested that elastic
interaction rather than frictional heating (up to 320° C) is responsible for loss of hydrogen
from a-C:H. Using simulation, Rusanov et al. [28] drew the conclusion that under the same
sliding conditions as in this study the model of thermal desorption can explain only about 10-
5% of the total MSGE yield. Similar findings were reported for different materials under mild
sliding conditions [23, 56, 58, 59].
Table 6. Calculation results of the maximal temperature increase for the PECVD coatings
Flat sample
(half space)
Pe ∆Tmax (K)
Friction stage II
(µ=3×10⁻³)
Friction stage IV
(µ=0.52)
a-C:H 0.485 0.057 14.8
Si 1.3×10⁻³ 2.8×10⁻³ 0.47
In addition to microscopic temperature rise, the existence of nanometre-scale localized hot
spots of several hundreds and even thousands K that may result from quasi-adiabatic energy
release accompanying molecular interaction and bonds breaking has been argued by many
researches as the activation factor for various mechanochemical reactions including the gas
emission [52, 60, 61]. However, the effect of these hot spots seems to be overestimated. Using
24
molecular dynamic (MD) simulation of a-C:H Schall et al. [62] determined that under severe
sliding with normal stress of 7.6 GPa and sliding velocity of 90.2 m s-1 the temperature
increase in a 2.5 Å thick section containing interface was only 282 ± 146 K. Ma et al. [63]
carried out MD simulation under even severer sliding conditions and proofed that the effect of
the hot spots on hydrogen depletion and degradation of a-C:H could be neglected. These
conclusions are in line with the basic principles of mechanochemistry pointing that neither the
total heat evolution nor local hot spots have significant influence on the mechanochemical
processes [64, 65]. Another argument against the hot spots is their short life, which typically
does not exceed 10-12 – 10-11 s due to decay via phonon excitation [14]. Since this time is
several orders of magnitude smaller, than the time constant for desorption of hydrogen and
methane [66], the probability of a molecule desorption during the lifetime of a hot spot is
vanishing.
Apart from the above theoretical considerations, the evidences against thermal mechanism
of MSGE can be found in our experiments. Bearing in mind that friction coefficient is a
measure of the mechanical energy dissipation, the temperature of the contact surfaces under
constant sliding conditions has to linearly depend on friction coefficient. On the other hand,
the rate of gas desorption is an exponential function of the surface temperature. Taken
together, these results suggest that, if MSGE is a temperature-driven process, the rate of
MSGE has to be an exponential function of friction coefficient. However, that was not
generally true. Actually, when comparing the stages I and III in Fig. 2, one can note only little
variation in friction coefficient while the MSGE rate and behaviour significantly varied. In a
rough-and-ready approach, the upper bound of the possible pressure increase on the stage I
can be assumed equal to the standard deviation of the background pressure: 2.30×10⁻¹¹ Pa for
hydrogen and 5.51×10⁻¹¹ Pa for methane. Then, the difference in the MSGE rate between the
stages I and III is nearly two orders of magnitude. Furthermore, the rate of gas desorption on
25
the stage III was noticeable even though friction coefficient was smaller than on the stage I
and below 0.1 (see inserts in Fig 2 a and b). Likewise, for all coatings there is a lack of
correlation between the MSGE and friction coefficient on the stages III and IV. So, the
experimental results have provided evidence that MSGE is almost independent on friction
under given sliding conditions.
4.3. Dependence of the MSGE on the coatings damage
While thermal desorption can be confidently ruled out, there are firm evidences [56, 67-72]
that the MSGE can be related to fracture, abrasion, plastic deformation and other forms of
material damage. In fact, certain conformity of the MSGE and the wear behaviour can be
easily observed. For the coatings with the SLF regime, both the MSGE and the wear rate were
minimal on the stages I and II and drastically increased on the stage III. For the IBD coatings,
intensive wear occurred from the commencement of sliding and, again, it was accompanied
by MSGE. In this context, the pressure spikes can be attributed to individual damage events,
e.g., cracking or detachment of debris from the coating, which can be observed in Fig. 6.
Further grinding and attrition of the debris in the contact zone can lead to continuous
decrement in the emission rate, thus, explaining slow transient pressure decay. Actually, only
fine wear debris could be found on sides of the wear track after friction test.
The run-in and SLF stages are not completely weariless since a thin transfer layer must be
formed on the pin surface in order to achieve the SLF. Nevertheless, the degree of the coating
damage during SLF is much less than on the stages III and IV (Fig. 6). This corroborates the
hypothesis of MSGE as the process driven by the coating structural degradation. When the
coating is fully gone (at the end of the stage IV) the desorption rate completely vanished. This
occurred because on this stage the pin slid on the silicon substrate, which usually gives no
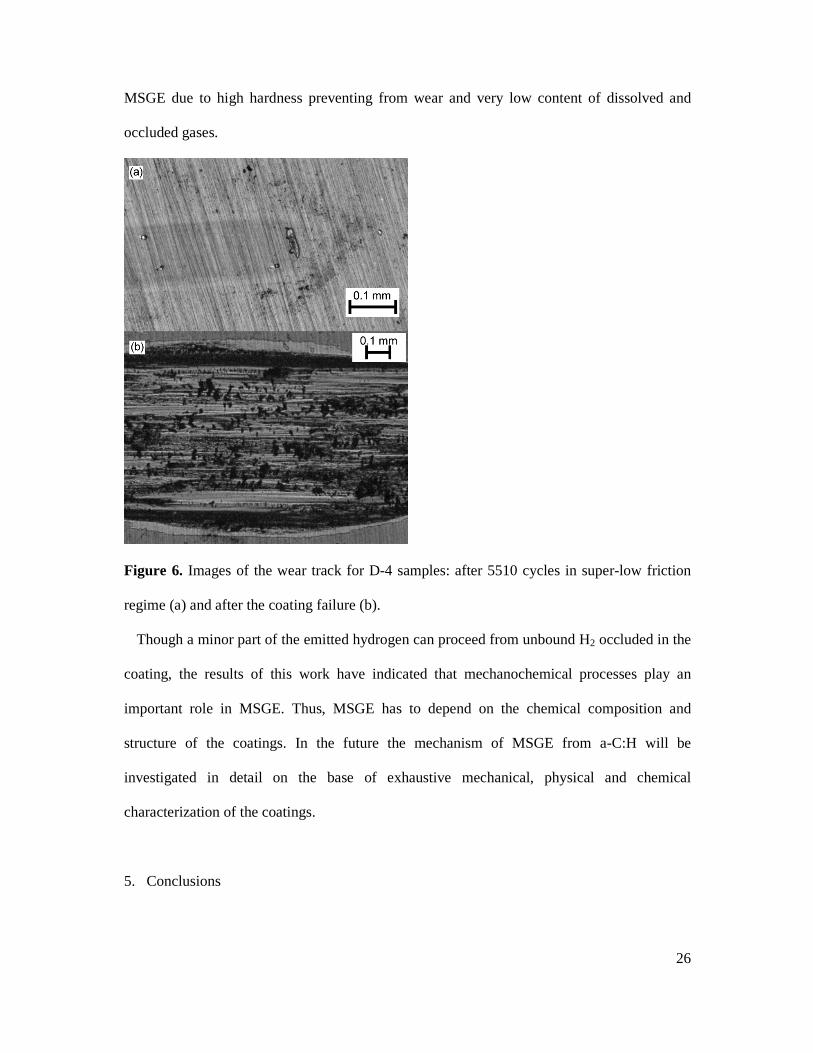
26
MSGE due to high hardness preventing from wear and very low content of dissolved and
occluded gases.
Figure 6. Images of the wear track for D-4 samples: after 5510 cycles in super-low friction
regime (a) and after the coating failure (b).
Though a minor part of the emitted hydrogen can proceed from unbound H2 occluded in the
coating, the results of this work have indicated that mechanochemical processes play an
important role in MSGE. Thus, MSGE has to depend on the chemical composition and
structure of the coatings. In the future the mechanism of MSGE from a-C:H will be
investigated in detail on the base of exhaustive mechanical, physical and chemical
characterization of the coatings.
5. Conclusions

27
For all studied coatings MSGE was observed only during the friction stages III and IV,
when both friction coefficient and wear rates were high. During run-in and SLF the rate of
MSGE was below the measurement limit being approximately 5.77×10⁸ mol s-1 for hydrogen.
For the IBD coatings the emitted gases included methane and/or argon depending whether
or not IBD was assisted by Ar+ bombardment. For the PECVD coatings, in addition to
methane intensive hydrogen emission was observed. Noticeable emission of ethane, propane,
carbon mono- and dioxide was also found during rubbing of D-4 coatings. The following
three parameters: the emission rates of methane, the hydrogen concentration in the coatings
and the specific amount emitted methane per total volume of mechanically affected a-C:H on
the friction zone increased in the following order D-2<D-1<D-3<D-4. The lowest hydrogen
concentration in D-2 can be related to the effect of Ar+ bombardment.
Statistical analysis of the mass-spectrometry data failed to confirm presence of methyl
radicals in the emitted gases.
For PECVD coatings, the composition of the emitted gases significantly varied in the
course of sliding. For D-3 coatings, a definite trend was observed which consisted in gradual
increase in the ratio CH4 : H2. This behaviour can be attributed to continuous hydrogen
depletion in the coating during intensive wear.
The experimental data gave no evidences of the dependence of MSGE on friction
coefficient. The calculated temperature increase on the contact zone was below 10 K.
Therefore, frictional heating has to be discarded as the reason for MSGE under given sliding
conditions. MSGE from a-C:H can be related to fracture, plastic deformation and other forms
of material damage. In fact, there is close correlation between the degree of the coating wear
out and the rate of MSGE: on the stages I and II when the wear rate was very low the MSGE
was below the measurement limit. In contrast, on the stages III and IV, which are
characterized by intensive wear, MSGE was significant. These findings have important
28
implications for developing of advanced tribological coatings with tailored or controlled
MSGE properties.
Acknowledgements
Rusanov acknowledges the Embassy of France in Moscow and Ecole Central de Lyon in
France for financial support. Roman Nevshupa acknowledges the financial support from the
Ministry of Economy and Competitiveness of Spain through the grants RYC-2009-0412,
BIA-2011-25653 and IPT-2012-1167-120000 with participation of the European Regional
Development Fund (FEDER).
References
[1] Fontaine J, Le Mogne T, Loubet JL, Belin M. Achieving superlow friction with hydrogenated amorphous carbon: some key requirements. Thin Solid Films. 2005;482(1-2):99-108. [2] Gao F, Erdemir A, Tysoe W. The Tribological Properties of Low-friction Hydrogenated Diamond-like Carbon Measured in Ultrahigh Vacuum. Tribology Letters. 2005;20(3):221-7. [3] Heitz T, Drévillon B, Godet C, Bourée JE. C-H bonding of polymer-like hydrogenated amorphous carbon films investigated by in-situ infrared ellipsometry. Carbon. 1999;37(5):771-5. [4] Merkle AP, Erdemir A, Eryilmaz OL, Johnson JA, Marks LD. In situ TEM studies of tribo-induced bonding modifications in near-frictionless carbon films. Carbon. 2010;48(3):587-91. [5] Panwar OS, Ishpal, Tripathi RK, Srivastava AK, Kumar M, Kumar S. Effect of substrate bias in hydrogenated amorphous carbon films having embedded nanocrystallites deposited by cathodic jet carbon arc technique. Diamond and Related Materials. 2012;25(0):63-72. [6] Rybachuk M, Bell JM. Electronic states of trans-polyacetylene, poly(p-phenylene vinylene) and sp-hybridised carbon species in amorphous hydrogenated carbon probed by resonant Raman scattering. Carbon. 2009;47(10):2481-90. [7] McKenzie DR. Tetrahedral bonding in amorphous carbon. Reports on Progress in Physics. 1996;59(12):1611. [8] Panwar OS, Khan MA, Bhattacharjee B, Pal AK, Satyanarayana BS, Dixit PN, et al. Reflectance and photoluminescence spectra of as grown and hydrogen and nitrogen incorporated tetrahedral amorphous carbon films deposited using an S bend filtered cathodic vacuum arc process. Thin Solid Films. 2006;515(4):1597-606.
29
[9] Wang Y, Guo J, Gao K, Zhang B, Liang A, Zhang J. Understanding the ultra-low friction behavior of hydrogenated fullerene-like carbon films grown with different flow rates of hydrogen gas. Carbon. 2014;77(0):518-24. [10] Koskinen J, Ronkainen H, Varjus S, Muukkonen T, Holmberg K, Sajavaara T. Low friction ta-C films with hydrogen reservoirs. Diamond and Related Materials. 2001;10(3-7):1030-5. [11] Fontaine J, Donnet C, Grill A, LeMogne T. Tribochemistry between hydrogen and diamond-like carbon films. Surface and Coatings Technology. 2001;146-147:286-91. [12] Zaidi H, Le Huu T, Paulmier D. Influence of hydrogen contained in hard carbon coatings on their tribological behaviour. Diamond and Related Materials. 1994;3(4-6):787-90. [13] Zaidi H, Mezin A, Nivoit M, Lepage J. The influence of the environment on the friction and wear of graphitic carbons: I. Action of atomic hydrogen. Applied Surface Science. 1989;40(1-2):103-14. [14] Gao GT, Mikulski PT, Chateauneuf GM, Harrison JA. The Effects of Film Structure and Surface Hydrogen on the Properties of Amorphous Carbon Films. The Journal of Physical Chemistry B. 2003;107(40):11082-90. [15] Donnet C, Fontaine J, Grill A, Le Mogne T. The role of hydrogen on the friction mechanism of diamond-like carbon films. Tribology Letters. 2001;9(3):137-42. [16] Krumpiegl T, Meerkamm H, Fruth W, Schaufler C, Erkens G, Böhner H. Amorphous carbon coatings and their tribological behaviour at high temperatures and in high vacuum. Surface and Coatings Technology. 1999;120-121:555-60. [17] Martin J-M, Bouchet M-IDB, Matta C, Zhang Q, Goddard WA, Okuda S, et al. Gas-Phase Lubrication of ta-C by Glycerol and Hydrogen Peroxide. Experimental and Computer Modeling. The Journal of Physical Chemistry C. 2010;114(11):5003-11. [18] Bai S, Onodera T, Nagumo R, Miura R, Suzuki A, Tsuboi H, et al. Friction Reduction Mechanism of Hydrogen- and Fluorine-Terminated Diamond-Like Carbon Films Investigated by Molecular Dynamics and Quantum Chemical Calculation. The Journal of Physical Chemistry C. 2012;116(23):12559-65. [19] Al-Azizi AA, Eryilmaz O, Erdemir A, Kim SH. Nano-texture for a wear-resistant and near-frictionless diamond-like carbon. Carbon. 2014;73(0):403-12. [20] Hayashi K, Tezuka K, Ozawa N, Shimazaki T, Adachi K, Kubo M. Tribochemical Reaction Dynamics Simulation of Hydrogen on a Diamond-like Carbon Surface Based on Tight-Binding Quantum Chemical Molecular Dynamics. The Journal of Physical Chemistry C. 2011;115(46):22981-6. [21] Kanai C, Watanabe K, Takakuwa Y. Ab Initio Study of Hydrogen Desorption from Diamond C(100) Surfaces. Japanese Journal of Applied Physics. 1999;38(Copyright (C) 1999 Publication Board, Japanese Journal of Applied Physics):L783. [22] Nevshupa RA, Roman E, de Segovia JL. Contamination of vacuum environment due to gas emission stimulated by friction. Tribology International. 2013;59:23-9. [23] Nevshupa R. The role of athermal mechanisms in the activation of tribodesorption and triboluminisence in miniature and lightly loaded friction units. Journal of Friction and Wear. 2009;30(2):118-26. [24] Schenk A, Winter B, Biener J, Lutterloh C, Schubert UA, Kuppers J. Growth and thermal decomposition of ultrathin ion-beam deposited C:H films. J Appl Phys. 1995;77(6):2462-73. [25] Ristein J, Stief RT, Ley L, Beyer W. A comparative analysis of a-C:H by infrared spectroscopy and mass selected thermal effusion. J Appl Phys. 1998;84(7):3836-47. [26] Malhotra M, Kumar S. Thermal gas effusion from diamond-like carbon films. Diamond and Related Materials. 1997;6(12):1830-5.

30
[27] Paulmier D, Zaidi H, Nery H, Huu TL, Mathia T. Tribological behaviour of diamond-like coatings: effect of active gases in atomic and molecular states. Surface and Coatings Technology. 1993;62(1-3):570-6. [28] Rusanov A, Fontaine J, Martin J-M, Le Mogne T, Nevshupa RA. Gas desorption during friction of amorphous carbon films. Journal of Physics: Conference Series. 2008;100(8):082050. [29] Eryilmaz OL, Erdemir A. On the hydrogen lubrication mechanism(s) of DLC films: An imaging TOF-SIMS study. Surface and Coatings Technology. 2008;203(5–7):750-5. [30] Donnet C, Fontaine J, Lefebvre F, Grill A, Patel V, Jahnes C. Solid state 13C and 1H nuclear magnetic resonance investigations of hydrogenated amorphous carbon. J Appl Phys. 1999;85(6):3264-70. [31] Tomasella E, Meunier C, Mikhailov S. a-C:H thin films deposited by radio-frequency plasma: influence of gas composition on structure, optical properties and stress levels. Surface and Coatings Technology. 2001;141(2-3):286-96. [32] Le Mogne T, Martin J-M, Grossiord C. Imaging the Chemistry of Transfer Film in AES/XPS Analytical UHV Tribotester. In: Dowson D, ed. Lubrication at the Frontier: The Role of the Interface and Surface Layers in the Thin Film and Boundary Regime. Amsterdam: Elsevier 1999, p. 413-22. [33] Draper NR, Smith H. Applied regression analysis: Wiley; 1981. [34] Bailey RA. Design of Comparative Experiments. Cambridge: Cambridge University Press; 2008. [35] Peressadko AG, Nevshupa RA, Deulin EA. Mechanically stimulated outgassing from ball bearings in vacuum. Vacuum. 2002;64(3-4):451-6. [36] Nevshupa RA, Roman E, de Segovia JL. Origin of hydrogen desorption during friction of stainless steel by alumina in ultrahigh vacuum. Journal of Vacuum Science & Technology A: Vacuum, Surfaces, and Films. 2008;26(5):1218-23. [37] Buijnsters JG, Gago R, Jimenez I, Camero M, Agullo-Rueda F, Gomez-Aleixandre C. Hydrogen quantification in hydrogenated amorphous carbon films by infrared, Raman, and x-ray absorption near edge spectroscopies. J Appl Phys. 2009;105(9):093510-7. [38] Fontaine J, Belin M, Le Mogne T, Grill A. How to restore superlow friction of DLC: the healing effect of hydrogen gas. Tribology International.37(11-12):869-77. [39] Racine B, Benlahsen M, Zellama K, Zarrabian M, Villain JP, Turban G, et al. Hydrogen stability in diamond-like carbon films during wear tests. Applied Physics Letters. 1999;75(22):3479-81. [40] Neyts E, Bogaerts A, Gijbels R, Benedikta J, van de Sanden MCM. Molecular dynamics simulation of the impact behaviour of various hydrocarbon species on DLC. Nuclear Instruments and Methods in Physics Research Section B: Beam Interactions with Materials and Atoms. 2005;228(1-4):315-8. [41] Buijnsters JG, Camero M, Vázquez L, Agulló-Rueda F, Gómez-Aleixandre C, Albella JM. DC substrate bias effects on the physical properties of hydrogenated amorphous carbon films grown by plasma-assisted chemical vapour deposition. Vacuum. 2007;81(11–12):1412-5. [42] Xiang JZ, Zheng ZH, Liao C, Xiong J, Wang YQ, Zhang F-Q. Ion implantation of diamond-like carbon films. 1991:683-7. [43] Calculating Partial Pressures. Inficon. [44] Camargo Jr SS, Santos RA, Beyer W. Characterization of DLC:Si films by the gas effusion technique. Diamond and Related Materials. 2000;9(3–6):658-62.
Copyright © 2022 FDOKUMEN