PREPARED BY - City of Faribault
183
35(3$5(' %< ),1$1&( '(3$570(17 .DUOD 0F&DOO )LQDQFH 'LUHFWRU 0HPEHU *)2$ RI 86 DQG &DQDGD 3XEOLVKHG -XQH &,7< 2) )$5,%$8/7 )$5,%$8/7 0,11(627$ &2035(+(16,9( $118$/ ),1$1&,$/ 5(3257 )25 7+( <($5 (1'(' '(&(0%(5
-
Upload
khangminh22 -
Category
Documents
-
view
0 -
download
0
Transcript of PREPARED BY - City of Faribault

hslechta
Text Box
7A-1.


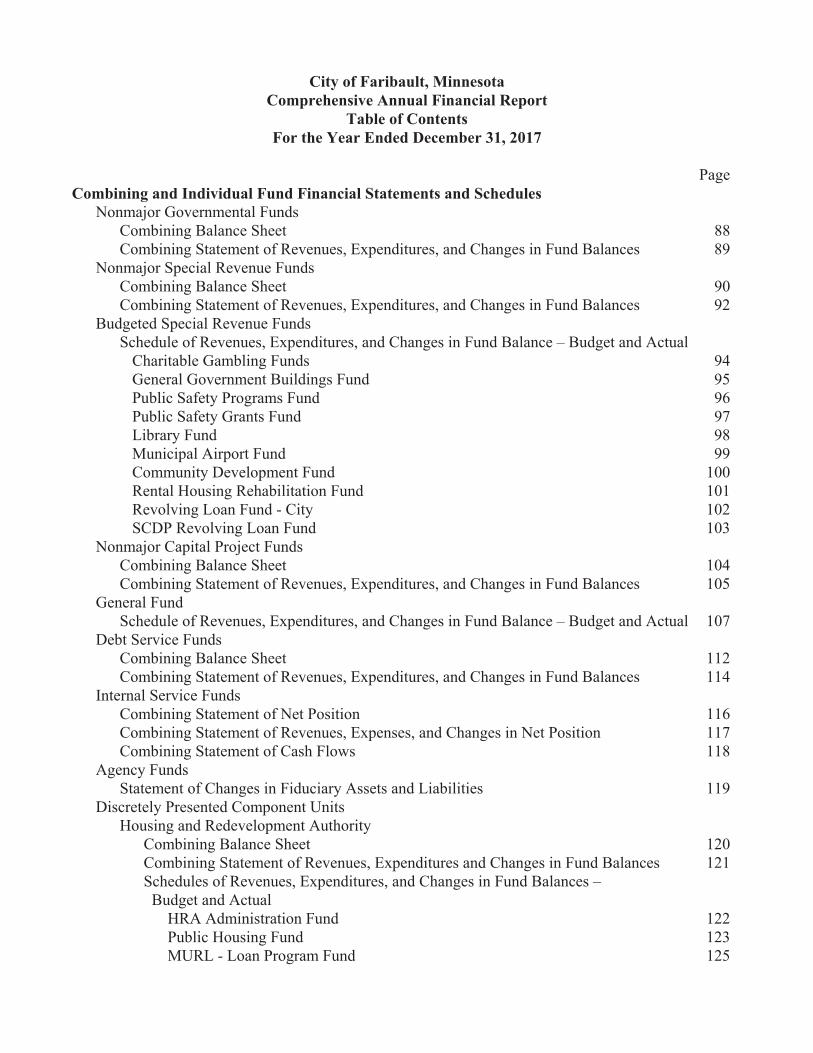
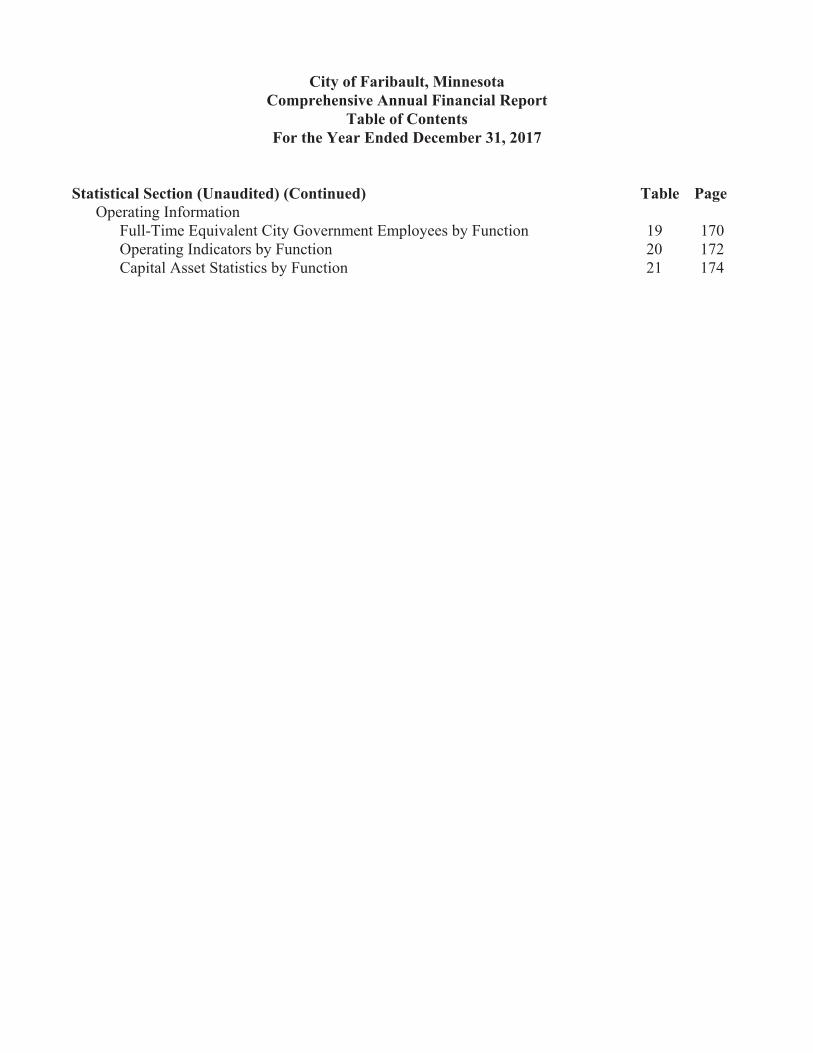
City of Faribault, Minnesota Comprehensive Annual Financial Report
Table of Contents For the Year Ended December 31, 2017
Page Introductory Section Letter of Transmittal 1 City Directory 5 Organizational Chart 7 GFOA Certificate of Achievement for Excellence in Financial Reporting 9 Financial Section Independent Auditor's Report 11 Management's Discussion and Analysis 15 Basic Financial Statements Government-Wide Financial Statements Statement of Net Position 26 Statement of Activities 28 Fund Financial Statements Governmental Funds
Balance Sheet 30 Reconciliation of the Balance Sheet to the Statement of Net Position 31 Statement of Revenues, Expenditures, and Changes in Fund Balances 32 Reconciliation of the Statement of Revenues, Expenditures, and Changes in
Fund Balances to the Statement of Activities 33 Statement of Revenues, Expenditures, and Changes in Fund Balance –
Budget and Actual 35 Proprietary Funds
Statement of Net Position 36 Statement of Revenues, Expenses, and Changes in Fund Net Position 39 Statement of Cash Flows 40
Fiduciary Fund Statement of Fiduciary Net Position 42
Notes to Financial Statements 43
Required Supplementary Information Schedule of City's Proportionate Share of Net Pension Liability –
General Employees Retirement Fund 80 Schedule of City's Proportionate Share of Net Pension Liability –
Public Employees Police and Fire Retirement Fund 80 Schedule of City Contributions – General Employees Retirement Fund 81 Schedule of City Contributions – Public Employees Police and Fire Retirement Fund 81 Schedule of Funding Progress for the Postemployment Benefit Plan 82 Notes to Required Supplementary Information 83


1

2

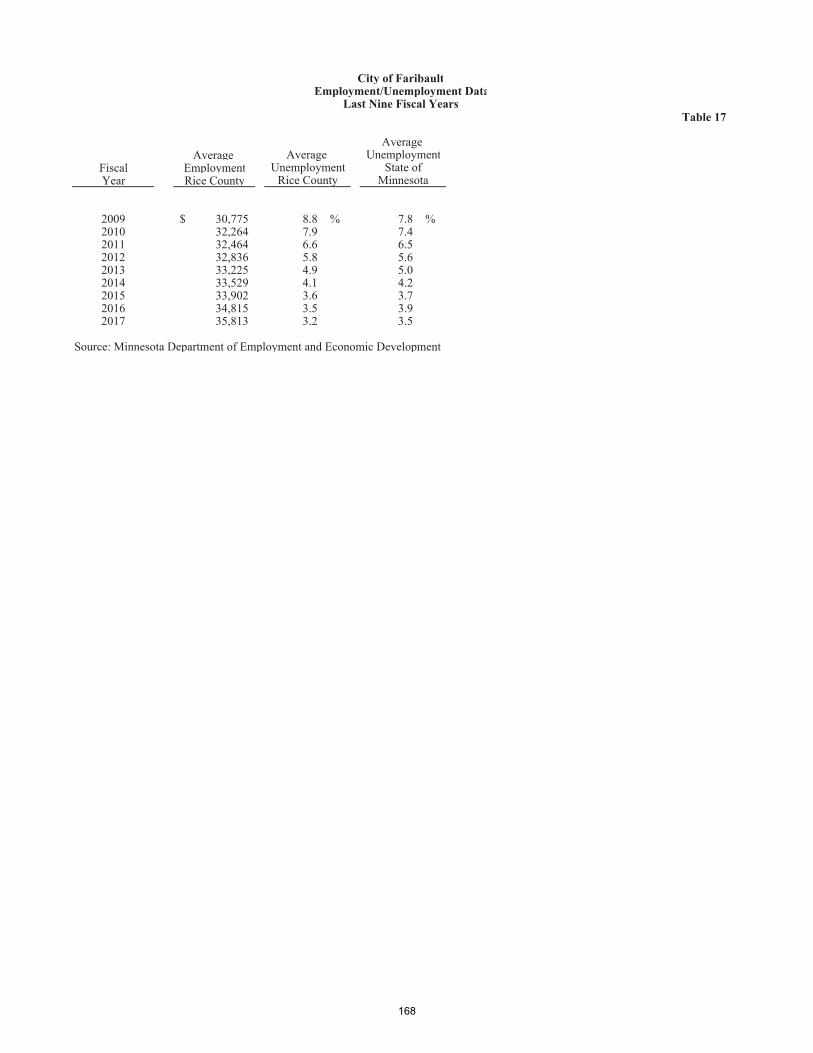
Source: Minnesota Department of Employment and Economic Development
3

4

5

6

7

8

Government Finance Officers Association
Certificate of Achievement for Excellence in Financial Reporting
Presented to
City of Faribault Minnesota
For its Comprehensive Annual Financial Report
for the Fiscal Year Ended
December 31, 2016
Executive Director/CEO
9

10

Government Auditing Standards
11

Required Supplementary Information
Other Information
12
Other Information (Continued)
Government Auditing StandardsGovernment Auditing Standards
'
Government Auditing Standards '
13

14

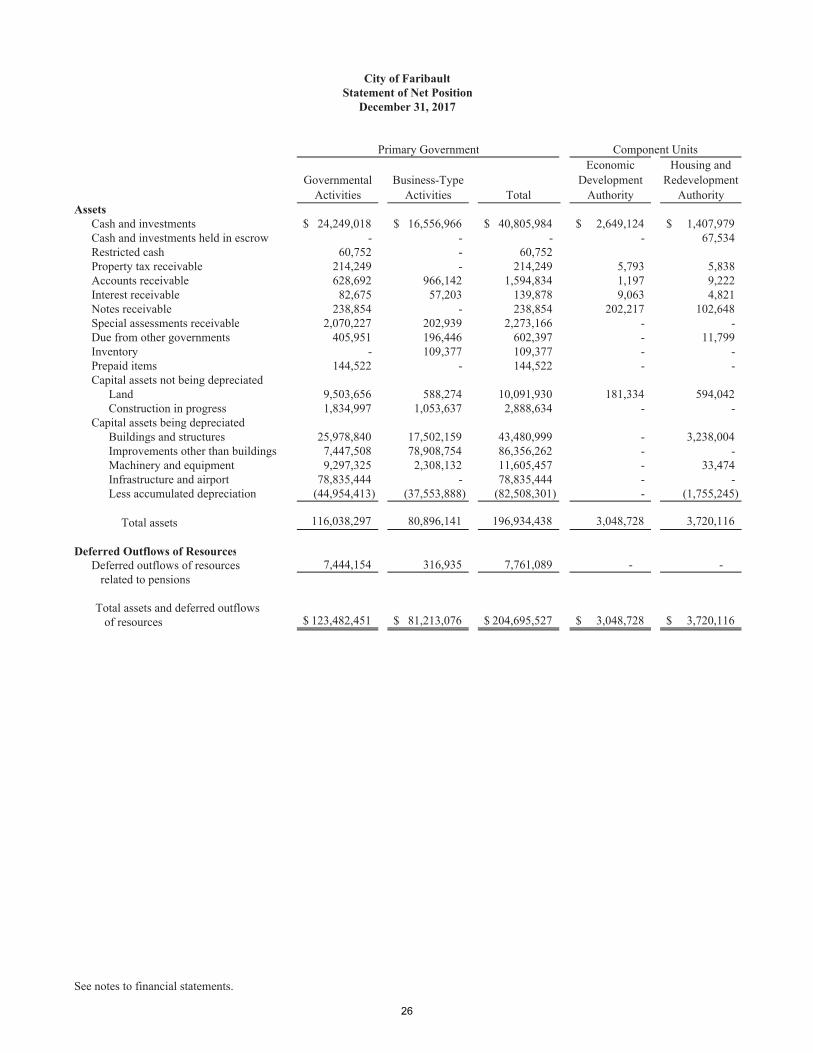
net positionunrestricted net position
government-wide financial statements
statement of net positionnet position
statement of activities
regardless of the timing of related cash flows
governmental activitiesbusiness-type activities
15
fund
Governmental funds Governmental fundsgovernmental activities
near-term inflows and outflows of spendable resourcesbalances of spendable resources
governmental fundsgovernmental activities
governmental funds governmental activities
combining statements and schedules
Proprietary funds Enterprise fundsbusiness-type activities
Internal Service funds
Fiduciary fundsnot
not
16

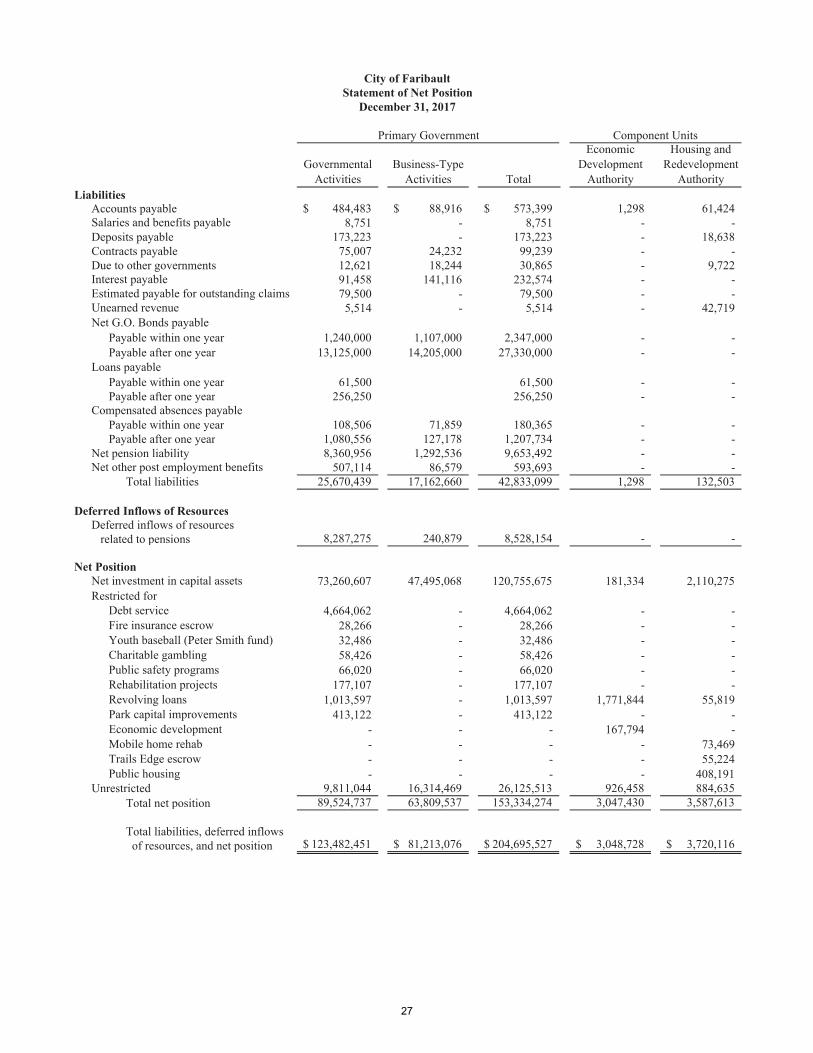
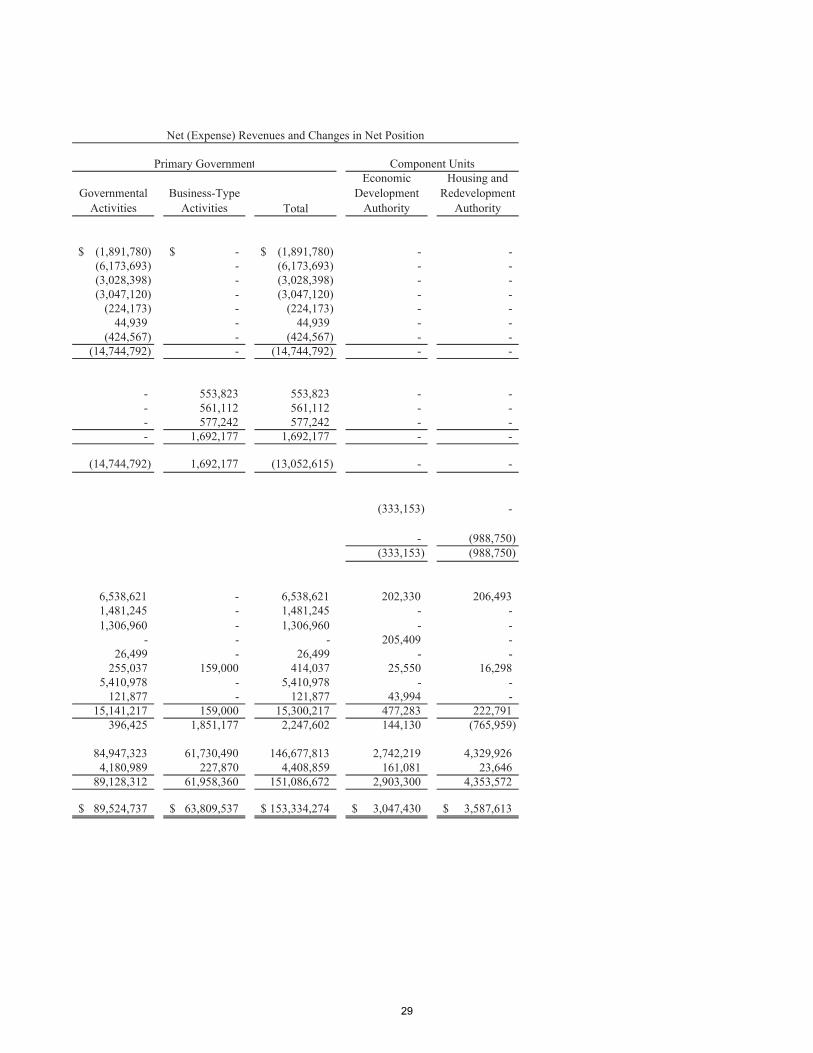
Other information. In addition to the basic financial statements and accompanying notes, this report also presents certain required supplementary information concerning the City’s progress in funding its obligation to provide pensions and other postemployment benefits to its employees. Required supplementary information can be found on page 80 of this report. The combining statements referred to earlier in connection with nonmajor governmental funds and internal service funds are presented following the required supplementary information. Combining and individual fund statements and schedules start on page 87 of this report. Government-wide Financial Analysis As noted earlier, net position may serve over time as a useful indicator of a government’s financial position. In the case of the City, assets and deferred outflows of resources exceeded liabilities and deferred inflows of resources by $153,334,274 at the close of the most recent fiscal year.
City of Faribault’s Summary of Net Position
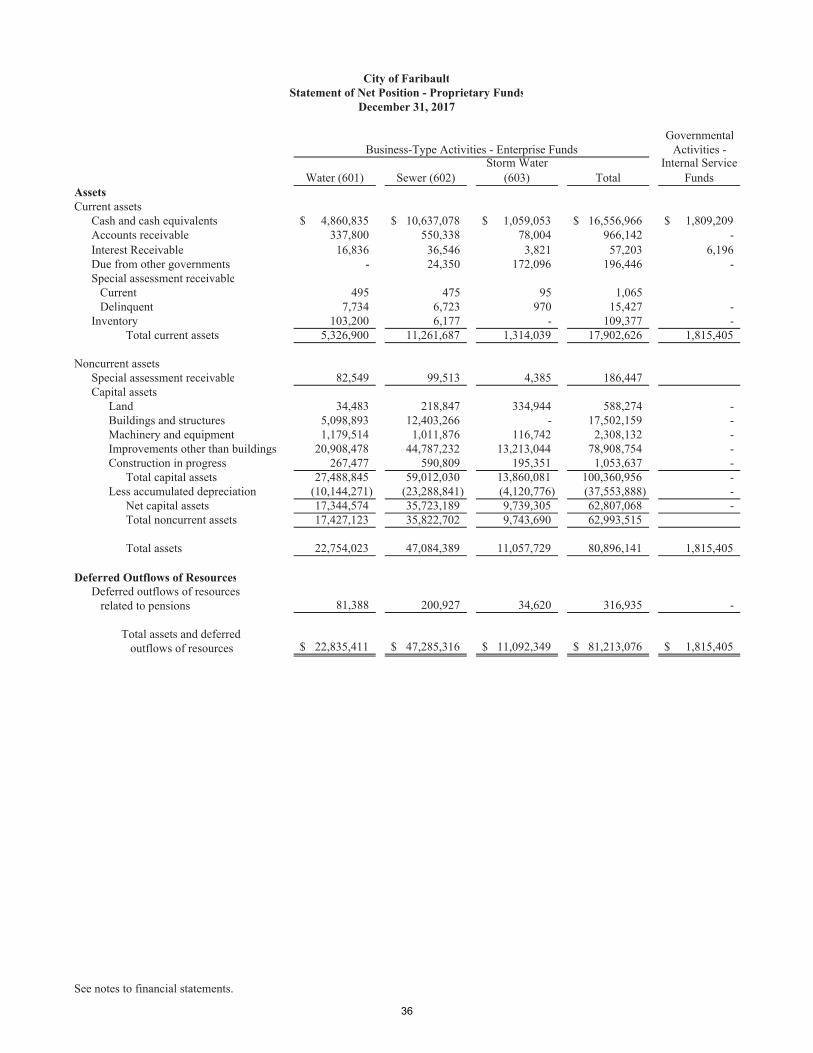
A major portion of the City’s net position ($120,755,675 or 78.8 percent) reflects its investment in capital assets (e.g., land, buildings, machinery and equipment); less any related debt used to acquire those assets that is still outstanding. The City uses these capital assets to provide services to citizens; consequently, these assets are not available for future spending. Although the City’s investment in its capital assets is reported net of related debt, it should be noted that the resources needed to repay this debt must be provided from other sources, since the capital assets themselves cannot be used to liquidate these liabilities. An additional portion of the City’s net position ($6,453,086 or 4.2 percent) represents resources that are subject to external restrictions on how they may be used. The remaining balance of unrestricted net position, ($26,125,513 or 17.0 percent), may be used to meet the City’s ongoing obligations to citizens and creditors. At the end of the current fiscal year, the City is able to report positive balances in all three categories of net position, both for the City as a whole, as well as for its separate governmental and business-type activities. The same situation held true for the prior fiscal year.
2017 2016 2017 2016 2017 2016Current and Other Assets 28,094,940$ 35,057,076$ 18,089,073$ 15,700,730$ 46,184,013$ 50,757,806$ Capital Assets 87,943,357 83,617,494 62,807,068 63,502,389 150,750,425 147,119,883
Total Assets 116,038,297 118,674,570 80,896,141 79,203,119 196,934,438 197,877,689
Deferred Outflows of Resources 7,444,154 12,401,828 316,935 379,921 7,761,089 12,781,749
Long-term liabilities outstanding 23,329,876 42,863,485 15,711,293 17,355,061 39,041,169 53,400,481 Other liabilities 2,340,563 973,215 1,451,367 447,766 3,791,930 8,320,818
Total Liabilities 25,670,439 43,836,700 17,162,660 17,802,827 42,833,099 61,721,299
Deferred Inflows of Resources 8,287,275 2,212,875 240,879 47,451 8,528,154 2,260,326
Net PositionNet investment in capital assets 73,260,607 67,463,694 47,495,068 47,136,852 120,755,675 114,599,633 Restricted 6,453,086 6,739,340 - - 6,453,086 6,739,340 Unrestricted 9,811,044 10,824,100 16,314,469 14,596,512 26,125,513 25,338,840
Total Net Position 89,524,737$ 85,027,134$ 63,809,537$ 61,733,364$ 153,334,274$ 146,677,813$
Governmental Activities Business-type Activities Totals
17

18

19

20

Governmental funds governmental fundsspendableunassigned fund balance
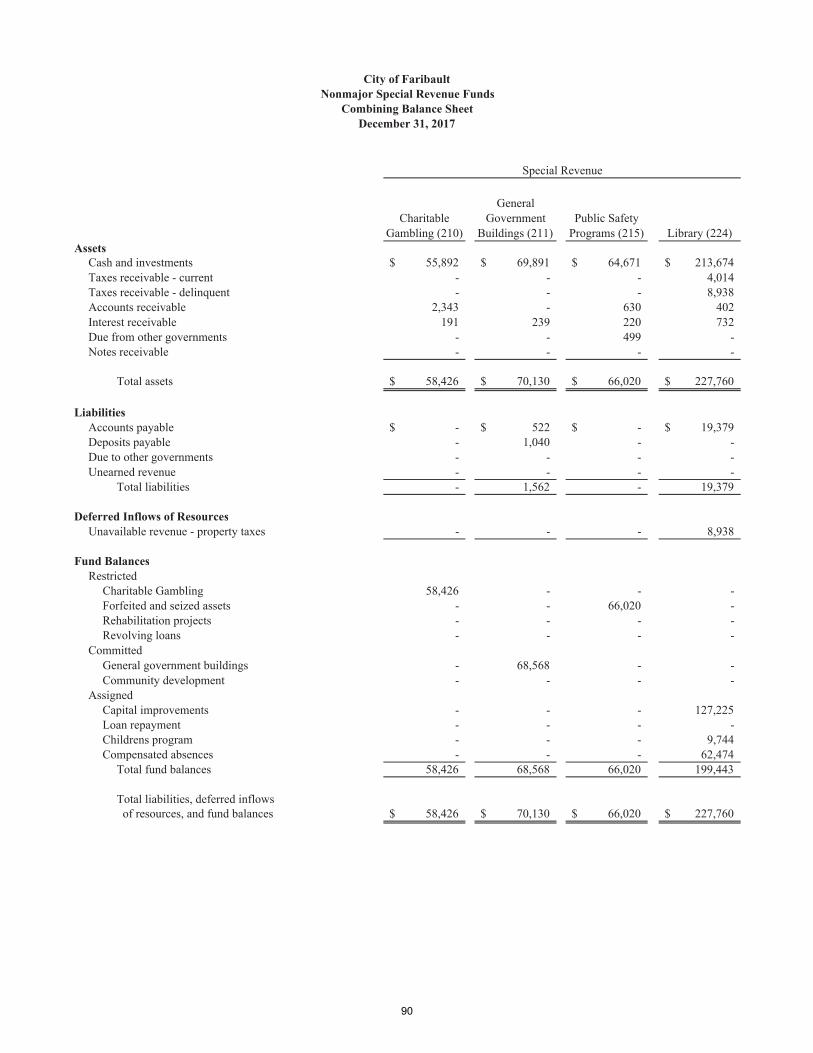
Nonmajor Government funds
Proprietary funds.
General
Debt Service
Street Improvement Projects
21
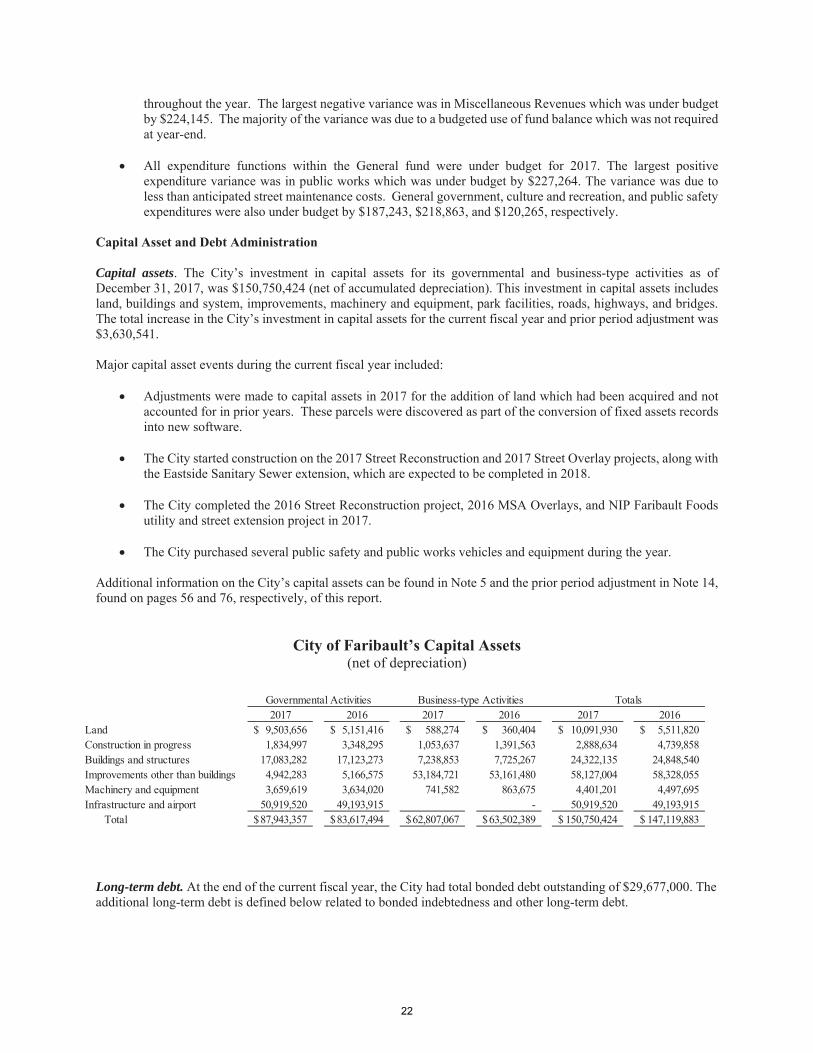
Capital assets
Long-term debt.
22

“The stable outlook reflects our expectation that Faribault will continue to exhibit strong financial performance with very strong budgetary flexibility and liquidity, all supported by very strong management.”
23

24

25
26
27

28
29

30

31

32

33

34

City of FaribaultStatement of Revenues, Expenditures, and
Changes in Fund Balances - Budget and Actual - General Fund
Year Ended December 31, 2017
Original FinalActual
AmountsRevenues
Taxes 5,803,613$ 5,803,613$ 5,792,829$ (10,784)$ Special assessments 21,000 21,000 17,676 (3,324) Licenses and permits 427,950 427,950 584,291 156,341 Intergovernmental 6,145,486 6,145,486 6,179,241 33,755 Charges for services 1,380,668 1,380,668 1,320,970 (59,698) Fines and forfeitures 116,000 116,000 133,629 17,629 Miscellaneous revenues
Investment income 94,020 94,020 66,068 (27,952) Contributions and donations 26,463 59,423 52,525 (6,898) Other 194,900 194,900 5,605 (189,295)
Total revenues 14,210,100 14,243,060 14,152,834 (90,226)
ExpendituresCurrent
General government 2,179,738 2,295,808 2,108,565 (187,243) Public safety 6,470,189 6,538,979 6,418,714 (120,265) Public works 2,586,668 2,595,168 2,367,904 (227,264) Culture and recreation 2,666,778 2,675,578 2,456,715 (218,863) Mass transportation and airport 10,000 10,000 - (10,000)
Total expenditures 13,913,373 14,115,533 13,351,898 (763,635)
Excess of revenues overexpenditures 296,727 127,527 800,936 673,409
Other Financing Sources (Uses)Proceeds from sale of capital asset - - 1,803 1,803 Transfers out (296,727) (1,196,727) (1,196,727) -
Total other financing sources (uses) (296,727) (1,196,727) (1,194,924) 1,803
Net change in fund balances -$ (1,069,200)$ (393,988) 675,212$
Fund BalancesBeginning of year 8,388,657
End of year 7,994,669$
See notes to financial statements.
Variance with Final Budget - Over (Under)
Budgeted Amounts
35
36

37

38

39

40

41

42
Minnesota Statutes
43

Faribault Housing and Redevelopment Authority (HRA)
Faribault Economic Development Authority (EDA)
44

45

46

'
Minnesota Statutes
'
47

48

49

.
50

''
'
51
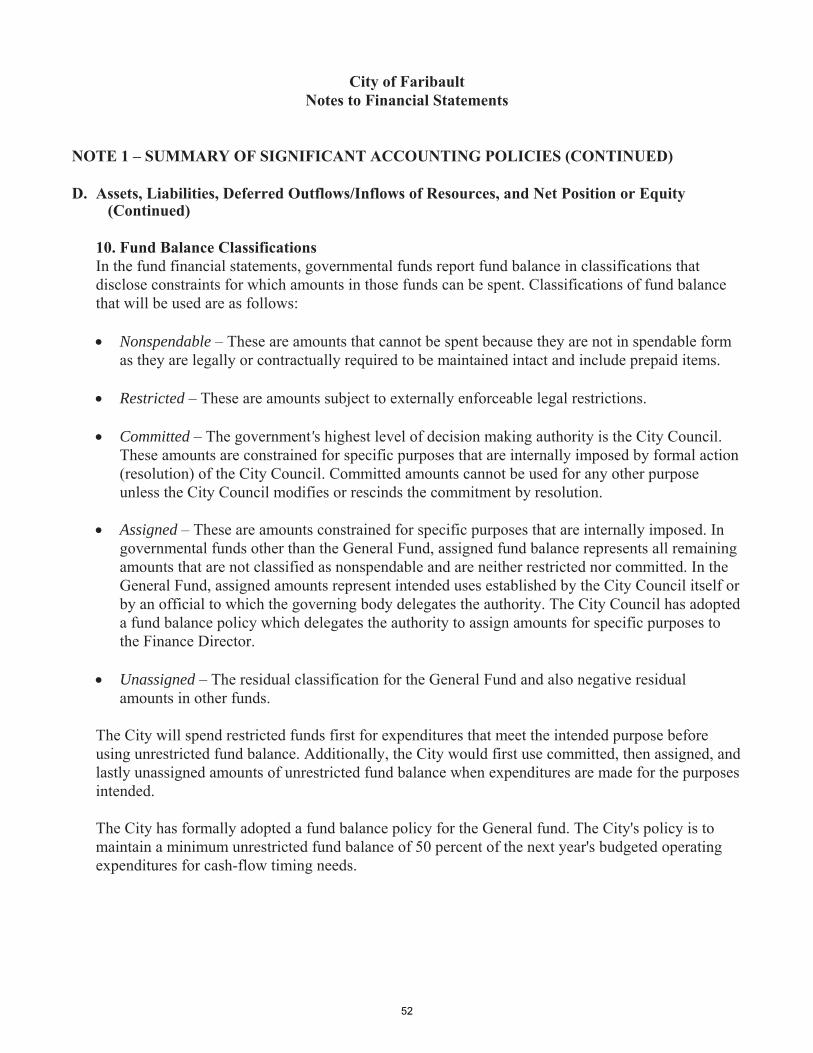
Nonspendable
Restricted
Committed '
Assigned
Unassigned
52
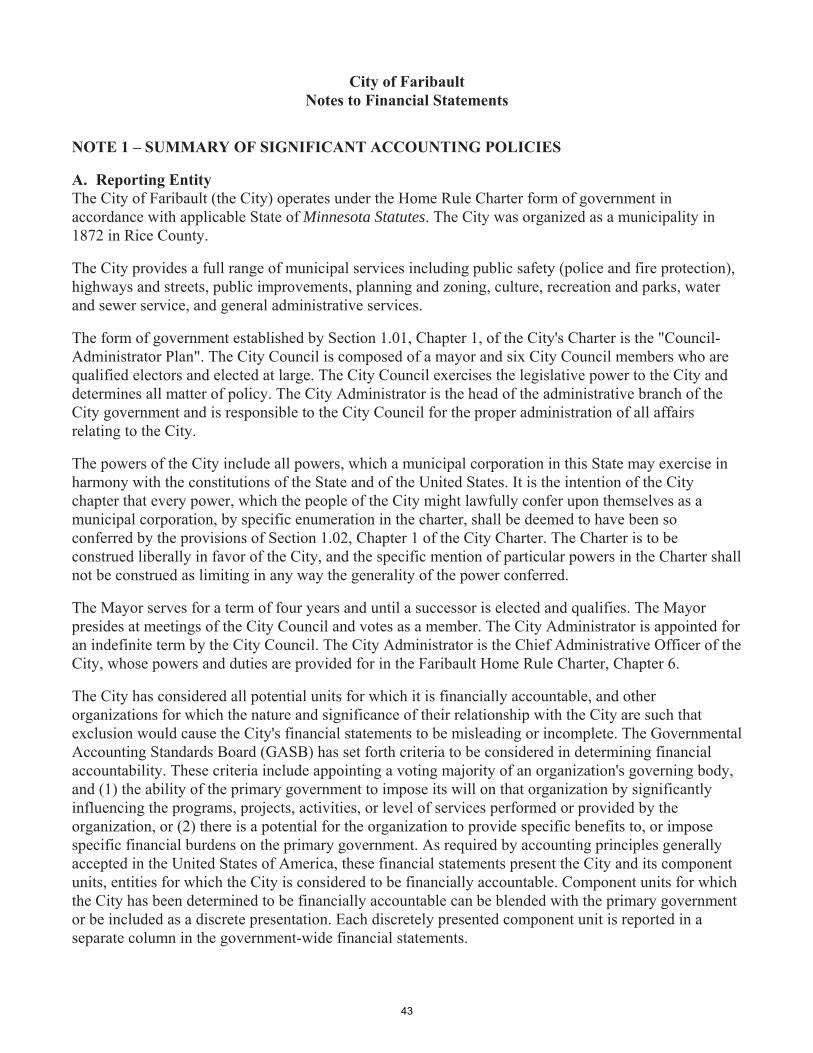
City of Faribault Notes to Financial Statements
NOTE 1 – SUMMARY OF SIGNIFICANT ACCOUNTING POLICIES (CONTINUED) D. Assets, Liabilities, Deferred Outflows/Inflows of Resources, and Net Position or Equity (Continued)
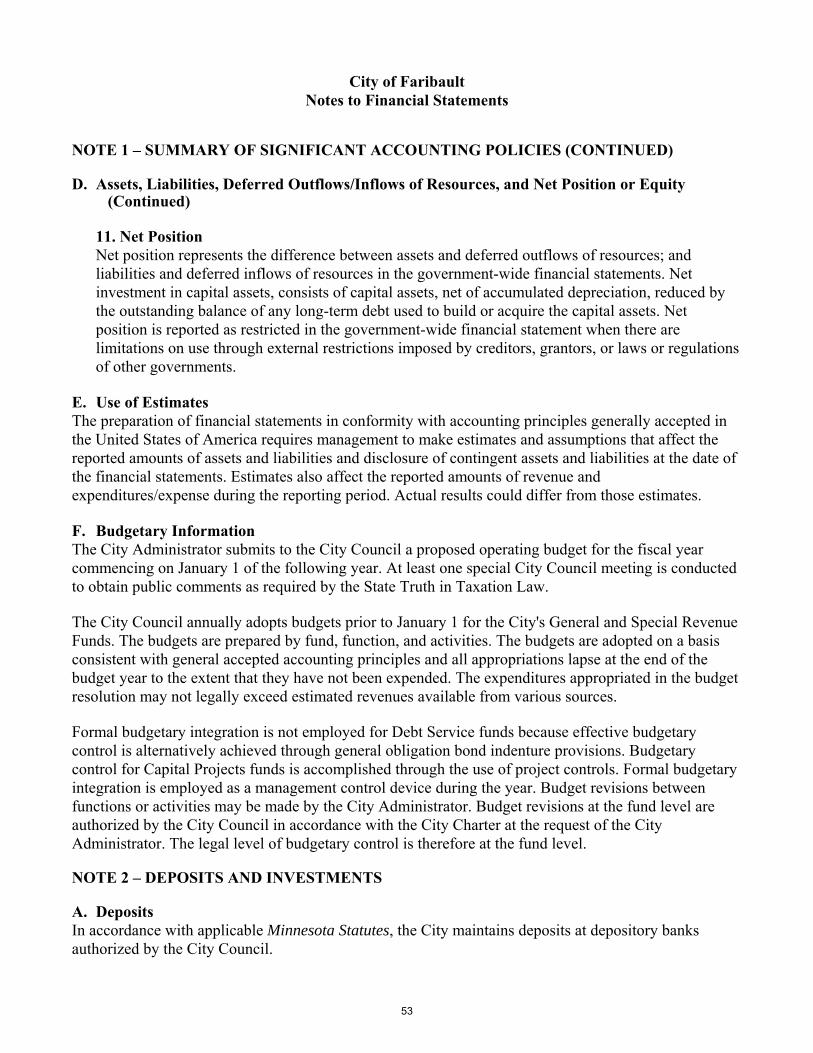
11. Net Position Net position represents the difference between assets and deferred outflows of resources; and liabilities and deferred inflows of resources in the government-wide financial statements. Net investment in capital assets, consists of capital assets, net of accumulated depreciation, reduced by the outstanding balance of any long-term debt used to build or acquire the capital assets. Net position is reported as restricted in the government-wide financial statement when there are limitations on use through external restrictions imposed by creditors, grantors, or laws or regulations of other governments.
E. Use of Estimates The preparation of financial statements in conformity with accounting principles generally accepted in the United States of America requires management to make estimates and assumptions that affect the reported amounts of assets and liabilities and disclosure of contingent assets and liabilities at the date of the financial statements. Estimates also affect the reported amounts of revenue and expenditures/expense during the reporting period. Actual results could differ from those estimates. F. Budgetary Information The City Administrator submits to the City Council a proposed operating budget for the fiscal year commencing on January 1 of the following year. At least one special City Council meeting is conducted to obtain public comments as required by the State Truth in Taxation Law. The City Council annually adopts budgets prior to January 1 for the City's General and Special Revenue Funds. The budgets are prepared by fund, function, and activities. The budgets are adopted on a basis consistent with general accepted accounting principles and all appropriations lapse at the end of the budget year to the extent that they have not been expended. The expenditures appropriated in the budget resolution may not legally exceed estimated revenues available from various sources. Formal budgetary integration is not employed for Debt Service funds because effective budgetary control is alternatively achieved through general obligation bond indenture provisions. Budgetary control for Capital Projects funds is accomplished through the use of project controls. Formal budgetary integration is employed as a management control device during the year. Budget revisions between functions or activities may be made by the City Administrator. Budget revisions at the fund level are authorized by the City Council in accordance with the City Charter at the request of the City Administrator. The legal level of budgetary control is therefore at the fund level. NOTE 2 – DEPOSITS AND INVESTMENTS A. Deposits In accordance with applicable Minnesota Statutes, the City maintains deposits at depository banks authorized by the City Council.
53
''
Minnesota Statutes'
''
Minnesota Statutes
54

55

56

57

58

59

60
61
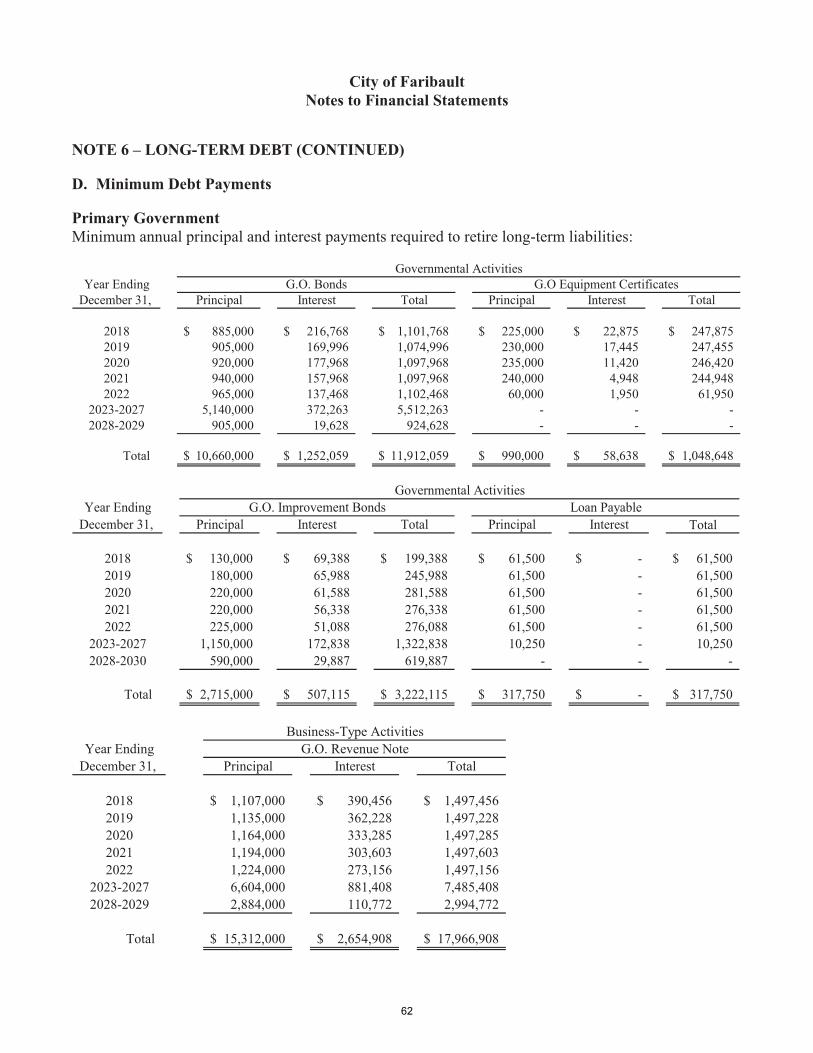
62

63
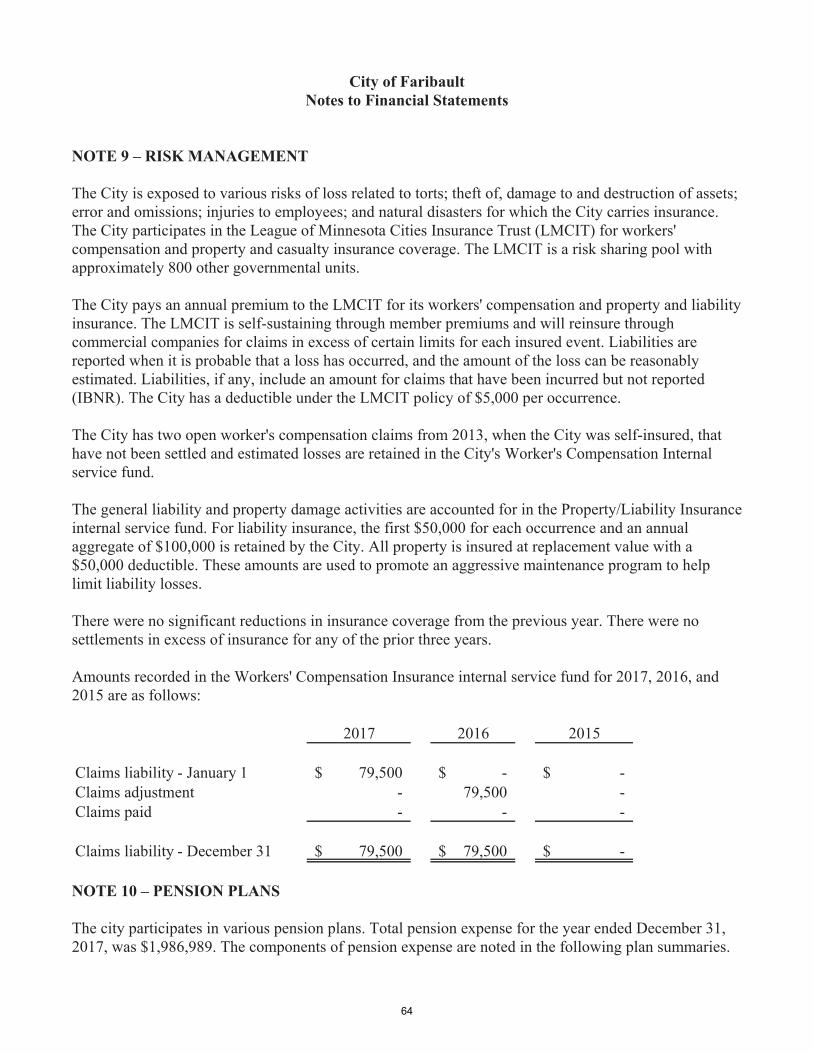
64

Minnesota Statutes
65

Minnesota Statutes
66

' .
67

68

69

70

.
Minnesota Statutes
71

72

Minnesota Statutes
'
'
73
'
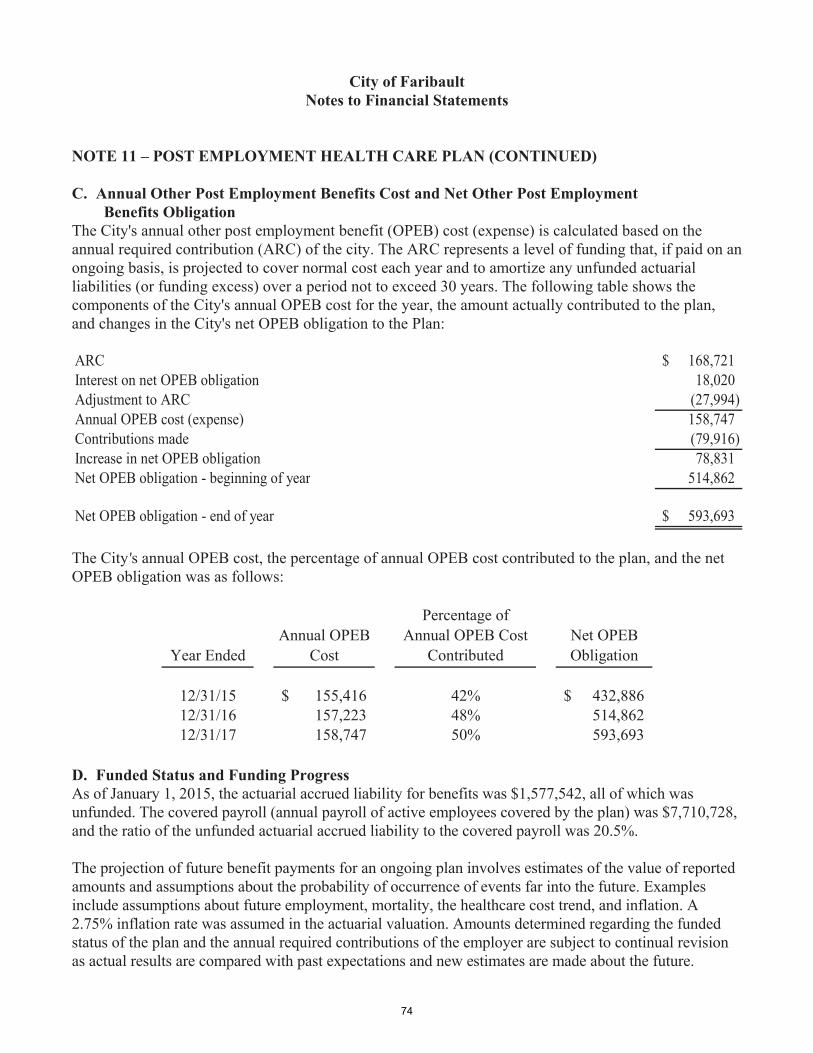
74

75

76

77

78

79
City's Covered Payroll
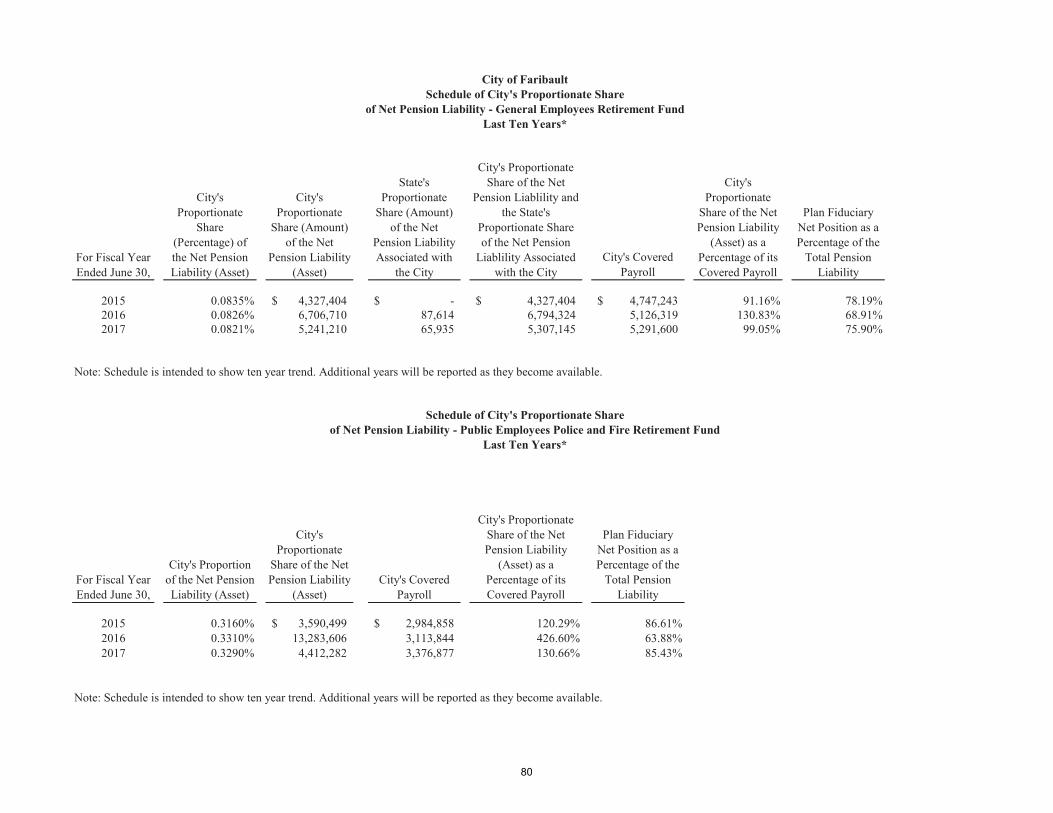
2015 0.0835% 4,327,404$ -$ 4,327,404$ 4,747,243$ 91.16% 78.19%2016 0.0826% 6,706,710 87,614 6,794,324 5,126,319 130.83% 68.91%2017 0.0821% 5,241,210 65,935 5,307,145 5,291,600 99.05% 75.90%
Note: Schedule is intended to show ten year trend. Additional years will be reported as they become available.
For Fiscal Year Ended June 30,
City's Proportion of the Net Pension Liability (Asset)
City's Proportionate
Share of the Net Pension Liability
(Asset) City's Covered
Payroll
City's Proportionate Share of the Net Pension Liability
(Asset) as a Percentage of its Covered Payroll
Plan Fiduciary Net Position as a Percentage of the
Total Pension Liability
2015 0.3160% 3,590,499$ 2,984,858$ 120.29% 86.61%2016 0.3310% 13,283,606 3,113,844 426.60% 63.88%2017 0.3290% 4,412,282 3,376,877 130.66% 85.43%
Note: Schedule is intended to show ten year trend. Additional years will be reported as they become available.
City of FaribaultSchedule of City's Proportionate Share
of Net Pension Liability - General Employees Retirement FundLast Ten Years*
of Net Pension Liability - Public Employees Police and Fire Retirement FundLast Ten Years*
City's Proportionate Share of the Net
Pension Liablility and the State's
Proportionate Share of the Net Pension
Liablility Associated with the City
For Fiscal Year Ended June 30,
City's Proportionate
Share (Percentage) of the Net Pension Liability (Asset)
City's Proportionate
Share (Amount) of the Net
Pension Liability (Asset)
State's Proportionate
Share (Amount) of the Net
Pension Liability Associated with
the City
City's Proportionate
Share of the Net Pension Liability
(Asset) as a Percentage of its Covered Payroll
Plan Fiduciary Net Position as a Percentage of the
Total Pension Liability
Schedule of City's Proportionate Share
80

81

82

83

84

85

86

87

88

89
90

91

92

93

94

95
96

97

98

99

100

101

City of FaribaultSchedule of Revenues, Expenditures, and
Changes in Fund Balances - Budget and Actual
Revolving Loan Fund - CityYear Ended December 31, 2017
With Comparative Actual Amounts for the Year Ended December 31, 2016
2016
Original FinalActual
AmountsActual
AmountsRevenues
MiscellaneousInvestment income 4,000$ 4,000$ 6,291$ 2,291$ 6,666$
ExpendituresCurrent
Community developmentOther services and charges 300,000 300,000 218,258 (81,742) 3,019
Net change in fund balances (296,000)$ (296,000)$ (211,967) 84,033$ 3,647
Fund BalancesBeginning of year 539,459 535,812
End of year 327,492$ 539,459$
Budgeted Amounts Variance with Final Budget - Over (Under)
2017
102

City of FaribaultSchedule of Revenues, Expenditures, and
Changes in Fund Balances - Budget and Actual
SCDP Revolving Loan FundYear Ended December 31, 2017
With Comparative Actual Amounts for the Year Ended December 31, 2016
2016
Original FinalActual
AmountsActual
AmountsRevenues
Charges for services Principal repayment 27,710$ 27,710$ 4,500$ (23,210)$ 10,506$ Miscellaneous
Investment income 9,560 9,560 11,188 1,628 11,319 Other - - - - 1,186
Total revenues 37,270 37,270 15,688 (21,582) 23,011
ExpendituresCurrent
Community developmentOther services and charges - - 1,057 1,057 -
Net change in fund balances 37,270$ 37,270$ 14,631 (22,639)$ 23,011
Fund BalancesBeginning of year 671,474 648,463
End of year 686,105$ 671,474$
Budgeted Amounts Variance with Final Budget - Over (Under)
2017
103

104

105

106
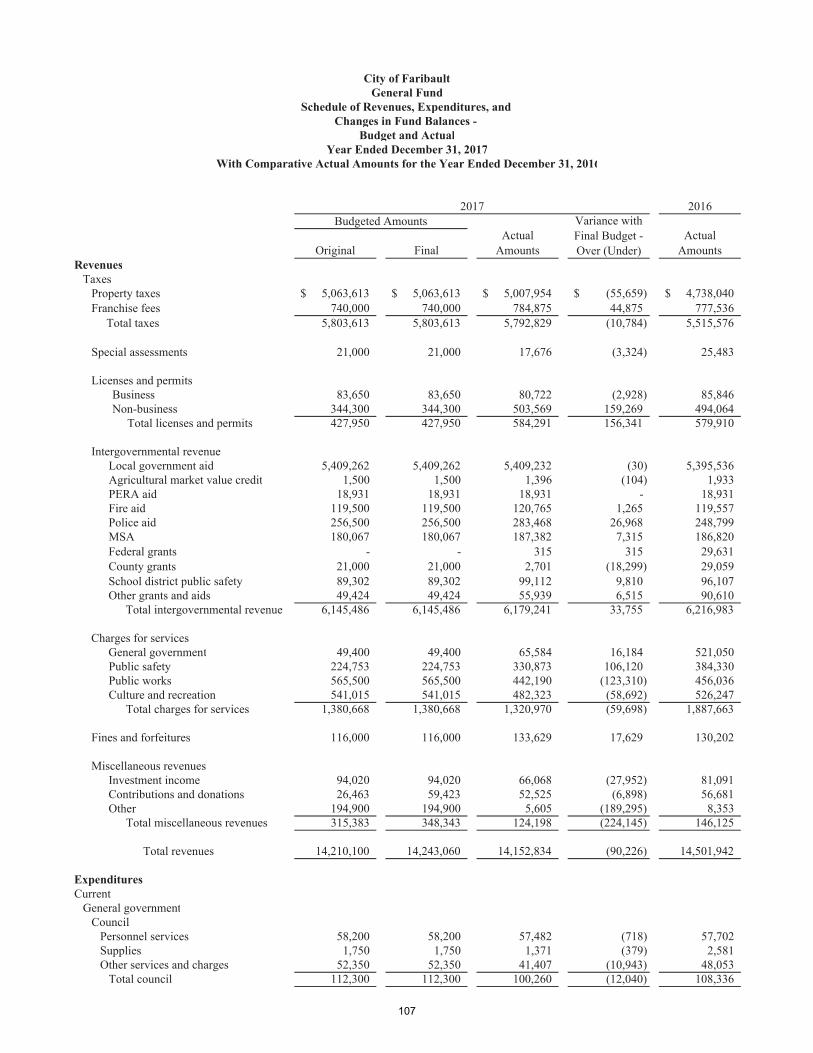
107

108

109

110

111
112

113

114

115

116

117

118

119

120

121

122
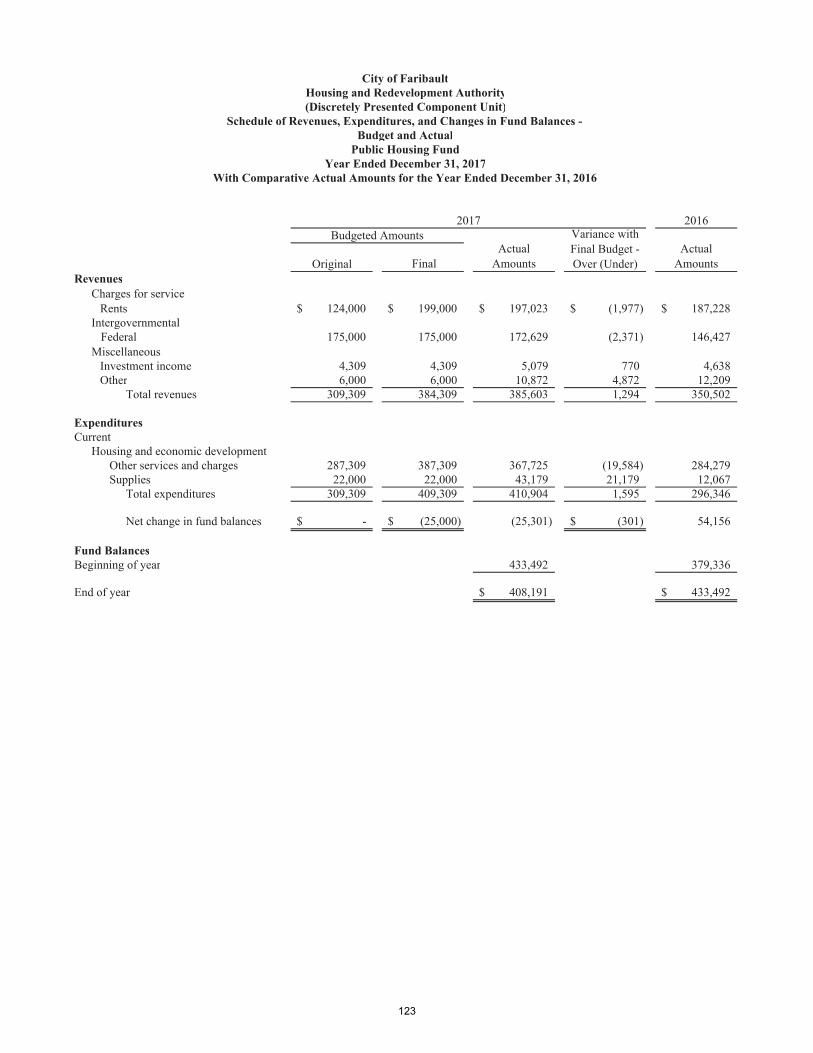
123

124

125

Economic Development
Authority Administration
(290)
Industrial Development Loan Program
(243)
MN Investment Fund - Federal
(248)MN Investment
Fund (249)Assets
Cash and investments 499,563$ 276,440$ 584,940$ 772,731$ Taxes receivable - current 1,520 - - - Taxes receivable - delinquent 4,273 - - - Accounts receivable 1,197 - - - Interest receivable 1,707 947 2,003 2,646 Notes receivable - 65,785 - 66,352
Total assets 508,260$ 343,172$ 586,943$ 841,729$
LiabilitiesAccounts payable 1,268$ -$ -$ -$
Deferred Inflows of ResourcesUnavailable revenue - property taxes 4,273 - - -
Fund BalancesRestricted Revolving loans - 343,172 586,943 841,729
Economic development - - - - Assigned for revolving loans - - - - Unassigned 502,719 - - -
Total fund balances 502,719 343,172 586,943 841,729
Total liabilities, deferred inflows of resources, and fund balances 508,260$ 343,172$ 586,943$ 841,729$
Total Fund balances reported above
Amounts reported for the Economic Development Authority in the Statement of Net Position are different because:
Capital assets used in governmental activities are not financial resources and, therefore, are not reported as assets in governmental funds Cost of capital assets
Some receivables are not available soon enough to pay for the current period's expenditures, and therefore are not reported as unavailable revenue in the fund Delinquent taxes receivable
Total net position - Economic Development Authority
Special Revenue
City of FaribaultEconomic Development Authority Component Unit
Combining Balance Sheet December 31, 2017
126

EDA Revolving Fund (292)
TIF Capital Projects Total
348,194$ 167,256$ 2,649,124$ - - 1,520 - - 4,273 - - 1,197
1,192 568 9,063 70,080 - 202,217
419,466$ 167,824$ 2,867,394$
-$ 30$ 1,298$
- - 4,273
- - 1,771,844 - 167,794 167,794
419,466 - 419,466 - - 502,719
419,466 167,794 2,861,823
419,466$ 167,824$ 2,867,394$
2,861,823$
181,334
4,273
3,047,430$
Capital Projects
127
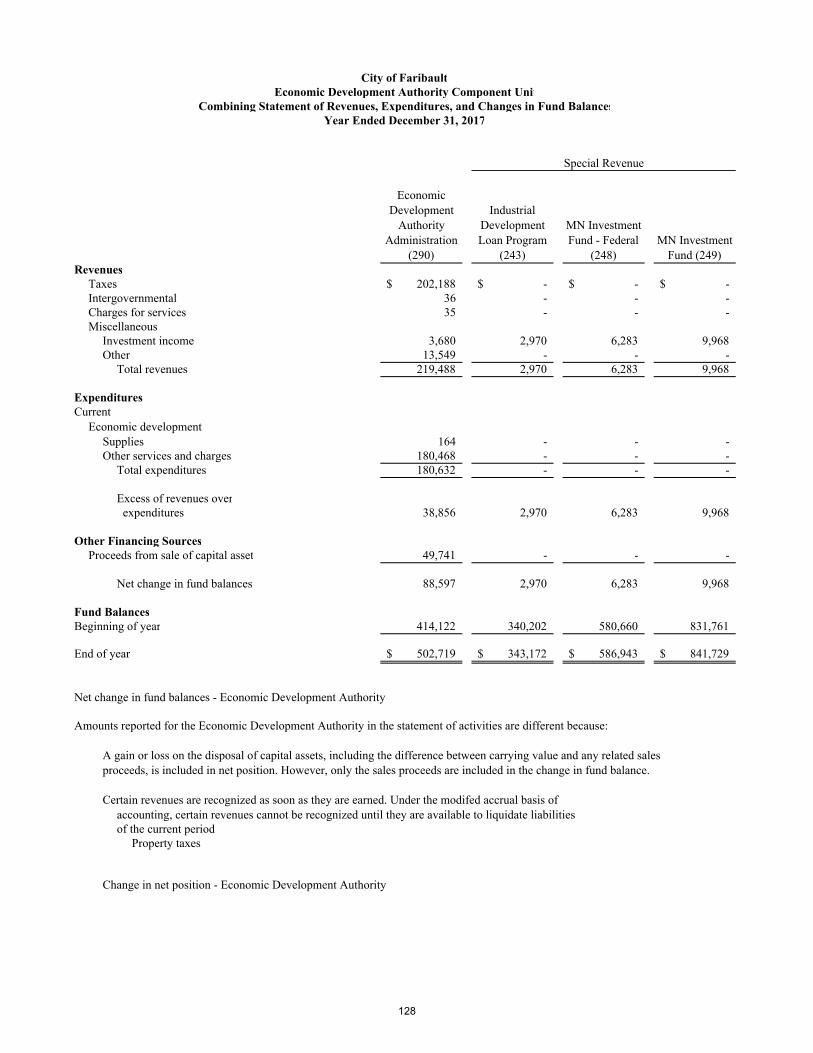
Economic Development
Authority Administration
(290)
Industrial Development Loan Program
(243)
MN Investment Fund - Federal
(248)MN Investment
Fund (249)Revenues
Taxes 202,188$ -$ -$ -$ Intergovernmental 36 - - - Charges for services 35 - - - Miscellaneous
Investment income 3,680 2,970 6,283 9,968 Other 13,549 - - -
Total revenues 219,488 2,970 6,283 9,968
ExpendituresCurrent
Economic developmentSupplies 164 - - - Other services and charges 180,468 - - -
Total expenditures 180,632 - - -
Excess of revenues over expenditures 38,856 2,970 6,283 9,968
Other Financing SourcesProceeds from sale of capital asset 49,741 - - -
Net change in fund balances 88,597 2,970 6,283 9,968
Fund BalancesBeginning of year 414,122 340,202 580,660 831,761
End of year 502,719$ 343,172$ 586,943$ 841,729$
Net change in fund balances - Economic Development Authority
Amounts reported for the Economic Development Authority in the statement of activities are different because:
A gain or loss on the disposal of capital assets, including the difference between carrying value and any related salesproceeds, is included in net position. However, only the sales proceeds are included in the change in fund balance.
Certain revenues are recognized as soon as they are earned. Under the modifed accrual basis of accounting, certain revenues cannot be recognized until they are available to liquidate liabilitiesof the current period Property taxes
Change in net position - Economic Development Authority
City of FaribaultEconomic Development Authority Component Unit
Combining Statement of Revenues, Expenditures, and Changes in Fund BalancesYear Ended December 31, 2017
Special Revenue
128

EDA Revolving Fund (292)
TIF Capital Projects Total
-$ 205,409$ 407,597$ - - 36 - - 35
- 5,905 1,833 30,639
- - 13,549 5,905 207,242 451,856
- - 164 - 171,230 351,698 - 171,230 351,862
5,905 36,012 99,994
- - 49,741
5,905 36,012 149,735
413,561 131,782 2,712,088
419,466$ 167,794$ 2,861,823$
149,735$
(5,747)
142
144,130$
Capital Projects
129

130
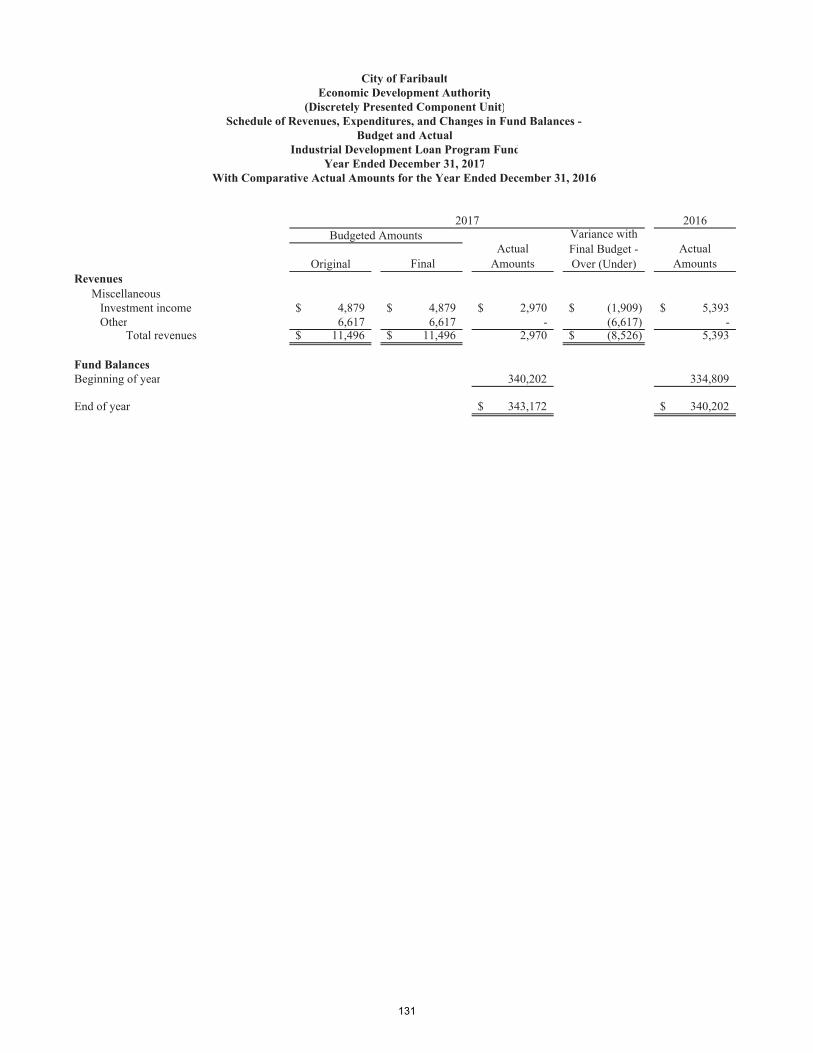
131

132
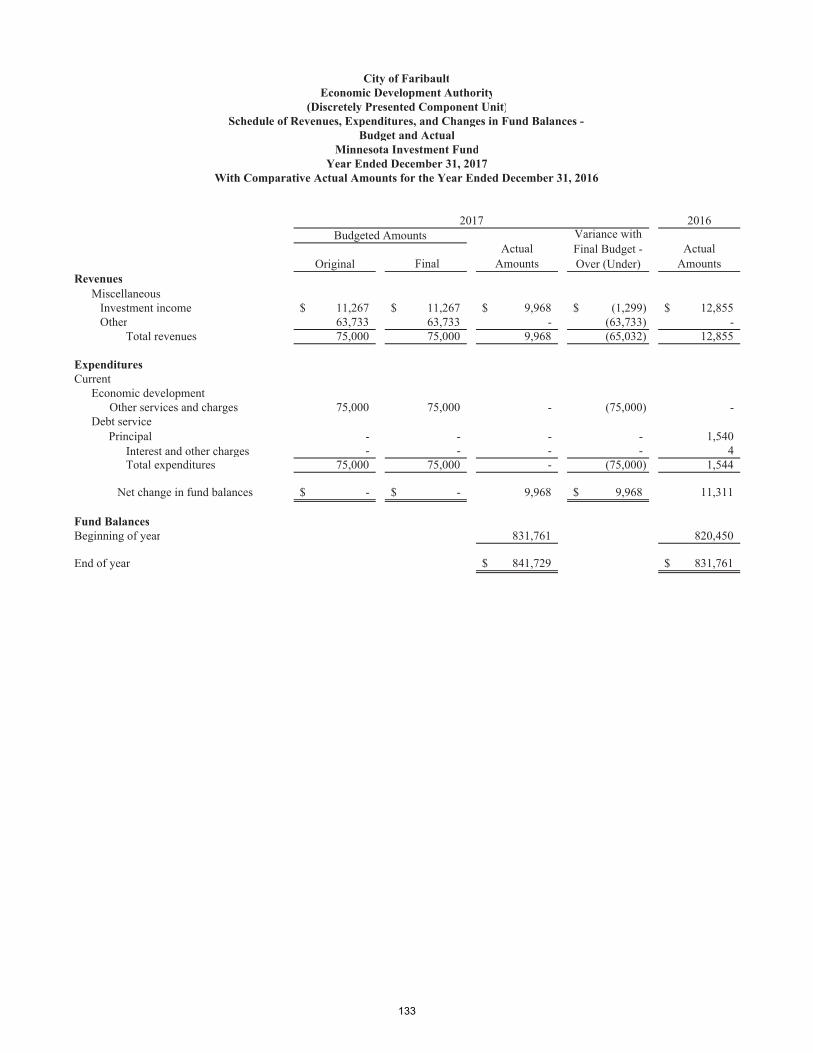
133

134

135

TIF District #6 Housing (263)
TIF District #8 River Ridge
(266)
TIF District #9 Faribault Road
(267)
TIF District #10 MRG Tool
(268)Assets
Cash and investments 69,426$ 39,078$ 49,309$ 7,304$ Interest receivable 236 133 167 25
Total assets 69,662$ 39,211$ 49,476$ 7,329$
LiabilitiesAccounts payable -$ -$ -$ -$
Fund BalancesRestricted for economic development 69,662 39,211 49,476 7,329
Total liabilities and fund balances 69,662$ 39,211$ 49,476$ 7,329$
City of FaribaultTax Increment Financing FundsSub Combining Balance Sheet
December 31, 2017
136

TIF District Garage #11
(269) Total
2,139$ 167,256$ 7 568
2,146$ 167,824$
30$ 30
2,116 167,794
2,146$ 167,824$
137

TIF District #6 Housing (263)
TIF District #8 River Ridge
(266)
TIF District #9 Faribault Road
(267)
TIF District #10 MRG Tool
(268)Revenues
Tax increments 17,792$ 69,537$ 88,116$ 20,693$ Miscellaneous
Investment income 675 571 496 71 Total revenues 18,467 70,108 88,612 20,764
ExpendituresCurrent
Economic development 475 63,058 79,780 19,098
Net change in fund balances 17,992 7,050 8,832 1,666
Fund BalancesBeginning of year 51,670 32,161 40,644 5,663
End of year 69,662$ 39,211$ 49,476$ 7,329$
City of FaribaultTax Increment Financing Funds
Sub Combining Schedule of Revenues, Expenditures,and Changes in Fund BalancesYear Ended December 31, 2017
138

TIF District Garage #11
(269) Total
9,271$ 205,409$
20 1,833 9,291 207,242
8,819 171,230
472 36,012
1,644 131,782
2,116$ 167,794$
139

140

141

142

143

144

145
146

147

148

149

150

151

152

153

154

155

156

157

158

159

160

161

162

Table 13
LessAmounts
General Available in NetFiscal Obligation Debt Service Bonded PerYear Bonds Funds Debt Capita
2008 23,025,000$ 2,110,016$ 20,914,984$ 1.4294 % 917 2009 24,406,501 4,106,070 20,300,431 1.3726 871 2010 32,561,143 3,026,406 29,534,737 2.0504 1,265 2011 40,826,552 2,749,312 38,077,240 2.8057 1,627 2012 48,696,461 3,309,456 45,387,005 3.8214 1,937 2013 45,375,000 5,099,642 40,275,358 3.7764 1,719 2014 43,399,000 5,730,322 37,668,678 3.5700 1,604 2015 37,593,000 5,878,832 31,714,168 2.9091 1,342 2016 34,991,000 4,804,920 30,186,080 2.6986 1,274 2017 28,687,000 2,023,433 26,663,567 2.2693 1,122
Note: Details regarding the City's outstanding debt can be found in the notes to the financial statements.See the Schedule of Demographic and Economic Statistics on page 167 for population data.See the Schedule of Tax Capacity, Market Value and Estimated Actual Value of Taxable Property on page 155 forproperty value information.
Percentage ofEstimated Actual
Value ofTaxable Property
City of Faribault, MinnesotaRatios of General Bonded Debt Outstanding
Last Ten Fiscal Years
163
164
165

166

167
168

169

170

171

172
173

174

175