Prepared by Division of Student Studies Circle, Washington ...
93
ED 121 209 AUTHOR TITLE INSTITUTION SPONS AGENCY PUB DATE NOTE AVAILABLE FROM EDRS PRICE DESCRIPTORS DOCUMENT RESUME HE 007 662 Johnson, Davis G.: Dube, V.P. Descriptive Study of Medical School Applicants: 1974-75. Association of American Medical Colleges, Washington, D. C. Health Resources Administration (DHEW/PHS), Bethesda, Md. Bureau of Health Manpower. Dec 75 93p.: Some tables may not reproduce clearly: Prepared by Division of Student Studies Association of American Medical Colleges, One Dupont Circle, Washington, D.C. 20036 MF-$0.83 HC-$4.67 Plus Postage Academic Standards: *Admission (School): Career Planning; Demography: Enrollment: Females: Grade Point Average: *Higher Education: *Medical Schools: *Medical Students: Minority Groups: School Surveys: *Statistical Data: Student Application: Tables (Data) ABSTRACT Tabular data are presented which indicate substantial increases in numbers of medical schools, applicants, applications, and new entrants from 1970-71 through 1974-75. It appears that the rates of increase have been declining somewhat since 1972-73. Substantial increases have been found among female and minority group applicants and acceptees. The quality of the applicant pool, as measured by MCAT scores and by undergraduate college grades, continues at a very high level and has shown less changes over the years under study. Major exceptions have been gains in the science subtest of the MCAT and in the proportion of admitted students with "A" average. It is concluded that the number of applicants may be starting to level off, but that the admission process at U.S. medical schools promises to continue to be a voluminous, expensive, and important activity. Each of the 25 tables is accompanied by descriptive commentary and deals with four major headings: applicant and application activity, academic background, demographic information, and career plans. (Author/LBH) *********************************************************************** Documents acquired by ERIC include many informal unpublished *' * materials not available* from other sources. ;ERIC makes' every effort * * to obtain the best copy available. Nevertheleis, items' of marginal *. * reproducibility are often encountered and this affects the quality * * of the microfiche and hardcopy reproductions ERIC makes available * * via the ERIC Document Reproduction Service (EDRS)._EDRS isnot * responsible for the quality of the original document. Reproductions * * supplied by EDRS are the best that can be made from .the original. * ***********************************************************************
-
Upload
khangminh22 -
Category
Documents
-
view
3 -
download
0
Transcript of Prepared by Division of Student Studies Circle, Washington ...

ED 121 209
AUTHORTITLE
INSTITUTION
SPONS AGENCY
PUB DATENOTE
AVAILABLE FROM
EDRS PRICEDESCRIPTORS
DOCUMENT RESUME
HE 007 662
Johnson, Davis G.: Dube, V.P.Descriptive Study of Medical School Applicants:1974-75.Association of American Medical Colleges, Washington,D. C.Health Resources Administration (DHEW/PHS), Bethesda,Md. Bureau of Health Manpower.Dec 7593p.: Some tables may not reproduce clearly: Preparedby Division of Student StudiesAssociation of American Medical Colleges, One DupontCircle, Washington, D.C. 20036
MF-$0.83 HC-$4.67 Plus PostageAcademic Standards: *Admission (School): CareerPlanning; Demography: Enrollment: Females: GradePoint Average: *Higher Education: *Medical Schools:*Medical Students: Minority Groups: School Surveys:*Statistical Data: Student Application: Tables(Data)
ABSTRACTTabular data are presented which indicate substantial
increases in numbers of medical schools, applicants, applications,and new entrants from 1970-71 through 1974-75. It appears that therates of increase have been declining somewhat since 1972-73.Substantial increases have been found among female and minority groupapplicants and acceptees. The quality of the applicant pool, asmeasured by MCAT scores and by undergraduate college grades,continues at a very high level and has shown less changes over theyears under study. Major exceptions have been gains in the sciencesubtest of the MCAT and in the proportion of admitted students with"A" average. It is concluded that the number of applicants may bestarting to level off, but that the admission process at U.S. medicalschools promises to continue to be a voluminous, expensive, andimportant activity. Each of the 25 tables is accompanied bydescriptive commentary and deals with four major headings: applicantand application activity, academic background, demographicinformation, and career plans. (Author/LBH)
***********************************************************************Documents acquired by ERIC include many informal unpublished *'
* materials not available* from other sources. ;ERIC makes' every effort ** to obtain the best copy available. Nevertheleis, items' of marginal *.* reproducibility are often encountered and this affects the quality ** of the microfiche and hardcopy reproductions ERIC makes available ** via the ERIC Document Reproduction Service (EDRS)._EDRS isnot* responsible for the quality of the original document. Reproductions ** supplied by EDRS are the best that can be made from .the original. ************************************************************************

I
DESCRIPTIVE STUDY OF
MEDICAL SCHOOL APPLICANTS
1974-75
DAVIS G. JOHNSON, PH.D.DIRECTORDIVISION OF STUDENT STUDIES
PREPARED BY:
W. F. DuBfAND ASSOCIATE DIRECTOR /
DIVISION OF STUDENT STUDIES
(1ASSOCIATION OF AMERICAN MEDICAL COLLEGES
....41
ONE DUPONT CIRCLE, N.W.tbVi WASHINGTON, D.C. 20036 .., s DEPARTMENT OF HEALTH.
EDUCATION, WELFARENATiONAI. INSTITUTE OF
EDUCATION
DECEMBER 1975 DUCED EXACTLY AS RECEIvED FROM
THIS DOCUMENT HAS /TEEN REPRO.
THE PERSON OR ORGANIZATION ORIGIN.ATINO IT POINTS OF VIEW OR OPINIONSSTATED 00 NOT NECESSARILY RE PRE.
EDUCATION POSITION OR POLICYSENTOFFICIAL NATIONAL INSTITUTE OF
2

DESCRIPTIVE STUDY OF
MEDICAL SCHOOL APPLICANTS
1974-75*
The work upon which this publicationis based was supported in part by theBureau of Health Manpower, Departmentof Health, Education and Welfare pur-suant to contract number 231-75-0007.However, any conclusions and/or recom-mendations expressed herein do notnecessarily represent the views of thesupporting agency.
* The authors of this report also acknowledge with thanks the generalconsultation provided by Mr. Gerald Kurtz, Director of the AAMCDivision of Student Services and the statistical assistance renderedby Ms. Julie A. Lambdin, Research Associate in the Division of StudentStudies.
3

i
Mt Division of Student Studies
Descriptive Study of Medical School Applicants, 1974-75
Table of Contents
I Introduction
II Tables and Commentary
A. APPLICANTS AND APPLICATION ACTIVITY
1. Summary of Application Activity, 1970-71
Through 1974-75
2. Comparison of Accepted Applicants, Non-
matriculants, and New First-Year Entrants,
1970-71 Through 1974-75
3. Comparative Acceptance Data for First-Time
and Repeat Applicants, 1974-75 Entering
Class
4. Applicants and New Entrants by Medical School
and Sex, 1974-75 First-Year Class (and total
comparative data for 1970-71)
5. Graduation Status and Acceptance of First-
Time and Repeat Applicants to the 1974-75
Entering Class
6. Application Frequency, Acceptance Rates, and
Ability Levels of Applicants to 1974-75
Entering Class
B. ACADEMIC BACKGROUND
7. Mean MCAT Scores of Accepted, Nonac.epted,
and Total Applicants 1970-71 Through
1974-75
4
Page
iv
1
3
6
8
17
19
21

11
8. Comparative Acceptance Data and MCAT Scores for
First-Time and Repeat Applicants, 1974-75
Entering Class 23
9. Mean Scores on MCAT Subtests for Men and
Women Applicants to Entering Classes,
1971-72, 1972-73, 1973-74, and 1974-75 25
10. Undergraduate Grades of First-Year U.S.
Medical Students, 1970-71 Through 1974-75
11. Distribution of Applicants and Acceptees by
Undergraduate College Grade-Point Average
(GPA) and by Scores on the Science Subtest
of the Medical College Admission Test (MCAT)
for the 1974-75 Entering Class 30
12. Acceptance to Medical School by Undergraduate
Major for 1974-75 Entering Class 33
27
C. DEMOORAPHIC INFORMATION
13. Comparative Acceptance Data for Men and
Women Applicants, 1970-71 Through 1974-75 36
14. Acceptance Rates of Applicants by Age,
1974-75 Entering Class 38
15. Women Applicants to U.S. Medical Schools and
Women New Entrants, 1970-71 Through 1974-75
First-Year Classes 40
16. Self-Description of Applicants and Acceptees
to U.S. Medical Schools, 1974-75 First-Year
Class 42
5

iii
17. Comparison of the Sex Distribution of Minority-
Group and Total Students Enrolled in the
1971-72 and 1974-75 First-Year Classes 45
18. MCAT Scores and Undergraduate College Grades
(GPA) of Applicants by Self-Description,
1974-75 Entering Class 47
19. MCAT Scores and Undergraduate College Grades
(GPA) of Applicants by Father's Occupation,
1974-75 Entering Class 49
20. Applicants and Applications by Place of
Residence and Sex, 1974-75 First-Year Class
(and total comparative data for 1970-71) 53
21. Geographic Origins of First-Year Foreign
Nationals in U.S. Medical Schools, 1970-71
Through 1974-75 57
D. CAREER PLANS
22. MCAT Scores and Undergraduate College Grades
(GPA) of Applicants by General Career Activity
Plans, 1974-75 Entering Class 60
23. MCAT Scores and Undergraduate College Grades
(GPA) of Applicants by Specialization Plans,
1974-75 Entering Class 62
24. MCAT Scores and Undergraduate College Grades
(GPA) of Applicants by Expected Character
of Medical Practice, 1974-75 Entering Class 64
25. MCAT Scores and College Grades of Applicants
by Location of Medical Practice, 1974-75
Entering Class 67
III. Summary and Conclusion 68

iv
IV. Appendices
A. Supplementary Tables for Report of MedicalSchool Applicants, 1974-75
Page.
Commentary 69
Table A-1 MCAT Scores and Undergraduate College 71Grades of Applicants by AcceptanceStatus and by Parental Income, 1974-75Entering Class
Table A-2 MCAT Scores and Undergraduate College 72Grades of Applicants by AcceptanceStatus and by Father's Occupation,1974-75 Entering Class
Table A-3 MCAT Scores and Undergraduate College 74Grades of Applicants by AcceptanceStatus and by General Career ActivityPlans, 1974-75 Entering Class
Table A-4 MCAT Scores and Undergraduate College 75Grades of Applicants by AcceptanceStatus and by Specialization Plans,1974-75 Entering Class
Table A-5 MCAT Scores and Undergraduate College 77Grades of Applicants by AcceptanceStatus and by Expected Character ofMedical Practice, 1974-75 EnteringClass
B. December 1975 Datagram, "Applicants for the 781974-75 First-Year Medical School Class."
C. Method for Testing the Statistical Significanceof Differences Between an Observed SampleProportion and a Specified (a priori) Value
Explanation 81
Figure 1 - Curves for Estimating Differences 82Between Observed Sample Proportions andSpecified (a priori) Values
7

vii
I. INTRODUCTION
As indicated in the research design that was submitted to the
NIH Bureau of Health Manpower (BHM) in September 1975, the
major deliverables to BHM under this contract are:
1. Approximately 25 tables of data as outlined in Exhibit A
of the research design.
2. A report which summarizes and interprets the data in these
tables.
A draft report was prepared in October 1975 which included
data for all of the tables outlined in the research design or
explanations of the reasons that several of these tables of
data were not being provided at that time. In addition, a
brief narrative accompanied each of the 25 actual or proposed
tables.
Since no comments were received from BHM relative to suggested
changes from the draft report, the general content and format
of this final report are similar to that previously submitted.
As indicated in the draft report, however, additional checks
have been made on the accuracy of the preliminary data, and
necessary modifications have been made in both the tables and the
narrative comments.
This final report also includes the missing data from Tables 5
and 18 plus five tables of supplementary data that are presented
8
viii
and explained in a newly added Appendix A.
As specified in the contract, major emphasis in the study
has been given to comparing the application situation in
1970-71 with that of 1974-75. Once again, the tables and
commentaries are grouped under the following four major head-
ings of:
A. Applicant and Application Activity
B. Academic Background
C. Demographic Information
D. Career Plans
Highlights of the 1974-75 aspects of this study were pub-
lished as a Datagram in the December 1975 issue of the Journal
of Medical Education. For the convenience of the reader of this
final report, a copy of that Datagram is attached as Appendix B.
It is anticipated that a complete report of the findings
of the study will also be submitted to the Journal of Medi -
dal Education for eventual publication.
Finally, a new Appendix C has been added to facilitate the
checking of the statistical significance of differences in
pertinent findings of this study. This appendix should be
of particular value in ascertaining whether variations in
the proportions of students accepted to medical school from
various subgroups are statistically different from the general
acceptance ratio of 35 percent that was true nationally for
9

ix
the 42,624 applicants to the 1974-75 first-year class.
As illustrated in the example provided in Appendix C, the
43 percent acceptance rate for chemistry majors is statistically
very different from the national rate of 35 percent. Figure
1 of this appendix can be used to test the significance of any
of the dozens of variations in acceptance rates that are reported
throughout the study. These reports include acceptance suc-
cess by sex, age, self-description, number of applications
filed, father's occupation, and career plans.
10

Table 1
Summary of Application Activity, 1970-71 Through 1974-75
Number of Percent of
No. of Applications Applicants Total
First-Year Medical Number of Number of per Accepted per First-Year Applicants
Class Schools Applicants Applications Individual* Applicants Acceptance Enrollment!' Accepted
1970-71 102 24,987 148,797 5.95 11,500 2.17 11,348 46.0
1971-72 108 29,172 210,943 7.23 12,335 2.36 12,361 42.3
1972-73 112 36,135 267,306 7.40 13,757 . 2.63 13,677 38.1
1973-74 114 40,506 328,275 8.10 14,335 2.83 14,159* 35.4
1974-75 114 42,624 362,376 8.50 15,066 2.83 14,763 35.3
Change from 1970-71 to 1974-75
Number 12 17,637 213,579 2.55 .66 3,415 -10.7
Percent 12% 71% 144% 43% 31% 30% 30% -23%
*
Average number.
t Includes previously enrolled students: data for 1974-75 enrollment from AAMC fall enrollment questionnaire.
Variation from previously published total reflects late reports.

-2-
Commentary on Table 1
As shown in Table 1, the number of medical schools increased
steadily from 102 in 1970 to 114 in 1973-74 and remained at
that level for the 1974-75 entering class. Whereas this re-
presented a 12 percent increase in the number of medical
schools, the number of applicants rose by over 70 percent, and
the number of applications rose at twice that rate, increasing
by over 140 percent during this five-year period.
The number of accepted applicants and the first-year enroll-
ment each rose approximately by 30 percent over this period
of time. Since the rate of growth in applicants was over
twice that of enrollments, it was inevitable that the percent
of total applicants accepted declined during this period.
It is noteworthy, that the applicants-to-place ratio estab-
lished for 1973-74 appears to have stabilized for 1974-75.
The number of applications per individual, however, continued
to rise.
12

Table
Comparison of Accepted Applicants, Nonmatriculants, and New
First-Year Entrants, 1970-71 Through 1974-75
First-Year
Class
No. of
Medical
Schools
Total
Accepted
Nonmatriculants
No. Percent
1970-71 102 11,500 331 2.9
1971-72 108 12,335 247 2.011I
1972-73 112 13,757 405 2.9
1973-74 114 14,335 459 3.2
1974-75 114 15,066' 488 3.2
Change from 1970-71 to 1974-75
Number 12 . 3,566 157 +0.3
Percent 12% 31% 47%, +10%
New Entrants
No. Percent
11,169 97.1i
12,088 .98.04i
13,352 97.r
13,876 96.8
14,578 96.8
3,409 -0.3
31% -0.31%
Commentary on Table 2
Of particular interest in this table are the data relative
to matriculants. Of the 11,500 individuals offered a place
in a U.S. medical school for 1970-71, only 331 or 2.9 percent
failed to enroll. These figures were even lower for 1971-72,
when only 247 students representing 2.0 percent of those
accepted, did not matriculate. For the 1972-73 entering class,
the proportion of nonmatriculants was back at the 2.9 percent
level, and for 1973-74 and 1974-75 it rose slightly to 3.2
percent for each of these years.
Possible hypotheses to explain these changes in nonmatriculants
include the following:
1. The end of the military draft (on July 1, 1973) with the
result that a few students who might have applied to medi-
cal school in order to escape conscription may have decided
to pursue a different type of graduate education and/or
career.
2. The growing numbers of minority and female acceptees,
some of whom may have been less likely to have matricu-
lated because of receiving less financial support from
their families.
3. The threat of declining financial aid for medical students
generally.
14

-5-
Commentary on Table 2 (cont.)
4. The new policy at some medical schools of allowing
students to wait a year after acceptance before they
actually matriculate.
By the use of the chi-square test, it was determined that
the variations in proportion of nonmatriculants during the
five years studied was significant at the .005 level. A
similar comparison between the nonmatriculants for 1970-71
and 1974-75, however, revealed only a marginally significant
difference (between the .05 and .10 levels).
15

Table 3
Comparative Acceptance Data for First-Time and Repeat Applicants,
1974-75 Entering Class*
Men Women Total
Percent Percent PercentCategory No Accepted No. Accepted No. Accepted
First-Time Applicants
Accepted 9,295 37.4 2,845 41.3 12,140 38.2
t....1t
Total 24,859 -- 6,894 -- 31,753 ..... a,Cb 1
Repeat Applicants
Accepted 2,379 26.3 547 30.1 2,926 26.9
Total 9,053 MP MO 1,818 IIM MN 10,871 IM
All Applicants
Accepted, 11,674 34.4 3,392 38,9 15,066 35.3
Total 33,912 00 ONO 8,712 IM 4.116 42,624 --
* Repeat Applicants are limited to those who also applied for the 1973-74 entering class.

Commentary on Table 3
The data in this table are generally comparable with those
for 1973-74, which was the first year this type of analysis
was carried out. As the year before, first-time applicants
had a higher acceptance rate (38.2 percent) than repeat
applicants (26.9 percent). Women continued to have higher
acceptance rates than men regardless of whether they were
first-time or repeat applicants.
The differential in the acceptance rates for men and women
repeat applicants, however, appears to be becoming smaller.
Whereas the comparable figures for the 1973-74 entering
class were 24.7 percent for men and 31.2 percent for women
(for a difference 6.5 percent), the differential for the
19741-75 entering class, as indicated in the table, was only
4 percent (26.3 for men compared with 30.1 for women).
It is also noteworthy that the total proportion of applicants
for the 1974-75 entering class who had also applied to the
previous first-year class was 25.5 percent as compared with
only 22.6 percent for the 1973-74 entering class. This
suggests that rejected applicants are continuing to reapply
at an increasing rate. It also illustrates that applicant
figures of recent years have been inflated by those who are
reapplying. Therefore, the actual number of individuals
applying each year provides a misleadingly high indication
of the true number seeking admission to medical school over a
protracted period of time.
17

Dame of School
Table 4
Applicants and New Entrants by Medical School and Sim, 1974-75 First-Year Class
(and total comparative data for 1970-71)
:No. of New First-Year Entrants Total Ho. of Applicants
1974-75 1970-71 Increase 1974-75 1970-71 Increase
Men Women Total Total No. Percent men Women Total Total
'(11)
(By State or Territory)
(1) (2) (3) (4) (5) (6)
Alabama
*Alabama-Birmingham 104 21 125 103 22
*South Alabama 47 17 64 64
Arizona
*Arizona 52 19 71 64 7
Arkansas
*Arkansas 106 15 121 110 21
California
*California -Davis 66 34 100 50 50
*California-Irvine 51 19 70 64 6
*California-Los Angeles 120 25 145 137 8
*California-San Diego 74 21 95 50 45
*California-San Francisco 94 53 147 133 14
Loma Linda 129 33 162 127 35
Southern California 98 30 128 94 34
Stanford 66 29 95 76 19
Colorado
*Colorado 88 37 125 113 12
Connecticut
*Connecticut,
Yale
49
75
11
27
60
102
33
93
27
9
(7) (8) (9) (10)
21 1,046 204 1,250
t 998 154 1,152
11 743 144 887
19 839 97 936
100 2,879 865 3,744
9 2,673 699 3,372
6 3,277 864 4,141
9 3,182 915 4,097
11 3,753 1,153 4,906
28 3,833 754 4,585
36 3,635 916 4,551
25 3,471 1,085 4,556
11 1,460 392 1,852
82 1,294 440 1,734
10 1,621 567 2,181
739
749
539
1,314
1,593
1,761
2,349.
2,055
;1,011.
1,952
1,983
1,799
1,411
1,886
Ho. Percent
(12) (13)
511 69
1,152 t
138 18
397 74
2,430 185
1,779 112
2,380 135
1,748 74
2,851 139
3,574 354
2,599 133
2,573 130
53 3
323 23
302 16
Fable 4
page 2
(1) (2) (3) (4) (5) (6) (7) (8) (9) (10) (13.) (12) (13)
District of Coluebia
George Washington 111 37 148 119 29 24 6,840 1,726 8,566 2,666 5,900 221
Georgetown 166 39 205 173 32 19 6,721 1,629 8,350 2,905 5,445 187
Howard 83 44 127 111 16 14 3,413 892 4,305 1,006 3,299 328
Florida
*Florida 60: 20. 80 68 12. 18 1,690 371 2,060 953 1,107 116
*Florida State 27 R 36 36 27 9 36 36 t
Miami 106 18 124 115 9 8 1,059 175 1,234 664 570 86
*South Florida 54 10 64 64 t 756 125 883 881 t
Georgii
IMEt 92 12 104 94 10 11 4,407 909 5,316 1,316 4,000 304
*med. Coll. of Georgia 152 27 179 136 43 32 1,325 260 1,585 415 1,170 282
Hawaii
*Hawaii 50 16 66 50 16 32 1,585 288 1,873 303 570 188
Illinois
Chicago Med. 91 10 101 83 18 22 4,574 999 5,573 1,879 3,694 197
Chicago-Pritsker , 82 22 104 90 14 16 5,355 1,260 6,615 1,457 5,158 354
*Illinois 273 58 331 225 106 47 2,140 543 2,683 1,123 560 56
Loyola (Stritdh) 104 26 130 121 9 7 6,015 1,649 7,664 2,155 5,509 256
Northwestern. 135 36 171 160 11 7 6,220 1,470 7,690 3,444 4,246 123
Rush 70 20 90 90 t 2,611 721 3,332 3,332 f
*Southern Illinois 45 10 55 55 t 1,024 221 1,245 1,245 t
Indiana
*Indiana 244 61 305 247 58 23 1,447 307 1,754 1,214 540 44
Iowa
*Iowa'28145 173 144 29 20 1,219 261 1,480 496 984 198

Table 4
page 3
(1) (2) (3) (4) (5) (6) (7) (8) (9) (10) (11) (12) (13
Kansas
*Kansas 126 37 163 131 32 24 810 197 1,007 588 419 71
Kentucky
*EalitittE 85 23 108 88 20 23 1,902 443 2,345 1,116 1,229 110
*Louisville 103 32 135 122 13 11 1,365 282 1,647 1,973 -326 -17
Louisiana
*Louisiana State-Mew Orleans 120
36
25
4
145
40
145
32
-
8
0
25
1,067
439
195
60
1,262
499
491
332
771
167
157,
50*Louisiana State-Shreveport
Tulane 124 24 14B 138 10 7 7,113 1,279 8,392 2,574 5,818 226
Maryland
Johns Hopkins 94 26 120 109 11 10 1,221 345 1,566 1,346 220 16
*Maryland 120 45 165 144 21 15 1,371 414 1,785 1,016 769 76
Massachusetts
Boston 95 36 131 94 37 39 3,803 1,320 5,123 2,358 2,765 117
Harvard 110 55 165 138 27 20 2,465 824 3,289 1,593 1,696 106
*Massachusetts 49 14 63 16 47 294 679 227 906 286 620 217
Tufts 99 46 145 122 23 19 3,281 1,138 4,419 2,126 2,293 108
Michigan
*Michigan 179 58 237 225 12 5 3,241 856 4,097 1,726 2,371 137
*Michigan State 65 40 105 46 59 128 1,991 528 2,519 841 1,678 200
*Wayne State 214 41 255 164 91 55 3,562 733 4,295 1,883 2,412 128
Minnesota
MAYO 32 9 41 41 t 1,401 339 1,740 1,740 t
*Minnesota-Duluth 29 7 36 36 r 880 170 1,050 1,050 t
*Minnesota -Minneapolis 198 41 239 229 10 4 1,S50 349 1,899 952 947 99
4

I
Table 4
Page 4
(1) (2) (3) (4) (5) (6) (7) (8) (9) (10) (11) (12) (13)
Mississippi
'Mississippi 125 2 150 94 56 60 840 127 967 504 463 92
Missouri
*Missouri-Co1umb1a 90 20 110 100 10 10 1.522 304 1,826 1.466 360 25
*Missouri -Manses City 52 19 71 71 t 67 23 90 90 t
St. Louis 122 32 154 141 13 9 7.710 1.484 9.194 2.581 6.613 256
Washington-St. Louis 86 34 120 110 10 9 4,214 1.080 5,294 2,003 3.291 164
Nebraska '
Creighton 94 16 110 88 22 25 7,205 1,299 8.504 2.369 6.135 259
*Nebraska 121 24 145 121 24 20 1.023 258 1,281 692 589 85
Nevada
*Nevada 36 12 48 48 t 715 133 848 84B t
New Nampshire
Dartmouth 47 17 64 53 11 21 2,105 694 2.799 1,052 1,747 166
New Jersey
*New Jersey wed. 80 32 112 85 27 32 .1.848 544 2.392 1,604' 788 49
Rutgers B3 25 108 80 28 35 1.529 437 1.966 916 1,050 115
NW Mexico
Mew Mexico 48 24 72* 47 25 53 837 219 1.056 331 725 219
New York
Albany 78 22 107 79 28 35 3.623 889 4.512 1,862 2.650 . 142
Albert Einstein 126 47 173 113 60 53 4,019 1.383 6.202 1,766 4,436 251
Columbia 104 42 146 136 10 7 3.314 1,155 4.469 1,798 2,671 149
Cornell .70 31 101 . 91 10 11 3.313 1,117 4.430 1.827. 2,603 142
Mount Sinai 62 10 80 40 40 100 2.467 821 3,280 1,590 1.690 107

Table 4page 5
(1) (2) (3) (4) (5) (6) (7) (9) (9) (10) (11) (12) (13)
New York Med. 251 82 333 133 200 150 3,767 1,076 4,843 2,765 2,178 79
New York Univ. 138 48 186 140 46 33 2,875 957 3.832 2,423 1.409 58
Rochester 72 24 97 79 20 25 3,312 888 4.200 1,625 2,575 158
*State Univ. of New York - Buffalo 106 29 135 125 10 8 4,214 1,103 5,317 2,129 3,188 150
*State Univ. of New York - Downstate 159 57 216 206 10 5 4,902 1,383 6,285 3,024 3,261 108
*State Univ. of New York-Stony Brook 23 27 50 50 1 1.377 536 1.913 1,913 t
*State Univ. of New York-Upstate 91 29 120 110 10 9 3.802 1,038 4,840 1,931 2,909 151
North Ca.roline 1-...,
NJBowman Gray 70 20 90 77 13 17 3.315 1411 3,916 1,920 1,996 104 1
h., Duke 85 32 117 105 12 11 3.112 822 3,934 1,804 2,130 118
N.W *East Carolina 17 3 20 20 t 290 44 334 334 t
*North Carolina 84 26 110 100 10 10 1,358 347 1,705 1,270 435 34
North Dakota
*North Dakota 56 11 67 52 15 29 164 31 135 138 57 41
Ohio
Case Western Reserve 100 37 137 108 29 27 6.634 1.606 8.240 2,210 6.030 273
*Cincinnati 151 33 184 107 77 72 5,326 1,206 6,532 1,764 '4.768 270
*Ned. Coll. of Ohio-Toledo 62 18 80 32 48 150 1,513 321 1,834 1,001 833 83
*Ohio State 185 41 226 216 10 5 2,221 457 2.678 1,132 1,546 137
Oklahoma
*Oklahoma 128 29 157 137 20 15 1.202 235 1,437 608 829 136
Oregon
*2E222T1 92 22 114 96 18 19 710 176 886 739 147 20
Pennsvlvania
Hahnenmann 130 32 162 122 40 33 2,618 653 3,271 2,771 500 18
.7 on 184 39 223 6 4,983 1,249 6,232 3,302 2,930 99
4 P 4 t

Table 4,
page 6
(1) (2) (3) (4) (5) (6) (7) (0) (9) (10) (11) (12) (13)
Med. Coll. of Pennsylvania 24 66 90 60 22 32 2,097 2,202 5,099 716 4,303 612
*Pennsylvania 112 48 160 149 11 7 2,076 071 3,747 2,430 1,309 54
*Pennsylvania State 74 17 91 69 22 32 2,060 641 2,701 2,486 215 9
Pittsburgh 99 37 136 125 11 9 3,101 724 3,025 1,919 1,906 99
*Temple 136 42 170 159 19 12 3,913 1,032 4,945 2,737 2,200 01
Rhode Island
Brown 46 14 60 21 39 186 222 63 205 27 250 956 -
South Carolina
*South Carolina 131 24 155 120 35 29 1,100 172 1,360 625 735 110
South Dakota1
South Dakota 52 13 65 54 11 20 251 50 309 704 -395 -564.4
I.a
Tennessee 1
Meharry 77 30 107 07 20 23 2,477 585 3,062 1,136 1,926 170
*Tennessee 172 32 204 192 12 6 730 127 057 848 9 1
Vanderbilt 69 14 03 75 0 11 3,792 964 4,756 1,202 3,554 296 .
Texas
Saylor 131 37 160 124 44 35 3,151 013 3,964 1,557 2,407 155
Texas-Galveston 155 4B 203 175 20 16 1,926 390 2,324 973 1,351 139
"Texas - Houston 46 6 52 52 t 1,075 407 2,202 2,282 1
*Texas+San Antonio 97 25 122 100 14 13 1,920 403 2,323 1,103 1,220 111
*Texas»Southwestern 172 20 200 110 90 02 1,963 417 2,380 1,003 1,297 120
*Texas Tech 29 11 40 40 t 1,410 232 1,642 1,642' t
Utah
AaNi 84 16 100 75 25 33 1,769 306 2,075 077 1,190 137
Vermont
*Vermont 59 24 83 76 7 9 1,702 400 2,182 1,635 547 33
Virginia
Easton Virginia 20 8 36 36 t 1,370 267 1,645 1,645

Table 4 page 7
(1) (2) (3) (4) (5) (6) (7) (8) (9) (10) (11) (12) (13
Med. Coll. of Virginia 137 28 165 135 30 22 2,809 594 3.403 1,501 1'905 127
*Virginia 111 22 133 95 38 40 2,249 536 2,785 1,391 1,394 140
Washington
'Washington 105 30 135 102 33 32 1,411 383 1,794 725 1,069 147
West Virginia
West Virginia 72 11 83 74 9 12 350 68 418 208 210 101
Wisconsin
Med. Coll. of Wisconsin 97 17 114 112 2 2 4.059 792 4,851 2,505 2,346 94 i
4-,
to.n.
*Wisconsin 122 37 159 114 45 39 1,037 278 1,315 804 511 64 4ai
*11,Puerto Rico
Puerto Rico 83 35 118 91 27 30 328 145 473 305 168 55
Total Schools
subtotals by Support
11,315 3,264 14,579 11,169 3410 31 288,962 73,414 362,376 144797 214579 144
Private (N=46) 4,464 1,431 sags 172.397 45.050 217,447
Public (Na68) 6.851 1,833 84,684 1164565 28,364 144,929
*Asterisks indicate schools that were publicly supported during 1974-75. Underlining indicates schools that participated
in AMCAS in the selection of their 1974-75 entering class as reported in 1974-75 Medical School Admission Requirements,
United States and Canada. Washington, D.C.: Association of American Medical Colleges, 1973.
Percentage increase not applicable because school had no students in 1970-71.

-15-
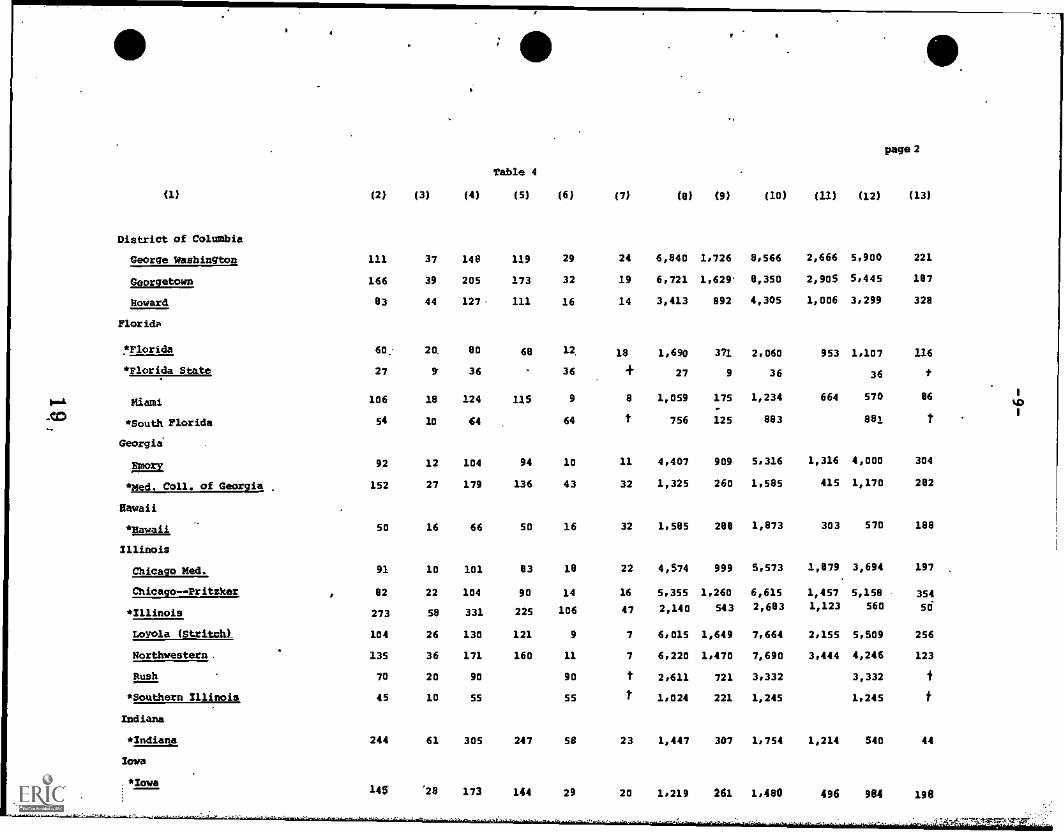
Commentary on Table 4
This table provides data on a school-by-school basis cover-
ing many of the same parameters previously reported nationally
in Tables 1 and 2.
For example, whereas the national increase in first-year
entrants from 1970-71 to 1974-75 was 31 percent, as indicated
on Table 2, column 7 of Table 4 reveals that on a school-by-
school basis this ranged all the way from no change at all at
LSU-New Orleans to an increase of 100 percent or over at
California-Davis, University of Massachusetts, Michigan State
University, Mount Sinai, New York Medical College, Medical
College of Ohio at Toledo and Brown University. Although
most of these large increases occurred at newly developing
schools, the situation at New York Medical College is unique
in that its growth is explained mostly by the one-time addition
of a second freshman class during the spring of 1975. This
supplementary group was related to a transition between a
three-year and a four-year curriculum.
Even greater school-by-school variability is found in the
change in the number of applicants from 1970-71 through 1974-75.
Although the average increase (as shown in column 13) was 144
percent, rises for individual institutions ranged all the way
from less than 10 percent for two schools to a growth of over
300 percent for 6 schools. In the former category were the
University of Colorado (3 percent) and Pennsylvania State
University (9 percent). These two schools and others with
small growth rates were mostly state schools that had
25

-16-
Commentary on Table 4 (cont.)
apparently clarified their geographical restriction in their
admissions literature.
At the other extreme, the six medical schools showing a growth
of applicants of more than 300 percent include Loma Linda
(354 percent), Howard (328 percent), Medical College of Penn-
sylvania (612 percent), Emory (304 percent), Chicago-Pritzker
(354 percent) and Brown (956 percent), Some of these rapid
increases are undoubtedly due to affirmative action programs
which opened the door to more women and students of various
racial/national backgrounds.
Data by type of support of school show that 46 or 40 percent
of the schools were privately supported during 1974-75 and
68 or 60 percent were publicly supported. It should be noted
that some of the schools categorized as privately supported
also received some state aid. This is particularly true for
schools in such states as Illinois, New York,and Pennsylvania.
It is also noteworthy that although private schools enrolled
less than 6,000 (or 41 percent) of the 14,579 new entrants,
they received over 217,000 (or 60 percent) of the 362,376 appli-
cations that were filed. This discrepancy is explained in
large part by the obvious fact that publicly supported schools
must observe much stricter geographical residence requirements
and thus receive fewer applications from out-of-state
residents.

Table 5
Graduation Status and Acceptance of First-Time and Repeat Applicants to the 1974 -75 Entering Class
Date Bachelor'sDegree Grantedor Expected
1971 or Before
1972
19/3
19i4
1975 or Later
Total
StatusWhenApplied
Graduate
Graduate
Graduate
Senior
Junior orLess
FirSt-Time Applicants Repeat Applicants
.4
Number
8,684
1,485
2,711
17,407
1,466
31,753
TotalPercent
27.3
4.6
8.5
54.8
4.6
99.8
AcceptedNumber Percent
2,365 27.2
378 25.4
916 33.7
7,847 45.0
634 43.2
12,140 38.2
TotalNumber Percent
3,736 34.3
1,308 12.0
4,242 39.0
1,547 14.2
38 .3
10,871 99.8
AcceptedNumber Percent
694 18.5
310 23.7
1,200 28.2
706 45.6
16 42.1
2,926 26.9

-18-
Commentary on Table 5
This table presents new data never before analyzed in AAMC
studies of applicants. It compares both the numbers and the
acceptance success of applicants in relation to the Aate they
were granted or expected to receive a bachelor's degree.
In terms of numbers applying, approximately 60 percent of the
first-time applicants were still in undergraduate college as
compared with less than 15 percent of the repeaZ-. applicants.
Conversely, 39 percent of the second-time applicants graduated
in 1973 as contrasted with only 8.5 percent of the "first-
timers."
Relative to medical school admission, the first-time applicants
had a higher success rate for all categories except seniors,
where 45.6 percent of repeaters and 45.0 percent of the first-
timers were offered a place. This is probably explained by the
fact that the repeat applicants among the seniors were probably
individuals who applied the previous year as juniors and
although well qualified, were declined in favor of equally
qualified candidates who were further along in their academic
careers.
The discrepancy in acceptance rates was particularly marked for
students who had obtained a bachelor's degree four or more years
prior to admission to medical school. Whereas 27 percent of
first-time applicants in that category were accepted, the com-
parable proportion of repeat applicants was only 18.5 percent.
28

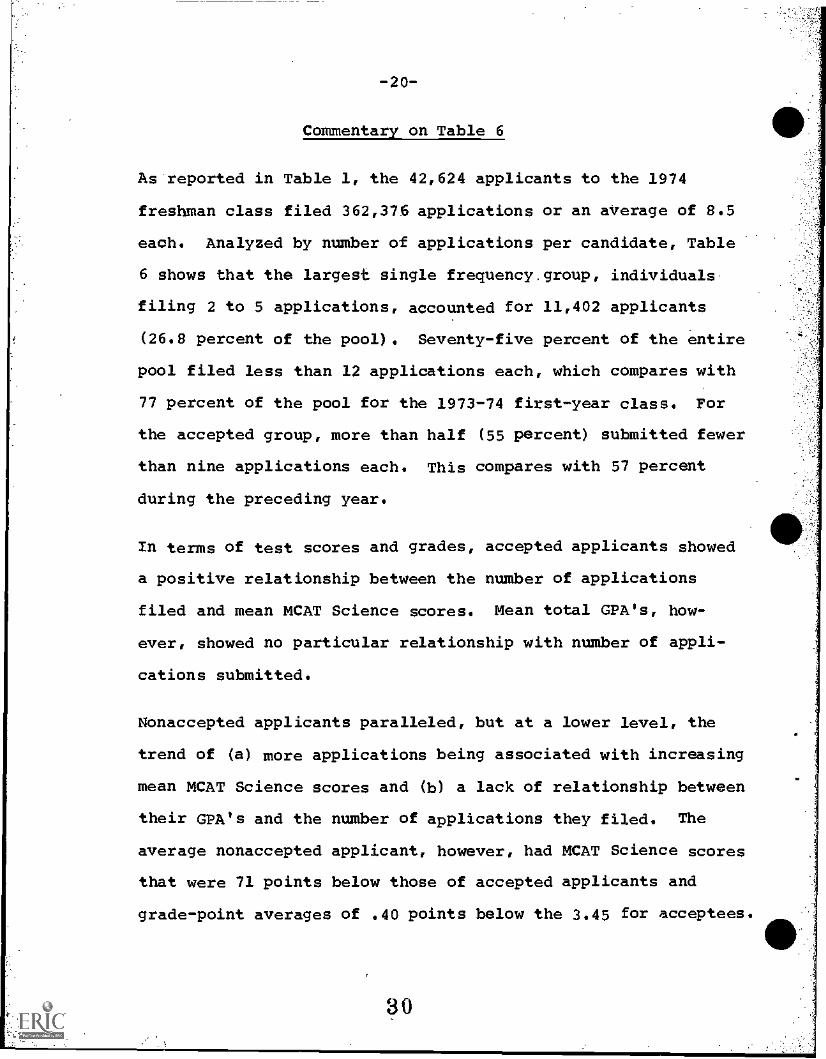
Table 6
Application Frequency, Acceptance Rates, and Ability Levels,of
Applicants to 1974-75 Entering Class
Frequency Groups* Total Applicants
No. Percent
Accepted Applicants
Per Frequency Group
No. Percent
Ability of Applicants
Mean MCAT Science Scores Mean Total GPA
Accepted Not Accepted Accepted Not Acceptedf'
1 7.069 16.6 2.1E0 14.5 596 505 3.52 3.00
2-5 11,402 26.8 3,171 21.1 584 520 3.46 3.02
: 6-8 8,405 19.7 2,955 19.6 601 536 3.47 3.06
9-11 5,222 12.3 2,029 13.5 606 543 3.43 3.06
N.) 12415 4,321 10.1 2,869 12.4 611 552 3.42 3.07
16-20 2,923 6.9 1,374 9.1 620 562 3.42 3.09
21-25 1,555 3.6 680 4.5 624 574 3.41 3.11
26-30 807 1.9 379 2.5 629 574 3.40 3.10
31 and over 920 2.1 429 2.e 627 577 3.40 3.09
Total 42,624 100.0 15,066 100.0 603 532 3.45 3.05
*By number of applications per applicant
-20-
Commentary on Table 6
As-reported in Table 1, the 42,624 applicants to the 1974
freshman class filed 362,376 applications or an average of 8.5
each. Analyzed by number of applications per candidate, Table
6 shows that the largest single frequency. group, individuals
filing 2 to 5 applications, accounted for 11,402 applicants
(26.8 percent of the pool). Seventy-five percent of the entire
pool filed less than 12 applications each, which compares with
77 percent of the pool for the 1973-74 first-year class. For
the accepted group, more than half (55 percent) submitted fewer
than nine applications each. This compares with 57 percent
during the preceding year.
In terms of test scores and grades, accepted applicants showed
a positive relationship between the number of applications
filed and mean MCAT Science scores. Mean total GPA's, how-
ever, showed no particular relationship with number of appli-
cations submitted.
Nonaccepted applicants paralleled, but at a lower level, the
trend of (a) more applications being associated with increasing
mean MCAT Science scores and (b) a lack of relationship between
their GPA's and the number of applications they filed. The
average nonaccepted applicant, however, had MCAT Science scores
that were 71 points below those of accepted applicants and
grade-point averages of .40 points below the 3.45 for acceptees.

Table 7
Mean MCAT Scores of Accepted, Honaccepted, and Total Applicantf
1970-71 Through 1974-75
Mean MCAT Scores Percentage of
First -Year Verbal Quantitative General No. Taking Total Total
Class Ability Ability Information Science MCAT Applicants Applicants
Accepted Applicants
1970-71 559 606 560 558 11,434 99.4 11,500
1971-72 560 606 556 565 12,324 99.9 12,335
1972-73 562 614 555 575 13,633 99.1 13,757
1973-74 567 609 563 592 14,062, 98.1 14,335
1974-75 563 611 559 603 14,943 99.2 15,066
Change from 1970-71 to 1974-75
Number 4 4 -1 45 3,509 -.2 3,566
Percent .7 .7 -.2 8.0 31 -.2 31
Nonaccepted Applicants
1970-71 506 539 518 499 12,783 94.7 13,487
1971-72 519 549 517 510 15,941 94.7 16,837
1972-73 512 551 514 510 21,080 94.2 22,378
1973-74 518 550 521 524 25,217 96.4 26,171
1974-75 518 555 518 532 26.921 97.7 27,558
Change from 1970-71 to 1974-75
Number 12 16 33 14,138 3.0 14,073
Percent 2.4 3.0 6.6 111 3.2 104
Total Applicants
1970-71 531 571 538 527 24,217 96.9 24,987
1971-72. 537 574 534 534 28,265 96.9 29,172
1972-73 531 575 530 536 34,713.
96.1 36,135-.
197344 535 571 536 548 39,279 97.0 40,506
1974-75 534 575 532 558 41.864 98.2 42,624
Change from 1970-71 to 1974-75
Number 3 4 -6 31 17,647 1.3 17.837
Percent .6 .7 -1.5 5.9 73 1 71
31

-22-
Commentary on Table 7
This table emphasizes that the mean MCAT scores of applicants
to U.S. medical schools remained remarkably constant over the
five years studied. The only exception was the Science subtest,
which showed significant increases for both accepted and non-
accepted applicants. Over the five-year period, the former
group improved its mean Science score by 45 and the latter by
33 points.
The proportion of total applicants taking the MCAT remained at
a very high level, rising from 97 percent for 1970-71 to 98
percent for 1974-75. Nonaccepted applicants taking the test
rose from 95 to 98 percent while almost 100 percent of the
"accepted" applicants took the test during each of the years
reported.

-23-
Table 8
Comparative Acceptance Data and MCAT Scores for First-Time and
Repeat Applicants, 1974-75 Entering Class
Category Number of Individuals Mean MCAT Scores
First-YearApplied for 1974-75 only
Total
No. taking
MCAT VA 411. GI Sci
Accepted 12,140 12,025 565 613 561 606
Not Accepted 19,613 19,012 515 554 516 530
Total 31,753 31,037 534 577 534 559
Percent Accepted 38.2 38.7
RepeatersApplied for 1973-74 and 1974-75
Accepted 2,926 2,918 556 598 548 591
Not Accepted 7,945 7,909 525 556 522 539
Total 10,871 10,827 533 567 529 553
Percent Accepted 26.9 27.0
33

-24-
Commentary on Table 8
This table provides another new type of analysis that has
not been included in recent studies of medical school appli-
cants. A comparison of first-time versus repeat applicants
shows that the MCAT scores of the former group were slightly
higher than those of the latter. These differences, however,
were not as great as might have been anticipated.
Another surprising finding was the fact that the mean scores
of nonaccepted repeat applicants were slightly higher than
the comparable scores for first-time applicants who were not
accepted. This finding tends to confirm that the selection
process of U.S. medical schools is based on a number of other
factors above and beyond test scores.
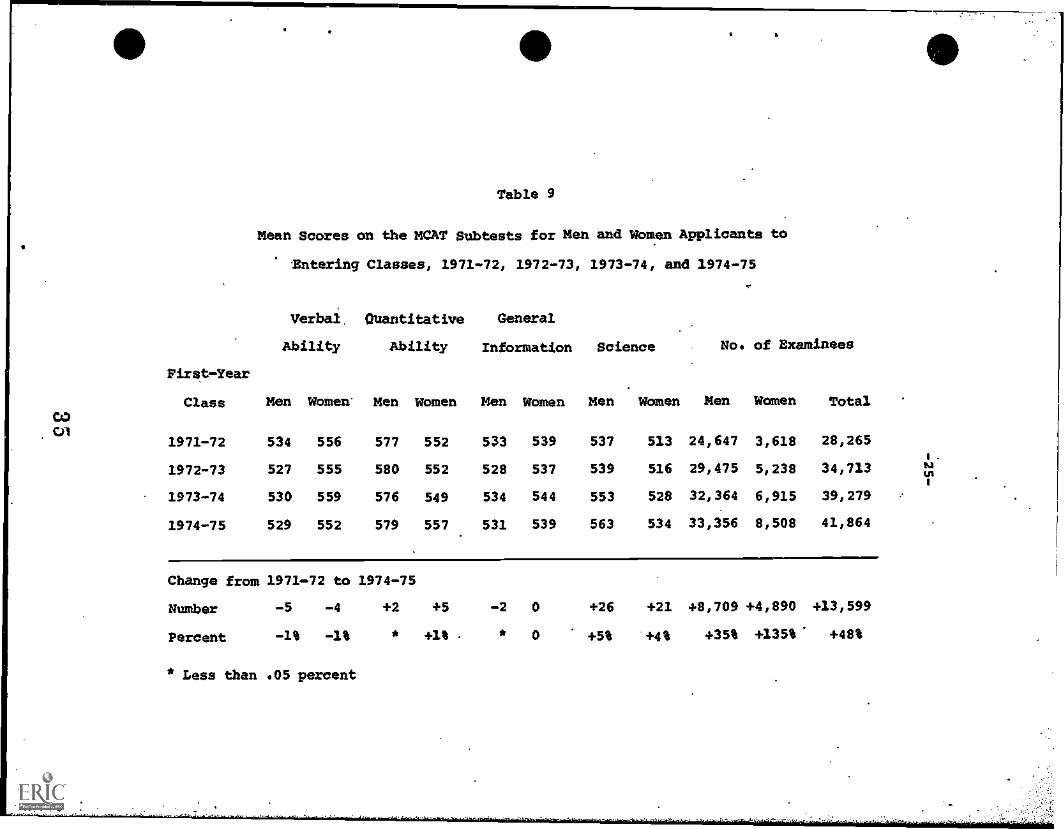
Table 9
Mean Scores on the MCAT Subtests for Men and Women Applicants to
Entering Classes, 1971-72, 1972-73, 1973-74, and 1974-75
Verbal, Quantitative General
Ability Ability Information Science No. of Examinees
First-Year
Class Men Women' Men women Men Women Men Women Men Women Total
1971-72 534 556 577 552 533 539 537 513 24,647 3,618 28,265
1972-73 527 555 580 552 528 537 539 516 29,475 5,238 34,713
1973-74 530 559 576 549 534 544 553 528 32,364 6,915 39,279
1974-75 529 552 579 557 531 539 563 534 33,356 8,508 41,864
Change from 1971-72 to 1974-75
Number -5 -4 +2 +5 -2 0 +26 +21 +8,709 +4,890 +23.599
Percent -1% -1% * +1% * 0 +5% .+4% +35% +135% +48%
* Less than .05 percent

-26-
Commentary on Table 9
The most important observation regarding this table is the
consistency of mean MCAT scores over the four first-year
classes for which such data are available.
As indicated in the "change" section of the table, the per-
centage shifts in Verbal Ability, Quantitative Ability, and
General Information were each one percent or less for both
men and women over this four-year period of time. The only
sizable change was in the Science score, which rose 26 points
or 5 percent for men and 21 points or 4 percent for women.
This table also highlights the impressive increase in the number
of MCAT examinees, which rose from approximately 28,000 for
the 1971-72 entering class to almost 42,000 for the 1974-75
class. The number of women examinees showed a particularly
striking advance, growing from less than 4,000 to over 8,500,
an increase of 135 percent during the four years reviewed.
36
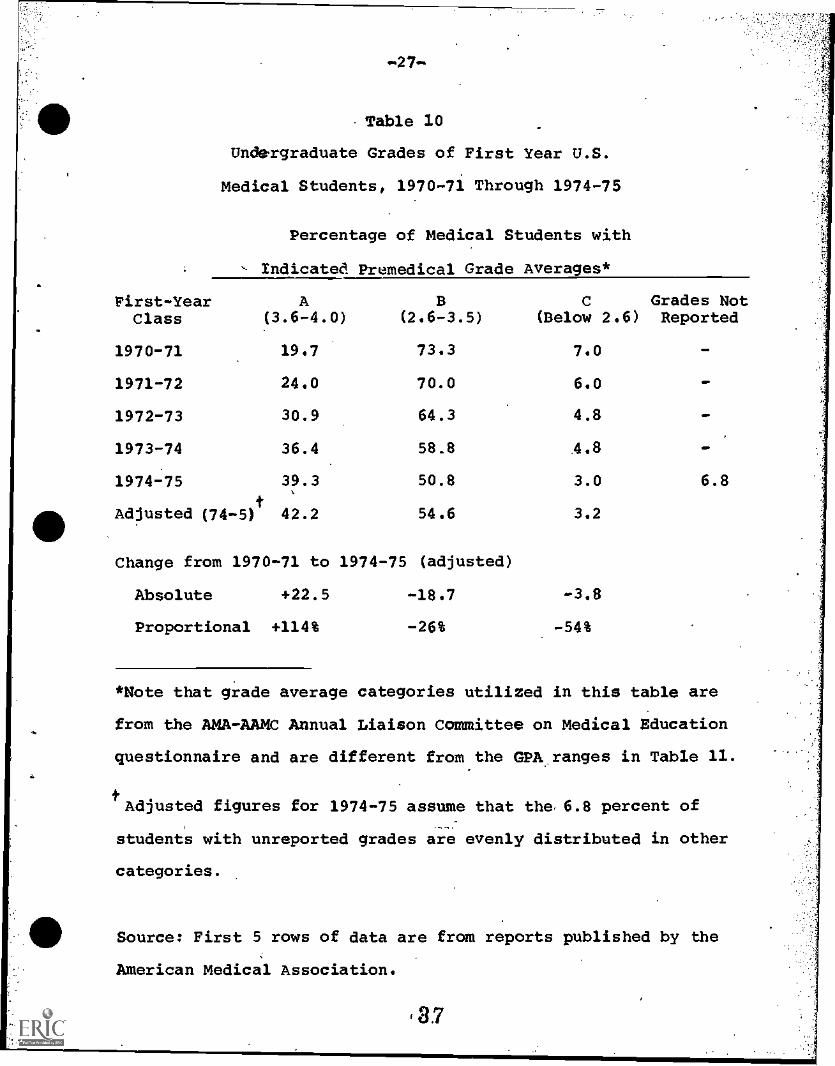
.Table 10
Undergraduate Grades of First Year U.S.
Medical Students, 1970-71 Through 1974-75
Percentage of Medical Students with
Indicated Premedical Grade Averages*
First-Year A BClass (3.6-4.0) (2.6-3.5)
C Grades Not(Below 2.6) Reported
1970-71 19.7 73.3 7.0
1971-72 24.0 70.0 6.0 -
1972 -73 30.9 64.3 4.8 -
1973 -74 36.4 58.8 4.8 -
1974 -75 39.3 50.8 3.0 6.8
Adjusted (74-5)t
42.2 54.6 3.2
Change from 1970-71 to 1974-75 (adjusted)
Absolute +22.5 -18.7 -3.8
Proportional +114% -26% -54%
*Note that grade average categories utilized in this table are
from the AMA -AAMC Annual Liaison Committee on Medical Education
questionnaire and are different from the GPA ranges in Table 11.
fAdjusted figures for 1974-75 assume that the6.8 percent of
students with unreported grades are evenly distributed in other
categories.
Source: First 5 rows of data are from reports published by the
American Medical Association.
'3.7

-28-
Commentary on Table 10
This table indicates that the changes in the overall pre-
medical grade-point averages of entering students were much
greater during the five years under study than were the com-
parable changes in MCAT scores reported in Table 7.
Whereas the mean MCAT Science scores of accepted applicants rose
by only about eight percent from 197C to 1974, Table 10 shows
that the proportion of admitted students with A averages
(3.6 or higher) increased from less than 20 percent to more
than 40 percent. Entrants with B averages dropped from 73
percent of the 1970-71 first-year class to 55 percent of the
1974-75 entering class, while comparable figures for students
with C averages dropped from 7 percent to approximately 3
percent.
The above findings may reflect in part the "grade inflation"
that has been increasingly reported in The Chronicle of Higher
Education and other media during the past several years.
However, it may also reflect the increasingly severe compe-
tition for places in medical schools and the expanded pool
of qualified applicants available for selection by admissions
committees.
Theoretically, it would be possible to admit first-year
classes almost entirely from students with averages of 3.6
38
-29-
Commentary on Table 10 (cont.)
or better (see Table 11). Nevertheless, it is gratifying to
see evidence that admissions committees are accepting indi-
viduals with slightly lower grade-point averages but with
presumably stronger overall personal qualifications than that
which characterizes some of their counterparts with superior
numerical credentials.
Incidentally, a chi-square comparison of the undergraduate
college GPA's of students entering medical school in 1970-71
and in 1974-75 shows that the differences are statistically
significant at the .005 level.
39

tA.Ch.)
Table 11
Distribution of Applicants and Acceptees by Undergraduate
Scores on the Science Subtest of the Medical College Admission
Medical College Admission Test (MCAT)GPA I R00 -700RANGES I-- ....... . ..
4.00A
70 18594.6 I
74 I I 216I....
892
31207N? 1 1052
3.00..3.29
22.30-T.99B O C. 1 144
83.8
1 63185.6 I
85 1 74.1I I
5215 I
I
730171.4
1
109 I 1028I 45:2
24tI 2896
..
36
... ..
2862
5900
. ..
84435.5 I I 22.0
3836
48.5
5
12
College Grade-Point Average (GPA) and by
Test (MCAT) for the 1974-75 Entering Cies/ ...... 7------;
I I
Science Subtest Scores I
ACC
I
I ACC% IAPP
I II ;
I I
I. .... .
0. I 1 I 1 324
00.0 I
2 I
I
1
50.0 I
39282.6
I 1 I 1 I I 1
a . ...... .. .1 0
1
41.7 I 0.03
I
I I 215 I
19.1 1 3I
1
48828.1
41II
1734I I I I
231 1
1 41I
I 13.3I
I 12.51735 I I 328 I..... ..
8 9,49921.4
I
i I
1
8.1 I
I 99 I 16.315
a a. ..I 1 I 1 2.255
I 4.3 I I 1.7 1
23 57 I 9,1164. .. . . .... .. 4
416 I I 512 1 i 335 I 1 90 I
25.0 i 1 20.5 l 1 13.9 I 1 12.5 I I 9.?2024 I 1 3682 I 2676
1
I 978 I......... ......2.002.29 I
2 IS18.2 16.1
C 11 I I 93
.... ......0
0.001.99 0.0I 11
27.33
......
109 1 I 49760 GRADES 1
66.51
164 I I 1173
BELOW C
. ...3
3.3I 5 I 1097
90 I 156 1 9.750..........I
348 1
I 218 I 3.7 263.8 3.2
43 1
I
45 1 8 I 11 1 I
115I I 16.0 12.9 I
I 31 I 995
... ... ...I1
1
.. .. .... .b.r... .t .. : ...14.6 i
101 13.9 o
0 1
13.9 1 0.0 I 0.0 1 ° 1 0.0 I1
19f I I I
72 I 75I
22 121
I
, .... .. .........
6
I
41
. ...
52142.4 I
1988
I
I
26.2
I I I... .
TOTAL 1.208 7059 405171.6 53.6
1.687 13,714 15.800
234
13.4 35 5.7 0.0 1
107 I 1 1,457I188 0
1
1 5,822I 94 1 397 11394 612
1002 21530.7 16:3
7071 2,429
a8.8 3.0
269
58.2
24.7
14.3
11.5
8.1
25.0
123 15,06616.3 35.3
754 42,624
ela
..
s

-31-
Commentary on Table 11
The data in this table provide a distribution by various
combinations of GPA and MCAT Science subtest scores for
both applicants and acceptees for the 1974-75 entering class.
For each cell, the proportion of accepted applicants is shown
to the right of the number of applicants and acceptees.
Although the GPA ranges in this table are different numerically,
the letter grades are the same as those reported in the 1972-
73 and 1973-74 AAMC studies of applicants. The numerical grade
ranges in Table 11 are somewhat stricter than those used in
the past and reflect the new "grading systems conversion
table" that appears on page 7 of the AMCAS Instruction Book-
let for the 1976-77 entering class. In view of the increasingly
competitive admissions situation and the trend toward "grade
inflation," it is believed that the new GPA ranges probably
provide a more realistic picture of an applicant's chances
for admission than did the similar tables pUblished previously.
As expected, Table 11 indicates a favorable acceptance rate
for individuals with bbth .high grades and high MCAT Science
scores, However, it also shows that some applicants with
relatively undistinguished numerical credentials were admitted,
and some with outstanding ones were rejected. For example,
9 percent (90 out of 978) were accepted with GPA's of B- to C+

-32-
Commentary on Table 11 (cont.)
and MCAT Science scores in the 300s; and 14 percent (31 of 216)
were not accepted even though they had straight A averages
and MCAT scores in the 600s. These data illustrate the fact
that the medical school selection process is based not only
on grades and test scores but also on such factors as personal-
ity, character, health, place of residence, career plans,
letters of evaluation, stringency of course work, and inter-
view impressions.
Chi-square tests confirm the high statistical significance
of the differences between the accepted and nonaccepted students
with respect to both their Science MCAT scores and their
undergraduate college grade-point averages. In both cases,
the differences calculated from Table 11 were significant
at the .005 level.
42
-3 3-
Table 12
Acceptance to Medical School by Undergraduate Major
for 1974-75 Entering Class
Total Applicants Accepted
Percent of
Applicants
Undergraduate Major No. Percent Applicants Accepted *
Biology /4,992 35.2 5,079 34
Chemistry 4,857 11.4 2,072 43
Zoology 3,460 8.1 14095 32
Psychology 2,934 6.9 972 33
Pre Medical 2,780 6.5 996 36
BiochamIstry 1,037 2.4 467 45
Microbiology 826 1.9 252 31
Mathematics 780 1.8 312 40
English 650 1.5 263 41
Chemistry and Biology 573 1.3 242 42
Pharmacy 565 1.3 119 21
History 519 1.2 194 37
Physics 511 1.2 200 39
Natural Sciences 428 1.0 190 44
Electrical Engineering 363 0.9 113 31
Medical Technology 344 0.8 68 20
Science (Other Biological) 313 0.7 123 39
Political Science 302 0.7 102 34
Philosophy 294 0.7 124 42
Sociology 274 0.6 85 31
Chemical Engineering 272 0.6 113 42
Engineering (Unspecified) 262 0.6 82 31
Foreign Language 262 0.6 102 39
Pre-Professional 250 0.6 113 45
Continues
* Proportion of applicants with specified major who were offered a placeby one or more medical schools.
43

-34-
Table 12 (continued)
Acceptance to Medical School by Undergraduate Major
for 1974-75 Entering Class
Undergraduate Major
Total Applicants Accepted
Applicants
Percent of
Applicants
Accepted *No. Percent
Economics y 226 0.5 82 36
No Major 216 0.5 118 55
Anthropology 210 0.5 83 40
Physiology 208 0.5 68 33
Psychobiology 207 0.5 86 42
Nursing 205 0.5 51 25
. Interdisciplinary 170 0.4 98 58
Biomedical Engineering 164 0.4 72 44
General Studies 148 0.3 52 35
Business 139 0.3 27 19
Mechanical Engineering 139 0.3 41 30
Education 134 0.3 27 20
Social Science III 0.3 38 34
Science (Other Physical) 100 0.2 29 29
Subtotal majors with 100+ 40,225 94.4 14,350 36Applicants
Other Known Majors 881 2.1 209 24
Not Specified 1,518 3.6 507 33
Total or average 42,624 100.0 15,055 35
* Proportion of applicants with specified major who were offered a placeby one or more medical schools.
44

-35-
Commentary on Table 12
This table reports applicant and acceptance information
related to all those undergraduate majors taken by'100
or more applicants each to the 1974-75 entering class.
As indicated in this rank order table, biology continues
to be the most popular major, with almost 15,000 or 35
percent of the applicant pool reporting this choice.
Chemistry, zoology, psychology, premedicine, and biochemistry
also each have more than 1,000 applicants selecting these
as their major subjects. A sizeable number of applicants,
however, also majored in such non-natural science fields
as English, history, political science, philosophy and
sociology. A significant number also majored in related
medical fields such as medical technology and nursing.
From the viewpoint of acceptance success, candidates
majoring in chemistry, mathematics, and natural sciences
tended to have a slightly higher success rate than
applicants in general. On the other hand, a number of
nonscience majors, including English, philosophy, anthropology,
and interdisciplinary majors had equally high success ratios.
Among those majors with'the lowest proportion of applicants
accepted were.some of the other professional fields such
as medical technology, nursing, and education.
45

Table 13
Comparative Acceptance Data for Men and Women Applicants,
1970-71 Through 1974-75
Men Women
Average No. Average No.
First-Year No. of No. of Applications No. Percent No. of No. of - Applications No. Percent
Class Applicants Applications Per Man Accepted Accepted Applicants Applications Per Woman Accepted Accepted
1970-71 22,253 134,277 6.0 10,203 45.9 2,734 14,520 5.3 1,297 47.4e
1971-72Aft
25,435 186,819 7.3 10,650 41.9 3,737 24,124 6.5 1,685 45.1e..
ate
G)1972-73 30,655 228,585 7.5 11,398 37.2 5,480 38,721 7.1 2,359 43.0
1973-74 33,304 271,630 8.2 11,488 34.5 7,202 56,645 7.8 2,847 39.5
1974-75 33,912 288,962 8.5 11,674 34.4 8,712 73,413 8.4 3,392 38.9
Change from 1970-71 to 1974-75
Number 11,659 154,685 2.5 1,471 -11.5 5,978 58,893 3.1 2,095 -8.5
Percent 52% 115% 42% 14% -25% 219% 406% 58% 162% -188

-37-
Commentary on Table 13
This table confirms the fact that the admissions picture
for women applicants has changed much more dramatically than
that for men over the five-year period under review.
Whereas the number of male applicants grew by 52 percent,
women applicants grew numerically by over 200 percent. Com-
parable figures for number of applications rose by 115 per-
cent for men and by over 400 percent for women. This is
explained, in part, by the overall increase in the average
number of applications filed, which amounted to an additional
3.1 for women as compared to an added 2.5 for men.
In spite of the 400-percent increase in application activity on
the part of women, the absolute number of men accepted rose sub-
stantially from approximately 10,000 for 1970-71 to almost
11,700 in 1974-75, an increase of approximately 14 percent.
The number of accepted women, on the other hand, more than
doubled, advancing from less than 1,300 to over 3,300, a gain
of over 160 percent.
The proportion of applicants who were accepted to one or more
medical schools dropped for both men and women, decreasing by
25 percent for males and by 18 percent for females.' Neverthe-
less, the differential between the two groups in percent ac-
cepted widened over the five years studied. This differential
went from 1.5 percent (45.9 for men vs. 47.4 for women) for
1970-71 to 4.5 percent (34.4 vs. 38.9) for 1974-75.
47

Age*
Table 14
Acceptance Rates of Applicants by Age, 1974-75 Entering Class
All Applicants Accepted ApplicantsNumber Total men women
Percent 'rotaT men women NO. eercent NO. ee.cent NO. percent
TOtal 100 42,624 33,912 8,712 15,066 35.3 11,674 .34.4 3,390 38.9
20 and under 4.8 2,030 1,407 623 1,121 55.3 787 -56.0 335 53.8
21-23 63.0 26,832 21,718 5,114 10,869 40.5 8,676 39.9 2,192 42.9
24-27 22.9 9,749 7,738 2,011 2,316 23.8 1,694 21.9 622 30.9
28-31 6.7 2,836 2,187 649 602 21.2 425 19.4 176 27.31
4.1
32-37 2.0 843 601 242 142 16.8 83 13.8 59 24.4a>
38 and over 0.4 181 123
1
58 12 6.6 6 4.9 6 10.3
unknown 0.4 153 138 15 3 2.0 3 2.2 0 0.0
Mean Ages 23.8 23.8 23.9 22.6 22.5 22.8
*As of September, 1974.
Oldest male applicant was 61; and oldest female applicant was 57. Oldest accepted male was 42;
and oldest accepted femal4 was 39.

-39-
Commentary on Table 14,
Age distributions of applicants to the 1974-75 entering
class closely resemble that of previous years. Five
percent of all applicants were under 21 years of age; the
largest proportion (63 percent) were between 21 and 23;
and less than 10 percent were over 27. Of the 21-23 year
olds, almost 11,000 (41 percent) were accepted, while
55 percent of the small group of applicants below age 21
were successful.
Acceptance percentages for all age groups of men were
below those recorded for the 1973-74 entering class. For
women, however, a larger proportion of individuals aged
24 or above were admitted for 1974 than for 1973. In every
category except for the individuals age 20 and under,
women applicants had higher acceptance percentages than
men.
As indicated in the footnote to Table 14, the oldest
male applicant was age 61 and the oldest male acceptee
was 42. Comparable figures for women were 57 for appli-
cants and 39 for acceptees.
43

Table 15
Women Applicants to U.S. Medical Schools and Women
New Entrants; 1970-71 Through 1974-75 First Year Claspes
Firit-Year Total Women Applicants Total Wornett New Entrants
Class Applicants No. Percent New Entrants* No. Percent
1970-71 24,987 2,734 10.9 11,169 1,228 11;0
1971-72 29,172 3,737 12.8 12,088 1,653. 13.7
1972-73 36,135 5,480 15.2 13,352 2,251 16.9
1973-74 40,506 7,202 17.8 13,876 2,726 19.6
1974-75 42,624 8,712 20.4 14,578 3,263 22.4
Change from 1970-71 to 1974-75
Number 17,637 5,978 9.5 3,409 2,035 11,4
Percent 71% 219% 87% 31% 166% 104%
* Excludes Repeating and Reentering Students

-41 -
Commentary on Table 15
This table further highlights the impressive increase in
women applicants and entrants over the five first-year
classes under study. While the total number of applicants
rose by 71 percent during this period, the number of women
applicants grew by over 200 percent. Similarly, the total
number of new entrants rose from approximately 1,200 to
over 3,000 or 166 percent.
As indicated in the table, these changes were consistent for
each of the years studied. Preliminary data for the 1975-76
and 1976-77 first-year classes suggest a continuance of these
general trends, at least in the "new entrant" category.
51

Table 16
Self-Description of Applicants and Acceptees to U.S. Medical
Schools, 1974-75 First -Year Class
Self-Description
(1)
ApplicantsPercent
allNumber Applicants
(2) (3)
AcceptancesPercent, all
Number Acceptees
(4) (5)
Percentof Applicants
Accepted
(6)
Total 42,624 100.0 15,066 100.0 35.3
Black/Afro-American 2,423 5.6 1,049 7.0 43.3 i
.D.
American Indian 134 0.3 64 0.4 47.8 t..)
i
White/Caucasian 36,090 84.6 12,775 84.8 35.4
Mexican/American or Chicano 440 1.0 217 1.4 49.3
Oriental/Asian-American 1,226 2.8 349 2.3 28.5
Puerto Rican (Mainland) 177 0.4 76 0.5 42.9
Puerto Ric4.i (Commonwealth) 280 0.6 102 0.7 36.4
Cuban 177 0.4 68 0.5 38.4
Other 1,012 2.3 213 1.4 21.0
No Response 665 1.5 153 1.0 23.0

-43-
Commentary on Table 16
This table compares the proportion of individuals from
various self-described racial/national backgrounds who applied
and were offered places in the 1974-75 first-year class. Also
included is a single figure showing the applicant to acceptee
ratio for each group.
For example, whereas black Americans constituted only 5.6 percent
of the applicant pool, they represented 7.0 percent of all
acceptees, giving them an acceptance ratio of 43.3 percent,
compared with the national ratio of 35.3 percent. According
to the statistical references in Appendix C, this difference is
significant at the 5 percent level.
Similar findings are also evident for most of the other
racial minority groups, with the acceptance percentages being
48 percent for American Indians, 49 percent for Mexican
Americans, 43 percent for Mainland Puerto Ricans and 38 percent
for Cubans.
As could be predicted, the acceptance rate for Caucasians was
essentially the same as for the applicant pool as a whole,
since they constituted approximately 85 percent of all
applicants.
The only groups that were less well represented among the accep-
tees than their proportion in the total applicant pool were
Oriental Americans, those with "other" unspecified backgrounds,
53

-44-
Commentary on Table 16 (cont.)
and applicants who chose not to respond to the self-description
question on the AMCAS application form or on the MCAT question-
naire.
It is possible that the lower than usual acceptance ratio
of Orientals may be related to the fact that many of them
are from California, which traditionally has a rather low
ratio of acceptees to applicants.

Table 17
Comparison of the Sex Distribution of Minority-Group and Total Students
Enrolled in the 1971-72 and 1974-75 First-Year Classes
Groups
1971-72 1974-75
Total Mn e Women
Percent
Women Total Men Women
Percent
Women
Total Students 12,361 10,668 1,693 13.7 14,763 11,488 3,275 22.2
Underrepresented Minorities
Black American 882 682 200 22.7 1,106 729 377 34.1
AmeXican Indian 23 15 8 34.8 71 54 17 23.9
Mexican American
Puerto Rican mainland
118
40
108
34
10
6
8.5
15.0
227
69
179
49
48
20
21.1
29.0to
Subtotal 1,063 839 224 21.1 1,473 1,011 462 31.4
Other U.S. minorities
American Oriental 217 175 42 19.4 275 197 78 28.4
Other * 91 68 23 25.3
Subtotal 217 175 42 19.4 366 265 101 27.6
Total minorities 1,280 1,014 266 20.8 1,839 1,276 563 30.6
*Data not collected for 1971-72.
Source - AAMC Student Record Files and Pall Enrollment questionnaires.
Data for 1974-75 do not include an additional 157 students admitted to New York Medical
College in the spring of 1975.

-46-
Commentary on Table 17
This table emphasizes not only the rather substantial growth
from 1971-72 to 1974-75 in number of first-year minority
students but also the rapid gain in numbers and proportions of
women.medical students from minority groups.
For example, the total number of minority group students rose
from 1,280 in 1971-72 to 1,839 in 1974-75, an increase of 44
percent. Comparable figures for women members of minority
groups rose from 266 (or 20.8 percent) of all minority first-
year students in 1971-72 to 563 (or 30.6 percent) of all first-
year minority enrollees in 1974-75.
Except for American Indian women, these general trends
were experienced by all subcategories of minority students that
are summarized on Table 17.
5 ci

Table 18
MCAT Scores and Undergraduate College Grades (GPA) of Applicants by
Self-Description, 1974-75 Entering Class*
Applicant Pool Mean MCAT Scores GradeApplicants by Total PointSelf-Description Number Percent VA QA Gen Sci Average
Total 42,624 100% 534 575 532 558 3.20
Black/Afro-American 2,423 6 435 454 441 431 2.67
American Indian. 134 ** 504 510 501 498 2.94
White/Caucasian 36,090 85 544 584 542 569 3.23
Mexican/American or Chicano 440 1 475 510 485 485 2.86
Oriental/Asian-American 1,226 3 501 609 495 564 3.25
Puerto Rican (Mainland) 177 ** 459 474 468 456 2.86
Puerto Rican (Commonwealth) 280 _ 1 435 492 450 440 3.15
Cuban 177 le* 483 542 501 523 3.12
Other 1,012 2 495 554 496 528 3.14
No Response 665 2 556 578 560 563 3.13
*Number with MCAT scores - 41,864; number with known GPAs - 36,802.
**Less than 0.5 percent.

-48-
Commentary on Table 18
This table summarizes means of (a) Medical College Admission
Test scores and (b) undergraduate college grade-point averages
by self-described racial/national background of applicants
to the 1974-75 first-year class.
In general, the highest MCAT scores were recorded for appli-
cants who identified themselves as Caucasians or Oriental
Americans or who elected not to respond to the racial/national
background question. Mean MCAT scores were somewhat lower for
applicants describing themselves as Black American, Puerto
Ricans, and Mexican Americans.
Differences in the mean grade-point averages for the various self-
described groups were not as marked as those observed for their
MCAT scores. Although this phenomenon may be partly related to
the grading standards of undergraduate colleges attended, it
may also be related to the way in which these two types of
measures are derived. For whereas the grade-point average
reflects three to four years of academic performance, the MCAT
scores are derived from a one-time four hour examination.
Although not shown in this table, the mean MCAT scores and
GPA's of the accepted applicants are higher than the means of
all applicants for each of the categories listed in the self-
description column.
58

Table 19
3
MCAT Scores and Undergraduate College Grades (GPA) of Applicants by
Father's Occupation, 1974-75 Entering Class*
Father's Occupation
Applicant Pool Mean MCAT Scores-Totaa.Number Percent VA 6A Gen
Total 42,624 100 534 575 532
Physician 4,880 11 544 575 541
Other_Health Profession 1,688 4 540 582 538
Health worker (Non-Professional) 91 -- 501 525 500
Ut Other Profession 9,412 22 551 589 545CJ
Owner, Manager,Administrator (Non-Farm)
10,433 24 538 583 537
Clerical or Sales worker 2,426 6 532 578 533
Transport or Equipment 642 505 543 509Operative
Craftsman, Skilled Worker,
Unskilled workers, Laborers,Private Household worker
4,254 10 521 561 522
(Non-Farm) 1,926 5 490 530 496
Farmer, Farm Managers 986 2 496 551 495
Farm Foreman, Farm Laborers 188 .... 489 533 486
Homemaker 28 .... 517 553 511
Other 3,942 9 520 567 521
Sci
GradePointAverage
558 3.20
560 3.15
567 3.25
504 3.02
572 3.24
564 3.22
560 3.22
531 3.14
546 3.18
513 3.06
537 3.24
515 3.05
532 3.13
545 3.19

Table 19 (cont.)
MCAT Scores and undergraduate College Grades (GPA) of Applicants by
Father's Occupation, 1974-75 Entering Class*
Father's Occupation
Applicant Pool Mean MCAT Scores' GradeTotal PointNumber Percent VA QA Gen Sci Average
No Response 1,728 4 539 571 538 552 2.97
CMCD *Number with MCAT Scores - 41,864; number with known GPAs 36,802 - Less than 0.5 percent.

-51-
Commentary on Table 19
This table gives a somewhat more complete occupational break-
down than provided in previous AAMC studies. Additional
categories include "health workers (nonprofessional);" "trans-
port and equipment operators," and subcategories of farmers into
the managerial and the working levels.
In general, the proportions of applicants with fathers in the
various occupational groups appear to be comparable 'to those
shown in previous AAMC studies. The percentage of physicians'
children, however, was slightly less than that of most studies
in the past when averages were 13 to 14 percent. This change
may be due in part to the large increase in the size of the over-.
all applicant pool, which rose from less than 25,000 for the
1970-71 first-year class to almost 43,000 for 1974-75.
Although the average undergraduate grade-point average of
applicants who were physicians' children (3.15) was'very slightly
below the national mean of 3.20, their mean MCAT scores were
generally above the national average, suggesting that they may
have attended somewhat more demanding undergraduate colleges
than did the remainder of the applicant pool.
The mean grade-point averages for applicants from all socio-
economic backgrounds were similar, ranging from a low of 2.97
for the "no response" category to a high of 3.24 for the
61

-52-
Commentary on Table 19 (cont.)
"other professions"and "farm managers" categories.
MCAT scores, however, showed somewhat more variation. For
example, mean Science MCAT's ranged from a low of 504 for
children of nonprofessional health workers to a high of 572 for
children of fathers who were in professions other than health.
These differences are probably also explained in part by the
undergraduate college attended.
For information concerning father's occupation for accepted
vs. nonaccepted applicants, see Appendix Table A-2.

Table 20
Applicants and Applications by Place of Residence and Sex. 1974-75 Pirst-Year Class
(and total comparative data for 1970-71)
Apolioants Receiviha One or More Arrepannoq Total Number of Applicants Number of Applications
State of Residence
Cl)
1974-75 1970-71
Total
(5)
Increase
10/4-75 1970-71
Total Total Total Total
Men Women Applicants Applicants
(8) (0) (10) (11)
Increase 1974-75 1970-71
Total
(14)
Total NIFIVetent
(15) (16) (17)
Men Women
(2) (3)
Total
(4)
No. Percent
(6) '(7)
No. Percent
(12) (13)
Alabama 179 57 236 123 113 92 409 104 513 293 220 75 2666 951 1715 180
Alaska 8 3 11 7 4 57 29 8 37 15 22 147 83 212 255
Arizona 71 19 90 91 -1 -1 333 70 403 210 193 92 2861 927 1934 209
Arkansas 118 18 136 128 8 6 326 46 372 204 168 82 0.077 398 679 171
California 874 309 1183 833 350 42 3162 933 4095 2246 1849 82 50941 17119 33822 198
Colorado 115 45 160 117 43 37 362 94 456 219 237 108 3294 1059 2235 211
Connecticut 168 52 220 169 51 30 493 143 636 395 241 61 8095 3333 4762 143
Delaware 25 8 33 28 5 18 85 17 102 47 55 - 117 897 312 585 188
District of Columbia 43 22 65 97 -32 -33 129 63 192 168 24 14 1411 808 603 75
arlFlorida 31.7 70 387 275 112 40 989 185 1174 648 526 81 8662 3243 5419 167
C43 Georgia 236 52 288 213 75 35 569 123 692 461 231 50 3727 1548 2179 141
Hawaii 63 15 82 56 26 46 195 48 243 95 148 156 1663 469 1194 255
Idaho 18 6 24 28 -4 -14 61 12 73 74 -1 -1 646 473 173 37
Illinois 744 163 907 604 303 50 1864 47S 2339 1255 1084 86 19660 6816 12844 188
Indiana 268 73 341 326 15 5 685 161 846 611 235 38 4162 2098 2064 98
Iowa 156 31 187 171 16 9 362 75 437 308 129 42 2195 1266 929 73
Kansas 131 46 177 136 41 30 317 79 396 267 129 48 1771 822 949 115
Kentucky 189 SS 244 198 46 23 499 118 617 349 268 77 2504 1041 1463 141
Louisiana 237 55 292 224 68 30 638 124 762 438 324 74 3481 1262 2219 176
maine 30 8 38 18 20 111 84 30 114 67 47 70 1124 475 649 137
Maryland 252 81 333 272 41 .22 703 227 930 545 385 71 7970 3100 4870 157
Massachusetts 262 81 343 323 20 :6 840 282 1122 727 395 54 13076 6931 6145 89
Michigan 486 142 628 458 170 37 1535 402 1937 1024 913 89 12904 4850 8054 166
Minnesota 302 63 365 240 125 52 724 156 880 424 456 108 5378 1752 3626 207

page 2
Applicants and Applications by Place of Residence and Sex, 1974-75 Pirst-Year Class
(and total comparative data for 1970-71)
Applicants Receiving One or More Acceptances Total Number of Applicants Number of Applications
State of Residence 1974-75 1970-71
Total
Increase
1974-75 1970-71
Total Total Total Total
Men Women Applicants Applicants
Increase 1974-75
Total
1970-71Increase
Total 07--,EnentMen Women Total No. Percent No. Percent
(1) (2) (3) (4) (5) (6) (7) (8) (9) (10) (11) (12), (13) (14) (15) (16) (17)
Mississippi 135 33 168 133 35 26 339 78 417 242 175 72 1463 635 828 130
Missouri 252 S7 309 176 133 76 679 136 615 386 429 ill 5247 X879 3368 179
<74 Montana 22 11 33 33 0 0 76 17 93 69 24 35 903 471 432 92
1.01%
Nebraska 154 34 8 125 63 SO 397 80 477 268 209 78 1913 627 1286 2O5s
tot
Nevada 37 10 47 16 31 194 92 21 111 43 70 163 513 361 152 42 .D.
New Hampshire 17 4 21 26 -5 -19 55 11 66 55 11 20 628 333 295 89
New Jersey 404 la 525 493 32 6 1268 329 1597 1231 366 30 18829 10294 6535 83
New Mexico 60 28 88 49 39 00 220 70 290 Ill 179 161 1528 386 1142 296
New York 1461 520 1981 1489 492 33 3910 1220 513e 3448 1682 49 79150 33244 45906 138
North Carolina 191 47 238 198 40 20 553 131 684 410 274 67 4281 1637 2644 162
North Dakota 61 9 70 51 19 37 114 18 132 76 56 74 500 186 314 169
Ohio 544 149 693 525 148 32 1443 325 1768 1107 661 60 1420A 6497 7707 119
Oklahoma 139 27 166 159 7 4 407 BO 487 282 205 73 1870 934 936 100
Oregon 105 31 136 93 43 46 300 75 375 183 192 105 2479 896 1583 177
Pennsylvania 716 259 975 747 228 39 2058 591 2649 1724 925 54 23717 10928 12789 117
Rhode Island 30 13 43 29 14 48 93 31 124 90 34 38 1250 902 348 39

Page 3Applicants and-Applications by Place of Residence and Sex. 1974-75 First-Year Class
(and total comparative data for 1970-71)
APPliCants Receiving One or More Acceptances Total Number of Applicants Number of Applications1974-75 1970-71.
State Of Pesideilce 1974-75 1970-71 Increase Total Total Total Total Increase 1974-75 1970-71Increase
Men WOmen Total Total No. Percent Men Women Applicants Applicants No. Percent Total Total 14E71Waint
(1) (2) (3) (4) (5) (6) (7) (8) (9) (10) (11) (12) (13) (14) (15) (16) (17)
South Carolina 146 40 186 150 36 24 443 89 532 266 268 100 2177 795 1382 174
South Dakota 56 14 70 42 28 67 101 30 131 66 65 98 407 176 231 131
CDCI Tennessee 228 49 277 257 20 8 690 136 826 391 435 111 2586 1136 1450 128
Texas 604 156 765 507 258 51 1578 354 1932 1051 881 84 12724 4871 7853 161
Utah 90 14 104 89 15 17 339 34 373 218 155 71 2425 1166 1259 108.
to
Vermont 25 25 50 43 7 16 100 40 140 67 73 109 1078 230 848 369 0.
Virginia 277 73 350 238 212 47 629 179 808 455 353 78 5283 1940 3343 172
Washington 122 38 160 160 0 0 360 109 469 297 172 58 3875 1684 2191 130
West Virginia 79 16 95 99 -4 -4 211 44 255 187 68 36 1064 643 421 65
Wisconsin 195 67 262 226 36 16 553 154 707 437 270 62 4429 2354 2075 88
Wyoming 21 5 26 18 8 44 39 7 46 35 11 31 430 197 233 118
Puerto Rico 87 39 126 102 24 24 231 126 357 248 109 44 1209 497 712 143
Other u.S. Poss. 2 0 2 2 0 0 11 2 13 9 4 44 101 46 55 120
Canada 5 0 5 23 -18 -78 45 9 54 189 -135 -71 107 646 -539 -83
Foreign 112 25 137 67 70 104t.
1185 211 1396 256 1140 445 5546 1070 4476 416
Total 11,674 3,392 15,066 21.900 3,566 31 33.922 8.712 42.624 24.987 17,637 71 3621376 148,797 2130679 144

-56-
Commentary on Table 20
The residence data in this table indicate a substantial over-
all increase in applicants and applications for U.S. medical
schools from most states and areas over the years from 1970
to 1974. There were, however, interesting variations by geo-
graphical area.
Canadian applicants, for example, decreased by 135 or 71 percent,
from 189 for the 1970-71 first-year class to 54 for the
1974-75 entering class. As a result, the total number ofC
applications filed by the Canadians as well as the number accepted
also dropped substantially. Other foreign residents, on the
other hand, showed a more than 400 percent rise in both the
number of applicants and applications and doubled their
number of accepted students from 67 in 1970-71 to 137 for
1974-75.
Limiting our analysis to the United States, only one state
(Idaho showed a decrease in the total number of applicants
(from 1970 to 1974) and only 5 states or districts (Arizona,
District of Columbia, Idaho, New Hampshire, and West Virginia)
showed a decrease in the number of their residents receiving
one or more acceptance.
All states showed a growth in the number of applications ranging
from a low of 37 percent for Idaho to a high of 369 percent for
Vermont. Eight states showed a growth of more than 200 percent
in the number of applications filed by their residents, while
13 states had gains of less than 100 percent.
66

Table 21
Geographic Origins of First-Year Foreign Nationals in U.S.
Medical Schools, 1970-71 Through 1974-75
Geographical Area 1970-71
Total 230
(Total Men/Women) (200/30)
1971-72
239
(198/41)
1972-73
241
(189/52)
1973-74
217
(176/41)
1974-75
219
(165/54)
Change from 1970No.
-11
(- 35/ +24)
eercent
-5
(- 18/ +80)
Africa 46 32 34 28 42 -4 -9
Americas 90 88 98 87 86 -4 -4
Central andSouth America (79) (69) (72) (74) (70) (-9) (-11)
Canada (11) (19) (26) (13) (16) (5) (46)
Asia 53 69 77 61 60 7 13.
Europe 30 36 18 25 22 -8 -27
Middle East 9 11 6 11 6 -3 -33
Oceania 2 3 6 3 2 0 -
Stateless 0 0 2 2 1. 1 100
No. of U.S.Medical SchoolsEnrolling ForeignFirst -Year Students 71 67 69 61 87 16 23
Source - AAMC Fall Enrollment Questionnaires

-58-
Commentary on Table 21
Whereas Table 20 is based on the place of legal residence of
the applicants at the time of application, Table 21 reports
on the citizenship status of students in the first-year class.
Nevertheless, some of the students included in Table 21 had
permanent residence status, others held temporary visas and
almost all of them were completing their premedical studies in
the United States. Since some of the permanent residents were
listed under one of the states in Table 20 rather than as
foreign students, the totals do not agree. Another difference
in Table 20 is caused by its limitation to applicants for new
places in the first-year class while Table 21 includes repeaters
and reentrants.
Being aware of these limitations and differences in the data,
several pertinent generalizations can be made concerning Table
2i. Although the number of U.S. medical schools enrolling
foreign first-year students rose from 71 in 1970-71 to 87
in 1974-75, the totals of foreign first-year students dropped
slightly (by 5 percent) from 230 to 219.
There are also several interesting changes in sex distributions
and in geographical area of origin. For example, the number
of foreign women enrolled actually increased from 30 to 54
while the number of men decreased from 200 to 165. Similarly,
there were slight increases in the number of students from
Canada and Asia axle slight decreases in numbers of students

-59-
Commentary on Table 21 (cont.)
from Africa, Central and South America, Europe, and the
Middle East. Their absolute numbers are so small, however,
that their statistical significance is questionable.
On the whole, it is obvious that the proportion of first-year
foreign nationals in U.S. medical schools remains at a very
low level, averaging only about two students per school per
first-year class. This is due in large part to the intense
competition for places from the tens of thousands of candidates
who are U.S. citizens.
69

CD
Table 22
MCAT Scores and Undergraduate College Grades (WA) of Applicants by
General Career Activity Plans, 1974-75 Entering Class*
Applicant Pool Mean MCAT Scores GradeGeneral Career Total Poin6Activity Plans Number Percent VA QA Gen Sci Average
Total 42,624 100 534 575 532 558 3.20
General Practice 15,919 37 526 565 527 549 3.16
Specialty Practice 11,463 27 526 568 525 546 3.19
Research and/or Teaching 1,697 4 540 595 539 583 3.22
Combination of SpecialtyPractice, Research, and/or Teaching 7,382 17 548 592 544 576 3.24
Other Medical Field 409 1 548 572 544 548 3.16
Other Non-Medical Field 59 522 567 501 532 3.07
Undecided' 4,442 10 553 592 548 578 3.30
No Response 1,253 3 547 576 546 556 2.93
*Number with MCAT scores - 41,864; number with known GPAs - 36,802
- less than 0.5 percent.

--61-
Commentary on Table 22
This table summarizes the general career activity plans and
ability levels of all applicants to the 1974-75 entering class
as reported when they took the MCAT. Almost all individuals are
in the mean MCAT score calculations, but only about 39,000 (or
91 percent) of the 43,000 applicants had known grade-point
averages. Those without known GPA's either did not participate
in AMCAS for the 1974-75 entering class or attended undergraduate
colleges that awarded nontraditional grades.
Of special interest is the finding that 38 percent of the
1974-75 applicants were interested in eventual careers in general
practice, even though this question was answered by most applicants
when taking the MCAT in 1973. This represents a substantial rise
over the 27 percent of applicants for the 1972-73 first-year class
who were aiming for general practice careers.
Moreover, the mean MCAT scores of the general practice aspirants
were at least comparable to the scores of those individuals aim-
ing for specialty practices; and their giade-point averages were
essentially the same (3.16 versus 3.19). Similar data for
1972-73 applicants showed the general practice aspirants to be
consistently lower than the specialty aspirants on all four MCAT
subtests and in their grade-point averages.
It would appear, therefore, that even as long ago as 1973, the
interest in eventual careers in primary care was growing and was
attracting an increasing number of high ability students. For
further details on 1974-75 applicants, see Appendix Table A-3.
71

Table 23
MCAT Scores and Undergraduate College Grades (GPA) of Applicants by
Specialization Plans, 1974-75 Entering Class*
Specialization Plans
(1)
Applicant Pool Mean MCAT Scores GradePoint
AverageTotalNumber Percent VA QA Gen Sci
Total 42,624 100 534 575 532 558 3.20
Basic Medical Science 1,162 3 544 595 542 586 3.23
Family Practice 10,226 24 532 565 531 551 3.17
Internal Medicine 2,930 7 536 573 532 564 3.17
Obstetrics/Gynecology0.4
1,234 3 505 540 505 512 3.09
10 Pediatrics 3,588 8 521 566 523 541 3.20
Psychiatry 1,499 4 566 576 564 557 3.18
Public Health, Community 1,981 5 542 562 541 545 3.12Medicine
Surgery 3,830 9 505 568 508 543 3.16
Surgical Sub-Specialty 1,622 4 529 579 528 559 3.18
Other Specialty (Known) 1,872 4 547 587 542 571 3.19
Plan to Specialize(Area Unknown) 3,557 8 546 595 543 577 3.31
Do Not Plan to Specialize 2,238 5 524 569 525 550 3.17
Undecided 5,589 13 549 595 544 580 3.31
No Response 1,296 3 542 574 544 554 2.93
Number with MCAT scores - 41,864; number with known GPAs - 36,802

-63-
Commentary on Table 23
Of all the specialty options listed on the MCAT questionnaire,
Table 23 shows that family practice was the most popular category
for the 1974-75 applicant pool, for it was listed by 24 percent
of these individuals. Among other popular potential specialties
were surgery (9 percent), pediatrics (8 percent), and internal
medicine (7 percent).
Individuals aiming for basic medical science, other known special,-
ties, and other unknown specialties tended to have slightly higher
science MCAT scores than did applicants in general. This was
also true of those who were undecided concerning their specialty
plans. Similar trends were evident for grade-point averages,
suggesting that some of the higher-achieving students may have
tended to keep their options open a little longer than some of
the applicants of lesser academic records. Applicants aiming
for family practice again showed ability levels generally
comparable with the total applicant pool.
The difference in the number of individuals interested in
general practice in Table 22 and those noting their tentative
specialty as family practice in Table 23 is undoubtedly ex-
plained in large part by the narrower definition of "family
practice" than that of "general practice." For further infor-
mation concerning the specialization plans of accepted vs. non-
accepted candidates, see Appendix Table A-4.
73

Table 24
MCAT Scores and Undergraduate College Grades (GPA) of Applicants by
_Expected Character of Medical Practice, 1974-75 Entering Class*
ExpectedCharacter of Practice
Applicant Pool Mean MCAT Scores GradePoint
AverageTotalNumber Percent VA QA Gen Sci
Total 42,624 100 534 575 532 558 3.20
Individual 8,062 19 528 569 529 553 3.17
Partnership 7,487 18 516 564 518 545 3.19
Private Group 4,446 10 543 577 538 561 3.20
Hospital Based Group 9,019 21 532 575 529 556 3.20
Full-Time Teaching and/or 1,809 4 548 600 544 590 3.23Research
Public Health 2,647 6 534 559 535 540 3.15
Industrial 40 0 541 597 522 553 3.15
Medical Administration 88 0 502 559 507 528 3.03
Other Medical Practice 770 2 558 584 553 566 3.18
Undecided 6,983 17 549 590 547 574 3.26
No Response 1,273 1 544 575 545 555 2.94
*Number with MCAT scores - 41,864; number with known GPAs - 36,802.

-65-
Commentary on Table 24
When applicants to the 1974-75 class were asked to anticipate
the eventual character of their medical practice, 17 percent
were undecided and 1 percent did not reply. The most popular
choices, however, were hospital-based group (21 percent),
individual practice (19 percent), partnership (18 percent),
and private group (10 percent). Among the less popular
potential types of medical activity were full-time teaching and/
or research (4 percent), public health (6 percent), and other
medical practice (2 percent). Less than half of one percent
indicated an interest in industrial medicine and/or medical
administration respectively. These preferences are similar to
those reported by applicants for the 1972-73 entering class and
published in Table 3 of "Recruitment and Progress of Minority
Medical School Entrants, 1970-72" by Johnson, Smith, and Tarnoff
(July 1975 Supplement to Journal of Medical Education).
Although the relationship between ability level and the tenta-
tive character of medical practice appears to be low, interesting
observations emerge. As might be expected, those individuals
contemplating possible careers in full-time teaching and/or
research tend f have slightly higher MCAT scores and GPA's than
the applicant pool as a whole. Similarly, those who do not feel
that they are ready to commit themselves and thus gave an
"undecided" response were at the higher end of the ability scale.
75

-66-
Commentary on Table 24 (cont.)
At the lower end of the scale, as measured by MCAT and GPA,
were students interested in public health and medical adminis-
tration.
For information concerning the expected character of medical
practice for accepted versus nonaccepted applicants, see
Appendix Table A-5.
76

-67-
Commentary on Table 25
This proposed table had the working title of "MCAT Scores
and College Grades of Applicants by Location of Medical
Practice, 1974-75 Entering Class."
In trying to produce this table, it was discovered that
the question about future location of medical practice was
not asked of applicants until the May 1974 version of the
Medical College Admission Test. Since almost all applicants
to and entrants in the 1974-75 class took the MCAT in 1973
or earlier, it was not possible to produce this table from
existing applicant study data.
If desired, however, a somewhat comparable table could be
produced for 1974-75 first-year students from the data file
that has been developed from the 1974-75 survey of how medical
students finance their education.
77

-68-
III SUMMARY AND CONCLUSION
As evidenced by the data provided and discussed in this report, there
have been substantial increases in numbers of medical schools, applicants,
applications, and new entrants from 1970-71 through 1974-75. It appears,
however, that the rates of increase have been declining somewhat since
1972-73.
Extraordinary gains have taken place relative to the numbers of appli-,
cants and acceptees who are women and members of underrepresented minority
groups. As a result, both the applicant pool and the entering class are
much more diverse now than they were five years ago.
The quality of the applicant pool, as measured by MCAT scores and by
undergraduate college grades, continues at a very high level and has
shown less change over the years under study. Major exceptions have
been gains in the Science subtest of the MCAT and in the proportion of
admitted students with "A" averages.
Looking to the future, it appears that the number of applicants may be
starting to level off. However, the admissions process at U.S. medical
schools promises to continue to be a voluminous, expensive, and important
activity that will affect the future careers of thousands and the future
health care of millions of American citizens.
78

APPENDIX A
Supplementary Tables
for Report of Medical School Applicants, 1974-75
Commentary,
This appendix to the 1974-75 Report of Applicants contains five tables
showing distributions of mean MCAT scores and GPA's of 1974-75 applicants
and acceptees by (1) Parental Income, (2) Father's Occupation, (3) Career
Activity Plans, (4) Specialization Plans, and (5) Expected Character of
Medical Practice. The latter 4 tables provide additional data to that
summarized for these same topics in Tables 19, 22, 23 and 24 respectively.
Table A-1, however, supplies new data not previously reported in this study.
Data for all of these tables were derived from a) applicant entries
on MCAT questionnaires and AMCAS applications b) MCAT test score reports,
and c) medical school application action reports. An example of how to
interpret these tables is provided by the following explanation of
Table A-1, "MCAT Scores and College Grades of Applicants by Parental
Income, 1974-75 First-Year Class."
In column one of this table, eight parental income groups are identified.
(Since most applicants for the 1974-75 first-year class took the MCAT during
1973, and since they were asked to report their parents' combined gross
annual income for the previous year, these data usually reflect 1972
income levels.)
The top or "Accepted" line in each group refers to all acceptees
with the parental incomes specified. The second line shows the number of
"non- accepted" applicants, and the third or "Total" line combines both
the accepted and non-accepted applicants in each income level grouping.

-70-
Thus, as indicated in column 13, 868 out of 2,757 applicants with parents
in the "Less than $5,000 /year" income bracket were accepted. Column 14
shows that these 868 acceptees represented 31.4 percent of the group total of
2,757 and that 1,889 or 68.5 percent of this income group were not accepted.
The group total of 2,757 constituted a 6.4 percent portion of the total appli-
cant pool of 42,624.
Columns 2 and 3 show total and percent of applicants for whom MCAT scores
were available, while columns 13 and 14 show number and percent of all appli-
cants belonging to a specific group regardless of the test score availability.
Although the corresponding columns are idential in many cases, they differ
substantially for the "no response" and "total" categories.
Columns 4, 5, 6 and 7 list for each of the MCAT subtests the mean scores
achieved by the accepted, non-accepted, and total category for each group,
with the abbreviations having the following meanings: VER = Verbal Ability;
QUA = Quantitative Ability; GEN = General Information; and SCI = Science.
Columns 8 and 9 indicate the number and percent of applicants per
category and group for whom undergraduate grade point averages were available.
Excluded from these figures are a) applicants not using the American Medical
College Application Service (AMCAS) and b) applicants using AMCAS but attend-
ing undergraduate colleges that do not award traditional grades.
Columns 10, 11 and 12 present separate mean undergraduate GPA's for
BCPM (Biology, Chemistry, Physics and Mathematics), AO (all other courses)
and Total by category for each income group. Finally, the "No Response"
group for all 14 columns consists of those who elected not to respond to
the parental income question on the MCAT questionnaire.
80

APPLICANTS AyPAPFNTA1 ImCnor
4 1
Table A-1
MCAT Scores and Undergraduate College Grades of Applicants
by Acceptance Status and by Parental Income, 1974-75 Entering Class
(1)
LFSt THAN 5.nnnACCEPTFnNnNAcCF27FnTOTAL
$5.000 - 9/999ACCFATE0 1604 31.7 541 591 539 5R3 1453 34.7 3.38 3.42 3.40NONACCFPTFD 345? 68.2 504 539 506 516 2788 65.7 2.96 3.10 3.03TOTE 5:668 1P.0 514 SS6 517 537 4241 II.S 3.1 3.21 3.15
$10.000 - 511.999ACCEPTER 1570 31.6 554 601 554 5913 1199 3P.8 3.44 3.46 3.45 157n 31.6 1
Nom-aCCFATEn 33AA ARO 514 591 517 533 2859 67.1 3.00 3.13 3.06 13RA 68.1 .47nT01 49SA 11.8 526 569 52,4 553 4258 11.5 3.14 3.24 3.19 495A 11.6 1-,
1
N1.10135R cA 4FAN 'CAT SCOPES NI1411;A % ',FAN UG nPA5 TOTAL %kiT7w WITH yrs:, 1Jo4 nFm SCI WITH wITH SCAM An TOTAL ALLMCATS MCATS _-_ __- ...... -.- OPAS 1-,PAS
(2) (3) (4) (5) (6) (7) (8) (9) (10) (11) (12) (13) (14)
84A 31.4 5n4 554 564 547 774 34.7 3.17 3.29 1.2? A6A 11.418AR 6R.5 477 511 479 487 1453 65.7. 2.84 3.n2 ?.93 IAS9 68.52756 6.5 4R7 526 487 506 2227 6.0 2.95 3.11 3.03 2757 b.4
16(1634535059
31.768.211.9
612.000 - $14.909ACCFATFO 2019 34.5 558 614 557 606 1816 35.6 3.50 3.50 3.5nNnm-ACCFATEDTOTAL
3A11 65.5 514 Sc6 519 533 3777 64.3 3.0n 3.IS 1.07SA52 13.9 532 576 53? 55R 5093 13.R 3.18 3.2P 3.23
c15.000 - s19.999
Mnm-ACCFPTEOACCFPTF( 2545 35.7 56A 619 seat 611 0)1 (3,3..;
3.47 3.4A 1.474576 64.2 5n 547 5 P5 544 3.00 3.14 3.07
TnTAL 71P1 17.0 54! 5A6 539 568 620? 1601 3.17 3.P7 3.2?4120.non - 6240q9
AcCFPTEn 1952 39.7 573 671 969 613 1788 40.4 3.52 3.51 3.52Nnm-ACCEPTED 2963 60.2 525 564 sPI 54? 263? 59.5 3.04 3.IA 3.11TOTAL 4915 11.7 544 SA7 540 S70 4420 12.0 3.23 3.32 3.27
sn.noo - 649.998nrcToTenNON-AcCFPTEnTnIAL
550.00n OP r.401),ACCFPITO 1316 42.3NnN-ArCFPTFoTOT A1
1795 57.73111 7.4
NO PFsPOVSFACCFPTin 4AA P5.5 5140 6)a m7? 60Ammm.AN7A7Fn 1424 74.4 515 561' 936 54?TnTm 1912 4.5 566 5Th 545 559
7579 41.7 5A1 671 574 615 214A 47.6 3.67 3.47 3.471607 58.2 5P9 547 c?46 S45 1P09 57.1 3.01 3.14 1.0A61A1 14.7 551 591 546 574 5597 15.2 3.?1 3.29 3.24
57 61s s6A577
656A 923
548 501 542
AO5S5633
2
TOTAL -
ACCFPTE13NnM-ACCFPTFOTOTAL
1246 44.01544 55.92830 7.6
44514891934
73.0/6.95.2
3.41 3.41 3.412.91 1.n9 1.011.14 3.23 3.19
3.1?2.892.99
7.761.033.10
1.362.947.05
14943 35.A 563 611 559 411 13609 36.9 3.44 3.44 3.4526921 64.3 518 560. 51A 532 23193 63.0 2.98 3.1? 1.0541864 100.0 534 575 532 S58 36802 IOn.O 3.15 3.75 1.20
20Pn3A115851
14.s65.413.7
254% 15.74578 6477123 16..7
1957 19.72961 60?4915 U.S
.
2579 41.73667 SA.?6181 14.5
11161795311)
1n20572667
42.1S7.77.1
72.A77.16.?
15066 74.127558 64.642624 Ino
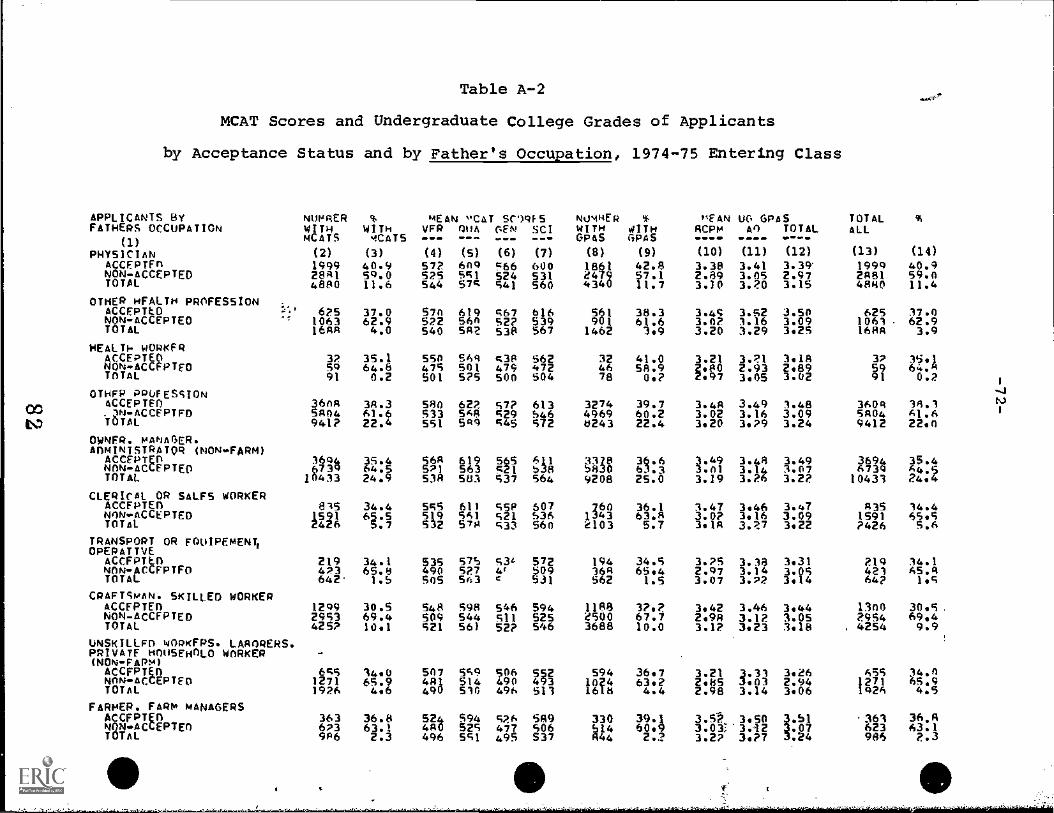
Table A-2
MCAT Scores and Undergraduate College Grades of Applicants
by Acceptance Status and by Father's Occupation, 1974-75 Entering Class
APPLICANTS BYFATHERS OCCUPATION
(11PHYSICIAN
ACCEPTEDNON-ACCEPTEDTOTAL
OTHER HEALTH PROFESSIONACCEPTLDNON-ACCEPTEOTOTAL
HEALTH WORKERACCEPTEDNONACCERTE0TOTAL
OTHER ARUFESCIONaccERTEn)N-ACCEPTED
TOTAL
OWNER. MANAGER.ADMINISTRATOR (NON-FARM)
ACCEPTEDNON-ACCFATEpTOTAL
NUMAER % HEAR 'CAT SC14F5 NommER % 'TAM Ur. OPAS TOTAL %WITH WITH vER nun GEN SCI WITH 4ITH AcAm an TOTAL ALLMC4TS SCATS --- --- --- --- GAAS GPAS
(2) (3)1999 40.92041 54. 048R0 11. 6
l''' 625 37.061063 2.9
16AA 4.0
5932
91
35.164.80.2
360A 34.35404 61.6941? 22.4
(4) (5) (6) (7)
572 6ng 566 600525 551 524 531544 575 541 560
57n 619 567 616522 56n 522 539540 SR?. 530 567
550 S6A 530 562475 501 479 472501 525 500 504
580 622 57? 613533 568 C29 546551 5gg c4s 572
(8) (9)
1861 42.82479 57.14340 11.7
561 38.3901 61.61462 3.9
32 41.046 54.978 O.?
3274 39.74969 60.2U43 22.4
3644 35.4 56A 619 565 611 3378 36.6
1E33 SI: EA Va &51 U: 438 U:3CLERICAL OR SALFS WORKER
ACCEPTEDNON-ACCEPTEDTOTAL
ell1591
34.4 555
BTRANSPORT OR FOUIPEmENTIOPEPATTVE
ACCFATtn 219 34.1 535NON- ACCFPTFOTOTAL
473642
65.81.5
490
CRAFTSMAN. SKILLEDSKILLED WORKER
1249 30.5 548NON-ACCEPTED 2953 69.4 509TOTAL 425? 10.1 521
LiNSKILLFI) wORKFAS. LAAORERS.PRIVATE HOUSEHOLD WORKER(NON-FARH1ACCFATEn eAS 14.0 507
NON-AC cEPTED
T12711926
65.94.6
494411
FARMER. FARM MANAGERSACCEPTER 363 36.8 54NONAcCEPTEn 673 623.1 4R0TOTAL 9P6 .3 496
611 CsA 607
57* ZA Wi
5' 53L 572u; 4C ei?
594 546 594544 511 525561 52? 546
scg 506 552514 490 493510 496 513
594 52R9525 477
6506
551 495 S37
760 36.11343 63.8ele3 5.7
194 34.5364 65.4562 1.5
1188 32.2esoo 67.73688 10.0
594 36.71024 63.21618 4.4
(10)
3.382.893.10
3.4c3.023.20
(11)
3.413.053.20
3.523.163.29
(12)
3.32.973.15
3.503.093.2S
3.21 3.21 3.1A2.110 2.93 2.892.97 3.05 3.02
3.4P 3.49 3.483.02 3.16 3.093.20 3.79 3.24
3.49 3.4R 3.493.01 3.14 3.073.19 3.26 3.22
3.47 3.46 3.473.0?3.1s
3.163.27
3.093.22
3.75 3.38 3.312.Q7 3.14 3.053.07 3.72 3.14
3.42 3.46 3.442.9A 3.12 3.053.1? 3.23 3.18
3.21 3.31 3.262.85 3.01 2.942.98 3.14 3.06
(13) (14)1999 40.42481 5904840 11.4
625 37.01061 62.91684 3.9
37 35.159 64.491 0.2
43: rii:2
9412 22.n
3694 35.46734 6410433 24.4
.5
A35 14.41591 65.57426 5.6
219 34.1421 45.464? 1.5
13n029544254
30.5.69.49.9
655 34.n1271 1:4
330?2:4 ia 3:?; pi,
.363 36.R623 63.1
A44 2.2 3.27 3.?7 .24 986 ?.3

CIO
CA.,
APPLICANTS RVFATHERS OCCUPATION
(1)
FARM FOPEmAN FARM LABORERSACCFPTEnNON-ACCEPTEnTOTAL-
HOMEMAKFRACCEPTED :Pe&
I'NON-ACCEPTEDTOTAL
OTHERACCEPTEnNON-ACCEPTEDTOTAL
No RESPnNSEACCEPTEDNON-ACCEPTEDTOTAL
TOTALACCEPTEO.NON-ACCEPTEDTOTAL
NUPAFRWITHMCATS(2)
47141IAA
91929
131626033939
222751973
149432692141864
0.
WITHMCATS(3)
25.075.00.4
3P.167.80.0
33.966.09.4
22.877.12.3
35.664.3100.0
Table A-2 (Continued)
IAN "CRT 5(00,F5 NoimMEPVFR Ullt (Et SCI WITH
(WAS(4) (5) (6) (7) (8)
534 506 529 583 38473 515 47? 492 93489 531 486 615 131
556 607 56n 599 849A SPA 487 505 15517 553 511 532 23
549 602 543 592 1182506 546 509 52? 2113520 567 521 545 3355
56f1 606 561 593 209531 560 531 540 938539 571 536 552 1147
563 610 550 603 1340951$ 555 RI/. 532 23193534 575' 532 S58 36802
0WITHVAS(9)
29.0(0.90.3
34.745.20.0
35.264.79.1
14.281.73.1
36.963.0100.0
mrAN UG APAS TOT41_ %BCPm An TOTAL ALL----(10)
3.232.862.97
3:ic02.95
3.413.043.14
3.232.922.90
3.442.983.15
(11)
3.343.043.13'
3.503.133.30
3.45'3.143.25
3.P62.973.02
3.463.123.25
(12)
3.28?.943.05
3.373.003.13
3.433.073.19
3.252.902.97
3.453.053.20
(13)
47141188
91921
1336Z606394?
34418417328
15n652 755642624
(14)
PS.n75.00.4
12.147.80.0.
33.R66..2 19.2
19.96004..0
35.34 4.6100.0

Table A-3
MCAT Scores and Undergraduate College Grades of Applicants
by Acceptance Status and by General Career Activity Plans, 1974-75 Entering Class
AoPlirAmIS AVCAOrF9 PLA/05
(1)
MiluoFPwiTmMCATS
Q.
WITHocATc
MEAN urAT scnoFsVFO (PIA Arai 50--- -.. --- ---
NmmFiFsa sWITH WITH61045 4AAS
',Taw OA GAASACIDm An TOTA1_---- ---- ---.
TOTAL41.1_
%
OFMFAA$ O04CT1rF (2) (3) (4) (5) (6) (7) (8) (9) (10) (11) (12) (13) (14)
ArCFrTrh 5001 11.4 555 641 Q93 597 4959 1?.4 3.44 1.42 50111 11.411..-krrF9Tcp 10915 69.5 513 54A 515 577 9134 67.1
3.41.96 3.11 3.03 100416 6A.S
TAT Al 15914 34.4 576 545 527 549 13491 37.7 3.11 1.72 3.16 15919 37.1
Wr10 TV PRaCTICFAerrzTF0 4169 16.3 555 6v1 591 597 3764 37.9 3.41 3.46 3.41 417n 16.3NelmAcCEPTFn 7707 61.6 snq S67 Slv 520 6162 62n 2.97 3.14 3.05 7Pq1 63.5/nTm 11461 27.3 576 564 575 546 9931 26.9 3.13 3.76 1.19 11463 P6.11
RFSFApri4 Amn/nP TFAcHINGArrFerFo 614 36.1 573 6,9 569 624 563 1R.R 3.40 3.43 1.47 614 16.1kn..trcroirninTal
10431697
63.84.0
577540
576595
573539
557S83
8961459
61.43.9
3.033.71
3.093.22
3.063.22
16970831Q3.63.R
CnmP1ATIOAP nF cArcIALTYCC)
OgArTIrF. OF5FAPC14, Amn/130TrArwtt.n
)0,. AccFFTFn p909 40.6 576 6?5 5E9 617 277A 42.7 3.44 3.47 3.48 29qq 446Nnm-ACCFATrn 414) 50.3 574 569 57,6 54R 3647 57.2 3.40 3.13 3.06 4341 59.1InTAI 7340 17.6 544 597 544 576 6375 17.3 3.21 3.78 3.24 7347 17.3
OTHFP °FDTC61 FIELRArr,c0Tfn 147 34.7 579 606 577 595 132 17.5 3.13 3.17 3.34 14, 34.7MAm-4rCFPTFP 767 65.2 531 591 526 S24 6g:1 7.90 3.09 3.05 267 65.2TOTM
VF', A,FIN..MFOIrAL Fmn
409 0.9 541:1 57, 544 5411;41
-3.11 1.20 3.16 409 0.9
ArrFc1F0ww-rup7rnTATA1
114 A
59
1A. 641.3D.)
SA250452?
64155)5A7
cAS482501
6"516537
92518
26763..30.1
1.33P.R9310
3.553.033.15
3.447.96 .3.07
1141;ss
161.4.R1.14.1
Um0FrInrAACCF/TFI 1901 47.8 575 627 5641 614 )739 43.4 3.51 3.91 3.51 1901 42.4wn4-ACCFPTFn 7541 577 537 570 cl, SS1 2261 56.5 3.07 3.'n 3.13 2541 57.1inT40 444? 10.6 sql 5ci;1 544 578 400n In.A 3.26 3.13 3.30 4447 10.4
NO PFCPANSFQr.CF07Fo 104 74.8 574 605 470 9S 110 14.5 3.73 3.73 3.23 276 161Nom-.'M-CFPTFO 304 79.1 544 56Q 540 546 644 85.4 7.79 P.43 7.04 10P7 41.9TOTM 49A 1.1 547 576 546 556 754 2.0 7.86 7.97 2.93 1253 2.Q
TOT/1ArfF0TF0 14941 35.6 961 61A 551 601 13609 36.9 3.44 3.46 3.45 15066 35.1mnm.-ArCcoTFO 269p1 64.3 514 555 514 537 23193 63.0 3.05 27564 64.6TrITM 41864 140.0 534 57'4 53? 958 36802 Ion.0 3:7; 3:A 42624 100.0

Table A-4
MCAT Scores and Undergraduate College Grades of Applicants
by Acceptance Status and by Specialization Plans, 1974-75 Entering Class
ApotTrANT5 AYSPfrTAI 17ATTnN PLANS
(1)8i5TC 1 f0ICAL 5C1FNCF
AccrPTEnNOS'-ACCFDTFn -
InTAi
FAMILY 0144rTTrFArcroffnmcIN-AcCF0TFnTniaj
INTF9NAt FOTrTPFArCFPIFf)NnMACCFATMInTm
OPSTFTPTCS/GYNFrOLOSYArcFPrFnNnm-AccFarFo/nrm
co 1411,001NaccF0TEnNAO-ACCF9TFffTOTAL,
pcY041ATRYACCP9/FAAm-ACCFOTFOTnT Al
PuR)IC wkALTH. cOmmuNTTYmCnIrIxF
ArC5PTFANnN-ArCFPIFnTOT A1
SugArPYACCPATFAponm-Arcrorr.r.TOTAI
SU9A1CM STIR-S0FCIALTYorrcp/Eqww-AcCF6unTOM
0Tmr9AcCFnTFT)Nelm..ACCFPTFOTRIAL
01
NIPP mFAM MCAT 5rnPFS NumnFo q.
wTT4 wTTH Vr8 091 ON 5C1 W/TH NTNKers mCATS (WAS (PAS
(2) (3) (4) (5) (6) (7) (8) (9)413 37.2 574 610 56Q 630 195 38.9729 6P.7 5a7 57c 5,5 554 620 61.0116? P.7 544 ,595 542 586 1015 2.7
!,..5296
"691A10226
l85?29Pq
3548751214
1304??A435RA
3P267.7p4.4
36.763,7.0
?9.070.9
36.3
6A.5
559 599 557 5975,0 Sort 519 53053? 565 531 551
s7n
516
516401505
551
52)
610552573
57S57c54n
59Q547566
RIs61653?
60A53A564
531 55,495 491ROR 512
551RO65,3
584516541
39Z?59518973
965157?2537
1,4681010
6
11182444?3124
5?? 34A SQS 617 590 605 476977 65 1 55n 55S 551 S3I A2h1444 3.5 566 574 564 557 110?
67713A?1979
1241P5AA3$1,44
34PA5.74.7
3P467.59.1
571 35.31049. 64.6168? 1.8
61612661872
3a.967.04,4
573 C01SPS 54P54? 56?
540
5054AR
S135ISP9
576533S47
cfo.5PA541
60P 537640 44454A 5ngt
6?n554574
6241.
5A7
R514R24
R70R214
cg2c26545
59s
54S1Q3
1
C311
4:.5Q
614550571
10131645
11002149349
SIP
1194
564106AIA24
31.666.124.3
3An61.96.R
3P..067.92.7
17.A6A .)
4
36.563.53.4
16.163.R4.6
31.016$.1AA
36.763.23.7
34.765.24.4
PAFAN Ur. C.PpS ?MAI.PCD' An TOTAL ALL
mlir
(10)
3.501.441.7?
3.41?973.1?
3.41P.953.13
309P.9.1303
mirwmb ww4110.0
(11)3.473.0Q3.P4
3.413.123.P?
3.4?3.173.20
3.163.4113.18
(12)
3.4g3.071.21
3.4?1.043.17
1.431.013.17
3.318.9113.09
3.40 1.46 3.43P97 1.16 1.061.11 3.?7 3.20
3.3n 3.4R 3.43P.90 3.17 1.053.0A 1.29 3.19
1PA2.9?3AS
1.412.QA3.1?
1.452.953.11
3.46
3.15
1.1A3.103.80
3.481.103.'1
3.461.0A3.??
1.101.45
3.27
1.3?3003.12
1.423.04'3.16
3.453.011.18
3.463.053.10
(13)4117,9116?
3,9AA9300,76
107710512934
3598751234
1304??843SRA
5PP9771490
67713041981
1,42p5AA381
571104916??
661261877
(14)17.26P,2.7
67.7?3.11
16.763?6.13
a9.470.QPQ
16.163.6144
34A .65.13.5
12.467.RR.9
15.164.61.A
1P.967.04.1

ApolArApI5 PySPECTALIZATIOm PLANS
(1)P1 Am yn Son-TAk IZF
ArrFD7FnN0N-AcCFPTRn7070.
00 17 PLAY TO SPECTALT7Eof CFPTFPNnN-ACCFATFOTnTAI
UNOFCInFPACCF2TEDNON-ACCEPTFnWITA1
Ni1-0F5DnN5FArt-FDTEnN91,1-occFgrrnToTM
TATiLArtFIDTFDNnm-bcCFPIEnTratit.
.NowaFRWITHMOATS(2)
147A19743597
:645P397217
?449114055019
17141A541
1 49432692141444
clk
WITHMCATS(3)
45.754,2R.5
2R.8'71.1S.3
41.1156.111.3
27.777.21.2
35. 6
64.3100.0
Table A-4 (Continued)
mrAw '!r AT RCFS NUHAFRVFQ Om% GEN SCI WITH--- --- --. --- (PAS(4) (5) (6) (7) (8)
571 626 667 616 14995?4 57(t 577 544 1645546 595 541 577 3144
544 605 544 599514 565 51Y 530 15128
86
S24 664 67 550 1414
572 67c7 666 617 2744511 57? 527 551 2770549 59', 544 540 5014
sAl 401 556 SSA 12A536 544, 539 544 679542 574 544 554 A07
561 6I0 559 603 136095IA 555 51A S32 23193534 575 53? 556 36802
WITHSPAS(9)
47.45204.5
10.669.15.?
44.755.213.6
15.444.12.1
36.4163.0100.0
MEAN VG OPASKrim AO TOTALr(10) (11) (12)
3.51 3.52 3.531.01 1.14 1.103.77 3.34 3.31
3.45 3.4A 3.46?.97 3.11 3.031.17 1.77 3.17
3.57 3.51 3.573.09 3.71 3.153.2A 3.15 3.31
3.26 3.25 3.257.74 7.41 P.R72.84 7.9R 2.93
3.44 3.46 3.457.9R 3.12 3.053.15 3.25 3.20
TOTALALL
(13)
162819 q93557
64S
723A1541
244o
553I4n;19
24S10511296
15066?755A47624
g
t
(14)
49.754.24.1
PA.A71.1S.,
43,A56.113.1
14.9
0A3.I.1
35.164.4100.0

Table A-5
MCAT Scores and Undergraduate College Grades of Applicants
by Acceptance Status and by Expected Character of Medical Practice, 1974-75 Entering Class
APPLICANTS BYCHAPACTIR OF MED, PRACTICE
(1)
INDIVIDUALACCEPTEDHON - ACCEPTEDTOTAL
PARTNERSHIPACCEPTEDNON-ACCEPTEDTOTAL
PRIVATE GROUPACCEPTEDNoN-ACCEPTEDTOTAL
HOSPITAL RA5ED GROUPACCEPTEDNON-ACCEPTEDTOTAL
FULL -TIME TEACHING AND/ORRESFARcH
ACCEPTEDNON- ACCEPTEDTOTAL
PUBLIC HEALTHACCEPTEDNON - ACCEPTEDTOTAL
/N00514IALACCEPTEDNoN-ACCEPTEDTOTAL
MEDICAL 4DmINISTRAT1ONACCEPTEDNO"-ACCEPTEDTOTAL
CTmF9ACCEPTEONON - ACCEPTEDTOTAL
UNDECIDEDACCEPTEONon-ACCEPTEDTOTAL
NO PESPONSEACCEPTEDNON - ACCEPTEDTOTAL
TOTALACPNnCN-EATCCEEDPTEDTOTAL
NUNRER % MEAN MCAT SCORES NUMBER 3 0.1,4N UG GPAS TOTAL %WITH WITH VER QUA GEN SCI wITH WITH PCP).* AO TOTAL ALLMCATS MCATS ---, --- - -- .m. GP4S GPAS ..m. mm.- m-m-
(2) (3)
2596 31.15553 68.88061 19.2
2496 33.34991 66,67487 17,8
BIS 38.5
4446 10:6
3314. 36.75703 63.29017 21.5
694 38.31,10, 61.6
923 34.81724 65.12647 6,3
13 32.527 67.540 0.1
29 32.959 67.088 0,2
241 37.7479 62.2770 1.8
2839 40,64143 59.36982 16.6
23.339751M 1.2
(4) (5) (6) (7)
5SA 619 557 605515 551 516 5295211 569 529 553
545 549 541 591502 re* M565 604 561 5995?9 557 523 538543 577 534 561
564 611 5551. 602513 540 512 528532 575 529 556
581 637 s7S 633 p
527 57r 525 563541 600 544 590
56n 5/44 558 578521 545 523 519534 554 535 540
54A 611 560 594537 590 504 533541 597 527 553
551 619 545 592479 S13 488 496502 555 507 528
583 618 576 607543 564 540 541558 SP4 553 566
575 622 570 61653? 567 531 546549 541 547 574
570 662 564 S94536 566 540 544544 575 545 555
(8) (9)
2293 32.6472i 67.37014 19.0
2280 34.84267 65.1 .
7 17.7
(10)
3.442.963.11
(11) (12) (13) (14)
3.47 1.45 2508 31.13.11 3.03 5554 68.A3.23 3.17 8062. 1R.9
3.46 3.462.99 3.123.15 3.24
IT N:1 3.42 3.462.98 3.12
J926 10.6 3.16 3.25
2995 39.5 3.4? 3.444768 61.4 2.49 3.137763 21.0 3.16 3,25
625 40.1 3.51 3.47430 54.4 3.03 3,071555 4.2 3.?3 3.23
844 37.4 3.30 3.401420 62.5 2.94 3.14e269 6.1 3.07 3.24
10 30.1 3.30 3.3123 69.7 1.08 3.1033 0.0 3.IP 3.09
3.463.05 1143?3.19 7487 17.5
3.44 1715 18.53.05 2731 61.43.20 4446 10.4
3.41 1315 36.71.06 5704 63.23.20 9019 21.1
3.50 694 18.13.053.23 114
3.35- 923 34.R3.04 1724 65.13.15 2647 6.?
3.30 13 32.53.04 27 A7.53.15 40 0.0
22 33.8 3.27 3.45 3.3643 66.1 2.81 2.40 2.0665 0.1 2.96 3.10 3.03
271 40.3 3.3R 3.41 3.40401 59.A 2.96 3.09 3.03612 1.8 3.13 3.23 3.18
2581 41.8 3.44 3.49 3.49J547 58.1 3.03 3.1A 3.106168 16.7 3.?? 3.11 3.26
662 83.8 2.79 2128 16.2 3.27 3.76 1.27
.43 2.87790 2.1 2.87 2.99 2.94
14943 35.6 563 61n 559 603 13609 36,9 3.44 3.46 3.4526911 64.3 51$ a7; m 53? sg4:3 1.13:2 7.9".1".0541864 100.0 3.15 3.25 3.2n
P,:g8A 0.21
291 17,7479 62.277o 1.8
2834 40.64144 59.364A1 16.1
243 19.91030 80,41271 2.9
15066 35.3p75SA 64,642624 100.0

-78- Appendix B
DATAGRAM
Applicants for the 1974-75 First-Year Medical School Class
U.S. medical schools continue to attract largenumbers of applicants. in the competition forplaces in the 1974-75 first year class, 42,624Individuals submitted 362,376 applications forapproximately 14,500 new places. This reflectsincreases over the previous year of 2,118 (5percent) in applicants and 34,101 (10 percent)in applications (Table 1). These increases, how-ever, amounted to less than half of the corre-sponding annual gains experienced for the1973-74 entering class and are indicative offurther declines in annual growth rates, Appli-
First-YearClass
the latter showed a small decrease from 35.4for 1973-74 to 35.3 for 1974-75 (Table I).
Although the overall applicant pool ad-vanced by only 5 percent, the number of womenapplicants increased by 21 percent and womenacceptees by 19 percent (Table 2). The numberof men applicants and men acceptees increasedby 1.8 percent and 1.6 percent respectively.Striking differences between the changing pro-portions of men and women applying and suc-ceeding are apparent, For both groups, slightlylower acceptance rates were recorded for
TABLE ISUMMARY OF APPLICATION ACTIVITY, 1970-71 THROUGH 1974-75
No. ofMedicalSchools
No. ofApplicants
No. ofApplica-
tions
Applies-dons Acceptedper Applicants
Individual
No. ofApplicants
PerAcceptance
First-Year
Enroll-ment'
Percent ofTotal
ApplicantsAccepted
1970 -71 102 24,987 148,797 5.95 11.500 2.17 11,348 46.001971-72 108 29,172 210.943 7.23 12,335 2.36 12,361 42.31972-73 112 36.135 267,306 7,40 13.757 2.63 13,677 38.11973-74 114 40.506 328,275 8.10 14.335 2.83 14,i 591. 35A1974 -75 114 42.624 362.376 830 15,066 L83 14.763 35.3
Includes previously enrolled students.Variation from previously published total reflects late reports.
Source: AAMC annual studies of U.S. medical school applicants; data for 1974-75 first-year enrollmentfrom AAMC 1974-75 fall enrollment questionnaire,
cations advanced more rapidly than applicantsbecause the average number filed per individualrose from 8.i for 1973-74 to 8.5 for 1974-75.
The total of 15,066 acceptees in 1974-75amounted to a 5.1 percent increase over1973-74; this was 0.9 above the 4.2 percentgain recorded in 1973-74 over 1972-73. Asimilar increase occurred in the gain in first-year class size discussed in a previous Data-gram (I). The number of medical schools ac-cepting applicants remained at 114.
The stabilizing admissions situation is also il-lustrated by the absence of significant changesin (a) applicants Por. acceptance Ind (b) per-cent of total applicants offered a place. Theformer remained at 2,83 for 1974-73, while
1974-75 than for 1973-74: 38.9 percent forwomen (39, in 1973-74) and 34.4 percent formen (34.5 in 1973-74). Women received 23percent of all acceptances offered, representinga modest increase from the comparable per-centage of 20 for 1973-74 and a spectaculardoubling of the 11 percent of all acceptances forwomen in 1970-71.
Age distributions for men and women appli-cants followed the patterns of previous years(2). More than half (63 percent) of all appli-cants were in the 21-23 age group, aboutone-fourth (23 percent) were in the 24-27 agegroup, only 5 percent were below age 21, andless than 10 percent were over 27.
For the selections of 1974-75 first-year stu-
1134
88
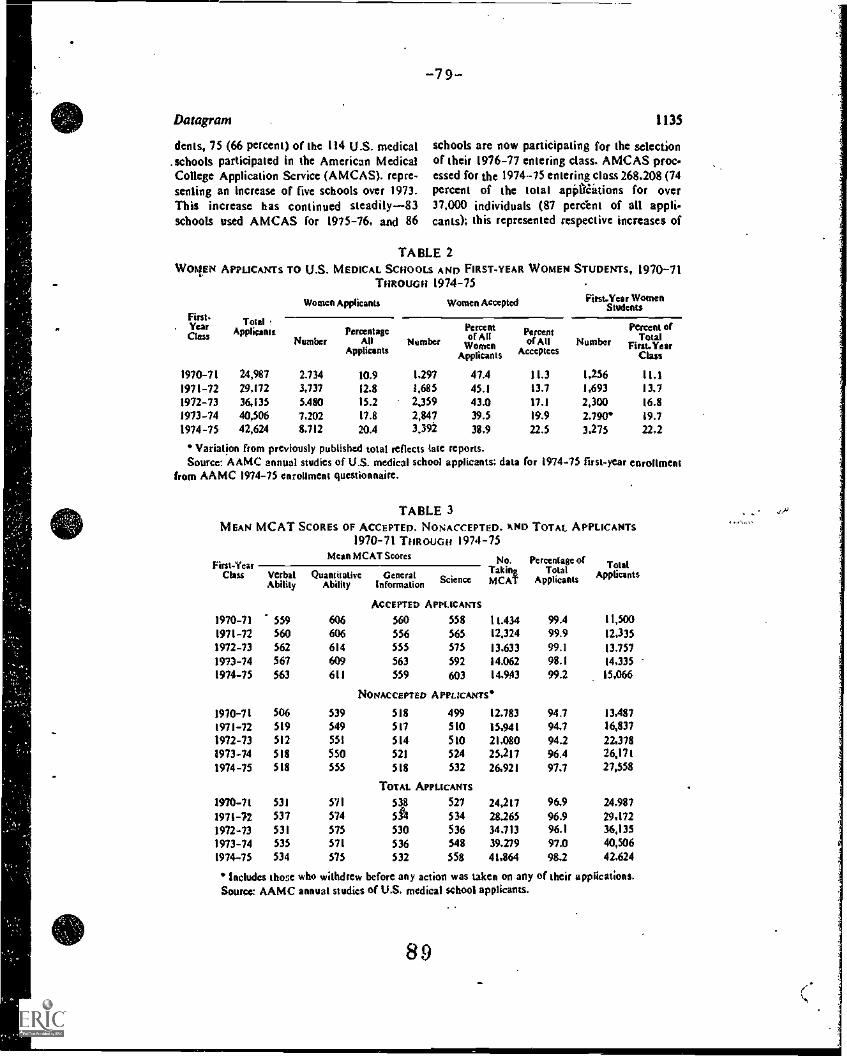
Datagram
dents, 75 (66 percent) of the 114 U.S. medical.schools participated in the American MedicalCollege Application Service (AMCAS). repre-senling an increase of five schools over 1973.This increase has continued steadily --83schools used AMCAS for 1975-76, and 86
-79-
1135
schools are now participating for the selectionof their 1976-77 entering class. AMCAS proc-essed for the 1974-75 entering class 268.208 (74percent of the total apPilattions for over37,000 individuals (87 percent of all appli-cants); this represented respective increases of
TABLE 2WOMEN APPLICANTS TO U.S. MEDICAL SCHOOLS AND FIRST-YEAR WOMEN STUDENTS, 1970-71
THROUGH 1974-75Pirst.Year Women
StudentsFirst-
. YearClass
TotalApplicants
Women Applicants
PercentageNumber All
Applicants
Women Accepted
Number
Percentof All
WomenApplicants
Percentof All Number
AccePtees
Percent ofTotal
First-YearClass
1970-71 24,987 2.734 10.9 1,297 47.4 11.3 1,256 11,11971-72 29,172 3,737 12,8 1,685 45.1 13.7 1,693 13,71972-73 36,135 5.480 15.2 2,359 43.0 17.1 2,300 16.81973-74 40,506 7,202 17.8 2,847 39.5 19.9 2.790 19.7
1974-75 42,624 8.712 20.4 3,392 38,9 22.5 3.275 22,2
Variation from previously published total reflects late reports.Source: AAMC annual studies of U.S. medical school applicants; data for 1974-75 first-year enrollment
from AAMC 1974-75 enrollment questionnaire.
TABLE 3MEAN MCAT SCORES OF ACCEPTED. NONACCEPTED. viND TOTAL APPLICANTS
1970-71 THROUGH 1974 -75Mean MCAT Scores
First-YearClass Verbal
AbilityQuantitative General
Ability Information
No.Taking
Science MCAT
ACCEPTED APPLICANTS
Percentage ofTotal
Applicants
TotalApplicants
1970-71 559 606 560 558 11.434 99.4 11,500
1971-72 560 606 556 565 12,324 99.9 12,335
1972-73 562 614 555 575 13,633 99.1 13.757
1973-74 567 609 563 592 14.062 98.1 14,335
1974-75 563 611 559 603 14,943 99.2 15,066
NONACCEPTED APPLICANTS`
1970-71 506 539 518 499 12,783 94.7 13,487
1971-72 519 549 517 510 15,941 94.7 16,837
1972-73 512 551 514 510 21,080 94.2 22.378
1973-74 518 550 521 524 25.217 96.4 26,171
1974-75 518 555 518 532 26.921 97.7 27,558
TOTAL APPLICANTS
1970-71 531 571 538 527 24.217 96.9 24.9871971-72 537 574 514 534 28.265 96.9 29,172
1972-73 531 575 530 536 34,713 96.1 36,135
1973-74 535 571 536 548 39.279 97.0 40,506
1974-75 534 575 532 55$ 41.864 981 42,624
Includes thoseSource; AAMC
who withdrew before any action was taken on any of their applications.annual studies or U.S. medical school applicants.
-80-
1136 Journal of Medical Education
19.3 percent and 10 percent over 1973-74AMCAS totals of 224.800 applications and33.862 applicants (3).
Mean Medical College Admission Test(MCAT) scores of applicants for the 1974-75first-year class showed only slight variationsfrom the year before. For the accepted and forthe total applicant groups. the Verbal Abilityand General Information subtests showedscores of a few points below 1973-74. while theQuantitative Ability and Science scores wereup. The largest increment. 11 points, occurred_in the Science subtest. The nonacccpted groupshowed no change in Verbal Ability scores, asmall decrease (3 points) in General Informa-tion, and increases in Quantitative Ability (5points) and Science (8 points) (Table 3).
Looking to the future. it appears that thenumber of applicants as predicted by MCATexaminees is continuing to level off. For exam-ple, the number taking the MCAT in 1974-75(58,296) was only 6 percent higher than thenumber of examinees in 1973-74 (55,017).Comparable annual gains in the numbers ofMCAT examinees from 1968-69 through1973-74 ranged from a low of 9 percent (from
Vol... 50, DECEMBER 1975
1968-69 to 1969-70) to a high of 14 percent(from 1971-72 to 1972-73) (4). Moreover.the proportion of individuals repeating theMCAT in a given calendar year has increasedsteadily from 21 percent in 1970-71 to ap-proximately 32 percent in 1974-75. The com-bination of lower annual increments in testpopulation and higher numbers of test re-peaters predicts further declining growth ratesin applicants for admission to medical school.
W. F. DUBEAssociate DirectorA AMC Division ofStudent StudiesWashington, D.C.
Rde rams
1. Dug, W. F. U.S. Medical Student Enrollment.1970-71 Through 1974-75. (Datagram). I. Med.Educ., 50:303-306, 1975.
2. Duet, W. F., and Jom.isom, D. G. Study of U.S.Medical School Applicants, 1973-74. J. Med.Educ.. 50:1015-1032. 1975.
3. Dust, W. F. Applicants for the 1973-74 MedicalSchool Entering Class. (Datagram). I. Med.Educ.. 49:1070-1072, 1974.
4. NELsON, B. C. Medical College Admission Test.(Datagram). J. Med. Educ.. 49:712-714. 1974.
The following statement will be added to the reprints
of this Datagram: "The work upon which this publication
is based was supported in part by contract. 231-75-0007
with the Bureau of Health Manpower, Department of Health,
Education, and Welfare. However, any conclusions and/or
recommendations expressed herein do not necessarily
represent the views of the supporting agency."
90

-81-
APPENDIX C
Method for Testing the Statistical Significance of Differences
Between an Observed Sample Proportion and a Specified (a priori) Value
Explanations
The curves shown in Figure I provide a method for testing the
statistical significance of differences between an observed sample
proportion and a specified (a priori) value. For a given sample size
(N) and specified a priori value (appearing as the abscissa in the
figure), these curves give the absolute value of the minimum difference
between the observed and the a priori proportions which is statistically
significant at the five percent level. Values shown in these curves were
obtained from the binomial approximation to the normal distribution
r-to2.=
where
P(1-10
z = normally distributed random variable,
x = sample proportion,
p = specified proportion,
N = sample size.
Thus, for the examile shown, 43 percent of 4,857 chemistry majors
were accepted into the 1974-75 first-year class (Table 12), a difference
of 8 percent from the overall acceptance rate of 35 percent (15,066 of
42,624). Since the difference required for significance at the five
percent level relative to the a priori value of 35 percent is only 1.3
percent, the percent of chemistry majors who were accepted is significantly
different from 35 percent at the 5 percent level.
91

-82-
EXAMPLE :
'Lie og I-059 owl, 11.;;SoCS PI; 1..(rAe1.L 12)
TIFF66.f.to.i. Fut'REQuig£1)101TFERe4t2. Foit ..I r., cit.ct. IL. 1.376
urvet SibN it th'i Al- -rpit. LEv£
pp r
toI
a.0
"IF FERE P4C -(1N pc Pyr.111 T.)
WHICH IS .5".0 -
t.10NtFiCANT
AT 114 C. 140
Tin. skfttebsT
1-4VC1.
1-£. Sit L-
J-0
1,ft.. So.;
11-4:10, 000
1 .
0 10 ac 3( IA- se .(c) 70 80 9t. boo
SPEC I r CD VAL TO SC Coil PARED( PERCE N T )
CAI (2 V E4
SAM P t.4
F I C. (AR E. 1
PeR T 111iFFUE NCE GETwegri
PRON RriottS P4 14 D SPECIFIES) CA PRIORI) VALutS
92

Studies in Medical Education
Anderson, P.~December,
Study of Salaried Medical SchoolFaculty. December, 1975.
Johnson, D.G. and Dube, W.F. Descriptive Study of MedicalSchool Applicants, 1974-75. December, 1975.
Lambdin, J.A. Survey of How Medical Students Finance TheirEducation, 1974-75. December, 1975.
Nunn, R. and Lain, L. Classification of Medical EducationInstitutions. December, 1975.
Rosenthal, J. Medical School Programs, Resources andFinancing.
Sedlacek, W.E. Variables Related to Increases in Medical SchoolClass Size. December, 1975.
Sherman, C. Study of Medical Education: InterrelationshipsBetween Component Variables. December, 1975.
Additional copies of these publications may be obtained from:
Association of American Medical CollegesAttention: Membership and Subscriptions1 Dupont Circle N.W.Washington, D.C. 20036
93