CITY PROSPERITY INDEX Ethiopian City – Addis Ababa By ...
30
CITY PROSPERITY INDEX Ethiopian City – Addis Ababa By John M. Obure Consultant Global Urban Observatory Research and Capacity Development Branch UH-HABITAT
-
Upload
khangminh22 -
Category
Documents
-
view
4 -
download
0
Transcript of CITY PROSPERITY INDEX Ethiopian City – Addis Ababa By ...

CITY PROSPERITY INDEX
Ethiopian City – Addis Ababa
By
John M. Obure Consultant
Global Urban Observatory Research and Capacity Development Branch
UH-HABITAT

i
Table of Content
List of Abbreviation ...................................................................................................................................... ii
Overview of Urbanization and commencements of towns in Ethiopia ..................................................... 1
Background to Addis Ababa City ............................................................................................................. 3
(Development) Evolution of Addis Ababa City........................................................................................ 4
Current Demographic Structure and its transition ........................................................................................ 4
Migration Pattern .......................................................................................................................................... 5
Economic and Infrastructure development of Addis Ababa City ................................................................. 5
Urban policies and programme of Addis Ababa ........................................................................................... 6
Table: The area increment of Addis Ababa since 1961 ................................................................................ 7
Tourism and Opportunities to Addis Ababa ................................................................................................. 7
Introduction of the city prosperity initiative ................................................................................................ 7
Reference .................................................................................................................................................... 27

ii
List of Abbreviation

1
Overview of Urbanization and commencements of towns in Ethiopia
Despite absence of permanent and steady city until the foundation and final consolidation of the
rulers at Addis Ababa in 1887, Ethiopia has long history of urbanization settlement and there
were significant towns established in the northern part of the then Ethiopian Empire, Abyssinia,
like the oldest cities of Axum, Gondar, Asmara. As archaeological and historical evidences
witness the existence of towns in Ethiopia since the Axumite period, the creation of earlier
Abyssinian towns Axum, Gondar and Asmara was attributed to political and commercial
situations in the northern Ethiopia. The ancient Ethiopian urbanization was extremely linked
with political capitals. After the abandonment of Aksum as a capital, Ethiopian kings had
practiced a tradition of roving capitals for centuries because of political, military, and
environmental reasons. Menilik’s decision to make Finfine (Addis Ababa) a permanent capital
represented an end to this longstanding practice. The government of the Ethiopia has formulated
a policy use to established the cities and towns in a standardized way
History of urban planning of Addis Ababa city
The construction of churches in haphazard way and the improper land occupation of the
international diplomatic offices (embassies) to some extent contributed for inappropriate use of
land and uneconomical land planning and use in the history of the city before 1974 in Ethiopia.
This legacy has left the city to be one of incongruously planned cities in Africa.
The modern master plan for the city of Finfine (Addis Ababa) first emerged during the Italian
occupation. However, there were some attempts made even before the arrival of the Italians.
During the Italian period of master plan development a segregation of the local people from the
Europeans was reflected in the planning (Mikyas, 2011). The Addis Katama was developed for
the indigenous people and the market was moved from Aradda to the new place where Markato
stands today. During this short stay of the Italians two plans were prepared for the city. The first
one was by Le Corbusier - which was a conceptual plan and the plan did not take into account
the topography of the area and hence it did not get acceptance. The second plan was prepared by
Guidi and Valle – a plan which had two main commercial political axes parallel to each other
and the gridiron plan for Addis Katama and the other two axes remain other strong elements of
the Addis Ababa city plan until today.

2
The period 1945-1956 was a landmark in the history of city planning of Ethiopia since this
period a plan was prepared by Sir Patrick Abercrombie who is an English town planner without
an accurate topographic map but partly depending on the earlier plan attempted by Regulator
plan.
In 1946, a major step for the development of Addis Ababa took place with the establishment of
Organization for African Union (OAU) head quarter in Addis Ababa. This led the then Emperor,
Haile Selassie, invited Sir Patrick Abercrombie, the famous planner, to prepare a master plan for
this African capital. The plan provided a park system basic framework of the present roads
system, general land use plan, residential areas designed up to 1984 for 460,000 people in
adequately serviced neighborhood units and proposed creation of 4 satellite (Kaliti, Kotebe,
Gefersa, Walate suk (along Alam-Gana Sabata road) and two semi-satellite towns (Yeka and
Kolfe) 25 - 45 kilometres radius to accommodate a total of 300,000 more inhabitants (Getahun
2000). But with the exception of the implementation of some of the proposed road networks, the
proposal lacked government endorsement and hence encountered actual implementation
problem.
However, Abercrombie’s idea introduced new type of environmental considerations in the
planning of the city which is plan for green areas.
In 1959, a British consulting group, Bolton Hennessy and Partners made another master plan
which more or less modified the plan of Abercrombie. The plan presented by the consulting
group envisaged the future of the city as that of the seat of government and trade centre and it
proposed urban renewal schemes.
In 1965, a French team led by L.de Marien reviewed all the previous master plans and drew yet
another master plan. One of the proposals of the French team was the extension of the city
southwards, the building of superhighways ring roads and the removal of the freight railway
station from its present location (Lagare) to Kaliti. However, it lacked awareness of the
socioeconomic problems of the city and the main constraints of the previous proposals (Getahun,
2000). During the Derg Regime (Ethiopian Socialist government) also master plan development
continued with the plan prepared by Hungarian professor C.K Polonyi who introduced the
concept of open space (the revolutionary square in Addis Ababa).
The latest developed master plan is the Revised Addis Ababa Master Plan (ORAAMP)
which was prepared in 2002/003 (Local Development Plans, LDP) and its main focus is on

3
reorganization of the 1986 master plan. But recently, in the year 2013 the Addis Ababa city
Government is announcing that it has again revised the existing master plan even though it is not
yet publicised. This work is under progress by the recently established city based office known
as
The Addis Ababa City Planning Project Office (AACPPO).
In general, it is possible to infer from the master plan experience of the city that it has
passed through a number of challenges from the foundation of the city to the present. Series of
master plans developed during the different regimes has introduced new concepts which are
requirements for any master plan. During the previous periods the master plans largely focused
on physical aspects only and were inconsistent. The recent master plans however, incorporated
the socio-economic circumstances in their planning proposal. Despite that, still the majority of
the developments carried out in the city are not complying with the master plan proposals. The
city government is largely looking for more space for the horizontal expansion of settlements and
industry to accommodate the ever increasing population contributed both by natural increase and
migration to the city. This condition perpetuated a continuous expansion of the city over the
fertile agricultural lands in the vicinity of Finfine. Except in very few cases, all the plans were
barely implemented because of the reasons mainly attributed to bureaucratic bottlenecks. On the
other hand, all the previous planners had underestimated the dynamics of population growth and
hence the basic resources and the social infrastructures that accompany population growth.
It is a rapidly expanding city even though the status urbanization of Ethiopia is low even in
African standard.
Background to Addis Ababa City
Menelik II Emperor of Ethiopia found and set up Addis Ababa as capital city in 1889. According
to Tolon (2008), factors that contributed to stay Addis Ababa as the capital city of Ethiopia are
the introduction of eucalyptus (a tree that grows very fast and provides a lot of wood for energy
and cooking), the proclamation for legalizing private ownership of urban land in 1907 and the
completion of the rail way of Addis Ababa to Djibouti in 1917 by French.
Addis Ababa is located almost in the center of Ethiopia with 8055 and 9005 N latitude, 38040
and 38050 E longitude, and an altitude of about 2,400 meter above sea level. The average annual

4
rainfall of the city is estimated to be 1200mm with the minimum and maximum temperature of
11-14 oC and 17-21 oC respectively. It had a built up area of 290 square km in 2004 and has an
estimated population of 4 million. The life expectancy is at 62.8 for males and at 66.5 for
females (UN-Habitat, 2007).
It is the seat of the United Nations Economic Commission for Africa (UNECA) and the African
Union (AU), what makes call Addis Ababa as the capital of Africa. Addis Ababa is the capital
city of the country since 1886. Even though Addis Ababa is currently experiencing one of the
lowest population growths of its history (6.37 in 1976, 3.95 in 1994, 2.92 in 2004), the capital
city continues to attract 90.000 to 120.000 new residents every year, mainly due to net
immigration (UN-Habitat, 2007).
(Development) Evolution of Addis Ababa City
Current Demographic Structure and its transition
Addis Ababa population trend and growth rate
According to CSA (2007), Addis Ababa City Administration has a total population of 2,738,248
of which 1,433,730 (52%) is female population and the remaining 1,304,518 (48%) is male
population and the sex ratio (number of males to number of female populations) is 0.91 in the
census year. Being among the ten largest cities in Sub-Saharan Africa with annual growth rate of
3.8%, the population growth in the city will have reached 8 million by 2020.
Comparing the population on average among districts in Addis Ababa, the female population
exceeds the male population by 1305 persons. The highest differences are in district 11 of Yeka
sub city, and district 5 of Bole sub city where female populations represent 57% and 56% of their
district population with a sex ratio of 0.76 and 0.79 respectively.
Population density measures the number of population per unit area like persons per square
kilometer of land and data on population density of all districts of Addis Ababa is 163 person per
hectare (10,000m2) (CSA, 2007).

5
Migration Pattern
Ethiopian political instability, economic hardship, war and famine have been the major
contributing factors for people to leave their country and migrate by crossing the border to other
countries.
Economic and Infrastructure development of Addis Ababa City
The principal economic bases of early 20th century for Addis Ababa were taxes, tributes and
tithes. Addis Ababa is the seat of the Ethiopian government and public administration and has
currently a diversified source of income, commerce, manufacturing, finance, real estate and
insurance.
The range of activities which is carried out in Addis Ababa has a consequence of fairly wide-
ranging and vibrant tax base to tap into if a truly transparent, efficient, reliable and accountable
tax collection system would put in place. The wide range of activities in the city also implies that
like other major cities in the Third World, Addis Ababa has a considerable well-developed
pecking order with income gaps, and hence the conflicts of interest between the haves and have-
nots are growing day by day. Even if Addis Ababa’s economy has been undergoing a remarkable
growth in the past few years, the economy gap among residents is still very wide and getting
wider and wider. The study by Association of Ethiopian Microfinance Institutions in 2002 shows
that the informal sector employs about 51 percent of the economically active labour force.
Unemployment which was at 34.7% in 1994 is a big problem in the city (CSA, 1994) and it is
even worse than other urban areas of the country (22 %) (UNHABITAT, 2007) and the poverty
in Addis Ababa is one of the major problems which is mainly arises as a result of income
inequality and it seems to have been increasing in the last years. Some authors claim that today,
about 70 to 80 % of the Addis Ababa population is living at or below subsistence level
(UNHABITAT, 2007). According to labour force survey conducted by National Statistics
Offices (2005), the unemployment rate of Addis Ababa city is 33.6%.
Slums constitute the biggest share of land and housing in the city. UNHABITAT (2008)
Ethiopian Urban Profile report asserted that about 80% of the built up areas of Addis Ababa was
branded as slum.

6
Urban policies and programme of Addis Ababa
There are about 973 settlements designated as urban with population size of at least 2000 in
Ethiopia (CSA, 2007) and the number of towns and cities is enormously increasing from time to
time. However, there are only 12 towns whose population size is more than 100,000 and Addis
Ababa is the only city with more than 1 million population.
Therefore, its primacy is unquestionable and now it is 10 times more than the second largest ton,
Dire Dawa, in population. Despite the Ethiopia long history of urban development, there is no
updated comprehensive national urban housing policy or strategy. Nonetheless, the country has
been experiencing various policy measures that have profoundly influenced the course of
development and the national urban housing sector for at least as of the first few decades of the
20th century. Slums constitute the large portion of the residential areas in Addis Ababa and the
city has not had a full-fledged comprehensive slum upgrading policy to date.
The city housing and demand would look like that there was no stern and proper planned public
guidance or control over housing development in Addis Ababa during the first 10 to 15 years
after evacuation of Italians in 1940. As a result, most of the housing was built without consent of
government and it appears only about a quarter of the housing units produced in Addis Ababa
had municipal permits as late as the early 1970s. Despite the fact that most of the housing units
built were small and shoddy but the city apparently did not suffer from any alarming housing
shortage when the February 1974 revolution broke out (UNHABITAT, 2007) and one of the
major underpinning factors for this would be as the number of residents at that time was not that
much as compared to the prevailing year.
Although the Department of Housing and three alternative master plans were available in the
early 1970s, Addis Ababa did not witness any significant government sponsored low-income
housing program. Absence of effective government response to the mounting pressure for low-
and moderate-income housing widened the gap between demand and supply of formal-sector
housing. Consequently, the proliferation of unauthorized housing building was accelerated in an
unprecedented scale. Indeed the production of formal sector residences was so far behind the
expected demand that between 1969 and 1972, only 12.62 percent of the total dwelling units
required by population increases were built with municipal permits (UN-Habitat, 2007).
Three major factors constrained the development of public or private formal sector low-income
housing in pre-1974 Addis Ababa (UN-Habitat, 2007):

7
• The first and perhaps the most important factor was the income structure of the needy
households. During the given period, the monthly income of the urban households in Ethiopia in
general was so low that approximately one-third of the needy households could not afford to pay
ETB11.25 in rent or monthly charges on a loan of ETB1,500.
• The second major factor that made it difficult to launch sound low- and moderate-income
housing programs before 1974 was the paucity of financial resources.
• Thirdly, the pre-Revolutionary land tenure system strongly facilitated the proliferation of
informal housing both directly and indirectly. About 95 percent of privately-owned land in pre-
1974 Addis Ababa was in the hands of only about five percent of the population.
Table: The area increment of Addis Ababa since 1961
Year Area increment in hectare Area in Hectare 1961 21800 - 1984 22200 400 1994 53014 30814 2000 53014 - 2005 54000 986
Source:
TourismandOpportunitiestoAddisAbaba
Introductionofthecityprosperityinitiative
CITY PROSPERITY INDEX (CPI) UN‐ Habitat has developed a new approach to urban prosperity, which is holistic, integrated and essential for the promotion and measurement of social development, social inclusion and progressive realization of the urban‐related human rights for all. This new approach redirects cities to function as the leaders of the world towards a path of an urban future that is economically, politically, socially and environmentally prosperous. In order to measure the current and future progress of cities to the road to prosperity, UN‐ Habitat has introduced a monitoring framework ‐The Cities Prosperity Index which, along with a conceptual matrix, The Wheel of Urban Prosperity, is intended to help decision makers and partners to use existing evidence and formulate clear policy interventions for their cities. The UN‐ Habitat’s Cities Prosperity Index (CPI) allows authorities and local groups to identify opportunities and potential areas for action or adjustments in order to make their cities more prosperous.

8
The Cities Prosperity Index (CPI) is a multidimensional measurement framework that integrates several dimensions and indicators. The CPI ensures that the prosperity of a city is explained by a group of factors or dimensions that are not only related, but have direct and indirect influence on each other on the path to prosperity. Through analysis, UN‐Habitat has identified a number of factors that may create a favorable environment for cities to thrive and prosper. These factors are mediated by the local context, and as such, their effects can vary across cities and regions. Based on surveys conducted in 2012 in 54 cities of the developing world, it was possible to identify the most critical components of a prosperous city; they were the following six dimensions: SIX DIMENSIONS OF CITY PROSPERITY 1. Productivity 2. Infrastructure Development 3. Quality of life 4. Equity and social inclusion 5. Environmental sustainability 6. Governance and legislation. ■■ Productivity ‐ a prosperous city contributes to economic growth and development, generating income, employment and equal opportunities that further provide adequate living standards for the entire population. ■■ Infrastructure – a prosperous city deploys the infrastructure, physical assets and amenities – adequate water, sanitation, power supply, road network, information and communications technology, etc. – required to sustain both the population and the economy, and provide better quality of life; ■■ Quality of Life‐ prosperous cities provide amenities such as social services, education, health, recreation, safety and security required for improved living standards, enabling the population to maximize individual potential and to lead fulfilling lives; ■■ Equity and inclusion – a city is only prosperous to the extent that poverty and inequalities are minimal. No city can claim to be prosperous when large segments of the population live in abject poverty and deprivation. This involves reducing the incidence of slums and new forms of poverty and marginalization; ■■ Environmental sustainability ‐ the growth of cities and their economic development should not destroy or degrade the environment; instead, the city’s natural assets are preserved for the sake of sustainable urbanization; ■■ Governance and legislation – Cities are best able to combine sustainability and shared prosperity through effective urban governance and transformational leadership, deploying appropriate and effective policies, laws and regulations, and creating adequate institutional frameworks with strong local institutions and sound institutional arrangements. ■■ Governance and Legislation In a prosperous city, instruments of power, good governance, urban planning, laws, regulations and institutional frameworks, ensure the conditions for the control and effective functioning of the other dimensions. At the global level, many city mayors and leaders have called for the adaptation of the CPI to track the performance in their nations and cities. Ethiopia is among many countries where CPI has been implemented in the last 2 years. Two cities were selected for the initial phase of the CPI roll‐out in Ethiopia, namely Addis Ababa and Mekelle. This report provides summary findings on the implementation of CPI approach in these two cities of Ethiopia.

9
GRADUAL APPROACH TO THE E‐CPI Ethiopia as a nation has a vision to attain middle income status by 2025. To achieve this, the Government, among other things, has been investing heavily in economic and social infrastructure, streamlining public services, revamping the tax collection system, and supporting small and medium enterprises to add value on their products. These enhanced pro‐poor investments and the resultant economic growth and prosperity are expected to have a direct impact on poverty and social well‐being across the nation. However, with more people living in cities, much of these investments will impact the cities directly and the way of lives for city residents. Therefore, the Ethiopian Cities Prosperity Initiative has an important role as an overall measurement framework for tracking the achievements along the journey to middle income status by 2025. The Basic CPI can be used to assess the situation or achievements of Ethiopian cities by comparing the performance of its cities with that of other cities in lower middle income economies like Hanoi in Vietnam. The CPI is also useful as a strategic policy tool where data and information that make the index is used to detect the progress of the dimensions of the prosperity and to understand the deficiencies. Therefore, the CPI is gradually built, at a level favoring Basic comparison to regional or global level, and an extended level providing the ability to integrate local aspects of each city, including its comparative advantages as well as elements of policies and actions. In its computation, the E‐CPI was tailored to be able to measure the achievements of the City of Addis Ababa towards attaining the status of a city in a lower middle income economy, in which case some specific indicators were bench‐marked using Hanoi – Vietnam. Vietnam is in the lower middle income category and also has a population more or less the same as Ethiopia. Hanoi is the capital city of Vietnam and has a population in the range of about three million just like Addis Ababa. SCALES OF PROSPERITY CPI index provides an indication of the strength or weakness in the factors of prosperity. The resulting values of the index can be grouped into six different scales ranging from cities with very solid to those with very weak factors. The ranking of cities according to the six scales shows the following CPI characteristics: Scale prosperity
Very Strong Factors
Strong Factors
Moderately Strong Factors
10
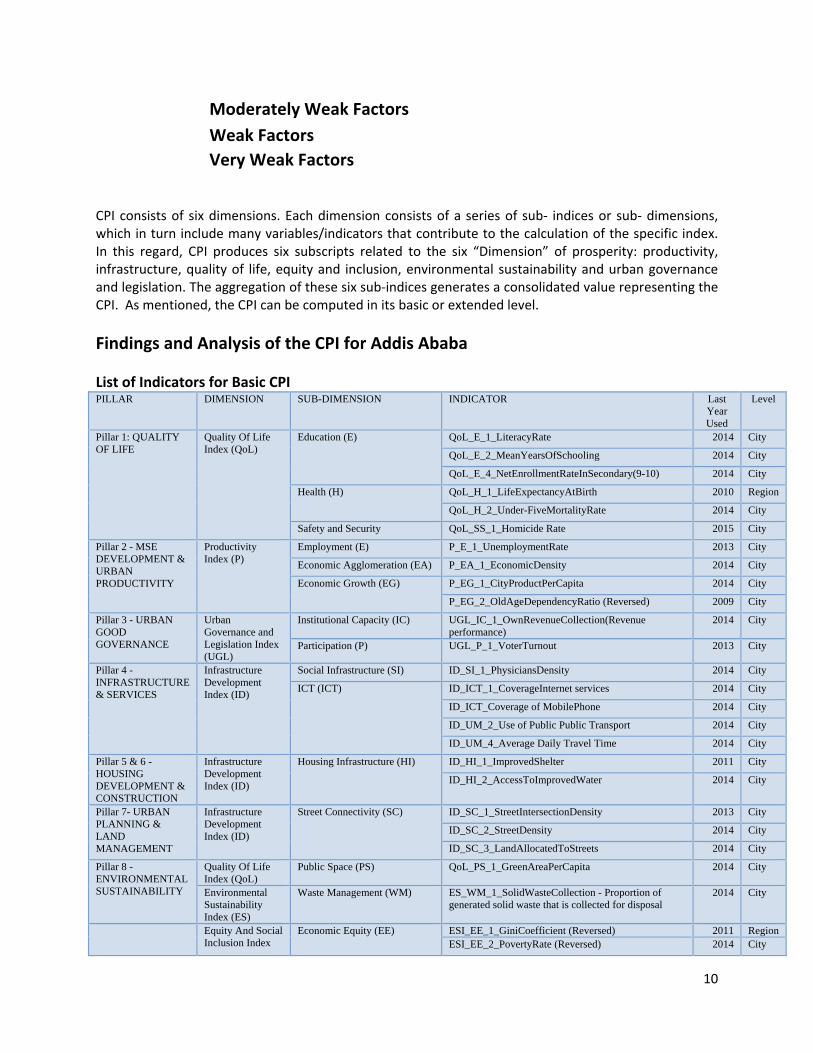
CPI consists of six dimensions. Each dimension consists of a series of sub‐ indices or sub‐ dimensions, which in turn include many variables/indicators that contribute to the calculation of the specific index. In this regard, CPI produces six subscripts related to the six “Dimension” of prosperity: productivity, infrastructure, quality of life, equity and inclusion, environmental sustainability and urban governance and legislation. The aggregation of these six sub‐indices generates a consolidated value representing the CPI. As mentioned, the CPI can be computed in its basic or extended level.
Findings and Analysis of the CPI for Addis Ababa
List of Indicators for Basic CPI PILLAR DIMENSION SUB-DIMENSION INDICATOR Last
Year Used
Level
Pillar 1: QUALITY OF LIFE
Quality Of Life Index (QoL)
Education (E) QoL_E_1_LiteracyRate 2014 City
QoL_E_2_MeanYearsOfSchooling 2014 City
QoL_E_4_NetEnrollmentRateInSecondary(9-10) 2014 City
Health (H) QoL_H_1_LifeExpectancyAtBirth 2010 Region
QoL_H_2_Under-FiveMortalityRate 2014 City
Safety and Security QoL_SS_1_Homicide Rate 2015 City
Pillar 2 - MSE DEVELOPMENT & URBAN PRODUCTIVITY
Productivity Index (P)
Employment (E) P_E_1_UnemploymentRate 2013 City
Economic Agglomeration (EA) P_EA_1_EconomicDensity 2014 City
Economic Growth (EG) P_EG_1_CityProductPerCapita 2014 City
P_EG_2_OldAgeDependencyRatio (Reversed) 2009 City
Pillar 3 - URBAN GOOD GOVERNANCE
Urban Governance and Legislation Index (UGL)
Institutional Capacity (IC) UGL_IC_1_OwnRevenueCollection(Revenue performance)
2014 City
Participation (P) UGL_P_1_VoterTurnout 2013 City
Pillar 4 - INFRASTRUCTURE & SERVICES
Infrastructure Development Index (ID)
Social Infrastructure (SI) ID_SI_1_PhysiciansDensity 2014 City
ICT (ICT) ID_ICT_1_CoverageInternet services 2014 City
ID_ICT_Coverage of MobilePhone 2014 City
ID_UM_2_Use of Public Public Transport 2014 City
ID_UM_4_Average Daily Travel Time 2014 City
Pillar 5 & 6 - HOUSING DEVELOPMENT & CONSTRUCTION
Infrastructure Development Index (ID)
Housing Infrastructure (HI) ID_HI_1_ImprovedShelter 2011 City
ID_HI_2_AccessToImprovedWater 2014 City
Pillar 7- URBAN PLANNING & LAND MANAGEMENT
Infrastructure Development Index (ID)
Street Connectivity (SC) ID_SC_1_StreetIntersectionDensity 2013 City
ID_SC_2_StreetDensity 2014 City
ID_SC_3_LandAllocatedToStreets 2014 City
Pillar 8 - ENVIRONMENTAL SUSTAINABILITY
Quality Of Life Index (QoL)
Public Space (PS) QoL_PS_1_GreenAreaPerCapita 2014 City
Environmental Sustainability Index (ES)
Waste Management (WM) ES_WM_1_SolidWasteCollection - Proportion of generated solid waste that is collected for disposal
2014 City
Equity And Social Inclusion Index
Economic Equity (EE) ESI_EE_1_GiniCoefficient (Reversed) 2011 Region ESI_EE_2_PovertyRate (Reversed) 2014 City
Moderately Weak Factors
Weak Factors
Very Weak Factors
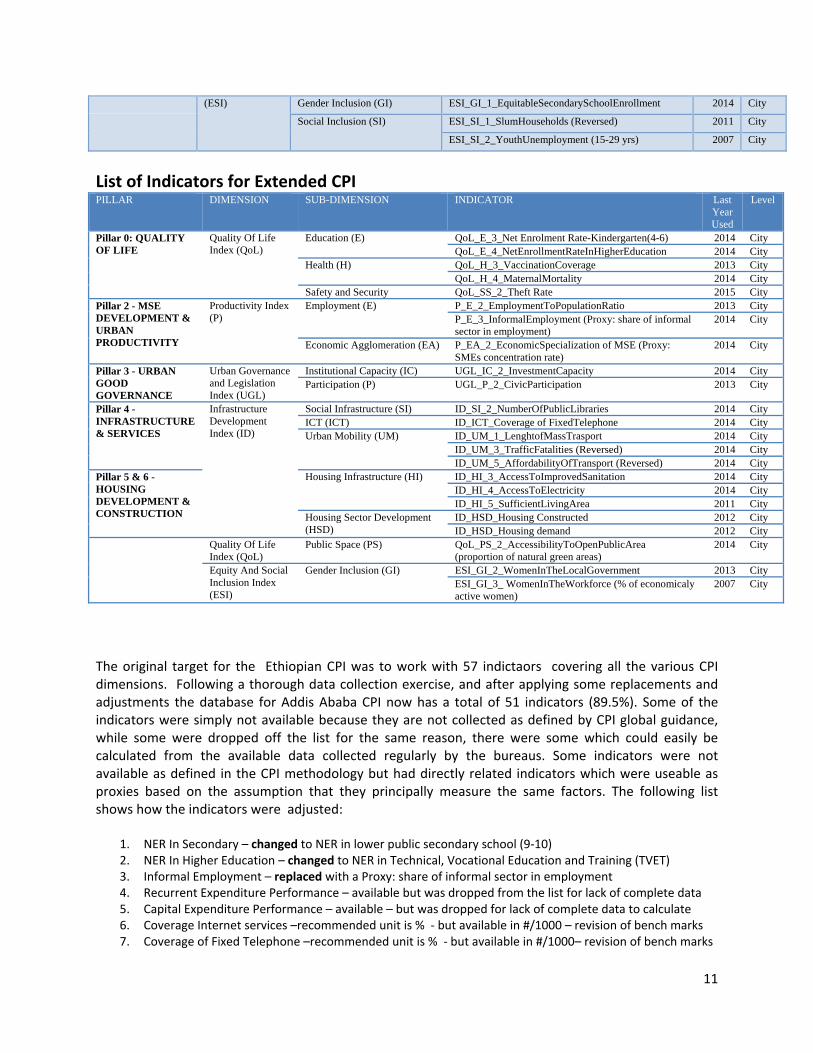
11
(ESI) Gender Inclusion (GI) ESI_GI_1_EquitableSecondarySchoolEnrollment 2014 City
Social Inclusion (SI) ESI_SI_1_SlumHouseholds (Reversed) 2011 City
ESI_SI_2_YouthUnemployment (15-29 yrs) 2007 City
List of Indicators for Extended CPI PILLAR DIMENSION SUB-DIMENSION INDICATOR Last
Year Used
Level
Pillar 0: QUALITY OF LIFE
Quality Of Life Index (QoL)
Education (E) QoL_E_3_Net Enrolment Rate-Kindergarten(4-6) 2014 City QoL_E_4_NetEnrollmentRateInHigherEducation 2014 City
Health (H) QoL_H_3_VaccinationCoverage 2013 City QoL_H_4_MaternalMortality 2014 City
Safety and Security QoL_SS_2_Theft Rate 2015 City Pillar 2 - MSE DEVELOPMENT & URBAN PRODUCTIVITY
Productivity Index (P)
Employment (E) P_E_2_EmploymentToPopulationRatio 2013 City P_E_3_InformalEmployment (Proxy: share of informal sector in employment)
2014 City
Economic Agglomeration (EA) P_EA_2_EconomicSpecialization of MSE (Proxy: SMEs concentration rate)
2014 City
Pillar 3 - URBAN GOOD GOVERNANCE
Urban Governance and Legislation Index (UGL)
Institutional Capacity (IC) UGL_IC_2_InvestmentCapacity 2014 City Participation (P) UGL_P_2_CivicParticipation 2013 City
Pillar 4 - INFRASTRUCTURE & SERVICES
Infrastructure Development Index (ID)
Social Infrastructure (SI) ID_SI_2_NumberOfPublicLibraries 2014 City ICT (ICT) ID_ICT_Coverage of FixedTelephone 2014 City Urban Mobility (UM) ID_UM_1_LenghtofMassTrasport 2014 City
ID_UM_3_TrafficFatalities (Reversed) 2014 City ID_UM_5_AffordabilityOfTransport (Reversed) 2014 City
Pillar 5 & 6 - HOUSING DEVELOPMENT & CONSTRUCTION
Housing Infrastructure (HI) ID_HI_3_AccessToImprovedSanitation 2014 City ID_HI_4_AccessToElectricity 2014 City ID_HI_5_SufficientLivingArea 2011 City
Housing Sector Development (HSD)
ID_HSD_Housing Constructed 2012 City ID_HSD_Housing demand 2012 City
Quality Of Life Index (QoL)
Public Space (PS) QoL_PS_2_AccessibilityToOpenPublicArea (proportion of natural green areas)
2014 City
Equity And Social Inclusion Index (ESI)
Gender Inclusion (GI) ESI_GI_2_WomenInTheLocalGovernment 2013 City ESI_GI_3_ WomenInTheWorkforce (% of economicaly active women)
2007 City
The original target for the Ethiopian CPI was to work with 57 indictaors covering all the various CPI dimensions. Following a thorough data collection exercise, and after applying some replacements and adjustments the database for Addis Ababa CPI now has a total of 51 indicators (89.5%). Some of the indicators were simply not available because they are not collected as defined by CPI global guidance, while some were dropped off the list for the same reason, there were some which could easily be calculated from the available data collected regularly by the bureaus. Some indicators were not available as defined in the CPI methodology but had directly related indicators which were useable as proxies based on the assumption that they principally measure the same factors. The following list shows how the indicators were adjusted:
1. NER In Secondary – changed to NER in lower public secondary school (9‐10) 2. NER In Higher Education – changed to NER in Technical, Vocational Education and Training (TVET) 3. Informal Employment – replaced with a Proxy: share of informal sector in employment 4. Recurrent Expenditure Performance – available but was dropped from the list for lack of complete data 5. Capital Expenditure Performance – available – but was dropped for lack of complete data to calculate 6. Coverage Internet services –recommended unit is % ‐ but available in #/1000 – revision of bench marks 7. Coverage of Fixed Telephone –recommended unit is % ‐ but available in #/1000– revision of bench marks

12
8. Coverage of Mobile Phone–recommended unit is % ‐ but available in #/1000– revision of bench marks 9. Average Daily Travel Time – round trip was used. 10. Housing Constructed – available but still largely inaccurate/representative, also needs bench marking 11. Housing demand ‐– available but still largely inaccurate/representative, also needs bench marking 12. Street Intersection Density – not collected by the cities – can be computed 13. Street Density – data available mainly cover roads 20m and above. 14. Land Allocated To Streets – not available but can easily be computed 15. Green Area Per Capita – not available due to differences in technical definitions 16. Accessibility To Open Public Area– not available due to differences in technical definitions 17. Share Of Renewable Energy Consumption– not available – dropped off the list 18. Solid Waste Collection – renamed ‐ for safe Disposal 19. Solid Waste Recycling Share – no data available ‐ for future use only 20. GiniCoefficient (Reversed) – not available at city level – can be computed for future use. 21. Equitable Secondary School Enrollment – not calculated – gender parity can be used as proxy. 22. Youth Unemployment – used age (15‐29 yrs) excluding 30 yrs.
Data Management Challenges The main data challenges in Addis Ababa in regard to CPI is that most indicators in the CPI do not share the same definitions as used by the local bureaus, including indicators for extended CPI which should reflect the local situation. The best solution is to mainstream CPI indicators into the available data collection systems used by the local city bureaus and national agencies and the level of computations of indicators to include cities disaggregated by rural and urban – where applicable.
1. Some indicators are regularly computed at sub‐city level only ANY EXAMPLES. 2. Data collection and management has not been standardized – every bureau collects and stores
data for their own use and the data is not accessible to other bureaus or agencies – similar indicators may have different definitions. ANY EXAMPLES can help guide this team in future.
Analysis of the CPI for Addis Ababa City The basic CPI scores and the extended CPI score are presented below. In Addis Ababa, the Basic CPI used (xx number) of indiators and is available for all the dimensions. On the other hand the Extended CPI score for Addis Ababa was based on (xxx number ) of indicators and computed for all the dimensions. The dimension with the most complete set of indicators at the basic level was xxxx, while for the extended it was xxx. The dimension with the least available set of required indicators at the basic level was xxx and at the extended this was xxx. IF THERE ANY IMPLICATIONS ON THE RESULTS FOR A DIMENSION BASED ON THE UNAVAILABLE INDICATOR, THEN STATE THIS HERE UPFRONT. The table below summarizes the overall CPI aggregate for the City of Addis Ababa, it indicates that the Basic CPI score for 2015 is 60.97 while the extended CPI score for the same year is 54.67.
CPI‐DIMENSIONS 2010 2011 2012 2013 2014 2015 CPI TYPE Comments
Quality Of Life Index (QOL) 38.64 37.53 37.72 37.46 38.28 38.75 Basic V. Weak
Quality Of Life Index (QOL) 36.56 36.42 38.56 39.11 40.12 39.41 Extended V. Weak
Urban Governance and Legislation Index (UGL) 80.24 80.11 80.64 80.74 76.94 76.94 Basic Strong
Urban Governance and Legislation Index (UGL) 59.06 58.31 57.59 60.12 56.72 56.72 Extended M. Weak
Productivity Index (P) 55.44 56.81 58.26 58.55 59.11 59.11 Basic M. Weak
Productivity Index (P) 55.51 57.52 59.53 61.92 62.44 62.44 Extended M. Strong
Infrastructure Development Index (ID) 41.49 43.13 45.07 48.97 49.80 50.13 Basic M. Weak
13
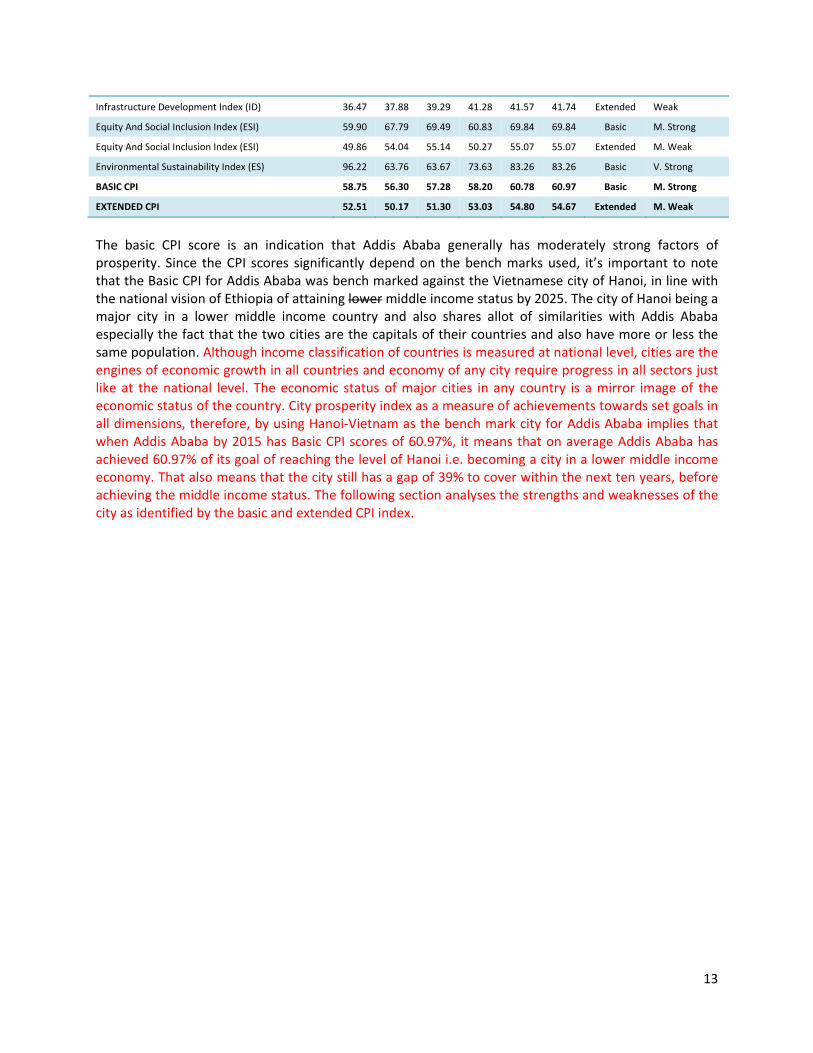
Infrastructure Development Index (ID) 36.47 37.88 39.29 41.28 41.57 41.74 Extended Weak
Equity And Social Inclusion Index (ESI) 59.90 67.79 69.49 60.83 69.84 69.84 Basic M. Strong
Equity And Social Inclusion Index (ESI) 49.86 54.04 55.14 50.27 55.07 55.07 Extended M. Weak
Environmental Sustainability Index (ES) 96.22 63.76 63.67 73.63 83.26 83.26 Basic V. Strong
BASIC CPI 58.75 56.30 57.28 58.20 60.78 60.97 Basic M. Strong
EXTENDED CPI 52.51 50.17 51.30 53.03 54.80 54.67 Extended M. Weak
The basic CPI score is an indication that Addis Ababa generally has moderately strong factors of prosperity. Since the CPI scores significantly depend on the bench marks used, it’s important to note that the Basic CPI for Addis Ababa was bench marked against the Vietnamese city of Hanoi, in line with the national vision of Ethiopia of attaining lower middle income status by 2025. The city of Hanoi being a major city in a lower middle income country and also shares allot of similarities with Addis Ababa especially the fact that the two cities are the capitals of their countries and also have more or less the same population. Although income classification of countries is measured at national level, cities are the engines of economic growth in all countries and economy of any city require progress in all sectors just like at the national level. The economic status of major cities in any country is a mirror image of the economic status of the country. City prosperity index as a measure of achievements towards set goals in all dimensions, therefore, by using Hanoi‐Vietnam as the bench mark city for Addis Ababa implies that when Addis Ababa by 2015 has Basic CPI scores of 60.97%, it means that on average Addis Ababa has achieved 60.97% of its goal of reaching the level of Hanoi i.e. becoming a city in a lower middle income economy. That also means that the city still has a gap of 39% to cover within the next ten years, before achieving the middle income status. The following section analyses the strengths and weaknesses of the city as identified by the basic and extended CPI index.

14
WHY IS EXTENDED NOT AVAILABLE FOR ENVIRONEMNTAL. SEE MY EARLIER NOTE ON DESCRIBING THE RESULTS SO THAT WE CAN MENTION UPFRONT WHICH DIMENSIONS HAVE LESS OR MORE AVAILABLE INDICATORS. THAT STATEMENT COULD ALREADY TO EXPLAIN THE GAP SEEN HERE IN THE SPIDER CHART. The findings in the figure above shows that one of the key factors contributing to prosperity for Addis Ababa city is its strength in good governance and legislation combined with good environmental management, these two factors need to be maintain or improved farther. Moderate factors that are contributing to the city’s prosperity are its productivity, infrastructure, and equity and social inclusion; these are the areas of opportunity for Addis Ababa since they just need little improvements to make the strong factors of prosperity for the city. Addis Ababa is doing badly on the quality of life dimension which is mainly attributed to the low level of public spaces in the city, which is an area which needs to be improved. Although there was little data for the environmental sustainability dimension, the solid waste management in the city is pretty good hence the high environmental scores. The chart also indicates that Addis Ababa can do better by improving on extended indicators of governance, infrastructure, equity and social inclusion; they pulled down the CPI in their respective dimension, however, growth on the basic indicators still remains key.
0.00
10.00
20.00
30.00
40.00
50.00
60.00
70.00
80.00
90.00
Quality Of LifeIndex
Urban Governanceand Legislation
Index
Productivity Index
InfrastructureDevelopment
Index
Equity And SocialInclusion Index
EnvironmentalSustainability
Index
CPI
Ethiopia CPI: Addis Ababa ‐ 2015
Basic Extended

15
The chart shows the trends of the CPI and its dimensions over the last five years. The chart shows that the basic CPI and most of its dimensions have maintained a very gentle increase except fluctuations in the environmental dimension and equity and social inclusion dimensions.
Strength and Weakness Analysis Based of E‐CPI Sub‐Dimensions 1. Analysis of the Strength and weaknesses in Productivity ‐ Addis Ababa City A prosperous city contributes to economic growth and development, generating income, employment and equal opportunities that further provide adequate living standards for the entire population. The following table breaks down the productivity dimension into its sub‐dimensions and highlights areas of strength and weaknesses. By 2015, Addis Ababa had a basic productivity index score of 59.11; this according to the CPI scale is moderately weak, although it’s a big area of an opportunity for improvemnt since it’s just one percentage point less to make it a moderately strong factor. This is mainly attributed to weaknesses in unemployment factor and high old age dependency ratio since the economic agglomeration is a very strong factor, thanks to the heavy investments into the SMEs sector of the economy. The city has an extended productivity index score of 62.44, which classifies the productivity dimension as a moderately strong factor of productivity. The positive difference between basic and extended CPI implies that productivity dimension has some localized indicators of productivity e.g employment that are very strong. The results show that its the share of the informal sector in employment, which has maintained a steady improvement over the last five years, that brings about the difference between the basic and extended CPI levels.
0.00
10.00
20.00
30.00
40.00
50.00
60.00
70.00
80.00
90.00
100.00
2010 2011 2012 2013 2014 2015
CPI Index
Trends in Basic CPI ‐ Addis Ababa 2015
Quality Of Life Index Urban Governance and Legislation Index
Productivity Index Infrastructure Development Index
Equity And Social Inclusion Index Environmental Sustainability Index
BASIC CPI

16
E‐CPI Addis Ababa: Productivity Index 2015 Sub‐Indices 2010 2011 2012 2013 2014 2015 Indicator Type Comments
Employment 39.27 41.65 44.46 42.89 42.89 42.89 Basic Weak
Employment 55.59 58.22 60.79 65.29 65.77 65.77 Extended M. Strong
Economic Agglomeration 84.75 83.97 83.24 82.22 81.44 81.44 Basic V. Strong
Economic Growth 42.30 44.82 47.09 50.54 52.99 52.99 Basic M. Weak
Productivity Index 55.44 56.81 58.26 58.55 59.11 59.11 Basic M. Weak
Productivity Index 55.51 57.52 59.53 61.92 62.44 62.44 Extended M. Strong
The chart below clearly shows that Economic Agglomeration sub index which mainly captured the SMEs sector is a source of strength to the economy of the city. Its followed by the localised indicators of employment in the city.
The trend analysis chart below shows that although economic agglomeration is the strongest factor of productivity in Addis Ababa its beginning to decline over time. This is an area which needs scrutiny to identify the problem and work on a reversal of the trend upwards. All the other indicators of productivity should closely be monitored to maintain the upward trend.
0.00
20.00
40.00
60.00
80.00
100.00
Employment(Basic)
Employment(Extended)
EconomicAgglomeration
(Basic)
Economic Growth(Basic)
Productivity Index(Basic)
Productivity Index(Extended)
E‐CPI Addis Ababa: Productivity Index

17
JOHN: THE GRAPHS NEED TO BE REDONE BY SCALES STARTING FROM 30 MIN TO ABOUT 90 MAX SO THAT THE DIFEFRENCES CAN BE OBSREVED IN MORE DETAIL. 2. Analysis of the Infrastructure Dimension of the CPI for Addis Ababa City A prosperous city deploys the infrastructure, physical assets and amenities – adequate water, sanitation, power supply, road network, information and communications technology, etc. – required to sustain both the population and the economy, and provide better quality of life. The table shows that Addis Ababa by 2015 had a basic infrastructure development index score of 50.13; this according to the CPI scale is moderately weak. Infrastructure being one of the most important factors of growth, the city should work on strengthening it. Although the dimension has one of the strongest factors of prosperity the city enjoys, the Housing infrastructure, this general weakness is mainly attributed to social infrastructure, weak ICT sector and some aspects of urban mobility and housing sector development. The city of Addis Ababa has a very strong basic housing infrastructure, moderately strong localized urban mobility factors, moderately strong localized factors of housing infrastructure and the basic street connectivity is also moderately weak with strong street density. These are factors that need to be improved to become strong factors and help place the city on the road to prosperity. The negative difference between basic and extended CPI scores implies that localized indicators of infrastructure development are generally weaker than basic indicators.
Sub‐Indices 2010 2011 2012 2013 2014 2015 Indicator Type Comment
Social Infrastructure (Basic) 4.88 4.88 4.88 4.88 11.25 11.25 Basic V. Weak
Social Infrastructure (Extended) 6.80 6.53 7.21 7.47 9.21 9.21 Extended V. Weak
ICT(Extended) 10.77 9.24 8.84 8.57 8.68 8.68 Extended V. Weak
ICT (Basic) 14.07 17.66 24.05 37.85 42.59 42.59 Basic Weak
0.00
10.00
20.00
30.00
40.00
50.00
60.00
70.00
80.00
90.00
100.00
2010 2011 2012 2013 2014 2015
CPI Index
E‐ CPI Addis Ababa: Trends in Productivity Index
Employment (Basic) Employment (Extended)
Economic Agglomeration (Basic) Economic Growth (Basic)
Productivity Index (Basic) Productivity Index (Extended)

18
Urban Mobility (Basic) 58.89 56.72 56.38 55.61 48.72 48.72 Basic Weak
Urban Mobility (Extended) 64.43 64.82 64.92 65.38 66.41 66.41 Extended M. Strong
Housing Infrastructure (Basic) 91.02 92.95 92.95 92.95 90.15 90.15 Basic V. Strong
Housing Infrastructure(Extended) 69.20 72.47 72.47 72.47 68.30 68.30 Extended M. Strong
Housing Sector Development(Extended) 6.01 10.11 14.09 14.09 14.09 14.09 Extended V. Weak
Street Connectivity (Basic) 38.61 43.46 47.10 53.59 56.30 57.96 Basic M. Weak
Infrastructure Dev. Index (Basic) 41.49 43.13 45.07 48.97 49.80 50.13 Basic M. Weak
Infrastructure Dev. Index (Extended) 33.12 34.38 35.43 36.16 36.08 36.14 Extended V. Weak
The chart above clearly indicates that Addis Ababa has strength in housing infrastructure both local and localized indicators, the urban mobility sub dimension is stronger on extended indicators than basic, while street connectivity and ICT both have very weak localized indicators and finally the social infrastructure is weak in both its localized and basic indicators.
0.00
10.00
20.00
30.00
40.00
50.00
60.00
70.00
80.00
90.00
100.00
SocialInfrastructure
ICT
Urban Mobility
HousingInfrastructure
Street Connectivity
Infrastructure Dev.Index
E‐CPI Addis Ababa: Inftastructure Dev. Index 2015
Basic Extended

19
The chart shows the trends in the infrastructure dimension of the CPI, it indicates that basic housing infrastructure indicators are the strongest but are on the decline since 2013, other factors that are on the decline trend are localized housing infrastructure and urban mobility. Infrastructure sub dimensions that are having gentle upwards trends are street connectivity, ICT, and social infrastructure. The housing sector development and extended indicators of urban mobility are more or less constant in the last three years. 3. Analysis of the Quality of Life dimension of the CPI for Addis Ababa City Quality of Life‐ prosperous cities provide amenities such as social services, education, health, recreation, safety and security required for improved living standards, enabling the population to maximize individual potential and to lead fulfilling lives. The table shows that in 2015 the basic quality of life index for Addis Ababa is at 38.75%, this implies that quality of life is generally a very weak factor of prosperity for the city. The extended quality of life index is even weaker at 12.05%. With only one moderately strong factor (education 61.75%), quality of life is one area which need more attention since the dimension contains the health sub dimension which is one of the basic ingredients of prosperity. Cities can only prosper when their inhabitants enjoy a long healthy and satisfying life.
E‐CPI Addis Ababa: Quality of Life Index 2015 Sub‐Indices 2010 2011 2012 2013 2014 2015 Indicator Type Comments
Education (Basic) 53.69 57.16 58.93 59.85 61.75 61.75 Basic M. Strong
Health (Basic) 38.14 38.35 38.58 38.79 39.01 39.01 Basic V. Weak
Safety and Security(Basic) 41.56 32.48 30.23 30.23 30.23 32.12 Basic V. Weak
0.00
10.00
20.00
30.00
40.00
50.00
60.00
70.00
80.00
90.00
100.00
2010 2011 2012 2013 2014 2015
CPI Index
E‐ CPI Addis Ababa: Trends in Infrastructure Development Index 2015
Social Infrastructure (Basic) Social Infrastructure (Extended)
ICT(Extended) ICT (Basic)Urban Mobility (Basic) Urban Mobility (Extended)
Housing Infrastructure (Basic) Housing Infrastructure(Extended)Housing Sector Development(Extended) Street Connectivity (Basic)

20
Public Space (Basic) 21.17 22.14 23.12 20.98 22.12 22.12 Basic V. Weak
Public Space (Extended) 1.65 1.73 1.80 1.85 1.95 1.95 Extended V. Weak
Quality Of Life Index (Basic) 38.64 37.53 37.72 37.46 38.28 38.75 Basic V. Weak
Quality Of Life Index (Extended) 11.41 11.94 12.46 11.42 12.04 12.04 Extended V. Weak
Addis Ababa is doing badly on the quality of life dimension which is mainly attributed to the low level of public spaces in the city, although spatial indicators such as this lacks elasticity, efforts and resources should be allocated to make more public spaces available and accessible to the public. The health and safety sub dimensions are also low and needs attention.
0.00
10.00
20.00
30.00
40.00
50.00
60.00
70.00Education (Basic)
Health (Basic)
Safety andSecurity(Basic)
Public Space(Basic)
Public Space(Extended)
Quality Of LifeIndex (Basic)
Quality Of LifeIndex (Extended)
E‐CPI Addis Ababa: Quality of Life Index 2015

21
The graph shows that public space is the lowest and has remained relatively constant over the years while education sub dimension is the strongest factor and is on an upwards trend. Safety and security is also on adownward trend since 2010. 4. Analysis of the Equity and Social Inclusion Dimension of the CPI for Addis Ababa City A city is only prosperous to the extent that poverty and inequalities are minimal. No city can claim to be prosperous when large segments of the population live in abject poverty and deprivation. This involves reducing the incidence of slums and new forms of poverty and marginalization. The table below shows a breakdown of the equity and social inclusion dimension into its sub dimensions and highlights areas of strength and weaknesses. The findings in the table shows that equity and social inclusion index is 69.84 for basic and 62.46 for extended, this means that equity and social inclusion is a moderately strong factor of prosperity for Addis Ababa, it also shows that the city has weak localized indicators of equity and social inclusion. The strongest equity and social inclusion factors for the city are economic equity which is attributed to the low poverty and improved distribution of income among the population. Gender inclusion is also one area of strength, mainly attributed to equitable secondary education and the high proportion of women in the workforce. Social inclusion and localized gender inclusion are the main areas of weaknesses that need improvements.
E‐CPI Addis Ababa: Equity and Social Inclusion Index 2015 Sub‐Indices 2010 2011 2012 2013 2014 2015 Indicator Type Comments
Economic Equity (Basic) 70.38 87.05 87.16 87.16 87.21 87.21 Basic V. Strong
Gender Inclusion (Basic) 75.00 82.00 87.00 61.00 88.00 88.00 Basic V. Strong
Gender Inclusion (Extended) 39.81 40.30 40.79 39.72 40.29 40.29 Extended Weak
Social Inclusion (Basic) 34.32 34.32 34.32 34.32 34.32 34.32 Basic V. Weak
Equity And Social Inclusion Index (Basic) 59.90 67.79 69.49 60.83 69.84 69.84 Basic M. Strong
0.00
10.00
20.00
30.00
40.00
50.00
60.00
70.00
2010 2011 2012 2013 2014 2015
CPI Index
E‐CPI Addis Ababa: Trends in Quality of Life Index
Education (Basic) Health (Basic)
Safety and Security(Basic) Public Space (Basic)
Public Space (Extended) Quality Of Life Index (Basic)
Quality Of Life Index (Extended)

22
Equity And Social Inclusion Index (Extended) 54.88 60.92 62.32 55.55 62.46 62.46 Extended M. Strong
According to the chart above, Economic equity is the strongest factor followed by gender equity and lastly social inclusion.
0.00
10.00
20.00
30.00
40.00
50.00
60.00
70.00
80.00
90.00Economic Equity (Basic)
Gender Inclusion (Basic)
Social Inclusion (Basic)
Equity And Social InclusionIndex (Basic)
E‐CPI Addis Ababa: Basic Equity & Social Inclusion Index 2015

23
From the graph it’s evident that gender inclusion is one of the strongest factors of prosperity for Addis Ababa but it has not been stable. Economic equity improved sharply in 2011 and has remained relatively constant while social inclusion and localized indicators of gender inclusion are constant. 5. Analysis of the Environmental Sustainability Dimension of the CPI for Addis Ababa City Environmental sustainability ‐ the growth of cities and their economic development should not destroy or degrade the environment; instead, the city’s natural assets are preserved for the sake of sustainable urbanization. Although there was little data for the environmental sustainability dimension, the solid waste management in the city is pretty good hence the high environmental scores.
E‐CPI Addis Ababa: Environmental Sustainability Index 2015
Sub‐Indices 2010 2011 2012 2013 2014 2015 Indicator Type Comments
Waste Management 96.22 63.76 63.67 73.63 83.26 83.26 Basic V. Strong
Based on the amount of solid waste generated in the city and the amount collected for safe disposal, the city enjoys very high level of environmental sustainability scores. There was no data on waste recycling, air quality and waste management data was not included as well.
0.00
10.00
20.00
30.00
40.00
50.00
60.00
70.00
80.00
90.00
100.00
2010 2011 2012 2013 2014 2015
CPI Index
E‐ CPI Addis Ababa: Trends in Equity & Social Inclusion Index 2015
Economic Equity (Basic) Gender Inclusion (Basic)
Social Inclusion (Basic) Equity And Social Inclusion Index (Basic)
Gender Inclusion (Extended) Equity And Social Inclusion Index (Extended)

24
This chart shows that the solid waste management in the city of Addis Ababa is very good but it has not been stable over the years, there was a sharp decline in 2011, it improved steadily to 2014. 6. Analysis of the Governance and Legislation Dimension of the CPI for Addis Ababa City Governance and Legislation in a prosperous city, instruments of power, good governance, urban planning, laws, regulations and institutional frameworks, ensure the conditions for the control and effective functioning of the other dimensions. Cities are best able to combine sustainability and shared prosperity through effective urban governance and transformational leadership, deploying appropriate and effective policies, laws and regulations, and creating adequate institutional frameworks with strong local institutions and sound institutional arrangements. The findings in the table below indicates that in 2015 the basic governance and legislation index for Addis Ababa was 76.94 while the extended index was 56.72, this means that governance and legislation is a strong factor of prosperity for the city of Addis Ababa, however, there are localized governance issues such as civic participation that still needs to be address, they pull the governance scores down from strong to a weak factors. The main sources of strength under this dimension are strong institutional capacity and basic civic participation such as voting in elections.
E‐CPI Addis Ababa: Governance and Legislation Index 2015 Sub‐Indices 2010 2011 2012 2013 2014 2015 Indicator Type Comments
Institutional Capacity (IC) 98.01 97.76 98.81 96.34 88.73 88.73 Basic V. Strong
Institutional Capacity (IC) 67.88 65.10 61.18 71.10 62.52 62.52 Extended M. Strong
Participation (P) 62.47 62.47 62.47 65.14 65.14 65.14 Basic M. Strong
Participation (P) 7.89 7.89 7.89 7.89 10.47 10.47 Extended V. Weak
Urban Governance and Legislation Index 80.24 80.11 80.64 80.74 76.94 76.94 Basic Strong
0.00
20.00
40.00
60.00
80.00
100.00
120.00
2010 2011 2012 2013 2014
CPI Index
E‐ CPI Addis Ababa: Trends in Environmental Sustainability Index 2015

25
Urban Governance and Legislation Index 59.06 58.31 57.59 60.12 56.72 56.72 Extended M. Weak
From the chart its clear that Addis Ababa has institutional capacity, both basic and localized are strong, it also has strength in basic public civic participation but very weak in localized indicators of civic participation or involvement of the public. PLEASE DEFINE WHAT I STHE INGREDIENT FOR THE BASIC PUBLIC CIVIC PARTICIPATION AND THE LOCALIZED INDICATORS. FOR ANY READER THAT CLARITY ON WHAT IS COMPOSITE OF THE TWO IS GOOD TO KNOW WHY ONE IS OK AND THE OTHER IS BAD.
0.0010.0020.0030.0040.0050.0060.0070.0080.0090.00
100.00
Institutional Capacity(Basic)
Institutional Capacity(Extended)
Participation (Basic)
Participation (Extended)
Urban Governance andLegislation Index (Basic)
Urban Governance andLegislation Index
(Extended)
E‐CPI Addis Ababa: Governance and Legislation Index 2015

26
Conclusions and Recommendations In conclusion, Addis Ababa is generally on the path to prosperity, it had many strong pillars of prosperity such as its education system, employment and especially the reduction of the share of informal sector is working well for the city, it has good economic agglomeration program with the SME working as a strong pillar. The city’s institutional capacity and civic participation are some of the areas which need to be made very strong to spur growth. The urban infrastructure is another area of strength which needs to be improved for quick returns on prosperity especially on the housing infrastructure and road network. There is good social and economic inclusion as well as public involvement in development issues. The areas of serious weakness are in social infrastructure, quality of life and health and security which have been good but expreineced somedeclines which needs to be investigated further. Lessons The most important lesson learnt is the importance of data; availability and accessibility as well structured data collection, storage systems. Data collection and keeping standard list of CPI indicators to be monitored over the years is key. Before rolling out CPI to other cities, there is need to establish a national CPI program at the office with dedicated personnel to ensure that CPI indicators and relevant
0.00
20.00
40.00
60.00
80.00
100.00
120.00
2010 2011 2012 2013 2014
CPI Index
E‐ CPI Addis Ababa: Trends in Governance and Legislation Index 2015
Institutional Capacity (Basic)
Institutional Capacity (Extended)
Participation (Basic)
Participation (Extended)
Urban Governance and Legislation Index (Basic)
Urban Governance and Legislation Index (Extended)

27
data is streamlined in the existing data collection and storage systems at national, regional and city level and ensure that all CPI indicators are harmonized throughout all these levels.
Reference
CSA (2007). Central Statistical Authority