west virginia tax policy & shared prosperity
38
WEST VIRGINIA TAX POLICY & SHARED PROSPERITY Recommenda*ons to Joint Select Commi2ee on Tax Reform October 20, 2015 presented by Ted Boe9ner, Execu@ve Director West Virginia Center on Budget and Policy www.wvpolicy.org @WVCBP 1
-
Upload
khangminh22 -
Category
Documents
-
view
0 -
download
0
Transcript of west virginia tax policy & shared prosperity
WEST VIRGINIA TAX POLICY & SHARED PROSPERITY
Recommenda*ons to Joint Select Commi2ee on Tax Reform
October 20, 2015 presented by Ted Boe9ner, Execu@ve Director West Virginia Center on Budget and Policy www.wvpolicy.org @WVCBP
1

Outline of Presenta*on
2
• Overview of West Virginia’s Fiscal Health • Principles of Sound Taxa*on & Tax Responsibili*es • Link Between Taxes and Economic Growth • Tax Policy Op*ons • Recommenda*ons to Improve Budget Transparency & Accountability
The West Virginia Center on Budget and Policy is a policy research organiza*on that is nonpar*san, nonprofit, and statewide. Our mission is to use sound research and analysis to advance the well-‐being of West Virginia communi*es. The Center is part of the State Priori@es Partnership and the Economic Analysis Research Network.

3
0
0.1
0.2
0.3
0.4
0.5
0.6
0.7
0.8
0.9
1
-‐15%
-‐10%
-‐5%
0%
5%
10%
2006 2007 2008 2009 2010 2011 2012 2013 2014 2015 Source: Pew Charitable Trusts analysis of U.S. Census Bureau, Nelson Rockefeller Ins*tute of Government and U.S. Bureau of Economic Analysis data.
West Virginia tax revenue growth lags behind most states Change in tax revenue from each state's peak quarter, adjusted for Infla@on
Great Recession West Virginia 50 states

West Virginia relies less on business, more on severance and personal income taxes to fund budget Revenue as a share of General Revenue Fund
4
29.6% 33.4% 43.8%
29.9% 31.3% 29.2%
9.3% 7.1% 9.9% 12.7% 8.0%
4.4% 9.5% 5.2% 2.9%
9.5% 15.0% 9.8%
0% 10% 20% 30% 40% 50% 60% 70% 80% 90%
100%
FY 1990 FY 2005 FY 2015 Source: WVCBP analysis of WV State Budget Office data
Personal Income Sales & Use Severance Corporate Income/Franchise Business & Occupa*on Other Revenue

As state revenue falls rela*ve to economy, WV loses ability to invest
5
6.2%
26-‐year average: 6.8%
5%
6%
7%
8%
FY 1990 FY 1995 FY 2000 FY 2005 FY 2010 FY 2015 Source: WVCBP analysis of WV State Budget Office and U.S. Bureau of Economic Analysis data
WV General Revenue Fund as a share of state personal income, 1990-‐2015 At 6.8%, WV GRF collec@ons would have been $445 million more in FY 2015

6
Major tax reduc*ons since 2006 hur*ng revenue growth
-‐$17 -‐$27 -‐$69
-‐$150 -‐$162
-‐$425
Other Business Tax Reduc*ons
Personal Income Tax
Cuts
Corporate Income Tax Reduc*on
Phase Out Franchise Tax
Repeal Grocery Tax Total
Source: West Virginia Department of Revenue
Expressed in Millions

Medicaid has a structural budget deficit
7
$21
$82
$190
$267
$95
FY 2012 FY 2013 FY 2014 FY 2015 FY 2016 Soure: WVCBP analysis of WV State Budget Office data
One-‐@me state-‐source revenue appropria@ons to Medicaid (in millions)
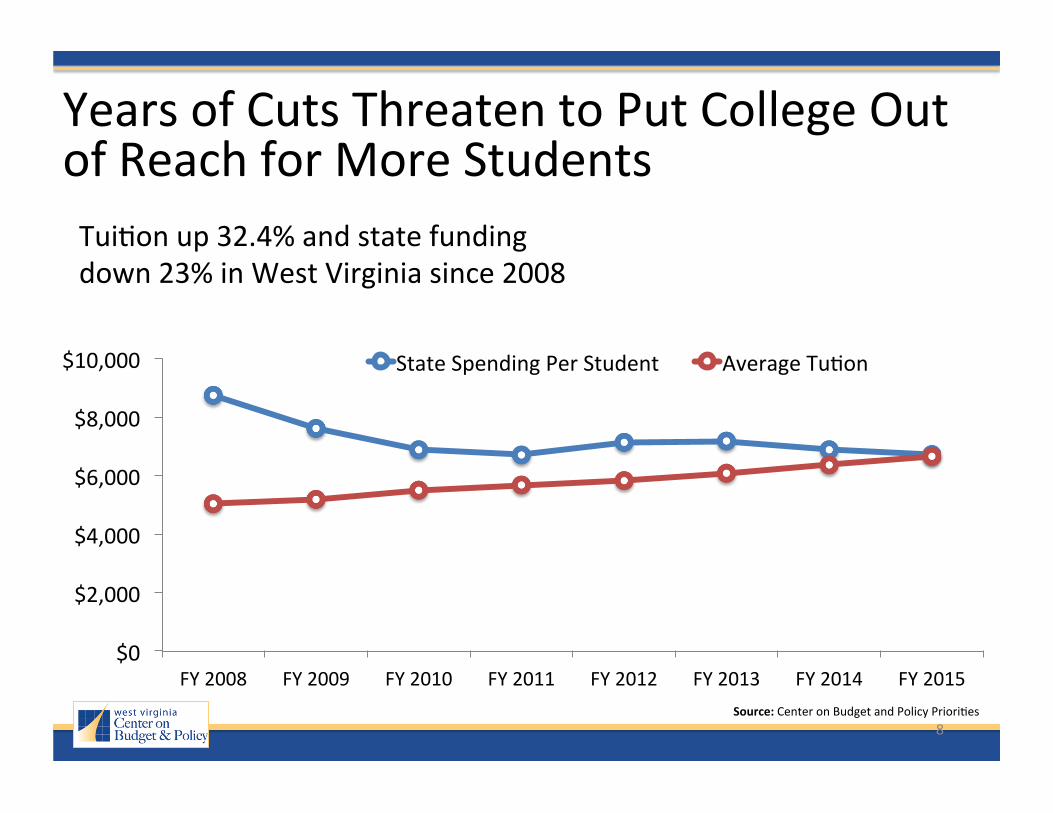
Years of Cuts Threaten to Put College Out of Reach for More Students
8
$0
$2,000
$4,000
$6,000
$8,000
$10,000
FY 2008 FY 2009 FY 2010 FY 2011 FY 2012 FY 2013 FY 2014 FY 2015 Source: Center on Budget and Policy Priori*es
Tui*on up 32.4% and state funding down 23% in West Virginia since 2008
State Spending Per Student Average Tu*on
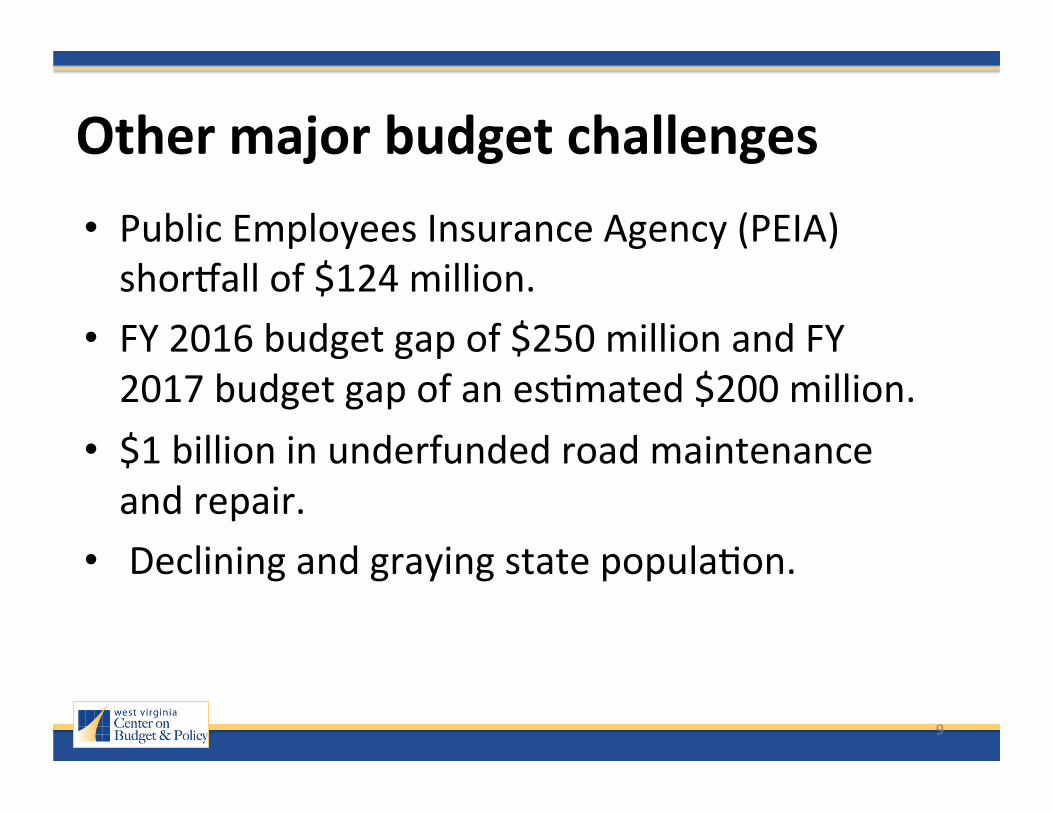
Other major budget challenges
9
• Public Employees Insurance Agency (PEIA) shorjall of $124 million.
• FY 2016 budget gap of $250 million and FY 2017 budget gap of an es*mated $200 million.
• $1 billion in underfunded road maintenance and repair.
• Declining and graying state popula*on.

West Virginia has strong reserve funds
10
105
0
50
100
150
200
250
300
350
Alaska
Wyoming
North Dakota
Texas
West V
irginia
Neb
raska
Iowa
Mon
tana
South Carolina
Delaware
Indiana
Utah
New
York
South Da
kota
Hawaii
Florida
Minne
sota
Oregon
New
Mexico
Idaho
Washington
Mississippi
Alabam
a Ohio
Colorado
50-‐state m
edian
Louisia
na
Verm
ont
Georgia
Rhod
e Island
Michigan
Maryland
Tenn
essee
Nevada
Missou
ri Arizo
na
Virginia
North Carolina
Massachuse2
s Oklahom
a Maine
Co
nnec*cut
New
Ham
pshire
Kentucky
California
New
Jersey
Kansas
Illinois
Penn
sylvania
Arkansas
Wisc
onsin
Source: Pew Charitable Trusts analysis of Na*onal Associa*on of Budget Officers (NASBO) data
Days' worth of General Fund expenditures in reserve funds, FY 2015

West Virginia reserve funds are declining
11
-‐10
30
70
110
150
FY 2000
FY 2001
FY 2002
FY 2003
FY 2004
FY 2005
FY 2006
FY 2007
FY 2008
FY 2009
FY 2010
FY 2011
FY 2012
FY 2013
FY 2014
FY 2015*
Days Each State Cou
ld Run
on Re
serve Fund
s
Source: Pew Charitable Trusts analysis of Na*onal Associa*on of Budget Officer (NASBO) data *FY 2015 Es*mate
Kansas and North Carolina have weak reserves
West Virginia 50-‐state median Kansas North Carolina
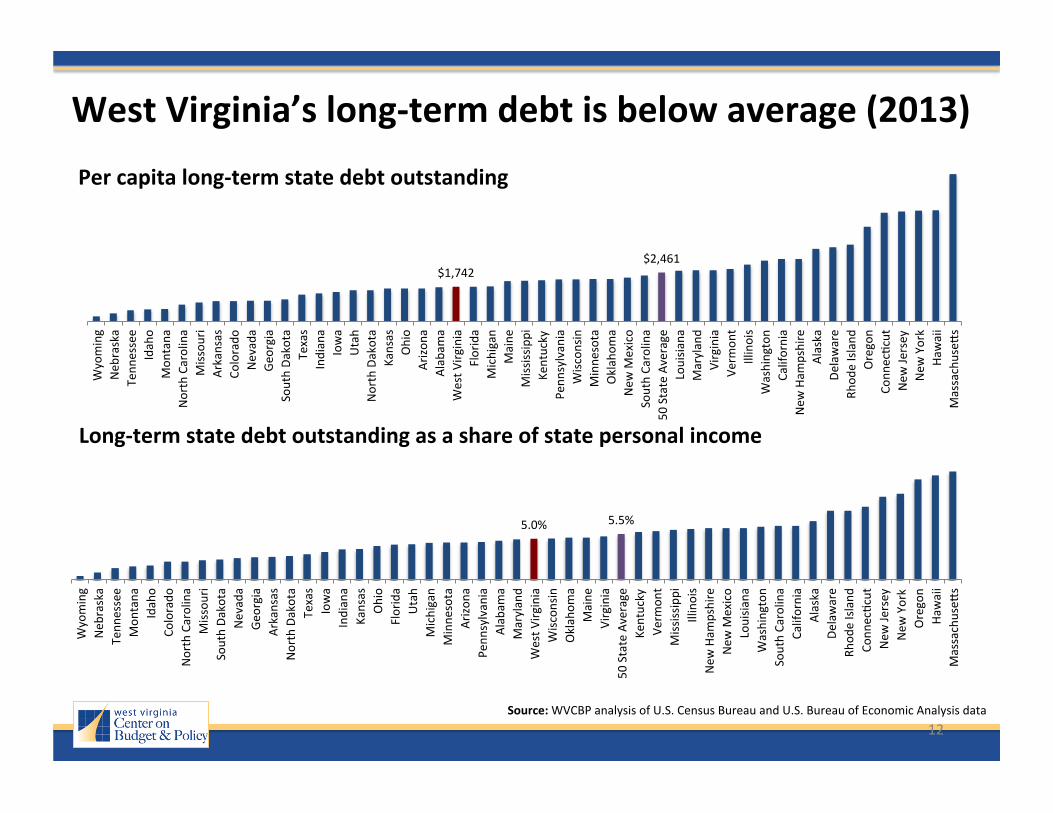
West Virginia’s long-‐term debt is below average (2013)
12
$1,742 $2,461
Wyoming
Neb
raska
Tenn
essee
Idaho
Mon
tana
North Carolina
Missou
ri Arkansas
Colorado
Nevada
Georgia
South Da
kota
Texas
Indiana
Iowa
Utah
North Dakota
Kansas
Ohio
Arizo
na
Alabam
a West V
irginia
Florida
Michigan
Maine
Mississippi
Kentucky
Penn
sylvania
Wisc
onsin
Minne
sota
Oklahom
a New
Mexico
South Carolina
50 State Average
Louisia
na
Maryland
Virginia
Verm
ont
Illinois
Washington
California
New
Ham
pshire
Alaska
Delaware
Rhod
e Island
Oregon
Conn
ec*cut
New
Jersey
New
York
Hawaii
Massachuse2
s
Per capita long-‐term state debt outstanding
5.0% 5.5%
Wyoming
Neb
raska
Tenn
essee
Mon
tana
Idaho
Colorado
North Carolina
Missou
ri South Da
kota
Nevada
Georgia
Arkansas
North Dakota
Texas
Iowa
Indiana
Kansas
Ohio
Florida
Utah
Michigan
Minne
sota
Arizo
na
Penn
sylvania
Alabam
a Maryland
West V
irginia
Wisc
onsin
Oklahom
a Maine
Virginia
50 State Average
Kentucky
Verm
ont
Mississippi
Illinois
New
Ham
pshire
New
Mexico
Louisia
na
Washington
South Carolina
California
Alaska
Delaware
Rhod
e Island
Co
nnec*cut
New
Jersey
New
York
Oregon
Hawaii
Massachuse2
s
Long-‐term state debt outstanding as a share of state personal income
Source: WVCBP analysis of U.S. Census Bureau and U.S. Bureau of Economic Analysis data

West Virginia’s pension funding ra*o below average but greatly improved
13
67.1% 71.8%
Illinois
Kentucky
Conn
ec*cut
Alaska
New
Ham
pshire
Mississippi
Louisia
na
Rhod
e Island
Kansas
Michigan
Hawaii
North Dakota
Massachuse2
s Co
lorado
Pe
nnsylvania
New
Jersey
South Carolina
Indiana
Maryland
Virginia
Alabam
a Oklahom
a New
Mexico
West V
irginia
Verm
ont
Nevada
Arizo
na
US To
tal
California
Mon
tana
Ohio
Arkansas
Minne
sota
Missou
ri Wyoming
Georgia
Maine
Neb
raska
Utah
Texas
Iowa
Florida
Idaho
Delaware
Washington
New
York
Tenn
essee
Oregon
North Carolina
Wisc
onsin
South Da
kota
Source; Pew Charitable Trusts
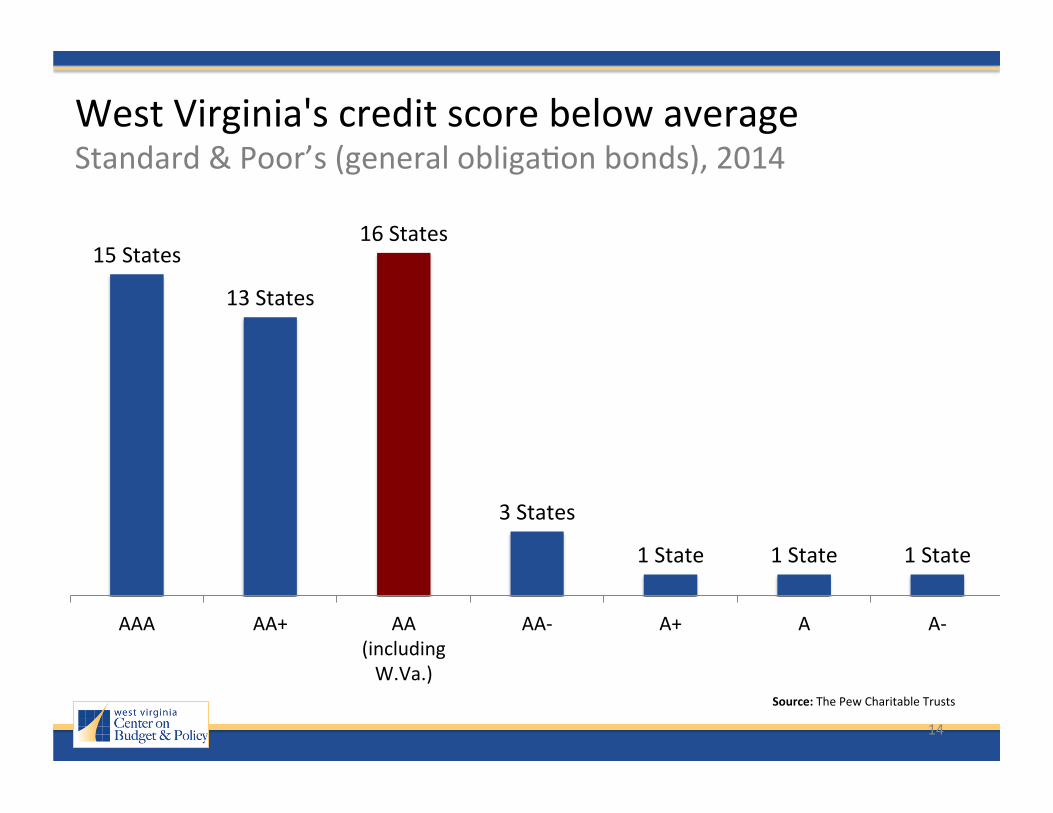
Ranking has improved from 50th in 2003 to 27th in 2013
14
15 States
13 States
16 States
3 States
1 State 1 State 1 State
AAA AA+ AA (including W.Va.)
AA-‐ A+ A A-‐
Source: The Pew Charitable Trusts
West Virginia's credit score below average Standard & Poor’s (general obliga*on bonds), 2014

West Virginia employment rate unrecovered and lowest in na*on
15
63%
65%
67%
69%
71%
73%
75%
77%
79%
81%
2007 Q4 2008 Q3 2009 Q2 2010 Q1 2010 Q4 2011 Q3 2012 Q2 2013 Q1 2013 Q4 2014 Q3 2015 Q2
Source: Pew Charitable Trusts
Employment to popula@on ra@o for those 25 to 54 year olds
West Virginia UNITED STATES

Tax Policy Principles
16
• Equity: A fair and equal tax system is one that demonstrates both “ver*cal” and “horizontal” equity. – Ver*cal equity means people with a greater ability to pay should pay more.
– Horizontal equity means people in similar situa*ons with the same ability to pay should pay equally.
• Adequacy: An adequate tax system raises enough funds to sustain the level of public services demanded by ci*zens and policymakers in the short and long-‐term. Two factors that contribute to adequacy of a tax are stability and elas*city. – Stability means tax revenue grows at a predictable rate (e.g. property tax) and elas@city is whether growth in a specific tax keeps up with the economy (e.g. personal income tax).

Tax Policy Principles Con’t
17
• Simplicity & Transparency: A tax system should be easy to understand, accountable, and transparent. Taxpayers should not have to navigate through complex requirements. Simple tax systems have fewer loopholes.
• Exportability: Ensuring that individuals and companies based in other states who benefit from our state’s public services pay their fair share (e.g. Motor Fuel Tax).
• Efficiency: An efficient tax system encourages neutrality by staying out of the way of economic decisions. In other words, tax rules should not favor one industry or investment over another. For instance, a book purchased online should be subject to the same sales tax rate as a book bought at a local bookstore.

WV has an upside down tax system
18
8.7% 8.6% 9.0% 8.6% 8.2% 6.6% 6.5%
0.0%
1.0%
2.0%
3.0%
4.0%
5.0%
6.0%
7.0%
8.0%
9.0%
10.0%
Less than
$16,000 (Lowest 20%)
$16K-‐$29K
(Second 20%)
$29K-‐$48K
(Middle 20%)
$48K-‐$77K (Fourth 20%)
$77K-‐$144K (Next 15%)
$144K-‐$306K (Next 4%)
More than $306K (TOP 1%)
Source: Ins*tute for Taxa*on and Economic Policy, Who Pays? 2015
West Virginia state and local taxes as a share of income Non-‐Elderly Families, 2015
Sales & Excise Taxes Property Taxes Income Taxes Total with Federal Offset
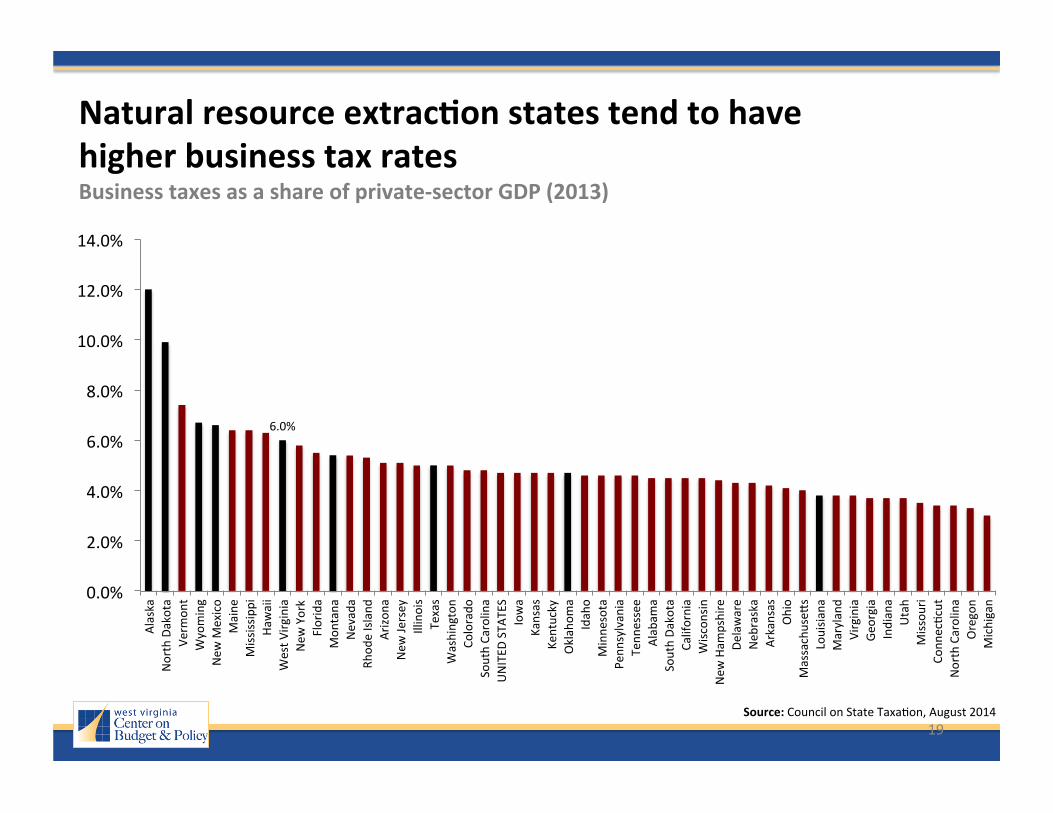
19
6.0%
0.0%
2.0%
4.0%
6.0%
8.0%
10.0%
12.0%
14.0%
Alaska
North Dakota
Verm
ont
Wyoming
New
Mexico
Maine
Mississippi
Hawaii
West V
irginia
New
York
Florida
Mon
tana
Nevada
Rhod
e Island
Arizo
na
New
Jersey
Illinois
Texas
Washington
Colorado
South Carolina
UNITED
STA
TES
Iowa
Kansas
Kentucky
Oklahom
a Idaho
Minne
sota
Penn
sylvania
Tenn
essee
Alabam
a South Da
kota
California
Wisc
onsin
New
Ham
pshire
Delaware
Neb
raska
Arkansas
Ohio
Massachuse2
s Louisia
na
Maryland
Virginia
Georgia
Indiana
Utah
Missou
ri Co
nnec*cut
North Carolina
Oregon
Michigan
Source: Council on State Taxa*on, August 2014
Natural resource extrac@on states tend to have higher business tax rates Business taxes as a share of private-‐sector GDP (2013)

Natural resource produc*on taxes and many business taxes are highly exportable
20
66.4% 61.6%
33.2% 21.3% 20.9%
1.9%
Natural Gas Tax Oil Produc*on Tax
Franchise Tax School Property Tax
Sales Tax Cigare2e Tax
Source: Tax Exemp*ons & Tax Incidence, March 2015, Texas Comptroller
Percent of Texas taxes paid by non-‐Texans
90% 83%
48% 41% 37%
Mining Produc*on Tax Industrial Property Tax Commercial Property Tax
Corporate Franchise Tax Motor Fuels Taxes
Source:2015 Minnesota Tax Incidence Study. March 9, 2015 Minnestota Tax Research Division
Percent of Minnesota taxes paid by non-‐Minnesotens

Exportability explains (in part) how natural resource states have higher business tax rates but can have “compe**ve business tax systems.”
21
Tax Founda*on adjusts for exportability of severance taxes when calcula*ng business tax index

Large business tax cuts and improving “business tax climate” not corresponding with job growth in West Virginia
22
766.4 (34th)
774 (37th)
777.6 (36th)
751.2 (37th)
740.9 (24th)
742.4 (23rd)
748.4 (23rd) 745.7
(23rd) 738.5 (21st)
7.0%
7.6%
6.6%
6.6% 6.9%
6.7%
6.3% 6.2%
5.8%
4.0%
4.5%
5.0%
5.5%
6.0%
6.5%
7.0%
7.5%
8.0%
700
710
720
730
740
750
760
770
780
790
2006 2007 2008 2009 2010 2011 2012 2013 2014
Busin
ess taxes as a
share of Priv
ate GDP
Thou
sand
s
Source: U.S. Bureau of Labor Sta*s*cs (LAUS), Council on State Taxa*on, and Tax Founda*on
Annual Employment State and Local Business Tax Rate (State Business Tax Rank)

23
-‐5.0%
-‐4.0%
-‐3.0%
-‐2.0%
-‐1.0%
0.0%
1.0% Ohio Maine Kansas Wisconsin N.Carolina
Difference in Growth Rates
between Biggest Tax Cuung States and
Na*onal Average
Source: U.S. Bureau of Labor Sta*s*cs, August 2015, and U.S. Bureau of Economic Analysis, 1st Quarter of 2015 Note: Effec*ve dates for tax cuts are June 2013 for Ohio, January 2012 for Maine, January 2013 for Kansas, January 2013 (retroac*ve from June 2013) for Wisconsin, and January 2014 for North Carolina. For personal income growth, period starts quarter before tax cuts effec*ve and for nonfarm employment month before tax cuts enacted.
Biggest Tax Cumng States Not Seeing Economic Boom Total nonfarm and personal income growth since the tax cuts took effect
Personal Income Growth
Nonfarm Job Growth

Link Between Tax Cuts & Economic Growth
24
There is no consensus whatsoever that cu0ng taxes is a good strategy to boost state economic growth and create jobs. “Clearly, taxes affect behavior; they affect some behaviors more than others. What has not been established is that the level of taxes has a clear and important impact on economic growth. And one reason is that this is not a well-‐posed ques*on. How government ac*vity affects prosperity depends not only on the level of taxes, but also on what the money is used for.” -‐-‐ University of Michigan tax economist Professor Joel Slemrod

25
20 Studies
11 Studies
6 Studies
No significant link between state/local tax levels and economic growth
Mixed or inconsistent results on link between state/local tax levels and
economic growth
Significant link between state/local tax levels and economic growth
Source: West Virginia Center on Budget and Policy and Center on Budget and Policy Priori*es
Most academic research shows state tax levels have li9le or no impact on economic growth Number of peer-‐reviewed ar@cles in academic journals and books since 2000
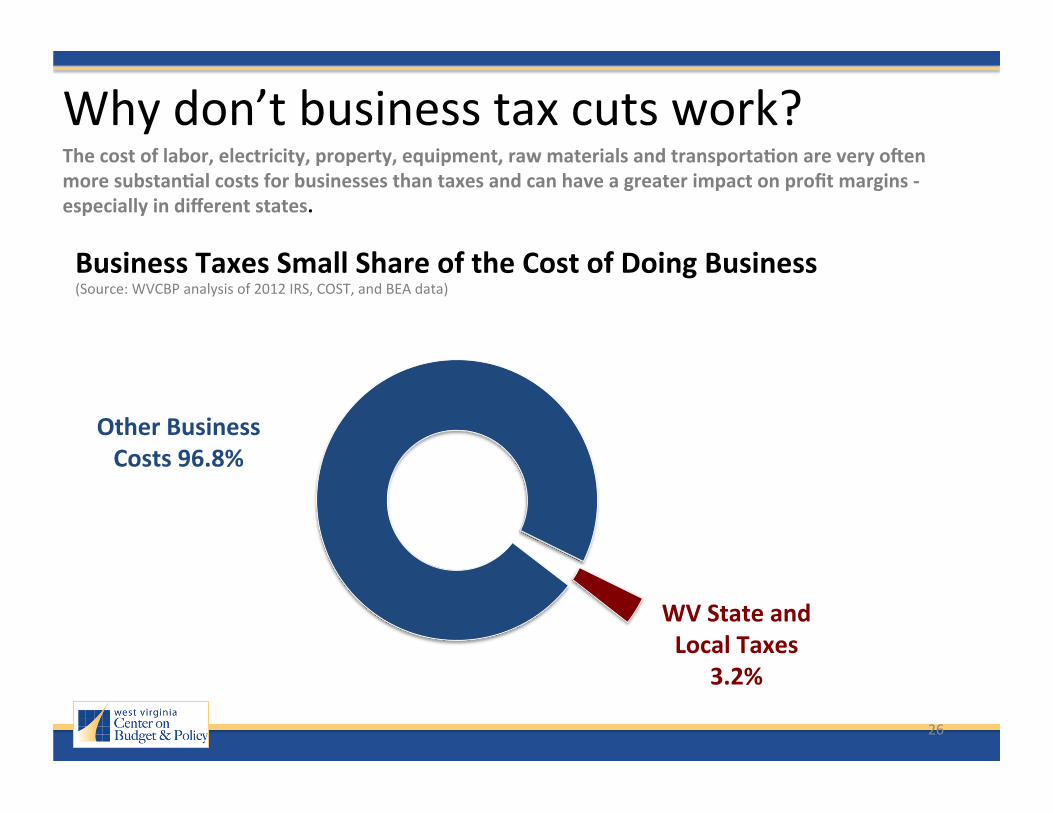
Why don’t business tax cuts work?
26
WV State and Local Taxes
3.2%
Other Business Costs 96.8%
Business Taxes Small Share of the Cost of Doing Business (Source: WVCBP analysis of 2012 IRS, COST, and BEA data)
The cost of labor, electricity, property, equipment, raw materials and transporta@on are very onen more substan@al costs for businesses than taxes and can have a greater impact on profit margins -‐ especially in different states.

A skilled and knowledgeable workforce is a higher priority for businesses
27
• A recent report from the Center for Business and Economic Research at the University of Kentucky asked the ques*on, why does Kentucky, a state similar to West Virginia, lag behind the rest of the south when it comes to economic growth? Of all the factors examined in the report – taxes, infrastructure, the size of government, business climate, etc. – the biggest factor in Kentucky’s poor economic performance was its stock of knowledge, par:cularly its low levels of educa:on among its workers.
• For businesses looking to locate or expand into a state, the quality of the workforce is one of the most important factors. A survey of corporate execu*ves by Area Development Magazine found that availability of skilled labor was second only to highway accessibility in the most important site selec*on factors for businesses.
• Many factors other than taxes can influence state economic growth and business investment, including climate, workforce, regula*ons, energy prices, economic recessions, federal and monetary policy, quality of life and ameni*es, consumer demand, public infrastructure and transporta*on, available sites, proximity to markets and suppliers, access to raw materials, and more.
Source: West Virginia Center on Budget and Policy, Fast Facts

West Virginia Property & Local Tax Op*ons
28
• Gradually Restore Regular Educa@on Levy Rates: The tax rates are nearly 15.5% lower than the rates in place prior to 1992 (Recommenda:on was included in WV Early Childhood Planning Task Force, September 2014).
• Modernize Excess Acreage Tax: Since 1905, a corpora*on purchasing more than 10,000 acres or more of real property in the state is subject to a one-‐*me five cents per acre tax on owning the property. In 1999, Governor Underwood’s Commission on Fair Taxa:on (3-‐694) recommended increasing this tax to 50 cents per acre, making it an annual tax, lowering the threshold to 1,000 acres and allowing a credit against the state’s severance tax. Consider a graduated rate structure star*ng at 50 cents per acre (1,000-‐2,499) and ending at $5.00 per acre above 250,000 acres. Poten*al yield = $10.6 million annually.
• Close the Online Hotel Tax Loophole: West Virginia allows online travel companies like Expedia, Orbitz, and Priceline to collect taxes on only part of the sales taxes due on hotel room bookings. This costs local governments in West Virginia an es*mated $1 to $2 million annually.

West Virginia Sales & Use Tax Op*ons
29
• Expand Sales Tax to Include Digital Downloads: West Virginia has not updated its sales taxes to cover various goods and services sold and delivered on the internet -‐ including sozware, music, movies, games, and books – even though West Virginia taxes the sale of iden*cal items sold in physical stores. Es*mated yield is $3.7 million annually.
• Expand Sales Tax to Include Barber Shops, Beauty Salons, Nail Salons, Message & Ta9oo Parlors and Fitness Centers: Over the last several decade West Virginia’s economy has shized from producing goods (e.g. steel) to providing services (e.g. retail), but the sales tax has not modernized to keep up with all of these changes. While West Virginia taxes more services than most states, there are many personal services that are exempt from the sales tax for no discernible reason. Es*mated yield is $5.8 million annually.

West Virginia Income Tax Op*ons
30
• Scale Back Personal Exemp@ons: West Virginians are provided a $2,000 personal exemp*on for each household member. Unlike the federal government that phases out its personal exemp*ons, West Virginia does not. If the $2,000 per person exemp*on were phased out for joint filers between $150,000 and $200,000 and eliminated for those over $200,000, it would increase revenue by an es*mated $9.9 million and improve the progressivity of our state’s personal income tax.
• Modernize Personal Income Tax Rates & Brackets: West Virginia’s personal income tax schedule has not changed since 1987, when the state’s top personal income rate was reduced from 13 to 6.5 percent. West Virginia should adjust its brackets and rates to be2er reflect modern income levels. This could include adop*ng a new bracket for higher-‐income earners and perhaps even lower rates for low and middle-‐income residents. For example, a new top bracket of 7.4 percent on taxable income above $150,000 would increase revenue by an es*mated $44.8 million.
• Create a refundable state earned income tax credit (EITC): Twenty-‐six states and the District of Columbia have enacted earned income tax credits to supplement the federal EITC. The EITC is a proven tool to fight poverty, increase labor force par*cipa*on, help low-‐income working families make ends meet and has las*ng effects such as improving the health, educa*onal achievement, and earnings of children that are EITC recipients. A refundable WV EITC at 15% of the federal credit would cost approximately $45 million.
• Reinstate the Estate Tax: First enacted in 1904, West Virginia’s estate tax effec*vely ended in 2005 when the state did not decouple from the federal estate tax changes. Today, 21 states collect over $4.5 billion per year from their estate tax while West Virginia collects next to nothing. Reinsta*ng this tax could raise an average of $15 to $20 million per year.
• Close Tax Haven Loopholes: While West Virginia has closed several corporate tax loopholes by enac*ng combined repor*ng, it did not include offshore tax havens beyond the U.S. border. West Virginia should replace its “water’s edge” with “world-‐wide” combined repor*ng to include offshore tax havens. According to the U.S. Public Interest Research Group, this could generate an es*mated $9.6 million.

West Virginia Severance Tax Op*ons
31
• Extend Workers’ Compensa@on Debt Taxes: According to the governor’s budget report, the workers’ compensa*on debt fund will be paid off by 2016. This debt is currently financed by several revenues sources, including a severance tax on coal (56 cents per ton), natural gas (7.7 cent per MCF), and *mber (2.78 percent of gross value). Altogether, these taxes yield about $80 to $100 million per year. Because the severance tax is highly exportable, and West Virginia under taxes its mineral wealth compared to many western states, it makes sense to extend all or part of these taxes to help balance the budget and fund important public investments (e.g. roads) and economic diversifica*on.
• Explore Taxing Exported Shale Gas at a Higher Rate: A new severance tax incen*ve, based on a higher rate for natural gas liquids, with a credit to related in-‐state industries, may encourage ethane cracking and other chemical manufacturing to create in-‐state jobs while genera*ng addi*onal tax revenue for investment in infrastructure and human capital. If West Virginia increased its severance tax on natural gas liquids from five to ten percent, it would increase revenue by an es*mated $168 million over the next five years. A por*on of this revenue could go into the WV Future Fund.
• Fund the West Virginia Future Fund: Legisla*on passed last year crea*ng the West Virginia Future Fund contained several triggers that have to be met in order for the fund to receive severance tax revenues. The triggers should be removed to allow the fund to build.

West Virginia Lo2ery & Sin Tax Op*ons
32
• Scale Back or Eliminate Greyhound Breeding Subsides: A recent audit found that the $29 million in annual lo2ery revenue that is used to subsidize greyhound racing in the state only yielded $30 million in sales. The audit concluded, “West Virginia could put the casino supplements to be2er use for the benefit of West Virginians.” Lawmakers should explore dras*cally scaling back or ending this subsidy.
• Increase the Tobacco Tax: The tax on cigare2es was last increased over a decade ago and West Virginia currently has the 46th lowest cigare2e tax among the 50 states. West Virginia also has a very low tax on non-‐cigare2e tobacco products. Increasing the cigare2e tax to $1.55 per pack and increasing the tax on other tobacco products to 50 percent of wholesale price would provide an es*mated $137.2 million in addi*onal revenues. Addi*onally, it could dras*cally reduce health care costs and prevent deaths, teen smoking, and other chronic health condi*ons associated with tobacco use. West Virginia could also begin taxing E-‐Cigare2e products. For example, Minnesota taxes electronic cigare2es, and e-‐juice that contains nico*ne, at 95 percent of their wholesale price.
• Raise Taxes on Alcohol Sales: West Virginia should explore raising state tax rates on liquor and beer, including raising the sales tax on liquor from five percent to six percent. Increasing the beer barrel tax from $5.50 per barrel to $11.00 per barrel would increase revenue by an es*mated $7.1 million, and requiring the Alcohol Beverage Control Administra*on to set higher wholesale prices on liquor and wine could yield an addi*onal $6.5 million to the General Revenue Fund.

Improving Transparency & Accountability
33
• Tax Expenditures: While West Virginia is currently not doing enough to properly evaluate its business tax expenditures, there are several ways the state could drama*cally improve its evalua*ons. The WV Tax Credit Review and Accountability Report, the Tax Expenditure Study, and the WV Tax Credit Disclosure List should be published on an annual basis. Company-‐specific informa*on pertaining to tax credits and incen*ve programs – including the recipients, amounts, demographics, and job-‐related outcomes – should be disclosed. All reports should be published in an online, easily accessible, and searchable database. Informa*on iden*fying amounts of subsides subject to redetermina*on should be published, and all major business tax incen*ves should be subject to these provisions.
• Require Corporate Disclosure of Taxes: With the end of the Business Franchise Tax in 2015, many corpora*ons are paying nothing in Corporate Net Income Taxes. West Virginia should explore manda*ng company-‐specific corporate tax disclosure by all publicly traded corpora*ons and their subsidiaries doing business here, and explore enac*ng a corporate minimum tax to ensure that all companies are paying something for the government services they receive.
• Unified Economic Development Budget: Five states – Rhode Island, New Jersey, Vermont, Texas, and Illinois – have enacted some type of unified economic development budget to compile all on-‐budget and off-‐budget economic spending into a single document. This enables policymakers to see how subsidies are distributed from various public agencies between regions, industries, and companies.

Improving Transparency & Accountability Con’t
34
Improve Fiscal Notes • Fiscal notes should be reviewed and finalized by a neutral and independent source, rather than the
affected agency. Establishing an independent Legisla*ve Fiscal Office or allowing the budget division of the Joint Commi2ee on Government and Finance to produce or oversee fiscal notes would eliminate the poten*al for agency bias. Agencies should be encouraged to provide informa*on, but the primary oversight of the fiscal note should be independent.
• The crea*on and enforcement of wri2en criteria and standards that fiscal notes must meet should also be a key aspect of the oversight role. While legisla*ve staff exercises some oversight of the fiscal note process, it is informal and subjec*ve.
• The legisla*ve rules governing fiscal notes should be revised, ensuring that fiscal notes are standardized, accurate, and comprehensive. Local impacts should be separated from state impacts, and official es*mates backed by data need to be dis*nguished from uncertain es*mates based on limited informa*on.
• All fiscal notes should contain an explana*on of the method used to produce the cost es*mate and the reasons why the method was used. Costs and offseung revenues should be fully calculated and explained. All fiscal notes should also describe the assump*ons used to determine the es*mate. While agencies are currently instructed to do this, these explana*ons rarely make it into the final fiscal note.
• West Virginia should add a feature to the legislature’s website allowing for searchable fiscal note tracking. This would ensure that all fiscal notes are easily found and publicly available.

Improving Transparency & Accountability Con’t
35
Enact Consensus Revenue Es@mate: West Virginia’s process for es*ma*ng revenues is *lted too far toward the Execu*ve Branch. Unlike many states, the West Virginia legislature does not work with the execu*ve branch to produce a consensus revenue forecast. When one branch is excluded from this process, key decision makers are more likely to dismiss or dispute the revenue es*mates. Crea*on of an independent Legisla*ve Fiscal Office would provide nonpar*san oversight of the state’s budget and create greater balance in the decision-‐making process. This office could also provide more accurate fiscal notes and es*mates of the costs of proposed legisla*on. Enact PAYGO: In West Virginia, as in most states, it is impossible for policymakers to know whether proposed program increases or tax cuts are affordable over the longer term. PAYGO or “pay-‐as-‐ you-‐go,” is a requirement where the governor and the legislature fully offset over a 5-‐year period the cost of proposed and enacted increases in spending or reduc*ons in revenues through spending cuts or revenue increases. Together with mul*-‐year projec*ons and current service budge*ng, PAYGO could help assure that West Virginia does not use temporary spikes in revenues to enact spending increases or tax cuts that they cannot afford over the long term. It could also minimize the need for deep budget cuts and large tax increases when the economy is weak, par*cularly if the state deposits revenues that cannot be spent under PAYGO rules in a well-‐designed stabiliza*on fund.

Improving Transparency & Accountability Con’t
36
Improve Online Transparency: Tradi*onal incremental budge*ng in West Virginia can some*mes lead to flawed decision-‐making; efforts toward performance and program budge*ng should be given adequate considera*on in budget development. These measures would enhance accountability of the budge*ng process. With growth in Internet technology, there is a trend toward revolu*onizing transparency and accessibility to informa*on through use of the Internet. West Virginia is not among the leading states in web transparency, and should do more to create a user-‐friendly web portal that provides ci*zens the ability to search across all agencies regarding expenditures and other detailed informa*on Current Services Baseline Budge@ng: Preparing a current services budget promotes the goal of improving government efficiency. A regular, thorough examina*on of each program’s costs and caseload can help policymakers and the public iden*fies inefficiencies and programs that are no longer needed. And it can help “right-‐size” programs, avoiding either over-‐funding or under-‐funding them. By preparing and publishing these current services baselines, West Virginia can help involve a broad segment of its residents in decisions about how their tax dollars are spend, as well as provide policymakers with important informa*on to help them evaluate policy proposals

Improving Transparency & Accountability Con’t
37
Consider Conduc@ng Tax Incidence Analysis: A tax incidence model would allow an objec*ve look at the West Virginia’s tax system in terms of income distribu*on and exportability and it would allow West Virginia to assess the regressivity or progressivity of proposed tax increases and decreases. Several states, including Minnesota, Texas, and Maine, have tax incidence models. Implement Evidence-‐Based Policymaking: States across the country are u*lizing evidence-‐based policymaking that allows policymakers to reduce wasteful spending, expand innova*ve programs and strengthen accountability. This is done through program assessment, budget development, implementa*on oversight, outcome monitoring, and targeted evalua*on. For example, Minnesota recently passed bipar*san legisla*on that will help state policymakers study the effec*veness of correc*ons and human services programs and iden*fy those with the greater return on investment.

For more informa*on, please go to www.wvpolicy.org
38