ECONOMIC PROSPERITY 5 - Florida Department of State
542
NATIONAL STATISTICAL REPORT | CREATING JOBS. GENERATING COMMERCE. DRIVING TOURISM. ARTS & ECONOMIC PROSPERITY 5 THE ECONOMIC IMPACT OF NONPROFIT ARTS & CULTURAL ORGANIZATIONS & THEIR AUDIENCES
-
Upload
khangminh22 -
Category
Documents
-
view
1 -
download
0
Transcript of ECONOMIC PROSPERITY 5 - Florida Department of State

NATIONAL STATISTICAL REPORT | CREATING JOBS. GENERATING COMMERCE. DRIVING TOURISM.
ARTS & ECONOMIC PROSPERITY 5THE ECONOMIC IMPACT OF NONPROFIT ARTS & CULTURAL ORGANIZATIONS & THEIR AUDIENCES
America’s Nonprofit Arts & Culture Industry
$166.3 billion in economic activity—$63.8 billion in spending by arts and cultural organizations and $102.5 billion in event-related spending by their audiences—supports 4.6 million jobs and generates $27.5 billion in government revenue.

1AMERICANS FOR THE ARTS© | Arts & Economic Prosperity® 5
The ArtsMEAN BUSINESS
Arts & Economic Prosperity 5 (AEP5) is Americans for the Arts’
fifth economic impact study of the nation’s nonprofit arts and
cultural organizations and their audiences. By every measure,
the results are impressive. Nationally, the nonprofit arts industry
generated $166.3 billion of economic activity in 2015—$63.8
billion in spending by arts and cultural organizations and an
additional $102.5 billion in event-related expenditures by their
audiences. This activity supported 4.6 million jobs and generated
$27.5 billion in revenue to local, state, and federal governments
(a yield well beyond their collective $5 billion in arts allocations).
AEP5 is the most comprehensive study of its kind ever conducted.
It provides detailed economic impact findings on 341 study
regions representing all 50 states and the District of Columbia.
Data was gathered from 14,439 organizations and 212,691
audience spending surveys and our project economist customized
input-output models for each and every study region to ensure
reliable and actionable localized results.
When Americans for the Arts published its first economic impact
study in 1994, it worked with 33 local partners. As evidence of
the value of these studies, AEP5 has grown this local participation
ten-fold. We also have witnessed a corresponding growth in the
understanding of the economic value of the arts. The US Bureau of
Economic Analysis, for example, now publishes an annual Arts &
Cultural Production Satellite Account, which extends beyond the
nonprofit sector to include the full breadth of commercial and for-
profit arts, education, and individual artists, and lists the sector as
a $730 billion industry (4.2 percent of the nation’s GDP—a larger
share of the economy than transportation, tourism, agriculture,
and construction). State and local governments have established
agencies to track and grow their creative economy.
What continues to set AEP5 apart from other studies is exactly why
it is so useful: it uses localized research that not only focuses on
arts organizations—but also incorporates the event-related spending
by their audiences. When patrons attend an arts event, they may
pay for parking, eat dinner at a restaurant, enjoy dessert after the
show, and return home to pay the babysitter. The study found that
the typical attendee spends $31.47 per person, per event beyond
the cost of admission. AEP5 also shows that one-third of attendees
(34 percent) were not from the county in which the arts event took
place. Their event-related spending was more than twice that of
their local counterparts ($47.57 vs. $23.44). What brought those
visitors to town? Two-thirds (69 percent) indicated that the primary
purpose for their visit was to attend that arts event. The message is
clear: a vibrant arts community not only keeps residents and their
discretionary spending close to home, it also attracts visitors who
spend money and help local businesses thrive.
AEP5 demonstrates that the arts provide both cultural and eco-
nomic benefits. No longer do community leaders need to feel that
a choice must be made between arts funding and economic pros-
perity. Arts & Economic Prosperity 5 proves that they can choose
both. Nationally as well as locally, the arts mean business.
In my travels, I meet business and government leaders who speak passionately about the value the arts
bring to their communities—fueling creativity, beautifying downtowns, and providing joy. Many also share
with me the challenge of balancing arts funding with the demands to support jobs and grow their economy.
To these community leaders, Arts & Economic Prosperity 5 offers a clear and welcome message: the arts
are an investment that delivers both community well-being and economic vitality.
BY AMERICANS FOR THE ARTS PRESIDENT & CEO ROBERT L. LYNCH
(Cover and Opposite) Andrew Shurtleff Photography. (Left) New World Symphony WALLCAST concert at the New World Center, Miami, FL. (Right) Street scene, St. Petersburg Arts Alliance, FL

2 AMERICANS FOR THE ARTS | Arts & Economic Prosperity 5
Economic Impact of America’sNONPROFIT ARTS & CULTURE INDUSTRY
From coast to coast and from our smallest rural towns to our largest urban cities, America’s 100,000 nonprofit arts and cultural organizations make their communities more desirable places to live and work every day of the year.
The arts provide inspiration and joy to residents, beautify public
spaces, and strengthen the social fabric of our communities.
Nonprofit arts and cultural organizations are also businesses.
They employ people locally, purchase goods and services from
local businesses, make communities more vibrant, and attract
tourists. Event-related spending by arts audiences generates
valuable revenue for local merchants such as restaurants, retail
stores, hotels, and parking garages.
Arts & Economic Prosperity 5 (AEP5) demonstrates that
the arts are an economic driver—an industry that supports
jobs, generates government revenue, and is the cornerstone
of our tourism industry. In 2015, the nation’s nonprofit arts
and culture industry generated $166.3 billion in economic
activity—$63.8 billion in spending by the organizations
themselves, which leveraged an additional $102.5 billion in
event-related spending by their audiences. The impact of this
economic activity is significant, supporting 4.6 million jobs
and generating $27.5 billion in government revenue.
AEP5 is the most comprehensive economic impact study
of the nonprofit arts and culture industry ever conducted.
It documents the economic contributions of the arts in
341 diverse communities and regions across the country,
representing all 50 states and the District of Columbia. The
participating communities range in population from 1,500 to
4 million and include rural, suburban, and urban areas (113
cities and 115 counties, 81 multicity or multicounty regions,
20 statewide study areas, and 12 arts districts).
“ As a banker, I have visited businesses in almost every city and town in my state. There is a visible difference in places with a vibrant arts community. I see people looking for places to park, stores staying open late, and restaurants packed with diners. The business day is extended and the cash registers are ringing.”
— KEN FERGESON, Chairman, NBC Oklahoma, Past Chair, American Bankers Association
87% of Americans believe arts & culture are important
to quality of life
82%of Americans believe
arts & culture are important to local
businesses and the economy
Source: Americans for the Arts 2016 survey of 3,020 adults by Ipsos Public Affairs

AMERICANS FOR THE ARTS | Arts & Economic Prosperity 5 3AMERICANS FOR THE ARTS | Arts & Economic Prosperity 5
Researchers collected detailed expenditure and attendance
data from 14,439 arts and cultural organizations and 212,691
of their attendees to measure total industry spending. Project
economists from the Georgia Institute of Technology customized
input-output analysis models for each study region to provide
specific and reliable economic impact data. AEP5 uses four
economic measures to define economic impact:
› Full-time Equivalent (FTE) Jobs is the total amount of labor
employed. Economists measure FTE jobs—not the total num-
ber of employees—because it is a more accurate measure
that accounts for part-time employment. (For instance, one
FTE job could be one person working full time or two people
who each work half time.)
› Resident Household Income (often called Personal Income)
includes salaries, wages, and entrepreneurial income paid to
residents. It is the money residents earn and use to pay for
food, mortgages, and other living expenses.
› Revenue to Local and State Governments includes revenue
from taxes (e.g., income, property, or sales), as well as funds
from license, utility, and filing fees, and other similar sources.
AEP5 focuses on nonprofit arts and cultural organizations (e.g.,
theaters, museums, arts education organizations) and their
audiences. The study takes an inclusive approach that accounts
for the uniqueness of different localities. For example, in some
communities the museum and performing arts center are govern-
ment-owned and government-operated entities, rather than a non-
profit organization. These are included in AEP5, as are municipal
arts agencies, living collections (such as zoos, aquariums, and
botanical gardens), university presenters, and arts programs that
are embedded under the umbrella of a nonarts organization or
facility (such as a hospital or church). The study excludes spend-
ing by individual artists and the for-profit arts and entertainment
sector (e.g., Broadway or the motion picture industry) from this
analysis—all vital and valued components of the nation’s arts
landscape, but beyond the scope of this study.
ECONOMIC IMPACT: Total, Direct, Indirect, & Induced
How can a dollar be respent?Consider the example of a theater company that purchases
a five-gallon bucket of paint from its local hardware store for
$100—a very simple transaction at the outset, but one that
initiates a complex sequence of income and spending by both
individuals and other businesses.
› Following the paint purchase, the hardware store may use a
portion of the $100 to pay the sales clerk who sold the bucket
of paint. The sales clerk then respends some of the money for
groceries; the grocery store uses some of the money to pay its
cashier; the cashier then spends some of the money for rent;
and so on.
› The hardware store also uses some of the $100 to purchase
goods and services from other businesses, such as the local
utility company, and then to buy a new bucket of paint from
the paint factory to restock its shelf. Those businesses, in turn,
respend the money they earned from the hardware store to pay
employees and buy goods and services from still other local
businesses, and so on.
› Eventually, the last of the $100 is spent outside of the
community and no longer has a local economic impact. It is
considered to have leaked out of the community.
The total economic impact describes this full economic effect,
starting with the theater’s initial paint purchase and ending when
the last of the $100 leaks out of the community. It is composed
of the direct economic impact (the effect of the initial expendi-
ture by the theater), as well as the indirect and induced economic
impacts, which are the effects of the subsequent rounds of
spending by businesses and individuals, respectively.
Interestingly, a dollar ripples very differently through each com-
munity, which is why each study region has its own customized
economic model.
Opposite Page: Hawai’i Arts Alliance mural
This Page: (Left) Lake Street Dive concert at the River Run Lodge, Sun Valley Center for the Arts, Ketchum, ID. (Right) Chehalem Cultural Center Summer Arts Camp, Yamhill County, OR

4 AMERICANS FOR THE ARTS | Arts & Economic Prosperity 5
Nonprofit Arts &CULTURAL ORGANIZATIONS
Arts and cultural organizations are valued members of the business community. They employ people locally, purchase goods and services from within the community, are members of their Chambers of Commerce, and promote their regions.
In 2015, these organizations—performing and visual arts
organizations, festivals, public art programs, municipally-
owned museums and arts centers, and more—pumped an
estimated $63.8 billion into the nation’s economy, supporting
2.3 million jobs, providing $49.4 billion in household income,
and generating $11.9 billion in total government revenue.
Economic Impact of the Nonprofit Arts & Culture Industry (2015)
■ Organization ■ Audiences ■ Total
Total Direct Expenditures$63.8 BIL + $102.5 BIL
$166.3BILLION
Full-Time Equivalent Jobs 2.3 MIL + 2.3 MIL
Total Government Revenue $11.86 BIL + $15.68 BIL
4.6MILLION
$27.54 BILLION
Resident Household Incomes $49.43 BIL + $46.64 BIL
$96.07BILLION
“ Investments in arts and culture enhance the quality of life, the third-highest measurement businesses use when gauging development trends —behind skilled labor and highway accessibility, but ahead of other factors such as corporate tax rates and incentives. These investments are breathing new life into our downtown areas, creating educational opportunities, and attracting businesses and highly skilled workers to Iowa. Today, nearly 6,000 arts organizations employ 23,000 people in Iowa, and that number jumps to 73,000 when all creative fields are counted. In all, that’s about four percent of our workforce.”
— GOVERNOR KIM REYNOLDS, Iowa

AMERICANS FOR THE ARTS | Arts & Economic Prosperity 5 5AMERICANS FOR THE ARTS | Arts & Economic Prosperity 5
Nonprofit arts and cultural organizations provide rewarding
employment for more than just artists, curators, and musicians.
They also directly support builders, plumbers, accountants,
printers, and an array of occupations spanning many industries.
The arts and culture industry is highly labor intensive, with
half (52.8 percent) of the typical organization’s expenditures
spent on artists and personnel costs. Of the 2.3 million jobs
supported by arts organizations across the country, 1.15 million
were a result of their actual direct expenditures. This represents
0.83 percent of the US workforce—a significant share of the
nation’s labor force when compared to the size of other sectors.
In total, these organizations support more jobs than that of the
legal or public safety sectors.
Elementary School Teachers // 1.00%
Police Officers // 0.48%
Lawyers // 0.44%
Farming, Fishing, & Forestry // 0.33%
Computer Programmers // 0.21%
Firefighters // 0.23%
Nonprofit Arts & Cultural Organizations // 0.83%
Percentage of US Workforce (2015)
“ In Rhode Island, we know cultural excellence is crucial to economic development and the success of businesses large and small. Arts-related industries create jobs, attract investments, and enhance tourism—the economic impact of arts organizations is significant. The arts also play a role in promoting the health and welfare of our military members, which makes our communities and our state stronger”
— LIEUTENANT GOVERNOR DAN MCKEE, Rhode Island; Chair, National Lieutenant Governors Association
Arts and cultural organizations provide rewarding employment for more than just artists, curators, and musicians. They also directly support builders, plumbers, accountants, printers, and an array of occupations spanning many industries.
(Left) Flash mob during the First Friday ArtWalk. Lane Arts Council, Eugene, OR. (Right) AMOCAT Arts Awards 2016, City of Tacoma, WA.

6 AMERICANS FOR THE ARTS | Arts & Economic Prosperity 5
ArtsAUDIENCES
Spending by Arts Audiences Sends $102.5 Billion to Local Businesses
Every day, millions of patrons attend arts events. The arts,
unlike most industries, leverage significant amounts of
events-related spending by their audiences. For example,
part of the arts experience may include dining out, paying
for parking, shopping in local retail stores, enjoying dessert
after the show, and returning home to pay the babysitter.
Based on the 212,691 audience surveys conducted for this
study, the typical arts attendee spends $31.47 per person,
per event, beyond the cost of admission. Nationally, total
event-related spending was an estimated $102.5 billion in
2015. This spending supported 2.3 million jobs, provided
$46.6 billion in household income, and generated $15.7
billion in total government revenue.
Local vs. Nonlocal AudiencesWhen a community attracts nonlocal arts attendees and
cultural tourists, it harnesses significant economic rewards.
In addition to spending data, researchers asked each of the
212,691 survey respondents to provide their home zip code.
Attendees that lived within the county in which the arts event
took place were considered local; those who live outside of
the county were categorized as nonlocal. While the ratio of
local to nonlocal attendees is different in every community,
the national sample revealed that 34.1 percent of attendees
traveled from outside of the county in which the event took
place (nonlocal), and 65.9 percent of attendees resided
within the county (local). Nonlocal attendees had twice as
much event-related spending as their local counterparts
($47.57 vs. $23.44).
Average Per Person Per Event Audience Expenditures: $31.47
$16.82Meals / Snacks / Refreshments
$4.48Overnight Lodging
$3.09Local Ground Transportation
$4.49Gifts / Souvenirs
$1.92Clothing /
Accessories
$0.38Child Care
$0.29Other
The average audience expenditure does not include cost of admission.
Local vs. Nonlocal Arts Audience Spending
Local Audience Spending // $23.44
Nonlocal Audience Spending // $47.57

AMERICANS FOR THE ARTS | Arts & Economic Prosperity 5 7AMERICANS FOR THE ARTS | Arts & Economic Prosperity 5
Arts Events Attract New Dollars and Retain Local DollarsNonlocal attendees were asked about the purpose of their
visit. More than two-thirds (68.9 percent) indicated that the
primary purpose of their visit was to “attend this arts event,”
demonstrating the power of the arts to attract visitors to the
community. As part of the survey, local attendees were asked
about what they would have done if the arts event that they
were attending was not taking place: 41 percent said they
would have “traveled to a different community to attend a
similar cultural event.”
Arts Drive TourismOf the 34.1 percent of nonlocal arts attendees, 14.3 percent
reported an overnight lodging expense. Not surprisingly, these
attendees spent considerably more money during their visit—an
average of $161.83 per person. In fact, nonlocal attendees who
reported overnight lodging expenses spent more per person in
every expenditure category (food, gifts and souvenirs, ground
transportation, etc.) than the average nonlocal attendee. For this
analysis, only one night of lodging expenses is counted toward
the audience expenditure analysis, regardless of how many
nights these cultural tourists actually stayed in the community.
This conservative approach ensures that the audience-spending
figures are not inflated by nonarts-related spending.
These figures demonstrate the economic impact of the nonprofit
arts and culture industry in its truest sense—by attracting
out-of-town visitors who spend money. If a community fails to
provide a variety of artistic and cultural experiences, not only
will it fail to attract new dollars from cultural tourists, it will
also lose the discretionary spending of its own residents who
will travel elsewhere for a similar arts experience.
Average Per Person Per Event Audience Expenditures: $31.47
Nationally, 69 percent of all nonlocal arts attendees reported that the primary reason for their trip is “specifically to attend this arts or cultural event.”
Arts and Culture Tourists Spend More and Stay Longer
As communities compete for the tourist’s dollar, arts and culture
is a proven magnet for travelers and their money. Local businesses
grow because travelers extend the length of their trips to attend
arts events. Multiple research studies have shown that travelers
who include arts and culture on their trips are ideal tourists and
differ from other US travelers in several important ways.
Arts and culture travelers…
› spend more than other travelers.
› are more likely to stay in a hotel or bed & breakfast.
› are more likely to spend $1,000 or more during their stay.
› stay longer than other travelers.
More than two-thirds (68 percent) of American adult travelers
included a cultural, arts, heritage, or historic activity or event while
on a trip of 50 miles or more, one-way, in 2012. This equates to
116 million cultural travelers. Of this group, 28 percent (32.5 mil-
lion travelers) added extra time to their trip because of a cultural,
arts, heritage, or historic activity or event. Of those who extended
their trip, 40 percent did so by one or more nights.
Cultural destinations also help grow the US economy by
attracting foreign visitor spending. The US Department of
Commerce reports that, between 2003 and 2015, the
percentage of international travelers who include “art gallery
and museum visits” on their trip grew from 17 to 29 percent,
and the share attending “concerts, plays, and musicals”
increased from 13 to 16 percent.
Cultural travelers to the United States out-stay, out-travel, and
out-spend other types of international tourists. In 2015, the
foreign cultural tourist’s median length of stay was 12 nights (for
business travelers the median was seven), with 89 percent going
shopping and 39 percent visiting more than one state (compared
to 79 percent and 26 percent of business travelers respectively).
Sources: US Department of Commerce, 2017; Mandala Research, 2013; US Travel Association.
Opposite Page: Cecilia Lueza’s Common Ground, St. Petersburg Arts Alliance, FL. Photo by Florida CraftArt.
This Page: (Left) San Jose Jazz SummerFest salsa dancing, San Jose, CA. Photo by Daniel Garcia. (Right) Kid at Downtown Festival and Art Show, Gainesville, FL.

8 AMERICANS FOR THE ARTS | Arts & Economic Prosperity 5
According to the US Bureau of Economic Analysis (BEA), the arts and culture sector is a $730 billion industry, which represents 4.2 percent of the
nation’s GDP—a larger share of the economy than transportation, tourism, agriculture, and construction. The BEA’s report takes into account the full
breadth of the nation’s arts and culture industries—nonprofit, public sector, commercial, entertainment, university education programs, etc.—unlike
Arts & Economic Prosperity 5, which focuses solely on the nonprofit and public sectors and their audiences.
Arts VolunteerismWhile arts volunteers do not have an economic impact as
defined in this study, they clearly have an enormous impact on
their communities by helping arts and cultural organizations
function as a viable industry. Local AEP5 study regions (cities
and counties) averaged 4,002 volunteers who donated 183,102
hours to nonprofit arts and cultural organizations during
2015—a donation valued at $4.3 million. The study’s partici-
pating organizations within these communities had an average
of 84.6 volunteers who volunteered 74.3 hours each (6,286.3
hours per organization), a donation valued at $148,105.
The Independent Sector places the value of the average
2015 volunteer hour at $23.56.
Value of In-kind ContributionsThe organizations that participated in this study also provided
data about their in-kind support (e.g., donated assets, office
space, airfare, and advertising space): 58.4 percent received
in-kind support, averaging $61,903 per organization during
the 2015 fiscal year. Like volunteerism, in-kind contributions
are not factored into the economic impact measures as defined
in this study, but they also provide an enormous assist to the
organizations and their ability to make their cultural product
accessible to the community.
$641in 2008
$617in 2009
$656in 2010
$661in 2011
$678in 2012
$704in 2013
$730in 2014
Contributions to the GDP by Arts & Culture Industries (Billions of Dollars)
— Arts & Cultural Production
“ A vital component to generating economic growth in our communities can be attributed to supporting and funding the arts. It is apparent that decreased support of the arts has negatively impacted some areas of our country. In order to compete and thrive in today’s workforce environment it is apparent that supporting the arts helps foster a more creative and innovative workforce that strengthens our economy.”
— NEVADA ASSEMBLYWOMAN MAGGIE CARLTON, Co-chair, Labor & Economic Development Committee, National Conference of State Legislatures
America’s Arts Industries Represent 4.2 Percent of the Nation’s Gross Domestic Product

AMERICANS FOR THE ARTS | Arts & Economic Prosperity 5 9AMERICANS FOR THE ARTS | Arts & Economic Prosperity 5
“ The success of my family’s business depends on finding and cultivating a creative and innovative workforce. I have witnessed firsthand the power of the arts in building these business skills. When we participate personally in the arts, we strengthen our ‘creativity muscles,’ which makes us not just a better ceramicist or chorus member, but a more creative worker—better able to identify challenges and innovative business solutions.”
— VICE CHAIRMAN CHRISTOPHER FORBES, Forbes, Inc.
Conclusion
Nonprofit arts and cultural organizations and their audiences in the United States are a $166.3 billion industry—one that supports 4.6 million full-time equivalent jobs and generates $27.5 billion in government revenue.
Arts organizations are businesses. They employ people locally,
purchase goods and services from local businesses, make
communities more vibrant, and attract tourists. Event-related
spending by arts audiences pumps vital revenue into restaurants,
hotels, retail stores, parking garages, and other local merchants.
This study puts to rest a misconception that communities support
arts and culture at the expense of local economic development.
In fact, communities are investing in an industry that supports
jobs, generates government revenue, and is the cornerstone of
tourism. Arts & Economic Prosperity 5 shows conclusively that,
locally as well as nationally, the arts mean business.
The Arts Provide Meaning to our Lives
Americans believe the arts improve the quality of our personal lives and our communities.
These personal benefits of the arts extend beyond the individual
and to the community: 67 percent of Americans believe “the arts
unify our communities regardless of age, race, and ethnicity,”
and 62 percent agree that the arts “help me understand other
cultures better.” These quality-of-life benefits are not limited to
the affluent, educated, or a particular racial group. Rather, they
cut across all socioeconomic strata.
64%feel “pure pleasure to experience and
participate in [the arts]”
73%say the arts are a
“positive experience in a troubled world”
63%believe the arts “lift
me up beyond everyday experiences”
Source: Americans for the Arts 2016 survey of 3,020 adults by Ipsos Public Affairs
Opposite Page: Chalk the Block 8 festival, El Paso Museums & Cultural Affairs Department, TX
This Page: (Top) Fargo-Moorhead Association of Realtors, “Home is where the art is”, Fargo, ND. (Bottom) The Arts Partnership of Greater Spartansburg, SC

10 AMERICANS FOR THE ARTS | Arts & Economic Prosperity 5
“ Even in a strong economy, some may perceive the arts as an unaffordable luxury. Fortunately, this rigorous report offers evidence that the nonprofit arts industry provides not just cultural benefits to our communities, but also makes significant positive economic contributions to the nation’s financial well-being regardless of the overall state of the economy. The arts as a driver of employment, vibrancy, tourism, and building a creative workforce is certainly something to applaud.”
— PRESIDENT & CEO JONATHAN SPECTOR, The Conference Board
About ThisSTUDY
Americans for the Arts conducted Arts &
Economic Prosperity 5 to document the economic impact of the nation’s nonprofit arts and culture industry. Detailed expenditure data was collected from 14,439 arts and cultural organizations and 212,691 of their attendees.
Project economists from the Georgia Institute of Technology
customized an input-output analysis model for each study
region to provide specific and localized data on four measures
of economic impact: full-time equivalent jobs, household
income, and local and state government revenue. These local-
ized models allow for the uniqueness of each local economy to
be reflected in the findings.
Studying Economic Impact Using Input-Output AnalysisTo derive the most reliable economic impact data, input-output
analysis was used to measure the impact of expenditures by arts
organizations and their audiences. This highly-regarded type of
economic analysis has been the basis for two Nobel Prizes in
economics. The models are systems of mathematical equations
that combine statistical methods and economic theory in an
area of study called econometrics. The analysis traces how many
times a dollar is respent within the local economy before it leaves
the community, and it quantifies the economic impact of each
of those rounds of spending. Project economists customized an
input-output model for each of the 341 participating study regions
based on the local dollar flow among 533 finely detailed industries
within its economy. This was accomplished by using detailed data
on employment, incomes, and government revenues provided by
the US Department of Commerce (County Business Patterns, the
Regional Economic Information System, and the Survey of State
and Local Finance), state and local tax data (e.g., sales taxes,
lodging tax, property taxes, income tax, and miscellaneous local
option taxes), and the survey data collected from the responding
arts and cultural organizations and their audiences.
Calculation of the National EstimatesHere are the steps by which the national estimates
were derived:
1. The 113 cities and towns that were part of the study were
stratified into six population groups, and an economic impact
average was calculated for each group. Several participating
cities were removed from the population group calculation
due to their comparably high levels of economic activity; this
was done to avoid inflating the national estimates.
2. The nation’s largest 13,338 incorporated places were
assigned to one of the six groups based on their population,
as supplied by the US Census Bureau.
3. Each was assigned the economic impact average for its
population group.
4. The values of the cities and towns were added together to
determine the national economic impact findings.
This Page: Northwest Connecticut Arts Council
Opposite Page: (Top) Property of the Saint Louis Art Museum, St. Louis, MO. (Bottom) Arts Council of Fairfax County, VA.

AMERICANS FOR THE ARTS | Arts & Economic Prosperity 5 11AMERICANS FOR THE ARTS | Arts & Economic Prosperity 5
Americans for the Arts partnered with 250 local, regional, and statewide organizations that represent the 341 study regions. Thirty partners included multiple study regions as part of their AEP5 participation.
All partners agreed to four participation criteria.
› Identify and code the comprehensive universe of nonprofit
arts and cultural organizations located in their study region.
› Assist with the collection of detailed financial and atten-
dance information from those organizations and review the
information for accuracy.
› Conduct audience-intercept surveys at a broad, representative
sample of cultural events that take place in their study region.
› Pay a modest cost-sharing fee. (No community was refused
participation for an inability to pay.)
Data from OrganizationsTo collect the required financial and attendance information
from eligible organizations, researchers implemented a multi-
pronged data collection process.
Americans for the Arts partnered with DataArts to collect detailed
budget and attendance information about each organization’s
fiscal year that ended in 2015. DataArts’ Cultural Data Profile
(CDP) is a unique system that enables arts and cultural
organizations to enter financial, programmatic, and operational
data into a standardized online form. To reduce the survey
response burden on responding organizations, and because the
CDP collects the detailed information required for this economic
impact analysis, researchers used confidential CDP data
as the primary organizational data collection mechanism for the
Arts & Economic Prosperity 5 study. This primary data collec-
tion effort was supplemented with an abbreviated one-page
paper version of the survey that was administered to organiza-
tions that did not respond to the initial web-based CDP survey.
Data was collected from a total of 14,439 organizations for this
study. Response rates among all eligible organizations located in
the 341 study regions was 54.0 percent, and ranged from 9.5
percent to 100 percent. Responding organizations had budgets
ranging from as low as $0 to as high as $785 million (Smithsonian
Institution). It is important to note that each study region’s results
are based solely on the actual survey data collected. There are
no estimates made to account for nonresponding organizations.
Therefore, the less-than-100 percent response rates suggest an
understatement of the economic impact findings in most of the
individual study regions.
Data from AudiencesAudience-intercept surveying, a common and accepted research
method, was completed in all 341 study regions to capture
information about spending by audiences at nonprofit arts and
culture events. Patrons were selected randomly and asked to
complete a short survey while attending an event. A total of
212,691 attendees completed the survey. The respondents
provided itemized travel party expenditure data on attendance-
related activities such as meals, souvenirs, transportation, and
lodging. Data was collected throughout the year to guard against
seasonal spikes or drop-offs in attendance, and at a broad range
of events (because a night at the opera will typically yield more
spending than a Saturday children’s theater production). Using
total attendance data for 2015 (collected from the participating
organizations), standard statistical methods were then used to
derive a reliable estimate of total expenditures by attendees in
each study region.
About Local & RegionalSTUDY PARTNERS

12 AMERICANS FOR THE ARTS | Arts & Economic Prosperity 5
Glossary
Cultural TourismTravel directed toward experiencing the arts, heritage,
and special character of a place.
Direct Economic ImpactA measure of the economic effect of the initial expenditure
within a community. For example, when the symphony pays its
players, each musician’s salary, the associated payroll taxes
paid by the nonprofit, and full-time equivalent employment
status represent the direct economic impact.
Direct ExpendituresThe first round of expenditures in the economic cycle. A paycheck
from the symphony to the violin player and a ballet company’s
purchase of dance shoes are examples of direct expenditures.
EconometricsThe process of using statistical methods and economic theory to
develop a system of mathematical equations that measures the
flow of dollars between local industries. The input-output model
developed for this study is an example of an econometric model.
Full-time Equivalent (FTE) JobsA term that describes the total amount of labor employed.
Economists measure FTE jobs—not the total number of
employees—because it is a more accurate measure of total
employment. It is a manager’s discretion to hire one full-time
employee, two half-time employees, four quarter-time employees,
etc. Almost always, more people are affected than are reflected
in the number of FTE jobs reported due to the abundance of part-
time employment, especially in arts and hospitality industries.
Indirect and Induced ImpactArts & Economic Prosperity 5 measures the economic impact of
the arts using a methodology that enables economists to track
how many times a dollar is respent within the local economy,
and thus to measure the economic impact generated by each
round of spending. When a theater company purchases paint
from the local hardware store, there is a measurable economic
effect of that initial expenditure within a community. However,
the economic benefits typically don’t end there, because the
hardware store uses some of its income to pay the clerk that sold
the paint, as well as to pay its electric bill and other expenses.
The indirect and induced economic impacts are the effects of
the subsequent rounds of spending by businesses and individu-
als, respectively. (See the example on page 3 of this report.)
Input-Output AnalysisA system of mathematical equations that combines statistical
methods and economic theory in an area of economic study
called econometrics. Economists use this model (occasionally
called an inter-industry model) to measure how many times a
dollar is respent in, or ripples through, a community before it
leaks out (see Leakage). The model is based on a matrix that
tracks the dollar flow among 533 finely detailed industries
in each community. It allows researchers to determine the
economic impact of local spending by nonprofit arts and
cultural organizations on jobs, household income, and
government revenue.
LeakageThe money that community members spend outside of a
community. This nonlocal spending has no economic impact
within the community. A ballet company purchasing shoes from
a nonlocal manufacturer is an example of leakage. If the shoe
company were local, the expenditure would remain within the
community and create another round of spending (and local
economic impact) by the shoe company.
This Page: Flash mob dancers at the third annual Block Party for Higher Education, hosted by Broward County in downtown Fort Lauderdale, FL.
Opposite Page: (Left) Outdoor concert, Richardson, TX. (Right) Art exhibit, Arts Council of Clatsop County, OR. (Bottom) The Palladium at the Center for the Performing Arts, Carmel, IN.

AMERICANS FOR THE ARTS | Arts & Economic Prosperity 5 13AMERICANS FOR THE ARTS | Arts & Economic Prosperity 5
MultiplierThe multiplier is an estimate of the number of times a dollar
changes hands within the community. It is quantified as
one number by which expenditures are multiplied. For more
information, see page 15.
Resident Household Income (or Personal Income)The salaries, wages, and entrepreneurial income residents earn
and use to pay for food, mortgages, and other living expenses. It is
important to note that resident household income is not just salary.
When a business receives money, for example, the owner usually
takes a percentage of the profit, resulting in income for the owner.
Revenue to Local and State GovernmentsLocal and state government revenue is not derived exclusively
from income, property, sales, and other taxes. It also includes
license, utility, user, and filing fees. Local government revenue
includes funds to governmental units such as a city, county,
township, school district, and other special districts.
“ Americans for the Arts’ Arts and Economic Prosperity 5 study is an invaluable tool for Guilford County and counties across the nation. The data it has collected and analyzed provide an unparalleled understanding of the influence of the arts on the economy, locally and nationally. It is vital that we continue to measure the impact of the arts on our economy in order to show our constituents and the nation its value. We are grateful for the work Americans for the Arts does to help us show what an important asset the arts are in the areas of education and health, both physical and mental, and as an economic driver in Guilford County and counties across the nation.”
— COMMISSIONER KAY CASHION, Guilford County, NC; Chair, National Association of Counties Arts & Culture Commission
14 AMERICANS FOR THE ARTS | Arts & Economic Prosperity 5
Frequently AskedQUESTIONS
How is the economic impact of arts and cultural organizations different from other industries?Any time money changes hands, there is a measurable
economic impact. Social service organizations, libraries, and
all entities that spend money have an economic impact. What
makes the economic impact of arts and cultural organizations
unique is that, unlike most other industries, they induce large
amounts of event-related spending by their audiences. For
example, when patrons attend a performing arts event, they may
purchase dinner at a restaurant, eat dessert after the show, and
return home and pay the babysitter. These expenditures have a
positive and measurable impact on the economy.
Will my local legislators believe these results?Yes, the Arts & Economic Prosperity 5 study makes a strong
argument to legislators, but you may need to provide them
with some extra help. It will be up to the user of this report to
educate the public about economic impact studies in general
and the results of this study. The user may need to explain
(1) the study methodology used, (2) that economists created
an input-output model for each community and region in the
study, and (3) the difference between input-output analysis
and a multiplier (see facing page). The good news is that as the
number of economic impact studies completed by arts orga-
nizations and other special interest areas increases, so does
the sophistication of community leaders whose influence these
studies are meant to affect. Today, most decision-makers want
to know what methodology is being used and how and where
data was gathered. You can be confident that the input-output
analysis used in this study is a highly-regarded model in the field
of economics (input-output analysis was the basis of two Nobel
Prizes in economics). As in any professional field, however, there
is disagreement about procedures, jargon, and the best way
to determine results. Ask 12 artists to define art and you will
get 12 answers; expect the same of economists. You may meet
an economist who believes that these studies should be done
differently (for example, a cost-benefit analysis of the arts). It
is also valuable to mention the conservative approach used by
AEP5. For example, organizational expenditures are based only
on the data collected. No estimates are made for nonresponding
organizations. The audience surveys are conducted at a broad
range of cultural events to ensure a representative sample, and
not just at the highest priced venues, which would inflate the
audience spending averages.
How can a community not participating in the Arts & Economic Prosperity 5 study apply these results?Because of the variety of communities studied and the
rigor with which the AEP5 study was conducted, nonprofit
and public sector arts and cultural organizations located in
communities that were not part of the study can estimate
their local economic impact. Estimates can be derived by
using the Arts & Economic Prosperity 5 Calculator (found at
AmericansForTheArts.org/EconomicImpact). Additionally, users
will find sample PowerPoint presentations, press releases,
op-eds, and other strategies for effective applications of their
estimated economic impact data.
How were the 341 participating communities and regions selected?In 2015, Americans for the Arts published a call for communi-
ties interested in participating in the AEP5 study. Of the more
than 300 organizations that expressed interest, 250 agreed to
participate and complete the study’s four participation criteria.
(See page 11 for more information.) Some partners requested
that multiple study regions be included in their study (for exam-
ple, a county as well as a specific city within the county). As a
result, the 250 study partners represent a total of 341 partici-
pating study regions.
How were the eligible arts organizations in each community selected?Each of the 250 study partners identified the universe of
nonprofit arts and cultural organizations located in its region(s).

AMERICANS FOR THE ARTS | Arts & Economic Prosperity 5 15AMERICANS FOR THE ARTS | Arts & Economic Prosperity 5
Eligibility was determined using the Urban Institute’s National
Taxonomy of Exempt Entities (NTEE) coding system as a
guideline. Communities were encouraged to include other types
of eligible organizations if they play a substantial role in the
cultural life of the community or if their primary purpose is to
promote participation in, appreciation for, and understanding
of the visual, performing, folk, literary, and media arts. These
include government-owned or operated cultural facilities and
institutions, municipal arts agencies or councils, living collec-
tions (such as zoos and botanical gardens), university museums
and presenters, and arts programs that are embedded under the
umbrella of a nonarts organization or facility. For-profit busi-
nesses and individual artists were strictly excluded from this
study. In short, if it displays the characteristics of a nonprofit
arts and cultural organization, it was included.
What type of economic analysis was done to determine the study results?An input-output analysis model was customized for each of the
341 participating communities and regions to determine the
local economic impact of their nonprofit and public sector arts
and cultural organizations and their audiences. Americans for
the Arts, which conducted the research, worked with a highly-
regarded economist from the Georgia Institute of Technology to
design and customize the input-output models used in this study.
(See page 10 for more information).
What other information was collected in addition to the arts surveys?In addition to detailed expenditure data provided by the partic-
ipating eligible organizations, extensive wage, labor, tax, and
commerce data were collected from local, state, and federal
governments for use in the input-output model.
Why are admission/ticket expenses excluded from the analysis of audience spending?Researchers assume that admission fees paid by attendees are
collected as revenue by the organization that is presenting the
event. The organization then spend those dollars as part of its
operating budget. Since the ticket fees are captured in the orga-
nization’s operating budget, admissions paid by attendees are
excluded from the overall analysis to avoid double counting.
Why doesn’t this study use a multiplier?When many people hear about an economic impact study, they
expect the result to be quantified in what is often called an
economic activity multiplier. The multiplier is an estimate of
the number of times a dollar changes hands within the com-
munity (e.g., a theater pays its actor, the actor spends money
at the grocery store, the grocery store pays the cashier, and so
on). It is quantified as one number by which expenditures are
multiplied. The convenience of the multiplier is that it is one
simple number. Users rarely note, however, that the multiplier
is developed by making gross estimates of the industries within
the local economy and does not allow for differences in the
characteristics of those industries. Using an economic activity
multiplier usually results in an overestimation of the economic
impact and therefore lacks reliability.
Opposite Page: The Freeman Stage at Bayside, Delaware Division of the Arts
This Page: (Left) Courtesy of Perez Art Museum, Miami, FL. (Right) FLUX by Crystal Wagner at the Bedford Gallery, Walnut Creek, CA. (Bottom) Marsh Symphony on the Prairie at the Connor Prairie Auditorium, Fishers, IN.

16 AMERICANS FOR THE ARTS | Arts & Economic Prosperity 5
Thank You to our PARTNER 250 ORGANIZATIONS
ALABAMA
Arts Huntsville
ALASKA
Fairbanks Arts Association
ARIZONA
Flagstaff Arts Council
Mesa Department of Arts and Culture
Phoenix Office of Arts and Culture
West Valley Arts Council
Walton Arts Center
CALIFORNIA
ARTS Obispo
City of Benicia Arts and Culture Commission
City of Laguna Beach Cultural Arts Department Arts Commission
City of San Diego Commission for Arts and Culture
City of San José Office of Cultural Affairs
City of Thousand Oaks Cultural Affairs Commission
City of Walnut Creek Department of Arts, Recreation & Community Services
Creative Sonoma
Riverside Arts Council
Sacramento Metropolitan Arts Commission
San Francisco Arts Commission
Santa Barbara County Arts Commission
Silicon Valley Creates
COLORADO
Center for the Arts Crested Butte
City of Boulder Office of Arts and Culture
City of Durango
Cultural Office of the Pikes Peak Region
Grand Junction Commission on Arts and Culture
CONNECTICUT
Connecticut Department of Economic and Community Development (Office of the Arts)
Arts Council of Greater New Haven
Cultural Alliance of Fairfield County (in partnership with the Cultural Alliance of Western Connecticut)
Northwest Connecticut Arts Council
Shoreline Arts Alliance
Southeastern Connecticut Cultural Coalition
DELAWARE
Delaware Division of the Arts
DISTRICT OF COLUMBIA
DC Commission on the Arts and Humanities
CultureCapital
FLORIDA
Citizens for Florida Arts
Art Mundo
Art, Culture and Entertainment, Inc.
Arts & Cultural Alliance of Sarasota County
Arts Council of Hillsborough County
Arts Council of Martin County
Broward County Cultural Division
City of Gainesville Division of Cultural Affairs
City of Ocala
Council on Culture & Arts
Cultural Council of Indian River County
Cultural Council of Palm Beach County
Florida Keys Council of the Arts
Lake County Arts and Culture Alliance
Lee County Alliance of the Arts
Miami-Dade County Department of Cultural Affairs
Polk Arts Alliance
Realize Bradenton
Seminole Cultural Arts Council
St. Petersburg Arts Alliance
United Arts Council of Collier County
United Arts of Central Florida
GEORGIA
Atlanta Regional Commission
City of Atlanta Office of Cultural Affairs
City of Savannah Department of Cultural Affairs
Community Foundation for Greater Atlanta
Fulton County Department of Arts & Culture
Greater Augusta Arts Council
Macon Arts Alliance
HAWAI’I
Hawai'i Arts Alliance
IDAHO
Sun Valley Economic Development
ILLINOIS
Arts Alliance Illinois
INDIANA
Arts Council of Indianapolis
Hamilton County Tourism, Inc.
IOWA
Bravo Greater Des Moines

AMERICANS FOR THE ARTS | Arts & Economic Prosperity 5 17AMERICANS FOR THE ARTS | Arts & Economic Prosperity 5
KANSAS
Arts Council of Johnson County
City of Lawrence
City of Wichita Division of Arts & Cultural Services
KENTUCKY
LexArts
Louisville Fund for the Arts
Paducah Convention & Visitors Bureau
LOUISIANA
Acadiana Symphony Orchestra & Conservatory of Music
MAINE
Maine Arts Commission
Belfast Creative Coalition
City of Bangor Commission on Cultural Development
Creative Portland
High Peaks Creative Council
Waterville Creates!
MARYLAND
Maryland Citizens for the Arts
Arts and Humanities Council of Montgomery County
City of Baltimore Office of Promotion & the Arts
Prince George’s Arts and Humanities Council
MASSACHUSETTS
Massachusetts Cultural Council
Cambridge Arts Council
City of Boston Mayor's Office of Arts & Culture
Cultural Alliance of Medfield
Cultural Organization of Lowell
Springfield Central Cultural District
Worcester Cultural Coalition
MICHIGAN
Ann Arbor Area Community Foundation
MINNESOTA
Creative Minnesota/Minnesota Citizens for the Arts
MISSISSIPPI
Yoknapatawpha Arts Council
MISSOURI
Missouri Arts Council
Allied Arts Council of St. Joseph
ArtsKC – Regional Arts Council
City of Columbia Office of Cultural Affairs
Connect2Culture
Hannibal Arts Council
Kansas City Office of Culture and Creative Services
Springfield Regional Arts Council
St. Louis Regional Arts Commission
MONTANA
Arts Missoula
NEBRASKA
Lincoln Arts Council
NEVADA
Nevada Arts Council
City of Reno Arts and Culture Commission
NEW HAMPSHIRE
Arts Alive!, Inc.
Art-Speak (the City of Portsmouth's Cultural Commission)
City of Rochester Department of Economic Development
Greater Concord Chamber of Commerce
NEW JERSEY
ArtPride New Jersey
Cape May County Department of Tourism
County of Mercer Office of Economic Development and Sustainability
Cumberland County Cultural & Heritage Commission
Morris Arts
Newark Arts Council
NEW MEXICO
City of Las Cruces Community Development Department
NEW YORK
Arts Services Initiative of Western New York, Inc.
ArtsWestchester
NORTH CAROLINA
North Carolina Arts Council
Alamance County Arts Council
Arts & Science Council of Charlotte/Mecklenburg
Arts Council of Fayetteville/ Cumberland County
Arts Council of Moore County
Arts Council of Wayne County
Arts Council of Wilmington and New Hanover County
Arts Council of Winston-Salem/ Forsyth County
Arts of the Albemarle
ArtsGreensboro
Asheville Area Arts Council
Cabarrus Arts Council
Americans for the Arts partnered with 250 local and statewide organizations that represent the 341 study regions. Thirty partners included multiple study regions as part of their AEP5 participation.

18 AMERICANS FOR THE ARTS | Arts & Economic Prosperity 5
Chapel Hill Public and Cultural Arts Office
Cleveland County Arts Council
Community Council for the Arts
Dare County Arts Council
Durham Arts Council
High Point Arts Council
Office of Raleigh Arts
Orange County Arts Commission
Pitt County Arts Council at Emerge
Robeson County Arts Council
Toe River Arts Council
Town of Carrboro Department of Economic & Community Development
Town of Cary Cultural Arts Division
Town of Hillsborough Planning Department
United Arts Council of Catawba County
United Arts Council of Raleigh and Wake County
Yadkin Arts Council
NORTH DAKOTA
North Dakota Council on the Arts
City of Grand Forks Public Arts Commission
Dakota West Arts Council
Jamestown Fine Arts Association (dba as The Arts Center)
Minot Area Council of the Arts
The Arts Partnership
OHIO
Culture Works
Greater Columbus Arts Council`
OKLAHOMA
Oklahomans for the Arts
Freedom West Community Development Corporation
Ponca City Art Center
The Arts in Guthrie
OREGON
Oregon Arts Commission
Arts and Business Alliance of Eugene
Arts and Culture Alliance of Central Oregon
Arts Council of Clatsop County
Arts East
City of Corvallis Department of Parks and Recreation
Clackamas County Arts Alliance
Oregon Coast Council on the Arts
Oregon Shakespeare Festival
Regional Arts and Culture Council
Westside Cultural Alliance
Yamhill County Cultural Coalition
PENNSYLVANIA
Citizens for the Arts in Pennsylvania
Berks Arts Council
Cultural Enrichment Fund
Erie Arts & Culture
Greater Philadelphia Cultural Alliance
Greater Pittsburgh Arts Council
Lehigh Valley Arts Council
Pennsylvania Rural Arts Alliance
RHODE ISLAND
City of Providence Department of Art, Culture, and Tourism
SOUTH CAROLINA
Arts Council of York County
City of Charleston Office of Cultural Affairs
One Columbia for Arts and History
The Arts Partnership of Greater Spartanburg
SOUTH DAKOTA
Rapid City Arts Council
Sioux Falls Arts Council
TENNESSEE
Tennessee Arts Commission
Arts & Culture Alliance of Greater Knoxville
Arts in McNairy
ArtsBuild
ArtsMemphis
Athens Area Council for the Arts
Campbell County Historical Society
City of Columbia Arts Council
City of Murfreesboro
City of Tullahoma Arts Council

AMERICANS FOR THE ARTS | Arts & Economic Prosperity 5 19AMERICANS FOR THE ARTS | Arts & Economic Prosperity 5
Clarksville/Montgomery County Arts and Heritage Development Council
Grinders Switch Foundation
Grundy Area Arts Council
Jackson Arts Council
Johnson City Arts
Kingsport Office of Cultural Arts
Macon County Arts Council
Metropolitan Nashville Arts Commission
Monroe Area Council for the Arts
Paris-Henry County Arts Council
Rose Center for the Arts
Sevier County
Tennessee Tech University
Tusculum College
University of Tennessee at Martin
West Tennessee Regional Art Center
TEXAS
Arts Council of Fort Worth
City of Dallas Office of Cultural Affairs
City of El Paso Museums and Cultural Affairs Department
City of San Antonio Department for Culture & Creative Development
City of Sugar Land
Creative Waco
Dallas Arts District
Houston Arts Alliance
Irving Arts Center
Medical Center of Lewisville Grand Theater
North Texas Business Council for the Arts
Richardson Cultural Arts Commission
UTAH
Cache Valley Center for the Arts
Cedar City Arts Council
Salt Lake City Arts Council
VERMONT
Vermont Arts Council
Burlington City Arts
VIRGINIA
Arlington Cultural Affairs
Arts Council of Fairfax County
City of Alexandria Office of the Arts
City of Lynchburg Office of Economic Development
City of Virginia Beach Office of Cultural Affairs
CultureWorks
Piedmont Council for the Arts
WASHINGTON
City of Tacoma Arts Division
Morgantown Area Chamber of Commerce
WISCONSIN
Wisconsin Arts Board
Dane County Cultural Affairs Commission
Eau Claire Regional Arts Council
Fox Cities Performing Arts Center
Mosaic Arts
Peninsula Arts and Humanities Alliance
Viterbo University Fine Arts Center
WYOMING
Center of Wonder
Each of the 341 study regions received its own customized report about its economic impact findings. Visit AmericansForTheArts.org/EconomicImpact to access free resources you can use to help make the economic case for arts funding and arts-friendly policies in your community.

20 AMERICANS FOR THE ARTS | Arts & Economic Prosperity 5
“ Mayors understand the connection between the arts industry and city revenues. Arts activity creates thousands of direct and indirect jobs and generates billions in government and business revenues. The arts also make our cities destinations for tourists, help attract and retain businesses, and play an important role in the economic revitalization of cities and the vibrancy of our neighborhoods.”
— OKLAHOMA CITY MAYOR MICK CORNETT, President, The United States Conference of Mayors
Acknowledgments
Americans for the Arts wishes to express its gratitude to the many people across the country who made Arts & Economic Prosperity 5 possible and assisted with its development, coordination, and production. A study of this size and scope cannot be completed without the collaboration of many partnering organizations.
Special thanks to the John D. and Catherine T. MacArthur
Foundation, Barr Foundation, and The Ruth Lilly Fund for
Americans for the Arts for their financial support.
Finally, each of our 250 local, regional, and statewide research
partners contributed both time and financial support toward the
completion of this study. We thank each and every one of them.
AEP5 would not have been possible without them. A study of this
magnitude is a total organizational effort; appreciation is extended
to the entire board and staff of Americans for the Arts. Research
Department staff responsible for producing this study include
Randy Cohen, Ben Davidson, Isaac Fitzsimons, and Graciela Kahn.
(Top) Hawai’i Arts Alliance. (Bottom) Laumeier Sculpture Park, Regional Arts Commission St Louis, MO. Photo by Abby Gillardi.
Appendix A:
About This StudyThe Detailed Research Methodology
A–1

SOURCE: Arts and Economic Prosperity 5, Americans for the Arts, 2017. For more information, visit www.AmericansForTheArts.org/EconomicImpact. A-2
About This Study—The Detailed Research Methodology
This Arts & Economic Prosperity 5 study was conducted by Americans for the Arts to document the economic impact of the nation’s
nonprofit arts and culture industry. The study focuses on nonprofit arts and cultural organizations and their audiences. It excludes
spending by individual artists and the for-profit arts and entertainment sector (e.g., Broadway or the motion picture industry). Detailed
expenditure and attendance data was collected from 14,439 nonprofit arts and cultural organizations and 212,691 of their attendees.
The project economists, from the Georgia Institute of Technology, constructed a customized input-output model for each study region
to provide specific and reliable economic impact data about each region’s nonprofit arts and culture sector. This methodology allows
the uniqueness of each economy to be reflected in the findings.
The 250 Local, Regional, and Statewide Study Partners
Americans for the Arts published a “Call for Participants” in 2015 seeking local, regional, and statewide organizations interested in
participating in the Arts & Economic Prosperity 5 study on behalf of their communities. Of the more than 300 organizations that
expressed interest, 250 agreed to participate. The 250 study partners represent a total of 341 participating study regions; 30 partners
represent multiple participating regions (such as a county analysis as well as a separate analysis for a city within the county). A
comprehensive list of the 341 study regions along with the affiliated study partner for reach region can be found Page B-5 in the
Appendix of this report
The 341 study regions include 113 cities, 115 counties, 81 multi-city or multi-county regions, 20 states, and 12 individual arts
districts. They represent all 50 U.S. states and the District of Columbia. The diverse communities range in population (1,500 to four
million) and type (small rural to large urban).
The 250 study partners agreed to complete four participation criteria: 1) identify and code the comprehensive universe of nonprofit
arts and cultural organizations located in their study region; 2) assist with the collection of detailed financial and attendance
information from those organizations, and review the information for accuracy; 3) conduct audience-intercept surveys at a broad,
representative sample of cultural events that take place in their study region; and 4) pay a modest cost-sharing fee. No community was
refused participation for an inability to pay the cost-sharing fee.

SOURCE: Arts and Economic Prosperity 5, Americans for the Arts, 2017. For more information, visit www.AmericansForTheArts.org/EconomicImpact. A-3
Definition of the Nonprofit Arts and Culture Industry
Each of the 250 study partners identified the comprehensive universe of eligible nonprofit arts and culture organizations that are
located within its region. Eligibility was determined using the Urban Institute’s National Taxonomy of Exempt Entities (NTEE)
coding system as a guideline. The NTEE system—developed by the National Center for Charitable Statistics at the Urban Institute—is
a definitive classification system for nonprofit organizations recognized as tax exempt by the Internal Revenue Code. This system
divides the entire universe of nonprofit organizations into 10 Major categories, including “Arts, Culture, and Humanities.” It is
estimated that approximately 100,000 nonprofit arts and culture organizations were registered with the IRS in 2015.
Below is a complete list of the 43 NTEE “Arts, Culture, and Humanities” subcategories that are included in the Arts & Economic
Prosperity 5 study analysis.
▪ A01 – Alliances and Advocacy
▪ A02 – Management and Technical Assistance
▪ A03 – Professional Societies and Associations
▪ A05 – Research Institutes and Public Policy Analysis
▪ A11 – Single Organization Support
▪ A12 – Fund Raising and Fund Distribution
▪ A19 – Support (not elsewhere classified)
▪ A20 – Arts and Culture (general)
▪ A23 – Cultural and Ethnic Awareness
▪ A24 – Folk Arts
▪ A25 – Arts Education
▪ A26 – Arts and Humanities Councils and Agencies
▪ A27 – Community Celebrations
▪ A30 – Media and Communications (general)
▪ A31 – Film and Video
▪ A32 – Television
▪ A33 – Printing and Publishing
▪ A34 – Radio
▪ A40 – Visual Arts (general)
▪ A50 – Museums (general)
▪ A51 – Art Museums
▪ A52 – Children’s Museums
▪ A53 – Folk Arts Museums
▪ A54 – History Museums
▪ A56 – Natural History and Natural Science Museums
▪ A57 – Science and Technology Museums
▪ A60 – Performing Arts (general)
▪ A61 – Performing Arts Centers
▪ A62 – Dance
▪ A63 – Ballet
▪ A65 – Theatre
▪ A68 – Music
▪ A69 – Symphony Orchestras
▪ A6A – Opera
▪ A6B – Singing and Choral Groups
▪ A6C – Bands and Ensembles
▪ A6E – Performing Arts Schools
▪ A70 – Humanities (general)
▪ A80 – Historical Organizations (general)
▪ A82 – Historical Societies and Historic Preservation
▪ A84 – Commemorative Events
▪ A90 – Arts Services (general)
▪ A99 – Arts, Culture, and Humanities (miscellaneous)

SOURCE: Arts and Economic Prosperity 5, Americans for the Arts, 2017. For more information, visit www.AmericansForTheArts.org/EconomicImpact. A-4
Study partners were encouraged to include other types of organizations if they play a substantial role in the cultural life of the
community or if their primary purpose is to promote participation in, appreciation for, and understanding of the visual, performing,
folk, and literary and media arts. These include government-owned and government-operated cultural facilities and institutions;
municipal arts agencies and councils; private community arts organizations; unincorporated arts groups; living collections (such as
zoos, aquariums, and botanical gardens); university presenters, programs, and facilities; and arts programs that are embedded under
the umbrella of a non-arts organization or facility (such as a hospital or church). If it displays the characteristics of a nonprofit arts and
cultural organization, it is included. With rare exception, for-profit businesses and individual artists are excluded from this study.
In the Spring of 2016, the study partners identified a total of 33,851 unique organizations that are located in the 341 study regions and
that were eligible to participate based on the definition described above.
Collection of Data from Eligible Arts and Cultural Organizations
Americans for the Arts partnered with DataArts to collect detailed budget and attendance information about each organization’s fiscal
year that ended in 2015. DataArts’ Cultural Data Profile (CDP) is a unique system that enables arts and cultural organizations to enter
financial, programmatic, and operational data into a standardized online form. To reduce the survey-response burden on responding
organizations, and because the CDP collects the detailed information required for this economic impact analysis, researchers used
confidential CDP data as the primary organizational data collection mechanism for the Arts & Economic Prosperity 5 study. For more
information about DataArts and its Cultural Data Profile online platform, visit www.culturaldata.org.
To collect the required financial and attendance information from eligible organizations, researchers implemented a multi-pronged
data collection process.
1. On July 11, 2016, DataArts emailed survey requests to each of the 33,851 organizations that were identified by a study partner
as eligible to be included in the study. Initially, two versions of the survey were available on DataArts’ online platform. Non-
participating organizations received multiple reminder emails during the months of July, August, and September.
a. Organizations located in Arizona, California, District of Columbia, Illinois, Maine, Maryland, Massachusetts,
Michigan, Minnesota, New York, Ohio, Oregon, Pennsylvania, Rhode Island, and Texas were requested to participate
in the comprehensive Cultural Data Profile. Due to their status as a statewide DataArts partner, these 15 states stood to
benefit from having all AEP5-eligible organization submit the comprehensive version of the DataArts survey.
i. However, eligible organizations in these 15 states were given the option within the DataArts platform to “opt-
out” of the full DataArts survey, and instead complete a shorter version of the survey that was designed to
collect only the information that is necessary for the AEP5 study’s economic impact analysis.

SOURCE: Arts and Economic Prosperity 5, Americans for the Arts, 2017. For more information, visit www.AmericansForTheArts.org/EconomicImpact. A-5
b. Organizations located in all other states were requested only to participate in the shorter version of the DataArts that
was designed to collect only the information necessary for the AEP5 study’s economic impact analysis.
2. On October 4, 2016, all organizations that had not yet participated in the survey process were sent a link to an abbreviated,
one-page version of the DataArts online survey. This survey requested totals only, rather than itemized categories of financial
and attendance information.
3. Finally, on October 25, 2016, Americans for the Arts sent the 250 study partners a link to download a paper version of the one-
page abbreviated survey. The study partners supplemented the data collected through the DataArts online survey platform with
information that they gathered from additional organizations using the paper version of the survey. This was accomplished by
emailing the paper version of the survey to non-participating organizations. In several study regions, one or more key
community organizations declined to participate in the survey process entirely. In those cases, the study partner identified the
information necessary to complete the paper survey through other means such as online annual reports, grant applications, and
publicly-available IRS Form 990 filings.
Using all methods of data capture, information was collected from a total of 14,439 eligible nonprofit arts and cultural organizations
(7,929 submitted information through the DataArts online platform, and 6,510 submitted information using the paper version of the
survey). After accounting for organizations that no longer existed or that were deemed to be ineligible, the response rate among all
eligible organizations was 54.0 percent. Among the 341 study regions, response rates 57.6 percent and ranged from 9.5 percent to 100
percent. Responding organizations had budgets ranging from as low as $0 to as high as $785 million (Smithsonian Institution). In
some cases, participating organizations provided FY2014 or FY2016 information (rather than FY2015) because it represented their
most recently completed fiscal year It is important to note that each study region’s organizational expenditure and attendance results
are based solely on the actual survey data collected. There are no estimates made to account for nonresponding organizations.
Therefore, the less-than-100 percent response rates suggest an understatement of the economic impact findings in most of the
individual study regions.
The questionnaires used for all methods of organizational data collection can be found in Appendix C of this Arts & Economic
Prosperity 5 National Statistical Report.
Collection of Data from Arts and Cultural Event Attendees
Audience-intercept surveying, a common and accepted research method, was conducted in all 341 study regions to capture
information about spending by audiences at nonprofit arts and cultural events. Patrons were asked to complete a short survey while in
SOURCE: Arts and Economic Prosperity 5, Americans for the Arts, 2017. For more information, visit www.AmericansForTheArts.org/EconomicImpact. A-6
attendance at an event. Researchers provided the local, regional, and statewide study partners with comprehensive and detailed
guidelines for collecting a random sample of surveys from attendees to a broad range of cultural events, performances, and exhibits
taking place in each study region during 2016. Surveys were collected throughout the calendar year (to guard against seasonal spikes)
as well as at a broad range of both paid and free events (a night at the opera will typically yield more spending than a Saturday
children’s theater production or a community festival, for example).
A total of 212,691 valid audience-intercept surveys were collected. The randomly selected respondents provided itemized expenditure
data on attendance-related activities such as meals, gifts and souvenirs, local ground transportation, and lodging. Using total
attendance data for 2015 (collected from the participating eligible organizations), standard statistical methods were then used to derive
a reliable estimate of total event-related expenditures by attendees in each study region. The respondents provided information about
the entire party with whom they were attending the event. With an overall average travel party size of 2.56 people, these survey data
actually represent the spending patterns of more than 544,489 attendees.
The study partners mailed or shipped the completed paper surveys to Americans for the Arts. Researchers completed the coding and
data entry of all surveys. The surveys were then subjected to a rigorous data cleaning procedure.
▪ Surveys were removed if the respondent did not provide either the ZIP code of his/her primary home, or their primary reason
for being in the study region. With neither of those two data points, the respondent’s residency status could not be determined.
▪ Surveys were removed if the respondent reported that he/she is younger than 18 years of age.
▪ Surveys were removed if the respondent reported that his/her immediate travel party spent more than seven nights away from
their primary residence(s) as a result of attending the cultural event where they were surveyed.
▪ Surveys were removed if the respondent reported that his/her immediate travel party included more than 12 people.
▪ Surveys were removed if the respondent reported that his/her immediate travel party spent more than $500 per person as a
result of attending the cultural event where they were surveyed.
The questionnaires used for audience-intercept data collection can be found in Appendix C of this Arts & Economic Prosperity 5
National Statistical Report (provided in both the English and Spanish languages, as well as in a large font format for the visually
impaired).
Economic Analysis
A common theory of community growth is that an area must export goods and services if it is to prosper economically. This theory is
called “economic-base theory,” and it depends on dividing the economy into two sectors: the export sector and the local sector.

SOURCE: Arts and Economic Prosperity 5, Americans for the Arts, 2017. For more information, visit www.AmericansForTheArts.org/EconomicImpact. A-7
Exporters such as automobile manufacturers, hotels, and department stores obtain income from customers outside of the community.
This “export income” then enters the local economy in the form of salaries, purchases of materials, dividends, and so forth, and
becomes income to residents. Much of it is re-spent locally; some, however, is spent for goods imported from outside of the region.
The dollars re-spent locally have a positive economic impact as they continue to circulate through the local economy. The dollars
spent non-locally cease having a local economic impact. This theory applies to arts organizations as well as to other producers. How
can a dollar be re-spent? Consider the example of a theater company that purchases a five-gallon bucket of paint from its local
hardware store for $100—a very simple transaction at the outset, but one that initiates a complex sequence of income and spending by
both individuals and other businesses.
Following the paint purchase, the hardware store may use a portion of the $100 to pay the sales clerk who sold the bucket of
paint. The sales clerk then respends some of the money for groceries; the grocery store uses some of the money to pay its
cashier; the cashier then spends some of the money for rent; and so on.
The hardware store also uses some of the $100 to purchase goods and services from other businesses, such as the local utility
company, and then to buy a new bucket of paint from the paint factory to restock its shelf. Those businesses, in turn, respend
the money they earned from the hardware store to buy goods and services from still other local businesses, and so on.
Eventually, the last of the $100 is spent outside of the community and no longer has a local economic impact. It is considered
to have leaked out of the community.
The total economic impact describes this full economic effect, starting with the theater’s initial paint purchase and ending when the
last of the $100 leaks out of the community. It is composed of the direct economic impact (the effect of the initial expenditure by the
theater), as well as the indirect and induced economic impacts, which are the effects of the subsequent rounds of spending by
businesses and individuals, respectively.
A dollar “ripples” very differently through each community, which is why project economists customized a unique input-output model
for each of the 341 participating study regions.
Studying Economic Impact Using Input-Output Analysis
To derive the most reliable economic impact data, input-output analysis is used to measure the impact of expenditures by nonprofit
arts and culture organizations and their audiences. This is a highly regarded type of economic analysis that has been the basis for two
Nobel Prizes in economics. The models are systems of mathematical equations that combine statistical methods and economic theory

SOURCE: Arts and Economic Prosperity 5, Americans for the Arts, 2017. For more information, visit www.AmericansForTheArts.org/EconomicImpact. A-8
in an area of study called econometrics. The analysis traces how many times a dollar is re-spent within the local economy before it
leaks out, and it quantifies the economic impact of each round of spending. This form of economic analysis is well suited for this
study because it can be customized specifically to each community, region, or state.
A unique input-output model was constructed for each of the 341 participating study regions based on the local dollar flow among 533
finely detailed industries within its economy. This was accomplished by using detailed data on employment, incomes, and government
revenues provided by the U.S. Department of Commerce (County Business Patterns, Regional Economic Information System, and
Survey of State and Local Finance), local tax data (sales taxes, property taxes, and miscellaneous local option taxes), as well as the
survey data from the responding nonprofit arts and culture organizations and their audiences.
The Input-Output Modeling Process
The input-output model is based on a table of 533 finely detailed industries showing local sales and purchases. The local and state
economy of each community is researched so the table can be customized for each community. The basic purchase patterns for local
industries are derived from a similar table for the U.S. economy for 2012 (the latest detailed data available from the U.S. Department
of Commerce). The table is first reduced to reflect the unique size and industry mix of the local economy, based on data from County
Business Patterns and the Regional Economic Information System of the U.S. Department of Commerce. It is then adjusted so that
only transactions with local businesses are recorded in the inter-industry part of the table. This technique compares supply and demand
and estimates the additional imports or exports required to make total supply equal total demand. The resulting table shows the
detailed sales and purchase patterns of the local industries. The 533-industry table is then aggregated to reflect the general activities of
32 industries plus local households, creating a total of 33 industries. To trace changes in the economy, each column is converted to
show the direct requirements per dollar of gross output for each sector. This direct-requirements table represents the “recipe” for
producing the output of each industry.
The economic impact figures for Arts & Economic Prosperity 5 were computed using what is called an “iterative” procedure. This
process uses the sum of a power series to approximate the solution to the economic model. This is what the process looks like in
matrix algebra:
T = IX + AX + A2X + A3X + ... + AnX
T is the solution, a column vector of changes in each industry’s outputs caused by the changes represented in the column vector X. A
is the 33 by 33 direct requirements matrix. This equation is used to trace the direct expenditures attributable to nonprofit arts
organizations and their audiences. A multiplier effect table is produced that displays the results of this equation. The total column is T.

SOURCE: Arts and Economic Prosperity 5, Americans for the Arts, 2017. For more information, visit www.AmericansForTheArts.org/EconomicImpact. A-9
The initial expenditure to be traced is IX (I is the identity matrix, which is operationally equivalent to the number 1 in ordinary
algebra). Round 1 is AX, the result of multiplying the matrix A by the vector X (the outputs required of each supplier to produce the
goods and services purchased in the initial change under study). Round 2 is A2X, which is the result of multiplying the matrix A by
Round 1 (it answers the same question applied to Round 1: “What are the outputs required of each supplier to produce the goods and
services purchased in Round 1 of this chain of events?”). Each of columns 1 through 12 in the multiplier effects table represents one of
the elements in the continuing but diminishing chain of expenditures on the right side of the equation. Their sum, T, represents the
total production required in the local economy in response to arts activities.
Calculation of the total impact of the nonprofit arts on the outputs of other industries (T) can then be converted to impacts on the final
incomes to local residents by multiplying the outputs produced by the ratios of household income to output and employment to output.
Thus, the employment impact of changes in outputs due to arts expenditures is calculated by multiplying elements in the column of
total outputs by the ratio of employment to output for the 32 industries in the region. Changes in household incomes, local government
revenues, and state government revenues due to nonprofit arts expenditures are similarly transformed.
Calculation of the National Estimates
To derive the national estimates, the 113 individual city study regions only—individual counties, multi-city and multi-county regions,
states, and individual arts districts are excluded from this analysis—were first stratified into six population groups, and an economic
impact average was calculated for each group. Second, each of the nation’s largest 13,338 cities was assigned to one of the six groups
based on its estimated 2015 population, as supplied by the U.S. Census Bureau. Third, each individual study region was assigned the
economic impact average for its population group. Finally, the values of the study regions were added together to determine the
national economic impact findings. Several outlier study regions were removed from the calculations of the national estimates due to
their comparably high levels of economic activity in their population categories (the outlier regions are identified in the applicable
numerical tables located in Appendix C of this Arts & Economic Prosperity 5 National Statistical Report).

THIS PAGE LEFT INTENTIONALLY BLANK

Appendix B:
About The DataThe Detailed Numerical Tables
B–1

Appendix B:Table of ContentsA List of the Detailed Numerical Tables
Page Name of Table
B–4 Introduction: The Detailed Numerical Tables and Their Explanations
B–5 Table 1: Descriptions and Populations of the 341 Participating Study Regions
Page Name of Table
B–23 Table 2: Total Expenditures Made by Nonprofit Arts and Cultural Organizations and Their Audiences Per Study Region During Fiscal Year 2015
B–39 Table 3: Total Economic Impact of Expenditures by Nonprofit Arts and Cultural Organizations and Their Audiences Per Study Region During Fiscal Year 2015
B–55 Table 4: Direct Economic Impact of Expenditures by Nonprofit Arts and Cultural Organizations and Their Audiences Per Study Region During Fiscal Year 2015
Page Name of Table
B–71 Table 5: Participation Rate of Eligible Nonprofit Arts and Cultural Organizations Per Study Region During Fiscal Year 2015
B–87 Table 6: Total Economic Impact of Expenditures by Nonprofit Arts and Cultural Organizations Per Study Region During Fiscal Year 2015
B–103 Table 7: Direct Economic Impact of Expenditures by Nonprofit Arts and Cultural Organizations Per Study Region During Fiscal Year2015
B–119 Table 8: Economic Impact Per $100,000 of Spending by Nonprofit Arts and Cultural Organizations Per Study Region During Fiscal Year 2015
B–135 Table 9: Total Categorized Nonprofit Arts and Cultural Organization Expenditures Per Study Region During Fiscal Year 2015
B–151 Table 10: Average Categorized Nonprofit Arts and Cultural Organization Expenditures Per Study Region During Fiscal Year 2015
B–167 Table 11: Categorized Nonprofit Arts and Cultural Organization Expenditures as a Percentage of Total Expenditures Per Study Region During Fiscal Year 2015
B–183 Table 12: Comparative Categorized Nonprofit Arts and Cultural Organization Expenditures Per Participating Organization During Fiscal Year 2015 (in DOLLARS)
B–185 Table 13: Comparative Categorized Nonprofit Arts and Cultural Organization Expenditures Per Participating Organization During Fiscal Year 2015 (in PERCENTAGES)
B–187 Table 14: Arts Volunteerism and In-Kind Contributions to Participating Nonprofit Arts and Cultural Organizations Per Study Region During Fiscal Year 2015
TABLES 2-4: The Entire Nonprofit Arts and Culture Industry
TABLES 5-14: Nonprofit Arts and Cultural ORGANIZATIONS
SOURCE: Arts and Economic Prosperity 5, Americans for the Arts, 2017. For more information, visit www.AmericansForTheArts.org/EconomicImpact. B–2

Appendix B:Table of ContentsA List of the Detailed Numerical Tables (continued)
Page Name of Table
B–203 Table 15: Total Attendance to Nonprofit Arts and Cultural Events Per Study Region During 2015
B–219 Table 16: Total Audience Expenditures Induced by Attendance to Nonprofit Arts and Cultural Events Per Study Region During 2015
B–235 Table 17: Total Economic Impact of Audience Expenditures Induced by Attendance to Nonprofit Arts and Cultural Events Per Study Region During 2015
B–251 Table 18: Direct Economic Impact of Audience Expenditures Induced by Attendance to Nonprofit Arts and Cultural Events Per Study Region During 2015
B–267 Table 19: Economic Impact per $100,000 of Spending by Nonprofit Arts and Cultural Event Attendees Per Study Region During 2015
B–283 Table 20: Total Categorized Audience Expenditures by All Attendees to Nonprofit Arts and Cultural Events Per Study Region During 2015
B–299 Table 21: Average Per Person Audience Spending by All Attendees to Nonprofit Arts and Cultural Events Per Study Region During 2016
B–315 Table 22: Total Categorized Audience Expenditure by Resident Attendees to Nonprofit Arts and Cultural Events Per Study Region During 2015
B–331 Table 23: Average Per Person Audience Spending by Resident Attendees to Nonprofit Arts and Cultural Events Per Study Region During 2016
B–347 Table 24: Total Categorized Audience Expenditures by Non-Resident Attendees to Nonprofit Arts and Cultural Events Per Study Region During 2015
B–363 Table 25: Average Per Person Audience Spending by Non-Resident Attendees to Nonprofit Arts and Cultural Events Per Study Region During 2016
B–379 Table 26: Travel Party Characteristics of Attendees to Cultural Events Per Study Region During 2016
B–395 Table 27: Educational Attainment and Annual Household Income of Resident Attendees to Cultural Events Per Study Region During 2016
B–411 Table 28: Age, Willingness to Travel, Repeat Visitation, and Civic Engagement of Resident Attendees to Cultural Events Per Study Region During 2016
B–427 Table 29: Educational Attainment and Annual Household Income of Non-Resident Attendees to Cultural Events Per Study Region During 2016
B–443 Table 30: Age, Willingness to Travel, Repeat Visitation, and Civic Engagement of Non-Resident Attendees to Cultural Events Per Study Region During 2016
TABLES 15-30: Nonprofit Arts and Cultural AUDIENCES
SOURCE: Arts and Economic Prosperity 5, Americans for the Arts, 2017. For more information, visit www.AmericansForTheArts.org/EconomicImpact. B–3

Introduction:The Detailed Numerical Tables and Their Explanations
Estimated 2015 Number of
Population Group Population of Study Region Participating Study Regions
Group A Less than 50,000 52
Group B 50,000 to 99,999 38
Group C 100,000 to 249,999 50
Group D 250,000 to 499,999 42
Group E 500,000 to 999,999 25
Group F 1,000,000 or More 21
Total Cities/Counties 228
Multi-City/County Study Regions Varying 81
Statewide Study Regions Varying 20
Individual Cultural Districts Varying 12
Total Number of Participating Study Regions: 341
Tables 1 through 30 summarize the collected survey data and the analyzed results for each of the 341 participating study regions. Detailed financial and attendance information were collected from a total of 14,439 eligible nonprofit arts and cultural organizations. Audience-intercept surveys requesting event-related expenditure information were collected from 212,691 cultural attendees.
Averages, medians, totals, standard deviations, and confidence intervals have been calculated for each population group (where appropriate). These summary statistics are located at the end of each section.
The numerical tables follow the format of the list below. The data for the 228 study regions that encompass a city or county are presented in six groupings that are stratified by their estimated 2015 population. These groupings are followed by a list of the 81 study regions that include multiple cities or multiple counties, then a list of the 20 statewide study regions, and finally a list of the 12 individual cultural districts.
Throughout the tables, some study regions have been identified by asterisks and/or table endnotes. If applicable, detailed descriptions of the asterisks and table endnotes are located on the final page of each table.
The name of each study region is always listed in the far left-hand column (Column One) of each table.
SOURCE: Arts and Economic Prosperity 5, Americans for the Arts, 2017. For more information, visit www.AmericansForTheArts.org/EconomicImpact. B–4

Explanation of Table 1:Descriptions and Populations of the 341 Participating Study Regions
Column Two:
Column Three:
Column Four:
This table presents for each study region the definition of the region studied, the estimated 2015 population of the region, and the name of the organization that served as our research partner. Summary statistics are calculated for each population group.
The type of region that was studied (113 cities, 115 counties, 81 multi-city or multi-county regions, 20 states, and 12 individual cultural districts).
The estimated year 2015 population of each study region as reported by the U.S. Census Bureau. The U.S. Census Bureau develops these estimates based on their decennial census efforts along with the assistance of the Federal State Cooperative Program for Population Estimates (FSCPE). These estimates are updated annually and are used in federal funding allocations, as denominators for vital rates and per capita time series, as survey controls, and in monitoring recent demographic changes.
The name of the research partner organization in each study region. The study partner organization served as the local and/or statewide project sponsor and mobilized the arts community in the region to complete the data collection requirements.
SOURCE: Arts and Economic Prosperity 5, Americans for the Arts, 2017. For more information, visit www.AmericansForTheArts.org/EconomicImpact. B–5

Table 1:Descriptions and Populations of the 341 Participating Study Regions
Population Cohort Group APopulation Fewer than 50,000
Sample Size = 52 Definition of Study Region Population Name of Study Partner Organization
Town of Crested Butte (CO) City 1,541 Center for the Arts Crested Butte
City of Pine City (MN) City 3,076 Creative Minnesota/Minnesota Citizens for the Arts
City of Alva (OK) City 5,174 Freedom West Community Development Corporation
Cook County (MN) County 5,233 Creative Minnesota/Minnesota Citizens for the Arts
Town of Hillsborough (NC) City 6,388 Town of Hillsborough Planning Department
City of Virginia (MN) City 8,649 Creative Minnesota/Minnesota Citizens for the Arts
Town of Jackson (WY) City 10,449 Center of Wonder
City of Guthrie (OK) City 11,096 The Arts in Guthrie
City of Grand Rapids (MN) City 11,097 Creative Minnesota/Minnesota Citizens for the Arts
Town of Medfield (MA) City 12,024 Cultural Alliance of Medfield
City of Fergus Falls (MN) City 13,304 Creative Minnesota/Minnesota Citizens for the Arts
Grundy County (TN) County 13,425 Grundy Area Arts Council
City of Falls Church (VA) City 13,601 Arts Council of Fairfax County
City of Jamestown (ND) City 15,446 Jamestown Fine Arts Association (dba as The Arts Center)
City of Waterville (ME) City 16,182 Waterville Creates!
City of Red Wing (MN) City 16,470 Creative Minnesota/Minnesota Citizens for the Arts
City of Durango (CO) City 17,834 City of Durango
City of Hannibal (MO) City 17,893 Hannibal Arts Council
City of Tullahoma (TN) City 18,899 City of Tullahoma Arts Council
City of Northfield (MN) City 20,356 Creative Minnesota/Minnesota Citizens for the Arts
Town of Carrboro (NC) City 20,984 Town of Carrboro Dept. of Economic & Community Development
Macon County (TN) County 23,003 Macon County Arts Council
City of Laguna Beach (CA) City 23,341 City of Laguna Beach Cultural Arts Department Arts Commission
Hickman County (TN) County 24,384 Grinders Switch Foundation
City of Fairfax (VA) City 24,483 Arts Council of Fairfax County
City of Ponca City (OK) City 24,766 Ponca City Art Center
City of Paducah (KY) City 24,978 Paducah Convention & Visitors Bureau
Mille Lacs County (MN) County 25,884 Creative Minnesota/Minnesota Citizens for the Arts
McNairy County (TN) County 26,267 Arts in McNairy
City of Winona (MN) City 27,384 Creative Minnesota/Minnesota Citizens for the Arts
SOURCE: Arts and Economic Prosperity 5, Americans for the Arts, 2017. For more information, visit www.AmericansForTheArts.org/EconomicImpact. B–6

Table 1:Descriptions and Populations of the 341 Participating Study Regions
Population Cohort Group APopulation Fewer than 50,000
Sample Size = 52 Definition of Study Region Population Name of Study Partner Organization
Door County (WI) County 27,766 Peninsula Arts and Humanities Alliance
City of Benicia (CA) City 27,930 City of Benicia Arts and Culture Commission
City of Winter Park (FL) City 29,442 United Arts of Central Florida
City of Rochester (NH) City 29,991 City of Rochester Department of Economic Development
City of Morgantown (WV) City 31,073 Morgantown Area Chamber of Commerce
Henry County (TN) County 32,204 Paris-Henry County Arts Council
City of Fairbanks (AK) City 32,469 Fairbanks Arts Association
City of Bangor (ME) City 32,568 City of Bangor Commission on Cultural Development
Weakley County (TN) County 34,373 University of Tennessee at Martin
Dare County (NC) County 35,104 Dare County Arts Council
City of Columbia (TN) City 36,071 City of Columbia Arts Council
City of Lake Worth (FL) City 37,097 Cultural Council of Palm Beach County
Clatsop County (OR) County 37,474 Arts Council of Clatsop County
Yadkin County (NC) County 37,792 Yadkin Arts Council
Greater Belfast Area (ME) County 39,051 Belfast Creative Coalition
Campbell County (TN) County 39,918 Campbell County Historical Society
Monroe County (TN) County 45,233 Monroe Area Council for the Arts
Lincoln County (OR) County 46,406 Oregon Coast Council on the Arts
Iron County (UT) County 47,269 Cedar City Arts Council
City of St. Louis Park (MN) City 47,502 Creative Minnesota/Minnesota Citizens for the Arts
City of Logan (UT) City 48,997 Cache Valley Center for the Arts
Gibson County (TN) County 49,472 West Tennessee Regional Art Center
Group A Average 25,169
Group A Median 24,872
SOURCE: Arts and Economic Prosperity 5, Americans for the Arts, 2017. For more information, visit www.AmericansForTheArts.org/EconomicImpact. B–7
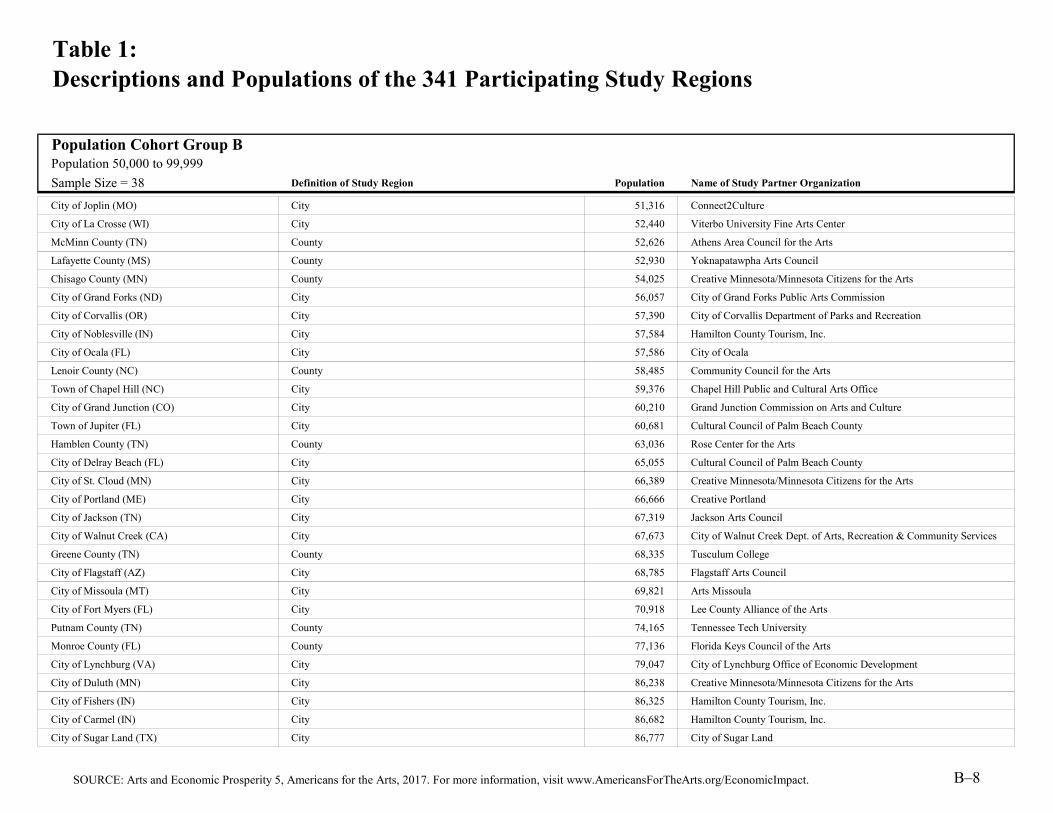
Table 1:Descriptions and Populations of the 341 Participating Study Regions
Population Cohort Group BPopulation 50,000 to 99,999
Sample Size = 38 Definition of Study Region Population Name of Study Partner Organization
City of Joplin (MO) City 51,316 Connect2Culture
City of La Crosse (WI) City 52,440 Viterbo University Fine Arts Center
McMinn County (TN) County 52,626 Athens Area Council for the Arts
Lafayette County (MS) County 52,930 Yoknapatawpha Arts Council
Chisago County (MN) County 54,025 Creative Minnesota/Minnesota Citizens for the Arts
City of Grand Forks (ND) City 56,057 City of Grand Forks Public Arts Commission
City of Corvallis (OR) City 57,390 City of Corvallis Department of Parks and Recreation
City of Noblesville (IN) City 57,584 Hamilton County Tourism, Inc.
City of Ocala (FL) City 57,586 City of Ocala
Lenoir County (NC) County 58,485 Community Council for the Arts
Town of Chapel Hill (NC) City 59,376 Chapel Hill Public and Cultural Arts Office
City of Grand Junction (CO) City 60,210 Grand Junction Commission on Arts and Culture
Town of Jupiter (FL) City 60,681 Cultural Council of Palm Beach County
Hamblen County (TN) County 63,036 Rose Center for the Arts
City of Delray Beach (FL) City 65,055 Cultural Council of Palm Beach County
City of St. Cloud (MN) City 66,389 Creative Minnesota/Minnesota Citizens for the Arts
City of Portland (ME) City 66,666 Creative Portland
City of Jackson (TN) City 67,319 Jackson Arts Council
City of Walnut Creek (CA) City 67,673 City of Walnut Creek Dept. of Arts, Recreation & Community Services
Greene County (TN) County 68,335 Tusculum College
City of Flagstaff (AZ) City 68,785 Flagstaff Arts Council
City of Missoula (MT) City 69,821 Arts Missoula
City of Fort Myers (FL) City 70,918 Lee County Alliance of the Arts
Putnam County (TN) County 74,165 Tennessee Tech University
Monroe County (FL) County 77,136 Florida Keys Council of the Arts
City of Lynchburg (VA) City 79,047 City of Lynchburg Office of Economic Development
City of Duluth (MN) City 86,238 Creative Minnesota/Minnesota Citizens for the Arts
City of Fishers (IN) City 86,325 Hamilton County Tourism, Inc.
City of Carmel (IN) City 86,682 Hamilton County Tourism, Inc.
City of Sugar Land (TX) City 86,777 City of Sugar Land
SOURCE: Arts and Economic Prosperity 5, Americans for the Arts, 2017. For more information, visit www.AmericansForTheArts.org/EconomicImpact. B–8

Table 1:Descriptions and Populations of the 341 Participating Study Regions
Population Cohort Group BPopulation 50,000 to 99,999
Sample Size = 38 Definition of Study Region Population Name of Study Partner Organization
City of Asheville (NC) City 87,882 Asheville Area Arts Council
Buchanan County (MO) County 89,486 Allied Arts Council of St. Joseph
City of Boca Raton (FL) City 91,332 Cultural Council of Palm Beach County
City of Miami Beach (FL) City 91,732 Miami-Dade County Department of Cultural Affairs
Moore County (NC) County 93,077 Arts Council of Moore County
Sevier County (TN) County 95,110 Sevier County
Cape May County (NJ) County 95,344 Cape May County Department of Tourism
Cleveland County (NC) County 97,076 Cleveland County Arts Council
Group B Average 71,635
Group B Median 68,004
SOURCE: Arts and Economic Prosperity 5, Americans for the Arts, 2017. For more information, visit www.AmericansForTheArts.org/EconomicImpact. B–9

Table 1:Descriptions and Populations of the 341 Participating Study Regions
Population Cohort Group CPopulation 100,000 to 249,999
Sample Size = 50 Definition of Study Region Population Name of Study Partner Organization
City of Las Cruces (NM) City 101,408 City of Las Cruces Community Development Department
Eau Claire County (WI) County 101,564 Eau Claire Regional Arts Council
Yamhill County (OR) County 101,758 Yamhill County Cultural Coalition
City of Lewisville (TX) City 102,889 Medical Center of Lewisville Grand Theater
City of West Palm Beach (FL) City 104,031 Cultural Council of Palm Beach County
City of Boulder (CO) City 105,112 City of Boulder Office of Arts and Culture
City of Richardson (TX) City 108,617 Richardson Cultural Arts Commission
City of High Point (NC) City 108,629 High Point Arts Council
City of Cambridge (MA) City 109,694 Cambridge Arts Council
City of Lowell (MA) City 109,945 Cultural Organization of Lowell
Douglas County (KS) County 116,585 City of Lawrence
City of Columbia (MO) City 116,906 City of Columbia Office of Cultural Affairs
City of Norman (OK) City 118,040 Oklahomans for the Arts
Wayne County (NC) County 124,456 Arts Council of Wayne County
City of Lafayette (LA) City 126,066 Acadiana Symphony Orchestra & Conservatory of Music
Washington County (TN) County 126,242 Johnson City Arts
City of Thousand Oaks (CA) City 129,342 City of Thousand Oaks Cultural Affairs Commission
City of Charleston (SC) City 130,113 City of Charleston Office of Cultural Affairs
City of Waco (TX) City 130,194 Creative Waco
Robeson County (NC) County 134,760 Robeson County Arts Council
Columbia County (GA) County 139,257 Greater Augusta Arts Council
Orange County (NC) County 140,420 Orange County Arts Commission
City of Savannah (GA) City 144,352 City of Savannah Department of Cultural Affairs
Indian River County (FL) County 144,755 Cultural Council of Indian River County
City of Alexandria (VA) City 150,575 City of Alexandria Office of the Arts
Martin County (FL) County 153,392 Arts Council of Martin County
Macon-Bibb County (GA) County 153,691 Macon Arts Alliance
City of Springfield (MA) City 153,991 Springfield Central Cultural District
Catawba County (NC) County 154,534 United Arts Council of Catawba County
Town of Cary (NC) City 155,227 Town of Cary Cultural Arts Division
SOURCE: Arts and Economic Prosperity 5, Americans for the Arts, 2017. For more information, visit www.AmericansForTheArts.org/EconomicImpact. B–10

Table 1:Descriptions and Populations of the 341 Participating Study Regions
Population Cohort Group CPopulation 100,000 to 249,999
Sample Size = 50 Definition of Study Region Population Name of Study Partner Organization
Alamance County (NC) County 155,792 Alamance County Arts Council
Cumberland County (NJ) County 157,389 Cumberland County Cultural & Heritage Commission
City of Eugene (OR) City 160,561 Arts and Business Alliance of Eugene
Middlesex County (CT) County 164,943 Shoreline Arts Alliance
City of Springfield (MO) City 165,378 Springfield Regional Arts Council
City of Sioux Falls (SD) City 168,586 Sioux Falls Arts Council
Pitt County (NC) County 175,354 Pitt County Arts Council at Emerge
City of Providence (RI) City 179,154 City of Providence Department of Art, Culture, and Tourism
City of Worcester (MA) City 183,016 Worcester Cultural Coalition
Montgomery County (TN) County 189,961 Clarksville/Montgomery County Arts and Heritage Development Council
Salt Lake City (UT) City 190,884 Salt Lake City Arts Council
Cabarrus County (NC) County 192,103 Cabarrus Arts Council
Richmond County (GA) County 201,368 Greater Augusta Arts Council
City of Tacoma (WA) City 203,446 City of Tacoma Arts Division
Doña Ana County (NM) County 213,676 City of Las Cruces Community Development Department
New Hanover County (NC) County 216,298 Arts Council of Wilmington and New Hanover County
Arlington County (VA) County 226,908 Arlington Cultural Affairs
City of Irving (TX) City 232,406 Irving Arts Center
City of Reno (NV) City 236,995 City of Reno Arts and Culture Commission
York County (SC) County 245,346 Arts Council of York County
Group C Average 153,122
Group C Median 151,984
SOURCE: Arts and Economic Prosperity 5, Americans for the Arts, 2017. For more information, visit www.AmericansForTheArts.org/EconomicImpact. B–11

Table 1:Descriptions and Populations of the 341 Participating Study Regions
Population Cohort Group DPopulation 250,000 to 499,999
Sample Size = 42 Definition of Study Region Population Name of Study Partner Organization
Buncombe County (NC) County 250,539 Asheville Area Arts Council
Alachua County (FL) County 256,380 City of Gainesville Division of Cultural Affairs
Greater Green Bay Area (WI) County 256,670 Mosaic Arts
City of Orlando (FL) City 262,372 United Arts of Central Florida
City of Lincoln (NE) City 272,996 Lincoln Arts Council
Southeastern Connecticut Region (CT) County 273,676 Southeastern Connecticut Cultural Coalition
Erie County (PA) County 278,443 Erie Arts & Culture
San Luis Obispo County (CA) County 279,083 ARTS Obispo
City of Newark (NJ) City 280,579 Newark Arts Council
Leon County (FL) County 283,988 Council on Culture & Arts
Rutherford County (TN) County 288,906 City of Murfreesboro
St. Lucie County (FL) County 291,028 Art Mundo
Greater Spartanburg Area (SC) County 293,542 The Arts Partnership of Greater Spartanburg
Durham County (NC) County 294,460 Durham Arts Council
City of St. Paul (MN) City 297,640 Creative Minnesota/Minnesota Citizens for the Arts
Hamilton County (IN) County 302,623 Hamilton County Tourism, Inc.
Osceola County (FL) County 310,211 United Arts of Central Florida
Escambia County (FL) County 310,659 Art, Culture and Entertainment, Inc.
Lexington-Fayette Urban County (KY) County 310,797 LexArts
Lake County (FL) County 315,690 Lake County Arts and Culture Alliance
City of Riverside (CA) City 319,504 Riverside Arts Council
Cumberland County (NC) County 326,328 Arts Council of Fayetteville/Cumberland County
Collier County (FL) County 348,777 United Arts Council of Collier County
Hamilton County (TN) County 351,220 ArtsBuild
Manatee County (FL) County 351,746 Realize Bradenton
City of Tampa (FL) City 358,699 Arts Council of Hillsborough County
Forsyth County (NC) County 365,298 Arts Council of Winston-Salem/Forsyth County
Mercer County (NJ) County 371,537 County of Mercer Office of Economic Development and Sustainability
City of Wichita (KS) City 388,413 City of Wichita Division of Arts & Cultural Services
Clackamas County (OR) County 394,972 Clackamas County Arts Alliance
SOURCE: Arts and Economic Prosperity 5, Americans for the Arts, 2017. For more information, visit www.AmericansForTheArts.org/EconomicImpact. B–12

Table 1:Descriptions and Populations of the 341 Participating Study Regions
Population Cohort Group DPopulation 250,000 to 499,999
Sample Size = 42 Definition of Study Region Population Name of Study Partner Organization
Sarasota County (FL) County 396,962 Arts & Cultural Alliance of Sarasota County
City of Minneapolis (MN) City 407,207 Creative Minnesota/Minnesota Citizens for the Arts
Berks County (PA) County 413,691 Berks Arts Council
City of Miami (FL) City 430,332 Miami-Dade County Department of Cultural Affairs
City of Raleigh (NC) City 439,896 Office of Raleigh Arts
Santa Barbara County (CA) County 440,668 Santa Barbara County Arts Commission
Seminole County (FL) County 442,516 Seminole Cultural Arts Council
City of Virginia Beach (VA) City 450,980 City of Virginia Beach Office of Cultural Affairs
City of Atlanta (GA) City 456,002 City of Atlanta Office of Cultural Affairs
City of Mesa (AZ) City 464,704 Mesa Department of Arts and Culture
City of Kansas City (MO) City 470,800 Kansas City Office of Culture and Creative Services
Morris County (NJ) County 499,727 Morris Arts
Group D Average 325,540
Group D Median 310,435
SOURCE: Arts and Economic Prosperity 5, Americans for the Arts, 2017. For more information, visit www.AmericansForTheArts.org/EconomicImpact. B–13

Table 1:Descriptions and Populations of the 341 Participating Study Regions
Population Cohort Group EPopulation 500,000 to 999,999
Sample Size = 25 Definition of Study Region Population Name of Study Partner Organization
Sonoma County (CA) County 500,292 Creative Sonoma
Volusia County (FL) County 507,531 United Arts of Central Florida
Guilford County (NC) County 512,119 ArtsGreensboro
Dane County (WI) County 516,284 Dane County Cultural Affairs Commission
Brevard County (FL) County 556,885 United Arts of Central Florida
Washington County (OR) County 562,998 Westside Cultural Alliance
Johnson County (KS) County 574,272 Arts Council of Johnson County
City of Louisville (KY) City 612,780 Louisville Fund for the Arts
City of Baltimore (MD) City 622,793 City of Baltimore Office of Promotion & the Arts
Polk County (FL) County 634,638 Polk Arts Alliance
City of Boston (MA) City 655,884 City of Boston Mayor's Office of Arts & Culture
District of Columbia (DC) City 658,893 CultureCapital
Nashville-Davidson County (TN) County 668,347 Metropolitan Nashville Arts Commission
City of El Paso (TX) City 679,036 City of El Paso Museums and Cultural Affairs Department
Lee County (FL) County 679,513 Lee County Alliance of the Arts
City of Fort Worth (TX) City 812,238 Arts Council of Fort Worth
City of Indianapolis (IN) City 848,788 Arts Council of Indianapolis
City and County of San Francisco (CA) County 852,469 San Francisco Arts Commission
Prince George's County (MD) County 904,430 Prince George’s Arts and Humanities Council
Pinellas County (FL) County 938,098 St. Petersburg Arts Alliance
Shelby County (TN) County 938,803 ArtsMemphis
Fairfield County (CT) County 945,438 Cultural Alliance of Fairfield County & Cultural Alliance of Western CT
Westchester County (NY) County 972,634 ArtsWestchester
Fulton County (GA) County 996,319 Fulton County Department of Arts & Culture
Wake County (NC) County 998,691 United Arts Council of Raleigh and Wake County
Group E Average 726,007
Group E Median 668,347
SOURCE: Arts and Economic Prosperity 5, Americans for the Arts, 2017. For more information, visit www.AmericansForTheArts.org/EconomicImpact. B–14

Table 1:Descriptions and Populations of the 341 Participating Study Regions
Population Cohort Group FPopulation 1,000,000 or More
Sample Size = 21 Definition of Study Region Population Name of Study Partner Organization
Mecklenburg County (NC) County 1,012,539 Arts & Science Council of Charlotte/Mecklenburg
City of San José (CA) City 1,015,785 City of San José Office of Cultural Affairs
Montgomery County (MD) County 1,030,447 Arts and Humanities Council of Montgomery County
Fairfax County (VA) County 1,137,538 Arts Council of Fairfax County
Allegheny County (PA) County 1,231,255 Greater Pittsburgh Arts Council
Greater Columbus Area (OH) County 1,231,393 Greater Columbus Arts Council
Orange County (FL) County 1,253,001 United Arts of Central Florida
City of Dallas (TX) City 1,281,047 City of Dallas Office of Cultural Affairs
Hillsborough County (FL) County 1,316,298 Arts Council of Hillsborough County
City of San Diego (CA) City 1,381,069 City of San Diego Commission for Arts and Culture
Palm Beach County (FL) County 1,397,710 Cultural Council of Palm Beach County
City of San Antonio (TX) City 1,436,697 City of San Antonio Department for Culture & Creative Development
Sacramento County (CA) County 1,482,026 Sacramento Metropolitan Arts Commission
City of Phoenix (AZ) City 1,537,058 Phoenix Office of Arts and Culture
City and County of Philadelphia (PA) County 1,560,297 Greater Philadelphia Cultural Alliance
Broward County (FL) County 1,869,235 Broward County Cultural Division
Santa Clara County (CA) County 1,894,605 Silicon Valley Creates
Riverside County (CA) County 2,329,271 Riverside Arts Council
Miami-Dade County (FL) County 2,662,874 Miami-Dade County Department of Cultural Affairs
City of Chicago (IL) City 2,722,389 Arts Alliance Illinois
Harris County (TX) County 4,441,370 Houston Arts Alliance
Group F Average 1,677,329
Group F Median 1,397,710
Average 349,392
Median 147,665
ALL CITY/COUNTY STUDY REGIONS
SOURCE: Arts and Economic Prosperity 5, Americans for the Arts, 2017. For more information, visit www.AmericansForTheArts.org/EconomicImpact. B–15
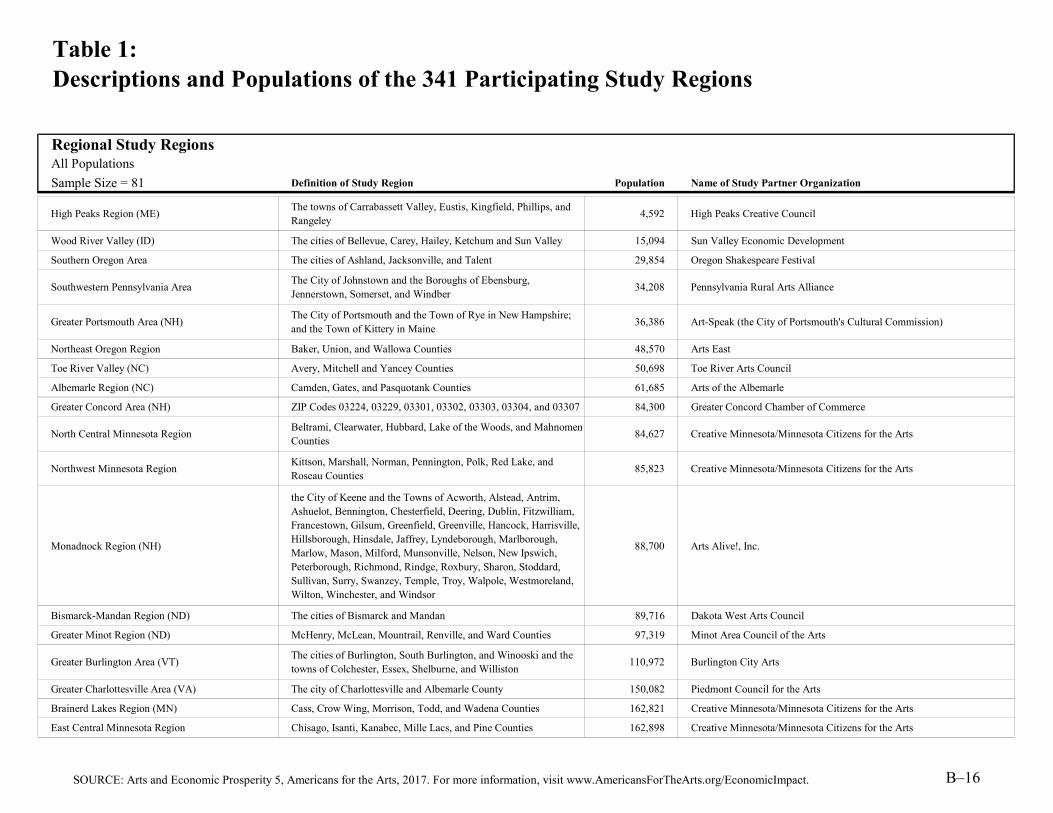
Table 1:Descriptions and Populations of the 341 Participating Study Regions
Regional Study RegionsAll Populations
Sample Size = 81 Definition of Study Region Population Name of Study Partner Organization
High Peaks Region (ME)The towns of Carrabassett Valley, Eustis, Kingfield, Phillips, and Rangeley
4,592 High Peaks Creative Council
Wood River Valley (ID) The cities of Bellevue, Carey, Hailey, Ketchum and Sun Valley 15,094 Sun Valley Economic Development
Southern Oregon Area The cities of Ashland, Jacksonville, and Talent 29,854 Oregon Shakespeare Festival
Southwestern Pennsylvania AreaThe City of Johnstown and the Boroughs of Ebensburg, Jennerstown, Somerset, and Windber
34,208 Pennsylvania Rural Arts Alliance
Greater Portsmouth Area (NH)The City of Portsmouth and the Town of Rye in New Hampshire; and the Town of Kittery in Maine
36,386 Art-Speak (the City of Portsmouth's Cultural Commission)
Northeast Oregon Region Baker, Union, and Wallowa Counties 48,570 Arts East
Toe River Valley (NC) Avery, Mitchell and Yancey Counties 50,698 Toe River Arts Council
Albemarle Region (NC) Camden, Gates, and Pasquotank Counties 61,685 Arts of the Albemarle
Greater Concord Area (NH) ZIP Codes 03224, 03229, 03301, 03302, 03303, 03304, and 03307 84,300 Greater Concord Chamber of Commerce
North Central Minnesota RegionBeltrami, Clearwater, Hubbard, Lake of the Woods, and Mahnomen Counties
84,627 Creative Minnesota/Minnesota Citizens for the Arts
Northwest Minnesota RegionKittson, Marshall, Norman, Pennington, Polk, Red Lake, and Roseau Counties
85,823 Creative Minnesota/Minnesota Citizens for the Arts
Monadnock Region (NH)
the City of Keene and the Towns of Acworth, Alstead, Antrim, Ashuelot, Bennington, Chesterfield, Deering, Dublin, Fitzwilliam, Francestown, Gilsum, Greenfield, Greenville, Hancock, Harrisville, Hillsborough, Hinsdale, Jaffrey, Lyndeborough, Marlborough, Marlow, Mason, Milford, Munsonville, Nelson, New Ipswich, Peterborough, Richmond, Rindge, Roxbury, Sharon, Stoddard, Sullivan, Surry, Swanzey, Temple, Troy, Walpole, Westmoreland, Wilton, Winchester, and Windsor
88,700 Arts Alive!, Inc.
Bismarck-Mandan Region (ND) The cities of Bismarck and Mandan 89,716 Dakota West Arts Council
Greater Minot Region (ND) McHenry, McLean, Mountrail, Renville, and Ward Counties 97,319 Minot Area Council of the Arts
Greater Burlington Area (VT)The cities of Burlington, South Burlington, and Winooski and the towns of Colchester, Essex, Shelburne, and Williston
110,972 Burlington City Arts
Greater Charlottesville Area (VA) The city of Charlottesville and Albemarle County 150,082 Piedmont Council for the Arts
Brainerd Lakes Region (MN) Cass, Crow Wing, Morrison, Todd, and Wadena Counties 162,821 Creative Minnesota/Minnesota Citizens for the Arts
East Central Minnesota Region Chisago, Isanti, Kanabec, Mille Lacs, and Pine Counties 162,898 Creative Minnesota/Minnesota Citizens for the Arts
SOURCE: Arts and Economic Prosperity 5, Americans for the Arts, 2017. For more information, visit www.AmericansForTheArts.org/EconomicImpact. B–16

Table 1:Descriptions and Populations of the 341 Participating Study Regions
Regional Study RegionsAll Populations
Sample Size = 81 Definition of Study Region Population Name of Study Partner Organization
Northwest Connecticut Region
the towns of Barkhamsted, Bethlehem, Burlington, Canaan, Colebrook, Cornwall, Goshen, Hartland, Harwinton, Kent, Litchfield, Morris, New Hartford, New Milford, Norfolk, North Canaan, Plymouth, Roxbury, Salisbury, Sharon, Tomaston, Torrington, Warren, Washington, and Winstead
184,993 Northwest Connecticut Arts Council
Central Oregon Region Deschutes and Jefferson Counties 192,580 Arts and Culture Alliance of Central Oregon
Greater Fargo-Moorhead Area (ND/MN)the cities of Fargo and West Fargo in North Dakota and the city of Moorhead in Minnesota
194,125 The Arts Partnership
Black Hills Region (SD)Butte, Custer, Fall River, Lawrence, Meade, Oglala Lakota, and Pennington Counties
199,656 Rapid City Arts Council
Greater Kingsport Area (TN) Hawkins and Sullivan Counties 213,782 Kingsport Office of Cultural Arts
Lake Region (MN)Becker, Clay, Douglas, Grant, Otter Tail, Pope, Stevens, Traverse, and Wilkin Counties
224,676 Creative Minnesota/Minnesota Citizens for the Arts
South Central Minnesota RegionBlue Earth, Brown, Faribault, LeSueur, Martin, Nicollet, Sibley, Waseca, and Watonwan Counties
231,622 Creative Minnesota/Minnesota Citizens for the Arts
Greater Sioux Falls Area (SD) Lincoln, McCook, Minnehaha, and Turner Counties 248,351 Sioux Falls Arts Council
Southwest Tennessee Development DistrictChester, Decatur, Hardeman, Hardin, Haywood, Henderson, Madison, and McNairy Counties
251,519 Tennessee Arts Commission
Northwest Tennessee Development DistrictBenton, Carroll, Crockett, Dyer, Gibson, Henry, Lake, Obion, and Weakley Counties
251,739 Tennessee Arts Commission
Southwest Minnesota RegionBig Stone, Chippewa, Cottonwood, Jackson, Kandiyohi, Lincoln, Lac qui Parle, Lyon, McLeod, Meeker, Murray, Nobles, Pipestone, Redwood, Renville, Rock, Swift, and Yellow Medicine Counties
278,421 Creative Minnesota/Minnesota Citizens for the Arts
Arrowhead Region (MN)Aitkin, Carlton, Cook, Itasca, Koochiching, Lake, and Saint Louis Counties
326,489 Creative Minnesota/Minnesota Citizens for the Arts
Maple Grove and the Northwest Suburbs (MN)the cities of Brooklyn Center, Brooklyn Park, Crystal, Golden Valley, Maple Grove, New Hope, Osseo, Plymouth, and Robbinsdale
332,654 Creative Minnesota/Minnesota Citizens for the Arts
Greater Augusta Area (GA) Columbia and Richmond Counties 340,625 Greater Augusta Arts Council
Upper Cumberland Development District (TN)Cannon, Clay, Cumberland, DeKalb, Fentress, Jackson, Macon, Overton, Pickett, Putnam, Smith, VanBuren, Warren, and White Counties
343,430 Tennessee Arts Commission
City of Huntsville/Madison County (AL) The City of Huntsville and Madison County 350,299 Arts Huntsville
SOURCE: Arts and Economic Prosperity 5, Americans for the Arts, 2017. For more information, visit www.AmericansForTheArts.org/EconomicImpact. B–17

Table 1:Descriptions and Populations of the 341 Participating Study Regions
Regional Study RegionsAll Populations
Sample Size = 81 Definition of Study Region Population Name of Study Partner Organization
Northeast Commission (NC)Beaufort, Bertie, Camden, Chowan, Currituck, Dare, Gates, Halifax, Hertford, Hyde, Martin, Northampton, Pasquotank, Perquimans, Tyrrell, and Washington Counties
363,945 North Carolina Arts Council
Greater Ann Arbor Area (MI)Washtenaw County as well as the City of Plymouth and Plymouth Township in Wayne County
393,331 Ann Arbor Area Community Foundation
Greater Fox Cities Region (WI) Calumet, Outagamie, and Winnebago Counties 401,008 Fox Cities Performing Arts Center
Central Minnesota Region Benton, Sherburne, Stearns, and Wright Counties 409,934 Creative Minnesota/Minnesota Citizens for the Arts
South Central Tennessee Development DistrictBedford, Coffee, Franklin, Giles, Hickman, Lawrence, Lewis, Lincoln, Marshall, Maury, Moore, Perry, and Wayne Counties
430,544 Tennessee Arts Commission
Northwest Arkansas Region Benton and Washington Counties 463,113 Walton Arts Center
Southeast Minnesota RegionDodge, Fillmore, Freeborn, Goodhue, Houston, Olmsted, Mower, Rice, Steele, Wabasha, and Winona Counties
500,137 Creative Minnesota/Minnesota Citizens for the Arts
First Tennessee Development DistrictCarter, Greene, Hancock, Hawkins, Johnson, Sullivan, Unicoi, and Washington Counties
507,724 Tennessee Arts Commission
Greater Harrisburg Area (PA) Cumberland, Dauphin, and Perry Counties 560,849 Cultural Enrichment Fund
Greater New Haven Area (CT)The cities of Bethany, Branford, East Haven, Guilford, Hamden, Madison, Meriden, Milford, New Haven, North Branford, North Haven, Orange, Wallingford, West Haven, and Woodbridge
570,001 Arts Council of Greater New Haven
Treasure Coast Region (FL) Indian River, Martin, and St. Lucie Counties 589,175 Arts Council of Martin County
Greater Des Moines Region (IA) Dallas, Guthrie, Madison, Polk, and Warren Counties 611,549 Bravo Greater Des Moines
Southeast Tennessee Development DistrictBledsoe, Bradley, Grundy, Hamilton, Marion, McMinn, Meigs, Polk, Rhea, and Sequatchie Counties
638,360 Tennessee Arts Commission
Greater Knoxville Region (TN) Anderson, Blount, and Knox Counties 650,511 Arts & Culture Alliance of Greater Knoxville
Greater Columbia Area (SC) Lexington and Richland Counties 679,454 One Columbia for Arts and History
Pikes Peak Region (CO) El Paso and Teller Counties 686,908 Cultural Office of the Pikes Peak Region
Lehigh Valley Region (PA) Carbon, Lehigh, and Northampton Counties 722,918 Lehigh Valley Arts Council
Greater Sarasota/Bradenton Area (FL) Manatee and Sarasota Counties 748,708 Arts & Cultural Alliance of Sarasota County
Dayton Region (OH) Clark, Greene, Miami, and Montgomery Counties 800,836 Culture Works
Richmond & Tri-Cities Region (VA)the cities of Colonial Heights, Hopewell, Petersburg, and Richmond; the town of Ashland; and Chesterfield, Hanover, and Henrico Counties
1,046,822 CultureWorks Richmond
SOURCE: Arts and Economic Prosperity 5, Americans for the Arts, 2017. For more information, visit www.AmericansForTheArts.org/EconomicImpact. B–18

Table 1:Descriptions and Populations of the 341 Participating Study Regions
Regional Study RegionsAll Populations
Sample Size = 81 Definition of Study Region Population Name of Study Partner Organization
Memphis Area Association of Governments (TN) Fayette, Lauderdale, Shelby, and Tipton Counties 1,066,819 Tennessee Arts Commission
Eastern Region (NC)Carteret, Craven, Duplin, Edgecombe, Greene, Jones, Lenoir, Nash, Onslow, Pamlico, Pitt, Wayne, and Wilson Counties
1,069,424 North Carolina Arts Council
Advantage West Region (NC)
Alleghany, Ashe, Avery, Buncombe, Burke, Caldwell, Cherokee, Clay, Graham, Haywood, Henderson, Jackson, Macon, Madison, McDowell, Mitchell, Polk, Rutherford, Swain, Transylvania, Watauga, Wilkes, and Yancey Counties
1,131,482 North Carolina Arts Council
Southeast Commission (NC)Bladen, Brunswick, Columbus, Cumberland, Hoke, New Hanover, Pender, Richmond, Robeson, Sampson, and Scotland Counties
1,151,993 North Carolina Arts Council
Greater Fairfax Area (VA) Fairfax County, Falls Church City, and Fairfax City 1,175,622 Arts Council of Fairfax County
Greater Tulsa Region (OK)Cherokee, Creek, Mayes, Muskogee, Okmulgee, Osage, Pawnee, Rogers, Tulsa, Wagoner, and Washington Counties
1,180,284 Oklahomans for the Arts
East Tennessee Development DistrictAnderson, Blount, Campbell, Claiborne, Cocke, Grainger, Hamblen, Jefferson, Knox, Loudon, Monroe, Morgan, Roane, Scott, Sevier, and Union Counties
1,202,594 Tennessee Arts Commission
West Valley Region (AZ)The Cities of Avondale, Buckeye, El Mirage, Glendale, Goodyear, Litchfield Park, Peoria, Sun City, Sun City West, Surprise, Tolleson, Wickenburg, and Youngtown
1,270,000 West Valley Arts Council
Greater St. Louis Area (MO) the City of St. Louis and St. Louis County 1,319,295 St. Louis Regional Arts Commission
Western New York Allegany, Cattaraugus, Chautauqua, Erie and Niagara Counties 1,394,749 Arts Services Initiative of Western New York
Greater Oklahoma City Region (OK)Canadian, Cleveland, Grady, Kingfisher, Lincoln, Logan, McClain, Oklahoma, Payne, and Pottawatomie Counties
1,504,374 Oklahomans for the Arts
Piedmont Triad Partnership (NC)Alamance, Caswell, Davidson, Davie, Forsyth, Guilford, Montgomery, Randolph, Rockingham, Stokes, Surry, and Yadkin Counties
1,679,041 North Carolina Arts Council
Greater Portland Area (OR) Clackamas, Multnomah, and Washington Counties 1,734,682 Regional Arts and Culture Council
Greater Kansas City Metropolitan Area (MO/KS)Clay, Jackson, and Platte Counties in Missouri; and Johnson and Wyandotte Counties in Kansas
1,747,569 ArtsKC – Regional Arts Council
Greater Nashville Regional Council (TN)Cheatham, Davidson, Dickson, Houston, Humphreys, Montgomery, Robertson, Rutherford, Stewart, Sumner, Trousdale, Williamson, and Wilson Counties
1,856,623 Tennessee Arts Commission
Research Triangle Regional Partnership (NC)Chatham, Durham, Franklin, Granville, Harnett, Johnston, Lee, Moore, Orange, Person, Vance, Wake, and Warren Counties
2,170,933 North Carolina Arts Council
SOURCE: Arts and Economic Prosperity 5, Americans for the Arts, 2017. For more information, visit www.AmericansForTheArts.org/EconomicImpact. B–19

Table 1:Descriptions and Populations of the 341 Participating Study Regions
Regional Study RegionsAll Populations
Sample Size = 81 Definition of Study Region Population Name of Study Partner Organization
Greater Tampa/St. Petersburg Area (FL) Hillsborough and Pinellas Counties 2,254,396 Arts Council of Hillsborough County
Charlotte Regional Partnership (NC)Alexander, Anson, Cabarrus, Catawba, Cleveland, Gaston, Iredell, Lincoln, Mecklenburg, Rowan, Stanly, and Union Counties
2,389,165 North Carolina Arts Council
Greater Charlotte Region (NC/SC)
Alexander, Anson, Cabarrus, Catawba, Cleveland, Gaston, Iredell, Lincoln, Mecklenburg, Rowan, Stanly, and Union Counties in North Carolina; and Chester, Chesterfield, Lancaster, and York Counties in South Carolina
2,801,806 Arts & Science Council of Charlotte/Mecklenburg
Seven-County Metro Area (MN)Anoka, Carver, Dakota, Hennepin, Ramsey, Scott, and Washington Counties
2,952,932 Creative Minnesota/Minnesota Citizens for the Arts
Central Florida RegionBrevard, Lake, Orange, Osceola, Polk, Seminole, and Volusia Counties
4,020,472 United Arts of Central Florida
Greater Philadelphia Region (PA) Bucks, Chester, Delaware, Montgomery, and Philadelphia Counties 4,079,583 Greater Philadelphia Cultural Alliance
Greater Washington Region (DC/MD/VA)The District of Columbia; Arlington and Fairfax Counties and the cities of Alexandria, Fairfax, and Falls Church in Virginia; and Montgomery and Prince George's Counties in Maryland
4,146,875 CultureCapital
Metro Atlanta Area (GA)Cherokee, Clayton, Cobb, DeKalb, Douglas, Fayette, Fulton, Gwinnett, Henry, and Rockdale Counties
4,375,973 Atlanta Regional Commission
Greater Atlanta Region (GA)
Barrow, Bartow, Butts, Carroll, Cherokee, Clayton, Cobb, Coweta, DeKalb, Douglas, Fayette, Forsyth, Fulton, Gwinnett, Hall, Henry, Morgan, Newton, Paulding, Pickens, Rockdale, Spaulding, and Walton Counties
5,647,894 Community Foundation for Greater Atlanta
Greater Houston Region (TX)Austin, Brazoria, Chambers, Fort Bend, Galveston, Harris, Liberty, Montgomery, San Jacinto, and Waller Counties
6,517,279 Houston Arts Alliance
Dallas-Fort Worth-Arlington MSA (TX)Collin, Dallas, Denton, Ellis, Hood, Hunt, Johnson, Kaufman, Parker, Rockwall, Tarrant, and Wise Counties
6,945,636 North Texas Business Council for the Arts
Average 1,063,292
Median 500,137
SOURCE: Arts and Economic Prosperity 5, Americans for the Arts, 2017. For more information, visit www.AmericansForTheArts.org/EconomicImpact. B–20
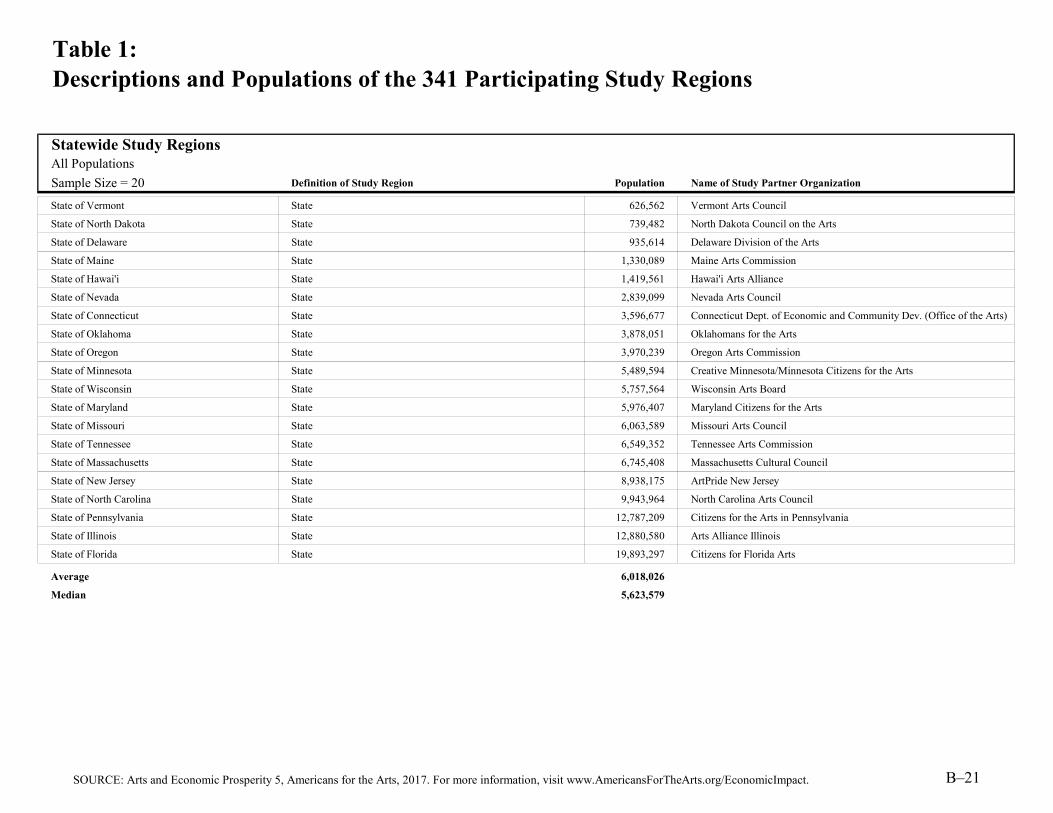
Table 1:Descriptions and Populations of the 341 Participating Study Regions
Statewide Study RegionsAll Populations
Sample Size = 20 Definition of Study Region Population Name of Study Partner Organization
State of Vermont State 626,562 Vermont Arts Council
State of North Dakota State 739,482 North Dakota Council on the Arts
State of Delaware State 935,614 Delaware Division of the Arts
State of Maine State 1,330,089 Maine Arts Commission
State of Hawai'i State 1,419,561 Hawai'i Arts Alliance
State of Nevada State 2,839,099 Nevada Arts Council
State of Connecticut State 3,596,677 Connecticut Dept. of Economic and Community Dev. (Office of the Arts)
State of Oklahoma State 3,878,051 Oklahomans for the Arts
State of Oregon State 3,970,239 Oregon Arts Commission
State of Minnesota State 5,489,594 Creative Minnesota/Minnesota Citizens for the Arts
State of Wisconsin State 5,757,564 Wisconsin Arts Board
State of Maryland State 5,976,407 Maryland Citizens for the Arts
State of Missouri State 6,063,589 Missouri Arts Council
State of Tennessee State 6,549,352 Tennessee Arts Commission
State of Massachusetts State 6,745,408 Massachusetts Cultural Council
State of New Jersey State 8,938,175 ArtPride New Jersey
State of North Carolina State 9,943,964 North Carolina Arts Council
State of Pennsylvania State 12,787,209 Citizens for the Arts in Pennsylvania
State of Illinois State 12,880,580 Arts Alliance Illinois
State of Florida State 19,893,297 Citizens for Florida Arts
Average 6,018,026
Median 5,623,579
SOURCE: Arts and Economic Prosperity 5, Americans for the Arts, 2017. For more information, visit www.AmericansForTheArts.org/EconomicImpact. B–21

Table 1:Descriptions and Populations of the 341 Participating Study Regions
Individual Arts, Cultural, and Entertainment DistrictsAll Populations
Sample Size = 12 Definition of Study Region Population Name of Study Partner Organization
James River Arts & Cultural District City of Lynchburg, VA 79,047 City of Lynchburg Office of Economic Development
Center City Charlotte City of Charlotte, NC 175,422 Arts & Science Council of Charlotte/Mecklenburg
Loch Haven Cultural Park City of Orlando, FL 262,372 United Arts of Central Florida
Downtown Colorado Springs Creative District City of Colorado Springs, CO 686,908 Cultural Office of the Pikes Peak Region
Fort Worth Cultural District City of Fort Worth, TX 812,238 Arts Council of Fort Worth
Dallas Arts District City of Dallas, TX 1,281,047 Dallas Arts District
Grand Center Arts & Entertainment District City of St. Louis, MO 1,319,295 St. Louis Regional Arts Commission
Balboa Park Cultural District City of San Diego, CA 1,381,069 City of San Diego Commission for Arts and Culture
East End Cultural District City of Houston, TX 4,441,370 Houston Arts Alliance
Houston Museum District Association City of Houston, TX 4,441,370 Houston Arts Alliance
Midtown Cultural District City of Houston, TX 4,441,370 Houston Arts Alliance
Washington Avenue Cultural District City of Houston, TX 4,441,370 Houston Arts Alliance
Average 1,980,240
Median 1,300,171
SOURCE: Arts and Economic Prosperity 5, Americans for the Arts, 2017. For more information, visit www.AmericansForTheArts.org/EconomicImpact. B–22

Explanation of Table 2:Total Expenditures Made by Nonprofit Arts and Cultural Organizationsand Their Audiences Per Study Region During Fiscal Year 2015
Column Two:
Column Three:
Column Four:
Column Five:
Column Six:
The total estimated expenditures made by arts audiences as a direct result of their attendance to nonprofit arts and culture events in each study region during fiscal year 2015. For example, when patrons attend an arts and culture event they may purchase dinner at a local restaurant, pay a valet to park their car, eat dessert after the event, and/or pay a babysitter upon returning home (see the audience expenditure survey instrument in Appendix C of the Arts & Economic Prosperity 5 National Statistical Report for a complete breakdown of audience expenditure categories).
The total spending by the nonprofit arts and culture industry in each study region during fiscal year 2015. This figure is the sum of total organizational expenditures (Column Four) and total event-related spending by arts audiences (Column Five).
This table presents for each study region the total spending by the nonprofit arts and culture industry—both nonprofit arts and cultural organizations and their audiences—during fiscal year 2015. Summary statistics are calculated for each population group.
The operating expenditures reported by responding nonprofit arts and cultural organizations in each study region during fiscal year 2015. Operating expenditure categories include payroll and payroll taxes, overhead and administrative expenses, event production costs including payments to artists, programmatic expenses, and facility expenses (see the organizational expenditure survey instrument in Appendix B for a detailed breakdown of organizational expenditure categories). These data are real dollars reported by the organizations that responded to the survey in each study region only; no multiplier was used to calculate these figures and no extrapolations were made for non-responding organizations.
The capital expenditures reported by responding nonprofit arts and cultural organizations in each study region during fiscal year 2015. According to generally-accepted accounting principles (GAAP), a capital expenditure is a cost which cannot be deducted in the year in which it is paid or incurred and must be capitalized. The general rule is that if the acquired asset's useful life is longer than the taxable year, then the cost must be capitalized. The capital expenditure costs are then amortized or depreciated over the life of the asset in question. For nonprofit arts and cultural organizations, capital expenditures typically include purchases of art, equipment, and real estate. Capital expenditures also include construction and renovation costs. These data are real dollars reported by the organizations that responded to the survey in each study region only; no multiplier was used to calculate these figures and no extrapolations were made for non-responding organizations.
The total organizational expenditures of nonprofit arts and cultural organizations in each study region during fiscal year 2015. This figure is the sum of operating expenditures (Column Two) and capital expenditures (Column Three). These data are real dollars reported by the organizations that responded to the survey in each study region only; no multiplier was used to calculate these figures and no extrapolations were made for non-responding organizations.
SOURCE: Arts and Economic Prosperity 5, Americans for the Arts, 2017. For more information, visit www.AmericansForTheArts.org/EconomicImpact. B–23

Table 2:Total Expenditures Made by Nonprofit Arts and Cultural Organizationsand Their Audiences Per Study Region During Fiscal Year 2015
Population Cohort Group A Total Total Total Expenditures
Population Fewer than 50,000 Operating Capital Organizational Audience (Both Organizations
Sample Size = 52 Expenditures Expenditures Expenditures Expenditures and Audiences)
Town of Crested Butte (CO)3 $4,460,046 $94,376 $4,554,422 $5,681,804 $10,236,226
City of Pine City (MN)2 $425,217 $0 $425,217 $561,510 $986,727
City of Alva (OK) $1,155,716 $33,000 $1,188,716 $569,771 $1,758,487
Cook County (MN)2 $2,458,849 $116,965 $2,575,814 $2,027,212 $4,603,026
Town of Hillsborough (NC) $1,575,593 $18,707 $1,594,300 $3,982,167 $5,576,467
City of Virginia (MN)2 $115,568 $0 $115,568 $64,430 $179,998
Town of Jackson (WY)3 $18,679,461 $46,519 $18,725,980 $32,521,961 $51,247,941
City of Guthrie (OK) $1,394,293 $217,389 $1,611,682 $2,331,481 $3,943,163
City of Grand Rapids (MN)2 $2,793,920 $40,000 $2,833,920 $2,246,065 $5,079,985
Town of Medfield (MA) $2,731,501 $17,226 $2,748,727 $382,700 $3,131,427
City of Fergus Falls (MN)2 $1,437,931 $835,023 $2,272,954 $682,635 $2,955,589
Grundy County (TN)4 $110,283 $0 $110,283 $916,143 $1,026,426
City of Falls Church (VA)3 $6,053,028 $696,122 $6,749,150 $19,029,073 $25,778,223
City of Jamestown (ND) $774,277 $281,103 $1,055,380 $5,806,005 $6,861,385
City of Waterville (ME)1 $4,449,410 $0 $4,449,410 $1,843,453 $6,292,863
City of Red Wing (MN)2 $1,724,398 $0 $1,724,398 $504,243 $2,228,641
City of Durango (CO)1 $8,526,566 $93,146 $8,619,712 $9,476,898 $18,096,610
City of Hannibal (MO) $1,330,525 $69,422 $1,399,947 $3,692,452 $5,092,399
City of Tullahoma (TN) $543,008 $67,707 $610,715 $457,871 $1,068,586
City of Northfield (MN)2 $1,297,441 $0 $1,297,441 $874,552 $2,171,993
Town of Carrboro (NC) $3,411,873 $228,884 $3,640,757 $4,070,927 $7,711,684
Macon County (TN)4 $63,869 $40,229 $104,098 $66,583 $170,681
City of Laguna Beach (CA)3 $31,750,656 $8,368,035 $40,118,691 $55,244,985 $95,363,676
Hickman County (TN)4 $1,148,455 $4,000 $1,152,455 $628,056 $1,780,511
City of Fairfax (VA) $2,639,540 $0 $2,639,540 $1,052,653 $3,692,193
City of Ponca City (OK) $2,612,457 $186,760 $2,799,217 $2,206,719 $5,005,936
City of Paducah (KY)1 $10,550,895 $7,504,956 $18,055,851 $9,391,310 $27,447,161
Mille Lacs County (MN)2 $565,805 $9,750 $575,555 $270,407 $845,962
McNairy County (TN)4 $22,544 $0 $22,544 $288,940 $311,484
City of Winona (MN)2 $3,269,157 $700 $3,269,857 $1,459,202 $4,729,059
+ =
SOURCE: Arts and Economic Prosperity 5, Americans for the Arts, 2017. For more information, visit www.AmericansForTheArts.org/EconomicImpact. B–24

Table 2:Total Expenditures Made by Nonprofit Arts and Cultural Organizationsand Their Audiences Per Study Region During Fiscal Year 2015
Population Cohort Group A Total Total Total Expenditures
Population Fewer than 50,000 Operating Capital Organizational Audience (Both Organizations
Sample Size = 52 Expenditures Expenditures Expenditures Expenditures and Audiences)
Door County (WI)4 $9,024,527 $706,233 $9,730,760 $14,967,671 $24,698,431
City of Benicia (CA) $2,901,634 $500 $2,902,134 $1,760,159 $4,662,293
City of Winter Park (FL)3 $16,572,396 $3,669 $16,576,065 $29,406,839 $45,982,904
City of Rochester (NH)1 $4,342,390 $11,553 $4,353,943 $7,902,214 $12,256,157
City of Morgantown (WV)1 $27,454,214 $0 $27,454,214 $8,020,706 $35,474,920
Henry County (TN)4 $183,375 $599 $183,974 $541,722 $725,696
City of Fairbanks (AK)1 $8,757,915 $21,850 $8,779,765 $9,283,046 $18,062,811
City of Bangor (ME) $3,437,656 $0 $3,437,656 $6,577,435 $10,015,091
Weakley County (TN)4 $211,563 $0 $211,563 $1,174,650 $1,386,213
Dare County (NC)4 $13,650,831 $139,363 $13,790,194 $41,040,752 $54,830,946
City of Columbia (TN) $1,268,724 $29,000 $1,297,724 $6,362,126 $7,659,850
City of Lake Worth (FL)3 $14,060,227 $595,832 $14,656,059 $12,613,298 $27,269,357
Clatsop County (OR)4 $2,829,081 $44,964 $2,874,045 $10,849,913 $13,723,958
Yadkin County (NC)4 $809,737 $0 $809,737 $70,670 $880,407
Greater Belfast Area (ME)4 $2,683,737 $0 $2,683,737 $5,124,419 $7,808,156
Campbell County (TN)4 $106,171 $2,500 $108,671 $436,962 $545,633
Monroe County (TN)4 $553,346 $113,534 $666,880 $6,027,214 $6,694,094
Lincoln County (OR)4 $1,593,530 $2,000 $1,595,530 $8,828,455 $10,423,985
Iron County (UT)4 $13,330,445 $0 $13,330,445 $62,797,842 $76,128,287
City of St. Louis Park (MN)2 $758,069 $0 $758,069 $759,072 $1,517,141
City of Logan (UT)1 $15,345,032 $2,227,754 $17,572,786 $13,753,037 $31,325,823
Gibson County (TN)4 $998,302 $5,351 $1,003,653 $7,117,024 $8,120,677
Group A Average $4,979,715 $439,898 $5,419,614 $8,148,989 $13,568,603
Percentage of Group A Total 36.7% 3.2% 39.9% 60.1% 100.0%
Group A Average Excluding Outliers/Exclusions $2,071,269 $4,946,157
Group A Median $2,535,653 $17,967 $2,607,677 $3,011,967 $5,334,433
+ =
SOURCE: Arts and Economic Prosperity 5, Americans for the Arts, 2017. For more information, visit www.AmericansForTheArts.org/EconomicImpact. B–25

Table 2:Total Expenditures Made by Nonprofit Arts and Cultural Organizationsand Their Audiences Per Study Region During Fiscal Year 2015
Population Cohort Group B Total Total Total Expenditures
Population 50,000 to 99,999 Operating Capital Organizational Audience (Both Organizations
Sample Size = 38 Expenditures Expenditures Expenditures Expenditures and Audiences)
City of Joplin (MO) $1,765,336 $27,300 $1,792,636 $3,558,721 $5,351,357
City of La Crosse (WI) $11,882,590 $945,262 $12,827,852 $19,855,615 $32,683,467
McMinn County (TN)4 $1,840,966 $180,554 $2,021,520 $5,383,250 $7,404,770
Lafayette County (MS)4 $1,514,783 $1,140,674 $2,655,457 $8,337,600 $10,993,057
Chisago County (MN)2 $655,430 $0 $655,430 $2,200,334 $2,855,764
City of Grand Forks (ND) $2,781,581 $0 $2,781,581 $3,159,035 $5,940,616
City of Corvallis (OR) $27,542,447 $3,000 $27,545,447 $44,324,930 $71,870,377
City of Noblesville (IN) $475,139 $0 $475,139 $1,701,673 $2,176,812
City of Ocala (FL) $13,195,541 $1,100,213 $14,295,754 $41,671,737 $55,967,491
Lenoir County (NC)4 $932,880 $0 $932,880 $12,666,803 $13,599,683
Town of Chapel Hill (NC) $82,923,455 $5,484,442 $88,407,897 $28,613,313 $117,021,210
City of Grand Junction (CO) $10,180,855 $1,094,245 $11,275,100 $5,991,168 $17,266,268
Town of Jupiter (FL) $7,844,533 $174,571 $8,019,104 $5,110,235 $13,129,339
Hamblen County (TN)4 $691,918 $68,400 $760,318 $1,259,169 $2,019,487
City of Delray Beach (FL) $11,281,497 $38,195 $11,319,692 $10,115,146 $21,434,838
City of St. Cloud (MN)2 $5,323,223 $22,132 $5,345,355 $7,088,986 $12,434,341
City of Portland (ME) $44,234,467 $2,337,935 $46,572,402 $29,028,265 $75,600,667
City of Jackson (TN) $2,654,496 $12,000 $2,666,496 $2,052,410 $4,718,906
City of Walnut Creek (CA) $20,999,826 $97,995 $21,097,821 $20,432,138 $41,529,959
Greene County (TN)4 $2,386,360 $119,261 $2,505,621 $2,241,470 $4,747,091
City of Flagstaff (AZ) $51,641,970 $24,774 $51,666,744 $38,129,798 $89,796,542
City of Missoula (MT) $19,940,806 $451,507 $20,392,313 $51,764,118 $72,156,431
City of Fort Myers (FL) $13,047,643 $634,419 $13,682,062 $36,033,896 $49,715,958
Putnam County (TN)4 $2,032,746 $5,456 $2,038,202 $365,463 $2,403,665
Monroe County (FL)4 $27,162,122 $26,631 $27,188,753 $57,877,545 $85,066,298
City of Lynchburg (VA) $6,328,848 $319,770 $6,648,618 $4,207,822 $10,856,440
City of Duluth (MN)2 $14,255,391 $36,000 $14,291,391 $21,734,978 $36,026,369
City of Fishers (IN) $22,846,569 $247,976 $23,094,545 $11,406,796 $34,501,341
City of Carmel (IN) $12,500,551 $58,874 $12,559,425 $6,951,895 $19,511,320
City of Sugar Land (TX) $625,740 $21,000 $646,740 $523,961 $1,170,701
+ =
SOURCE: Arts and Economic Prosperity 5, Americans for the Arts, 2017. For more information, visit www.AmericansForTheArts.org/EconomicImpact. B–26

Table 2:Total Expenditures Made by Nonprofit Arts and Cultural Organizationsand Their Audiences Per Study Region During Fiscal Year 2015
Population Cohort Group B Total Total Total Expenditures
Population 50,000 to 99,999 Operating Capital Organizational Audience (Both Organizations
Sample Size = 38 Expenditures Expenditures Expenditures Expenditures and Audiences)
City of Asheville (NC) $18,220,470 $1,320,996 $19,541,466 $39,114,604 $58,656,070
Buchanan County (MO)4 $10,079,729 $0 $10,079,729 $10,978,269 $21,057,998
City of Boca Raton (FL) $10,553,059 $204,714 $10,757,773 $11,057,891 $21,815,664
City of Miami Beach (FL)3 $79,444,914 $5,325,477 $84,770,391 $75,134,150 $159,904,541
Moore County (NC)4 $6,586,038 $290,941 $6,876,979 $6,389,283 $13,266,262
Sevier County (TN)4 $3,643,416 $2,000 $3,645,416 $42,123,668 $45,769,084
Cape May County (NJ)4 $4,427,588 $117,396 $4,544,984 $15,021,250 $19,566,234
Cleveland County (NC)4 $2,244,419 $43,320 $2,287,739 $3,367,458 $5,655,197
Group B Average $14,649,720 $578,353 $15,228,073 $18,078,285 $33,306,358
Percentage of Group B Total 44.0% 1.7% 45.7% 54.3% 100.0%
Group B Average Excluding Outliers/Exclusions $18,548,482 $18,854,780
Group B Median $8,962,131 $83,198 $9,049,417 $10,546,708 $19,538,777
+ =
SOURCE: Arts and Economic Prosperity 5, Americans for the Arts, 2017. For more information, visit www.AmericansForTheArts.org/EconomicImpact. B–27

Table 2:Total Expenditures Made by Nonprofit Arts and Cultural Organizationsand Their Audiences Per Study Region During Fiscal Year 2015
Population Cohort Group C Total Total Total Expenditures
Population 100,000 to 249,999 Operating Capital Organizational Audience (Both Organizations
Sample Size = 50 Expenditures Expenditures Expenditures Expenditures and Audiences)
City of Las Cruces (NM) $8,477,579 $30,853 $8,508,432 $10,596,813 $19,105,245
Eau Claire County (WI)4 $3,394,103 $1,115,240 $4,509,343 $5,800,746 $10,310,089
Yamhill County (OR)4 $17,420,453 $3,244,187 $20,664,640 $24,305,837 $44,970,477
City of Lewisville (TX) $1,506,902 $6,382 $1,513,284 $304,772 $1,818,056
City of West Palm Beach (FL) $95,412,080 $21,598,162 $117,010,242 $105,023,175 $222,033,417
City of Boulder (CO) $35,064,024 $450,357 $35,514,381 $34,283,259 $69,797,640
City of Richardson (TX) $12,143,635 $0 $12,143,635 $8,452,425 $20,596,060
City of High Point (NC) $2,461,321 $98,968 $2,560,289 $3,190,517 $5,750,806
City of Cambridge (MA) $119,802,629 $0 $119,802,629 $55,007,895 $174,810,524
City of Lowell (MA) $8,688,661 $0 $8,688,661 $3,605,666 $12,294,327
Douglas County (KS)4 $15,067,198 $603,693 $15,670,891 $15,090,256 $30,761,147
City of Columbia (MO) $9,013,950 $138,394 $9,152,344 $5,561,719 $14,714,063
City of Norman (OK) $11,337,698 $215,179 $11,552,877 $44,621,918 $56,174,795
Wayne County (NC)4 $1,526,265 $43,774 $1,570,039 $3,260,763 $4,830,802
City of Lafayette (LA) $6,356,368 $0 $6,356,368 $10,620,627 $16,976,995
Washington County (TN)4 $3,201,537 $56,366 $3,257,903 $15,198,698 $18,456,601
City of Thousand Oaks (CA) $8,538,482 $71,190 $8,609,672 $4,203,069 $12,812,741
City of Charleston (SC) $65,988,815 $103,175 $66,091,990 $120,433,761 $186,525,751
City of Waco (TX) $30,355,479 $1,036,431 $31,391,910 $32,298,881 $63,690,791
Robeson County (NC)4 $2,907,420 $7,000 $2,914,420 $1,037,548 $3,951,968
Columbia County (GA)4 $25,211 $18,000 $43,211 $44,626 $87,837
Orange County (NC)4 $87,910,921 $5,732,554 $93,643,475 $36,666,872 $130,310,347
City of Savannah (GA) $34,462,355 $336,830 $34,799,185 $101,140,651 $135,939,836
Indian River County (FL)4 $15,547,199 $471,824 $16,019,023 $8,855,149 $24,874,172
City of Alexandria (VA) $33,647,422 $2,179,677 $35,827,099 $76,016,409 $111,843,508
Martin County (FL)4 $13,443,227 $823,505 $14,266,732 $12,885,638 $27,152,370
Macon-Bibb County (GA)4 $46,431,604 $2,708,130 $49,139,734 $38,937,787 $88,077,521
City of Springfield (MA) $33,796,191 $2,313,053 $36,109,244 $13,876,246 $49,985,490
Catawba County (NC)4 $11,673,660 $895,564 $12,569,224 $36,671,219 $49,240,443
Town of Cary (NC) $5,948,204 $205,439 $6,153,643 $10,826,761 $16,980,404
+ =
SOURCE: Arts and Economic Prosperity 5, Americans for the Arts, 2017. For more information, visit www.AmericansForTheArts.org/EconomicImpact. B–28

Table 2:Total Expenditures Made by Nonprofit Arts and Cultural Organizationsand Their Audiences Per Study Region During Fiscal Year 2015
Population Cohort Group C Total Total Total Expenditures
Population 100,000 to 249,999 Operating Capital Organizational Audience (Both Organizations
Sample Size = 50 Expenditures Expenditures Expenditures Expenditures and Audiences)
Alamance County (NC)4 $3,627,125 $250,600 $3,877,725 $4,937,353 $8,815,078
Cumberland County (NJ) $9,253,366 $293,358 $9,546,724 $7,196,474 $16,743,198
City of Eugene (OR) $40,101,848 $678,667 $40,780,515 $21,423,287 $62,203,802
Middlesex County (CT)4 $20,798,311 $85,372 $20,883,683 $11,117,321 $32,001,004
City of Springfield (MO) $9,170,576 $607,928 $9,778,504 $17,087,113 $26,865,617
City of Sioux Falls (SD) $19,792,501 $320,000 $20,112,501 $84,438,598 $104,551,099
Pitt County (NC)4 $12,620,007 $69,840 $12,689,847 $5,422,000 $18,111,847
City of Providence (RI) $93,718,391 $114,164 $93,832,555 $111,948,211 $205,780,766
City of Worcester (MA) $61,732,448 $2,772,188 $64,504,636 $61,185,858 $125,690,494
Montgomery County (TN)4 $2,964,420 $0 $2,964,420 $2,041,349 $5,005,769
Salt Lake City (UT) $111,472,408 $970,356 $112,442,764 $194,120,153 $306,562,917
Cabarrus County (NC)4 $2,077,306 $188,265 $2,265,571 $4,677,402 $6,942,973
Richmond County (GA)4 $36,888,150 $923,288 $37,811,438 $19,941,434 $57,752,872
City of Tacoma (WA) $65,685,768 $8,962,691 $74,648,459 $62,565,471 $137,213,930
Doña Ana County (NM)4 $12,844,357 $75,853 $12,920,210 $20,191,146 $33,111,356
New Hanover County (NC)4 $14,053,652 $788,085 $14,841,737 $40,963,688 $55,805,425
Arlington County (VA)4 $167,434,420 $3,328,057 $170,762,477 $18,476,219 $189,238,696
City of Irving (TX) $24,192,919 $0 $24,192,919 $1,260,973 $25,453,892
City of Reno (NV) $44,800,864 $5,338,539 $50,139,403 $38,895,672 $89,035,075
York County (SC)4 $13,256,469 $23,176 $13,279,645 $13,756,005 $27,035,650
Group C Average $30,160,718 $1,405,887 $31,566,605 $31,609,309 $63,175,914
Percentage of Group C Total 47.7% 2.2% 50.0% 50.0% 100.0%
Group C Average Excluding Outliers/Exclusions $38,600,672 $45,666,293
Group C Median $13,748,440 $271,979 $14,554,235 $15,144,477 $31,381,076
+ =
SOURCE: Arts and Economic Prosperity 5, Americans for the Arts, 2017. For more information, visit www.AmericansForTheArts.org/EconomicImpact. B–29

Table 2:Total Expenditures Made by Nonprofit Arts and Cultural Organizationsand Their Audiences Per Study Region During Fiscal Year 2015
Population Cohort Group D Total Total Total Expenditures
Population 250,000 to 499,999 Operating Capital Organizational Audience (Both Organizations
Sample Size = 42 Expenditures Expenditures Expenditures Expenditures and Audiences)
Buncombe County (NC)4 $24,406,698 $1,957,184 $26,363,882 $42,520,698 $68,884,580
Alachua County (FL)4 $36,037,714 $525,433 $36,563,147 $67,892,593 $104,455,740
Greater Green Bay Area (WI)4 $22,421,258 $971,188 $23,392,446 $12,925,635 $36,318,081
City of Orlando (FL) $123,108,734 $539,441 $123,648,175 $65,576,512 $189,224,687
City of Lincoln (NE) $50,480,134 $185,428 $50,665,562 $48,329,810 $98,995,372
Southeastern Connecticut Region (CT)4 $86,330,330 $829,436 $87,159,766 $81,213,782 $168,373,548
Erie County (PA)4 $18,960,756 $130,394 $19,091,150 $23,147,814 $42,238,964
San Luis Obispo County (CA)4 $12,959,361 $733,661 $13,693,022 $14,029,567 $27,722,589
City of Newark (NJ) $108,326,194 $1,039,050 $109,365,244 $68,963,054 $178,328,298
Leon County (FL)4 $98,312,201 $2,141,809 $100,454,010 $101,416,276 $201,870,286
Rutherford County (TN)4 $9,667,954 $1,130,833 $10,798,787 $20,370,806 $31,169,593
St. Lucie County (FL)4 $3,119,978 $0 $3,119,978 $4,697,606 $7,817,584
Greater Spartanburg Area (SC)4 $20,039,638 $1,332,045 $21,371,683 $10,670,113 $32,041,796
Durham County (NC)4 $98,590,291 $6,028,835 $104,619,126 $49,550,897 $154,170,023
City of St. Paul (MN)2 $275,926,038 $5,683,920 $281,609,958 $195,262,963 $476,872,921
Hamilton County (IN)4 $35,871,289 $333,450 $36,204,739 $21,902,882 $58,107,621
Osceola County (FL)4 $1,919,906 $2,500 $1,922,406 $1,731,658 $3,654,064
Escambia County (FL)4 $27,184,419 $265,556 $27,449,975 $61,364,635 $88,814,610
Lexington-Fayette Urban County (KY)4 $13,317,334 $2,811,988 $16,129,322 $15,984,825 $32,114,147
Lake County (FL)4 $1,137,478 $0 $1,137,478 $8,016,604 $9,154,082
City of Riverside (CA) $17,566,798 $8,290 $17,575,088 $25,414,927 $42,990,015
Cumberland County (NC)4 $29,233,362 $422,581 $29,655,943 $29,520,110 $59,176,053
Collier County (FL)4 $60,653,748 $2,319,974 $62,973,722 $44,713,126 $107,686,848
Hamilton County (TN)4 $64,027,056 $741,799 $64,768,855 $107,710,825 $172,479,680
Manatee County (FL)4 $14,422,608 $19,094 $14,441,702 $32,987,303 $47,429,005
City of Tampa (FL) $121,456,312 $9,245,676 $130,701,988 $218,525,750 $349,227,738
Forsyth County (NC)4 $102,819,168 $1,887,629 $104,706,797 $52,083,038 $156,789,835
Mercer County (NJ)4 $21,726,187 $368,960 $22,095,147 $18,713,948 $40,809,095
City of Wichita (KS) $43,115,058 $821,598 $43,936,656 $50,788,472 $94,725,128
Clackamas County (OR)4 $5,821,109 $0 $5,821,109 $9,016,568 $14,837,677
+ =
SOURCE: Arts and Economic Prosperity 5, Americans for the Arts, 2017. For more information, visit www.AmericansForTheArts.org/EconomicImpact. B–30

Table 2:Total Expenditures Made by Nonprofit Arts and Cultural Organizationsand Their Audiences Per Study Region During Fiscal Year 2015
Population Cohort Group D Total Total Total Expenditures
Population 250,000 to 499,999 Operating Capital Organizational Audience (Both Organizations
Sample Size = 42 Expenditures Expenditures Expenditures Expenditures and Audiences)
Sarasota County (FL)4 $177,825,864 $23,689,073 $201,514,937 $93,489,521 $295,004,458
City of Minneapolis (MN)2 $318,756,265 $4,638,259 $323,394,524 $217,285,067 $540,679,591
Berks County (PA)4 $10,452,105 $353,422 $10,805,527 $8,140,047 $18,945,574
City of Miami (FL) $311,769,047 $175,809,421 $487,578,468 $262,596,886 $750,175,354
City of Raleigh (NC) $147,841,621 $19,827,335 $167,668,956 $363,988,155 $531,657,111
Santa Barbara County (CA)4 $120,104,471 $6,198,798 $126,303,269 $72,295,776 $198,599,045
Seminole County (FL)4 $8,247,427 $5,746 $8,253,173 $8,306,215 $16,559,388
City of Virginia Beach (VA) $24,654,536 $1,274,833 $25,929,369 $61,802,150 $87,731,519
City of Atlanta (GA) $341,096,598 $30,802,912 $371,899,510 $232,656,425 $604,555,935
City of Mesa (AZ) $16,852,127 $2,500 $16,854,627 $12,783,542 $29,638,169
City of Kansas City (MO) $154,932,522 $6,774,071 $161,706,593 $82,505,241 $244,211,834
Morris County (NJ)4 $15,484,375 $299,804 $15,784,179 $16,028,988 $31,813,167
Group D Average $76,118,478 $7,432,236 $83,550,714 $69,926,686 $153,477,400
Percentage of Group D Total 49.6% 4.8% 54.4% 45.6% 100.0%
Group D Average Excluding Outliers/Exclusions $142,294,186 $124,494,244
Group D Median $32,552,326 $825,517 $32,930,341 $46,521,468 $88,273,065
+ =
SOURCE: Arts and Economic Prosperity 5, Americans for the Arts, 2017. For more information, visit www.AmericansForTheArts.org/EconomicImpact. B–31

Table 2:Total Expenditures Made by Nonprofit Arts and Cultural Organizationsand Their Audiences Per Study Region During Fiscal Year 2015
Population Cohort Group E Total Total Total Expenditures
Population 500,000 to 999,999 Operating Capital Organizational Audience (Both Organizations
Sample Size = 25 Expenditures Expenditures Expenditures Expenditures and Audiences)
Sonoma County (CA)4 $44,938,414 $179,799 $45,118,213 $35,290,315 $80,408,528
Volusia County (FL)4 $13,625,874 $94,757 $13,720,631 $35,015,240 $48,735,871
Guilford County (NC)4 $62,172,032 $4,890,694 $67,062,726 $95,171,867 $162,234,593
Dane County (WI)4 $145,331,037 $408,575 $145,739,612 $104,161,585 $249,901,197
Brevard County (FL)4 $7,119,716 $0 $7,119,716 $3,505,227 $10,624,943
Washington County (OR)4 $13,683,183 $130,081 $13,813,264 $7,272,749 $21,086,013
Johnson County (KS)4 $11,804,710 $531,129 $12,335,839 $10,438,987 $22,774,826
City of Louisville (KY) $193,945,296 $30,615,264 $224,560,560 $237,946,184 $462,506,744
City of Baltimore (MD) $324,644,774 $1,688,378 $326,333,152 $279,675,260 $606,008,412
Polk County (FL)4 $15,544,744 $245,688 $15,790,432 $30,799,415 $46,589,847
City of Boston (MA) $753,635,477 $10,252,535 $763,888,012 $590,249,049 $1,354,137,061
District of Columbia (DC)3 $1,519,386,543 $134,847,625 $1,654,234,168 $1,252,037,358 $2,906,271,526
City of Nashville-Davidson County (TN) $172,803,135 $5,977,149 $178,780,284 $250,560,557 $429,340,841
City of El Paso (TX) $57,885,862 $2,092,824 $59,978,686 $43,468,775 $103,447,461
Lee County (FL)4 $32,408,924 $1,569,760 $33,978,684 $106,117,364 $140,096,048
City of Fort Worth (TX) $253,140,680 $2,835,573 $255,976,253 $194,654,565 $450,630,818
City of Indianapolis (IN) $211,387,341 $15,906,150 $227,293,491 $213,236,618 $440,530,109
City and County of San Francisco (CA) $778,618,884 $1,994,214 $780,613,098 $667,740,510 $1,448,353,608
Prince George's County (MD)4 $23,780,172 $2,576 $23,782,748 $34,910,511 $58,693,259
Pinellas County (FL)4 $96,487,644 $3,707,416 $100,195,060 $140,781,982 $240,977,042
Shelby County (TN)4 $104,138,496 $14,058,111 $118,196,607 $79,131,575 $197,328,182
Fairfield County (CT)4 $146,354,877 $2,266,381 $148,621,258 $86,618,360 $235,239,618
Westchester County (NY)4 $101,403,051 $5,166,658 $106,569,709 $65,689,723 $172,259,432
Fulton County (GA)4 $351,939,799 $30,802,912 $382,742,711 $236,232,626 $618,975,337
Wake County (NC)4 $157,579,218 $21,567,051 $179,146,269 $378,008,208 $557,154,477
Group E Average $223,750,395 $11,673,252 $235,423,647 $207,148,584 $442,572,232
Percentage of Group E Total 50.6% 2.6% 53.2% 46.8% 100.0%
Group E Average Excluding Outliers/Exclusions $352,177,942 $309,691,440
Group E Median $104,138,496 $2,266,381 $118,196,607 $104,161,585 $235,239,618
+ =
SOURCE: Arts and Economic Prosperity 5, Americans for the Arts, 2017. For more information, visit www.AmericansForTheArts.org/EconomicImpact. B–32

Table 2:Total Expenditures Made by Nonprofit Arts and Cultural Organizationsand Their Audiences Per Study Region During Fiscal Year 2015
Population Cohort Group F Total Total Total Expenditures
Population 1,000,000 or More Operating Capital Organizational Audience (Both Organizations
Sample Size = 21 Expenditures Expenditures Expenditures Expenditures and Audiences)
Mecklenburg County (NC)4 $133,897,279 $3,840,574 $137,737,853 $104,985,768 $242,723,621
City of San José (CA) $73,221,310 $241,243 $73,462,553 $117,746,926 $191,209,479
Montgomery County (MD)4 $105,073,377 $31,379 $105,104,756 $78,111,500 $183,216,256
Fairfax County (VA)4 $168,854,526 $4,555,292 $173,409,818 $98,189,315 $271,599,133
Allegheny County (PA)4 $549,611,255 $263,391 $549,874,646 $509,510,265 $1,059,384,911
Greater Columbus Area (OH)4 $220,502,471 $1,975,022 $222,477,493 $189,782,016 $412,259,509
Orange County (FL)4 $153,603,600 $743,936 $154,347,536 $110,252,239 $264,599,775
City of Dallas (TX) $630,886,100 $583,225 $631,469,325 $259,701,224 $891,170,549
Hillsborough County (FL)4 $163,638,378 $11,586,882 $175,225,260 $257,987,724 $433,212,984
City of San Diego (CA) $541,134,165 $12,429,228 $553,563,393 $546,370,965 $1,099,934,358
Palm Beach County (FL)4 $161,187,251 $23,104,939 $184,292,190 $160,992,666 $345,284,856
City of San Antonio (TX) $142,773,352 $353,784 $143,127,136 $280,305,439 $423,432,575
Sacramento County (CA)4 $78,952,540 $3,383,816 $82,336,356 $84,387,257 $166,723,613
City of Phoenix (AZ) $164,575,985 $28,300 $164,604,285 $237,176,500 $401,780,785
City and County of Philadelphia (PA) $828,608,880 $20,313,643 $848,922,523 $765,177,606 $1,614,100,129
Broward County (FL)4 $136,586,542 $11,901,465 $148,488,007 $265,744,813 $414,232,820
Santa Clara County (CA)4 $112,089,976 $252,364 $112,342,340 $138,697,159 $251,039,499
Riverside County (CA)4 $63,966,727 $8,290 $63,975,017 $61,196,927 $125,171,944
Miami-Dade County (FL)4 $614,954,238 $236,959,758 $851,913,996 $578,598,817 $1,430,512,813
City of Chicago (IL) $1,328,784,955 $46,080,860 $1,374,865,815 $1,836,870,238 $3,211,736,053
Harris County (TX)4 $502,580,416 $62,562,594 $565,143,010 $528,903,379 $1,094,046,389
Group F Average $327,403,968 $21,009,523 $348,413,491 $343,366,131 $691,779,621
Percentage of Group F Total 47.3% 3.0% 50.4% 49.6% 100.0%
Group F Average Excluding Outliers/Exclusions $541,430,719 $577,621,271
Group F Median $163,638,378 $3,383,816 $173,409,818 $237,176,500 $412,259,509
Average $78,903,025 $5,089,174 $83,992,199 $79,024,175 $163,016,374
Percentage of Total 48.4% 3.1% 51.5% 48.5% 100.0%
Median $14,339,000 $249,288 $15,727,535 $18,871,511 $35,750,645
+ =
ALL CITY/COUNTY STUDY REGIONS
SOURCE: Arts and Economic Prosperity 5, Americans for the Arts, 2017. For more information, visit www.AmericansForTheArts.org/EconomicImpact. B–33

Table 2:Total Expenditures Made by Nonprofit Arts and Cultural Organizationsand Their Audiences Per Study Region During Fiscal Year 2015
Regional Study Regions Total Total Total Expenditures
All Populations Operating Capital Organizational Audience (Both Organizations
Sample Size = 81 Expenditures Expenditures Expenditures Expenditures and Audiences)
High Peaks Region (ME) $675,336 $58,382 $733,718 $1,021,519 $1,755,237
Wood River Valley (ID) $14,980,837 $488,313 $15,469,150 $13,849,987 $29,319,137
Southern Oregon Area $36,260,917 $1,270,200 $37,531,117 $63,078,564 $100,609,681
Southwestern Pennsylvania Area $12,896,774 $257,809 $13,154,583 $27,580,415 $40,734,998
Greater Portsmouth Area (NH) $20,718,285 $738,342 $21,456,627 $36,585,032 $58,041,659
Northeast Oregon Region $651,726 $282 $652,008 $556,935 $1,208,943
Toe River Valley (NC) $7,948,852 $3,758,027 $11,706,879 $5,401,784 $17,108,663
Albemarle Region (NC) $2,486,217 $238,611 $2,724,828 $4,231,853 $6,956,681
Greater Concord Area (NH) $15,806,968 $2,026,582 $17,833,550 $13,351,816 $31,185,366
North Central Minnesota Region2 $1,629,565 $1,000 $1,630,565 $1,435,387 $3,065,952
Northwest Minnesota Region2 $614,542 $1,600 $616,142 $477,641 $1,093,783
Monadnock Region (NH) $13,194,532 $76,852 $13,271,384 $5,280,101 $18,551,485
Bismarck-Mandan Region (ND) $20,980,512 $3,396,582 $24,377,094 $19,127,116 $43,504,210
Greater Minot Region (ND) $8,709,861 $30,000 $8,739,861 $4,770,610 $13,510,471
Greater Burlington Area (VT) $55,237,397 $3,883,143 $59,120,540 $36,038,913 $95,159,453
Greater Charlottesville Area (VA) $53,405,129 $7,154,789 $60,559,918 $61,250,521 $121,810,439
Brainerd Lakes Region (MN)2 $2,470,383 $283,150 $2,753,533 $885,007 $3,638,540
East Central Minnesota Region2 $3,750,014 $52,455 $3,802,469 $5,924,425 $9,726,894
Northwest Connecticut Region $20,025,639 $1,457,322 $21,482,961 $12,877,676 $34,360,637
Central Oregon Region $9,497,621 $460,937 $9,958,558 $24,706,823 $34,665,381
Greater Fargo-Moorhead Area (ND/MN) $20,589,600 $229,902 $20,819,502 $24,848,393 $45,667,895
Black Hills Region (SD) $22,529,134 $445,635 $22,974,769 $91,334,299 $114,309,068
Greater Kingsport Area (TN) $8,421,711 $1,140,576 $9,562,287 $19,946,401 $29,508,688
Lake Region (MN)2 $5,586,185 $899,481 $6,485,666 $3,338,821 $9,824,487
South Central Minnesota Region2 $6,276,592 $157,058 $6,433,650 $7,166,691 $13,600,341
Greater Sioux Falls Area (SD) $20,281,653 $320,000 $20,601,653 $84,845,941 $105,447,594
Southwest Tennessee Development District $3,114,895 $14,360 $3,129,255 $3,150,012 $6,279,267
Northwest Tennessee Development District $2,277,352 $5,950 $2,283,302 $9,771,421 $12,054,723
Southwest Minnesota Region2 $4,274,347 $593,927 $4,868,274 $2,416,051 $7,284,325
Arrowhead Region (MN)2 $19,165,336 $472,523 $19,637,859 $20,102,830 $39,740,689
+ =
SOURCE: Arts and Economic Prosperity 5, Americans for the Arts, 2017. For more information, visit www.AmericansForTheArts.org/EconomicImpact. B–34

Table 2:Total Expenditures Made by Nonprofit Arts and Cultural Organizationsand Their Audiences Per Study Region During Fiscal Year 2015
Regional Study Regions Total Total Total Expenditures
All Populations Operating Capital Organizational Audience (Both Organizations
Sample Size = 81 Expenditures Expenditures Expenditures Expenditures and Audiences)
Maple Grove and the Northwest Suburbs (MN)2 $1,395,295 $91,903 $1,487,198 $2,534,610 $4,021,808
Greater Augusta Area (GA) $36,913,361 $941,288 $37,854,649 $19,986,060 $57,840,709
Upper Cumberland Development District (TN) $6,192,874 $141,822 $6,334,696 $4,778,035 $11,112,731
City of Huntsville/Madison County (AL) $51,450,016 $2,393,547 $53,843,563 $36,057,737 $89,901,300
Northeast Commission (NC) $22,199,997 $442,821 $22,642,818 $53,311,686 $75,954,504
Greater Ann Arbor Area (MI)5 $49,657,759 $258,882 $49,916,641 $50,031,630 $99,948,271
Greater Fox Cities Region (WI) $39,718,637 $359,036 $40,077,673 $18,279,758 $58,357,431
Central Minnesota Region2 $8,763,387 $37,259 $8,800,646 $7,633,741 $16,434,387
South Central Tennessee Development District $3,782,749 $281,707 $4,064,456 $10,903,233 $14,967,689
Northwest Arkansas Region $62,482,485 $5,021,121 $67,503,606 $63,693,488 $131,197,094
Southeast Minnesota Region2 $16,519,391 $170,819 $16,690,210 $8,885,650 $25,575,860
First Tennessee Development District $14,057,813 $1,326,999 $15,384,812 $38,063,182 $53,447,994
Greater Harrisburg Area (PA) $12,684,667 $0 $12,684,667 $7,409,784 $20,094,451
Greater New Haven Area (CT) $81,772,905 $33,095,086 $114,867,991 $19,821,820 $134,689,811
Treasure Coast Region (FL) $32,110,404 $1,295,329 $33,405,733 $26,438,393 $59,844,126
Greater Des Moines Region (IA) $59,274,753 $12,648,149 $71,922,902 $113,115,609 $185,038,511
Southeast Tennessee Development District $66,415,679 $936,871 $67,352,550 $116,017,033 $183,369,583
Greater Knoxville Region (TN) $47,261,830 $899,050 $48,160,880 $97,766,533 $145,927,413
Greater Columbia Area (SC) $21,585,322 $895,352 $22,480,674 $42,190,412 $64,671,086
Pikes Peak Region (CO) $47,944,339 $3,248,872 $51,193,211 $102,068,841 $153,262,052
Lehigh Valley Region (PA) $76,218,658 $6,945,943 $83,164,601 $103,220,986 $186,385,587
Greater Sarasota/Bradenton Area (FL) $192,248,472 $23,708,167 $215,956,639 $126,476,824 $342,433,463
Dayton Region (OH) $94,035,966 $1,123,759 $95,159,725 $118,527,088 $213,686,813
Richmond & Tri-Cities Region (VA) $190,476,959 $21,203,726 $211,680,685 $148,391,431 $360,072,116
Memphis Area Association of Governments (TN) $104,257,817 $14,058,111 $118,315,928 $79,242,425 $197,558,353
Eastern Region (NC) $27,446,937 $283,165 $27,730,102 $56,999,129 $84,729,231
Advantage West Region (NC) $68,160,834 $7,069,757 $75,230,591 $164,631,483 $239,862,074
Southeast Commission (NC) $49,086,373 $1,266,611 $50,352,984 $77,078,611 $127,431,595
Greater Fairfax Area (VA) $177,547,094 $5,251,414 $182,798,508 $118,271,041 $301,069,549
Greater Tulsa Region (OK) $78,671,317 $12,510,848 $91,182,165 $137,689,013 $228,871,178
=+
SOURCE: Arts and Economic Prosperity 5, Americans for the Arts, 2017. For more information, visit www.AmericansForTheArts.org/EconomicImpact. B–35
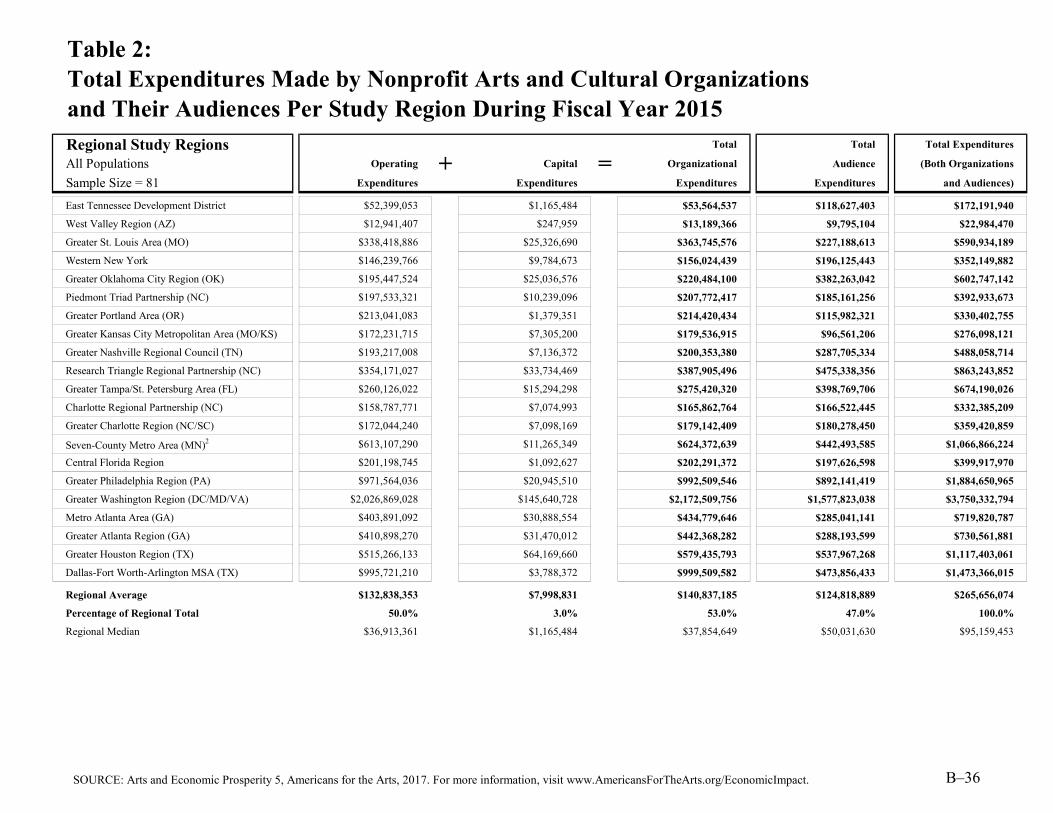
Table 2:Total Expenditures Made by Nonprofit Arts and Cultural Organizationsand Their Audiences Per Study Region During Fiscal Year 2015
Regional Study Regions Total Total Total Expenditures
All Populations Operating Capital Organizational Audience (Both Organizations
Sample Size = 81 Expenditures Expenditures Expenditures Expenditures and Audiences)
East Tennessee Development District $52,399,053 $1,165,484 $53,564,537 $118,627,403 $172,191,940
West Valley Region (AZ) $12,941,407 $247,959 $13,189,366 $9,795,104 $22,984,470
Greater St. Louis Area (MO) $338,418,886 $25,326,690 $363,745,576 $227,188,613 $590,934,189
Western New York $146,239,766 $9,784,673 $156,024,439 $196,125,443 $352,149,882
Greater Oklahoma City Region (OK) $195,447,524 $25,036,576 $220,484,100 $382,263,042 $602,747,142
Piedmont Triad Partnership (NC) $197,533,321 $10,239,096 $207,772,417 $185,161,256 $392,933,673
Greater Portland Area (OR) $213,041,083 $1,379,351 $214,420,434 $115,982,321 $330,402,755
Greater Kansas City Metropolitan Area (MO/KS) $172,231,715 $7,305,200 $179,536,915 $96,561,206 $276,098,121
Greater Nashville Regional Council (TN) $193,217,008 $7,136,372 $200,353,380 $287,705,334 $488,058,714
Research Triangle Regional Partnership (NC) $354,171,027 $33,734,469 $387,905,496 $475,338,356 $863,243,852
Greater Tampa/St. Petersburg Area (FL) $260,126,022 $15,294,298 $275,420,320 $398,769,706 $674,190,026
Charlotte Regional Partnership (NC) $158,787,771 $7,074,993 $165,862,764 $166,522,445 $332,385,209
Greater Charlotte Region (NC/SC) $172,044,240 $7,098,169 $179,142,409 $180,278,450 $359,420,859
Seven-County Metro Area (MN)2 $613,107,290 $11,265,349 $624,372,639 $442,493,585 $1,066,866,224
Central Florida Region $201,198,745 $1,092,627 $202,291,372 $197,626,598 $399,917,970
Greater Philadelphia Region (PA) $971,564,036 $20,945,510 $992,509,546 $892,141,419 $1,884,650,965
Greater Washington Region (DC/MD/VA) $2,026,869,028 $145,640,728 $2,172,509,756 $1,577,823,038 $3,750,332,794
Metro Atlanta Area (GA) $403,891,092 $30,888,554 $434,779,646 $285,041,141 $719,820,787
Greater Atlanta Region (GA) $410,898,270 $31,470,012 $442,368,282 $288,193,599 $730,561,881
Greater Houston Region (TX) $515,266,133 $64,169,660 $579,435,793 $537,967,268 $1,117,403,061
Dallas-Fort Worth-Arlington MSA (TX) $995,721,210 $3,788,372 $999,509,582 $473,856,433 $1,473,366,015
Regional Average $132,838,353 $7,998,831 $140,837,185 $124,818,889 $265,656,074
Percentage of Regional Total 50.0% 3.0% 53.0% 47.0% 100.0%
Regional Median $36,913,361 $1,165,484 $37,854,649 $50,031,630 $95,159,453
+ =
SOURCE: Arts and Economic Prosperity 5, Americans for the Arts, 2017. For more information, visit www.AmericansForTheArts.org/EconomicImpact. B–36

Table 2:Total Expenditures Made by Nonprofit Arts and Cultural Organizationsand Their Audiences Per Study Region During Fiscal Year 2015
Statewide Study Regions Total Total Total Expenditures
All Populations Operating Capital Organizational Audience (Both Organizations
Sample Size = 20 Expenditures Expenditures Expenditures Expenditures and Audiences)
State of Vermont $74,816,897 $4,040,014 $78,856,911 $44,027,403 $122,884,314
State of North Dakota $51,592,618 $4,865,931 $56,458,549 $52,755,615 $109,214,164
State of Delaware $96,895,395 $6,728,980 $103,624,375 $46,279,508 $149,903,883
State of Maine $90,073,184 $2,504,420 $92,577,604 $57,967,891 $150,545,495
State of Hawai'i $121,952,469 $3,968,883 $125,921,352 $79,722,005 $205,643,357
State of Nevada $217,929,239 $9,369,133 $227,298,372 $244,426,892 $471,725,264
State of Connecticut $475,104,646 $40,206,724 $515,311,370 $281,938,021 $797,249,391
State of Oklahoma $293,330,548 $37,919,238 $331,249,786 $541,580,846 $872,830,632
State of Oregon $356,620,105 $7,445,182 $364,065,287 $322,956,808 $687,022,095
State of Minnesota2 $682,157,032 $13,934,621 $696,091,653 $500,759,829 $1,196,851,482
State of Wisconsin $364,740,290 $12,175,701 $376,915,991 $279,941,276 $656,857,267
State of Maryland $509,408,166 $1,991,206 $511,399,372 $450,172,892 $961,572,264
State of Missouri $569,589,266 $33,314,472 $602,903,738 $436,105,742 $1,039,009,480
State of Tennessee $445,715,240 $25,067,676 $470,782,916 $668,258,078 $1,139,040,994
State of Massachusetts $1,356,788,567 $29,914,708 $1,386,703,275 $879,596,273 $2,266,299,548
State of New Jersey $292,708,413 $3,431,935 $296,140,348 $223,674,136 $519,814,484
State of North Carolina $877,386,260 $60,110,912 $937,497,172 $1,179,042,966 $2,116,540,138
State of Pennsylvania $1,723,237,567 $30,072,155 $1,753,309,722 $1,634,835,604 $3,388,145,326
State of Illinois $1,732,186,708 $48,439,631 $1,780,626,339 $2,253,017,062 $4,033,643,401
State of Florida $1,962,006,113 $323,665,152 $2,285,671,265 $2,390,536,073 $4,676,207,338
Statewide Average $614,711,936 $34,958,334 $649,670,270 $628,379,746 $1,278,050,016
Percentage of Statewide Total 48.1% 2.7% 50.8% 49.2% 100.0%
Statewide Median $405,227,765 $13,055,161 $423,849,454 $379,531,275 $835,040,012
+ =
SOURCE: Arts and Economic Prosperity 5, Americans for the Arts, 2017. For more information, visit www.AmericansForTheArts.org/EconomicImpact. B–37

Table 2:Total Expenditures Made by Nonprofit Arts and Cultural Organizationsand Their Audiences Per Study Region During Fiscal Year 2015
Individual Arts Districts Total Total Total Expenditures
All Populations Operating Capital Organizational Audience (Both Organizations
Sample Size = 12 Expenditures Expenditures Expenditures Expenditures and Audiences)
James River Arts & Cultural District $6,076,479 $317,770 $6,394,249 $3,759,455 $10,153,704
Center City Charlotte $120,261,925 $3,829,692 $124,091,617 $92,406,680 $216,498,297
Loch Haven Cultural Park $28,781,190 $472,026 $29,253,216 $30,590,137 $59,843,353
Downtown Colorado Springs Creative District $19,995,072 $778,299 $20,773,371 $16,271,894 $37,045,265
Fort Worth Cultural District $147,405,286 $2,605,166 $150,010,452 $114,739,000 $264,749,452
Dallas Arts District $281,695,062 $539,330 $282,234,392 $113,567,787 $395,802,179
Grand Center Arts & Entertainment District $62,667,280 $14,507,517 $77,174,797 $29,240,126 $106,414,923
Balboa Park Cultural District $380,114,728 $323,182 $380,437,910 $289,710,435 $670,148,345
East End Cultural District $3,177,402 $0 $3,177,402 $5,028,736 $8,206,138
Houston Museum District Association $260,838,799 $60,711,514 $321,550,313 $324,523,136 $646,073,449
Midtown Cultural District $4,111,803 $0 $4,111,803 $4,719,940 $8,831,743
Washington Avenue Cultural District $2,520,607 $0 $2,520,607 $2,196,630 $4,717,237
Arts District Average $109,803,803 $7,007,041 $116,810,844 $85,562,830 $202,373,674
Percentage of Arts District Total 54.3% 3.5% 57.7% 42.3% 100.0%
Arts District Median $45,724,235 $505,678 $53,214,007 $29,915,132 $83,129,138
Explanation of the Outliers and Exclusions:1
2
3
4
5 The expenditure and attendance data collected from eligible organizations in this study region were collected for fiscal year 2014 (rather than 2015), and audience-intercepts surveys collected from attendees to cultural events in this study region were collected during calendar year 2015 (rather than 2016).
The expenditure and attendance data collected from eligible organizations in these study regions were collected for fiscal year 2013 (rather than 2015), and audience-intercepts surveys collected from attendees to cultural events in these study regions were collected during calendar year 2014 (rather than 2016). Where applicable, these study regions are excluded from the national extrapolations.
Both the organizational expenditure and attendance findings and the audience expenditure findings for these city study regions were determined by researchers to be outliers when compared to the findings for cohort regions in the same population category. For this reason, these study regions are excluded from the national extrapolations.
The organizational expenditure and attendance findings for these city study regions were determined by researchers to be outliers when compared to the findings for cohort regions in the same population category. For this reason, the organizational expenditure and attendance findings for these study regions are excluded from the national extrapolations.
These county study regions are excluded from the national extrapolations. The national extrapolations are based on city study regions only.
+ =
SOURCE: Arts and Economic Prosperity 5, Americans for the Arts, 2017. For more information, visit www.AmericansForTheArts.org/EconomicImpact. B–38

Explanation of Table 3:Total Economic Impact of Expenditures by Nonprofit Arts and Cultural Organizationsand Their Audiences Per Study Region During Fiscal Year 2015
Column Two:
Column Three:
Column Four:
Column Five:
Column Six:
The total amount of revenue that the local government receives (e.g., licenses, fees, taxes) as a result of the expenditures generated by each participating study region's nonprofit arts and culture industry. Local government includes the city and county governments located within each participating study region.
The total amount of revenue that the state government receives (e.g., licenses, fees, taxes) as a result of the expenditures generated by each participating study region's nonprofit arts and culture industry.
This table presents for each study region the total economic impact of spending by the nonprofit arts and culture industry—both nonprofit arts and cultural organizations and their audiences—during fiscal year 2015. Summary statistics are calculated for each population group.
The total direct spending by the nonprofit arts and culture industry in each participating study region during fiscal year 2015. This figure is the sum of expenditures made by responding nonprofit arts and cultural organizations and induced event-related audience spending.
The total number of full-time equivalent (FTE) jobs supported by the expenditures generated by each participating study region's nonprofit arts and culture industry. Economists measure FTE jobs—not the total number of employees—because it is a more accurate measure of total employment, Each FTE job can represent one full-time employee, two employees who work half-time, four employees who work quarter-time, etc.
The total amount of household income paid to study region residents as a result of the expenditures generated by each participating study region's nonprofit arts and culture industry. Household income includes salaries, wages, and proprietary income.
The total impact is a measure of the effect each expended dollar has on the study region's economy as it is spent and re-spent within the region. It includes direct economic impacts plus indirect and induced economic impacts. It is derived from input-output models that are customized for each participating study region. See Background and Scope of Study and Frequently Used Terms in this Arts & Economic Prosperity 5 National Statistical Report for more information about direct, indirect, and induced economic impacts.
SOURCE: Arts and Economic Prosperity 5, Americans for the Arts, 2017. For more information, visit www.AmericansForTheArts.org/EconomicImpact. B–39

Table 3:Total Economic Impact of Expenditures by Nonprofit Arts and Cultural Organizationsand Their Audiences Per Study Region During Fiscal Year 2015
Population Cohort Group A Direct
Population Fewer than 50,000 Expenditures Full-Time Resident Local State
Sample Size = 52 (Organizations + Audiences) Equivalent Jobs Household Income Government Revenue Government Revenue
Town of Crested Butte (CO)3 $10,236,226 252 $5,198,000 $455,000 $245,000
City of Pine City (MN)2 $986,727 18 $442,000 $15,000 $78,000
City of Alva (OK) $1,758,487 66 $974,000 $54,000 $56,000
Cook County (MN)2 $4,603,026 127 $2,941,000 $94,000 $368,000
Town of Hillsborough (NC) $5,576,467 185 $3,798,000 $296,000 $327,000
City of Virginia (MN)2 $179,998 5 $117,000 $4,000 $15,000
Town of Jackson (WY)3 $51,247,941 1,058 $22,721,000 $1,930,000 $3,145,000
City of Guthrie (OK) $3,943,163 79 $1,565,000 $153,000 $185,000
City of Grand Rapids (MN)2 $5,079,985 139 $3,244,000 $103,000 $407,000
Town of Medfield (MA) $3,131,427 125 $2,087,000 $113,000 $111,000
City of Fergus Falls (MN)2 $2,955,589 86 $1,850,000 $49,000 $222,000
Grundy County (TN)4 $1,026,426 16 $284,000 $44,000 $61,000
City of Falls Church (VA)3 $25,778,223 626 $8,156,000 $1,066,000 $1,804,000
City of Jamestown (ND) $6,861,385 193 $3,653,000 $377,000 $376,000
City of Waterville (ME)1 $6,292,863 259 $3,931,000 $317,000 $290,000
City of Red Wing (MN)2 $2,228,641 66 $1,383,000 $36,000 $189,000
City of Durango (CO)1 $18,096,610 602 $12,313,000 $975,000 $476,000
City of Hannibal (MO) $5,092,399 126 $2,430,000 $323,000 $183,000
City of Tullahoma (TN) $1,068,586 32 $561,000 $31,000 $54,000
City of Northfield (MN)2 $2,171,993 59 $1,267,000 $35,000 $184,000
Town of Carrboro (NC) $7,711,684 274 $5,670,000 $370,000 $439,000
Macon County (TN)4 $170,681 3 $73,000 $5,000 $10,000
City of Laguna Beach (CA)3 $95,363,676 2,512 $58,914,000 $4,046,000 $4,788,000
Hickman County (TN)4 $1,780,511 39 $1,107,000 $50,000 $103,000
City of Fairfax (VA) $3,692,193 106 $2,175,000 $145,000 $137,000
City of Ponca City (OK) $5,005,936 112 $2,317,000 $158,000 $147,000
City of Paducah (KY)1 $27,447,161 991 $16,512,000 $608,000 $1,135,000
Mille Lacs County (MN)2 $845,962 17 $435,000 $14,000 $67,000
McNairy County (TN)4 $311,484 5 $87,000 $14,000 $14,000
City of Winona (MN)2 $4,729,059 135 $2,853,000 $76,000 $402,000
TOTAL Economic Impact of NONPROFIT ARTS AND CULTURE INDUSTRY Spending
SOURCE: Arts and Economic Prosperity 5, Americans for the Arts, 2017. For more information, visit www.AmericansForTheArts.org/EconomicImpact. B–40

Table 3:Total Economic Impact of Expenditures by Nonprofit Arts and Cultural Organizationsand Their Audiences Per Study Region During Fiscal Year 2015
Population Cohort Group A Direct
Population Fewer than 50,000 Expenditures Full-Time Resident Local State
Sample Size = 52 (Organizations + Audiences) Equivalent Jobs Household Income Government Revenue Government Revenue
Door County (WI)4 $24,698,431 632 $12,247,000 $1,240,000 $1,274,000
City of Benicia (CA) $4,662,293 149 $2,730,000 $174,000 $240,000
City of Winter Park (FL)3 $45,982,904 1,649 $32,723,000 $1,801,000 $2,217,000
City of Rochester (NH)1 $12,256,157 405 $8,080,000 $444,000 $604,000
City of Morgantown (WV)1 $35,474,920 1,538 $23,710,000 $729,000 $2,305,000
Henry County (TN)4 $725,696 18 $355,000 $29,000 $47,000
City of Fairbanks (AK)1 $18,062,811 548 $10,982,000 $805,000 $1,295,000
City of Bangor (ME) $10,015,091 312 $6,193,000 $561,000 $496,000
Weakley County (TN)4 $1,386,213 37 $686,000 $63,000 $97,000
Dare County (NC)4 $54,830,946 1,307 $24,927,000 $1,881,000 $1,898,000
City of Columbia (TN) $7,659,850 213 $3,657,000 $317,000 $493,000
City of Lake Worth (FL)3 $27,269,357 650 $14,933,000 $1,247,000 $1,420,000
Clatsop County (OR)4 $13,723,958 359 $6,738,000 $702,000 $560,000
Yadkin County (NC)4 $880,407 28 $461,000 $26,000 $35,000
Greater Belfast Area (ME)4 $7,808,156 155 $3,190,000 $348,000 $372,000
Campbell County (TN)4 $545,633 9 $171,000 $17,000 $32,000
Monroe County (TN)4 $6,694,094 145 $3,033,000 $264,000 $434,000
Lincoln County (OR)4 $10,423,985 272 $5,056,000 $529,000 $515,000
Iron County (UT)4 $76,128,287 1,955 $34,261,000 $3,451,000 $3,571,000
City of St. Louis Park (MN)2 $1,517,141 40 $1,030,000 $36,000 $128,000
City of Logan (UT)1 $31,325,823 1,104 $17,351,000 $1,453,000 $1,241,000
Gibson County (TN)4 $8,120,677 151 $3,402,000 $212,000 $402,000
Group A Average $13,568,603 384 $7,403,346 $543,942 $686,423
Group A Median $5,334,433 147 $3,111,500 $238,000 $347,500
TOTAL Economic Impact of NONPROFIT ARTS AND CULTURE INDUSTRY Spending
SOURCE: Arts and Economic Prosperity 5, Americans for the Arts, 2017. For more information, visit www.AmericansForTheArts.org/EconomicImpact. B–41
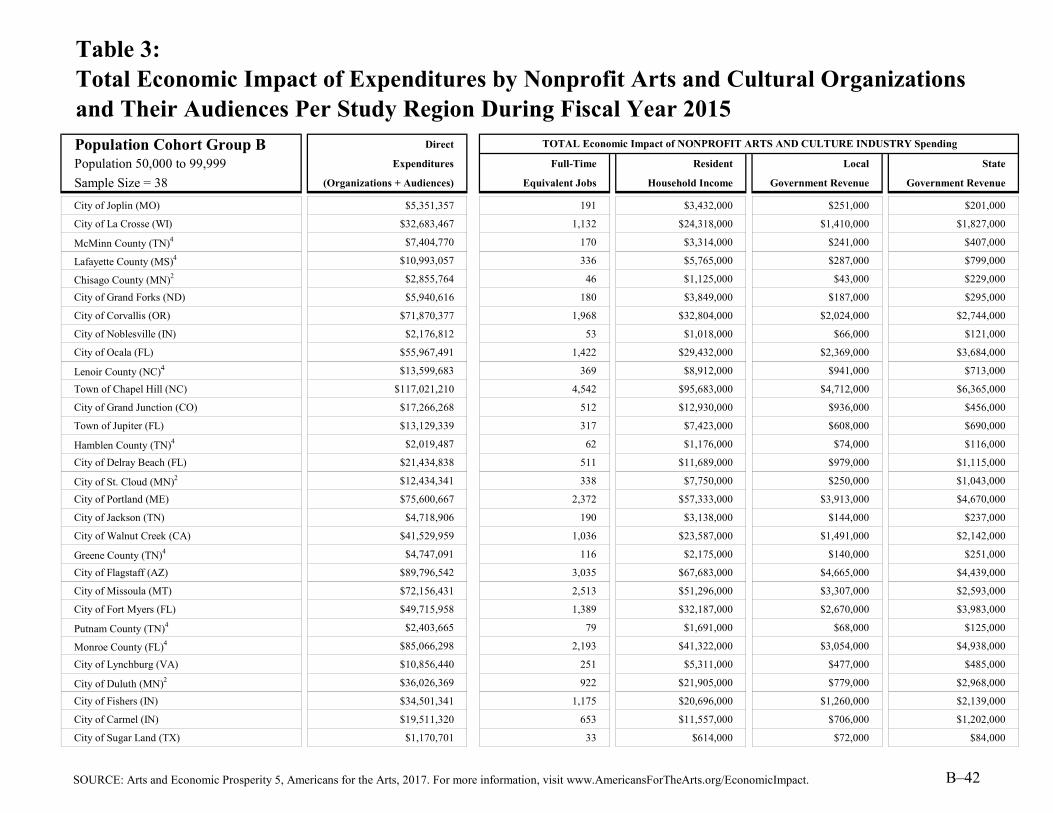
Table 3:Total Economic Impact of Expenditures by Nonprofit Arts and Cultural Organizationsand Their Audiences Per Study Region During Fiscal Year 2015
Population Cohort Group B Direct
Population 50,000 to 99,999 Expenditures Full-Time Resident Local State
Sample Size = 38 (Organizations + Audiences) Equivalent Jobs Household Income Government Revenue Government Revenue
City of Joplin (MO) $5,351,357 191 $3,432,000 $251,000 $201,000
City of La Crosse (WI) $32,683,467 1,132 $24,318,000 $1,410,000 $1,827,000
McMinn County (TN)4 $7,404,770 170 $3,314,000 $241,000 $407,000
Lafayette County (MS)4 $10,993,057 336 $5,765,000 $287,000 $799,000
Chisago County (MN)2 $2,855,764 46 $1,125,000 $43,000 $229,000
City of Grand Forks (ND) $5,940,616 180 $3,849,000 $187,000 $295,000
City of Corvallis (OR) $71,870,377 1,968 $32,804,000 $2,024,000 $2,744,000
City of Noblesville (IN) $2,176,812 53 $1,018,000 $66,000 $121,000
City of Ocala (FL) $55,967,491 1,422 $29,432,000 $2,369,000 $3,684,000
Lenoir County (NC)4 $13,599,683 369 $8,912,000 $941,000 $713,000
Town of Chapel Hill (NC) $117,021,210 4,542 $95,683,000 $4,712,000 $6,365,000
City of Grand Junction (CO) $17,266,268 512 $12,930,000 $936,000 $456,000
Town of Jupiter (FL) $13,129,339 317 $7,423,000 $608,000 $690,000
Hamblen County (TN)4 $2,019,487 62 $1,176,000 $74,000 $116,000
City of Delray Beach (FL) $21,434,838 511 $11,689,000 $979,000 $1,115,000
City of St. Cloud (MN)2 $12,434,341 338 $7,750,000 $250,000 $1,043,000
City of Portland (ME) $75,600,667 2,372 $57,333,000 $3,913,000 $4,670,000
City of Jackson (TN) $4,718,906 190 $3,138,000 $144,000 $237,000
City of Walnut Creek (CA) $41,529,959 1,036 $23,587,000 $1,491,000 $2,142,000
Greene County (TN)4 $4,747,091 116 $2,175,000 $140,000 $251,000
City of Flagstaff (AZ) $89,796,542 3,035 $67,683,000 $4,665,000 $4,439,000
City of Missoula (MT) $72,156,431 2,513 $51,296,000 $3,307,000 $2,593,000
City of Fort Myers (FL) $49,715,958 1,389 $32,187,000 $2,670,000 $3,983,000
Putnam County (TN)4 $2,403,665 79 $1,691,000 $68,000 $125,000
Monroe County (FL)4 $85,066,298 2,193 $41,322,000 $3,054,000 $4,938,000
City of Lynchburg (VA) $10,856,440 251 $5,311,000 $477,000 $485,000
City of Duluth (MN)2 $36,026,369 922 $21,905,000 $779,000 $2,968,000
City of Fishers (IN) $34,501,341 1,175 $20,696,000 $1,260,000 $2,139,000
City of Carmel (IN) $19,511,320 653 $11,557,000 $706,000 $1,202,000
City of Sugar Land (TX) $1,170,701 33 $614,000 $72,000 $84,000
TOTAL Economic Impact of NONPROFIT ARTS AND CULTURE INDUSTRY Spending
SOURCE: Arts and Economic Prosperity 5, Americans for the Arts, 2017. For more information, visit www.AmericansForTheArts.org/EconomicImpact. B–42

Table 3:Total Economic Impact of Expenditures by Nonprofit Arts and Cultural Organizationsand Their Audiences Per Study Region During Fiscal Year 2015
Population Cohort Group B Direct
Population 50,000 to 99,999 Expenditures Full-Time Resident Local State
Sample Size = 38 (Organizations + Audiences) Equivalent Jobs Household Income Government Revenue Government Revenue
City of Asheville (NC) $58,656,070 1,894 $42,728,000 $3,047,000 $3,288,000
Buchanan County (MO)4 $21,057,998 869 $17,207,000 $875,000 $843,000
City of Boca Raton (FL) $21,815,664 517 $11,712,000 $990,000 $1,130,000
City of Miami Beach (FL)3 $159,904,541 4,489 $143,228,000 $7,745,000 $11,605,000
Moore County (NC)4 $13,266,262 311 $6,888,000 $407,000 $505,000
Sevier County (TN)4 $45,769,084 1,047 $19,109,000 $2,364,000 $2,360,000
Cape May County (NJ)4 $19,566,234 430 $8,344,000 $1,216,000 $1,055,000
Cleveland County (NC)4 $5,655,197 138 $2,814,000 $223,000 $245,000
Group B Average $33,306,358 995 $22,188,026 $1,447,132 $1,897,158
Group B Median $19,538,777 512 $11,623,000 $905,500 $1,049,000
TOTAL Economic Impact of NONPROFIT ARTS AND CULTURE INDUSTRY Spending
SOURCE: Arts and Economic Prosperity 5, Americans for the Arts, 2017. For more information, visit www.AmericansForTheArts.org/EconomicImpact. B–43

Table 3:Total Economic Impact of Expenditures by Nonprofit Arts and Cultural Organizationsand Their Audiences Per Study Region During Fiscal Year 2015
Population Cohort Group C Direct
Population 100,000 to 249,999 Expenditures Full-Time Resident Local State
Sample Size = 50 (Organizations + Audiences) Equivalent Jobs Household Income Government Revenue Government Revenue
City of Las Cruces (NM) $19,105,245 426 $10,560,000 $700,000 $1,276,000
Eau Claire County (WI)4 $10,310,089 393 $8,745,000 $525,000 $554,000
Yamhill County (OR)4 $44,970,477 1,150 $20,635,000 $1,418,000 $1,469,000
City of Lewisville (TX) $1,818,056 66 $1,229,000 $125,000 $139,000
City of West Palm Beach (FL) $222,033,417 5,291 $121,024,000 $10,139,000 $11,550,000
City of Boulder (CO) $69,797,640 1,832 $47,649,000 $2,224,000 $2,331,000
City of Richardson (TX) $20,596,060 694 $14,840,000 $831,000 $1,095,000
City of High Point (NC) $5,750,806 204 $4,823,000 $257,000 $307,000
City of Cambridge (MA) $174,810,524 6,129 $98,251,000 $7,038,000 $6,595,000
City of Lowell (MA) $12,294,327 500 $8,002,000 $478,000 $469,000
Douglas County (KS)4 $30,761,147 1,061 $19,290,000 $1,255,000 $1,537,000
City of Columbia (MO) $14,714,063 659 $10,766,000 $679,000 $605,000
City of Norman (OK) $56,174,795 1,544 $29,213,000 $1,856,000 $2,983,000
Wayne County (NC)4 $4,830,802 152 $3,209,000 $239,000 $236,000
City of Lafayette (LA) $16,976,995 580 $11,975,000 $724,000 $749,000
Washington County (TN)4 $18,456,601 553 $10,962,000 $1,373,000 $1,223,000
City of Thousand Oaks (CA) $12,812,741 450 $8,370,000 $461,000 $646,000
City of Charleston (SC) $186,525,751 6,744 $131,328,000 $9,794,000 $9,294,000
City of Waco (TX) $63,690,791 2,184 $42,720,000 $3,782,000 $3,617,000
Robeson County (NC)4 $3,951,968 124 $2,229,000 $128,000 $155,000
Columbia County (GA)4 $87,837 2 $35,000 $4,000 $3,000
Orange County (NC)4 $130,310,347 5,001 $105,151,000 $5,378,000 $7,131,000
City of Savannah (GA) $135,939,836 4,548 $86,377,000 $9,373,000 $5,338,000
Indian River County (FL)4 $24,874,172 651 $12,661,000 $1,127,000 $1,893,000
City of Alexandria (VA) $111,843,508 2,628 $56,913,000 $3,831,000 $3,710,000
Martin County (FL)4 $27,152,370 752 $14,437,000 $1,015,000 $1,994,000
Macon-Bibb County (GA)4 $88,077,521 3,222 $66,058,000 $3,675,000 $3,091,000
City of Springfield (MA) $49,985,490 1,857 $34,734,000 $2,251,000 $2,201,000
Catawba County (NC)4 $49,240,443 1,442 $29,903,000 $1,941,000 $2,223,000
Town of Cary (NC) $16,980,404 628 $13,733,000 $924,000 $977,000
TOTAL Economic Impact of NONPROFIT ARTS AND CULTURE INDUSTRY Spending
SOURCE: Arts and Economic Prosperity 5, Americans for the Arts, 2017. For more information, visit www.AmericansForTheArts.org/EconomicImpact. B–44

Table 3:Total Economic Impact of Expenditures by Nonprofit Arts and Cultural Organizationsand Their Audiences Per Study Region During Fiscal Year 2015
Population Cohort Group C Direct
Population 100,000 to 249,999 Expenditures Full-Time Resident Local State
Sample Size = 50 (Organizations + Audiences) Equivalent Jobs Household Income Government Revenue Government Revenue
Alamance County (NC)4 $8,815,078 299 $5,233,000 $304,000 $405,000
Cumberland County (NJ) $16,743,198 576 $9,272,000 $884,000 $839,000
City of Eugene (OR) $62,203,802 2,401 $45,714,000 $2,366,000 $1,567,000
Middlesex County (CT)4 $32,001,004 995 $17,217,000 $1,249,000 $1,477,000
City of Springfield (MO) $26,865,617 1,065 $20,543,000 $1,265,000 $1,042,000
City of Sioux Falls (SD) $104,551,099 3,535 $70,356,000 $3,350,000 $5,188,000
Pitt County (NC)4 $18,111,847 882 $17,525,000 $751,000 $807,000
City of Providence (RI) $205,780,766 5,115 $121,255,000 $10,024,000 $10,910,000
City of Worcester (MA) $125,690,494 4,062 $72,793,000 $4,434,000 $5,467,000
Montgomery County (TN)4 $5,005,769 181 $2,756,000 $215,000 $380,000
Salt Lake City (UT) $306,562,917 10,479 $215,686,000 $13,080,000 $14,857,000
Cabarrus County (NC)4 $6,942,973 209 $4,333,000 $293,000 $322,000
Richmond County (GA)4 $57,752,872 2,403 $40,466,000 $2,657,000 $1,986,000
City of Tacoma (WA) $137,213,930 3,656 $86,035,000 $5,979,000 $7,977,000
Doña Ana County (NM)4 $33,111,356 743 $18,032,000 $1,241,000 $2,199,000
New Hanover County (NC)4 $55,805,425 2,076 $44,122,000 $2,933,000 $2,709,000
Arlington County (VA)4 $189,238,696 5,156 $118,675,000 $7,512,000 $6,392,000
City of Irving (TX) $25,453,892 1,031 $20,911,000 $1,151,000 $1,407,000
City of Reno (NV) $89,035,075 2,658 $52,815,000 $2,645,000 $5,323,000
York County (SC)4 $27,035,650 846 $17,057,000 $825,000 $1,189,000
Group C Average $63,175,914 1,997 $40,532,360 $2,734,060 $2,956,680
Group C Median $31,381,076 1,046 $19,916,500 $1,260,000 $1,552,000
TOTAL Economic Impact of NONPROFIT ARTS AND CULTURE INDUSTRY Spending
SOURCE: Arts and Economic Prosperity 5, Americans for the Arts, 2017. For more information, visit www.AmericansForTheArts.org/EconomicImpact. B–45

Table 3:Total Economic Impact of Expenditures by Nonprofit Arts and Cultural Organizationsand Their Audiences Per Study Region During Fiscal Year 2015
Population Cohort Group D Direct
Population 250,000 to 499,999 Expenditures Full-Time Resident Local State
Sample Size = 42 (Organizations + Audiences) Equivalent Jobs Household Income Government Revenue Government Revenue
Buncombe County (NC)4 $68,884,580 2,233 $51,258,000 $3,472,000 $3,811,000
Alachua County (FL)4 $104,455,740 2,847 $60,433,000 $3,987,000 $5,124,000
Greater Green Bay Area (WI)4 $36,318,081 1,311 $25,617,000 $1,369,000 $1,820,000
City of Orlando (FL) $189,224,687 6,907 $162,458,000 $6,907,000 $8,703,000
City of Lincoln (NE) $98,995,372 2,976 $74,020,000 $4,743,000 $5,086,000
Southeastern Connecticut Region (CT)4 $168,373,548 4,460 $83,747,000 $3,889,000 $6,591,000
Erie County (PA)4 $42,238,964 1,456 $29,795,000 $1,601,000 $2,386,000
San Luis Obispo County (CA)4 $27,722,589 916 $16,842,000 $1,101,000 $1,650,000
City of Newark (NJ) $178,328,298 4,963 $133,752,000 $7,208,000 $8,360,000
Leon County (FL)4 $201,870,286 7,161 $125,694,000 $10,926,000 $15,646,000
Rutherford County (TN)4 $31,169,593 1,054 $18,266,000 $1,396,000 $1,992,000
St. Lucie County (FL)4 $7,817,584 222 $4,576,000 $288,000 $496,000
Greater Spartanburg Area (SC)4 $32,041,796 1,130 $22,372,000 $1,110,000 $1,549,000
Durham County (NC)4 $154,170,023 5,722 $132,528,000 $6,960,000 $6,397,000
City of St. Paul (MN)2 $476,872,921 13,406 $335,781,000 $10,784,000 $40,249,000
Hamilton County (IN)4 $58,107,621 1,921 $34,068,000 $2,087,000 $3,562,000
Osceola County (FL)4 $3,654,064 113 $2,501,000 $88,000 $235,000
Escambia County (FL)4 $88,814,610 2,932 $58,223,000 $4,410,000 $6,223,000
Lexington-Fayette Urban County (KY)4 $32,114,147 1,185 $29,247,000 $840,000 $2,357,000
Lake County (FL)4 $9,154,082 201 $3,692,000 $380,000 $635,000
City of Riverside (CA) $42,990,015 1,268 $28,968,000 $1,784,000 $2,746,000
Cumberland County (NC)4 $59,176,053 1,867 $38,161,000 $2,924,000 $3,189,000
Collier County (FL)4 $107,686,848 2,923 $57,399,000 $3,560,000 $7,193,000
Hamilton County (TN)4 $172,479,680 6,345 $144,945,000 $7,284,000 $12,582,000
Manatee County (FL)4 $47,429,005 1,260 $23,956,000 $2,221,000 $3,562,000
City of Tampa (FL) $349,227,738 11,889 $262,991,000 $16,937,000 $24,867,000
Forsyth County (NC)4 $156,789,835 5,559 $129,468,000 $6,052,000 $8,710,000
Mercer County (NJ)4 $40,809,095 1,367 $24,778,000 $2,144,000 $1,936,000
City of Wichita (KS) $94,725,128 2,841 $70,925,000 $4,985,000 $4,526,000
Clackamas County (OR)4 $14,837,677 417 $8,027,000 $491,000 $708,000
TOTAL Economic Impact of NONPROFIT ARTS AND CULTURE INDUSTRY Spending
SOURCE: Arts and Economic Prosperity 5, Americans for the Arts, 2017. For more information, visit www.AmericansForTheArts.org/EconomicImpact. B–46

Table 3:Total Economic Impact of Expenditures by Nonprofit Arts and Cultural Organizationsand Their Audiences Per Study Region During Fiscal Year 2015
Population Cohort Group D Direct
Population 250,000 to 499,999 Expenditures Full-Time Resident Local State
Sample Size = 42 (Organizations + Audiences) Equivalent Jobs Household Income Government Revenue Government Revenue
Sarasota County (FL)4 $295,004,458 7,445 $220,677,000 $12,495,000 $19,944,000
City of Minneapolis (MN)2 $540,679,591 15,264 $381,858,000 $12,170,000 $45,634,000
Berks County (PA)4 $18,945,574 625 $11,551,000 $785,000 $1,095,000
City of Miami (FL) $750,175,354 21,198 $685,600,000 $31,350,000 $48,607,000
City of Raleigh (NC) $531,657,111 18,894 $356,720,000 $25,817,000 $27,648,000
Santa Barbara County (CA)4 $198,599,045 5,857 $131,421,000 $8,326,000 $10,737,000
Seminole County (FL)4 $16,559,388 464 $10,682,000 $851,000 $1,188,000
City of Virginia Beach (VA) $87,731,519 2,875 $52,494,000 $3,739,000 $3,285,000
City of Atlanta (GA) $604,555,935 19,392 $478,089,000 $27,322,000 $27,118,000
City of Mesa (AZ) $29,638,169 1,024 $24,996,000 $1,371,000 $1,723,000
City of Kansas City (MO) $244,211,834 7,515 $220,798,000 $7,918,000 $10,856,000
Morris County (NJ)4 $31,813,167 982 $17,218,000 $1,404,000 $1,781,000
Group D Average $153,477,400 4,771 $113,966,476 $6,082,762 $9,345,405
Group D Median $88,273,065 2,844 $54,946,500 $3,649,500 $4,168,500
TOTAL Economic Impact of NONPROFIT ARTS AND CULTURE INDUSTRY Spending
SOURCE: Arts and Economic Prosperity 5, Americans for the Arts, 2017. For more information, visit www.AmericansForTheArts.org/EconomicImpact. B–47

Table 3:Total Economic Impact of Expenditures by Nonprofit Arts and Cultural Organizationsand Their Audiences Per Study Region During Fiscal Year 2015
Population Cohort Group E Direct
Population 500,000 to 999,999 Expenditures Full-Time Resident Local State
Sample Size = 25 (Organizations + Audiences) Equivalent Jobs Household Income Government Revenue Government Revenue
Sonoma County (CA)4 $80,408,528 2,684 $47,873,000 $3,167,000 $4,210,000
Volusia County (FL)4 $48,735,871 1,472 $32,370,000 $2,980,000 $4,016,000
Guilford County (NC)4 $162,234,593 5,963 $112,060,000 $7,299,000 $8,293,000
Dane County (WI)4 $249,901,197 9,154 $183,574,000 $9,943,000 $13,953,000
Brevard County (FL)4 $10,624,943 415 $7,711,000 $439,000 $734,000
Washington County (OR)4 $21,086,013 942 $14,947,000 $765,000 $795,000
Johnson County (KS)4 $22,774,826 875 $14,761,000 $874,000 $1,161,000
City of Louisville (KY) $462,506,744 17,529 $353,818,000 $10,786,000 $32,088,000
City of Baltimore (MD) $606,008,412 15,052 $392,817,000 $27,740,000 $26,734,000
Polk County (FL)4 $46,589,847 1,469 $32,345,000 $2,569,000 $3,703,000
City of Boston (MA) $1,354,137,061 45,889 $908,937,000 $34,909,000 $52,418,000
District of Columbia (DC)3,6 $2,906,271,526 39,720 $1,234,017,000 $193,041,000 $0
City of Nashville-Davidson County (TN) $429,340,841 14,277 $309,406,000 $19,642,000 $31,470,000
City of El Paso (TX) $103,447,461 4,193 $73,708,000 $5,795,000 $6,352,000
Lee County (FL)4 $140,096,048 3,875 $89,250,000 $7,565,000 $11,238,000
City of Fort Worth (TX) $450,630,818 14,480 $337,917,000 $26,552,000 $29,403,000
City of Indianapolis (IN) $440,530,109 14,729 $361,653,000 $17,826,000 $29,907,000
City and County of San Francisco (CA) $1,448,353,608 39,699 $1,006,718,000 $53,862,000 $77,227,000
Prince George's County (MD)4 $58,693,259 1,160 $31,096,000 $2,353,000 $2,722,000
Pinellas County (FL)4 $240,977,042 7,211 $155,244,000 $11,621,000 $18,130,000
Shelby County (TN)4 $197,328,182 6,138 $160,806,000 $8,332,000 $14,044,000
Fairfield County (CT)4 $235,239,618 6,789 $142,288,000 $9,375,000 $11,239,000
Westchester County (NY)4 $172,259,432 5,179 $126,199,000 $13,957,000 $11,820,000
Fulton County (GA)4 $618,975,337 19,842 $490,550,000 $27,881,000 $27,670,000
Wake County (NC)4 $557,154,477 19,873 $377,750,000 $27,110,000 $29,095,000
Group E Average $442,572,232 11,944 $279,912,600 $21,055,320 $17,936,880
Group E Median $235,239,618 6,789 $155,244,000 $9,943,000 $11,820,000
TOTAL Economic Impact of NONPROFIT ARTS AND CULTURE INDUSTRY Spending
SOURCE: Arts and Economic Prosperity 5, Americans for the Arts, 2017. For more information, visit www.AmericansForTheArts.org/EconomicImpact. B–48

Table 3:Total Economic Impact of Expenditures by Nonprofit Arts and Cultural Organizationsand Their Audiences Per Study Region During Fiscal Year 2015
Population Cohort Group F Direct
Population 1,000,000 or More Expenditures Full-Time Resident Local State
Sample Size = 21 (Organizations + Audiences) Equivalent Jobs Household Income Government Revenue Government Revenue
Mecklenburg County (NC)4 $242,723,621 7,652 $185,664,000 $9,804,000 $11,844,000
City of San José (CA) $191,209,479 4,255 $91,719,000 $5,866,000 $7,612,000
Montgomery County (MD)4 $183,216,256 3,807 $84,248,000 $7,052,000 $7,937,000
Fairfax County (VA)4 $271,599,133 6,220 $145,515,000 $9,268,000 $10,033,000
Allegheny County (PA)4 $1,059,384,911 32,211 $640,526,000 $47,724,000 $67,397,000
Greater Columbus Area (OH)4 $412,259,509 14,980 $373,393,000 $20,321,000 $26,453,000
Orange County (FL)4 $264,599,775 9,630 $218,241,000 $9,853,000 $12,263,000
City of Dallas (TX) $891,170,549 33,554 $856,249,000 $45,100,000 $52,132,000
Hillsborough County (FL)4 $433,212,984 14,962 $329,133,000 $20,950,000 $30,964,000
City of San Diego (CA) $1,099,934,358 35,914 $894,406,000 $48,122,000 $67,871,000
Palm Beach County (FL)4 $345,284,856 8,237 $188,770,000 $15,787,000 $17,977,000
City of San Antonio (TX) $423,432,575 15,193 $367,271,000 $23,606,000 $31,693,000
Sacramento County (CA)4 $166,723,613 5,888 $133,213,000 $8,856,000 $10,998,000
City of Phoenix (AZ) $401,780,785 12,815 $285,526,000 $19,544,000 $24,950,000
City and County of Philadelphia (PA) $1,614,100,129 37,590 $930,418,000 $81,093,000 $75,979,000
Broward County (FL)4 $414,232,820 11,078 $268,867,000 $20,107,000 $19,951,000
Santa Clara County (CA)4 $251,039,499 5,816 $127,837,000 $9,434,000 $11,667,000
Riverside County (CA)4 $125,171,944 3,683 $80,448,000 $5,653,000 $7,162,000
Miami-Dade County (FL)4 $1,430,512,813 40,944 $1,305,508,000 $60,648,000 $96,213,000
City of Chicago (IL) $3,211,736,053 85,248 $1,995,330,000 $182,015,000 $154,469,000
Harris County (TX)4 $1,094,046,389 25,102 $785,492,000 $56,045,000 $60,644,000
Group F Average $691,779,621 19,751 $489,894,000 $33,659,429 $38,390,905
Group F Median $412,259,509 12,815 $285,526,000 $20,107,000 $24,950,000
Average $163,016,374 4,699 $111,082,974 $7,494,237 $8,345,430
Median $35,750,645 1,131 $23,154,000 $1,407,000 $1,961,000
TOTAL Economic Impact of NONPROFIT ARTS AND CULTURE INDUSTRY Spending
ALL CITY/COUNTY STUDY REGIONS
SOURCE: Arts and Economic Prosperity 5, Americans for the Arts, 2017. For more information, visit www.AmericansForTheArts.org/EconomicImpact. B–49

Table 3:Total Economic Impact of Expenditures by Nonprofit Arts and Cultural Organizationsand Their Audiences Per Study Region During Fiscal Year 2015
Regional Study Regions Direct
All Populations Expenditures Full-Time Resident Local State
Sample Size = 81 (Organizations + Audiences) Equivalent Jobs Household Income Government Revenue Government Revenue
High Peaks Region (ME) $1,755,237 46 $850,000 $71,000 $80,000
Wood River Valley (ID) $29,319,137 891 $15,594,000 $705,000 $1,350,000
Southern Oregon Area $100,609,681 3,365 $65,420,000 $6,968,000 $1,755,000
Southwestern Pennsylvania Area $40,734,998 1,160 $24,419,000 $1,084,000 $2,212,000
Greater Portsmouth Area (NH) $58,041,659 1,825 $38,408,000 $3,707,000 $3,061,000
Northeast Oregon Region $1,208,943 39 $657,000 $38,000 $34,000
Toe River Valley (NC) $17,108,663 412 $8,047,000 $524,000 $738,000
Albemarle Region (NC) $6,956,681 209 $3,754,000 $236,000 $301,000
Greater Concord Area (NH) $31,185,366 962 $22,438,000 $1,422,000 $1,332,000
North Central Minnesota Region2 $3,065,952 62 $1,554,000 $49,000 $263,000
Northwest Minnesota Region2 $1,093,783 23 $555,000 $18,000 $88,000
Monadnock Region (NH) $18,551,485 659 $12,724,000 $963,000 $941,000
Bismarck-Mandan Region (ND) $43,504,210 1,670 $29,279,000 $1,282,000 $2,441,000
Greater Minot Region (ND) $13,510,471 303 $6,081,000 $465,000 $696,000
Greater Burlington Area (VT) $95,159,453 3,671 $60,485,000 $2,475,000 $6,616,000
Greater Charlottesville Area (VA) $121,810,439 2,131 $54,685,000 $5,717,000 $3,844,000
Brainerd Lakes Region (MN)2 $3,638,540 95 $2,282,000 $62,000 $290,000
East Central Minnesota Region2 $9,726,894 172 $4,248,000 $150,000 $775,000
Northwest Connecticut Region $34,360,637 812 $16,727,000 $1,447,000 $1,903,000
Central Oregon Region $34,665,381 968 $18,522,000 $1,482,000 $939,000
Greater Fargo-Moorhead Area (ND/MN) $45,667,895 1,708 $33,157,000 $1,394,000 $2,553,000
Black Hills Region (SD) $114,309,068 3,573 $70,882,000 $3,783,000 $6,247,000
Greater Kingsport Area (TN) $29,508,688 793 $16,034,000 $1,263,000 $1,749,000
Lake Region (MN)2 $9,824,487 273 $5,952,000 $161,000 $746,000
South Central Minnesota Region2 $13,600,341 348 $7,729,000 $265,000 $1,058,000
Greater Sioux Falls Area (SD) $105,447,594 3,567 $71,135,000 $3,380,000 $5,232,000
Southwest Tennessee Development District $6,279,267 236 $3,949,000 $205,000 $327,000
Northwest Tennessee Development District $12,054,723 259 $5,426,000 $365,000 $652,000
Southwest Minnesota Region2 $7,284,325 208 $4,556,000 $130,000 $570,000
Arrowhead Region (MN)2 $39,740,689 1,063 $24,897,000 $827,000 $3,219,000
TOTAL Economic Impact of NONPROFIT ARTS AND CULTURE INDUSTRY Spending
SOURCE: Arts and Economic Prosperity 5, Americans for the Arts, 2017. For more information, visit www.AmericansForTheArts.org/EconomicImpact. B–50

Table 3:Total Economic Impact of Expenditures by Nonprofit Arts and Cultural Organizationsand Their Audiences Per Study Region During Fiscal Year 2015
Regional Study Regions Direct
All Populations Expenditures Full-Time Resident Local State
Sample Size = 81 (Organizations + Audiences) Equivalent Jobs Household Income Government Revenue Government Revenue
Maple Grove and the Northwest Suburbs (MN)2 $4,021,808 99 $2,584,000 $103,000 $339,000
Greater Augusta Area (GA) $57,840,709 2,405 $40,501,000 $2,661,000 $1,989,000
Upper Cumberland Development District (TN) $11,112,731 327 $6,312,000 $436,000 $678,000
City of Huntsville/Madison County (AL) $89,901,300 3,073 $53,530,000 $3,133,000 $3,467,000
Northeast Commission (NC) $75,954,504 1,916 $36,187,000 $2,617,000 $2,791,000
Greater Ann Arbor Area (MI)5 $99,948,271 2,574 $66,475,000 $2,786,000 $9,966,000
Greater Fox Cities Region (WI) $58,357,431 1,613 $32,445,000 $2,790,000 $2,725,000
Central Minnesota Region2 $16,434,387 468 $10,531,000 $321,000 $1,379,000
South Central Tennessee Development District $14,967,689 392 $7,349,000 $569,000 $916,000
Northwest Arkansas Region $131,197,094 4,647 $92,899,000 $3,466,000 $10,792,000
Southeast Minnesota Region2 $25,575,860 716 $15,757,000 $412,000 $2,171,000
First Tennessee Development District $53,447,994 1,481 $29,564,000 $2,821,000 $3,277,000
Greater Harrisburg Area (PA) $20,094,451 763 $16,347,000 $705,000 $1,292,000
Greater New Haven Area (CT) $134,689,811 5,667 $92,553,000 $6,340,000 $7,236,000
Treasure Coast Region (FL) $59,844,126 1,625 $31,674,000 $2,430,000 $4,383,000
Greater Des Moines Region (IA) $185,038,511 5,677 $124,804,000 $7,460,000 $9,308,000
Southeast Tennessee Development District $183,369,583 6,607 $150,096,000 $7,688,000 $13,233,000
Greater Knoxville Region (TN) $145,927,413 5,503 $104,004,000 $8,398,000 $10,242,000
Greater Columbia Area (SC) $64,671,086 2,630 $55,052,000 $3,333,000 $3,963,000
Pikes Peak Region (CO) $153,262,052 5,070 $100,801,000 $10,849,000 $5,052,000
Lehigh Valley Region (PA) $186,385,587 6,908 $140,215,000 $7,095,000 $11,710,000
Greater Sarasota/Bradenton Area (FL) $342,433,463 8,705 $244,633,000 $14,716,000 $23,506,000
Dayton Region (OH) $213,686,813 8,829 $153,262,000 $10,770,000 $13,085,000
Richmond & Tri-Cities Region (VA) $360,072,116 10,702 $204,206,000 $14,655,000 $16,976,000
Memphis Area Association of Governments (TN) $197,558,353 6,145 $160,968,000 $8,341,000 $14,060,000
Eastern Region (NC) $84,729,231 2,857 $58,982,000 $3,926,000 $4,349,000
Advantage West Region (NC) $239,862,074 7,064 $149,553,000 $11,539,000 $12,901,000
Southeast Commission (NC) $127,431,595 4,347 $90,030,000 $6,336,000 $6,481,000
Greater Fairfax Area (VA) $301,069,549 6,952 $155,846,000 $10,479,000 $11,974,000
Greater Tulsa Region (OK) $228,871,178 7,876 $156,636,000 $9,441,000 $12,309,000
TOTAL Economic Impact of NONPROFIT ARTS AND CULTURE INDUSTRY Spending
SOURCE: Arts and Economic Prosperity 5, Americans for the Arts, 2017. For more information, visit www.AmericansForTheArts.org/EconomicImpact. B–51

Table 3:Total Economic Impact of Expenditures by Nonprofit Arts and Cultural Organizationsand Their Audiences Per Study Region During Fiscal Year 2015
Regional Study Regions Direct
All Populations Expenditures Full-Time Resident Local State
Sample Size = 81 (Organizations + Audiences) Equivalent Jobs Household Income Government Revenue Government Revenue
East Tennessee Development District $172,191,940 5,927 $109,067,000 $9,342,000 $10,988,000
West Valley Region (AZ) $22,984,470 758 $18,005,000 $1,087,000 $1,503,000
Greater St. Louis Area (MO) $590,934,189 19,129 $476,226,000 $28,586,000 $29,110,000
Western New York $352,149,882 10,160 $208,246,000 $27,497,000 $12,801,000
Greater Oklahoma City Region (OK) $602,747,142 20,571 $417,582,000 $28,183,000 $33,536,000
Piedmont Triad Partnership (NC) $392,933,673 14,234 $292,819,000 $16,467,000 $20,770,000
Greater Portland Area (OR) $330,402,755 11,505 $268,293,000 $13,663,000 $13,979,000
Greater Kansas City Metropolitan Area (MO/KS) $276,098,121 8,970 $253,634,000 $10,097,000 $14,473,000
Greater Nashville Regional Council (TN) $488,058,714 16,228 $345,770,000 $22,329,000 $35,566,000
Research Triangle Regional Partnership (NC) $863,243,852 31,219 $628,044,000 $40,218,000 $43,560,000
Greater Tampa/St. Petersburg Area (FL) $674,190,026 22,173 $484,377,000 $32,571,000 $49,094,000
Charlotte Regional Partnership (NC) $332,385,209 10,340 $242,047,000 $13,441,000 $16,057,000
Greater Charlotte Region (NC/SC) $359,420,859 11,186 $259,104,000 $14,266,000 $17,246,000
Seven-County Metro Area (MN)2 $1,066,866,224 29,953 $749,630,000 $24,208,000 $90,046,000
Central Florida Region $399,917,970 13,764 $307,542,000 $17,160,000 $22,774,000
Greater Philadelphia Region (PA) $1,884,650,965 55,225 $1,296,510,000 $98,659,000 $125,606,000
Greater Washington Region (DC/MD/VA) $3,750,332,794 59,423 $1,680,795,000 $224,268,000 $32,735,000
Metro Atlanta Area (GA) $719,820,787 23,514 $565,754,000 $32,929,000 $31,579,000
Greater Atlanta Region (GA) $730,561,881 23,943 $574,219,000 $33,475,000 $32,014,000
Greater Houston Region (TX) $1,117,403,061 25,817 $801,630,000 $57,332,000 $62,007,000
Dallas-Fort Worth-Arlington MSA (TX) $1,473,366,015 52,848 $1,300,922,000 $78,216,000 $88,992,000
Regional Average $265,656,074 7,679 $178,943,926 $12,731,457 $13,074,049
Regional Median $95,159,453 2,857 $58,982,000 $3,380,000 $4,349,000
TOTAL Economic Impact of NONPROFIT ARTS AND CULTURE INDUSTRY Spending
SOURCE: Arts and Economic Prosperity 5, Americans for the Arts, 2017. For more information, visit www.AmericansForTheArts.org/EconomicImpact. B–52

Table 3:Total Economic Impact of Expenditures by Nonprofit Arts and Cultural Organizationsand Their Audiences Per Study Region During Fiscal Year 2015
Statewide Study Regions Direct
All Populations Expenditures Full-Time Resident Local State
Sample Size = 20 (Organizations + Audiences) Equivalent Jobs Household Income Government Revenue Government Revenue
State of Vermont $122,884,314 4,268 $71,747,000 $2,597,000 $7,188,000
State of North Dakota $109,214,164 4,006 $74,735,000 $3,676,000 $6,317,000
State of Delaware $149,903,883 4,062 $111,640,000 $1,805,000 $8,647,000
State of Maine $150,545,495 4,190 $93,219,000 $5,647,000 $6,651,000
State of Hawai'i $205,643,357 5,968 $154,068,000 $4,039,000 $19,163,000
State of Nevada $471,725,264 10,494 $250,658,000 $12,001,000 $24,827,000
State of Connecticut $797,249,391 23,114 $524,913,000 $29,743,000 $42,528,000
State of Oklahoma $872,830,632 29,165 $588,207,000 $38,107,000 $46,397,000
State of Oregon $687,022,095 22,299 $469,461,000 $29,319,000 $23,636,000
State of Minnesota2 $1,196,851,482 33,381 $827,691,000 $26,603,000 $100,605,000
State of Wisconsin $656,857,267 26,695 $555,512,000 $34,718,000 $40,510,000
State of Maryland $961,572,264 25,248 $643,499,000 $41,770,000 $45,596,000
State of Missouri $1,039,009,480 31,925 $805,621,000 $42,612,000 $46,998,000
State of Tennessee $1,139,040,994 37,602 $818,501,000 $52,096,000 $79,697,000
State of Massachusetts $2,266,299,548 73,288 $1,435,631,000 $62,997,000 $96,187,000
State of New Jersey $519,814,484 14,342 $340,048,000 $17,305,000 $23,659,000
State of North Carolina $2,116,540,138 71,977 $1,497,662,000 $94,544,000 $106,909,000
State of Pennsylvania $3,388,145,326 100,114 $2,205,857,000 $178,522,000 $223,594,000
State of Illinois $4,033,643,401 111,068 $2,998,841,000 $247,032,000 $231,495,000
State of Florida $4,676,207,338 132,366 $3,348,159,000 $201,165,000 $291,176,000
Statewide Average $1,278,050,016 38,279 $890,783,500 $56,314,900 $73,589,000
Statewide Median $835,040,012 25,972 $571,859,500 $32,230,500 $44,062,000
TOTAL Economic Impact of NONPROFIT ARTS AND CULTURE INDUSTRY Spending
SOURCE: Arts and Economic Prosperity 5, Americans for the Arts, 2017. For more information, visit www.AmericansForTheArts.org/EconomicImpact. B–53

Table 3:Total Economic Impact of Expenditures by Nonprofit Arts and Cultural Organizationsand Their Audiences Per Study Region During Fiscal Year 2015
Individual Arts Districts Direct
All Populations Expenditures Full-Time Resident Local State
Sample Size = 12 (Organizations + Audiences) Equivalent Jobs Household Income Government Revenue Government Revenue
James River Arts & Cultural District $10,153,704 234 $4,945,000 $444,000 $454,000
Center City Charlotte $216,498,297 6,830 $166,089,000 $8,713,000 $10,566,000
Loch Haven Cultural Park $59,843,353 2,185 $48,518,000 $2,413,000 $3,005,000
Downtown Colorado Springs Creative District $37,045,265 1,239 $24,954,000 $2,304,000 $1,124,000
Fort Worth Cultural District $264,749,452 8,504 $198,470,000 $15,599,000 $17,279,000
Dallas Arts District $395,802,179 14,932 $380,988,000 $19,996,000 $23,142,000
Grand Center Arts & Entertainment District $106,414,923 3,441 $89,009,000 $4,712,000 $5,112,000
Balboa Park Cultural District $670,148,345 22,578 $555,306,000 $28,904,000 $40,591,000
East End Cultural District $8,206,138 185 $5,699,000 $447,000 $504,000
Houston Museum District Association $646,073,449 14,783 $461,644,000 $33,392,000 $36,369,000
Midtown Cultural District $8,831,743 201 $6,259,000 $463,000 $510,000
Washington Avenue Cultural District $4,717,237 109 $3,402,000 $240,000 $258,000
Arts District Average $202,373,674 6,268 $162,106,917 $9,802,250 $11,576,167
Arts District Median $83,129,138 2,813 $68,763,500 $3,562,500 $4,058,500
Explanation of the Outliers and Exclusions:1
2
3
4
5
6 The economic impact findings for the District of Columbia exclude state government revenues due to Washington, DC's unique status as a study region with no state government.
The expenditure and attendance data collected from eligible organizations in this study region were collected for fiscal year 2014 (rather than 2015), and audience-intercepts surveys collected from attendees to cultural events in this study region were collected during calendar year 2015 (rather than 2016).
These county study regions are excluded from the national extrapolations. The national extrapolations are based on city study regions only.
Both the organizational expenditure and attendance findings and the audience expenditure findings for these city study regions were determined by researchers to be outliers when compared to the findings for cohort regions in the same population category. For this reason, these study regions are excluded from the national extrapolations.
The expenditure and attendance data collected from eligible organizations in these study regions were collected for fiscal year 2013 (rather than 2015), and audience-intercepts surveys collected from attendees to cultural events in these study regions were collected during calendar year 2014 (rather than 2016). Where applicable, these study regions are excluded from the national extrapolations.
The organizational expenditure and attendance findings for these city study regions were determined by researchers to be outliers when compared to the findings for cohort regions in the same population category. For this reason, the organizational expenditure and attendance findings for these study regions are excluded from the national extrapolations.
TOTAL Economic Impact of NONPROFIT ARTS AND CULTURE INDUSTRY Spending
SOURCE: Arts and Economic Prosperity 5, Americans for the Arts, 2017. For more information, visit www.AmericansForTheArts.org/EconomicImpact. B–54

Explanation of Table 4:Direct Economic Impact of Expenditures by Nonprofit Arts and Cultural Organizationsand Their Audiences Per Study Region During Fiscal Year 2015
Column Two:
Column Three:
Column Four:
Column Five:
Column Six:
The total amount of revenue that the local government receives (e.g., licenses, fees, taxes) as a direct result of the expenditures generated by each participating study region's nonprofit arts and culture industry. Local government includes the city and county governments located within each participating study region.
The total amount of revenue that the state government receives (e.g., licenses, fees, taxes) as a direct result of the expenditures generated by each participating study region's nonprofit arts and culture industry.
This table presents for each study region the direct economic impact of spending by the nonprofit arts and culture industry—both nonprofit arts and cultural organizations and their audiences—during fiscal year 2015. Summary statistics are calculated for each population group.
The total direct spending by the nonprofit arts and culture industry in each participating study region during fiscal year 2010. This figure is the sum of expenditures made by responding nonprofit arts and cultural organizations and induced event-related audience spending.
The number of full-time equivalent (FTE) jobs directly supported by the expenditures generated by each participating study region's nonprofit arts and culture industry. Economists measure FTE jobs—not the total number of employees—because it is a more accurate measure of total employment. Each FTE job can represent one full-time employee, two employees who work half-time, four employees who work quarter-time, etc.
The total amount of household income paid to study region residents as a direct result of the expenditures generated by each participating study region's nonprofit arts and culture industry. Household income includes salaries, wages, and proprietary income.
The direct impact is a measure of the effect of the initial direct expenditures made by nonprofit arts and cultural organizations and their audiences. It excludes indirect and induced impacts. Because it includes only one round of spending, the direct impact is always smaller than the total impact (which measures the effect of each dollar as it is spent and re-spent within the study region's economy). The direct impact is derived from input-output models that are customized for each participating study region. See Background and Scope of Study and Frequently Used Terms in this Arts & Economic Prosperity 5 National Statistical Report for more information about direct, indirect, and induced economic impacts.
SOURCE: Arts and Economic Prosperity 5, Americans for the Arts, 2017. For more information, visit www.AmericansForTheArts.org/EconomicImpact. B–55

Table 4:Direct Economic Impact of Expenditures by Nonprofit Arts and Cultural Organizationsand Their Audiences Per Study Region During Fiscal Year 2015
Population Cohort Group A Direct
Population Fewer than 50,000 Expenditures Full-Time Resident Local State
Sample Size = 52 (Organizations + Audiences) Equivalent Jobs Household Income Government Revenue Government Revenue
Town of Crested Butte (CO)3 $10,236,226 169 $3,556,000 $264,000 $120,000
City of Pine City (MN)2 $986,727 13 $305,000 $8,000 $41,000
City of Alva (OK) $1,758,487 41 $698,000 $27,000 $27,000
Cook County (MN)2 $4,603,026 96 $1,755,000 $45,000 $232,000
Town of Hillsborough (NC) $5,576,467 114 $2,284,000 $149,000 $167,000
City of Virginia (MN)2 $179,998 3 $70,000 $2,000 $9,000
Town of Jackson (WY)3 $51,247,941 711 $15,527,000 $1,042,000 $1,580,000
City of Guthrie (OK) $3,943,163 50 $1,056,000 $109,000 $134,000
City of Grand Rapids (MN)2 $5,079,985 86 $1,936,000 $51,000 $255,000
Town of Medfield (MA) $3,131,427 68 $1,391,000 $51,000 $39,000
City of Fergus Falls (MN)2 $2,955,589 52 $962,000 $20,000 $63,000
Grundy County (TN)4 $1,026,426 11 $205,000 $29,000 $42,000
City of Falls Church (VA)3 $25,778,223 446 $6,601,000 $454,000 $1,155,000
City of Jamestown (ND) $6,861,385 105 $1,976,000 $232,000 $205,000
City of Waterville (ME)1 $6,292,863 130 $2,330,000 $196,000 $131,000
City of Red Wing (MN)2 $2,228,641 41 $857,000 $15,000 $50,000
City of Durango (CO)1 $18,096,610 376 $7,869,000 $488,000 $215,000
City of Hannibal (MO) $5,092,399 76 $1,505,000 $212,000 $106,000
City of Tullahoma (TN) $1,068,586 17 $351,000 $16,000 $28,000
City of Northfield (MN)2 $2,171,993 41 $804,000 $17,000 $62,000
Town of Carrboro (NC) $7,711,684 167 $3,547,000 $168,000 $205,000
Macon County (TN)4 $170,681 2 $40,000 $2,000 $5,000
City of Laguna Beach (CA)3 $95,363,676 1,180 $26,816,000 $1,760,000 $2,089,000
Hickman County (TN)4 $1,780,511 28 $933,000 $25,000 $52,000
City of Fairfax (VA) $3,692,193 65 $1,408,000 $58,000 $73,000
City of Ponca City (OK) $5,005,936 68 $1,593,000 $92,000 $81,000
City of Paducah (KY)1 $27,447,161 349 $6,694,000 $306,000 $405,000
Mille Lacs County (MN)2 $845,962 9 $285,000 $7,000 $29,000
McNairy County (TN)4 $311,484 4 $57,000 $8,000 $10,000
City of Winona (MN)2 $4,729,059 83 $1,784,000 $33,000 $122,000
DIRECT Economic Impact of NONPROFIT ARTS AND CULTURE INDUSTRY Spending
SOURCE: Arts and Economic Prosperity 5, Americans for the Arts, 2017. For more information, visit www.AmericansForTheArts.org/EconomicImpact. B–56

Table 4:Direct Economic Impact of Expenditures by Nonprofit Arts and Cultural Organizationsand Their Audiences Per Study Region During Fiscal Year 2015
Population Cohort Group A Direct
Population Fewer than 50,000 Expenditures Full-Time Resident Local State
Sample Size = 52 (Organizations + Audiences) Equivalent Jobs Household Income Government Revenue Government Revenue
Door County (WI)4 $24,698,431 383 $8,073,000 $754,000 $757,000
City of Benicia (CA) $4,662,293 92 $1,946,000 $74,000 $103,000
City of Winter Park (FL)3 $45,982,904 794 $14,939,000 $843,000 $1,031,000
City of Rochester (NH)1 $12,256,157 242 $4,764,000 $136,000 $211,000
City of Morgantown (WV)1 $35,474,920 838 $15,493,000 $264,000 $1,186,000
Henry County (TN)4 $725,696 12 $219,000 $17,000 $28,000
City of Fairbanks (AK)1 $18,062,811 349 $7,185,000 $381,000 $453,000
City of Bangor (ME) $10,015,091 162 $3,338,000 $284,000 $255,000
Weakley County (TN)4 $1,386,213 23 $428,000 $38,000 $59,000
Dare County (NC)4 $54,830,946 799 $15,333,000 $1,242,000 $1,163,000
City of Columbia (TN) $7,659,850 131 $2,200,000 $184,000 $295,000
City of Lake Worth (FL)3 $27,269,357 320 $7,420,000 $545,000 $678,000
Clatsop County (OR)4 $13,723,958 221 $4,152,000 $424,000 $228,000
Yadkin County (NC)4 $880,407 19 $373,000 $17,000 $24,000
Greater Belfast Area (ME)4 $7,808,156 94 $2,099,000 $198,000 $254,000
Campbell County (TN)4 $545,633 6 $113,000 $10,000 $21,000
Monroe County (TN)4 $6,694,094 91 $1,869,000 $158,000 $266,000
Lincoln County (OR)4 $10,423,985 169 $3,017,000 $324,000 $215,000
Iron County (UT)4 $76,128,287 1,198 $19,882,000 $2,160,000 $2,093,000
City of St. Louis Park (MN)2 $1,517,141 25 $547,000 $19,000 $49,000
City of Logan (UT)1 $31,325,823 604 $10,595,000 $852,000 $657,000
Gibson County (TN)4 $8,120,677 94 $2,117,000 $117,000 $233,000
Group A Average $13,568,603 217 $4,255,712 $287,058 $345,981
Group A Median $5,334,433 93 $1,941,000 $126,500 $150,500
DIRECT Economic Impact of NONPROFIT ARTS AND CULTURE INDUSTRY Spending
SOURCE: Arts and Economic Prosperity 5, Americans for the Arts, 2017. For more information, visit www.AmericansForTheArts.org/EconomicImpact. B–57

Table 4:Direct Economic Impact of Expenditures by Nonprofit Arts and Cultural Organizationsand Their Audiences Per Study Region During Fiscal Year 2015
Population Cohort Group B Direct
Population 50,000 to 99,999 Expenditures Full-Time Resident Local State
Sample Size = 38 (Organizations + Audiences) Equivalent Jobs Household Income Government Revenue Government Revenue
City of Joplin (MO) $5,351,357 105 $1,966,000 $129,000 $102,000
City of La Crosse (WI) $32,683,467 594 $12,256,000 $580,000 $842,000
McMinn County (TN)4 $7,404,770 106 $2,158,000 $145,000 $244,000
Lafayette County (MS)4 $10,993,057 172 $2,941,000 $124,000 $443,000
Chisago County (MN)2 $2,855,764 33 $820,000 $24,000 $139,000
City of Grand Forks (ND) $5,940,616 98 $2,350,000 $91,000 $141,000
City of Corvallis (OR) $71,870,377 1,219 $21,765,000 $1,027,000 $1,171,000
City of Noblesville (IN) $2,176,812 28 $536,000 $38,000 $74,000
City of Ocala (FL) $55,967,491 779 $16,299,000 $1,101,000 $1,920,000
Lenoir County (NC)4 $13,599,683 217 $4,901,000 $513,000 $432,000
Town of Chapel Hill (NC) $117,021,210 2,721 $62,774,000 $1,690,000 $2,508,000
City of Grand Junction (CO) $17,266,268 248 $7,745,000 $372,000 $160,000
Town of Jupiter (FL) $13,129,339 152 $3,672,000 $257,000 $322,000
Hamblen County (TN)4 $2,019,487 35 $708,000 $40,000 $62,000
City of Delray Beach (FL) $21,434,838 253 $5,811,000 $429,000 $534,000
City of St. Cloud (MN)2 $12,434,341 243 $4,921,000 $110,000 $412,000
City of Portland (ME) $75,600,667 1,062 $27,099,000 $1,139,000 $1,651,000
City of Jackson (TN) $4,718,906 100 $1,878,000 $67,000 $102,000
City of Walnut Creek (CA) $41,529,959 622 $14,589,000 $607,000 $1,078,000
Greene County (TN)4 $4,747,091 70 $1,490,000 $77,000 $140,000
City of Flagstaff (AZ) $89,796,542 1,745 $41,625,000 $2,552,000 $2,406,000
City of Missoula (MT) $72,156,431 1,386 $26,511,000 $1,281,000 $719,000
City of Fort Myers (FL) $49,715,958 759 $16,801,000 $1,047,000 $2,006,000
Putnam County (TN)4 $2,403,665 37 $1,013,000 $31,000 $51,000
Monroe County (FL)4 $85,066,298 1,370 $26,400,000 $1,900,000 $2,974,000
City of Lynchburg (VA) $10,856,440 186 $4,510,000 $285,000 $346,000
City of Duluth (MN)2 $36,026,369 633 $13,314,000 $412,000 $2,029,000
City of Fishers (IN) $34,501,341 526 $10,721,000 $861,000 $1,348,000
City of Carmel (IN) $19,511,320 295 $5,992,000 $479,000 $757,000
City of Sugar Land (TX) $1,170,701 18 $377,000 $51,000 $58,000
DIRECT Economic Impact of NONPROFIT ARTS AND CULTURE INDUSTRY Spending
SOURCE: Arts and Economic Prosperity 5, Americans for the Arts, 2017. For more information, visit www.AmericansForTheArts.org/EconomicImpact. B–58

Table 4:Direct Economic Impact of Expenditures by Nonprofit Arts and Cultural Organizationsand Their Audiences Per Study Region During Fiscal Year 2015
Population Cohort Group B Direct
Population 50,000 to 99,999 Expenditures Full-Time Resident Local State
Sample Size = 38 (Organizations + Audiences) Equivalent Jobs Household Income Government Revenue Government Revenue
City of Asheville (NC) $58,656,070 988 $21,505,000 $1,615,000 $1,642,000
Buchanan County (MO)4 $21,057,998 481 $9,829,000 $365,000 $379,000
City of Boca Raton (FL) $21,815,664 260 $5,835,000 $441,000 $548,000
City of Miami Beach (FL)3 $159,904,541 1,836 $58,817,000 $2,953,000 $4,809,000
Moore County (NC)4 $13,266,262 199 $4,664,000 $182,000 $243,000
Sevier County (TN)4 $45,769,084 681 $11,873,000 $1,676,000 $1,572,000
Cape May County (NJ)4 $19,566,234 270 $5,320,000 $741,000 $646,000
Cleveland County (NC)4 $5,655,197 79 $1,748,000 $125,000 $134,000
Group B Average $33,306,358 542 $12,198,263 $672,553 $924,842
Group B Median $19,538,777 257 $5,823,000 $420,500 $488,500
DIRECT Economic Impact of NONPROFIT ARTS AND CULTURE INDUSTRY Spending
SOURCE: Arts and Economic Prosperity 5, Americans for the Arts, 2017. For more information, visit www.AmericansForTheArts.org/EconomicImpact. B–59

Table 4:Direct Economic Impact of Expenditures by Nonprofit Arts and Cultural Organizationsand Their Audiences Per Study Region During Fiscal Year 2015
Population Cohort Group C Direct
Population 100,000 to 249,999 Expenditures Full-Time Resident Local State
Sample Size = 50 (Organizations + Audiences) Equivalent Jobs Household Income Government Revenue Government Revenue
City of Las Cruces (NM) $19,105,245 244 $6,734,000 $412,000 $701,000
Eau Claire County (WI)4 $10,310,089 184 $4,056,000 $172,000 $245,000
Yamhill County (OR)4 $44,970,477 639 $12,672,000 $756,000 $736,000
City of Lewisville (TX) $1,818,056 33 $730,000 $95,000 $95,000
City of West Palm Beach (FL) $222,033,417 2,618 $60,171,000 $4,444,000 $5,536,000
City of Boulder (CO) $69,797,640 1,071 $28,391,000 $941,000 $1,079,000
City of Richardson (TX) $20,596,060 321 $8,019,000 $356,000 $511,000
City of High Point (NC) $5,750,806 94 $2,153,000 $115,000 $129,000
City of Cambridge (MA) $174,810,524 2,880 $53,701,000 $4,119,000 $3,663,000
City of Lowell (MA) $12,294,327 270 $5,094,000 $231,000 $217,000
Douglas County (KS)4 $30,761,147 608 $12,287,000 $497,000 $717,000
City of Columbia (MO) $14,714,063 311 $5,829,000 $309,000 $267,000
City of Norman (OK) $56,174,795 908 $16,942,000 $950,000 $1,578,000
Wayne County (NC)4 $4,830,802 88 $1,831,000 $110,000 $121,000
City of Lafayette (LA) $16,976,995 299 $6,426,000 $337,000 $355,000
Washington County (TN)4 $18,456,601 307 $5,834,000 $901,000 $700,000
City of Thousand Oaks (CA) $12,812,741 256 $5,584,000 $214,000 $269,000
City of Charleston (SC) $186,525,751 3,444 $68,729,000 $5,204,000 $4,519,000
City of Waco (TX) $63,690,791 1,074 $23,212,000 $1,979,000 $1,687,000
Robeson County (NC)4 $3,951,968 72 $1,547,000 $73,000 $76,000
Columbia County (GA)4 $87,837 1 $14,000 $2,000 $2,000
Orange County (NC)4 $130,310,347 3,002 $68,606,000 $2,008,000 $2,880,000
City of Savannah (GA) $135,939,836 2,423 $45,402,000 $5,289,000 $2,815,000
Indian River County (FL)4 $24,874,172 367 $8,274,000 $701,000 $1,188,000
City of Alexandria (VA) $111,843,508 1,550 $33,074,000 $1,896,000 $1,976,000
Martin County (FL)4 $27,152,370 407 $8,772,000 $556,000 $1,217,000
Macon-Bibb County (GA)4 $88,077,521 1,361 $31,090,000 $1,767,000 $1,466,000
City of Springfield (MA) $49,985,490 832 $19,112,000 $1,071,000 $769,000
Catawba County (NC)4 $49,240,443 757 $15,495,000 $1,060,000 $1,235,000
Town of Cary (NC) $16,980,404 299 $6,335,000 $433,000 $430,000
DIRECT Economic Impact of NONPROFIT ARTS AND CULTURE INDUSTRY Spending
SOURCE: Arts and Economic Prosperity 5, Americans for the Arts, 2017. For more information, visit www.AmericansForTheArts.org/EconomicImpact. B–60

Table 4:Direct Economic Impact of Expenditures by Nonprofit Arts and Cultural Organizationsand Their Audiences Per Study Region During Fiscal Year 2015
Population Cohort Group C Direct
Population 100,000 to 249,999 Expenditures Full-Time Resident Local State
Sample Size = 50 (Organizations + Audiences) Equivalent Jobs Household Income Government Revenue Government Revenue
Alamance County (NC)4 $8,815,078 171 $3,232,000 $145,000 $203,000
Cumberland County (NJ) $16,743,198 319 $5,820,000 $496,000 $416,000
City of Eugene (OR) $62,203,802 1,347 $27,040,000 $709,000 $467,000
Middlesex County (CT)4 $32,001,004 553 $11,211,000 $771,000 $810,000
City of Springfield (MO) $26,865,617 477 $9,430,000 $600,000 $488,000
City of Sioux Falls (SD) $104,551,099 1,895 $34,654,000 $1,562,000 $2,677,000
Pitt County (NC)4 $18,111,847 489 $10,789,000 $275,000 $289,000
City of Providence (RI) $205,780,766 2,602 $64,522,000 $2,606,000 $4,688,000
City of Worcester (MA) $125,690,494 2,033 $40,929,000 $2,093,000 $2,653,000
Montgomery County (TN)4 $5,005,769 104 $1,782,000 $136,000 $229,000
Salt Lake City (UT) $306,562,917 4,819 $101,895,000 $6,190,000 $7,092,000
Cabarrus County (NC)4 $6,942,973 118 $2,471,000 $144,000 $169,000
Richmond County (GA)4 $57,752,872 1,115 $21,894,000 $1,176,000 $860,000
City of Tacoma (WA) $137,213,930 1,885 $45,981,000 $2,296,000 $3,298,000
Doña Ana County (NM)4 $33,111,356 430 $11,346,000 $730,000 $1,210,000
New Hanover County (NC)4 $55,805,425 1,139 $22,681,000 $1,407,000 $1,395,000
Arlington County (VA)4 $189,238,696 3,328 $81,569,000 $3,023,000 $2,959,000
City of Irving (TX) $25,453,892 404 $10,963,000 $619,000 $628,000
City of Reno (NV) $89,035,075 1,267 $28,608,000 $1,391,000 $2,566,000
York County (SC)4 $27,035,650 504 $11,439,000 $339,000 $529,000
Group C Average $63,175,914 1,034 $22,287,440 $1,274,120 $1,416,100
Group C Median $31,381,076 529 $11,392,500 $719,500 $752,500
DIRECT Economic Impact of NONPROFIT ARTS AND CULTURE INDUSTRY Spending
SOURCE: Arts and Economic Prosperity 5, Americans for the Arts, 2017. For more information, visit www.AmericansForTheArts.org/EconomicImpact. B–61

Table 4:Direct Economic Impact of Expenditures by Nonprofit Arts and Cultural Organizationsand Their Audiences Per Study Region During Fiscal Year 2015
Population Cohort Group D Direct
Population 250,000 to 499,999 Expenditures Full-Time Resident Local State
Sample Size = 42 (Organizations + Audiences) Equivalent Jobs Household Income Government Revenue Government Revenue
Buncombe County (NC)4 $68,884,580 1,150 $25,914,000 $1,794,000 $1,845,000
Alachua County (FL)4 $104,455,740 1,609 $33,487,000 $1,318,000 $2,483,000
Greater Green Bay Area (WI)4 $36,318,081 598 $13,867,000 $754,000 $809,000
City of Orlando (FL) $189,224,687 2,998 $75,754,000 $2,828,000 $3,331,000
City of Lincoln (NE) $98,995,372 1,597 $40,984,000 $1,969,000 $2,262,000
Southeastern Connecticut Region (CT)4 $168,373,548 2,620 $55,276,000 $2,551,000 $3,626,000
Erie County (PA)4 $42,238,964 785 $15,861,000 $579,000 $1,033,000
San Luis Obispo County (CA)4 $27,722,589 499 $10,084,000 $604,000 $802,000
City of Newark (NJ) $178,328,298 2,869 $84,524,000 $2,434,000 $3,325,000
Leon County (FL)4 $201,870,286 2,529 $48,806,000 $6,970,000 $9,104,000
Rutherford County (TN)4 $31,169,593 603 $10,871,000 $731,000 $992,000
St. Lucie County (FL)4 $7,817,584 130 $2,974,000 $135,000 $225,000
Greater Spartanburg Area (SC)4 $32,041,796 540 $12,542,000 $516,000 $667,000
Durham County (NC)4 $154,170,023 2,907 $74,173,000 $2,764,000 $2,254,000
City of St. Paul (MN)2 $476,872,921 7,148 $176,100,000 $5,313,000 $13,728,000
Hamilton County (IN)4 $58,107,621 873 $17,672,000 $1,407,000 $2,240,000
Osceola County (FL)4 $3,654,064 73 $1,687,000 $32,000 $103,000
Escambia County (FL)4 $88,814,610 1,538 $30,685,000 $2,139,000 $3,171,000
Lexington-Fayette Urban County (KY)4 $32,114,147 533 $13,379,000 $268,000 $935,000
Lake County (FL)4 $9,154,082 121 $2,103,000 $207,000 $374,000
City of Riverside (CA) $42,990,015 737 $16,600,000 $755,000 $1,416,000
Cumberland County (NC)4 $59,176,053 1,176 $24,485,000 $1,113,000 $1,360,000
Collier County (FL)4 $107,686,848 1,753 $39,282,000 $1,881,000 $4,107,000
Hamilton County (TN)4 $172,479,680 3,239 $73,568,000 $3,413,000 $5,878,000
Manatee County (FL)4 $47,429,005 703 $13,816,000 $1,279,000 $2,227,000
City of Tampa (FL) $349,227,738 5,262 $121,307,000 $7,958,000 $11,403,000
Forsyth County (NC)4 $156,789,835 2,556 $64,613,000 $2,230,000 $3,364,000
Mercer County (NJ)4 $40,809,095 704 $14,604,000 $1,160,000 $914,000
City of Wichita (KS) $94,725,128 1,543 $39,055,000 $1,959,000 $1,862,000
Clackamas County (OR)4 $14,837,677 229 $4,732,000 $235,000 $281,000
DIRECT Economic Impact of NONPROFIT ARTS AND CULTURE INDUSTRY Spending
SOURCE: Arts and Economic Prosperity 5, Americans for the Arts, 2017. For more information, visit www.AmericansForTheArts.org/EconomicImpact. B–62

Table 4:Direct Economic Impact of Expenditures by Nonprofit Arts and Cultural Organizationsand Their Audiences Per Study Region During Fiscal Year 2015
Population Cohort Group D Direct
Population 250,000 to 499,999 Expenditures Full-Time Resident Local State
Sample Size = 42 (Organizations + Audiences) Equivalent Jobs Household Income Government Revenue Government Revenue
Sarasota County (FL)4 $295,004,458 3,958 $126,431,000 $5,214,000 $9,422,000
City of Minneapolis (MN)2 $540,679,591 8,816 $200,061,000 $5,963,000 $15,397,000
Berks County (PA)4 $18,945,574 297 $6,216,000 $491,000 $573,000
City of Miami (FL) $750,175,354 8,060 $277,431,000 $10,867,000 $18,141,000
City of Raleigh (NC) $531,657,111 9,133 $164,625,000 $12,143,000 $12,256,000
Santa Barbara County (CA)4 $198,599,045 3,316 $78,777,000 $3,507,000 $4,448,000
Seminole County (FL)4 $16,559,388 260 $6,136,000 $299,000 $536,000
City of Virginia Beach (VA) $87,731,519 1,602 $28,890,000 $1,927,000 $1,803,000
City of Atlanta (GA) $604,555,935 8,772 $231,608,000 $11,588,000 $10,774,000
City of Mesa (AZ) $29,638,169 532 $13,889,000 $518,000 $666,000
City of Kansas City (MO) $244,211,834 3,461 $108,693,000 $2,886,000 $3,852,000
Morris County (NJ)4 $31,813,167 503 $9,888,000 $726,000 $987,000
Group D Average $153,477,400 2,341 $57,415,476 $2,700,595 $3,928,000
Group D Median $88,273,065 1,541 $29,787,500 $1,837,500 $2,233,500
DIRECT Economic Impact of NONPROFIT ARTS AND CULTURE INDUSTRY Spending
SOURCE: Arts and Economic Prosperity 5, Americans for the Arts, 2017. For more information, visit www.AmericansForTheArts.org/EconomicImpact. B–63

Table 4:Direct Economic Impact of Expenditures by Nonprofit Arts and Cultural Organizationsand Their Audiences Per Study Region During Fiscal Year 2015
Population Cohort Group E Direct
Population 500,000 to 999,999 Expenditures Full-Time Resident Local State
Sample Size = 25 (Organizations + Audiences) Equivalent Jobs Household Income Government Revenue Government Revenue
Sonoma County (CA)4 $80,408,528 1,522 $30,681,000 $1,602,000 $1,966,000
Volusia County (FL)4 $48,735,871 788 $16,578,000 $1,384,000 $1,978,000
Guilford County (NC)4 $162,234,593 2,804 $50,113,000 $3,321,000 $3,508,000
Dane County (WI)4 $249,901,197 4,694 $97,787,000 $3,084,000 $5,225,000
Brevard County (FL)4 $10,624,943 249 $5,508,000 $147,000 $306,000
Washington County (OR)4 $21,086,013 461 $8,454,000 $338,000 $255,000
Johnson County (KS)4 $22,774,826 419 $7,805,000 $400,000 $554,000
City of Louisville (KY) $462,506,744 7,185 $155,176,000 $4,779,000 $13,236,000
City of Baltimore (MD) $606,008,412 8,067 $214,759,000 $10,365,000 $10,760,000
Polk County (FL)4 $46,589,847 769 $16,486,000 $1,117,000 $1,846,000
City of Boston (MA) $1,354,137,061 20,402 $452,369,000 $20,772,000 $26,699,000
District of Columbia (DC)3,6 $2,906,271,526 32,042 $1,049,304,000 $127,905,000 $0
City of Nashville-Davidson County (TN) $429,340,841 6,213 $144,321,000 $10,189,000 $15,018,000
City of El Paso (TX) $103,447,461 1,955 $38,796,000 $2,587,000 $2,859,000
Lee County (FL)4 $140,096,048 2,141 $46,512,000 $2,968,000 $5,725,000
City of Fort Worth (TX) $450,630,818 7,511 $182,950,000 $10,217,000 $12,955,000
City of Indianapolis (IN) $440,530,109 6,812 $169,565,000 $6,628,000 $11,625,000
City and County of San Francisco (CA) $1,448,353,608 22,667 $591,186,000 $27,207,000 $36,716,000
Prince George's County (MD)4 $58,693,259 702 $20,227,000 $921,000 $1,109,000
Pinellas County (FL)4 $240,977,042 3,447 $79,765,000 $5,841,000 $9,043,000
Shelby County (TN)4 $197,328,182 2,629 $73,855,000 $3,464,000 $5,712,000
Fairfield County (CT)4 $235,239,618 3,822 $85,453,000 $3,331,000 $5,497,000
Westchester County (NY)4 $172,259,432 2,879 $72,217,000 $5,611,000 $5,943,000
Fulton County (GA)4 $618,975,337 8,966 $237,692,000 $11,792,000 $10,950,000
Wake County (NC)4 $557,154,477 9,585 $174,347,000 $12,721,000 $12,853,000
Group E Average $442,572,232 6,349 $160,876,240 $11,147,640 $8,093,520
Group E Median $235,239,618 3,447 $79,765,000 $3,464,000 $5,712,000
DIRECT Economic Impact of NONPROFIT ARTS AND CULTURE INDUSTRY Spending
SOURCE: Arts and Economic Prosperity 5, Americans for the Arts, 2017. For more information, visit www.AmericansForTheArts.org/EconomicImpact. B–64

Table 4:Direct Economic Impact of Expenditures by Nonprofit Arts and Cultural Organizationsand Their Audiences Per Study Region During Fiscal Year 2015
Population Cohort Group F Direct
Population 1,000,000 or More Expenditures Full-Time Resident Local State
Sample Size = 21 (Organizations + Audiences) Equivalent Jobs Household Income Government Revenue Government Revenue
Mecklenburg County (NC)4 $242,723,621 3,516 $89,288,000 $4,334,000 $4,531,000
City of San José (CA) $191,209,479 2,544 $56,120,000 $2,727,000 $3,825,000
Montgomery County (MD)4 $183,216,256 2,265 $52,729,000 $3,021,000 $4,025,000
Fairfax County (VA)4 $271,599,133 3,874 $95,899,000 $3,764,000 $4,858,000
Allegheny County (PA)4 $1,059,384,911 15,212 $302,226,000 $19,606,000 $30,310,000
Greater Columbus Area (OH)4 $412,259,509 7,051 $176,410,000 $7,956,000 $10,147,000
Orange County (FL)4 $264,599,775 4,290 $101,314,000 $4,184,000 $4,937,000
City of Dallas (TX) $891,170,549 15,414 $442,675,000 $16,822,000 $20,093,000
Hillsborough County (FL)4 $433,212,984 6,539 $152,535,000 $9,791,000 $14,026,000
City of San Diego (CA) $1,099,934,358 18,650 $475,986,000 $22,479,000 $31,107,000
Palm Beach County (FL)4 $345,284,856 4,065 $93,815,000 $6,900,000 $8,597,000
City of San Antonio (TX) $423,432,575 7,790 $184,207,000 $10,873,000 $14,928,000
Sacramento County (CA)4 $166,723,613 2,718 $62,481,000 $3,194,000 $4,968,000
City of Phoenix (AZ) $401,780,785 6,221 $136,160,000 $8,842,000 $12,019,000
City and County of Philadelphia (PA) $1,614,100,129 18,727 $483,054,000 $37,785,000 $34,582,000
Broward County (FL)4 $414,232,820 5,436 $123,669,000 $8,486,000 $9,683,000
Santa Clara County (CA)4 $251,039,499 3,468 $79,186,000 $4,419,000 $5,865,000
Riverside County (CA)4 $125,171,944 2,118 $47,474,000 $2,360,000 $3,387,000
Miami-Dade County (FL)4 $1,430,512,813 16,198 $532,128,000 $21,708,000 $37,618,000
City of Chicago (IL) $3,211,736,053 40,529 $934,687,000 $89,279,000 $74,315,000
Harris County (TX)4 $1,094,046,389 12,443 $389,660,000 $20,969,000 $29,912,000
Group F Average $691,779,621 9,479 $238,652,524 $14,738,048 $17,320,619
Group F Median $412,259,509 6,221 $136,160,000 $8,486,000 $10,147,000
Average $163,016,374 2,367 $58,088,868 $3,534,232 $3,749,943
Median $35,750,645 615 $13,346,500 $754,000 $961,000
DIRECT Economic Impact of NONPROFIT ARTS AND CULTURE INDUSTRY Spending
ALL CITY/COUNTY STUDY REGIONS
SOURCE: Arts and Economic Prosperity 5, Americans for the Arts, 2017. For more information, visit www.AmericansForTheArts.org/EconomicImpact. B–65

Table 4:Direct Economic Impact of Expenditures by Nonprofit Arts and Cultural Organizationsand Their Audiences Per Study Region During Fiscal Year 2015
Regional Study Regions Direct
All Populations Expenditures Full-Time Resident Local State
Sample Size = 81 (Organizations + Audiences) Equivalent Jobs Household Income Government Revenue Government Revenue
High Peaks Region (ME) $1,755,237 27 $547,000 $39,000 $47,000
Wood River Valley (ID) $29,319,137 557 $10,747,000 $460,000 $716,000
Southern Oregon Area $100,609,681 1,710 $34,340,000 $4,084,000 $846,000
Southwestern Pennsylvania Area $40,734,998 656 $13,353,000 $405,000 $1,131,000
Greater Portsmouth Area (NH) $58,041,659 1,030 $21,406,000 $1,242,000 $1,220,000
Northeast Oregon Region $1,208,943 25 $459,000 $22,000 $16,000
Toe River Valley (NC) $17,108,663 177 $4,123,000 $288,000 $397,000
Albemarle Region (NC) $6,956,681 115 $2,165,000 $127,000 $165,000
Greater Concord Area (NH) $31,185,366 488 $12,166,000 $555,000 $505,000
North Central Minnesota Region2 $3,065,952 38 $975,000 $27,000 $89,000
Northwest Minnesota Region2 $1,093,783 14 $344,000 $4,000 $35,000
Monadnock Region (NH) $18,551,485 312 $7,259,000 $496,000 $465,000
Bismarck-Mandan Region (ND) $43,504,210 761 $15,375,000 $519,000 $996,000
Greater Minot Region (ND) $13,510,471 180 $3,717,000 $197,000 $315,000
Greater Burlington Area (VT) $95,159,453 1,834 $34,678,000 $1,176,000 $2,748,000
Greater Charlottesville Area (VA) $121,810,439 1,877 $48,865,000 $3,730,000 $3,068,000
Brainerd Lakes Region (MN)2 $3,638,540 49 $1,303,000 $27,000 $83,000
East Central Minnesota Region2 $9,726,894 120 $2,967,000 $81,000 $423,000
Northwest Connecticut Region $34,360,637 442 $10,586,000 $938,000 $1,345,000
Central Oregon Region $34,665,381 550 $10,684,000 $832,000 $380,000
Greater Fargo-Moorhead Area (ND/MN) $45,667,895 838 $17,533,000 $617,000 $1,115,000
Black Hills Region (SD) $114,309,068 1,981 $37,049,000 $1,579,000 $3,217,000
Greater Kingsport Area (TN) $29,508,688 435 $9,091,000 $706,000 $926,000
Lake Region (MN)2 $9,824,487 136 $3,224,000 $69,000 $258,000
South Central Minnesota Region2 $13,600,341 218 $4,944,000 $134,000 $517,000
Greater Sioux Falls Area (SD) $105,447,594 1,914 $35,128,000 $1,576,000 $2,700,000
Southwest Tennessee Development District $6,279,267 132 $2,440,000 $106,000 $164,000
Northwest Tennessee Development District $12,054,723 165 $3,493,000 $211,000 $386,000
Southwest Minnesota Region2 $7,284,325 95 $2,311,000 $63,000 $196,000
Arrowhead Region (MN)2 $39,740,689 628 $14,965,000 $420,000 $2,095,000
DIRECT Economic Impact of NONPROFIT ARTS AND CULTURE INDUSTRY Spending
SOURCE: Arts and Economic Prosperity 5, Americans for the Arts, 2017. For more information, visit www.AmericansForTheArts.org/EconomicImpact. B–66

Table 4:Direct Economic Impact of Expenditures by Nonprofit Arts and Cultural Organizationsand Their Audiences Per Study Region During Fiscal Year 2015
Regional Study Regions Direct
All Populations Expenditures Full-Time Resident Local State
Sample Size = 81 (Organizations + Audiences) Equivalent Jobs Household Income Government Revenue Government Revenue
Maple Grove and the Northwest Suburbs (MN)2 $4,021,808 67 $1,399,000 $58,000 $152,000
Greater Augusta Area (GA) $57,840,709 1,116 $21,908,000 $1,178,000 $862,000
Upper Cumberland Development District (TN) $11,112,731 198 $4,246,000 $296,000 $411,000
City of Huntsville/Madison County (AL) $89,901,300 1,671 $33,230,000 $1,510,000 $1,589,000
Northeast Commission (NC) $75,954,504 1,185 $22,753,000 $1,722,000 $1,726,000
Greater Ann Arbor Area (MI)5 $99,948,271 1,494 $43,169,000 $1,600,000 $5,298,000
Greater Fox Cities Region (WI) $58,357,431 414 $9,134,000 $1,296,000 $1,267,000
Central Minnesota Region2 $16,434,387 286 $6,634,000 $137,000 $516,000
South Central Tennessee Development District $14,967,689 256 $5,016,000 $350,000 $572,000
Northwest Arkansas Region $131,197,094 2,300 $47,198,000 $1,731,000 $5,059,000
Southeast Minnesota Region2 $25,575,860 428 $9,559,000 $180,000 $706,000
First Tennessee Development District $53,447,994 827 $16,682,000 $1,721,000 $1,807,000
Greater Harrisburg Area (PA) $20,094,451 359 $8,352,000 $244,000 $513,000
Greater New Haven Area (CT) $134,689,811 2,029 $41,692,000 $2,271,000 $2,866,000
Treasure Coast Region (FL) $59,844,126 904 $20,020,000 $1,392,000 $2,630,000
Greater Des Moines Region (IA) $185,038,511 2,468 $55,804,000 $3,942,000 $4,257,000
Southeast Tennessee Development District $183,369,583 3,406 $76,889,000 $3,672,000 $6,290,000
Greater Knoxville Region (TN) $145,927,413 2,762 $51,524,000 $4,745,000 $5,158,000
Greater Columbia Area (SC) $64,671,086 1,318 $26,093,000 $1,355,000 $1,828,000
Pikes Peak Region (CO) $153,262,052 2,805 $53,164,000 $5,083,000 $2,545,000
Lehigh Valley Region (PA) $186,385,587 3,504 $70,172,000 $3,141,000 $5,497,000
Greater Sarasota/Bradenton Area (FL) $342,433,463 4,661 $140,247,000 $6,493,000 $11,649,000
Dayton Region (OH) $213,686,813 4,205 $76,755,000 $4,905,000 $6,285,000
Richmond & Tri-Cities Region (VA) $360,072,116 7,220 $147,458,000 $9,480,000 $12,346,000
Memphis Area Association of Governments (TN) $197,558,353 2,632 $73,940,000 $3,470,000 $5,721,000
Eastern Region (NC) $84,729,231 1,742 $36,519,000 $2,191,000 $2,627,000
Advantage West Region (NC) $239,862,074 4,169 $86,875,000 $7,409,000 $8,109,000
Southeast Commission (NC) $127,431,595 2,571 $52,414,000 $2,798,000 $3,090,000
Greater Fairfax Area (VA) $301,069,549 4,385 $103,908,000 $4,276,000 $6,086,000
Greater Tulsa Region (OK) $228,871,178 3,769 $79,992,000 $4,908,000 $5,945,000
DIRECT Economic Impact of NONPROFIT ARTS AND CULTURE INDUSTRY Spending
SOURCE: Arts and Economic Prosperity 5, Americans for the Arts, 2017. For more information, visit www.AmericansForTheArts.org/EconomicImpact. B–67

Table 4:Direct Economic Impact of Expenditures by Nonprofit Arts and Cultural Organizationsand Their Audiences Per Study Region During Fiscal Year 2015
Regional Study Regions Direct
All Populations Expenditures Full-Time Resident Local State
Sample Size = 81 (Organizations + Audiences) Equivalent Jobs Household Income Government Revenue Government Revenue
East Tennessee Development District $172,191,940 2,948 $54,683,000 $5,226,000 $5,415,000
West Valley Region (AZ) $22,984,470 340 $8,278,000 $443,000 $663,000
Greater St. Louis Area (MO) $590,934,189 9,290 $240,676,000 $11,230,000 $11,618,000
Western New York $352,149,882 6,015 $125,180,000 $12,809,000 $6,511,000
Greater Oklahoma City Region (OK) $602,747,142 11,147 $230,995,000 $17,894,000 $18,506,000
Piedmont Triad Partnership (NC) $392,933,673 6,788 $143,443,000 $7,313,000 $8,980,000
Greater Portland Area (OR) $330,402,755 5,916 $149,125,000 $4,586,000 $5,801,000
Greater Kansas City Metropolitan Area (MO/KS) $276,098,121 4,030 $120,818,000 $3,426,000 $4,595,000
Greater Nashville Regional Council (TN) $488,058,714 7,318 $165,620,000 $11,761,000 $17,301,000
Research Triangle Regional Partnership (NC) $863,243,852 15,859 $325,009,000 $17,876,000 $18,463,000
Greater Tampa/St. Petersburg Area (FL) $674,190,026 9,986 $232,300,000 $15,632,000 $23,069,000
Charlotte Regional Partnership (NC) $332,385,209 4,951 $119,484,000 $6,391,000 $6,917,000
Charlotte Regional Partnership (NC/SC) $359,420,859 5,455 $130,923,000 $6,730,000 $7,446,000
Seven-County Metro Area (MN)2 $1,066,866,224 14,994 $393,426,000 $11,972,000 $30,944,000
Central Florida Region $399,917,970 6,550 $149,812,000 $7,370,000 $10,080,000
Greater Philadelphia Region (PA) $1,884,650,965 26,608 $650,389,000 $46,839,000 $48,822,000
Greater Washington Region (DC/MD/VA) $3,750,332,794 44,272 $1,340,811,000 $141,042,000 $16,155,000
Metro Atlanta Area (GA) $719,820,787 10,770 $278,341,000 $14,569,000 $13,016,000
Greater Atlanta Region (GA) $730,561,881 10,957 $282,785,000 $14,837,000 $13,214,000
Greater Houston Region (TX) $1,117,403,061 12,826 $398,676,000 $21,569,000 $30,614,000
Dallas-Fort Worth-Arlington MSA (TX) $1,473,366,015 25,114 $683,780,000 $29,592,000 $36,009,000
Regional Average $265,656,074 4,010 $98,932,556 $6,338,160 $5,853,210
Regional Median $95,159,453 1,710 $34,678,000 $1,600,000 $2,627,000
DIRECT Economic Impact of NONPROFIT ARTS AND CULTURE INDUSTRY Spending
SOURCE: Arts and Economic Prosperity 5, Americans for the Arts, 2017. For more information, visit www.AmericansForTheArts.org/EconomicImpact. B–68

Table 4:Direct Economic Impact of Expenditures by Nonprofit Arts and Cultural Organizationsand Their Audiences Per Study Region During Fiscal Year 2015
Statewide Study Regions Direct
All Populations Expenditures Full-Time Resident Local State
Sample Size = 20 (Organizations + Audiences) Equivalent Jobs Household Income Government Revenue Government Revenue
State of Vermont $122,884,314 2,262 $43,954,000 $1,281,000 $3,310,000
State of North Dakota $109,214,164 1,947 $39,883,000 $1,629,000 $2,731,000
State of Delaware $149,903,883 2,931 $82,649,000 $1,292,000 $6,480,000
State of Maine $150,545,495 2,238 $53,635,000 $2,216,000 $3,104,000
State of Hawai'i $205,643,357 4,375 $116,638,000 $2,448,000 $13,142,000
State of Nevada $471,725,264 5,795 $147,088,000 $8,003,000 $16,717,000
State of Connecticut $797,249,391 11,274 $300,662,000 $12,477,000 $19,267,000
State of Oklahoma $872,830,632 15,396 $321,609,000 $23,211,000 $24,927,000
State of Oregon $687,022,095 11,998 $267,927,000 $12,888,000 $9,936,000
State of Minnesota2 $1,196,851,482 17,006 $440,652,000 $13,114,000 $35,862,000
State of Wisconsin $656,857,267 13,770 $280,738,000 $13,471,000 $15,683,000
State of Maryland $961,572,264 12,213 $317,287,000 $14,925,000 $17,200,000
State of Missouri $1,039,009,480 15,427 $407,507,000 $16,808,000 $18,116,000
State of Tennessee $1,139,040,994 17,882 $403,009,000 $26,813,000 $38,067,000
State of Massachusetts $2,266,299,548 33,295 $743,953,000 $31,909,000 $41,093,000
State of New Jersey $519,814,484 7,652 $193,618,000 $7,642,000 $10,099,000
State of North Carolina $2,116,540,138 37,265 $786,497,000 $45,700,000 $49,912,000
State of Pennsylvania $3,388,145,326 48,806 $1,104,559,000 $71,904,000 $89,398,000
State of Illinois $4,033,643,401 54,547 $1,423,423,000 $105,964,000 $109,633,000
State of Florida $4,676,207,338 61,143 $1,574,328,000 $88,163,000 $136,209,000
Statewide Average $1,278,050,016 18,861 $452,480,800 $25,092,900 $33,044,300
Statewide Median $835,040,012 12,992 $308,974,500 $13,292,500 $17,658,000
DIRECT Economic Impact of NONPROFIT ARTS AND CULTURE INDUSTRY Spending
SOURCE: Arts and Economic Prosperity 5, Americans for the Arts, 2017. For more information, visit www.AmericansForTheArts.org/EconomicImpact. B–69

Table 4:Direct Economic Impact of Expenditures by Nonprofit Arts and Cultural Organizationsand Their Audiences Per Study Region During Fiscal Year 2015
Individual Arts Districts Direct
All Populations Expenditures Full-Time Resident Local State
Sample Size = 12 (Organizations + Audiences) Equivalent Jobs Household Income Government Revenue Government Revenue
James River Arts & Cultural District $10,153,704 173 $4,216,000 $265,000 $323,000
Center City Charlotte $216,498,297 3,133 $79,922,000 $3,835,000 $4,024,000
Loch Haven Cultural Park $59,843,353 1,008 $22,329,000 $1,082,000 $1,315,000
Downtown Colorado Springs Creative District $37,045,265 653 $13,557,000 $976,000 $499,000
Fort Worth Cultural District $264,749,452 4,412 $107,426,000 $6,006,000 $7,619,000
Dallas Arts District $395,802,179 6,854 $197,086,000 $7,440,000 $8,889,000
Grand Center Arts & Entertainment District $106,414,923 1,618 $45,558,000 $1,688,000 $1,869,000
Balboa Park Cultural District $670,148,345 11,614 $298,910,000 $13,061,000 $17,727,000
East End Cultural District $8,206,138 95 $2,796,000 $172,000 $261,000
Houston Museum District Association $646,073,449 7,367 $228,649,000 $12,549,000 $18,084,000
Midtown Cultural District $8,831,743 101 $3,091,000 $176,000 $257,000
Washington Avenue Cultural District $4,717,237 54 $1,691,000 $89,000 $126,000
Arts District Average $202,373,674 3,090 $83,769,250 $3,944,917 $5,082,750
Arts District Median $83,129,138 1,313 $33,943,500 $1,385,000 $1,592,000
Explanation of the Outliers and Exclusions:1
2
3
4
5
6 The economic impact findings for the District of Columbia exclude state government revenues due to Washington, DC's unique status as a study region with no state government.
The expenditure and attendance data collected from eligible organizations in this study region were collected for fiscal year 2014 (rather than 2015), and audience-intercepts surveys collected from attendees to cultural events in this study region were collected during calendar year 2015 (rather than 2016).
The organizational expenditure and attendance findings for these city study regions were determined by researchers to be outliers when compared to the findings for cohort regions in the same population category. For this reason, the organizational expenditure and attendance findings for these study regions are excluded from the national extrapolations.
The expenditure and attendance data collected from eligible organizations in these study regions were collected for fiscal year 2013 (rather than 2015), and audience-intercepts surveys collected from attendees to cultural events in these study regions were collected during calendar year 2014 (rather than 2016). Where applicable, these study regions are excluded from the national extrapolations.
Both the organizational expenditure and attendance findings and the audience expenditure findings for these city study regions were determined by researchers to be outliers when compared to the findings for cohort regions in the same population category. For this reason, these study regions are excluded from the national extrapolations.
These county study regions are excluded from the national extrapolations. The national extrapolations are based on city study regions only.
DIRECT Economic Impact of NONPROFIT ARTS AND CULTURE INDUSTRY Spending
SOURCE: Arts and Economic Prosperity 5, Americans for the Arts, 2017. For more information, visit www.AmericansForTheArts.org/EconomicImpact. B–70

Explanation of Table 5:Participation Rate of Eligible Nonprofit Arts and Cultural OrganizationsPer Study Region During Fiscal Year 2015
Column Two:
Column Three:
Column Four:
Column Five:
Column Six:
Column Seven:
Column Eight:The total estimated expenditures (direct expenditures plus indirect and induced expenditures) that occurred in each participating study region during fiscal year 2015 as a result of the initial direct expenditures made by participating nonprofit arts and cultural organizations (Column Five). In other words, this figure represents the initial direct organizational expenditures plus each additional round of spending that occurred as those dollars were re-spent within the study region before the dollars were spent on goods and services and households located outside of the study region. This figure is calculated by an input-output model that is customized for each study region using detailed commerce data.
The total direct expenditures made by participating nonprofit arts and cultural organizations that were spent on local industries in each participating study region during fiscal year 2015. This figure is calculated by an input-output model that is customized for each study region using detailed commerce data to estimate the dollars spent on imported goods and services. Additionally, it subtracts payments to non-local artists and state and federal taxes. Dollars are that are spent outside of the study region are considered to have "leaked" from the study region's economy and have no economic impact on the study region's economy. See "Background and Scope of Study" and "Frequently Used Terms" in this Arts & Economic Prosperity 5 National Statistical Report for more information about input-output methodology.
The total local organizational expenditures as a percentage of the total direct organizational expenditures; this portrays the percentage of direct organizational expenditures that are spent on local industries. This figure is calculated by dividing the total local organizational expenditures (Column Six) by the total organizational expenditures (Column Five) for each participating study region.
This table presents for each study region the total number of nonprofit arts and cultural organizations eligible to participate in the organizational expenditure survey, as well as the number of organizations from which data were collected. Summary statistics are calculated for each population group.
The number of nonprofit arts and cultural organizations eligible to participate in each of the 341 study regions. The study partner organization in each study region identified the universe of eligible nonprofit arts and cultural organizations. (A list of the eligible organization types is provided in Appendix A, along with a detailed description of the data collection methodologies. Examples of all data collection tools are included in Appendix C.)
The number of eligible nonprofit arts and cultural organizations from which detailed expenditure and event attendance data were collected in each participating study region.
The percentage of eligible nonprofit arts and cultural organizations from which expenditure and event attendance data were collected. This figure is calculated by dividing the number of participating nonprofit arts and cultural organizations (Column Three) by the total number of organizations eligible to participate (Column Two).
The total organizational expenditures made by the participating nonprofit arts and cultural organizations in each participating community during fiscal year 2015. This figure is the sum of operating expenditures and capital expenditures. These data are real dollars reported by the organizations that responded to the survey in each study region only; no multiplier was used to calculate these figures and no extrapolations were made for non-responding organizations.
SOURCE: Arts and Economic Prosperity 5, Americans for the Arts, 2017. For more information, visit www.AmericansForTheArts.org/EconomicImpact. B–71

Table 5:Participation Rate of Eligible Nonprofit Arts and Cultural OrganizationsPer Study Region During Fiscal Year 2015
Population Cohort Group A Universe of Number of Direct Local Direct Local as Total Spending
Population Fewer than 50,000 Eligible Participating Participation Organizational Organizational a Percent (Direct, Indirect,
Sample Size = 52 Organizations Organizations Rate Expenditures Expenditures of Total and Induced)
Town of Crested Butte (CO) 12 12 100.0% $4,554,422 $3,214,575 70.6% $6,624,693
City of Pine City (MN) 5 5 100.0% $425,217 $291,620 68.6% $695,230
City of Alva (OK) 15 13 86.7% $1,188,716 $786,265 66.1% $1,744,457
Cook County (MN) 17 17 100.0% $2,575,814 $1,766,529 68.6% $4,785,862
Town of Hillsborough (NC) 38 16 42.1% $1,594,300 $1,166,268 73.2% $2,571,695
City of Virginia (MN) 4 4 100.0% $115,568 $79,258 68.6% $214,725.34
Town of Jackson (WY) 36 18 50.0% $18,725,980 $12,205,538 65.2% $26,532,773
City of Guthrie (OK) 15 12 80.0% $1,611,682 $1,137,222 70.6% $2,352,190
City of Grand Rapids (MN) 12 12 100.0% $2,833,920 $1,943,542 68.6% $5,265,423
Town of Medfield (MA) 17 17 100.0% $2,748,727 $1,921,504 69.9% $4,476,375
City of Fergus Falls (MN) 9 9 100.0% $2,272,954 $1,558,824 68.6% $4,245,878
Grundy County (TN) 10 10 100.0% $110,283 $59,958 54.4% $134,164
City of Falls Church (VA) 25 11 44.0% $6,749,150 $3,544,900 52.5% $7,471,401
City of Jamestown (ND) 9 3 33.3% $1,055,380 $739,483 70.1% $1,896,633
City of Waterville (ME) 30 4 13.3% $4,449,410 $3,064,524 68.9% $7,559,722
City of Red Wing (MN) 9 9 100.0% $1,724,398 $1,182,616 68.6% $2,964,240
City of Durango (CO) 34 26 76.5% $8,619,712 $6,033,491 70.0% $13,477,378
City of Hannibal (MO) 7 6 85.7% $1,399,947 $869,521 62.1% $2,089,531
City of Tullahoma (TN) 12 11 91.7% $610,715 $389,916 63.8% $927,654
City of Northfield (MN) 14 14 100.0% $1,297,441 $889,803 68.6% $2,722,031
Town of Carrboro (NC) 24 10 41.7% $3,640,757 $2,663,299 73.2% $5,872,745
Macon County (TN) 14 7 50.0% $104,098 $75,561 72.6% $172,717
City of Laguna Beach (CA) 23 16 69.6% $40,118,691 $33,663,966 83.9% $85,179,509
Hickman County (TN) 21 21 100.0% $1,152,455 $886,104 76.9% $1,441,898
City of Fairfax (VA) 19 7 36.8% $2,639,540 $2,001,643 75.8% $4,198,919
City of Ponca City (OK) 20 16 80.0% $2,799,217 $1,739,467 62.1% $3,995,452
City of Paducah (KY) 55 19 34.5% $18,055,851 $13,129,736 72.7% $35,536,883
Mille Lacs County (MN) 10 10 100.0% $575,555 $394,724 68.6% $941,032
McNairy County (TN) 15 5 33.3% $22,544 $13,895 61.6% $29,749
City of Winona (MN) 17 17 100.0% $3,269,857 $2,242,514 68.6% $5,620,884
SOURCE: Arts and Economic Prosperity 5, Americans for the Arts, 2017. For more information, visit www.AmericansForTheArts.org/EconomicImpact. B–72

Table 5:Participation Rate of Eligible Nonprofit Arts and Cultural OrganizationsPer Study Region During Fiscal Year 2015
Population Cohort Group A Universe of Number of Direct Local Direct Local as Total Spending
Population Fewer than 50,000 Eligible Participating Participation Organizational Organizational a Percent (Direct, Indirect,
Sample Size = 52 Organizations Organizations Rate Expenditures Expenditures of Total and Induced)
Door County (WI) 21 16 76.2% $9,730,760 $6,898,489 70.9% $14,656,006
City of Benicia (CA) 12 12 100.0% $2,902,134 $2,079,525 71.7% $4,371,128
City of Winter Park (FL) 35 20 57.1% $16,576,065 $13,880,965 83.7% $35,748,577
City of Rochester (NH) 33 12 36.4% $4,353,943 $3,174,476 72.9% $7,097,479
City of Morgantown (WV) 47 34 72.3% $27,454,214 $20,520,141 74.7% $45,717,740
Henry County (TN) 6 3 50.0% $183,974 $113,152 61.5% $267,453
City of Fairbanks (AK) 43 23 53.5% $8,779,765 $5,957,725 67.9% $13,631,272
City of Bangor (ME) 34 13 38.2% $3,437,656 $2,579,027 75.0% $6,124,380
Weakley County (TN) 15 8 53.3% $211,563 $130,038 61.5% $298,659
Dare County (NC) 25 20 80.0% $13,790,194 $8,312,090 60.3% $20,565,995
City of Columbia (TN) 23 7 30.4% $1,297,724 $784,431 60.4% $1,903,954
City of Lake Worth (FL) 27 12 44.4% $14,656,059 $12,204,577 83.3% $28,501,568
Clatsop County (OR) 27 22 81.5% $2,874,045 $1,890,462 65.8% $4,267,628
Yadkin County (NC) 1 1 100.0% $809,737 $481,915 59.5% $1,045,698
Greater Belfast Area (ME) 49 20 40.8% $2,683,737 $2,026,784 75.5% $4,129,399
Campbell County (TN) 7 7 100.0% $108,671 $58,735 54.0% $146,224
Monroe County (TN) 21 8 38.1% $666,880 $476,836 71.5% $1,023,875
Lincoln County (OR) 52 10 19.2% $1,595,530 $981,093 61.5% $2,363,944
Iron County (UT) 30 19 63.3% $13,330,445 $9,440,946 70.8% $21,440,789
City of St. Louis Park (MN) 15 15 100.0% $758,069 $519,894 68.6% $1,590,429
City of Logan (UT) 36 24 66.7% $17,572,786 $12,854,880 73.2% $29,240,172
Gibson County (TN) 18 11 61.1% $1,003,653 $688,759 68.6% $1,441,091
Group A Average 21.6 13.0 69.5% $5,419,614 $3,955,985 68.6% $9,371,448
Group A Median 19 12 74.3% $2,607,677 $1,752,998 68.6% $4,164,159
Group A Total 1,125 674
SOURCE: Arts and Economic Prosperity 5, Americans for the Arts, 2017. For more information, visit www.AmericansForTheArts.org/EconomicImpact. B–73

Table 5:Participation Rate of Eligible Nonprofit Arts and Cultural OrganizationsPer Study Region During Fiscal Year 2015
Population Cohort Group B Universe of Number of Direct Local Direct Local as Total Spending
Population 50,000 to 99,999 Eligible Participating Participation Organizational Organizational a Percent (Direct, Indirect,
Sample Size = 38 Organizations Organizations Rate Expenditures Expenditures of Total and Induced)
City of Joplin (MO) 54 20 37.0% $1,792,636 $1,344,645 75.0% $3,052,764
City of La Crosse (WI) 50 33 66.0% $12,827,852 $10,319,995 80.4% $25,023,713
McMinn County (TN) 23 20 87.0% $2,021,520 $1,334,496 66.0% $2,953,798
Lafayette County (MS) 33 19 57.6% $2,655,457 $2,204,438 83.0% $5,203,337
Chisago County (MN) 6 6 100.0% $655,430 $483,235 73.7% $1,071,628
City of Grand Forks (ND) 27 13 48.1% $2,781,581 $2,132,681 76.7% $4,654,539
City of Corvallis (OR) 37 22 59.5% $27,545,447 $18,628,854 67.6% $40,604,282
City of Noblesville (IN) 6 2 33.3% $475,139 $396,419 83.4% $894,318
City of Ocala (FL) 37 29 78.4% $14,295,754 $10,986,750 76.9% $25,249,617
Lenoir County (NC) 20 11 55.0% $932,880 $610,622 65.5% $1,458,748
Town of Chapel Hill (NC) 104 55 52.9% $88,407,897 $64,672,448 73.2% $142,606,887
City of Grand Junction (CO) 110 32 29.1% $11,275,100 $8,969,257 79.5% $20,342,284
Town of Jupiter (FL) 18 3 16.7% $8,019,104 $6,677,769 83.3% $15,594,713
Hamblen County (TN) 11 6 54.5% $760,318 $486,047 63.9% $1,170,716
City of Delray Beach (FL) 26 12 46.2% $11,319,692 $9,426,276 83.3% $22,013,351
City of St. Cloud (MN) 25 25 100.0% $5,345,355 $3,941,019 73.7% $9,504,041
City of Portland (ME) 125 46 36.8% $46,572,402 $37,978,492 81.5% $99,531,552
City of Jackson (TN) 27 13 48.1% $2,666,496 $1,904,970 71.4% $4,487,017
City of Walnut Creek (CA) 46 29 63.0% $21,097,821 $16,443,870 77.9% $34,951,812
Greene County (TN) 25 9 36.0% $2,505,621 $1,544,464 61.6% $3,569,305
City of Flagstaff (AZ) 55 50 90.9% $51,666,744 $36,312,539 70.3% $84,571,189
City of Missoula (MT) 58 34 58.6% $20,392,313 $15,356,582 75.3% $37,490,397
City of Fort Myers (FL) 28 14 50.0% $13,682,062 $10,881,100 79.5% $25,342,162
Putnam County (TN) 26 9 34.6% $2,038,202 $1,496,594 73.4% $3,446,424
Monroe County (FL) 93 53 57.0% $27,188,753 $17,477,238 64.3% $40,054,563
City of Lynchburg (VA) 60 20 33.3% $6,648,618 $3,193,295 48.0% $6,946,733
City of Duluth (MN) 37 37 100.0% $14,291,391 $10,536,745 73.7% $26,553,404
City of Fishers (IN) 8 6 75.0% $23,094,545 $19,268,279 83.4% $43,469,115
City of Carmel (IN) 18 12 66.7% $12,559,425 $10,478,600 83.4% $23,639,656
City of Sugar Land (TX) 41 5 12.2% $646,740 $546,714 84.5% $1,107,710
SOURCE: Arts and Economic Prosperity 5, Americans for the Arts, 2017. For more information, visit www.AmericansForTheArts.org/EconomicImpact. B–74

Table 5:Participation Rate of Eligible Nonprofit Arts and Cultural OrganizationsPer Study Region During Fiscal Year 2015
Population Cohort Group B Universe of Number of Direct Local Direct Local as Total Spending
Population 50,000 to 99,999 Eligible Participating Participation Organizational Organizational a Percent (Direct, Indirect,
Sample Size = 38 Organizations Organizations Rate Expenditures Expenditures of Total and Induced)
City of Asheville (NC) 60 43 71.7% $19,541,466 $15,857,211 81.1% $38,356,124
Buchanan County (MO) 39 27 69.2% $10,079,729 $6,464,291 64.1% $16,876,799
City of Boca Raton (FL) 37 10 27.0% $10,757,773 $8,958,347 83.3% $20,920,590
City of Miami Beach (FL) 83 75 90.4% $84,770,391 $70,731,369 83.4% $192,571,437
Moore County (NC) 47 34 72.3% $6,876,979 $4,593,674 66.8% $10,193,388
Sevier County (TN) 42 10 23.8% $3,645,416 $2,117,138 58.1% $5,095,858
Cape May County (NJ) 51 7 13.7% $4,544,984 $3,008,855 66.2% $6,702,631
Cleveland County (NC) 15 15 100.0% $2,287,739 $1,484,361 64.9% $3,492,532
Group B Average 42.3 22.8 56.6% $15,228,073 $11,559,202 73.7% $27,651,819
Group B Median 37 20 56.0% $9,049,417 $6,571,030 74.4% $16,235,756
Group B Total 1,608 866
SOURCE: Arts and Economic Prosperity 5, Americans for the Arts, 2017. For more information, visit www.AmericansForTheArts.org/EconomicImpact. B–75

Table 5:Participation Rate of Eligible Nonprofit Arts and Cultural OrganizationsPer Study Region During Fiscal Year 2015
Population Cohort Group C Universe of Number of Direct Local Direct Local as Total Spending
Population 100,000 to 249,999 Eligible Participating Participation Organizational Organizational a Percent (Direct, Indirect,
Sample Size = 50 Organizations Organizations Rate Expenditures Expenditures of Total and Induced)
City of Las Cruces (NM) 80 22 27.5% $8,508,432 $5,833,720 68.6% $13,160,464
Eau Claire County (WI) 32 15 46.9% $4,509,343 $3,803,103 84.3% $9,543,035
Yamhill County (OR) 78 53 67.9% $20,664,640 $14,252,525 69.0% $32,666,441
City of Lewisville (TX) 10 8 80.0% $1,513,284 $1,304,316 86.2% $2,702,746
City of West Palm Beach (FL) 67 29 43.3% $117,010,242 $97,438,234 83.3% $227,549,259
City of Boulder (CO) 198 65 32.8% $35,514,381 $25,956,110 73.1% $59,862,705
City of Richardson (TX) 32 24 75.0% $12,143,635 $9,679,955 79.7% $23,303,428
City of High Point (NC) 18 10 55.6% $2,560,289 $2,110,058 82.4% $5,547,007
City of Cambridge (MA) 67 35 52.2% $119,802,629 $87,811,074 73.3% $211,974,736
City of Lowell (MA) 56 15 26.8% $8,688,661 $6,951,618 80.0% $14,963,562
Douglas County (KS) 59 23 39.0% $15,670,891 $11,354,568 72.5% $25,128,636
City of Columbia (MO) 32 29 90.6% $9,152,344 $6,902,797 75.4% $16,864,712
City of Norman (OK) 36 24 66.7% $11,552,877 $8,962,225 77.6% $19,531,911
Wayne County (NC) 24 15 62.5% $1,570,039 $1,047,451 66.7% $2,565,399
City of Lafayette (LA) 34 10 29.4% $6,356,368 $4,722,987 74.3% $11,489,275
Washington County (TN) 46 20 43.5% $3,257,903 $2,428,584 74.5% $5,629,702
City of Thousand Oaks (CA) 70 12 17.1% $8,609,672 $6,585,777 76.5% $14,127,810
City of Charleston (SC) 64 38 59.4% $66,091,990 $50,340,271 76.2% $122,331,725
City of Waco (TX) 34 30 88.2% $31,391,910 $22,019,809 70.1% $55,879,012
Robeson County (NC) 13 9 69.2% $2,914,420 $1,819,739 62.4% $4,263,109
Columbia County (GA) 20 5 25.0% $43,211 $31,810 73.6% $80,371
Orange County (NC) 166 82 49.4% $93,643,475 $68,502,396 73.2% $151,052,167
City of Savannah (GA) 135 45 33.3% $34,799,185 $25,051,338 72.0% $61,924,914
Indian River County (FL) 46 10 21.7% $16,019,023 $10,777,563 67.3% $24,564,209
City of Alexandria (VA) 60 50 83.3% $35,827,099 $27,646,969 77.2% $60,808,335
Martin County (FL) 37 20 54.1% $14,266,732 $10,693,547 75.0% $23,401,234
Macon-Bibb County (GA) 57 48 84.2% $49,139,734 $41,244,082 83.9% $105,449,190
City of Springfield (MA) 26 15 57.7% $36,109,244 $26,795,932 74.2% $67,333,454
Catawba County (NC) 37 25 67.6% $12,569,224 $9,343,150 74.3% $22,689,817
Town of Cary (NC) 53 37 69.8% $6,153,643 $5,175,801 84.1% $13,182,150
SOURCE: Arts and Economic Prosperity 5, Americans for the Arts, 2017. For more information, visit www.AmericansForTheArts.org/EconomicImpact. B–76

Table 5:Participation Rate of Eligible Nonprofit Arts and Cultural OrganizationsPer Study Region During Fiscal Year 2015
Population Cohort Group C Universe of Number of Direct Local Direct Local as Total Spending
Population 100,000 to 249,999 Eligible Participating Participation Organizational Organizational a Percent (Direct, Indirect,
Sample Size = 50 Organizations Organizations Rate Expenditures Expenditures of Total and Induced)
Alamance County (NC) 34 34 100.0% $3,877,725 $2,764,704 71.3% $6,254,881
Cumberland County (NJ) 35 25 71.4% $9,546,724 $6,662,785 69.8% $15,416,477
City of Eugene (OR) 82 40 48.8% $40,780,515 $30,597,802 75.0% $71,599,032
Middlesex County (CT) 27 15 55.6% $20,883,683 $14,872,041 71.2% $33,336,447
City of Springfield (MO) 85 24 28.2% $9,778,504 $7,551,793 77.2% $20,440,739
City of Sioux Falls (SD) 49 26 53.1% $20,112,501 $14,460,602 71.9% $37,030,783
Pitt County (NC) 42 23 54.8% $12,689,847 $8,835,670 69.6% $21,456,973
City of Providence (RI) 127 56 44.1% $93,832,555 $73,218,670 78.0% $177,864,863
City of Worcester (MA) 57 57 100.0% $64,504,636 $47,647,610 73.9% $114,482,072
Montgomery County (TN) 43 20 46.5% $2,964,420 $2,127,115 71.8% $4,674,215
Salt Lake City (UT) 114 57 50.0% $112,442,764 $87,820,626 78.1% $229,710,023
Cabarrus County (NC) 18 18 100.0% $2,265,571 $1,736,534 76.6% $3,907,520
Richmond County (GA) 74 28 37.8% $37,811,438 $28,578,106 75.6% $70,851,719
City of Tacoma (WA) 118 66 55.9% $74,648,459 $56,512,956 75.7% $136,716,128
Doña Ana County (NM) 90 29 32.2% $12,920,210 $8,858,611 68.6% $19,984,406
New Hanover County (NC) 79 35 44.3% $14,841,737 $11,057,606 74.5% $27,437,332
Arlington County (VA) 127 72 56.7% $170,762,477 $125,748,393 73.6% $260,613,369
City of Irving (TX) 19 17 89.5% $24,192,919 $20,120,397 83.2% $49,366,168
City of Reno (NV) 92 47 51.1% $50,139,403 $39,312,152 78.4% $93,018,110
York County (SC) 17 13 76.5% $13,279,645 $9,785,604 73.7% $20,220,955
Group C Average 60.3 30.5 56.3% $31,566,605 $23,897,146 75.0% $56,479,055
Group C Median 51 25 54.4% $14,554,235 $10,735,555 74.4% $23,982,722
Group C Total 3,016 1,525
SOURCE: Arts and Economic Prosperity 5, Americans for the Arts, 2017. For more information, visit www.AmericansForTheArts.org/EconomicImpact. B–77

Table 5:Participation Rate of Eligible Nonprofit Arts and Cultural OrganizationsPer Study Region During Fiscal Year 2015
Population Cohort Group D Universe of Number of Direct Local Direct Local as Total Spending
Population 250,000 to 499,999 Eligible Participating Participation Organizational Organizational a Percent (Direct, Indirect,
Sample Size = 42 Organizations Organizations Rate Expenditures Expenditures of Total and Induced)
Buncombe County (NC) 79 52 65.8% $26,363,882 $21,393,361 81.1% $51,747,209
Alachua County (FL) 68 44 64.7% $36,563,147 $26,551,198 72.6% $63,308,426
Greater Green Bay Area (WI) 92 41 44.6% $23,392,446 $18,456,323 78.9% $44,537,511
City of Orlando (FL) 132 55 41.7% $123,648,175 $103,544,233 83.7% $266,664,394
City of Lincoln (NE) 98 40 40.8% $50,665,562 $37,812,870 74.6% $93,116,118
Southeastern Connecticut Region (CT) 223 70 31.4% $87,159,766 $60,676,283 69.6% $132,775,198
Erie County (PA) 156 46 29.5% $19,091,150 $14,551,962 76.2% $35,248,449
San Luis Obispo County (CA) 61 28 45.9% $13,693,022 $10,013,587 73.1% $23,270,915
City of Newark (NJ) 52 31 59.6% $109,365,244 $81,624,673 74.6% $187,756,171
Leon County (FL) 274 69 25.2% $100,454,010 $89,922,730 89.5% $227,350,168
Rutherford County (TN) 36 36 100.0% $10,798,787 $7,596,496 70.3% $17,683,021
St. Lucie County (FL) 30 5 16.7% $3,119,978 $2,639,761 84.6% $5,197,215
Greater Spartanburg Area (SC) 66 29 43.9% $21,371,683 $16,174,236 75.7% $38,436,048
Durham County (NC) 102 69 67.6% $104,619,126 $80,744,646 77.2% $193,420,670
City of St. Paul (MN) 167 167 100.0% $281,609,958 $220,597,941 78.3% $590,817,692
Hamilton County (IN) 34 21 61.8% $36,204,739 $30,206,398 83.4% $68,145,442
Osceola County (FL) 20 7 35.0% $1,922,406 $1,386,761 72.1% $2,947,329
Escambia County (FL) 33 25 75.8% $27,449,975 $21,002,851 76.5% $50,108,918
Lexington-Fayette Urban County (KY) 85 34 40.0% $16,129,322 $12,838,937 79.6% $33,587,347
Lake County (FL) 71 11 15.5% $1,137,478 $831,837 73.1% $1,858,935
City of Riverside (CA) 71 45 63.4% $17,575,088 $12,811,179 72.9% $29,497,094
Cumberland County (NC) 120 48 40.0% $29,655,943 $23,516,786 79.3% $47,836,714
Collier County (FL) 182 45 24.7% $62,973,722 $44,901,377 71.3% $95,207,663
Hamilton County (TN) 203 53 26.1% $64,768,855 $48,937,065 75.6% $124,043,151
Manatee County (FL) 47 32 68.1% $14,441,702 $11,402,059 79.0% $24,161,473
City of Tampa (FL) 84 56 66.7% $130,701,988 $110,043,494 84.2% $280,693,830
Forsyth County (NC) 99 59 59.6% $104,706,797 $84,329,859 80.5% $209,901,509
Mercer County (NJ) 128 25 19.5% $22,095,147 $17,827,112 80.7% $39,477,963
City of Wichita (KS) 82 34 41.5% $43,936,656 $31,909,942 72.6% $78,509,369
Clackamas County (OR) 109 18 16.5% $5,821,109 $4,650,687 79.9% $9,994,039
SOURCE: Arts and Economic Prosperity 5, Americans for the Arts, 2017. For more information, visit www.AmericansForTheArts.org/EconomicImpact. B–78

Table 5:Participation Rate of Eligible Nonprofit Arts and Cultural OrganizationsPer Study Region During Fiscal Year 2015
Population Cohort Group D Universe of Number of Direct Local Direct Local as Total Spending
Population 250,000 to 499,999 Eligible Participating Participation Organizational Organizational a Percent (Direct, Indirect,
Sample Size = 42 Organizations Organizations Rate Expenditures Expenditures of Total and Induced)
Sarasota County (FL) 102 51 50.0% $201,514,937 $159,579,523 79.2% $357,367,520
City of Minneapolis (MN) 297 297 100.0% $323,394,524 $253,329,700 78.3% $678,481,711
Berks County (PA) 32 20 62.5% $10,805,527 $8,428,946 78.0% $19,966,122
City of Miami (FL) 232 216 93.1% $487,578,468 $406,829,463 83.4% $1,107,623,610
City of Raleigh (NC) 188 78 41.5% $167,668,956 $141,025,589 84.1% $359,175,427
Santa Barbara County (CA) 160 93 58.1% $126,303,269 $93,397,728 73.9% $217,307,561
Seminole County (FL) 88 21 23.9% $8,253,173 $6,439,317 78.0% $14,684,480
City of Virginia Beach (VA) 49 33 67.3% $25,929,369 $20,234,834 78.0% $45,573,178
City of Atlanta (GA) 511 146 28.6% $371,899,510 $313,827,716 84.4% $796,234,613
City of Mesa (AZ) 18 14 77.8% $16,854,627 $15,249,813 90.5% $34,082,991
City of Kansas City (MO) 165 91 55.2% $161,706,593 $128,149,211 79.2% $338,675,250
Morris County (NJ) 148 14 9.5% $15,784,179 $12,911,047 81.8% $28,471,714
Group D Average 118.9 56.4 50.0% $83,550,714 $66,864,275 78.3% $168,212,956
Group D Median 95 43 45.2% $32,930,341 $25,033,992 78.3% $57,527,818
Group D Total 4,994 2,369
SOURCE: Arts and Economic Prosperity 5, Americans for the Arts, 2017. For more information, visit www.AmericansForTheArts.org/EconomicImpact. B–79
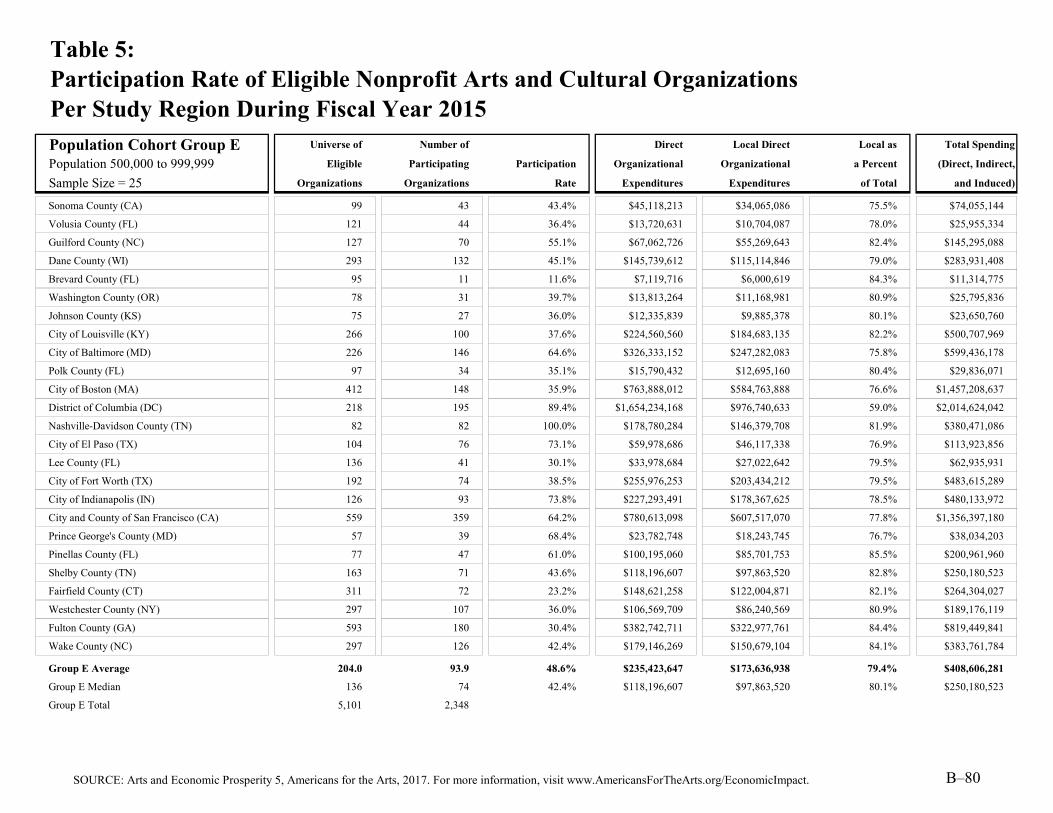
Table 5:Participation Rate of Eligible Nonprofit Arts and Cultural OrganizationsPer Study Region During Fiscal Year 2015
Population Cohort Group E Universe of Number of Direct Local Direct Local as Total Spending
Population 500,000 to 999,999 Eligible Participating Participation Organizational Organizational a Percent (Direct, Indirect,
Sample Size = 25 Organizations Organizations Rate Expenditures Expenditures of Total and Induced)
Sonoma County (CA) 99 43 43.4% $45,118,213 $34,065,086 75.5% $74,055,144
Volusia County (FL) 121 44 36.4% $13,720,631 $10,704,087 78.0% $25,955,334
Guilford County (NC) 127 70 55.1% $67,062,726 $55,269,643 82.4% $145,295,088
Dane County (WI) 293 132 45.1% $145,739,612 $115,114,846 79.0% $283,931,408
Brevard County (FL) 95 11 11.6% $7,119,716 $6,000,619 84.3% $11,314,775
Washington County (OR) 78 31 39.7% $13,813,264 $11,168,981 80.9% $25,795,836
Johnson County (KS) 75 27 36.0% $12,335,839 $9,885,378 80.1% $23,650,760
City of Louisville (KY) 266 100 37.6% $224,560,560 $184,683,135 82.2% $500,707,969
City of Baltimore (MD) 226 146 64.6% $326,333,152 $247,282,083 75.8% $599,436,178
Polk County (FL) 97 34 35.1% $15,790,432 $12,695,160 80.4% $29,836,071
City of Boston (MA) 412 148 35.9% $763,888,012 $584,763,888 76.6% $1,457,208,637
District of Columbia (DC) 218 195 89.4% $1,654,234,168 $976,740,633 59.0% $2,014,624,042
Nashville-Davidson County (TN) 82 82 100.0% $178,780,284 $146,379,708 81.9% $380,471,086
City of El Paso (TX) 104 76 73.1% $59,978,686 $46,117,338 76.9% $113,923,856
Lee County (FL) 136 41 30.1% $33,978,684 $27,022,642 79.5% $62,935,931
City of Fort Worth (TX) 192 74 38.5% $255,976,253 $203,434,212 79.5% $483,615,289
City of Indianapolis (IN) 126 93 73.8% $227,293,491 $178,367,625 78.5% $480,133,972
City and County of San Francisco (CA) 559 359 64.2% $780,613,098 $607,517,070 77.8% $1,356,397,180
Prince George's County (MD) 57 39 68.4% $23,782,748 $18,243,745 76.7% $38,034,203
Pinellas County (FL) 77 47 61.0% $100,195,060 $85,701,753 85.5% $200,961,960
Shelby County (TN) 163 71 43.6% $118,196,607 $97,863,520 82.8% $250,180,523
Fairfield County (CT) 311 72 23.2% $148,621,258 $122,004,871 82.1% $264,304,027
Westchester County (NY) 297 107 36.0% $106,569,709 $86,240,569 80.9% $189,176,119
Fulton County (GA) 593 180 30.4% $382,742,711 $322,977,761 84.4% $819,449,841
Wake County (NC) 297 126 42.4% $179,146,269 $150,679,104 84.1% $383,761,784
Group E Average 204.0 93.9 48.6% $235,423,647 $173,636,938 79.4% $408,606,281
Group E Median 136 74 42.4% $118,196,607 $97,863,520 80.1% $250,180,523
Group E Total 5,101 2,348
SOURCE: Arts and Economic Prosperity 5, Americans for the Arts, 2017. For more information, visit www.AmericansForTheArts.org/EconomicImpact. B–80

Table 5:Participation Rate of Eligible Nonprofit Arts and Cultural OrganizationsPer Study Region During Fiscal Year 2015
Population Cohort Group F Universe of Number of Direct Local Direct Local as Total Spending
Population 1,000,000 or More Eligible Participating Participation Organizational Organizational a Percent (Direct, Indirect,
Sample Size = 21 Organizations Organizations Rate Expenditures Expenditures of Total and Induced)
Mecklenburg County (NC) 201 82 40.8% $137,737,853 $114,134,997 82.9% $287,076,107
City of San José (CA) 114 67 58.8% $73,462,553 $54,565,342 74.3% $119,896,030
Montgomery County (MD) 157 149 94.9% $105,104,756 $80,701,093 76.8% $173,215,391
Fairfax County (VA) 126 85 67.5% $173,409,818 $132,740,855 76.5% $273,739,058
Allegheny County (PA) 348 194 55.7% $549,874,646 $431,195,669 78.4% $1,128,172,078
Greater Columbus Area (OH) 294 92 31.3% $222,477,493 $182,396,521 82.0% $474,761,480
Orange County (FL) 198 90 45.5% $154,347,536 $129,252,188 83.7% $332,871,813
City of Dallas (TX) 227 209 92.1% $631,469,325 $515,778,835 81.7% $1,270,870,870
Hillsborough County (FL) 118 76 64.4% $175,225,260 $147,529,507 84.2% $376,311,410
City of San Diego (CA) 293 137 46.8% $553,563,393 $442,455,363 79.9% $1,044,188,898
Palm Beach County (FL) 240 79 32.9% $184,292,190 $153,466,100 83.3% $358,392,141
City of San Antonio (TX) 88 76 86.4% $143,127,136 $118,014,738 82.5% $282,151,164
Sacramento County (CA) 206 110 53.4% $82,336,356 $65,188,948 79.2% $165,452,392
City of Phoenix (AZ) 161 90 55.9% $164,604,285 $131,455,130 79.9% $332,175,354
City and County of Philadelphia (PA) 435 395 90.8% $848,922,523 $619,572,800 73.0% $1,591,075,865
Broward County (FL) 351 103 29.3% $148,488,007 $120,981,700 81.5% $309,054,010
Santa Clara County (CA) 278 115 41.4% $112,342,340 $83,443,850 74.3% $183,350,565
Riverside County (CA) 137 94 68.6% $63,975,017 $46,633,929 72.9% $107,372,269
Miami-Dade County (FL) 677 632 93.4% $851,913,996 $710,826,535 83.4% $1,935,278,355
City of Chicago (IL) 701 466 66.5% $1,374,865,815 $1,111,895,159 80.9% $2,863,387,767
Harris County (TX) 1,056 198 18.8% $565,143,010 $465,407,808 82.4% $1,137,932,340
Group F Average 305.0 168.5 58.8% $348,413,491 $278,935,098 79.7% $702,225,017
Group F Median 227 103 55.9% $173,409,818 $132,740,855 80.9% $332,871,813
Group F Total 6,406 3,539
Average 97.6 49.7 57.6% $83,992,199 $65,117,010 74.8% $159,600,279
Median 52.5 26.5 55.1% $15,727,535 $11,803,318 75.5% $26,995,368
Minimum 9.5%
Maximum 100.0%
ALL CITY/COUNTY STUDY REGIONS
SOURCE: Arts and Economic Prosperity 5, Americans for the Arts, 2017. For more information, visit www.AmericansForTheArts.org/EconomicImpact. B–81

Table 5:Participation Rate of Eligible Nonprofit Arts and Cultural OrganizationsPer Study Region During Fiscal Year 2015
Regional Study Regions Universe of Number of Direct Local Direct Local as Total Spending
All Populations Eligible Participating Participation Organizational Organizational a Percent (Direct, Indirect,
Sample Size = 81 Organizations Organizations Rate Expenditures Expenditures of Total and Induced)
High Peaks Region (ME) 19 11 57.9% $733,718 $485,836 66.2% $1,112,971
Wood River Valley (ID) 30 24 80.0% $15,469,150 $10,427,646 67.4% $22,664,675
Southern Oregon Area 17 4 23.5% $37,531,117 $29,493,645 78.6% $69,956,556
Southwestern Pennsylvania Area 29 29 100.0% $13,154,583 $8,907,963 67.7% $22,667,251
Greater Portsmouth Area (NH) 52 26 50.0% $21,456,627 $17,097,540 79.7% $38,547,565
Northeast Oregon Region 44 5 11.4% $652,008 $431,613 66.2% $947,916
Toe River Valley (NC) 16 9 56.3% $11,706,879 $8,209,883 70.1% $20,126,416
Albemarle Region (NC) 40 7 17.5% $2,724,828 $1,839,227 67.5% $4,471,743
Greater Concord Area (NH) 29 15 51.7% $17,833,550 $12,944,511 72.6% $32,063,182
North Central Minnesota Region 151 39 25.8% $1,630,565 $1,222,601 75.0% $2,819,247
Northwest Minnesota Region 122 26 21.3% $616,142 $461,985 75.0% $785,581
Monadnock Region (NH) 144 36 25.0% $13,271,384 $10,094,596 76.1% $23,975,203
Bismarck-Mandan Region (ND) 129 31 24.0% $24,377,094 $18,602,895 76.3% $46,564,948
Greater Minot Region (ND) 116 24 20.7% $8,739,861 $5,969,005 68.3% $14,304,937
Greater Burlington Area (VT) 80 49 61.3% $59,120,540 $42,923,004 72.6% $105,086,861
Greater Charlottesville Area (VA) 216 44 20.4% $60,559,918 $25,560,291 42.2% $64,512,647
Brainerd Lakes Region (MN) 192 37 19.3% $2,753,533 $2,064,606 75.0% $5,060,994
East Central Minnesota Region 140 29 20.7% $3,802,469 $2,851,100 75.0% $6,217,037
Northwest Connecticut Region 125 56 44.8% $21,482,961 $16,124,582 75.1% $34,204,084
Central Oregon Region 48 13 27.1% $9,958,558 $7,203,500 72.3% $16,750,821
Greater Fargo-Moorhead Area (ND/MN) 97 53 54.6% $20,819,502 $15,786,887 75.8% $38,964,212
Black Hills Region (SD) 111 67 60.4% $22,974,769 $16,996,244 74.0% $41,141,031
Greater Kingsport Area (TN) 31 25 80.6% $9,562,287 $6,678,031 69.8% $15,999,084
Lake Region (MN) 229 50 21.8% $6,485,666 $4,862,968 75.0% $12,115,224
South Central Minnesota Region 297 89 30.0% $6,433,650 $4,823,966 75.0% $11,168,816
Greater Sioux Falls Area (SD) 65 33 50.8% $20,601,653 $14,781,011 71.7% $37,716,603
Southwest Tennessee Development District 66 29 43.9% $3,129,255 $2,194,030 70.1% $5,017,966
Northwest Tennessee Development District 76 29 38.2% $2,283,302 $1,470,834 64.4% $3,330,067
Southwest Minnesota Region 299 70 23.4% $4,868,274 $3,650,243 75.0% $9,356,823
Arrowhead Region (MN) 304 107 35.2% $19,637,859 $14,724,513 75.0% $36,487,142
SOURCE: Arts and Economic Prosperity 5, Americans for the Arts, 2017. For more information, visit www.AmericansForTheArts.org/EconomicImpact. B–82

Table 5:Participation Rate of Eligible Nonprofit Arts and Cultural OrganizationsPer Study Region During Fiscal Year 2015
Regional Study Regions Universe of Number of Direct Local Direct Local as Total Spending
All Populations Eligible Participating Participation Organizational Organizational a Percent (Direct, Indirect,
Sample Size = 81 Organizations Organizations Rate Expenditures Expenditures of Total and Induced)
Maple Grove and the Northwest Suburbs (MN) 15 15 100.0% $1,487,198 $1,115,105 75.0% $3,120,141
Greater Augusta Area (GA) 94 33 35.1% $37,854,649 $28,609,916 75.6% $70,932,090
Upper Cumberland Development District (TN) 109 42 38.5% $6,334,696 $4,228,832 66.8% $9,788,135
City of Huntsville/Madison County (AL) 63 34 54.0% $53,843,563 $36,396,196 67.6% $86,363,171
Northeast Commission (NC) 139 62 44.6% $22,642,818 $13,840,625 61.1% $34,845,069
Greater Ann Arbor Area (MI) 133 87 65.4% $49,916,641 $37,427,615 75.0% $96,089,534
Greater Fox Cities Region (WI) 116 18 15.5% $40,077,673 $34,539,898 86.2% $90,188,206
Central Minnesota Region 204 54 26.5% $8,800,646 $6,598,745 75.0% $15,647,549
South Central Tennessee Development District 113 60 53.1% $4,064,456 $2,764,683 68.0% $6,140,841
Northwest Arkansas Region 99 23 23.2% $67,503,606 $55,849,709 82.7% $133,712,296
Southeast Minnesota Region 347 122 35.2% $16,690,210 $12,514,359 75.0% $28,690,471
First Tennessee Development District 119 58 48.7% $15,384,812 $10,910,650 70.9% $26,485,111
Greater Harrisburg Area (PA) 80 25 31.3% $12,684,667 $10,252,618 80.8% $25,036,945
Greater New Haven Area (CT) 263 35 13.3% $114,867,991 $92,787,357 80.8% $233,181,794
Treasure Coast Region (FL) 113 35 31.0% $33,405,733 $24,110,871 72.2% $53,162,659
Greater Des Moines Region (IA) 91 65 71.4% $71,922,902 $58,285,952 81.0% $151,604,863
Southeast Tennessee Development District 296 93 31.4% $67,352,550 $50,824,500 75.5% $126,234,794
Greater Knoxville Region (TN) 195 60 30.8% $48,160,880 $37,589,924 78.1% $93,148,037
Greater Columbia Area (SC) 80 33 41.3% $22,480,674 $17,748,386 78.9% $45,749,170
Pikes Peak Region (CO) 166 87 52.4% $51,193,211 $35,911,250 70.1% $90,513,051
Lehigh Valley Region (PA) 141 98 69.5% $83,164,601 $66,041,159 79.4% $159,973,723
Greater Sarasota/Bradenton Area (FL) 159 83 52.2% $215,956,639 $170,981,581 79.2% $381,528,993
Dayton Region (OH) 232 113 48.7% $95,159,725 $75,614,691 79.5% $188,167,353
Richmond & Tri-Cities Region (VA) 131 83 63.4% $211,680,685 $140,774,696 66.5% $284,969,711
Memphis Area Association of Governments (TN) 229 73 31.9% $118,315,928 $97,879,824 82.7% $248,133,177
Eastern Region (NC) 195 110 56.4% $27,730,102 $19,332,044 69.7% $47,769,947
Advantage West Region (NC) 376 184 48.9% $75,230,591 $57,772,467 76.8% $138,727,261
Southeast Commission (NC) 285 127 44.6% $50,352,984 $38,503,476 76.5% $87,269,427
Greater Fairfax Area (VA) 170 103 60.6% $182,798,508 $138,287,398 75.7% $285,409,378
Greater Tulsa Region (OK) 228 123 53.9% $91,182,165 $78,433,755 86.0% $185,268,981
SOURCE: Arts and Economic Prosperity 5, Americans for the Arts, 2017. For more information, visit www.AmericansForTheArts.org/EconomicImpact. B–83

Table 5:Participation Rate of Eligible Nonprofit Arts and Cultural OrganizationsPer Study Region During Fiscal Year 2015
Regional Study Regions Universe of Number of Direct Local Direct Local as Total Spending
All Populations Eligible Participating Participation Organizational Organizational a Percent (Direct, Indirect,
Sample Size = 81 Organizations Organizations Rate Expenditures Expenditures of Total and Induced)
East Tennessee Development District 321 100 31.2% $53,564,537 $40,416,741 75.5% $99,956,390
West Valley Region (AZ) 84 20 23.8% $13,189,366 $10,896,386 82.6% $27,544,338
Greater St. Louis Area (MO) 285 163 57.2% $363,745,576 $294,356,279 80.9% $737,737,175
Western New York 171 126 73.7% $156,024,439 $102,338,002 65.6% $247,645,896
Greater Oklahoma City Region (OK) 249 153 61.4% $220,484,100 $176,171,032 79.9% $466,517,563
Piedmont Triad Partnership (NC) 329 206 62.6% $207,772,417 $167,689,893 80.7% $424,961,810
Greater Portland Area (OR) 505 183 36.2% $214,420,434 $176,788,194 82.4% $441,194,847
Greater Kansas City Metropolitan Area (MO/KS) 309 133 43.0% $179,536,915 $142,279,381 79.2% $376,018,742
Greater Nashville Regional Council (TN) 234 158 67.5% $200,353,380 $165,308,517 82.5% $416,198,229
Research Triangle Regional Partnership (NC) 695 357 51.4% $387,905,496 $313,023,759 80.7% $797,185,698
Greater Tampa/St. Petersburg Area (FL) 256 123 48.0% $275,420,320 $245,281,276 89.1% $558,329,480
Charlotte Regional Partnership (NC) 395 187 47.3% $165,862,764 $136,215,489 82.1% $344,117,788
Charlotte Regional Partnership (NC/SC) 440 200 45.5% $179,142,409 $147,159,680 82.1% $372,840,798
Seven-County Metro Area (MN) 2,458 645 26.2% $624,372,639 $468,156,072 75.0% $1,309,933,797
Central Florida Region 690 218 31.6% $202,291,372 $167,309,969 82.7% $419,468,739
Greater Philadelphia Region (PA) 588 492 83.7% $992,509,546 $776,393,540 78.2% $1,990,143,855
Greater Washington Region (DC/MD/VA) 810 608 75.1% $2,172,509,756 $1,367,368,230 62.9% $2,832,704,718
Metro Atlanta Area (GA) 1,248 269 21.6% $434,779,646 $364,605,996 83.9% $930,761,930
Greater Atlanta Region (GA) 1,477 297 20.1% $442,368,282 $370,663,037 83.8% $949,165,808
Greater Houston Region (TX) 1,402 209 14.9% $579,435,793 $475,732,036 82.1% $1,152,164,226
Dallas-Fort Worth-Arlington MSA (TX) 497 454 91.3% $999,509,582 $809,074,973 80.9% $1,996,339,843
Regional Average 268.4 105.0 44.2% $140,837,185 $107,185,698 75.0% $260,036,064
Regional Median 151 60 44.6% $37,854,649 $28,609,916 75.1% $69,956,556
Regional Total 21,738 8,505
SOURCE: Arts and Economic Prosperity 5, Americans for the Arts, 2017. For more information, visit www.AmericansForTheArts.org/EconomicImpact. B–84

Table 5:Participation Rate of Eligible Nonprofit Arts and Cultural OrganizationsPer Study Region During Fiscal Year 2015
Statewide Study Regions Universe of Number of Direct Local Direct Local as Total Spending
All Populations Eligible Participating Participation Organizational Organizational a Percent (Direct, Indirect,
Sample Size = 20 Organizations Organizations Rate Expenditures Expenditures of Total and Induced)
State of Vermont 217 86 39.6% $78,856,911 $53,647,734 68.0% $107,400,435
State of North Dakota 678 135 19.9% $56,458,549 $39,267,449 69.6% $78,374,116
State of Delaware 135 95 70.4% $103,624,375 $74,756,167 72.1% $149,533,026
State of Maine 602 123 20.4% $92,577,604 $65,273,365 70.5% $124,242,624
State of Hawai'i 236 109 46.2% $125,921,352 $86,878,417 69.0% $172,894,474
State of Nevada 581 164 28.2% $227,298,372 $157,015,019 69.1% $316,217,421
State of Connecticut 1,137 324 28.5% $515,311,370 $367,057,692 71.2% $725,993,144
State of Oklahoma 712 392 55.1% $331,249,786 $236,630,082 71.4% $477,314,040
State of Oregon 1,075 365 34.0% $364,065,287 $258,348,441 71.0% $503,632,080
State of Minnesota 4,743 1,268 26.7% $696,091,653 $521,931,158 75.0% $1,438,282,680
State of Wisconsin 1,042 363 34.8% $376,915,991 $261,811,907 69.5% $527,213,192
State of Maryland 592 522 88.2% $511,399,372 $350,510,376 68.5% $689,819,257
State of Missouri 1,307 491 37.6% $602,903,738 $423,350,149 70.2% $851,825,315
State of Tennessee 1,663 642 38.6% $470,782,916 $338,067,759 71.8% $672,397,715
State of Massachusetts 1,620 643 39.7% $1,386,703,275 $934,024,483 67.4% $1,908,013,933
State of New Jersey 530 183 34.5% $296,140,348 $215,261,237 72.7% $402,335,766
State of North Carolina 2,414 1,233 51.1% $937,497,172 $661,128,510 70.5% $1,324,561,192
State of Pennsylvania 1,431 1,077 75.3% $1,753,309,722 $1,183,996,385 67.5% $2,429,145,594
State of Illinois 1,279 808 63.2% $1,780,626,339 $1,216,478,671 68.3% $2,469,573,785
State of Florida 4,312 1,688 39.1% $2,285,671,265 $1,712,031,446 74.9% $3,473,760,407
Statewide Average 1,315.3 535.6 43.6% $649,670,270 $457,873,322 70.2% $942,126,510
Statewide Median 1,059 379 38.9% $423,849,454 $299,939,833 70.4% $599,805,454
Statewide Total 26,306 10,711
SOURCE: Arts and Economic Prosperity 5, Americans for the Arts, 2017. For more information, visit www.AmericansForTheArts.org/EconomicImpact. B–85

Table 5:Participation Rate of Eligible Nonprofit Arts and Cultural OrganizationsPer Study Region During Fiscal Year 2015
Individual Arts Districts Universe of Number of Direct Local Direct Local as Total Spending
All Populations Eligible Participating Participation Organizational Organizational a Percent (Direct, Indirect,
Sample Size = 12 Organizations Organizations Rate Expenditures Expenditures of Total and Induced)
James River Arts & Cultural District 21 15 71.4% $6,394,249 $3,071,123 48.0% $6,680,958
Center City Charlotte 72 35 48.6% $124,091,617 $102,827,190 82.9% $258,634,337
Loch Haven Cultural Park 9 8 88.9% $29,253,216 $24,496,939 83.7% $63,088,607
Downtown Colorado Springs Creative District 54 30 55.6% $20,773,371 $14,572,200 70.1% $36,728,722
Fort Worth Cultural District 26 16 61.5% $150,010,452 $119,219,098 79.5% $283,414,369
Dallas Arts District 28 15 53.6% $282,234,392 $230,526,678 81.7% $568,014,079
Grand Center Arts & Entertainment District 47 20 42.6% $77,174,797 $62,452,680 80.9% $156,523,462
Balboa Park Cultural District 44 24 54.5% $380,437,910 $304,078,622 79.9% $717,621,589
East End Cultural District 9 9 100.0% $3,177,402 $2,616,661 82.4% $6,397,794
Houston Museum District Association 25 22 88.0% $321,550,313 $264,803,817 82.4% $647,451,165
Midtown Cultural District 6 5 83.3% $4,111,803 $3,386,161 82.4% $8,279,238
Washington Avenue Cultural District 8 6 75.0% $2,520,607 $2,075,776 82.4% $5,075,318
Arts District Average 29.1 17.1 68.6% $116,810,844 $94,510,579 78.0% $229,825,803
Arts District Median 26 16 66.5% $53,214,007 $43,474,810 82.0% $109,806,034
Arts District Total 349 205
Average 54.0% 74.8%
Median 51.1% 75.0%
Minimum 9.5% 42.2%
Maximum 100.0% 90.5%
Total 33,851 14,439
SUMMARY STATISTICS FOR ALL 341 PARTICIPATING STUDY REGIONS (as appropriate)
SOURCE: Arts and Economic Prosperity 5, Americans for the Arts, 2017. For more information, visit www.AmericansForTheArts.org/EconomicImpact. B–86

Explanation of Table 6:Total Economic Impact of Expenditures by Nonprofit Arts and Cultural OrganizationsPer Study Region During Fiscal Year 2015
Column Two:
Column Three:
Column Four:
Column Five:
Column Six:
The total amount of revenue that the local government receives (e.g., licenses, fees, taxes) as a result of the expenditures made by the responding nonprofit arts and cultural organizations in each participating study region. Local government includes the city and county governments located within each participating study region.
The total amount of revenue that the state government receives (e.g., licenses, fees, taxes) as a result of the expenditures made by the responding nonprofit arts and cultural organizations in each participating study region.
This table presents for each study region the total economic impact of the expenditures made by responding nonprofit arts and cultural organizations during fiscal year 2015. Summary statistics are calculated for each population group.
The total direct organizational expenditures reported by responding nonprofit arts and cultural organizations in each participating study region during fiscal year 2015. This figure is the sum of operating expenditures and capital expenditures. These data are real dollars reported by the organizations that responded to the survey in each study region only; no multiplier was used to calculate these figures and no extrapolations were made for non-responding organizations.
The total number of full-time equivalent (FTE) jobs supported by the expenditures made by the responding nonprofit arts and cultural organizations in each participating study region. Economists measure FTE jobs—not the total number of employees—because it is a more accurate measure of total employment. Each FTE job can represent one full-time employee, two employees who work half-time, four employees who work quarter-time, etc.
The total amount of household income paid to study region residents as a result of the expenditures made by the responding nonprofit arts and cultural organizations in each participating study region. Household income includes salaries, wages, and proprietary income.
The total impact is a measure of the effect each expended dollar has on the study region's economy as it is spent and re-spent within the region. It includes direct economic impacts plus indirect and induced economic impacts. It is derived from input-output models that are customized for each participating study region. See Background and Scope of Study and Frequently Used Terms in this Arts & Economic Prosperity 5 National Statistical Report for more information about direct, indirect, and induced economic impacts.
SOURCE: Arts and Economic Prosperity 5, Americans for the Arts, 2017. For more information, visit www.AmericansForTheArts.org/EconomicImpact. B–87

Table 6:Total Economic Impact of Expenditures by Nonprofit Arts and Cultural OrganizationsPer Study Region During Fiscal Year 2015
Population Cohort Group A Direct
Population Fewer than 50,000 Organizational Full-Time Resident Local State
Sample Size = 52 Expenditures Equivalent Jobs Household Income Government Revenue Government Revenue
Town of Crested Butte (CO)3 $4,554,422 102 $2,419,000 $112,000 $93,000
City of Pine City (MN)2 $425,217 10 $255,000 $7,000 $33,000
City of Alva (OK) $1,188,716 54 $741,000 $22,000 $32,000
Cook County (MN)2 $2,575,814 84 $1,861,000 $43,000 $190,000
Town of Hillsborough (NC) $1,594,300 66 $1,417,000 $54,000 $83,000
City of Virginia (MN)2 $115,568 4 $83,000 $2,000 $9,000
Town of Jackson (WY)3 $18,725,980 375 $11,060,000 $481,000 $1,052,000
City of Guthrie (OK) $1,611,682 41 $892,000 $57,000 $83,000
City of Grand Rapids (MN)2 $2,833,920 92 $2,047,000 $47,000 $210,000
Town of Medfield (MA) $2,748,727 118 $1,944,000 $98,000 $86,000
City of Fergus Falls (MN)2 $2,272,954 73 $1,519,000 $38,000 $167,000
Grundy County (TN)4 $110,283 3 $53,000 $3,000 $5,000
City of Falls Church (VA)3 $6,749,150 170 $3,307,000 $288,000 $550,000
City of Jamestown (ND) $1,055,380 45 $638,000 $26,000 $52,000
City of Waterville (ME)1 $4,449,410 211 $2,998,000 $270,000 $202,000
City of Red Wing (MN)2 $1,724,398 56 $1,154,000 $27,000 $147,000
City of Durango (CO)1 $8,619,712 320 $6,402,000 $258,000 $175,000
City of Hannibal (MO) $1,399,947 39 $844,000 $24,000 $31,000
City of Tullahoma (TN) $610,715 22 $351,000 $16,000 $28,000
City of Northfield (MN)2 $1,297,441 42 $869,000 $20,000 $111,000
Town of Carrboro (NC) $3,640,757 152 $3,236,000 $122,000 $190,000
Macon County (TN)4 $104,098 2 $56,000 $3,000 $6,000
City of Laguna Beach (CA)3 $40,118,691 1,185 $32,649,000 $1,586,000 $2,024,000
Hickman County (TN)4 $1,152,455 27 $846,000 $33,000 $70,000
City of Fairfax (VA) $2,639,540 91 $1,868,000 $94,000 $73,000
City of Ponca City (OK) $2,799,217 73 $1,483,000 $67,000 $71,000
City of Paducah (KY)1 $18,055,851 739 $11,535,000 $230,000 $595,000
Mille Lacs County (MN)2 $575,555 13 $345,000 $10,000 $45,000
McNairy County (TN)4 $22,544 1 $13,000 $1,000 $1,000
City of Winona (MN)2 $3,269,857 106 $2,189,000 $51,000 $279,000
TOTAL Economic Impact of ORGANIZATIONAL Spending
SOURCE: Arts and Economic Prosperity 5, Americans for the Arts, 2017. For more information, visit www.AmericansForTheArts.org/EconomicImpact. B–88

Table 6:Total Economic Impact of Expenditures by Nonprofit Arts and Cultural OrganizationsPer Study Region During Fiscal Year 2015
Population Cohort Group A Direct
Population Fewer than 50,000 Organizational Full-Time Resident Local State
Sample Size = 52 Expenditures Equivalent Jobs Household Income Government Revenue Government Revenue
Door County (WI)4 $9,730,760 300 $6,139,000 $331,000 $434,000
City of Benicia (CA) $2,902,134 119 $2,103,000 $123,000 $132,000
City of Winter Park (FL)3 $16,576,065 605 $15,899,000 $471,000 $615,000
City of Rochester (NH)1 $4,353,943 217 $3,902,000 $161,000 $211,000
City of Morgantown (WV)1 $27,454,214 1,347 $19,952,000 $556,000 $1,758,000
Henry County (TN)4 $183,974 6 $112,000 $4,000 $8,000
City of Fairbanks (AK)1 $8,779,765 355 $6,606,000 $381,000 $852,000
City of Bangor (ME) $3,437,656 141 $2,599,000 $209,000 $163,000
Weakley County (TN)4 $211,563 6 $128,000 $5,000 $10,000
Dare County (NC)4 $13,790,194 378 $6,968,000 $127,000 $202,000
City of Columbia (TN) $1,297,724 55 $774,000 $32,000 $58,000
City of Lake Worth (FL)3 $14,656,059 374 $9,668,000 $726,000 $806,000
Clatsop County (OR)4 $2,874,045 93 $1,741,000 $88,000 $50,000
Yadkin County (NC)4 $809,737 27 $438,000 $22,000 $31,000
Greater Belfast Area (ME)4 $2,683,737 76 $1,699,000 $161,000 $160,000
Campbell County (TN)4 $108,671 3 $52,000 $3,000 $6,000
Monroe County (TN)4 $666,880 24 $415,000 $17,000 $33,000
Lincoln County (OR)4 $1,595,530 44 $894,000 $38,000 $29,000
Iron County (UT)4 $13,330,445 240 $6,830,000 $243,000 $357,000
City of St. Louis Park (MN)2 $758,069 26 $621,000 $13,000 $64,000
City of Logan (UT)1 $17,572,786 772 $10,901,000 $505,000 $595,000
Gibson County (TN)4 $1,003,653 46 $649,000 $26,000 $56,000
Group A Average $5,419,614 184 $3,733,923 $160,231 $256,212
Group A Average Excluding Outliers/Exclusions $2,071,269 78 $1,453,077 $72,615 $83,231
Group A Median $2,607,677 75 $1,609,000 $52,500 $89,500
TOTAL Economic Impact of ORGANIZATIONAL Spending
SOURCE: Arts and Economic Prosperity 5, Americans for the Arts, 2017. For more information, visit www.AmericansForTheArts.org/EconomicImpact. B–89

Table 6:Total Economic Impact of Expenditures by Nonprofit Arts and Cultural OrganizationsPer Study Region During Fiscal Year 2015
Population Cohort Group B Direct
Population 50,000 to 99,999 Organizational Full-Time Resident Local State
Sample Size = 38 Expenditures Equivalent Jobs Household Income Government Revenue Government Revenue
City of Joplin (MO) $1,792,636 88 $1,390,000 $61,000 $52,000
City of La Crosse (WI) $12,827,852 428 $10,504,000 $510,000 $602,000
McMinn County (TN)4 $2,021,520 60 $1,184,000 $50,000 $88,000
Lafayette County (MS)4 $2,655,457 122 $1,683,000 $77,000 $183,000
Chisago County (MN)2 $655,430 15 $393,000 $11,000 $51,000
City of Grand Forks (ND) $2,781,581 96 $2,126,000 $78,000 $126,000
City of Corvallis (OR) $27,545,447 1,082 $16,938,000 $1,013,000 $462,000
City of Noblesville (IN) $475,139 20 $331,000 $19,000 $32,000
City of Ocala (FL) $14,295,754 531 $10,486,000 $736,000 $1,039,000
Lenoir County (NC)4 $932,880 30 $657,000 $25,000 $28,000
Town of Chapel Hill (NC) $88,407,897 3,687 $78,578,000 $2,972,000 $4,612,000
City of Grand Junction (CO) $11,275,100 339 $9,350,000 $490,000 $277,000
Town of Jupiter (FL) $8,019,104 205 $5,290,000 $397,000 $441,000
Hamblen County (TN)4 $760,318 26 $467,000 $17,000 $29,000
City of Delray Beach (FL) $11,319,692 289 $7,467,000 $561,000 $623,000
City of St. Cloud (MN)2 $5,345,355 183 $3,836,000 $90,000 $451,000
City of Portland (ME) $46,572,402 1,446 $41,386,000 $2,217,000 $2,842,000
City of Jackson (TN) $2,666,496 134 $1,985,000 $61,000 $111,000
City of Walnut Creek (CA) $21,097,821 716 $17,012,000 $941,000 $1,145,000
Greene County (TN)4 $2,505,621 75 $1,451,000 $61,000 $121,000
City of Flagstaff (AZ) $51,666,744 1,980 $44,116,000 $1,793,000 $1,988,000
City of Missoula (MT) $20,392,313 798 $16,699,000 $606,000 $913,000
City of Fort Myers (FL) $13,682,062 467 $12,000,000 $647,000 $1,067,000
Putnam County (TN)4 $2,038,202 67 $1,472,000 $52,000 $99,000
Monroe County (FL)4 $27,188,753 754 $15,041,000 $590,000 $1,346,000
City of Lynchburg (VA) $6,648,618 140 $2,931,000 $263,000 $302,000
City of Duluth (MN)2 $14,291,391 466 $10,323,000 $237,000 $1,057,000
City of Fishers (IN) $23,094,545 953 $16,092,000 $943,000 $1,543,000
City of Carmel (IN) $12,559,425 518 $8,751,000 $513,000 $839,000
City of Sugar Land (TX) $646,740 25 $447,000 $51,000 $57,000
TOTAL Economic Impact of ORGANIZATIONAL Spending
SOURCE: Arts and Economic Prosperity 5, Americans for the Arts, 2017. For more information, visit www.AmericansForTheArts.org/EconomicImpact. B–90

Table 6:Total Economic Impact of Expenditures by Nonprofit Arts and Cultural OrganizationsPer Study Region During Fiscal Year 2015
Population Cohort Group B Direct
Population 50,000 to 99,999 Organizational Full-Time Resident Local State
Sample Size = 38 Expenditures Equivalent Jobs Household Income Government Revenue Government Revenue
City of Asheville (NC) $19,541,466 666 $18,347,000 $613,000 $900,000
Buchanan County (MO)4 $10,079,729 516 $9,572,000 $389,000 $321,000
City of Boca Raton (FL) $10,757,773 275 $7,096,000 $533,000 $592,000
City of Miami Beach (FL)3 $84,770,391 2,442 $85,756,000 $2,714,000 $4,340,000
Moore County (NC)4 $6,876,979 182 $4,446,000 $189,000 $250,000
Sevier County (TN)4 $3,645,416 88 $1,749,000 $20,000 $59,000
Cape May County (NJ)4 $4,544,984 132 $2,558,000 $226,000 $196,000
Cleveland County (NC)4 $2,287,739 68 $1,425,000 $73,000 $87,000
Group B Average $15,228,073 529 $12,403,553 $548,395 $770,289
Group B Average Excluding Outliers/Exclusions $18,548,482 677 $14,969,182 $728,091 $934,773
Group B Median $9,049,417 240 $6,193,000 $326,000 $381,000
TOTAL Economic Impact of ORGANIZATIONAL Spending
SOURCE: Arts and Economic Prosperity 5, Americans for the Arts, 2017. For more information, visit www.AmericansForTheArts.org/EconomicImpact. B–91

Table 6:Total Economic Impact of Expenditures by Nonprofit Arts and Cultural OrganizationsPer Study Region During Fiscal Year 2015
Population Cohort Group C Direct
Population 100,000 to 249,999 Organizational Full-Time Resident Local State
Sample Size = 50 Expenditures Equivalent Jobs Household Income Government Revenue Government Revenue
City of Las Cruces (NM) $8,508,432 178 $5,398,000 $239,000 $598,000
Eau Claire County (WI)4 $4,509,343 191 $3,913,000 $218,000 $190,000
Yamhill County (OR)4 $20,664,640 717 $12,264,000 $747,000 $384,000
City of Lewisville (TX) $1,513,284 60 $1,100,000 $116,000 $122,000
City of West Palm Beach (FL) $117,010,242 2,990 $77,184,000 $5,799,000 $6,438,000
City of Boulder (CO) $35,514,381 968 $29,275,000 $1,092,000 $1,028,000
City of Richardson (TX) $12,143,635 502 $10,143,000 $517,000 $651,000
City of High Point (NC) $2,560,289 92 $2,151,000 $72,000 $131,000
City of Cambridge (MA) $119,802,629 5,204 $79,023,000 $5,268,000 $4,534,000
City of Lowell (MA) $8,688,661 444 $6,782,000 $388,000 $327,000
Douglas County (KS)4 $15,670,891 646 $11,318,000 $664,000 $636,000
City of Columbia (MO) $9,152,344 483 $7,250,000 $362,000 $355,000
City of Norman (OK) $11,552,877 462 $8,269,000 $459,000 $662,000
Wayne County (NC)4 $1,570,039 54 $1,061,000 $71,000 $53,000
City of Lafayette (LA) $6,356,368 253 $4,742,000 $235,000 $270,000
Washington County (TN)4 $3,257,903 148 $2,528,000 $78,000 $159,000
City of Thousand Oaks (CA) $8,609,672 364 $6,569,000 $356,000 $422,000
City of Charleston (SC) $66,091,990 3,014 $53,659,000 $2,209,000 $2,554,000
City of Waco (TX) $31,391,910 1,253 $22,337,000 $1,438,000 $1,513,000
Robeson County (NC)4 $2,914,420 100 $1,743,000 $80,000 $103,000
Columbia County (GA)4 $43,211 1 $21,000 $2,000 $2,000
Orange County (NC)4 $93,643,475 3,905 $83,231,000 $3,148,000 $4,885,000
City of Savannah (GA) $34,799,185 1,670 $26,472,000 $1,389,000 $1,106,000
Indian River County (FL)4 $16,019,023 471 $9,468,000 $796,000 $1,328,000
City of Alexandria (VA) $35,827,099 1,157 $27,302,000 $1,088,000 $1,281,000
Martin County (FL)4 $14,266,732 490 $9,514,000 $653,000 $1,211,000
Macon-Bibb County (GA)4 $49,139,734 2,120 $41,526,000 $1,829,000 $1,662,000
City of Springfield (MA) $36,109,244 1,498 $26,976,000 $1,693,000 $1,450,000
Catawba County (NC)4 $12,569,224 442 $8,825,000 $372,000 $392,000
Town of Cary (NC) $6,153,643 296 $5,745,000 $202,000 $340,000
TOTAL Economic Impact of ORGANIZATIONAL Spending
SOURCE: Arts and Economic Prosperity 5, Americans for the Arts, 2017. For more information, visit www.AmericansForTheArts.org/EconomicImpact. B–92

Table 6:Total Economic Impact of Expenditures by Nonprofit Arts and Cultural OrganizationsPer Study Region During Fiscal Year 2015
Population Cohort Group C Direct
Population 100,000 to 249,999 Organizational Full-Time Resident Local State
Sample Size = 50 Expenditures Equivalent Jobs Household Income Government Revenue Government Revenue
Alamance County (NC)4 $3,877,725 166 $2,723,000 $116,000 $147,000
Cumberland County (NJ) $9,546,724 439 $6,185,000 $474,000 $391,000
City of Eugene (OR) $40,780,515 1,745 $31,585,000 $1,454,000 $711,000
Middlesex County (CT)4 $20,883,683 798 $13,655,000 $830,000 $986,000
City of Springfield (MO) $9,778,504 510 $8,078,000 $343,000 $310,000
City of Sioux Falls (SD) $20,112,501 821 $14,887,000 $589,000 $926,000
Pitt County (NC)4 $12,689,847 716 $13,964,000 $440,000 $514,000
City of Providence (RI) $93,832,555 2,282 $72,051,000 $4,176,000 $4,983,000
City of Worcester (MA) $64,504,636 2,801 $46,052,000 $3,107,000 $2,579,000
Montgomery County (TN)4 $2,964,420 137 $1,831,000 $109,000 $220,000
Salt Lake City (UT) $112,442,764 5,157 $93,990,000 $4,315,000 $5,740,000
Cabarrus County (NC)4 $2,265,571 62 $1,678,000 $77,000 $87,000
Richmond County (GA)4 $37,811,438 1,827 $28,306,000 $1,474,000 $1,195,000
City of Tacoma (WA) $74,648,459 2,201 $55,617,000 $3,120,000 $4,440,000
Doña Ana County (NM)4 $12,920,210 271 $8,197,000 $362,000 $908,000
New Hanover County (NC)4 $14,841,737 671 $14,259,000 $490,000 $502,000
Arlington County (VA)4 $170,762,477 4,840 $112,541,000 $6,492,000 $5,841,000
City of Irving (TX) $24,192,919 1,000 $20,228,000 $1,102,000 $1,343,000
City of Reno (NV) $50,139,403 1,875 $36,270,000 $1,450,000 $3,225,000
York County (SC)4 $13,279,645 569 $10,337,000 $377,000 $533,000
Group C Average $31,566,605 1,181 $23,564,460 $1,249,540 $1,407,360
Group C Average Excluding Outliers/Exclusions $38,600,672 1,455 $28,856,852 $1,576,963 $1,779,222
Group C Median $14,554,235 608 $10,827,500 $553,000 $656,500
TOTAL Economic Impact of ORGANIZATIONAL Spending
SOURCE: Arts and Economic Prosperity 5, Americans for the Arts, 2017. For more information, visit www.AmericansForTheArts.org/EconomicImpact. B–93

Table 6:Total Economic Impact of Expenditures by Nonprofit Arts and Cultural OrganizationsPer Study Region During Fiscal Year 2015
Population Cohort Group D Direct
Population 250,000 to 499,999 Organizational Full-Time Resident Local State
Sample Size = 42 Expenditures Equivalent Jobs Household Income Government Revenue Government Revenue
Buncombe County (NC)4 $26,363,882 898 $24,753,000 $827,000 $1,215,000
Alachua County (FL)4 $36,563,147 863 $21,791,000 $1,152,000 $1,210,000
Greater Green Bay Area (WI)4 $23,392,446 962 $18,269,000 $919,000 $1,102,000
City of Orlando (FL) $123,648,175 4,512 $118,597,000 $3,517,000 $4,587,000
City of Lincoln (NE) $50,665,562 1,397 $43,161,000 $1,755,000 $2,294,000
Southeastern Connecticut Region (CT)4 $87,159,766 2,994 $55,301,000 $1,211,000 $2,931,000
Erie County (PA)4 $19,091,150 672 $14,793,000 $705,000 $1,047,000
San Luis Obispo County (CA)4 $13,693,022 543 $9,527,000 $507,000 $632,000
City of Newark (NJ) $109,365,244 3,798 $104,329,000 $5,043,000 $5,096,000
Leon County (FL)4 $100,454,010 4,493 $68,357,000 $6,297,000 $8,901,000
Rutherford County (TN)4 $10,798,787 526 $7,570,000 $305,000 $559,000
St. Lucie County (FL)4 $3,119,978 118 $2,630,000 $163,000 $228,000
Greater Spartanburg Area (SC)4 $21,371,683 799 $15,970,000 $805,000 $908,000
Durham County (NC)4 $104,619,126 4,238 $98,643,000 $3,143,000 $3,946,000
City of St. Paul (MN)2 $281,609,958 9,716 $230,560,000 $4,745,000 $23,745,000
Hamilton County (IN)4 $36,204,739 1,494 $25,227,000 $1,478,000 $2,418,000
Osceola County (FL)4 $1,922,406 65 $1,539,000 $40,000 $108,000
Escambia County (FL)4 $27,449,975 1,104 $21,175,000 $1,357,000 $1,931,000
Lexington-Fayette Urban County (KY)4 $16,129,322 621 $16,413,000 $353,000 $1,066,000
Lake County (FL)4 $1,137,478 44 $721,000 $63,000 $99,000
City of Riverside (CA) $17,575,088 543 $13,400,000 $743,000 $852,000
Cumberland County (NC)4 $29,655,943 989 $19,520,000 $1,228,000 $1,384,000
Collier County (FL)4 $62,973,722 2,011 $40,879,000 $2,305,000 $4,528,000
Hamilton County (TN)4 $64,768,855 3,095 $64,442,000 $2,046,000 $3,846,000
Manatee County (FL)4 $14,441,702 570 $10,654,000 $770,000 $1,399,000
City of Tampa (FL) $130,701,988 5,793 $116,515,000 $5,953,000 $10,040,000
Forsyth County (NC)4 $104,706,797 3,818 $90,307,000 $3,376,000 $5,165,000
Mercer County (NJ)4 $22,095,147 1,047 $17,661,000 $1,396,000 $1,102,000
City of Wichita (KS) $43,936,656 1,249 $37,149,000 $1,782,000 $1,897,000
Clackamas County (OR)4 $5,821,109 255 $4,356,000 $254,000 $128,000
TOTAL Economic Impact of ORGANIZATIONAL Spending
SOURCE: Arts and Economic Prosperity 5, Americans for the Arts, 2017. For more information, visit www.AmericansForTheArts.org/EconomicImpact. B–94

Table 6:Total Economic Impact of Expenditures by Nonprofit Arts and Cultural OrganizationsPer Study Region During Fiscal Year 2015
Population Cohort Group D Direct
Population 250,000 to 499,999 Organizational Full-Time Resident Local State
Sample Size = 42 Expenditures Equivalent Jobs Household Income Government Revenue Government Revenue
Sarasota County (FL)4 $201,514,937 5,517 $166,978,000 $6,829,000 $11,649,000
City of Minneapolis (MN)2 $323,394,524 11,157 $264,770,000 $5,449,000 $27,269,000
Berks County (PA)4 $10,805,527 434 $7,678,000 $462,000 $646,000
City of Miami (FL) $487,578,468 14,043 $493,248,000 $15,613,000 $24,963,000
City of Raleigh (NC) $167,668,956 8,057 $156,529,000 $5,509,000 $9,263,000
Santa Barbara County (CA)4 $126,303,269 3,832 $96,363,000 $4,617,000 $6,060,000
Seminole County (FL)4 $8,253,173 272 $6,205,000 $385,000 $576,000
City of Virginia Beach (VA) $25,929,369 1,125 $18,696,000 $994,000 $842,000
City of Atlanta (GA) $371,899,510 12,106 $337,428,000 $11,231,000 $14,254,000
City of Mesa (AZ) $16,854,627 652 $16,662,000 $745,000 $941,000
City of Kansas City (MO) $161,706,593 5,060 $162,112,000 $4,250,000 $6,670,000
Morris County (NJ)4 $15,784,179 759 $12,080,000 $898,000 $664,000
Group D Average $83,550,714 2,911 $72,689,476 $2,648,095 $4,718,119
Group D Average Excluding Outliers/Exclusions $142,294,186 4,861 $134,818,833 $4,761,250 $6,808,250
Group D Median $32,930,341 1,115 $23,272,000 $1,292,500 $1,648,000
TOTAL Economic Impact of ORGANIZATIONAL Spending
SOURCE: Arts and Economic Prosperity 5, Americans for the Arts, 2017. For more information, visit www.AmericansForTheArts.org/EconomicImpact. B–95

Table 6:Total Economic Impact of Expenditures by Nonprofit Arts and Cultural OrganizationsPer Study Region During Fiscal Year 2015
Population Cohort Group E Direct
Population 500,000 to 999,999 Organizational Full-Time Resident Local State
Sample Size = 25 Expenditures Equivalent Jobs Household Income Government Revenue Government Revenue
Sonoma County (CA)4 $45,118,213 1,952 $33,394,000 $2,064,000 $2,292,000
Volusia County (FL)4 $13,720,631 415 $9,936,000 $731,000 $1,053,000
Guilford County (NC)4 $67,062,726 2,414 $56,346,000 $1,879,000 $3,429,000
Dane County (WI)4 $145,739,612 5,792 $125,149,000 $5,455,000 $8,007,000
Brevard County (FL)4 $7,119,716 334 $6,244,000 $334,000 $504,000
Washington County (OR)4 $13,813,264 772 $11,348,000 $594,000 $248,000
Johnson County (KS)4 $12,335,839 622 $9,538,000 $549,000 $591,000
City of Louisville (KY) $224,560,560 9,999 $192,086,000 $5,272,000 $16,141,000
City of Baltimore (MD) $326,333,152 8,125 $259,948,000 $13,504,000 $14,519,000
Polk County (FL)4 $15,790,432 611 $12,875,000 $897,000 $1,238,000
City of Boston (MA) $763,888,012 31,703 $586,913,000 $17,361,000 $25,919,000
District of Columbia (DC)3,6 $1,654,234,168 32,514 $1,091,081,000 $149,332,000 $0
City of Nashville-Davidson County (TN) $178,780,284 7,391 $153,884,000 $5,896,000 $13,078,000
City of El Paso (TX) $59,978,686 2,881 $45,313,000 $3,374,000 $3,374,000
Lee County (FL)4 $33,978,684 1,160 $29,801,000 $1,607,000 $2,650,000
City of Fort Worth (TX) $255,976,253 9,211 $209,158,000 $15,369,000 $15,426,000
City of Indianapolis (IN) $227,293,491 6,949 $213,234,000 $7,567,000 $13,153,000
City and County of San Francisco (CA) $780,613,098 23,160 $659,077,000 $20,883,000 $36,144,000
Prince George's County (MD)4 $23,782,748 566 $19,800,000 $1,060,000 $1,535,000
Pinellas County (FL)4 $100,195,060 3,889 $82,083,000 $5,489,000 $8,814,000
Shelby County (TN)4 $118,196,607 3,762 $102,452,000 $3,641,000 $7,227,000
Fairfield County (CT)4 $148,621,258 5,699 $115,151,000 $6,695,000 $7,309,000
Westchester County (NY)4 $106,569,709 3,387 $81,291,000 $9,361,000 $5,697,000
Fulton County (GA)4 $382,742,711 12,459 $347,266,000 $11,558,000 $14,670,000
Wake County (NC)4 $179,146,269 8,609 $167,244,000 $5,887,000 $9,897,000
Group E Average $235,423,647 7,375 $184,824,480 $11,854,360 $8,516,600
Group E Average Excluding Outliers/Exclusions $352,177,942 12,427 $289,951,625 $11,153,250 $17,219,250
Group E Median $118,196,607 3,889 $102,452,000 $5,455,000 $7,227,000
TOTAL Economic Impact of ORGANIZATIONAL Spending
SOURCE: Arts and Economic Prosperity 5, Americans for the Arts, 2017. For more information, visit www.AmericansForTheArts.org/EconomicImpact. B–96

Table 6:Total Economic Impact of Expenditures by Nonprofit Arts and Cultural OrganizationsPer Study Region During Fiscal Year 2015
Population Cohort Group F Direct
Population 1,000,000 or More Organizational Full-Time Resident Local State
Sample Size = 21 Expenditures Equivalent Jobs Household Income Government Revenue Government Revenue
Mecklenburg County (NC)4 $137,737,853 4,592 $128,748,000 $4,032,000 $6,774,000
City of San José (CA) $73,462,553 2,286 $57,300,000 $2,492,000 $3,195,000
Montgomery County (MD)4 $105,104,756 2,832 $65,879,000 $4,006,000 $4,813,000
Fairfax County (VA)4 $173,409,818 5,017 $124,096,000 $5,807,000 $6,725,000
Allegheny County (PA)4 $549,874,646 16,518 $391,241,000 $22,832,000 $27,599,000
Greater Columbus Area (OH)4 $222,477,493 8,189 $205,098,000 $9,249,000 $12,738,000
Orange County (FL)4 $154,347,536 5,633 $148,042,000 $4,390,000 $5,726,000
City of Dallas (TX) $631,469,325 26,818 $678,879,000 $28,388,000 $35,695,000
Hillsborough County (FL)4 $175,225,260 7,766 $156,206,000 $7,982,000 $13,460,000
City of San Diego (CA) $553,563,393 22,513 $516,229,000 $21,577,000 $29,322,000
Palm Beach County (FL)4 $184,292,190 4,709 $121,566,000 $9,134,000 $10,140,000
City of San Antonio (TX) $143,127,136 5,841 $143,374,000 $7,330,000 $8,709,000
Sacramento County (CA)4 $82,336,356 3,705 $79,942,000 $4,531,000 $5,160,000
City of Phoenix (AZ) $164,604,285 5,967 $136,758,000 $7,040,000 $8,623,000
City and County of Philadelphia (PA) $848,922,523 18,780 $580,185,000 $35,766,000 $36,364,000
Broward County (FL)4 $148,488,007 3,812 $115,647,000 $6,413,000 $6,114,000
Santa Clara County (CA)4 $112,342,340 3,497 $87,626,000 $3,811,000 $4,886,000
Riverside County (CA)4 $63,975,017 1,978 $48,778,000 $2,705,000 $3,101,000
Miami-Dade County (FL)4 $851,913,996 24,537 $861,821,000 $27,279,000 $43,616,000
City of Chicago (IL) $1,374,865,815 41,621 $1,029,071,000 $64,521,000 $55,691,000
Harris County (TX)4 $565,143,010 13,876 $455,460,000 $22,331,000 $18,836,000
Group F Average $348,413,491 10,976 $291,997,429 $14,362,667 $16,537,476
Group F Average Excluding Outliers/Exclusions $541,430,719 17,689 $448,828,000 $23,873,429 $25,371,286
Group F Median $173,409,818 5,841 $143,374,000 $7,330,000 $8,709,000
Average $83,992,199 2,745 $68,637,009 $3,512,469 $3,821,601
Median $15,727,535 608 $11,441,500 $592,000 $840,500
TOTAL Economic Impact of ORGANIZATIONAL Spending
ALL CITY/COUNTY STUDY REGIONS
SOURCE: Arts and Economic Prosperity 5, Americans for the Arts, 2017. For more information, visit www.AmericansForTheArts.org/EconomicImpact. B–97

Table 6:Total Economic Impact of Expenditures by Nonprofit Arts and Cultural OrganizationsPer Study Region During Fiscal Year 2015
Regional Study Regions Direct
All Populations Organizational Full-Time Resident Local State
Sample Size = 81 Expenditures Equivalent Jobs Household Income Government Revenue Government Revenue
High Peaks Region (ME) $733,718 22 $424,000 $30,000 $26,000
Wood River Valley (ID) $15,469,150 570 $9,518,000 $101,000 $566,000
Southern Oregon Area $37,531,117 1,624 $28,488,000 $1,800,000 $923,000
Southwestern Pennsylvania Area $13,154,583 423 $8,397,000 $426,000 $573,000
Greater Portsmouth Area (NH) $21,456,627 839 $18,810,000 $1,256,000 $1,089,000
Northeast Oregon Region $652,008 27 $423,000 $21,000 $10,000
Toe River Valley (NC) $11,706,879 319 $6,040,000 $300,000 $454,000
Albemarle Region (NC) $2,724,828 96 $1,610,000 $78,000 $100,000
Greater Concord Area (NH) $17,833,550 618 $14,735,000 $884,000 $962,000
North Central Minnesota Region2 $1,630,565 37 $961,000 $28,000 $148,000
Northwest Minnesota Region2 $616,142 14 $352,000 $10,000 $47,000
Monadnock Region (NH) $13,271,384 528 $9,938,000 $774,000 $819,000
Bismarck-Mandan Region (ND) $24,377,094 1,187 $18,556,000 $779,000 $1,371,000
Greater Minot Region (ND) $8,739,861 178 $3,497,000 $186,000 $293,000
Greater Burlington Area (VT) $59,120,540 2,790 $42,273,000 $1,473,000 $4,202,000
Greater Charlottesville Area (VA) $60,559,918 1,389 $38,153,000 $2,060,000 $1,623,000
Brainerd Lakes Region (MN)2 $2,753,533 75 $1,817,000 $46,000 $214,000
East Central Minnesota Region2 $3,802,469 88 $2,278,000 $65,000 $297,000
Northwest Connecticut Region $21,482,961 640 $13,530,000 $1,153,000 $1,382,000
Central Oregon Region $9,958,558 390 $6,749,000 $357,000 $197,000
Greater Fargo-Moorhead Area (ND/MN) $20,819,502 955 $16,776,000 $608,000 $1,098,000
Black Hills Region (SD) $22,974,769 893 $16,659,000 $923,000 $1,232,000
Greater Kingsport Area (TN) $9,562,287 330 $6,456,000 $269,000 $475,000
Lake Region (MN)2 $6,485,666 209 $4,334,000 $107,000 $477,000
South Central Minnesota Region2 $6,433,650 202 $4,143,000 $103,000 $472,000
Greater Sioux Falls Area (SD) $20,601,653 839 $15,265,000 $603,000 $947,000
Southwest Tennessee Development District $3,129,255 155 $2,309,000 $75,000 $136,000
Northwest Tennessee Development District $2,283,302 91 $1,457,000 $58,000 $120,000
Southwest Minnesota Region2 $4,868,274 156 $3,320,000 $81,000 $376,000
Arrowhead Region (MN)2 $19,637,859 641 $14,185,000 $326,000 $1,452,000
TOTAL Economic Impact of ORGANIZATIONAL Spending
SOURCE: Arts and Economic Prosperity 5, Americans for the Arts, 2017. For more information, visit www.AmericansForTheArts.org/EconomicImpact. B–98

Table 6:Total Economic Impact of Expenditures by Nonprofit Arts and Cultural OrganizationsPer Study Region During Fiscal Year 2015
Regional Study Regions Direct
All Populations Organizational Full-Time Resident Local State
Sample Size = 81 Expenditures Equivalent Jobs Household Income Government Revenue Government Revenue
Maple Grove and the Northwest Suburbs (MN)2 $1,487,198 51 $1,218,000 $25,000 $125,000
Greater Augusta Area (GA) $37,854,649 1,828 $28,327,000 $1,476,000 $1,197,000
Upper Cumberland Development District (TN) $6,334,696 214 $4,140,000 $183,000 $342,000
City of Huntsville/Madison County (AL) $53,843,563 2,269 $35,912,000 $1,281,000 $2,008,000
Northeast Commission (NC) $22,642,818 661 $11,987,000 $343,000 $498,000
Greater Ann Arbor Area (MI)5 $49,916,641 1,692 $43,290,000 $1,255,000 $4,915,000
Greater Fox Cities Region (WI) $40,077,673 1,348 $26,807,000 $2,337,000 $1,961,000
Central Minnesota Region2 $8,800,646 301 $6,316,000 $149,000 $742,000
South Central Tennessee Development District $4,064,456 144 $2,621,000 $110,000 $208,000
Northwest Arkansas Region $67,503,606 2,786 $56,013,000 $1,297,000 $4,275,000
Southeast Minnesota Region2 $16,690,210 542 $11,714,000 $258,000 $1,425,000
First Tennessee Development District $15,384,812 555 $10,476,000 $410,000 $759,000
Greater Harrisburg Area (PA) $12,684,667 555 $11,356,000 $379,000 $664,000
Greater New Haven Area (CT) $114,867,991 5,303 $84,913,000 $5,827,000 $6,300,000
Treasure Coast Region (FL) $33,405,733 1,079 $21,612,000 $1,612,000 $2,767,000
Greater Des Moines Region (IA) $71,922,902 2,708 $58,664,000 $2,363,000 $3,401,000
Southeast Tennessee Development District $67,352,550 3,179 $66,018,000 $2,114,000 $3,971,000
Greater Knoxville Region (TN) $48,160,880 2,397 $38,680,000 $1,486,000 $2,929,000
Greater Columbia Area (SC) $22,480,674 1,098 $19,881,000 $889,000 $1,054,000
Pikes Peak Region (CO) $51,193,211 1,749 $36,060,000 $2,332,000 $1,293,000
Lehigh Valley Region (PA) $83,164,601 3,333 $69,337,000 $2,659,000 $3,838,000
Greater Sarasota/Bradenton Area (FL) $215,956,639 6,087 $177,632,000 $7,599,000 $13,048,000
Dayton Region (OH) $95,159,725 5,071 $76,918,000 $4,922,000 $5,742,000
Richmond & Tri-Cities Region (VA) $211,680,685 6,720 $114,780,000 $8,527,000 $8,655,000
Memphis Area Association of Governments (TN) $118,315,928 3,766 $102,549,000 $3,645,000 $7,236,000
Eastern Region (NC) $27,730,102 1,327 $24,343,000 $960,000 $1,184,000
Advantage West Region (NC) $75,230,591 2,735 $57,442,000 $2,476,000 $3,493,000
Southeast Commission (NC) $50,352,984 1,886 $37,789,000 $1,903,000 $2,126,000
Greater Fairfax Area (VA) $182,798,508 5,278 $129,271,000 $6,189,000 $7,348,000
Greater Tulsa Region (OK) $91,182,165 4,494 $80,129,000 $3,871,000 $5,499,000
TOTAL Economic Impact of ORGANIZATIONAL Spending
SOURCE: Arts and Economic Prosperity 5, Americans for the Arts, 2017. For more information, visit www.AmericansForTheArts.org/EconomicImpact. B–99
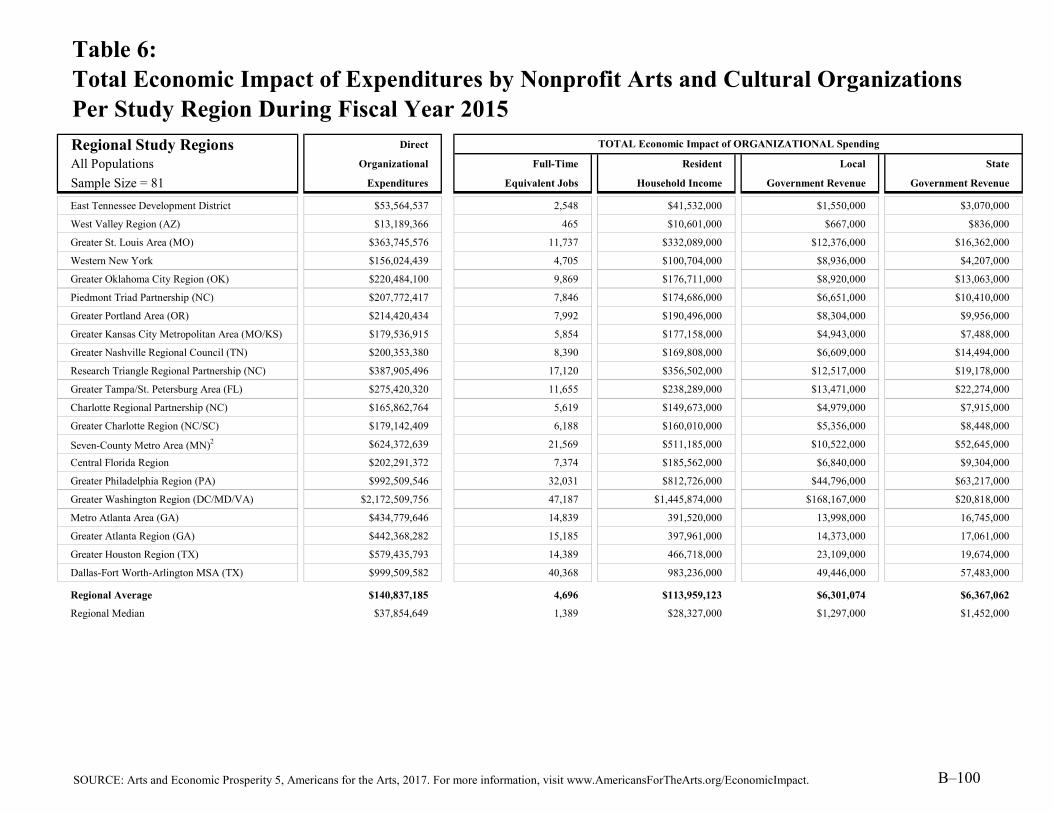
Table 6:Total Economic Impact of Expenditures by Nonprofit Arts and Cultural OrganizationsPer Study Region During Fiscal Year 2015
Regional Study Regions Direct
All Populations Organizational Full-Time Resident Local State
Sample Size = 81 Expenditures Equivalent Jobs Household Income Government Revenue Government Revenue
East Tennessee Development District $53,564,537 2,548 $41,532,000 $1,550,000 $3,070,000
West Valley Region (AZ) $13,189,366 465 $10,601,000 $667,000 $836,000
Greater St. Louis Area (MO) $363,745,576 11,737 $332,089,000 $12,376,000 $16,362,000
Western New York $156,024,439 4,705 $100,704,000 $8,936,000 $4,207,000
Greater Oklahoma City Region (OK) $220,484,100 9,869 $176,711,000 $8,920,000 $13,063,000
Piedmont Triad Partnership (NC) $207,772,417 7,846 $174,686,000 $6,651,000 $10,410,000
Greater Portland Area (OR) $214,420,434 7,992 $190,496,000 $8,304,000 $9,956,000
Greater Kansas City Metropolitan Area (MO/KS) $179,536,915 5,854 $177,158,000 $4,943,000 $7,488,000
Greater Nashville Regional Council (TN) $200,353,380 8,390 $169,808,000 $6,609,000 $14,494,000
Research Triangle Regional Partnership (NC) $387,905,496 17,120 $356,502,000 $12,517,000 $19,178,000
Greater Tampa/St. Petersburg Area (FL) $275,420,320 11,655 $238,289,000 $13,471,000 $22,274,000
Charlotte Regional Partnership (NC) $165,862,764 5,619 $149,673,000 $4,979,000 $7,915,000
Greater Charlotte Region (NC/SC) $179,142,409 6,188 $160,010,000 $5,356,000 $8,448,000
Seven-County Metro Area (MN)2 $624,372,639 21,569 $511,185,000 $10,522,000 $52,645,000
Central Florida Region $202,291,372 7,374 $185,562,000 $6,840,000 $9,304,000
Greater Philadelphia Region (PA) $992,509,546 32,031 $812,726,000 $44,796,000 $63,217,000
Greater Washington Region (DC/MD/VA) $2,172,509,756 47,187 $1,445,874,000 $168,167,000 $20,818,000
Metro Atlanta Area (GA) $434,779,646 14,839 391,520,000 13,998,000 16,745,000
Greater Atlanta Region (GA) $442,368,282 15,185 397,961,000 14,373,000 17,061,000
Greater Houston Region (TX) $579,435,793 14,389 466,718,000 23,109,000 19,674,000
Dallas-Fort Worth-Arlington MSA (TX) $999,509,582 40,368 983,236,000 49,446,000 57,483,000
Regional Average $140,837,185 4,696 $113,959,123 $6,301,074 $6,367,062
Regional Median $37,854,649 1,389 $28,327,000 $1,297,000 $1,452,000
TOTAL Economic Impact of ORGANIZATIONAL Spending
SOURCE: Arts and Economic Prosperity 5, Americans for the Arts, 2017. For more information, visit www.AmericansForTheArts.org/EconomicImpact. B–100

Table 6:Total Economic Impact of Expenditures by Nonprofit Arts and Cultural OrganizationsPer Study Region During Fiscal Year 2015
Statewide Study Regions Direct
All Populations Organizational Full-Time Resident Local State
Sample Size = 20 Expenditures Equivalent Jobs Household Income Government Revenue Government Revenue
State of Vermont $78,856,911 3,360 $52,769,000 $1,572,000 $4,692,000
State of North Dakota $56,458,549 2,429 $40,869,000 $1,669,000 $2,922,000
State of Delaware $103,624,375 2,810 $79,372,000 $1,181,000 $5,955,000
State of Maine $92,577,604 2,884 $69,193,000 $3,214,000 $4,009,000
State of Hawai'i $125,921,352 4,403 $107,616,000 $2,385,000 $12,306,000
State of Nevada $227,298,372 6,342 $128,409,000 $3,758,000 $10,605,000
State of Connecticut $515,311,370 17,671 $399,187,000 $20,314,000 $25,234,000
State of Oklahoma $331,249,786 14,948 $267,263,000 $13,027,000 $18,898,000
State of Oregon $364,065,287 13,939 $294,030,000 $13,893,000 $12,771,000
State of Minnesota2 $696,091,653 23,834 $560,605,000 $11,695,000 $58,295,000
State of Wisconsin $376,915,991 17,480 $344,729,000 $19,480,000 $19,556,000
State of Maryland $511,399,372 13,026 $375,363,000 $19,040,000 $21,885,000
State of Missouri $602,903,738 19,966 $550,957,000 $18,779,000 $25,290,000
State of Tennessee $470,782,916 19,042 $400,910,000 $14,754,000 $30,336,000
State of Massachusetts $1,386,703,275 51,108 $944,990,000 $31,088,000 $40,622,000
State of New Jersey $296,140,348 9,900 $219,605,000 $9,845,000 $10,347,000
State of North Carolina $937,497,172 37,194 $812,422,000 $29,829,000 $44,804,000
State of Pennsylvania $1,753,309,722 55,491 $1,354,295,000 $72,775,000 $98,996,000
State of Illinois $1,780,626,339 57,304 $1,570,448,000 $84,705,000 $96,052,000
State of Florida $2,285,671,265 72,108 $1,967,176,000 $87,300,000 $130,842,000
Statewide Average $649,670,270 22,262 $527,010,400 $23,015,150 $33,720,850
Statewide Median $423,849,454 16,214 $360,046,000 $14,323,500 $20,720,500
TOTAL Economic Impact of ORGANIZATIONAL Spending
SOURCE: Arts and Economic Prosperity 5, Americans for the Arts, 2017. For more information, visit www.AmericansForTheArts.org/EconomicImpact. B–101

Table 6:Total Economic Impact of Expenditures by Nonprofit Arts and Cultural OrganizationsPer Study Region During Fiscal Year 2015
Individual Arts Districts Direct
All Populations Organizational Full-Time Resident Local State
Sample Size = 12 Expenditures Equivalent Jobs Household Income Government Revenue Government Revenue
James River Arts & Cultural District $6,394,249 135 $2,819,000 $253,000 $291,000
Center City Charlotte $124,091,617 4,137 $115,993,000 $3,633,000 $6,103,000
Loch Haven Cultural Park $29,253,216 1,068 $28,058,000 $832,000 $1,085,000
Downtown Colorado Springs Creative District $20,773,371 710 $14,633,000 $946,000 $525,000
Fort Worth Cultural District $150,010,452 5,398 $122,573,000 $9,007,000 $9,040,000
Dallas Arts District $282,234,392 11,986 $303,424,000 $12,688,000 $15,954,000
Grand Center Arts & Entertainment District $77,174,797 2,490 $70,458,000 $2,626,000 $3,471,000
Balboa Park Cultural District $380,437,910 15,472 $354,780,000 $14,829,000 $20,151,000
East End Cultural District $3,177,402 78 $2,561,000 $126,000 $106,000
Houston Museum District Association $321,550,313 7,895 $259,144,000 $12,706,000 $10,717,000
Midtown Cultural District $4,111,803 101 $3,314,000 $162,000 $137,000
Washington Avenue Cultural District $2,520,607 62 $2,031,000 $100,000 $84,000
Arts District Average $116,810,844 4,128 $106,649,000 $4,825,667 $5,638,667
Arts District Median $53,214,007 1,779 $49,258,000 $1,786,000 $2,278,000
Explanation of the Outliers and Exclusions:1
2
3
4
5
6 The economic impact findings for the District of Columbia exclude state government revenues due to Washington, DC's unique status as a study region with no state government.
The expenditure and attendance data collected from eligible organizations in this study region were collected for fiscal year 2014 (rather than 2015), and audience-intercepts surveys collected from attendees to cultural events in this study region were collected during calendar year 2015 (rather than 2016).
TOTAL Economic Impact of ORGANIZATIONAL Spending
The expenditure and attendance data collected from eligible organizations in these study regions were collected for fiscal year 2013 (rather than 2015), and audience-intercepts surveys collected from attendees to cultural events in these study regions were collected during calendar year 2014 (rather than 2016). Where applicable, these study regions are excluded from the national extrapolations.
Both the organizational expenditure and attendance findings and the audience expenditure findings for these city study regions were determined by researchers to be outliers when compared to the findings for cohort regions in the same population category. For this reason, these study regions are excluded from the national extrapolations.
These county study regions are excluded from the national extrapolations. The national extrapolations are based on city study regions only.
The organizational expenditure and attendance findings for these city study regions were determined by researchers to be outliers when compared to the findings for cohort regions in the same population category. For this reason, the organizational expenditure and attendance findings for these study regions are excluded from the national extrapolations.
SOURCE: Arts and Economic Prosperity 5, Americans for the Arts, 2017. For more information, visit www.AmericansForTheArts.org/EconomicImpact. B–102

Explanation of Table 7:Direct Economic Impact of Expenditures by Nonprofit Arts and Cultural OrganizationsPer Study Region During Fiscal Year 2015
Column Two:
Column Three:
Column Four:
Column Five:
Column Six:The amount of revenue that the state government receives (e.g., licenses, fees, taxes) as a direct result of the expenditures made by the responding nonprofit arts and cultural organizations in each participating study region.
This table presents for each study region the direct economic impact of the expenditures made by responding nonprofit arts and cultural organizations during fiscal year 2015. Summary statistics are calculated for each population group.
The direct impact is a measure of the effect of the initial direct expenditures made by the organizations. It excludes indirect and induced impacts. Because it includes only one round of spending, the direct impact is always smaller than the total impact (which measures the effect of each dollar as it is spent and re-spent within the study region's economy). The direct impact is derived from input-output models that are customized for each participating study region. See Background and Scope of Study and Frequently Used Terms in this Arts & Economic Prosperity 5 National Statistical Report for more information about direct, indirect, and induced economic impacts.
The total direct organizational expenditures reported by responding nonprofit arts and cultural organizations in each participating study region during fiscal year 2015. This figure is the sum of operating expenditures and capital expenditures. These data are real dollars reported by the organizations that responded to the survey in each study region only; no multiplier was used to calculate these figures and no extrapolations were made for non-responding organizations.
The number of full-time equivalent (FTE) jobs directly supported by the expenditures made by the responding nonprofit arts and cultural organizations in each participating study region. Economists measure FTE jobs—not the total number of employees—because it is a more accurate measure of total employment. Each FTE job can represent one full-time employee, two employees who work half-time, four employees who work quarter-time, etc.
The amount of household income paid to study region residents as a direct result of the expenditures made by the responding nonprofit arts and cultural organizations in each participating study region. Household income includes salaries, wages, and proprietary income.
The amount of revenue that the local government receives (e.g., licenses, fees, taxes) as a direct result of the expenditures made by the responding nonprofit arts and cultural organizations in each participating study region. Local government includes the city and county governments located within each participating study region.
SOURCE: Arts and Economic Prosperity 5, Americans for the Arts, 2017. For more information, visit www.AmericansForTheArts.org/EconomicImpact. B–103
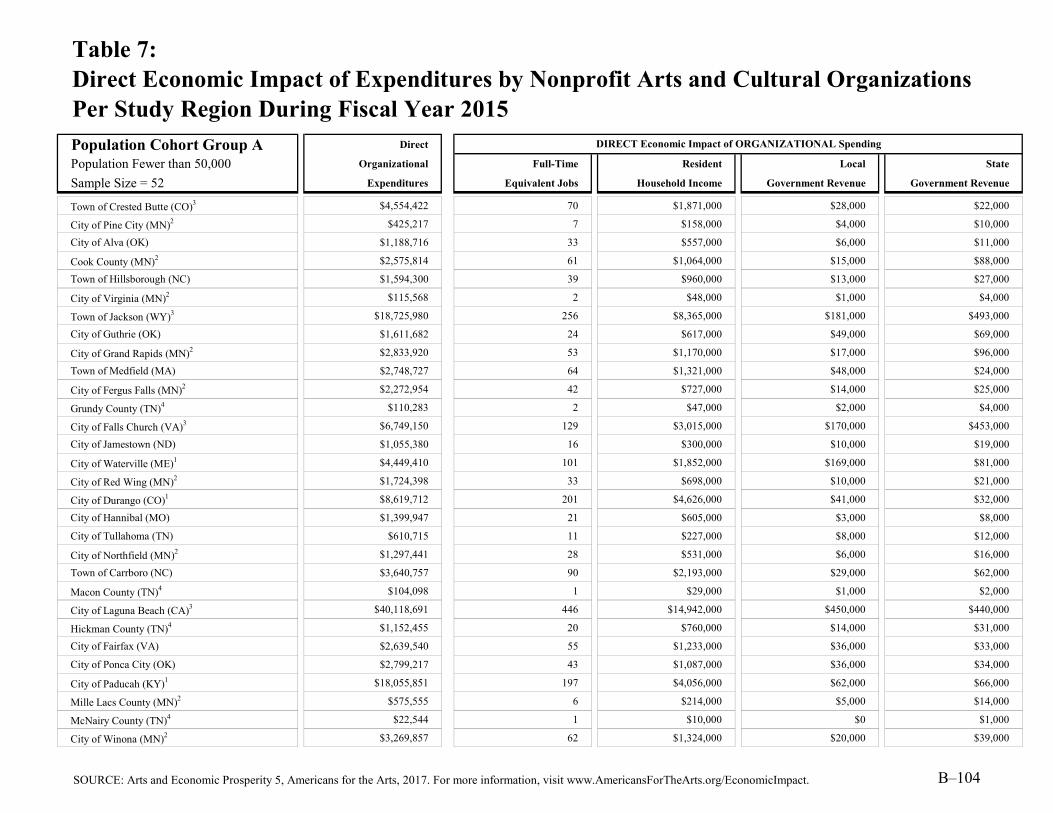
Table 7:Direct Economic Impact of Expenditures by Nonprofit Arts and Cultural OrganizationsPer Study Region During Fiscal Year 2015
Population Cohort Group A Direct
Population Fewer than 50,000 Organizational Full-Time Resident Local State
Sample Size = 52 Expenditures Equivalent Jobs Household Income Government Revenue Government Revenue
Town of Crested Butte (CO)3 $4,554,422 70 $1,871,000 $28,000 $22,000
City of Pine City (MN)2 $425,217 7 $158,000 $4,000 $10,000
City of Alva (OK) $1,188,716 33 $557,000 $6,000 $11,000
Cook County (MN)2 $2,575,814 61 $1,064,000 $15,000 $88,000
Town of Hillsborough (NC) $1,594,300 39 $960,000 $13,000 $27,000
City of Virginia (MN)2 $115,568 2 $48,000 $1,000 $4,000
Town of Jackson (WY)3 $18,725,980 256 $8,365,000 $181,000 $493,000
City of Guthrie (OK) $1,611,682 24 $617,000 $49,000 $69,000
City of Grand Rapids (MN)2 $2,833,920 53 $1,170,000 $17,000 $96,000
Town of Medfield (MA) $2,748,727 64 $1,321,000 $48,000 $24,000
City of Fergus Falls (MN)2 $2,272,954 42 $727,000 $14,000 $25,000
Grundy County (TN)4 $110,283 2 $47,000 $2,000 $4,000
City of Falls Church (VA)3 $6,749,150 129 $3,015,000 $170,000 $453,000
City of Jamestown (ND) $1,055,380 16 $300,000 $10,000 $19,000
City of Waterville (ME)1 $4,449,410 101 $1,852,000 $169,000 $81,000
City of Red Wing (MN)2 $1,724,398 33 $698,000 $10,000 $21,000
City of Durango (CO)1 $8,619,712 201 $4,626,000 $41,000 $32,000
City of Hannibal (MO) $1,399,947 21 $605,000 $3,000 $8,000
City of Tullahoma (TN) $610,715 11 $227,000 $8,000 $12,000
City of Northfield (MN)2 $1,297,441 28 $531,000 $6,000 $16,000
Town of Carrboro (NC) $3,640,757 90 $2,193,000 $29,000 $62,000
Macon County (TN)4 $104,098 1 $29,000 $1,000 $2,000
City of Laguna Beach (CA)3 $40,118,691 446 $14,942,000 $450,000 $440,000
Hickman County (TN)4 $1,152,455 20 $760,000 $14,000 $31,000
City of Fairfax (VA) $2,639,540 55 $1,233,000 $36,000 $33,000
City of Ponca City (OK) $2,799,217 43 $1,087,000 $36,000 $34,000
City of Paducah (KY)1 $18,055,851 197 $4,056,000 $62,000 $66,000
Mille Lacs County (MN)2 $575,555 6 $214,000 $5,000 $14,000
McNairy County (TN)4 $22,544 1 $10,000 $0 $1,000
City of Winona (MN)2 $3,269,857 62 $1,324,000 $20,000 $39,000
DIRECT Economic Impact of ORGANIZATIONAL Spending
SOURCE: Arts and Economic Prosperity 5, Americans for the Arts, 2017. For more information, visit www.AmericansForTheArts.org/EconomicImpact. B–104

Table 7:Direct Economic Impact of Expenditures by Nonprofit Arts and Cultural OrganizationsPer Study Region During Fiscal Year 2015
Population Cohort Group A Direct
Population Fewer than 50,000 Organizational Full-Time Resident Local State
Sample Size = 52 Expenditures Equivalent Jobs Household Income Government Revenue Government Revenue
Door County (WI)4 $9,730,760 169 $4,399,000 $191,000 $227,000
City of Benicia (CA) $2,902,134 73 $1,603,000 $52,000 $34,000
City of Winter Park (FL)3 $16,576,065 227 $7,585,000 $138,000 $140,000
City of Rochester (NH)1 $4,353,943 125 $2,507,000 $57,000 $92,000
City of Morgantown (WV)1 $27,454,214 720 $13,449,000 $180,000 $853,000
Henry County (TN)4 $183,974 4 $81,000 $2,000 $3,000
City of Fairbanks (AK)1 $8,779,765 229 $4,756,000 $102,000 $301,000
City of Bangor (ME) $3,437,656 63 $1,554,000 $118,000 $62,000
Weakley County (TN)4 $211,563 3 $94,000 $3,000 $5,000
Dare County (NC)4 $13,790,194 202 $4,676,000 $45,000 $31,000
City of Columbia (TN) $1,297,724 32 $559,000 $14,000 $23,000
City of Lake Worth (FL)3 $14,656,059 153 $4,694,000 $260,000 $330,000
Clatsop County (OR)4 $2,874,045 53 $1,271,000 $54,000 $30,000
Yadkin County (NC)4 $809,737 18 $358,000 $14,000 $21,000
Greater Belfast Area (ME)4 $2,683,737 42 $1,187,000 $103,000 $121,000
Campbell County (TN)4 $108,671 2 $39,000 $2,000 $4,000
Monroe County (TN)4 $666,880 13 $285,000 $9,000 $13,000
Lincoln County (OR)4 $1,595,530 23 $600,000 $21,000 $23,000
Iron County (UT)4 $13,330,445 138 $4,598,000 $80,000 $100,000
City of St. Louis Park (MN)2 $758,069 15 $310,000 $4,000 $9,000
City of Logan (UT)1 $17,572,786 394 $6,894,000 $242,000 $252,000
Gibson County (TN)4 $1,003,653 29 $489,000 $14,000 $30,000
Group A Average $5,419,614 93 $2,242,212 $60,635 $95,019
Group A Average Excluding Outliers/Exclusions $2,071,269 43 $985,846 $32,462 $32,154
Group A Median $2,607,677 43 $1,075,500 $20,500 $30,500
DIRECT Economic Impact of ORGANIZATIONAL Spending
SOURCE: Arts and Economic Prosperity 5, Americans for the Arts, 2017. For more information, visit www.AmericansForTheArts.org/EconomicImpact. B–105

Table 7:Direct Economic Impact of Expenditures by Nonprofit Arts and Cultural OrganizationsPer Study Region During Fiscal Year 2015
Population Cohort Group B Direct
Population 50,000 to 99,999 Organizational Full-Time Resident Local State
Sample Size = 38 Expenditures Equivalent Jobs Household Income Government Revenue Government Revenue
City of Joplin (MO) $1,792,636 44 $915,000 $20,000 $12,000
City of La Crosse (WI) $12,827,852 186 $5,536,000 $163,000 $123,000
McMinn County (TN)4 $2,021,520 34 $840,000 $29,000 $41,000
Lafayette County (MS)4 $2,655,457 37 $638,000 $35,000 $78,000
Chisago County (MN)2 $655,430 8 $244,000 $6,000 $16,000
City of Grand Forks (ND) $2,781,581 47 $1,441,000 $33,000 $42,000
City of Corvallis (OR) $27,545,447 640 $12,296,000 $613,000 $316,000
City of Noblesville (IN) $475,139 8 $170,000 $14,000 $20,000
City of Ocala (FL) $14,295,754 247 $6,468,000 $371,000 $417,000
Lenoir County (NC)4 $932,880 17 $434,000 $6,000 $7,000
Town of Chapel Hill (NC) $88,407,897 2,184 $53,260,000 $716,000 $1,504,000
City of Grand Junction (CO) $11,275,100 146 $5,950,000 $112,000 $56,000
Town of Jupiter (FL) $8,019,104 84 $2,568,000 $142,000 $181,000
Hamblen County (TN)4 $760,318 13 $305,000 $6,000 $8,000
City of Delray Beach (FL) $11,319,692 118 $3,625,000 $201,000 $255,000
City of St. Cloud (MN)2 $5,345,355 105 $2,341,000 $32,000 $128,000
City of Portland (ME) $46,572,402 557 $20,204,000 $569,000 $671,000
City of Jackson (TN) $2,666,496 67 $1,281,000 $18,000 $25,000
City of Walnut Creek (CA) $21,097,821 416 $11,006,000 $385,000 $474,000
Greene County (TN)4 $2,505,621 43 $1,055,000 $29,000 $57,000
City of Flagstaff (AZ) $51,666,744 1,110 $28,987,000 $735,000 $860,000
City of Missoula (MT) $20,392,313 397 $9,909,000 $160,000 $302,000
City of Fort Myers (FL) $13,682,062 207 $6,429,000 $252,000 $400,000
Putnam County (TN)4 $2,038,202 30 $897,000 $22,000 $35,000
Monroe County (FL)4 $27,188,753 429 $10,770,000 $382,000 $788,000
City of Lynchburg (VA) $6,648,618 104 $2,731,000 $149,000 $212,000
City of Duluth (MN)2 $14,291,391 285 $5,902,000 $86,000 $486,000
City of Fishers (IN) $23,094,545 388 $8,270,000 $698,000 $989,000
City of Carmel (IN) $12,559,425 211 $4,498,000 $380,000 $538,000
City of Sugar Land (TX) $646,740 13 $283,000 $41,000 $42,000
DIRECT Economic Impact of ORGANIZATIONAL Spending
SOURCE: Arts and Economic Prosperity 5, Americans for the Arts, 2017. For more information, visit www.AmericansForTheArts.org/EconomicImpact. B–106

Table 7:Direct Economic Impact of Expenditures by Nonprofit Arts and Cultural OrganizationsPer Study Region During Fiscal Year 2015
Population Cohort Group B Direct
Population 50,000 to 99,999 Organizational Full-Time Resident Local State
Sample Size = 38 Expenditures Equivalent Jobs Household Income Government Revenue Government Revenue
City of Asheville (NC) $19,541,466 291 $9,677,000 $154,000 $234,000
Buchanan County (MO)4 $10,079,729 275 $6,019,000 $111,000 $66,000
City of Boca Raton (FL) $10,757,773 113 $3,445,000 $191,000 $243,000
City of Miami Beach (FL)3 $84,770,391 728 $33,505,000 $621,000 $997,000
Moore County (NC)4 $6,876,979 114 $3,218,000 $57,000 $85,000
Sevier County (TN)4 $3,645,416 53 $1,324,000 $7,000 $14,000
Cape May County (NJ)4 $4,544,984 78 $1,885,000 $163,000 $103,000
Cleveland County (NC)4 $2,287,739 36 $985,000 $38,000 $38,000
Group B Average $15,228,073 260 $7,087,132 $203,868 $285,868
Group B Average Excluding Outliers/Exclusions $18,548,482 344 $9,043,136 $278,045 $359,818
Group B Median $9,049,417 114 $3,331,500 $127,000 $125,500
DIRECT Economic Impact of ORGANIZATIONAL Spending
SOURCE: Arts and Economic Prosperity 5, Americans for the Arts, 2017. For more information, visit www.AmericansForTheArts.org/EconomicImpact. B–107

Table 7:Direct Economic Impact of Expenditures by Nonprofit Arts and Cultural OrganizationsPer Study Region During Fiscal Year 2015
Population Cohort Group C Direct
Population 100,000 to 249,999 Organizational Full-Time Resident Local State
Sample Size = 50 Expenditures Equivalent Jobs Household Income Government Revenue Government Revenue
City of Las Cruces (NM) $8,508,432 89 $3,840,000 $142,000 $326,000
Eau Claire County (WI)4 $4,509,343 69 $1,738,000 $47,000 $30,000
Yamhill County (OR)4 $20,664,640 360 $7,699,000 $429,000 $272,000
City of Lewisville (TX) $1,513,284 29 $659,000 $92,000 $85,000
City of West Palm Beach (FL) $117,010,242 1,224 $37,473,000 $2,074,000 $2,638,000
City of Boulder (CO) $35,514,381 549 $19,002,000 $268,000 $319,000
City of Richardson (TX) $12,143,635 217 $5,895,000 $214,000 $257,000
City of High Point (NC) $2,560,289 34 $977,000 $17,000 $30,000
City of Cambridge (MA) $119,802,629 2,323 $44,065,000 $3,205,000 $2,368,000
City of Lowell (MA) $8,688,661 237 $4,490,000 $190,000 $127,000
Douglas County (KS)4 $15,670,891 351 $7,910,000 $252,000 $161,000
City of Columbia (MO) $9,152,344 210 $4,148,000 $135,000 $123,000
City of Norman (OK) $11,552,877 238 $5,470,000 $300,000 $284,000
Wayne County (NC)4 $1,570,039 30 $690,000 $23,000 $13,000
City of Lafayette (LA) $6,356,368 111 $2,806,000 $94,000 $97,000
Washington County (TN)4 $3,257,903 70 $1,566,000 $25,000 $42,000
City of Thousand Oaks (CA) $8,609,672 204 $4,652,000 $174,000 $134,000
City of Charleston (SC) $66,091,990 1,334 $32,076,000 $732,000 $472,000
City of Waco (TX) $31,391,910 548 $13,241,000 $678,000 $464,000
Robeson County (NC)4 $2,914,420 57 $1,270,000 $44,000 $44,000
Columbia County (GA)4 $43,211 0 $5,000 $1,000 $1,000
Orange County (NC)4 $93,643,475 2,314 $56,414,000 $759,000 $1,593,000
City of Savannah (GA) $34,799,185 775 $16,138,000 $493,000 $309,000
Indian River County (FL)4 $16,019,023 250 $6,415,000 $538,000 $860,000
City of Alexandria (VA) $35,827,099 645 $16,839,000 $409,000 $458,000
Martin County (FL)4 $14,266,732 240 $5,942,000 $403,000 $763,000
Macon-Bibb County (GA)4 $49,139,734 746 $20,155,000 $762,000 $634,000
City of Springfield (MA) $36,109,244 631 $15,439,000 $828,000 $316,000
Catawba County (NC)4 $12,569,224 185 $5,063,000 $179,000 $106,000
Town of Cary (NC) $6,153,643 117 $2,685,000 $49,000 $83,000
DIRECT Economic Impact of ORGANIZATIONAL Spending
SOURCE: Arts and Economic Prosperity 5, Americans for the Arts, 2017. For more information, visit www.AmericansForTheArts.org/EconomicImpact. B–108

Table 7:Direct Economic Impact of Expenditures by Nonprofit Arts and Cultural OrganizationsPer Study Region During Fiscal Year 2015
Population Cohort Group C Direct
Population 100,000 to 249,999 Organizational Full-Time Resident Local State
Sample Size = 50 Expenditures Equivalent Jobs Household Income Government Revenue Government Revenue
Alamance County (NC)4 $3,877,725 89 $1,861,000 $43,000 $47,000
Cumberland County (NJ) $9,546,724 237 $4,139,000 $267,000 $129,000
City of Eugene (OR) $40,780,515 957 $20,034,000 $388,000 $260,000
Middlesex County (CT)4 $20,883,683 429 $9,283,000 $531,000 $507,000
City of Springfield (MO) $9,778,504 185 $4,025,000 $101,000 $64,000
City of Sioux Falls (SD) $20,112,501 348 $8,676,000 $293,000 $349,000
Pitt County (NC)4 $12,689,847 391 $8,935,000 $97,000 $117,000
City of Providence (RI) $93,832,555 1,034 $41,518,000 $1,108,000 $1,381,000
City of Worcester (MA) $64,504,636 1,300 $27,753,000 $1,702,000 $871,000
Montgomery County (TN)4 $2,964,420 76 $1,241,000 $73,000 $132,000
Salt Lake City (UT) $112,442,764 1,979 $49,777,000 $1,666,000 $2,129,000
Cabarrus County (NC)4 $2,265,571 27 $1,062,000 $29,000 $29,000
Richmond County (GA)4 $37,811,438 785 $15,964,000 $516,000 $395,000
City of Tacoma (WA) $74,648,459 1,024 $30,746,000 $797,000 $1,473,000
Doña Ana County (NM)4 $12,920,210 136 $5,832,000 $216,000 $495,000
New Hanover County (NC)4 $14,841,737 313 $8,003,000 $107,000 $96,000
Arlington County (VA)4 $170,762,477 3,116 $77,851,000 $2,407,000 $2,595,000
City of Irving (TX) $24,192,919 387 $10,662,000 $595,000 $591,000
City of Reno (NV) $50,139,403 798 $20,242,000 $735,000 $1,360,000
York County (SC)4 $13,279,645 340 $7,813,000 $111,000 $140,000
Group C Average $31,566,605 563 $14,003,580 $506,760 $531,380
Group C Average Excluding Outliers/Exclusions $38,600,672 649 $16,419,556 $647,370 $643,259
Group C Median $14,554,235 327 $7,756,000 $267,500 $278,000
DIRECT Economic Impact of ORGANIZATIONAL Spending
SOURCE: Arts and Economic Prosperity 5, Americans for the Arts, 2017. For more information, visit www.AmericansForTheArts.org/EconomicImpact. B–109

Table 7:Direct Economic Impact of Expenditures by Nonprofit Arts and Cultural OrganizationsPer Study Region During Fiscal Year 2015
Population Cohort Group D Direct
Population 250,000 to 499,999 Organizational Full-Time Resident Local State
Sample Size = 42 Expenditures Equivalent Jobs Household Income Government Revenue Government Revenue
Buncombe County (NC)4 $26,363,882 393 $13,055,000 $207,000 $315,000
Alachua County (FL)4 $36,563,147 447 $13,510,000 $350,000 $352,000
Greater Green Bay Area (WI)4 $23,392,446 399 $10,370,000 $540,000 $383,000
City of Orlando (FL) $123,648,175 1,697 $56,582,000 $1,031,000 $1,042,000
City of Lincoln (NE) $50,665,562 680 $26,146,000 $450,000 $655,000
Southeastern Connecticut Region (CT)4 $87,159,766 1,681 $38,939,000 $749,000 $1,245,000
Erie County (PA)4 $19,091,150 332 $8,696,000 $203,000 $253,000
San Luis Obispo County (CA)4 $13,693,022 272 $6,196,000 $298,000 $166,000
City of Newark (NJ) $109,365,244 2,223 $69,910,000 $1,550,000 $1,423,000
Leon County (FL)4 $100,454,010 1,001 $20,455,000 $4,713,000 $5,390,000
Rutherford County (TN)4 $10,798,787 281 $5,056,000 $85,000 $136,000
St. Lucie County (FL)4 $3,119,978 65 $1,920,000 $88,000 $75,000
Greater Spartanburg Area (SC)4 $21,371,683 343 $9,325,000 $401,000 $279,000
Durham County (NC)4 $104,619,126 2,021 $57,274,000 $593,000 $787,000
City of St. Paul (MN)2 $281,609,958 4,855 $115,178,000 $1,408,000 $3,379,000
Hamilton County (IN)4 $36,204,739 608 $12,965,000 $1,095,000 $1,551,000
Osceola County (FL)4 $1,922,406 42 $1,141,000 $10,000 $26,000
Escambia County (FL)4 $27,449,975 473 $12,405,000 $671,000 $795,000
Lexington-Fayette Urban County (KY)4 $16,129,322 215 $7,395,000 $92,000 $215,000
Lake County (FL)4 $1,137,478 23 $484,000 $48,000 $64,000
City of Riverside (CA) $17,575,088 298 $8,535,000 $275,000 $234,000
Cumberland County (NC)4 $29,655,943 634 $14,212,000 $247,000 $347,000
Collier County (FL)4 $62,973,722 1,159 $29,641,000 $1,293,000 $2,557,000
Hamilton County (TN)4 $64,768,855 1,444 $36,368,000 $443,000 $966,000
Manatee County (FL)4 $14,441,702 273 $6,444,000 $516,000 $977,000
City of Tampa (FL) $130,701,988 2,049 $58,239,000 $2,471,000 $3,521,000
Forsyth County (NC)4 $104,706,797 1,580 $46,719,000 $868,000 $1,384,000
Mercer County (NJ)4 $22,095,147 515 $11,083,000 $794,000 $406,000
City of Wichita (KS) $43,936,656 630 $22,895,000 $523,000 $327,000
Clackamas County (OR)4 $5,821,109 133 $2,845,000 $138,000 $78,000
DIRECT Economic Impact of ORGANIZATIONAL Spending
SOURCE: Arts and Economic Prosperity 5, Americans for the Arts, 2017. For more information, visit www.AmericansForTheArts.org/EconomicImpact. B–110

Table 7:Direct Economic Impact of Expenditures by Nonprofit Arts and Cultural OrganizationsPer Study Region During Fiscal Year 2015
Population Cohort Group D Direct
Population 250,000 to 499,999 Organizational Full-Time Resident Local State
Sample Size = 42 Expenditures Equivalent Jobs Household Income Government Revenue Government Revenue
Sarasota County (FL)4 $201,514,937 2,749 $97,091,000 $2,153,000 $4,820,000
City of Minneapolis (MN)2 $323,394,524 6,284 $132,268,000 $1,617,000 $3,881,000
Berks County (PA)4 $10,805,527 184 $4,284,000 $319,000 $313,000
City of Miami (FL) $487,578,468 4,186 $192,713,000 $3,573,000 $5,734,000
City of Raleigh (NC) $167,668,956 3,188 $73,147,000 $1,334,000 $2,251,000
Santa Barbara County (CA)4 $126,303,269 2,072 $60,230,000 $1,555,000 $1,590,000
Seminole County (FL)4 $8,253,173 142 $3,830,000 $128,000 $205,000
City of Virginia Beach (VA) $25,929,369 530 $11,190,000 $514,000 $349,000
City of Atlanta (GA) $371,899,510 4,854 $167,966,000 $2,467,000 $3,383,000
City of Mesa (AZ) $16,854,627 325 $10,139,000 $183,000 $231,000
City of Kansas City (MO) $161,706,593 2,122 $83,061,000 $1,177,000 $1,491,000
Morris County (NJ)4 $15,784,179 370 $7,304,000 $556,000 $287,000
Group D Average $83,550,714 1,280 $37,314,429 $898,238 $1,282,452
Group D Average Excluding Outliers/Exclusions $142,294,186 1,899 $65,043,583 $1,295,667 $1,720,083
Group D Median $32,930,341 569 $13,282,500 $531,500 $530,500
DIRECT Economic Impact of ORGANIZATIONAL Spending
SOURCE: Arts and Economic Prosperity 5, Americans for the Arts, 2017. For more information, visit www.AmericansForTheArts.org/EconomicImpact. B–111

Table 7:Direct Economic Impact of Expenditures by Nonprofit Arts and Cultural OrganizationsPer Study Region During Fiscal Year 2015
Population Cohort Group E Direct
Population 500,000 to 999,999 Organizational Full-Time Resident Local State
Sample Size = 25 Expenditures Equivalent Jobs Household Income Government Revenue Government Revenue
Sonoma County (CA)4 $45,118,213 1,071 $23,047,000 $1,114,000 $797,000
Volusia County (FL)4 $13,720,631 177 $5,271,000 $281,000 $370,000
Guilford County (NC)4 $67,062,726 888 $25,583,000 $449,000 $785,000
Dane County (WI)4 $145,739,612 2,793 $71,488,000 $1,545,000 $1,956,000
Brevard County (FL)4 $7,119,716 198 $4,710,000 $105,000 $171,000
Washington County (OR)4 $13,813,264 362 $6,722,000 $282,000 $126,000
Johnson County (KS)4 $12,335,839 271 $5,320,000 $264,000 $208,000
City of Louisville (KY) $224,560,560 3,110 $85,975,000 $2,277,000 $4,775,000
City of Baltimore (MD) $326,333,152 4,078 $151,027,000 $4,072,000 $3,512,000
Polk County (FL)4 $15,790,432 280 $7,018,000 $293,000 $473,000
City of Boston (MA) $763,888,012 12,276 $303,089,000 $10,720,000 $10,266,000
District of Columbia (DC)3,6 $1,654,234,168 27,084 $951,744,000 $97,590,000 $0
City of Nashville-Davidson County (TN) $178,780,284 2,514 $75,783,000 $2,041,000 $4,505,000
City of El Paso (TX) $59,978,686 1,221 $25,283,000 $1,524,000 $1,168,000
Lee County (FL)4 $33,978,684 514 $15,966,000 $625,000 $994,000
City of Fort Worth (TX) $255,976,253 4,459 $121,023,000 $4,800,000 $5,045,000
City of Indianapolis (IN) $227,293,491 2,648 $106,254,000 $1,868,000 $1,995,000
City and County of San Francisco (CA) $780,613,098 12,802 $419,133,000 $7,166,000 $11,161,000
Prince George's County (MD)4 $23,782,748 346 $14,055,000 $366,000 $384,000
Pinellas County (FL)4 $100,195,060 1,590 $46,516,000 $2,939,000 $4,067,000
Shelby County (TN)4 $118,196,607 1,323 $47,114,000 $833,000 $1,968,000
Fairfield County (CT)4 $148,621,258 3,175 $72,038,000 $2,207,000 $3,120,000
Westchester County (NY)4 $106,569,709 1,783 $48,533,000 $3,486,000 $2,504,000
Fulton County (GA)4 $382,742,711 4,996 $172,863,000 $2,539,000 $3,481,000
Wake County (NC)4 $179,146,269 3,406 $78,155,000 $1,425,000 $2,405,000
Group E Average $235,423,647 3,735 $115,348,400 $6,032,440 $2,649,440
Group E Average Excluding Outliers/Exclusions $352,177,942 5,389 $160,945,875 $4,308,500 $5,303,375
Group E Median $118,196,607 1,783 $48,533,000 $1,545,000 $1,968,000
DIRECT Economic Impact of ORGANIZATIONAL Spending
SOURCE: Arts and Economic Prosperity 5, Americans for the Arts, 2017. For more information, visit www.AmericansForTheArts.org/EconomicImpact. B–112
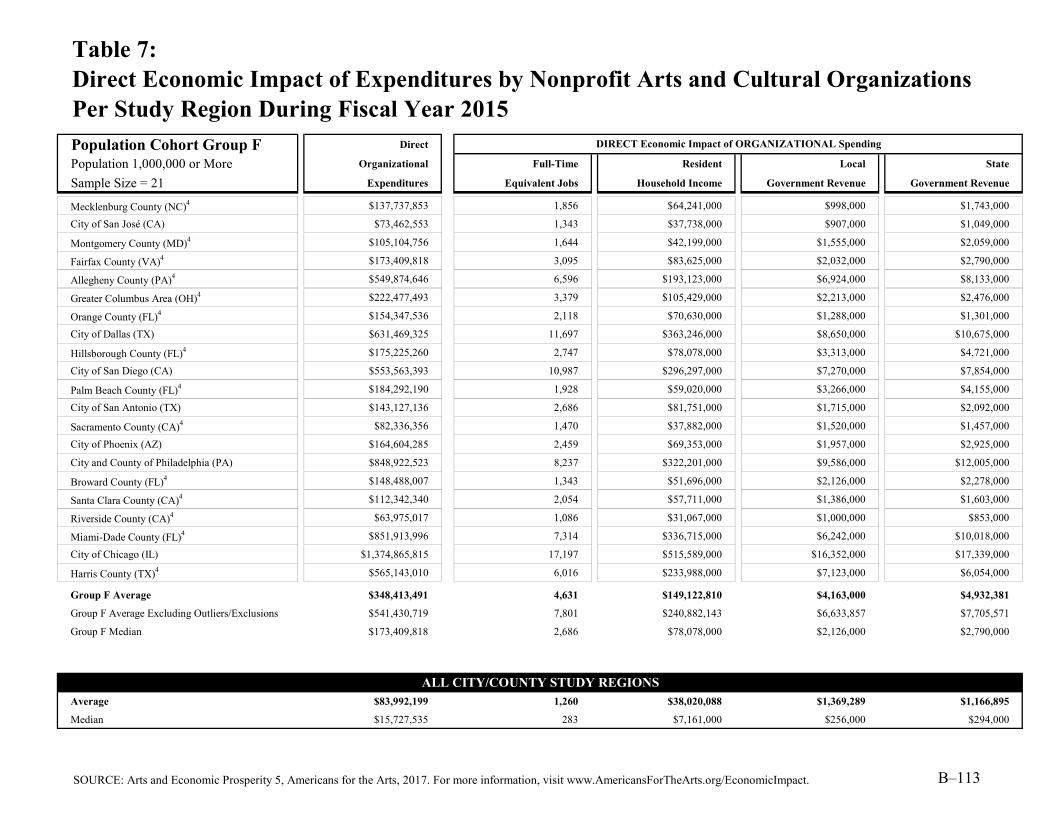
Table 7:Direct Economic Impact of Expenditures by Nonprofit Arts and Cultural OrganizationsPer Study Region During Fiscal Year 2015
Population Cohort Group F Direct
Population 1,000,000 or More Organizational Full-Time Resident Local State
Sample Size = 21 Expenditures Equivalent Jobs Household Income Government Revenue Government Revenue
Mecklenburg County (NC)4 $137,737,853 1,856 $64,241,000 $998,000 $1,743,000
City of San José (CA) $73,462,553 1,343 $37,738,000 $907,000 $1,049,000
Montgomery County (MD)4 $105,104,756 1,644 $42,199,000 $1,555,000 $2,059,000
Fairfax County (VA)4 $173,409,818 3,095 $83,625,000 $2,032,000 $2,790,000
Allegheny County (PA)4 $549,874,646 6,596 $193,123,000 $6,924,000 $8,133,000
Greater Columbus Area (OH)4 $222,477,493 3,379 $105,429,000 $2,213,000 $2,476,000
Orange County (FL)4 $154,347,536 2,118 $70,630,000 $1,288,000 $1,301,000
City of Dallas (TX) $631,469,325 11,697 $363,246,000 $8,650,000 $10,675,000
Hillsborough County (FL)4 $175,225,260 2,747 $78,078,000 $3,313,000 $4,721,000
City of San Diego (CA) $553,563,393 10,987 $296,297,000 $7,270,000 $7,854,000
Palm Beach County (FL)4 $184,292,190 1,928 $59,020,000 $3,266,000 $4,155,000
City of San Antonio (TX) $143,127,136 2,686 $81,751,000 $1,715,000 $2,092,000
Sacramento County (CA)4 $82,336,356 1,470 $37,882,000 $1,520,000 $1,457,000
City of Phoenix (AZ) $164,604,285 2,459 $69,353,000 $1,957,000 $2,925,000
City and County of Philadelphia (PA) $848,922,523 8,237 $322,201,000 $9,586,000 $12,005,000
Broward County (FL)4 $148,488,007 1,343 $51,696,000 $2,126,000 $2,278,000
Santa Clara County (CA)4 $112,342,340 2,054 $57,711,000 $1,386,000 $1,603,000
Riverside County (CA)4 $63,975,017 1,086 $31,067,000 $1,000,000 $853,000
Miami-Dade County (FL)4 $851,913,996 7,314 $336,715,000 $6,242,000 $10,018,000
City of Chicago (IL) $1,374,865,815 17,197 $515,589,000 $16,352,000 $17,339,000
Harris County (TX)4 $565,143,010 6,016 $233,988,000 $7,123,000 $6,054,000
Group F Average $348,413,491 4,631 $149,122,810 $4,163,000 $4,932,381
Group F Average Excluding Outliers/Exclusions $541,430,719 7,801 $240,882,143 $6,633,857 $7,705,571
Group F Median $173,409,818 2,686 $78,078,000 $2,126,000 $2,790,000
Average $83,992,199 1,260 $38,020,088 $1,369,289 $1,166,895
Median $15,727,535 283 $7,161,000 $256,000 $294,000
DIRECT Economic Impact of ORGANIZATIONAL Spending
ALL CITY/COUNTY STUDY REGIONS
SOURCE: Arts and Economic Prosperity 5, Americans for the Arts, 2017. For more information, visit www.AmericansForTheArts.org/EconomicImpact. B–113

Table 7:Direct Economic Impact of Expenditures by Nonprofit Arts and Cultural OrganizationsPer Study Region During Fiscal Year 2015
Regional Study Regions Direct
All Populations Organizational Full-Time Resident Local State
Sample Size = 81 Expenditures Equivalent Jobs Household Income Government Revenue Government Revenue
High Peaks Region (ME) $733,718 11 $290,000 $19,000 $12,000
Wood River Valley (ID) $15,469,150 347 $7,090,000 $36,000 $219,000
Southern Oregon Area $37,531,117 700 $16,164,000 $1,018,000 $521,000
Southwestern Pennsylvania Area $13,154,583 212 $4,975,000 $184,000 $172,000
Greater Portsmouth Area (NH) $21,456,627 444 $11,618,000 $380,000 $386,000
Northeast Oregon Region $652,008 17 $323,000 $13,000 $6,000
Toe River Valley (NC) $11,706,879 118 $2,923,000 $151,000 $213,000
Albemarle Region (NC) $2,724,828 44 $959,000 $41,000 $44,000
Greater Concord Area (NH) $17,833,550 285 $8,198,000 $295,000 $364,000
North Central Minnesota Region2 $1,630,565 17 $530,000 $16,000 $11,000
Northwest Minnesota Region2 $616,142 9 $248,000 $1,000 $17,000
Monadnock Region (NH) $13,271,384 236 $5,896,000 $428,000 $432,000
Bismarck-Mandan Region (ND) $24,377,094 488 $10,096,000 $309,000 $408,000
Greater Minot Region (ND) $8,739,861 102 $2,319,000 $57,000 $88,000
Greater Burlington Area (VT) $59,120,540 1,313 $25,564,000 $664,000 $1,418,000
Greater Charlottesville Area (VA) $60,559,918 1,331 $36,632,000 $1,521,000 $1,472,000
Brainerd Lakes Region (MN)2 $2,753,533 33 $969,000 $19,000 $25,000
East Central Minnesota Region2 $3,802,469 48 $1,415,000 $34,000 $91,000
Northwest Connecticut Region $21,482,961 330 $8,732,000 $799,000 $1,020,000
Central Oregon Region $9,958,558 198 $4,392,000 $207,000 $111,000
Greater Fargo-Moorhead Area (ND/MN) $20,819,502 418 $9,935,000 $255,000 $317,000
Black Hills Region (SD) $22,974,769 406 $10,240,000 $507,000 $491,000
Greater Kingsport Area (TN) $9,562,287 152 $3,915,000 $103,000 $155,000
Lake Region (MN)2 $6,485,666 86 $2,075,000 $39,000 $71,000
South Central Minnesota Region2 $6,433,650 101 $2,400,000 $26,000 $58,000
Greater Sioux Falls Area (SD) $20,601,653 356 $8,898,000 $297,000 $355,000
Southwest Tennessee Development District $3,129,255 79 $1,500,000 $23,000 $36,000
Northwest Tennessee Development District $2,283,302 56 $1,086,000 $28,000 $56,000
Southwest Minnesota Region2 $4,868,274 60 $1,504,000 $29,000 $44,000
Arrowhead Region (MN)2 $19,637,859 308 $8,110,000 $118,000 $668,000
DIRECT Economic Impact of ORGANIZATIONAL Spending
SOURCE: Arts and Economic Prosperity 5, Americans for the Arts, 2017. For more information, visit www.AmericansForTheArts.org/EconomicImpact. B–114

Table 7:Direct Economic Impact of Expenditures by Nonprofit Arts and Cultural OrganizationsPer Study Region During Fiscal Year 2015
Regional Study Regions Direct
All Populations Organizational Full-Time Resident Local State
Sample Size = 81 Expenditures Equivalent Jobs Household Income Government Revenue Government Revenue
Maple Grove and the Northwest Suburbs (MN)2 $1,487,198 32 $608,000 $7,000 $18,000
Greater Augusta Area (GA) $37,854,649 785 $15,969,000 $517,000 $396,000
Upper Cumberland Development District (TN) $6,334,696 108 $2,689,000 $93,000 $144,000
City of Huntsville/Madison County (AL) $53,843,563 1,186 $23,794,000 $349,000 $750,000
Northeast Commission (NC) $22,642,818 342 $7,894,000 $155,000 $156,000
Greater Ann Arbor Area (MI)5 $49,916,641 830 $25,208,000 $449,000 $2,396,000
Greater Fox Cities Region (WI) $40,077,673 263 $6,417,000 $1,099,000 $831,000
Central Minnesota Region2 $8,800,646 158 $3,855,000 $53,000 $211,000
South Central Tennessee Development District $4,064,456 86 $2,016,000 $49,000 $87,000
Northwest Arkansas Region $67,503,606 1,213 $29,076,000 $370,000 $1,254,000
Southeast Minnesota Region2 $16,690,210 287 $6,760,000 $100,000 $200,000
First Tennessee Development District $15,384,812 266 $6,561,000 $158,000 $255,000
Greater Harrisburg Area (PA) $12,684,667 244 $6,097,000 $118,000 $157,000
Greater New Haven Area (CT) $114,867,991 1,816 $37,980,000 $2,093,000 $2,305,000
Treasure Coast Region (FL) $33,405,733 555 $14,277,000 $1,029,000 $1,698,000
Greater Des Moines Region (IA) $71,922,902 845 $26,553,000 $1,100,000 $814,000
Southeast Tennessee Development District $67,352,550 1,489 $37,450,000 $480,000 $1,024,000
Greater Knoxville Region (TN) $48,160,880 1,012 $21,656,000 $496,000 $942,000
Greater Columbia Area (SC) $22,480,674 478 $10,487,000 $199,000 $180,000
Pikes Peak Region (CO) $51,193,211 839 $20,624,000 $673,000 $376,000
Lehigh Valley Region (PA) $83,164,601 1,483 $36,982,000 $810,000 $891,000
Greater Sarasota/Bradenton Area (FL) $215,956,639 3,022 $103,535,000 $2,669,000 $5,797,000
Dayton Region (OH) $95,159,725 2,082 $41,702,000 $2,257,000 $2,199,000
Richmond & Tri-Cities Region (VA) $211,680,685 4,488 $87,551,000 $6,354,000 $6,937,000
Memphis Area Association of Governments (TN) $118,315,928 1,324 $47,159,000 $835,000 $1,972,000
Eastern Region (NC) $27,730,102 688 $15,438,000 $319,000 $385,000
Advantage West Region (NC) $75,230,591 1,159 $31,114,000 $974,000 $1,293,000
Southeast Commission (NC) $50,352,984 1,068 $25,003,000 $436,000 $529,000
Greater Fairfax Area (VA) $182,798,508 3,279 $87,873,000 $2,238,000 $3,276,000
Greater Tulsa Region (OK) $91,182,165 1,896 $45,172,000 $2,058,000 $2,241,000
DIRECT Economic Impact of ORGANIZATIONAL Spending
SOURCE: Arts and Economic Prosperity 5, Americans for the Arts, 2017. For more information, visit www.AmericansForTheArts.org/EconomicImpact. B–115

Table 7:Direct Economic Impact of Expenditures by Nonprofit Arts and Cultural OrganizationsPer Study Region During Fiscal Year 2015
Regional Study Regions Direct
All Populations Organizational Full-Time Resident Local State
Sample Size = 81 Expenditures Equivalent Jobs Household Income Government Revenue Government Revenue
East Tennessee Development District $53,564,537 1,097 $23,707,000 $522,000 $986,000
West Valley Region (AZ) $13,189,366 177 $4,982,000 $227,000 $292,000
Greater St. Louis Area (MO) $363,745,576 5,067 $174,707,000 $2,910,000 $4,484,000
Western New York $156,024,439 2,618 $65,925,000 $2,644,000 $1,233,000
Greater Oklahoma City Region (OK) $220,484,100 3,536 $87,203,000 $4,486,000 $4,557,000
Piedmont Triad Partnership (NC) $207,772,417 3,109 $87,244,000 $1,930,000 $2,885,000
Greater Portland Area (OR) $214,420,434 3,631 $104,958,000 $2,490,000 $3,450,000
Greater Kansas City Metropolitan Area (MO/KS) $179,536,915 2,465 $91,203,000 $1,481,000 $1,750,000
Greater Nashville Regional Council (TN) $200,353,380 2,994 $85,400,000 $2,318,000 $5,030,000
Research Triangle Regional Partnership (NC) $387,905,496 7,928 $196,596,000 $2,891,000 $4,937,000
Greater Tampa/St. Petersburg Area (FL) $275,420,320 4,337 $124,594,000 $6,252,000 $8,788,000
Charlotte Regional Partnership (NC) $165,862,764 2,271 $75,932,000 $1,442,000 $2,141,000
Charlotte Regional Partnership (NC/SC) $179,142,409 2,611 $83,745,000 $1,553,000 $2,281,000
Seven-County Metro Area (MN)2 $624,372,639 8,935 $255,368,000 $3,122,000 $7,492,000
Central Florida Region $202,291,372 2,980 $93,084,000 $2,153,000 $2,610,000
Greater Philadelphia Region (PA) $992,509,546 14,030 $446,398,000 $12,218,000 $20,461,000
Greater Washington Region (DC/MD/VA) $2,172,509,756 36,114 $1,190,561,000 $104,565,000 $8,772,000
Metro Atlanta Area (GA) $434,779,646 5,875 195,207,000 3,520,000 4,199,000
Greater Atlanta Region (GA) $442,368,282 6,003 198,463,000 3,673,000 4,311,000
Greater Houston Region (TX) $579,435,793 6,244 239,901,000 7,399,000 6,362,000
Dallas-Fort Worth-Arlington MSA (TX) $999,509,582 18,038 536,286,000 15,538,000 17,955,000
Regional Average $140,837,185 2,243 $66,518,025 $2,709,728 $2,024,333
Regional Median $37,854,649 700 $15,969,000 $480,000 $668,000
DIRECT Economic Impact of ORGANIZATIONAL Spending
SOURCE: Arts and Economic Prosperity 5, Americans for the Arts, 2017. For more information, visit www.AmericansForTheArts.org/EconomicImpact. B–116

Table 7:Direct Economic Impact of Expenditures by Nonprofit Arts and Cultural OrganizationsPer Study Region During Fiscal Year 2015
Statewide Study Regions Direct
All Populations Organizational Full-Time Resident Local State
Sample Size = 20 Expenditures Equivalent Jobs Household Income Government Revenue Government Revenue
State of Vermont $78,856,911 1,716 $34,162,000 $749,000 $1,904,000
State of North Dakota $56,458,549 1,050 $23,523,000 $656,000 $856,000
State of Delaware $103,624,375 2,073 $60,813,000 $864,000 $4,799,000
State of Maine $92,577,604 1,484 $41,884,000 $1,239,000 $1,595,000
State of Hawai'i $125,921,352 3,351 $85,981,000 $1,373,000 $8,632,000
State of Nevada $227,298,372 3,773 $91,186,000 $3,440,000 $9,973,000
State of Connecticut $515,311,370 9,101 $258,330,000 $8,692,000 $13,047,000
State of Oklahoma $331,249,786 5,804 $140,144,000 $6,762,000 $7,104,000
State of Oregon $364,065,287 6,738 $171,385,000 $5,305,000 $5,043,000
State of Minnesota2 $696,091,653 10,042 $283,234,000 $3,557,000 $8,888,000
State of Wisconsin $376,915,991 10,324 $222,668,000 $9,566,000 $9,183,000
State of Maryland $511,399,372 7,144 $231,804,000 $6,479,000 $7,112,000
State of Missouri $602,903,738 8,769 $293,129,000 $5,075,000 $6,921,000
State of Tennessee $470,782,916 7,499 $207,568,000 $4,506,000 $9,590,000
State of Massachusetts $1,386,703,275 23,299 $555,198,000 $19,733,000 $20,622,000
State of New Jersey $296,140,348 6,139 $158,978,000 $4,854,000 $5,639,000
State of North Carolina $937,497,172 16,565 $439,221,000 $8,147,000 $12,326,000
State of Pennsylvania $1,753,309,722 24,250 $731,861,000 $21,060,000 $31,494,000
State of Illinois $1,780,626,339 29,255 $949,693,000 $28,630,000 $49,259,000
State of Florida $2,285,671,265 26,878 $917,510,000 $33,176,000 $48,890,000
Statewide Average $649,670,270 10,263 $294,913,600 $8,693,150 $13,143,850
Statewide Median $423,849,454 7,322 $215,118,000 $5,190,000 $8,760,000
DIRECT Economic Impact of ORGANIZATIONAL Spending
SOURCE: Arts and Economic Prosperity 5, Americans for the Arts, 2017. For more information, visit www.AmericansForTheArts.org/EconomicImpact. B–117

Table 7:Direct Economic Impact of Expenditures by Nonprofit Arts and Cultural OrganizationsPer Study Region During Fiscal Year 2015
Individual Arts Districts Direct
All Populations Organizational Full-Time Resident Local State
Sample Size = 12 Expenditures Equivalent Jobs Household Income Government Revenue Government Revenue
James River Arts & Cultural District $6,394,249 100 $2,627,000 $144,000 $204,000
Center City Charlotte $124,091,617 1,672 $57,876,000 $899,000 $1,570,000
Loch Haven Cultural Park $29,253,216 401 $13,386,000 $244,000 $247,000
Downtown Colorado Springs Creative District $20,773,371 340 $8,369,000 $273,000 $153,000
Fort Worth Cultural District $150,010,452 2,613 $70,923,000 $2,813,000 $2,956,000
Dallas Arts District $282,234,392 5,228 $162,352,000 $3,866,000 $4,771,000
Grand Center Arts & Entertainment District $77,174,797 1,075 $37,067,000 $617,000 $951,000
Balboa Park Cultural District $380,437,910 7,551 $203,631,000 $4,996,000 $5,398,000
East End Cultural District $3,177,402 34 $1,316,000 $40,000 $34,000
Houston Museum District Association $321,550,313 3,423 $133,132,000 $4,053,000 $3,445,000
Midtown Cultural District $4,111,803 44 $1,702,000 $52,000 $44,000
Washington Avenue Cultural District $2,520,607 27 $1,044,000 $32,000 $27,000
Arts District Average $116,810,844 1,876 $57,785,417 $1,502,417 $1,650,000
Arts District Median $53,214,007 738 $25,226,500 $445,000 $599,000
Explanation of the Outliers and Exclusions:1
2
3
4
5
6 The economic impact findings for the District of Columbia exclude state government revenues due to Washington, DC's unique status as a study region with no state government.
The expenditure and attendance data collected from eligible organizations in this study region were collected for fiscal year 2014 (rather than 2015), and audience-intercepts surveys collected from attendees to cultural events in this study region were collected during calendar year 2015 (rather than 2016).
The expenditure and attendance data collected from eligible organizations in these study regions were collected for fiscal year 2013 (rather than 2015), and audience-intercepts surveys collected from attendees to cultural events in these study regions were collected during calendar year 2014 (rather than 2016). Where applicable, these study regions are excluded from the national extrapolations.
Both the organizational expenditure and attendance findings and the audience expenditure findings for these city study regions were determined by researchers to be outliers when compared to the findings for cohort regions in the same population category. For this reason, these study regions are excluded from the national extrapolations.
These county study regions are excluded from the national extrapolations. The national extrapolations are based on city study regions only.
DIRECT Economic Impact of ORGANIZATIONAL Spending
The organizational expenditure and attendance findings for these city study regions were determined by researchers to be outliers when compared to the findings for cohort regions in the same population category. For this reason, the organizational expenditure and attendance findings for these study regions are excluded from the national extrapolations.
SOURCE: Arts and Economic Prosperity 5, Americans for the Arts, 2017. For more information, visit www.AmericansForTheArts.org/EconomicImpact. B–118

Explanation of Table 8:Economic Impact Per $100,000 of Direct Spending by Nonprofit Arts andCultural Organizations Per Study Region During Fiscal Year 2015
Column Two:
Column Three:
Column Four:
Column Five:
Column Six:
Column Seven:
Column Eight:
Column Nine:
The direct economic impact ratio for the total amount of local government revenue generated per $100,000 in direct spending.
The direct economic impact ratio for the total amount of state government revenue generated per $100,000 in direct spending.
The economic impact ratio for the total amount of revenue generated to state government (e.g., licenses, fees, taxes) per $100,000 of spending by nonprofit arts and cultural organizations in each participating study region.
The direct economic impact ratio for the total number of full-time equivalent (FTE) jobs supported per $100,000 in direct spending.
This table summarizes both the total and direct economic impacts of expenditures made by nonprofit arts and cultural organizations in the form of ratios. Summary statistics are calculated for each population group.
The economic impact ratio for the total number of full-time equivalent (FTE) jobs supported per $100,000 of spending by nonprofit arts and cultural organizations in each participating study region.
The economic impact ratio for the total amount of household income paid to study region residents per $100,000 of spending by nonprofit arts and cultural organizations in each participating study region.
The economic impact ratio for the total amount of revenue generated to local government (e.g., licenses, fees, taxes) per $100,000 of spending by nonprofit arts and cultural organizations in each participating study region. Local government includes city and county governments located within each participating study region.
Using this chart, a determination can be made of the economic impact per $100,000 of direct spending by nonprofit arts and cultural organizations. These ratios are derived by dividing the total and direct economic impact of expenditures by nonprofit arts and cultural organizations (found on Tables 6 and 7) by the total expenditures made by responding nonprofit arts and cultural organizations, and then multiplying by 100,000. See Background and Scope of Study and Frequently Used Terms in this Arts & Economic Prosperity 5 National Statistical Report for more information about the differences between total and direct economic impacts.
The direct economic impact ratio for the total amount of household income paid to study region residents per $100,000 in direct spending.
SOURCE: Arts and Economic Prosperity 5, Americans for the Arts, 2017. For more information, visit www.AmericansForTheArts.org/EconomicImpact. B–119

Table 8:Economic Impact Per $100,000 of Direct Spending by Nonprofit Arts andCultural Organizations Per Study Region During Fiscal Year 2015
Population Cohort Group APopulation Fewer than 50,000 Full-Time Household Local State Full-Time Household Local State
Sample Size = 52 Equivalent Jobs Income Govt. Revenue Govt. Revenue Equivalent Jobs Income Govt. Revenue Govt. Revenue
Town of Crested Butte (CO) 2.24 $53,113 $2,459 $2,042 1.54 $41,081 $615 $483
City of Pine City (MN) 2.35 $59,969 $1,646 $7,761 1.65 $37,157 $941 $2,352
City of Alva (OK) 4.54 $62,336 $1,851 $2,692 2.78 $46,857 $505 $925
Cook County (MN) 3.26 $72,249 $1,669 $7,376 2.37 $41,307 $582 $3,416
Town of Hillsborough (NC) 4.14 $88,879 $3,387 $5,206 2.45 $60,215 $815 $1,694
City of Virginia (MN) 3.46 $71,819 $1,731 $7,788 1.73 $41,534 $865 $3,461
Town of Jackson (WY) 2.00 $59,062 $2,569 $5,618 1.37 $44,671 $967 $2,633
City of Guthrie (OK) 2.54 $55,346 $3,537 $5,150 1.49 $38,283 $3,040 $4,281
City of Grand Rapids (MN) 3.25 $72,232 $1,658 $7,410 1.87 $41,286 $600 $3,388
Town of Medfield (MA) 4.29 $70,724 $3,565 $3,129 2.33 $48,059 $1,746 $873
City of Fergus Falls (MN) 3.21 $66,829 $1,672 $7,347 1.85 $31,985 $616 $1,100
Grundy County (TN) 2.72 $48,058 $2,720 $4,534 1.81 $42,618 $1,814 $3,627
City of Falls Church (VA) 2.52 $48,999 $4,267 $8,149 1.91 $44,672 $2,519 $6,712
City of Jamestown (ND) 4.26 $60,452 $2,464 $4,927 1.52 $28,426 $948 $1,800
City of Waterville (ME) 4.74 $67,380 $6,068 $4,540 2.27 $41,623 $3,798 $1,820
City of Red Wing (MN) 3.25 $66,922 $1,566 $8,525 1.91 $40,478 $580 $1,218
City of Durango (CO) 3.71 $74,272 $2,993 $2,030 2.33 $53,668 $476 $371
City of Hannibal (MO) 2.79 $60,288 $1,714 $2,214 1.50 $43,216 $214 $571
City of Tullahoma (TN) 3.60 $57,474 $2,620 $4,585 1.80 $37,170 $1,310 $1,965
City of Northfield (MN) 3.24 $66,978 $1,541 $8,555 2.16 $40,927 $462 $1,233
Town of Carrboro (NC) 4.17 $88,883 $3,351 $5,219 2.47 $60,235 $797 $1,703
Macon County (TN) 1.92 $53,795 $2,882 $5,764 0.96 $27,858 $961 $1,921
City of Laguna Beach (CA) 2.95 $81,381 $3,953 $5,045 1.11 $37,244 $1,122 $1,097
Hickman County (TN) 2.34 $73,409 $2,863 $6,074 1.74 $65,946 $1,215 $2,690
City of Fairfax (VA) 3.45 $70,770 $3,561 $2,766 2.08 $46,713 $1,364 $1,250
City of Ponca City (OK) 2.61 $52,979 $2,394 $2,536 1.54 $38,832 $1,286 $1,215
City of Paducah (KY) 4.09 $63,885 $1,274 $3,295 1.09 $22,464 $343 $366
Mille Lacs County (MN) 2.26 $59,942 $1,737 $7,819 1.04 $37,182 $869 $2,432
McNairy County (TN) 4.44 $57,665 $4,436 $4,436 4.44 $44,358 $0 $4,436
City of Winona (MN) 3.24 $66,945 $1,560 $8,532 1.90 $40,491 $612 $1,193
TOTAL Impacts per $100,000 of Spending DIRECT Impacts per $100,000 of Spending
SOURCE: Arts and Economic Prosperity 5, Americans for the Arts, 2017. For more information, visit www.AmericansForTheArts.org/EconomicImpact. B–120

Table 8:Economic Impact Per $100,000 of Direct Spending by Nonprofit Arts andCultural Organizations Per Study Region During Fiscal Year 2015
Population Cohort Group APopulation Fewer than 50,000 Full-Time Household Local State Full-Time Household Local State
Sample Size = 52 Equivalent Jobs Income Govt. Revenue Govt. Revenue Equivalent Jobs Income Govt. Revenue Govt. Revenue
Door County (WI) 3.08 $63,089 $3,402 $4,460 1.74 $45,207 $1,963 $2,333
City of Benicia (CA) 4.10 $72,464 $4,238 $4,548 2.52 $55,235 $1,792 $1,172
City of Winter Park (FL) 3.65 $95,915 $2,841 $3,710 1.37 $45,759 $833 $845
City of Rochester (NH) 4.98 $89,620 $3,698 $4,846 2.87 $57,580 $1,309 $2,113
City of Morgantown (WV) 4.91 $72,674 $2,025 $6,403 2.62 $48,987 $656 $3,107
Henry County (TN) 3.26 $60,878 $2,174 $4,348 2.17 $44,028 $1,087 $1,631
City of Fairbanks (AK) 4.04 $75,241 $4,340 $9,704 2.61 $54,170 $1,162 $3,428
City of Bangor (ME) 4.10 $75,604 $6,080 $4,742 1.83 $45,205 $3,433 $1,804
Weakley County (TN) 2.84 $60,502 $2,363 $4,727 1.42 $44,431 $1,418 $2,363
Dare County (NC) 2.74 $50,529 $921 $1,465 1.46 $33,908 $326 $225
City of Columbia (TN) 4.24 $59,643 $2,466 $4,469 2.47 $43,075 $1,079 $1,772
City of Lake Worth (FL) 2.55 $65,966 $4,954 $5,499 1.04 $32,028 $1,774 $2,252
Clatsop County (OR) 3.24 $60,577 $3,062 $1,740 1.84 $44,223 $1,879 $1,044
Yadkin County (NC) 3.33 $54,092 $2,717 $3,828 2.22 $44,212 $1,729 $2,593
Greater Belfast Area (ME) 2.83 $63,307 $5,999 $5,962 1.56 $44,229 $3,838 $4,509
Campbell County (TN) 2.76 $47,851 $2,761 $5,521 1.84 $35,888 $1,840 $3,681
Monroe County (TN) 3.60 $62,230 $2,549 $4,948 1.95 $42,736 $1,350 $1,949
Lincoln County (OR) 2.76 $56,032 $2,382 $1,818 1.44 $37,605 $1,316 $1,442
Iron County (UT) 1.80 $51,236 $1,823 $2,678 1.04 $34,492 $600 $750
City of St. Louis Park (MN) 3.43 $81,919 $1,715 $8,443 1.98 $40,893 $528 $1,187
City of Logan (UT) 4.39 $62,033 $2,874 $3,386 2.24 $39,231 $1,377 $1,434
Gibson County (TN) 4.58 $64,664 $2,591 $5,580 2.89 $48,722 $1,395 $2,989
Group A Average 3.36 $65,367 $2,840 $5,075 1.93 $42,854 $1,244 $2,055
Group A Standard Deviation 0.82 $11,091 $1,210 $2,087 0.61 $8,211 $848 $1,278
Group A Confidence Interval (95 percent) 0.22 $2,958 $323 $557 0.16 $2,190 $226 $341
Group A Median 3.25 $63,198 $2,605 $4,887 1.85 $42,677 $1,083 $1,802
TOTAL Impacts per $100,000 of Spending DIRECT Impacts per $100,000 of Spending
SOURCE: Arts and Economic Prosperity 5, Americans for the Arts, 2017. For more information, visit www.AmericansForTheArts.org/EconomicImpact. B–121

Table 8:Economic Impact Per $100,000 of Direct Spending by Nonprofit Arts andCultural Organizations Per Study Region During Fiscal Year 2015
Population Cohort Group BPopulation 50,000 to 99,999 Full-Time Household Local State Full-Time Household Local State
Sample Size = 38 Equivalent Jobs Income Govt. Revenue Govt. Revenue Equivalent Jobs Income Govt. Revenue Govt. Revenue
City of Joplin (MO) 4.91 $77,539 $3,403 $2,901 2.45 $51,042 $1,116 $669
City of La Crosse (WI) 3.34 $81,884 $3,976 $4,693 1.45 $43,156 $1,271 $959
McMinn County (TN) 2.97 $58,570 $2,473 $4,353 1.68 $41,553 $1,435 $2,028
Lafayette County (MS) 4.59 $63,379 $2,900 $6,891 1.39 $24,026 $1,318 $2,937
Chisago County (MN) 2.29 $59,961 $1,678 $7,781 1.22 $37,227 $915 $2,441
City of Grand Forks (ND) 3.45 $76,431 $2,804 $4,530 1.69 $51,805 $1,186 $1,510
City of Corvallis (OR) 3.93 $61,491 $3,678 $1,677 2.32 $44,639 $2,225 $1,147
City of Noblesville (IN) 4.21 $69,664 $3,999 $6,735 1.68 $35,779 $2,947 $4,209
City of Ocala (FL) 3.71 $73,350 $5,148 $7,268 1.73 $45,244 $2,595 $2,917
Lenoir County (NC) 3.22 $70,427 $2,680 $3,001 1.82 $46,523 $643 $750
Town of Chapel Hill (NC) 4.17 $88,881 $3,362 $5,217 2.47 $60,243 $810 $1,701
City of Grand Junction (CO) 3.01 $82,926 $4,346 $2,457 1.29 $52,771 $993 $497
Town of Jupiter (FL) 2.56 $65,967 $4,951 $5,499 1.05 $32,024 $1,771 $2,257
Hamblen County (TN) 3.42 $61,422 $2,236 $3,814 1.71 $40,115 $789 $1,052
City of Delray Beach (FL) 2.55 $65,965 $4,956 $5,504 1.04 $32,024 $1,776 $2,253
City of St. Cloud (MN) 3.42 $71,763 $1,684 $8,437 1.96 $43,795 $599 $2,395
City of Portland (ME) 3.10 $88,864 $4,760 $6,102 1.20 $43,382 $1,222 $1,441
City of Jackson (TN) 5.03 $74,442 $2,288 $4,163 2.51 $48,041 $675 $938
City of Walnut Creek (CA) 3.39 $80,634 $4,460 $5,427 1.97 $52,167 $1,825 $2,247
Greene County (TN) 2.99 $57,910 $2,435 $4,829 1.72 $42,105 $1,157 $2,275
City of Flagstaff (AZ) 3.83 $85,386 $3,470 $3,848 2.15 $56,104 $1,423 $1,665
City of Missoula (MT) 3.91 $81,889 $2,972 $4,477 1.95 $48,592 $785 $1,481
City of Fort Myers (FL) 3.41 $87,706 $4,729 $7,799 1.51 $46,989 $1,842 $2,924
Putnam County (TN) 3.29 $72,221 $2,551 $4,857 1.47 $44,009 $1,079 $1,717
Monroe County (FL) 2.77 $55,321 $2,170 $4,951 1.58 $39,612 $1,405 $2,898
City of Lynchburg (VA) 2.11 $44,084 $3,956 $4,542 1.56 $41,076 $2,241 $3,189
City of Duluth (MN) 3.26 $72,232 $1,658 $7,396 1.99 $41,298 $602 $3,401
City of Fishers (IN) 4.13 $69,679 $4,083 $6,681 1.68 $35,809 $3,022 $4,282
City of Carmel (IN) 4.12 $69,677 $4,085 $6,680 1.68 $35,814 $3,026 $4,284
City of Sugar Land (TX) 3.87 $69,116 $7,886 $8,813 2.01 $43,758 $6,339 $6,494
DIRECT Impacts per $100,000 of SpendingTOTAL Impacts per $100,000 of Spending
SOURCE: Arts and Economic Prosperity 5, Americans for the Arts, 2017. For more information, visit www.AmericansForTheArts.org/EconomicImpact. B–122

Table 8:Economic Impact Per $100,000 of Direct Spending by Nonprofit Arts andCultural Organizations Per Study Region During Fiscal Year 2015
Population Cohort Group BPopulation 50,000 to 99,999 Full-Time Household Local State Full-Time Household Local State
Sample Size = 38 Equivalent Jobs Income Govt. Revenue Govt. Revenue Equivalent Jobs Income Govt. Revenue Govt. Revenue
City of Asheville (NC) 3.41 $93,888 $3,137 $4,606 1.49 $49,520 $788 $1,197
Buchanan County (MO) 5.12 $94,963 $3,859 $3,185 2.73 $59,714 $1,101 $655
City of Boca Raton (FL) 2.56 $65,962 $4,955 $5,503 1.05 $32,023 $1,775 $2,259
City of Miami Beach (FL) 2.88 $101,163 $3,202 $5,120 0.86 $39,524 $733 $1,176
Moore County (NC) 2.65 $64,650 $2,748 $3,635 1.66 $46,794 $829 $1,236
Sevier County (TN) 2.41 $47,978 $549 $1,618 1.45 $36,320 $192 $384
Cape May County (NJ) 2.90 $56,282 $4,973 $4,312 1.72 $41,474 $3,586 $2,266
Cleveland County (NC) 2.97 $62,289 $3,191 $3,803 1.57 $43,056 $1,661 $1,661
Group B Average 3.42 $71,736 $3,484 $5,082 1.70 $43,399 $1,571 $2,100
Group B Standard Deviation 0.75 $13,032 $1,336 $1,773 0.43 $7,737 $1,119 $1,269
Group B Confidence Interval (95 percent) 0.23 $4,039 $414 $549 0.13 $2,398 $347 $393
Group B Median 3.37 $70,053 $3,382 $4,843 1.68 $43,269 $1,246 $1,873
TOTAL Impacts per $100,000 of Spending DIRECT Impacts per $100,000 of Spending
SOURCE: Arts and Economic Prosperity 5, Americans for the Arts, 2017. For more information, visit www.AmericansForTheArts.org/EconomicImpact. B–123

Table 8:Economic Impact Per $100,000 of Direct Spending by Nonprofit Arts andCultural Organizations Per Study Region During Fiscal Year 2015
Population Cohort Group CPopulation 100,000 to 249,999 Full-Time Household Local State Full-Time Household Local State
Sample Size = 50 Equivalent Jobs Income Govt. Revenue Govt. Revenue Equivalent Jobs Income Govt. Revenue Govt. Revenue
City of Las Cruces (NM) 2.09 $63,443 $2,809 $7,028 1.05 $45,132 $1,669 $3,831
Eau Claire County (WI) 4.24 $86,775 $4,834 $4,213 1.53 $38,542 $1,042 $665
Yamhill County (OR) 3.47 $59,348 $3,615 $1,858 1.74 $37,257 $2,076 $1,316
City of Lewisville (TX) 3.96 $72,690 $7,665 $8,062 1.92 $43,548 $6,079 $5,617
City of West Palm Beach (FL) 2.56 $65,963 $4,956 $5,502 1.05 $32,025 $1,772 $2,255
City of Boulder (CO) 2.73 $82,431 $3,075 $2,895 1.55 $53,505 $755 $898
City of Richardson (TX) 4.13 $83,525 $4,257 $5,361 1.79 $48,544 $1,762 $2,116
City of High Point (NC) 3.59 $84,014 $2,812 $5,117 1.33 $38,160 $664 $1,172
City of Cambridge (MA) 4.34 $65,961 $4,397 $3,785 1.94 $36,781 $2,675 $1,977
City of Lowell (MA) 5.11 $78,056 $4,466 $3,764 2.73 $51,677 $2,187 $1,462
Douglas County (KS) 4.12 $72,223 $4,237 $4,058 2.24 $50,476 $1,608 $1,027
City of Columbia (MO) 5.28 $79,215 $3,955 $3,879 2.29 $45,322 $1,475 $1,344
City of Norman (OK) 4.00 $71,575 $3,973 $5,730 2.06 $47,348 $2,597 $2,458
Wayne County (NC) 3.44 $67,578 $4,522 $3,376 1.91 $43,948 $1,465 $828
City of Lafayette (LA) 3.98 $74,602 $3,697 $4,248 1.75 $44,145 $1,479 $1,526
Washington County (TN) 4.54 $77,596 $2,394 $4,880 2.15 $48,068 $767 $1,289
City of Thousand Oaks (CA) 4.23 $76,298 $4,135 $4,901 2.37 $54,032 $2,021 $1,556
City of Charleston (SC) 4.56 $81,188 $3,342 $3,864 2.02 $48,532 $1,108 $714
City of Waco (TX) 3.99 $71,155 $4,581 $4,820 1.75 $42,180 $2,160 $1,478
Robeson County (NC) 3.43 $59,806 $2,745 $3,534 1.96 $43,576 $1,510 $1,510
Columbia County (GA) 2.31 $48,599 $4,628 $4,628 0.00 $11,571 $2,314 $2,314
Orange County (NC) 4.17 $88,881 $3,362 $5,217 2.47 $60,243 $811 $1,701
City of Savannah (GA) 4.80 $76,071 $3,991 $3,178 2.23 $46,375 $1,417 $888
Indian River County (FL) 2.94 $59,105 $4,969 $8,290 1.56 $40,046 $3,359 $5,369
City of Alexandria (VA) 3.23 $76,205 $3,037 $3,576 1.80 $47,001 $1,142 $1,278
Martin County (FL) 3.43 $66,687 $4,577 $8,488 1.68 $41,649 $2,825 $5,348
Macon-Bibb County (GA) 4.31 $84,506 $3,722 $3,382 1.52 $41,016 $1,551 $1,290
City of Springfield (MA) 4.15 $74,707 $4,689 $4,016 1.75 $42,756 $2,293 $875
Catawba County (NC) 3.52 $70,211 $2,960 $3,119 1.47 $40,281 $1,424 $843
Town of Cary (NC) 4.81 $93,359 $3,283 $5,525 1.90 $43,633 $796 $1,349
TOTAL Impacts per $100,000 of Spending DIRECT Impacts per $100,000 of Spending
SOURCE: Arts and Economic Prosperity 5, Americans for the Arts, 2017. For more information, visit www.AmericansForTheArts.org/EconomicImpact. B–124
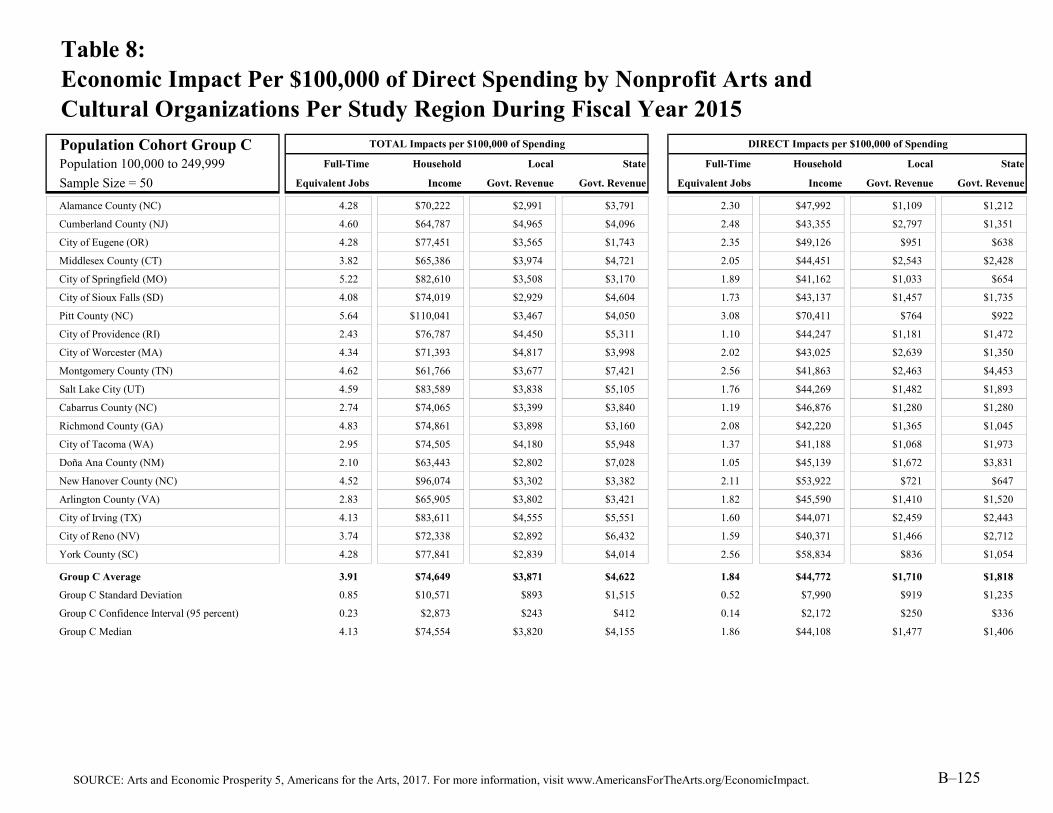
Table 8:Economic Impact Per $100,000 of Direct Spending by Nonprofit Arts andCultural Organizations Per Study Region During Fiscal Year 2015
Population Cohort Group CPopulation 100,000 to 249,999 Full-Time Household Local State Full-Time Household Local State
Sample Size = 50 Equivalent Jobs Income Govt. Revenue Govt. Revenue Equivalent Jobs Income Govt. Revenue Govt. Revenue
Alamance County (NC) 4.28 $70,222 $2,991 $3,791 2.30 $47,992 $1,109 $1,212
Cumberland County (NJ) 4.60 $64,787 $4,965 $4,096 2.48 $43,355 $2,797 $1,351
City of Eugene (OR) 4.28 $77,451 $3,565 $1,743 2.35 $49,126 $951 $638
Middlesex County (CT) 3.82 $65,386 $3,974 $4,721 2.05 $44,451 $2,543 $2,428
City of Springfield (MO) 5.22 $82,610 $3,508 $3,170 1.89 $41,162 $1,033 $654
City of Sioux Falls (SD) 4.08 $74,019 $2,929 $4,604 1.73 $43,137 $1,457 $1,735
Pitt County (NC) 5.64 $110,041 $3,467 $4,050 3.08 $70,411 $764 $922
City of Providence (RI) 2.43 $76,787 $4,450 $5,311 1.10 $44,247 $1,181 $1,472
City of Worcester (MA) 4.34 $71,393 $4,817 $3,998 2.02 $43,025 $2,639 $1,350
Montgomery County (TN) 4.62 $61,766 $3,677 $7,421 2.56 $41,863 $2,463 $4,453
Salt Lake City (UT) 4.59 $83,589 $3,838 $5,105 1.76 $44,269 $1,482 $1,893
Cabarrus County (NC) 2.74 $74,065 $3,399 $3,840 1.19 $46,876 $1,280 $1,280
Richmond County (GA) 4.83 $74,861 $3,898 $3,160 2.08 $42,220 $1,365 $1,045
City of Tacoma (WA) 2.95 $74,505 $4,180 $5,948 1.37 $41,188 $1,068 $1,973
Doña Ana County (NM) 2.10 $63,443 $2,802 $7,028 1.05 $45,139 $1,672 $3,831
New Hanover County (NC) 4.52 $96,074 $3,302 $3,382 2.11 $53,922 $721 $647
Arlington County (VA) 2.83 $65,905 $3,802 $3,421 1.82 $45,590 $1,410 $1,520
City of Irving (TX) 4.13 $83,611 $4,555 $5,551 1.60 $44,071 $2,459 $2,443
City of Reno (NV) 3.74 $72,338 $2,892 $6,432 1.59 $40,371 $1,466 $2,712
York County (SC) 4.28 $77,841 $2,839 $4,014 2.56 $58,834 $836 $1,054
Group C Average 3.91 $74,649 $3,871 $4,622 1.84 $44,772 $1,710 $1,818
Group C Standard Deviation 0.85 $10,571 $893 $1,515 0.52 $7,990 $919 $1,235
Group C Confidence Interval (95 percent) 0.23 $2,873 $243 $412 0.14 $2,172 $250 $336
Group C Median 4.13 $74,554 $3,820 $4,155 1.86 $44,108 $1,477 $1,406
TOTAL Impacts per $100,000 of Spending DIRECT Impacts per $100,000 of Spending
SOURCE: Arts and Economic Prosperity 5, Americans for the Arts, 2017. For more information, visit www.AmericansForTheArts.org/EconomicImpact. B–125

Table 8:Economic Impact Per $100,000 of Direct Spending by Nonprofit Arts andCultural Organizations Per Study Region During Fiscal Year 2015
Population Cohort Group DPopulation 250,000 to 499,999 Full-Time Household Local State Full-Time Household Local State
Sample Size = 42 Equivalent Jobs Income Govt. Revenue Govt. Revenue Equivalent Jobs Income Govt. Revenue Govt. Revenue
Buncombe County (NC) 3.41 $93,890 $3,137 $4,609 1.49 $49,519 $785 $1,195
Alachua County (FL) 2.36 $59,598 $3,151 $3,309 1.22 $36,950 $957 $963
Greater Green Bay Area (WI) 4.11 $78,098 $3,929 $4,711 1.71 $44,331 $2,308 $1,637
City of Orlando (FL) 3.65 $95,915 $2,844 $3,710 1.37 $45,760 $834 $843
City of Lincoln (NE) 2.76 $85,188 $3,464 $4,528 1.34 $51,605 $888 $1,293
Southeastern Connecticut Region (CT) 3.44 $63,448 $1,389 $3,363 1.93 $44,675 $859 $1,428
Erie County (PA) 3.52 $77,486 $3,693 $5,484 1.74 $45,550 $1,063 $1,325
San Luis Obispo County (CA) 3.97 $69,576 $3,703 $4,615 1.99 $45,249 $2,176 $1,212
City of Newark (NJ) 3.47 $95,395 $4,611 $4,660 2.03 $63,923 $1,417 $1,301
Leon County (FL) 4.47 $68,048 $6,269 $8,861 1.00 $20,363 $4,692 $5,366
Rutherford County (TN) 4.87 $70,100 $2,824 $5,177 2.60 $46,820 $787 $1,259
St. Lucie County (FL) 3.78 $84,295 $5,224 $7,308 2.08 $61,539 $2,821 $2,404
Greater Spartanburg Area (SC) 3.74 $74,725 $3,767 $4,249 1.60 $43,633 $1,876 $1,305
Durham County (NC) 4.05 $94,288 $3,004 $3,772 1.93 $54,745 $567 $752
City of St. Paul (MN) 3.45 $81,872 $1,685 $8,432 1.72 $40,900 $500 $1,200
Hamilton County (IN) 4.13 $69,679 $4,082 $6,679 1.68 $35,810 $3,024 $4,284
Osceola County (FL) 3.38 $80,056 $2,081 $5,618 2.18 $59,353 $520 $1,352
Escambia County (FL) 4.02 $77,140 $4,944 $7,035 1.72 $45,191 $2,444 $2,896
Lexington-Fayette Urban County (KY) 3.85 $101,759 $2,189 $6,609 1.33 $45,848 $570 $1,333
Lake County (FL) 3.87 $63,386 $5,539 $8,703 2.02 $42,550 $4,220 $5,626
City of Riverside (CA) 3.09 $76,244 $4,228 $4,848 1.70 $48,563 $1,565 $1,331
Cumberland County (NC) 3.33 $65,822 $4,141 $4,667 2.14 $47,923 $833 $1,170
Collier County (FL) 3.19 $64,914 $3,660 $7,190 1.84 $47,069 $2,053 $4,060
Hamilton County (TN) 4.78 $99,495 $3,159 $5,938 2.23 $56,150 $684 $1,491
Manatee County (FL) 3.95 $73,772 $5,332 $9,687 1.89 $44,621 $3,573 $6,765
City of Tampa (FL) 4.43 $89,146 $4,555 $7,682 1.57 $44,559 $1,891 $2,694
Forsyth County (NC) 3.65 $86,248 $3,224 $4,933 1.51 $44,619 $829 $1,322
Mercer County (NJ) 4.74 $79,932 $6,318 $4,988 2.33 $50,160 $3,594 $1,838
City of Wichita (KS) 2.84 $84,551 $4,056 $4,318 1.43 $52,109 $1,190 $744
Clackamas County (OR) 4.38 $74,831 $4,363 $2,199 2.28 $48,874 $2,371 $1,340
TOTAL Impacts per $100,000 of Spending DIRECT Impacts per $100,000 of Spending
SOURCE: Arts and Economic Prosperity 5, Americans for the Arts, 2017. For more information, visit www.AmericansForTheArts.org/EconomicImpact. B–126

Table 8:Economic Impact Per $100,000 of Direct Spending by Nonprofit Arts andCultural Organizations Per Study Region During Fiscal Year 2015
Population Cohort Group DPopulation 250,000 to 499,999 Full-Time Household Local State Full-Time Household Local State
Sample Size = 42 Equivalent Jobs Income Govt. Revenue Govt. Revenue Equivalent Jobs Income Govt. Revenue Govt. Revenue
Sarasota County (FL) 2.74 $82,861 $3,389 $5,781 1.36 $48,181 $1,068 $2,392
City of Minneapolis (MN) 3.45 $81,872 $1,685 $8,432 1.94 $40,900 $500 $1,200
Berks County (PA) 4.02 $71,056 $4,276 $5,978 1.70 $39,646 $2,952 $2,897
City of Miami (FL) 2.88 $101,163 $3,202 $5,120 0.86 $39,525 $733 $1,176
City of Raleigh (NC) 4.81 $93,356 $3,286 $5,525 1.90 $43,626 $796 $1,343
Santa Barbara County (CA) 3.03 $76,295 $3,655 $4,798 1.64 $47,687 $1,231 $1,259
Seminole County (FL) 3.30 $75,183 $4,665 $6,979 1.72 $46,406 $1,551 $2,484
City of Virginia Beach (VA) 4.34 $72,104 $3,833 $3,247 2.04 $43,156 $1,982 $1,346
City of Atlanta (GA) 3.26 $90,731 $3,020 $3,833 1.31 $45,164 $663 $910
City of Mesa (AZ) 3.87 $98,857 $4,420 $5,583 1.93 $60,156 $1,086 $1,371
City of Kansas City (MO) 3.13 $100,251 $2,628 $4,125 1.31 $51,365 $728 $922
Morris County (NJ) 4.81 $76,532 $5,689 $4,207 2.34 $46,274 $3,523 $1,818
Group D Average 3.72 $80,932 $3,769 $5,512 1.75 $46,692 $1,636 $1,925
Group D Standard Deviation 0.63 $11,669 $1,162 $1,725 0.38 $7,453 $1,118 $1,380
Group D Confidence Interval (95 percent) 0.18 $3,448 $343 $510 0.11 $2,202 $330 $408
Group D Median 3.69 $79,015 $3,698 $5,054 1.72 $45,804 $1,138 $1,336
TOTAL Impacts per $100,000 of Spending DIRECT Impacts per $100,000 of Spending
SOURCE: Arts and Economic Prosperity 5, Americans for the Arts, 2017. For more information, visit www.AmericansForTheArts.org/EconomicImpact. B–127

Table 8:Economic Impact Per $100,000 of Direct Spending by Nonprofit Arts andCultural Organizations Per Study Region During Fiscal Year 2015
Population Cohort Group EPopulation 500,000 to 999,999 Full-Time Household Local State Full-Time Household Local State
Sample Size = 25 Equivalent Jobs Income Govt. Revenue Govt. Revenue Equivalent Jobs Income Govt. Revenue Govt. Revenue
Sonoma County (CA) 4.33 $74,014 $4,575 $5,080 2.37 $51,081 $2,469 $1,766
Volusia County (FL) 3.02 $72,416 $5,328 $7,675 1.29 $38,417 $2,048 $2,697
Guilford County (NC) 3.60 $84,020 $2,802 $5,113 1.32 $38,148 $670 $1,171
Dane County (WI) 3.97 $85,872 $3,743 $5,494 1.92 $49,052 $1,060 $1,342
Brevard County (FL) 4.69 $87,700 $4,691 $7,079 2.78 $66,154 $1,475 $2,402
Washington County (OR) 5.59 $82,153 $4,300 $1,795 2.62 $48,663 $2,042 $912
Johnson County (KS) 5.04 $77,319 $4,450 $4,791 2.20 $43,126 $2,140 $1,686
City of Louisville (KY) 4.45 $85,539 $2,348 $7,188 1.38 $38,286 $1,014 $2,126
City of Baltimore (MD) 2.49 $79,657 $4,138 $4,449 1.25 $46,280 $1,248 $1,076
Polk County (FL) 3.87 $81,537 $5,681 $7,840 1.77 $44,445 $1,856 $2,995
City of Boston (MA) 4.15 $76,832 $2,273 $3,393 1.61 $39,677 $1,403 $1,344
District of Columbia (DC)1 1.97 $65,957 $9,027 $0 1.64 $57,534 $5,899 $0
Nashville-Davidson County (TN) 4.13 $86,074 $3,298 $7,315 1.41 $42,389 $1,142 $2,520
City of El Paso (TX) 4.80 $75,549 $5,625 $5,625 2.04 $42,153 $2,541 $1,947
Lee County (FL) 3.41 $87,705 $4,729 $7,799 1.51 $46,988 $1,839 $2,925
City of Fort Worth (TX) 3.60 $81,710 $6,004 $6,026 1.74 $47,279 $1,875 $1,971
City of Indianapolis (IN) 3.06 $93,814 $3,329 $5,787 1.17 $46,747 $822 $878
City and County of San Francisco (CA) 2.97 $84,431 $2,675 $4,630 1.64 $53,693 $918 $1,430
Prince George's County (MD) 2.38 $83,254 $4,457 $6,454 1.45 $59,097 $1,539 $1,615
Pinellas County (FL) 3.88 $81,923 $5,478 $8,797 1.59 $46,425 $2,933 $4,059
Shelby County (TN) 3.18 $86,679 $3,080 $6,114 1.12 $39,861 $705 $1,665
Fairfield County (CT) 3.83 $77,479 $4,505 $4,918 2.14 $48,471 $1,485 $2,099
Westchester County (NY) 3.18 $76,280 $8,784 $5,346 1.67 $45,541 $3,271 $2,350
Fulton County (GA) 3.26 $90,731 $3,020 $3,833 1.31 $45,164 $663 $909
Wake County (NC) 4.81 $93,356 $3,286 $5,525 1.90 $43,626 $795 $1,342
Group E Average 3.75 $82,080 $4,465 $5,523 1.71 $46,732 $1,754 $1,809
Group E Standard Deviation 0.88 $6,613 $1,714 $1,946 0.44 $6,800 $1,123 $853
Group E Confidence Interval (95 percent) 0.35 $2,592 $672 $763 0.17 $2,665 $440 $334
Group E Median 3.83 $82,153 $4,450 $5,525 1.64 $46,280 $1,485 $1,686
TOTAL Impacts per $100,000 of Spending DIRECT Impacts per $100,000 of Spending
SOURCE: Arts and Economic Prosperity 5, Americans for the Arts, 2017. For more information, visit www.AmericansForTheArts.org/EconomicImpact. B–128

Table 8:Economic Impact Per $100,000 of Direct Spending by Nonprofit Arts andCultural Organizations Per Study Region During Fiscal Year 2015
Population Cohort Group FPopulation 1,000,000 or More Full-Time Household Local State Full-Time Household Local State
Sample Size = 21 Equivalent Jobs Income Govt. Revenue Govt. Revenue Equivalent Jobs Income Govt. Revenue Govt. Revenue
Mecklenburg County (NC) 3.33 $93,473 $2,927 $4,918 1.35 $46,640 $725 $1,265
City of San José (CA) 3.11 $77,999 $3,392 $4,349 1.83 $51,370 $1,235 $1,428
Montgomery County (MD) 2.69 $62,679 $3,811 $4,579 1.56 $40,149 $1,479 $1,959
Fairfax County (VA) 2.89 $71,562 $3,349 $3,878 1.78 $48,224 $1,172 $1,609
Allegheny County (PA) 3.00 $71,151 $4,152 $5,019 1.20 $35,121 $1,259 $1,479
Greater Columbus Area (OH) 3.68 $92,188 $4,157 $5,726 1.52 $47,389 $995 $1,113
Orange County (FL) 3.65 $95,915 $2,844 $3,710 1.37 $45,760 $834 $843
City of Dallas (TX) 4.25 $107,508 $4,496 $5,653 1.85 $57,524 $1,370 $1,691
Hillsborough County (FL) 4.43 $89,146 $4,555 $7,682 1.57 $44,559 $1,891 $2,694
City of San Diego (CA) 4.07 $93,256 $3,898 $5,297 1.98 $53,525 $1,313 $1,419
Palm Beach County (FL) 2.56 $65,964 $4,956 $5,502 1.05 $32,025 $1,772 $2,255
City of San Antonio (TX) 4.08 $100,172 $5,121 $6,085 1.88 $57,118 $1,198 $1,462
Sacramento County (CA) 4.50 $97,092 $5,503 $6,267 1.79 $46,009 $1,846 $1,770
City of Phoenix (AZ) 3.63 $83,083 $4,277 $5,239 1.49 $42,133 $1,189 $1,777
City and County of Philadelphia (PA) 2.21 $68,344 $4,213 $4,284 0.97 $37,954 $1,129 $1,414
Broward County (FL) 2.57 $77,883 $4,319 $4,118 0.90 $34,815 $1,432 $1,534
Santa Clara County (CA) 3.11 $77,999 $3,392 $4,349 1.83 $51,371 $1,234 $1,427
Riverside County (CA) 3.09 $76,245 $4,228 $4,847 1.70 $48,561 $1,563 $1,333
Miami-Dade County (FL) 2.88 $101,163 $3,202 $5,120 0.86 $39,525 $733 $1,176
City of Chicago (IL) 3.03 $74,849 $4,693 $4,051 1.25 $37,501 $1,189 $1,261
Harris County (TX) 2.46 $80,592 $3,951 $3,333 1.06 $41,403 $1,260 $1,071
Group F Average 3.30 $83,727 $4,068 $4,953 1.47 $44,699 $1,277 $1,523
Group F Standard Deviation 0.68 $12,845 $708 $1,006 0.36 $7,208 $319 $414
Group F Confidence Interval (95 percent) 0.29 $5,494 $303 $430 0.15 $3,083 $137 $177
Group F Median 3.11 $80,592 $4,157 $4,918 1.52 $45,760 $1,235 $1,428
Average 3.59 $74,855 $3,636 $5,095 1.77 $44,667 $1,532 $1,911
Standard Deviation 0.80 $12,858 $1,284 $1,765 0.50 $7,774 $978 $1,193
Confidence Interval (95 percent) 0.10 $1,669 $167 $229 0.06 $1,009 $127 $155
Median 3.52 $74,554 $3,563 $4,891 1.74 $44,344 $1,298 $1,501
TOTAL Impacts per $100,000 of Spending DIRECT Impacts per $100,000 of Spending
ALL CITY/COUNTY STUDY REGIONS
SOURCE: Arts and Economic Prosperity 5, Americans for the Arts, 2017. For more information, visit www.AmericansForTheArts.org/EconomicImpact. B–129

Table 8:Economic Impact Per $100,000 of Direct Spending by Nonprofit Arts andCultural Organizations Per Study Region During Fiscal Year 2015
Regional Study RegionsAll Populations Full-Time Household Local State Full-Time Household Local State
Sample Size = 81 Equivalent Jobs Income Govt. Revenue Govt. Revenue Equivalent Jobs Income Govt. Revenue Govt. Revenue
High Peaks Region (ME) 3.00 $57,788 $4,089 $3,544 1.50 $39,525 $2,590 $1,636
Wood River Valley (ID) 3.68 $61,529 $653 $3,659 2.24 $45,833 $233 $1,416
Southern Oregon Area 4.33 $75,905 $4,796 $2,459 1.87 $43,068 $2,712 $1,388
Southwestern Pennsylvania Area 3.22 $63,833 $3,238 $4,356 1.61 $37,820 $1,399 $1,308
Greater Portsmouth Area (NH) 3.91 $87,665 $5,854 $5,075 2.07 $54,146 $1,771 $1,799
Northeast Oregon Region 4.14 $64,877 $3,221 $1,534 2.61 $49,539 $1,994 $920
Toe River Valley (NC) 2.72 $51,594 $2,563 $3,878 1.01 $24,968 $1,290 $1,819
Albemarle Region (NC) 3.52 $59,086 $2,863 $3,670 1.61 $35,195 $1,505 $1,615
Greater Concord Area (NH) 3.47 $82,625 $4,957 $5,394 1.60 $45,970 $1,654 $2,041
North Central Minnesota Region 2.27 $58,937 $1,717 $9,077 1.04 $32,504 $981 $675
Northwest Minnesota Region 2.27 $57,130 $1,623 $7,628 1.46 $40,250 $162 $2,759
Monadnock Region (NH) 3.98 $74,883 $5,832 $6,171 1.78 $44,426 $3,225 $3,255
Bismarck-Mandan Region (ND) 4.87 $76,121 $3,196 $5,624 2.00 $41,416 $1,268 $1,674
Greater Minot Region (ND) 2.04 $40,012 $2,128 $3,352 1.17 $26,534 $652 $1,007
Greater Burlington Area (VT) 4.72 $71,503 $2,492 $7,108 2.22 $43,240 $1,123 $2,398
Greater Charlottesville Area (VA) 2.29 $63,000 $3,402 $2,680 2.20 $60,489 $2,512 $2,431
Brainerd Lakes Region (MN) 2.72 $65,988 $1,671 $7,772 1.20 $35,191 $690 $908
East Central Minnesota Region 2.31 $59,908 $1,709 $7,811 1.26 $37,213 $894 $2,393
Northwest Connecticut Region 2.98 $62,980 $5,367 $6,433 1.54 $40,646 $3,719 $4,748
Central Oregon Region 3.92 $67,771 $3,585 $1,978 1.99 $44,103 $2,079 $1,115
Greater Fargo-Moorhead Area (ND/MN) 4.59 $80,578 $2,920 $5,274 2.01 $47,720 $1,225 $1,523
Black Hills Region (SD) 3.89 $72,510 $4,017 $5,362 1.77 $44,571 $2,207 $2,137
Greater Kingsport Area (TN) 3.45 $67,515 $2,813 $4,967 1.59 $40,942 $1,077 $1,621
Lake Region (MN) 3.22 $66,824 $1,650 $7,355 1.33 $31,994 $601 $1,095
South Central Minnesota Region 3.14 $64,396 $1,601 $7,336 1.57 $37,304 $404 $902
Greater Sioux Falls Area (SD) 4.07 $74,096 $2,927 $4,597 1.73 $43,191 $1,442 $1,723
Southwest Tennessee Development District 4.95 $73,788 $2,397 $4,346 2.52 $47,935 $735 $1,150
Northwest Tennessee Development District 3.99 $63,811 $2,540 $5,256 2.45 $47,563 $1,226 $2,453
Southwest Minnesota Region 3.20 $68,197 $1,664 $7,723 1.23 $30,894 $596 $904
Arrowhead Region (MN) 3.26 $72,233 $1,660 $7,394 1.57 $41,298 $601 $3,402
TOTAL Impacts per $100,000 of Spending DIRECT Impacts per $100,000 of Spending
SOURCE: Arts and Economic Prosperity 5, Americans for the Arts, 2017. For more information, visit www.AmericansForTheArts.org/EconomicImpact. B–130

Table 8:Economic Impact Per $100,000 of Direct Spending by Nonprofit Arts andCultural Organizations Per Study Region During Fiscal Year 2015
Regional Study RegionsAll Populations Full-Time Household Local State Full-Time Household Local State
Sample Size = 81 Equivalent Jobs Income Govt. Revenue Govt. Revenue Equivalent Jobs Income Govt. Revenue Govt. Revenue
Maple Grove and the Northwest Suburbs (MN) 3.43 $81,899 $1,681 $8,405 2.15 $40,882 $471 $1,210
Greater Augusta Area (GA) 4.83 $74,831 $3,899 $3,162 2.07 $42,185 $1,366 $1,046
Upper Cumberland Development District (TN) 3.38 $65,354 $2,889 $5,399 1.70 $42,449 $1,468 $2,273
City of Huntsville/Madison County (AL) 4.21 $66,697 $2,379 $3,729 2.20 $44,191 $648 $1,393
Northeast Commission (NC) 2.92 $52,940 $1,515 $2,199 1.51 $34,863 $685 $689
Greater Ann Arbor Area (MI) 3.39 $86,725 $2,514 $9,846 1.66 $50,500 $899 $4,800
Greater Fox Cities Region (WI) 3.36 $66,888 $5,831 $4,893 0.66 $16,011 $2,742 $2,073
Central Minnesota Region 3.42 $71,767 $1,693 $8,431 1.80 $43,804 $602 $2,398
South Central Tennessee Development District 3.54 $64,486 $2,706 $5,118 2.12 $49,601 $1,206 $2,141
Northwest Arkansas Region 4.13 $82,978 $1,921 $6,333 1.80 $43,073 $548 $1,858
Southeast Minnesota Region 3.25 $70,185 $1,546 $8,538 1.72 $40,503 $599 $1,198
First Tennessee Development District 3.61 $68,093 $2,665 $4,933 1.73 $42,646 $1,027 $1,657
Greater Harrisburg Area (PA) 4.38 $89,525 $2,988 $5,235 1.92 $48,066 $930 $1,238
Greater New Haven Area (CT) 4.62 $73,922 $5,073 $5,485 1.58 $33,064 $1,822 $2,007
Treasure Coast Region (FL) 3.23 $64,695 $4,826 $8,283 1.66 $42,738 $3,080 $5,083
Greater Des Moines Region (IA) 3.77 $81,565 $3,285 $4,729 1.17 $36,919 $1,529 $1,132
Southeast Tennessee Development District 4.72 $98,019 $3,139 $5,896 2.21 $55,603 $713 $1,520
Greater Knoxville Region (TN) 4.98 $80,314 $3,085 $6,082 2.10 $44,966 $1,030 $1,956
Greater Columbia Area (SC) 4.88 $88,436 $3,955 $4,688 2.13 $46,649 $885 $801
Pikes Peak Region (CO) 3.42 $70,439 $4,555 $2,526 1.64 $40,287 $1,315 $734
Lehigh Valley Region (PA) 4.01 $83,373 $3,197 $4,615 1.78 $44,468 $974 $1,071
Greater Sarasota/Bradenton Area (FL) 2.82 $82,254 $3,519 $6,042 1.40 $47,942 $1,236 $2,684
Dayton Region (OH) 5.33 $80,830 $5,172 $6,034 2.19 $43,823 $2,372 $2,311
Richmond & Tri-Cities Region (VA) 3.17 $54,223 $4,028 $4,089 2.12 $41,360 $3,002 $3,277
Memphis Area Association of Governments (TN) 3.18 $86,674 $3,081 $6,116 1.12 $39,859 $706 $1,667
Eastern Region (NC) 4.79 $87,785 $3,462 $4,270 2.48 $55,672 $1,150 $1,388
Advantage West Region (NC) 3.64 $76,355 $3,291 $4,643 1.54 $41,358 $1,295 $1,719
Southeast Commission (NC) 3.75 $75,048 $3,779 $4,222 2.12 $49,655 $866 $1,051
Greater Fairfax Area (VA) 2.89 $70,718 $3,386 $4,020 1.79 $48,071 $1,224 $1,792
Greater Tulsa Region (OK) 4.93 $87,878 $4,245 $6,031 2.08 $49,540 $2,257 $2,458
TOTAL Impacts per $100,000 of Spending DIRECT Impacts per $100,000 of Spending
SOURCE: Arts and Economic Prosperity 5, Americans for the Arts, 2017. For more information, visit www.AmericansForTheArts.org/EconomicImpact. B–131

Table 8:Economic Impact Per $100,000 of Direct Spending by Nonprofit Arts andCultural Organizations Per Study Region During Fiscal Year 2015
Regional Study RegionsAll Populations Full-Time Household Local State Full-Time Household Local State
Sample Size = 81 Equivalent Jobs Income Govt. Revenue Govt. Revenue Equivalent Jobs Income Govt. Revenue Govt. Revenue
East Tennessee Development District 4.76 $77,536 $2,894 $5,731 2.05 $44,259 $975 $1,841
West Valley Region (AZ) 3.53 $80,375 $5,057 $6,338 1.34 $37,773 $1,721 $2,214
Greater St. Louis Area (MO) 3.23 $91,297 $3,402 $4,498 1.39 $48,030 $800 $1,233
Western New York 3.02 $64,544 $5,727 $2,696 1.68 $42,253 $1,695 $790
Greater Oklahoma City Region (OK) 4.48 $80,147 $4,046 $5,925 1.60 $39,551 $2,035 $2,067
Piedmont Triad Partnership (NC) 3.78 $84,076 $3,201 $5,010 1.50 $41,990 $929 $1,389
Greater Portland Area (OR) 3.73 $88,842 $3,873 $4,643 1.69 $48,950 $1,161 $1,609
Greater Kansas City Metropolitan Area (MO/KS) 3.26 $98,675 $2,753 $4,171 1.37 $50,799 $825 $975
Greater Nashville Regional Council (TN) 4.19 $84,754 $3,299 $7,234 1.49 $42,625 $1,157 $2,511
Research Triangle Regional Partnership (NC) 4.41 $91,904 $3,227 $4,944 2.04 $50,681 $745 $1,273
Greater Tampa/St. Petersburg Area (FL) 4.23 $86,518 $4,891 $8,087 1.57 $45,238 $2,270 $3,191
Charlotte Regional Partnership (NC) 3.39 $90,239 $3,002 $4,772 1.37 $45,780 $869 $1,291
Charlotte Regional Partnership (NC/SC) 3.45 $89,320 $2,990 $4,716 1.46 $46,748 $867 $1,273
Seven-County Metro Area (MN) 3.45 $81,872 $1,685 $8,432 1.43 $40,900 $500 $1,200
Central Florida Region 3.65 $91,730 $3,381 $4,599 1.47 $46,015 $1,064 $1,290
Greater Philadelphia Region (PA) 3.23 $81,886 $4,513 $6,369 1.41 $44,977 $1,231 $2,062
Greater Washington Region (DC/MD/VA) 2.17 $66,553 $7,741 $958 1.66 $54,801 $4,813 $404
Metro Atlanta Area (GA) 3.41 $90,050 $3,220 $3,851 1.35 $44,898 $810 $966
Greater Atlanta Region (GA) 3.43 $89,961 $3,249 $3,857 1.36 $44,864 $830 $975
Greater Houston Region (TX) 2.48 $80,547 $3,988 $3,395 1.08 $41,403 $1,277 $1,098
Dallas-Fort Worth-Arlington MSA (TX) 4.04 $98,372 $4,947 $5,751 1.80 $53,655 $1,555 $1,796
Regional Average 3.65 $75,076 $3,328 $5,294 1.70 $43,116 $1,350 $1,757
Regional Standard Deviation 0.75 $12,088 $1,285 $1,837 0.39 $6,968 $830 $898
Regional Confidence Interval (95 percent) 0.16 $2,632 $280 $400 0.08 $1,517 $181 $196
Regional Median 3.52 $74,883 $3,220 $5,075 1.66 $43,240 $1,157 $1,615
TOTAL Impacts per $100,000 of Spending DIRECT Impacts per $100,000 of Spending
SOURCE: Arts and Economic Prosperity 5, Americans for the Arts, 2017. For more information, visit www.AmericansForTheArts.org/EconomicImpact. B–132

Table 8:Economic Impact Per $100,000 of Direct Spending by Nonprofit Arts andCultural Organizations Per Study Region During Fiscal Year 2015
Statewide Study RegionsAll Populations Full-Time Household Local State Full-Time Household Local State
Sample Size = 20 Equivalent Jobs Income Govt. Revenue Govt. Revenue Equivalent Jobs Income Govt. Revenue Govt. Revenue
State of Vermont 4.26 $66,917 $1,993 $5,950 2.18 $43,322 $950 $2,414
State of North Dakota 4.30 $72,388 $2,956 $5,175 1.86 $41,664 $1,162 $1,516
State of Delaware 2.71 $76,596 $1,140 $5,747 2.00 $58,686 $834 $4,631
State of Maine 3.12 $74,741 $3,472 $4,330 1.60 $45,242 $1,338 $1,723
State of Hawai'i 3.50 $85,463 $1,894 $9,773 2.66 $68,282 $1,090 $6,855
State of Nevada 2.79 $56,494 $1,653 $4,666 1.66 $40,117 $1,513 $4,388
State of Connecticut 3.43 $77,465 $3,942 $4,897 1.77 $50,131 $1,687 $2,532
State of Oklahoma 4.51 $80,683 $3,933 $5,705 1.75 $42,308 $2,041 $2,145
State of Oregon 3.83 $80,763 $3,816 $3,508 1.85 $47,075 $1,457 $1,385
State of Minnesota 3.42 $80,536 $1,680 $8,375 1.44 $40,689 $511 $1,277
State of Wisconsin 4.64 $91,460 $5,168 $5,188 2.74 $59,076 $2,538 $2,436
State of Maryland 2.55 $73,399 $3,723 $4,279 1.40 $45,327 $1,267 $1,391
State of Missouri 3.31 $91,384 $3,115 $4,195 1.45 $48,620 $842 $1,148
State of Tennessee 4.04 $85,158 $3,134 $6,444 1.59 $44,090 $957 $2,037
State of Massachusetts 3.69 $68,147 $2,242 $2,929 1.68 $40,037 $1,423 $1,487
State of New Jersey 3.34 $74,156 $3,324 $3,494 2.07 $53,683 $1,639 $1,904
State of North Carolina 3.97 $86,659 $3,182 $4,779 1.77 $46,850 $869 $1,315
State of Pennsylvania 3.16 $77,242 $4,151 $5,646 1.38 $41,742 $1,201 $1,796
State of Illinois 3.22 $88,196 $4,757 $5,394 1.64 $53,335 $1,608 $2,766
State of Florida 3.15 $86,066 $3,819 $5,724 1.18 $40,142 $1,451 $2,139
Statewide Average 3.55 $78,696 $3,155 $5,310 1.78 $47,521 $1,319 $2,364
Statewide Standard Deviation 0.59 $8,844 $1,088 $1,590 0.40 $7,664 $464 $1,412
Statewide Confidence Interval (95 percent) 0.26 $3,876 $477 $697 0.17 $3,359 $203 $619
Statewide Median 3.43 $79,001 $3,253 $5,182 1.72 $45,285 $1,303 $1,971
DIRECT Impacts per $100,000 of SpendingTOTAL Impacts per $100,000 of Spending
SOURCE: Arts and Economic Prosperity 5, Americans for the Arts, 2017. For more information, visit www.AmericansForTheArts.org/EconomicImpact. B–133

Table 8:Economic Impact Per $100,000 of Direct Spending by Nonprofit Arts andCultural Organizations Per Study Region During Fiscal Year 2015
Individual Arts DistrictsAll Populations Full-Time Household Local State Full-Time Household Local State
Sample Size = 12 Equivalent Jobs Income Govt. Revenue Govt. Revenue Equivalent Jobs Income Govt. Revenue Govt. Revenue
James River Arts & Cultural District 2.11 $44,086 $3,957 $4,551 1.56 $41,084 $2,252 $3,190
Center City Charlotte 3.33 $93,474 $2,928 $4,918 1.35 $46,640 $724 $1,265
Loch Haven Cultural Park 3.65 $95,914 $2,844 $3,709 1.37 $45,759 $834 $844
Downtown Colorado Springs Creative District 3.42 $70,441 $4,554 $2,527 1.64 $40,287 $1,314 $737
Fort Worth Cultural District 3.60 $81,710 $6,004 $6,026 1.74 $47,279 $1,875 $1,971
Dallas Arts District 4.25 $107,508 $4,496 $5,653 1.85 $57,524 $1,370 $1,690
Grand Center Arts & Entertainment District 3.23 $91,297 $3,403 $4,498 1.39 $48,030 $799 $1,232
Balboa Park Cultural District 4.07 $93,256 $3,898 $5,297 1.98 $53,525 $1,313 $1,419
East End Cultural District 2.45 $80,600 $3,966 $3,336 1.07 $41,417 $1,259 $1,070
Houston Museum District Association 2.46 $80,592 $3,951 $3,333 1.06 $41,403 $1,260 $1,071
Midtown Cultural District 2.46 $80,597 $3,940 $3,332 1.07 $41,393 $1,265 $1,070
Washington Avenue Cultural District 2.46 $80,576 $3,967 $3,333 1.07 $41,419 $1,270 $1,071
Arts District Average 3.12 $83,338 $3,992 $4,209 1.43 $45,480 $1,295 $1,386
Arts District Standard Deviation 0.71 $15,802 $822 $1,104 0.33 $5,507 $431 $663
Arts District Confidence Interval (95 percent) 0.40 $8,940 $465 $625 0.19 $3,116 $244 $375
Arts District Median 3.28 $81,155 $3,954 $4,103 1.38 $43,589 $1,267 $1,152
Explanation of the Outliers and Exclusions:1 The economic impact findings for the District of Columbia exclude state government revenues due to Washington, DC's unique status as a study region with no state government.
DIRECT Impacts per $100,000 of SpendingTOTAL Impacts per $100,000 of Spending
SOURCE: Arts and Economic Prosperity 5, Americans for the Arts, 2017. For more information, visit www.AmericansForTheArts.org/EconomicImpact. B–134

Explanation of Table 9:Total Categorized Nonprofit Arts and Cultural Organization ExpendituresPer Study Region During Fiscal Year 2015
Column Two:
Column Three:
Column Four:
Column Five:
Column Six:
Column Seven:
Column Eight:The number of eligible nonprofit arts and cultural organizations from which detailed expenditure and event attendance data were collected in each participating study region.
This table presents the total categorized expenditures made by participating nonprofit arts and cultural organizations in each participating study region during fiscal year 2015. Summary statistics are calculated for each population group.
The total organizational expenditures of nonprofit arts and cultural organizations in each study region during year fiscal 2015. This figure is the sum of total operating expenditures (Column Five) and total capital expenditures (Column Six).
The total operating expenditures made by participating nonprofit arts and cultural organizations in each participating study region during fiscal year 2015. This figure is the sum of Columns Two through Four. (See the survey instruments in Appendix C for a detailed breakdown of organizational expenditure categories.) These data are based on the real dollars reported by the organizations that responded to the survey in each study region only; no multiplier was used to calculate these figures and no extrapolations were made for non-responding organizations.
The total capital expenditures reported by participating nonprofit arts and cultural organizations in each study region during fiscal year 2015. According to generally-accepted accounting principles (GAAP), a capital expenditure is a cost which cannot be deducted in the year in which it is paid or incurred and must be capitalized. The general rule is that if the acquired asset's useful life is longer than the taxable year, then the cost must be capitalized. The capital expenditure costs are then amortized or depreciated over the life of the asset in question. For nonprofit arts and cultural organizations, capital expenditures typically include purchases of art, equipment, and real estate. Capital expenditures also include construction and renovation costs. These data are real dollars reported by the organizations that responded to the survey in each study region only; no multiplier was used to calculate these figures and no extrapolations were made for non-responding organizations.
The total personnel-related expenses paid by participating nonprofit arts and cultural organizations in each participating study region during fiscal year 2015. Payroll-related expenses include salaries and wages paid to staff and employees, the costs for contracted staff (i.e., "contractors"), the fees paid to artists and performers, and any applicable payroll taxes and fringe benefits.
The total programmatic, production, and overhead expenses paid by participating nonprofit arts and cultural organizations in each participating study region during fiscal year 2015. Programmatic, production, and overhead expenses include marketing and advertising costs, supplies and office machinery, travel, insurance, communication costs, and the costs associated with programming and producing performances, events, and activities.
The total facility expenses paid by participating nonprofit arts and cultural organizations in each participating study region during fiscal year 2015. Facility expenses include rental and/or lease costs, mortgage costs, property taxes, and utilities.
SOURCE: Arts and Economic Prosperity 5, Americans for the Arts, 2017. For more information, visit www.AmericansForTheArts.org/EconomicImpact. B–135

Table 9:Total Categorized Nonprofit Arts and Cultural Organization ExpendituresPer Study Region During Fiscal Year 2015
Population Cohort Group A Personnel Expenses Programmatic, TOTAL
Population Fewer than 50,000 (staff, employees, Production and Facility OPERATING CAPITAL Organizational Sample
Sample Size = 52 contractors and artists) Overhead Expenses Expenses Expenditures Expenditures Expenditures Size
Town of Crested Butte (CO) $2,527,827 $1,525,412 $406,807 $4,460,046 $94,376 $4,554,422 12
City of Pine City (MN) $236,502 $158,427 $30,288 $425,217 $0 $425,217 5
City of Alva (OK) $756,818 $291,143 $107,755 $1,155,716 $33,000 $1,188,716 13
Cook County (MN) $1,367,589 $916,110 $175,150 $2,458,849 $116,965 $2,575,814 17
Town of Hillsborough (NC) $866,174 $637,665 $71,754 $1,575,593 $18,707 $1,594,300 16
City of Virginia (MN) $64,278 $43,058 $8,232 $115,568 $0 $115,568 4
Town of Jackson (WY) $10,782,174 $6,197,863 $1,699,424 $18,679,461 $46,519 $18,725,980 18
City of Guthrie (OK) $779,047 $516,244 $99,002 $1,394,293 $217,389 $1,611,682 12
City of Grand Rapids (MN) $1,553,953 $1,040,948 $199,019 $2,793,920 $40,000 $2,833,920 12
Town of Medfield (MA) $2,018,668 $535,518 $177,315 $2,731,501 $17,226 $2,748,727 17
City of Fergus Falls (MN) $799,765 $535,738 $102,428 $1,437,931 $835,023 $2,272,954 9
Grundy County (TN) $59,089 $43,352 $7,842 $110,283 $0 $110,283 10
City of Falls Church (VA) $3,868,210 $1,921,768 $263,050 $6,053,028 $696,122 $6,749,150 11
City of Jamestown (ND) $374,099 $377,160 $23,018 $774,277 $281,103 $1,055,380 3
City of Waterville (ME) $2,334,428 $1,755,824 $359,158 $4,449,410 $0 $4,449,410 4
City of Red Wing (MN) $959,094 $642,471 $122,833 $1,724,398 $0 $1,724,398 9
City of Durango (CO) $5,429,057 $2,671,726 $425,783 $8,526,566 $93,146 $8,619,712 26
City of Hannibal (MO) $741,336 $480,257 $108,932 $1,330,525 $69,422 $1,399,947 6
City of Tullahoma (TN) $281,432 $208,770 $52,806 $543,008 $67,707 $610,715 11
City of Northfield (MN) $721,625 $483,395 $92,421 $1,297,441 $0 $1,297,441 14
Town of Carrboro (NC) $2,024,351 $1,205,340 $182,182 $3,411,873 $228,884 $3,640,757 10
Macon County (TN) $31,554 $28,215 $4,100 $63,869 $40,229 $104,098 7
City of Laguna Beach (CA) $17,942,036 $11,546,582 $2,262,038 $31,750,656 $8,368,035 $40,118,691 16
Hickman County (TN) $894,281 $214,554 $39,620 $1,148,455 $4,000 $1,152,455 21
City of Fairfax (VA) $1,460,237 $993,166 $186,137 $2,639,540 $0 $2,639,540 7
City of Ponca City (OK) $1,506,466 $808,837 $297,154 $2,612,457 $186,760 $2,799,217 16
City of Paducah (KY) $6,414,150 $3,497,867 $638,878 $10,550,895 $7,504,956 $18,055,851 19
Mille Lacs County (MN) $314,696 $210,806 $40,303 $565,805 $9,750 $575,555 10
McNairy County (TN) $12,576 $8,363 $1,605 $22,544 $0 $22,544 5
City of Winona (MN) $1,818,274 $1,218,013 $232,870 $3,269,157 $700 $3,269,857 17
SOURCE: Arts and Economic Prosperity 5, Americans for the Arts, 2017. For more information, visit www.AmericansForTheArts.org/EconomicImpact. B–136

Table 9:Total Categorized Nonprofit Arts and Cultural Organization ExpendituresPer Study Region During Fiscal Year 2015
Population Cohort Group A Personnel Expenses Programmatic, TOTAL
Population Fewer than 50,000 (staff, employees, Production and Facility OPERATING CAPITAL Organizational Sample
Sample Size = 52 contractors and artists) Overhead Expenses Expenses Expenses Expenditures Expenditures Size
Door County (WI) $5,263,891 $3,004,539 $756,097 $9,024,527 $706,233 $9,730,760 16
City of Benicia (CA) $2,265,379 $568,657 $67,598 $2,901,634 $500 $2,902,134 12
City of Winter Park (FL) $7,392,113 $8,415,064 $765,219 $16,572,396 $3,669 $16,576,065 20
City of Rochester (NH) $2,425,110 $1,612,779 $304,501 $4,342,390 $11,553 $4,353,943 12
City of Morgantown (WV) $16,238,208 $10,538,939 $677,067 $27,454,214 $0 $27,454,214 34
Henry County (TN) $102,293 $68,024 $13,058 $183,375 $599 $183,974 3
City of Fairbanks (AK) $5,003,798 $3,156,849 $597,268 $8,757,915 $21,850 $8,779,765 23
City of Bangor (ME) $1,921,904 $1,268,472 $247,280 $3,437,656 $0 $3,437,656 13
Weakley County (TN) $118,016 $78,482 $15,065 $211,563 $0 $211,563 8
Dare County (NC) $6,101,877 $7,066,776 $482,178 $13,650,831 $139,363 $13,790,194 20
City of Columbia (TN) $705,501 $473,192 $90,031 $1,268,724 $29,000 $1,297,724 7
City of Lake Worth (FL) $4,776,671 $8,819,802 $463,754 $14,060,227 $595,832 $14,656,059 12
Clatsop County (OR) $1,583,614 $1,022,380 $223,087 $2,829,081 $44,964 $2,874,045 22
Yadkin County (NC)1 not reported not reported not reported not reported not reported not reported 1
Greater Belfast Area (ME) $1,497,087 $995,545 $191,105 $2,683,737 $0 $2,683,737 20
Campbell County (TN) $49,167 $50,728 $6,276 $106,171 $2,500 $108,671 7
Monroe County (TN) $361,710 $123,037 $68,599 $553,346 $113,534 $666,880 8
Lincoln County (OR) $775,029 $775,025 $43,476 $1,593,530 $2,000 $1,595,530 10
Iron County (UT) $7,442,673 $4,941,158 $946,614 $13,330,445 $0 $13,330,445 19
City of St. Louis Park (MN) $421,631 $282,439 $53,999 $758,069 $0 $758,069 15
City of Logan (UT) $8,673,297 $5,433,412 $1,238,323 $15,345,032 $2,227,754 $17,572,786 24
Gibson County (TN) $577,711 $369,991 $50,600 $998,302 $5,351 $1,003,653 11
Group A Average $2,751,695 $1,924,620 $303,399 $4,979,715 $439,898 $5,419,614 13.0
Percent of Group A Total 50.8% 35.5% 5.6% 91.9% 8.1% 100.0%
Group A Median $1,413,913 $708,748 $148,992 $2,535,653 $17,967 $2,607,677
SOURCE: Arts and Economic Prosperity 5, Americans for the Arts, 2017. For more information, visit www.AmericansForTheArts.org/EconomicImpact. B–137

Table 9:Total Categorized Nonprofit Arts and Cultural Organization ExpendituresPer Study Region During Fiscal Year 2015
Population Cohort Group B Personnel Expenses Programmatic, TOTAL
Population 50,000 to 99,999 (staff, employees, Production and Facility OPERATING CAPITAL Organizational Sample
Sample Size = 38 contractors and artists) Overhead Expenses Expenses Expenses Expenditures Expenditures Size
City of Joplin (MO) $1,081,716 $571,612 $112,008 $1,765,336 $27,300 $1,792,636 20
City of La Crosse (WI) $6,623,164 $4,354,493 $904,933 $11,882,590 $945,262 $12,827,852 33
McMinn County (TN) $1,007,584 $675,293 $158,089 $1,840,966 $180,554 $2,021,520 20
Lafayette County (MS) $789,136 $599,190 $126,457 $1,514,783 $1,140,674 $2,655,457 19
Chisago County (MN) $364,545 $244,198 $46,687 $655,430 $0 $655,430 6
City of Grand Forks (ND) $1,747,210 $870,075 $164,296 $2,781,581 $0 $2,781,581 13
City of Corvallis (OR) $15,476,971 $10,138,122 $1,927,354 $27,542,447 $3,000 $27,545,447 22
City of Noblesville (IN) $288,909 $186,230 $0 $475,139 $0 $475,139 2
City of Ocala (FL) $7,788,173 $4,500,439 $906,929 $13,195,541 $1,100,213 $14,295,754 29
Lenoir County (NC) $520,394 $346,058 $66,428 $932,880 $0 $932,880 11
Town of Chapel Hill (NC) $54,794,240 $23,758,368 $4,370,847 $82,923,455 $5,484,442 $88,407,897 55
City of Grand Junction (CO) $7,537,746 $2,097,257 $545,852 $10,180,855 $1,094,245 $11,275,100 32
Town of Jupiter (FL) $4,362,480 $2,925,624 $556,429 $7,844,533 $174,571 $8,019,104 3
Hamblen County (TN) $382,405 $247,425 $62,088 $691,918 $68,400 $760,318 6
City of Delray Beach (FL) $6,737,187 $3,820,714 $723,596 $11,281,497 $38,195 $11,319,692 12
City of St. Cloud (MN) $2,960,727 $1,983,309 $379,187 $5,323,223 $22,132 $5,345,355 25
City of Portland (ME) $24,511,129 $16,483,559 $3,239,779 $44,234,467 $2,337,935 $46,572,402 46
City of Jackson (TN) $1,498,012 $1,030,830 $125,654 $2,654,496 $12,000 $2,666,496 13
City of Walnut Creek (CA) $12,073,299 $7,357,669 $1,568,858 $20,999,826 $97,995 $21,097,821 29
Greene County (TN) $1,331,196 $885,236 $169,928 $2,386,360 $119,261 $2,505,621 9
City of Flagstaff (AZ) $32,682,013 $21,481,559 $3,823,080 $57,986,652 $24,774 $58,011,426 55
City of Missoula (MT) $11,809,618 $7,103,463 $1,027,725 $19,940,806 $451,507 $20,392,313 34
City of Fort Myers (FL) $7,383,059 $4,529,801 $1,134,783 $13,047,643 $634,419 $13,682,062 14
Putnam County (TN) $1,130,095 $755,785 $146,866 $2,032,746 $5,456 $2,038,202 9
Monroe County (FL) $14,816,391 $10,204,466 $2,141,265 $27,162,122 $26,631 $27,188,753 53
City of Lynchburg (VA) $3,524,268 $2,276,860 $527,720 $6,328,848 $319,770 $6,648,618 20
City of Duluth (MN) $7,928,715 $5,311,228 $1,015,448 $14,255,391 $36,000 $14,291,391 37
City of Fishers (IN) $10,001,116 $12,198,612 $646,841 $22,846,569 $247,976 $23,094,545 6
City of Carmel (IN) $6,323,335 $4,951,845 $1,225,371 $12,500,551 $58,874 $12,559,425 12
City of Sugar Land (TX) $338,569 $222,820 $64,351 $625,740 $21,000 $646,740 5
SOURCE: Arts and Economic Prosperity 5, Americans for the Arts, 2017. For more information, visit www.AmericansForTheArts.org/EconomicImpact. B–138

Table 9:Total Categorized Nonprofit Arts and Cultural Organization ExpendituresPer Study Region During Fiscal Year 2015
Population Cohort Group B Personnel Expenses Programmatic, TOTAL
Population 50,000 to 99,999 (staff, employees, Production and Facility OPERATING CAPITAL Organizational Sample
Sample Size = 38 contractors and artists) Overhead Expenses Expenses Expenses Expenditures Expenditures Size
City of Asheville (NC) $9,876,443 $6,884,962 $1,459,065 $18,220,470 $1,320,996 $19,541,466 43
Buchanan County (MO) $5,224,594 $4,195,248 $659,887 $10,079,729 $0 $10,079,729 27
City of Boca Raton (FL) $6,048,418 $3,758,170 $746,471 $10,553,059 $204,714 $10,757,773 10
City of Miami Beach (FL) $45,303,357 $28,115,622 $6,025,935 $79,444,914 $5,325,477 $84,770,391 75
Moore County (NC) $3,795,611 $2,360,964 $429,463 $6,586,038 $290,941 $6,876,979 34
Sevier County (TN) $1,720,657 $1,262,528 $660,231 $3,643,416 $2,000 $3,645,416 10
Cape May County (NJ) $2,466,152 $1,709,865 $251,571 $4,427,588 $117,396 $4,544,984 7
Cleveland County (NC) $1,207,192 $896,510 $140,717 $2,244,419 $43,320 $2,287,739 15
Group B Average $8,511,995 $5,297,263 $1,007,426 $14,816,685 $578,353 $15,395,038 22.9
Percent of Group B Total 55.3% 34.4% 6.5% 96.2% 3.8% 100.0%
Group B Median $4,793,537 $2,643,294 $601,635 $8,962,131 $83,198 $9,049,417
SOURCE: Arts and Economic Prosperity 5, Americans for the Arts, 2017. For more information, visit www.AmericansForTheArts.org/EconomicImpact. B–139

Table 9:Total Categorized Nonprofit Arts and Cultural Organization ExpendituresPer Study Region During Fiscal Year 2015
Population Cohort Group C Personnel Expenses Programmatic, TOTAL
Population 100,000 to 249,999 (staff, employees, Production and Facility OPERATING CAPITAL Organizational Sample
Sample Size = 50 contractors and artists) Overhead Expenses Expenses Expenses Expenditures Expenditures Size
City of Las Cruces (NM) $4,756,672 $3,096,992 $623,915 $8,477,579 $30,853 $8,508,432 22
Eau Claire County (WI) $1,996,144 $1,235,640 $162,319 $3,394,103 $1,115,240 $4,509,343 15
Yamhill County (OR) $9,696,359 $6,492,316 $1,231,778 $17,420,453 $3,244,187 $20,664,640 53
City of Lewisville (TX) $714,769 $642,508 $149,625 $1,506,902 $6,382 $1,513,284 8
City of West Palm Beach (FL) $49,495,377 $39,815,192 $6,101,511 $95,412,080 $21,598,162 $117,010,242 29
City of Boulder (CO) $19,569,046 $13,012,877 $2,482,101 $35,064,024 $450,357 $35,514,381 65
City of Richardson (TX) $7,836,332 $4,029,254 $278,049 $12,143,635 $0 $12,143,635 24
City of High Point (NC) $1,501,614 $822,175 $137,532 $2,461,321 $98,968 $2,560,289 10
City of Cambridge (MA) $60,017,916 $48,732,096 $11,052,617 $119,802,629 $0 $119,802,629 35
City of Lowell (MA) $5,442,378 $2,632,969 $613,314 $8,688,661 $0 $8,688,661 15
Douglas County (KS) $9,938,563 $4,750,376 $378,259 $15,067,198 $603,693 $15,670,891 23
City of Columbia (MO) $5,064,557 $3,403,105 $546,288 $9,013,950 $138,394 $9,152,344 29
City of Norman (OK) $6,831,096 $3,966,050 $540,552 $11,337,698 $215,179 $11,552,877 24
Wayne County (NC) $799,777 $571,247 $155,241 $1,526,265 $43,774 $1,570,039 15
City of Lafayette (LA) $3,540,500 $2,365,047 $450,821 $6,356,368 $0 $6,356,368 10
Washington County (TN) $1,893,600 $1,083,520 $224,417 $3,201,537 $56,366 $3,257,903 20
City of Thousand Oaks (CA) $5,491,476 $2,495,087 $551,919 $8,538,482 $71,190 $8,609,672 12
City of Charleston (SC) $41,350,256 $19,614,400 $5,024,159 $65,988,815 $103,175 $66,091,990 38
City of Waco (TX) $16,618,441 $11,595,017 $2,142,021 $30,355,479 $1,036,431 $31,391,910 30
Robeson County (NC) $1,598,657 $1,091,814 $216,949 $2,907,420 $7,000 $2,914,420 9
Columbia County (GA) $6,837 $11,317 $7,057 $25,211 $18,000 $43,211 5
Orange County (NC) $57,684,765 $25,601,373 $4,624,783 $87,910,921 $5,732,554 $93,643,475 82
City of Savannah (GA) $21,494,282 $11,165,160 $1,802,913 $34,462,355 $336,830 $34,799,185 45
Indian River County (FL) $7,649,010 $6,658,374 $1,239,815 $15,547,199 $471,824 $16,019,023 10
City of Alexandria (VA) $18,217,712 $12,788,992 $2,640,718 $33,647,422 $2,179,677 $35,827,099 50
Martin County (FL) $7,482,346 $5,357,398 $603,483 $13,443,227 $823,505 $14,266,732 20
Macon-Bibb County (GA) $25,188,640 $17,960,274 $3,282,690 $46,431,604 $2,708,130 $49,139,734 48
City of Springfield (MA) $20,437,966 $10,626,012 $2,732,213 $33,796,191 $2,313,053 $36,109,244 15
Catawba County (NC) $6,210,382 $4,049,937 $1,413,341 $11,673,660 $895,564 $12,569,224 25
Town of Cary (NC) $4,031,562 $1,184,736 $731,906 $5,948,204 $205,439 $6,153,643 37
SOURCE: Arts and Economic Prosperity 5, Americans for the Arts, 2017. For more information, visit www.AmericansForTheArts.org/EconomicImpact. B–140

Table 9:Total Categorized Nonprofit Arts and Cultural Organization ExpendituresPer Study Region During Fiscal Year 2015
Population Cohort Group C Personnel Expenses Programmatic, TOTAL
Population 100,000 to 249,999 (staff, employees, Production and Facility OPERATING CAPITAL Organizational Sample
Sample Size = 50 contractors and artists) Overhead Expenses Expenses Expenses Expenditures Expenditures Size
Alamance County (NC) $2,316,917 $1,096,560 $213,648 $3,627,125 $250,600 $3,877,725 34
Cumberland County (NJ) $5,255,232 $3,167,837 $830,297 $9,253,366 $293,358 $9,546,724 25
City of Eugene (OR) $23,139,973 $14,571,583 $2,390,292 $40,101,848 $678,667 $40,780,515 40
Middlesex County (CT) $11,692,001 $7,640,623 $1,465,687 $20,798,311 $85,372 $20,883,683 15
City of Springfield (MO) $4,966,490 $3,391,995 $812,091 $9,170,576 $607,928 $9,778,504 24
City of Sioux Falls (SD) $10,962,183 $7,516,203 $1,314,115 $19,792,501 $320,000 $20,112,501 26
Pitt County (NC) $7,151,755 $4,565,317 $902,935 $12,620,007 $69,840 $12,689,847 23
City of Providence (RI) $56,686,862 $31,026,137 $6,005,392 $93,718,391 $114,164 $93,832,555 56
City of Worcester (MA) $34,941,048 $21,649,633 $5,141,767 $61,732,448 $2,772,188 $64,504,636 57
Montgomery County (TN) $1,447,491 $1,394,715 $122,214 $2,964,420 $0 $2,964,420 20
Salt Lake City (UT) $64,442,469 $40,661,393 $6,368,546 $111,472,408 $970,356 $112,442,764 57
Cabarrus County (NC) $1,282,668 $695,618 $99,020 $2,077,306 $188,265 $2,265,571 18
Richmond County (GA) $19,905,529 $14,333,799 $2,648,822 $36,888,150 $923,288 $37,811,438 28
City of Tacoma (WA) $38,782,931 $22,560,251 $4,342,586 $65,685,768 $8,962,691 $74,648,459 66
Doña Ana County (NM) $7,233,336 $4,685,116 $925,905 $12,844,357 $75,853 $12,920,210 29
New Hanover County (NC) $7,632,840 $5,435,536 $985,276 $14,053,652 $788,085 $14,841,737 35
Arlington County (VA) $93,192,088 $65,740,630 $8,501,702 $167,434,420 $3,328,057 $170,762,477 72
City of Irving (TX) $13,131,074 $9,379,381 $1,682,464 $24,192,919 $0 $24,192,919 17
City of Reno (NV) $25,322,687 $16,315,001 $3,163,176 $44,800,864 $5,338,539 $50,139,403 47
York County (SC) $9,761,789 $3,273,573 $221,107 $13,256,469 $23,176 $13,279,645 13
Group C Average $17,236,088 $10,919,043 $2,005,587 $30,160,718 $1,405,887 $31,566,605 30.5
Percent of Group C Total 54.6% 34.6% 6.4% 95.5% 4.5% 100.0%
Group C Median $7,742,671 $5,053,887 $955,591 $13,748,440 $271,979 $14,554,235
SOURCE: Arts and Economic Prosperity 5, Americans for the Arts, 2017. For more information, visit www.AmericansForTheArts.org/EconomicImpact. B–141

Table 9:Total Categorized Nonprofit Arts and Cultural Organization ExpendituresPer Study Region During Fiscal Year 2015
Population Cohort Group D Personnel Expenses Programmatic, TOTAL
Population 250,000 to 499,999 (staff, employees, Production and Facility OPERATING CAPITAL Organizational Sample
Sample Size = 42 contractors and artists) Overhead Expenses Expenses Expenses Expenditures Expenditures Size
Buncombe County (NC) $12,867,828 $9,629,652 $1,909,218 $24,406,698 $1,957,184 $26,363,882 52
Alachua County (FL) $20,570,324 $13,091,216 $2,376,174 $36,037,714 $525,433 $36,563,147 44
Greater Green Bay Area (WI) $12,943,654 $7,684,505 $1,793,099 $22,421,258 $971,188 $23,392,446 41
City of Orlando (FL) $65,270,721 $49,109,092 $8,728,921 $123,108,734 $539,441 $123,648,175 55
City of Lincoln (NE) $27,620,731 $19,536,656 $3,322,747 $50,480,134 $185,428 $50,665,562 40
Southeastern Connecticut Region (CT) $48,291,212 $31,600,561 $6,438,557 $86,330,330 $829,436 $87,159,766 70
Erie County (PA) $10,388,542 $7,273,308 $1,298,906 $18,960,756 $130,394 $19,091,150 46
San Luis Obispo County (CA) $7,824,609 $4,222,669 $912,083 $12,959,361 $733,661 $13,693,022 28
City of Newark (NJ) $69,404,309 $30,737,994 $8,183,891 $108,326,194 $1,039,050 $109,365,244 31
Leon County (FL) $25,545,634 $69,886,387 $2,880,180 $98,312,201 $2,141,809 $100,454,010 69
Rutherford County (TN) $6,575,766 $2,531,063 $561,125 $9,667,954 $1,130,833 $10,798,787 36
St. Lucie County (FL) $2,194,334 $596,319 $329,325 $3,119,978 $0 $3,119,978 5
Greater Spartanburg Area (SC) $12,570,498 $5,979,086 $1,490,054 $20,039,638 $1,332,045 $21,371,683 29
Durham County (NC) $58,932,422 $33,329,409 $6,328,460 $98,590,291 $6,028,835 $104,619,126 69
City of St. Paul (MN) $153,467,494 $102,803,635 $19,654,909 $275,926,038 $5,683,920 $281,609,958 167
Hamilton County (IN) $16,640,711 $17,354,875 $1,875,703 $35,871,289 $333,450 $36,204,739 21
Osceola County (FL) $1,196,502 $558,760 $164,644 $1,919,906 $2,500 $1,922,406 7
Escambia County (FL) $15,490,872 $9,747,425 $1,946,122 $27,184,419 $265,556 $27,449,975 25
Lexington-Fayette Urban County (KY) $7,073,482 $5,235,298 $1,008,554 $13,317,334 $2,811,988 $16,129,322 34
Lake County (FL) $605,840 $404,060 $127,578 $1,137,478 $0 $1,137,478 11
City of Riverside (CA) $9,442,841 $6,875,095 $1,248,862 $17,566,798 $8,290 $17,575,088 45
Cumberland County (NC) $19,922,397 $7,775,831 $1,535,134 $29,233,362 $422,581 $29,655,943 48
Collier County (FL) $37,478,355 $20,529,719 $2,645,674 $60,653,748 $2,319,974 $62,973,722 45
Hamilton County (TN) $35,263,630 $24,070,695 $4,692,731 $64,027,056 $741,799 $64,768,855 53
Manatee County (FL) $7,784,441 $5,620,077 $1,018,090 $14,422,608 $19,094 $14,441,702 32
City of Tampa (FL) $72,183,748 $44,106,365 $5,166,199 $121,456,312 $9,245,676 $130,701,988 56
Forsyth County (NC) $56,423,338 $38,436,776 $7,959,054 $102,819,168 $1,887,629 $104,706,797 59
Mercer County (NJ) $13,496,927 $6,319,263 $1,909,997 $21,726,187 $368,960 $22,095,147 25
City of Wichita (KS) $25,194,595 $13,860,329 $4,060,134 $43,115,058 $821,598 $43,936,656 34
Clackamas County (OR) $3,662,883 $1,836,504 $321,722 $5,821,109 $0 $5,821,109 18
SOURCE: Arts and Economic Prosperity 5, Americans for the Arts, 2017. For more information, visit www.AmericansForTheArts.org/EconomicImpact. B–142
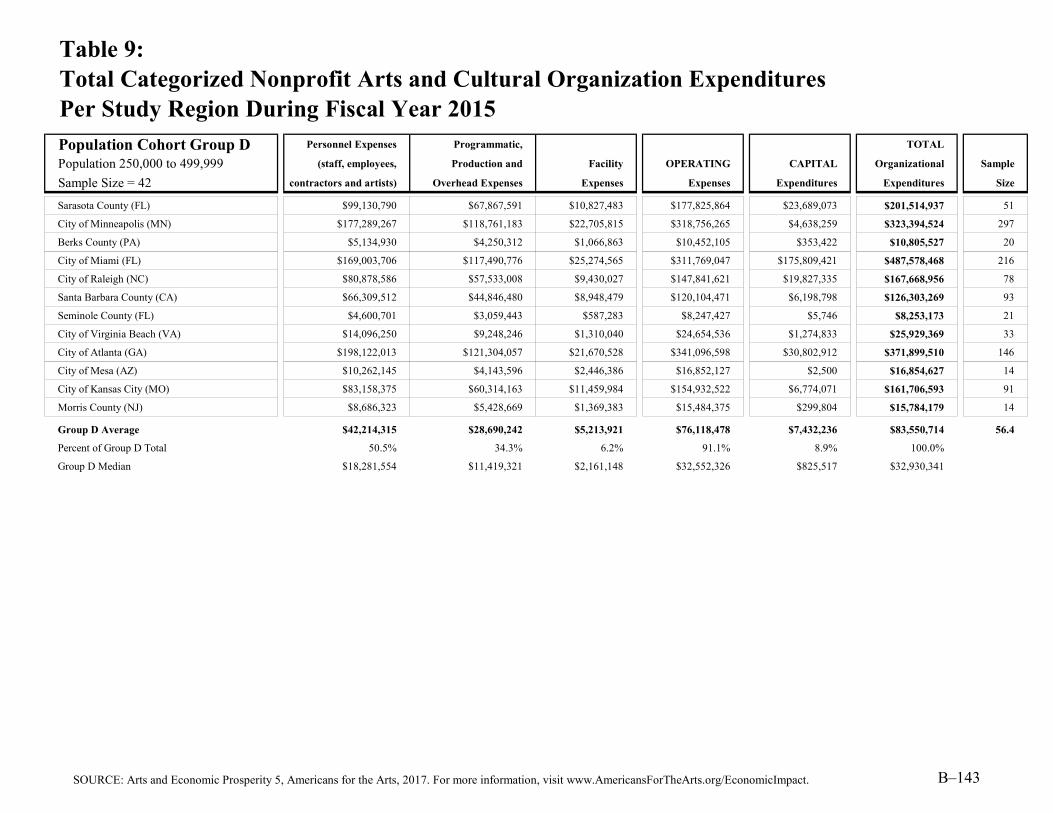
Table 9:Total Categorized Nonprofit Arts and Cultural Organization ExpendituresPer Study Region During Fiscal Year 2015
Population Cohort Group D Personnel Expenses Programmatic, TOTAL
Population 250,000 to 499,999 (staff, employees, Production and Facility OPERATING CAPITAL Organizational Sample
Sample Size = 42 contractors and artists) Overhead Expenses Expenses Expenses Expenditures Expenditures Size
Sarasota County (FL) $99,130,790 $67,867,591 $10,827,483 $177,825,864 $23,689,073 $201,514,937 51
City of Minneapolis (MN) $177,289,267 $118,761,183 $22,705,815 $318,756,265 $4,638,259 $323,394,524 297
Berks County (PA) $5,134,930 $4,250,312 $1,066,863 $10,452,105 $353,422 $10,805,527 20
City of Miami (FL) $169,003,706 $117,490,776 $25,274,565 $311,769,047 $175,809,421 $487,578,468 216
City of Raleigh (NC) $80,878,586 $57,533,008 $9,430,027 $147,841,621 $19,827,335 $167,668,956 78
Santa Barbara County (CA) $66,309,512 $44,846,480 $8,948,479 $120,104,471 $6,198,798 $126,303,269 93
Seminole County (FL) $4,600,701 $3,059,443 $587,283 $8,247,427 $5,746 $8,253,173 21
City of Virginia Beach (VA) $14,096,250 $9,248,246 $1,310,040 $24,654,536 $1,274,833 $25,929,369 33
City of Atlanta (GA) $198,122,013 $121,304,057 $21,670,528 $341,096,598 $30,802,912 $371,899,510 146
City of Mesa (AZ) $10,262,145 $4,143,596 $2,446,386 $16,852,127 $2,500 $16,854,627 14
City of Kansas City (MO) $83,158,375 $60,314,163 $11,459,984 $154,932,522 $6,774,071 $161,706,593 91
Morris County (NJ) $8,686,323 $5,428,669 $1,369,383 $15,484,375 $299,804 $15,784,179 14
Group D Average $42,214,315 $28,690,242 $5,213,921 $76,118,478 $7,432,236 $83,550,714 56.4
Percent of Group D Total 50.5% 34.3% 6.2% 91.1% 8.9% 100.0%
Group D Median $18,281,554 $11,419,321 $2,161,148 $32,552,326 $825,517 $32,930,341
SOURCE: Arts and Economic Prosperity 5, Americans for the Arts, 2017. For more information, visit www.AmericansForTheArts.org/EconomicImpact. B–143

Table 9:Total Categorized Nonprofit Arts and Cultural Organization ExpendituresPer Study Region During Fiscal Year 2015
Population Cohort Group E Personnel Expenses Programmatic, TOTAL
Population 500,000 to 999,999 (staff, employees, Production and Facility OPERATING CAPITAL Organizational Sample
Sample Size = 25 contractors and artists) Overhead Expenses Expenses Expenses Expenditures Expenditures Size
Sonoma County (CA) $28,114,308 $14,081,637 $2,742,469 $44,938,414 $179,799 $45,118,213 43
Volusia County (FL) $7,134,765 $5,128,456 $1,362,653 $13,625,874 $94,757 $13,720,631 44
Guilford County (NC) $30,404,857 $26,853,785 $4,913,390 $62,172,032 $4,890,694 $67,062,726 70
Dane County (WI) $86,427,358 $48,514,418 $10,389,261 $145,331,037 $408,575 $145,739,612 132
Brevard County (FL) $5,423,326 $1,576,386 $120,004 $7,119,716 $0 $7,119,716 11
Washington County (OR) $8,379,592 $4,560,205 $743,386 $13,683,183 $130,081 $13,813,264 31
Johnson County (KS) $6,705,072 $4,165,970 $933,668 $11,804,710 $531,129 $12,335,839 27
City of Louisville (KY) $110,415,639 $69,486,759 $14,042,898 $193,945,296 $30,615,264 $224,560,560 100
City of Baltimore (MD) $186,964,112 $107,953,816 $29,726,846 $324,644,774 $1,688,378 $326,333,152 146
Polk County (FL) $8,472,724 $6,296,406 $775,614 $15,544,744 $245,688 $15,790,432 34
City of Boston (MA) $387,229,005 $302,816,386 $63,590,086 $753,635,477 $10,252,535 $763,888,012 148
District of Columbia (DC) $913,695,086 $494,324,306 $111,367,151 $1,519,386,543 $134,847,625 $1,654,234,168 195
Nashville-Davidson County (TN) $92,137,739 $69,495,617 $11,169,779 $172,803,135 $5,977,149 $178,780,284 82
City of El Paso (TX) $31,943,714 $21,601,309 $4,340,839 $57,885,862 $2,092,824 $59,978,686 76
Lee County (FL) $16,200,296 $12,690,195 $3,518,433 $32,408,924 $1,569,760 $33,978,684 41
City of Fort Worth (TX) $144,160,884 $90,818,116 $18,161,680 $253,140,680 $2,835,573 $255,976,253 74
City of Indianapolis (IN) $124,773,748 $70,016,761 $16,596,832 $211,387,341 $15,906,150 $227,293,491 93
City and County of San Francisco (CA) $474,125,385 $258,436,835 $46,056,664 $778,618,884 $1,994,214 $780,613,098 359
Prince George's County (MD) $15,348,988 $5,980,606 $2,450,578 $23,780,172 $2,576 $23,782,748 39
Pinellas County (FL) $56,389,602 $32,025,346 $8,072,696 $96,487,644 $3,707,416 $100,195,060 47
Shelby County (TN) $54,982,038 $43,281,734 $5,874,724 $104,138,496 $14,058,111 $118,196,607 71
Fairfield County (CT) $86,015,945 $49,863,817 $10,475,115 $146,354,877 $2,266,381 $148,621,258 72
Westchester County (NY) $57,735,071 $36,798,636 $6,869,344 $101,403,051 $5,166,658 $106,569,709 107
Fulton County (GA) $204,007,282 $125,582,373 $22,350,144 $351,939,799 $30,802,912 $382,742,711 180
Wake County (NC) $87,144,903 $59,922,031 $10,512,284 $157,579,218 $21,567,051 $179,146,269 126
Group E Average $128,973,258 $78,490,876 $16,286,262 $223,750,395 $11,673,252 $235,423,647 93.9
Percent of Group E Total 54.8% 33.3% 6.9% 95.0% 5.0% 100.0%
Group E Median $57,735,071 $43,281,734 $8,072,696 $104,138,496 $2,266,381 $118,196,607
SOURCE: Arts and Economic Prosperity 5, Americans for the Arts, 2017. For more information, visit www.AmericansForTheArts.org/EconomicImpact. B–144

Table 9:Total Categorized Nonprofit Arts and Cultural Organization ExpendituresPer Study Region During Fiscal Year 2015
Population Cohort Group F Personnel Expenses Programmatic, TOTAL
Population 1,000,000 or More (staff, employees, Production and Facility OPERATING CAPITAL Organizational Sample
Sample Size = 21 contractors and artists) Overhead Expenses Expenses Expenses Expenditures Expenditures Size
Mecklenburg County (NC) $72,544,054 $51,908,970 $9,444,255 $133,897,279 $3,840,574 $137,737,853 82
City of San José (CA) $40,940,415 $26,379,773 $5,901,122 $73,221,310 $241,243 $73,462,553 67
Montgomery County (MD) $55,542,078 $40,683,797 $8,847,502 $105,073,377 $31,379 $105,104,756 149
Fairfax County (VA) $99,334,694 $57,255,479 $12,264,353 $168,854,526 $4,555,292 $173,409,818 85
Allegheny County (PA) $283,753,655 $218,279,831 $47,577,769 $549,611,255 $263,391 $549,874,646 194
Greater Columbus Area (OH) $126,635,659 $76,550,540 $17,316,272 $220,502,471 $1,975,022 $222,477,493 92
Orange County (FL) $77,100,789 $66,179,192 $10,323,619 $153,603,600 $743,936 $154,347,536 90
City of Dallas (TX) $351,541,996 $236,406,474 $42,937,630 $630,886,100 $583,225 $631,469,325 209
Hillsborough County (FL) $96,355,418 $59,246,558 $8,036,402 $163,638,378 $11,586,882 $175,225,260 76
City of San Diego (CA) $296,397,694 $210,483,170 $34,253,301 $541,134,165 $12,429,228 $553,563,393 137
Palm Beach County (FL) $83,595,880 $67,478,930 $10,112,441 $161,187,251 $23,104,939 $184,292,190 79
City of San Antonio (TX) $80,225,773 $52,148,270 $10,399,309 $142,773,352 $353,784 $143,127,136 76
Sacramento County (CA) $37,371,724 $36,796,942 $4,783,874 $78,952,540 $3,383,816 $82,336,356 110
City of Phoenix (AZ) $84,306,271 $70,425,043 $9,844,671 $164,575,985 $28,300 $164,604,285 90
City and County of Philadelphia (PA) $446,312,924 $312,608,847 $69,687,109 $828,608,880 $20,313,643 $848,922,523 395
Broward County (FL) $62,466,183 $64,774,132 $9,346,227 $136,586,542 $11,901,465 $148,488,007 103
Santa Clara County (CA) $64,760,922 $37,270,772 $10,058,282 $112,089,976 $252,364 $112,342,340 115
Riverside County (CA) $34,508,818 $25,137,123 $4,320,786 $63,966,727 $8,290 $63,975,017 94
Miami-Dade County (FL) $334,999,542 $235,187,539 $44,767,157 $614,954,238 $236,959,758 $851,913,996 632
City of Chicago (IL) $703,781,182 $518,982,007 $106,021,766 $1,328,784,955 $46,080,860 $1,374,865,815 466
Harris County (TX) $277,294,408 $190,879,200 $34,406,808 $502,580,416 $62,562,594 $565,143,010 198
Group F Average $176,655,718 $126,431,552 $24,316,698 $327,403,968 $21,009,523 $348,413,491 168.5
Percent of Group F Total 50.7% 36.3% 7.0% 94.0% 6.0% 100.0%
Group F Median $84,306,271 $66,179,192 $10,323,619 $163,638,378 $3,383,816 $173,409,818
Average $44,015,137 $29,252,864 $5,662,852 $78,930,853 $5,089,174 $84,020,027 49.7
Percent of Total 52.4% 34.8% 6.7% 93.9% 6.1% 100.0%
Median $7,882,524 $5,431,041 $1,016,769 $14,339,000 $249,288 $15,727,535
ALL CITY/COUNTY STUDY REGIONS
SOURCE: Arts and Economic Prosperity 5, Americans for the Arts, 2017. For more information, visit www.AmericansForTheArts.org/EconomicImpact. B–145

Table 9:Total Categorized Nonprofit Arts and Cultural Organization ExpendituresPer Study Region During Fiscal Year 2015
Regional Study Regions Personnel Expenses Programmatic, TOTAL
All Populations (staff, employees, Production and Facility OPERATING CAPITAL Organizational Sample
Sample Size = 81 contractors and artists) Overhead Expenses Expenses Expenses Expenditures Expenditures Size
High Peaks Region (ME) $353,817 $278,277 $43,242 $675,336 $58,382 $733,718 11
Wood River Valley (ID) $8,629,149 $5,476,031 $875,657 $14,980,837 $488,313 $15,469,150 24
Southern Oregon Area $20,352,096 $13,265,683 $2,643,138 $36,260,917 $1,270,200 $37,531,117 4
Southwestern Pennsylvania Area $6,590,254 $5,139,167 $1,167,353 $12,896,774 $257,809 $13,154,583 29
Greater Portsmouth Area (NH) $12,599,993 $6,837,492 $1,280,800 $20,718,285 $738,342 $21,456,627 26
Northeast Oregon Region $363,606 $256,421 $31,699 $651,726 $282 $652,008 5
Toe River Valley (NC) $3,689,991 $3,810,143 $448,718 $7,948,852 $3,758,027 $11,706,879 9
Albemarle Region (NC) $1,232,853 $1,102,981 $150,383 $2,486,217 $238,611 $2,724,828 7
Greater Concord Area (NH) $8,258,183 $6,212,609 $1,336,176 $15,806,968 $2,026,582 $17,833,550 15
North Central Minnesota Region $906,350 $607,137 $116,078 $1,629,565 $1,000 $1,630,565 39
Northwest Minnesota Region $341,802 $228,965 $43,775 $614,542 $1,600 $616,142 26
Monadnock Region (NH) $7,369,439 $4,748,357 $1,076,736 $13,194,532 $76,852 $13,271,384 36
Bismarck-Mandan Region (ND) $12,324,903 $7,407,914 $1,247,695 $20,980,512 $3,396,582 $24,377,094 31
Greater Minot Region (ND) $4,742,389 $3,337,236 $630,236 $8,709,861 $30,000 $8,739,861 24
Greater Burlington Area (VT) $31,732,480 $19,428,654 $4,076,263 $55,237,397 $3,883,143 $59,120,540 49
Greater Charlottesville Area (VA) $28,497,961 $22,790,550 $2,116,618 $53,405,129 $7,154,789 $60,559,918 44
Brainerd Lakes Region (MN) $1,374,004 $920,408 $175,971 $2,470,383 $283,150 $2,753,533 37
East Central Minnesota Region $2,085,724 $1,397,166 $267,124 $3,750,014 $52,455 $3,802,469 29
Northwest Connecticut Region $11,530,356 $7,119,173 $1,376,110 $20,025,639 $1,457,322 $21,482,961 56
Central Oregon Region $5,361,263 $3,454,289 $682,069 $9,497,621 $460,937 $9,958,558 13
Greater Fargo-Moorhead Area (ND/MN) $12,155,227 $6,750,458 $1,683,915 $20,589,600 $229,902 $20,819,502 53
Black Hills Region (SD) $12,844,421 $8,195,338 $1,489,375 $22,529,134 $445,635 $22,974,769 67
Greater Kingsport Area (TN) $4,808,013 $3,003,164 $610,534 $8,421,711 $1,140,576 $9,562,287 25
Lake Region (MN) $3,106,983 $2,081,284 $397,918 $5,586,185 $899,481 $6,485,666 50
South Central Minnesota Region $3,490,981 $2,338,514 $447,097 $6,276,592 $157,058 $6,433,650 89
Greater Sioux Falls Area (SD) $11,192,419 $7,729,054 $1,360,180 $20,281,653 $320,000 $20,601,653 33
Southwest Tennessee Development District $1,751,258 $1,207,419 $156,218 $3,114,895 $14,360 $3,129,255 29
Northwest Tennessee Development District $1,346,710 $796,145 $134,497 $2,277,352 $5,950 $2,283,302 29
Southwest Minnesota Region $2,377,352 $1,592,523 $304,472 $4,274,347 $593,927 $4,868,274 70
Arrowhead Region (MN) $10,659,581 $7,140,560 $1,365,195 $19,165,336 $472,523 $19,637,859 107
SOURCE: Arts and Economic Prosperity 5, Americans for the Arts, 2017. For more information, visit www.AmericansForTheArts.org/EconomicImpact. B–146

Table 9:Total Categorized Nonprofit Arts and Cultural Organization ExpendituresPer Study Region During Fiscal Year 2015
Regional Study Regions Personnel Expenses Programmatic, TOTAL
All Populations (staff, employees, Production and Facility OPERATING CAPITAL Organizational Sample
Sample Size = 81 contractors and artists) Overhead Expenses Expenses Expenses Expenditures Expenditures Size
Maple Grove and the Northwest Suburbs (MN) $776,051 $519,854 $99,390 $1,395,295 $91,903 $1,487,198 15
Greater Augusta Area (GA) $19,912,366 $14,345,116 $2,655,879 $36,913,361 $941,288 $37,854,649 33
Upper Cumberland Development District (TN) $3,251,734 $2,512,061 $429,079 $6,192,874 $141,822 $6,334,696 42
City of Huntsville/Madison County (AL) $29,742,010 $16,931,035 $4,776,971 $51,450,016 $2,393,547 $53,843,563 34
Northeast Commission (NC) $10,734,321 $10,334,445 $1,131,231 $22,199,997 $442,821 $22,642,818 62
Greater Ann Arbor Area (MI) $27,619,183 $18,501,329 $3,537,247 $49,657,759 $258,882 $49,916,641 87
Greater Fox Cities Region (WI) $7,574,120 $30,567,814 $1,576,703 $39,718,637 $359,036 $40,077,673 18
Central Minnesota Region $4,874,113 $3,265,036 $624,238 $8,763,387 $37,259 $8,800,646 54
South Central Tennessee Development District $2,305,974 $1,223,934 $252,841 $3,782,749 $281,707 $4,064,456 60
Northwest Arkansas Region $33,121,960 $26,302,059 $3,058,466 $62,482,485 $5,021,121 $67,503,606 23
Southeast Minnesota Region $9,187,932 $6,154,742 $1,176,717 $16,519,391 $170,819 $16,690,210 122
First Tennessee Development District $8,059,729 $4,989,785 $1,008,299 $14,057,813 $1,326,999 $15,384,812 58
Greater Harrisburg Area (PA) $7,057,217 $5,069,199 $558,251 $12,684,667 $0 $12,684,667 25
Greater New Haven Area (CT) $48,314,930 $28,315,253 $5,142,722 $81,772,905 $33,095,086 $114,867,991 35
Treasure Coast Region (FL) $17,325,690 $12,612,091 $2,172,623 $32,110,404 $1,295,329 $33,405,733 35
Greater Des Moines Region (IA) $32,951,110 $22,855,499 $3,468,144 $59,274,753 $12,648,149 $71,922,902 65
Southeast Tennessee Development District $36,566,455 $24,961,575 $4,887,649 $66,415,679 $936,871 $67,352,550 93
Greater Knoxville Region (TN) $28,694,202 $16,491,283 $2,076,345 $47,261,830 $899,050 $48,160,880 60
Greater Columbia Area (SC) $12,431,415 $7,643,152 $1,510,755 $21,585,322 $895,352 $22,480,674 33
Pikes Peak Region (CO) $24,396,547 $18,586,063 $4,961,729 $47,944,339 $3,248,872 $51,193,211 87
Lehigh Valley Region (PA) $43,327,436 $28,066,984 $4,824,238 $76,218,658 $6,945,943 $83,164,601 98
Greater Sarasota/Bradenton Area (FL) $106,915,231 $73,487,668 $11,845,573 $192,248,472 $23,708,167 $215,956,639 83
Dayton Region (OH) $50,709,802 $35,472,039 $7,854,125 $94,035,966 $1,123,759 $95,159,725 113
Richmond & Tri-Cities Region (VA) $108,687,665 $69,398,376 $12,390,918 $190,476,959 $21,203,726 $211,680,685 83
Memphis Area Association of Governments (TN) $55,048,599 $43,325,997 $5,883,221 $104,257,817 $14,058,111 $118,315,928 73
Eastern Region (NC) $14,853,532 $10,635,231 $1,958,174 $27,446,937 $283,165 $27,730,102 110
Advantage West Region (NC) $38,364,680 $25,261,445 $4,534,709 $68,160,834 $7,069,757 $75,230,591 184
Southeast Commission (NC) $30,717,890 $15,405,884 $2,962,599 $49,086,373 $1,266,611 $50,352,984 127
Greater Fairfax Area (VA) $104,663,141 $60,170,413 $12,713,540 $177,547,094 $5,251,414 $182,798,508 103
Greater Tulsa Region (OK) $44,798,650 $28,425,367 $5,447,300 $78,671,317 $12,510,848 $91,182,165 123
SOURCE: Arts and Economic Prosperity 5, Americans for the Arts, 2017. For more information, visit www.AmericansForTheArts.org/EconomicImpact. B–147
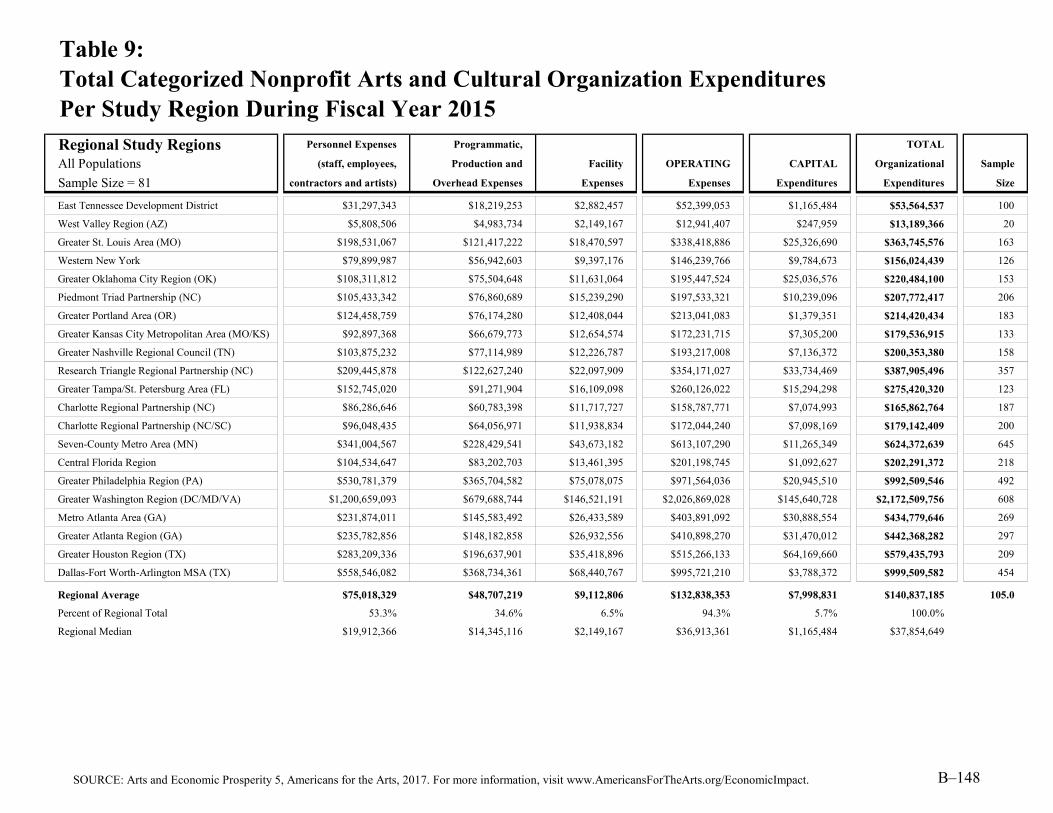
Table 9:Total Categorized Nonprofit Arts and Cultural Organization ExpendituresPer Study Region During Fiscal Year 2015
Regional Study Regions Personnel Expenses Programmatic, TOTAL
All Populations (staff, employees, Production and Facility OPERATING CAPITAL Organizational Sample
Sample Size = 81 contractors and artists) Overhead Expenses Expenses Expenses Expenditures Expenditures Size
East Tennessee Development District $31,297,343 $18,219,253 $2,882,457 $52,399,053 $1,165,484 $53,564,537 100
West Valley Region (AZ) $5,808,506 $4,983,734 $2,149,167 $12,941,407 $247,959 $13,189,366 20
Greater St. Louis Area (MO) $198,531,067 $121,417,222 $18,470,597 $338,418,886 $25,326,690 $363,745,576 163
Western New York $79,899,987 $56,942,603 $9,397,176 $146,239,766 $9,784,673 $156,024,439 126
Greater Oklahoma City Region (OK) $108,311,812 $75,504,648 $11,631,064 $195,447,524 $25,036,576 $220,484,100 153
Piedmont Triad Partnership (NC) $105,433,342 $76,860,689 $15,239,290 $197,533,321 $10,239,096 $207,772,417 206
Greater Portland Area (OR) $124,458,759 $76,174,280 $12,408,044 $213,041,083 $1,379,351 $214,420,434 183
Greater Kansas City Metropolitan Area (MO/KS) $92,897,368 $66,679,773 $12,654,574 $172,231,715 $7,305,200 $179,536,915 133
Greater Nashville Regional Council (TN) $103,875,232 $77,114,989 $12,226,787 $193,217,008 $7,136,372 $200,353,380 158
Research Triangle Regional Partnership (NC) $209,445,878 $122,627,240 $22,097,909 $354,171,027 $33,734,469 $387,905,496 357
Greater Tampa/St. Petersburg Area (FL) $152,745,020 $91,271,904 $16,109,098 $260,126,022 $15,294,298 $275,420,320 123
Charlotte Regional Partnership (NC) $86,286,646 $60,783,398 $11,717,727 $158,787,771 $7,074,993 $165,862,764 187
Charlotte Regional Partnership (NC/SC) $96,048,435 $64,056,971 $11,938,834 $172,044,240 $7,098,169 $179,142,409 200
Seven-County Metro Area (MN) $341,004,567 $228,429,541 $43,673,182 $613,107,290 $11,265,349 $624,372,639 645
Central Florida Region $104,534,647 $83,202,703 $13,461,395 $201,198,745 $1,092,627 $202,291,372 218
Greater Philadelphia Region (PA) $530,781,379 $365,704,582 $75,078,075 $971,564,036 $20,945,510 $992,509,546 492
Greater Washington Region (DC/MD/VA) $1,200,659,093 $679,688,744 $146,521,191 $2,026,869,028 $145,640,728 $2,172,509,756 608
Metro Atlanta Area (GA) $231,874,011 $145,583,492 $26,433,589 $403,891,092 $30,888,554 $434,779,646 269
Greater Atlanta Region (GA) $235,782,856 $148,182,858 $26,932,556 $410,898,270 $31,470,012 $442,368,282 297
Greater Houston Region (TX) $283,209,336 $196,637,901 $35,418,896 $515,266,133 $64,169,660 $579,435,793 209
Dallas-Fort Worth-Arlington MSA (TX) $558,546,082 $368,734,361 $68,440,767 $995,721,210 $3,788,372 $999,509,582 454
Regional Average $75,018,329 $48,707,219 $9,112,806 $132,838,353 $7,998,831 $140,837,185 105.0
Percent of Regional Total 53.3% 34.6% 6.5% 94.3% 5.7% 100.0%
Regional Median $19,912,366 $14,345,116 $2,149,167 $36,913,361 $1,165,484 $37,854,649
SOURCE: Arts and Economic Prosperity 5, Americans for the Arts, 2017. For more information, visit www.AmericansForTheArts.org/EconomicImpact. B–148

Table 9:Total Categorized Nonprofit Arts and Cultural Organization ExpendituresPer Study Region During Fiscal Year 2015
Statewide Study Regions Personnel Expenses Programmatic, TOTAL
All Populations (staff, employees, Production and Facility OPERATING CAPITAL Organizational Sample
Sample Size = 20 contractors and artists) Overhead Expenses Expenses Expenses Expenditures Expenditures Size
State of Vermont $42,256,350 $26,243,157 $6,317,390 $74,816,897 $4,040,014 $78,856,911 86
State of North Dakota $30,221,172 $17,984,211 $3,387,235 $51,592,618 $4,865,931 $56,458,549 135
State of Delaware $49,921,505 $40,257,529 $6,716,361 $96,895,395 $6,728,980 $103,624,375 95
State of Maine $53,789,343 $30,412,355 $5,871,486 $90,073,184 $2,504,420 $92,577,604 123
State of Hawai'i $70,715,559 $42,017,290 $9,219,620 $121,952,469 $3,968,883 $125,921,352 109
State of Nevada $114,957,817 $87,662,126 $15,309,296 $217,929,239 $9,369,133 $227,298,372 164
State of Connecticut $274,704,089 $167,425,018 $32,975,539 $475,104,646 $40,206,724 $515,311,370 324
State of Oklahoma $163,840,696 $110,822,180 $18,667,672 $293,330,548 $37,919,238 $331,249,786 392
State of Oregon $205,893,979 $128,797,818 $21,928,308 $356,620,105 $7,445,182 $364,065,287 365
State of Minnesota $379,409,389 $254,155,875 $48,591,768 $682,157,032 $13,934,621 $696,091,653 1,268
State of Wisconsin $200,861,369 $139,630,335 $24,248,586 $364,740,290 $12,175,701 $376,915,991 363
State of Maryland $284,391,203 $179,406,265 $45,610,698 $509,408,166 $1,991,206 $511,399,372 522
State of Missouri $323,653,221 $210,636,783 $35,299,262 $569,589,266 $33,314,472 $602,903,738 491
State of Tennessee $243,503,034 $174,351,158 $27,861,048 $445,715,240 $25,067,676 $470,782,916 642
State of Massachusetts $718,521,575 $522,962,019 $115,304,973 $1,356,788,567 $29,914,708 $1,386,703,275 643
State of New Jersey $177,443,633 $94,703,164 $20,561,616 $292,708,413 $3,431,935 $296,140,348 183
State of North Carolina $495,836,289 $321,908,332 $59,641,639 $877,386,260 $60,110,912 $937,497,172 1,233
State of Pennsylvania $926,884,143 $660,222,936 $136,130,488 $1,723,237,567 $30,072,155 $1,753,309,722 1,077
State of Illinois $931,362,848 $664,316,791 $136,507,069 $1,732,186,708 $48,439,631 $1,780,626,339 808
State of Florida $1,034,757,218 $798,629,081 $128,619,814 $1,962,006,113 $323,665,152 $2,285,671,265 1,688
Statewide Average $336,146,222 $233,627,221 $44,938,493 $614,711,936 $34,958,334 $649,670,270 535.6
Percent of Statewide Total 51.7% 36.0% 6.9% 94.6% 5.4% 100.0%
Statewide Median $224,698,507 $153,527,677 $26,054,817 $405,227,765 $13,055,161 $423,849,454
SOURCE: Arts and Economic Prosperity 5, Americans for the Arts, 2017. For more information, visit www.AmericansForTheArts.org/EconomicImpact. B–149

Table 9:Total Categorized Nonprofit Arts and Cultural Organization ExpendituresPer Study Region During Fiscal Year 2015
Individual Arts Districts Personnel Expenses Programmatic, TOTAL
All Populations (staff, employees, Production and Facility OPERATING CAPITAL Organizational Sample
Sample Size = 12 contractors and artists) Overhead Expenses Expenses Expenses Expenditures Expenditures Size
James River Arts & Cultural District $3,409,179 $2,154,365 $512,935 $6,076,479 $317,770 $6,394,249 15
Center City Charlotte $64,869,704 $46,958,198 $8,434,023 $120,261,925 $3,829,692 $124,091,617 35
Loch Haven Cultural Park $14,994,081 $11,312,165 $2,474,944 $28,781,190 $472,026 $29,253,216 8
Downtown Colorado Springs Creative District $10,477,813 $6,970,577 $2,546,682 $19,995,072 $778,299 $20,773,371 30
Fort Worth Cultural District $82,025,553 $55,074,837 $10,304,896 $147,405,286 $2,605,166 $150,010,452 16
Dallas Arts District $154,559,670 $109,261,378 $17,874,014 $281,695,062 $539,330 $282,234,392 15
Grand Center Arts & Entertainment District $40,570,240 $19,203,500 $2,893,540 $62,667,280 $14,507,517 $77,174,797 20
Balboa Park Cultural District $206,645,108 $147,610,977 $25,858,643 $380,114,728 $323,182 $380,437,910 24
East End Cultural District $1,926,650 $898,508 $352,244 $3,177,402 $0 $3,177,402 9
Houston Museum District Association $141,865,988 $101,501,236 $17,471,575 $260,838,799 $60,711,514 $321,550,313 22
Midtown Cultural District $2,014,058 $1,618,650 $479,095 $4,111,803 $0 $4,111,803 5
Washington Avenue Cultural District $1,274,602 $1,054,423 $191,582 $2,520,607 $0 $2,520,607 6
Arts District Average $60,386,054 $41,968,235 $7,449,514 $109,803,803 $7,007,041 $116,810,844 17.1
Percent of Arts District Total 51.7% 35.9% 6.4% 94.0% 6.0% 100.0%
Arts District Median $27,782,161 $15,257,833 $2,720,111 $45,724,235 $505,678 $53,214,007
Explanation of the Outliers and Exclusions:1 Only one eligible nonprofit arts and cultural organization provided detailed financial information for use in the analysis for Yadkin County, NC. While these itemized data are not reported
on this table to protect confidentiality, the data are included in the summary statistics for population Group A as well as for all individual city/county study regions.
SOURCE: Arts and Economic Prosperity 5, Americans for the Arts, 2017. For more information, visit www.AmericansForTheArts.org/EconomicImpact. B–150

Explanation of Table 10:Average Categorized Nonprofit Arts and Cultural Organization ExpendituresPer Study Region During Fiscal Year 2015
Column Two:
Column Three:
Column Four:
Column Five:
Column Six:
Column Seven:
Column Eight:
The average organizational expenditures of nonprofit arts and cultural organizations in each study region during year fiscal 2015. This figure is the sum of average operating expenditures (Column Five) and average capital expenditures (Column Six).
The number of eligible nonprofit arts and cultural organizations from which detailed expenditure and event attendance data were collected in each participating study region.
This table presents the average categorized expenditures made by participating nonprofit arts and cultural organizations in each participating study region during fiscal year 2015. Summary statistics are calculated for each population group.
The average personnel-related expenses paid by participating nonprofit arts and cultural organizations in each participating study region during fiscal year 2015. Payroll-related expenses include salaries and wages paid to staff and employees, the costs for contracted staff (i.e., "contractors"), the fees paid to artists and performers, and any applicable payroll taxes and fringe benefits.
The average programmatic, production, and overhead expenses paid by participating nonprofit arts and cultural organizations in each participating study region during fiscal year 2015. Programmatic, production, and overhead expenses include marketing and advertising costs, supplies and office machinery, travel, insurance, communication costs, and the costs associated with programming and producing performances, events, and activities.
The average facility expenses paid by participating nonprofit arts and cultural organizations in each participating study region during fiscal year 2015. Facility expenses include rental and/or lease costs, mortgage costs, property taxes, and utilities.
The average operating expenditures made by participating nonprofit arts and cultural organizations in each participating study region during fiscal year 2015. This figure is the sum of Columns Two through Four. (See the survey instruments in Appendix C for a detailed breakdown of organizational expenditure categories.) These data are based on the real dollars reported by the organizations that responded to the survey in each study region only; no multiplier was used to calculate these figures and no extrapolations were made for non-responding organizations.
The average capital expenditures reported by participating nonprofit arts and cultural organizations in each study region during fiscal year 2015. According to generally-accepted accounting principles (GAAP), a capital expenditure is a cost which cannot be deducted in the year in which it is paid or incurred and must be capitalized. The general rule is that if the acquired asset's useful life is longer than the taxable year, then the cost must be capitalized. The capital expenditure costs are then amortized or depreciated over the life of the asset in question. For nonprofit arts and cultural organizations, capital expenditures typically include purchases of art, equipment, and real estate. Capital expenditures also include construction and renovation costs. These data are real dollars reported by the organizations that responded to the survey in each study region only; no multiplier was used to calculate these figures and no extrapolations were made for non-responding organizations.
SOURCE: Arts and Economic Prosperity 5, Americans for the Arts, 2017. For more information, visit www.AmericansForTheArts.org/EconomicImpact. B–151

Table 10:Average Categorized Nonprofit Arts and Cultural Organization ExpendituresPer Study Region During Fiscal Year 2015
Population Cohort Group A Personnel Expenses Programmatic, TOTAL
Population Fewer than 50,000 (staff, employees, Production and Facility OPERATING CAPITAL Organizational Sample
Sample Size = 52 contractors and artists) Overhead Expenses Expenses Expenditures Expenditures Expenditures Size
Town of Crested Butte (CO) $210,652 $127,118 $33,901 $371,671 $7,865 $379,535 12
City of Pine City (MN) $47,300 $31,685 $6,058 $85,043 $0 $85,043 5
City of Alva (OK) $58,217 $22,396 $8,289 $88,901 $2,538 $91,440 13
Cook County (MN) $80,446 $53,889 $10,303 $144,638 $6,880 $151,518 17
Town of Hillsborough (NC) $54,136 $39,854 $4,485 $98,475 $1,169 $99,644 16
City of Virginia (MN) $16,070 $10,765 $2,058 $28,892 $0 $28,892 4
Town of Jackson (WY) $599,010 $344,326 $94,412 $1,037,748 $2,584 $1,040,332 18
City of Guthrie (OK) $64,921 $43,020 $8,250 $116,191 $18,116 $134,307 12
City of Grand Rapids (MN) $129,496 $86,746 $16,585 $232,827 $3,333 $236,160 12
Town of Medfield (MA) $118,745 $31,501 $10,430 $160,677 $1,013 $161,690 17
City of Fergus Falls (MN) $88,863 $59,526 $11,381 $159,770 $92,780 $252,550 9
Grundy County (TN) $5,909 $4,335 $784 $11,028 $0 $11,028 10
City of Falls Church (VA) $351,655 $174,706 $23,914 $550,275 $63,284 $613,559 11
City of Jamestown (ND) $124,700 $125,720 $7,673 $258,092 $93,701 $351,793 3
City of Waterville (ME) $583,607 $438,956 $89,790 $1,112,353 $0 $1,112,353 4
City of Red Wing (MN) $106,566 $71,386 $13,648 $191,600 $0 $191,600 9
City of Durango (CO) $208,810 $102,759 $16,376 $327,945 $3,583 $331,527 26
City of Hannibal (MO) $123,556 $80,043 $18,155 $221,754 $11,570 $233,325 6
City of Tullahoma (TN) $25,585 $18,979 $4,801 $49,364 $6,155 $55,520 11
City of Northfield (MN) $51,545 $34,528 $6,602 $92,674 $0 $92,674 14
Town of Carrboro (NC) $202,435 $120,534 $18,218 $341,187 $22,888 $364,076 10
Macon County (TN) $4,508 $4,031 $586 $9,124 $5,747 $14,871 7
City of Laguna Beach (CA) $1,121,377 $721,661 $141,377 $1,984,416 $523,002 $2,507,418 16
Hickman County (TN) $42,585 $10,217 $1,887 $54,688 $190 $54,879 21
City of Fairfax (VA) $208,605 $141,881 $26,591 $377,077 $0 $377,077 7
City of Ponca City (OK) $94,154 $50,552 $18,572 $163,279 $11,673 $174,951 16
City of Paducah (KY) $337,587 $184,098 $33,625 $555,310 $394,998 $950,308 19
Mille Lacs County (MN) $31,470 $21,081 $4,030 $56,581 $975 $57,556 10
McNairy County (TN) $2,515 $1,673 $321 $4,509 $0 $4,509 5
City of Winona (MN) $106,957 $71,648 $13,698 $192,303 $41 $192,345 17
SOURCE: Arts and Economic Prosperity 5, Americans for the Arts, 2017. For more information, visit www.AmericansForTheArts.org/EconomicImpact. B–152
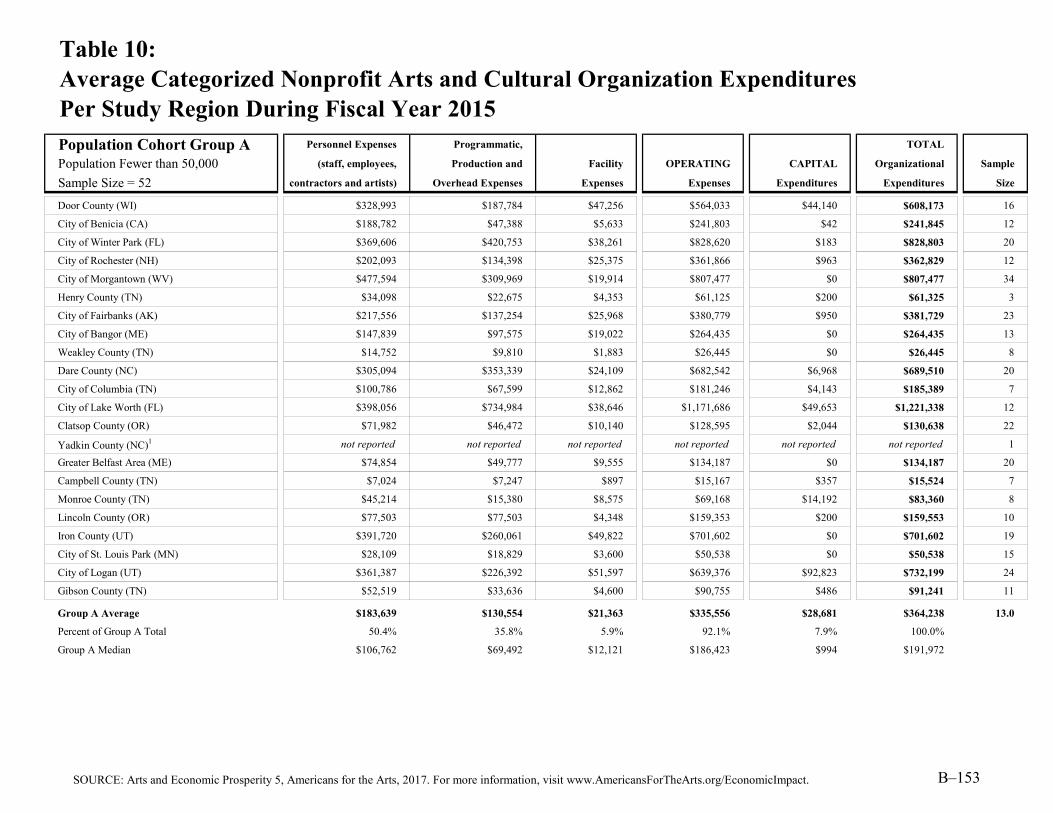
Table 10:Average Categorized Nonprofit Arts and Cultural Organization ExpendituresPer Study Region During Fiscal Year 2015
Population Cohort Group A Personnel Expenses Programmatic, TOTAL
Population Fewer than 50,000 (staff, employees, Production and Facility OPERATING CAPITAL Organizational Sample
Sample Size = 52 contractors and artists) Overhead Expenses Expenses Expenses Expenditures Expenditures Size
Door County (WI) $328,993 $187,784 $47,256 $564,033 $44,140 $608,173 16
City of Benicia (CA) $188,782 $47,388 $5,633 $241,803 $42 $241,845 12
City of Winter Park (FL) $369,606 $420,753 $38,261 $828,620 $183 $828,803 20
City of Rochester (NH) $202,093 $134,398 $25,375 $361,866 $963 $362,829 12
City of Morgantown (WV) $477,594 $309,969 $19,914 $807,477 $0 $807,477 34
Henry County (TN) $34,098 $22,675 $4,353 $61,125 $200 $61,325 3
City of Fairbanks (AK) $217,556 $137,254 $25,968 $380,779 $950 $381,729 23
City of Bangor (ME) $147,839 $97,575 $19,022 $264,435 $0 $264,435 13
Weakley County (TN) $14,752 $9,810 $1,883 $26,445 $0 $26,445 8
Dare County (NC) $305,094 $353,339 $24,109 $682,542 $6,968 $689,510 20
City of Columbia (TN) $100,786 $67,599 $12,862 $181,246 $4,143 $185,389 7
City of Lake Worth (FL) $398,056 $734,984 $38,646 $1,171,686 $49,653 $1,221,338 12
Clatsop County (OR) $71,982 $46,472 $10,140 $128,595 $2,044 $130,638 22
Yadkin County (NC)1 not reported not reported not reported not reported not reported not reported 1
Greater Belfast Area (ME) $74,854 $49,777 $9,555 $134,187 $0 $134,187 20
Campbell County (TN) $7,024 $7,247 $897 $15,167 $357 $15,524 7
Monroe County (TN) $45,214 $15,380 $8,575 $69,168 $14,192 $83,360 8
Lincoln County (OR) $77,503 $77,503 $4,348 $159,353 $200 $159,553 10
Iron County (UT) $391,720 $260,061 $49,822 $701,602 $0 $701,602 19
City of St. Louis Park (MN) $28,109 $18,829 $3,600 $50,538 $0 $50,538 15
City of Logan (UT) $361,387 $226,392 $51,597 $639,376 $92,823 $732,199 24
Gibson County (TN) $52,519 $33,636 $4,600 $90,755 $486 $91,241 11
Group A Average $183,639 $130,554 $21,363 $335,556 $28,681 $364,238 13.0
Percent of Group A Total 50.4% 35.8% 5.9% 92.1% 7.9% 100.0%
Group A Median $106,762 $69,492 $12,121 $186,423 $994 $191,972
SOURCE: Arts and Economic Prosperity 5, Americans for the Arts, 2017. For more information, visit www.AmericansForTheArts.org/EconomicImpact. B–153

Table 10:Average Categorized Nonprofit Arts and Cultural Organization ExpendituresPer Study Region During Fiscal Year 2015
Population Cohort Group B Personnel Expenses Programmatic, TOTAL
Population 50,000 to 99,999 (staff, employees, Production and Facility OPERATING CAPITAL Organizational Sample
Sample Size = 38 contractors and artists) Overhead Expenses Expenses Expenses Expenditures Expenditures Size
City of Joplin (MO) $54,086 $28,581 $5,600 $88,267 $1,365 $89,632 20
City of La Crosse (WI) $200,702 $131,954 $27,422 $360,078 $28,644 $388,723 33
McMinn County (TN) $50,379 $33,765 $7,904 $92,048 $9,028 $101,076 20
Lafayette County (MS) $41,533 $31,536 $6,656 $79,725 $60,035 $139,761 19
Chisago County (MN) $60,758 $40,700 $7,781 $109,238 $0 $109,238 6
City of Grand Forks (ND) $134,401 $66,929 $12,638 $213,968 $0 $213,968 13
City of Corvallis (OR) $703,499 $460,824 $87,607 $1,251,929 $136 $1,252,066 22
City of Noblesville (IN) $144,455 $93,115 $0 $237,570 $0 $237,570 2
City of Ocala (FL) $268,558 $155,188 $31,273 $455,019 $37,938 $492,957 29
Lenoir County (NC) $47,309 $31,460 $6,039 $84,807 $0 $84,807 11
Town of Chapel Hill (NC) $996,259 $431,970 $79,470 $1,507,699 $99,717 $1,607,416 55
City of Grand Junction (CO) $235,555 $65,539 $17,058 $318,152 $34,195 $352,347 32
Town of Jupiter (FL) $1,454,160 $975,208 $185,476 $2,614,844 $58,190 $2,673,035 3
Hamblen County (TN) $63,734 $41,238 $10,348 $115,320 $11,400 $126,720 6
City of Delray Beach (FL) $561,432 $318,393 $60,300 $940,125 $3,183 $943,308 12
City of St. Cloud (MN) $118,429 $79,332 $15,167 $212,929 $885 $213,814 25
City of Portland (ME) $532,851 $358,338 $70,430 $961,619 $50,825 $1,012,444 46
City of Jackson (TN) $115,232 $79,295 $9,666 $204,192 $923 $205,115 13
City of Walnut Creek (CA) $416,321 $253,713 $54,099 $724,132 $3,379 $727,511 29
Greene County (TN) $147,911 $98,360 $18,881 $265,151 $13,251 $278,402 9
City of Flagstaff (AZ) $594,218 $390,574 $69,511 $1,054,303 $450 $1,054,753 55
City of Missoula (MT) $347,342 $208,925 $30,227 $586,494 $13,280 $599,774 34
City of Fort Myers (FL) $527,361 $323,557 $81,056 $931,975 $45,316 $977,290 14
Putnam County (TN) $125,566 $83,976 $16,318 $225,861 $606 $226,467 9
Monroe County (FL) $279,555 $192,537 $40,401 $512,493 $502 $512,995 53
City of Lynchburg (VA) $176,213 $113,843 $26,386 $316,442 $15,989 $332,431 20
City of Duluth (MN) $214,290 $143,547 $27,445 $385,281 $973 $386,254 37
City of Fishers (IN) $1,666,853 $2,033,102 $107,807 $3,807,762 $41,329 $3,849,091 6
City of Carmel (IN) $526,945 $412,654 $102,114 $1,041,713 $4,906 $1,046,619 12
City of Sugar Land (TX) $67,714 $44,564 $12,870 $125,148 $4,200 $129,348 5
SOURCE: Arts and Economic Prosperity 5, Americans for the Arts, 2017. For more information, visit www.AmericansForTheArts.org/EconomicImpact. B–154
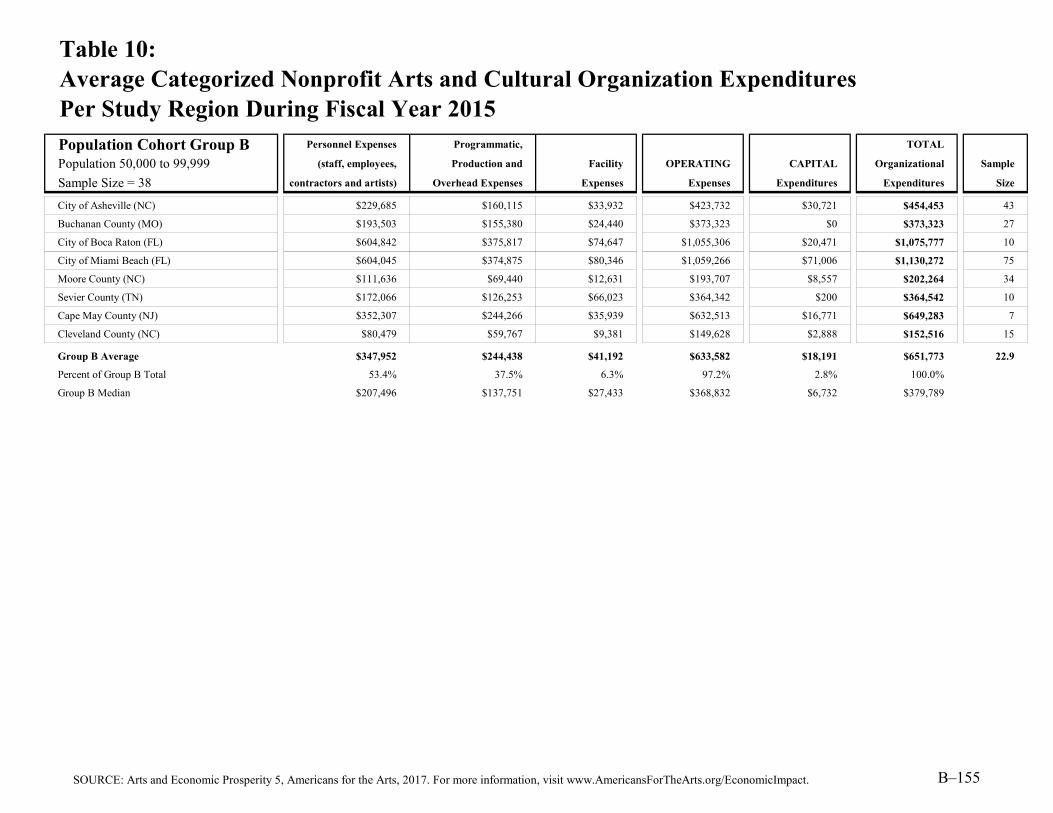
Table 10:Average Categorized Nonprofit Arts and Cultural Organization ExpendituresPer Study Region During Fiscal Year 2015
Population Cohort Group B Personnel Expenses Programmatic, TOTAL
Population 50,000 to 99,999 (staff, employees, Production and Facility OPERATING CAPITAL Organizational Sample
Sample Size = 38 contractors and artists) Overhead Expenses Expenses Expenses Expenditures Expenditures Size
City of Asheville (NC) $229,685 $160,115 $33,932 $423,732 $30,721 $454,453 43
Buchanan County (MO) $193,503 $155,380 $24,440 $373,323 $0 $373,323 27
City of Boca Raton (FL) $604,842 $375,817 $74,647 $1,055,306 $20,471 $1,075,777 10
City of Miami Beach (FL) $604,045 $374,875 $80,346 $1,059,266 $71,006 $1,130,272 75
Moore County (NC) $111,636 $69,440 $12,631 $193,707 $8,557 $202,264 34
Sevier County (TN) $172,066 $126,253 $66,023 $364,342 $200 $364,542 10
Cape May County (NJ) $352,307 $244,266 $35,939 $632,513 $16,771 $649,283 7
Cleveland County (NC) $80,479 $59,767 $9,381 $149,628 $2,888 $152,516 15
Group B Average $347,952 $244,438 $41,192 $633,582 $18,191 $651,773 22.9
Percent of Group B Total 53.4% 37.5% 6.3% 97.2% 2.8% 100.0%
Group B Median $207,496 $137,751 $27,433 $368,832 $6,732 $379,789
SOURCE: Arts and Economic Prosperity 5, Americans for the Arts, 2017. For more information, visit www.AmericansForTheArts.org/EconomicImpact. B–155

Table 10:Average Categorized Nonprofit Arts and Cultural Organization ExpendituresPer Study Region During Fiscal Year 2015
Population Cohort Group C Personnel Expenses Programmatic, TOTAL
Population 100,000 to 249,999 (staff, employees, Production and Facility OPERATING CAPITAL Organizational Sample
Sample Size = 50 contractors and artists) Overhead Expenses Expenses Expenses Expenditures Expenditures Size
City of Las Cruces (NM) $216,212 $140,772 $28,360 $385,345 $1,402 $386,747 22
Eau Claire County (WI) $133,076 $82,376 $10,821 $226,274 $74,349 $300,623 15
Yamhill County (OR) $182,950 $122,497 $23,241 $328,688 $61,211 $389,899 53
City of Lewisville (TX) $89,346 $80,314 $18,703 $188,363 $798 $189,161 8
City of West Palm Beach (FL) $1,706,737 $1,372,938 $210,397 $3,290,072 $744,764 $4,034,836 29
City of Boulder (CO) $301,062 $200,198 $38,186 $539,447 $6,929 $546,375 65
City of Richardson (TX) $326,514 $167,886 $11,585 $505,985 $0 $505,985 24
City of High Point (NC) $150,161 $82,218 $13,753 $246,132 $9,897 $256,029 10
City of Cambridge (MA) $1,714,798 $1,392,346 $315,789 $3,422,932 $0 $3,422,932 35
City of Lowell (MA) $362,825 $175,531 $40,888 $579,244 $0 $579,244 15
Douglas County (KS) $432,111 $206,538 $16,446 $655,096 $26,248 $681,343 23
City of Columbia (MO) $174,640 $117,348 $18,838 $310,826 $4,772 $315,598 29
City of Norman (OK) $284,629 $165,252 $22,523 $472,404 $8,966 $481,370 24
Wayne County (NC) $53,318 $38,083 $10,349 $101,751 $2,918 $104,669 15
City of Lafayette (LA) $354,050 $236,505 $45,082 $635,637 $0 $635,637 10
Washington County (TN) $94,680 $54,176 $11,221 $160,077 $2,818 $162,895 20
City of Thousand Oaks (CA) $457,623 $207,924 $45,993 $711,540 $5,933 $717,473 12
City of Charleston (SC) $1,088,165 $516,168 $132,215 $1,736,548 $2,715 $1,739,263 38
City of Waco (TX) $553,948 $386,501 $71,401 $1,011,849 $34,548 $1,046,397 30
Robeson County (NC) $177,629 $121,313 $24,105 $323,047 $778 $323,824 9
Columbia County (GA) $1,367 $2,263 $1,411 $5,042 $3,600 $8,642 5
Orange County (NC) $703,473 $312,212 $56,400 $1,072,084 $69,909 $1,141,994 82
City of Savannah (GA) $477,651 $248,115 $40,065 $765,830 $7,485 $773,315 45
Indian River County (FL) $764,901 $665,837 $123,982 $1,554,720 $47,182 $1,601,902 10
City of Alexandria (VA) $364,354 $255,780 $52,814 $672,948 $43,594 $716,542 50
Martin County (FL) $374,117 $267,870 $30,174 $672,161 $41,175 $713,337 20
Macon-Bibb County (GA) $524,763 $374,172 $68,389 $967,325 $56,419 $1,023,744 48
City of Springfield (MA) $1,362,531 $708,401 $182,148 $2,253,079 $154,204 $2,407,283 15
Catawba County (NC) $248,415 $161,997 $56,534 $466,946 $35,823 $502,769 25
Town of Cary (NC) $108,961 $32,020 $19,781 $160,762 $5,552 $166,315 37
SOURCE: Arts and Economic Prosperity 5, Americans for the Arts, 2017. For more information, visit www.AmericansForTheArts.org/EconomicImpact. B–156

Table 10:Average Categorized Nonprofit Arts and Cultural Organization ExpendituresPer Study Region During Fiscal Year 2015
Population Cohort Group C Personnel Expenses Programmatic, TOTAL
Population 100,000 to 249,999 (staff, employees, Production and Facility OPERATING CAPITAL Organizational Sample
Sample Size = 50 contractors and artists) Overhead Expenses Expenses Expenses Expenditures Expenditures Size
Alamance County (NC) $68,145 $32,252 $6,284 $106,680 $7,371 $114,051 34
Cumberland County (NJ) $210,209 $126,713 $33,212 $370,135 $11,734 $381,869 25
City of Eugene (OR) $578,499 $364,290 $59,757 $1,002,546 $16,967 $1,019,513 40
Middlesex County (CT) $779,467 $509,375 $97,712 $1,386,554 $5,691 $1,392,246 15
City of Springfield (MO) $206,937 $141,333 $33,837 $382,107 $25,330 $407,438 24
City of Sioux Falls (SD) $421,622 $289,085 $50,543 $761,250 $12,308 $773,558 26
Pitt County (NC) $310,946 $198,492 $39,258 $548,696 $3,037 $551,732 23
City of Providence (RI) $1,012,265 $554,038 $107,239 $1,673,543 $2,039 $1,675,581 56
City of Worcester (MA) $613,001 $379,818 $90,206 $1,083,025 $48,635 $1,131,660 57
Montgomery County (TN) $72,375 $69,736 $6,111 $148,221 $0 $148,221 20
Salt Lake City (UT) $1,130,570 $713,358 $111,729 $1,955,656 $17,024 $1,972,680 57
Cabarrus County (NC) $71,259 $38,645 $5,501 $115,406 $10,459 $125,865 18
Richmond County (GA) $710,912 $511,921 $94,601 $1,317,434 $32,975 $1,350,409 28
City of Tacoma (WA) $587,620 $341,822 $65,797 $995,239 $135,798 $1,131,037 66
Doña Ana County (NM) $249,425 $161,556 $31,928 $442,909 $2,616 $445,524 29
New Hanover County (NC) $218,081 $155,301 $28,151 $401,533 $22,517 $424,050 35
Arlington County (VA) $1,294,335 $913,064 $118,079 $2,325,478 $46,223 $2,371,701 72
City of Irving (TX) $772,416 $551,728 $98,968 $1,423,113 $0 $1,423,113 17
City of Reno (NV) $538,781 $347,128 $67,302 $953,210 $113,586 $1,066,796 47
York County (SC) $750,907 $251,813 $17,008 $1,019,728 $1,783 $1,021,511 13
Group C Average $487,656 $310,940 $58,096 $856,692 $39,402 $896,094 30.5
Percent of Group C Total 54.4% 34.7% 6.5% 95.6% 4.4% 100.0%
Group C Median $363,590 $207,231 $39,661 $645,366 $9,431 $658,490
SOURCE: Arts and Economic Prosperity 5, Americans for the Arts, 2017. For more information, visit www.AmericansForTheArts.org/EconomicImpact. B–157

Table 10:Average Categorized Nonprofit Arts and Cultural Organization ExpendituresPer Study Region During Fiscal Year 2015
Population Cohort Group D Personnel Expenses Programmatic, TOTAL
Population 250,000 to 499,999 (staff, employees, Production and Facility OPERATING CAPITAL Organizational Sample
Sample Size = 42 contractors and artists) Overhead Expenses Expenses Expenses Expenditures Expenditures Size
Buncombe County (NC) $247,458 $185,186 $36,716 $469,360 $37,638 $506,998 52
Alachua County (FL) $467,507 $297,528 $54,004 $819,039 $11,942 $830,981 44
Greater Green Bay Area (WI) $315,699 $187,427 $43,734 $546,860 $23,688 $570,547 41
City of Orlando (FL) $1,186,740 $892,893 $158,708 $2,238,341 $9,808 $2,248,149 55
City of Lincoln (NE) $690,518 $488,416 $83,069 $1,262,003 $4,636 $1,266,639 40
Southeastern Connecticut Region (CT) $689,874 $451,437 $91,979 $1,233,290 $11,849 $1,245,140 70
Erie County (PA) $225,838 $158,115 $28,237 $412,190 $2,835 $415,025 46
San Luis Obispo County (CA) $279,450 $150,810 $32,574 $462,834 $26,202 $489,037 28
City of Newark (NJ) $2,238,849 $991,548 $263,996 $3,494,393 $33,518 $3,527,911 31
Leon County (FL) $370,227 $1,012,846 $41,742 $1,424,815 $31,041 $1,455,855 69
Rutherford County (TN) $182,660 $70,307 $15,587 $268,554 $31,412 $299,966 36
St. Lucie County (FL) $438,867 $119,264 $65,865 $623,996 $0 $623,996 5
Greater Spartanburg Area (SC) $433,465 $206,175 $51,381 $691,022 $45,933 $736,955 29
Durham County (NC) $854,093 $483,035 $91,717 $1,428,845 $87,374 $1,516,219 69
City of St. Paul (MN) $918,967 $615,591 $117,694 $1,652,252 $34,035 $1,686,287 167
Hamilton County (IN) $792,415 $826,423 $89,319 $1,708,157 $15,879 $1,724,035 21
Osceola County (FL) $170,929 $79,823 $23,521 $274,272 $357 $274,629 7
Escambia County (FL) $619,635 $389,897 $77,845 $1,087,377 $10,622 $1,097,999 25
Lexington-Fayette Urban County (KY) $208,044 $153,979 $29,663 $391,686 $82,706 $474,392 34
Lake County (FL) $55,076 $36,733 $11,598 $103,407 $0 $103,407 11
City of Riverside (CA) $209,841 $152,780 $27,752 $390,373 $184 $390,558 45
Cumberland County (NC) $415,050 $161,996 $31,982 $609,028 $8,804 $617,832 48
Collier County (FL) $832,852 $456,216 $58,793 $1,347,861 $51,555 $1,399,416 45
Hamilton County (TN) $665,352 $454,164 $88,542 $1,208,058 $13,996 $1,222,054 53
Manatee County (FL) $243,264 $175,627 $31,815 $450,707 $597 $451,303 32
City of Tampa (FL) $1,288,996 $787,614 $92,254 $2,168,863 $165,101 $2,333,964 56
Forsyth County (NC) $956,328 $651,471 $134,899 $1,742,698 $31,994 $1,774,691 59
Mercer County (NJ) $539,877 $252,771 $76,400 $869,047 $14,758 $883,806 25
City of Wichita (KS) $741,018 $407,657 $119,416 $1,268,090 $24,165 $1,292,255 34
Clackamas County (OR) $203,494 $102,028 $17,873 $323,395 $0 $323,395 18
SOURCE: Arts and Economic Prosperity 5, Americans for the Arts, 2017. For more information, visit www.AmericansForTheArts.org/EconomicImpact. B–158

Table 10:Average Categorized Nonprofit Arts and Cultural Organization ExpendituresPer Study Region During Fiscal Year 2015
Population Cohort Group D Personnel Expenses Programmatic, TOTAL
Population 250,000 to 499,999 (staff, employees, Production and Facility OPERATING CAPITAL Organizational Sample
Sample Size = 42 contractors and artists) Overhead Expenses Expenses Expenses Expenditures Expenditures Size
Sarasota County (FL) $1,943,741 $1,330,737 $212,304 $3,486,782 $464,492 $3,951,273 51
City of Minneapolis (MN) $596,934 $399,869 $76,451 $1,073,253 $15,617 $1,088,870 297
Berks County (PA) $256,747 $212,516 $53,343 $522,605 $17,671 $540,276 20
City of Miami (FL) $782,425 $543,939 $117,012 $1,443,375 $813,933 $2,257,308 216
City of Raleigh (NC) $1,036,905 $737,603 $120,898 $1,895,405 $254,197 $2,149,602 78
Santa Barbara County (CA) $713,006 $482,220 $96,220 $1,291,446 $66,654 $1,358,100 93
Seminole County (FL) $219,081 $145,688 $27,966 $392,735 $274 $393,008 21
City of Virginia Beach (VA) $427,159 $280,250 $39,698 $747,107 $38,631 $785,738 33
City of Atlanta (GA) $1,357,000 $830,850 $148,428 $2,336,278 $210,979 $2,547,257 146
City of Mesa (AZ) $733,010 $295,971 $174,742 $1,203,723 $179 $1,203,902 14
City of Kansas City (MO) $913,828 $662,793 $125,934 $1,702,555 $74,440 $1,776,996 91
Morris County (NJ) $620,452 $387,762 $97,813 $1,106,027 $21,415 $1,127,441 14
Group D Average $644,825 $421,666 $80,464 $1,146,955 $66,455 $1,213,410 56.4
Percent of Group D Total 53.1% 34.8% 6.6% 94.5% 5.5% 100.0%
Group D Median $608,284 $388,830 $76,425 $1,096,702 $22,551 $1,112,720
SOURCE: Arts and Economic Prosperity 5, Americans for the Arts, 2017. For more information, visit www.AmericansForTheArts.org/EconomicImpact. B–159

Table 10:Average Categorized Nonprofit Arts and Cultural Organization ExpendituresPer Study Region During Fiscal Year 2015
Population Cohort Group E Personnel Expenses Programmatic, TOTAL
Population 500,000 to 999,999 (staff, employees, Production and Facility OPERATING CAPITAL Organizational Sample
Sample Size = 25 contractors and artists) Overhead Expenses Expenses Expenses Expenditures Expenditures Size
Sonoma County (CA) $653,821 $327,480 $63,778 $1,045,079 $4,181 $1,049,261 43
Volusia County (FL) $162,154 $116,556 $30,969 $309,679 $2,154 $311,833 44
Guilford County (NC) $434,355 $383,626 $70,191 $888,172 $69,867 $958,039 70
Dane County (WI) $654,753 $367,533 $78,707 $1,100,993 $3,095 $1,104,088 132
Brevard County (FL) $493,030 $143,308 $10,909 $647,247 $0 $647,247 11
Washington County (OR) $270,309 $147,103 $23,980 $441,393 $4,196 $445,589 31
Johnson County (KS) $248,336 $154,295 $34,580 $437,211 $19,671 $456,883 27
City of Louisville (KY) $1,104,156 $694,868 $140,429 $1,939,453 $306,153 $2,245,606 100
City of Baltimore (MD) $1,280,576 $739,410 $203,609 $2,223,594 $11,564 $2,235,159 146
Polk County (FL) $249,198 $185,188 $22,812 $457,198 $7,226 $464,424 34
City of Boston (MA) $2,616,412 $2,046,057 $429,663 $5,092,132 $69,274 $5,161,405 148
District of Columbia (DC) $4,685,616 $2,534,996 $571,114 $7,791,726 $691,526 $8,483,252 195
Nashville-Davidson County (TN) $1,123,631 $847,508 $136,217 $2,107,355 $72,892 $2,180,247 82
City of El Paso (TX) $420,312 $284,228 $57,116 $761,656 $27,537 $789,193 76
Lee County (FL) $395,129 $309,517 $85,815 $790,462 $38,287 $828,748 41
City of Fort Worth (TX) $1,948,120 $1,227,272 $245,428 $3,420,820 $38,319 $3,459,139 74
City of Indianapolis (IN) $1,341,653 $752,868 $178,461 $2,272,982 $171,034 $2,444,016 93
City and County of San Francisco (CA) $1,320,684 $719,880 $128,292 $2,168,855 $5,555 $2,174,410 359
Prince George's County (MD) $393,564 $153,349 $62,835 $609,748 $66 $609,814 39
Pinellas County (FL) $1,199,779 $681,390 $171,759 $2,052,929 $78,881 $2,131,810 47
Shelby County (TN) $774,395 $609,602 $82,743 $1,466,739 $198,002 $1,664,741 71
Fairfield County (CT) $1,194,666 $692,553 $145,488 $2,032,707 $31,478 $2,064,184 72
Westchester County (NY) $539,580 $343,912 $64,199 $947,692 $48,287 $995,979 107
Fulton County (GA) $1,133,374 $697,680 $124,167 $1,955,221 $171,127 $2,126,348 180
Wake County (NC) $691,626 $475,572 $83,431 $1,250,629 $171,167 $1,421,796 126
Group E Average $1,013,169 $625,430 $129,868 $1,768,467 $89,662 $1,858,128 93.9
Percent of Group E Total 54.5% 33.7% 7.0% 95.2% 4.8% 100.0%
Group E Median $691,626 $475,572 $83,431 $1,250,629 $38,287 $1,421,796
SOURCE: Arts and Economic Prosperity 5, Americans for the Arts, 2017. For more information, visit www.AmericansForTheArts.org/EconomicImpact. B–160
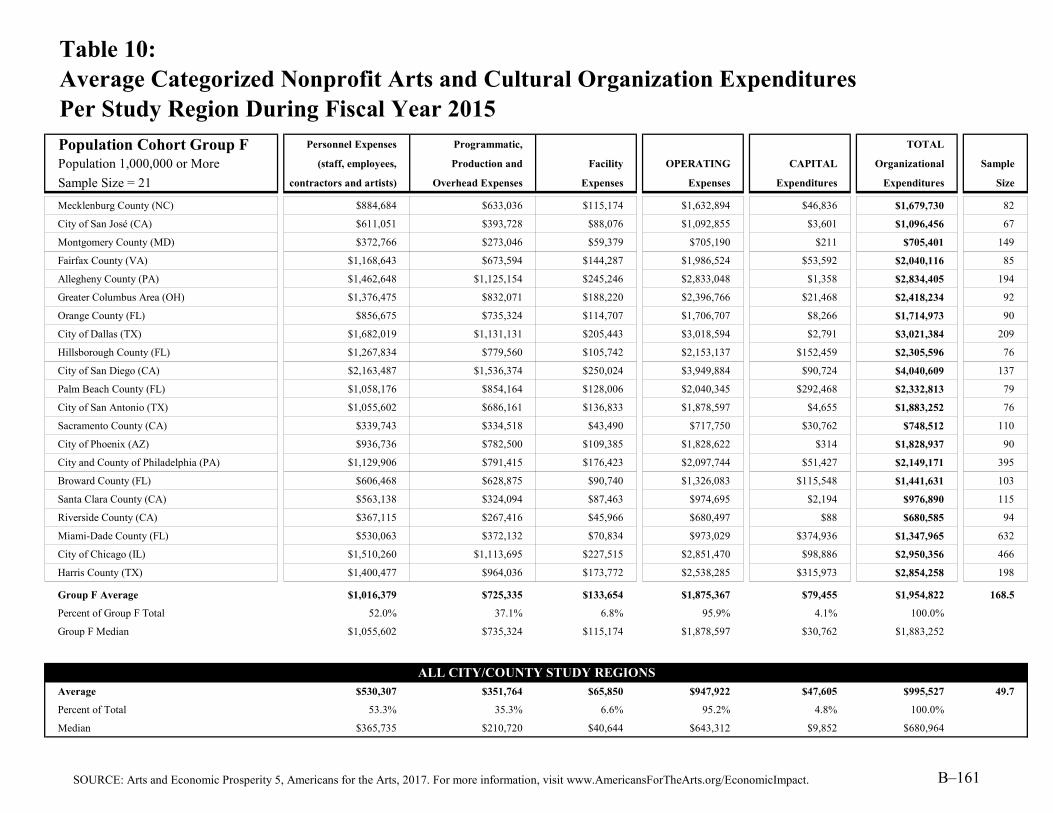
Table 10:Average Categorized Nonprofit Arts and Cultural Organization ExpendituresPer Study Region During Fiscal Year 2015
Population Cohort Group F Personnel Expenses Programmatic, TOTAL
Population 1,000,000 or More (staff, employees, Production and Facility OPERATING CAPITAL Organizational Sample
Sample Size = 21 contractors and artists) Overhead Expenses Expenses Expenses Expenditures Expenditures Size
Mecklenburg County (NC) $884,684 $633,036 $115,174 $1,632,894 $46,836 $1,679,730 82
City of San José (CA) $611,051 $393,728 $88,076 $1,092,855 $3,601 $1,096,456 67
Montgomery County (MD) $372,766 $273,046 $59,379 $705,190 $211 $705,401 149
Fairfax County (VA) $1,168,643 $673,594 $144,287 $1,986,524 $53,592 $2,040,116 85
Allegheny County (PA) $1,462,648 $1,125,154 $245,246 $2,833,048 $1,358 $2,834,405 194
Greater Columbus Area (OH) $1,376,475 $832,071 $188,220 $2,396,766 $21,468 $2,418,234 92
Orange County (FL) $856,675 $735,324 $114,707 $1,706,707 $8,266 $1,714,973 90
City of Dallas (TX) $1,682,019 $1,131,131 $205,443 $3,018,594 $2,791 $3,021,384 209
Hillsborough County (FL) $1,267,834 $779,560 $105,742 $2,153,137 $152,459 $2,305,596 76
City of San Diego (CA) $2,163,487 $1,536,374 $250,024 $3,949,884 $90,724 $4,040,609 137
Palm Beach County (FL) $1,058,176 $854,164 $128,006 $2,040,345 $292,468 $2,332,813 79
City of San Antonio (TX) $1,055,602 $686,161 $136,833 $1,878,597 $4,655 $1,883,252 76
Sacramento County (CA) $339,743 $334,518 $43,490 $717,750 $30,762 $748,512 110
City of Phoenix (AZ) $936,736 $782,500 $109,385 $1,828,622 $314 $1,828,937 90
City and County of Philadelphia (PA) $1,129,906 $791,415 $176,423 $2,097,744 $51,427 $2,149,171 395
Broward County (FL) $606,468 $628,875 $90,740 $1,326,083 $115,548 $1,441,631 103
Santa Clara County (CA) $563,138 $324,094 $87,463 $974,695 $2,194 $976,890 115
Riverside County (CA) $367,115 $267,416 $45,966 $680,497 $88 $680,585 94
Miami-Dade County (FL) $530,063 $372,132 $70,834 $973,029 $374,936 $1,347,965 632
City of Chicago (IL) $1,510,260 $1,113,695 $227,515 $2,851,470 $98,886 $2,950,356 466
Harris County (TX) $1,400,477 $964,036 $173,772 $2,538,285 $315,973 $2,854,258 198
Group F Average $1,016,379 $725,335 $133,654 $1,875,367 $79,455 $1,954,822 168.5
Percent of Group F Total 52.0% 37.1% 6.8% 95.9% 4.1% 100.0%
Group F Median $1,055,602 $735,324 $115,174 $1,878,597 $30,762 $1,883,252
Average $530,307 $351,764 $65,850 $947,922 $47,605 $995,527 49.7
Percent of Total 53.3% 35.3% 6.6% 95.2% 4.8% 100.0%
Median $365,735 $210,720 $40,644 $643,312 $9,852 $680,964
ALL CITY/COUNTY STUDY REGIONS
SOURCE: Arts and Economic Prosperity 5, Americans for the Arts, 2017. For more information, visit www.AmericansForTheArts.org/EconomicImpact. B–161

Table 10:Average Categorized Nonprofit Arts and Cultural Organization ExpendituresPer Study Region During Fiscal Year 2015
Regional Study Regions Personnel Expenses Programmatic, TOTAL
All Populations (staff, employees, Production and Facility OPERATING CAPITAL Organizational Sample
Sample Size = 81 contractors and artists) Overhead Expenses Expenses Expenses Expenditures Expenditures Size
High Peaks Region (ME) $32,165 $25,298 $3,931 $61,394 $5,307 $66,702 11
Wood River Valley (ID) $359,548 $228,168 $36,486 $624,202 $20,346 $644,548 24
Southern Oregon Area $5,088,024 $3,316,421 $660,785 $9,065,229 $317,550 $9,382,779 4
Southwestern Pennsylvania Area $227,250 $177,213 $40,254 $444,716 $8,890 $453,606 29
Greater Portsmouth Area (NH) $484,615 $262,980 $49,262 $796,857 $28,398 $825,255 26
Northeast Oregon Region $72,721 $51,284 $6,340 $130,345 $56 $130,402 5
Toe River Valley (NC) $409,999 $423,349 $49,858 $883,206 $417,559 $1,300,764 9
Albemarle Region (NC) $176,122 $157,569 $21,483 $355,174 $34,087 $389,261 7
Greater Concord Area (NH) $550,546 $414,174 $89,078 $1,053,798 $135,105 $1,188,903 15
North Central Minnesota Region $23,240 $15,568 $2,976 $41,784 $26 $41,809 39
Northwest Minnesota Region $13,146 $8,806 $1,684 $23,636 $62 $23,698 26
Monadnock Region (NH) $204,707 $131,899 $29,909 $366,515 $2,135 $368,650 36
Bismarck-Mandan Region (ND) $397,578 $238,965 $40,248 $676,791 $109,567 $786,358 31
Greater Minot Region (ND) $197,600 $139,052 $26,260 $362,911 $1,250 $364,161 24
Greater Burlington Area (VT) $647,602 $396,503 $83,189 $1,127,294 $79,248 $1,206,542 49
Greater Charlottesville Area (VA) $647,681 $517,967 $48,105 $1,213,753 $162,609 $1,376,362 44
Brainerd Lakes Region (MN) $37,135 $24,876 $4,756 $66,767 $7,653 $74,420 37
East Central Minnesota Region $71,922 $48,178 $9,211 $129,311 $1,809 $131,120 29
Northwest Connecticut Region $205,899 $127,128 $24,573 $357,601 $26,024 $383,624 56
Central Oregon Region $412,405 $265,715 $52,467 $730,586 $35,457 $766,043 13
Greater Fargo-Moorhead Area (ND/MN) $229,344 $127,367 $31,772 $388,483 $4,338 $392,821 53
Black Hills Region (SD) $191,708 $122,318 $22,229 $336,256 $6,651 $342,907 67
Greater Kingsport Area (TN) $192,321 $120,127 $24,421 $336,868 $45,623 $382,491 25
Lake Region (MN) $62,140 $41,626 $7,958 $111,724 $17,990 $129,713 50
South Central Minnesota Region $39,225 $26,275 $5,024 $70,524 $1,765 $72,288 89
Greater Sioux Falls Area (SD) $339,164 $234,214 $41,218 $614,596 $9,697 $624,293 33
Southwest Tennessee Development District $60,388 $41,635 $5,387 $107,410 $495 $107,905 29
Northwest Tennessee Development District $46,438 $27,453 $4,638 $78,529 $205 $78,735 29
Southwest Minnesota Region $33,962 $22,750 $4,350 $61,062 $8,485 $69,547 70
Arrowhead Region (MN) $99,622 $66,734 $12,759 $179,115 $4,416 $183,531 107
SOURCE: Arts and Economic Prosperity 5, Americans for the Arts, 2017. For more information, visit www.AmericansForTheArts.org/EconomicImpact. B–162

Table 10:Average Categorized Nonprofit Arts and Cultural Organization ExpendituresPer Study Region During Fiscal Year 2015
Regional Study Regions Personnel Expenses Programmatic, TOTAL
All Populations (staff, employees, Production and Facility OPERATING CAPITAL Organizational Sample
Sample Size = 81 contractors and artists) Overhead Expenses Expenses Expenses Expenditures Expenditures Size
Maple Grove and the Northwest Suburbs (MN) $51,737 $34,657 $6,626 $93,020 $6,127 $99,147 15
Greater Augusta Area (GA) $603,405 $434,700 $80,481 $1,118,587 $28,524 $1,147,111 33
Upper Cumberland Development District (TN) $77,422 $59,811 $10,216 $147,449 $3,377 $150,826 42
City of Huntsville/Madison County (AL) $874,765 $497,972 $140,499 $1,513,236 $70,398 $1,583,634 34
Northeast Commission (NC) $173,134 $166,685 $18,246 $358,064 $7,142 $365,207 62
Greater Ann Arbor Area (MI) $317,462 $212,659 $40,658 $570,779 $2,976 $573,754 87
Greater Fox Cities Region (WI) $420,784 $1,698,212 $87,595 $2,206,591 $19,946 $2,226,537 18
Central Minnesota Region $90,261 $60,464 $11,560 $162,285 $690 $162,975 54
South Central Tennessee Development District $38,433 $20,399 $4,214 $63,046 $4,695 $67,741 60
Northwest Arkansas Region $1,440,085 $1,143,568 $132,977 $2,716,630 $218,310 $2,934,939 23
Southeast Minnesota Region $75,311 $50,449 $9,645 $135,405 $1,400 $136,805 122
First Tennessee Development District $138,961 $86,031 $17,384 $242,376 $22,879 $265,255 58
Greater Harrisburg Area (PA) $282,289 $202,768 $22,330 $507,387 $0 $507,387 25
Greater New Haven Area (CT) $1,380,427 $809,007 $146,935 $2,336,369 $945,574 $3,281,943 35
Treasure Coast Region (FL) $495,020 $360,345 $62,075 $917,440 $37,009 $954,450 35
Greater Des Moines Region (IA) $506,940 $351,623 $53,356 $911,919 $194,587 $1,106,506 65
Southeast Tennessee Development District $393,188 $268,404 $52,555 $714,147 $10,074 $724,221 93
Greater Knoxville Region (TN) $478,237 $274,855 $34,606 $787,697 $14,984 $802,681 60
Greater Columbia Area (SC) $376,710 $231,611 $45,780 $654,101 $27,132 $681,233 33
Pikes Peak Region (CO) $280,420 $213,633 $57,031 $551,084 $37,343 $588,428 87
Lehigh Valley Region (PA) $442,117 $286,398 $49,227 $777,741 $70,877 $848,618 98
Greater Sarasota/Bradenton Area (FL) $1,288,135 $885,394 $142,718 $2,316,247 $285,641 $2,601,887 83
Dayton Region (OH) $448,759 $313,912 $69,506 $832,177 $9,945 $842,121 113
Richmond & Tri-Cities Region (VA) $1,309,490 $836,125 $149,288 $2,294,903 $255,467 $2,550,370 83
Memphis Area Association of Governments (TN) $754,090 $593,507 $80,592 $1,428,189 $192,577 $1,620,766 73
Eastern Region (NC) $135,032 $96,684 $17,802 $249,518 $2,574 $252,092 110
Advantage West Region (NC) $208,504 $137,290 $24,645 $370,439 $38,423 $408,862 184
Southeast Commission (NC) $241,873 $121,306 $23,328 $386,507 $9,973 $396,480 127
Greater Fairfax Area (VA) $1,016,147 $584,179 $123,432 $1,723,758 $50,985 $1,774,743 103
Greater Tulsa Region (OK) $364,217 $231,101 $44,287 $639,604 $101,714 $741,318 123
SOURCE: Arts and Economic Prosperity 5, Americans for the Arts, 2017. For more information, visit www.AmericansForTheArts.org/EconomicImpact. B–163

Table 10:Average Categorized Nonprofit Arts and Cultural Organization ExpendituresPer Study Region During Fiscal Year 2015
Regional Study Regions Personnel Expenses Programmatic, TOTAL
All Populations (staff, employees, Production and Facility OPERATING CAPITAL Organizational Sample
Sample Size = 81 contractors and artists) Overhead Expenses Expenses Expenses Expenditures Expenditures Size
East Tennessee Development District $312,973 $182,193 $28,825 $523,991 $11,655 $535,645 100
West Valley Region (AZ) $290,425 $249,187 $107,458 $647,070 $12,398 $659,468 20
Greater St. Louis Area (MO) $1,217,982 $744,891 $113,317 $2,076,189 $155,378 $2,231,568 163
Western New York $634,127 $451,925 $74,581 $1,160,633 $77,656 $1,238,289 126
Greater Oklahoma City Region (OK) $707,920 $493,494 $76,020 $1,277,435 $163,638 $1,441,073 153
Piedmont Triad Partnership (NC) $511,812 $373,110 $73,977 $958,900 $49,704 $1,008,604 206
Greater Portland Area (OR) $680,103 $416,253 $67,804 $1,164,159 $7,537 $1,171,696 183
Greater Kansas City Metropolitan Area (MO/KS) $698,476 $501,352 $95,147 $1,294,975 $54,926 $1,349,902 133
Greater Nashville Regional Council (TN) $657,438 $488,070 $77,385 $1,222,892 $45,167 $1,268,059 158
Research Triangle Regional Partnership (NC) $586,683 $343,494 $61,899 $992,076 $94,494 $1,086,570 357
Greater Tampa/St. Petersburg Area (FL) $1,241,829 $742,048 $130,968 $2,114,846 $124,344 $2,239,190 123
Charlotte Regional Partnership (NC) $461,426 $325,045 $62,662 $849,132 $37,834 $886,967 187
Charlotte Regional Partnership (NC/SC) $480,242 $320,285 $59,694 $860,221 $35,491 $895,712 200
Seven-County Metro Area (MN) $528,689 $354,154 $67,710 $950,554 $17,466 $968,020 645
Central Florida Region $479,517 $381,664 $61,750 $922,930 $5,012 $927,942 218
Greater Philadelphia Region (PA) $1,078,824 $743,302 $152,598 $1,974,724 $42,572 $2,017,296 492
Greater Washington Region (DC/MD/VA) $1,974,768 $1,117,909 $240,989 $3,333,666 $239,541 $3,573,207 608
Metro Atlanta Area (GA) $861,985 $541,203 $98,266 $1,501,454 $114,827 $1,616,281 269
Greater Atlanta Region (GA) $793,882 $498,932 $90,682 $1,383,496 $105,960 $1,489,455 297
Greater Houston Region (TX) $1,355,069 $940,851 $169,468 $2,465,388 $307,032 $2,772,420 209
Dallas-Fort Worth-Arlington MSA (TX) $1,230,278 $812,190 $150,751 $2,193,219 $8,344 $2,201,563 454
Regional Average $531,383 $371,443 $64,965 $967,791 $72,532 $1,040,323 105.0
Percent of Regional Total 51.1% 35.7% 6.2% 93.0% 7.0% 100.0%
Regional Median $397,578 $262,980 $49,227 $714,147 $26,024 $766,043
SOURCE: Arts and Economic Prosperity 5, Americans for the Arts, 2017. For more information, visit www.AmericansForTheArts.org/EconomicImpact. B–164
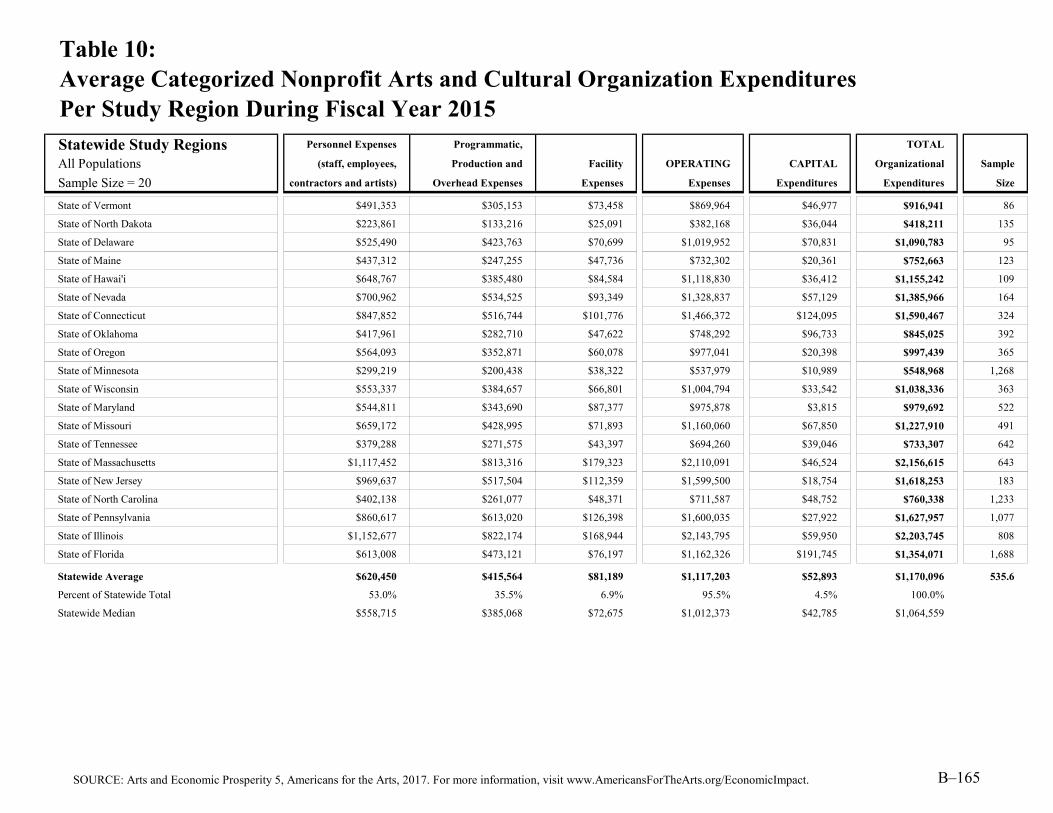
Table 10:Average Categorized Nonprofit Arts and Cultural Organization ExpendituresPer Study Region During Fiscal Year 2015
Statewide Study Regions Personnel Expenses Programmatic, TOTAL
All Populations (staff, employees, Production and Facility OPERATING CAPITAL Organizational Sample
Sample Size = 20 contractors and artists) Overhead Expenses Expenses Expenses Expenditures Expenditures Size
State of Vermont $491,353 $305,153 $73,458 $869,964 $46,977 $916,941 86
State of North Dakota $223,861 $133,216 $25,091 $382,168 $36,044 $418,211 135
State of Delaware $525,490 $423,763 $70,699 $1,019,952 $70,831 $1,090,783 95
State of Maine $437,312 $247,255 $47,736 $732,302 $20,361 $752,663 123
State of Hawai'i $648,767 $385,480 $84,584 $1,118,830 $36,412 $1,155,242 109
State of Nevada $700,962 $534,525 $93,349 $1,328,837 $57,129 $1,385,966 164
State of Connecticut $847,852 $516,744 $101,776 $1,466,372 $124,095 $1,590,467 324
State of Oklahoma $417,961 $282,710 $47,622 $748,292 $96,733 $845,025 392
State of Oregon $564,093 $352,871 $60,078 $977,041 $20,398 $997,439 365
State of Minnesota $299,219 $200,438 $38,322 $537,979 $10,989 $548,968 1,268
State of Wisconsin $553,337 $384,657 $66,801 $1,004,794 $33,542 $1,038,336 363
State of Maryland $544,811 $343,690 $87,377 $975,878 $3,815 $979,692 522
State of Missouri $659,172 $428,995 $71,893 $1,160,060 $67,850 $1,227,910 491
State of Tennessee $379,288 $271,575 $43,397 $694,260 $39,046 $733,307 642
State of Massachusetts $1,117,452 $813,316 $179,323 $2,110,091 $46,524 $2,156,615 643
State of New Jersey $969,637 $517,504 $112,359 $1,599,500 $18,754 $1,618,253 183
State of North Carolina $402,138 $261,077 $48,371 $711,587 $48,752 $760,338 1,233
State of Pennsylvania $860,617 $613,020 $126,398 $1,600,035 $27,922 $1,627,957 1,077
State of Illinois $1,152,677 $822,174 $168,944 $2,143,795 $59,950 $2,203,745 808
State of Florida $613,008 $473,121 $76,197 $1,162,326 $191,745 $1,354,071 1,688
Statewide Average $620,450 $415,564 $81,189 $1,117,203 $52,893 $1,170,096 535.6
Percent of Statewide Total 53.0% 35.5% 6.9% 95.5% 4.5% 100.0%
Statewide Median $558,715 $385,068 $72,675 $1,012,373 $42,785 $1,064,559
SOURCE: Arts and Economic Prosperity 5, Americans for the Arts, 2017. For more information, visit www.AmericansForTheArts.org/EconomicImpact. B–165
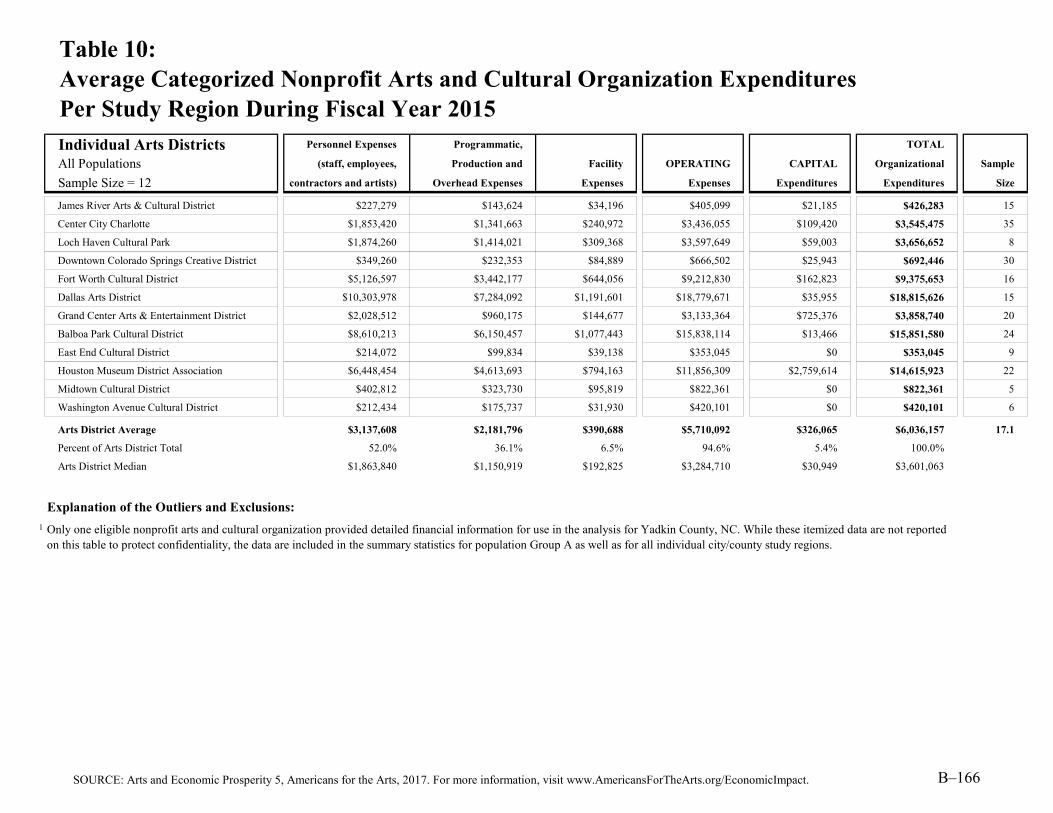
Table 10:Average Categorized Nonprofit Arts and Cultural Organization ExpendituresPer Study Region During Fiscal Year 2015
Individual Arts Districts Personnel Expenses Programmatic, TOTAL
All Populations (staff, employees, Production and Facility OPERATING CAPITAL Organizational Sample
Sample Size = 12 contractors and artists) Overhead Expenses Expenses Expenses Expenditures Expenditures Size
James River Arts & Cultural District $227,279 $143,624 $34,196 $405,099 $21,185 $426,283 15
Center City Charlotte $1,853,420 $1,341,663 $240,972 $3,436,055 $109,420 $3,545,475 35
Loch Haven Cultural Park $1,874,260 $1,414,021 $309,368 $3,597,649 $59,003 $3,656,652 8
Downtown Colorado Springs Creative District $349,260 $232,353 $84,889 $666,502 $25,943 $692,446 30
Fort Worth Cultural District $5,126,597 $3,442,177 $644,056 $9,212,830 $162,823 $9,375,653 16
Dallas Arts District $10,303,978 $7,284,092 $1,191,601 $18,779,671 $35,955 $18,815,626 15
Grand Center Arts & Entertainment District $2,028,512 $960,175 $144,677 $3,133,364 $725,376 $3,858,740 20
Balboa Park Cultural District $8,610,213 $6,150,457 $1,077,443 $15,838,114 $13,466 $15,851,580 24
East End Cultural District $214,072 $99,834 $39,138 $353,045 $0 $353,045 9
Houston Museum District Association $6,448,454 $4,613,693 $794,163 $11,856,309 $2,759,614 $14,615,923 22
Midtown Cultural District $402,812 $323,730 $95,819 $822,361 $0 $822,361 5
Washington Avenue Cultural District $212,434 $175,737 $31,930 $420,101 $0 $420,101 6
Arts District Average $3,137,608 $2,181,796 $390,688 $5,710,092 $326,065 $6,036,157 17.1
Percent of Arts District Total 52.0% 36.1% 6.5% 94.6% 5.4% 100.0%
Arts District Median $1,863,840 $1,150,919 $192,825 $3,284,710 $30,949 $3,601,063
Explanation of the Outliers and Exclusions:1 Only one eligible nonprofit arts and cultural organization provided detailed financial information for use in the analysis for Yadkin County, NC. While these itemized data are not reported
on this table to protect confidentiality, the data are included in the summary statistics for population Group A as well as for all individual city/county study regions.
SOURCE: Arts and Economic Prosperity 5, Americans for the Arts, 2017. For more information, visit www.AmericansForTheArts.org/EconomicImpact. B–166

Explanation of Table 11:Categorized Nonprofit Arts and Cultural Organization Expenditures as aPercentage of Total Expenditures Per Study Region During Fiscal Year 2015
Column Two:
Column Three:
Column Four:
Column Five:
Column Six:
Column Seven:
Column Eight:
The sum of the percentage of total organizational expenditures spent on operating expenditures and the percentage of total organizational expenditures spent on capital expenditures. This figure is the sum of operating expenditures (Column Five) and capital expenditures (Column Six). It is always 100 percent.
The number of eligible nonprofit arts and cultural organizations from which detailed expenditure and event attendance data were collected in each participating study region.
This table presents the categorized expenditures made by participating nonprofit arts and cultural organizations as a percentage of the total organizational expenditures in each participating study region during fiscal year 2015. Summary statistics are calculated for each population group. The averages on this table are calculated per participating study region.
The percentage of total organizational expenditures spent on personnel-related expenses by participating nonprofit arts and cultural organizations in each participating study region during fiscal year 2015. Payroll-related expenses include salaries and wages paid to staff and employees, the costs for contracted staff (i.e., "contractors"), the fees paid to artists and performers, and any applicable payroll taxes and fringe benefits.
The percentage of total organizational expenditures spent on programmatic, production, and overhead expenses by participating nonprofit arts and cultural organizations in each participating study region during fiscal year 2015. Programmatic, production, and overhead expenses include marketing and advertising costs, supplies and office machinery, travel, insurance, communication costs, and the costs associated with programming and producing performances, events, and activities.
The percentage of total organizational expenditures spent on facility expenses by participating nonprofit arts and cultural organizations in each participating study region during fiscal year 2015. Facility expenses include rental and/or lease costs, mortgage costs, property taxes, and utilities.
The percentage of total organizational expenditures spent on operating expenditures by participating nonprofit arts and cultural organizations in each participating study region during fiscal year 2015. This figure is the sum of Columns Two through Four. (See the survey instruments in Appendix C for a detailed breakdown of organizational expenditure categories.) These data are based on the real dollars reported by the organizations that responded to the survey in each study region only; no multiplier was used to calculate these figures and no extrapolations were made for non-responding organizations.
The percentage of total organizational expenditures spent on capital expenditures by participating nonprofit arts and cultural organizations in each study region during fiscal year 2015. According to generally-accepted accounting principles (GAAP), a capital expenditure is a cost which cannot be deducted in the year in which it is paid or incurred and must be capitalized. The general rule is that if the acquired asset's useful life is longer than the taxable year, then the cost must be capitalized. The capital expenditure costs are then amortized or depreciated over the life of the asset in question. For nonprofit arts and cultural organizations, capital expenditures typically include purchases of art, equipment, and real estate. Capital expenditures also include construction and renovation costs. These data are real dollars reported by the organizations that responded to the survey in each study region only; no multiplier was used to calculate these figures and no extrapolations were made for non-responding organizations.
SOURCE: Arts and Economic Prosperity 5, Americans for the Arts, 2017. For more information, visit www.AmericansForTheArts.org/EconomicImpact. B–167

Table 11:Categorized Nonprofit Arts and Cultural Organization Expenditures as aPercentage of Total Expenditures Per Study Region During Fiscal Year 2015
Population Cohort Group A Personnel Expenses Programmatic, TOTAL
Population Fewer than 50,000 (staff, employees, Production and Facility OPERATING CAPITAL Organizational Sample
Sample Size = 52 contractors and artists) Overhead Expenses Expenses Expenditures Expenditures Expenditures Size
Town of Crested Butte (CO) 55.5% 33.5% 8.9% 97.9% 2.1% 100.0% 12
City of Pine City (MN) 55.6% 37.3% 7.1% 100.0% 0.0% 100.0% 5
City of Alva (OK) 63.7% 24.5% 9.1% 97.2% 2.8% 100.0% 13
Cook County (MN) 53.1% 35.6% 6.8% 95.5% 4.5% 100.0% 17
Town of Hillsborough (NC) 54.3% 40.0% 4.5% 98.8% 1.2% 100.0% 16
City of Virginia (MN) 55.6% 37.3% 7.1% 100.0% 0.0% 100.0% 4
Town of Jackson (WY) 57.6% 33.1% 9.1% 99.8% 0.2% 100.0% 18
City of Guthrie (OK) 48.3% 32.0% 6.1% 86.5% 13.5% 100.0% 12
City of Grand Rapids (MN) 54.8% 36.7% 7.0% 98.6% 1.4% 100.0% 12
Town of Medfield (MA) 73.4% 19.5% 6.5% 99.4% 0.6% 100.0% 17
City of Fergus Falls (MN) 35.2% 23.6% 4.5% 63.3% 36.7% 100.0% 9
Grundy County (TN) 53.6% 39.3% 7.1% 100.0% 0.0% 100.0% 10
City of Falls Church (VA) 57.3% 28.5% 3.9% 89.7% 10.3% 100.0% 11
City of Jamestown (ND) 35.4% 35.7% 2.2% 73.4% 26.6% 100.0% 3
City of Waterville (ME) 52.5% 39.5% 8.1% 100.0% 0.0% 100.0% 4
City of Red Wing (MN) 55.6% 37.3% 7.1% 100.0% 0.0% 100.0% 9
City of Durango (CO) 63.0% 31.0% 4.9% 98.9% 1.1% 100.0% 26
City of Hannibal (MO) 53.0% 34.3% 7.8% 95.0% 5.0% 100.0% 6
City of Tullahoma (TN) 46.1% 34.2% 8.6% 88.9% 11.1% 100.0% 11
City of Northfield (MN) 55.6% 37.3% 7.1% 100.0% 0.0% 100.0% 14
Town of Carrboro (NC) 55.6% 33.1% 5.0% 93.7% 6.3% 100.0% 10
Macon County (TN) 30.3% 27.1% 3.9% 61.4% 38.6% 100.0% 7
City of Laguna Beach (CA) 44.7% 28.8% 5.6% 79.1% 20.9% 100.0% 16
Hickman County (TN) 77.6% 18.6% 3.4% 99.7% 0.3% 100.0% 21
City of Fairfax (VA) 55.3% 37.6% 7.1% 100.0% 0.0% 100.0% 7
City of Ponca City (OK) 53.8% 28.9% 10.6% 93.3% 6.7% 100.0% 16
City of Paducah (KY) 35.5% 19.4% 3.5% 58.4% 41.6% 100.0% 19
Mille Lacs County (MN) 54.7% 36.6% 7.0% 98.3% 1.7% 100.0% 10
McNairy County (TN) 55.8% 37.1% 7.1% 100.0% 0.0% 100.0% 5
City of Winona (MN) 55.6% 37.2% 7.1% 100.0% 0.0% 100.0% 17
SOURCE: Arts and Economic Prosperity 5, Americans for the Arts, 2017. For more information, visit www.AmericansForTheArts.org/EconomicImpact. B–168

Table 11:Categorized Nonprofit Arts and Cultural Organization Expenditures as aPercentage of Total Expenditures Per Study Region During Fiscal Year 2015
Population Cohort Group A Personnel Expenses Programmatic, TOTAL
Population Fewer than 50,000 (staff, employees, Production and Facility OPERATING CAPITAL Organizational Sample
Sample Size = 52 contractors and artists) Overhead Expenses Expenses Expenses Expenditures Expenditures Size
Door County (WI) 54.1% 30.9% 7.8% 92.7% 7.3% 100.0% 16
City of Benicia (CA) 78.1% 19.6% 2.3% 100.0% 0.0% 100.0% 12
City of Winter Park (FL) 44.6% 50.8% 4.6% 100.0% 0.0% 100.0% 20
City of Rochester (NH) 55.7% 37.0% 7.0% 99.7% 0.3% 100.0% 12
City of Morgantown (WV) 59.1% 38.4% 2.5% 100.0% 0.0% 100.0% 34
Henry County (TN) 55.6% 37.0% 7.1% 99.7% 0.3% 100.0% 3
City of Fairbanks (AK) 57.0% 36.0% 6.8% 99.8% 0.2% 100.0% 23
City of Bangor (ME) 55.9% 36.9% 7.2% 100.0% 0.0% 100.0% 13
Weakley County (TN) 55.8% 37.1% 7.1% 100.0% 0.0% 100.0% 8
Dare County (NC) 44.2% 51.2% 3.5% 99.0% 1.0% 100.0% 20
City of Columbia (TN) 54.4% 36.5% 6.9% 97.8% 2.2% 100.0% 7
City of Lake Worth (FL) 32.6% 60.2% 3.2% 95.9% 4.1% 100.0% 12
Clatsop County (OR) 55.1% 35.6% 7.8% 98.4% 1.6% 100.0% 22
Yadkin County (NC)1 not reported not reported not reported not reported not reported not reported 1
Greater Belfast Area (ME) 55.8% 37.1% 7.1% 100.0% 0.0% 100.0% 20
Campbell County (TN) 45.2% 46.7% 5.8% 97.7% 2.3% 100.0% 7
Monroe County (TN) 54.2% 18.4% 10.3% 83.0% 17.0% 100.0% 8
Lincoln County (OR) 48.6% 48.6% 2.7% 99.9% 0.1% 100.0% 10
Iron County (UT) 55.8% 37.1% 7.1% 100.0% 0.0% 100.0% 19
City of St. Louis Park (MN) 55.6% 37.3% 7.1% 100.0% 0.0% 100.0% 15
City of Logan (UT) 49.4% 30.9% 7.0% 87.3% 12.7% 100.0% 24
Gibson County (TN) 57.6% 36.9% 5.0% 99.5% 0.5% 100.0% 11
Group A Average 53.4% 34.8% 6.3% 94.6% 5.4% 100.0% 13.0
Group A Median 55.4% 36.7% 7.0% 99.2% 0.8% 100.0%
SOURCE: Arts and Economic Prosperity 5, Americans for the Arts, 2017. For more information, visit www.AmericansForTheArts.org/EconomicImpact. B–169

Table 11:Categorized Nonprofit Arts and Cultural Organization Expenditures as aPercentage of Total Expenditures Per Study Region During Fiscal Year 2015
Population Cohort Group B Personnel Expenses Programmatic, TOTAL
Population 50,000 to 99,999 (staff, employees, Production and Facility OPERATING CAPITAL Organizational Sample
Sample Size = 38 contractors and artists) Overhead Expenses Expenses Expenses Expenditures Expenditures Size
City of Joplin (MO) 60.3% 31.9% 6.2% 98.5% 1.5% 100.0% 20
City of La Crosse (WI) 51.6% 33.9% 7.1% 92.6% 7.4% 100.0% 33
McMinn County (TN) 49.8% 33.4% 7.8% 91.1% 8.9% 100.0% 20
Lafayette County (MS) 29.7% 22.6% 4.8% 57.0% 43.0% 100.0% 19
Chisago County (MN) 55.6% 37.3% 7.1% 100.0% 0.0% 100.0% 6
City of Grand Forks (ND) 62.8% 31.3% 5.9% 100.0% 0.0% 100.0% 13
City of Corvallis (OR) 56.2% 36.8% 7.0% 100.0% 0.0% 100.0% 22
City of Noblesville (IN) 60.8% 39.2% 0.0% 100.0% 0.0% 100.0% 2
City of Ocala (FL) 54.5% 31.5% 6.3% 92.3% 7.7% 100.0% 29
Lenoir County (NC) 55.8% 37.1% 7.1% 100.0% 0.0% 100.0% 11
Town of Chapel Hill (NC) 62.0% 26.9% 4.9% 93.8% 6.2% 100.0% 55
City of Grand Junction (CO) 66.9% 18.6% 4.8% 90.3% 9.7% 100.0% 32
Town of Jupiter (FL) 54.4% 36.5% 6.9% 97.8% 2.2% 100.0% 3
Hamblen County (TN) 50.3% 32.5% 8.2% 91.0% 9.0% 100.0% 6
City of Delray Beach (FL) 59.5% 33.8% 6.4% 99.7% 0.3% 100.0% 12
City of St. Cloud (MN) 55.4% 37.1% 7.1% 99.6% 0.4% 100.0% 25
City of Portland (ME) 52.6% 35.4% 7.0% 95.0% 5.0% 100.0% 46
City of Jackson (TN) 56.2% 38.7% 4.7% 99.5% 0.5% 100.0% 13
City of Walnut Creek (CA) 57.2% 34.9% 7.4% 99.5% 0.5% 100.0% 29
Greene County (TN) 53.1% 35.3% 6.8% 95.2% 4.8% 100.0% 9
City of Flagstaff (AZ) 56.3% 37.0% 6.6% 100.0% 0.0% 100.0% 55
City of Missoula (MT) 57.9% 34.8% 5.0% 97.8% 2.2% 100.0% 34
City of Fort Myers (FL) 54.0% 33.1% 8.3% 95.4% 4.6% 100.0% 14
Putnam County (TN) 55.4% 37.1% 7.2% 99.7% 0.3% 100.0% 9
Monroe County (FL) 54.5% 37.5% 7.9% 99.9% 0.1% 100.0% 53
City of Lynchburg (VA) 53.0% 34.2% 7.9% 95.2% 4.8% 100.0% 20
City of Duluth (MN) 55.5% 37.2% 7.1% 99.7% 0.3% 100.0% 37
City of Fishers (IN) 43.3% 52.8% 2.8% 98.9% 1.1% 100.0% 6
City of Carmel (IN) 50.3% 39.4% 9.8% 99.5% 0.5% 100.0% 12
City of Sugar Land (TX) 52.4% 34.5% 10.0% 96.8% 3.2% 100.0% 5
SOURCE: Arts and Economic Prosperity 5, Americans for the Arts, 2017. For more information, visit www.AmericansForTheArts.org/EconomicImpact. B–170

Table 11:Categorized Nonprofit Arts and Cultural Organization Expenditures as aPercentage of Total Expenditures Per Study Region During Fiscal Year 2015
Population Cohort Group B Personnel Expenses Programmatic, TOTAL
Population 50,000 to 99,999 (staff, employees, Production and Facility OPERATING CAPITAL Organizational Sample
Sample Size = 38 contractors and artists) Overhead Expenses Expenses Expenses Expenditures Expenditures Size
City of Asheville (NC) 50.5% 35.2% 7.5% 93.2% 6.8% 100.0% 43
Buchanan County (MO) 51.8% 41.6% 6.5% 100.0% 0.0% 100.0% 27
City of Boca Raton (FL) 56.2% 34.9% 6.9% 98.1% 1.9% 100.0% 10
City of Miami Beach (FL) 53.4% 33.2% 7.1% 93.7% 6.3% 100.0% 75
Moore County (NC) 55.2% 34.3% 6.2% 95.8% 4.2% 100.0% 34
Sevier County (TN) 47.2% 34.6% 18.1% 99.9% 0.1% 100.0% 10
Cape May County (NJ) 54.3% 37.6% 5.5% 97.4% 2.6% 100.0% 7
Cleveland County (NC) 52.8% 39.2% 6.2% 98.1% 1.9% 100.0% 15
Group B Average 54.2% 35.1% 6.8% 96.1% 3.9% 100.0% 22.9
Group B Median 54.5% 35.1% 6.9% 98.1% 1.9% 100.0%
SOURCE: Arts and Economic Prosperity 5, Americans for the Arts, 2017. For more information, visit www.AmericansForTheArts.org/EconomicImpact. B–171

Table 11:Categorized Nonprofit Arts and Cultural Organization Expenditures as aPercentage of Total Expenditures Per Study Region During Fiscal Year 2015
Population Cohort Group C Personnel Expenses Programmatic, TOTAL
Population 100,000 to 249,999 (staff, employees, Production and Facility OPERATING CAPITAL Organizational Sample
Sample Size = 50 contractors and artists) Overhead Expenses Expenses Expenses Expenditures Expenditures Size
City of Las Cruces (NM) 55.9% 36.4% 7.3% 99.6% 0.4% 100.0% 22
Eau Claire County (WI) 44.3% 27.4% 3.6% 75.3% 24.7% 100.0% 15
Yamhill County (OR) 46.9% 31.4% 6.0% 84.3% 15.7% 100.0% 53
City of Lewisville (TX) 47.2% 42.5% 9.9% 99.6% 0.4% 100.0% 8
City of West Palm Beach (FL) 42.3% 34.0% 5.2% 81.5% 18.5% 100.0% 29
City of Boulder (CO) 55.1% 36.6% 7.0% 98.7% 1.3% 100.0% 65
City of Richardson (TX) 64.5% 33.2% 2.3% 100.0% 0.0% 100.0% 24
City of High Point (NC) 58.7% 32.1% 5.4% 96.1% 3.9% 100.0% 10
City of Cambridge (MA) 50.1% 40.7% 9.2% 100.0% 0.0% 100.0% 35
City of Lowell (MA) 62.6% 30.3% 7.1% 100.0% 0.0% 100.0% 15
Douglas County (KS) 63.4% 30.3% 2.4% 96.1% 3.9% 100.0% 23
City of Columbia (MO) 55.3% 37.2% 6.0% 98.5% 1.5% 100.0% 29
City of Norman (OK) 59.1% 34.3% 4.7% 98.1% 1.9% 100.0% 24
Wayne County (NC) 50.9% 36.4% 9.9% 97.2% 2.8% 100.0% 15
City of Lafayette (LA) 55.7% 37.2% 7.1% 100.0% 0.0% 100.0% 10
Washington County (TN) 58.1% 33.3% 6.9% 98.3% 1.7% 100.0% 20
City of Thousand Oaks (CA) 63.8% 29.0% 6.4% 99.2% 0.8% 100.0% 12
City of Charleston (SC) 62.6% 29.7% 7.6% 99.8% 0.2% 100.0% 38
City of Waco (TX) 52.9% 36.9% 6.8% 96.7% 3.3% 100.0% 30
Robeson County (NC) 54.9% 37.5% 7.4% 99.8% 0.2% 100.0% 9
Columbia County (GA) 15.8% 26.2% 16.3% 58.3% 41.7% 100.0% 5
Orange County (NC) 61.6% 27.3% 4.9% 93.9% 6.1% 100.0% 82
City of Savannah (GA) 61.8% 32.1% 5.2% 99.0% 1.0% 100.0% 45
Indian River County (FL) 47.7% 41.6% 7.7% 97.1% 2.9% 100.0% 10
City of Alexandria (VA) 50.8% 35.7% 7.4% 93.9% 6.1% 100.0% 50
Martin County (FL) 52.4% 37.6% 4.2% 94.2% 5.8% 100.0% 20
Macon-Bibb County (GA) 51.3% 36.5% 6.7% 94.5% 5.5% 100.0% 48
City of Springfield (MA) 56.6% 29.4% 7.6% 93.6% 6.4% 100.0% 15
Catawba County (NC) 49.4% 32.2% 11.2% 92.9% 7.1% 100.0% 25
Town of Cary (NC) 65.5% 19.3% 11.9% 96.7% 3.3% 100.0% 37
SOURCE: Arts and Economic Prosperity 5, Americans for the Arts, 2017. For more information, visit www.AmericansForTheArts.org/EconomicImpact. B–172

Table 11:Categorized Nonprofit Arts and Cultural Organization Expenditures as aPercentage of Total Expenditures Per Study Region During Fiscal Year 2015
Population Cohort Group C Personnel Expenses Programmatic, TOTAL
Population 100,000 to 249,999 (staff, employees, Production and Facility OPERATING CAPITAL Organizational Sample
Sample Size = 50 contractors and artists) Overhead Expenses Expenses Expenses Expenditures Expenditures Size
Alamance County (NC) 59.7% 28.3% 5.5% 93.5% 6.5% 100.0% 34
Cumberland County (NJ) 55.0% 33.2% 8.7% 96.9% 3.1% 100.0% 25
City of Eugene (OR) 56.7% 35.7% 5.9% 98.3% 1.7% 100.0% 40
Middlesex County (CT) 56.0% 36.6% 7.0% 99.6% 0.4% 100.0% 15
City of Springfield (MO) 50.8% 34.7% 8.3% 93.8% 6.2% 100.0% 24
City of Sioux Falls (SD) 54.5% 37.4% 6.5% 98.4% 1.6% 100.0% 26
Pitt County (NC) 56.4% 36.0% 7.1% 99.4% 0.6% 100.0% 23
City of Providence (RI) 60.4% 33.1% 6.4% 99.9% 0.1% 100.0% 56
City of Worcester (MA) 54.2% 33.6% 8.0% 95.7% 4.3% 100.0% 57
Montgomery County (TN) 48.8% 47.0% 4.1% 100.0% 0.0% 100.0% 20
Salt Lake City (UT) 57.3% 36.2% 5.7% 99.1% 0.9% 100.0% 57
Cabarrus County (NC) 56.6% 30.7% 4.4% 91.7% 8.3% 100.0% 18
Richmond County (GA) 52.6% 37.9% 7.0% 97.6% 2.4% 100.0% 28
City of Tacoma (WA) 52.0% 30.2% 5.8% 88.0% 12.0% 100.0% 66
Doña Ana County (NM) 56.0% 36.3% 7.2% 99.4% 0.6% 100.0% 29
New Hanover County (NC) 51.4% 36.6% 6.6% 94.7% 5.3% 100.0% 35
Arlington County (VA) 54.6% 38.5% 5.0% 98.1% 1.9% 100.0% 72
City of Irving (TX) 54.3% 38.8% 7.0% 100.0% 0.0% 100.0% 17
City of Reno (NV) 50.5% 32.5% 6.3% 89.4% 10.6% 100.0% 47
York County (SC) 73.5% 24.7% 1.7% 99.8% 0.2% 100.0% 13
Group C Average 54.6% 34.0% 6.7% 95.3% 4.7% 100.0% 30.5
Group C Median 55.1% 34.5% 6.8% 97.8% 2.2% 100.0%
SOURCE: Arts and Economic Prosperity 5, Americans for the Arts, 2017. For more information, visit www.AmericansForTheArts.org/EconomicImpact. B–173

Table 11:Categorized Nonprofit Arts and Cultural Organization Expenditures as aPercentage of Total Expenditures Per Study Region During Fiscal Year 2015
Population Cohort Group D Personnel Expenses Programmatic, TOTAL
Population 250,000 to 499,999 (staff, employees, Production and Facility OPERATING CAPITAL Organizational Sample
Sample Size = 42 contractors and artists) Overhead Expenses Expenses Expenses Expenditures Expenditures Size
Buncombe County (NC) 48.8% 36.5% 7.2% 92.6% 7.4% 100.0% 52
Alachua County (FL) 56.3% 35.8% 6.5% 98.6% 1.4% 100.0% 44
Greater Green Bay Area (WI) 55.3% 32.9% 7.7% 95.8% 4.2% 100.0% 41
City of Orlando (FL) 52.8% 39.7% 7.1% 99.6% 0.4% 100.0% 55
City of Lincoln (NE) 54.5% 38.6% 6.6% 99.6% 0.4% 100.0% 40
Southeastern Connecticut Region (CT) 55.4% 36.3% 7.4% 99.0% 1.0% 100.0% 70
Erie County (PA) 54.4% 38.1% 6.8% 99.3% 0.7% 100.0% 46
San Luis Obispo County (CA) 57.1% 30.8% 6.7% 94.6% 5.4% 100.0% 28
City of Newark (NJ) 63.5% 28.1% 7.5% 99.0% 1.0% 100.0% 31
Leon County (FL) 25.4% 69.6% 2.9% 97.9% 2.1% 100.0% 69
Rutherford County (TN) 60.9% 23.4% 5.2% 89.5% 10.5% 100.0% 36
St. Lucie County (FL) 70.3% 19.1% 10.6% 100.0% 0.0% 100.0% 5
Greater Spartanburg Area (SC) 58.8% 28.0% 7.0% 93.8% 6.2% 100.0% 29
Durham County (NC) 56.3% 31.9% 6.0% 94.2% 5.8% 100.0% 69
City of St. Paul (MN) 54.5% 36.5% 7.0% 98.0% 2.0% 100.0% 167
Hamilton County (IN) 46.0% 47.9% 5.2% 99.1% 0.9% 100.0% 21
Osceola County (FL) 62.2% 29.1% 8.6% 99.9% 0.1% 100.0% 7
Escambia County (FL) 56.4% 35.5% 7.1% 99.0% 1.0% 100.0% 25
Lexington-Fayette Urban County (KY) 43.9% 32.5% 6.3% 82.6% 17.4% 100.0% 34
Lake County (FL) 53.3% 35.5% 11.2% 100.0% 0.0% 100.0% 11
City of Riverside (CA) 53.7% 39.1% 7.1% 100.0% 0.0% 100.0% 45
Cumberland County (NC) 67.2% 26.2% 5.2% 98.6% 1.4% 100.0% 48
Collier County (FL) 59.5% 32.6% 4.2% 96.3% 3.7% 100.0% 45
Hamilton County (TN) 54.4% 37.2% 7.2% 98.9% 1.1% 100.0% 53
Manatee County (FL) 53.9% 38.9% 7.0% 99.9% 0.1% 100.0% 32
City of Tampa (FL) 55.2% 33.7% 4.0% 92.9% 7.1% 100.0% 56
Forsyth County (NC) 53.9% 36.7% 7.6% 98.2% 1.8% 100.0% 59
Mercer County (NJ) 61.1% 28.6% 8.6% 98.3% 1.7% 100.0% 25
City of Wichita (KS) 57.3% 31.5% 9.2% 98.1% 1.9% 100.0% 34
Clackamas County (OR) 62.9% 31.5% 5.5% 100.0% 0.0% 100.0% 18
SOURCE: Arts and Economic Prosperity 5, Americans for the Arts, 2017. For more information, visit www.AmericansForTheArts.org/EconomicImpact. B–174

Table 11:Categorized Nonprofit Arts and Cultural Organization Expenditures as aPercentage of Total Expenditures Per Study Region During Fiscal Year 2015
Population Cohort Group D Personnel Expenses Programmatic, TOTAL
Population 250,000 to 499,999 (staff, employees, Production and Facility OPERATING CAPITAL Organizational Sample
Sample Size = 42 contractors and artists) Overhead Expenses Expenses Expenses Expenditures Expenditures Size
Sarasota County (FL) 49.2% 33.7% 5.4% 88.2% 11.8% 100.0% 51
City of Minneapolis (MN) 54.8% 36.7% 7.0% 98.6% 1.4% 100.0% 297
Berks County (PA) 47.5% 39.3% 9.9% 96.7% 3.3% 100.0% 20
City of Miami (FL) 34.7% 24.1% 5.2% 63.9% 36.1% 100.0% 216
City of Raleigh (NC) 48.2% 34.3% 5.6% 88.2% 11.8% 100.0% 78
Santa Barbara County (CA) 52.5% 35.5% 7.1% 95.1% 4.9% 100.0% 93
Seminole County (FL) 55.7% 37.1% 7.1% 99.9% 0.1% 100.0% 21
City of Virginia Beach (VA) 54.4% 35.7% 5.1% 95.1% 4.9% 100.0% 33
City of Atlanta (GA) 53.3% 32.6% 5.8% 91.7% 8.3% 100.0% 146
City of Mesa (AZ) 60.9% 24.6% 14.5% 100.0% 0.0% 100.0% 14
City of Kansas City (MO) 51.4% 37.3% 7.1% 95.8% 4.2% 100.0% 91
Morris County (NJ) 55.0% 34.4% 8.7% 98.1% 1.9% 100.0% 14
Group D Average 54.4% 34.5% 7.0% 95.8% 4.2% 100.0% 56.4
Group D Median 54.7% 35.0% 7.0% 98.2% 1.8% 100.0%
SOURCE: Arts and Economic Prosperity 5, Americans for the Arts, 2017. For more information, visit www.AmericansForTheArts.org/EconomicImpact. B–175

Table 11:Categorized Nonprofit Arts and Cultural Organization Expenditures as aPercentage of Total Expenditures Per Study Region During Fiscal Year 2015
Population Cohort Group E Personnel Expenses Programmatic, TOTAL
Population 500,000 to 999,999 (staff, employees, Production and Facility OPERATING CAPITAL Organizational Sample
Sample Size = 25 contractors and artists) Overhead Expenses Expenses Expenses Expenditures Expenditures Size
Sonoma County (CA) 62.3% 31.2% 6.1% 99.6% 0.4% 100.0% 43
Volusia County (FL) 52.0% 37.4% 9.9% 99.3% 0.7% 100.0% 44
Guilford County (NC) 45.3% 40.0% 7.3% 92.7% 7.3% 100.0% 70
Dane County (WI) 59.3% 33.3% 7.1% 99.7% 0.3% 100.0% 132
Brevard County (FL) 76.2% 22.1% 1.7% 100.0% 0.0% 100.0% 11
Washington County (OR) 60.7% 33.0% 5.4% 99.1% 0.9% 100.0% 31
Johnson County (KS) 54.4% 33.8% 7.6% 95.7% 4.3% 100.0% 27
City of Louisville (KY) 49.2% 30.9% 6.3% 86.4% 13.6% 100.0% 100
City of Baltimore (MD) 57.3% 33.1% 9.1% 99.5% 0.5% 100.0% 146
Polk County (FL) 53.7% 39.9% 4.9% 98.4% 1.6% 100.0% 34
City of Boston (MA) 50.7% 39.6% 8.3% 98.7% 1.3% 100.0% 148
District of Columbia (DC) 55.2% 29.9% 6.7% 91.8% 8.2% 100.0% 195
Nashville-Davidson County (TN) 51.5% 38.9% 6.2% 96.7% 3.3% 100.0% 82
City of El Paso (TX) 53.3% 36.0% 7.2% 96.5% 3.5% 100.0% 76
Lee County (FL) 47.7% 37.3% 10.4% 95.4% 4.6% 100.0% 41
City of Fort Worth (TX) 56.3% 35.5% 7.1% 98.9% 1.1% 100.0% 74
City of Indianapolis (IN) 54.9% 30.8% 7.3% 93.0% 7.0% 100.0% 93
City and County of San Francisco (CA) 60.7% 33.1% 5.9% 99.7% 0.3% 100.0% 359
Prince George's County (MD) 64.5% 25.1% 10.3% 100.0% 0.0% 100.0% 39
Pinellas County (FL) 56.3% 32.0% 8.1% 96.3% 3.7% 100.0% 47
Shelby County (TN) 46.5% 36.6% 5.0% 88.1% 11.9% 100.0% 71
Fairfield County (CT) 57.9% 33.6% 7.0% 98.5% 1.5% 100.0% 72
Westchester County (NY) 54.2% 34.5% 6.4% 95.2% 4.8% 100.0% 107
Fulton County (GA) 53.3% 32.8% 5.8% 92.0% 8.0% 100.0% 180
Wake County (NC) 48.6% 33.4% 5.9% 88.0% 12.0% 100.0% 126
Group E Average 55.3% 33.8% 6.9% 96.0% 4.0% 100.0% 93.9
Group E Median 54.4% 33.4% 7.0% 96.7% 3.3% 100.0%
SOURCE: Arts and Economic Prosperity 5, Americans for the Arts, 2017. For more information, visit www.AmericansForTheArts.org/EconomicImpact. B–176

Table 11:Categorized Nonprofit Arts and Cultural Organization Expenditures as aPercentage of Total Expenditures Per Study Region During Fiscal Year 2015
Population Cohort Group F Personnel Expenses Programmatic, TOTAL
Population 1,000,000 or More (staff, employees, Production and Facility OPERATING CAPITAL Organizational Sample
Sample Size = 21 contractors and artists) Overhead Expenses Expenses Expenses Expenditures Expenditures Size
Mecklenburg County (NC) 52.7% 37.7% 6.9% 97.2% 2.8% 100.0% 82
City of San José (CA) 55.7% 35.9% 8.0% 99.7% 0.3% 100.0% 67
Montgomery County (MD) 52.8% 38.7% 8.4% 100.0% 0.0% 100.0% 149
Fairfax County (VA) 57.3% 33.0% 7.1% 97.4% 2.6% 100.0% 85
Allegheny County (PA) 51.6% 39.7% 8.7% 100.0% 0.0% 100.0% 194
Greater Columbus Area (OH) 56.9% 34.4% 7.8% 99.1% 0.9% 100.0% 92
Orange County (FL) 50.0% 42.9% 6.7% 99.5% 0.5% 100.0% 90
City of Dallas (TX) 55.7% 37.4% 6.8% 99.9% 0.1% 100.0% 209
Hillsborough County (FL) 55.0% 33.8% 4.6% 93.4% 6.6% 100.0% 76
City of San Diego (CA) 53.5% 38.0% 6.2% 97.8% 2.2% 100.0% 137
Palm Beach County (FL) 45.4% 36.6% 5.5% 87.5% 12.5% 100.0% 79
City of San Antonio (TX) 56.1% 36.4% 7.3% 99.8% 0.2% 100.0% 76
Sacramento County (CA) 45.4% 44.7% 5.8% 95.9% 4.1% 100.0% 110
City of Phoenix (AZ) 51.2% 42.8% 6.0% 100.0% 0.0% 100.0% 90
City and County of Philadelphia (PA) 52.6% 36.8% 8.2% 97.6% 2.4% 100.0% 395
Broward County (FL) 42.1% 43.6% 6.3% 92.0% 8.0% 100.0% 103
Santa Clara County (CA) 57.6% 33.2% 9.0% 99.8% 0.2% 100.0% 115
Riverside County (CA) 53.9% 39.3% 6.8% 100.0% 0.0% 100.0% 94
Miami-Dade County (FL) 39.3% 27.6% 5.3% 72.2% 27.8% 100.0% 632
City of Chicago (IL) 51.2% 37.7% 7.7% 96.6% 3.4% 100.0% 466
Harris County (TX) 49.1% 33.8% 6.1% 88.9% 11.1% 100.0% 198
Group F Average 51.7% 37.3% 6.9% 95.9% 4.1% 100.0% 168.5
Group F Median 52.7% 37.4% 6.8% 97.8% 2.2% 100.0%
Average 54.0% 34.7% 6.7% 95.5% 4.5% 100.0% 49.7
Median 54.7% 35.5% 7.0% 98.3% 1.7% 100.0%
ALL CITY/COUNTY STUDY REGIONS
SOURCE: Arts and Economic Prosperity 5, Americans for the Arts, 2017. For more information, visit www.AmericansForTheArts.org/EconomicImpact. B–177

Table 11:Categorized Nonprofit Arts and Cultural Organization Expenditures as aPercentage of Total Expenditures Per Study Region During Fiscal Year 2015
Regional Study Regions Personnel Expenses Programmatic, TOTAL
All Populations (staff, employees, Production and Facility OPERATING CAPITAL Organizational Sample
Sample Size = 81 contractors and artists) Overhead Expenses Expenses Expenses Expenditures Expenditures Size
High Peaks Region (ME) 48.2% 37.9% 5.9% 92.0% 8.0% 100.0% 11
Wood River Valley (ID) 55.8% 35.4% 5.7% 96.8% 3.2% 100.0% 24
Southern Oregon Area 54.2% 35.3% 7.0% 96.6% 3.4% 100.0% 4
Southwestern Pennsylvania Area 50.1% 39.1% 8.9% 98.0% 2.0% 100.0% 29
Greater Portsmouth Area (NH) 58.7% 31.9% 6.0% 96.6% 3.4% 100.0% 26
Northeast Oregon Region 55.8% 39.3% 4.9% 100.0% 0.0% 100.0% 5
Toe River Valley (NC) 31.5% 32.5% 3.8% 67.9% 32.1% 100.0% 9
Albemarle Region (NC) 45.2% 40.5% 5.5% 91.2% 8.8% 100.0% 7
Greater Concord Area (NH) 46.3% 34.8% 7.5% 88.6% 11.4% 100.0% 15
North Central Minnesota Region 55.6% 37.2% 7.1% 99.9% 0.1% 100.0% 39
Northwest Minnesota Region 55.5% 37.2% 7.1% 99.7% 0.3% 100.0% 26
Monadnock Region (NH) 55.5% 35.8% 8.1% 99.4% 0.6% 100.0% 36
Bismarck-Mandan Region (ND) 50.6% 30.4% 5.1% 86.1% 13.9% 100.0% 31
Greater Minot Region (ND) 54.3% 38.2% 7.2% 99.7% 0.3% 100.0% 24
Greater Burlington Area (VT) 53.7% 32.9% 6.9% 93.4% 6.6% 100.0% 49
Greater Charlottesville Area (VA) 47.1% 37.6% 3.5% 88.2% 11.8% 100.0% 44
Brainerd Lakes Region (MN) 49.9% 33.4% 6.4% 89.7% 10.3% 100.0% 37
East Central Minnesota Region 54.9% 36.7% 7.0% 98.6% 1.4% 100.0% 29
Northwest Connecticut Region 53.7% 33.1% 6.4% 93.2% 6.8% 100.0% 56
Central Oregon Region 53.8% 34.7% 6.8% 95.4% 4.6% 100.0% 13
Greater Fargo-Moorhead Area (ND/MN) 58.4% 32.4% 8.1% 98.9% 1.1% 100.0% 53
Black Hills Region (SD) 55.9% 35.7% 6.5% 98.1% 1.9% 100.0% 67
Greater Kingsport Area (TN) 50.3% 31.4% 6.4% 88.1% 11.9% 100.0% 25
Lake Region (MN) 47.9% 32.1% 6.1% 86.1% 13.9% 100.0% 50
South Central Minnesota Region 54.3% 36.3% 6.9% 97.6% 2.4% 100.0% 89
Greater Sioux Falls Area (SD) 54.3% 37.5% 6.6% 98.4% 1.6% 100.0% 33
Southwest Tennessee Development District 56.0% 38.6% 5.0% 99.5% 0.5% 100.0% 29
Northwest Tennessee Development District 59.0% 34.9% 5.9% 99.7% 0.3% 100.0% 29
Southwest Minnesota Region 48.8% 32.7% 6.3% 87.8% 12.2% 100.0% 70
Arrowhead Region (MN) 54.3% 36.4% 7.0% 97.6% 2.4% 100.0% 107
SOURCE: Arts and Economic Prosperity 5, Americans for the Arts, 2017. For more information, visit www.AmericansForTheArts.org/EconomicImpact. B–178

Table 11:Categorized Nonprofit Arts and Cultural Organization Expenditures as aPercentage of Total Expenditures Per Study Region During Fiscal Year 2015
Regional Study Regions Personnel Expenses Programmatic, TOTAL
All Populations (staff, employees, Production and Facility OPERATING CAPITAL Organizational Sample
Sample Size = 81 contractors and artists) Overhead Expenses Expenses Expenses Expenditures Expenditures Size
Maple Grove and the Northwest Suburbs (MN) 52.2% 35.0% 6.7% 93.8% 6.2% 100.0% 15
Greater Augusta Area (GA) 52.6% 37.9% 7.0% 97.5% 2.5% 100.0% 33
Upper Cumberland Development District (TN) 51.3% 39.7% 6.8% 97.8% 2.2% 100.0% 42
City of Huntsville/Madison County (AL) 55.2% 31.4% 8.9% 95.6% 4.4% 100.0% 34
Northeast Commission (NC) 47.4% 45.6% 5.0% 98.0% 2.0% 100.0% 62
Greater Ann Arbor Area (MI) 55.3% 37.1% 7.1% 99.5% 0.5% 100.0% 87
Greater Fox Cities Region (WI) 18.9% 76.3% 3.9% 99.1% 0.9% 100.0% 18
Central Minnesota Region 55.4% 37.1% 7.1% 99.6% 0.4% 100.0% 54
South Central Tennessee Development District 56.7% 30.1% 6.2% 93.1% 6.9% 100.0% 60
Northwest Arkansas Region 49.1% 39.0% 4.5% 92.6% 7.4% 100.0% 23
Southeast Minnesota Region 55.0% 36.9% 7.1% 99.0% 1.0% 100.0% 122
First Tennessee Development District 52.4% 32.4% 6.6% 91.4% 8.6% 100.0% 58
Greater Harrisburg Area (PA) 55.6% 40.0% 4.4% 100.0% 0.0% 100.0% 25
Greater New Haven Area (CT) 42.1% 24.7% 4.5% 71.2% 28.8% 100.0% 35
Treasure Coast Region (FL) 51.9% 37.8% 6.5% 96.1% 3.9% 100.0% 35
Greater Des Moines Region (IA) 45.8% 31.8% 4.8% 82.4% 17.6% 100.0% 65
Southeast Tennessee Development District 54.3% 37.1% 7.3% 98.6% 1.4% 100.0% 93
Greater Knoxville Region (TN) 59.6% 34.2% 4.3% 98.1% 1.9% 100.0% 60
Greater Columbia Area (SC) 55.3% 34.0% 6.7% 96.0% 4.0% 100.0% 33
Pikes Peak Region (CO) 47.7% 36.3% 9.7% 93.7% 6.3% 100.0% 87
Lehigh Valley Region (PA) 52.1% 33.7% 5.8% 91.6% 8.4% 100.0% 98
Greater Sarasota/Bradenton Area (FL) 49.5% 34.0% 5.5% 89.0% 11.0% 100.0% 83
Dayton Region (OH) 53.3% 37.3% 8.3% 98.8% 1.2% 100.0% 113
Richmond & Tri-Cities Region (VA) 51.3% 32.8% 5.9% 90.0% 10.0% 100.0% 83
Memphis Area Association of Governments (TN) 46.5% 36.6% 5.0% 88.1% 11.9% 100.0% 73
Eastern Region (NC) 53.6% 38.4% 7.1% 99.0% 1.0% 100.0% 110
Advantage West Region (NC) 51.0% 33.6% 6.0% 90.6% 9.4% 100.0% 184
Southeast Commission (NC) 61.0% 30.6% 5.9% 97.5% 2.5% 100.0% 127
Greater Fairfax Area (VA) 57.3% 32.9% 7.0% 97.1% 2.9% 100.0% 103
Greater Tulsa Region (OK) 49.1% 31.2% 6.0% 86.3% 13.7% 100.0% 123
SOURCE: Arts and Economic Prosperity 5, Americans for the Arts, 2017. For more information, visit www.AmericansForTheArts.org/EconomicImpact. B–179

Table 11:Categorized Nonprofit Arts and Cultural Organization Expenditures as aPercentage of Total Expenditures Per Study Region During Fiscal Year 2015
Regional Study Regions Personnel Expenses Programmatic, TOTAL
All Populations (staff, employees, Production and Facility OPERATING CAPITAL Organizational Sample
Sample Size = 81 contractors and artists) Overhead Expenses Expenses Expenses Expenditures Expenditures Size
East Tennessee Development District 58.4% 34.0% 5.4% 97.8% 2.2% 100.0% 100
West Valley Region (AZ) 44.0% 37.8% 16.3% 98.1% 1.9% 100.0% 20
Greater St. Louis Area (MO) 54.6% 33.4% 5.1% 93.0% 7.0% 100.0% 163
Western New York 51.2% 36.5% 6.0% 93.7% 6.3% 100.0% 126
Greater Oklahoma City Region (OK) 49.1% 34.2% 5.3% 88.6% 11.4% 100.0% 153
Piedmont Triad Partnership (NC) 50.7% 37.0% 7.3% 95.1% 4.9% 100.0% 206
Greater Portland Area (OR) 58.0% 35.5% 5.8% 99.4% 0.6% 100.0% 183
Greater Kansas City Metropolitan Area (MO/KS) 51.7% 37.1% 7.0% 95.9% 4.1% 100.0% 133
Greater Nashville Regional Council (TN) 51.8% 38.5% 6.1% 96.4% 3.6% 100.0% 158
Research Triangle Regional Partnership (NC) 54.0% 31.6% 5.7% 91.3% 8.7% 100.0% 357
Greater Tampa/St. Petersburg Area (FL) 55.5% 33.1% 5.8% 94.4% 5.6% 100.0% 123
Charlotte Regional Partnership (NC) 52.0% 36.6% 7.1% 95.7% 4.3% 100.0% 187
Charlotte Regional Partnership (NC/SC) 53.6% 35.8% 6.7% 96.0% 4.0% 100.0% 200
Seven-County Metro Area (MN) 54.6% 36.6% 7.0% 98.2% 1.8% 100.0% 645
Central Florida Region 51.7% 41.1% 6.7% 99.5% 0.5% 100.0% 218
Greater Philadelphia Region (PA) 53.5% 36.8% 7.6% 97.9% 2.1% 100.0% 492
Greater Washington Region (DC/MD/VA) 55.3% 31.3% 6.7% 93.3% 6.7% 100.0% 608
Metro Atlanta Area (GA) 53.3% 33.5% 6.1% 92.9% 7.1% 100.0% 269
Greater Atlanta Region (GA) 53.3% 33.5% 6.1% 92.9% 7.1% 100.0% 297
Greater Houston Region (TX) 48.9% 33.9% 6.1% 88.9% 11.1% 100.0% 209
Dallas-Fort Worth-Arlington MSA (TX) 55.9% 36.9% 6.8% 99.6% 0.4% 100.0% 454
Regional Average 52.1% 35.8% 6.4% 94.4% 5.6% 100.0% 105.0
Regional Median 53.5% 35.7% 6.4% 96.0% 4.0% 100.0%
SOURCE: Arts and Economic Prosperity 5, Americans for the Arts, 2017. For more information, visit www.AmericansForTheArts.org/EconomicImpact. B–180

Table 11:Categorized Nonprofit Arts and Cultural Organization Expenditures as aPercentage of Total Expenditures Per Study Region During Fiscal Year 2015
Statewide Study Regions Personnel Expenses Programmatic, TOTAL
All Populations (staff, employees, Production and Facility OPERATING CAPITAL Organizational Sample
Sample Size = 20 contractors and artists) Overhead Expenses Expenses Expenses Expenditures Expenditures Size
State of Vermont 53.6% 33.3% 8.0% 94.9% 5.1% 100.0% 86
State of North Dakota 53.5% 31.9% 6.0% 91.4% 8.6% 100.0% 135
State of Delaware 48.2% 38.8% 6.5% 93.5% 6.5% 100.0% 95
State of Maine 58.1% 32.9% 6.3% 97.3% 2.7% 100.0% 123
State of Hawai'i 56.2% 33.4% 7.3% 96.8% 3.2% 100.0% 109
State of Nevada 50.6% 38.6% 6.7% 95.9% 4.1% 100.0% 164
State of Connecticut 53.3% 32.5% 6.4% 92.2% 7.8% 100.0% 324
State of Oklahoma 49.5% 33.5% 5.6% 88.6% 11.4% 100.0% 392
State of Oregon 56.6% 35.4% 6.0% 98.0% 2.0% 100.0% 365
State of Minnesota 54.5% 36.5% 7.0% 98.0% 2.0% 100.0% 1,268
State of Wisconsin 53.3% 37.0% 6.4% 96.8% 3.2% 100.0% 363
State of Maryland 55.6% 35.1% 8.9% 99.6% 0.4% 100.0% 522
State of Missouri 53.7% 34.9% 5.9% 94.5% 5.5% 100.0% 491
State of Tennessee 51.7% 37.0% 5.9% 94.7% 5.3% 100.0% 642
State of Massachusetts 51.8% 37.7% 8.3% 97.8% 2.2% 100.0% 643
State of New Jersey 59.9% 32.0% 6.9% 98.8% 1.2% 100.0% 183
State of North Carolina 52.9% 34.3% 6.4% 93.6% 6.4% 100.0% 1,233
State of Pennsylvania 52.9% 37.7% 7.8% 98.3% 1.7% 100.0% 1,077
State of Illinois 52.3% 37.3% 7.7% 97.3% 2.7% 100.0% 808
State of Florida 45.3% 34.9% 5.6% 85.8% 14.2% 100.0% 1,688
Statewide Average 53.2% 35.2% 6.8% 95.2% 4.8% 100.0% 535.6
Statewide Median 53.3% 35.0% 6.5% 96.3% 3.7% 100.0%
SOURCE: Arts and Economic Prosperity 5, Americans for the Arts, 2017. For more information, visit www.AmericansForTheArts.org/EconomicImpact. B–181

Table 11:Categorized Nonprofit Arts and Cultural Organization Expenditures as aPercentage of Total Expenditures Per Study Region During Fiscal Year 2015
Individual Arts Districts Personnel Expenses Programmatic, TOTAL
All Populations (staff, employees, Production and Facility OPERATING CAPITAL Organizational Sample
Sample Size = 12 contractors and artists) Overhead Expenses Expenses Expenses Expenditures Expenditures Size
James River Arts & Cultural District 53.3% 33.7% 8.0% 95.0% 5.0% 100.0% 15
Center City Charlotte 52.3% 37.8% 6.8% 96.9% 3.1% 100.0% 35
Loch Haven Cultural Park 51.3% 38.7% 8.5% 98.4% 1.6% 100.0% 8
Downtown Colorado Springs Creative District 50.4% 33.6% 12.3% 96.3% 3.7% 100.0% 30
Fort Worth Cultural District 54.7% 36.7% 6.9% 98.3% 1.7% 100.0% 16
Dallas Arts District 54.8% 38.7% 6.3% 99.8% 0.2% 100.0% 15
Grand Center Arts & Entertainment District 52.6% 24.9% 3.7% 81.2% 18.8% 100.0% 20
Balboa Park Cultural District 54.3% 38.8% 6.8% 99.9% 0.1% 100.0% 24
East End Cultural District 60.6% 28.3% 11.1% 100.0% 0.0% 100.0% 9
Houston Museum District Association 44.1% 31.6% 5.4% 81.1% 18.9% 100.0% 22
Midtown Cultural District 49.0% 39.4% 11.7% 100.0% 0.0% 100.0% 5
Washington Avenue Cultural District 50.6% 41.8% 7.6% 100.0% 0.0% 100.0% 6
Arts District Average 52.3% 35.3% 7.9% 95.6% 4.4% 100.0% 17.1
Arts District Median 52.4% 37.3% 7.2% 98.3% 1.7% 100.0%
Explanation of the Outliers and Exclusions:1 Only one eligible nonprofit arts and cultural organization provided detailed financial information for use in the analysis for Yadkin County, NC. While these itemized data are not reported
on this table to protect confidentiality, the data are included in the summary statistics for population Group A as well as for all individual city/county study regions.
SOURCE: Arts and Economic Prosperity 5, Americans for the Arts, 2017. For more information, visit www.AmericansForTheArts.org/EconomicImpact. B–182

Explanation of Table 12:Comparative Categorized Nonprofit Arts and Cultural Organization ExpendituresPer Participating Organization During Fiscal Year 2015 (in DOLLARS)
Column One:
Column Two:
Column Three:
Column Four:
Column Five:
Column Six:
Column Seven:
Column Eight:
Column Nine:
Column Ten:The average categorized expenditures for all 14,439 participating nonprofit arts and cultural organizations during fiscal year 2015.
The average categorized expenditures for responding nonprofit arts and cultural organizations in the study regions that include multiple cities or multiple counties during fiscal year 2015.
The average categorized expenditures for responding nonprofit arts and cultural organizations in Population Cohort Group C during fiscal year 2015 (city/county study regions that have a population of 100,000 to 249,999).
The average categorized expenditures for responding nonprofit arts and cultural organizations in Population Cohort Group D during fiscal year 2015 (city/county study regions that have a population of 250,000 to 499,999).
The average categorized expenditures for responding nonprofit arts and cultural organizations in Population Cohort Group E during fiscal year 2015 (city/county study regions that have a population of 500,000 to 999,999).
The average categorized expenditures for responding nonprofit arts and cultural organizations in Population Cohort Group F during fiscal year 2015 (city/county study regions that have a population of 1,000,000 or more).
The categories of organizational expenditure. Expenditure categories are grouped by personnel-related costs; programmatic, production, and overhead costs; and facility costs. (See the organizational expenditure survey instrument in Appendix C for a detailed breakdown of organizational expenditure categories.)
The average categorized expenditures for responding nonprofit arts and cultural organizations in Population Cohort Group A during fiscal year 2015 (city/county study regions that have a population of less than 50,000).
The average categorized expenditures for responding nonprofit arts and cultural organizations in Population Cohort Group B during fiscal year 2015 (city/county study regions that have a population of 50,000 to 99,999).
This table summarizes in dollars the average expenditures for the 14,439 eligible nonprofit arts and cultural organizations from which fiscal year 2015 financial data were collected. Summary statistics are calculated for each of the population groups (Cohort Groups A through F), the Regional study regions, the Statewide study regions, the Art District study regions, and for all 14,439 participating nonprofit arts and cultural organizations. These averages differ from the averages reported in Table 10; in that case, the averages are calculated per study region.
The average categorized expenditures for responding nonprofit arts and cultural organizations in the Statewide study regions during fiscal year 2015.
SOURCE: Arts and Economic Prosperity 5, Americans for the Arts, 2017. For more information, visit www.AmericansForTheArts.org/EconomicImpact. B–183

Table 12:Comparative Categorized Nonprofit Arts and Cultural Organization ExpendituresPer Participating Organization During Fiscal Year 2015 (in DOLLARS)
Group A Group B Group C Group D Group E Group F Regional Statewide Arts Districts Average of All
Less than 50,000 50,000 to 99,999 100,000 to 249,999 250,000 to 499,999 500,000 to 999,999 1,000,000 or More Varying Pop. Varying Pop. Varying Pop. Organizations
Category of Expense N = 570 N = 827 N = 1,484 N = 1,905 N = 2,349 N = 3,473 N = 6,476 N = 9,444 N = 216 N = 14,439
Payroll (e.g., salaries, wages, artist fees) $182,161 $274,574 $439,293 $586,676 $1,065,049 $810,048 $629,139 $517,269 $2,943,642 $603,515
Payroll Taxes and Fringe Benefits $39,712 $52,533 $92,937 $108,949 $213,222 $164,365 $120,005 $103,747 $585,685 $120,165
Contract Staff (i.e., "contractors") $15,280 $52,818 $44,407 $61,459 $94,953 $82,305 $55,092 $50,753 $228,357 $56,110
Total Personnel $237,153 $379,926 $576,638 $757,084 $1,373,225 $1,056,718 $804,236 $671,769 $3,757,683 $779,790
Advertising, Marketing, and Promotion $22,796 $26,091 $38,001 $57,913 $88,416 $77,026 $56,540 $47,818 $298,818 $54,089
Conferences and Meetings $3,076 $3,690 $7,389 $7,369 $17,939 $13,460 $9,238 $8,258 $39,563 $9,875
Dues and Subscriptions $1,288 $3,629 $2,968 $4,114 $6,868 $6,713 $4,151 $4,059 $20,244 $4,381
Insurance $4,266 $7,048 $10,048 $16,787 $23,364 $21,536 $15,226 $13,877 $76,041 $15,166
Office Administration $13,505 $23,289 $31,938 $48,301 $81,479 $68,872 $50,632 $44,949 $215,997 $49,622
Printing, Postage, and Shipping $5,396 $9,275 $13,437 $15,628 $29,019 $27,290 $18,336 $16,356 $94,310 $18,464
Programs, Production, and Grantmaking $86,505 $111,654 $179,231 $260,401 $382,627 $370,393 $247,433 $223,054 $1,231,683 $246,748
Travel $4,902 $9,795 $15,617 $18,995 $33,012 $28,166 $20,357 $16,137 $98,610 $19,313
Other Overhead/Programmatic Costs $24,561 $44,448 $66,694 $86,725 $172,995 $143,654 $100,276 $93,393 $460,323 $100,898
Total Programmatic and Overhead $166,295 $238,919 $365,321 $516,234 $835,721 $757,111 $522,187 $467,901 $2,535,589 $518,557
Occupancy Costs (e.g., rent, lease, utilities) $25,893 $46,124 $67,047 $92,716 $173,406 $145,378 $97,569 $90,033 $455,148 $99,540
Total Facility $25,893 $46,124 $67,047 $92,716 $173,406 $145,378 $97,569 $90,033 $455,148 $99,540
OPERATING Expenditures $429,341 $664,968 $1,009,007 $1,366,033 $2,382,351 $1,959,207 $1,423,993 $1,229,703 $6,748,420 $1,397,887
CAPITAL Expenditures $38,649 $26,792 $47,341 $158,442 $124,289 $126,968 $90,250 $72,565 $389,512 $77,883
TOTAL EXPENDITURES $467,991 $691,761 $1,056,348 $1,524,475 $2,506,640 $2,086,174 $1,514,243 $1,302,268 $7,137,932 $1,475,770
SOURCE: Arts and Economic Prosperity 5, Americans for the Arts, 2017. For more information, visit www.AmericansForTheArts.org/EconomicImpact. B–184

Explanation of Table 13:Comparative Categorized Nonprofit Arts and Cultural Organization ExpendituresPer Participating Organization During Fiscal Year 2015 (in PERCENTAGES)
Column One:
Column Two:
Column Three:
Column Four:
Column Five:
Column Six:
Column Seven:
Column Eight:
Column Nine:
Column Ten:
The average categorized expenditures for responding nonprofit arts and cultural organizations in Population Cohort Group D during fiscal year 2015 (city/county study regions that have a population of 250,000 to 499,999).
This table summarizes in percentages the average expenditures for the 14,439 eligible nonprofit arts and cultural organizations from which fiscal year 2015 financial data were collected. Summary statistics are calculated for each of the population groups (Cohort Groups A through F), the Regional study regions, the Statewide study regions, the Art District study regions, and for all 14,439 participating nonprofit arts and cultural organizations. These percentages differ from the averages reported in Table 11; in that case, the percentages are calculated per study region.
The categories of organizational expenditure. Expenditure categories are grouped by personnel-related costs; programmatic, production, and overhead costs; and facility costs. (See the organizational expenditure survey instrument in Appendix C for a detailed breakdown of organizational expenditure categories.)
The average categorized expenditures for responding nonprofit arts and cultural organizations in Population Cohort Group A during fiscal year 2015 (city/county study regions that have a population of less than 50,000).
The average categorized expenditures for responding nonprofit arts and cultural organizations in Population Cohort Group B during fiscal year 2015 (city/county study regions that have a population of 50,000 to 99,999).
The average categorized expenditures for responding nonprofit arts and cultural organizations in Population Cohort Group C during fiscal year 2015 (city/county study regions that have a population of 100,000 to 249,999).
The average categorized expenditures for responding nonprofit arts and cultural organizations in Population Cohort Group E during fiscal year 2015 (city/county study regions that have a population of 500,000 to 999,999).
The average categorized expenditures for responding nonprofit arts and cultural organizations in Population Cohort Group F during fiscal year 2015 (city/county study regions that have a population of 1,000,000 or more).
The average categorized expenditures for responding nonprofit arts and cultural organizations in the study regions that include multiple cities or multiple counties during fiscal year 2015.
The average categorized expenditures for responding nonprofit arts and cultural organizations in the Statewide study regions during fiscal year 2015.
The average categorized expenditures for all 14,439 participating nonprofit arts and cultural organizations during fiscal year 2015.
SOURCE: Arts and Economic Prosperity 5, Americans for the Arts, 2017. For more information, visit www.AmericansForTheArts.org/EconomicImpact. B–185

Table 13:Comparative Categorized Nonprofit Arts and Cultural Organization ExpendituresPer Participating Organization During Fiscal Year 2015 (in PERCENTAGES)
Group A Group B Group C Group D Group E Group F Regional Statewide Arts Districts Average of All
Less than 50,000 50,000 to 99,999 100,000 to 249,999 250,000 to 499,999 500,000 to 999,999 1,000,000 or More Varying Pop. Varying Pop. Varying Pop. Organizations
Category of Expense N = 570 N = 827 N = 1,484 N = 1,905 N = 2,349 N = 3,473 N = 6,476 N = 9,444 N = 216 N = 14,439
Payroll (e.g., salaries, wages, artist fees) 38.9% 39.7% 41.6% 38.5% 42.5% 38.8% 41.5% 39.7% 41.2% 40.9%
Payroll Taxes and Fringe Benefits 8.5% 7.6% 8.8% 7.1% 8.5% 7.9% 7.9% 8.0% 8.2% 8.1%
Contract Staff (i.e., "contractors") 3.3% 7.6% 4.2% 4.0% 3.8% 3.9% 3.6% 3.9% 3.2% 3.8%
Total Personnel 50.7% 54.9% 54.6% 49.7% 54.8% 50.7% 53.1% 51.6% 52.6% 52.8%
Advertising, Marketing, and Promotion 4.9% 3.8% 3.6% 3.8% 3.5% 3.7% 3.7% 3.7% 4.2% 3.7%
Conferences and Meetings 0.7% 0.5% 0.7% 0.5% 0.7% 0.6% 0.6% 0.6% 0.6% 0.7%
Dues and Subscriptions 0.3% 0.5% 0.3% 0.3% 0.3% 0.3% 0.3% 0.3% 0.3% 0.3%
Insurance 0.9% 1.0% 1.0% 1.1% 0.9% 1.0% 1.0% 1.1% 1.1% 1.0%
Office Administration 2.9% 3.4% 3.0% 3.2% 3.3% 3.3% 3.3% 3.5% 3.0% 3.4%
Printing, Postage, and Shipping 1.2% 1.3% 1.3% 1.0% 1.2% 1.3% 1.2% 1.3% 1.3% 1.3%
Programs, Production, and Grantmaking 18.5% 16.1% 17.0% 17.1% 15.3% 17.8% 16.3% 17.1% 17.3% 16.7%
Travel 1.0% 1.4% 1.5% 1.2% 1.3% 1.4% 1.3% 1.2% 1.4% 1.3%
Other Overhead/Programmatic Costs 5.2% 6.4% 6.3% 5.7% 6.9% 6.9% 6.6% 7.2% 6.4% 6.8%
Total Programmatic and Overhead 35.5% 34.5% 34.6% 33.9% 33.3% 36.3% 34.5% 35.9% 35.5% 35.1%
Occupancy Costs (e.g., rent, lease, utilities) 5.5% 6.7% 6.3% 6.1% 6.9% 7.0% 6.4% 6.9% 6.4% 6.7%
Total Facility 5.5% 6.7% 6.3% 6.1% 6.9% 7.0% 6.4% 6.9% 6.4% 6.7%
OPERATING Expenditures 91.7% 96.1% 95.5% 89.6% 95.0% 93.9% 94.0% 94.4% 94.5% 94.7%
CAPITAL Expenditures 8.3% 3.9% 4.5% 10.4% 5.0% 6.1% 6.0% 5.6% 5.5% 5.3%
TOTAL EXPENDITURES 100.0% 100.0% 100.0% 100.0% 100.0% 100.0% 100.0% 100.0% 100.0% 100.0%
SOURCE: Arts and Economic Prosperity 5, Americans for the Arts, 2017. For more information, visit www.AmericansForTheArts.org/EconomicImpact. B–186

Explanation of Table 14:Arts Volunteerism and In-Kind Contributions to Participating NonprofitArts and Cultural Organizations Per Study Region During Fiscal Year 2015
Column Two:
Column Three:
Column Four:
Column Five:
Column Six:
Column Seven:
Column Eight:
Column Nine:
The total value of in-kind contributions received by reporting nonprofit arts and cultural organizations in each participating study region during fiscal year 2015.
The average value of all in-kind contributions received per reporting nonprofit arts and cultural organization in each participating study region during fiscal year 2015. This figure is calculated by dividing the total value of all in-kind contributions received (Column Eight) by the total number of responding nonprofit arts and cultural organizations in each study region (Table 5, Column Three).
This table summarizes the number of volunteers, number of volunteer hours, and dollar value of volunteer time donated to participating nonprofit arts and cultural organizations in each participating study region during fiscal year 2015. It also summarizes the total value of the in-kind contributions that were donated to the participating organizations. Summary statistics are calculated for each population group.
The estimated dollar value of the volunteer hours donated to responding nonprofit arts and cultural organizations in each participating study region during fiscal year 2015. This figure is calculated by multiplying the total number of volunteer hours by $23.56 (the dollar value of the average volunteer hour during fiscal year 2015 based on Giving and Volunteering in the United States, published in 2016 by Independent Sector).
The average number of volunteer hours donated, per volunteer, to responding nonprofit arts and cultural organizations in each participating study region during fiscal year 2015. This figure is calculated by dividing the total number of donated volunteer hours (Column Three) by the total number of volunteers (Column Two).
The average number of volunteers, per organization, who donated their time to a nonprofit arts and cultural organization in each participating study region during fiscal year 2015. This figure is calculated by dividing the number of volunteers in each study region (Column One) by the number of responding nonprofit arts and cultural organizations (Table 5, Column Three).
The average number of volunteer hours, per organization, that were donated to responding nonprofit arts and cultural organizations in each participating study region during fiscal year 2015. This figure is calculated by dividing the number of volunteer hours donated in each study region (Column Three) by the number of responding nonprofit arts and cultural organizations (Table 5, Column Three).
The total number of people who volunteered at responding nonprofit arts and cultural organizations in each participating study region during fiscal year 2015. Volunteers can include professional volunteers (e.g., unpaid executive staff, unpaid program staff, and board members), artistic volunteers (e.g., artists, choreographers, designers), clerical volunteers (e.g., unpaid administrative support staff), service volunteers (e.g., ticket takers, docents, gift shop volunteers), and seasonal volunteers who assist with festivals and special events.
The total number of volunteer hours donated to responding nonprofit arts and cultural organizations in each participating study region during fiscal year 2015.
SOURCE: Arts and Economic Prosperity 5, Americans for the Arts, 2017. For more information, visit www.AmericansForTheArts.org/EconomicImpact. B–187

Table 14:Arts Volunteerism and In-Kind Contributions to Participating NonprofitArts and Cultural Organizations Per Study Region During Fiscal Year 2015
Population Cohort Group A Estimated Estimated Estimated Average Average Average Total Value In-Kind
Population Fewer than 50,000 Number of Number of Value of Hours Per Volunteers Per Hours Per of In-Kind Value Per
Sample Size = 52 Volunteers Vol. Hours Vol. Hours Volunteer Organization Organization Contributions Organization
Town of Crested Butte (CO) 1,002 48,428 $1,140,964 48.3 83.5 4,035.7 $815,855 $67,988
City of Pine City (MN) n/a n/a n/a n/a n/a n/a n/a n/a
City of Alva (OK) 290 37,008 $871,918 127.6 22.3 2,846.8 $66,000 $5,077
Cook County (MN) 818 28,569 $673,086 34.9 48.1 1,680.5 $57,675 $3,393
Town of Hillsborough (NC) 777 54,962 $1,294,902 70.7 48.6 3,435.1 $45,229 $2,827
City of Virginia (MN) 50 3,800 $89,528 76.0 12.5 950.0 $800 $200
Town of Jackson (WY) 1,187 70,827 $1,668,694 59.7 65.9 3,934.9 $314,205 $17,456
City of Guthrie (OK) 829 48,505 $1,142,778 58.5 69.1 4,042.1 $80,037 $6,670
City of Grand Rapids (MN) 54 2,611 $61,515 48.4 4.5 217.6 $55,327 $4,611
Town of Medfield (MA) 882 43,965 $1,035,825 49.8 51.9 2,586.2 $22,900 $1,347
City of Fergus Falls (MN) 331 13,462 $317,165 40.7 36.8 1,495.8 n/a n/a
Grundy County (TN) 707 37,657 $887,189 53.3 70.7 3,765.7 $2,743 $274
City of Falls Church (VA) 522 35,454 $835,294 67.9 47.5 3,223.1 $19,923 $1,811
City of Jamestown (ND) 137 10,318 $243,085 75.3 45.7 3,439.2 $0 $0
City of Waterville (ME) 309 14,568 $343,232 47.1 77.3 3,642.1 $89,146 $22,287
City of Red Wing (MN) 189 9,099 $214,372 48.1 21.0 1,011.0 $65,500 $7,278
City of Durango (CO) 1,787 102,142 $2,406,473 57.2 68.7 3,928.6 $363,238 $13,971
City of Hannibal (MO) 373 21,881 $515,521 58.7 62.2 3,646.9 $28,465 $4,744
City of Tullahoma (TN) 416 43,117 $1,015,839 103.6 37.8 3,919.7 $171,267 $15,570
City of Northfield (MN) 511 23,320 $549,419 45.6 36.5 1,665.7 $19,560 $1,397
Town of Carrboro (NC) 993 50,696 $1,194,405 51.1 99.3 5,069.6 $70,719 $7,072
Macon County (TN) 561 31,271 $736,740 55.7 80.1 4,467.3 $96,619 $13,803
City of Laguna Beach (CA) 992 51,444 $1,212,014 51.9 62.0 3,215.2 $1,057,814 $66,113
Hickman County (TN) 439 36,769 $866,280 83.8 20.9 1,750.9 $35,786 $1,704
City of Fairfax (VA) 520 18,925 $445,868 36.4 74.3 2,703.5 $3,900 $557
City of Ponca City (OK) 942 59,194 $1,394,608 62.8 58.9 3,699.6 $13,685 $855
City of Paducah (KY) 1,470 107,905 $2,542,232 73.4 77.4 5,679.2 $833,900 $43,889
Mille Lacs County (MN) 100 10,268 $241,914 102.7 10.0 1,026.8 $85,590 $8,559
McNairy County (TN) 401 20,814 $490,385 51.9 80.2 4,162.9 $0 $0
City of Winona (MN) 898 43,785 $1,031,575 48.8 52.8 2,575.6 $160,883 $9,464
SOURCE: Arts and Economic Prosperity 5, Americans for the Arts, 2017. For more information, visit www.AmericansForTheArts.org/EconomicImpact. B–188
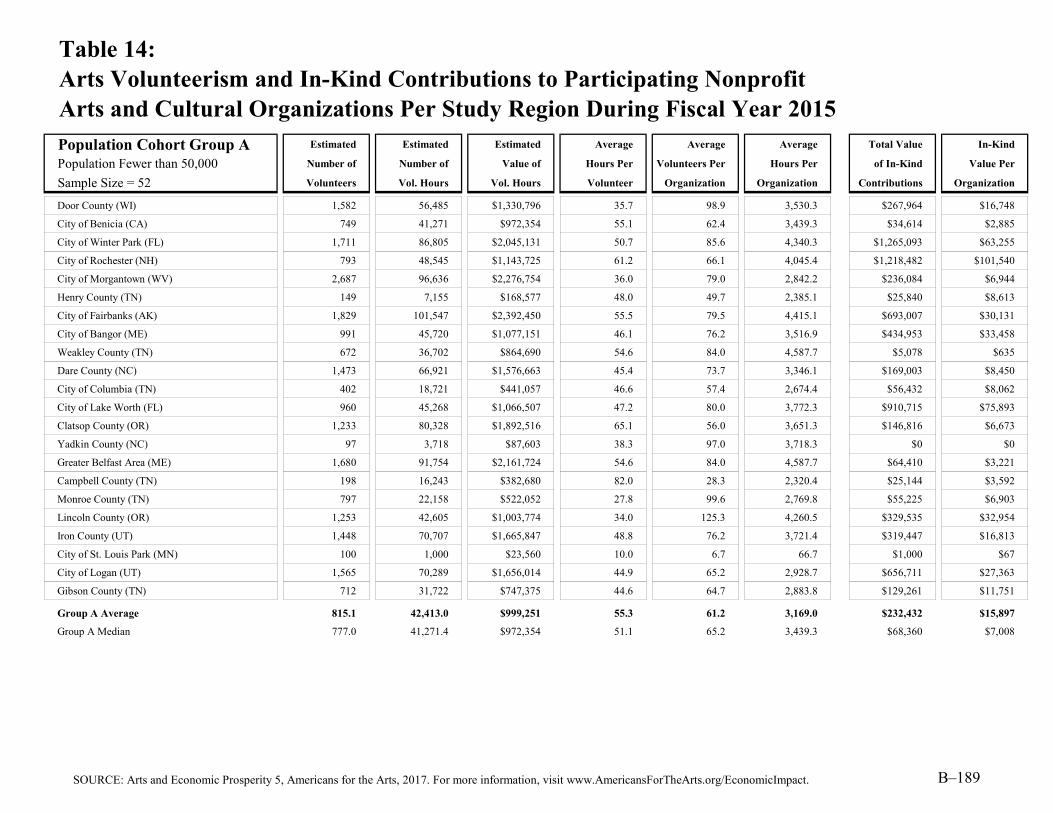
Table 14:Arts Volunteerism and In-Kind Contributions to Participating NonprofitArts and Cultural Organizations Per Study Region During Fiscal Year 2015
Population Cohort Group A Estimated Estimated Estimated Average Average Average Total Value In-Kind
Population Fewer than 50,000 Number of Number of Value of Hours Per Volunteers Per Hours Per of In-Kind Value Per
Sample Size = 52 Volunteers Vol. Hours Vol. Hours Volunteer Organization Organization Contributions Organization
Door County (WI) 1,582 56,485 $1,330,796 35.7 98.9 3,530.3 $267,964 $16,748
City of Benicia (CA) 749 41,271 $972,354 55.1 62.4 3,439.3 $34,614 $2,885
City of Winter Park (FL) 1,711 86,805 $2,045,131 50.7 85.6 4,340.3 $1,265,093 $63,255
City of Rochester (NH) 793 48,545 $1,143,725 61.2 66.1 4,045.4 $1,218,482 $101,540
City of Morgantown (WV) 2,687 96,636 $2,276,754 36.0 79.0 2,842.2 $236,084 $6,944
Henry County (TN) 149 7,155 $168,577 48.0 49.7 2,385.1 $25,840 $8,613
City of Fairbanks (AK) 1,829 101,547 $2,392,450 55.5 79.5 4,415.1 $693,007 $30,131
City of Bangor (ME) 991 45,720 $1,077,151 46.1 76.2 3,516.9 $434,953 $33,458
Weakley County (TN) 672 36,702 $864,690 54.6 84.0 4,587.7 $5,078 $635
Dare County (NC) 1,473 66,921 $1,576,663 45.4 73.7 3,346.1 $169,003 $8,450
City of Columbia (TN) 402 18,721 $441,057 46.6 57.4 2,674.4 $56,432 $8,062
City of Lake Worth (FL) 960 45,268 $1,066,507 47.2 80.0 3,772.3 $910,715 $75,893
Clatsop County (OR) 1,233 80,328 $1,892,516 65.1 56.0 3,651.3 $146,816 $6,673
Yadkin County (NC) 97 3,718 $87,603 38.3 97.0 3,718.3 $0 $0
Greater Belfast Area (ME) 1,680 91,754 $2,161,724 54.6 84.0 4,587.7 $64,410 $3,221
Campbell County (TN) 198 16,243 $382,680 82.0 28.3 2,320.4 $25,144 $3,592
Monroe County (TN) 797 22,158 $522,052 27.8 99.6 2,769.8 $55,225 $6,903
Lincoln County (OR) 1,253 42,605 $1,003,774 34.0 125.3 4,260.5 $329,535 $32,954
Iron County (UT) 1,448 70,707 $1,665,847 48.8 76.2 3,721.4 $319,447 $16,813
City of St. Louis Park (MN) 100 1,000 $23,560 10.0 6.7 66.7 $1,000 $67
City of Logan (UT) 1,565 70,289 $1,656,014 44.9 65.2 2,928.7 $656,711 $27,363
Gibson County (TN) 712 31,722 $747,375 44.6 64.7 2,883.8 $129,261 $11,751
Group A Average 815.1 42,413.0 $999,251 55.3 61.2 3,169.0 $232,432 $15,897
Group A Median 777.0 41,271.4 $972,354 51.1 65.2 3,439.3 $68,360 $7,008
SOURCE: Arts and Economic Prosperity 5, Americans for the Arts, 2017. For more information, visit www.AmericansForTheArts.org/EconomicImpact. B–189

Table 14:Arts Volunteerism and In-Kind Contributions to Participating NonprofitArts and Cultural Organizations Per Study Region During Fiscal Year 2015
Population Cohort Group B Estimated Estimated Estimated Average Average Average Total Value In-Kind
Population 50,000 to 99,999 Number of Number of Value of Hours Per Volunteers Per Hours Per of In-Kind Value Per
Sample Size = 38 Volunteers Vol. Hours Vol. Hours Volunteer Organization Organization Contributions Organization
City of Joplin (MO) 835 37,594 $885,719 45.0 41.8 1,879.7 $43,470 $2,174
City of La Crosse (WI) 3,508 143,564 $3,382,361 40.9 106.3 4,350.4 $351,374 $10,648
McMinn County (TN) 2,001 100,674 $2,371,879 50.3 100.1 5,033.7 $100,996 $5,050
Lafayette County (MS) 722 43,000 $1,013,082 59.6 38.0 2,263.2 $235,795 $12,410
Chisago County (MN) 204 3,951 $93,086 19.4 34.0 658.5 $15,899 $2,650
City of Grand Forks (ND) 1,105 36,965 $870,902 33.5 85.0 2,843.5 $84,035 $6,464
City of Corvallis (OR) 1,878 111,124 $2,618,079 59.2 85.4 5,051.1 $675,100 $30,686
City of Noblesville (IN) 38 1,240 $29,214 32.6 19.0 620.0 $1,500 $750
City of Ocala (FL) 2,031 102,018 $2,403,551 50.2 70.0 3,517.9 $1,241,312 $42,804
Lenoir County (NC) 930 47,568 $1,120,700 51.1 84.5 4,324.4 $14,360 $1,305
Town of Chapel Hill (NC) 3,250 140,562 $3,311,645 43.2 59.1 2,555.7 $1,064,651 $19,357
City of Grand Junction (CO) 1,980 99,417 $2,342,257 50.2 61.9 3,106.8 $259,881 $8,121
Town of Jupiter (FL) 417 24,322 $573,019 58.3 139.0 8,107.2 $139,247 $46,416
Hamblen County (TN) 747 45,941 $1,082,361 61.5 124.5 7,656.8 $234,390 $39,065
City of Delray Beach (FL) 748 39,254 $924,822 52.5 62.3 3,271.2 $357,559 $29,797
City of St. Cloud (MN) 487 5,191 $122,300 10.7 19.5 207.6 $38,380 $1,535
City of Portland (ME) 4,165 148,297 $3,493,873 35.6 90.5 3,223.8 $754,767 $16,408
City of Jackson (TN) 921 49,282 $1,161,072 53.5 70.8 3,790.9 $595,115 $45,778
City of Walnut Creek (CA) 2,808 116,396 $2,742,287 41.5 96.8 4,013.7 $337,381 $11,634
Greene County (TN) 766 33,342 $785,533 43.5 85.1 3,704.6 $290,541 $32,282
City of Flagstaff (AZ) 4,989 206,945 $4,875,619 41.5 90.7 3,762.6 $1,703,033 $30,964
City of Missoula (MT) 2,915 94,633 $2,229,544 32.5 85.7 2,783.3 $826,195 $24,300
City of Fort Myers (FL) 1,032 48,495 $1,142,542 47.0 73.7 3,463.9 $1,053,268 $75,233
Putnam County (TN) 476 45,621 $1,074,835 95.8 52.9 5,069.0 $58,466 $6,496
Monroe County (FL) 1,471 72,200 $1,701,032 49.1 27.8 1,362.3 $259,285 $4,892
City of Lynchburg (VA) 1,340 69,717 $1,642,535 52.0 67.0 3,485.9 $300,589 $15,029
City of Duluth (MN) 1,949 73,542 $1,732,650 37.7 52.7 1,987.6 $234,617 $6,341
City of Fishers (IN) 531 19,137 $450,872 36.0 88.5 3,189.5 $146,016 $24,336
City of Carmel (IN) 3,123 69,943 $1,647,862 22.4 260.3 5,828.6 $644,056 $53,671
City of Sugar Land (TX) 282 12,919 $304,381 45.8 56.4 2,583.9 $18,425 $3,685
SOURCE: Arts and Economic Prosperity 5, Americans for the Arts, 2017. For more information, visit www.AmericansForTheArts.org/EconomicImpact. B–190

Table 14:Arts Volunteerism and In-Kind Contributions to Participating NonprofitArts and Cultural Organizations Per Study Region During Fiscal Year 2015
Population Cohort Group B Estimated Estimated Estimated Average Average Average Total Value In-Kind
Population 50,000 to 99,999 Number of Number of Value of Hours Per Volunteers Per Hours Per of In-Kind Value Per
Sample Size = 38 Volunteers Vol. Hours Vol. Hours Volunteer Organization Organization Contributions Organization
City of Asheville (NC) 3,126 137,981 $3,250,830 44.1 72.7 3,208.9 $1,022,648 $23,783
Buchanan County (MO) 4,079 136,633 $3,219,081 33.5 151.1 5,060.5 $272,571 $10,095
City of Boca Raton (FL) 1,019 51,592 $1,215,505 50.6 101.9 5,159.2 $896,105 $89,611
City of Miami Beach (FL) 3,104 198,658 $4,680,375 64.0 41.4 2,648.8 $2,250,183 $30,002
Moore County (NC) 2,325 123,601 $2,912,035 53.2 68.4 3,635.3 $90,686 $2,667
Sevier County (TN) 557 32,334 $761,777 58.0 55.7 3,233.4 $96,696 $9,670
Cape May County (NJ) 582 30,917 $728,397 53.1 83.1 4,416.7 $105,348 $15,050
Cleveland County (NC) 1,268 49,382 $1,163,440 38.9 84.5 3,292.1 $32,756 $2,184
Group B Average 1,676.6 73,788.2 $1,738,449 46.0 78.6 3,535.6 $443,334 $20,877
Group B Median 1,186.5 50,487.0 $1,189,473 46.4 73.2 3,378.0 $259,583 $13,720
SOURCE: Arts and Economic Prosperity 5, Americans for the Arts, 2017. For more information, visit www.AmericansForTheArts.org/EconomicImpact. B–191

Table 14:Arts Volunteerism and In-Kind Contributions to Participating NonprofitArts and Cultural Organizations Per Study Region During Fiscal Year 2015
Population Cohort Group C Estimated Estimated Estimated Average Average Average Total Value In-Kind
Population 100,000 to 249,999 Number of Number of Value of Hours Per Volunteers Per Hours Per of In-Kind Value Per
Sample Size = 50 Volunteers Vol. Hours Vol. Hours Volunteer Organization Organization Contributions Organization
City of Las Cruces (NM) 1,224 37,658 $887,227 30.8 55.6 1,711.7 $221,361 $10,062
Eau Claire County (WI) 2,231 76,922 $1,812,275 34.5 148.7 5,128.1 $70,098 $4,673
Yamhill County (OR) 5,268 184,564 $4,348,321 35.0 99.4 3,482.3 $421,787 $7,958
City of Lewisville (TX) 646 46,998 $1,107,271 72.8 80.8 5,874.7 $8,750 $1,094
City of West Palm Beach (FL) 2,698 110,716 $2,608,478 41.0 93.0 3,817.8 $2,831,411 $97,635
City of Boulder (CO) 5,087 265,505 $6,255,291 52.2 78.3 4,084.7 $1,922,117 $29,571
City of Richardson (TX) 3,428 116,863 $2,753,288 34.1 142.8 4,869.3 $104,388 $4,350
City of High Point (NC) 443 23,097 $544,156 52.1 44.3 2,309.7 $61,232 $6,123
City of Cambridge (MA) 2,934 149,286 $3,517,188 50.9 83.8 4,265.3 $2,471,390 $70,611
City of Lowell (MA) 1,891 51,595 $1,215,571 27.3 126.1 3,439.6 $772,231 $51,482
Douglas County (KS) 1,907 96,964 $2,284,472 50.8 82.9 4,215.8 $131,160 $5,703
City of Columbia (MO) 3,158 105,927 $2,495,650 33.5 108.9 3,652.7 $960,448 $33,119
City of Norman (OK) 1,736 55,974 $1,318,750 32.2 72.3 2,332.3 $272,000 $11,333
Wayne County (NC) 835 47,036 $1,108,173 56.3 55.7 3,135.7 $57,210 $3,814
City of Lafayette (LA) 1,018 47,089 $1,109,424 46.3 101.8 4,708.9 $159,442 $15,944
Washington County (TN) 1,638 86,651 $2,041,505 52.9 81.9 4,332.6 $353,252 $17,663
City of Thousand Oaks (CA) 1,791 65,902 $1,552,642 36.8 149.3 5,491.8 $180,668 $15,056
City of Charleston (SC) 3,265 130,981 $3,085,912 40.1 85.9 3,446.9 $930,578 $24,489
City of Waco (TX) 1,517 71,532 $1,685,284 47.2 50.6 2,384.4 $1,514,041 $50,468
Robeson County (NC) 353 59,310 $1,397,344 168.0 39.2 6,590.0 $149,219 $16,580
Columbia County (GA) 160 30,091 $708,944 188.1 32.0 6,018.2 $5,000 $1,000
Orange County (NC) 5,034 246,771 $5,813,925 49.0 61.4 3,009.4 $1,180,599 $14,398
City of Savannah (GA) 3,163 158,997 $3,745,972 50.3 70.3 3,533.3 $638,791 $14,195
Indian River County (FL) 1,364 66,418 $1,564,813 48.7 136.4 6,641.8 $347,120 $34,712
City of Alexandria (VA) 3,599 152,774 $3,599,358 42.4 72.0 3,055.5 $1,504,387 $30,088
Martin County (FL) 1,458 85,525 $2,014,974 58.7 72.9 4,276.3 $411,227 $20,561
Macon-Bibb County (GA) 3,923 184,170 $4,339,045 46.9 81.7 3,836.9 $1,263,281 $26,318
City of Springfield (MA) 1,369 52,751 $1,242,814 38.5 91.3 3,516.7 $1,798,808 $119,921
Catawba County (NC) 4,092 130,290 $3,069,642 31.8 163.7 5,211.6 $1,020,410 $40,816
Town of Cary (NC) 2,810 126,599 $2,982,661 45.1 75.9 3,421.6 $46,466 $1,256
SOURCE: Arts and Economic Prosperity 5, Americans for the Arts, 2017. For more information, visit www.AmericansForTheArts.org/EconomicImpact. B–192

Table 14:Arts Volunteerism and In-Kind Contributions to Participating NonprofitArts and Cultural Organizations Per Study Region During Fiscal Year 2015
Population Cohort Group C Estimated Estimated Estimated Average Average Average Total Value In-Kind
Population 100,000 to 249,999 Number of Number of Value of Hours Per Volunteers Per Hours Per of In-Kind Value Per
Sample Size = 50 Volunteers Vol. Hours Vol. Hours Volunteer Organization Organization Contributions Organization
Alamance County (NC) 1,557 114,669 $2,701,604 73.6 45.8 3,372.6 $130,853 $3,849
Cumberland County (NJ) 1,331 97,468 $2,296,348 73.2 53.2 3,898.7 $993,724 $39,749
City of Eugene (OR) 3,255 196,728 $4,634,907 60.4 81.4 4,918.2 $733,384 $18,335
Middlesex County (CT) 1,150 56,591 $1,333,282 49.2 76.7 3,772.7 $355,688 $23,713
City of Springfield (MO) 1,678 98,237 $2,314,457 58.5 69.9 4,093.2 $381,285 $15,887
City of Sioux Falls (SD) 2,946 98,432 $2,319,051 33.4 113.3 3,785.8 $790,104 $30,389
Pitt County (NC) 1,876 84,146 $1,982,487 44.9 81.6 3,658.5 $652,616 $28,375
City of Providence (RI) 5,295 231,909 $5,463,785 43.8 94.6 4,141.2 $2,697,397 $48,168
City of Worcester (MA) 4,679 241,600 $5,692,098 51.6 82.1 4,238.6 $3,013,501 $52,868
Montgomery County (TN) 830 47,076 $1,109,108 56.7 41.5 2,353.8 $71,486 $3,574
Salt Lake City (UT) 5,435 219,266 $5,165,916 40.3 95.4 3,846.8 $6,368,929 $111,736
Cabarrus County (NC) 1,496 75,688 $1,783,216 50.6 83.1 4,204.9 $294,840 $16,380
Richmond County (GA) 3,413 130,786 $3,081,306 38.3 121.9 4,670.9 $607,313 $21,690
City of Tacoma (WA) 6,030 298,995 $7,044,332 49.6 91.4 4,530.2 $2,359,649 $35,752
Doña Ana County (NM) 1,647 64,119 $1,510,634 38.9 56.8 2,211.0 $412,379 $14,220
New Hanover County (NC) 3,095 160,543 $3,782,384 51.9 88.4 4,586.9 $524,181 $14,977
Arlington County (VA) 4,924 218,660 $5,151,625 44.4 68.4 3,036.9 $1,441,527 $20,021
City of Irving (TX) 1,139 66,238 $1,560,572 58.2 67.0 3,896.4 $413,024 $24,296
City of Reno (NV) 3,344 214,379 $5,050,765 64.1 71.1 4,561.3 $3,095,368 $65,859
York County (SC) 1,226 97,055 $2,286,623 79.2 94.3 7,465.8 $83,798 $6,446
Group C Average 2,527.7 117,550.8 $2,769,497 53.1 84.3 4,060.8 $944,598 $27,545
Group C Median 1,899.0 97,852.4 $2,305,403 48.9 81.6 3,897.5 $472,984 $19,178
SOURCE: Arts and Economic Prosperity 5, Americans for the Arts, 2017. For more information, visit www.AmericansForTheArts.org/EconomicImpact. B–193

Table 14:Arts Volunteerism and In-Kind Contributions to Participating NonprofitArts and Cultural Organizations Per Study Region During Fiscal Year 2015
Population Cohort Group D Estimated Estimated Estimated Average Average Average Total Value In-Kind
Population 250,000 to 499,999 Number of Number of Value of Hours Per Volunteers Per Hours Per of In-Kind Value Per
Sample Size = 42 Volunteers Vol. Hours Vol. Hours Volunteer Organization Organization Contributions Organization
Buncombe County (NC) 4,813 182,250 $4,293,815 37.9 92.6 3,504.8 $1,161,386 $22,334
Alachua County (FL) 3,350 200,596 $4,726,030 59.9 76.1 4,559.0 $1,395,554 $31,717
Greater Green Bay Area (WI) 3,595 155,214 $3,656,835 43.2 87.7 3,785.7 $118,017 $2,878
City of Orlando (FL) 6,236 267,852 $6,310,593 43.0 113.4 4,870.0 $5,158,619 $93,793
City of Lincoln (NE) 3,461 155,112 $3,654,432 44.8 86.5 3,877.8 $1,500,140 $37,504
Southeastern Connecticut Region (CT) 5,025 242,803 $5,720,432 48.3 71.8 3,468.6 $1,920,119 $27,430
Erie County (PA) 4,839 156,847 $3,695,313 32.4 105.2 3,409.7 $489,846 $10,649
San Luis Obispo County (CA) 2,438 112,914 $2,660,249 46.3 87.1 4,032.6 $564,601 $20,164
City of Newark (NJ) 2,813 153,662 $3,620,277 54.6 90.7 4,956.8 $1,516,068 $48,905
Leon County (FL) 6,300 372,211 $8,769,298 59.1 91.3 5,394.4 $2,058,044 $29,827
Rutherford County (TN) 2,239 125,562 $2,958,236 56.1 62.2 3,487.8 $221,452 $6,151
St. Lucie County (FL) 670 26,935 $634,589 40.2 134.0 5,387.0 $14,600 $2,920
Greater Spartanburg Area (SC) 2,151 100,533 $2,368,567 46.7 74.2 3,466.7 $210,680 $7,265
Durham County (NC) 6,421 256,840 $6,051,153 40.0 93.1 3,722.3 $1,449,280 $21,004
City of St. Paul (MN) 1,964 59,760 $1,407,946 30.4 11.8 357.8 $380,239 $2,277
Hamilton County (IN) 3,770 92,939 $2,189,633 24.7 179.5 4,425.6 $791,572 $37,694
Osceola County (FL) 1,236 46,840 $1,103,541 37.9 176.6 6,691.4 $19,442 $2,777
Escambia County (FL) 3,061 109,475 $2,579,238 35.8 122.4 4,379.0 $845,205 $33,808
Lexington-Fayette Urban County (KY) 3,000 125,118 $2,947,785 41.7 88.2 3,679.9 $631,749 $18,581
Lake County (FL) 897 50,640 $1,193,081 56.5 81.5 4,603.6 $371,632 $33,785
City of Riverside (CA) 3,597 185,035 $4,359,422 51.4 79.9 4,111.9 $420,037 $9,334
Cumberland County (NC) 5,098 148,774 $3,505,111 29.2 106.2 3,099.5 $948,655 $19,764
Collier County (FL) 4,530 221,378 $5,215,656 48.9 100.7 4,919.5 $717,640 $15,948
Hamilton County (TN) 5,268 189,981 $4,475,943 36.1 99.4 3,584.5 $1,352,902 $25,526
Manatee County (FL) 2,868 115,889 $2,730,350 40.4 89.6 3,621.5 $723,515 $22,610
City of Tampa (FL) 5,374 268,953 $6,336,523 50.0 96.0 4,802.7 $4,688,727 $83,727
Forsyth County (NC) 6,227 278,974 $6,572,627 44.8 105.5 4,728.4 $1,934,824 $32,794
Mercer County (NJ) 1,798 88,973 $2,096,204 49.5 71.9 3,558.9 $759,871 $30,395
City of Wichita (KS) 2,750 129,374 $3,048,044 47.0 80.9 3,805.1 $1,840,512 $54,133
Clackamas County (OR) 1,346 54,129 $1,275,270 40.2 74.8 3,007.1 $96,617 $5,368
SOURCE: Arts and Economic Prosperity 5, Americans for the Arts, 2017. For more information, visit www.AmericansForTheArts.org/EconomicImpact. B–194

Table 14:Arts Volunteerism and In-Kind Contributions to Participating NonprofitArts and Cultural Organizations Per Study Region During Fiscal Year 2015
Population Cohort Group D Estimated Estimated Estimated Average Average Average Total Value In-Kind
Population 250,000 to 499,999 Number of Number of Value of Hours Per Volunteers Per Hours Per of In-Kind Value Per
Sample Size = 42 Volunteers Vol. Hours Vol. Hours Volunteer Organization Organization Contributions Organization
Sarasota County (FL) 6,185 264,262 $6,226,022 42.7 121.3 5,181.6 $4,272,410 $83,773
City of Minneapolis (MN) 18,752 873,784 $20,586,351 46.6 63.1 2,942.0 $4,473,090 $15,061
Berks County (PA) 2,072 82,967 $1,954,712 40.0 103.6 4,148.4 $268,629 $13,431
City of Miami (FL) 9,826 705,980 $16,632,884 71.8 45.5 3,268.4 $8,619,323 $39,904
City of Raleigh (NC) 9,429 317,212 $7,473,524 33.6 120.9 4,066.8 $4,111,461 $52,711
Santa Barbara County (CA) 6,927 327,899 $7,725,305 47.3 74.5 3,525.8 $4,094,244 $44,024
Seminole County (FL) 1,730 86,861 $2,046,436 50.2 82.4 4,136.2 $214,943 $10,235
City of Virginia Beach (VA) 2,130 108,857 $2,564,676 51.1 64.5 3,298.7 $1,188,280 $36,008
City of Atlanta (GA) 13,073 522,329 $12,306,078 40.0 89.5 3,577.6 $4,151,904 $28,438
City of Mesa (AZ) 1,974 95,770 $2,256,332 48.5 141.0 6,840.7 $86,632 $6,188
City of Kansas City (MO) 7,616 346,465 $8,162,704 45.5 83.7 3,807.3 $3,588,494 $39,434
Morris County (NJ) 1,107 87,590 $2,063,627 79.1 79.1 6,256.5 $29,200 $2,086
Group D Average 4,475.1 202,274.7 $4,765,591 45.6 92.9 4,103.6 $1,652,385 $27,675
Group D Median 3,528.0 154,386.9 $3,637,354 45.2 88.9 3,842.5 $896,930 $24,068
SOURCE: Arts and Economic Prosperity 5, Americans for the Arts, 2017. For more information, visit www.AmericansForTheArts.org/EconomicImpact. B–195

Table 14:Arts Volunteerism and In-Kind Contributions to Participating NonprofitArts and Cultural Organizations Per Study Region During Fiscal Year 2015
Population Cohort Group E Estimated Estimated Estimated Average Average Average Total Value In-Kind
Population 500,000 to 999,999 Number of Number of Value of Hours Per Volunteers Per Hours Per of In-Kind Value Per
Sample Size = 25 Volunteers Vol. Hours Vol. Hours Volunteer Organization Organization Contributions Organization
Sonoma County (CA) 3,836 178,122 $4,196,545 46.4 89.2 4,142.4 $1,292,562 $30,060
Volusia County (FL) 3,860 242,259 $5,707,622 62.8 87.7 5,505.9 $1,076,229 $24,460
Guilford County (NC) 6,457 256,295 $6,038,301 39.7 92.2 3,661.4 $2,171,552 $31,022
Dane County (WI) 7,814 399,302 $9,407,543 51.1 59.2 3,025.0 $3,431,055 $25,993
Brevard County (FL) 1,254 63,400 $1,493,709 50.6 114.0 5,763.7 $542,786 $49,344
Washington County (OR) 2,639 133,226 $3,138,802 50.5 85.1 4,297.6 $164,856 $5,318
Johnson County (KS) 2,261 94,987 $2,237,884 42.0 83.7 3,518.0 $1,090,815 $40,401
City of Louisville (KY) 9,229 451,157 $10,629,252 48.9 92.3 4,511.6 $2,923,836 $29,238
City of Baltimore (MD) 15,785 665,410 $15,677,053 42.2 108.1 4,557.6 $5,147,569 $35,257
Polk County (FL) 2,584 139,593 $3,288,821 54.0 76.0 4,105.7 $2,241,040 $65,913
City of Boston (MA) 13,230 557,577 $13,136,516 42.1 89.4 3,767.4 $17,195,134 $116,183
District of Columbia (DC) 17,256 697,550 $16,434,280 40.4 88.5 3,577.2 $15,382,653 $78,885
Nashville-Davidson County (TN) 7,065 357,801 $8,429,789 50.6 86.2 4,363.4 $5,586,392 $68,127
City of El Paso (TX) 4,700 246,660 $5,811,298 52.5 61.8 3,245.5 $967,745 $12,733
Lee County (FL) 3,061 184,129 $4,338,072 60.2 74.7 4,490.9 $3,481,543 $84,916
City of Fort Worth (TX) 6,208 298,524 $7,033,228 48.1 83.9 4,034.1 $4,668,422 $63,087
City of Indianapolis (IN) 9,848 403,832 $9,514,270 41.0 105.9 4,342.3 $3,183,531 $34,232
City and County of San Francisco (CA) 29,991 1,151,576 $27,131,135 38.4 83.5 3,207.7 $16,235,480 $45,224
Prince George's County (MD) 3,151 162,850 $3,836,744 51.7 80.8 4,175.6 $848,459 $21,755
Pinellas County (FL) 5,097 238,389 $5,616,454 46.8 108.4 5,072.1 $4,532,861 $96,444
Shelby County (TN) 6,544 293,477 $6,914,320 44.8 92.2 4,133.5 $5,212,175 $73,411
Fairfield County (CT) 5,918 254,417 $5,994,053 43.0 82.2 3,533.6 $2,900,514 $40,285
Westchester County (NY) 7,176 301,083 $7,093,515 42.0 67.1 2,813.9 $2,559,448 $23,920
Fulton County (GA) 16,147 639,512 $15,066,903 39.6 89.7 3,552.8 $4,462,436 $24,791
Wake County (NC) 13,205 478,559 $11,274,855 36.2 104.8 3,798.1 $4,205,062 $33,374
Group E Average 8,172.6 355,587.4 $8,377,639 46.6 87.5 4,047.9 $4,460,166 $46,175
Group E Median 6,457.0 293,477.1 $6,914,320 46.4 87.7 4,105.7 $3,183,531 $35,257
SOURCE: Arts and Economic Prosperity 5, Americans for the Arts, 2017. For more information, visit www.AmericansForTheArts.org/EconomicImpact. B–196

Table 14:Arts Volunteerism and In-Kind Contributions to Participating NonprofitArts and Cultural Organizations Per Study Region During Fiscal Year 2015
Population Cohort Group F Estimated Estimated Estimated Average Average Average Total Value In-Kind
Population 1,000,000 or More Number of Number of Value of Hours Per Volunteers Per Hours Per of In-Kind Value Per
Sample Size = 21 Volunteers Vol. Hours Vol. Hours Volunteer Organization Organization Contributions Organization
Mecklenburg County (NC) 8,622 322,179 $7,590,533 37.4 105.1 3,929.0 $3,266,785 $39,839
City of San José (CA) 7,171 303,317 $7,146,144 42.3 107.0 4,527.1 $5,746,148 $85,763
Montgomery County (MD) 14,821 550,178 $12,962,194 37.1 99.5 3,692.5 $7,313,872 $49,086
Fairfax County (VA) 7,109 303,569 $7,152,093 42.7 83.6 3,571.4 $4,006,386 $47,134
Allegheny County (PA) 16,584 796,073 $18,755,468 48.0 85.5 4,103.5 $7,029,670 $36,235
Greater Columbus Area (OH) 8,531 377,095 $8,884,346 44.2 92.7 4,098.9 $6,231,073 $67,729
Orange County (FL) 9,491 427,691 $10,076,398 45.1 105.5 4,752.1 $7,254,802 $80,609
City of Dallas (TX) 17,467 873,954 $20,590,363 50.0 83.6 4,181.6 $16,346,842 $78,215
Hillsborough County (FL) 7,339 353,694 $8,333,026 48.2 96.6 4,653.9 $4,916,248 $64,687
City of San Diego (CA) 12,377 593,781 $13,989,480 48.0 90.3 4,334.2 $12,771,530 $93,223
Palm Beach County (FL) 7,024 315,957 $7,443,937 45.0 88.9 3,999.5 $5,847,915 $74,024
City of San Antonio (TX) 6,035 230,147 $5,422,266 38.1 79.4 3,028.3 $3,718,516 $48,928
Sacramento County (CA) 10,338 471,002 $11,096,817 45.6 94.0 4,281.8 $4,451,450 $40,468
City of Phoenix (AZ) 12,079 482,355 $11,364,277 39.9 134.2 5,359.5 $8,596,330 $95,515
City and County of Philadelphia (PA) 32,628 1,356,483 $31,958,732 41.6 82.6 3,434.1 $16,030,269 $40,583
Broward County (FL) 8,659 347,011 $8,175,589 40.1 84.1 3,369.0 $6,033,307 $58,576
Santa Clara County (CA) 11,652 481,953 $11,354,808 41.4 101.3 4,190.9 $6,726,543 $58,492
Riverside County (CA) 7,939 381,048 $8,977,496 48.0 84.5 4,053.7 $3,396,306 $36,131
Miami-Dade County (FL) 27,979 1,969,499 $46,401,401 70.4 44.3 3,116.3 $19,599,651 $31,012
City of Chicago (IL) 33,698 1,645,750 $38,773,868 48.8 72.3 3,531.7 $29,019,768 $62,274
Harris County (TX) 16,960 751,750 $17,711,221 44.3 85.7 3,796.7 $7,774,596 $39,266
Group F Average 13,547.8 634,975.5 $14,960,022 45.1 90.5 4,000.3 $8,860,857 $58,466
Group F Median 10,338.0 471,002.4 $11,096,817 44.3 88.9 4,053.7 $6,726,543 $58,492
Average 4,001.9 183,102.5 $4,313,894 49.6 80.7 3,773.4 $1,958,763 $28,805
Median 2,072.0 99,416.7 $2,342,257 47.2 82.1 3,767.4 $619,531 $22,310
ALL CITY/COUNTY STUDY REGIONS
SOURCE: Arts and Economic Prosperity 5, Americans for the Arts, 2017. For more information, visit www.AmericansForTheArts.org/EconomicImpact. B–197

Table 14:Arts Volunteerism and In-Kind Contributions to Participating NonprofitArts and Cultural Organizations Per Study Region During Fiscal Year 2015
Regional Study Regions Estimated Estimated Estimated Average Average Average Total Value In-Kind
All Populations Number of Number of Value of Hours Per Volunteers Per Hours Per of In-Kind Value Per
Sample Size = 81 Volunteers Vol. Hours Vol. Hours Volunteer Organization Organization Contributions Organization
High Peaks Region (ME) 787 35,162 $828,424 44.7 71.5 3,196.6 $46,901 $4,264
Wood River Valley (ID) 1,986 59,796 $1,408,784 30.1 82.8 2,491.5 $973,654 $40,569
Southern Oregon Area 499 20,836 $490,896 41.8 124.8 5,209.0 $385,622 $96,406
Southwestern Pennsylvania Area 2,953 102,974 $2,426,065 34.9 101.8 3,550.8 $366,490 $12,638
Greater Portsmouth Area (NH) 3,073 109,334 $2,575,897 35.6 118.2 4,205.1 $685,707 $26,373
Northeast Oregon Region 245 13,696 $322,673 55.9 49.0 2,739.2 $97,520 $19,504
Toe River Valley (NC) 1,013 25,955 $611,497 25.6 112.6 2,883.9 $25,742 $2,860
Albemarle Region (NC) 585 36,621 $862,800 62.6 83.6 5,231.6 $17,472 $2,496
Greater Concord Area (NH) 1,108 62,071 $1,462,402 56.0 73.9 4,138.1 $429,560 $28,637
North Central Minnesota Region 993 47,710 $1,124,048 48.0 25.5 1,223.3 $25,671 $658
Northwest Minnesota Region 237 19,266 $453,907 81.3 9.1 741.0 $75,565 $2,906
Monadnock Region (NH) 2,394 121,868 $2,871,198 50.9 66.5 3,385.2 $170,175 $4,727
Bismarck-Mandan Region (ND) 1,431 91,636 $2,158,942 64.0 46.2 2,956.0 $277,610 $8,955
Greater Minot Region (ND) 2,124 78,485 $1,849,104 37.0 88.5 3,270.2 $248,774 $10,366
Greater Burlington Area (VT) 3,484 164,779 $3,882,184 47.3 71.1 3,362.8 $1,813,462 $37,009
Greater Charlottesville Area (VA) 3,978 223,644 $5,269,041 56.2 90.4 5,082.8 $855,901 $19,452
Brainerd Lakes Region (MN) 1,131 28,465 $670,635 25.2 30.6 769.3 $42,482 $1,148
East Central Minnesota Region 905 26,977 $635,578 29.8 31.2 930.2 $133,489 $4,603
Northwest Connecticut Region 3,211 158,096 $3,724,730 49.2 57.3 2,823.1 $1,009,300 $18,023
Central Oregon Region 1,757 53,620 $1,263,285 30.5 135.2 4,124.6 $700,100 $53,854
Greater Fargo-Moorhead Area (ND/MN) 2,541 99,476 $2,343,657 39.1 47.9 1,876.9 $825,616 $15,578
Black Hills Region (SD) 5,419 287,534 $6,774,308 53.1 80.9 4,291.6 $1,162,375 $17,349
Greater Kingsport Area (TN) 2,709 144,283 $3,399,307 53.3 108.4 5,771.3 $742,249 $29,690
Lake Region (MN) 1,552 66,778 $1,573,290 43.0 31.0 1,335.6 $402,559 $8,051
South Central Minnesota Region 1,790 65,627 $1,546,172 36.7 20.1 737.4 $173,044 $1,944
Greater Sioux Falls Area (SD) 3,652 134,720 $3,174,008 36.9 110.7 4,082.4 $829,887 $25,148
Southwest Tennessee Development District 1,730 100,626 $2,370,744 58.2 59.7 3,469.9 $654,122 $22,556
Northwest Tennessee Development District 1,946 99,560 $2,345,634 51.2 67.1 3,433.1 $285,667 $9,851
Southwest Minnesota Region 1,395 42,024 $990,085 30.1 19.9 600.3 $170,100 $2,430
Arrowhead Region (MN) 3,564 140,527 $3,310,816 39.4 33.3 1,313.3 $394,152 $3,684
SOURCE: Arts and Economic Prosperity 5, Americans for the Arts, 2017. For more information, visit www.AmericansForTheArts.org/EconomicImpact. B–198

Table 14:Arts Volunteerism and In-Kind Contributions to Participating NonprofitArts and Cultural Organizations Per Study Region During Fiscal Year 2015
Regional Study Regions Estimated Estimated Estimated Average Average Average Total Value In-Kind
All Populations Number of Number of Value of Hours Per Volunteers Per Hours Per of In-Kind Value Per
Sample Size = 81 Volunteers Vol. Hours Vol. Hours Volunteer Organization Organization Contributions Organization
Maple Grove and the Northwest Suburbs (MN) 478 15,748 $371,023 32.9 31.9 1,049.9 $120,000 $8,000
Greater Augusta Area (GA) 3,573 160,877 $3,790,250 45.0 108.3 4,875.0 $612,313 $18,555
Upper Cumberland Development District (TN) 2,868 162,405 $3,826,250 56.6 68.3 3,866.8 $291,435 $6,939
City of Huntsville/Madison County (AL) 6,332 189,184 $4,457,184 29.9 186.2 5,564.2 $1,178,841 $34,672
Northeast Commission (NC) 4,895 239,823 $5,650,230 49.0 79.0 3,868.1 $259,465 $4,185
Greater Ann Arbor Area (MI) 13,672 415,630 $9,792,243 30.4 157.1 4,777.4 $1,291,684 $14,847
Greater Fox Cities Region (WI) 1,651 77,897 $1,835,249 47.2 91.7 4,327.6 $450,221 $25,012
Central Minnesota Region 2,277 62,911 $1,482,183 27.6 42.2 1,165.0 $189,465 $3,509
South Central Tennessee Development District 2,260 168,777 $3,976,384 74.7 37.7 2,812.9 $318,820 $5,314
Northwest Arkansas Region 2,254 101,741 $2,397,023 45.1 98.0 4,423.5 $1,820,318 $79,144
Southeast Minnesota Region 5,829 251,117 $5,916,317 43.1 47.8 2,058.3 $565,867 $4,638
First Tennessee Development District 5,387 279,281 $6,579,870 51.8 92.9 4,815.2 $1,386,242 $23,901
Greater Harrisburg Area (PA) 2,830 102,074 $2,404,854 36.1 113.2 4,082.9 $736,124 $29,445
Greater New Haven Area (CT) 3,028 141,122 $3,324,839 46.6 86.5 4,032.1 $2,693,162 $76,947
Treasure Coast Region (FL) 3,492 178,878 $4,214,375 51.2 99.8 5,110.8 $772,947 $22,084
Greater Des Moines Region (IA) 7,590 277,664 $6,541,754 36.6 116.8 4,271.7 $3,231,795 $49,720
Southeast Tennessee Development District 8,472 343,775 $8,099,332 40.6 91.1 3,696.5 $1,480,590 $15,920
Greater Knoxville Region (TN) 5,525 274,306 $6,462,659 49.6 92.1 4,571.8 $3,808,856 $63,481
Greater Columbia Area (SC) 2,409 129,196 $3,043,862 53.6 73.0 3,915.0 $2,938,579 $89,048
Pikes Peak Region (CO) 4,555 297,676 $7,013,249 65.4 52.4 3,421.6 $4,042,270 $46,463
Lehigh Valley Region (PA) 6,952 323,354 $7,618,208 46.5 70.9 3,299.5 $3,238,931 $33,050
Greater Sarasota/Bradenton Area (FL) 9,053 380,152 $8,956,372 42.0 109.1 4,580.1 $4,995,925 $60,192
Dayton Region (OH) 11,577 440,510 $10,378,411 38.1 102.5 3,898.3 $4,377,163 $38,736
Richmond & Tri-Cities Region (VA) 7,849 310,883 $7,324,413 39.6 94.6 3,745.6 $1,790,697 $21,575
Memphis Area Association of Governments (TN) 6,705 300,625 $7,082,727 44.8 91.8 4,118.2 $5,212,175 $71,400
Eastern Region (NC) 9,273 425,070 $10,014,642 45.8 84.3 3,864.3 $837,540 $7,614
Advantage West Region (NC) 16,312 655,639 $15,446,864 40.2 88.7 3,563.3 $1,985,400 $10,790
Southeast Commission (NC) 11,093 490,708 $11,561,090 44.2 87.3 3,863.8 $1,759,031 $13,851
Greater Fairfax Area (VA) 8,151 357,948 $8,433,255 43.9 79.1 3,475.2 $4,030,209 $39,128
Greater Tulsa Region (OK) 9,210 401,324 $9,455,191 43.6 74.9 3,262.8 $1,736,184 $14,115
SOURCE: Arts and Economic Prosperity 5, Americans for the Arts, 2017. For more information, visit www.AmericansForTheArts.org/EconomicImpact. B–199

Table 14:Arts Volunteerism and In-Kind Contributions to Participating NonprofitArts and Cultural Organizations Per Study Region During Fiscal Year 2015
Regional Study Regions Estimated Estimated Estimated Average Average Average Total Value In-Kind
All Populations Number of Number of Value of Hours Per Volunteers Per Hours Per of In-Kind Value Per
Sample Size = 81 Volunteers Vol. Hours Vol. Hours Volunteer Organization Organization Contributions Organization
East Tennessee Development District 8,150 416,996 $9,824,426 51.2 81.5 4,170.0 $4,272,311 $42,723
West Valley Region (AZ) 1,706 87,670 $2,065,496 51.4 85.3 4,383.5 $612,025 $30,601
Greater St. Louis Area (MO) 14,267 607,661 $14,316,498 42.6 87.5 3,728.0 $4,359,215 $26,744
Western New York 12,215 587,340 $13,837,719 48.1 96.9 4,661.4 $4,171,986 $33,111
Greater Oklahoma City Region (OK) 13,743 510,713 $12,032,396 37.2 89.8 3,338.0 $6,319,491 $41,304
Piedmont Triad Partnership (NC) 17,767 805,452 $18,976,442 45.3 86.2 3,910.0 $4,335,728 $21,047
Greater Portland Area (OR) 17,601 786,215 $18,523,228 44.7 96.2 4,296.3 $5,925,760 $32,381
Greater Kansas City Metropolitan Area (MO/KS) 11,505 521,841 $12,294,569 45.4 86.5 3,923.6 $5,013,440 $37,695
Greater Nashville Regional Council (TN) 11,443 583,307 $13,742,718 51.0 72.4 3,691.8 $6,181,260 $39,122
Research Triangle Regional Partnership (NC) 31,149 1,260,236 $29,691,165 40.5 87.3 3,530.1 $7,078,014 $19,826
Greater Tampa/St. Petersburg Area (FL) 12,436 592,083 $13,949,480 47.6 101.1 4,813.7 $9,449,109 $76,822
Charlotte Regional Partnership (NC) 19,036 739,881 $17,431,599 38.9 101.8 3,956.6 $4,829,040 $25,824
Charlotte Regional Partnership (NC/SC) 20,262 836,936 $19,718,222 41.3 101.3 4,184.7 $4,912,838 $24,564
Seven-County Metro Area (MN) 42,705 1,958,967 $46,153,263 45.9 66.2 3,037.2 $7,382,567 $11,446
Central Florida Region 21,052 1,057,284 $24,909,606 50.2 96.6 4,849.9 $11,720,874 $53,765
Greater Philadelphia Region (PA) 41,017 1,810,215 $42,648,675 44.1 83.4 3,679.3 $17,009,165 $34,571
Greater Washington Region (DC/MD/VA) 51,902 2,139,960 $50,417,455 41.2 85.4 3,519.7 $30,521,107 $50,199
Metro Atlanta Area (GA) 26,187 991,262 $23,354,142 37.9 97.3 3,685.0 $5,223,768 $19,419
Greater Atlanta Region (GA) 29,239 1,096,785 $25,840,259 37.5 98.4 3,692.9 $5,265,768 $17,730
Greater Houston Region (TX) 17,819 792,452 $18,670,160 44.5 85.3 3,791.6 $8,529,175 $40,809
Dallas-Fort Worth-Arlington MSA (TX) 39,157 1,958,957 $46,153,017 50.0 86.2 4,314.9 $23,989,319 $52,840
Regional Average 8,717.3 379,761.1 $8,947,172 44.8 81.1 3,540.3 $3,077,471 $27,118
Regional Median 3,978.0 189,184.4 $4,457,184 44.7 86.2 3,745.6 $1,162,375 $22,084
SOURCE: Arts and Economic Prosperity 5, Americans for the Arts, 2017. For more information, visit www.AmericansForTheArts.org/EconomicImpact. B–200

Table 14:Arts Volunteerism and In-Kind Contributions to Participating NonprofitArts and Cultural Organizations Per Study Region During Fiscal Year 2015
Statewide Study Regions Estimated Estimated Estimated Average Average Average Total Value In-Kind
All Populations Number of Number of Value of Hours Per Volunteers Per Hours Per of In-Kind Value Per
Sample Size = 20 Volunteers Vol. Hours Vol. Hours Volunteer Organization Organization Contributions Organization
State of Vermont 5,950 263,025 $6,196,871 44.2 69.2 3,058.4 $2,118,792 $24,637
State of North Dakota 7,615 345,191 $8,132,705 45.3 56.4 2,557.0 $1,216,296 $9,010
State of Delaware 7,707 441,526 $10,402,343 57.3 81.1 4,647.6 $1,795,211 $18,897
State of Maine 9,789 436,498 $10,283,891 44.6 79.6 3,548.8 $1,794,487 $14,589
State of Hawai'i 10,017 507,657 $11,960,399 50.7 91.9 4,657.4 $3,266,642 $29,969
State of Nevada 11,065 581,343 $13,696,443 52.5 67.5 3,544.8 $9,178,680 $55,968
State of Connecticut 25,960 1,148,853 $27,066,970 44.3 80.1 3,545.8 $11,184,199 $34,519
State of Oklahoma 30,446 1,263,516 $29,768,432 41.5 77.7 3,223.3 $8,880,296 $22,654
State of Oregon 36,750 1,592,988 $37,530,788 43.3 100.7 4,364.3 $9,913,250 $27,160
State of Minnesota 62,378 2,710,369 $63,856,294 43.5 49.2 2,137.5 $9,554,961 $7,535
State of Wisconsin 30,076 1,410,365 $33,228,199 46.9 82.9 3,885.3 $9,334,085 $25,714
State of Maryland 52,152 2,196,568 $51,751,142 42.1 99.9 4,208.0 $18,226,793 $34,917
State of Missouri 43,310 1,959,507 $46,165,985 45.2 88.2 3,990.8 $11,220,872 $22,853
State of Tennessee 48,961 2,455,352 $57,848,084 50.1 76.3 3,824.5 $20,082,622 $31,281
State of Massachusetts 53,473 2,467,674 $58,138,404 46.1 83.2 3,837.8 $32,896,598 $51,161
State of New Jersey 14,112 709,327 $16,711,744 50.3 77.1 3,876.1 $7,735,313 $42,269
State of North Carolina 109,525 4,616,810 $108,772,032 42.2 88.8 3,744.4 $21,084,218 $17,100
State of Pennsylvania 93,757 4,064,021 $95,748,337 43.3 87.1 3,773.5 $32,114,498 $29,818
State of Illinois 66,126 3,182,248 $74,973,770 48.1 81.8 3,938.4 $44,512,095 $55,089
State of Florida 121,264 6,522,918 $153,679,955 53.8 71.8 3,864.3 $71,073,471 $42,105
Statewide Average 42,021.7 1,943,787.8 $45,795,639 46.8 79.5 3,711.4 $16,359,169 $29,862
Statewide Median 33,598.0 1,501,676.3 $35,379,494 45.3 80.6 3,831.1 $9,734,106 $28,489
SOURCE: Arts and Economic Prosperity 5, Americans for the Arts, 2017. For more information, visit www.AmericansForTheArts.org/EconomicImpact. B–201

Table 14:Arts Volunteerism and In-Kind Contributions to Participating NonprofitArts and Cultural Organizations Per Study Region During Fiscal Year 2015
Individual Arts Districts Estimated Estimated Estimated Average Average Average Total Value In-Kind
All Populations Number of Number of Value of Hours Per Volunteers Per Hours Per of In-Kind Value Per
Sample Size = 12 Volunteers Vol. Hours Vol. Hours Volunteer Organization Organization Contributions Organization
James River Arts & Cultural District 1,066 51,531 $1,214,061 48.3 71.1 3,435.4 $298,589 $19,906
Center City Charlotte 5,059 154,499 $3,639,994 30.5 144.5 4,414.3 $2,847,159 $81,347
Loch Haven Cultural Park 3,118 75,135 $1,770,178 24.1 389.8 9,391.9 $2,544,526 $318,066
Downtown Colorado Springs Creative District 1,570 99,563 $2,345,709 63.4 52.3 3,318.8 $3,308,793 $110,293
Fort Worth Cultural District 1,433 66,819 $1,574,260 46.6 89.6 4,176.2 $1,738,381 $108,649
Dallas Arts District 1,315 71,404 $1,682,281 54.3 87.7 4,760.3 $6,679,252 $445,283
Grand Center Arts & Entertainment District 2,029 85,822 $2,021,971 42.3 101.5 4,291.1 $664,855 $33,243
Balboa Park Cultural District 2,973 139,003 $3,274,899 46.8 123.9 5,791.8 $9,124,412 $380,184
East End Cultural District 449 26,645 $627,751 59.3 49.9 2,960.5 $38,552 $4,284
Houston Museum District Association 2,380 104,961 $2,472,872 44.1 108.2 4,770.9 $2,587,476 $117,613
Midtown Cultural District 469 17,973 $423,446 38.3 93.8 3,594.6 $108,700 $21,740
Washington Avenue Cultural District 221 11,515 $271,284 52.1 36.8 1,919.1 $102,313 $17,052
Arts District Average 1,840.2 75,405.7 $1,776,559 45.9 112.4 4,402.1 $2,503,584 $138,138
Arts District Median 1,501.5 73,269.5 $1,726,229 46.7 91.7 4,233.7 $2,141,454 $94,998
SOURCE: Arts and Economic Prosperity 5, Americans for the Arts, 2017. For more information, visit www.AmericansForTheArts.org/EconomicImpact. B–202
Explanation of Table 15:Total Attendance to Nonprofit Arts and Cultural EventsPer Study Region During 2015
Column Two:
Column Three:
Column Four:
Column Five:
Column Six:
Column Seven:
This table presents the total attendance to arts and cultural events in each study region during 2015, as reported by the participating nonprofit arts and cultural organizations. Summary statistics are calculated for each population group.
The percentage of arts and cultural event attendees who are residents. Residents are attendees who reported that their primary residence is located within the county where the nonprofit arts and cultural event took place (or within the multi-city or multi-county region for regional analyses, or within the state for statewide analyses). Residency is determined based on the ZIP code provided by each audience-intercept respondent.
The total estimated number of arts and cultural event attendees who are residents. This figure was calculated by multiplying the percentage of arts and cultural event attendees who are residents (Column Four) by the total 2015 arts and cultural event attendance for each participating study region (Column Three).
The percentage of arts and cultural event attendees who are non-residents. Non-residents are attendees who reported that their primary residence is located outside the county where the nonprofit arts and culture event took place (or outside the multi-city or multi-county region for regional analyses, or outside the state for statewide analyses). Residency is determined based on the ZIP code provided by each audience-intercept respondent.
The total estimated number of arts and cultural event attendees who are non-residents. This figure was calculated by multiplying the percentage of arts and cultural event attendees who are non-residents (Column Six) by the total 2015 arts and cultural event attendance for each participating study region (Column Three).
The total number of audience-intercept surveys that were collected from arts and cultural event attendees in each participating study region. (The audience-intercept survey instrument is included in Appendix C to this Arts & Economic Prosperity 5 National Statistical Report.)
The total attendance to arts and cultural events in each participating study region during 2015, as reported by the participating nonprofit arts and cultural organizations.
SOURCE: Arts and Economic Prosperity 5, Americans for the Arts, 2017. For more information, visit www.AmericansForTheArts.org/EconomicImpact. B–203

Table 15:Total Attendance to Nonprofit Arts and Cultural EventsPer Study Region During 2015
Population Cohort Group A Total Reported Number of
Population Fewer than 50,000 Attendance to Audience Surveys Percent of Estimated Attendance Percent of Estimated Attendance
Sample Size = 52 Arts/Cultural Events Collected Total Attendees by Residents Total Attendees by Non-Residents
Town of Crested Butte (CO) 106,378 826 71.2% 75,741 28.8% 30,637
City of Pine City (MN) 21,150 274 60.2% 12,732 39.8% 8,418
City of Alva (OK) 35,230 370 87.6% 30,861 12.4% 4,369
Cook County (MN) 77,964 225 75.5% 58,863 24.5% 19,101
Town of Hillsborough (NC) 284,309 140 61.4% 174,566 38.6% 109,743
City of Virginia (MN) 2,478 225 75.5% 1,871 24.5% 607
Town of Jackson (WY) 597,580 689 75.3% 449,978 24.7% 147,602
City of Guthrie (OK) 71,495 432 49.5% 35,390 50.5% 36,105
City of Grand Rapids (MN) 86,381 225 75.5% 65,218 24.5% 21,163
Town of Medfield (MA) 30,997 527 92.6% 28,703 7.4% 2,294
City of Fergus Falls (MN) 42,384 270 88.0% 37,298 12.0% 5,086
Grundy County (TN) 24,241 440 30.2% 7,321 69.8% 16,920
City of Falls Church (VA) 495,458 560 36.4% 180,347 63.6% 315,111
City of Jamestown (ND) 194,000 429 70.6% 136,964 29.4% 57,036
City of Waterville (ME) 126,240 162 61.1% 77,133 38.9% 49,107
City of Red Wing (MN) 41,094 268 79.9% 32,834 20.1% 8,260
City of Durango (CO) 287,519 556 73.9% 212,477 26.1% 75,042
City of Hannibal (MO) 150,619 219 71.7% 107,994 28.3% 42,625
City of Tullahoma (TN) 37,119 695 88.3% 32,776 11.7% 4,343
City of Northfield (MN) 71,273 268 79.9% 56,947 20.1% 14,326
Town of Carrboro (NC) 212,888 233 42.1% 89,626 57.9% 123,262
Macon County (TN) 5,694 350 73.7% 4,196 26.3% 1,498
City of Laguna Beach (CA) 937,034 458 65.3% 611,883 34.7% 325,151
Hickman County (TN) 28,275 809 57.1% 16,145 42.9% 12,130
City of Fairfax (VA) 49,241 85 75.3% 37,078 24.7% 12,163
City of Ponca City (OK) 83,984 290 85.9% 72,142 14.1% 11,842
City of Paducah (KY) 240,595 375 30.1% 72,419 69.9% 168,176
Mille Lacs County (MN) 10,185 274 60.2% 6,131 39.8% 4,054
McNairy County (TN) 22,950 683 76.6% 17,580 23.4% 5,370
City of Winona (MN) 118,920 268 79.9% 95,017 20.1% 23,903
RESIDENT Audiences NON-Resident Audiences
SOURCE: Arts and Economic Prosperity 5, Americans for the Arts, 2017. For more information, visit www.AmericansForTheArts.org/EconomicImpact. B–204

Table 15:Total Attendance to Nonprofit Arts and Cultural EventsPer Study Region During 2015
Population Cohort Group A Total Reported Number of
Population Fewer than 50,000 Attendance to Audience Surveys Percent of Estimated Attendance Percent of Estimated Attendance
Sample Size = 52 Arts/Cultural Events Collected Total Attendees by Residents Total Attendees by Non-Residents
Door County (WI) 194,424 1,762 22.0% 42,773 78.0% 151,651
City of Benicia (CA) 49,382 1,292 64.8% 32,000 35.2% 17,382
City of Winter Park (FL) 1,070,230 786 46.1% 493,376 53.9% 576,854
City of Rochester (NH) 342,538 773 71.7% 245,600 28.3% 96,938
City of Morgantown (WV) 278,154 847 70.7% 196,655 29.3% 81,499
Henry County (TN) 31,416 101 79.2% 24,881 20.8% 6,535
City of Fairbanks (AK) 352,100 1,028 92.0% 323,932 8.0% 28,168
City of Bangor (ME) 201,218 1,275 56.9% 114,493 43.1% 86,725
Weakley County (TN) 75,000 531 55.7% 41,775 44.3% 33,225
Dare County (NC) 672,672 237 64.1% 431,183 35.9% 241,489
City of Columbia (TN) 282,326 534 80.5% 227,272 19.5% 55,054
City of Lake Worth (FL) 448,227 456 88.6% 397,129 11.4% 51,098
Clatsop County (OR) 160,816 787 54.4% 87,484 45.6% 73,332
Yadkin County (NC) 3,000 278 38.1% 1,143 61.9% 1,857
Greater Belfast Area (ME) 194,873 793 62.5% 121,796 37.5% 73,077
Campbell County (TN) 19,015 790 75.4% 14,337 24.6% 4,678
Monroe County (TN) 234,741 761 50.2% 117,840 49.8% 116,901
Lincoln County (OR) 211,830 1,463 69.3% 146,798 30.7% 65,032
Iron County (UT) 497,192 766 9.4% 46,736 90.6% 450,456
City of St. Louis Park (MN) 27,363 789 85.6% 23,423 14.4% 3,940
City of Logan (UT) 317,040 1,604 59.5% 188,639 40.5% 128,401
Gibson County (TN) 153,529 119 57.1% 87,665 42.9% 65,864
Group A Average 198,284 565 65.5% 120,099 34.5% 78,185
Group A Median 122,580 457 70.7% 72,281 29.4% 34,665
RESIDENT Audiences NON-Resident Audiences
SOURCE: Arts and Economic Prosperity 5, Americans for the Arts, 2017. For more information, visit www.AmericansForTheArts.org/EconomicImpact. B–205

Table 15:Total Attendance to Nonprofit Arts and Cultural EventsPer Study Region During 2015
Population Cohort Group B Total Reported Number of
Population 50,000 to 99,999 Attendance to Audience Surveys Percent of Estimated Attendance Percent of Estimated Attendance
Sample Size = 38 Arts/Cultural Events Collected Total Attendees by Residents Total Attendees by Non-Residents
City of Joplin (MO) 187,835 782 85.5% 160,599 14.5% 27,236
City of La Crosse (WI) 1,013,889 877 62.3% 631,653 37.7% 382,236
McMinn County (TN) 218,733 521 68.5% 149,832 31.5% 68,901
Lafayette County (MS) 223,150 1,303 68.9% 153,750 31.1% 69,400
Chisago County (MN) 82,880 274 60.2% 49,894 39.8% 32,986
City of Grand Forks (ND) 116,581 804 72.3% 84,288 27.7% 32,293
City of Corvallis (OR) 1,894,669 793 75.5% 1,430,475 24.5% 464,194
City of Noblesville (IN) 110,387 392 82.4% 90,959 17.6% 19,428
City of Ocala (FL) 1,141,752 822 75.2% 858,598 24.8% 283,154
Lenoir County (NC) 186,358 771 79.5% 148,155 20.5% 38,203
Town of Chapel Hill (NC) 1,475,944 540 43.5% 642,036 56.5% 833,908
City of Grand Junction (CO) 230,062 1,551 85.6% 196,933 14.4% 33,129
Town of Jupiter (FL) 174,638 958 60.2% 105,132 39.8% 69,506
Hamblen County (TN) 41,472 417 47.2% 19,575 52.8% 21,897
City of Delray Beach (FL) 255,525 1,064 55.8% 142,583 44.2% 112,942
City of St. Cloud (MN) 327,947 235 74.2% 243,337 25.8% 84,610
City of Portland (ME) 1,028,924 773 66.2% 681,148 33.8% 347,776
City of Jackson (TN) 106,663 665 72.3% 77,117 27.7% 29,546
City of Walnut Creek (CA) 640,720 1,222 74.6% 477,977 25.4% 162,743
Greene County (TN) 82,233 200 50.5% 41,528 49.5% 40,705
City of Flagstaff (AZ) 831,737 2,748 71.4% 593,860 28.6% 237,877
City of Missoula (MT) 1,991,208 788 79.3% 1,579,028 20.7% 412,180
City of Fort Myers (FL) 1,199,838 676 79.0% 947,872 21.0% 251,966
Putnam County (TN) 33,106 169 67.5% 22,347 32.5% 10,759
Monroe County (FL) 1,725,969 35,967 63.6% 1,097,716 36.4% 628,253
City of Lynchburg (VA) 191,045 919 69.0% 131,821 31.0% 59,224
City of Duluth (MN) 835,898 225 75.5% 631,103 24.5% 204,795
City of Fishers (IN) 847,865 395 63.5% 538,394 36.5% 309,471
City of Carmel (IN) 263,379 396 59.8% 157,501 40.2% 105,878
City of Sugar Land (TX) 23,125 426 72.3% 16,719 27.7% 6,406
RESIDENT Audiences NON-Resident Audiences
SOURCE: Arts and Economic Prosperity 5, Americans for the Arts, 2017. For more information, visit www.AmericansForTheArts.org/EconomicImpact. B–206

Table 15:Total Attendance to Nonprofit Arts and Cultural EventsPer Study Region During 2015
Population Cohort Group B Total Reported Number of
Population 50,000 to 99,999 Attendance to Audience Surveys Percent of Estimated Attendance Percent of Estimated Attendance
Sample Size = 38 Arts/Cultural Events Collected Total Attendees by Residents Total Attendees by Non-Residents
City of Asheville (NC) 866,847 662 57.9% 501,904 42.1% 364,943
Buchanan County (MO) 481,326 530 69.4% 334,040 30.6% 147,286
City of Boca Raton (FL) 350,006 1,706 58.7% 205,454 41.3% 144,552
City of Miami Beach (FL) 1,868,555 642 69.2% 1,293,040 30.8% 575,515
Moore County (NC) 327,505 604 81.6% 267,244 18.4% 60,261
Sevier County (TN) 655,014 732 38.3% 250,870 61.7% 404,144
Cape May County (NJ) 300,026 565 61.2% 183,616 38.8% 116,410
Cleveland County (NC) 107,927 468 56.2% 60,655 43.8% 47,272
Group B Average 590,546 1,673 67.2% 399,967 32.8% 190,579
Group B Median 313,766 671 69.0% 201,194 31.1% 109,410
NON-Resident AudiencesRESIDENT Audiences
SOURCE: Arts and Economic Prosperity 5, Americans for the Arts, 2017. For more information, visit www.AmericansForTheArts.org/EconomicImpact. B–207

Table 15:Total Attendance to Nonprofit Arts and Cultural EventsPer Study Region During 2015
Population Cohort Group C Total Reported Number of
Population 100,000 to 249,999 Attendance to Audience Surveys Percent of Estimated Attendance Percent of Estimated Attendance
Sample Size = 50 Arts/Cultural Events Collected Total Attendees by Residents Total Attendees by Non-Residents
City of Las Cruces (NM) 329,967 634 84.1% 277,502 15.9% 52,465
Eau Claire County (WI) 287,030 828 57.7% 165,616 42.3% 121,414
Yamhill County (OR) 778,786 789 63.0% 490,635 37.0% 288,151
City of Lewisville (TX) 16,416 488 75.4% 12,378 24.6% 4,038
City of West Palm Beach (FL) 3,655,228 5,538 74.4% 2,719,490 25.6% 935,738
City of Boulder (CO) 1,308,552 834 74.7% 977,488 25.3% 331,064
City of Richardson (TX) 325,624 527 81.8% 266,360 18.2% 59,264
City of High Point (NC) 185,816 1,077 63.0% 117,064 37.0% 68,752
City of Cambridge (MA) 1,616,032 775 48.3% 780,543 51.7% 835,489
City of Lowell (MA) 116,199 806 72.6% 84,360 27.4% 31,839
Douglas County (KS) 622,772 1,219 77.4% 482,026 22.6% 140,746
City of Columbia (MO) 335,633 829 81.3% 272,870 18.7% 62,763
City of Norman (OK) 1,009,235 836 63.5% 640,864 36.5% 368,371
Wayne County (NC) 137,360 570 77.0% 105,767 23.0% 31,593
City of Lafayette (LA) 328,950 53 69.8% 229,607 30.2% 99,343
Washington County (TN) 251,582 322 46.3% 116,482 53.7% 135,100
City of Thousand Oaks (CA) 148,926 875 70.3% 104,695 29.7% 44,231
City of Charleston (SC) 3,128,361 865 69.5% 2,174,211 30.5% 954,150
City of Waco (TX) 1,305,905 1,164 68.5% 894,545 31.5% 411,360
Robeson County (NC) 48,650 466 77.7% 37,801 22.3% 10,849
Columbia County (GA) 1,590 563 59.3% 943 40.7% 647
Orange County (NC) 1,973,166 913 45.9% 905,683 54.1% 1,067,483
City of Savannah (GA) 2,025,943 793 68.3% 1,383,719 31.7% 642,224
Indian River County (FL) 346,697 768 74.9% 259,676 25.1% 87,021
City of Alexandria (VA) 2,373,339 1,071 37.1% 880,509 62.9% 1,492,830
Martin County (FL) 497,859 723 60.2% 299,711 39.8% 198,148
Macon-Bibb County (GA) 1,462,765 808 64.5% 943,483 35.5% 519,282
City of Springfield (MA) 521,378 798 74.6% 388,948 25.4% 132,430
Catawba County (NC) 882,347 828 60.4% 532,938 39.6% 349,409
Town of Cary (NC) 608,168 408 85.3% 518,767 14.7% 89,401
RESIDENT Audiences NON-Resident Audiences
SOURCE: Arts and Economic Prosperity 5, Americans for the Arts, 2017. For more information, visit www.AmericansForTheArts.org/EconomicImpact. B–208

Table 15:Total Attendance to Nonprofit Arts and Cultural EventsPer Study Region During 2015
Population Cohort Group C Total Reported Number of
Population 100,000 to 249,999 Attendance to Audience Surveys Percent of Estimated Attendance Percent of Estimated Attendance
Sample Size = 50 Arts/Cultural Events Collected Total Attendees by Residents Total Attendees by Non-Residents
Alamance County (NC) 251,313 807 64.9% 163,102 35.1% 88,211
Cumberland County (NJ) 350,948 350 35.4% 124,236 64.6% 226,712
City of Eugene (OR) 1,115,873 892 87.9% 980,852 12.1% 135,021
Middlesex County (CT) 344,344 55 47.3% 162,875 52.7% 181,469
City of Springfield (MO) 711,131 793 68.7% 488,547 31.3% 222,584
City of Sioux Falls (SD) 2,454,161 705 51.5% 1,263,893 48.5% 1,190,268
Pitt County (NC) 215,229 388 74.5% 160,346 25.5% 54,883
City of Providence (RI) 3,839,971 400 62.0% 2,380,782 38.0% 1,459,189
City of Worcester (MA) 2,256,669 762 82.7% 1,866,265 17.3% 390,404
Montgomery County (TN) 75,210 597 76.2% 57,310 23.8% 17,900
Salt Lake City (UT) 7,398,371 846 75.1% 5,556,177 24.9% 1,842,194
Cabarrus County (NC) 273,694 635 69.0% 188,849 31.0% 84,845
Richmond County (GA) 694,096 1,074 42.1% 292,214 57.9% 401,882
City of Tacoma (WA) 2,703,154 1,124 72.6% 1,962,490 27.4% 740,664
Doña Ana County (NM) 661,846 812 83.4% 551,980 16.6% 109,866
New Hanover County (NC) 1,807,916 198 63.6% 1,149,835 36.4% 658,081
Arlington County (VA) 749,223 915 41.1% 307,931 58.9% 441,292
City of Irving (TX) 68,132 482 59.8% 40,743 40.2% 27,389
City of Reno (NV) 1,305,530 784 82.1% 1,071,840 17.9% 233,690
York County (SC) 421,600 753 73.8% 311,141 26.2% 110,459
Group C Average 1,086,574 811 66.8% 722,922 33.2% 363,652
Group C Median 615,470 791 69.3% 350,045 30.8% 161,108
RESIDENT Audiences NON-Resident Audiences
SOURCE: Arts and Economic Prosperity 5, Americans for the Arts, 2017. For more information, visit www.AmericansForTheArts.org/EconomicImpact. B–209

Table 15:Total Attendance to Nonprofit Arts and Cultural EventsPer Study Region During 2015
Population Cohort Group D Total Reported Number of
Population 250,000 to 499,999 Attendance to Audience Surveys Percent of Estimated Attendance Percent of Estimated Attendance
Sample Size = 42 Arts/Cultural Events Collected Total Attendees by Residents Total Attendees by Non-Residents
Buncombe County (NC) 932,567 786 58.1% 541,821 41.9% 390,746
Alachua County (FL) 2,424,533 1,255 72.2% 1,750,513 27.8% 674,020
Greater Green Bay Area (WI) 378,621 454 65.2% 246,861 34.8% 131,760
City of Orlando (FL) 2,161,634 1,837 55.9% 1,208,353 44.1% 953,281
City of Lincoln (NE) 2,316,510 1,121 79.2% 1,834,676 20.8% 481,834
Southeastern Connecticut Region (CT) 3,151,493 786 66.3% 2,089,440 33.7% 1,062,053
Erie County (PA) 1,171,729 779 87.4% 1,024,091 12.6% 147,638
San Luis Obispo County (CA) 457,105 918 83.4% 381,226 16.6% 75,879
City of Newark (NJ) 2,504,507 842 58.6% 1,467,641 41.4% 1,036,866
Leon County (FL) 2,846,437 780 84.0% 2,391,007 16.0% 455,430
Rutherford County (TN) 946,081 810 73.8% 698,208 26.2% 247,873
St. Lucie County (FL) 119,103 190 56.3% 67,055 43.7% 52,048
Greater Spartanburg Area (SC) 682,459 427 84.8% 578,725 15.2% 103,734
Durham County (NC) 2,802,066 824 56.6% 1,585,969 43.4% 1,216,097
City of St. Paul (MN) 7,038,796 789 85.6% 6,025,209 14.4% 1,013,587
Hamilton County (IN) 1,321,631 1,183 68.6% 906,639 31.4% 414,992
Osceola County (FL) 73,351 40 60.0% 44,011 40.0% 29,340
Escambia County (FL) 2,482,632 387 64.3% 1,596,332 35.7% 886,300
Lexington-Fayette Urban County (KY) 722,806 853 72.2% 521,866 27.8% 200,940
Lake County (FL) 324,785 283 73.9% 240,016 26.1% 84,769
City of Riverside (CA) 874,799 400 75.5% 660,473 24.5% 214,326
Cumberland County (NC) 1,500,405 1,194 73.2% 1,098,296 26.8% 402,109
Collier County (FL) 1,384,218 748 61.2% 847,141 38.8% 537,077
Hamilton County (TN) 2,641,673 785 72.9% 1,925,780 27.1% 715,893
Manatee County (FL) 1,113,905 900 63.3% 705,102 36.7% 408,803
City of Tampa (FL) 4,041,236 1,793 52.9% 2,137,814 47.1% 1,903,422
Forsyth County (NC) 2,434,829 787 65.4% 1,592,378 34.6% 842,451
Mercer County (NJ) 682,771 178 28.7% 195,955 71.3% 486,816
City of Wichita (KS) 2,411,517 972 77.7% 1,873,749 22.3% 537,768
Clackamas County (OR) 335,949 377 67.6% 227,102 32.4% 108,847
RESIDENT Audiences NON-Resident Audiences
SOURCE: Arts and Economic Prosperity 5, Americans for the Arts, 2017. For more information, visit www.AmericansForTheArts.org/EconomicImpact. B–210

Table 15:Total Attendance to Nonprofit Arts and Cultural EventsPer Study Region During 2015
Population Cohort Group D Total Reported Number of
Population 250,000 to 499,999 Attendance to Audience Surveys Percent of Estimated Attendance Percent of Estimated Attendance
Sample Size = 42 Arts/Cultural Events Collected Total Attendees by Residents Total Attendees by Non-Residents
Sarasota County (FL) 2,473,124 4,049 49.7% 1,229,143 50.3% 1,243,981
City of Minneapolis (MN) 7,832,644 789 85.6% 6,704,743 14.4% 1,127,901
Berks County (PA) 264,940 881 76.5% 202,679 23.5% 62,261
City of Miami (FL) 7,386,432 1,708 77.5% 5,724,485 22.5% 1,661,947
City of Raleigh (NC) 10,598,307 826 63.9% 6,772,318 36.1% 3,825,989
Santa Barbara County (CA) 2,558,563 195 72.8% 1,862,634 27.2% 695,929
Seminole County (FL) 480,681 100 59.0% 283,602 41.0% 197,079
City of Virginia Beach (VA) 1,987,610 1,408 63.3% 1,258,157 36.7% 729,453
City of Atlanta (GA) 8,516,788 232 37.1% 3,159,728 62.9% 5,357,060
City of Mesa (AZ) 719,470 847 87.0% 625,939 13.0% 93,531
City of Kansas City (MO) 2,948,739 1,258 33.9% 999,623 66.1% 1,949,116
Morris County (NJ) 519,713 669 54.4% 282,724 45.6% 236,989
Group D Average 2,346,837 868 66.8% 1,561,172 33.2% 785,665
Group D Median 1,744,008 789 67.0% 1,061,194 33.1% 484,325
RESIDENT Audiences NON-Resident Audiences
SOURCE: Arts and Economic Prosperity 5, Americans for the Arts, 2017. For more information, visit www.AmericansForTheArts.org/EconomicImpact. B–211

Table 15:Total Attendance to Nonprofit Arts and Cultural EventsPer Study Region During 2015
Population Cohort Group E Total Reported Number of
Population 500,000 to 999,999 Attendance to Audience Surveys Percent of Estimated Attendance Percent of Estimated Attendance
Sample Size = 25 Arts/Cultural Events Collected Total Attendees by Residents Total Attendees by Non-Residents
Sonoma County (CA) 1,175,598 1,095 85.3% 1,002,785 14.7% 172,813
Volusia County (FL) 1,092,820 84 85.7% 936,547 14.3% 156,273
Guilford County (NC) 3,882,025 2,251 66.7% 2,589,311 33.3% 1,292,714
Dane County (WI) 5,485,515 564 87.1% 4,777,884 12.9% 707,631
Brevard County (FL) 153,082 84 86.9% 133,028 13.1% 20,054
Washington County (OR) 361,440 457 66.5% 240,358 33.5% 121,082
Johnson County (KS) 494,405 395 72.4% 357,949 27.6% 136,456
City of Louisville (KY) 9,326,468 792 80.2% 7,479,827 19.8% 1,846,641
City of Baltimore (MD) 9,300,448 769 24.3% 2,260,009 75.7% 7,040,439
Polk County (FL) 930,679 714 64.4% 599,357 35.6% 331,322
City of Boston (MA) 19,512,675 743 37.6% 7,336,766 62.4% 12,175,909
District of Columbia (DC) 35,749,647 787 42.9% 15,336,599 57.1% 20,413,048
Nashville-Davidson County (TN) 6,573,673 920 60.4% 3,970,498 39.6% 2,603,175
City of El Paso (TX) 1,958,418 750 91.9% 1,799,786 8.1% 158,632
Lee County (FL) 3,422,836 781 75.7% 2,591,087 24.3% 831,749
City of Fort Worth (TX) 5,145,458 547 64.2% 3,303,384 35.8% 1,842,074
City of Indianapolis (IN) 6,952,660 847 63.9% 4,442,750 36.1% 2,509,910
City and County of San Francisco (CA) 15,605,760 763 40.8% 6,367,150 59.2% 9,238,610
Prince George's County (MD) 1,341,612 493 77.1% 1,034,383 22.9% 307,229
Pinellas County (FL) 4,264,849 778 65.6% 2,797,741 34.4% 1,467,108
Shelby County (TN) 2,565,708 761 80.0% 2,052,566 20.0% 513,142
Fairfield County (CT) 2,545,085 791 79.4% 2,020,797 20.6% 524,288
Westchester County (NY) 3,006,758 931 72.8% 2,188,920 27.2% 817,838
Fulton County (GA) 8,648,092 683 68.7% 5,941,239 31.3% 2,706,853
Wake County (NC) 11,319,197 1,358 72.3% 8,183,779 27.7% 3,135,418
Group E Average 6,432,596 766 68.5% 3,589,780 31.5% 2,842,816
Group E Median 3,882,025 763 72.3% 2,589,311 27.7% 831,749
RESIDENT Audiences NON-Resident Audiences
SOURCE: Arts and Economic Prosperity 5, Americans for the Arts, 2017. For more information, visit www.AmericansForTheArts.org/EconomicImpact. B–212

Table 15:Total Attendance to Nonprofit Arts and Cultural EventsPer Study Region During 2015
Population Cohort Group F Total Reported Number of
Population 1,000,000 or More Attendance to Audience Surveys Percent of Estimated Attendance Percent of Estimated Attendance
Sample Size = 21 Arts/Cultural Events Collected Total Attendees by Residents Total Attendees by Non-Residents
Mecklenburg County (NC) 3,576,703 635 66.5% 2,378,507 33.5% 1,198,196
City of San José (CA) 3,453,232 562 78.5% 2,710,787 21.5% 742,445
Montgomery County (MD) 3,468,322 1,057 63.9% 2,216,258 36.1% 1,252,064
Fairfax County (VA) 4,498,546 970 58.5% 2,631,649 41.5% 1,866,897
Allegheny County (PA) 16,629,848 1,084 78.5% 13,054,431 21.5% 3,575,417
Greater Columbus Area (OH) 7,597,918 669 70.4% 5,348,934 29.6% 2,248,984
Orange County (FL) 3,732,886 3,134 53.7% 2,004,560 46.3% 1,728,326
City of Dallas (TX) 8,098,283 1,827 56.9% 4,607,923 43.1% 3,490,360
Hillsborough County (FL) 4,820,624 2,114 58.0% 2,795,962 42.0% 2,024,662
City of San Diego (CA) 12,357,170 1,261 70.3% 8,687,091 29.7% 3,670,079
Palm Beach County (FL) 5,420,593 11,450 66.0% 3,577,591 34.0% 1,843,002
City of San Antonio (TX) 7,105,199 387 77.5% 5,506,529 22.5% 1,598,670
Sacramento County (CA) 3,201,448 991 81.3% 2,602,777 18.7% 598,671
City of Phoenix (AZ) 6,819,583 818 80.6% 5,496,584 19.4% 1,322,999
City and County of Philadelphia (PA) 18,076,391 863 36.3% 6,561,730 63.7% 11,514,661
Broward County (FL) 8,035,745 2,483 58.2% 4,676,804 41.8% 3,358,941
Santa Clara County (CA) 4,250,445 1,043 73.3% 3,115,576 26.7% 1,134,869
Riverside County (CA) 1,597,913 783 76.4% 1,220,806 23.6% 377,107
Miami-Dade County (FL) 16,071,458 3,300 72.7% 11,683,950 27.3% 4,387,508
City of Chicago (IL) 36,336,899 824 67.0% 24,345,722 33.0% 11,991,177
Harris County (TX) 19,836,986 1,960 80.2% 15,909,263 19.8% 3,927,723
Group F Average 9,285,057 1,820 67.8% 6,244,449 32.2% 3,040,608
Group F Median 6,819,583 1,043 70.3% 4,607,923 29.7% 1,866,897
Average 2,374,774 997 66.8% 1,508,935 33.2% 865,839
Median 677,566 773 69.1% 480,002 30.9% 197,614
ALL CITY/COUNTY STUDY REGIONS
RESIDENT Audiences NON-Resident Audiences
SOURCE: Arts and Economic Prosperity 5, Americans for the Arts, 2017. For more information, visit www.AmericansForTheArts.org/EconomicImpact. B–213

Table 15:Total Attendance to Nonprofit Arts and Cultural EventsPer Study Region During 2015
Regional Study Regions Total Reported Number of
All Populations Attendance to Audience Surveys Percent of Estimated Attendance Percent of Estimated Attendance
Sample Size = 81 Arts/Cultural Events Collected Total Attendees by Residents Total Attendees by Non-Residents
High Peaks Region (ME) 31,280 484 52.9% 16,547 47.1% 14,733
Wood River Valley (ID) 201,517 635 54.5% 109,827 45.5% 91,690
Southern Oregon Area 437,923 476 17.6% 77,074 82.4% 360,849
Southwestern Pennsylvania Area 1,581,981 973 79.0% 1,249,765 21.0% 332,216
Greater Portsmouth Area (NH) 1,212,260 781 65.2% 790,394 34.8% 421,866
Northeast Oregon Region 19,118 217 86.2% 16,480 13.8% 2,638
Toe River Valley (NC) 71,219 682 48.4% 34,470 51.6% 36,749
Albemarle Region (NC) 153,827 909 75.8% 116,601 24.2% 37,226
Greater Concord Area (NH) 385,798 719 46.3% 178,624 53.7% 207,174
North Central Minnesota Region 68,457 254 81.3% 55,660 18.7% 12,797
Northwest Minnesota Region 31,411 288 83.8% 26,329 16.2% 5,082
Monadnock Region (NH) 247,610 961 76.3% 188,926 23.7% 58,684
Bismarck-Mandan Region (ND) 785,725 674 87.8% 689,867 12.2% 95,858
Greater Minot Region (ND) 338,213 381 84.8% 286,805 15.2% 51,408
Greater Burlington Area (VT) 1,125,173 829 72.7% 818,001 27.3% 307,172
Greater Charlottesville Area (VA) 1,696,390 1,339 64.0% 1,085,690 36.0% 610,700
Brainerd Lakes Region (MN) 91,548 262 81.3% 74,420 18.7% 17,128
East Central Minnesota Region 223,072 274 60.2% 134,213 39.8% 88,859
Northwest Connecticut Region 534,107 1,206 59.7% 318,862 40.3% 215,245
Central Oregon Region 435,840 498 63.5% 276,758 36.5% 159,082
Greater Fargo-Moorhead Area (ND/MN) 1,253,032 1,009 81.7% 1,023,727 18.3% 229,305
Black Hills Region (SD) 4,330,052 683 89.6% 3,879,727 10.4% 450,325
Greater Kingsport Area (TN) 685,512 845 57.3% 392,798 42.7% 292,714
Lake Region (MN) 207,438 270 88.0% 182,643 12.0% 24,795
South Central Minnesota Region 358,731 309 74.7% 267,825 25.3% 90,906
Greater Sioux Falls Area (SD) 2,467,576 858 66.4% 1,638,470 33.6% 829,106
Southwest Tennessee Development District 180,541 1,355 83.6% 150,932 16.4% 29,609
Northwest Tennessee Development District 306,954 854 71.4% 219,165 28.6% 87,789
Southwest Minnesota Region 117,937 236 73.1% 86,221 26.9% 31,716
Arrowhead Region (MN) 773,204 225 75.5% 583,848 24.5% 189,356
RESIDENT Audiences NON-Resident Audiences
SOURCE: Arts and Economic Prosperity 5, Americans for the Arts, 2017. For more information, visit www.AmericansForTheArts.org/EconomicImpact. B–214
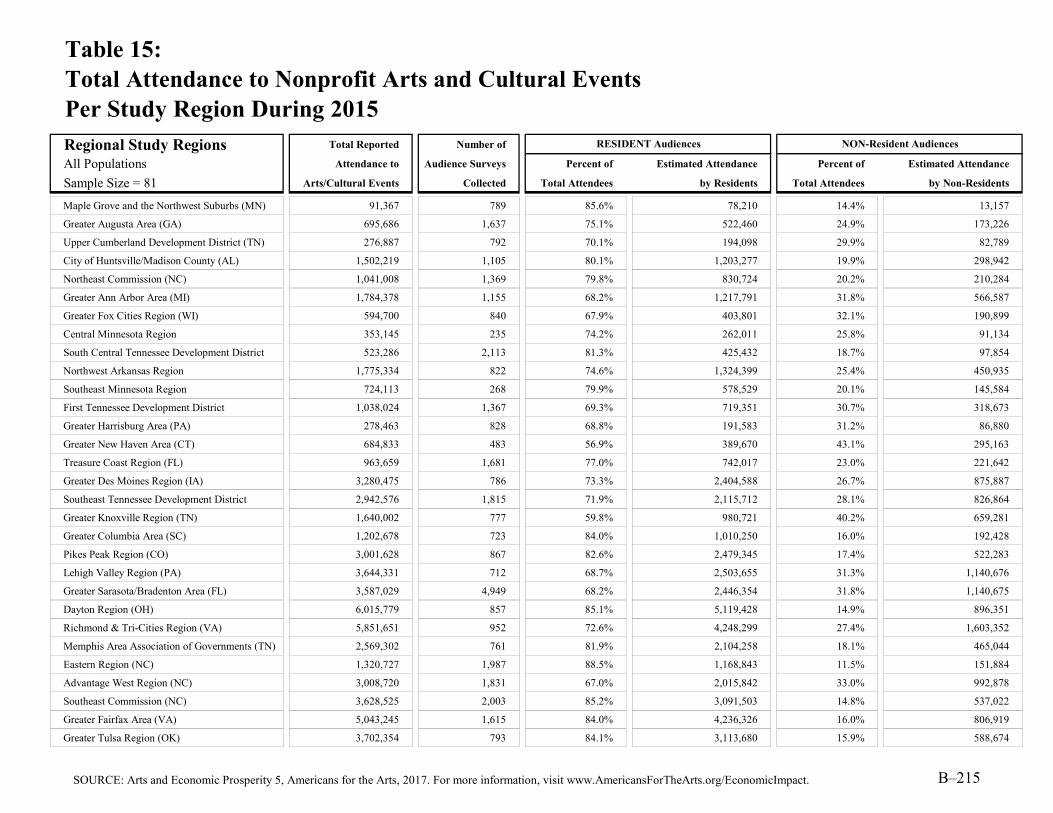
Table 15:Total Attendance to Nonprofit Arts and Cultural EventsPer Study Region During 2015
Regional Study Regions Total Reported Number of
All Populations Attendance to Audience Surveys Percent of Estimated Attendance Percent of Estimated Attendance
Sample Size = 81 Arts/Cultural Events Collected Total Attendees by Residents Total Attendees by Non-Residents
Maple Grove and the Northwest Suburbs (MN) 91,367 789 85.6% 78,210 14.4% 13,157
Greater Augusta Area (GA) 695,686 1,637 75.1% 522,460 24.9% 173,226
Upper Cumberland Development District (TN) 276,887 792 70.1% 194,098 29.9% 82,789
City of Huntsville/Madison County (AL) 1,502,219 1,105 80.1% 1,203,277 19.9% 298,942
Northeast Commission (NC) 1,041,008 1,369 79.8% 830,724 20.2% 210,284
Greater Ann Arbor Area (MI) 1,784,378 1,155 68.2% 1,217,791 31.8% 566,587
Greater Fox Cities Region (WI) 594,700 840 67.9% 403,801 32.1% 190,899
Central Minnesota Region 353,145 235 74.2% 262,011 25.8% 91,134
South Central Tennessee Development District 523,286 2,113 81.3% 425,432 18.7% 97,854
Northwest Arkansas Region 1,775,334 822 74.6% 1,324,399 25.4% 450,935
Southeast Minnesota Region 724,113 268 79.9% 578,529 20.1% 145,584
First Tennessee Development District 1,038,024 1,367 69.3% 719,351 30.7% 318,673
Greater Harrisburg Area (PA) 278,463 828 68.8% 191,583 31.2% 86,880
Greater New Haven Area (CT) 684,833 483 56.9% 389,670 43.1% 295,163
Treasure Coast Region (FL) 963,659 1,681 77.0% 742,017 23.0% 221,642
Greater Des Moines Region (IA) 3,280,475 786 73.3% 2,404,588 26.7% 875,887
Southeast Tennessee Development District 2,942,576 1,815 71.9% 2,115,712 28.1% 826,864
Greater Knoxville Region (TN) 1,640,002 777 59.8% 980,721 40.2% 659,281
Greater Columbia Area (SC) 1,202,678 723 84.0% 1,010,250 16.0% 192,428
Pikes Peak Region (CO) 3,001,628 867 82.6% 2,479,345 17.4% 522,283
Lehigh Valley Region (PA) 3,644,331 712 68.7% 2,503,655 31.3% 1,140,676
Greater Sarasota/Bradenton Area (FL) 3,587,029 4,949 68.2% 2,446,354 31.8% 1,140,675
Dayton Region (OH) 6,015,779 857 85.1% 5,119,428 14.9% 896,351
Richmond & Tri-Cities Region (VA) 5,851,651 952 72.6% 4,248,299 27.4% 1,603,352
Memphis Area Association of Governments (TN) 2,569,302 761 81.9% 2,104,258 18.1% 465,044
Eastern Region (NC) 1,320,727 1,987 88.5% 1,168,843 11.5% 151,884
Advantage West Region (NC) 3,008,720 1,831 67.0% 2,015,842 33.0% 992,878
Southeast Commission (NC) 3,628,525 2,003 85.2% 3,091,503 14.8% 537,022
Greater Fairfax Area (VA) 5,043,245 1,615 84.0% 4,236,326 16.0% 806,919
Greater Tulsa Region (OK) 3,702,354 793 84.1% 3,113,680 15.9% 588,674
RESIDENT Audiences NON-Resident Audiences
SOURCE: Arts and Economic Prosperity 5, Americans for the Arts, 2017. For more information, visit www.AmericansForTheArts.org/EconomicImpact. B–215

Table 15:Total Attendance to Nonprofit Arts and Cultural EventsPer Study Region During 2015
Regional Study Regions Total Reported Number of
All Populations Attendance to Audience Surveys Percent of Estimated Attendance Percent of Estimated Attendance
Sample Size = 81 Arts/Cultural Events Collected Total Attendees by Residents Total Attendees by Non-Residents
East Tennessee Development District 2,615,827 3,484 76.9% 2,011,571 23.1% 604,256
West Valley Region (AZ) 590,125 1,431 85.3% 503,377 14.7% 86,748
Greater St. Louis Area (MO) 11,779,277 1,523 79.6% 9,376,304 20.4% 2,402,973
Western New York 6,637,846 1,302 86.5% 5,741,737 13.5% 896,109
Greater Oklahoma City Region (OK) 8,462,337 2,346 76.6% 6,482,150 23.4% 1,980,187
Piedmont Triad Partnership (NC) 7,970,741 4,279 84.3% 6,719,335 15.7% 1,251,406
Greater Portland Area (OR) 4,647,870 1,474 84.3% 3,918,154 15.7% 729,716
Greater Kansas City Metropolitan Area (MO/KS) 3,587,047 1,853 85.3% 3,059,751 14.7% 527,296
Greater Nashville Regional Council (TN) 8,097,234 2,374 84.8% 6,866,454 15.2% 1,230,780
Research Triangle Regional Partnership (NC) 16,637,073 3,823 87.5% 14,557,439 12.5% 2,079,634
Greater Tampa/St. Petersburg Area (FL) 9,085,473 2,892 72.5% 6,586,968 27.5% 2,498,505
Charlotte Regional Partnership (NC) 5,423,453 2,859 83.6% 4,534,007 16.4% 889,446
Charlotte Regional Partnership (NC/SC) 5,845,053 3,641 84.8% 4,956,605 15.2% 888,448
Seven-County Metro Area (MN) 15,954,677 789 85.6% 13,665,035 14.4% 2,289,642
Central Florida Region 6,788,284 4,439 80.7% 5,478,145 19.3% 1,310,139
Greater Philadelphia Region (PA) 21,672,595 1,486 60.5% 13,111,920 39.5% 8,560,675
Greater Washington Region (DC/MD/VA) 48,725,388 5,938 84.3% 41,075,502 15.7% 7,649,886
Metro Atlanta Area (GA) 10,440,147 683 68.7% 7,172,381 31.3% 3,267,766
Greater Atlanta Region (GA) 10,555,893 683 68.7% 7,251,898 31.3% 3,303,995
Greater Houston Region (TX) 20,122,687 2,708 91.7% 18,452,504 8.3% 1,670,183
Dallas-Fort Worth-Arlington MSA (TX) 13,970,196 4,103 89.4% 12,489,355 10.6% 1,480,841
Regional Average 3,984,306 1,364 74.9% 3,174,116 25.1% 810,190
Regional Median 1,320,727 858 76.9% 1,023,727 23.1% 332,216
RESIDENT Audiences NON-Resident Audiences
SOURCE: Arts and Economic Prosperity 5, Americans for the Arts, 2017. For more information, visit www.AmericansForTheArts.org/EconomicImpact. B–216

Table 15:Total Attendance to Nonprofit Arts and Cultural EventsPer Study Region During 2015
Statewide Study Regions Total Reported Number of
All Populations Attendance to Audience Surveys Percent of Estimated Attendance Percent of Estimated Attendance
Sample Size = 20 Arts/Cultural Events Collected Total Attendees by Residents Total Attendees by Non-Residents
State of Vermont 1,418,807 1,528 83.6% 1,186,123 16.4% 232,684
State of North Dakota 2,622,508 3,297 86.1% 2,257,979 13.9% 364,529
State of Delaware 1,530,657 1,417 68.2% 1,043,908 31.8% 486,749
State of Maine 2,040,379 3,906 86.6% 1,766,968 13.4% 273,411
State of Hawai'i 3,157,012 1,212 92.1% 2,907,608 7.9% 249,404
State of Nevada 8,410,979 2,045 91.3% 7,679,224 8.7% 731,755
State of Connecticut 9,796,824 3,321 84.9% 8,317,504 15.1% 1,479,320
State of Oklahoma 12,763,620 3,823 87.9% 11,219,222 12.1% 1,544,398
State of Oregon 9,911,552 7,389 86.1% 8,533,846 13.9% 1,377,706
State of Minnesota 18,903,733 3,410 84.2% 15,916,734 15.8% 2,986,999
State of Wisconsin 10,745,093 8,060 85.5% 9,187,055 14.5% 1,558,038
State of Maryland 16,348,651 2,805 84.9% 13,880,005 15.1% 2,468,646
State of Missouri 21,406,026 6,134 90.8% 19,436,672 9.2% 1,969,354
State of Tennessee 18,550,631 14,915 88.4% 16,398,758 11.6% 2,151,873
State of Massachusetts 29,741,228 5,566 87.9% 26,142,539 12.1% 3,598,689
State of New Jersey 7,482,307 4,057 84.6% 6,330,032 15.4% 1,152,275
State of North Carolina 39,030,247 18,151 92.0% 35,907,827 8.0% 3,122,420
State of Pennsylvania 47,547,237 6,790 86.1% 40,938,171 13.9% 6,609,066
State of Illinois 48,204,108 1,634 79.9% 38,515,082 20.1% 9,689,026
State of Florida 69,997,134 35,967 84.8% 59,357,570 15.2% 10,639,564
Statewide Average 18,980,437 6,771 85.8% 16,346,141 14.2% 2,634,295
Statewide Median 11,754,357 3,865 86.1% 10,203,139 13.9% 1,551,218
RESIDENT Audiences NON-Resident Audiences
SOURCE: Arts and Economic Prosperity 5, Americans for the Arts, 2017. For more information, visit www.AmericansForTheArts.org/EconomicImpact. B–217

Table 15:Total Attendance to Nonprofit Arts and Cultural EventsPer Study Region During 2015
Individual Arts Districts Total Reported Number of
All Populations Attendance to Audience Surveys Percent of Estimated Attendance Percent of Estimated Attendance
Sample Size = 12 Arts/Cultural Events Collected Total Attendees by Residents Total Attendees by Non-Residents
James River Arts & Cultural District 168,805 617 70.8% 119,514 29.2% 49,291
Center City Charlotte 3,101,241 462 65.4% 2,028,212 34.6% 1,073,029
Loch Haven Cultural Park 1,052,068 1,096 54.0% 568,117 46.0% 483,951
Downtown Colorado Springs Creative District 543,756 373 88.2% 479,593 11.8% 64,163
Fort Worth Cultural District 2,940,522 374 60.2% 1,770,194 39.8% 1,170,328
Dallas Arts District 3,508,760 1,310 55.1% 1,933,327 44.9% 1,575,433
Grand Center Arts & Entertainment District 1,548,683 562 83.6% 1,294,699 16.4% 253,984
Balboa Park Cultural District 6,734,386 460 57.4% 3,865,538 42.6% 2,868,848
East End Cultural District 219,158 437 78.9% 172,916 21.1% 46,242
Houston Museum District Association 12,679,677 365 86.8% 11,005,960 13.2% 1,673,717
Midtown Cultural District 176,713 390 81.3% 143,668 18.7% 33,045
Washington Avenue Cultural District 73,762 325 80.0% 59,010 20.0% 14,752
Arts District Average 2,728,961 564 71.8% 1,953,396 28.2% 775,565
Arts District Median 1,300,376 449 74.9% 931,408 25.2% 368,968
RESIDENT Audiences NON-Resident Audiences
SOURCE: Arts and Economic Prosperity 5, Americans for the Arts, 2017. For more information, visit www.AmericansForTheArts.org/EconomicImpact. B–218

Explanation of Table 16:Total Audience Expenditures Induced by Attendance toNonprofit Arts and Cultural Events Per Study Region During 2015
Column Two:
Column Three:
Column Four:
Column Five:
Column Six:
Column Seven:
Column Eight:
Column Nine:
Column Ten:
Column Eleven:The total estimated expenditures (both direct and indirect) that occurred in each participating study region during fiscal year 2015 as a result of the initial direct expenditures made by attendees to nonprofit arts and cultural events (Column Eight). In other words, this figure represents the initial direct audience expenditures plus each additional round of spending that occurred as those dollars were re-spent within the study region before the dollars were spent on good and services located outside of the study region. This figure is calculated by an input-output model that is customized for each study region using detailed commerce data.
The total event-related direct expenditures made by arts audiences that were spent on local industries in each participating study region during 2015. This figure is calculated by an input-output model that is customized for each study region by using detailed commerce data to estimate the dollars spent on imported goods and services.
The total local event-related audience expenditures as a percentage of the total estimated expenditures; this portrays the percentage of total direct audience expenditures that are spent on local industries. This figure is calculated by dividing the total local event-related audience expenditures (Column Nine) by the total estimated audience expenditures (Column Eight) for each participating study region.
The total number of arts and cultural event attendees who are residents. Residents are attendees who report that their primary residence is located within the county where the nonprofit arts and cultural event took place (or within the multi-city or multi-county region for regional analyses, or within the state for statewide analyses). Residency is determined based on the ZIP code provided by each audience-intercept respondent.
The average dollars spent per person by residents as a direct result of their attendance to nonprofit arts and cultural events. This figure is calculated with data from the audience-intercept surveys.
This table presents the total expenditures made by arts audiences in each participating study region as a direct result of their attendance to nonprofit arts and cultural events during 2015. Summary statistics are calculated for each population group.
The total estimated expenditures made by arts and cultural audiences in each participating study region as a direct result of their attendance to nonprofit arts and cultural events during 2015. For example, when patrons attend an arts/culture event, they may purchase dinner at a restaurant, pay a valet to park their car, eat dessert after the performance, and or pay a babysitter upon returning home. In addition to these categories of expense, non-resident arts and cultural audiences often stay overnight at a hotel. This figure is the sum of total arts and cultural event-related spending by residents (Column Four) and total arts and cultural event-related spending by non-residents (Column Seven).
The total dollars spent by residents during 2015 directly as a result of attending nonprofit arts and cultural events. This figure is calculated by multiplying the total number of resident arts and cultural event attendees (Column Two) by the average arts and cultural event-related dollars spent per person by residents (Column Three).
The total number of arts and cultural event attendees who are non-residents. Non-residents are attendees who report that their primary residence is located outside the county where the nonprofit arts and cultural event took place (or outside the multi-city or multi-county region for regional analyses, or outside the state for statewide analyses). Residency is determined based on the ZIP code provided by each audience-intercept respondent.
The average dollars spent per person by non-residents as a direct result of their attendance to nonprofit arts and cultural events. This figure is calculated with data from the audience-intercept surveys.
The total dollars spent by non-residents during 2015 directly as a result of attending nonprofit arts and cultural events. This figure is calculated by multiplying the total number of non-resident arts and cultural event attendees (Column Five) by the average arts and cultural event-related dollars spent per person by non-residents (Column Six).
SOURCE: Arts and Economic Prosperity 5, Americans for the Arts, 2017. For more information, visit www.AmericansForTheArts.org/EconomicImpact. B–219

Table 16:Total Audience Expenditures Induced by Attendance toNonprofit Arts and Cultural Events Per Study Region During 2015
Population Cohort Group A Total Spending
Population Fewer than 50,000 Resident Per Person Total Non-Resident Per Person Total Total Est. Local Percent (Direct, Indirect,
Sample Size = 52 Attendance Expenditure Expenditures Attendance Expenditure Expenditures Expenditures Expenditures Local and Induced)
Town of Crested Butte (CO) 75,741 $31.82 $2,410,079 30,637 $106.79 $3,271,725 $5,681,804 $5,330,852 93.8% $12,400,359
City of Pine City (MN) 12,732 $15.11 $192,381 8,418 $43.85 $369,129 $561,510 $415,526 74.0% $1,046,655
City of Alva (OK) 30,861 $14.65 $452,114 4,369 $26.93 $117,657 $569,771 $455,849 80.0% $1,152,323
Cook County (MN) 58,863 $19.85 $1,168,431 19,101 $44.96 $858,781 $2,027,212 $1,500,169 74.0% $4,877,472
Town of Hillsborough (NC) 174,566 $12.20 $2,129,705 109,743 $16.88 $1,852,462 $3,982,167 $3,221,896 80.9% $8,544,201
City of Virginia (MN) 1,871 $19.85 $37,139 607 $44.96 $27,291 $64,430 $47,679 74.0% $155,019
Town of Jackson (WY) 449,978 $45.39 $20,424,501 147,602 $81.96 $12,097,460 $32,521,961 $23,368,721 71.9% $62,292,918
City of Guthrie (OK) 35,390 $21.46 $759,469 36,105 $43.54 $1,572,012 $2,331,481 $1,463,449 62.8% $4,051,814
City of Grand Rapids (MN) 65,218 $19.85 $1,294,577 21,163 $44.96 $951,488 $2,246,065 $1,662,124 74.0% $5,404,032
Town of Medfield (MA) 28,703 $12.02 $345,010 2,294 $16.43 $37,690 $382,700 $222,294 58.1% $746,991
City of Fergus Falls (MN) 37,298 $13.43 $500,912 5,086 $35.73 $181,723 $682,635 $505,161 74.0% $1,488,827
Grundy County (TN) 7,321 $21.16 $154,912 16,920 $44.99 $761,231 $916,143 $555,111 60.6% $1,548,946
City of Falls Church (VA) 180,347 $33.23 $5,992,931 315,111 $41.37 $13,036,142 $19,029,073 $1,804,541 9.5% $20,776,034
City of Jamestown (ND) 136,964 $8.41 $1,151,867 57,036 $81.60 $4,654,138 $5,806,005 $5,388,102 92.8% $13,265,513
City of Waterville (ME) 77,133 $12.65 $975,732 49,107 $17.67 $867,721 $1,843,453 $1,457,985 79.1% $4,119,402
City of Red Wing (MN) 32,834 $9.77 $320,788 8,260 $22.21 $183,455 $504,243 $373,148 74.0% $1,109,335
City of Durango (CO) 212,477 $20.48 $4,351,529 75,042 $68.30 $5,125,369 $9,476,898 $8,655,873 91.3% $22,062,855
City of Hannibal (MO) 107,994 $20.44 $2,207,397 42,625 $34.84 $1,485,055 $3,692,452 $3,003,625 81.3% $7,832,120
City of Tullahoma (TN) 32,776 $11.79 $386,429 4,343 $16.45 $71,442 $457,871 $378,848 82.7% $945,395
City of Northfield (MN) 56,947 $9.77 $556,372 14,326 $22.21 $318,180 $874,552 $647,182 74.0% $2,111,169
Town of Carrboro (NC) 89,626 $15.99 $1,433,120 123,262 $21.40 $2,637,807 $4,070,927 $3,293,710 80.9% $8,734,646
Macon County (TN) 4,196 $9.31 $39,065 1,498 $18.37 $27,518 $66,583 $37,226 55.9% $111,942
City of Laguna Beach (CA) 611,883 $44.30 $27,106,417 325,151 $86.54 $28,138,568 $55,244,985 $43,371,092 78.5% $133,285,876
Hickman County (TN) 16,145 $16.97 $273,981 12,130 $29.19 $354,075 $628,056 $287,678 45.8% $958,995
City of Fairfax (VA) 37,078 $17.46 $647,382 12,163 $33.32 $405,271 $1,052,653 $446,170 42.4% $1,660,876
City of Ponca City (OK) 72,142 $24.41 $1,760,986 11,842 $37.64 $445,733 $2,206,719 $1,541,858 69.9% $4,173,820
City of Paducah (KY) 72,419 $31.82 $2,304,373 168,176 $42.14 $7,086,937 $9,391,310 $8,595,229 91.5% $22,178,079
Mille Lacs County (MN) 6,131 $15.11 $92,639 4,054 $43.85 $177,768 $270,407 $200,105 74.0% $504,039
McNairy County (TN) 17,580 $11.64 $204,631 5,370 $15.70 $84,309 $288,940 $152,550 52.8% $472,558
City of Winona (MN) 95,017 $9.77 $928,316 23,903 $22.21 $530,886 $1,459,202 $1,079,833 74.0% $3,210,244
RESIDENT Audiences NON-Resident Audiences TOTAL DIRECT AUDIENCE SPENDING
SOURCE: Arts and Economic Prosperity 5, Americans for the Arts, 2017. For more information, visit www.AmericansForTheArts.org/EconomicImpact. B–220

Table 16:Total Audience Expenditures Induced by Attendance toNonprofit Arts and Cultural Events Per Study Region During 2015
Population Cohort Group A Total Spending
Population Fewer than 50,000 Resident Per Person Total Non-Resident Per Person Total Total Est. Local Percent (Direct, Indirect,
Sample Size = 52 Attendance Expenditure Expenditures Attendance Expenditure Expenditures Expenditures Expenditures Local and Induced)
Door County (WI) 42,773 $28.96 $1,238,706 151,651 $90.53 $13,728,965 $14,967,671 $12,486,199 83.4% $31,108,761
City of Benicia (CA) 32,000 $26.14 $836,480 17,382 $53.14 $923,679 $1,760,159 $1,097,842 62.4% $3,366,213
City of Winter Park (FL) 493,376 $18.81 $9,280,403 576,854 $34.89 $20,126,436 $29,406,839 $27,360,121 93.0% $80,218,104
City of Rochester (NH) 245,600 $22.73 $5,582,488 96,938 $23.93 $2,319,726 $7,902,214 $5,671,207 71.8% $16,049,831
City of Morgantown (WV) 196,655 $25.34 $4,983,238 81,499 $37.27 $3,037,468 $8,020,706 $6,448,547 80.4% $17,382,632
Henry County (TN) 24,881 $13.83 $344,104 6,535 $30.24 $197,618 $541,722 $440,710 81.4% $1,144,942
City of Fairbanks (AK) 323,932 $20.60 $6,672,999 28,168 $92.66 $2,610,047 $9,283,046 $6,539,322 70.4% $18,701,841
City of Bangor (ME) 114,493 $21.87 $2,503,962 86,725 $46.97 $4,073,473 $6,577,435 $5,575,890 84.8% $15,334,527
Weakley County (TN) 41,775 $13.89 $580,255 33,225 $17.89 $594,395 $1,174,650 $1,061,633 90.4% $2,552,114
Dare County (NC) 431,183 $46.49 $20,045,698 241,489 $86.94 $20,995,054 $41,040,752 $33,783,790 82.3% $86,288,223
City of Columbia (TN) 227,272 $19.05 $4,329,532 55,054 $36.92 $2,032,594 $6,362,126 $5,288,836 83.1% $13,549,498
City of Lake Worth (FL) 397,129 $25.80 $10,245,928 51,098 $46.33 $2,367,370 $12,613,298 $8,320,269 66.0% $25,438,517
Clatsop County (OR) 87,484 $27.08 $2,369,067 73,332 $115.65 $8,480,846 $10,849,913 $9,423,886 86.9% $23,681,577
Yadkin County (NC) 1,143 $16.89 $19,305 1,857 $27.66 $51,365 $70,670 $48,139 68.1% $128,083
Greater Belfast Area (ME) 121,796 $15.98 $1,946,300 73,077 $43.49 $3,178,119 $5,124,419 $3,050,821 59.5% $8,963,739
Campbell County (TN) 14,337 $18.80 $269,536 4,678 $35.79 $167,426 $436,962 $246,763 56.5% $743,226
Monroe County (TN) 117,840 $18.46 $2,175,326 116,901 $32.95 $3,851,888 $6,027,214 $5,003,086 83.0% $12,474,660
Lincoln County (OR) 146,798 $18.52 $2,718,699 65,032 $93.95 $6,109,756 $8,828,455 $7,996,219 90.6% $19,622,955
Iron County (UT) 46,736 $19.85 $927,710 450,456 $137.35 $61,870,132 $62,797,842 $58,542,854 93.2% $145,508,824
City of St. Louis Park (MN) 23,423 $25.82 $604,782 3,940 $39.16 $154,290 $759,072 $561,725 74.0% $1,832,400
City of Logan (UT) 188,639 $12.96 $2,444,761 128,401 $88.07 $11,308,276 $13,753,037 $12,480,946 90.8% $30,728,178
Gibson County (TN) 87,665 $31.56 $2,766,707 65,864 $66.05 $4,350,317 $7,117,024 $4,812,942 67.6% $13,387,198
Group A Average 120,099 $20.38 $3,144,023 78,185 $47.79 $5,004,967 $8,148,989 $6,455,872 74.0% $17,681,317
Percent of Group A Total 38.6% 61.4%
Group A Median 72,281 $18.93 $1,203,569 34,665 $40.27 $1,528,534 $3,011,967 $1,733,332 74.0% $6,618,076
RESIDENT Audiences NON-Resident Audiences TOTAL DIRECT AUDIENCE SPENDING
SOURCE: Arts and Economic Prosperity 5, Americans for the Arts, 2017. For more information, visit www.AmericansForTheArts.org/EconomicImpact. B–221

Table 16:Total Audience Expenditures Induced by Attendance toNonprofit Arts and Cultural Events Per Study Region During 2015
Population Cohort Group B Total Spending
Population 50,000 to 99,999 Resident Per Person Total Non-Resident Per Person Total Total Est. Local Percent (Direct, Indirect,
Sample Size = 38 Attendance Expenditure Expenditures Attendance Expenditure Expenditures Expenditures Expenditures Local and Induced)
City of Joplin (MO) 160,599 $17.96 $2,884,358 27,236 $24.76 $674,363 $3,558,721 $3,337,140 93.8% $8,710,154
City of La Crosse (WI) 631,653 $14.66 $9,260,033 382,236 $27.72 $10,595,582 $19,855,615 $18,689,549 94.1% $50,515,024
McMinn County (TN) 149,832 $20.62 $3,089,536 68,901 $33.29 $2,293,714 $5,383,250 $4,239,512 78.8% $10,499,407
Lafayette County (MS) 153,750 $23.76 $3,653,100 69,400 $67.50 $4,684,500 $8,337,600 $7,318,305 87.8% $18,460,987
Chisago County (MN) 49,894 $15.11 $753,898 32,986 $43.85 $1,446,436 $2,200,334 $1,690,065 76.8% $4,101,423
City of Grand Forks (ND) 84,288 $23.38 $1,970,653 32,293 $36.80 $1,188,382 $3,159,035 $2,762,777 87.5% $7,306,124
City of Corvallis (OR) 1,430,475 $18.84 $26,950,149 464,194 $37.43 $17,374,781 $44,324,930 $30,267,805 68.3% $83,859,066
City of Noblesville (IN) 90,959 $14.84 $1,349,832 19,428 $18.11 $351,841 $1,701,673 $1,107,413 65.1% $3,353,361
City of Ocala (FL) 858,598 $27.27 $23,413,967 283,154 $64.48 $18,257,770 $41,671,737 $31,484,290 75.6% $89,797,296
Lenoir County (NC) 148,155 $65.17 $9,655,261 38,203 $78.83 $3,011,542 $12,666,803 $10,730,171 84.7% $27,913,455
Town of Chapel Hill (NC) 642,036 $16.94 $10,876,090 833,908 $21.27 $17,737,223 $28,613,313 $23,150,490 80.9% $61,393,182
City of Grand Junction (CO) 196,933 $18.29 $3,601,905 33,129 $72.12 $2,389,263 $5,991,168 $5,624,523 93.9% $14,894,106
Town of Jupiter (FL) 105,132 $20.08 $2,111,051 69,506 $43.15 $2,999,184 $5,110,235 $3,370,929 66.0% $10,306,329
Hamblen County (TN) 19,575 $28.44 $556,713 21,897 $32.08 $702,456 $1,259,169 $1,193,754 94.8% $2,862,377
City of Delray Beach (FL) 142,583 $35.40 $5,047,438 112,942 $44.87 $5,067,708 $10,115,146 $6,672,382 66.0% $20,400,240
City of St. Cloud (MN) 243,337 $20.85 $5,073,576 84,610 $23.82 $2,015,410 $7,088,986 $5,445,015 76.8% $16,978,121
City of Portland (ME) 681,148 $21.53 $14,665,116 347,776 $41.30 $14,363,149 $29,028,265 $24,721,387 85.2% $75,015,304
City of Jackson (TN) 77,117 $18.17 $1,401,216 29,546 $22.04 $651,194 $2,052,410 $1,821,480 88.7% $4,803,232
City of Walnut Creek (CA) 477,977 $30.82 $14,731,251 162,743 $35.03 $5,700,887 $20,432,138 $9,545,041 46.7% $34,462,034
Greene County (TN) 41,528 $26.52 $1,101,323 40,705 $28.01 $1,140,147 $2,241,470 $1,415,862 63.2% $4,074,755
City of Flagstaff (AZ) 593,860 $29.41 $17,465,423 237,877 $86.87 $20,664,375 $38,129,798 $31,056,085 81.4% $83,647,637
City of Missoula (MT) 1,579,028 $18.83 $29,733,097 412,180 $53.45 $22,031,021 $51,764,118 $48,038,988 92.8% $132,122,557
City of Fort Myers (FL) 947,872 $26.12 $24,758,417 251,966 $44.75 $11,275,479 $36,033,896 $27,828,053 77.2% $79,271,817
Putnam County (TN) 22,347 $9.45 $211,179 10,759 $14.34 $154,284 $365,463 $350,809 96.0% $877,791
Monroe County (FL) 1,097,716 $26.53 $29,122,405 628,253 $45.77 $28,755,140 $57,877,545 $49,850,331 86.1% $123,761,949
City of Lynchburg (VA)1 131,821 $18.13 $2,791,602 59,224 $24.68 $1,416,220 $4,207,822 $271,614 6.5% $4,443,150
City of Duluth (MN) 631,103 $19.85 $12,527,395 204,795 $44.96 $9,207,583 $21,734,978 $16,694,527 76.8% $52,294,357
City of Fishers (IN) 538,394 $11.53 $6,207,683 309,471 $16.80 $5,199,113 $11,406,796 $7,423,306 65.1% $22,478,529
City of Carmel (IN) 157,501 $15.73 $2,477,491 105,878 $42.26 $4,474,404 $6,951,895 $4,524,149 65.1% $13,699,585
City of Sugar Land (TX) 16,719 $21.86 $365,477 6,406 $24.74 $158,484 $523,961 $299,811 57.2% $943,669
TOTAL DIRECT AUDIENCE SPENDINGRESIDENT Audiences NON-Resident Audiences
SOURCE: Arts and Economic Prosperity 5, Americans for the Arts, 2017. For more information, visit www.AmericansForTheArts.org/EconomicImpact. B–222

Table 16:Total Audience Expenditures Induced by Attendance toNonprofit Arts and Cultural Events Per Study Region During 2015
Population Cohort Group B Total Spending
Population 50,000 to 99,999 Resident Per Person Total Non-Resident Per Person Total Total Est. Local Percent (Direct, Indirect,
Sample Size = 38 Attendance Expenditure Expenditures Attendance Expenditure Expenditures Expenditures Expenditures Local and Induced)
City of Asheville (NC) 501,904 $21.37 $10,725,688 364,943 $77.79 $28,388,916 $39,114,604 $35,152,793 89.9% $96,340,517
Buchanan County (MO) 334,040 $20.29 $6,777,672 147,286 $28.52 $4,200,597 $10,978,269 $10,720,782 97.7% $27,895,411
City of Boca Raton (FL) 205,454 $23.16 $4,758,315 144,552 $43.58 $6,299,576 $11,057,891 $7,294,257 66.0% $22,301,570
City of Miami Beach (FL) 1,293,040 $34.29 $44,338,342 575,515 $53.51 $30,795,808 $75,134,150 $62,398,974 83.1% $190,815,236
Moore County (NC) 267,244 $16.99 $4,540,476 60,261 $30.68 $1,848,807 $6,389,283 $4,092,137 64.0% $11,752,350
Sevier County (TN) 250,870 $19.83 $4,974,752 404,144 $91.92 $37,148,916 $42,123,668 $36,252,301 86.1% $88,961,892
Cape May County (NJ) 183,616 $17.75 $3,259,184 116,410 $101.04 $11,762,066 $15,021,250 $11,734,648 78.1% $30,415,201
Cleveland County (NC) 60,655 $22.98 $1,393,852 47,272 $41.75 $1,973,606 $3,367,458 $2,535,777 75.3% $6,970,661
Group B Average 399,967 $22.44 $9,173,024 190,579 $43.79 $8,905,261 $18,078,285 $14,502,822 76.8% $40,492,101
Percent of Group B Total 50.7% 49.3%
Group B Median 201,194 $20.46 $4,866,534 109,410 $41.53 $4,579,452 $10,546,708 $7,306,281 78.4% $21,350,905
RESIDENT Audiences NON-Resident Audiences TOTAL DIRECT AUDIENCE SPENDING
SOURCE: Arts and Economic Prosperity 5, Americans for the Arts, 2017. For more information, visit www.AmericansForTheArts.org/EconomicImpact. B–223
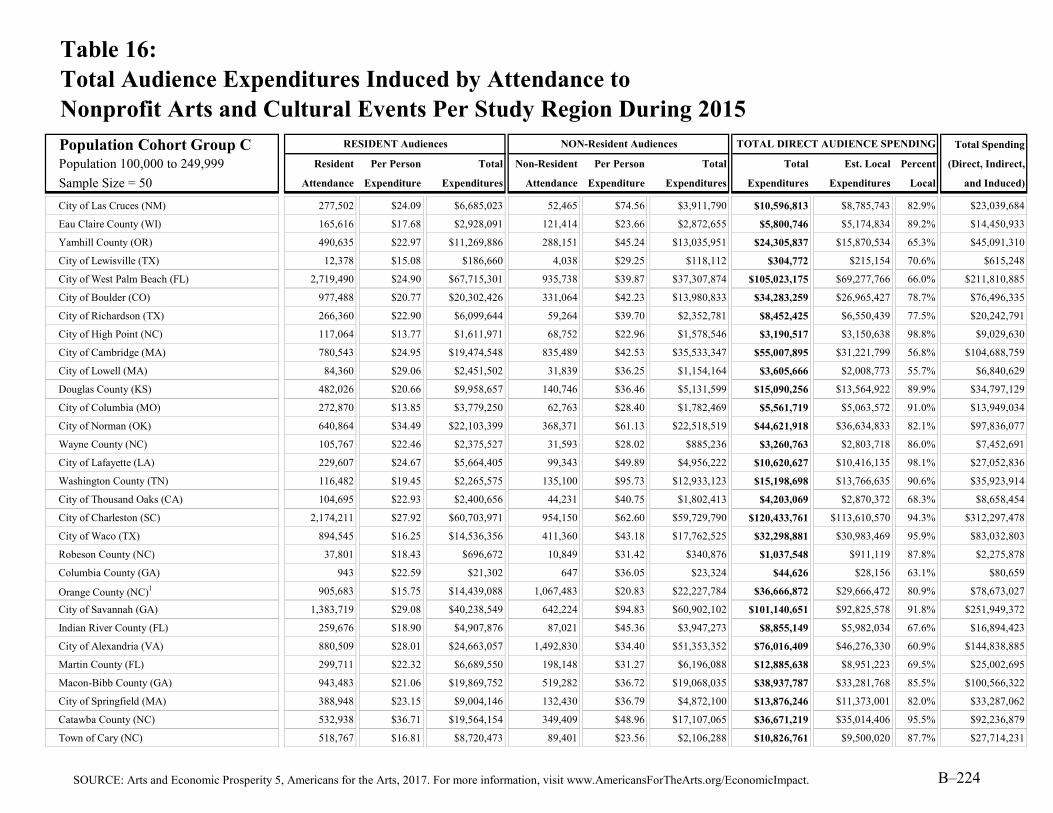
Table 16:Total Audience Expenditures Induced by Attendance toNonprofit Arts and Cultural Events Per Study Region During 2015
Population Cohort Group C Total Spending
Population 100,000 to 249,999 Resident Per Person Total Non-Resident Per Person Total Total Est. Local Percent (Direct, Indirect,
Sample Size = 50 Attendance Expenditure Expenditures Attendance Expenditure Expenditures Expenditures Expenditures Local and Induced)
City of Las Cruces (NM) 277,502 $24.09 $6,685,023 52,465 $74.56 $3,911,790 $10,596,813 $8,785,743 82.9% $23,039,684
Eau Claire County (WI) 165,616 $17.68 $2,928,091 121,414 $23.66 $2,872,655 $5,800,746 $5,174,834 89.2% $14,450,933
Yamhill County (OR) 490,635 $22.97 $11,269,886 288,151 $45.24 $13,035,951 $24,305,837 $15,870,534 65.3% $45,091,310
City of Lewisville (TX) 12,378 $15.08 $186,660 4,038 $29.25 $118,112 $304,772 $215,154 70.6% $615,248
City of West Palm Beach (FL) 2,719,490 $24.90 $67,715,301 935,738 $39.87 $37,307,874 $105,023,175 $69,277,766 66.0% $211,810,885
City of Boulder (CO) 977,488 $20.77 $20,302,426 331,064 $42.23 $13,980,833 $34,283,259 $26,965,427 78.7% $76,496,335
City of Richardson (TX) 266,360 $22.90 $6,099,644 59,264 $39.70 $2,352,781 $8,452,425 $6,550,439 77.5% $20,242,791
City of High Point (NC) 117,064 $13.77 $1,611,971 68,752 $22.96 $1,578,546 $3,190,517 $3,150,638 98.8% $9,029,630
City of Cambridge (MA) 780,543 $24.95 $19,474,548 835,489 $42.53 $35,533,347 $55,007,895 $31,221,799 56.8% $104,688,759
City of Lowell (MA) 84,360 $29.06 $2,451,502 31,839 $36.25 $1,154,164 $3,605,666 $2,008,773 55.7% $6,840,629
Douglas County (KS) 482,026 $20.66 $9,958,657 140,746 $36.46 $5,131,599 $15,090,256 $13,564,922 89.9% $34,797,129
City of Columbia (MO) 272,870 $13.85 $3,779,250 62,763 $28.40 $1,782,469 $5,561,719 $5,063,572 91.0% $13,949,034
City of Norman (OK) 640,864 $34.49 $22,103,399 368,371 $61.13 $22,518,519 $44,621,918 $36,634,833 82.1% $97,836,077
Wayne County (NC) 105,767 $22.46 $2,375,527 31,593 $28.02 $885,236 $3,260,763 $2,803,718 86.0% $7,452,691
City of Lafayette (LA) 229,607 $24.67 $5,664,405 99,343 $49.89 $4,956,222 $10,620,627 $10,416,135 98.1% $27,052,836
Washington County (TN) 116,482 $19.45 $2,265,575 135,100 $95.73 $12,933,123 $15,198,698 $13,766,635 90.6% $35,923,914
City of Thousand Oaks (CA) 104,695 $22.93 $2,400,656 44,231 $40.75 $1,802,413 $4,203,069 $2,870,372 68.3% $8,658,454
City of Charleston (SC) 2,174,211 $27.92 $60,703,971 954,150 $62.60 $59,729,790 $120,433,761 $113,610,570 94.3% $312,297,478
City of Waco (TX) 894,545 $16.25 $14,536,356 411,360 $43.18 $17,762,525 $32,298,881 $30,983,469 95.9% $83,032,803
Robeson County (NC) 37,801 $18.43 $696,672 10,849 $31.42 $340,876 $1,037,548 $911,119 87.8% $2,275,878
Columbia County (GA) 943 $22.59 $21,302 647 $36.05 $23,324 $44,626 $28,156 63.1% $80,659
Orange County (NC)1 905,683 $15.75 $14,439,088 1,067,483 $20.83 $22,227,784 $36,666,872 $29,666,472 80.9% $78,673,027
City of Savannah (GA) 1,383,719 $29.08 $40,238,549 642,224 $94.83 $60,902,102 $101,140,651 $92,825,578 91.8% $251,949,372
Indian River County (FL) 259,676 $18.90 $4,907,876 87,021 $45.36 $3,947,273 $8,855,149 $5,982,034 67.6% $16,894,423
City of Alexandria (VA) 880,509 $28.01 $24,663,057 1,492,830 $34.40 $51,353,352 $76,016,409 $46,276,330 60.9% $144,838,885
Martin County (FL) 299,711 $22.32 $6,689,550 198,148 $31.27 $6,196,088 $12,885,638 $8,951,223 69.5% $25,002,695
Macon-Bibb County (GA) 943,483 $21.06 $19,869,752 519,282 $36.72 $19,068,035 $38,937,787 $33,281,768 85.5% $100,566,322
City of Springfield (MA) 388,948 $23.15 $9,004,146 132,430 $36.79 $4,872,100 $13,876,246 $11,373,001 82.0% $33,287,062
Catawba County (NC) 532,938 $36.71 $19,564,154 349,409 $48.96 $17,107,065 $36,671,219 $35,014,406 95.5% $92,236,879
Town of Cary (NC) 518,767 $16.81 $8,720,473 89,401 $23.56 $2,106,288 $10,826,761 $9,500,020 87.7% $27,714,231
RESIDENT Audiences NON-Resident Audiences TOTAL DIRECT AUDIENCE SPENDING
SOURCE: Arts and Economic Prosperity 5, Americans for the Arts, 2017. For more information, visit www.AmericansForTheArts.org/EconomicImpact. B–224

Table 16:Total Audience Expenditures Induced by Attendance toNonprofit Arts and Cultural Events Per Study Region During 2015
Population Cohort Group C Total Spending
Population 100,000 to 249,999 Resident Per Person Total Non-Resident Per Person Total Total Est. Local Percent (Direct, Indirect,
Sample Size = 50 Attendance Expenditure Expenditures Attendance Expenditure Expenditures Expenditures Expenditures Local and Induced)
Alamance County (NC) 163,102 $19.39 $3,162,548 88,211 $20.12 $1,774,805 $4,937,353 $4,572,692 92.6% $11,546,763
Cumberland County (NJ) 124,236 $16.52 $2,052,379 226,712 $22.69 $5,144,095 $7,196,474 $5,547,967 77.1% $15,258,955
City of Eugene (OR) 980,852 $16.02 $15,713,249 135,021 $42.29 $5,710,038 $21,423,287 $18,800,539 87.8% $52,085,548
Middlesex County (CT) 162,875 $23.98 $3,905,743 181,469 $39.74 $7,211,578 $11,117,321 $6,469,351 58.2% $20,547,561
City of Springfield (MO) 488,547 $22.10 $10,796,889 222,584 $28.26 $6,290,224 $17,087,113 $16,516,641 96.7% $48,178,522
City of Sioux Falls (SD) 1,263,893 $24.91 $31,483,575 1,190,268 $44.49 $52,955,023 $84,438,598 $80,286,509 95.1% $221,289,929
Pitt County (NC) 160,346 $21.53 $3,452,249 54,883 $35.89 $1,969,751 $5,422,000 $5,019,364 92.6% $12,992,907
City of Providence (RI) 2,380,782 $25.57 $60,876,596 1,459,189 $35.00 $51,071,615 $111,948,211 $90,914,992 81.2% $267,041,555
City of Worcester (MA) 1,866,265 $26.43 $49,325,384 390,404 $30.38 $11,860,474 $61,185,858 $41,787,000 68.3% $128,491,952
Montgomery County (TN) 57,310 $23.76 $1,361,686 17,900 $37.97 $679,663 $2,041,349 $1,618,206 79.3% $4,190,767
Salt Lake City (UT) 5,556,177 $21.44 $119,124,435 1,842,194 $40.71 $74,995,718 $194,120,153 $161,663,901 83.3% $501,284,045
Cabarrus County (NC) 188,849 $15.45 $2,917,717 84,845 $20.74 $1,759,685 $4,677,402 $4,518,686 96.6% $11,460,141
Richmond County (GA) 292,214 $27.85 $8,138,160 401,882 $29.37 $11,803,274 $19,941,434 $17,998,167 90.3% $49,582,227
City of Tacoma (WA) 1,962,490 $20.23 $39,701,173 740,664 $30.87 $22,864,298 $62,565,471 $43,068,329 68.8% $131,669,621
Doña Ana County (NM)1 551,980 $22.05 $12,788,176 109,866 $63.37 $7,402,970 $20,191,146 $16,740,337 82.9% $43,899,767
New Hanover County (NC) 1,149,835 $21.97 $25,261,875 658,081 $23.86 $15,701,813 $40,963,688 $38,946,781 95.1% $103,852,913
Arlington County (VA) 307,931 $20.19 $6,217,127 441,292 $27.78 $12,259,092 $18,476,219 $9,723,898 52.6% $31,135,637
City of Irving (TX) 40,743 $14.93 $608,293 27,389 $23.83 $652,680 $1,260,973 $965,787 76.6% $3,049,252
City of Reno (NV) 1,071,840 $24.21 $25,949,246 233,690 $55.40 $12,946,426 $38,895,672 $25,931,171 66.7% $80,617,331
York County (SC) 311,141 $29.34 $9,128,877 110,459 $41.89 $4,627,128 $13,756,005 $10,598,456 77.0% $29,460,677
Group C Average 722,922 $22.19 $16,865,857 363,652 $39.55 $14,743,452 $31,609,309 $25,488,684 80.6% $73,489,242
Percent of Group C Total 53.4% 46.6%
Group C Median 350,045 $22.21 $8,862,310 161,108 $36.59 $6,243,156 $15,144,477 $12,468,962 82.5% $34,042,096
TOTAL DIRECT AUDIENCE SPENDINGRESIDENT Audiences NON-Resident Audiences
SOURCE: Arts and Economic Prosperity 5, Americans for the Arts, 2017. For more information, visit www.AmericansForTheArts.org/EconomicImpact. B–225

Table 16:Total Audience Expenditures Induced by Attendance toNonprofit Arts and Cultural Events Per Study Region During 2015
Population Cohort Group D Total Spending
Population 250,000 to 499,999 Resident Per Person Total Non-Resident Per Person Total Total Est. Local Percent (Direct, Indirect,
Sample Size = 42 Attendance Expenditure Expenditures Attendance Expenditure Expenditures Expenditures Expenditures Local and Induced)
Buncombe County (NC)1 541,821 $27.81 $11,787,557 390,746 $85.13 $30,733,141 $42,520,698 $38,213,893 89.9% $104,729,835
Alachua County (FL) 1,750,513 $20.21 $35,377,868 674,020 $48.24 $32,514,725 $67,892,593 $58,601,148 86.3% $158,406,804
Greater Green Bay Area (WI) 246,861 $28.87 $7,126,877 131,760 $44.01 $5,798,758 $12,925,635 $10,955,778 84.8% $31,265,030
City of Orlando (FL)1 1,208,353 $25.19 $29,145,207 953,281 $39.57 $36,431,305 $65,576,512 $61,012,382 93.0% $178,884,356
City of Lincoln (NE) 1,834,676 $15.06 $27,630,221 481,834 $42.96 $20,699,589 $48,329,810 $44,014,910 91.1% $122,018,360
Southeastern Connecticut Region (CT) 2,089,440 $17.81 $37,212,926 1,062,053 $41.43 $44,000,856 $81,213,782 $52,831,401 65.1% $152,726,271
Erie County (PA) 1,024,091 $16.73 $17,133,042 147,638 $40.74 $6,014,772 $23,147,814 $21,000,059 90.7% $58,095,259
San Luis Obispo County (CA) 381,226 $23.37 $8,909,252 75,879 $67.48 $5,120,315 $14,029,567 $12,580,604 89.7% $33,012,949
City of Newark (NJ) 1,467,641 $22.58 $33,139,334 1,036,866 $34.55 $35,823,720 $68,963,054 $39,769,762 57.7% $133,548,157
Leon County (FL) 2,391,007 $29.41 $70,319,516 455,430 $68.28 $31,096,760 $101,416,276 $85,252,439 84.1% $237,964,124
Rutherford County (TN) 698,208 $18.60 $12,986,669 247,873 $29.79 $7,384,137 $20,370,806 $17,827,484 87.5% $46,598,160
St. Lucie County (FL) 67,055 $37.51 $2,515,233 52,048 $41.93 $2,182,373 $4,697,606 $3,226,578 68.7% $9,486,391
Greater Spartanburg Area (SC) 578,725 $13.94 $8,067,427 103,734 $25.09 $2,602,686 $10,670,113 $10,187,824 95.5% $26,720,492
Durham County (NC) 1,585,969 $14.19 $22,504,900 1,216,097 $22.24 $27,045,997 $49,550,897 $41,494,926 83.7% $115,209,695
City of St. Paul (MN) 6,025,209 $25.82 $155,570,896 1,013,587 $39.16 $39,692,067 $195,262,963 $158,203,762 81.0% $471,364,793
Hamilton County (IN)1 906,639 $14.07 $11,000,208 414,992 $27.94 $10,902,674 $21,902,882 $14,253,940 65.1% $43,162,389
Osceola County (FL) 44,011 $11.34 $499,085 29,340 $42.01 $1,232,573 $1,731,658 $1,493,422 86.2% $3,843,569
Escambia County (FL) 1,596,332 $20.43 $32,613,063 886,300 $32.44 $28,751,572 $61,364,635 $55,430,516 90.3% $149,854,104
Lexington-Fayette Urban County (KY) 521,866 $20.08 $10,479,069 200,940 $27.40 $5,505,756 $15,984,825 $14,326,899 89.6% $40,690,124
Lake County (FL) 240,016 $16.49 $3,957,864 84,769 $47.88 $4,058,740 $8,016,604 $5,486,198 68.4% $15,985,996
City of Riverside (CA) 660,473 $25.49 $16,835,457 214,326 $40.03 $8,579,470 $25,414,927 $19,800,489 77.9% $56,355,886
Cumberland County (NC) 1,098,296 $19.12 $20,999,420 402,109 $21.19 $8,520,690 $29,520,110 $27,253,499 92.3% $69,059,055
Collier County (FL) 847,141 $27.39 $23,203,192 537,077 $40.05 $21,509,934 $44,713,126 $31,065,872 69.5% $86,675,781
Hamilton County (TN) 1,925,780 $33.37 $64,263,279 715,893 $60.69 $43,447,546 $107,710,825 $102,855,790 95.5% $285,983,157
Manatee County (FL) 705,102 $22.52 $15,878,897 408,803 $41.85 $17,108,406 $32,987,303 $23,259,013 70.5% $65,774,166
City of Tampa (FL) 2,137,814 $40.09 $85,704,963 1,903,422 $69.78 $132,820,787 $218,525,750 $194,694,071 89.1% $583,753,438
Forsyth County (NC) 1,592,378 $19.82 $31,560,932 842,451 $24.36 $20,522,106 $52,083,038 $48,977,395 94.0% $136,560,592
Mercer County (NJ) 195,955 $25.17 $4,932,187 486,816 $28.31 $13,781,761 $18,713,948 $10,979,348 58.7% $36,091,308
City of Wichita (KS) 1,873,749 $16.69 $31,272,871 537,768 $36.29 $19,515,601 $50,788,472 $46,777,293 92.1% $129,769,461
Clackamas County (OR) 227,102 $21.37 $4,853,170 108,847 $38.25 $4,163,398 $9,016,568 $6,050,648 67.1% $18,480,477
RESIDENT Audiences NON-Resident Audiences TOTAL DIRECT AUDIENCE SPENDING
SOURCE: Arts and Economic Prosperity 5, Americans for the Arts, 2017. For more information, visit www.AmericansForTheArts.org/EconomicImpact. B–226

Table 16:Total Audience Expenditures Induced by Attendance toNonprofit Arts and Cultural Events Per Study Region During 2015
Population Cohort Group D Total Spending
Population 250,000 to 499,999 Resident Per Person Total Non-Resident Per Person Total Total Est. Local Percent (Direct, Indirect,
Sample Size = 42 Attendance Expenditure Expenditures Attendance Expenditure Expenditures Expenditures Expenditures Local and Induced)
Sarasota County (FL) 1,229,143 $29.05 $35,706,604 1,243,981 $46.45 $57,782,917 $93,489,521 $66,255,057 70.9% $189,501,663
City of Minneapolis (MN) 6,704,743 $25.82 $173,116,464 1,127,901 $39.16 $44,168,603 $217,285,067 $176,046,263 81.0% $524,526,152
Berks County (PA) 202,679 $21.31 $4,319,089 62,261 $61.37 $3,820,958 $8,140,047 $6,449,009 79.2% $18,356,546
City of Miami (FL) 5,724,485 $30.59 $175,111,996 1,661,947 $52.64 $87,484,890 $262,596,886 $218,086,932 83.1% $666,906,948
City of Raleigh (NC) 6,772,318 $22.94 $155,356,975 3,825,989 $54.53 $208,631,180 $363,988,155 $319,384,042 87.7% $931,733,134
Santa Barbara County (CA) 1,862,634 $19.43 $36,190,979 695,929 $51.88 $36,104,797 $72,295,776 $61,203,478 84.7% $165,084,852
Seminole County (FL) 283,602 $16.21 $4,597,188 197,079 $18.82 $3,709,027 $8,306,215 $6,136,086 73.9% $18,035,156
City of Virginia Beach (VA) 1,258,157 $27.02 $33,995,402 729,453 $38.12 $27,806,748 $61,802,150 $53,785,280 87.0% $143,772,274
City of Atlanta (GA) 3,159,728 $17.31 $54,694,892 5,357,060 $33.22 $177,961,533 $232,656,425 $198,330,284 85.2% $592,802,352
City of Mesa (AZ) 625,939 $15.61 $9,770,908 93,531 $32.21 $3,012,634 $12,783,542 $10,361,906 81.1% $31,523,725
City of Kansas City (MO) 999,623 $21.74 $21,731,804 1,949,116 $31.18 $60,773,437 $82,505,241 $69,301,402 84.0% $215,147,650
Morris County (NJ) 282,724 $29.36 $8,300,777 236,989 $32.61 $7,728,211 $16,028,988 $8,014,145 50.0% $28,759,425
Group D Average 1,561,172 $22.55 $36,913,659 785,665 $41.46 $33,013,027 $69,926,686 $58,362,648 81.0% $169,719,525
Percent of Group D Total 52.8% 47.2%
Group D Median 1,061,194 $21.56 $22,118,352 484,325 $39.80 $20,610,848 $46,521,468 $38,991,828 84.4% $109,969,765
RESIDENT Audiences NON-Resident Audiences TOTAL DIRECT AUDIENCE SPENDING
SOURCE: Arts and Economic Prosperity 5, Americans for the Arts, 2017. For more information, visit www.AmericansForTheArts.org/EconomicImpact. B–227

Table 16:Total Audience Expenditures Induced by Attendance toNonprofit Arts and Cultural Events Per Study Region During 2015
Population Cohort Group E Total Spending
Population 500,000 to 999,999 Resident Per Person Total Non-Resident Per Person Total Total Est. Local Percent (Direct, Indirect,
Sample Size = 25 Attendance Expenditure Expenditures Attendance Expenditure Expenditures Expenditures Expenditures Local and Induced)
Sonoma County (CA) 1,002,785 $23.92 $23,986,617 172,813 $65.41 $11,303,698 $35,290,315 $23,723,272 67.2% $71,515,532
Volusia County (FL) 936,547 $30.86 $28,901,840 156,273 $39.12 $6,113,400 $35,015,240 $28,366,413 81.0% $79,919,300
Guilford County (NC)1 2,589,311 $20.21 $51,437,119 1,292,714 $34.25 $43,734,748 $95,171,867 $93,982,294 98.8% $269,350,298
Dane County (WI) 4,777,884 $16.78 $80,172,894 707,631 $33.90 $23,988,691 $104,161,585 $90,091,815 86.5% $267,127,605
Brevard County (FL) 133,028 $15.39 $2,047,301 20,054 $72.70 $1,457,926 $3,505,227 $2,569,986 73.3% $7,237,969
Washington County (OR) 240,358 $17.79 $4,275,969 121,082 $24.75 $2,996,780 $7,272,749 $5,263,775 72.4% $16,108,774
Johnson County (KS) 357,949 $19.53 $6,990,744 136,456 $25.27 $3,448,243 $10,438,987 $7,778,718 74.5% $23,593,095
City of Louisville (KY) 7,479,827 $21.85 $163,434,220 1,846,641 $40.35 $74,511,964 $237,946,184 $211,323,081 88.8% $642,106,982
City of Baltimore (MD) 2,260,009 $25.62 $57,901,431 7,040,439 $31.50 $221,773,829 $279,675,260 $191,493,606 68.5% $600,669,041
Polk County (FL) 599,357 $22.83 $13,683,320 331,322 $51.66 $17,116,095 $30,799,415 $24,551,307 79.7% $71,026,028
City of Boston (MA) 7,336,766 $19.81 $145,341,334 12,175,909 $36.54 $444,907,715 $590,249,049 $461,338,597 78.2% $1,359,066,989
District of Columbia (DC) 15,336,599 $26.76 $410,407,389 20,413,048 $41.23 $841,629,969 $1,252,037,358 $271,868,032 21.7% $1,543,195,693
Nashville-Davidson County (TN) 3,970,498 $26.41 $104,860,852 2,603,175 $55.97 $145,699,705 $250,560,557 $216,734,612 86.5% $646,326,047
City of El Paso (TX) 1,799,786 $20.49 $36,877,615 158,632 $41.55 $6,591,160 $43,468,775 $41,956,809 96.5% $115,201,177
Lee County (FL)1 2,591,087 $26.46 $69,285,543 831,749 $47.31 $36,831,821 $106,117,364 $81,951,716 77.2% $233,450,091
City of Fort Worth (TX)1 3,303,384 $25.35 $83,095,748 1,842,074 $55.78 $111,558,817 $194,654,565 $156,739,737 80.5% $459,801,702
City of Indianapolis (IN) 4,442,750 $23.67 $105,159,893 2,509,910 $43.06 $108,076,725 $213,236,618 $204,057,302 95.7% $603,309,803
City and County of San Francisco (CA) 6,367,150 $24.59 $156,568,219 9,238,610 $55.33 $511,172,291 $667,740,510 $496,892,636 74.4% $1,462,194,011
Prince George's County (MD) 1,034,383 $19.82 $20,501,471 307,229 $46.90 $14,409,040 $34,910,511 $21,839,330 62.6% $67,097,837
Pinellas County (FL) 2,797,741 $28.07 $78,532,590 1,467,108 $42.43 $62,249,392 $140,781,982 $107,733,539 76.5% $331,037,900
Shelby County (TN) 2,052,566 $26.50 $54,392,999 513,142 $48.21 $24,738,576 $79,131,575 $66,682,306 84.3% $197,680,101
Fairfield County (CT) 2,020,797 $31.37 $63,392,402 524,288 $44.30 $23,225,958 $86,618,360 $38,886,157 44.9% $148,620,394
Westchester County (NY) 2,188,920 $20.52 $44,916,638 817,838 $25.40 $20,773,085 $65,689,723 $26,314,039 40.1% $105,203,315
Fulton County (GA)1 5,941,239 $22.66 $56,738,960 2,706,853 $37.28 $179,493,666 $236,232,626 $201,378,852 85.2% $601,914,417
Wake County (NC)1 8,183,779 $20.62 $165,757,937 3,135,418 $48.45 $212,250,271 $378,008,208 $331,686,039 87.7% $967,621,521
Group E Average 3,589,780 $23.12 $81,146,442 2,842,816 $43.55 $126,002,143 $207,148,584 $136,208,159 75.3% $435,615,025
Percent of Group E Total 39.2% 60.8%
Group E Median 2,589,311 $22.83 $57,901,431 831,749 $42.43 $36,831,821 $104,161,585 $90,091,815 78.2% $267,127,605
TOTAL DIRECT AUDIENCE SPENDINGRESIDENT Audiences NON-Resident Audiences
SOURCE: Arts and Economic Prosperity 5, Americans for the Arts, 2017. For more information, visit www.AmericansForTheArts.org/EconomicImpact. B–228
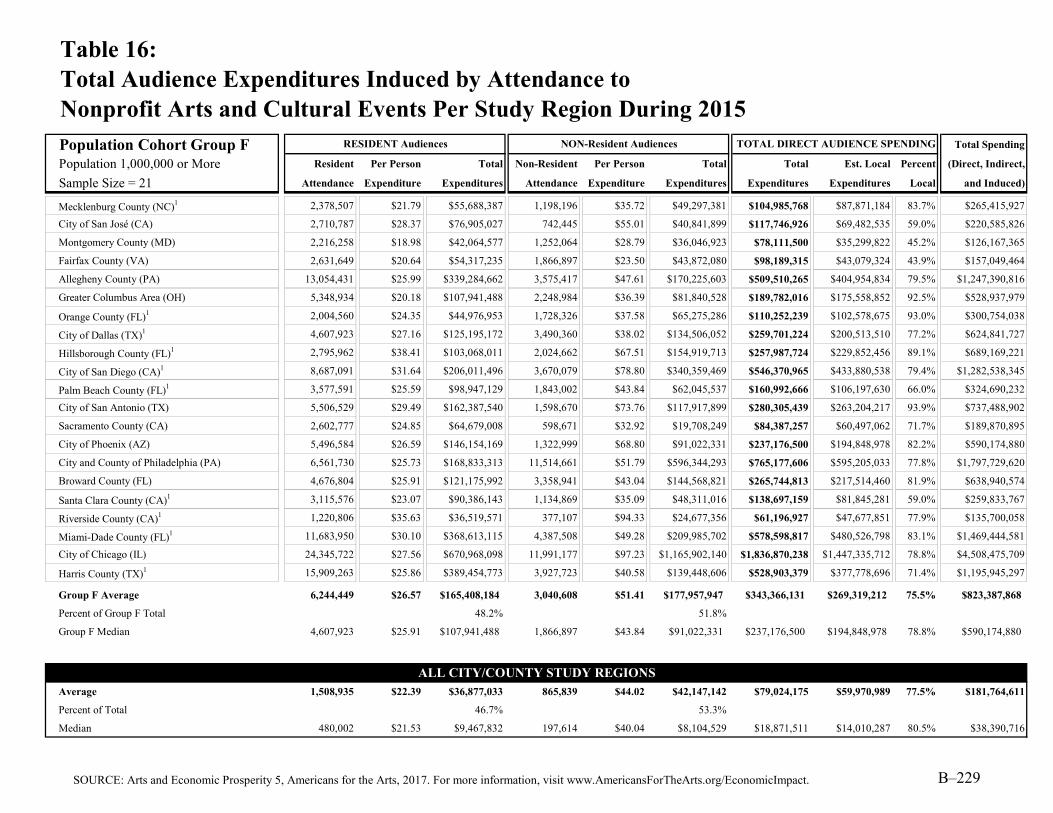
Table 16:Total Audience Expenditures Induced by Attendance toNonprofit Arts and Cultural Events Per Study Region During 2015
Population Cohort Group F Total Spending
Population 1,000,000 or More Resident Per Person Total Non-Resident Per Person Total Total Est. Local Percent (Direct, Indirect,
Sample Size = 21 Attendance Expenditure Expenditures Attendance Expenditure Expenditures Expenditures Expenditures Local and Induced)
Mecklenburg County (NC)1 2,378,507 $21.79 $55,688,387 1,198,196 $35.72 $49,297,381 $104,985,768 $87,871,184 83.7% $265,415,927
City of San José (CA) 2,710,787 $28.37 $76,905,027 742,445 $55.01 $40,841,899 $117,746,926 $69,482,535 59.0% $220,585,826
Montgomery County (MD) 2,216,258 $18.98 $42,064,577 1,252,064 $28.79 $36,046,923 $78,111,500 $35,299,822 45.2% $126,167,365
Fairfax County (VA) 2,631,649 $20.64 $54,317,235 1,866,897 $23.50 $43,872,080 $98,189,315 $43,079,324 43.9% $157,049,464
Allegheny County (PA) 13,054,431 $25.99 $339,284,662 3,575,417 $47.61 $170,225,603 $509,510,265 $404,954,834 79.5% $1,247,390,816
Greater Columbus Area (OH) 5,348,934 $20.18 $107,941,488 2,248,984 $36.39 $81,840,528 $189,782,016 $175,558,852 92.5% $528,937,979
Orange County (FL)1 2,004,560 $24.35 $44,976,953 1,728,326 $37.58 $65,275,286 $110,252,239 $102,578,675 93.0% $300,754,038
City of Dallas (TX)1 4,607,923 $27.16 $125,195,172 3,490,360 $38.02 $134,506,052 $259,701,224 $200,513,510 77.2% $624,841,727
Hillsborough County (FL)1 2,795,962 $38.41 $103,068,011 2,024,662 $67.51 $154,919,713 $257,987,724 $229,852,456 89.1% $689,169,221
City of San Diego (CA)1 8,687,091 $31.64 $206,011,496 3,670,079 $78.80 $340,359,469 $546,370,965 $433,880,538 79.4% $1,282,538,345
Palm Beach County (FL)1 3,577,591 $25.59 $98,947,129 1,843,002 $43.84 $62,045,537 $160,992,666 $106,197,630 66.0% $324,690,232
City of San Antonio (TX) 5,506,529 $29.49 $162,387,540 1,598,670 $73.76 $117,917,899 $280,305,439 $263,204,217 93.9% $737,488,902
Sacramento County (CA) 2,602,777 $24.85 $64,679,008 598,671 $32.92 $19,708,249 $84,387,257 $60,497,062 71.7% $189,870,895
City of Phoenix (AZ) 5,496,584 $26.59 $146,154,169 1,322,999 $68.80 $91,022,331 $237,176,500 $194,848,978 82.2% $590,174,880
City and County of Philadelphia (PA) 6,561,730 $25.73 $168,833,313 11,514,661 $51.79 $596,344,293 $765,177,606 $595,205,033 77.8% $1,797,729,620
Broward County (FL) 4,676,804 $25.91 $121,175,992 3,358,941 $43.04 $144,568,821 $265,744,813 $217,514,460 81.9% $638,940,574
Santa Clara County (CA)1 3,115,576 $23.07 $90,386,143 1,134,869 $35.09 $48,311,016 $138,697,159 $81,845,281 59.0% $259,833,767
Riverside County (CA)1 1,220,806 $35.63 $36,519,571 377,107 $94.33 $24,677,356 $61,196,927 $47,677,851 77.9% $135,700,058
Miami-Dade County (FL)1 11,683,950 $30.10 $368,613,115 4,387,508 $49.28 $209,985,702 $578,598,817 $480,526,798 83.1% $1,469,444,581
City of Chicago (IL) 24,345,722 $27.56 $670,968,098 11,991,177 $97.23 $1,165,902,140 $1,836,870,238 $1,447,335,712 78.8% $4,508,475,709
Harris County (TX)1 15,909,263 $25.86 $389,454,773 3,927,723 $40.58 $139,448,606 $528,903,379 $377,778,696 71.4% $1,195,945,297
Group F Average 6,244,449 $26.57 $165,408,184 3,040,608 $51.41 $177,957,947 $343,366,131 $269,319,212 75.5% $823,387,868
Percent of Group F Total 48.2% 51.8%
Group F Median 4,607,923 $25.91 $107,941,488 1,866,897 $43.84 $91,022,331 $237,176,500 $194,848,978 78.8% $590,174,880
Average 1,508,935 $22.39 $36,877,033 865,839 $44.02 $42,147,142 $79,024,175 $59,970,989 77.5% $181,764,611
Percent of Total 46.7% 53.3%
Median 480,002 $21.53 $9,467,832 197,614 $40.04 $8,104,529 $18,871,511 $14,010,287 80.5% $38,390,716
ALL CITY/COUNTY STUDY REGIONS
RESIDENT Audiences NON-Resident Audiences TOTAL DIRECT AUDIENCE SPENDING
SOURCE: Arts and Economic Prosperity 5, Americans for the Arts, 2017. For more information, visit www.AmericansForTheArts.org/EconomicImpact. B–229

Table 16:Total Audience Expenditures Induced by Attendance toNonprofit Arts and Cultural Events Per Study Region During 2015
Regional Study Regions Total Spending
All Populations Resident Per Person Total Non-Resident Per Person Total Total Est. Local Percent (Direct, Indirect,
Sample Size = 81 Attendance Expenditure Expenditures Attendance Expenditure Expenditures Expenditures Expenditures Local and Induced)
High Peaks Region (ME) 16,547 $20.43 $338,055 14,733 $46.39 $683,464 $1,021,519 $832,271 81.5% $2,101,917
Wood River Valley (ID) 109,827 $40.00 $4,393,080 91,690 $103.14 $9,456,907 $13,849,987 $11,665,223 84.2% $29,154,247
Southern Oregon Area 77,074 $25.31 $1,950,743 360,849 $169.40 $61,127,821 $63,078,564 $59,875,086 94.9% $159,064,836
Southwestern Pennsylvania Area 1,249,765 $15.71 $19,633,808 332,216 $23.92 $7,946,607 $27,580,415 $22,323,446 80.9% $61,953,215
Greater Portsmouth Area (NH) 790,394 $26.56 $20,992,865 421,866 $36.96 $15,592,167 $36,585,032 $28,700,585 78.4% $82,227,492
Northeast Oregon Region 16,480 $17.44 $287,411 2,638 $102.17 $269,524 $556,935 $435,001 78.1% $1,138,245
Toe River Valley (NC) 34,470 $56.90 $1,961,343 36,749 $93.62 $3,440,441 $5,401,784 $4,042,895 74.8% $10,687,473
Albemarle Region (NC) 116,601 $24.50 $2,856,725 37,226 $36.94 $1,375,128 $4,231,853 $3,679,963 87.0% $9,384,129
Greater Concord Area (NH) 178,624 $17.58 $3,140,210 207,174 $49.29 $10,211,606 $13,351,816 $10,475,468 78.5% $29,277,474
North Central Minnesota Region 55,660 $20.42 $1,136,577 12,797 $23.35 $298,810 $1,435,387 $1,163,970 81.1% $2,931,060
Northwest Minnesota Region 26,329 $13.86 $364,921 5,082 $22.18 $112,720 $477,641 $387,324 81.1% $712,640
Monadnock Region (NH) 188,926 $18.12 $3,423,339 58,684 $31.64 $1,856,762 $5,280,101 $4,114,463 77.9% $12,027,918
Bismarck-Mandan Region (ND) 689,867 $22.24 $15,342,642 95,858 $39.48 $3,784,474 $19,127,116 $15,991,752 83.6% $45,182,142
Greater Minot Region (ND) 286,805 $11.57 $3,318,334 51,408 $28.25 $1,452,276 $4,770,610 $3,718,339 77.9% $10,302,952
Greater Burlington Area (VT) 818,001 $24.17 $19,771,084 307,172 $52.96 $16,267,829 $36,038,913 $28,980,132 80.4% $82,539,266
Greater Charlottesville Area (VA) 1,085,690 $22.88 $24,840,587 610,700 $59.62 $36,409,934 $61,250,521 $2,067,173 3.4% $63,030,492
Brainerd Lakes Region (MN) 74,420 $8.93 $664,570 17,128 $12.87 $220,437 $885,007 $717,661 81.1% $2,002,771
East Central Minnesota Region 134,213 $15.11 $2,027,958 88,859 $43.85 $3,896,467 $5,924,425 $4,804,175 81.1% $11,043,128
Northwest Connecticut Region 318,862 $18.11 $5,774,591 215,245 $33.00 $7,103,085 $12,877,676 $6,178,327 48.0% $21,065,683
Central Oregon Region 276,758 $25.90 $7,168,032 159,082 $110.25 $17,538,791 $24,706,823 $20,256,191 82.0% $54,910,888
Greater Fargo-Moorhead Area (ND/MN) 1,023,727 $14.95 $15,304,719 229,305 $41.62 $9,543,674 $24,848,393 $23,320,766 93.9% $65,249,497
Black Hills Region (SD) 3,879,727 $19.27 $74,762,339 450,325 $36.80 $16,571,960 $91,334,299 $82,622,555 90.5% $225,790,504
Greater Kingsport Area (TN) 392,798 $24.81 $9,745,318 292,714 $34.85 $10,201,083 $19,946,401 $16,678,448 83.6% $43,821,519
Lake Region (MN) 182,643 $13.43 $2,452,896 24,795 $35.73 $885,925 $3,338,821 $2,707,483 81.1% $7,281,969
South Central Minnesota Region 267,825 $15.49 $4,148,610 90,906 $33.20 $3,018,081 $7,166,691 $5,811,541 81.1% $16,010,388
Greater Sioux Falls Area (SD)1 1,638,470 $21.69 $31,676,790 829,106 $47.51 $53,169,151 $84,845,941 $80,515,404 94.9% $221,174,533
Southwest Tennessee Development District1 150,932 $14.56 $2,225,754 29,609 $22.60 $924,258 $3,150,012 $2,720,115 86.4% $7,094,483
Northwest Tennessee Development District1 219,165 $15.91 $4,225,069 87,789 $30.05 $5,546,352 $9,771,421 $7,766,132 79.5% $20,738,817
Southwest Minnesota Region 86,221 $16.60 $1,431,269 31,716 $31.05 $984,782 $2,416,051 $1,959,200 81.1% $5,368,465
Arrowhead Region (MN) 583,848 $19.85 $11,589,384 189,356 $44.96 $8,513,446 $20,102,830 $16,301,586 81.1% $48,367,409
RESIDENT Audiences NON-Resident Audiences TOTAL DIRECT AUDIENCE SPENDING
SOURCE: Arts and Economic Prosperity 5, Americans for the Arts, 2017. For more information, visit www.AmericansForTheArts.org/EconomicImpact. B–230

Table 16:Total Audience Expenditures Induced by Attendance toNonprofit Arts and Cultural Events Per Study Region During 2015
Regional Study Regions Total Spending
All Populations Resident Per Person Total Non-Resident Per Person Total Total Est. Local Percent (Direct, Indirect,
Sample Size = 81 Attendance Expenditure Expenditures Attendance Expenditure Expenditures Expenditures Expenditures Local and Induced)
Maple Grove and the Northwest Suburbs (MN) 78,210 $25.82 $2,019,382 13,157 $39.16 $515,228 $2,534,610 $2,053,563 81.0% $6,118,549
Greater Augusta Area (GA)1 522,460 $25.54 $8,159,462 173,226 $37.39 $11,826,598 $19,986,060 $18,026,323 90.2% $49,662,886
Upper Cumberland Development District (TN)1 194,098 $12.51 $2,338,150 82,789 $31.72 $2,439,885 $4,778,035 $3,894,484 81.5% $10,257,242
City of Huntsville/Madison County (AL) 1,203,277 $21.81 $26,243,471 298,942 $32.83 $9,814,266 $36,057,737 $28,333,771 78.6% $78,344,236
Northeast Commission (NC)1 830,724 $27.92 $27,681,713 210,284 $75.23 $25,629,973 $53,311,686 $47,743,307 89.6% $123,354,798
Greater Ann Arbor Area (MI) 1,217,791 $20.58 $25,062,140 566,587 $44.07 $24,969,490 $50,031,630 $40,536,065 81.0% $113,221,579
Greater Fox Cities Region (WI) 403,801 $24.52 $9,901,201 190,899 $43.89 $8,378,557 $18,279,758 $16,158,949 88.4% $45,029,889
Central Minnesota Region 262,011 $20.85 $5,462,930 91,134 $23.82 $2,170,811 $7,633,741 $6,190,277 81.1% $18,282,810
South Central Tennessee Development District1 425,432 $16.49 $7,343,642 97,854 $33.55 $3,559,591 $10,903,233 $8,263,012 75.8% $22,070,948
Northwest Arkansas Region 1,324,399 $23.85 $31,586,916 450,935 $71.20 $32,106,572 $63,693,488 $55,861,858 87.7% $155,146,830
Southeast Minnesota Region 578,529 $9.77 $5,652,229 145,584 $22.21 $3,233,421 $8,885,650 $7,205,462 81.1% $19,548,430
First Tennessee Development District1 719,351 $22.80 $13,407,636 318,673 $66.41 $24,655,546 $38,063,182 $33,699,373 88.5% $89,079,630
Greater Harrisburg Area (PA) 191,583 $23.24 $4,452,389 86,880 $34.04 $2,957,395 $7,409,784 $5,906,279 79.7% $17,721,505
Greater New Haven Area (CT) 389,670 $23.16 $9,024,757 295,163 $36.58 $10,797,063 $19,821,820 $11,881,597 59.9% $39,493,882
Treasure Coast Region (FL)1 742,017 $24.12 $14,112,659 221,642 $37.76 $12,325,734 $26,438,393 $18,159,835 68.7% $51,383,509
Greater Des Moines Region (IA) 2,404,588 $22.09 $53,117,349 875,887 $68.50 $59,998,260 $113,115,609 $93,661,479 82.8% $279,607,768
Southeast Tennessee Development District1 2,115,712 $27.48 $68,652,296 826,864 $52.97 $47,364,737 $116,017,033 $106,844,563 92.1% $298,033,237
Greater Knoxville Region (TN) 980,721 $35.16 $34,482,150 659,281 $95.99 $63,284,383 $97,766,533 $95,364,010 97.5% $263,095,309
Greater Columbia Area (SC) 1,010,250 $30.57 $30,883,343 192,428 $58.76 $11,307,069 $42,190,412 $40,367,667 95.7% $115,831,996
Pikes Peak Region (CO)1 2,479,345 $28.73 $71,406,204 522,283 $64.23 $30,662,637 $102,068,841 $85,824,434 84.1% $239,093,395
Lehigh Valley Region (PA) 2,503,655 $19.35 $48,445,724 1,140,676 $48.02 $54,775,262 $103,220,986 $79,950,725 77.5% $237,698,088
Greater Sarasota/Bradenton Area (FL)1 2,446,354 $27.45 $51,585,501 1,140,675 $55.29 $74,891,323 $126,476,824 $89,514,070 70.8% $255,275,829
Dayton Region (OH) 5,119,428 $17.87 $91,484,178 896,351 $30.17 $27,042,910 $118,527,088 $108,584,404 91.6% $310,763,217
Richmond & Tri-Cities Region (VA) 4,248,299 $24.03 $102,086,625 1,603,352 $28.88 $46,304,806 $148,391,431 $24,690,648 16.6% $175,640,855
Memphis Area Association of Governments (TN)1 2,104,258 $26.78 $54,471,813 465,044 $49.21 $24,770,612 $79,242,425 $65,538,327 82.7% $195,150,623
Eastern Region (NC)1 1,168,843 $43.91 $45,863,268 151,884 $58.61 $11,135,861 $56,999,129 $52,133,912 91.5% $141,329,461
Advantage West Region (NC)1 2,015,842 $40.81 $68,569,218 992,878 $93.54 $96,062,265 $164,631,483 $149,087,895 90.6% $403,741,867
Southeast Commission (NC)1 3,091,503 $19.96 $51,575,992 537,022 $23.37 $25,502,619 $77,078,611 $71,084,896 92.2% $192,614,482
Greater Fairfax Area (VA)1 4,236,326 $25.66 $60,957,548 806,919 $37.45 $57,313,493 $118,271,041 $45,330,034 38.3% $179,486,374
Greater Tulsa Region (OK) 3,113,680 $28.92 $90,047,626 588,674 $80.93 $47,641,387 $137,689,013 $109,808,893 79.8% $335,127,257
TOTAL DIRECT AUDIENCE SPENDINGRESIDENT Audiences NON-Resident Audiences
SOURCE: Arts and Economic Prosperity 5, Americans for the Arts, 2017. For more information, visit www.AmericansForTheArts.org/EconomicImpact. B–231
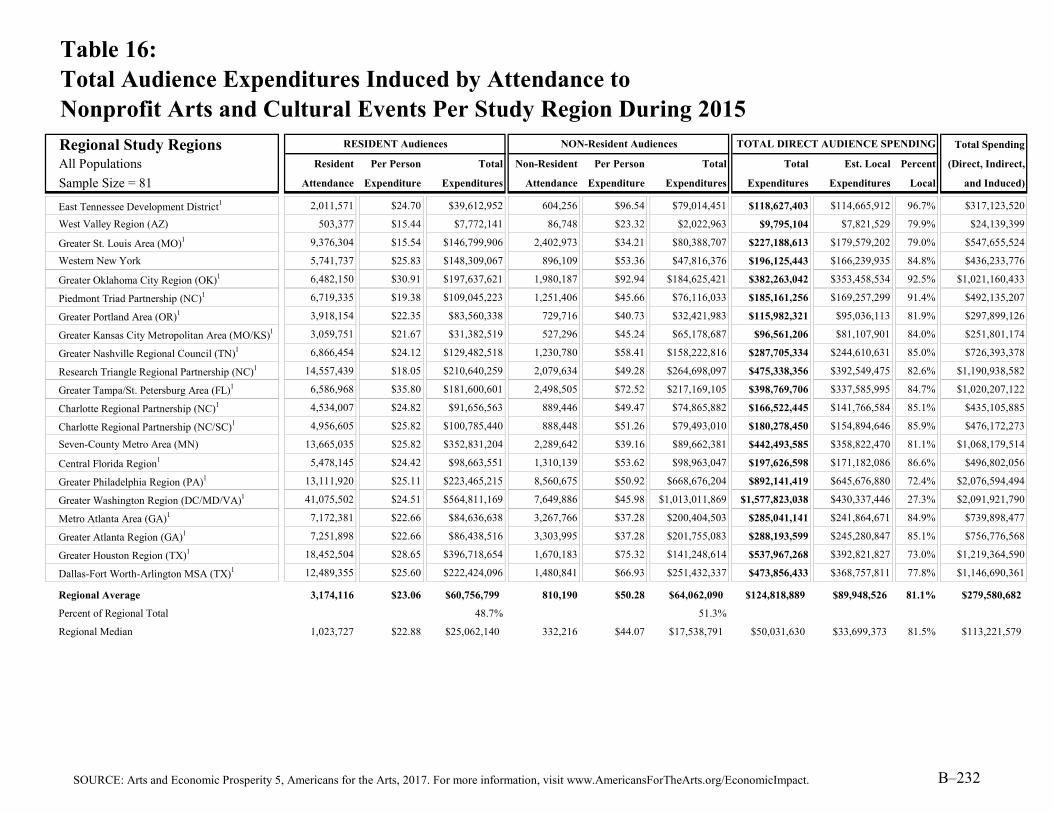
Table 16:Total Audience Expenditures Induced by Attendance toNonprofit Arts and Cultural Events Per Study Region During 2015
Regional Study Regions Total Spending
All Populations Resident Per Person Total Non-Resident Per Person Total Total Est. Local Percent (Direct, Indirect,
Sample Size = 81 Attendance Expenditure Expenditures Attendance Expenditure Expenditures Expenditures Expenditures Local and Induced)
East Tennessee Development District1 2,011,571 $24.70 $39,612,952 604,256 $96.54 $79,014,451 $118,627,403 $114,665,912 96.7% $317,123,520
West Valley Region (AZ) 503,377 $15.44 $7,772,141 86,748 $23.32 $2,022,963 $9,795,104 $7,821,529 79.9% $24,139,399
Greater St. Louis Area (MO)1 9,376,304 $15.54 $146,799,906 2,402,973 $34.21 $80,388,707 $227,188,613 $179,579,202 79.0% $547,655,524
Western New York 5,741,737 $25.83 $148,309,067 896,109 $53.36 $47,816,376 $196,125,443 $166,239,935 84.8% $436,233,776
Greater Oklahoma City Region (OK)1 6,482,150 $30.91 $197,637,621 1,980,187 $92.94 $184,625,421 $382,263,042 $353,458,534 92.5% $1,021,160,433
Piedmont Triad Partnership (NC)1 6,719,335 $19.38 $109,045,223 1,251,406 $45.66 $76,116,033 $185,161,256 $169,257,299 91.4% $492,135,207
Greater Portland Area (OR)1 3,918,154 $22.35 $83,560,338 729,716 $40.73 $32,421,983 $115,982,321 $95,036,113 81.9% $297,899,126
Greater Kansas City Metropolitan Area (MO/KS)1 3,059,751 $21.67 $31,382,519 527,296 $45.24 $65,178,687 $96,561,206 $81,107,901 84.0% $251,801,174
Greater Nashville Regional Council (TN)1 6,866,454 $24.12 $129,482,518 1,230,780 $58.41 $158,222,816 $287,705,334 $244,610,631 85.0% $726,393,378
Research Triangle Regional Partnership (NC)1 14,557,439 $18.05 $210,640,259 2,079,634 $49.28 $264,698,097 $475,338,356 $392,549,475 82.6% $1,190,938,582
Greater Tampa/St. Petersburg Area (FL)1 6,586,968 $35.80 $181,600,601 2,498,505 $72.52 $217,169,105 $398,769,706 $337,585,995 84.7% $1,020,207,122
Charlotte Regional Partnership (NC)1 4,534,007 $24.82 $91,656,563 889,446 $49.47 $74,865,882 $166,522,445 $141,766,584 85.1% $435,105,885
Charlotte Regional Partnership (NC/SC)1 4,956,605 $25.82 $100,785,440 888,448 $51.26 $79,493,010 $180,278,450 $154,894,646 85.9% $476,172,273
Seven-County Metro Area (MN) 13,665,035 $25.82 $352,831,204 2,289,642 $39.16 $89,662,381 $442,493,585 $358,822,470 81.1% $1,068,179,514
Central Florida Region1 5,478,145 $24.42 $98,663,551 1,310,139 $53.62 $98,963,047 $197,626,598 $171,182,086 86.6% $496,802,056
Greater Philadelphia Region (PA)1 13,111,920 $25.11 $223,465,215 8,560,675 $50.92 $668,676,204 $892,141,419 $645,676,880 72.4% $2,076,594,494
Greater Washington Region (DC/MD/VA)1 41,075,502 $24.51 $564,811,169 7,649,886 $45.98 $1,013,011,869 $1,577,823,038 $430,337,446 27.3% $2,091,921,790
Metro Atlanta Area (GA)1 7,172,381 $22.66 $84,636,638 3,267,766 $37.28 $200,404,503 $285,041,141 $241,864,671 84.9% $739,898,477
Greater Atlanta Region (GA)1 7,251,898 $22.66 $86,438,516 3,303,995 $37.28 $201,755,083 $288,193,599 $245,280,847 85.1% $756,776,568
Greater Houston Region (TX)1 18,452,504 $28.65 $396,718,654 1,670,183 $75.32 $141,248,614 $537,967,268 $392,821,827 73.0% $1,219,364,590
Dallas-Fort Worth-Arlington MSA (TX)1 12,489,355 $25.60 $222,424,096 1,480,841 $66.93 $251,432,337 $473,856,433 $368,757,811 77.8% $1,146,690,361
Regional Average 3,174,116 $23.06 $60,756,799 810,190 $50.28 $64,062,090 $124,818,889 $89,948,526 81.1% $279,580,682
Percent of Regional Total 48.7% 51.3%
Regional Median 1,023,727 $22.88 $25,062,140 332,216 $44.07 $17,538,791 $50,031,630 $33,699,373 81.5% $113,221,579
RESIDENT Audiences NON-Resident Audiences TOTAL DIRECT AUDIENCE SPENDING
SOURCE: Arts and Economic Prosperity 5, Americans for the Arts, 2017. For more information, visit www.AmericansForTheArts.org/EconomicImpact. B–232

Table 16:Total Audience Expenditures Induced by Attendance toNonprofit Arts and Cultural Events Per Study Region During 2015
Statewide Study Regions Total Spending
All Populations Resident Per Person Total Non-Resident Per Person Total Total Est. Local Percent (Direct, Indirect,
Sample Size = 20 Attendance Expenditure Expenditures Attendance Expenditure Expenditures Expenditures Expenditures Local and Induced)
State of Vermont1 1,186,123 $23.45 $25,527,543 232,684 $46.35 $18,499,860 $44,027,403 $33,186,220 75.4% $56,363,501
State of North Dakota1 2,257,979 $19.23 $33,886,932 364,529 $47.51 $18,868,683 $52,755,615 $39,122,191 74.2% $67,799,698
State of Delaware 1,043,908 $20.80 $21,713,286 486,749 $50.47 $24,566,222 $46,279,508 $34,237,648 74.0% $59,372,435
State of Maine1 1,766,968 $25.96 $30,722,123 273,411 $66.50 $27,245,768 $57,967,891 $40,396,364 69.7% $78,028,146
State of Hawai'i 2,907,608 $22.50 $65,421,180 249,404 $57.34 $14,300,825 $79,722,005 $60,145,258 75.4% $101,823,077
State of Nevada1 7,679,224 $24.16 $182,681,810 731,755 $78.94 $61,745,082 $244,426,892 $189,841,909 77.7% $305,302,477
State of Connecticut1 8,317,504 $23.78 $170,529,709 1,479,320 $49.78 $111,408,312 $281,938,021 $234,779,567 83.3% $335,361,501
State of Oklahoma1 11,219,222 $31.93 $303,362,238 1,544,398 $92.83 $238,218,608 $541,580,846 $363,664,232 67.1% $742,017,883
State of Oregon1 8,533,846 $31.52 $157,654,870 1,377,706 $111.36 $165,301,938 $322,956,808 $206,323,902 63.9% $456,632,340
State of Minnesota1 15,916,734 $19.57 $387,762,548 2,986,999 $36.20 $112,997,281 $500,759,829 $406,071,150 81.1% $1,199,728,584
State of Wisconsin1 9,187,055 $30.27 $182,859,014 1,558,038 $78.38 $97,082,262 $279,941,276 $187,425,651 67.0% $385,683,581
State of Maryland1 13,880,005 $22.87 $163,927,111 2,468,646 $41.47 $286,245,781 $450,172,892 $360,831,322 80.2% $543,867,272
State of Missouri1 19,436,672 $19.87 $305,682,502 1,969,354 $39.18 $130,423,240 $436,105,742 $340,574,909 78.1% $546,333,457
State of Tennessee1 16,398,758 $23.99 $321,759,830 2,151,873 $73.95 $346,498,248 $668,258,078 $454,135,981 68.0% $916,565,337
State of Massachusetts1 26,142,539 $24.57 $348,770,229 3,598,689 $47.17 $530,826,044 $879,596,273 $695,654,265 79.1% $1,085,930,679
State of New Jersey1 6,330,032 $27.64 $124,741,716 1,152,275 $51.32 $98,932,420 $223,674,136 $168,256,168 75.2% $285,123,756
State of North Carolina1 35,907,827 $27.95 $605,032,236 3,122,420 $61.86 $574,010,730 $1,179,042,966 $834,761,090 70.8% $1,579,675,250
State of Pennsylvania1 40,938,171 $23.59 $703,517,240 6,609,066 $52.79 $931,318,364 $1,634,835,604 $1,200,484,443 73.4% $2,140,007,327
State of Illinois1 38,515,082 $23.62 $894,930,576 9,689,026 $80.57 $1,358,086,486 $2,253,017,062 $1,485,529,917 65.9% $3,121,956,416
State of Florida1 59,357,570 $29.37 $1,333,011,954 10,639,564 $56.80 $1,057,524,119 $2,390,536,073 $1,729,253,319 72.3% $3,139,327,427
Statewide Average 16,346,141 $24.83 $318,174,732 2,634,295 $61.04 $310,205,014 $628,379,746 $453,233,775 73.2% $857,345,007
Percent of Statewide Total 50.6% 49.4%
Statewide Median 10,203,139 $23.89 $182,770,412 1,551,218 $54.80 $121,710,261 $379,531,275 $287,677,238 74.1% $500,249,806
RESIDENT Audiences NON-Resident Audiences TOTAL DIRECT AUDIENCE SPENDING
SOURCE: Arts and Economic Prosperity 5, Americans for the Arts, 2017. For more information, visit www.AmericansForTheArts.org/EconomicImpact. B–233

Table 16:Total Audience Expenditures Induced by Attendance toNonprofit Arts and Cultural Events Per Study Region During 2015
Individual Arts Districts Total Spending
All Populations Resident Per Person Total Non-Resident Per Person Total Total Est. Local Percent (Direct, Indirect,
Sample Size = 12 Attendance Expenditure Expenditures Attendance Expenditure Expenditures Expenditures Expenditures Local and Induced)
James River Arts & Cultural District 119,514 $21.03 $2,513,379 49,291 $25.28 $1,246,076 $3,759,455 $242,672 6.5% $3,969,707
Center City Charlotte 2,028,212 $24.06 $48,798,781 1,073,029 $40.64 $43,607,899 $92,406,680 $77,342,715 83.7% $233,614,566
Loch Haven Cultural Park 568,117 $23.80 $13,521,185 483,951 $35.27 $17,068,952 $30,590,137 $28,461,061 93.0% $83,445,990
Downtown Colorado Springs Creative District 479,593 $27.27 $13,078,501 64,163 $49.77 $3,193,393 $16,271,894 $13,682,198 84.1% $38,116,455
Fort Worth Cultural District 1,770,194 $26.67 $47,211,074 1,170,328 $57.70 $67,527,926 $114,739,000 $92,390,130 80.5% $271,029,798
Dallas Arts District 1,933,327 $28.07 $54,268,489 1,575,433 $37.64 $59,299,298 $113,567,787 $87,684,899 77.2% $273,244,350
Grand Center Arts & Entertainment District 1,294,699 $15.64 $20,249,092 253,984 $35.40 $8,991,034 $29,240,126 $23,112,595 79.0% $70,485,560
Balboa Park Cultural District 3,865,538 $20.94 $80,944,366 2,868,848 $72.77 $208,766,069 $289,710,435 $230,062,956 79.4% $680,059,457
East End Cultural District 172,916 $21.57 $3,729,798 46,242 $28.09 $1,298,938 $5,028,736 $3,591,865 71.4% $11,370,873
Houston Museum District Association 11,005,960 $21.96 $241,690,882 1,673,717 $49.49 $82,832,254 $324,523,136 $231,796,453 71.4% $733,804,951
Midtown Cultural District 143,668 $25.41 $3,650,604 33,045 $32.36 $1,069,336 $4,719,940 $3,371,302 71.4% $10,672,630
Washington Avenue Cultural District 59,010 $28.52 $1,682,965 14,752 $34.82 $513,665 $2,196,630 $1,568,982 71.4% $4,966,974
Arts District Average 1,953,396 $23.75 $44,278,260 775,565 $41.60 $41,284,570 $85,562,830 $66,108,986 72.4% $201,231,776
Percent of Arts District Total 51.7% 48.3%
Arts District Median 931,408 $23.93 $16,885,139 368,968 $36.52 $13,029,993 $29,915,132 $25,786,828 78.1% $76,965,775
Explanation of the Outliers and Exclusions:1 These study regions include at least one smaller sub-region that also participated in this study. To calculate the total estimated audience expenditures in these larger regions, the unique findings were first
calculated for each of the sub-regions. The residency percentages and per person spending averages for the larger region were then applied to any additional data that were collected for the larger region, and the result was summed with the aggregate of the findings from the sub-region(s). Therefore, total audience expenditures for these study regions do not equal the average per person expenditure multipled by the total event attendance.
TOTAL DIRECT AUDIENCE SPENDINGRESIDENT Audiences NON-Resident Audiences
SOURCE: Arts and Economic Prosperity 5, Americans for the Arts, 2017. For more information, visit www.AmericansForTheArts.org/EconomicImpact. B–234

Explanation of Table 17:Total Economic Impact of the Audience Expenditures Induced by Attendance toNonprofit Arts and Cultural Events Per Study Region During Fiscal Year 2015
Column Two:
Column Three:
Column Four:
Column Five:
Column Six:The total amount of revenue that the state government receives (e.g., licenses, fees, taxes) as a result of the expenditures made by nonprofit arts and cultural event attendees in each participating study region.
This table presents for each study region the total economic impact of the expenditures made by arts and cultural audiences in each participating study region as a direct result of their attendance to nonprofit arts and cultural events during 2015. Summary statistics are calculated for each population group.
The total impact is a measure of the effect each expended dollar has on the study region's economy as it is spent and re-spent within the region. It includes direct economic impacts plus indirect and induced economic impacts. It is derived from input-output models that are customized for each participating study region. See Background and Scope of Study and Frequently Used Terms in this Arts & Economic Prosperity 5 National Statistical Report for more information about direct, indirect, and induced economic impacts.
The total direct expenditures made by arts and cultural event attendees in each participating study region as a direct result of their attendance to nonprofit arts and culture events during 2015. For example, when patrons attend an event they may purchase dinner at a restaurant, pay a valet to park their car, eat dessert after the performance, and/or pay a babysitter upon returning home. In addition to these categories of expense, non-resident cultural attendees often stay overnight at a hotel.
The total number of full-time equivalent (FTE) jobs supported by the expenditures made by nonprofit arts and cultural event attendees in each participating study region. Economists measure FTE jobs—not the total number of employees—because it is a more accurate measure of total employment. Each FTE job can represent one full-time employee, two employees who work half-time, four employees who work quarter-time, etc.
The total amount of household income paid to study region residents as a result of the expenditures made by nonprofit arts and cultural event attendees in each participating study region. Household income includes salaries, wages, and proprietary income.
The total amount of revenue that the local government receives (e.g., licenses, fees, taxes) as a result of the expenditures made by nonprofit arts and cultural event attendees in each participating study region. Local government includes the city and county governments located within each participating study region.
SOURCE: Arts and Economic Prosperity 5, Americans for the Arts, 2017. For more information, visit www.AmericansForTheArts.org/EconomicImpact. B–235

Table 17:Total Economic Impact of the Audience Expenditures Induced by Attendance toNonprofit Arts and Cultural Events Per Study Region During Fiscal Year 2015
Population Cohort Group A Direct
Population Fewer than 50,000 Audience Full-Time Resident Local State
Sample Size = 52 Expenditures Equivalent Jobs Household Income Government Revenue Government Revenue
Town of Crested Butte (CO)3 $5,681,804 150 $2,779,000 $343,000 $152,000
City of Pine City (MN)2 $561,510 8 $187,000 $8,000 $45,000
City of Alva (OK) $569,771 12 $233,000 $32,000 $24,000
Cook County (MN)2 $2,027,212 43 $1,080,000 $51,000 $178,000
Town of Hillsborough (NC) $3,982,167 119 $2,381,000 $242,000 $244,000
City of Virginia (MN)2 $64,430 1 $34,000 $2,000 $6,000
Town of Jackson (WY)3 $32,521,961 683 $11,661,000 $1,449,000 $2,093,000
City of Guthrie (OK) $2,331,481 38 $673,000 $96,000 $102,000
City of Grand Rapids (MN)2 $2,246,065 47 $1,197,000 $56,000 $197,000
Town of Medfield (MA) $382,700 7 $143,000 $15,000 $25,000
City of Fergus Falls (MN)2 $682,635 13 $331,000 $11,000 $55,000
Grundy County (TN)4 $916,143 13 $231,000 $41,000 $56,000
City of Falls Church (VA)3 $19,029,073 456 $4,849,000 $778,000 $1,254,000
City of Jamestown (ND) $5,806,005 148 $3,015,000 $351,000 $324,000
City of Waterville (ME)1 $1,843,453 48 $933,000 $47,000 $88,000
City of Red Wing (MN)2 $504,243 10 $229,000 $9,000 $42,000
City of Durango (CO)1 $9,476,898 282 $5,911,000 $717,000 $301,000
City of Hannibal (MO) $3,692,452 87 $1,586,000 $299,000 $152,000
City of Tullahoma (TN) $457,871 10 $210,000 $15,000 $26,000
City of Northfield (MN)2 $874,552 17 $398,000 $15,000 $73,000
Town of Carrboro (NC) $4,070,927 122 $2,434,000 $248,000 $249,000
Macon County (TN)4 $66,583 1 $17,000 $2,000 $4,000
City of Laguna Beach (CA)3 $55,244,985 1,327 $26,265,000 $2,460,000 $2,764,000
Hickman County (TN)4 $628,056 12 $261,000 $17,000 $33,000
City of Fairfax (VA) $1,052,653 15 $307,000 $51,000 $64,000
City of Ponca City (OK) $2,206,719 39 $834,000 $91,000 $76,000
City of Paducah (KY)1 $9,391,310 252 $4,977,000 $378,000 $540,000
Mille Lacs County (MN)2 $270,407 4 $90,000 $4,000 $22,000
McNairy County (TN)4 $288,940 4 $74,000 $13,000 $13,000
City of Winona (MN)2 $1,459,202 29 $664,000 $25,000 $123,000
TOTAL Economic Impact of AUDIENCE Spending
SOURCE: Arts and Economic Prosperity 5, Americans for the Arts, 2017. For more information, visit www.AmericansForTheArts.org/EconomicImpact. B–236

Table 17:Total Economic Impact of the Audience Expenditures Induced by Attendance toNonprofit Arts and Cultural Events Per Study Region During Fiscal Year 2015
Population Cohort Group A Direct
Population Fewer than 50,000 Audience Full-Time Resident Local State
Sample Size = 52 Expenditures Equivalent Jobs Household Income Government Revenue Government Revenue
Door County (WI)4 $14,967,671 332 $6,108,000 $909,000 $840,000
City of Benicia (CA) $1,760,159 30 $627,000 $51,000 $108,000
City of Winter Park (FL)3 $29,406,839 1,044 $16,824,000 $1,330,000 $1,602,000
City of Rochester (NH)1 $7,902,214 188 $4,178,000 $283,000 $393,000
City of Morgantown (WV)1 $8,020,706 191 $3,758,000 $173,000 $547,000
Henry County (TN)4 $541,722 12 $243,000 $25,000 $39,000
City of Fairbanks (AK)1 $9,283,046 193 $4,376,000 $424,000 $443,000
City of Bangor (ME) $6,577,435 171 $3,594,000 $352,000 $333,000
Weakley County (TN)4 $1,174,650 31 $558,000 $58,000 $87,000
Dare County (NC)4 $41,040,752 929 $17,959,000 $1,754,000 $1,696,000
City of Columbia (TN) $6,362,126 158 $2,883,000 $285,000 $435,000
City of Lake Worth (FL)3 $12,613,298 276 $5,265,000 $521,000 $614,000
Clatsop County (OR)4 $10,849,913 266 $4,997,000 $614,000 $510,000
Yadkin County (NC)4 $70,670 1 $23,000 $4,000 $4,000
Greater Belfast Area (ME)4 $5,124,419 79 $1,491,000 $187,000 $212,000
Campbell County (TN)4 $436,962 6 $119,000 $14,000 $26,000
Monroe County (TN)4 $6,027,214 121 $2,618,000 $247,000 $401,000
Lincoln County (OR)4 $8,828,455 228 $4,162,000 $491,000 $486,000
Iron County (UT)4 $62,797,842 1,715 $27,431,000 $3,208,000 $3,214,000
City of St. Louis Park (MN)2 $759,072 14 $409,000 $23,000 $64,000
City of Logan (UT)1 $13,753,037 332 $6,450,000 $948,000 $646,000
Gibson County (TN)4 $7,117,024 105 $2,753,000 $186,000 $346,000
Group A Average $8,148,989 200 $3,669,423 $383,712 $430,212
Group A Average Excluding Outliers/Exclusions $4,946,157 122 $2,475,150 $254,900 $256,000
Group A Median $3,011,967 64 $1,344,000 $134,500 $165,000
TOTAL Economic Impact of AUDIENCE Spending
SOURCE: Arts and Economic Prosperity 5, Americans for the Arts, 2017. For more information, visit www.AmericansForTheArts.org/EconomicImpact. B–237

Table 17:Total Economic Impact of the Audience Expenditures Induced by Attendance toNonprofit Arts and Cultural Events Per Study Region During Fiscal Year 2015
Population Cohort Group B Direct
Population 50,000 to 99,999 Audience Full-Time Resident Local State
Sample Size = 38 Expenditures Equivalent Jobs Household Income Government Revenue Government Revenue
City of Joplin (MO) $3,558,721 103 $2,042,000 $190,000 $149,000
City of La Crosse (WI) $19,855,615 704 $13,814,000 $900,000 $1,225,000
McMinn County (TN)4 $5,383,250 110 $2,130,000 $191,000 $319,000
Lafayette County (MS)4 $8,337,600 214 $4,082,000 $210,000 $616,000
Chisago County (MN)2 $2,200,334 31 $732,000 $32,000 $178,000
City of Grand Forks (ND) $3,159,035 84 $1,723,000 $109,000 $169,000
City of Corvallis (OR) $44,324,930 886 $15,866,000 $1,011,000 $2,282,000
City of Noblesville (IN) $1,701,673 33 $687,000 $47,000 $89,000
City of Ocala (FL) $41,671,737 891 $18,946,000 $1,633,000 $2,645,000
Lenoir County (NC)4 $12,666,803 339 $8,255,000 $916,000 $685,000
Town of Chapel Hill (NC) $28,613,313 855 $17,105,000 $1,740,000 $1,753,000
City of Grand Junction (CO) $5,991,168 173 $3,580,000 $446,000 $179,000
Town of Jupiter (FL) $5,110,235 112 $2,133,000 $211,000 $249,000
Hamblen County (TN)4 $1,259,169 36 $709,000 $57,000 $87,000
City of Delray Beach (FL) $10,115,146 222 $4,222,000 $418,000 $492,000
City of St. Cloud (MN)2 $7,088,986 155 $3,914,000 $160,000 $592,000
City of Portland (ME) $29,028,265 926 $15,947,000 $1,696,000 $1,828,000
City of Jackson (TN) $2,052,410 56 $1,153,000 $83,000 $126,000
City of Walnut Creek (CA) $20,432,138 320 $6,575,000 $550,000 $997,000
Greene County (TN)4 $2,241,470 41 $724,000 $79,000 $130,000
City of Flagstaff (AZ) $38,129,798 1,055 $23,567,000 $2,872,000 $2,451,000
City of Missoula (MT) $51,764,118 1,715 $34,597,000 $2,701,000 $1,680,000
City of Fort Myers (FL) $36,033,896 922 $20,187,000 $2,023,000 $2,916,000
Putnam County (TN)4 $365,463 12 $219,000 $16,000 $26,000
Monroe County (FL)4 $57,877,545 1,439 $26,281,000 $2,464,000 $3,592,000
City of Lynchburg (VA) $4,207,822 111 $2,380,000 $214,000 $183,000
City of Duluth (MN)2 $21,734,978 456 $11,582,000 $542,000 $1,911,000
City of Fishers (IN) $11,406,796 222 $4,604,000 $317,000 $596,000
City of Carmel (IN) $6,951,895 135 $2,806,000 $193,000 $363,000
City of Sugar Land (TX) $523,961 8 $167,000 $21,000 $27,000
TOTAL Economic Impact of AUDIENCE Spending
SOURCE: Arts and Economic Prosperity 5, Americans for the Arts, 2017. For more information, visit www.AmericansForTheArts.org/EconomicImpact. B–238

Table 17:Total Economic Impact of the Audience Expenditures Induced by Attendance toNonprofit Arts and Cultural Events Per Study Region During Fiscal Year 2015
Population Cohort Group B Direct
Population 50,000 to 99,999 Audience Full-Time Resident Local State
Sample Size = 38 Expenditures Equivalent Jobs Household Income Government Revenue Government Revenue
City of Asheville (NC) $39,114,604 1,228 $24,381,000 $2,434,000 $2,388,000
Buchanan County (MO)4 $10,978,269 353 $7,635,000 $486,000 $522,000
City of Boca Raton (FL) $11,057,891 242 $4,616,000 $457,000 $538,000
City of Miami Beach (FL)3 $75,134,150 2,047 $57,472,000 $5,031,000 $7,265,000
Moore County (NC)4 $6,389,283 129 $2,442,000 $218,000 $255,000
Sevier County (TN)4 $42,123,668 959 $17,360,000 $2,344,000 $2,301,000
Cape May County (NJ)4 $15,021,250 298 $5,786,000 $990,000 $859,000
Cleveland County (NC)4 $3,367,458 70 $1,389,000 $150,000 $158,000
Group B Average $18,078,285 466 $9,784,474 $898,737 $1,126,868
Group B Average Excluding Outliers/Exclusions $18,854,780 500 $10,049,909 $921,182 $1,060,227
Group B Median $10,546,708 222 $4,413,000 $432,000 $565,000
TOTAL Economic Impact of AUDIENCE Spending
SOURCE: Arts and Economic Prosperity 5, Americans for the Arts, 2017. For more information, visit www.AmericansForTheArts.org/EconomicImpact. B–239

Table 17:Total Economic Impact of the Audience Expenditures Induced by Attendance toNonprofit Arts and Cultural Events Per Study Region During Fiscal Year 2015
Population Cohort Group C Direct
Population 100,000 to 249,999 Audience Full-Time Resident Local State
Sample Size = 50 Expenditures Equivalent Jobs Household Income Government Revenue Government Revenue
City of Las Cruces (NM) $10,596,813 248 $5,162,000 $461,000 $678,000
Eau Claire County (WI)4 $5,800,746 202 $4,832,000 $307,000 $364,000
Yamhill County (OR)4 $24,305,837 433 $8,371,000 $671,000 $1,085,000
City of Lewisville (TX) $304,772 6 $129,000 $9,000 $17,000
City of West Palm Beach (FL) $105,023,175 2,301 $43,840,000 $4,340,000 $5,112,000
City of Boulder (CO) $34,283,259 864 $18,374,000 $1,132,000 $1,303,000
City of Richardson (TX) $8,452,425 192 $4,697,000 $314,000 $444,000
City of High Point (NC) $3,190,517 112 $2,672,000 $185,000 $176,000
City of Cambridge (MA) $55,007,895 925 $19,228,000 $1,770,000 $2,061,000
City of Lowell (MA) $3,605,666 56 $1,220,000 $90,000 $142,000
Douglas County (KS)4 $15,090,256 415 $7,972,000 $591,000 $901,000
City of Columbia (MO) $5,561,719 176 $3,516,000 $317,000 $250,000
City of Norman (OK) $44,621,918 1,082 $20,944,000 $1,397,000 $2,321,000
Wayne County (NC)4 $3,260,763 98 $2,148,000 $168,000 $183,000
City of Lafayette (LA) $10,620,627 327 $7,233,000 $489,000 $479,000
Washington County (TN)4 $15,198,698 405 $8,434,000 $1,295,000 $1,064,000
City of Thousand Oaks (CA) $4,203,069 86 $1,801,000 $105,000 $224,000
City of Charleston (SC) $120,433,761 3,730 $77,669,000 $7,585,000 $6,740,000
City of Waco (TX) $32,298,881 931 $20,383,000 $2,344,000 $2,104,000
Robeson County (NC)4 $1,037,548 24 $486,000 $48,000 $52,000
Columbia County (GA)4 $44,626 1 $14,000 $2,000 $1,000
Orange County (NC)4 $36,666,872 1,096 $21,920,000 $2,230,000 $2,246,000
City of Savannah (GA) $101,140,651 2,878 $59,905,000 $7,984,000 $4,232,000
Indian River County (FL)4 $8,855,149 180 $3,193,000 $331,000 $565,000
City of Alexandria (VA) $76,016,409 1,471 $29,611,000 $2,743,000 $2,429,000
Martin County (FL)4 $12,885,638 262 $4,923,000 $362,000 $783,000
Macon-Bibb County (GA)4 $38,937,787 1,102 $24,532,000 $1,846,000 $1,429,000
City of Springfield (MA) $13,876,246 359 $7,758,000 $558,000 $751,000
Catawba County (NC)4 $36,671,219 1,000 $21,078,000 $1,569,000 $1,831,000
Town of Cary (NC) $10,826,761 332 $7,988,000 $722,000 $637,000
TOTAL Economic Impact of AUDIENCE Spending
SOURCE: Arts and Economic Prosperity 5, Americans for the Arts, 2017. For more information, visit www.AmericansForTheArts.org/EconomicImpact. B–240

Table 17:Total Economic Impact of the Audience Expenditures Induced by Attendance toNonprofit Arts and Cultural Events Per Study Region During Fiscal Year 2015
Population Cohort Group C Direct
Population 100,000 to 249,999 Audience Full-Time Resident Local State
Sample Size = 50 Expenditures Equivalent Jobs Household Income Government Revenue Government Revenue
Alamance County (NC)4 $4,937,353 133 $2,510,000 $188,000 $258,000
Cumberland County (NJ) $7,196,474 137 $3,087,000 $410,000 $448,000
City of Eugene (OR) $21,423,287 656 $14,129,000 $912,000 $856,000
Middlesex County (CT)4 $11,117,321 197 $3,562,000 $419,000 $491,000
City of Springfield (MO) $17,087,113 555 $12,465,000 $922,000 $732,000
City of Sioux Falls (SD) $84,438,598 2,714 $55,469,000 $2,761,000 $4,262,000
Pitt County (NC)4 $5,422,000 166 $3,561,000 $311,000 $293,000
City of Providence (RI) $111,948,211 2,833 $49,204,000 $5,848,000 $5,927,000
City of Worcester (MA) $61,185,858 1,261 $26,741,000 $1,327,000 $2,888,000
Montgomery County (TN)4 $2,041,349 44 $925,000 $106,000 $160,000
Salt Lake City (UT) $194,120,153 5,322 $121,696,000 $8,765,000 $9,117,000
Cabarrus County (NC)4 $4,677,402 147 $2,655,000 $216,000 $235,000
Richmond County (GA)4 $19,941,434 576 $12,160,000 $1,183,000 $791,000
City of Tacoma (WA) $62,565,471 1,455 $30,418,000 $2,859,000 $3,537,000
Doña Ana County (NM)4 $20,191,146 472 $9,835,000 $879,000 $1,291,000
New Hanover County (NC)4 $40,963,688 1,405 $29,863,000 $2,443,000 $2,207,000
Arlington County (VA)4 $18,476,219 316 $6,134,000 $1,020,000 $551,000
City of Irving (TX) $1,260,973 31 $683,000 $49,000 $64,000
City of Reno (NV) $38,895,672 783 $16,545,000 $1,195,000 $2,098,000
York County (SC)4 $13,756,005 277 $6,720,000 $448,000 $656,000
Group C Average $31,609,309 815 $16,967,900 $1,484,520 $1,549,320
Group C Average Excluding Outliers/Exclusions $28,949,633 743 $15,255,440 $1,241,680 $1,514,560
Group C Median $15,144,477 382 $7,980,000 $696,500 $767,000
TOTAL Economic Impact of AUDIENCE Spending
SOURCE: Arts and Economic Prosperity 5, Americans for the Arts, 2017. For more information, visit www.AmericansForTheArts.org/EconomicImpact. B–241

Table 17:Total Economic Impact of the Audience Expenditures Induced by Attendance toNonprofit Arts and Cultural Events Per Study Region During Fiscal Year 2015
Population Cohort Group D Direct
Population 250,000 to 499,999 Audience Full-Time Resident Local State
Sample Size = 42 Expenditures Equivalent Jobs Household Income Government Revenue Government Revenue
Buncombe County (NC)4 $42,520,698 1,335 $26,505,000 $2,645,000 $2,596,000
Alachua County (FL)4 $67,892,593 1,984 $38,642,000 $2,835,000 $3,914,000
Greater Green Bay Area (WI)4 $12,925,635 349 $7,348,000 $450,000 $718,000
City of Orlando (FL) $65,576,512 2,395 $43,861,000 $3,390,000 $4,116,000
City of Lincoln (NE) $48,329,810 1,579 $30,859,000 $2,988,000 $2,792,000
Southeastern Connecticut Region (CT)4 $81,213,782 1,466 $28,446,000 $2,678,000 $3,660,000
Erie County (PA)4 $23,147,814 784 $15,002,000 $896,000 $1,339,000
San Luis Obispo County (CA)4 $14,029,567 373 $7,315,000 $594,000 $1,018,000
City of Newark (NJ) $68,963,054 1,165 $29,423,000 $2,165,000 $3,264,000
Leon County (FL)4 $101,416,276 2,668 $57,337,000 $4,629,000 $6,745,000
Rutherford County (TN)4 $20,370,806 528 $10,696,000 $1,091,000 $1,433,000
St. Lucie County (FL)4 $4,697,606 104 $1,946,000 $125,000 $268,000
Greater Spartanburg Area (SC)4 $10,670,113 331 $6,402,000 $305,000 $641,000
Durham County (NC)4 $49,550,897 1,484 $33,885,000 $3,817,000 $2,451,000
City of St. Paul (MN)2 $195,262,963 3,690 $105,221,000 $6,039,000 $16,504,000
Hamilton County (IN)4 $21,902,882 427 $8,841,000 $609,000 $1,144,000
Osceola County (FL)4 $1,731,658 48 $962,000 $48,000 $127,000
Escambia County (FL)4 $61,364,635 1,828 $37,048,000 $3,053,000 $4,292,000
Lexington-Fayette Urban County (KY)4 $15,984,825 564 $12,834,000 $487,000 $1,291,000
Lake County (FL)4 $8,016,604 157 $2,971,000 $317,000 $536,000
City of Riverside (CA) $25,414,927 725 $15,568,000 $1,041,000 $1,894,000
Cumberland County (NC)4 $29,520,110 878 $18,641,000 $1,696,000 $1,805,000
Collier County (FL)4 $44,713,126 912 $16,520,000 $1,255,000 $2,665,000
Hamilton County (TN)4 $107,710,825 3,250 $80,503,000 $5,238,000 $8,736,000
Manatee County (FL)4 $32,987,303 690 $13,302,000 $1,451,000 $2,163,000
City of Tampa (FL) $218,525,750 6,096 $146,476,000 $10,984,000 $14,827,000
Forsyth County (NC)4 $52,083,038 1,741 $39,161,000 $2,676,000 $3,545,000
Mercer County (NJ)4 $18,713,948 320 $7,117,000 $748,000 $834,000
City of Wichita (KS) $50,788,472 1,592 $33,776,000 $3,203,000 $2,629,000
Clackamas County (OR)4 $9,016,568 162 $3,671,000 $237,000 $580,000
TOTAL Economic Impact of AUDIENCE Spending
SOURCE: Arts and Economic Prosperity 5, Americans for the Arts, 2017. For more information, visit www.AmericansForTheArts.org/EconomicImpact. B–242

Table 17:Total Economic Impact of the Audience Expenditures Induced by Attendance toNonprofit Arts and Cultural Events Per Study Region During Fiscal Year 2015
Population Cohort Group D Direct
Population 250,000 to 499,999 Audience Full-Time Resident Local State
Sample Size = 42 Expenditures Equivalent Jobs Household Income Government Revenue Government Revenue
Sarasota County (FL)4 $93,489,521 1,928 $53,699,000 $5,666,000 $8,295,000
City of Minneapolis (MN)2 $217,285,067 4,107 $117,088,000 $6,721,000 $18,365,000
Berks County (PA)4 $8,140,047 191 $3,873,000 $323,000 $449,000
City of Miami (FL) $262,596,886 7,155 $192,352,000 $15,737,000 $23,644,000
City of Raleigh (NC) $363,988,155 10,837 $200,191,000 $20,308,000 $18,385,000
Santa Barbara County (CA)4 $72,295,776 2,025 $35,058,000 $3,709,000 $4,677,000
Seminole County (FL)4 $8,306,215 192 $4,477,000 $466,000 $612,000
City of Virginia Beach (VA) $61,802,150 1,750 $33,798,000 $2,745,000 $2,443,000
City of Atlanta (GA) $232,656,425 7,286 $140,661,000 $16,091,000 $12,864,000
City of Mesa (AZ) $12,783,542 372 $8,334,000 $626,000 $782,000
City of Kansas City (MO) $82,505,241 2,455 $58,686,000 $3,668,000 $4,186,000
Morris County (NJ)4 $16,028,988 223 $5,138,000 $506,000 $1,117,000
Group D Average $69,926,686 1,861 $41,277,000 $3,434,667 $4,627,286
Group D Average Excluding Outliers/Exclusions $38,394,495 928 $18,947,400 $1,564,300 $2,130,500
Group D Median $46,521,468 1,250 $27,475,500 $2,405,000 $2,523,500
TOTAL Economic Impact of AUDIENCE Spending
SOURCE: Arts and Economic Prosperity 5, Americans for the Arts, 2017. For more information, visit www.AmericansForTheArts.org/EconomicImpact. B–243

Table 17:Total Economic Impact of the Audience Expenditures Induced by Attendance toNonprofit Arts and Cultural Events Per Study Region During Fiscal Year 2015
Population Cohort Group E Direct
Population 500,000 to 999,999 Audience Full-Time Resident Local State
Sample Size = 25 Expenditures Equivalent Jobs Household Income Government Revenue Government Revenue
Sonoma County (CA)4 $35,290,315 732 $14,479,000 $1,103,000 $1,918,000
Volusia County (FL)4 $35,015,240 1,057 $22,434,000 $2,249,000 $2,963,000
Guilford County (NC)4 $95,171,867 3,549 $55,714,000 $5,420,000 $4,864,000
Dane County (WI)4 $104,161,585 3,362 $58,425,000 $4,488,000 $5,946,000
Brevard County (FL)4 $3,505,227 81 $1,467,000 $105,000 $230,000
Washington County (OR)4 $7,272,749 170 $3,599,000 $171,000 $547,000
Johnson County (KS)4 $10,438,987 253 $5,223,000 $325,000 $570,000
City of Louisville (KY) $237,946,184 7,530 $161,732,000 $5,514,000 $15,947,000
City of Baltimore (MD) $279,675,260 6,927 $132,869,000 $14,236,000 $12,215,000
Polk County (FL)4 $30,799,415 858 $19,470,000 $1,672,000 $2,465,000
City of Boston (MA) $590,249,049 14,186 $322,024,000 $17,548,000 $26,499,000
District of Columbia (DC)3,6 $1,252,037,358 7,206 $142,936,000 $43,709,000 $0
City of Nashville-Davidson County (TN) $250,560,557 6,886 $155,522,000 $13,746,000 $18,392,000
City of El Paso (TX) $43,468,775 1,312 $28,395,000 $2,421,000 $2,978,000
Lee County (FL)4 $106,117,364 2,715 $59,449,000 $5,958,000 $8,588,000
City of Fort Worth (TX) $194,654,565 5,269 $128,759,000 $11,183,000 $13,977,000
City of Indianapolis (IN) $213,236,618 7,780 $148,419,000 $10,259,000 $16,754,000
City and County of San Francisco (CA) $667,740,510 16,539 $347,641,000 $32,979,000 $41,083,000
Prince George's County (MD)4 $34,910,511 594 $11,296,000 $1,293,000 $1,187,000
Pinellas County (FL)4 $140,781,982 3,322 $73,161,000 $6,132,000 $9,316,000
Shelby County (TN)4 $79,131,575 2,376 $58,354,000 $4,691,000 $6,817,000
Fairfield County (CT)4 $86,618,360 1,090 $27,137,000 $2,680,000 $3,930,000
Westchester County (NY)4 $65,689,723 1,792 $44,908,000 $4,596,000 $6,123,000
Fulton County (GA)4 $236,232,626 7,383 $143,284,000 $16,323,000 $13,000,000
Wake County (NC)4 $378,008,208 11,264 $210,506,000 $21,223,000 $19,198,000
Group E Average $207,148,584 4,569 $95,088,120 $9,200,960 $9,420,280
Group E Average Excluding Outliers/Exclusions $251,976,744 6,296 $139,665,250 $11,313,875 $15,188,375
Group E Median $104,161,585 3,322 $58,425,000 $5,420,000 $6,123,000
TOTAL Economic Impact of AUDIENCE Spending
SOURCE: Arts and Economic Prosperity 5, Americans for the Arts, 2017. For more information, visit www.AmericansForTheArts.org/EconomicImpact. B–244
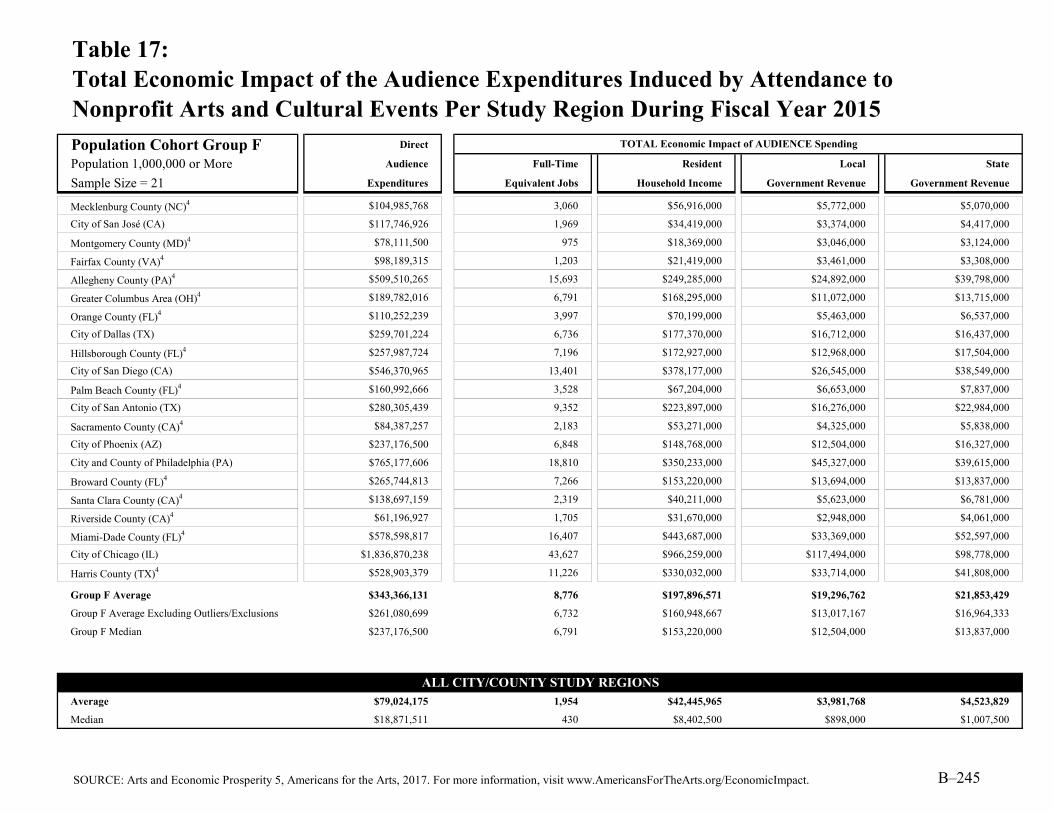
Table 17:Total Economic Impact of the Audience Expenditures Induced by Attendance toNonprofit Arts and Cultural Events Per Study Region During Fiscal Year 2015
Population Cohort Group F Direct
Population 1,000,000 or More Audience Full-Time Resident Local State
Sample Size = 21 Expenditures Equivalent Jobs Household Income Government Revenue Government Revenue
Mecklenburg County (NC)4 $104,985,768 3,060 $56,916,000 $5,772,000 $5,070,000
City of San José (CA) $117,746,926 1,969 $34,419,000 $3,374,000 $4,417,000
Montgomery County (MD)4 $78,111,500 975 $18,369,000 $3,046,000 $3,124,000
Fairfax County (VA)4 $98,189,315 1,203 $21,419,000 $3,461,000 $3,308,000
Allegheny County (PA)4 $509,510,265 15,693 $249,285,000 $24,892,000 $39,798,000
Greater Columbus Area (OH)4 $189,782,016 6,791 $168,295,000 $11,072,000 $13,715,000
Orange County (FL)4 $110,252,239 3,997 $70,199,000 $5,463,000 $6,537,000
City of Dallas (TX) $259,701,224 6,736 $177,370,000 $16,712,000 $16,437,000
Hillsborough County (FL)4 $257,987,724 7,196 $172,927,000 $12,968,000 $17,504,000
City of San Diego (CA) $546,370,965 13,401 $378,177,000 $26,545,000 $38,549,000
Palm Beach County (FL)4 $160,992,666 3,528 $67,204,000 $6,653,000 $7,837,000
City of San Antonio (TX) $280,305,439 9,352 $223,897,000 $16,276,000 $22,984,000
Sacramento County (CA)4 $84,387,257 2,183 $53,271,000 $4,325,000 $5,838,000
City of Phoenix (AZ) $237,176,500 6,848 $148,768,000 $12,504,000 $16,327,000
City and County of Philadelphia (PA) $765,177,606 18,810 $350,233,000 $45,327,000 $39,615,000
Broward County (FL)4 $265,744,813 7,266 $153,220,000 $13,694,000 $13,837,000
Santa Clara County (CA)4 $138,697,159 2,319 $40,211,000 $5,623,000 $6,781,000
Riverside County (CA)4 $61,196,927 1,705 $31,670,000 $2,948,000 $4,061,000
Miami-Dade County (FL)4 $578,598,817 16,407 $443,687,000 $33,369,000 $52,597,000
City of Chicago (IL) $1,836,870,238 43,627 $966,259,000 $117,494,000 $98,778,000
Harris County (TX)4 $528,903,379 11,226 $330,032,000 $33,714,000 $41,808,000
Group F Average $343,366,131 8,776 $197,896,571 $19,296,762 $21,853,429
Group F Average Excluding Outliers/Exclusions $261,080,699 6,732 $160,948,667 $13,017,167 $16,964,333
Group F Median $237,176,500 6,791 $153,220,000 $12,504,000 $13,837,000
Average $79,024,175 1,954 $42,445,965 $3,981,768 $4,523,829
Median $18,871,511 430 $8,402,500 $898,000 $1,007,500
TOTAL Economic Impact of AUDIENCE Spending
ALL CITY/COUNTY STUDY REGIONS
SOURCE: Arts and Economic Prosperity 5, Americans for the Arts, 2017. For more information, visit www.AmericansForTheArts.org/EconomicImpact. B–245

Table 17:Total Economic Impact of the Audience Expenditures Induced by Attendance toNonprofit Arts and Cultural Events Per Study Region During Fiscal Year 2015
Regional Study Regions Direct
All Populations Audience Full-Time Resident Local State
Sample Size = 81 Expenditures Equivalent Jobs Household Income Government Revenue Government Revenue
High Peaks Region (ME) $1,021,519 24 $426,000 $41,000 $54,000
Wood River Valley (ID) $13,849,987 321 $6,076,000 $604,000 $784,000
Southern Oregon Area $63,078,564 1,741 $36,932,000 $5,168,000 $832,000
Southwestern Pennsylvania Area $27,580,415 737 $16,022,000 $658,000 $1,639,000
Greater Portsmouth Area (NH) $36,585,032 986 $19,598,000 $2,451,000 $1,972,000
Northeast Oregon Region $556,935 12 $234,000 $17,000 $24,000
Toe River Valley (NC) $5,401,784 93 $2,007,000 $224,000 $284,000
Albemarle Region (NC) $4,231,853 113 $2,144,000 $158,000 $201,000
Greater Concord Area (NH) $13,351,816 344 $7,703,000 $538,000 $370,000
North Central Minnesota Region2 $1,435,387 25 $593,000 $21,000 $115,000
Northwest Minnesota Region2 $477,641 9 $203,000 $8,000 $41,000
Monadnock Region (NH) $5,280,101 131 $2,786,000 $189,000 $122,000
Bismarck-Mandan Region (ND) $19,127,116 483 $10,723,000 $503,000 $1,070,000
Greater Minot Region (ND) $4,770,610 125 $2,584,000 $279,000 $403,000
Greater Burlington Area (VT) $36,038,913 881 $18,212,000 $1,002,000 $2,414,000
Greater Charlottesville Area (VA) $61,250,521 742 $16,532,000 $3,657,000 $2,221,000
Brainerd Lakes Region (MN)2 $885,007 20 $465,000 $16,000 $76,000
East Central Minnesota Region2 $5,924,425 84 $1,970,000 $85,000 $478,000
Northwest Connecticut Region $12,877,676 172 $3,197,000 $294,000 $521,000
Central Oregon Region $24,706,823 578 $11,773,000 $1,125,000 $742,000
Greater Fargo-Moorhead Area (ND/MN) $24,848,393 753 $16,381,000 $786,000 $1,455,000
Black Hills Region (SD) $91,334,299 2,680 $54,223,000 $2,860,000 $5,015,000
Greater Kingsport Area (TN) $19,946,401 463 $9,578,000 $994,000 $1,274,000
Lake Region (MN)2 $3,338,821 64 $1,618,000 $54,000 $269,000
South Central Minnesota Region2 $7,166,691 146 $3,586,000 $162,000 $586,000
Greater Sioux Falls Area (SD) $84,845,941 2,728 $55,870,000 $2,777,000 $4,285,000
Southwest Tennessee Development District $3,150,012 81 $1,640,000 $130,000 $191,000
Northwest Tennessee Development District $9,771,421 168 $3,969,000 $307,000 $532,000
Southwest Minnesota Region2 $2,416,051 52 $1,236,000 $49,000 $194,000
Arrowhead Region (MN)2 $20,102,830 422 $10,712,000 $501,000 $1,767,000
TOTAL Economic Impact of AUDIENCE Spending
SOURCE: Arts and Economic Prosperity 5, Americans for the Arts, 2017. For more information, visit www.AmericansForTheArts.org/EconomicImpact. B–246
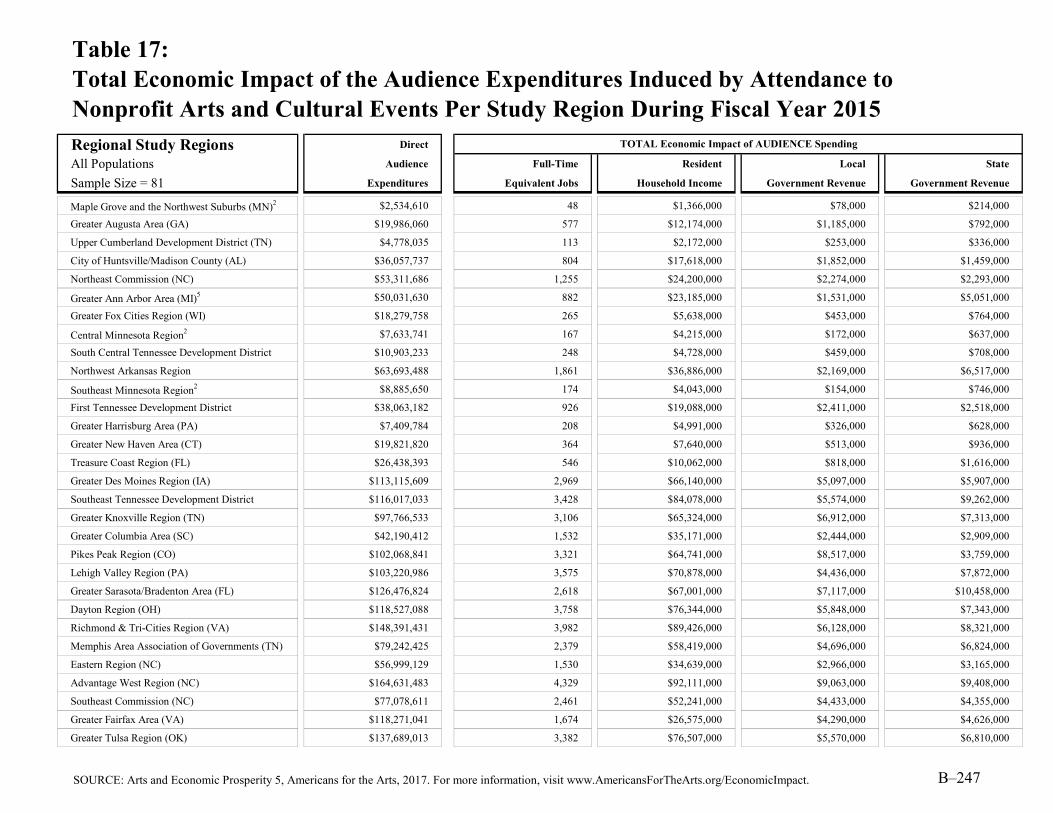
Table 17:Total Economic Impact of the Audience Expenditures Induced by Attendance toNonprofit Arts and Cultural Events Per Study Region During Fiscal Year 2015
Regional Study Regions Direct
All Populations Audience Full-Time Resident Local State
Sample Size = 81 Expenditures Equivalent Jobs Household Income Government Revenue Government Revenue
Maple Grove and the Northwest Suburbs (MN)2 $2,534,610 48 $1,366,000 $78,000 $214,000
Greater Augusta Area (GA) $19,986,060 577 $12,174,000 $1,185,000 $792,000
Upper Cumberland Development District (TN) $4,778,035 113 $2,172,000 $253,000 $336,000
City of Huntsville/Madison County (AL) $36,057,737 804 $17,618,000 $1,852,000 $1,459,000
Northeast Commission (NC) $53,311,686 1,255 $24,200,000 $2,274,000 $2,293,000
Greater Ann Arbor Area (MI)5 $50,031,630 882 $23,185,000 $1,531,000 $5,051,000
Greater Fox Cities Region (WI) $18,279,758 265 $5,638,000 $453,000 $764,000
Central Minnesota Region2 $7,633,741 167 $4,215,000 $172,000 $637,000
South Central Tennessee Development District $10,903,233 248 $4,728,000 $459,000 $708,000
Northwest Arkansas Region $63,693,488 1,861 $36,886,000 $2,169,000 $6,517,000
Southeast Minnesota Region2 $8,885,650 174 $4,043,000 $154,000 $746,000
First Tennessee Development District $38,063,182 926 $19,088,000 $2,411,000 $2,518,000
Greater Harrisburg Area (PA) $7,409,784 208 $4,991,000 $326,000 $628,000
Greater New Haven Area (CT) $19,821,820 364 $7,640,000 $513,000 $936,000
Treasure Coast Region (FL) $26,438,393 546 $10,062,000 $818,000 $1,616,000
Greater Des Moines Region (IA) $113,115,609 2,969 $66,140,000 $5,097,000 $5,907,000
Southeast Tennessee Development District $116,017,033 3,428 $84,078,000 $5,574,000 $9,262,000
Greater Knoxville Region (TN) $97,766,533 3,106 $65,324,000 $6,912,000 $7,313,000
Greater Columbia Area (SC) $42,190,412 1,532 $35,171,000 $2,444,000 $2,909,000
Pikes Peak Region (CO) $102,068,841 3,321 $64,741,000 $8,517,000 $3,759,000
Lehigh Valley Region (PA) $103,220,986 3,575 $70,878,000 $4,436,000 $7,872,000
Greater Sarasota/Bradenton Area (FL) $126,476,824 2,618 $67,001,000 $7,117,000 $10,458,000
Dayton Region (OH) $118,527,088 3,758 $76,344,000 $5,848,000 $7,343,000
Richmond & Tri-Cities Region (VA) $148,391,431 3,982 $89,426,000 $6,128,000 $8,321,000
Memphis Area Association of Governments (TN) $79,242,425 2,379 $58,419,000 $4,696,000 $6,824,000
Eastern Region (NC) $56,999,129 1,530 $34,639,000 $2,966,000 $3,165,000
Advantage West Region (NC) $164,631,483 4,329 $92,111,000 $9,063,000 $9,408,000
Southeast Commission (NC) $77,078,611 2,461 $52,241,000 $4,433,000 $4,355,000
Greater Fairfax Area (VA) $118,271,041 1,674 $26,575,000 $4,290,000 $4,626,000
Greater Tulsa Region (OK) $137,689,013 3,382 $76,507,000 $5,570,000 $6,810,000
TOTAL Economic Impact of AUDIENCE Spending
SOURCE: Arts and Economic Prosperity 5, Americans for the Arts, 2017. For more information, visit www.AmericansForTheArts.org/EconomicImpact. B–247

Table 17: $82,505,241 $2,455 $58,686,000 $3,668,000 $4,186,000
Total Economic Impact of the Audience Expenditures Induced by Attendance toNonprofit Arts and Cultural Events Per Study Region During Fiscal Year 2015
Regional Study Regions Direct
All Populations Audience Full-Time Resident Local State
Sample Size = 81 Expenditures Equivalent Jobs Household Income Government Revenue Government Revenue
East Tennessee Development District $118,627,403 3,379 $67,535,000 $7,792,000 $7,918,000
West Valley Region (AZ) $9,795,104 293 $7,404,000 $420,000 $667,000
Greater St. Louis Area (MO) $227,188,613 7,392 $144,137,000 $16,210,000 $12,748,000
Western New York $196,125,443 5,455 $107,542,000 $18,561,000 $8,594,000
Greater Oklahoma City Region (OK) $382,263,042 10,702 $240,871,000 $19,263,000 $20,473,000
Piedmont Triad Partnership (NC) $185,161,256 6,388 $118,133,000 $9,816,000 $10,360,000
Greater Portland Area (OR) $115,982,321 3,513 $77,797,000 $5,359,000 $4,023,000
Greater Kansas City Metropolitan Area (MO/KS) $96,561,206 3,116 $76,476,000 $5,154,000 $6,985,000
Greater Nashville Regional Council (TN) $287,705,334 7,838 $175,962,000 $15,720,000 $21,072,000
Research Triangle Regional Partnership (NC) $475,338,356 14,099 $271,542,000 $27,701,000 $24,382,000
Greater Tampa/St. Petersburg Area (FL) $398,769,706 10,518 $246,088,000 $19,100,000 $26,820,000
Charlotte Regional Partnership (NC) $166,522,445 4,721 $92,374,000 $8,462,000 $8,142,000
Charlotte Regional Partnership (NC/SC) $180,278,450 4,998 $99,094,000 $8,910,000 $8,798,000
Seven-County Metro Area (MN)2 $442,493,585 8,384 $238,445,000 $13,686,000 $37,401,000
Central Florida Region $197,626,598 6,390 $121,980,000 $10,320,000 $13,470,000
Greater Philadelphia Region (PA) $892,141,419 23,194 $483,784,000 $53,863,000 $62,389,000
Greater Washington Region (DC/MD/VA) $1,577,823,038 12,236 $234,921,000 $56,101,000 $11,917,000
Metro Atlanta Area (GA) $285,041,141 8,675 174,234,000 18,931,000 14,834,000
Greater Atlanta Region (GA) $288,193,599 8,758 176,258,000 19,102,000 14,953,000
Greater Houston Region (TX) $537,967,268 11,428 334,912,000 34,223,000 42,333,000
Dallas-Fort Worth-Arlington MSA (TX) $473,856,433 12,480 317,686,000 28,770,000 31,509,000
Regional Average $124,818,889 2,983 $64,984,802 $6,430,383 $6,706,988
Regional Median $50,031,630 986 $23,185,000 $2,411,000 $2,414,000
TOTAL Economic Impact of AUDIENCE Spending
SOURCE: Arts and Economic Prosperity 5, Americans for the Arts, 2017. For more information, visit www.AmericansForTheArts.org/EconomicImpact. B–248

Table 17:Total Economic Impact of the Audience Expenditures Induced by Attendance toNonprofit Arts and Cultural Events Per Study Region During Fiscal Year 2015
Statewide Study Regions Direct
All Populations Audience Full-Time Resident Local State
Sample Size = 20 Expenditures Equivalent Jobs Household Income Government Revenue Government Revenue
State of Vermont $44,027,403 908 $18,978,000 $1,025,000 $2,496,000
State of North Dakota $52,755,615 1,577 $33,866,000 $2,007,000 $3,395,000
State of Delaware $46,279,508 1,252 $32,268,000 $624,000 $2,692,000
State of Maine $57,967,891 1,306 $24,026,000 $2,433,000 $2,642,000
State of Hawai'i $79,722,005 1,565 $46,452,000 $1,654,000 $6,857,000
State of Nevada $244,426,892 4,152 $122,249,000 $8,243,000 $14,222,000
State of Connecticut $281,938,021 5,443 $125,726,000 $9,429,000 $17,294,000
State of Oklahoma $541,580,846 14,217 $320,944,000 $25,080,000 $27,499,000
State of Oregon $322,956,808 8,360 $175,431,000 $15,426,000 $10,865,000
State of Minnesota2 $500,759,829 9,547 $267,086,000 $14,908,000 $42,310,000
State of Wisconsin $279,941,276 9,215 $210,783,000 $15,238,000 $20,954,000
State of Maryland $450,172,892 12,222 $268,136,000 $22,730,000 $23,711,000
State of Missouri $436,105,742 11,959 $254,664,000 $23,833,000 $21,708,000
State of Tennessee $668,258,078 18,560 $417,591,000 $37,342,000 $49,361,000
State of Massachusetts $879,596,273 22,180 $490,641,000 $31,909,000 $55,565,000
State of New Jersey $223,674,136 4,442 $120,443,000 $7,460,000 $13,312,000
State of North Carolina $1,179,042,966 34,783 $685,240,000 $64,715,000 $62,105,000
State of Pennsylvania $1,634,835,604 44,623 $851,562,000 $105,747,000 $124,598,000
State of Illinois $2,253,017,062 53,764 $1,428,393,000 $162,327,000 $135,443,000
State of Florida $2,390,536,073 60,258 $1,380,983,000 $113,865,000 $160,334,000
Statewide Average $628,379,746 16,017 $363,773,100 $33,299,750 $39,868,150
Statewide Median $379,531,275 9,381 $232,723,500 $15,332,000 $21,331,000
TOTAL Economic Impact of AUDIENCE Spending
SOURCE: Arts and Economic Prosperity 5, Americans for the Arts, 2017. For more information, visit www.AmericansForTheArts.org/EconomicImpact. B–249

Table 17:Total Economic Impact of the Audience Expenditures Induced by Attendance toNonprofit Arts and Cultural Events Per Study Region During Fiscal Year 2015
Individual Arts Districts Direct
All Populations Audience Full-Time Resident Local State
Sample Size = 12 Expenditures Equivalent Jobs Household Income Government Revenue Government Revenue
James River Arts & Cultural District $3,759,455 99 $2,126,000 $191,000 $163,000
Center City Charlotte $92,406,680 2,693 $50,096,000 $5,080,000 $4,463,000
Loch Haven Cultural Park $30,590,137 1,117 $20,460,000 $1,581,000 $1,920,000
Downtown Colorado Springs Creative District $16,271,894 529 $10,321,000 $1,358,000 $599,000
Fort Worth Cultural District $114,739,000 3,106 $75,897,000 $6,592,000 $8,239,000
Dallas Arts District $113,567,787 2,946 $77,564,000 $7,308,000 $7,188,000
Grand Center Arts & Entertainment District $29,240,126 951 $18,551,000 $2,086,000 $1,641,000
Balboa Park Cultural District $289,710,435 7,106 $200,526,000 $14,075,000 $20,440,000
East End Cultural District $5,028,736 107 $3,138,000 $321,000 $398,000
Houston Museum District Association $324,523,136 6,888 $202,500,000 $20,686,000 $25,652,000
Midtown Cultural District $4,719,940 100 $2,945,000 $301,000 $373,000
Washington Avenue Cultural District $2,196,630 47 $1,371,000 $140,000 $174,000
Arts District Average $85,562,830 2,141 $55,457,917 $4,976,583 $5,937,500
Arts District Median $29,915,132 1,034 $19,505,500 $1,833,500 $1,780,500
Explanation of the Outliers and Exclusions:1
2
3
4
5
6 The economic impact findings for the District of Columbia exclude state government revenues due to Washington, DC's unique status as a study region with no state government.
The expenditure and attendance data collected from eligible organizations in this study region were collected for fiscal year 2014 (rather than 2015), and audience-intercepts surveys collected from attendees to cultural events in this study region were collected during calendar year 2015 (rather than 2016).
The organizational expenditure and attendance findings for these city study regions were determined by researchers to be outliers when compared to the findings for cohort regions in the same population category. For this reason, the organizational expenditure and attendance findings for these study regions are excluded from the national extrapolations.
The expenditure and attendance data collected from eligible organizations in these study regions were collected for fiscal year 2013 (rather than 2015), and audience-intercepts surveys collected from attendees to cultural events in these study regions were collected during calendar year 2014 (rather than 2016). Where applicable, these study regions are excluded from the national extrapolations.
Both the organizational expenditure and attendance findings and the audience expenditure findings for these city study regions were determined by researchers to be outliers when compared to the findings for cohort regions in the same population category. For this reason, these study regions are excluded from the national extrapolations.
These county study regions are excluded from the national extrapolations. The national extrapolations are based on city study regions only.
TOTAL Economic Impact of AUDIENCE Spending
SOURCE: Arts and Economic Prosperity 5, Americans for the Arts, 2017. For more information, visit www.AmericansForTheArts.org/EconomicImpact. B–250

Explanation of Table 18:Direct Economic Impact of the Audience Expenditures Induced by Attendance toNonprofit Arts and Cultural Events Per Study Region During Fiscal Year 2015
Column Two:
Column Three:
Column Four:
Column Five:
Column Six:The amount of revenue that the state government receives (e.g., licenses, fees, taxes) as a direct result of the expenditures made by nonprofit arts and cultural event attendees in each participating study region.
This table presents for each study region the direct economic impact of the expenditures made by arts and cultural audiences in each participating study region as a direct result of their attendance to nonprofit arts and cultural events during 2015. Summary statistics are calculated for each population group.
The direct impact is a measure of the effect of the initial direct expenditures made by the organizations. It excludes indirect and induced impacts. Because it includes only one round of spending, the direct impact is always smaller than the total impact (which measures the effect of each dollar as it is spent and re-spent within the study region's economy). The direct impact is derived from input-output models that are customized for each participating study region. See Background and Scope of Study and Frequently Used Terms in this Arts & Economic Prosperity 5 National Statistical Report for more information about direct, indirect, and induced economic impacts.
The total direct expenditures made by arts and cultural event attendees in each participating study region as a direct result of their attendance to nonprofit arts and culture events during 2015. For example, when patrons attend an event they may purchase dinner at a restaurant, pay a valet to park their car, eat dessert after the performance, and/or pay a babysitter upon returning home. In addition to these categories of expense, non-resident cultural attendees often stay overnight at a hotel.
The number of full-time equivalent (FTE) jobs directly supported by the expenditures made by nonprofit arts and cultural event attendees in each participating study region. Economists measure FTE jobs—not the total number of employees—because it is a more accurate measure of total employment. Each FTE job can represent one full-time employee, two employees who work half-time, four employees who work quarter-time, etc.
The amount of household income paid to study region residents as a direct result of the expenditures made by nonprofit arts and cultural event attendees in each participating study region. Household income includes salaries, wages, and proprietary income.
The amount of revenue that the local government receives (e.g., licenses, fees, taxes) as a direct result of the expenditures made by nonprofit arts and cultural event attendees in each participating study region. Local government includes the city and county governments located within each participating study region.
SOURCE: Arts and Economic Prosperity 5, Americans for the Arts, 2017. For more information, visit www.AmericansForTheArts.org/EconomicImpact. B–251
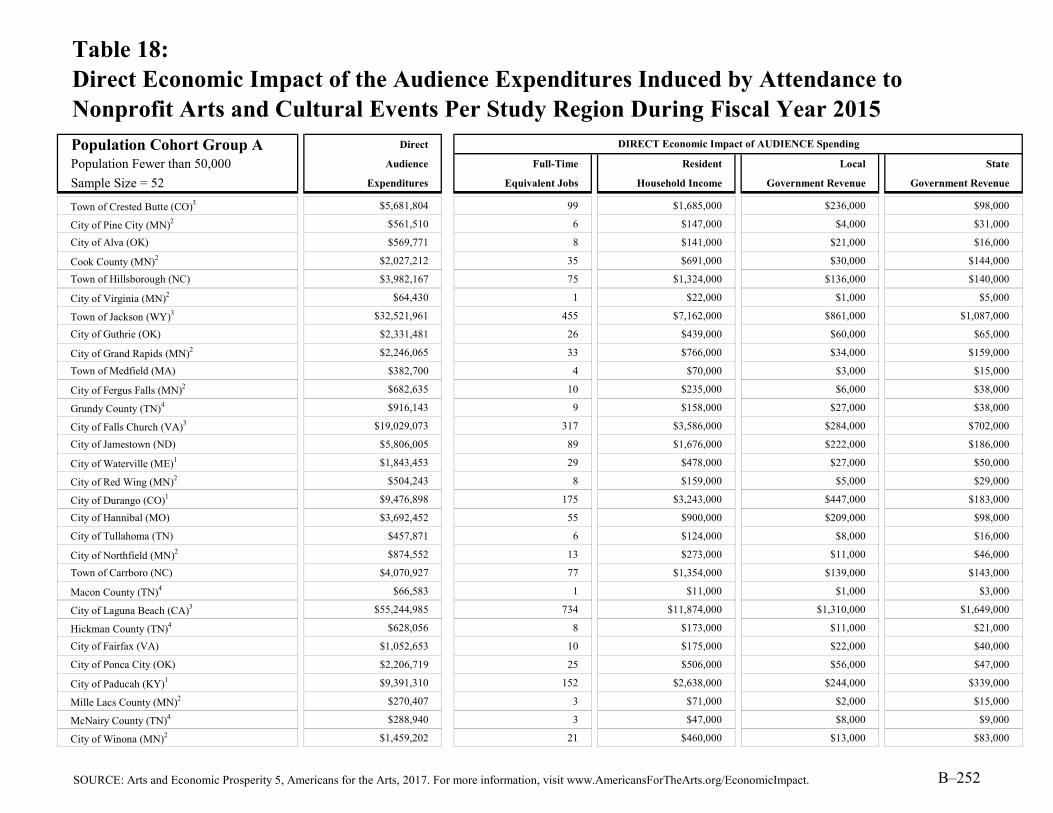
Table 18:Direct Economic Impact of the Audience Expenditures Induced by Attendance toNonprofit Arts and Cultural Events Per Study Region During Fiscal Year 2015
Population Cohort Group A Direct
Population Fewer than 50,000 Audience Full-Time Resident Local State
Sample Size = 52 Expenditures Equivalent Jobs Household Income Government Revenue Government Revenue
Town of Crested Butte (CO)3 $5,681,804 99 $1,685,000 $236,000 $98,000
City of Pine City (MN)2 $561,510 6 $147,000 $4,000 $31,000
City of Alva (OK) $569,771 8 $141,000 $21,000 $16,000
Cook County (MN)2 $2,027,212 35 $691,000 $30,000 $144,000
Town of Hillsborough (NC) $3,982,167 75 $1,324,000 $136,000 $140,000
City of Virginia (MN)2 $64,430 1 $22,000 $1,000 $5,000
Town of Jackson (WY)3 $32,521,961 455 $7,162,000 $861,000 $1,087,000
City of Guthrie (OK) $2,331,481 26 $439,000 $60,000 $65,000
City of Grand Rapids (MN)2 $2,246,065 33 $766,000 $34,000 $159,000
Town of Medfield (MA) $382,700 4 $70,000 $3,000 $15,000
City of Fergus Falls (MN)2 $682,635 10 $235,000 $6,000 $38,000
Grundy County (TN)4 $916,143 9 $158,000 $27,000 $38,000
City of Falls Church (VA)3 $19,029,073 317 $3,586,000 $284,000 $702,000
City of Jamestown (ND) $5,806,005 89 $1,676,000 $222,000 $186,000
City of Waterville (ME)1 $1,843,453 29 $478,000 $27,000 $50,000
City of Red Wing (MN)2 $504,243 8 $159,000 $5,000 $29,000
City of Durango (CO)1 $9,476,898 175 $3,243,000 $447,000 $183,000
City of Hannibal (MO) $3,692,452 55 $900,000 $209,000 $98,000
City of Tullahoma (TN) $457,871 6 $124,000 $8,000 $16,000
City of Northfield (MN)2 $874,552 13 $273,000 $11,000 $46,000
Town of Carrboro (NC) $4,070,927 77 $1,354,000 $139,000 $143,000
Macon County (TN)4 $66,583 1 $11,000 $1,000 $3,000
City of Laguna Beach (CA)3 $55,244,985 734 $11,874,000 $1,310,000 $1,649,000
Hickman County (TN)4 $628,056 8 $173,000 $11,000 $21,000
City of Fairfax (VA) $1,052,653 10 $175,000 $22,000 $40,000
City of Ponca City (OK) $2,206,719 25 $506,000 $56,000 $47,000
City of Paducah (KY)1 $9,391,310 152 $2,638,000 $244,000 $339,000
Mille Lacs County (MN)2 $270,407 3 $71,000 $2,000 $15,000
McNairy County (TN)4 $288,940 3 $47,000 $8,000 $9,000
City of Winona (MN)2 $1,459,202 21 $460,000 $13,000 $83,000
DIRECT Economic Impact of AUDIENCE Spending
SOURCE: Arts and Economic Prosperity 5, Americans for the Arts, 2017. For more information, visit www.AmericansForTheArts.org/EconomicImpact. B–252

Table 18:Direct Economic Impact of the Audience Expenditures Induced by Attendance toNonprofit Arts and Cultural Events Per Study Region During Fiscal Year 2015
Population Cohort Group A Direct
Population Fewer than 50,000 Audience Full-Time Resident Local State
Sample Size = 52 Expenditures Equivalent Jobs Household Income Government Revenue Government Revenue
Door County (WI)4 $14,967,671 214 $3,674,000 $563,000 $530,000
City of Benicia (CA) $1,760,159 19 $343,000 $22,000 $69,000
City of Winter Park (FL)3 $29,406,839 567 $7,354,000 $705,000 $891,000
City of Rochester (NH)1 $7,902,214 117 $2,257,000 $79,000 $119,000
City of Morgantown (WV)1 $8,020,706 118 $2,044,000 $84,000 $333,000
Henry County (TN)4 $541,722 8 $138,000 $15,000 $25,000
City of Fairbanks (AK)1 $9,283,046 120 $2,429,000 $279,000 $152,000
City of Bangor (ME) $6,577,435 99 $1,784,000 $166,000 $193,000
Weakley County (TN)4 $1,174,650 20 $334,000 $35,000 $54,000
Dare County (NC)4 $41,040,752 597 $10,657,000 $1,197,000 $1,132,000
City of Columbia (TN) $6,362,126 99 $1,641,000 $170,000 $272,000
City of Lake Worth (FL)3 $12,613,298 167 $2,726,000 $285,000 $348,000
Clatsop County (OR)4 $10,849,913 168 $2,881,000 $370,000 $198,000
Yadkin County (NC)4 $70,670 1 $15,000 $3,000 $3,000
Greater Belfast Area (ME)4 $5,124,419 52 $912,000 $95,000 $133,000
Campbell County (TN)4 $436,962 4 $74,000 $8,000 $17,000
Monroe County (TN)4 $6,027,214 78 $1,584,000 $149,000 $253,000
Lincoln County (OR)4 $8,828,455 146 $2,417,000 $303,000 $192,000
Iron County (UT)4 $62,797,842 1,060 $15,284,000 $2,080,000 $1,993,000
City of St. Louis Park (MN)2 $759,072 10 $237,000 $15,000 $40,000
City of Logan (UT)1 $13,753,037 210 $3,701,000 $610,000 $405,000
Gibson County (TN)4 $7,117,024 65 $1,628,000 $103,000 $203,000
Group A Average $8,148,989 124 $2,013,500 $226,423 $250,962
Group A Average Excluding Outliers/Exclusions $4,946,157 76 $1,363,350 $150,200 $144,050
Group A Median $3,011,967 44 $833,000 $69,500 $108,500
DIRECT Economic Impact of AUDIENCE Spending
SOURCE: Arts and Economic Prosperity 5, Americans for the Arts, 2017. For more information, visit www.AmericansForTheArts.org/EconomicImpact. B–253

Table 18:Direct Economic Impact of the Audience Expenditures Induced by Attendance toNonprofit Arts and Cultural Events Per Study Region During Fiscal Year 2015
Population Cohort Group B Direct
Population 50,000 to 99,999 Audience Full-Time Resident Local State
Sample Size = 38 Expenditures Equivalent Jobs Household Income Government Revenue Government Revenue
City of Joplin (MO) $3,558,721 61 $1,051,000 $109,000 $90,000
City of La Crosse (WI) $19,855,615 408 $6,720,000 $417,000 $719,000
McMinn County (TN)4 $5,383,250 72 $1,318,000 $116,000 $203,000
Lafayette County (MS)4 $8,337,600 135 $2,303,000 $89,000 $365,000
Chisago County (MN)2 $2,200,334 25 $576,000 $18,000 $123,000
City of Grand Forks (ND) $3,159,035 51 $909,000 $58,000 $99,000
City of Corvallis (OR) $44,324,930 579 $9,469,000 $414,000 $855,000
City of Noblesville (IN) $1,701,673 20 $366,000 $24,000 $54,000
City of Ocala (FL) $41,671,737 532 $9,831,000 $730,000 $1,503,000
Lenoir County (NC)4 $12,666,803 200 $4,467,000 $507,000 $425,000
Town of Chapel Hill (NC) $28,613,313 537 $9,514,000 $974,000 $1,004,000
City of Grand Junction (CO) $5,991,168 102 $1,795,000 $260,000 $104,000
Town of Jupiter (FL) $5,110,235 68 $1,104,000 $115,000 $141,000
Hamblen County (TN)4 $1,259,169 22 $403,000 $34,000 $54,000
City of Delray Beach (FL) $10,115,146 135 $2,186,000 $228,000 $279,000
City of St. Cloud (MN)2 $7,088,986 138 $2,580,000 $78,000 $284,000
City of Portland (ME) $29,028,265 505 $6,895,000 $570,000 $980,000
City of Jackson (TN) $2,052,410 33 $597,000 $49,000 $77,000
City of Walnut Creek (CA) $20,432,138 206 $3,583,000 $222,000 $604,000
Greene County (TN)4 $2,241,470 27 $435,000 $48,000 $83,000
City of Flagstaff (AZ) $38,129,798 635 $12,638,000 $1,817,000 $1,546,000
City of Missoula (MT) $51,764,118 989 $16,602,000 $1,121,000 $417,000
City of Fort Myers (FL) $36,033,896 552 $10,372,000 $795,000 $1,606,000
Putnam County (TN)4 $365,463 7 $116,000 $9,000 $16,000
Monroe County (FL)4 $57,877,545 941 $15,630,000 $1,518,000 $2,186,000
City of Lynchburg (VA) $4,207,822 82 $1,779,000 $136,000 $134,000
City of Duluth (MN)2 $21,734,978 348 $7,412,000 $326,000 $1,543,000
City of Fishers (IN) $11,406,796 138 $2,451,000 $163,000 $359,000
City of Carmel (IN) $6,951,895 84 $1,494,000 $99,000 $219,000
City of Sugar Land (TX) $523,961 5 $94,000 $10,000 $16,000
DIRECT Economic Impact of AUDIENCE Spending
SOURCE: Arts and Economic Prosperity 5, Americans for the Arts, 2017. For more information, visit www.AmericansForTheArts.org/EconomicImpact. B–254

Table 18:Direct Economic Impact of the Audience Expenditures Induced by Attendance toNonprofit Arts and Cultural Events Per Study Region During Fiscal Year 2015
Population Cohort Group B Direct
Population 50,000 to 99,999 Audience Full-Time Resident Local State
Sample Size = 38 Expenditures Equivalent Jobs Household Income Government Revenue Government Revenue
City of Asheville (NC) $39,114,604 697 $11,828,000 $1,461,000 $1,408,000
Buchanan County (MO)4 $10,978,269 206 $3,810,000 $254,000 $313,000
City of Boca Raton (FL) $11,057,891 147 $2,390,000 $250,000 $305,000
City of Miami Beach (FL)3 $75,134,150 1,108 $25,312,000 $2,332,000 $3,812,000
Moore County (NC)4 $6,389,283 85 $1,446,000 $125,000 $158,000
Sevier County (TN)4 $42,123,668 628 $10,549,000 $1,669,000 $1,558,000
Cape May County (NJ)4 $15,021,250 192 $3,435,000 $578,000 $543,000
Cleveland County (NC)4 $3,367,458 43 $763,000 $87,000 $96,000
Group B Average $18,078,285 283 $5,111,132 $468,684 $638,974
Group B Average Excluding Outliers/Exclusions $18,854,780 298 $5,166,727 $455,545 $569,045
Group B Median $10,546,708 138 $2,420,500 $225,000 $309,000
DIRECT Economic Impact of AUDIENCE Spending
SOURCE: Arts and Economic Prosperity 5, Americans for the Arts, 2017. For more information, visit www.AmericansForTheArts.org/EconomicImpact. B–255
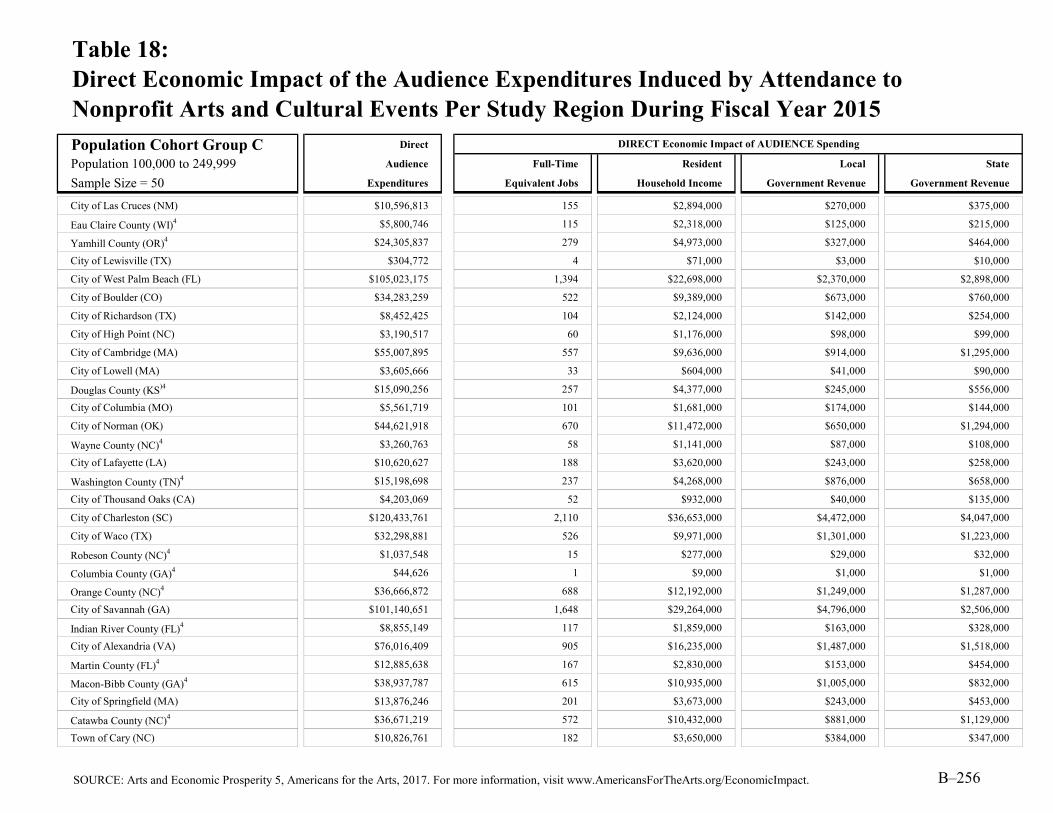
Table 18:Direct Economic Impact of the Audience Expenditures Induced by Attendance toNonprofit Arts and Cultural Events Per Study Region During Fiscal Year 2015
Population Cohort Group C Direct
Population 100,000 to 249,999 Audience Full-Time Resident Local State
Sample Size = 50 Expenditures Equivalent Jobs Household Income Government Revenue Government Revenue
City of Las Cruces (NM) $10,596,813 155 $2,894,000 $270,000 $375,000
Eau Claire County (WI)4 $5,800,746 115 $2,318,000 $125,000 $215,000
Yamhill County (OR)4 $24,305,837 279 $4,973,000 $327,000 $464,000
City of Lewisville (TX) $304,772 4 $71,000 $3,000 $10,000
City of West Palm Beach (FL) $105,023,175 1,394 $22,698,000 $2,370,000 $2,898,000
City of Boulder (CO) $34,283,259 522 $9,389,000 $673,000 $760,000
City of Richardson (TX) $8,452,425 104 $2,124,000 $142,000 $254,000
City of High Point (NC) $3,190,517 60 $1,176,000 $98,000 $99,000
City of Cambridge (MA) $55,007,895 557 $9,636,000 $914,000 $1,295,000
City of Lowell (MA) $3,605,666 33 $604,000 $41,000 $90,000
Douglas County (KS)4 $15,090,256 257 $4,377,000 $245,000 $556,000
City of Columbia (MO) $5,561,719 101 $1,681,000 $174,000 $144,000
City of Norman (OK) $44,621,918 670 $11,472,000 $650,000 $1,294,000
Wayne County (NC)4 $3,260,763 58 $1,141,000 $87,000 $108,000
City of Lafayette (LA) $10,620,627 188 $3,620,000 $243,000 $258,000
Washington County (TN)4 $15,198,698 237 $4,268,000 $876,000 $658,000
City of Thousand Oaks (CA) $4,203,069 52 $932,000 $40,000 $135,000
City of Charleston (SC) $120,433,761 2,110 $36,653,000 $4,472,000 $4,047,000
City of Waco (TX) $32,298,881 526 $9,971,000 $1,301,000 $1,223,000
Robeson County (NC)4 $1,037,548 15 $277,000 $29,000 $32,000
Columbia County (GA)4 $44,626 1 $9,000 $1,000 $1,000
Orange County (NC)4 $36,666,872 688 $12,192,000 $1,249,000 $1,287,000
City of Savannah (GA) $101,140,651 1,648 $29,264,000 $4,796,000 $2,506,000
Indian River County (FL)4 $8,855,149 117 $1,859,000 $163,000 $328,000
City of Alexandria (VA) $76,016,409 905 $16,235,000 $1,487,000 $1,518,000
Martin County (FL)4 $12,885,638 167 $2,830,000 $153,000 $454,000
Macon-Bibb County (GA)4 $38,937,787 615 $10,935,000 $1,005,000 $832,000
City of Springfield (MA) $13,876,246 201 $3,673,000 $243,000 $453,000
Catawba County (NC)4 $36,671,219 572 $10,432,000 $881,000 $1,129,000
Town of Cary (NC) $10,826,761 182 $3,650,000 $384,000 $347,000
DIRECT Economic Impact of AUDIENCE Spending
SOURCE: Arts and Economic Prosperity 5, Americans for the Arts, 2017. For more information, visit www.AmericansForTheArts.org/EconomicImpact. B–256
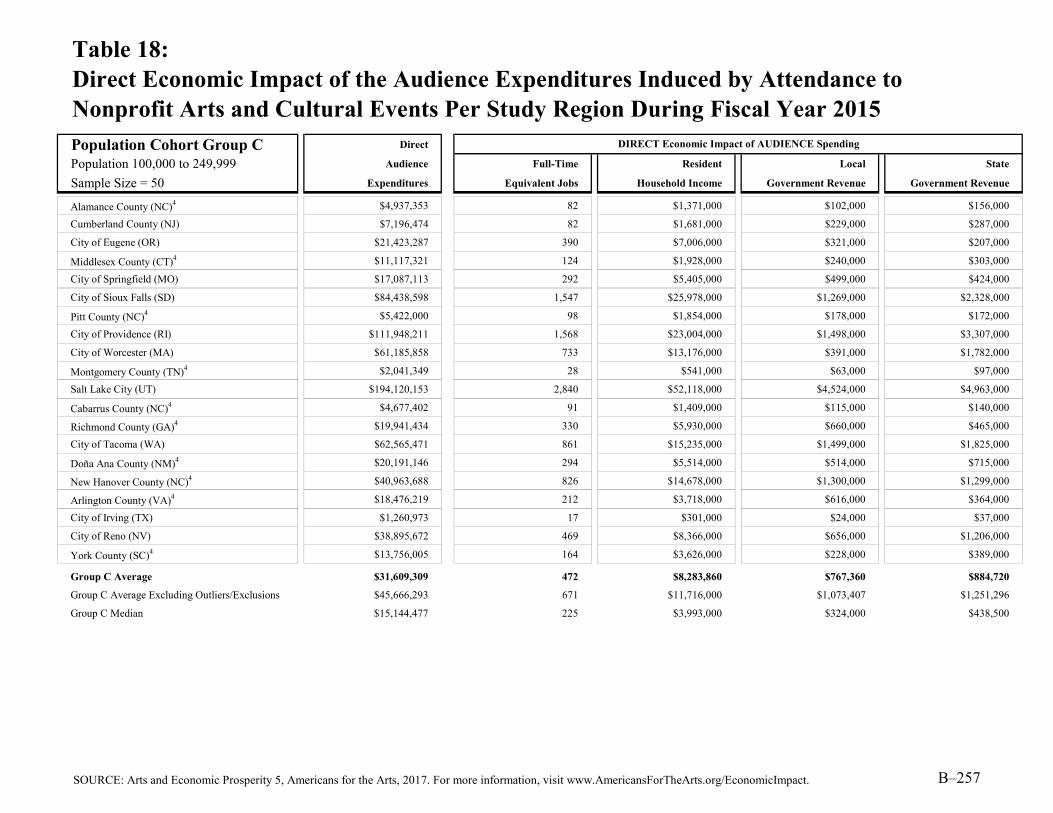
Table 18:Direct Economic Impact of the Audience Expenditures Induced by Attendance toNonprofit Arts and Cultural Events Per Study Region During Fiscal Year 2015
Population Cohort Group C Direct
Population 100,000 to 249,999 Audience Full-Time Resident Local State
Sample Size = 50 Expenditures Equivalent Jobs Household Income Government Revenue Government Revenue
Alamance County (NC)4 $4,937,353 82 $1,371,000 $102,000 $156,000
Cumberland County (NJ) $7,196,474 82 $1,681,000 $229,000 $287,000
City of Eugene (OR) $21,423,287 390 $7,006,000 $321,000 $207,000
Middlesex County (CT)4 $11,117,321 124 $1,928,000 $240,000 $303,000
City of Springfield (MO) $17,087,113 292 $5,405,000 $499,000 $424,000
City of Sioux Falls (SD) $84,438,598 1,547 $25,978,000 $1,269,000 $2,328,000
Pitt County (NC)4 $5,422,000 98 $1,854,000 $178,000 $172,000
City of Providence (RI) $111,948,211 1,568 $23,004,000 $1,498,000 $3,307,000
City of Worcester (MA) $61,185,858 733 $13,176,000 $391,000 $1,782,000
Montgomery County (TN)4 $2,041,349 28 $541,000 $63,000 $97,000
Salt Lake City (UT) $194,120,153 2,840 $52,118,000 $4,524,000 $4,963,000
Cabarrus County (NC)4 $4,677,402 91 $1,409,000 $115,000 $140,000
Richmond County (GA)4 $19,941,434 330 $5,930,000 $660,000 $465,000
City of Tacoma (WA) $62,565,471 861 $15,235,000 $1,499,000 $1,825,000
Doña Ana County (NM)4 $20,191,146 294 $5,514,000 $514,000 $715,000
New Hanover County (NC)4 $40,963,688 826 $14,678,000 $1,300,000 $1,299,000
Arlington County (VA)4 $18,476,219 212 $3,718,000 $616,000 $364,000
City of Irving (TX) $1,260,973 17 $301,000 $24,000 $37,000
City of Reno (NV) $38,895,672 469 $8,366,000 $656,000 $1,206,000
York County (SC)4 $13,756,005 164 $3,626,000 $228,000 $389,000
Group C Average $31,609,309 472 $8,283,860 $767,360 $884,720
Group C Average Excluding Outliers/Exclusions $45,666,293 671 $11,716,000 $1,073,407 $1,251,296
Group C Median $15,144,477 225 $3,993,000 $324,000 $438,500
DIRECT Economic Impact of AUDIENCE Spending
SOURCE: Arts and Economic Prosperity 5, Americans for the Arts, 2017. For more information, visit www.AmericansForTheArts.org/EconomicImpact. B–257

Table 18:Direct Economic Impact of the Audience Expenditures Induced by Attendance toNonprofit Arts and Cultural Events Per Study Region During Fiscal Year 2015
Population Cohort Group D Direct
Population 250,000 to 499,999 Audience Full-Time Resident Local State
Sample Size = 42 Expenditures Equivalent Jobs Household Income Government Revenue Government Revenue
Buncombe County (NC)4 $42,520,698 757 $12,859,000 $1,587,000 $1,530,000
Alachua County (FL)4 $67,892,593 1,162 $19,977,000 $968,000 $2,131,000
Greater Green Bay Area (WI)4 $12,925,635 199 $3,497,000 $214,000 $426,000
City of Orlando (FL) $65,576,512 1,301 $19,172,000 $1,797,000 $2,289,000
City of Lincoln (NE) $48,329,810 917 $14,838,000 $1,519,000 $1,607,000
Southeastern Connecticut Region (CT)4 $81,213,782 939 $16,337,000 $1,802,000 $2,381,000
Erie County (PA)4 $23,147,814 453 $7,165,000 $376,000 $780,000
San Luis Obispo County (CA)4 $14,029,567 227 $3,888,000 $306,000 $636,000
City of Newark (NJ) $68,963,054 646 $14,614,000 $884,000 $1,902,000
Leon County (FL)4 $101,416,276 1,528 $28,351,000 $2,257,000 $3,714,000
Rutherford County (TN)4 $20,370,806 322 $5,815,000 $646,000 $856,000
St. Lucie County (FL)4 $4,697,606 65 $1,054,000 $47,000 $150,000
Greater Spartanburg Area (SC)4 $10,670,113 197 $3,217,000 $115,000 $388,000
Durham County (NC)4 $49,550,897 886 $16,899,000 $2,171,000 $1,467,000
City of St. Paul (MN)2 $195,262,963 2,293 $60,922,000 $3,905,000 $10,349,000
Hamilton County (IN)4 $21,902,882 265 $4,707,000 $312,000 $689,000
Osceola County (FL)4 $1,731,658 31 $546,000 $22,000 $77,000
Escambia County (FL)4 $61,364,635 1,065 $18,280,000 $1,468,000 $2,376,000
Lexington-Fayette Urban County (KY)4 $15,984,825 318 $5,984,000 $176,000 $720,000
Lake County (FL)4 $8,016,604 98 $1,619,000 $159,000 $310,000
City of Riverside (CA) $25,414,927 439 $8,065,000 $480,000 $1,182,000
Cumberland County (NC)4 $29,520,110 542 $10,273,000 $866,000 $1,013,000
Collier County (FL)4 $44,713,126 594 $9,641,000 $588,000 $1,550,000
Hamilton County (TN)4 $107,710,825 1,795 $37,200,000 $2,970,000 $4,912,000
Manatee County (FL)4 $32,987,303 430 $7,372,000 $763,000 $1,250,000
City of Tampa (FL) $218,525,750 3,213 $63,068,000 $5,487,000 $7,882,000
Forsyth County (NC)4 $52,083,038 976 $17,894,000 $1,362,000 $1,980,000
Mercer County (NJ)4 $18,713,948 189 $3,521,000 $366,000 $508,000
City of Wichita (KS) $50,788,472 913 $16,160,000 $1,436,000 $1,535,000
Clackamas County (OR)4 $9,016,568 96 $1,887,000 $97,000 $203,000
DIRECT Economic Impact of AUDIENCE Spending
SOURCE: Arts and Economic Prosperity 5, Americans for the Arts, 2017. For more information, visit www.AmericansForTheArts.org/EconomicImpact. B–258

Table 18:Direct Economic Impact of the Audience Expenditures Induced by Attendance toNonprofit Arts and Cultural Events Per Study Region During Fiscal Year 2015
Population Cohort Group D Direct
Population 250,000 to 499,999 Audience Full-Time Resident Local State
Sample Size = 42 Expenditures Equivalent Jobs Household Income Government Revenue Government Revenue
Sarasota County (FL)4 $93,489,521 1,209 $29,340,000 $3,061,000 $4,602,000
City of Minneapolis (MN)2 $217,285,067 2,532 $67,793,000 $4,346,000 $11,516,000
Berks County (PA)4 $8,140,047 113 $1,932,000 $172,000 $260,000
City of Miami (FL) $262,596,886 3,874 $84,718,000 $7,294,000 $12,407,000
City of Raleigh (NC) $363,988,155 5,945 $91,478,000 $10,809,000 $10,005,000
Santa Barbara County (CA)4 $72,295,776 1,244 $18,547,000 $1,952,000 $2,858,000
Seminole County (FL)4 $8,306,215 118 $2,306,000 $171,000 $331,000
City of Virginia Beach (VA) $61,802,150 1,072 $17,700,000 $1,413,000 $1,454,000
City of Atlanta (GA) $232,656,425 3,918 $63,642,000 $9,121,000 $7,391,000
City of Mesa (AZ) $12,783,542 207 $3,750,000 $335,000 $435,000
City of Kansas City (MO) $82,505,241 1,339 $25,632,000 $1,709,000 $2,361,000
Morris County (NJ)4 $16,028,988 133 $2,584,000 $170,000 $700,000
Group D Average $69,926,686 1,061 $20,101,048 $1,802,357 $2,645,548
Group D Average Excluding Outliers/Exclusions $124,494,244 1,982 $35,236,417 $3,523,667 $4,204,167
Group D Median $46,521,468 702 $13,736,500 $926,000 $1,498,500
DIRECT Economic Impact of AUDIENCE Spending
SOURCE: Arts and Economic Prosperity 5, Americans for the Arts, 2017. For more information, visit www.AmericansForTheArts.org/EconomicImpact. B–259

Table 18:Direct Economic Impact of the Audience Expenditures Induced by Attendance toNonprofit Arts and Cultural Events Per Study Region During Fiscal Year 2015
Population Cohort Group E Direct
Population 500,000 to 999,999 Audience Full-Time Resident Local State
Sample Size = 25 Expenditures Equivalent Jobs Household Income Government Revenue Government Revenue
Sonoma County (CA)4 $35,290,315 451 $7,634,000 $488,000 $1,169,000
Volusia County (FL)4 $35,015,240 611 $11,307,000 $1,103,000 $1,608,000
Guilford County (NC)4 $95,171,867 1,916 $24,530,000 $2,872,000 $2,723,000
Dane County (WI)4 $104,161,585 1,901 $26,299,000 $1,539,000 $3,269,000
Brevard County (FL)4 $3,505,227 51 $798,000 $42,000 $135,000
Washington County (OR)4 $7,272,749 99 $1,732,000 $56,000 $129,000
Johnson County (KS)4 $10,438,987 148 $2,485,000 $136,000 $346,000
City of Louisville (KY) $237,946,184 4,075 $69,201,000 $2,502,000 $8,461,000
City of Baltimore (MD) $279,675,260 3,989 $63,732,000 $6,293,000 $7,248,000
Polk County (FL)4 $30,799,415 489 $9,468,000 $824,000 $1,373,000
City of Boston (MA) $590,249,049 8,126 $149,280,000 $10,052,000 $16,433,000
District of Columbia (DC)3,6 $1,252,037,358 4,958 $97,560,000 $30,315,000 $0
City of Nashville-Davidson County (TN) $250,560,557 3,699 $68,538,000 $8,148,000 $10,513,000
City of El Paso (TX) $43,468,775 734 $13,513,000 $1,063,000 $1,691,000
Lee County (FL)4 $106,117,364 1,627 $30,546,000 $2,343,000 $4,731,000
City of Fort Worth (TX) $194,654,565 3,052 $61,927,000 $5,417,000 $7,910,000
City of Indianapolis (IN) $213,236,618 4,164 $63,311,000 $4,760,000 $9,630,000
City and County of San Francisco (CA) $667,740,510 9,865 $172,053,000 $20,041,000 $25,555,000
Prince George's County (MD)4 $34,910,511 356 $6,172,000 $555,000 $725,000
Pinellas County (FL)4 $140,781,982 1,857 $33,249,000 $2,902,000 $4,976,000
Shelby County (TN)4 $79,131,575 1,306 $26,741,000 $2,631,000 $3,744,000
Fairfield County (CT)4 $86,618,360 647 $13,415,000 $1,124,000 $2,377,000
Westchester County (NY)4 $65,689,723 1,096 $23,684,000 $2,125,000 $3,439,000
Fulton County (GA)4 $236,232,626 3,970 $64,829,000 $9,253,000 $7,469,000
Wake County (NC)4 $378,008,208 6,179 $96,192,000 $11,296,000 $10,448,000
Group E Average $207,148,584 2,615 $45,527,840 $5,115,200 $5,444,080
Group E Average Excluding Outliers/Exclusions $309,691,440 4,713 $82,694,375 $7,284,500 $10,930,125
Group E Median $104,161,585 1,857 $26,741,000 $2,502,000 $3,439,000
DIRECT Economic Impact of AUDIENCE Spending
SOURCE: Arts and Economic Prosperity 5, Americans for the Arts, 2017. For more information, visit www.AmericansForTheArts.org/EconomicImpact. B–260

Table 18:Direct Economic Impact of the Audience Expenditures Induced by Attendance toNonprofit Arts and Cultural Events Per Study Region During Fiscal Year 2015
Population Cohort Group F Direct
Population 1,000,000 or More Audience Full-Time Resident Local State
Sample Size = 21 Expenditures Equivalent Jobs Household Income Government Revenue Government Revenue
Mecklenburg County (NC)4 $104,985,768 1,660 $25,047,000 $3,336,000 $2,788,000
City of San José (CA) $117,746,926 1,201 $18,382,000 $1,820,000 $2,776,000
Montgomery County (MD)4 $78,111,500 621 $10,530,000 $1,466,000 $1,966,000
Fairfax County (VA)4 $98,189,315 779 $12,274,000 $1,732,000 $2,068,000
Allegheny County (PA)4 $509,510,265 8,616 $109,103,000 $12,682,000 $22,177,000
Greater Columbus Area (OH)4 $189,782,016 3,672 $70,981,000 $5,743,000 $7,671,000
Orange County (FL)4 $110,252,239 2,172 $30,684,000 $2,896,000 $3,636,000
City of Dallas (TX) $259,701,224 3,717 $79,429,000 $8,172,000 $9,418,000
Hillsborough County (FL)4 $257,987,724 3,792 $74,457,000 $6,478,000 $9,305,000
City of San Diego (CA) $546,370,965 7,663 $179,689,000 $15,209,000 $23,253,000
Palm Beach County (FL)4 $160,992,666 2,137 $34,795,000 $3,634,000 $4,442,000
City of San Antonio (TX) $280,305,439 5,104 $102,456,000 $9,158,000 $12,836,000
Sacramento County (CA)4 $84,387,257 1,248 $24,599,000 $1,674,000 $3,511,000
City of Phoenix (AZ) $237,176,500 3,762 $66,807,000 $6,885,000 $9,094,000
City and County of Philadelphia (PA) $765,177,606 10,490 $160,853,000 $28,199,000 $22,577,000
Broward County (FL)4 $265,744,813 4,093 $71,973,000 $6,360,000 $7,405,000
Santa Clara County (CA)4 $138,697,159 1,414 $21,475,000 $3,033,000 $4,262,000
Riverside County (CA)4 $61,196,927 1,032 $16,407,000 $1,360,000 $2,534,000
Miami-Dade County (FL)4 $578,598,817 8,884 $195,413,000 $15,466,000 $27,600,000
City of Chicago (IL) $1,836,870,238 23,332 $419,098,000 $72,927,000 $56,976,000
Harris County (TX)4 $528,903,379 6,427 $155,672,000 $13,846,000 $23,858,000
Group F Average $343,366,131 4,848 $89,529,714 $10,575,048 $12,388,238
Group F Average Excluding Outliers/Exclusions $577,621,271 7,896 $146,673,429 $20,338,571 $19,561,429
Group F Median $237,176,500 3,717 $70,981,000 $6,360,000 $7,671,000
Average $79,024,175 1,107 $20,068,781 $2,164,943 $2,583,048
Median $18,871,511 272 $4,587,000 $402,500 $549,500
DIRECT Economic Impact of AUDIENCE Spending
ALL CITY/COUNTY STUDY REGIONS
SOURCE: Arts and Economic Prosperity 5, Americans for the Arts, 2017. For more information, visit www.AmericansForTheArts.org/EconomicImpact. B–261

Table 18:Direct Economic Impact of the Audience Expenditures Induced by Attendance toNonprofit Arts and Cultural Events Per Study Region During Fiscal Year 2015
Regional Study Regions Direct
All Populations Audience Full-Time Resident Local State
Sample Size = 81 Expenditures Equivalent Jobs Household Income Government Revenue Government Revenue
High Peaks Region (ME) $1,021,519 16 $257,000 $20,000 $35,000
Wood River Valley (ID) $13,849,987 210 $3,657,000 $424,000 $497,000
Southern Oregon Area $63,078,564 1,010 $18,176,000 $3,066,000 $325,000
Southwestern Pennsylvania Area $27,580,415 444 $8,378,000 $221,000 $959,000
Greater Portsmouth Area (NH) $36,585,032 586 $9,788,000 $862,000 $834,000
Northeast Oregon Region $556,935 8 $136,000 $9,000 $10,000
Toe River Valley (NC) $5,401,784 59 $1,200,000 $137,000 $184,000
Albemarle Region (NC) $4,231,853 71 $1,206,000 $86,000 $121,000
Greater Concord Area (NH) $13,351,816 203 $3,968,000 $260,000 $141,000
North Central Minnesota Region2 $1,435,387 21 $445,000 $11,000 $78,000
Northwest Minnesota Region2 $477,641 5 $96,000 $3,000 $18,000
Monadnock Region (NH) $5,280,101 76 $1,363,000 $68,000 $33,000
Bismarck-Mandan Region (ND) $19,127,116 273 $5,279,000 $210,000 $588,000
Greater Minot Region (ND) $4,770,610 78 $1,398,000 $140,000 $227,000
Greater Burlington Area (VT) $36,038,913 521 $9,114,000 $512,000 $1,330,000
Greater Charlottesville Area (VA) $61,250,521 546 $12,233,000 $2,209,000 $1,596,000
Brainerd Lakes Region (MN)2 $885,007 16 $334,000 $8,000 $58,000
East Central Minnesota Region2 $5,924,425 72 $1,552,000 $47,000 $332,000
Northwest Connecticut Region $12,877,676 112 $1,854,000 $139,000 $325,000
Central Oregon Region $24,706,823 352 $6,292,000 $625,000 $269,000
Greater Fargo-Moorhead Area (ND/MN) $24,848,393 420 $7,598,000 $362,000 $798,000
Black Hills Region (SD) $91,334,299 1,575 $26,809,000 $1,072,000 $2,726,000
Greater Kingsport Area (TN) $19,946,401 283 $5,176,000 $603,000 $771,000
Lake Region (MN)2 $3,338,821 50 $1,149,000 $30,000 $187,000
South Central Minnesota Region2 $7,166,691 117 $2,544,000 $108,000 $459,000
Greater Sioux Falls Area (SD) $84,845,941 1,558 $26,230,000 $1,279,000 $2,345,000
Southwest Tennessee Development District $3,150,012 53 $940,000 $83,000 $128,000
Northwest Tennessee Development District $9,771,421 109 $2,407,000 $183,000 $330,000
Southwest Minnesota Region2 $2,416,051 35 $807,000 $34,000 $152,000
Arrowhead Region (MN)2 $20,102,830 320 $6,855,000 $302,000 $1,427,000
DIRECT Economic Impact of AUDIENCE Spending
SOURCE: Arts and Economic Prosperity 5, Americans for the Arts, 2017. For more information, visit www.AmericansForTheArts.org/EconomicImpact. B–262

Table 18:Direct Economic Impact of the Audience Expenditures Induced by Attendance toNonprofit Arts and Cultural Events Per Study Region During Fiscal Year 2015
Regional Study Regions Direct
All Populations Audience Full-Time Resident Local State
Sample Size = 81 Expenditures Equivalent Jobs Household Income Government Revenue Government Revenue
Maple Grove and the Northwest Suburbs (MN)2 $2,534,610 35 $791,000 $51,000 $134,000
Greater Augusta Area (GA) $19,986,060 331 $5,939,000 $661,000 $466,000
Upper Cumberland Development District (TN) $4,778,035 90 $1,557,000 $203,000 $267,000
City of Huntsville/Madison County (AL) $36,057,737 485 $9,436,000 $1,161,000 $839,000
Northeast Commission (NC) $53,311,686 843 $14,859,000 $1,567,000 $1,570,000
Greater Ann Arbor Area (MI)5 $50,031,630 664 $17,961,000 $1,151,000 $2,902,000
Greater Fox Cities Region (WI) $18,279,758 151 $2,717,000 $197,000 $436,000
Central Minnesota Region2 $7,633,741 128 $2,779,000 $84,000 $305,000
South Central Tennessee Development District $10,903,233 170 $3,000,000 $301,000 $485,000
Northwest Arkansas Region $63,693,488 1,087 $18,122,000 $1,361,000 $3,805,000
Southeast Minnesota Region2 $8,885,650 141 $2,799,000 $80,000 $506,000
First Tennessee Development District $38,063,182 561 $10,121,000 $1,563,000 $1,552,000
Greater Harrisburg Area (PA) $7,409,784 115 $2,255,000 $126,000 $356,000
Greater New Haven Area (CT) $19,821,820 213 $3,712,000 $178,000 $561,000
Treasure Coast Region (FL) $26,438,393 349 $5,743,000 $363,000 $932,000
Greater Des Moines Region (IA) $113,115,609 1,623 $29,251,000 $2,842,000 $3,443,000
Southeast Tennessee Development District $116,017,033 1,917 $39,439,000 $3,192,000 $5,266,000
Greater Knoxville Region (TN) $97,766,533 1,750 $29,868,000 $4,249,000 $4,216,000
Greater Columbia Area (SC) $42,190,412 840 $15,606,000 $1,156,000 $1,648,000
Pikes Peak Region (CO) $102,068,841 1,966 $32,540,000 $4,410,000 $2,169,000
Lehigh Valley Region (PA) $103,220,986 2,021 $33,190,000 $2,331,000 $4,606,000
Greater Sarasota/Bradenton Area (FL) $126,476,824 1,639 $36,712,000 $3,824,000 $5,852,000
Dayton Region (OH) $118,527,088 2,123 $35,053,000 $2,648,000 $4,086,000
Richmond & Tri-Cities Region (VA) $148,391,431 2,732 $59,907,000 $3,126,000 $5,409,000
Memphis Area Association of Governments (TN) $79,242,425 1,308 $26,781,000 $2,635,000 $3,749,000
Eastern Region (NC) $56,999,129 1,054 $21,081,000 $1,872,000 $2,242,000
Advantage West Region (NC) $164,631,483 3,010 $55,761,000 $6,435,000 $6,816,000
Southeast Commission (NC) $77,078,611 1,503 $27,411,000 $2,362,000 $2,561,000
Greater Fairfax Area (VA) $118,271,041 1,106 $16,035,000 $2,038,000 $2,810,000
Greater Tulsa Region (OK) $137,689,013 1,873 $34,820,000 $2,850,000 $3,704,000
DIRECT Economic Impact of AUDIENCE Spending
SOURCE: Arts and Economic Prosperity 5, Americans for the Arts, 2017. For more information, visit www.AmericansForTheArts.org/EconomicImpact. B–263

Table 18:Direct Economic Impact of the Audience Expenditures Induced by Attendance toNonprofit Arts and Cultural Events Per Study Region During Fiscal Year 2015
Regional Study Regions Direct
All Populations Audience Full-Time Resident Local State
Sample Size = 81 Expenditures Equivalent Jobs Household Income Government Revenue Government Revenue
East Tennessee Development District $118,627,403 1,851 $30,976,000 $4,704,000 $4,429,000
West Valley Region (AZ) $9,795,104 163 $3,296,000 $216,000 $371,000
Greater St. Louis Area (MO) $227,188,613 4,223 $65,969,000 $8,320,000 $7,134,000
Western New York $196,125,443 3,397 $59,255,000 $10,165,000 $5,278,000
Greater Oklahoma City Region (OK) $382,263,042 7,611 $143,792,000 $13,408,000 $13,949,000
Piedmont Triad Partnership (NC) $185,161,256 3,679 $56,199,000 $5,383,000 $6,095,000
Greater Portland Area (OR) $115,982,321 2,285 $44,167,000 $2,096,000 $2,351,000
Greater Kansas City Metropolitan Area (MO/KS) $96,561,206 1,565 $29,615,000 $1,945,000 $2,845,000
Greater Nashville Regional Council (TN) $287,705,334 4,324 $80,220,000 $9,443,000 $12,271,000
Research Triangle Regional Partnership (NC) $475,338,356 7,931 $128,413,000 $14,985,000 $13,526,000
Greater Tampa/St. Petersburg Area (FL) $398,769,706 5,649 $107,706,000 $9,380,000 $14,281,000
Charlotte Regional Partnership (NC) $166,522,445 2,680 $43,552,000 $4,949,000 $4,776,000
Charlotte Regional Partnership (NC/SC) $180,278,450 2,844 $47,178,000 $5,177,000 $5,165,000
Seven-County Metro Area (MN)2 $442,493,585 6,059 $138,058,000 $8,850,000 $23,452,000
Central Florida Region $197,626,598 3,570 $56,728,000 $5,217,000 $7,470,000
Greater Philadelphia Region (PA) $892,141,419 12,578 $203,991,000 $34,621,000 $28,361,000
Greater Washington Region (DC/MD/VA) $1,577,823,038 8,158 $150,250,000 $36,477,000 $7,383,000
Metro Atlanta Area (GA) $285,041,141 4,895 83,134,000 11,049,000 8,817,000
Greater Atlanta Region (GA) $288,193,599 4,954 84,322,000 11,164,000 8,903,000
Greater Houston Region (TX) $537,967,268 6,582 158,775,000 14,170,000 24,252,000
Dallas-Fort Worth-Arlington MSA (TX) $473,856,433 7,076 147,494,000 14,054,000 18,054,000
Regional Average $124,818,889 1,767 $32,414,531 $3,628,432 $3,828,877
Regional Median $50,031,630 664 $14,859,000 $1,161,000 $1,570,000
DIRECT Economic Impact of AUDIENCE Spending
SOURCE: Arts and Economic Prosperity 5, Americans for the Arts, 2017. For more information, visit www.AmericansForTheArts.org/EconomicImpact. B–264

Table 18:Direct Economic Impact of the Audience Expenditures Induced by Attendance toNonprofit Arts and Cultural Events Per Study Region During Fiscal Year 2015
Statewide Study Regions Direct
All Populations Audience Full-Time Resident Local State
Sample Size = 20 Expenditures Equivalent Jobs Household Income Government Revenue Government Revenue
State of Vermont $44,027,403 546 $9,792,000 $532,000 $1,406,000
State of North Dakota $52,755,615 897 $16,360,000 $973,000 $1,875,000
State of Delaware $46,279,508 858 $21,836,000 $428,000 $1,681,000
State of Maine $57,967,891 754 $11,751,000 $977,000 $1,509,000
State of Hawai'i $79,722,005 1,024 $30,657,000 $1,075,000 $4,510,000
State of Nevada $244,426,892 2,022 $55,902,000 $4,563,000 $6,744,000
State of Connecticut $281,938,021 2,173 $42,332,000 $3,785,000 $6,220,000
State of Oklahoma $541,580,846 9,592 $181,465,000 $16,449,000 $17,823,000
State of Oregon $322,956,808 5,260 $96,542,000 $7,583,000 $4,893,000
State of Minnesota2 $500,759,829 6,964 $157,418,000 $9,557,000 $26,974,000
State of Wisconsin $279,941,276 3,446 $58,070,000 $3,905,000 $6,500,000
State of Maryland $450,172,892 5,069 $85,483,000 $8,446,000 $10,088,000
State of Missouri $436,105,742 6,658 $114,378,000 $11,733,000 $11,195,000
State of Tennessee $668,258,078 10,383 $195,441,000 $22,307,000 $28,477,000
State of Massachusetts $879,596,273 9,996 $188,755,000 $12,176,000 $20,471,000
State of New Jersey $223,674,136 1,513 $34,640,000 $2,788,000 $4,460,000
State of North Carolina $1,179,042,966 20,700 $347,276,000 $37,553,000 $37,586,000
State of Pennsylvania $1,634,835,604 24,556 $372,698,000 $50,844,000 $57,904,000
State of Illinois $2,253,017,062 25,292 $473,730,000 $77,334,000 $60,374,000
State of Florida $2,390,536,073 34,265 $656,818,000 $54,987,000 $87,319,000
Statewide Average $628,379,746 8,598 $157,567,200 $16,399,750 $19,900,450
Statewide Median $379,531,275 5,165 $91,012,500 $8,014,500 $8,416,000
DIRECT Economic Impact of AUDIENCE Spending
SOURCE: Arts and Economic Prosperity 5, Americans for the Arts, 2017. For more information, visit www.AmericansForTheArts.org/EconomicImpact. B–265

Table 18:Direct Economic Impact of the Audience Expenditures Induced by Attendance toNonprofit Arts and Cultural Events Per Study Region During Fiscal Year 2015
Individual Arts Districts Direct
All Populations Audience Full-Time Resident Local State
Sample Size = 12 Expenditures Equivalent Jobs Household Income Government Revenue Government Revenue
James River Arts & Cultural District $3,759,455 73 $1,589,000 $121,000 $119,000
Center City Charlotte $92,406,680 1,461 $22,046,000 $2,936,000 $2,454,000
Loch Haven Cultural Park $30,590,137 607 $8,943,000 $838,000 $1,068,000
Downtown Colorado Springs Creative District $16,271,894 313 $5,188,000 $703,000 $346,000
Fort Worth Cultural District $114,739,000 1,799 $36,503,000 $3,193,000 $4,663,000
Dallas Arts District $113,567,787 1,626 $34,734,000 $3,574,000 $4,118,000
Grand Center Arts & Entertainment District $29,240,126 543 $8,491,000 $1,071,000 $918,000
Balboa Park Cultural District $289,710,435 4,063 $95,279,000 $8,065,000 $12,329,000
East End Cultural District $5,028,736 61 $1,480,000 $132,000 $227,000
Houston Museum District Association $324,523,136 3,944 $95,517,000 $8,496,000 $14,639,000
Midtown Cultural District $4,719,940 57 $1,389,000 $124,000 $213,000
Washington Avenue Cultural District $2,196,630 27 $647,000 $57,000 $99,000
Arts District Average $85,562,830 1,215 $25,983,833 $2,442,500 $3,432,750
Arts District Median $29,915,132 575 $8,717,000 $954,500 $993,000
Explanation of the Outliers and Exclusions:1
2
3
4
5
6 The economic impact findings for the District of Columbia exclude state government revenues due to Washington, DC's unique status as a study region with no state government.
DIRECT Economic Impact of AUDIENCE Spending
Both the organizational expenditure and attendance findings and the audience expenditure findings for these city study regions were determined by researchers to be outliers when compared to the findings for cohort regions in the same population category. For this reason, these study regions are excluded from the national extrapolations.
These county study regions are excluded from the national extrapolations. The national extrapolations are based on city study regions only.
The expenditure and attendance data collected from eligible organizations in this study region were collected for fiscal year 2014 (rather than 2015), and audience-intercepts surveys collected from attendees to cultural events in this study region were collected during calendar year 2015 (rather than 2016).
The organizational expenditure and attendance findings for these city study regions were determined by researchers to be outliers when compared to the findings for cohort regions in the same population category. For this reason, the organizational expenditure and attendance findings for these study regions are excluded from the national extrapolations.
The expenditure and attendance data collected from eligible organizations in these study regions were collected for fiscal year 2013 (rather than 2015), and audience-intercepts surveys collected from attendees to cultural events in these study regions were collected during calendar year 2014 (rather than 2016). Where applicable, these study regions are excluded from the national extrapolations.
SOURCE: Arts and Economic Prosperity 5, Americans for the Arts, 2017. For more information, visit www.AmericansForTheArts.org/EconomicImpact. B–266

Explanation of Table 19:Economic Impact per $100,000 of Direct Spending byNonprofit Arts and Cultural Event Attendees Per Study Region During 2010
Column Two:
Column Three:
Column Four:
Column Five:
Column Six:
Column Seven:
Column Eight:
Column Nine:
The direct economic impact ratio for the total amount of household income paid to the study region's residents per $100,000 in direct spending.
The direct economic impact ratio for the total amount of local government revenue generated per $100,000 in direct spending.
The direct economic impact ratio for the total amount of state government revenue generated per $100,000 in direct spending.
The economic impact ratio for the total amount of revenue generated to state government (e.g., licenses, fees, taxes) per $100,000 of direct spending by nonprofit arts and culture audiences in each participating study region.
The direct economic impact ratio for the total number of full-time equivalent (FTE) jobs supported per $100,000 in direct spending.
This table summarizes the total and direct economic impacts of expenditures made by nonprofit arts and cultural event attendees in the form of ratios. Summary statistics are calculated for each population group.
The economic impact ratio for the total number of full-time equivalent (FTE) jobs supported per $100,000 of direct spending by nonprofit arts and culture audiences in each participating study region.
The economic impact ratio for the total amount of household income paid to study region residents per $100,000 of direct spending by nonprofit arts and culture audiences in each participating study region.
The economic impact ratio for the total amount of revenue generated to local government (e.g., licenses, fees, taxes) per $100,000 of direct spending by nonprofit arts and culture audiences in each participating study region. Local government includes the city and county governments located within each participating study region.
Using this chart, a determination can be made of the economic impact per $100,000 of direct spending by nonprofit arts and cultural event attendees. These ratios are derived by dividing the total and direct economic impact of expenditures by nonprofit arts and cultural event attendees (found on Tables 16 and 17) by the total expenditures made by nonprofit arts and cultural event attendees and then multiplying by 100,000. See Background and Scope of Study and Frequently Used Terms in this Arts & Economic Prosperity 5 National Statistical Report for more information about direct and total economic impact.
SOURCE: Arts and Economic Prosperity 5, Americans for the Arts, 2017. For more information, visit www.AmericansForTheArts.org/EconomicImpact. B–267

Table 19:Economic Impact per $100,000 of Direct Spending byNonprofit Arts and Cultural Event Attendees Per Study Region During 2010
Population Cohort Group APopulation Fewer than 50,000 Full-Time Household Local State Full-Time Household Local State
Sample Size = 52 Equivalent Jobs Income Govt. Revenue Govt. Revenue Equivalent Jobs Income Govt. Revenue Govt. Revenue
Town of Crested Butte (CO) 2.64 $48,911 $6,037 $2,675 1.74 $29,656 $4,154 $1,725
City of Pine City (MN) 1.42 $33,303 $1,425 $8,014 1.07 $26,179 $712 $5,521
City of Alva (OK) 2.11 $40,894 $5,616 $4,212 1.40 $24,747 $3,686 $2,808
Cook County (MN) 2.12 $53,275 $2,516 $8,781 1.73 $34,086 $1,480 $7,103
Town of Hillsborough (NC) 2.99 $59,792 $6,077 $6,127 1.88 $33,248 $3,415 $3,516
City of Virginia (MN) 1.55 $52,770 $3,104 $9,312 1.55 $34,146 $1,552 $7,760
Town of Jackson (WY) 2.10 $35,856 $4,455 $6,436 1.40 $22,022 $2,647 $3,342
City of Guthrie (OK) 1.63 $28,866 $4,118 $4,375 1.12 $18,829 $2,573 $2,788
City of Grand Rapids (MN) 2.09 $53,293 $2,493 $8,771 1.47 $34,104 $1,514 $7,079
Town of Medfield (MA) 1.83 $37,366 $3,920 $6,533 1.05 $18,291 $784 $3,920
City of Fergus Falls (MN) 1.90 $48,489 $1,611 $8,057 1.46 $34,425 $879 $5,567
Grundy County (TN) 1.42 $25,214 $4,475 $6,113 0.98 $17,246 $2,947 $4,148
City of Falls Church (VA) 2.40 $25,482 $4,088 $6,590 1.67 $18,845 $1,492 $3,689
City of Jamestown (ND) 2.55 $51,929 $6,045 $5,580 1.53 $28,867 $3,824 $3,204
City of Waterville (ME) 2.60 $50,612 $2,550 $4,774 1.57 $25,930 $1,465 $2,712
City of Red Wing (MN) 1.98 $45,415 $1,785 $8,329 1.59 $31,532 $992 $5,751
City of Durango (CO) 2.98 $62,373 $7,566 $3,176 1.85 $34,220 $4,717 $1,931
City of Hannibal (MO) 2.36 $42,952 $8,098 $4,117 1.49 $24,374 $5,660 $2,654
City of Tullahoma (TN) 2.18 $45,864 $3,276 $5,678 1.31 $27,082 $1,747 $3,494
City of Northfield (MN) 1.94 $45,509 $1,715 $8,347 1.49 $31,216 $1,258 $5,260
Town of Carrboro (NC) 3.00 $59,790 $6,092 $6,117 1.89 $33,260 $3,414 $3,513
Macon County (TN) 1.50 $25,532 $3,004 $6,008 1.50 $16,521 $1,502 $4,506
City of Laguna Beach (CA) 2.40 $47,543 $4,453 $5,003 1.33 $21,493 $2,371 $2,985
Hickman County (TN) 1.91 $41,557 $2,707 $5,254 1.27 $27,545 $1,751 $3,344
City of Fairfax (VA) 1.42 $29,164 $4,845 $6,080 0.95 $16,625 $2,090 $3,800
City of Ponca City (OK) 1.77 $37,794 $4,124 $3,444 1.13 $22,930 $2,538 $2,130
City of Paducah (KY) 2.68 $52,996 $4,025 $5,750 1.62 $28,090 $2,598 $3,610
Mille Lacs County (MN) 1.48 $33,283 $1,479 $8,136 1.11 $26,257 $740 $5,547
McNairy County (TN) 1.38 $25,611 $4,499 $4,499 1.04 $16,266 $2,769 $3,115
City of Winona (MN) 1.99 $45,504 $1,713 $8,429 1.44 $31,524 $891 $5,688
TOTAL Impacts per $100,000 of Spending by AUDIENCES DIRECT Impacts per $100,000 of Spending by AUDIENCES
SOURCE: Arts and Economic Prosperity 5, Americans for the Arts, 2017. For more information, visit www.AmericansForTheArts.org/EconomicImpact. B–268

Table 19:Economic Impact per $100,000 of Direct Spending byNonprofit Arts and Cultural Event Attendees Per Study Region During 2010
Population Cohort Group APopulation Fewer than 50,000 Full-Time Household Local State Full-Time Household Local State
Sample Size = 52 Equivalent Jobs Income Govt. Revenue Govt. Revenue Equivalent Jobs Income Govt. Revenue Govt. Revenue
Door County (WI) 2.22 $40,808 $6,073 $5,612 1.43 $24,546 $3,761 $3,541
City of Benicia (CA) 1.70 $35,622 $2,897 $6,136 1.08 $19,487 $1,250 $3,920
City of Winter Park (FL) 3.55 $57,211 $4,523 $5,448 1.93 $25,008 $2,397 $3,030
City of Rochester (NH) 2.38 $52,871 $3,581 $4,973 1.48 $28,562 $1,000 $1,506
City of Morgantown (WV) 2.38 $46,854 $2,157 $6,820 1.47 $25,484 $1,047 $4,152
Henry County (TN) 2.22 $44,857 $4,615 $7,199 1.48 $25,474 $2,769 $4,615
City of Fairbanks (AK) 2.08 $47,140 $4,567 $4,772 1.29 $26,166 $3,005 $1,637
City of Bangor (ME) 2.60 $54,641 $5,352 $5,063 1.51 $27,123 $2,524 $2,934
Weakley County (TN) 2.64 $47,504 $4,938 $7,406 1.70 $28,434 $2,980 $4,597
Dare County (NC) 2.26 $43,759 $4,274 $4,132 1.45 $25,967 $2,917 $2,758
City of Columbia (TN) 2.48 $45,315 $4,480 $6,837 1.56 $25,793 $2,672 $4,275
City of Lake Worth (FL) 2.19 $41,742 $4,131 $4,868 1.32 $21,612 $2,260 $2,759
Clatsop County (OR) 2.45 $46,056 $5,659 $4,700 1.55 $26,553 $3,410 $1,825
Yadkin County (NC) 1.42 $32,546 $5,660 $5,660 1.42 $21,225 $4,245 $4,245
Greater Belfast Area (ME) 1.54 $29,096 $3,649 $4,137 1.01 $17,797 $1,854 $2,595
Campbell County (TN) 1.37 $27,233 $3,204 $5,950 0.92 $16,935 $1,831 $3,890
Monroe County (TN) 2.01 $43,436 $4,098 $6,653 1.29 $26,281 $2,472 $4,198
Lincoln County (OR) 2.58 $47,143 $5,562 $5,505 1.65 $27,377 $3,432 $2,175
Iron County (UT) 2.73 $43,681 $5,108 $5,118 1.69 $24,338 $3,312 $3,174
City of St. Louis Park (MN) 1.84 $53,882 $3,030 $8,431 1.32 $31,222 $1,976 $5,270
City of Logan (UT) 2.41 $46,899 $6,893 $4,697 1.53 $26,910 $4,435 $2,945
Gibson County (TN) 1.48 $38,682 $2,613 $4,862 0.91 $22,875 $1,447 $2,852
Group A Average 2.13 $43,345 $4,134 $5,956 1.42 $25,668 $2,407 $3,752
Group A Standard Deviation 0.50 $9,706 $1,589 $1,575 0.26 $5,256 $1,152 $1,411
Group A Confidence Interval (95 percent) 0.13 $2,589 $424 $420 0.07 $1,402 $307 $376
Group A Median 2.11 $45,365 $4,127 $5,714 1.47 $26,066 $2,435 $3,514
TOTAL Impacts per $100,000 of Spending by AUDIENCES DIRECT Impacts per $100,000 of Spending by AUDIENCES
SOURCE: Arts and Economic Prosperity 5, Americans for the Arts, 2017. For more information, visit www.AmericansForTheArts.org/EconomicImpact. B–269
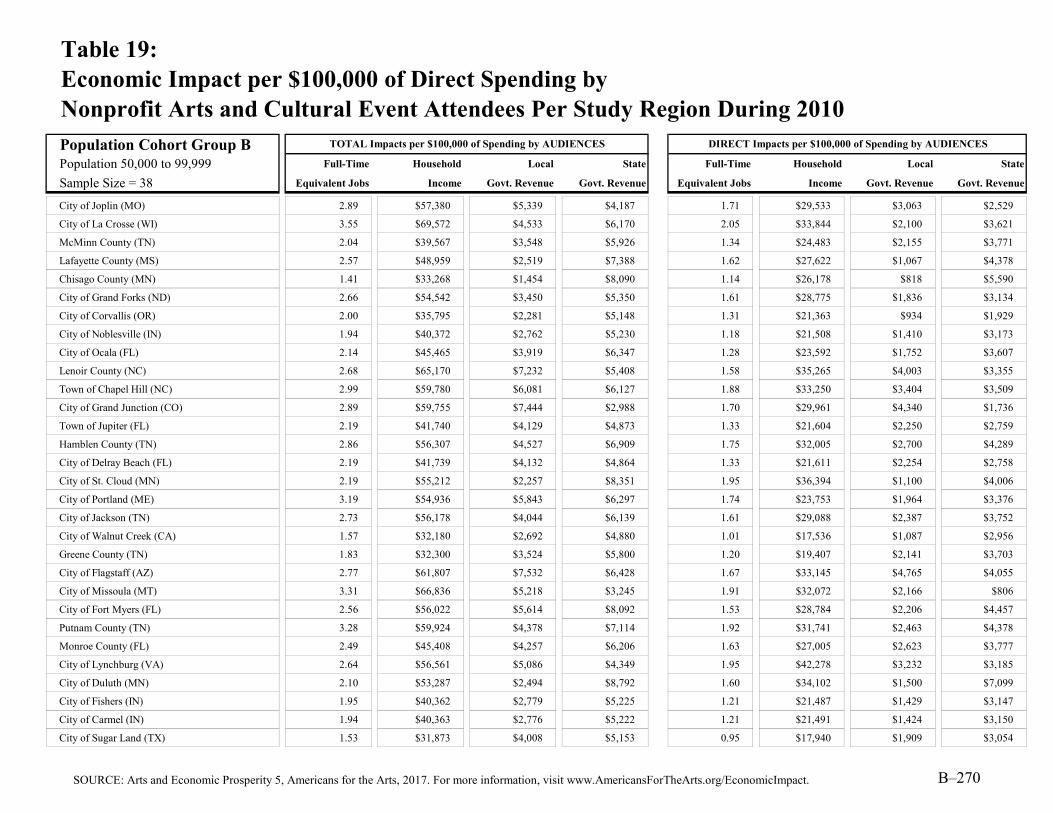
Table 19:Economic Impact per $100,000 of Direct Spending byNonprofit Arts and Cultural Event Attendees Per Study Region During 2010
Population Cohort Group BPopulation 50,000 to 99,999 Full-Time Household Local State Full-Time Household Local State
Sample Size = 38 Equivalent Jobs Income Govt. Revenue Govt. Revenue Equivalent Jobs Income Govt. Revenue Govt. Revenue
City of Joplin (MO) 2.89 $57,380 $5,339 $4,187 1.71 $29,533 $3,063 $2,529
City of La Crosse (WI) 3.55 $69,572 $4,533 $6,170 2.05 $33,844 $2,100 $3,621
McMinn County (TN) 2.04 $39,567 $3,548 $5,926 1.34 $24,483 $2,155 $3,771
Lafayette County (MS) 2.57 $48,959 $2,519 $7,388 1.62 $27,622 $1,067 $4,378
Chisago County (MN) 1.41 $33,268 $1,454 $8,090 1.14 $26,178 $818 $5,590
City of Grand Forks (ND) 2.66 $54,542 $3,450 $5,350 1.61 $28,775 $1,836 $3,134
City of Corvallis (OR) 2.00 $35,795 $2,281 $5,148 1.31 $21,363 $934 $1,929
City of Noblesville (IN) 1.94 $40,372 $2,762 $5,230 1.18 $21,508 $1,410 $3,173
City of Ocala (FL) 2.14 $45,465 $3,919 $6,347 1.28 $23,592 $1,752 $3,607
Lenoir County (NC) 2.68 $65,170 $7,232 $5,408 1.58 $35,265 $4,003 $3,355
Town of Chapel Hill (NC) 2.99 $59,780 $6,081 $6,127 1.88 $33,250 $3,404 $3,509
City of Grand Junction (CO) 2.89 $59,755 $7,444 $2,988 1.70 $29,961 $4,340 $1,736
Town of Jupiter (FL) 2.19 $41,740 $4,129 $4,873 1.33 $21,604 $2,250 $2,759
Hamblen County (TN) 2.86 $56,307 $4,527 $6,909 1.75 $32,005 $2,700 $4,289
City of Delray Beach (FL) 2.19 $41,739 $4,132 $4,864 1.33 $21,611 $2,254 $2,758
City of St. Cloud (MN) 2.19 $55,212 $2,257 $8,351 1.95 $36,394 $1,100 $4,006
City of Portland (ME) 3.19 $54,936 $5,843 $6,297 1.74 $23,753 $1,964 $3,376
City of Jackson (TN) 2.73 $56,178 $4,044 $6,139 1.61 $29,088 $2,387 $3,752
City of Walnut Creek (CA) 1.57 $32,180 $2,692 $4,880 1.01 $17,536 $1,087 $2,956
Greene County (TN) 1.83 $32,300 $3,524 $5,800 1.20 $19,407 $2,141 $3,703
City of Flagstaff (AZ) 2.77 $61,807 $7,532 $6,428 1.67 $33,145 $4,765 $4,055
City of Missoula (MT) 3.31 $66,836 $5,218 $3,245 1.91 $32,072 $2,166 $806
City of Fort Myers (FL) 2.56 $56,022 $5,614 $8,092 1.53 $28,784 $2,206 $4,457
Putnam County (TN) 3.28 $59,924 $4,378 $7,114 1.92 $31,741 $2,463 $4,378
Monroe County (FL) 2.49 $45,408 $4,257 $6,206 1.63 $27,005 $2,623 $3,777
City of Lynchburg (VA) 2.64 $56,561 $5,086 $4,349 1.95 $42,278 $3,232 $3,185
City of Duluth (MN) 2.10 $53,287 $2,494 $8,792 1.60 $34,102 $1,500 $7,099
City of Fishers (IN) 1.95 $40,362 $2,779 $5,225 1.21 $21,487 $1,429 $3,147
City of Carmel (IN) 1.94 $40,363 $2,776 $5,222 1.21 $21,491 $1,424 $3,150
City of Sugar Land (TX) 1.53 $31,873 $4,008 $5,153 0.95 $17,940 $1,909 $3,054
TOTAL Impacts per $100,000 of Spending by AUDIENCES DIRECT Impacts per $100,000 of Spending by AUDIENCES
SOURCE: Arts and Economic Prosperity 5, Americans for the Arts, 2017. For more information, visit www.AmericansForTheArts.org/EconomicImpact. B–270

Table 19:Economic Impact per $100,000 of Direct Spending byNonprofit Arts and Cultural Event Attendees Per Study Region During 2010
Population Cohort Group BPopulation 50,000 to 99,999 Full-Time Household Local State Full-Time Household Local State
Sample Size = 38 Equivalent Jobs Income Govt. Revenue Govt. Revenue Equivalent Jobs Income Govt. Revenue Govt. Revenue
City of Asheville (NC) 3.14 $62,332 $6,223 $6,105 1.78 $30,239 $3,735 $3,600
Buchanan County (MO) 3.22 $69,546 $4,427 $4,755 1.88 $34,705 $2,314 $2,851
City of Boca Raton (FL) 2.19 $41,744 $4,133 $4,865 1.33 $21,614 $2,261 $2,758
City of Miami Beach (FL) 2.72 $76,493 $6,696 $9,669 1.47 $33,689 $3,104 $5,074
Moore County (NC) 2.02 $38,220 $3,412 $3,991 1.33 $22,632 $1,956 $2,473
Sevier County (TN) 2.28 $41,212 $5,565 $5,462 1.49 $25,043 $3,962 $3,699
Cape May County (NJ) 1.98 $38,519 $6,591 $5,719 1.28 $22,868 $3,848 $3,615
Cleveland County (NC) 2.08 $41,248 $4,454 $4,692 1.28 $22,658 $2,584 $2,851
Group B Average 2.44 $50,052 $4,404 $5,830 1.52 $27,375 $2,375 $3,473
Group B Standard Deviation 0.54 $12,032 $1,561 $1,456 0.29 $5,928 $991 $1,068
Group B Confidence Interval (95 percent) 0.17 $3,729 $484 $451 0.09 $1,837 $307 $331
Group B Median 2.38 $51,123 $4,195 $5,591 1.56 $27,314 $2,228 $3,442
TOTAL Impacts per $100,000 of Spending by AUDIENCES DIRECT Impacts per $100,000 of Spending by AUDIENCES
SOURCE: Arts and Economic Prosperity 5, Americans for the Arts, 2017. For more information, visit www.AmericansForTheArts.org/EconomicImpact. B–271

Table 19:Economic Impact per $100,000 of Direct Spending byNonprofit Arts and Cultural Event Attendees Per Study Region During 2010
Population Cohort Group CPopulation 100,000 to 249,999 Full-Time Household Local State Full-Time Household Local State
Sample Size = 50 Equivalent Jobs Income Govt. Revenue Govt. Revenue Equivalent Jobs Income Govt. Revenue Govt. Revenue
City of Las Cruces (NM) 2.34 $48,713 $4,350 $6,398 1.46 $27,310 $2,548 $3,539
Eau Claire County (WI) 3.48 $83,300 $5,292 $6,275 1.98 $39,960 $2,155 $3,706
Yamhill County (OR) 1.78 $34,440 $2,761 $4,464 1.15 $20,460 $1,345 $1,909
City of Lewisville (TX) 1.97 $42,327 $2,953 $5,578 1.31 $23,296 $984 $3,281
City of West Palm Beach (FL) 2.19 $41,743 $4,132 $4,867 1.33 $21,612 $2,257 $2,759
City of Boulder (CO) 2.52 $53,595 $3,302 $3,801 1.52 $27,387 $1,963 $2,217
City of Richardson (TX) 2.27 $55,570 $3,715 $5,253 1.23 $25,129 $1,680 $3,005
City of High Point (NC) 3.51 $83,748 $5,798 $5,516 1.88 $36,859 $3,072 $3,103
City of Cambridge (MA) 1.68 $34,955 $3,218 $3,747 1.01 $17,517 $1,662 $2,354
City of Lowell (MA) 1.55 $33,836 $2,496 $3,938 0.92 $16,751 $1,137 $2,496
Douglas County (KS) 2.75 $52,829 $3,916 $5,971 1.70 $29,005 $1,624 $3,684
City of Columbia (MO) 3.16 $63,218 $5,700 $4,495 1.82 $30,224 $3,129 $2,589
City of Norman (OK) 2.42 $46,937 $3,131 $5,201 1.50 $25,709 $1,457 $2,900
Wayne County (NC) 3.01 $65,874 $5,152 $5,612 1.78 $34,992 $2,668 $3,312
City of Lafayette (LA) 3.08 $68,103 $4,604 $4,510 1.77 $34,085 $2,288 $2,429
Washington County (TN) 2.66 $55,492 $8,520 $7,001 1.56 $28,081 $5,764 $4,329
City of Thousand Oaks (CA) 2.05 $42,850 $2,498 $5,329 1.24 $22,174 $952 $3,212
City of Charleston (SC) 3.10 $64,491 $6,298 $5,596 1.75 $30,434 $3,713 $3,360
City of Waco (TX) 2.88 $63,107 $7,257 $6,514 1.63 $30,871 $4,028 $3,787
Robeson County (NC) 2.31 $46,841 $4,626 $5,012 1.45 $26,698 $2,795 $3,084
Columbia County (GA) 2.24 $31,372 $4,482 $2,241 2.24 $20,168 $2,241 $2,241
Orange County (NC) 2.99 $59,781 $6,082 $6,125 1.88 $33,251 $3,406 $3,510
City of Savannah (GA) 2.85 $59,229 $7,894 $4,184 1.63 $28,934 $4,742 $2,478
Indian River County (FL) 2.03 $36,058 $3,738 $6,380 1.32 $20,993 $1,841 $3,704
City of Alexandria (VA) 1.94 $38,953 $3,608 $3,195 1.19 $21,357 $1,956 $1,997
Martin County (FL) 2.03 $38,205 $2,809 $6,077 1.30 $21,962 $1,187 $3,523
Macon-Bibb County (GA) 2.83 $63,003 $4,741 $3,670 1.58 $28,083 $2,581 $2,137
City of Springfield (MA) 2.59 $55,908 $4,021 $5,412 1.45 $26,470 $1,751 $3,265
Catawba County (NC) 2.73 $57,478 $4,279 $4,993 1.56 $28,447 $2,402 $3,079
Town of Cary (NC) 3.07 $73,780 $6,669 $5,884 1.68 $33,713 $3,547 $3,205
TOTAL Impacts per $100,000 of Spending by AUDIENCES DIRECT Impacts per $100,000 of Spending by AUDIENCES
SOURCE: Arts and Economic Prosperity 5, Americans for the Arts, 2017. For more information, visit www.AmericansForTheArts.org/EconomicImpact. B–272

Table 19:Economic Impact per $100,000 of Direct Spending byNonprofit Arts and Cultural Event Attendees Per Study Region During 2010
Population Cohort Group CPopulation 100,000 to 249,999 Full-Time Household Local State Full-Time Household Local State
Sample Size = 50 Equivalent Jobs Income Govt. Revenue Govt. Revenue Equivalent Jobs Income Govt. Revenue Govt. Revenue
Alamance County (NC) 2.69 $50,837 $3,808 $5,225 1.66 $27,768 $2,066 $3,160
Cumberland County (NJ) 1.90 $42,896 $5,697 $6,225 1.14 $23,359 $3,182 $3,988
City of Eugene (OR) 3.06 $65,952 $4,257 $3,996 1.82 $32,703 $1,498 $966
Middlesex County (CT) 1.77 $32,040 $3,769 $4,417 1.12 $17,342 $2,159 $2,725
City of Springfield (MO) 3.25 $72,950 $5,396 $4,284 1.71 $31,632 $2,920 $2,481
City of Sioux Falls (SD) 3.21 $65,692 $3,270 $5,047 1.83 $30,766 $1,503 $2,757
Pitt County (NC) 3.06 $65,677 $5,736 $5,404 1.81 $34,194 $3,283 $3,172
City of Providence (RI) 2.53 $43,952 $5,224 $5,294 1.40 $20,549 $1,338 $2,954
City of Worcester (MA) 2.06 $43,705 $2,169 $4,720 1.20 $21,534 $639 $2,912
Montgomery County (TN) 2.16 $45,313 $5,193 $7,838 1.37 $26,502 $3,086 $4,752
Salt Lake City (UT) 2.74 $62,691 $4,515 $4,697 1.46 $26,848 $2,331 $2,557
Cabarrus County (NC) 3.14 $56,762 $4,618 $5,024 1.95 $30,124 $2,459 $2,993
Richmond County (GA) 2.89 $60,979 $5,932 $3,967 1.65 $29,737 $3,310 $2,332
City of Tacoma (WA) 2.33 $48,618 $4,570 $5,653 1.38 $24,350 $2,396 $2,917
Doña Ana County (NM) 2.34 $48,709 $4,353 $6,394 1.46 $27,309 $2,546 $3,541
New Hanover County (NC) 3.43 $72,901 $5,964 $5,388 2.02 $35,832 $3,174 $3,171
Arlington County (VA) 1.71 $33,199 $5,521 $2,982 1.15 $20,123 $3,334 $1,970
City of Irving (TX) 2.46 $54,165 $3,886 $5,075 1.35 $23,870 $1,903 $2,934
City of Reno (NV) 2.01 $42,537 $3,072 $5,394 1.21 $21,509 $1,687 $3,101
York County (SC) 2.01 $48,851 $3,257 $4,769 1.19 $26,359 $1,657 $2,828
Group C Average 2.54 $53,083 $4,565 $5,101 1.51 $26,887 $2,387 $2,968
Group C Standard Deviation 0.53 $13,314 $1,398 $1,061 0.29 $5,441 $996 $662
Group C Confidence Interval (95 percent) 0.14 $3,619 $380 $288 0.08 $1,479 $271 $180
Group C Median 2.53 $53,212 $4,418 $5,213 1.48 $27,079 $2,272 $2,999
TOTAL Impacts per $100,000 of Spending by AUDIENCES DIRECT Impacts per $100,000 of Spending by AUDIENCES
SOURCE: Arts and Economic Prosperity 5, Americans for the Arts, 2017. For more information, visit www.AmericansForTheArts.org/EconomicImpact. B–273

Table 19:Economic Impact per $100,000 of Direct Spending byNonprofit Arts and Cultural Event Attendees Per Study Region During 2010
Population Cohort Group DPopulation 250,000 to 499,999 Full-Time Household Local State Full-Time Household Local State
Sample Size = 42 Equivalent Jobs Income Govt. Revenue Govt. Revenue Equivalent Jobs Income Govt. Revenue Govt. Revenue
Buncombe County (NC) 3.14 $62,334 $6,220 $6,105 1.78 $30,242 $3,732 $3,598
Alachua County (FL) 2.92 $56,916 $4,176 $5,765 1.71 $29,424 $1,426 $3,139
Greater Green Bay Area (WI) 2.70 $56,848 $3,481 $5,555 1.54 $27,055 $1,656 $3,296
City of Orlando (FL) 3.65 $66,885 $5,170 $6,277 1.98 $29,236 $2,740 $3,491
City of Lincoln (NE) 3.27 $63,851 $6,183 $5,777 1.90 $30,702 $3,143 $3,325
Southeastern Connecticut Region (CT) 1.81 $35,026 $3,297 $4,507 1.16 $20,116 $2,219 $2,932
Erie County (PA) 3.39 $64,810 $3,871 $5,785 1.96 $30,953 $1,624 $3,370
San Luis Obispo County (CA) 2.66 $52,140 $4,234 $7,256 1.62 $27,713 $2,181 $4,533
City of Newark (NJ) 1.69 $42,665 $3,139 $4,733 0.94 $21,191 $1,282 $2,758
Leon County (FL) 2.63 $56,536 $4,564 $6,651 1.51 $27,955 $2,225 $3,662
Rutherford County (TN) 2.59 $52,507 $5,356 $7,035 1.58 $28,546 $3,171 $4,202
St. Lucie County (FL) 2.21 $41,425 $2,661 $5,705 1.38 $22,437 $1,001 $3,193
Greater Spartanburg Area (SC) 3.10 $59,999 $2,858 $6,007 1.85 $30,150 $1,078 $3,636
Durham County (NC) 2.99 $68,384 $7,703 $4,946 1.79 $34,104 $4,381 $2,961
City of St. Paul (MN) 1.89 $53,887 $3,093 $8,452 1.17 $31,200 $2,000 $5,300
Hamilton County (IN) 1.95 $40,365 $2,780 $5,223 1.21 $21,490 $1,424 $3,146
Osceola County (FL) 2.77 $55,554 $2,772 $7,334 1.79 $31,530 $1,270 $4,447
Escambia County (FL) 2.98 $60,374 $4,975 $6,994 1.74 $29,789 $2,392 $3,872
Lexington-Fayette Urban County (KY) 3.53 $80,289 $3,047 $8,076 1.99 $37,436 $1,101 $4,504
Lake County (FL) 1.96 $37,061 $3,954 $6,686 1.22 $20,196 $1,983 $3,867
City of Riverside (CA) 2.85 $61,255 $4,096 $7,452 1.73 $31,733 $1,889 $4,651
Cumberland County (NC) 2.97 $63,147 $5,745 $6,114 1.84 $34,800 $2,934 $3,432
Collier County (FL) 2.04 $36,947 $2,807 $5,960 1.33 $21,562 $1,315 $3,467
Hamilton County (TN) 3.02 $74,740 $4,863 $8,111 1.67 $34,537 $2,757 $4,560
Manatee County (FL) 2.09 $40,325 $4,399 $6,557 1.30 $22,348 $2,313 $3,789
City of Tampa (FL) 2.79 $67,029 $5,026 $6,785 1.47 $28,861 $2,511 $3,607
Forsyth County (NC) 3.34 $75,190 $5,138 $6,806 1.87 $34,357 $2,615 $3,802
Mercer County (NJ) 1.71 $38,030 $3,997 $4,457 1.01 $18,815 $1,956 $2,715
City of Wichita (KS) 3.13 $66,503 $6,307 $5,176 1.80 $31,818 $2,827 $3,022
Clackamas County (OR) 1.80 $40,714 $2,628 $6,433 1.06 $20,928 $1,076 $2,251
TOTAL Impacts per $100,000 of Spending by AUDIENCES DIRECT Impacts per $100,000 of Spending by AUDIENCES
SOURCE: Arts and Economic Prosperity 5, Americans for the Arts, 2017. For more information, visit www.AmericansForTheArts.org/EconomicImpact. B–274

Table 19:Economic Impact per $100,000 of Direct Spending byNonprofit Arts and Cultural Event Attendees Per Study Region During 2010
Population Cohort Group DPopulation 250,000 to 499,999 Full-Time Household Local State Full-Time Household Local State
Sample Size = 42 Equivalent Jobs Income Govt. Revenue Govt. Revenue Equivalent Jobs Income Govt. Revenue Govt. Revenue
Sarasota County (FL) 2.06 $57,439 $6,061 $8,873 1.29 $31,383 $3,274 $4,922
City of Minneapolis (MN) 1.89 $53,887 $3,093 $8,452 1.17 $31,200 $2,000 $5,300
Berks County (PA) 2.35 $47,580 $3,968 $5,516 1.39 $23,735 $2,113 $3,194
City of Miami (FL) 2.72 $73,250 $5,993 $9,004 1.48 $32,262 $2,778 $4,725
City of Raleigh (NC) 2.98 $54,999 $5,579 $5,051 1.63 $25,132 $2,970 $2,749
Santa Barbara County (CA) 2.80 $48,492 $5,130 $6,469 1.72 $25,654 $2,700 $3,953
Seminole County (FL) 2.31 $53,899 $5,610 $7,368 1.42 $27,762 $2,059 $3,985
City of Virginia Beach (VA) 2.83 $54,687 $4,442 $3,953 1.73 $28,640 $2,286 $2,353
City of Atlanta (GA) 3.13 $60,459 $6,916 $5,529 1.68 $27,354 $3,920 $3,177
City of Mesa (AZ) 2.91 $65,193 $4,897 $6,117 1.62 $29,335 $2,621 $3,403
City of Kansas City (MO) 2.98 $71,130 $4,446 $5,074 1.62 $31,067 $2,071 $2,862
Morris County (NJ) 1.39 $32,054 $3,157 $6,969 0.83 $16,121 $1,061 $4,367
Group D Average 2.62 $55,829 $4,472 $6,359 1.54 $27,878 $2,240 $3,655
Group D Standard Deviation 0.57 $12,180 $1,294 $1,224 0.30 $4,978 $816 $751
Group D Confidence Interval (95 percent) 0.17 $3,599 $382 $362 0.09 $1,471 $241 $222
Group D Median 2.78 $56,692 $4,420 $6,197 1.62 $29,048 $2,200 $3,544
TOTAL Impacts per $100,000 of Spending by AUDIENCES DIRECT Impacts per $100,000 of Spending by AUDIENCES
SOURCE: Arts and Economic Prosperity 5, Americans for the Arts, 2017. For more information, visit www.AmericansForTheArts.org/EconomicImpact. B–275

Table 19:Economic Impact per $100,000 of Direct Spending byNonprofit Arts and Cultural Event Attendees Per Study Region During 2010
Population Cohort Group EPopulation 500,000 to 999,999 Full-Time Household Local State Full-Time Household Local State
Sample Size = 25 Equivalent Jobs Income Govt. Revenue Govt. Revenue Equivalent Jobs Income Govt. Revenue Govt. Revenue
Sonoma County (CA) 2.07 $41,028 $3,126 $5,435 1.28 $21,632 $1,383 $3,313
Volusia County (FL) 3.02 $64,069 $6,423 $8,462 1.74 $32,292 $3,150 $4,592
Guilford County (NC) 3.73 $58,540 $5,695 $5,111 2.01 $25,774 $3,018 $2,861
Dane County (WI) 3.23 $56,091 $4,309 $5,708 1.83 $25,248 $1,478 $3,138
Brevard County (FL) 2.31 $41,852 $2,996 $6,562 1.45 $22,766 $1,198 $3,851
Washington County (OR) 2.34 $49,486 $2,351 $7,521 1.36 $23,815 $770 $1,774
Johnson County (KS) 2.42 $50,034 $3,113 $5,460 1.42 $23,805 $1,303 $3,314
City of Louisville (KY) 3.16 $67,970 $2,317 $6,702 1.71 $29,083 $1,051 $3,556
City of Baltimore (MD) 2.48 $47,508 $5,090 $4,368 1.43 $22,788 $2,250 $2,592
Polk County (FL) 2.79 $63,215 $5,429 $8,003 1.59 $30,741 $2,675 $4,458
City of Boston (MA) 2.40 $54,557 $2,973 $4,489 1.38 $25,291 $1,703 $2,784
District of Columbia (DC)1 0.58 $11,416 $3,491 $0 0.40 $7,792 $2,421 $0
Nashville-Davidson County (TN) 2.75 $62,070 $5,486 $7,340 1.48 $27,354 $3,252 $4,196
City of El Paso (TX) 3.02 $65,323 $5,570 $6,851 1.69 $31,087 $2,445 $3,890
Lee County (FL) 2.56 $56,022 $5,615 $8,093 1.53 $28,785 $2,208 $4,458
City of Fort Worth (TX) 2.71 $66,147 $5,745 $7,180 1.57 $31,814 $2,783 $4,064
City of Indianapolis (IN) 3.65 $69,603 $4,811 $7,857 1.95 $29,690 $2,232 $4,516
City and County of San Francisco (CA) 2.48 $52,062 $4,939 $6,153 1.48 $25,766 $3,001 $3,827
Prince George's County (MD) 1.70 $32,357 $3,704 $3,400 1.02 $17,679 $1,590 $2,077
Pinellas County (FL) 2.36 $51,968 $4,356 $6,617 1.32 $23,617 $2,061 $3,535
Shelby County (TN) 3.00 $73,743 $5,928 $8,615 1.65 $33,793 $3,325 $4,731
Fairfield County (CT) 1.26 $31,329 $3,094 $4,537 0.75 $15,487 $1,298 $2,744
Westchester County (NY) 2.73 $68,364 $6,997 $9,321 1.67 $36,054 $3,235 $5,235
Fulton County (GA) 3.13 $60,654 $6,910 $5,503 1.68 $27,443 $3,917 $3,162
Wake County (NC) 2.98 $55,688 $5,614 $5,079 1.63 $25,447 $2,988 $2,764
Group E Average 2.59 $54,044 $4,643 $6,175 1.48 $25,802 $2,269 $3,417
Group E Standard Deviation 0.69 $14,195 $1,412 $1,988 0.35 $6,073 $856 $1,119
Group E Confidence Interval (95 percent) 0.27 $5,564 $553 $779 0.14 $2,381 $336 $439
Group E Median 2.71 $56,022 $4,939 $6,562 1.53 $25,766 $2,250 $3,535
TOTAL Impacts per $100,000 of Spending by AUDIENCES DIRECT Impacts per $100,000 of Spending by AUDIENCES
SOURCE: Arts and Economic Prosperity 5, Americans for the Arts, 2017. For more information, visit www.AmericansForTheArts.org/EconomicImpact. B–276

Table 19:Economic Impact per $100,000 of Direct Spending byNonprofit Arts and Cultural Event Attendees Per Study Region During 2010
Population Cohort Group FPopulation 1,000,000 or More Full-Time Household Local State Full-Time Household Local State
Sample Size = 21 Equivalent Jobs Income Govt. Revenue Govt. Revenue Equivalent Jobs Income Govt. Revenue Govt. Revenue
Mecklenburg County (NC) 2.91 $54,213 $5,498 $4,829 1.58 $23,858 $3,178 $2,656
City of San José (CA) 1.67 $29,231 $2,865 $3,751 1.02 $15,611 $1,546 $2,358
Montgomery County (MD) 1.25 $23,516 $3,900 $3,999 0.80 $13,481 $1,877 $2,517
Fairfax County (VA) 1.23 $21,814 $3,525 $3,369 0.79 $12,500 $1,764 $2,106
Allegheny County (PA) 3.08 $48,926 $4,885 $7,811 1.69 $21,413 $2,489 $4,353
Greater Columbus Area (OH) 3.58 $88,678 $5,834 $7,227 1.93 $37,401 $3,026 $4,042
Orange County (FL) 3.63 $63,671 $4,955 $5,929 1.97 $27,831 $2,627 $3,298
City of Dallas (TX) 2.59 $68,298 $6,435 $6,329 1.43 $30,585 $3,147 $3,626
Hillsborough County (FL) 2.79 $67,029 $5,027 $6,785 1.47 $28,861 $2,511 $3,607
City of San Diego (CA) 2.45 $69,216 $4,858 $7,055 1.40 $32,888 $2,784 $4,256
Palm Beach County (FL) 2.19 $41,744 $4,132 $4,868 1.33 $21,613 $2,257 $2,759
City of San Antonio (TX) 3.34 $79,876 $5,807 $8,200 1.82 $36,552 $3,267 $4,579
Sacramento County (CA) 2.59 $63,127 $5,125 $6,918 1.48 $29,150 $1,984 $4,161
City of Phoenix (AZ) 2.89 $62,725 $5,272 $6,884 1.59 $28,168 $2,903 $3,834
City and County of Philadelphia (PA) 2.46 $45,771 $5,924 $5,177 1.37 $21,022 $3,685 $2,951
Broward County (FL) 2.73 $57,657 $5,153 $5,207 1.54 $27,084 $2,393 $2,787
Santa Clara County (CA) 1.67 $28,992 $4,054 $4,889 1.02 $15,483 $2,187 $3,073
Riverside County (CA) 2.79 $51,751 $4,817 $6,636 1.69 $26,810 $2,222 $4,141
Miami-Dade County (FL) 2.84 $76,683 $5,767 $9,090 1.54 $33,773 $2,673 $4,770
City of Chicago (IL) 2.38 $52,604 $6,396 $5,378 1.27 $22,816 $3,970 $3,102
Harris County (TX) 2.12 $62,399 $6,374 $7,905 1.22 $29,433 $2,618 $4,511
Group F Average 2.53 $55,139 $5,076 $6,107 1.43 $25,540 $2,624 $3,499
Group F Standard Deviation 0.67 $18,380 $964 $1,549 0.33 $7,221 $618 $808
Group F Confidence Interval (95 percent) 0.29 $7,861 $412 $663 0.14 $3,088 $264 $345
Group F Median 2.59 $57,657 $5,125 $6,329 1.47 $27,084 $2,618 $3,607
Average 2.45 $51,157 $4,478 $5,860 1.48 $26,630 $2,371 $3,456
Standard Deviation 0.59 $13,502 $1,431 $1,496 0.30 $5,664 $956 $1,049
Confidence Interval (95 percent) 0.08 $1,753 $186 $194 0.04 $735 $124 $136
Median 2.46 $52,101 $4,449 $5,692 1.49 $27,068 $2,274 $3,320
TOTAL Impacts per $100,000 of Spending by AUDIENCES DIRECT Impacts per $100,000 of Spending by AUDIENCES
ALL CITY/COUNTY STUDY REGIONS
SOURCE: Arts and Economic Prosperity 5, Americans for the Arts, 2017. For more information, visit www.AmericansForTheArts.org/EconomicImpact. B–277
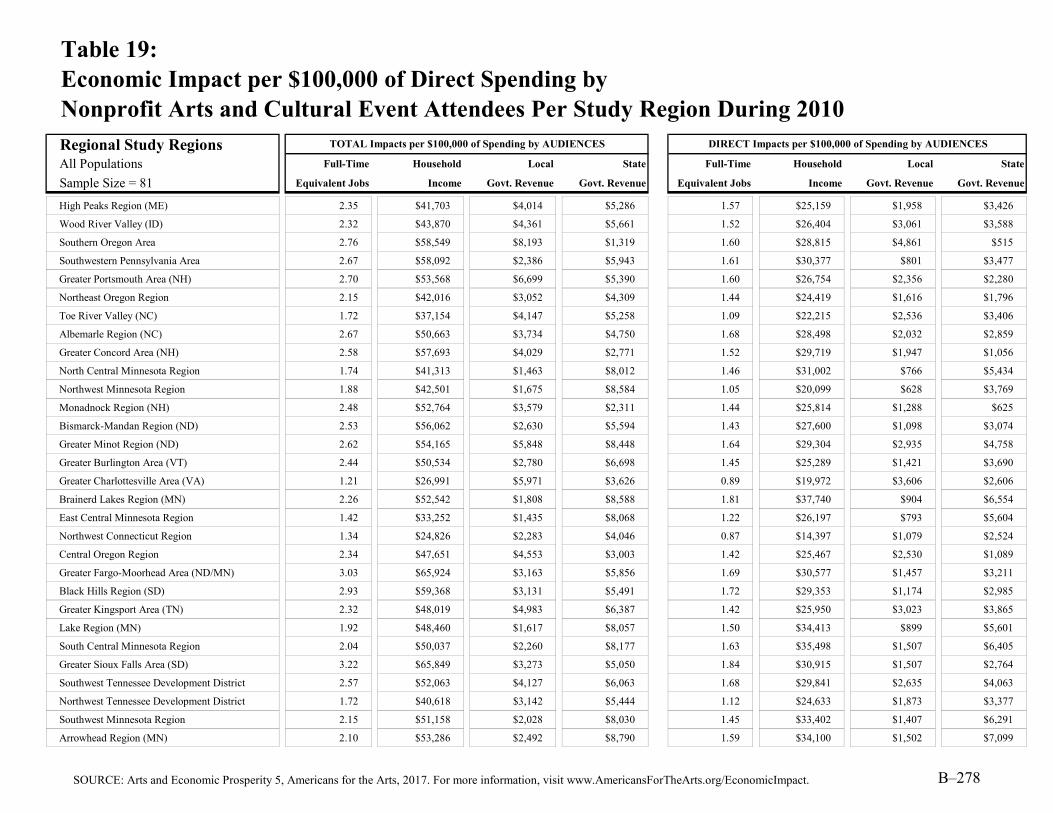
Table 19:Economic Impact per $100,000 of Direct Spending byNonprofit Arts and Cultural Event Attendees Per Study Region During 2010
Regional Study RegionsAll Populations Full-Time Household Local State Full-Time Household Local State
Sample Size = 81 Equivalent Jobs Income Govt. Revenue Govt. Revenue Equivalent Jobs Income Govt. Revenue Govt. Revenue
High Peaks Region (ME) 2.35 $41,703 $4,014 $5,286 1.57 $25,159 $1,958 $3,426
Wood River Valley (ID) 2.32 $43,870 $4,361 $5,661 1.52 $26,404 $3,061 $3,588
Southern Oregon Area 2.76 $58,549 $8,193 $1,319 1.60 $28,815 $4,861 $515
Southwestern Pennsylvania Area 2.67 $58,092 $2,386 $5,943 1.61 $30,377 $801 $3,477
Greater Portsmouth Area (NH) 2.70 $53,568 $6,699 $5,390 1.60 $26,754 $2,356 $2,280
Northeast Oregon Region 2.15 $42,016 $3,052 $4,309 1.44 $24,419 $1,616 $1,796
Toe River Valley (NC) 1.72 $37,154 $4,147 $5,258 1.09 $22,215 $2,536 $3,406
Albemarle Region (NC) 2.67 $50,663 $3,734 $4,750 1.68 $28,498 $2,032 $2,859
Greater Concord Area (NH) 2.58 $57,693 $4,029 $2,771 1.52 $29,719 $1,947 $1,056
North Central Minnesota Region 1.74 $41,313 $1,463 $8,012 1.46 $31,002 $766 $5,434
Northwest Minnesota Region 1.88 $42,501 $1,675 $8,584 1.05 $20,099 $628 $3,769
Monadnock Region (NH) 2.48 $52,764 $3,579 $2,311 1.44 $25,814 $1,288 $625
Bismarck-Mandan Region (ND) 2.53 $56,062 $2,630 $5,594 1.43 $27,600 $1,098 $3,074
Greater Minot Region (ND) 2.62 $54,165 $5,848 $8,448 1.64 $29,304 $2,935 $4,758
Greater Burlington Area (VT) 2.44 $50,534 $2,780 $6,698 1.45 $25,289 $1,421 $3,690
Greater Charlottesville Area (VA) 1.21 $26,991 $5,971 $3,626 0.89 $19,972 $3,606 $2,606
Brainerd Lakes Region (MN) 2.26 $52,542 $1,808 $8,588 1.81 $37,740 $904 $6,554
East Central Minnesota Region 1.42 $33,252 $1,435 $8,068 1.22 $26,197 $793 $5,604
Northwest Connecticut Region 1.34 $24,826 $2,283 $4,046 0.87 $14,397 $1,079 $2,524
Central Oregon Region 2.34 $47,651 $4,553 $3,003 1.42 $25,467 $2,530 $1,089
Greater Fargo-Moorhead Area (ND/MN) 3.03 $65,924 $3,163 $5,856 1.69 $30,577 $1,457 $3,211
Black Hills Region (SD) 2.93 $59,368 $3,131 $5,491 1.72 $29,353 $1,174 $2,985
Greater Kingsport Area (TN) 2.32 $48,019 $4,983 $6,387 1.42 $25,950 $3,023 $3,865
Lake Region (MN) 1.92 $48,460 $1,617 $8,057 1.50 $34,413 $899 $5,601
South Central Minnesota Region 2.04 $50,037 $2,260 $8,177 1.63 $35,498 $1,507 $6,405
Greater Sioux Falls Area (SD) 3.22 $65,849 $3,273 $5,050 1.84 $30,915 $1,507 $2,764
Southwest Tennessee Development District 2.57 $52,063 $4,127 $6,063 1.68 $29,841 $2,635 $4,063
Northwest Tennessee Development District 1.72 $40,618 $3,142 $5,444 1.12 $24,633 $1,873 $3,377
Southwest Minnesota Region 2.15 $51,158 $2,028 $8,030 1.45 $33,402 $1,407 $6,291
Arrowhead Region (MN) 2.10 $53,286 $2,492 $8,790 1.59 $34,100 $1,502 $7,099
TOTAL Impacts per $100,000 of Spending by AUDIENCES DIRECT Impacts per $100,000 of Spending by AUDIENCES
SOURCE: Arts and Economic Prosperity 5, Americans for the Arts, 2017. For more information, visit www.AmericansForTheArts.org/EconomicImpact. B–278

Table 19:Economic Impact per $100,000 of Direct Spending byNonprofit Arts and Cultural Event Attendees Per Study Region During 2010
Regional Study RegionsAll Populations Full-Time Household Local State Full-Time Household Local State
Sample Size = 81 Equivalent Jobs Income Govt. Revenue Govt. Revenue Equivalent Jobs Income Govt. Revenue Govt. Revenue
Maple Grove and the Northwest Suburbs (MN) 1.89 $53,894 $3,077 $8,443 1.38 $31,208 $2,012 $5,287
Greater Augusta Area (GA) 2.89 $60,912 $5,929 $3,963 1.66 $29,716 $3,307 $2,332
Upper Cumberland Development District (TN) 2.36 $45,458 $5,295 $7,032 1.88 $32,587 $4,249 $5,588
City of Huntsville/Madison County (AL) 2.23 $48,861 $5,136 $4,046 1.35 $26,169 $3,220 $2,327
Northeast Commission (NC) 2.35 $45,393 $4,265 $4,301 1.58 $27,872 $2,939 $2,945
Greater Ann Arbor Area (MI) 1.76 $46,341 $3,060 $10,096 1.33 $35,899 $2,301 $5,800
Greater Fox Cities Region (WI) 1.45 $30,843 $2,478 $4,179 0.83 $14,863 $1,078 $2,385
Central Minnesota Region 2.19 $55,215 $2,253 $8,345 1.68 $36,404 $1,100 $3,995
South Central Tennessee Development District 2.27 $43,363 $4,210 $6,493 1.56 $27,515 $2,761 $4,448
Northwest Arkansas Region 2.92 $57,912 $3,405 $10,232 1.71 $28,452 $2,137 $5,974
Southeast Minnesota Region 1.96 $45,500 $1,733 $8,396 1.59 $31,500 $900 $5,695
First Tennessee Development District 2.43 $50,148 $6,334 $6,615 1.47 $26,590 $4,106 $4,077
Greater Harrisburg Area (PA) 2.81 $67,357 $4,400 $8,475 1.55 $30,433 $1,700 $4,804
Greater New Haven Area (CT) 1.84 $38,543 $2,588 $4,722 1.07 $18,727 $898 $2,830
Treasure Coast Region (FL) 2.07 $38,058 $3,094 $6,112 1.32 $21,722 $1,373 $3,525
Greater Des Moines Region (IA) 2.62 $58,471 $4,506 $5,222 1.43 $25,859 $2,512 $3,044
Southeast Tennessee Development District 2.95 $72,470 $4,804 $7,983 1.65 $33,994 $2,751 $4,539
Greater Knoxville Region (TN) 3.18 $66,816 $7,070 $7,480 1.79 $30,550 $4,346 $4,312
Greater Columbia Area (SC) 3.63 $83,363 $5,793 $6,895 1.99 $36,989 $2,740 $3,906
Pikes Peak Region (CO) 3.25 $63,429 $8,344 $3,683 1.93 $31,880 $4,321 $2,125
Lehigh Valley Region (PA) 3.46 $68,666 $4,298 $7,626 1.96 $32,154 $2,258 $4,462
Greater Sarasota/Bradenton Area (FL) 2.07 $52,975 $5,627 $8,269 1.30 $29,027 $3,023 $4,627
Dayton Region (OH) 3.17 $64,411 $4,934 $6,195 1.79 $29,574 $2,234 $3,447
Richmond & Tri-Cities Region (VA) 2.68 $60,264 $4,130 $5,607 1.84 $40,371 $2,107 $3,645
Memphis Area Association of Governments (TN) 3.00 $73,722 $5,926 $8,612 1.65 $33,796 $3,325 $4,731
Eastern Region (NC) 2.68 $60,771 $5,204 $5,553 1.85 $36,985 $3,284 $3,933
Advantage West Region (NC) 2.63 $55,950 $5,505 $5,715 1.83 $33,870 $3,909 $4,140
Southeast Commission (NC) 3.19 $67,776 $5,751 $5,650 1.95 $35,562 $3,064 $3,323
Greater Fairfax Area (VA) 1.42 $22,470 $3,627 $3,911 0.94 $13,558 $1,723 $2,376
Greater Tulsa Region (OK) 2.46 $55,565 $4,045 $4,946 1.36 $25,289 $2,070 $2,690
TOTAL Impacts per $100,000 of Spending by AUDIENCES DIRECT Impacts per $100,000 of Spending by AUDIENCES
SOURCE: Arts and Economic Prosperity 5, Americans for the Arts, 2017. For more information, visit www.AmericansForTheArts.org/EconomicImpact. B–279

Table 19:Economic Impact per $100,000 of Direct Spending byNonprofit Arts and Cultural Event Attendees Per Study Region During 2010
Regional Study RegionsAll Populations Full-Time Household Local State Full-Time Household Local State
Sample Size = 81 Equivalent Jobs Income Govt. Revenue Govt. Revenue Equivalent Jobs Income Govt. Revenue Govt. Revenue
East Tennessee Development District 2.85 $56,930 $6,568 $6,675 1.56 $26,112 $3,965 $3,734
West Valley Region (AZ) 2.99 $75,589 $4,288 $6,810 1.66 $33,649 $2,205 $3,788
Greater St. Louis Area (MO) 3.25 $63,444 $7,135 $5,611 1.86 $29,037 $3,662 $3,140
Western New York 2.78 $54,833 $9,464 $4,382 1.73 $30,213 $5,183 $2,691
Greater Oklahoma City Region (OK) 2.80 $63,012 $5,039 $5,356 1.99 $37,616 $3,508 $3,649
Piedmont Triad Partnership (NC) 3.45 $63,800 $5,301 $5,595 1.99 $30,351 $2,907 $3,292
Greater Portland Area (OR) 3.03 $67,077 $4,621 $3,469 1.97 $38,081 $1,807 $2,027
Greater Kansas City Metropolitan Area (MO/KS) 3.23 $79,200 $5,338 $7,234 1.62 $30,670 $2,014 $2,946
Greater Nashville Regional Council (TN) 2.72 $61,160 $5,464 $7,324 1.50 $27,883 $3,282 $4,265
Research Triangle Regional Partnership (NC) 2.97 $57,126 $5,828 $5,129 1.67 $27,015 $3,152 $2,846
Greater Tampa/St. Petersburg Area (FL) 2.64 $61,712 $4,790 $6,726 1.42 $27,010 $2,352 $3,581
Charlotte Regional Partnership (NC) 2.84 $55,472 $5,082 $4,889 1.61 $26,154 $2,972 $2,868
Charlotte Regional Partnership (NC/SC) 2.77 $54,967 $4,942 $4,880 1.58 $26,170 $2,872 $2,865
Seven-County Metro Area (MN) 1.89 $53,887 $3,093 $8,452 1.37 $31,200 $2,000 $5,300
Central Florida Region 3.23 $61,722 $5,222 $6,816 1.81 $28,705 $2,640 $3,780
Greater Philadelphia Region (PA) 2.60 $54,227 $6,037 $6,993 1.41 $22,865 $3,881 $3,179
Greater Washington Region (DC/MD/VA) 0.78 $14,889 $3,556 $755 0.52 $9,523 $2,312 $468
Metro Atlanta Area (GA) 3.04 $61,126 $6,641 $5,204 1.72 $29,166 $3,876 $3,093
Greater Atlanta Region (GA) 3.04 $61,160 $6,628 $5,189 1.72 $29,259 $3,874 $3,089
Greater Houston Region (TX) 2.12 $62,255 $6,362 $7,869 1.22 $29,514 $2,634 $4,508
Dallas-Fort Worth-Arlington MSA (TX) 2.63 $67,043 $6,071 $6,649 1.49 $31,126 $2,966 $3,810
Regional Average 2.49 $53,904 $4,434 $6,072 1.54 $28,696 $2,432 $3,630
Regional Standard Deviation 0.57 $12,482 $1,709 $1,898 0.29 $5,642 $1,066 $1,368
Regional Confidence Interval (95 percent) 0.12 $2,718 $372 $413 0.06 $1,229 $232 $298
Regional Median 2.60 $54,967 $4,361 $5,856 1.58 $29,259 $2,352 $3,525
TOTAL Impacts per $100,000 of Spending by AUDIENCES DIRECT Impacts per $100,000 of Spending by AUDIENCES
SOURCE: Arts and Economic Prosperity 5, Americans for the Arts, 2017. For more information, visit www.AmericansForTheArts.org/EconomicImpact. B–280

Table 19:Economic Impact per $100,000 of Direct Spending byNonprofit Arts and Cultural Event Attendees Per Study Region During 2010
Statewide Study RegionsAll Populations Full-Time Household Local State Full-Time Household Local State
Sample Size = 20 Equivalent Jobs Income Govt. Revenue Govt. Revenue Equivalent Jobs Income Govt. Revenue Govt. Revenue
State of Vermont 2.06 $43,105 $2,328 $5,669 1.24 $22,241 $1,208 $3,193
State of North Dakota 2.99 $64,194 $3,804 $6,435 1.70 $31,011 $1,844 $3,554
State of Delaware 2.71 $69,724 $1,348 $5,817 1.85 $47,183 $925 $3,632
State of Maine 2.25 $41,447 $4,197 $4,558 1.30 $20,272 $1,685 $2,603
State of Hawai'i 1.96 $58,267 $2,075 $8,601 1.28 $38,455 $1,348 $5,657
State of Nevada 1.70 $50,015 $3,372 $5,819 0.83 $22,871 $1,867 $2,759
State of Connecticut 1.93 $44,593 $3,344 $6,134 0.77 $15,015 $1,342 $2,206
State of Oklahoma 2.63 $59,261 $4,631 $5,078 1.77 $33,507 $3,037 $3,291
State of Oregon 2.59 $54,320 $4,776 $3,364 1.63 $29,893 $2,348 $1,515
State of Minnesota 1.91 $53,336 $2,977 $8,449 1.39 $31,436 $1,908 $5,387
State of Wisconsin 3.29 $75,295 $5,443 $7,485 1.23 $20,744 $1,395 $2,322
State of Maryland 2.71 $59,563 $5,049 $5,267 1.13 $18,989 $1,876 $2,241
State of Missouri 2.74 $58,395 $5,465 $4,978 1.53 $26,227 $2,690 $2,567
State of Tennessee 2.78 $62,489 $5,588 $7,387 1.55 $29,246 $3,338 $4,261
State of Massachusetts 2.52 $55,780 $3,628 $6,317 1.14 $21,459 $1,384 $2,327
State of New Jersey 1.99 $53,848 $3,335 $5,952 0.68 $15,487 $1,246 $1,994
State of North Carolina 2.95 $58,118 $5,489 $5,267 1.76 $29,454 $3,185 $3,188
State of Pennsylvania 2.73 $52,089 $6,468 $7,621 1.50 $22,797 $3,110 $3,542
State of Illinois 2.39 $63,399 $7,205 $6,012 1.12 $21,026 $3,432 $2,680
State of Florida 2.52 $57,769 $4,763 $6,707 1.43 $27,476 $2,300 $3,653
Statewide Average 2.47 $56,750 $4,264 $6,146 1.34 $26,239 $2,074 $3,129
Statewide Standard Deviation 0.43 $8,364 $1,499 $1,299 0.34 $7,860 $803 $1,062
Statewide Confidence Interval (95 percent) 0.19 $3,666 $657 $569 0.15 $3,445 $352 $466
Statewide Median 2.56 $57,944 $4,414 $5,982 1.35 $24,549 $1,871 $2,973
TOTAL Impacts per $100,000 of Spending by AUDIENCES DIRECT Impacts per $100,000 of Spending by AUDIENCES
SOURCE: Arts and Economic Prosperity 5, Americans for the Arts, 2017. For more information, visit www.AmericansForTheArts.org/EconomicImpact. B–281

Table 19:Economic Impact per $100,000 of Direct Spending byNonprofit Arts and Cultural Event Attendees Per Study Region During 2010
Individual Arts DistrictsAll Populations Full-Time Household Local State Full-Time Household Local State
Sample Size = 12 Equivalent Jobs Income Govt. Revenue Govt. Revenue Equivalent Jobs Income Govt. Revenue Govt. Revenue
James River Arts & Cultural District 2.63 $56,551 $5,081 $4,336 1.94 $42,267 $3,219 $3,165
Center City Charlotte 2.91 $54,213 $5,497 $4,830 1.58 $23,858 $3,177 $2,656
Loch Haven Cultural Park 3.65 $66,884 $5,168 $6,277 1.98 $29,235 $2,739 $3,491
Downtown Colorado Springs Creative District 3.25 $63,428 $8,346 $3,681 1.92 $31,883 $4,320 $2,126
Fort Worth Cultural District 2.71 $66,148 $5,745 $7,181 1.57 $31,814 $2,783 $4,064
Dallas Arts District 2.59 $68,298 $6,435 $6,329 1.43 $30,584 $3,147 $3,626
Grand Center Arts & Entertainment District 3.25 $63,444 $7,134 $5,612 1.86 $29,039 $3,663 $3,140
Balboa Park Cultural District 2.45 $69,216 $4,858 $7,055 1.40 $32,888 $2,784 $4,256
East End Cultural District 2.13 $62,401 $6,383 $7,915 1.21 $29,431 $2,625 $4,514
Houston Museum District Association 2.12 $62,399 $6,374 $7,905 1.22 $29,433 $2,618 $4,511
Midtown Cultural District 2.12 $62,395 $6,377 $7,903 1.21 $29,428 $2,627 $4,513
Washington Avenue Cultural District 2.14 $62,414 $6,373 $7,921 1.23 $29,454 $2,595 $4,507
Arts District Average 2.66 $63,149 $6,148 $6,412 1.55 $30,776 $3,025 $3,714
Arts District Standard Deviation 0.52 $4,391 $974 $1,505 0.31 $4,256 $525 $814
Arts District Confidence Interval (95 percent) 0.29 $2,484 $551 $852 0.18 $2,408 $297 $461
Arts District Median 2.61 $62,921 $6,374 $6,692 1.50 $29,444 $2,783 $3,845
Explanation of the Outliers and Exclusions:1 The economic impact findings for the District of Columbia exclude state government revenues due to Washington, DC's unique status as a study region with no state government.
TOTAL Impacts per $100,000 of Spending by AUDIENCES DIRECT Impacts per $100,000 of Spending by AUDIENCES
SOURCE: Arts and Economic Prosperity 5, Americans for the Arts, 2017. For more information, visit www.AmericansForTheArts.org/EconomicImpact. B–282

Explanation of Table 20:Total Categorized Audience Expenditures by All Attendees toNonprofit Arts and Cultural Events Per Study Region During 2015
Column Two:
Column Three:
Column Four:
Column Five:
Column Six:
Column Seven:
Column Eight:
Column Nine:
Column Ten:
This table presents the total estimated dollars spent by all nonprofit arts and culture audiences (both residents and non-residents) as a direct result of their attendance to nonprofit arts and cultural events in each participating study region during 2015. To calculate these figures, the total estimated dollars spent by resident attendees and the total estimated dollars spent by non-resident attendees are summed. Therefore, the figures in Table 19 do not equal the overall average per person arts and culture event-related expenditure (for all audiences) multiplied by the total event attendance. Summary statistics are calculated for each population group.
The total estimated dollars spent by all arts and culture audiences—both residents and non-residents—on overnight lodging (e.g., hotel, motel, bed-and-breakfast) for the purpose of attending nonprofit arts and cultural events. (The audience-intercept survey instrument requested that respondents limit their response by providing the cost of one night only.)
The total estimated dollars spent by all arts and culture audiences—both residents and non-residents—on miscellaneous products and services for the purpose of or as a result of attending nonprofit arts and cultural events.
The total estimated expenditures made by all arts and culture audiences—both residents and non-residents—for the purpose of or as a result of attending nonprofit arts and cultural events. This figure is the sum of Column Two through Column Nine.
The total estimated dollars spent by all arts and culture audiences—both residents and non-residents—to purchase souvenirs and/or gifts (e.g., books, recordings, art) as a result of attending nonprofit arts and cultural events.
The total estimated dollars spent by all arts and culture audiences—both residents and non-residents—on local ground transportation (e.g., gas, parking, taxi fares, tolls, car rentals) for the purpose of attending nonprofit arts and cultural events.
The total estimated dollars spent by all arts and culture audiences—both residents and non-residents—on child care for the purpose of attending nonprofit arts and cultural events.
The total estimated dollars spent by all arts and culture audiences—both residents and non-residents—to purchase refreshments (e.g., snacks) while attending nonprofit arts and cultural
The total estimated dollars spent by all arts and culture audiences—both residents and non-residents—to purchase food, drinks, and/or meals (e.g., dinner at a restaurant, coffee at a cafe) before or after attending nonprofit arts and cultural events.
The total estimated dollars spent by all arts and culture audiences—both residents and non-residents—to purchase clothing or accessories for the purpose of attending nonprofit arts and cultural events.
SOURCE: Arts and Economic Prosperity 5, Americans for the Arts, 2017. For more information, visit www.AmericansForTheArts.org/EconomicImpact. B–283
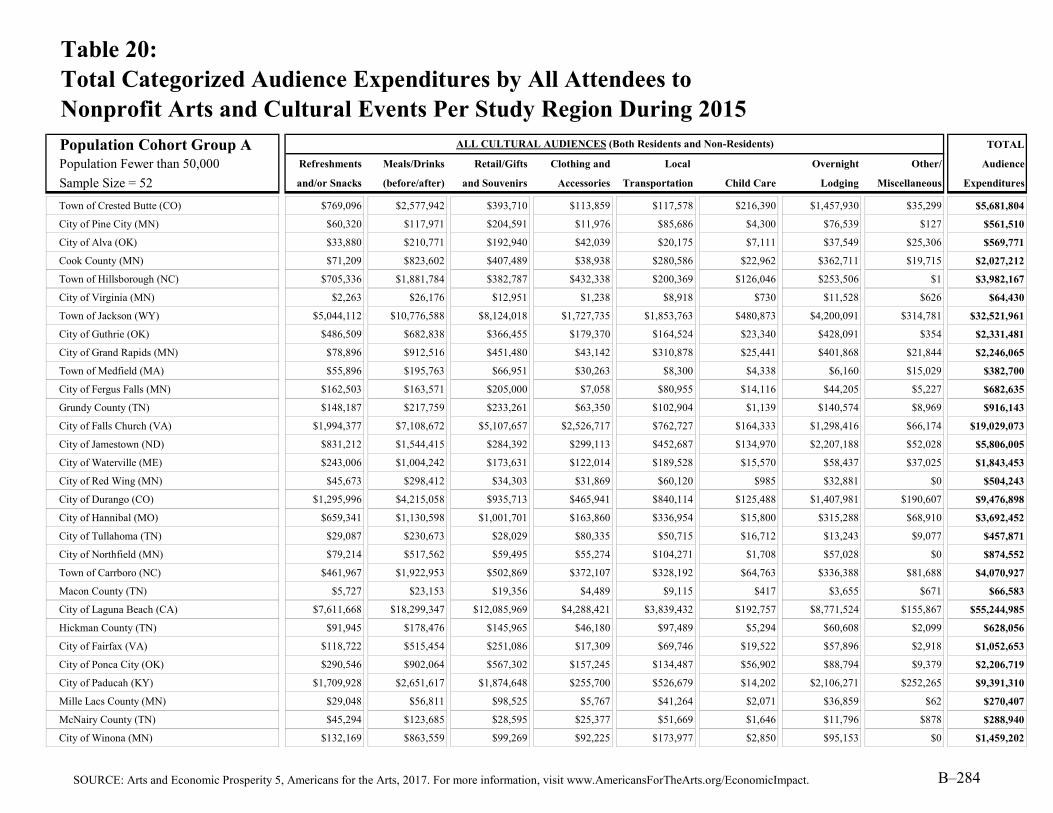
Table 20:Total Categorized Audience Expenditures by All Attendees toNonprofit Arts and Cultural Events Per Study Region During 2015
Population Cohort Group A TOTAL
Population Fewer than 50,000 Refreshments Meals/Drinks Retail/Gifts Clothing and Local Overnight Other/ Audience
Sample Size = 52 and/or Snacks (before/after) and Souvenirs Accessories Transportation Child Care Lodging Miscellaneous Expenditures
Town of Crested Butte (CO) $769,096 $2,577,942 $393,710 $113,859 $117,578 $216,390 $1,457,930 $35,299 $5,681,804
City of Pine City (MN) $60,320 $117,971 $204,591 $11,976 $85,686 $4,300 $76,539 $127 $561,510
City of Alva (OK) $33,880 $210,771 $192,940 $42,039 $20,175 $7,111 $37,549 $25,306 $569,771
Cook County (MN) $71,209 $823,602 $407,489 $38,938 $280,586 $22,962 $362,711 $19,715 $2,027,212
Town of Hillsborough (NC) $705,336 $1,881,784 $382,787 $432,338 $200,369 $126,046 $253,506 $1 $3,982,167
City of Virginia (MN) $2,263 $26,176 $12,951 $1,238 $8,918 $730 $11,528 $626 $64,430
Town of Jackson (WY) $5,044,112 $10,776,588 $8,124,018 $1,727,735 $1,853,763 $480,873 $4,200,091 $314,781 $32,521,961
City of Guthrie (OK) $486,509 $682,838 $366,455 $179,370 $164,524 $23,340 $428,091 $354 $2,331,481
City of Grand Rapids (MN) $78,896 $912,516 $451,480 $43,142 $310,878 $25,441 $401,868 $21,844 $2,246,065
Town of Medfield (MA) $55,896 $195,763 $66,951 $30,263 $8,300 $4,338 $6,160 $15,029 $382,700
City of Fergus Falls (MN) $162,503 $163,571 $205,000 $7,058 $80,955 $14,116 $44,205 $5,227 $682,635
Grundy County (TN) $148,187 $217,759 $233,261 $63,350 $102,904 $1,139 $140,574 $8,969 $916,143
City of Falls Church (VA) $1,994,377 $7,108,672 $5,107,657 $2,526,717 $762,727 $164,333 $1,298,416 $66,174 $19,029,073
City of Jamestown (ND) $831,212 $1,544,415 $284,392 $299,113 $452,687 $134,970 $2,207,188 $52,028 $5,806,005
City of Waterville (ME) $243,006 $1,004,242 $173,631 $122,014 $189,528 $15,570 $58,437 $37,025 $1,843,453
City of Red Wing (MN) $45,673 $298,412 $34,303 $31,869 $60,120 $985 $32,881 $0 $504,243
City of Durango (CO) $1,295,996 $4,215,058 $935,713 $465,941 $840,114 $125,488 $1,407,981 $190,607 $9,476,898
City of Hannibal (MO) $659,341 $1,130,598 $1,001,701 $163,860 $336,954 $15,800 $315,288 $68,910 $3,692,452
City of Tullahoma (TN) $29,087 $230,673 $28,029 $80,335 $50,715 $16,712 $13,243 $9,077 $457,871
City of Northfield (MN) $79,214 $517,562 $59,495 $55,274 $104,271 $1,708 $57,028 $0 $874,552
Town of Carrboro (NC) $461,967 $1,922,953 $502,869 $372,107 $328,192 $64,763 $336,388 $81,688 $4,070,927
Macon County (TN) $5,727 $23,153 $19,356 $4,489 $9,115 $417 $3,655 $671 $66,583
City of Laguna Beach (CA) $7,611,668 $18,299,347 $12,085,969 $4,288,421 $3,839,432 $192,757 $8,771,524 $155,867 $55,244,985
Hickman County (TN) $91,945 $178,476 $145,965 $46,180 $97,489 $5,294 $60,608 $2,099 $628,056
City of Fairfax (VA) $118,722 $515,454 $251,086 $17,309 $69,746 $19,522 $57,896 $2,918 $1,052,653
City of Ponca City (OK) $290,546 $902,064 $567,302 $157,245 $134,487 $56,902 $88,794 $9,379 $2,206,719
City of Paducah (KY) $1,709,928 $2,651,617 $1,874,648 $255,700 $526,679 $14,202 $2,106,271 $252,265 $9,391,310
Mille Lacs County (MN) $29,048 $56,811 $98,525 $5,767 $41,264 $2,071 $36,859 $62 $270,407
McNairy County (TN) $45,294 $123,685 $28,595 $25,377 $51,669 $1,646 $11,796 $878 $288,940
City of Winona (MN) $132,169 $863,559 $99,269 $92,225 $173,977 $2,850 $95,153 $0 $1,459,202
ALL CULTURAL AUDIENCES (Both Residents and Non-Residents)
SOURCE: Arts and Economic Prosperity 5, Americans for the Arts, 2017. For more information, visit www.AmericansForTheArts.org/EconomicImpact. B–284

Table 20:Total Categorized Audience Expenditures by All Attendees toNonprofit Arts and Cultural Events Per Study Region During 2015
Population Cohort Group A TOTAL
Population Fewer than 50,000 Refreshments Meals/Drinks Retail/Gifts Clothing and Local Overnight Other/ Audience
Sample Size = 52 and/or Snacks (before/after) and Souvenirs Accessories Transportation Child Care Lodging Miscellaneous Expenditures
Door County (WI) $1,030,992 $4,093,484 $2,854,264 $685,928 $1,405,609 $80,064 $4,664,162 $153,168 $14,967,671
City of Benicia (CA) $217,999 $605,539 $696,082 $92,099 $78,145 $13,949 $47,686 $8,660 $1,760,159
City of Winter Park (FL) $2,442,019 $14,469,392 $2,021,054 $2,259,855 $3,644,144 $264,903 $4,087,551 $217,921 $29,406,839
City of Rochester (NH) $1,914,274 $3,495,436 $892,538 $528,221 $429,392 $67,734 $366,056 $208,563 $7,902,214
City of Morgantown (WV) $719,462 $2,980,770 $2,705,465 $334,458 $514,429 $43,353 $686,572 $36,197 $8,020,706
Henry County (TN) $69,382 $179,299 $163,393 $38,633 $43,708 $7,118 $38,099 $2,090 $541,722
City of Fairbanks (AK) $1,037,709 $3,693,952 $1,710,924 $441,393 $1,081,088 $120,559 $1,064,610 $132,811 $9,283,046
City of Bangor (ME) $1,124,899 $2,321,068 $774,229 $320,770 $635,414 $69,978 $1,198,282 $132,795 $6,577,435
Weakley County (TN) $311,345 $379,667 $174,181 $63,657 $135,455 $2,336 $94,293 $13,716 $1,174,650
Dare County (NC) $5,061,311 $11,307,957 $11,921,018 $2,381,266 $2,258,631 $345,821 $7,672,982 $91,766 $41,040,752
City of Columbia (TN) $1,166,853 $2,239,158 $1,214,710 $521,950 $664,046 $110,164 $425,961 $19,284 $6,362,126
City of Lake Worth (FL) $1,142,046 $6,335,788 $1,864,221 $1,229,971 $1,017,305 $70,255 $707,492 $246,220 $12,613,298
Clatsop County (OR) $1,222,342 $3,318,044 $1,738,523 $393,073 $713,482 $109,921 $3,317,797 $36,731 $10,849,913
Yadkin County (NC) $7,573 $25,648 $6,291 $2,635 $8,403 $1,429 $14,875 $3,816 $70,670
Greater Belfast Area (ME) $862,069 $1,946,048 $554,169 $257,719 $558,797 $44,577 $863,039 $38,001 $5,124,419
Campbell County (TN) $72,836 $105,361 $144,889 $39,222 $49,663 $3,765 $20,944 $282 $436,962
Monroe County (TN) $915,006 $1,370,662 $1,681,835 $729,246 $732,688 $59,826 $522,754 $15,197 $6,027,214
Lincoln County (OR) $713,228 $3,564,023 $618,394 $364,937 $697,235 $30,976 $2,727,637 $112,025 $8,828,455
Iron County (UT) $3,786,863 $19,310,670 $4,201,084 $1,152,312 $5,077,256 $270,990 $28,408,569 $590,098 $62,797,842
City of St. Louis Park (MN) $88,198 $326,100 $136,096 $47,849 $89,505 $9,501 $51,271 $10,552 $759,072
City of Logan (UT) $714,671 $4,887,231 $900,551 $580,769 $1,359,022 $118,874 $4,993,769 $198,150 $13,753,037
Gibson County (TN) $1,003,113 $1,938,571 $1,115,814 $1,699,233 $817,361 $174,753 $361,593 $6,586 $7,117,024
Group A Average $940,718 $2,866,690 $1,392,882 $497,432 $640,665 $72,762 $1,667,618 $70,222 $8,148,989
Percent of Group A Total 11.5% 35.2% 17.1% 6.1% 7.9% 0.9% 20.5% 0.9% 100.0%
Group A Median $474,238 $1,067,420 $429,485 $160,553 $240,478 $24,391 $348,991 $19,500 $3,011,967
ALL CULTURAL AUDIENCES (Both Residents and Non-Residents)
SOURCE: Arts and Economic Prosperity 5, Americans for the Arts, 2017. For more information, visit www.AmericansForTheArts.org/EconomicImpact. B–285

Table 20:Total Categorized Audience Expenditures by All Attendees toNonprofit Arts and Cultural Events Per Study Region During 2015
Population Cohort Group B TOTAL
Population 50,000 to 99,999 Refreshments Meals/Drinks Retail/Gifts Clothing and Local Overnight Other/ Audience
Sample Size = 38 and/or Snacks (before/after) and Souvenirs Accessories Transportation Child Care Lodging Miscellaneous Expenditures
City of Joplin (MO) $344,668 $1,740,620 $505,182 $324,823 $409,001 $58,689 $129,953 $45,785 $3,558,721
City of La Crosse (WI) $3,603,848 $8,511,141 $1,597,088 $922,315 $1,962,351 $211,751 $2,460,718 $586,403 $19,855,615
McMinn County (TN) $678,532 $2,352,518 $753,339 $398,597 $577,116 $217,486 $382,236 $23,426 $5,383,250
Lafayette County (MS) $1,431,053 $2,882,622 $1,345,227 $465,570 $699,834 $115,429 $1,305,992 $91,873 $8,337,600
Chisago County (MN) $236,370 $462,281 $801,709 $46,928 $335,770 $16,852 $299,925 $499 $2,200,334
City of Grand Forks (ND) $607,535 $1,160,793 $682,323 $288,936 $203,340 $34,920 $166,013 $15,175 $3,159,035
City of Corvallis (OR) $5,883,137 $19,898,099 $8,620,649 $1,688,908 $2,614,833 $415,311 $4,066,339 $1,137,654 $44,324,930
City of Noblesville (IN) $355,437 $820,316 $285,488 $102,448 $63,777 $11,816 $33,222 $29,169 $1,701,673
City of Ocala (FL) $5,519,320 $14,193,434 $8,384,113 $3,550,117 $3,914,654 $199,852 $5,816,167 $94,080 $41,671,737
Lenoir County (NC) $990,522 $3,888,074 $4,681,506 $843,112 $1,246,201 $334,383 $665,227 $17,778 $12,666,803
Town of Chapel Hill (NC) $3,983,720 $12,198,750 $3,276,005 $1,961,235 $3,679,454 $892,799 $2,579,654 $41,696 $28,613,313
City of Grand Junction (CO) $816,150 $2,492,088 $607,622 $450,738 $522,628 $55,215 $921,686 $125,041 $5,991,168
Town of Jupiter (FL) $367,278 $2,112,177 $427,849 $324,142 $486,573 $22,382 $1,111,970 $257,864 $5,110,235
Hamblen County (TN) $147,969 $662,779 $189,511 $24,429 $96,540 $74,003 $62,844 $1,094 $1,259,169
City of Delray Beach (FL) $2,438,138 $2,130,266 $2,138,785 $557,929 $967,765 $58,771 $1,635,293 $188,199 $10,115,146
City of St. Cloud (MN) $1,069,627 $2,823,069 $1,239,205 $266,269 $697,356 $156,990 $744,220 $92,250 $7,088,986
City of Portland (ME) $3,876,532 $16,086,669 $1,546,966 $1,013,120 $3,052,631 $403,606 $2,590,952 $457,789 $29,028,265
City of Jackson (TN) $354,792 $806,463 $185,844 $303,659 $248,066 $48,864 $103,179 $1,543 $2,052,410
City of Walnut Creek (CA) $2,233,460 $14,515,576 $487,050 $702,972 $1,576,594 $192,011 $476,837 $247,638 $20,432,138
Greene County (TN) $768,950 $622,163 $418,409 $51,971 $270,012 $15,283 $90,612 $4,070 $2,241,470
City of Flagstaff (AZ) $3,269,492 $9,741,339 $10,858,427 $2,091,753 $5,490,748 $108,159 $6,377,283 $192,597 $38,129,798
City of Missoula (MT) $9,583,584 $22,875,774 $4,919,120 $2,456,334 $4,373,190 $301,409 $6,659,953 $594,754 $51,764,118
City of Fort Myers (FL) $5,681,473 $17,191,519 $5,355,597 $3,184,250 $2,337,045 $200,013 $1,944,458 $139,541 $36,033,896
Putnam County (TN) $31,682 $249,900 $11,802 $19,963 $28,677 $9,237 $12,265 $1,937 $365,463
Monroe County (FL) $8,896,749 $22,343,912 $6,576,564 $4,252,166 $6,147,833 $591,524 $8,238,468 $830,329 $57,877,545
City of Lynchburg (VA) $595,630 $1,845,670 $862,593 $378,693 $278,536 $40,460 $202,940 $3,300 $4,207,822
City of Duluth (MN) $763,473 $8,830,341 $4,368,936 $417,478 $3,008,335 $246,188 $3,888,844 $211,383 $21,734,978
City of Fishers (IN) $3,074,952 $4,833,254 $1,190,233 $943,038 $569,087 $276,319 $488,964 $30,949 $11,406,796
City of Carmel (IN) $1,121,456 $3,001,207 $515,733 $594,113 $411,977 $48,520 $1,252,537 $6,352 $6,951,895
City of Sugar Land (TX) $94,499 $201,736 $48,808 $60,527 $49,384 $8,364 $58,471 $2,172 $523,961
ALL CULTURAL AUDIENCES (Both Residents and Non-Residents)
SOURCE: Arts and Economic Prosperity 5, Americans for the Arts, 2017. For more information, visit www.AmericansForTheArts.org/EconomicImpact. B–286

Table 20:Total Categorized Audience Expenditures by All Attendees toNonprofit Arts and Cultural Events Per Study Region During 2015
Population Cohort Group B TOTAL
Population 50,000 to 99,999 Refreshments Meals/Drinks Retail/Gifts Clothing and Local Overnight Other/ Audience
Sample Size = 38 and/or Snacks (before/after) and Souvenirs Accessories Transportation Child Care Lodging Miscellaneous Expenditures
City of Asheville (NC) $2,601,859 $13,719,062 $7,192,018 $1,850,823 $3,525,998 $379,124 $9,696,093 $149,627 $39,114,604
Buchanan County (MO) $2,720,628 $3,782,000 $1,871,558 $542,955 $812,325 $37,717 $964,723 $246,363 $10,978,269
City of Boca Raton (FL) $993,474 $3,467,540 $1,877,698 $682,467 $1,066,697 $150,796 $2,305,193 $514,026 $11,057,891
City of Miami Beach (FL) $9,158,760 $40,674,855 $1,656,138 $5,144,879 $9,270,798 $637,925 $8,283,006 $307,789 $75,134,150
Moore County (NC) $921,573 $3,197,550 $976,017 $545,650 $473,153 $53,685 $221,656 -$1 $6,389,283
Sevier County (TN) $5,657,549 $10,009,216 $6,883,801 $1,980,913 $3,579,785 $32,194 $13,814,512 $165,698 $42,123,668
Cape May County (NJ) $1,213,977 $5,024,162 $1,734,690 $396,454 $739,672 $141,528 $5,584,188 $186,579 $15,021,250
Cleveland County (NC) $524,888 $1,081,409 $836,328 $173,037 $289,035 $8,705 $385,127 $68,929 $3,367,458
Group B Average $2,437,177 $7,432,377 $2,523,946 $1,052,729 $1,738,862 $179,165 $2,526,887 $187,141 $18,078,285
Percent of Group B Total 13.5% 41.1% 14.0% 5.8% 9.6% 1.0% 14.0% 1.0% 100.0%
Group B Median $1,095,542 $3,332,545 $1,292,216 $544,303 $719,753 $111,794 $1,038,347 $93,165 $10,546,708
ALL CULTURAL AUDIENCES (Both Residents and Non-Residents)
SOURCE: Arts and Economic Prosperity 5, Americans for the Arts, 2017. For more information, visit www.AmericansForTheArts.org/EconomicImpact. B–287
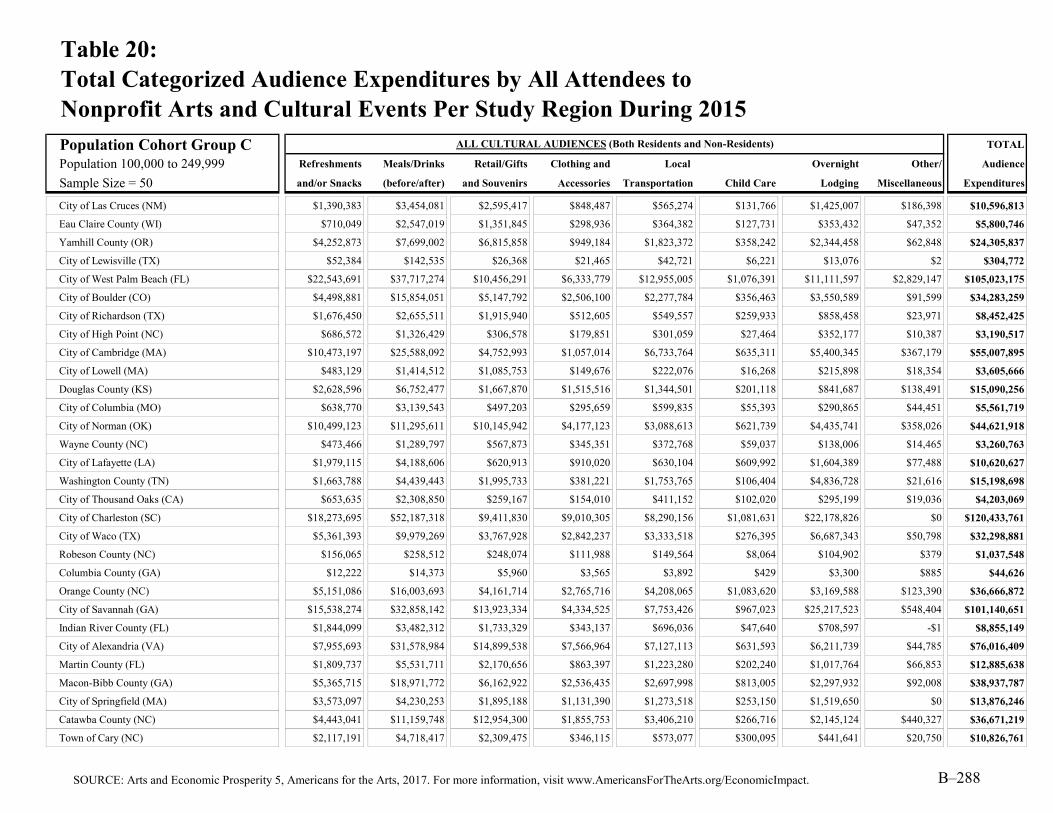
Table 20:Total Categorized Audience Expenditures by All Attendees toNonprofit Arts and Cultural Events Per Study Region During 2015
Population Cohort Group C TOTAL
Population 100,000 to 249,999 Refreshments Meals/Drinks Retail/Gifts Clothing and Local Overnight Other/ Audience
Sample Size = 50 and/or Snacks (before/after) and Souvenirs Accessories Transportation Child Care Lodging Miscellaneous Expenditures
City of Las Cruces (NM) $1,390,383 $3,454,081 $2,595,417 $848,487 $565,274 $131,766 $1,425,007 $186,398 $10,596,813
Eau Claire County (WI) $710,049 $2,547,019 $1,351,845 $298,936 $364,382 $127,731 $353,432 $47,352 $5,800,746
Yamhill County (OR) $4,252,873 $7,699,002 $6,815,858 $949,184 $1,823,372 $358,242 $2,344,458 $62,848 $24,305,837
City of Lewisville (TX) $52,384 $142,535 $26,368 $21,465 $42,721 $6,221 $13,076 $2 $304,772
City of West Palm Beach (FL) $22,543,691 $37,717,274 $10,456,291 $6,333,779 $12,955,005 $1,076,391 $11,111,597 $2,829,147 $105,023,175
City of Boulder (CO) $4,498,881 $15,854,051 $5,147,792 $2,506,100 $2,277,784 $356,463 $3,550,589 $91,599 $34,283,259
City of Richardson (TX) $1,676,450 $2,655,511 $1,915,940 $512,605 $549,557 $259,933 $858,458 $23,971 $8,452,425
City of High Point (NC) $686,572 $1,326,429 $306,578 $179,851 $301,059 $27,464 $352,177 $10,387 $3,190,517
City of Cambridge (MA) $10,473,197 $25,588,092 $4,752,993 $1,057,014 $6,733,764 $635,311 $5,400,345 $367,179 $55,007,895
City of Lowell (MA) $483,129 $1,414,512 $1,085,753 $149,676 $222,076 $16,268 $215,898 $18,354 $3,605,666
Douglas County (KS) $2,628,596 $6,752,477 $1,667,870 $1,515,516 $1,344,501 $201,118 $841,687 $138,491 $15,090,256
City of Columbia (MO) $638,770 $3,139,543 $497,203 $295,659 $599,835 $55,393 $290,865 $44,451 $5,561,719
City of Norman (OK) $10,499,123 $11,295,611 $10,145,942 $4,177,123 $3,088,613 $621,739 $4,435,741 $358,026 $44,621,918
Wayne County (NC) $473,466 $1,289,797 $567,873 $345,351 $372,768 $59,037 $138,006 $14,465 $3,260,763
City of Lafayette (LA) $1,979,115 $4,188,606 $620,913 $910,020 $630,104 $609,992 $1,604,389 $77,488 $10,620,627
Washington County (TN) $1,663,788 $4,439,443 $1,995,733 $381,221 $1,753,765 $106,404 $4,836,728 $21,616 $15,198,698
City of Thousand Oaks (CA) $653,635 $2,308,850 $259,167 $154,010 $411,152 $102,020 $295,199 $19,036 $4,203,069
City of Charleston (SC) $18,273,695 $52,187,318 $9,411,830 $9,010,305 $8,290,156 $1,081,631 $22,178,826 $0 $120,433,761
City of Waco (TX) $5,361,393 $9,979,269 $3,767,928 $2,842,237 $3,333,518 $276,395 $6,687,343 $50,798 $32,298,881
Robeson County (NC) $156,065 $258,512 $248,074 $111,988 $149,564 $8,064 $104,902 $379 $1,037,548
Columbia County (GA) $12,222 $14,373 $5,960 $3,565 $3,892 $429 $3,300 $885 $44,626
Orange County (NC) $5,151,086 $16,003,693 $4,161,714 $2,765,716 $4,208,065 $1,083,620 $3,169,588 $123,390 $36,666,872
City of Savannah (GA) $15,538,274 $32,858,142 $13,923,334 $4,334,525 $7,753,426 $967,023 $25,217,523 $548,404 $101,140,651
Indian River County (FL) $1,844,099 $3,482,312 $1,733,329 $343,137 $696,036 $47,640 $708,597 -$1 $8,855,149
City of Alexandria (VA) $7,955,693 $31,578,984 $14,899,538 $7,566,964 $7,127,113 $631,593 $6,211,739 $44,785 $76,016,409
Martin County (FL) $1,809,737 $5,531,711 $2,170,656 $863,397 $1,223,280 $202,240 $1,017,764 $66,853 $12,885,638
Macon-Bibb County (GA) $5,365,715 $18,971,772 $6,162,922 $2,536,435 $2,697,998 $813,005 $2,297,932 $92,008 $38,937,787
City of Springfield (MA) $3,573,097 $4,230,253 $1,895,188 $1,131,390 $1,273,518 $253,150 $1,519,650 $0 $13,876,246
Catawba County (NC) $4,443,041 $11,159,748 $12,954,300 $1,855,753 $3,406,210 $266,716 $2,145,124 $440,327 $36,671,219
Town of Cary (NC) $2,117,191 $4,718,417 $2,309,475 $346,115 $573,077 $300,095 $441,641 $20,750 $10,826,761
ALL CULTURAL AUDIENCES (Both Residents and Non-Residents)
SOURCE: Arts and Economic Prosperity 5, Americans for the Arts, 2017. For more information, visit www.AmericansForTheArts.org/EconomicImpact. B–288

Table 20:Total Categorized Audience Expenditures by All Attendees toNonprofit Arts and Cultural Events Per Study Region During 2015
Population Cohort Group C TOTAL
Population 100,000 to 249,999 Refreshments Meals/Drinks Retail/Gifts Clothing and Local Overnight Other/ Audience
Sample Size = 50 and/or Snacks (before/after) and Souvenirs Accessories Transportation Child Care Lodging Miscellaneous Expenditures
Alamance County (NC) $561,177 $1,917,322 $1,390,984 $244,822 $469,242 $34,568 $198,191 $121,047 $4,937,353
Cumberland County (NJ) $738,479 $1,791,168 $2,472,162 $144,977 $724,714 $83,982 $1,140,361 $100,631 $7,196,474
City of Eugene (OR) $3,550,261 $10,818,973 $2,093,881 $938,125 $1,736,366 $210,309 $1,379,993 $695,379 $21,423,287
Middlesex County (CT) $1,649,683 $5,118,799 $719,314 $610,129 $507,115 $624,847 $1,589,668 $297,766 $11,117,321
City of Springfield (MO) $1,924,470 $7,855,722 $3,107,038 $1,476,095 $1,565,925 $263,118 $894,745 $0 $17,087,113
City of Sioux Falls (SD) $10,502,827 $44,287,912 $4,139,433 $4,844,636 $7,815,889 $805,456 $9,554,784 $2,487,661 $84,438,598
Pitt County (NC) $791,849 $2,304,876 $656,040 $383,408 $439,044 $125,887 $692,905 $27,991 $5,422,000
City of Providence (RI) $16,455,812 $62,544,680 $8,134,595 $6,205,393 $8,808,125 $6,759,885 $3,025,129 $14,592 $111,948,211
City of Worcester (MA) $11,465,210 $25,553,121 $12,922,115 $2,448,147 $5,353,090 $1,189,558 $1,768,530 $486,087 $61,185,858
Montgomery County (TN) $250,698 $574,865 $574,245 $165,641 $192,500 $68,115 $208,448 $6,837 $2,041,349
Salt Lake City (UT) $36,299,293 $78,726,212 $22,726,094 $12,199,322 $19,454,237 $3,291,239 $18,346,404 $3,077,352 $194,120,153
Cabarrus County (NC) $521,934 $2,887,417 $477,897 $145,824 $312,066 $39,275 $281,850 $11,139 $4,677,402
Richmond County (GA) $3,772,210 $8,241,155 $2,762,870 $1,752,419 $1,780,204 $515,428 $1,066,000 $51,148 $19,941,434
City of Tacoma (WA) $7,502,225 $32,822,398 $6,975,056 $3,807,446 $7,761,890 $884,634 $2,318,224 $493,598 $62,565,471
Doña Ana County (NM) $2,649,127 $6,692,922 $4,819,883 $1,748,556 $1,090,811 $272,297 $2,584,195 $333,355 $20,191,146
New Hanover County (NC) $5,902,050 $23,690,930 $1,426,446 $3,093,490 $3,974,811 $822,964 $2,052,997 $0 $40,963,688
Arlington County (VA) $3,014,933 $9,888,903 $1,905,087 $830,012 $1,408,614 $149,942 $1,235,932 $42,796 $18,476,219
City of Irving (TX) $132,939 $684,410 $54,016 $74,452 $158,558 $4,088 $147,853 $4,657 $1,260,973
City of Reno (NV) $8,779,024 $16,832,108 $2,788,508 $2,230,772 $3,091,848 $388,356 $3,998,801 $786,255 $38,895,672
York County (SC) $1,956,569 $4,446,631 $1,964,951 $2,404,883 $1,371,034 $284,057 $1,190,571 $137,309 $13,756,005
Group C Average $5,106,524 $13,409,357 $4,119,288 $2,001,921 $2,855,753 $550,022 $3,268,943 $297,500 $31,609,309
Percent of Group C Total 16.2% 42.4% 13.0% 6.3% 9.0% 1.7% 10.3% 0.9% 100.0%
Group C Median $2,372,894 $6,112,317 $2,132,269 $943,655 $1,357,768 $264,917 $1,402,500 $50,973 $15,144,477
ALL CULTURAL AUDIENCES (Both Residents and Non-Residents)
SOURCE: Arts and Economic Prosperity 5, Americans for the Arts, 2017. For more information, visit www.AmericansForTheArts.org/EconomicImpact. B–289
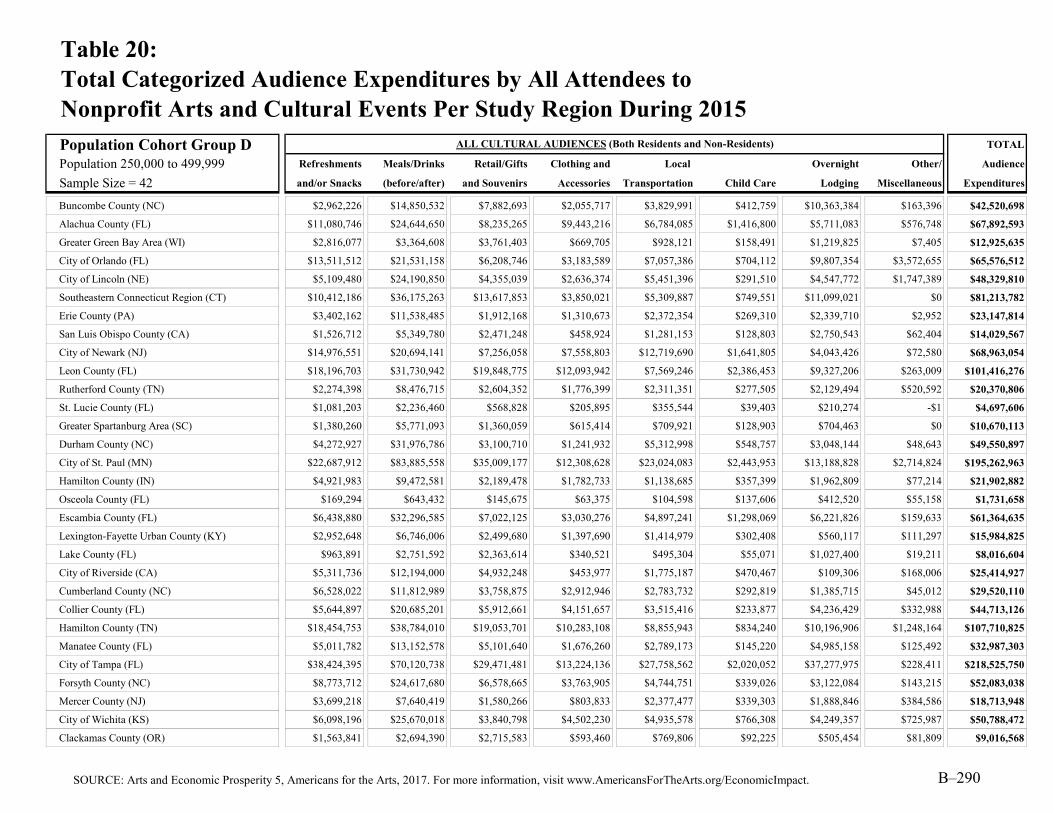
Table 20:Total Categorized Audience Expenditures by All Attendees toNonprofit Arts and Cultural Events Per Study Region During 2015
Population Cohort Group D TOTAL
Population 250,000 to 499,999 Refreshments Meals/Drinks Retail/Gifts Clothing and Local Overnight Other/ Audience
Sample Size = 42 and/or Snacks (before/after) and Souvenirs Accessories Transportation Child Care Lodging Miscellaneous Expenditures
Buncombe County (NC) $2,962,226 $14,850,532 $7,882,693 $2,055,717 $3,829,991 $412,759 $10,363,384 $163,396 $42,520,698
Alachua County (FL) $11,080,746 $24,644,650 $8,235,265 $9,443,216 $6,784,085 $1,416,800 $5,711,083 $576,748 $67,892,593
Greater Green Bay Area (WI) $2,816,077 $3,364,608 $3,761,403 $669,705 $928,121 $158,491 $1,219,825 $7,405 $12,925,635
City of Orlando (FL) $13,511,512 $21,531,158 $6,208,746 $3,183,589 $7,057,386 $704,112 $9,807,354 $3,572,655 $65,576,512
City of Lincoln (NE) $5,109,480 $24,190,850 $4,355,039 $2,636,374 $5,451,396 $291,510 $4,547,772 $1,747,389 $48,329,810
Southeastern Connecticut Region (CT) $10,412,186 $36,175,263 $13,617,853 $3,850,021 $5,309,887 $749,551 $11,099,021 $0 $81,213,782
Erie County (PA) $3,402,162 $11,538,485 $1,912,168 $1,310,673 $2,372,354 $269,310 $2,339,710 $2,952 $23,147,814
San Luis Obispo County (CA) $1,526,712 $5,349,780 $2,471,248 $458,924 $1,281,153 $128,803 $2,750,543 $62,404 $14,029,567
City of Newark (NJ) $14,976,551 $20,694,141 $7,256,058 $7,558,803 $12,719,690 $1,641,805 $4,043,426 $72,580 $68,963,054
Leon County (FL) $18,196,703 $31,730,942 $19,848,775 $12,093,942 $7,569,246 $2,386,453 $9,327,206 $263,009 $101,416,276
Rutherford County (TN) $2,274,398 $8,476,715 $2,604,352 $1,776,399 $2,311,351 $277,505 $2,129,494 $520,592 $20,370,806
St. Lucie County (FL) $1,081,203 $2,236,460 $568,828 $205,895 $355,544 $39,403 $210,274 -$1 $4,697,606
Greater Spartanburg Area (SC) $1,380,260 $5,771,093 $1,360,059 $615,414 $709,921 $128,903 $704,463 $0 $10,670,113
Durham County (NC) $4,272,927 $31,976,786 $3,100,710 $1,241,932 $5,312,998 $548,757 $3,048,144 $48,643 $49,550,897
City of St. Paul (MN) $22,687,912 $83,885,558 $35,009,177 $12,308,628 $23,024,083 $2,443,953 $13,188,828 $2,714,824 $195,262,963
Hamilton County (IN) $4,921,983 $9,472,581 $2,189,478 $1,782,733 $1,138,685 $357,399 $1,962,809 $77,214 $21,902,882
Osceola County (FL) $169,294 $643,432 $145,675 $63,375 $104,598 $137,606 $412,520 $55,158 $1,731,658
Escambia County (FL) $6,438,880 $32,296,585 $7,022,125 $3,030,276 $4,897,241 $1,298,069 $6,221,826 $159,633 $61,364,635
Lexington-Fayette Urban County (KY) $2,952,648 $6,746,006 $2,499,680 $1,397,690 $1,414,979 $302,408 $560,117 $111,297 $15,984,825
Lake County (FL) $963,891 $2,751,592 $2,363,614 $340,521 $495,304 $55,071 $1,027,400 $19,211 $8,016,604
City of Riverside (CA) $5,311,736 $12,194,000 $4,932,248 $453,977 $1,775,187 $470,467 $109,306 $168,006 $25,414,927
Cumberland County (NC) $6,528,022 $11,812,989 $3,758,875 $2,912,946 $2,783,732 $292,819 $1,385,715 $45,012 $29,520,110
Collier County (FL) $5,644,897 $20,685,201 $5,912,661 $4,151,657 $3,515,416 $233,877 $4,236,429 $332,988 $44,713,126
Hamilton County (TN) $18,454,753 $38,784,010 $19,053,701 $10,283,108 $8,855,943 $834,240 $10,196,906 $1,248,164 $107,710,825
Manatee County (FL) $5,011,782 $13,152,578 $5,101,640 $1,676,260 $2,789,173 $145,220 $4,985,158 $125,492 $32,987,303
City of Tampa (FL) $38,424,395 $70,120,738 $29,471,481 $13,224,136 $27,758,562 $2,020,052 $37,277,975 $228,411 $218,525,750
Forsyth County (NC) $8,773,712 $24,617,680 $6,578,665 $3,763,905 $4,744,751 $339,026 $3,122,084 $143,215 $52,083,038
Mercer County (NJ) $3,699,218 $7,640,419 $1,580,266 $803,833 $2,377,477 $339,303 $1,888,846 $384,586 $18,713,948
City of Wichita (KS) $6,098,196 $25,670,018 $3,840,798 $4,502,230 $4,935,578 $766,308 $4,249,357 $725,987 $50,788,472
Clackamas County (OR) $1,563,841 $2,694,390 $2,715,583 $593,460 $769,806 $92,225 $505,454 $81,809 $9,016,568
ALL CULTURAL AUDIENCES (Both Residents and Non-Residents)
SOURCE: Arts and Economic Prosperity 5, Americans for the Arts, 2017. For more information, visit www.AmericansForTheArts.org/EconomicImpact. B–290

Table 20:Total Categorized Audience Expenditures by All Attendees toNonprofit Arts and Cultural Events Per Study Region During 2015
Population Cohort Group D TOTAL
Population 250,000 to 499,999 Refreshments Meals/Drinks Retail/Gifts Clothing and Local Overnight Other/ Audience
Sample Size = 42 and/or Snacks (before/after) and Souvenirs Accessories Transportation Child Care Lodging Miscellaneous Expenditures
Sarasota County (FL) $9,149,520 $49,123,092 $3,417,659 $7,964,943 $6,651,986 $396,293 $16,003,210 $782,818 $93,489,521
City of Minneapolis (MN) $25,246,695 $93,346,320 $38,957,574 $13,696,817 $25,620,780 $2,719,586 $14,676,287 $3,021,008 $217,285,067
Berks County (PA) $1,518,941 $3,289,999 $830,283 $332,566 $571,330 $25,090 $1,470,035 $101,803 $8,140,047
City of Miami (FL) $55,619,833 $92,428,269 $20,146,493 $22,728,051 $42,086,042 $4,725,470 $24,303,205 $559,523 $262,596,886
City of Raleigh (NC) $47,109,793 $146,222,300 $32,522,919 $24,095,569 $43,765,074 $9,074,482 $55,229,582 $5,968,436 $363,988,155
Santa Barbara County (CA) $9,373,961 $31,672,757 $3,391,631 $6,143,621 $6,935,547 $1,528,792 $12,790,153 $459,314 $72,295,776
Seminole County (FL) $1,799,045 $4,316,275 $297,349 $277,017 $797,642 $192,993 $566,771 $59,123 $8,306,215
City of Virginia Beach (VA) $5,607,604 $39,041,928 $3,467,068 $2,756,020 $3,679,345 $1,137,688 $5,572,703 $539,794 $61,802,150
City of Atlanta (GA) $18,866,815 $96,668,016 $25,294,010 $10,126,802 $28,183,329 $6,850,649 $43,024,004 $3,642,800 $232,656,425
City of Mesa (AZ) $2,450,731 $4,707,923 $2,416,556 $615,507 $953,441 $225,626 $1,307,420 $106,338 $12,783,542
City of Kansas City (MO) $11,393,633 $41,426,125 $4,824,432 $7,392,282 $9,543,829 $1,070,038 $6,600,014 $254,888 $82,505,241
Morris County (NJ) $2,550,502 $7,806,089 $2,354,300 $648,685 $1,520,763 $227,385 $664,692 $256,572 $16,028,988
Group D Average $10,031,795 $28,946,389 $8,411,408 $4,884,934 $7,706,732 $1,129,912 $8,115,250 $700,267 $69,926,686
Percent of Group D Total 14.3% 41.4% 12.0% 7.0% 11.0% 1.6% 11.6% 1.0% 100.0%
Group D Median $5,459,670 $20,689,671 $3,801,101 $2,696,197 $3,754,668 $376,846 $4,139,928 $165,701 $46,521,468
ALL CULTURAL AUDIENCES (Both Residents and Non-Residents)
SOURCE: Arts and Economic Prosperity 5, Americans for the Arts, 2017. For more information, visit www.AmericansForTheArts.org/EconomicImpact. B–291

Table 20:Total Categorized Audience Expenditures by All Attendees toNonprofit Arts and Cultural Events Per Study Region During 2015
Population Cohort Group E TOTAL
Population 500,000 to 999,999 Refreshments Meals/Drinks Retail/Gifts Clothing and Local Overnight Other/ Audience
Sample Size = 25 and/or Snacks (before/after) and Souvenirs Accessories Transportation Child Care Lodging Miscellaneous Expenditures
Sonoma County (CA) $7,370,059 $17,115,050 $1,905,809 $1,396,775 $3,313,330 $594,030 $3,396,869 $198,393 $35,290,315
Volusia County (FL) $4,742,239 $10,282,626 $4,361,991 $7,295,778 $4,326,332 $654,173 $3,222,396 $129,705 $35,015,240
Guilford County (NC) $16,110,963 $40,329,789 $10,397,635 $6,783,239 $10,067,664 $1,616,464 $9,190,850 $675,263 $95,171,867
Dane County (WI) $26,931,518 $45,327,522 $11,510,255 $4,406,130 $10,807,615 $930,617 $3,579,023 $668,905 $104,161,585
Brevard County (FL) $450,274 $1,583,131 $770,566 $141,303 $388,639 $16,297 $136,768 $18,249 $3,505,227
Washington County (OR) $1,053,290 $4,143,872 $308,345 $377,000 $797,680 $173,618 $415,311 $3,633 $7,272,749
Johnson County (KS) $1,603,039 $5,396,115 $1,769,396 $288,258 $877,253 $143,555 $325,576 $35,795 $10,438,987
City of Louisville (KY) $28,583,014 $134,219,814 $7,967,789 $11,226,829 $33,502,912 $4,681,700 $17,464,933 $299,193 $237,946,184
City of Baltimore (MD) $48,106,660 $124,520,071 $32,909,449 $13,039,786 $29,452,845 $4,832,792 $21,096,113 $5,717,544 $279,675,260
Polk County (FL) $3,944,925 $9,904,288 $6,860,930 $2,175,704 $3,444,295 $356,674 $3,950,922 $161,677 $30,799,415
City of Boston (MA) $85,067,458 $254,562,357 $36,477,775 $37,581,412 $93,980,847 $10,510,307 $71,216,580 $852,313 $590,249,049
District of Columbia (DC) $168,942,464 $594,255,656 $53,463,597 $66,618,751 $179,378,143 $13,998,489 $170,269,488 $5,110,770 $1,252,037,358
Nashville-Davidson County (TN) $39,849,870 $73,979,593 $48,589,700 $18,846,195 $26,906,308 $1,654,462 $37,654,794 $3,079,635 $250,560,557
City of El Paso (TX) $10,316,614 $13,928,661 $8,842,023 $3,073,385 $4,519,069 $804,596 $1,894,437 $89,990 $43,468,775
Lee County (FL) $15,331,974 $47,468,175 $18,282,110 $9,456,062 $7,190,096 $519,547 $7,502,158 $367,242 $106,117,364
City of Fort Worth (TX) $30,776,235 $80,058,257 $16,434,882 $10,485,072 $20,730,782 $2,362,491 $32,146,287 $1,660,559 $194,654,565
City of Indianapolis (IN) $27,463,842 $105,134,855 $26,285,435 $10,250,445 $22,422,537 $2,842,804 $17,760,916 $1,075,784 $213,236,618
City and County of San Francisco (CA) $91,438,518 $266,042,003 $45,627,497 $31,224,005 $103,281,417 $6,482,009 $118,748,598 $4,896,463 $667,740,510
Prince George's County (MD) $7,481,928 $9,030,121 $6,725,125 $4,105,319 $3,816,913 $654,613 $2,142,326 $954,166 $34,910,511
Pinellas County (FL) $18,064,194 $59,142,537 $24,526,976 $8,769,894 $13,517,865 $1,087,366 $15,401,222 $271,928 $140,781,982
Shelby County (TN) $14,732,296 $29,495,381 $7,640,679 $9,652,193 $7,871,594 $1,395,745 $7,712,523 $631,164 $79,131,575
Fairfield County (CT) $9,541,067 $40,230,415 $24,539,457 $3,504,684 $4,707,390 $1,040,431 $3,054,918 -$2 $86,618,360
Westchester County (NY) $5,396,529 $39,835,214 $4,812,737 $3,778,412 $7,681,665 $1,254,179 $2,529,044 $401,943 $65,689,723
Fulton County (GA) $19,341,293 $98,073,743 $25,702,369 $10,500,597 $28,550,879 $6,970,258 $43,384,694 $3,708,793 $236,232,626
Wake County (NC) $49,702,560 $152,236,035 $35,200,271 $24,645,701 $44,674,520 $9,461,510 $56,058,680 $6,028,931 $378,008,208
Group E Average $29,293,713 $90,251,811 $18,476,512 $11,984,917 $26,648,344 $3,001,549 $26,010,217 $1,481,521 $207,148,584
Percent of Group E Total 14.1% 43.6% 8.9% 5.8% 12.9% 1.4% 12.6% 0.7% 100.0%
Group E Median $16,110,963 $45,327,522 $11,510,255 $8,769,894 $10,067,664 $1,254,179 $7,712,523 $631,164 $104,161,585
ALL CULTURAL AUDIENCES (Both Residents and Non-Residents)
SOURCE: Arts and Economic Prosperity 5, Americans for the Arts, 2017. For more information, visit www.AmericansForTheArts.org/EconomicImpact. B–292

Table 20:Total Categorized Audience Expenditures by All Attendees toNonprofit Arts and Cultural Events Per Study Region During 2015
Population Cohort Group F TOTAL
Population 1,000,000 or More Refreshments Meals/Drinks Retail/Gifts Clothing and Local Overnight Other/ Audience
Sample Size = 21 and/or Snacks (before/after) and Souvenirs Accessories Transportation Child Care Lodging Miscellaneous Expenditures
Mecklenburg County (NC) $14,496,272 $52,238,182 $3,843,994 $7,033,942 $9,603,768 $2,973,435 $14,654,276 $141,899 $104,985,768
City of San José (CA) $19,321,006 $38,764,947 $11,532,759 $7,598,837 $19,644,747 $4,038,037 $16,594,853 $251,740 $117,746,926
Montgomery County (MD) $8,578,721 $43,243,836 $7,802,996 $3,110,703 $8,787,687 $2,487,272 $3,813,177 $287,108 $78,111,500
Fairfax County (VA) $21,285,546 $48,710,256 $9,364,173 $4,735,844 $9,914,796 $1,661,763 $2,434,614 $82,323 $98,189,315
Allegheny County (PA) $49,265,093 $240,253,908 $63,236,660 $26,391,569 $57,543,430 $5,915,237 $57,359,667 $9,544,701 $509,510,265
Greater Columbus Area (OH) $31,631,045 $92,126,277 $20,036,013 $5,882,612 $16,845,497 $3,998,936 $18,946,778 $314,858 $189,782,016
Orange County (FL) $18,788,830 $41,702,686 $9,518,358 $6,330,624 $12,437,891 $1,124,512 $16,098,077 $4,251,261 $110,252,239
City of Dallas (TX) $49,272,111 $112,978,514 $15,916,596 $12,378,006 $30,719,190 $5,755,313 $32,497,582 $183,912 $259,701,224
Hillsborough County (FL) $45,578,553 $82,662,650 $34,848,167 $16,306,927 $32,445,490 $2,424,398 $43,435,764 $285,775 $257,987,724
City of San Diego (CA) $70,418,643 $173,826,758 $47,767,007 $21,969,826 $62,284,941 $4,048,766 $165,552,345 $502,679 $546,370,965
Palm Beach County (FL) $30,224,350 $57,452,124 $18,921,096 $10,168,397 $18,475,726 $1,519,066 $19,702,117 $4,529,790 $160,992,666
City of San Antonio (TX) $28,546,913 $95,531,178 $40,924,171 $24,401,030 $30,912,946 $3,977,135 $55,100,825 $911,241 $280,305,439
Sacramento County (CA) $16,606,647 $34,130,958 $12,574,647 $3,779,277 $11,387,039 $810,511 $4,546,121 $552,057 $84,387,257
City of Phoenix (AZ) $37,550,261 $78,742,724 $35,556,623 $20,367,366 $29,197,635 $1,864,747 $33,179,588 $717,556 $237,176,500
City and County of Philadelphia (PA) $89,874,731 $288,383,873 $55,426,734 $22,315,666 $105,038,473 $3,711,806 $197,432,511 $2,993,812 $765,177,606
Broward County (FL) $40,216,975 $103,309,304 $20,662,954 $20,730,936 $33,784,038 $4,162,837 $41,139,635 $1,738,134 $265,744,813
Santa Clara County (CA) $22,272,902 $47,078,468 $13,487,398 $9,047,676 $22,865,464 $4,619,460 $19,004,932 $320,859 $138,697,159
Riverside County (CA) $16,122,726 $20,896,678 $14,223,396 $1,464,804 $4,116,110 $794,914 $3,342,205 $236,094 $61,196,927
Miami-Dade County (FL) $105,182,271 $236,351,940 $36,638,271 $47,274,788 $83,869,635 $9,836,772 $57,368,655 $2,076,485 $578,598,817
City of Chicago (IL) $177,607,495 $630,198,111 $113,799,902 $66,772,686 $253,627,923 $22,067,399 $565,235,013 $7,561,709 $1,836,870,238
Harris County (TX) $44,757,726 $253,318,109 $50,948,328 $48,454,535 $76,535,451 $12,073,964 $41,157,380 $1,657,886 $528,903,379
Group F Average $44,647,563 $131,995,309 $30,334,773 $18,405,526 $44,287,518 $4,755,537 $67,076,005 $1,863,899 $343,366,131
Percent of Group F Total 13.0% 38.4% 8.8% 5.4% 12.9% 1.4% 19.5% 0.5% 100.0%
Group F Median $31,631,045 $82,662,650 $20,036,013 $12,378,006 $29,197,635 $3,977,135 $32,497,582 $552,057 $237,176,500
Average $10,912,865 $32,218,909 $8,011,081 $4,637,160 $9,482,931 $1,142,343 $12,043,321 $575,566 $79,024,175
Percent of Total 13.8% 40.8% 10.1% 5.9% 12.0% 1.4% 15.2% 0.7% 100.0%
Median $2,684,878 $7,752,546 $2,443,902 $1,035,067 $1,543,344 $240,033 $2,007,903 $111,661 $18,871,511
ALL CITY/COUNTY STUDY REGIONS
ALL CULTURAL AUDIENCES (Both Residents and Non-Residents)
SOURCE: Arts and Economic Prosperity 5, Americans for the Arts, 2017. For more information, visit www.AmericansForTheArts.org/EconomicImpact. B–293

Table 20:Total Categorized Audience Expenditures by All Attendees toNonprofit Arts and Cultural Events Per Study Region During 2015
Regional Study Regions TOTAL
All Populations Refreshments Meals/Drinks Retail/Gifts Clothing and Local Overnight Other/ Audience
Sample Size = 81 and/or Snacks (before/after) and Souvenirs Accessories Transportation Child Care Lodging Miscellaneous Expenditures
High Peaks Region (ME) $166,108 $332,804 $224,111 $35,693 $112,226 $5,080 $142,188 $3,309 $1,021,519
Wood River Valley (ID) $1,511,044 $4,860,294 $1,969,081 $1,406,377 $1,032,370 $102,391 $2,925,375 $43,055 $13,849,987
Southern Oregon Area $3,881,681 $19,862,383 $5,346,170 $1,533,923 $3,219,158 $38,117 $28,749,680 $447,452 $63,078,564
Southwestern Pennsylvania Area $4,410,405 $14,023,629 $1,843,166 $1,641,305 $3,583,978 $402,931 $1,569,325 $105,676 $27,580,415
Greater Portsmouth Area (NH) $5,215,433 $19,181,152 $3,907,502 $1,034,736 $2,786,063 $654,524 $2,846,335 $959,287 $36,585,032
Northeast Oregon Region $86,247 $177,649 $133,038 $22,085 $47,554 $10,831 $74,752 $4,779 $556,935
Toe River Valley (NC) $308,088 $914,221 $3,176,780 $51,825 $339,065 $19,135 $586,147 $6,523 $5,401,784
Albemarle Region (NC) $607,700 $2,064,893 $629,312 $357,420 $295,597 $37,986 $200,756 $38,189 $4,231,853
Greater Concord Area (NH) $1,446,852 $5,321,477 $1,099,355 $1,255,578 $864,655 $224,341 $2,937,098 $202,460 $13,351,816
North Central Minnesota Region $150,560 $520,694 $188,606 $52,143 $223,982 $12,233 $106,537 $180,632 $1,435,387
Northwest Minnesota Region $59,419 $145,125 $108,160 $15,271 $101,850 $20,659 $24,140 $3,017 $477,641
Monadnock Region (NH) $567,488 $2,898,918 $412,937 $327,746 $461,762 $129,143 $439,684 $42,423 $5,280,101
Bismarck-Mandan Region (ND) $2,405,654 $7,179,669 $4,404,931 $1,577,217 $1,670,104 $578,576 $1,049,146 $261,819 $19,127,116
Greater Minot Region (ND) $516,384 $2,710,438 $218,918 $153,657 $591,520 $46,809 $461,455 $71,429 $4,770,610
Greater Burlington Area (VT) $4,647,673 $14,856,907 $5,801,954 $1,608,805 $2,721,725 $174,919 $4,453,994 $1,772,936 $36,038,913
Greater Charlottesville Area (VA) $8,849,048 $25,194,780 $9,752,205 $1,296,042 $4,617,572 $393,563 $11,023,135 $124,176 $61,250,521
Brainerd Lakes Region (MN) $173,061 $404,064 $33,766 $14,187 $138,319 $34,977 $86,633 $0 $885,007
East Central Minnesota Region $636,430 $1,244,697 $2,158,611 $126,355 $904,064 $45,374 $807,552 $1,342 $5,924,425
Northwest Connecticut Region $1,500,130 $6,889,793 $1,461,856 $352,516 $1,535,547 $105,230 $942,682 $89,922 $12,877,676
Central Oregon Region $3,211,075 $7,969,753 $4,447,081 $1,554,752 $1,920,511 $299,509 $5,118,016 $186,126 $24,706,823
Greater Fargo-Moorhead Area (ND/MN) $2,972,869 $10,864,390 $3,250,829 $2,271,334 $2,392,427 $214,243 $2,489,112 $393,189 $24,848,393
Black Hills Region (SD) $14,493,896 $41,296,918 $12,393,994 $4,577,385 $8,114,169 $1,428,917 $7,709,913 $1,319,107 $91,334,299
Greater Kingsport Area (TN) $2,032,721 $7,985,030 $3,124,741 $2,080,879 $1,842,541 $295,072 $2,479,966 $105,451 $19,946,401
Lake Region (MN) $794,813 $800,037 $1,002,671 $34,520 $395,956 $69,042 $216,212 $25,570 $3,338,821
South Central Minnesota Region $512,293 $3,308,752 $663,555 $430,302 $1,355,769 $196,532 $467,257 $232,231 $7,166,691
Greater Sioux Falls Area (SD) $10,558,470 $44,494,243 $4,159,278 $4,867,052 $7,857,347 $810,060 $9,600,651 $2,498,840 $84,845,941
Southwest Tennessee Development District $535,573 $1,258,415 $290,472 $428,539 $416,085 $63,935 $153,295 $3,698 $3,150,012
Northwest Tennessee Development District $1,565,455 $2,809,061 $1,603,915 $1,907,821 $1,105,675 $194,959 $556,032 $28,503 $9,771,421
Southwest Minnesota Region $246,768 $758,697 $319,908 $134,974 $484,296 $0 $459,347 $12,061 $2,416,051
Arrowhead Region (MN) $706,141 $8,167,243 $4,040,859 $386,128 $2,782,430 $227,701 $3,596,818 $195,510 $20,102,830
ALL CULTURAL AUDIENCES (Both Residents and Non-Residents)
SOURCE: Arts and Economic Prosperity 5, Americans for the Arts, 2017. For more information, visit www.AmericansForTheArts.org/EconomicImpact. B–294

Table 20:Total Categorized Audience Expenditures by All Attendees toNonprofit Arts and Cultural Events Per Study Region During 2015
Regional Study Regions TOTAL
All Populations Refreshments Meals/Drinks Retail/Gifts Clothing and Local Overnight Other/ Audience
Sample Size = 81 and/or Snacks (before/after) and Souvenirs Accessories Transportation Child Care Lodging Miscellaneous Expenditures
Maple Grove and the Northwest Suburbs (MN) $294,500 $1,088,876 $454,436 $159,772 $298,864 $31,724 $171,198 $35,240 $2,534,610
Greater Augusta Area (GA) $3,784,432 $8,255,528 $2,768,830 $1,755,984 $1,784,096 $515,857 $1,069,300 $52,033 $19,986,060
Upper Cumberland Development District (TN) $492,091 $2,003,365 $820,814 $235,219 $545,998 $35,844 $623,739 $20,965 $4,778,035
City of Huntsville/Madison County (AL) $3,529,238 $15,933,663 $6,546,535 $3,713,771 $3,862,552 $258,442 $1,935,070 $278,466 $36,057,737
Northeast Commission (NC) $6,783,026 $16,575,004 $13,954,734 $3,286,027 $3,181,938 $446,122 $8,898,326 $186,509 $53,311,686
Greater Ann Arbor Area (MI) $4,013,001 $22,606,059 $9,253,991 $1,109,720 $4,769,074 $606,056 $7,207,297 $466,432 $50,031,630
Greater Fox Cities Region (WI) $2,739,224 $7,157,876 $2,550,823 $1,893,216 $1,810,411 $216,881 $1,642,677 $268,650 $18,279,758
Central Minnesota Region $1,151,823 $3,040,009 $1,334,432 $286,731 $750,945 $169,054 $801,410 $99,337 $7,633,741
South Central Tennessee Development District $1,758,846 $3,856,862 $2,045,757 $1,009,574 $1,242,719 $188,023 $748,297 $53,155 $10,903,233
Northwest Arkansas Region $10,620,901 $23,731,849 $6,934,739 $2,653,450 $6,935,450 $603,614 $11,828,522 $384,963 $63,693,488
Southeast Minnesota Region $804,831 $5,258,545 $604,488 $561,592 $1,059,414 $17,356 $579,424 $0 $8,885,650
First Tennessee Development District $4,554,307 $13,279,690 $5,640,361 $2,557,562 $3,936,963 $424,121 $7,536,801 $133,377 $38,063,182
Greater Harrisburg Area (PA) $826,121 $3,915,145 $558,975 $525,760 $1,066,110 $101,071 $410,854 $5,748 $7,409,784
Greater New Haven Area (CT) $1,483,355 $10,990,008 $2,930,695 $866,670 $2,631,930 $102,958 $709,946 $106,258 $19,821,820
Treasure Coast Region (FL) $4,735,039 $11,250,483 $4,472,813 $1,412,429 $2,274,860 $289,283 $1,936,635 $66,851 $26,438,393
Greater Des Moines Region (IA) $22,180,210 $39,566,566 $9,073,269 $6,475,494 $10,691,167 $977,450 $23,625,920 $525,533 $113,115,609
Southeast Tennessee Development District $19,597,334 $42,048,513 $20,416,353 $10,910,828 $9,730,003 $1,078,105 $10,936,739 $1,299,158 $116,017,033
Greater Knoxville Region (TN) $19,820,868 $36,218,594 $8,722,319 $3,492,024 $7,390,145 $895,080 $21,135,203 $92,300 $97,766,533
Greater Columbia Area (SC) $9,794,608 $19,353,010 $3,350,660 $2,056,579 $3,221,251 $940,976 $3,343,920 $129,408 $42,190,412
Pikes Peak Region (CO) $19,003,738 $40,796,073 $17,008,992 $5,499,733 $10,177,289 $1,266,113 $7,765,815 $551,088 $102,068,841
Lehigh Valley Region (PA) $13,475,936 $41,503,867 $15,341,978 $5,566,643 $10,111,854 $236,736 $16,281,783 $702,189 $103,220,986
Greater Sarasota/Bradenton Area (FL) $14,161,302 $62,275,670 $8,519,299 $9,641,203 $9,441,159 $541,513 $20,988,368 $908,310 $126,476,824
Dayton Region (OH) $19,838,475 $61,326,535 $8,384,011 $9,211,240 $12,580,257 $993,205 $5,681,422 $511,943 $118,527,088
Richmond & Tri-Cities Region (VA) $24,708,362 $73,398,545 $16,313,116 $9,066,899 $14,060,932 $2,528,264 $6,471,691 $1,843,622 $148,391,431
Memphis Area Association of Governments (TN) $14,752,946 $29,536,691 $7,651,385 $9,665,727 $7,882,628 $1,397,698 $7,723,313 $632,037 $79,242,425
Eastern Region (NC) $5,440,926 $18,749,528 $18,495,592 $3,836,297 $5,525,404 $1,254,610 $3,542,099 $154,673 $56,999,129
Advantage West Region (NC) $13,514,724 $43,967,757 $56,230,033 $6,543,258 $13,460,520 $1,170,712 $29,276,427 $468,052 $164,631,483
Southeast Commission (NC) $13,620,845 $37,843,197 $6,341,515 $6,668,506 $7,491,524 $1,183,393 $3,877,202 $52,429 $77,078,611
Greater Fairfax Area (VA) $23,398,645 $56,334,382 $14,722,916 $7,279,870 $10,747,269 $1,845,618 $3,790,926 $151,415 $118,271,041
Greater Tulsa Region (OK) $18,168,709 $56,799,032 $13,677,828 $6,424,139 $13,402,001 $3,256,665 $25,158,671 $801,968 $137,689,013
ALL CULTURAL AUDIENCES (Both Residents and Non-Residents)
SOURCE: Arts and Economic Prosperity 5, Americans for the Arts, 2017. For more information, visit www.AmericansForTheArts.org/EconomicImpact. B–295

Table 20:Total Categorized Audience Expenditures by All Attendees toNonprofit Arts and Cultural Events Per Study Region During 2015
Regional Study Regions TOTAL
All Populations Refreshments Meals/Drinks Retail/Gifts Clothing and Local Overnight Other/ Audience
Sample Size = 81 and/or Snacks (before/after) and Souvenirs Accessories Transportation Child Care Lodging Miscellaneous Expenditures
East Tennessee Development District $17,887,937 $33,110,103 $20,949,310 $6,645,345 $10,650,471 $919,251 $28,144,254 $320,732 $118,627,403
West Valley Region (AZ) $1,376,762 $4,167,114 $1,833,399 $637,677 $1,054,394 $43,044 $566,938 $115,776 $9,795,104
Greater St. Louis Area (MO) $58,692,385 $100,427,040 $21,962,290 $10,162,540 $17,918,106 $2,117,350 $12,233,942 $3,674,960 $227,188,613
Western New York $30,267,250 $83,582,429 $27,251,013 $10,668,014 $21,768,815 $1,273,803 $18,146,209 $3,167,910 $196,125,443
Greater Oklahoma City Region (OK) $64,450,907 $101,601,049 $60,995,798 $29,274,288 $38,133,887 $4,906,038 $80,819,976 $2,081,099 $382,263,042
Piedmont Triad Partnership (NC) $30,480,723 $80,515,193 $23,256,045 $12,952,002 $18,755,293 $2,441,072 $15,423,649 $1,337,279 $185,161,256
Greater Portland Area (OR) $17,659,575 $54,656,269 $14,523,739 $6,177,273 $11,960,255 $2,058,255 $8,292,131 $654,824 $115,982,321
Greater Kansas City Metropolitan Area (MO/KS) $13,492,631 $48,691,100 $6,867,157 $7,964,151 $10,811,580 $1,259,806 $7,173,264 $301,517 $96,561,206
Greater Nashville Regional Council (TN) $44,461,757 $87,763,963 $54,682,508 $21,972,467 $30,963,821 $2,216,621 $41,838,718 $3,805,479 $287,705,334
Research Triangle Regional Partnership (NC) $60,689,797 $205,622,193 $43,970,642 $29,500,731 $55,142,578 $11,249,225 $62,921,887 $6,241,303 $475,338,356
Greater Tampa/St. Petersburg Area (FL) $63,642,747 $141,805,187 $59,375,143 $25,076,821 $45,963,355 $3,511,764 $58,836,986 $557,703 $398,769,706
Charlotte Regional Partnership (NC) $22,156,811 $73,985,411 $21,891,836 $10,128,885 $15,182,095 $3,510,730 $18,829,641 $837,036 $166,522,445
Charlotte Regional Partnership (NC/SC) $24,113,380 $78,432,042 $23,856,787 $12,533,768 $16,553,129 $3,794,787 $20,020,212 $974,345 $180,278,450
Seven-County Metro Area (MN) $51,414,028 $190,096,579 $79,335,763 $27,893,097 $52,175,840 $5,538,344 $29,887,756 $6,152,178 $442,493,585
Central Florida Region $30,858,498 $71,184,030 $24,318,483 $16,624,322 $21,994,701 $2,537,326 $25,414,854 $4,694,384 $197,626,598
Greater Philadelphia Region (PA) $105,997,773 $335,945,471 $68,282,444 $26,094,917 $121,353,013 $4,526,526 $226,601,149 $3,340,126 $892,141,419
Greater Washington Region (DC/MD/VA) $219,372,384 $744,331,882 $99,519,259 $89,511,619 $211,265,739 $19,767,527 $187,463,588 $6,591,040 $1,577,823,038
Metro Atlanta Area (GA) $25,817,044 $117,259,304 $31,275,714 $15,602,201 $33,567,253 $8,602,695 $48,307,450 $4,609,480 $285,041,141
Greater Atlanta Region (GA) $26,235,301 $118,498,467 $31,635,687 $15,931,706 $33,891,253 $8,708,131 $48,625,401 $4,667,653 $288,193,599
Greater Houston Region (TX) $45,804,378 $257,409,700 $51,803,927 $49,174,729 $77,602,951 $12,221,732 $42,239,073 $1,710,778 $537,967,268
Dallas-Fort Worth-Arlington MSA (TX) $83,503,667 $200,638,870 $35,265,845 $24,052,542 $53,198,004 $8,579,536 $66,720,236 $1,897,733 $473,856,433
Regional Average $17,434,489 $51,813,339 $14,396,818 $7,462,736 $14,023,279 $1,730,776 $16,993,575 $963,878 $124,818,889
Percent of Regional Total 14.0% 41.5% 11.5% 6.0% 11.2% 1.4% 13.6% 0.8% 100.0%
Regional Median $5,215,433 $19,181,152 $5,801,954 $2,271,334 $3,862,552 $515,857 $4,453,994 $261,819 $50,031,630
ALL CULTURAL AUDIENCES (Both Residents and Non-Residents)
SOURCE: Arts and Economic Prosperity 5, Americans for the Arts, 2017. For more information, visit www.AmericansForTheArts.org/EconomicImpact. B–296

Table 20:Total Categorized Audience Expenditures by All Attendees toNonprofit Arts and Cultural Events Per Study Region During 2015
Statewide Study Regions TOTAL
All Populations Refreshments Meals/Drinks Retail/Gifts Clothing and Local Overnight Other/ Audience
Sample Size = 20 and/or Snacks (before/after) and Souvenirs Accessories Transportation Child Care Lodging Miscellaneous Expenditures
State of Vermont $5,583,508 $18,567,396 $6,850,850 $1,919,341 $3,382,261 $220,068 $5,426,816 $2,077,163 $44,027,403
State of North Dakota $6,702,660 $21,372,321 $8,153,989 $4,156,794 $4,851,121 $954,900 $5,841,280 $722,550 $52,755,615
State of Delaware $4,640,462 $18,426,570 $8,734,511 $2,636,312 $4,384,506 $827,779 $6,232,285 $397,083 $46,279,508
State of Maine $8,336,153 $27,188,273 $5,137,144 $2,337,856 $6,045,608 $663,940 $7,410,449 $848,468 $57,967,891
State of Hawai'i $11,724,448 $37,560,456 $4,676,545 $7,506,270 $9,617,964 $1,129,831 $6,748,430 $758,061 $79,722,005
State of Nevada $46,211,808 $96,574,003 $30,164,524 $15,156,934 $26,113,289 $2,470,537 $23,658,085 $4,077,712 $244,426,892
State of Connecticut $32,421,447 $134,272,739 $55,874,146 $11,897,707 $20,942,004 $3,333,366 $22,449,404 $747,208 $281,938,021
State of Oklahoma $85,749,427 $165,310,347 $78,321,511 $37,192,401 $53,540,580 $8,517,754 $109,901,278 $3,047,548 $541,580,846
State of Oregon $41,450,472 $131,248,706 $45,516,037 $13,976,437 $25,375,580 $3,606,883 $58,360,401 $3,422,292 $322,956,808
State of Minnesota $56,650,167 $213,744,442 $89,790,819 $29,935,300 $60,372,865 $6,331,272 $37,033,086 $6,901,878 $500,759,829
State of Wisconsin $49,390,977 $107,792,459 $40,042,396 $14,187,480 $27,527,565 $2,676,120 $35,537,429 $2,786,850 $279,941,276
State of Maryland $72,569,883 $203,445,345 $54,357,023 $23,780,410 $48,293,621 $9,397,925 $30,590,680 $7,738,005 $450,172,892
State of Missouri $90,305,583 $200,576,819 $45,413,473 $25,413,556 $38,828,989 $4,559,293 $25,875,056 $5,132,973 $436,105,742
State of Tennessee $105,606,246 $215,666,663 $114,100,875 $55,333,082 $66,474,363 $6,518,557 $98,261,188 $6,297,104 $668,258,078
State of Massachusetts $137,351,126 $378,407,152 $79,592,897 $49,919,896 $122,623,319 $14,748,031 $94,229,228 $2,724,624 $879,596,273
State of New Jersey $38,243,117 $82,507,651 $28,464,974 $14,525,642 $28,495,312 $3,972,304 $25,659,044 $1,806,092 $223,674,136
State of North Carolina $152,686,852 $477,258,283 $184,140,397 $72,915,706 $118,739,352 $21,255,864 $142,769,231 $9,277,281 $1,179,042,966
State of Pennsylvania $187,392,960 $678,413,297 $158,569,876 $64,909,636 $203,853,661 $12,016,898 $315,414,695 $14,264,581 $1,634,835,604
State of Illinois $219,342,452 $792,279,739 $141,113,352 $85,825,727 $310,943,932 $28,024,263 $666,471,443 $9,016,154 $2,253,017,062
State of Florida $383,915,850 $936,751,881 $264,754,165 $188,295,092 $272,286,017 $30,636,458 $294,488,691 $19,407,919 $2,390,536,073
Statewide Average $86,813,780 $246,868,227 $72,188,475 $36,091,079 $72,634,595 $8,093,102 $100,617,910 $5,072,577 $628,379,746
Percent of Statewide Total 13.8% 39.3% 11.5% 5.7% 11.6% 1.3% 16.0% 0.8% 100.0%
Statewide Median $53,020,572 $149,791,543 $49,936,530 $19,468,672 $33,662,151 $4,265,799 $33,064,055 $3,234,920 $379,531,275
ALL CULTURAL AUDIENCES (Both Residents and Non-Residents)
SOURCE: Arts and Economic Prosperity 5, Americans for the Arts, 2017. For more information, visit www.AmericansForTheArts.org/EconomicImpact. B–297
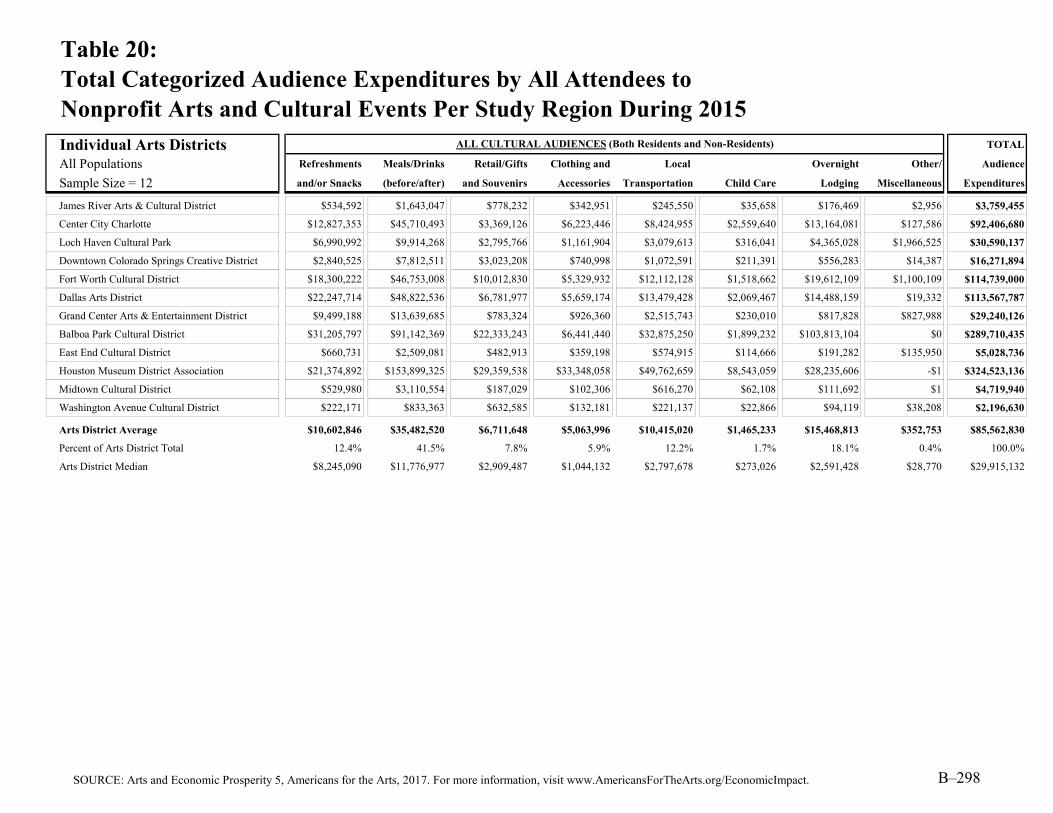
Table 20:Total Categorized Audience Expenditures by All Attendees toNonprofit Arts and Cultural Events Per Study Region During 2015
Individual Arts Districts TOTAL
All Populations Refreshments Meals/Drinks Retail/Gifts Clothing and Local Overnight Other/ Audience
Sample Size = 12 and/or Snacks (before/after) and Souvenirs Accessories Transportation Child Care Lodging Miscellaneous Expenditures
James River Arts & Cultural District $534,592 $1,643,047 $778,232 $342,951 $245,550 $35,658 $176,469 $2,956 $3,759,455
Center City Charlotte $12,827,353 $45,710,493 $3,369,126 $6,223,446 $8,424,955 $2,559,640 $13,164,081 $127,586 $92,406,680
Loch Haven Cultural Park $6,990,992 $9,914,268 $2,795,766 $1,161,904 $3,079,613 $316,041 $4,365,028 $1,966,525 $30,590,137
Downtown Colorado Springs Creative District $2,840,525 $7,812,511 $3,023,208 $740,998 $1,072,591 $211,391 $556,283 $14,387 $16,271,894
Fort Worth Cultural District $18,300,222 $46,753,008 $10,012,830 $5,329,932 $12,112,128 $1,518,662 $19,612,109 $1,100,109 $114,739,000
Dallas Arts District $22,247,714 $48,822,536 $6,781,977 $5,659,174 $13,479,428 $2,069,467 $14,488,159 $19,332 $113,567,787
Grand Center Arts & Entertainment District $9,499,188 $13,639,685 $783,324 $926,360 $2,515,743 $230,010 $817,828 $827,988 $29,240,126
Balboa Park Cultural District $31,205,797 $91,142,369 $22,333,243 $6,441,440 $32,875,250 $1,899,232 $103,813,104 $0 $289,710,435
East End Cultural District $660,731 $2,509,081 $482,913 $359,198 $574,915 $114,666 $191,282 $135,950 $5,028,736
Houston Museum District Association $21,374,892 $153,899,325 $29,359,538 $33,348,058 $49,762,659 $8,543,059 $28,235,606 -$1 $324,523,136
Midtown Cultural District $529,980 $3,110,554 $187,029 $102,306 $616,270 $62,108 $111,692 $1 $4,719,940
Washington Avenue Cultural District $222,171 $833,363 $632,585 $132,181 $221,137 $22,866 $94,119 $38,208 $2,196,630
Arts District Average $10,602,846 $35,482,520 $6,711,648 $5,063,996 $10,415,020 $1,465,233 $15,468,813 $352,753 $85,562,830
Percent of Arts District Total 12.4% 41.5% 7.8% 5.9% 12.2% 1.7% 18.1% 0.4% 100.0%
Arts District Median $8,245,090 $11,776,977 $2,909,487 $1,044,132 $2,797,678 $273,026 $2,591,428 $28,770 $29,915,132
ALL CULTURAL AUDIENCES (Both Residents and Non-Residents)
SOURCE: Arts and Economic Prosperity 5, Americans for the Arts, 2017. For more information, visit www.AmericansForTheArts.org/EconomicImpact. B–298

Explanation of Table 21:Average Per Person Audience Spending by All Attendees toNonprofit Arts and Cultural Events Per Study Region During 2016
Column Two:
Column Three:
Column Four:
Column Five:
Column Six:
Column Seven:
Column Eight:
Column Nine:
Column Ten:
The average dollars spent per person by all arts and culture audience members—both residents and non-residents—on local ground transportation (e.g., gas, parking, taxi fares, tolls, car rentals) for the purpose of attending nonprofit arts and cultural events.
The average dollars spent per person by all arts and culture audience members—both residents and non-residents—on overnight lodging (e.g., hotel, motel, bed-and-breakfast) for the purpose of attending nonprofit arts and cultural events. (The audience-intercept survey instrument requested that respondents limit their response by providing the cost of one night only.)
The average dollars spent per person by all arts and culture audience members—both residents and non-residents—on miscellaneous products and services for the purpose of or as a result of attending nonprofit arts and cultural events.
The average dollars spent per person by all arts and culture audience members—both residents and non-residents—for the purpose of or as a result of attending nonprofit arts and cultural events. This figure is the sum of Column Two through Column Nine.
The average dollars spent per person by all arts and culture audience members—both residents and non-residents—to purchase refreshments (e.g., snacks) while attending nonprofit arts and cultural events.
The average dollars spent per person by all arts and cultureaudience members—both residents and non-residents—on child care for the purpose of attending nonprofit arts and cultural events.
This table presents the average dollars spent per person by all nonprofit arts and culture audiences (both residents and non-residents) as a direct result of their attendance to nonprofit arts and cultural events in each participating study region during 2016. These averages were calculated using the 212,691 audience-intercept surveys that were collected. Summary statistics are calculated for each population group.
The average dollars spent per person by all arts and culture audience members—both residents and non-residents—to purchase food, drinks, and/or meals (e.g., dinner at a restaurant, coffee at a cafe) before or after attending nonprofit arts and cultural events.
The average dollars spent per person by all arts and culture audience members—both residents and non-residents—to purchase souvenirs and/or gifts (e.g., books, recordings, art) as a result of attending nonprofit arts and cultural events.
The average dollars spent per person by all arts and culture audience members—both residents and non-residents—to purchase clothing or accessories for the purpose of attending nonprofit arts and cultural events.
SOURCE: Arts and Economic Prosperity 5, Americans for the Arts, 2017. For more information, visit www.AmericansForTheArts.org/EconomicImpact. B–299

Table 21:Average Per Person Audience Spending by All Attendees toNonprofit Arts and Cultural Events Per Study Region During 2016
Population Cohort Group A Per Person
Population Fewer than 50,000 Refreshments Meals/Drinks Retail/Gifts Clothing and Local Overnight Other/ Audience
Sample Size = 52 and/or Snacks (before/after) and Souvenirs Accessories Transportation Child Care Lodging Miscellaneous Expenditures
Town of Crested Butte (CO) $7.23 $24.24 $3.70 $1.07 $1.11 $2.03 $13.71 $0.33 $53.43
City of Pine City (MN) $2.87 $5.47 $9.29 $0.57 $3.92 $0.19 $3.37 $0.00 $25.68
City of Alva (OK) $0.96 $5.98 $5.47 $1.20 $0.58 $0.20 $1.07 $0.72 $16.18
Cook County (MN) $0.92 $10.33 $5.21 $0.53 $3.23 $0.33 $3.18 $0.26 $23.99
Town of Hillsborough (NC) $2.48 $6.62 $1.35 $1.52 $0.70 $0.44 $0.89 $0.00 $14.00
City of Virginia (MN) $0.92 $10.33 $5.21 $0.53 $3.23 $0.33 $3.18 $0.26 $23.99
Town of Jackson (WY) $8.44 $18.03 $13.60 $2.89 $3.10 $0.81 $7.02 $0.53 $54.42
City of Guthrie (OK) $6.81 $9.55 $5.12 $2.51 $2.30 $0.32 $5.99 $0.00 $32.60
City of Grand Rapids (MN) $0.92 $10.33 $5.21 $0.53 $3.23 $0.33 $3.18 $0.26 $23.99
Town of Medfield (MA) $1.80 $6.32 $2.16 $0.98 $0.27 $0.14 $0.20 $0.48 $12.35
City of Fergus Falls (MN) $3.85 $3.89 $4.92 $0.16 $1.96 $0.33 $1.16 $0.12 $16.39
Grundy County (TN) $6.11 $8.98 $9.62 $2.61 $4.25 $0.04 $5.80 $0.37 $37.79
City of Falls Church (VA) $4.02 $14.35 $10.30 $5.10 $1.54 $0.33 $2.62 $0.13 $38.40
City of Jamestown (ND) $4.29 $7.96 $1.47 $1.54 $2.33 $0.70 $11.37 $0.27 $29.91
City of Waterville (ME) $1.92 $7.96 $1.37 $0.97 $1.50 $0.12 $0.46 $0.30 $14.61
City of Red Wing (MN) $1.09 $7.23 $0.78 $0.78 $1.41 $0.03 $0.73 $0.00 $12.05
City of Durango (CO) $4.51 $14.66 $3.26 $1.62 $2.92 $0.44 $4.89 $0.66 $32.95
City of Hannibal (MO) $4.38 $7.51 $6.65 $1.09 $2.24 $0.11 $2.10 $0.46 $24.52
City of Tullahoma (TN) $0.79 $6.21 $0.75 $2.16 $1.36 $0.45 $0.36 $0.24 $12.33
City of Northfield (MN) $1.09 $7.23 $0.78 $0.78 $1.41 $0.03 $0.73 $0.00 $12.05
Town of Carrboro (NC) $2.17 $9.04 $2.36 $1.75 $1.54 $0.30 $1.58 $0.39 $19.13
Macon County (TN) $1.01 $4.06 $3.40 $0.78 $1.60 $0.07 $0.64 $0.12 $11.68
City of Laguna Beach (CA) $8.13 $19.53 $12.90 $4.58 $4.10 $0.21 $9.36 $0.17 $58.97
Hickman County (TN) $3.25 $6.31 $5.16 $1.63 $3.45 $0.19 $2.15 $0.07 $22.22
City of Fairfax (VA) $2.41 $10.46 $5.10 $0.35 $1.42 $0.40 $1.18 $0.06 $21.38
City of Ponca City (OK) $3.46 $10.74 $6.75 $1.87 $1.60 $0.68 $1.06 $0.11 $26.28
City of Paducah (KY) $7.11 $11.02 $7.79 $1.07 $2.19 $0.06 $8.75 $1.05 $39.03
Mille Lacs County (MN) $2.87 $5.47 $9.29 $0.57 $3.92 $0.19 $3.37 $0.00 $25.68
McNairy County (TN) $1.97 $5.39 $1.25 $1.10 $2.25 $0.07 $0.51 $0.04 $12.58
City of Winona (MN) $1.09 $7.23 $0.78 $0.78 $1.41 $0.03 $0.73 $0.00 $12.05
ALL CULTURAL AUDIENCES (Both Residents and Non-Residents)
SOURCE: Arts and Economic Prosperity 5, Americans for the Arts, 2017. For more information, visit www.AmericansForTheArts.org/EconomicImpact. B–300
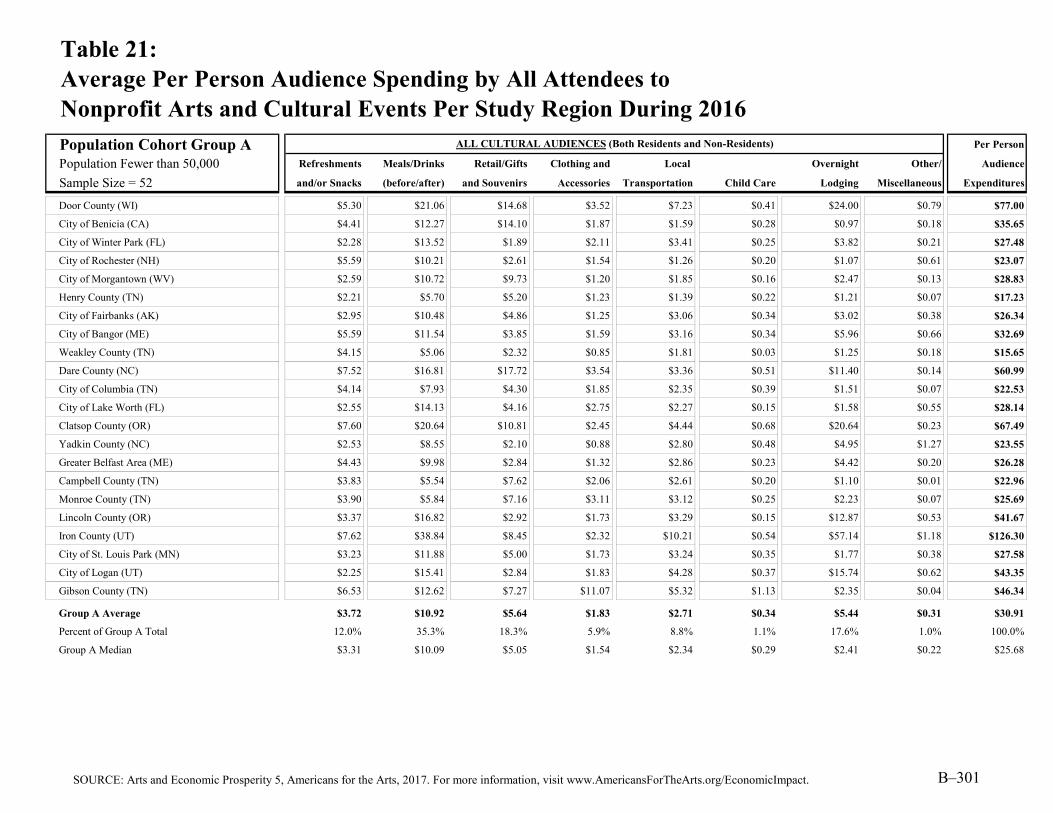
Table 21:Average Per Person Audience Spending by All Attendees toNonprofit Arts and Cultural Events Per Study Region During 2016
Population Cohort Group A Per Person
Population Fewer than 50,000 Refreshments Meals/Drinks Retail/Gifts Clothing and Local Overnight Other/ Audience
Sample Size = 52 and/or Snacks (before/after) and Souvenirs Accessories Transportation Child Care Lodging Miscellaneous Expenditures
Door County (WI) $5.30 $21.06 $14.68 $3.52 $7.23 $0.41 $24.00 $0.79 $77.00
City of Benicia (CA) $4.41 $12.27 $14.10 $1.87 $1.59 $0.28 $0.97 $0.18 $35.65
City of Winter Park (FL) $2.28 $13.52 $1.89 $2.11 $3.41 $0.25 $3.82 $0.21 $27.48
City of Rochester (NH) $5.59 $10.21 $2.61 $1.54 $1.26 $0.20 $1.07 $0.61 $23.07
City of Morgantown (WV) $2.59 $10.72 $9.73 $1.20 $1.85 $0.16 $2.47 $0.13 $28.83
Henry County (TN) $2.21 $5.70 $5.20 $1.23 $1.39 $0.22 $1.21 $0.07 $17.23
City of Fairbanks (AK) $2.95 $10.48 $4.86 $1.25 $3.06 $0.34 $3.02 $0.38 $26.34
City of Bangor (ME) $5.59 $11.54 $3.85 $1.59 $3.16 $0.34 $5.96 $0.66 $32.69
Weakley County (TN) $4.15 $5.06 $2.32 $0.85 $1.81 $0.03 $1.25 $0.18 $15.65
Dare County (NC) $7.52 $16.81 $17.72 $3.54 $3.36 $0.51 $11.40 $0.14 $60.99
City of Columbia (TN) $4.14 $7.93 $4.30 $1.85 $2.35 $0.39 $1.51 $0.07 $22.53
City of Lake Worth (FL) $2.55 $14.13 $4.16 $2.75 $2.27 $0.15 $1.58 $0.55 $28.14
Clatsop County (OR) $7.60 $20.64 $10.81 $2.45 $4.44 $0.68 $20.64 $0.23 $67.49
Yadkin County (NC) $2.53 $8.55 $2.10 $0.88 $2.80 $0.48 $4.95 $1.27 $23.55
Greater Belfast Area (ME) $4.43 $9.98 $2.84 $1.32 $2.86 $0.23 $4.42 $0.20 $26.28
Campbell County (TN) $3.83 $5.54 $7.62 $2.06 $2.61 $0.20 $1.10 $0.01 $22.96
Monroe County (TN) $3.90 $5.84 $7.16 $3.11 $3.12 $0.25 $2.23 $0.07 $25.69
Lincoln County (OR) $3.37 $16.82 $2.92 $1.73 $3.29 $0.15 $12.87 $0.53 $41.67
Iron County (UT) $7.62 $38.84 $8.45 $2.32 $10.21 $0.54 $57.14 $1.18 $126.30
City of St. Louis Park (MN) $3.23 $11.88 $5.00 $1.73 $3.24 $0.35 $1.77 $0.38 $27.58
City of Logan (UT) $2.25 $15.41 $2.84 $1.83 $4.28 $0.37 $15.74 $0.62 $43.35
Gibson County (TN) $6.53 $12.62 $7.27 $11.07 $5.32 $1.13 $2.35 $0.04 $46.34
Group A Average $3.72 $10.92 $5.64 $1.83 $2.71 $0.34 $5.44 $0.31 $30.91
Percent of Group A Total 12.0% 35.3% 18.3% 5.9% 8.8% 1.1% 17.6% 1.0% 100.0%
Group A Median $3.31 $10.09 $5.05 $1.54 $2.34 $0.29 $2.41 $0.22 $25.68
ALL CULTURAL AUDIENCES (Both Residents and Non-Residents)
SOURCE: Arts and Economic Prosperity 5, Americans for the Arts, 2017. For more information, visit www.AmericansForTheArts.org/EconomicImpact. B–301

Table 21:Average Per Person Audience Spending by All Attendees toNonprofit Arts and Cultural Events Per Study Region During 2016
Population Cohort Group B Per Person
Population 50,000 to 99,999 Refreshments Meals/Drinks Retail/Gifts Clothing and Local Overnight Other/ Audience
Sample Size = 38 and/or Snacks (before/after) and Souvenirs Accessories Transportation Child Care Lodging Miscellaneous Expenditures
City of Joplin (MO) $1.84 $9.26 $2.69 $1.73 $2.18 $0.31 $0.69 $0.24 $18.95
City of La Crosse (WI) $3.55 $8.39 $1.58 $0.91 $1.94 $0.21 $2.43 $0.58 $19.59
McMinn County (TN) $3.10 $10.75 $3.44 $1.82 $2.64 $0.99 $1.75 $0.11 $24.60
Lafayette County (MS) $6.41 $12.92 $6.03 $2.09 $3.14 $0.52 $5.85 $0.41 $37.36
Chisago County (MN) $2.87 $5.47 $9.29 $0.57 $3.92 $0.19 $3.37 $0.00 $25.68
City of Grand Forks (ND) $5.21 $9.96 $5.86 $2.47 $1.75 $0.30 $1.43 $0.13 $27.10
City of Corvallis (OR) $3.11 $10.50 $4.55 $0.89 $1.38 $0.22 $2.14 $0.60 $23.39
City of Noblesville (IN) $3.22 $7.43 $2.58 $0.93 $0.58 $0.11 $0.30 $0.26 $15.41
City of Ocala (FL) $4.84 $12.43 $7.35 $3.11 $3.43 $0.17 $5.09 $0.08 $36.51
Lenoir County (NC) $5.31 $20.86 $25.12 $4.52 $6.69 $1.80 $3.57 $0.10 $67.97
Town of Chapel Hill (NC) $2.70 $8.26 $2.22 $1.33 $2.49 $0.61 $1.75 $0.03 $19.39
City of Grand Junction (CO) $3.54 $10.83 $2.64 $1.96 $2.27 $0.24 $4.00 $0.55 $26.03
Town of Jupiter (FL) $2.10 $12.09 $2.45 $1.85 $2.78 $0.13 $6.36 $1.48 $29.25
Hamblen County (TN) $3.57 $15.98 $4.57 $0.59 $2.33 $1.79 $1.51 $0.02 $30.37
City of Delray Beach (FL) $9.54 $8.34 $8.37 $2.19 $3.79 $0.23 $6.40 $0.74 $39.59
City of St. Cloud (MN) $3.33 $8.65 $3.76 $0.83 $2.10 $0.49 $2.08 $0.28 $21.52
City of Portland (ME) $3.77 $15.63 $1.50 $0.98 $2.97 $0.39 $2.52 $0.45 $28.22
City of Jackson (TN) $3.33 $7.56 $1.74 $2.85 $2.32 $0.46 $0.97 $0.02 $19.24
City of Walnut Creek (CA) $3.49 $22.66 $0.76 $1.10 $2.46 $0.30 $0.74 $0.38 $31.90
Greene County (TN) $9.35 $7.56 $5.09 $0.63 $3.28 $0.19 $1.10 $0.05 $27.25
City of Flagstaff (AZ) $3.93 $11.72 $13.06 $2.51 $6.61 $0.13 $7.68 $0.23 $45.86
City of Missoula (MT) $4.81 $11.49 $2.47 $1.23 $2.20 $0.15 $3.34 $0.30 $25.99
City of Fort Myers (FL) $4.74 $14.33 $4.46 $2.65 $1.95 $0.17 $1.62 $0.12 $30.03
Putnam County (TN) $0.96 $7.55 $0.36 $0.60 $0.87 $0.28 $0.37 $0.06 $11.04
Monroe County (FL) $5.15 $12.94 $3.81 $2.46 $3.56 $0.35 $4.77 $0.48 $33.53
City of Lynchburg (VA) $2.74 $9.11 $3.79 $1.61 $1.48 $0.21 $1.19 $0.02 $20.15
City of Duluth (MN) $0.92 $10.33 $5.21 $0.53 $3.23 $0.33 $3.18 $0.26 $23.99
City of Fishers (IN) $3.63 $5.70 $1.40 $1.11 $0.67 $0.32 $0.58 $0.04 $13.46
City of Carmel (IN) $4.26 $11.39 $1.96 $2.25 $1.56 $0.19 $4.75 $0.03 $26.39
City of Sugar Land (TX) $4.09 $8.72 $2.11 $2.62 $2.13 $0.36 $2.53 $0.09 $22.64
ALL CULTURAL AUDIENCES (Both Residents and Non-Residents)
SOURCE: Arts and Economic Prosperity 5, Americans for the Arts, 2017. For more information, visit www.AmericansForTheArts.org/EconomicImpact. B–302

Table 21:Average Per Person Audience Spending by All Attendees toNonprofit Arts and Cultural Events Per Study Region During 2016
Population Cohort Group B Per Person
Population 50,000 to 99,999 Refreshments Meals/Drinks Retail/Gifts Clothing and Local Overnight Other/ Audience
Sample Size = 38 and/or Snacks (before/after) and Souvenirs Accessories Transportation Child Care Lodging Miscellaneous Expenditures
City of Asheville (NC) $3.00 $15.83 $8.30 $2.13 $4.07 $0.44 $11.20 $0.17 $45.15
Buchanan County (MO) $5.65 $7.86 $3.89 $1.13 $1.68 $0.08 $2.00 $0.51 $22.81
City of Boca Raton (FL) $2.84 $9.91 $5.36 $1.95 $3.05 $0.44 $6.58 $1.47 $31.59
City of Miami Beach (FL) $4.90 $21.77 $0.88 $2.76 $4.97 $0.34 $4.43 $0.16 $40.21
Moore County (NC) $2.81 $9.76 $2.98 $1.67 $1.44 $0.17 $0.68 $0.00 $19.51
Sevier County (TN) $8.64 $15.29 $10.51 $3.03 $5.47 $0.05 $21.11 $0.25 $64.33
Cape May County (NJ) $4.04 $16.74 $5.78 $1.32 $2.46 $0.47 $18.60 $0.62 $50.03
Cleveland County (NC) $4.87 $10.02 $7.75 $1.61 $2.68 $0.08 $3.57 $0.64 $31.21
Group B Average $4.11 $11.47 $4.89 $1.75 $2.75 $0.37 $4.01 $0.31 $29.66
Percent of Group B Total 13.9% 38.7% 16.5% 5.9% 9.3% 1.3% 13.5% 1.1% 100.0%
Group B Median $3.60 $10.42 $3.80 $1.70 $2.46 $0.29 $2.52 $0.23 $26.74
ALL CULTURAL AUDIENCES (Both Residents and Non-Residents)
SOURCE: Arts and Economic Prosperity 5, Americans for the Arts, 2017. For more information, visit www.AmericansForTheArts.org/EconomicImpact. B–303

Table 21:Average Per Person Audience Spending by All Attendees toNonprofit Arts and Cultural Events Per Study Region During 2016
Population Cohort Group C Per Person
Population 100,000 to 249,999 Refreshments Meals/Drinks Retail/Gifts Clothing and Local Overnight Other/ Audience
Sample Size = 50 and/or Snacks (before/after) and Souvenirs Accessories Transportation Child Care Lodging Miscellaneous Expenditures
City of Las Cruces (NM) $4.22 $10.47 $7.87 $2.57 $1.71 $0.40 $4.32 $0.57 $32.13
Eau Claire County (WI) $2.47 $8.87 $4.71 $1.04 $1.27 $0.45 $1.23 $0.17 $20.20
Yamhill County (OR) $5.46 $9.89 $8.75 $1.22 $2.34 $0.46 $3.01 $0.08 $31.22
City of Lewisville (TX) $3.19 $8.68 $1.61 $1.31 $2.60 $0.38 $0.80 $0.00 $18.57
City of West Palm Beach (FL) $6.17 $10.32 $2.86 $1.73 $3.54 $0.29 $3.04 $0.77 $28.74
City of Boulder (CO) $3.44 $12.12 $3.94 $1.92 $1.74 $0.27 $2.71 $0.07 $26.20
City of Richardson (TX) $5.15 $8.15 $5.88 $1.57 $1.69 $0.80 $2.63 $0.08 $25.95
City of High Point (NC) $3.69 $7.14 $1.65 $0.97 $1.62 $0.15 $1.90 $0.06 $17.17
City of Cambridge (MA) $6.48 $15.83 $2.94 $0.65 $4.17 $0.39 $3.34 $0.23 $34.04
City of Lowell (MA) $4.16 $12.17 $9.34 $1.29 $1.92 $0.14 $1.86 $0.16 $31.03
Douglas County (KS) $4.22 $10.85 $2.68 $2.43 $2.16 $0.33 $1.35 $0.22 $24.25
City of Columbia (MO) $1.90 $9.35 $1.48 $0.88 $1.79 $0.17 $0.87 $0.13 $16.57
City of Norman (OK) $10.40 $11.19 $10.05 $4.14 $3.06 $0.62 $4.39 $0.36 $44.21
Wayne County (NC) $3.45 $9.39 $4.14 $2.52 $2.71 $0.43 $1.01 $0.11 $23.75
City of Lafayette (LA) $6.02 $12.74 $1.89 $2.77 $1.92 $1.86 $4.87 $0.24 $32.29
Washington County (TN) $6.61 $17.65 $7.94 $1.51 $6.97 $0.42 $19.24 $0.09 $60.44
City of Thousand Oaks (CA) $4.39 $15.50 $1.74 $1.04 $2.76 $0.68 $1.98 $0.13 $28.23
City of Charleston (SC) $5.84 $16.69 $3.01 $2.88 $2.65 $0.35 $7.09 $0.00 $38.51
City of Waco (TX) $4.11 $7.64 $2.89 $2.18 $2.55 $0.21 $5.12 $0.04 $24.74
Robeson County (NC) $3.21 $5.31 $5.10 $2.30 $3.07 $0.17 $2.16 $0.01 $21.33
Columbia County (GA) $7.68 $9.04 $3.75 $2.24 $2.45 $0.27 $2.08 $0.56 $28.07
Orange County (NC) $2.53 $8.21 $2.12 $1.47 $1.98 $0.50 $1.57 $0.12 $18.49
City of Savannah (GA) $7.67 $16.21 $6.87 $2.14 $3.83 $0.48 $12.43 $0.27 $49.89
Indian River County (FL) $5.32 $10.05 $5.00 $0.99 $2.01 $0.14 $2.05 $0.00 $25.56
City of Alexandria (VA) $3.35 $13.31 $6.27 $3.19 $3.01 $0.27 $2.62 $0.02 $32.04
Martin County (FL) $3.63 $11.11 $4.36 $1.73 $2.46 $0.41 $2.05 $0.14 $25.88
Macon-Bibb County (GA) $3.67 $12.97 $4.21 $1.74 $1.84 $0.55 $1.57 $0.07 $26.63
City of Springfield (MA) $6.86 $8.11 $3.64 $2.17 $2.44 $0.49 $2.92 $0.00 $26.63
Catawba County (NC) $5.03 $12.65 $14.68 $2.10 $3.86 $0.30 $2.43 $0.50 $41.56
Town of Cary (NC) $3.48 $7.76 $3.80 $0.57 $0.94 $0.49 $0.73 $0.03 $17.81
ALL CULTURAL AUDIENCES (Both Residents and Non-Residents)
SOURCE: Arts and Economic Prosperity 5, Americans for the Arts, 2017. For more information, visit www.AmericansForTheArts.org/EconomicImpact. B–304

Table 21:Average Per Person Audience Spending by All Attendees toNonprofit Arts and Cultural Events Per Study Region During 2016
Population Cohort Group C Per Person
Population 100,000 to 249,999 Refreshments Meals/Drinks Retail/Gifts Clothing and Local Overnight Other/ Audience
Sample Size = 50 and/or Snacks (before/after) and Souvenirs Accessories Transportation Child Care Lodging Miscellaneous Expenditures
Alamance County (NC) $2.24 $7.63 $5.54 $0.98 $1.86 $0.13 $0.79 $0.48 $19.65
Cumberland County (NJ) $2.11 $5.11 $7.04 $0.41 $2.07 $0.24 $3.25 $0.29 $20.51
City of Eugene (OR) $3.18 $9.70 $1.87 $0.84 $1.56 $0.19 $1.24 $0.62 $19.21
Middlesex County (CT) $4.79 $14.87 $2.09 $1.77 $1.47 $1.82 $4.62 $0.86 $32.29
City of Springfield (MO) $2.71 $11.05 $4.37 $2.08 $2.20 $0.37 $1.26 $0.00 $24.03
City of Sioux Falls (SD) $4.28 $18.05 $1.69 $1.97 $3.18 $0.33 $3.90 $1.01 $34.41
Pitt County (NC) $3.68 $10.71 $3.05 $1.78 $2.04 $0.59 $3.22 $0.13 $25.19
City of Providence (RI) $4.29 $16.29 $2.12 $1.62 $2.30 $1.76 $0.79 $0.00 $29.16
City of Worcester (MA) $5.08 $11.32 $5.73 $1.09 $2.37 $0.53 $0.78 $0.22 $27.12
Montgomery County (TN) $3.33 $7.65 $7.64 $2.20 $2.56 $0.91 $2.77 $0.09 $27.15
Salt Lake City (UT) $4.91 $10.64 $3.07 $1.65 $2.63 $0.45 $2.48 $0.42 $26.25
Cabarrus County (NC) $1.91 $10.55 $1.74 $0.53 $1.14 $0.15 $1.03 $0.04 $17.09
Richmond County (GA) $5.43 $11.87 $3.98 $2.52 $2.57 $0.74 $1.54 $0.07 $28.73
City of Tacoma (WA) $2.78 $12.14 $2.58 $1.41 $2.87 $0.33 $0.85 $0.18 $23.14
Doña Ana County (NM) $3.80 $9.76 $6.70 $2.71 $1.59 $0.43 $3.50 $0.44 $28.93
New Hanover County (NC) $3.27 $13.10 $0.79 $1.71 $2.20 $0.46 $1.14 $0.00 $22.66
Arlington County (VA) $4.02 $13.20 $2.54 $1.11 $1.88 $0.20 $1.65 $0.05 $24.66
City of Irving (TX) $1.95 $10.05 $0.79 $1.09 $2.33 $0.06 $2.17 $0.07 $18.51
City of Reno (NV) $6.72 $12.89 $2.14 $1.71 $2.37 $0.30 $3.05 $0.60 $29.78
York County (SC) $4.64 $10.54 $4.66 $5.70 $3.25 $0.67 $2.82 $0.32 $32.62
Group C Average $4.38 $11.13 $4.31 $1.80 $2.43 $0.47 $2.92 $0.22 $27.66
Percent of Group C Total 15.8% 40.2% 15.6% 6.5% 8.8% 1.7% 10.6% 0.8% 100.0%
Group C Median $4.13 $10.68 $3.77 $1.72 $2.34 $0.40 $2.17 $0.13 $26.44
ALL CULTURAL AUDIENCES (Both Residents and Non-Residents)
SOURCE: Arts and Economic Prosperity 5, Americans for the Arts, 2017. For more information, visit www.AmericansForTheArts.org/EconomicImpact. B–305

Table 21:Average Per Person Audience Spending by All Attendees toNonprofit Arts and Cultural Events Per Study Region During 2016
Population Cohort Group D Per Person
Population 250,000 to 499,999 Refreshments Meals/Drinks Retail/Gifts Clothing and Local Overnight Other/ Audience
Sample Size = 42 and/or Snacks (before/after) and Souvenirs Accessories Transportation Child Care Lodging Miscellaneous Expenditures
Buncombe County (NC) $5.48 $17.21 $10.50 $3.12 $4.62 $0.51 $10.14 $0.21 $51.80
Alachua County (FL) $4.57 $10.17 $3.40 $3.89 $2.80 $0.58 $2.36 $0.24 $28.01
Greater Green Bay Area (WI) $7.44 $8.89 $9.93 $1.77 $2.45 $0.42 $3.22 $0.02 $34.15
City of Orlando (FL) $5.88 $10.47 $3.07 $1.82 $3.59 $0.35 $4.91 $1.45 $31.54
City of Lincoln (NE) $2.21 $10.44 $1.88 $1.14 $2.35 $0.13 $1.96 $0.75 $20.86
Southeastern Connecticut Region (CT) $3.30 $11.48 $4.32 $1.22 $1.69 $0.24 $3.52 $0.00 $25.77
Erie County (PA) $2.90 $9.84 $1.63 $1.12 $2.02 $0.23 $1.99 $0.00 $19.75
San Luis Obispo County (CA) $3.34 $11.70 $5.41 $1.00 $2.80 $0.28 $6.00 $0.14 $30.67
City of Newark (NJ) $5.98 $8.27 $2.90 $3.01 $5.08 $0.66 $1.61 $0.03 $27.53
Leon County (FL) $6.40 $11.15 $6.98 $4.25 $2.66 $0.84 $3.28 $0.09 $35.64
Rutherford County (TN) $2.41 $8.96 $2.75 $1.88 $2.44 $0.29 $2.25 $0.55 $21.53
St. Lucie County (FL) $9.08 $18.77 $4.77 $1.73 $2.98 $0.33 $1.76 $0.00 $39.44
Greater Spartanburg Area (SC) $2.02 $8.46 $1.99 $0.90 $1.04 $0.19 $1.03 $0.00 $15.63
Durham County (NC) $1.53 $11.41 $1.11 $0.44 $1.90 $0.20 $1.09 $0.02 $17.69
City of St. Paul (MN) $3.23 $11.88 $5.00 $1.73 $3.24 $0.35 $1.77 $0.38 $27.58
Hamilton County (IN) $3.70 $8.18 $1.98 $1.43 $0.94 $0.21 $1.88 $0.11 $18.43
Osceola County (FL) $2.31 $8.77 $1.99 $0.86 $1.43 $1.88 $5.63 $0.75 $23.61
Escambia County (FL) $2.60 $13.01 $2.83 $1.22 $1.98 $0.52 $2.50 $0.06 $24.71
Lexington-Fayette Urban County (KY) $4.09 $9.33 $3.45 $1.93 $1.96 $0.42 $0.77 $0.16 $22.11
Lake County (FL) $2.97 $8.48 $7.28 $1.05 $1.53 $0.17 $3.17 $0.06 $24.70
City of Riverside (CA) $6.07 $13.94 $5.64 $0.52 $2.03 $0.53 $0.13 $0.19 $29.05
Cumberland County (NC) $4.35 $7.87 $2.50 $1.94 $1.86 $0.20 $0.92 $0.03 $19.68
Collier County (FL) $4.08 $14.94 $4.27 $3.00 $2.54 $0.17 $3.06 $0.24 $32.30
Hamilton County (TN) $6.99 $14.68 $7.22 $3.89 $3.36 $0.32 $3.86 $0.47 $40.78
Manatee County (FL) $4.50 $11.80 $4.58 $1.51 $2.50 $0.13 $4.47 $0.11 $29.60
City of Tampa (FL) $9.51 $17.36 $7.29 $3.27 $6.87 $0.50 $9.23 $0.06 $54.08
Forsyth County (NC) $3.60 $10.11 $2.70 $1.54 $1.95 $0.14 $1.28 $0.06 $21.39
Mercer County (NJ) $5.42 $11.19 $2.31 $1.18 $3.48 $0.50 $2.77 $0.56 $27.41
City of Wichita (KS) $2.52 $10.65 $1.60 $1.87 $2.05 $0.32 $1.76 $0.30 $21.07
Clackamas County (OR) $4.65 $8.02 $8.08 $1.77 $2.29 $0.27 $1.50 $0.24 $26.83
ALL CULTURAL AUDIENCES (Both Residents and Non-Residents)
SOURCE: Arts and Economic Prosperity 5, Americans for the Arts, 2017. For more information, visit www.AmericansForTheArts.org/EconomicImpact. B–306

Table 21:Average Per Person Audience Spending by All Attendees toNonprofit Arts and Cultural Events Per Study Region During 2016
Population Cohort Group D Per Person
Population 250,000 to 499,999 Refreshments Meals/Drinks Retail/Gifts Clothing and Local Overnight Other/ Audience
Sample Size = 42 and/or Snacks (before/after) and Souvenirs Accessories Transportation Child Care Lodging Miscellaneous Expenditures
Sarasota County (FL) $3.70 $19.86 $1.38 $3.22 $2.69 $0.16 $6.47 $0.32 $37.80
City of Minneapolis (MN) $3.23 $11.88 $5.00 $1.73 $3.24 $0.35 $1.77 $0.38 $27.58
Berks County (PA) $5.73 $12.42 $3.13 $1.26 $2.16 $0.10 $5.55 $0.39 $30.73
City of Miami (FL) $7.53 $12.51 $2.73 $3.08 $5.69 $0.64 $3.29 $0.08 $35.54
City of Raleigh (NC) $4.45 $13.79 $3.07 $2.27 $4.13 $0.86 $5.21 $0.56 $34.34
Santa Barbara County (CA) $3.66 $12.37 $1.32 $2.40 $2.71 $0.60 $5.00 $0.18 $28.25
Seminole County (FL) $3.74 $8.98 $0.62 $0.58 $1.66 $0.40 $1.18 $0.13 $17.29
City of Virginia Beach (VA) $2.82 $19.64 $1.75 $1.39 $1.85 $0.58 $2.81 $0.27 $31.10
City of Atlanta (GA) $2.22 $11.35 $2.97 $1.19 $3.31 $0.80 $5.05 $0.43 $27.33
City of Mesa (AZ) $3.40 $6.54 $3.36 $0.85 $1.33 $0.31 $1.81 $0.15 $17.77
City of Kansas City (MO) $3.86 $14.05 $1.64 $2.50 $3.23 $0.36 $2.24 $0.09 $27.97
Morris County (NJ) $4.90 $15.02 $4.53 $1.24 $2.93 $0.44 $1.28 $0.49 $30.84
Group D Average $4.34 $11.81 $3.83 $1.85 $2.70 $0.42 $3.13 $0.26 $28.33
Percent of Group D Total 15.3% 41.7% 13.5% 6.5% 9.5% 1.5% 11.1% 0.9% 100.0%
Group D Median $3.80 $11.38 $3.07 $1.73 $2.48 $0.35 $2.43 $0.17 $27.58
ALL CULTURAL AUDIENCES (Both Residents and Non-Residents)
SOURCE: Arts and Economic Prosperity 5, Americans for the Arts, 2017. For more information, visit www.AmericansForTheArts.org/EconomicImpact. B–307

Table 21:Average Per Person Audience Spending by All Attendees toNonprofit Arts and Cultural Events Per Study Region During 2016
Population Cohort Group E Per Person
Population 500,000 to 999,999 Refreshments Meals/Drinks Retail/Gifts Clothing and Local Overnight Other/ Audience
Sample Size = 25 and/or Snacks (before/after) and Souvenirs Accessories Transportation Child Care Lodging Miscellaneous Expenditures
Sonoma County (CA) $6.27 $14.56 $1.62 $1.18 $2.82 $0.50 $2.89 $0.17 $30.02
Volusia County (FL) $4.34 $9.41 $3.99 $6.68 $3.96 $0.60 $2.95 $0.12 $32.04
Guilford County (NC) $4.17 $10.55 $2.73 $1.79 $2.64 $0.43 $2.39 $0.18 $24.90
Dane County (WI) $4.91 $8.27 $2.10 $0.80 $1.97 $0.17 $0.66 $0.12 $19.00
Brevard County (FL) $2.95 $10.34 $5.03 $0.92 $2.54 $0.11 $0.89 $0.12 $22.90
Washington County (OR) $2.91 $11.47 $0.86 $1.04 $2.20 $0.48 $1.15 $0.01 $20.11
Johnson County (KS) $3.24 $10.92 $3.58 $0.58 $1.78 $0.29 $0.66 $0.08 $21.13
City of Louisville (KY) $3.06 $14.39 $0.86 $1.20 $3.59 $0.50 $1.87 $0.03 $25.51
City of Baltimore (MD) $5.18 $13.39 $3.54 $1.40 $3.17 $0.52 $2.27 $0.62 $30.08
Polk County (FL) $4.24 $10.64 $7.37 $2.34 $3.70 $0.38 $4.24 $0.17 $33.09
City of Boston (MA) $4.36 $13.05 $1.87 $1.93 $4.81 $0.54 $3.66 $0.04 $30.26
District of Columbia (DC) $4.73 $16.62 $1.49 $1.86 $5.02 $0.39 $4.76 $0.14 $35.02
Nashville-Davidson County (TN) $6.06 $11.25 $7.39 $2.87 $4.09 $0.25 $5.72 $0.47 $38.11
City of El Paso (TX) $5.27 $7.11 $4.52 $1.57 $2.31 $0.41 $0.97 $0.05 $22.21
Lee County (FL) $4.34 $13.62 $5.81 $2.82 $2.19 $0.14 $2.50 $0.10 $31.53
City of Fort Worth (TX) $5.66 $15.10 $2.91 $2.34 $3.91 $0.38 $5.69 $0.26 $36.26
City of Indianapolis (IN) $3.95 $15.13 $3.78 $1.47 $3.22 $0.41 $2.55 $0.16 $30.67
City and County of San Francisco (CA) $5.86 $17.05 $2.92 $2.00 $6.62 $0.42 $7.62 $0.31 $42.80
Prince George's County (MD) $5.58 $6.73 $5.01 $3.06 $2.84 $0.49 $1.60 $0.71 $26.03
Pinellas County (FL) $4.23 $13.87 $5.75 $2.06 $3.17 $0.26 $3.62 $0.07 $33.02
Shelby County (TN) $5.74 $11.50 $2.98 $3.76 $3.07 $0.55 $3.01 $0.24 $30.85
Fairfield County (CT) $3.75 $15.81 $9.64 $1.37 $1.85 $0.41 $1.20 $0.00 $34.04
Westchester County (NY) $1.80 $13.25 $1.60 $1.26 $2.55 $0.41 $0.84 $0.13 $21.84
Fulton County (GA) $3.61 $10.71 $3.11 $2.85 $2.80 $0.91 $2.75 $0.50 $27.23
Wake County (NC) $4.22 $11.49 $3.26 $1.81 $2.99 $0.77 $3.44 $0.35 $28.33
Group E Average $4.42 $12.25 $3.75 $2.04 $3.19 $0.43 $2.80 $0.21 $29.08
Percent of Group E Total 15.2% 42.1% 12.9% 7.0% 11.0% 1.5% 9.6% 0.7% 100.0%
Group E Median $4.34 $11.50 $3.26 $1.81 $2.99 $0.41 $2.55 $0.14 $30.08
ALL CULTURAL AUDIENCES (Both Residents and Non-Residents)
SOURCE: Arts and Economic Prosperity 5, Americans for the Arts, 2017. For more information, visit www.AmericansForTheArts.org/EconomicImpact. B–308

Table 21:Average Per Person Audience Spending by All Attendees toNonprofit Arts and Cultural Events Per Study Region During 2016
Population Cohort Group F Per Person
Population 1,000,000 or More Refreshments Meals/Drinks Retail/Gifts Clothing and Local Overnight Other/ Audience
Sample Size = 21 and/or Snacks (before/after) and Souvenirs Accessories Transportation Child Care Lodging Miscellaneous Expenditures
Mecklenburg County (NC) $3.51 $13.73 $1.00 $1.71 $2.48 $0.87 $3.14 $0.03 $26.45
City of San José (CA) $5.60 $11.23 $3.34 $2.20 $5.69 $1.17 $4.81 $0.08 $34.12
Montgomery County (MD) $2.48 $12.47 $2.25 $0.90 $2.53 $0.71 $1.10 $0.08 $22.53
Fairfax County (VA) $4.73 $10.83 $2.08 $1.05 $2.20 $0.37 $0.54 $0.02 $21.83
Allegheny County (PA) $2.96 $14.45 $3.80 $1.59 $3.46 $0.36 $3.44 $0.58 $30.64
Greater Columbus Area (OH) $4.17 $12.12 $2.63 $0.77 $2.22 $0.52 $2.50 $0.04 $24.98
Orange County (FL) $5.66 $11.38 $2.57 $1.77 $3.46 $0.31 $4.40 $0.92 $30.48
City of Dallas (TX) $5.89 $13.98 $1.99 $1.47 $3.75 $0.80 $3.92 $0.04 $31.84
Hillsborough County (FL) $9.18 $16.09 $6.90 $3.95 $6.01 $0.52 $7.90 $0.07 $50.63
City of San Diego (CA) $6.97 $14.71 $4.52 $2.76 $5.23 $0.38 $11.00 $0.09 $45.66
Palm Beach County (FL) $5.10 $10.59 $4.02 $1.94 $3.69 $0.26 $5.28 $0.92 $31.80
City of San Antonio (TX) $4.02 $13.44 $5.76 $3.44 $4.35 $0.56 $7.75 $0.13 $39.45
Sacramento County (CA) $5.19 $10.66 $3.93 $1.18 $3.55 $0.25 $1.42 $0.17 $26.36
City of Phoenix (AZ) $5.51 $11.55 $5.22 $2.99 $4.29 $0.27 $4.87 $0.10 $34.80
City and County of Philadelphia (PA) $4.97 $15.95 $3.07 $1.23 $5.81 $0.20 $10.93 $0.17 $42.34
Broward County (FL) $5.00 $12.86 $2.57 $2.58 $4.21 $0.52 $5.12 $0.22 $33.08
Santa Clara County (CA) $3.70 $10.43 $2.45 $1.82 $4.04 $0.73 $3.02 $0.08 $26.27
Riverside County (CA) $14.96 $12.04 $12.85 $1.40 $3.24 $0.45 $4.48 $0.10 $49.51
Miami-Dade County (FL) $5.93 $15.14 $2.18 $2.85 $4.77 $0.66 $3.63 $0.18 $35.34
City of Chicago (IL) $4.89 $17.34 $3.13 $1.84 $6.98 $0.61 $15.56 $0.21 $50.56
Harris County (TX) $3.29 $13.90 $3.03 $2.17 $3.79 $0.50 $1.88 $0.22 $28.77
Group F Average $5.41 $13.09 $3.78 $1.98 $4.08 $0.53 $5.08 $0.21 $34.16
Percent of Group F Total 15.8% 38.3% 11.1% 5.8% 12.0% 1.5% 14.9% 0.6% 100.0%
Group F Median $5.00 $12.86 $3.07 $1.82 $3.79 $0.52 $4.40 $0.10 $31.84
Average $4.28 $11.57 $4.51 $1.85 $2.83 $0.41 $3.90 $0.26 $29.61
Percent of Total 14.4% 39.1% 15.2% 6.3% 9.6% 1.4% 13.2% 0.9% 100.0%
Median $4.03 $10.97 $3.67 $1.72 $2.55 $0.35 $2.54 $0.16 $27.37
ALL CULTURAL AUDIENCES (Both Residents and Non-Residents)
ALL CITY/COUNTY STUDY REGIONS
SOURCE: Arts and Economic Prosperity 5, Americans for the Arts, 2017. For more information, visit www.AmericansForTheArts.org/EconomicImpact. B–309

Table 21:Average Per Person Audience Spending by All Attendees toNonprofit Arts and Cultural Events Per Study Region During 2016
Regional Study Regions Per Person
All Populations Refreshments Meals/Drinks Retail/Gifts Clothing and Local Overnight Other/ Audience
Sample Size = 81 and/or Snacks (before/after) and Souvenirs Accessories Transportation Child Care Lodging Miscellaneous Expenditures
High Peaks Region (ME) $5.31 $10.64 $7.16 $1.15 $3.59 $0.16 $4.55 $0.10 $32.67
Wood River Valley (ID) $7.49 $24.12 $9.77 $6.98 $5.13 $0.51 $14.52 $0.21 $68.74
Southern Oregon Area $8.86 $45.34 $12.20 $3.50 $7.35 $0.08 $65.61 $1.02 $143.96
Southwestern Pennsylvania Area $2.79 $8.87 $1.17 $1.04 $2.27 $0.26 $0.99 $0.07 $17.44
Greater Portsmouth Area (NH) $4.31 $15.82 $3.22 $0.85 $2.30 $0.54 $2.35 $0.79 $30.18
Northeast Oregon Region $4.52 $9.30 $6.96 $1.16 $2.49 $0.56 $3.92 $0.25 $29.17
Toe River Valley (NC) $4.33 $12.84 $44.61 $0.73 $4.76 $0.27 $8.23 $0.09 $75.86
Albemarle Region (NC) $3.95 $13.43 $4.09 $2.33 $1.92 $0.25 $1.30 $0.25 $27.53
Greater Concord Area (NH) $3.75 $13.79 $2.85 $3.25 $2.24 $0.58 $7.61 $0.52 $34.60
North Central Minnesota Region $2.20 $7.49 $2.83 $0.75 $3.27 $0.18 $1.56 $2.59 $20.87
Northwest Minnesota Region $1.84 $4.58 $3.47 $0.50 $3.25 $0.63 $0.66 $0.08 $15.01
Monadnock Region (NH) $2.29 $11.71 $1.67 $1.33 $1.86 $0.52 $1.78 $0.17 $21.32
Bismarck-Mandan Region (ND) $3.06 $9.13 $5.60 $2.01 $2.12 $0.74 $1.33 $0.33 $24.33
Greater Minot Region (ND) $1.53 $8.01 $0.64 $0.45 $1.75 $0.14 $1.36 $0.21 $14.10
Greater Burlington Area (VT) $4.13 $13.20 $5.16 $1.43 $2.41 $0.16 $3.95 $1.58 $32.01
Greater Charlottesville Area (VA) $5.21 $14.85 $5.75 $0.76 $2.73 $0.24 $6.50 $0.07 $36.11
Brainerd Lakes Region (MN) $1.91 $4.41 $0.37 $0.16 $1.48 $0.39 $0.90 $0.00 $9.62
East Central Minnesota Region $2.87 $5.47 $9.29 $0.57 $3.92 $0.19 $3.37 $0.00 $25.68
Northwest Connecticut Region $2.81 $12.90 $2.74 $0.66 $2.87 $0.20 $1.76 $0.17 $24.10
Central Oregon Region $7.37 $18.29 $10.21 $3.57 $4.41 $0.69 $11.76 $0.43 $56.71
Greater Fargo-Moorhead Area (ND/MN) $2.37 $8.67 $2.59 $1.81 $1.91 $0.17 $1.99 $0.31 $19.83
Black Hills Region (SD) $3.34 $9.54 $2.86 $1.06 $1.88 $0.33 $1.78 $0.31 $21.10
Greater Kingsport Area (TN) $2.96 $11.65 $4.56 $3.03 $2.69 $0.43 $3.62 $0.15 $29.09
Lake Region (MN) $3.85 $3.89 $4.92 $0.16 $1.96 $0.33 $1.16 $0.12 $16.39
South Central Minnesota Region $1.41 $9.22 $1.85 $1.19 $3.68 $0.52 $1.23 $0.61 $19.71
Greater Sioux Falls Area (SD) $4.15 $15.38 $1.48 $1.67 $3.09 $0.34 $3.41 $0.83 $30.35
Southwest Tennessee Development District $2.66 $6.44 $1.49 $1.95 $2.29 $0.26 $0.75 $0.03 $15.87
Northwest Tennessee Development District $3.87 $6.62 $3.20 $2.26 $2.32 $0.23 $1.32 $0.13 $19.94
Southwest Minnesota Region $2.04 $6.31 $2.68 $1.12 $4.08 $0.00 $3.44 $0.10 $19.77
Arrowhead Region (MN) $0.92 $10.33 $5.21 $0.53 $3.23 $0.33 $3.18 $0.26 $23.99
ALL CULTURAL AUDIENCES (Both Residents and Non-Residents)
SOURCE: Arts and Economic Prosperity 5, Americans for the Arts, 2017. For more information, visit www.AmericansForTheArts.org/EconomicImpact. B–310

Table 21:Average Per Person Audience Spending by All Attendees toNonprofit Arts and Cultural Events Per Study Region During 2016
Regional Study Regions Per Person
All Populations Refreshments Meals/Drinks Retail/Gifts Clothing and Local Overnight Other/ Audience
Sample Size = 81 and/or Snacks (before/after) and Souvenirs Accessories Transportation Child Care Lodging Miscellaneous Expenditures
Maple Grove and the Northwest Suburbs (MN) $3.23 $11.88 $5.00 $1.73 $3.24 $0.35 $1.77 $0.38 $27.58
Greater Augusta Area (GA) $6.21 $10.90 $3.90 $2.43 $2.53 $0.58 $1.72 $0.24 $28.50
Upper Cumberland Development District (TN) $1.91 $7.27 $3.32 $0.88 $2.13 $0.11 $2.55 $0.08 $18.26
City of Huntsville/Madison County (AL) $2.35 $10.60 $4.36 $2.47 $2.57 $0.17 $1.29 $0.19 $24.01
Northeast Commission (NC) $5.20 $14.92 $6.54 $2.55 $2.92 $0.29 $4.77 $0.26 $37.45
Greater Ann Arbor Area (MI) $2.41 $12.49 $5.17 $0.90 $2.58 $0.25 $3.62 $0.25 $27.67
Greater Fox Cities Region (WI) $4.60 $12.04 $4.29 $3.19 $3.04 $0.37 $2.77 $0.45 $30.74
Central Minnesota Region $3.33 $8.65 $3.76 $0.83 $2.10 $0.49 $2.08 $0.28 $21.52
South Central Tennessee Development District $2.69 $6.88 $3.75 $2.06 $2.46 $0.32 $1.41 $0.13 $19.68
Northwest Arkansas Region $5.99 $13.37 $3.91 $1.50 $3.91 $0.34 $6.67 $0.22 $35.89
Southeast Minnesota Region $1.09 $7.23 $0.78 $0.78 $1.41 $0.03 $0.73 $0.00 $12.05
First Tennessee Development District $4.76 $12.47 $5.43 $2.32 $3.78 $0.39 $6.93 $0.12 $36.21
Greater Harrisburg Area (PA) $2.97 $14.06 $2.01 $1.89 $3.83 $0.36 $1.47 $0.02 $26.61
Greater New Haven Area (CT) $2.17 $16.04 $4.28 $1.26 $3.84 $0.15 $1.04 $0.16 $28.94
Treasure Coast Region (FL) $5.02 $11.49 $4.70 $1.39 $2.31 $0.27 $2.01 $0.06 $27.27
Greater Des Moines Region (IA) $6.76 $12.07 $2.77 $1.98 $3.26 $0.29 $7.21 $0.16 $34.49
Southeast Tennessee Development District $5.45 $11.99 $6.49 $2.87 $3.35 $0.43 $3.74 $0.32 $34.64
Greater Knoxville Region (TN) $12.08 $22.08 $5.32 $2.13 $4.50 $0.55 $12.87 $0.06 $59.59
Greater Columbia Area (SC) $8.14 $16.09 $2.78 $1.71 $2.68 $0.78 $2.78 $0.11 $35.08
Pikes Peak Region (CO) $6.58 $13.42 $5.69 $1.93 $3.71 $0.43 $2.94 $0.22 $34.92
Lehigh Valley Region (PA) $3.70 $11.39 $4.21 $1.53 $2.77 $0.06 $4.47 $0.19 $28.33
Greater Sarasota/Bradenton Area (FL) $3.84 $18.40 $1.96 $2.91 $2.66 $0.15 $6.11 $0.28 $36.31
Dayton Region (OH) $3.30 $10.19 $1.39 $1.53 $2.09 $0.16 $0.95 $0.09 $19.71
Richmond & Tri-Cities Region (VA) $4.23 $12.54 $2.79 $1.55 $2.40 $0.43 $1.10 $0.31 $25.36
Memphis Area Association of Governments (TN) $5.74 $11.50 $2.98 $3.76 $3.07 $0.55 $3.01 $0.24 $30.85
Eastern Region (NC) $4.07 $14.42 $16.10 $2.89 $4.44 $0.94 $2.62 $0.12 $45.60
Advantage West Region (NC) $5.11 $14.07 $22.53 $2.21 $4.64 $0.37 $9.16 $0.15 $58.24
Southeast Commission (NC) $3.81 $7.66 $3.34 $2.03 $2.15 $0.22 $1.23 $0.02 $20.46
Greater Fairfax Area (VA) $4.36 $12.03 $5.09 $2.42 $1.93 $0.36 $1.30 $0.06 $27.55
Greater Tulsa Region (OK) $4.91 $15.34 $3.69 $1.74 $3.62 $0.88 $6.79 $0.22 $37.19
ALL CULTURAL AUDIENCES (Both Residents and Non-Residents)
SOURCE: Arts and Economic Prosperity 5, Americans for the Arts, 2017. For more information, visit www.AmericansForTheArts.org/EconomicImpact. B–311

Table 21:Average Per Person Audience Spending by All Attendees toNonprofit Arts and Cultural Events Per Study Region During 2016
Regional Study Regions Per Person
All Populations Refreshments Meals/Drinks Retail/Gifts Clothing and Local Overnight Other/ Audience
Sample Size = 81 and/or Snacks (before/after) and Souvenirs Accessories Transportation Child Care Lodging Miscellaneous Expenditures
East Tennessee Development District $6.67 $12.59 $7.24 $2.33 $3.72 $0.45 $8.24 $0.09 $41.30
West Valley Region (AZ) $2.34 $7.06 $3.11 $1.08 $1.78 $0.07 $0.96 $0.19 $16.60
Greater St. Louis Area (MO) $4.81 $8.48 $2.07 $0.90 $1.50 $0.19 $1.12 $0.28 $19.35
Western New York $4.56 $12.59 $4.10 $1.60 $3.28 $0.19 $2.74 $0.48 $29.54
Greater Oklahoma City Region (OK) $7.24 $12.13 $6.84 $3.37 $4.72 $0.58 $10.28 $0.23 $45.40
Piedmont Triad Partnership (NC) $3.59 $9.74 $3.49 $1.54 $2.47 $0.32 $2.07 $0.28 $23.50
Greater Portland Area (OR) $3.81 $12.10 $2.91 $1.32 $2.63 $0.46 $1.86 $0.14 $25.23
Greater Kansas City Metropolitan Area (MO/KS) $3.44 $12.98 $1.90 $1.97 $2.71 $0.32 $1.72 $0.07 $25.12
Greater Nashville Regional Council (TN) $4.16 $9.43 $5.80 $2.36 $3.09 $0.43 $3.68 $0.39 $29.35
Research Triangle Regional Partnership (NC) $2.98 $10.26 $2.47 $1.41 $2.21 $0.47 $1.97 $0.18 $21.96
Greater Tampa/St. Petersburg Area (FL) $7.85 $15.50 $6.59 $3.44 $5.25 $0.45 $6.75 $0.07 $45.89
Charlotte Regional Partnership (NC) $3.73 $11.36 $6.48 $1.58 $2.70 $0.39 $2.34 $0.30 $28.88
Charlotte Regional Partnership (NC/SC) $3.99 $11.15 $6.08 $2.51 $2.82 $0.44 $2.42 $0.30 $29.70
Seven-County Metro Area (MN) $3.23 $11.88 $5.00 $1.73 $3.24 $0.35 $1.77 $0.38 $27.58
Central Florida Region $5.11 $10.94 $3.67 $1.86 $3.31 $0.33 $4.14 $0.69 $30.06
Greater Philadelphia Region (PA) $4.48 $13.23 $3.58 $1.05 $4.53 $0.23 $8.11 $0.10 $35.31
Greater Washington Region (DC/MD/VA) $3.94 $12.69 $3.92 $2.06 $2.71 $0.40 $2.04 $0.12 $27.88
Metro Atlanta Area (GA) $3.61 $10.71 $3.11 $2.85 $2.80 $0.91 $2.75 $0.50 $27.23
Greater Atlanta Region (GA) $3.61 $10.71 $3.11 $2.85 $2.80 $0.91 $2.75 $0.50 $27.23
Greater Houston Region (TX) $3.63 $14.81 $3.07 $2.51 $3.88 $0.53 $3.89 $0.19 $32.51
Dallas-Fort Worth-Arlington MSA (TX) $5.03 $13.03 $2.91 $1.84 $3.15 $0.60 $3.34 $0.08 $29.98
Regional Average $4.15 $11.96 $5.02 $1.85 $3.02 $0.37 $4.30 $0.28 $30.94
Percent of Regional Total 13.4% 38.7% 16.2% 6.0% 9.8% 1.2% 13.9% 0.9% 100.0%
Regional Median $3.85 $11.88 $3.76 $1.73 $2.80 $0.35 $2.62 $0.19 $27.88
ALL CULTURAL AUDIENCES (Both Residents and Non-Residents)
SOURCE: Arts and Economic Prosperity 5, Americans for the Arts, 2017. For more information, visit www.AmericansForTheArts.org/EconomicImpact. B–312

Table 21:Average Per Person Audience Spending by All Attendees toNonprofit Arts and Cultural Events Per Study Region During 2016
Statewide Study Regions Per Person
All Populations Refreshments Meals/Drinks Retail/Gifts Clothing and Local Overnight Other/ Audience
Sample Size = 20 and/or Snacks (before/after) and Souvenirs Accessories Transportation Child Care Lodging Miscellaneous Expenditures
State of Vermont $3.19 $12.64 $3.57 $1.06 $2.25 $0.16 $3.31 $1.04 $27.21
State of North Dakota $3.36 $8.91 $3.63 $1.82 $1.95 $0.38 $2.87 $0.25 $23.17
State of Delaware $3.03 $12.04 $5.71 $1.72 $2.86 $0.54 $4.07 $0.26 $30.24
State of Maine $4.51 $12.00 $4.07 $1.28 $3.27 $0.28 $5.58 $0.39 $31.38
State of Hawai'i $3.71 $11.90 $1.48 $2.38 $3.05 $0.35 $2.14 $0.24 $25.26
State of Nevada $5.27 $11.21 $3.85 $1.82 $3.24 $0.29 $2.76 $0.46 $28.90
State of Connecticut $3.09 $13.74 $4.97 $1.07 $2.47 $0.28 $1.99 $0.10 $27.70
State of Oklahoma $5.84 $12.08 $6.02 $2.70 $3.85 $0.61 $7.90 $0.27 $39.26
State of Oregon $4.74 $15.72 $5.64 $1.69 $3.08 $0.36 $10.95 $0.41 $42.59
State of Minnesota $2.39 $7.90 $3.84 $0.91 $2.94 $0.32 $1.78 $0.40 $20.48
State of Wisconsin $4.15 $13.18 $5.88 $1.90 $3.68 $0.34 $7.75 $0.38 $37.26
State of Maryland $3.75 $11.91 $3.09 $1.57 $2.79 $0.64 $1.58 $0.35 $25.68
State of Missouri $3.51 $10.14 $2.54 $1.53 $2.11 $0.24 $1.37 $0.20 $21.64
State of Tennessee $4.56 $9.95 $5.08 $2.32 $3.07 $0.38 $4.23 $0.18 $29.77
State of Massachusetts $4.62 $11.75 $3.94 $1.32 $2.65 $0.37 $2.49 $0.18 $27.32
State of New Jersey $4.82 $12.66 $4.18 $1.59 $3.33 $0.49 $3.95 $0.26 $31.30
State of North Carolina $3.83 $11.21 $7.26 $1.86 $2.88 $0.42 $2.98 $0.20 $30.66
State of Pennsylvania $3.69 $12.13 $2.84 $1.32 $3.14 $0.23 $4.06 $0.20 $27.62
State of Illinois $3.52 $13.66 $2.30 $1.60 $4.83 $0.50 $8.55 $0.12 $35.08
State of Florida $5.15 $12.94 $3.81 $2.46 $3.56 $0.35 $4.77 $0.48 $33.53
Statewide Average $4.04 $11.89 $4.19 $1.70 $3.05 $0.38 $4.25 $0.32 $29.80
Percent of Statewide Total 13.5% 39.9% 14.0% 5.7% 10.2% 1.3% 14.3% 1.1% 100.0%
Statewide Median $3.79 $12.02 $3.90 $1.65 $3.06 $0.36 $3.63 $0.26 $29.33
ALL CULTURAL AUDIENCES (Both Residents and Non-Residents)
SOURCE: Arts and Economic Prosperity 5, Americans for the Arts, 2017. For more information, visit www.AmericansForTheArts.org/EconomicImpact. B–313

Table 21:Average Per Person Audience Spending by All Attendees toNonprofit Arts and Cultural Events Per Study Region During 2016
Individual Arts Districts Per Person
All Populations Refreshments Meals/Drinks Retail/Gifts Clothing and Local Overnight Other/ Audience
Sample Size = 12 and/or Snacks (before/after) and Souvenirs Accessories Transportation Child Care Lodging Miscellaneous Expenditures
James River Arts & Cultural District $3.17 $9.73 $4.61 $2.04 $1.46 $0.21 $1.04 $0.02 $22.27
Center City Charlotte $4.13 $14.74 $1.09 $2.00 $2.72 $0.82 $4.25 $0.04 $29.79
Loch Haven Cultural Park $6.65 $9.42 $2.66 $1.10 $2.93 $0.30 $4.14 $1.87 $29.07
Downtown Colorado Springs Creative District $5.23 $14.37 $5.56 $1.36 $1.97 $0.39 $1.03 $0.03 $29.93
Fort Worth Cultural District $6.23 $15.90 $3.40 $1.81 $4.12 $0.51 $6.68 $0.37 $39.03
Dallas Arts District $6.34 $13.92 $1.93 $1.61 $3.84 $0.59 $4.13 $0.01 $32.37
Grand Center Arts & Entertainment District $6.13 $8.80 $0.50 $0.60 $1.62 $0.15 $0.53 $0.54 $18.87
Balboa Park Cultural District $4.63 $13.54 $3.31 $0.96 $4.88 $0.28 $15.42 $0.00 $43.03
East End Cultural District $3.01 $11.45 $2.20 $1.64 $2.62 $0.52 $0.87 $0.62 $22.94
Houston Museum District Association $1.69 $12.14 $2.31 $2.63 $3.92 $0.67 $2.22 $0.00 $25.58
Midtown Cultural District $3.00 $17.61 $1.06 $0.58 $3.49 $0.35 $0.63 $0.00 $26.72
Washington Avenue Cultural District $3.02 $11.30 $8.57 $1.79 $3.00 $0.31 $1.28 $0.51 $29.78
Arts District Average $4.44 $12.74 $3.10 $1.51 $3.05 $0.43 $3.52 $0.33 $29.12
Percent of Arts District Total 15.2% 43.8% 10.7% 5.2% 10.5% 1.5% 12.1% 1.1% 100.0%
Arts District Median $4.38 $12.84 $2.49 $1.63 $2.97 $0.37 $1.75 $0.03 $29.43
Average $4.54 $12.36 $4.47 $1.99 $3.10 $0.39 $4.49 $0.30 $31.66
Average $4.16 $12.57 $4.95 $1.75 $3.04 $0.34 $4.72 $0.28 $31.81
Average $3.41 $12.40 $3.26 $1.49 $3.08 $0.38 $3.44 $0.21 $27.67
Average $4.42 $12.40 $4.49 $1.92 $3.09 $0.38 $4.48 $0.29 $31.47
ALL CULTURAL AUDIENCES (Both Residents and Non-Residents)
Average for the 161,656 Surveys Where Residency Was Determined Based on a Single County
Average for the 75,452 Surveys Where Residency Was Determined Based on a Multi-City or Multi-County Region
Average for the 135,427 Surveys Where Residency Was Determined Based on an Entire State
Average Per Person Expenditure for All 212,691 Audience-Intercept Surveys Collected For This Study
SOURCE: Arts and Economic Prosperity 5, Americans for the Arts, 2017. For more information, visit www.AmericansForTheArts.org/EconomicImpact. B–314
Explanation of Table 22:Total Categorized Audience Expenditures by Resident Attendees toNonprofit Arts and Cultural Events Per Study Region During 2015
Column Two:
Column Three:
Column Four:
Column Five:
Column Six:
Column Seven:
Column Eight:
Column Nine:
Column Ten:
The total estimated dollars spent by resident audience members to purchase food, drinks, and/or meals (e.g., dinner at a restaurant, coffee at a cafe) before or after attending nonprofit arts and cultural events.
This table presents the total estimated dollars spent by residents as a direct result of their attendance to nonprofit arts and cultural events in each participating study region during 2015. Residents are attendees who reside within the county in which the nonprofit arts and cultural event at which they were surveyed took place (within the multi-city or multi-county region for regional analyses, and within the state for statewide analyses). Residency is determined based on the ZIP code provided by each audience-intercept survey respondent. Summary statistics are calculated for each population group.
The total estimated dollars spent by resident audience members to purchase refreshments (e.g., food, snacks, drinks) while attending nonprofit arts and cultural events.
The total estimated dollars spent by resident audience members on overnight lodging (e.g., hotel, motel, bed-and-breakfast) for the purpose of attending nonprofit arts and cultural events. (The audience-intercept survey instrument requested that respondents limit their response by providing the cost of one night only.)
The total estimated dollars spent by resident audience members on local ground transportation (e.g., gas, parking, taxi fares, tolls, car rentals) for the purpose of attending nonprofit arts and cultural events.
The total estimated expenditures made by resident audience members for the purpose of or as a result of attending nonprofit arts and cultural events. This figure is the sum of Column Two through Column Nine.
The total estimated dollars spent by resident audience members to purchase souvenirs and/or gifts (e.g., books, recordings, art) as a result of attending nonprofit arts and cultural events.
The total estimated dollars spent by resident audience members to purchase clothing or accessories for the purpose of attending nonprofit arts and cultural events.
The total estimated dollars spent by resident audience members on child care for the purpose of attending nonprofit arts and cultural events.
The total estimated dollars spent by resident audience members on miscellaneous products and services for the purpose of or as a result of attending nonprofit arts and cultural events.
SOURCE: Arts and Economic Prosperity 5, Americans for the Arts, 2017. For more information, visit www.AmericansForTheArts.org/EconomicImpact. B–315
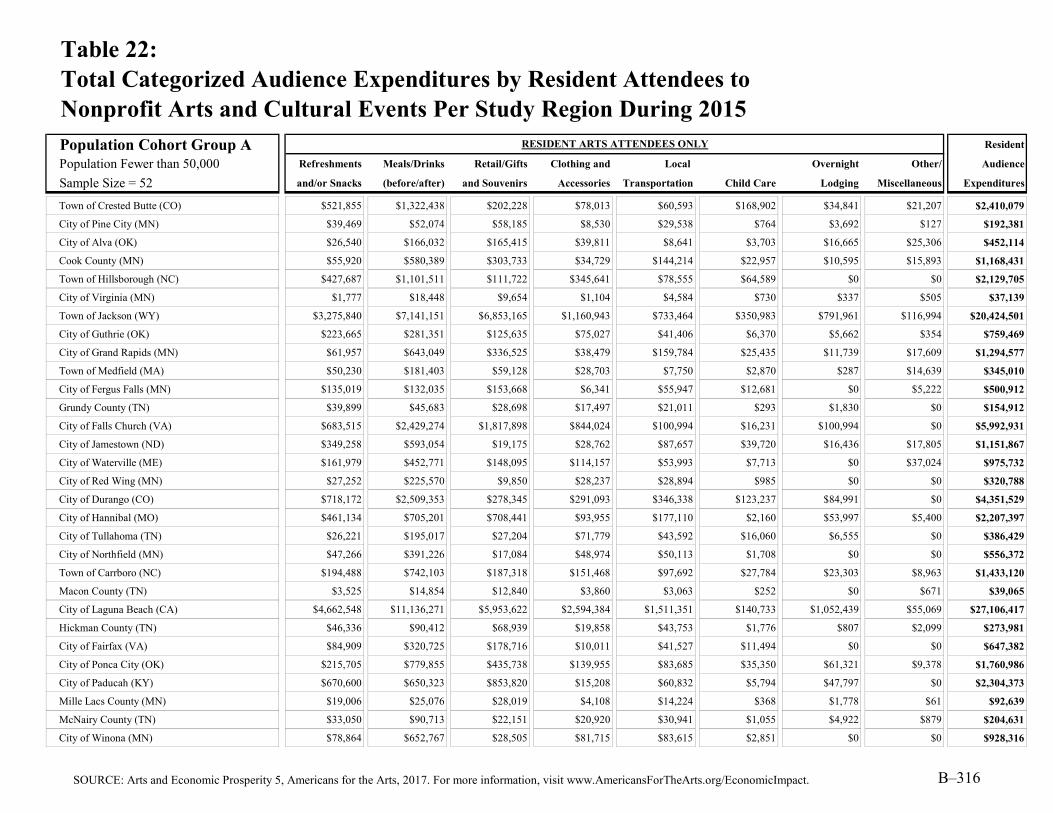
Table 22:Total Categorized Audience Expenditures by Resident Attendees toNonprofit Arts and Cultural Events Per Study Region During 2015
Population Cohort Group A Resident
Population Fewer than 50,000 Refreshments Meals/Drinks Retail/Gifts Clothing and Local Overnight Other/ Audience
Sample Size = 52 and/or Snacks (before/after) and Souvenirs Accessories Transportation Child Care Lodging Miscellaneous Expenditures
Town of Crested Butte (CO) $521,855 $1,322,438 $202,228 $78,013 $60,593 $168,902 $34,841 $21,207 $2,410,079
City of Pine City (MN) $39,469 $52,074 $58,185 $8,530 $29,538 $764 $3,692 $127 $192,381
City of Alva (OK) $26,540 $166,032 $165,415 $39,811 $8,641 $3,703 $16,665 $25,306 $452,114
Cook County (MN) $55,920 $580,389 $303,733 $34,729 $144,214 $22,957 $10,595 $15,893 $1,168,431
Town of Hillsborough (NC) $427,687 $1,101,511 $111,722 $345,641 $78,555 $64,589 $0 $0 $2,129,705
City of Virginia (MN) $1,777 $18,448 $9,654 $1,104 $4,584 $730 $337 $505 $37,139
Town of Jackson (WY) $3,275,840 $7,141,151 $6,853,165 $1,160,943 $733,464 $350,983 $791,961 $116,994 $20,424,501
City of Guthrie (OK) $223,665 $281,351 $125,635 $75,027 $41,406 $6,370 $5,662 $354 $759,469
City of Grand Rapids (MN) $61,957 $643,049 $336,525 $38,479 $159,784 $25,435 $11,739 $17,609 $1,294,577
Town of Medfield (MA) $50,230 $181,403 $59,128 $28,703 $7,750 $2,870 $287 $14,639 $345,010
City of Fergus Falls (MN) $135,019 $132,035 $153,668 $6,341 $55,947 $12,681 $0 $5,222 $500,912
Grundy County (TN) $39,899 $45,683 $28,698 $17,497 $21,011 $293 $1,830 $0 $154,912
City of Falls Church (VA) $683,515 $2,429,274 $1,817,898 $844,024 $100,994 $16,231 $100,994 $0 $5,992,931
City of Jamestown (ND) $349,258 $593,054 $19,175 $28,762 $87,657 $39,720 $16,436 $17,805 $1,151,867
City of Waterville (ME) $161,979 $452,771 $148,095 $114,157 $53,993 $7,713 $0 $37,024 $975,732
City of Red Wing (MN) $27,252 $225,570 $9,850 $28,237 $28,894 $985 $0 $0 $320,788
City of Durango (CO) $718,172 $2,509,353 $278,345 $291,093 $346,338 $123,237 $84,991 $0 $4,351,529
City of Hannibal (MO) $461,134 $705,201 $708,441 $93,955 $177,110 $2,160 $53,997 $5,400 $2,207,397
City of Tullahoma (TN) $26,221 $195,017 $27,204 $71,779 $43,592 $16,060 $6,555 $0 $386,429
City of Northfield (MN) $47,266 $391,226 $17,084 $48,974 $50,113 $1,708 $0 $0 $556,372
Town of Carrboro (NC) $194,488 $742,103 $187,318 $151,468 $97,692 $27,784 $23,303 $8,963 $1,433,120
Macon County (TN) $3,525 $14,854 $12,840 $3,860 $3,063 $252 $0 $671 $39,065
City of Laguna Beach (CA) $4,662,548 $11,136,271 $5,953,622 $2,594,384 $1,511,351 $140,733 $1,052,439 $55,069 $27,106,417
Hickman County (TN) $46,336 $90,412 $68,939 $19,858 $43,753 $1,776 $807 $2,099 $273,981
City of Fairfax (VA) $84,909 $320,725 $178,716 $10,011 $41,527 $11,494 $0 $0 $647,382
City of Ponca City (OK) $215,705 $779,855 $435,738 $139,955 $83,685 $35,350 $61,321 $9,378 $1,760,986
City of Paducah (KY) $670,600 $650,323 $853,820 $15,208 $60,832 $5,794 $47,797 $0 $2,304,373
Mille Lacs County (MN) $19,006 $25,076 $28,019 $4,108 $14,224 $368 $1,778 $61 $92,639
McNairy County (TN) $33,050 $90,713 $22,151 $20,920 $30,941 $1,055 $4,922 $879 $204,631
City of Winona (MN) $78,864 $652,767 $28,505 $81,715 $83,615 $2,851 $0 $0 $928,316
RESIDENT ARTS ATTENDEES ONLY
SOURCE: Arts and Economic Prosperity 5, Americans for the Arts, 2017. For more information, visit www.AmericansForTheArts.org/EconomicImpact. B–316

Table 22:Total Categorized Audience Expenditures by Resident Attendees toNonprofit Arts and Cultural Events Per Study Region During 2015
Population Cohort Group A Resident
Population Fewer than 50,000 Refreshments Meals/Drinks Retail/Gifts Clothing and Local Overnight Other/ Audience
Sample Size = 52 and/or Snacks (before/after) and Souvenirs Accessories Transportation Child Care Lodging Miscellaneous Expenditures
Door County (WI) $151,416 $450,827 $301,977 $114,204 $131,741 $7,271 $81,269 $0 $1,238,706
City of Benicia (CA) $132,480 $322,560 $290,560 $42,560 $31,040 $3,520 $7,360 $6,400 $836,480
City of Winter Park (FL) $1,011,421 $5,205,117 $567,382 $1,031,156 $725,263 $207,218 $320,694 $212,152 $9,280,403
City of Rochester (NH) $1,407,288 $2,475,648 $638,560 $395,416 $216,128 $63,856 $191,568 $194,024 $5,582,488
City of Morgantown (WV) $513,270 $1,944,918 $1,883,955 $239,919 $243,852 $29,498 $125,859 $1,967 $4,983,238
Henry County (TN) $50,757 $124,405 $131,372 $19,158 $14,431 $3,981 $0 $0 $344,104
City of Fairbanks (AK) $894,052 $3,057,918 $1,282,771 $362,804 $667,300 $110,137 $165,205 $132,812 $6,672,999
City of Bangor (ME) $543,842 $956,017 $370,957 $185,479 $231,276 $56,102 $141,971 $18,319 $2,503,962
Weakley County (TN) $175,455 $182,975 $99,425 $48,041 $67,676 $1,671 $2,924 $2,089 $580,255
Dare County (NC) $2,716,453 $5,717,487 $7,067,089 $1,466,022 $1,401,345 $237,151 $1,440,151 $0 $20,045,698
City of Columbia (TN) $965,906 $1,581,813 $734,089 $409,090 $393,181 $72,727 $154,545 $18,182 $4,329,532
City of Lake Worth (FL) $1,044,449 $5,444,639 $1,509,090 $1,147,703 $750,574 $43,684 $59,569 $246,220 $10,245,928
Clatsop County (OR) $266,826 $1,236,149 $529,278 $122,478 $131,226 $13,123 $55,990 $13,997 $2,369,067
Yadkin County (NC) $2,949 $8,824 $1,909 $2,263 $1,977 $537 $0 $846 $19,305
Greater Belfast Area (ME) $443,337 $953,663 $188,784 $143,719 $165,643 $14,616 $3,654 $32,885 $1,946,300
Campbell County (TN) $46,452 $71,398 $86,882 $31,972 $27,957 $3,298 $1,577 $0 $269,536
Monroe County (TN) $252,178 $659,904 $687,007 $266,318 $258,070 $25,925 $25,925 $0 $2,175,326
Lincoln County (OR) $397,823 $1,536,975 $182,030 $183,498 $229,005 $26,424 $110,099 $52,847 $2,718,699
Iron County (UT) $133,665 $400,528 $65,898 $26,172 $104,221 $32,248 $164,978 $0 $927,710
City of St. Louis Park (MN) $77,296 $269,130 $125,313 $35,135 $67,927 $8,198 $12,180 $9,603 $604,782
City of Logan (UT) $147,138 $1,392,156 $222,594 $133,934 $218,821 $86,774 $201,844 $41,501 $2,444,761
Gibson County (TN) $373,453 $766,192 $331,374 $1,035,324 $256,858 $3,507 $0 $0 $2,766,707
Group A Average $482,531 $1,315,949 $701,958 $266,147 $202,699 $41,289 $107,698 $25,751 $3,144,023
Percent of Group A Total 15.3% 41.9% 22.3% 8.5% 6.4% 1.3% 3.4% 0.8% 100.0%
Group A Median $168,717 $618,052 $184,674 $76,520 $83,650 $12,902 $11,960 $2,094 $1,203,569
RESIDENT ARTS ATTENDEES ONLY
SOURCE: Arts and Economic Prosperity 5, Americans for the Arts, 2017. For more information, visit www.AmericansForTheArts.org/EconomicImpact. B–317

Table 22:Total Categorized Audience Expenditures by Resident Attendees toNonprofit Arts and Cultural Events Per Study Region During 2015
Population Cohort Group B Resident
Population 50,000 to 99,999 Refreshments Meals/Drinks Retail/Gifts Clothing and Local Overnight Other/ Audience
Sample Size = 38 and/or Snacks (before/after) and Souvenirs Accessories Transportation Child Care Lodging Miscellaneous Expenditures
City of Joplin (MO) $287,472 $1,414,877 $452,889 $316,380 $284,260 $54,604 $28,908 $44,968 $2,884,358
City of La Crosse (WI) $1,711,780 $4,314,190 $821,149 $612,703 $720,084 $120,014 $549,538 $410,574 $9,260,033
McMinn County (TN) $401,550 $1,418,909 $415,035 $347,610 $271,196 $185,792 $49,445 $0 $3,089,536
Lafayette County (MS) $920,963 $1,539,038 $595,013 $184,500 $259,838 $52,275 $63,038 $38,438 $3,653,100
Chisago County (MN) $154,671 $204,066 $228,016 $33,429 $115,754 $2,994 $14,469 $499 $753,898
City of Grand Forks (ND) $427,340 $781,350 $443,355 $177,848 $89,345 $27,815 $23,601 $0 $1,970,653
City of Corvallis (OR) $3,747,845 $13,246,199 $6,680,318 $1,373,256 $929,809 $257,486 $0 $715,238 $26,950,149
City of Noblesville (IN) $270,148 $639,442 $267,419 $99,145 $36,384 $9,096 $0 $28,197 $1,349,832
City of Ocala (FL) $3,786,417 $8,680,426 $6,379,383 $2,069,221 $2,000,533 $154,548 $283,337 $60,102 $23,413,967
Lenoir County (NC) $853,373 $2,644,567 $4,262,419 $742,257 $740,775 $312,607 $81,485 $17,779 $9,655,261
Town of Chapel Hill (NC) $1,682,134 $4,301,641 $1,483,103 $1,027,258 $1,444,581 $584,253 $353,120 $0 $10,876,090
City of Grand Junction (CO) $618,370 $1,794,060 $456,885 $334,786 $228,442 $47,264 $31,509 $90,589 $3,601,905
Town of Jupiter (FL) $201,853 $1,158,555 $130,364 $238,650 $129,312 $16,821 $110,389 $125,107 $2,111,051
Hamblen County (TN) $76,147 $301,259 $108,054 $17,422 $16,835 $36,997 $0 $0 $556,713
City of Delray Beach (FL) $1,231,917 $1,364,519 $1,226,214 $429,175 $471,950 $32,794 $189,635 $101,234 $5,047,438
City of St. Cloud (MN) $956,314 $2,185,166 $871,146 $240,904 $467,207 $126,535 $148,436 $77,868 $5,073,576
City of Portland (ME) $2,193,297 $9,113,760 $687,959 $606,222 $1,355,485 $320,140 $163,476 $224,779 $14,665,116
City of Jackson (TN) $261,427 $560,641 $122,616 $225,953 $137,268 $44,728 $47,041 $1,542 $1,401,216
City of Walnut Creek (CA) $1,715,937 $10,749,703 $358,483 $458,858 $1,080,228 $152,953 $0 $215,090 $14,731,251
Greene County (TN) $453,486 $317,689 $162,374 $34,468 $109,634 $11,213 $12,458 $0 $1,101,323
City of Flagstaff (AZ) $1,787,519 $5,742,626 $7,256,969 $1,116,457 $1,306,492 $53,447 $142,526 $59,386 $17,465,423
City of Missoula (MT) $6,995,094 $15,600,797 $2,573,816 $1,500,077 $2,242,220 $268,435 $300,015 $252,644 $29,733,097
City of Fort Myers (FL) $4,464,477 $12,900,538 $3,601,914 $2,000,010 $1,412,329 $104,266 $170,617 $104,266 $24,758,417
Putnam County (TN) $18,771 $161,569 $2,011 $16,090 $7,375 $5,363 $0 $0 $211,179
Monroe County (FL) $5,554,443 $12,920,117 $3,787,120 $2,700,381 $2,755,267 $384,201 $680,584 $340,292 $29,122,405
City of Lynchburg (VA) $437,946 $1,239,740 $585,404 $316,693 $138,874 $30,130 $42,816 -$1 $2,791,602
City of Duluth (MN) $599,548 $6,222,676 $3,256,491 $372,351 $1,546,202 $246,130 $113,599 $170,398 $12,527,395
City of Fishers (IN) $1,642,102 $3,128,069 $339,188 $667,609 $188,438 $242,277 $0 $0 $6,207,683
City of Carmel (IN) $481,953 $1,445,859 $303,977 $110,251 $113,401 $22,050 $0 $0 $2,477,491
City of Sugar Land (TX) $70,220 $144,787 $35,611 $51,495 $28,757 $6,186 $26,249 $2,173 $365,477
RESIDENT ARTS ATTENDEES ONLY
SOURCE: Arts and Economic Prosperity 5, Americans for the Arts, 2017. For more information, visit www.AmericansForTheArts.org/EconomicImpact. B–318

Table 22:Total Categorized Audience Expenditures by Resident Attendees toNonprofit Arts and Cultural Events Per Study Region During 2015
Population Cohort Group B Resident
Population 50,000 to 99,999 Refreshments Meals/Drinks Retail/Gifts Clothing and Local Overnight Other/ Audience
Sample Size = 38 and/or Snacks (before/after) and Souvenirs Accessories Transportation Child Care Lodging Miscellaneous Expenditures
City of Asheville (NC) $1,269,817 $6,128,248 $1,681,378 $496,885 $898,408 $185,704 $65,248 $0 $10,725,688
Buchanan County (MO) $1,984,198 $2,378,365 $1,616,754 $444,273 $330,700 $20,042 $0 $3,340 $6,777,672
City of Boca Raton (FL) $528,017 $1,871,686 $1,058,088 $571,162 $302,017 $30,818 $242,436 $154,091 $4,758,315
City of Miami Beach (FL) $6,361,757 $26,649,554 $930,989 $3,142,087 $5,495,420 $620,659 $1,060,293 $77,582 $44,338,342
Moore County (NC) $499,746 $2,349,075 $833,801 $451,642 $320,693 $37,414 $48,104 $0 $4,540,476
Sevier County (TN) $1,026,058 $1,166,546 $1,294,489 $574,492 $504,249 $20,070 $388,849 $0 $4,974,752
Cape May County (NJ) $530,650 $1,755,369 $716,102 $132,204 $80,791 $1,836 $0 $42,232 $3,259,184
Cleveland County (NC) $249,292 $584,108 $356,045 $55,803 $99,474 $3,033 $35,786 $10,311 $1,393,852
Group B Average $1,485,633 $4,450,521 $1,483,746 $639,211 $754,211 $127,184 $143,869 $88,650 $9,173,024
Percent of Group B Total 16.2% 48.5% 16.2% 7.0% 8.2% 1.4% 1.6% 1.0% 100.0%
Group B Median $735,871 $1,832,873 $702,031 $400,763 $311,355 $49,769 $48,774 $33,317 $4,866,534
RESIDENT ARTS ATTENDEES ONLY
SOURCE: Arts and Economic Prosperity 5, Americans for the Arts, 2017. For more information, visit www.AmericansForTheArts.org/EconomicImpact. B–319

Table 22:Total Categorized Audience Expenditures by Resident Attendees toNonprofit Arts and Cultural Events Per Study Region During 2015
Population Cohort Group C Resident
Population 100,000 to 249,999 Refreshments Meals/Drinks Retail/Gifts Clothing and Local Overnight Other/ Audience
Sample Size = 50 and/or Snacks (before/after) and Souvenirs Accessories Transportation Child Care Lodging Miscellaneous Expenditures
City of Las Cruces (NM) $979,582 $2,461,443 $1,850,938 $635,480 $224,777 $116,551 $308,027 $108,226 $6,685,023
Eau Claire County (WI) $349,450 $1,336,521 $920,825 $119,244 $96,057 $82,808 $23,186 $0 $2,928,091
Yamhill County (OR) $2,031,229 $3,566,916 $3,954,518 $554,418 $515,167 $225,692 $402,321 $19,625 $11,269,886
City of Lewisville (TX) $36,515 $92,464 $13,244 $14,358 $20,795 $5,818 $3,466 $0 $186,660
City of West Palm Beach (FL) $15,609,873 $27,630,018 $7,125,064 $4,677,523 $8,566,394 $571,093 $1,604,499 $1,930,838 $67,715,301
City of Boulder (CO) $3,108,412 $10,547,096 $3,518,957 $1,651,955 $1,026,362 $273,697 $107,524 $68,424 $20,302,426
City of Richardson (TX) $1,307,828 $2,013,682 $1,496,943 $263,696 $335,614 $191,779 $466,130 $23,972 $6,099,644
City of High Point (NC) $442,502 $691,848 $181,449 $84,286 $126,429 $19,901 $62,044 $3,512 $1,611,971
City of Cambridge (MA) $4,683,258 $9,655,317 $1,912,330 $413,688 $2,021,606 $351,244 $312,217 $124,887 $19,474,548
City of Lowell (MA) $374,558 $1,002,197 $832,633 $93,640 $107,137 $11,810 $11,810 $17,716 $2,451,502
Douglas County (KS) $1,947,385 $4,478,022 $1,248,447 $1,200,245 $751,961 $134,967 $159,069 $38,562 $9,958,657
City of Columbia (MO) $461,150 $2,333,039 $354,731 $204,653 $327,444 $49,117 $19,101 $30,016 $3,779,250
City of Norman (OK) $5,364,032 $6,786,750 $4,819,297 $2,685,220 $1,121,512 $448,605 $685,724 $192,259 $22,103,399
Wayne County (NC) $388,165 $989,979 $472,778 $252,783 $188,265 $39,134 $35,961 $8,461 $2,375,527
City of Lafayette (LA) $1,122,778 $2,775,949 $309,969 $619,939 $422,477 $413,293 $0 $0 $5,664,405
Washington County (TN) $384,391 $1,064,645 $513,686 $40,769 $193,360 $10,483 $58,241 $0 $2,265,575
City of Thousand Oaks (CA) $438,672 $1,491,904 $122,493 $88,991 $172,747 $61,770 $12,563 $11,516 $2,400,656
City of Charleston (SC) $10,936,281 $32,026,128 $4,478,875 $6,500,891 $4,435,390 $652,263 $1,674,142 $0 $60,703,971
City of Waco (TX) $3,193,526 $5,170,470 $1,842,763 $1,994,835 $1,350,763 $214,691 $751,418 $17,891 $14,536,356
Robeson County (NC) $119,829 $160,654 $201,857 $78,248 $105,843 $4,158 $25,705 $378 $696,672
Columbia County (GA) $5,752 $7,450 $2,970 $1,565 $1,763 $255 $660 $886 $21,302
Orange County (NC) $2,304,336 $6,145,332 $1,782,164 $1,524,386 $1,620,846 $676,633 $376,427 $8,964 $14,439,088
City of Savannah (GA) $9,976,614 $16,051,140 $7,070,804 $2,947,321 $2,352,322 $678,022 $1,037,789 $124,535 $40,238,549
Indian River County (FL) $1,280,203 $2,168,295 $838,753 $111,661 $350,563 $41,548 $116,854 $0 $4,907,876
City of Alexandria (VA) $3,178,637 $10,231,515 $7,898,166 $1,655,357 $1,364,789 $79,246 $255,348 $0 $24,663,057
Martin County (FL) $1,270,775 $3,389,731 $1,066,971 $413,601 $323,688 $134,870 $32,968 $56,945 $6,689,550
Macon-Bibb County (GA) $3,179,538 $9,972,615 $3,358,799 $1,368,050 $1,207,658 $537,785 $179,262 $66,044 $19,869,752
City of Springfield (MA) $2,648,736 $2,819,873 $1,291,307 $844,017 $762,338 $237,258 $400,616 $0 $9,004,146
Catawba County (NC) $2,867,206 $6,624,419 $7,066,758 $1,289,710 $1,023,241 $175,870 $90,599 $426,350 $19,564,154
Town of Cary (NC) $1,914,250 $3,870,002 $2,069,880 $285,322 $420,201 $140,067 $0 $20,751 $8,720,473
RESIDENT ARTS ATTENDEES ONLY
SOURCE: Arts and Economic Prosperity 5, Americans for the Arts, 2017. For more information, visit www.AmericansForTheArts.org/EconomicImpact. B–320

Table 22:Total Categorized Audience Expenditures by Resident Attendees toNonprofit Arts and Cultural Events Per Study Region During 2015
Population Cohort Group C Resident
Population 100,000 to 249,999 Refreshments Meals/Drinks Retail/Gifts Clothing and Local Overnight Other/ Audience
Sample Size = 50 and/or Snacks (before/after) and Souvenirs Accessories Transportation Child Care Lodging Miscellaneous Expenditures
Alamance County (NC) $365,348 $1,117,249 $1,167,810 $177,781 $238,129 $19,572 $35,882 $40,776 $3,162,548
Cumberland County (NJ) $226,110 $609,999 $839,835 $63,360 $146,598 $65,845 $0 $100,631 $2,052,379
City of Eugene (OR) $3,168,152 $8,190,114 $1,549,746 $882,767 $1,186,831 $176,553 $39,234 $519,852 $15,713,249
Middlesex County (CT) $745,968 $1,879,578 $407,188 $187,306 $231,283 $312,720 $0 $141,701 $3,905,743
City of Springfield (MO) $1,143,200 $4,846,386 $2,203,347 $1,182,284 $840,301 $180,762 $400,609 $0 $10,796,889
City of Sioux Falls (SD) $5,801,269 $19,173,257 $1,996,951 $2,047,507 $1,971,673 $341,251 $151,667 $0 $31,483,575
Pitt County (NC) $556,401 $1,664,391 $545,176 $192,415 $205,243 $94,604 $194,019 $0 $3,452,249
City of Providence (RI) $9,451,705 $33,069,062 $3,975,906 $4,118,753 $4,999,642 $4,118,753 $1,142,775 $0 $60,876,596
City of Worcester (MA) $9,536,614 $20,790,192 $11,645,494 $2,202,193 $3,639,217 $1,045,108 $0 $466,566 $49,325,384
Montgomery County (TN) $186,258 $387,989 $503,182 $126,082 $75,076 $44,129 $38,398 $573 $1,361,686
Salt Lake City (UT) $25,725,100 $53,617,108 $16,057,352 $7,667,524 $10,501,175 $2,278,033 $3,111,459 $166,685 $119,124,435
Cabarrus County (NC) $319,155 $1,958,364 $311,601 $107,644 $132,194 $35,881 $43,435 $9,442 $2,917,717
Richmond County (GA) $1,674,386 $3,269,875 $1,151,323 $695,469 $610,727 $350,657 $382,800 $2,922 $8,138,160
City of Tacoma (WA) $5,102,474 $22,490,135 $3,767,981 $2,237,239 $4,651,101 $647,622 $392,498 $412,123 $39,701,173
Doña Ana County (NM) $1,876,372 $4,756,007 $3,428,624 $1,297,001 $446,207 $241,105 $548,832 $194,028 $12,788,176
New Hanover County (NC) $3,736,964 $13,602,548 $1,011,855 $2,817,096 $2,092,700 $816,383 $1,184,330 $0 $25,261,875
Arlington County (VA) $1,108,552 $3,353,369 $828,334 $437,262 $415,707 $30,793 $40,031 $3,079 $6,217,127
City of Irving (TX) $69,671 $381,762 $41,965 $38,298 $68,448 $2,445 $5,704 $0 $608,293
City of Reno (NV) $6,956,242 $12,347,597 $2,197,272 $1,929,312 $1,554,168 $332,270 $514,483 $117,902 $25,949,246
York County (SC) $1,353,463 $2,962,062 $1,462,363 $2,069,088 $743,627 $252,024 $155,571 $130,679 $9,128,877
Group C Average $3,220,177 $7,760,449 $2,474,234 $1,261,845 $1,325,751 $359,339 $351,908 $112,154 $16,865,857
Percent of Group C Total 19.1% 46.0% 14.7% 7.5% 7.9% 2.1% 2.1% 0.7% 100.0%
Group C Median $1,513,925 $3,371,550 $1,376,835 $627,709 $480,687 $178,658 $134,261 $17,803 $8,862,310
RESIDENT ARTS ATTENDEES ONLY
SOURCE: Arts and Economic Prosperity 5, Americans for the Arts, 2017. For more information, visit www.AmericansForTheArts.org/EconomicImpact. B–321

Table 22:Total Categorized Audience Expenditures by Resident Attendees toNonprofit Arts and Cultural Events Per Study Region During 2015
Population Cohort Group D Resident
Population 250,000 to 499,999 Refreshments Meals/Drinks Retail/Gifts Clothing and Local Overnight Other/ Audience
Sample Size = 42 and/or Snacks (before/after) and Souvenirs Accessories Transportation Child Care Lodging Miscellaneous Expenditures
Buncombe County (NC) $1,456,150 $6,626,918 $1,876,111 $569,051 $991,193 $198,686 $69,448 $0 $11,787,557
Alachua County (FL) $6,214,321 $16,017,194 $3,571,047 $4,691,375 $2,975,872 $1,207,854 $507,649 $192,556 $35,377,868
Greater Green Bay Area (WI) $1,673,718 $1,999,574 $2,387,146 $385,103 $382,635 $150,585 $140,711 $7,406 $7,126,877
City of Orlando (FL) $7,878,694 $11,303,065 $3,618,936 $1,837,954 $3,054,723 $523,923 $264,047 $663,865 $29,145,207
City of Lincoln (NE) $3,871,166 $15,209,464 $2,495,159 $1,797,982 $2,825,401 $238,508 $110,081 $1,082,459 $27,630,221
Southeastern Connecticut Region (CT) $5,516,122 $21,019,766 $5,620,594 $2,235,701 $1,943,179 $271,627 $605,938 $0 $37,212,926
Erie County (PA) $3,000,587 $9,452,360 $1,423,486 $1,167,464 $1,310,836 $256,023 $522,286 $0 $17,133,042
San Luis Obispo County (CA) $1,269,483 $4,014,310 $2,184,425 $285,920 $697,644 $118,180 $301,169 $38,123 $8,909,252
City of Newark (NJ) $7,220,794 $10,097,370 $4,373,570 $3,991,984 $4,124,071 $895,261 $2,436,284 $0 $33,139,334
Leon County (FL) $14,680,783 $24,412,181 $15,613,276 $8,751,086 $4,016,892 $1,434,604 $1,147,683 $263,011 $70,319,516
Rutherford County (TN) $1,731,556 $6,144,230 $1,612,860 $1,270,739 $1,277,721 $230,409 $377,032 $342,122 $12,986,669
St. Lucie County (FL) $630,988 $1,297,514 $264,867 $150,203 $137,463 $34,198 $0 $0 $2,515,233
Greater Spartanburg Area (SC) $1,105,365 $4,461,970 $1,290,557 $422,469 $503,491 $92,596 $190,979 $0 $8,067,427
Durham County (NC) $2,156,918 $15,146,004 $2,188,637 $475,791 $1,871,443 $475,791 $190,316 $0 $22,504,900
City of St. Paul (MN) $19,883,190 $69,229,651 $32,234,868 $9,037,814 $17,473,106 $2,108,823 $3,133,109 $2,470,336 $155,570,896
Hamilton County (IN) $2,601,375 $5,712,778 $1,042,982 $946,977 $371,151 $288,515 $0 $36,430 $11,000,208
Osceola County (FL) $80,980 $237,659 $64,696 $44,891 $25,086 $45,771 $0 $0 $499,085
Escambia County (FL) $4,134,500 $19,666,810 $4,230,280 $1,452,662 $2,123,122 $846,056 $0 $159,633 $32,613,063
Lexington-Fayette Urban County (KY) $2,144,869 $4,310,613 $1,826,531 $1,132,449 $761,924 $187,872 $93,936 $20,875 $10,479,069
Lake County (FL) $525,635 $1,680,112 $1,291,286 $160,811 $252,017 $43,203 $0 $4,800 $3,957,864
City of Riverside (CA) $3,830,743 $8,209,679 $3,421,250 $389,679 $587,821 $284,003 $0 $112,280 $16,835,457
Cumberland County (NC) $4,887,417 $8,676,538 $2,624,927 $2,108,728 $1,746,291 $252,608 $669,961 $32,949 $20,999,420
Collier County (FL) $3,346,207 $11,936,217 $2,727,794 $2,685,437 $1,812,882 $169,428 $525,227 $0 $23,203,192
Hamilton County (TN) $12,247,961 $25,189,202 $14,443,350 $6,374,332 $4,159,685 $712,539 $847,343 $288,867 $64,263,279
Manatee County (FL) $2,947,326 $7,318,959 $2,742,847 $1,177,520 $761,510 $63,459 $782,663 $84,612 $15,878,897
City of Tampa (FL) $17,829,369 $32,452,017 $16,204,630 $5,686,585 $8,914,684 $1,410,957 $3,206,721 $0 $85,704,963
Forsyth County (NC) $5,589,247 $15,637,152 $4,219,802 $2,786,662 $2,579,652 $254,780 $493,637 $0 $31,560,932
Mercer County (NJ) $1,459,865 $2,071,244 $630,975 $248,863 $444,818 $76,422 $0 $0 $4,932,187
City of Wichita (KS) $4,796,797 $17,388,391 $2,136,074 $3,335,273 $2,042,386 $599,600 $974,349 $0 $31,272,871
Clackamas County (OR) $781,231 $1,507,957 $1,730,517 $347,466 $295,233 $45,420 $88,570 $56,776 $4,853,170
RESIDENT ARTS ATTENDEES ONLY
SOURCE: Arts and Economic Prosperity 5, Americans for the Arts, 2017. For more information, visit www.AmericansForTheArts.org/EconomicImpact. B–322

Table 22:Total Categorized Audience Expenditures by Resident Attendees toNonprofit Arts and Cultural Events Per Study Region During 2015
Population Cohort Group D Resident
Population 250,000 to 499,999 Refreshments Meals/Drinks Retail/Gifts Clothing and Local Overnight Other/ Audience
Sample Size = 42 and/or Snacks (before/after) and Souvenirs Accessories Transportation Child Care Lodging Miscellaneous Expenditures
Sarasota County (FL) $4,633,869 $22,812,894 $1,302,892 $3,834,926 $2,335,372 $147,497 $565,406 $73,749 $35,706,604
City of Minneapolis (MN) $22,125,652 $77,037,497 $35,870,375 $10,057,115 $19,443,755 $2,346,660 $3,486,466 $2,748,945 $173,116,464
Berks County (PA) $1,100,547 $2,272,032 $496,564 $152,009 $243,215 $18,241 $32,429 $4,054 $4,319,089
City of Miami (FL) $41,559,761 $64,972,905 $14,711,926 $17,974,883 $29,023,139 $3,778,160 $2,747,753 $343,469 $175,111,996
City of Raleigh (NC) $24,651,238 $71,041,616 $10,293,923 $13,612,359 $15,644,055 $8,194,505 $6,027,363 $5,891,917 $155,356,975
Santa Barbara County (CA) $6,277,077 $18,011,671 $2,570,435 $1,508,734 $3,017,467 $651,922 $4,153,674 $0 $36,190,979
Seminole County (FL) $1,006,787 $2,552,418 $238,226 $229,718 $314,798 $96,425 $158,817 $0 $4,597,188
City of Virginia Beach (VA) $3,623,492 $23,351,394 $1,723,675 $1,836,909 $1,673,349 $641,660 $1,144,923 $0 $33,995,402
City of Atlanta (GA) $2,527,782 $23,919,141 $3,222,923 $4,234,036 $7,772,931 $3,475,701 $9,542,379 $0 $54,694,892
City of Mesa (AZ) $2,090,636 $3,711,818 $2,121,933 $588,383 $663,495 $219,079 $287,932 $87,631 $9,770,908
City of Kansas City (MO) $3,928,518 $11,955,491 $1,569,408 $1,759,336 $2,059,223 $309,883 $89,966 $59,977 $21,731,804
Morris County (NJ) $1,365,557 $4,085,362 $1,441,892 $435,395 $684,192 $101,781 $50,890 $135,708 $8,300,777
Group D Average $6,199,626 $16,765,503 $5,134,706 $2,908,876 $3,650,927 $797,600 $1,094,456 $361,965 $36,913,659
Percent of Group D Total 16.8% 45.4% 13.9% 7.9% 9.9% 2.2% 3.0% 1.0% 100.0%
Group D Median $3,484,850 $10,700,218 $2,287,892 $1,480,698 $1,779,586 $255,402 $339,100 $26,912 $22,118,352
RESIDENT ARTS ATTENDEES ONLY
SOURCE: Arts and Economic Prosperity 5, Americans for the Arts, 2017. For more information, visit www.AmericansForTheArts.org/EconomicImpact. B–323

Table 22:Total Categorized Audience Expenditures by Resident Attendees toNonprofit Arts and Cultural Events Per Study Region During 2015
Population Cohort Group E Resident
Population 500,000 to 999,999 Refreshments Meals/Drinks Retail/Gifts Clothing and Local Overnight Other/ Audience
Sample Size = 25 and/or Snacks (before/after) and Souvenirs Accessories Transportation Child Care Lodging Miscellaneous Expenditures
Sonoma County (CA) $5,755,986 $13,276,873 $1,534,261 $952,646 $1,815,041 $521,448 $120,334 $10,028 $23,986,617
Volusia County (FL) $4,579,715 $8,166,690 $3,671,264 $7,230,143 $3,427,762 $524,466 $1,301,800 $0 $28,901,840
Guilford County (NC) $9,983,488 $24,063,565 $7,183,103 $4,152,148 $4,169,637 $833,473 $900,270 $151,435 $51,437,119
Dane County (WI) $21,404,920 $37,649,726 $8,361,297 $3,917,865 $7,262,384 $286,673 $621,125 $668,904 $80,172,894
Brevard County (FL) $361,836 $1,189,270 $168,946 $95,780 $228,808 $2,661 $0 $0 $2,047,301
Washington County (OR) $660,985 $2,518,952 $216,322 $264,394 $516,770 $98,547 $0 $0 $4,275,969
Johnson County (KS) $1,199,129 $3,500,741 $1,370,945 $254,144 $476,072 $93,067 $60,851 $35,795 $6,990,744
City of Louisville (KY) $20,494,726 $99,706,094 $3,665,115 $8,826,196 $24,085,043 $3,739,914 $2,617,939 $299,193 $163,434,220
City of Baltimore (MD) $9,243,437 $32,431,129 $3,480,414 $3,887,215 $6,712,227 $1,875,807 $45,200 $226,001 $57,901,431
Polk County (FL) $2,709,094 $4,884,760 $3,050,727 $1,516,373 $1,174,740 $167,820 $47,949 $131,859 $13,683,320
City of Boston (MA) $24,431,431 $65,957,526 $5,429,207 $12,986,076 $24,578,166 $3,448,280 $8,510,649 $0 $145,341,334
District of Columbia (DC) $72,388,747 $222,534,051 $18,557,285 $12,115,913 $57,512,246 $8,895,227 $14,109,671 $4,294,248 $410,407,389
Nashville-Davidson County (TN) $18,581,931 $35,218,317 $24,458,268 $10,958,574 $11,157,099 $873,510 $3,136,693 $476,460 $104,860,852
City of El Paso (TX) $8,980,932 $11,896,585 $7,181,146 $2,573,694 $4,049,519 $791,906 $1,313,844 $89,989 $36,877,615
Lee County (FL) $11,986,633 $34,928,508 $11,628,913 $5,803,158 $3,953,371 $272,547 $439,866 $272,547 $69,285,543
City of Fort Worth (TX) $16,367,876 $38,891,103 $9,582,230 $5,511,224 $9,957,576 $584,076 $2,201,664 -$1 $83,095,748
City of Indianapolis (IN) $19,281,535 $53,179,718 $13,861,380 $4,753,743 $10,751,455 $1,688,245 $844,123 $799,695 $105,159,893
City and County of San Francisco (CA) $30,371,306 $77,297,201 $11,906,571 $8,404,638 $23,367,441 $1,400,773 $3,820,290 $0 $156,568,219
Prince George's County (MD) $4,209,939 $5,730,482 $4,313,377 $2,854,897 $2,379,081 $227,564 $403,409 $382,722 $20,501,471
Pinellas County (FL) $11,946,354 $36,622,430 $17,206,107 $5,483,572 $5,595,482 $867,300 $671,458 $139,887 $78,532,590
Shelby County (TN) $11,350,690 $21,592,994 $6,014,018 $7,963,956 $4,618,274 $1,005,757 $1,313,642 $533,667 $54,392,999
Fairfield County (CT) $6,547,382 $30,756,530 $17,964,885 $2,849,324 $3,071,611 $909,359 $1,293,310 $0 $63,392,402
Westchester County (NY) $3,392,826 $29,309,639 $3,283,380 $2,976,931 $3,567,940 $788,011 $1,269,574 $328,338 $44,916,638
Fulton County (GA) $2,756,905 $24,763,469 $3,466,479 $4,495,633 $8,033,626 $3,540,649 $9,642,508 $39,691 $56,738,960
Wake County (NC) $26,880,885 $75,658,955 $12,572,438 $14,026,448 $16,199,543 $8,400,585 $6,067,297 $5,951,786 $165,757,937
Group E Average $13,834,747 $39,669,012 $8,005,123 $5,394,187 $9,546,436 $1,673,507 $2,430,139 $593,290 $81,146,442
Percent of Group E Total 17.0% 48.9% 9.9% 6.6% 11.8% 2.1% 3.0% 0.7% 100.0%
Group E Median $9,983,488 $30,756,530 $6,014,018 $4,495,633 $4,618,274 $833,473 $1,269,574 $139,887 $57,901,431
RESIDENT ARTS ATTENDEES ONLY
SOURCE: Arts and Economic Prosperity 5, Americans for the Arts, 2017. For more information, visit www.AmericansForTheArts.org/EconomicImpact. B–324

Table 22:Total Categorized Audience Expenditures by Resident Attendees toNonprofit Arts and Cultural Events Per Study Region During 2015
Population Cohort Group F Resident
Population 1,000,000 or More Refreshments Meals/Drinks Retail/Gifts Clothing and Local Overnight Other/ Audience
Sample Size = 21 and/or Snacks (before/after) and Souvenirs Accessories Transportation Child Care Lodging Miscellaneous Expenditures
Mecklenburg County (NC) $9,703,094 $33,186,520 $1,663,981 $3,781,570 $4,835,236 $1,817,830 $676,712 $23,444 $55,688,387
City of San José (CA) $13,960,553 $26,945,223 $9,297,999 $5,557,113 $12,903,346 $3,117,405 $4,960,740 $162,647 $76,905,027
Montgomery County (MD) $4,321,703 $24,888,577 $5,474,157 $1,595,706 $4,255,215 $997,316 $332,439 $199,463 $42,064,577
Fairfax County (VA) $9,710,785 $29,369,203 $6,526,490 $4,026,423 $4,052,739 $578,963 $26,316 $26,316 $54,317,235
Allegheny County (PA) $37,466,217 $180,151,148 $50,651,192 $21,278,723 $35,769,141 $4,699,595 $3,263,608 $6,005,038 $339,284,662
Greater Columbus Area (OH) $21,128,289 $53,061,425 $16,100,291 $5,027,998 $8,344,337 $2,941,914 $1,337,234 $0 $107,941,488
Orange County (FL) $10,560,909 $19,287,458 $4,850,869 $3,348,017 $4,428,394 $849,523 $681,599 $970,184 $44,976,953
City of Dallas (TX) $27,440,576 $64,146,702 $7,577,208 $5,887,853 $14,889,229 $2,951,358 $2,256,800 $45,446 $125,195,172
Hillsborough County (FL) $21,549,699 $38,663,115 $19,355,384 $7,499,285 $10,478,760 $1,713,827 $3,789,859 $18,082 $103,068,011
City of San Diego (CA) $41,741,403 $90,166,075 $21,545,862 $14,472,179 $24,876,953 $3,484,841 $9,605,598 $118,585 $206,011,496
Palm Beach County (FL) $20,384,565 $41,137,457 $12,310,484 $7,865,157 $11,194,847 $759,002 $2,482,960 $2,812,657 $98,947,129
City of San Antonio (TX) $22,631,834 $66,243,544 $25,385,099 $18,501,937 $18,667,133 $3,193,787 $7,764,206 $0 $162,387,540
Sacramento County (CA) $13,846,774 $25,168,854 $10,515,219 $2,941,138 $8,615,192 $702,750 $2,498,666 $390,417 $64,679,008
City of Phoenix (AZ) $29,241,827 $57,879,030 $24,020,072 $12,257,382 $16,324,854 $1,758,907 $4,232,370 $439,727 $146,154,169
City and County of Philadelphia (PA) $25,853,216 $86,877,305 $14,895,127 $8,267,780 $20,866,301 $2,099,754 $9,973,830 $0 $168,833,313
Broward County (FL) $23,758,164 $54,671,839 $11,224,330 $12,299,995 $12,253,226 $2,852,850 $3,788,211 $327,376 $121,175,992
Santa Clara County (CA) $16,075,925 $32,619,329 $10,805,640 $6,597,268 $14,966,126 $3,549,829 $5,574,315 $197,711 $90,386,143
Riverside County (CA) $9,371,907 $14,043,646 $9,437,529 $792,974 $1,466,231 $449,741 $801,066 $156,477 $36,519,571
Miami-Dade County (FL) $76,862,070 $159,216,488 $26,049,620 $35,438,579 $54,935,524 $8,165,055 $7,227,392 $718,387 $368,613,115
City of Chicago (IL) $113,694,522 $317,468,215 $40,413,899 $30,919,067 $129,519,241 $16,311,634 $22,154,607 $486,914 $670,968,098
Harris County (TX) $35,128,520 $206,800,652 $40,111,866 $40,804,958 $55,537,760 $10,057,565 $955,685 $57,767 $389,454,773
Group F Average $27,830,122 $77,237,705 $17,533,920 $11,864,814 $22,341,895 $3,478,735 $4,494,486 $626,507 $165,408,184
Percent of Group F Total 16.8% 46.7% 10.6% 7.2% 13.5% 2.1% 2.7% 0.4% 100.0%
Group F Median $21,549,699 $53,061,425 $12,310,484 $7,499,285 $12,903,346 $2,852,850 $3,263,608 $162,647 $107,941,488
Average $6,286,140 $17,295,789 $4,388,570 $2,664,081 $4,239,770 $760,251 $1,007,752 $234,679 $36,877,033
Percent of Total 17.0% 46.9% 11.9% 7.2% 11.5% 2.1% 2.7% 0.6% 100.0%
Median $1,657,910 $4,193,502 $1,490,023 $609,463 $690,918 $161,184 $141,341 $18,132 $9,467,832
ALL CITY/COUNTY STUDY REGIONS
RESIDENT ARTS ATTENDEES ONLY
SOURCE: Arts and Economic Prosperity 5, Americans for the Arts, 2017. For more information, visit www.AmericansForTheArts.org/EconomicImpact. B–325

Table 22:Total Categorized Audience Expenditures by Resident Attendees toNonprofit Arts and Cultural Events Per Study Region During 2015
Regional Study Regions Resident
All Populations Refreshments Meals/Drinks Retail/Gifts Clothing and Local Overnight Other/ Audience
Sample Size = 81 and/or Snacks (before/after) and Souvenirs Accessories Transportation Child Care Lodging Miscellaneous Expenditures
High Peaks Region (ME) $81,246 $96,634 $96,965 $20,518 $23,828 $1,986 $13,569 $3,309 $338,055
Wood River Valley (ID) $705,089 $1,908,793 $730,350 $682,026 $232,833 $64,798 $47,226 $21,965 $4,393,080
Southern Oregon Area $403,097 $1,040,499 $99,425 $141,045 $119,465 $9,249 $137,962 $0 $1,950,743
Southwestern Pennsylvania Area $3,486,844 $10,747,979 $1,374,742 $1,362,244 $2,162,093 $299,944 $137,474 $62,488 $19,633,808
Greater Portsmouth Area (NH) $3,295,943 $11,768,967 $2,797,995 $545,372 $1,161,879 $553,276 $268,734 $600,699 $20,992,865
Northeast Oregon Region $62,294 $102,176 $64,107 $17,469 $21,094 $9,723 $5,768 $4,779 $287,411
Toe River Valley (NC) $120,300 $307,128 $1,447,740 $16,546 $63,080 $5,171 $0 $1,379 $1,961,343
Albemarle Region (NC) $436,088 $1,454,014 $445,416 $283,340 $150,415 $26,818 $46,640 $13,992 $2,856,725
Greater Concord Area (NH) $435,843 $1,729,080 $328,668 $219,708 $176,838 $151,830 $94,671 $3,572 $3,140,210
North Central Minnesota Region $121,895 $386,837 $178,112 $38,962 $182,008 $8,906 $86,830 $133,027 $1,136,577
Northwest Minnesota Region $41,073 $114,531 $95,048 $15,271 $86,096 $12,375 $0 $527 $364,920
Monadnock Region (NH) $353,292 $2,074,407 $298,503 $262,607 $239,936 $103,909 $62,346 $28,339 $3,423,339
Bismarck-Mandan Region (ND) $2,124,790 $5,746,592 $3,690,788 $1,345,241 $1,131,382 $476,008 $682,968 $144,872 $15,342,642
Greater Minot Region (ND) $453,152 $2,156,774 $157,743 $123,326 $349,902 $20,076 $22,944 $34,417 $3,318,334
Greater Burlington Area (VT) $2,863,004 $9,668,772 $4,106,365 $564,421 $1,357,882 $122,700 $0 $1,087,941 $19,771,084
Greater Charlottesville Area (VA) $5,276,453 $12,333,438 $4,646,753 $477,704 $1,509,109 $271,423 $293,136 $32,571 $24,840,587
Brainerd Lakes Region (MN) $154,049 $325,960 $30,512 $10,419 $78,885 $34,977 $29,768 $0 $664,571
East Central Minnesota Region $416,060 $548,931 $613,353 $89,923 $311,374 $8,053 $38,922 $1,342 $2,027,958
Northwest Connecticut Region $781,212 $3,271,524 $915,134 $124,356 $446,407 $19,132 $178,563 $38,263 $5,774,591
Central Oregon Region $1,547,077 $3,946,569 $345,948 $517,537 $337,645 $262,920 $210,336 $0 $7,168,032
Greater Fargo-Moorhead Area (ND/MN) $2,170,301 $7,647,241 $2,395,521 $1,576,540 $911,117 $163,796 $143,322 $296,881 $15,304,719
Black Hills Region (SD) $12,453,924 $36,973,798 $10,669,249 $4,190,105 $5,664,401 $1,280,310 $2,211,444 $1,319,107 $74,762,339
Greater Kingsport Area (TN) $1,268,738 $4,238,290 $2,062,190 $1,170,538 $671,685 $216,039 $106,055 $11,784 $9,745,318
Lake Region (MN) $661,168 $646,556 $752,489 $31,049 $273,965 $62,099 $0 $25,570 $2,452,895
South Central Minnesota Region $321,390 $2,450,599 $500,833 $281,216 $527,615 $40,174 $0 $26,783 $4,148,609
Greater Sioux Falls Area (SD) $5,840,731 $19,286,834 $2,007,106 $2,057,484 $1,987,351 $344,458 $152,825 $1 $31,676,790
Southwest Tennessee Development District $404,323 $910,216 $207,354 $326,916 $246,975 $57,704 $68,568 $3,698 $2,225,754
Northwest Tennessee Development District $711,097 $1,257,503 $648,430 $1,184,755 $401,058 $11,844 $3,931 $6,451 $4,225,069
Southwest Minnesota Region $156,060 $495,771 $221,588 $87,083 $343,160 $0 $121,572 $6,035 $1,431,269
Arrowhead Region (MN) $554,656 $5,756,741 $3,012,656 $344,470 $1,430,428 $227,701 $105,093 $157,639 $11,589,383
RESIDENT ARTS ATTENDEES ONLY
SOURCE: Arts and Economic Prosperity 5, Americans for the Arts, 2017. For more information, visit www.AmericansForTheArts.org/EconomicImpact. B–326

Table 22:Total Categorized Audience Expenditures by Resident Attendees toNonprofit Arts and Cultural Events Per Study Region During 2015
Regional Study Regions Resident
All Populations Refreshments Meals/Drinks Retail/Gifts Clothing and Local Overnight Other/ Audience
Sample Size = 81 and/or Snacks (before/after) and Souvenirs Accessories Transportation Child Care Lodging Miscellaneous Expenditures
Maple Grove and the Northwest Suburbs (MN) $258,093 $898,633 $418,424 $117,315 $226,809 $27,374 $40,669 $32,066 $2,019,382
Greater Augusta Area (GA) $1,680,139 $3,277,324 $1,154,294 $697,035 $612,491 $350,911 $383,460 $3,809 $8,159,462
Upper Cumberland Development District (TN) $277,651 $1,167,803 $452,126 $180,173 $194,027 $23,974 $23,366 $19,030 $2,338,150
City of Huntsville/Madison County (AL) $2,671,275 $11,984,639 $5,222,222 $3,020,225 $2,430,620 $216,590 $625,704 $72,197 $26,243,471
Northeast Commission (NC) $3,845,812 $9,280,414 $8,442,002 $2,158,477 $1,875,286 $305,052 $1,709,322 $65,348 $27,681,713
Greater Ann Arbor Area (MI) $2,094,601 $13,724,505 $5,796,685 $1,096,012 $1,510,061 $280,092 $267,914 $292,270 $25,062,139
Greater Fox Cities Region (WI) $1,748,458 $4,223,758 $1,724,230 $1,041,807 $783,374 $161,520 $157,482 $60,570 $9,901,201
Central Minnesota Region $1,029,703 $2,352,859 $937,999 $259,391 $503,061 $136,246 $159,827 $83,844 $5,462,929
South Central Tennessee Development District $1,389,591 $2,783,601 $1,229,890 $791,906 $764,569 $136,238 $214,719 $33,128 $7,343,642
Northwest Arkansas Region $6,873,631 $15,177,613 $3,814,269 $1,801,183 $2,940,166 $450,296 $397,320 $132,440 $31,586,916
Southeast Minnesota Region $480,179 $3,974,494 $173,559 $497,535 $509,106 $17,356 $0 $0 $5,652,228
First Tennessee Development District $2,157,406 $5,747,603 $2,794,095 $1,271,300 $1,001,241 $242,400 $181,289 $12,302 $13,407,636
Greater Harrisburg Area (PA) $475,126 $2,674,499 $367,839 $356,344 $486,621 $49,812 $36,401 $5,747 $4,452,389
Greater New Haven Area (CT) $724,786 $5,225,475 $1,410,605 $506,571 $981,968 $35,070 $140,281 $0 $9,024,757
Treasure Coast Region (FL) $3,181,965 $6,855,540 $2,170,592 $675,465 $811,713 $210,616 $149,822 $56,945 $14,112,659
Greater Des Moines Region (IA) $15,076,767 $21,497,017 $5,674,828 $3,558,790 $4,568,717 $793,514 $1,947,716 $0 $53,117,349
Southeast Tennessee Development District $12,891,001 $27,095,711 $15,115,330 $6,862,726 $4,544,357 $920,283 $928,607 $294,281 $68,652,296
Greater Knoxville Region (TN) $9,905,282 $16,044,596 $2,755,826 $1,441,660 $2,412,574 $578,625 $1,343,588 $0 $34,482,150
Greater Columbia Area (SC) $7,758,720 $15,042,623 $2,596,343 $1,565,888 $1,980,090 $929,430 $919,328 $90,923 $30,883,343
Pikes Peak Region (CO) $13,411,552 $32,007,414 $13,617,327 $4,482,296 $4,906,401 $1,110,224 $1,815,999 $54,991 $71,406,204
Lehigh Valley Region (PA) $6,860,015 $23,834,796 $8,862,939 $3,855,629 $3,530,154 $225,329 $1,076,572 $200,292 $48,445,724
Greater Sarasota/Bradenton Area (FL) $7,581,195 $30,131,853 $4,045,738 $5,012,447 $3,096,882 $210,956 $1,348,069 $158,361 $51,585,501
Dayton Region (OH) $15,921,421 $49,351,286 $6,501,674 $6,450,479 $8,958,999 $921,497 $2,866,880 $511,943 $91,484,178
Richmond & Tri-Cities Region (VA) $18,182,720 $50,342,343 $13,042,278 $6,245,000 $9,218,809 $1,614,354 $1,741,803 $1,699,320 $102,086,625
Memphis Area Association of Governments (TN) $11,367,024 $21,624,396 $6,022,700 $7,975,257 $4,625,219 $1,007,170 $1,315,643 $534,404 $54,471,813
Eastern Region (NC) $4,600,033 $14,826,056 $17,194,461 $3,103,949 $3,777,246 $1,131,301 $1,114,040 $116,182 $45,863,268
Advantage West Region (NC) $7,057,138 $22,301,467 $29,558,617 $2,990,115 $4,748,365 $499,384 $1,385,888 $28,244 $68,569,218
Southeast Commission (NC) $9,614,139 $24,177,284 $4,632,218 $5,501,505 $4,423,757 $1,128,676 $2,060,460 $37,953 $51,575,992
Greater Fairfax Area (VA) $10,479,209 $32,119,202 $8,523,103 $4,880,458 $4,195,261 $606,688 $127,311 $26,316 $60,957,548
Greater Tulsa Region (OK) $13,170,866 $43,871,751 $10,493,102 $4,981,888 $8,033,294 $3,144,817 $5,573,487 $778,420 $90,047,626
RESIDENT ARTS ATTENDEES ONLY
SOURCE: Arts and Economic Prosperity 5, Americans for the Arts, 2017. For more information, visit www.AmericansForTheArts.org/EconomicImpact. B–327

Table 22:Total Categorized Audience Expenditures by Resident Attendees toNonprofit Arts and Cultural Events Per Study Region During 2015
Regional Study Regions Resident
All Populations Refreshments Meals/Drinks Retail/Gifts Clothing and Local Overnight Other/ Audience
Sample Size = 81 and/or Snacks (before/after) and Souvenirs Accessories Transportation Child Care Lodging Miscellaneous Expenditures
East Tennessee Development District $7,574,460 $13,342,372 $8,939,241 $3,118,857 $3,855,498 $701,091 $2,043,011 $38,422 $39,612,952
West Valley Region (AZ) $1,248,375 $3,478,335 $1,238,307 $533,580 $855,741 $35,236 $266,790 $115,777 $7,772,141
Greater St. Louis Area (MO) $44,057,106 $67,412,946 $16,414,509 $7,082,442 $9,834,169 $1,510,120 $0 $488,614 $146,799,906
Western New York $25,033,973 $70,221,444 $21,990,853 $6,832,667 $15,962,029 $1,148,347 $4,650,807 $2,468,947 $148,309,067
Greater Oklahoma City Region (OK) $41,831,831 $64,459,358 $34,856,237 $19,214,292 $15,920,670 $3,904,105 $16,693,086 $758,042 $197,637,621
Piedmont Triad Partnership (NC) $19,834,507 $51,480,754 $16,277,325 $8,806,027 $9,065,915 $1,415,121 $1,771,943 $393,631 $109,045,223
Greater Portland Area (OR) $13,730,857 $41,958,513 $11,604,579 $5,074,402 $8,171,867 $1,675,884 $854,529 $489,707 $83,560,338
Greater Kansas City Metropolitan Area (MO/KS) $5,553,586 $16,920,628 $3,169,894 $2,245,476 $2,802,888 $431,182 $158,182 $100,683 $31,382,519
Greater Nashville Regional Council (TN) $22,084,186 $45,430,528 $28,929,675 $13,335,023 $13,510,820 $1,343,974 $3,926,937 $921,375 $129,482,518
Research Triangle Regional Partnership (NC) $32,355,799 $101,012,414 $17,783,654 $16,724,871 $20,319,368 $9,684,547 $6,763,090 $5,996,516 $210,640,259
Greater Tampa/St. Petersburg Area (FL) $33,496,053 $75,285,545 $36,561,491 $12,982,857 $16,074,242 $2,581,127 $4,461,317 $157,969 $181,600,601
Charlotte Regional Partnership (NC) $14,843,968 $47,746,781 $12,107,250 $5,980,152 $7,025,581 $2,227,496 $1,114,495 $610,840 $91,656,563
Charlotte Regional Partnership (NC/SC) $16,197,431 $50,708,843 $13,569,613 $8,049,240 $7,769,208 $2,479,520 $1,270,066 $741,519 $100,785,440
Seven-County Metro Area (MN) $45,094,616 $157,011,252 $73,107,937 $20,497,553 $39,628,602 $4,782,762 $7,105,818 $5,602,664 $352,831,204
Central Florida Region $19,824,956 $37,998,367 $13,336,014 $12,625,733 $9,851,605 $1,729,869 $2,190,165 $1,106,842 $98,663,551
Greater Philadelphia Region (PA) $34,120,887 $111,440,992 $22,466,573 $11,052,680 $28,089,635 $2,687,194 $13,346,170 $261,084 $223,465,215
Greater Washington Region (DC/MD/VA) $95,686,787 $298,857,196 $45,594,423 $23,539,593 $70,122,298 $10,836,834 $15,268,208 $4,905,830 $564,811,169
Metro Atlanta Area (GA) $5,884,006 $36,286,958 $6,790,562 $8,065,945 $11,591,626 $4,427,071 $11,009,076 $581,394 $84,636,638
Greater Atlanta Region (GA) $6,085,982 $37,031,246 $7,005,261 $8,296,547 $11,821,433 $4,484,324 $11,097,341 $616,382 $86,438,516
Greater Houston Region (TX) $36,043,885 $210,364,543 $40,843,337 $41,448,777 $56,394,807 $10,196,181 $1,331,068 $96,056 $396,718,654
Dallas-Fort Worth-Arlington MSA (TX) $46,585,355 $108,997,969 $19,469,379 $12,215,909 $26,004,003 $3,899,475 $5,159,970 $92,036 $222,424,096
Regional Average $9,970,806 $28,524,157 $8,416,574 $4,311,230 $6,122,508 $1,166,848 $1,800,070 $444,606 $60,756,799
Percent of Regional Total 16.4% 46.9% 13.9% 7.1% 10.1% 1.9% 3.0% 0.7% 100.0%
Regional Median $3,486,844 $11,984,639 $3,169,894 $1,441,660 $1,875,286 $299,944 $267,914 $65,348 $25,062,139
RESIDENT ARTS ATTENDEES ONLY
SOURCE: Arts and Economic Prosperity 5, Americans for the Arts, 2017. For more information, visit www.AmericansForTheArts.org/EconomicImpact. B–328

Table 22:Total Categorized Audience Expenditures by Resident Attendees toNonprofit Arts and Cultural Events Per Study Region During 2015
Statewide Study Regions Resident
All Populations Refreshments Meals/Drinks Retail/Gifts Clothing and Local Overnight Other/ Audience
Sample Size = 20 and/or Snacks (before/after) and Souvenirs Accessories Transportation Child Care Lodging Miscellaneous Expenditures
State of Vermont $3,626,441 $12,540,865 $4,990,086 $812,354 $1,802,197 $166,886 $255,297 $1,333,417 $25,527,543
State of North Dakota $5,053,347 $15,402,083 $6,183,106 $2,942,723 $2,358,373 $683,959 $824,015 $439,326 $33,886,932
State of Delaware $2,912,503 $10,366,006 $3,497,092 $1,920,791 $2,004,303 $365,368 $605,467 $41,756 $21,713,286
State of Maine $5,124,656 $15,862,899 $2,840,836 $1,569,676 $2,884,896 $511,575 $1,468,535 $459,050 $30,722,123
State of Hawai'i $10,380,161 $33,001,351 $3,140,217 $6,832,879 $7,879,618 $1,104,891 $2,907,608 $174,456 $65,421,180
State of Nevada $36,538,216 $79,101,657 $24,448,625 $12,957,680 $17,318,246 $2,278,453 $9,337,177 $701,756 $182,681,810
State of Connecticut $20,690,958 $89,421,006 $35,709,327 $7,992,523 $10,637,589 $2,150,995 $3,639,653 $287,658 $170,529,709
State of Oklahoma $57,526,171 $114,008,122 $48,147,387 $25,387,952 $25,197,446 $7,349,410 $24,069,185 $1,676,565 $303,362,238
State of Oregon $26,103,168 $77,141,732 $25,784,887 $9,127,580 $12,035,871 $2,719,984 $2,869,867 $1,871,781 $157,654,870
State of Minnesota $49,030,849 $174,064,531 $79,624,086 $22,152,872 $43,874,298 $5,330,647 $7,647,829 $6,037,431 $387,762,543
State of Wisconsin $36,179,007 $78,513,919 $25,660,323 $10,008,896 $16,153,171 $1,524,740 $12,907,908 $1,911,050 $182,859,014
State of Maryland $24,464,100 $84,067,395 $18,588,760 $11,416,288 $18,021,236 $4,202,855 $1,731,193 $1,435,284 $163,927,111
State of Missouri $70,579,799 $146,813,842 $36,268,717 $20,067,655 $24,666,522 $3,219,067 $2,669,129 $1,397,771 $305,682,502
State of Tennessee $58,856,739 $119,359,733 $64,338,841 $35,046,913 $29,143,764 $4,444,678 $8,706,071 $1,863,091 $321,759,830
State of Massachusetts $64,420,818 $156,396,618 $39,866,797 $22,817,213 $42,314,236 $7,146,208 $14,384,670 $1,423,669 $348,770,229
State of New Jersey $23,331,711 $50,126,205 $18,601,578 $8,757,300 $12,828,547 $2,304,150 $7,852,856 $939,369 $124,741,716
State of North Carolina $92,151,396 $270,825,170 $105,995,527 $45,265,096 $51,235,518 $16,391,577 $15,919,238 $7,248,714 $605,032,236
State of Pennsylvania $93,431,535 $363,301,095 $90,978,100 $41,823,064 $76,589,319 $8,712,102 $21,826,016 $6,856,009 $703,517,240
State of Illinois $145,458,887 $428,027,169 $55,395,301 $43,245,537 $168,110,574 $21,147,403 $32,963,973 $581,732 $894,930,576
State of Florida $258,530,718 $591,317,007 $170,283,939 $126,274,908 $143,032,111 $22,595,366 $41,246,147 -$20,268,242 $1,333,011,954
Statewide Average $54,219,559 $145,482,920 $43,017,177 $22,820,995 $35,404,392 $5,717,516 $10,691,592 $820,582 $318,174,732
Percent of Statewide Total 17.0% 45.7% 13.5% 7.2% 11.1% 1.8% 3.4% 0.3% 100.0%
Statewide Median $36,358,612 $86,744,201 $30,747,107 $12,186,984 $17,669,741 $2,969,526 $7,750,342 $1,365,594 $182,770,412
RESIDENT ARTS ATTENDEES ONLY
SOURCE: Arts and Economic Prosperity 5, Americans for the Arts, 2017. For more information, visit www.AmericansForTheArts.org/EconomicImpact. B–329

Table 22:Total Categorized Audience Expenditures by Resident Attendees toNonprofit Arts and Cultural Events Per Study Region During 2015
Individual Arts Districts Resident
All Populations Refreshments Meals/Drinks Retail/Gifts Clothing and Local Overnight Other/ Audience
Sample Size = 12 and/or Snacks (before/after) and Souvenirs Accessories Transportation Child Care Lodging Miscellaneous Expenditures
James River Arts & Cultural District $395,591 $1,112,675 $525,862 $289,224 $124,295 $26,293 $39,440 $0 $2,513,379
Center City Charlotte $8,599,619 $29,003,432 $1,480,595 $3,326,268 $4,218,681 $1,561,723 $588,181 $20,282 $48,798,781
Loch Haven Cultural Park $3,971,138 $5,181,227 $1,590,728 $721,509 $1,318,031 $238,609 $96,580 $403,363 $13,521,185
Downtown Colorado Springs Creative District $1,880,005 $6,508,077 $2,877,558 $685,818 $724,185 $196,633 $191,837 $14,388 $13,078,501
Fort Worth Cultural District $9,417,432 $21,649,473 $5,717,727 $2,708,397 $6,248,785 $371,741 $1,097,520 $0 $47,211,074
Dallas Arts District $11,928,628 $27,743,242 $3,189,990 $2,571,325 $6,689,311 $966,664 $1,159,996 $19,333 $54,268,489
Grand Center Arts & Entertainment District $7,573,989 $9,593,720 $453,145 $893,342 $1,527,745 $207,152 $0 $0 $20,249,092
Balboa Park Cultural District $15,771,395 $40,162,940 $8,620,150 $3,285,707 $9,895,777 $1,468,904 $1,739,492 $0 $80,944,366
East End Cultural District $511,831 $2,036,950 $395,978 $280,124 $402,894 $86,458 $15,562 $0 $3,729,798
Houston Museum District Association $16,839,119 $128,659,672 $22,011,920 $29,716,092 $37,310,204 $7,153,874 $0 $0 $241,690,882
Midtown Cultural District $449,681 $2,450,976 $132,175 $93,384 $462,611 $61,777 $0 $0 $3,650,604
Washington Avenue Cultural District $164,638 $655,601 $569,447 $95,596 $145,165 $20,063 $28,325 $4,131 $1,682,965
Arts District Average $6,458,589 $22,896,499 $3,963,773 $3,722,232 $5,755,640 $1,029,991 $413,078 $38,458 $44,278,260
Percent of Arts District Total 14.6% 51.7% 9.0% 8.4% 13.0% 2.3% 0.9% 0.1% 100.0%
Arts District Median $5,772,563 $8,050,898 $1,535,661 $807,425 $1,422,888 $222,880 $68,010 $0 $16,885,139
RESIDENT ARTS ATTENDEES ONLY
SOURCE: Arts and Economic Prosperity 5, Americans for the Arts, 2017. For more information, visit www.AmericansForTheArts.org/EconomicImpact. B–330

Explanation of Table 23:Average Per Person Audience Spending by Resident Attendees toNonprofit Arts and Cultural Events Per Study Region During 2016
Column Two:
Column Three:
Column Four:
Column Five:
Column Six:
Column Seven:
Column Eight:
Column Nine:
Column Ten:
The average dollars spent per person by resident audience members on local ground transportation (e.g., gas, parking, taxi fares, tolls, car rentals) for the purpose of attending nonprofit arts and cultural events.
The average dollars spent per person by resident audience members on child care for the purpose of attending nonprofit arts and cultural events.
The average dollars spent per person by resident audience members on overnight lodging (e.g., hotel, motel, bed-and-breakfast) for the purpose of attending nonprofit arts and cultural events. (The audience-intercept survey instrument requested that respondents limit their response by providing the cost of one night only.)
The average dollars spent per person by resident audience members on miscellaneous products and services for the purpose of or as a result of attending nonprofit arts and cultural events.
The average dollars spent per person by resident audience members for the purpose of or as a result of attending nonprofit arts and cultural events. This figure is the sum of Column Two through Column Nine.
The average dollars spent per person by resident audience members to purchase clothing or accessories for the purpose of attending nonprofit arts and cultural events.
This table presents the average dollars spent per person by resident audience members as a direct result of their attendance to nonprofit arts and cultural events in each participating study region during 2016. Residents are attendees who reside within the county in which the nonprofit arts and cultural event at which they were surveyed took place (within the multi-city or multi-county region for regional analyses, and within the state for statewide analyses). Residency is determined based on the ZIP code provided by each audience-intercept survey respondent. Summary statistics are calculated for each population group.
The average dollars spent per person by resident audience members to purchase refreshments (e.g., snacks) while attending nonprofit arts and cultural events.
The average dollars spent per person by resident audience members to purchase food, drinks, and/or meals (e.g., dinner at a restaurant, coffee at a cafe) before or after attending nonprofit arts and cultural events.
The average dollars spent per person by resident audience members to purchase souvenirs and/or gifts (e.g., books, recordings, art) as a result of attending nonprofit arts and cultural events.
SOURCE: Arts and Economic Prosperity 5, Americans for the Arts, 2017. For more information, visit www.AmericansForTheArts.org/EconomicImpact. B–331

Table 23:Average Per Person Audience Spending by Resident Attendees toNonprofit Arts and Cultural Events Per Study Region During 2016
Population Cohort Group A Per Person
Population Fewer than 50,000 Refreshments Meals/Drinks Retail/Gifts Clothing and Local Overnight Other/ Audience
Sample Size = 52 and/or Snacks (before/after) and Souvenirs Accessories Transportation Child Care Lodging Miscellaneous Expenditures
Town of Crested Butte (CO) $6.89 $17.46 $2.67 $1.03 $0.80 $2.23 $0.46 $0.28 $31.82
City of Pine City (MN) $3.10 $4.09 $4.57 $0.67 $2.32 $0.06 $0.29 $0.01 $15.11
City of Alva (OK) $0.86 $5.38 $5.36 $1.29 $0.28 $0.12 $0.54 $0.82 $14.65
Cook County (MN) $0.95 $9.86 $5.16 $0.59 $2.45 $0.39 $0.18 $0.27 $19.85
Town of Hillsborough (NC) $2.45 $6.31 $0.64 $1.98 $0.45 $0.37 $0.00 $0.00 $12.20
City of Virginia (MN) $0.95 $9.86 $5.16 $0.59 $2.45 $0.39 $0.18 $0.27 $19.85
Town of Jackson (WY) $7.28 $15.87 $15.23 $2.58 $1.63 $0.78 $1.76 $0.26 $45.39
City of Guthrie (OK) $6.32 $7.95 $3.55 $2.12 $1.17 $0.18 $0.16 $0.01 $21.46
City of Grand Rapids (MN) $0.95 $9.86 $5.16 $0.59 $2.45 $0.39 $0.18 $0.27 $19.85
Town of Medfield (MA) $1.75 $6.32 $2.06 $1.00 $0.27 $0.10 $0.01 $0.51 $12.02
City of Fergus Falls (MN) $3.62 $3.54 $4.12 $0.17 $1.50 $0.34 $0.00 $0.14 $13.43
Grundy County (TN) $5.45 $6.24 $3.92 $2.39 $2.87 $0.04 $0.25 $0.00 $21.16
City of Falls Church (VA) $3.79 $13.47 $10.08 $4.68 $0.56 $0.09 $0.56 $0.00 $33.23
City of Jamestown (ND) $2.55 $4.33 $0.14 $0.21 $0.64 $0.29 $0.12 $0.13 $8.41
City of Waterville (ME) $2.10 $5.87 $1.92 $1.48 $0.70 $0.10 $0.00 $0.48 $12.65
City of Red Wing (MN) $0.83 $6.87 $0.30 $0.86 $0.88 $0.03 $0.00 $0.00 $9.77
City of Durango (CO) $3.38 $11.81 $1.31 $1.37 $1.63 $0.58 $0.40 $0.00 $20.48
City of Hannibal (MO) $4.27 $6.53 $6.56 $0.87 $1.64 $0.02 $0.50 $0.05 $20.44
City of Tullahoma (TN) $0.80 $5.95 $0.83 $2.19 $1.33 $0.49 $0.20 $0.00 $11.79
City of Northfield (MN) $0.83 $6.87 $0.30 $0.86 $0.88 $0.03 $0.00 $0.00 $9.77
Town of Carrboro (NC) $2.17 $8.28 $2.09 $1.69 $1.09 $0.31 $0.26 $0.10 $15.99
Macon County (TN) $0.84 $3.54 $3.06 $0.92 $0.73 $0.06 $0.00 $0.16 $9.31
City of Laguna Beach (CA) $7.62 $18.20 $9.73 $4.24 $2.47 $0.23 $1.72 $0.09 $44.30
Hickman County (TN) $2.87 $5.60 $4.27 $1.23 $2.71 $0.11 $0.05 $0.13 $16.97
City of Fairfax (VA) $2.29 $8.65 $4.82 $0.27 $1.12 $0.31 $0.00 $0.00 $17.46
City of Ponca City (OK) $2.99 $10.81 $6.04 $1.94 $1.16 $0.49 $0.85 $0.13 $24.41
City of Paducah (KY) $9.26 $8.98 $11.79 $0.21 $0.84 $0.08 $0.66 $0.00 $31.82
Mille Lacs County (MN) $3.10 $4.09 $4.57 $0.67 $2.32 $0.06 $0.29 $0.01 $15.11
McNairy County (TN) $1.88 $5.16 $1.26 $1.19 $1.76 $0.06 $0.28 $0.05 $11.64
City of Winona (MN) $0.83 $6.87 $0.30 $0.86 $0.88 $0.03 $0.00 $0.00 $9.77
RESIDENT ARTS ATTENDEES ONLY
SOURCE: Arts and Economic Prosperity 5, Americans for the Arts, 2017. For more information, visit www.AmericansForTheArts.org/EconomicImpact. B–332

Table 23:Average Per Person Audience Spending by Resident Attendees toNonprofit Arts and Cultural Events Per Study Region During 2016
Population Cohort Group A Per Person
Population Fewer than 50,000 Refreshments Meals/Drinks Retail/Gifts Clothing and Local Overnight Other/ Audience
Sample Size = 52 and/or Snacks (before/after) and Souvenirs Accessories Transportation Child Care Lodging Miscellaneous Expenditures
Door County (WI) $3.54 $10.54 $7.06 $2.67 $3.08 $0.17 $1.90 $0.00 $28.96
City of Benicia (CA) $4.14 $10.08 $9.08 $1.33 $0.97 $0.11 $0.23 $0.20 $26.14
City of Winter Park (FL) $2.05 $10.55 $1.15 $2.09 $1.47 $0.42 $0.65 $0.43 $18.81
City of Rochester (NH) $5.73 $10.08 $2.60 $1.61 $0.88 $0.26 $0.78 $0.79 $22.73
City of Morgantown (WV) $2.61 $9.89 $9.58 $1.22 $1.24 $0.15 $0.64 $0.01 $25.34
Henry County (TN) $2.04 $5.00 $5.28 $0.77 $0.58 $0.16 $0.00 $0.00 $13.83
City of Fairbanks (AK) $2.76 $9.44 $3.96 $1.12 $2.06 $0.34 $0.51 $0.41 $20.60
City of Bangor (ME) $4.75 $8.35 $3.24 $1.62 $2.02 $0.49 $1.24 $0.16 $21.87
Weakley County (TN) $4.20 $4.38 $2.38 $1.15 $1.62 $0.04 $0.07 $0.05 $13.89
Dare County (NC) $6.30 $13.26 $16.39 $3.40 $3.25 $0.55 $3.34 $0.00 $46.49
City of Columbia (TN) $4.25 $6.96 $3.23 $1.80 $1.73 $0.32 $0.68 $0.08 $19.05
City of Lake Worth (FL) $2.63 $13.71 $3.80 $2.89 $1.89 $0.11 $0.15 $0.62 $25.80
Clatsop County (OR) $3.05 $14.13 $6.05 $1.40 $1.50 $0.15 $0.64 $0.16 $27.08
Yadkin County (NC) $2.58 $7.72 $1.67 $1.98 $1.73 $0.47 $0.00 $0.74 $16.89
Greater Belfast Area (ME) $3.64 $7.83 $1.55 $1.18 $1.36 $0.12 $0.03 $0.27 $15.98
Campbell County (TN) $3.24 $4.98 $6.06 $2.23 $1.95 $0.23 $0.11 $0.00 $18.80
Monroe County (TN) $2.14 $5.60 $5.83 $2.26 $2.19 $0.22 $0.22 $0.00 $18.46
Lincoln County (OR) $2.71 $10.47 $1.24 $1.25 $1.56 $0.18 $0.75 $0.36 $18.52
Iron County (UT) $2.86 $8.57 $1.41 $0.56 $2.23 $0.69 $3.53 $0.00 $19.85
City of St. Louis Park (MN) $3.30 $11.49 $5.35 $1.50 $2.90 $0.35 $0.52 $0.41 $25.82
City of Logan (UT) $0.78 $7.38 $1.18 $0.71 $1.16 $0.46 $1.07 $0.22 $12.96
Gibson County (TN) $4.26 $8.74 $3.78 $11.81 $2.93 $0.04 $0.00 $0.00 $31.56
Group A Average $3.20 $8.53 $4.40 $1.68 $1.58 $0.28 $0.52 $0.17 $20.38
Percent of Group A Total 15.7% 41.9% 21.6% 8.2% 7.8% 1.4% 2.5% 0.9% 100.0%
Group A Median $2.87 $8.12 $3.86 $1.27 $1.53 $0.20 $0.26 $0.10 $18.93
RESIDENT ARTS ATTENDEES ONLY
SOURCE: Arts and Economic Prosperity 5, Americans for the Arts, 2017. For more information, visit www.AmericansForTheArts.org/EconomicImpact. B–333

Table 23:Average Per Person Audience Spending by Resident Attendees toNonprofit Arts and Cultural Events Per Study Region During 2016
Population Cohort Group B Per Person
Population 50,000 to 99,999 Refreshments Meals/Drinks Retail/Gifts Clothing and Local Overnight Other/ Audience
Sample Size = 38 and/or Snacks (before/after) and Souvenirs Accessories Transportation Child Care Lodging Miscellaneous Expenditures
City of Joplin (MO) $1.79 $8.81 $2.82 $1.97 $1.77 $0.34 $0.18 $0.28 $17.96
City of La Crosse (WI) $2.71 $6.83 $1.30 $0.97 $1.14 $0.19 $0.87 $0.65 $14.66
McMinn County (TN) $2.68 $9.47 $2.77 $2.32 $1.81 $1.24 $0.33 $0.00 $20.62
Lafayette County (MS) $5.99 $10.01 $3.87 $1.20 $1.69 $0.34 $0.41 $0.25 $23.76
Chisago County (MN) $3.10 $4.09 $4.57 $0.67 $2.32 $0.06 $0.29 $0.01 $15.11
City of Grand Forks (ND) $5.07 $9.27 $5.26 $2.11 $1.06 $0.33 $0.28 $0.00 $23.38
City of Corvallis (OR) $2.62 $9.26 $4.67 $0.96 $0.65 $0.18 $0.00 $0.50 $18.84
City of Noblesville (IN) $2.97 $7.03 $2.94 $1.09 $0.40 $0.10 $0.00 $0.31 $14.84
City of Ocala (FL) $4.41 $10.11 $7.43 $2.41 $2.33 $0.18 $0.33 $0.07 $27.27
Lenoir County (NC) $5.76 $17.85 $28.77 $5.01 $5.00 $2.11 $0.55 $0.12 $65.17
Town of Chapel Hill (NC) $2.62 $6.70 $2.31 $1.60 $2.25 $0.91 $0.55 $0.00 $16.94
City of Grand Junction (CO) $3.14 $9.11 $2.32 $1.70 $1.16 $0.24 $0.16 $0.46 $18.29
Town of Jupiter (FL) $1.92 $11.02 $1.24 $2.27 $1.23 $0.16 $1.05 $1.19 $20.08
Hamblen County (TN) $3.89 $15.39 $5.52 $0.89 $0.86 $1.89 $0.00 $0.00 $28.44
City of Delray Beach (FL) $8.64 $9.57 $8.60 $3.01 $3.31 $0.23 $1.33 $0.71 $35.40
City of St. Cloud (MN) $3.93 $8.98 $3.58 $0.99 $1.92 $0.52 $0.61 $0.32 $20.85
City of Portland (ME) $3.22 $13.38 $1.01 $0.89 $1.99 $0.47 $0.24 $0.33 $21.53
City of Jackson (TN) $3.39 $7.27 $1.59 $2.93 $1.78 $0.58 $0.61 $0.02 $18.17
City of Walnut Creek (CA) $3.59 $22.49 $0.75 $0.96 $2.26 $0.32 $0.00 $0.45 $30.82
Greene County (TN) $10.92 $7.65 $3.91 $0.83 $2.64 $0.27 $0.30 $0.00 $26.52
City of Flagstaff (AZ) $3.01 $9.67 $12.22 $1.88 $2.20 $0.09 $0.24 $0.10 $29.41
City of Missoula (MT) $4.43 $9.88 $1.63 $0.95 $1.42 $0.17 $0.19 $0.16 $18.83
City of Fort Myers (FL) $4.71 $13.61 $3.80 $2.11 $1.49 $0.11 $0.18 $0.11 $26.12
Putnam County (TN) $0.84 $7.23 $0.09 $0.72 $0.33 $0.24 $0.00 $0.00 $9.45
Monroe County (FL) $5.06 $11.77 $3.45 $2.46 $2.51 $0.35 $0.62 $0.31 $26.53
City of Lynchburg (VA) $2.76 $8.28 $3.88 $1.79 $0.95 $0.25 $0.22 $0.00 $18.13
City of Duluth (MN) $0.95 $9.86 $5.16 $0.59 $2.45 $0.39 $0.18 $0.27 $19.85
City of Fishers (IN) $3.05 $5.81 $0.63 $1.24 $0.35 $0.45 $0.00 $0.00 $11.53
City of Carmel (IN) $3.06 $9.18 $1.93 $0.70 $0.72 $0.14 $0.00 $0.00 $15.73
City of Sugar Land (TX) $4.20 $8.66 $2.13 $3.08 $1.72 $0.37 $1.57 $0.13 $21.86
RESIDENT ARTS ATTENDEES ONLY
SOURCE: Arts and Economic Prosperity 5, Americans for the Arts, 2017. For more information, visit www.AmericansForTheArts.org/EconomicImpact. B–334

Table 23:Average Per Person Audience Spending by Resident Attendees toNonprofit Arts and Cultural Events Per Study Region During 2016
Population Cohort Group B Per Person
Population 50,000 to 99,999 Refreshments Meals/Drinks Retail/Gifts Clothing and Local Overnight Other/ Audience
Sample Size = 38 and/or Snacks (before/after) and Souvenirs Accessories Transportation Child Care Lodging Miscellaneous Expenditures
City of Asheville (NC) $2.53 $12.21 $3.35 $0.99 $1.79 $0.37 $0.13 $0.00 $21.37
Buchanan County (MO) $5.94 $7.12 $4.84 $1.33 $0.99 $0.06 $0.00 $0.01 $20.29
City of Boca Raton (FL) $2.57 $9.11 $5.15 $2.78 $1.47 $0.15 $1.18 $0.75 $23.16
City of Miami Beach (FL) $4.92 $20.61 $0.72 $2.43 $4.25 $0.48 $0.82 $0.06 $34.29
Moore County (NC) $1.87 $8.79 $3.12 $1.69 $1.20 $0.14 $0.18 $0.00 $16.99
Sevier County (TN) $4.09 $4.65 $5.16 $2.29 $2.01 $0.08 $1.55 $0.00 $19.83
Cape May County (NJ) $2.89 $9.56 $3.90 $0.72 $0.44 $0.01 $0.00 $0.23 $17.75
Cleveland County (NC) $4.11 $9.63 $5.87 $0.92 $1.64 $0.05 $0.59 $0.17 $22.98
Group B Average $3.77 $10.00 $4.27 $1.67 $1.72 $0.38 $0.41 $0.21 $22.44
Percent of Group B Total 16.8% 44.6% 19.0% 7.4% 7.7% 1.7% 1.8% 0.9% 100.0%
Group B Median $3.18 $9.27 $3.52 $1.47 $1.71 $0.25 $0.26 $0.12 $20.46
RESIDENT ARTS ATTENDEES ONLY
SOURCE: Arts and Economic Prosperity 5, Americans for the Arts, 2017. For more information, visit www.AmericansForTheArts.org/EconomicImpact. B–335

Table 23:Average Per Person Audience Spending by Resident Attendees toNonprofit Arts and Cultural Events Per Study Region During 2016
Population Cohort Group C Per Person
Population 100,000 to 249,999 Refreshments Meals/Drinks Retail/Gifts Clothing and Local Overnight Other/ Audience
Sample Size = 50 and/or Snacks (before/after) and Souvenirs Accessories Transportation Child Care Lodging Miscellaneous Expenditures
City of Las Cruces (NM) $3.53 $8.87 $6.67 $2.29 $0.81 $0.42 $1.11 $0.39 $24.09
Eau Claire County (WI) $2.11 $8.07 $5.56 $0.72 $0.58 $0.50 $0.14 $0.00 $17.68
Yamhill County (OR) $4.14 $7.27 $8.06 $1.13 $1.05 $0.46 $0.82 $0.04 $22.97
City of Lewisville (TX) $2.95 $7.47 $1.07 $1.16 $1.68 $0.47 $0.28 $0.00 $15.08
City of West Palm Beach (FL) $5.74 $10.16 $2.62 $1.72 $3.15 $0.21 $0.59 $0.71 $24.90
City of Boulder (CO) $3.18 $10.79 $3.60 $1.69 $1.05 $0.28 $0.11 $0.07 $20.77
City of Richardson (TX) $4.91 $7.56 $5.62 $0.99 $1.26 $0.72 $1.75 $0.09 $22.90
City of High Point (NC) $3.78 $5.91 $1.55 $0.72 $1.08 $0.17 $0.53 $0.03 $13.77
City of Cambridge (MA) $6.00 $12.37 $2.45 $0.53 $2.59 $0.45 $0.40 $0.16 $24.95
City of Lowell (MA) $4.44 $11.88 $9.87 $1.11 $1.27 $0.14 $0.14 $0.21 $29.06
Douglas County (KS) $4.04 $9.29 $2.59 $2.49 $1.56 $0.28 $0.33 $0.08 $20.66
City of Columbia (MO) $1.69 $8.55 $1.30 $0.75 $1.20 $0.18 $0.07 $0.11 $13.85
City of Norman (OK) $8.37 $10.59 $7.52 $4.19 $1.75 $0.70 $1.07 $0.30 $34.49
Wayne County (NC) $3.67 $9.36 $4.47 $2.39 $1.78 $0.37 $0.34 $0.08 $22.46
City of Lafayette (LA) $4.89 $12.09 $1.35 $2.70 $1.84 $1.80 $0.00 $0.00 $24.67
Washington County (TN) $3.30 $9.14 $4.41 $0.35 $1.66 $0.09 $0.50 $0.00 $19.45
City of Thousand Oaks (CA) $4.19 $14.25 $1.17 $0.85 $1.65 $0.59 $0.12 $0.11 $22.93
City of Charleston (SC) $5.03 $14.73 $2.06 $2.99 $2.04 $0.30 $0.77 $0.00 $27.92
City of Waco (TX) $3.57 $5.78 $2.06 $2.23 $1.51 $0.24 $0.84 $0.02 $16.25
Robeson County (NC) $3.17 $4.25 $5.34 $2.07 $2.80 $0.11 $0.68 $0.01 $18.43
Columbia County (GA) $6.10 $7.90 $3.15 $1.66 $1.87 $0.27 $0.70 $0.94 $22.59
Orange County (NC) $2.48 $6.99 $1.92 $1.70 $1.61 $0.66 $0.37 $0.02 $15.75
City of Savannah (GA) $7.21 $11.60 $5.11 $2.13 $1.70 $0.49 $0.75 $0.09 $29.08
Indian River County (FL) $4.93 $8.35 $3.23 $0.43 $1.35 $0.16 $0.45 $0.00 $18.90
City of Alexandria (VA) $3.61 $11.62 $8.97 $1.88 $1.55 $0.09 $0.29 $0.00 $28.01
Martin County (FL) $4.24 $11.31 $3.56 $1.38 $1.08 $0.45 $0.11 $0.19 $22.32
Macon-Bibb County (GA) $3.37 $10.57 $3.56 $1.45 $1.28 $0.57 $0.19 $0.07 $21.06
City of Springfield (MA) $6.81 $7.25 $3.32 $2.17 $1.96 $0.61 $1.03 $0.00 $23.15
Catawba County (NC) $5.38 $12.43 $13.26 $2.42 $1.92 $0.33 $0.17 $0.80 $36.71
Town of Cary (NC) $3.69 $7.46 $3.99 $0.55 $0.81 $0.27 $0.00 $0.04 $16.81
RESIDENT ARTS ATTENDEES ONLY
SOURCE: Arts and Economic Prosperity 5, Americans for the Arts, 2017. For more information, visit www.AmericansForTheArts.org/EconomicImpact. B–336

Table 23:Average Per Person Audience Spending by Resident Attendees toNonprofit Arts and Cultural Events Per Study Region During 2016
Population Cohort Group C Per Person
Population 100,000 to 249,999 Refreshments Meals/Drinks Retail/Gifts Clothing and Local Overnight Other/ Audience
Sample Size = 50 and/or Snacks (before/after) and Souvenirs Accessories Transportation Child Care Lodging Miscellaneous Expenditures
Alamance County (NC) $2.24 $6.85 $7.16 $1.09 $1.46 $0.12 $0.22 $0.25 $19.39
Cumberland County (NJ) $1.82 $4.91 $6.76 $0.51 $1.18 $0.53 $0.00 $0.81 $16.52
City of Eugene (OR) $3.23 $8.35 $1.58 $0.90 $1.21 $0.18 $0.04 $0.53 $16.02
Middlesex County (CT) $4.58 $11.54 $2.50 $1.15 $1.42 $1.92 $0.00 $0.87 $23.98
City of Springfield (MO) $2.34 $9.92 $4.51 $2.42 $1.72 $0.37 $0.82 $0.00 $22.10
City of Sioux Falls (SD) $4.59 $15.17 $1.58 $1.62 $1.56 $0.27 $0.12 $0.00 $24.91
Pitt County (NC) $3.47 $10.38 $3.40 $1.20 $1.28 $0.59 $1.21 $0.00 $21.53
City of Providence (RI) $3.97 $13.89 $1.67 $1.73 $2.10 $1.73 $0.48 $0.00 $25.57
City of Worcester (MA) $5.11 $11.14 $6.24 $1.18 $1.95 $0.56 $0.00 $0.25 $26.43
Montgomery County (TN) $3.25 $6.77 $8.78 $2.20 $1.31 $0.77 $0.67 $0.01 $23.76
Salt Lake City (UT) $4.63 $9.65 $2.89 $1.38 $1.89 $0.41 $0.56 $0.03 $21.44
Cabarrus County (NC) $1.69 $10.37 $1.65 $0.57 $0.70 $0.19 $0.23 $0.05 $15.45
Richmond County (GA) $5.73 $11.19 $3.94 $2.38 $2.09 $1.20 $1.31 $0.01 $27.85
City of Tacoma (WA) $2.60 $11.46 $1.92 $1.14 $2.37 $0.33 $0.20 $0.21 $20.23
Doña Ana County (NM) $3.24 $8.29 $5.70 $2.39 $0.80 $0.45 $0.87 $0.31 $22.05
New Hanover County (NC) $3.25 $11.83 $0.88 $2.45 $1.82 $0.71 $1.03 $0.00 $21.97
Arlington County (VA) $3.60 $10.89 $2.69 $1.42 $1.35 $0.10 $0.13 $0.01 $20.19
City of Irving (TX) $1.71 $9.37 $1.03 $0.94 $1.68 $0.06 $0.14 $0.00 $14.93
City of Reno (NV) $6.49 $11.52 $2.05 $1.80 $1.45 $0.31 $0.48 $0.11 $24.21
York County (SC) $4.35 $9.52 $4.70 $6.65 $2.39 $0.81 $0.50 $0.42 $29.34
Group C Average $4.05 $9.74 $4.02 $1.68 $1.58 $0.48 $0.47 $0.17 $22.19
Percent of Group C Total 18.2% 43.9% 18.1% 7.6% 7.1% 2.2% 2.1% 0.8% 100.0%
Group C Median $3.74 $9.79 $3.36 $1.54 $1.56 $0.39 $0.39 $0.06 $22.21
RESIDENT ARTS ATTENDEES ONLY
SOURCE: Arts and Economic Prosperity 5, Americans for the Arts, 2017. For more information, visit www.AmericansForTheArts.org/EconomicImpact. B–337

Table 23:Average Per Person Audience Spending by Resident Attendees toNonprofit Arts and Cultural Events Per Study Region During 2016
Population Cohort Group D Per Person
Population 250,000 to 499,999 Refreshments Meals/Drinks Retail/Gifts Clothing and Local Overnight Other/ Audience
Sample Size = 42 and/or Snacks (before/after) and Souvenirs Accessories Transportation Child Care Lodging Miscellaneous Expenditures
Buncombe County (NC) $4.88 $13.06 $5.10 $1.89 $2.43 $0.34 $0.11 $0.00 $27.81
Alachua County (FL) $3.55 $9.15 $2.04 $2.68 $1.70 $0.69 $0.29 $0.11 $20.21
Greater Green Bay Area (WI) $6.78 $8.10 $9.67 $1.56 $1.55 $0.61 $0.57 $0.03 $28.87
City of Orlando (FL) $6.30 $9.87 $3.27 $1.80 $2.80 $0.46 $0.27 $0.42 $25.19
City of Lincoln (NE) $2.11 $8.29 $1.36 $0.98 $1.54 $0.13 $0.06 $0.59 $15.06
Southeastern Connecticut Region (CT) $2.64 $10.06 $2.69 $1.07 $0.93 $0.13 $0.29 $0.00 $17.81
Erie County (PA) $2.93 $9.23 $1.39 $1.14 $1.28 $0.25 $0.51 $0.00 $16.73
San Luis Obispo County (CA) $3.33 $10.53 $5.73 $0.75 $1.83 $0.31 $0.79 $0.10 $23.37
City of Newark (NJ) $4.92 $6.88 $2.98 $2.72 $2.81 $0.61 $1.66 $0.00 $22.58
Leon County (FL) $6.14 $10.21 $6.53 $3.66 $1.68 $0.60 $0.48 $0.11 $29.41
Rutherford County (TN) $2.48 $8.80 $2.31 $1.82 $1.83 $0.33 $0.54 $0.49 $18.60
St. Lucie County (FL) $9.41 $19.35 $3.95 $2.24 $2.05 $0.51 $0.00 $0.00 $37.51
Greater Spartanburg Area (SC) $1.91 $7.71 $2.23 $0.73 $0.87 $0.16 $0.33 $0.00 $13.94
Durham County (NC) $1.36 $9.55 $1.38 $0.30 $1.18 $0.30 $0.12 $0.00 $14.19
City of St. Paul (MN) $3.30 $11.49 $5.35 $1.50 $2.90 $0.35 $0.52 $0.41 $25.82
Hamilton County (IN) $3.02 $7.28 $1.93 $1.02 $0.48 $0.22 $0.00 $0.12 $14.07
Osceola County (FL) $1.84 $5.40 $1.47 $1.02 $0.57 $1.04 $0.00 $0.00 $11.34
Escambia County (FL) $2.59 $12.32 $2.65 $0.91 $1.33 $0.53 $0.00 $0.10 $20.43
Lexington-Fayette Urban County (KY) $4.11 $8.26 $3.50 $2.17 $1.46 $0.36 $0.18 $0.04 $20.08
Lake County (FL) $2.19 $7.00 $5.38 $0.67 $1.05 $0.18 $0.00 $0.02 $16.49
City of Riverside (CA) $5.80 $12.43 $5.18 $0.59 $0.89 $0.43 $0.00 $0.17 $25.49
Cumberland County (NC) $4.45 $7.90 $2.39 $1.92 $1.59 $0.23 $0.61 $0.03 $19.12
Collier County (FL) $3.95 $14.09 $3.22 $3.17 $2.14 $0.20 $0.62 $0.00 $27.39
Hamilton County (TN) $6.36 $13.08 $7.50 $3.31 $2.16 $0.37 $0.44 $0.15 $33.37
Manatee County (FL) $4.18 $10.38 $3.89 $1.67 $1.08 $0.09 $1.11 $0.12 $22.52
City of Tampa (FL) $8.34 $15.18 $7.58 $2.66 $4.17 $0.66 $1.50 $0.00 $40.09
Forsyth County (NC) $3.51 $9.82 $2.65 $1.75 $1.62 $0.16 $0.31 $0.00 $19.82
Mercer County (NJ) $7.45 $10.57 $3.22 $1.27 $2.27 $0.39 $0.00 $0.00 $25.17
City of Wichita (KS) $2.56 $9.28 $1.14 $1.78 $1.09 $0.32 $0.52 $0.00 $16.69
Clackamas County (OR) $3.44 $6.64 $7.62 $1.53 $1.30 $0.20 $0.39 $0.25 $21.37
RESIDENT ARTS ATTENDEES ONLY
SOURCE: Arts and Economic Prosperity 5, Americans for the Arts, 2017. For more information, visit www.AmericansForTheArts.org/EconomicImpact. B–338

Table 23:Average Per Person Audience Spending by Resident Attendees toNonprofit Arts and Cultural Events Per Study Region During 2016
Population Cohort Group D Per Person
Population 250,000 to 499,999 Refreshments Meals/Drinks Retail/Gifts Clothing and Local Overnight Other/ Audience
Sample Size = 42 and/or Snacks (before/after) and Souvenirs Accessories Transportation Child Care Lodging Miscellaneous Expenditures
Sarasota County (FL) $3.77 $18.56 $1.06 $3.12 $1.90 $0.12 $0.46 $0.06 $29.05
City of Minneapolis (MN) $3.30 $11.49 $5.35 $1.50 $2.90 $0.35 $0.52 $0.41 $25.82
Berks County (PA) $5.43 $11.21 $2.45 $0.75 $1.20 $0.09 $0.16 $0.02 $21.31
City of Miami (FL) $7.26 $11.35 $2.57 $3.14 $5.07 $0.66 $0.48 $0.06 $30.59
City of Raleigh (NC) $3.64 $10.49 $1.52 $2.01 $2.31 $1.21 $0.89 $0.87 $22.94
Santa Barbara County (CA) $3.37 $9.67 $1.38 $0.81 $1.62 $0.35 $2.23 $0.00 $19.43
Seminole County (FL) $3.55 $9.00 $0.84 $0.81 $1.11 $0.34 $0.56 $0.00 $16.21
City of Virginia Beach (VA) $2.88 $18.56 $1.37 $1.46 $1.33 $0.51 $0.91 $0.00 $27.02
City of Atlanta (GA) $0.80 $7.57 $1.02 $1.34 $2.46 $1.10 $3.02 $0.00 $17.31
City of Mesa (AZ) $3.34 $5.93 $3.39 $0.94 $1.06 $0.35 $0.46 $0.14 $15.61
City of Kansas City (MO) $3.93 $11.96 $1.57 $1.76 $2.06 $0.31 $0.09 $0.06 $21.74
Morris County (NJ) $4.83 $14.45 $5.10 $1.54 $2.42 $0.36 $0.18 $0.48 $29.36
Group D Average $4.09 $10.53 $3.40 $1.65 $1.81 $0.40 $0.53 $0.13 $22.55
Percent of Group D Total 18.2% 46.7% 15.1% 7.3% 8.0% 1.8% 2.3% 0.6% 100.0%
Group D Median $3.55 $9.97 $2.67 $1.54 $1.62 $0.35 $0.45 $0.04 $21.56
RESIDENT ARTS ATTENDEES ONLY
SOURCE: Arts and Economic Prosperity 5, Americans for the Arts, 2017. For more information, visit www.AmericansForTheArts.org/EconomicImpact. B–339

Table 23:Average Per Person Audience Spending by Resident Attendees toNonprofit Arts and Cultural Events Per Study Region During 2016
Population Cohort Group E Per Person
Population 500,000 to 999,999 Refreshments Meals/Drinks Retail/Gifts Clothing and Local Overnight Other/ Audience
Sample Size = 25 and/or Snacks (before/after) and Souvenirs Accessories Transportation Child Care Lodging Miscellaneous Expenditures
Sonoma County (CA) $5.74 $13.24 $1.53 $0.95 $1.81 $0.52 $0.12 $0.01 $23.92
Volusia County (FL) $4.89 $8.72 $3.92 $7.72 $3.66 $0.56 $1.39 $0.00 $30.86
Guilford County (NC) $3.87 $9.48 $2.84 $1.65 $1.64 $0.33 $0.34 $0.06 $20.21
Dane County (WI) $4.48 $7.88 $1.75 $0.82 $1.52 $0.06 $0.13 $0.14 $16.78
Brevard County (FL) $2.72 $8.94 $1.27 $0.72 $1.72 $0.02 $0.00 $0.00 $15.39
Washington County (OR) $2.75 $10.48 $0.90 $1.10 $2.15 $0.41 $0.00 $0.00 $17.79
Johnson County (KS) $3.35 $9.78 $3.83 $0.71 $1.33 $0.26 $0.17 $0.10 $19.53
City of Louisville (KY) $2.74 $13.33 $0.49 $1.18 $3.22 $0.50 $0.35 $0.04 $21.85
City of Baltimore (MD) $4.09 $14.35 $1.54 $1.72 $2.97 $0.83 $0.02 $0.10 $25.62
Polk County (FL) $4.52 $8.15 $5.09 $2.53 $1.96 $0.28 $0.08 $0.22 $22.83
City of Boston (MA) $3.33 $8.99 $0.74 $1.77 $3.35 $0.47 $1.16 $0.00 $19.81
District of Columbia (DC) $4.72 $14.51 $1.21 $0.79 $3.75 $0.58 $0.92 $0.28 $26.76
Nashville-Davidson County (TN) $4.68 $8.87 $6.16 $2.76 $2.81 $0.22 $0.79 $0.12 $26.41
City of El Paso (TX) $4.99 $6.61 $3.99 $1.43 $2.25 $0.44 $0.73 $0.05 $20.49
Lee County (FL) $4.47 $13.09 $4.77 $2.26 $1.51 $0.10 $0.16 $0.10 $26.46
City of Fort Worth (TX) $4.91 $12.18 $2.73 $1.98 $2.62 $0.15 $0.78 $0.00 $25.35
City of Indianapolis (IN) $4.34 $11.97 $3.12 $1.07 $2.42 $0.38 $0.19 $0.18 $23.67
City and County of San Francisco (CA) $4.77 $12.14 $1.87 $1.32 $3.67 $0.22 $0.60 $0.00 $24.59
Prince George's County (MD) $4.07 $5.54 $4.17 $2.76 $2.30 $0.22 $0.39 $0.37 $19.82
Pinellas County (FL) $4.27 $13.09 $6.15 $1.96 $2.00 $0.31 $0.24 $0.05 $28.07
Shelby County (TN) $5.53 $10.52 $2.93 $3.88 $2.25 $0.49 $0.64 $0.26 $26.50
Fairfield County (CT) $3.24 $15.22 $8.89 $1.41 $1.52 $0.45 $0.64 $0.00 $31.37
Westchester County (NY) $1.55 $13.39 $1.50 $1.36 $1.63 $0.36 $0.58 $0.15 $20.52
Fulton County (GA) $2.54 $9.36 $2.70 $2.90 $2.89 $0.72 $1.11 $0.44 $22.66
Wake County (NC) $3.87 $9.17 $2.56 $1.58 $1.66 $0.81 $0.49 $0.48 $20.62
Group E Average $4.02 $10.76 $3.07 $1.93 $2.34 $0.39 $0.48 $0.13 $23.12
Percent of Group E Total 17.4% 46.5% 13.3% 8.4% 10.1% 1.7% 2.1% 0.5% 100.0%
Group E Median $4.27 $10.48 $2.73 $1.58 $2.25 $0.38 $0.39 $0.10 $22.83
RESIDENT ARTS ATTENDEES ONLY
SOURCE: Arts and Economic Prosperity 5, Americans for the Arts, 2017. For more information, visit www.AmericansForTheArts.org/EconomicImpact. B–340

Table 23:Average Per Person Audience Spending by Resident Attendees toNonprofit Arts and Cultural Events Per Study Region During 2016
Population Cohort Group F Per Person
Population 1,000,000 or More Refreshments Meals/Drinks Retail/Gifts Clothing and Local Overnight Other/ Audience
Sample Size = 21 and/or Snacks (before/after) and Souvenirs Accessories Transportation Child Care Lodging Miscellaneous Expenditures
Mecklenburg County (NC) $3.49 $13.23 $0.58 $1.44 $1.95 $0.81 $0.28 $0.01 $21.79
City of San José (CA) $5.15 $9.94 $3.43 $2.05 $4.76 $1.15 $1.83 $0.06 $28.37
Montgomery County (MD) $1.95 $11.23 $2.47 $0.72 $1.92 $0.45 $0.15 $0.09 $18.98
Fairfax County (VA) $3.69 $11.16 $2.48 $1.53 $1.54 $0.22 $0.01 $0.01 $20.64
Allegheny County (PA) $2.87 $13.80 $3.88 $1.63 $2.74 $0.36 $0.25 $0.46 $25.99
Greater Columbus Area (OH) $3.95 $9.92 $3.01 $0.94 $1.56 $0.55 $0.25 $0.00 $20.18
Orange County (FL) $6.21 $10.33 $2.47 $1.78 $2.41 $0.44 $0.36 $0.35 $24.35
City of Dallas (TX) $5.94 $13.94 $1.68 $1.27 $3.14 $0.76 $0.42 $0.01 $27.16
Hillsborough County (FL) $8.23 $13.74 $6.97 $4.01 $3.46 $0.67 $1.29 $0.04 $38.41
City of San Diego (CA) $6.57 $12.65 $3.27 $2.83 $3.79 $0.51 $1.99 $0.03 $31.64
Palm Beach County (FL) $4.99 $10.35 $3.56 $2.26 $2.75 $0.18 $0.78 $0.72 $25.59
City of San Antonio (TX) $4.11 $12.03 $4.61 $3.36 $3.39 $0.58 $1.41 $0.00 $29.49
Sacramento County (CA) $5.32 $9.67 $4.04 $1.13 $3.31 $0.27 $0.96 $0.15 $24.85
City of Phoenix (AZ) $5.32 $10.53 $4.37 $2.23 $2.97 $0.32 $0.77 $0.08 $26.59
City and County of Philadelphia (PA) $3.94 $13.24 $2.27 $1.26 $3.18 $0.32 $1.52 $0.00 $25.73
Broward County (FL) $5.08 $11.69 $2.40 $2.63 $2.62 $0.61 $0.81 $0.07 $25.91
Santa Clara County (CA) $3.62 $9.71 $2.58 $1.78 $3.53 $0.74 $1.05 $0.06 $23.07
Riverside County (CA) $10.03 $10.56 $10.89 $0.73 $1.59 $0.30 $1.45 $0.08 $35.63
Miami-Dade County (FL) $5.84 $13.64 $2.10 $2.89 $4.12 $0.76 $0.69 $0.06 $30.10
City of Chicago (IL) $4.67 $13.04 $1.66 $1.27 $5.32 $0.67 $0.91 $0.02 $27.56
Harris County (TX) $3.20 $13.61 $3.17 $1.98 $3.21 $0.51 $0.17 $0.01 $25.86
Group F Average $4.96 $11.81 $3.42 $1.89 $3.01 $0.53 $0.83 $0.11 $26.57
Percent of Group F Total 18.7% 44.5% 12.9% 7.1% 11.3% 2.0% 3.1% 0.4% 100.0%
Group F Median $4.99 $11.69 $3.01 $1.78 $3.14 $0.51 $0.78 $0.06 $25.91
Average $3.90 $9.95 $3.88 $1.72 $1.86 $0.40 $0.52 $0.16 $22.39
Percent of Total 17.4% 44.5% 17.3% 7.7% 8.3% 1.8% 2.3% 0.7% 100.0%
Median $3.62 $9.69 $3.23 $1.50 $1.70 $0.33 $0.35 $0.06 $21.53
RESIDENT ARTS ATTENDEES ONLY
ALL CITY/COUNTY STUDY REGIONS
SOURCE: Arts and Economic Prosperity 5, Americans for the Arts, 2017. For more information, visit www.AmericansForTheArts.org/EconomicImpact. B–341

Table 23:Average Per Person Audience Spending by Resident Attendees toNonprofit Arts and Cultural Events Per Study Region During 2016
Regional Study Regions Per Person
All Populations Refreshments Meals/Drinks Retail/Gifts Clothing and Local Overnight Other/ Audience
Sample Size = 81 and/or Snacks (before/after) and Souvenirs Accessories Transportation Child Care Lodging Miscellaneous Expenditures
High Peaks Region (ME) $4.91 $5.84 $5.86 $1.24 $1.44 $0.12 $0.82 $0.20 $20.43
Wood River Valley (ID) $6.42 $17.38 $6.65 $6.21 $2.12 $0.59 $0.43 $0.20 $40.00
Southern Oregon Area $5.23 $13.50 $1.29 $1.83 $1.55 $0.12 $1.79 $0.00 $25.31
Southwestern Pennsylvania Area $2.79 $8.60 $1.10 $1.09 $1.73 $0.24 $0.11 $0.05 $15.71
Greater Portsmouth Area (NH) $4.17 $14.89 $3.54 $0.69 $1.47 $0.70 $0.34 $0.76 $26.56
Northeast Oregon Region $3.78 $6.20 $3.89 $1.06 $1.28 $0.59 $0.35 $0.29 $17.44
Toe River Valley (NC) $3.49 $8.91 $42.00 $0.48 $1.83 $0.15 $0.00 $0.04 $56.90
Albemarle Region (NC) $3.74 $12.47 $3.82 $2.43 $1.29 $0.23 $0.40 $0.12 $24.50
Greater Concord Area (NH) $2.44 $9.68 $1.84 $1.23 $0.99 $0.85 $0.53 $0.02 $17.58
North Central Minnesota Region $2.19 $6.95 $3.20 $0.70 $3.27 $0.16 $1.56 $2.39 $20.42
Northwest Minnesota Region $1.56 $4.35 $3.61 $0.58 $3.27 $0.47 $0.00 $0.02 $13.86
Monadnock Region (NH) $1.87 $10.98 $1.58 $1.39 $1.27 $0.55 $0.33 $0.15 $18.12
Bismarck-Mandan Region (ND) $3.08 $8.33 $5.35 $1.95 $1.64 $0.69 $0.99 $0.21 $22.24
Greater Minot Region (ND) $1.58 $7.52 $0.55 $0.43 $1.22 $0.07 $0.08 $0.12 $11.57
Greater Burlington Area (VT) $3.50 $11.82 $5.02 $0.69 $1.66 $0.15 $0.00 $1.33 $24.17
Greater Charlottesville Area (VA) $4.86 $11.36 $4.28 $0.44 $1.39 $0.25 $0.27 $0.03 $22.88
Brainerd Lakes Region (MN) $2.07 $4.38 $0.41 $0.14 $1.06 $0.47 $0.40 $0.00 $8.93
East Central Minnesota Region $3.10 $4.09 $4.57 $0.67 $2.32 $0.06 $0.29 $0.01 $15.11
Northwest Connecticut Region $2.45 $10.26 $2.87 $0.39 $1.40 $0.06 $0.56 $0.12 $18.11
Central Oregon Region $5.59 $14.26 $1.25 $1.87 $1.22 $0.95 $0.76 $0.00 $25.90
Greater Fargo-Moorhead Area (ND/MN) $2.12 $7.47 $2.34 $1.54 $0.89 $0.16 $0.14 $0.29 $14.95
Black Hills Region (SD) $3.21 $9.53 $2.75 $1.08 $1.46 $0.33 $0.57 $0.34 $19.27
Greater Kingsport Area (TN) $3.23 $10.79 $5.25 $2.98 $1.71 $0.55 $0.27 $0.03 $24.81
Lake Region (MN) $3.62 $3.54 $4.12 $0.17 $1.50 $0.34 $0.00 $0.14 $13.43
South Central Minnesota Region $1.20 $9.15 $1.87 $1.05 $1.97 $0.15 $0.00 $0.10 $15.49
Greater Sioux Falls Area (SD) $4.43 $12.75 $1.14 $1.12 $1.76 $0.36 $0.13 $0.00 $21.69
Southwest Tennessee Development District $2.58 $6.08 $1.47 $1.88 $1.85 $0.28 $0.39 $0.03 $14.56
Northwest Tennessee Development District $3.32 $5.48 $2.57 $2.45 $1.85 $0.08 $0.03 $0.13 $15.91
Southwest Minnesota Region $1.81 $5.75 $2.57 $1.01 $3.98 $0.00 $1.41 $0.07 $16.60
Arrowhead Region (MN) $0.95 $9.86 $5.16 $0.59 $2.45 $0.39 $0.18 $0.27 $19.85
RESIDENT ARTS ATTENDEES ONLY
SOURCE: Arts and Economic Prosperity 5, Americans for the Arts, 2017. For more information, visit www.AmericansForTheArts.org/EconomicImpact. B–342

Table 23:Average Per Person Audience Spending by Resident Attendees toNonprofit Arts and Cultural Events Per Study Region During 2016
Regional Study Regions Per Person
All Populations Refreshments Meals/Drinks Retail/Gifts Clothing and Local Overnight Other/ Audience
Sample Size = 81 and/or Snacks (before/after) and Souvenirs Accessories Transportation Child Care Lodging Miscellaneous Expenditures
Maple Grove and the Northwest Suburbs (MN) $3.30 $11.49 $5.35 $1.50 $2.90 $0.35 $0.52 $0.41 $25.82
Greater Augusta Area (GA) $5.65 $10.39 $3.50 $2.21 $2.08 $0.67 $0.75 $0.29 $25.54
Upper Cumberland Development District (TN) $1.53 $5.94 $2.62 $0.96 $1.10 $0.11 $0.14 $0.11 $12.51
City of Huntsville/Madison County (AL) $2.22 $9.96 $4.34 $2.51 $2.02 $0.18 $0.52 $0.06 $21.81
Northeast Commission (NC) $4.05 $12.32 $5.43 $2.39 $1.89 $0.24 $1.30 $0.30 $27.92
Greater Ann Arbor Area (MI) $1.72 $11.27 $4.76 $0.90 $1.24 $0.23 $0.22 $0.24 $20.58
Greater Fox Cities Region (WI) $4.33 $10.46 $4.27 $2.58 $1.94 $0.40 $0.39 $0.15 $24.52
Central Minnesota Region $3.93 $8.98 $3.58 $0.99 $1.92 $0.52 $0.61 $0.32 $20.85
South Central Tennessee Development District $2.46 $6.42 $2.80 $2.04 $1.99 $0.32 $0.37 $0.09 $16.49
Northwest Arkansas Region $5.19 $11.46 $2.88 $1.36 $2.22 $0.34 $0.30 $0.10 $23.85
Southeast Minnesota Region $0.83 $6.87 $0.30 $0.86 $0.88 $0.03 $0.00 $0.00 $9.77
First Tennessee Development District $3.92 $9.80 $4.31 $1.97 $2.05 $0.36 $0.35 $0.04 $22.80
Greater Harrisburg Area (PA) $2.48 $13.96 $1.92 $1.86 $2.54 $0.26 $0.19 $0.03 $23.24
Greater New Haven Area (CT) $1.86 $13.41 $3.62 $1.30 $2.52 $0.09 $0.36 $0.00 $23.16
Treasure Coast Region (FL) $5.36 $11.12 $3.65 $1.31 $1.56 $0.30 $0.76 $0.06 $24.12
Greater Des Moines Region (IA) $6.27 $8.94 $2.36 $1.48 $1.90 $0.33 $0.81 $0.00 $22.09
Southeast Tennessee Development District $4.84 $10.61 $5.48 $2.96 $2.22 $0.52 $0.72 $0.13 $27.48
Greater Knoxville Region (TN) $10.10 $16.36 $2.81 $1.47 $2.46 $0.59 $1.37 $0.00 $35.16
Greater Columbia Area (SC) $7.68 $14.89 $2.57 $1.55 $1.96 $0.92 $0.91 $0.09 $30.57
Pikes Peak Region (CO) $5.68 $12.56 $5.29 $1.87 $2.06 $0.45 $0.80 $0.02 $28.73
Lehigh Valley Region (PA) $2.74 $9.52 $3.54 $1.54 $1.41 $0.09 $0.43 $0.08 $19.35
Greater Sarasota/Bradenton Area (FL) $3.80 $16.39 $1.82 $2.87 $1.76 $0.14 $0.55 $0.12 $27.45
Dayton Region (OH) $3.11 $9.64 $1.27 $1.26 $1.75 $0.18 $0.56 $0.10 $17.87
Richmond & Tri-Cities Region (VA) $4.28 $11.85 $3.07 $1.47 $2.17 $0.38 $0.41 $0.40 $24.03
Memphis Area Association of Governments (TN) $5.55 $10.67 $2.95 $3.84 $2.36 $0.48 $0.68 $0.25 $26.78
Eastern Region (NC) $4.05 $13.77 $17.22 $2.77 $3.82 $0.99 $1.16 $0.13 $43.91
Advantage West Region (NC) $4.08 $11.44 $19.53 $1.79 $2.75 $0.22 $0.98 $0.02 $40.81
Southeast Commission (NC) $3.76 $7.51 $3.43 $2.15 $2.07 $0.24 $0.78 $0.02 $19.96
Greater Fairfax Area (VA) $4.23 $11.61 $5.31 $2.38 $1.48 $0.36 $0.27 $0.02 $25.66
Greater Tulsa Region (OK) $4.23 $14.09 $3.37 $1.60 $2.58 $1.01 $1.79 $0.25 $28.92
RESIDENT ARTS ATTENDEES ONLY
SOURCE: Arts and Economic Prosperity 5, Americans for the Arts, 2017. For more information, visit www.AmericansForTheArts.org/EconomicImpact. B–343

Table 23:Average Per Person Audience Spending by Resident Attendees toNonprofit Arts and Cultural Events Per Study Region During 2016
Regional Study Regions Per Person
All Populations Refreshments Meals/Drinks Retail/Gifts Clothing and Local Overnight Other/ Audience
Sample Size = 81 and/or Snacks (before/after) and Souvenirs Accessories Transportation Child Care Lodging Miscellaneous Expenditures
East Tennessee Development District $4.82 $8.70 $5.28 $1.74 $2.38 $0.48 $1.27 $0.03 $24.70
West Valley Region (AZ) $2.48 $6.91 $2.46 $1.06 $1.70 $0.07 $0.53 $0.23 $15.44
Greater St. Louis Area (MO) $4.48 $7.10 $1.96 $0.76 $1.02 $0.16 $0.00 $0.06 $15.54
Western New York $4.36 $12.23 $3.83 $1.19 $2.78 $0.20 $0.81 $0.43 $25.83
Greater Oklahoma City Region (OK) $6.41 $10.15 $5.29 $2.91 $2.61 $0.61 $2.83 $0.10 $30.91
Piedmont Triad Partnership (NC) $3.30 $9.03 $3.14 $1.43 $1.76 $0.26 $0.29 $0.17 $19.38
Greater Portland Area (OR) $3.69 $11.39 $2.90 $1.34 $2.21 $0.46 $0.23 $0.13 $22.35
Greater Kansas City Metropolitan Area (MO/KS) $3.47 $11.93 $1.87 $1.89 $2.18 $0.23 $0.06 $0.04 $21.67
Greater Nashville Regional Council (TN) $3.72 $8.64 $5.53 $2.30 $2.35 $0.46 $0.88 $0.24 $24.12
Research Triangle Regional Partnership (NC) $2.73 $9.10 $2.16 $1.31 $1.63 $0.50 $0.43 $0.19 $18.05
Greater Tampa/St. Petersburg Area (FL) $7.07 $13.89 $6.15 $3.46 $3.46 $0.49 $1.22 $0.06 $35.80
Charlotte Regional Partnership (NC) $3.50 $11.07 $5.56 $1.53 $1.92 $0.40 $0.55 $0.29 $24.82
Charlotte Regional Partnership (NC/SC) $3.79 $10.73 $5.37 $2.58 $2.05 $0.47 $0.53 $0.30 $25.82
Seven-County Metro Area (MN) $3.30 $11.49 $5.35 $1.50 $2.90 $0.35 $0.52 $0.41 $25.82
Central Florida Region $5.35 $10.24 $2.93 $1.83 $2.59 $0.36 $0.83 $0.29 $24.42
Greater Philadelphia Region (PA) $3.80 $11.29 $3.48 $1.28 $3.32 $0.27 $1.55 $0.12 $25.11
Greater Washington Region (DC/MD/VA) $3.74 $11.99 $3.97 $1.81 $2.21 $0.36 $0.35 $0.08 $24.51
Metro Atlanta Area (GA) $2.54 $9.36 $2.70 $2.90 $2.89 $0.72 $1.11 $0.44 $22.66
Greater Atlanta Region (GA) $2.54 $9.36 $2.70 $2.90 $2.89 $0.72 $1.11 $0.44 $22.66
Greater Houston Region (TX) $3.51 $14.20 $2.89 $2.46 $3.44 $0.55 $1.45 $0.15 $28.65
Dallas-Fort Worth-Arlington MSA (TX) $4.82 $12.28 $2.68 $1.77 $2.59 $0.58 $0.80 $0.08 $25.60
Regional Average $3.73 $10.21 $4.24 $1.67 $2.04 $0.37 $0.61 $0.19 $23.06
Percent of Regional Total 16.2% 44.3% 18.4% 7.2% 8.9% 1.6% 2.6% 0.8% 100.0%
Regional Median $3.69 $10.39 $3.43 $1.50 $1.96 $0.35 $0.52 $0.12 $22.88
RESIDENT ARTS ATTENDEES ONLY
SOURCE: Arts and Economic Prosperity 5, Americans for the Arts, 2017. For more information, visit www.AmericansForTheArts.org/EconomicImpact. B–344
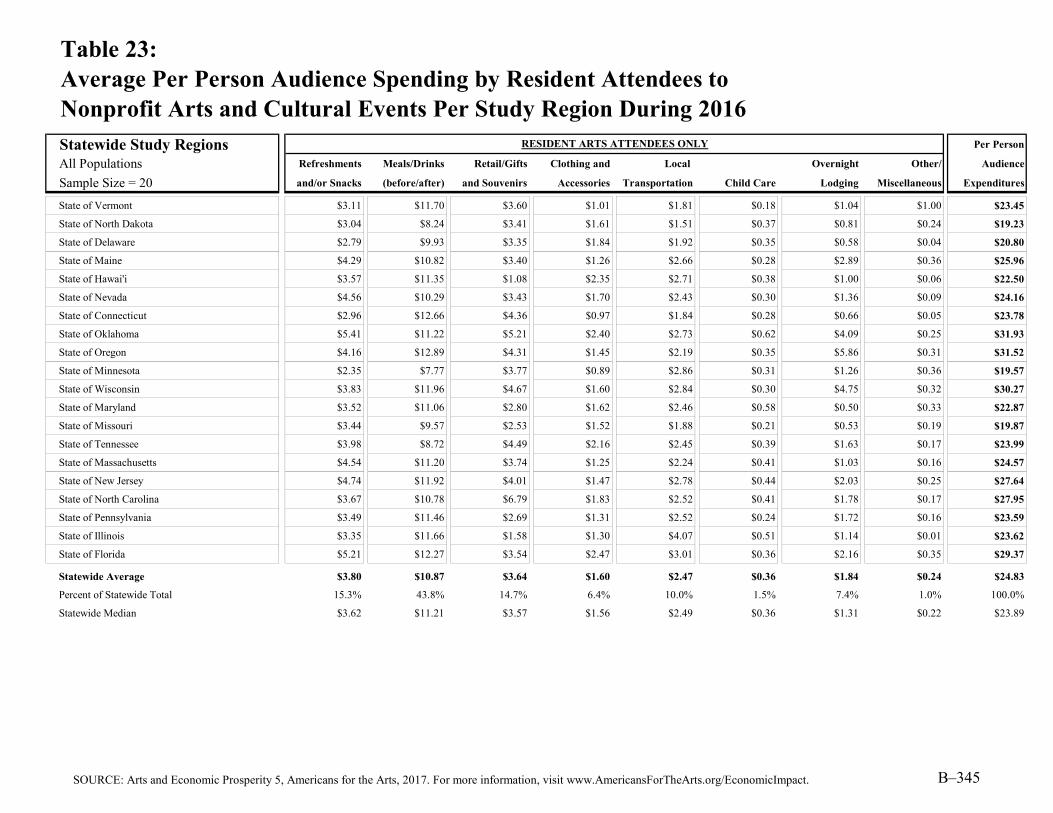
Table 23:Average Per Person Audience Spending by Resident Attendees toNonprofit Arts and Cultural Events Per Study Region During 2016
Statewide Study Regions Per Person
All Populations Refreshments Meals/Drinks Retail/Gifts Clothing and Local Overnight Other/ Audience
Sample Size = 20 and/or Snacks (before/after) and Souvenirs Accessories Transportation Child Care Lodging Miscellaneous Expenditures
State of Vermont $3.11 $11.70 $3.60 $1.01 $1.81 $0.18 $1.04 $1.00 $23.45
State of North Dakota $3.04 $8.24 $3.41 $1.61 $1.51 $0.37 $0.81 $0.24 $19.23
State of Delaware $2.79 $9.93 $3.35 $1.84 $1.92 $0.35 $0.58 $0.04 $20.80
State of Maine $4.29 $10.82 $3.40 $1.26 $2.66 $0.28 $2.89 $0.36 $25.96
State of Hawai'i $3.57 $11.35 $1.08 $2.35 $2.71 $0.38 $1.00 $0.06 $22.50
State of Nevada $4.56 $10.29 $3.43 $1.70 $2.43 $0.30 $1.36 $0.09 $24.16
State of Connecticut $2.96 $12.66 $4.36 $0.97 $1.84 $0.28 $0.66 $0.05 $23.78
State of Oklahoma $5.41 $11.22 $5.21 $2.40 $2.73 $0.62 $4.09 $0.25 $31.93
State of Oregon $4.16 $12.89 $4.31 $1.45 $2.19 $0.35 $5.86 $0.31 $31.52
State of Minnesota $2.35 $7.77 $3.77 $0.89 $2.86 $0.31 $1.26 $0.36 $19.57
State of Wisconsin $3.83 $11.96 $4.67 $1.60 $2.84 $0.30 $4.75 $0.32 $30.27
State of Maryland $3.52 $11.06 $2.80 $1.62 $2.46 $0.58 $0.50 $0.33 $22.87
State of Missouri $3.44 $9.57 $2.53 $1.52 $1.88 $0.21 $0.53 $0.19 $19.87
State of Tennessee $3.98 $8.72 $4.49 $2.16 $2.45 $0.39 $1.63 $0.17 $23.99
State of Massachusetts $4.54 $11.20 $3.74 $1.25 $2.24 $0.41 $1.03 $0.16 $24.57
State of New Jersey $4.74 $11.92 $4.01 $1.47 $2.78 $0.44 $2.03 $0.25 $27.64
State of North Carolina $3.67 $10.78 $6.79 $1.83 $2.52 $0.41 $1.78 $0.17 $27.95
State of Pennsylvania $3.49 $11.46 $2.69 $1.31 $2.52 $0.24 $1.72 $0.16 $23.59
State of Illinois $3.35 $11.66 $1.58 $1.30 $4.07 $0.51 $1.14 $0.01 $23.62
State of Florida $5.21 $12.27 $3.54 $2.47 $3.01 $0.36 $2.16 $0.35 $29.37
Statewide Average $3.80 $10.87 $3.64 $1.60 $2.47 $0.36 $1.84 $0.24 $24.83
Percent of Statewide Total 15.3% 43.8% 14.7% 6.4% 10.0% 1.5% 7.4% 1.0% 100.0%
Statewide Median $3.62 $11.21 $3.57 $1.56 $2.49 $0.36 $1.31 $0.22 $23.89
RESIDENT ARTS ATTENDEES ONLY
SOURCE: Arts and Economic Prosperity 5, Americans for the Arts, 2017. For more information, visit www.AmericansForTheArts.org/EconomicImpact. B–345

Table 23:Average Per Person Audience Spending by Resident Attendees toNonprofit Arts and Cultural Events Per Study Region During 2016
Individual Arts Districts Per Person
All Populations Refreshments Meals/Drinks Retail/Gifts Clothing and Local Overnight Other/ Audience
Sample Size = 12 and/or Snacks (before/after) and Souvenirs Accessories Transportation Child Care Lodging Miscellaneous Expenditures
James River Arts & Cultural District $3.31 $9.31 $4.40 $2.42 $1.04 $0.22 $0.33 $0.00 $21.03
Center City Charlotte $4.24 $14.30 $0.73 $1.64 $2.08 $0.77 $0.29 $0.01 $24.06
Loch Haven Cultural Park $6.99 $9.12 $2.80 $1.27 $2.32 $0.42 $0.17 $0.71 $23.80
Downtown Colorado Springs Creative District $3.92 $13.57 $6.00 $1.43 $1.51 $0.41 $0.40 $0.03 $27.27
Fort Worth Cultural District $5.32 $12.23 $3.23 $1.53 $3.53 $0.21 $0.62 $0.00 $26.67
Dallas Arts District $6.17 $14.35 $1.65 $1.33 $3.46 $0.50 $0.60 $0.01 $28.07
Grand Center Arts & Entertainment District $5.85 $7.41 $0.35 $0.69 $1.18 $0.16 $0.00 $0.00 $15.64
Balboa Park Cultural District $4.08 $10.39 $2.23 $0.85 $2.56 $0.38 $0.45 $0.00 $20.94
East End Cultural District $2.96 $11.78 $2.29 $1.62 $2.33 $0.50 $0.09 $0.00 $21.57
Houston Museum District Association $1.53 $11.69 $2.00 $2.70 $3.39 $0.65 $0.00 $0.00 $21.96
Midtown Cultural District $3.13 $17.06 $0.92 $0.65 $3.22 $0.43 $0.00 $0.00 $25.41
Washington Avenue Cultural District $2.79 $11.11 $9.65 $1.62 $2.46 $0.34 $0.48 $0.07 $28.52
Arts District Average $4.19 $11.86 $3.02 $1.48 $2.42 $0.42 $0.29 $0.07 $23.75
Percent of Arts District Total 17.6% 49.9% 12.7% 6.2% 10.2% 1.8% 1.2% 0.3% 100.0%
Arts District Median $4.00 $11.74 $2.26 $1.48 $2.40 $0.42 $0.31 $0.00 $23.93
Average $4.12 $10.53 $3.87 $1.83 $1.98 $0.38 $0.53 $0.19 $23.44
Average $3.64 $10.53 $4.02 $1.50 $1.94 $0.35 $0.68 $0.21 $22.86
Average $3.24 $11.45 $2.61 $1.45 $2.40 $0.36 $1.35 $0.12 $22.98
Average for the 106,575 RESIDENT Surveys Where Residency Was Determined Based on a Single County
Average for the 57,519 RESIDENT Surveys Where Residency Was Determined Based on a Multi-City or Multi-County Region
Average for the 117,931 RESIDENT Surveys Where Residency Was Determined Based on an Entire State
RESIDENT ARTS ATTENDEES ONLY
SOURCE: Arts and Economic Prosperity 5, Americans for the Arts, 2017. For more information, visit www.AmericansForTheArts.org/EconomicImpact. B–346

Explanation of Table 24:Total Categorized Audience Expenditures by Non-Resident Attendees toNonprofit Arts and Cultural Events Per Study Region During 2015
Column Two:
Column Three:
Column Four:
Column Five:
Column Six:
Column Seven:
Column Eight:
Column Nine:
Column Ten:
The total estimated dollars spent by non-resident audience members on local ground transportation (e.g., gas, parking, taxi fares, tolls, car rentals) for the purpose of attending nonprofit arts and cultural events.
The total estimated dollars spent by non-resident audience members on child care for the purpose of attending nonprofit arts and cultural events.
The total estimated dollars spent by non-resident audience members on overnight lodging (e.g., hotel, motel, bed-and-breakfast) for the purpose of attending nonprofit arts and cultural events. (The audience-intercept survey instrument requested that respondents limit their response by providing the cost of one night only.)
The total estimated dollars spent by non-resident audience members on miscellaneous products and services for the purpose of or as a result of attending nonprofit arts and cultural events.
The total estimated expenditures made by non-resident audience members for the purpose of or as a result of attending nonprofit arts and cultural events. This figure is the sum of Column Two through Column Nine.
The total estimated dollars spent by non-resident audience members to purchase clothing or accessories for the purpose of attending nonprofit arts and cultural events.
This table presents the total estimated dollars spent by non-residents as a direct result of their attendance to nonprofit arts and cultural events in each participating study region during 2015. Non-residents are attendees who reside outside the county in which the nonprofit arts and cultural event at which they were surveyed took place (outside the multi-city or multi-county region for regional analyses, and outside the state for statewide analyses). Residency is determined based on the ZIP code provided by each audience-intercept survey respondent. Summary statistics are calculated for each population group.
The total estimated dollars spent by non-resident audience members to purchase refreshments (e.g., food, snacks, drinks) while attending nonprofit arts and cultural events.
The total estimated dollars spent by non-resident audience members to purchase food, drinks, and/or meals (e.g., dinner at a restaurant, coffee at a cafe) before or after attending nonprofit arts and cultural events.
The total estimated dollars spent by non-resident audience members to purchase souvenirs and/or gifts (e.g., books, recordings, art) as a result of attending nonprofit arts and cultural events.
SOURCE: Arts and Economic Prosperity 5, Americans for the Arts, 2017. For more information, visit www.AmericansForTheArts.org/EconomicImpact. B–347

Table 24:Total Categorized Audience Expenditures by Non-Resident Attendees toNonprofit Arts and Cultural Events Per Study Region During 2015
Population Cohort Group A Non-Resident
Population Fewer than 50,000 Refreshments Meals/Drinks Retail/Gifts Clothing and Local Overnight Other/ Audience
Sample Size = 52 and/or Snacks (before/after) and Souvenirs Accessories Transportation Child Care Lodging Miscellaneous Expenditures
Town of Crested Butte (CO) $247,241 $1,255,504 $191,482 $35,846 $56,985 $47,488 $1,423,089 $14,092 $3,271,725
City of Pine City (MN) $20,851 $65,897 $146,406 $3,446 $56,148 $3,536 $72,847 $0 $369,129
City of Alva (OK) $7,340 $44,739 $27,525 $2,228 $11,534 $3,408 $20,884 $0 $117,657
Cook County (MN) $15,289 $243,213 $103,756 $4,209 $136,372 $5 $352,116 $3,822 $858,781
Town of Hillsborough (NC) $277,649 $780,273 $271,065 $86,697 $121,814 $61,457 $253,506 $1 $1,852,462
City of Virginia (MN) $486 $7,728 $3,297 $134 $4,334 $0 $11,191 $121 $27,291
Town of Jackson (WY) $1,768,272 $3,635,437 $1,270,853 $566,792 $1,120,299 $129,890 $3,408,130 $197,787 $12,097,460
City of Guthrie (OK) $262,844 $401,488 $240,821 $104,343 $123,118 $16,970 $422,429 $0 $1,572,012
City of Grand Rapids (MN) $16,939 $269,467 $114,955 $4,663 $151,094 $6 $390,129 $4,235 $951,488
Town of Medfield (MA) $5,666 $14,360 $7,823 $1,560 $550 $1,468 $5,873 $390 $37,690
City of Fergus Falls (MN) $27,484 $31,536 $51,332 $717 $25,008 $1,435 $44,205 $5 $181,723
Grundy County (TN) $108,288 $172,076 $204,563 $45,853 $81,893 $846 $138,744 $8,969 $761,231
City of Falls Church (VA) $1,310,862 $4,679,398 $3,289,759 $1,682,693 $661,733 $148,102 $1,197,422 $66,174 $13,036,142
City of Jamestown (ND) $481,954 $951,361 $265,217 $270,351 $365,030 $95,250 $2,190,752 $34,223 $4,654,138
City of Waterville (ME) $81,027 $551,471 $25,536 $7,857 $135,535 $7,857 $58,437 $1 $867,721
City of Red Wing (MN) $18,421 $72,842 $24,453 $3,632 $31,226 $0 $32,881 $0 $183,455
City of Durango (CO) $577,824 $1,705,705 $657,368 $174,848 $493,776 $2,251 $1,322,990 $190,607 $5,125,369
City of Hannibal (MO) $198,207 $425,397 $293,260 $69,905 $159,844 $13,640 $261,291 $63,510 $1,485,055
City of Tullahoma (TN) $2,866 $35,656 $825 $8,556 $7,123 $652 $6,688 $9,077 $71,442
City of Northfield (MN) $31,948 $126,336 $42,411 $6,300 $54,158 $0 $57,028 $0 $318,180
Town of Carrboro (NC) $267,479 $1,180,850 $315,551 $220,639 $230,500 $36,979 $313,085 $72,725 $2,637,807
Macon County (TN) $2,202 $8,299 $6,516 $629 $6,052 $165 $3,655 $0 $27,518
City of Laguna Beach (CA) $2,949,120 $7,163,076 $6,132,347 $1,694,037 $2,328,081 $52,024 $7,719,085 $100,798 $28,138,568
Hickman County (TN) $45,609 $88,064 $77,026 $26,322 $53,736 $3,518 $59,801 $0 $354,075
City of Fairfax (VA) $33,813 $194,729 $72,370 $7,298 $28,219 $8,028 $57,896 $2,918 $405,271
City of Ponca City (OK) $74,841 $122,209 $131,564 $17,290 $50,802 $21,552 $27,473 $1 $445,733
City of Paducah (KY) $1,039,328 $2,001,294 $1,020,828 $240,492 $465,847 $8,408 $2,058,474 $252,265 $7,086,937
Mille Lacs County (MN) $10,042 $31,735 $70,506 $1,659 $27,040 $1,703 $35,081 $1 $177,768
McNairy County (TN) $12,244 $32,972 $6,444 $4,457 $20,728 $591 $6,874 -$1 $84,309
City of Winona (MN) $53,305 $210,792 $70,764 $10,510 $90,362 -$1 $95,153 $0 $530,886
NON-RESIDENT ARTS ATTENDEES ONLY
SOURCE: Arts and Economic Prosperity 5, Americans for the Arts, 2017. For more information, visit www.AmericansForTheArts.org/EconomicImpact. B–348

Table 24:Total Categorized Audience Expenditures by Non-Resident Attendees toNonprofit Arts and Cultural Events Per Study Region During 2015
Population Cohort Group A Non-Resident
Population Fewer than 50,000 Refreshments Meals/Drinks Retail/Gifts Clothing and Local Overnight Other/ Audience
Sample Size = 52 and/or Snacks (before/after) and Souvenirs Accessories Transportation Child Care Lodging Miscellaneous Expenditures
Door County (WI) $879,576 $3,642,657 $2,552,287 $571,724 $1,273,868 $72,793 $4,582,893 $153,168 $13,728,965
City of Benicia (CA) $85,519 $282,979 $405,522 $49,539 $47,105 $10,429 $40,326 $2,260 $923,679
City of Winter Park (FL) $1,430,598 $9,264,275 $1,453,672 $1,228,699 $2,918,881 $57,685 $3,766,857 $5,769 $20,126,436
City of Rochester (NH) $506,986 $1,019,788 $253,978 $132,805 $213,264 $3,878 $174,488 $14,539 $2,319,726
City of Morgantown (WV) $206,192 $1,035,852 $821,510 $94,539 $270,577 $13,855 $560,713 $34,230 $3,037,468
Henry County (TN) $18,625 $54,894 $32,021 $19,475 $29,277 $3,137 $38,099 $2,090 $197,618
City of Fairbanks (AK) $143,657 $636,034 $428,153 $78,589 $413,788 $10,422 $899,405 -$1 $2,610,047
City of Bangor (ME) $581,057 $1,365,051 $403,272 $135,291 $404,138 $13,876 $1,056,311 $114,476 $4,073,473
Weakley County (TN) $135,890 $196,693 $74,757 $15,616 $67,780 $665 $91,369 $11,627 $594,395
Dare County (NC) $2,344,858 $5,590,470 $4,853,929 $915,244 $857,286 $108,670 $6,232,831 $91,766 $20,995,054
City of Columbia (TN) $200,947 $657,345 $480,621 $112,860 $270,865 $37,437 $271,416 $1,102 $2,032,594
City of Lake Worth (FL) $97,597 $891,149 $355,131 $82,268 $266,731 $26,571 $647,923 $0 $2,367,370
Clatsop County (OR) $955,516 $2,081,895 $1,209,245 $270,595 $582,256 $96,798 $3,261,807 $22,734 $8,480,846
Yadkin County (NC) $4,624 $16,824 $4,382 $372 $6,426 $892 $14,875 $2,970 $51,365
Greater Belfast Area (ME) $418,732 $992,385 $365,385 $114,000 $393,154 $29,961 $859,385 $5,116 $3,178,119
Campbell County (TN) $26,384 $33,963 $58,007 $7,250 $21,706 $467 $19,367 $282 $167,426
Monroe County (TN) $662,828 $710,758 $994,828 $462,928 $474,618 $33,901 $496,829 $15,197 $3,851,888
Lincoln County (OR) $315,405 $2,027,048 $436,364 $181,440 $468,230 $4,552 $2,617,539 $59,178 $6,109,756
Iron County (UT) $3,653,198 $18,910,142 $4,135,186 $1,126,140 $4,973,035 $238,742 $28,243,591 $590,098 $61,870,132
City of St. Louis Park (MN) $10,902 $56,970 $10,783 $12,715 $21,578 $1,303 $39,091 $949 $154,290
City of Logan (UT) $567,533 $3,495,075 $677,957 $446,835 $1,140,201 $32,100 $4,791,925 $156,649 $11,308,276
Gibson County (TN) $629,660 $1,172,379 $784,440 $663,909 $560,503 $171,246 $361,593 $6,586 $4,350,317
Group A Average $458,187 $1,550,741 $690,924 $231,285 $437,966 $31,473 $1,559,920 $44,471 $5,004,967
Percent of Group A Total 9.2% 31.0% 13.8% 4.6% 8.8% 0.6% 31.2% 0.9% 100.0%
Group A Median $139,773 $488,434 $247,399 $59,722 $135,953 $8,218 $266,354 $4,029 $1,528,534
NON-RESIDENT ARTS ATTENDEES ONLY
SOURCE: Arts and Economic Prosperity 5, Americans for the Arts, 2017. For more information, visit www.AmericansForTheArts.org/EconomicImpact. B–349

Table 24:Total Categorized Audience Expenditures by Non-Resident Attendees toNonprofit Arts and Cultural Events Per Study Region During 2015
Population Cohort Group B Non-Resident
Population 50,000 to 99,999 Refreshments Meals/Drinks Retail/Gifts Clothing and Local Overnight Other/ Audience
Sample Size = 38 and/or Snacks (before/after) and Souvenirs Accessories Transportation Child Care Lodging Miscellaneous Expenditures
City of Joplin (MO) $57,196 $325,743 $52,293 $8,443 $124,741 $4,085 $101,045 $817 $674,363
City of La Crosse (WI) $1,892,068 $4,196,951 $775,939 $309,612 $1,242,267 $91,737 $1,911,180 $175,829 $10,595,582
McMinn County (TN) $276,982 $933,609 $338,304 $50,987 $305,920 $31,694 $332,791 $23,426 $2,293,714
Lafayette County (MS) $510,091 $1,343,585 $750,215 $281,070 $439,997 $63,154 $1,242,955 $53,436 $4,684,500
Chisago County (MN) $81,699 $258,215 $573,693 $13,499 $220,016 $13,858 $285,456 $0 $1,446,436
City of Grand Forks (ND) $180,195 $379,443 $238,968 $111,088 $113,995 $7,105 $142,412 $15,175 $1,188,382
City of Corvallis (OR) $2,135,293 $6,651,901 $1,940,331 $315,652 $1,685,024 $157,826 $4,066,339 $422,417 $17,374,781
City of Noblesville (IN) $85,289 $180,874 $18,069 $3,303 $27,393 $2,720 $33,222 $972 $351,841
City of Ocala (FL) $1,732,903 $5,513,008 $2,004,730 $1,480,896 $1,914,121 $45,304 $5,532,830 $33,978 $18,257,770
Lenoir County (NC) $137,149 $1,243,507 $419,087 $100,855 $505,426 $21,776 $583,742 -$1 $3,011,542
Town of Chapel Hill (NC) $2,301,586 $7,897,109 $1,792,902 $933,977 $2,234,873 $308,546 $2,226,534 $41,696 $17,737,223
City of Grand Junction (CO) $197,780 $698,028 $150,737 $115,952 $294,186 $7,951 $890,177 $34,452 $2,389,263
Town of Jupiter (FL) $165,425 $953,622 $297,485 $85,492 $357,261 $5,561 $1,001,581 $132,757 $2,999,184
Hamblen County (TN) $71,822 $361,520 $81,457 $7,007 $79,706 $37,006 $62,844 $1,094 $702,456
City of Delray Beach (FL) $1,206,221 $765,747 $912,571 $128,754 $495,815 $25,977 $1,445,658 $86,965 $5,067,708
City of St. Cloud (MN) $113,313 $637,903 $368,059 $25,365 $230,149 $30,455 $595,784 $14,382 $2,015,410
City of Portland (ME) $1,683,235 $6,972,909 $859,007 $406,898 $1,697,146 $83,466 $2,427,476 $233,010 $14,363,149
City of Jackson (TN) $93,365 $245,822 $63,228 $77,706 $110,798 $4,136 $56,138 $1 $651,194
City of Walnut Creek (CA) $517,523 $3,765,873 $128,567 $244,114 $496,366 $39,058 $476,837 $32,548 $5,700,887
Greene County (TN) $315,464 $304,474 $256,035 $17,503 $160,378 $4,070 $78,154 $4,070 $1,140,147
City of Flagstaff (AZ) $1,481,973 $3,998,713 $3,601,458 $975,296 $4,184,256 $54,712 $6,234,757 $133,211 $20,664,375
City of Missoula (MT) $2,588,490 $7,274,977 $2,345,304 $956,257 $2,130,970 $32,974 $6,359,938 $342,110 $22,031,021
City of Fort Myers (FL) $1,216,996 $4,290,981 $1,753,683 $1,184,240 $924,716 $95,747 $1,773,841 $35,275 $11,275,479
Putnam County (TN) $12,911 $88,331 $9,791 $3,873 $21,302 $3,874 $12,265 $1,937 $154,284
Monroe County (FL) $3,342,306 $9,423,795 $2,789,444 $1,551,785 $3,392,566 $207,323 $7,557,884 $490,037 $28,755,140
City of Lynchburg (VA) $157,684 $605,930 $277,189 $62,000 $139,662 $10,331 $160,124 $3,301 $1,416,220
City of Duluth (MN) $163,925 $2,607,665 $1,112,445 $45,127 $1,462,133 $58 $3,775,245 $40,985 $9,207,583
City of Fishers (IN) $1,432,850 $1,705,185 $851,045 $275,429 $380,649 $34,042 $488,964 $30,949 $5,199,113
City of Carmel (IN) $639,503 $1,555,348 $211,756 $483,862 $298,576 $26,470 $1,252,537 $6,352 $4,474,404
City of Sugar Land (TX) $24,279 $56,949 $13,197 $9,032 $20,627 $2,178 $32,222 -$1 $158,484
NON-RESIDENT ARTS ATTENDEES ONLY
SOURCE: Arts and Economic Prosperity 5, Americans for the Arts, 2017. For more information, visit www.AmericansForTheArts.org/EconomicImpact. B–350
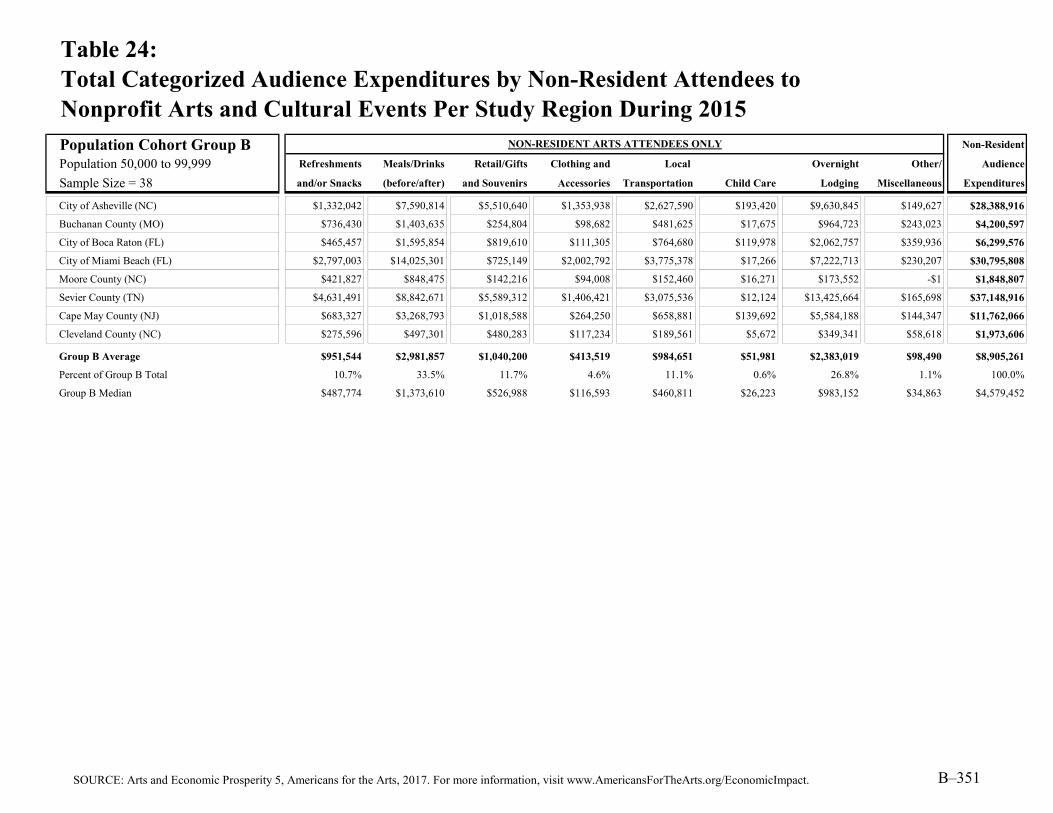
Table 24:Total Categorized Audience Expenditures by Non-Resident Attendees toNonprofit Arts and Cultural Events Per Study Region During 2015
Population Cohort Group B Non-Resident
Population 50,000 to 99,999 Refreshments Meals/Drinks Retail/Gifts Clothing and Local Overnight Other/ Audience
Sample Size = 38 and/or Snacks (before/after) and Souvenirs Accessories Transportation Child Care Lodging Miscellaneous Expenditures
City of Asheville (NC) $1,332,042 $7,590,814 $5,510,640 $1,353,938 $2,627,590 $193,420 $9,630,845 $149,627 $28,388,916
Buchanan County (MO) $736,430 $1,403,635 $254,804 $98,682 $481,625 $17,675 $964,723 $243,023 $4,200,597
City of Boca Raton (FL) $465,457 $1,595,854 $819,610 $111,305 $764,680 $119,978 $2,062,757 $359,936 $6,299,576
City of Miami Beach (FL) $2,797,003 $14,025,301 $725,149 $2,002,792 $3,775,378 $17,266 $7,222,713 $230,207 $30,795,808
Moore County (NC) $421,827 $848,475 $142,216 $94,008 $152,460 $16,271 $173,552 -$1 $1,848,807
Sevier County (TN) $4,631,491 $8,842,671 $5,589,312 $1,406,421 $3,075,536 $12,124 $13,425,664 $165,698 $37,148,916
Cape May County (NJ) $683,327 $3,268,793 $1,018,588 $264,250 $658,881 $139,692 $5,584,188 $144,347 $11,762,066
Cleveland County (NC) $275,596 $497,301 $480,283 $117,234 $189,561 $5,672 $349,341 $58,618 $1,973,606
Group B Average $951,544 $2,981,857 $1,040,200 $413,519 $984,651 $51,981 $2,383,019 $98,490 $8,905,261
Percent of Group B Total 10.7% 33.5% 11.7% 4.6% 11.1% 0.6% 26.8% 1.1% 100.0%
Group B Median $487,774 $1,373,610 $526,988 $116,593 $460,811 $26,223 $983,152 $34,863 $4,579,452
NON-RESIDENT ARTS ATTENDEES ONLY
SOURCE: Arts and Economic Prosperity 5, Americans for the Arts, 2017. For more information, visit www.AmericansForTheArts.org/EconomicImpact. B–351

Table 24:Total Categorized Audience Expenditures by Non-Resident Attendees toNonprofit Arts and Cultural Events Per Study Region During 2015
Population Cohort Group C Non-Resident
Population 100,000 to 249,999 Refreshments Meals/Drinks Retail/Gifts Clothing and Local Overnight Other/ Audience
Sample Size = 50 and/or Snacks (before/after) and Souvenirs Accessories Transportation Child Care Lodging Miscellaneous Expenditures
City of Las Cruces (NM) $410,801 $992,638 $744,479 $213,007 $340,497 $15,215 $1,116,980 $78,172 $3,911,790
Eau Claire County (WI) $360,599 $1,210,498 $431,020 $179,692 $268,325 $44,923 $330,246 $47,352 $2,872,655
Yamhill County (OR) $2,221,644 $4,132,086 $2,861,340 $394,766 $1,308,205 $132,550 $1,942,137 $43,223 $13,035,951
City of Lewisville (TX) $15,869 $50,071 $13,124 $7,107 $21,926 $403 $9,610 $2 $118,112
City of West Palm Beach (FL) $6,933,818 $10,087,256 $3,331,227 $1,656,256 $4,388,612 $505,298 $9,507,098 $898,309 $37,307,874
City of Boulder (CO) $1,390,469 $5,306,955 $1,628,835 $854,145 $1,251,422 $82,766 $3,443,065 $23,175 $13,980,833
City of Richardson (TX) $368,622 $641,829 $418,997 $248,909 $213,943 $68,154 $392,328 -$1 $2,352,781
City of High Point (NC) $244,070 $634,581 $125,129 $95,565 $174,630 $7,563 $290,133 $6,875 $1,578,546
City of Cambridge (MA) $5,789,939 $15,932,775 $2,840,663 $643,326 $4,712,158 $284,067 $5,088,128 $242,292 $35,533,347
City of Lowell (MA) $108,571 $412,315 $253,120 $56,036 $114,939 $4,458 $204,088 $638 $1,154,164
Douglas County (KS) $681,211 $2,274,455 $419,423 $315,271 $592,540 $66,151 $682,618 $99,929 $5,131,599
City of Columbia (MO) $177,620 $806,505 $142,472 $91,007 $272,391 $6,276 $271,764 $14,435 $1,782,469
City of Norman (OK) $5,135,091 $4,508,861 $5,326,645 $1,491,903 $1,967,101 $173,134 $3,750,017 $165,767 $22,518,519
Wayne County (NC) $85,301 $299,818 $95,095 $92,568 $184,503 $19,903 $102,045 $6,004 $885,236
City of Lafayette (LA) $856,337 $1,412,657 $310,944 $290,081 $207,627 $196,699 $1,604,389 $77,488 $4,956,222
Washington County (TN) $1,279,397 $3,374,798 $1,482,047 $340,452 $1,560,405 $95,921 $4,778,487 $21,616 $12,933,123
City of Thousand Oaks (CA) $214,963 $816,946 $136,674 $65,019 $238,405 $40,250 $282,636 $7,520 $1,802,413
City of Charleston (SC) $7,337,414 $20,161,190 $4,932,955 $2,509,414 $3,854,766 $429,368 $20,504,684 $0 $59,729,790
City of Waco (TX) $2,167,867 $4,808,799 $1,925,165 $847,402 $1,982,755 $61,704 $5,935,925 $32,907 $17,762,525
Robeson County (NC) $36,236 $97,858 $46,217 $33,740 $43,721 $3,906 $79,197 $1 $340,876
Columbia County (GA) $6,470 $6,923 $2,990 $2,000 $2,129 $174 $2,640 -$1 $23,324
Orange County (NC) $2,846,750 $9,858,361 $2,379,550 $1,241,330 $2,587,219 $406,987 $2,793,161 $114,426 $22,227,784
City of Savannah (GA) $5,561,660 $16,807,002 $6,852,530 $1,387,204 $5,401,104 $289,001 $24,179,734 $423,869 $60,902,102
Indian River County (FL) $563,896 $1,314,017 $894,576 $231,476 $345,473 $6,092 $591,743 -$1 $3,947,273
City of Alexandria (VA) $4,777,056 $21,347,469 $7,001,372 $5,911,607 $5,762,324 $552,347 $5,956,391 $44,785 $51,353,352
Martin County (FL) $538,962 $2,141,980 $1,103,685 $449,796 $899,592 $67,370 $984,796 $9,908 $6,196,088
Macon-Bibb County (GA) $2,186,177 $8,999,157 $2,804,123 $1,168,385 $1,490,340 $275,220 $2,118,670 $25,964 $19,068,035
City of Springfield (MA) $924,361 $1,410,380 $603,881 $287,373 $511,180 $15,892 $1,119,034 $0 $4,872,100
Catawba County (NC) $1,575,835 $4,535,329 $5,887,542 $566,043 $2,382,969 $90,846 $2,054,525 $13,977 $17,107,065
Town of Cary (NC) $202,941 $848,415 $239,595 $60,793 $152,876 $160,028 $441,641 -$1 $2,106,288
NON-RESIDENT ARTS ATTENDEES ONLY
SOURCE: Arts and Economic Prosperity 5, Americans for the Arts, 2017. For more information, visit www.AmericansForTheArts.org/EconomicImpact. B–352
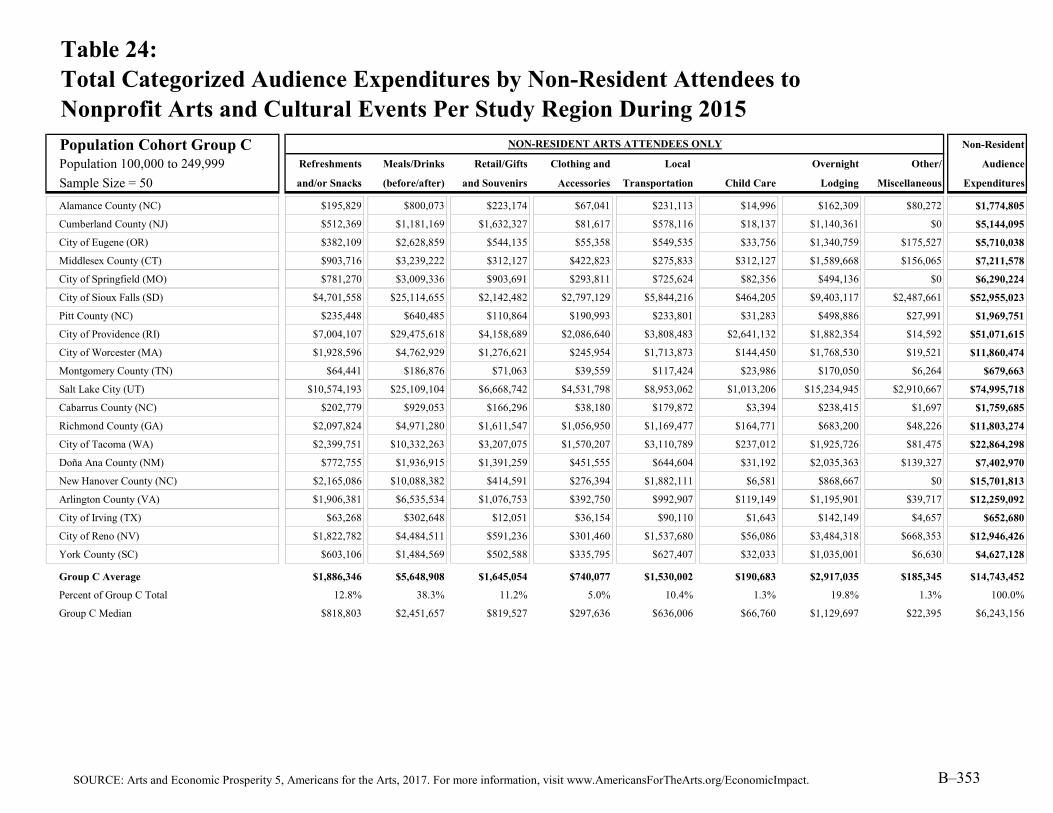
Table 24:Total Categorized Audience Expenditures by Non-Resident Attendees toNonprofit Arts and Cultural Events Per Study Region During 2015
Population Cohort Group C Non-Resident
Population 100,000 to 249,999 Refreshments Meals/Drinks Retail/Gifts Clothing and Local Overnight Other/ Audience
Sample Size = 50 and/or Snacks (before/after) and Souvenirs Accessories Transportation Child Care Lodging Miscellaneous Expenditures
Alamance County (NC) $195,829 $800,073 $223,174 $67,041 $231,113 $14,996 $162,309 $80,272 $1,774,805
Cumberland County (NJ) $512,369 $1,181,169 $1,632,327 $81,617 $578,116 $18,137 $1,140,361 $0 $5,144,095
City of Eugene (OR) $382,109 $2,628,859 $544,135 $55,358 $549,535 $33,756 $1,340,759 $175,527 $5,710,038
Middlesex County (CT) $903,716 $3,239,222 $312,127 $422,823 $275,833 $312,127 $1,589,668 $156,065 $7,211,578
City of Springfield (MO) $781,270 $3,009,336 $903,691 $293,811 $725,624 $82,356 $494,136 $0 $6,290,224
City of Sioux Falls (SD) $4,701,558 $25,114,655 $2,142,482 $2,797,129 $5,844,216 $464,205 $9,403,117 $2,487,661 $52,955,023
Pitt County (NC) $235,448 $640,485 $110,864 $190,993 $233,801 $31,283 $498,886 $27,991 $1,969,751
City of Providence (RI) $7,004,107 $29,475,618 $4,158,689 $2,086,640 $3,808,483 $2,641,132 $1,882,354 $14,592 $51,071,615
City of Worcester (MA) $1,928,596 $4,762,929 $1,276,621 $245,954 $1,713,873 $144,450 $1,768,530 $19,521 $11,860,474
Montgomery County (TN) $64,441 $186,876 $71,063 $39,559 $117,424 $23,986 $170,050 $6,264 $679,663
Salt Lake City (UT) $10,574,193 $25,109,104 $6,668,742 $4,531,798 $8,953,062 $1,013,206 $15,234,945 $2,910,667 $74,995,718
Cabarrus County (NC) $202,779 $929,053 $166,296 $38,180 $179,872 $3,394 $238,415 $1,697 $1,759,685
Richmond County (GA) $2,097,824 $4,971,280 $1,611,547 $1,056,950 $1,169,477 $164,771 $683,200 $48,226 $11,803,274
City of Tacoma (WA) $2,399,751 $10,332,263 $3,207,075 $1,570,207 $3,110,789 $237,012 $1,925,726 $81,475 $22,864,298
Doña Ana County (NM) $772,755 $1,936,915 $1,391,259 $451,555 $644,604 $31,192 $2,035,363 $139,327 $7,402,970
New Hanover County (NC) $2,165,086 $10,088,382 $414,591 $276,394 $1,882,111 $6,581 $868,667 $0 $15,701,813
Arlington County (VA) $1,906,381 $6,535,534 $1,076,753 $392,750 $992,907 $119,149 $1,195,901 $39,717 $12,259,092
City of Irving (TX) $63,268 $302,648 $12,051 $36,154 $90,110 $1,643 $142,149 $4,657 $652,680
City of Reno (NV) $1,822,782 $4,484,511 $591,236 $301,460 $1,537,680 $56,086 $3,484,318 $668,353 $12,946,426
York County (SC) $603,106 $1,484,569 $502,588 $335,795 $627,407 $32,033 $1,035,001 $6,630 $4,627,128
Group C Average $1,886,346 $5,648,908 $1,645,054 $740,077 $1,530,002 $190,683 $2,917,035 $185,345 $14,743,452
Percent of Group C Total 12.8% 38.3% 11.2% 5.0% 10.4% 1.3% 19.8% 1.3% 100.0%
Group C Median $818,803 $2,451,657 $819,527 $297,636 $636,006 $66,760 $1,129,697 $22,395 $6,243,156
NON-RESIDENT ARTS ATTENDEES ONLY
SOURCE: Arts and Economic Prosperity 5, Americans for the Arts, 2017. For more information, visit www.AmericansForTheArts.org/EconomicImpact. B–353

Table 24:Total Categorized Audience Expenditures by Non-Resident Attendees toNonprofit Arts and Cultural Events Per Study Region During 2015
Population Cohort Group D Non-Resident
Population 250,000 to 499,999 Refreshments Meals/Drinks Retail/Gifts Clothing and Local Overnight Other/ Audience
Sample Size = 42 and/or Snacks (before/after) and Souvenirs Accessories Transportation Child Care Lodging Miscellaneous Expenditures
Buncombe County (NC) $1,506,076 $8,223,614 $6,006,582 $1,486,666 $2,838,798 $214,073 $10,293,936 $163,396 $30,733,141
Alachua County (FL) $4,866,425 $8,627,456 $4,664,218 $4,751,841 $3,808,213 $208,946 $5,203,434 $384,192 $32,514,725
Greater Green Bay Area (WI) $1,142,359 $1,365,034 $1,374,257 $284,602 $545,486 $7,906 $1,079,114 -$1 $5,798,758
City of Orlando (FL) $5,632,818 $10,228,093 $2,589,810 $1,345,635 $4,002,663 $180,189 $9,543,307 $2,908,790 $36,431,305
City of Lincoln (NE) $1,238,314 $8,981,386 $1,859,880 $838,392 $2,625,995 $53,002 $4,437,691 $664,930 $20,699,589
Southeastern Connecticut Region (CT) $4,896,064 $15,155,497 $7,997,259 $1,614,320 $3,366,708 $477,924 $10,493,083 $0 $44,000,856
Erie County (PA) $401,575 $2,086,125 $488,682 $143,209 $1,061,518 $13,287 $1,817,424 $2,952 $6,014,772
San Luis Obispo County (CA) $257,229 $1,335,470 $286,823 $173,005 $583,509 $10,623 $2,449,374 $24,281 $5,120,315
City of Newark (NJ) $7,755,757 $10,596,771 $2,882,488 $3,566,819 $8,595,619 $746,544 $1,607,142 $72,580 $35,823,720
Leon County (FL) $3,515,920 $7,318,761 $4,235,499 $3,342,856 $3,552,354 $951,849 $8,179,523 -$2 $31,096,760
Rutherford County (TN) $542,842 $2,332,485 $991,492 $505,660 $1,033,630 $47,096 $1,752,462 $178,470 $7,384,137
St. Lucie County (FL) $450,215 $938,946 $303,961 $55,692 $218,081 $5,205 $210,274 -$1 $2,182,373
Greater Spartanburg Area (SC) $274,895 $1,309,123 $69,502 $192,945 $206,430 $36,307 $513,484 $0 $2,602,686
Durham County (NC) $2,116,009 $16,830,782 $912,073 $766,141 $3,441,555 $72,966 $2,857,828 $48,643 $27,045,997
City of St. Paul (MN) $2,804,722 $14,655,907 $2,774,309 $3,270,815 $5,550,977 $335,130 $10,055,719 $244,488 $39,692,067
Hamilton County (IN) $2,320,608 $3,759,803 $1,146,496 $835,756 $767,534 $68,884 $1,962,809 $40,784 $10,902,674
Osceola County (FL) $88,314 $405,773 $80,979 $18,484 $79,512 $91,835 $412,520 $55,158 $1,232,573
Escambia County (FL) $2,304,380 $12,629,775 $2,791,845 $1,577,614 $2,774,119 $452,013 $6,221,826 $0 $28,751,572
Lexington-Fayette Urban County (KY) $807,779 $2,435,393 $673,149 $265,241 $653,055 $114,536 $466,181 $90,422 $5,505,756
Lake County (FL) $438,256 $1,071,480 $1,072,328 $179,710 $243,287 $11,868 $1,027,400 $14,411 $4,058,740
City of Riverside (CA) $1,480,993 $3,984,321 $1,510,998 $64,298 $1,187,366 $186,464 $109,306 $55,726 $8,579,470
Cumberland County (NC) $1,640,605 $3,136,451 $1,133,948 $804,218 $1,037,441 $40,211 $715,754 $12,063 $8,520,690
Collier County (FL) $2,298,690 $8,748,984 $3,184,867 $1,466,220 $1,702,534 $64,449 $3,711,202 $332,988 $21,509,934
Hamilton County (TN) $6,206,792 $13,594,808 $4,610,351 $3,908,776 $4,696,258 $121,701 $9,349,563 $959,297 $43,447,546
Manatee County (FL) $2,064,456 $5,833,619 $2,358,793 $498,740 $2,027,663 $81,761 $4,202,495 $40,880 $17,108,406
City of Tampa (FL) $20,595,026 $37,668,721 $13,266,851 $7,537,551 $18,843,878 $609,095 $34,071,254 $228,411 $132,820,787
Forsyth County (NC) $3,184,465 $8,980,528 $2,358,863 $977,244 $2,165,099 $84,246 $2,628,447 $143,215 $20,522,106
Mercer County (NJ) $2,239,353 $5,569,175 $949,291 $554,970 $1,932,659 $262,881 $1,888,846 $384,586 $13,781,761
City of Wichita (KS) $1,301,399 $8,281,627 $1,704,724 $1,166,957 $2,893,192 $166,708 $3,275,008 $725,987 $19,515,601
Clackamas County (OR) $782,610 $1,186,433 $985,066 $245,994 $474,573 $46,805 $416,884 $25,034 $4,163,398
NON-RESIDENT ARTS ATTENDEES ONLY
SOURCE: Arts and Economic Prosperity 5, Americans for the Arts, 2017. For more information, visit www.AmericansForTheArts.org/EconomicImpact. B–354

Table 24:Total Categorized Audience Expenditures by Non-Resident Attendees toNonprofit Arts and Cultural Events Per Study Region During 2015
Population Cohort Group D Non-Resident
Population 250,000 to 499,999 Refreshments Meals/Drinks Retail/Gifts Clothing and Local Overnight Other/ Audience
Sample Size = 42 and/or Snacks (before/after) and Souvenirs Accessories Transportation Child Care Lodging Miscellaneous Expenditures
Sarasota County (FL) $4,515,651 $26,310,198 $2,114,767 $4,130,017 $4,316,614 $248,796 $15,437,804 $709,069 $57,782,917
City of Minneapolis (MN) $3,121,043 $16,308,823 $3,087,199 $3,639,703 $6,177,025 $372,926 $11,189,821 $272,063 $44,168,603
Berks County (PA) $418,394 $1,017,967 $333,719 $180,557 $328,115 $6,849 $1,437,606 $97,749 $3,820,958
City of Miami (FL) $14,060,072 $27,455,364 $5,434,567 $4,753,168 $13,062,903 $947,310 $21,555,452 $216,054 $87,484,890
City of Raleigh (NC) $22,458,555 $75,180,684 $22,228,996 $10,483,210 $28,121,019 $879,977 $49,202,219 $76,519 $208,631,180
Santa Barbara County (CA) $3,096,884 $13,661,086 $821,196 $4,634,887 $3,918,080 $876,870 $8,636,479 $459,314 $36,104,797
Seminole County (FL) $792,258 $1,763,857 $59,123 $47,299 $482,844 $96,568 $407,954 $59,123 $3,709,027
City of Virginia Beach (VA) $1,984,112 $15,690,534 $1,743,393 $919,111 $2,005,996 $496,028 $4,427,780 $539,794 $27,806,748
City of Atlanta (GA) $16,339,033 $72,748,875 $22,071,087 $5,892,766 $20,410,398 $3,374,948 $33,481,625 $3,642,800 $177,961,533
City of Mesa (AZ) $360,095 $996,105 $294,623 $27,124 $289,946 $6,547 $1,019,488 $18,707 $3,012,634
City of Kansas City (MO) $7,465,115 $29,470,634 $3,255,024 $5,632,946 $7,484,606 $760,155 $6,510,048 $194,911 $60,773,437
Morris County (NJ) $1,184,945 $3,720,727 $912,408 $213,290 $836,571 $125,604 $613,802 $120,864 $7,728,211
Group D Average $3,832,169 $12,180,886 $3,276,702 $1,976,058 $4,055,805 $332,311 $7,020,794 $338,301 $33,013,027
Percent of Group D Total 11.6% 36.9% 9.9% 6.0% 12.3% 1.0% 21.3% 1.0% 100.0%
Group D Median $2,090,232 $8,252,621 $1,724,059 $878,751 $2,096,381 $123,653 $3,066,418 $94,086 $20,610,848
NON-RESIDENT ARTS ATTENDEES ONLY
SOURCE: Arts and Economic Prosperity 5, Americans for the Arts, 2017. For more information, visit www.AmericansForTheArts.org/EconomicImpact. B–355

Table 24:Total Categorized Audience Expenditures by Non-Resident Attendees toNonprofit Arts and Cultural Events Per Study Region During 2015
Population Cohort Group E Non-Resident
Population 500,000 to 999,999 Refreshments Meals/Drinks Retail/Gifts Clothing and Local Overnight Other/ Audience
Sample Size = 25 and/or Snacks (before/after) and Souvenirs Accessories Transportation Child Care Lodging Miscellaneous Expenditures
Sonoma County (CA) $1,614,073 $3,838,177 $371,548 $444,129 $1,498,289 $72,582 $3,276,535 $188,365 $11,303,698
Volusia County (FL) $162,524 $2,115,936 $690,727 $65,635 $898,570 $129,707 $1,920,596 $129,705 $6,113,400
Guilford County (NC) $6,127,475 $16,266,224 $3,214,532 $2,631,091 $5,898,027 $782,991 $8,290,580 $523,828 $43,734,748
Dane County (WI) $5,526,598 $7,677,796 $3,148,958 $488,265 $3,545,231 $643,944 $2,957,898 $1 $23,988,691
Brevard County (FL) $88,438 $393,861 $601,620 $45,523 $159,831 $13,636 $136,768 $18,249 $1,457,926
Washington County (OR) $392,306 $1,624,920 $92,023 $112,606 $280,910 $75,071 $415,311 $3,633 $2,996,780
Johnson County (KS) $403,910 $1,895,374 $398,451 $34,114 $401,181 $50,488 $264,725 $0 $3,448,243
City of Louisville (KY) $8,088,288 $34,513,720 $4,302,674 $2,400,633 $9,417,869 $941,787 $14,846,994 $0 $74,511,964
City of Baltimore (MD) $38,863,223 $92,088,942 $29,429,035 $9,152,571 $22,740,618 $2,956,985 $21,050,913 $5,491,543 $221,773,829
Polk County (FL) $1,235,831 $5,019,528 $3,810,203 $659,331 $2,269,555 $188,854 $3,902,973 $29,818 $17,116,095
City of Boston (MA) $60,636,027 $188,604,831 $31,048,568 $24,595,336 $69,402,681 $7,062,027 $62,705,931 $852,313 $444,907,715
District of Columbia (DC) $96,553,717 $371,721,605 $34,906,312 $54,502,838 $121,865,897 $5,103,262 $156,159,817 $816,522 $841,629,969
Nashville-Davidson County (TN) $21,267,939 $38,761,276 $24,131,432 $7,887,621 $15,749,209 $780,952 $34,518,101 $2,603,175 $145,699,705
City of El Paso (TX) $1,335,682 $2,032,076 $1,660,877 $499,691 $469,551 $12,690 $580,593 $1 $6,591,160
Lee County (FL) $3,345,341 $12,539,667 $6,653,197 $3,652,904 $3,236,725 $247,000 $7,062,292 $94,695 $36,831,821
City of Fort Worth (TX) $14,408,359 $41,167,154 $6,852,652 $4,973,848 $10,773,206 $1,778,415 $29,944,623 $1,660,560 $111,558,817
City of Indianapolis (IN) $8,182,307 $51,955,138 $12,424,055 $5,496,703 $11,671,082 $1,154,559 $16,916,794 $276,089 $108,076,725
City and County of San Francisco (CA) $61,067,213 $188,744,802 $33,720,927 $22,819,367 $79,913,977 $5,081,236 $114,928,308 $4,896,463 $511,172,291
Prince George's County (MD) $3,271,989 $3,299,639 $2,411,748 $1,250,422 $1,437,832 $427,049 $1,738,917 $571,444 $14,409,040
Pinellas County (FL) $6,117,840 $22,520,107 $7,320,869 $3,286,322 $7,922,383 $220,066 $14,729,764 $132,041 $62,249,392
Shelby County (TN) $3,381,606 $7,902,387 $1,626,661 $1,688,237 $3,253,321 $389,988 $6,398,881 $97,497 $24,738,576
Fairfield County (CT) $2,993,685 $9,473,885 $6,574,572 $655,360 $1,635,779 $131,072 $1,761,608 -$2 $23,225,958
Westchester County (NY) $2,003,703 $10,525,575 $1,529,357 $801,481 $4,113,725 $466,168 $1,259,470 $73,605 $20,773,085
Fulton County (GA) $16,584,388 $73,310,274 $22,235,890 $6,004,964 $20,517,253 $3,429,609 $33,742,186 $3,669,102 $179,493,666
Wake County (NC) $22,821,675 $76,577,080 $22,627,833 $10,619,253 $28,474,977 $1,060,925 $49,991,383 $77,145 $212,250,271
Group E Average $15,458,965 $50,582,799 $10,471,389 $6,590,730 $17,101,907 $1,328,042 $23,580,078 $888,232 $126,002,143
Percent of Group E Total 12.3% 40.1% 8.3% 5.2% 13.6% 1.1% 18.7% 0.7% 100.0%
Group E Median $5,526,598 $12,539,667 $4,302,674 $2,400,633 $4,113,725 $466,168 $7,062,292 $129,705 $36,831,821
NON-RESIDENT ARTS ATTENDEES ONLY
SOURCE: Arts and Economic Prosperity 5, Americans for the Arts, 2017. For more information, visit www.AmericansForTheArts.org/EconomicImpact. B–356

Table 24:Total Categorized Audience Expenditures by Non-Resident Attendees toNonprofit Arts and Cultural Events Per Study Region During 2015
Population Cohort Group F Non-Resident
Population 1,000,000 or More Refreshments Meals/Drinks Retail/Gifts Clothing and Local Overnight Other/ Audience
Sample Size = 21 and/or Snacks (before/after) and Souvenirs Accessories Transportation Child Care Lodging Miscellaneous Expenditures
Mecklenburg County (NC) $4,793,178 $19,051,662 $2,180,013 $3,252,372 $4,768,532 $1,155,605 $13,977,564 $118,455 $49,297,381
City of San José (CA) $5,360,453 $11,819,724 $2,234,760 $2,041,724 $6,741,401 $920,632 $11,634,113 $89,093 $40,841,899
Montgomery County (MD) $4,257,018 $18,355,259 $2,328,839 $1,514,997 $4,532,472 $1,489,956 $3,480,738 $87,645 $36,046,923
Fairfax County (VA) $11,574,761 $19,341,053 $2,837,683 $709,421 $5,862,057 $1,082,800 $2,408,298 $56,007 $43,872,080
Allegheny County (PA) $11,798,876 $60,102,760 $12,585,468 $5,112,846 $21,774,289 $1,215,642 $54,096,059 $3,539,663 $170,225,603
Greater Columbus Area (OH) $10,502,756 $39,064,852 $3,935,722 $854,614 $8,501,160 $1,057,022 $17,609,545 $314,858 $81,840,528
Orange County (FL) $8,227,921 $22,415,228 $4,667,489 $2,982,607 $8,009,497 $274,989 $15,416,478 $3,281,077 $65,275,286
City of Dallas (TX) $21,831,535 $48,831,812 $8,339,388 $6,490,153 $15,829,961 $2,803,955 $30,240,782 $138,466 $134,506,052
Hillsborough County (FL) $24,028,854 $43,999,535 $15,492,783 $8,807,642 $21,966,730 $710,571 $39,645,905 $267,693 $154,919,713
City of San Diego (CA) $28,677,240 $83,660,683 $26,221,145 $7,497,647 $37,407,988 $563,925 $155,946,747 $384,094 $340,359,469
Palm Beach County (FL) $9,839,785 $16,314,667 $6,610,612 $2,303,240 $7,280,879 $760,064 $17,219,157 $1,717,133 $62,045,537
City of San Antonio (TX) $5,915,079 $29,287,634 $15,539,072 $5,899,093 $12,245,813 $783,348 $47,336,619 $911,241 $117,917,899
Sacramento County (CA) $2,759,873 $8,962,104 $2,059,428 $838,139 $2,771,847 $107,761 $2,047,455 $161,640 $19,708,249
City of Phoenix (AZ) $8,308,434 $20,863,694 $11,536,551 $8,109,984 $12,872,781 $105,840 $28,947,218 $277,829 $91,022,331
City and County of Philadelphia (PA) $64,021,515 $201,506,568 $40,531,607 $14,047,886 $84,172,172 $1,612,052 $187,458,681 $2,993,812 $596,344,293
Broward County (FL) $16,458,811 $48,637,465 $9,438,624 $8,430,941 $21,530,812 $1,309,987 $37,351,424 $1,410,758 $144,568,821
Santa Clara County (CA) $6,196,977 $14,459,139 $2,681,758 $2,450,408 $7,899,338 $1,069,631 $13,430,617 $123,148 $48,311,016
Riverside County (CA) $6,750,819 $6,853,032 $4,785,867 $671,830 $2,649,879 $345,173 $2,541,139 $79,617 $24,677,356
Miami-Dade County (FL) $28,320,201 $77,135,452 $10,588,651 $11,836,209 $28,934,111 $1,671,717 $50,141,263 $1,358,098 $209,985,702
City of Chicago (IL) $63,912,973 $312,729,896 $73,386,003 $35,853,619 $124,108,682 $5,755,765 $543,080,406 $7,074,795 $1,165,902,140
Harris County (TX) $9,629,206 $46,517,457 $10,836,462 $7,649,577 $20,997,691 $2,016,399 $40,201,695 $1,600,119 $139,448,606
Group F Average $16,817,441 $54,757,604 $12,800,854 $6,540,712 $21,945,623 $1,276,802 $62,581,519 $1,237,392 $177,957,947
Percent of Group F Total 9.5% 30.8% 7.2% 3.7% 12.3% 0.7% 35.2% 0.7% 100.0%
Group F Median $9,839,785 $29,287,634 $8,339,388 $5,112,846 $12,245,813 $1,069,631 $28,947,218 $314,858 $91,022,331
Average $4,626,725 $14,923,120 $3,622,511 $1,973,079 $5,243,161 $382,092 $11,035,568 $340,886 $42,147,142
Percent of Total 11.0% 35.4% 8.6% 4.7% 12.4% 0.9% 26.2% 0.8% 100.0%
Median $1,090,844 $3,187,836 $967,178 $325,724 $846,929 $66,760 $1,745,689 $44,004 $8,104,529
NON-RESIDENT ARTS ATTENDEES ONLY
ALL CITY/COUNTY STUDY REGIONS
SOURCE: Arts and Economic Prosperity 5, Americans for the Arts, 2017. For more information, visit www.AmericansForTheArts.org/EconomicImpact. B–357

Table 24:Total Categorized Audience Expenditures by Non-Resident Attendees toNonprofit Arts and Cultural Events Per Study Region During 2015
Regional Study Regions Non-Resident
All Populations Refreshments Meals/Drinks Retail/Gifts Clothing and Local Overnight Other/ Audience
Sample Size = 81 and/or Snacks (before/after) and Souvenirs Accessories Transportation Child Care Lodging Miscellaneous Expenditures
High Peaks Region (ME) $84,862 $236,170 $127,146 $15,175 $88,398 $3,094 $128,619 $0 $683,464
Wood River Valley (ID) $805,955 $2,951,501 $1,238,731 $724,351 $799,537 $37,593 $2,878,149 $21,090 $9,456,907
Southern Oregon Area $3,478,584 $18,821,884 $5,246,745 $1,392,878 $3,099,693 $28,868 $28,611,718 $447,452 $61,127,821
Southwestern Pennsylvania Area $923,561 $3,275,650 $468,425 $279,061 $1,421,885 $102,987 $1,431,851 $43,188 $7,946,607
Greater Portsmouth Area (NH) $1,919,490 $7,412,185 $1,109,507 $489,364 $1,624,184 $101,248 $2,577,601 $358,588 $15,592,167
Northeast Oregon Region $23,953 $75,473 $68,931 $4,616 $26,460 $1,108 $68,984 $0 $269,524
Toe River Valley (NC) $187,788 $607,093 $1,729,040 $35,279 $275,985 $13,965 $586,147 $5,144 $3,440,441
Albemarle Region (NC) $171,612 $610,879 $183,896 $74,080 $145,182 $11,168 $154,116 $24,197 $1,375,128
Greater Concord Area (NH) $1,011,009 $3,592,397 $770,687 $1,035,870 $687,817 $72,511 $2,842,427 $198,888 $10,211,606
North Central Minnesota Region $28,665 $133,857 $10,494 $13,181 $41,974 $3,327 $19,707 $47,605 $298,810
Northwest Minnesota Region $18,346 $30,594 $13,112 $0 $15,754 $8,284 $24,140 $2,490 $112,721
Monadnock Region (NH) $214,196 $824,511 $114,434 $65,139 $221,826 $25,234 $377,338 $14,084 $1,856,762
Bismarck-Mandan Region (ND) $280,864 $1,433,077 $714,143 $231,976 $538,722 $102,568 $366,178 $116,947 $3,784,474
Greater Minot Region (ND) $63,232 $553,664 $61,175 $30,331 $241,618 $26,733 $438,511 $37,012 $1,452,276
Greater Burlington Area (VT) $1,784,670 $5,188,135 $1,695,589 $1,044,384 $1,363,843 $52,219 $4,453,994 $684,995 $16,267,829
Greater Charlottesville Area (VA) $3,572,595 $12,861,342 $5,105,452 $818,338 $3,108,463 $122,141 $10,729,999 $91,605 $36,409,934
Brainerd Lakes Region (MN) $19,012 $78,104 $3,254 $3,768 $59,434 $0 $56,865 $0 $220,436
East Central Minnesota Region $220,370 $695,766 $1,545,258 $36,432 $592,690 $37,321 $768,630 $0 $3,896,467
Northwest Connecticut Region $718,918 $3,618,269 $546,722 $228,160 $1,089,140 $86,098 $764,119 $51,659 $7,103,085
Central Oregon Region $1,663,998 $4,023,184 $4,101,134 $1,037,215 $1,582,866 $36,589 $4,907,680 $186,126 $17,538,791
Greater Fargo-Moorhead Area (ND/MN) $802,568 $3,217,149 $855,308 $694,794 $1,481,310 $50,447 $2,345,790 $96,308 $9,543,674
Black Hills Region (SD) $2,039,972 $4,323,120 $1,724,745 $387,280 $2,449,768 $148,607 $5,498,469 $0 $16,571,960
Greater Kingsport Area (TN) $763,983 $3,746,740 $1,062,552 $910,341 $1,170,856 $79,033 $2,373,911 $93,667 $10,201,083
Lake Region (MN) $133,645 $153,481 $250,182 $3,471 $121,992 $6,943 $216,212 $0 $885,926
South Central Minnesota Region $190,903 $858,153 $162,722 $149,086 $828,154 $156,358 $467,257 $205,449 $3,018,082
Greater Sioux Falls Area (SD) $4,717,739 $25,207,409 $2,152,172 $2,809,568 $5,869,996 $465,602 $9,447,826 $2,498,839 $53,169,151
Southwest Tennessee Development District $131,250 $348,199 $83,118 $101,623 $169,110 $6,231 $84,727 $0 $924,258
Northwest Tennessee Development District $854,358 $1,551,558 $955,485 $723,066 $704,617 $183,115 $552,101 $22,052 $5,546,352
Southwest Minnesota Region $90,708 $262,926 $98,320 $47,891 $141,136 $0 $337,775 $6,026 $984,782
Arrowhead Region (MN) $151,485 $2,410,502 $1,028,203 $41,658 $1,352,002 $0 $3,491,725 $37,871 $8,513,447
NON-RESIDENT ARTS ATTENDEES ONLY
SOURCE: Arts and Economic Prosperity 5, Americans for the Arts, 2017. For more information, visit www.AmericansForTheArts.org/EconomicImpact. B–358

Table 24:Total Categorized Audience Expenditures by Non-Resident Attendees toNonprofit Arts and Cultural Events Per Study Region During 2015
Regional Study Regions Non-Resident
All Populations Refreshments Meals/Drinks Retail/Gifts Clothing and Local Overnight Other/ Audience
Sample Size = 81 and/or Snacks (before/after) and Souvenirs Accessories Transportation Child Care Lodging Miscellaneous Expenditures
Maple Grove and the Northwest Suburbs (MN) $36,407 $190,243 $36,013 $42,457 $72,055 $4,351 $130,529 $3,174 $515,228
Greater Augusta Area (GA) $2,104,293 $4,978,204 $1,614,536 $1,058,949 $1,171,605 $164,946 $685,840 $48,224 $11,826,598
Upper Cumberland Development District (TN) $214,440 $835,562 $368,688 $55,046 $351,971 $11,870 $600,373 $1,935 $2,439,885
City of Huntsville/Madison County (AL) $857,963 $3,949,024 $1,324,313 $693,546 $1,431,932 $41,852 $1,309,366 $206,269 $9,814,266
Northeast Commission (NC) $2,937,214 $7,294,590 $5,512,732 $1,127,550 $1,306,652 $141,070 $7,189,004 $121,161 $25,629,973
Greater Ann Arbor Area (MI) $1,918,400 $8,881,554 $3,457,306 $13,708 $3,259,013 $325,964 $6,939,383 $174,162 $24,969,491
Greater Fox Cities Region (WI) $990,766 $2,934,118 $826,593 $851,409 $1,027,037 $55,361 $1,485,195 $208,080 $8,378,557
Central Minnesota Region $122,120 $687,150 $396,433 $27,340 $247,884 $32,808 $641,583 $15,493 $2,170,812
South Central Tennessee Development District $369,255 $1,073,261 $815,867 $217,668 $478,150 $51,785 $533,578 $20,027 $3,559,591
Northwest Arkansas Region $3,747,270 $8,554,236 $3,120,470 $852,267 $3,995,284 $153,318 $11,431,202 $252,523 $32,106,572
Southeast Minnesota Region $324,652 $1,284,051 $430,929 $64,057 $550,308 $0 $579,424 $0 $3,233,422
First Tennessee Development District $2,396,901 $7,532,087 $2,846,266 $1,286,262 $2,935,722 $181,721 $7,355,512 $121,075 $24,655,546
Greater Harrisburg Area (PA) $350,995 $1,240,646 $191,136 $169,416 $579,489 $51,259 $374,453 $1 $2,957,395
Greater New Haven Area (CT) $758,569 $5,764,533 $1,520,090 $360,099 $1,649,962 $67,888 $569,665 $106,258 $10,797,063
Treasure Coast Region (FL) $1,553,074 $4,394,943 $2,302,221 $736,964 $1,463,147 $78,667 $1,786,813 $9,906 $12,325,734
Greater Des Moines Region (IA) $7,103,443 $18,069,549 $3,398,441 $2,916,704 $6,122,450 $183,936 $21,678,204 $525,533 $59,998,260
Southeast Tennessee Development District $6,706,333 $14,952,802 $5,301,023 $4,048,102 $5,185,646 $157,822 $10,008,132 $1,004,877 $47,364,737
Greater Knoxville Region (TN) $9,915,586 $20,173,998 $5,966,493 $2,050,364 $4,977,571 $316,455 $19,791,615 $92,300 $63,284,383
Greater Columbia Area (SC) $2,035,888 $4,310,388 $754,318 $490,692 $1,241,161 $11,546 $2,424,593 $38,486 $11,307,069
Pikes Peak Region (CO) $5,592,186 $8,788,659 $3,391,665 $1,017,437 $5,270,888 $155,889 $5,949,816 $496,097 $30,662,637
Lehigh Valley Region (PA) $6,615,921 $17,669,071 $6,479,039 $1,711,014 $6,581,700 $11,407 $15,205,211 $501,897 $54,775,262
Greater Sarasota/Bradenton Area (FL) $6,580,107 $32,143,817 $4,473,561 $4,628,757 $6,344,277 $330,557 $19,640,299 $749,949 $74,891,323
Dayton Region (OH) $3,917,054 $11,975,249 $1,882,337 $2,760,761 $3,621,258 $71,708 $2,814,542 $0 $27,042,910
Richmond & Tri-Cities Region (VA) $6,525,642 $23,056,202 $3,270,838 $2,821,899 $4,842,123 $913,910 $4,729,888 $144,302 $46,304,806
Memphis Area Association of Governments (TN) $3,385,922 $7,912,295 $1,628,685 $1,690,470 $3,257,409 $390,528 $6,407,670 $97,633 $24,770,612
Eastern Region (NC) $840,893 $3,923,472 $1,301,131 $732,348 $1,748,158 $123,309 $2,428,059 $38,491 $11,135,861
Advantage West Region (NC) $6,457,586 $21,666,290 $26,671,416 $3,553,143 $8,712,155 $671,328 $27,890,539 $439,808 $96,062,265
Southeast Commission (NC) $4,006,706 $13,665,913 $1,709,297 $1,167,001 $3,067,767 $54,717 $1,816,742 $14,476 $25,502,619
Greater Fairfax Area (VA) $12,919,436 $24,215,180 $6,199,813 $2,399,412 $6,552,008 $1,238,930 $3,663,615 $125,099 $57,313,493
Greater Tulsa Region (OK) $4,997,843 $12,927,281 $3,184,726 $1,442,251 $5,368,707 $111,848 $19,585,184 $23,548 $47,641,387
NON-RESIDENT ARTS ATTENDEES ONLY
SOURCE: Arts and Economic Prosperity 5, Americans for the Arts, 2017. For more information, visit www.AmericansForTheArts.org/EconomicImpact. B–359

Table 24:Total Categorized Audience Expenditures by Non-Resident Attendees toNonprofit Arts and Cultural Events Per Study Region During 2015
Regional Study Regions Non-Resident
All Populations Refreshments Meals/Drinks Retail/Gifts Clothing and Local Overnight Other/ Audience
Sample Size = 81 and/or Snacks (before/after) and Souvenirs Accessories Transportation Child Care Lodging Miscellaneous Expenditures
East Tennessee Development District $10,313,477 $19,767,731 $12,010,069 $3,526,488 $6,794,973 $218,160 $26,101,243 $282,310 $79,014,451
West Valley Region (AZ) $128,387 $688,779 $595,092 $104,097 $198,653 $7,808 $300,148 -$1 $2,022,963
Greater St. Louis Area (MO) $14,635,279 $33,014,094 $5,547,781 $3,080,098 $8,083,937 $607,230 $12,233,942 $3,186,346 $80,388,707
Western New York $5,233,277 $13,360,985 $5,260,160 $3,835,347 $5,806,786 $125,456 $13,495,402 $698,963 $47,816,376
Greater Oklahoma City Region (OK) $22,619,076 $37,141,691 $26,139,561 $10,059,996 $22,213,217 $1,001,933 $64,126,890 $1,323,057 $184,625,421
Piedmont Triad Partnership (NC) $10,646,216 $29,034,439 $6,978,720 $4,145,975 $9,689,378 $1,025,951 $13,651,706 $943,648 $76,116,033
Greater Portland Area (OR) $3,928,718 $12,697,756 $2,919,160 $1,102,871 $3,788,388 $382,371 $7,437,602 $165,117 $32,421,983
Greater Kansas City Metropolitan Area (MO/KS) $7,939,045 $31,770,472 $3,697,263 $5,718,675 $8,008,692 $828,624 $7,015,082 $200,834 $65,178,687
Greater Nashville Regional Council (TN) $22,377,571 $42,333,435 $25,752,833 $8,637,444 $17,453,001 $872,647 $37,911,781 $2,884,104 $158,222,816
Research Triangle Regional Partnership (NC) $28,333,998 $104,609,779 $26,186,988 $12,775,860 $34,823,210 $1,564,678 $56,158,797 $244,787 $264,698,097
Greater Tampa/St. Petersburg Area (FL) $30,146,694 $66,519,642 $22,813,652 $12,093,964 $29,889,113 $930,637 $54,375,669 $399,734 $217,169,105
Charlotte Regional Partnership (NC) $7,312,843 $26,238,630 $9,784,586 $4,148,733 $8,156,514 $1,283,234 $17,715,146 $226,196 $74,865,882
Charlotte Regional Partnership (NC/SC) $7,915,949 $27,723,199 $10,287,174 $4,484,528 $8,783,921 $1,315,267 $18,750,146 $232,826 $79,493,010
Seven-County Metro Area (MN) $6,319,413 $33,085,327 $6,227,826 $7,395,545 $12,547,239 $755,582 $22,781,938 $549,514 $89,662,381
Central Florida Region $11,033,542 $33,185,663 $10,982,469 $3,998,589 $12,143,096 $807,457 $23,224,689 $3,587,542 $98,963,047
Greater Philadelphia Region (PA) $71,876,886 $224,504,479 $45,815,871 $15,042,237 $93,263,378 $1,839,332 $213,254,979 $3,079,042 $668,676,204
Greater Washington Region (DC/MD/VA) $123,685,597 $445,474,686 $53,924,836 $65,972,026 $141,143,441 $8,930,693 $172,195,380 $1,685,210 $1,013,011,869
Metro Atlanta Area (GA) $19,933,038 $80,972,346 $24,485,152 $7,536,256 $21,975,627 $4,175,624 $37,298,374 $4,028,086 $200,404,503
Greater Atlanta Region (GA) $20,149,319 $81,467,221 $24,630,426 $7,635,159 $22,069,820 $4,223,807 $37,528,060 $4,051,271 $201,755,083
Greater Houston Region (TX) $9,760,493 $47,045,157 $10,960,590 $7,725,952 $21,208,144 $2,025,551 $40,908,005 $1,614,722 $141,248,614
Dallas-Fort Worth-Arlington MSA (TX) $36,918,312 $91,640,901 $15,796,466 $11,836,633 $27,194,001 $4,680,061 $61,560,266 $1,805,697 $251,432,337
Regional Average $7,463,683 $23,289,182 $5,980,244 $3,151,505 $7,900,771 $563,929 $15,193,504 $519,272 $64,062,090
Percent of Regional Total 11.7% 36.4% 9.3% 4.9% 12.3% 0.9% 23.7% 0.8% 100.0%
Regional Median $2,039,972 $7,294,590 $1,729,040 $1,017,437 $1,748,158 $111,848 $3,663,615 $121,075 $17,538,791
NON-RESIDENT ARTS ATTENDEES ONLY
SOURCE: Arts and Economic Prosperity 5, Americans for the Arts, 2017. For more information, visit www.AmericansForTheArts.org/EconomicImpact. B–360
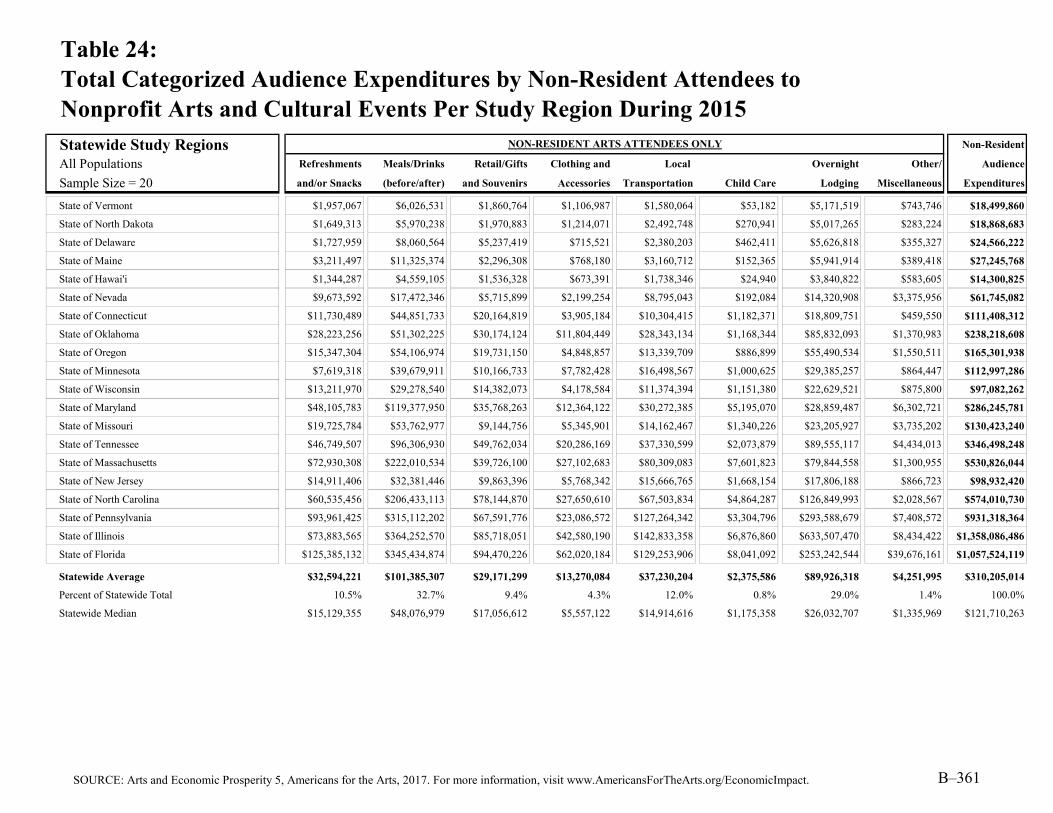
Table 24:Total Categorized Audience Expenditures by Non-Resident Attendees toNonprofit Arts and Cultural Events Per Study Region During 2015
Statewide Study Regions Non-Resident
All Populations Refreshments Meals/Drinks Retail/Gifts Clothing and Local Overnight Other/ Audience
Sample Size = 20 and/or Snacks (before/after) and Souvenirs Accessories Transportation Child Care Lodging Miscellaneous Expenditures
State of Vermont $1,957,067 $6,026,531 $1,860,764 $1,106,987 $1,580,064 $53,182 $5,171,519 $743,746 $18,499,860
State of North Dakota $1,649,313 $5,970,238 $1,970,883 $1,214,071 $2,492,748 $270,941 $5,017,265 $283,224 $18,868,683
State of Delaware $1,727,959 $8,060,564 $5,237,419 $715,521 $2,380,203 $462,411 $5,626,818 $355,327 $24,566,222
State of Maine $3,211,497 $11,325,374 $2,296,308 $768,180 $3,160,712 $152,365 $5,941,914 $389,418 $27,245,768
State of Hawai'i $1,344,287 $4,559,105 $1,536,328 $673,391 $1,738,346 $24,940 $3,840,822 $583,605 $14,300,825
State of Nevada $9,673,592 $17,472,346 $5,715,899 $2,199,254 $8,795,043 $192,084 $14,320,908 $3,375,956 $61,745,082
State of Connecticut $11,730,489 $44,851,733 $20,164,819 $3,905,184 $10,304,415 $1,182,371 $18,809,751 $459,550 $111,408,312
State of Oklahoma $28,223,256 $51,302,225 $30,174,124 $11,804,449 $28,343,134 $1,168,344 $85,832,093 $1,370,983 $238,218,608
State of Oregon $15,347,304 $54,106,974 $19,731,150 $4,848,857 $13,339,709 $886,899 $55,490,534 $1,550,511 $165,301,938
State of Minnesota $7,619,318 $39,679,911 $10,166,733 $7,782,428 $16,498,567 $1,000,625 $29,385,257 $864,447 $112,997,286
State of Wisconsin $13,211,970 $29,278,540 $14,382,073 $4,178,584 $11,374,394 $1,151,380 $22,629,521 $875,800 $97,082,262
State of Maryland $48,105,783 $119,377,950 $35,768,263 $12,364,122 $30,272,385 $5,195,070 $28,859,487 $6,302,721 $286,245,781
State of Missouri $19,725,784 $53,762,977 $9,144,756 $5,345,901 $14,162,467 $1,340,226 $23,205,927 $3,735,202 $130,423,240
State of Tennessee $46,749,507 $96,306,930 $49,762,034 $20,286,169 $37,330,599 $2,073,879 $89,555,117 $4,434,013 $346,498,248
State of Massachusetts $72,930,308 $222,010,534 $39,726,100 $27,102,683 $80,309,083 $7,601,823 $79,844,558 $1,300,955 $530,826,044
State of New Jersey $14,911,406 $32,381,446 $9,863,396 $5,768,342 $15,666,765 $1,668,154 $17,806,188 $866,723 $98,932,420
State of North Carolina $60,535,456 $206,433,113 $78,144,870 $27,650,610 $67,503,834 $4,864,287 $126,849,993 $2,028,567 $574,010,730
State of Pennsylvania $93,961,425 $315,112,202 $67,591,776 $23,086,572 $127,264,342 $3,304,796 $293,588,679 $7,408,572 $931,318,364
State of Illinois $73,883,565 $364,252,570 $85,718,051 $42,580,190 $142,833,358 $6,876,860 $633,507,470 $8,434,422 $1,358,086,486
State of Florida $125,385,132 $345,434,874 $94,470,226 $62,020,184 $129,253,906 $8,041,092 $253,242,544 $39,676,161 $1,057,524,119
Statewide Average $32,594,221 $101,385,307 $29,171,299 $13,270,084 $37,230,204 $2,375,586 $89,926,318 $4,251,995 $310,205,014
Percent of Statewide Total 10.5% 32.7% 9.4% 4.3% 12.0% 0.8% 29.0% 1.4% 100.0%
Statewide Median $15,129,355 $48,076,979 $17,056,612 $5,557,122 $14,914,616 $1,175,358 $26,032,707 $1,335,969 $121,710,263
NON-RESIDENT ARTS ATTENDEES ONLY
SOURCE: Arts and Economic Prosperity 5, Americans for the Arts, 2017. For more information, visit www.AmericansForTheArts.org/EconomicImpact. B–361

Table 24:Total Categorized Audience Expenditures by Non-Resident Attendees toNonprofit Arts and Cultural Events Per Study Region During 2015
Individual Arts Districts Non-Resident
All Populations Refreshments Meals/Drinks Retail/Gifts Clothing and Local Overnight Other/ Audience
Sample Size = 12 and/or Snacks (before/after) and Souvenirs Accessories Transportation Child Care Lodging Miscellaneous Expenditures
James River Arts & Cultural District $139,001 $530,372 $252,370 $53,727 $121,255 $9,365 $137,029 $2,956 $1,246,076
Center City Charlotte $4,227,734 $16,707,061 $1,888,531 $2,897,178 $4,206,274 $997,917 $12,575,900 $107,304 $43,607,899
Loch Haven Cultural Park $3,019,854 $4,733,041 $1,205,038 $440,395 $1,761,582 $77,432 $4,268,448 $1,563,162 $17,068,952
Downtown Colorado Springs Creative District $960,520 $1,304,434 $145,650 $55,180 $348,406 $14,758 $364,446 -$1 $3,193,393
Fort Worth Cultural District $8,882,790 $25,103,535 $4,295,103 $2,621,535 $5,863,343 $1,146,921 $18,514,589 $1,100,109 $67,527,926
Dallas Arts District $10,319,086 $21,079,294 $3,591,987 $3,087,849 $6,790,117 $1,102,804 $13,328,163 -$1 $59,299,298
Grand Center Arts & Entertainment District $1,925,199 $4,045,965 $330,179 $33,018 $987,998 $22,858 $817,828 $827,988 $8,991,034
Balboa Park Cultural District $15,434,402 $50,979,429 $13,713,093 $3,155,733 $22,979,473 $430,328 $102,073,612 $0 $208,766,069
East End Cultural District $148,900 $472,131 $86,935 $79,074 $172,021 $28,208 $175,720 $135,950 $1,298,938
Houston Museum District Association $4,535,773 $25,239,653 $7,347,618 $3,631,966 $12,452,455 $1,389,185 $28,235,606 -$1 $82,832,254
Midtown Cultural District $80,299 $659,578 $54,854 $8,922 $153,659 $331 $111,692 $1 $1,069,336
Washington Avenue Cultural District $57,533 $177,762 $63,139 $36,585 $75,972 $2,803 $65,794 $34,077 $513,665
Arts District Average $4,144,258 $12,586,021 $2,747,875 $1,341,764 $4,659,380 $435,242 $15,055,735 $314,295 $41,284,570
Percent of Arts District Total 10.0% 30.5% 6.7% 3.3% 11.3% 1.1% 36.5% 0.8% 100.0%
Arts District Median $2,472,527 $4,389,503 $767,609 $259,735 $1,374,790 $52,820 $2,543,138 $18,517 $13,029,993
NON-RESIDENT ARTS ATTENDEES ONLY
SOURCE: Arts and Economic Prosperity 5, Americans for the Arts, 2017. For more information, visit www.AmericansForTheArts.org/EconomicImpact. B–362

Explanation of Table 25:Average Per Person Audience Spending by Non-Resident Attendees toNonprofit Arts and Cultural Events Per Study Region During 2016
Column Two:
Column Three:
Column Four:
Column Five:
Column Six:
Column Seven:
Column Eight:
Column Nine:
Column Ten:
The average dollars spent per person by non-resident audience members on local ground transportation (e.g., gas, parking, taxi fares, tolls, car rentals) for the purpose of attending nonprofit arts and cultural events.
The average dollars spent per person by non-resident audience members on child care for the purpose of attending nonprofit arts and cultural events.
The average dollars spent per person by non-resident audience members on overnight lodging (e.g., hotel, motel, bed-and-breakfast) for the purpose of attending nonprofit arts and cultural events. (The audience-intercept survey instrument requested that respondents limit their response by providing the cost of one night only.)
The average dollars spent per person by non-resident audience members for the purpose of or as a result of attending nonprofit arts and cultural events. This figure is the sum of Column Two through Column Nine.
The average dollars spent per person by non-resident audience members to purchase souvenirs and/or gifts (e.g., books, recordings, art) as a result of attending nonprofit arts and cultural events.
The average dollars spent per person by non-resident audience members on miscellaneous products and services for the purpose of or as a result of attending nonprofit arts and cultural events.
This table presents the average dollars spent per person by non-resident audience members as a direct result of their attendance to nonprofit arts and cultural events in each participating study region during 2016. Non-residents are attendees who reside outside the county in which the nonprofit arts and cultural event at which they were surveyed took place (ourside the multi-city or multi-county region for regional analyses, and outside the state for statewide analyses). Residency is determined based on the ZIP code provided by each audience-intercept survey respondent. Summary statistics are calculated for each population group.
The average dollars spent per person by non-resident audience members to purchase refreshments (e.g., snacks) while attending nonprofit arts and cultural events.
The average dollars spent per person by non-resident audience members to purchase food, drinks, and/or meals (e.g., dinner at a restaurant, coffee at a cafe) before or after attending nonprofit arts and cultural events.
The average dollars spent per person by non-resident audience members to purchase clothing or accessories for the purpose of attending nonprofit arts and cultural events.
SOURCE: Arts and Economic Prosperity 5, Americans for the Arts, 2017. For more information, visit www.AmericansForTheArts.org/EconomicImpact. B–363
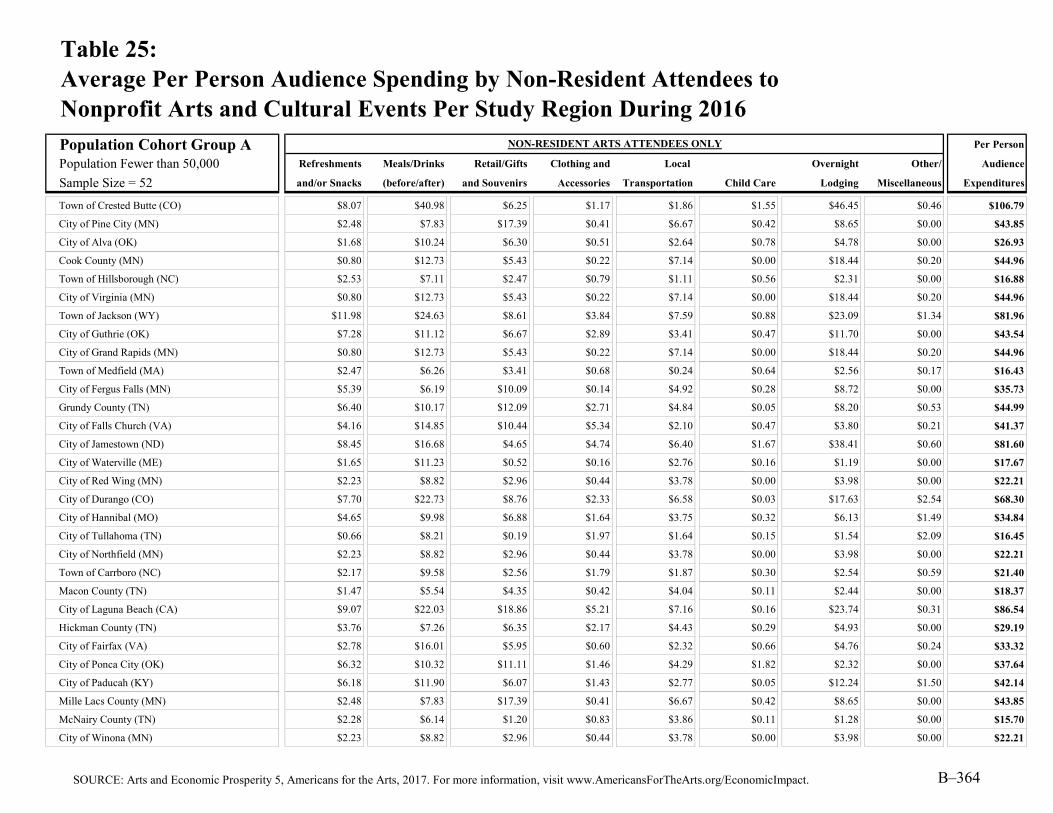
Table 25:Average Per Person Audience Spending by Non-Resident Attendees toNonprofit Arts and Cultural Events Per Study Region During 2016
Population Cohort Group A Per Person
Population Fewer than 50,000 Refreshments Meals/Drinks Retail/Gifts Clothing and Local Overnight Other/ Audience
Sample Size = 52 and/or Snacks (before/after) and Souvenirs Accessories Transportation Child Care Lodging Miscellaneous Expenditures
Town of Crested Butte (CO) $8.07 $40.98 $6.25 $1.17 $1.86 $1.55 $46.45 $0.46 $106.79
City of Pine City (MN) $2.48 $7.83 $17.39 $0.41 $6.67 $0.42 $8.65 $0.00 $43.85
City of Alva (OK) $1.68 $10.24 $6.30 $0.51 $2.64 $0.78 $4.78 $0.00 $26.93
Cook County (MN) $0.80 $12.73 $5.43 $0.22 $7.14 $0.00 $18.44 $0.20 $44.96
Town of Hillsborough (NC) $2.53 $7.11 $2.47 $0.79 $1.11 $0.56 $2.31 $0.00 $16.88
City of Virginia (MN) $0.80 $12.73 $5.43 $0.22 $7.14 $0.00 $18.44 $0.20 $44.96
Town of Jackson (WY) $11.98 $24.63 $8.61 $3.84 $7.59 $0.88 $23.09 $1.34 $81.96
City of Guthrie (OK) $7.28 $11.12 $6.67 $2.89 $3.41 $0.47 $11.70 $0.00 $43.54
City of Grand Rapids (MN) $0.80 $12.73 $5.43 $0.22 $7.14 $0.00 $18.44 $0.20 $44.96
Town of Medfield (MA) $2.47 $6.26 $3.41 $0.68 $0.24 $0.64 $2.56 $0.17 $16.43
City of Fergus Falls (MN) $5.39 $6.19 $10.09 $0.14 $4.92 $0.28 $8.72 $0.00 $35.73
Grundy County (TN) $6.40 $10.17 $12.09 $2.71 $4.84 $0.05 $8.20 $0.53 $44.99
City of Falls Church (VA) $4.16 $14.85 $10.44 $5.34 $2.10 $0.47 $3.80 $0.21 $41.37
City of Jamestown (ND) $8.45 $16.68 $4.65 $4.74 $6.40 $1.67 $38.41 $0.60 $81.60
City of Waterville (ME) $1.65 $11.23 $0.52 $0.16 $2.76 $0.16 $1.19 $0.00 $17.67
City of Red Wing (MN) $2.23 $8.82 $2.96 $0.44 $3.78 $0.00 $3.98 $0.00 $22.21
City of Durango (CO) $7.70 $22.73 $8.76 $2.33 $6.58 $0.03 $17.63 $2.54 $68.30
City of Hannibal (MO) $4.65 $9.98 $6.88 $1.64 $3.75 $0.32 $6.13 $1.49 $34.84
City of Tullahoma (TN) $0.66 $8.21 $0.19 $1.97 $1.64 $0.15 $1.54 $2.09 $16.45
City of Northfield (MN) $2.23 $8.82 $2.96 $0.44 $3.78 $0.00 $3.98 $0.00 $22.21
Town of Carrboro (NC) $2.17 $9.58 $2.56 $1.79 $1.87 $0.30 $2.54 $0.59 $21.40
Macon County (TN) $1.47 $5.54 $4.35 $0.42 $4.04 $0.11 $2.44 $0.00 $18.37
City of Laguna Beach (CA) $9.07 $22.03 $18.86 $5.21 $7.16 $0.16 $23.74 $0.31 $86.54
Hickman County (TN) $3.76 $7.26 $6.35 $2.17 $4.43 $0.29 $4.93 $0.00 $29.19
City of Fairfax (VA) $2.78 $16.01 $5.95 $0.60 $2.32 $0.66 $4.76 $0.24 $33.32
City of Ponca City (OK) $6.32 $10.32 $11.11 $1.46 $4.29 $1.82 $2.32 $0.00 $37.64
City of Paducah (KY) $6.18 $11.90 $6.07 $1.43 $2.77 $0.05 $12.24 $1.50 $42.14
Mille Lacs County (MN) $2.48 $7.83 $17.39 $0.41 $6.67 $0.42 $8.65 $0.00 $43.85
McNairy County (TN) $2.28 $6.14 $1.20 $0.83 $3.86 $0.11 $1.28 $0.00 $15.70
City of Winona (MN) $2.23 $8.82 $2.96 $0.44 $3.78 $0.00 $3.98 $0.00 $22.21
NON-RESIDENT ARTS ATTENDEES ONLY
SOURCE: Arts and Economic Prosperity 5, Americans for the Arts, 2017. For more information, visit www.AmericansForTheArts.org/EconomicImpact. B–364

Table 25:Average Per Person Audience Spending by Non-Resident Attendees toNonprofit Arts and Cultural Events Per Study Region During 2016
Population Cohort Group A Per Person
Population Fewer than 50,000 Refreshments Meals/Drinks Retail/Gifts Clothing and Local Overnight Other/ Audience
Sample Size = 52 and/or Snacks (before/after) and Souvenirs Accessories Transportation Child Care Lodging Miscellaneous Expenditures
Door County (WI) $5.80 $24.02 $16.83 $3.77 $8.40 $0.48 $30.22 $1.01 $90.53
City of Benicia (CA) $4.92 $16.28 $23.33 $2.85 $2.71 $0.60 $2.32 $0.13 $53.14
City of Winter Park (FL) $2.48 $16.06 $2.52 $2.13 $5.06 $0.10 $6.53 $0.01 $34.89
City of Rochester (NH) $5.23 $10.52 $2.62 $1.37 $2.20 $0.04 $1.80 $0.15 $23.93
City of Morgantown (WV) $2.53 $12.71 $10.08 $1.16 $3.32 $0.17 $6.88 $0.42 $37.27
Henry County (TN) $2.85 $8.40 $4.90 $2.98 $4.48 $0.48 $5.83 $0.32 $30.24
City of Fairbanks (AK) $5.10 $22.58 $15.20 $2.79 $14.69 $0.37 $31.93 $0.00 $92.66
City of Bangor (ME) $6.70 $15.74 $4.65 $1.56 $4.66 $0.16 $12.18 $1.32 $46.97
Weakley County (TN) $4.09 $5.92 $2.25 $0.47 $2.04 $0.02 $2.75 $0.35 $17.89
Dare County (NC) $9.71 $23.15 $20.10 $3.79 $3.55 $0.45 $25.81 $0.38 $86.94
City of Columbia (TN) $3.65 $11.94 $8.73 $2.05 $4.92 $0.68 $4.93 $0.02 $36.92
City of Lake Worth (FL) $1.91 $17.44 $6.95 $1.61 $5.22 $0.52 $12.68 $0.00 $46.33
Clatsop County (OR) $13.03 $28.39 $16.49 $3.69 $7.94 $1.32 $44.48 $0.31 $115.65
Yadkin County (NC) $2.49 $9.06 $2.36 $0.20 $3.46 $0.48 $8.01 $1.60 $27.66
Greater Belfast Area (ME) $5.73 $13.58 $5.00 $1.56 $5.38 $0.41 $11.76 $0.07 $43.49
Campbell County (TN) $5.64 $7.26 $12.40 $1.55 $4.64 $0.10 $4.14 $0.06 $35.79
Monroe County (TN) $5.67 $6.08 $8.51 $3.96 $4.06 $0.29 $4.25 $0.13 $32.95
Lincoln County (OR) $4.85 $31.17 $6.71 $2.79 $7.20 $0.07 $40.25 $0.91 $93.95
Iron County (UT) $8.11 $41.98 $9.18 $2.50 $11.04 $0.53 $62.70 $1.31 $137.35
City of St. Louis Park (MN) $2.76 $14.45 $2.72 $3.23 $5.48 $0.33 $9.95 $0.24 $39.16
City of Logan (UT) $4.42 $27.22 $5.28 $3.48 $8.88 $0.25 $37.32 $1.22 $88.07
Gibson County (TN) $9.56 $17.80 $11.91 $10.08 $8.51 $2.60 $5.49 $0.10 $66.05
Group A Average $4.58 $14.45 $7.74 $2.02 $4.89 $0.44 $13.22 $0.44 $47.79
Percent of Group A Total 9.6% 30.2% 16.2% 4.2% 10.2% 0.9% 27.7% 0.9% 100.0%
Group A Median $4.13 $11.92 $6.28 $1.59 $4.46 $0.31 $7.45 $0.20 $40.27
NON-RESIDENT ARTS ATTENDEES ONLY
SOURCE: Arts and Economic Prosperity 5, Americans for the Arts, 2017. For more information, visit www.AmericansForTheArts.org/EconomicImpact. B–365

Table 25:Average Per Person Audience Spending by Non-Resident Attendees toNonprofit Arts and Cultural Events Per Study Region During 2016
Population Cohort Group B Per Person
Population 50,000 to 99,999 Refreshments Meals/Drinks Retail/Gifts Clothing and Local Overnight Other/ Audience
Sample Size = 38 and/or Snacks (before/after) and Souvenirs Accessories Transportation Child Care Lodging Miscellaneous Expenditures
City of Joplin (MO) $2.10 $11.96 $1.92 $0.31 $4.58 $0.15 $3.71 $0.03 $24.76
City of La Crosse (WI) $4.95 $10.98 $2.03 $0.81 $3.25 $0.24 $5.00 $0.46 $27.72
McMinn County (TN) $4.02 $13.55 $4.91 $0.74 $4.44 $0.46 $4.83 $0.34 $33.29
Lafayette County (MS) $7.35 $19.36 $10.81 $4.05 $6.34 $0.91 $17.91 $0.77 $67.50
Chisago County (MN) $2.48 $7.83 $17.39 $0.41 $6.67 $0.42 $8.65 $0.00 $43.85
City of Grand Forks (ND) $5.58 $11.75 $7.40 $3.44 $3.53 $0.22 $4.41 $0.47 $36.80
City of Corvallis (OR) $4.60 $14.33 $4.18 $0.68 $3.63 $0.34 $8.76 $0.91 $37.43
City of Noblesville (IN) $4.39 $9.31 $0.93 $0.17 $1.41 $0.14 $1.71 $0.05 $18.11
City of Ocala (FL) $6.12 $19.47 $7.08 $5.23 $6.76 $0.16 $19.54 $0.12 $64.48
Lenoir County (NC) $3.59 $32.55 $10.97 $2.64 $13.23 $0.57 $15.28 $0.00 $78.83
Town of Chapel Hill (NC) $2.76 $9.47 $2.15 $1.12 $2.68 $0.37 $2.67 $0.05 $21.27
City of Grand Junction (CO) $5.97 $21.07 $4.55 $3.50 $8.88 $0.24 $26.87 $1.04 $72.12
Town of Jupiter (FL) $2.38 $13.72 $4.28 $1.23 $5.14 $0.08 $14.41 $1.91 $43.15
Hamblen County (TN) $3.28 $16.51 $3.72 $0.32 $3.64 $1.69 $2.87 $0.05 $32.08
City of Delray Beach (FL) $10.68 $6.78 $8.08 $1.14 $4.39 $0.23 $12.80 $0.77 $44.87
City of St. Cloud (MN) $1.34 $7.54 $4.35 $0.30 $2.72 $0.36 $7.04 $0.17 $23.82
City of Portland (ME) $4.84 $20.05 $2.47 $1.17 $4.88 $0.24 $6.98 $0.67 $41.30
City of Jackson (TN) $3.16 $8.32 $2.14 $2.63 $3.75 $0.14 $1.90 $0.00 $22.04
City of Walnut Creek (CA) $3.18 $23.14 $0.79 $1.50 $3.05 $0.24 $2.93 $0.20 $35.03
Greene County (TN) $7.75 $7.48 $6.29 $0.43 $3.94 $0.10 $1.92 $0.10 $28.01
City of Flagstaff (AZ) $6.23 $16.81 $15.14 $4.10 $17.59 $0.23 $26.21 $0.56 $86.87
City of Missoula (MT) $6.28 $17.65 $5.69 $2.32 $5.17 $0.08 $15.43 $0.83 $53.45
City of Fort Myers (FL) $4.83 $17.03 $6.96 $4.70 $3.67 $0.38 $7.04 $0.14 $44.75
Putnam County (TN) $1.20 $8.21 $0.91 $0.36 $1.98 $0.36 $1.14 $0.18 $14.34
Monroe County (FL) $5.32 $15.00 $4.44 $2.47 $5.40 $0.33 $12.03 $0.78 $45.77
City of Lynchburg (VA) $2.71 $10.96 $3.60 $1.20 $2.67 $0.14 $3.35 $0.05 $24.68
City of Duluth (MN) $0.80 $12.73 $5.43 $0.22 $7.14 $0.00 $18.44 $0.20 $44.96
City of Fishers (IN) $4.63 $5.51 $2.75 $0.89 $1.23 $0.11 $1.58 $0.10 $16.80
City of Carmel (IN) $6.04 $14.69 $2.00 $4.57 $2.82 $0.25 $11.83 $0.06 $42.26
City of Sugar Land (TX) $3.79 $8.89 $2.06 $1.41 $3.22 $0.34 $5.03 $0.00 $24.74
NON-RESIDENT ARTS ATTENDEES ONLY
SOURCE: Arts and Economic Prosperity 5, Americans for the Arts, 2017. For more information, visit www.AmericansForTheArts.org/EconomicImpact. B–366

Table 25:Average Per Person Audience Spending by Non-Resident Attendees toNonprofit Arts and Cultural Events Per Study Region During 2016
Population Cohort Group B Per Person
Population 50,000 to 99,999 Refreshments Meals/Drinks Retail/Gifts Clothing and Local Overnight Other/ Audience
Sample Size = 38 and/or Snacks (before/after) and Souvenirs Accessories Transportation Child Care Lodging Miscellaneous Expenditures
City of Asheville (NC) $3.65 $20.80 $15.10 $3.71 $7.20 $0.53 $26.39 $0.41 $77.79
Buchanan County (MO) $5.00 $9.53 $1.73 $0.67 $3.27 $0.12 $6.55 $1.65 $28.52
City of Boca Raton (FL) $3.22 $11.04 $5.67 $0.77 $5.29 $0.83 $14.27 $2.49 $43.58
City of Miami Beach (FL) $4.86 $24.37 $1.26 $3.48 $6.56 $0.03 $12.55 $0.40 $53.51
Moore County (NC) $7.00 $14.08 $2.36 $1.56 $2.53 $0.27 $2.88 $0.00 $30.68
Sevier County (TN) $11.46 $21.88 $13.83 $3.48 $7.61 $0.03 $33.22 $0.41 $91.92
Cape May County (NJ) $5.87 $28.08 $8.75 $2.27 $5.66 $1.20 $47.97 $1.24 $101.04
Cleveland County (NC) $5.83 $10.52 $10.16 $2.48 $4.01 $0.12 $7.39 $1.24 $41.75
Group B Average $4.72 $14.55 $5.64 $1.91 $5.00 $0.33 $11.14 $0.50 $43.79
Percent of Group B Total 10.8% 33.2% 12.9% 4.4% 11.4% 0.8% 25.5% 1.1% 100.0%
Group B Median $4.73 $13.64 $4.40 $1.32 $4.20 $0.24 $7.22 $0.27 $41.53
NON-RESIDENT ARTS ATTENDEES ONLY
SOURCE: Arts and Economic Prosperity 5, Americans for the Arts, 2017. For more information, visit www.AmericansForTheArts.org/EconomicImpact. B–367

Table 25:Average Per Person Audience Spending by Non-Resident Attendees toNonprofit Arts and Cultural Events Per Study Region During 2016
Population Cohort Group C Per Person
Population 100,000 to 249,999 Refreshments Meals/Drinks Retail/Gifts Clothing and Local Overnight Other/ Audience
Sample Size = 50 and/or Snacks (before/after) and Souvenirs Accessories Transportation Child Care Lodging Miscellaneous Expenditures
City of Las Cruces (NM) $7.83 $18.92 $14.19 $4.06 $6.49 $0.29 $21.29 $1.49 $74.56
Eau Claire County (WI) $2.97 $9.97 $3.55 $1.48 $2.21 $0.37 $2.72 $0.39 $23.66
Yamhill County (OR) $7.71 $14.34 $9.93 $1.37 $4.54 $0.46 $6.74 $0.15 $45.24
City of Lewisville (TX) $3.93 $12.40 $3.25 $1.76 $5.43 $0.10 $2.38 $0.00 $29.25
City of West Palm Beach (FL) $7.41 $10.78 $3.56 $1.77 $4.69 $0.54 $10.16 $0.96 $39.87
City of Boulder (CO) $4.20 $16.03 $4.92 $2.58 $3.78 $0.25 $10.40 $0.07 $42.23
City of Richardson (TX) $6.22 $10.83 $7.07 $4.20 $3.61 $1.15 $6.62 $0.00 $39.70
City of High Point (NC) $3.55 $9.23 $1.82 $1.39 $2.54 $0.11 $4.22 $0.10 $22.96
City of Cambridge (MA) $6.93 $19.07 $3.40 $0.77 $5.64 $0.34 $6.09 $0.29 $42.53
City of Lowell (MA) $3.41 $12.95 $7.95 $1.76 $3.61 $0.14 $6.41 $0.02 $36.25
Douglas County (KS) $4.84 $16.16 $2.98 $2.24 $4.21 $0.47 $4.85 $0.71 $36.46
City of Columbia (MO) $2.83 $12.85 $2.27 $1.45 $4.34 $0.10 $4.33 $0.23 $28.40
City of Norman (OK) $13.94 $12.24 $14.46 $4.05 $5.34 $0.47 $10.18 $0.45 $61.13
Wayne County (NC) $2.70 $9.49 $3.01 $2.93 $5.84 $0.63 $3.23 $0.19 $28.02
City of Lafayette (LA) $8.62 $14.22 $3.13 $2.92 $2.09 $1.98 $16.15 $0.78 $49.89
Washington County (TN) $9.47 $24.98 $10.97 $2.52 $11.55 $0.71 $35.37 $0.16 $95.73
City of Thousand Oaks (CA) $4.86 $18.47 $3.09 $1.47 $5.39 $0.91 $6.39 $0.17 $40.75
City of Charleston (SC) $7.69 $21.13 $5.17 $2.63 $4.04 $0.45 $21.49 $0.00 $62.60
City of Waco (TX) $5.27 $11.69 $4.68 $2.06 $4.82 $0.15 $14.43 $0.08 $43.18
Robeson County (NC) $3.34 $9.02 $4.26 $3.11 $4.03 $0.36 $7.30 $0.00 $31.42
Columbia County (GA) $10.00 $10.70 $4.62 $3.09 $3.29 $0.27 $4.08 $0.00 $36.05
Orange County (NC) $2.57 $9.24 $2.30 $1.27 $2.29 $0.37 $2.60 $0.19 $20.83
City of Savannah (GA) $8.66 $26.17 $10.67 $2.16 $8.41 $0.45 $37.65 $0.66 $94.83
Indian River County (FL) $6.48 $15.10 $10.28 $2.66 $3.97 $0.07 $6.80 $0.00 $45.36
City of Alexandria (VA) $3.20 $14.30 $4.69 $3.96 $3.86 $0.37 $3.99 $0.03 $34.40
Martin County (FL) $2.72 $10.81 $5.57 $2.27 $4.54 $0.34 $4.97 $0.05 $31.27
Macon-Bibb County (GA) $4.21 $17.33 $5.40 $2.25 $2.87 $0.53 $4.08 $0.05 $36.72
City of Springfield (MA) $6.98 $10.65 $4.56 $2.17 $3.86 $0.12 $8.45 $0.00 $36.79
Catawba County (NC) $4.51 $12.98 $16.85 $1.62 $6.82 $0.26 $5.88 $0.04 $48.96
Town of Cary (NC) $2.27 $9.49 $2.68 $0.68 $1.71 $1.79 $4.94 $0.00 $23.56
NON-RESIDENT ARTS ATTENDEES ONLY
SOURCE: Arts and Economic Prosperity 5, Americans for the Arts, 2017. For more information, visit www.AmericansForTheArts.org/EconomicImpact. B–368

Table 25:Average Per Person Audience Spending by Non-Resident Attendees toNonprofit Arts and Cultural Events Per Study Region During 2016
Population Cohort Group C Per Person
Population 100,000 to 249,999 Refreshments Meals/Drinks Retail/Gifts Clothing and Local Overnight Other/ Audience
Sample Size = 50 and/or Snacks (before/after) and Souvenirs Accessories Transportation Child Care Lodging Miscellaneous Expenditures
Alamance County (NC) $2.22 $9.07 $2.53 $0.76 $2.62 $0.17 $1.84 $0.91 $20.12
Cumberland County (NJ) $2.26 $5.21 $7.20 $0.36 $2.55 $0.08 $5.03 $0.00 $22.69
City of Eugene (OR) $2.83 $19.47 $4.03 $0.41 $4.07 $0.25 $9.93 $1.30 $42.29
Middlesex County (CT) $4.98 $17.85 $1.72 $2.33 $1.52 $1.72 $8.76 $0.86 $39.74
City of Springfield (MO) $3.51 $13.52 $4.06 $1.32 $3.26 $0.37 $2.22 $0.00 $28.26
City of Sioux Falls (SD) $3.95 $21.10 $1.80 $2.35 $4.91 $0.39 $7.90 $2.09 $44.49
Pitt County (NC) $4.29 $11.67 $2.02 $3.48 $4.26 $0.57 $9.09 $0.51 $35.89
City of Providence (RI) $4.80 $20.20 $2.85 $1.43 $2.61 $1.81 $1.29 $0.01 $35.00
City of Worcester (MA) $4.94 $12.20 $3.27 $0.63 $4.39 $0.37 $4.53 $0.05 $30.38
Montgomery County (TN) $3.60 $10.44 $3.97 $2.21 $6.56 $1.34 $9.50 $0.35 $37.97
Salt Lake City (UT) $5.74 $13.63 $3.62 $2.46 $4.86 $0.55 $8.27 $1.58 $40.71
Cabarrus County (NC) $2.39 $10.95 $1.96 $0.45 $2.12 $0.04 $2.81 $0.02 $20.74
Richmond County (GA) $5.22 $12.37 $4.01 $2.63 $2.91 $0.41 $1.70 $0.12 $29.37
City of Tacoma (WA) $3.24 $13.95 $4.33 $2.12 $4.20 $0.32 $2.60 $0.11 $30.87
Doña Ana County (NM) $6.57 $17.14 $11.74 $4.33 $5.52 $0.29 $16.67 $1.11 $63.37
New Hanover County (NC) $3.29 $15.33 $0.63 $0.42 $2.86 $0.01 $1.32 $0.00 $23.86
Arlington County (VA) $4.32 $14.81 $2.44 $0.89 $2.25 $0.27 $2.71 $0.09 $27.78
City of Irving (TX) $2.31 $11.05 $0.44 $1.32 $3.29 $0.06 $5.19 $0.17 $23.83
City of Reno (NV) $7.80 $19.19 $2.53 $1.29 $6.58 $0.24 $14.91 $2.86 $55.40
York County (SC) $5.46 $13.44 $4.55 $3.04 $5.68 $0.29 $9.37 $0.06 $41.89
Group C Average $5.06 $14.08 $5.02 $2.06 $4.26 $0.48 $8.20 $0.39 $39.55
Percent of Group C Total 12.8% 35.6% 12.7% 5.2% 10.8% 1.2% 20.7% 1.0% 100.0%
Group C Median $4.42 $13.21 $3.99 $2.14 $4.06 $0.37 $6.24 $0.12 $36.59
NON-RESIDENT ARTS ATTENDEES ONLY
SOURCE: Arts and Economic Prosperity 5, Americans for the Arts, 2017. For more information, visit www.AmericansForTheArts.org/EconomicImpact. B–369

Table 25:Average Per Person Audience Spending by Non-Resident Attendees toNonprofit Arts and Cultural Events Per Study Region During 2016
Population Cohort Group D Per Person
Population 250,000 to 499,999 Refreshments Meals/Drinks Retail/Gifts Clothing and Local Overnight Other/ Audience
Sample Size = 42 and/or Snacks (before/after) and Souvenirs Accessories Transportation Child Care Lodging Miscellaneous Expenditures
Buncombe County (NC) $6.32 $22.98 $18.01 $4.82 $7.67 $0.75 $24.08 $0.50 $85.13
Alachua County (FL) $7.22 $12.80 $6.92 $7.05 $5.65 $0.31 $7.72 $0.57 $48.24
Greater Green Bay Area (WI) $8.67 $10.36 $10.43 $2.16 $4.14 $0.06 $8.19 $0.00 $44.01
City of Orlando (FL) $5.34 $11.23 $2.83 $1.85 $4.58 $0.21 $10.78 $2.75 $39.57
City of Lincoln (NE) $2.57 $18.64 $3.86 $1.74 $5.45 $0.11 $9.21 $1.38 $42.96
Southeastern Connecticut Region (CT) $4.61 $14.27 $7.53 $1.52 $3.17 $0.45 $9.88 $0.00 $41.43
Erie County (PA) $2.72 $14.13 $3.31 $0.97 $7.19 $0.09 $12.31 $0.02 $40.74
San Luis Obispo County (CA) $3.39 $17.60 $3.78 $2.28 $7.69 $0.14 $32.28 $0.32 $67.48
City of Newark (NJ) $7.48 $10.22 $2.78 $3.44 $8.29 $0.72 $1.55 $0.07 $34.55
Leon County (FL) $7.72 $16.07 $9.30 $7.34 $7.80 $2.09 $17.96 $0.00 $68.28
Rutherford County (TN) $2.19 $9.41 $4.00 $2.04 $4.17 $0.19 $7.07 $0.72 $29.79
St. Lucie County (FL) $8.65 $18.04 $5.84 $1.07 $4.19 $0.10 $4.04 $0.00 $41.93
Greater Spartanburg Area (SC) $2.65 $12.62 $0.67 $1.86 $1.99 $0.35 $4.95 $0.00 $25.09
Durham County (NC) $1.74 $13.84 $0.75 $0.63 $2.83 $0.06 $2.35 $0.04 $22.24
City of St. Paul (MN) $2.76 $14.45 $2.72 $3.23 $5.48 $0.33 $9.95 $0.24 $39.16
Hamilton County (IN) $5.19 $10.14 $2.09 $2.33 $1.94 $0.18 $5.99 $0.08 $27.94
Osceola County (FL) $3.01 $13.83 $2.76 $0.63 $2.71 $3.13 $14.06 $1.88 $42.01
Escambia County (FL) $2.60 $14.25 $3.15 $1.78 $3.13 $0.51 $7.02 $0.00 $32.44
Lexington-Fayette Urban County (KY) $4.02 $12.12 $3.35 $1.32 $3.25 $0.57 $2.32 $0.45 $27.40
Lake County (FL) $5.17 $12.64 $12.65 $2.12 $2.87 $0.14 $12.12 $0.17 $47.88
City of Riverside (CA) $6.91 $18.59 $7.05 $0.30 $5.54 $0.87 $0.51 $0.26 $40.03
Cumberland County (NC) $4.08 $7.80 $2.82 $2.00 $2.58 $0.10 $1.78 $0.03 $21.19
Collier County (FL) $4.28 $16.29 $5.93 $2.73 $3.17 $0.12 $6.91 $0.62 $40.05
Hamilton County (TN) $8.67 $18.99 $6.44 $5.46 $6.56 $0.17 $13.06 $1.34 $60.69
Manatee County (FL) $5.05 $14.27 $5.77 $1.22 $4.96 $0.20 $10.28 $0.10 $41.85
City of Tampa (FL) $10.82 $19.79 $6.97 $3.96 $9.90 $0.32 $17.90 $0.12 $69.78
Forsyth County (NC) $3.78 $10.66 $2.80 $1.16 $2.57 $0.10 $3.12 $0.17 $24.36
Mercer County (NJ) $4.60 $11.44 $1.95 $1.14 $3.97 $0.54 $3.88 $0.79 $28.31
City of Wichita (KS) $2.42 $15.40 $3.17 $2.17 $5.38 $0.31 $6.09 $1.35 $36.29
Clackamas County (OR) $7.19 $10.90 $9.05 $2.26 $4.36 $0.43 $3.83 $0.23 $38.25
NON-RESIDENT ARTS ATTENDEES ONLY
SOURCE: Arts and Economic Prosperity 5, Americans for the Arts, 2017. For more information, visit www.AmericansForTheArts.org/EconomicImpact. B–370

Table 25:Average Per Person Audience Spending by Non-Resident Attendees toNonprofit Arts and Cultural Events Per Study Region During 2016
Population Cohort Group D Per Person
Population 250,000 to 499,999 Refreshments Meals/Drinks Retail/Gifts Clothing and Local Overnight Other/ Audience
Sample Size = 42 and/or Snacks (before/after) and Souvenirs Accessories Transportation Child Care Lodging Miscellaneous Expenditures
Sarasota County (FL) $3.63 $21.15 $1.70 $3.32 $3.47 $0.20 $12.41 $0.57 $46.45
City of Minneapolis (MN) $2.76 $14.45 $2.72 $3.23 $5.48 $0.33 $9.95 $0.24 $39.16
Berks County (PA) $6.72 $16.35 $5.36 $2.90 $5.27 $0.11 $23.09 $1.57 $61.37
City of Miami (FL) $8.46 $16.52 $3.27 $2.86 $7.86 $0.57 $12.97 $0.13 $52.64
City of Raleigh (NC) $5.87 $19.65 $5.81 $2.74 $7.35 $0.23 $12.86 $0.02 $54.53
Santa Barbara County (CA) $4.45 $19.63 $1.18 $6.66 $5.63 $1.26 $12.41 $0.66 $51.88
Seminole County (FL) $4.02 $8.95 $0.30 $0.24 $2.45 $0.49 $2.07 $0.30 $18.82
City of Virginia Beach (VA) $2.72 $21.51 $2.39 $1.26 $2.75 $0.68 $6.07 $0.74 $38.12
City of Atlanta (GA) $3.05 $13.58 $4.12 $1.10 $3.81 $0.63 $6.25 $0.68 $33.22
City of Mesa (AZ) $3.85 $10.65 $3.15 $0.29 $3.10 $0.07 $10.90 $0.20 $32.21
City of Kansas City (MO) $3.83 $15.12 $1.67 $2.89 $3.84 $0.39 $3.34 $0.10 $31.18
Morris County (NJ) $5.00 $15.70 $3.85 $0.90 $3.53 $0.53 $2.59 $0.51 $32.61
Group D Average $4.91 $14.69 $4.62 $2.40 $4.71 $0.46 $9.19 $0.47 $41.46
Percent of Group D Total 11.8% 35.4% 11.2% 5.8% 11.4% 1.1% 22.2% 1.1% 100.0%
Group D Median $4.37 $14.27 $3.33 $2.08 $4.18 $0.32 $7.96 $0.24 $39.80
NON-RESIDENT ARTS ATTENDEES ONLY
SOURCE: Arts and Economic Prosperity 5, Americans for the Arts, 2017. For more information, visit www.AmericansForTheArts.org/EconomicImpact. B–371

Table 25:Average Per Person Audience Spending by Non-Resident Attendees toNonprofit Arts and Cultural Events Per Study Region During 2016
Population Cohort Group E Per Person
Population 500,000 to 999,999 Refreshments Meals/Drinks Retail/Gifts Clothing and Local Overnight Other/ Audience
Sample Size = 25 and/or Snacks (before/after) and Souvenirs Accessories Transportation Child Care Lodging Miscellaneous Expenditures
Sonoma County (CA) $9.34 $22.21 $2.15 $2.57 $8.67 $0.42 $18.96 $1.09 $65.41
Volusia County (FL) $1.04 $13.54 $4.42 $0.42 $5.75 $0.83 $12.29 $0.83 $39.12
Guilford County (NC) $4.78 $12.70 $2.51 $2.06 $4.65 $0.63 $6.50 $0.42 $34.25
Dane County (WI) $7.81 $10.85 $4.45 $0.69 $5.01 $0.91 $4.18 $0.00 $33.90
Brevard County (FL) $4.41 $19.64 $30.00 $2.27 $7.97 $0.68 $6.82 $0.91 $72.70
Washington County (OR) $3.24 $13.42 $0.76 $0.93 $2.32 $0.62 $3.43 $0.03 $24.75
Johnson County (KS) $2.96 $13.89 $2.92 $0.25 $2.94 $0.37 $1.94 $0.00 $25.27
City of Louisville (KY) $4.38 $18.69 $2.33 $1.30 $5.10 $0.51 $8.04 $0.00 $40.35
City of Baltimore (MD) $5.52 $13.08 $4.18 $1.30 $3.23 $0.42 $2.99 $0.78 $31.50
Polk County (FL) $3.73 $15.15 $11.50 $1.99 $6.85 $0.57 $11.78 $0.09 $51.66
City of Boston (MA) $4.98 $15.49 $2.55 $2.02 $5.70 $0.58 $5.15 $0.07 $36.54
District of Columbia (DC) $4.73 $18.21 $1.71 $2.67 $5.97 $0.25 $7.65 $0.04 $41.23
Nashville-Davidson County (TN) $8.17 $14.89 $9.27 $3.03 $6.05 $0.30 $13.26 $1.00 $55.97
City of El Paso (TX) $8.42 $12.81 $10.47 $3.15 $2.96 $0.08 $3.66 $0.00 $41.55
Lee County (FL) $3.94 $15.27 $9.07 $4.57 $4.28 $0.28 $9.79 $0.11 $47.31
City of Fort Worth (TX) $7.00 $20.35 $3.24 $2.98 $6.22 $0.80 $14.48 $0.71 $55.78
City of Indianapolis (IN) $3.26 $20.70 $4.95 $2.19 $4.65 $0.46 $6.74 $0.11 $43.06
City and County of San Francisco (CA) $6.61 $20.43 $3.65 $2.47 $8.65 $0.55 $12.44 $0.53 $55.33
Prince George's County (MD) $10.65 $10.74 $7.85 $4.07 $4.68 $1.39 $5.66 $1.86 $46.90
Pinellas County (FL) $4.17 $15.35 $4.99 $2.24 $5.40 $0.15 $10.04 $0.09 $42.43
Shelby County (TN) $6.59 $15.40 $3.17 $3.29 $6.34 $0.76 $12.47 $0.19 $48.21
Fairfield County (CT) $5.71 $18.07 $12.54 $1.25 $3.12 $0.25 $3.36 $0.00 $44.30
Westchester County (NY) $2.45 $12.87 $1.87 $0.98 $5.03 $0.57 $1.54 $0.09 $25.40
Fulton County (GA) $5.97 $13.66 $4.01 $2.73 $2.60 $1.33 $6.34 $0.64 $37.28
Wake County (NC) $5.13 $17.55 $5.10 $2.41 $6.44 $0.67 $11.13 $0.02 $48.45
Group E Average $5.40 $15.80 $5.99 $2.15 $5.22 $0.58 $8.03 $0.38 $43.55
Percent of Group E Total 12.4% 36.3% 13.7% 4.9% 12.0% 1.3% 18.4% 0.9% 100.0%
Group E Median $4.98 $15.27 $4.18 $2.24 $5.10 $0.57 $6.82 $0.11 $42.43
NON-RESIDENT ARTS ATTENDEES ONLY
SOURCE: Arts and Economic Prosperity 5, Americans for the Arts, 2017. For more information, visit www.AmericansForTheArts.org/EconomicImpact. B–372

Table 25:Average Per Person Audience Spending by Non-Resident Attendees toNonprofit Arts and Cultural Events Per Study Region During 2016
Population Cohort Group F Per Person
Population 1,000,000 or More Refreshments Meals/Drinks Retail/Gifts Clothing and Local Overnight Other/ Audience
Sample Size = 21 and/or Snacks (before/after) and Souvenirs Accessories Transportation Child Care Lodging Miscellaneous Expenditures
Mecklenburg County (NC) $3.55 $14.72 $1.83 $2.23 $3.53 $0.99 $8.80 $0.07 $35.72
City of San José (CA) $7.22 $15.92 $3.01 $2.75 $9.08 $1.24 $15.67 $0.12 $55.01
Montgomery County (MD) $3.40 $14.66 $1.86 $1.21 $3.62 $1.19 $2.78 $0.07 $28.79
Fairfax County (VA) $6.20 $10.36 $1.52 $0.38 $3.14 $0.58 $1.29 $0.03 $23.50
Allegheny County (PA) $3.30 $16.81 $3.52 $1.43 $6.09 $0.34 $15.13 $0.99 $47.61
Greater Columbus Area (OH) $4.67 $17.37 $1.75 $0.38 $3.78 $0.47 $7.83 $0.14 $36.39
Orange County (FL) $5.02 $12.60 $2.69 $1.76 $4.69 $0.16 $9.08 $1.58 $37.58
City of Dallas (TX) $5.82 $14.03 $2.40 $1.72 $4.57 $0.86 $8.55 $0.07 $38.02
Hillsborough County (FL) $10.49 $19.34 $6.80 $3.88 $9.54 $0.31 $17.03 $0.12 $67.51
City of San Diego (CA) $7.93 $19.57 $7.49 $2.60 $8.64 $0.08 $32.26 $0.23 $78.80
Palm Beach County (FL) $5.32 $11.07 $4.90 $1.31 $5.52 $0.42 $13.99 $1.31 $43.84
City of San Antonio (TX) $3.70 $18.32 $9.72 $3.69 $7.66 $0.49 $29.61 $0.57 $73.76
Sacramento County (CA) $4.61 $14.97 $3.44 $1.40 $4.63 $0.18 $3.42 $0.27 $32.92
City of Phoenix (AZ) $6.28 $15.77 $8.72 $6.13 $9.73 $0.08 $21.88 $0.21 $68.80
City and County of Philadelphia (PA) $5.56 $17.50 $3.52 $1.22 $7.31 $0.14 $16.28 $0.26 $51.79
Broward County (FL) $4.90 $14.48 $2.81 $2.51 $6.41 $0.39 $11.12 $0.42 $43.04
Santa Clara County (CA) $3.93 $12.40 $2.10 $1.92 $5.44 $0.70 $8.44 $0.16 $35.09
Riverside County (CA) $30.88 $16.81 $19.19 $3.56 $8.57 $0.93 $14.25 $0.14 $94.33
Miami-Dade County (FL) $6.16 $19.16 $2.38 $2.73 $6.50 $0.38 $11.48 $0.49 $49.28
City of Chicago (IL) $5.33 $26.08 $6.12 $2.99 $10.35 $0.48 $45.29 $0.59 $97.23
Harris County (TX) $3.63 $15.08 $2.48 $2.94 $6.15 $0.45 $8.77 $1.08 $40.58
Group F Average $6.57 $16.05 $4.68 $2.32 $6.43 $0.52 $14.43 $0.42 $51.41
Percent of Group F Total 12.8% 31.2% 9.1% 4.5% 12.5% 1.0% 28.1% 0.8% 100.0%
Group F Median $5.32 $15.77 $3.01 $2.23 $6.15 $0.45 $11.48 $0.23 $43.84
Average $5.04 $14.73 $5.74 $2.12 $4.91 $0.46 $10.57 $0.44 $44.02
Percent of Total 11.5% 33.5% 13.1% 4.8% 11.2% 1.0% 24.0% 1.0% 100.0%
Median $4.64 $14.06 $4.27 $2.01 $4.54 $0.34 $7.69 $0.19 $40.04
NON-RESIDENT ARTS ATTENDEES ONLY
ALL CITY/COUNTY STUDY REGIONS
SOURCE: Arts and Economic Prosperity 5, Americans for the Arts, 2017. For more information, visit www.AmericansForTheArts.org/EconomicImpact. B–373

Table 25:Average Per Person Audience Spending by Non-Resident Attendees toNonprofit Arts and Cultural Events Per Study Region During 2016
Regional Study Regions Per Person
All Populations Refreshments Meals/Drinks Retail/Gifts Clothing and Local Overnight Other/ Audience
Sample Size = 81 and/or Snacks (before/after) and Souvenirs Accessories Transportation Child Care Lodging Miscellaneous Expenditures
High Peaks Region (ME) $5.76 $16.03 $8.63 $1.03 $6.00 $0.21 $8.73 $0.00 $46.39
Wood River Valley (ID) $8.79 $32.19 $13.51 $7.90 $8.72 $0.41 $31.39 $0.23 $103.14
Southern Oregon Area $9.64 $52.16 $14.54 $3.86 $8.59 $0.08 $79.29 $1.24 $169.40
Southwestern Pennsylvania Area $2.78 $9.86 $1.41 $0.84 $4.28 $0.31 $4.31 $0.13 $23.92
Greater Portsmouth Area (NH) $4.55 $17.57 $2.63 $1.16 $3.85 $0.24 $6.11 $0.85 $36.96
Northeast Oregon Region $9.08 $28.61 $26.13 $1.75 $10.03 $0.42 $26.15 $0.00 $102.17
Toe River Valley (NC) $5.11 $16.52 $47.05 $0.96 $7.51 $0.38 $15.95 $0.14 $93.62
Albemarle Region (NC) $4.61 $16.41 $4.94 $1.99 $3.90 $0.30 $4.14 $0.65 $36.94
Greater Concord Area (NH) $4.88 $17.34 $3.72 $5.00 $3.32 $0.35 $13.72 $0.96 $49.29
North Central Minnesota Region $2.24 $10.46 $0.82 $1.03 $3.28 $0.26 $1.54 $3.72 $23.35
Northwest Minnesota Region $3.61 $6.02 $2.58 $0.00 $3.10 $1.63 $4.75 $0.49 $22.18
Monadnock Region (NH) $3.65 $14.05 $1.95 $1.11 $3.78 $0.43 $6.43 $0.24 $31.64
Bismarck-Mandan Region (ND) $2.93 $14.95 $7.45 $2.42 $5.62 $1.07 $3.82 $1.22 $39.48
Greater Minot Region (ND) $1.23 $10.77 $1.19 $0.59 $4.70 $0.52 $8.53 $0.72 $28.25
Greater Burlington Area (VT) $5.81 $16.89 $5.52 $3.40 $4.44 $0.17 $14.50 $2.23 $52.96
Greater Charlottesville Area (VA) $5.85 $21.06 $8.36 $1.34 $5.09 $0.20 $17.57 $0.15 $59.62
Brainerd Lakes Region (MN) $1.11 $4.56 $0.19 $0.22 $3.47 $0.00 $3.32 $0.00 $12.87
East Central Minnesota Region $2.48 $7.83 $17.39 $0.41 $6.67 $0.42 $8.65 $0.00 $43.85
Northwest Connecticut Region $3.34 $16.81 $2.54 $1.06 $5.06 $0.40 $3.55 $0.24 $33.00
Central Oregon Region $10.46 $25.29 $25.78 $6.52 $9.95 $0.23 $30.85 $1.17 $110.25
Greater Fargo-Moorhead Area (ND/MN) $3.50 $14.03 $3.73 $3.03 $6.46 $0.22 $10.23 $0.42 $41.62
Black Hills Region (SD) $4.53 $9.60 $3.83 $0.86 $5.44 $0.33 $12.21 $0.00 $36.80
Greater Kingsport Area (TN) $2.61 $12.80 $3.63 $3.11 $4.00 $0.27 $8.11 $0.32 $34.85
Lake Region (MN) $5.39 $6.19 $10.09 $0.14 $4.92 $0.28 $8.72 $0.00 $35.73
South Central Minnesota Region $2.10 $9.44 $1.79 $1.64 $9.11 $1.72 $5.14 $2.26 $33.20
Greater Sioux Falls Area (SD) $3.59 $20.58 $2.15 $2.76 $5.72 $0.31 $9.92 $2.48 $47.51
Southwest Tennessee Development District $3.07 $8.31 $1.61 $2.33 $4.50 $0.18 $2.60 $0.00 $22.60
Northwest Tennessee Development District $5.22 $9.49 $4.78 $1.79 $3.50 $0.60 $4.54 $0.13 $30.05
Southwest Minnesota Region $2.86 $8.29 $3.10 $1.51 $4.45 $0.00 $10.65 $0.19 $31.05
Arrowhead Region (MN) $0.80 $12.73 $5.43 $0.22 $7.14 $0.00 $18.44 $0.20 $44.96
NON-RESIDENT ARTS ATTENDEES ONLY
SOURCE: Arts and Economic Prosperity 5, Americans for the Arts, 2017. For more information, visit www.AmericansForTheArts.org/EconomicImpact. B–374

Table 25:Average Per Person Audience Spending by Non-Resident Attendees toNonprofit Arts and Cultural Events Per Study Region During 2016
Regional Study Regions Per Person
All Populations Refreshments Meals/Drinks Retail/Gifts Clothing and Local Overnight Other/ Audience
Sample Size = 81 and/or Snacks (before/after) and Souvenirs Accessories Transportation Child Care Lodging Miscellaneous Expenditures
Maple Grove and the Northwest Suburbs (MN) $2.76 $14.45 $2.72 $3.23 $5.48 $0.33 $9.95 $0.24 $39.16
Greater Augusta Area (GA) $7.90 $12.42 $5.09 $3.09 $3.88 $0.29 $4.65 $0.07 $37.39
Upper Cumberland Development District (TN) $2.80 $10.38 $4.95 $0.71 $4.56 $0.11 $8.21 $0.00 $31.72
City of Huntsville/Madison County (AL) $2.87 $13.21 $4.43 $2.32 $4.79 $0.14 $4.38 $0.69 $32.83
Northeast Commission (NC) $9.71 $25.23 $10.96 $3.19 $7.02 $0.49 $18.51 $0.12 $75.23
Greater Ann Arbor Area (MI) $4.02 $15.33 $6.11 $0.88 $5.68 $0.29 $11.49 $0.27 $44.07
Greater Fox Cities Region (WI) $5.19 $15.37 $4.33 $4.46 $5.38 $0.29 $7.78 $1.09 $43.89
Central Minnesota Region $1.34 $7.54 $4.35 $0.30 $2.72 $0.36 $7.04 $0.17 $23.82
South Central Tennessee Development District $3.65 $8.90 $7.84 $2.13 $4.46 $0.31 $5.96 $0.30 $33.55
Northwest Arkansas Region $8.31 $18.97 $6.92 $1.89 $8.86 $0.34 $25.35 $0.56 $71.20
Southeast Minnesota Region $2.23 $8.82 $2.96 $0.44 $3.78 $0.00 $3.98 $0.00 $22.21
First Tennessee Development District $6.63 $18.48 $7.95 $3.13 $7.68 $0.47 $21.77 $0.30 $66.41
Greater Harrisburg Area (PA) $4.04 $14.28 $2.20 $1.95 $6.67 $0.59 $4.31 $0.00 $34.04
Greater New Haven Area (CT) $2.57 $19.53 $5.15 $1.22 $5.59 $0.23 $1.93 $0.36 $36.58
Treasure Coast Region (FL) $3.89 $12.73 $8.21 $1.67 $4.83 $0.19 $6.20 $0.04 $37.76
Greater Des Moines Region (IA) $8.11 $20.63 $3.88 $3.33 $6.99 $0.21 $24.75 $0.60 $68.50
Southeast Tennessee Development District $7.02 $15.50 $9.08 $2.61 $6.24 $0.22 $11.49 $0.81 $52.97
Greater Knoxville Region (TN) $15.04 $30.60 $9.05 $3.11 $7.55 $0.48 $30.02 $0.14 $95.99
Greater Columbia Area (SC) $10.58 $22.40 $3.92 $2.55 $6.45 $0.06 $12.60 $0.20 $58.76
Pikes Peak Region (CO) $10.83 $17.50 $7.59 $2.25 $11.51 $0.33 $13.06 $1.16 $64.23
Lehigh Valley Region (PA) $5.80 $15.49 $5.68 $1.50 $5.77 $0.01 $13.33 $0.44 $48.02
Greater Sarasota/Bradenton Area (FL) $3.93 $22.71 $2.26 $2.98 $4.57 $0.18 $18.03 $0.63 $55.29
Dayton Region (OH) $4.37 $13.36 $2.10 $3.08 $4.04 $0.08 $3.14 $0.00 $30.17
Richmond & Tri-Cities Region (VA) $4.07 $14.38 $2.04 $1.76 $3.02 $0.57 $2.95 $0.09 $28.88
Memphis Area Association of Governments (TN) $6.63 $15.22 $3.11 $3.43 $6.28 $0.83 $13.50 $0.21 $49.21
Eastern Region (NC) $4.26 $19.35 $7.52 $3.87 $9.17 $0.56 $13.83 $0.05 $58.61
Advantage West Region (NC) $7.20 $19.40 $28.62 $3.07 $8.46 $0.67 $25.71 $0.41 $93.54
Southeast Commission (NC) $4.10 $8.54 $2.85 $1.31 $2.60 $0.10 $3.81 $0.06 $23.37
Greater Fairfax Area (VA) $5.05 $14.23 $3.94 $2.62 $4.29 $0.36 $6.67 $0.29 $37.45
Greater Tulsa Region (OK) $8.49 $21.96 $5.41 $2.45 $9.12 $0.19 $33.27 $0.04 $80.93
NON-RESIDENT ARTS ATTENDEES ONLY
SOURCE: Arts and Economic Prosperity 5, Americans for the Arts, 2017. For more information, visit www.AmericansForTheArts.org/EconomicImpact. B–375

Table 25:Average Per Person Audience Spending by Non-Resident Attendees toNonprofit Arts and Cultural Events Per Study Region During 2016
Regional Study Regions Per Person
All Populations Refreshments Meals/Drinks Retail/Gifts Clothing and Local Overnight Other/ Audience
Sample Size = 81 and/or Snacks (before/after) and Souvenirs Accessories Transportation Child Care Lodging Miscellaneous Expenditures
East Tennessee Development District $12.79 $25.52 $13.74 $4.27 $8.17 $0.35 $31.44 $0.26 $96.54
West Valley Region (AZ) $1.48 $7.94 $6.86 $1.20 $2.29 $0.09 $3.46 $0.00 $23.32
Greater St. Louis Area (MO) $6.09 $13.88 $2.50 $1.46 $3.40 $0.28 $5.47 $1.13 $34.21
Western New York $5.84 $14.91 $5.87 $4.28 $6.48 $0.14 $15.06 $0.78 $53.36
Greater Oklahoma City Region (OK) $9.97 $18.66 $11.91 $4.90 $11.65 $0.47 $34.71 $0.67 $92.94
Piedmont Triad Partnership (NC) $5.16 $13.52 $5.36 $2.14 $6.32 $0.65 $11.63 $0.88 $45.66
Greater Portland Area (OR) $4.44 $15.94 $2.97 $1.20 $4.89 $0.42 $10.65 $0.22 $40.73
Greater Kansas City Metropolitan Area (MO/KS) $3.31 $19.12 $2.07 $2.44 $5.81 $0.85 $11.36 $0.28 $45.24
Greater Nashville Regional Council (TN) $6.58 $13.79 $7.32 $2.68 $7.24 $0.27 $19.27 $1.26 $58.41
Research Triangle Regional Partnership (NC) $4.75 $18.41 $4.66 $2.05 $6.21 $0.28 $12.75 $0.17 $49.28
Greater Tampa/St. Petersburg Area (FL) $9.91 $19.74 $7.75 $3.40 $9.96 $0.34 $21.32 $0.10 $72.52
Charlotte Regional Partnership (NC) $4.87 $12.82 $11.20 $1.83 $6.65 $0.29 $11.46 $0.35 $49.47
Charlotte Regional Partnership (NC/SC) $5.09 $13.48 $10.01 $2.06 $7.07 $0.26 $12.99 $0.30 $51.26
Seven-County Metro Area (MN) $2.76 $14.45 $2.72 $3.23 $5.48 $0.33 $9.95 $0.24 $39.16
Central Florida Region $4.09 $13.88 $6.75 $1.98 $6.33 $0.23 $17.97 $2.39 $53.62
Greater Philadelphia Region (PA) $5.53 $16.19 $3.72 $0.70 $6.40 $0.16 $18.16 $0.06 $50.92
Greater Washington Region (DC/MD/VA) $5.02 $16.45 $3.66 $3.43 $5.40 $0.57 $11.12 $0.33 $45.98
Metro Atlanta Area (GA) $5.97 $13.66 $4.01 $2.73 $2.60 $1.33 $6.34 $0.64 $37.28
Greater Atlanta Region (GA) $5.97 $13.66 $4.01 $2.73 $2.60 $1.33 $6.34 $0.64 $37.28
Greater Houston Region (TX) $4.91 $21.60 $5.09 $3.09 $8.71 $0.32 $30.93 $0.67 $75.32
Dallas-Fort Worth-Arlington MSA (TX) $6.88 $19.31 $4.78 $2.40 $7.90 $0.82 $24.78 $0.06 $66.93
Regional Average $5.26 $15.93 $6.72 $2.28 $5.87 $0.38 $13.32 $0.51 $50.28
Percent of Regional Total 10.5% 31.7% 13.4% 4.5% 11.7% 0.8% 26.5% 1.0% 100.0%
Regional Median $4.87 $14.95 $4.78 $2.14 $5.62 $0.31 $10.65 $0.27 $44.07
NON-RESIDENT ARTS ATTENDEES ONLY
SOURCE: Arts and Economic Prosperity 5, Americans for the Arts, 2017. For more information, visit www.AmericansForTheArts.org/EconomicImpact. B–376

Table 25:Average Per Person Audience Spending by Non-Resident Attendees toNonprofit Arts and Cultural Events Per Study Region During 2016
Statewide Study Regions Per Person
All Populations Refreshments Meals/Drinks Retail/Gifts Clothing and Local Overnight Other/ Audience
Sample Size = 20 and/or Snacks (before/after) and Souvenirs Accessories Transportation Child Care Lodging Miscellaneous Expenditures
State of Vermont $3.58 $17.41 $3.43 $1.30 $4.49 $0.02 $14.90 $1.22 $46.35
State of North Dakota $5.32 $13.04 $5.00 $3.10 $4.68 $0.46 $15.57 $0.34 $47.51
State of Delaware $3.55 $16.56 $10.76 $1.47 $4.89 $0.95 $11.56 $0.73 $50.47
State of Maine $5.91 $19.68 $8.41 $1.45 $7.21 $0.23 $23.01 $0.60 $66.50
State of Hawai'i $5.39 $18.28 $6.16 $2.70 $6.97 $0.10 $15.40 $2.34 $57.34
State of Nevada $12.70 $21.01 $8.29 $3.07 $11.74 $0.22 $17.53 $4.38 $78.94
State of Connecticut $3.81 $19.84 $8.39 $1.63 $5.97 $0.28 $9.48 $0.38 $49.78
State of Oklahoma $9.03 $18.37 $11.90 $4.87 $12.04 $0.51 $35.69 $0.42 $92.83
State of Oregon $8.34 $33.31 $13.91 $3.22 $8.58 $0.43 $42.58 $0.99 $111.36
State of Minnesota $3.23 $10.19 $5.08 $1.22 $4.26 $0.53 $10.68 $1.01 $36.20
State of Wisconsin $5.98 $20.39 $13.03 $3.69 $8.58 $0.58 $25.41 $0.72 $78.38
State of Maryland $5.07 $16.67 $4.73 $1.32 $4.62 $0.95 $7.66 $0.45 $41.47
State of Missouri $4.26 $15.86 $2.63 $1.55 $4.36 $0.58 $9.68 $0.26 $39.18
State of Tennessee $8.99 $19.36 $9.61 $3.53 $7.80 $0.31 $24.10 $0.25 $73.95
State of Massachusetts $5.14 $15.80 $5.37 $1.85 $5.60 $0.13 $13.01 $0.27 $47.17
State of New Jersey $5.27 $16.72 $5.13 $2.26 $6.37 $0.78 $14.49 $0.30 $51.32
State of North Carolina $5.70 $16.22 $12.73 $2.26 $7.02 $0.52 $16.78 $0.63 $61.86
State of Pennsylvania $4.92 $16.29 $3.84 $1.40 $7.04 $0.20 $18.65 $0.45 $52.79
State of Illinois $4.18 $21.60 $5.17 $2.82 $7.85 $0.47 $37.91 $0.57 $80.57
State of Florida $4.83 $16.71 $5.31 $2.45 $6.67 $0.26 $19.37 $1.20 $56.80
Statewide Average $5.76 $18.17 $7.44 $2.36 $6.84 $0.43 $19.17 $0.88 $61.04
Percent of Statewide Total 9.4% 29.8% 12.2% 3.9% 11.2% 0.7% 31.4% 1.4% 100.0%
Statewide Median $5.21 $17.07 $5.77 $2.26 $6.82 $0.45 $16.18 $0.59 $54.80
NON-RESIDENT ARTS ATTENDEES ONLY
SOURCE: Arts and Economic Prosperity 5, Americans for the Arts, 2017. For more information, visit www.AmericansForTheArts.org/EconomicImpact. B–377

Table 25:Average Per Person Audience Spending by Non-Resident Attendees toNonprofit Arts and Cultural Events Per Study Region During 2016
Individual Arts Districts Per Person
All Populations Refreshments Meals/Drinks Retail/Gifts Clothing and Local Overnight Other/ Audience
Sample Size = 12 and/or Snacks (before/after) and Souvenirs Accessories Transportation Child Care Lodging Miscellaneous Expenditures
James River Arts & Cultural District $2.82 $10.76 $5.12 $1.09 $2.46 $0.19 $2.78 $0.06 $25.28
Center City Charlotte $3.94 $15.57 $1.76 $2.70 $3.92 $0.93 $11.72 $0.10 $40.64
Loch Haven Cultural Park $6.24 $9.78 $2.49 $0.91 $3.64 $0.16 $8.82 $3.23 $35.27
Downtown Colorado Springs Creative District $14.97 $20.33 $2.27 $0.86 $5.43 $0.23 $5.68 $0.00 $49.77
Fort Worth Cultural District $7.59 $21.45 $3.67 $2.24 $5.01 $0.98 $15.82 $0.94 $57.70
Dallas Arts District $6.55 $13.38 $2.28 $1.96 $4.31 $0.70 $8.46 $0.00 $37.64
Grand Center Arts & Entertainment District $7.58 $15.93 $1.30 $0.13 $3.89 $0.09 $3.22 $3.26 $35.40
Balboa Park Cultural District $5.38 $17.77 $4.78 $1.10 $8.01 $0.15 $35.58 $0.00 $72.77
East End Cultural District $3.22 $10.21 $1.88 $1.71 $3.72 $0.61 $3.80 $2.94 $28.09
Houston Museum District Association $2.71 $15.08 $4.39 $2.17 $7.44 $0.83 $16.87 $0.00 $49.49
Midtown Cultural District $2.43 $19.96 $1.66 $0.27 $4.65 $0.01 $3.38 $0.00 $32.36
Washington Avenue Cultural District $3.90 $12.05 $4.28 $2.48 $5.15 $0.19 $4.46 $2.31 $34.82
Arts District Average $5.61 $15.19 $2.99 $1.47 $4.80 $0.42 $10.05 $1.07 $41.60
Percent of Arts District Total 13.5% 36.5% 7.2% 3.5% 11.5% 1.0% 24.2% 2.6% 100.0%
Arts District Median $4.66 $15.33 $2.39 $1.41 $4.48 $0.21 $7.07 $0.08 $36.52
Average $5.36 $15.90 $5.63 $2.30 $5.28 $0.41 $12.16 $0.53 $47.57
Average $5.54 $17.95 $7.41 $2.41 $5.97 $0.31 $15.39 $0.48 $55.45
Average $4.33 $17.58 $6.76 $1.71 $6.78 $0.48 $14.83 $0.74 $53.21
Average for the 55,081 NON-RESIDENT Surveys Where Residency Was Determined Based on a Single County
Average for the 17,933 NON-RESIDENT Surveys Where Residency Was Determined Based on a Multi-City or Multi-County Region
Average for the 17,496 NON-RESIDENT Surveys Where Residency Was Determined Based on an Entire State
NON-RESIDENT ARTS ATTENDEES ONLY
SOURCE: Arts and Economic Prosperity 5, Americans for the Arts, 2017. For more information, visit www.AmericansForTheArts.org/EconomicImpact. B–378

Explanation of Table 26:Travel Party Characteristics of Attendees to Cultural EventsPer Study Region During 2016
Columns Two through Four:
Column Five:
Columns Six through Eight:
Column Nine:
Column Ten:
Column Eleven:
Column Twelve:
This table presents the travel party characteristics of the respondents to the audience-intercept survey in each participating study region during 2016. Residents are attendees who reside within the county in which the nonprofit arts and cultural event at which they were surveyed took place (within the multi-city or multi-county region for regional analyses, and within the state for statewide analyses). Non-residents are attendees who reside outside the county in which the nonprofit arts and cultural event at which they were surveyed took place (outside the multi-city or multi-county region for regional analyses, and outside the state for statewide analyses). Residency is determined based on the ZIP code provided by each audience-intercept survey respondent. Summary statistics are calculated for each population group.
The percentage of non-resident audience-intercept survey respondents who reported that attending the nonprofit arts or cultural event where they completed the audience-intercept survey was the primary reason for their trip. Other reasons requested on the survey include a vacation or holiday, to visit friends and/or relatives, or other (the "other" category included work/business, for a combination of business and pleasure, for personal business, and other miscellaneous responses).
The average number of adults (18 years of age or older), the average number of children (younger than 18 years of age), and the average number of people in total (adults plus children) in each travel party for which an audience-intercept survey was completed by a resident.
The average number of adults (18 years of age or older), the average number of children (younger than 18 years of age), and the average number of people in total (adults plus children) in each travel party for which an audience-intercept survey was completed by a non-resident.
The average number nights that non-resident audience-intercept survey respondents reported that they would spend away from their primary residence as a direct result of attending the nonprofit arts or cultural event where they completed the survey. These are not always nights spent in paid lodging; they can includes nights spent at the homes of family and/or friends.
The average per person expenditure made by only those non-resident audience members who reported spending any dollars on overnight paid lodging expenses within the study region for the purpose of or as a direct result of attending the nonprofit arts or cultural event where they completed the survey.
The percentage of non-resident audience-intercept survey respondents who reported spending any dollars on overnight paid lodging located within the study region for the purpose of or as a direct result of attending the nonprofit arts or cultural event where they completed the survey.
The average number nights that resident audience-intercept survey respondents reported that they would spend away from their primary residence as a direct result of attending the nonprofit arts or cultural event where they completed the survey.
SOURCE: Arts and Economic Prosperity 5, Americans for the Arts, 2017. For more information, visit www.AmericansForTheArts.org/EconomicImpact. B–379

Table 26:Travel Party Characteristics of Attendees to Cultural EventsPer Study Region During 2016
Population Cohort Group APopulation Fewer than 50,000 Nights Nights Arts Event is Primary
Sample Size = 52 Adults Children Total Away Adults Children Total Away Percent Per Person $ Reason for Trip
Town of Crested Butte (CO) 1.9 0.4 2.3 0.0 2.2 0.1 2.3 1.5 61.8% $146.38 26.9%
City of Pine City (MN) 2.4 0.1 2.5 0.1 2.6 0.3 2.9 0.3 7.9% $205.10 61.1%
City of Alva (OK) 1.9 0.2 2.1 0.0 1.8 0.3 2.1 0.2 8.7% $84.75 60.9%
Cook County (MN) 2.0 0.2 2.2 0.2 2.7 0.9 3.6 1.3 35.1% $88.37 22.2%
Town of Hillsborough (NC) 2.5 0.8 3.3 0.0 2.5 0.7 3.2 0.3 1.9% $187.00 79.6%
City of Virginia (MN) 2.0 0.2 2.2 0.2 2.7 0.9 3.6 1.3 35.1% $88.37 22.2%
Town of Jackson (WY) 2.0 0.2 2.2 0.1 2.0 0.2 2.2 1.2 23.5% $192.79 33.5%
City of Guthrie (OK) 2.2 0.8 3.0 0.1 2.6 0.8 3.4 0.6 19.7% $125.03 85.3%
City of Grand Rapids (MN) 2.0 0.2 2.2 0.2 2.7 0.9 3.6 1.3 35.1% $88.37 22.2%
Town of Medfield (MA) 1.8 0.7 2.5 0.1 2.1 0.4 2.5 0.5 2.6% $138.33 79.5%
City of Fergus Falls (MN) 2.0 0.2 2.2 0.1 1.8 0.2 2.0 0.2 8.3% $202.33 78.3%
Grundy County (TN) 2.2 0.9 3.1 0.2 2.2 0.4 2.6 0.5 11.4% $158.24 86.3%
City of Falls Church (VA) 2.1 0.7 2.8 0.1 2.0 0.6 2.6 0.3 5.9% $162.92 51.7%
City of Jamestown (ND) 2.3 0.1 2.4 0.0 2.4 0.0 2.4 1.3 57.9% $123.96 92.1%
City of Waterville (ME) 2.0 0.2 2.2 0.0 2.2 0.3 2.5 0.0 1.6% $95.00 96.8%
City of Red Wing (MN) 2.7 0.1 2.8 0.1 3.0 0.1 3.1 0.3 6.1% $92.50 84.0%
City of Durango (CO) 2.1 0.1 2.2 0.1 2.4 0.1 2.5 0.9 21.4% $204.87 48.3%
City of Hannibal (MO) 2.1 0.2 2.3 0.1 2.7 0.4 3.1 0.4 12.9% $114.03 87.1%
City of Tullahoma (TN) 2.3 0.5 2.8 0.1 2.4 0.2 2.6 0.3 1.2% $170.00 79.0%
City of Northfield (MN) 2.7 0.1 2.8 0.1 3.0 0.1 3.1 0.3 6.1% $92.50 84.0%
Town of Carrboro (NC) 2.0 0.4 2.4 0.1 2.2 0.1 2.3 0.1 3.0% $199.75 97.8%
Macon County (TN) 1.6 0.4 2.0 0.1 1.7 0.4 2.1 0.2 4.3% $89.04 82.6%
City of Laguna Beach (CA) 2.4 0.2 2.6 0.2 2.6 0.1 2.7 1.0 22.0% $210.62 42.1%
Hickman County (TN) 1.9 0.2 2.1 0.0 2.1 0.3 2.4 0.7 3.7% $182.10 86.2%
City of Fairfax (VA) 2.2 0.5 2.7 0.0 3.9 0.1 4.0 0.1 4.8% $101.26 71.4%
City of Ponca City (OK) 2.2 0.2 2.4 0.0 2.1 0.0 2.1 0.6 7.3% $92.92 70.7%
City of Paducah (KY) 2.2 0.2 2.4 0.1 2.2 0.1 2.3 0.8 23.7% $117.22 49.6%
Mille Lacs County (MN) 2.4 0.1 2.5 0.1 2.6 0.3 2.9 0.3 7.9% $205.10 61.1%
McNairy County (TN) 2.1 0.6 2.7 0.1 2.2 0.3 2.5 0.2 1.9% $148.17 88.1%
City of Winona (MN) 2.7 0.1 2.8 0.1 3.0 0.1 3.1 0.3 6.1% $92.50 84.0%
Average Travel Party Size With Paid Lodging Expenses
NON-RESIDENT ATTENDEES ONLYRESIDENT ATTENDEES ONLY
Average Travel Party Size
SOURCE: Arts and Economic Prosperity 5, Americans for the Arts, 2017. For more information, visit www.AmericansForTheArts.org/EconomicImpact. B–380

Table 26:Travel Party Characteristics of Attendees to Cultural EventsPer Study Region During 2016
Population Cohort Group APopulation Fewer than 50,000 Nights Nights Arts Event is Primary
Sample Size = 52 Adults Children Total Away Adults Children Total Away Percent Per Person $ Reason for Trip
Door County (WI) 2.2 0.1 2.3 0.2 2.6 0.2 2.8 2.5 42.8% $132.17 50.6%
City of Benicia (CA) 2.2 0.2 2.4 0.1 2.4 0.1 2.5 0.2 2.4% $169.03 51.2%
City of Winter Park (FL) 2.1 0.2 2.3 0.1 2.2 0.1 2.3 0.5 8.0% $144.76 80.7%
City of Rochester (NH) 2.1 0.5 2.6 0.2 2.3 0.4 2.7 0.1 2.7% $110.97 58.4%
City of Morgantown (WV) 2.1 0.4 2.5 0.1 2.3 0.3 2.6 0.5 8.9% $146.67 53.6%
Henry County (TN) 2.0 0.7 2.7 0.1 2.5 0.5 3.0 0.8 14.3% $69.92 61.9%
City of Fairbanks (AK) 2.0 0.3 2.3 0.1 2.3 0.3 2.6 1.9 39.0% $169.49 26.8%
City of Bangor (ME) 2.0 0.3 2.3 0.1 2.4 0.2 2.6 0.6 15.5% $160.69 86.5%
Weakley County (TN) 2.2 0.5 2.7 0.0 2.2 0.2 2.4 0.2 3.0% $152.62 93.6%
Dare County (NC) 2.1 0.1 2.2 0.2 2.7 0.3 3.0 2.3 31.8% $160.94 43.5%
City of Columbia (TN) 1.8 1.0 2.8 0.0 2.0 0.4 2.4 0.3 5.8% $142.08 69.2%
City of Lake Worth (FL) 2.9 0.2 3.1 0.0 2.9 0.1 3.0 0.8 15.4% $134.29 73.1%
Clatsop County (OR) 2.2 0.1 2.3 0.1 2.4 0.1 2.5 1.5 47.6% $186.94 66.0%
Yadkin County (NC) 2.7 0.0 2.7 0.1 2.5 0.1 2.6 0.6 10.5% $148.68 94.2%
Greater Belfast Area (ME) 1.9 0.2 2.1 0.0 2.1 0.2 2.3 0.6 16.2% $151.05 78.5%
Campbell County (TN) 1.9 0.4 2.3 0.0 2.3 0.3 2.6 0.4 5.7% $141.70 80.4%
Monroe County (TN) 2.2 0.5 2.7 0.1 2.3 0.6 2.9 0.4 5.8% $163.31 90.5%
Lincoln County (OR) 2.1 0.2 2.3 0.1 2.2 0.1 2.3 1.7 43.9% $174.10 61.7%
Iron County (UT) 2.1 0.2 2.3 0.2 2.4 0.2 2.6 2.2 71.0% $176.91 57.1%
City of St. Louis Park (MN) 2.3 0.2 2.5 0.1 2.5 0.2 2.7 0.6 11.4% $151.74 50.0%
City of Logan (UT) 2.4 0.3 2.7 0.1 2.5 0.2 2.7 1.4 45.3% $159.97 58.7%
Gibson County (TN) 2.3 0.5 2.8 0.1 2.6 0.6 3.2 0.6 7.8% $291.25 96.1%
Group A Average 2.2 0.3 2.5 0.1 2.4 0.3 2.7 0.7 17.4% $146.90 67.2%
Group A Median 2.1 0.2 2.4 0.1 2.4 0.2 2.6 0.6 8.8% $148.43 71.1%
With Paid Lodging Expenses
RESIDENT ATTENDEES ONLY NON-RESIDENT ATTENDEES ONLY
Average Travel Party Size Average Travel Party Size
SOURCE: Arts and Economic Prosperity 5, Americans for the Arts, 2017. For more information, visit www.AmericansForTheArts.org/EconomicImpact. B–381

Table 26:Travel Party Characteristics of Attendees to Cultural EventsPer Study Region During 2016
Population Cohort Group BPopulation 50,000 to 99,999 Nights Nights Arts Event is Primary
Sample Size = 38 Adults Children Total Away Adults Children Total Away Percent Per Person $ Reason for Trip
City of Joplin (MO) 2.1 0.3 2.4 0.1 2.7 0.1 2.8 0.4 6.2% $127.93 83.2%
City of La Crosse (WI) 2.2 0.2 2.4 0.1 2.5 0.2 2.7 0.3 10.0% $109.19 84.0%
McMinn County (TN) 1.9 0.3 2.2 0.0 2.1 0.2 2.3 0.3 9.1% $111.58 86.6%
Lafayette County (MS) 2.2 0.4 2.6 0.1 2.5 0.2 2.7 0.8 22.7% $162.49 53.6%
Chisago County (MN) 2.4 0.1 2.5 0.1 2.6 0.3 2.9 0.3 7.9% $205.10 61.1%
City of Grand Forks (ND) 2.4 0.2 2.6 0.1 2.5 0.3 2.8 0.5 9.4% $113.28 79.4%
City of Corvallis (OR) 2.3 0.2 2.5 0.1 2.3 0.2 2.5 0.4 10.3% $139.04 83.0%
City of Noblesville (IN) 2.3 0.4 2.7 0.0 2.6 0.3 2.9 0.2 4.3% $94.54 52.2%
City of Ocala (FL) 2.3 0.4 2.7 0.1 2.6 0.1 2.7 0.7 15.7% $223.13 87.7%
Lenoir County (NC) 1.9 0.1 2.0 0.0 2.4 0.2 2.6 0.3 20.9% $198.65 91.8%
Town of Chapel Hill (NC) 1.7 0.3 2.0 0.0 2.0 0.4 2.4 0.2 2.6% $174.72 92.8%
City of Grand Junction (CO) 2.1 0.2 2.3 0.1 2.7 0.2 2.9 1.0 39.5% $147.25 54.7%
Town of Jupiter (FL) 2.7 0.2 2.9 0.0 2.6 0.3 2.9 0.3 17.6% $135.68 44.6%
Hamblen County (TN) 2.3 0.7 3.0 0.0 2.3 0.7 3.0 0.1 5.9% $91.51 69.1%
City of Delray Beach (FL) 2.5 0.2 2.7 0.1 2.5 0.2 2.7 0.9 13.2% $143.64 63.2%
City of St. Cloud (MN) 2.6 0.2 2.8 0.1 2.3 1.0 3.3 0.3 7.4% $189.38 66.7%
City of Portland (ME) 2.2 0.2 2.4 0.1 2.4 0.3 2.7 0.4 9.2% $145.84 82.0%
City of Jackson (TN) 2.3 0.3 2.6 0.1 2.3 0.3 2.6 0.2 3.8% $87.45 79.9%
City of Walnut Creek (CA) 2.3 0.1 2.4 0.1 2.4 0.1 2.5 0.2 4.8% $115.77 65.5%
Greene County (TN) 1.7 0.3 2.0 0.1 2.1 0.2 2.3 0.2 5.1% $71.27 83.8%
City of Flagstaff (AZ) 1.8 0.3 2.1 0.0 2.1 0.4 2.5 0.5 40.2% $133.81 35.8%
City of Missoula (MT) 2.2 0.2 2.4 0.1 2.6 0.3 2.9 1.1 22.1% $146.60 41.1%
City of Fort Myers (FL) 2.4 0.2 2.6 0.0 2.3 0.1 2.4 0.5 6.3% $177.69 81.0%
Putnam County (TN) 1.8 0.2 2.0 0.0 2.2 0.2 2.4 0.1 1.8% $62.50 90.9%
Monroe County (FL) 2.3 0.3 2.6 0.1 2.4 0.3 2.7 0.8 12.1% $171.27 70.2%
City of Lynchburg (VA) 2.3 0.4 2.7 0.1 2.5 0.3 2.8 0.2 4.2% $148.47 64.2%
City of Duluth (MN) 2.0 0.2 2.2 0.2 2.7 0.9 3.6 1.3 35.1% $88.37 22.2%
City of Fishers (IN) 2.4 0.8 3.2 0.0 2.4 0.8 3.2 0.2 2.8% $136.75 62.5%
City of Carmel (IN) 2.3 0.4 2.7 0.0 2.1 0.3 2.4 0.4 13.2% $169.24 62.9%
City of Sugar Land (TX) 1.9 0.7 2.6 0.1 2.0 0.4 2.4 0.2 4.2% $207.74 53.4%
RESIDENT ATTENDEES ONLY NON-RESIDENT ATTENDEES ONLY
Average Travel Party Size Average Travel Party Size With Paid Lodging Expenses
SOURCE: Arts and Economic Prosperity 5, Americans for the Arts, 2017. For more information, visit www.AmericansForTheArts.org/EconomicImpact. B–382

Table 26:Travel Party Characteristics of Attendees to Cultural EventsPer Study Region During 2016
Population Cohort Group BPopulation 50,000 to 99,999 Nights Nights Arts Event is Primary
Sample Size = 38 Adults Children Total Away Adults Children Total Away Percent Per Person $ Reason for Trip
City of Asheville (NC) 2.0 0.1 2.1 0.0 2.2 0.1 2.3 0.9 25.8% $178.26 62.4%
Buchanan County (MO) 2.4 0.5 2.9 0.1 2.7 0.4 3.1 0.5 13.0% $99.60 83.3%
City of Boca Raton (FL) 2.2 0.2 2.4 0.0 2.2 0.2 2.4 0.9 12.1% $192.08 57.8%
City of Miami Beach (FL) 2.1 0.0 2.1 0.1 2.3 0.1 2.4 0.5 9.1% $200.14 84.8%
Moore County (NC) 2.4 0.2 2.6 0.1 2.4 0.2 2.6 0.3 4.5% $126.66 74.8%
Sevier County (TN) 2.1 1.0 3.1 0.2 2.9 0.5 3.4 1.9 37.2% $203.90 72.1%
Cape May County (NJ) 1.7 0.0 1.7 0.0 2.4 0.0 2.4 1.8 43.8% $190.36 54.3%
Cleveland County (NC) 2.0 0.5 2.5 0.0 2.7 0.4 3.1 0.5 10.7% $150.68 76.6%
Group B Average 2.2 0.3 2.5 0.1 2.4 0.3 2.7 0.5 13.8% $146.62 68.8%
Group B Median 2.2 0.2 2.5 0.1 2.4 0.3 2.7 0.4 9.7% $146.22 69.7%
Average Travel Party Size Average Travel Party Size With Paid Lodging Expenses
RESIDENT ATTENDEES ONLY NON-RESIDENT ATTENDEES ONLY
SOURCE: Arts and Economic Prosperity 5, Americans for the Arts, 2017. For more information, visit www.AmericansForTheArts.org/EconomicImpact. B–383

Table 26:Travel Party Characteristics of Attendees to Cultural EventsPer Study Region During 2016
Population Cohort Group CPopulation 100,000 to 249,999 Nights Nights Arts Event is Primary
Sample Size = 50 Adults Children Total Away Adults Children Total Away Percent Per Person $ Reason for Trip
City of Las Cruces (NM) 2.1 0.5 2.6 0.1 2.5 0.3 2.8 0.9 24.8% $166.54 46.5%
Eau Claire County (WI) 2.3 0.3 2.6 0.1 2.7 0.2 2.9 0.2 5.4% $108.05 91.1%
Yamhill County (OR) 2.1 0.4 2.5 0.1 2.5 0.3 2.8 0.7 11.0% $145.72 82.9%
City of Lewisville (TX) 2.5 0.5 3.0 0.1 2.4 0.4 2.8 0.3 5.8% $181.24 52.5%
City of West Palm Beach (FL) 2.2 0.5 2.7 0.0 2.4 0.7 3.1 0.7 10.6% $142.73 69.3%
City of Boulder (CO) 2.1 0.3 2.4 0.1 2.4 0.2 2.6 0.7 11.4% $174.48 52.6%
City of Richardson (TX) 2.3 0.3 2.6 0.1 2.3 0.3 2.6 0.4 9.4% $169.43 50.0%
City of High Point (NC) 2.5 0.3 2.8 0.1 2.8 0.3 3.1 0.3 7.0% $115.84 93.0%
City of Cambridge (MA) 2.1 0.1 2.2 0.1 2.1 0.1 2.2 0.4 7.0% $136.77 80.8%
City of Lowell (MA) 1.9 0.2 2.1 0.2 2.0 0.1 2.1 0.2 4.1% $225.84 81.9%
Douglas County (KS) 2.2 0.5 2.7 0.1 2.5 0.5 3.0 0.5 9.1% $112.27 52.2%
City of Columbia (MO) 2.0 0.2 2.2 0.1 2.3 0.2 2.5 0.6 9.0% $106.26 83.2%
City of Norman (OK) 2.5 0.4 2.9 0.1 2.6 0.6 3.2 0.5 18.0% $185.94 91.8%
Wayne County (NC) 2.3 0.4 2.7 0.1 2.4 0.5 2.9 0.4 6.9% $82.26 83.2%
City of Lafayette (LA) 2.5 0.4 2.9 0.0 2.2 1.0 3.2 0.0 12.5% $178.12 75.0%
Washington County (TN) 1.8 0.2 2.0 0.1 2.2 0.2 2.4 1.0 29.5% $261.89 88.4%
City of Thousand Oaks (CA) 2.4 0.3 2.7 0.2 2.2 0.3 2.5 0.3 8.5% $145.56 63.1%
City of Charleston (SC) 2.3 0.3 2.6 0.1 2.4 0.4 2.8 1.3 20.5% $181.43 48.5%
City of Waco (TX) 2.1 0.6 2.7 0.0 2.3 0.5 2.8 0.6 19.6% $145.96 51.5%
Robeson County (NC) 2.2 0.5 2.7 0.1 2.4 0.4 2.8 0.4 9.6% $153.96 84.6%
Columbia County (GA) 2.4 0.6 3.0 0.1 2.2 0.4 2.6 0.4 5.2% $170.46 63.8%
Orange County (NC) 2.0 0.4 2.4 0.0 2.1 0.3 2.4 0.2 2.6% $183.37 92.7%
City of Savannah (GA) 2.3 0.7 3.0 0.0 2.6 0.6 3.2 1.4 39.0% $190.74 40.2%
Indian River County (FL) 2.2 0.2 2.4 0.1 2.3 0.1 2.4 0.4 7.3% $222.35 71.0%
City of Alexandria (VA) 1.8 0.4 2.2 0.1 2.1 0.3 2.4 0.3 5.0% $141.90 57.9%
Martin County (FL) 2.2 0.5 2.7 0.1 2.5 0.7 3.2 0.8 7.6% $125.84 60.4%
Macon-Bibb County (GA) 2.2 0.1 2.3 0.1 2.6 0.2 2.8 0.3 6.3% $153.13 55.4%
City of Springfield (MA) 2.4 0.5 2.9 0.2 2.3 0.2 2.5 0.4 9.9% $198.44 77.8%
Catawba County (NC) 2.5 0.2 2.7 0.0 2.5 0.2 2.7 0.3 9.5% $141.89 89.3%
Town of Cary (NC) 2.2 0.3 2.5 0.1 2.2 0.3 2.5 0.6 8.3% $104.03 78.3%
RESIDENT ATTENDEES ONLY NON-RESIDENT ATTENDEES ONLY
Average Travel Party Size Average Travel Party Size With Paid Lodging Expenses
SOURCE: Arts and Economic Prosperity 5, Americans for the Arts, 2017. For more information, visit www.AmericansForTheArts.org/EconomicImpact. B–384

Table 26:Travel Party Characteristics of Attendees to Cultural EventsPer Study Region During 2016
Population Cohort Group CPopulation 100,000 to 249,999 Nights Nights Arts Event is Primary
Sample Size = 50 Adults Children Total Away Adults Children Total Away Percent Per Person $ Reason for Trip
Alamance County (NC) 2.4 0.6 3.0 0.1 2.4 0.6 3.0 0.2 5.3% $82.43 89.8%
Cumberland County (NJ) 2.3 0.5 2.8 0.0 2.4 0.7 3.1 0.4 8.0% $109.91 67.3%
City of Eugene (OR) 2.2 0.1 2.3 0.1 2.3 0.1 2.4 0.8 15.7% $124.88 77.8%
Middlesex County (CT) 2.5 0.0 2.5 0.0 2.4 0.1 2.5 0.6 10.3% $117.00 89.7%
City of Springfield (MO) 2.1 0.5 2.6 0.1 2.2 0.4 2.6 0.2 4.0% $123.19 83.9%
City of Sioux Falls (SD) 2.3 0.2 2.5 0.1 2.5 0.2 2.7 0.4 12.9% $122.29 62.3%
Pitt County (NC) 2.3 0.5 2.8 0.1 2.2 0.3 2.5 0.4 10.1% $152.81 84.8%
City of Providence (RI) 2.0 0.3 2.3 0.1 2.2 0.5 2.7 0.3 2.6% $128.25 62.5%
City of Worcester (MA) 2.0 0.2 2.2 0.2 2.1 0.1 2.2 0.3 6.1% $166.04 76.5%
Montgomery County (TN) 2.0 0.2 2.2 0.1 2.1 0.2 2.3 0.4 12.7% $144.57 80.3%
Salt Lake City (UT) 2.4 0.2 2.6 0.1 2.4 0.3 2.7 0.5 10.4% $163.24 60.7%
Cabarrus County (NC) 2.5 0.1 2.6 0.1 2.5 0.2 2.7 0.2 6.1% $103.44 89.8%
Richmond County (GA) 2.2 0.5 2.7 0.2 2.3 0.4 2.7 0.3 3.2% $157.65 60.9%
City of Tacoma (WA) 2.2 0.2 2.4 0.1 2.4 0.3 2.7 0.2 4.2% $113.87 61.4%
Doña Ana County (NM) 2.3 0.6 2.9 0.1 2.8 0.3 3.1 0.7 19.3% $164.55 38.5%
New Hanover County (NC) 2.3 0.2 2.5 0.0 2.2 0.2 2.4 0.2 2.8% $88.75 91.7%
Arlington County (VA) 2.0 0.4 2.4 0.1 2.2 0.2 2.4 0.3 3.3% $129.55 61.6%
City of Irving (TX) 2.4 0.2 2.6 0.1 2.7 0.2 2.9 0.3 7.7% $114.68 71.1%
City of Reno (NV) 2.4 0.4 2.8 0.1 2.2 0.2 2.4 0.8 23.6% $132.49 76.4%
York County (SC) 2.3 0.3 2.6 0.1 2.4 0.2 2.6 0.4 10.7% $171.62 59.4%
Group C Average 2.2 0.3 2.6 0.1 2.4 0.3 2.7 0.5 10.4% $147.27 71.1%
Group C Median 2.3 0.3 2.6 0.1 2.4 0.3 2.7 0.4 8.8% $145.07 73.1%
RESIDENT ATTENDEES ONLY NON-RESIDENT ATTENDEES ONLY
Average Travel Party Size Average Travel Party Size With Paid Lodging Expenses
SOURCE: Arts and Economic Prosperity 5, Americans for the Arts, 2017. For more information, visit www.AmericansForTheArts.org/EconomicImpact. B–385

Table 26:Travel Party Characteristics of Attendees to Cultural EventsPer Study Region During 2016
Population Cohort Group DPopulation 250,000 to 499,999 Nights Nights Arts Event is Primary
Sample Size = 42 Adults Children Total Away Adults Children Total Away Percent Per Person $ Reason for Trip
Buncombe County (NC) 2.1 0.1 2.2 0.1 2.2 0.1 2.3 1.1 24.0% $184.87 64.4%
Alachua County (FL) 2.2 0.4 2.6 0.1 2.3 0.6 2.9 0.5 10.9% $143.92 86.5%
Greater Green Bay Area (WI) 2.1 0.6 2.7 0.1 2.4 0.3 2.7 0.5 13.3% $127.27 93.7%
City of Orlando (FL) 2.1 0.5 2.6 0.1 2.2 0.6 2.8 0.6 12.8% $151.97 81.6%
City of Lincoln (NE) 2.0 0.3 2.3 0.0 2.2 0.2 2.4 0.4 14.6% $120.73 64.4%
Southeastern Connecticut Region (CT) 2.0 0.4 2.4 0.1 2.6 0.5 3.1 0.5 11.7% $148.88 78.1%
Erie County (PA) 2.4 0.3 2.7 0.1 2.6 0.5 3.1 0.8 19.4% $126.86 73.5%
San Luis Obispo County (CA) 2.3 0.3 2.6 0.1 2.4 0.3 2.7 1.3 24.3% $190.10 46.7%
City of Newark (NJ) 2.0 0.3 2.3 0.4 2.1 0.2 2.3 0.3 1.7% $156.17 79.4%
Leon County (FL) 2.1 0.2 2.3 0.1 2.2 0.4 2.6 0.8 28.0% $159.58 76.8%
Rutherford County (TN) 2.2 0.4 2.6 0.1 2.3 0.3 2.6 0.5 8.0% $134.52 80.7%
St. Lucie County (FL) 2.3 0.1 2.4 0.1 2.4 0.0 2.4 0.5 4.8% $327.75 79.5%
Greater Spartanburg Area (SC) 2.3 0.4 2.7 0.1 2.4 0.3 2.7 0.3 4.6% $218.50 56.9%
Durham County (NC) 2.1 0.2 2.3 0.0 2.1 0.2 2.3 0.3 3.6% $124.60 89.1%
City of St. Paul (MN) 2.3 0.2 2.5 0.1 2.5 0.2 2.7 0.6 11.4% $151.74 50.0%
Hamilton County (IN) 2.3 0.5 2.8 0.0 2.3 0.5 2.8 0.3 7.5% $156.60 60.8%
Osceola County (FL) 2.8 0.5 3.3 0.1 2.3 0.1 2.4 0.3 12.5% $223.00 87.5%
Escambia County (FL) 2.3 0.3 2.6 0.0 2.1 0.9 3.0 0.7 8.0% $191.38 76.8%
Lexington-Fayette Urban County (KY) 2.1 0.3 2.4 0.1 2.3 0.3 2.6 0.4 4.6% $101.44 56.5%
Lake County (FL) 2.2 0.1 2.3 0.1 2.2 0.3 2.5 0.7 10.8% $200.81 74.3%
City of Riverside (CA) 1.8 0.3 2.1 0.0 2.0 0.5 2.5 0.0 1.0% $88.75 66.3%
Cumberland County (NC) 2.1 0.4 2.5 0.1 2.3 0.6 2.9 0.4 3.4% $116.28 73.1%
Collier County (FL) 2.3 0.2 2.5 0.1 2.4 0.1 2.5 1.1 6.6% $183.37 61.7%
Hamilton County (TN) 2.3 0.4 2.7 0.1 2.5 0.4 2.9 0.6 16.0% $160.97 79.3%
Manatee County (FL) 2.5 0.3 2.8 0.1 2.6 0.3 2.9 0.7 10.6% $172.85 63.3%
City of Tampa (FL) 2.3 0.2 2.5 0.1 2.4 0.2 2.6 0.7 18.0% $211.92 78.7%
Forsyth County (NC) 2.2 0.4 2.6 0.1 2.4 0.4 2.8 0.3 4.4% $140.00 85.3%
Mercer County (NJ) 2.0 0.3 2.3 0.0 2.9 0.3 3.2 0.2 3.9% $183.13 86.6%
City of Wichita (KS) 2.2 0.2 2.4 0.0 2.5 0.3 2.8 0.4 8.8% $163.17 57.6%
Clackamas County (OR) 1.9 0.3 2.2 0.0 2.2 0.3 2.5 0.4 5.7% $142.54 79.5%
RESIDENT ATTENDEES ONLY NON-RESIDENT ATTENDEES ONLY
Average Travel Party Size Average Travel Party Size With Paid Lodging Expenses
SOURCE: Arts and Economic Prosperity 5, Americans for the Arts, 2017. For more information, visit www.AmericansForTheArts.org/EconomicImpact. B–386

Table 26:Travel Party Characteristics of Attendees to Cultural EventsPer Study Region During 2016
Population Cohort Group DPopulation 250,000 to 499,999 Nights Nights Arts Event is Primary
Sample Size = 42 Adults Children Total Away Adults Children Total Away Percent Per Person $ Reason for Trip
Sarasota County (FL) 2.3 0.1 2.4 0.1 2.4 0.0 2.4 0.6 9.9% $191.31 76.3%
City of Minneapolis (MN) 2.3 0.2 2.5 0.1 2.5 0.2 2.7 0.6 11.4% $151.74 50.0%
Berks County (PA) 2.4 0.2 2.6 0.1 2.4 0.1 2.5 0.7 20.3% $212.94 84.1%
City of Miami (FL) 2.3 0.2 2.5 0.1 2.4 0.2 2.6 0.7 10.2% $211.33 74.5%
City of Raleigh (NC) 2.2 0.4 2.6 0.1 2.2 0.4 2.6 0.8 14.8% $166.83 80.9%
Santa Barbara County (CA) 1.9 0.1 2.0 0.0 2.1 0.2 2.3 0.7 13.2% $136.06 56.6%
Seminole County (FL) 1.9 0.6 2.5 0.0 2.3 0.3 2.6 0.1 2.4% $145.00 95.1%
City of Virginia Beach (VA) 2.4 0.1 2.5 0.0 2.4 0.2 2.6 0.3 7.9% $142.70 59.2%
City of Atlanta (GA) 1.8 1.0 2.8 0.2 2.2 0.5 2.7 0.3 8.2% $205.72 72.6%
City of Mesa (AZ) 2.1 0.9 3.0 0.0 2.4 0.4 2.8 0.5 11.8% $154.96 46.4%
City of Kansas City (MO) 2.2 0.1 2.3 0.1 2.3 0.1 2.4 0.2 3.9% $158.71 96.0%
Morris County (NJ) 2.3 0.5 2.8 0.1 2.4 0.4 2.8 0.1 2.3% $231.46 93.8%
Group D Average 2.2 0.3 2.5 0.1 2.3 0.3 2.7 0.5 10.3% $166.96 73.2%
Group D Median 2.2 0.3 2.5 0.1 2.4 0.3 2.6 0.5 10.1% $157.66 76.6%
RESIDENT ATTENDEES ONLY NON-RESIDENT ATTENDEES ONLY
Average Travel Party Size Average Travel Party Size With Paid Lodging Expenses
SOURCE: Arts and Economic Prosperity 5, Americans for the Arts, 2017. For more information, visit www.AmericansForTheArts.org/EconomicImpact. B–387

Table 26:Travel Party Characteristics of Attendees to Cultural EventsPer Study Region During 2016
Population Cohort Group EPopulation 500,000 to 999,999 Nights Nights Arts Event is Primary
Sample Size = 25 Adults Children Total Away Adults Children Total Away Percent Per Person $ Reason for Trip
Sonoma County (CA) 2.4 0.1 2.5 0.1 2.5 0.1 2.6 0.6 13.7% $234.93 51.6%
Volusia County (FL) 1.5 0.0 1.5 0.0 1.4 0.0 1.4 0.3 8.3% $337.50 75.0%
Guilford County (NC) 2.3 0.2 2.5 0.1 2.6 0.2 2.8 0.4 9.9% $140.86 91.1%
Dane County (WI) 2.2 0.3 2.5 0.0 2.4 0.3 2.7 0.8 5.5% $147.50 80.8%
Brevard County (FL) 2.4 0.2 2.6 0.0 2.0 0.0 2.0 0.2 9.1% $135.00 100.0%
Washington County (OR) 2.2 0.2 2.4 0.1 2.5 0.1 2.6 0.2 4.6% $110.33 91.5%
Johnson County (KS) 2.2 0.2 2.4 0.1 2.3 0.2 2.5 0.3 1.8% $158.25 63.3%
City of Louisville (KY) 2.4 0.4 2.8 0.0 2.3 0.3 2.6 0.7 10.2% $127.40 57.3%
City of Baltimore (MD) 2.3 0.4 2.7 0.1 2.3 0.3 2.6 0.2 4.6% $150.24 94.5%
Polk County (FL) 2.2 0.4 2.6 0.0 2.7 0.4 3.1 1.0 18.1% $130.83 67.7%
City of Boston (MA) 2.1 0.2 2.3 0.1 2.3 0.3 2.6 0.3 5.6% $169.06 82.8%
District of Columbia (DC) 2.0 0.1 2.1 0.1 2.2 0.1 2.3 0.4 7.8% $159.73 53.7%
Nashville-Davidson County (TN) 2.1 0.3 2.4 0.1 2.3 0.4 2.7 0.8 12.9% $186.50 75.0%
City of El Paso (TX) 2.2 1.0 3.2 0.2 2.4 0.7 3.1 0.8 8.2% $218.55 45.9%
Lee County (FL) 2.4 0.2 2.6 0.0 2.4 0.1 2.5 0.6 8.9% $173.69 73.2%
City of Fort Worth (TX) 2.3 0.3 2.6 0.1 2.3 0.3 2.6 0.6 16.3% $186.70 59.7%
City of Indianapolis (IN) 2.1 0.2 2.3 0.1 2.4 0.2 2.6 0.3 8.2% $147.76 60.1%
City and County of San Francisco (CA) 2.2 0.2 2.4 0.1 2.3 0.2 2.5 0.6 9.3% $228.43 54.6%
Prince George's County (MD) 2.0 0.5 2.5 0.1 2.2 0.3 2.5 0.4 4.4% $230.00 77.9%
Pinellas County (FL) 2.3 0.1 2.4 0.1 2.3 0.2 2.5 0.7 11.6% $156.36 70.1%
Shelby County (TN) 2.4 0.5 2.9 0.1 2.4 0.5 2.9 0.7 19.7% $134.47 73.7%
Fairfield County (CT) 2.1 0.2 2.3 0.0 2.4 0.3 2.7 0.2 3.7% $144.71 90.8%
Westchester County (NY) 2.2 0.1 2.3 0.1 2.3 0.2 2.5 0.3 2.4% $133.96 62.1%
Fulton County (GA) 2.3 0.5 2.8 0.1 2.6 0.4 3.0 0.4 8.9% $183.59 93.0%
Wake County (NC) 2.2 0.4 2.6 0.1 2.2 0.4 2.6 0.7 13.6% $156.06 80.6%
Group E Average 2.2 0.3 2.5 0.1 2.3 0.3 2.6 0.5 9.1% $171.30 73.0%
Group E Median 2.2 0.2 2.5 0.1 2.3 0.3 2.6 0.4 8.9% $156.36 73.7%
NON-RESIDENT ATTENDEES ONLY
Average Travel Party Size Average Travel Party Size With Paid Lodging Expenses
RESIDENT ATTENDEES ONLY
SOURCE: Arts and Economic Prosperity 5, Americans for the Arts, 2017. For more information, visit www.AmericansForTheArts.org/EconomicImpact. B–388

Table 26:Travel Party Characteristics of Attendees to Cultural EventsPer Study Region During 2016
Population Cohort Group FPopulation 1,000,000 or More Nights Nights Arts Event is Primary
Sample Size = 21 Adults Children Total Away Adults Children Total Away Percent Per Person $ Reason for Trip
Mecklenburg County (NC) 2.0 0.5 2.5 0.1 2.3 0.7 3.0 0.4 7.0% $186.92 84.0%
City of San José (CA) 2.2 0.2 2.4 0.1 2.1 0.2 2.3 0.6 15.7% $187.71 52.1%
Montgomery County (MD) 2.1 0.4 2.5 0.0 2.1 0.3 2.4 0.2 3.4% $146.38 89.8%
Fairfax County (VA) 2.2 0.3 2.5 0.1 2.3 0.3 2.6 0.1 1.7% $148.29 64.0%
Allegheny County (PA) 2.1 0.2 2.3 0.1 2.2 0.1 2.3 0.4 13.3% $192.13 84.5%
Greater Columbus Area (OH) 2.3 0.3 2.6 0.1 2.7 0.5 3.2 0.5 11.6% $131.99 55.6%
Orange County (FL) 2.1 0.4 2.5 0.1 2.2 0.4 2.6 0.5 10.9% $156.08 82.6%
City of Dallas (TX) 2.3 0.2 2.5 0.2 2.5 0.4 2.9 0.6 10.8% $122.79 52.4%
Hillsborough County (FL) 2.4 0.1 2.5 0.1 2.4 0.2 2.6 0.7 17.1% $211.92 78.7%
City of San Diego (CA) 2.3 0.3 2.6 0.1 2.5 0.4 2.9 1.8 34.1% $164.44 22.9%
Palm Beach County (FL) 2.4 0.4 2.8 0.0 2.4 0.5 2.9 1.0 13.5% $160.48 59.1%
City of San Antonio (TX) 2.4 0.5 2.9 0.2 2.6 0.4 3.0 1.0 29.9% $181.71 37.9%
Sacramento County (CA) 2.1 0.4 2.5 0.1 2.4 0.2 2.6 0.2 3.8% $145.36 62.7%
City of Phoenix (AZ) 2.3 0.4 2.7 0.1 2.6 0.4 3.0 1.9 35.8% $141.62 28.9%
City and County of Philadelphia (PA) 2.0 0.2 2.2 0.2 2.1 0.4 2.5 0.7 16.4% $163.00 66.5%
Broward County (FL) 2.4 0.3 2.7 0.2 2.5 0.2 2.7 1.1 13.1% $150.14 63.0%
Santa Clara County (CA) 2.1 0.3 2.4 0.1 2.1 0.2 2.3 0.4 7.6% $200.26 60.1%
Riverside County (CA) 1.9 0.4 2.3 0.0 2.2 0.5 2.7 0.4 14.6% $369.44 67.0%
Miami-Dade County (FL) 2.3 0.2 2.5 0.1 2.4 0.2 2.6 0.7 9.9% $188.67 76.6%
City of Chicago (IL) 2.1 0.1 2.2 0.1 2.4 0.3 2.7 1.5 37.1% $204.03 37.9%
Harris County (TX) 2.1 0.2 2.3 0.1 2.3 0.4 2.7 0.6 9.8% $176.41 60.7%
Group F Average 2.2 0.3 2.5 0.1 2.3 0.3 2.7 0.7 15.1% $177.61 61.3%
Group F Median 2.2 0.3 2.5 0.1 2.4 0.4 2.7 0.6 13.1% $164.44 62.7%
Average 2.2 0.3 2.5 0.1 2.4 0.3 2.7 0.6 12.8% $156.13 69.5%
Median 2.2 0.3 2.5 0.1 2.4 0.3 2.6 0.5 9.4% $151.74 72.4%
ALL CITY/COUNTY STUDY REGIONS
RESIDENT ATTENDEES ONLY NON-RESIDENT ATTENDEES ONLY
Average Travel Party Size Average Travel Party Size With Paid Lodging Expenses
SOURCE: Arts and Economic Prosperity 5, Americans for the Arts, 2017. For more information, visit www.AmericansForTheArts.org/EconomicImpact. B–389

Table 26:Travel Party Characteristics of Attendees to Cultural EventsPer Study Region During 2016
Regional Study RegionsAll Populations Nights Nights Arts Event is Primary
Sample Size = 81 Adults Children Total Away Adults Children Total Away Percent Per Person $ Reason for Trip
High Peaks Region (ME) 2.2 0.4 2.6 0.1 2.3 0.4 2.7 1.1 14.0% $152.42 71.1%
Wood River Valley (ID) 2.4 0.3 2.7 0.2 2.9 0.3 3.2 1.7 25.3% $227.57 72.3%
Southern Oregon Area 2.4 0.2 2.6 0.0 2.6 0.2 2.8 3.0 79.8% $201.39 76.5%
Southwestern Pennsylvania Area 2.4 0.1 2.5 0.1 2.7 0.1 2.8 0.4 6.9% $116.29 87.3%
Greater Portsmouth Area (NH) 2.1 0.3 2.4 0.1 2.1 0.3 2.4 0.3 6.3% $165.32 81.3%
Northeast Oregon Region 1.9 0.2 2.1 0.1 2.0 0.0 2.0 0.9 30.0% $239.53 83.3%
Toe River Valley (NC) 1.9 0.2 2.1 0.0 2.4 0.2 2.6 0.8 18.2% $205.11 77.3%
Albemarle Region (NC) 2.1 0.2 2.3 0.1 2.7 0.2 2.9 0.6 5.5% $158.18 83.6%
Greater Concord Area (NH) 2.1 0.2 2.3 0.1 2.3 0.2 2.5 0.4 17.1% $157.72 93.3%
North Central Minnesota Region 2.1 0.4 2.5 0.2 2.9 0.3 3.2 5.0 2.6% $171.20 75.0%
Northwest Minnesota Region 2.3 0.3 2.6 0.1 2.8 0.3 3.1 0.4 5.0% $132.50 40.9%
Monadnock Region (NH) 2.3 0.3 2.6 0.1 2.3 0.2 2.5 0.5 11.4% $101.05 89.0%
Bismarck-Mandan Region (ND) 2.3 0.2 2.5 0.1 2.5 0.2 2.7 0.7 7.3% $123.65 75.6%
Greater Minot Region (ND) 2.3 0.2 2.5 0.0 2.4 0.2 2.6 0.5 15.5% $104.44 87.9%
Greater Burlington Area (VT) 1.9 0.3 2.2 0.0 2.1 0.5 2.6 0.6 17.3% $156.31 77.4%
Greater Charlottesville Area (VA) 2.2 0.2 2.4 0.1 2.4 0.2 2.6 0.7 15.4% $221.05 84.4%
Brainerd Lakes Region (MN) 2.6 0.2 2.8 0.1 2.5 0.6 3.1 0.8 8.9% $52.50 60.0%
East Central Minnesota Region 2.4 0.1 2.5 0.1 2.6 0.3 2.9 0.3 7.9% $205.10 61.1%
Northwest Connecticut Region 1.9 0.1 2.0 0.1 2.2 0.1 2.3 0.3 5.1% $153.20 90.3%
Central Oregon Region 2.2 0.1 2.3 0.1 2.5 0.2 2.7 1.9 35.2% $217.72 71.4%
Greater Fargo-Moorhead Area (ND/MN) 2.2 0.2 2.4 0.0 2.2 0.2 2.4 0.5 13.5% $142.23 83.2%
Black Hills Region (SD) 2.2 0.2 2.4 0.1 2.4 0.2 2.6 1.0 16.9% $144.30 74.6%
Greater Kingsport Area (TN) 2.1 0.4 2.5 0.1 2.3 0.4 2.7 0.4 10.0% $152.39 84.8%
Lake Region (MN) 2.0 0.2 2.2 0.1 1.8 0.2 2.0 0.2 8.3% $202.33 78.3%
South Central Minnesota Region 2.4 0.4 2.8 0.1 2.6 0.4 3.0 0.6 8.1% $155.13 68.4%
Greater Sioux Falls Area (SD) 2.5 0.2 2.7 0.0 2.7 0.2 2.9 0.5 17.0% $118.08 59.7%
Southwest Tennessee Development District 2.2 0.5 2.7 0.1 2.3 0.2 2.5 0.3 5.0% $100.15 79.7%
Northwest Tennessee Development District 2.3 0.5 2.8 0.1 2.4 0.4 2.8 0.4 6.6% $160.19 92.2%
Southwest Minnesota Region 2.1 0.4 2.5 0.1 2.6 0.6 3.2 0.7 11.5% $177.71 50.0%
Arrowhead Region (MN) 2.0 0.2 2.2 0.2 2.7 0.9 3.6 1.3 35.1% $88.37 22.2%
RESIDENT ATTENDEES ONLY NON-RESIDENT ATTENDEES ONLY
Average Travel Party Size Average Travel Party Size With Paid Lodging Expenses
SOURCE: Arts and Economic Prosperity 5, Americans for the Arts, 2017. For more information, visit www.AmericansForTheArts.org/EconomicImpact. B–390

Table 26:Travel Party Characteristics of Attendees to Cultural EventsPer Study Region During 2016
Regional Study RegionsAll Populations Nights Nights Arts Event is Primary
Sample Size = 81 Adults Children Total Away Adults Children Total Away Percent Per Person $ Reason for Trip
Maple Grove and the Northwest Suburbs (MN) 2.3 0.2 2.5 0.1 2.5 0.2 2.7 0.6 11.4% $151.74 50.0%
Greater Augusta Area (GA) 2.3 0.5 2.8 0.2 2.3 0.3 2.6 0.4 7.4% $161.29 55.1%
Upper Cumberland Development District (TN) 2.0 0.3 2.3 0.1 2.4 0.5 2.9 0.6 10.1% $128.96 88.6%
City of Huntsville/Madison County (AL) 2.2 0.5 2.7 0.1 2.3 0.5 2.8 0.6 7.7% $112.62 74.1%
Northeast Commission (NC) 2.2 0.2 2.4 0.1 2.7 0.2 2.9 1.7 24.6% $153.59 68.5%
Greater Ann Arbor Area (MI) 2.3 0.4 2.7 0.2 2.3 0.5 2.8 0.6 10.0% $186.74 74.8%
Greater Fox Cities Region (WI) 2.4 0.3 2.7 0.2 2.4 0.3 2.7 0.5 12.6% $152.69 95.6%
Central Minnesota Region 2.6 0.2 2.8 0.1 2.3 1.0 3.3 0.3 7.4% $189.38 66.7%
South Central Tennessee Development District 2.1 0.5 2.6 0.0 2.1 0.3 2.4 0.7 5.1% $183.74 82.3%
Northwest Arkansas Region 2.3 0.3 2.6 0.0 2.3 0.4 2.7 1.0 34.0% $140.17 85.6%
Southeast Minnesota Region 2.7 0.1 2.8 0.1 3.0 0.1 3.1 0.3 6.1% $92.50 84.0%
First Tennessee Development District 2.0 0.4 2.4 0.1 2.3 0.3 2.6 0.8 21.4% $211.79 82.6%
Greater Harrisburg Area (PA) 2.2 0.2 2.4 0.1 2.3 0.2 2.5 0.3 5.4% $175.63 90.3%
Greater New Haven Area (CT) 2.3 0.3 2.6 0.1 2.4 0.4 2.8 0.3 2.9% $180.42 84.1%
Treasure Coast Region (FL) 2.2 0.3 2.5 0.1 2.5 0.4 2.9 0.8 8.0% $167.06 55.3%
Greater Des Moines Region (IA) 2.4 0.5 2.9 0.1 2.8 0.5 3.3 1.0 32.9% $163.32 79.0%
Southeast Tennessee Development District 2.2 0.4 2.6 0.1 2.3 0.3 2.6 0.6 15.5% $148.88 81.2%
Greater Knoxville Region (TN) 2.3 0.2 2.5 0.1 2.4 0.2 2.6 1.7 32.7% $216.77 68.6%
Greater Columbia Area (SC) 2.2 0.3 2.5 0.2 2.3 0.3 2.6 0.6 19.8% $139.70 79.3%
Pikes Peak Region (CO) 2.3 0.3 2.6 0.2 2.7 0.3 3.0 1.5 18.5% $140.22 72.8%
Lehigh Valley Region (PA) 2.5 0.3 2.8 0.1 2.5 0.1 2.6 0.5 13.0% $186.75 82.5%
Greater Sarasota/Bradenton Area (FL) 2.3 0.1 2.4 0.1 2.4 0.1 2.5 0.9 14.7% $189.37 62.6%
Dayton Region (OH) 2.1 0.4 2.5 0.1 2.0 0.4 2.4 0.4 4.7% $129.00 87.5%
Richmond & Tri-Cities Region (VA) 2.2 0.3 2.5 0.1 2.3 0.4 2.7 0.3 3.4% $176.94 92.7%
Memphis Area Association of Governments (TN) 2.4 0.6 3.0 0.1 2.5 0.4 2.9 0.8 21.0% $136.86 71.0%
Eastern Region (NC) 2.1 0.2 2.3 0.1 2.2 0.3 2.5 0.5 19.7% $160.65 83.0%
Advantage West Region (NC) 2.1 0.2 2.3 0.1 2.4 0.2 2.6 1.3 29.3% $176.12 66.3%
Southeast Commission (NC) 2.2 0.4 2.6 0.1 2.3 0.5 2.8 0.5 6.1% $137.89 72.0%
Greater Fairfax Area (VA) 2.2 0.4 2.6 0.1 2.2 0.4 2.6 0.4 10.1% $159.01 57.4%
Greater Tulsa Region (OK) 2.3 0.5 2.8 0.1 2.4 0.2 2.6 0.8 31.0% $207.08 85.7%
RESIDENT ATTENDEES ONLY NON-RESIDENT ATTENDEES ONLY
With Paid Lodging ExpensesAverage Travel Party Size Average Travel Party Size
SOURCE: Arts and Economic Prosperity 5, Americans for the Arts, 2017. For more information, visit www.AmericansForTheArts.org/EconomicImpact. B–391

Table 26:Travel Party Characteristics of Attendees to Cultural EventsPer Study Region During 2016
Regional Study RegionsAll Populations Nights Nights Arts Event is Primary
Sample Size = 81 Adults Children Total Away Adults Children Total Away Percent Per Person $ Reason for Trip
East Tennessee Development District 2.2 0.5 2.7 0.1 2.7 0.4 3.1 1.9 35.9% $202.87 67.3%
West Valley Region (AZ) 2.3 0.2 2.5 0.1 2.5 0.1 2.6 0.4 5.7% $97.25 82.5%
Greater St. Louis Area (MO) 2.1 0.3 2.4 0.1 2.5 0.6 3.1 0.4 6.8% $174.86 86.1%
Western New York 2.1 0.3 2.4 0.1 2.3 0.4 2.7 0.9 19.3% $141.15 67.0%
Greater Oklahoma City Region (OK) 2.3 0.6 2.9 0.1 2.6 0.5 3.1 1.5 42.5% $180.57 65.9%
Piedmont Triad Partnership (NC) 2.4 0.3 2.7 0.1 2.5 0.3 2.8 0.7 18.0% $137.25 85.1%
Greater Portland Area (OR) 2.1 0.2 2.3 0.1 2.4 0.2 2.6 0.6 11.7% $149.69 79.2%
Greater Kansas City Metropolitan Area (MO/KS) 2.3 0.1 2.4 0.1 2.4 0.1 2.5 0.7 12.9% $159.44 81.3%
Greater Nashville Regional Council (TN) 2.1 0.3 2.4 0.1 2.3 0.4 2.7 1.0 20.7% $166.95 64.4%
Research Triangle Regional Partnership (NC) 2.2 0.3 2.5 0.1 2.2 0.3 2.5 0.9 15.4% $155.25 74.1%
Greater Tampa/St. Petersburg Area (FL) 2.3 0.1 2.4 0.1 2.4 0.2 2.6 0.9 21.9% $201.40 70.8%
Charlotte Regional Partnership (NC) 2.3 0.3 2.6 0.1 2.5 0.3 2.8 0.7 15.5% $151.74 78.9%
Charlotte Regional Partnership (NC/SC) 2.3 0.3 2.6 0.1 2.5 0.3 2.8 0.7 16.8% $157.36 75.5%
Seven-County Metro Area (MN) 2.3 0.2 2.5 0.1 2.5 0.2 2.7 0.6 11.4% $151.74 50.0%
Central Florida Region 2.2 0.3 2.5 0.1 2.3 0.5 2.8 1.1 21.3% $156.51 65.3%
Greater Philadelphia Region (PA) 2.2 0.3 2.5 0.1 2.2 0.4 2.6 0.8 18.6% $161.65 65.6%
Greater Washington Region (DC/MD/VA) 2.1 0.3 2.4 0.1 2.3 0.3 2.6 0.7 13.1% $153.60 56.5%
Metro Atlanta Area (GA) 2.3 0.5 2.8 0.1 2.6 0.4 3.0 0.4 8.9% $183.59 93.0%
Greater Atlanta Region (GA) 2.3 0.5 2.8 0.1 2.6 0.4 3.0 0.4 8.9% $183.59 93.0%
Greater Houston Region (TX) 2.1 0.3 2.4 0.2 2.5 0.2 2.7 1.5 33.9% $173.42 55.4%
Dallas-Fort Worth-Arlington MSA (TX) 2.4 0.3 2.7 0.1 2.4 0.3 2.7 1.3 31.0% $146.43 34.9%
Regional Average 2.2 0.3 2.5 0.1 2.4 0.3 2.7 0.8 16.1% $159.83 74.1%
Regional Median 2.2 0.3 2.5 0.1 2.4 0.3 2.7 0.6 13.1% $157.72 76.5%
RESIDENT ATTENDEES ONLY NON-RESIDENT ATTENDEES ONLY
Average Travel Party Size Average Travel Party Size With Paid Lodging Expenses
SOURCE: Arts and Economic Prosperity 5, Americans for the Arts, 2017. For more information, visit www.AmericansForTheArts.org/EconomicImpact. B–392
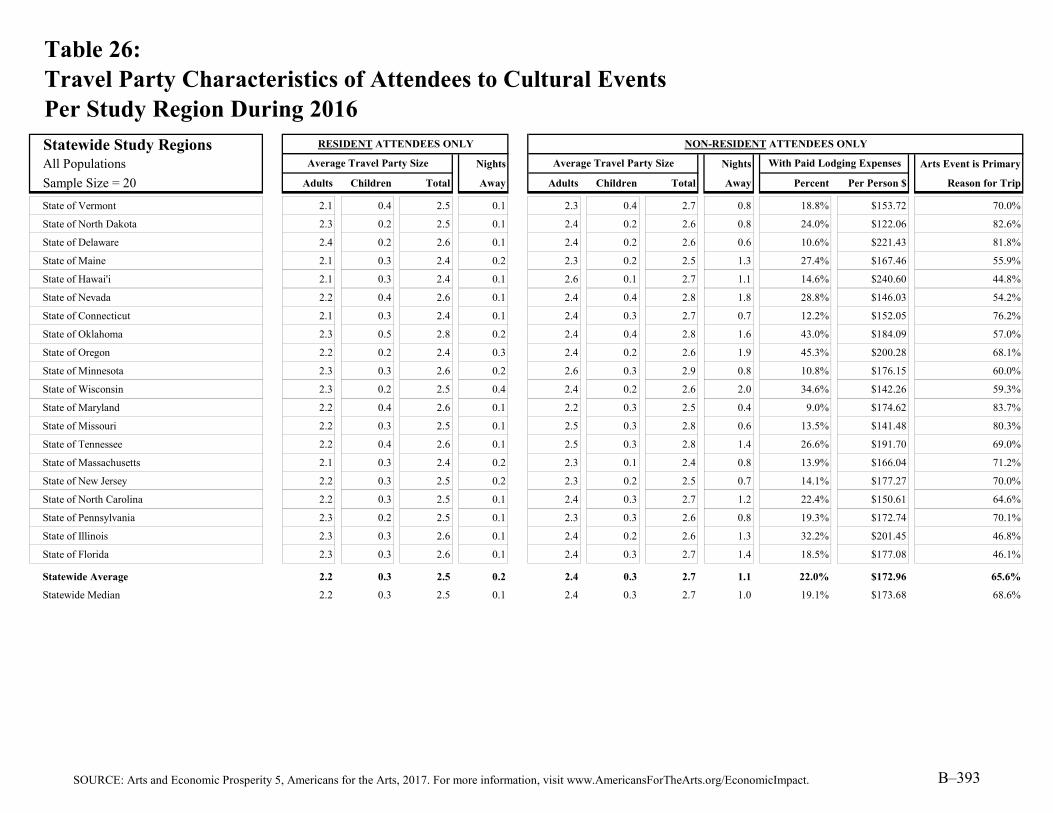
Table 26:Travel Party Characteristics of Attendees to Cultural EventsPer Study Region During 2016
Statewide Study RegionsAll Populations Nights Nights Arts Event is Primary
Sample Size = 20 Adults Children Total Away Adults Children Total Away Percent Per Person $ Reason for Trip
State of Vermont 2.1 0.4 2.5 0.1 2.3 0.4 2.7 0.8 18.8% $153.72 70.0%
State of North Dakota 2.3 0.2 2.5 0.1 2.4 0.2 2.6 0.8 24.0% $122.06 82.6%
State of Delaware 2.4 0.2 2.6 0.1 2.4 0.2 2.6 0.6 10.6% $221.43 81.8%
State of Maine 2.1 0.3 2.4 0.2 2.3 0.2 2.5 1.3 27.4% $167.46 55.9%
State of Hawai'i 2.1 0.3 2.4 0.1 2.6 0.1 2.7 1.1 14.6% $240.60 44.8%
State of Nevada 2.2 0.4 2.6 0.1 2.4 0.4 2.8 1.8 28.8% $146.03 54.2%
State of Connecticut 2.1 0.3 2.4 0.1 2.4 0.3 2.7 0.7 12.2% $152.05 76.2%
State of Oklahoma 2.3 0.5 2.8 0.2 2.4 0.4 2.8 1.6 43.0% $184.09 57.0%
State of Oregon 2.2 0.2 2.4 0.3 2.4 0.2 2.6 1.9 45.3% $200.28 68.1%
State of Minnesota 2.3 0.3 2.6 0.2 2.6 0.3 2.9 0.8 10.8% $176.15 60.0%
State of Wisconsin 2.3 0.2 2.5 0.4 2.4 0.2 2.6 2.0 34.6% $142.26 59.3%
State of Maryland 2.2 0.4 2.6 0.1 2.2 0.3 2.5 0.4 9.0% $174.62 83.7%
State of Missouri 2.2 0.3 2.5 0.1 2.5 0.3 2.8 0.6 13.5% $141.48 80.3%
State of Tennessee 2.2 0.4 2.6 0.1 2.5 0.3 2.8 1.4 26.6% $191.70 69.0%
State of Massachusetts 2.1 0.3 2.4 0.2 2.3 0.1 2.4 0.8 13.9% $166.04 71.2%
State of New Jersey 2.2 0.3 2.5 0.2 2.3 0.2 2.5 0.7 14.1% $177.27 70.0%
State of North Carolina 2.2 0.3 2.5 0.1 2.4 0.3 2.7 1.2 22.4% $150.61 64.6%
State of Pennsylvania 2.3 0.2 2.5 0.1 2.3 0.3 2.6 0.8 19.3% $172.74 70.1%
State of Illinois 2.3 0.3 2.6 0.1 2.4 0.2 2.6 1.3 32.2% $201.45 46.8%
State of Florida 2.3 0.3 2.6 0.1 2.4 0.3 2.7 1.4 18.5% $177.08 46.1%
Statewide Average 2.2 0.3 2.5 0.2 2.4 0.3 2.7 1.1 22.0% $172.96 65.6%
Statewide Median 2.2 0.3 2.5 0.1 2.4 0.3 2.7 1.0 19.1% $173.68 68.6%
Average Travel Party Size Average Travel Party Size With Paid Lodging Expenses
RESIDENT ATTENDEES ONLY NON-RESIDENT ATTENDEES ONLY
SOURCE: Arts and Economic Prosperity 5, Americans for the Arts, 2017. For more information, visit www.AmericansForTheArts.org/EconomicImpact. B–393

Table 26:Travel Party Characteristics of Attendees to Cultural EventsPer Study Region During 2016
Individual Arts DistrictsAll Populations Nights Nights Arts Event is Primary
Sample Size = 12 Adults Children Total Away Adults Children Total Away Percent Per Person $ Reason for Trip
James River Arts & Cultural District 2.3 0.4 2.7 0.1 2.6 0.3 2.9 0.2 3.9% $161.14 63.9%
Center City Charlotte 2.1 0.4 2.5 0.1 2.2 0.7 2.9 0.5 9.4% $186.92 81.3%
Loch Haven Cultural Park 2.0 0.7 2.7 0.0 2.2 0.8 3.0 0.6 9.9% $151.25 83.7%
Downtown Colorado Springs Creative District 2.2 0.1 2.3 0.1 2.5 0.0 2.5 0.5 6.8% $154.83 88.6%
Fort Worth Cultural District 2.2 0.3 2.5 0.0 2.2 0.4 2.6 0.6 16.8% $193.81 61.1%
Dallas Arts District 2.4 0.2 2.6 0.2 2.6 0.3 2.9 0.5 9.9% $130.33 54.3%
Grand Center Arts & Entertainment District 2.0 0.2 2.2 0.0 2.2 0.4 2.6 0.4 5.4% $161.63 92.4%
Balboa Park Cultural District 2.2 0.4 2.6 0.0 2.3 0.4 2.7 1.8 38.3% $147.37 16.3%
East End Cultural District 1.9 0.2 2.1 0.2 2.5 0.2 2.7 0.6 6.5% $124.00 55.4%
Houston Museum District Association 1.8 0.0 1.8 0.1 2.1 0.1 2.2 1.4 16.7% $193.78 52.1%
Midtown Cultural District 2.4 0.2 2.6 0.2 2.6 0.5 3.1 0.4 6.8% $108.80 56.2%
Washington Avenue Cultural District 2.0 0.1 2.1 0.2 2.5 0.0 2.5 0.4 3.1% $336.00 72.3%
Arts District Average 2.1 0.3 2.4 0.1 2.4 0.3 2.7 0.7 11.1% $170.82 64.8%
Arts District Median 2.2 0.2 2.5 0.1 2.4 0.4 2.7 0.5 8.1% $157.99 62.5%
RESIDENT ATTENDEES ONLY NON-RESIDENT ATTENDEES ONLY
Average Travel Party Size Average Travel Party Size With Paid Lodging Expenses
SOURCE: Arts and Economic Prosperity 5, Americans for the Arts, 2017. For more information, visit www.AmericansForTheArts.org/EconomicImpact. B–394
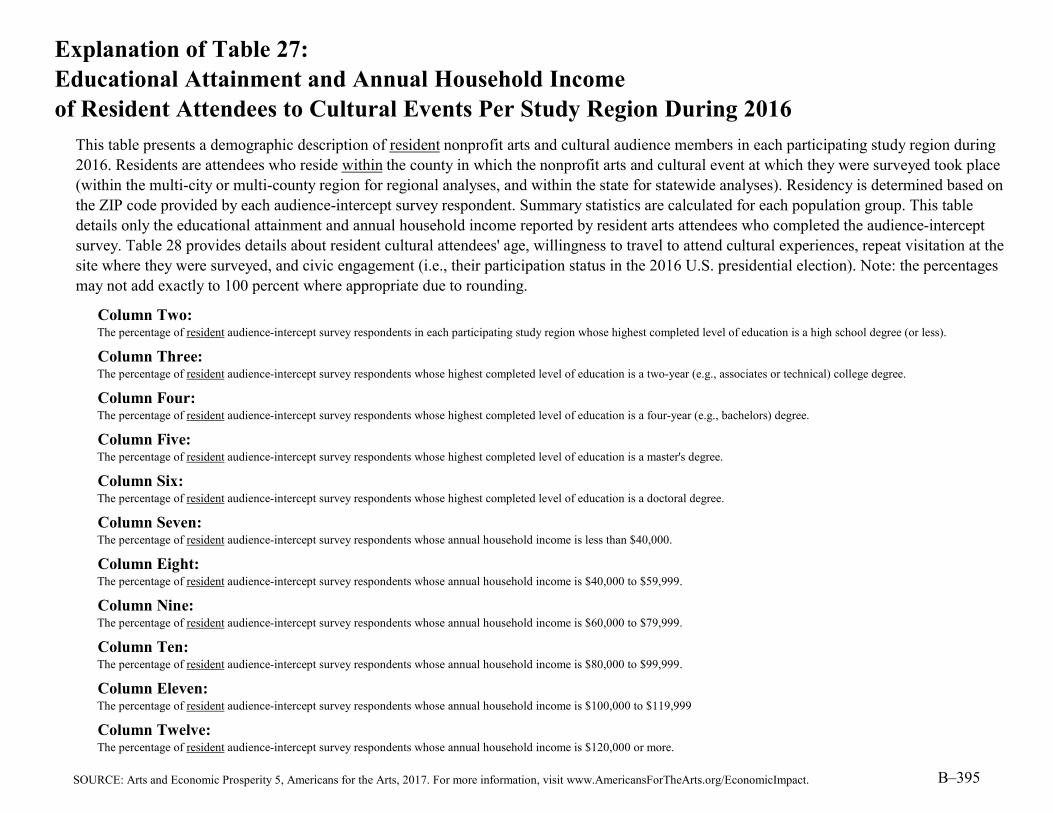
Explanation of Table 27:Educational Attainment and Annual Household Incomeof Resident Attendees to Cultural Events Per Study Region During 2016
Column Two:
Column Three:
Column Four:
Column Five:
Column Six:
Column Seven:
Column Eight:
Column Nine:
Column Ten:
Column Eleven:
Column Twelve:The percentage of resident audience-intercept survey respondents whose annual household income is $120,000 or more.
The percentage of resident audience-intercept survey respondents whose highest completed level of education is a doctoral degree.
The percentage of resident audience-intercept survey respondents whose annual household income is less than $40,000.
The percentage of resident audience-intercept survey respondents whose annual household income is $40,000 to $59,999.
The percentage of resident audience-intercept survey respondents whose annual household income is $60,000 to $79,999.
The percentage of resident audience-intercept survey respondents whose annual household income is $80,000 to $99,999.
The percentage of resident audience-intercept survey respondents whose annual household income is $100,000 to $119,999
The percentage of resident audience-intercept survey respondents whose highest completed level of education is a master's degree.
This table presents a demographic description of resident nonprofit arts and cultural audience members in each participating study region during 2016. Residents are attendees who reside within the county in which the nonprofit arts and cultural event at which they were surveyed took place (within the multi-city or multi-county region for regional analyses, and within the state for statewide analyses). Residency is determined based on the ZIP code provided by each audience-intercept survey respondent. Summary statistics are calculated for each population group. This table details only the educational attainment and annual household income reported by resident arts attendees who completed the audience-intercept survey. Table 28 provides details about resident cultural attendees' age, willingness to travel to attend cultural experiences, repeat visitation at the site where they were surveyed, and civic engagement (i.e., their participation status in the 2016 U.S. presidential election). Note: the percentages may not add exactly to 100 percent where appropriate due to rounding.
The percentage of resident audience-intercept survey respondents in each participating study region whose highest completed level of education is a high school degree (or less).
The percentage of resident audience-intercept survey respondents whose highest completed level of education is a two-year (e.g., associates or technical) college degree.
The percentage of resident audience-intercept survey respondents whose highest completed level of education is a four-year (e.g., bachelors) degree.
SOURCE: Arts and Economic Prosperity 5, Americans for the Arts, 2017. For more information, visit www.AmericansForTheArts.org/EconomicImpact. B–395

Table 27:Educational Attainment and Annual Household Incomeof Resident Attendees to Cultural Events Per Study Region During 2016
Population Cohort Group APopulation Fewer than 50,000 High School 2-Year 4-Year Master's Doctoral Less than $40,000 to $60,000 to $80,000 to $100,000 to $120,000
Sample Size = 52 or Less Degree Degree Degree Degree $40,000 $59,999 $79,999 $99,999 $119,999 or More
Town of Crested Butte (CO) 1.2% 6.0% 51.0% 36.7% 5.1% 4.8% 5.5% 24.0% 26.9% 29.6% 9.2%
City of Pine City (MN) 21.5% 27.9% 27.3% 20.4% 2.9% 30.0% 20.0% 19.4% 13.8% 10.6% 6.3%
City of Alva (OK) 13.1% 11.5% 62.0% 7.8% 5.6% 15.0% 21.2% 24.3% 24.6% 12.1% 2.8%
Cook County (MN) 12.4% 12.4% 37.1% 28.0% 10.2% 27.3% 19.2% 20.9% 14.5% 8.7% 9.3%
Town of Hillsborough (NC) 1.2% 6.0% 43.4% 39.8% 9.6% 4.1% 6.8% 17.6% 35.1% 12.2% 24.3%
City of Virginia (MN) 12.4% 12.4% 37.1% 28.0% 10.2% 27.3% 19.2% 20.9% 14.5% 8.7% 9.3%
Town of Jackson (WY) 5.3% 10.5% 54.4% 23.3% 6.5% 22.0% 17.5% 14.5% 12.1% 10.9% 23.0%
City of Guthrie (OK) 26.5% 30.8% 26.0% 14.9% 1.9% 28.5% 24.5% 18.0% 11.0% 8.5% 9.5%
City of Grand Rapids (MN) 12.4% 12.4% 37.1% 28.0% 10.2% 27.3% 19.2% 20.9% 14.5% 8.7% 9.3%
Town of Medfield (MA) 3.1% 6.5% 42.2% 37.6% 10.6% 6.5% 4.5% 6.5% 6.2% 13.2% 63.3%
City of Fergus Falls (MN) 16.4% 22.4% 34.5% 22.8% 3.9% 21.1% 22.0% 30.7% 11.9% 8.7% 5.5%
Grundy County (TN) 28.8% 29.6% 25.6% 14.4% 1.6% 35.3% 31.1% 20.2% 2.5% 6.7% 4.2%
City of Falls Church (VA) 2.6% 5.2% 42.9% 36.6% 12.6% 6.5% 8.6% 5.4% 9.7% 18.9% 50.8%
City of Jamestown (ND) 28.0% 13.8% 34.6% 17.6% 5.9% 20.4% 20.0% 22.4% 13.3% 12.5% 11.4%
City of Waterville (ME) 11.6% 17.9% 33.7% 29.5% 7.4% 25.0% 22.7% 23.9% 3.4% 13.6% 11.4%
City of Red Wing (MN) 10.2% 13.5% 40.9% 29.3% 6.1% 8.2% 18.0% 21.3% 15.9% 16.4% 20.2%
City of Durango (CO) 7.3% 11.6% 43.3% 26.2% 11.6% 17.4% 13.6% 17.2% 12.8% 13.4% 25.6%
City of Hannibal (MO) 18.1% 20.6% 40.0% 16.8% 4.5% 23.6% 21.5% 26.4% 13.2% 3.5% 11.8%
City of Tullahoma (TN) 18.3% 22.5% 32.2% 20.5% 6.4% 16.3% 22.6% 15.0% 16.5% 11.0% 18.4%
City of Northfield (MN) 10.2% 13.5% 40.9% 29.3% 6.1% 8.2% 18.0% 21.3% 15.9% 16.4% 20.2%
Town of Carrboro (NC) 4.1% 2.1% 29.2% 45.8% 18.8% 15.3% 12.9% 15.3% 10.6% 10.6% 35.3%
Macon County (TN) 34.4% 25.6% 23.6% 15.6% 0.8% 38.7% 23.0% 18.3% 14.1% 3.1% 2.6%
City of Laguna Beach (CA) 6.1% 17.8% 42.8% 25.7% 7.5% 10.0% 11.1% 13.3% 11.1% 12.6% 41.9%
Hickman County (TN) 30.6% 22.7% 32.8% 10.0% 3.8% 29.9% 26.1% 21.7% 13.0% 4.9% 4.3%
City of Fairfax (VA) 1.6% 6.3% 34.4% 46.9% 10.9% 5.7% 1.9% 7.5% 13.2% 17.0% 54.7%
City of Ponca City (OK) 18.0% 18.5% 37.4% 18.5% 7.6% 24.2% 19.3% 20.8% 14.5% 9.7% 11.6%
City of Paducah (KY) 23.3% 24.4% 30.2% 19.8% 2.3% 22.1% 19.5% 13.0% 13.0% 13.0% 19.5%
Mille Lacs County (MN) 21.5% 27.9% 27.3% 20.4% 2.9% 30.0% 20.0% 19.4% 13.8% 10.6% 6.3%
McNairy County (TN) 35.9% 22.0% 24.7% 13.9% 3.5% 31.1% 24.7% 19.5% 11.2% 5.5% 8.0%
City of Winona (MN) 10.2% 13.5% 40.9% 29.3% 6.1% 8.2% 18.0% 21.3% 15.9% 16.4% 20.2%
RESIDENTS ONLY -- EDUCATIONAL ATTAINMENT RESIDENTS ONLY -- HOUSEHOLD INCOME
SOURCE: Arts and Economic Prosperity 5, Americans for the Arts, 2017. For more information, visit www.AmericansForTheArts.org/EconomicImpact. B–396

Table 27:Educational Attainment and Annual Household Incomeof Resident Attendees to Cultural Events Per Study Region During 2016
Population Cohort Group APopulation Fewer than 50,000 High School 2-Year 4-Year Master's Doctoral Less than $40,000 to $60,000 to $80,000 to $100,000 to $120,000
Sample Size = 52 or Less Degree Degree Degree Degree $40,000 $59,999 $79,999 $99,999 $119,999 or More
Door County (WI) 7.3% 9.4% 40.8% 33.0% 9.4% 12.3% 18.1% 20.2% 18.1% 13.2% 18.1%
City of Benicia (CA) 6.3% 18.2% 38.8% 29.6% 7.1% 7.9% 15.8% 15.0% 15.6% 15.0% 30.7%
City of Winter Park (FL) 6.6% 16.6% 41.8% 26.4% 8.6% 15.6% 15.9% 15.9% 13.0% 12.0% 27.6%
City of Rochester (NH) 22.3% 27.9% 31.6% 16.1% 2.0% 21.5% 21.9% 20.9% 12.6% 9.9% 13.2%
City of Morgantown (WV) 10.8% 10.2% 36.3% 25.4% 17.3% 19.7% 13.7% 16.3% 12.5% 14.5% 23.3%
Henry County (TN) 18.8% 17.5% 42.5% 15.0% 6.3% 19.7% 26.3% 14.5% 19.7% 9.2% 10.5%
City of Fairbanks (AK) 10.0% 14.0% 34.4% 30.4% 11.3% 12.6% 17.7% 17.3% 18.6% 13.2% 20.6%
City of Bangor (ME) 14.1% 14.4% 32.0% 26.1% 13.4% 28.3% 21.4% 14.9% 12.4% 10.2% 12.9%
Weakley County (TN) 30.5% 11.1% 24.2% 17.6% 16.6% 33.2% 20.4% 18.5% 12.5% 6.4% 9.1%
Dare County (NC) 6.7% 20.8% 38.9% 26.8% 6.7% 11.9% 25.9% 17.8% 17.8% 10.4% 16.3%
City of Columbia (TN) 20.4% 20.2% 39.9% 16.4% 3.1% 14.9% 26.3% 23.9% 17.3% 8.3% 9.3%
City of Lake Worth (FL) 10.0% 17.5% 34.2% 28.3% 10.0% 7.9% 13.5% 18.2% 16.4% 12.9% 31.1%
Clatsop County (OR) 9.1% 18.1% 37.9% 28.2% 6.7% 20.3% 21.3% 18.9% 17.4% 9.9% 12.1%
Yadkin County (NC) 20.0% 29.0% 27.0% 19.0% 5.0% 12.5% 19.3% 15.9% 19.3% 18.2% 14.8%
Greater Belfast Area (ME) 9.9% 14.0% 40.9% 30.4% 4.8% 28.2% 23.6% 16.3% 13.7% 7.6% 10.6%
Campbell County (TN) 35.5% 21.2% 30.0% 10.6% 2.6% 29.6% 25.4% 16.4% 14.1% 9.6% 4.9%
Monroe County (TN) 23.7% 23.2% 28.8% 19.1% 5.1% 25.2% 21.4% 20.3% 15.9% 7.0% 10.1%
Lincoln County (OR) 9.2% 21.9% 30.7% 28.7% 9.6% 21.8% 20.5% 20.0% 15.3% 9.4% 13.0%
Iron County (UT) 9.9% 19.7% 32.4% 28.2% 9.9% 31.7% 20.6% 25.4% 3.2% 7.9% 11.1%
City of St. Louis Park (MN) 8.1% 12.7% 39.6% 30.0% 9.6% 18.9% 17.4% 16.2% 14.8% 12.1% 20.7%
City of Logan (UT) 14.0% 16.6% 34.8% 21.3% 13.2% 23.3% 17.0% 21.2% 11.9% 9.1% 17.4%
Gibson County (TN) 13.1% 31.1% 34.4% 19.7% 1.6% 18.2% 14.5% 21.8% 18.2% 12.7% 14.5%
Group A Average 14.7% 17.2% 36.2% 24.6% 7.4% 19.7% 18.7% 18.6% 14.4% 11.3% 17.3%
Group A Median 12.4% 17.5% 35.6% 25.9% 6.6% 20.4% 19.4% 19.2% 14.0% 10.6% 13.0%
RESIDENTS ONLY -- EDUCATIONAL ATTAINMENT RESIDENTS ONLY -- HOUSEHOLD INCOME
SOURCE: Arts and Economic Prosperity 5, Americans for the Arts, 2017. For more information, visit www.AmericansForTheArts.org/EconomicImpact. B–397

Table 27:Educational Attainment and Annual Household Incomeof Resident Attendees to Cultural Events Per Study Region During 2016
Population Cohort Group BPopulation 50,000 to 99,999 High School 2-Year 4-Year Master's Doctoral Less than $40,000 to $60,000 to $80,000 to $100,000 to $120,000
Sample Size = 38 or Less Degree Degree Degree Degree $40,000 $59,999 $79,999 $99,999 $119,999 or More
City of Joplin (MO) 13.6% 18.0% 40.5% 18.5% 9.5% 26.6% 23.5% 15.2% 9.7% 10.3% 14.7%
City of La Crosse (WI) 22.2% 16.9% 30.5% 23.3% 7.2% 31.4% 19.1% 16.8% 9.7% 10.1% 12.9%
McMinn County (TN) 13.2% 16.6% 35.0% 27.2% 8.0% 14.9% 16.7% 22.4% 21.5% 7.2% 17.3%
Lafayette County (MS) 7.1% 7.5% 44.1% 28.1% 13.3% 30.2% 17.4% 13.7% 12.5% 9.5% 16.8%
Chisago County (MN) 21.5% 27.9% 27.3% 20.4% 2.9% 30.0% 20.0% 19.4% 13.8% 10.6% 6.3%
City of Grand Forks (ND) 10.0% 20.1% 41.4% 19.8% 8.7% 24.6% 21.7% 16.4% 13.6% 10.6% 13.0%
City of Corvallis (OR) 4.3% 10.0% 34.7% 34.1% 16.9% 13.3% 16.2% 19.6% 17.3% 14.5% 19.1%
City of Noblesville (IN) 11.6% 12.3% 47.8% 25.8% 2.5% 9.9% 13.1% 16.3% 21.2% 15.5% 24.0%
City of Ocala (FL) 14.3% 27.8% 33.8% 18.2% 5.8% 18.6% 23.7% 22.5% 14.4% 7.4% 13.4%
Lenoir County (NC) 4.5% 34.3% 43.5% 14.0% 3.8% 6.1% 25.2% 26.1% 25.7% 9.9% 7.1%
Town of Chapel Hill (NC) 11.5% 4.0% 31.3% 33.9% 19.4% 25.0% 10.4% 10.4% 10.8% 10.8% 32.5%
City of Grand Junction (CO) 15.5% 17.7% 38.2% 22.1% 6.6% 29.2% 17.5% 16.4% 12.9% 10.8% 13.3%
Town of Jupiter (FL) 13.3% 40.0% 26.7% 20.0% 0.0% 4.8% 5.6% 11.3% 18.1% 18.1% 42.1%
Hamblen County (TN) 6.1% 15.3% 46.9% 29.1% 2.6% 4.6% 20.9% 22.4% 30.6% 17.3% 4.1%
City of Delray Beach (FL) 6.7% 26.7% 20.0% 33.3% 13.3% 14.9% 14.3% 17.6% 20.6% 14.5% 18.2%
City of St. Cloud (MN) 14.4% 17.2% 43.9% 19.4% 5.0% 30.2% 16.0% 23.1% 13.0% 8.9% 8.9%
City of Portland (ME) 5.4% 9.0% 37.5% 34.3% 13.8% 18.6% 15.1% 14.0% 12.7% 13.0% 26.6%
City of Jackson (TN) 13.6% 17.0% 38.7% 21.4% 9.2% 20.0% 22.0% 16.8% 10.7% 10.4% 20.0%
City of Walnut Creek (CA) 4.7% 11.9% 39.5% 31.3% 12.6% 4.5% 5.3% 11.6% 12.2% 14.5% 51.8%
Greene County (TN) 15.1% 16.2% 57.6% 10.1% 1.0% 25.3% 26.3% 18.2% 16.2% 7.1% 7.1%
City of Flagstaff (AZ) 7.9% 12.6% 37.3% 27.7% 14.4% 22.9% 19.5% 20.5% 13.3% 10.5% 13.3%
City of Missoula (MT) 10.0% 10.4% 36.6% 29.3% 13.7% 24.6% 21.4% 23.2% 11.6% 10.3% 8.9%
City of Fort Myers (FL) 7.8% 17.3% 34.6% 30.2% 10.1% 9.6% 14.3% 16.8% 19.1% 15.7% 24.4%
Putnam County (TN) 13.5% 12.6% 30.6% 28.8% 14.4% 17.6% 11.1% 23.1% 18.5% 17.6% 12.0%
Monroe County (FL) 8.7% 17.0% 35.4% 27.6% 11.3% 13.6% 15.7% 17.1% 14.1% 13.5% 25.9%
City of Lynchburg (VA) 10.3% 12.4% 37.7% 27.9% 11.7% 20.3% 19.0% 17.3% 11.4% 13.3% 18.6%
City of Duluth (MN) 12.4% 12.4% 37.1% 28.0% 10.2% 27.3% 19.2% 20.9% 14.5% 8.7% 9.3%
City of Fishers (IN) 5.8% 10.7% 59.1% 19.4% 5.0% 6.7% 10.2% 16.9% 21.3% 21.8% 23.1%
City of Carmel (IN) 2.2% 8.4% 55.5% 26.0% 7.9% 2.8% 4.2% 12.6% 28.8% 25.6% 26.0%
City of Sugar Land (TX) 6.9% 8.9% 43.4% 33.8% 7.0% 5.2% 13.3% 12.2% 12.2% 16.2% 41.0%
RESIDENTS ONLY -- EDUCATIONAL ATTAINMENT RESIDENTS ONLY -- HOUSEHOLD INCOME
SOURCE: Arts and Economic Prosperity 5, Americans for the Arts, 2017. For more information, visit www.AmericansForTheArts.org/EconomicImpact. B–398

Table 27:Educational Attainment and Annual Household Incomeof Resident Attendees to Cultural Events Per Study Region During 2016
Population Cohort Group BPopulation 50,000 to 99,999 High School 2-Year 4-Year Master's Doctoral Less than $40,000 to $60,000 to $80,000 to $100,000 to $120,000
Sample Size = 38 or Less Degree Degree Degree Degree $40,000 $59,999 $79,999 $99,999 $119,999 or More
City of Asheville (NC) 5.4% 10.1% 42.0% 29.2% 13.4% 29.2% 14.6% 18.7% 13.4% 7.6% 16.6%
Buchanan County (MO) 27.2% 19.9% 31.2% 16.9% 4.8% 26.0% 19.0% 15.8% 16.7% 10.6% 11.9%
City of Boca Raton (FL) 12.8% 9.1% 40.0% 21.8% 16.4% 15.8% 13.9% 14.5% 11.6% 16.0% 28.1%
City of Miami Beach (FL) 2.5% 7.8% 28.1% 38.8% 22.8% 11.3% 9.7% 13.3% 11.8% 11.0% 43.0%
Moore County (NC) 5.8% 11.3% 38.3% 34.6% 10.0% 6.4% 14.0% 20.7% 19.5% 15.0% 24.4%
Sevier County (TN) 41.0% 25.5% 23.8% 8.4% 1.3% 31.4% 29.1% 16.1% 6.3% 9.9% 7.2%
Cape May County (NJ) 20.7% 15.3% 34.1% 24.0% 6.0% 19.2% 27.9% 20.6% 13.6% 7.7% 11.1%
Cleveland County (NC) 12.7% 28.3% 35.1% 19.9% 4.0% 18.6% 23.6% 22.4% 12.7% 11.8% 11.0%
Group B Average 11.6% 16.2% 37.9% 25.2% 9.1% 18.2% 17.1% 17.7% 15.5% 12.5% 19.1%
Group B Median 10.9% 15.3% 37.4% 26.6% 9.0% 18.6% 17.1% 17.0% 13.6% 10.8% 16.7%
RESIDENTS ONLY -- EDUCATIONAL ATTAINMENT RESIDENTS ONLY -- HOUSEHOLD INCOME
SOURCE: Arts and Economic Prosperity 5, Americans for the Arts, 2017. For more information, visit www.AmericansForTheArts.org/EconomicImpact. B–399

Table 27:Educational Attainment and Annual Household Incomeof Resident Attendees to Cultural Events Per Study Region During 2016
Population Cohort Group CPopulation 100,000 to 249,999 High School 2-Year 4-Year Master's Doctoral Less than $40,000 to $60,000 to $80,000 to $100,000 to $120,000
Sample Size = 50 or Less Degree Degree Degree Degree $40,000 $59,999 $79,999 $99,999 $119,999 or More
City of Las Cruces (NM) 11.3% 19.2% 34.4% 25.9% 9.3% 29.0% 21.0% 15.0% 13.1% 8.2% 13.7%
Eau Claire County (WI) 12.4% 22.8% 40.0% 19.7% 5.0% 13.7% 22.3% 24.5% 18.4% 9.1% 12.1%
Yamhill County (OR) 15.3% 23.0% 35.2% 21.5% 5.0% 25.3% 18.9% 18.9% 13.0% 11.0% 13.0%
City of Lewisville (TX) 9.4% 22.1% 44.2% 18.2% 6.1% 6.2% 14.9% 16.7% 15.2% 15.8% 31.3%
City of West Palm Beach (FL) 7.1% 15.7% 37.1% 28.6% 11.4% 12.0% 13.8% 18.9% 17.8% 17.0% 20.5%
City of Boulder (CO) 3.7% 6.4% 39.0% 35.7% 15.3% 17.1% 12.0% 11.1% 15.7% 14.8% 29.2%
City of Richardson (TX) 5.2% 11.5% 42.5% 30.8% 10.0% 7.3% 9.9% 14.4% 12.1% 15.2% 41.1%
City of High Point (NC) 11.6% 14.6% 47.4% 20.8% 5.6% 18.0% 17.8% 18.0% 15.1% 14.2% 17.0%
City of Cambridge (MA) 1.4% 2.8% 29.9% 46.5% 19.4% 12.5% 11.6% 12.5% 13.7% 12.2% 37.5%
City of Lowell (MA) 12.3% 11.8% 39.0% 30.8% 6.1% 23.3% 16.7% 14.3% 14.7% 11.4% 19.5%
Douglas County (KS) 6.3% 11.2% 33.6% 30.5% 18.4% 15.9% 14.9% 16.2% 14.9% 13.4% 24.8%
City of Columbia (MO) 7.1% 9.7% 35.5% 29.4% 18.2% 20.3% 13.4% 19.4% 14.4% 12.6% 19.9%
City of Norman (OK) 21.2% 17.5% 31.5% 21.7% 8.2% 29.7% 20.3% 17.5% 10.8% 9.3% 12.4%
Wayne County (NC) 18.2% 27.6% 28.1% 20.5% 5.7% 25.6% 21.4% 18.5% 14.3% 8.1% 12.1%
City of Lafayette (LA) 8.1% 0.0% 70.3% 18.9% 2.7% 17.6% 20.6% 29.4% 17.6% 11.8% 2.9%
Washington County (TN) 14.1% 9.9% 32.4% 28.2% 15.5% 26.5% 25.0% 21.2% 9.1% 6.8% 11.4%
City of Thousand Oaks (CA) 8.8% 18.5% 38.6% 25.4% 8.6% 8.4% 11.0% 13.3% 13.0% 15.0% 39.3%
City of Charleston (SC) 7.2% 12.2% 37.8% 30.4% 12.4% 12.5% 13.8% 16.1% 13.6% 14.4% 29.5%
City of Waco (TX) 19.3% 19.9% 32.7% 19.3% 8.8% 30.4% 17.0% 15.8% 10.4% 9.5% 16.9%
Robeson County (NC) 20.7% 24.0% 29.0% 18.9% 7.5% 37.6% 19.5% 15.7% 11.5% 6.6% 9.1%
Columbia County (GA) 11.3% 15.9% 41.5% 24.1% 7.3% 12.1% 11.7% 21.6% 14.9% 14.3% 25.4%
Orange County (NC) 7.6% 3.9% 33.3% 37.9% 17.2% 18.6% 10.2% 12.9% 15.6% 11.1% 31.5%
City of Savannah (GA) 6.7% 14.4% 38.3% 31.1% 9.7% 18.1% 16.4% 15.4% 16.2% 12.8% 21.1%
Indian River County (FL) 9.3% 25.4% 42.4% 18.2% 4.8% 12.3% 19.4% 31.5% 11.0% 8.9% 16.8%
City of Alexandria (VA) 2.3% 5.4% 34.4% 46.0% 11.8% 3.3% 9.2% 14.7% 16.1% 16.1% 40.6%
Martin County (FL) 8.2% 20.3% 39.4% 24.7% 7.5% 10.7% 14.6% 13.5% 16.9% 17.7% 26.6%
Macon-Bibb County (GA) 5.9% 12.0% 39.7% 26.9% 15.5% 16.5% 16.9% 13.6% 14.6% 12.7% 25.6%
City of Springfield (MA) 15.9% 19.9% 41.9% 19.1% 3.1% 17.4% 24.5% 24.7% 15.2% 11.4% 6.7%
Catawba County (NC) 8.0% 18.6% 38.7% 25.8% 9.0% 9.3% 14.6% 19.1% 13.5% 14.0% 29.5%
Town of Cary (NC) 5.4% 11.7% 38.7% 34.8% 9.3% 12.5% 12.5% 12.8% 17.2% 14.3% 30.8%
RESIDENTS ONLY -- EDUCATIONAL ATTAINMENT RESIDENTS ONLY -- HOUSEHOLD INCOME
SOURCE: Arts and Economic Prosperity 5, Americans for the Arts, 2017. For more information, visit www.AmericansForTheArts.org/EconomicImpact. B–400

Table 27:Educational Attainment and Annual Household Incomeof Resident Attendees to Cultural Events Per Study Region During 2016
Population Cohort Group CPopulation 100,000 to 249,999 High School 2-Year 4-Year Master's Doctoral Less than $40,000 to $60,000 to $80,000 to $100,000 to $120,000
Sample Size = 50 or Less Degree Degree Degree Degree $40,000 $59,999 $79,999 $99,999 $119,999 or More
Alamance County (NC) 14.6% 17.7% 36.0% 24.5% 7.2% 16.8% 18.5% 20.3% 15.9% 11.2% 17.2%
Cumberland County (NJ) 29.3% 15.5% 36.2% 15.5% 3.4% 20.9% 22.0% 23.1% 16.5% 8.8% 8.8%
City of Eugene (OR) 9.7% 15.2% 33.9% 27.7% 13.6% 26.5% 18.1% 16.3% 11.3% 10.4% 17.4%
Middlesex County (CT) 19.2% 3.8% 30.8% 38.5% 7.7% 0.0% 8.3% 20.8% 8.3% 16.7% 45.8%
City of Springfield (MO) 9.9% 18.8% 40.3% 23.0% 8.0% 27.1% 16.0% 18.4% 12.0% 10.6% 15.8%
City of Sioux Falls (SD) 14.0% 14.9% 35.4% 24.6% 11.1% 13.0% 19.3% 16.8% 16.1% 12.7% 22.2%
Pitt County (NC) 10.7% 12.4% 45.0% 23.8% 8.2% 28.3% 15.9% 17.0% 11.2% 9.1% 18.5%
City of Providence (RI) 6.0% 8.5% 43.4% 32.8% 9.4% 16.1% 20.0% 17.6% 17.6% 5.9% 22.9%
City of Worcester (MA) 9.1% 12.8% 40.1% 31.2% 6.8% 23.6% 20.8% 16.0% 7.2% 10.3% 22.0%
Montgomery County (TN) 10.9% 16.5% 24.4% 28.0% 20.3% 16.9% 16.6% 16.6% 14.0% 18.3% 17.6%
Salt Lake City (UT) 11.7% 14.7% 37.2% 25.9% 10.5% 23.7% 16.3% 17.3% 12.0% 10.2% 20.4%
Cabarrus County (NC) 16.8% 17.7% 38.1% 18.7% 8.6% 10.8% 15.2% 20.7% 10.2% 11.9% 31.2%
Richmond County (GA) 10.0% 15.9% 36.0% 26.4% 11.6% 17.1% 16.2% 19.6% 15.2% 12.5% 19.4%
City of Tacoma (WA) 7.0% 13.1% 34.9% 32.4% 12.7% 16.1% 16.0% 17.9% 14.3% 15.1% 20.6%
Doña Ana County (NM) 14.9% 18.7% 34.7% 23.6% 8.0% 30.5% 22.4% 15.0% 13.2% 7.1% 11.9%
New Hanover County (NC) 3.4% 11.1% 39.3% 32.5% 13.7% 11.9% 14.7% 11.0% 11.9% 19.3% 31.2%
Arlington County (VA) 7.6% 6.3% 29.9% 39.5% 16.7% 13.1% 8.3% 8.8% 13.1% 15.0% 41.7%
City of Irving (TX) 13.1% 14.5% 44.5% 20.1% 7.8% 16.0% 18.7% 19.5% 9.3% 12.5% 24.1%
City of Reno (NV) 11.4% 22.8% 36.1% 23.3% 6.5% 19.9% 15.0% 16.9% 14.3% 15.0% 18.9%
York County (SC) 10.5% 14.3% 44.4% 25.3% 5.5% 19.6% 14.0% 17.6% 14.6% 14.0% 20.2%
Group C Average 10.8% 14.7% 37.7% 27.0% 9.8% 17.8% 16.4% 17.5% 13.8% 12.3% 22.3%
Group C Median 10.0% 14.8% 37.5% 25.9% 8.7% 17.0% 16.3% 17.0% 14.3% 12.5% 20.5%
RESIDENTS ONLY -- HOUSEHOLD INCOMERESIDENTS ONLY -- EDUCATIONAL ATTAINMENT
SOURCE: Arts and Economic Prosperity 5, Americans for the Arts, 2017. For more information, visit www.AmericansForTheArts.org/EconomicImpact. B–401

Table 27:Educational Attainment and Annual Household Incomeof Resident Attendees to Cultural Events Per Study Region During 2016
Population Cohort Group DPopulation 250,000 to 499,999 High School 2-Year 4-Year Master's Doctoral Less than $40,000 to $60,000 to $80,000 to $100,000 to $120,000
Sample Size = 42 or Less Degree Degree Degree Degree $40,000 $59,999 $79,999 $99,999 $119,999 or More
Buncombe County (NC) 5.7% 10.7% 42.8% 29.2% 11.6% 28.9% 15.5% 17.7% 14.1% 8.5% 15.3%
Alachua County (FL) 6.9% 15.1% 32.4% 26.6% 19.1% 25.9% 17.6% 15.7% 10.0% 11.3% 19.6%
Greater Green Bay Area (WI) 10.4% 21.5% 38.9% 23.6% 5.6% 15.1% 21.7% 16.9% 15.8% 14.7% 15.8%
City of Orlando (FL) 10.3% 14.5% 42.7% 24.7% 7.8% 16.3% 18.2% 17.5% 13.7% 10.5% 23.8%
City of Lincoln (NE) 8.3% 12.4% 35.0% 27.2% 17.0% 16.7% 16.1% 20.7% 14.4% 10.8% 21.2%
Southeastern Connecticut Region (CT) 11.7% 14.5% 35.8% 30.4% 7.6% 16.0% 14.6% 16.7% 16.4% 12.8% 23.5%
Erie County (PA) 21.7% 13.9% 29.7% 26.8% 7.9% 19.2% 21.9% 17.6% 15.8% 12.5% 13.0%
San Luis Obispo County (CA) 6.6% 16.9% 42.0% 24.9% 9.6% 11.7% 12.6% 18.2% 18.3% 13.8% 25.4%
City of Newark (NJ) 23.2% 27.7% 27.3% 15.2% 6.6% 38.0% 24.3% 15.3% 7.4% 5.6% 9.5%
Leon County (FL) 4.4% 8.8% 33.2% 34.7% 18.9% 16.2% 17.0% 15.1% 13.0% 13.1% 25.6%
Rutherford County (TN) 18.0% 16.6% 38.3% 20.9% 6.1% 21.1% 18.8% 17.3% 11.8% 11.1% 19.9%
St. Lucie County (FL) 18.2% 31.3% 27.3% 22.2% 1.0% 15.5% 17.5% 17.5% 16.5% 14.4% 18.6%
Greater Spartanburg Area (SC) 13.1% 19.4% 37.6% 24.2% 5.7% 21.2% 22.9% 14.7% 11.8% 6.5% 22.9%
Durham County (NC) 3.9% 10.0% 34.9% 33.6% 17.6% 15.9% 15.4% 15.2% 18.0% 12.9% 22.7%
City of St. Paul (MN) 8.1% 12.7% 39.6% 30.0% 9.6% 18.9% 17.4% 16.2% 14.8% 12.1% 20.7%
Hamilton County (IN) 7.1% 10.7% 53.5% 23.9% 4.8% 6.8% 9.5% 15.4% 23.5% 20.5% 24.3%
Osceola County (FL) 13.0% 26.1% 39.1% 13.0% 8.7% 50.0% 0.0% 15.0% 10.0% 10.0% 15.0%
Escambia County (FL) 7.7% 14.1% 38.7% 26.6% 12.9% 14.8% 16.6% 17.5% 20.5% 11.4% 19.2%
Lexington-Fayette Urban County (KY) 10.8% 10.7% 38.5% 27.3% 12.7% 25.7% 16.5% 15.5% 9.5% 11.3% 21.4%
Lake County (FL) 16.5% 27.3% 32.0% 21.6% 2.6% 18.9% 25.0% 23.2% 12.8% 10.4% 9.8%
City of Riverside (CA) 21.2% 20.2% 43.0% 14.2% 1.3% 16.9% 12.9% 23.5% 26.5% 14.2% 6.0%
Cumberland County (NC) 16.5% 25.6% 32.9% 20.2% 4.8% 24.6% 19.7% 19.2% 12.6% 10.6% 13.4%
Collier County (FL) 8.7% 15.6% 34.4% 32.3% 8.9% 9.0% 10.9% 12.0% 13.6% 15.2% 39.4%
Hamilton County (TN) 6.6% 15.9% 44.4% 25.0% 8.1% 24.5% 18.6% 16.1% 11.9% 10.0% 18.9%
Manatee County (FL) 13.9% 21.9% 33.7% 24.3% 6.3% 16.4% 17.9% 16.4% 12.3% 14.7% 22.3%
City of Tampa (FL) 7.1% 14.5% 39.5% 28.1% 10.7% 14.7% 17.4% 16.6% 13.4% 12.6% 25.4%
Forsyth County (NC) 10.3% 14.7% 35.8% 29.4% 9.7% 15.7% 17.8% 17.6% 13.5% 12.7% 22.6%
Mercer County (NJ) 2.0% 13.7% 17.6% 45.1% 21.6% 9.3% 4.7% 4.7% 11.6% 18.6% 51.2%
City of Wichita (KS) 11.8% 15.4% 38.2% 25.8% 8.9% 16.8% 16.8% 17.6% 15.3% 13.9% 19.7%
Clackamas County (OR) 10.0% 18.5% 39.4% 28.5% 3.6% 16.1% 18.8% 21.4% 17.9% 12.1% 13.8%
RESIDENTS ONLY -- HOUSEHOLD INCOMERESIDENTS ONLY -- EDUCATIONAL ATTAINMENT
SOURCE: Arts and Economic Prosperity 5, Americans for the Arts, 2017. For more information, visit www.AmericansForTheArts.org/EconomicImpact. B–402
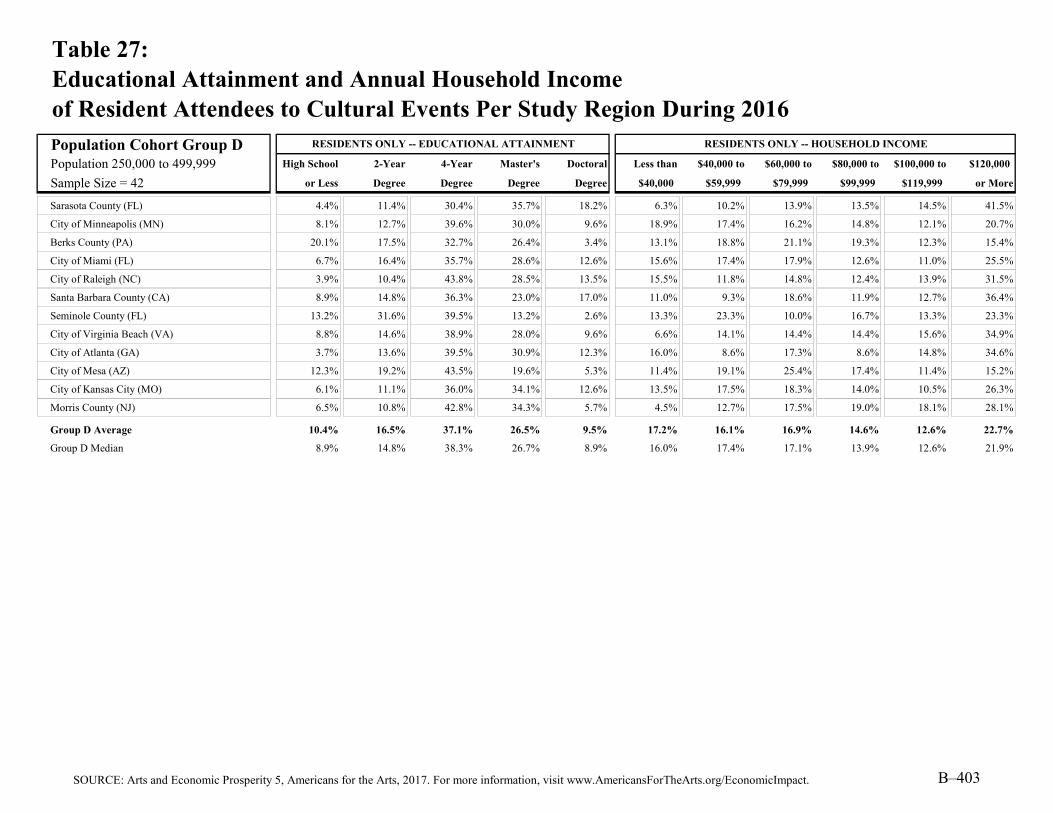
Table 27:Educational Attainment and Annual Household Incomeof Resident Attendees to Cultural Events Per Study Region During 2016
Population Cohort Group DPopulation 250,000 to 499,999 High School 2-Year 4-Year Master's Doctoral Less than $40,000 to $60,000 to $80,000 to $100,000 to $120,000
Sample Size = 42 or Less Degree Degree Degree Degree $40,000 $59,999 $79,999 $99,999 $119,999 or More
Sarasota County (FL) 4.4% 11.4% 30.4% 35.7% 18.2% 6.3% 10.2% 13.9% 13.5% 14.5% 41.5%
City of Minneapolis (MN) 8.1% 12.7% 39.6% 30.0% 9.6% 18.9% 17.4% 16.2% 14.8% 12.1% 20.7%
Berks County (PA) 20.1% 17.5% 32.7% 26.4% 3.4% 13.1% 18.8% 21.1% 19.3% 12.3% 15.4%
City of Miami (FL) 6.7% 16.4% 35.7% 28.6% 12.6% 15.6% 17.4% 17.9% 12.6% 11.0% 25.5%
City of Raleigh (NC) 3.9% 10.4% 43.8% 28.5% 13.5% 15.5% 11.8% 14.8% 12.4% 13.9% 31.5%
Santa Barbara County (CA) 8.9% 14.8% 36.3% 23.0% 17.0% 11.0% 9.3% 18.6% 11.9% 12.7% 36.4%
Seminole County (FL) 13.2% 31.6% 39.5% 13.2% 2.6% 13.3% 23.3% 10.0% 16.7% 13.3% 23.3%
City of Virginia Beach (VA) 8.8% 14.6% 38.9% 28.0% 9.6% 6.6% 14.1% 14.4% 14.4% 15.6% 34.9%
City of Atlanta (GA) 3.7% 13.6% 39.5% 30.9% 12.3% 16.0% 8.6% 17.3% 8.6% 14.8% 34.6%
City of Mesa (AZ) 12.3% 19.2% 43.5% 19.6% 5.3% 11.4% 19.1% 25.4% 17.4% 11.4% 15.2%
City of Kansas City (MO) 6.1% 11.1% 36.0% 34.1% 12.6% 13.5% 17.5% 18.3% 14.0% 10.5% 26.3%
Morris County (NJ) 6.5% 10.8% 42.8% 34.3% 5.7% 4.5% 12.7% 17.5% 19.0% 18.1% 28.1%
Group D Average 10.4% 16.5% 37.1% 26.5% 9.5% 17.2% 16.1% 16.9% 14.6% 12.6% 22.7%
Group D Median 8.9% 14.8% 38.3% 26.7% 8.9% 16.0% 17.4% 17.1% 13.9% 12.6% 21.9%
RESIDENTS ONLY -- HOUSEHOLD INCOMERESIDENTS ONLY -- EDUCATIONAL ATTAINMENT
SOURCE: Arts and Economic Prosperity 5, Americans for the Arts, 2017. For more information, visit www.AmericansForTheArts.org/EconomicImpact. B–403

Table 27:Educational Attainment and Annual Household Incomeof Resident Attendees to Cultural Events Per Study Region During 2016
Population Cohort Group EPopulation 500,000 to 999,999 High School 2-Year 4-Year Master's Doctoral Less than $40,000 to $60,000 to $80,000 to $100,000 to $120,000
Sample Size = 25 or Less Degree Degree Degree Degree $40,000 $59,999 $79,999 $99,999 $119,999 or More
Sonoma County (CA) 9.0% 15.6% 37.4% 28.1% 9.9% 10.0% 12.4% 16.9% 13.1% 17.2% 30.4%
Volusia County (FL) 9.7% 22.2% 34.7% 26.4% 6.9% 21.7% 26.7% 16.7% 18.3% 8.3% 8.3%
Guilford County (NC) 7.7% 12.2% 43.4% 25.9% 10.8% 14.5% 16.6% 17.6% 14.3% 12.8% 24.1%
Dane County (WI) 8.3% 5.6% 41.7% 32.3% 12.1% 26.7% 18.0% 18.0% 11.6% 10.3% 15.5%
Brevard County (FL) 16.7% 16.7% 30.6% 29.2% 6.9% 8.8% 17.5% 19.3% 19.3% 19.3% 15.8%
Washington County (OR) 8.5% 13.2% 44.1% 26.4% 7.8% 12.2% 15.6% 18.1% 15.6% 15.2% 23.3%
Johnson County (KS) 5.8% 13.7% 38.3% 33.2% 9.0% 10.9% 14.9% 16.5% 13.3% 15.7% 28.6%
City of Louisville (KY) 8.8% 8.3% 40.8% 31.6% 10.5% 10.6% 13.5% 19.2% 18.3% 16.2% 22.2%
City of Baltimore (MD) 9.8% 9.8% 30.1% 29.5% 20.8% 9.9% 17.4% 15.7% 16.9% 14.0% 26.2%
Polk County (FL) 13.5% 22.3% 36.0% 23.9% 4.3% 18.2% 21.9% 22.4% 13.2% 11.2% 13.2%
City of Boston (MA) 14.7% 8.1% 45.2% 24.6% 7.4% 27.8% 12.8% 19.9% 13.9% 9.4% 16.2%
District of Columbia (DC) 3.9% 4.3% 29.6% 43.0% 19.2% 12.5% 10.9% 10.5% 12.5% 13.1% 40.6%
Nashville-Davidson County (TN) 5.3% 9.7% 47.3% 27.1% 10.6% 21.7% 19.3% 15.8% 10.4% 10.8% 21.9%
City of El Paso (TX) 19.2% 28.8% 34.8% 15.2% 2.1% 39.1% 24.6% 13.7% 10.1% 5.6% 6.9%
Lee County (FL) 7.9% 16.9% 34.7% 29.8% 10.7% 10.1% 15.0% 17.2% 18.1% 15.2% 24.3%
City of Fort Worth (TX) 8.0% 16.6% 40.5% 27.5% 7.4% 8.9% 17.2% 19.6% 12.6% 11.0% 30.7%
City of Indianapolis (IN) 4.7% 10.5% 36.4% 33.2% 15.2% 15.9% 18.5% 12.0% 15.0% 11.0% 27.6%
City and County of San Francisco (CA) 7.9% 11.1% 41.6% 30.5% 8.9% 20.2% 14.4% 17.1% 12.0% 11.6% 24.7%
Prince George's County (MD) 15.1% 15.7% 29.8% 32.0% 7.3% 11.3% 15.4% 15.7% 12.5% 16.5% 28.7%
Pinellas County (FL) 9.7% 19.4% 33.8% 28.7% 8.3% 17.2% 18.1% 17.6% 10.8% 13.7% 22.7%
Shelby County (TN) 7.8% 12.4% 36.9% 29.6% 13.3% 17.0% 19.9% 13.5% 13.7% 9.0% 26.9%
Fairfield County (CT) 8.9% 10.2% 44.2% 30.3% 6.5% 6.7% 4.8% 12.5% 17.3% 20.2% 38.6%
Westchester County (NY) 7.9% 8.0% 28.7% 40.6% 14.8% 6.3% 9.3% 12.6% 10.8% 14.9% 46.1%
Fulton County (GA) 5.1% 11.0% 41.3% 33.4% 9.2% 12.2% 15.8% 21.7% 15.0% 11.0% 24.3%
Wake County (NC) 5.8% 12.0% 41.5% 29.7% 11.1% 15.0% 11.7% 14.3% 14.8% 14.2% 30.0%
Group E Average 9.2% 13.4% 37.7% 29.7% 10.0% 15.4% 16.1% 16.6% 14.1% 13.1% 24.7%
Group E Median 8.3% 12.2% 37.4% 29.6% 9.2% 12.5% 15.8% 16.9% 13.7% 13.1% 24.3%
RESIDENTS ONLY -- HOUSEHOLD INCOMERESIDENTS ONLY -- EDUCATIONAL ATTAINMENT
SOURCE: Arts and Economic Prosperity 5, Americans for the Arts, 2017. For more information, visit www.AmericansForTheArts.org/EconomicImpact. B–404

Table 27:Educational Attainment and Annual Household Incomeof Resident Attendees to Cultural Events Per Study Region During 2016
Population Cohort Group FPopulation 1,000,000 or More High School 2-Year 4-Year Master's Doctoral Less than $40,000 to $60,000 to $80,000 to $100,000 to $120,000
Sample Size = 21 or Less Degree Degree Degree Degree $40,000 $59,999 $79,999 $99,999 $119,999 or More
Mecklenburg County (NC) 4.6% 12.1% 40.2% 33.2% 9.9% 12.7% 11.9% 16.0% 14.5% 14.0% 31.0%
City of San José (CA) 8.5% 16.2% 40.6% 27.6% 7.1% 16.3% 14.0% 14.0% 9.5% 13.3% 32.8%
Montgomery County (MD) 3.6% 4.8% 32.1% 38.8% 20.7% 6.7% 7.9% 10.2% 12.2% 18.0% 45.0%
Fairfax County (VA) 4.4% 6.0% 31.2% 43.1% 15.4% 2.4% 5.5% 11.2% 11.8% 15.9% 53.1%
Allegheny County (PA) 7.7% 8.1% 31.2% 35.0% 18.1% 20.2% 14.8% 13.5% 12.9% 11.3% 27.3%
Greater Columbus Area (OH) 11.3% 8.7% 40.3% 27.5% 12.1% 17.3% 16.6% 14.1% 11.5% 12.2% 28.2%
Orange County (FL) 9.0% 15.1% 42.7% 25.3% 7.9% 15.7% 17.7% 18.0% 12.3% 11.1% 25.2%
City of Dallas (TX) 10.5% 10.2% 45.1% 26.1% 8.2% 17.6% 19.3% 13.2% 9.9% 10.1% 29.9%
Hillsborough County (FL) 10.2% 16.2% 37.6% 26.3% 9.7% 15.0% 17.6% 17.1% 13.6% 12.9% 23.9%
City of San Diego (CA) 6.2% 14.2% 38.0% 27.8% 13.8% 13.9% 11.4% 13.5% 14.6% 14.6% 32.1%
Palm Beach County (FL) 9.0% 16.2% 36.2% 27.0% 11.6% 12.0% 13.2% 17.2% 16.7% 16.2% 24.8%
City of San Antonio (TX) 9.3% 20.9% 38.7% 24.3% 6.8% 22.4% 19.4% 17.5% 10.4% 13.4% 16.8%
Sacramento County (CA) 8.0% 15.2% 46.9% 23.3% 6.6% 13.4% 20.3% 22.5% 18.0% 10.8% 15.0%
City of Phoenix (AZ) 11.4% 17.3% 35.2% 25.6% 10.5% 20.7% 17.4% 18.8% 13.9% 9.8% 19.5%
City and County of Philadelphia (PA) 8.4% 7.1% 34.6% 33.3% 16.5% 21.3% 19.6% 14.3% 12.9% 10.5% 21.3%
Broward County (FL) 12.1% 22.1% 35.4% 22.6% 7.8% 14.6% 20.7% 17.0% 11.9% 11.6% 24.1%
Santa Clara County (CA) 5.9% 11.7% 38.9% 33.7% 9.9% 11.8% 10.0% 12.2% 9.0% 15.0% 41.9%
Riverside County (CA) 16.7% 22.1% 45.3% 14.7% 1.2% 11.4% 12.5% 30.4% 27.9% 13.0% 4.7%
Miami-Dade County (FL) 6.1% 14.3% 34.3% 30.7% 14.7% 13.7% 15.5% 16.5% 12.0% 11.0% 31.4%
City of Chicago (IL) 3.0% 5.6% 40.6% 35.6% 15.2% 19.2% 15.3% 13.1% 11.9% 11.5% 29.0%
Harris County (TX) 7.2% 8.6% 35.8% 29.1% 19.3% 15.6% 12.9% 12.9% 12.2% 9.7% 36.7%
Group F Average 8.2% 13.0% 38.1% 29.1% 11.6% 14.9% 14.9% 15.9% 13.3% 12.7% 28.3%
Group F Median 8.4% 14.2% 38.0% 27.6% 10.5% 15.0% 15.3% 14.3% 12.2% 12.2% 28.2%
Average 11.3% 15.5% 37.3% 26.5% 9.3% 17.7% 16.8% 17.4% 14.3% 12.3% 21.5%
Median 9.9% 14.7% 37.4% 27.0% 8.8% 16.5% 17.4% 17.2% 13.7% 12.1% 20.3%
RESIDENTS ONLY -- HOUSEHOLD INCOME
ALL CITY/COUNTY STUDY REGIONS
RESIDENTS ONLY -- EDUCATIONAL ATTAINMENT
SOURCE: Arts and Economic Prosperity 5, Americans for the Arts, 2017. For more information, visit www.AmericansForTheArts.org/EconomicImpact. B–405

Table 27:Educational Attainment and Annual Household Incomeof Resident Attendees to Cultural Events Per Study Region During 2016
Regional Study RegionsAll Populations High School 2-Year 4-Year Master's Doctoral Less than $40,000 to $60,000 to $80,000 to $100,000 to $120,000
Sample Size = 81 or Less Degree Degree Degree Degree $40,000 $59,999 $79,999 $99,999 $119,999 or More
High Peaks Region (ME) 21.9% 16.7% 39.0% 19.5% 2.8% 25.6% 29.1% 21.6% 11.5% 7.0% 5.3%
Wood River Valley (ID) 5.5% 10.0% 47.9% 25.2% 11.3% 7.4% 9.8% 12.6% 11.9% 13.7% 44.6%
Southern Oregon Area 7.4% 21.0% 35.8% 21.0% 14.8% 7.9% 13.2% 15.8% 17.1% 21.1% 25.0%
Southwestern Pennsylvania Area 25.7% 18.5% 29.0% 21.4% 5.4% 25.0% 25.0% 20.7% 11.0% 10.6% 7.7%
Greater Portsmouth Area (NH) 2.9% 7.3% 43.5% 36.5% 9.8% 12.3% 11.6% 14.8% 18.3% 13.9% 29.2%
Northeast Oregon Region 11.4% 13.7% 43.7% 25.1% 6.0% 38.5% 23.0% 12.6% 12.6% 6.9% 6.3%
Toe River Valley (NC) 10.1% 12.6% 40.5% 27.0% 9.8% 18.9% 30.1% 22.1% 12.8% 7.1% 9.0%
Albemarle Region (NC) 10.5% 24.8% 32.8% 22.1% 9.7% 12.0% 18.0% 19.7% 15.7% 10.6% 23.9%
Greater Concord Area (NH) 10.6% 17.2% 33.5% 29.5% 9.1% 19.3% 17.9% 15.0% 12.4% 10.9% 24.5%
North Central Minnesota Region 12.7% 17.3% 42.1% 22.9% 5.1% 23.3% 28.0% 19.7% 12.4% 9.8% 6.7%
Northwest Minnesota Region 32.4% 29.9% 27.0% 8.7% 2.1% 28.1% 28.1% 18.2% 12.8% 5.9% 6.9%
Monadnock Region (NH) 12.1% 13.8% 35.5% 29.4% 9.2% 14.3% 15.2% 19.0% 16.5% 14.3% 20.7%
Bismarck-Mandan Region (ND) 12.6% 19.0% 41.6% 20.0% 6.9% 14.8% 19.3% 16.3% 15.2% 11.4% 22.9%
Greater Minot Region (ND) 16.3% 17.0% 37.2% 21.2% 8.3% 17.6% 16.9% 18.3% 17.3% 11.3% 18.7%
Greater Burlington Area (VT) 3.6% 7.3% 36.9% 38.9% 13.3% 17.9% 14.8% 15.0% 14.8% 14.3% 23.1%
Greater Charlottesville Area (VA) 6.5% 6.5% 36.7% 33.2% 17.0% 19.2% 11.1% 12.1% 15.4% 13.0% 29.2%
Brainerd Lakes Region (MN) 24.4% 24.0% 34.1% 13.8% 3.7% 23.5% 21.0% 16.5% 17.0% 13.5% 8.5%
East Central Minnesota Region 21.5% 27.9% 27.3% 20.4% 2.9% 30.0% 20.0% 19.4% 13.8% 10.6% 6.3%
Northwest Connecticut Region 8.4% 14.8% 31.8% 36.1% 8.9% 13.5% 13.8% 17.8% 14.0% 12.9% 28.0%
Central Oregon Region 6.0% 20.5% 37.2% 27.2% 9.1% 10.7% 11.5% 20.6% 16.4% 16.4% 24.4%
Greater Fargo-Moorhead Area (ND/MN) 7.9% 12.5% 41.7% 24.1% 13.9% 17.9% 14.6% 16.9% 15.7% 14.2% 20.7%
Black Hills Region (SD) 11.4% 16.5% 37.1% 25.3% 9.6% 19.6% 19.1% 20.3% 16.1% 9.9% 15.0%
Greater Kingsport Area (TN) 21.7% 15.4% 37.0% 19.9% 6.1% 20.4% 14.4% 17.5% 15.4% 13.9% 18.3%
Lake Region (MN) 16.4% 22.4% 34.5% 22.8% 3.9% 21.1% 22.0% 30.7% 11.9% 8.7% 5.5%
South Central Minnesota Region 16.2% 18.3% 35.3% 20.4% 9.8% 20.4% 19.0% 21.8% 16.6% 8.5% 13.7%
Greater Sioux Falls Area (SD) 14.7% 19.1% 32.8% 21.8% 11.6% 11.9% 18.3% 18.1% 16.5% 11.9% 23.3%
Southwest Tennessee Development District 26.1% 20.9% 30.1% 17.1% 5.9% 25.7% 22.9% 18.9% 11.7% 7.9% 12.8%
Northwest Tennessee Development District 28.1% 17.8% 26.4% 17.8% 9.8% 29.9% 22.4% 16.8% 14.6% 6.9% 9.3%
Southwest Minnesota Region 29.0% 25.7% 32.4% 8.4% 4.5% 19.1% 29.9% 25.5% 11.5% 8.3% 5.7%
Arrowhead Region (MN) 12.4% 12.4% 37.1% 28.0% 10.2% 27.3% 19.2% 20.9% 14.5% 8.7% 9.3%
RESIDENTS ONLY -- HOUSEHOLD INCOMERESIDENTS ONLY -- EDUCATIONAL ATTAINMENT
SOURCE: Arts and Economic Prosperity 5, Americans for the Arts, 2017. For more information, visit www.AmericansForTheArts.org/EconomicImpact. B–406

Table 27:Educational Attainment and Annual Household Incomeof Resident Attendees to Cultural Events Per Study Region During 2016
Regional Study RegionsAll Populations High School 2-Year 4-Year Master's Doctoral Less than $40,000 to $60,000 to $80,000 to $100,000 to $120,000
Sample Size = 81 or Less Degree Degree Degree Degree $40,000 $59,999 $79,999 $99,999 $119,999 or More
Maple Grove and the Northwest Suburbs (MN) 8.1% 12.7% 39.6% 30.0% 9.6% 18.9% 17.4% 16.2% 14.8% 12.1% 20.7%
Greater Augusta Area (GA) 9.6% 17.7% 37.7% 25.6% 9.4% 14.1% 14.1% 19.5% 15.5% 13.0% 23.8%
Upper Cumberland Development District (TN) 28.2% 22.6% 26.5% 18.9% 3.7% 28.8% 21.8% 20.1% 14.4% 8.7% 6.1%
City of Huntsville/Madison County (AL) 7.0% 9.2% 37.9% 33.5% 12.5% 9.3% 11.7% 12.4% 12.1% 16.2% 38.3%
Northeast Commission (NC) 11.5% 23.5% 34.1% 22.9% 8.0% 13.5% 19.7% 19.6% 15.8% 11.2% 20.3%
Greater Ann Arbor Area (MI) 8.2% 6.4% 32.0% 35.4% 18.0% 18.7% 11.2% 16.3% 13.4% 12.9% 27.5%
Greater Fox Cities Region (WI) 17.8% 19.8% 37.8% 19.1% 5.5% 13.7% 18.7% 19.3% 15.3% 14.1% 18.9%
Central Minnesota Region 14.4% 17.2% 43.9% 19.4% 5.0% 30.2% 16.0% 23.1% 13.0% 8.9% 8.9%
South Central Tennessee Development District 22.5% 22.3% 34.1% 16.4% 4.7% 20.6% 24.2% 20.3% 15.4% 8.4% 11.1%
Northwest Arkansas Region 10.3% 12.5% 36.9% 29.6% 10.7% 15.0% 15.3% 13.4% 13.7% 11.4% 31.2%
Southeast Minnesota Region 10.2% 13.5% 40.9% 29.3% 6.1% 8.2% 18.0% 21.3% 15.9% 16.4% 20.2%
First Tennessee Development District 17.7% 16.4% 37.1% 20.5% 8.3% 23.1% 20.5% 17.0% 13.5% 11.1% 14.8%
Greater Harrisburg Area (PA) 7.2% 10.1% 34.2% 33.3% 15.3% 10.6% 15.0% 15.7% 15.7% 17.3% 25.7%
Greater New Haven Area (CT) 9.5% 11.4% 31.1% 36.7% 11.4% 9.8% 15.7% 16.6% 11.9% 20.9% 25.1%
Treasure Coast Region (FL) 10.5% 24.0% 39.0% 21.1% 5.4% 12.6% 16.4% 21.6% 14.9% 13.0% 21.5%
Greater Des Moines Region (IA) 10.0% 16.5% 46.1% 22.6% 4.8% 17.3% 16.0% 15.5% 15.3% 13.8% 22.2%
Southeast Tennessee Development District 11.8% 17.2% 38.8% 24.6% 7.6% 23.2% 18.9% 18.3% 13.7% 8.3% 17.5%
Greater Knoxville Region (TN) 6.7% 13.3% 44.0% 24.7% 11.2% 15.7% 17.9% 18.1% 13.0% 13.2% 22.1%
Greater Columbia Area (SC) 5.7% 9.6% 43.4% 28.2% 13.0% 23.4% 19.6% 13.9% 10.7% 10.8% 21.6%
Pikes Peak Region (CO) 7.0% 19.4% 35.7% 30.3% 7.6% 16.4% 16.2% 14.9% 15.0% 15.9% 21.6%
Lehigh Valley Region (PA) 13.1% 14.6% 34.0% 30.2% 8.2% 16.1% 16.3% 15.8% 13.3% 15.4% 23.2%
Greater Sarasota/Bradenton Area (FL) 6.5% 13.3% 31.3% 33.2% 15.7% 8.4% 11.8% 14.2% 13.5% 14.8% 37.3%
Dayton Region (OH) 13.2% 16.2% 30.6% 32.0% 8.0% 16.9% 13.8% 20.9% 15.3% 14.0% 19.1%
Richmond & Tri-Cities Region (VA) 5.7% 9.1% 44.6% 29.2% 11.5% 16.5% 13.5% 13.5% 11.2% 11.2% 34.0%
Memphis Area Association of Governments (TN) 8.1% 12.3% 36.7% 29.6% 13.3% 16.8% 19.8% 13.6% 13.4% 9.3% 27.1%
Eastern Region (NC) 10.7% 24.0% 40.5% 19.6% 5.2% 16.5% 20.6% 21.1% 19.2% 11.0% 11.6%
Advantage West Region (NC) 8.9% 12.0% 40.8% 28.4% 9.9% 22.3% 22.1% 20.2% 13.9% 8.7% 12.8%
Southeast Commission (NC) 16.9% 23.2% 32.9% 21.2% 5.8% 25.0% 19.6% 19.2% 12.6% 10.1% 13.6%
Greater Fairfax Area (VA) 3.3% 5.8% 35.0% 40.4% 15.6% 4.7% 6.2% 10.0% 13.8% 15.0% 50.3%
Greater Tulsa Region (OK) 8.2% 16.4% 40.9% 27.5% 7.1% 19.3% 17.7% 17.3% 14.9% 9.6% 21.3%
RESIDENTS ONLY -- EDUCATIONAL ATTAINMENT RESIDENTS ONLY -- HOUSEHOLD INCOME
SOURCE: Arts and Economic Prosperity 5, Americans for the Arts, 2017. For more information, visit www.AmericansForTheArts.org/EconomicImpact. B–407

Table 27:Educational Attainment and Annual Household Incomeof Resident Attendees to Cultural Events Per Study Region During 2016
Regional Study RegionsAll Populations High School 2-Year 4-Year Master's Doctoral Less than $40,000 to $60,000 to $80,000 to $100,000 to $120,000
Sample Size = 81 or Less Degree Degree Degree Degree $40,000 $59,999 $79,999 $99,999 $119,999 or More
East Tennessee Development District 23.4% 19.3% 34.0% 18.2% 5.0% 21.1% 22.3% 19.2% 15.7% 11.8% 9.8%
West Valley Region (AZ) 15.1% 21.5% 33.2% 22.7% 7.5% 14.7% 18.6% 21.2% 17.0% 10.0% 18.4%
Greater St. Louis Area (MO) 7.0% 8.3% 46.4% 26.2% 12.1% 12.5% 14.7% 15.3% 22.1% 14.4% 20.9%
Western New York 10.1% 17.9% 30.7% 34.3% 6.9% 22.0% 18.4% 17.9% 14.0% 12.0% 15.7%
Greater Oklahoma City Region (OK) 18.7% 19.5% 34.3% 21.0% 6.5% 23.4% 21.2% 17.8% 12.7% 10.5% 14.4%
Piedmont Triad Partnership (NC) 11.2% 15.9% 39.1% 25.2% 8.7% 14.9% 18.7% 18.3% 14.5% 12.7% 20.9%
Greater Portland Area (OR) 6.8% 13.1% 38.3% 32.7% 9.1% 13.4% 14.9% 17.0% 15.7% 14.8% 24.3%
Greater Kansas City Metropolitan Area (MO/KS) 7.6% 13.4% 36.5% 32.3% 10.2% 12.7% 15.6% 17.5% 14.3% 13.4% 26.5%
Greater Nashville Regional Council (TN) 12.6% 14.5% 37.8% 23.9% 11.1% 20.2% 18.1% 16.0% 12.7% 12.7% 20.3%
Research Triangle Regional Partnership (NC) 5.6% 9.6% 37.5% 32.7% 14.6% 14.1% 12.9% 15.6% 15.9% 13.6% 27.9%
Greater Tampa/St. Petersburg Area (FL) 9.6% 16.7% 36.9% 27.3% 9.5% 15.6% 18.2% 16.9% 12.5% 13.5% 23.2%
Charlotte Regional Partnership (NC) 11.6% 18.6% 37.8% 23.9% 8.0% 12.8% 15.3% 19.5% 12.8% 13.6% 26.0%
Charlotte Regional Partnership (NC/SC) 11.3% 18.1% 39.1% 24.3% 7.3% 14.0% 15.3% 19.0% 13.4% 13.6% 24.8%
Seven-County Metro Area (MN) 8.1% 12.7% 39.6% 30.0% 9.6% 18.9% 17.4% 16.2% 14.8% 12.1% 20.7%
Central Florida Region 10.2% 18.2% 40.2% 24.4% 7.0% 16.3% 18.8% 18.9% 13.7% 11.9% 20.3%
Greater Philadelphia Region (PA) 8.4% 9.6% 35.2% 32.6% 14.2% 15.6% 15.8% 13.6% 12.9% 13.7% 28.4%
Greater Washington Region (DC/MD/VA) 4.4% 6.4% 33.4% 40.0% 15.8% 7.6% 8.9% 11.4% 13.1% 15.5% 43.6%
Metro Atlanta Area (GA) 5.1% 11.0% 41.3% 33.4% 9.2% 12.2% 15.8% 21.7% 15.0% 11.0% 24.3%
Greater Atlanta Region (GA) 5.1% 11.0% 41.3% 33.4% 9.2% 12.2% 15.8% 21.7% 15.0% 11.0% 24.3%
Greater Houston Region (TX) 7.8% 10.1% 37.5% 28.8% 15.8% 12.9% 12.5% 13.8% 12.3% 11.6% 37.0%
Dallas-Fort Worth-Arlington MSA (TX) 9.2% 13.7% 43.6% 25.7% 7.8% 13.0% 15.6% 15.5% 12.2% 12.6% 31.1%
Regional Average 12.1% 15.8% 36.9% 26.1% 9.1% 17.5% 17.7% 17.8% 14.3% 12.1% 20.7%
Regional Median 10.3% 16.4% 37.1% 25.3% 9.1% 16.5% 17.7% 17.8% 14.3% 12.0% 20.9%
RESIDENTS ONLY -- HOUSEHOLD INCOMERESIDENTS ONLY -- EDUCATIONAL ATTAINMENT
SOURCE: Arts and Economic Prosperity 5, Americans for the Arts, 2017. For more information, visit www.AmericansForTheArts.org/EconomicImpact. B–408
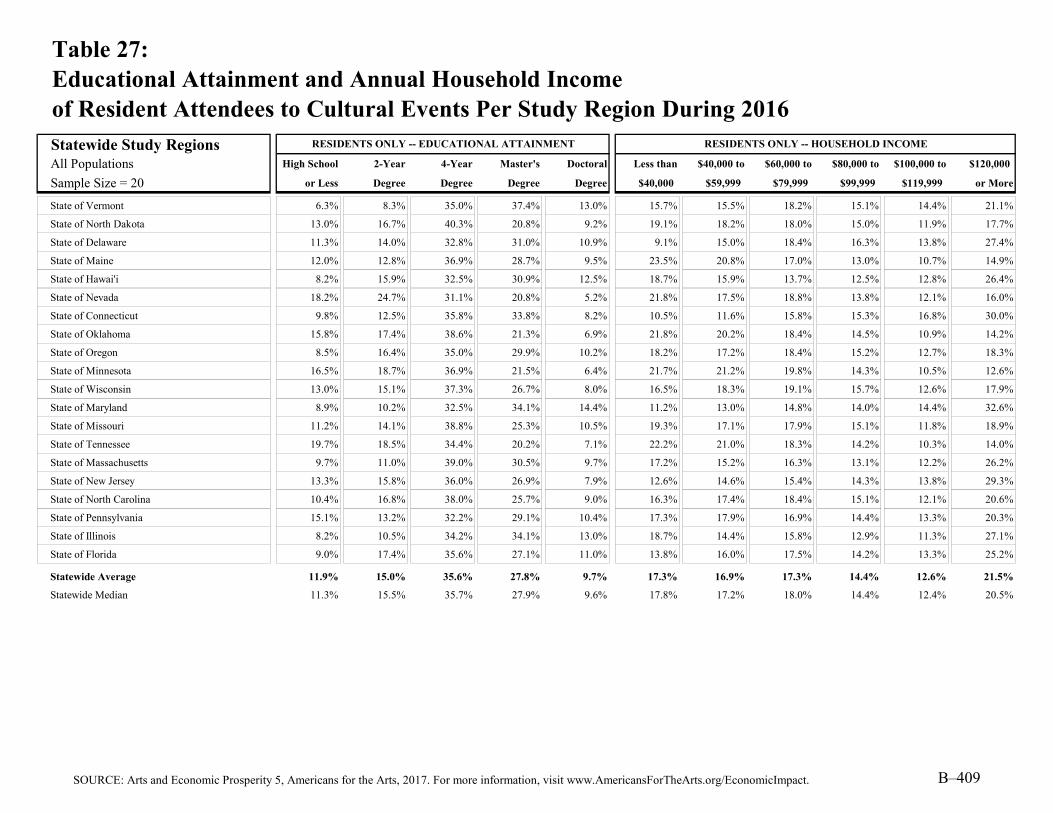
Table 27:Educational Attainment and Annual Household Incomeof Resident Attendees to Cultural Events Per Study Region During 2016
Statewide Study RegionsAll Populations High School 2-Year 4-Year Master's Doctoral Less than $40,000 to $60,000 to $80,000 to $100,000 to $120,000
Sample Size = 20 or Less Degree Degree Degree Degree $40,000 $59,999 $79,999 $99,999 $119,999 or More
State of Vermont 6.3% 8.3% 35.0% 37.4% 13.0% 15.7% 15.5% 18.2% 15.1% 14.4% 21.1%
State of North Dakota 13.0% 16.7% 40.3% 20.8% 9.2% 19.1% 18.2% 18.0% 15.0% 11.9% 17.7%
State of Delaware 11.3% 14.0% 32.8% 31.0% 10.9% 9.1% 15.0% 18.4% 16.3% 13.8% 27.4%
State of Maine 12.0% 12.8% 36.9% 28.7% 9.5% 23.5% 20.8% 17.0% 13.0% 10.7% 14.9%
State of Hawai'i 8.2% 15.9% 32.5% 30.9% 12.5% 18.7% 15.9% 13.7% 12.5% 12.8% 26.4%
State of Nevada 18.2% 24.7% 31.1% 20.8% 5.2% 21.8% 17.5% 18.8% 13.8% 12.1% 16.0%
State of Connecticut 9.8% 12.5% 35.8% 33.8% 8.2% 10.5% 11.6% 15.8% 15.3% 16.8% 30.0%
State of Oklahoma 15.8% 17.4% 38.6% 21.3% 6.9% 21.8% 20.2% 18.4% 14.5% 10.9% 14.2%
State of Oregon 8.5% 16.4% 35.0% 29.9% 10.2% 18.2% 17.2% 18.4% 15.2% 12.7% 18.3%
State of Minnesota 16.5% 18.7% 36.9% 21.5% 6.4% 21.7% 21.2% 19.8% 14.3% 10.5% 12.6%
State of Wisconsin 13.0% 15.1% 37.3% 26.7% 8.0% 16.5% 18.3% 19.1% 15.7% 12.6% 17.9%
State of Maryland 8.9% 10.2% 32.5% 34.1% 14.4% 11.2% 13.0% 14.8% 14.0% 14.4% 32.6%
State of Missouri 11.2% 14.1% 38.8% 25.3% 10.5% 19.3% 17.1% 17.9% 15.1% 11.8% 18.9%
State of Tennessee 19.7% 18.5% 34.4% 20.2% 7.1% 22.2% 21.0% 18.3% 14.2% 10.3% 14.0%
State of Massachusetts 9.7% 11.0% 39.0% 30.5% 9.7% 17.2% 15.2% 16.3% 13.1% 12.2% 26.2%
State of New Jersey 13.3% 15.8% 36.0% 26.9% 7.9% 12.6% 14.6% 15.4% 14.3% 13.8% 29.3%
State of North Carolina 10.4% 16.8% 38.0% 25.7% 9.0% 16.3% 17.4% 18.4% 15.1% 12.1% 20.6%
State of Pennsylvania 15.1% 13.2% 32.2% 29.1% 10.4% 17.3% 17.9% 16.9% 14.4% 13.3% 20.3%
State of Illinois 8.2% 10.5% 34.2% 34.1% 13.0% 18.7% 14.4% 15.8% 12.9% 11.3% 27.1%
State of Florida 9.0% 17.4% 35.6% 27.1% 11.0% 13.8% 16.0% 17.5% 14.2% 13.3% 25.2%
Statewide Average 11.9% 15.0% 35.6% 27.8% 9.7% 17.3% 16.9% 17.3% 14.4% 12.6% 21.5%
Statewide Median 11.3% 15.5% 35.7% 27.9% 9.6% 17.8% 17.2% 18.0% 14.4% 12.4% 20.5%
RESIDENTS ONLY -- HOUSEHOLD INCOMERESIDENTS ONLY -- EDUCATIONAL ATTAINMENT
SOURCE: Arts and Economic Prosperity 5, Americans for the Arts, 2017. For more information, visit www.AmericansForTheArts.org/EconomicImpact. B–409

Table 27:Educational Attainment and Annual Household Incomeof Resident Attendees to Cultural Events Per Study Region During 2016
Individual Arts DistrictsAll Populations High School 2-Year 4-Year Master's Doctoral Less than $40,000 to $60,000 to $80,000 to $100,000 to $120,000
Sample Size = 12 or Less Degree Degree Degree Degree $40,000 $59,999 $79,999 $99,999 $119,999 or More
James River Arts & Cultural District 9.7% 11.8% 38.2% 29.2% 11.0% 20.1% 21.2% 17.4% 12.3% 11.8% 17.2%
Center City Charlotte 5.1% 11.1% 41.6% 31.8% 10.5% 13.9% 11.7% 17.1% 13.2% 12.5% 31.7%
Loch Haven Cultural Park 10.7% 14.6% 44.1% 23.9% 6.7% 15.6% 16.0% 17.3% 13.9% 10.1% 27.2%
Downtown Colorado Springs Creative District 7.0% 15.8% 36.4% 33.5% 7.3% 14.3% 16.3% 15.0% 14.3% 17.6% 22.5%
Fort Worth Cultural District 7.3% 17.4% 35.6% 29.7% 10.0% 8.6% 17.6% 20.0% 11.4% 11.4% 31.0%
Dallas Arts District 11.2% 8.8% 45.8% 26.0% 8.1% 18.2% 17.7% 12.2% 9.7% 11.6% 30.7%
Grand Center Arts & Entertainment District 5.9% 8.1% 47.1% 27.0% 12.0% 8.6% 14.6% 14.3% 25.2% 14.3% 22.9%
Balboa Park Cultural District 7.5% 15.4% 39.5% 26.5% 11.1% 14.6% 12.1% 14.6% 15.8% 15.0% 27.9%
East End Cultural District 10.9% 12.1% 40.0% 28.2% 8.8% 23.4% 17.1% 16.8% 12.1% 8.7% 21.8%
Houston Museum District Association 1.6% 4.5% 28.5% 33.0% 32.4% 8.4% 14.3% 9.4% 12.9% 9.8% 45.1%
Midtown Cultural District 6.3% 8.2% 40.5% 27.1% 18.0% 9.8% 11.6% 15.4% 10.5% 8.8% 43.9%
Washington Avenue Cultural District 11.0% 13.0% 35.0% 28.0% 13.0% 28.5% 13.2% 13.2% 12.3% 11.1% 21.7%
Arts District Average 7.9% 11.7% 39.4% 28.7% 12.4% 15.3% 15.3% 15.2% 13.6% 11.9% 28.6%
Arts District Median 7.4% 12.0% 39.8% 28.1% 10.8% 14.5% 15.3% 15.2% 12.6% 11.5% 27.6%
RESIDENTS ONLY -- HOUSEHOLD INCOMERESIDENTS ONLY -- EDUCATIONAL ATTAINMENT
SOURCE: Arts and Economic Prosperity 5, Americans for the Arts, 2017. For more information, visit www.AmericansForTheArts.org/EconomicImpact. B–410

Explanation of Table 28:Age, Willingness to Travel, Repeat Visitation, and Civic Engagmentof Resident Attendees to Cultural Events Per Study Region During 2016
Column Two:
Column Three:
Column Four:
Column Five:
Column Six:
Columns Seven though Nine:
Column Seven: The percentage of resident audience-intercept survey respondents who responded, "No, I would have skipped the cultural experience altogether."
Column Eight: The percentage of resident audience-intercept survey respondents who responded, "No, I would have replaced it with another nearby cultural experience."
Column Nine: The percentage of resident audience-intercept survey respondents who responded, "Yes, I would have traveled to a different community."
Column Ten:
Column Eleven:The percentage of resident audience-intercept survey respondents in each participating study region who reported that they planned to vote in the 2016 U.S. presidential election.
This table presents a demographic description of resident nonprofit arts and cultural audience members in each participating study region during 2016. Residents are attendees who reside within the county in which the nonprofit arts and cultural event at which they were surveyed took place (within the multi-city or multi-county region for regional analyses, and within the state for statewide analyses). Residency is determined based on the ZIP code provided by each audience-intercept survey respondent. Summary statistics are calculated for each population group. This table details the age, willingness to travel to attend cultural experiences, repeat visitation at the site where they were surveyed, and civic engagement (i.e., their participation status in the 2016 U.S. presidential election) reported by resident arts attendees who completed the audience-intercept survey. Table 27 provides details about resident attendees' educational attainment and annual household income. Note: the percentages may not add exactly to 100 percent where appropriate due to rounding.
The percentage of resident audience-intercept survey respondents in each participating study region who are 18 to 34 years of age. Audience-intercept survey respondents were required to be at least 18 years old.
The percentage of resident audience-intercept survey respondents who are 35 to 44 years of age.
The percentage of resident audience-intercept survey respondents who are 45 to 54 years of age.
The percentage of resident audience-intercept survey respondents who are 55 to 64 years of age.
The percentage of resident audience-intercept survey respondents who are 65 years of age or older.
The percentage of resident audience-intercept survey respondents in each participating study region who reported that they were first time visitors/attendees to the specific nonprofit arts or cultural event (or facility) where they filled out the audience-intercept survey.
The audience-intercept survey included the question, "If this arts event or exhibit were not happening, would you have traveled to another community to attend a similar cultural experience?"
SOURCE: Arts and Economic Prosperity 5, Americans for the Arts, 2017. For more information, visit www.AmericansForTheArts.org/EconomicImpact. B–411

Table 28:Age, Willingness to Travel, Repeat Visitation, and Civic Engagmentof Resident Attendees to Cultural Events Per Study Region During 2016
Population Cohort Group A First Voted in
Population Fewer than 50,000 Skip Replace Different Time 2016
Sample Size = 52 18-34 35-44 45-54 55-64 65 or Older Altogether Nearby Community Attendee Election
Town of Crested Butte (CO) 10.8% 24.9% 42.5% 19.5% 2.4% 30.2% 45.6% 24.2% 13.6% 92.8%
City of Pine City (MN) 5.8% 5.2% 9.8% 35.8% 43.4% 40.4% 16.4% 43.3% n/a n/a
City of Alva (OK) 29.4% 30.3% 17.3% 14.6% 8.4% 90.7% 3.1% 6.2% 39.9% 93.5%
Cook County (MN) 15.1% 7.5% 17.2% 30.7% 29.6% 40.0% 27.2% 32.8% n/a n/a
Town of Hillsborough (NC) 8.3% 21.4% 19.0% 25.0% 26.2% 51.2% 16.7% 32.1% 45.0% 93.5%
City of Virginia (MN) 15.1% 7.5% 17.2% 30.7% 29.6% 40.0% 27.2% 32.8% n/a n/a
Town of Jackson (WY) 32.9% 18.1% 17.3% 16.9% 14.8% 41.0% 31.6% 27.4% 10.0% 91.1%
City of Guthrie (OK) 19.2% 19.7% 20.7% 24.0% 16.3% 26.8% 13.6% 59.6% 24.7% 88.6%
City of Grand Rapids (MN) 15.1% 7.5% 17.2% 30.7% 29.6% 40.0% 27.2% 32.8% n/a n/a
Town of Medfield (MA) 3.2% 20.5% 33.1% 22.2% 21.1% 53.0% 7.2% 39.8% 24.4% 92.9%
City of Fergus Falls (MN) 11.1% 14.5% 14.1% 27.4% 32.9% 39.4% 19.5% 41.1% n/a n/a
Grundy County (TN) 22.6% 16.9% 15.3% 25.0% 20.2% 28.5% 9.8% 61.8% 56.9% 85.6%
City of Falls Church (VA) 12.1% 28.8% 24.2% 20.2% 14.6% 49.7% 13.1% 37.2% 18.8% 82.1%
City of Jamestown (ND) 8.8% 12.6% 15.6% 23.5% 39.5% 52.1% 16.1% 31.8% 6.8% 91.5%
City of Waterville (ME) 10.8% 6.5% 10.8% 29.0% 43.0% 31.6% 20.0% 48.4% 19.8% 94.8%
City of Red Wing (MN) 1.4% 5.5% 14.3% 25.4% 53.5% 31.6% 24.5% 43.9% n/a n/a
City of Durango (CO) 17.3% 8.9% 10.6% 26.7% 36.4% 43.2% 26.0% 30.8% 16.3% 94.0%
City of Hannibal (MO) 9.7% 11.0% 9.7% 21.9% 47.7% 52.7% 15.8% 31.5% 6.0% 88.5%
City of Tullahoma (TN) 7.8% 20.8% 25.3% 19.4% 26.7% 39.1% 14.1% 46.9% 11.6% 88.4%
City of Northfield (MN) 1.4% 5.5% 14.3% 25.4% 53.5% 31.6% 24.5% 43.9% n/a n/a
Town of Carrboro (NC) 8.3% 21.9% 13.5% 17.7% 38.5% 39.4% 17.0% 43.6% 9.7% 95.9%
Macon County (TN) 7.8% 13.2% 18.9% 24.7% 35.4% 40.8% 14.7% 44.5% n/a 88.0%
City of Laguna Beach (CA) 8.6% 8.6% 23.1% 28.6% 31.0% 35.2% 14.8% 50.0% 20.9% 91.6%
Hickman County (TN) 14.7% 9.9% 16.1% 31.2% 28.2% 40.9% 26.6% 32.5% 24.6% 83.0%
City of Fairfax (VA) 15.9% 12.7% 19.0% 33.3% 19.0% 46.0% 9.5% 44.4% 46.0% 95.2%
City of Ponca City (OK) 14.8% 15.2% 11.8% 18.1% 40.1% 37.6% 19.0% 43.5% 20.2% 91.8%
City of Paducah (KY) 18.4% 18.4% 18.4% 29.6% 15.3% 44.9% 13.3% 41.8% 11.1% 93.0%
Mille Lacs County (MN) 5.8% 5.2% 9.8% 35.8% 43.4% 40.4% 16.4% 43.3% n/a n/a
McNairy County (TN) 17.1% 17.7% 18.9% 18.3% 27.9% 36.4% 11.2% 52.4% 22.3% 89.7%
City of Winona (MN) 1.4% 5.5% 14.3% 25.4% 53.5% 31.6% 24.5% 43.9% n/a n/a
RESIDENTS ONLY -- AGE Willingness to Travel for Cultural Experiences
SOURCE: Arts and Economic Prosperity 5, Americans for the Arts, 2017. For more information, visit www.AmericansForTheArts.org/EconomicImpact. B–412

Table 28:Age, Willingness to Travel, Repeat Visitation, and Civic Engagmentof Resident Attendees to Cultural Events Per Study Region During 2016
Population Cohort Group A First Voted in
Population Fewer than 50,000 Skip Replace Different Time 2016
Sample Size = 52 18-34 35-44 45-54 55-64 65 or Older Altogether Nearby Community Attendee Election
Door County (WI) 5.8% 3.1% 6.0% 19.1% 66.0% 30.7% 21.9% 47.5% 7.0% 94.3%
City of Benicia (CA) 3.9% 11.1% 16.6% 30.9% 37.5% 39.4% 8.4% 52.2% 26.7% 90.3%
City of Winter Park (FL) 14.2% 10.9% 15.1% 17.3% 42.5% 29.7% 21.2% 49.2% 28.9% 91.7%
City of Rochester (NH) 16.4% 20.1% 18.6% 25.2% 19.7% 36.6% 7.8% 55.7% 31.7% 90.9%
City of Morgantown (WV) 24.0% 17.9% 19.1% 23.5% 15.5% 39.2% 17.8% 43.0% 21.6% 86.5%
Henry County (TN) 19.0% 22.8% 22.8% 17.7% 17.7% 50.0% 22.4% 27.6% 12.3% 91.1%
City of Fairbanks (AK) 12.9% 12.8% 15.0% 26.5% 32.7% 42.0% 29.8% 28.2% 12.5% 89.9%
City of Bangor (ME) 20.7% 13.6% 14.6% 18.4% 32.8% 41.8% 17.6% 40.5% 17.8% 91.3%
Weakley County (TN) 38.7% 17.8% 16.0% 16.4% 11.1% 39.6% 12.6% 47.7% 21.1% 87.2%
Dare County (NC) 12.8% 6.1% 13.5% 20.9% 46.6% 39.0% 21.2% 39.7% 15.6% 93.4%
City of Columbia (TN) 33.3% 26.2% 17.3% 11.8% 11.3% 43.2% 8.6% 48.2% 27.1% 83.2%
City of Lake Worth (FL) 3.7% 5.3% 8.2% 19.7% 63.2% 31.2% 26.6% 42.2% 24.0% 95.2%
Clatsop County (OR) 7.2% 14.9% 17.3% 26.7% 33.7% 35.1% 20.0% 45.0% 16.1% 93.3%
Yadkin County (NC) 2.9% 3.8% 8.7% 46.2% 38.5% 35.4% 5.1% 59.6% 14.0% 91.9%
Greater Belfast Area (ME) 12.8% 9.1% 17.1% 26.7% 34.3% 34.4% 15.4% 50.1% 23.0% 93.8%
Campbell County (TN) 18.8% 18.3% 22.4% 19.3% 21.2% 42.6% 14.7% 42.8% 55.0% 83.1%
Monroe County (TN) 8.8% 16.6% 12.3% 29.1% 33.2% 36.2% 9.7% 54.1% 17.3% 90.9%
Lincoln County (OR) 4.1% 7.6% 10.9% 26.5% 50.8% 39.4% 20.7% 39.8% 6.6% 94.2%
Iron County (UT) 21.7% 14.5% 14.5% 17.4% 31.9% 47.8% 17.4% 34.8% 20.3% 91.4%
City of St. Louis Park (MN) 22.5% 13.2% 18.8% 20.0% 25.6% 24.9% 28.0% 47.1% n/a n/a
City of Logan (UT) 16.3% 11.2% 11.6% 17.4% 43.4% 40.7% 24.8% 34.5% 13.8% 90.9%
Gibson County (TN) 8.3% 18.3% 26.7% 20.0% 26.7% 15.5% 5.2% 79.3% 13.1% 95.1%
Group A Average 13.5% 13.8% 16.8% 24.1% 31.9% 39.6% 18.1% 42.3% 21.3% 90.8%
Group A Median 12.8% 13.2% 16.4% 24.4% 32.3% 39.4% 17.2% 43.3% 19.8% 91.5%
RESIDENTS ONLY -- AGE Willingness to Travel for Cultural Experiences
SOURCE: Arts and Economic Prosperity 5, Americans for the Arts, 2017. For more information, visit www.AmericansForTheArts.org/EconomicImpact. B–413
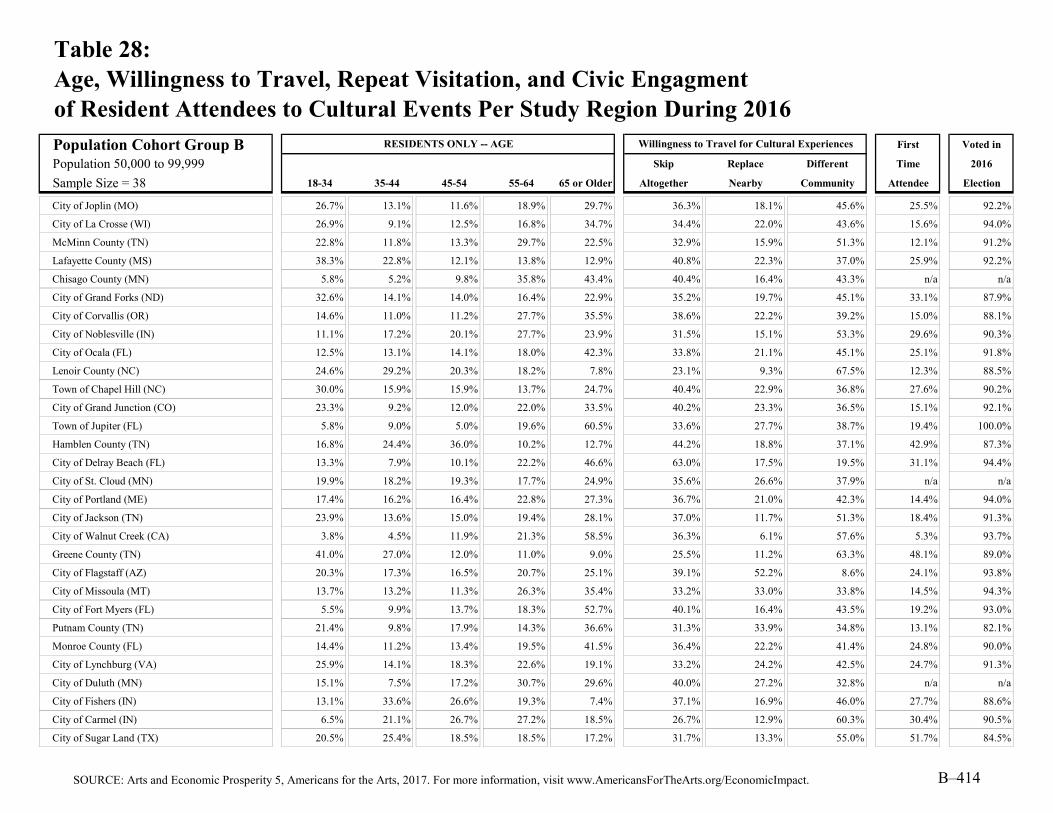
Table 28:Age, Willingness to Travel, Repeat Visitation, and Civic Engagmentof Resident Attendees to Cultural Events Per Study Region During 2016
Population Cohort Group B First Voted in
Population 50,000 to 99,999 Skip Replace Different Time 2016
Sample Size = 38 18-34 35-44 45-54 55-64 65 or Older Altogether Nearby Community Attendee Election
City of Joplin (MO) 26.7% 13.1% 11.6% 18.9% 29.7% 36.3% 18.1% 45.6% 25.5% 92.2%
City of La Crosse (WI) 26.9% 9.1% 12.5% 16.8% 34.7% 34.4% 22.0% 43.6% 15.6% 94.0%
McMinn County (TN) 22.8% 11.8% 13.3% 29.7% 22.5% 32.9% 15.9% 51.3% 12.1% 91.2%
Lafayette County (MS) 38.3% 22.8% 12.1% 13.8% 12.9% 40.8% 22.3% 37.0% 25.9% 92.2%
Chisago County (MN) 5.8% 5.2% 9.8% 35.8% 43.4% 40.4% 16.4% 43.3% n/a n/a
City of Grand Forks (ND) 32.6% 14.1% 14.0% 16.4% 22.9% 35.2% 19.7% 45.1% 33.1% 87.9%
City of Corvallis (OR) 14.6% 11.0% 11.2% 27.7% 35.5% 38.6% 22.2% 39.2% 15.0% 88.1%
City of Noblesville (IN) 11.1% 17.2% 20.1% 27.7% 23.9% 31.5% 15.1% 53.3% 29.6% 90.3%
City of Ocala (FL) 12.5% 13.1% 14.1% 18.0% 42.3% 33.8% 21.1% 45.1% 25.1% 91.8%
Lenoir County (NC) 24.6% 29.2% 20.3% 18.2% 7.8% 23.1% 9.3% 67.5% 12.3% 88.5%
Town of Chapel Hill (NC) 30.0% 15.9% 15.9% 13.7% 24.7% 40.4% 22.9% 36.8% 27.6% 90.2%
City of Grand Junction (CO) 23.3% 9.2% 12.0% 22.0% 33.5% 40.2% 23.3% 36.5% 15.1% 92.1%
Town of Jupiter (FL) 5.8% 9.0% 5.0% 19.6% 60.5% 33.6% 27.7% 38.7% 19.4% 100.0%
Hamblen County (TN) 16.8% 24.4% 36.0% 10.2% 12.7% 44.2% 18.8% 37.1% 42.9% 87.3%
City of Delray Beach (FL) 13.3% 7.9% 10.1% 22.2% 46.6% 63.0% 17.5% 19.5% 31.1% 94.4%
City of St. Cloud (MN) 19.9% 18.2% 19.3% 17.7% 24.9% 35.6% 26.6% 37.9% n/a n/a
City of Portland (ME) 17.4% 16.2% 16.4% 22.8% 27.3% 36.7% 21.0% 42.3% 14.4% 94.0%
City of Jackson (TN) 23.9% 13.6% 15.0% 19.4% 28.1% 37.0% 11.7% 51.3% 18.4% 91.3%
City of Walnut Creek (CA) 3.8% 4.5% 11.9% 21.3% 58.5% 36.3% 6.1% 57.6% 5.3% 93.7%
Greene County (TN) 41.0% 27.0% 12.0% 11.0% 9.0% 25.5% 11.2% 63.3% 48.1% 89.0%
City of Flagstaff (AZ) 20.3% 17.3% 16.5% 20.7% 25.1% 39.1% 52.2% 8.6% 24.1% 93.8%
City of Missoula (MT) 13.7% 13.2% 11.3% 26.3% 35.4% 33.2% 33.0% 33.8% 14.5% 94.3%
City of Fort Myers (FL) 5.5% 9.9% 13.7% 18.3% 52.7% 40.1% 16.4% 43.5% 19.2% 93.0%
Putnam County (TN) 21.4% 9.8% 17.9% 14.3% 36.6% 31.3% 33.9% 34.8% 13.1% 82.1%
Monroe County (FL) 14.4% 11.2% 13.4% 19.5% 41.5% 36.4% 22.2% 41.4% 24.8% 90.0%
City of Lynchburg (VA) 25.9% 14.1% 18.3% 22.6% 19.1% 33.2% 24.2% 42.5% 24.7% 91.3%
City of Duluth (MN) 15.1% 7.5% 17.2% 30.7% 29.6% 40.0% 27.2% 32.8% n/a n/a
City of Fishers (IN) 13.1% 33.6% 26.6% 19.3% 7.4% 37.1% 16.9% 46.0% 27.7% 88.6%
City of Carmel (IN) 6.5% 21.1% 26.7% 27.2% 18.5% 26.7% 12.9% 60.3% 30.4% 90.5%
City of Sugar Land (TX) 20.5% 25.4% 18.5% 18.5% 17.2% 31.7% 13.3% 55.0% 51.7% 84.5%
RESIDENTS ONLY -- AGE Willingness to Travel for Cultural Experiences
SOURCE: Arts and Economic Prosperity 5, Americans for the Arts, 2017. For more information, visit www.AmericansForTheArts.org/EconomicImpact. B–414

Table 28:Age, Willingness to Travel, Repeat Visitation, and Civic Engagmentof Resident Attendees to Cultural Events Per Study Region During 2016
Population Cohort Group B First Voted in
Population 50,000 to 99,999 Skip Replace Different Time 2016
Sample Size = 38 18-34 35-44 45-54 55-64 65 or Older Altogether Nearby Community Attendee Election
City of Asheville (NC) 20.1% 11.9% 11.4% 27.9% 28.7% 34.0% 27.5% 38.5% 26.1% 94.6%
Buchanan County (MO) 16.7% 14.7% 15.5% 23.6% 29.6% 39.5% 18.6% 41.8% 8.8% 88.2%
City of Boca Raton (FL) 17.7% 7.9% 11.1% 22.8% 40.4% 44.8% 24.5% 30.7% 36.9% 91.1%
City of Miami Beach (FL) 8.7% 4.8% 10.8% 16.1% 59.5% 39.6% 21.0% 39.4% 8.5% 90.8%
Moore County (NC) 3.8% 5.2% 10.0% 16.3% 64.6% 39.4% 16.4% 44.2% 14.4% 95.8%
Sevier County (TN) 23.0% 25.8% 14.5% 19.9% 16.8% 39.2% 12.8% 48.0% 39.5% 77.7%
Cape May County (NJ) 0.6% 0.6% 0.9% 17.1% 80.9% 38.6% 20.4% 41.1% 10.7% 90.6%
Cleveland County (NC) 16.6% 14.6% 17.0% 27.5% 24.3% 39.6% 13.1% 47.3% 21.8% 89.5%
Group B Average 17.8% 14.2% 14.8% 20.8% 32.4% 36.9% 20.4% 42.7% 23.2% 90.7%
Group B Median 17.1% 13.2% 13.9% 19.6% 29.2% 36.9% 20.1% 42.4% 24.1% 91.1%
RESIDENTS ONLY -- AGE Willingness to Travel for Cultural Experiences
SOURCE: Arts and Economic Prosperity 5, Americans for the Arts, 2017. For more information, visit www.AmericansForTheArts.org/EconomicImpact. B–415

Table 28:Age, Willingness to Travel, Repeat Visitation, and Civic Engagmentof Resident Attendees to Cultural Events Per Study Region During 2016
Population Cohort Group C First Voted in
Population 100,000 to 249,999 Skip Replace Different Time 2016
Sample Size = 50 18-34 35-44 45-54 55-64 65 or Older Altogether Nearby Community Attendee Election
City of Las Cruces (NM) 26.4% 15.3% 16.3% 16.5% 25.4% 36.5% 24.1% 39.4% 30.1% 85.1%
Eau Claire County (WI) 12.5% 15.0% 21.7% 23.7% 27.2% 40.0% 23.3% 36.7% 13.3% 88.3%
Yamhill County (OR) 20.4% 13.6% 13.4% 19.8% 32.9% 32.6% 15.2% 52.2% 24.2% 91.0%
City of Lewisville (TX) 9.2% 15.9% 20.6% 29.2% 25.1% 30.8% 8.1% 61.1% 21.3% 91.1%
City of West Palm Beach (FL) 20.1% 14.3% 13.4% 18.6% 33.7% 41.8% 28.2% 30.0% 29.8% 85.0%
City of Boulder (CO) 14.6% 13.7% 21.8% 21.9% 28.0% 35.6% 24.8% 39.7% 24.6% 93.6%
City of Richardson (TX) 7.7% 14.6% 15.6% 24.9% 37.3% 29.4% 9.2% 61.4% 18.3% 94.0%
City of High Point (NC) 8.3% 10.3% 15.1% 25.0% 41.3% 34.9% 9.2% 55.9% 32.1% 94.3%
City of Cambridge (MA) 25.2% 12.5% 14.1% 22.8% 25.5% 34.3% 13.8% 51.9% 27.5% 92.2%
City of Lowell (MA) 23.4% 12.7% 17.7% 23.6% 22.7% 34.0% 20.1% 46.0% 29.3% 90.4%
Douglas County (KS) 9.3% 15.5% 15.8% 19.9% 39.4% 36.2% 21.6% 42.2% 13.9% 93.3%
City of Columbia (MO) 18.6% 13.2% 13.6% 20.0% 34.7% 39.8% 27.5% 32.7% 17.7% 93.1%
City of Norman (OK) 37.0% 16.8% 13.6% 17.2% 15.4% 32.2% 19.0% 48.8% 20.2% 88.6%
Wayne County (NC) 18.5% 18.8% 20.0% 20.9% 21.8% 31.9% 12.8% 55.3% 14.6% 87.2%
City of Lafayette (LA) 40.5% 45.9% 8.1% 2.7% 2.7% 10.8% 86.5% 2.7% 10.8% 56.8%
Washington County (TN) 25.4% 8.5% 14.8% 21.8% 29.6% 37.1% 13.3% 49.7% 23.9% 87.6%
City of Thousand Oaks (CA) 12.4% 9.8% 21.7% 26.6% 29.5% 32.6% 9.5% 57.9% 14.4% 90.5%
City of Charleston (SC) 15.8% 13.9% 14.1% 22.0% 34.2% 34.9% 26.1% 39.1% 29.5% 93.4%
City of Waco (TX) 40.1% 13.7% 15.7% 13.9% 16.6% 34.2% 23.4% 42.3% 25.1% 82.9%
Robeson County (NC) 12.7% 12.7% 20.4% 22.1% 32.2% 26.6% 13.0% 60.4% 37.1% 87.9%
Columbia County (GA) 23.5% 23.2% 21.9% 16.3% 15.0% 32.4% 19.9% 47.7% 25.2% 89.5%
Orange County (NC) 20.4% 18.4% 16.0% 17.0% 28.3% 42.4% 20.2% 37.4% 26.9% 92.2%
City of Savannah (GA) 25.7% 24.1% 13.8% 14.7% 21.6% 44.8% 22.3% 33.0% 28.0% 87.5%
Indian River County (FL) 12.0% 17.1% 14.0% 28.1% 28.8% 31.9% 25.0% 43.2% 33.1% 91.8%
City of Alexandria (VA) 18.6% 19.4% 18.9% 22.0% 21.2% 38.1% 15.3% 46.6% 36.4% 86.3%
Martin County (FL) 10.2% 13.7% 14.2% 19.2% 42.7% 38.2% 18.6% 43.2% 20.2% 87.4%
Macon-Bibb County (GA) 18.3% 11.5% 12.7% 21.4% 36.1% 36.6% 31.5% 31.9% 14.7% 92.0%
City of Springfield (MA) 20.7% 20.3% 20.5% 25.0% 13.5% 38.9% 8.9% 52.1% 28.1% 84.6%
Catawba County (NC) 10.9% 5.9% 20.1% 28.1% 35.0% 29.9% 14.0% 56.2% 18.8% 94.7%
Town of Cary (NC) 7.5% 10.5% 24.1% 26.2% 31.6% 35.4% 12.7% 51.9% 28.1% 94.6%
RESIDENTS ONLY -- AGE Willingness to Travel for Cultural Experiences
SOURCE: Arts and Economic Prosperity 5, Americans for the Arts, 2017. For more information, visit www.AmericansForTheArts.org/EconomicImpact. B–416
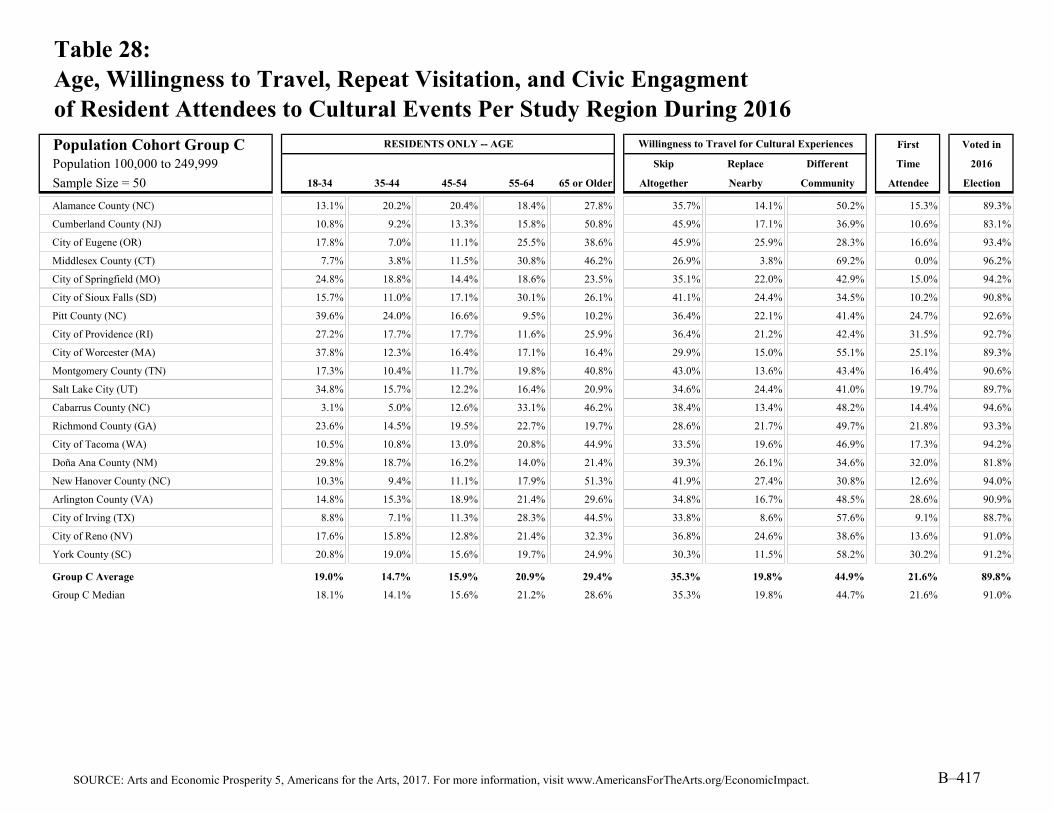
Table 28:Age, Willingness to Travel, Repeat Visitation, and Civic Engagmentof Resident Attendees to Cultural Events Per Study Region During 2016
Population Cohort Group C First Voted in
Population 100,000 to 249,999 Skip Replace Different Time 2016
Sample Size = 50 18-34 35-44 45-54 55-64 65 or Older Altogether Nearby Community Attendee Election
Alamance County (NC) 13.1% 20.2% 20.4% 18.4% 27.8% 35.7% 14.1% 50.2% 15.3% 89.3%
Cumberland County (NJ) 10.8% 9.2% 13.3% 15.8% 50.8% 45.9% 17.1% 36.9% 10.6% 83.1%
City of Eugene (OR) 17.8% 7.0% 11.1% 25.5% 38.6% 45.9% 25.9% 28.3% 16.6% 93.4%
Middlesex County (CT) 7.7% 3.8% 11.5% 30.8% 46.2% 26.9% 3.8% 69.2% 0.0% 96.2%
City of Springfield (MO) 24.8% 18.8% 14.4% 18.6% 23.5% 35.1% 22.0% 42.9% 15.0% 94.2%
City of Sioux Falls (SD) 15.7% 11.0% 17.1% 30.1% 26.1% 41.1% 24.4% 34.5% 10.2% 90.8%
Pitt County (NC) 39.6% 24.0% 16.6% 9.5% 10.2% 36.4% 22.1% 41.4% 24.7% 92.6%
City of Providence (RI) 27.2% 17.7% 17.7% 11.6% 25.9% 36.4% 21.2% 42.4% 31.5% 92.7%
City of Worcester (MA) 37.8% 12.3% 16.4% 17.1% 16.4% 29.9% 15.0% 55.1% 25.1% 89.3%
Montgomery County (TN) 17.3% 10.4% 11.7% 19.8% 40.8% 43.0% 13.6% 43.4% 16.4% 90.6%
Salt Lake City (UT) 34.8% 15.7% 12.2% 16.4% 20.9% 34.6% 24.4% 41.0% 19.7% 89.7%
Cabarrus County (NC) 3.1% 5.0% 12.6% 33.1% 46.2% 38.4% 13.4% 48.2% 14.4% 94.6%
Richmond County (GA) 23.6% 14.5% 19.5% 22.7% 19.7% 28.6% 21.7% 49.7% 21.8% 93.3%
City of Tacoma (WA) 10.5% 10.8% 13.0% 20.8% 44.9% 33.5% 19.6% 46.9% 17.3% 94.2%
Doña Ana County (NM) 29.8% 18.7% 16.2% 14.0% 21.4% 39.3% 26.1% 34.6% 32.0% 81.8%
New Hanover County (NC) 10.3% 9.4% 11.1% 17.9% 51.3% 41.9% 27.4% 30.8% 12.6% 94.0%
Arlington County (VA) 14.8% 15.3% 18.9% 21.4% 29.6% 34.8% 16.7% 48.5% 28.6% 90.9%
City of Irving (TX) 8.8% 7.1% 11.3% 28.3% 44.5% 33.8% 8.6% 57.6% 9.1% 88.7%
City of Reno (NV) 17.6% 15.8% 12.8% 21.4% 32.3% 36.8% 24.6% 38.6% 13.6% 91.0%
York County (SC) 20.8% 19.0% 15.6% 19.7% 24.9% 30.3% 11.5% 58.2% 30.2% 91.2%
Group C Average 19.0% 14.7% 15.9% 20.9% 29.4% 35.3% 19.8% 44.9% 21.6% 89.8%
Group C Median 18.1% 14.1% 15.6% 21.2% 28.6% 35.3% 19.8% 44.7% 21.6% 91.0%
RESIDENTS ONLY -- AGE Willingness to Travel for Cultural Experiences
SOURCE: Arts and Economic Prosperity 5, Americans for the Arts, 2017. For more information, visit www.AmericansForTheArts.org/EconomicImpact. B–417

Table 28:Age, Willingness to Travel, Repeat Visitation, and Civic Engagmentof Resident Attendees to Cultural Events Per Study Region During 2016
Population Cohort Group D First Voted in
Population 250,000 to 499,999 Skip Replace Different Time 2016
Sample Size = 42 18-34 35-44 45-54 55-64 65 or Older Altogether Nearby Community Attendee Election
Buncombe County (NC) 20.8% 15.1% 12.2% 25.3% 26.6% 32.5% 26.4% 41.1% 28.0% 95.5%
Alachua County (FL) 26.8% 12.3% 15.7% 20.3% 24.9% 34.1% 25.4% 40.5% 23.5% 90.1%
Greater Green Bay Area (WI) 21.3% 21.3% 14.6% 18.5% 24.4% 33.8% 19.4% 46.8% 23.5% 92.1%
City of Orlando (FL) 27.4% 16.4% 18.9% 16.3% 21.0% 34.9% 22.5% 42.6% 25.5% 88.6%
City of Lincoln (NE) 13.5% 12.0% 10.4% 19.7% 44.3% 41.4% 26.4% 32.2% 12.3% 95.2%
Southeastern Connecticut Region (CT) 10.9% 12.3% 15.7% 23.7% 37.4% 36.7% 8.8% 54.5% 17.2% 84.8%
Erie County (PA) 11.4% 16.7% 16.1% 27.6% 28.2% 39.4% 22.5% 38.1% 16.7% 90.6%
San Luis Obispo County (CA) 11.8% 13.7% 13.3% 24.4% 36.8% 32.4% 22.9% 44.6% 22.1% 92.5%
City of Newark (NJ) 30.1% 17.0% 20.5% 20.0% 12.4% 21.8% 9.7% 68.5% 31.3% 86.6%
Leon County (FL) 19.2% 10.5% 16.5% 22.0% 31.8% 31.9% 22.2% 45.9% 20.1% 95.9%
Rutherford County (TN) 27.1% 15.6% 17.9% 19.0% 20.4% 36.7% 16.7% 46.6% 23.9% 87.7%
St. Lucie County (FL) 3.8% 3.8% 17.3% 39.4% 35.6% 23.5% 14.7% 61.8% 24.8% 84.8%
Greater Spartanburg Area (SC) 18.1% 14.3% 24.5% 19.0% 24.2% 38.2% 18.5% 43.2% 24.0% 91.0%
Durham County (NC) 16.6% 14.6% 14.6% 26.4% 27.7% 35.4% 25.6% 39.0% 22.8% 92.5%
City of St. Paul (MN) 22.5% 13.2% 18.8% 20.0% 25.6% 24.9% 28.0% 47.1% n/a n/a
Hamilton County (IN) 10.4% 23.4% 24.1% 24.9% 17.2% 31.9% 15.1% 53.1% 29.2% 89.9%
Osceola County (FL) 8.3% 20.8% 20.8% 8.3% 41.7% 41.7% 12.5% 45.8% 8.3% 95.2%
Escambia County (FL) 23.4% 13.3% 13.3% 11.3% 38.7% 45.0% 27.7% 27.3% 24.8% 86.2%
Lexington-Fayette Urban County (KY) 33.4% 15.2% 13.7% 18.0% 19.7% 36.0% 26.2% 37.8% 19.9% 90.3%
Lake County (FL) 4.5% 1.0% 3.5% 14.4% 76.7% 34.3% 13.2% 52.5% 18.5% 87.9%
City of Riverside (CA) 31.5% 29.8% 20.9% 10.9% 7.0% 23.6% 46.8% 29.6% 37.3% 89.7%
Cumberland County (NC) 25.7% 16.5% 19.5% 20.3% 18.0% 33.7% 18.2% 48.1% 26.0% 86.4%
Collier County (FL) 9.8% 4.0% 10.5% 17.6% 58.1% 38.6% 18.2% 43.2% 20.9% 87.6%
Hamilton County (TN) 33.0% 20.6% 19.0% 15.6% 11.7% 29.7% 23.6% 46.7% 23.4% 88.5%
Manatee County (FL) 6.4% 5.3% 10.0% 22.5% 55.8% 30.4% 16.3% 53.3% 24.2% 88.7%
City of Tampa (FL) 21.2% 17.6% 18.8% 19.7% 22.6% 30.2% 16.2% 53.6% 24.3% 90.7%
Forsyth County (NC) 17.4% 13.6% 16.8% 23.6% 28.6% 33.7% 19.8% 46.5% 28.3% 92.3%
Mercer County (NJ) 10.2% 20.4% 10.2% 26.5% 32.7% 22.9% 16.7% 60.4% 8.2% 94.1%
City of Wichita (KS) 10.5% 5.7% 8.2% 27.7% 48.0% 37.8% 26.2% 36.0% 8.5% 91.0%
Clackamas County (OR) 10.4% 10.8% 16.1% 26.5% 36.1% 38.5% 11.7% 49.8% 37.7% 94.4%
RESIDENTS ONLY -- AGE Willingness to Travel for Cultural Experiences
SOURCE: Arts and Economic Prosperity 5, Americans for the Arts, 2017. For more information, visit www.AmericansForTheArts.org/EconomicImpact. B–418

Table 28:Age, Willingness to Travel, Repeat Visitation, and Civic Engagmentof Resident Attendees to Cultural Events Per Study Region During 2016
Population Cohort Group D First Voted in
Population 250,000 to 499,999 Skip Replace Different Time 2016
Sample Size = 42 18-34 35-44 45-54 55-64 65 or Older Altogether Nearby Community Attendee Election
Sarasota County (FL) 1.8% 2.1% 4.7% 15.2% 76.3% 33.0% 28.9% 38.2% 13.2% 93.6%
City of Minneapolis (MN) 22.5% 13.2% 18.8% 20.0% 25.6% 24.9% 28.0% 47.1% n/a n/a
Berks County (PA) 4.4% 7.2% 16.9% 35.4% 36.0% 28.9% 16.9% 54.2% 12.8% 89.1%
City of Miami (FL) 16.8% 13.4% 17.9% 21.5% 30.4% 34.7% 18.6% 46.7% 18.3% 85.9%
City of Raleigh (NC) 16.0% 18.4% 23.5% 21.7% 20.4% 35.4% 20.5% 44.1% 23.8% 91.7%
Santa Barbara County (CA) 10.9% 3.6% 14.6% 28.5% 42.3% 50.0% 22.1% 27.9% 12.6% 91.9%
Seminole County (FL) 3.5% 12.3% 31.6% 26.3% 26.3% 29.8% 12.3% 57.9% 34.0% 83.8%
City of Virginia Beach (VA) 7.8% 4.3% 10.7% 30.1% 47.1% 38.0% 12.8% 49.2% 11.5% 92.7%
City of Atlanta (GA) 8.3% 36.9% 23.8% 11.9% 19.0% 18.5% 12.3% 69.1% 22.2% 92.9%
City of Mesa (AZ) 16.2% 27.0% 20.3% 17.0% 19.5% 26.0% 21.5% 52.5% 30.4% 77.2%
City of Kansas City (MO) 19.2% 8.2% 12.5% 22.6% 37.5% 43.0% 27.9% 29.1% 15.0% 93.9%
Morris County (NJ) 15.3% 18.4% 23.4% 25.4% 17.5% 31.3% 17.4% 51.3% 24.6% 85.8%
Group D Average 16.2% 14.1% 16.5% 21.5% 31.7% 33.3% 20.4% 46.3% 21.8% 90.0%
Group D Median 16.1% 13.7% 16.7% 20.9% 28.0% 33.8% 19.6% 46.7% 23.5% 90.5%
RESIDENTS ONLY -- AGE Willingness to Travel for Cultural Experiences
SOURCE: Arts and Economic Prosperity 5, Americans for the Arts, 2017. For more information, visit www.AmericansForTheArts.org/EconomicImpact. B–419

Table 28:Age, Willingness to Travel, Repeat Visitation, and Civic Engagmentof Resident Attendees to Cultural Events Per Study Region During 2016
Population Cohort Group E First Voted in
Population 500,000 to 999,999 Skip Replace Different Time 2016
Sample Size = 25 18-34 35-44 45-54 55-64 65 or Older Altogether Nearby Community Attendee Election
Sonoma County (CA) 5.9% 4.6% 9.5% 23.0% 57.0% 38.7% 16.4% 44.8% 12.8% 93.5%
Volusia County (FL) 0.0% 1.4% 1.4% 19.4% 77.8% 29.6% 11.3% 59.2% 4.3% 93.0%
Guilford County (NC) 10.8% 11.6% 14.5% 23.2% 40.0% 36.3% 15.2% 48.6% 25.5% 94.9%
Dane County (WI) 30.6% 19.7% 14.5% 18.4% 16.8% 41.8% 29.8% 28.4% 30.7% 93.3%
Brevard County (FL) 6.8% 2.7% 17.8% 35.6% 37.0% 45.1% 16.9% 38.0% 22.2% 91.4%
Washington County (OR) 8.8% 6.5% 17.0% 25.9% 41.8% 33.6% 12.1% 54.4% 19.3% 95.4%
Johnson County (KS) 8.6% 8.3% 18.3% 26.6% 38.1% 34.9% 25.8% 39.3% 16.7% 95.8%
City of Louisville (KY) 23.8% 26.8% 16.1% 15.8% 17.5% 58.0% 33.2% 8.8% 20.6% 96.5%
City of Baltimore (MD) 11.0% 20.3% 16.5% 27.5% 24.7% 33.5% 13.6% 52.8% 32.3% 92.4%
Polk County (FL) 11.7% 14.0% 13.3% 24.4% 36.6% 34.9% 15.0% 50.1% 22.3% 92.1%
City of Boston (MA) 49.1% 22.9% 13.3% 9.6% 5.2% 21.5% 42.5% 36.0% 48.9% 87.2%
District of Columbia (DC) 31.8% 13.8% 16.5% 17.1% 20.7% 36.1% 26.6% 37.3% 32.9% 89.9%
Nashville-Davidson County (TN) 35.2% 20.0% 17.1% 15.8% 12.0% 36.5% 27.1% 36.4% 31.3% 90.6%
City of El Paso (TX) 45.4% 24.9% 12.9% 10.3% 6.4% 27.7% 25.9% 46.4% 39.3% 71.3%
Lee County (FL) 5.7% 9.3% 13.7% 17.9% 53.4% 39.8% 16.7% 43.5% 20.5% 92.9%
City of Fort Worth (TX) 21.3% 13.4% 13.4% 27.4% 24.5% 29.6% 22.4% 48.1% 30.4% 89.6%
City of Indianapolis (IN) 20.8% 10.8% 15.3% 23.8% 29.3% 33.0% 28.6% 38.4% 23.0% 95.9%
City and County of San Francisco (CA) 30.3% 20.1% 19.4% 16.1% 14.1% 37.8% 22.7% 39.5% 32.5% 90.8%
Prince George's County (MD) 8.5% 20.8% 16.0% 24.5% 30.1% 27.1% 16.2% 56.7% 30.1% 94.8%
Pinellas County (FL) 9.7% 8.0% 12.9% 26.6% 42.9% 30.8% 20.9% 48.4% 18.6% 91.6%
Shelby County (TN) 17.0% 20.7% 21.9% 19.5% 20.9% 32.1% 25.5% 42.4% 22.9% 90.3%
Fairfield County (CT) 10.7% 12.5% 25.6% 27.6% 23.5% 24.4% 11.2% 64.4% 23.0% 91.8%
Westchester County (NY) 3.3% 5.5% 14.4% 26.8% 49.9% 25.4% 10.0% 64.6% 24.2% 92.1%
Fulton County (GA) 13.9% 25.3% 19.8% 17.2% 23.8% 27.4% 17.5% 55.1% 30.8% 92.5%
Wake County (NC) 12.7% 15.5% 24.5% 22.8% 24.5% 34.2% 17.2% 48.6% 25.5% 93.1%
Group E Average 17.3% 14.4% 15.8% 21.7% 30.7% 34.0% 20.8% 45.2% 25.6% 91.7%
Group E Median 11.7% 13.8% 16.0% 23.0% 24.7% 33.6% 17.5% 46.4% 24.2% 92.4%
RESIDENTS ONLY -- AGE Willingness to Travel for Cultural Experiences
SOURCE: Arts and Economic Prosperity 5, Americans for the Arts, 2017. For more information, visit www.AmericansForTheArts.org/EconomicImpact. B–420

Table 28:Age, Willingness to Travel, Repeat Visitation, and Civic Engagmentof Resident Attendees to Cultural Events Per Study Region During 2016
Population Cohort Group F First Voted in
Population 1,000,000 or More Skip Replace Different Time 2016
Sample Size = 21 18-34 35-44 45-54 55-64 65 or Older Altogether Nearby Community Attendee Election
Mecklenburg County (NC) 11.2% 19.5% 27.3% 16.6% 25.4% 34.6% 22.9% 42.4% 20.4% 92.0%
City of San José (CA) 29.8% 14.7% 15.9% 16.3% 23.3% 25.0% 15.5% 59.5% 24.4% 89.6%
Montgomery County (MD) 9.2% 13.2% 20.5% 23.0% 34.1% 39.2% 14.2% 46.6% 28.3% 94.1%
Fairfax County (VA) 5.6% 13.3% 18.0% 18.9% 44.2% 44.5% 11.2% 44.3% 19.2% 92.6%
Allegheny County (PA) 22.6% 11.0% 17.0% 21.5% 27.9% 32.0% 17.5% 50.4% n/a 92.9%
Greater Columbus Area (OH) 25.3% 12.7% 17.8% 18.7% 25.5% 39.6% 25.1% 35.4% 20.0% 91.1%
Orange County (FL) 23.3% 14.8% 18.2% 17.5% 26.2% 32.9% 21.4% 45.7% 25.8% 89.8%
City of Dallas (TX) 42.5% 16.5% 13.8% 14.3% 12.9% 37.6% 20.2% 42.3% 25.5% 86.6%
Hillsborough County (FL) 17.3% 15.0% 16.8% 20.8% 30.2% 32.7% 16.0% 51.3% 26.0% 90.6%
City of San Diego (CA) 27.8% 17.5% 18.2% 17.0% 19.6% 33.6% 21.5% 45.0% 29.9% 86.2%
Palm Beach County (FL) 16.4% 11.7% 11.9% 19.2% 40.8% 41.8% 26.4% 31.7% 29.5% 92.5%
City of San Antonio (TX) 36.6% 18.8% 11.6% 17.5% 15.4% 26.7% 28.5% 44.8% 34.7% 84.5%
Sacramento County (CA) 18.3% 17.1% 17.8% 23.3% 23.5% 29.6% 22.1% 48.2% 34.8% 89.8%
City of Phoenix (AZ) 30.1% 15.1% 12.3% 18.6% 24.0% 28.9% 20.5% 50.6% 31.0% 83.3%
City and County of Philadelphia (PA) 36.3% 19.0% 10.3% 14.5% 19.9% 32.2% 25.6% 42.2% 30.0% 92.5%
Broward County (FL) 13.3% 16.6% 19.9% 19.9% 30.2% 30.1% 13.8% 56.1% 31.8% 85.8%
Santa Clara County (CA) 22.6% 16.1% 18.6% 19.0% 23.7% 28.0% 17.4% 54.6% 22.6% 88.1%
Riverside County (CA) 28.9% 29.3% 19.7% 13.2% 8.9% 31.0% 38.6% 30.4% 38.4% 76.0%
Miami-Dade County (FL) 15.1% 11.7% 15.9% 19.6% 37.7% 34.6% 18.3% 47.1% 18.9% 87.0%
City of Chicago (IL) 31.1% 12.8% 12.6% 18.1% 25.5% 29.6% 27.0% 43.3% 21.7% 94.1%
Harris County (TX) 23.2% 14.2% 14.4% 20.9% 27.4% 31.9% 34.9% 33.2% 26.2% 88.0%
Group F Average 23.2% 15.7% 16.6% 18.5% 26.0% 33.1% 21.8% 45.0% 27.0% 88.9%
Group F Median 23.2% 15.0% 17.0% 18.7% 25.5% 32.2% 21.4% 45.0% 26.1% 89.8%
Average 17.2% 14.4% 16.1% 21.6% 30.7% 35.8% 19.9% 44.2% # 22.9% 90.3%
Median 16.1% 13.8% 15.9% 20.8% 28.5% 35.4% 19.5% 44.0% # 23.0% 91.1%
RESIDENTS ONLY -- AGE
ALL CITY/COUNTY STUDY REGIONS
Willingness to Travel for Cultural Experiences
SOURCE: Arts and Economic Prosperity 5, Americans for the Arts, 2017. For more information, visit www.AmericansForTheArts.org/EconomicImpact. B–421

Table 28:Age, Willingness to Travel, Repeat Visitation, and Civic Engagmentof Resident Attendees to Cultural Events Per Study Region During 2016
Regional Study Regions First Voted in
All Populations Skip Replace Different Time 2016
Sample Size = 81 18-34 35-44 45-54 55-64 65 or Older Altogether Nearby Community Attendee Election
High Peaks Region (ME) 12.4% 13.1% 13.9% 24.3% 36.3% 36.4% 13.2% 50.4% 21.8% 91.3%
Wood River Valley (ID) 6.1% 7.3% 13.7% 23.2% 49.7% 35.6% 27.4% 37.0% 12.1% 90.0%
Southern Oregon Area 9.8% 9.8% 23.2% 29.3% 28.0% 38.0% 16.5% 45.6% 7.4% 92.9%
Southwestern Pennsylvania Area 5.9% 6.0% 11.1% 27.7% 49.3% 39.2% 17.1% 43.7% 12.5% 91.0%
Greater Portsmouth Area (NH) 10.4% 13.0% 27.2% 23.6% 25.8% 34.1% 25.4% 40.6% 17.2% 92.5%
Northeast Oregon Region 22.8% 20.7% 11.4% 16.8% 28.3% 42.3% 24.6% 33.1% 10.9% 92.9%
Toe River Valley (NC) 3.4% 9.8% 20.9% 32.0% 33.8% 61.1% 7.9% 31.0% 20.0% 94.8%
Albemarle Region (NC) 7.7% 9.9% 16.2% 24.5% 41.7% 40.9% 15.2% 44.0% 11.5% 91.9%
Greater Concord Area (NH) 6.0% 8.8% 16.7% 29.6% 39.0% 33.9% 16.6% 49.5% 5.3% 94.7%
North Central Minnesota Region 10.2% 12.6% 10.7% 26.1% 40.5% 27.4% 28.4% 44.2% n/a n/a
Northwest Minnesota Region 9.7% 8.5% 13.8% 23.9% 44.1% 36.4% 14.4% 49.2% n/a n/a
Monadnock Region (NH) 12.3% 15.1% 19.0% 24.5% 29.2% 39.7% 13.3% 47.0% 12.0% 93.2%
Bismarck-Mandan Region (ND) 20.2% 18.8% 22.4% 15.7% 22.9% 49.8% 23.9% 26.3% 21.8% 89.4%
Greater Minot Region (ND) 11.3% 9.0% 11.0% 28.7% 40.0% 48.1% 28.6% 23.4% 9.1% 93.3%
Greater Burlington Area (VT) 18.8% 13.9% 17.2% 22.0% 28.2% 42.8% 18.2% 39.0% 13.4% 82.8%
Greater Charlottesville Area (VA) 24.7% 11.6% 15.1% 22.2% 26.4% 41.9% 23.2% 34.9% 18.7% 93.3%
Brainerd Lakes Region (MN) 14.3% 12.9% 21.7% 22.1% 29.0% 36.7% 15.7% 47.6% n/a n/a
East Central Minnesota Region 5.8% 5.2% 9.8% 35.8% 43.4% 40.4% 16.4% 43.3% n/a n/a
Northwest Connecticut Region 4.0% 5.2% 11.9% 26.7% 52.3% 29.8% 12.3% 57.9% 19.3% 93.2%
Central Oregon Region 5.1% 9.1% 17.2% 33.3% 35.4% 40.4% 20.9% 38.7% 16.7% 94.7%
Greater Fargo-Moorhead Area (ND/MN) 11.9% 14.3% 15.5% 23.6% 34.7% 37.6% 34.8% 27.6% 16.2% 94.3%
Black Hills Region (SD) 14.1% 11.6% 11.7% 26.7% 35.9% 38.5% 20.8% 40.7% 10.9% 90.8%
Greater Kingsport Area (TN) 13.4% 18.8% 26.4% 17.3% 24.0% 32.4% 13.4% 54.2% 27.0% 84.9%
Lake Region (MN) 11.1% 14.5% 14.1% 27.4% 32.9% 39.4% 19.5% 41.1% n/a n/a
South Central Minnesota Region 8.9% 13.6% 12.3% 24.7% 40.4% 36.3% 20.8% 42.9% n/a n/a
Greater Sioux Falls Area (SD) 14.7% 12.2% 17.4% 28.1% 27.6% 41.6% 21.6% 36.7% 12.9% 90.9%
Southwest Tennessee Development District 19.9% 15.4% 17.5% 18.9% 28.2% 36.7% 10.9% 52.4% 21.7% 90.3%
Northwest Tennessee Development District 28.4% 18.2% 18.6% 16.5% 18.2% 35.3% 12.0% 52.7% 24.2% 88.3%
Southwest Minnesota Region 8.8% 10.4% 13.7% 29.7% 37.4% 32.8% 11.9% 55.4% n/a n/a
Arrowhead Region (MN) 15.1% 7.5% 17.2% 30.7% 29.6% 40.0% 27.2% 32.8% n/a n/a
RESIDENTS ONLY -- AGE Willingness to Travel for Cultural Experiences
SOURCE: Arts and Economic Prosperity 5, Americans for the Arts, 2017. For more information, visit www.AmericansForTheArts.org/EconomicImpact. B–422

Table 28:Age, Willingness to Travel, Repeat Visitation, and Civic Engagmentof Resident Attendees to Cultural Events Per Study Region During 2016
Regional Study Regions First Voted in
All Populations Skip Replace Different Time 2016
Sample Size = 81 18-34 35-44 45-54 55-64 65 or Older Altogether Nearby Community Attendee Election
Maple Grove and the Northwest Suburbs (MN) 22.5% 13.2% 18.8% 20.0% 25.6% 24.9% 28.0% 47.1% n/a n/a
Greater Augusta Area (GA) 23.1% 18.6% 20.9% 20.8% 16.7% 30.8% 20.7% 48.6% 23.6% 92.1%
Upper Cumberland Development District (TN) 13.1% 11.6% 18.0% 19.1% 38.1% 39.4% 17.6% 43.0% 17.3% 87.0%
City of Huntsville/Madison County (AL) 12.7% 16.7% 18.9% 21.7% 30.0% 36.7% 25.0% 38.3% 16.5% 92.2%
Northeast Commission (NC) 8.5% 9.3% 14.6% 26.5% 41.2% 39.9% 14.4% 45.7% 15.3% 91.6%
Greater Ann Arbor Area (MI) 23.2% 17.9% 16.8% 17.3% 24.8% 30.3% 31.2% 38.4% n/a n/a
Greater Fox Cities Region (WI) 16.8% 15.9% 20.2% 21.4% 25.7% 36.0% 13.4% 50.5% 8.2% 92.9%
Central Minnesota Region 19.9% 18.2% 19.3% 17.7% 24.9% 35.6% 26.6% 37.9% n/a n/a
South Central Tennessee Development District 16.3% 18.6% 19.9% 21.2% 24.1% 40.9% 15.1% 44.0% 21.5% 85.6%
Northwest Arkansas Region 20.5% 17.6% 16.9% 16.4% 28.6% 36.8% 21.6% 41.6% 11.1% 89.1%
Southeast Minnesota Region 1.4% 5.5% 14.3% 25.4% 53.5% 31.6% 24.5% 43.9% n/a n/a
First Tennessee Development District 21.5% 16.6% 20.4% 18.0% 23.4% 33.3% 11.8% 54.9% 31.7% 86.7%
Greater Harrisburg Area (PA) 9.8% 10.9% 15.4% 25.0% 38.8% 32.4% 19.1% 48.5% 14.2% 96.4%
Greater New Haven Area (CT) 13.7% 23.4% 19.1% 26.6% 17.2% 25.8% 27.4% 46.8% 18.9% 94.6%
Treasure Coast Region (FL) 11.8% 14.8% 14.5% 25.6% 33.3% 33.1% 19.5% 47.4% 27.9% 88.8%
Greater Des Moines Region (IA) 31.3% 20.2% 17.2% 13.5% 17.8% 41.3% 22.4% 36.3% 20.9% 90.0%
Southeast Tennessee Development District 27.0% 16.5% 17.4% 21.1% 18.0% 31.8% 18.1% 50.1% 24.8% 89.1%
Greater Knoxville Region (TN) 21.7% 17.5% 15.2% 20.5% 25.1% 33.9% 18.2% 47.8% 20.0% 93.2%
Greater Columbia Area (SC) 37.0% 23.3% 14.6% 16.0% 9.2% 28.7% 28.2% 43.1% 26.7% 91.7%
Pikes Peak Region (CO) 17.1% 11.6% 19.1% 22.8% 29.4% 33.2% 21.7% 45.1% 17.4% 89.6%
Lehigh Valley Region (PA) 16.8% 12.6% 12.6% 25.2% 32.8% 30.9% 16.2% 52.9% 21.9% 89.0%
Greater Sarasota/Bradenton Area (FL) 2.9% 2.7% 5.7% 17.1% 71.5% 31.4% 25.0% 43.7% 16.6% 92.5%
Dayton Region (OH) 9.3% 14.0% 15.9% 24.6% 36.1% 36.4% 18.4% 45.2% 22.5% 92.9%
Richmond & Tri-Cities Region (VA) 20.0% 16.0% 16.4% 20.0% 27.6% 38.5% 26.0% 35.5% 20.4% 93.2%
Memphis Area Association of Governments (TN) 17.1% 20.6% 21.9% 19.7% 20.7% 32.2% 25.0% 42.7% 22.9% 90.6%
Eastern Region (NC) 22.4% 22.1% 19.0% 19.3% 17.2% 28.5% 12.2% 59.3% 20.9% 90.6%
Advantage West Region (NC) 11.6% 11.3% 13.7% 27.6% 35.8% 41.1% 15.2% 43.8% 25.7% 94.6%
Southeast Commission (NC) 20.3% 14.1% 17.7% 21.2% 26.6% 33.1% 16.9% 50.0% 28.8% 88.4%
Greater Fairfax Area (VA) 11.8% 17.8% 19.9% 19.5% 31.0% 43.4% 9.6% 47.1% 26.1% 91.2%
Greater Tulsa Region (OK) 25.8% 18.0% 13.8% 20.2% 22.2% 37.6% 28.3% 34.2% 17.6% 86.7%
RESIDENTS ONLY -- AGE Willingness to Travel for Cultural Experiences
SOURCE: Arts and Economic Prosperity 5, Americans for the Arts, 2017. For more information, visit www.AmericansForTheArts.org/EconomicImpact. B–423

Table 28:Age, Willingness to Travel, Repeat Visitation, and Civic Engagmentof Resident Attendees to Cultural Events Per Study Region During 2016
Regional Study Regions First Voted in
All Populations Skip Replace Different Time 2016
Sample Size = 81 18-34 35-44 45-54 55-64 65 or Older Altogether Nearby Community Attendee Election
East Tennessee Development District 15.8% 19.6% 20.0% 21.6% 22.9% 38.5% 14.1% 47.4% 39.0% 86.5%
West Valley Region (AZ) 6.6% 5.7% 6.9% 15.2% 65.6% 30.9% 10.6% 58.5% 30.3% 90.3%
Greater St. Louis Area (MO) 18.9% 24.8% 18.8% 18.4% 19.0% 50.8% 26.7% 22.5% 33.8% 89.0%
Western New York 23.4% 14.5% 14.0% 21.4% 26.7% 32.6% 24.5% 42.9% 22.0% 88.1%
Greater Oklahoma City Region (OK) 31.5% 17.8% 16.0% 17.9% 16.9% 32.3% 15.5% 52.2% 27.5% 87.6%
Piedmont Triad Partnership (NC) 12.8% 14.7% 16.3% 22.8% 33.5% 34.5% 13.5% 52.0% 27.5% 92.6%
Greater Portland Area (OR) 10.3% 11.7% 17.5% 23.2% 37.2% 38.5% 16.1% 45.4% 25.5% 96.3%
Greater Kansas City Metropolitan Area (MO/KS) 14.7% 9.6% 13.5% 24.3% 38.0% 40.1% 25.9% 34.0% 16.0% 93.8%
Greater Nashville Regional Council (TN) 27.9% 16.2% 16.2% 18.5% 21.2% 38.1% 18.0% 43.8% 27.7% 88.9%
Research Triangle Regional Partnership (NC) 13.5% 14.6% 18.0% 21.6% 32.3% 36.3% 16.6% 47.0% 25.0% 92.9%
Greater Tampa/St. Petersburg Area (FL) 14.9% 12.6% 16.3% 22.5% 33.7% 30.8% 15.7% 53.5% 24.3% 90.7%
Charlotte Regional Partnership (NC) 10.1% 11.8% 19.1% 25.6% 33.5% 34.5% 14.2% 51.4% 23.8% 93.6%
Charlotte Regional Partnership (NC/SC) 12.2% 13.3% 18.3% 24.7% 31.5% 33.5% 13.3% 53.2% 26.2% 92.9%
Seven-County Metro Area (MN) 22.5% 13.2% 18.8% 20.0% 25.6% 24.9% 28.0% 47.1% n/a n/a
Central Florida Region 17.5% 12.8% 15.7% 19.3% 34.6% 32.6% 17.0% 50.4% 26.6% 90.0%
Greater Philadelphia Region (PA) 21.3% 15.7% 14.5% 22.7% 25.8% 30.7% 20.8% 48.6% 29.1% 91.7%
Greater Washington Region (DC/MD/VA) 15.6% 16.0% 18.4% 21.0% 28.9% 36.8% 12.3% 50.8% 31.2% 90.9%
Metro Atlanta Area (GA) 13.9% 25.3% 19.8% 17.2% 23.8% 27.4% 17.5% 55.1% 30.8% 92.5%
Greater Atlanta Region (GA) 13.9% 25.3% 19.8% 17.2% 23.8% 27.4% 17.5% 55.1% 30.8% 92.5%
Greater Houston Region (TX) 22.1% 15.3% 15.0% 21.7% 25.9% 33.3% 27.0% 39.8% 31.6% 87.4%
Dallas-Fort Worth-Arlington MSA (TX) 25.8% 15.2% 16.4% 20.8% 21.8% 31.8% 14.8% 53.4% 26.7% 88.6%
Regional Average 15.5% 14.2% 16.6% 22.5% 31.1% 35.9% 19.4% 44.7% 21.1% 91.0%
Regional Median 14.3% 14.1% 16.8% 22.0% 29.0% 36.0% 18.1% 45.4% 21.8% 91.3%
RESIDENTS ONLY -- AGE Willingness to Travel for Cultural Experiences
SOURCE: Arts and Economic Prosperity 5, Americans for the Arts, 2017. For more information, visit www.AmericansForTheArts.org/EconomicImpact. B–424

Table 28:Age, Willingness to Travel, Repeat Visitation, and Civic Engagmentof Resident Attendees to Cultural Events Per Study Region During 2016
Statewide Study Regions First Voted in
All Populations Skip Replace Different Time 2016
Sample Size = 20 18-34 35-44 45-54 55-64 65 or Older Altogether Nearby Community Attendee Election
State of Vermont 14.1% 13.4% 16.4% 23.3% 32.7% 37.8% 14.6% 47.6% 16.3% 87.5%
State of North Dakota 18.2% 14.1% 16.1% 21.4% 30.2% 42.7% 24.9% 32.3% 20.4% 91.1%
State of Delaware 7.8% 9.9% 14.8% 23.8% 43.6% 36.3% 14.4% 49.4% 20.8% 92.0%
State of Maine 15.1% 12.2% 14.6% 23.0% 35.2% 36.5% 14.3% 49.2% 23.3% 92.7%
State of Hawai'i 19.4% 13.7% 15.8% 21.5% 29.6% 31.2% 18.1% 50.7% 22.1% 88.2%
State of Nevada 17.9% 15.5% 16.5% 21.7% 28.4% 38.5% 19.7% 41.8% 26.4% 87.2%
State of Connecticut 9.5% 11.4% 18.5% 26.3% 34.3% 28.6% 11.0% 60.4% 23.3% 90.7%
State of Oklahoma 28.6% 18.8% 15.2% 18.5% 18.9% 40.0% 16.4% 43.6% 28.0% 88.4%
State of Oregon 11.8% 10.8% 14.2% 25.2% 38.0% 39.8% 18.3% 41.9% 21.3% 93.7%
State of Minnesota 13.3% 11.6% 16.3% 24.9% 33.9% 32.8% 22.1% 45.2% n/a n/a
State of Wisconsin 14.1% 11.6% 14.7% 23.7% 35.8% 37.1% 19.8% 43.1% 19.9% 93.4%
State of Maryland 13.6% 14.8% 17.4% 22.9% 31.3% 33.5% 15.7% 50.8% 30.3% 93.8%
State of Missouri 19.8% 15.5% 14.9% 21.3% 28.4% 42.0% 22.8% 35.3% 22.2% 91.4%
State of Tennessee 21.3% 17.0% 18.6% 20.1% 23.0% 36.8% 14.9% 48.3% 30.1% 87.8%
State of Massachusetts 23.9% 15.1% 18.1% 20.5% 22.4% 34.3% 14.6% 51.1% 30.4% 89.6%
State of New Jersey 13.0% 14.0% 19.6% 23.0% 30.5% 28.8% 10.4% 60.8% 27.5% 89.8%
State of North Carolina 14.6% 14.3% 17.3% 23.3% 30.5% 34.5% 14.0% 51.4% 27.1% 92.3%
State of Pennsylvania 13.8% 11.4% 15.3% 26.6% 32.8% 32.9% 17.2% 49.9% 20.9% 91.5%
State of Illinois 24.7% 14.2% 14.4% 17.7% 29.0% 36.3% 21.9% 41.8% 22.7% 92.2%
State of Florida 15.1% 11.4% 13.7% 19.4% 40.4% 35.4% 19.7% 44.8% 28.6% 90.0%
Statewide Average 16.5% 13.5% 16.1% 22.4% 31.4% 35.8% 17.2% 47.0% 24.3% 90.7%
Statewide Median 14.9% 13.9% 16.0% 23.0% 30.9% 36.3% 16.8% 48.0% 23.3% 91.1%
RESIDENTS ONLY -- AGE Willingness to Travel for Cultural Experiences
SOURCE: Arts and Economic Prosperity 5, Americans for the Arts, 2017. For more information, visit www.AmericansForTheArts.org/EconomicImpact. B–425

Table 28:Age, Willingness to Travel, Repeat Visitation, and Civic Engagmentof Resident Attendees to Cultural Events Per Study Region During 2016
Individual Arts Districts First Voted in
All Populations Skip Replace Different Time 2016
Sample Size = 12 18-34 35-44 45-54 55-64 65 or Older Altogether Nearby Community Attendee Election
James River Arts & Cultural District 29.8% 14.8% 16.3% 21.1% 18.1% 33.2% 24.6% 42.1% 26.2% 90.2%
Center City Charlotte 12.9% 18.0% 29.9% 15.0% 24.1% 36.1% 23.6% 40.2% 18.6% 92.2%
Loch Haven Cultural Park 24.9% 19.5% 21.9% 17.8% 16.0% 35.7% 22.6% 41.7% 24.2% 89.9%
Downtown Colorado Springs Creative District 10.5% 7.3% 19.2% 24.0% 39.0% 35.6% 21.7% 42.7% 8.7% 92.4%
Fort Worth Cultural District 24.7% 14.2% 10.5% 22.8% 27.9% 29.2% 22.2% 48.6% 29.4% 86.9%
Dallas Arts District 50.8% 14.7% 13.5% 11.9% 9.0% 40.4% 17.7% 41.9% 28.2% 84.1%
Grand Center Arts & Entertainment District 21.7% 28.1% 17.4% 16.2% 16.7% 59.0% 26.0% 15.0% 37.3% 88.4%
Balboa Park Cultural District 33.2% 17.8% 19.4% 13.8% 15.8% 35.8% 26.0% 38.2% 32.9% 84.7%
East End Cultural District 34.7% 20.3% 14.4% 19.4% 11.2% 25.7% 35.0% 39.2% 34.4% 85.0%
Houston Museum District Association 11.2% 5.4% 9.9% 26.3% 47.1% 37.1% 36.4% 26.5% 14.8% 90.6%
Midtown Cultural District 20.8% 10.9% 18.6% 22.4% 27.2% 31.8% 35.1% 33.1% 38.3% 88.8%
Washington Avenue Cultural District 42.4% 16.1% 15.3% 12.5% 13.7% 25.8% 38.9% 35.3% 30.1% 85.6%
Arts District Average 26.5% 15.6% 17.2% 18.6% 22.2% 35.5% 27.5% 37.0% 26.9% 88.2%
Arts District Median 24.8% 15.5% 16.9% 18.6% 17.4% 35.7% 25.3% 39.7% 28.8% 88.6%
RESIDENTS ONLY -- AGE Willingness to Travel for Cultural Experiences
SOURCE: Arts and Economic Prosperity 5, Americans for the Arts, 2017. For more information, visit www.AmericansForTheArts.org/EconomicImpact. B–426

Explanation of Table 29:Educational Attainment and Annual Household Incomeof Non-Resident Attendees to Cultural Events Per Study Region During 2016
Column Two:
Column Three:
Column Four:
Column Five:
Column Six:
Column Seven:
Column Eight:
Column Nine:
Column Ten:
Column Eleven:
Column Twelve:The percentage of non-resident audience-intercept survey respondents whose annual household income is $120,000 or more.
The percentage of non-resident audience-intercept survey respondents whose highest completed level of education is a doctoral degree.
The percentage of non-resident audience-intercept survey respondents whose annual household income is less than $40,000.
The percentage of non-resident audience-intercept survey respondents whose annual household income is $40,000 to $59,999.
The percentage of non-resident audience-intercept survey respondents whose annual household income is $60,000 to $79,999.
The percentage of non-resident audience-intercept survey respondents whose annual household income is $80,000 to $99,999.
The percentage of non-resident audience-intercept survey respondents whose annual household income is $100,000 to $119,999
The percentage of non-resident audience-intercept survey respondents whose highest completed level of education is a master's degree.
This table presents a demographic description of non-resident nonprofit arts and cultural audience members in each participating study region during 2016. Non-residents are attendees who reside outside the county in which the nonprofit arts and cultural event at which they were surveyed took place (within the multi-city or multi-county region for regional analyses, and within the state for statewide analyses). Residency is determined based on the ZIP code provided by each audience-intercept survey respondent. Summary statistics are calculated for each population group. This table details only the educational attainment and annual household income reported by non-resident arts attendees who completed the audience-intercept survey. Table 30 provides details about non-resident cultural attendees' age, willingness to travel to attend cultural experiences, repeat visitation at the site where they were surveyed, and civic engagement (i.e., their participation status in the 2016 U.S. presidential election). Note: the percentages may not add exactly to 100 percent where appropriate due to rounding.
The percentage of non-resident audience-intercept survey respondents in each participating study region whose highest completed level of education is a high school degree (or less).
The percentage of non-resident audience-intercept survey respondents whose highest completed level of education is a two-year (e.g., associates or technical) college degree.
The percentage of non-resident audience-intercept survey respondents whose highest completed level of education is a four-year (e.g., bachelors) degree.
SOURCE: Arts and Economic Prosperity 5, Americans for the Arts, 2017. For more information, visit www.AmericansForTheArts.org/EconomicImpact. B–427
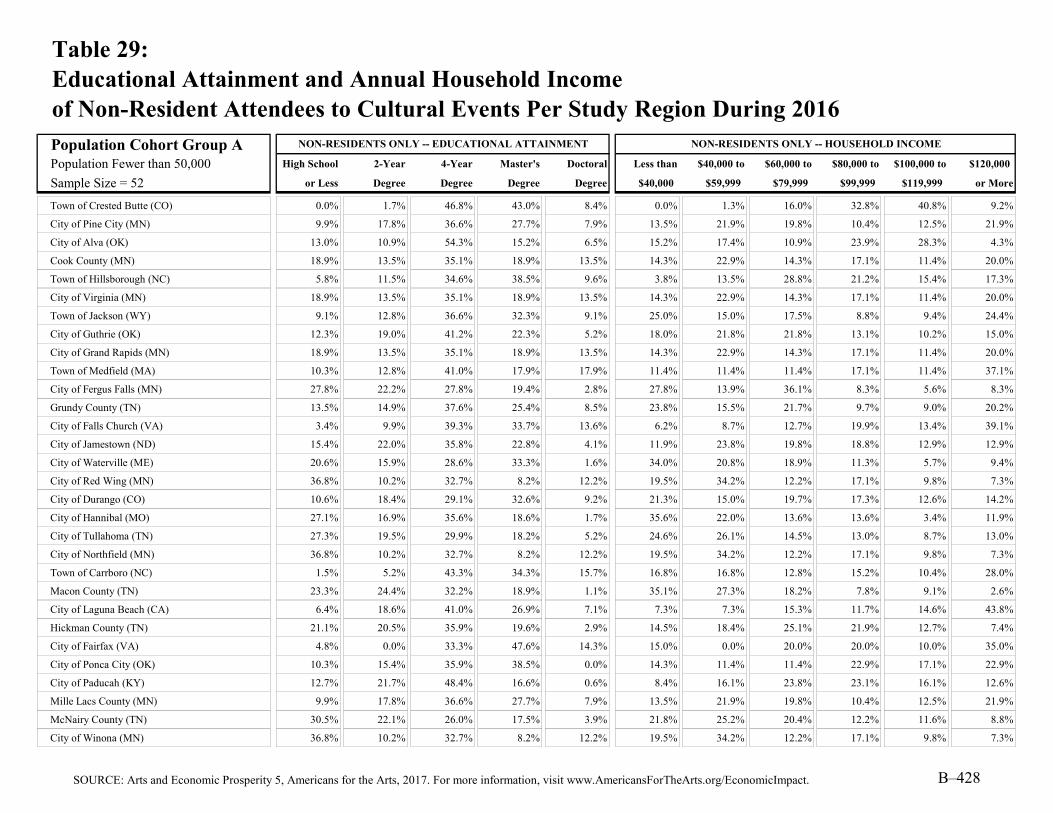
Table 29:Educational Attainment and Annual Household Incomeof Non-Resident Attendees to Cultural Events Per Study Region During 2016
Population Cohort Group APopulation Fewer than 50,000 High School 2-Year 4-Year Master's Doctoral Less than $40,000 to $60,000 to $80,000 to $100,000 to $120,000
Sample Size = 52 or Less Degree Degree Degree Degree $40,000 $59,999 $79,999 $99,999 $119,999 or More
Town of Crested Butte (CO) 0.0% 1.7% 46.8% 43.0% 8.4% 0.0% 1.3% 16.0% 32.8% 40.8% 9.2%
City of Pine City (MN) 9.9% 17.8% 36.6% 27.7% 7.9% 13.5% 21.9% 19.8% 10.4% 12.5% 21.9%
City of Alva (OK) 13.0% 10.9% 54.3% 15.2% 6.5% 15.2% 17.4% 10.9% 23.9% 28.3% 4.3%
Cook County (MN) 18.9% 13.5% 35.1% 18.9% 13.5% 14.3% 22.9% 14.3% 17.1% 11.4% 20.0%
Town of Hillsborough (NC) 5.8% 11.5% 34.6% 38.5% 9.6% 3.8% 13.5% 28.8% 21.2% 15.4% 17.3%
City of Virginia (MN) 18.9% 13.5% 35.1% 18.9% 13.5% 14.3% 22.9% 14.3% 17.1% 11.4% 20.0%
Town of Jackson (WY) 9.1% 12.8% 36.6% 32.3% 9.1% 25.0% 15.0% 17.5% 8.8% 9.4% 24.4%
City of Guthrie (OK) 12.3% 19.0% 41.2% 22.3% 5.2% 18.0% 21.8% 21.8% 13.1% 10.2% 15.0%
City of Grand Rapids (MN) 18.9% 13.5% 35.1% 18.9% 13.5% 14.3% 22.9% 14.3% 17.1% 11.4% 20.0%
Town of Medfield (MA) 10.3% 12.8% 41.0% 17.9% 17.9% 11.4% 11.4% 11.4% 17.1% 11.4% 37.1%
City of Fergus Falls (MN) 27.8% 22.2% 27.8% 19.4% 2.8% 27.8% 13.9% 36.1% 8.3% 5.6% 8.3%
Grundy County (TN) 13.5% 14.9% 37.6% 25.4% 8.5% 23.8% 15.5% 21.7% 9.7% 9.0% 20.2%
City of Falls Church (VA) 3.4% 9.9% 39.3% 33.7% 13.6% 6.2% 8.7% 12.7% 19.9% 13.4% 39.1%
City of Jamestown (ND) 15.4% 22.0% 35.8% 22.8% 4.1% 11.9% 23.8% 19.8% 18.8% 12.9% 12.9%
City of Waterville (ME) 20.6% 15.9% 28.6% 33.3% 1.6% 34.0% 20.8% 18.9% 11.3% 5.7% 9.4%
City of Red Wing (MN) 36.8% 10.2% 32.7% 8.2% 12.2% 19.5% 34.2% 12.2% 17.1% 9.8% 7.3%
City of Durango (CO) 10.6% 18.4% 29.1% 32.6% 9.2% 21.3% 15.0% 19.7% 17.3% 12.6% 14.2%
City of Hannibal (MO) 27.1% 16.9% 35.6% 18.6% 1.7% 35.6% 22.0% 13.6% 13.6% 3.4% 11.9%
City of Tullahoma (TN) 27.3% 19.5% 29.9% 18.2% 5.2% 24.6% 26.1% 14.5% 13.0% 8.7% 13.0%
City of Northfield (MN) 36.8% 10.2% 32.7% 8.2% 12.2% 19.5% 34.2% 12.2% 17.1% 9.8% 7.3%
Town of Carrboro (NC) 1.5% 5.2% 43.3% 34.3% 15.7% 16.8% 16.8% 12.8% 15.2% 10.4% 28.0%
Macon County (TN) 23.3% 24.4% 32.2% 18.9% 1.1% 35.1% 27.3% 18.2% 7.8% 9.1% 2.6%
City of Laguna Beach (CA) 6.4% 18.6% 41.0% 26.9% 7.1% 7.3% 7.3% 15.3% 11.7% 14.6% 43.8%
Hickman County (TN) 21.1% 20.5% 35.9% 19.6% 2.9% 14.5% 18.4% 25.1% 21.9% 12.7% 7.4%
City of Fairfax (VA) 4.8% 0.0% 33.3% 47.6% 14.3% 15.0% 0.0% 20.0% 20.0% 10.0% 35.0%
City of Ponca City (OK) 10.3% 15.4% 35.9% 38.5% 0.0% 14.3% 11.4% 11.4% 22.9% 17.1% 22.9%
City of Paducah (KY) 12.7% 21.7% 48.4% 16.6% 0.6% 8.4% 16.1% 23.8% 23.1% 16.1% 12.6%
Mille Lacs County (MN) 9.9% 17.8% 36.6% 27.7% 7.9% 13.5% 21.9% 19.8% 10.4% 12.5% 21.9%
McNairy County (TN) 30.5% 22.1% 26.0% 17.5% 3.9% 21.8% 25.2% 20.4% 12.2% 11.6% 8.8%
City of Winona (MN) 36.8% 10.2% 32.7% 8.2% 12.2% 19.5% 34.2% 12.2% 17.1% 9.8% 7.3%
NON-RESIDENTS ONLY -- EDUCATIONAL ATTAINMENT NON-RESIDENTS ONLY -- HOUSEHOLD INCOME
SOURCE: Arts and Economic Prosperity 5, Americans for the Arts, 2017. For more information, visit www.AmericansForTheArts.org/EconomicImpact. B–428

Table 29:Educational Attainment and Annual Household Incomeof Non-Resident Attendees to Cultural Events Per Study Region During 2016
Population Cohort Group APopulation Fewer than 50,000 High School 2-Year 4-Year Master's Doctoral Less than $40,000 to $60,000 to $80,000 to $100,000 to $120,000
Sample Size = 52 or Less Degree Degree Degree Degree $40,000 $59,999 $79,999 $99,999 $119,999 or More
Door County (WI) 6.7% 12.4% 38.3% 31.8% 10.8% 7.6% 12.8% 18.5% 17.2% 14.7% 29.2%
City of Benicia (CA) 8.3% 17.2% 43.3% 24.2% 7.0% 9.0% 10.8% 19.1% 18.3% 14.2% 28.6%
City of Winter Park (FL) 13.3% 15.3% 36.0% 23.0% 12.3% 10.5% 18.2% 21.9% 13.6% 13.6% 22.2%
City of Rochester (NH) 22.6% 28.2% 31.0% 16.9% 1.4% 25.5% 18.2% 17.2% 15.1% 12.5% 11.5%
City of Morgantown (WV) 23.2% 16.6% 34.9% 19.1% 6.2% 19.5% 17.7% 17.7% 12.4% 11.5% 21.2%
Henry County (TN) 14.3% 14.3% 38.1% 23.8% 9.5% 11.1% 11.1% 44.4% 11.1% 11.1% 11.1%
City of Fairbanks (AK) 11.1% 16.0% 38.3% 25.9% 8.6% 7.9% 15.8% 21.1% 14.5% 14.5% 26.3%
City of Bangor (ME) 10.6% 13.1% 34.0% 32.3% 10.1% 18.5% 17.5% 20.6% 14.5% 13.3% 15.6%
Weakley County (TN) 49.3% 19.3% 18.5% 8.6% 4.3% 40.5% 16.7% 16.3% 12.1% 7.0% 7.4%
Dare County (NC) 7.5% 27.5% 38.8% 17.5% 8.8% 7.9% 11.8% 22.4% 15.8% 23.7% 18.4%
City of Columbia (TN) 20.8% 20.8% 44.6% 11.9% 2.0% 25.0% 21.9% 17.7% 13.5% 8.3% 13.5%
City of Lake Worth (FL) 10.5% 15.8% 31.6% 31.6% 10.5% 7.0% 7.0% 16.3% 16.3% 11.6% 41.9%
Clatsop County (OR) 8.0% 16.0% 39.5% 28.7% 7.7% 13.7% 14.8% 15.4% 16.0% 10.8% 29.4%
Yadkin County (NC) 9.9% 18.5% 39.5% 25.3% 6.8% 16.7% 22.2% 16.0% 12.5% 9.0% 23.6%
Greater Belfast Area (ME) 13.7% 8.9% 45.2% 25.7% 6.5% 27.1% 16.8% 19.8% 11.7% 10.3% 14.3%
Campbell County (TN) 27.4% 22.6% 32.8% 14.0% 3.2% 17.5% 29.4% 22.0% 13.0% 10.2% 7.9%
Monroe County (TN) 22.8% 24.7% 28.8% 19.8% 3.8% 22.6% 19.9% 21.4% 15.2% 8.9% 11.9%
Lincoln County (OR) 6.5% 14.6% 31.3% 36.1% 11.6% 13.5% 13.5% 18.6% 17.2% 15.2% 22.1%
Iron County (UT) 4.0% 12.4% 35.8% 32.3% 15.5% 9.3% 11.8% 16.1% 14.2% 15.0% 33.5%
City of St. Louis Park (MN) 9.7% 12.5% 35.6% 26.0% 16.4% 13.3% 21.4% 16.3% 13.3% 13.3% 22.5%
City of Logan (UT) 8.4% 11.3% 34.2% 28.5% 17.6% 12.9% 15.8% 17.2% 18.2% 12.9% 23.0%
Gibson County (TN) 14.6% 16.7% 43.8% 22.9% 2.1% 15.2% 23.9% 15.2% 15.2% 17.4% 13.0%
Group A Average 15.7% 15.7% 36.2% 24.1% 8.2% 16.8% 17.9% 18.5% 15.5% 12.6% 18.7%
Group A Median 12.9% 15.9% 35.8% 23.4% 8.2% 14.8% 17.5% 17.7% 15.2% 11.6% 17.9%
NON-RESIDENTS ONLY -- EDUCATIONAL ATTAINMENT NON-RESIDENTS ONLY -- HOUSEHOLD INCOME
SOURCE: Arts and Economic Prosperity 5, Americans for the Arts, 2017. For more information, visit www.AmericansForTheArts.org/EconomicImpact. B–429

Table 29:Educational Attainment and Annual Household Incomeof Non-Resident Attendees to Cultural Events Per Study Region During 2016
Population Cohort Group BPopulation 50,000 to 99,999 High School 2-Year 4-Year Master's Doctoral Less than $40,000 to $60,000 to $80,000 to $100,000 to $120,000
Sample Size = 38 or Less Degree Degree Degree Degree $40,000 $59,999 $79,999 $99,999 $119,999 or More
City of Joplin (MO) 15.2% 21.4% 27.7% 24.1% 11.6% 30.0% 13.0% 28.0% 10.0% 14.0% 5.0%
City of La Crosse (WI) 26.0% 14.7% 33.5% 21.6% 4.1% 26.1% 18.2% 17.9% 13.4% 9.1% 15.3%
McMinn County (TN) 18.7% 17.5% 38.8% 18.1% 6.9% 15.4% 16.1% 18.1% 19.5% 10.1% 20.8%
Lafayette County (MS) 15.7% 12.2% 42.4% 22.1% 7.6% 27.7% 18.9% 13.2% 11.8% 8.8% 19.7%
Chisago County (MN) 9.9% 17.8% 36.6% 27.7% 7.9% 13.5% 21.9% 19.8% 10.4% 12.5% 21.9%
City of Grand Forks (ND) 21.0% 23.7% 35.2% 14.2% 5.9% 17.5% 19.0% 24.5% 17.0% 11.0% 11.0%
City of Corvallis (OR) 4.7% 15.7% 29.8% 41.4% 8.4% 16.3% 17.9% 16.3% 21.2% 12.5% 15.8%
City of Noblesville (IN) 22.4% 22.4% 40.3% 14.9% 0.0% 17.2% 25.0% 20.3% 9.4% 17.2% 10.9%
City of Ocala (FL) 10.9% 21.4% 35.3% 27.4% 5.0% 15.6% 16.3% 28.1% 15.6% 11.3% 13.1%
Lenoir County (NC) 11.0% 16.2% 49.4% 20.8% 2.6% 13.9% 20.1% 15.3% 20.1% 13.9% 16.7%
Town of Chapel Hill (NC) 8.8% 9.8% 37.8% 28.4% 15.2% 21.7% 15.5% 17.3% 9.4% 9.4% 26.7%
City of Grand Junction (CO) 26.3% 20.1% 34.0% 15.3% 4.3% 23.9% 15.7% 11.2% 14.2% 11.7% 23.4%
Town of Jupiter (FL) 12.5% 18.8% 37.5% 28.1% 3.1% 12.4% 13.6% 13.6% 15.8% 17.9% 26.7%
Hamblen County (TN) 5.9% 10.0% 40.5% 39.5% 4.1% 2.8% 10.7% 22.0% 31.3% 29.4% 3.7%
City of Delray Beach (FL) 9.5% 19.0% 38.1% 23.8% 9.5% 13.4% 17.2% 14.7% 14.7% 12.7% 27.4%
City of St. Cloud (MN) 13.4% 23.1% 40.4% 23.2% 0.0% 14.3% 24.5% 24.5% 14.3% 8.2% 14.3%
City of Portland (ME) 12.2% 11.4% 38.2% 26.8% 11.4% 16.9% 21.0% 10.3% 16.5% 15.6% 19.8%
City of Jackson (TN) 23.2% 21.9% 35.6% 15.6% 3.8% 21.8% 23.2% 17.6% 18.3% 7.7% 11.3%
City of Walnut Creek (CA) 3.6% 15.2% 40.3% 28.4% 12.5% 7.4% 10.8% 13.0% 14.1% 15.6% 39.0%
Greene County (TN) 19.4% 25.5% 45.9% 7.1% 2.0% 29.9% 21.6% 15.5% 20.6% 4.1% 8.2%
City of Flagstaff (AZ) 6.3% 18.8% 38.6% 28.6% 7.8% 15.1% 15.7% 20.9% 15.8% 12.4% 20.1%
City of Missoula (MT) 11.2% 7.5% 35.6% 32.5% 13.1% 18.6% 7.6% 24.1% 15.2% 12.4% 22.1%
City of Fort Myers (FL) 7.0% 12.7% 40.1% 28.9% 11.3% 4.3% 10.3% 19.7% 22.2% 18.8% 24.8%
Putnam County (TN) 24.5% 13.2% 39.6% 20.8% 1.9% 13.2% 30.2% 34.0% 9.4% 9.4% 3.8%
Monroe County (FL) 9.0% 16.4% 34.5% 28.8% 11.3% 12.0% 14.8% 17.0% 14.4% 13.9% 27.9%
City of Lynchburg (VA) 13.3% 18.1% 37.1% 23.0% 8.5% 16.8% 23.2% 16.8% 13.2% 14.1% 15.9%
City of Duluth (MN) 18.9% 13.5% 35.1% 18.9% 13.5% 14.3% 22.9% 14.3% 17.1% 11.4% 20.0%
City of Fishers (IN) 15.1% 19.4% 39.6% 18.0% 7.9% 14.8% 14.8% 22.2% 16.3% 10.4% 21.5%
City of Carmel (IN) 8.3% 14.6% 43.3% 25.5% 8.3% 8.1% 14.2% 16.9% 18.9% 12.8% 29.1%
City of Sugar Land (TX) 5.2% 12.1% 30.2% 39.7% 12.9% 15.0% 14.0% 21.5% 17.8% 17.8% 14.0%
NON-RESIDENTS ONLY -- EDUCATIONAL ATTAINMENT NON-RESIDENTS ONLY -- HOUSEHOLD INCOME
SOURCE: Arts and Economic Prosperity 5, Americans for the Arts, 2017. For more information, visit www.AmericansForTheArts.org/EconomicImpact. B–430

Table 29:Educational Attainment and Annual Household Incomeof Non-Resident Attendees to Cultural Events Per Study Region During 2016
Population Cohort Group BPopulation 50,000 to 99,999 High School 2-Year 4-Year Master's Doctoral Less than $40,000 to $60,000 to $80,000 to $100,000 to $120,000
Sample Size = 38 or Less Degree Degree Degree Degree $40,000 $59,999 $79,999 $99,999 $119,999 or More
City of Asheville (NC) 10.1% 8.9% 42.8% 29.0% 9.3% 14.8% 14.8% 12.8% 14.4% 13.6% 29.6%
Buchanan County (MO) 29.6% 22.6% 25.8% 16.8% 5.2% 21.8% 25.4% 24.6% 15.5% 7.7% 4.9%
City of Boca Raton (FL) 4.2% 20.8% 50.0% 20.8% 4.2% 19.9% 14.6% 14.3% 11.9% 12.1% 27.1%
City of Miami Beach (FL) 4.1% 8.1% 32.0% 28.9% 26.9% 9.0% 11.3% 14.7% 11.9% 11.9% 41.2%
Moore County (NC) 12.4% 12.4% 40.0% 24.8% 10.5% 10.3% 12.4% 16.5% 19.6% 13.4% 27.8%
Sevier County (TN) 24.4% 26.2% 28.6% 16.3% 4.5% 16.1% 21.5% 22.7% 13.4% 12.5% 13.7%
Cape May County (NJ) 10.0% 12.3% 32.7% 33.2% 11.8% 5.9% 14.6% 20.5% 7.0% 14.1% 37.8%
Cleveland County (NC) 11.6% 19.6% 37.7% 23.6% 7.5% 15.6% 19.0% 14.5% 19.0% 13.4% 18.4%
Group B Average 13.6% 16.7% 37.4% 24.4% 8.0% 15.9% 17.4% 18.7% 15.5% 12.8% 19.7%
Group B Median 11.9% 17.0% 37.8% 24.0% 7.9% 15.3% 16.2% 17.5% 15.4% 12.5% 19.9%
NON-RESIDENTS ONLY -- EDUCATIONAL ATTAINMENT NON-RESIDENTS ONLY -- HOUSEHOLD INCOME
SOURCE: Arts and Economic Prosperity 5, Americans for the Arts, 2017. For more information, visit www.AmericansForTheArts.org/EconomicImpact. B–431

Table 29:Educational Attainment and Annual Household Incomeof Non-Resident Attendees to Cultural Events Per Study Region During 2016
Population Cohort Group CPopulation 100,000 to 249,999 High School 2-Year 4-Year Master's Doctoral Less than $40,000 to $60,000 to $80,000 to $100,000 to $120,000
Sample Size = 50 or Less Degree Degree Degree Degree $40,000 $59,999 $79,999 $99,999 $119,999 or More
City of Las Cruces (NM) 7.8% 12.2% 40.0% 30.0% 10.0% 18.4% 24.1% 13.8% 18.4% 9.2% 16.1%
Eau Claire County (WI) 17.0% 29.6% 37.3% 13.5% 2.6% 18.7% 20.8% 25.8% 14.8% 10.2% 9.5%
Yamhill County (OR) 11.8% 17.8% 32.1% 30.3% 8.0% 15.5% 16.7% 20.1% 13.3% 15.9% 18.6%
City of Lewisville (TX) 5.9% 16.1% 36.4% 33.9% 7.6% 10.6% 8.0% 14.2% 15.0% 15.9% 36.3%
City of West Palm Beach (FL) 2.0% 3.9% 47.1% 33.3% 13.7% 14.4% 13.6% 19.2% 15.3% 15.5% 22.0%
City of Boulder (CO) 7.9% 10.8% 42.2% 27.9% 11.3% 16.2% 15.7% 16.2% 13.6% 13.6% 24.7%
City of Richardson (TX) 10.4% 14.6% 36.5% 29.2% 9.4% 11.8% 9.4% 9.4% 14.1% 12.9% 42.4%
City of High Point (NC) 17.6% 22.8% 36.3% 18.9% 4.4% 14.3% 24.5% 20.9% 13.4% 10.7% 16.1%
City of Cambridge (MA) 5.9% 6.4% 39.0% 33.3% 15.4% 17.6% 12.3% 11.8% 11.8% 11.5% 35.0%
City of Lowell (MA) 11.5% 10.0% 34.2% 32.9% 11.4% 22.8% 10.4% 13.9% 12.9% 14.9% 25.2%
Douglas County (KS) 8.5% 11.5% 40.4% 29.6% 10.0% 15.1% 15.5% 18.5% 12.8% 15.5% 22.6%
City of Columbia (MO) 15.4% 10.0% 32.0% 32.0% 10.7% 25.7% 11.8% 18.4% 17.6% 9.6% 16.9%
City of Norman (OK) 26.3% 20.4% 32.2% 16.1% 4.9% 31.1% 23.1% 15.7% 10.8% 9.8% 9.4%
Wayne County (NC) 21.7% 20.2% 34.1% 20.9% 3.1% 25.6% 19.0% 22.3% 15.7% 6.6% 10.7%
City of Lafayette (LA) 0.0% 6.3% 68.8% 25.0% 0.0% 26.7% 13.3% 40.0% 13.3% 0.0% 6.7%
Washington County (TN) 13.3% 18.2% 27.9% 27.3% 13.3% 22.8% 20.9% 14.6% 11.4% 9.5% 20.9%
City of Thousand Oaks (CA) 9.4% 19.7% 39.4% 25.6% 5.9% 7.4% 11.8% 14.8% 14.0% 12.2% 39.7%
City of Charleston (SC) 7.9% 14.6% 37.4% 32.7% 7.5% 9.9% 16.4% 18.1% 19.0% 15.1% 21.6%
City of Waco (TX) 28.1% 16.9% 33.3% 16.9% 4.7% 23.5% 12.5% 15.2% 16.7% 8.0% 24.1%
Robeson County (NC) 22.0% 17.6% 29.7% 26.4% 4.4% 18.1% 30.1% 18.1% 13.3% 12.0% 8.4%
Columbia County (GA) 13.5% 27.8% 35.9% 17.0% 5.8% 21.2% 16.5% 17.9% 16.5% 11.8% 16.0%
Orange County (NC) 6.4% 8.7% 39.0% 31.1% 14.7% 18.3% 15.6% 17.4% 12.3% 10.4% 26.0%
City of Savannah (GA) 5.8% 16.9% 35.5% 34.3% 7.4% 6.7% 12.0% 20.4% 16.9% 12.4% 31.6%
Indian River County (FL) 6.3% 21.5% 36.1% 29.1% 7.0% 12.1% 12.1% 20.2% 17.7% 12.9% 25.0%
City of Alexandria (VA) 3.5% 8.1% 38.0% 38.0% 12.5% 8.3% 9.2% 11.2% 14.1% 19.3% 38.0%
Martin County (FL) 11.7% 24.6% 29.9% 28.1% 5.7% 12.9% 8.7% 17.1% 18.6% 17.9% 24.7%
Macon-Bibb County (GA) 10.2% 17.7% 38.2% 27.9% 6.0% 14.9% 18.3% 18.3% 16.0% 13.0% 19.5%
City of Springfield (MA) 14.8% 16.8% 40.8% 19.9% 7.7% 12.6% 28.8% 19.4% 19.4% 7.3% 12.6%
Catawba County (NC) 8.5% 16.4% 37.5% 31.2% 6.3% 11.5% 18.0% 18.6% 14.2% 13.9% 23.7%
Town of Cary (NC) 10.7% 12.5% 33.9% 33.9% 8.9% 14.0% 18.6% 9.3% 16.3% 9.3% 32.6%
NON-RESIDENTS ONLY -- EDUCATIONAL ATTAINMENT NON-RESIDENTS ONLY -- HOUSEHOLD INCOME
SOURCE: Arts and Economic Prosperity 5, Americans for the Arts, 2017. For more information, visit www.AmericansForTheArts.org/EconomicImpact. B–432

Table 29:Educational Attainment and Annual Household Incomeof Non-Resident Attendees to Cultural Events Per Study Region During 2016
Population Cohort Group CPopulation 100,000 to 249,999 High School 2-Year 4-Year Master's Doctoral Less than $40,000 to $60,000 to $80,000 to $100,000 to $120,000
Sample Size = 50 or Less Degree Degree Degree Degree $40,000 $59,999 $79,999 $99,999 $119,999 or More
Alamance County (NC) 12.0% 17.5% 41.1% 23.3% 6.2% 11.6% 20.9% 18.1% 21.7% 13.3% 14.5%
Cumberland County (NJ) 14.1% 14.1% 38.8% 24.3% 8.7% 10.4% 14.8% 13.2% 21.4% 12.6% 27.5%
City of Eugene (OR) 12.4% 12.4% 37.1% 24.8% 13.3% 19.2% 17.2% 17.2% 11.1% 16.2% 19.2%
Middlesex County (CT) 3.8% 15.4% 42.3% 30.8% 7.7% 12.5% 8.3% 4.2% 4.2% 29.2% 41.7%
City of Springfield (MO) 15.2% 19.7% 38.9% 20.9% 5.3% 18.9% 16.7% 21.9% 15.5% 11.6% 15.5%
City of Sioux Falls (SD) 13.4% 18.9% 33.8% 17.4% 16.5% 10.7% 14.1% 18.6% 15.1% 12.7% 28.9%
Pitt County (NC) 14.8% 15.8% 44.2% 18.9% 6.3% 25.3% 7.7% 17.6% 17.6% 9.9% 22.0%
City of Providence (RI) 7.4% 10.1% 37.2% 35.1% 10.1% 11.6% 14.7% 20.2% 14.7% 3.9% 34.9%
City of Worcester (MA) 11.8% 14.2% 37.0% 27.6% 9.4% 18.7% 21.1% 19.5% 8.9% 8.1% 23.6%
Montgomery County (TN) 10.1% 17.4% 31.9% 29.7% 10.9% 21.3% 17.2% 20.5% 20.5% 5.7% 14.8%
Salt Lake City (UT) 11.1% 22.1% 33.7% 24.0% 9.1% 31.3% 14.9% 14.4% 10.4% 10.0% 18.9%
Cabarrus County (NC) 13.4% 23.5% 40.6% 16.0% 6.4% 8.6% 21.0% 22.2% 10.5% 15.4% 22.2%
Richmond County (GA) 9.6% 19.6% 36.3% 26.2% 8.3% 10.9% 14.7% 20.5% 16.2% 11.2% 26.6%
City of Tacoma (WA) 7.3% 16.1% 41.6% 28.2% 6.7% 13.8% 16.9% 16.6% 14.8% 14.8% 23.1%
Doña Ana County (NM) 10.5% 12.9% 38.7% 29.0% 8.9% 15.7% 22.3% 15.7% 16.5% 11.6% 18.2%
New Hanover County (NC) 10.3% 10.3% 33.8% 39.7% 5.9% 9.7% 14.5% 16.1% 9.7% 16.1% 33.9%
Arlington County (VA) 3.6% 6.4% 35.5% 40.3% 14.3% 10.3% 10.1% 10.9% 11.0% 13.5% 44.2%
City of Irving (TX) 10.0% 12.1% 47.9% 21.6% 8.4% 16.6% 12.0% 17.1% 12.6% 16.0% 25.7%
City of Reno (NV) 11.5% 19.4% 31.7% 31.7% 5.8% 14.4% 14.4% 12.1% 23.5% 13.6% 22.0%
York County (SC) 12.3% 19.5% 41.5% 24.1% 2.6% 15.6% 19.4% 17.8% 16.1% 10.6% 20.6%
Group C Average 11.1% 15.8% 37.7% 27.2% 8.2% 16.1% 16.0% 17.3% 14.8% 12.3% 23.5%
Group C Median 10.6% 16.3% 37.2% 28.0% 7.7% 15.0% 15.6% 17.7% 14.8% 12.3% 22.4%
NON-RESIDENTS ONLY -- EDUCATIONAL ATTAINMENT NON-RESIDENTS ONLY -- HOUSEHOLD INCOME
SOURCE: Arts and Economic Prosperity 5, Americans for the Arts, 2017. For more information, visit www.AmericansForTheArts.org/EconomicImpact. B–433

Table 29:Educational Attainment and Annual Household Incomeof Non-Resident Attendees to Cultural Events Per Study Region During 2016
Population Cohort Group DPopulation 250,000 to 499,999 High School 2-Year 4-Year Master's Doctoral Less than $40,000 to $60,000 to $80,000 to $100,000 to $120,000
Sample Size = 42 or Less Degree Degree Degree Degree $40,000 $59,999 $79,999 $99,999 $119,999 or More
Buncombe County (NC) 8.8% 11.6% 42.3% 28.2% 9.1% 18.9% 13.9% 12.8% 13.2% 13.2% 28.0%
Alachua County (FL) 16.9% 30.4% 25.6% 19.2% 8.0% 25.4% 20.5% 20.5% 10.6% 9.6% 13.5%
Greater Green Bay Area (WI) 17.6% 24.2% 37.3% 18.3% 2.6% 15.5% 18.3% 20.4% 19.7% 14.1% 12.0%
City of Orlando (FL) 11.1% 19.2% 35.4% 27.2% 7.1% 13.9% 17.6% 16.9% 17.4% 13.6% 20.6%
City of Lincoln (NE) 8.8% 18.0% 35.1% 28.5% 9.6% 13.0% 16.9% 25.6% 14.5% 9.7% 20.3%
Southeastern Connecticut Region (CT) 7.2% 14.8% 36.5% 33.1% 8.4% 10.2% 13.0% 15.3% 16.2% 15.7% 29.6%
Erie County (PA) 17.7% 22.9% 19.8% 33.3% 6.3% 22.0% 18.7% 20.9% 15.4% 11.0% 12.1%
San Luis Obispo County (CA) 8.7% 18.7% 41.3% 24.7% 6.7% 11.6% 18.1% 9.4% 16.7% 14.5% 29.7%
City of Newark (NJ) 12.0% 15.1% 40.7% 25.0% 7.1% 11.0% 13.9% 18.8% 16.2% 13.3% 26.9%
Leon County (FL) 9.8% 18.0% 37.7% 21.3% 13.1% 24.8% 10.7% 15.7% 14.0% 14.9% 19.8%
Rutherford County (TN) 34.2% 19.0% 31.7% 11.2% 3.9% 31.7% 20.1% 20.6% 4.2% 9.5% 13.8%
St. Lucie County (FL) 16.7% 24.4% 35.9% 20.5% 2.6% 14.1% 21.8% 11.5% 15.4% 12.8% 24.4%
Greater Spartanburg Area (SC) 5.1% 13.6% 47.5% 27.1% 6.8% 7.3% 26.8% 26.8% 12.2% 9.8% 17.1%
Durham County (NC) 4.0% 6.5% 34.6% 35.7% 19.3% 13.2% 10.8% 13.5% 14.8% 16.0% 31.7%
City of St. Paul (MN) 9.7% 12.5% 35.6% 26.0% 16.4% 13.3% 21.4% 16.3% 13.3% 13.3% 22.5%
Hamilton County (IN) 13.5% 17.9% 41.3% 20.7% 6.6% 12.4% 16.4% 19.6% 16.1% 12.7% 22.8%
Osceola County (FL) 12.5% 31.3% 31.3% 25.0% 0.0% 46.2% 7.7% 7.7% 30.8% 0.0% 7.7%
Escambia County (FL) 10.9% 16.1% 38.7% 26.3% 8.0% 7.8% 17.8% 16.3% 19.4% 16.3% 22.5%
Lexington-Fayette Urban County (KY) 13.4% 18.5% 36.2% 22.8% 9.1% 26.5% 16.4% 14.6% 13.7% 11.4% 17.4%
Lake County (FL) 16.4% 19.4% 31.3% 26.9% 6.0% 16.4% 21.3% 24.6% 9.8% 14.8% 13.1%
City of Riverside (CA) 11.2% 11.2% 46.9% 22.4% 8.2% 8.2% 9.2% 14.3% 31.6% 23.5% 13.3%
Cumberland County (NC) 24.7% 23.8% 30.9% 16.1% 4.5% 27.6% 17.9% 22.6% 9.0% 8.6% 14.3%
Collier County (FL) 8.7% 12.4% 35.6% 32.4% 10.9% 7.4% 7.4% 15.3% 13.2% 12.0% 44.6%
Hamilton County (TN) 14.7% 22.9% 40.0% 20.0% 2.4% 26.9% 15.9% 12.9% 10.9% 16.9% 16.4%
Manatee County (FL) 10.2% 18.4% 30.5% 32.1% 8.9% 8.6% 17.3% 12.6% 16.5% 14.4% 30.6%
City of Tampa (FL) 10.1% 14.8% 39.2% 28.5% 7.3% 13.4% 19.0% 17.7% 15.0% 14.3% 20.7%
Forsyth County (NC) 11.0% 16.7% 41.8% 22.8% 7.6% 14.2% 19.3% 13.7% 11.6% 15.0% 26.2%
Mercer County (NJ) 10.3% 6.8% 35.0% 35.0% 12.8% 4.6% 7.3% 11.0% 15.6% 22.9% 38.5%
City of Wichita (KS) 13.2% 20.3% 31.6% 26.9% 8.0% 8.2% 19.2% 29.1% 16.5% 14.3% 12.6%
Clackamas County (OR) 8.4% 16.8% 39.5% 27.7% 7.6% 14.3% 20.5% 17.9% 10.7% 10.7% 25.9%
NON-RESIDENTS ONLY -- EDUCATIONAL ATTAINMENT NON-RESIDENTS ONLY -- HOUSEHOLD INCOME
SOURCE: Arts and Economic Prosperity 5, Americans for the Arts, 2017. For more information, visit www.AmericansForTheArts.org/EconomicImpact. B–434

Table 29:Educational Attainment and Annual Household Incomeof Non-Resident Attendees to Cultural Events Per Study Region During 2016
Population Cohort Group DPopulation 250,000 to 499,999 High School 2-Year 4-Year Master's Doctoral Less than $40,000 to $60,000 to $80,000 to $100,000 to $120,000
Sample Size = 42 or Less Degree Degree Degree Degree $40,000 $59,999 $79,999 $99,999 $119,999 or More
Sarasota County (FL) 4.3% 10.2% 29.1% 36.5% 19.9% 6.1% 8.7% 12.9% 12.8% 14.5% 45.0%
City of Minneapolis (MN) 9.7% 12.5% 35.6% 26.0% 16.4% 13.3% 21.4% 16.3% 13.3% 13.3% 22.5%
Berks County (PA) 14.5% 18.0% 33.5% 26.0% 8.0% 7.6% 18.6% 16.3% 17.4% 14.0% 26.2%
City of Miami (FL) 6.9% 12.4% 36.4% 30.1% 14.2% 10.1% 17.6% 13.7% 12.2% 13.4% 33.0%
City of Raleigh (NC) 7.7% 14.3% 34.5% 28.2% 15.3% 11.8% 16.0% 17.9% 15.2% 11.8% 27.4%
Santa Barbara County (CA) 11.5% 7.7% 46.2% 25.0% 9.6% 6.4% 10.6% 12.8% 21.3% 10.6% 38.3%
Seminole County (FL) 8.3% 33.3% 41.7% 12.5% 4.2% 0.0% 22.7% 27.3% 13.6% 18.2% 18.2%
City of Virginia Beach (VA) 11.9% 14.5% 36.2% 28.0% 9.5% 11.0% 13.0% 14.5% 14.9% 12.1% 34.4%
City of Atlanta (GA) 3.5% 14.7% 34.3% 35.0% 12.6% 13.3% 15.6% 13.3% 15.6% 13.3% 28.9%
City of Mesa (AZ) 10.4% 19.8% 34.9% 30.2% 4.7% 10.2% 14.8% 23.9% 14.8% 8.0% 28.4%
City of Kansas City (MO) 6.3% 11.3% 36.7% 32.3% 13.4% 13.0% 13.0% 15.8% 13.3% 15.3% 29.5%
Morris County (NJ) 7.7% 13.2% 44.6% 25.0% 9.5% 7.6% 12.7% 15.3% 14.9% 14.9% 34.5%
Group D Average 11.4% 17.1% 36.4% 26.2% 8.9% 14.3% 16.2% 17.0% 15.1% 13.3% 24.2%
Group D Median 10.4% 16.8% 36.1% 26.6% 8.0% 13.0% 17.1% 16.1% 14.9% 13.4% 23.6%
NON-RESIDENTS ONLY -- EDUCATIONAL ATTAINMENT NON-RESIDENTS ONLY -- HOUSEHOLD INCOME
SOURCE: Arts and Economic Prosperity 5, Americans for the Arts, 2017. For more information, visit www.AmericansForTheArts.org/EconomicImpact. B–435

Table 29:Educational Attainment and Annual Household Incomeof Non-Resident Attendees to Cultural Events Per Study Region During 2016
Population Cohort Group EPopulation 500,000 to 999,999 High School 2-Year 4-Year Master's Doctoral Less than $40,000 to $60,000 to $80,000 to $100,000 to $120,000
Sample Size = 25 or Less Degree Degree Degree Degree $40,000 $59,999 $79,999 $99,999 $119,999 or More
Sonoma County (CA) 7.1% 21.2% 37.2% 23.7% 10.9% 9.3% 10.0% 11.4% 12.1% 18.6% 38.6%
Volusia County (FL) 8.3% 33.3% 41.7% 16.7% 0.0% 18.2% 45.5% 18.2% 18.2% 0.0% 0.0%
Guilford County (NC) 12.7% 18.5% 38.3% 24.9% 5.6% 14.0% 22.0% 20.8% 13.4% 13.4% 16.3%
Dane County (WI) 11.5% 13.0% 37.7% 30.4% 7.2% 31.1% 32.8% 11.5% 4.9% 9.8% 9.8%
Brevard County (FL) 9.1% 27.3% 36.4% 18.2% 9.1% 9.1% 9.1% 45.5% 9.1% 9.1% 18.2%
Washington County (OR) 3.3% 9.3% 32.7% 38.7% 16.0% 10.7% 16.4% 20.0% 13.6% 15.7% 23.6%
Johnson County (KS) 6.7% 13.5% 41.3% 31.7% 6.7% 12.9% 20.4% 16.1% 19.4% 12.9% 18.3%
City of Louisville (KY) 7.1% 14.8% 36.8% 33.5% 7.7% 7.2% 10.5% 21.1% 22.4% 11.2% 27.6%
City of Baltimore (MD) 13.2% 12.3% 31.8% 31.3% 11.4% 20.2% 13.8% 15.4% 14.1% 9.7% 26.8%
Polk County (FL) 8.8% 19.3% 35.7% 30.5% 5.6% 9.7% 18.4% 21.7% 19.8% 12.0% 18.4%
City of Boston (MA) 9.7% 7.5% 42.4% 27.4% 13.0% 14.4% 10.6% 19.7% 15.6% 14.0% 25.7%
District of Columbia (DC) 4.8% 5.3% 32.0% 38.2% 19.8% 8.0% 8.0% 14.0% 10.6% 11.8% 47.7%
Nashville-Davidson County (TN) 11.5% 16.0% 42.7% 21.1% 8.7% 16.0% 18.1% 13.1% 17.2% 12.8% 22.7%
City of El Paso (TX) 18.4% 15.0% 33.3% 23.3% 10.0% 31.0% 20.7% 13.8% 13.8% 10.3% 10.3%
Lee County (FL) 7.6% 14.1% 40.0% 27.6% 10.8% 6.6% 8.6% 20.4% 19.1% 18.4% 27.0%
City of Fort Worth (TX) 8.4% 19.5% 40.5% 26.8% 4.7% 11.4% 17.9% 15.2% 15.2% 15.2% 25.0%
City of Indianapolis (IN) 4.6% 8.3% 38.3% 33.3% 15.5% 11.4% 8.8% 16.9% 18.0% 12.5% 32.4%
City and County of San Francisco (CA) 6.3% 13.0% 41.1% 29.2% 10.3% 19.9% 17.8% 10.2% 11.4% 13.7% 27.0%
Prince George's County (MD) 7.2% 21.4% 39.3% 25.9% 6.3% 12.1% 10.3% 19.6% 13.1% 12.1% 32.7%
Pinellas County (FL) 8.4% 21.6% 36.4% 25.4% 8.3% 18.8% 17.1% 20.4% 10.6% 13.5% 19.6%
Shelby County (TN) 13.8% 15.8% 33.6% 30.3% 6.6% 17.0% 15.6% 15.6% 13.5% 14.2% 24.1%
Fairfield County (CT) 14.4% 18.9% 38.4% 20.8% 7.5% 7.5% 10.2% 19.0% 17.7% 15.0% 30.6%
Westchester County (NY) 5.4% 15.8% 34.4% 30.8% 13.6% 11.7% 12.6% 15.0% 12.6% 16.0% 32.0%
Fulton County (GA) 7.7% 19.2% 41.3% 25.0% 6.7% 12.3% 15.9% 13.3% 12.3% 14.9% 31.3%
Wake County (NC) 8.0% 13.9% 34.9% 29.1% 14.1% 11.8% 17.6% 16.7% 14.9% 11.8% 27.2%
Group E Average 9.0% 16.3% 37.5% 27.8% 9.4% 14.1% 16.3% 17.8% 14.5% 12.7% 24.5%
Group E Median 8.3% 15.8% 37.7% 27.6% 8.7% 12.1% 15.9% 16.7% 13.8% 12.9% 25.7%
NON-RESIDENTS ONLY -- EDUCATIONAL ATTAINMENT NON-RESIDENTS ONLY -- HOUSEHOLD INCOME
SOURCE: Arts and Economic Prosperity 5, Americans for the Arts, 2017. For more information, visit www.AmericansForTheArts.org/EconomicImpact. B–436

Table 29:Educational Attainment and Annual Household Incomeof Non-Resident Attendees to Cultural Events Per Study Region During 2016
Population Cohort Group FPopulation 1,000,000 or More High School 2-Year 4-Year Master's Doctoral Less than $40,000 to $60,000 to $80,000 to $100,000 to $120,000
Sample Size = 21 or Less Degree Degree Degree Degree $40,000 $59,999 $79,999 $99,999 $119,999 or More
Mecklenburg County (NC) 8.1% 16.2% 38.1% 27.6% 10.0% 13.2% 10.0% 15.3% 14.2% 18.9% 28.4%
City of San José (CA) 6.1% 12.2% 35.7% 34.8% 11.3% 14.7% 11.9% 13.8% 9.2% 11.0% 39.4%
Montgomery County (MD) 5.9% 7.8% 30.5% 39.6% 16.3% 8.1% 11.4% 15.3% 11.7% 12.2% 41.4%
Fairfax County (VA) 4.1% 6.8% 32.0% 41.3% 15.9% 2.8% 6.1% 10.0% 12.8% 12.0% 56.3%
Allegheny County (PA) 12.8% 11.1% 31.0% 32.7% 12.4% 17.9% 13.0% 14.0% 13.5% 12.6% 29.0%
Greater Columbus Area (OH) 12.9% 13.0% 33.7% 29.5% 10.9% 10.2% 12.9% 17.2% 12.9% 18.8% 28.0%
Orange County (FL) 11.5% 18.2% 36.9% 24.6% 8.8% 13.9% 18.3% 18.6% 15.9% 13.0% 20.3%
City of Dallas (TX) 11.3% 13.1% 45.6% 22.2% 7.7% 20.6% 14.1% 15.1% 11.5% 10.0% 28.8%
Hillsborough County (FL) 11.2% 15.6% 38.1% 27.8% 7.2% 13.6% 18.8% 17.7% 14.8% 14.1% 21.0%
City of San Diego (CA) 9.2% 14.9% 39.2% 26.2% 10.5% 13.3% 13.8% 13.8% 13.8% 11.6% 33.6%
Palm Beach County (FL) 6.4% 14.1% 40.4% 30.8% 8.3% 14.1% 14.4% 16.1% 14.3% 14.1% 27.1%
City of San Antonio (TX) 11.6% 14.0% 46.5% 19.8% 8.1% 13.9% 21.5% 20.3% 8.9% 8.9% 26.6%
Sacramento County (CA) 10.5% 25.4% 32.0% 24.3% 7.7% 12.7% 11.0% 20.8% 15.6% 15.6% 24.3%
City of Phoenix (AZ) 8.0% 14.6% 37.7% 29.8% 9.9% 15.4% 18.2% 15.4% 16.8% 14.7% 19.6%
City and County of Philadelphia (PA) 7.3% 11.6% 33.6% 31.2% 16.3% 13.7% 12.0% 12.9% 10.6% 13.3% 37.5%
Broward County (FL) 10.5% 19.1% 39.0% 23.8% 7.7% 9.2% 17.4% 21.8% 13.9% 15.1% 22.6%
Santa Clara County (CA) 4.5% 9.6% 31.7% 40.6% 13.7% 8.1% 10.9% 10.5% 11.3% 18.1% 41.1%
Riverside County (CA) 8.1% 17.3% 47.6% 21.1% 5.9% 4.9% 6.5% 13.5% 38.4% 25.9% 10.8%
Miami-Dade County (FL) 6.1% 12.0% 35.1% 30.2% 16.6% 8.6% 15.6% 14.5% 13.2% 13.2% 34.8%
City of Chicago (IL) 5.9% 13.3% 38.1% 31.1% 11.5% 15.0% 7.1% 12.3% 18.2% 14.2% 33.2%
Harris County (TX) 10.6% 10.6% 39.7% 26.7% 12.4% 15.2% 8.8% 14.0% 9.1% 12.6% 40.4%
Group F Average 8.7% 13.8% 37.2% 29.3% 10.9% 12.3% 13.0% 15.4% 14.3% 14.3% 30.7%
Group F Median 8.1% 13.3% 37.7% 29.5% 10.5% 13.6% 12.9% 15.1% 13.5% 13.3% 28.8%
Average 12.2% 16.0% 37.0% 26.1% 8.7% 15.3% 16.5% 17.6% 15.1% 12.9% 22.7%
Median 10.5% 15.8% 36.6% 26.6% 8.3% 14.1% 16.1% 17.0% 14.8% 12.7% 22.2%
NON-RESIDENTS ONLY -- EDUCATIONAL ATTAINMENT NON-RESIDENTS ONLY -- HOUSEHOLD INCOME
ALL CITY/COUNTY STUDY REGIONS
SOURCE: Arts and Economic Prosperity 5, Americans for the Arts, 2017. For more information, visit www.AmericansForTheArts.org/EconomicImpact. B–437

Table 29:Educational Attainment and Annual Household Incomeof Non-Resident Attendees to Cultural Events Per Study Region During 2016
Regional Study RegionsAll Populations High School 2-Year 4-Year Master's Doctoral Less than $40,000 to $60,000 to $80,000 to $100,000 to $120,000
Sample Size = 81 or Less Degree Degree Degree Degree $40,000 $59,999 $79,999 $99,999 $119,999 or More
High Peaks Region (ME) 14.7% 12.0% 39.2% 29.5% 4.6% 9.9% 18.8% 20.4% 16.2% 11.5% 23.0%
Wood River Valley (ID) 4.3% 8.9% 39.7% 30.0% 17.1% 5.1% 9.7% 7.6% 14.3% 14.8% 48.5%
Southern Oregon Area 2.9% 7.1% 27.3% 38.6% 24.1% 5.3% 7.0% 15.4% 12.6% 17.6% 42.0%
Southwestern Pennsylvania Area 28.2% 15.4% 27.7% 22.9% 5.9% 31.9% 23.3% 17.2% 8.6% 11.0% 8.0%
Greater Portsmouth Area (NH) 5.1% 12.5% 38.7% 29.7% 14.1% 14.3% 14.3% 17.3% 13.4% 13.4% 27.3%
Northeast Oregon Region 20.7% 6.9% 41.4% 31.0% 0.0% 44.4% 14.8% 7.4% 14.8% 0.0% 18.5%
Toe River Valley (NC) 7.1% 9.8% 38.8% 30.8% 13.6% 14.2% 14.9% 21.8% 20.3% 11.7% 17.1%
Albemarle Region (NC) 10.0% 21.3% 41.2% 20.4% 7.1% 17.8% 17.3% 19.4% 16.2% 12.0% 17.3%
Greater Concord Area (NH) 12.5% 17.0% 35.7% 27.2% 7.6% 12.9% 13.8% 14.7% 13.8% 16.0% 28.8%
North Central Minnesota Region 5.1% 23.1% 46.2% 20.5% 5.1% 30.0% 23.3% 16.7% 20.0% 3.3% 6.7%
Northwest Minnesota Region 22.5% 27.5% 35.0% 15.0% 0.0% 29.4% 23.5% 17.7% 8.8% 14.7% 5.9%
Monadnock Region (NH) 15.4% 11.3% 36.2% 27.6% 9.5% 24.2% 18.2% 14.1% 12.6% 11.1% 19.7%
Bismarck-Mandan Region (ND) 19.5% 22.0% 36.6% 20.7% 1.2% 18.9% 13.5% 29.7% 16.2% 6.8% 14.9%
Greater Minot Region (ND) 20.7% 22.4% 34.5% 17.2% 5.2% 28.8% 19.2% 19.2% 9.6% 3.8% 19.2%
Greater Burlington Area (VT) 8.3% 9.6% 31.2% 42.7% 8.3% 16.9% 19.7% 16.4% 11.7% 12.7% 22.5%
Greater Charlottesville Area (VA) 10.2% 12.6% 33.9% 30.4% 12.8% 17.1% 14.2% 16.6% 14.2% 11.6% 26.3%
Brainerd Lakes Region (MN) 20.5% 25.0% 47.7% 6.8% 0.0% 22.0% 14.6% 31.7% 24.4% 0.0% 7.3%
East Central Minnesota Region 9.9% 17.8% 36.6% 27.7% 7.9% 13.5% 21.9% 19.8% 10.4% 12.5% 21.9%
Northwest Connecticut Region 8.2% 9.6% 30.0% 41.3% 10.9% 9.1% 13.8% 12.1% 14.5% 16.6% 34.0%
Central Oregon Region 12.2% 20.1% 32.9% 29.9% 4.9% 5.0% 16.1% 24.8% 8.7% 19.9% 25.5%
Greater Fargo-Moorhead Area (ND/MN) 16.4% 16.5% 34.1% 18.1% 14.8% 19.7% 16.8% 21.4% 15.6% 8.7% 17.9%
Black Hills Region (SD) 14.4% 20.3% 42.0% 18.8% 4.3% 15.2% 15.2% 18.2% 21.2% 15.2% 15.2%
Greater Kingsport Area (TN) 11.4% 20.8% 33.1% 23.8% 10.9% 21.1% 20.5% 20.1% 10.7% 13.0% 14.6%
Lake Region (MN) 27.8% 22.2% 27.8% 19.4% 2.8% 27.8% 13.9% 36.1% 8.3% 5.6% 8.3%
South Central Minnesota Region 19.2% 15.1% 39.7% 16.4% 9.6% 27.1% 21.4% 7.1% 12.9% 10.0% 21.4%
Greater Sioux Falls Area (SD) 14.4% 19.5% 36.1% 16.6% 13.4% 14.8% 18.9% 17.2% 13.9% 13.5% 21.7%
Southwest Tennessee Development District 26.2% 16.8% 35.1% 17.8% 4.0% 20.7% 27.7% 16.3% 13.6% 10.9% 10.9%
Northwest Tennessee Development District 41.7% 17.1% 24.6% 10.8% 5.8% 32.4% 16.7% 21.2% 11.3% 9.5% 9.0%
Southwest Minnesota Region 30.0% 26.0% 30.0% 6.0% 8.0% 18.2% 25.0% 15.9% 18.2% 9.1% 13.6%
Arrowhead Region (MN) 18.9% 13.5% 35.1% 18.9% 13.5% 14.3% 22.9% 14.3% 17.1% 11.4% 20.0%
NON-RESIDENTS ONLY -- EDUCATIONAL ATTAINMENT NON-RESIDENTS ONLY -- HOUSEHOLD INCOME
SOURCE: Arts and Economic Prosperity 5, Americans for the Arts, 2017. For more information, visit www.AmericansForTheArts.org/EconomicImpact. B–438

Table 29:Educational Attainment and Annual Household Incomeof Non-Resident Attendees to Cultural Events Per Study Region During 2016
Regional Study RegionsAll Populations High School 2-Year 4-Year Master's Doctoral Less than $40,000 to $60,000 to $80,000 to $100,000 to $120,000
Sample Size = 81 or Less Degree Degree Degree Degree $40,000 $59,999 $79,999 $99,999 $119,999 or More
Maple Grove and the Northwest Suburbs (MN) 9.7% 12.5% 35.6% 26.0% 16.4% 13.3% 21.4% 16.3% 13.3% 13.3% 22.5%
Greater Augusta Area (GA) 13.7% 22.9% 35.6% 21.4% 6.4% 14.8% 16.6% 22.2% 16.4% 10.0% 20.1%
Upper Cumberland Development District (TN) 25.7% 24.9% 28.0% 18.2% 3.1% 22.7% 22.2% 21.2% 11.6% 14.1% 8.1%
City of Huntsville/Madison County (AL) 11.5% 20.3% 30.9% 28.1% 9.2% 14.1% 12.6% 18.1% 14.1% 12.1% 29.1%
Northeast Commission (NC) 8.6% 18.7% 40.3% 24.6% 7.8% 16.7% 11.4% 19.9% 15.4% 14.6% 22.0%
Greater Ann Arbor Area (MI) 14.1% 15.2% 33.3% 29.8% 7.6% 18.7% 15.1% 13.8% 14.5% 10.6% 27.3%
Greater Fox Cities Region (WI) 24.1% 17.3% 32.3% 23.7% 2.6% 12.4% 16.0% 17.6% 19.2% 16.8% 18.0%
Central Minnesota Region 13.4% 23.1% 40.4% 23.2% 0.0% 14.3% 24.5% 24.5% 14.3% 8.2% 14.3%
South Central Tennessee Development District 19.0% 17.1% 40.1% 20.2% 3.6% 15.7% 20.8% 18.4% 20.5% 12.7% 12.0%
Northwest Arkansas Region 13.9% 13.4% 37.8% 26.9% 8.0% 22.0% 16.2% 18.3% 12.0% 11.0% 20.4%
Southeast Minnesota Region 36.8% 10.2% 32.7% 8.2% 12.2% 19.5% 34.2% 12.2% 17.1% 9.8% 7.3%
First Tennessee Development District 13.7% 19.5% 35.4% 22.2% 9.2% 21.8% 17.4% 20.5% 13.4% 10.8% 16.1%
Greater Harrisburg Area (PA) 9.2% 8.4% 34.9% 36.1% 11.2% 9.4% 15.9% 15.9% 15.9% 19.3% 23.6%
Greater New Haven Area (CT) 17.2% 8.3% 33.3% 33.3% 7.8% 6.7% 13.4% 20.7% 7.8% 22.9% 28.5%
Treasure Coast Region (FL) 8.7% 22.8% 31.5% 30.7% 6.2% 11.2% 11.5% 15.7% 17.6% 18.2% 25.9%
Greater Des Moines Region (IA) 11.8% 18.1% 38.7% 19.6% 11.8% 17.0% 15.5% 17.0% 13.5% 13.5% 23.5%
Southeast Tennessee Development District 15.6% 19.5% 37.8% 21.3% 5.7% 22.8% 14.3% 17.9% 13.8% 13.0% 18.3%
Greater Knoxville Region (TN) 13.6% 13.3% 45.1% 19.9% 8.0% 25.8% 17.2% 13.5% 15.2% 11.1% 17.2%
Greater Columbia Area (SC) 7.8% 19.0% 40.5% 20.7% 12.1% 30.9% 15.5% 10.9% 8.2% 13.6% 20.9%
Pikes Peak Region (CO) 11.7% 16.6% 40.0% 19.3% 12.4% 21.2% 12.9% 15.2% 15.9% 15.2% 19.7%
Lehigh Valley Region (PA) 15.9% 17.3% 34.1% 22.3% 10.5% 15.8% 12.8% 16.8% 14.8% 17.3% 22.4%
Greater Sarasota/Bradenton Area (FL) 4.4% 11.0% 27.9% 37.2% 19.4% 5.9% 9.2% 12.7% 12.9% 14.0% 45.4%
Dayton Region (OH) 15.4% 13.8% 31.7% 31.7% 7.3% 19.3% 16.0% 16.0% 16.0% 10.1% 22.7%
Richmond & Tri-Cities Region (VA) 8.2% 11.1% 37.3% 31.6% 11.9% 8.7% 9.1% 14.3% 14.7% 17.3% 35.9%
Memphis Area Association of Governments (TN) 13.0% 16.7% 34.1% 30.4% 5.8% 18.0% 15.6% 15.6% 14.8% 13.3% 22.7%
Eastern Region (NC) 13.2% 19.0% 44.3% 18.1% 5.4% 19.2% 14.3% 18.7% 15.8% 11.3% 20.7%
Advantage West Region (NC) 8.3% 13.1% 36.5% 28.4% 13.8% 14.7% 11.7% 14.5% 16.8% 15.1% 27.2%
Southeast Commission (NC) 21.3% 21.7% 31.0% 20.3% 5.7% 25.7% 19.4% 17.9% 10.1% 10.1% 16.8%
Greater Fairfax Area (VA) 6.0% 12.3% 33.3% 38.9% 9.5% 1.8% 8.3% 13.2% 13.6% 13.2% 50.0%
Greater Tulsa Region (OK) 10.0% 13.3% 37.5% 30.8% 8.3% 20.0% 24.2% 15.8% 15.0% 9.2% 15.8%
NON-RESIDENTS ONLY -- EDUCATIONAL ATTAINMENT NON-RESIDENTS ONLY -- HOUSEHOLD INCOME
SOURCE: Arts and Economic Prosperity 5, Americans for the Arts, 2017. For more information, visit www.AmericansForTheArts.org/EconomicImpact. B–439

Table 29:Educational Attainment and Annual Household Incomeof Non-Resident Attendees to Cultural Events Per Study Region During 2016
Regional Study RegionsAll Populations High School 2-Year 4-Year Master's Doctoral Less than $40,000 to $60,000 to $80,000 to $100,000 to $120,000
Sample Size = 81 or Less Degree Degree Degree Degree $40,000 $59,999 $79,999 $99,999 $119,999 or More
East Tennessee Development District 16.4% 21.9% 35.0% 22.0% 4.6% 18.8% 18.2% 19.1% 16.6% 13.3% 14.0%
West Valley Region (AZ) 14.6% 19.7% 31.8% 25.3% 8.6% 13.8% 20.8% 20.8% 13.2% 9.4% 22.0%
Greater St. Louis Area (MO) 9.8% 17.0% 37.3% 24.3% 11.6% 14.0% 17.7% 18.1% 10.3% 14.8% 25.1%
Western New York 12.9% 17.0% 32.7% 28.7% 8.8% 10.3% 16.4% 20.6% 18.8% 10.9% 23.0%
Greater Oklahoma City Region (OK) 16.1% 15.8% 37.9% 23.0% 7.2% 20.3% 16.3% 18.7% 14.8% 12.6% 17.3%
Piedmont Triad Partnership (NC) 10.1% 14.8% 43.3% 25.4% 6.5% 14.5% 19.2% 17.7% 15.3% 12.9% 20.4%
Greater Portland Area (OR) 6.2% 15.0% 33.5% 30.8% 14.5% 15.8% 12.4% 16.3% 17.2% 12.9% 25.4%
Greater Kansas City Metropolitan Area (MO/KS) 6.4% 10.9% 35.7% 29.3% 17.7% 14.4% 12.4% 15.2% 14.0% 16.4% 27.6%
Greater Nashville Regional Council (TN) 19.8% 17.5% 37.0% 19.5% 6.2% 22.9% 19.5% 19.2% 12.8% 9.5% 16.2%
Research Triangle Regional Partnership (NC) 11.4% 14.7% 36.1% 28.9% 9.0% 17.1% 17.3% 15.7% 13.5% 11.1% 25.3%
Greater Tampa/St. Petersburg Area (FL) 11.9% 18.2% 37.1% 26.5% 6.3% 14.3% 17.4% 19.8% 15.0% 13.3% 20.2%
Charlotte Regional Partnership (NC) 8.2% 18.7% 38.0% 28.2% 6.9% 14.8% 20.1% 14.8% 18.4% 12.9% 18.9%
Charlotte Regional Partnership (NC/SC) 9.6% 18.5% 39.0% 26.8% 6.2% 15.8% 19.2% 15.8% 17.6% 12.4% 19.0%
Seven-County Metro Area (MN) 9.7% 12.5% 35.6% 26.0% 16.4% 13.3% 21.4% 16.3% 13.3% 13.3% 22.5%
Central Florida Region 14.0% 19.0% 31.5% 27.1% 8.4% 11.1% 19.3% 20.7% 16.9% 11.5% 20.4%
Greater Philadelphia Region (PA) 8.4% 13.1% 34.1% 29.9% 14.5% 14.0% 13.6% 13.8% 11.5% 13.6% 33.5%
Greater Washington Region (DC/MD/VA) 6.9% 11.9% 34.1% 35.6% 11.5% 8.5% 9.2% 14.3% 12.3% 13.3% 42.4%
Metro Atlanta Area (GA) 7.7% 19.2% 41.3% 25.0% 6.7% 12.3% 15.9% 13.3% 12.3% 14.9% 31.3%
Greater Atlanta Region (GA) 7.7% 19.2% 41.3% 25.0% 6.7% 12.3% 15.9% 13.3% 12.3% 14.9% 31.3%
Greater Houston Region (TX) 11.4% 13.6% 31.4% 32.3% 11.4% 17.1% 8.0% 16.1% 11.6% 12.6% 34.7%
Dallas-Fort Worth-Arlington MSA (TX) 10.7% 15.4% 42.2% 23.1% 8.6% 21.5% 13.2% 15.7% 14.2% 11.9% 23.5%
Regional Average 13.9% 16.5% 35.9% 25.1% 8.7% 17.3% 16.8% 17.4% 14.3% 12.3% 21.9%
Regional Median 12.5% 17.0% 35.6% 25.3% 8.0% 15.8% 16.2% 16.8% 14.2% 12.7% 20.9%
NON-RESIDENTS ONLY -- EDUCATIONAL ATTAINMENT NON-RESIDENTS ONLY -- HOUSEHOLD INCOME
SOURCE: Arts and Economic Prosperity 5, Americans for the Arts, 2017. For more information, visit www.AmericansForTheArts.org/EconomicImpact. B–440

Table 29:Educational Attainment and Annual Household Incomeof Non-Resident Attendees to Cultural Events Per Study Region During 2016
Statewide Study RegionsAll Populations High School 2-Year 4-Year Master's Doctoral Less than $40,000 to $60,000 to $80,000 to $100,000 to $120,000
Sample Size = 20 or Less Degree Degree Degree Degree $40,000 $59,999 $79,999 $99,999 $119,999 or More
State of Vermont 11.4% 12.2% 29.0% 37.6% 9.8% 20.0% 13.0% 17.4% 12.6% 11.3% 25.7%
State of North Dakota 19.5% 21.6% 32.4% 18.0% 8.4% 17.1% 18.4% 21.8% 16.9% 9.9% 15.9%
State of Delaware 8.3% 9.9% 34.9% 31.9% 15.0% 10.2% 10.2% 12.5% 13.5% 13.5% 40.1%
State of Maine 7.9% 11.3% 32.2% 37.2% 11.5% 14.0% 10.8% 17.3% 11.7% 14.2% 32.0%
State of Hawai'i 4.3% 19.6% 34.8% 33.7% 7.6% 8.3% 14.3% 21.4% 14.3% 8.3% 33.3%
State of Nevada 14.5% 24.3% 30.1% 27.2% 4.0% 18.0% 12.4% 18.6% 19.3% 14.9% 16.8%
State of Connecticut 10.4% 12.5% 33.0% 33.4% 10.7% 10.2% 14.0% 14.2% 12.0% 15.6% 34.1%
State of Oklahoma 13.2% 16.3% 41.0% 24.3% 5.2% 16.7% 16.9% 18.6% 17.4% 11.2% 19.3%
State of Oregon 6.7% 13.4% 31.8% 33.5% 14.5% 13.1% 11.6% 15.4% 13.6% 14.0% 32.3%
State of Minnesota 17.8% 21.7% 30.0% 18.9% 11.7% 18.3% 20.5% 22.5% 13.0% 8.3% 17.2%
State of Wisconsin 9.1% 12.8% 34.8% 32.3% 10.9% 12.2% 13.2% 17.8% 13.8% 13.1% 29.9%
State of Maryland 7.5% 8.6% 32.4% 37.2% 14.4% 12.0% 9.4% 14.5% 11.0% 12.0% 41.1%
State of Missouri 12.5% 15.9% 31.7% 26.1% 13.7% 18.8% 12.7% 17.6% 12.4% 15.3% 23.3%
State of Tennessee 17.9% 18.8% 35.9% 21.7% 5.7% 21.0% 17.7% 17.8% 14.3% 12.4% 16.7%
State of Massachusetts 12.2% 11.3% 36.3% 29.9% 10.4% 18.4% 12.7% 16.2% 13.1% 10.4% 29.2%
State of New Jersey 8.2% 13.6% 38.4% 30.0% 9.8% 9.9% 12.3% 17.0% 11.0% 15.1% 34.7%
State of North Carolina 10.8% 17.1% 36.6% 25.9% 9.5% 15.9% 16.8% 16.9% 14.2% 13.2% 23.0%
State of Pennsylvania 9.7% 13.0% 32.6% 31.4% 13.3% 14.7% 14.9% 13.3% 11.8% 14.3% 31.0%
State of Illinois 8.5% 12.5% 39.0% 30.5% 9.5% 17.4% 11.3% 16.5% 17.1% 11.9% 25.8%
State of Florida 7.8% 13.4% 32.2% 33.6% 13.1% 8.5% 11.7% 14.4% 14.4% 15.7% 35.3%
Statewide Average 10.9% 15.0% 34.0% 29.7% 10.4% 14.7% 13.7% 17.1% 13.9% 12.7% 27.8%
Statewide Median 10.1% 13.4% 32.8% 31.0% 10.6% 15.3% 12.9% 17.2% 13.6% 13.2% 29.6%
NON-RESIDENTS ONLY -- EDUCATIONAL ATTAINMENT NON-RESIDENTS ONLY -- HOUSEHOLD INCOME
SOURCE: Arts and Economic Prosperity 5, Americans for the Arts, 2017. For more information, visit www.AmericansForTheArts.org/EconomicImpact. B–441
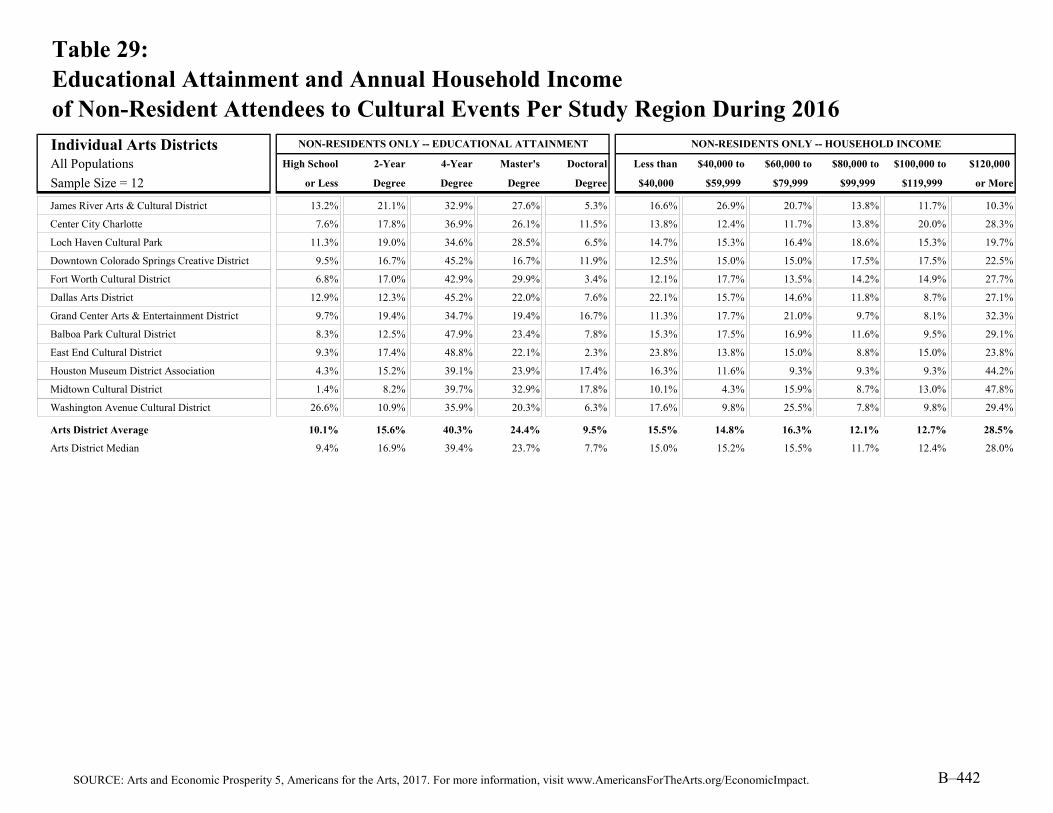
Table 29:Educational Attainment and Annual Household Incomeof Non-Resident Attendees to Cultural Events Per Study Region During 2016
Individual Arts DistrictsAll Populations High School 2-Year 4-Year Master's Doctoral Less than $40,000 to $60,000 to $80,000 to $100,000 to $120,000
Sample Size = 12 or Less Degree Degree Degree Degree $40,000 $59,999 $79,999 $99,999 $119,999 or More
James River Arts & Cultural District 13.2% 21.1% 32.9% 27.6% 5.3% 16.6% 26.9% 20.7% 13.8% 11.7% 10.3%
Center City Charlotte 7.6% 17.8% 36.9% 26.1% 11.5% 13.8% 12.4% 11.7% 13.8% 20.0% 28.3%
Loch Haven Cultural Park 11.3% 19.0% 34.6% 28.5% 6.5% 14.7% 15.3% 16.4% 18.6% 15.3% 19.7%
Downtown Colorado Springs Creative District 9.5% 16.7% 45.2% 16.7% 11.9% 12.5% 15.0% 15.0% 17.5% 17.5% 22.5%
Fort Worth Cultural District 6.8% 17.0% 42.9% 29.9% 3.4% 12.1% 17.7% 13.5% 14.2% 14.9% 27.7%
Dallas Arts District 12.9% 12.3% 45.2% 22.0% 7.6% 22.1% 15.7% 14.6% 11.8% 8.7% 27.1%
Grand Center Arts & Entertainment District 9.7% 19.4% 34.7% 19.4% 16.7% 11.3% 17.7% 21.0% 9.7% 8.1% 32.3%
Balboa Park Cultural District 8.3% 12.5% 47.9% 23.4% 7.8% 15.3% 17.5% 16.9% 11.6% 9.5% 29.1%
East End Cultural District 9.3% 17.4% 48.8% 22.1% 2.3% 23.8% 13.8% 15.0% 8.8% 15.0% 23.8%
Houston Museum District Association 4.3% 15.2% 39.1% 23.9% 17.4% 16.3% 11.6% 9.3% 9.3% 9.3% 44.2%
Midtown Cultural District 1.4% 8.2% 39.7% 32.9% 17.8% 10.1% 4.3% 15.9% 8.7% 13.0% 47.8%
Washington Avenue Cultural District 26.6% 10.9% 35.9% 20.3% 6.3% 17.6% 9.8% 25.5% 7.8% 9.8% 29.4%
Arts District Average 10.1% 15.6% 40.3% 24.4% 9.5% 15.5% 14.8% 16.3% 12.1% 12.7% 28.5%
Arts District Median 9.4% 16.9% 39.4% 23.7% 7.7% 15.0% 15.2% 15.5% 11.7% 12.4% 28.0%
NON-RESIDENTS ONLY -- EDUCATIONAL ATTAINMENT NON-RESIDENTS ONLY -- HOUSEHOLD INCOME
SOURCE: Arts and Economic Prosperity 5, Americans for the Arts, 2017. For more information, visit www.AmericansForTheArts.org/EconomicImpact. B–442

Explanation of Table 30:Age, Willingness to Travel, Repeat Visitation, and Civic Engagmentof Non-Resident Attendees to Cultural Events Per Study Region During 2016
Column Two:
Column Three:
Column Four:
Column Five:
Column Six:
Columns Seven though Nine:
Column Seven: The percentage of non-resident audience-intercept survey respondents who responded, "No, I would have skipped the cultural experience altogether."
Column Eight: The percentage of non-resident audience-intercept survey respondents who responded, "No, I would have replaced it with another nearby cultural experience."
Column Nine: The percentage of non-resident audience-intercept survey respondents who responded, "Yes, I would have traveled to a different community."
Column Ten:
Column Eleven:
The percentage of non-resident audience-intercept survey respondents who are 65 years of age or older.
The audience-intercept survey included the question, "If this arts event or exhibit were not happening, would you have traveled to another community to attend a similar cultural experience?"
The percentage of non-resident audience-intercept survey respondents in each participating study region who reported that they were first time visitors/attendees to the specific nonprofit arts or cultural event (or facility) where they filled out the audience-intercept survey.
The percentage of non-resident audience-intercept survey respondents in each participating study region who reported that they planned to vote in the 2016 U.S. presidential election.
This table presents a demographic description of non-resident nonprofit arts and cultural audience members in each participating study region during 2016. Non-residents are attendees who reside outside the county in which the nonprofit arts and cultural event at which they were surveyed took place (outside the multi-city or multi-county region for regional analyses, and outside the state for statewide analyses). Residency is determined based on the ZIP code provided by each audience-intercept survey respondent. Summary statistics are calculated for each population group. This table details the age, willingness to travel to attend cultural experiences, repeat visitation at the site where they were surveyed, and civic engagement (i.e., their participation status in the 2016 U.S. presidential election) reported by non-resident arts attendees who completed the audience-intercept survey. Table 29 provides details about non-resident attendees' educational attainment and annual household income. Note: the percentages may not add exactly to 100 percent where appropriate due to rounding.
The percentage of non-resident audience-intercept survey respondents in each participating study region who are 18 to 34 years of age. Audience-intercept survey respondents were required to be at least 18 years old.
The percentage of non-resident audience-intercept survey respondents who are 35 to 44 years of age.
The percentage of non-resident audience-intercept survey respondents who are 45 to 54 years of age.
The percentage of non-resident audience-intercept survey respondents who are 55 to 64 years of age.
SOURCE: Arts and Economic Prosperity 5, Americans for the Arts, 2017. For more information, visit www.AmericansForTheArts.org/EconomicImpact. B–443

Table 30:Age, Willingness to Travel, Repeat Visitation, and Civic Engagmentof Non-Resident Attendees to Cultural Events Per Study Region During 2016
Population Cohort Group A First Voted in
Population Fewer than 50,000 Skip Replace Different Time 2016
Sample Size = 52 18-34 35-44 45-54 55-64 65 or Older Altogether Nearby Community Attendee Election
Town of Crested Butte (CO) 4.2% 23.9% 49.2% 20.6% 2.1% 14.0% 37.3% 48.7% 69.2% 89.9%
City of Pine City (MN) 12.9% 10.9% 19.8% 35.6% 20.8% 30.6% 16.3% 53.1% n/a n/a
City of Alva (OK) 30.4% 41.3% 13.0% 10.9% 4.3% 65.2% 13.0% 21.7% 69.0% 87.0%
Cook County (MN) 16.2% 13.5% 21.6% 21.6% 27.0% 23.5% 44.1% 32.4% n/a n/a
Town of Hillsborough (NC) 15.4% 26.9% 19.2% 19.2% 19.2% 51.9% 5.8% 42.3% 55.1% 82.4%
City of Virginia (MN) 16.2% 13.5% 21.6% 21.6% 27.0% 23.5% 44.1% 32.4% n/a n/a
Town of Jackson (WY) 34.0% 12.3% 15.4% 24.1% 14.2% 37.0% 20.0% 43.0% 47.5% 91.5%
City of Guthrie (OK) 23.6% 14.6% 19.8% 25.0% 17.0% 26.5% 9.5% 64.0% 49.5% 89.3%
City of Grand Rapids (MN) 16.2% 13.5% 21.6% 21.6% 27.0% 23.5% 44.1% 32.4% n/a n/a
Town of Medfield (MA) 18.4% 10.5% 15.8% 26.3% 28.9% 45.9% 5.4% 48.6% 37.8% 100.0%
City of Fergus Falls (MN) 5.6% 11.1% 19.4% 36.1% 27.8% 28.6% 20.0% 51.4% n/a n/a
Grundy County (TN) 15.6% 9.5% 18.0% 26.5% 30.3% 37.5% 7.6% 55.0% 39.9% 92.6%
City of Falls Church (VA) 19.2% 23.9% 24.8% 18.0% 14.2% 45.0% 8.4% 46.5% 39.3% 85.3%
City of Jamestown (ND) 13.0% 8.1% 12.2% 27.6% 39.0% 34.2% 3.3% 62.5% 28.1% 92.5%
City of Waterville (ME) 8.1% 16.1% 14.5% 21.0% 40.3% 28.3% 3.3% 68.3% 50.8% 87.3%
City of Red Wing (MN) 8.3% 2.1% 10.4% 22.9% 56.3% 42.6% 21.3% 36.2% n/a n/a
City of Durango (CO) 19.7% 10.6% 14.8% 28.9% 26.1% 47.1% 13.6% 39.3% 38.2% 90.2%
City of Hannibal (MO) 24.2% 12.9% 9.7% 29.0% 24.2% 30.6% 24.2% 45.2% 32.1% 83.6%
City of Tullahoma (TN) 7.6% 8.9% 27.8% 16.5% 39.2% 39.7% 11.5% 48.7% 25.6% 93.3%
City of Northfield (MN) 8.3% 2.1% 10.4% 22.9% 56.3% 42.6% 21.3% 36.2% n/a n/a
Town of Carrboro (NC) 10.5% 11.3% 15.0% 36.1% 27.1% 34.1% 13.2% 52.7% 13.4% 94.0%
Macon County (TN) 12.6% 18.4% 11.5% 25.3% 32.2% 54.2% 4.8% 41.0% n/a 92.3%
City of Laguna Beach (CA) 9.0% 8.3% 16.7% 32.1% 34.0% 30.9% 11.8% 57.2% 39.2% 88.4%
Hickman County (TN) 9.2% 15.4% 20.6% 31.7% 23.1% 37.6% 8.9% 53.5% 56.8% 86.4%
City of Fairfax (VA) 57.1% 9.5% 23.8% 4.8% 4.8% 38.1% 9.5% 52.4% 82.4% 95.2%
City of Ponca City (OK) 7.3% 17.1% 24.4% 19.5% 31.7% 35.0% 10.0% 55.0% 41.0% 97.6%
City of Paducah (KY) 9.3% 12.2% 29.8% 29.3% 19.5% 55.5% 13.2% 31.4% 46.4% 81.7%
Mille Lacs County (MN) 12.9% 10.9% 19.8% 35.6% 20.8% 30.6% 16.3% 53.1% n/a n/a
McNairy County (TN) 17.9% 11.3% 17.2% 21.9% 31.8% 31.8% 9.5% 58.8% 52.9% 87.3%
City of Winona (MN) 8.3% 2.1% 10.4% 22.9% 56.3% 42.6% 21.3% 36.2% n/a n/a
NON-RESIDENTS ONLY -- AGE Willingness to Travel for Cultural Experiences
SOURCE: Arts and Economic Prosperity 5, Americans for the Arts, 2017. For more information, visit www.AmericansForTheArts.org/EconomicImpact. B–444

Table 30:Age, Willingness to Travel, Repeat Visitation, and Civic Engagmentof Non-Resident Attendees to Cultural Events Per Study Region During 2016
Population Cohort Group A First Voted in
Population Fewer than 50,000 Skip Replace Different Time 2016
Sample Size = 52 18-34 35-44 45-54 55-64 65 or Older Altogether Nearby Community Attendee Election
Door County (WI) 5.7% 5.6% 11.2% 29.0% 48.6% 35.0% 20.4% 44.6% 35.1% 92.6%
City of Benicia (CA) 6.5% 10.8% 16.3% 33.6% 32.7% 41.3% 6.7% 52.0% 54.1% 89.6%
City of Winter Park (FL) 9.9% 6.0% 12.6% 19.1% 52.4% 30.7% 15.5% 53.8% 39.9% 90.8%
City of Rochester (NH) 19.5% 14.3% 19.0% 21.9% 25.2% 26.0% 3.8% 70.2% 54.6% 85.6%
City of Morgantown (WV) 25.3% 15.4% 20.3% 21.2% 17.8% 40.0% 9.8% 50.2% 38.7% 81.5%
Henry County (TN) 15.0% 20.0% 10.0% 25.0% 30.0% 52.4% 23.8% 23.8% 47.6% 90.0%
City of Fairbanks (AK) 13.9% 8.9% 21.5% 26.6% 29.1% 48.1% 21.0% 30.9% 54.7% 89.0%
City of Bangor (ME) 9.1% 6.3% 13.7% 22.6% 48.4% 39.1% 6.4% 54.5% 26.5% 91.7%
Weakley County (TN) 53.9% 13.9% 15.7% 7.0% 9.6% 39.1% 13.0% 47.8% 38.5% 80.6%
Dare County (NC) 13.8% 8.8% 20.0% 28.8% 28.8% 27.7% 27.7% 44.6% 53.8% 90.5%
City of Columbia (TN) 26.0% 24.0% 18.3% 15.4% 16.3% 43.9% 6.1% 50.0% 45.4% 84.5%
City of Lake Worth (FL) 8.3% 4.2% 16.7% 22.9% 47.9% 40.8% 12.2% 46.9% 47.8% 89.5%
Clatsop County (OR) 9.2% 11.5% 14.4% 34.0% 30.8% 44.9% 15.7% 39.4% 41.9% 91.5%
Yadkin County (NC) 6.1% 4.2% 12.1% 36.4% 41.2% 17.9% 3.1% 79.0% 48.2% 93.3%
Greater Belfast Area (ME) 25.1% 16.8% 15.1% 18.2% 24.7% 32.3% 7.5% 60.2% 51.9% 94.2%
Campbell County (TN) 5.3% 26.5% 16.9% 21.7% 29.6% 45.9% 12.2% 42.0% 67.9% 86.3%
Monroe County (TN) 11.9% 13.8% 18.5% 26.2% 29.6% 21.7% 6.0% 72.3% 45.0% 87.0%
Lincoln County (OR) 6.4% 6.4% 9.3% 28.7% 49.2% 45.3% 14.2% 40.5% 41.8% 94.7%
Iron County (UT) 9.3% 7.1% 14.0% 22.1% 47.5% 44.8% 3.1% 52.1% 15.8% 92.0%
City of St. Louis Park (MN) 15.2% 9.2% 18.1% 36.2% 21.0% 26.7% 26.7% 46.5% n/a n/a
City of Logan (UT) 8.2% 6.5% 7.7% 17.2% 60.3% 36.5% 7.3% 56.1% 24.9% 91.2%
Gibson County (TN) 14.9% 10.6% 10.6% 27.7% 36.2% 21.3% 2.1% 76.6% 39.6% 95.9%
Group A Average 15.2% 12.6% 17.3% 24.6% 30.4% 36.7% 14.6% 48.7% 44.6% 89.8%
Group A Median 12.9% 11.2% 16.7% 23.5% 29.0% 37.3% 12.2% 48.7% 45.0% 90.1%
NON-RESIDENTS ONLY -- AGE Willingness to Travel for Cultural Experiences
SOURCE: Arts and Economic Prosperity 5, Americans for the Arts, 2017. For more information, visit www.AmericansForTheArts.org/EconomicImpact. B–445

Table 30:Age, Willingness to Travel, Repeat Visitation, and Civic Engagmentof Non-Resident Attendees to Cultural Events Per Study Region During 2016
Population Cohort Group B First Voted in
Population 50,000 to 99,999 Skip Replace Different Time 2016
Sample Size = 38 18-34 35-44 45-54 55-64 65 or Older Altogether Nearby Community Attendee Election
City of Joplin (MO) 24.5% 9.1% 12.7% 27.3% 26.4% 38.7% 6.6% 54.7% 45.9% 86.2%
City of La Crosse (WI) 29.0% 11.4% 16.4% 19.9% 23.3% 40.1% 16.8% 43.1% 30.4% 90.5%
McMinn County (TN) 12.1% 17.2% 16.6% 28.0% 26.1% 36.3% 6.9% 56.9% 44.2% 87.6%
Lafayette County (MS) 33.7% 17.6% 12.2% 17.3% 19.1% 33.8% 11.3% 54.9% 50.5% 92.6%
Chisago County (MN) 12.9% 10.9% 19.8% 35.6% 20.8% 30.6% 16.3% 53.1% n/a n/a
City of Grand Forks (ND) 19.5% 14.0% 16.7% 30.7% 19.1% 45.0% 10.9% 44.1% 42.1% 81.3%
City of Corvallis (OR) 12.7% 15.9% 19.0% 23.3% 29.1% 38.8% 11.2% 50.0% 39.8% 90.4%
City of Noblesville (IN) 21.2% 10.6% 25.8% 21.2% 21.2% 26.9% 7.5% 65.7% 55.4% 88.2%
City of Ocala (FL) 9.5% 6.5% 10.0% 19.4% 54.7% 26.4% 10.7% 62.9% 46.5% 92.5%
Lenoir County (NC) 16.6% 19.9% 25.2% 17.2% 21.2% 26.9% 3.8% 69.2% 25.5% 91.3%
Town of Chapel Hill (NC) 34.0% 17.0% 12.9% 17.0% 19.0% 33.1% 11.7% 55.2% 38.2% 90.6%
City of Grand Junction (CO) 41.4% 7.9% 16.3% 24.2% 10.2% 42.5% 19.3% 38.2% 31.8% 88.0%
Town of Jupiter (FL) 14.0% 12.1% 12.9% 22.3% 38.7% 34.3% 23.0% 42.7% 71.3% 96.8%
Hamblen County (TN) 9.5% 22.7% 45.5% 17.7% 4.5% 42.3% 19.1% 38.6% 62.7% 82.7%
City of Delray Beach (FL) 22.8% 12.8% 12.1% 16.3% 36.0% 73.7% 8.7% 17.6% 49.9% 86.4%
City of St. Cloud (MN) 27.8% 16.7% 24.1% 16.7% 14.8% 22.6% 17.0% 60.4% n/a n/a
City of Portland (ME) 23.6% 16.9% 15.4% 18.1% 26.0% 27.6% 12.2% 60.2% 28.9% 88.9%
City of Jackson (TN) 24.3% 17.8% 20.7% 18.9% 18.3% 37.4% 6.9% 55.7% 23.1% 90.4%
City of Walnut Creek (CA) 6.6% 5.0% 17.2% 24.1% 47.2% 33.3% 2.0% 64.6% 22.8% 91.8%
Greene County (TN) 55.6% 16.2% 13.1% 6.1% 9.1% 31.9% 18.1% 50.0% 46.6% 82.8%
City of Flagstaff (AZ) 19.9% 17.6% 17.8% 23.9% 20.8% 39.7% 32.1% 28.1% 63.8% 88.1%
City of Missoula (MT) 15.8% 15.8% 10.8% 29.1% 28.5% 49.1% 17.2% 33.7% 41.5% 91.3%
City of Fort Myers (FL) 5.8% 10.1% 11.6% 23.9% 48.6% 28.8% 8.6% 62.6% 42.0% 92.3%
Putnam County (TN) 20.0% 16.4% 20.0% 7.3% 36.4% 45.3% 34.0% 20.8% 29.5% 85.5%
Monroe County (FL) 14.8% 11.2% 13.5% 20.0% 40.6% 33.3% 16.8% 49.9% 47.2% 87.5%
City of Lynchburg (VA) 16.7% 15.4% 16.3% 28.9% 22.8% 34.4% 15.4% 50.2% 34.3% 92.1%
City of Duluth (MN) 16.2% 13.5% 21.6% 21.6% 27.0% 23.5% 44.1% 32.4% n/a n/a
City of Fishers (IN) 19.7% 23.4% 22.6% 20.4% 13.9% 34.0% 5.7% 60.3% 29.0% 94.4%
City of Carmel (IN) 12.1% 19.7% 28.0% 20.4% 19.7% 26.3% 9.6% 64.1% 47.0% 93.1%
City of Sugar Land (TX) 35.9% 20.5% 11.1% 17.9% 14.5% 26.5% 2.7% 70.8% 64.9% 80.3%
NON-RESIDENTS ONLY -- AGE Willingness to Travel for Cultural Experiences
SOURCE: Arts and Economic Prosperity 5, Americans for the Arts, 2017. For more information, visit www.AmericansForTheArts.org/EconomicImpact. B–446

Table 30:Age, Willingness to Travel, Repeat Visitation, and Civic Engagmentof Non-Resident Attendees to Cultural Events Per Study Region During 2016
Population Cohort Group B First Voted in
Population 50,000 to 99,999 Skip Replace Different Time 2016
Sample Size = 38 18-34 35-44 45-54 55-64 65 or Older Altogether Nearby Community Attendee Election
City of Asheville (NC) 17.7% 9.2% 12.2% 38.7% 22.1% 29.5% 22.0% 48.5% 53.0% 88.4%
Buchanan County (MO) 11.9% 11.9% 20.1% 23.3% 32.7% 38.5% 15.4% 46.2% 25.5% 87.0%
City of Boca Raton (FL) 23.1% 8.8% 14.9% 23.0% 30.3% 35.2% 19.7% 45.1% 63.7% 91.7%
City of Miami Beach (FL) 6.2% 4.1% 8.7% 19.5% 61.5% 28.9% 9.5% 61.6% 18.4% 89.2%
Moore County (NC) 6.4% 10.1% 17.4% 22.9% 43.1% 34.3% 12.0% 53.7% 45.7% 93.4%
Sevier County (TN) 10.1% 17.0% 16.1% 28.3% 28.5% 35.9% 10.0% 54.1% 47.8% 90.1%
Cape May County (NJ) 5.1% 1.9% 12.6% 29.9% 50.5% 43.9% 19.2% 36.9% 48.1% 96.8%
Cleveland County (NC) 11.3% 10.8% 15.9% 28.2% 33.8% 30.1% 5.9% 64.0% 61.6% 91.5%
Group B Average 18.9% 13.6% 17.3% 22.3% 27.9% 35.2% 14.2% 50.5% 43.4% 89.5%
Group B Median 16.7% 13.8% 16.3% 22.0% 26.1% 34.2% 11.9% 53.4% 45.7% 90.4%
NON-RESIDENTS ONLY -- AGE Willingness to Travel for Cultural Experiences
SOURCE: Arts and Economic Prosperity 5, Americans for the Arts, 2017. For more information, visit www.AmericansForTheArts.org/EconomicImpact. B–447

Table 30:Age, Willingness to Travel, Repeat Visitation, and Civic Engagmentof Non-Resident Attendees to Cultural Events Per Study Region During 2016
Population Cohort Group C First Voted in
Population 100,000 to 249,999 Skip Replace Different Time 2016
Sample Size = 50 18-34 35-44 45-54 55-64 65 or Older Altogether Nearby Community Attendee Election
City of Las Cruces (NM) 34.8% 12.4% 16.9% 20.2% 15.7% 31.9% 15.4% 52.7% 47.7% 82.8%
Eau Claire County (WI) 14.2% 14.2% 21.3% 28.4% 21.9% 42.6% 12.6% 44.7% 25.4% 85.4%
Yamhill County (OR) 21.5% 15.4% 16.1% 25.4% 21.5% 35.9% 4.9% 59.2% 53.6% 90.5%
City of Lewisville (TX) 13.3% 9.7% 21.2% 31.9% 23.9% 36.2% 3.4% 60.3% 47.8% 86.6%
City of West Palm Beach (FL) 27.1% 18.7% 13.6% 16.7% 23.8% 40.7% 20.1% 39.2% 57.7% 93.3%
City of Boulder (CO) 27.9% 14.4% 20.7% 17.8% 19.2% 30.8% 9.6% 59.6% 48.2% 90.8%
City of Richardson (TX) 9.7% 6.5% 21.5% 34.4% 28.0% 29.7% 3.3% 67.0% 44.0% 86.3%
City of High Point (NC) 10.6% 14.8% 19.5% 27.4% 27.7% 34.4% 5.3% 60.3% 51.7% 91.3%
City of Cambridge (MA) 30.9% 13.1% 17.0% 18.3% 20.6% 30.4% 8.7% 60.9% 45.5% 90.1%
City of Lowell (MA) 17.6% 11.6% 13.9% 26.9% 30.1% 30.4% 11.7% 57.9% 41.9% 90.1%
Douglas County (KS) 15.8% 14.7% 14.3% 24.8% 30.5% 31.7% 11.4% 56.8% 41.2% 94.5%
City of Columbia (MO) 22.8% 12.1% 14.1% 28.9% 22.1% 34.9% 15.8% 49.3% 35.4% 87.7%
City of Norman (OK) 46.7% 18.2% 16.6% 15.6% 3.0% 34.2% 9.3% 56.5% 36.3% 84.1%
Wayne County (NC) 23.6% 17.3% 17.3% 25.2% 16.5% 25.4% 5.4% 69.2% 46.5% 93.1%
City of Lafayette (LA) 37.5% 43.8% 12.5% 6.3% 0.0% 37.5% 56.3% 6.3% 18.8% 68.8%
Washington County (TN) 22.6% 9.5% 11.3% 19.6% 36.9% 38.7% 9.5% 51.8% 34.7% 91.9%
City of Thousand Oaks (CA) 15.0% 13.0% 23.7% 24.1% 24.1% 25.9% 4.3% 69.8% 44.1% 91.1%
City of Charleston (SC) 14.7% 18.6% 18.6% 21.7% 26.4% 35.9% 20.7% 43.4% 45.2% 91.4%
City of Waco (TX) 44.5% 13.3% 16.0% 11.9% 14.4% 37.7% 17.7% 44.5% 49.6% 82.1%
Robeson County (NC) 18.5% 9.8% 19.6% 30.4% 21.7% 30.1% 5.4% 64.5% 43.5% 94.7%
Columbia County (GA) 29.9% 19.0% 23.1% 17.6% 10.4% 28.1% 20.6% 51.3% 50.9% 90.8%
Orange County (NC) 25.5% 16.5% 14.2% 22.5% 21.3% 35.5% 11.5% 53.1% 33.2% 90.7%
City of Savannah (GA) 13.1% 20.1% 25.4% 21.7% 19.7% 34.1% 22.0% 43.9% 62.6% 88.6%
Indian River County (FL) 13.5% 17.8% 11.9% 25.4% 31.4% 35.7% 14.1% 50.3% 55.8% 91.4%
City of Alexandria (VA) 20.9% 14.0% 16.2% 21.5% 27.4% 35.1% 11.1% 53.7% 46.6% 85.6%
Martin County (FL) 17.2% 14.0% 15.4% 16.1% 37.2% 30.6% 14.6% 54.8% 46.9% 83.3%
Macon-Bibb County (GA) 14.0% 15.4% 21.1% 19.3% 30.2% 40.5% 10.8% 48.7% 34.6% 87.0%
City of Springfield (MA) 30.4% 18.0% 21.6% 18.6% 11.3% 36.4% 10.8% 52.8% 53.3% 85.4%
Catawba County (NC) 19.2% 13.5% 17.9% 24.8% 24.5% 24.5% 4.6% 70.9% 49.8% 92.9%
Town of Cary (NC) 14.5% 20.0% 25.5% 16.4% 23.6% 32.8% 6.9% 60.3% 42.4% 94.9%
NON-RESIDENTS ONLY -- AGE Willingness to Travel for Cultural Experiences
SOURCE: Arts and Economic Prosperity 5, Americans for the Arts, 2017. For more information, visit www.AmericansForTheArts.org/EconomicImpact. B–448

Table 30:Age, Willingness to Travel, Repeat Visitation, and Civic Engagmentof Non-Resident Attendees to Cultural Events Per Study Region During 2016
Population Cohort Group C First Voted in
Population 100,000 to 249,999 Skip Replace Different Time 2016
Sample Size = 50 18-34 35-44 45-54 55-64 65 or Older Altogether Nearby Community Attendee Election
Alamance County (NC) 18.5% 20.3% 17.3% 19.6% 24.4% 36.4% 9.5% 54.2% 40.7% 88.5%
Cumberland County (NJ) 12.0% 13.0% 20.7% 21.2% 33.2% 37.9% 6.4% 55.7% 47.7% 88.0%
City of Eugene (OR) 21.6% 7.8% 15.7% 20.6% 34.3% 44.7% 18.4% 36.9% 34.6% 90.6%
Middlesex County (CT) 7.4% 3.7% 11.1% 22.2% 55.6% 17.9% 7.1% 75.0% 24.1% 96.6%
City of Springfield (MO) 23.6% 15.4% 18.3% 27.6% 15.0% 35.4% 13.6% 51.0% 31.8% 93.1%
City of Sioux Falls (SD) 12.7% 7.5% 17.2% 31.6% 31.0% 41.2% 9.8% 49.0% 14.5% 91.4%
Pitt County (NC) 31.6% 14.3% 12.2% 20.4% 21.4% 43.9% 9.2% 46.9% 46.8% 91.7%
City of Providence (RI) 23.6% 16.9% 20.3% 20.3% 18.9% 32.9% 9.4% 57.7% 32.3% 89.2%
City of Worcester (MA) 36.7% 10.9% 21.1% 17.2% 14.1% 33.3% 7.8% 58.9% 52.0% 89.5%
Montgomery County (TN) 22.5% 13.8% 15.2% 26.1% 22.5% 39.7% 10.3% 50.0% 50.8% 85.8%
Salt Lake City (UT) 42.2% 19.4% 13.1% 13.6% 11.7% 33.2% 10.4% 56.4% 31.3% 85.0%
Cabarrus County (NC) 6.5% 5.4% 17.4% 31.0% 39.7% 38.0% 7.3% 54.7% 52.4% 92.9%
Richmond County (GA) 17.7% 19.7% 23.1% 22.6% 16.9% 32.8% 17.7% 49.5% 25.0% 91.7%
City of Tacoma (WA) 21.3% 11.0% 19.0% 24.0% 24.7% 34.2% 8.4% 57.4% 43.5% 91.1%
Doña Ana County (NM) 34.1% 15.4% 18.7% 19.5% 12.2% 42.3% 13.8% 43.9% 50.4% 81.7%
New Hanover County (NC) 14.5% 4.3% 10.1% 31.9% 39.1% 38.8% 19.4% 41.8% 36.2% 95.5%
Arlington County (VA) 18.2% 13.1% 20.1% 23.9% 24.8% 27.5% 5.8% 66.6% 39.2% 92.0%
City of Irving (TX) 16.8% 9.4% 14.7% 25.1% 34.0% 27.2% 3.1% 69.6% 25.8% 84.6%
City of Reno (NV) 16.3% 16.3% 20.0% 20.0% 27.4% 33.6% 17.2% 49.3% 38.3% 87.2%
York County (SC) 16.5% 16.0% 13.9% 28.9% 24.7% 26.8% 6.8% 66.3% 62.2% 88.8%
Group C Average 21.6% 14.5% 17.5% 22.5% 23.8% 34.1% 11.8% 54.1% 42.3% 89.0%
Group C Median 18.9% 14.3% 17.3% 22.0% 23.9% 34.3% 10.1% 54.5% 44.1% 90.3%
NON-RESIDENTS ONLY -- AGE Willingness to Travel for Cultural Experiences
SOURCE: Arts and Economic Prosperity 5, Americans for the Arts, 2017. For more information, visit www.AmericansForTheArts.org/EconomicImpact. B–449

Table 30:Age, Willingness to Travel, Repeat Visitation, and Civic Engagmentof Non-Resident Attendees to Cultural Events Per Study Region During 2016
Population Cohort Group D First Voted in
Population 250,000 to 499,999 Skip Replace Different Time 2016
Sample Size = 42 18-34 35-44 45-54 55-64 65 or Older Altogether Nearby Community Attendee Election
Buncombe County (NC) 20.3% 10.9% 12.2% 35.9% 20.6% 31.5% 18.9% 49.5% 51.5% 88.0%
Alachua County (FL) 30.6% 17.7% 16.8% 17.4% 17.4% 37.2% 7.6% 55.2% 42.9% 88.1%
Greater Green Bay Area (WI) 16.0% 22.0% 14.7% 31.3% 16.0% 29.5% 8.3% 62.2% 39.6% 89.8%
City of Orlando (FL) 21.7% 16.7% 16.9% 16.4% 28.3% 30.6% 15.9% 53.5% 39.9% 85.2%
City of Lincoln (NE) 15.4% 8.8% 12.7% 22.8% 40.4% 38.5% 12.8% 48.7% 27.4% 94.8%
Southeastern Connecticut Region (CT) 15.9% 13.5% 17.9% 21.0% 31.7% 35.0% 6.3% 58.7% 38.5% 90.4%
Erie County (PA) 19.1% 20.2% 18.1% 21.3% 21.3% 47.9% 9.4% 42.7% 34.0% 85.6%
San Luis Obispo County (CA) 14.3% 11.6% 17.0% 21.1% 36.1% 28.7% 12.0% 59.3% 44.5% 91.9%
City of Newark (NJ) 21.4% 15.9% 26.3% 18.3% 18.0% 24.2% 5.7% 70.1% 37.9% 92.5%
Leon County (FL) 20.7% 13.2% 24.8% 22.3% 19.0% 28.3% 10.8% 60.8% 40.7% 93.6%
Rutherford County (TN) 47.3% 11.2% 12.7% 18.0% 10.7% 42.2% 11.3% 46.6% 49.5% 81.0%
St. Lucie County (FL) 11.4% 10.1% 15.2% 39.2% 24.1% 20.7% 8.5% 70.7% 39.0% 86.6%
Greater Spartanburg Area (SC) 24.2% 21.0% 9.7% 19.4% 25.8% 37.1% 4.8% 58.1% 54.2% 93.5%
Durham County (NC) 11.2% 12.4% 18.7% 25.4% 32.3% 37.4% 10.1% 52.6% 34.4% 90.7%
City of St. Paul (MN) 15.2% 9.2% 18.1% 36.2% 21.0% 26.7% 26.7% 46.5% n/a n/a
Hamilton County (IN) 16.7% 19.4% 25.6% 20.6% 17.8% 29.4% 7.7% 62.9% 41.5% 92.7%
Osceola County (FL) 18.8% 0.0% 12.5% 6.3% 62.5% 31.3% 6.3% 62.5% 20.0% 100.0%
Escambia County (FL) 14.8% 24.4% 14.8% 11.1% 34.8% 46.7% 14.6% 38.7% 47.0% 92.0%
Lexington-Fayette Urban County (KY) 35.1% 15.6% 16.5% 19.0% 13.9% 30.1% 16.2% 53.7% 37.8% 89.0%
Lake County (FL) 4.2% 1.4% 11.3% 28.2% 54.9% 35.7% 11.4% 52.9% 60.6% 89.4%
City of Riverside (CA) 19.4% 36.7% 23.5% 19.4% 1.0% 13.4% 5.2% 81.4% 69.4% 86.7%
Cumberland County (NC) 33.8% 21.3% 14.8% 20.0% 10.2% 34.3% 11.7% 54.0% 49.3% 88.4%
Collier County (FL) 10.4% 7.5% 11.1% 19.6% 51.4% 39.6% 18.9% 41.4% 46.5% 86.7%
Hamilton County (TN) 27.9% 17.2% 23.5% 16.7% 14.7% 30.8% 13.7% 55.5% 45.6% 83.8%
Manatee County (FL) 5.7% 9.5% 10.2% 25.7% 48.9% 29.7% 10.2% 60.1% 52.5% 87.8%
City of Tampa (FL) 15.3% 14.8% 18.1% 24.0% 27.8% 23.5% 9.3% 67.2% 42.3% 84.6%
Forsyth County (NC) 20.7% 17.2% 17.2% 19.9% 24.9% 32.1% 10.4% 57.5% 50.2% 89.2%
Mercer County (NJ) 19.2% 13.3% 12.5% 22.5% 32.5% 38.5% 6.8% 54.7% 45.8% 91.6%
City of Wichita (KS) 8.0% 8.0% 14.6% 22.2% 47.2% 41.7% 12.3% 46.0% 18.4% 91.7%
Clackamas County (OR) 9.1% 16.5% 15.7% 28.1% 30.6% 36.1% 6.7% 57.1% 58.0% 92.5%
NON-RESIDENTS ONLY -- AGE Willingness to Travel for Cultural Experiences
SOURCE: Arts and Economic Prosperity 5, Americans for the Arts, 2017. For more information, visit www.AmericansForTheArts.org/EconomicImpact. B–450

Table 30:Age, Willingness to Travel, Repeat Visitation, and Civic Engagmentof Non-Resident Attendees to Cultural Events Per Study Region During 2016
Population Cohort Group D First Voted in
Population 250,000 to 499,999 Skip Replace Different Time 2016
Sample Size = 42 18-34 35-44 45-54 55-64 65 or Older Altogether Nearby Community Attendee Election
Sarasota County (FL) 2.7% 1.6% 4.7% 17.0% 73.9% 28.1% 25.0% 46.9% 27.0% 91.6%
City of Minneapolis (MN) 15.2% 9.2% 18.1% 36.2% 21.0% 26.7% 26.7% 46.5% n/a n/a
Berks County (PA) 8.0% 2.0% 13.9% 44.3% 31.8% 25.9% 4.5% 69.7% 42.8% 89.8%
City of Miami (FL) 18.0% 13.5% 20.7% 22.0% 25.7% 22.4% 10.3% 67.3% 43.4% 77.3%
City of Raleigh (NC) 14.4% 15.5% 20.4% 19.0% 30.6% 35.1% 11.5% 53.5% 34.1% 88.5%
Santa Barbara County (CA) 1.9% 9.4% 9.4% 45.3% 34.0% 30.8% 9.6% 59.6% 40.0% 94.3%
Seminole County (FL) 5.0% 7.5% 15.0% 37.5% 35.0% 36.6% 9.8% 53.7% 51.3% 96.2%
City of Virginia Beach (VA) 11.6% 10.6% 17.4% 30.9% 29.5% 26.9% 8.0% 65.1% 34.6% 92.3%
City of Atlanta (GA) 15.3% 20.8% 18.1% 20.8% 25.0% 31.0% 21.1% 47.9% 34.5% 92.4%
City of Mesa (AZ) 7.5% 11.2% 15.0% 21.5% 44.9% 38.7% 7.5% 53.8% 54.9% 80.7%
City of Kansas City (MO) 17.7% 9.2% 13.4% 23.6% 36.0% 42.2% 22.9% 34.9% 17.9% 91.8%
Morris County (NJ) 11.9% 17.0% 30.6% 23.5% 17.0% 24.7% 7.3% 68.0% 43.6% 89.2%
Group D Average 16.5% 13.4% 16.4% 24.1% 29.5% 32.3% 11.8% 55.9% 42.1% 89.5%
Group D Median 15.4% 13.3% 16.1% 21.8% 28.1% 31.2% 10.3% 55.0% 42.6% 89.8%
NON-RESIDENTS ONLY -- AGE Willingness to Travel for Cultural Experiences
SOURCE: Arts and Economic Prosperity 5, Americans for the Arts, 2017. For more information, visit www.AmericansForTheArts.org/EconomicImpact. B–451

Table 30:Age, Willingness to Travel, Repeat Visitation, and Civic Engagmentof Non-Resident Attendees to Cultural Events Per Study Region During 2016
Population Cohort Group E First Voted in
Population 500,000 to 999,999 Skip Replace Different Time 2016
Sample Size = 25 18-34 35-44 45-54 55-64 65 or Older Altogether Nearby Community Attendee Election
Sonoma County (CA) 8.4% 7.1% 18.1% 23.2% 43.2% 38.4% 7.9% 53.6% 41.1% 92.2%
Volusia County (FL) 0.0% 0.0% 8.3% 41.7% 50.0% 41.7% 0.0% 58.3% 36.4% 91.7%
Guilford County (NC) 16.0% 16.1% 17.5% 21.7% 28.7% 29.0% 5.8% 65.2% 46.2% 89.8%
Dane County (WI) 32.4% 11.8% 8.8% 20.6% 26.5% 32.9% 28.6% 38.6% 44.1% 85.7%
Brevard County (FL) 0.0% 9.1% 0.0% 27.3% 63.6% 18.2% 9.1% 72.7% 54.5% 100.0%
Washington County (OR) 10.5% 10.5% 19.7% 21.7% 37.5% 27.8% 6.6% 65.6% 36.8% 96.1%
Johnson County (KS) 12.1% 7.5% 12.1% 28.0% 40.2% 25.7% 18.1% 56.2% 27.7% 97.2%
City of Louisville (KY) 14.4% 14.4% 32.7% 20.3% 18.3% 59.5% 15.0% 25.5% 28.4% 96.8%
City of Baltimore (MD) 28.3% 16.8% 17.0% 17.7% 20.1% 29.8% 18.8% 51.4% 40.2% 91.7%
Polk County (FL) 11.0% 11.4% 25.2% 23.6% 28.9% 36.1% 10.7% 53.2% 43.1% 87.0%
City of Boston (MA) 37.7% 22.6% 16.2% 12.3% 11.2% 21.9% 20.0% 58.1% 48.8% 87.0%
District of Columbia (DC) 22.3% 13.2% 15.5% 22.3% 26.7% 40.7% 13.4% 45.8% 38.8% 91.4%
Nashville-Davidson County (TN) 29.8% 20.2% 18.8% 17.7% 13.5% 36.0% 17.7% 46.3% 48.3% 86.9%
City of El Paso (TX) 28.8% 20.3% 18.6% 15.3% 16.9% 31.7% 21.7% 46.7% 55.8% 60.7%
Lee County (FL) 7.6% 8.1% 12.4% 23.2% 48.6% 33.9% 10.8% 55.4% 39.9% 93.1%
City of Fort Worth (TX) 22.7% 17.3% 15.1% 27.6% 17.3% 29.6% 10.1% 60.3% 51.4% 89.5%
City of Indianapolis (IN) 16.5% 12.1% 15.5% 28.3% 27.6% 42.7% 15.3% 42.0% 31.3% 93.8%
City and County of San Francisco (CA) 31.4% 15.5% 16.6% 18.2% 18.4% 35.7% 13.3% 51.0% 44.1% 84.5%
Prince George's County (MD) 9.4% 12.3% 24.5% 33.0% 20.8% 15.3% 7.2% 77.5% 49.1% 90.8%
Pinellas County (FL) 18.2% 10.5% 14.7% 24.8% 31.8% 28.6% 12.2% 59.2% 49.2% 87.9%
Shelby County (TN) 22.0% 18.0% 25.3% 17.3% 17.3% 33.6% 17.4% 49.0% 37.3% 86.2%
Fairfield County (CT) 17.8% 14.0% 24.2% 28.0% 15.9% 26.9% 3.8% 69.4% 53.5% 91.8%
Westchester County (NY) 13.9% 8.1% 18.8% 22.4% 36.8% 37.5% 5.8% 56.7% 39.6% 90.3%
Fulton County (GA) 13.3% 18.0% 17.1% 21.8% 29.9% 34.0% 14.2% 51.9% 26.6% 91.0%
Wake County (NC) 14.9% 16.6% 21.3% 18.0% 29.2% 34.3% 11.0% 54.7% 36.3% 89.6%
Group E Average 17.6% 13.3% 17.4% 23.0% 28.8% 32.9% 12.6% 54.6% 41.9% 89.7%
Group E Median 16.0% 13.2% 17.1% 22.3% 27.6% 33.6% 12.2% 54.7% 41.1% 90.8%
NON-RESIDENTS ONLY -- AGE Willingness to Travel for Cultural Experiences
SOURCE: Arts and Economic Prosperity 5, Americans for the Arts, 2017. For more information, visit www.AmericansForTheArts.org/EconomicImpact. B–452

Table 30:Age, Willingness to Travel, Repeat Visitation, and Civic Engagmentof Non-Resident Attendees to Cultural Events Per Study Region During 2016
Population Cohort Group F First Voted in
Population 1,000,000 or More Skip Replace Different Time 2016
Sample Size = 21 18-34 35-44 45-54 55-64 65 or Older Altogether Nearby Community Attendee Election
Mecklenburg County (NC) 14.5% 20.3% 23.7% 17.9% 23.7% 29.3% 14.1% 56.6% 28.1% 95.7%
City of San José (CA) 27.2% 14.9% 21.1% 21.1% 15.8% 31.0% 6.0% 62.9% 44.8% 81.4%
Montgomery County (MD) 16.1% 16.1% 16.6% 19.6% 31.6% 30.9% 4.0% 65.1% 39.7% 92.1%
Fairfax County (VA) 13.1% 12.3% 18.6% 23.9% 32.2% 36.9% 4.8% 58.3% 33.0% 95.0%
Allegheny County (PA) 20.8% 6.9% 17.3% 29.4% 25.5% 32.6% 13.2% 54.2% n/a 91.3%
Greater Columbus Area (OH) 20.0% 12.6% 23.2% 23.7% 20.5% 44.0% 13.0% 43.0% 30.1% 95.3%
Orange County (FL) 17.4% 12.3% 15.3% 17.9% 37.0% 30.8% 14.7% 54.5% 40.0% 87.5%
City of Dallas (TX) 42.9% 19.0% 19.1% 10.9% 8.2% 27.7% 15.8% 56.5% 47.1% 82.3%
Hillsborough County (FL) 14.6% 14.1% 17.7% 24.1% 29.6% 23.8% 9.4% 66.8% 42.2% 84.5%
City of San Diego (CA) 37.8% 19.0% 14.9% 15.5% 12.8% 26.2% 29.2% 44.5% 67.7% 75.8%
Palm Beach County (FL) 21.6% 14.0% 14.5% 19.6% 30.4% 42.3% 21.1% 36.7% 59.5% 92.6%
City of San Antonio (TX) 20.0% 23.8% 16.3% 20.0% 20.0% 26.7% 23.3% 50.0% 54.9% 84.7%
Sacramento County (CA) 12.6% 14.2% 13.1% 33.3% 26.8% 35.6% 10.0% 54.4% 37.7% 85.2%
City of Phoenix (AZ) 19.7% 19.7% 9.9% 22.4% 28.3% 28.5% 19.9% 51.7% 70.5% 83.0%
City and County of Philadelphia (PA) 25.0% 16.0% 17.7% 20.7% 20.5% 29.6% 24.5% 45.9% 44.1% 89.6%
Broward County (FL) 12.3% 13.8% 15.2% 21.1% 37.5% 28.7% 13.1% 58.2% 57.5% 82.1%
Santa Clara County (CA) 20.0% 14.8% 19.3% 22.6% 23.3% 36.8% 8.2% 55.0% 39.7% 86.0%
Riverside County (CA) 21.6% 38.4% 19.5% 18.4% 2.2% 23.4% 6.0% 70.7% 57.1% 73.0%
Miami-Dade County (FL) 13.8% 10.6% 15.4% 19.1% 41.1% 24.3% 10.7% 65.0% 42.2% 83.2%
City of Chicago (IL) 27.6% 17.2% 19.8% 16.0% 19.4% 29.5% 29.1% 41.4% 56.0% 81.2%
Harris County (TX) 30.1% 17.0% 17.0% 19.4% 16.5% 32.5% 23.5% 44.1% 48.5% 87.4%
Group F Average 21.4% 16.5% 17.4% 20.8% 23.9% 31.0% 14.9% 54.1% 47.0% 86.1%
Group F Median 20.0% 14.9% 17.3% 20.0% 23.7% 29.6% 13.2% 54.5% 44.5% 85.2%
Average 18.3% 13.8% 17.2% 23.1% 27.6% 34.1% 13.2% 52.7% # 43.3% 89.1%
Median 16.2% 13.5% 16.9% 22.2% 26.4% 34.0% 11.3% 53.6% # 43.5% 90.0%
NON-RESIDENTS ONLY -- AGE Willingness to Travel for Cultural Experiences
ALL CITY/COUNTY STUDY REGIONS
SOURCE: Arts and Economic Prosperity 5, Americans for the Arts, 2017. For more information, visit www.AmericansForTheArts.org/EconomicImpact. B–453

Table 30:Age, Willingness to Travel, Repeat Visitation, and Civic Engagmentof Non-Resident Attendees to Cultural Events Per Study Region During 2016
Regional Study Regions First Voted in
All Populations Skip Replace Different Time 2016
Sample Size = 81 18-34 35-44 45-54 55-64 65 or Older Altogether Nearby Community Attendee Election
High Peaks Region (ME) 6.4% 9.1% 14.6% 32.4% 37.4% 36.9% 23.0% 40.1% 44.6% 92.0%
Wood River Valley (ID) 6.6% 4.7% 12.8% 29.1% 46.9% 44.0% 21.0% 35.0% 37.0% 92.5%
Southern Oregon Area 7.3% 6.3% 14.9% 23.8% 47.8% 44.5% 7.9% 47.6% 16.5% 93.8%
Southwestern Pennsylvania Area 11.3% 6.2% 10.8% 20.5% 51.3% 34.6% 9.9% 55.5% 36.4% 91.8%
Greater Portsmouth Area (NH) 18.2% 15.5% 20.8% 25.8% 19.7% 29.9% 17.8% 52.3% 30.5% 93.3%
Northeast Oregon Region 27.6% 10.3% 17.2% 10.3% 34.5% 37.0% 18.5% 44.4% 18.5% 96.6%
Toe River Valley (NC) 7.4% 12.7% 18.3% 33.7% 27.8% 46.6% 9.7% 43.7% 42.4% 92.2%
Albemarle Region (NC) 8.3% 9.7% 13.0% 37.0% 31.9% 38.8% 12.6% 48.6% 33.6% 89.9%
Greater Concord Area (NH) 6.2% 14.0% 22.7% 28.9% 28.3% 28.7% 3.4% 68.0% 28.5% 93.5%
North Central Minnesota Region 2.6% 10.5% 15.8% 29.0% 42.1% 23.7% 29.0% 47.4% n/a n/a
Northwest Minnesota Region 7.5% 0.0% 30.0% 22.5% 40.0% 55.3% 13.2% 31.6% n/a n/a
Monadnock Region (NH) 26.5% 5.0% 15.5% 28.3% 24.7% 39.4% 5.0% 55.7% 33.0% 91.7%
Bismarck-Mandan Region (ND) 19.2% 7.7% 16.7% 23.1% 33.3% 46.2% 17.9% 35.9% 36.7% 84.8%
Greater Minot Region (ND) 8.6% 5.2% 19.0% 31.0% 36.2% 57.4% 14.8% 27.8% 21.1% 86.3%
Greater Burlington Area (VT) 23.4% 13.1% 14.0% 21.5% 28.0% 43.3% 11.1% 45.6% 32.1% 75.7%
Greater Charlottesville Area (VA) 20.7% 10.9% 15.2% 23.5% 29.7% 37.3% 14.8% 47.9% 35.7% 92.2%
Brainerd Lakes Region (MN) 13.3% 13.3% 15.6% 35.6% 22.2% 37.2% 16.3% 46.5% n/a n/a
East Central Minnesota Region 12.9% 10.9% 19.8% 35.6% 20.8% 30.6% 16.3% 53.1% n/a n/a
Northwest Connecticut Region 8.6% 7.7% 16.9% 27.3% 39.5% 28.5% 5.3% 66.2% 33.5% 91.0%
Central Oregon Region 11.7% 7.0% 11.7% 31.6% 38.0% 31.4% 16.9% 51.7% 65.2% 93.9%
Greater Fargo-Moorhead Area (ND/MN) 14.4% 5.5% 9.9% 27.6% 42.5% 49.7% 11.9% 38.4% 35.8% 90.7%
Black Hills Region (SD) 12.7% 11.3% 11.3% 26.8% 38.0% 41.2% 17.6% 41.2% 35.9% 89.9%
Greater Kingsport Area (TN) 21.2% 15.0% 12.7% 24.5% 26.5% 29.3% 8.9% 61.8% 47.6% 89.4%
Lake Region (MN) 5.6% 11.1% 19.4% 36.1% 27.8% 28.6% 20.0% 51.4% n/a n/a
South Central Minnesota Region 12.2% 12.2% 13.5% 24.3% 37.8% 43.1% 15.3% 41.7% n/a n/a
Greater Sioux Falls Area (SD) 14.7% 5.7% 12.9% 33.0% 33.7% 37.2% 6.3% 56.5% 18.1% 89.8%
Southwest Tennessee Development District 23.5% 16.7% 17.2% 21.1% 21.6% 33.7% 9.1% 57.2% 39.8% 88.0%
Northwest Tennessee Development District 48.1% 12.3% 13.2% 12.3% 14.0% 38.1% 12.3% 49.6% 39.6% 85.4%
Southwest Minnesota Region 7.7% 19.2% 26.9% 25.0% 21.2% 41.7% 16.7% 41.7% n/a n/a
Arrowhead Region (MN) 16.2% 13.5% 21.6% 21.6% 27.0% 23.5% 44.1% 32.4% n/a n/a
NON-RESIDENTS ONLY -- AGE Willingness to Travel for Cultural Experiences
SOURCE: Arts and Economic Prosperity 5, Americans for the Arts, 2017. For more information, visit www.AmericansForTheArts.org/EconomicImpact. B–454

Table 30:Age, Willingness to Travel, Repeat Visitation, and Civic Engagmentof Non-Resident Attendees to Cultural Events Per Study Region During 2016
Regional Study Regions First Voted in
All Populations Skip Replace Different Time 2016
Sample Size = 81 18-34 35-44 45-54 55-64 65 or Older Altogether Nearby Community Attendee Election
Maple Grove and the Northwest Suburbs (MN) 15.2% 9.2% 18.1% 36.2% 21.0% 26.7% 26.7% 46.5% n/a n/a
Greater Augusta Area (GA) 19.7% 19.7% 24.7% 20.2% 15.7% 31.3% 16.7% 52.0% 40.5% 89.8%
Upper Cumberland Development District (TN) 17.5% 10.9% 16.6% 24.5% 30.6% 47.6% 11.0% 41.4% 24.7% 87.0%
City of Huntsville/Madison County (AL) 23.0% 13.8% 20.7% 18.0% 24.4% 35.1% 15.2% 49.8% 35.1% 88.0%
Northeast Commission (NC) 14.0% 10.0% 17.0% 28.8% 30.3% 37.3% 15.9% 46.9% 44.3% 91.2%
Greater Ann Arbor Area (MI) 29.5% 19.5% 15.9% 21.6% 13.5% 23.7% 22.5% 53.9% n/a n/a
Greater Fox Cities Region (WI) 19.2% 15.4% 21.1% 24.1% 20.3% 32.0% 7.9% 60.2% 29.5% 88.2%
Central Minnesota Region 27.8% 16.7% 24.1% 16.7% 14.8% 22.6% 17.0% 60.4% n/a n/a
South Central Tennessee Development District 15.6% 15.0% 21.1% 26.4% 21.9% 38.9% 9.6% 51.5% 54.7% 86.3%
Northwest Arkansas Region 29.4% 14.4% 14.9% 19.4% 21.9% 25.9% 9.3% 64.9% 43.7% 87.3%
Southeast Minnesota Region 8.3% 2.1% 10.4% 22.9% 56.3% 42.6% 21.3% 36.2% n/a n/a
First Tennessee Development District 27.0% 14.5% 11.0% 20.0% 27.5% 30.2% 12.1% 57.7% 45.0% 89.2%
Greater Harrisburg Area (PA) 13.8% 21.9% 20.6% 20.2% 23.5% 33.3% 6.0% 60.7% 39.6% 96.0%
Greater New Haven Area (CT) 17.6% 17.6% 23.1% 22.6% 19.1% 17.8% 17.3% 64.9% 41.1% 86.6%
Treasure Coast Region (FL) 13.0% 13.8% 13.8% 21.5% 37.9% 31.1% 16.5% 52.4% 56.3% 87.2%
Greater Des Moines Region (IA) 26.6% 15.9% 13.0% 18.4% 26.1% 34.7% 14.4% 51.0% 29.5% 87.0%
Southeast Tennessee Development District 20.0% 13.2% 18.1% 24.2% 24.4% 36.0% 8.9% 55.1% 46.6% 88.6%
Greater Knoxville Region (TN) 25.4% 13.1% 13.7% 22.7% 25.1% 33.4% 14.9% 51.7% 46.5% 90.8%
Greater Columbia Area (SC) 52.2% 12.2% 12.2% 12.2% 11.3% 35.7% 11.3% 53.0% 48.2% 93.0%
Pikes Peak Region (CO) 20.3% 11.9% 14.0% 28.7% 25.2% 37.8% 11.5% 50.7% 41.3% 88.4%
Lehigh Valley Region (PA) 14.4% 9.0% 18.9% 28.4% 29.3% 29.9% 9.0% 61.1% 27.7% 89.9%
Greater Sarasota/Bradenton Area (FL) 3.2% 2.8% 5.7% 18.3% 69.9% 28.3% 23.5% 48.2% 36.2% 90.3%
Dayton Region (OH) 11.9% 14.3% 20.6% 20.6% 32.5% 42.3% 8.9% 48.8% 28.0% 91.1%
Richmond & Tri-Cities Region (VA) 13.7% 14.1% 18.1% 22.2% 31.9% 42.0% 17.6% 40.4% 29.4% 94.4%
Memphis Area Association of Governments (TN) 22.1% 18.4% 25.7% 16.2% 17.6% 33.3% 18.5% 48.1% 38.9% 84.8%
Eastern Region (NC) 21.4% 14.3% 20.5% 25.0% 18.8% 33.9% 6.7% 59.4% 46.6% 87.8%
Advantage West Region (NC) 12.1% 10.8% 15.6% 32.8% 28.7% 36.9% 16.6% 46.4% 47.1% 91.0%
Southeast Commission (NC) 28.0% 18.4% 14.5% 22.3% 16.7% 35.9% 10.0% 54.1% 55.1% 89.8%
Greater Fairfax Area (VA) 15.0% 14.2% 23.7% 25.7% 21.3% 43.0% 6.8% 50.2% 41.4% 89.0%
Greater Tulsa Region (OK) 34.4% 16.4% 10.7% 20.5% 18.0% 32.2% 16.1% 51.7% 43.0% 91.0%
NON-RESIDENTS ONLY -- AGE Willingness to Travel for Cultural Experiences
SOURCE: Arts and Economic Prosperity 5, Americans for the Arts, 2017. For more information, visit www.AmericansForTheArts.org/EconomicImpact. B–455

Table 30:Age, Willingness to Travel, Repeat Visitation, and Civic Engagmentof Non-Resident Attendees to Cultural Events Per Study Region During 2016
Regional Study Regions First Voted in
All Populations Skip Replace Different Time 2016
Sample Size = 81 18-34 35-44 45-54 55-64 65 or Older Altogether Nearby Community Attendee Election
East Tennessee Development District 15.3% 15.1% 18.8% 24.5% 26.3% 31.1% 10.6% 58.3% 52.9% 89.7%
West Valley Region (AZ) 4.5% 2.5% 7.5% 16.4% 69.2% 32.0% 9.8% 58.2% 42.8% 90.7%
Greater St. Louis Area (MO) 18.1% 19.9% 20.9% 22.3% 18.8% 44.4% 16.5% 39.1% 38.8% 87.6%
Western New York 19.4% 15.9% 18.8% 18.2% 27.6% 28.1% 21.6% 50.3% 51.5% 75.7%
Greater Oklahoma City Region (OK) 25.1% 15.0% 15.6% 23.0% 21.3% 35.5% 11.1% 53.4% 52.1% 85.5%
Piedmont Triad Partnership (NC) 19.6% 13.5% 17.4% 22.6% 27.0% 28.7% 7.0% 64.3% 52.6% 89.0%
Greater Portland Area (OR) 15.0% 12.8% 16.3% 21.6% 34.4% 34.2% 19.7% 46.1% 37.9% 90.4%
Greater Kansas City Metropolitan Area (MO/KS) 19.0% 7.5% 14.9% 25.0% 33.6% 39.8% 10.3% 49.8% 30.6% 92.9%
Greater Nashville Regional Council (TN) 35.9% 15.1% 16.0% 17.7% 15.4% 41.8% 15.6% 42.7% 58.6% 83.1%
Research Triangle Regional Partnership (NC) 18.7% 12.8% 16.7% 20.0% 31.7% 37.9% 12.9% 49.2% 45.6% 87.8%
Greater Tampa/St. Petersburg Area (FL) 16.0% 14.3% 15.9% 25.0% 28.9% 25.2% 11.3% 63.5% 51.7% 83.4%
Charlotte Regional Partnership (NC) 16.4% 10.0% 16.9% 27.5% 29.3% 26.0% 7.1% 66.9% 53.4% 92.9%
Charlotte Regional Partnership (NC/SC) 17.3% 10.7% 16.1% 27.8% 28.1% 26.3% 8.1% 65.6% 55.3% 92.5%
Seven-County Metro Area (MN) 15.2% 9.2% 18.1% 36.2% 21.0% 26.7% 26.7% 46.5% n/a n/a
Central Florida Region 13.9% 9.3% 18.0% 20.0% 38.9% 34.3% 15.5% 50.2% 50.5% 85.5%
Greater Philadelphia Region (PA) 23.8% 13.1% 17.8% 21.3% 24.0% 28.9% 20.5% 50.5% 45.8% 90.2%
Greater Washington Region (DC/MD/VA) 17.1% 13.4% 20.2% 25.5% 23.8% 35.3% 9.8% 54.9% 51.4% 89.9%
Metro Atlanta Area (GA) 13.3% 18.0% 17.1% 21.8% 29.9% 34.0% 14.2% 51.9% 26.6% 91.0%
Greater Atlanta Region (GA) 13.3% 18.0% 17.1% 21.8% 29.9% 34.0% 14.2% 51.9% 26.6% 91.0%
Greater Houston Region (TX) 25.5% 14.4% 13.9% 19.0% 27.3% 28.8% 20.3% 50.9% 56.8% 87.6%
Dallas-Fort Worth-Arlington MSA (TX) 34.5% 16.5% 15.8% 19.4% 13.7% 29.6% 13.8% 56.6% 62.7% 82.6%
Regional Average 17.8% 12.3% 16.8% 24.2% 29.0% 35.0% 14.4% 50.7% 40.7% 89.2%
Regional Median 16.2% 13.1% 16.7% 23.1% 27.6% 34.3% 14.2% 50.9% 40.8% 89.9%
NON-RESIDENTS ONLY -- AGE Willingness to Travel for Cultural Experiences
SOURCE: Arts and Economic Prosperity 5, Americans for the Arts, 2017. For more information, visit www.AmericansForTheArts.org/EconomicImpact. B–456

Table 30:Age, Willingness to Travel, Repeat Visitation, and Civic Engagmentof Non-Resident Attendees to Cultural Events Per Study Region During 2016
Statewide Study Regions First Voted in
All Populations Skip Replace Different Time 2016
Sample Size = 20 18-34 35-44 45-54 55-64 65 or Older Altogether Nearby Community Attendee Election
State of Vermont 22.9% 9.0% 14.7% 20.8% 32.7% 45.8% 11.3% 42.9% 37.0% 82.0%
State of North Dakota 13.6% 8.9% 13.6% 28.0% 36.0% 46.7% 11.2% 42.1% 35.4% 86.4%
State of Delaware 11.6% 9.1% 14.8% 28.8% 35.6% 35.3% 7.7% 57.0% 39.7% 92.1%
State of Maine 11.7% 8.4% 13.3% 23.3% 43.2% 34.9% 18.7% 46.4% 46.6% 90.4%
State of Hawai'i 18.9% 13.3% 11.1% 27.8% 28.9% 27.2% 25.0% 47.8% 61.1% 81.5%
State of Nevada 18.3% 14.2% 16.0% 23.7% 27.8% 36.3% 16.1% 47.6% 53.9% 89.3%
State of Connecticut 14.8% 11.1% 16.5% 23.4% 34.2% 29.8% 10.8% 59.4% 42.7% 91.0%
State of Oklahoma 24.3% 17.0% 15.6% 20.9% 22.2% 35.7% 14.9% 49.4% 52.1% 86.9%
State of Oregon 10.6% 8.5% 13.0% 27.9% 39.9% 39.0% 15.2% 45.9% 39.0% 89.9%
State of Minnesota 12.5% 7.6% 16.9% 33.7% 29.4% 38.2% 21.9% 39.9% n/a n/a
State of Wisconsin 13.2% 7.0% 12.5% 25.5% 41.8% 37.0% 17.3% 45.7% 37.5% 89.6%
State of Maryland 16.7% 17.9% 14.2% 18.4% 32.8% 31.2% 7.0% 61.7% 42.7% 90.3%
State of Missouri 18.0% 14.0% 15.8% 23.5% 28.7% 40.8% 13.5% 45.7% 37.0% 87.8%
State of Tennessee 21.2% 14.8% 17.2% 22.5% 24.3% 35.8% 12.8% 51.4% 50.4% 87.7%
State of Massachusetts 25.5% 10.0% 19.1% 22.1% 23.3% 31.1% 12.6% 56.3% 53.0% 88.9%
State of New Jersey 13.5% 12.1% 18.9% 24.6% 31.0% 34.1% 7.3% 58.5% 52.6% 90.1%
State of North Carolina 16.4% 10.8% 15.4% 25.6% 31.8% 36.2% 15.0% 48.8% 51.4% 87.6%
State of Pennsylvania 20.4% 12.2% 16.7% 22.0% 28.6% 32.5% 16.7% 50.8% 44.1% 90.8%
State of Illinois 25.2% 14.4% 16.6% 16.9% 27.0% 32.8% 26.4% 40.8% 57.5% 83.1%
State of Florida 11.1% 10.2% 11.9% 21.3% 45.5% 34.4% 23.4% 42.2% 57.5% 83.5%
Statewide Average 17.0% 11.5% 15.2% 24.0% 32.2% 35.7% 15.2% 49.0% 46.9% 87.8%
Statewide Median 16.6% 11.0% 15.5% 23.5% 31.4% 35.5% 15.0% 47.7% 46.6% 88.9%
NON-RESIDENTS ONLY -- AGE Willingness to Travel for Cultural Experiences
SOURCE: Arts and Economic Prosperity 5, Americans for the Arts, 2017. For more information, visit www.AmericansForTheArts.org/EconomicImpact. B–457

Table 30:Age, Willingness to Travel, Repeat Visitation, and Civic Engagmentof Non-Resident Attendees to Cultural Events Per Study Region During 2016
Individual Arts Districts First Voted in
All Populations Skip Replace Different Time 2016
Sample Size = 12 18-34 35-44 45-54 55-64 65 or Older Altogether Nearby Community Attendee Election
James River Arts & Cultural District 19.5% 15.4% 14.1% 30.2% 20.8% 35.1% 15.2% 49.7% 31.5% 92.3%
Center City Charlotte 14.1% 20.5% 25.6% 15.4% 24.4% 29.2% 14.9% 55.8% 27.2% 95.5%
Loch Haven Cultural Park 23.8% 20.1% 16.3% 16.8% 23.1% 31.6% 15.7% 52.7% 36.5% 88.7%
Downtown Colorado Springs Creative District 15.4% 7.7% 10.3% 25.6% 41.0% 35.7% 7.1% 57.1% 37.5% 93.0%
Fort Worth Cultural District 24.1% 15.9% 13.8% 27.6% 18.6% 27.3% 7.7% 65.0% 48.2% 88.3%
Dallas Arts District 49.2% 14.8% 19.7% 9.2% 7.1% 29.8% 16.3% 54.0% 47.4% 79.7%
Grand Center Arts & Entertainment District 17.1% 25.0% 21.1% 15.8% 21.1% 53.0% 16.9% 30.1% 42.9% 91.1%
Balboa Park Cultural District 43.8% 21.4% 13.5% 9.9% 11.5% 25.1% 33.5% 41.4% 73.8% 72.3%
East End Cultural District 38.6% 14.8% 17.0% 19.3% 10.2% 28.4% 23.9% 47.7% 57.8% 83.1%
Houston Museum District Association 19.6% 23.9% 15.2% 26.1% 15.2% 40.4% 12.8% 46.8% 40.0% 93.3%
Midtown Cultural District 19.2% 19.2% 20.5% 20.5% 20.5% 30.6% 30.6% 38.9% 62.0% 90.3%
Washington Avenue Cultural District 53.1% 6.3% 6.3% 14.1% 20.3% 26.6% 17.2% 56.3% 61.7% 82.8%
Arts District Average 28.1% 17.1% 16.1% 19.2% 19.5% 32.7% 17.7% 49.6% 47.2% 87.5%
Arts District Median 21.7% 17.6% 15.8% 18.1% 20.4% 30.2% 16.0% 51.2% 45.2% 89.5%
NON-RESIDENTS ONLY -- AGE Willingness to Travel for Cultural Experiences
SOURCE: Arts and Economic Prosperity 5, Americans for the Arts, 2017. For more information, visit www.AmericansForTheArts.org/EconomicImpact. B–458

Page Data Collection Instrument Instrument
C–2 DataArts Cultural Data Profile (Full FY2015 Profile)
C–33 DataArts Cultural Data Profile (Arts & Economic Prosperity 5 Survey)
C–41 DataArts Cultural Data Profile (Abbreviated Arts & Economic Prosperity 5 Survey)
C–46 Abbreviated Arts & Economic Prosperity 5 Organizational Expenditure Survey
C–47 Arts & Economic Prosperity 5 Audience Expenditure Survey (English)
C–48 Arts & Economic Prosperity 5 Audience Expenditure Survey (Spanish)
C–49 Arts & Economic Prosperity 5 Audience Expenditure Survey (Farge Font)
Appendix C:
About the Data Collection
The Survey Instruments
C–1
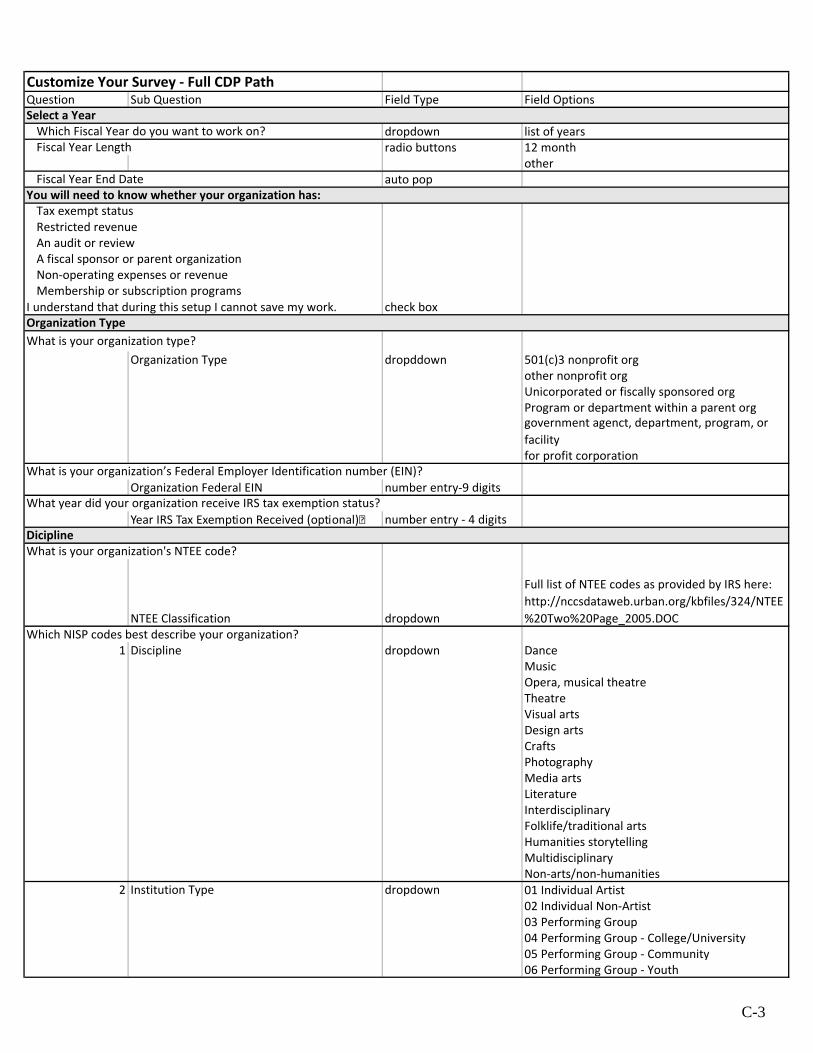
Customize Your Survey - Full CDP PathQuestion Sub Question Field Type Field Options
dropdown list of yearsradio buttons 12 month
otherauto pop
I understand that during this setup I cannot save my work. check box
Organization Type dropddown 501(c)3 nonprofit orgother nonprofit orgUnicorporated or fiscally sponsored orgProgram or department within a parent orggovernment agenct, department, program, or facilityfor profit corporation
Organization Federal EIN number entry-9 digits
Year IRS Tax Exemption Received (optional) number entry - 4 digits
NTEE Classification dropdown
Full list of NTEE codes as provided by IRS here: http://nccsdataweb.urban.org/kbfiles/324/NTEE%20Two%20Page_2005.DOC
Which NISP codes best describe your organization?1 Discipline dropdown Dance
MusicOpera, musical theatreTheatreVisual artsDesign artsCraftsPhotographyMedia artsLiteratureInterdisciplinaryFolklife/traditional artsHumanities storytellingMultidisciplinaryNon-arts/non-humanities
2 Institution Type dropdown 01 Individual Artist02 Individual Non-Artist03 Performing Group04 Performing Group - College/University05 Performing Group - Community06 Performing Group - Youth
What is your organization type?
What is your organization's NTEE code?Dicipline
What is your organization’s Federal Employer Identification number (EIN)?
What year did your organization receive IRS tax exemption status?
Organization Type
You will need to know whether your organization has:
Select a YearWhich Fiscal Year do you want to work on?Fiscal Year Length
Fiscal Year End Date
Tax exempt statusRestricted revenueAn audit or reviewA fiscal sponsor or parent organizationNon-operating expenses or revenueMembership or subscription programs
C-3

2 Institution Type (continued) dropdown 07 Performance Facility08 Art Museum09 Other Museum10 Gallery/Exhibit Space11 Cinema12 Independent Press13 Literary Magazine14 Fair/Festival15 Arts Center16 Arts Council/Agency17 Arts Service Organizaition18 Union/Professional Association19 School District20 Parent-Teacher Organization21 Elementary School22 Middle School23 Secondary School24 Vocational/Technical School25 Other School26 College/University27 Library28 Historical Society29 Humanities Council30 Foundation31 Corporation32 Community Service Org33 Correctional Institution34 Health Care Facility35 Religious Organization36 Seniors' Center37 Parks & Recreation38 Government - Executive39 Government - Judicial40 Government - Legislative (House)41 Government - Legislative (Senate)42 Media - Periodical43 Media - Daily Newspaper44 Media -Weekly Newspaper45 Media - Radio46 Media- TV47 Cultural Series Organization48 Schools of the Arts49 Arts Camp/Institute50 Social Service Organization51 Child Care Provider99 None of the Above
Is your organization a member of, or do you want to complete a survey for, any of these groups?Select all that apply check boxes Arts & Economic Prosperity 5
League of American OrchestrasArt House ConvergenceBarbershop Harmony SocietyOPERA America
National Guild for Community Arts EducationFederation of State Humanities Councils
Survey Providers
C-4

Organization zip code number entry - 5 digitszip is in a DataArts region (continue full CDP path)zip is not in a DataArts region (move to AEP5-only path)
radio buttons yes (skip to Summary, Save and Finish)no (continue with this form)
Based on the NTEE and NISP codes you selected, we have identified some program activities that your organization may engage in.Select all activities that apply. check boxes Advocacy
Arts EducationBroadcastingCirculating Works
Classes, lectures, or professional development
Commissioning WorksCompetitionsConducting ResearchConferencesConsulting or fee-for-service workDeveloping worksExhibits
Festivals, fairs, parades, or community events
Field tripsFilm screeningsFinancingFiscal sponsorshipGrantmakingGuided toursHistoric preservation or restorationOpen rehearsalsPerformancesProviding equipment, sets, costumes, or other materialsProviding rehearsal, meeting, office, or other spaceProviding residenciesPublishing books or periodicalsOther types of programs
radio button YesNo
radio button YesNo
radio button Yes
radio button YesNo
Do you have a completed audit or review for 2016?Financial Information Part 1
Did you have temporarily or permanently restricted contirbutions, grants, in-kind, or investment revenue?
Did you have temporarily or permanently restricted earned revenue (this is rare)?
Financial Information Part 2
Did your organization have non-operating revenues in FY 2016?
Organization LocationConfirm your organization's zip code.
Total ExpensesAre your total expenses less than $50,000?
Program Activity
C-5

radio button YesNo
radio button YesNo
radio button YesNo
radio button YesNo
Summary Screen Save and Finish
Financial Information Part 2 (continued)
Continue to Customized Survey on Next Page
Did your organization have non-operating expenses in FY 2016?
Did your organization have a donor-restricted endowment, a board designated endowment, or reserve funds in FY 2016?
Membership & Subscriptions
Did your organization offer individual or group membership programs in 2016?
Did your organization offer event or performance subscriptions in
C-6

Revenue
Earned Revenue Unrestricted Temporarily Restricted*
Food and Concessions Revenue $ $
Gift Shop and Merchandise Fees $ $
Parking Fees $ $
Advertising Revenue $ $
Sponsorship Revenue $ $
Membership Revenue* $ $
Revenue from Full Subscriptions* $ $
Revenue from Partial Subscriptions* $ $
Single Ticket Sales* $ $
Group Ticket Sales* $ $
Touring Fees* $ $
Media Subscription Revenue* $ $
Broadcast Subscription Revenue* $ $
Publication Sales* $ $
Royalties, Rights, and Reproductions* $ $
Admissions* $ $
Guided or Group Tour Revenue* $ $
Gallery Sales* $ $
Space Rentals* $ $
Equipment or Other Rentals* $ $
Contracted Services* $ $
Loan Interest* $ $
Application Fees* $ $
Fiscal Sponsorship Administration Fees* $ $
Tuition and Registration Fees* $ $
Other Program Revenue $ $
Other Earned Revenue $ $
Investment Revenue Unrestricted Temporarily Restricted*
Permanently Restricted*
Investment Revenue - Operating $ $ $
Investment Revenue - Non-Operating* $ $ $
Contributed Revenue $ $ $
Trustee/Board Contributions $ $ $
Individual Contributions $ $ $
Corporate Contributions $ $ $
Foundation Contributions $ $ $
City Government Contributions $ $ $
County Government Contributions $ $ $
Note: *Starred line items only appear if applicable to your organization, based on program activities or other options selected in the Data Profile Wizard.
C-7

Revenue
State Government Contributions $ $ $
Federal Government Contributions $ $ $
Total Government Contributions $ $ $
Tribal Contributions $ $ $
Parent Organization Support* $ $ $
In-Kind Contributions $ $ $
Other Contributions $ $ $
Net Assets Released from Restriction $ $ $
Cash Contributions - Non-Operating* $ $ $
In-Kind Contributions - Non-Operating* $ $ $
o Yes
o No
o Yes
o No
Other Non-Operating Revenue
Transfers and Reclassifications * $ $ $
Other Non-Operating Revenue * $ $ $
Summary
Earned Revenue calc. calc. calc.
Investment Revenue calc. calc. calc.
Total Operating Revenue calc. calc. calc.
Prior Period Adjustments $ $ $
Total Non-Operating Revenue * calc calc. calc.
Total Revenue calc. calc. calc.
Membership
Paid Free
Organizational Members n. n.
Individual Members n. n.
Other Memberships n. n.
New Returned Lapsed
Organizational Member Status n. n. n.
Individual Member Status n. n. n.
Other Member Status n. n. n.
Is any of your contributed revenue from special events?
Are you in the middle of a capital campaign?
*The section below appears if you indicate that you have a membership program in the Data Profile Wizard. This entire section is optional.
C-8

Revenue
High Low
Price Range - Organizational Membership $ $
Standard Price Range - Individual Membership $ $
Standard Price Range - Other Memberships $ $
Subscriptions
Tickets Sold Subscribers
Full-Season Subscription Program n. n.
Partial-Season Subscription Program n. n.
Subscriber Status n. n. n.
High Low
Full-Season Subscription Price Range n. n.
Publication Subscribers
Broadcast Subscribers n. n.
Contributors
Trustee/Board Contributors n.
Individual Contributors n.
Corporate Contributors n.
Foundation Contributors n.
City Government Contributors n.
County Government Contributors n.
State Government Contributors n.
Federal Government Contributors n.
Tribal Contributors n.
Net Assets Released from Restriction Detail
Trustee/Board Contributions Released from Restriction $
$
$
$
Individual Contributions Released from Restriction
Corporate Contributions Released from Restriction
Foundation Contributions Released from Restriction
The section below appears if you enter a value greate than $500,000 in Net Assets Released - Unrestricted. This entire section is optional.
*The section below appears if you indicate that you have a subscription program in the Data Profile Wizard. This entire section is optional.
*The questions below appears if you indicate that you have a media subscription program in the Data Profile Wizard.
C-9

Revenue
$
County Government Contributions Released from Restriction $
State Government Contributions Released from Restriction $
Federal Government Contributions Released from Restriction $
Tribal Contributions Released from Restriction $
Other Contributions Released from Restriction $
Total Contributions Released from Restriction $
Special Events
Description of Special Events text
Special Events Contributed Revenue - Gross $
Special Events Contributed Revenue - Net $
Individuals Corporations Other
Contributors, Underwriters, and Sponsors n. n. n.
Drop-down menu of contributed revenue line items
In-Kind Revenue Detail
In-Kind Independent Contractors $
In-Kind Professional Fees $
In-Kind Advertising and Promotion $
In-Kind Conferences and Meetings $
In-Kind Insurance $
In-Kind Occupancy $
In-Kind Office and Administration $
In-Kind Printing and Postage $
In-Kind Travel $
In-Kind Other Expenses $
In-Kind Other Expenses - Description $
In-Kind Land $
In-Kind Buildings $
In-Kind Construction in Progress $
In-Kind Capitalized Equipment $
In-Kind Leasehold Improvements $
In-Kind Other Capitalized Assets $
In-Kind Total $
*The section below appears if you enter a value greater than $25,000 in In-Kind Contributions - Unrestricted. This entire section is optional.
*The section below appears if you answer yes to "Is any of your contributed revenue from special events?" This entire section is optional.
City Government Contributions Released from Restriction
Contributed Revenue Lines Containing Special Events Revenue
C-10

Expense
Personnel Expenses Program Fundraising General and
Administrative
Employee Salaries $ $ $Payroll Taxes and Fringe Benefits $ $ $Independent Contractors $ $ $Professional Fees $ $ $
o Yes
o No
Payments to Artists and Performers Visual Artists Performing
Artists Other Artists Artists and Performers - Employees $ $ $Artists and Performers - Independent Contractors $ $ $Artists and Performers - Professional Fees $ $ $
Local Non-Local Payments to Artists and Performers - Local and Non-Local
$ $
Non-Personnel Expenses Program Fundraising General and
Administrative
Advertising and Promotion $ $ $Conferences and Meetings $ $ $Dues and Subscriptions $ $ $Grant Awards* $ $ $Insurance $ $ $Occupancy Costs $ $ $Office and Administration $ $ $Printing, Postage, and Shipping $ $ $Travel $ $ $Recording and Broadcasting Expenses* $ $ $Royalties, Rights, and Reproductions* $ $ $Exhibition Costs* $ $ $Collections Management* $ $ $Production and Event Costs* $ $ $Interest Expense $ $ $Depreciation $ $ $Other Operating Expenses $ $ $
Do you pay artists directly? (required)
*The section below appears if you answer 'Yes' to "Do you pay artists directly?"
Note: *Starred line items are only shown if applicable to your organization, based on program activities selected in the Data Profile Wizard.
C-11

Expense
Non-Operating Expenses*Non-Operating Personnel Expenses* $ $ $
Other Non-Operating Expenses* $ $ $
Summary Program Fundraising General and
Administrative
Total Personnel Expenses calc. calc. calc. Total Non-Personnel Expenses calc. calc. calc. Total Operating Expenses calc. calc. calc.
Total Non-Operating Expenses calc. calc. calc. Total Expenses calc. calc. calc.
o Yes
o No
Total Capital Expenditures $
Change in Net Assets Program Fundraising General and
Administrative
Total Operating Revenue calc. calc. calc. Total Operating Expenses calc. calc. calc. Operating Change in Net Assets calc. calc. calc.
Total Non-Operating Revenue* calc. calc. calc. Total Non-Operating Expenses* calc. calc. calc. Non-Operating Change in Net Assets* calc. calc. calc. Total Change in Net Assets* calc. calc. calc.
Workforce (Staff, Board and Volunteers)Full-Time Permanent Employees n.
Number Hours Worked Calculated FTE
Full-Time Seasonal Employees n. n. calc.Part-Time Permanent Employees n. n. calc.Part-Time Seasonal Employees n. n. calc.Independent Contractors n.
Full-Time Volunteers n.
Did you have any capital expenditures that are not already reflected in your total expenditures? (required)
The question below is shown to those who select 'Yes' in the previous question
*The section below appears if you indicated you had non-operating expenses in the Data Profile Wizard.
*The questions below are shown if your organization indicated you had non-operating expenses in the Data Profile Wizard.
C-12

Expense
NumberHours
Contributed Calculated FTE
Part-Time Volunteers n. n. calc.Board Members n. n.
Full-Time Artists (Breakout) n.Part-Time Artists (Breakout) n.Independent Contractor Artists (Breakout) n.
Workspace Workspace Address textWorkspace Status textWorkspace Type textADA Compliance text textTotal Gross Square Footage text texttext
Marketing Total Marketing Expenses $
o Yes
o No
Marketing Personnel Expenses $
Marketing Consultants/Agencies
Print, Radio, and Television Advertising $
Digital, Mobile, and Online Advertising
Other $$ $
Direct Mail Recipients
Email Recipients n.
Social Media and Web * This entire section is optional
Unique Fans/ Followers
Facebook n.
Twitter n.
YouTube n.
Instagram n.
Tumblr n.
Pinterest n.
Google+ n.
Vimeo n.
Flickr n.
Other Social Media n.
Website Page Views n.
Website Sessions/Visits n.
Website Unique Visitors n.
Note: Up to five workspaces with separate addresses can be entered if desired. Only one workspace is required.
C-13

Balance Sheet
Unrestricted* Temporarily Restricted*
Permanently Restricted*
Assets $ $ $
Cash and Cash Equivalents $ $ $
Accounts Receivable $ $ $
Grants and Pledges Receivable - Current $ $ $
Prepaid Expenses $ $ $
Investments - Current $ $ $
Other Current Assets $ $ $
Grants and Pledges Receivable - Non-Current $ $ $
Investments - Non-Current $ $ $
Fixed Assets - Net $ $ $
Other Non-Current Assets $ $ $
Due To/(Due From) $ $ $
Liabilities Accounts Payable $ $ $
Accrued Expenses $ $ $
Deferred Revenue $ $ $
Loans - Current $ $ $
Other Current Liabilities $ $ $
Total Current Liabilities $ $ $
Loans - Non-Current $ $ $
Other Non-Current Liabilities $ $ $
Total Non-Current Liabilities $ $ $
Due To/(Due From) $ $ $
Net AssetsTotal Assets calc. calc. calc.
Total Liabilities calc. calc. calc.
Net Assets calc. calc. calc.
Total Liabilities and Net Assets calc. calc. calc.
Endowment and Reserve Funds
Board designated endowment
Term endowment
Permanently restricted endowment
Reserve fund
Fund Types
*The Endowment and Reserve Fund section appears if you indicated that your organization had an endowment or reserve fund in the Data Profile Wizard.
Note: *three columns byrestriction are only displayed for audited organizations (as indicated in the Data Profile Wizard). All other organizations complete a single column balance sheet.
C-14

Balance Sheet
Board-Designated Endowment*
Board-Designated Assets - Cash* $
Board-Designated Assets - Investments* $
Board-Designated Assets - Other Assets* $
Total Board-Designated Endowment* calc.
o Yes
o No
Endowment Corpus $
Amount Withdrawn $
Maximum Annual Withdrawal Percentage $
Revenue Lines Containing Endowment Draw dropdown menu
Notes text
Term Endowment Unrestricted Temporarily
Restricted
Term Endowment Assets - Cash $ $
Term Endowment Assets - Investments $ $
Term Endowment Assets - Other Assets $ $
Total Term Endowment calc . calc.
o Yes
o No
Term Endowment Corpus $ $
Amount Withdrawn $ $
Maximum Annual Withdrawal Percentage $ $
Revenue Lines Containing Endowment Draw dropdown menu
Notes text
Permanent Endowment Unrestricted Temporarily
RestrictedPermanently
Restricted
Permanent Endowment Assets - Cash $ $ $
Permanent Endowment Assets - Investments $ $ $
Permanent Endowment Assets - Other Assets $ $ $
Total Permanent Endowment calc . calc. calc.
o Yes
o No
*The questions below appear if you select Board designated endowment in Fund Types.
*The questions below appear if you select term endowment in Fund Types.
*The questions below appear if Permanent Endowment is selected in Fund Types.
Does this endowment appear on your balance sheet?
Does this endowment appear on your balance sheet?
Does this endowment appear on your balance sheet?
C-15

Balance Sheet
Original Endowment Corpus* $ $ $
Amount Withdrawn* $ $ $
Revenue Lines Containing Endowment Draw* dropdown menu
Notes* text
Reserve Funds*
Reserves - Cash* $
Reserve - Investments* $ $
Reserves - Other Assets* $ $
Total Reserve Funds* $ $
Reserves - Cash* $
Reserve - Investments* $
Reserves - Other Assets* $
Maximum Annual Withdrawal Percentage* text text
Revenue Lines Containing Reserve Draw* text text
Fixed Assets Details text text
Land $
Buildings $
Furniture, Fixtures, and Equipment $ $
Construction in Progress
Leasehold and Building Improvements text text
Intangible Fixed Assets $
Other Fixed Assets $
Less Accumulated Depreciation $
Net Fixed Assets calc.
Loan Details
Line of Credit - Limit $
Line of Credit - Balance $
Mortgage - Current $
Mortgage - Non-Current $
Bonds Payable - Current $
Bonds Payable - Non-Current $
Other Notes and Loans - Current $
Other Notes and Loans - Non-Current $
Total Loans calc.
*The section below appears if your organization is audited, and you enter any value in Loans - Current or Loans - Non-Current. This entire section is optional.
*The questions below are only shown if Reserve Fund is selected in Fund Types.
*The section below appears if you enter a value greater than $500,000 in Fixed Assets - Net in the Balance Sheet. This entire section is optional.
C-16

Customized Program Activity
Advocacy 12
Book Publishing 12
Broadcasting 12
Circulating Works 13
Classes/Workshops 14
Commissioning Works 14
Competitions 14
Conferences 15
Consulting/Fee-for-Service Work 15
Developing Works 15
Exhibits 15
Fairs/Festivals/Parades 16
Field Trips 17
Fiscal Sponsorship 17
Grantmaking 17
Guided Tours 18
Historic Preservation/Restoration 18
Loan Programs 19
Open Rehearsals/Runouts 19
Performances 20
Private Lessons 20
Programs in Schools 20
Provide Equipment 21
Provide Space 21
Publishing Periodicals 21
Research 22
Residencies 22
Screenings 22Other Programs 23
Program Activity Summary 23
Constituencies Served 23
The Program Activity section is customized based on your answers in the Profile Wizard. A list of all possible sections is below, followed by full questions in each section.
These sections appear for all organizations.
These sections appear based on the program activities you selected in the Profile Wizard.
C-17

Customized Program Activity
Advocacy Narrative text
Issue 1 text
Issue 2 text
Issue 3 text
Issue 4 text
Advocacy Engagement (number of people) n.
What's missing from this section? text
Book Publishing Narrative text
Total Book Titles n.
New Book Titles n.
Frontlist Backlist
Physical Books n. n.
Digital Books n. n.
Percent Sold Through a Distributor n.
High Low
List Prices $ $
Broadcasting Narrative text
Broadcast Format
c AM Radio
c FM Radio
c Internet Radio (Live)
c On-Demand Audio (Podcasts)
c On-Demand Video
c Live-Stream Audio
c Live-Stream Video
c Television
c Cinema
c Other
Paid Free
Listeners n. n.
Viewers n. n.
Advocacy *Appears if you select 'Advocacy' as a program activity in the Data Profile Wizard.
Book Publishing *Appears if you select 'Publishing books or periodicals' as a program activity in the Data Profile Wizard.
Broadcasting *Appears if you select 'Broadcasting' as a program activity in the Data Profile Wizard.
C-18

Customized Program Activity
Hours Produced
Hours Broadcast
Audio Content n. n.
Video Content n. n.
Cinema Content n. n.
Content - Other Formats n. n.
What's missing from this section? text
Circulation Program Narrative text
Types of Works Circulated
c Aeronautics, space/airplanes c Photography, prints
c Animals, live c Physical science projects
c Animals, preserved c Plants, live
c Anthropological, ethnographic c Plant, preserved
c Archaeological c Sculpture, indoor
c Books c Sculpture, outdoor
c Ceramics, glass, metals, plastics c Textiles and costumes
c Documents, manuscripts c Tools
c Furniture/wooden objects c Toys and dolls
c Geological, mineral, paleontological c Transportation, excluding airplanes
c Historic building c Works of art on paper
c Historic sites c Anthropological, ethnographic
c Horological (clocks) c Archaeological
c Landscape features, constructed c Books
c Machinery c Ceramics, glass, metals, plastics
c Maritime, historic ships c Documents, manuscripts
c Medals c Furniture/wooden objects
c Medical, dental, health, pharmacological c Geological, mineral, paleontological
c Military, including weapons c Historic building
c Motion picture, audiovisual c Historic sites
c Musical instruments c Horological (clocks)
c Numismatics (money) c Landscape features, constructed
c Paintings c Machinery
c Philatelic (stamps) c Maritime, historic ships
c Photography, negatives c Medals
Works Available n.
Circulating Works *Appears if you select 'Circulating works' as a program activity in the Data Profile Wizard.
c Other objects not listed above (please specify)
C-19

Customized Program Activity
Works Circulated n.
Works Acquired n.
Individuals Entities
Borrowers n. n.
What's missing from this section?
Classes/ Workshops Narrative text
One-time Classes/Workshops n. n.
Class Series/Courses n. n.
Paid Free
Registrants n. n.
High Low
Class Fee $ $
Session Fee/Tuition $ $
What's missing from this section? text
Commissioned Works Narrative text
Works Commissioned n.
What's missing from this section? text
Competitions Narrative text
Competitions Hosted n.
Competitors n.
Competition Winners n.
High Low
Entry Fee $ $
What's missing from this section? text
Classes/Workshops *Appears if you select 'Arts education' OR 'Classes, lectures, or professional development' as a program activity in
the Data Profile Wizard.
Commissioning Works *Appears if you select 'Commissioning works' as a program activity in the Data Profile Wizard.
Competitions *Appears if you select 'Competitions' as a program activity in the Data Profile Wizard.
C-20

Customized Program Activity
Conferences Narrative text
Conferences Hosted n.
Paid Free
Attendees n. n.
High Low
Registration Fee $ $
What's missing from this section? text
Consulting Services Narrative text
Clients n.
High Low
Fee Range $ $
What's missing from this section? text
New Work Development Narrative text
Works Developed n.
Workshops/Readings n.
What's missing from this section? text
Exhibits Narrative text
High Low
Standard Admission Price Range $ $
Suggested Donation Amount $
Conferences *Appears if you select 'Conferences' as a program activity in the Data Profile Wizard.
Consulting/Fee-for-Service Work *Appears if you select 'Consulting or fee-for-service work' as a program activity in the Data Profile Wizard.
Developing Works *Appears if you select 'Developing works' as a program activity in the Data Profile Wizard.
Exhibits *Appears if you select 'Exhibits' as a program activity in the Data Profile Wizard.
C-21

Customized Program Activity
Paid Admissions
Free Admissions
Suggested Donation
Admissions (no. of people) n. n. n.
Permanent Exhibits n.
Temporary Exhibits n.
Traveling Exhibits n.
World NationalLocal/
Regional
Premieres - Exhibits n. n. n.
c Objects
c Live Animals
c Live Plants
c No Collection
Animals / Plants Description text
Animals/Plants/Objects/Works in Collection n.
Animals on Exhibit / Plants/Objects Works Exhibited
n.
Species (Animals/Plants) n.
Endangered Species (Animals) n.
What's missing from this section? text
Fairs/Festivals/Parades Narrative text
Fairs/Festivals/Parades Organized n.
c Indoor
c Outdoor
What type of collection does your organization own?
*The questions below are customized based on your answer to "What type of collection does your organization own?"
Fairs/Festivals/Parades *Appears If you select 'Festivals, fairs, parades or community events' as a program activity in the Data Profile Wizard.
Event Location(s)
C-22

Customized Program Activity
Paid FreeSuggested Donation
Attendees (no. of people) n. n. n.
What's missing from this section? text
Field Trip Description text
Distinct Total
Field Trips n. n.
Paid Free
Participants n. n.
High Low
Price Per Person $ $
What's missing from this section? text
Fiscal Sponsorship Narrative text
Sponsorship Applicants n.
New Sponsored Projects n.
Total Sponsored Projects n.
Amount Distributed $
What's missing from this section? text
Grantmaking Narrative text
c Direct
c Intermediary
c Re-Grantor
Amount Awarded calc.
Fiscal Sponsorship *Appears if you select 'Fiscal sponsorship' as a Program Activity in the Data Profile Wizard.
Field Trips *Appears if you select 'Field trips' as a program activity in the Data Profile Wizard.
Grantmaking *Appears if you select 'Grant making' as a program activity in the Data Profile Wizard.
Grantmaking Type
* This field is calculated based on
related question in Expenses.
C-23

Customized Program Activity
Grant Applicants* n.
Grant Recipients* n.
*number of organizations or projects
What's missing from this section? text
Guided Tours Narrative text
Distinct Total
Guided Tours n. n.
Paid Free
Participants n. n.
High Low
Price Range $ $
What's missing from this section? text
Historic Preservation/Restoration Narrative text
Types of Objects Restored
c Aeronautics, space/airplanes c Motion picture, audiovisual
c Animals, live c Musical instruments
c Animals, preserved c Numismatics (money)
c Anthropological, ethnographic c Paintings
c Archaeological c Philatelic (stamps)
c Books c Photography, negatives
c Ceramics, glass, metals, plastics c Photography, prints
c Documents, manuscripts c Physical science projects
c Furniture/wooden objects c Plants, live
c Geological, mineral, paleontological c Plant, preserved
c Historic building c Sculpture, indoor
c Historic sites c Sculpture, outdoor
c Horological (clocks) c Textiles and costumes
* This field is calculated based on
related question in Expenses.
Organizations/Projects
Guided Tours *Appears if you select 'Guided tours' as a program activity in the Data Profile Wizard.
Historic Preservation/Restoration *Appears if you select 'Historic preservation or restoration' as a program activity in the Data Profile Wizard.
C-24

Customized Program Activity
c Landscape features, constructed c Tools
c Machinery c Toys and dolls
c Maritime, historic ships c Transportation, excluding airplanes
c Medals c Works of art on paper
c Medical, dental, health, pharmacological c Other objects not listed above
c Military, including weapons (please specify)
Describe Other Objects text
What's missing from this section? text
Lectures Narrative text
Distinct Total
Lectures n. n.Paid Free
Lecture Attendees n. n.
What's missing from this section? text
Loan Programs Narrative text
Number of Loans n.
Amount Loaned $
Loan Recipients n.
What's missing from this section? text
Open Rehearsals Narrative text
Open Rehearsals n.
Paid Free
Tickets/Seats n. n.
Lectures *Appears if you select 'Arts education' OR 'Classes, lectures, or professional development' as a program activity in
the Data Profile Wizard.
Loan Programs *Appears if you select 'Financing' as a program activity in the Data Profile Wizard.
Open Rehearsals *Appears if you select 'Open rehearsals' as a progam activity in the Data Profile Wizard.
C-25

Customized Program Activity
What's missing from this section? text
Performance Description text
ProductionsTotal
Performances
Performances n. n.
World NationalLocal/
Regional
Premieres n. n. n.
Sold Free Capacity
Tickets n. n. n.
High Low
Single Adult Ticket Price Range $ $
What's missing from this section? text
Private Lessons Narrative text
Lessons Offered (classes) n.
Paid Free
Students n. n.
High Low
Fee Range $ $
What's missing from this section? text
Programs in Schools Narrative text
Programs in Schools n.
Time in Schools (hours) n.
Programs in Schools*Appears if you select 'Arts education' OR 'Classes, lectures, or professional development' as a progam activity in the Data
Profile Wizard.
Private Lessons*Appears if you select 'Arts education' OR 'Classes, lectures, or professional development' as a progam activity in the
Data Profile Wizard.
Performances*Appears if you select 'Performances' as a progam activity in the Data Profile Wizard.
C-26

Customized Program Activity
Schools Served n.
Artists in Schools n.
Children Served in School n.
What's missing from this section? text
Pieces Available n.
Pieces Rented n.
What's missing from this section? text
Space Rental Narrative text
Rental Time Period
⃝
⃝ Hour
⃝
⃝ Day
⃝
⃝ Week
⃝
⃝ Month
⃝
⃝ Year
High Low
[Hourly/Daily/Weekly/Monthly/Yearly] Fee $ $
Available Rented
[Hourly/Daily/Weekly/Monthly/Yearly] Rental n. n.
Square Footage n.
What's missing from this section? text
Periodical Publishing Narrative text
Number of Periodicals n.
Number of Issues n.
Provide Equipment*Appears if you select 'Providing equipment, sets, costumes, or other materials' as a progam activity in the Data
Profile Wizard.
Provide Space*Appears if you select 'Providing rehearsal, meeting, office or other space' as a progam activity in the Data Profile
Wizard.
The below items are customized based on the answer to the question above:
Publishing Periodicals*Appears if you select 'Publishing books or periodicals' as a progam activity in the Data Profile Wizard.
C-27

Customized Program Activity
Individuals Institutions
Individual and/or Institutional Subscribers n. n.
Paid Free
Paid and/or Free Subscribers n. n.
Physical Digital
Periodicals Distributed $ $
High Low
Issue Price $ $
Subscription Price $ $
What's missing from this section? text
Research Narrative text
Reports Issued n.
Residency Applicants text
Residencies Awarded n.
What's missing from this section? text
Screenings Narrative text
Unique FilmsTotal
Screenings
Screenings n. n.
Sold Complimentary
Tickets/Seats n. n.
High Low
Price Range $ $
What's missing from this section? text
Research*Appears if you select 'Conducting Research' as a progam activity in the Data Profile Wizard.
Residencies*Appears if you select 'Providing residencies' as a progam activity in the Data Profile Wizard.
Screenings*Appears if you select 'Film screenings' as a progam activity in the Data Profile Wizard.
C-28
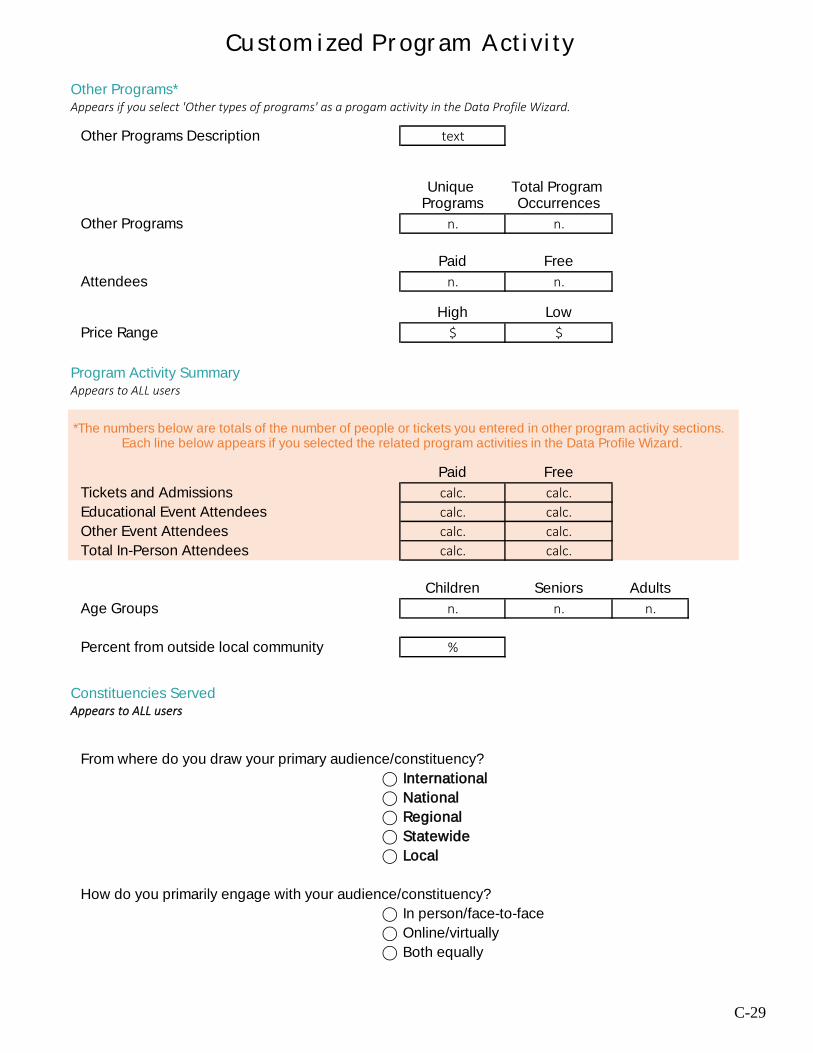
Customized Program Activity
Other Programs Description text
Unique Programs
Total Program Occurrences
Other Programs n. n.
Paid Free
Attendees n. n.
High Low
Price Range $ $
Paid Free
Tickets and Admissions calc. calc.
Educational Event Attendees calc. calc.
Other Event Attendees calc. calc.
Total In-Person Attendees calc. calc.
Children Seniors Adults
Age Groups n. n. n.
Percent from outside local community %
From where do you draw your primary audience/constituency?
⃝
⃝ International
⃝
⃝ National
⃝
⃝ Regional
⃝
⃝ Statewide
⃝
⃝ Local
How do you primarily engage with your audience/constituency?
⃝
⃝ In person/face-to-face
⃝
⃝ Online/virtually
⃝
⃝ Both equally
Constituencies ServedAppears to ALL users
Other Programs*Appears if you select 'Other types of programs' as a progam activity in the Data Profile Wizard.
Program Activity SummaryAppears to ALL users
*The numbers below are totals of the number of people or tickets you entered in other program activity sections. Each line below appears if you selected the related program activities in the Data Profile Wizard.
C-29

Customized Program Activity
Which term best describes the local community you serve?
⃝
⃝ Urban
⃝
⃝ Suburban
⃝
⃝ Rural
⃝
⃝ Yes
⃝
⃝ No
Primary ethnic group served*
⃝
⃝ Indigenous people
⃝
⃝ People of African descent
⃝
⃝ People of Asian descent
⃝
⃝ People of Latin American descent
⃝
⃝ People of European descent
⃝
⃝ People of Middle Eastern descent
⃝
⃝ Other ethnic group (please specify)
Does your organization primarily serve a specific gender?
⃝
⃝ Yes
⃝
⃝ No
Primary Gender Served*
⃝
⃝ Men
⃝
⃝ Women
⃝ People with non-binary gender identities
Does your organization primarily serve a specific age group?
⃝
⃝ Yes
⃝
⃝ No
Primary Age Group Served*
⃝
⃝ Pre-kindergarten (0-5 years)
⃝
⃝ K-12 (6-17 years)
⃝
⃝ Young adults (18-24 years)
⃝
⃝ Adults (25-64 years)
⃝
⃝ Older Adults (65+ years)
Does your organization primarily serve a particular ethnic group?
The question below appears if you select 'Yes'
The question below appears if you select 'Yes'
The question below appears if you select 'Yes'
C-30

Customized Program Activity
Are there other distinct groups that you define as primary constituencies?
⃝
⃝ Yes
⃝
⃝ No
Other Distinct Group Served* c Artists c Immigrant populations
c People of a particular faith c People who identify as LGBTQ
c People with disabilities c Military veterans/active personnel
c People of low socio-economic status c Other distinct group(s) (please describe)
Describe Other Distinct Group text
The question below appears if you select 'Yes'
C-31

THIS PAGE LEFT INTENTIONALLY BLANK
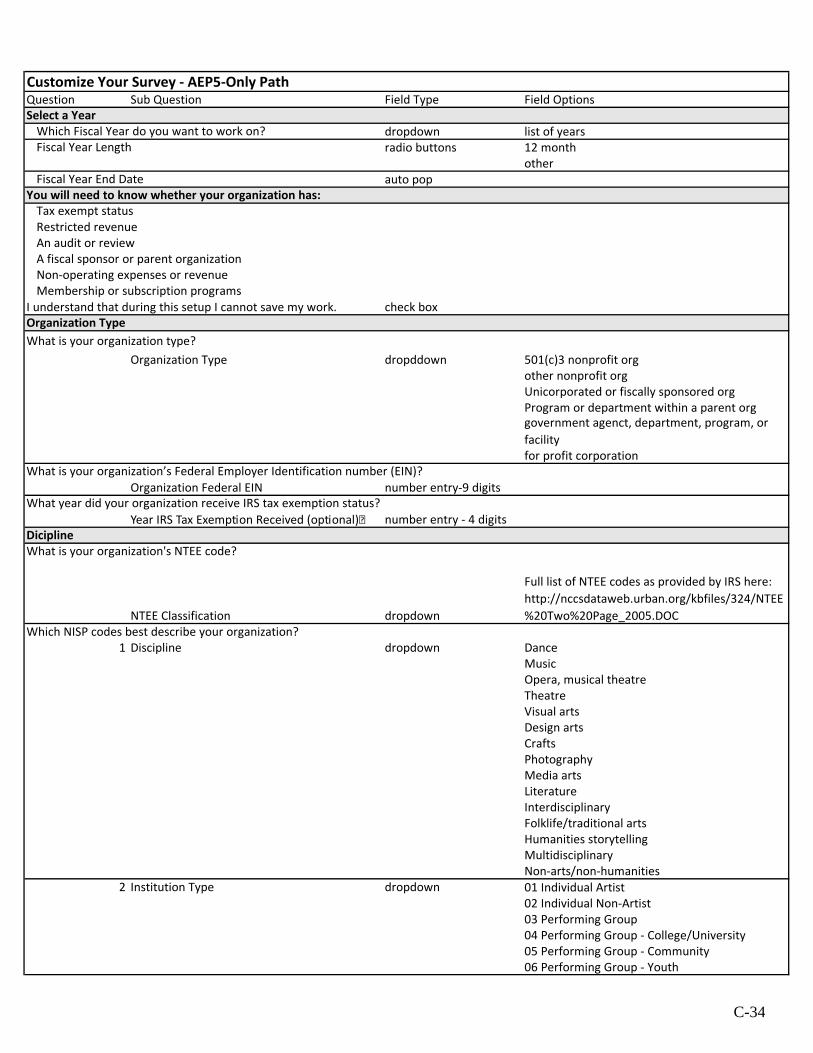
Customize Your Survey - AEP5-Only PathQuestion Sub Question Field Type Field Options
dropdown list of yearsradio buttons 12 month
otherauto pop
I understand that during this setup I cannot save my work. check box
Organization Type dropddown 501(c)3 nonprofit orgother nonprofit orgUnicorporated or fiscally sponsored orgProgram or department within a parent orggovernment agenct, department, program, or facilityfor profit corporation
Organization Federal EIN number entry-9 digits
Year IRS Tax Exemption Received (optional) number entry - 4 digits
NTEE Classification dropdown
Full list of NTEE codes as provided by IRS here: http://nccsdataweb.urban.org/kbfiles/324/NTEE%20Two%20Page_2005.DOC
Which NISP codes best describe your organization?1 Discipline dropdown Dance
MusicOpera, musical theatreTheatreVisual artsDesign artsCraftsPhotographyMedia artsLiteratureInterdisciplinaryFolklife/traditional artsHumanities storytellingMultidisciplinaryNon-arts/non-humanities
2 Institution Type dropdown 01 Individual Artist02 Individual Non-Artist03 Performing Group04 Performing Group - College/University05 Performing Group - Community06 Performing Group - Youth
Restricted revenue
Select a YearWhich Fiscal Year do you want to work on?Fiscal Year Length
Fiscal Year End DateYou will need to know whether your organization has:
Tax exempt status
What is your organization’s Federal Employer Identification number (EIN)?
What year did your organization receive IRS tax exemption status?
DiciplineWhat is your organization's NTEE code?
Organization Type
An audit or reviewA fiscal sponsor or parent organizationNon-operating expenses or revenueMembership or subscription programs
What is your organization type?
C-34

2 Institution Type (continued) dropdown 07 Performance Facility08 Art Museum09 Other Museum10 Gallery/Exhibit Space11 Cinema12 Independent Press13 Literary Magazine14 Fair/Festival15 Arts Center16 Arts Council/Agency17 Arts Service Organizaition18 Union/Professional Association19 School District20 Parent-Teacher Organization21 Elementary School22 Middle School23 Secondary School24 Vocational/Technical School25 Other School26 College/University27 Library28 Historical Society29 Humanities Council30 Foundation31 Corporation32 Community Service Org33 Correctional Institution34 Health Care Facility35 Religious Organization36 Seniors' Center37 Parks & Recreation38 Government - Executive39 Government - Judicial40 Government - Legislative (House)41 Government - Legislative (Senate)42 Media - Periodical43 Media - Daily Newspaper44 Media -Weekly Newspaper45 Media - Radio46 Media- TV47 Cultural Series Organization48 Schools of the Arts49 Arts Camp/Institute50 Social Service Organization51 Child Care Provider99 None of the Above
Is your organization a member of, or do you want to complete a survey for, any of these groups?Select all that apply check boxes Arts & Economic Prosperity 5
League of American OrchestrasArt House ConvergenceBarbershop Harmony SocietyOPERA AmericaNational Guild for Community Arts EducationFederation of State Humanities Councils
Survey Providers
C-35

Organization zip code number entry - 5 digits zip is in a DataArts region (move to full CDP path)zip is not in a DataArts region (continue AEP5-only path)
Radio buttonsMy organization will only complete the AEP5 SurveyMy organization will submit the full CDP (see long form)
Summary Screen Save and Finish
Arts & Economic Prosperity 5Below please confirm which category best describes you so we can customize your survey experience.
Organization Location
Continue to Customized Survey on Next Page
Confirm your organization's zip code.
C-36

Revenue
Operating Revenues
Trustee/Board Contributions $Individual Contributions $Corporate Contributions $Foundation Contributions $City Government Contributions $County Government Contributions $State Government Contributions $Federal Government Contributions $Other Cash Contributions $In-Kind Contributions $Investment Income $Earned Program Revenue $Other Earned Revenue $
Calculated Total $
C-37

Expense
Operating Expenses
Employee Salaries $Payroll Taxes and Fringe Benefits $Independent Contractors $Professional Fees $Advertising and Promotion $Conferences and Meetings $Dues and Subscriptions $Grants Awarded* $Insurance $Occupancy Costs $Office and Administration $Printing, Postage, and Shipping $Travel $Interest Expense $Depreciation $Other Expenses $
Total (Calculated) $
o Yes
o No
Local Non LocalPayments to Artists and Performers $ $
Direct FinancialSupport to
Organizations
Direct FinancialSupport toIndividual
Artists
Grants Awarded Details $ $
Do you pay artists directly? (required)
The below question is shown to those who select 'Yes'
*The below question is shown to those who entered a value into the above 'Grants Awarded' row.
C-38

Expense
Summary
PersonnelExpenses
Non-PersonnelExpenses
Total Operating Expenses (Calculated) $ $
o Yes
o No
Total Capital Expenditures $
Workforce (Staff, Board and Volunteers)
Full-Time Permanent Employees n.
Number Hours Worked CalculatedFTE
Full-Time Seasonal Employees n. n. calc.Part-Time Permanent Employees n. n. calc.Part-Time Seasonal Employees n. n. calc.Independent Contractors n.
Full-Time Volunteers n.
Number HoursContributed
CalculatedFTE
Part-Time Volunteers n. n. calc.Board Members n. n.
Did you have any capital expenditures that are not already reflected in your totalexpenditures? (required)
The below question is shown to those who select 'Yes'
C-39

Program Activity
Attendance and Participation
Paid Free
Physical/In-person Attendance andParticipation n. n.
Virtual/Online Attendance and Participation n. n.
Percent of physical attendance fromoutside local community %
Percent of physical attendance youngerthan 18 %
C-40

Customize Your Survey - AEP5-Only PathQuestion Sub Question Field Type Field Options
dropdown list of yearsradio buttons 12 month
otherauto pop
I understand that during this setup I cannot save my work. check box
Organization Type dropddown 501(c)3 nonprofit orgother nonprofit orgUnicorporated or fiscally sponsored orgProgram or department within a parent orggovernment agenct, department, program, or facilityfor profit corporation
Organization Federal EIN number entry-9 digits
Year IRS Tax Exemption Received (optional) number entry - 4 digits
NTEE Classification dropdown
Full list of NTEE codes as provided by IRS here: http://nccsdataweb.urban.org/kbfiles/324/NTEE%20Two%20Page_2005.DOC
Which NISP codes best describe your organization?1 Discipline dropdown Dance
MusicOpera, musical theatreTheatreVisual artsDesign artsCraftsPhotographyMedia artsLiteratureInterdisciplinaryFolklife/traditional artsHumanities storytellingMultidisciplinaryNon-arts/non-humanities
2 Institution Type dropdown 01 Individual Artist02 Individual Non-Artist03 Performing Group04 Performing Group - College/University05 Performing Group - Community06 Performing Group - Youth
Restricted revenue
Select a YearWhich Fiscal Year do you want to work on?Fiscal Year Length
Fiscal Year End DateYou will need to know whether your organization has:
Tax exempt status
What is your organization’s Federal Employer Identification number (EIN)?
What year did your organization receive IRS tax exemption status?
DiciplineWhat is your organization's NTEE code?
Organization Type
An audit or reviewA fiscal sponsor or parent organizationNon-operating expenses or revenueMembership or subscription programs
What is your organization type?
C-42

2 Institution Type (continued) dropdown 07 Performance Facility08 Art Museum09 Other Museum10 Gallery/Exhibit Space11 Cinema12 Independent Press13 Literary Magazine14 Fair/Festival15 Arts Center16 Arts Council/Agency17 Arts Service Organizaition18 Union/Professional Association19 School District20 Parent-Teacher Organization21 Elementary School22 Middle School23 Secondary School24 Vocational/Technical School25 Other School26 College/University27 Library28 Historical Society29 Humanities Council30 Foundation31 Corporation32 Community Service Org33 Correctional Institution34 Health Care Facility35 Religious Organization36 Seniors' Center37 Parks & Recreation38 Government - Executive39 Government - Judicial40 Government - Legislative (House)41 Government - Legislative (Senate)42 Media - Periodical43 Media - Daily Newspaper44 Media -Weekly Newspaper45 Media - Radio46 Media- TV47 Cultural Series Organization48 Schools of the Arts49 Arts Camp/Institute50 Social Service Organization51 Child Care Provider99 None of the Above
Is your organization a member of, or do you want to complete a survey for, any of these groups?Select all that apply check boxes Arts & Economic Prosperity 5
League of American OrchestrasArt House ConvergenceBarbershop Harmony SocietyOPERA AmericaNational Guild for Community Arts EducationFederation of State Humanities Councils
Survey Providers
C-43

Organization zip code number entry - 5 digits zip is in a DataArts region (move to full CDP path)zip is not in a DataArts region (continue AEP5-only path)
Radio buttonsMy organization will only complete the AEP5 SurveyMy organization will submit the full CDP (see long form)
Summary Screen Save and Finish
Arts & Economic Prosperity 5Below please confirm which category best describes you so we can customize your survey experience.
Organization Location
Continue to Customized Survey on Next Page
Confirm your organization's zip code.
C-44

One-Page Abbreviated AEP5 Survey
C-45

THANK YOU!!! RETURN COMPLETED SURVEY TO:
Page 1 of 1 Ben Davidson, Senior Director of Research Services
Americans for the Arts
[email protected] 202-371-0424 (fax)
1000 Vermont Avenue NW, Sixth Floor, Washington, DC 20005
The Abbreviated Organizational Survey
Formal Name of Organization/Program:
City, State, and ZIP Code:
County (not country):
1. Which of the following best characterizes the LEGAL STATUS of your organization/cultural program?
501(c)3 nonprofit organization Program or department within a parent organization
Other nonprofit organization Government agency, department, program or facility
Unincorporated or fiscally sponsored For-profit business
2. What is the END DATE of your organization’s fiscal year?
3. For which FISCAL YEAR will you complete this survey? 2015 2016 Other
4. Provide your organization’s total EARNED REVENUE.
5. Provide ALL OTHER INCOME and SUPPORT to your organization.
6. Provide the value of IN-KIND DONATIONS received by your organization.
7. Provide your organization’s total OPERATING expenditures.
8. Provide your organization’s total CAPITAL expenditures.
9. Complete the table below to provide your organization’s WORKFORCE and VOLUNTEERS.
Full-time, permanent employees...............................................................................
Full-time, seasonal employees..................................................................................
Part-time employees (permanent and seasonal)........................................................
Independent contractors............................................................................................
Full-time volunteers..................................................................................................
Part-time volunteers..................................................................................................
Board/commission members.....................................................................................
10. Provide your organization’s total physical ATTENDANCE. (Include physical attendance only; exclude
virtual attendance such as website visits, social media. online gallery views, or viewership/listenership.)
Free Attendance........................................................................................................
Paid Attendance........................................................................................................
C-46

Dear Arts Patron:
1.
Adults: Children (<18):
2.
A. $
B. $
C. $
D. $
E. $
F. $
G. $
H. $
I. Other (provide description): $
3.
4.
A E I am here to conduct business (e.g., meeting, conference)
B I am a part-time resident (e.g., I own a vacation home here) F I am here on a vacation/holiday
C I am here specifically to attend this arts/cultural event G I am visiting family and/or friends who live here
D I work here, but I live somewhere else H Other (Please specify):
5.
# of Nights:
6.
A
B
C
7. A Yes B No
8.
A Younger than 18 B 18-34 C 35-44 D 45-54 E 55-64 F 65+
9.
A Less than high school C 2-year college/technical/associates degree E Masters degree
B High school D 4-year college degree F Doctoral degree
10.
A Less than $40,000 C $60,000 - $79,999 E $100,000 - $119,999
B $40,000 - $59,999 D $80,000 - $99,999 F $120,000 or More
11.
A Yes, I plan to vote (or I have voted already) B No C I don't know/Undecided D Not applicable
Please take a few minutes to answer the following questions. This survey is part of a study to
measure the economic impact of the arts and culture in this community. Your answers are
anonymous and will be kept strictly confidential. Please answer each question completely and
return the survey to the person who gave it to you. Thank you!
Which of the following best describes your primary reason for being in this community today? (Check only one response)
I am a full-time resident (e.g., I live here, I go to school here)
If this performance, event, or exhibit were not happening, would you have traveled to another community to attend a similar
arts experience? (Check only one response)
List the estimated amounts of money that you and the members of your immediate travel party will spend in this community
specifically as a result of your attendance at this arts/cultural performance, event, or exhibit. Remember to include money spent
before, during, and after the event. If exact figures are not available, use your best estimates.
SECTION ONE: First, please tell us about today's visit to this arts/cultural performance, event, or exhibit ...
SECTION TWO: To finish the survey, please tell us a little bit more about YOU …
Child-care specifically to attend this event
(If you currently are staying in a vacation property or second home that you own, provide the ZIP code for that vacation/second home).
Including yourself, how many people are attending this arts event with you?
Include only the people in your immediate travel party (e.g., not tour groups).
Local transportation (e.g., gas, parking, tolls, rental car, taxi or bus fare -- not airfare)
Overnight accommodations to attend this event (e.g., hotel, motel, inn) (include one night only)
Is this your first time attending this arts event or facility?
Do you plan to vote in the 2016 United States presidential election? (Check only one response)
How many nights away from your primary residence will you spend in this community specifically
because of your attendance at this arts/cultural event? If you are a full-time or part-time resident, and you
will not spend any nights away from your home, please respond with "0".
Admission/tickets for your travel party's attendance to this event
Refreshments and/or snacks purchased by your travel party while at this event
Food, drinks, or meals purchased before or after this event (e.g., at a local restaurant)
Souvenirs, gifts, books, recordings, and/or art
Clothing or accessories specifically for this event
What is the ZIP code or postal code of your primary home residence?
No, I would have skipped the arts experience altogether
No, I would have replaced it with another arts experience in this community
Yes, I would have traveled to a different community to attend a similar arts experience
What is the highest level of education that you have completed? (Check only one response)
Which of the following ranges includes your annual household income? (Check only one response)
Which of the following ranges includes your current age? (Check only one response)
C-47

Estimado Asistente:
1.
Adultos: Niños (<18):
2.
A. $
B. $
C. $
D. $
E. $
F. $
G. $
H. $
I. Otros (proporcione descripción): $
3.
4.
A E Estoy aquí por negocios (p. ej., juntas, conferencias)
B Soy residente de tiempo parcial (p. ej., tengo una casa de verano) F Estoy aquí de vacaciones
C Estoy aquí específicamente para asistir a este evento G Estoy visitando familia y/o amigos que viven aquí
D Trabajo aquí, pero vivo en otra parte H Otro (especificar)
5.
# de Noches:
6.
A
B
C
7. A Si B No
8.
A Menos de 18 B 18-34 C 35-44 D 45-54 E 55-64 F 65+
9.
A Menos que preparatoria C Universidad de 2 años/carrera técnica/grado asociado E Maestría
B Preparatoria D Universidad (4 años) F Doctorado
10.
A Menos de $40,000 C $60,000 - $79,999 E $100,000 - $119,999
B $40,000 - $59,999 D $80,000 - $99,999 F $120,000 o más
11.
A Sí, tengo la intención de votar (o ya voté) B No C No se/Indeciso D No aplicable
Costo de admisión o boletos para la asistencia a este evento de usted y su grupo
Por favor tome unos minutos para responder las siguientes preguntas. Esta encuesta es parte de
un estudio para medir el impacto económico de las artes y la cultura en esta comunidad. Sus
respuestas son anónimas y se mantendrán estrictamente confidenciales. Por favor conteste cada
pregunta completamente y devuelva la encuesta a la persona que se la dio. ¡Gracias!
PRIMERA SECCIÓN: Díganos sobre su visita del día de hoy a este espectáculo, evento o exhibición de arte/cultural
Incluyéndose a usted, ¿con cuantas personas está asistiendo a este evento?
Incluya sólo las personas en su grupo inmediato (p. ej., no grupos de turistas)
Liste las cantidades estimadas de dinero que usted y los miembros de su grupo inmediato gastarán en esta comunidad
específicamente como resultado de su asistencia a este espectáculo cultural/de arte, evento o exhibición. Recuerde incluir dinero
gastado antes, durante y después del evento. Si no tiene cifras exactas, use sus mejores estimaciones.
Soy residente de tiempo completo (p. ej., vivo o estudio aquí)
Bebidas y/o bocadillos comprados por su grupo durante este evento
Alimentos o bebidas comprados antes o después de este evento (p. ej., en un restaurante local)
Recuerdos, regalos, libros, material en video o audio y/o arte
Ropa o accesorios específicamente para este evento
Transporte local (p. ej., gasolina, estacionamiento, taxi o renta de auto - no boletos de avión)
Guardería/cuidado de niños específicamente para asistir a este evento
Hospedaje para asistir a este evento (p. ej., hotel, motel, hostal) (incluir sólo una noche)
SEGUNDA SECCIÓN: Para terminar la encuesta, por favor díganos un poco más sobre USTED…
¿Cuál es el código postal de su residencia principal?
(Si actualmente se hospeda en una segunda casa o casa de vacaciones de su propiedad, proporcione el código postal de esa residencia)
¿Cuál de las siguientes opciones describe mejor su razón principal para estar en esta comunidad hoy? (Marque sólo una )
¿Cuál de los siguientes rangos incluye su edad actual? (Marque sólo una respuesta)
¿Cuál es el nivel educativo más alto que ha completado? (Marque sólo una respuesta)
¿Cuál de los siguientes rangos incluye el ingreso anual de su hogar? - Cantidades en USD (Marque sólo una respuesta)
¿Planea votar en la elección presidencial de 2016 en Estados Unidos? (Marque sólo una respuesta)
¿Cuántas noches pasará en esta comunidad, lejos de su residencia habitual, específicamente debido a su
asistencia a este evento de arte/cultural? Si es residente de tiempo completo o parcial, y no pasará noches
lejos de su casa, por favor responda con "0".
¿Si este espectáculo, evento o exhibición no estuviera sucediendo, habría viajado a otra comunidad para asistir a una experiencia
de arte similar? (Marque sólo una respuesta)
No, hubiera omitido la experiencia artística completamente
No, la hubiera reemplazado con otra experiencia artística en esta comunidad
Sí, hubiera viajado a otra comunidad para asistir a una experiencia artística similar
¿Es la primera vez que asiste a este evento o espacio cultural?
C-48

Dear Arts Patron:
1. Including yourself, how many people are attending this arts event with you?
Include only the people in your immediate travel party (e.g., not tour groups).
Adults: Children (<18):
2.
A. $
B. $
C. $
D. $
E. $
F. $
G. $
H. $
I. Other (provide description): $
3.
Page 1 of 2 Turn over and complete other side …
Please take a few minutes to answer the following questions. This
survey is part of a study to measure the economic impact of the arts and
culture in this community. Your answers are anonymous and will be
kept strictly confidential. Please answer each question completely and
return the survey to the person who gave it to you. Thank you!
List the estimated amounts of money that you and the members of your immediate travel
party will spend in this community specifically as a result of your attendance at this
arts/cultural performance, event, or exhibit. Remember to include money spent before,
during, and after the event. If exact figures are not available, use your best estimates.
SECTION ONE:
SECTION TWO:
Child-care specifically to attend this event
Local transportation (e.g., gas, parking, tolls, taxi -- not airfare)
Overnight accommodations to attend this event (e.g., hotel, motel, inn)
First, please tell us about today's visit to this arts/cultural performance, event, or exhibit …
To finish the survey, please tell us a little bit more about YOU …
Admission/tickets for your travel party's attendance to this event
Refreshments and/or snacks purchased while at this event
Food, drinks, or meals purchased before or after this event
Souvenirs, gifts, books, recordings, and/or art
Clothing or accessories specifically for this event
What is the ZIP code or postal code of your primary home residence? (If you currently are
staying in a vacation property or second home that you own, provide the ZIP code for that
vacation/second home).
C-49
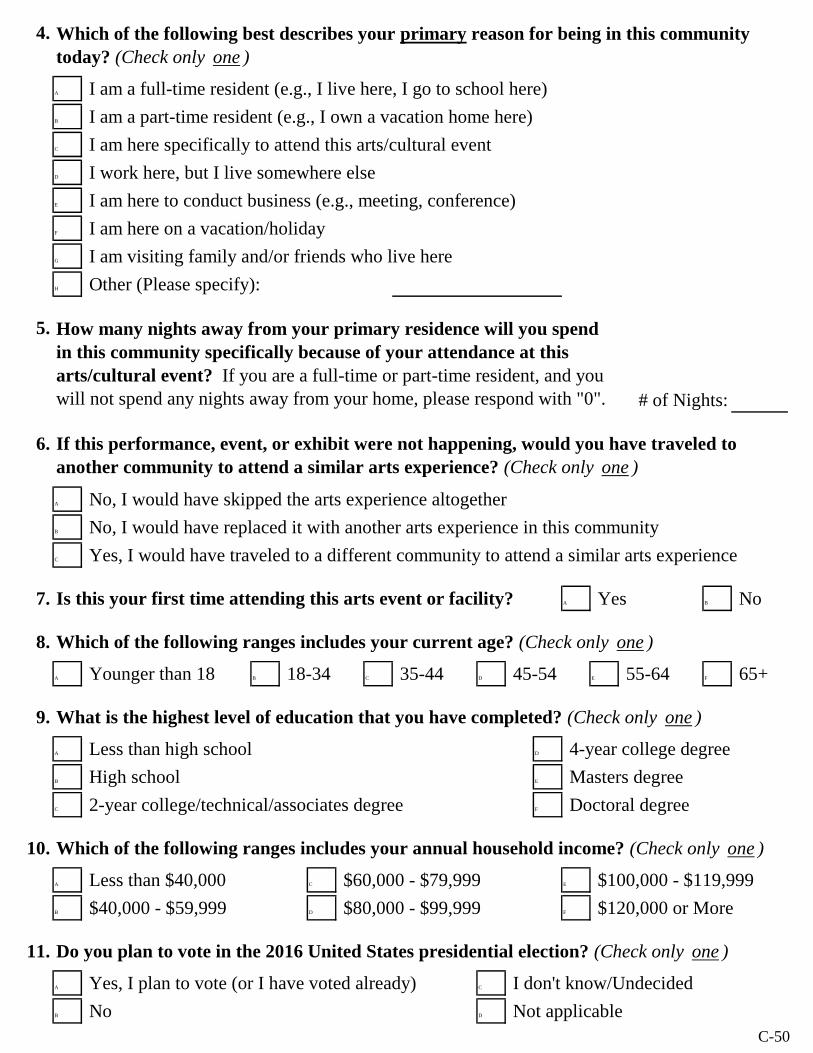
4.
A
B I am a part-time resident (e.g., I own a vacation home here)
C I am here specifically to attend this arts/cultural event
D I work here, but I live somewhere else
E I am here to conduct business (e.g., meeting, conference)
F I am here on a vacation/holiday
G I am visiting family and/or friends who live here
H Other (Please specify):
5.
# of Nights:
6.
A No, I would have skipped the arts experience altogether
B No, I would have replaced it with another arts experience in this community
C Yes, I would have traveled to a different community to attend a similar arts experience
7. Is this your first time attending this arts event or facility? A Yes B No
8.
A Younger than 18 B 18-34 C 35-44 D 45-54 E 55-64 F 65+
9.
A Less than high school D 4-year college degree
B High school E Masters degree
C 2-year college/technical/associates degree F Doctoral degree
10.
A Less than $40,000 C $60,000 - $79,999 E $100,000 - $119,999
B $40,000 - $59,999 D $80,000 - $99,999 F $120,000 or More
11.
A Yes, I plan to vote (or I have voted already) C I don't know/Undecided
B No D Not applicable
Which of the following best describes your primary reason for being in this community
today? (Check only one )
How many nights away from your primary residence will you spend
in this community specifically because of your attendance at this
arts/cultural event? If you are a full-time or part-time resident, and you
will not spend any nights away from your home, please respond with "0".
I am a full-time resident (e.g., I live here, I go to school here)
If this performance, event, or exhibit were not happening, would you have traveled to
another community to attend a similar arts experience? (Check only one )
Do you plan to vote in the 2016 United States presidential election? (Check only one )
What is the highest level of education that you have completed? (Check only one )
Which of the following ranges includes your annual household income? (Check only one )
Which of the following ranges includes your current age? (Check only one )
C-50

AMERICANS FOR THE ARTS | Arts & Economic Prosperity 5 21AMERICANS FOR THE ARTS | Arts & Economic Prosperity 5
Learn more about ARTS & ECONOMIC PROSPERITY 5Visit AmericansForTheArts.org/EconomicImpact to access
free resources you can use to help make the economic case for arts funding and arts-friendly policies in your community.
Arts & Economic Prosperity 5 highlights pamphlet
Arts & Economic Prosperity 5 Summary Report
Arts & Economic Prosperity 5 National Report, complete with
national and local findings, background, scope, and
methodology
A downloadable and customizable PowerPoint presentation that effectively
communicates this study’s findings
A press release announcing the study results
Sample opinion-editorials (op-eds) and letters to the editor
Arts & Economic Prosperity 5 Slide Rule enables users to
estimate the economic impact of their organization.
ARTS &
ECONOMIC PROSPERITY 5THE ECONOMIC IMPACT OF NONPROFIT ARTS & CULTURAL ORGANIZATIONS & THEIR AUDIENCES
1000 Vermont Avenue NW, 6th Floor, Washington, DC 20005 202.371.2830 | [email protected] | #AEP5
AmericansForTheArts.org
In communities coast-to-coast, from our smallest rural towns to our largest urban cities, America’s 100,000 nonprofit arts and cultural organizations make their communities more desirable places to live and work every day of the year. Nonprofit arts and cultural organizations are also businesses. They attract audiences, spur business development, support jobs, generate government revenue, and are the cornerstone of tourism.
The following national organizations partner with Americans for the Arts to help
public and private sector leaders understand the economic and social benefits
that the arts bring to their communities, states, and the nation.
OUR PARTNERS
Americans for the Arts serves, advances, and leads the network of organizations
and individuals who cultivate, promote, sustain, and support the arts in America.
Founded in 1960, Americans for the Arts is the nation’s leading nonprofit
organization for advancing the arts and arts education.
ABOUT AMERICANS FOR THE ARTS
The ArtsMEAN BUSINESS
Arts businesses are rooted locally—jobs that cannot be shipped overseas. Arts & Economic Prosperity 5 sends an important message to community leaders: Support for the arts is an investment in economic well-being and quality of life. Nationally as well as locally, the arts mean business!
Arts & Economic Prosperity 5 is the most comprehensive economic impact study of the nonprofit arts and culture industry ever conducted.
It documents the economic contributions of the arts in 341 communities and regions across the country, representing all 50 states and the District of Columbia. The diverse participat-ing communities range in population from 1,500 to 4 million and include rural, suburban, and urban.
Researchers collected detailed expenditure and attendance data from 14,439 arts and cultural organizations and 212,691 of their attendees to measure total industry spending. Project economists from the Georgia Institute of Technology customized input-output analysis models for each study region to provide specific and reliable economic impact data. This study uses four economic measures to define economic impact: full-time equivalent jobs, resident household income, and revenue to local and state government.
For more information about Arts & Economic Prosperity 5, including methodology and how to download and purchase the report, please visit AmericansForTheArts.org/EconomicImpact.
Americans for the Arts staff are available for speaking engagements. If interested, please contact the Research Department at 202.371.2830 or at [email protected].
“ Arts and Economic Prosperity 5 provides an unparalleled understanding of the influence of the arts on the economy, locally and nationally. We are grateful for the work Americans for the Arts does to help us show what an important asset the arts are in the areas of education and health, both physical and mental, and as an economic driver in Guilford County and counties across the nation.”
— COMMISSIONER KAY CASHION, Guilford County, NC; Chair, National Association of Counties Arts & Culture Commission
About This Study
Americans for the Arts©, Arts & Economic Prosperity®
CREATING JOBS.GENERATING COMMERCE.DRIVING TOURISM.
Source: Americans for the Arts 2016 survey of 3,020 adults by Ipsos Public Affairs
Cover: Andrew Shurtleff Photography.
Back Cover: The Arts Partnership of Greater Spartansburg, SC; Hilltop Artists student, City of Tacoma, WA; Art gallery in Carmel, IN.
Interior: Northwest Connecticut Arts Council; Hillsborough Handmade Parade, NC. Photo by Donn Young, Orange County Arts Commission; Wilmington Creative District mural dedication, Delaware Division of the Arts; Laumeier Sculpture Park, Regional Arts Commission St Louis, MO. Photo by Abby Gillardi.
87% of Americans believe arts & culture are important
to quality of life
82%of Americans believe
arts & culture are important to local
businesses and the economy
INSTRUCTIONS
In the vertical window, choose the number that best matches your annual attendance.
Match that with the number that best corresponds to your organization’s annual expenses.
In the horizontal window, see the total economic impact of your organization.
DEFINITIONSTotal Economic Activity: The estimated spending by your organization PLUS the estimated event-related spending by your audiences (excluding cost of admission).
FTE Jobs: The number of full-time equivalent jobs in your community supported by the expenditures made by your organization and its audiences. A FTE job can be one full-time employee, two half-time employees, etc.
Local and State Government Revenue: The total dollars received by your local and state government (e.g., license fees, taxes) as a result of the expenditures made by your organization and its audiences.
CALCULATORFor an even more accurate estimate of your economic impact, access the online calculator—plus full reports and more—at AmericansForTheArts.org/EconomicImpact.
QUICK FACTSAmerica’s nonprofit arts and culture industry generates $166.3 billion in economic activity every year: $63.8 billion in spending by organizations and $102.5 billion in event-related spending by audiences. The industry supports 4.6 million jobs and generates $27.5 billion in government revenue.
total economic activity
economic IMPACT
attendance
organization’s annual expenses
—$10,000
—$25,000
—$50,000
—$100,000
—$250,000
—$500,000
—$1,000,000
—$2,500,000
—$5,000,000
—$10,000,000
fte jobs
local govt revenue
state govt revenue
Use
oth
er s
ide
for
atte
ndan
ce >
50,
000.
ARTS & ECONOMIC PROSPERITY 5
THE ECONOMIC IMPACT OF NONPROFIT ARTS & CULTURAL ORGANIZATIONS & THEIR AUDIENCES
1
2
3
ARTS & ECONOMIC PROSPERITY 5
CREATING JOBS. GENERATING COMMERCE. DRIVING TOURISM.
– The City of Fairbanks, Arkansas –
THE ECONOMIC IMPACT OF NONPROFIT ARTS & CULTURE ORGANIZATIONS & THEIR AUDIENCES
SUMMARY REPORT | CREATING JOBS. GENERATING COMMERCE. DRIVING TOURISM.
ARTS & ECONOMIC PROSPERITY 5THE ECONOMIC IMPACT OF NONPROFIT ARTS & CULTURE ORGANIZATIONS & THEIR AUDIENCES

AMERICANS FOR THE ARTS IS THE NATION’S LEADING
NONPROFIT ORGANIZATION FOR ADVANCING THE ARTS
IN AMERICA. ESTABLISHED IN 1960, WE ARE DEDICATED
TO REPRESENTING AND SERVING LOCAL COMMUNITIES
AND CREATING OPPORTUNITIES FOR EVERY AMERICAN TO
PARTICIPATE IN AND APPRECIATE ALL FORMS OF THE ARTS.
The following national organizations partner with Americans for the Arts to help public and private-sector leaders understand the economic and social benefits that the arts bring to their communities, states, and the nation.
Cover: Andrew Shurtleff Photography
(Clockwise from Top) Concert for Miami, Knight Concert Hall, Miami-Dade, FL.; Photos from the Broward 100 ‘InsideOut’ campaign “Creatives Making a Difference in Hollywood”. Presented by the Community Redevelopment Agency of Hollywood and supported by the Downtown Hollywood Mural Project and the Art and Cultural Center of Hollywood, FL. Photo by Jill Weisberg.; The Pool, El Paso Museums & Cultural Affairs Department, TX. Photo by Jen Lewin.; Dancer at outdoor performance. Fulton County Arts Council, GA. Photo by CGC Studios.
1000 Vermont Avenue, NW, 6th Floor Washington, DC 20005 | 202.371.2830 | [email protected]
www.AmericansForTheArts.org | #AEP5