AAU Institutional Repository - Addis Ababa University
88
ADDIS ABABA UNIVERSITY COLLEGE OF BUSINESS AND ECONOMICS SCHOOL OF COMMERCE DEPARTMENT OF MARKETING MANAGEMENT Challenges and Prospects of Sales Operations Systems In Ethiopian Bottled Water Industries: The case of ASKU PLC A Thesis Submitted to School of Commerce in Partial Fulfillment of the Requirements for the Degree of Masters of Arts in Marketing Management By Biniyam Getachew Gessesse Advisor: Temesgen Belayneh (PhD) May, 2019 Addis Ababa, Ethiopia i
-
Upload
khangminh22 -
Category
Documents
-
view
7 -
download
0
Transcript of AAU Institutional Repository - Addis Ababa University

ADDIS ABABA UNIVERSITY
COLLEGE OF BUSINESS AND ECONOMICS
SCHOOL OF COMMERCE
DEPARTMENT OF MARKETING MANAGEMENT
Challenges and Prospects of Sales Operations Systems
In
Ethiopian Bottled Water Industries: The case of ASKU PLC
A Thesis Submitted to School of Commerce in Partial Fulfillment of the
Requirements for the Degree of Masters of Arts in Marketing Management
By
Biniyam Getachew Gessesse
Advisor: Temesgen Belayneh (PhD)
May, 2019
Addis Ababa, Ethiopia
i

ADDIS ABABA UNIVERSITY
COLLEGE OF BUSINESS AND ECONOMICS
SCHOOL OF COMMERCE
DEPARTMENT OF MARKETING MANAGEMENT
CHALLENGES AND PROSPECTS OF SALES OPERATIONS SYSTEMS
IN
ETHIOPIAN BOTTLED WATER INDUSTRIES: THE CASE OF ASKU PLC
BY
BINIYAM GETACHEW GESSESSE
Approved by Board of Examiners
Advisor Signature
Internal Examiner Signature
Internal Examiner Signature
May 2019
Addis Ababa, Ethiopia

DECLARATION
I, the undersign, declare that “Challenges and Prospects of Sales Operations Systems in
Ethiopian Bottled Water Industries: The Case of ASKU PLC” is original work of my own,
has not been presented for a degree of any other university, and all the sources that I have
used or quoted have been indicated and acknowledged by means of referencing. It is
submitted in partial fulfillment of the requirements for the degree of Masters of Arts in
Marketing Management at Addis Ababa University.
Declared by:
Biniyam Getachew Gessesse
Signature Date
Confirmed by:
Temesgen Belayneh (Ph.D)
Signature Date

ACKNOWLEDGEMENT
First and foremost, I would like to praise God for his generous blessings and provision of the
courage, persistence and perseverance to realize my long awaited dream. Next to this, I
would like to express my deep whole-hearted gratitude and indebtedness to my research
advisor Dr. Temesgen Belayneh for his skillful and valuable support throughout the course of
this work. His critical and valuable comments, suggestions and advice are worthy enough to
be mentioned here. Without his support and endless understanding, this study would not have
had its present shape. He deserves my special thanks. I owe special debt to the teaching,
administrative and supporting staff of School of Commerce, Addis Ababa University, for the
full support they provided me. I gratefully acknowledge the moral, support and
encouragement that I have obtained from my indebted and beautiful wife Meseheb Ayalew.
Her moral, support, patience above all caring of our little angel both as a mom and dad was
an engine of my life and a driving force to reach at this point. I am also very much indebted
to sales operations and management staff members of ASKU PLC. I am also especially
indebted to those people who sacrificed a great length of their precious time in providing me
with the necessary data through interview and discussions.
i

TABLE OF CONTENTS
ACKNOWLEDGEMENT ......................................................................................................... i
TABLE OF CONTENTS .......................................................................................................... ii
LIST OF ABBREVIATIONS AND ACRONYMS ................................................................. v
LIST OF TABLES .................................................................................................................... ii
LIST OF FIGURES ................................................................................................................. iii
ABSTRACT ............................................................................................................................. iv
CHAPTER ONE: INTRODUCTION ....................................................................................... 1
1.1. Background to the Study ............................................................................................ 1
1.2. Statement of the Problem ........................................................................................... 3
1.3. Research questions ..................................................................................................... 4
1.4. Objectives of the study ............................................................................................... 4
1.4.1. General objective ................................................................................................ 4
1.4.2. Specific objectives .............................................................................................. 5
1.5. Significance of the Study ........................................................................................... 5
1.6. Scope of the study ...................................................................................................... 5
1.7. Limitation of the study ............................................................................................... 6
1.8. Definition of terms ..................................................................................................... 6
1.9. Organization of the study ........................................................................................... 7
CHAPTER TWO: REVIEW OF RELATED LITERATURES ............................................... 9
2.1. Introduction ................................................................................................................ 9
ii
2.2. Basics and Concepts of Sales Operations ................................................................ 11
2.2.1. Functions and Key Issues of a Sales Operations .............................................. 12
2.3. Common Challenges and Difficulties of Sales Management and Operation ........... 17
2.3.1. Personnel Challenges of Sales Operations and Systems ................................... 18
2.3.2. Technological Challenges of Sales operations ................................................. 18
2.3.3. Management Challenges of Sales Operations ................................................... 19
2.4. History of bottled water............................................................................................ 20
2.5. Significance of Bottled Water .................................................................................. 21
2.6. Preference of Bottled Water ..................................................................................... 22
2.7. Consumption of Bottled Water ................................................................................ 22
2.8. Conceptual Framework of the Study ........................................................................ 23
CHAPTER THREE: RESEARCH METHODOLOGY ......................................................... 25
3.1. Introduction .............................................................................................................. 25
3.2. Description of the Study Area .................................................................................. 25
3.3. Research Approach .................................................................................................. 26
3.4. Research Design ....................................................................................................... 26
3.5. Population and Sample ............................................................................................. 27
3.5.1. Sampling Design, Techniques and Methods ..................................................... 28
3.6. Data Collection Procedures ...................................................................................... 28
3.7. Validity and Reliability ............................................................................................ 28
3.8. Ethical Issues ............................................................................................................ 29
iii
3.9. Methods of Data Analysis ........................................................................................ 30
CHAPTER FOUR: DATA PRESENTATIONS, ANALYSIS AND INTERPRETATIONS 32
4.1. Introduction .............................................................................................................. 32
4.2. Socio-demographic characteristics of Respondents ................................................. 32
4.2.1. Socio-demographic characteristics of sales operations and management staffs 33
4.2.2. Socio-demographic characteristics of sales agents and key accounts .............. 36
4.3. Sales Operation Planning and Performance Perspectives of Respondents .............. 43
4.3.1. Sales Operation Planning Approach, Process and System ............................... 43
4.3.2. Sales Operation Planning and Performance of the Company ........................... 46
4.4. Service Delivery System, Sales Facility, Technology and Working Environment of
the Company ........................................................................................................................... 50
4.4.1. Sales Service Delivery System of ASKU PLC ................................................. 50
4.4.2. Sales Facility, Technology and Working Environment of the Company ......... 57
CHAPTER FIVE: SUMMARY, CONCLUSIONS AND RECOMMENDATIONS ............ 62
5.1. Introduction .............................................................................................................. 62
5.2. Summary of Key Findings ....................................................................................... 62
5.3. Conclusions .............................................................................................................. 63
5.4. Recommendations .................................................................................................... 65
5.5. Future research areas ................................................................................................ 66
References ............................................................................................................................... 67
Appendices: Data Collection Instruments ................................................................................. i
iv

LIST OF ABBREVIATIONS AND ACRONYMS
CRM
CSA
ERP
ETB
MoFED
MoI
Ops
SPSS
Customers Relationship Management
Central Statistics Authority
Enterprise Resource Planning
Ethiopian Birr
Ministry of Finance and Economic
Development
Ministry of Industry
Operations
Statistical Packages for Social Sciences
v

LIST OF TABLES
Table 1: Age and Gender of the staff member ........................................................................ 33
Table 2: Educational Qualifications of Sales Staffs ............................................................... 34
Table 3: Age of the Customer by Type of Customers ............................................................ 37
Table 4: Educational Status of Key Accounts and Regional Sales Agents ............................ 39
Table 5: General Experience of Customers in Selling Bottled Water .................................... 40
Table 6: Level and Nature of Exclusiveness of Key Accounts and Regional Agents ............ 42
Table 7: Planning Approach and Process of ASKU PLC ....................................................... 44
Table 8: Customers Perspectives about Demand and Supply of Company’s Products .......... 44
Table 9: Correlation Analysis of Company’s plan to Meet Demand and Availability of its
Products................................................................................................................................... 46
Table 10: Correlation of the Annual Sales Operation planning and Performance of ASKU
PLC ......................................................................................................................................... 48
Table 11: Correlations between Demand, Production Trend and Availability of Products as
compared with its competitors ................................................................................................ 48
Table 12: Product Delivery System of the Company ............................................................. 52
Table 13: Comparison of ASKU’s Sales Operations Service Delivery System & Major
Competitors ............................................................................................................................. 53
Table 14: Major Challenges Contributing for Poor Service Delivery System ....................... 54
Table 15: Comparison of Prices between ASKU and Major Competitors ............................. 57
Table 16: Major Contributors for the Bad Facilities of Sales Operation System ................... 58
ii

LIST OF FIGURES
Figure 1: Conceptual Frame Work of the Study ..................................................................... 24
Figure 2: Marital Status of Sales operation and Management Staffs ...................................... 33
Figure 3: Overall Relevant Experience of Sales Staffs ........................................................... 34
Figure 4: Experience of sales staff in the company ................................................................ 35
Figure 5: Gender mix of Key Accounts and Regional Agents ............................................... 37
Figure 6: Marital Status of Key Accounts and Regional Sales Agents .................................. 38
Figure 7: Specific Sales and Distribution Experience of Customers ...................................... 41
Figure 8: Level and Nature of Exclusiveness of Customers ................................................... 42
Figure 9: Sales Staffs Perspectives Regarding Level of Planning Approach ......................... 45
Figure 10: Perspectives of Sales Staffs about Performance of Sales Operation ..................... 47
Figure 11: Sales Operations Staffs View about the Sales Supervision, Evaluation and
Monitoring System.................................................................................................................. 49
Figure 12: Customer’s View about Sales operations Service Delivery System ..................... 51
Figure 13: Customer’s View about the Efforts Applied by the Company to Improve Sales
Operation Service Delivery System ........................................................................................ 55
Figure 14: Perception on Brand of Products of ASKU PLC .................................................. 56
Figure 15: Working Environment of Sales Operation ............................................................ 58
Figure 16: Technologies under Implementation to Facilitate Sales Operations systems ....... 60
iii

ABSTRACT
Sales Operations is usually considered as tool towards achieving the objectives commonly
shared by business firms, perhaps it is more than anything else in bringing a system to
selling. Nevertheless, the activities and functions of sales operations require the direct
involvement of many departments other than the sales department. For this and some other
related issues, sales operations naturally alive with critical challenges and problems. The
objective of this study was to assess the challenges of sales operations systems and
investigating the prospects associated with of ASKU PLC. In doing so, both qualitative and
quantitative research methods were employed to gather and analyze the necessary data.
Structured questionnaires prepared for two categories and direct observations were used to
collect primary data and analysis was made with the aid of IBM SPSS version 20. The
findings of the study indicated that the overall sales operations system of the company is
constrained by many challenges to fully achieve its sales operations plan in which improper
planning system took the largest share. However, inefficient sales facilities, poorly arranged
working conditions, and unfair and non-uniform product delivery and distribution system
were identified as significant challenges. Added to that, growing brand perception of ASKU’s
natural spring water products, reforms underway to be implemented by the company itself,
the nationally witnessed increased demand for bottled water, and the recent decisions made
by the company are investigated as major opportunities and prospects of the sales operations
systems of ASKU PLC. Prior to anything else, the company is recommended to thrown away
the existing methods, systems and approaches of sales operations and management planning
to make the sales plan can reconcile both the interests of the company and its customers.
More importantly, as far as both the challenges identified and the prospects investigated are
more of internal and under control to act on, the company should urgently prepare an action
plan so as to make visible changes in the above situations.
Key words: Sales Operations, Challenges, Prospects, ASKU PLC, Bottled Water.
iv

CHAPTER ONE: INTRODUCTION
1.1. Background to the Study
The Production and consumption of bottled water has become very popular globally after
1999, the time when globalization has become to new habits on drinking water. Before that,
only an irrelevant percentage of people used to drink still water in bottles (Gleick, 2004).
According to the International Bottled Water Association, the United States (U.S.) is the
largest consumer market for bottled water; the consumption in 2008 was estimated to be 8.6
billion gallons, or 27.6 gallons per person (Durga, 2010). With the fastest growth registered
in the developing nations of Asia and South America, Gleick (2004) indicated that the
consumption of bottled water is increasing globally by ten percent every year as many
consumers believe that bottled water is convenient and has better taste than tap water.
Since the introduction of the product to the country through the first brand, highland springs,
in 1999, the sector has seen tremendous growth. Now the number of firms producing bottled
water has reached to 67 creating more than 10,000 jobs and more plants are on their way to
be operational. There are many reasons for this fast growth. One of the major reasons is the
general economic growth the country has been registering in the past decade. Though this
growth is accompanied by unprecedented inflation, the income of the urban population has
also shown tremendous growth (MoFED, 2012/13).
Many factors, such as the growing number of conferences and summits in Addis Ababa, the
increased tourist traffic, and the expansion of the hospitality sector have contributed to this
growth. This can easily be seen in the growth of number of bottled water producing
industries from 11 in 2006/07 to 67 in 2017/18 to reach to 74 very soon. Furthermore,
according to sources from the Ministry of Trade and Industry, several other companies are in
1

the pipeline to join the sector. However, there is still a huge demand for bottled water which
producers could not satisfy. For a country with more than 100 million people, only 1.5
millions of bottles of water are supplied per day.
ASKU PLC is a food and beverage manufacturing company established in 1999 by Ethiopian
stakeholders under an investment group called ABIG which provides its services to a
portfolio of companies in different sectors ranging from food and beverages, health care,
petro chemicals, construction, real estate and merchandize trading. It is a company engaged
in the manufacturing sector with the aim of becoming the largest food and beverage industry
in Ethiopia. As part of the PLC, the bottled water manufacturing plant produces aquaddis, a
brand that is loved by many for its quality and purity, is a market leader in is segment and is
distributed nationwide (Asku, 2018).
The bottled water manufacturing plant of ASKU plc is located in Oromiya Region, Burayu
town along the Addis-Ambo road exactly 19 kms away from the capital city of Ethiopia,
Addis Ababa. With a plot size of 45,000 square meters, Asku plc started the development of
the site by ensuring that the ecosystem was environmentally friendly and also developed an
impressive green area, to bring back the badly affected fauna and flora that once use to live
there.
ASKU PLC is one of the most popular and fast-growing food and beverage factories in
Ethiopia. It is among the leading companies in providing the best pure natural bottled water
to the consumer. The brand the company is producing, aqua-addis, has gained recognition in
a very short space of nationally (Asku, 2018).
2

1.2. Statement of the Problem
Despite the fact that business firms do have different mixes of objectives with different
emphasis and priority, they all typically shared optimized profitability, sales volume, market
share, growth and corporate image/brand in common. Sales operations and management,
most of the time, is taken as a tool towards achieving those objectives. As far as the operation
and management process of selling of products and services of any company incorporates a
set of processes and procedures that are implemented in collaborate with different
departments within the same company, sales operations and management alive with critical
challenges and problems.
Carbonated soft drinks, including bottled water, are progressively overpowering alcoholic
drinks as the leading beverage segment in the world with an increased consumption by 5
percent a year globally (Zenith, 2014). According to Ministry of Industry (2018), the demand
and market for bottled water was averagely growing by 13 percent for the previous years and
shockingly boosted to 37 percent last year. About nine bottlers have joined the industry and
some of the existing factories have expanded their capacity last year and seven additional
new firms are expected to join the market very soon. The report further indicated that there is
a huge demand for bottled water which producers could not satisfy; only one million bottles
of water are supplied per day, for a country of more than 100 million. As a result, the
numbers of bottled water manufacturing industries recently have reached 67 in Ethiopia. As
far as all of them are offering the same type and easily suitable products, the selling
operations and competition environment had become more tough, challenging and crucial
aspect as a business’ survival strategy. Due to this and other related factors, ASKU PLC,
3

could achieve a minimum of 66% and maximum of 78% of its annual sales operations plan
for the last five years which clicks one’s mind to raise a question why?
The data stated above has shown us that the market for bottled water and the number of
bottlers in the country is growing at an alarming rate. This would bring both opportunities
and challenges for the firms operating this sector. As a crucial aspect, to stay profitably in the
business, the selling operation system and competition environment had become more tough
and challenging in the industry. ASKU PLC in its history had never achieved its sales plan
fully which needs to be answered through scientific researches. Therefore, assessing the
company’s sales operation systems by identifying the major challenges and investigating the
associated prospects of ASKU PLC is fundamental for the betterment of the situations stated
above.
1.3. Research questions
To achieve the objectives of the study, the following research questions were seriously to
answer;
1) How the current sales operations system, position & situation of ASKU PLC looks
like?
2) What are the major challenges related with sales operations system of the company is
facing?
3) What are the considerable prospects of the sales operations system of the company?
1.4. Objectives of the study
1.4.1. General objective
The broad objective of this study was to assess the challenges and investigate the prospects
of the sales operations system of ASKU PLC.
4

1.4.2. Specific objectives
This research was specifically aim to:-
a) Assess the current sales operations system, position & situation of ASKU PLC;
b) Identify the major companywide challenges for sales operations system;
c) Look into the prospects for an efficient and modern sales management system.
1.5. Significance of the Study
Up on its successful completion, this research was expected to have valuable contributions
especially for those who are responsible for managing and owing the sales management
department in Ethiopian bottled water industries and academics. The following are the main
significances this research would worth;
a) The research and its findings would help firms involved in the bottled water industry to
know how the sales management system in the sector generally and in ASKU PLC
specifically looks like currently;
b) It will support the continuous sales management system improvement initiatives by
devising strategies based on the current situations;
c) The research and its findings will be used as a reference for scholars, experts and students
in the field of sales and marketing management;
d) It would add considerable value to the body of knowledge on sales management systems.
1.6. Scope of the study
Generally, the concept of sales operation is vast and complicated. As a result, this study
would conceptually be delimited to focus more on identifying and investigating the
challenges and prospects of sales operation systems of ASKU plc. In addition to, the research
was heart on the regional sales agents and firms listed as key accounts by the company but
5

actively working with it. Moreover, the study did not include any product other than bottled
water.
1.7. Limitation of the study
The main limitations the researcher facing while undertaking this research were obtaining
relevant, recent and accurate data. Most of the literatures referred and reviewed were not be
as relevant as expected, touching not the exact points the researcher strongly seeking, and not
in line with the topic under study. The other limitation that should be mentioned here was
that the issue under discussion in the research is not yet researched well. As a result the
researcher did face difficulties in comparing the methods followed, the results and findings
obtained, and the remarks that would be concluded.
1.8. Definition of terms
Sales Management: is the planning, direction and control of personal selling including
recruiting, selecting, equipping assigning, routing, supervising, paying and motivating as
these task apply to personal sales force (Kotler & Keller, 2012)
Sales operation: is defined as a set of critical and increasingly strategic function which is
generally organized as a set of persons basically to reduce frictions in the sales process in
order to achieve sales productivity, revenues, and profits goals of a firm (Milner & Edward,
2004).
Key account management: is a strategic business approach with the objective of ensuring
ling term and sustainable business partnerships with strategically important customers
(Kotler 2005).
6

Distribution management: The management of resources and processes used to deliver a
product from a production location to point-of-sale including storage at warehousing
locations or delivery to retail distribution points (Milner & Edward, 2004)
Supply: is a fundamental economic concept that describes the total amount of a specific
good or service that is available to consumers (Kotler & Gary, 2005).
Demand: is the quantity of a commodity an individual is willing and able to purchase at a
particular price, during a specific time period, given his/her money income, his/her taste and
prices of other (Kotler & Gary, 2005)
Wholesaler: is a person or firm that buys a large quantity of goods from various producers or
vendors, warehouses them, and resells to retailers (Milner & Edward, 2004).
Sales representative: sales person or agent (whether or not under the control of a firm)
authorized to solicit business for a firm, and compensated usually through a commission or
salary or a combination of both (Milner & Edward, 2004).
1.9. Organization of the study
This study basically consists of five chapters and is organized in the following manner. The
first chapter gives readers a general overview to the national as well as global existing
situation of the bottled water sector. It also highlights the confusions existing between the
demand and supply of products of bottled water. Thus, together with the objectives,
significance, scopes and limitations of the study, this chapter has presented statement of the
problem and other related rationales that initiated the researcher to undertake this study. The
second chapter discusses on review of related theoretical and empirical literatures that are
vital for the study. The third chapter presents the methods, materials and processes followed
and used to achieve the objectives of the study. The data and information gathered are
7

presented and analyzed in the fourth chapter. More importantly, the findings of the research
are briefly discussed in this part. Eventually, the last but not the least part, chapter five, winds
up the research through concluding statements, recommendations, and future research
directions.
8

CHAPTER TWO: REVIEW OF RELATED LITERATURES
2.1. Introduction
In any manufacturing company like ASKU PLC, sales operation is the core part of the
organization that generates revenue so as to run stable, profitable, with dependable continuity
as a sound business. Therefore, no matter how good the business operation is, how advanced
the technology is, how progressive and forward thinking the management techniques are, it
must still have a good sales operation and management system in place with all. Because, the
long run survival of any organization depends on its sales performance.
Sales operation and management basically involving selling of products and services in
return of money or other compensation, is initiated and completed by the sales
representatives selling the product and service. Thus, for any company to improve its sales
operation performance, should carefully recruited and trained must equipped its sales
representatives with the required resources (Shauntelle, 2011). According to his explanation,
the performance of sales operation is affected by different factors which can be classified as
internal and external. Internal factors are those factors which are born in and under the
control of the company and those externals as the name implies are factors which are beyond
the control of the company. Sales facility, working environment, sales service delivery
system can be taken as internal factors and competitors situations, government policies,
regulations and strategies, and other related factors are taken as External factors affecting the
sales operation and management systems.
Sales management, originally, was referred to the direction of sales force personnel (Kotler,
2005). However, it has gained a significant position in many firms in the today’s world.
Now, it incorporates management of all marketing activities including advertising, sales
9

promotion, marketing research, physical distribution, pricing, and product merchandising.
The American marketers association (AMA’s) definition, takes into consideration a number
of these viewpoints which include the planning, direction, and control of the personnel,
selling activities of a business unit including recruiting, selecting, training, assigning, rating,
supervising, paying, motivating, as all these tasks apply to the personnel sales-force (Kotler
& Keller, 2012).
The term may also be quoted as a socio-scientific process which involves the application of
group efforts to accomplish common pre-determined goals or objectives. The process mainly
needs to focus more on harmony not on conflicts and coordination is taken as a key for
accomplishment (Kooper, 2004).
According to Milner & Edward (2004) sales management basically differs from other
disciplines of management in various aspects as the selling operation of the products and/or
services of a firm do not exist in isolation. Thus, simultaneous with the changes taking place
in the business, as well as marketing-orientation, a new concept of sales management has
evolved. The business is now society-oriented, on human welfare aspects. So, sales-
management has to work in a broader and newer environment, in co-existence with the
traditional lines.
According to Kotler (2005) the evolving field of sales operations covers a diverse set of roles
and responsibilities, and is meant to reduce friction in the sales process to increase sales
productivity, revenues, and profits. With that support, sales people can continue selling,
while sales operations people make them as effective as possible through processes like data
analysis, lead management, hiring and training, process optimization, communication and
reporting, and increasingly, sales and revenue strategy (not only tactics). Milner & Edward,
10

(2004) states sales operation as “The unspoken, but overall goal (of sales operations), is to
reduce or eliminate selling thieves. According to them any process that takes the sales person
out of the field, or off the phone, or away from selling, is a sales thief.”
Kooper (2004) states sales operation as a set of critical and increasingly strategic function
which is generally organized as a set of persons to support the selling process of a company.
Effective selling, sales operations and management are usually considered as vital to
marketing success. Taking it in to consideration and based on their size and sophistication,
many of today’s companies dedicate an entire department to run their sales operations
(Milner & Edward, 2004). The main roles and responsibilities of sales operation is reducing
friction in the sales process in order to achieve sales productivity, revenues, and profits goals
of a firm. With that support, sales people can continue selling, while sales operations people
make them as effective as possible through processes like data analysis, lead management,
hiring and training, process optimization, communication and reporting, and increasingly,
sales and revenue strategy (Milner & Edward, 2004).
2.2. Basics and Concepts of Sales Operations
According to Kooper (2004) sales operations refers to the unit, role, activities and processes
within a sales organization that support, enable, and drive front line sales teams to sell better,
faster, and more efficiently. In order to drive the business results expected from it, sales
operation is strategically implemented through goal oriented trainings, software applications
and relevant engagement techniques (Milner & Edward, 2004). They also stated that more
than anything the target of sales operation is paving a way for a system for efficient, effective
and productive selling. This often overlooked and sometimes under-appreciated department
uses data to drive strategy, best practices to guide training, and technology to hack success.
11

Due to its broad scope and deep impact on both top line (productivity) and bottom line
(efficiency) performance, the sales operation department has become a strategic and
indispensable component of a mature sales organization (Kotler & Gary, 2005).
2.2.1. Functions and Key Issues of a Sales Operations
Sales Ops has expanded its role to include nearly all functions that provide strategic insight
needed by a sales team to achieve sustainable growth. The composition, hierarchy, and
primary role of sales ops may differ across industries and even across similar businesses of
diverse sizes, but many of today’s sales ops leaders perform a standard core set of functions
Kotler (2005). According to him Sales Ops functions generally contains the following key
issues.
A. Strategy
Sales ops originally functioned as a small team of number crunchers who executed financial
analyses, reporting, and sales forecasting. As the volume of business information exploded,
sales ops has evolved into a more powerful data analysis and reporting unit that can provide
critical insight on the following areas:
1) Sales Process Optimization
2) Performance Metrics Analyses
3) Formulation of Incentives Program
4) Evaluation of Sales Team Training Needs
5) Assessment and Adoption of Sales Methodologies
6) Selection of Enablement Software and other Technology Tools
7) Sales Territory Assignment and Growth Forecasting
12

B. Process and Performance
Sales ops emerged to improve sales performance so as to achieve that staff members of sales
operations help streamline process to speed up the sales cycle and enable sellers to close
more deals. Understandably, this is where the number-crunching prowess of sales ops
analysts has the most significant impact. The process and performance functions of sales
operation contains;
a) Selection of Key Sales Metrics to Adopt
b) Training & Development (Coaching and Mentoring)
c) Optimization and Implementation of Sales Process which includes workflows, sales
activities, lead generation and conversion Rates
d) Implementation of Sales Frameworks, and Methodologies.
e) Optimization of Sales Tools, Knowledge Base and other Assets through CRM,
Automation, Data Analytics, Contract Management, Forms and Templates and Client
Engagement & Outreach
C. Technology Adoption and Optimization
Today, sales teams harness the power of big data analytics, artificial intelligence and
machine learning to improve performance and future proof profitability. But because tool
complexity can distract sellers, sales ops should own the stack.
Here’s what Sales Ops leaders should own regarding the tech stack: Defragmentation &
Integration of Technology Tools, Customer Relationship Management (CRM) Platform,
Business Intelligence Services, Data Analytics Software, Communication and Conferencing
Tools, Content Sharing and Management, Contract Lifecycle Management, Email
Automation and Performance Management Software
13

D. The Structure of Sales Operations Unit
Given the variance of organizational structures even among similarly scaled players in the
same industry, pinning down the ideal structure for sales ops is nearly impossible. Even then,
there are organizational models and structural templates you can build from.
Kooper (2004) proposed a guide on how to build a sales ops unit for fast growing companies.
In the guide, he described the different stages based on; annual recurring revenue (ARR) at
which companies should hire its sales ops people. Based on his matrix, companies reeling in
below one million dollars in ARR can hire a number of tech-savvy staff, analysts and
administrators to: Manage the CRM, Generate, analyze and present reports, Manage
compensation.
In addition to the technical and sales enablement responsibilities, the newly formed Sales
Ops unit will be responsible for the following tasks: Go-to-market strategy & planning, Sales
growth and operating plan, Deals desk, Territory design, Compensation plan, Forecasting,
and Sales process enforcement
E. Sales Operations and Typical Sales Management
A sales ops unit aims to support sales managers not only to achieve targets but to optimize
the talent pool (i.e., the sales floor) under their care. To do this, sales operations assumes
many of the administrative and operational loads required to run a sales organization. This
frees up the sales operations system to focus more on leading the selling process in meeting
their quotas and making tactical decisions and strategic plans for long-term growth.
F. The Sales Operations Process
Among the key benefits of having a functional sales ops unit is formulating, adopting and
executing efficient sales process guiding of the entire sales organization. Established
14

processes serve as templates and reference points, salespeople return to when the road ahead
turns hazy or a new challenge suddenly emerges.
The gateway (i.e., demand) for sales ops in early-stage sales organizations may occur at
different points in the sales process or in their structural and functional makeup. For example,
sales ops may emerge to assist the sales leader in handling: Administrative tasks, Technical
functions, and Strategic responsibilities.
In many mature organizations, sales ops fully assume ownership of administrative and
technical functions while lending sales leaders its analytical support where strategy
formulations and other critical decision-making scenarios are concerned.
G. Common Sales Operations Metrics & Key Performance Indexes
Preferred metrics vary across teams and organizations. For sales ops, these key metrics
provide insight not only on how to improve win rates but also on how the entire process can
still be optimized.
The following are just a subset of all metrics commonly used by many sales operations units
to evaluate past performance and to consistently improve organizational results in the long
term:
Sales force Quota Achievement Rate: is the percentage of the sales team that has
achieved 100% of quota during a given period.
Average Win Rate: is the ratio of closed won deals over the total number of won and
lost deals.
Average Sales Cycle Length: is the average length of time it takes to close deals.
Average Deal Size: is the average value of deal sizes sellers are managing at any given
point in the process.
15

Time Spent Selling: is the actual time sellers spend selling as compared to other tasks
such as internal meetings, training, and administrative work.
Lead Response Time: is the time it takes before leads respond positively to a pitch or
call to action.
Weighted Pipeline Value: is the estimated value of the pipeline at a given time in the
process, used to make profit/loss forecasts.
Pipeline Efficiency: measures how effective sellers are at managing their pipelines.
Forecast Accuracy: computes the rate of error of prior forecasts vs. actual results or
performance.
Number of Prospect Meetings per Period: is a measure of prospecting activity that
compares the number of meetings individual sellers were able to set in a given period.
H. Sales Enablement and Sales Operations
Sales operations and sales enablement are sometimes used interchangeably but they are not
synonyms. They do coincide in several areas and share many goals. Both aim to significantly
improve the performance of a sales organization.
Sales ops will focus on the entire organization and the structures, processes, human
resources, and technologies that comprise it meanwhile sales enablement will focus only on
the efficiency and performance of sellers and the satisfaction and experience of customers. In
this context, you may think of sales enablement (which historically emerged much later) as a
subset of sales operations.
I. Sales Operations Best Practices
The sales ops unit is an entity that emerged to bring system, science, and best practices into
the world of selling. However, while sales ops has become an integral part of the sales
16

organization, variations in terms of structure, role, and implementation exist across
businesses and industries such that one way of running a sales ops team may perfectly fit one
company but not another. Corporate culture, scale, target markets, and sales maturity are just
some of the factors that shape the ideal sales ops structure for each organization.
2.3. Common Challenges and Difficulties of Sales Management and Operation
As full of many tasks and functions to full fill both the interests and needs of a company,
managing sales operations is literally filled with many challenges. Milner and Edwardo
(2004) classify the pin points of sales operations and management into three as management,
technology and people. They stated that the methodology followed to monitor and lead the
sales operation and management system is significant to achieve sales objectives and goals.
Most companies fail to achieve their sales plan searching to evolve new and branded sales
management techniques (Milner and Edwardo, 2004).
Developing and using appropriate technology is becoming mandatory in any business
process. The basic challenge in sales operation and management is going with technological
dynamism. As long as there are limitless issues associated with personnel working in the
sales team, any company couldn’t possibly address them all which directly affect the success
of sales operation (Milner and Edwardo, 2004).
Kotler (2005) on the other hand compare sales operations teams with car engines. Although
not seen by drivers, it's working away under the hood, powering the car to get from one point
to another. In the same way, sales operations teams are the people making sure the sales force
is always moving forward successfully. The team is responsible for leveraging technology
and information to support sales, troubleshoot CRM issues, and design solutions that drive
sales onward and upward. In playing its roles, responsibilities and functions, sales operations
17

teams face five common challenges. Nevertheless, the challenges are more or less the same
as compared with Kotler’s perspectives. The challenges of sales operations can generally be
condensed as follows.
2.3.1. Personnel Challenges of Sales Operations and Systems
Sales personnel have defined role, convert leads into buyers. As seen in the above parts sales
operation teams, to the reverse of the role of sales personnel, posses a range of
responsibilities which include overseeing sales performance analysis, developing a sales
incentive program, managing sales force automation and CRM, evaluating and designing
sales force strategies, and providing technical support for sales functionalities and tools.
Everything related to sales team that is not defined within the duties of sales personnel is
usually relegated to sales ops. If one look at a typical sales ops job description, it is to find a
range of responsibilities. This wide range of tasks, in addition to addressing the immediate
needs of sales personnel, can become overwhelming and taxing for sales ops teams.
Therefore, the additional undefined roles that are thrown to sales operations teams force it to
wear many hats which indirectly influence them not to succeed in their major duties.
2.3.2. Technological Challenges of Sales operations
The dynamic world of CRM, marketing automation, and predictive marketing analytics tools
is forcing sales ops to constantly reevaluate their strategies to stay ahead of the game. With
sales becoming more aligned with other departments like marketing and customer success,
sales tools need to be able to integrate and connect to other business tools. Sales operation is
responsible for making sure the tools in place are cost-effective and bring in measurable ROI.
Therefore, a drastic change in technology with timely investment costs both for installation
and training is among the considerable challenges that bottlenecks sales operation.
18

With increased information technology based electronic commerce (E-Commerce), currently
consumers have access to more information about a product than ever before. Before
speaking to sales representative consumers try their best to get the information of the product
they are seeking to buy the blog content, videos, tutorials, reviews, and free trials. Due to this
it can be difficult for sales rep to find a reason to get them on the phone. It's up to sales ops
and managers to determine how to engage with potential customers when they already know
so much about the product, as well as how to shift the sales conversation from "what" to
"how and why." Therefore adjusting/shifting sales operations systems to meet the tastes and
preferences of customers is another big challenge.
2.3.3. Management Challenges of Sales Operations
Because a huge part of sales operations involves supporting and managing the sales force and
corresponding tools, it's impossible to plan out when requests are going to arise. It's difficult
to keep a consistent, predictable workflow in an environment where sales strategies and
technologies are constantly changing. Work management and instant messaging platforms
are becoming more popular across sales ops teams to stay on top of requests and
communicate quickly.
The top priorities of sales operations are accelerating revenue and sales growth. But new
lead-gathering strategies outlined by executives, combined with input from the full sales
team, can be overwhelming. Unless there is a clear, continued understanding between
executives, marketing, and sales on how to identify high-value prospects for sales personnel,
the sales funnel will flood with uninterested leads and general inquiries. And while sales
operations may be focusing on reaching their lead conversion goal for their quarterly OKRs
(Objectives and Key Results), sales managers could be pushing their representatives to focus
19

on target accounts which could mean fewer overall conversions, damaging the sales
operations perceived success.
2.4. History of bottled water
Evidences from various sources indicated that the production and consumption of bottled
water dates back to the 18th century. Gleick (2004) argued that Jackson’s Spa in Boston has
started selling bottled water in 1767. The sale of bottled water has shown rise in the
nineteenth century as the cost of bottled water become affordable through manufacturing
technologies. Gleick (2004) also depicted that a company called Saratogo Springs has
produced more than 7 million bottles of water every year.
To the reverse of that, Durga (2010) stated that the history of bottled water has begun in
1900’s in USA. The market of bottled water has immerged in Europe and Russia in early
1900’s and has started to be used in US and China in the following years. The major reason
for its growing demand was health issue and possibly medical properties. It soon became to
show a noticeable growth in the market of Europe and has become one of the demanded
products in the beverage industry. The real sales of bottled water were witnessed as French
company ‘Vittel’ launches its first plastic water in 1968 for the general public consumption.
Europe then became the leading bottled water sales region with France and Germany being
on the top with the highest sales (Durga, 2010). Generally, the Production and consumption of packaged water has become very popular
globally after 1999, the time after when globalization has become to new habits on drinking
water (Gleick, 2004). Before that, only an irrelevant percentage of people used to drink still
water in bottles. According to the International Bottled Water Association, consumption of
20

bottled water in the US continues to rise from 9.1 billion gallons in 2011 to 9.67 billion in
2012.
According to capital (2018), selling water traditionally was considered as un-imaginable, in
Ethiopian context. Now, things have changed, and bottled water has become by far, one of
the most sellable products in the country. Bottled water has become an essential aspect of life
in general urban life style. A decade ago, the idea of bottled water for many Ethiopians was a
trend that characterized the Diaspora and the modern wealth-driven way of life. Today it is
common to see people purchase bottled water along with their groceries, in super markets
and kiosks. Young people order bottled water in cafes and restaurants. In several offices,
bottled water also has become another choice in addition to the ‘tea and coffee’ offered by
secretaries to visitors. Bottled water has a constant presence in meetings and discussions
forums. Urbanities from many different walks of life have made it part of everyday
consumption (Capital, 2018)
2.5. Significance of Bottled Water
As a basic need of human body like food and air, it is a must for each of us to take water
daily. The Institute of Medicine in US, as referred by University of Nevada in 2013, men and
women are recommended to drink 13 and 9 glasses of water in a day. Sawka et al (2014), on
the other hand, recommended 3.7 Liter for men and 2.7 Liter of water for women per day.
However, the intake of water is not only bound on water itself but also the water contained
from other beverages and foods that human consume.
Linden (2013) indicated that there is not significance difference between bottled and tap
water. Similarly, Mekonnen et al (2015) stated that bottled water might not necessarily be
safer than tap water we consume and through time concerns of its quality is rising worldwide.
21

The result of the test taken by NRDC from 103 brands out of the 1000 bottled waters
concluded that water cannot be taken as clean or safe just because it comes out of bottle
(Linden, 2013). However, people drink bottled water more comfortably than tap water for
health reason driven by different motivations like advertisement, reputation of the bottled
water, taking it as luxury product, package and chemical smell (Islam and Habib, 2009).
2.6. Preference of Bottled Water
Various researches show that preference of bottled water is not highly influenced by brand
loyalty; rather it is driven by beliefs and perception about the water (Malotra, 2016).
Moreover, Enisermu (2012), found out that consumers justify their preference of bottled
water at different locations like home and hotel is that the bottled water is cleaner, cold and
fashionable for their use. The research under taken by the American Water Works
Association (AWWA) in 2005 showed that consumers were satisfied with the quality as well
as the safety of bottled water and they consider bottled water as a luxury item and the reason
they prefer it is not related with some problem with their tap water. However, they prefer
bottled water for its safety, healthiness and taste (Malotra, 2006). As he found out, earlier
researches which argue the perceived purity, safety and taste are the major reasons for bottled
water consumption are not valid. Rather findings in recent research done in England showed
that health factor is not the main driver for bottled water use. However, convenience and
taste are found to be the major reasons for it.
2.7. Consumption of Bottled Water
According to Carlucci et al (2016) bottled water has become a business that has got its global
level. Every year the consumption is increasing by tenfold globally (Hu et al, 2011).
Mekonnen et al (2015) pointed out that the sales as well as consumption of bottled has being
22

skyrocketed worldwide becoming the fastest growing drink. It is also seen as one of the
major consumptions in urban areas of Ethiopia (Malotra, 2005). Consumption of bottled
water is determined by differences in beliefs and perceptions about water not so much about
brand loyalty (Linden, 2013). More than half of American people drink bottled water and
about third of the population drink bottled water on regular basis (Gleick, 2004). Similarly,
population living in cities like Addis Ababa, with a size of 4.30 million, prefers to drink
bottled water than tap water (Ensermu, 2014).
With regards to the options that consumers have, there are more than 700 brands of bottled
water only in United States. Consumers in one state alone could have hundreds of options.
For example, New York State has more than 100 brands of bottled water which buyers can
choose and consume (Mehta, Lemley and Schwartz,1999). The consumption of bottled water
in Canada has also increased by 150% from 1999 to 2005 and three out of 10 households
take bottled water for their consumption. According to human development reports of the
UNDP, even if over 1 billion people in our world do not have access to drinking water
especially in developing countries (Queiroz et al, 2012), Ethiopia has more than 67 bottled
water manufactures. As per Mahta et al (1999), it is noted that large number of bottled water
available in market that shows there is diverse consumer demand for the product and the
need for good-tasting drinking water.
2.8. Conceptual Framework of the Study
Up on the review of theoretical and empirical literatures that are relevant to the topic of the
study, the conceptual framework of the study is drawn and presented in the following figure.
As shown in the figure, the performance, efficiency, effectiveness and productivity of sales
operations system is dependent on many factors which can either be external or internal. The
23

upper three parts i.e., competitors’, government and nature related issues are generally
considered as external factors which can directly controlled by the firm’s effort. And the
lower four parts (sales team status, sales working environment, sales service delivery system
and sales operations technology related issues) are considered as internal factors which are
under the control of the company.
Figure 1: Conceptual Frame Work of the Study
(Source: Own Survey)
Sales Operations Facility and Technology
Sales Operations Service Delivery
System
Sales Operations
working Environment
Sales Team Skill, Competency and
Efficiency
Competitors’ Sales operations
Environment
Sales Operations
Systems
24

CHAPTER THREE: RESEARCH METHODOLOGY
3.1. Introduction
This section of the study concentrates more on the scope of the researcher on methodological
procedures to be employed in the study. The main items of concern includes research design,
sample design procedures, data collection instruments and procedures, data analysis
techniques, reliability and validity of research instrument and ethical considerations.
3.2. Description of the Study Area
ASKU PLC is a food and beverage manufacturing company established in 1999 by Ethiopian
stakeholders under an investment group called ABIG which provides its services to a
portfolio of companies in different sectors ranging from food and beverages, health care,
petro chemicals, construction, real estate and merchandize trading. It is a company engaged
in the manufacturing sector with the aim of becoming the largest food and beverage industry
in Ethiopia. As part of the PLC, the bottled water manufacturing plant produces aquaddis, a
brand that is loved by many for its quality and purity, is a market leader in is segment and is
distributed nationwide (www.ab-ig.com).
The bottled water manufacturing plant of ASKU plc is located in Ethiopia, Oromiya Region,
Burayu town along the Addis-Ambo road exactly 18 kms away from the capital city of
Ethiopia, Addis Ababa. With a plot size of 45,000 square meters, Asku plc started the
development of the site by ensuring that the ecosystem was environmentally friendly and
also developed an impressive green area, to bring back the badly affected fauna and flora that
once use to live there.
25

3.3. Research Approach
Among the three i.e., qualitative, quantitative and mixed types of research approaches, this
research has employed the mixed type one. The main reason to select this approach was the
need of the researcher to achieve the research objectives with the use of statistical tools and
numbers to address the mentioned research questions. The qualitative approach had helped to
answer the research questions that do not need statistical summary and analysis and the
quantitative approach was employed to achieve research objectives that require detail
statistical analysis.
3.4. Research Design
Research design explains and justifies the type and method of data collection, source of
information, sampling strategy and time-cost constraints (Saunders, 2012). There are four
types of research designs based on the study purpose: exploratory, explanatory, descriptive
and causal.
This study had used a combination of explanatory and descriptive research design as far as
both explanatory and descriptive research designs are utilized to obtain information regarding
the present status of the phenomena to clarify what exists with respect to variables or
circumstances in a situation. The explanatory research design was aimed at linking ideas in
order to realize the associations of variables in terms of cause and result relationship.
Descriptive research helped to explain the characteristics and scope of the problem (Malhotra
& Birks, 2006). Hence an analysis conducted to assess the interconnection between
production, sales operation and management, distribution management, key account
management and customer satisfaction aiming at assessing the major challenges and
investigating the prospective prospects of sales operations systems.
26

This research has tried to identify the challenges and prospects of sales operations systems of
a bottled water manufacturing company. Therefore descriptive study was the appropriate
method of research design. The choice of cross-sectional allowed collection of quantitative
data from a population is an economical way (Saunders et al.,2009). Explanatory research
design was representative because of its suitability in elaborating the characteristics of a
particular individual or a group of individuals (Kothari, 2005).
The main aim of explanatory research is to identify any causal links variables that pertain to
the research problem; such research is also very structured in nature. In this study, by
employing cross-sectional field surveys, independent and dependent variables were measured
at the same point in time using questionnaires. Therefore, the researcher has developed
questionnaires to collect relevant data prior to the final analysis and presentation.
3.5. Population and Sample
The target population of the study comprised sales operation and management staffs of
ASKU plc, all the firms listed as active key accounts in Addis Ababa City and all the
regional agents actively working with the company under study. The unit of analysis planned
to include 1 National and 3 Regional Sales Managers, 5 sales supervisors, about 22 sales
personnel, 45 active regional agents and 185 customers listed as key accounts of the
company. All the data and information necessary for this study was gathered from both the
sales team and key customers of the company. The unit of analysis was significantly included
ASKU plc and the results and findings more or less were expected to represent how the sales
management situation of Ethiopian bottled water industry looks like.
27

3.5.1. Sampling Design, Techniques and Methods
In order to have intensive data and information in the specific subject matter under study, all
the population targeted were included in this study. As a result, there is no any need to deal
with sampling techniques, design and related subject matters.
3.6. Data Collection Procedures
The study made use of primary data sources to produce information that was used to answer
the research questions from the primary sources. The research instrument used in this study
was self–administered questionnaires, observations and discussions, involving both
structured and unstructured question items. The structured items allowed the researcher to
tabulate and analyze data with easiness, while the unstructured ones was set to facilitate in-
depth responses and opinions beyond the researcher’s scope of understandability. Self
administered questionnaires were a suitable method in a survey study since they avoid
subjectivity due to absence of interviewers’ influence. Also, they would allow respondents
sufficient time on items that require consultation before response (Kothari, 2004). The
researcher visited and distributed questionnaires to the respondents in their respective work
places. The task was scheduled on appointments with the respondents with the intention of
allowing respondents to have adequate time to answer research questions.
3.7. Validity and Reliability
Validity, generally, is concerned about how well the research questions would measure the
matters chosen to be studied. To meet these objectives, the researcher has conducted a pilot
test with a small group so as to check validity and would receive to redefine it.
Reliability basically targets to tell about the stability of the results that is how accurately the
study or measuring would be carried out. It would also help whether a measurement
28

instrument is able to yield consistent results each time it is applied. It is also the property of
measurement device that causes it yield similar outcomes for similar inputs. In this study,
Alpha reliability was used to measure internal consistency of the mean of the items at the
time of administration of the questionnaire.
3.8. Ethical Issues
As a marketing research, the study required to follow a serious ethical consideration.
Cognizant of this fact, the researcher has taken all precautions while securing the necessary
information for the accomplishment of the research objective. The researcher has exerted his
effort to get the consent of the company under study prior to the collection of the data.
Besides, the employees who had participated in the study have been informed in advance
about the objective of the study so as to ensure their voluntariness.
Customers who became the subject of the study were being briefed about the importance of
the study and their valuable contribution in providing the necessary information. These
people were treated with respect and care as the same time they were assured that the data
obtained from them was being kept confidential and only be used for academic purpose. The
attempt here was to foster trust in the research process and get honest opinion from the
respondents.
Finally, the data have been collected with strict adherence to the aforementioned research
ethics and code of conduct of the company. The researcher has taken maximum care to avoid
the conflict of interest that may arise as a result of working in the company under
consideration and made a report of the information that had collected from all the participants
in the study objectively and honestly.
29

3.9. Methods of Data Analysis
Different statistical techniques were employed on the basis of the nature of the data collected.
In analyzing the quantitative data, respondents were categorized and frequencies were tallied.
Percentage and frequency counts were used to analyze the response obtained from the
respondents. In analyzing the data obtained through discussions and observations, first
summary sheets were prepared and then responses were analyzed by using SPSS version 20.
In this study both qualitative and quantitative methods of data analysis were employed.
Descriptive statistics were used to analysis the collected data. The gathered quantitative data
was encoded into the Statistical Package for the Social Sciences (SPSS) for analysis. After
the completing entering data, frequencies were generated for descriptive statistics. For each
question or variable in the study, the overall frequencies, and percentages were presented in
table and chart form. The qualitative data collected from the managers through open-ended
questions also analyzed using content analysis by using deductive approach, through
grouping, coding and categorizing.
i) Quantitative data analysis method
The primary data generated through self administered questionnaires from two different
categories (i.e., sales staff members and customers) were categorized in a way that suits to
address the research questions raised at the beginning of the study. Based on that, the data
and information were entered into Microsoft Excel and the raw data set have been
established. Following this, the raw data had been imported to IBM-SPSS version 20 and
then descriptive statistics was applied for socio-demographic variables describing the
characteristics of the respondents in the data set. Therefore, descriptive analysis had been
carried out using the frequency tables and on the basis of the categorization mentioned here
30

above. To determine the correlations and associations between independent variables and the
dependent variable, bivariate logistic regression were carried out. Consequently,
multivariable logistic regression was being done to establish the determinants sales
management system.
ii) Qualitative data analysis
The observations made by the researcher and the discussions that were being held with the
managers and employees in the sales operations and management division as well as the
focus group members were analyzed qualitatively. Qualitative data and information obtained
from the observations and discussions sessions have been summarized and analyzed using
qualitative data analysis method.
31

CHAPTER FOUR: DATA PRESENTATIONS, ANALYSIS AND
INTERPRETATIONS
4.1. Introduction
Using the data collection tools specified at the research methodology part of this study, data
were collected, cleaned and prepared for analysis. Based on that, the data and information
were entered into Microsoft Excel and the raw data set have been established. Following this,
the raw data had been imported to IBM-SPSS version 20 and then descriptive statistics was
applied for socio-demographic variables describing the characteristics of the respondents in
the data set. This section of the research, therefore, incorporates the analysis, interpretation
and discussion of the data obtained from the participants of the research.
In this study, the data were planned to be gathered from 31 employees who are responsible
for sales operations systems and 230 esteemed customers actively working with ASKU PLC
i.e., 185 key accounts and 45 regional sales agents. In doing so, the questionnaire used for
gathering data was prepared in two categories (31 copies for the staff members and 230 for
customers). Out of the total 31 copies of questionnaires distributed for sales staffs, all were
returned and of the 230 to be collected from customers, 215 were collected. Therefore, the
response rate of sales staffs were 100% and the cumulative rate of response for customers
were 93.5% (94.05% for key accounts and 91.1% for regional sales agents).
4.2. Socio-demographic characteristics of Respondents
To have overall highlights on who were the participants of the research, this part of study
presents the socio demographic characteristics sales staffs as well as customers in two
consecutive parts.
32

4.2.1. Socio-demographic characteristics of sales operations and management staffs
In this study a total of 31 sales team staffs including sales personnel (16), sales supervisors
(11) and managers (4) were participated. In general, the socio demographic characteristics of
this category are presented as follows.
Table 1: Age and Gender of the staff member
Gender of the staff member Total
Male Female
Age of the staff member
18-25 3 7 10
25<x<35 5 8 13
36<x<45 7 1 8
Total 15 16 31
(Source: Own Survey)
The data in table 1 above show that more than 74% of the staffs of sales operation and
management of ASKU PLC are youngsters between the age of 18 and 35 together with a
considerable share of aged but productive staff members i.e., above 25% of the staffs are
aged between 36 and 45. The gender mix of the team members is more or less balanced with
about 51% females and the rest are males.
Figure 2: Marital Status of Sales operation and Management Staffs
(Source: Own Survey)
33
If one sees the marital status of the staff members as shown in the figure 2 above, more than
54% are married, 42% are single and the remaining are divorced. There is not any marital
status observed other than stated above.
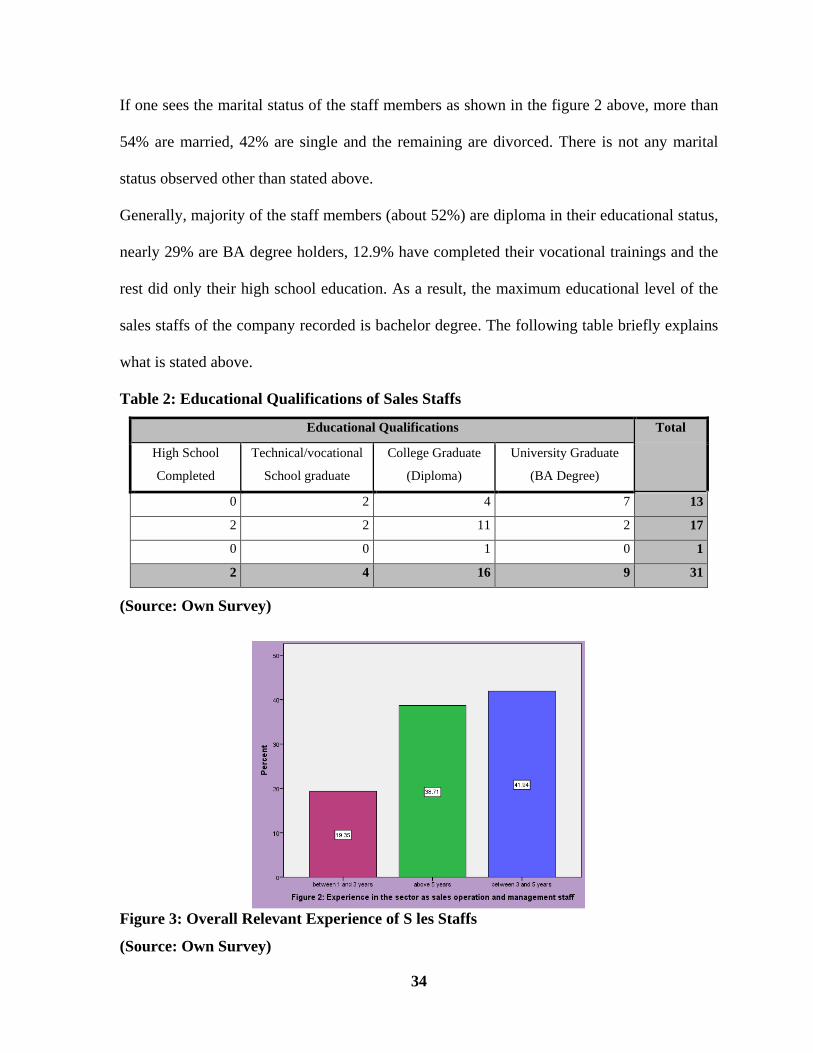
Generally, majority of the staff members (about 52%) are diploma in their educational status,
nearly 29% are BA degree holders, 12.9% have completed their vocational trainings and the
rest did only their high school education. As a result, the maximum educational level of the
sales staffs of the company recorded is bachelor degree. The following table briefly explains
what is stated above.
Table 2: Educational Qualifications of Sales Staffs
Educational Qualifications Total
High School
Completed
Technical/vocational
School graduate
College Graduate
(Diploma)
University Graduate
(BA Degree)
0 2 4 7 13
2 2 11 2 17
0 0 1 0 1
2 4 16 9 31
(Source: Own Survey)
Figure 3: Overall Relevant Experience of S les Staffs
(Source: Own Survey)
34

The experience records of the staff members of the sales team member of ASKU PLC as
shown in figure 3 above indicates that about 42% are junior sales staffs working in areas of
sales operations and management for 3 to 5 years, nearly 39 % are senior staffs working for
above 5 years and the remaining 19% could be taken as beginners working for 1 to 3 years.
In addition to this, most of the staff members as shown in figure 4 below (45.16%) of the
team are working in the company as sales staff for 3 to 5 years, 38.71% are working in the
company as team members for 1 to 3 years, 12.9% worked for above 5 years and the
remaining percentage of staffs are working in the team for a year and below. The mean value
for the experience of the staff members in the sector as sales staff is 4.83 yrs and their mean
experience in the company is 3.92 yrs.
Generally, from the data presented in the above table and figure, it is logical to take a note
that the educational background and the experience of sales operation and management staff
members is good. As the same time, one from the figure shown below can conclude that the
in-house experience of the staffs is so nice that they are well equipped to know well the sales
operation procedures, process and policy of the company.
Figure 4: Experience of sales staff in the company
(Source: Own Survey)
35

The results also indicate that those employees with diploma status in their education (10 out
of 16 which is about 62.5%) have stayed in the company as sales staff members for more
years (above 3 years) than others. Sales staff members with higher educational status i.e.
degree holders have served both the company and the sector for 3 or less years that seems the
turnover of employees in the team is not bad.
To conclude it, the socio demographic characteristics of the staff members of ASKU PLC in
all parameters is good as far as there is not seen anything that is extremely dominating them.
Reasonably the mix of staff members includes balanced figures of males and females,
youngsters and elders, middle and high level educated personnel, and an acceptable extent of
marital status. Moreover, the experiences obtained by the company’s sales team employees
either in the company or other companies in relevant positions is sufficient to make effective
selling. As the same time the overall socio demographic nature of the employees participated
in this study would dare someone to say that the responses given here would be acceptable
and logical.
4.2.2. Socio-demographic characteristics of sales agents and key accounts
This research has considered 41 (out of 45) regional sales agents distributing the products of
the company in different regions of the country and 174 (out of 185) active customers listed
as key accounts found in different sub-cities of Addis Ababa. This part, therefore, presents
their socio-demographic characteristics.
When one look at the overall age mixes of customers under study as indicated in the table 3,
about 51.2% are youngsters with an age range between 18 and 35. Considerable numbers of
them (about 22.33%) are also elders with an age of above 46 years. More than half of the key
accounts (54%) and 39% of the regional sales agents are young. About 44% of the regional
36

agents, which took the maximum share, are unfortunately aged customers greater than 46
which are somewhat shocking as compared with the younger agents (39%).
Table 3: Age of the Customer by Type of Customers Type of the Customer Total
Key Account Regional Sales Agents
Age of the Customer
18-25 51 8 59
26-35 43 8 51
36-45 50 7 57
Above 46 30 18 48
Total 174 41 215
(Source: Own Survey)
When one sees the gender mix of customers as shown in the following figure, females are
dominating the sales and distribution of the products of ASKU PLC. Out of the 215
customers who are distributing and selling products of aquaaddis natural spring water, 126
(58.6%) are female and the rest 89 (41.4%) are males. Based on the groups/types of
customers, 99 out of the 174 key accounts (56.9%) and 27 out of the 41 Regional Agents
(65.85%) are females.
Figure 5: Gender mix of Key Accounts and Regional Agents
(Source: Own Survey)
37

In general, it is possible to say that the company had unfortunately given chances for females
to join the selling and distribution process so as to enjoy the job opportunities as well as the
profits they would make from it.
In reference with the marital status of the respondents, out of the total 215 respondents 126
(58.6%) are married, 73 (34%) are single, 14 (6.5%) are divorced and the remaining 2 (0.9%)
are widowed. Nearly 58% and 61% of key accounts and regional agents respectively are
married, about 34.5% of key accounts as well as 31.7% of the regional agents are not married
yet, 6.9% of key accounts at the same time 4.9% of the agents are divorced and the remaining
percentage share of the customers are widowed. The data presented in the figure 6 below,
one could take a note that majority of the customers involved in this study were married as
well as considerable number of single key accounts and regional agents are working with the
company.
Figure 6: Marital Status of Key Accounts and Regional Sales Agents
(Source: Own Survey)
38

As indicated in the following table, the educational status of the key accounts and regional
sales agents are relatively dominated by high school completed people (33%) though
considerable number of customers are college (Diploma holders) and university graduates
(BA Degree Holders) (23.7% and 24.7% respectively). It can also be seen that 25 out of the
41 Regional sales agents (about 61%) and 46 out of the 174 key accounts (about 26%) have
completed only their high school. Moreover, one can see from the table that educational
status of the key accounts is more or less evenly distributed except customers with lower
grades of primary school and those who graduates from technical/vocational school; 26.45%
for both of each of high school completed and university graduates, 25.3% for diploma
(college) graduates and the remaining 5.1% and 16.7% for lower grades of primary school
and vocational graduates.
Table 4: Educational Status of Key Accounts and Regional Sales Agents Type of the Customer Total
Key Account
Regional Sales Agents
Education Status of the Customer
Below grade 8 9 0 9 High School Completed 46 25 71 Technical/vocational School graduate 29 2 31 College Graduate (Diploma) 44 7 51 University Graduate (BA Degree) 46 7 53
Total 174 41 215
(Source: Own Survey)
When one come to the experience of customers, only about quarter of them have experiences
less than a year in selling and distributing bottled water. As shown in table 5 below, above
74% of the key accounts and about 75.6% of the regional sales agents have experiences of
selling bottled water. Significant numbers of key accounts (nearly 20%) and regional sales
agents (about 12%) are selling bottled water for above 5 years. There are also considerable
39

numbers of customers recently started selling bottled water in the last 12 months; 28.6% of
key accounts and 24.4% of regional sales agents are under this group. In general, from the
data presented in the table, one can dare to say that the company has owned satisfactorily
experienced customers that are able to analyze practically the situations of selling bottled
water. As far as most of them have many experiences in selling bottled water, it would help
in identifying the actual challenges and weaknesses of the industry.
Table 5: General Experience of Customers in Selling Bottled Water
General Experience in Selling Bottled Water Total Below 1 year
between 1 and 3 years
between 3 and 5 years
above 5 years
Type of the Customer
Key Account 45 84 11 34 174 Sales Agents 10 25 1 5 41
Total 55 109 12 39 215
(Source: Own Survey)
As shown in the following graph (see figure 7), about 125 (58.14%) of customers among the
215 selected and responded to the questioner are selling aquaddis natural spring water for a
maximum of one year. The remaining 90 customers (41.86%) are distributing and selling the
products of ASKU PLC for a minimum of 12 months. Literally, most of both the key
accounts and regional sales agents (above 83%) are working for a maximum of 3 years. The
data presented in the figure below also speaks about that regional sales agents are more
experienced than key accounts in selling of the company’s products i.e., only 37.9% of the
key accounts and about 58.5% of the regional sales agents are working with the company for
above 1 year. However, no regional sales agent is selling and distributing ASKU’s products
for above 5 years even if there are 10 out of the 174 (about 5.7%) of the key accounts are
continuing to work with the company for above five years.
Generally, from the data presented, it is possible to judge that it seems there is a problem in
the quality of the recruitment process as well as in supporting customers who are working
40

with the company. Hoping to have better benefits and sales services from the company,
significant numbers of experienced customers have recently joined the sales and distribution
system of the company (Note that 20% of key accounts and 12% of the regional sales agents
have 5 years or more experiences with other bottled water companies as stated in the above
parts).
Figure 7: Specific Sales and Distribution Experience of Customers
(Source: Own Survey)
Regarding the level and nature of exclusiveness of customers as presented in figure 8 and
table 6 below, more than half of them (55.3%) are exclusively selling the bottled water
products of the company under study. In addition to this, 57 out of the 215 customers
(26.5%), are dominantly selling ASKU’s natural spring water and the remaining 18.2% are
selling either the products they have got in the market or cannot judge their nature and level
41

of exclusiveness. If one see the data with respect to the type of customers, about 54% of key
accounts 61% the regional agents are fully exclusive and nearly 24.5% of the key accounts
and 34.14% of the regional sales agents are dominantly selling the company’s product.
Generally, the data presented here is expected to alarm the company so as to make it ready
for meeting the demands, preferences and tests of its customers.
Figure 8: Level and Nature of Exclusiveness of Customers
(Source: Own Survey)
Table 6: Level and Nature of Exclusiveness of Key Accounts and Regional Agents
Type of the Customer Total Key Account Agent
How is your status of Exclusiveness?
Exclusively selling Aquaddis 94 25 119
Dominantly selling Aquaddis 43 14 57 Selling depending on availability 22 1 23 Cannot be judged 15 1 16
Total 174 41 215
(Source: Own Survey)
Generally, when one sees the socio demographic nature and characteristics of the customers
of ASKU PLC under study, it is above expectations for the company to have such customers
in any measurement used here. Logically speaking the mix of both the key accounts and
regional sales agents includes balanced shares of males and females, youths and elders,
42

unexpected number of educated operators, and acceptable extent of marital status. Moreover,
the experience owned by them both in and out of the company as sales agents, whole sellers,
and key accounts is adequate to operate the selling process. As the same time, one can dare to
say confidently that the overall socio demographic nature of the customers participated in
this study indicate that the responses given by them in this study is acceptable.
4.3. Sales Operation Planning and Performance Perspectives of Respondents
This part of the study presents the stands and perspectives of the staff members of the sales
team as well as the key accounts and regional agents regarding the sales operation planning,
processes and systems and the overall sales performance of the company. Basically, this part
tries to oversee the planning process and the overall performance of the sales operation and
management team of the company from different perspectives.
4.3.1. Sales Operation Planning Approach, Process and System
One of the parameter that was seriously being seen here is the sales operation planning
approach, process and system of ASKU plc. If one sees the data presented in the following
table all of the staff members of the sales team believe that the planning approach the
company is following company driven (non customer oriented). The production division of
the company without any data from and the participation of the sales operations team prepare
the total quantity and mix of the products to be produced and send to sales operation and
management team. As a result, the sales operation and management division would devise
strategies so as to get the products sold accordingly. Almost all of them repeatedly
complained that this type of planning approach is totally wrong as they believe it wouldn’t
lead them to satisfy their customers. In addition to the draw backs of the planning approach,
above 61% of the sales staffs didn’t have any orientation by the sales operation and
43

management team about the plan whoever had prepared it. However, considerable amount of
staffs i.e., about 39% of the staff members were being clued about the annual production plan
of the company. The table 7 summarizes what is presented above.
Table 7: Planning Approach and Process of ASKU PLC How do you evaluate the planning
process?
Total
participatory non participatory
What do you think the sales operation
planning approach of the company?
Company Driven 12 19 31
Customer Driven 0 0 0
Total 12 19 31
(Source: Own Survey)
Majority of the customers (about 80%), as shown in table 8 below, believe that the plan and
initiation of the company to balance the demand and supply of the products are not
satisfactory. They either couldn’t judge or agreed the demand is too much higher than the
supply of the products; what so ever the situation it is they noted the imbalance between
demand and supply. The remaining 20% agreed the demand is perfectly matched with the
supply.
Table 8: Customers Perspectives about Demand and Supply of Company’s Products Frequency Percent Valid Percent Cumulative
Percent
Valid
Perfect Match Between Demand and Supply 43 20.0 20.0 20.0
Greater Demand but Lower Supply 109 50.7 50.7 70.7
Impossible to Judge 63 29.3 29.3 100.0
Total 215 100.0 100.0
(Source: Own Survey)
In addition to the above facts, the data presented in figure 9 below indicates that out of the 31
staff members of the sales operation team, 10 of them (about 32%) strictly believe that the
planning approach is incompetent as compared with the major competitors of the company as
well as less responsive to satisfy its customers. Significant number of the staffs (61.3%) are
44

at the midpoint to decide whether the planning approach is competent or not and the rest
(nearly 6.7%) believed that the company is running highly competent plan which is somehow
controversial with the actual sales performance.
Figure 9: Sales Staffs Perspectives Regarding Level of Planning Approach
(Source: Own Survey)
Generally, the data presented in the last two consecutive tables above (Table 7 and Table 8)
and figure 9 indicate that the sales operations planning process and approach of the company
is very poor which needs urgent decisions to get improvement. Both the sales staffs and
customers are not satisfied with the sales operations planning approach, process and systems.
However, the bivariate correlation analysis made and presented in the table below seems to
go to the opposite directions of the points that have been discussed above. If one needs to
justify the correlation between the company’s plans to meet customers’ demand by
comparing with the availability of its products with the major competitors, he/she would have
got significantly correlated; meaning that the company’s initiation to meet the demands of its
customer is positively and significantly correlated with availing its products for its customers
relatively better than its major competitors. These all tell us that the planning process,
45

approaches and systems of the company is controversial which even side for the company’s
interest.
Table 9: Correlation Analysis of Company’s plan to Meet Demand and Availability of
its Products
Company’s plan to meet
customer’s demand
Availability of products
of ASKU PLC as
compared with other
competitors
Company’s plan to meet
customer’s demand?
Pearson Correlation 1 .527**
Sig. (2-tailed) .000
N 215 215
Availability of products of ASKU
PLC as compared with other
competitors
Pearson Correlation .527** 1
Sig. (2-tailed) .000
N 215 215
**. Correlation is significant at the 0.01 level (2-tailed).
(Source: Own Survey)
4.3.2. Sales Operation Planning and Performance of the Company
As an essential part of the study to get its objectives achieved, this part of the thesis tries to
present how the overall sales operations performance of ASKU PLC looks like. As a result,
the challenges and their root causes for underperforming its plan would be identified. The
data in the figure 10 below indicates that there is no consensus reached by sales staffs
regarding the sales operations performance of the company. From the data it can be noted
that more than half of the sales staffs of the company (51.6%) believe that the sales
operations performance of the company is growing from time to time and the rest of them are
either in the state of dilemma to judge (about 32.3%) or concluded it is declining from time
to time (about 16.13%).
46

Figure 10: Perspectives of Sales Staffs about Performance of Sales Operation
(Source: Own Survey)
If one sees the data presented in table 10 below, it is easy to understand that the annual sales
operations planning process and the annual sales operations performance of the company are
negatively correlated. This means that the sales operations planning process of the company
did not consider the annual sales operations performance and vice versa i.e., the two issues
under discussions are seen as two separate concepts which could not convince anyone who
has hints on planning and performance. Management considers them as key concepts which
cannot be implemented separately in any firm that is the planning process of any department
starts through evaluation of its previous performances and the performance evaluation
process always asks what was the plan planned to do so.
47

Table 10: Correlation of the Annual Sales Operation planning and Performance of
ASKU PLC
How do you evaluate
the planning
process?
How do you evaluate the
annual sales performance of
the company?
How do you evaluate the
planning process?
Pearson
Correlation 1 -.319
Sig. (2-tailed) .080
N 31 31
How do you evaluate the
annual sales performance
of the company?
Pearson
Correlation -.319 1
Sig. (2-tailed) .080
N 31 31
(Source: Own Survey)
If one sees two more correlations established between the demand for products, availability
of the products as compared with the production trend to meet the demand as presented in
table 11 below, it is surprising to have significant and positive correlations that click
someone’s mind to raise questions why and how? The table shows the three issues under
discussions are strongly correlated.
Table 11: Correlations between Demand, Production Trend and Availability of
Products as compared with its competitors Demand for
products Availability of
ASKU’s products Production trend in meeting the demand
Demand for products Pearson Correlation 1 .427** .447** Sig. (2-tailed) .000 .000 N 215 215 215
Availability of ASKU’s products
Pearson Correlation .427** 1 .391** Sig. (2-tailed) .000 .000 N 215 215 215
Production trend in meeting the demand
Pearson Correlation .447** .391** 1 Sig. (2-tailed) .000 .000 N 215 215 215
**. Correlation is significant at the 0.01 level (2-tailed).
(Source: Own Survey)
48

Having given a chance for sales staffs to have their say on the sales supervision, evaluation
and monitoring system of the company, majority of them (about 45.2%) believe it is poor,
12.9% think it is strong and the remaining 41.9% are at the midpoint of confusion to judge
either poor or strong. Blindly speaking, one can judge from the data presented in the figure
below that there is a the gap of sales operation and management team of the company in
supervising, evaluating and monitoring sales operation activities is wider which has to be
corrected very soon.
Figure 11: Sales Operations Staffs View about the Sales Supervision, Evaluation and
Monitoring System
(Source: Own Survey)
However, from the data presented above together with the key points raised in the previous
sections, it is not as such difficult to say the planning process, approach and system is
controversial. It can be taken as the major contributor for the underperformance of the sales
operations and management team of the company. The production driven/company driven
planning system, approach and process could be taken as the responsible root cause for all
the problems that are stated here.
49

4.4. Service Delivery System, Sales Facility, Technology and Working Environment
of the Company
As very crucial elements for the success of any sales operation and management system, it is
very interesting to deal with the facility, technology and the working environments of the
company so as to put logical judgments. This section of the study, therefore, tries to assess
the status of those conditions separately from different sides and different perspectives.
4.4.1. Sales Service Delivery System of ASKU PLC
To measure the level of satisfaction of customers regarding the service delivery system of the
company, a chance was given for them to have their say during the data collection phase of
the study. As shown in figure 12 below, above 61% of them evaluate it as poor, 24.19%
believed it is fair, 13.02% thought the service is good and about 1.4% are satisfied with it.
This implied that even though the level of dissatisfaction varied from customers to
customers, except very few (about 1.4%), majority of them do have complains on the service
delivery system of sales operation and management. Above all, more than 61% of them are
totally claiming the service delivery system is poor which clicks the company in general as
well as the sales team specifically to answer what is wrong with the system.
50

Figure 12: Customer’s View about Sales operations Service Delivery System
(Source: Own Survey)
To have a knowhow on the details of the products delivery system of the company,
customers were asked about the processes. As shown in table 12 below, any customer had
basically three chances to get the company’s products; loading from the factory/warehouse
with discounted price with own/rented vehicle, the company delivers to customer’s store by
its vehicle with discounted price, the company delivers to customer’s store by its vehicle with
cash sales price and using the above methods interchangeably. Majority of the customers
(about 54.9%) as presented in the table are using the three methods of getting products
interchangeably, 28.4% are obtaining the products by loading from the factory/warehouse
using own/rented vehicles with discounted price and considerable share of customers are
getting the company’s products from the company’s vehicles with the normal cash sales.
Only negligible amount of customers (0.9%) are getting the products from the company’s
51

vehicle with discounted price. This clearly tells us the company does not have uniform and
clearly defined means of product distribution mechanism.
Table 12: Product Delivery System of the Company
Frequency Percent Valid Percent
Valid
loading from factory/warehouse by own vehicle with discounted price
61 28.4 28.4
the company delivers to my store by its vehicle with discounted price
2 .9 .9
the company delivers to my store by its vehicle with cash sales price
34 15.8 15.8
using the above systems interchangeably
118 54.9 54.9
Total 215 100.0 100.0
(Source: Own Survey)
More importantly, even though the Ethiopian trade practices and consumer protection
proclamation No 685/2010 strictly prohibits manufacturers to distribute their products on
their own force so as to make their focus on productivity, efficiency and effectiveness,
ASKU PLC was both the producer and distributor of Aquaddis Natural Spring Water for
more than 8 years especially in Addis and its peripheral areas. Now a day the company is
enforced by the government and established a sister company (Yehulie Gebeya Whole Seller
and Retail Trading) responsible for the distribution process which can be taken as another
mistakes. In addition to this, even though they are not well organized, the company had
rented warehouses in different cities (Kombolcha, Bahir Dar, Hawassa, Jimma) to avail its
products for the nearby regional agents at agent’s price. If one sees, the distribution system
of its major competitors producing Yes, Eden, Abyssiniya and One water for example, they
all outsourced the distribution part and pay their attention on the manufacturing and
distribution process. Having applied these experiences, very young companies producing
52

WOW, Fikir, Top and Daily water are building their brand image with in short period of
time. Therefore, this is one of the challenges that contribute for underperforming of sales
operations.
If one sees the cross tabulated data presented in table 13 below, which shows the
comparison of the sales operation delivery system of the company with major competitors,
nearly 48% of the customers strongly complained that the major competitors of the
company are better in their services than ASKU. Surprisingly those who are even satisfied
with the sales operation of the company witnessed that ASKU’s service is the worst as
compared with its competitors. No customer has compared the company’s service as good
except 64 customers (about 30%) insisted they could not compare it, which does necessarily
imply it is neither good nor bad. The remaining 22% of customers compare the sales
operation system of the competitors as same. In this regard, the tendency of customers in
the service delivery system of the company still implies is not satisfactory.
Table 13: Comparison of ASKU’s Sales Operations Service Delivery System & Major
Competitors
How do you evaluate the Sales Operation Service Delivery
system of ASKU?
Total
satisfied Good Fair Poor
How do you compare the
sales operation service
delivery system of ASKU
with major competitors?
Cannot compare 0 25 0 39 64
Worst 3 0 37 63 103
Same 0 3 15 30 48
Good 0 0 0 0 0
Total 3 28 52 132 215
(Source: Own Survey)
Customers justifying the major reasons contributing for the poor service delivery system of
the company’s sales operations, the overall companywide challenges born and grown there
53

do significantly affect the process (about 36.3%). The data presented in the following table
(table 14) indicates that the sales force unfit for the assigned responsibilities are taking
21.9%, the nation’ wide challenges share 18.1%, product and production related challenges
contribute 16.7% and the remaining 7% is assigned for technological challenges. Most of the
challenges stated (nearly three forth of them) are internal issues under the company’s control
that can be resolved by itself. Among those challenges the countrywide and technological
challenges (which took 25.1%) are external which are out of the control of the company.
Therefore, it is logical to say that it is possible to bring visible changes in areas of service
delivery of sales operations by facing the major internal challenges the company can improve
by itself.
Table 14: Major Challenges Contributing for Poor Service Delivery System
Frequency Percent Valid Percent Cumulative Percent
Valid
unskilled sales force 47 21.9 21.9 21.9 Overall companywide related challenges
78 36.3 36.3 58.1
Technological challenges 15 7.0 7.0 65.1 Product and production related challenges
36 16.7 16.7 81.9
Countrywide challenges 39 18.1 18.1 100.0 Total 215 100.0 100.0
(Source: Own Survey)
When a question is raised for customers about the efforts applied by the company to make
changes on its sales operations service delivery system, above half of them believed that no
efforts are applied to get the system changed rather actions that lead the system to the worst
position (see figure 13 below). About 24.7% of the customers believed that there is no an
effort by the company applied to change the situation of service delivery system which
allowed to continue as it is and the remaining 22.3% % stayed in dilemma on the company’s
54

effort. In short, the efforts the company is applying to get the sales operation and
management service delivery systems changed, its decisions/moves are not promising. To the
reverse of making decisions that can bring changes, its efforts are incapable even to continue
the existing system i.e., unless the company could make urgent decisions, the sales
operations service delivery system of the company would probably become worst.
Figure 13: Customer’s View about the Efforts Applied by the Company to Improve
Sales Operation Service Delivery System
(Source: Own Survey)
Generally, the sales operations service delivery system of the company seems unsatisfactory
by the customers under considerations. The staff members of sales operations and
management team of the company also thought that the overall sales operations system of the
company is not designed to satisfy customers, which is challenging for the betterment of
performance of sales operation and management the company.
If one is interested to know the perception of the brand the company is producing, as
presented in figure 14 below, majority of the customers (about 89.3%) thought that Aquaddis
55

is a very well known and perceived natural spring water brand and only 10.7% are in doubt
on its acceptance as shown in the pie chart shown below. However, there is still a difference
in its extent of perception; meaning that out of the 89.3%, 58.14% believed that it is a highly
perceived brand so that users are loyal for it and 31.86% thought that the brand is perceived
even though users are switch off. The implication of this is that the problems which challenge
the sales operation performance lie elsewhere other than the brand image of the company.
Figure 14: Perception on Brand of Products of ASKU PLC
(Source: Own Survey)
The key accounts and regional agents participated in the study were given a chance to
compare and contrast the prices of products of ASKU with its competitors and as indicated in
table 15 below most of them j.e., 46.5% believed that the price is more or less the same.
Significant number of customers (about 36.3%) has got the price expensive and the rest
17.2% whispered is as cheap. As per the above responses, the price set by the company is not
an urgent issue that critically needs to be dealt. However, the observation made by the
56
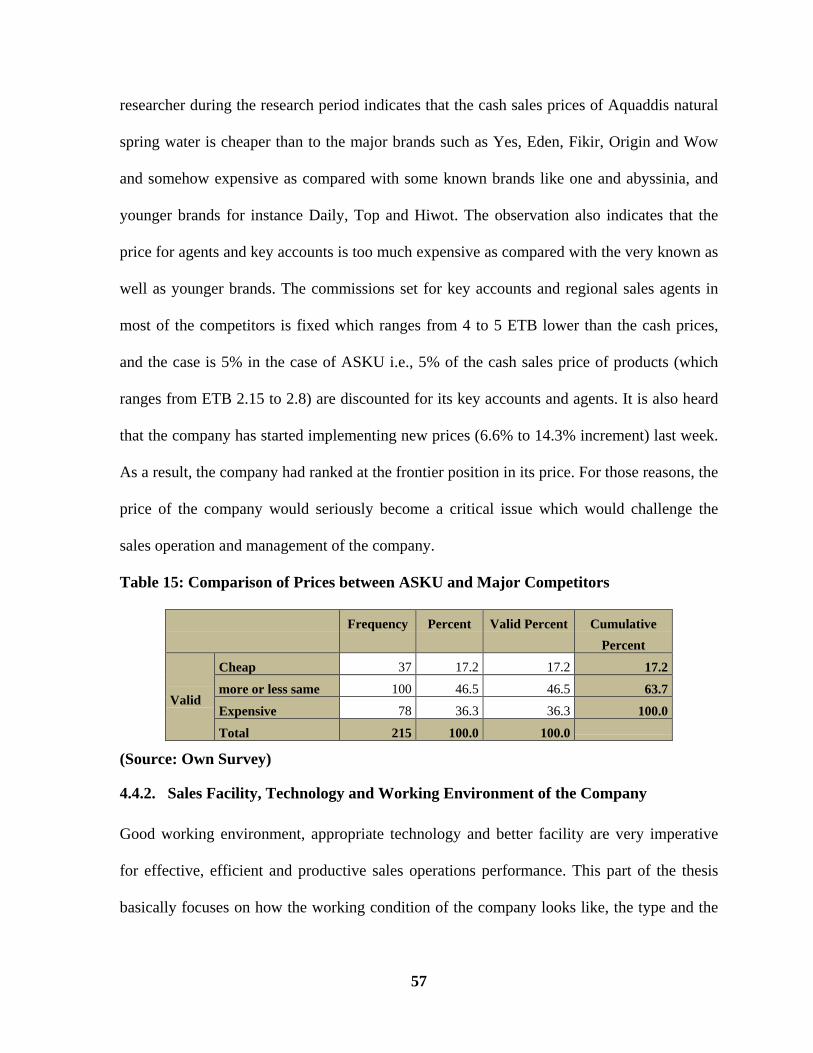
researcher during the research period indicates that the cash sales prices of Aquaddis natural
spring water is cheaper than to the major brands such as Yes, Eden, Fikir, Origin and Wow
and somehow expensive as compared with some known brands like one and abyssinia, and
younger brands for instance Daily, Top and Hiwot. The observation also indicates that the
price for agents and key accounts is too much expensive as compared with the very known as
well as younger brands. The commissions set for key accounts and regional sales agents in
most of the competitors is fixed which ranges from 4 to 5 ETB lower than the cash prices,
and the case is 5% in the case of ASKU i.e., 5% of the cash sales price of products (which
ranges from ETB 2.15 to 2.8) are discounted for its key accounts and agents. It is also heard
that the company has started implementing new prices (6.6% to 14.3% increment) last week.
As a result, the company had ranked at the frontier position in its price. For those reasons, the
price of the company would seriously become a critical issue which would challenge the
sales operation and management of the company.
Table 15: Comparison of Prices between ASKU and Major Competitors
Frequency Percent Valid Percent Cumulative Percent
Valid
Cheap 37 17.2 17.2 17.2 more or less same 100 46.5 46.5 63.7 Expensive 78 36.3 36.3 100.0 Total 215 100.0 100.0
(Source: Own Survey)
4.4.2. Sales Facility, Technology and Working Environment of the Company
Good working environment, appropriate technology and better facility are very imperative
for effective, efficient and productive sales operations performance. This part of the thesis
basically focuses on how the working condition of the company looks like, the type and the
57

scope of technology utilization and the existing sales operations facilities of the company
under study.
Regarding the overall working environment of the company as shown in the figure 15 below,
only 9.67% think it is good. About 61.29% considered it is satisfactory which still needs
some improvements and the remaining 29.04% felt it as bad. The extent to which the
working environment of the company reaches is critical. From the figures noted above, one
can dare to say that the company is in risky position on its working condition which might
even lead to failure of its business.
Figure 15: Working Environment of Sales Operation
(Source: Own Survey)
Table 16: Major Contributors for the Bad Facilities of Sales Operation System Frequency Percent Valid Percent Cumulative
Percent
Valid
Sales vehicle 12 38.7 38.7 38.7 Sales crew mix (both in quality and quantity)
12 38.7 38.7 77.4
Sales Territory related issues 2 6.5 6.5 83.9 Timing to selling 5 16.1 16.1 100.0 Total 31 100.0 100.0
(Source: Own Survey)
58

As per the data presented in the above table, there are many facilities which contribute for the
sales operation performance to be bad. Even though there are some measures are currently
taken by the company to change the situation, nothing would take the greater share of sales
vehicles. The vehicles assigned are not technically good, working for the last 25 years, which
would add supplementary responsibilities for the sales operation and management team for
technical correction and loading and unloading works. Generally, 38.7% of the staff
members complain that the sales vehicles are the major reasons to say the sales operations
facilities are poor. The same numbers of them (38.7%) also thought that the quality as well
the quantity of sales crew mix is the major reason to choose on the facilities bad. Sales
Territory related issues (6.5%) and timing of selling (16.1%) are also considerable
contributors for the bad facility situations of sales operations and management systems.
The observation done by the researcher in sales operations and management team of the
company shown that the number one facility that hiders the sales operation system of the
company is the sales vehicles. Above 80% are too old continuously serving for the company
for more than 25 years. With those vehicles, it is being flippant to expect smooth sales
operation. However, this issue is on its way to get changed, as far as the company had bought
and injected about 20 new vehicles to be used for sales operations. Nevertheless, the rest
challenges remained unchanged which might continue as they are unless the company makes
sudden decisions as that of the vehicles.
59

Figure 16: Technologies under Implementation to Facilitate Sales Operations systems
(Source: Own Survey)
To have a look on the provision of the technology to improve the sales operation and
management of the company, the staff members of the team were asked to put their opinions,
about three fourth of them, as indicated in the following bar chart, cannot list any technology
they are using to enhance sales operations and management. Some (about 19%) listed
Enterprise Resource Planning (ERP) and the remaining 6.5% believe that they are using
some technologies like WhatsAPP, Viber, Telegram and some more other social media
channels to facilitate sales operation process. However, all of the sales operators noted that
they are using cell phones provided by the company for enhancing their responsibilities.
Nevertheless, the researcher’s observation indicates that the company has installed ERP three
years before to enhance the overall system of the company including the processes of sales
operations. In addition to this, during this research period the company was on its way for
upgrading the existing system with new technology that will network all the processes
60

basically the production, supply chain, sales operations and customer services. Moreover, the
company had loaded Geographical Positioning System on the newly bought vehicles and
networked with the sales operation and management system of the company. The most
difficult thing is most of the sales staffs did not have any information about those issues.
Therefore, the company has expected to prepare training program to introduce its staffs on
those technological related issues.
61

CHAPTER FIVE: SUMMARY, CONCLUSIONS AND
RECOMMENDATIONS
5.1. Introduction
Having collected and analyzed relevant data important for the study, the following parts of
the thesis outline the summary of the key findings obtained, the major conclusions drawn and
lists out a set of recommendations. Added to that, the future research works which are to be
carried out related to the topic of this research are finally proposed.
5.2. Summary of Key Findings
Having considered the general of objective of assessing the challenges and investigate the
prospects of the sales operations system of ASKU PLC and up on the data and information
gathered, analyzed and interpreted, the key findings of this study are summarized below.
1. The major challenge that hiders the sales operation team to perform under its plan is the
planning processes, approaches and systems the company has chosen to follow. The
process of planning, as identified in this study, is one directional which is not satisfying
both the staff members of the sales operations and key customers of the company. The
plan is totally production/company driven and the sales operations and management
team, except accepting and devising strategies to implement the plan, did not have any
involvement in the process. Generally, all the problems born in the sales team are
resulted from the poor planning process, system and approach.
2. The other challenge contributing for the lower performance of the team is poor sales
service delivery system which includes the poor product delivery and distribution
system. The unsatisfactory working environment, the less accepted sales operations
facilities and the poorly introduced technology implemented in the sales operation
62

systems are seen as additional challenges. More importantly, the price adjustments made
currently might be additional risk which could be grown to critical challenges.
3. In addition to the challenges specified above, many opportunities and prospects that are
capable of changing the sales operation performance of the company were also
investigated.
A) The most important thing seen here is the perception of customers towards ASKU’s
brand. In this study Aquaddis natural spring water is identified as one of the well known
and perceived brand that is solely preferred product especially in Addis and its
peripherals.
B) The reforms underway and the decisions the company had made currently like installing
new technology to upgrade the current sales operations and management system, buying
and injecting technologically advanced sales vehicles are also seen as considerable
prospects which are powerful in changing the current situation.
C) The educational status and experiences mixes of both the sales staffs and esteemed
customers is at an acceptable level which can be considered as one of the opportunities
and the company would have while sales operations performances are thought to be
progressed.
5.3. Conclusions
No matter how good the business operation is, how advanced the technology it is, how
progressive and forward thinking the management techniques are, it must still needs to have
efficient, effective and productive sales operation and management system in place so as to
survive in the dynamically changing business world. As full of many tasks and functions
which require the participation of many departments other than sales operations and
63

management as well as there are a lot of interests to be fulfilled by it, managing sales
operations is literally filled with many challenges.
This study, therefore, was aimed at assessing the challenges and prospects of sales operations
systems of ASKU plc. Based on the findings of the study, the following points are concluded.
The planning process, system and approach of ASKU PLC are the major challenge
hindering the overall sales operations system and performance of the company.
Poor and non responsive sales operations service delivery system, un suitable
working condition, in efficient sales operations facilities, and installation of
inadequately introduced sales operation technology are seen as additional challenges
to get to the bottom of sales operations performance related issues.
In addition to this, the company is injecting price as additional challenge through the
recently adjusted prices effected last week.
Even though the company is on its way to make changes in it, product delivery and
distribution system is among the critical challenges the sales operation system of the
company is facing.
In addition to those challenges, the following are taken as the major opportunities and
prospects the company owned.
Generally, the demand for bottled water is increasing between 13 and 37% in the last
five years which paves the way for companies like ASKU plc to think how to exploit
this growing demand. Moreover, Aquaddis, the brand the company under study is
producing, has become one of the well known and perceived brands especially in
Addis and its peripherals.
64

Underway reforms taken by the company like installation of new technology and
injecting technologically advanced sales vehicles are considered as significant
prospects
Finally, the last but not the least prospect seen is the educational and experience mix
of both customers and sales operations staffs.
Generally, all the challenges identified above are more or less internal which were born and
grown in the company to act on and at the same time the prospects investigated are on the
hand of the company to make use of.
5.4. Recommendations
The findings of this study indicate that the sales operations planning process, approach and
system of the company together with non responsive sales service delivery system,
inefficient sales operations facilities, poorly fixed working conditions are seriously
challenging the sales operation performance of the company. To the reverse of this, the
findings point out that there are many prospects observed to maintain those situations such as
highly perceived demand, underway reforms, recent decisions made to improve the sales
operation environment and so forth. Up on those findings, the researcher recommended the
following points so as to bring urgent decisions.
ASKU plc should urgently make decisions so as to change the planning processes,
approaches and systems from company/production to customers driven. Participatory
process of planning should also be in practice. This would help to improve the level
of satisfactions both for customers and sales operations staffs.
65

It is seriously recommended that the company should seriously think of, analyze and
hold the prices effected last week. The company should critically consider the product
delivery and distribution system through its reforms.
The company is also recommended to keep on the reforms on underway with the
consultation and participation of its sales staffs as they are considered as mouths of its
customers.
More importantly, the company should apply more efforts in keeping the perception
of its brand. Above all, it should work on widening its perception in areas out of
Addis surroundings.
5.5. Future research areas
Even though there are a lot of reports and documents prepared by many web sites talking
about sales operations and management, one could not find studies undertaken on the
challenges and prospects of sales operations system. For this reason, the main limitation of
this study was the absence of previous research work in the area, and obtaining structured
data to analyze, compare and contrast the results obtained.
Taking this study in to considerations, the following points could be taken as thematic areas
for further research;
The same topic but at industry level
Developing sales operations and management system model that would be able to
address the challenges identified and make use of the prospects induced.
Assessing the challenges and prospects of marketing operations in the same company.
66

References
Banik (2004) Principles of Marketing. 11th Edition prentice Hall of india private limited
Belch M. (2003).Principles of Marketing Management New Delhi; Tata Mc
Beverage Marketing: New York, NY, USA, Smaller Categories Still Saw Growth as the U.S.
Liquid Refreshment Beverage Market Shrank by 2.0% in 2008; Available online:
http://www.beveragemarketing.com/?section=news&newsID=111 (accessed on 26
September 2018).
Carlucci, D., Gennaro, B., & Roselli, L. (2016). Competitive Strategies of Italian Bottled
Water Industry: Evidence from Hedonic Analysis. Rivista di Economia Agraria
David Jobber (2001) Principles & Practice of Marketing. 3rdedition MCRAW–Hill produced
company.
Durga, M. (2010). Consumers Buying Behavior of Bottled Water in Suriname: A Study on
The Relation Between Demographic and Psychological Factors and Buying
Behavior.Suriname.
Ensermu, M. (2014). Trends in Bottled Water Use Survey in Addis Ababa: Implication on
Reverse Logistics of Bottled Water Manufacturing in Ethiopia. International Journal of
Science and Research
Gleick, P.H. The myth and reality of bottled water. In The World’s Water: The Biennial
Report on Freshwater Resources 2004–2005;Island Press: Washington, DC, USA, 2004.
Graw Hill pvt L Black (2005) Marketing Management Practice: Logistical Approach.
Himalaya PUO listing
Hu, Z., Wright, L. M., & Mahler, R. (2011). Bottled Water: United States Consumers and
Their Perceptions of Water Quality. International Journal of Environmental Research
67

Islam, N., & Habib, W. (2009, October 14). Health Beliefs and Motivating Factors to Buy
Bottled Water: A Case Study of the University Students of Bangladesh. Fall Conference.
Istanbul, Turkey.
Kooper(2004) Principle of Marketing Edition Ph learning private limited
Kotler Philip (2005) Marketing management. 8th edition prentice Hall of India private
Limited.
Kotler Philip and Gary Armstrong (2005) Principle of Marketing.11th edition prentice-Hall
of India private limited.
Kotler, P., & Keller, K. (2012). Marketing Management: 14th edition.New Jersey: Prentice
Hall
Kumar (2001) Marketing Management. Prectice Hall ,opper saddle Ritver Tata MC Growing
publication company.
Kumare N and Mlttal R. (2002) Marketing Management. 1st edition J.L Kumar for Armol
Publication private limited company.
Linden, S. V. (2013). Exploring Beliefs About Bottled Water and Intentions To Reduce
Consumption: The Dual -Effect of Social Norm Activation and Persuasive Information.
Journal of Environment and Behavior
Malotra.K.(2006) Marketing Researchnew delhi practice-hall private Ltd.
Mehta , A., Lemley , A., & Schwartz, J. (1999). Drinking Water, Alternatives. Cornell
University .
Mekonnen, Y., Surur, A., Rajasekhar, K., & Rafi, M. (2015). Assessment of Chemical
Quality of Major Brands of Water Marketed in Gondar Town, Ethiopia . International
Journal of Innovative Pharmaceutical Research
68

Milner Still and Edward W. (2004) Sales Promotion Management private limited company.
Mittal (2002) Marking Management. 3rd edition Tata Mc Graw –Hill Publication Company
limited.
Queiroz, J., Rosenberg, M., Heller, L., Zhouri, A., & Silva, S. (2012). News About Tap and
Bottled Water: Can This Influence People's Choice?
Rajagopal, Ananya Rajagopal (2008). Performance Ma nagement; Emerald Article: Team
performance and control process in sales Organizations
Sawka, M., Cheuvront, S., & Carter, R. (2014). Human Water Needs.Nutrition Revolution.
Shauntelle Hamlett,(2013). Characteristics of a Good Sales Representative
69

Appendices: Data Collection Instruments CONSENT OF RESPONDENT
My name is ----------------- (Interviewer), I am working with a graduate student researcher
from Addis Ababa University, College of Business and Economics, School of Commerce,
Department of Marketing Management.
This is a study to be conducted with the objective of assessing the challenges and
investigating the prospects of the sales management system of ASKU PLC. You are one of
the members who have been selected to participate in this study. Therefore, you are
kindly requested to participate in this study and provide the information required from you. I
would like to ask for you a few questions related with the sales operations and management
of ASKU PLC, if I may. However, you can refuse to answer any question I ask. You may
end the interview at any time. You can also refuse to participate in the study entirely. Your
refusal will not restrict you from obtaining the required any service and opportunity the
company will provide for you. The interview will last approximately 30-45 minutes. Your
responses will be kept confidential and there will be no way of linking your
individual responses to the final results of the study findings. I would like to inform you
that the responses that you provide to the questions are very essential, not only for the
successful accomplishment of the study, but also used to devise and suggest scientific and
logical management and operations of the selling system of the company.
If you have any question, you can contact the following person with these addresses
Biniyam Getachew (Mob No0975642244) (Email: [email protected])
Given all the above information, may I Proceed with the questions?
Yes; ----proceed with the interview No; ---- thank her and End.
Name of Data collector: _______________Signature ____________ Date: ___________
i

Questionnaire prepared for Sales Operation and Management Staffs of ASKU PLC
Part I: Socio-Economic Demographic Characteristics
(1) Age of the staff member
Between 18 and 25 years Between 26 and 35 years
Between 35 and 45 years Above 46
(2) Sex of the staff member
Male Female
(3) Marital Status of the staff member
Single Married Divorced Widowed
(4) Educational Qualifications
High School Completed Technical/vocational School graduate
College Graduate (Diploma) University Graduate (BA Degree)
Post graduate and above
(5) Experience in the sector as sales operation and management staff
Below 1 year between 1 and 3 years between 3 and 5 years
above 5 years (please specify)
(6) Experience in the company
Below 1 year between 1 and 3 years between 3 and 5 years
above 5 years (please specify)
Part II: Sales planning and performance perspectives of the company
(7) What do you think the planning approach of the company to sell its products?
Production/Company’s interest driven Demand driven
(8) Did you/those you represent involve in the sales planning process?
Yes No
(9) How do you rank the competence of the planning approach in meeting the demand of
customers and competing with the company’s major competitors?
High Medium Poor
(10) How do you evaluate the annual sales plan and performance of the company in line
with its major competitors and the growing bottled water sector?
Growing from time to time Declining from time to time
More or less remained constant Difficult to judge
ii

(11) Do you think the sales operation of bottled water products of the company is
responsive in meeting the time, quality, quantity, product (types and mixes), price and
other related needs, preferences and choices of customers?
Yes No
(12) Which of the following parameter highly affects the process, if you don’t think the
sales operation of the company is responsive?
Quality related issues Quantity related issues
Product (types and mixes) related issues Price related issues
Time related issues Other factors (specify)
(13) Did you obtain any training regarding sales operation and management in the last 12
months?
Yes No
(14) If your answer for question # 13 is yes, how do you get the training in improving your
sales performance?
Good Not a such
(15) Is there either any meeting or evaluation system you knew the company is
implementing seriously to evaluate the performance of sales operation and
management team?
Yes No
(16) If your question for question # 15 is yes, how do you evaluate it?
Good Not a such
(17) What do you think the major sales operation and management challenge critically
affecting the overall performance of the company?
Part III: Sales Facility, technology and Working Environment of the Company
(18) How do you evaluate the overall working condition/environment of the company to
meet its sales plan?
Bad Satisfactory Good Very good
(19) Which facility among the following do you think highly contributes, if your answer for
question #12 is bad?
Sales vehicle Sales crew mix (both in quality and quantity)
Sales Territory related issues Timing to sell/sales hour
iii
(20) Are you using any type of technology to facilitate your selling operation?
Yes No
(21) If your answer for question # 20 is yes, can you state the type of technology and the
type of activities you are applied on it?
-------------------------------------------------------------------------------------------------------
-------------------------------------------------------------------------------------------------------
-------------------------------------------------------------------------------------------------------
(22) How do you see the overall adequacy of resources assigned by the company to run
your selling operation?
Bad Satisfactory Good Very good
(23) If your answer for question #22 is bad, which resource you usually lacked and what do
you think the reason behind it is?
Type of resource---------------------------------------------------------------------------------------
------------------------------------------------------------------------------------------------------------
Reason---------------------------------------------------------------------------------------------------
------------------------------------------------------------------------------------------------------------
(24) Can you state the major challenges hindering your sales operation?
Challenge #1------------------------------------------------------------------------------------------------
----------------------------------------------------------------------------------------------------------------
Challenge #2------------------------------------------------------------------------------------------------
----------------------------------------------------------------------------------------------------------------
Challenge #3------------------------------------------------------------------------------------------------
----------------------------------------------------------------------------------------------------------------
(25) Can you recommend some points for the company to improve the above situations and
stay competent in the market?
Recommendation #1---------------------------------------------------------------------------------------
----------------------------------------------------------------------------------------------------------------
Recommendation #2--------------------------------------------------------------------------------------
----------------------------------------------------------------------------------------------------------------
iv

Questionnaire prepared for Major Sales Agents and Key Accounts of ASKU PLC
Part I: Socio-Economic Demographic Characteristics of the customers
1) Age of the Customer
Between 18 and 25 years Between 26 and 35 years
Between 35 and 45 years Above 46
2) Sex of the customer
Male Female
3) Marital Status of the Customer
Single Married Divorced Widowed
4) Educational Qualifications of the customer
Below 8th grade Elementary School completed
High School Completed Technical/vocational School graduate
College Graduate (Diploma) University Graduate (BA Degree)
Post graduate and above
5) Type of customer
Key account Whole seller Agent
6) Experience in selling bottled water
Below 1 year between 1 and 3 years between 3 and 5 years
above 5 years (please specify)
7) For how long did you work with ASKU plc?
Below 1 year between 1 and 3 years between 3 and 5 years
above 5 years (please specify)
8) Who initiates you to work with ASKU plc?
Family friends my self
Sales team staff member staff member out of the sales team
v

Part II: Match of demand and supply of products
9) How do you rank your demand of bottled water in their product type?
Type of the
Product
Rate of Demand
1 2 3 4 5
0.5 lit
1 lit
1.5 lit
2 lit
20 lit
10) How do you see/measure the initiative of the company to meet your demand in product
type, timing and service delivery?
Satisfactory Unsatisfactory
11) If your answer for question no 8 is unsatisfactory, which one of the following is your
justification?
Un-match of supply of products in amount
Un-match of supply of products in type
Lack of appropriate customer service delivery
Other (please specify)-----------------------------------------------------------------------------
------------------------------------------------------------------------------------------------------------
12) How do you see the acceptance of the brand by your customers while you are selling the
company’s product?
Good Cannot be judged Bad
vi

13) What is your reason for question #12?
Most of them are loyal for the brand and do not want to consume without it
Most of them demanded it depending on their condition
Most of them never want to consume it
Other (please specify)--------------------------------------------------------------------------------
---------------------------------------------------------------------------------------------------------
14) How do you get the company’s product?
By loading at the factory/warehouse using own vehicle with discounted price
The company delivers on its truck at discounted price
The company delivers on its truck at normal price
Other (please specify)---------------------------------------------------------------------------------
------------------------------------------------------------------------------------------------------------
15) How do you compare the price of the products of the company as compared with other
competitors?
Cheap More or less the same Expensive
16) Did you think the production trend/operation and the demand for products of the
company are compatible (in a good position to meet each other)?
Yes No
17) If your answer for question no 16 is no, what do you think the reason behind it?
Profit orientation of the company
Effect of Competitors’ production planning/strategies
Demand related challenges
Problems/challenges beyond the company (like hard currency, energy…)
Other (please specify)---------------------------------------------------------------------------------
------------------------------------------------------------------------------------------------------------
Part III: Service Delivery Related Issues
18) How did you rate the overall sales operation and management services of the company?
Highly satisfied Satisfied
Good Fair
Poor
vii

19) If your answer for question no 18 is fair and poor, what do you think the reason behind
it?
Unskilled sales force Overall companywide related challenges
Technological challenges Product and production related challenges
Countrywide challenges
Other (please specify)-----------------------------------------------------------------------------
-------------------------------------------------------------------------------------------------------
20) Have you worked with the same company/competitors’ before?
Yes No
21) If your answer for question no 20 is yes, how do you compare its/their sales operation
and management services with ASKU PLC?
Better More or less the same Worst
22) How do you evaluate the sales operation and management service delivery system of the
company from time to time?
Getting better Getting worse Remained constant Difficult to judge
23) Can you state the major challenges hindering you to work with ASKU plc?
Challenge #1------------------------------------------------------------------------------------------------
----------------------------------------------------------------------------------------------------------------
Challenge #2------------------------------------------------------------------------------------------------
----------------------------------------------------------------------------------------------------------------
Challenge #3------------------------------------------------------------------------------------------------
----------------------------------------------------------------------------------------------------------------
24) What could you recommend the sales team of the company should do to stay in
competition, satisfy its customers and make changes in the current situation?
Recommendation #1---------------------------------------------------------------------------------------
----------------------------------------------------------------------------------------------------------------
Recommendation #2---------------------------------------------------------------------------------------
---------------------------------------------------------------------------------------------------------------
Recommendation #3---------------------------------------------------------------------------------------
----------------------------------------------------------------------------------------------------------------
viii