Addis Ababa University College of Business and Economics
66
Addis Ababa University SERVICE QUALITY IN BANKING A thesis submitted to the Graduate program of the Department of Management and the College of Business and Economics of Addis Ababa University In partial fulfillment of the requirements for the Degree Master of Science in Management (TQM) By Debebe Gadissa Addis Ababa September, 2019
-
Upload
khangminh22 -
Category
Documents
-
view
3 -
download
0
Transcript of Addis Ababa University College of Business and Economics

Addis Ababa University
SERVICE QUALITY IN BANKING
A thesis submitted to the Graduate program of the Department of Management and
the College of Business and Economics of Addis Ababa University
In partial fulfillment of the requirements for the Degree
Master of Science in Management
(TQM)
By
Debebe Gadissa
Addis Ababa
September, 2019

i
Addis Ababa University
SERVICE QUALITY IN BANKING
A thesis submitted to the Graduate program of the Department of Management and
the College of Business and Economics of Addis Ababa University
In partial fulfillment of the requirements for the Degree
Master of Science in Management
(TQM)
By
Debebe Gadissa
Advisor: Tilahun Teklu (PhD)
Addis Ababa
September, 2019
ii
Declaration
I, the undersigned, declare that this research project is my own work and effort and
it has not been submitted anywhere for any award. Where other sources of
information have been used, they have been duly acknowledged.
Declared by: Confirmed by advisor
Name: Debebe Gadissa Name: Tilahun Teklu (PhD)
Signature: Signature:
Date: Date:

iii
CERTIFICATION OF APPROVAL
I certify that I have read Service Quality in Banking by Debebe Gadissa, and that
in my opinion this work meets the criteria for approving a thesis submitted in
partial fulfillment of the requirement for the degree Master of science in
Management: Total Quality Management at Addis Ababa University.
Advisor: Signature: Date:
Internal Examiner : Signature: Date:
External Examiner : Signature: Date:

iv
Acknowledgements
I would like to express my deepest and greatest appreciation to my Advisor Dr. Tilahun Teklu
for his valuable and constructive comments and advice in the course of this paper preparation.
My special thanks to Mrs. Meaza Kassahun for her unreserved advice and technical assistance
throughout my paper work.
I also want to extend my gratitude to the respondents in responding to the questionnaires from
their busy time. `

v
Table of contents
Contents page no
Acronyms and Abbreviation ......................................................................................................... viii
List of Tables ................................................................................................................................ viii
List of Figures ................................................................................................................................. ix
Abstract ............................................................................................................................................ x
Chapter one ..................................................................................................................................... 1
1. Introduction ................................................................................................................................. 1
1.1 Back ground of the study ...................................................................................................... 1
1.2 Statement of the problem ...................................................................................................... 2
1.3 Objective of the study ........................................................................................................... 3
1.3.1 General objectives .......................................................................................................... 3
1.3.2 Specific objectives .......................................................................................................... 3
1.4 Research questions ................................................................................................................ 3
1.5 Scope of the study ................................................................................................................. 3
1.6 Significance of the study ....................................................................................................... 4
1.7 Limitation of the study .......................................................................................................... 4
Chapter two ..................................................................................................................................... 5
2. Literature Review........................................................................................................................ 5
2.1 Definitions of Service............................................................................................................ 5
2.2. The Concept of Quality ........................................................................................................ 5
2.3 Concepts of Service and Service Quality .............................................................................. 6
2.4 Customer Satisfaction and Service Quality ........................................................................... 6
2.5. Customer Expectation of Service Quality ............................................................................ 7

vi
2.6 Service Quality Gaps ............................................................................................................. 8
2.7 Service Quality Measurement ............................................................................................... 9
2.7.1 Technical and functional quality model (Grönroos Quality Model) .............................. 9
2.7.2 GAP model ................................................................................................................... 10
2.7.3 SERVQUAL model ...................................................................................................... 12
2.7.4 SERVPERF (Performance only model) ................................................................... 13
2.8 Banks in Ethiopia ................................................................................................................ 13
2.9 Conceptual frame work ....................................................................................................... 16
Chapter three ................................................................................................................................. 17
3. Research Method ...................................................................................................................... 17
3.1 Research design ................................................................................................................... 17
3.2 Target Population ................................................................................................................ 17
3.3 Sample Size determination and Sampling technique .......................................................... 17
3.4 Source of Data and Method of Data Collection .................................................................. 18
3.5 Methods of Data Analysis ................................................................................................... 19
Chapter four .................................................................................................................................. 21
4. Result and Discussions ............................................................................................................. 21
4.1. Demographic Information of the Respondents .................................................................. 21
4.2 Reliability Test .................................................................................................................... 22
4.3 Descriptive Analysis of Service Quality Measurement ...................................................... 23
4.3.1 Responsiveness ............................................................................................................. 23
4.3.2 Assurance...................................................................................................................... 24
4.3.3 Empathy ........................................................................................................................ 25
4.3.4 Reliability ..................................................................................................................... 25

vii
4.3.5 Tangibility .................................................................................................................... 26
4.4 Overall SERVQUAL dimensions ....................................................................................... 27
4.5 Descriptive analysis of customer satisfaction items ............................................................. 28
4.6 Overall Customer Satisfaction ............................................................................................. 30
4.7. Correlation Analysis between Service Quality Dimensions and Customer Satisfaction 31
4.8. Linearity Test ...................................................................................................................... 33
4.9 Normality Test ..................................................................................................................... 34
4.10 Multiple Regression Analysis ............................................................................................. 35
Chapter five ................................................................................................................................... 39
5. Summary of Findings, Conclusion and Recommendations ...................................................... 39
5.1 Summary of Findings .......................................................................................................... 39
5.2 Conclusion ........................................................................................................................... 40
5.3 Recommendations ............................................................................................................... 41
References ..................................................................................................................................... 42
Appendix I .................................................................................................................................... 45
Appendix II…………………………………………………………………………………...….56

viii
Acronyms and Abbreviation
AIB Awash International bank
CBE Commercial Bank of Ethiopia
DBE Development Bank of Ethiopia
SPSS Statistical Package for Social Science
List of Tables
Table 1: sampling proportion for the selected banks .................................................................... 18
Table 2: Response rate of collected questioner............................................................................. 19
Table 3: Demographic characteristic of respondents .................................................................... 21
Table 4:Cronbach’s Alpha (Reliability analysis) .......................................................................... 23
Table 5: Responsiveness items mean value .................................................................................. 24

ix
Table 6: Assurance items mean score ........................................................................................... 24
Table 7: Empathy dimension items mean score ........................................................................... 25
Table 8: Reliability dimension mean score ................................................................................... 26
Table 9: Tangibility dimension mean score .................................................................................. 26
Table 10: Overall Mean and standard deviation of Service Quality measurements ..................... 27
Table 11: customer’s satisfaction percentage on respectful behavior of the bank staffs .............. 28
Table 12: customer’s satisfaction percentage with the communicative ........................................ 28
Table 13: customer’s satisfaction percentage with the performance of the employee of the bank
....................................................................................................................................................... 29
Table 14: Customer’s satisfaction percentage with various rang of service of bank.................... 29
Table 15: customer’s satisfaction percentage with the bank services ........................................... 30
Table 16: Descriptive statistics of all over customer satisfaction ................................................. 30
Table 17: correlation of SERVQUAL dimensions and customer satisfaction ............................. 31
Table 18: R2and Adjusted R
2 values of multicollinearity analysis ............................................... 36
Table 19: Avova of multicollinearity analysis .............................................................................. 36
Table 20: Multiple Regression Analysis ....................................................................................... 37
List of Figures
Figure 1:Gronoroos service quality model ................................................................................... 10
Figure 2:GAP model ..................................................................................................................... 11
Figure 3: Conceptual frame work of study ................................................................................... 16
Figure 4: Educational level of respondents ................................................................................... 22

x
Figure 5: Normal point plot of standardized residual ................................................................... 33
Figure 6: Frequency Distribution of Standardized Residual......................................................... 34
Abstract
Service sector has been increased due to the increment of the competition especially in banking
Ethiopia. This study was aimed to measure the level of service quality in banks from the
prospective of their clients in Ethiopia with the selected four banks in Addis Ababa. Total of 382
questioners were distributed but 334 respondents were filled prepared questioner correctly taken
and use for analysis. Questioner included all quality dimensions of SERVQUAL model namely
responsiveness, assurance, empathy, reliability and tangibles and level of customer satisfaction.
The collected data were analyzed using SPSSV.25. Descriptive statistics, Pearson correlation
and regression analysis was applied. The finding indicates that the mean score of the satisfaction
was 3.979(79.58%). Pearson correlation result reveals that there was a positive relationship

xi
between the service quality dimensions and customer satisfaction. Reliability was found to have
the highest correlation with customer satisfaction. In addition, the regression result indicates
that all the service quality dimensions had aggregate impact on customer satisfaction with R
square value of 0.568 but Empathy and assurance have no significant impact among the five
service quality dimensions. Thus bank responsible body should satisfaction with respect to
aspects of service quality.
Key words: Service quality, customer satisfaction, SERVQUAL dimensions

1
Chapter one
1. Introduction
1.1 Back ground of the study
Definition given for the term service quality may differ from person to person. Generally, it is
defined as thing that meets customer’s expectations which is key gaining and retaining customers
(Ijaz.A.T& Ali.A, 2013).
Service quality is a recent and more dynamic decisive issue in management thought. It helps to
control competitive position and consequently determines profits (Shabib.A, 2002). Therefore,
the ability of banks to going on and survive in the market depends on their ability to respond to
the requirements of change and interact with the output of it. As the customers' needs and wishes
are shaped and formed in the light of their economic, social and civilization conditions build
close relationship between the banks and customers. As a result, the bank can continue, survive
and increase their ability to create new services that fit within the increasing and changing needs
of the customers (N. Ragavan and R. Mageh, 2013).
Hence Service organizations, especially banks should work hard to find effective ways to counter
external changes in order to survive and enhance their effectiveness through activation of their
services and creation and development of new ones for their customers. Thus, importance of
achieving high levels of service quality lies in the number of economic and non-economic
benefits resulting from quality commitment and helps to eliminating its problems and major
causes of the problem (Mesay.S, 2013).
Service quality is important as banks working in Ethiopia put into lot of pressures there is need
to address the service quality of banks using SERVQUAL the most widely used models in
measuring service quality in the banking sector to evaluate the overall service quality of banks,
identify the major factors that affect the service quality and the dimensions of the model which
affect the customer satisfaction.

2
1.2 Statement of the problem
In banking sector offering quality services is very significant to create closer attachment with the
entire customers. The issue of quality service is becoming a global concern that requires
continuous improvement to fit unbalanced environment and changing customer needs. Good
services quality has power to create customer satisfaction and poor quality of services result
customer dissatisfaction and defection which lowers service quality performance (Shifera.B,
2011).
Many firms including banking industries begin to track their customers’ satisfaction through
measuring their level of service quality perceived by their customers. In order to satisfy
customers banking sectors should have to focus on effective customer services to meet their
needs. Customers of a bank rely on the services delivered to them. When service interactions are
not properly controlled and handled, or not even handled at all the outcome is poor perception of
service quality and customer dissatisfaction. Therefore, delivering quality service has become
one of the most important ways to gain superior customer satisfaction and increase bank
profitability (Kotler.P.B, 2003).
In the banking sector in which what is served to the customer is service crucial to be aware of the
factors that influence customer satisfaction. For this reason, it becomes an obligation for banks to
consistently measure customer satisfaction and to improve the quality of services that cause
dissatisfaction. Today, bank aim should be not only to attract new customers but also to ensure
that existing ones will keep being our customers. This can be achieved only by maintaining, and
even improving customer satisfaction. Given the fact that banking sector can survive as long as
they have customers and they can increase profitability, expectations of customers should be
consistently assessed and satisfied. Therefore, there is a constant need for examining the
expected and perceived quality of services especially in Ethiopia where many critics were
forwarded from different customers on the banks way of operation even if banks in Ethiopia
aggressively working in branch expansions, human resource development, introducing new
modern technology and striving to realize its vision of achieving country mission.
The SERVQUAL Analysis was employed in these study one of the most popular methods used
to measure quality of services. Finally, by addressing expectations and the understanding of

3
service in the banking industry, the applications performed to measure the service quality were
presented.
1.3 Objective of the study
1.3.1 General objectives
The general objective of the study was to evaluate impact of service quality on customer’s
satisfaction in banking sector.
1.3.2 Specific objectives
To investigate the relationship between service quality dimensions and customer
satisfaction in selected banks.
To measure the overall service quality in selected banks to delight customers.
To explain service quality (SERVQUAL) dimensions that are dominant in influencing
customer satisfaction in selected banks.
To identify the area of improvement in selected banks in Ethiopia.
1.4 Research questions
1 What kind of relation exists between service quality (SERVQUAL dimensions) and
customer satisfaction?
2 What overall service quality look like in selected banks?
3 Which SERVQUAL dimensions affect dominantly customer satisfaction?
4 Which dimension is done well among all dimensions of service quality in banking?
5 What are the areas do the banks work effectively for the future to enhance customer
satisfaction?
1.5 Scope of the study
The study focuses on service quality in banking sector Ethiopia and evaluates SERVQUAL
model service quality dimensions. Due to time and financial constraints this studies undertaken
in DBE, CBE, Awash, and Dashen banks, Addis Ababa.

4
1.6 Significance of the study
Findings of this study provided an insight to the nature of service quality in the banking sector
and inform the organizations to evaluate and review their service quality policies of banking
sector in Ethiopia. It also draws attention of other business organizations on what to do to satisfy
their customers through the application of SERVQUAL model. It can be used as reference for
other researchers.
1.7 Limitation of the study
Due to shortage of time and financial constraints study limited to Addis Ababa. There are some
limitations associated with this study. Firstly, the results obtained from this study cannot be
generalized to a wide range of similar situations. However, the above limitations are less
significant compared to the importance of carrying out this type of study. Such a study should be
carried out frequently in order to monitor service quality and find out satisfaction levels of
customers and hence make necessary adjustments in case of any weaknesses or strengths.
1.8 Organization of the Paper
The paper is prepared in five chapters. The first chapter dealt with introductory part consisting of
background of the study, statement of the problem, objectives of the study, methodology,
significance of the study and scope and limitation of the study.
In the second chapter of the paper where literature review is presented various theoretical
concepts that are related with service, quality, service quality dimensions, Service quality
measurement models and issues related with customer satisfaction and finally the conceptual
model are discussed.
The third chapter presents details of the research design, sample size determination, sampling
technique, data source and collection method, procedure of data collection, questionnaire and the
method of data analysis.
Results of collected data and interpretation of results are presented in the fourth chapter. The
final chapter presents summaries of findings, conclusions and possible recommendations.

5
Chapter two
2. REVIEW OF RELATED LITERATURE
2.1 Definitions of Service
Different scholars define service and its feature in different ways some of these are:
Services are actions, processes and performances provided by one entity or person for another
entity or person. It differs from product due to their intangibility, heterogeneity, simultaneous
production and consumption and perishes ability (Zeithaml.V.A, 2009). According to James
B.et.al, (1987), service is a serious of activities of more or less intangible nature that normally
but not necessarily take place in interaction between customers and service employees and, or
physical resource and, or system of the service provider which are provided as solution to
customer problems.
2.2. The Concept of Quality
Quality has become essential for firms not to make more profits and to survive competition.
Firms that operate under current competitive conditions should plan, implement and constantly
improve their quality policies (Cirpin. B.K. and Sarica. K,2014). Although the term quality is
quite widely used by practitioners and academics, there is no generally agreed definition of it,
since different definitions of quality are appropriate under different circumstances (Ibrahim.E,
2012). According to Juran.J.M and Godfrey.A.B,(1999), Quality is defined as fitness for purpose
and use as a predictable degree of uniformity and dependability with a quality standard suited to
the customer. The aim in quality is not only endow the product with superior features but also to
attain high levels of market and profitability performance. The concept of quality is defined in
ISO 9000:2005 as the set of characteristics of a good or a service oriented towards satisfying
defined needs. American Society of Quality Control (ASQC) in 2004 defines quality as the set of
characteristics that demonstrate the ability of goods and services to satisfy certain needs. In the
contemporary understanding of quality, it is not enough to only have good features. It is also
necessary to identify customers’ preferences to fully integrate them into goods and services
(Ryall.J and Kruithof.J, 2001). Simultaneously ensuring the efficiency of production and the
satisfaction of needs and expectations is key to competitiveness, profitability and sustainability.
In the case of similar services and prices, firms need to create strong brands in order to make

6
customers feel that they are different than other brands. It is known that brands created by those
firms that achieve distinctiveness and specialization are perceived as higher quality by customers
(Hoyle, 2007). The quality perception of customers depends not only on the product or the
service but also on the brands and firm’s image and recognition as well as previous experiences
with the product or brand (Nelsen.D and Daniels.S, 2007)
2.3 Concepts of Service and Service Quality
It has been observed in recent three or four decades that the importance of services within the
larger economy is rapidly increasing. While the growth rates in manufacturing industries have
been declining the share of the services industry has significantly grown bigger (Cirpin. B.K. and
Sarica.s,2014). The concept of service is defined differently by many different authors
Edvardson.Bo (2005), define service as activities, practices, processes and interaction that their
outcomes are not tangible, mostly abstract values such as comfort, joy, convenience.
Service quality can be defined as meeting the needs and expectations of the customers (Smith.S,
1998; Czepiel.J, 1990; Munusamy.J.et al., 2010). Service quality is the difference between
customer perceptions of the current service being provided by a given organization and customer
expectations of excellent service within that given industry (Parasuraman.A. et.al., 1985,1988).
Eshghi.A.et.al (2008), defined service quality as the overall assessment of a service by the
customers, while others assumed service to be of good quality when it consistently conforms to
customer expectations (Asubonteng.P. et.al., 2006). In addition, Parasuraman et.al (1985) stated
ten quality dimensions for measuring service quality; competence, courtesy, credibility, security,
access, reliability and responsiveness, understanding and tangible. Nevertheless, Parasuraman.A
et.al. (1988) shortened the dimensions of quality into five factors; reliability, responsiveness,
assurance, empathy and tangibles. Those five factors represent the base for SERVQUAL model
of measuring service quality in organization.
2.4 Customer Satisfaction and Service Quality
Customer satisfaction is the outcome felt by buyers who have experienced a company
performance that has fulfilled expectations are met and delighted when their expectations are
exceeded. Recently, discussion arose regarding whether satisfaction leads to quality or, whether
quality results in satisfaction. Many authors clearly indicated that service quality is as antecedent

7
of satisfaction. So, judgment of satisfaction is base to service quality. Others conclude that the
two concepts resemble each other quiet closely. Service quality is the key driver of usage rates
and customer retention. Superior service quality leads to more favorable behavioral intentions by
customer to stay/remain which results in ongoing revenues increased spending and referred
customers. On the on the other hand, inferior services quality will lead to unfavorable behavioral
intentions by customers leading to deceased spending, lost customers and additional costs to
attract new customers (Kottler.P,2003).
2.5. Customer Expectation of Service Quality
Expectations are reference points against which service delivery is compared only at beginning.
The level of expectation can vary widely depending on the reference point of the customer hold.
Customer expectations include several elements some of these are desired service, adequate
service, predicated services and zone of tolerance that falls between the desired and adequate
service levels (Lovelock and Jochen. W, 2004)
A. Desired and Adequate Service
The type of service customers hopes to receive termed desired service. It is a Wished-for level. It
is combination of what customers believe can and should be delivered in the context of their
personal needs. However, most customers are realistic and understand that companies can’t
always deliver the desired level of service due to this fact they have a threshold level of
expectations, termed adequate service which is defined as the minimum level of service that
customers will accept without being dissatisfied (Lovelock and Jochen.W, 2004).
B. Predicted Service
The level of service that customers anticipate receiving is known as predicted service which is
directly affected how they define adequate service on that occasion. If good service is predicated
the adequate level will be higher than if poorer service is predicted. Customers’ predications of
service may be situation specific (Lovelock and Jochen.W, 2004).
8
C. Zone of Tolerance
Making consistent service delivery is difficult across employees in the same company and even
by the same service employee from one day to another. The extent to which customers are
willing to accept this variation is called the zone of tolerance. Others look the zone of tolerance
as the range of service with in which customers do not pay explicit attention to service
performance. When service falls outside this range, customers will react either positively or
negatively. This proposes that satisfaction will result as long as customer perceptions of service
performance fall in the zone and also proposed that adequate service expectations are subject to
change, while desired service expectations are relatively enduring. In other words, high
involvement of customers generates a narrower zone of tolerance, while low involvement
generates a wider zone of tolerance (Lovelock and Jochen.W, 2004).
2.6 Service Quality Gaps
There are six major gaps in the service quality concept. According to Curry, 1999; Luk and
Layton, 2002, the three important gaps are more associated with the external customers, are
Gap1, Gap5 and Gap6; since they have a direct relationship with customers. the remaining three
gaps Gap2, Gap3 and Gap4 are from gap model developed by Parasuraman.A et al., 1988.
Gap1: Customers expectations versus management perceptions: as a result of the lack of
a marketing research orientation, inadequate upward communication and too many
layers of management (Curry, 1999; Luk and Layton, 2002).
Gap2: Management perceptions versus service specifications: as a result of inadequate
commitment to service quality, apperception of unfeasibility, inadequate task
standardization and an absence of goal setting (Parasuraman.A et al., 1988).
Gap3: Service specifications versus service delivery: as a result of role ambiguity and
conflict, poor employee-job fit and poor technology-job fit, inappropriate supervisory
control systems, lack of perceived control and lack of teamwork (Parasuraman.A et al.,
1988).
Gap4: Service delivery versus external communication: as a result of inadequate
horizontal Communications and propensity to over-promise (Parasuraman.A et al.,
1988).

9
Gap5: The discrepancy between customer expectations and their perceptions of the
service delivered: as a result of the influences exerted from the customer side and the
shortfalls (gaps) on the part of the service provider. In this case, customer expectations
are influenced by the extent of personal needs, word of mouth recommendation and past
service experiences (Curry, 1999; Luk and Layton, 2002).
Gap6: The discrepancy between customer expectations and employees’ perceptions: as a
result of the differences in the understanding of customer expectations by front-line
service providers (Curry, 1999; Luk and Layton, 2002).
2.7 Service Quality Measurement
2.7.1 Technical and functional quality model (Grönroos Quality Model)
Grönroos, (1984) defines service quality as the outcome of an evaluation process, where the
customers compare their expectations with the service they have received. The customers
perceive what customers receive as the outcome of the process in which the resources are used,
i.e. the technical or outcome quality of the process. In his model he differentiated between the
three components of service quality. The technical aspect (what service is provided), the
functional aspect (how the service is provided) and the image.
Technical quality represents what the customer actually receives from the total service as a result
of the process and is further known as the outcome dimension. Services are designed to produce
a somehow tangible outcome and therefore customers can think of the quality of services varying
according to the outcome received (Grönroos.C, 1984). Generally technical quality is what the
customers receive as the result of using the actual service (result dimension). Functional quality
dimension is how the customer receives the service and it concerns the process of delivering the
service. The process delivery is conceived of as the moment of truth because it encompasses the
crucial moment in the service experience where the business is truly exposed to the customer
through interaction with customers. Generally functional quality is how the service is provided
according to subjective perception of the customer and the customer evaluates the service
procedure (process dimension).

10
Figure 1:Gronoroos service quality model
2.7.2 GAP model
Parasuraman et al. (1985) proposed that service quality is a function of the differences between
expectation and perception performance along the quality dimensions. They developed a service
quality model (Figure 2) based on gap analysis. The various gaps visualized in the model are:
Gap 1 - Difference between consumer’s expectation and managements perceptions of those
expectations, i.e. not knowing what consumers expect.
Gap 2 - Difference between management’s perceptions of consumers’ expectations and service
quality specifications, i.e. improper service-quality standards.
Gap 3 - Difference between service quality specifications and service actually delivered i.e. the
service performance gap.
Gap 4 - Difference between service delivery and the communications to consumers about service
delivery, i.e. whether promises match delivery?
Gap 5 - Difference between consumers’ expectation and perceived service. This gap depends on
size and direction of the four gaps associated with the delivery of service quality on the
marketer’s side.
Expected
service
Perceived
service
quality
Service
quality
Image
Technical quality
What?
Functional quality
How?

11
According to this model, the service quality is a function of perception and expectations. This
exploratory research was refined with their subsequent scale named SERVQUAL for measuring
customer’s perceptions of service quality (Parasuraman.A et al., 1988). At this point the original
ten dimensions of service quality collapsed in to five dimensions: reliability, responsiveness,
tangibles, assurance (communication, competence, credibility, courtesy, and security) and empathy
which capture access and understanding/knowing the customers.
Figure 2: GAP model
Words of mouth
communication
Personal need Past experience
Expected
service
Perceived
service
Service delivery External
communication
Transformation of
perception in to service
quality specification
Management perception
of customer expectation
Gap 2
Gap 3
Gap 4 Gap 1
Gap 5

12
2.7.3 SERVQUAL model
The SERVQUAL model was developed by Zeithaml.V.A, (2009). to measures the quality of
service on five identified quality dimension. This scale is designed to measure the difference
between customers’ expectations and perception on a 22-item, representing five service quality
dimensions’ Reliability, Assurance, responsive, Empathy and Tangible.
1. Reliability: delivering on promises
Reliability is defined as the ability to perform the promised service dependably and accurate. In
the broadest sense, reliability means that the company delivers on its promises- promises about
delivery, service provision, problem resolution, and pricing. Customers want to do businesses
with companies that keep their promises, particularly their promises about the service out come
and core service attributes Zeithaml.V.A, (2009).
2. Tangibles: representing the service physically
Tangibles are defined as the appearance of physical facilities, equipment, personnel and
communication materials. Tangibles provide physical representations or images if the service
that customer, particular new customers will use to evaluate quality Zeithaml.V.A, (2009).
3. Responsiveness: being willing to help
Responsiveness is the willingness to help customers and provide prompt services Zeithaml.V.A,
(2009).
4. Assurance: inspiring trust and confidence
An assurance is defined as employees’ knowledge and courtesy and the ability of the firm and its
employees to inspire trust and confidence. This diminution is likely to be particularly important
for services that customers perceive as high risk or for services of which they feel uncertain
about their ability evaluate outcomes Zeithaml.V.A, (2009).
5. Empathy: treating customers as individuals
Empathy is defined as the caring, individualized attention that the firm provide its customers.
The essence of empathy is conveying, though personalized or customized service, customers are
unique and special and that their needs are understood. Customers want to feel understood by

13
and important to firms that provide service to them. Personal at small service firms often know
customers by name and build relationships that reflect their personal knowledge of customer
requirements and preferences. when such a small firm compete with larger firms, the ability to be
empathic may give the small firm a clear advantage Zeithaml.V.A, (2009).
The SERVQUAL model gives customers opportunity to offer their views regarding service
encounters. It enables management to look at the perceptions from both business and customers’
perspective. By closing the gaps, businesses can use the information generated to formulate
strategies to ensure customer expectations are fulfilled on a consisted basis. But SERVQUAL is
limited as it addresses only continuous improvement in a fast moving world where continuous
improvement alone may not ensure business success unless blended with service and product
innovation (Tan.K and Pawitra. T, 2001)
2.7.4 SERVPERF (Performance only model)
Cronin and Taylor, 1992 investigated the conceptualization and measurement of service quality
and its relationship with consumer satisfaction and purchase intentions. They compared
computed difference scores with perception to conclude that perceptions only are better predictor
of service quality. They argued on the framework of Parasuraman et al. (1985), with respect to
conceptualization and measurement of service quality and developed performance only
measurement of service quality called SERVPERF by illustrating that service quality is a form of
consumer attitude and the performance only measure of service quality is an enhanced means of
measuring service quality.
2.8 Banks in Ethiopia
The first modern banking bank in Ethiopia started in1905 marked Abyssinian bank. The financial
sector was dominated by foreign ownership until the Abyssinian Bank was nationalized in 1931
and renamed the Bank of Ethiopia, thereby becoming the first bank to be nationally owned in
Africa (Belay.G, 1990, Befekadu.D,1995). Further financial institutions were established during
the Italian five years occupations in the late 1930s. In 1943 the State Bank of Ethiopia was
founded, despite considerable British opposition (Befekadu.D,1995, for an interesting neo-
colonial story). Resistance to foreign control of the financial system has therefore been a

14
longstanding theme in Ethiopia's banking history, including arguments by the countries famous
economist in the last century GebreHiwot B. in 1920s and it still i s an influence today.
The State Bank of Ethiopia operated as both a commercial and central bank until 1963 when it
was dissolved to form the central bank, the National Bank of Ethiopia (NBE,2018), and the
Commercial Bank of Ethiopia (CBE). A number of other private financial institutions were also
established during the 1960s. The structure of Ethiopia's financial system therefore resembled
other African countries.
All of this changed with the overthrow of the monarchy of Haile Selassie in 1974. Under the
Derg all privately owned financial institutions including three commercial banks, thirteen
insurance companies and two non-bank financial intermediaries were nationalized on January
1975 (Befekadu.D,1995). The NBE continued its functions as a central bank, although the
directives of the planning system now circumscribed its activities. The NBE fixed both deposit
and loan rates, administered the allocation of foreign exchange and directly financed the fiscal
deficit (NBE 2018).
Currently the number of banks operating in Ethiopia remained at 18, of which 16 were private
banks. These banks opened 204 new branches during the first quarter of 2018 thereby increasing
the total number of bank branches to 4,461of the total bank branches, about 34.4 percent were
located in Addis Ababa and private Banks accounted for about 67.5 percent of the total bank
branches in the country (NBE, 2018).
Total capital of the banking system reached Birr 80.2 billion, of the total capital, private banks
accounted for 35.8 percent while that of public banks, namely Commercial Bank of Ethiopia and
Development Bank of Ethiopia, stood at 64.2 percent and 9.6 percent, respectively. The banking
sector disbursed about Birr 22.8 billion in new loans, registering a 2 percent annual decline. Of
the total new loan disbursement, the share of public banks was 33.1 percent and that of private
banks 66.9 percent (NBE, 2018).
According to NBE (2018), the top ten banks in Ethiopia are Commercial bank of Ethiopia,
developmental bank of Ethiopia from government banks and private banks Awash bank, Dahsen

15
bank, Cooperative bank of oromiya, Abissiniya bank, Wegagen bank, Zemen bank, NIB bank
and United bank are listed. (NBE,2018).
Commercial Bank of Ethiopia (CBE) is one of the leading banks in Ethiopia established in
1963.It operates a network of 1,250 branches and 1,501 ATMs across Ethiopia and total assets
ETB 485.7 billion. Development Bank of Ethiopia, formerly known as the Agricultural and
Industrial aims to promote Ethiopia’s economic development by financing agriculture,
commerce, industry, and manufacturing activities and oversees around 32 branches throughout
the country and total assets ETB 52.17 billion (NBE, 2018). Awash Bank is the first private
commercial banks in Ethiopia established in 1994. The bank manages more than 346 branches
trough out the country and total assets ETB 42 billion. Dashen Bank was established in 1995. It
is the largest private banks in Ethiopia. the bank oversees 196 branches, 220 ATMs, nine forex
bureaus, and 958 POS terminals located throughout the country and total assets of ETB 34.62
billion (NBE, 2018).
Bank of Abyssinia established in 1996 bank operates a network of 233 branches and sub-
branches, 114 ATMs, and 200 POS terminals and total assets ETB 25.32 billion. United Bank
provides incorporated as a share company in 1998. The bank operates a network of 202
branches and 19 sub-branches and total assets ETB 21.9 billion. Nib International Bank founded
in 1999. It manages 130 branches with total assets of ETB 21.1 billion. Wegagen Bank
established in 1997.The bank oversees 211 branches and total assets ETB 20.95 billion (NBE,
2018).
Cooperative Bank of Oromia commenced banking operations in 2005, focusing on cooperatives
and agro-based businesses in Ethiopia more than 289 branches and employs 3,138 agents across
the country and total assets ET B10.69 billion. Zemen Bank commenced its operations in 2008
was established in 2006 with total assets of ETB 9.67 billion (NBE, 2018).

16
2.9 Conceptual frame work
Conceptual framework summarizes the idea obtained from past literature for this study area.
Thus, purpose of this study was to examine how tangibility, reliability, responsiveness,
assurance, empathy independent variables can affect the dependent variables customer
satisfaction in selected Ethiopian banks using SERQUAL model.
Figure 3: Conceptual frame work of study adopted from Parasuraman et al., 1988
Customer
Satisfaction
Reliability
Empathy
Assurance
Responsiveness
Tangibility
Service quality Dimensions

17
Chapter three
3. Research Methodology
3.1 Research design
The study areas were top four banks in Ethiopia; Commercial bank and Developmental bank of
Ethiopia were from government bank and Awash and Dashen from the private bank.
Quantitative approach was used to conduct this study. It is the major approaches being used
today in the social and human science. The research design was descriptive type that involves
describing, organizes, tabulates and depicts collected data.
3.2 Target Population
Target population of this study were customers of top four banks in Ethiopia namely Andent
branch of commercial bank of Ethiopia, Development bank of Ethiopia head office, Kasanches
branch of Awash bank and Haile G/Selassie branch of Dashen bank. The target populations for
this study were customers available during data collection time period from July 1 to 30 2019.
3.3 Sample Size determination and Sampling technique
Total numbers of customers of selected banks are 70,701 among these 56,709 were form CBE,
2,946 from DBE, 8,285 from Awash and Dashen 2,761 customers. The sample size was
determined by using sample size determination formula (Equation1) developed by Cochran
(1963). Accordingly, a total of 382 customers have been selected proportion formula sample size
were determined for each selected bank as shown in table1. Using convenience sampling
methods samples were selected from the available population. It’s impossible to carry out
probability sampling because there is no point in time during which all customers are available
due to different reasons and it is not possible to contact everyone who may be sampled.

18
………. Equation 1
where no= is the sample size, Z2 is abscissa of the normal curve, e the desired level of precision, p
is the estimated proportion of an attribute that is present in the population, and q is 1-p.
( ) ( )( )
( )
( )
……………Equation 2
Where no is the sample size and N is the population
( )
n=382
Table 1: sampling proportion for the selected banks
S.no Banks Number of active customers
in each bank
Percentage
proportion
Sample
size
1 CBE Andent
branch
56709 80.2% 306
2 AIB Kasanches
branch
8285 11.7% 45
3 DBE head office 2946 4.2% 16
4 Dashen bank
Haile G/Selassie
branch
2761 3.9% 15
Total 70701 100 382
Source: Survey result (2019)
3.4 Source of Data and Method of Data Collection
For the purpose of this study primary data were collected through questioner. It was prepared in
English and interpreted to Amharic before they were distributed. The questioner consists of 22

19
items that indicated the customers’ assessments of the service provided by the bank adopted from
SERQUAL model by Cronin and Taylor’s (1992). The items were measured using Likert scale
with five response categories (strongly agree, agree, neither agree nor disagree, disagree and
strongly disagree). The Likert scale method was refereed to make the questions interesting to the
respondents and to insure maximum response rate. Customer satisfaction had 5 items that were
measured in five scales with response of highly satisfied, satisfied, neutral, dissatisfied and
highly dissatisfied. The data collection was done using self-administered questionnaire to be
filled by the bank’s customers. Total of 382 questioners were distributed among them properly
filled 334 questionnaires were taken for analysis. Response rate was 87.4 %.
Table 2: Response rate of collected questioner
S.no Banks Sample
distributed
Sample
response
Response
rate
1 CBE Andent
branch
306 262 85.6%
2 AIB Kasanches
branch
45
42
95.5%
3 DBE head office 16 16 100%
4 Dashen bank
Haile G/Selassie
branch
15 14 93.3%
Total 382 334 87.4%
Source: Survey result (2019)
3.5 Methods of Data Analysis
Data collected were analyzed using statistical software packages SPSS.V.25 before the main
analysis reliability test was done for the collected data Cronbach’s alpha was used in this study to
assess the internal consistency or reliability of the instrument (questionnaire).
The descriptive statistical analysis results were presented by tables, frequency distributions and
percentages to give a condensed picture of the data. it was done through summary of statistics,

20
which includes the means and standard deviations values which are computed for each variable
of the study. Pearson’s correlation coefficient was used to determine the relationships between
service quality dimension (Tangible, reliability, responsiveness, assurance, empathy) and
customer satisfaction. Multiple regression analysis was used to investigate the effect of service
quality dimensions (Tangible, reliability, responsiveness, assurance, empathy) and customer
satisfaction.
The equation of multiple regressions to this study was generally built around two sets of variable,
namely dependent and independent variables. The basic objective of using regression equation
was used for effective description, understanding and prediction of the stated variables.
Regress customer satisfaction on the service quality dimensions
X= β1 + β2Y2 + β3Y3 + β 4Y4 + β 5Y5 + β6Y6
Where X is the dependent variable- customer satisfaction, Y2= responsiveness, Y3=assurance,
Y4=empathy, Y5= reliability and Y6=Tangible were the explanatory variables (or the regresses).
β1 is the intercept term- it gives the mean or average effect on Y of all the variables excluded
from the equation, although its mechanical interpretation is the average value of Y when the
stated independent variables are set equal to zero. β2, β3, β4, β5 and β6 refer to the coefficient of
their respective independent variable which measures the change in the mean value of Y, per unit
change in their respective independent variables.

21
Chapter four
4. Result and Discussions
4.1. Demographic Information of the Respondents
The first part of the questionnaire requested a limited amount of information related to personal
and demographic characteristics of respondents. Demographic variables of respondents were
summarized and described in the subsequent tables and pie chart. These variables include sex,
age, marital status and educational level.
Table 3: Demographic characteristic of respondents
Demographic
factor Frequency Percent
Gender male 212 63.5
female 122 36.5
Total 334 100.0
Age 18-29 years old 122 36.5
30-39 years old 125 37.4
40-49 years old 56 16.8
50 years old and above 31 9.3
Total 334 100.0
Marital Status Single 140 41.9
Married 179 53.6
Divorced 15 4.5
Total 334 100.0
Source: Survey result (2019)
As the above table about 63.5% respondents were male and 36.5% the respondents were female.
In addition to the gender demographic distribution of the respondents, it is possible to see their
proportion in terms of as their age. The largest age group of participant was 30-39 years age
group which accounted 37.4%. The second (36.5%) was 18-29 years age group. The third
(16.8%) 40-49 years age group and the remaining 9.3% of the respondents were above 50 years
old age group. marital status of respondents indicated that 41.9 % were single, 53.6% were
married and the remaining 4.5% of the were divorced

22
Figure 4: Educational level of respondents
Majority of the respondents were first degree holder 47.31%followed by diploma holder
(21.56%) and secondary school (18.26%) as shown in Figure 4.
4.2 Reliability Test
To measure the internal consistency of the questioner Cronbach‟s alpha coefficient reliability
test was used. The coefficient has to be between 0 and 1 to label as reliable. The internal
consistency of the item is better as the result approaches to 1, which means all the items
measures the same variable i.e. over all service quality and customers’ satisfaction.

23
Table 4: Cronbach’s Alpha (Reliability analysis)
Dimensions Coronbach’s
alpha value
Number
of items
Responsiveness 0.736 4
Assurance 0.728 4
Empathy 0.798 5
Reliability 0.776 5
tangibility 0.766 4
Source: Survey result (2019)
The highest cronbach alpha coefficient was 0.798 for empathy dimension and lowest 0.728
assurance dimension. Cronbach alpha for reliability, responsive and reliability was 0.736,
0.776and 0.766 tangibility. The overall Cronbach’s alpha for the independent variables
(Tangibility, Reliability, Responsiveness, Empathy and Assurance) was found to be 0.937. As
described by Field, 2005 and Muijs.D, 2010, the values of Cronbach’s alpha more than 0.7 is
good though alpha values in this study were above 0.7 therefore questioners had very good
reliability.
4.3 Descriptive Analysis of Service Quality Measurement
To measure the customers’ perception of the service quality provided by banks, SERVQUAL
model was used in this study. SERVQUAL directly measures the customer’s perception of
service quality. For all the service quality dimensions (Tangibles, Reliability, Responsiveness,
Empathy and Assurance), the mean score has been computed. The following tables represent the
results.
4.3.1 Responsiveness
The mean the Employees responds to requests quickly for the customers was greater with mean
of 3.934 followed by employees are willing to help you mean was 3.904; the employees tells you
exactly when services will be provided mean was 3.889 and Employees give prompt service
mean was 3.850 as shown in table 5.

24
Table 5: Responsiveness items mean value
Source: Survey result (2019)
4.3.2 Assurance
Assurance is the knowledge and courtesy of employees and their ability to convey trust and
confidence so that the customer feels he or she is in courteous, able and competent hands. The
mean score of the item listed as you feel safe in your transactions with bank was higher (3.943);
the employees has product knowledge of bank information mean of 3.916; The employees are
trustworthy mean was 3.895 and the employees speak with you by using an appropriately
address forms was 3.889 (table 6).
Table 6: Assurance items mean score
No Assurance Mean
1 The employees has product knowledge of bank
information
3.916
2 The employees speak with you by using an
appropriately address forms
3.889
3 The employees are trustworthy 3.895
4 You feel safe in your transactions with bank. 3.943
Source: Survey result (2019)
No Responsiveness mean
1 The employees tells you exactly when services
will be provided
3.889
2 The employees are willing to help you 3.904
3 Employees respond to requests quickly 3.934
4 Employees give prompt service 3.850

25
4.3.3 Empathy
Empathy is providing caring and individualized attention to customers to make them feel they
are receiving caring services and individualized attention. The mean score of employees are able
to communicate effectively with you was 3.898; the employees knows your specific needs and
Bank has operating time convenient to you were 3.847; The employees shows personal attention
to you was 3.838 and Employees pass transactions in a caring manner 3.811 as shown in table7.
Table 7: Empathy dimension items mean score
No Empathy Mean
1 The employees are able to communicate effectively
with you
3.898
2 The employees shows personal attention to you 3..838
3 The employees knows your specific needs 3.847
4 Bank has operating time convenient to you 3.847
5 Employees pass transactions in a caring manner 3.811
Source: Survey result (2019)
4.3.4 Reliability
Reliability is the ability to perform the promised service dependably, accurately and consistently.
The mean score of employees perform the service right at the first time was 3.925 followed by
the employees provide you accurate information 3.880, the employees can provide you the
services as promised 3.856, Bank insists on error-free and accurate records 3.850 and the
employees offer you some help 3.832.

26
Table 8: Reliability dimension mean score
No Reliability mean
1 The employees can provide you the services as
promised
3.856
2 The employees provide you accurate information 3.880
3 The employees perform the service right at the first
time
3.925
4 The employees offer you some help 3.832
5 Bank insists on error-free and accurate records 3.850
Source: Survey result (2019)
4.3.5 Tangibility
Tangibility refers to the appearance of physical facilities, equipment, personnel and
communication materials. Accordingly, the mean score of the employees dress properly was
3.994; for was the employee provides the services with smiling 3.937; Bank’s physical facilities
are visually appealing and has modern-looking equipment 3.931 and the employees have
attractive appearance 3.892 and as it can be seen from the table from the four questions asked
under tangibility the highest mean score is obtained employees dress properly agree 3.994. The
lowest mean score is obtained in the statement which asks the employees have attractive
appearance i.e. elegant, smart, etc.
Table 9: Tangibility dimension mean score
Tangibility Perception
1 The employees dress properly 3.994
2 The employees have attractive appearance i.e.
elegant, smart, etc
3.892
3 The employee provides the services with
smiling
3.937
4 Bank’s physical facilities are visually appealing
and has modern-looking equipment
3.931
Source: Survey result (2019)

27
4.4 Overall SERVQUAL dimensions
SERQUAL model was used in this paper to measuring respondents’ perception towards banks
service delivery quality by using five service quality dimensions having 22 items. To measuring
respondents’ perception of banks over all service quality dimensions and their satisfaction level
mean score was used.
Table 10: Overall Mean and standard deviation of Service Quality measurements
Mean Std. Deviation
Responsiveness 3.8945 .60489
Assurance 3.9109 .59946
Empathy 3.8485 .62360
Reliability 3.8689 .59683
Tangibility 3.9386 .66043
Customer Satisfaction 3.9790 .56964
Source: Survey result (2019)
The above table showed that respondent’s perception towards service quality dimensions, over
all service quality and customer satisfaction. As clearly seen in the table 10, the perception of
respondents on tangibility, 3.938 mean score which was better than other service quality
dimensions, assurance and responsiveness had mean score of 3.910, and 3.894 respectively.
However, customers’ perception on reliability and empathy are relatively the least perceived
value from the services quality dimensions with mean score of 3.868 and 3.848respectively.

28
4.5 Descriptive analysis of customer satisfaction items
Respondents were asked to rate level of their satisfaction on Liker’s 5-point Scale of five
customer satisfaction measurements. The responses of the question on respectful behavior of the
bank staffs indicated that only 57.5% respondents were satisfied and 23.1 % respondents were
highly satisfied (Table 11).
Table 11: customer’s satisfaction percentage on respectful behavior of the bank staffs
Source: Survey result (2018)
The responses of the question on the communicative item of were shown on table12.The and
59% and 24.9% of respondents were satisfied and strongly satisfied with the communicative
respectively.
Table 12: customer’s satisfaction percentage with the communicative
Frequency Percent Valid
Percent
Cumulative Percent
strongly
dissatisfied
1 .3 .3 .3
dissatisfied 12 3.6 3.6 3.9
Neutral 41 12.3 12.3 16.2
satisfied 197 59.0 59.0 75.1
strongly
satisfied
83 24.9 24.9 100.0
Total 334 100.0 100.0
Source: Survey result (2019)
Frequency Percent Valid
Percent
Cumulative
Percent
dissatisfied 20 6.0 6.0 6.0
Neutral 45 13.5 13.5 19.5
satisfied 192 57.5 57.5 76.9
strongly
satisfied
77 23.1 23.1 100.0
Total 334 100.0 100.0

29
The following table 13 showed response of respondents on performance of the employee of the
bank. Satisfaction of the respondents indicated that only 26.6%were highly satisfied and over
half of the customers were (58.4%) were satisfied and about one fourth of customers (26.6%)
were highly satisfied.
Table 13: customer’s satisfaction percentage with the performance of the employee of the bank
Source: Survey result (2019)
The responses of the question asked on various rang of service of bank were shown on table 14.
The overall satisfaction of the respondents indicated that only 22.8%were highly satisfied and
58.7% were satisfied on various rang of service of bank.
Table 14: Customer’s satisfaction percentage with various rang of service of bank
Frequency Percent Valid
Percent
Cumulative
Percent
strongly
dissatisfied
5 1.5 1.5 1.5
dissatisfied 17 5.1 5.1 6.6
Neutral 40 12.0 12.0 18.6
satisfied 196 58.7 58.7 77.2
strongly
satisfied
76 22.8 22.8 100.0
Total 334 100.0 100.0
Source: Survey result (2019)
Frequency Percent Valid
Percent
Cumulative
Percent
strongly
dissatisfied
3 .9 .9 .9
dissatisfied 19 5.7 5.7 6.6
Neutral 28 8.4 8.4 15.0
satisfied 195 58.4 58.4 73.4
strongly
satisfied
89 26.6 26.6 100.0
Total 334 100.0 100.0

30
4.6 Overall Customer Satisfaction
In order to generate the overall score of customer service, respondents were asked to rate level of
their satisfaction on Liker’s 5-point Scale. The responses of the question were shown on table 15.
The overall satisfaction of the respondents indicated that 65% were satisfied, 15.3% were neutral
and 14.1% were highly satisfied and were and with service delivery of bank.
Table 15: customer’s satisfaction percentage with the bank services
Frequency Percent Valid
Percent
Cumulative
Percent
strongly
dissatisfied
1 .3 .3 .3
dissatisfied 18 5.4 5.4 5.7
Neutral 51 15.3 15.3 21.0
satisfied 217 65.0 65.0 85.9
strongly
satisfied
47 14.1 14.1 100.0
Total 334 100.0 100.0
Source: Survey result (2019)
Table 16: Descriptive statistics of all over customer satisfaction
Source: Survey result (2019)
The mean score of overall customer the satisfaction was 3.979(79.58%), minimum was 1.8 and
maximum of 5.
Customer Satisfaction
Mean 3.9790
Median 4.2000
Mode 4.20
Std. Deviation .56964
Minimum 1.80
Maximum 4.80

31
4.7. Correlation Analysis between Service Quality Dimensions and
Customer Satisfaction
Table 17: correlation of SERVQUAL dimensions and customer satisfaction
Source: Survey result (2019)
To check the relationship between service quality dimensions and customer satisfaction
Pearson’s correlation coefficient (r) was used. it measures the strength and direction of a linear
relationship between two variables. Values of Pearson’s correlation coefficient value ranges
between -1 and +1 (Dancey.C & Reidy.J, 2004). The above table 17 indicated that all five
dimensions of service quality and customer satisfaction had significant positive relationship. The
highest correlation was observed between reliability and customer satisfaction (0.678) next by
responsiveness (0.668), assurance (0.664) and the remaining dimension tangibility (0.66) and
empathy (0.617) respectively.
The inter correlation between the service quality dimensions we can see that there is a positive
and significant relationship which implies that a change made in one of the service quality
dimension will positively motivate the other service quality dimension. The highest inter
correlation is between reliability and assurance (r=0.794) followed by assurance and
Correlations
Responsiveness Assurance Empathy Reliability Tangibility Customer
Satisfaction
Responsiveness 1
Assurance .699**
1
Empathy .653**
.775**
1
Reliability .714**
.794**
.753**
1
Tangibility .643**
.726**
.680**
.747**
1
Customer
Satisfaction
.668**
.664**
.617**
.678**
.662**
1
**. Correlation is significant at the 0.01 level (2-tailed).
32
empathy(r=0.775), reliability and tangibility (r=0.747), tangibility and assurance (0.726) and
reliability and responsiveness (0.714).
The correlation magnitudes of customer satisfaction with all service quality dimensions were
greater than 0.5 which indicated that the dimensions had strong relationship between customer
satisfactions (Dancey.C& Reidy.J, 2004). it proves that reliability as a determinant factor for
customer satisfaction and service quality followed by responsiveness. This indicates
improvement on reliable and responsiveness had significant effect on customer satisfaction
levels. Even if, assurance and tangibility had relatively less correlation improving these
dimensions has also effect on customer satisfaction. The study entitled on the impact of service
quality on customer satisfaction the case of commercial bank of Ethiopia by Betelhem.T in 2015
find out that responsiveness and reliability had higher significant effect on customer satisfaction.
This research finding was similar to Yeshitila (2018) reliability have a higher coefficient and
strong relationship with customer satisfaction. However, responsiveness had lower coefficient
value.
The study of Girma.B. (2015) on assessment of service quality and its influence on customer
satisfaction: the case of Oromia International Bank showed that all service quality dimensions
have positive and significant relationship with customer satisfaction. The result of the study
made by Meron.M (2015) revealed that customers were most satisfied by assurance followed by
responsiveness. All service quality dimensions have positive and significant relationship with
customer satisfaction. Tizazu.K in 2013 conducted research titled the effect of customer service
quality on customer satisfaction on private banks indicated that customers were most satisfied
with assurance and tangibility. There were a positive and significant correlation between the four
service quality dimensions (tangibility, reliability, assurance and empathy) and customer
satisfaction. It also indicated that all service quality dimensions have positive and significant
effect on customer satisfaction like the result obtained from this study.
The research made by El Saghier.N and Nathan.D(2013), on service quality dimensions and
customers satisfaction of banks in Egypt depicted that customer service was significantly
affected by the four service quality dimensions; reliability, responsiveness, assurance and
empathy. But, tangibility did not have significant impact on service quality unlike this research
finding. The study made by Al-Azzam.A.F, (2015) entitled the impact of service quality

33
dimensions on customer satisfaction on Arab bank in Irbid city, Jordan indicated that Jordanian
banking services was significantly affected by tangibility, reliability, responsiveness, empathy
and security and customers‟ perception was highest for reliability. To conclude, as observed
from the above studies, most of the service quality dimensions have positive and significant
correlation with customer satisfaction. However, the dominant service quality dimension differs
from study to study.
4.8. Linearity Test
Linearity refers to the degree to which the change in the dependent variable is related to the
change in the independent variables. To determine whether the relationship between the
dependent variable customer satisfaction and the independent variables, Reliability, Assurance,
Tangibility, Empathy and Responsiveness is linear; plots of the regression residuals through
SPSS software was used.
Figure 5: Normal point plot of standardized residual

34
The p plot of residuals reveals no large deviation in the spread of the residuals as we look from
left to right on the figure and it is almost all residuals lay on the linear straight line therefore this
tells us the relationship between the independent variables and the dependent variable (customers
satisfaction) was linear as shown in figure5.
4.9 Normality Test
The assumption of normality of disturbances was very much needed for the validity of the results
for testing of hypothesis, confidence intervals and prediction intervals. Small departures from
normality may not affect the model greatly but gross non normality is more serious. So data
would be distributed symmetrically around the center of all scores. As such, drew a vertical line
through the center of the distribution then it should look the same on both sides. This is known as
a normal distribution and is characterized by the bell-shaped curve.
The normality tests for this study as shown in figure 6 the kurtosis was close to 3, skewness close
to 0. As figure displays some standard residuals are a little bit far away from the curve, many of
the residuals are fairly close more to the curve and the histogram is bell shaped. This shape
basically implies that the majority of scores lie around the center of the distribution (so the
largest bars on the histogram are all around the central value as shown in figure 6. Therefore, this
indicates that the residuals or (disturbance or errors) are normally distributed.
Figure 6: Frequency Distribution of Standardized Residual

35
4.10 Multiple Regression Analysis
Regression is statistical process used to analyze the relationship between dependent variable and
independent variable. Regression analysis used to know the dependent variable changes when
any one the independent varied. The other independent variables are hold fixed.
Multiple regression analysis has multicollinearity (collinearity) characters that check weather one
variable can be linearly correlates with the other two or more predictor variables. It explains
how much independent is dependent to another independent variable in the model. Test of
multicollinearity is detected by tolerance and variance inflation VIF (George,D and
Mallery.P.,2003).
The formula used in multicolloninearity is 1-R for each variable result of less than 0.1 means the
variable is highly correlated with other variable and multicollinearity is existed between variable
and variance inflation factor (VIF=1/(1-R)) above 10 existences of multicollinearity between
variable. Therefore, in this results no multicollinearity problem when the tolerance value and
VIF are above 0.1 and below 10 respectively (Chris.B. 2014).
Table 18: multicollinearity analysis
Source: Survey result (2019)
Model Collinearity Statistics
(Constant) Tolerance VIF
Responsiveness .428 2.337
Assurance .268 3.725
Empathy .337 2.972
Reliability .265 3.767
Tangibility .379 2.640

36
In this study multiple regression analysis was used to test effect of service quality dimensions on
customer satisfaction. Table 18 shows the results of multiple regressions analysis correlation
coefficients (R2) which tells the level of variance in the dependent variable (customer
satisfaction) that is explained by the model.
Table 19: R2and Adjusted R
2 values of multicollinearity analysis
Model R R
Square
Adjusted R
Square
Std. Error of
the Estimate
Durbin-
Watson
1 .754a .568 .562 .37718 1.992
Source: Survey result (2019)
Table 20: Avova of multicollinearity analysis
ANOVAa
Model Sum of
Squares
df Mean
Square
F Sig.
1 Regression 61.389 5 12.278 86.301 .000b
Residual 46.664 328 .142
Total 108.053 333
Source: Survey result (2019)
The results of multiple regressions table 18 showed that there was positive and statistically
significant relationship between the independent variables (tangibility, reliability,
responsiveness, empathy and assurance) and the dependent variable (customer satisfaction) with
p<0.01. R square value showed the degree to which overall customer satisfaction (dependent
variable) is explained by the model (services quality dimensions). the aggregate of the
independent variables R square value was 0.568. This implies that customer satisfaction is
impacted or explained by service quality dimensions to the extent of 56.8%. From the ANOVA
table it has been determined that Sig. was .000 which confirms service quality dimensions have a
positive and significant effect on customer satisfaction.

37
Table 21: Multiple Regression Analysis
Source: Survey result (2019)
Table 21 shows the contribution of each independent variable to the model and its statistical
significance. The Beta value shows the contribution of each independent variable on the
predicted variable (dependent variable). in this research empathy and assurance has no
significant effect on customer satisfaction since the p-value was 0.354 and 0.063 is greater than
the significant value 0.05. like this research in Betelhem.T, (2015) find out empathy did not have
impact on customer satisfaction with regard less of their magnitude Dejene.G, (2017),
Meron.M,(2017), Yeshitila.T,(2018), find out all SERVQUAL service quality dimensions had
significant impact on customer satisfaction similar to the finding of this research and showed
some dissimilarity with this finding, The 0.258 beta coefficient for responsiveness P 0.079 level
of significance. Responsiveness positively affects customer satisfaction a. Hence one percent
change in responsiveness when all other independent variables are kept constant increases
customer satisfaction by 25% though the higher on responsiveness service the higher will be the
customer satisfaction.
The 0.196 beta coefficient for tangibility in the table shows that at P 0.00 level of significance;
tangibility positively affects customer satisfaction. Hence a one percent change in assurance
when all other independent variables are kept constant increases customer satisfaction by 19.6 %.
Model Unstandardized
Coefficients
Standardized
Coefficients
t Sig.
B Std.
Error
Beta
1 (Constant) .901 .151 5.983 .000
Responsiveness .258 .052 .274 4.945 .000
Assurance .124 .067 .131 1.866 .063
Empathy .053 .057 .058 .928 .354
Reliability .158 .067 .165 2.349 .019
Tangibility .196 .051 .227 3.850 .000

38
Reliability have a beta coefficient of 0.158 with p value of 0.019, empathy positively affects
customer satisfaction. When there is a one unit change in reliability when all other independent
variables kept constant increase customer satisfaction by15%.
As result in table 21 above indicates that at 95% confidence interval only all independent
variables; have a statistically significant effect. The variables are reliability, assurance
responsiveness, empathy and tangibility dimension have significant influence on customers’
satisfaction. From the above regression analysis empathy and assurance has no significant effect
on customer satisfaction since the p-value is 0.354 and 0.063 is greater than the significant value
0.05; and the regression analysis result the most significant service quality measurement is
responsiveness, reliability and tangibility since the p-value 0.000, 0.019 and 0.000 less than the
significant value 0.05, the coefficient is positive.
As a result, the Fitted Regression Model for this study was
Customer satisfaction = 0.901 +0.258Responsiveness +0.124Assurance+ 0.053Empathy
0.158Relability +0.196Tangebility

39
Chapter five
5. Summary of Findings, Conclusion and Recommendations
5.1 Summary of Findings
The main focus this study was to find out the impact of service quality on customer satisfaction
in the case of selected banks located in Addis Ababa. The 22 service quality item of the
SERVQUAL dimensions were used to investigate the relationship between the service quality
dimensions and customer satisfaction. The data obtained from the respondents was analyzed
using SPSSV.25.
The result of the background information of respondents indicated that the majority of the
respondents were male (63.5%) aged in the range of 18 to 29 (36.5%) and 30 to 39 (37.4%).
Regarding the education background 47.31% were first degree holder and 21.56 % respondents
were diploma holder.
The mean result indicated tangibility dimension had higher mean (3.94) followed by assurance
dimension (3.91) and responsiveness dimension (3.89) of service quality.
The mean score of the satisfaction was 3.979(79.58%) out of maximum of 5 indicated that there
was opportunity for improving in the level of satisfaction.
The finding from the correlation result reveals that there was a positive and significant
relationship between the service quality dimensions and customer satisfaction. Reliability had
highest correlation with customer satisfaction than others. the inter correlation was higher
between reliability and assurance.
Having tested the relationship of all independent and dependent variables, it was checked that
there was no multi-collinearity problem among the predictor variables with tolerance value more
than 0.1 and VIF value less than 10.
From the regression analysis empathy and assurance had no significant effect on customer
satisfaction since the p-value was 0.354 and 0.063. the most significant service quality
measurement was responsiveness followed by reliability and tangibility at p-value of 0.000,

40
0.019 and 0.000 respectively. In addition, the finding from the regression result indicated that all
the service quality dimensions have a positive impact on customer satisfaction. reliability was
relatively higher service quality dimension that affects customer satisfaction.
the R square value showed that 56.8% of variation in customer satisfaction was explained by the
service quality dimensions.
5.2 Conclusion
The overall mean of customer satisfaction was 3.979 (79.58%) customer satisfied the remaining
percent were not satisfied. These indicated that banks need to work more on value add to
improve service quality and to satisfy customer. In award where client expectation increases
continuously it was necessary to follow this expectation closely and promptly take the essential
step to meet them. Banks that target client dependency should always increase their service
quality.
Pearson’s correlation result also indicated that there was a positive relationship between the
service quality dimensions (reliability, tangibility, responsiveness, assurance and empathy) and
customer satisfaction. Among five dimensions’ reliability was highly correlated with customer
satisfaction than the other dimensions. The correlation was observed between reliability and
customer satisfaction (0.678) next by responsiveness (0.668), assurance (0.664) and the
remaining dimension tangibility (0.66) and empathy (0.617) respectively.
the correlation between independent variables highest correlation was found between reliability
and assurance(r=0.794) followed by assurance and empathy (0.775) while the lowest relationship
was found between reliability and responsiveness (0.714). Thus the change in one of the service
quality dimension will positively affect the other service quality dimension.
The overall regression result 56.8% of variation in customer satisfaction was explained by the
service quality dimensions which imply that 43.2% of variation in customer satisfaction was
explained by other variables. The regression also indicated that reliability tangibility,
responsiveness has significant impact but assurance and empathy are not significant.

41
5.3 Recommendations
Based on the results find out from research the following suggestion are given to increase service
quality
The bank should have strong emphasis on responsiveness service quality dimension that
includes willing to serve customer, respond request quickly and give prompt service in
maintaining and improving the service quality to provide service which deliver.
The bank responsible body should focus on reliability service quality dimension
specially on services as promised, give accurate information, give service right at the first
time, help customer properly and error-free and accurate records items.
The bank should have to work on tangibility service quality which focus on employees
dressing, services with smiling and bank’s physical facilities are visually appealing and
has modern-looking equipment
The satisfaction level result showed that 0.3% were strongly dissatisfied 5.4% were
dissatisfied and 15.3% were neutral. one fifth of respondents were not satisfied with
service provided by banks though the banks responsible body should have to exert its
maximum effort to change this result for customers are key divers of its performance.
Current environment services preference of customers and their demands keeps on
changing at a rapid speed and the bank should operate proactively in meeting its
customers’ needs and preferences. Accordingly, the bank should have to customer centric
and management’s focus area should emanate from the customer’s need
The banks customer service managers should have to undertake assessment to find out
the gap on their service delivery and improve customer satisfaction.
Due to the increasing competition in banking sector, customer service is an important part
then bank managers and responsible employees should have to arrange training on
customers handling techniques to improve customer satisfaction with respect to service
quality.

42
References
Al-Azzam,A.F. (2015) The Impact of Service Quality Dimensions on Customer
Satisfaction: A Field Study of Arab Bank in Irbid City, Jordan European Journal of
Business and Management: ISSN 2222-1905 (Paper) ISSN 2222-2839
Anderson, E.W., Fornell, C., and Lehmann, D.R. (1994). Customer Satisfaction,
MarketShare and Profitability: Findings from Sweden. Journal of Marketing.
Befekadu.D.(1995). Africa in the Year 2025: Getting there from here
Belay,G.(1987).Currencyandbanking:Ethiopia.fromhttp://www.ethiopianreview.com/arch
ive/164 095842808211102_ethiopia.html
Betelhem T. (2015). The Impact of Service Quality on Customer Satisfaction: The Case
of Commercial Bank of Ethiopia M.sc thesis St. Mary’s University Addis Ababa.
B. Edvardson (2005). Service Quality: Beyond Cognitive Assessment. Managing Service
Quality, 15, 2, 127-131
Chris, B. (2014). Introductory Econometrics for Finance 3rd
ed Cambridge University
Press www.cambridge.org
Cirpin, B.K. and Sarica, K. (2014). Measurement of service quality in banking industry: a
case study from Turkey, Istanbul University Journal of the School of Business, Vol. 43,
No. 2, pp. 205-217
Cronin, J.J. and Taylor, S.A. (1992), “Measuring service quality: a reexamination and
extension, Journal of Marketing, Vol. 6, 55-68.
Collart, D. (2000). Customers Relationship management, price water house cooper, New
York,USA
Czepiel, J (1990). Managing relationship with customers: a differentiation philosophy of
marketing
DBE (2017). Customer and Employee Survey Addis Ababa Ethiopia unpublished
Dancey, C. and Reidy, J. (2004) Statistics without Maths for Psychology: using SPSS for
Windows. Prentice Hall, London.
Dejene, G. (2017). The Effect of Service Quality on Customer Satisfaction: The Case of
Dashen Bank S.C M.Sc thesis Addis Ababa University, Addis Ababa

43
El Saghier, N. and Nathan, D. (2013). Service Quality Dimensions and Customers'
Satisfactions of Banks in Egypt.
Eshghi, A., Roy, S. and Ganguli, S. (2008). Service quality and customer satisfaction: an
empirical investigation in Indian mobile telecommunications services, Marketing
Management Journal, 18 (2), 119-144.
Field, A. P. (2005). Discovering statistics using SPSS (2nd edition). London: Sage.
GebreHiwot, B. (2014). State and Economy of Early 20th Century Ethiopia
George,D.I and Mallery,P.(2003). SPSS for windows step by step. A simple guide and
Reference 11.0 4th ed). Boston: Allyn and Bocon.
Girma,B. (2015). Assessment of service quality and its influence on customer
satisfaction: the case of Oromia International Bank M.Sc thesis Addis Ababa University.
Gronroos, C. (1984), A service quality model and its marketing implications, European
Journal of Marketing, Vol. 18 No. 4, pp. 36-44.
Hoyle, D. 2007. Quality management Essentials. UK: Elsevier Limited
Ijaz, A. T., & Ali, A (2013). Assessing Service Attitude: Service Quality Measures Taken
by Islamic Banks in Pakistan.
Ibrahim. E. (2012). What is the Meaning of Quality Suez Canal University, Management
department, Egypt
ISO 9000:2005, Quality management systems Fundamentals and vocabulary,
International Organization for Standardization, Geneva
Juran,J.M and Godfrey,A.B (1999)Quality Handbooks, 5th
ed. NewYork: McGraw-Hill
Kotler, P. (2003). Marketing Management, International Edition, Prentice Hal
Lovelock.C and Jochen.W. (2004). Service Marketing: Indian Baba Barkha McGraw.
Hill Concise Encyclopedia of engineering, 2004, Product Quality, Available at
http://www.en.wikipedia.org/wiki/customer satisfaction.
Meron.M.(2015). Impact of Service Quality on Customer Satisfaction: The Case of Bank
of Abyssinia S.C M.Sc theis Addis Ababa university
Mesay.S.(2013). Bank Service Quality, Customer Satisfaction and Loyalty in Ethiopian
Banking sector; Journal of Business Administration and Management Sciences Research
Vol. 1(1), pp. 001-009
Muijs, D. (2010). Doing quantitative research in education with SPSS. London Sage

44
Munusamy, J., Chelliah, S. and Mun, H. (2010). Service quality delivery and its impact
on customer satisfaction in the banking sector in Malaysia, International Journal of
Innovation, Management and Technology, 1 (4), 398-404
NBE (2018) Annual report of Ethiopia. Addis Ababa: NBE
Parasuraman, A., Zeithaml, V.A. and Berry, L.L. (1985), “A conceptual model of service
qualityand its implications for future research”, Journal of Marketing, Vol. 49(4). 41-50
Parasuraman, A., Zeithaml, V.A. and Berry, L.L. (1988), “SERVQUAL: a multiple item
scale for measuring consumer perception of service quality”, Journal of Retailing, Vol.
64(1).12-40.
Ryall, J. and Kruithof, J. (2001). The Quality Systems Handbook. Australia: Consensus
Books
Shabib. A. (2002). Measuring Customer Satisfaction for Business Services Quality to
Islamic Financial Institutions in Kuwait. Unpublished Master Thesis, Faculty of
Commerce, Shams University
Shifera Bekele (2011). The impact of relationship marketing on Customer loyalty in
banking industry, the Case of bank of Abyssinia, Addis Ababa University, Addis Ababa,
Ethiopia
Smith, S. (1998). How to create a plan to deliver great customer service, In Zemke, R.
and Woods, J. (Eds.), Best Practices in Customer Service, New York, NY, 145-260.
Tan, K. and Pawitra, T. (2001). Integrating SERVQUAL and Kano's model into QFD for
service excellence development, Managing Service Quality
Tizazu, K. (2012). The Effect of Customer Service Quality on Customer Satisfaction in
Selected Private Banks. MBA Thesis, Addis Ababa University.
Yeshitila,T.(2018) Assessment of Service Quality And Customer Satisfaction The Case
of Commercial Nominees PLC M.Sc theis Addis Ababa university
Zeithaml, V.A., Berry, L.L. and Parasuraman, A. (2009). Communication and control
processes in the delivery of service quality, Journal of Marketing, Vol. 52.

45
Appendix I
Addis Ababa University
College of Business and Economics
Department of Management
Questionnaire to be filled by Customer of ----- banks
Dear Respondent,
The purpose of this questionnaire is to collect primary data for study entitled "Service quality in
Banking" for the partial fulfillment of the Masters of Science in management at Addis Ababa
University. I kindly request you to provide me reliable information. Your responses will be kept
confidential.
Thank you in advance for your cooperation
N.B
No need to write your name
Part I. Personal information
1.1 Gender Male Female
1.2 Age 18-29 years old 30-39 years’ old
40-49 years old 50 years old and above
1.3 Marital Status Single Married Divorced
1.4 Educational level Primary and high school Diploma
First degree Second degree and above
Others

46
Part II: Survey of your perceptions towards service quality banking
This part deals with your opinion about banking. There is no right or wrong answers all I am
interested is a number that show your best about the Service Quality System of banks. Based on
this please put a tick (√) in the boxes which explain your attitudes.
The score levels are described as:
1- Strongly Disagree 2- Disagree 3- Neutral 4- Agree 5- Strongly Agree
No Dimensions 1 2 3 4 5
Responsiveness
The employees tells you exactly when
services will be provided
The employees are willing to help you
Employees respond to requests quickly
Employees give prompt service
Assurance
The employees has product knowledge of
bank information
The employees speak with you by using an
appropriately address forms
The employees are trustworthy
You feel safe in your transactions with
bank.
Empathy
The employees are able to communicate
effectively with you.
The employees shows personal attention to
you
The employees knows your specific needs
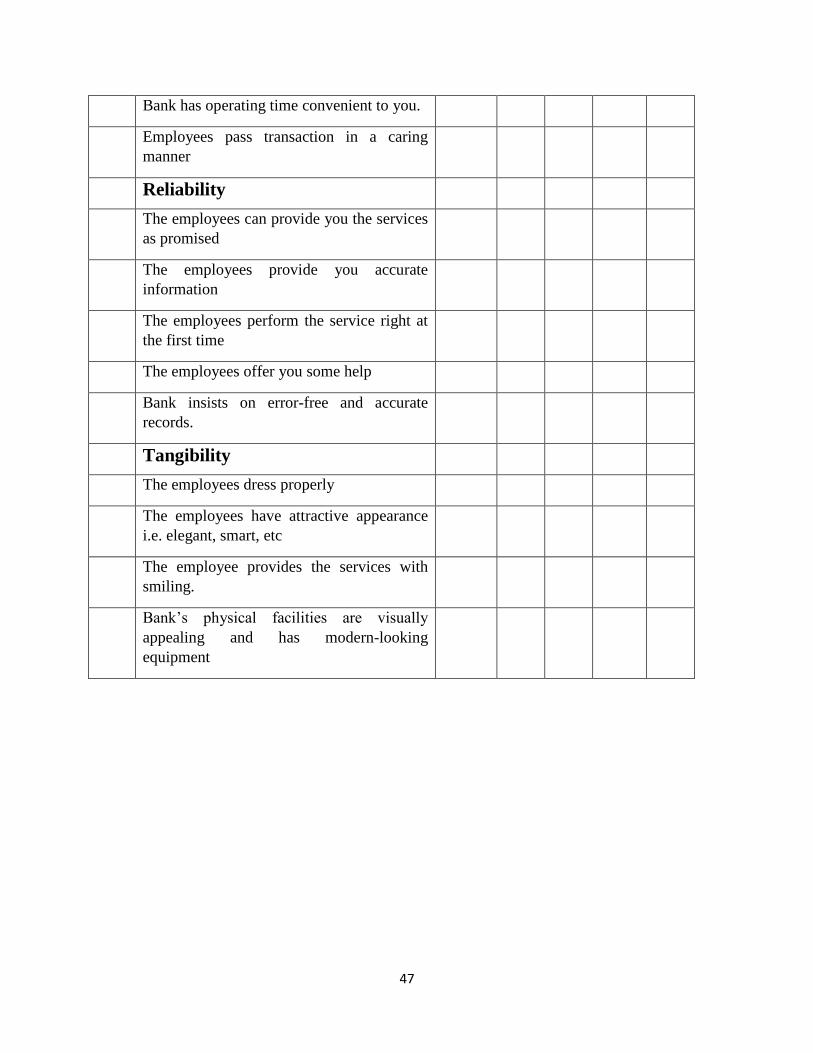
47
Bank has operating time convenient to you.
Employees pass transaction in a caring
manner
Reliability
The employees can provide you the services
as promised
The employees provide you accurate
information
The employees perform the service right at
the first time
The employees offer you some help
Bank insists on error-free and accurate
records.
Tangibility
The employees dress properly
The employees have attractive appearance
i.e. elegant, smart, etc
The employee provides the services with
smiling.
Bank’s physical facilities are visually
appealing and has modern-looking
equipment

48
Part Three:
In this part of the questionnaire, your valuable information on the overall level of service quality
and your overall level of satisfaction on the delivery of bank service will be sought. Please tick
(√) a number that shows your overall service quality perception and your level of satisfaction
with respect to the following statements
Level of Customers Satisfaction
Your satisfaction
level on the bank
service delivers.
Strongly
dissatisfied
Dissatisfied Neutral Satisfied Strongly
Satisfied
I am satisfied with
the security of the
bank services
I am satisfied with
respectful behavior
of the bank staffs
I am satisfied with
the communicative
ability of the
employee of the
bank
I am satisfied with
the performance of
the employee of the
bank
I am satisfied with
various rang of
service of bank

49
አዲስአበባዩኒቨርስቲ የቢዝነስእናኢኮኖሚክስኮላጅ የስራ አመራር ትምህርት ክፍሌ
ይህ መጠይቅ የተዘጋጀዉ በአዲስ አበባ ዩኒቨርስቲ የድህረ-ምረቃ ተማሪ ሲሆን አሊማዉም የኢትዮጵያ ባንኮች አገሌግልት አሰጣጥ ጥራት በሚሌ ርዕስ ሇሚዯረግ ጥናት የመጀመሪያ ዯረጃ መረጃ ሇመሰብሰብ ነው᎓፡ የሚሰጡት መሌስ የሚዉሇዉ ሇዚህ ጥናት አሊማ ብቻ ነው፡፡ስሇሆነም ከዚህ በታች ሇቀረቡት ጥያቄዎች ትክክሌ ነው የሚለትን መሌስ ይሰጡ ዘንድ በትህትና እጠይቃሇሁ፡፡
ስሇትብብሮ በቅድሚያ አመሰግናሇሁ፡፡
መመሪያ፡
ስምዎን መጥቀስ አያስፈሌግም
ትክክሌ ነዉ የሚለትን መሌስ በተዘጋጀዉ ሳጥን ዉስጥ ምሌክት ያስቀምጡ፡፡
ክፍሌ አንድ
1.1 ፆታ ወንድ ሴት
1.2 ዕ ድሜ
ከ18-29 አመት ከ30-39 አመት
ከ40-49 አመት 50 አመት ና በሊይ
1.3 የጋብቻ ሁኔታ
ያሊገባ/ች ያገባ/ች ፍቺ የፈፀሙ 1.4 የትምህርት ዯረጃ
አንዯኛ እና ሁሇተኛ ዯረጃ የመጀመሪያ ዲግሪ የተሇየ ዲፕልማ ሁሇተኛ ዲግሪ እና በሊይ
ክፍሌ ሁሇት
እንዯ አንድ የባንክ አገሌግልት ተጠቃሚ በባንኩ የተሰጦዎትን አገሌግልት ከዚህ በታች የተጠቀሱትን ጉዳዮች ያስፈሊጊነታቸዉን ዯረጃ ከ 1 - 5 የቀረቡትን ቁጥሮች ውጤቱን
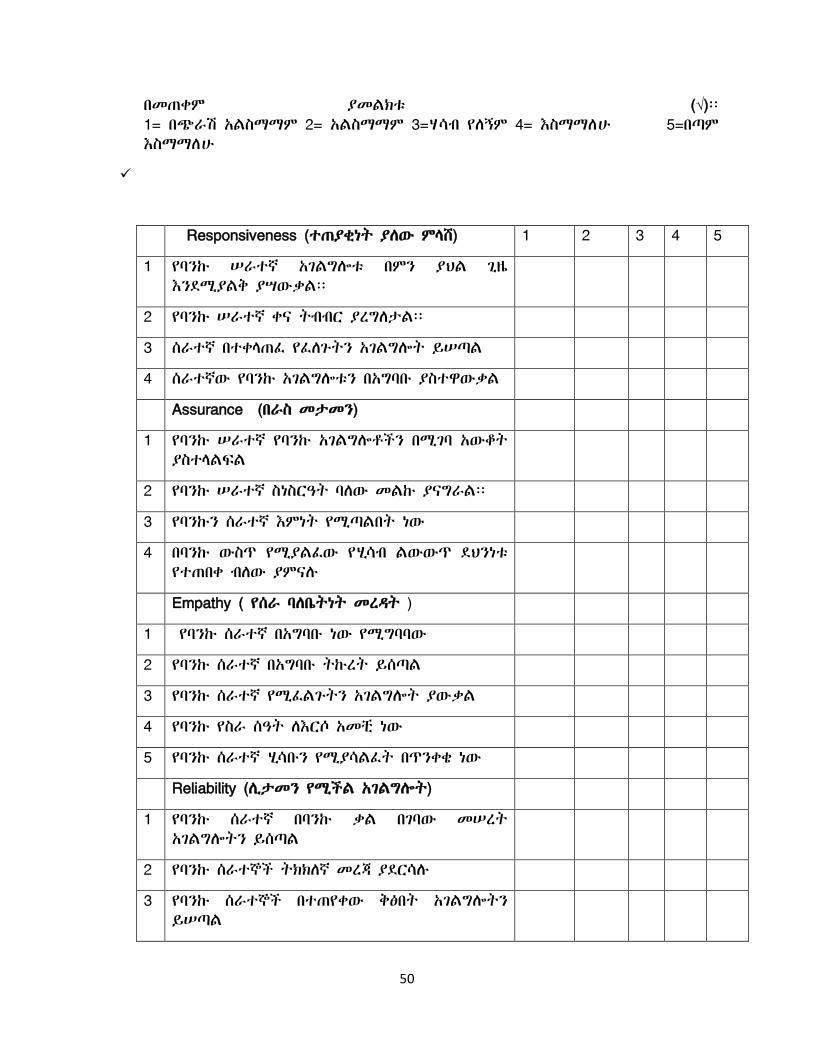
50
በመጠቀም ያመሌክቱ (√)፡፡ 1= በጭራሽ አሌስማማም 2= አሌስማማም 3=ሃሳብ የሇኝም 4= እስማማሇሁ 5=በጣም እስማማሇሁ
Responsiveness (ተጠያቂነት ያሇው ምሊሸ) 1 2 3 4 5
1 የባንኩ ሠራተኛ አገሌግልቱ በምን ያህሌ ጊዜ እንዯሚያሌቅ ያሣውቃሌ፡፡
2 የባንኩ ሠራተኛ ቀና ትብብር ያረግሇታሌ፡፡
3 ሰራተኛ በተቀሊጠፈ የፈሇጉትን አገሌግልት ይሠጣሌ
4 ሰራተኛው የባንኩ አገሌግልቱን በአግባቡ ያስተዋውቃሌ
Assurance (በራስ መታመን)
1 የባንኩ ሠራተኛ የባንኩ አገሌግልቶችን በሚገባ አውቆት ያስተሊሌፍሌ
2 የባንኩ ሠራተኛ ስነስርዓት ባሇው መሌኩ ያናግራሌ፡፡
3 የባንኩን ሰራተኛ እምነት የሚጣሌበት ነው
4 በባንኩ ውስጥ የሚያሌፈው የሂሳብ ሌውውጥ ዯህንነቱ የተጠበቀ ብሇው ያምናለ
Empathy ( የሰራ ባሇቤትነት መረዳት )
1 የባንኩ ሰራተኛ በአግባቡ ነው የሚግባባው
2 የባንኩ ሰራተኛ በአግባቡ ትኩረት ይሰጣሌ
3 የባንኩ ሰራተኛ የሚፈሌጉትን አገሌግልት ያውቃሌ
4 የባንኩ የስራ ሰዓት ሇእርሶ አመቺ ነው
5 የባንኩ ሰራተኛ ሂሳቡን የሚያሳሌፈት በጥንቀቄ ነው
Reliability (ሉታመን የሚችሌ አገሌግልት)
1 የባንኩ ሰራተኛ በባንኩ ቃሌ በገባው መሠረት አገሌግልትን ይሰጣሌ
2 የባንኩ ሰራተኞች ትክክሇኛ መረጃ ያዯርሳለ
3 የባንኩ ሰራተኞች በተጠየቀው ቅፅበት አገሌግልትን ይሠጣሌ
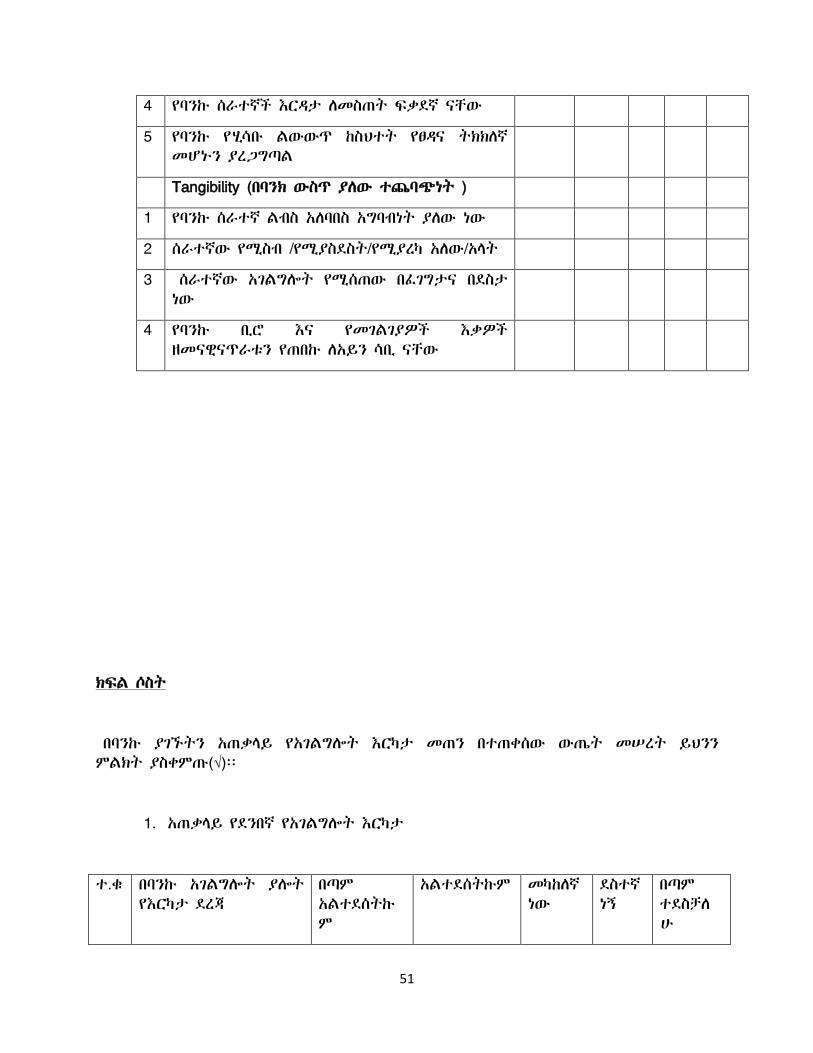
51
4 የባንኩ ሰራተኛች እርዳታ ሇመስጠት ፍቃዯኛ ናቸው
5 የባንኩ የሂሳቡ ሌውውጥ ከስህተት የፀዳና ትክክሇኛ መሆኑን ያረጋግጣሌ
Tangibility (በባንክ ውስጥ ያሇው ተጨባጭነት )
1 የባንኩ ሰራተኛ ሌብስ አሇባበስ አግባብነት ያሇው ነው
2 ሰራተኛው የሚስብ /የሚያስዯስት/የሚያረካ አሇው/አሊት
3 ሰራተኛው አገሌግልት የሚሰጠው በፈገግታና በዯስታ ነው
4 የባንኩ ቢሮ እና የመገሌገያዎች እቃዎች ዘመናዊናጥራቱን የጠበኩ ሇአይን ሳቢ ናቸው
ክፍሌ ሶስት
በባንኩ ያገኙትን አጠቃሊይ የአገሌግልት እርካታ መጠን በተጠቀሰው ውጤት መሠረት ይህንን ምሌክት ያስቀምጡ(√)፡፡
1. አጠቃሊይ የዯንበኛ የአገሌግልት እርካታ
ተ.ቁ በባንኩ አገሌግልት ያልት የእርካታ ዯረጃ
በጣም አሌተዯሰትኩም
አሌተዯሰትኩም መካከሇኛ ነው
ዯስተኛ ነኝ
በጣም ተዯስቻሇሁ

52
1 በባንኩ ዋስትና ያሇው አገሌግልት ዯረጃ
2 የባንኩ ሰራተኞች ትሆት ባህሪ
3 የባንኩ ሰራተኞች በመግባባት የመስጠት ችልታ
4 በባንኩ ሰራተኞች ብቃት
5 በባንኩ የተሟሊ አጠቃሊይ አገሌግልት
Appendix II
Demographic characteristic of the respondents
Gender
Frequency Percent Valid Percent
Cumulative
Percent
Valid male 212 63.5 63.5 63.5
female 122 36.5 36.5 100.0

53
Total 334 100.0 100.0
Age
Frequency Percent Valid Percent
Cumulative
Percent
Valid 18-29 years old 122 36.5 36.5 36.5
30-39 years old 125 37.4 37.4 74.0
40-49 years old 56 16.8 16.8 90.7
50 years old and above 31 9.3 9.3 100.0
Total 334 100.0 100.0
Marital status
Frequency Percent Valid Percent
Cumulative
Percent
Valid Single 140 41.9 41.9 41.9
Married 179 53.6 53.6 95.5
Divorced 15 4.5 4.5 100.0
Total 334 100.0 100.0
Pearson correlation of service quality dimensions and customer satisfaction

54
Correlations
Responsiveness Assurance Empathy Reliability Tangibility
Customer
Satisfaction
Responsiveness Pearson Correlation 1 .699**
.653**
.714**
.643**
.668**
Sig. (2-tailed) .000 .000 .000 .000 .000
N 334 334 334 334 334 334
Assurance Pearson Correlation .699**
1 .775**
.794**
.726**
.664**
Sig. (2-tailed) .000 .000 .000 .000 .000
N 334 334 334 334 334 334
Empathy Pearson Correlation .653**
.775**
1 .753**
.680**
.617**
Sig. (2-tailed) .000 .000 .000 .000 .000
N 334 334 334 334 334 334
Reliability Pearson Correlation .714**
.794**
.753**
1 .747**
.678**
Sig. (2-tailed) .000 .000 .000 .000 .000
N 334 334 334 334 334 334
Tangibility Pearson Correlation .643**
.726**
.680**
.747**
1 .662**
Sig. (2-tailed) .000 .000 .000 .000 .000
N 334 334 334 334 334 334
Customer Satisfaction Pearson Correlation .668**
.664**
.617**
.678**
.662**
1
Sig. (2-tailed) .000 .000 .000 .000 .000
N 334 334 334 334 334 334