addis ababa university - CiteSeerX
111
ADDIS ABABA UNIVERSITY FACULTY OF VETERINARY MEDICINE EPIDEMIOLOGY OF BOVINE TRYPANOSOMOSIS IN THE ABBAY BASIN AREAS OF NORTHWEST ETHIOPIA By SHIMELIS DAGNACHEW NIGATU JUNE, 2004 DEBRE ZEIT, ETHIOPIA
-
Upload
khangminh22 -
Category
Documents
-
view
1 -
download
0
Transcript of addis ababa university - CiteSeerX
ADDIS ABABA UNIVERSITY
FACULTY OF VETERINARY MEDICINE
EPIDEMIOLOGY OF BOVINE TRYPANOSOMOSIS IN THE ABBAY BASIN
AREAS OF NORTHWEST ETHIOPIA
By
SHIMELIS DAGNACHEW NIGATU
JUNE, 2004
DEBRE ZEIT, ETHIOPIA

ADDIS ABABA UNIVERSITY
FACULTY OF VETERINARY MEDICINE
EPIDEMIOLOGY OF BOVINE TRYPANOSOMOSIS IN THE ABBAY BASIN
AREAS OF NORTHWEST ETHIOPIA
A thesis submitted to the Faculty of Veterinary Medicine, Addis Ababa University in
partial fulfillment of the requirements for Degree of Master of Science in Tropical
Veterinary Epidemiology
By
SHIMELIS DAGNACHEW NIGATU
JUNE, 2004
DEBRE ZEIT, ETHIOPIA
EPIDEMIOLOGY OF BOVINE TRYPANOSOMOSIS IN THE ABBAY BASIN
AREAS OF NORTHWEST ETHIOPIA
By
SHIMELIS DAGNACHEW NIGATU
Board of external examiners Signature
1. Prof. Ph. Dorchies __________________
2. Prof. Feseha Gebreab ____________________
3. Dr.Wondwossen Abebe Gebreyes ____________________
4. Dr. Giles Innocent ___________________
5. Dr. Andy Catley ____________________
6. Dr. David Barrett
____________________
Academic advisors
1. Dr. Arun K. Sangwan ____________________
2. Prof. Getachew Abebe _____________________

DECLARATION
I, the underside, declare that the thesis is my original work and has not been presented for a
degree in any university.
Name____________________________________
Signature_________________________________
Date of submission___________________________
This thesis has been submitted for examination with our approval as university advisors.
1.________________________________
2.________________________________
I
ACKNOWLEDGEMENTS
The author would like to thank:
Dr. Arun K. Sangwan and Prof. Getachew Abebe for their guidance and devotion of time in
rectifying the thesis. Dr. Nega Tewelde, Dr. Bayleyegn Molla, Dr. Bewuket Seraw, Dr. Kassa
Teferi, Dr. Gebreyesus Mekonnen, Dr. Legesse T/Giorgis, Dr. Gedion Yilma, Ato Habtamu
Kefyalew, Ato Meselu Wagaw, Ato Assefa Sharew, Ato Belistie Esubalew, Ato Belistie
Yenalem and Ato Tafere Kerebeh and the farmers at the study area for their help in various
ways.
Faculty of Veterinary Medicine of Addis Ababa University, Amhara Region Bureau of
Agriculture, Amhara Region Agricultural Research Institute, Bahir Dar Regional Veterinary
Laboratory, Dembecha and Jabitehenan weredas Office of Agriculture and Debre Genet
Orthodox Church Monastery for their financial, logistic and other supports.

I
TABLE OF CONTENTS
ACKNOWLEDGEMENTS .................................................................................................................................. I
LIST OF TABLES.............................................................................................................................................. III
LIST OF FIGURES............................................................................................................................................ IV
LIST OF ANNEXES.............................................................................................................................................V
LIST OF ABBREVIATIONS ............................................................................................................................ VI
ABSTRACT .......................................................................................................................................................VII
1. INTRODUCTION .............................................................................................................................................1
2. LITERATURE REVIEW .................................................................................................................................5
2.1. Animal trypanosomosis .............................................................................................5 2.2. Epidemiology .............................................................................................................6
2.2.1. Transmission and distribution ...............................................................................6 2.2.2. Biology and distribution of tsetse fly.....................................................................7
2.3. Pathogenesis of trypanosomosis ................................................................................9 2.4. Diagnostic methods..................................................................................................10
2.4.1. Clinical diagnosis................................................................................................11 2.4.2. Parasitological diagnosis .....................................................................................11 2.4.3. Serological diagnosis ..........................................................................................12 2.4.4. Polymerase chain reaction...................................................................................13
2.5. Control of trypanosomosis ......................................................................................14 2.5.1. Chemotherapy and chemoprophylaxis.................................................................15 2.5.2. Trypanocidal drug resistance...............................................................................15 2.5.2.2. Detection of drug resistance .............................................................................17
3. MATERIALS AND METHODS ....................................................................................................................20
3.1. Study area ................................................................................................................20 3.1.1. Socioeconomic situation and farming system of the study area............................21 3.1.2. Constraints of livestock production in the study area...........................................21
3.2. Study design.............................................................................................................23 3.2.1. Questionnaire survey ..........................................................................................23 3.2.2. Entomological survey .........................................................................................23 3.2.3. Parasitological survey .........................................................................................24 3.2.4. Assessment of trypanocidal drug resistance (Isometamidium block treatment study) ...........................................................................................................................26
3.3. Data analysis ............................................................................................................29
4. RESULTS .........................................................................................................................................................30
4.1. Questionnaire survey...............................................................................................30 4.2. Entomological survey ..............................................................................................36 4.3. Parasitological survey..............................................................................................40
4.3.1. Trypanosome prevalence ....................................................................................40 4.3.2. Haematological findings .....................................................................................46
4.4. Assessment of trypanocidal drug resistance (Isometamidium block treatment
study) ..............................................................................................................................50
5. DISCUSSION...................................................................................................................................................62
5.1. Questionnaire survey...............................................................................................62 5.2. Entomological survey ..............................................................................................63 5.3. Parasitological survey..............................................................................................65

II
5.4. Assessment of trypanocidal drug resistance (Isometamidium block treatment
study) ..............................................................................................................................70
6. CONCLUSIONS AND RECOMMENDATIONS.........................................................................................74
7. REFERENCES ................................................................................................................................................76
8. ANNEXES ........................................................................................................................................................90
9. CURRICULUM VITAE..................................................................................................................................97

III
LIST OF TABLES
Table 1. The different fly catches in two seasons in the Abbay basin areas of northwest Ethiopia...... 36 Table 2. The mean fly catches in three trap types during the late rainy season. ................................... 37 Table 3. Apparent densities of tsetse and other biting flies in different vegetation types in the Abbay
basin areas of northwest Ethiopia during the two study seasons................................................. 38 Table 4. Prevalence of trypanosome infection in two seasons in the Abbay basin areas of northwest
Ethiopia. ...................................................................................................................................... 41 Table 5. Prevalence of trypanosomes in male and female cattle during the late rainy season in the
Abbay basin areas of northwest Ethiopia. ................................................................................... 42 Table 6. Prevalence of trypanosomes in male and female cattle during the dry season in the Abbay
basin areas of northwest Ethiopia................................................................................................ 42 Table 7. Prevalence of trypanosomes in different age groups of cattle in the late rainy season in the
Abbay basin areas of northwest Ethiopia. ................................................................................... 43 Table 8. Prevalence of trypanosomes in different age groups of cattle in the dry season in the Abbay
basin areas of northwest Ethiopia................................................................................................ 43 Table 9. Prevalence of trypanosomes in cattle at different altitudes during the late rainy season in the
Abbay basin areas of northwest Ethiopia. ................................................................................... 44 Table 10. Prevalence of trypanosomes in cattle at different altitudes during the dry season in the
Abbay basin areas of northwest Ethiopia. ................................................................................... 44 Table 11. The overall prevalence of trypanosome in different sex, age and altitude categories during
the study period in the Abbay basin areas of northwest Ethiopia. .............................................. 45 Table 12. The mean PCV (%) and mean slope of PCV values in the control and treatment groups of
cattle in Ergib and Melkachaba villages of ISMM block treatment study in the Abbay basin areas of northwest Ethiopia. ........................................................................................................ 53
Table 13. The 25% survival time of the control and treatment groups of cattle upto day 56 of the ISMM block treatment study at Ergib village in the Abbay basin areas of northwest Ethiopia. 54
Table 14. The 25% survival time of the control and treatment groups of cattle upto day 56 of the ISMM block treatment study at Melkachaba village in the Abbay basin areas of northwest Ethiopia. ...................................................................................................................................... 54
Table 15. Mean hazard rate and 25% survival time of control and treatment groups of cattle upto day 56 of the ISMM block treatment study in Ergib village in the Abbay basin areas of northwest Ethiopia. ...................................................................................................................................... 55
Table 16. Mean hazard rate and 25% survival time of control and treatment group of cattle upto day 56 of the ISMM block treatment study in Melkachaba village in the Abbay basin areas of northwest Ethiopia. ...................................................................................................................................... 55
Table 17. Hazard ratio of control and treatment groups of cattle upto day 56 of ISMM block treatment study in Ergib and Melkachaba villages in the Abbay basin areas of northwest Ethiopia.......... 56
Table 18. Proportion of cattle became parasitaemic upto day 56 since day 0 of ISMM block treatment in Ergib and Melkachaba villages in the Abbay basin areas of northwest Ethiopia ................... 56
Table 19. ISMM block treatment study: Cattle becoming parasitaemic at least twice after treatment with diminazine aceturate at dose rate of 7mg/kg body weight in Ergib and Melkachaba villages in the Abbay basin areas of northwest Ethiopia .......................................................................... 60
Table 20. Comparison between trypanosome incidence and trypanosome infection recurrence rate in cattle which were examined every 2 weeks interval for a total of 14 weeks in Ergib and Melkachaba villages in the Abbay basin areas of northwest Ethiopia. ....................................... 61

IV
LIST OF FIGURES
Figure 1. Map of Amhara Regional State showing the study weredas (Dembecha and
Jabitehenan). ...............................................................................................................22 Figure 2. Major livestock diseases in the Abbay basin areas of northwest Ethiopia. .............32 Figure 3. A farmer injecting trypanocidal drug to an ox on the gluteal muscle. .....................35 Figure 4. A farmer injecting trypanocidal drug to an ox between the last two ribs below the
vertebrae. ....................................................................................................................35 Figure 5. Proportion of fly catches during the study seasons in the Abbay basin areas of
northwest Ethiopia. .....................................................................................................36 Figure 6. Tsetse apparent density in late rainy season and in dry season in the Abbay basin
areas of northwest Ethiopia. ........................................................................................38 Figure 7. Biting flies apparent density in late rainy season and in dry season in the Abbay
basin areas of northwest Ethiopia. ...............................................................................39 Figure 8. Tsetse apparent density at the different altitudes in late rainy season and dry season
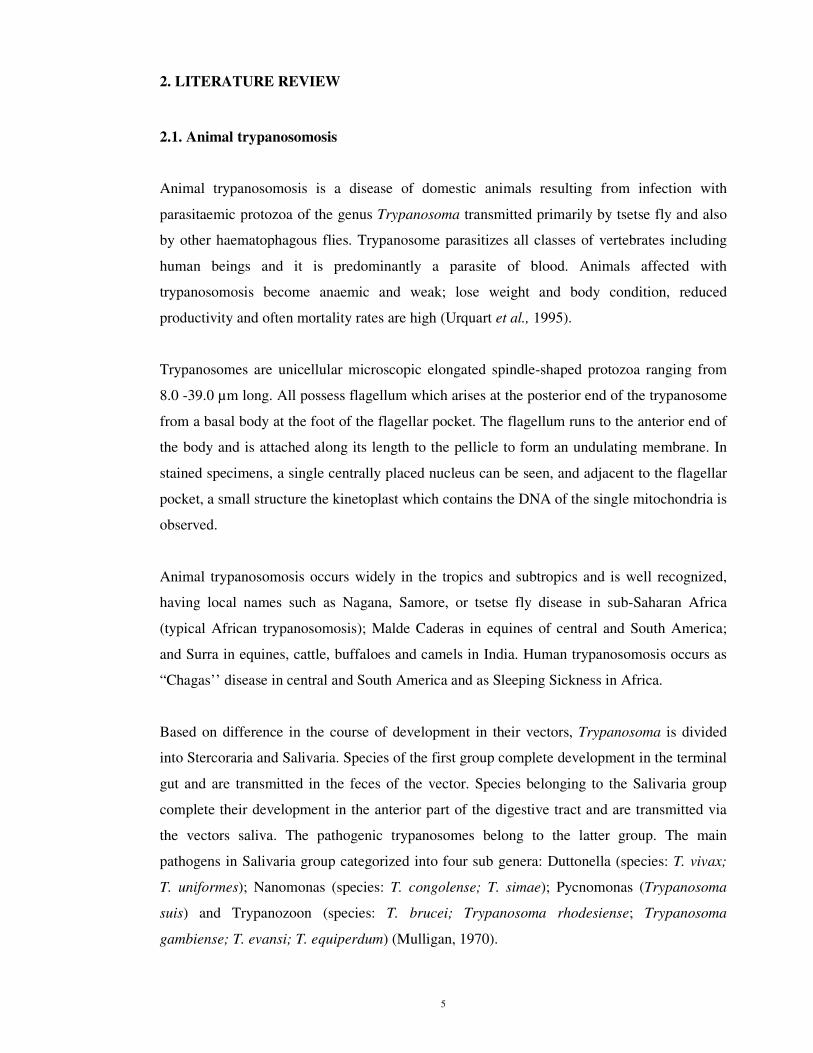
in the Abbay basin areas of northwest Ethiopia. ..........................................................39 Figure 9. Frequency distribution of PCV values of parasitaemic and aparasitaemic animals
during the late rainy season in the Abbay basin areas of northwest Ethiopia. ...............47 Figure 10. Frequency distribution of PCV values of parasitaemic and aparasitaemic animals
during the dry season in the Abbay basin areas of northwest Ethiopia. ......................47 Figure 11. The overall averages PCV values and herd prevalence rate of trypanosome in the37
cattle herds in the Abbay basin areas of northwest Ethiopia.........................................48 Figure 12. The average PCV values and herd prevalence rate of trypanosome infection in
the19 cattle herds during the late rainy season in the Abbay basin areas of northwest Ethiopia. .....................................................................................................................49
Figure 13. The average PCV values and herd prevalence rate of trypanosome infection in the18 cattle herds during the dry season in the Abbay basin areas of northwest Ethiopia....................................................................................................................................49
Figure 14. The comparison of herd prevalence rates of trypanosome infection between seasons in the Abbay basin areas of northwest Ethiopia...............................................50
Figure 15. Prevalence of trypanosomes in the control and treatment groups of cattle in Ergib village of the ISMM block treatment study in the Abbay basin areas of northwest Ethiopia. .....................................................................................................................51
Figure 16. Prevalence of trypanosomes in the control and treatment groups of cattle in Melkachaba village of the ISMM block treatment study in the Abbay basin areas of northwest Ethiopia ......................................................................................................52
Figure 17. Kaplan-Meier survival estimates and statistical test for the equality of the survivor function of the control and treatment group of cattle in Ergib village in the Abbay basin areas of northwest Ethiopia. ........................................................................................57
Figure 18. Kaplan-Meier survival estimates and statistical test for the equality of the survivor function of the control and treatment group of cattle in Melkachaba village in the Abbay basin areas of northwest Ethiopia. ...............................................................................58

V
LIST OF ANNEXES
Annexe1. Questionnaire format to interview farmers individually in the Abbay basin areas of northwest Ethiopia. .....................................................................................................90
Annexe 2. Wing fray analysis for the estimation of average age of the tsetse population in the late rainy season and in the dry season in the Abbay basin areas of northwest Ethiopia....................................................................................................................................94
Annexe 3. Parasitological results in the ISMM block treatment study from day 0 to day 84: Trypanosome species diagnosed and mean PCV in control and treatment group at each village from 0-84 days.................................................................................................95
Annexe 4. A farmer practicing preparation of trypanocidal drugs for treatment of their animals in Melkachaba village of the Abbay basin areas of northwest Ethiopia. ..........96
Annexe 5. A herd of cattle sampled in Melkachaba village of the Abbay basin areas of northwest Ethiopia during the study period..................................................................96

VI
LIST OF ABBREVIATIONS
AAU Addis Ababa university AAT African Animal Trypanosomosis BCT Buffy coat technique bw Body weight oC Degree centigrade CI Confidence interval DNA Deoxy ribonucleic acid ELISA Enzyme Linked Immuno Sorbant Assay ESTC Ethiopian Science and Technology Commission FAO Food and Agricultural Organization of the United Nation FITCA Farming in tsetse controlled areas of Africa FVM Faculty of Veterinary Medicine GDP Gross Domestic Product HCT Haematocrit centrifugation technique IBAR Inter African Bureau of Animal Resources ICIPE International Center for Insect Physiology and Ecology ILCA International Livestock Center for Africa ILRI International Livestock Research Institute ISCTRC International Scientific Council for Trypanosomosis Research and Control ISMM Isometamidium chloride NTTICC National Tsetse and Trypanosomosis Investigation and Control Center mg Milligram MoA Ministry of Agriculture mm Millimeter nm Nanometer m.a.s.l. Meter above sea level µl Microlitre OAU Organization of African Unity PA Peasant Association PCV Packed Cell Volume PCR Polymerase Chain Reaction RBC Red Blood Cells SD Standard deviation SIT Sterile insect technique Spp. Species SRVETEP Southern Rift Valley of Ethiopia Tsetse Eradication Project T.b Trypanosoma brucei T.c Trypanosoma congolense T.v Trypanosoma vivax US$ United States dollar

VII
ABSTRACT
Tsetse transmitted animal trypanosomosis is a serious constraint to livestock production and
agricultural development in Ethiopia. Part of Abbay basin (Blue Nile) in northwest Ethiopia is
tsetse infested where animal trypanosomosis is a serious threat to economic development. The
objectives of the study were to generate a base line data on epidemiology of tsetse and
trypanosomosis, to assess trypanocidal drug resistance and to know the community awareness
regarding the disease and control methods in the area. The study was conducted between
September 2003 to April 2004 in Dembecha and Jabitehenan weredas of the Abbay basin
areas of northwest Ethiopia. The study methodology was based on questionnaire survey,
seasonal cross-sectional studies of tsetse and trypanosomosis and longitudinal study for the
assessment of trypanocidal drug resistance in the field.
The questionnaire survey indicated that trypanosomosis is the most important problem
affecting the animals and impeding agricultural activity in the area. Entomological survey
revealed that Glossina. m. submorsitans was the only prevalent tsetse fly along with other
biting tabanid and muscid flies. The apparent fly densities were significantly higher (p<0.05)
in the late rainy season (1.08fly/trap/day, 8.78fly/trap/day and 91fly/trap/day) for G. m.
submorsitans, tabanids and muscids respectively than the dry season (0.68fly/trap/day,
0.35fly/trap/day and 7.33fly/trap/day) respectively. In the lowland areas (<1600 m. a. s. l.) the
apparent density for G. m. submorsitans was significantly higher (p<0.05) than the midland
areas (1600-2000 m.a.s.l.) in the both seasons. The altitudinal distribution limit of G. m.
submorsitans was upto 1780 m.a.s.l.The proportion of tsetse flies caught was higher in the
savanna vegetation type followed by riverine, forest, bush and cultivated lands with maize,
teff and horticulture plantations.
In the parasitological survey a total of 1,648 animals, 814 in the late rainy season and 834 in
the dry season were examined with buffy coat technique and the prevalence of
trypanosomosis was 17.07% and 12.35% respectively with a significant difference (p<0.05)
between seasons. Higher infection rates found in the lowland areas below 1600 m.a.s.l.
(19.87% and 17.62%) than the midland areas ≥1600 m.a.s.l.(13.39% and 6.54%) in the late
rainy and dry season respectively with significant difference (p<0.05).The mean PCV values
(%) of parasitaemic and aparasitaemic animals during the late rainy season were 20.7±3.5SD

VIII
and 26.6±4.3SD (p<0.001, 95% CI=25.3-25.9) while during the dry season 21.4±3.6SD and
26.6±4.3SD (p<0.001, 95% CI=25.4-25.9) respectively. The regression analysis of herd
average PCV from herd prevalence indicated that herd average PCV decreased with
increasing prevalence of trypanosome infections with a regression coefficient of negative
values in both the seasons.
A total of 100 animals were selected for the assessment of Isometamidium chloride (ISMM)
and Diminazine aceturate resistance, 50 from each of the high risk villages identified in the
area with similar agroecological zones. The selected animals in each village were grouped
into 25 in control and 25 in treatment groups and were identified with ear-tags. At day minus
14 of the study all the 100 cattle were treated with Diminazine aceturate at a dose rate of
7mg/kg bw. After two weeks (day 0) the treatment groups were given ISMM at a dose rate of
1mg/kg bw. Both groups of cattle were examined for trypanosome parasite using buffy coat
technique every 14 days interval until 84 days. The three indices used in assessing ISMM
resistance (the proportion of infection during 8 weeks follow-up period, the 25% survival time
and the ratio of mean hazard rates in the control and treatment groups of cattle) provided
consistent results across the two villages for the occurrence of ISMM resistant trypanosome
infections in the area. There was no significant difference between the Kaplan-Meier survival
curve estimates of the control and treatment groups in both villages (p>0.05).The results of
Diminazine aceturate efficacy showed 16 animals became recurrent infections with T.
congolense but there was no significant difference between trypanosome incidence rate and
trypanosome recurrence rate.
Therefore, trypanosomosis is the most important problem for agricultural activity and animal
production in the Abbay basin areas of northwest Ethiopia (Dembecha and Jabitehenan
weredas of Amhara Region) and the situation is getting worse as the control and prevention of
trypanosomosis is facing a challenge due to limitation of vector control activities and the
development of drug resistance in the area.
Keywords: Epidemiology/ Bovine/ Trypanosomosis/ Glossina m. submorsitans/ Drug
Resistance/ Survival Analysis/ Season/ Altitude/Abbay Basin/ Dembecha/ Jabitehenan/
Northwest Ethiopia.
1
1. INTRODUCTION
Currently in Ethiopia population is estimated to be 67.2 million with 2.9% growth rate and
90% of the population is engaged in agriculture economy (CSA, 2002). Livestock sector plays
a significant role for the economy and has a great potential to assist the economic
development by providing meat, milk, other food products, cultivation power, transport,
security in times of crop failure and farm yard manure (fertility and energy) and also plays a
major role in export commodity. The sector contributes 12% of total GDP and over 30% of
the agricultural GDP (MoA, 1998).
The Amhara region covers an area of 150,123 km2 with 11 zones and 109 weredas and the
population is estimated to be 17.205 million people (CSA, 2002).Three river basins Abbay,
Tekeze and Awash and Lakes such as Tana, Zengena, Gudena, Yetilba and Hike are found in
the region. Generally the economic situation of the region depends on crop and livestock
production. Fogera breed of cattle and Menz breed of sheep found in the region. Although
40% of the Ethiopian livestock is found in this region, the livestock production is low
consequently impeding the overall agricultural development. One of the most important
constraints for this is trypanosomosis by affecting the health and productivity of livestock in
the most fertile and arable land of the country due to the infestation of tsetse fly.
Trypanosomosis is the most important constraint to livestock and mixed crop-livestock
farming in tropical Africa. Currently about 3 million livestock die every year due to tsetse fly
transmitted trypanosomosis which covers one third of the continent estimated to be 10 million
km2. In this region at least 46 million cattle are exposed to the risk of contracting tsetse-borne
trypanosomosis, as are millions of sheep, goats, donkeys, camels and horses (Reid et al.,
1998). A recent study estimated the direct annual cost of trypanosomosis to be about 1.34
billion US$ (Kristjanson et al., 1999). African livestock producers are administering an
estimated 35 million curative and prophylactic treatments annually which costs the producers
and the government at least 35 million US$ (Geerts and Holmes, 1998). The direct losses
from trypanosomosis in livestock include mortality, morbidity, impaired fertility and the cost
of implementing and maintaining tsetse fly and trypanosomosis control operations. Indirect
losses stem from farmers responses to the perceived risk of the disease, including the
reduction and in some cases, the exclusion of livestock from tsetse-infested grazing lands and
reduced crop production due to insufficient animal draught power (ILRAD, 1993).
2
The host range of trypanosomosis includes domestic and wild animals as well as human
beings. The vector includes several species of tsetse flies and biting flies. Tsetse flies are
grouped in the three categories: Glossina morsitans group (savanna areas), Glossina fusca
group (forest areas) and Glossina palpalis group (river and lake areas). The most important
trypanosome species that affect cattle, sheep and goats are: Trypanosoma congolense, T. vivax
and T. brucei.
Tsetse transmitted animal trypanosomosis is a serious constraint to livestock production and
agricultural development in Ethiopia. A total of 14.8 million cattle, 6.12 million sheep and
goats, 1 million camels and 1.23 million are at risk of contracting trypanosomosis (MoA,
1995). According to this report 1 to 2 million doses of trypanocidal drugs are administered at
the cost of 0.5 to1 million US$ per annum in Ethiopia.
There are five 5 species of Glossina in Ethiopia: G. pallidipes, G. morsitans submorsitans, G.
fuscipes, G. tachinoides and G. logipennis. Several reports made in Ethiopia revealed that
tsetse fly occupy over 66,000 km2 areas (Ford et al., 1976) based on a 1500 m.a.s.l. breeding
limit in the southern and southwestern valleys of the country. Langridge (1976) has reported
that some 98,000 km2 area 1600 m.a.s.l. breeding limit in the southern and southwestern parts
of Ethiopia. However, due to the advancement of tsetse flies into formerly free areas reaching
130,000 to 150,000 km2 (Silnbergh, 1992) basedon 1700 m.a.s.l. nd recently 220,000 km2
areas is estimated to be affected by tsetse flies (NTTICC, 1996) based on 2000 m.a.s.l.
breeding limit. These areas follow the Baro, Omo and Abbay valleys of the large rivers in the
country. On the other hand these areas possess the most arable land with a high potential for
agricultural development due the high annual rain fall (Jemal and Hugh-Jones, 1995).
There are five economically important animal trypanosome species in Ethiopia: T.
congolense, T. vivax, T. brucei brucei, T. evansi (Langridge, 1976) and T. equiperdum
(Dagnachew and Shafo, 1981). The most prevalent trypanosome species in tsetse-infested
areas of Ethiopia are T. congolense and T. vivax. Rowlands et al. (1993) reported a prevalence
rate of 37% for T. congolense in southwest Ethiopia. Abebe and Jobre (1996) reported an
infection rate of 58.5% for T. congolense, 31.2% for T. vivax and 3.5% for T. brucei in
southwest Ethiopia. In the same report it is also indicated that 8.71% prevalence rate was
recorded in the highlands (tsetse free areas) of which 99% is due to T. vivax. Different
workers (Afewerk, 1998; Tewelde, 2001; Muturi, 1999) indicated a prevalence rate of 17.2%,
3
21% and 14% in Metekel district, in Upper Didessa Valley and Southern Rift Valley areas of
tsetse infested regions respectively and the dominant species was T. congolense.
In the western part of the Amhara regional state bordering the Abbay river, one of the north
western tsetse belt areas of Ethiopia, tsetse transmitted trypanosomosis is becoming a serious
threat for livestock production and agricultural activity in particular. Reports made by Bahir
Dar regional veterinary laboratory in 1999 indicated the presence of tsetse transmitted
trypanosomosis in three districts of the region (Bure, Jabithen and Ankasha) bordering the
Abbay valley areas. A preliminary survey conducted in Dembecha wereda by the
ESTC/SRVETEP (2000) indicated a trypanosome prevalence rate of 23% with a dominant
species of T. congolense and tsetse fly identified was G. m. submorsitans.
Earlier works by Langridge (1976) indicated that the tsetse belts extend from the southern part
of the Rift valley, around the southern corner of the country and along the western lowlands
and escarpment to the Abbay river. There is a suspicion that G. morsitans may extend
northwards from the Abbay to Tekeze river (Mulligan, 1970). In Ethiopia both G. morsitans
and G. tachinoides have been caught at nearly 1800 m in western Amhara region. Langridge
explain this as an exceptional condition as these flies had been forced up to the high level by
large grass fires which started in the bottom of the Abbay valley and worked the slopes to the
top of the valley walls. According to Langridge (1976) tsetse infested areas of Gojjam are all
associated with the Abbay river and G. m. ugandensis and G. tachinoides are found all along
this river system from Beles river valley of Metekel district of the Benshangul-Gumz region
upto within 40 km of the bridges on the main highway from Addis Ababa to Debre Markose.
The principle of prevention and control of tsetse-transmitted trypanosomosis depends on
minimizing contact between domestic, game animals and tsetse flies. So far the methods used
for the control of trypanosomosis in tsetse infested areas include control of tsetse fly numbers,
use of curative or prophylactic trypanocidal drugs and use of livestock breeds that tolerate the
disease. However, uses of these methods are highly variable.
Trypanocidal drugs remain the principal method of animal trypanosomosis control in most
African countries including Ethiopia. With increasing liberalization of veterinary drugs the
controls on the use of trypanocides are diminishing, hence there is a growing concern that
their future effectiveness may be severely curtailed by widespread drug resistance. In general,
in areas where trypanocides have been used intensively drug resistance is more common than
4
in areas where they have been used less intensively. The problems of drug resistance have
been reported from 13 countries in sub-Saharan Africa (Peregrine et al., 1994). Drug resistant
T. congolense have been reported in Ethiopia by different workers (Scott and Pegram, 1974;
Codjia et al., 1993; Wubete et al., 1997; Afewerk et al., 2000; Assefa and Abebe, 2001;
Tewelde et al, 2004). For the effective way of controlling tsetse transmitted trypanosomosis
the knowledge of insect biology and ecology, the status of the disease prevalence and
trypanocidal drug efficacy is of paramount importance. As a result the present research
proposal is initiated to generate a base line data on the epidemiological status of tsetse and
trypanosomosis and to study drug resistance in the Abbay basin areas of northwest Ethiopia
Therefore, the specific objectives of this research are:
� To determine the seasonal apparent density, distribution and species of tsetse flies and
other biting flies in the Abbay basin areas of northwest Ethiopia.
� To determine the seasonal prevalence of trypanosomosis in the study area.
� To assess trypanocidal drug resistance (ISMM and diminazine aceturate) in the field cattle
in the Abbay basin areas of northwest Ethiopia.
� To assess the community awareness regarding the effect of trypanosomosis and control
methods.
5
2. LITERATURE REVIEW
2.1. Animal trypanosomosis
Animal trypanosomosis is a disease of domestic animals resulting from infection with
parasitaemic protozoa of the genus Trypanosoma transmitted primarily by tsetse fly and also
by other haematophagous flies. Trypanosome parasitizes all classes of vertebrates including
human beings and it is predominantly a parasite of blood. Animals affected with
trypanosomosis become anaemic and weak; lose weight and body condition, reduced
productivity and often mortality rates are high (Urquart et al., 1995).
Trypanosomes are unicellular microscopic elongated spindle-shaped protozoa ranging from
8.0 -39.0 µm long. All possess flagellum which arises at the posterior end of the trypanosome
from a basal body at the foot of the flagellar pocket. The flagellum runs to the anterior end of
the body and is attached along its length to the pellicle to form an undulating membrane. In
stained specimens, a single centrally placed nucleus can be seen, and adjacent to the flagellar
pocket, a small structure the kinetoplast which contains the DNA of the single mitochondria is
observed.
Animal trypanosomosis occurs widely in the tropics and subtropics and is well recognized,
having local names such as Nagana, Samore, or tsetse fly disease in sub-Saharan Africa
(typical African trypanosomosis); Malde Caderas in equines of central and South America;
and Surra in equines, cattle, buffaloes and camels in India. Human trypanosomosis occurs as
“Chagas’’ disease in central and South America and as Sleeping Sickness in Africa.
Based on difference in the course of development in their vectors, Trypanosoma is divided
into Stercoraria and Salivaria. Species of the first group complete development in the terminal
gut and are transmitted in the feces of the vector. Species belonging to the Salivaria group
complete their development in the anterior part of the digestive tract and are transmitted via
the vectors saliva. The pathogenic trypanosomes belong to the latter group. The main
pathogens in Salivaria group categorized into four sub genera: Duttonella (species: T. vivax;
T. uniformes); Nanomonas (species: T. congolense; T. simae); Pycnomonas (Trypanosoma
suis) and Trypanozoon (species: T. brucei; Trypanosoma rhodesiense; Trypanosoma
gambiense; T. evansi; T. equiperdum) (Mulligan, 1970).

6
Trypanosomosis in Africa is mainly restricted to areas in which the vector, tsetse fly
(Glossina species) can survive. The disease is also found outside the tsetse belt areas
transmitted mechanically by biting flies of the genus Tabanus, Hematopota, Chrysops, and
Stomxys. This type of transmission have caused the spread of T. evansi and T. vivax, outside
tsetse infested areas. The most pathogenic trypanosomes are T. congolense and T. vivax.
Trypanosoma congolense is responsible for the most important form of animal
trypanosomosis in domestic animals. Report from tsetse-infested areas of Ethiopia indicated
that T. congolense is the most prevalent trypanosome species (Codjia et al.1993; Abebe and
Jobre, 1996).
2.2. Epidemiology
The epidemiology of African animal trypanosomosis is highly dependent on the parasite,
vector and host factors. Trypanosome species occur in a variety of genotypes with different
strains, virulence, immunogenecity and response to chemotherapeutic agent. The severity of
the disease also depends on the species and strain of trypanosomes involved. Since the
parasite infects a wide range of animals including wild animals which constitute the reservoirs
of the disease, the epidemiology of trypanosomosis extremely complicated. The degree of risk
to which domestic animals are exposed to the trypanosomosis depends on the species and
density of tsetse present, infection rate in tsetse, species and strain of trypanosomes, source of
infection (wild or domestic animals) and feeding preference of the flies (MacLennan, 1970).
2.2.1. Transmission and distribution
The transmission of the disease is either cyclically by tsetse flies or mechanically by
haematophagous flies. Transmission by tsetse fly is a complex mechanism in which the fly
remains life long carrier. In the vector trypanosome changes through several morphological
distinct stages (amastigote, promastigote and epimastigote) until it reaches trypomastigote
(metacyclic stage) which is infective for mammals (Stephan, 1986; Urquart et al., 1995).
Tsetse flies occur only in Africa south of the Sahara and north of the temperate climate in the
south of the continent that covers between 150N and 250S latitude (Hoar, 1957). Animal
trypanosomosis cause huge economic losses that are greatest in the vast tsetse infested tracts
of sub-Saharan Africa where cattle production is affected in approximately 10 million km2
areas. There are 31 species and subspecies of tsetse flies identified at present (Leak, 1999).

7
2.2.2. Biology and distribution of tsetse fly
The most distinctive feature of the life history of tsetse flies, shared with only a few other
small families of Diptera, is retention of the single egg in the uterus of the female, where it
hatches to a larva and nourished by the products of a pair of modified accessory glands. This
method of reproduction is referred to as adenotrophic viviparity (Langley and Weidehaas,
1986; Jordan, 1993 and Leak, 1999).
This form of reproduction involves cyclical production of eggs, which hatch in the uterus and
the insect does not feed from the time it leaves the female fly as a mature larva until the adult
emerges from the pupa (Phelps and Lovemore, 1994; Leak, 1999). Females are receptive to
males as soon as they start seeking food and often mate when taking their first blood meal or
soon after. They usually mate once but sometimes more than once mating can occur. Male
flies may not mate soon after emergence from the pupa and they are not fully fertile until they
are a few days old. Active and viable sperms can remain in the spemathecae, nourished by a
secretion of layers of cells, which surrounds the cuticular lining of the lumen of each
spermathecae, through out the life of the female. This is the basis for the need to mate not
more than once in the female. The whole pregnancy cycle takes about 9 days, although the
rate of development of each stage is temperature dependent. By the ninth day the third instar
larva with its two conspicuous black polypneustic lobes at the posterior end is deposited
through the vagina (Larviposition) on the ground (Jordan, 1993; Nagel, 1995; Leak, 1999).
The successful burrowing in the soil by the deposited larva depends on various factors, for
instance, soil particle size, moisture content of the soil, and possibly the soil temperature are
the most important ones.
Under favourable environmental conditions (temperature and moisture of the soil) newly
deposited larva is transformed, within a few hours, in to a hard almost black larva and moults
to form the prepupa, but remains within the third cuticle, which then harden to form the
puparium within an hour of larviposition. Thirty days later adult fly emerges from the
puparium with the sex ratio of 1:1. The puparial period is highly dependent on temperature for
example; Jordan (1993) indicated that at a minimum temperature of 200C the duration of
puparium period is about 47 days while at 300C it is about 20 days only. At temperature
below 170C and above 320C there are insufficient fat reserves within the puparium and
development can not be successfully completed. The optimum temperature for the puparium

8
development is about 250C (Leak, 1999) and at this temperature males emerge after 27 days
(Jordan, 1993).
Both sexes of tsetse flies feed exclusively on blood of vertebrates (mainly from mammals but
some species take the meal from reptiles and birds). They usually search for hosts and food
when they are active. It has been noted that female flies live longer than males. As a result of
this, there are always more females than males in any tsetse population. A female fly may
produce about 8-10 offspring in her life time. Consequently the rate of reproduction is much
lower than in any oviparous insects and in fact resembles that of small mammals (Langley and
Weidehaas, 1986; Leak, 1999) that is why the sterile insect technique (SIT) control method is
facilitated. Leak (1999) noted that eventhough more precise limits of distribution, particularly
in low densities, are not known, the general distribution of tsetse flies is determined
principally by climate and influenced by altitude, vegetation and the presence of suitable host
animals.
Climate: the effect of climate on tsetse distribution is often through its effect on vegetation.
Buxton (1955) discussed in detail the relationship between tsetse flies and different climatic
factors and effect of temperature on the ecology of tsetse flies is through its effect on the
interval and puparial duration and also the influence on the activity of the flies. In temperature
below 150C tsetse fly are inactive and above 350c they seek refuge in rot-holes in the trees and
animal burrows and deep tissues in the barks, where they remain inactive (Phelps and
Lovemore, 1994). Humidity is also important factor both for pupal and adult fly development
(Nagel, 1995). Cummulative effect of long rainy season or dry season are thought to have
been important in influencing advances and recession in tsetse population (Leak et al., 1999).
Humidity has also an important effect in relation to the behavior of the flies. Tsetse flies use
light for searching food and most of them are active during day time (Buxton, 1955).The
effect of altitude on tsetse distribution is through its effect on climate, mainly temperature. As
temperature fall with increasing altitude the geographic limitations of different species may be
due to their inactivity in lower temperature (Vreyesen et al., 1999).
Vegetation: different species of tsetse flies require particular vegetation type that would
provide an optimal condition for growth and survival, and vegetation is also important that
provides shelter for their hosts (Buxton, 1955; Leak, 1999). The highest catches of G.
pallidipes were in bushes and wooden grass land in the Southern Rift Valley of Ethiopia

9
(Vreyesen et al., 1999). Vegetation types like wooded grassland, forest, riverine forest, bush
land, grassland and cultivated land are seen in tsetse infested areas.
Host animal: the presence of wide different types of host animals is essential component of
tsetse fly distribution. The distribution and abundance of some species of tsetse flies such as
G. morsitans and G. pallidipes which are often known as game tsetse flies are closely related
to the number and habitats of certain wild animals. Nagel (1995) also described that the
highest densities of certain tsetse fly species are reported from areas with very high densities
of wild animals and low human population areas.
2.3. Pathogenesis of trypanosomosis
African trypanosomosis (Nagana) in all species is a progressive and often fatal disease. The
pathogenesis of trypanosomosis depends on the pathogenicity of the strain; the animal host’s
breed, genotype, age, sex, skin type etc.; and most importantly, on the method by which the
infection was induced i.e. natural or artificial (Leak et al., 1987). Once the metacyclic
trypanosomes are injected into the host by the fly during feeding, they multiply at the
subcutaneous site provoking a local skin reaction called a chancre which is most pronounced
in a fully susceptible host and may be slight or absent with some strains or species of
trypanosomes. Within a chancre, metacyclic parasites change to trypomastigote form and
enter the blood stream directly or through the lymphatic.
The appearance of chancre, follow detectable parasitaemia in a few days, is accompanied by
the development of fever and marked enlargement of draining lymph nodes. As the lesion i.e.
chancre decreases in size increased numbers of mature plasma cells, macrophages,
eosinophils, and mast cells are found, and these compositions of cells within the chancre
suggest an initial immune response. This behaviour largely depends on the species of
trypanosomes. Trypanosoma. vivax usually multiplies rapidly in blood and is evenly dispersed
throughout the cardiovascular system, whereas T. congolense tends to aggregate in small
blood vessels and capillaries of the heart, brain and skeletal muscle from where a small
proportion of parasites enter the blood circulation. Trypanosoma brucei and rarely T. vivax
have the added capability of passing out of the capillaries into the interstitial tissues and
serous fluids of body cavities where they continue to multiply (Abebe,1991; Luckins et al.,
1994).

10
Trypanosoma vivax and T. congolense exert their effect mainly by causing sever anaemia and
mild to moderate organ damage. In very acute infections as seen with highly susceptible
exotic animals infected with T. vivax or in pigs infected with T. simae, there is disseminated
intravascular coagulation. Trypanosomes can also pass through the placenta and into the fetus
in pregnant animals. As a result some cows abort and some calves are born before birth time.
A cerebral form of the disease occurs with T. brucei alone or in mixed infections with the
other species (Stephan, 1986). Murray (1979) stated that the onset and severity of the anaemia
is directly related to the appearance of the parasite in the blood and to the level of the
parasitaemia. The rapid decline in the hemoglobin concentration, red blood cell number and
PCV and the clear clinical sign of pallor of the mucus membrane in infected animal leave as
no doubt that anaemia is a very important part of the pathogenesis of trypanosomosis.
When an animal is infected with trypanosomes, antibodies against the surface coat are
produced. The problem is that these trypanosomes have multiple genes, which code for
different surface proteins; this allows organisms with a new coat glycoprotein to elude the
immune response. This process is called antigenic variation and results in the persistence of
the organism and this prevents the development of vaccine and permits re-infection when
animals are bitten by tsetse flies carrying trypanosomes with surface coat glycoproteins of
new antigenic type. Genetic resistance to animal trypanosomosis has been attributed to certain
breeds of livestock, e.g. West African N'Dama. This resistance is manifested by ability to
withstand the adverse effects of trypanosomes by regulating parasite growth; their ability to
prevent or reduce the rate and degree of development of anaemia (Murray, 1988; Seifert,
1996).
2.4. Diagnostic methods
Diagnosis of trypanosomosis in tsetse, humans or domestic livestock is a basic requirement
for epidemiological studies as well as for planning and implementing chemotherapy and for
monitoring vector control operations. Accurate diagnosis of trypanosome infection in
livestock is required for a proper appreciation of the epidemiology of the disease in any
geographical locality. Besides clinical diagnosis, direct (parasitological) and indirect
(serological) diagnostic methods with varying degrees of sensitivity and specificity are
available for trypanosomosis.

11
2.4.1. Clinical diagnosis
In general, diagnosis of trypanosome infection based on clinical signs alone is rather difficult,
but haematological parameters like PCV could be reliable indicators of the progress of the
disease. Intermittent fever can be observed due to the variation in parasitaemia and if the
animal survives, the disease becomes chronic and there is development of anaemia and
emaciation. Therefore, fever, anaemia and loss of body condition are important parameters
used routinely for tentative diagnosis of trypanosomosis in areas where this disease is
endemic and laboratory service are not available.
2.4.2. Parasitological diagnosis
Parasitological diagnosis is the direct demonstration of the parasite in blood or less frequently
in other body fluids (using a microscope). The scarcity of the parasites and the fluctuating
nature of the parasitaemia limit the use of laboratory tests based on demonstration of
trypanosomes in accessible body tissues such as the peripheral blood (Doyle, 1977).
Therefore, several techniques for the concentration of blood trypanosomes have been
developed, which increases the chance of trypanosome detection.
.
2.4.2.1. Dark ground or phase contrast buffy coat technique
The buffy coat zone prepared in a microhaematocrit capillary tube filled with 70µl of blood
and centrifuged for 5 minute at 10,000 revolutions is examined for trypanosomes by cutting
the capillary tube to include 1mm of erythrocytes and 1cm of the plasma. The buffy coat is
poured on a slide and covered with a 22x22mm coverslip. The preparation is examined using
a microscope with a phase contrast and dark ground illumination. The use of 10x eyepiece in
combination with a 25x objective gives optimal viewing, by allowing large visual fields and
sufficient magnification for ready identification of trypanosomes. This technique is the most
sensitive of the parasitological tests for the detection of T. congolense and T. vivax detecting
trypanosomes to an estimated level of just over 102 parasites per ml (Murray et al., 1977). In
addition, species identification based on size and movement is easier (Paris et al., 1982).
Trypanosomes can be identified and the level of parasitaemia estimated using a scoring
system (Murray et al., 1983). The PCV is measured before examination of the blood for
parasitaemic detection.

12
2.4.2.2. Haematocrit centrifugation technique (Woo, 1970)
A microhaematocrit capillary tube containing 70 µl of blood is centrifuged for 8 minute at
10,000 revolutions as for measurement of PCV. Two rectangular pieces of glass from a
standard microscope slide (1.2 mm thick) are fixed 1.5 mm apart on a microscope slide .The
prepared capillary tube is then placed in the slot and a drop of immersion oil put on top of the
capillary tube. The oil fills the space between the capillary tube and the two pieces of glass,
thus reducing the effect of light diffraction. By slowly rotating the tube the Buffy coat plasma
junction is examined using a long working distance (6.7mm) objective which allows
considerable depth of focus through the capillary unlike the standard objective where the
average working distance is approximately 0.5mm. Depending on the trypanosome species
the analytic sensitivity for this method is 1-5 x10² trypanosome per ml of blood.
2.4.2.3. Capillary concentration technique
Because of the tendency of T. congolense to be retained amongst red blood cells (RBC), this
technique was designed to create a large differential density between the RBC and the
parasite. This was achieved by mixing infected blood with a strongly hypertonic nontoxic
medium (Walker solution). On centrifugation, the denser red cells separate from the
trypanosomes, which display normal motility. Equal volume of diluents and blood are mixed
on a micro titer titration plate. After being allowed to stand for a minimum of 15 minutes
plain capillary tubes are three quarter filled from the wells, sealed and spun for 2 minute in a
microhaematocrit centrifuge. The capillary tubes are placed on a clean microscope slide and
the Buffy coat zone covered with a few drops of diluents beneath a coverslip. This technique
is more sensitive than haematocrit centrifugation test in the detection of T. congolense.
However, it needs more time to prepare the samples and PCV cannot be measured at the same
time (Walker, 1972).
2.4.3. Serological diagnosis
Serological methods are playing an increasingly important role in the diagnosis and
epidemiological assessment of trypanosomosis. Antibody ELISA and antigen ELISA are the
methods widely used currently for the diagnosis of cattle trypanosomosis.

13
2.4.3.1. Antibody ELISA
Luckins and Mehlitz (1976) used micro plate-ELISA system in their study of bovine
trypanosomosis and found that cattle developed positive ELISA values after infection but it
was not possible to differentiate between T. vivax, T. congolense, T. brucei or T. rhodesiense.
The serological tests in current use suffer from a lack of well-defined antigens necessary for
designing simple and accurate tests that are easily adaptive for field use. Secondly, the
detection of antitrypanosomal antibodies in serum can not distinguished between an active
infection and a past infection (Voller, 1977). The length of time taken for antibodies to
disappear from circulation after a successful therapy of cattle is not yet clear. Thirdly, the
present serological tests are not sufficiently specific to reveal conclusively the identity of the
infecting trypanosomal species (Nantulya, et al., 1987).
2.4.3.2. Antigen ELISA
The detection of circulating trypanosomal antigens may be a more sensitive means of
practical diagnosis and could increase the reliability of detection of current infection in
animals undergoing trypanocidal drug therapy during a period at which it is not possible to
isolate parasite from the peripheral circulation. Species-specific monoclonal antibodies,
produced against procyclic forms of T. congolense, T. brucei and T. vivax were used to
develope antigen-captured enzyme–linked immunosorbant assay (Ag-ELISA) for the
diagnosis of bovine trypanosomosis (Nantulya et al., 1989). Ag-ELISA is no more in use due
to problem associated with T. brucei. In almost all study areas there were high prevalence rate
of T. brucei which is not as such really when using parasitological technique. The cross
reaction of T.b. brucei and T. vivax in T. evansi and T. congolense infections is the limiting
problem of this test.
2.4.4. Polymerase chain reaction
Polymerase chain reaction (PCR) with the amplification of DNA samples has been developed
as a diagnostic test for a number of parasites both in tsetse and cattle using PCR and DNA
probes. In an evaluation of a PCR for detecting T. vivax in cattle, sensitivity was not greater
than direct technique and gave false negative results when parasitaemia was high. This was
thought to be due to the presence of a component in the test sera that inhibited the PCR
reaction (Desquesnes, 1997).

14
2.5. Control of trypanosomosis
Prevention and control of tsetse-transmitted trypanosomosis depends on minimizing contact
between domestic livestock, game animals and tsetse fly. There are a number of control
measures directed to the parasite, vector and host. However, uses of these methods are highly
variable. The methods include reducing tsetse fly population with different techniques,
treating infected animals with drugs, preventing animals from the disease using prophylactic
drugs and using indigenous breeds of livestock that are genetically resistant to the disease.
Each of these approaches is useful but has important limitations, such as expensive,
environmental pollution, drug resistance and poor availability. Vector control may play a role
by reducing the level of tsetse challenges to livestock which will in turn encourage the
development of land use practices involving livestock. Insecticides in the form of ground
spraying and aerial spraying have been employed but the recent development of insecticide
impregnated, odour-baited traps and targets which attract and kill tsetse flies offer the
prospect of cheaper alternatives with less damage to the environment (Jordan, 1986).
Application of deltamethrin pour-on to cattle against tsetse flies has proved to be very
efficient in controlling tsetse fly vectors in the pastoral zones of Samorogouan, Burkina Faso
(Bauer et al., 1995). Clausen et al (1992) indicated that efficient tsetse fly control will lead to
a reduction of the use of trypanocidal drugs and this will leave their role as an efficient means
to cure the disease in case of an outbreak.
Sterile Insect Technique (SIT) in which artificially sterilized males competes with wild tsetse
males for mating with females (Dame and Schanidt, 1970). However this is considered to be
very expensive and moreover has the potential of increasing the trypanosomosis risk in the
affected area because the sterile male have been found to be as capable as normal male tsetse
fly in transmitting the disease (Moloo,1982).
A safe and cost effective vaccine against trypanosome would be a much more effective and
sustainable way of controlling the disease. However, because of the ability of trypanosomes to
undergo antigenic variation immunization of cattle against trypanosomosis has been
unsuccessful (Doyle, 1977). The attempts of vaccine of trypanosomosis failed and now it is
recognized that a major obstacle to immunization lies in the phenomenon of antigenic
variation in trypanosomes. The phenomenon of antigenic variation and its genetic control
have been described and it has been concluded that vaccines based on immune responses to
the variant surface coat are unlikely to have any impact on trypanosomosis control. Therefore,

15
looking for molecular biology of cells component and products responsible for the
development of disease is the current research area. This approach could lead to the
development of vaccines based on immune responses to invariant molecules such as cysteine
proteases or cyclophilins produced by trypanosomes (Teale, 1993).
The introduction and keeping of trypanotolerant West African taurine cattle breeds seem to be
an alternative biological method for preventing clinical trypanosomosis and thus economic
losses for the animal holders. Trypanotolerance is a feature of both West African long horn
and short horn Bos taurs breeds such as the N’Dama and Baoule breeds. These breeds of
animals possess an increased titer of resistant factors (lysozyme, hemolytic complement C9
and the third complement component C3) and are better able to stabilize the balance of the
host-parasite relation ship known as premunity (Seifert, 1996). Trypanotolerance is
manifested by the ability of the trypanotolerant animals to regulate parasite growth and to
prevent or reduce the rate and degree of development of anaemia (Murray et al., 1988).
2.5.1. Chemotherapy and chemoprophylaxis
Trypanocidal drugs remain the principal method of animal trypanosomosis control in most
African countries (Geerts and Holmes, 1998). The chemotherapy and chemoprophylaxis of
animal trypanosomosis relies essentially on three drugs, namely: Homidium (Homidium
chloride-Novidium; and Homidium bromide-Ethidium), Diminazine aceturate (Berenil) and
Isometamidium chloride (Samorin, Trypamidium). All the three compounds are closely
related chemically and have been available for at least 35 years and it is estimated that about
35 million doses per year are currently used in Africa (Budd, 1999). Chemoprophylaxis has
been used to protect livestock under low to medium trypanosome challenge using
Isometamidium at a dose range of 0.5 to 1.0 mg/kg body weight depending on the
trypanosome challenge. Although these drugs have effectively controlled the disease when
rationally used in the field, the prevalence of resistance to each of these compounds appears to
be increasing (Pinder and Authie, 1984).
2.5.2. Trypanocidal drug resistance
The repeated use of chemicals as pesticides or chemotherapeutic agents inevitably leads to the
development of resistance in the target organism (Geerts and Holmes, 1998). Drug resistance
is defined as a loss of sensitivity by a strain of an organism to a compound to which it had

16
been previously susceptible (Uilenberg, 1997). Because of misuse of trypanocidal drugs and
lack of essential information dissemination at all levels, the effectiveness of trypanocidal
drugs is often limited and this is mainly due to the development of drug resistance (Conner,
1992).
Resistance systematically occurs within approximately ten years following the introduction of
antimicrobials, insecticides and anthelmentics to the market (reviewed by Geerts and Holmes
1998). This also occurred with trypanocidal drugs, such as ISMM, the Homidium salts and
Diminazine aceturate, which were introduced during the 1950s; the first reports of acquired
resistance were published during 1960s. Quinapyramine was marketed earlier, but withdrawn
in 1976 because of resistance and toxicity problems. It was later reintroduced for use in
camels and horses and may still be used in error in cattle in some locations (Ndoutamia et al.,
1993).
2.5.2.1. Current situation of resistance against trypanocidal drug
So far, resistance to one or more of the three trypanocidal drugs used in cattle has been
reported in at least 13 countries in sub-Saharan Africa such as Burkina Faso, Chad, Cote
d’Ivore, Ethiopia, Kenya, Nigeria, Somalia, Sudan, Uganda, Zimbabwe, Tanzania, Central
African Republic and Zambia (Finelle and Yvore, 1960; Peregrine, 1994). This is probably an
underestimation of the true situation, because in several countries surveys for resistance have
not yet been carried out or cases of resistance have not been published. In eight of the13
countries, multiple resistances have been reported. Most of the currently available information
on drug resistance, however, is derived from limited numbers of case reports and does not
give any indication of the prevalence of resistance in a region or a country as systematic
surveys have not been conducted. There is an urgent need for surveys in which representative
numbers of trypanosome isolates are examined for drug resistance.
At present, the most widely used trypanocidal drugs for T.congolense and T.vivax infection in
Ethiopia are ISMM and Diminazine aceturate. The occurrence of drug resistant trypanosome
across Ethiopia is not well known. Scott and Pegram (1974) described the occurrence of
Homidium-resistant population of T. congolense in Didessa and Angar Valley in Wollega
province. The current situation on the phenomenon of trypanocidal resistance particularly
against T. congolense infection is well documented in the Ghibe Valley (Codjia et al., 1993;
Mulugeta et al., 1997). Recent investigation in Metekel district of northwestern Ethiopia,

17
North Omo Zone of southern Ethiopia from donkey and cattle isolates, and western Ethiopia
indicates the occurrence of drug resistant T. congolense infections (Afewerk et al., 2001;
Assefa and Abebe, 2001; Ademe and Abebe, 2001; Tewelde et al., 2004) respectively.
2.5.2.2. Detection of drug resistance
Several methods have been described to identify drug resistance in trypanosomes (reviewed
by Geerts and Holmes, 1994). At present, three types of techniques are commonly used to
identify drug resistance: tests in ruminants; tests in mice; and in vitro assays. None of these is,
however, an ideal test and other tests are still in the phase of development or validation. The
use of Trypanocidal ELISA is becoming a promising method of detection.
2.5.2.2.1. Test in ruminants
Tests in ruminants provide direct information from studies in ruminants using recommended
doses of trypanocidal drugs. The tests commonly consist of infecting a group of cattle or
small ruminants with the isolate under investigation and later, when the animals are
parasitaemic, treating them with various levels of trypanocide. The animals are then regularly
monitored over a prolonged period (up to 100 days) to determine the effective dose (ED), i.e.
the dose that clears the parasites from the circulation, and the curative dose (CD), i.e. the dose
that provides a permanent cure (Sones et al.1988). For these studies, the cattle or small
ruminants must be kept in fly-proof accommodation or in a non-tsetse area in order to
eliminate the risk of re-infection during the study. A useful indication of the level of
resistance can be obtained from studies in ruminants by recording the length of time between
treatment and the detection of breakthrough populations of trypanosomes. Most trypanosome
isolates of cattle are able to grow in these hosts and that the data obtained are directly
applicable to the field. If only one isolate per animal is tested it is usually impractical and too
expensive to examine a large number of isolates.
2.5.2.2.2. Test in mice
After expansion of an isolate in a donor mouse, groups of 5 or 6 mice are inoculated with
trypanosomes, 24 hours later or at the first peak of parasitaemia each group except the control
group is treated with a range of drug doses. Thereafter, the mice should be monitored three

18
times a weak for 60 days. The ED50 or ED95 (the effective dose that gives temporary clearance
of the parasites in 50 or 95 percent of the animals, respectively) can be calculated, as can the
CD50 or CD95 (the curative dose that gives complete cure in 50 or 95 percent of animals,
respectively). Sones et al. (1988) used groups of five mice, which allowed an easy calculation
of ED80 and CD80 values (1 out of 5 mice was not cleared or cured). These figures should be
compared with those obtained using reference sensitive trypanosome strains. The advantage
of mouse assay is that it is cheaper than the test in cattle. There are several disadvantages,
however: 1) most T. vivax isolates, and also some T. congolense isolates, do not grow in mice;
2) higher doses of drug must be used in mice (normally 10x higher) in order to obtain
comparable results to those obtained in cattle because of the vast difference in metabolic size
(Sones et al., 1988); 3) precise assessment of the degree of resistance needs a large number of
mice per isolate, which makes it a labor intensive test identification of a discriminatory dose,
and 4) it takes as long as 60 days to evaluate the drug sensitivity of an isolate.
2.5.2.2.3. In vitro assays
Further progress has been made in the field of in vitro assays (Kaminsky et al., 1990). The
advantage of this technique is that large number of isolates can be examined; tests with
metacyclic trypanosomes correlate well with field observations. The disadvantages of this
technique are: in vitro cultivation of blood stream forms is only possible using pre-adapted
lines and not using isolates directly from naturally infected animals in addition it is expensive;
require good laboratory and well-trained staff.
2.5.2.2.4. Trypanocidal drug ELISA
The use of trypanocidal drug ELISA in combination with parasite detection tests has given
promising results for the detection of resistant trypanosomes. The test is both sensitive,
detecting subnanogramme concentrations, and specific. It allows the monitoring of drug levels
over extended periods and the evaluation of factors influencing drug disappearance rates from
the plasma. One interesting finding has been that the drug disappears more rapidly in animals
challenged and becoming infected with drug-resistant trypanosome isolates than in those
challenged but protected against infection with sensitive trypanosomes (Eisler et al., 1994).
Observations showed that the presence of trypanosomes in animals with an ISMM
concentration of > 0.4 ng/ml suggests resistance; the higher the drug level detected the greater

19
the degree of resistance that could be inferred (Eisler et al., 1997). The advantage of the
ISMM-ELISA is that large numbers of sera can be tested within a relatively short time. The
disadvantage is that the correlation between protection against tsetse challenge with various
trypanosome populations and the ISMM concentration in the serum is not understood. It is not
yet possible to draw firm conclusions on the sensitivity or resistance of a trypanosome
population at the level of individual animal. The ELISA should, however, some indications of
the resistance situation at the level of the herd.
2.5.2.2.5. Field methods for rapid assessment of trypanocidal drug resistance
To overcome constraints associated with laboratory tests, field methods to assess resistance of
trypanosomes to trypanocides in cattle herds under natural tsetse challenge, have been
proposed. Rowlands e al. (1993, 2001) developed a model to distinguish new and recurrent
infections in order to determine if the high infection rates observed in cattle in Ghibe valley,
south west Ethiopia following treatment of T. congolense infections with Diminazine
aceturate were due to the tsetse challenge or if they were instead due to relapse of infections
following treatment. An infection was defined as a new infection if it was preceded by two
previous months in which monthly collected samples had a PCV ≥ 26% and were not detected
with trypanosomes. Eisler et al. (2000) have developed a method for the assessment of
trypanosomosis risk and the level and prevalence of resistance to ISMM, utilizing cattle
populations under natural challenge in the field. This protocol compares new trypanosome
infections in a group of cattle treated with ISMM to untreated group. The rate at which new
infections occur in the two groups is assessed by a comparison of their survival curves over an
8-12 weeks period. This provides a rapid and accurate assessment of ISMM resistance and the
impact of drug use relative to no treatment (Eisler et al., 2000). The main difference between
Rowlands and Eisler approaches is that the former addresses the issue of resistance to curative
trypanocide Diminazine aceturate, where as the later addresses resistance to ISMM which is
first used primarily as a prophylactic drug. This method proposed by Eisler et al. (2000) was
applied in southwest Ethiopia by Tewelde et al. (2004).

20
3. MATERIALS AND METHODS
3.1. Study area
The present study was conducted in 8 Peasant Associations (PAs) in Dembecha and
Jabitehenan weredas of West Gojjam Zone in Amhara Regional State, northwest Ethiopia
located about 380 km northwest of Addis Ababa and 220 km southeast of Bahir Dar the
capital city of Amhara region. West Gojjam Zone is located at 100 30’ North latitude and 370
29’ East longitude. The climatology alternates with long summer rainfall (June-September)
and winter dry season (December-March) with mean annual rain fall of 1200-1600 mm. The
mean temperature is between 10-200C and the altitude ranges from 1400-2300 m.a.s.l. The
river valleys altitude level ranges from 1700 m.a.s.l. from the main road of Addis Ababa to
Bahir Dar to 1300 m.a.s.l. to the lower valley of Abbay.
The study areas includes 8 PAs six from Dembecha wereda namely: Yezeleka, Enewende,
Gedebe, Kendamo and Egzabeherab bordering Temechaen and Bir rivers which join together
before entering the main river Abbay and two PAs from Jabitehenan wereda namely:
Weynema and Adankegne bordering Bir river valley. Ponds and marshy areas are commonly
found in the lowland areas of the majority of the study PAs. The different vegetation types
such as savanna grassland, forest, riverine and bushlands along with the recently expanded
cultivated lands are found. These vegetation types are mainly found in areas below 1700
m.a.s.l. whereas above this altitude the land is occupied by cultivated lands and small areas
left for grazing purposes.
The middle Abbay river valley where the present work was undertaken is adjacent to the
upper Didessa valley and to the upper most limit of tsetse transmitted areas of the Metekel
district where multiple drug resistance of Trypanosoma congolense reported by (Codjia,
1993) and Afewerk et al.(2000) respectively. The presence of tsetse fly and tsetse transmitted
trypanosomosis was also reported by Langridge (1976) in the area.

21
3.1.1. Socioeconomic situation and farming system of the study area
Agriculture is the mainstay of the livelihood of people with a mixed farming system and
livestock plays an integral role for agricultural activity. Livestock also provide meat, milk,
cash income and transportation purposes. The livestock species reared include; cattle, sheep,
goat and equines. Animals kept in communal grazing system with herds locally they called it
“Sheha / Akata”. The herd is owned by 7-10 owners or household levels with the average
number of animals per herd are estimated to be 43 for cattle. The herds are managed in
outdoor system for 14-21 days by close supervision of one owner and animals at night kept in
barn /”berete” system in cultivated land to fertilize the land. The crops commonly produced
are maize, teff, sorghum, wheat, pepper, pulses, groundnut, etc.
3.1.2. Constraints of livestock production in the study area
According to the report of Amhara region BoA (1999) animal health problems such as
infectious diseases, internal and external parasitic diseases, and protozoan diseases are the
main constraints of livestock production and agricultural development in the region.
Trypanosomosis is commonly found in the western part of the region where the present study
area is located and is becoming a serious threat for livestock production and utilization of the
fertile and arable land.
A survey conducted by ESTC/SRVETEP in October( 2000) indicated that tsetse transmitted
trypanosomosis is the most important problem for agricultural activity and livestock
production in Dembecha wereda and the problem was also commonly observed in
Jabitehenan, Bure, Ankasha and Dangela weredas of West Gojjam Zone of Amhara region.
For instance much of the trypanocidal drugs supply from the Bureau of Agriculture is
delivered to West Gojjam Zone and intensive usage of these drugs by local farmers is a long
history in the mentioned weredas.

22
Figure 1. Map of Amhara Regional State showing the study weredas (Dembecha and
Jabitehenan).

23
3.2. Study design
The study was based on questionnaire survey, vector studies (entomological survey),
parasitological studies and field assessment of trypanocidal drug resistance. It was an
epidemiological cross-sectional study covering two weredas with lowland and midland
agroecological zones in two seasons of the year. The area was stratified in to two based on
altitude levels that are below 1600 m.a.s.l. and 1600-2000 m.a.s.l. The vegetation types were
classified into five (bush land, cultivated land, forest, riverine and savanna) according to the
wereda office of agriculture, ESTC/SRVETEP (2000) survey and our observation during the
field work. Bush land: if the habitat is dominated by trees and shrubs with the total canopy
cover greater than 20% and the single canopy is not more than 10 meters. Cultivated land: if a
habitat dominated by man-made cultivated crops. Forest: a habitat that consists of evergreen
and some semidecidous trees usually with a closed canopy. Riverine forest: forest or bush
habitat along the river banks. Savanna: if the typical savanna grass lands are dominant in an
area found.
3.2.1. Questionnaire survey
To assess the perception of farmers on the occurrence of tsetse and trypanosomosis, livestock
constraints, socioeconomic status, herd composition, use and source of trypanocidal drugs as
well as delivery of the drug for treating their animals and other control methods of
trypanosomosis and tsetse fly, a questionnaire survey was undertaken. A total of 80 farmers
were selected randomly in the study area for this purpose. The questions included during the
interview are shown in Annexe 1.
3.2.2. Entomological survey
To assess the apparent density, species of tsetse fly and other biting flies in relation to season,
altitude levels, trap and vegetation types, sampling were done in selected sites of the study
area. The altitude levels and vegetation types were recorded during the sampling period.

24
3.2.2.1. Collection of tsetse and other biting flies
Entomological data were collected twice during the study period; in the late rainy season in
October 2003 and during the dry period in February 2004. The flies were caught with
Monoconical, Biconical and NGU traps baited with acetone and three week old cow urine
(Brightwell et al., 1987). In the selected sites of the study area about 142 traps, 70 in late
rainy season and 72 in dry season (From December to April) were deployed before sun rise in
the morning and kept in position for 72 hours. During trapping acetone was dispensed from
open vials through an approximately,’O’- sized hole while cow urine from open bottles into
which a quarter of tissue paper was used. All odours were placed on the ground about 30 cm
upwind of the trap. Late rainy season is the time period just after the main rainy season from
September to November while dry season is the time from December to April and sampling
of tsetse and other biting flies carried out in October and February in this study protocol
respectively.
The different fly catches in each trap were counted, identified and analysed; the species of
tsetse fly was identified based on the characteristic morphology (Langridge, 1976; Ford et al.,
1976, Leak et al., 1993) and for other biting flies according to their morphological
characteristics such as size, color, wing venation structure and proboscis at the genus level
(Walle and Shearer, 1997). Average aging of tsetse was done by categorizing the degree of
wear of wings on scales of 1-6 using wing fray method described by (Jackson, 1946; Challier,
1965). Mean wing fray was calculated as the sum of each category total divided by the sum of
fly number for each category and find the corresponding number from tables. Sexing were
done just by observing the posterior end of the ventral aspect of the abdomen by microscopic
lenses as a result male flies easily identified by enlarged hypophgeum in the posterior ventral
part of the abdomen. Tsetse fly apparent density is the mean catches in traps deployed,
expressed as the number of tsetse catch/trap/day (Leak et al., 1987).
3.2.3. Parasitological survey
To determine the seasonal prevalence of trypanosomosis and to assess the risk factors
associated with trypanosomosis snapshot cross-sectional studies were conducted twice during
the study period; in the late rainy season (September 25, 2003 to November 5, 2003) and
during dry season (February 10, 2004 to March 10, 2004) in 8 PAs of the study area.

25
3.2.3.1. Study animals
The study animals constituted about 600 herds of 30,000 cattle in 8 PAs of the Abbay basin
areas of Dembecha and Jabitehenan weredas.
3.2.2.2.. Sampling method and sample size determination
The sampling strategy was cluster sampling method (Martin, 1987) and herds were considered
as clusters. The sample size was determined based on the expected prevalence rate of 20%
and absolute desired precision of 4% at confidence level of 95%. As a result a total of 384
animals were needed to be sampled (Thrusfield, 1995). But in case of cluster sampling the
subjects are not independent and hence larger sample is required. Therefore, as rule of thumb
double the number of animals required for simple random sample are needed for cluster
sampling (Martin, 1987). So the optimum sample size for this study was about 800 and
actually 814 and 834 samples were taken during the late rainy season and in the dry season
respectively.
One stage clustering was considered on herds in the study area. Herd (locally called
“Sheha/Akata”) is defined as a group of cattle owned by peoples living together in a village
and their animals share the same barn at night and the same grazing area and watering points.
About 600 herds were estimated to be present in the 8 PAs of the sudsy area out of which 19
herds (814 cattle) and 18 herds (834 cattle) were sampled during the late rainy season and in
the dry season respectively.
3.2.2.3. Sample collection and parasitological examination
Paired blood samples were collected from auricular vein of each animal using two
haematocrite capillary tubes that filled 3/4 of the height and sealed with Cristaseal. The
capillaries were also used to measure the PCV values for the determination of anaemia and
comparison of infected animals with non-infected animals. The capillary tube was cut 1mm
below the buffy coat to include the top layer of red cells. The content of the capillary tube was
expressed onto a clean slide, mixed and covered with a 22x22mm coverslip.Then the slide
examined for trypanosomes based on the type of movement in the microscopic field.
Confirmation of trypanosome species by morphological characteristics were done after
staining with Giemsa by examination with oil immersion microscopy with 100x power of

26
magnifications (Murray et al., 1977). During sampling age, sex, herd number, PA, wereda,
altitude and previous history of treatment with trypanocidal drugs were recorded. Altitudes
were stratified into two, lowland (<1600 m.a.s.l.) and midland (1600-2000 m.a.s.l.). The
altitude range of the area was 1400-2000 m.a.s.l. The age was categorized into three (<1year,
1-3 year and >3 year) groups.
3.2.4. Assessment of trypanocidal drug resistance (Isometamidium block treatment study)
Based on the results of the trypanosome prevalence rate Melkachaba village from Gedebe PA
of Dembecha wereda and Ergib village from Weynema PA of Jabitehenan were selected for
ISMM block treatment using purposive sampling method because it had a prevalence rate of
trypanosome above 20% and the complain of drug failure mentioned by the interviewed
people in these PAs were suggestive too. This study was conducted from December 10, 2003
to March10, 2004. The grazing area and watering points as well as the husbandry systems of
the study animals were similar. Diminazine aceturate and ISMM were the trypanocidal drugs
used in the study area.
A total of 100 animals 50 from each village were selected with a simple random method. All
these animals were treated with Diminazine aceturate (DiminazineTM, Lot No.9687, exp. 07-
2006, Farvet Laboratories B.V., Bladel-Holland) at a dose rate of 7mg/kg body weight to
eliminate the existing trypanosome infection while parasitological examination was done to
determine the initial prevalence of trypanosomosis. Cattle of each village were then
randomized into 25 ISMM treatment group and 25 control (sentinel) groups following the
methods proposed by (Rowlands, 2001; Eisler et al., 2000). Animals in each group were ear
tagged using yellow plastic tags, which allow easy identification of animals during each visit
for parasitological examination.
After two weeks of the blanket treatment (day 0), one group was treated with ISMM
(TrypamidiumTM, Lot/Batch: W391971 Aut. Av/Exp.:06/2008, MERIAL -17, rue Bourgelat
69002 LYON - France) at a dose rate of 1mg/kg body weight and the other group was left as
untreated control group. Body weight of each animal was estimated using heart girth
measuring tape (Arora et al., 1981). Blood examination of animals for trypanosome infection
was conducted every two weeks starting from day of blanket treatment upto 12 weeks
following ISMM block treatment i.e. day 0, 14, 28, 42, 56, 70 and 84. Date of treatment,
dosage of trypanocidal drugs, PCV values and trypanosome infections were recorded during

27
each examination. In each group, cattle which were found to be infected with trypanosomes
were treated with diminazine aceturate at a dose rate of 7mg/kg body weight.
Survival analysis of time was done to ascertain the occurrence of ISMM resistance. Survival
time is the time to first detection of trypanosome upto 8 weeks post treatment with ISMM at
1mg//kg body weight. Survival analysis of time provides a rapid and accurate assessment of
ISMM resistance in the field and impact of ISMM prophylaxis relative to no prophylaxis and
moreover applicable to all species and strains that are pathogenic to cattle (Eisler et al., 2000).
The efficacy of diminazine aceturate treatment was assessed on the basis of whether or not
parasitaemia followed within two weeks after each treatment of any cattle on day 0 to 84
(Rowlands, et al., 2001).
Survival analysis was used to answer the following three practical questions which cattle
keepers are facing (Eisler et al., 2000):
1. Was challenge sufficient to warrant prophylaxis in the study village?
2. Was there evidence of ISMM resistance in each village?
3. If resistance was suscepected, had the drug nevertheless sufficient effect to make its use
worthwhile?
To resolve these questions three measures were proposed (Eisler et al., 2000):
1. The time after prophylaxis by which 25% of the herd becomes infected
2. The proportion of cattle becoming infected by 8 weeks following prophylaxis
3. The ratio of the mean hazard rate for the control and prophylaxis herds over 8 weeks
period.
Interpretation of survival data (Eisler et al., 2000):
If fewer than 25% of control cattle become infected within 8 weeks of exposure, then the
challenge was insufficient to warrant ISMM prophylaxis, which would be undesirable on
grounds of cost, possible side effects and unnecessary drug pressure tending to develop drug
resistance. If more than 25% ISMM treated cattle become infected within 8 weeks of
exposure, this was strongly suspicious of the occurrence of drug resistant trypanosome,
provided there was good evidence that the drug was administered correctly.
Where there was evidence of drug resistance on the grounds of the number of ISMM treated
cattle becoming infected within 8 weeks of exposure it may nevertheless be worth continuing
prophylaxis in situations where the ratio of the mean hazard rate for the control and
prophylaxis herds over 1-8 weeks greater than 2. Accordingly, 25% survival time: the time by
which 25% of the animals were parasitaemic as a result of trypanosome infection after the
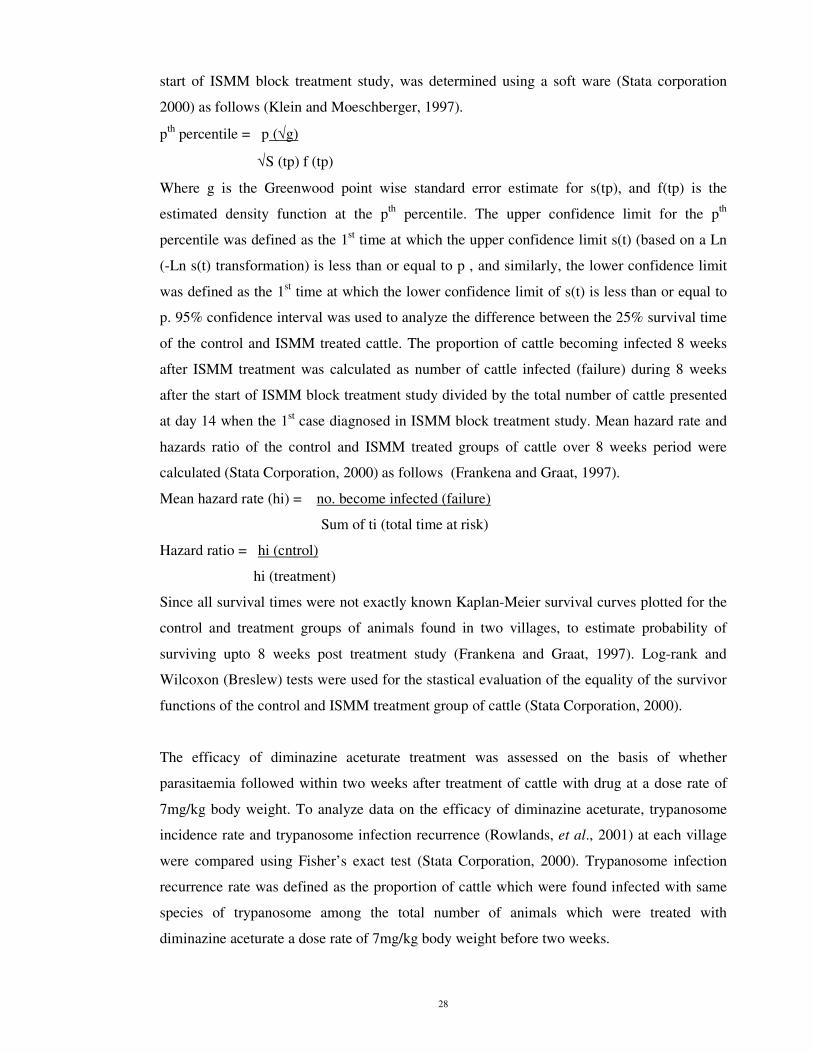
28
start of ISMM block treatment study, was determined using a soft ware (Stata corporation
2000) as follows (Klein and Moeschberger, 1997).
pth percentile = p (√g)
√S (tp) f (tp)
Where g is the Greenwood point wise standard error estimate for s(tp), and f(tp) is the
estimated density function at the pth percentile. The upper confidence limit for the pth
percentile was defined as the 1st time at which the upper confidence limit s(t) (based on a Ln
(-Ln s(t) transformation) is less than or equal to p , and similarly, the lower confidence limit
was defined as the 1st time at which the lower confidence limit of s(t) is less than or equal to
p. 95% confidence interval was used to analyze the difference between the 25% survival time
of the control and ISMM treated cattle. The proportion of cattle becoming infected 8 weeks
after ISMM treatment was calculated as number of cattle infected (failure) during 8 weeks
after the start of ISMM block treatment study divided by the total number of cattle presented
at day 14 when the 1st case diagnosed in ISMM block treatment study. Mean hazard rate and
hazards ratio of the control and ISMM treated groups of cattle over 8 weeks period were
calculated (Stata Corporation, 2000) as follows (Frankena and Graat, 1997).
Mean hazard rate (hi) = no. become infected (failure)
Sum of ti (total time at risk)
Hazard ratio = hi (cntrol)
hi (treatment)
Since all survival times were not exactly known Kaplan-Meier survival curves plotted for the
control and treatment groups of animals found in two villages, to estimate probability of
surviving upto 8 weeks post treatment study (Frankena and Graat, 1997). Log-rank and
Wilcoxon (Breslew) tests were used for the stastical evaluation of the equality of the survivor
functions of the control and ISMM treatment group of cattle (Stata Corporation, 2000).
The efficacy of diminazine aceturate treatment was assessed on the basis of whether
parasitaemia followed within two weeks after treatment of cattle with drug at a dose rate of
7mg/kg body weight. To analyze data on the efficacy of diminazine aceturate, trypanosome
incidence rate and trypanosome infection recurrence (Rowlands, et al., 2001) at each village
were compared using Fisher’s exact test (Stata Corporation, 2000). Trypanosome infection
recurrence rate was defined as the proportion of cattle which were found infected with same
species of trypanosome among the total number of animals which were treated with
diminazine aceturate a dose rate of 7mg/kg body weight before two weeks.

29
3.3. Data analysis
For the management, analysis and interpretation of data collected based on the study
methodology statistical softwares were employed. Stata version 7.0 Software and Excel were
used. The following parameters were analysed: The apparent fly catches in relation to
variables measured (season, altitude level, and vegetation and trap types) were analyzed using
Kruskal Wallis test. The prevalence of trypanosomosis in different variables (altitude levels,
season, sex and age) were compared by χ2-test. A multivariate computation was conducted
using logistic regression analysis in order to establish the effects of different risk factors (age,
sex, altitude and season) compared with odds ratio for each risk factors. Student’s t-test and
ANOVA were employed to compare the mean PCV of the parasitaemic and aparasitaemic
animals and the effect of altitude on PCV values in the two seasons. The relationship between
herd prevalence of trypanosome infections and herd average PCV were examined by
regression analysis using herd average PCV as the dependent variable and the prevalence of
trypanosome infections in a herd as independent variable.
Data from ISMM block treatment studies were used to calculate parameters such as
trypanosome prevalence; incidence rate and cumulative incidence rate. Mean trypanosome
prevalence was calculated to compare study villages during 8 weeks period as the mean of the
two weekly trypanosome prevalence during 0-56 days. Since all animals at each village were
not presented at regular intervals, the cumulative incidence rate was calculated as the number
of animals’ contract trypanosome infection at day t and before divided by the number of
animals at risk at the start of the study-1/2 the number of withdrawals. Mean slope of PCV
and 95% confidence interval were used to assess for any change in PCV values of the ISMM
treated and control groups of cattle over 8 weeks in each village.
Survival analysis was done during the 8 weeks time to determine the 25% survival time and
95% CI, hazard ratio and proportion of animals infected during 8 weeks time. Log-rank and
Wilcoxon (Breslew) tests employed for the equality of survivor function curves between the
control and treatment groups of cattle. The difference in the trypanosome incidence rate and
trypanosome infection recurrence rate was compared by Fisher’s exact test for the assessment
of resistance against diminazine aceturate. Data on the questionnaire were summerised using
frequency distribution and percentages (proportions). Significant level was determined at
p<0.05 for all statistical results.

30
4. RESULTS
4.1. Questionnaire survey
History of farmers settlement
A total of 80 villagers were interviewed, of which 5 were monks and the remaining 75 were
farmers. The interviewees were selected randomly from the study area. All the interviewed
people responded to the prepared questionnaire format. Twenty percent of the respondent
started to live in the present settlement area in 1940s, 40% in 1960s, 20% in 1970s, 15% in
1980s and 5% in 1990s. The farmers still settle in the lowland areas from highland weredas of
West Gojjam Zone and from the same wereda by adjusting their own indigenous social and
cultural management system. The peoples in the monastery started to live in Kendamo PA in
one of the study area since 1969 and established as a monastery in 1970s for male and female
monks.
Socioeconomic status
Above 97% of the respondents livelihood is depends on mixed crop livestock production
systems. Livestock are integral part of agricultural activity and are used as food, source of
income and for transport purposes. The average number for cattle was 5cattle/household and
the cultivated land was about 3 hectar/household level.
Livestock management
Livestock is reared primarily for draught purposes where oxen, donkeys and sometimes cows
used for this purpose in order of importance. Livestock also used for milk, meat, source of
income and transportation. The composition of livestock species in the lowland was cattle
(75%), small ruminants (15%) and equines (10%) area while in the midland it was 60%, 35%
and 5% respectively. The average cattle herd size was 43 and each herd included cattle from
several owners (average 7). Each herd was kept together for grazing and watering as well as at
night in the barn (“Beret”). Each herd “Akata” or “Sheha” was managed by one of the owner
or Kenjja (partner in herding) for 2-3 weeks in his own supervision at the grazing area and at
night in his own “Beret” in the cultivated land for the purpose of fertilizing the crop land to

31
increase crop productivity. Milking is carried out in the “Beret” at 6 AM in the morning and 7
PM by individual owners. Majority of activities are carried out by the males in the study area.
Each herd (Akata) has one responsible person elected by the agreement of all the people of
the Akata member for managerial and decision requirements for the husbandry and health
care practice.
The grazing and watering points are far away from their locality (90% of the respondents)
during the dry period. Draught animals travel more long distance than non-draught animals
from midland areas to lowland during the rainy season for cultivation purposes. Crop residues
and grasses were not preserved for feed source in the lowland area while in the midland area
preservation of crop residues and hay for dry period shortage of feeds is practiced.
Livestock rearing including cattle and donkeys were practiced in the monastery but stopped
due to livestock diseases. As a result the monks reported the problem to the ESTC and the
Amhara Region Bureau of Agriculture. Based on the complaint the ESTC/SRVETEP carried
out a survey of trypanosomosis and tsetse fly and implement control activities in and around
the monastery for a limited period of time with the assistance of the FAO regional office for
Africa.
Livestock constraints
According to the respondents the main livestock constraints in the study area include
livestock diseases, lack of grazing land and watering points and scarcity of modern veterinary
service. Based on the interview result the main livestock diseases in order of importance are;
trypanosomosis, anthrax, pasteurollosis, blackleg, contagious bovine pleuro pneumonia
(CBPP), internal parasites, abortion and external parasites as shown in Figure 2.

32
Figure 2. Major livestock diseases in the Abbay basin areas of northwest Ethiopia.
0
2
4
6
8
10
12
Trypano
som
osis
Anthr
ax
Paste
urollo
sis
Black
leg
CBPP
Inte
rnal p
arasit
e
Aborti
on
Extern
al p
arasi
te
Diseases
De
gre
e o
f im
po
rta
nc
e
The status of trypanososmosis
Trypanosomosis as a disease of livestock local name “Mich“or Ghendi is the most important
and the first problems affecting livestock productivity and agricultural activity as per 95% of
the respondents. The disease had a history of 30-40 years of occurrence as per 60% of the
respondent. Twenty five percent of the respondents indicated that they knew trypanosomosis
at the start of settlement in their locality and 15% informed that the disease appeared 5-10
years after settlement. Almost 100% of the respondents consider trypanosomosis is mainly a
disease of cattle followed by equines and then followed by small ruminants. The main clinical
signs of trypanososmosis as known by the interviewed people included; ruffled hair coat,
diarrhea, coughing, constipation, emaciation, weakness, reluctant to move, isolated from the
herd, depression, abortion, inappetance etc. The impacts of trypanosomosis explained by the
respondents in the following sequence: loss of draught power, under cultivation, abortion,
reduced fertility, cost of treatment, mortality, loss of milk and meat production, etc.
The questions about transmission of trypanosomosis was responded as follows; 80% of the
respondents indicated that the transmitter and cause of the disease is the environment, 15% of
the respondent believe biting flies locally called ‘Lesso’ and “Wegie” their equivalent are

33
tabanids and muscids flies, and other flies they characterize small in size brown in color biting
their animals where the animals move to the forest and savanna vegetation types their
equivalent might be tsetse fly. Only 5% of the interviewed people didn’t know any about the
cause and transmitter of trypanosomosis.
The agroecological occurrence of trypanosomosis was high in areas bordering Abbay valley
and the tributaries of Abbay such as Bir and Temechan river valleys. 80% of the respondent in
the midland areas revealed that their animals contract trypanosomosis from lowland areas of
the river valleys when animals move for grazing and draught purposes. The seasonal
occurrence of trypanosomosis was indicated by respondents (98%) after the long rainy season
and after short rainy season.
Control methods of trypanosomosis
The only control method of trypanosomosis (Mich/Ghendi) was the use of trypanocidal drugs
(100%). A recent method of control of trypanosomosis by applying fly traps and mobile
targets initiated by monks in the monastery with the assistance by FAO/ESTC and the
Amhara Region Bureau of Agriculture was practiced for a limited period. This activity
created awareness about the control methods of trypanosomosis and tsetse fly. As a result the
midland people decreased their animal movement into the lowland areas particularly after
rainy season. Chemotherapy is the main practice for the treatment of animals affected by
trypanosomosis for the last 20-30 years. Diminazine aceturate (Berenil) locally known as
“Bicha” or German and Isometamidium chloride (Trypamidium) locally known as “Buna” has
been used extensively (97% respondent). 90% of the treatment was given to clinical cases and
10% to non clinical cases.
Above 60% of the respondents indicated that the sources of trypanocidal drugs are the private
legal and illegal shops while the remaining was from the veterinary clinics. About 70% of the
animals treated by farmers got 55% with Berenil and 45% Trypamidium. Forty five percent of
the treatment of infected animals was done by the owner himself, 15% by other partner with
improved skill and 40% by veterinary post personnel.
Most of the farmers treatment practice didn’t follow the proper dosage and site of injection.
As a result treatment of clinical and poor body conditioned animals was done 3-4 times per
month in the lowland areas and 1-2 times per month in the midland areas after the long rainy

34
season and after the short rainy season. Later on mixing of Berenil and Trypamidium was
started when treatment failure was encountered by most of the interviewed people. The
injection sites of trypanocidal drugs known by local peoples were the gluteal muscle and
between the last two ribs below the vertebrae on the right side of the body as shown in
Figures 3 and 4. On an average 12-16 birr/month/animal were spent for Berenil and 24-50
birr/month/animal for Trypamidium. No traditional method of treatment was being tried for
the control of trypanosomosis which is a common practice for other livestock diseases. The
curative efficiency of trypanocidal drugs was reported to be poor by 60% of the respondents
and good by 30% of the respondents and unknown by 10%. For this reason frequent treatment
and mixing of drugs was the conventional solutions accepted by the local farmers.

35
Figure 3. A farmer injecting trypanocidal drug to an ox on the gluteal muscle.
Figure 4. A farmer injecting trypanocidal drug to an ox between the last two ribs below the
vertebrae.

36
4.2. Entomological survey
Fly Species
A total of 13,927 flies were caught during the late rainy season and 1,731 flies during the dry
season as shown in Table 1. The tsetse fly found during the study period was Glossina. m.
submorsitans. Tabanid and biting flies of the Muscid groups were caught along the tsetse fly
and in areas where tsetse fly were not caught. The tsetse fly accounted for 1.12% of the total
fly catches while tabanids account for 8.45% and the rest covers 90.42% during late rainy
season and 7.79%, 4.27% and 87.92% during dry season. The tabanid flies included Tabanus,
Haematopota and Chrysops whilst the majority of Muscids were Stomoxys. The proportion of
fly types caught in the late rainy season and in the dry season is shown in Figure 5.
Table 1. The different fly catches in two seasons in the Abbay basin areas of northwest
Ethiopia.
Fly types(no.)
Season Tsetse Tabanids Muscids Total
Late rainy season 157 1176 1258 13927
Dry season 135 74 1522 1731
Total 292 1250 2780 15658
Figure 5. Proportion of fly catches during the study seasons in the Abbay basin areas of
northwest Ethiopia.
0
10
20
30
40
50
60
70
80
90
100
Late rainy season Dry season
Pro
port
ion o
f fly c
atc
hes
Tsetse
Tabanids
Muscids

37
The mean catches of flies by three different types of traps (Monoconical, Biconical and NGU)
during late rainy season are shown in Table 2; Monoconical tap performed the best in the
study area was used for determination of apparent density and statistical description.
Table 2. The mean fly catches in three trap types during the late rainy season.
Mean catches/trap
Trap type Tsetse Tabanid Muscid
Biconical 2.29 13.76 145.47
Monoconical 3.22 26.36 274.31
NGU 1.51 11.7 131.77
There was significant difference between trap types for the mean catches of flies (Kruskal-
Wallis test, χ2 = 8.38 with 2 d.f. and p=0.0151).
The apparent fly density was found to be 1.08fly/trap/day, 8.78fly/trap/day and 91fly/trap/day
for tsetse, tabanids and muscids in the late rainy season and 0.68fly/trap/day, 0.35fly/trap/day
and 7.33fly/trap/day in the dry season with a significant difference (p<0.05) shown in Figure
6 for tsetse and in Figure 7 for other biting flies. The apparent fly density in five vegetation
types indicated in Table 3 showed no significant difference. Altitude has a significant effect
on the apparent density of tsetse in both seasons (p<0.05) shown in Figure 8. In the late rainy
season the lowland areas (below 1600 m.a.s.l.) recorded higher apparent density
1.35fly/trap/day than the midland areas (1600-2000 m.a.s.l.) with 0.66fly/trap/day, and during
the dry season the apparent density was 0.95fly/trap/day and 0.15fly/trap/day in the lowland
and midland areas respectively. Higher apparent density for biting flies also found in the
lowland but not significant.

38
Table 3. Apparent densities of tsetse and other biting flies in different vegetation types in the
Abbay basin areas of northwest Ethiopia during the two study seasons.
Late rainy season Dry season Vegetation type
Tsetse Tabanid Muscid Tsetse Tabanid Muscid
Bushland 1.0 1.33 57.25 0.5 0.3 4
Cultivated land 0.66 17 108.33 0 0.05 15.33
Forest 1.0 17.08 51.91 0.88 0.36 3.86
Riverine 1.88 5.66 227.22 0.49 0.37 4.86
Savanna 1.08 16.8 84.5 1.02 6 12.72
Relatively higher apparent density of tsetse caught in riverine and savanna vegetation types in
late rainy season where as in the dry season higher apparent density was caught in savanna
and forest areas, in both seasons the lowest was in cultivated lands.
Figure 6. Tsetse apparent density in late rainy season and in dry season in the Abbay basin
areas of northwest Ethiopia.
0
0.2
0.4
0.6
0.8
1
1.2
Fly/trap/day
Late rainy season Dry season
Tsetse
There was significant difference between seasons in the apparent density of tsetse (Kruskal-
Wallis test, χ2 = 4.319 with 1 d.f. p = 0.0377).

39
Figure 7. Biting flies apparent density in late rainy season and in dry season in the Abbay
basin areas of northwest Ethiopia.
0
10
20
30
40
50
60
Fly/trap/day
Tabnids Muscids
Late rainy season
Dry season
There was significant difference in apparent fly density between seasons (Kruskal-Wallis test,
χ2 =13.268 with 1 d.f. p =0.0003) for biting flies.
Figure 8. Tsetse apparent density at the different altitudes in late rainy season and dry season
in the Abbay basin areas of northwest Ethiopia.
0
0.2
0.4
0.6
0.8
1
1.2
1.4
Fly/trap/day
<1600 m.a.s.l. 1600-2000 m.a.s.l.
Late rainy season
Dry season
There was significant difference in altitude levels in both seasons (Kruskal-Wallis test, χ2
=3.65 with 1 d.f. p = 0.0002).
Tsetse fly sexing in the study period indicated that the predominant sex was females (88.78%)
during the late rainy season and 53.33% in the dry season. Based on the wing fray analysis the

40
average age of the population of tsetse fly were 31 days in the late rainy and 26 days during
the dry seasons as shown in Annex 2. The mean wing fray age of tsetse fly was slightly higher
during the late rainy season than the dry season. Female flies were caught at altitude levels
upto 1780 m.a.s.l. while males upto 1650 m.a.s.l.
An attempt was made to detect infection rates in tsetse which were found to be alive during
fly identification for sexing and aging. A total 60 flies were dissected and in two (3.3%) male
flies “congolense type” infection was found from the mid gut content only.
4.3. Parasitological survey
4.3.1. Trypanosome prevalence
A season based cross-sectional study was carried out during the study period in late rainy
season and during dry season. A total of 1,648 animals (cattle) were examined in both seasons
i.e. 814 during the late rainy season and 834 during the dry season. The prevalence of
trypanosomosis was determined and compared with risk factors such as altitude, season, sex,
and age. The herd prevalence was determined with altitude levels and between seasons. The
prevalence of trypanosome infection rates between trypanosome species were also assessed at
each season.
The prevalence of trypanosomosis during the late rainy season was 17.07% of which 66.9 %
(95% CI=0.58-0.74) was T. congolense infection where as during the dry season the
prevalence was 12.35% of which T. congolense infection covered 79.61% (95% CI=0.70-
0.86) as shown in Table 4. Trypanosoma. vivax infection was 31.65% and mixed infections
(T. congolense and T. vivax) was 1.45% during the late rainy season and 16.5% for T. vivax
and the remaining infections 1.94% and 1.94% were due to mixed infections (T. congolense
and T.vivax) and T. brucei infection at dry season. The risk of infections in the dry season was
0.7 times Odds ratio lower than late rainy season (95% CI=0.53-0.92) with a significant
difference.
The prevalence rate of trypanosome infection between sex category (Tables 5 and 6) was
18.45% for males and 13.87% for females in the late rainy season and 12.82% and 11.32%
during the dry season but there was no significant difference between sex groups within the

41
same season or between seasons. There was no significant difference (p>0.05) observed in the
age groups in the study seasons (Tables 7 and 8). Higher infection rates observed in older
animals 17.2% (95% CI=0.14-0.20) and lower in young animals 11% (95% CI=0.04-
0.23).The relatively lower infection rates observed during the dry period in calves 2.56%
(95% CI=0.001-0.13) and in adult animals 15% (95% CI=0.1-0.15).
The prevalence of trypanosomosis was 19.87% in lowland areas (<1600 m.a.s.l.) and 13.39%
in midland areas (≥1600 m.a.s.l.) during the late rainy season while in dry season 17.62% and
6.54% respectively (p<0.05) as shown in Tables 9 and 10. In both seasons 0.5 times Odds
ratio lower infection rates observed in midland areas than the lowland areas (95% CI=0.35-
.65).
Table 4. Prevalence of trypanosome infection in two seasons in the Abbay basin areas of
northwest Ethiopia.
Trypanosome spp.diagnosed
Season
Infected
Noninfected
Total T.c T.v T.b Mixed
Prevalence
rate (%)
Late rainy
season
139 675 814 93 44 0 2 17.07
Dry season 103 731 834 82 17 2 2 12.35
Total 242 1406 1648 175 61 2 4 14.68
T.c=Trypanosoma congolense, T.v=T. vivax, T.b= T. brucei, Mixed =T. congolense and T.
vivax
There was statistical significant difference between seasons (p=0.007, χ2 = 7.3 at 1 d.f). The
risk of animals being infected with trypanosome during the dry period was lower than the late
rainy season by 0.7 times Odds ratio (95% CI=0.53, 0.92). The prevalence of trypanosome
infection in the late rainy season was 17.07% (95% CI=0.14-0.19) and in the dry season 12.35
% (95% CI=0.1-0.14). The overall prevalence rate of trypanosomosis was 14.68% (95%
CI=0.13-0.16) and the predominant trypanosome species was T. congolense i.e.72.3% (95%
CI=0.66-0.77).

42
Table 5. Prevalence of trypanosomes in male and female cattle during the late rainy season in
the Abbay basin areas of northwest Ethiopia.
Trypanosome spp.diagnosed
Sex
Infected
Noninfected
Total T.c T.v T.b Mixed
Prevalence
rate (%)
Male 105 464 569 71 32 0 2 18.45
Female 34 211 245 22 12 0 0 13.87
Total 139 675 814 93 44 0 2 17.07
T.c=Trypanosoma congolense, T.v=T. vivax, T.b= T. brucei, Mixed =T. congolense and T.
vivax
Higher prevalence rates of trypanosome infection were observed in male animals 18.45%
(95% CI=0.15-0.21) than female animals 13.87% (95% CI=0.09-0.18) but there was not
significant difference (p>0.05).
Table 6. Prevalence of trypanosomes in male and female cattle during the dry season in the
Abbay basin areas of northwest Ethiopia.
Trypanosome spp. diagnosed Sex Infected Noninfected Total
T.c T.v T.b Mixed
Prevalence
rate (%)
Male 73 496 569 60 12 1 0 12.82
Female 30 235 265 22 5 1 2 11.32
Total 103 731 834 82 17 2 2 12.35
T.c=Trypanosoma congolense, T.v=T. vivax, T.b= T. brucei, Mixed =T. congolense and T.
vivax.
The sex groups in the dry season were almost equally affected with the disease as the
prevalence was 12.82% (95% CI=0.10-0.15) for male animals and 11.32% (95% CI=0.07-
0.15) for female animals (P>0.05).

43
Table 7. Prevalence of trypanosomes in different age groups of cattle in the late rainy season
in the Abbay basin areas of northwest Ethiopia.
Trypanosome spp.diagnosed Age Infected Noninfected Total
T.c T.v T.b Mixed
Prevalence
rate (%)
<1 year 6 45 51 5 1 0 0 11
1-3 year 19 84 103 8 11 0 0 18
>3 year 114 546 660 80 32 0 2 17.2
Total 139 675 814 93 44 0 2 17.07
T.c=Trypanosoma congolense, T.v=T. vivax, T.b= T. brucei, Mixed =T. congolense and T.
vivax.
No significant difference was observed in the age groups in the late rainy season while higher
infection rates seen in older animals >3year 17.2% (95% CI=0.14-0.20) than calves (<1year
old) 11% (95% CI=0.04-0.23).
Table 8. Prevalence of trypanosomes in different age groups of cattle in the dry season in the
Abbay basin areas of northwest Ethiopia.
Trypanosome spp.diagnosed Age Infected Noninfected Total
T.c T.v T.b Mixed
Prevalence
rate (%)
<1year 1 38 39 1 0 0 0 2.56
1-3year 12 63 75 5 7 0 0 16
>3year 90 630 720 76 10 2 2 15
Total 103 731 834 82 17 2 2 12.35
T.c=Trypanosoma congolense, T.v=T. vivax, T.b= T. brucei, Mixed=T. congolense and T.
vivax.
Lower infection rates were observed during the dry period in calves (<1year) 2.56 % (95%
CI=0.01-0.13) than in adult animals (.>3year) 15 % (95% CI=0.1-0.15) but statistically the
different was not significant (p>0.05).

44
Table 9. Prevalence of trypanosomes in cattle at different altitudes during the late rainy season
in the Abbay basin areas of northwest Ethiopia.
Trypanosome spp.diagnosed Altitude
(m.a.s.l.)
Infected Noninfected Total
T.c T.v T.b Mixed
Prevalence
rate (%)
<1600
(lowland)
92
371
463
68
24
0
0
19.87
1600-2000
(midland)
47 304 351
25
20
0
2
13.39
Total 139 675 814 93 44 0 2 17.07
T.c=Trypanosoma congolense, T.v=T. vivax, T.b= T. brucei, Mixed =T. congolense and T.
vivax
The prevalence of trypanosome infection varied significantly between the lowland and
midland areas (p=0.015, χ2=5.9205 at 1d.f) and animals in the midland area was at lower risk
from lowland area by 0.7 times Odds ratio from lowland areas (95% CI=0.42-0.91).The
prevalence of trypanosome in the lowland areas was 19.87% (95% CI=0.16-0.23) and in the
midland areas 13.39% (95% CI=0.10-0.17). The predominant trypanosome infection was T.
congolense at both altitude levels with 73.9% (95% CI=0.63-0.82) and 53.2 % (95% CI=0.38-
0.67) in the lowland and midland areas respectively.
Table 10. Prevalence of trypanosomes in cattle at different altitudes during the dry season in
the Abbay basin areas of northwest Ethiopia.
Trypanosome spp.diagnosed Altitude
(m.a.s.l.)
Infected Noninfected Total
T.c T.v T.b Mixed
Prevalence
rate (%)
<1600
(lowland)
77
360
437
73
3
1
0
17.62
1600-2000
(midland)
26 371 397
9
14
1
2
6.54
Total 103 731 834 82 17 2 2 12.35
T.c=Trypanosoma congolense, T.v=T. vivax, T.b= T. brucei, Mixed =T. congolense and T.
vivax
There was significant difference in the lowland and midland areas in the dry season (p =
0.000, χ2 = 23.55 at 1 d.f) as animals in the midland area were at lower risk than animals in
lowland areas, 0.3 Odds ratio (95% CI= 0.15-0.47). Prevalence rate of trypanosomosis in the
dry season were 17.62% (95% CI=0.14-0.21) in lowland areas and 6.54% (95%CI=0.04-0.09)
in the midland areas. The predominant trypanosome infection was T. congolense in lowland

45
areas with 94.8% (95% CI=0.87-0.98) whilst the predominant trypanosome parasite in the
midland areas was T. vivax 53.8 % (95% CI=0.33-0.73).
The overall prevalence rates of trypanosome infection in sex, age and altitude categories are
shown Table 11. Significant difference observed in altitude levels in the overall infection rates
(p<0.05) with the risk of infection in midland areas was 0.6 times Odds ratio lower than the
lowland areas.
Table 11. The overall prevalence of trypanosome in different sex, age and altitude categories
during the study period in the Abbay basin areas of northwest Ethiopia.
Trypanosome
spp.diagnosed
Prevalence
rate (%)
Variable Infected Non
infected
Total
T.c T.v T.b Mixed
178 960 1138 131 44 1 2 15.37 Sex Male
Female
64 446 510
44
17
1
2
12.54
7 83 90 6 1 0 0 7.77
31 147 178 13 18 0 0 17.41
Age <1yr
1-3yr
>3yr 204 1176 1380 156 42 2 4 14.78
169 731 900 141 27 1 0 18.77 Altitude<1600m.as.l.
≥1600 m.a.s.l.
73 675 748
34
34
1
4
9.75
Total 242 1406 1648 175 61 2 4 14.68
T.c=Trypanosoma congolense, T.v=T. vivax, T.b= T. brucei, Mixed =T. congolense and T.
vivax
The relatively higher infection rates were observed in male animals 15.37% (95% CI=0.13-
0.17) than female animals 12.54% (95% CI=0.09-0.15) but the difference was not significant
(p>0.05). There was not significant difference between the age groups of animals as the
prevalence in adult animals (>3 year) was 14.78% (95% CI=0.12-0.16) and in calves (<1year)
7.77% (95% CI=0.03-0.15) (p>0.05). There was significant difference in trypanosome
prevalence rate with altitude levels (p=0.000) and risk of trypanosome infection in animals of
the midland area was lower by 0.5 times Odds ratio than the lowland areas (95%CI= 0.35 -
0.63). The prevalence rates in the lowland areas was 18.77% (95%CI=0.16-0.21) and in the

46
midland areas 9.75% (95%CI=0.07-0.12). The predominant trypanosome species in the
lowland areas was T. congolense 83.43% (95%CI=0.76-0.88) while in the midland altitude
levels infection rates were the same for T. congolense and T. vivax infections 46.56%
(95%CI=0.34-0.58). The remaining infections were due to mixed (T. congolense and T. vivax)
and T. brucei.
Herd prevalence was determined from a total of 1,648 animals sampled from 37 herds, 19
herds during the late rainy season and 18 during the dry season to assess the effect of
trypanosomosis on the herd average PCV values. The herd prevalence of trypanosome in the
late rainy season was 16.02% and in the dry season 12.38% (P<0.05) and the overall herd
prevalence was 14.25%. All the sampled herds were positive for trypanosome infections.
4.3.2. Haematological findings
The mean PCV (%) values of parasitaemic and aparasitaemic animals during the late rainy
season was 20.7±3.5 and 26.6± 4.3 (p<0.001, 95%CI=25.3-25.9) while during the dry season
21.4%± 3.6 and 26.6%±4.3 (p<0.001, 95%CI=25.4-25.9) respectively. The overall mean PCV
values were also significantly different between parasitaemic and aparasitaemic animals
25.63±4.5 (p<0.0001, 95%CI= 25.4 - 25.8).
The range of PCV values in parasitaemic animals was from 11-35% and in aparasitaemic
animals from 14-43% in the late rainy season while in the dry season from 14-32% in
parasitaemic animals and in aparasitaemic animals from 16- 44%.. The frequency distribution
of PCV values of parasitaemic and aparasitaemic animals in the late rainy season and in the
dry season are shown in Figures 9 and 10.
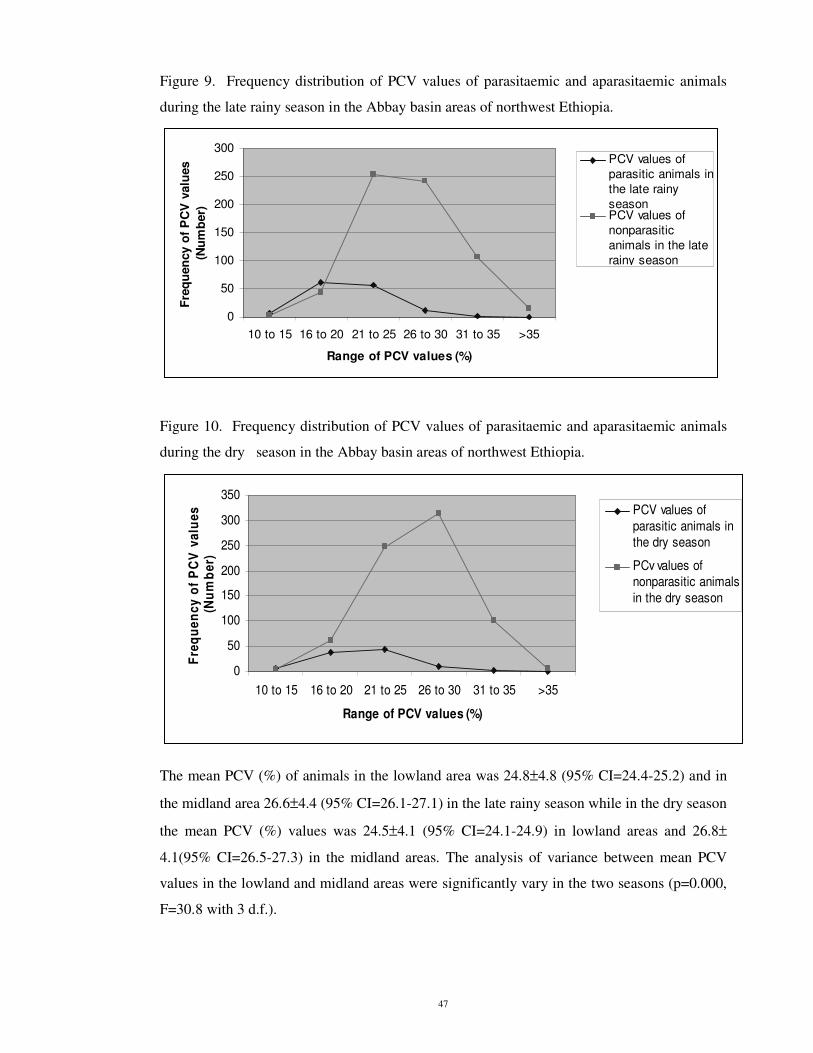
47
Figure 9. Frequency distribution of PCV values of parasitaemic and aparasitaemic animals
during the late rainy season in the Abbay basin areas of northwest Ethiopia.
0
50
100
150
200
250
300
10 to 15 16 to 20 21 to 25 26 to 30 31 to 35 >35
Range of PCV values (%)
Fre
qu
en
cy o
f P
CV
valu
es
(Nu
mb
er)
PCV values of
parasitic animals in
the late rainy
seasonPCV values of
nonparasitic
animals in the late
rainy season
Figure 10. Frequency distribution of PCV values of parasitaemic and aparasitaemic animals
during the dry season in the Abbay basin areas of northwest Ethiopia.
0
50
100
150
200
250
300
350
10 to 15 16 to 20 21 to 25 26 to 30 31 to 35 >35
Range of PCV values (%)
Fre
qu
en
cy
of
PC
V v
alu
es
(N
um
be
r)
PCV values of
parasitic animals in
the dry season
PCv values of
nonparasitic animals
in the dry season
The mean PCV (%) of animals in the lowland area was 24.8±4.8 (95% CI=24.4-25.2) and in
the midland area 26.6±4.4 (95% CI=26.1-27.1) in the late rainy season while in the dry season
the mean PCV (%) values was 24.5±4.1 (95% CI=24.1-24.9) in lowland areas and 26.8±
4.1(95% CI=26.5-27.3) in the midland areas. The analysis of variance between mean PCV
values in the lowland and midland areas were significantly vary in the two seasons (p=0.000,
F=30.8 with 3 d.f.).

48
The mean PCV (%) values of parasitaemic animals in late rainy season in the lowland areas
was 20.3± 3.5 (95% CI=19.5-21.0) and in the midland areas 21.6±3.5 (95% CI=20.5-22.6)
while for aparasitaemic animals 25.9±4.4 (95%CI=24.2-26.2) and 27.4±4.0 (95% CI=25.4-
28.1) respectively. In the dry season the mean PCV (%) values of parasitaemic animals were
21.4± 4.2 (95% CI=20.5-22.4) in the lowland areas and 21.2±3.6 (95% CI=19.7-22.7) in the
midland while for aparasitaemic animals 26.3±3.9 (95% CI=25.9-26.5) and 27.2±3.8 (95%
CI=26.8-27.7) respectively. No significant difference found within the parasitaemic animals
and aparasitaemic animals between altitude levels in both seasons.
The overall average PCV values of herds (37) was 25.73% significantly varied with the
prevalence of trypanosome in herds 14.25% (p<0.0001, 95% CI= -0.23 to -0.12) with
regression coefficient of -0.17 shown in Figure11. The average PCV values of herds (19) was
25.78% significantly varied with mean prevalence of trypanosome in herds 16.02% (p<0.002,
95% CI=-0.29 to -0.15) with a regression coefficient -0.22 during the late rainy season as
shown in Figure 12. During the dry season the average PCV values of herds (18) was 25.68%
with a significant difference with the mean prevalence of trypanosome in herds 12.38%
(p<0.002, 95% CI=-0.27 to -0.07) with a regression coefficient of -0.17 as shown in Figure
13. The comparison of herd prevalence rates between seasons were indicated in Figure 14.
Figure 11. The overall averages PCV values and herd prevalence rate of trypanosome in the
37 cattle herds in the Abbay basin areas of northwest Ethiopia.
0
5
10
15
20
25
30
35
Herds
Avera
ge P
CV
valu
es a
nd
th
e
resp
ecti
ve h
erd
pre
vale
nce i
n
perc
en
t
Average
PCV values
of herdsHerd
prevalence
When the mean prevalence of herds increased the herd average PCV decreased.

49
Figure 12. The average PCV values and herd prevalence rate of trypanosome infection in the
19 cattle herds during the late rainy season in the Abbay basin areas of northwest Ethiopia.
0
5
10
15
20
25
30
35
Herds
Avera
ge P
CV
valu
es a
nd
th
e
resp
ecti
ve h
erd
pre
vale
nce i
n
perc
en
t
Average PCV
values of herds
Herd prevalence
As the average PCV values of the herds decreased the herd prevalence of trypanosome
infections increased considerably.
Figure 13. The average PCV values and herd prevalence rate of trypanosome infection in the
18 cattle herds during the dry season in the Abbay basin areas of northwest Ethiopia.
0
5
10
15
20
25
30
35
Herds
Avera
ge P
CV
valu
es a
nd
th
e
resp
ecti
ve h
erd
pre
vale
nce i
n
perc
en
t
Average PCV
values of herdsHerd prevalence
As the average PCV values of the herds decreased the herd prevalence of trypanosome
infections increased significantly.
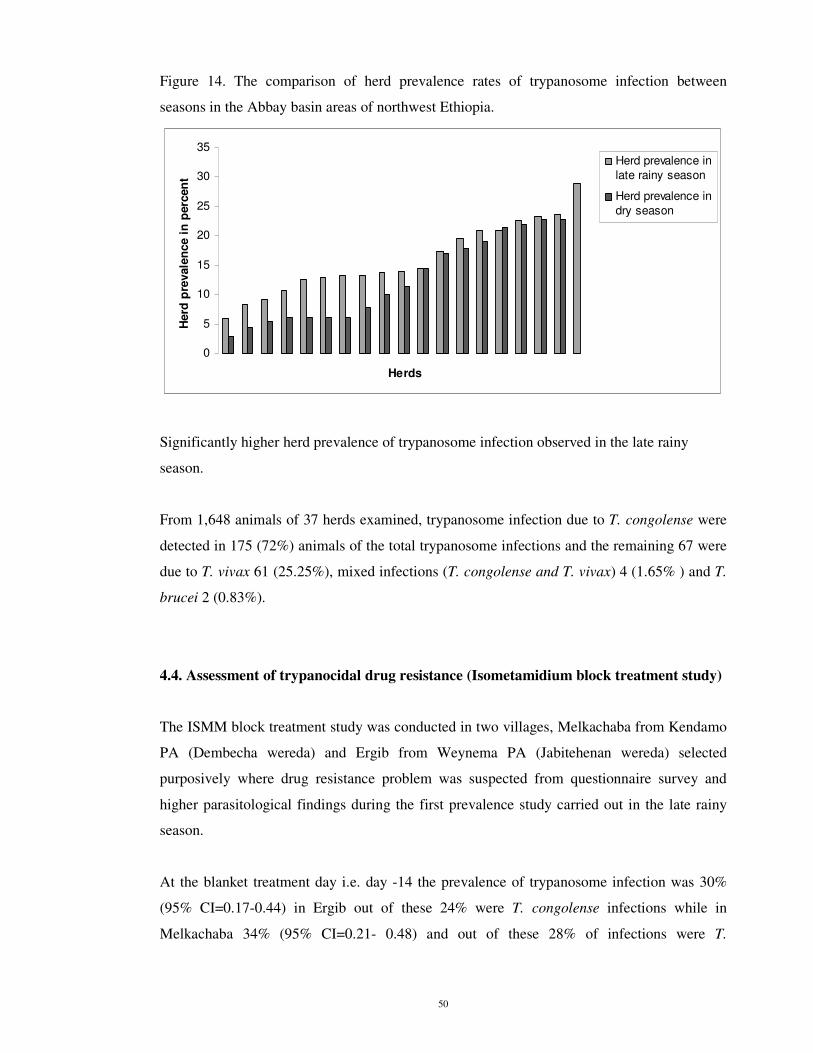
50
Figure 14. The comparison of herd prevalence rates of trypanosome infection between
seasons in the Abbay basin areas of northwest Ethiopia.
0
5
10
15
20
25
30
35
Herds
Herd
pre
vale
nce i
n p
erc
en
t
Herd prevalence in
late rainy season
Herd prevalence in
dry season
Significantly higher herd prevalence of trypanosome infection observed in the late rainy
season.
From 1,648 animals of 37 herds examined, trypanosome infection due to T. congolense were
detected in 175 (72%) animals of the total trypanosome infections and the remaining 67 were
due to T. vivax 61 (25.25%), mixed infections (T. congolense and T. vivax) 4 (1.65% ) and T.
brucei 2 (0.83%).
4.4. Assessment of trypanocidal drug resistance (Isometamidium block treatment study)
The ISMM block treatment study was conducted in two villages, Melkachaba from Kendamo
PA (Dembecha wereda) and Ergib from Weynema PA (Jabitehenan wereda) selected
purposively where drug resistance problem was suspected from questionnaire survey and
higher parasitological findings during the first prevalence study carried out in the late rainy
season.
At the blanket treatment day i.e. day -14 the prevalence of trypanosome infection was 30%
(95% CI=0.17-0.44) in Ergib out of these 24% were T. congolense infections while in
Melkachaba 34% (95% CI=0.21- 0.48) and out of these 28% of infections were T.

51
congolense. The proportion of infection rates in control and treatment groups were 32% and
28% in Ergib and 28% and 40% in Melkachaba villages Annexe 3.
At day 0 of the ISMM block treatment study 4% infection in treatment groups and 12%
infection in control group average (7%) in Ergib while 12% infection in treatment groups and
8% infection in control group of Melkachaba village average (10%) were diagnosed. Fourteen
days after ISMM block treatment, one animal with T. congolense infection in the treatment
group and 2 animals with T. congolense and T. vivax infection in the control group were
found in Ergib village where as in Melkachaba 5 animals were parasitaemic with T.
congolense in the treatment group and 3 animals with T. congolense infection in the control
group. The trypanosome infection rates and mean PCV values of the control and treatment
groups of cattle from day 0 to day 84 is indicated in Annexe 3.
The mean prevalence rate of trypanosome infection during 8 weeks period at Ergib was
7.52% in the treatment group and 13.6% in the control group and in Melkachaba villages
22.4% and 18.12% respectively. The prevalence rates of trypanosome infection in the ISMM
block treatment study for two villages were shown in Figures 15 and 16.
Figure 15. Prevalence of trypanosomes in the control and treatment groups of cattle in Ergib
village of the ISMM block treatment study in the Abbay basin areas of northwest Ethiopia.
0
5
10
15
20
25
30
35
-14 0 14 28 42 56 70 84
Days
Pre
va
len
ce
(%
)
Control
Treatment
`

52
Figure 16. Prevalence of trypanosomes in the control and treatment groups of cattle in
Melkachaba village of the ISMM block treatment study in the Abbay basin areas of northwest
Ethiopia
.
0
5
10
15
20
25
30
35
40
45
-14 0 14 28 42 56 70 84
Days
Pre
va
len
ce
(%
)
Control
Treatment
Trypanosome incidence rate
Trypanosome incidence rate at 8 weeks of ISMM block treatment study was the number of
new cases of trypanosome infection in each group of cattle divided by the sum of cattle days
at risk during the 8 weeks period. Only new cases were considered for this study. Incidence
rate in control group of cattle in Ergib and Melkachaba villages were 0.0097 and 0.0122 and
in the treatment group 0.0056 and 0.0175 respectively (Tables 15 and 16). There was not
significant difference in the incidence rate between control and treatment group in both
villages (p>0.05).
Trypanosome cumulative incidence rate at 8 weeks of ISMM block treatment study were
52.17% and 21.73% for the control and treatment groups in Ergib and 62.22% and 73.91% in
Melkachaba respectively. Cumulative incidence rate was calculated as the number of animal
contract disease at day t and before divided by number of animals at the start of the day-1/2
the number withdrawals.
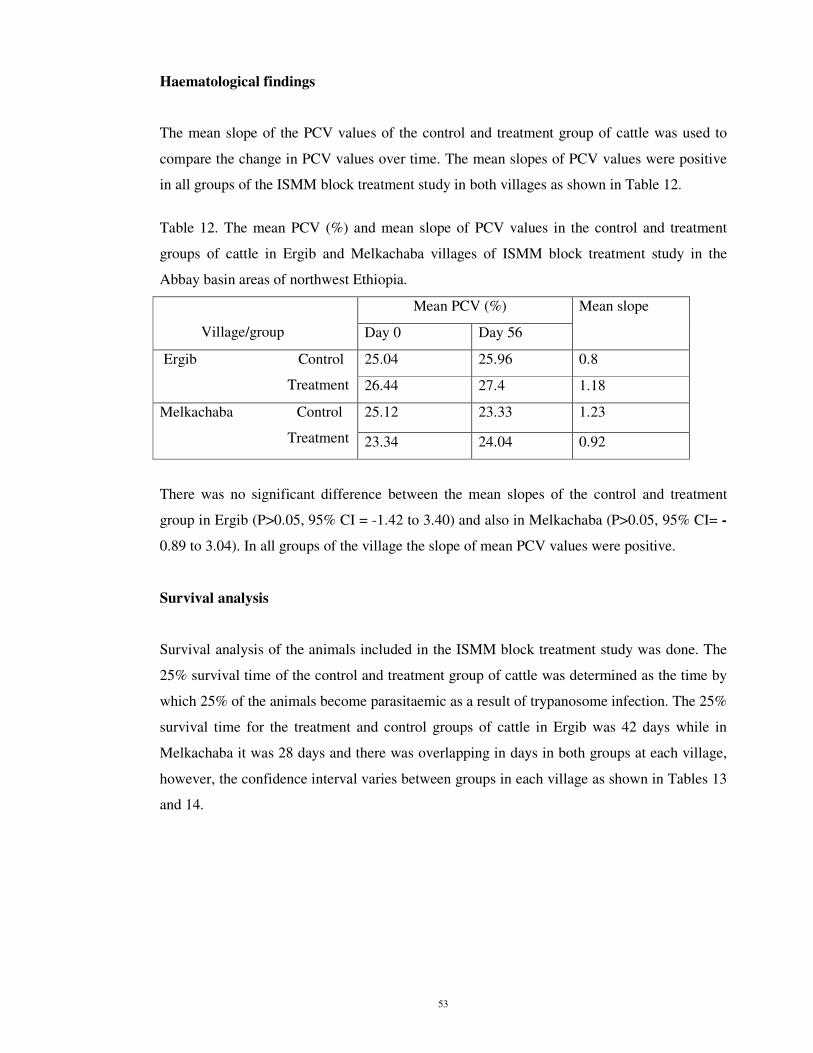
53
Haematological findings
The mean slope of the PCV values of the control and treatment group of cattle was used to
compare the change in PCV values over time. The mean slopes of PCV values were positive
in all groups of the ISMM block treatment study in both villages as shown in Table 12.
Table 12. The mean PCV (%) and mean slope of PCV values in the control and treatment
groups of cattle in Ergib and Melkachaba villages of ISMM block treatment study in the
Abbay basin areas of northwest Ethiopia.
Mean PCV (%)
Village/group Day 0 Day 56
Mean slope
25.04 25.96 0.8 Ergib Control
Treatment 26.44 27.4 1.18
25.12 23.33 1.23 Melkachaba Control
Treatment 23.34 24.04 0.92
There was no significant difference between the mean slopes of the control and treatment
group in Ergib (P>0.05, 95% CI = -1.42 to 3.40) and also in Melkachaba (P>0.05, 95% CI= -
0.89 to 3.04). In all groups of the village the slope of mean PCV values were positive.
Survival analysis
Survival analysis of the animals included in the ISMM block treatment study was done. The
25% survival time of the control and treatment group of cattle was determined as the time by
which 25% of the animals become parasitaemic as a result of trypanosome infection. The 25%
survival time for the treatment and control groups of cattle in Ergib was 42 days while in
Melkachaba it was 28 days and there was overlapping in days in both groups at each village,
however, the confidence interval varies between groups in each village as shown in Tables 13
and 14.

54
Table 13. The 25% survival time of the control and treatment groups of cattle upto day 56 of
the ISMM block treatment study at Ergib village in the Abbay basin areas of northwest
Ethiopia.
Group No.aof
subjects
25% survival
time(days)
Std. Err 95% CI (days)
Control 22 42 7.306614 14 56
Treatment 24 42 7.638733 14 70
Total 46 42 7.970852 28 56
a –number of animals examined when the first case of parasitaemic animals detected at day 14
Table 14. The 25% survival time of the control and treatment groups of cattle upto day 56 of
the ISMM block treatment study at Melkachaba village in the Abbay basin areas of northwest
Ethiopia.
Group Noa.of
subjects
25% survival
time (days)
Std. Err 95% C I (days)
Control 23 28 4.297546 14 42
Treatment 21 28 3.083022 14 28
Total 44 28 3.768138 14 28
a =number of animals examined when the first case of parasitaemic animals detected at day 14
The mean hazard rates of the treatment and control groups of cattle in Ergib were 0.0056 and
0 .0097 (Table 15) while in Melkachaba 0.0178 and 0.0122 (Table 16) respectively. The
hazard ratio of control to treatment group of cattle for Ergib was 1.73 and for Melkachaba was
0.68 (Table 17). The mean hazard rate is calculated as the number of cattle infected with
trypanosome (failure) divided by the total time at risk from day 0 to 56 of the ISMM block
treatment study and the hazard ratio is calculated as the ratio of the mean hazard rate of
control to treatment group of cattle. More than 25% of the animals at each village of the
treatment group were found infected with trypanosome by day 56 (8th week) of the ISMM
block treatment study (Table 18). Therefore the three indices in both villages indicated the
occurrence of drug resistance to ISMM and the prophylactic failures is strongly appreciated.

55
Table 15. Mean hazard rate and 25% survival time of control and treatment groups of cattle
upto day 56 of the ISMM block treatment study in Ergib village in the Abbay basin areas of
northwest Ethiopia.
Group No.a of
subjects
No.
failure
Time at
risk
Meanb hazard
rate
25%c
survival
time(days)
95%CI
(days)
Control 22 10 1022 0.0097 42 14 56
Treatment 22 6 1064 0.0056 42 14 70
Total 44 16 2086 0.0056 42 28 56
a=Total no. of .cattle presented at day 14 when the first case was diagnosed.
b=Number cattle infected (failure) divided by total time at risk from day 0 to 56 of ISMM block treatment study.
c=Time by which 25% of the animal become parasitaemic as a result of trypanosomosis infection.
Table 16. Mean hazard rate and 25% survival time of control and treatment group of cattle
upto day 56 of the ISMM block treatment study in Melkachaba village in the Abbay basin
areas of northwest Ethiopia.
Group No.a of
subjects
No. failure Time at
risk
Mean b
hazard rate
25% c
survival
time(days)
95%CI
(days)
Control 23 12 980 0.0122 28 14 42
Treatment 21 13 728 0.0178 28 14 28
Total 44 25 1708 0.0146 28 14 28
a=Total no. of cattle presented at day 14 when the first case was diagnosed.
b=Number cattle infected (failure) divided by total time at risk from day 0 to 56 of ISMM block treatment study.
c=Time by which 25% of the animal become parasitaemic as a result of trypanosome infection.

56
Table 17. Hazard ratio of control and treatment groups of cattle upto day 56 of ISMM block
treatment study in Ergib and Melkachaba villages in the Abbay basin areas of northwest
Ethiopia.
Village Group No. a of
subjects
No. failure Time at
risk
Mean
hazard rate
Hazardb
ratio
Control 22 10 1022 0.0097
Treatment 22 6 1064 0.0056
Ergib
Total 44 16 2086 0.0056
1.73
Control 23 12 980 0.0122
Treatment 21 13 728 0.0178
Melkachaba
Total 44 25 1708 0.0146
0.68
a=Total no. of cattle presented at day 14 when the first case was diagnosed.
b=The ratio of mean hazard rate of control to treatment groups of cattle in the ISMM block treatment study since day 0 upto day 56
Table 18. Proportion of cattle become parasitaemic upto day 56 since day 0 of ISMM block
treatment in Ergib and Melkachaba villages in the Abbay basin areas of northwest Ethiopia
Village Group No. a of
subjects
No. failure Proportionb
Control 22 10 0.45
Treatment 22 6 0.27
Ergib
Total 44 16 0.36
Control 23 12 0.52
Treatment 21 13 0.61
Melkachaba
Total 44 25 0.56
a-Total no .cattle presented at day 14 when the first case was diagnosed.
b- The proportion of cattle becoming parasitaemic during the 8 weeks period of ISMM block treatment study since day 0.
The Kaplan-Meier survival curves (Stata Corporation 2000) were plotted for the control and
treatment groups of cattle in each village. The equality of the survivor function during the 8
weeks after ISMM block treatment study was tested using Log-rank and Wilcoxon (Breslew)
tests (Stata Corporation 2000). The probability to survive, 8 weeks after the start of ISMM
block treatment study varied between village and between cattle. However there was no
statistical difference between Kaplan-Meier survival estimates of the control and treatment
groups at each village (P>0.05) as shown in Figures 17 and 18.

57
Figure 17. Kaplan-Meier survival estimates and statistical test for the equality of the survivor
function of the control and treatment group of cattle in Ergib village in the Abbay basin areas
of northwest Ethiopia.
Kaplan-Meier survival estimates, by group
analysis time0 20 40 60 80
0.00
0.25
0.50
0.75
1.00
group 0
group 1
Group 0=Control group in Ergib village in the ISMM block treatment study from day 0 to day 84
Group1=Treatment group in Ergib village in the ISMM block treatment study from day 0 to day 84
Log-rank test (p =0.2503) and Wilcoxon (Breslow) test (p = 0.2815) for equality of survivor
functions revealed no significant difference between control and treatment groups.

58
Figure 18. Kaplan-Meier survival estimates and statistical test for the equality of the survivor
function of the control and treatment group of cattle in Melkachaba village in the Abbay basin
areas of northwest Ethiopia.
Kaplan-Meier survival estimates, by group
analysis time0 20 40 60 80
0.00
0.25
0.50
0.75
1.00
group 0
group 1
Group 0=Control group in Melkachaba village in the ISMM block treatment study from day 0 to day 84
Group1=Treatment group in Melkachaba village in the ISMM block treatment study from day 0 to day 84
Log-rank test (p=0.2310) and Wilcoxon (Breslow) test (p=0.1159) for equality of survivor
functions showed no significant difference between control and treatment groups.
In both villages the two tests performed on the Kaplan-Meier survivor function curves of the
control and treatment groups of cattle showed no significant difference on the probability of
surviving from infection by trypanosome pathogen consequently the prophylactic activity of
ISMM was not as effective as recommended by drug manufacturers and the level of resistance
was high along the previous indices.
Efficacy of diminazine aceturate treatment
The efficacy of diminazine aceturate was assessed on the basis of parasitaemia after each
diminazine aceturate treatment on day 0, 14, 28, 42, 56, 70, 84. All the cases found infected
were again treated with diminazine aceturate (7mg/kg body weight). At day 0 three animals

59
from the control group and one animal from the treatment group were parasitaemic in Ergib
and two and three animals in Melkachaba respectively. At day 14 two animals were
parasitaemic in control group and 1 animal in the treatment group in Ergib and three and five
animals in Melkachaba respectively.
In Ergib village a total of 39 cattle (24 from control and 15 from treatment group) were found
at least one times parasitaemic in 84 days follow up out of this 26 were during the 8 weeks
time and 22(87.5%) were due to T. congolense infection. Seven animals from 39 became
parasitaemic at least twice during the 84 days of the study, 4 from control group and 3 from
treatment group as shown in Table 19. Five animals (2 from treatment group and 3 from
control group) were recurrent infections during the 84 days while 3 of 5 recurrent infections
were within 8 weeks time. All the recurrent parasitaemia were due to T. congolense
infections.
In Melkachaba village a total of 70 cattle (32 from control group and 38 from treatment
group) were found to be at least one times parasitaemic in 84 days follow up out of these 52
were during the 8 weeks time and 47(90.62%) were due to T. congolense infection. 21
animals (11 from treatment group and 10 from control group) of 70 became parasitaemic at
least twice. On the otherhand 11 (5 from treatment group and 6 from control group) of the 21
multiple parasitaemic cases were recurrent infections. 100% of the recurrent infections were
due to T. congolense. Eventhough the required doses of diminazine aceturate were given with
some animals remains positive for trypanosome infections with T. congolense upto day 56
and this was detected in both villages. The comparison of trypanosome incidence rate and
trypanosome recurrence infection rate is shown in Table 20 and there was no significant
difference between the two rates at each village.

60
Table 19. ISMM block treatment study: Cattle becoming parasitaemic at least twice after
treatment with diminazine aceturate at dose rate of 7mg/kg body weight in Ergib and
Melkachaba villages in the Abbay basin areas of northwest Ethiopia.
Days after ISMM block treatment Village
Group
Tag no. (ID) 0 14 28 42 56 70 84
Ergib Treatment 5 - - - T.c T.c T.c T.c
Ergib Treatment 18 - - - T.c T.c - -
Ergib Treatment 25 - - T.c - - T.c -
Ergib Control 51 T.c - - T.c - - -
Ergib Control 55 T.c - T.c - T.c T.c T.c
Ergib Control 58 - - - - T.c T.c T.c
Ergib Control 66 - - - T.c T.c - T.c
Melkachaba Treatment 28 T.c - T.c - - T.c -
Melkachaba Treatment 29 T.c - - T.c T.c T.c T.c
Melkachaba Treatment 31 - T.c - T.c - - -
Melkachaba Treatment 33 T.c T.c - T.c - - - Melkachaba Treatment 34 - T.c - - T.c - -
Melkachaba Treatment 36 - - - T.c T.c T.c - Melkachaba Treatment 40 - - T.c - T.c - -
Melkachaba Treatment 41 - - T.c - - - T.c
Melkachaba Treatment 43 - - - T.c - T.c T.c
Melkachaba Treatment 44 - - T.c T.c - T.c -
Melkachaba Treatment 49 - - - T.c T.c - T.c
Melkachaba Control 76 - T.c - T.c - - T.c Melkachaba Control 79 - - - - - T.c T.c
Melkachaba Control 82 - - - T.c T.c - -
Melkachaba Control 83 T.c T.c T.c - - T.c T.c
Melkachaba Control 85 - - T.c T.c - - -
Melkachaba Control 86 - - - T.c - T.c -
Melkachaba Control 92 - - - T.c - T.c -
Melkachaba Control 96 - - T.c - - T.c - Melkachaba Control 98 - - T.c - T.c - T.c
Melkachaba Control 100 T.c T.c T.c - - - - T.c= Trypanosoma congolense, - = Negative from parasitaemia
All the parasitaemic cases were due to T. congolense infection in each village during the study
period while 75% of the multiple parasitaemic cases were observed in Melkachaba village.

61
Table 20. Comparison between trypanosome incidence and trypanosome infection recurrence
rate in cattle which were examined every 2 weeks interval for a total of 14 weeks in Ergib and
Melkachaba villages in the Abbay basin areas of northwest Ethiopia.
Ergib Melkachaba
Day Trypanosome
incidence rate
Trypanosome1
recurrence
rate
P2-
value
Trypanosome
incidence rate
Trypanosome1
recurrence
rate
P2-
value
-14 15/50=0.3 0 17/50=0.34 0
0 4/50=0.08 0 6/50=0.12 0
14 3/48=0.0625 0/4=0 8/50=0.16 3/6=0.5 NS
28 6/50=0.12 0/3=0 14/48=0.291 0/8=0
42 7/48=0.1458 1/6=0.166 NS 13/46=0.282 2/14=0.14 NS
56 6/49=0.1224 2/7=0.428 NS 9/49=0.183 4/13=0.30 NS
70 6/49=0.1224 2/6=0.33 NS 10/48=0.208 0/9=0
84 7/48=0.1458 0/6=0 10/48=0.208 2/10=0.2 NS
1= The number of cattle which were found infected with the same species of trypanosome among the total number of animals
treated with diminazine aceturate
2= Fisher’s exact value for the comparison of recurrence and incidence of trypanosome infections
NS=Nonsignificant (P>0.05)
The trypanosome incidence rate and trypanosome infection recurrence indicated no
significant difference during the 14 weeks observation time with Fisher’s exact test (P-value >
0.05). Higher recurrence infection of 68.75% was detected in Melkachaba than in Ergib.

62
5. DISCUSSION
5.1. Questionnaire survey
The results the questionnaire survey revealed that trypanosomosis is the most important
problem for agricultural activity and animal production in the Abbay basin areas of Amhara
Region northwest Ethiopia. Above 97% of the interviewed farmer’s livelihood depends on
mixed agriculture (crop-livestock) farming system which is consistent with the general
situation of Ethiopia where above 80% of the population is engaged in mixed farming system.
The majority of livestock reared in the study area were Cattle (75%), small ruminants (15%)
and equines (10%) in the lowland areas and 60%, 30% and 10% respectively in the high land
areas. The assessment of tsetse and trypanosomosis situation and the current initiative and
awareness to other modern control methods in the Abbay basin areas of Dembecha and
Jabitehenan districts showed livestock diseases, scarcity of grazing land and watering points
and lack of veterinary service are bottleneck challenges for development of the area.
The disease trypanosomosis, locally called as ‘Mich /Ghendi’ was reported to be the most
important livestock constraint limiting the overall agricultural activity and livestock
productivity by 90% of the interviewed people. The same result reported by (Tewelde, 2001;
Afewerk, 1998) in the western and northwestern parts of Ethiopia where tsetse-transmitted
trypanosomosis is the primary problem for livestock productivity and agricultural
development. The occurrence of trypanosomosis is throughout the year but major infections
are observed after rainy season and after short rainy season. Tewelde (2001), Nagaro and
Mwenndia (2000) and Afewerk (1998) reported consistent results; however their results
indicated the occurrence of trypanosomosis was in all seasons. Absence of tsetse control
activity generally makes the farmers prone and dependable on the use of chemotherapy and
above 60% of the respondents admitted using trypanocidal drugs for the last 25 years.
Diminazine aceturate and Trypamidium drugs are used and 95% of the respondents are
familiar with these drugs. About 65% of animals are treated by the farmers themselves and
55% diminazine aceturate and 45% Trypamidium drugs are used. The dosage required for
treatment was not properly known by 55% of the respondents and 25 % didn’t have any idea.
Similar results were also reported by Tewelde (2001) and Afewerk (1998) about 57% and
43% of the drugs applied by the farmers themselves and other uncertified people. In the same

63
report 48% and 40% of the treatment were given below the recommended dose while 20%
and 40% were did not have any idea.
Above 90% of the treatment was given for clinical cases and 10% for nonclinical cases.
Similar results in two areas of Zambia and in the upper Didessa valleys of Ethiopia (Van den
Bossche 2000; Tewelde, 2001) showed 85% of the treatment was given for clinical cases.
Survey conducted in West Africa (Bauer, 2001) indicated that trypanocidal drugs used greater
than 90% of all cases without diagnosis of the exact cause of the disease entity. Pan African
Rinderpest Campaign (PARC) report (1998) indicated clinical service delivered in clinics and
animal health posts for diseased animals and mobile clinic to remote areas is not practical
either financially or sustainable way.
Van den Bossche, et al. (2000) indicated that the majority of farmers prefer to use diminazine
aceturate than ISMM and most of the time treatment is given for clinical cases not only for
trypanosomosis and oxen and cows took priority for treatment. In tsetse infested areas cattle
owners administered most trypanocides themselves. The frequency interval of treatment given
for each animal was 3.0-4.0 per month in the late rainy season and after short rainy season as
indicated by 75% of the interviewed people. Tewelde (2001) reported 2.5–3.5 per month and
Afewerk (1998) reported treatment was delivered every 4 months. Uilenberg (1997) reported
that the number of treatment over a year reflects the magnitude of trypanosome challenge in
an area.
5.2. Entomological survey
Glossina m. submorsitans is the only species of tsetse fly found in the Abbay basin areas of
northwest Ethiopia with apparent density of 1.08fly/trap/day in the late rainy season and
0.68fly/trap/day in the dry season during the present research work. Biting flies of tabanids
and muscids also caught along with tsetse fly and in areas where tsetse were not found. The
apparent density was 6fly/trap/day and 91fly/trap/day in the late rainy season and
0.43fly/trap/day and 7fly/trap/day in the dry season for tabanids and muscids respectively.
The result of tsetse fly survey agrees well with the general knowledge on the ecology of tsetse
species found in southwest Ethiopia for the morsitans group. Typical habitat pattern were
found in the study area for the savannah species G. m. submorsitans which prefers for savanna
grass, riverine, and forest land. The geographical distribution of G. m. submorsitans is

64
concentrated in the lowland area as climatic conditions are more favourable. Some flies,
however, were found as high as 1780 m.a.s.l.
Earlier works by (Krug, 1971; Ford et al., 1976; Langridge, 1976) had established the tsetse
geographical limit at 1600 m.a.s.l. and later Tikubet and Gemechu (1984) the upper limit
reaches to 1700 m.a.s.l. and NTTICC (1996) reported the limit to be 2000 m.a.s.l. while in the
present survey the maximum limit was 1780 m.a.s.l. Survey conducted by ESTC/SRVETEP
(2000) in this study area indicated that the upper limit was below 1900 m.a.s.l. This is
therefore an indication of the advancement of the fly into higher altitudes.
The apparent density of G. pallidipes were 2.4 and 0.6 in the wet and dry season and for G.
fuscipes 0.1 and 0.06 respectively reported by (Msangi, 1999) in southern rift valley of
Ethiopia and the mean fly catches of G. pallidipes was 1.42 and G. fuscipes was 0.29 at Ghibe
valley by (Leak et al., 1993). G. tachinoides and G. m. submorsitans were detected by
Langridge (1976) in the Abbay valley areas and Beles river valleys is also incriminated with
these species of tsetse fly. While Tikubet and Gemechu (1984) also reported G. tachinoides
and G. m. submorsitans in the Abbay and Didessa valleys.
Most of the tsetse were caught in the lowland areas so that the apparent density decreases as
altitude increases (p<0.05). This findings support earlier works by Langridge (1976), Tikubet
and Gemechu (1984) and Leak et al. (1999) indicated that climate, which is largely dependent
(influenced) by altitude has an impact on tsetse population.
The apparent density of the different flies was significantly higher during the late rainy
season. Similar results were reported by Msangi (1999), Mohamed-Ahmed and Dairri (1987)
and Leak et al. (1987). This could suggest an absolute increase in the number of tsetse flies
due to favourable environment such as enough moisture, vegetation growth and suitable
habitat or spread of flies from the rivers and thickets where they usually inhabit during the dry
season, to more open areas during the rains increases relative density in open areas
(Brightwell et al., 1992). Leak et al. (1993) also cited the latter as possible reason for the high
densities of G. pallidipes obtained during dry season when the traps were deployed in the
Ghibe river valley.
Sex ratio and age composition of the flies were assessed and higher number of female and the
adult flies were recorded during the present study. Similar results have been reported by

65
Msangi (1999), Mohamed-Ahmed and Dairri (1987) and Allosopp et al. (1972). Leak (1999)
showed that in unbiased sample female would comprise between 70-80% of the mean
population. The only host like bait that gave fair representation of the relative abundance of
each sex was traps. The mean age of fly population was 31days in the late rainy season and 26
days in the dry season with wing fray analysis. Wing fray analysis for the estimation of the
age of fly population was also supported by Msangi (1999) as compared to ovarian dissection
provided the flies are collected frequently less than 24 hours. It is more reliable in Savanna
species than riverine species. NGU traps are efficient for savanna species (Leak et al., 1987)
but in this case monoconical traps was the best of three trap types used during tsetse fly
sampling. Glossina. m. submorsitans was detected in western Ethiopia Gullele/Tolly (Leak et
al., 1989) and they indicated that biconical traps were not efficient while G. m. submorsitans
was the only species of tsetse than previously G. tachinoides found is that the higher
efficiency in the transmission of trypanosomosis and the potential occupation of the savanna
wood land in the valleys than other morsitans groups (Jordan, 1986).
Slingenbergh(1992), discussing the invasion of G. m. submorsitans in to the upper Didessa
valley, cited a USAID report (USAID, 1976) which suggested that the invasion of tsetse
began during the 1970s and was responsible for an evacuation of the human population from
the Didessa valley at that time. The Didessa and Angar rivers are both tributaries of the Abbay
river (Blue Nile). Ford et al. (1976) reported that 5902 km2 of the river basin of the Angar,
Didessa and Wama valleys were infested by G. m. submorsitans and G. tachinoides. G. m.
submorsitans has a more wide spread habitat than G. tachinoides and G. pallidipes and also
an efficient vector of pathogenic trypanosome to domestic livestock. The advance of G. m.
submorsitans in the Abbay basin areas of northwest Ethiopia as seen in the present study
could have great importance regarding the epidemiology of bovine trypanosomosis and
human settlement in study area mainly due to high level of drug resistance observed for
ISMM.
5.3. Parasitological survey
The highest prevalence of bovine trypanosomosis was found in the low altitude areas along
the river valleys of Bir, Temechan and Abbay compared to the mid altitude areas. The
seasonal occurrence of the disease is also consistent with the general knowledge of the vectors
of trypanosomosis and hence it was higher during the late rainy season. The most prevalent
66
trypanosome species in tsetse-infested areas of Ethiopia are T. congolense and T. vivax.
Rowlands et al. (1993) reported a prevalence rate of 37% for T. congolense in southwest
Ethiopia. Abebe and Jobre (1996) reported an infection rate of 58.5% for T. congolense,
31.2% for T. vivax and 3.5% for T. brucei in southwest Ethiopia. In the same report it is also
indicated that 8.71% prevalence rate was recorded in the highlands (tsetse free areas) of which
99% is due to T. vivax. Different workers (Afewerk, 1998; Tewelde, 2001; Muturi, 2001)
reported a prevalence rate of 17.2%, 21% and 17.5% in Metekel district, in Upper Didessa
Valley and Southern Rift Valley areas of tsetse infested regions respectively and the dominant
species was T. congolense.
Higher challenge of trypanosomosis 5 years before as during that time farmers used labour
power and equines for cultivation purposes. But due to the awareness of the control methods
such as mass treatment as well as increase in the cultivated land reduced the prevalence of
trypanosomosis than reported earlier by ESTC/SRETEP (2000) in the five PAs about 23%.
Jemal and Johns (1995) indicated, trypanosome cumulative incidence rate of 11.5-14.1% in
southwest Ethiopia. Survey conducted by NTTICC (1998) along the escarpment of the upper
Didessa valley revealed 29% prevalence. All these results are in agreement to the present
finding.
The prevalence of bovine trypanosomosis in North Omo Zone in the dry and wet season were
14.2% and 21.5% (Muturi, 1999) respectively. The dominant trypanosome species was T.
congolense (66.1%) followed by T. vivax (20.8%). The same trend also reported by Rowlands
et al. (1995) in southern Rift Valley of Ethiopia. In Ghibe their work indicated T. congolense
(84%) and T. vivax (14%). In the northwestern and southwestern parts of Ethiopia (Afewerk,
1998; Abebe and Jobre, 1996; Tewelde, 2001) reported the dominant species was T.
congolense.
The predominance of T. congolense infection in cattle may be due to the high number of
serodemes of T. congolense as compared to T. vivax and the development of better immune
response to T. vivax infected animals (Leak et al., 1999; MacLennan, 1970). In the midland
areas tsetse apparent density for G. pallidipes during the dry and wet season were 0.02 and
0.17 and therefore the proportion of T. vivax infection would have been expected to be higher
than in the lowland where tsetse apparent density during the dry and wet season were 0.6 and
2.9 (Msangi, 1999). But their observation confirms that animals in the midland area are
grazing in the lowland areas during the day time. In addition the result agrees to the known
67
“vivax-ratio” (Ford, 1976) in cattle which is affected by the species of tsetse to which cattle
are exposed. G. morsitans and G. pallidipes are efficient in the transmission of T. congolense
than T. vivax in East Africa (Langridge, 1976). The present finding was in a harmony that G.
m. submorsitans the species of tsetse caught might increase the infections due to T.
congolense and most of the animals in the study areas also graze during the day time in
lowland areas. The apparent density was also 1.35 in lowland and 0.66 in the midland areas in
the late rainy season, and 0.95 and 0.15 in the dry season respectively.
Higher infection rates were observed in male animals in the present study but the difference
was not significant. Similar results reported by different workers (Afewerk, 1998; Muturi,
1999; Tewelde, 2001). Other findings indicated that lactation stress results into higher
prevalence than nonlactating cows (Rowlands et al., 1995). The possible suggestion to the
present findings would be that male animals are more exposed to draught purposes travel long
distances for draught in areas where the tsetse challenge is high and as a result the risk of
trypanosomosis also high. Female animals are usually not used for draught and milk
production was not the primary objectives of local farmers in the study area.
Age was not found to be a risk factor in the present finding but higher infection rates were
observed in adult animals and animals above one years of age in both altitude levels and
seasons. This could be associated to the fact that animals travel long distance for feed and
draught as well as for harvesting crops to tsetse high challenge areas. Rowlands et al. (1995)
in Ghibe valley indicated that suckling calves did not go out with their dams but graze at
homesteads until weaned off. Young animals are also naturally protected to some extent by
maternal antibodies (Fimmen et al., 1982). This could result in low prevalence of
trypanosome that was observed in calves. T. congolense infection was chronic diseases that
increase infection rates with age. T. congolense infection is usually higher in adult animals
than youngs (McDermott and Coelman, 1999). Rowlands et al. (1995) found that cows ≥ 9
years had 1.15x higher trypanocidal treatment than the corresponding values in 3 year old
animals. This is a reflection of higher risk of trypanosomosis in adults than as compared to
young/calves.
The prevalence of trypanosomosis in low altitude areas (lowland) in late rainy season 19.87%
and in the dry season 17.62% have been found significantly higher than the mid altitude areas
(midland) 13.39% and 6.54% respectively. Odds ratio indicated the risk of trypanosomosis in
the midland areas were 0.7 times lower than lowland areas. Similar findings reported by

68
Muturi (1999) in North Omo Zone significant difference found between lowland and midland
areas. 29.9% and 22.2% in lowland areas in wet and dry seasons while in the midland areas
13% and 5.7% respectively with Odds ratio of 3.3x higher risk in the lowland areas compared
to midland areas. This might be attributed to the difference in tsetse apparent density in the
two altitude levels. It is a known fact that the risk of trypanosomosis is influenced by tsetse
apparent density and infection rates in flies. Riordan (1977) demonstrated that a high tsetse
apparent density and infection rates of 50% in tsetse results 42% trypanosome prevalence in
cattle exposed to tsetse flies. The present study also reveals that the apparent tsetse density
varies significantly between altitude levels and concurrently the risk of trypanosomosis also
varies as G. m. submorsitans was found higher apparent density in the lowlands.
There was significant difference (p<0.05) between sampling seasons that higher prevalence of
trypanosomosis found in the late rainy season (17.07%) than dry season (12.35%). The risks
of trypanosomosis in cattle were 0.5 times lower in the dry season than in the late rainy
season. The concurrent tsetse survey at the same time in the same altitude areas revealed that
higher apparent density was caught in the late rainy season than the dry season. Similar results
reported by Muturi (1999) in North Omo Zone higher prevalence of trypanosomosis found in
the wet season than the dry season. The increase in tsetse apparent density during the wet
season have been reported in Ethiopia (Msangi, 1999) in Somalia (Mohamed and Dairri,1987)
and Cote d’Ivore, Togo, Gabon and Zaire (Leak et al.,1988). The increase in apparent tsetse
density led to an increase in trypanosome challenge to cattle in the study area resulted into the
observed difference in trypanosome prevalence during the two sampling seasons (late rainy
season October 2003 and dry season February 2004).
Trypanosome infection and mean PCV obtained between parasitaemic and aparasitaemic
animals had significant difference (p<0.05). It was in agreement to the work done in Ghibe,
southwest Ethiopia indicated PCV less than 26% required treatment, and for animals
treatment was given with positive cases. Rowlands et al. (2001) in Ghibe observed in an
increase in PCV value, the proportion of positivity decreases and hence mean PCV was a
good indicator for the health status of herds in an endemic area. The lower mean PCV value
in parasitaemic animals than the aparasitaemic animals is reported by several authors (Leak,
1987; Afewerk, 1998; Muturi, 1999; Tewelde, 2001).
Analysis of variance for the mean PCV of animals in the late rainy season were 24.8% in the
lowland area and 26.6% in the midland area while in the dry season the mean PCV values
69
were 24.5% in lowland areas and 26.8%in the midland areas were significant ( p<0.05). The
mean PCV of parasitaemic animals in the lowland areas in late rainy season was 20.3% and in
the midland areas 21.6% while for aparasitaemic animals 25.9% and 27.4% respectively. In
the dry season the mean PCV of parasitaemic animals were 21.4% and in the midland 21.2%
while for aparasitaemic animals 26.3% and 27.2% respectively. The significant change in the
mean PCV values between altitude levels may be attributed to the higher infection rates
observed in the lowland areas during the study period. Similar finding reported by Muturi
(1999) 24.9% and 25.5% in the dry and wet season in lowland areas respectively and in the
midland areas the mean PCV were 27.3% and 27.4% in the dry and wet seasons respectively.
The mean PCV of parasitaemic cattle in the same study indicated 16.7% and 18% in the
lowland and midland areas to 28% and 28.3% in aparasitaemic cattle.
The PCV profile in herd level analysis indicated that the herd average PCV were dependent
on herd prevalence that regression coefficient were negatively correlated. The same result
reported by Van den Bossche and Rowlands (2001) that regression analysis of herd average
PCV of parasitologically positive herds decreased with increasing prevalence of trypanosomal
infection. The development of anaemia is one of the most typical signs of trypanosomosis
caused by T. congolense in susceptible cattle breeds (Murray and Dexter, 1988). The level of
anaemia or the PCV usually gives a reliable indication of the disease status and productive
performance of an infected animal (Trail et al., 1991b). Bovine trypanosomosis control aims
at reducing the prevalence of infection with a concomitant increase in the herd average PCV
(Bauer et al., 1999).Therefore the knowledge of relationship between prevalence of
trypanosome infection and herd average PCV could be a useful tool for the assessment of
impact of control intervention. However, the herd average PCV is affected by factors other
than trypanosomosis (Conner, 1994). These confounding factors are not always identifiable
but they are likely to affect both trypanosomosis positive and negative animals.
Further analysis of PCV values revealed that 88.9% of all parasitaemic animals had a mean
PCV below 26% which agrees with the work conducted by (Leak et al., 1993; Rowlands et
al., 1995; Abebe and Jobre, 1996; Afewerk, 1998; Muturi, 1999). As anaemia is the classical
symptom of the disease pathogenicity (Murray et al., 1977; Seifert, 1996) the low PCV in
parasitaemic animals could have contributed in reducing the mean PCV for cattle in the
lowland area and midland areas.

70
The resultant low PCV values in infected animals may not only be trypanosomosis as a sole
factor, however the difference in mean PCV between parasitaemic and aparasitaemic animals
indicating that trypanosomosis involves in reducing the PCV values in infected animals.
Other diseases considered to be affecting the PCV values in animals in the study area are
helmenthiasis, Tick borne diseases and nutritional imbalances. On the otherhand most of the
parasitaemic animals in the lowland areas were in good body condition despite having low
PCV%. This could be attributed to the fact that animals in the low altitude were at high plan
of nutrition due availability of sufficient pasture.
Conner (1994) indicated anaemia associated trypanosomosis causes weakness, lethargy and
lack of stamina which ultimately reduce efficiency of working animals. The consequence of
anaemia is one of the most typical signs trypanosome caused by T. congolense in susceptible
cattle breeds (Murray and Dexter, 1988; Abebe, 1991). Swallow (2000) indicated that animals
in tsetse infested area has lower calving rate, milk yield, calf mortality and more treatment
with trypanocidal drugs and trypanosusptible animal can be devastated by sudden exposure to
high levels of trypanosome risk.
5.4. Assessment of trypanocidal drug resistance (Isometamidium block treatment study)
In the two villages during the blanket treatment day T. congolense was the dominant parasite
and similar results were reported in tsetse infested areas particularly in savannah species of
tsetse (Tewelde et al., 2004; Afewerk et al., 2000). The mean prevalence of trypanosome
infection in ISMM treated group during the 8 week was lower in Ergib than Melkachaba. The
strong correlation between overall trypanosomosis prevalence and recurrent infection
prevalence in cattle were studied in southwest Ethiopia exposed to a high challenge of drug
resistant trypanosomes (Rowlands et al., 2001). The difference in the incidence rate of the
control and treatment group of cattle in Ergib may be associated to the total time at risk.
Cumulative incidence rate of trypanosome infection in the ISMM treated group of cattle at the
two villages was consistent with the findings of the prevalence data.
The 25% survival time analysis showed that 25% of the control group of cattle become
infected with trypanosome parasite by day 42 in Ergib while equal proportion of cattle in the
control group of cattle in Melkachaba were infected with trypanosome by day 28 of the study
period. There was a surprising condition that overlapping of the control and treatment group

71
of cattle in both villages for the 25% survival time but the confidence interval varies between
groups. The confidence interval in the treatment group of cattle at Melkachaba was lower than
the control group. The result here indicated that the tsetse challenge was sufficiently high at
all villages and a prophylactic regimen is more valuable if trypanosomosis is to be controlled
efficiently but the prophylactic effect of ISMM was found to be low. However protective
level of the treatment groups of cattle were the same in both villages and the prophylactic way
of treatment is useless and other approaches should be found.
Based on Eisler et al. (2000), challenge was insufficient to warrant ISMM prophylaxis when
fewer than 25% of the sentinel (control) cattle become infected within 8 weeks of exposure.
This was justified on the grounds of cost, possible side effects and unnecessary drug pressure
tending to develop drug resistance. In both villages more than 25% of the ISMM treated
groups of cattle were parasitaemic 27% and 61% in Ergib and Melkachaba in 8 weeks
following ISMM block treatment study and this might suggest that there is an indication of
resistance of trypanosome due to T. congolense against ISMM. Resistance against this drug
was strongly suspected when more than 25% of ISMM treated cattle became parasitaemic
within 8 weeks of exposure (Eisler et al., 2000). The same results reported by Tewelde et al.
(2004) in one village of southwest Ethiopia from three villages.
The ratio of the mean hazard rate for both villages was lower than 2 and hence it might be no
value to continue using ISMM at the villages. In areas with evidence of drug resistance on the
grounds of the ISMM treated cattle becoming infected within 8 weeks of exposure, it may
nevertheless be worth continuing prophylaxis in situations where the ratio of the mean hazard
rate for the sentinel and prophylaxis herds over 8 weeks is greater than 2 ( Eisler et al.,
2000).Generally Eisler et al. (2000) has suggested that whenever there are indicators of drug
resistance, chemotherapy has to be combined with other methods such as vector control and
other integrated methods.
The Kaplan-Meier survival curves also in agreement with what we reported so far in the
present findings. In general the probability to survive was some what higher in the treated
group in Ergib than in Melkachaba but in both villages ISMM treatment had insignificant
effect on survival time. ISMM treatment had minimal effect on survival times in high drug
resistance situation in coastal areas of Kenya (Eisler et al., 2000) and southwest Ethiopia
(Tewelde et al., 2004).

72
The assessment of the efficacy of diminazine aceturate showed no statistical difference,
however, the repeated recurrence infection of trypanosome after treatment with the
recommended dosage in both villages contradict the results particularly in Melkachaba where
68.8% of recurrent infections recorded. Therefore, the recurrent infections might not be only
due to new infections but also resistant strains might be detected. Hence instead of fully
depending on treatment by diminazine aceturate the principle of sanative pairs of treatment
should be practiced in both villages. The comparisons of incidence rate and trypanosome
infection recurrence rate in southwest Ethiopia showed drug resistant trypanosomes against
diminazine aceturate was reported by (Rowlands, 2001) using a long-term study.
The period of ISMM prophylaxis in infected cattle in the field was less than 1 month by
Afewerk (1998) northwest Ethiopia. Rowlands et al. (1993) from southwest Ethiopia under
laboratory condition indicated 1mg/kg bw ISMM was less than 28 days in cattle challenged
with clone of T. congolense which in therapeutic trials had been shown to be highly resistant
to ISMM. The present result is in agreement with previous works in southwest Ethiopia (Scott
and Pegram, 1974; Codjia et al., 1993; Tewelde et al., 2004), northwest Ethiopia (Afewerk et
al., 2000) and in Southern Rift valley of Ethiopia (Muturi, 1999; Ademe and Abebe., 2001).
Scott and Pegram (1974) described the occurrence of Homidium resistant T. congolense in
Didessa and Angar valley in Wellega province. Their field observation showed that 25% of
the treated cattle developed parasitaemia within 30 days of treatment 1mg/kg Homidium.
Field observation in Ethiopia based on cloned population indicated that the drug resistant
phenotype of T. congolense had not altered over a period of 4 years (Mulugeta et al., 1997).
Because high level of multiple drug resistance infections appeared to be expressed at the level
of individual trypanosome, chemotherapeutic agents only did not control trypanosomosis at
Ghibe on a long term basis (Codjia et al., 1993).
Whiteside (1960) indicated that under-dosing, irregular use of prophylactics and
discontinuation while at risk time and high incidence of trypanosomosis are the root cause of
development of drug resistance. Clausen et al. (1992) and Geerts and Holmes (1999) stressed
that the prolonged and frequent use of trypanocides in high challenge areas resulting high
selection pressure for resistance as well. The epidemiology of drug resistance population of
trypanosome is dynamic when the incidence is progressively spread within the population.
For instance in Ghibe 7% recurrent infection in 1986 increased to 14% in 1989 (Rowlands et
al., 1993). Transmission of resistant trypanosome by tsetse do not change the strains resistant

73
after passage, the trait stable for long time and spread by cattle movement and or spread of
tsetse population (Moloo and Kutuzu, 1990).
The method generates useful information on the efficacy of ISMM and diminazine aceturate
to trypanosome populations present in the area and laboratory limitations common. Hence 14-
36 weeks prophylactic efficacy of ISMM was not recommendable by this result. However the
method usually required long follow up and the interference of farmers intervention on the
study animals should be considered. Experimental work in the field and laboratory to monitor
development of drug resistance in pathogenic trypanosomes and its impact on livestock
productivity and studies on factors which influence the development of resistance to
trypanocidal drugs have paramount importance.

74
6. CONCLUSIONS AND RECOMMENDATIONS
The result of the present research work revealed that trypanosomosis is the most important
problem for agricultural activity and animal production in the Abbay basin areas of north west
Ethiopia (Dembecha and Jabitehenan weredas of Amhara Region) and the situation is getting
worse as the control and prevention of trypanosomosis is facing a challenge due to limitation
of vector control activities and the development of drug resistance in the area.
Only one species of tsetse G. m. submorsitans, the main vector of pathogenic trypanosome in
the savanna areas of Africa and biting flies such as tabanids and muscids were caught.
Glossina. m. submorsitans advanced as high altitude as 1780 m.a.s.l. posing a risk to areas
considered tsetse free by earlier studies. It can be said that the control and sampling of G. m.
submorsitans can be done by monoconical trap in the area instead of NGU trap which were
used in the study area for a pilot survey and control programme before.
The prevalence of bovine trypanosomosis was found to be 17.07% in the late rainy season and
12.35% in the dry season (p<0.05). The prevalence was higher in low altitude areas
compared to mid altitude (p<0.05) in both the seasons. The mean PCV values of parasitaemic
and aparasitaemic animals had significant difference (p<0.05) and the herd average PCV
values were also negatively correlated to the herd prevalence. Eventhough the present study
did not include the whole year, altitude and seasons have been found to be important risk
factors for the apparent density of vectors and the prevalence of trypanosomosis.
The application of rapid prevalence studies followed by 3 months block treatment study
indicated the occurrence of ISMM resistant trypanosomes in cattle under natural field
conditions. As a result the three indices; the proportion of animals becomes infected in 8
weeks time (>25%), the hazard ratio (<2) and the 25% survival time (<56 days) were
consistent in both villages for the occurrence of resistant trypanosome against ISMM. Log-
rank and Wilcoxon (Breslew) statistical tests also showed no significant difference (p>0.05)
between the treatment and control groups of cattle in both villages. The assessment of
diminazine aceturate efficacy showed no significant difference between trypanosome
incidence rate and trypanosome recurrence rate, however, 68.8% of the recurrence infections
were recorded in Melkachaba village.

75
Thus the research work gave vital information for the epidemiological picture of
trypanosomosis and its vector and occurrence of drug resistance.
Therefore, the following recommendations are forwarded:
1. Designing and implementation of control strategies of trypanosomosis focusing integrated
approach (vector control and chemotherapy) should be undertaken in the Abbay basin areas of
northwest Ethiopia (Dembecha and Jabitehenan weredas of Amhara Region).
2. Proper and strict follow-up of trypanocidal drugs treatment should be done by professionals
and supervision of the field personnel by experts should be practiced. The delivery and
distribution of trypanocidal drugs need special attention to avoid misuse.
3. Awareness creation about the disease and control methods as well as the risk of
trypanocidal drug resistance is required in the area.
4. Further studies on the tsetse challenge, the economic impact of trypanosomosis and drug
resistance have essential roles for the overall control of tsetse transmitted trypanosomosis in
the Abbay basin areas of northwest Ethiopia.

76
7. REFERENCES
Abebe, G. (1991): The integrity of the hypothalamic-pituitary-adrenal axis in Boran (Bos indicus)
cattle infected with Trypanosoma congolense. Brunel University, UK, PhD Thesis.
Abebe, G. and Jobre, Y. (1996): Trypanosomosis: A threat to cattle production in Ethiopia. Rev. Med.
Vet., 147: 897-902.
Ademe, M. and Abebe, G. (2001): Field study on drug resistance trypanosomes in cattle (Bos
Indicus) in Kindo Koysha wereda, Southern Ethiopia. Bull.Anim.Hlth.Prod. 48, 131-138.
Afewerk, Y. (1998): Field investigation on the appearance of drug resistant population of
trypanosomes in Metekel district, northwest Ethiopia. Addis Ababa University and
Freiuniverstat Berlin, Faculty of Vetrinary Medicine, Ethiopia, MSc Thesis.
Afewerk, Y., Clausen, P. H., Abebe, G., Tilahun, G., Mehlitz, D. (2000): Multiple-drug resistant
Trypanosoma congolense population in village cattle of Metekel district, northwest Ethiopia.
Acta Trop.76, 231-238.
Akinbamijo O.O., Bennison J. J. Jaitner, J., Demplfe, L. (1998): Haematological changes in
N’Dama and Gobra zebu bulls during Trypanosoma congolense infection maintained under a
controlled feeding regimen. Acta Trop. 69, 181-192.
Allosopp, R. (1985): Wing fray in Glossina morsitans centralis. (Diptera: Glossinidae). Bull. Ent.
Res. 75, 1-11.
Allosopp, R. (1991): A practical guide line to aerial spraying for tsetse control. Aerial spraying
research and development project. Final Report, volume 2. EC Delegation, Harare,
Zimbabwe.
Arora, V.K., Sharma, R. C., Singh, B.P., Tamor, N. S. (1981): A note of body measurement in
Hariana cow. Vet. Res. J. 4, 181-182.

77
Assefa, E. and Abebe, G. (2001): Drug resistant trypanosoma congolense in naturally infected
donkeys in North Omo Zone, Southern Ethiopia. Vet. Parasitol. 99, 261-271.
Bancha, B. (2001): Integration of tsetse survey data and agro-ecological characteristics from
remotely sensed and field observations in a geographic information system Southern Rift
Valley of Ethiopia. Addis Ababa University, Faculty of Veterinary Medicine, Ethiopia, MSc
Thesis.
Bauer, B., Amsler-Delafosse, S., Clausen, P.-H., Kebore, I., Petrich-Bauer, J. (1995): Successful
application of delthametrin pour-on to cattle in a campaign against tsetse flies (Glossina
species) in the pastoral zones of Samorogouan, Burkina Faso. Trop. Med. and Parasitol. 46,
256-266.
Bauer, B. (2001): Improved strategies for sustainable trypanosomosis management within the
context of primary animal health care. In: Proceeding of the International Scientific Council
for Trypanosomosis Research and Control (ISCTRC), Mombassa, Kenya. No.120: 123-130.
Bengaly, Z., Kanwe, B.A., Duvaller, G., Ganaba, R. (1998): Application of antigen-detection ELISA
test in the diagnosis of trypanosomal infections in ruminants in Burkina Faso. In: antigen
ELISA for trypanosomes. Evaluation of the performance workshop on antigen ELISAs for
trypanosomes. ILRI, Nairobi, Kenya. 9-11 Dec 1996.
Bengaly, Z., Kesbari, M., Desquesnes, M., Sidibe, I. (2001): Validation of PCR assay for monitoring
the therapeutic efficacy of diminazine aceturate in trypanosome infected sheep. Vet.Parasitol.
96, 101-113.
Bourn, D., Reid, D., Snow, B., Wint, W. (2001): Environmental change and the autonomous control
of tsetse and trypanosomosis in Sub-Saharan Africa. Case history from Ethiopia, The Gambia,
Kenya, Nigeria and Zimbabwe. Environmental Research Group Oxford, UK. pp 1-23.
Brightwell, R., Dransfield, R. D., Korku, C. A., Golder, T. K., Tarimo, S. A. and Mugnai,
D. (1987): A new trap for Glossina pallidipes. Tropical Pest Management, 33, 151-159.
BRVL (1999): Annual report on survey of vectors of hemoparasites. Bahir Dar Regional Veterinary
Laboratory. Amhara Region Bureau of Agriculture, Bahir Dar, Ethiopia.
78
BoA (1999): Annual report. Animal and Fisheries Resource Production and Health Department.
Bureau of Agriculture, Amhara region, Bahir Dar, Ethiopia.
Budd, L. T. (1999): DFID-funded tsetse and trypanosome research and development since 1990,
Volume 2, Economic Analysis. DIFID Animal Health Program.
Buxton, P. A. (1955): Tsetse and climate: A consideration of the growth of knowledge. Proceeding of
the Royal Entomological Society of London, 19, 71-78.
Challier, A. (1965): Method for the determination of physiological age of Glossina. Insect
Physiology and Biology, 6, 241-248.
Clausen, P.-H., Sidibe, I., Kabore, I., Bauer, B. (1992): Development of Multiple Drug Resistance of
Trypanosoma Congolense in Zebu Cattle Under High Natural Tsetse Fly Challenge in the
Pastoral Zones of Samorogouan, Burkina Faso. Acta Trop. 51, 229-236.
Clausen, P.-H., Adeyemi, I., Bauer, B., Breloer, M., Salchew, F., Steak, C. (1998): Host preference of
tsetse (Diptera: Glossinidae) based on blood meal identification. Med. Vet. Ent. 12, 169-180.
Codjia, V., Mulatu, W., Majiwa, P. A. O., d’Ieteren, G. D. M. and Peregrine, A. S. (1993):
Epidemiology of bovine trypanosomosis in the Ghibe valley, southwest Ethiopia. Occurrence
of population of Trypanosoma congolense resistant to diminazine, isometamidium and
homidium. Acta Trop. 53, 151-163.
Conner, R. J. (1992): The diagnosis, treatment and prevention of animal trypanosomosis under field
conditions. FAO, Anim. Prod. Hlth. 100, 1-35.
Conner, R. J. (1994): Improving draught animal management with strategic chemotherapeutic control
of trypanosomosis. In: improving animal traction technology. Workshop of the animal
traction network for Eastern and Southern Africa, Lusaka, Zambia, 18-23 Jan 1992.
CSA (2002): Census. Central Statistics Authority. Ethiopian Agricultural Enumeration Results for
Amhara Region. Pp. 29-55.
79
Dagnachew, Z. and Shafo, K. (1981): An investigation of dourine in Arsi administrative region.
Eth.Vet.Bull. 4: 3-9.
Dame, D. A. and Schmidt, C. H. (1970): The sterile male technique against tsetse flies (Glossina
species). Bulletin of the Entomological Society of America, 16, 24-30.
Desquesenes, M. (1997): Evaluation of a simple polymerase chain reaction technique for the
diagnosis of Trypanosoma vivax infection in the serum of cattle in comparison to
parasitological techniques and antigen enzyme linked immune sorbant assay. Acta Trop.
65,139-148.
d’ Ieteren G.D.M., Authie, E., Wissocq, N. Murray, M. (2000): Exploitation of resistance to
trypanosome and trypanosomosis. Breeding for disease resistance in farm animals. CAB
International.9eds R. F.E. Axford, S.C. Bishop, F.W. Nicholas and J.B.Owen).
Doyle, J. J. (1977): Antigenic Variation in Salivarian Trypanosomes. In: Blood Borne Parasitaemic
Diseases. J. L. J. Mckelvey (Eds.) Plenum, New York. P. 31.
Gebreab, F. (1998): Prevalent diseases of draught oxen and control measures. In: First national oxen
traction research review and strategy workshop, Debre Zeit, Ethiopia, 3-5 Dec 1997.
Eisler, M.C., Peregrine, A. S., Arowols, R.O.A., Gault, E. A., Moloo, S. K., Holmes, P.-H. (1994):
Isometamidium concentration in the serum of treated cattle: Correlation with prophylaxis
against tsetse transmitted Trypanosoma congolense. Acta Trop. 16, 39-50.
Eisler, M.C., Stevenson, P., Munga, L., Symth, J. B. A. (1997): Concentration of isometamidium in
the sera of cattle challenged with drug-resistant Trypanosoma Congolense. Acta Trop., 63, 89-
100.
Eisler, M.C., McDermott J., Mdachi, R., Brandt J., Murilla G.A, Sinyangwe L., Mubanga, J., Machila
N., Mbody Weightambo, H., Coleman, P.G., Clausen P.-H., Bauer, B., Sidibe, I.., Geerts, S.,
Peregrine, A.S. (2000): Rapid method for the assessment of trypanocidal drug resistance in
the field. In: The proceeding of the 9th Symposium of the International Society for Veterinary
Epidemiology and Economics (ISVEE9). Breckenridge, Colorado, USA, 6-11.

80
Eisler, M. C., Brandt, J., Bauer, B., Clausen, P.-H., Delespaux, V., Holmes, P.-H., Ilemobade, A.,
Machila N., Mbywambo, H., McDermott J., Mehlitz, D., Murilla, G., Ndungu, J. M.,
Peregrine, A. S., Sidibe, I.., Sinyangwe, L., Geerts, S. (2001): Standardized tests in mice and
cattle for the detection of drug resistance in tsetse transmitted trypanosomes of African
domestic cattle. Vet.Parasitol. 97, 171-182.
Erkelens, A. M., Dwinger, R. D., Bedane, B., Slingenbergh, J. H. W., Wint, W. (2000): Selection of
priority areas for tsetse control in Africa: a decision tool using GIS in Didessa valley,
Ethiopia, as a pilot study. In: Animal Trypanosomosis: Diagnosis and Epidemiology. ISBN
90-5782-065-x. International Atomic Energy Agency. Vienna, Austria, pp 213-227.
ESTC /SRVETEP (2000): Pilot survey on tsetse and trypanosomosis in Dembecha wereda. Amhara
region, northwest Ethiopia.
Fimmen, H.O. Mehlitz, D., Horchner, F., Korb, E. (1992): Colstral antibodies and Trypanosoma
congolense infection in calves.Trypanotolerance research and application.GTZ, No.116,
Germany.pp173-187.
Finelle, P. (1973): African animal trypanosomosis. Chemoprophylaxis and raising of trypanotolerant
livestock. FAO, Wld. Anm. Res., 8, 24-27.
Finelle, P. and Yvore, P. (1962): Proceeding of the 19th International Scientific Council for
Trypanosomosis Research and Control (ISCTRC) meeting. Pp.107-110.
Ford, J., Makin, M. J. and Grimble, R. J. (1976): Trypanosomosis Control Program for Ethiopia.
Ministry of Overseas Development of Great Britain. Pp.1-30.
Frankena, K. and Graat, E. A. M. (1997): Analysis of Time at Risk (Survival) Data. In: Application
of Quantitative Methods in Veterinary Epidemiology. Ed1, The Netherlands, Wageningen
Pers, Wageningen.
Geerts, S. and Holmes, P.-H. (1998): Drug management and parasite resistance in bovine
trypanosomosis in Africa. PAAT Technical and Scientific Series, no.1, vii+31p.FAO, Rome
(Italy): ISBN 92-5-104185-7.

81
Geerts, S., Ndungu, J. M., Murilla, G. A., Mbwambo, H., Sinyangwe, L., Machila, N., Delespaux, V.,
Brandt, J., Peregrine, A. S., McDermott, J. J., Holmes, P.-H., Eisler, M. C. (1999): A
simplified cost-effective method for area-wide testing of trypanocidal drug sensitivity of
Trypanosoma congolense in mice. In: Proceeding of the 25th ISCTRC Conference,
Mombassa.
Geerts, S., Ndungu, J. M., Murilla, G. A., Mbodyweightambo, H., Sinyangwe, L., Machila, N.,
Delespaux, V., Brandt, J., Peregrine, A. S., McDermott, J. J., Holmes, P.-H., Eisler, M. C.
(2000): In vivo tests for the detection of resistance to trypanocidal drugs: Tests in mice and
ruminants. In: The proceedings of the workshop on drug delivery and resistance in the context
of integrated disease management. Nairobi, Kenya 31 May-4 June 1999. Newsletter on
Integrated Control of Pathogenic Trypanosomes and Their Vectors (ICPTV), No.2. Pp.6-7.
Gray, M. A., Peregrine, A. S. (1993): An in vitro assay for drug sensitivity of Trypanosoma
congolense using in vitro-derived metacyclic trypanosomes. Acta Trop.54, 291-300.
GU, Y., Gettinby, G., Murray, M., Peregrine, A. S., Revie, C. (1999): Development of decision
support system for trypanocidal drug control of bovine trypanosomosis. Vet. Parasitol, 87: 9-
23.
Hoare, C. A. (1957): The spread of animal trypanosomosis beyond their natural range.Tropical
Medicine Parasitology, 8, 151-161.
International Laboratory for Research on Animal Diseases Reports, ILRAD (1993): Estimating the
costs of animal trypanosomosis in Africa. ILRI, Nairobi, Kenya.
ICPTV (2000): Conclusion and recommendations of a workshop on drug delivery and resistance in
the context of integrated disease management. Newsletter No. 2 of EU Concerted Action on
Integrated Control of Pathogenic Trypanosome and Their Vectors (ICPTV), Nairobi, 31 May-
4 June 1990, pp.3-12.
Jackson, C. H. N. (1946): An artificially isolated generation of tsetse flies (Diptera). Bull Ent.Res.37,
291-299.
82
Jemal, A. and Hugh-Johns, M. E. (1995): Association of tsetse control with health and productivity in
the Didessa valley, western Ethiopia. Prev. Med. 22, 29-40.
Jordan, A. M. (1993): Tsetse flies (Glossinidae). In: Lane, R.P. and Crosskey, R.W. (Eds). Medical
Insects and Arachnids. Champan and Hall, London.
Jordan, A. M. (1986): Trypanosomiasis Control and African Rural Development. Longman, London.
Kalu A.U. (1996): Current status of tsetse fly and animal trypanosomosis on the Jos plateau, Nigeria.
Prev. Vet. Med. 27, 107-113.
Kaminsky, K. (1990): In vitro techniques for assessment of drug resistance in trypanosomosis. Ag.
Biotech. News Inf. 2, 205-210.
Klein, J. P. and Moeschberger, M. C. (1997): Survival analysis: Techniques for censored and
truncated data. New York Springer-verlag. pp341.
Kristjanson, P. M., Swallow, B. M., Rowlands, G. J., Kruska, R. L. (1999): Measuring the cost of
African animal trypanosomosis, the potential benefits of control and returns to research.
Agricultural System, 59, 79-98.
Krug, W. (1971): A survey of trypanosomosis with particular emphasis to livestock, in the south
western province of Ethiopia. Bull.Epizoot.Dis.Afr.19, 243-255.
Langley, P. A. and Weidehaas, D. (1986): Trapping as a means of controlling tsetse, Glossina species
(Diptera: Glossinidae). The relative merits of killing and of sterilization. Bull. Ent. Res. 76,
89-95.
Langridge, W.P. (1976): Tsetse and Trypanosomosis Survey of Ethiopia. Ministry of Overseas
Department UK. Pp.1-40.
Leak, S. K. A., Woume, K. A., Colardelle, C., Duffera, W., Feron, A., Mulingo, M., Tikubet, G.,
Toure, M., and Yangari, G. (1987): Determination of tsetse challenge and its relationship with
trypanosomosis prevalence. In: Livestock production in tsetse infested areas of Africa, ATLN,
1987, 43-52, Nairobi, Kenya.
83
Leak, S. G. A., Mulatu, W., Authie, E., Perergrine, A. S., Rowlands, G. J. Trail, J. C. M. (1993):
Tsetse challenge and its relationship to trypanosomosis prevalence in cattle. Acta Trop., 53,
121-134.
Leak, S. G. A., and Mulatu, W. (1993): Advance of Glossina morsitans submorsitans and G.
pallidipes along the Ghibe river system in southwest Ethiopia. Acta Trop. 55, 91-95.
Leak, S. G. A. (1999): Tsetse Biology and Ecology: Their Role in the Epidemiology and Control of
Trypanosomosis. CABI publishing in association with the ILRI.pp152-210.
Lloyd, L. and Johnson, W. B. (1924): The trypanosome infection of tsetse flies in Northern Nigeria.
Bulletin of Entomology Research, 14, 265.
Luckins, A. G. and Mehlitz, J. D. (1976): Observations on serum immunoglobulin levels in cattle
infected with Trypanosoma vivax and trypanosoma congolense. Ann. Trop. Med. Parasitol.
79, 479-480.
Luckins, A. G., Sutherland, D., Mwangi, D., Hopkins, J. (1994): Early stages of infection with
Trypanosoma congolense parasite kinetics and expression of metacyclic variable antigen
types. Acta Trop. 58, 199-206.
McDermott, J. J., Woitag, T., Sidibe, I., Bauer, B., Boucader, D., Ouedrago, D., Kamuanga, M.,
Peregrine, A.S., Eisler, M. C., Zessin, K.-H., Mehlitz, J. D., Clausen, P.-H. (2003): Field
studies on drug- resistant animal trypanosomes in Kenedogou province, Burkina Faso. Acta
Trop. 86, 93-103.
MacLennan, K. J. R. (1980): Tsetse transmitted trypanosomosis in relation to the rural economy.
Wld.Anim.Rev. 36: 2-22.
Martin, S. W., Meek, A. H., Willeberg, P. (1987): Veterinary Epidemiology. Principles and Methods.
Iowa State University Press/Ames.
Mdachi, R. F. (1999): Epidemiological studies into the impact of trypanocidal drug resistance on the
control of trypanosomosis in coastal Kenya. University of Glasgow, PhD Thesis. Pp392.

84
Ministry of Agriculture (1995): Ethiopian Ruminant Livestock Development Strategy. Ministry of
Agriculture (MoA), Addis Ababa, Ethiopia. Pp.112-113.
Ministry of Agriculture (1998): Ethiopian Ruminant Livestock Development Strategy.Ministry of
Agriculture (MoA), Addis Ababa, Ethiopia.p.12.
Mohammed-Ahemed, M. M. and Dairri, M. F. (1987): Trypanosome infection rate of G. pallidipes
during wet and dry season in Somalia. Trop.Anim.Hlth.Prod. 19, 11-20.
Mohammed-Ahemed, M. M., Ahmed, A.I., Ishag, A. (1989): Trypanosome infection rate of Glossina
morsitans submorsitans in Bahr el Arab, South Darfur Province, Sudan.
Trop.Anim.Hlth.Prod. 21, 239-244.
Mohammed-Ahemed, M. M., Rehman, P. H., Abdel Karim, E. I. (1992): Multiple drug- resistant
bovine trypanosomes in south Darfur province, Sudan. Trop. Anim. Hlth. Prod. 24, 179-181.
Moloo, S. R. (1982): Cyclical transmission of pathogenic trypanosoma species by gamma-irradiated
sterile male Glossina morsitan morsitans. Parasitology, 84, 289.
Moloo, S. K. and Kutuzu, S. B. (1990): Expression of resistance to isometamidium chloride and
Diminazene aceturate in Trypanosoma congolense in Boran cattle infected by Glossina
morsitans centralis. Acta Trop. 47, 79-89.
Molyneux, D.H. and Ashford, R.W. (1983): The Biology of Trypanosoma and Leshimania, Parasites
of Man and Domestic Animals. 4 John Street, London WCIN 2ET. Pp.144-160.
Msangi, S. (1999): Distribution, density and infection rates of tsetse in selected sites of Southern Rift
valley of Ethiopia. MSc Thesis, FVM, AAU Ethiopia.
Mulligan, H. W. (1970): The African Trypanosomosis. Ministry of Overseas Development and
George Allen and Unwin, London.
Mulugeta, W., Wilkes, J., Mulatu, W., Majiwa, P. A. O., Masake, R., Peregrine, A. S. (1997): Long-
term occurrence of Trypanosoma Congolense resistant to Diminazine, Isometamidium and
Homidium in cattle at Ghibe, Ethiopia. Acta Trop. 64, 205-217.

85
Murray, M., Murray, P.K., Mc Intyre, W. I. M. (1977): An improved parasitological technique for
the diagnosis of African trypanosomosis. Trans. R. Soc.Trop. Med. Hyg. 71: 325-326.
Murray, M. (1979): Anaemia of Bovine African Trypanosomosis: An Overview in Pathogenecity of
Trypanosomes (Losos, G. and Chouinard, A., eds.) Ottawa, I.D.R.C.
Murray, M. (1988): Trypanotolerance, its criteria and genetic and environmental influence. In:
Proceeding of a meeting on livestock production in tsetse affected areas of Africa.
ILCA/ILRAD, Nairobi, Kenya.
Muturi, K. S. (1999): Epidemiology of bovine trypanosomsis in selected sites of the Southern
Rift valley of Ethiopia. FVM, AAU, Ethiopia, MSc Thesis.
Muturi, K. S., Msangi, S., Munstermann, S., Clausen P.-H., Abebe G., Getachew T., Bergenie B.,
Assefa, M. (1999): Trypanosomosis risk assessment in selected sites of the southern rift
valley of Ethiopia, International Scientific Council for Trypanosomiasis Research and
Control(ISCTRC) Twenty Fifth Meeting, Mombasa, Kenya, Publication No.120.
Nantulya, V. M., Bajana, E. and Hamers, R. (1989): Detection of circulating trypanosomal antigen in
Trypanosoma evansi infected animals using a Trypanosoma brucei group-specific
monoclonal. Tropical Medicine and Parasitology, 40, 263-266.
Nantulya, V. M., Musoke, A. J., Saigar, N., Minja, S. H. (1987): Monoclonal antibody that
distinguishes Trypanosoma congolense and Trypanosoma brucei. Parasite Immunology, 9,
421-431.
Nagel, P. (1995): Environmental Monitoring Hand Book for Tsetse Control Operations.The Scientific
Environmental Monitoring Group (SEMG), Margraf Verlag Publisher.
Ndoutamia, G., Moloo, S. K., Murphy, N. B. (1993): Derivation and characterization of a
quinapyramine-resistant clone of Trypanosoma congolense. Antimicrob.Agents Chemother.
37, 1163-1166.
Ngare, P. M. and Mwendia, C.M.T. (2000): Tsetse and trypanosomosis: An epidemiological survey
in Osupuko and Mara division of Narok district. International Scientific Council for

86
Trypanosomiasis Research and Control. 25th Meeting, Mombassa (Kenya), 25 Sep-1 Oct
1999.
NTTICC (1996): Annual Report. Ministry of Agriculture, National Tsetse and Trypanosomosis
Investigation and Control Center (NTTICC). Bedelle, Illubabor, Ethiopia. Pp.29.
NTTICC (1998): Annual Report. Ministry of Agriculture, National Tsetse and Trypanosomosis
Investigation and Control Center (NTTICC). Bedelle, Illubabor, Ethiopia. Pp.28.
Otte, M. J. and Gumm, I. D. (1997): Intra-cluster correlation coefficient of 20 infections calculated
from the results of cluster- sample surveys. Prev.vet. Med. 31, 147-150.
PARC (1998): Consultancy report on cost recovery of animal health service. Ministry of Agriculture,
Addis Ababa, Ethiopia. Pp.1-2.
Paris, J., Murray, M., McOimba, F. (1982): A comparative evaluation of the parasitological
techniques currently available for the diagnosis of African trypanosomosis in cattle. Acta
Trop. 39: 307-316.
Pind, M. and Authie, E. (1984): The appearance of isometamidium chloride resistant Trypanosoma
congolense in West Africa. Acta.Trop. 41: 247-252
Phelps, R. J. and Lovemore, D. F. (1994): Vectors: Tsetse Flies. In: Cozter, J.A.W., Thomson G.R.
and Tustin, R.C. (Eds). Infectious Disease of Livestock. Oxford University Press, Cape Town,
pp. 25-52.
Rogers, D. J. and Randolph, S. E. (1991): Mortality rates and population density of tsetse flies
correlated with satellite imagery. Nature, 351, 739-741.
Reid, R. S., Kruska, R. L., Wilson, C. J., Perry, B. D. (1998): The Impact of Controlling Tsetse Fly
on Land-Use and the Environment. In: Lyman, J., Carter, S. and Reid. R.S. (Eds). Spatial and
Temporal Dynamics of African Farming Systems.

87
Riordan, K. (1977): Long-term variations in trypanosome infection rates in highly infected tsetse flies
on a cattle route in south west Nigeria. Annual Tropical Medicine and Parasitology, 71, 11-
20.
Rowlands, G. J., Mulatu, W., Authie, E., Leak, S. G. A., and Peregrine, A. S. (1993): Epidemiology
of bovine trypanosomosis in the Ghibe valley, southwest Ethiopia. Acta Trop. 53, 135-150
Rowlands, G. J., Mulatu, W., Authie, E., D’Ieteren, G.D.M., Leak, S.G.A., Nagda, S.M., (1994):
Effects of trypanosomosis on reproduction of east African zebu cows exposed to drug
resistant trypanosomes. Prev. Vet Med. 21, 237-250.
Rowlands, G. J., Mulatu, W., Nagda, S.M., Dolan, R.B., d’Ieteren, G. D. M. (1995): Genetic
variation in packed red cell volume and frequency of parasitaemia in East African Zebu cattle
exposed to drug resistant trypanosomes. Livestock Production Science. 43, 75-84.
Rowlands, G. J., Leak, S. G. A., Peregrine, A. S., Nagda, S. M., Mulatu, W., d’Ieteren, G. D. M.
(2001): The incidence of new and the prevalence of recurrent trypanosome infection in cattle
in southwest Ethiopia exposed to a high challenge with drug-resistant parasite. Acta Trop. 79,
149-163.
Seifert, S. H. H. (1996): Tropical Animal Health. 2nd Ed. Dordrech: Kluwer Academic Publisher.
Sinyangwe, L. N., Machila N., Mubanga, J., Delespaux, V., Brandt, J., Geerts, S., Holmes, P.-H.,
Eisler, M. C. (1999): Trypanocidal drug resistance inn the Eastern province of Zambia.
International Scientific Council for Trypanosomosis Research and Control (ISCTRC), Twenty
Fifth Meeting, Mombassa Kenya. Publication No. 120.
Slingenbergh, J. (1992): Tsetse Control and Agricultural Development in Ethiopia.Wld Anim.Rev.
(FAO) 70-71, 30-36.
Stata Corporation (2000): Intercooled Stata Version 7.0 For Windows 95/98/NT. University Drive
East College Station, Texas, USA.

88
Swallow, B. M. (2000): Impact of Trypanosomosis on African agriculture. FAO PAAT, Technical
and Scientific Series, No.2 Pp52. FAO, Rome (Italy). Program Against African
Trypanosomosis. Rome (Italy): FAO ISBN 92-5-104413-9.
Teale, A. J. (1993): The trypanosomosis research program at international Laboratory for Research in
Animal Diseases (ILRAD). In: Mc Keever, D.J. (Ed). Novel immunization strategies against
protozoan parasites. Proceeding of workshop held at ILRAD, November 1993. Nairobi,
Kenya, 3-5.
Tewelde, T. (2001): Study on the occurrence of drug resistant trypanosomes in cattle in the farming
in tsetse control areas (FITCA) project in western Ethiopia. Addis Ababa University, Faculty
of Veterinary Medicine, Ethiopia, MSc Thesis.
Tewelde T., Abebe G., Eisler M. C., McDermott, J., Greiner, M., Afewerk, Y., Kyule, M.,
Munstermann, S., Zessin, K.-H., Clausen, P.-H. (2004): Application of field methods to assess
isometamidium resistance of trypanosomes in cattle in western Ethiopia. Acta Trop. 90, 163-
170
Thrusfield, M. V. (1995): Veterinary Epidemiology. 2nd Ed.Black Well Science, Oxford. Pp183-198.
Tikubet, G. and Gemechu, T. (1984): Altitudinal distribution of tsetse flies in the Fincha valley
(western part of Ethiopia). Insect. Sci. Application. 5, 389-395.
Tilahun, G., Balecha, F., Kassa, T., Birre, H., Gemechu, T.(1997): tsetse and trypanosomosis pilot
control trial at Pawe settlement area, Tana Beles valley, Mtekel zone, region 6, northwestern
Ethiopia. Proceeding of 13th conference of Ethiopian Veterinary Association. Addis Ababa.
Trail, J.C.M., d’Ieteren, G.D.M.., Maile, J.C., Yangari, G. (1991b): Genetic aspects of control of
anaemia development in trypanotolerant N’Dama cattle. Acta Trop. 48, 285-291.
Urquart, G. M., Armour, J., Dunncan, J.L., Dunn, A. M., Jennings, F.W. (1995): Veterinary
Parasitology. The University of Glasgow, Elbs ed.pp.203-212.
Vale, G. A. (1993): Development of baits for tsetse flies (Diptera: Glossinidae) In Zimbabwe. Jour.
Med. Ent. 30, 831-842.

89
Vale, G. A., Phelps, R. J. (1978): Sampling problems with tsetse flies (Diptera: Glossinidae). Journal
of Applied Ecology. 15, 715-726.
Van den Bossche, P., Doran, M., Conner, R. J. (2000b): An analysis of trypanocidal use in the
eastern province of Zambia. Acta Trop.75, 247-258.
Van den Bossche, P., Rowlands G. J. (2001): The relationship between the parasitological prevalence
of trypanosomal infection and herd average packed cell volume.Acta Trop. 78, 163-170.
Vreyesen, M. J. B., Mebrate, A., Minutet, M., Bergenie, B., Gizaw, W., Kiflome, M., Kassahun, B.,
Gezehagn, A. (1999): The distribution and relative abundance of tsetse flies in the southern
rift valley of Ethiopia, preliminary survey results. Proceeding of the 25th meeting of the
International Scientific Council for Trypanosomosis Research and Control (ISCTRC),
Mombassa (Kenya), Publication No. 120.
Walle, R. and Shearer, D. (1997): Vetrinary Entomology. Arthropod Ectoparasites of Veterinary
Importance. Champman and Hall, London.pp.141-193.
Walker, P. J. (1972): Capillary concentration technique applicable to infection of Trypanosoma
congolense in cattle. Trans. R. Soc. Trop. Med. Hyg. 66, 348.
Whiteside, E. F. (1960): Recent work in Kenya on the control of drug-resistant cattle trypanosome.
In: International Scientific Council for Trypanosomiasis Research and Control.8th meeting.
Jos Nigeria Publication 62. Commission for Technical Co-operation, South of Sahara,
London.
Whitelaw, D. D., Bell, I. R., Holmes, P.-H., Moloo, S. K., Hirumi, H., Urquart, G. M., Murray, M.
(1986): Isometamidium chloride prophylaxis against Trypanosoma congolense challenge and
the development of immune responses in Boran cattle. Vet. Rec.118, 722-726.
Williams, J. (1970): Review of Chemotherapeutic and Chemoprophylactic Agents. In: Mulligan
H.W. (Ed): The African Trypanosomiasis.George Allen and Unwinltd.Pp.125-221.
Woo, P. T. K. (1970): Haematocrit Centrifugation Technique for the Diagnosis of African
Trypanosomosis. Acta Trop.27, 384-386.

90
8. ANNEXES
Annexe1. Questionnaire format to interview farmers individually in the Abbay basin areas of northwest Ethiopia.
Region____________ Peasant Association______________
Zone_____________ Village________________________
Wereda__________ Name_________________________
I. Livestock management and farming system
1. When did you start farming in the area? Specify
2. What type of farming started at that time?
Livestock and crop production
Livestock production
Crop production
Others
3. Which livestock species are commonly found?
Cattle
Sheep and goat
Equines
Others
4. What are the major types of crop produced in the area?
Teff
Maize
Barely
Pulses
Others
5. What are the main inputs required for agricultural activity?
Livestock
Fertilizers
Land
6. Which livestock species used for agricultural activity?
Cattle
Equines
Others
7. What is the management system of cattle?

91
Communal and free grazing; live at the out side of the farmers’ house in beret system
Private and free grazing; live at the out side of farmers’ house
Tether
Stall feed
If the cattle managed in communal and free grazing type, are they in small group or in
herds?
8. Where is the grazing and watering point?
Around the locality of farmers
Long distance away from the farmers’ residential area
9. Are the watering points perennial or seasonal?
If it is perennial; Rivers and ponds
If it is seasonal; Rivers, ponds and streams
10. In which season does the availability of water and forage scarcity occurs?
After rainy season
During dry season
During the rainy season
11. What are the major types of forages/feeds/season
II. Major constraints of livestock and agricultural activity
1. Feed shortage
Lack of grazing land
Drought
Lack of cultivated land
2. Livestock diseases
2.1. What are the most common livestock diseases affecting your cattle?
2.2. Does trypanosomosis occur in this area?
Yes No I don’t know exactly
2.3. What do you call it by local name?
2.4. What is the importance of this disease compared to other diseases?
2.5. Which livestock species is affected most by trypanosomosis?
Cattle Small ruminants Equines
2.6. What are the main clinical signs observed when an animal affected by trypanosomosis?
2.7. In which season does the disease occur commonly?
2.8. Since when did you know the problem of trypanosomosis in this area?
a. Just when you started to live here
b. After 5 years of settlement

92
c. After 10 years of settlement
d. After 20 years of settlement
e. After 50 years of settlement
f. Before settlement
2.9. What is the status of the disease once you know in this area?
It is getting better
It is getting worse
Nothing is changed
I don’t know.
2.10. What is the transmitter (vector) of this disease?
Flies
Ticks
Others
I don’t know
2.11. If flies are the transmitter of the disease, which flies do you think and specify it
characteristically?
2.12. What is local name of that fly that transmitter of trypanosomosis?
2.13. In which season does this flies are most abundant?
2.14. Where this fly population is very high?
a. In grass land areas
b. In cultivated land
c. In bush land
d. In savanna areas
e. In areas close to river and watering points
2.15. What are the main control measures of trypanosomosis?
Treatment of affected animals
Feeding well of affected animals
Resting the animal from working conditions
Others
2.16. Where are the common drug sources?
Veterinary clinics
Private legal and illegal drug shops
Others
2.17. Who are giving the treatment?
Veterinarians, Animal health assistant, Animal health technicians

93
Local farmers
The owner himself
Others
2.18. Which drugs are most commonly used in the area? (name, types, color, etc.)
2.18. When did you start treatment of animals with trypanocidal drugs? Specify in years
2.19. When do you treat animals and how many times treatment per year. Specify
2.20. Is treatment effective or not effective?
If it is not effective what is the reason behind that?
2.21. Are there traditional method of treatment and management practices for controlling and
prevention of trypanosomosis?
Thank you!
Name of interviewer_______________
Signature________________________
Date_____________________________
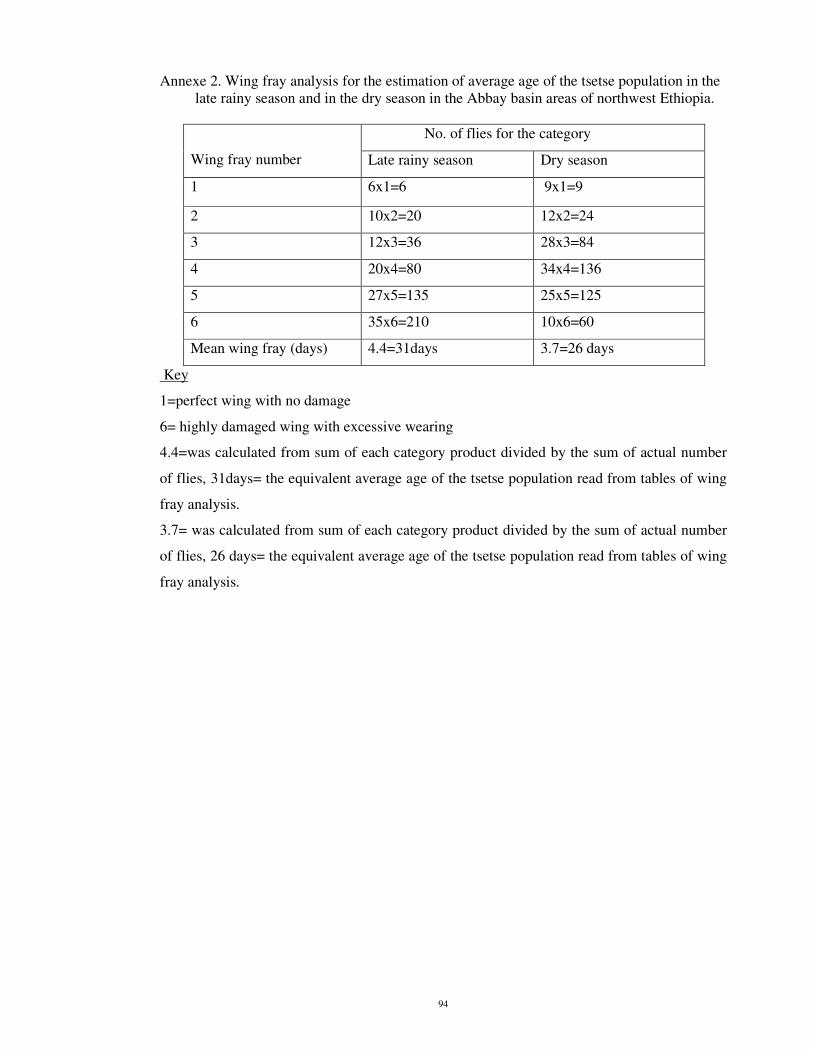
94
Annexe 2. Wing fray analysis for the estimation of average age of the tsetse population in the late rainy season and in the dry season in the Abbay basin areas of northwest Ethiopia.
No. of flies for the category
Wing fray number Late rainy season Dry season
1 6x1=6 9x1=9
2 10x2=20 12x2=24
3 12x3=36 28x3=84
4 20x4=80 34x4=136
5 27x5=135 25x5=125
6 35x6=210 10x6=60
Mean wing fray (days) 4.4=31days 3.7=26 days
Key
1=perfect wing with no damage
6= highly damaged wing with excessive wearing
4.4=was calculated from sum of each category product divided by the sum of actual number
of flies, 31days= the equivalent average age of the tsetse population read from tables of wing
fray analysis.
3.7= was calculated from sum of each category product divided by the sum of actual number
of flies, 26 days= the equivalent average age of the tsetse population read from tables of wing
fray analysis.

95
Annexe 3. Parasitological results in the ISMM block treatment study from day 0 to day 84: Trypanosome species diagnosed and mean PCV in control and treatment group at each village from 0-84 days.
Trypanosome spp. diagnosed
Day Village Group No. animal Infection rate (%)
T.c T.v
Mean PCV
Control 25 12 3 0 25.04
Treatment 25 4 1 1 26.44
Ergib
Total 50 8 4 1 25.74
Control 25 8 2 0 25.12
Treatment 25 12 1 0 23.34
0
Melkachaba
Total 50 10 3 0 24.23
Control 25 8 1 1 24.48
Treatment 23 4.3 1 0 26.25
Ergib
Total 48 6.15 2 1 25.36
Control 25 12 3 0 26.4
Treatment 25 20 5 0 24.16
14
Melkachaba
Total 50 16 8 0 25.25
Control 25 16 3 1 25.76
Treatment 25 8 2 0 28.6
Ergib
Total 50 12 5 1 27.18
Control 25 28 6 1 23
Treatment 23 39 7 0 23.86
28
Melkachaba
Total 48 29 13 1 23.43
Control 25 16 4 0 24.4
Treatment 23 13 3 0 24.5
Ergib
Total 48 14.5 7 0 24.45
Control 23 26 6 0 23.66
Treatment 23 30 7 0 23.18
42
Melkachaba
Total 46 28 13 0 23.42
Control 25 16 3 0 25.96
Treatment 24 8.3 2 1 27.4
Ergib
Total 49 12.15 5 0 26.68
Control 24 16.6 4 0 23.33
Treatment 25 20 5 0 24.04
56
Melkachaba
Total 49 18.3 9 0 23.68
Control 25 12 3 0 25.44
Treatment 25 8 2 0 26.35
Ergib
Total 50 10 5 0 25.89
Control 23 21.7 5 0 24.33
Treatment 25 20 5 0 22.96
70
Melkachaba
Total 48 20.85 10 0 23.65
Control 24 16 4 0 25.81
Treatment 24 12.5 3 0 25.85
Ergib
Total 48 14.25 7 0 25.83
Control 23 21.7 5 0 26
Treatment 25 20 5 0 23.48
84
Melkachaba
Total 48 20.85 10 0 24.74
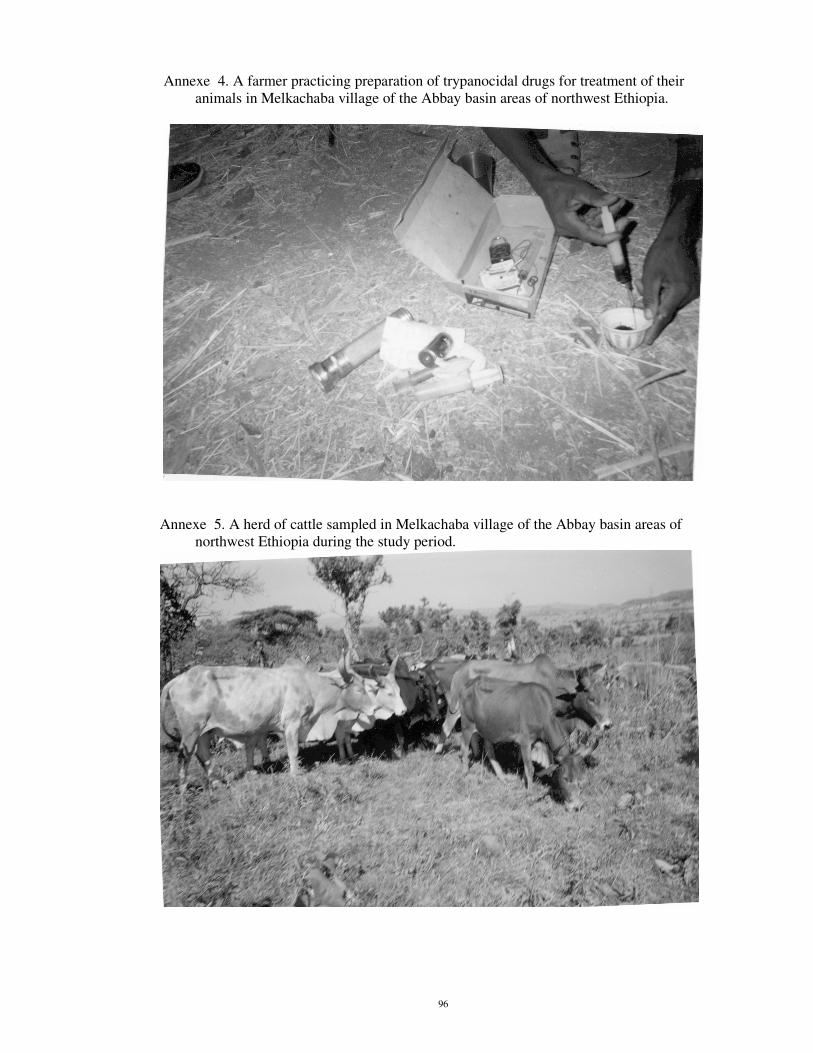
96
Annexe 4. A farmer practicing preparation of trypanocidal drugs for treatment of their animals in Melkachaba village of the Abbay basin areas of northwest Ethiopia.
Annexe 5. A herd of cattle sampled in Melkachaba village of the Abbay basin areas of northwest Ethiopia during the study period.

97
9. CURRICULUM VITAE
1. Personal identification
Name Shimelis Dagnachew Nigatu
Address Ebinat wereda, South Gondar Zone
Nationality Ethiopian
Language Amharic: Speaking, Reading and Writing
English: Speaking, Reading and Writing
Sex Male
Date of birth March 5, 1975
Place of birth Neftegna Selassie, Hulte-Eju Enesse, East Gojjam Zone
Marital status Single
Religion Orthodox
Profession Veterinarian
Occupation Field veterinary practitioner
2. Educational back ground
Year of education Place
1982- 1986 Tekeldengaye Elementary School, Hulte-Eju Ensesse,
East Gojjam (Certificate)
1987-1989 Seddie Junior Secondary School, Hulte-Eju Ensesse,
East Gojjam (Certificate)
1990-1993 Motta Seinior Secondary School, Hulte-Eju Ensesse,
East Gojjam (ESLCE)
1994-1999 Addis Ababa University, Faculty of Vetrinary Medicine (DVM)
2002-2004 Addis Ababa University, Faculty of Vetrinary Medicine (MSc)
3. Work Experience
Nov.1999- Sep.2002 Veterinary practioner in Ebinat Wereda, South Gondar Zone, Amhara
Region.

98
4. Paper Writing
1. Incidence rate of major postpartum problems and estimation of uterine involution in
Welayta Soddo dairy farms (Jersey, Holstein and Cross Breed Cattle). DVM Thesis, AAU,
FVM, Debre Zeit, Ethiopia. June, 1999.
2. The Impact of Stress on Hormonal Regulation and Immune Function in Domestic Animals.
Seminar on current topics in livestock production and development. AAU, FVM, Debre Zeit,
Ethiopia, 1998.
3. Bovine trypanosomosis in the Tekeze basin of Ebinat wereda, northwest Ethiopia with a
projected assisted by ORDA, Ebinat-Belssa IFSP, GAA, South Gondar, Amhara Region
Bureau of Agriculture, 2000.
4. Bovine trypanosomosis and drug resistance in tsetse infested areas of Africa. Seminar on
current topics on basic sciences in MSc course work, 2003.
5. Epidemiology of bovine trypanosomosis in the Abbay basin areas of northwest Ethiopia.
MSc thesis, AAU, FVM Debre Zeit, 2004.
5. Membership to the Scientific Associations
Ethiopian Veterinary Association
6. Contact Address
Reference:
Prof. Getachew Abebe, AAU, FVM, Debre Zeit
Dr. Bayleyegn Molla, Associate Dean for Research and Graduate Studies, AAU, FVM
Debre Zeit.
Dr. Arun K. Sangwan, AAU, FVM, Debre Zeit
Dr. Bewuket Seraw, BoA, Animal and Fisheries Production and Health Department Head
Bahir Dar