PUBLIC TRANSPORT ROUTE PLANNER FOR ADDIS ABABA
71
PUBLIC TRANSPORT ROUTE PLANNER FOR ADDIS ABABA By Addisu Andarge A project paper submitted to the School of Graduate Studies of Addis Ababa University in partial fulfillment of the requirements for the Degree of Master of Science in Computer Science June 2010
-
Upload
khangminh22 -
Category
Documents
-
view
2 -
download
0
Transcript of PUBLIC TRANSPORT ROUTE PLANNER FOR ADDIS ABABA
PUBLIC TRANSPORT ROUTE PLANNER FOR
ADDIS ABABA
By
Addisu Andarge
A project paper
submitted to the School of Graduate Studies of Addis Ababa University
in partial fulfillment of the requirements for the Degree of Master of
Science in Computer Science
June 2010
Addis Ababa University
School of Graduate Studies
Faculty of Informatics
Department of Computer Science
Public Transport Route Planner for Addis Ababa
By
Addisu Andarge
Name and signature of members of the examining board:
Name Signature
1. Dr. Yaregal Assabie (Advisor) _______________
2. ________________________ _______________
3. ________________________ _______________

ACKNOWLEDGMENT
I would like to express my deepest gratitude to my advisor Dr. Yaregal Assabie for his guidance
and invaluable comments throughout the project. My special thanks go to route planning
department of Anbessa City Bus Enterprise for availing me important data, without which this
project could not be accomplished. I would also like to thank Ato Wondifraw Abi for his help
throughout the data collection process.
I am also indebted to Washera Broadview College, Debre Markos.
Finally, I would like to thank W/ro Melkie Admasu, my family, and friends for their support.
TABLE OF CONTENTS
LIST OF FIGURES .................................................................................................................... I
ABBREVIATIONS ................................................................................................................... II
ABSTRACT .............................................................................................................................III
1. INTRODUCTION...................................................................................................................1
1.1 Background ..................................................................................................................... 1
1.2 Statement of the Problem................................................................................................. 2
1.3 Objective ......................................................................................................................... 3
1.3.1 General Objective.......................................................................................................3
1.3.2 Specific Objectives.....................................................................................................3
1.4. Scope of the Project ........................................................................................................ 4
1.5 Methodology ................................................................................................................... 4
1.5.1 Data Collection ..........................................................................................................4
1.5.2 Tools and Techniques.................................................................................................4
1.6 Application of Results ..................................................................................................... 5
1.7 Organization of the Document ......................................................................................... 5
2. LITERATURE REVIEW........................................................................................................6
2.1 Characteristics of Public Transport in Addis Ababa ......................................................... 6
2.1.1 Anbessa City Bus Enterprise ......................................................................................7
2.1.2 Taxi Service .............................................................................................................10
2.1.3 Problems in Public Transport Service of Addis Ababa..............................................11
2.2 Route Planners................................................................................................................14
3. GRAPH THEORY AND ALGORITHMS.............................................................................18
3.1 Graphs ............................................................................................................................18
3.1.1 Types of graph .........................................................................................................18
3.1.2 Representation of Graph in Computers .....................................................................20
3.2 Applications of Graphs ...................................................................................................22
3.3 Graph Based Algorithms.................................................................................................23
3.3.1 Shortest Path Algorithms..........................................................................................23
3.2.2 Path Identification Algorithms for Public Transport Networks..................................25
4. SYSTEM REQUIREMENTS ANALYSIS............................................................................27
4.1 Functional Requirements ................................................................................................27
4.2 Nonfunctional Requirements...........................................................................................29
4.3 System Models ...............................................................................................................30
4.3.1 Use Cases.................................................................................................................30
4.3.2 Use Case Description ...............................................................................................30
4.3.3 Sequence Diagrams ..................................................................................................33
4.3.4 Activity Diagram......................................................................................................36
4.3.5 Class Diagram..........................................................................................................37
5. SYSTEM DESIGN ...............................................................................................................39
5.1 Design Goals ..................................................................................................................39
5.2 Persistent Data Management ...........................................................................................40
5.3 Algorithm Design ...........................................................................................................42
5.3.1 Construction of the Transfer Matrix..........................................................................46
5.3.2 Resource Requirement of the Transfer Matrix ..........................................................48
6. THE PROTOTYPE...............................................................................................................50
6.1 Programming Language..................................................................................................50
6.2 Implementation Challenges and Decisions ......................................................................50
6.3 User Interface of the Prototype .......................................................................................52
7. CONCLUSION AND FUTURE WORKS.............................................................................57
7.1 Conclusion......................................................................................................................57
7.2 Future Works..................................................................................................................58
REFERENCES .........................................................................................................................60
APPENDIX ..............................................................................................................................62
DECLARATION ......................................................................................................................63
I
LIST OF FIGURES
Figure 1: Undirected Graph G1 ......................................................................................................19
Figure 2: Digraph G2 .....................................................................................................................19
Figure 3: Complete digraph (a) and, complete undirected graph (b)................................................19
Figure 4: Weighted undirected graph..............................................................................................20
Figure 5: Array representation of the graph in Figure 4; (a) vertices of the graph, (b) edges of the
graph...............................................................................................................................................20
Figure 6: Linked structure representation of the graph in Figure 4 ..................................................21
Figure 7: The combined array and linked structure representation for the graph in Figure 4............22
Figure 8: Use case model for PTRPAA ..........................................................................................30
Figure 9: Sequence diagram for Find Journey Route use case.........................................................33
Figure 10: Sequence diagram for Update Tariff use case ................................................................34
Figure 11: Sequence diagram for View Bus Route use case............................................................35
Figure 12: Sequence diagram for View Tariff use case ...................................................................35
Figure 13: Activity diagram for PTRPAA ......................................................................................36
Figure 14: Class diagram for PTRPAA ..........................................................................................37
Figure 15: A simple road network with six vertices ........................................................................44
Figure 16: The transfer matrix for the road network shown in Figure 15.........................................44
Figure 17: Taxi service network on six sample locations of Addis Ababa.......................................45
Figure 18: The transfer matrix M for the taxi service network shown in Figure 17 .........................45
Figure 19: The initial values when constructing a transfer matrix ...................................................46
Figure 20: The user interface for Find Journey Route use case .......................................................52
Figure 21: Route data for a trip from Arat Kilo to Kazanchees using bus........................................53
Figure 22: The user interface for Update Tariff use case after taxi transport service is selected.......54
Figure 23: The user interface for View Bus Route use case with service number 31 displayed .......55
Figure 24: The user interface for View Tariff use case ...................................................................56
II
ABBREVIATIONS
E.C. – Ethiopian Calendar
PC – Personal Computer
PDA – Personal Digital Assistant
SMS – Short Message Service
PTRPAA – Public Transport Route Planner for Addis Ababa
III
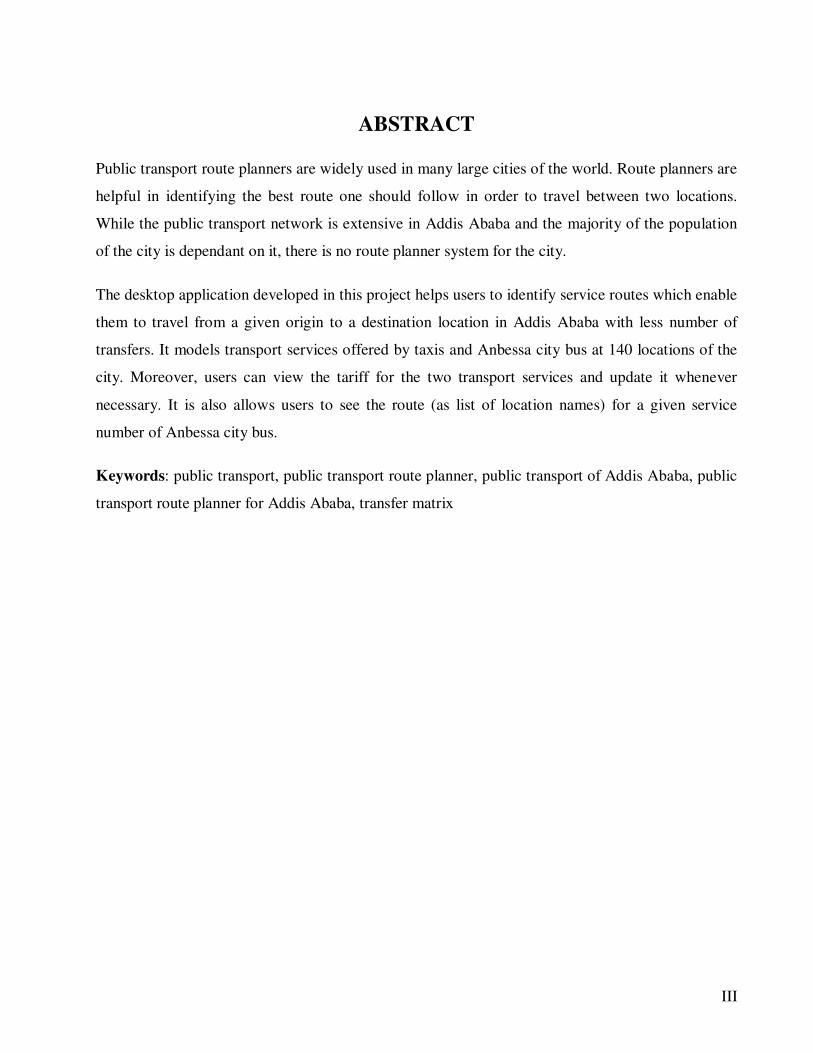
ABSTRACT
Public transport route planners are widely used in many large cities of the world. Route planners are
helpful in identifying the best route one should follow in order to travel between two locations.
While the public transport network is extensive in Addis Ababa and the majority of the population
of the city is dependant on it, there is no route planner system for the city.
The desktop application developed in this project helps users to identify service routes which enable
them to travel from a given origin to a destination location in Addis Ababa with less number of
transfers. It models transport services offered by taxis and Anbessa city bus at 140 locations of the
city. Moreover, users can view the tariff for the two transport services and update it whenever
necessary. It is also allows users to see the route (as list of location names) for a given service
number of Anbessa city bus.
Keywords: public transport, public transport route planner, public transport of Addis Ababa, public
transport route planner for Addis Ababa, transfer matrix
1
1. INTRODUCTION
1.1 Background
Addis Ababa is the largest city in Ethiopia. Based on the 2007 census report, the population size
of the city is more than 2.7 million (2,738,248), constituting 3.7% of the country’s population
[1]. The total length of road in the city is 1,329.59 km, out of which 29.7% (395.27 km) is
asphalt road [2]. However, the present road space network capacity is badly constrained by poor
quality and standard, absence of linkages and lack of alternate shortcut routes, and the
absence/inadequacy of pedestrian walkways [3].
According to the Office for the Revision of Addis Ababa Master Plan (ORAAMP), the high rate
of population growth coupled with the limited capacity of the public transport resulted in severe
pressure on mass transport in the city. The urban mobility of Addis Ababa is highly dependent
on public transport. 26% of the city’s population is bus user, while 72% depend on taxis, and
only 4% own private cars [2]. Furthermore, the number of bus users in Addis Ababa is 43%
higher than that anticipated in the 1986 master plan which forces the city government to increase
the number of buses [4]. Given the fact that large proportion of vehicles in Addis Ababa are
those for public transport and large number of people are dependent on the public transport on
daily basis, it is quite easy to deduce that the public transport sector plays a critical role in the
daily socio economic activities of the city.
The public transport of Addis Ababa is composed of three main systems:
• Anbessa City Bus Enterprise which is owned and subsided by the government. Currently,
the bus network has ninety three routes covering the city and connecting it with its
surrounding towns. According to a study on the urban public transport conditions in
Addis Ababa, Anbessa is serving up to 700,000 passengers per day [5].
• Privately owned taxis, with fixed tariff rates and partially defined paths and stops. The
network of taxis has the most extensive service coverage in the city and its surrounding.
There were over 7,500 registered minibus taxis giving services in Addis Ababa in the
year 2005. The study of urban public transport conditions in Addis Ababa has identified
2
106 taxi routes made up of with more than 300 segments. About 1.2 million passengers
depend on taxi services each day [5].
• Midi bus transport service, which is much like taxi but with fixed paths and stops. This
public transport service is relatively new to the city and was introduced to relieve the
pressures on the core public transport services of Anbessa bus and taxis.
In addition to those mentioned above, privately owned public transport buses and minibuses
normally used outside of Addis Ababa operate in the city. They give service specifically during
peak hours.
1.2 Statement of the Problem
A route planner (also called journey planner) is an electronic search tool that enables users to
find the optimal path between two points by some means of transport. It finds one or more
suggested paths between an origin and a destination location. The origin and destination points
can be specified as geospatial coordinates, name of places, or other location identifiers such as
bus stops, railway stations, and air ports. The search can be optimized on different criteria such
as fastest (time criteria), shortest (distance criteria), cheapest (cost criteria), least transfers, etc.
There are different types of route planners. Some common types of route planners are
• Intermodal route Planner: combines many modes of transport such as air, bus, and rail
way services
• Road Route Planner: a route planner specialized for road network use.
• Public Transport Route Planner: a route planner specialized for use on public transport
service.
• Bus Route Planners: a route planner for bus transport services
Public transport route planner systems have been widely used in many large cities. Many
websites offer trip planning services for large metropolitan areas, or even on national level. In
cities with such a system, any person with the intention of using public transport can access the
system to gain valuable information. Some of the information one can get include:
3
• The optimal path to follow to reach a destination from a specific origin.
• Which transportation option could minimize cost; and
• The arrival time of a bus or train on a particular station. This enables users to schedule
their time of arrival at that station.
It is not always easy to use public transport service to move around Addis Ababa. Finding travel
plans for non recurrent trips is not an easy task even for residents of Addis Ababa, let alone for
those new to the city. Often, passengers begin their journey without a plan and gather
information on their way. Their main source of information is through informal conversation
with people who use similar public transport. However, this is not a good mechanism of planning
a journey because it does not guarantee that the path they follow is the optimal. What makes the
situation worse in Addis Ababa is that there is no route planner system that helps the public to
gain information on the public transport system of the city.
Route planner systems use graph data structure to represent transport network. The nodes of the
graph represent locations in the transport network and the edges of the graph represent the path
to be taken between two locations. The edges can be weighted using distance, cost, or other
metrics.
1.3 Objective
1.3.1 General Objective
The general objective of the project is to develop a system that can be used to identify the
optimal path from a given origin to a specific destination in Addis Ababa while using public
transport system. The optimality of the path is constrained to the number of transfers required.
1.3.2 Specific Objectives
The specific objectives of the project are:
• identifying the public transport routes in Addis Ababa;
• identifying alternative paths with minimum number of transfers for a given origin and
destination location pairs; and
• developing a prototype;
4
1.4. Scope of the Project
The core public transport services in Addis Ababa are those of Anbessa City Bus Enterprise and
taxis. Therefore, this project is limited to these two services. The recently introduced midi bus
service is not included for the reason that they have less network coverage and lack of adequate
information on their service routes.
As stated earlier, the services provided by Anbessa and taxis are extended to the surrounding
towns of Addis Ababa. However, as the main objective of the project is specific within Addis
Ababa, services offered to locations outside of the city are not included. The limits of the city are
considered to be Dil Ber to the north, Kara Alo to the east, Kaliti to the south east, Kara Kore to
the south west, and Asco to the west.
1.5 Methodology
1.5.1 Data Collection
The data used in the project are:
• service routes of Anbessa city buses;
• taxi service routes; and
• transport tariff for both of these public transport services.
The service routes of Anbessa City Bus Enterprise are obtained from the enterprise. The data on
public transport tariff, even for taxis, is also obtained from the enterprise. The routes for taxis are
not available in recorded form. Thus, route information of taxis is collected mostly through
discussion with individuals engaged in the service and some from experience.
1.5.2 Tools and Techniques
Public transport route planner systems can be implemented as web based or desktop applications.
Nowadays, the implementation practices of route planners for self-use by the public are inclined
to web based. Nevertheless, although it is possible to implement this project as a web based
application, it is implemented as a desktop application for the basic reason that while there are a
5
large number of people in Addis Ababa who have PCs, the number of people with Internet
connection is much less.
The tools used in the project are:
• Microsoft Visual C++ for prototype development
• Microsoft Office Word for document preparation
• Microsoft Office Excel for data organization
1.6 Application of Results
The result of the project is mainly targeted to be used by anyone who has the intension of using
public transport in Addis Ababa. In practice, this refers to the greater majority of the population
of the city who depend on the public transport services on daily basis. Using a route planner,
users could easily get information about a journey before they set off.
1.7 Organization of the Document
This document is composed of seven sections including this introduction section. Section 2 deals
with literature review on the public transport system of Addis Ababa and properties of route
planners. Section 3 presents concepts in graph theory, their computer representation, their real
world applications and some of the graph based algorithms. Sections 4 and 5 present the
requirements analysis and system design respectively. Section 6 describes implementation issues
of the prototype and Section 7 states conclusions and outlines future works.
6
2. LITERATURE REVIEW
2.1 Characteristics of Public Transport in Addis Ababa
The current governing legislation of urban transport system is the 1992 Proclamation to Provide
for the Regulation of Road Transport [5]. The legislation allows regional states to develop their
own public transport regulatory framework. It also permits the establishment of the privately
owned public transport companies including city bus transport providers. However, city bus
transport service was limited to Anbessa City Bus Services Enterprise until recently. The lack of
private investors in the city bus sector is mainly attributed to the fact that Anbessa City Bus
Services Enterprise is subsidized by the city government administration which affects the
commercial competitiveness of possible rivals. The city government subsidy is now reduced year
by year and is planned to be terminated gradually.
Another result of the proclamation is the elimination of zonal (Kettana) regulation of minibus
taxis. Prior to this proclamation, a license had to be obtained in order to operate in one of the five
Kettanas and a taxi was allowed to operate only in the Kettanas in which it had obtained a
license. The right to operate city buses was also exclusively given to Anbessa City Bus
Enterprise before this proclamation.
After the proclamation, the responsibility of approving operation license for taxis is that of the
Bureau of Trade and Industry Development, but has been delegated to the Transport Authority.
A taxi owner is expected to pay a permit fee which will be renewed annually. Besides the fee, the
efficiency (quality) of the vehicle, the driver’s qualification, and the presence of an attending
operator (popularly known as weyala) are also required to get permission. Unlike that obtained
during the zonal system, the permit is valid throughout the city.
The proclamation encourages taxi service providers to organize themselves into associations.
However, the number of association members is limited to 750 to avoid a possible monopoly of
the sector by a single association with large number of members. Since membership to an
association is not a precondition to get license, large proportion of the industry are not members
of any association. In fact, only three associations exist. Although these associations represent
7
only a small proportion of the industry, the Transport Authority of Addis Ababa negotiates with
them concerning regulations that will be enforced on all.
The public transport services in Addis Ababa can be grouped into two main categories as
Anbessa city bus and minibus taxi transport services. Anbessa City Bus Services Enterprise is
owned by the Federal government, although it is financially supported by the Addis Ababa City
Government. The minibus taxis are privately owned. The next two sub sections present the
characteristics of these two public transport services.
2.1.1 Anbessa City Bus Enterprise
Anbessa City Bus Enterprise began operation in 1935 Ethiopian calendar (E.C.) with 10 buses
and spare parts which were left by the invading Italian force. Before the number of service routes
was increased to 14 in 1952 E.C., there were only four service routes with two buses on each
route [21]. The service routes were:
• Service route 1: Legehar to Kechene
• Service route 2: Old Air Port to Menelik Square (Giorgis)
• Service route 3: De Gaulle Square (Piassa) to Lam Beret
• Service route 4: De Gaulle Square to Gullelle
The tariff of that period was Birr 0.40 for round trip and Birr 0.25 for single trip. In 1951 E.C. it
was revised to Birr 0.25 for round trip and Birr 0.15 for single trip.
To increase the availability of its service with the increased demand, Anbessa increased its fleet
at different times. It has purchased 20 buses in 1957 E.C, and increased the number of buses to
163 by 1966 E.C. Anbessa acquired 100 buses in 1989 E.C, 166 in 1990 E.C, 50 in 1993 E.C,
and 150 in 1995 E.C through purchase and aid [21].
The enterprise built its first headquarters in 1957 E.C at Lideta. Currently, Anbessa operates out
of three sites (depots): Yeka to the East of Addis Ababa, the other is at Shegole to the northwest,
and the third is at Mekanissa to the south of the city. The enterprise’s headquarter is at the Yeka
depot. This depot also contains the central workshop and the main spare parts warehouse of the
8
enterprise. Each of the three depots is capable of basing 300 buses, but is currently under-
exploited. Although heavy maintenance is carried out only at the Yeka depot, each depot is self-
sufficient [21].
Anbessa is financially dependant on the subsidy of the City Government of Addis Ababa. It does
not have the freedom to set its own prices to maximize profit because the government focuses on
affordability of the service rather than profit maximization. Despite the fact that the income of
the enterprise increases due to the expanding service, it is still unable to cover its expenditures.
According to the information obtained from the enterprise, currently, there are 93 routes
operating in Addis Ababa and its surrounding. The service starts at 6AM and continues until
9PM. Most of these routes are operated towards the central business districts of the city,
especially toward Merkato. The three main terminals at which administrative and light
maintenance services are available are Merkato (Addis Ketema), Giorgis (Menelik Square), and
Legehar. The enterprise also operates 4 routes in Jimma town and its surrounding.
From the route map available at the headquarters and the route information obtained, it is
possible to deduce that there is a high degree of overlap between service routes. Some service
routes even exhibit complete overlap (routes 27 and 60, for example). While most of the routes
originate at the suburbs and end up at the business centers of the city, the following 11 routes
connect the city business centers with nearby towns by moving out from Addis Ababa in 5
directions [21].
• Service route 7: from Megenagna to Legettafo, Legedady, Sendafa, Beke
• Service route 24: from Piassa to Burayu
• Service route 26: from Merkato to Alemgena, Sebeta
• Service route 30: from Merkato to Sululta
• Service route 43: from Merkato to Burayu, Gefersa, Tattek, Menagesha
• Service route 44: from Merkato to Legettafo, Legedady
• Service route 60: from Legehar to Akaki, Dukem, Bishoftu
9
• Service route 85: from Merkato to Burayu, Gefersa, Tattek, Menagesha, Holeta
• Service route 88: from Merkato to Sululta, Chancho
• Service route 89: from Merkato to Legettafo, Legedady, Sendafa
• Service route 91: from Merkato to Alemgena, Sebeta, Tefki
All Anbessa routes have schedule timetables, but the timetable information is available for the
public at very few major terminals. The schedule is based on the distance between stops and is
the same for each trip irrespective of the time of the day and the direction of the trip. The time of
the day affects the timetable in such a way that delays happen at rush hours [5]. The direction of
trip influences the timetable due to differences in the terrain, which is particularly observed in
the northern half of the city. In general, the service fails to run according to the schedules. The
failure is attributed to problems in timetable preparation method, time lost at stops while issuing
tickets to passengers, poor road network infrastructure, and increased traffic congestion.
The study on urban public transport characteristics of Addis Ababa [5] shows that only 5 routes
provide service frequency of 6 or more per hour, 26 routes provide 3 or 4 services, 31 routes
provide 2 services and 18 routes only 1 service per hour. The operation frequency of routes
operating outside the cities peripheries ranges form 1 in one half to three hours. The normal
standard for urban bus service is 6 or more services per hour.
Anbessa offers two types of passenger tickets: single trip tickets and ten-trip student tickets. The
later are valid only on school days. Single trip tickets are printed in two colors each of which are
used in each direction. The color difference along with the serial numbers helps the enterprise to
avoid ticket reuse. At the end of each trip the ticketer fills out a form showing the number of
tickets sold, hence the passenger numbers, which enables the enterprise to control its revenue and
keep detailed record on the number of passengers.
The urban transport study reported that the passenger carrying of Anbessa can approach 40,000
per day [5]. The average number of passengers per trip (load factor) is estimated to be 110 which
could rise to 150 or more during peak hours. This very high load factor is due to the bi-
directional nature of the traffic, i.e., a balanced load factor in either directions of a service route.
10
The average kilometer run of Anbessa city buses is 176 kilometers per bus per day. Taking the
number of buses actively engaged in service to be 344, the total kilometer run of Anbessa is
equated to 60,544 kilometers per day [5].
2.1.2 Taxi Service
This category of public transport service consists of privately owned minibus and the so called
Wuyeyit taxis. The later particularly give service on certain routes only. For the sake of
simplicity, the term ‘minibus taxis’ or ‘taxis’ is used through out this document to refer to both
taxi types.
The number of minibus taxis operating in Addis Ababa is reported differently in different
documents. One of the estimates puts the number between 10,000 and 12,000 [17]. The urban
transport characteristics study reported a little more than 7,500 taxis. This information was
backed by the computerized registration system at the Transport Authority. The same report also
indicated that this number is reduced by 2,400 during the new plate registration introduced in the
year 2003.
An attempt to estimate the number of passengers served by a minibus taxi within a day comes up
with a range of 132 to 312 [5]. The reason for this wide difference is attributed to attempts of
getting extra fair by break up of routes into small segments at peak hours. Another factor is the
unavailability of detailed data recording system by taxi owners and drivers. The actual number is
expected to be the average of the two and would be consistent to the international experience of
similar transport service. The average occupancy of minibus taxis is found to be 10.8 at peak
hours and 10.0 at other times. This is due to the bi-directional nature of traffic together with the
practice of load maximization. Considering the estimate on the number of minibus taxis on
service, the daily total passenger carrying would be about 1.2 million, which is more than half of
the total public transport daily carrying capacity.
Although there is no record on the number of minibus taxi routes in Addis Ababa, the urban
transport characteristics study identified 106 routes [5]. These routes are usually broken into
smaller segments to exploit the authorized fare system. The Transport Authority estimates the
number of route segments to be as high as 300. The existence of route segments makes route
identification difficult and error prone.

11
Minibus taxis operate without timetable schedules. The operation principle is fill-and-run. On
most taxi terminals, taxis wait in queues to be filled. The consequence of this is long waiting
times on routes with few passengers and inconvenience of passengers as they are forced to walk
to the nearest taxi terminal and suffer from the expected wait until the taxi is filled.
Taxi queues at terminals are managed by order attendants (tera askebariwoch). Taxi drivers pay
Birr 0.50 or Birr1.00 to order attendants at departure which sums up to 10 to 20 Birr per day. The
order attendants have unions for which they would pay membership fees as high as Birr 2,000
annually [5].
Just like lack of data on the number of passengers, there is no record on daily kilometer run of
minibus taxis. The situation is aggravated by the fact that odometers of most taxis are not
functional. However, information gathered through interviews with taxi drivers and owners
combined with the information on route distances and estimates obtained from the Transport
Authority, the daily kilometer run is expected to be 130. The overall daily kilometer run by the
industry is estimated to be around 800,000 [5].
2.1.3 Problems in Public Transport Service of Addis Ababa
The report of the study on urban public transport characteristics of Addis Ababa identified the
following problems [5].
• Inadequate service quantity: From passengers’ perspective, inadequacy of service
quantity can be expressed by longer waiting time and overcrowding on vehicles while
high profit and high price are its indicators from operators’ point of view. Surprisingly,
both of these indicators coexist in Addis Ababa because of the authorized tariff system.
• Low safety level: Generally, the safety level of Anbessa is high due to its high operating
standards. Accidents are very rarely serious and mostly happen when passengers try to
get on board or off board while the bus is still moving. The safety level of taxis is lower
than that of buses. More than 20% of accidents are related to taxis. However, the most
serious safety problem in relation to public transport is that of pedestrians.
12
• Poor service quality: The most serious service quality problem of bus users is
overcrowding and the related petty crime. Another problem is service breakdowns which
are less likely to be replaced. What makes bus breakdown problems worse than taxis is
that the bus users are less likely to get another vehicle quickly to board on, given its high
occupancy. Moreover, bus stops are characterized by lack of passenger information and
basic facilities such as shelters. The major service quality problem of minibus taxis is
relate to drivers’ level of experience and maturity as well as their assistants’ behavior.
The physical condition of vehicles and their cleanliness is also a major concern on
minibuses than buses which reflects the poor maintenance culture of their owners and
lack of effective enforcement by the government.
• Low level of affordability: The monthly household expenditure on public transport is low
in comparison to international standards. This can be accredited to the authorized tariff
system with the aim of providing affordability and the compact settlement in Addis
Ababa. Yet, 60% of pedestrians walking more than two kilometers were found not able to
afford using transport service and 83% of bus users were not able to afford minibus fairs.
Another issue is the coupling of higher transport costs with low income as households
with lower income are forced to live far from the city center where house rents are lower.
• Low operating speeds: 73% of minibus passengers interviewed by the urban transport
improvement study indicates that they choose minibus for their shorter travel time.
Nevertheless, the operating speed of taxis in affected by the fill-and-run operation
mechanism particularly at off-peak hours. The operating speed for Anbessa is 16.8
kilometers per hour which appears to be overly optimistic specially at peak hours.
• Poor service accessibility: The main indicator for accessibility is walking time to the
nearest boarding post, but has not yet been surveyed. The high number of Anbessa bus
routes may seem to enhance its accessibility. In reality, it is characterized by lower
accessibility because of route overlaps resulting in lower spatial coverage. Anbessa does
not offer service to areas with low population density and unsuitable road network. Taxi
transport networks provide better area coverage.
13
• Inappropriate vehicle type and size: The core transport service is provided by buses with
more than 100 passenger capacity or taxis with passenger size of 14. The late
introduction of intermediate capacity buses (so called Higer buses) is a direct
consequence of this. The large capacity buses are appropriate on the main roads where
there is high demand. Standing passenger configuration for buses with long distance
routes is rather less comfortable. The high floors of Anbessa buses also result in access
difficulty particularly for the mobility impaired. The lateral seats of wuyeyit taxis are
another example of less comfortable and inappropriate transport service.
• Poor vehicle condition: The mechanical and passenger saloon conditions of public
transport vehicles in Addis Ababa are of poor quality. There is no preventive
maintenance culture in the industry and lack of sanctions against vehicles with poor
conditions has contributed for the continuation of this culture. The other reasons are lack
of spare parts for vehicles of older age, high price of spare parts, and constrained cash
flow.
• Inefficient operating procedures: The strict rotation of taxis at terminals enforced by
order attendants resulted in low priority toward passengers’ needs as they are not able to
choose a taxi with regard to its physical and mechanical conditions. The authorized fare
structure has its own share to the inefficient operating procedures as long distance trips
are broken into smaller ones for the sake of profit maximization by taxi drivers. Another
source of passenger inconveniency is the fill-and-run practice which forces them to walk
to the nearest taxi terminal even if another boarding point is more suitable for them. All
these factors resulted in prioritizing taxi owners’ interests rather than that of passengers’.
• Inefficient network design: The main reason for inefficient network design is the
authorized fair structure. The price for a route would only be changed when the route is
either extended or redesigned which promotes Anbessa to construct a complex network
with high degree of overlap. In the minibus sector, the authorized fair created a complex
network composed of short length routes derived by profit maximization.
14
In general, the causes for the afore mentioned problems of public transport in Addis Ababa are
attributed to the following points [5].
• Poor operating standards and lack of adequate enforcements
• Lack of profitability and investment
• Lack of skill base by individuals in the industry
• Violent and illegal behavior in the operating industry caused by market competition and
administrative corruption. However, the level of violence is very low compared to the
conditions in sub-Saharan Africa.
• Lack of economic regulation, network planning, and supporting institutions
• Inappropriate ownership structures and size as observed in single unit, semi-passive
ownership of taxis. Similarly, Anbessa is owned by the Federal Government while it is
more appropriate to be under the City Administration.
• Inadequate transport infrastructure due to poor road design and conditions, high level of
congestion (specially at peak hours), and lack of suitable stops
• Lack of empowerment of transport users
2.2 Route Planners
Transportation plays a crucial role in every society. It facilitates the economic and social
integration and development of a society. In fact, the level of transportation network of a country
can be taken as a measuring scale of its level of development. With this regard, developed
nations are characterized by high quality and quite complex transportation network with a wide
variety of options (private cars, buses, trains, etc) while developing nations have low quality and
simpler transportation networks with few options.
However, the development of transportation network comes with its own problems. Some of
these are: congestion, increased oil consumption which has economic and environmental
15
impacts, noise and air pollution, and land loss to roads. One way to alleviate these problems is to
encourage the use of public transport and make it more attractive [9].
To encourage the use of public transport, authorities in many cities take measures such as
banning the use of private cars on specific days or in specific parts of the city and restricting
some roads for exclusive use by public transport [6]. Another way of promoting the use of public
transport is making timing and transfer information available for the public.
In line with providing public transport information, in many large cities, real time arrival
information is available at major bus stops, rail stations, and major transit areas. However,
availing such displays at every stop is prohibitively expensive [10]. Therefore, it is important to
use other means of communication so that anyone can have the information anywhere. Public
transport route planners play a great role as such an alternative.
Before continuing with route planners, it is important to distinguish between two types of vehicle
location and navigation systems: route planners and route guidance systems [14]. Route planners
are used to identify a route between two locations prior to beginning the travel. Route guidance
systems, on the other hand, are real time guiding tools which guide drivers along the route while
driving. Route guidance systems can further be divided into two as centralized and decentralized.
In decentralized route guidance systems, vehicles use on board computers and static road maps
and apply heuristic algorithms to find the shortest path. In centralized route guidance systems, on
board computers are linked to traffic management centers which reply path queries. A server at a
traffic management center stores all shortest paths available at a given time (dynamic road
network map).
Many route planners are in use in many large cities. The increased number of route planners can
be considered as an evidence for their popularity. As there are many multi modal route planners
(route planners which take several types of transport options into consideration), there are also
specialized route planners such as route planners for pedestrians, for cyclists, and for buses.
Route planners can be deployed through a variety of channels [8, 10]. For example, a
commercial route planner called IPTIS (Integrated Public Transport Information System) [8]
comes in the form of:
16
• an application for standalone PC (IPTIS call center),
• a web site (IPTISNet),
• a web service with PDA interface (PocketIPTIS), and
• SMS accessible web service.
The main goal of route planners is identifying the optimal route from origin to destination under
a given set of route selection constraints [8]. Besides identifying the optimal route, some online
route planners provide extra information such as weather forecasts, traffic congestion level, and
road blockage information.
The optimality of a route is constrained by a number of criteria. For route selection, most route
planners have user interfaces which allow their users to set the route selection criteria while
some others use a predefined set of criteria hidden from users [11]. The basic criteria for route
selection are:
• number of transfers needed (maximum number of transfers tolerable)
• cost of transportation (cheapest), and
• time constraints (fastest, early arrival, late departure, minimum waiting time)
A route planner is expected to take into consideration at least these constraints [12]. Some other
route planners provide much refined route selection criteria like:
• which locations to include or exclude (via or not via specific stops)
• which mode of transportation to use or not to use
• walking time and distance to the next stop
• real time road congestions and blockades
• weather conditions
• consideration of scenic locations (specially for cyclists and pedestrians)
• safety level (specially for cyclists and pedestrians)

17
Taking all these constraints into consideration and allowing the user to set them makes the route
planner algorithm much complex. The user interface will also become much cluttered and less
usable. On top of the diverse optimization criteria selected by users, the existence of a number of
transportation means (buses, train, taxi, etc) and a number of transport operators in a region
makes the route planner algorithm even more complex [8]. The use of different charge rates by
different transport operators has its own impact on the complexity of the algorithm while
considering cost as a route selection criterion [13].
Nowadays, incorporating maps to route planners is becoming a common practice. Maps are
primarily used as supplementary output mechanisms by most route planners. The identified route
is described in words and then displayed on the map (possibly with a request by the user.) A few
route planners use maps for input as well [8, 12]. In such systems, the user can select the origin
and destination locations of a journey by clicking on the map. When a user clicks on the map, the
system automatically identifies nearby stops. Because using maps for input introduces
challenges, most route planners restrict user input in the form of text. Another limitation in using
maps for input purpose is that, maps may not contain enough details or scale to be useful to the
user. Moreover, some users may not be capable of identifying locations on maps easily.
The algorithms in commercially available journey planners can be grouped into two broad
categories [8]:
• Static (Pre-calculated) algorithms: pre-calculate and store all possible paths between any
two locations and filter the stored paths according to the given user preferences. Unless
all possible paths are obtained and stored, finding the best path under the given
constraints is not guaranteed. Since discovering all possible paths is very tedious
(especially for a large transport network) and needs large amount of storage, only a
fraction of them are stored. Routes constrained with different criteria are required to be
stored separately to allow users to select routes with different criteria.
• Dynamic algorithms: there is no need of preliminary work for calculating and storing
paths. The journey planner algorithm tries to identify the optimal path under the given
constraints at run time. The downside of these algorithms is that it would take longer time
to give response.
18
3. GRAPH THEORY AND ALGORITHMS
Route planners model transport networks using graph (also called network) data structure. Thus,
it is worthwhile to give explanation about graphs. Shortest path algorithms are applied on graph
models of transport networks to identify shortest paths between two locations. This section
therefore, discuses graphs, shortest path algorithms, and other algorithms particularly useful in
public transport route planners.
3.1 Graphs
Graph data structure is a computer representation of the graph theory in mathematics. In
mathematics, a graph is a collection of vertices and edges.
• Vertices: also called nodes, are collection of points.
• Edges: also called arcs, are a set of lines that connect vertices of a graph. Edges represent
the relationship among vertices.
Formally, a graph G is defined as G= (V, E); where:
V(G) is a finite, nonempty set of vertices and
E(G) is a set of edges, written as pairs of vertices.
For example, the set of vertices and edges of the graph G1 shown in Figure 1 are:
V(G1)={A, B, C, D, E}
E(G1)={(A, B), (A, C), (A, D), (B, C), (D, E)}
If a graph is used to represent a road transport network, the vertices of the graph are locations
such as bus stops and the edges are roads that connect these locations.
3.1.1 Types of graph
The term graph is a general term. There are a several types of graph differing in the number of
connectivity and the existence of direction on edges [7].
Undirected graph: A graph in which the edges have no direction. Figure 1 shows an undirected
graph. The order of vertices of an edge of an undirected graph is not important. The edges
of G1 can be written as:
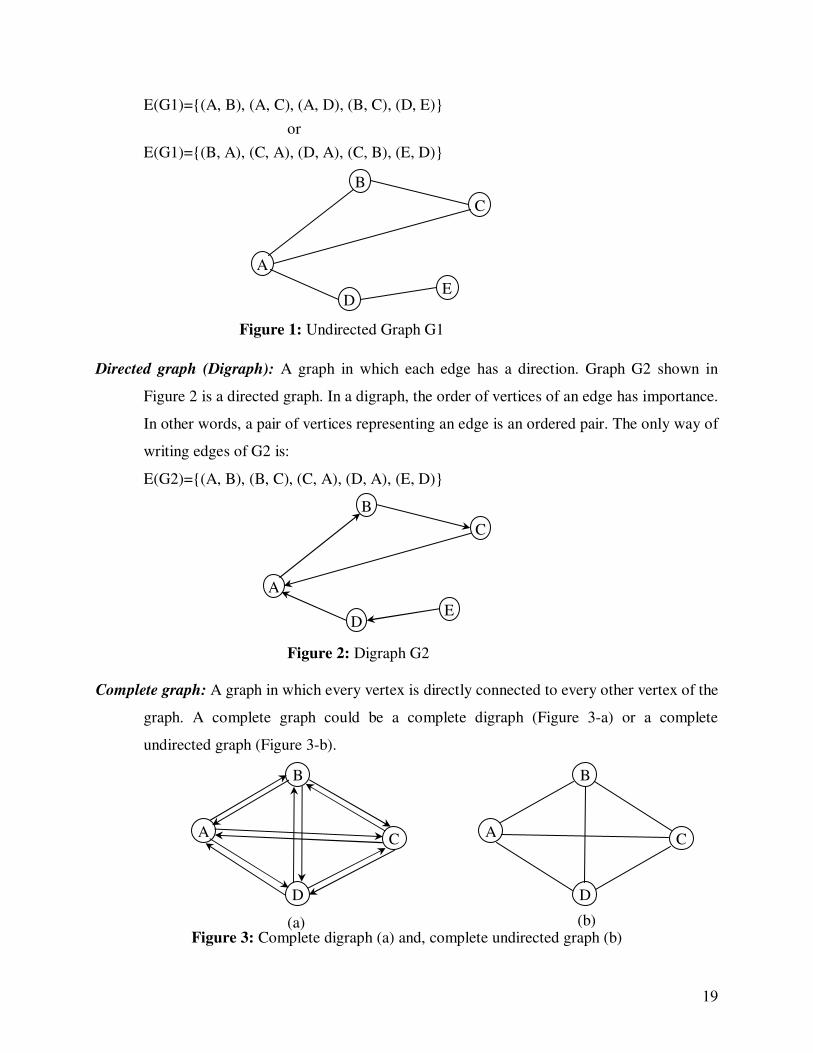
19
E(G1)={(A, B), (A, C), (A, D), (B, C), (D, E)}
or
E(G1)={(B, A), (C, A), (D, A), (C, B), (E, D)}
Figure 1: Undirected Graph G1
Directed graph (Digraph): A graph in which each edge has a direction. Graph G2 shown in
Figure 2 is a directed graph. In a digraph, the order of vertices of an edge has importance.
In other words, a pair of vertices representing an edge is an ordered pair. The only way of
writing edges of G2 is:
E(G2)={(A, B), (B, C), (C, A), (D, A), (E, D)}
Figure 2: Digraph G2
Complete graph: A graph in which every vertex is directly connected to every other vertex of the
graph. A complete graph could be a complete digraph (Figure 3-a) or a complete
undirected graph (Figure 3-b).
Figure 3: Complete digraph (a) and, complete undirected graph (b)
A
B
D E
C
A
B
D
C A
B
D
C
(a) (b)
A
B
D E
C
20
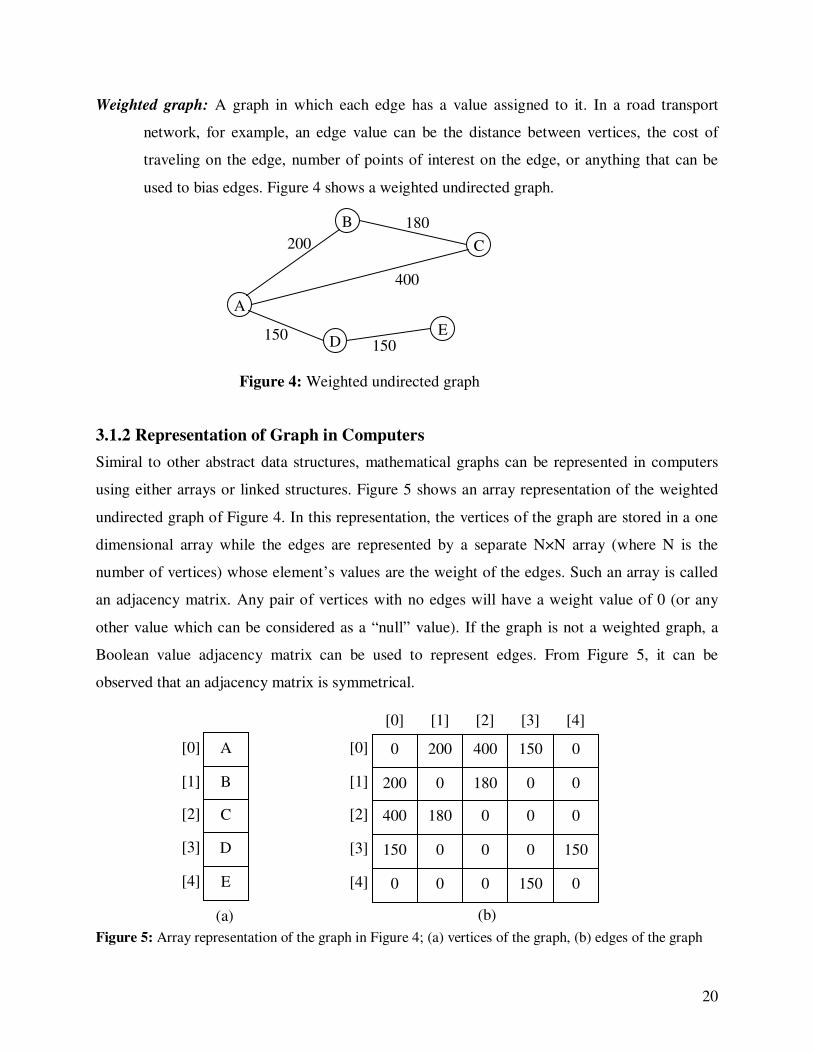
Weighted graph: A graph in which each edge has a value assigned to it. In a road transport
network, for example, an edge value can be the distance between vertices, the cost of
traveling on the edge, number of points of interest on the edge, or anything that can be
used to bias edges. Figure 4 shows a weighted undirected graph.
Figure 4: Weighted undirected graph
3.1.2 Representation of Graph in Computers
Simiral to other abstract data structures, mathematical graphs can be represented in computers
using either arrays or linked structures. Figure 5 shows an array representation of the weighted
undirected graph of Figure 4. In this representation, the vertices of the graph are stored in a one
dimensional array while the edges are represented by a separate N×N array (where N is the
number of vertices) whose element’s values are the weight of the edges. Such an array is called
an adjacency matrix. Any pair of vertices with no edges will have a weight value of 0 (or any
other value which can be considered as a “null” value). If the graph is not a weighted graph, a
Boolean value adjacency matrix can be used to represent edges. From Figure 5, it can be
observed that an adjacency matrix is symmetrical.
Figure 5: Array representation of the graph in Figure 4; (a) vertices of the graph, (b) edges of the graph
200
180
150 150
400
A
B
D E
C
0
200
0
400
150
200
0
0
180
0
400
180
0
0
0
150
0
150
0
0
0
0
0
0
150
[0]
[1]
[4]
[2]
[3]
[0] [1] [2] [3] [4]
(b) (a)
A
B
E
C
D
[0]
[1]
[4]
[2]
[3]
21
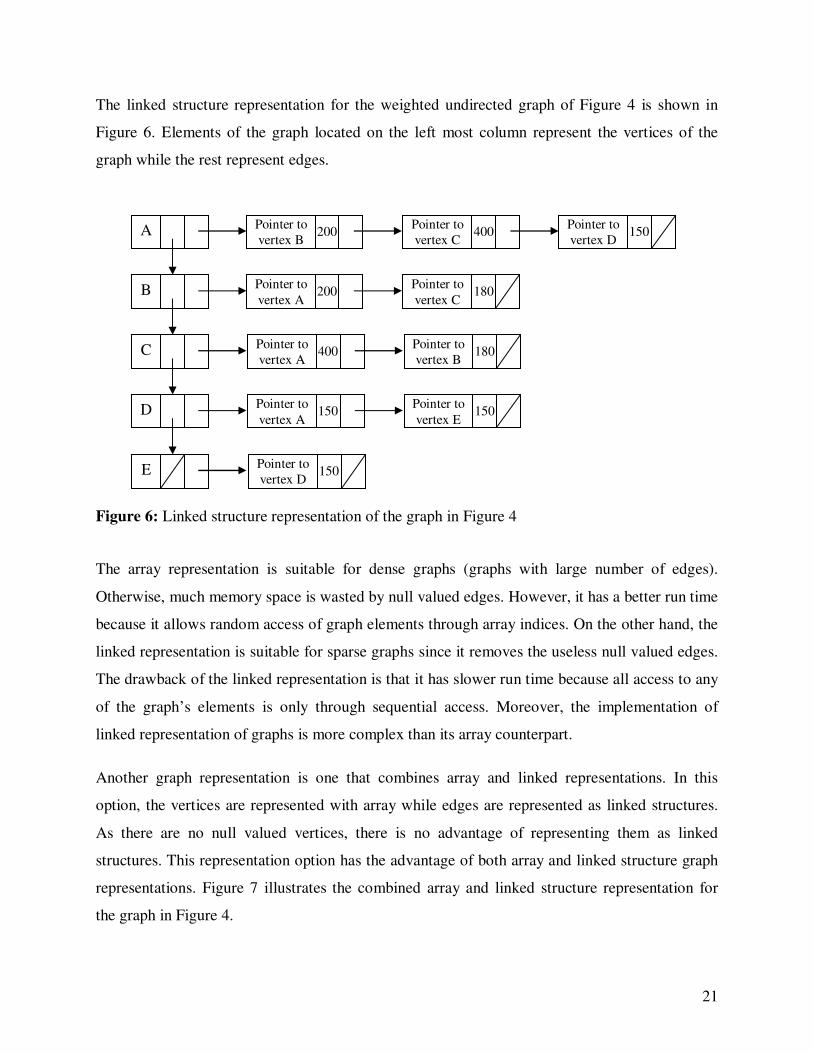
The linked structure representation for the weighted undirected graph of Figure 4 is shown in
Figure 6. Elements of the graph located on the left most column represent the vertices of the
graph while the rest represent edges.
Figure 6: Linked structure representation of the graph in Figure 4
The array representation is suitable for dense graphs (graphs with large number of edges).
Otherwise, much memory space is wasted by null valued edges. However, it has a better run time
because it allows random access of graph elements through array indices. On the other hand, the
linked representation is suitable for sparse graphs since it removes the useless null valued edges.
The drawback of the linked representation is that it has slower run time because all access to any
of the graph’s elements is only through sequential access. Moreover, the implementation of
linked representation of graphs is more complex than its array counterpart.
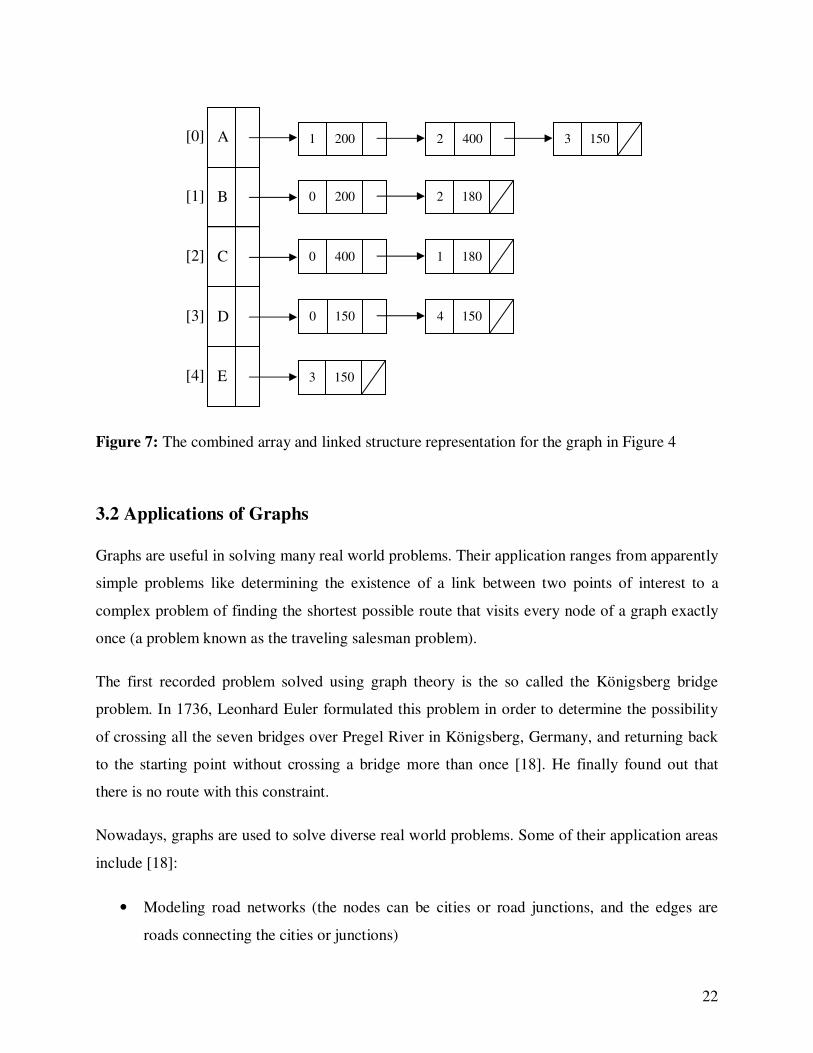
Another graph representation is one that combines array and linked representations. In this
option, the vertices are represented with array while edges are represented as linked structures.
As there are no null valued vertices, there is no advantage of representing them as linked
structures. This representation option has the advantage of both array and linked structure graph
representations. Figure 7 illustrates the combined array and linked structure representation for
the graph in Figure 4.
A
E
B
C
D
Pointer to
vertex B 200 Pointer to
vertex C 400 Pointer to
vertex D 150
Pointer to
vertex A 200 Pointer to
vertex C 180
Pointer to
vertex A 400 Pointer to
vertex B 180
Pointer to
vertex A 150 Pointer to
vertex E 150
Pointer to
vertex D 150
22
Figure 7: The combined array and linked structure representation for the graph in Figure 4
3.2 Applications of Graphs
Graphs are useful in solving many real world problems. Their application ranges from apparently
simple problems like determining the existence of a link between two points of interest to a
complex problem of finding the shortest possible route that visits every node of a graph exactly
once (a problem known as the traveling salesman problem).
The first recorded problem solved using graph theory is the so called the Königsberg bridge
problem. In 1736, Leonhard Euler formulated this problem in order to determine the possibility
of crossing all the seven bridges over Pregel River in Königsberg, Germany, and returning back
to the starting point without crossing a bridge more than once [18]. He finally found out that
there is no route with this constraint.
Nowadays, graphs are used to solve diverse real world problems. Some of their application areas
include [18]:
• Modeling road networks (the nodes can be cities or road junctions, and the edges are
roads connecting the cities or junctions)
[0] A
[1] B
[2] C
[3] D
[4] E
1 200 3 150 2 400
0 200 2 180
0 400 1 180
0 150 4 150
3 150
23
• Designing least cost model in telecommunication systems
• To optimize routing algorithms, in computer networks
• Determining the least cost model in pipeline construction
• Modeling fiscal flow
• Identifying the shortest path in a road network for automobile drivers (route guidance
systems)
• Identifying optimal paths for public transport users (route planners)
• Computer games
• Designing integrated circuit chips
3.3 Graph Based Algorithms
Since Dijkstra published his famous paper on graphs in 1959, a large number of algorithms have
been devised [14]. Even some of these algorithms have a large number of alternatives. Some of
the major algorithms which are used to find the shortest path in a graph and those which are
specifically designed for public transport are summarized below.
3.3.1 Shortest Path Algorithms
Shortest path problem is the most extensively studied problem in operations research. These are
particularly useful on analysis of transport network related problems. The shortest path problems
can be categorized as one-to-one, one-to-some, one-to-all, all-to-one, and all-to-all shortest paths
depending on the number of nodes used as source and target [14]. There is another category of
shortest path algorithms known as K-shortest path (KSP) algorithms which find the first, second,
third, …, the kth shortest path between two nodes. Their argument is that, it is better to have other
alternative shortest paths if the better shortest paths could not be available.
All graph algorithms are characterized by large memory space requirement and larger run time
complexity. In general, the performance of the algorithms is affected by:
• the sparseness of the graph
24
• the representation of the graph data structure, and
• the presence of edge weights and their use
Dijkstra’s Algorithm: Devised by the Dutch computer scientist Edsger Dijkstra in 1959, the
algorithm computes the shortest paths from a node to every other node in a graph with
nonnegative edge costs (one-to-all problem). The output of the algorithm is a shortest path
spanning tree. This algorithm can be modified and used for one-to-one shortest path problems.
Dijkstra’s algorithm is typically used as a benchmark to compare the performance of other
shortest path algorithms [14].
A* Algorithm: Dijkstra’s algorithm searches a large area around the source node. A* reduces the
search space to the box that bounds the origin and destination nodes [16]. The reduction is due to
the fact that A* decides the next node on the path by heuristically checking it is the nearest to the
destination. The node selection function [19] (the cost of moving to a node) is
f(x)=g(x)+h(x); where
g(x) is the cost from the source to the current node, and
h(x) is the heuristic estimate of the cost from the current node to the destination
Since the algorithm takes the remaining cost to reach the destination into account, it is
considered as an informed search algorithm. For the reason that it also takes the already incurred
cost, it differs from greedy best-first search. A* is a widely used one-to-one shortest path
algorithm and has variants [14].
Kruskal’s Algorithm: Kruskal’s algorithm works with undirected graphs [18]. It starts with N
nodes and iteratively adds the shortest link between two of the nodes that would not form a
cycle. The iterative selection of shortest link stops when N-1 links are identified. When the
algorithm stops, the shortest spanning tree of a node on the graph is identified. Kruskal’s
algorithm is a one-to-all shortest path algorithm.
Bellman-Ford Algorithm: This algorithm calculates the shortest path on a directed weighted
graph in which negative edge weights are allowed. When used on graphs with nonnegative
vertices, the algorithm is similar to that of Dijkstra’s. It is primarily used on graphs with negative
edge weights [20].
25
Breadth-First Search (BFS) and Depth-First Search (DFS) Algorithms: BFS starts with a
node and searches all nodes one-link-away from the sources and then all two-links-away nodes
and so on until the destination is reached. On the other hand, DFS starts with a node and works
as deep as possible along one branch and then backtracks until the destination is reached. Both
BFS and DFS are considered as special cases of A*. The A* algorithm is implemented using
priority queue. When the A* algorithm is implemented using FIFO queue on an unweighted
graph, it works as BFS. Similarly, when implemented with LIFO stack on an unweighted graph,
A* behaves like a DFS.
There are numerous shortest path algorithms proposed over the course of time and, in fact, it is
not possible to enumerate them all. Nevertheless, Dijkstra’s and A* algorithms are the most
widely used [14].
3.2.2 Path Identification Algorithms for Public Transport Networks
Identifying the optimal route in public transport in a road network is not the same as identifying
the shortest driving path [6]. A public transport route planner should consider the route constraint
of public transport systems. A public transport service, for example a bus, does not necessarily
follow the shortest driving path between two locations and the passengers cannot order the driver
to change route.
Although, the so called “standard” shortest path algorithms described above and their variants
are widely used on graphs, they have limitations when used on public transport. One of their
limitations is that they do not take the dynamic nature of the public transport systems with regard
to time constraint. Most public transport systems work according to a well defined schedule.
Another limitation is that they do not provide a simple mechanism to identify the route with less
number of transfers. The number of transfers has an effect on the cost and time of a trip and thus
passengers prefer a path with less number of transfers even if it is not the shortest path [6]. They
also assume that one can travel on any of the available edges. This assumption is not true for
public transports since there is restriction on their routes. With these motivations, other search
algorithms are devised.
Liu et al. present a technique that identifies the number of direct ways one can travel from one
point to another by using adjacency matrices [6]. Using this technique, it is possible to identify
26
the number of alternative direct routes to travel between any two given locations. Liu et al.
present another technique that can be used to identify the number of possibilities one can transfer
from one service route to another by using connectivity matrices. Both of these techniques use
matrix multiplication and are implemented on the service route level, such as a bus service
number, rather than on stop level.
Another strategy proposed by Liu et al. to identify the possibility of transfer from one service
route to another is through the use of transfer hubs. A transfer hub is a location (node) in the
public transport network at which a large number of service routes concentrate. Typically, hubs
are business centers or junctions of many roads. Since such locations are common in any
transport network, this strategy tries to take advantage of them. When using this strategy, the
transport network is divided up into two layers, one layer contains only the hubs and the other
layer contains all the nodes.
Other algorithms are also available which tries to consider the working hours of institutions like
banks and museums so that users can plan their trips in conjunction with working hours [15].
27
4. SYSTEM REQUIREMENTS ANALYSIS
4.1 Functional Requirements
Route planners are expected to provide the user a means to input the origin and destination of the
trip. The route planner finds the optimal path for the requested origin-destination pair according
to some path selection criteria and displays the output.
The primary input and output of route planners is in the form of text. If map is used, it is used as
a supplementary output mechanism and, on some systems, for input. When using text input, the
main problem is that the user may not know the exact name of the origin and/or destination or
they misspelled the name of the location. Hence, it is better to aid the user to identify origin and
destination with pull down menus [12]. The location names could be names of streets,
institutions, neighborhoods (localities), landmarks, etc.
In PTRPAA (Public Transport Route Planner for Addis Ababa), the user is allowed to enter the
origin and destination names with the help of pull down menus. Since the main location
identification system in Addis Ababa is neighborhood names, these names are used to identify
origin and destination. The output is displayed in textual form. Because a suitable digital map of
Addis Ababa is not available, it is not possible to use map to display the selected route. In reality,
this will not create a major problem to users because maps are used only to provide
supplementary information which has no aim other than creating a visual effect.
Regarding the route selection criteria, particularly in public transport route planners, the basic
criteria are time (schedule), cost of transportation, and number of transfers. Even though city
buses in Addis Ababa have timetables, it is more convenient to ignore them because the
schedules are not well followed and thus it could give misleading information to the user.
Moreover, taxis do not have any schedule at all and also can be considered readily available with
respect to time. Therefore, the main route selection criterion in this project is number of
transfers.
28
The selection of number-of-transfers as the route selection criteria is due to the following
practical conditions of public transport in Addis Ababa.
• It directly affects the fare factor. The cost of traveling on buses may become more than
double if one uses two buses instead of one for the same length of ride. Similarly, the cost
of traveling on minibuses increases with increasing number of transfers as the charge is
based on kilometer ranges rather than exact kilometer runs. This is the main reason for
taxi drivers to partition routes into smaller segments to collect extra charge.
• The chance of reducing travel time by increasing the number of bus transfers in minimal
as service frequency of buses is low. The same is true for taxi service as there is long
waiting time to get taxi at peak hours and due to the fill-and-run working principle at off
peak hours.
• Due to lack of adequate shortcut roads and as the public transport is limited to the main
corridors of the city, it is unlikely to decrease the kilometer run of a trip by increasing
transfers. Moreover, most public transport routes in Addis Ababa interconnect locations
on more or less direct paths.
• Since public transport service routes of Addis Ababa have high degree of overlap, it is
possible to get a number of alternative direct service routes with buses and, especially on
short distance trips, using taxis.
• Increasing transfers also affects the comfort of passengers particularly if they carry
luggage, or they have disabilities, and for the elderly. For this reason, it is the main
criteria of public transport users to select transport services.
Another issue to consider is the type of public transport service users want to use. In this project,
the user is allowed to select service options of bus or taxi. Due to the unavailability of midi bus
route data, they are excluded from the system.
It is known that, because of the current fluctuation of global oil price, the Ethiopian Government
conducts regular public transport tariff revision. In line with this, the system is required to allow
users to update the tariff whenever necessary.
29
In short, the system has the following functional requirements.
• Allow users to enter origin and destination locations for a trip with the help of pull down
menus.
• Select and display a route (routes) with the minimum amount of transfers. If alternative
routes with the same number of transfers are available, they will be ranked and displayed
in increasing order of cost.
• Users are allowed to select the type of public transport service to use as bus or taxi.
• Allow users to update the public transport tariff whenever there is a change.
• Enable the user to view the route for a given bus service number.
• Enable the user to view the public transport tariff for a selected transport service type.
4.2 Nonfunctional Requirements
Run time and memory requirement: Algorithms with graph data structures like route planners
are known for their higher run time complexity and memory requirements. Therefore, the system
is required to minimize memory requirements and should have fast response time.
Usability: The system should be easy to use with minimum user interaction. The help provided
to the user in entering the origin and destination would increase the usability of the system.
Availability: The system is required to be available to the user whenever necessary.
30
4.3 System Models
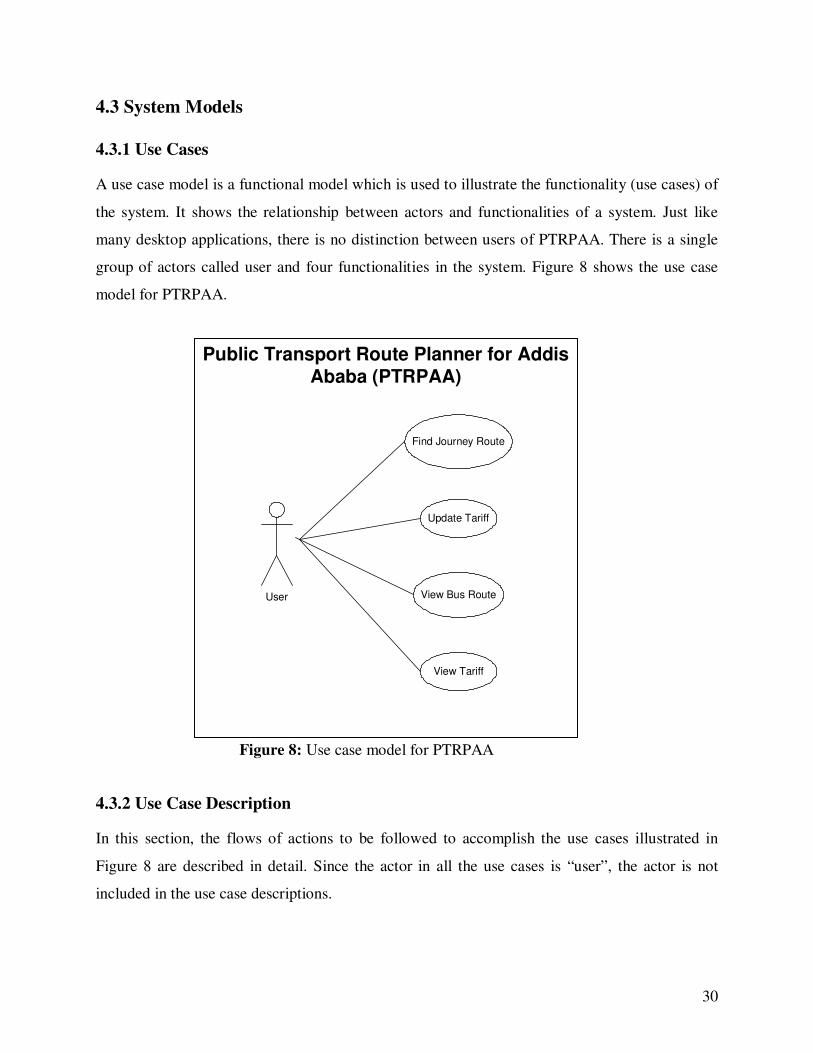
4.3.1 Use Cases
A use case model is a functional model which is used to illustrate the functionality (use cases) of
the system. It shows the relationship between actors and functionalities of a system. Just like
many desktop applications, there is no distinction between users of PTRPAA. There is a single
group of actors called user and four functionalities in the system. Figure 8 shows the use case
model for PTRPAA.
Figure 8: Use case model for PTRPAA
4.3.2 Use Case Description
In this section, the flows of actions to be followed to accomplish the use cases illustrated in
Figure 8 are described in detail. Since the actor in all the use cases is “user”, the actor is not
included in the use case descriptions.
Public Transport Route Planner for Addis Ababa (PTRPAA)
User
Find Journey Route
Update Tariff
View Bus Route
View Tariff
31
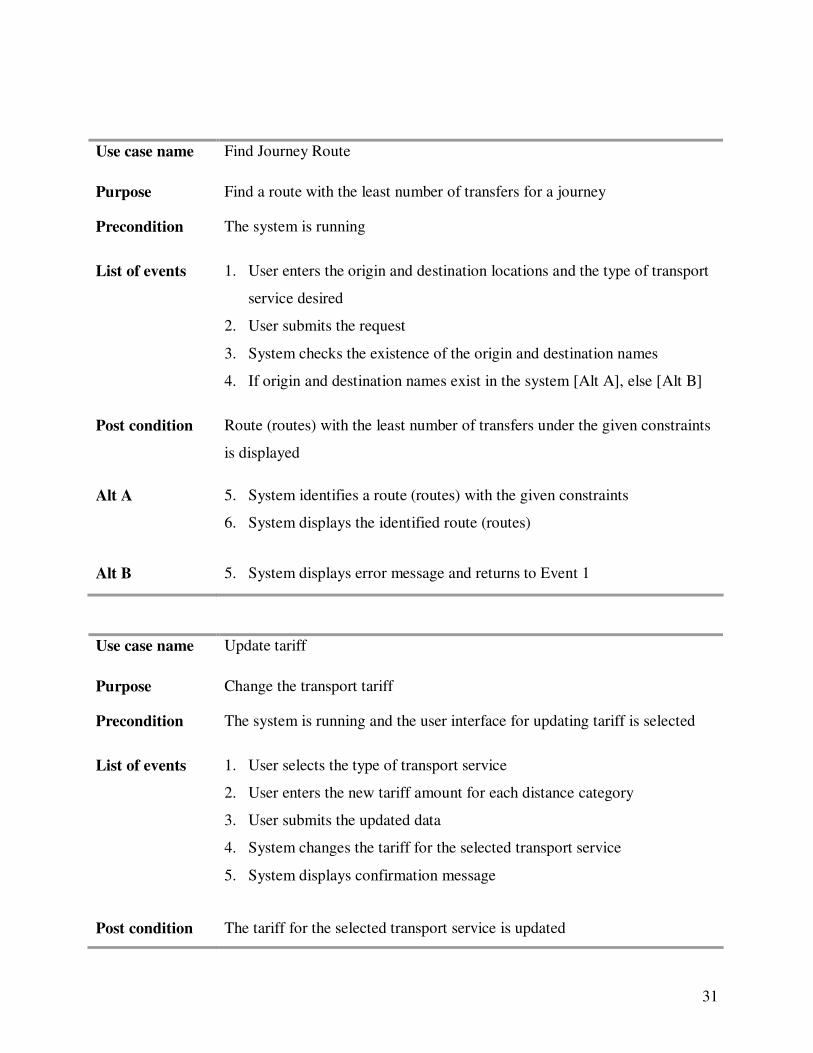
Use case name Find Journey Route
Purpose Find a route with the least number of transfers for a journey
Precondition The system is running
List of events 1. User enters the origin and destination locations and the type of transport
service desired
2. User submits the request
3. System checks the existence of the origin and destination names
4. If origin and destination names exist in the system [Alt A], else [Alt B]
Post condition Route (routes) with the least number of transfers under the given constraints
is displayed
Alt A 5. System identifies a route (routes) with the given constraints
6. System displays the identified route (routes)
Alt B 5. System displays error message and returns to Event 1
Use case name Update tariff
Purpose Change the transport tariff
Precondition The system is running and the user interface for updating tariff is selected
List of events 1. User selects the type of transport service
2. User enters the new tariff amount for each distance category
3. User submits the updated data
4. System changes the tariff for the selected transport service
5. System displays confirmation message
Post condition The tariff for the selected transport service is updated
32
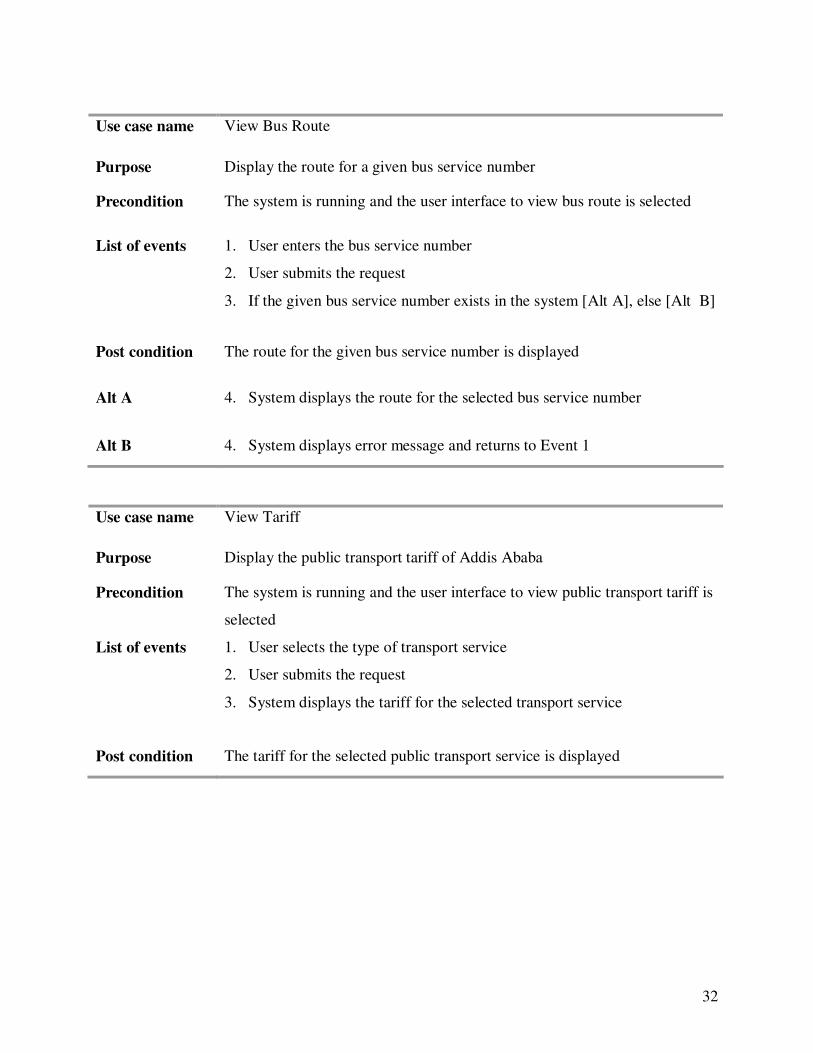
Use case name View Bus Route
Purpose Display the route for a given bus service number
Precondition The system is running and the user interface to view bus route is selected
List of events 1. User enters the bus service number
2. User submits the request
3. If the given bus service number exists in the system [Alt A], else [Alt B]
Post condition The route for the given bus service number is displayed
Alt A 4. System displays the route for the selected bus service number
Alt B 4. System displays error message and returns to Event 1
Use case name View Tariff
Purpose Display the public transport tariff of Addis Ababa
Precondition The system is running and the user interface to view public transport tariff is
selected
List of events 1. User selects the type of transport service
2. User submits the request
3. System displays the tariff for the selected transport service
Post condition The tariff for the selected public transport service is displayed
33
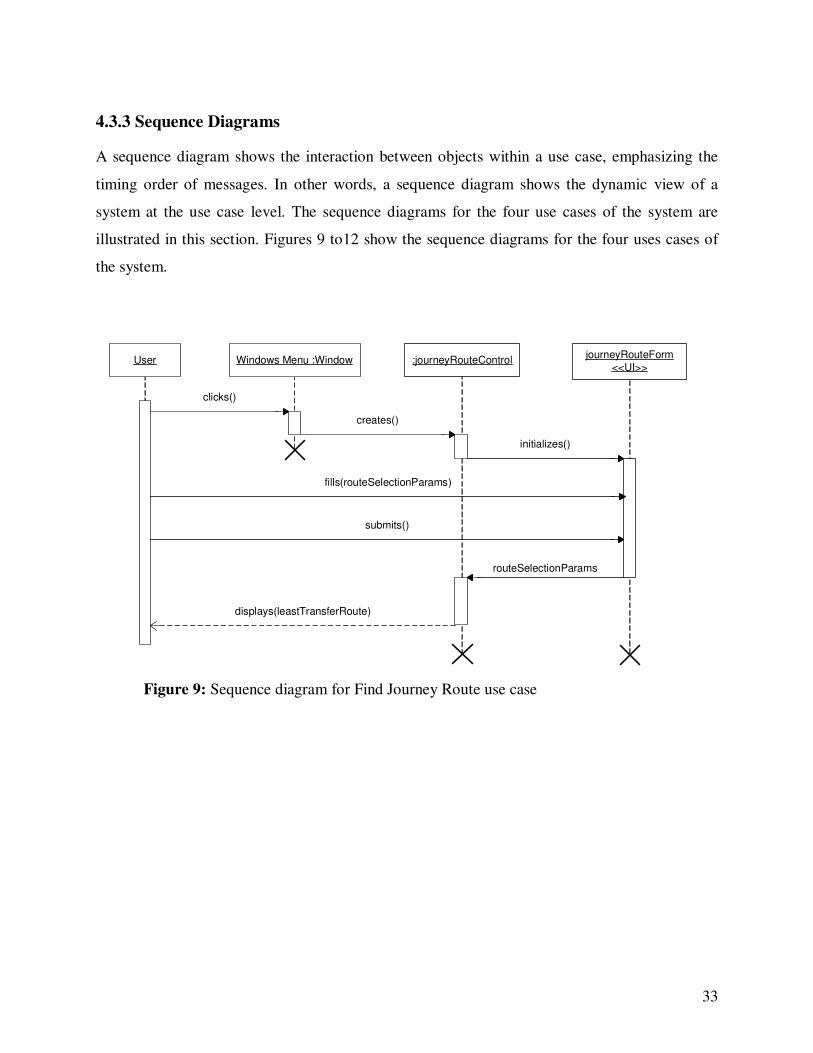
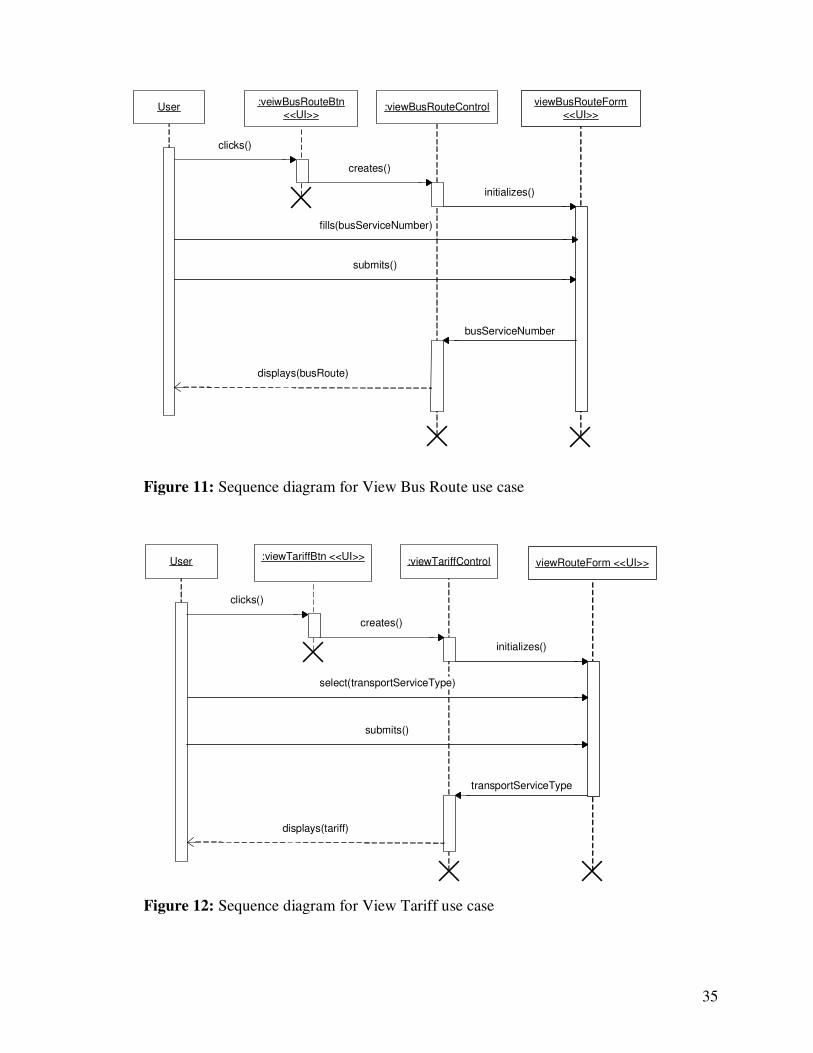
4.3.3 Sequence Diagrams
A sequence diagram shows the interaction between objects within a use case, emphasizing the
timing order of messages. In other words, a sequence diagram shows the dynamic view of a
system at the use case level. The sequence diagrams for the four use cases of the system are
illustrated in this section. Figures 9 to12 show the sequence diagrams for the four uses cases of
the system.
Figure 9: Sequence diagram for Find Journey Route use case
User Windows Menu :Window :journeyRouteControljourneyRouteForm
<<UI>>
clicks()
creates()
initializes()
fills(routeSelectionParams)
submits()
routeSelectionParams
displays(leastTransferRoute)
34
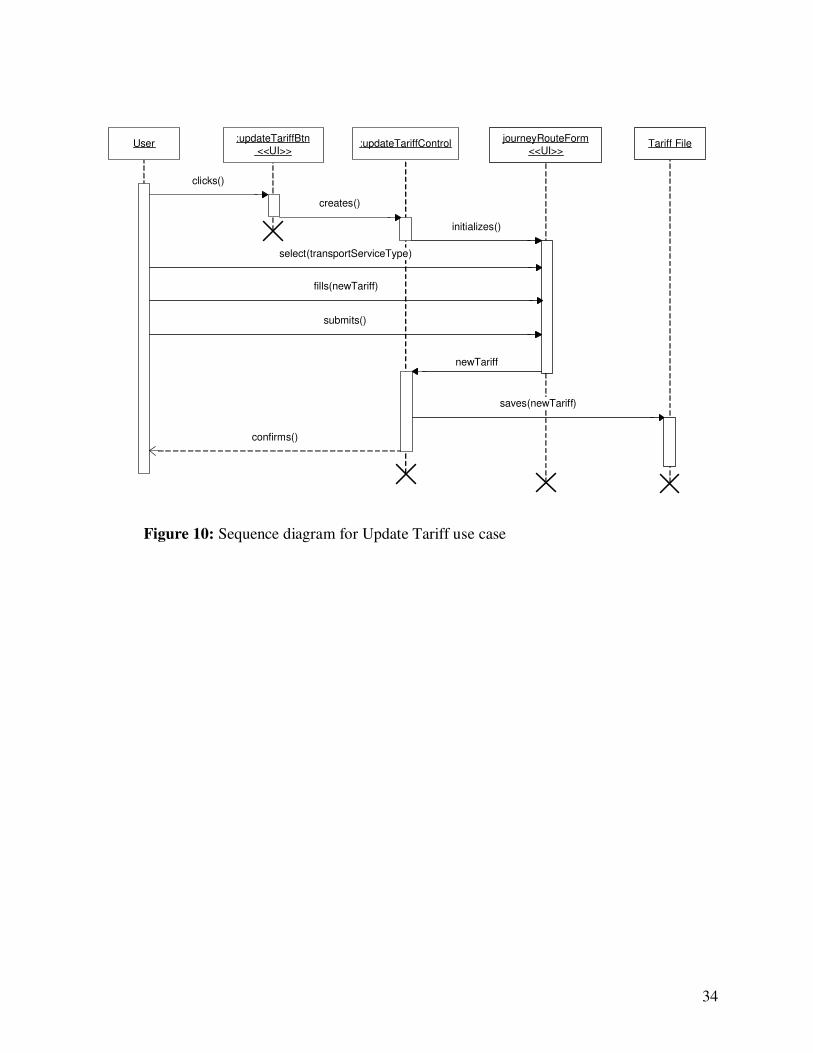
Figure 10: Sequence diagram for Update Tariff use case
User:updateTariffBtn
<<UI>>:updateTariffControl
journeyRouteForm <<UI>>
clicks()
creates()
initializes()
fills(newTariff)
submits()
newTariff
Tariff File
saves(newTariff)
confirms()
select(transportServiceType)
35
Figure 11: Sequence diagram for View Bus Route use case
Figure 12: Sequence diagram for View Tariff use case
User :viewTariffBtn <<UI>> :viewTariffControl viewRouteForm <<UI>>
clicks()
creates()
initializes()
submits()
transportServiceType
displays(tariff)
select(transportServiceType)
User :veiwBusRouteBtn <<UI>>
:viewBusRouteControl viewBusRouteForm <<UI>>
clicks()
creates()
initializes()
fills(busServiceNumber)
submits()
busServiceNumber
displays(busRoute)
36
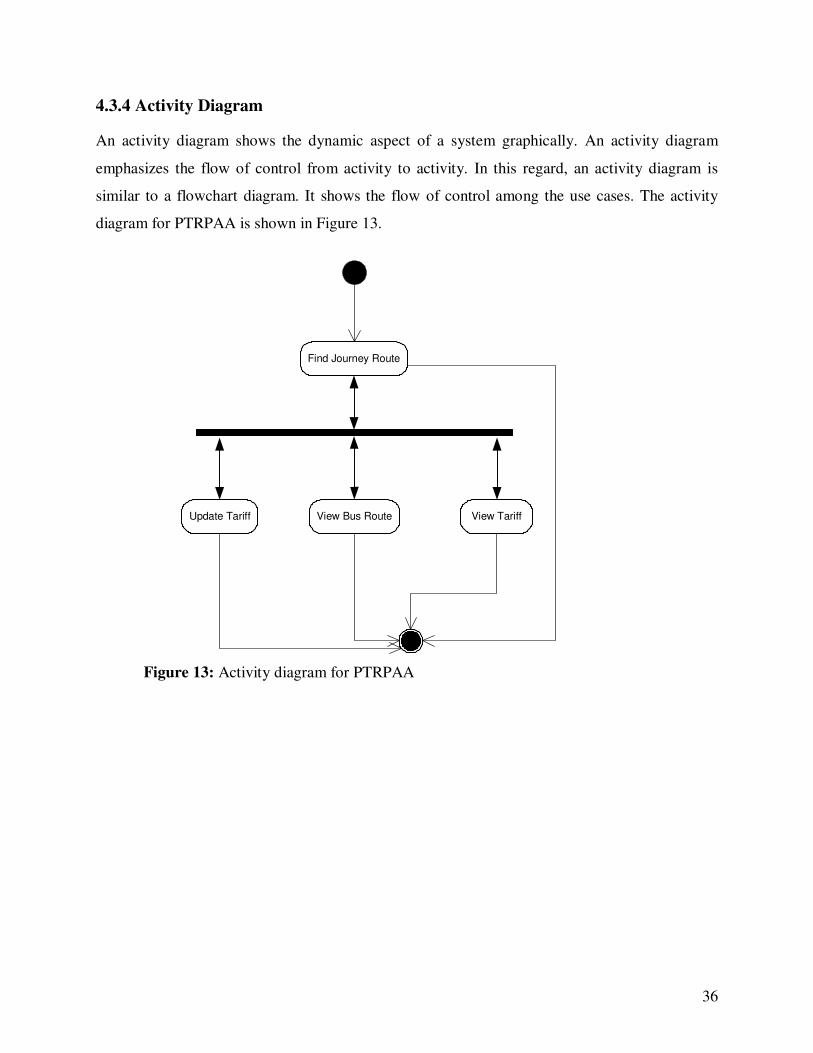
4.3.4 Activity Diagram
An activity diagram shows the dynamic aspect of a system graphically. An activity diagram
emphasizes the flow of control from activity to activity. In this regard, an activity diagram is
similar to a flowchart diagram. It shows the flow of control among the use cases. The activity
diagram for PTRPAA is shown in Figure 13.
Figure 13: Activity diagram for PTRPAA
Find Journey Route
Update Tariff View Bus Route View Tariff
37
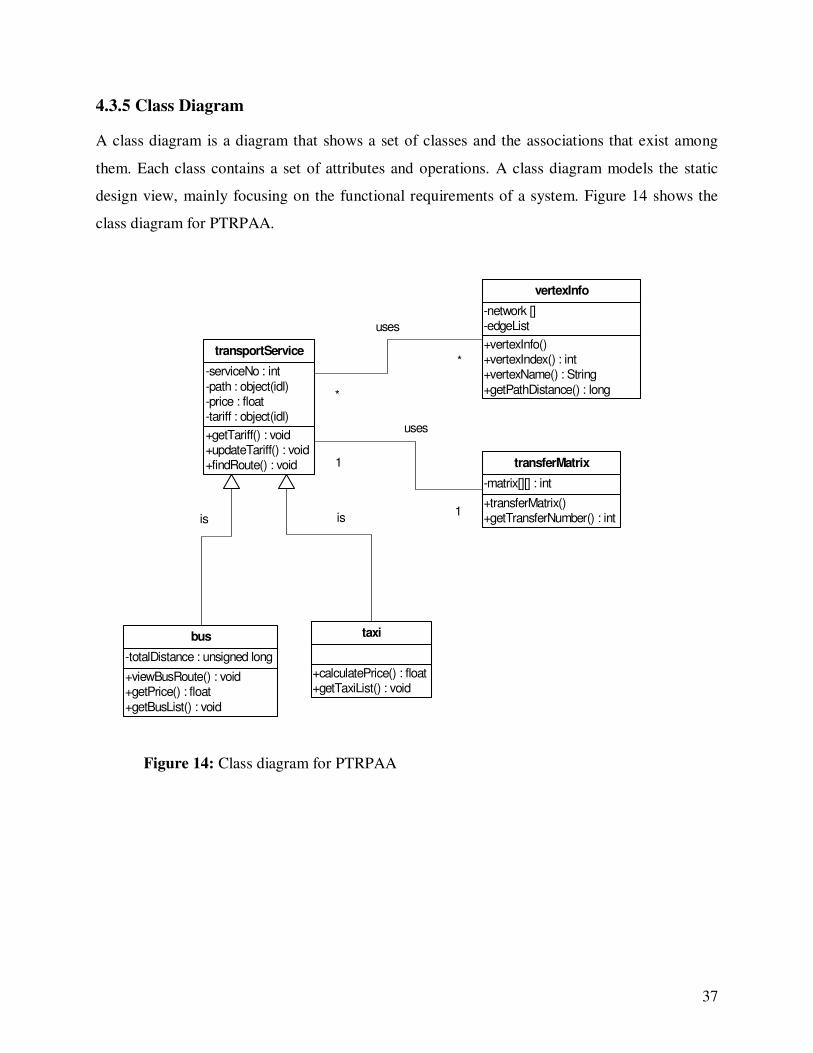
4.3.5 Class Diagram
A class diagram is a diagram that shows a set of classes and the associations that exist among
them. Each class contains a set of attributes and operations. A class diagram models the static
design view, mainly focusing on the functional requirements of a system. Figure 14 shows the
class diagram for PTRPAA.
Figure 14: Class diagram for PTRPAA
+vertexInfo()+vertexIndex() : int+vertexName() : String
+getPathDistance() : long
-network []-edgeList
vertexInfo
+getTariff() : void+updateTariff() : void+findRoute() : void
-serviceNo : int
-path : object(idl)-price : float-tariff : object(idl)
transportService
+viewBusRoute() : void+getPrice() : float
+getBusList() : void
-totalDistance : unsigned long
bus
+calculatePrice() : float+getTaxiList() : void
taxi
is is
*
*
uses
+transferMatrix()+getTransferNumber() : int
-matrix[][] : int
transferMatrix1
1
uses
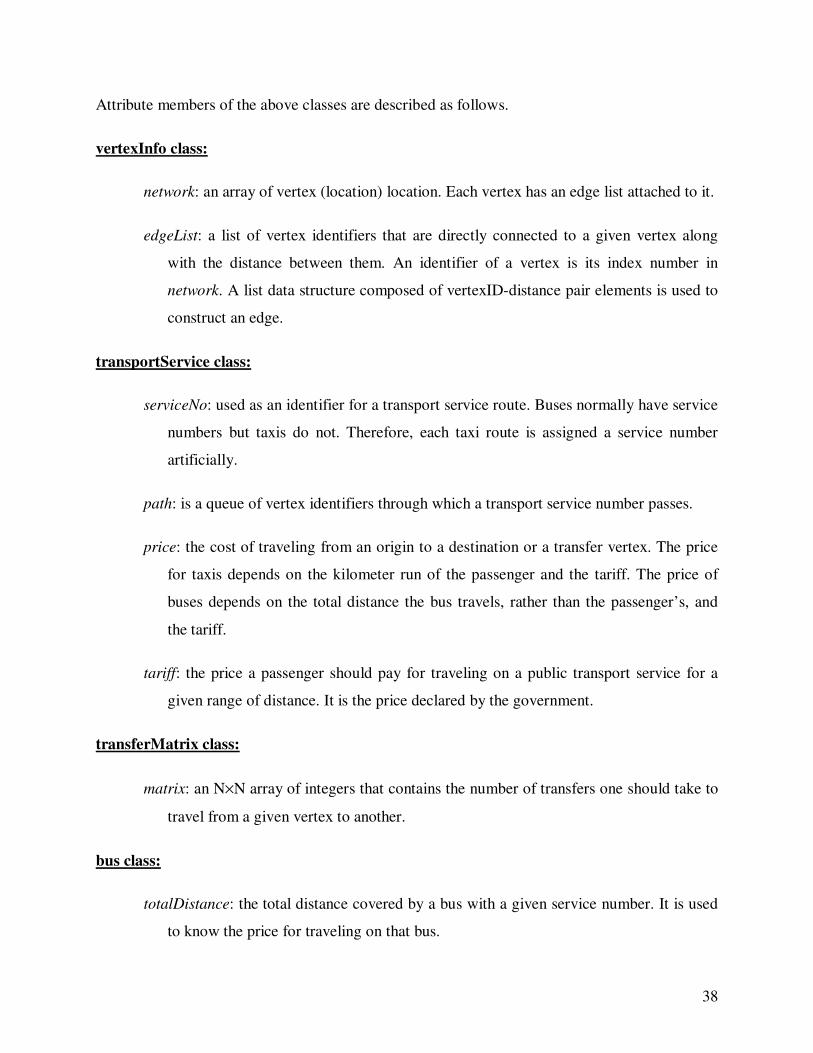
38
Attribute members of the above classes are described as follows.
vertexInfo class:
network: an array of vertex (location) location. Each vertex has an edge list attached to it.
edgeList: a list of vertex identifiers that are directly connected to a given vertex along
with the distance between them. An identifier of a vertex is its index number in
network. A list data structure composed of vertexID-distance pair elements is used to
construct an edge.
transportService class:
serviceNo: used as an identifier for a transport service route. Buses normally have service
numbers but taxis do not. Therefore, each taxi route is assigned a service number
artificially.
path: is a queue of vertex identifiers through which a transport service number passes.
price: the cost of traveling from an origin to a destination or a transfer vertex. The price
for taxis depends on the kilometer run of the passenger and the tariff. The price of
buses depends on the total distance the bus travels, rather than the passenger’s, and
the tariff.
tariff: the price a passenger should pay for traveling on a public transport service for a
given range of distance. It is the price declared by the government.
transferMatrix class:
matrix: an N×N array of integers that contains the number of transfers one should take to
travel from a given vertex to another.
bus class:
totalDistance: the total distance covered by a bus with a given service number. It is used
to know the price for traveling on that bus.
39
5. SYSTEM DESIGN
The requirements analysis model focuses on the functional requirements of the system and is
from the users’ point of view. System design, on the other hand, shows the internal details of the
system. It is the first step from the problem domain to the solution domain.
5.1 Design Goals
The goals of a system describe the issues the system focuses on. They arise from the
nonfunctional requirements of the system described earlier.
Response time: The response time of PTRPAA is required to be fast enough to give response for
user’s requests. Since algorithms for route planners are characterized by higher run time
complexity which affects the response time, it is important to have an efficient algorithm. In fact,
response time is one of the criteria used by users to select a system from a set of alternatives.
Memory: The memory requirement of route planner systems is usually high. To minimize the
memory usage of PTRPAA, dynamic memory allocation and de-allocation is used and objects
which are no more important are removed from the system. However, there should be a
compromise between memory usage minimization and memory usage to improve response time.
Robustness: Any system should be able to revive from possible errors. One source of errors is
user input. Therefore, the system’s user interface should be designed in a way that could
minimize user input errors.
Reliability: PTRPAA is required to be reliable so that users get the appropriate and correct
answers.
Availability: A route planner is expected to be available at any time. In line with this, PTRPAA
required to be available at any time.
Usability: PTRPAA is required to be easy to use. The user interface is designed in such a way
that it is simple to users to input their request. The user interface elements are labeled to help
users to easily identify and use them.
40
5.2 Persistent Data Management
The PTRPAA system consists of data that need to remain intact even after the program stops
running. Among the alternative mechanisms to store data, flat file system is selected for this
system. Flat file systems are suitable for PTRPAA for the following reasons.
• The data in the system are unstructured. For example, the number of edges for a vertex
can be only one while there can be more than five for another vertex. Similarly, the
number of vertices a bus or taxi may pass trough varies from one bus/taxi service route to
another. Therefore, it is better to store the data in flat files rather than in a database which
stores structured data.
• The operations with regard to the persistent data in the system are mostly reading which
do not involve complex queries as in report generation. Therefore, there is no need for a
database management system.
• The write operation of the system is limited to tariff records, all the rest are read-only
operations. Since the number of tariff records is very few and a write operation normally
affects all the records, it is possible to overwrite the whole file. Thus, a database is not
necessary for record selection.
There are a number of files created for the system. These files can be broadly categorized into
four as vertex-edge record, transport route record, tariff record, and number-of-transfers record
files. For the sake of optimization, files that adjoin records in two files (similar to tables of a
database which link up two tables in a many-to-many relationship) are required to be created and
used. The files in the system are:
• Vertices file: contains the vertex name along with their neighboring vertices (edges) and
distances between the vertex and each of its neighbors. The records are sorted in
ascending order of vertex name.
• Bus route file: stores the bus service numbers and the route (sequence of vertices) for
each bus. The records are sorted in ascending order of bus service number.
41
• Taxi route file: stores taxi route identifier numbers along with the route for each of them.
The records are stored in ascending order of taxi route identifier numbers.
• Vertex-Bus file: contains the bus service numbers passing through a given vertex. The
records are sorted in ascending order of vertex names. This table serves as a link
between the vertices and bus files whose records have many-to-many relationship. Thus,
the vertices file and the bus file are equivalent to tables in many-to-many relationship of
a relational database and the vertex-bus file is analogous to a table with one-to-many
relationship with both tables to link them.
• Vertex-Taxi file: contains vertex names along with route identifiers of taxis which pass
through them. The records are sorted in ascending order of vertex names. This file is
used as a link between the vertices file and the taxi file.
• Bus tariff file: contains the kilometer range along with the respective tariff for Anbessa
city buses.
• Taxi tariff file: contains the kilometer range along with the respective tariff for minibus
taxis in Addis Ababa.
• Transfer file: stores the number of transfers needed to move from a given origin vertex to
a destination vertex on a transport service. The information in this file can be viewed as a
two dimensional array of numbers where each number shows the number of buses/taxis
one should take when traveling between two vertices. The vertices are represented by
their index instead of their names. Their names can be referred from the vertices file
whenever necessary. More on the use of transfer values is presented in the next sub
sections.
• Special vertices file: stores locations at the outskirts of Addis Ababa served by Anbessa
bus routes that travel out of the boundaries of the city. This special vertices file is
necessary because some vertices on these routes are not included in the transport
network model yet they are needed in the view bus route use case.
42
5.3 Algorithm Design
The major use case of the system is Find Journey Route. It involves all the classes and data
storage files. The other use cases are implemented as direct reading/writing to a file. These use
cases are restricted to accessing one or two files only. Hence, only the algorithm for the Find
Journey Route use case is detailed in this section. The series of activities performed in this use
case are:
1. The user selects the origin and destination locations (vertices) and the type of transport
service to use. Then the user submits the request.
2. The system takes the journey specification parameters and selects the path with the
minimum number of transfers.
3. The system displays the transport services available from origin to destination including
the locations at which one need to transfer from one bus/taxi to another.
As stated in the requirements section, the selection of origin and destination vertices is required
to get aid from the system in such a way that the user can select them from a pull down list.
Thus, the origin and destination pull down lists are populated with the list of vertex names.
The activity outlined at the second step is composed of several sub activities that involve all the
classes and the files in the system. The sub activities of this step can be stated as follows. For
ease of explanation, the steps described below assume that the user selects bus as the desired
transport service.
1. Get the index number for the origin and destination vertices. All the subsequent vertex
references use index numbers instead of string names for the sake of code simplicity.
2. Get the number of transfers needed to travel from the given origin to the destination with
the selected transport service. The vertex indices obtained at step 1 are used to index into
the transfer matrix.
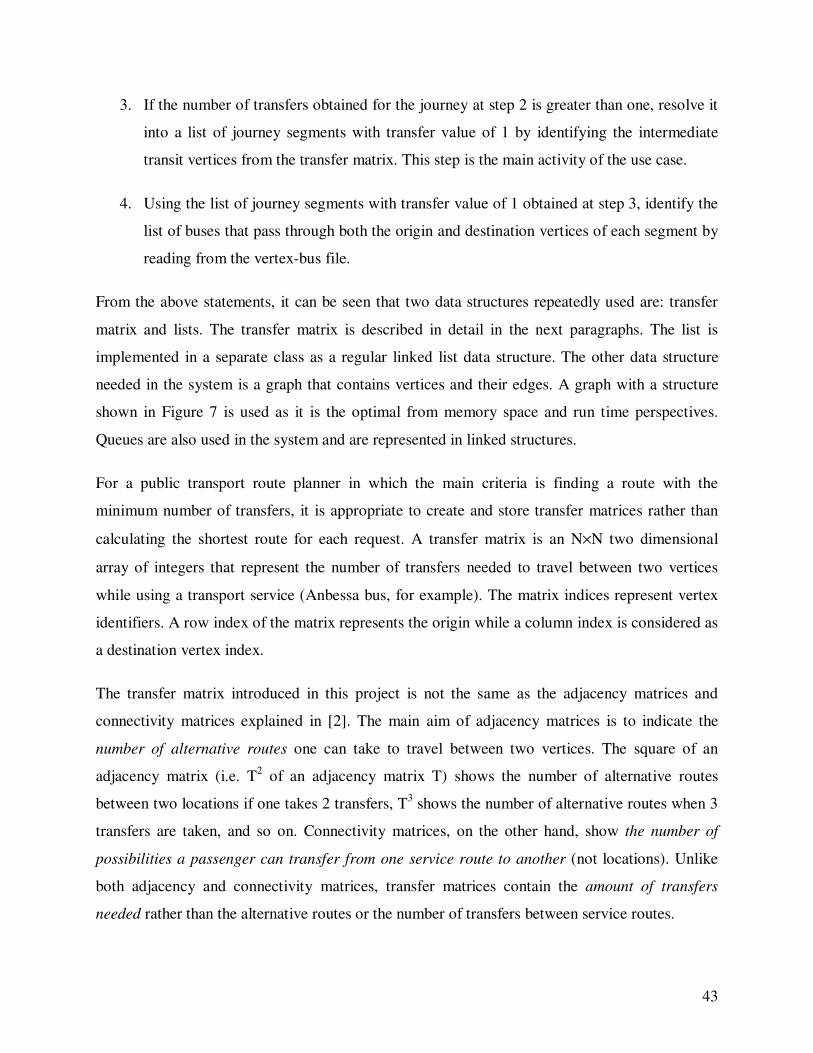
43
3. If the number of transfers obtained for the journey at step 2 is greater than one, resolve it
into a list of journey segments with transfer value of 1 by identifying the intermediate
transit vertices from the transfer matrix. This step is the main activity of the use case.
4. Using the list of journey segments with transfer value of 1 obtained at step 3, identify the
list of buses that pass through both the origin and destination vertices of each segment by
reading from the vertex-bus file.
From the above statements, it can be seen that two data structures repeatedly used are: transfer
matrix and lists. The transfer matrix is described in detail in the next paragraphs. The list is
implemented in a separate class as a regular linked list data structure. The other data structure
needed in the system is a graph that contains vertices and their edges. A graph with a structure
shown in Figure 7 is used as it is the optimal from memory space and run time perspectives.
Queues are also used in the system and are represented in linked structures.
For a public transport route planner in which the main criteria is finding a route with the
minimum number of transfers, it is appropriate to create and store transfer matrices rather than
calculating the shortest route for each request. A transfer matrix is an N×N two dimensional
array of integers that represent the number of transfers needed to travel between two vertices
while using a transport service (Anbessa bus, for example). The matrix indices represent vertex
identifiers. A row index of the matrix represents the origin while a column index is considered as
a destination vertex index.
The transfer matrix introduced in this project is not the same as the adjacency matrices and
connectivity matrices explained in [2]. The main aim of adjacency matrices is to indicate the
number of alternative routes one can take to travel between two vertices. The square of an
adjacency matrix (i.e. T2 of an adjacency matrix T) shows the number of alternative routes
between two locations if one takes 2 transfers, T3 shows the number of alternative routes when 3
transfers are taken, and so on. Connectivity matrices, on the other hand, show the number of
possibilities a passenger can transfer from one service route to another (not locations). Unlike
both adjacency and connectivity matrices, transfer matrices contain the amount of transfers
needed rather than the alternative routes or the number of transfers between service routes.

44
To explain the transfer matrix in detail, let us consider a simple road network with six vertices as
shown in Figure 15. Let us assume that it is possible to travel without transfer only between two
vertices with an edge. In other words, a transport service connects no more than two vertices.
The transfer matrix for this road network is shown in Figure 16.
Figure 15: A simple road network with six vertices
Figure 16: The transfer matrix for the road network shown in Figure 15
From Figure 16, it can be seen that the transfer matrix is symmetrical about the diagonal.
Therefore, it is sufficient to store only either the lower or upper half of the matrix. To save
memory space, the transfer matrix for two transport services can be stored in a single matrix,
each on either of its halves. The value along the diagonal is 0 indicating there is no need to take
any transport service to travel from a vertex to itself. A 0 value at any other location of the
matrix indicates that there is no service with the given transport facility at that location. A value
of 1 indicates that a direct service is available between a vertex whose index is the row number
and a vertex whose index is the column number of the matrix.
1
6
4
35
2
0 2 1 2 3 1
2 0 1 1 1 2
1 1 0 1 2 1
2 1 1 0 2 1
3 1 2 2 0 3
1 2 1 1 3 0
45
To make the concept of transfer matrix clearer, let us take a real example by taking six locations
of Addis Ababa and see the transfer matrix for taxi service. The selected locations are Arat Kilo,
Haya Hulet Mazoria, Kazanchees, Kebena, Megenagna, and Shola Gebeya. Their index numbers
are 1, 2, 3, 4, 5, and 6 respectively. The taxi transport network connecting these points is
illustrated in Figure 17. The transfer matrix M for taxi service on these locations is shown in
Figure 18. From the transfer matrix we can see that one has to take two taxis to travel from
Kazanchees to Shola Gebeya (M[3][6]) or vice versa (M[6][3]) while there is a direct taxi service
from Arat Kilo to Kazanchees (M[1][3]) or vice versa (M[3][1]).
Figure 17: Taxi service network on six sample locations of Addis Ababa
Figure 18: The transfer matrix M for the taxi service network shown in Figure 17
0 1 1 1 1 1
1 0 1 2 1 2
1 1 0 2 1 2
1 2 2 0 1 1
1 1 1 1 0 1
1 2 2 1 1 0
1
4 6
5
2
3
Arat Kilo
Kebena Shola Gebeya
Megenagna
Haya Hulet
Mazoria
Kazanchees

46
5.3.1 Construction of the Transfer Matrix
Initially, only transfer values of 1 are entered in the matrix and all the rest are set to 0. The initial
matrix for the network of Figure 15 is shown in Figure 19. The list of vertices with transfer value
of 1 (with direct transport services) can be obtained from each bus/taxi service number path
information.
Figure 19: The initial values when constructing a transfer matrix
The next step is filling the appropriate transfer values at the 0 valued locations of the matrix.
This process begins at the first row and works down row by row until the last one. For a non
diagonal value of 0 at row i and column j, each pair-wise sum of matrix[i][k] and matrix[k][j],
where both values are non-0 and k runs from the first to the last matrix index, is compared and
the least sum is taken as the transfer value of matrix[i][j]. The variable which controls the least
sum of matrix[i][k] and matrix[k][j] should be initialized to a higher integer value that logically
cannot be a transfer value (in the system developed, 100 is used as such an integer).
However, visiting the matrix elements once does not guarantee that all the correct transfer values
are obtained. There could be some remaining non-diagonal 0-valued matrix elements. This may
happen because it is not possible to get n-transfer values before (n-1)-transfers are identified.
Therefore, whenever the least transfer value identified is the special high value integer (100, in
this system), it is essential to mark this matrix element by adding it to a queue of matrix elements
of similar property for further investigation. The calculation of least transfer values and the
marking would continue until the queue is empty. The pseudo code for this algorithm is shown
below.
0 0 1 0 0 1
0 0 1 1 1 0
1 1 0 1 0 1
0 1 1 0 0 1
0 1 0 0 0 0
1 0 1 1 0 0
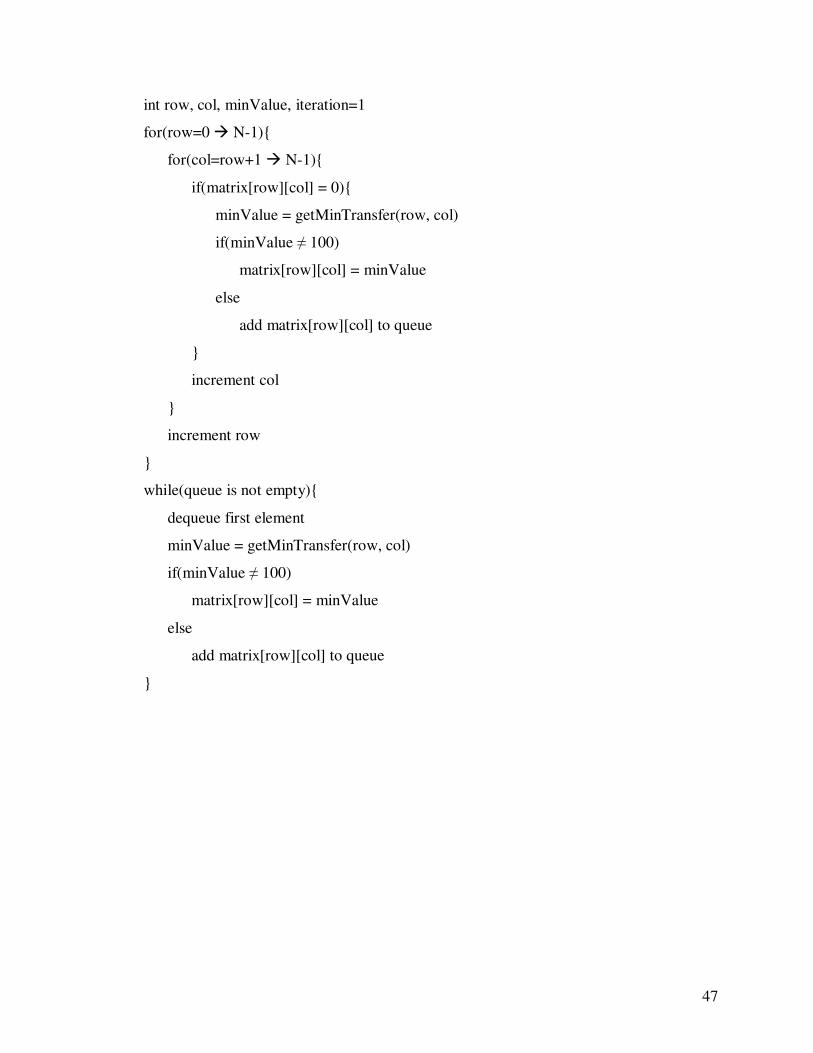
47
int row, col, minValue, iteration=1
for(row=0 � N-1){
for(col=row+1 � N-1){
if(matrix[row][col] = 0){
minValue = getMinTransfer(row, col)
if(minValue ≠ 100)
matrix[row][col] = minValue
else
add matrix[row][col] to queue
}
increment col
}
increment row
}
while(queue is not empty){
dequeue first element
minValue = getMinTransfer(row, col)
if(minValue ≠ 100)
matrix[row][col] = minValue
else
add matrix[row][col] to queue
}
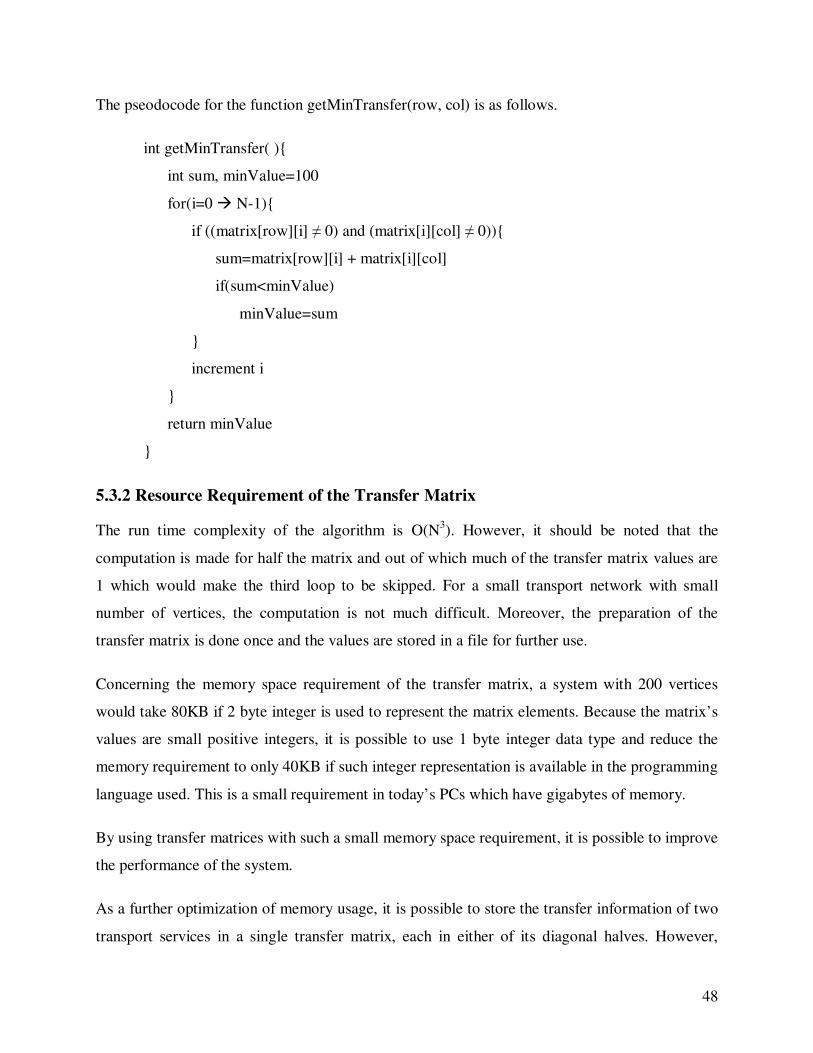
48
The pseodocode for the function getMinTransfer(row, col) is as follows.
int getMinTransfer( ){
int sum, minValue=100
for(i=0 � N-1){
if ((matrix[row][i] ≠ 0) and (matrix[i][col] ≠ 0)){
sum=matrix[row][i] + matrix[i][col]
if(sum<minValue)
minValue=sum
}
increment i
}
return minValue
}
5.3.2 Resource Requirement of the Transfer Matrix
The run time complexity of the algorithm is O(N3). However, it should be noted that the
computation is made for half the matrix and out of which much of the transfer matrix values are
1 which would make the third loop to be skipped. For a small transport network with small
number of vertices, the computation is not much difficult. Moreover, the preparation of the
transfer matrix is done once and the values are stored in a file for further use.
Concerning the memory space requirement of the transfer matrix, a system with 200 vertices
would take 80KB if 2 byte integer is used to represent the matrix elements. Because the matrix’s
values are small positive integers, it is possible to use 1 byte integer data type and reduce the
memory requirement to only 40KB if such integer representation is available in the programming
language used. This is a small requirement in today’s PCs which have gigabytes of memory.
By using transfer matrices with such a small memory space requirement, it is possible to improve
the performance of the system.
As a further optimization of memory usage, it is possible to store the transfer information of two
transport services in a single transfer matrix, each in either of its diagonal halves. However,
49
special attention should be taken when combining transfer matrices of two transport services
because there could be some vertices which are served by one of the two transport services and
not served by the other. To avoid this problem, the transfer information of the two transport
services should be stored together in a file. Similar technique is used in PTRPAA. The vertices
which are not served by a given transport service would have a 0 value entry in the transfer
matrix.
The transfer matrix and the vertex graph are required to be constructed at start up of the
application by reading data stored in the transfer file and vertices file. These data structures need
to remain in memory until the program is terminated because they are used repeatedly. Other
data structures such as lists and queues of journey segments and service routes should be de-
allocated when they are no more necessary.
50
6. THE PROTOTYPE
6.1 Programming Language
The programming language used to develop the prototype is Microsoft Visual C++ 2005. Visual
studio 2005 contains several programming languages which are used to develop Windows
applications, consol applications, and web applications. Among the programming languages
offered in Visual Studio 2005, C++ is selected for its flexibility in dynamic memory allocation.
Since almost all variables of the system are allocated dynamically, selecting a programming
language with good dynamic memory allocation is essential. Furthermore, a Visual C++
Windows application is user friendly just like other Windows applications.
Microsoft Visual Studio 2005 is based on the .NET Framework. The .NET Framework is a
library that can be used by the various programming languages contained in Visual Studio. In
previous versions of Microsoft Visual Studio (before Visual Studio 2003), Visual C++ used a
library called Microsoft Foundation Classes (MFC) while Visual Basic (the other language
included in Visual Studio) used other set of libraries. The reason for the use of separate libraries
is that, MFC is a customized version of Win32 library of Microsoft Windows was implemented
in C and cannot be directly used by Visual Basic. Newer versions of Microsoft Visual Studio
versions starting from Visual Studio 2003 use the .NET Framework library, which is shared by
all languages contained in the Visual Studio suit. However, the MFC library is still included in
newer versions of Visual Studio.
6.2 Implementation Challenges and Decisions
There were a number of challenges related to the collected data and the data collection itself.
These issues and the decisions taken are listed and discussed in this sub section.
• Identification of minibus taxi service routes is difficult. Information on the routes is not
readily available as that of Anbessa city buses. As a result, most of the minibus service
routes are obtained through consultation with individuals who work on minibus taxis and
some from experience.
51
• Another problem with minibus taxi service routes is that the routes do not have clearly
defined starting/end locations. This is especially true on long distance routes. For
example, a service route may start from Piassa and end at Megenagna while some taxis
on the same route may continue to Kotebe. Short distance routes usually have well
defined start and end points. As a solution, long distance routes are assumed to terminate
at business centers of the city such as Piassa, Mexico, Merkato, etc. It should also be
remembered that, minibus drivers break route into smaller segments to exploit the
authorized tariff system.
• Some of the location names for bus stops obtained from Anbessa City Bus Enterprise,
such as ‘under the bridge’, are too vague to be used in the prototype. Therefore, they are
not included in the system. It is also true that some locations are referred by more than
one name (Giorgis and Menelik Square, for example). Such names are identified and one
of the names is used for consistency. Another problem with location names is the use of
identical names for two or more locations (Hana Mariam, for example.) If two or more
locations have identical names and if a name refers to a large geographical area (such as
Bole), additional qualifiers are added to the name.
• The distance information used in the system is the inter-bus-stop distance data obtained
from Anbessa City Bus Enterprise. Inter-stop distance measure for minibus taxi service
is not available. Fortunately, taxi terminals are usually near to bus stops hence the inter-
bus-stop distances are used for taxis as well.
In general, the 93 Anbessa bus routes and 75 minibus taxi routes are used in the system. The
number of selected locations (neighborhoods) is 140 (see the Appendix). These locations are
selected based on the following criteria.
• The location is a business or commercial center;
• The location is a road junction where two or more service routes intersect;
• The location is where a service route begins/terminates;
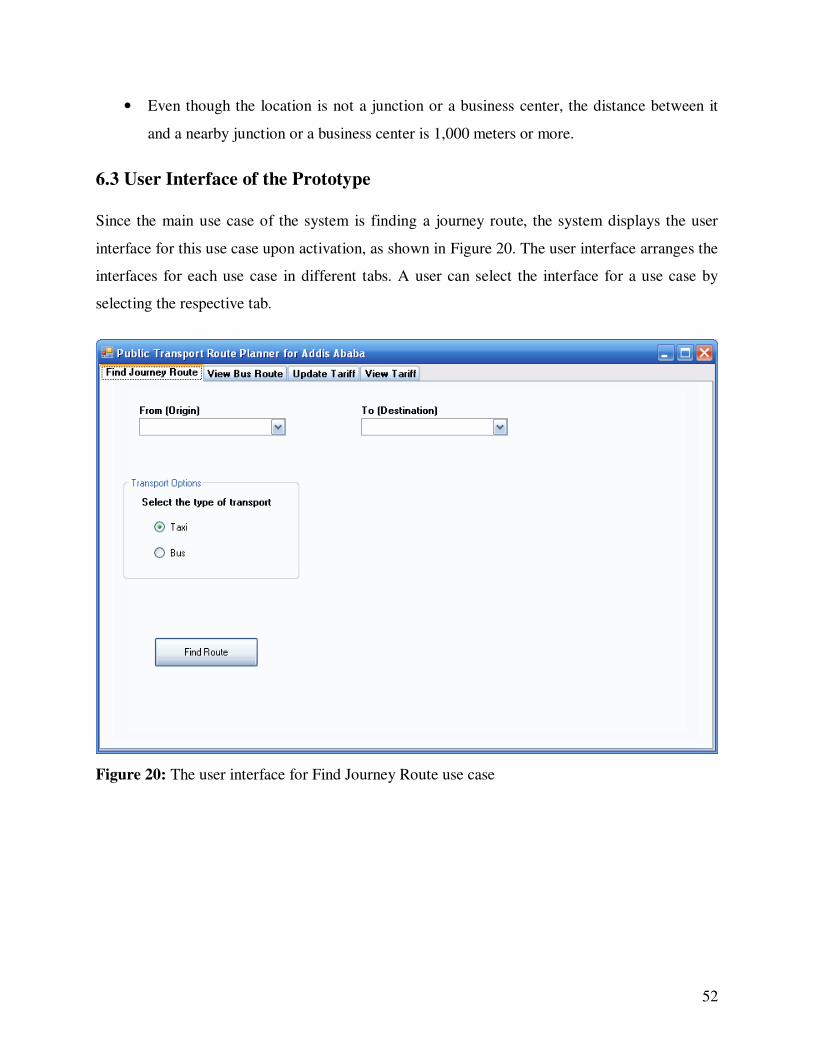
52
• Even though the location is not a junction or a business center, the distance between it
and a nearby junction or a business center is 1,000 meters or more.
6.3 User Interface of the Prototype
Since the main use case of the system is finding a journey route, the system displays the user
interface for this use case upon activation, as shown in Figure 20. The user interface arranges the
interfaces for each use case in different tabs. A user can select the interface for a use case by
selecting the respective tab.
Figure 20: The user interface for Find Journey Route use case
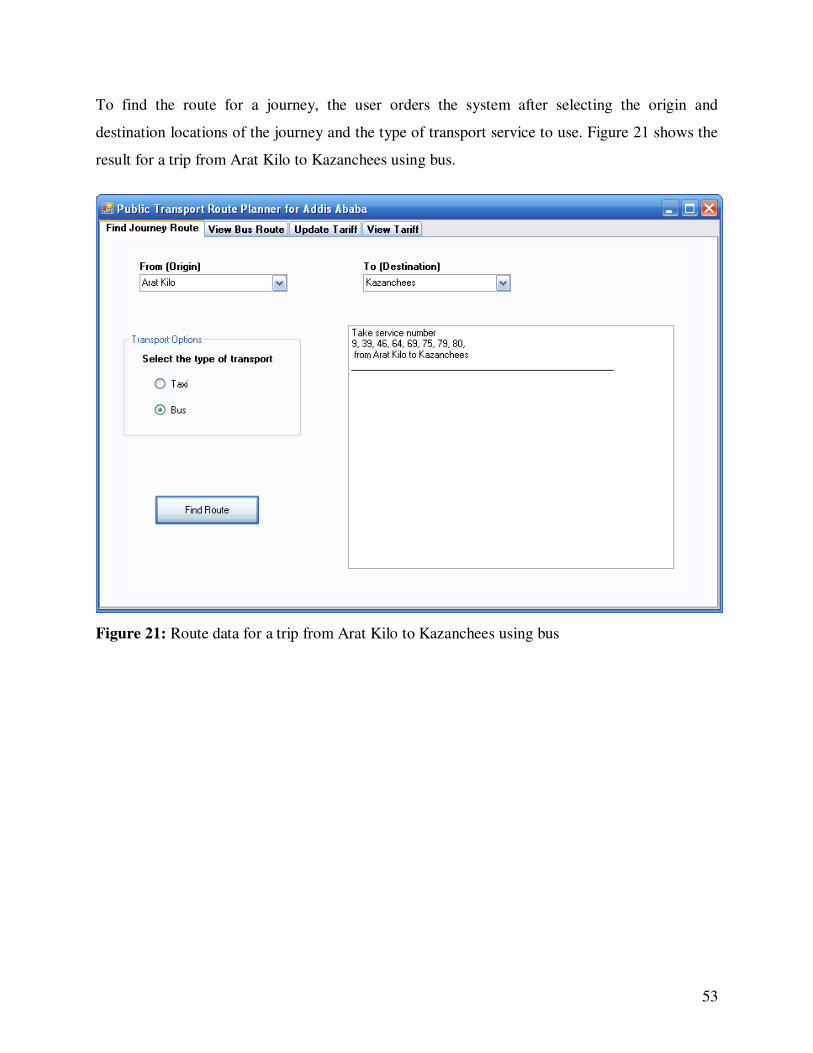
53
To find the route for a journey, the user orders the system after selecting the origin and
destination locations of the journey and the type of transport service to use. Figure 21 shows the
result for a trip from Arat Kilo to Kazanchees using bus.
Figure 21: Route data for a trip from Arat Kilo to Kazanchees using bus
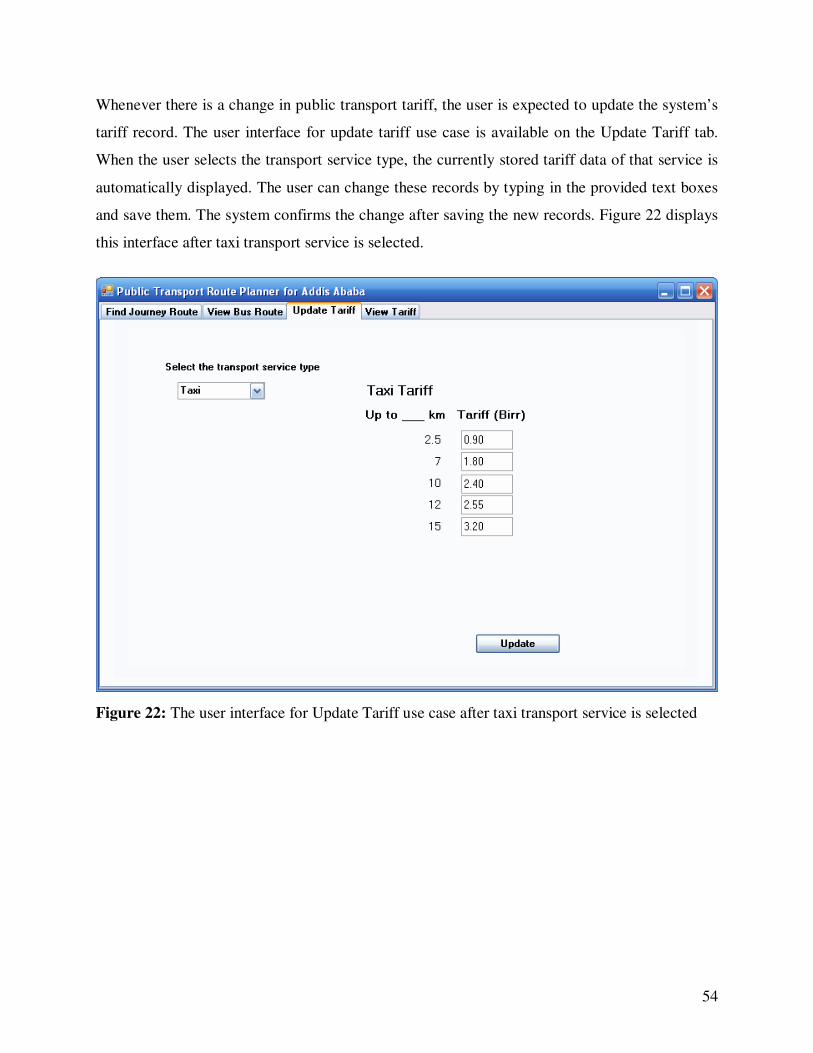
54
Whenever there is a change in public transport tariff, the user is expected to update the system’s
tariff record. The user interface for update tariff use case is available on the Update Tariff tab.
When the user selects the transport service type, the currently stored tariff data of that service is
automatically displayed. The user can change these records by typing in the provided text boxes
and save them. The system confirms the change after saving the new records. Figure 22 displays
this interface after taxi transport service is selected.
Figure 22: The user interface for Update Tariff use case after taxi transport service is selected
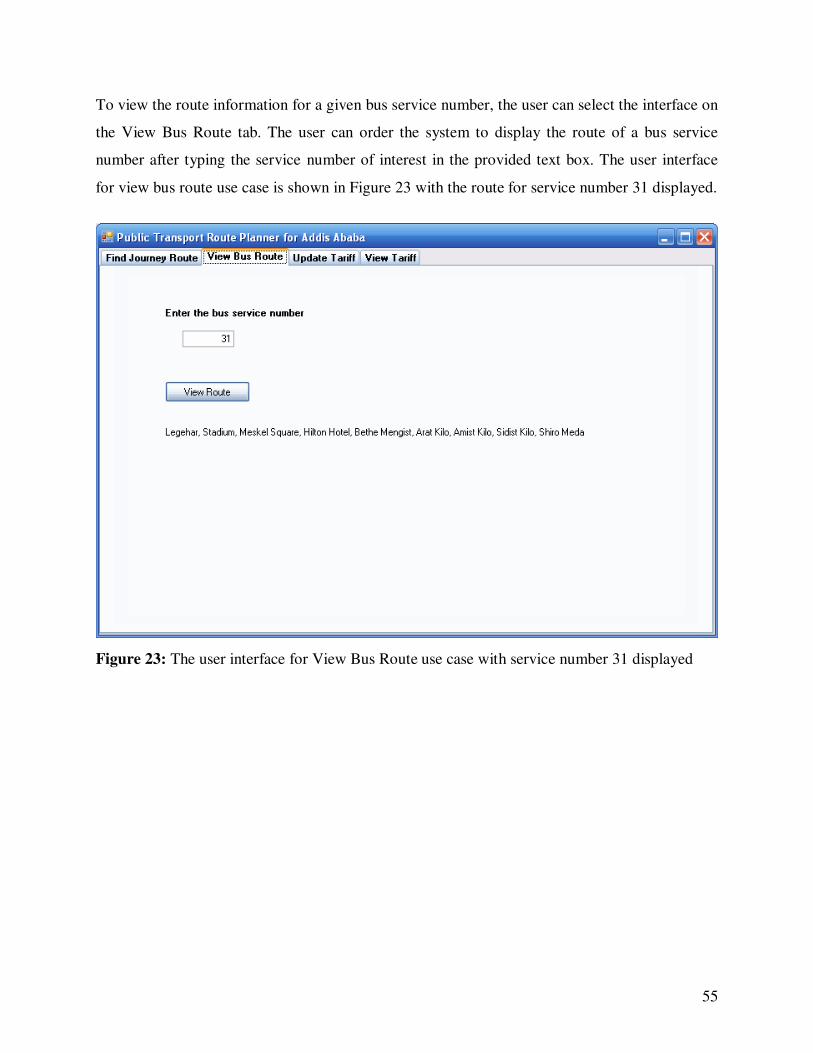
55
To view the route information for a given bus service number, the user can select the interface on
the View Bus Route tab. The user can order the system to display the route of a bus service
number after typing the service number of interest in the provided text box. The user interface
for view bus route use case is shown in Figure 23 with the route for service number 31 displayed.
Figure 23: The user interface for View Bus Route use case with service number 31 displayed
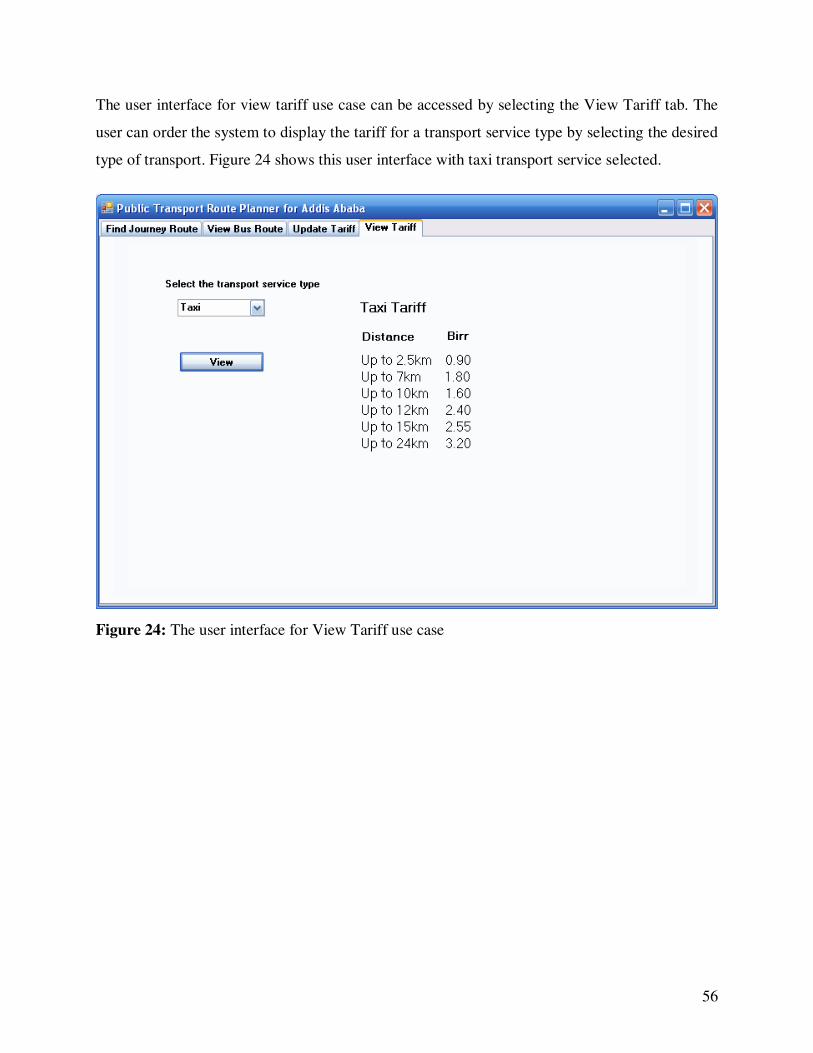
56
The user interface for view tariff use case can be accessed by selecting the View Tariff tab. The
user can order the system to display the tariff for a transport service type by selecting the desired
type of transport. Figure 24 shows this user interface with taxi transport service selected.
Figure 24: The user interface for View Tariff use case
57
7. CONCLUSION AND FUTURE WORKS
7.1 Conclusion
The development of a route planner needs the processing of large amount of data and longer time
as it needs modeling of the transport network which is composed of large number of locations,
service routes, and service type/operators. What makes the situation worse in Addis Ababa is that
there is lack of readily available data on transport network routes, except that of Anbessa city bus
service.
Route planner for personal computer systems can be implemented as web based applications or
desktop applications. They can also be developed for use through mobile phones and smart
phones. Route planners can be equipped with digital maps as an additional means of origin and
destination selection (to accept input) and to display the identified path (graphical display of
output).
Another distinction is made among route planners by considering when they identify routes.
Some route planners identify optimal routes between any two locations in a transport network
with respect to a criterion such as shortest distances and store them in a database. When a query
is presented, they retrieve the pre-calculated information and present it to the user. Route
planners in the other category try to identify the optimal route on the fly. The application
developed in this project is a type of route planner in which the routes with the least number of
transfers between locations are stored in the form of a transfer matrix.
Route planners help users to identify the optimal route for a given origin and destination pair in
different criteria. The common criteria are shortest distance, least fare, least waiting and travel
time, and minimum number of transfers. Given the characteristics of public transport service in
Addis Ababa, the most important criterion is minimizing the number of transfers needed.
Minimizing number of transfers has implications on minimizing cost, waiting time, and travel
distance. Thus, the developed application is targeted in finding only the routes with the least
number of transfers.
58
This project explores the characteristics of public transport services in Addis Ababa. It is found
out that there is a high degree of overlap between service routes. The reasons for the overlaps
arise from poor transport design, lack of alternate routes suitable for public transport, and the
authorized public transport tariff.
The absence of suitable location identification in Addis Ababa is another problem posed at the
development of a route planner for the city. It is difficult to give a suitable identifier for some
terminals. The other problem with terminals is that taxis board and alight passengers not at
defined stops.
7.2 Future Works
Development of route planners for Addis Ababa is still an open research subject. Moreover,
since route planners can be developed with the aim of identifying routes optimized in different
user criteria, many route planners can be developed in the future. For those who have interest to
engage in a similar work, possible extensions and other development issues are outlined below.
• The developed route planner uses pre-calculated and stored paths with minimum number
of transfers. Although number of transfers is a major route selection criterion which has
influence on distance, cost, and time factors in the current actual transport network of
Addis Ababa, it is also possible that routes can be optimized with other parameters, such
as distance. Creating such route planners for Addis Ababa is still open.
• Most potential users of the system are Amharic language speakers. Therefore, the
developed system can be enhanced by incorporating Amharic language at the interface
and data storage level and making it multilingual.
• Currently, the developed system includes public transport services offered by Anbessa
City Bus Enterprise and minibus taxis. In a future work, midi bus transport service can be
included.
• It is known that the public transport services offered by Anbessa and minibus taxis extend
beyond the boundaries of Addis Ababa so as to link the city with surrounding towns.
59
Such services are not included in the developed system. Therefore, it can be extended by
including services to nearby towns.
• Digital maps are used in route planners to visually display identified routes and possibly
as a means of input in which the user can click on the map to identify origin and
destination locations. Since maps are not included in the current system, it can be
included in a future extension of the system. However, it should be noted that due to the
unavailability of suitable digital map of Addis Ababa at the present, much preprocessing
effort is required to have a suitable map.
• The current application is developed as a desktop application. It is therefore, important to
develop web based systems which can be accessed through PCs and mobile phones for
alternative accessibility.
60
REFERENCES
[1] Federal Democratic Republic of Ethiopia Population Census Commission, “Summary and
Statistical Report of the 2007 Population and Housing Census. Population Size by Age and
Sex”, Addis Ababa, December 2008.
[2] Fanuael Samson, “Analysis of Traffic Accident in Addis Ababa: Traffic Simulation”,
M.Sc. thesis, School of Graduate Studies, Addis Ababa University, 2006.
[3] Office for the Revision of Addis Ababa Master Plan (ORAAMP), “Road Network:
Efficient Streets Efficient City”, available at
http://www.telecom.net.et/~aamp/Road%20Network.htm, last visited on Feb 09, 2010.
[4] Office for the Revision of Addis Ababa Master Plan (ORAAMP), “Transportation:
Affordable Transport, Enhanced Access and Mobility”, available at
http://www.telecom.net.et/~aamp/Transport.htm, last visited on Feb 09, 2010.
[5] IBIS Transport Consultants Ltd., “Study of urban public transport conditions in Addis
Ababa, Ethiopia”, March 2005.
[6] Chao-Lin Liu, Tun-Wen Pai, Chun-Tien Chang, Chang-Ming Hsieh, “Path-Planning
Algorithms for Public Transportation Systems”, The Fourth International IEEE
Conference on Intelligent Transportation Systems, Oakland, California, USA, August
2001, 1-6.
[7] Nell Dale, C++ Plus Data Structures (4th Edition), Jones and Bartlett Publishers, 2007.
[8] Jeppesen, “IPTIS - Public transport journey planning”, retrieved from
http://www.jeppesen.com/documents/land/IPTIS-white-paper-20090105.pdf, last visited on
April 20, 2010.
[9] Paul André, Max L. Wilson, Alisdair Owens, Daniel A. Smith, “Journey Planning Based
on User Needs”, Student Design Competition, San Jose, CA, USA, April 28-May 3, 2007,
2025-2030.
[10] Brian Ferris, Kari Watkins, Alan Borning, “OneBusAway: A Transit Traveller Information
System”, available at http://www.onebusaway.org/research/mobicase-2009.pdf, last visited
on April 20, 2010.
[11] Hartwig H. Hochmair, “Grouping of Optimized Pedestrian Routes for Multi-Modal Route
Planning: A Comparison of Two Cities”, In Proc. of the 11th AGILE Conference, Girona,
Spain, 5-8 May, 2008, 339-358.
[12] Christopher Cherry, Mark Hickman, Anirudh Garg, “Design of a Map-Based Transit
Itinerary Planner”, Journal of Public Transportation, Vol. 9, No. 2, 2006, 45-68.
61
[13] Dan Costelloe, Peter Mooney, Adam Winstanley, “Multi-Objective Optimisation on
Transportation Networks”, In Proc. of 4th AGIL Conference on GIS, 2001, 523-530.
[14] S.Meena Kumari and Dr.N.Geethanjali, “A Survey on Shortest Path Routing Algorithms
for Public Transport Travel”, Global Journal of Computer Science and Technology Vol. 9
Issue 5 (Ver 2.0), January 2010, 73-76.
[15] S. Kolyaie, M.R. Delavar, M.R. Malek, “Travel Itinerary Planning in Public Transportation
Network using Activity-Based Modeling”, Journal of Applied Sciences 9 (14) 2009, 2532-
2543.
[16] Andrew V. Goldberg and Chris Harrelson, “Computing the Shortest Path: A* Search Meets
Graph Theory”, In Proc. of 16th ACM-SIAM Symposium on Discrete Algorithms, 2005,
156-165.
[17] Bitew Mebrahtu, “Taxi Traffic Accidents in Addis Ababa: Causes, Temporal and Spatial
Variations, and Consequences”, M.Sc. thesis, School of Graduate Studies, Addis Ababa
University, June 2002.
[18] J E Beasley, “OR-Notes”, available at
http://people.brunel.ac.uk/~mastjjb/jeb/or/graph.html, last visited on February 18, 2010.
[19] “Notes: A* Algorithm”, available at
http://www.cs.trincoll.edu/~ram/cpsc352/notes/astar.html, last visited on April 28, 2010.
[20] Paul E. Black, U.S. National Institute of Standards and Technology, “Bellman-Ford
Algorithm”, available at, http://www.itl.nist.gov/div897/sqg/dads/HTML/bellmanford.html,
last visited on April 28, 2010.
[21] ���� ��� ��� ������ ����� “���� ��� ��� ������ ���� 1935-1996”� �� �� � 1996.

62
APPENDIX
List of neighborhoods of Addis Ababa included in the PTRPAA prototype
1 Abnet Hotel 48 Gerji (Roba Dabo Bet) 95 Megenagna
2 Abuware 49 Gerji (Russia Camp) 96 Mekanisa
3 Addisu Gebeya 50 Giorgis 97 Mekanisa Abo
4 Addisu Sefer 51 Gofa Camp 98 Menelik Hospital
5 Adey Abeba 52 Gofa Gebriel 99 Menen
6 Adwa Dildye 53 Gojjam Berenda 100 Meri
7 Afncho Ber 54 Goro 101 Merkato
8 Africa Union 55 Gotera 102 Mesalemiya
9 Alem Bank 56 Gurara 103 Meshualekia
10 Amanuel 57 Gurd Shola 104 Meskel Square
11 Ambassador Theater 58 Habte Giorgis 105 Mexico
12 Amist Kilo 59 Hamle 19 Park 106 Mickyliland Village
13 Arat Kilo 60 Hana Mariam (Kotebe) 107 Olompia
14 Arogew Kera 61 Hana Mariam (Lafto) 108 Ourael
15 Asco 62 Haya Hulet Mazoria 109 Paster
16 Atlas Hotel 63 Hilton Hotel 110 Piassa
17 Autobus Tera 64 Huletegna Polis Tabiya 111 Qusquam
18 Ayat 65 Imperial Hotel 112 Ras Mekonnen Dildye
19 Ayer Tena 66 Iyesus 113 Rufael
20 Bambis 67 Janmeda 114 Rwanda Embassy
21 Bela 68 Jara Park 115 Saalite Mhirete
22 Bethe Mengist 69 Kaliti 116 Sar Bet
23 Bethel 70 Kara Alo 117 Saris
24 Bherawi Mehandis 71 Kara Kore 118 Semen Hotel
25 Bherawi Theater 72 Kazanchees 119 Semit
26 Birchiko Fabrica 73 Kebena 120 Shegole
27 Bisrate Gebriel 74 Kechene 121 Shiro Meda
28 Bole 75 Kechene Medhanealem 122 Shola
29 Bole Bulbula 76 Kera 123 Shola Gebeya
30 Bole Medhanealem 77 Keraniyo 124 Sidist Kilo
31 Bole Michael 78 Kirkos 125 St. Gebriel Hospital
32 Building College 79 Kolfe Gebeya 126 Stadium
33 Bulgaria Mazoria 80 Kolfe Polis Maseltegna 127 Tekle Haymanot
34 Chilot 81 Korki Fabrica 128 Tewodros Square
35 CMC 82 Kotebe 33 Mazoria 129 Tikur Anbessa
36 Crown Hotel 83 Kotebe Breta Bret 130 Tor Hailoch
37 Dil Ber 84 Kotebe College 131 Total (3 qutr Mazoria)
38 Enderase 85 Lafto 132 Total (Tsion Holel)
39 Enqulal Fabrica 86 Lafto (Mebrat Hail) 133 Vatican Embassy
40 Entoto Kidane Mhiret 87 Lafto Michael 134 Weyra Sefer
41 Entoto Mariam 88 Lam Beret 135 Wingate
42 Erer Ber 89 Lancha 136 Wolo Sefer
43 Ethio China College 90 Legehar 137 Wuha Limat
44 Ferensay Embassy 91 Lideta (Balcha Hospital) 138 Yohannes
45 Filwuha 92 Lideta (Fird Bet) 139 Yosef
46 Genet Hotel 93 Luquanda 140 Zenebe Work
47 Gerji (Mebrat Hail) 94 Medhanealem School
63
DECLARATION
This project is my original work, has not been presented for a degree in any other university and
that all sources of material used for the project have been acknowledged.
____________________________
Addisu Andarge
June 2010
Confirmed by advisor:
__________________________
Yaregal Assabie (Ph.D.)
June 2010