addis ababa university school of graduate studies college of ...
85
ADDIS ABABA UNIVERSITY SCHOOL OF GRADUATE STUDIES COLLEGE OF SOCIAL SCIENCES URBAN EXPANSION AND ITS IMPACT ON THE LIVELIHOOD OF PERIPHERAL FARMING COMMUNITIES: THE CASE OF KUTABER TOWN, AMHARA REGION, ETHIOPIA BY Ahlam Yimam A Thesis Submitted to the Department of Geography and Environmental Studies Presented in Partial Fulfillment of the Requirements for the Degree of Master of Arts in Geography and Environmental Studies June, 2017 Addis Ababa, Ethiopia
-
Upload
khangminh22 -
Category
Documents
-
view
0 -
download
0
Transcript of addis ababa university school of graduate studies college of ...

ADDIS ABABA UNIVERSITY
SCHOOL OF GRADUATE STUDIES
COLLEGE OF SOCIAL SCIENCES
URBAN EXPANSION AND ITS IMPACT ON THE LIVELIHOOD OF PERIPHERAL
FARMING COMMUNITIES: THE CASE OF KUTABER TOWN, AMHARA REGION,
ETHIOPIA
BY
Ahlam Yimam
A Thesis Submitted to the Department of Geography and Environmental Studies Presented
in Partial Fulfillment of the Requirements for the Degree of Master of Arts in Geography
and Environmental Studies
June, 2017
Addis Ababa, Ethiopia

Addis Ababa University
School of Graduate Studies
This is to certify that the thesis prepared by Ahlam Yimam, entitled: Urban Expansion and its Impact
on Peripheral Farming Communities: the Case of Kutaber town, Amhara Region, Ethiopia and
submitted in partial fulfillment of the requirements for the Degree of Master of Arts in Geography and
Environmental Studies complies with the regulations of the University and meets the accepted
standards with respect to originality and quality.
Approved by Board of Examiners:
Internal Examiner: __________________ Signature____________ Date ___________
External Examiner: ___________________ Signature_____________ Date ___________
Advisor: Fekadu Gurmessa (PhD) Signature______________Date ___________
Chair of Department or Graduate Program Coordinator

DECLARATION
I declare that this MA thesis is my original work, has never been presented for a degree in this or
any other university and that all sources of materials used for the thesis have been fully
acknowledged.
Declarer's Name: Ahlam Yimam Signature __________ Date __________
Advisor's Name: Fekadu Gurmessa (PhD) Signature __________ Date __________

Acknowledgement
First and for most, I would like to thank the Almighty God for giving me grace, provision of
knowledge, wisdom and diligence required for the successful completion of the masters program
in Geography and Environmental Studies. Next, I would like express my sincere and deepest
gratefulness to my advisor Fekadu Gurmessa (PhD) for his intellectual advice, guidance,
encouragement and regular discussion were very valuable and inspiring in the processes of
proposal writing, research undertaking and thesis writing. Without his support and endless
understanding, this paper would not have had its present shape. The understanding, support and
encouragement that I have obtained from my husband Mohammed Yimam was a driving force
throughout my study time. He has taken all responsibilities in making things at home as well as out
of home more convenient and adorable. In every movement of my academic success Mohammed's
contribution has been there.
Special thanks go to my organization, the Ethiopian Mapping Authority (EMA), especially the
General Manager Sultan Mohammed who facilitated the sponsorship process of the Authority and
acquisition of data as well as the benefits of utilizing equipments for processing research paper. I
am especially grateful to all departments of EMA, especially, the Remote Sensing, Cartography
(Digital Cartography), Photogrammetry (Orthophoto Service), and the Reproduction (Photo
Laboratory) sections. Computer department and Surveying helped me in providing all the
materials and services needed for the study. I am thankful to the graduate school of AAU for the
financial support of the study.

Table of Contents
Content Page
List of Tables i
List of Figures iii
List of Appendices iv
ACRONYMS v
Abstract vi
CHAPTER ONE : INTRODUCTION 1
1.1. Background of the Study ..................................................................................................... 1
1.2. Statement of the Problem ......................................................................................................... 3
1.3. Objectives of the Study ............................................................................................................ 4
1.3.1. General Objective .......................................................................................................... 4
1.3.2. Specific Objectives ........................................................................................................ 4
1.4. Research Questions .................................................................................................................. 4
1.5. Significance of the Study ......................................................................................................... 4
1.6. Scope of the Study ................................................................................................................... 5
1.7. Limitation of Study .................................................................................................................. 5
1.8. Organization of the Thesis 5
CHAPTER TWO : REVIEW OF RELATED LITERATURE 6
2.1. Operational Definition of Related Words and Concepts ......................................................... 6
2.2. Urbanization and Urban Sprawl............................................................................................... 8
2.3. Urbanization in Africa ............................................................................................................. 8
2.4. Urbanization in Ethiopia .......................................................................................................... 9
2.5. Urbanization in Kutaber.................................................................................................... 9
2.6. Causes of Urban Expansion ..................................................................................................... 9
2.7. Consequences of Urban Expansion ......................................................................................... 9
2.7.1. Positive Impacts ...................................................................................................... 10
2.7.2. Negative Impacts ..................................................................................................... 10
2.8. Rural- Urban Linkage ............................................................................................................ 12
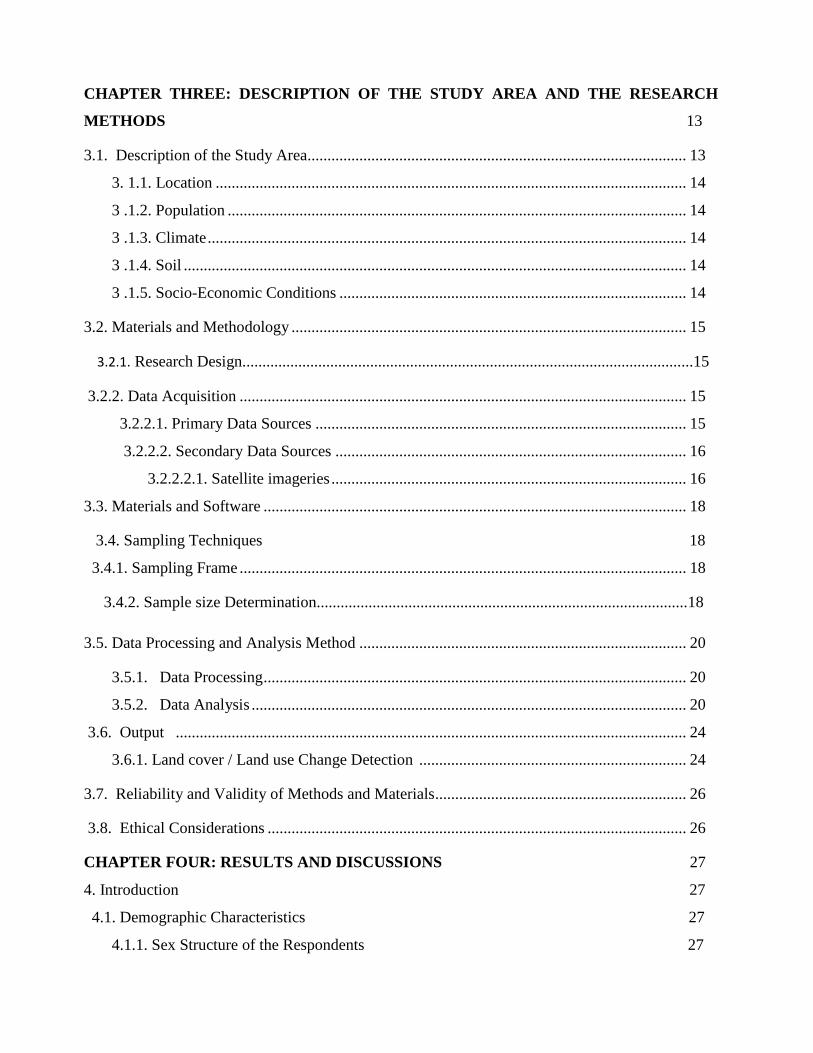
CHAPTER THREE: DESCRIPTION OF THE STUDY AREA AND THE RESEARCH
METHODS 13
3.1. Description of the Study Area............................................................................................... 13
3. 1.1. Location ...................................................................................................................... 14
3 .1.2. Population ................................................................................................................... 14
3 .1.3. Climate ........................................................................................................................ 14
3 .1.4. Soil .............................................................................................................................. 14
3 .1.5. Socio-Economic Conditions ....................................................................................... 14
3.2. Materials and Methodology ................................................................................................... 15
3.2.1. Research Design.................................................................................................................15
3.2.2. Data Acquisition ................................................................................................................ 15
3.2.2.1. Primary Data Sources ............................................................................................. 15
3.2.2.2. Secondary Data Sources ........................................................................................ 16
3.2.2.2.1. Satellite imageries ......................................................................................... 16
3.3. Materials and Software .......................................................................................................... 18
3.4. Sampling Techniques 18
3.4.1. Sampling Frame ................................................................................................................ 18
3.4.2. Sample size Determination.............................................................................................18
3.5. Data Processing and Analysis Method .................................................................................. 20
3.5.1. Data Processing .......................................................................................................... 20
3.5.2. Data Analysis ............................................................................................................. 20
3.6. Output ................................................................................................................................ 24
3.6.1. Land cover / Land use Change Detection ................................................................... 24
3.7. Reliability and Validity of Methods and Materials............................................................... 26
3.8. Ethical Considerations ......................................................................................................... 26
CHAPTER FOUR: RESULTS AND DISCUSSIONS 27
4. Introduction 27
4.1. Demographic Characteristics 27
4.1.1. Sex Structure of the Respondents 27

4.1.2. Households‟ Family Size 27
4.1.3. Marital Status of the Respondents 28
4.1.4. Age of Household Head 28
4.1.5.Education Status of the Respondents 29
4.2. Current Land Ownership of the Respondents 30
4.2.1. Respondents Land size in Hectare 30
4.2.2. Respondents‟ land Allotment Purposes 30
4.3. Urban Expansion Impact on Farmers‟ Financial Capital 31
4.4. Awareness of the house holds about Urban Expansion 32
4.4.1.Ways of households‟ Awareness about Urban Expansion 33
4.5. Farmers‟ Participation in Decision making and Implementation of Expansion Program 33
4.5.1. Benefits Farmers Gained as a result of their Participation 33
4.6. The Impact of Urban Expansion on the Land holding of Farming Community 34
4.6.1. Amount of Land the Farmers Lost 34
4.6.2. Type of Land lost due to Urban Expansion 35
4.7. Compensation Given for the Land Vacated 35
4.7.1. Kinds of Compensation Paid 36
4.7.2. Levels of Farmers‟ Satisfaction with Compensation Served 36
4. 8. Whether or not Required Training was Delivered to the Evicted households 37
4.8.1. Types of Training on which the households Participated 37
4.9. The Impact of Urban Expansion on Livestock Production 38
4.9.1. Oxen households Possessed before and after Urban Expansion in Number 38
4.9.2. Cows households Possessed before and after Urban Expansion in Number 38
4.9.3. Sheep Possessed before and after Urban Expansion in Number 39
4.9.4. Goats Possessed before and after Urban Expansion in Number 39
4.10. Urban Expansion Impact on Farmers‟ housing Status 40
4.11. Impact of Urban Expansion on Infrastructure of households 41
4.12. Job and related condition of the Affected households in Post Expansion Periods 42
4.13. Land-use/Land-cover Change Detection 43
4.13.1. Land use/Land cover in 1986 43
4.13.2. Land use/Land cover in 2000 44
4.13.3. Land use /Land cover in 2016 46
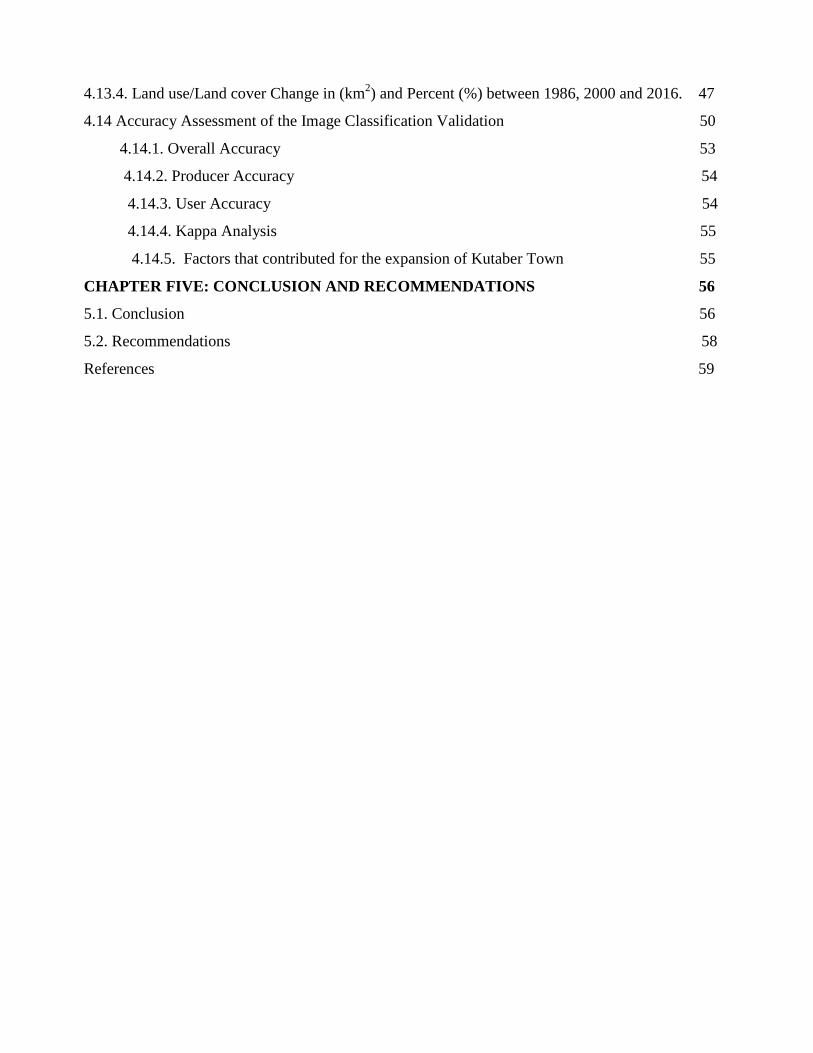
4.13.4. Land use/Land cover Change in (km2) and Percent (%) between 1986, 2000 and 2016. 47
4.14 Accuracy Assessment of the Image Classification Validation 50
4.14.1. Overall Accuracy 53
4.14.2. Producer Accuracy 54
4.14.3. User Accuracy 54
4.14.4. Kappa Analysis 55
4.14.5. Factors that contributed for the expansion of Kutaber Town 55
CHAPTER FIVE: CONCLUSION AND RECOMMENDATIONS 56
5.1. Conclusion 56
5.2. Recommendations 58
References 59

List of Tables page
Table 3.1. The characteristics of landsat satellite data used in this study 17
Table 3.2. Materials and Software‟s were used 18
Table 3.3. Sampling frame used to identify sample households 18
Table 3.4. Sample size determination proportionality 19
Table 3.5. Land use/land cover classes descriptions. 23
Table 4.1. Sex of household head. 27
Table 4.2. Households‟ family size 28
Table 4.3. Marital status of households 28
Table 4.4. Age of Household Heads 28
Table 4.5. Education status of the respondents 29
Table 4.6. Whether the respondents have land or not 30
Table 4.7. Land holding size of respondents 30
Table 4.8. Respondents‟ land allotment purposes 31
Table 4.9. Annual income before and after Urban Expansion in quintal and percent 32
Table 4.10. Community‟s awareness on Urban Expansion 32
Table 4.11. Means of awareness of Urban Expansion 32
Table 4.12.Farmers‟ participation in decision making & implementation of expansion program33
Table 4.13. Benefits farmers gained from participation 34
Table 4.14. The Impact of Urban Expansion on the land holding of farming community 34
Table 4.15. Amount of land the farmers lost 34
Table 4.16. Type of land lost due to Urban Expansion 35
Table 4.17. Compensation given instead of the land vacated 35
Table 4.18. Kinds of compensation paid 36
Table 4:19. The recipients‟ satisfaction condition towards a served compensation 36
Table 4.20. Whether or not required training was delivered to the evicted households 37
Table 4.21. Types of training in which the households participated 37
Table 4.22. Oxen Possessed before and after Urban Expansion in Number 38
Table 4.23 Cows Household Possessed before and after Urban Expansion in Number 38
Table 4.24. Sheep Possessed before and after Urban Expansion in Number 39
i

Table 4.25. Goats Possessed before and after Urban Expansion in Number 40
Table 4.26. House in room Possessed before and after Urban Expansion 41
Table 4.27 Impact of Urban Expansion on Infrastructure of households 41
Table 4.28. Whether these households believe that they get jobs before urban expansion 42
Table 4.29. Whether these households have a job currently. 42
Table 4.30. Job types the households have currently 42
Table 4.31. Absolute area and percentage coverage land use/land cover of 1986 43
Table 4.32. Absolute area and percentage coverage of Land use /Land cover of 2000 45
Table 4.33. Absolute area and percentage coverage of Land use / Land cover of 2016 46
Table4.34.Landuse/landcover change in(km2)&percent(%) between1986&2000 48
Table 4.35.Landuse/landcover change in (km2)&percent (%) between 2000&2016 48
Table 4.36.Landuse/landcover change in (km2)&percent (%) between 1986 & 2016 49
Table 4.37. Confusion matrix for land cover map of 1986 51
Table 4.38. Confusion matrix for land cover map of 2000 52
Table 4.39. Confusion matrix for land cover map of 2016 53
Table 4.40. Factors that contributed for the expansion of Kutaber Town 55
ii

List of Figures page
Figure 3.1. Location map of the study area 13
Figure 3.2. False color composite of landsat image of 1986, 2000 and 2016 17
Figure 3.3. Land use/land cover classification 21
Figure 3.4. High resolution images (Google earth) 22
Figure 3.5. Ground truth data from field observations 23
Figure3.6.Flowchartofthemethodology 25
Figure 4.1. Land use/ land cover map of the study area in 1986 44
Figure 4.2. Land use/ land cover map of the study area in 2000 45
Figure 4.3. Land use/ land cover map of the study area in 2016 47
Figure 4.4. Land use/land cover map of the years 1986, 2000 and 2016 50
iii

List of Appendices page
Appendex-1. Research Questioner for sample households 61
Appendex-2. Interview Questions for key informants 66
Appendex-3. Original Aerial photographs and topographic map of the study area 67
Appendex-4. Partial view of Urban Expansion in study Area 68
iv

ACRONYMS
AMSL: Above Mean Sea Level
AOI: Area of Interest
°C: Degree Celsius
CSA: Central Statistical Agency
EMA: Ethiopian Mapping Agency
ERDAS: Earth Resource Development Application System
ETM: Enhanced Thematic Mapper
ETB: Ethiopian Birr
FAO: Food and Agricultural Organization
FCC: False Color Composite
GCP: Ground Control Point
GIS: Geographic Information System
GLCF: Global Land Cover Facility
GPS: Global Positioning System
Ha: Hectare
Km2
: Square Kilometer
KWARDO: Kutaber Woreda Agricultural and Rural Development Office
LULC: Land Use Land Cover
LULCC: Land use Land Cover Change
MLC: Maximum Likelihood Classifier
RGB: Red Green Blue
SPSS: Statistical Package for Social Science
TM: Thematic Mapper
UN: United Nations
UNCED: United Nations Conference on Environment and Development
USGS: United States Geological Survey
UTM: Universal Transverses Mercator
v

Abstract
Currently, urban expansion is becoming a big problems in sub-Saharan African countries as they
are expanded without well planed urbanization. Therefore, the objective of this study is to assess
Urban Expansion and its Impact on Peripheral Farming Communities: the Case of Kutaber town,
Amhara Region, Ethiopia. GIS and remote sensing were used to analyze the phenomena of
agricultural land transformation into urban land use. Having employing the descriptive research
methods, the researcher collected data based on survey on 145 households, those who were
displaced and hence whose livelihood had been adversely affected. Research questionnaire, key
informants' interviews, the researcher's participatory observation, GPS data, Satellite Image and
documentary resources were tools to collect data. Data sources were of both quantitative and
qualitative data collection. The change detection method has been applied to investigate LULCC.
In order to achieve these, satellite data of Landsat TM for 1986, ETM for 2000 and 2016 have
been obtained and processed using ERDAS IMAGINE 2013. The Maximum Likelihood Algorithm
of Supervised Classification has been used to generate land use/land cover maps. For the accuracy
of classified Land use/Land cover maps, a confusion matrix was used to derive overall accuracy
and results were above the minimum and maximum threshold level. . The satellite image results
show that built up areas increased by 32.887km2(38.025%), 18.36km
2(21.228%) and 51.247km
2
(59.254%) respectively in the first, the second and the entire study periods. While farm land, grass
land, forest land, water body, shrub land and bare land decreased in both first, second and in the
entire study periods, respondents who have income 41-50quintal decreased from 0.7% to 0%, 31-
40quintals from 5.5% to 0.7%, 21-30quintal from 20% to 6.9% and 11-20quintal from 44.1% to
35.2%, and decreased livestock, before urban expansion these households had the an average
oxen of 2.22, cows 2.83, sheep 13.72, and goats 10.47. But after then, currently, these
households had the average oxen 0.92, cows 0.95, sheep 3.01 and goats 2.42 and increased
displacement of the households who had been involved in farming.
Key Terms: Urban expansion, peripheral farming communities, displacement, compensation, Land
use/land cover change.
vi

1
CHAPTERN ONE: INTRODUCTION
1.1. Background of the Study
Urban expansion as a dynamic process of land use change is a complicated social/economic
phenomenon. It may be linked with details related to topography, transportation, land use, social
structure and economic type, but it is generally related to demography and economy in a city (Lin
Li et al., 2003).
Urban expansion is synonymous with urban sprawl, to connote the extension of urban settlement to
the surrounding area whose function are non agricultural. Urban expansion is a common
phenomenon in both developed and developing countries. However, in developing countries urban
expansions are known with its negative effect. The major effects contributing for rapid urban
expansion in Ethiopia are higher natural population growth, rural to urban migration and spatial
urban development (Fekadu, 2015). This expansion has its own negative impact on farmers
livelihood which has different components.
Urbanization, the process of urban expansion may involve both horizontal and vertical expansion
of the physical structure of urban areas. It can result in loss of agricultural land, natural beauties,
range lands, parks and sceneries (Melesse, 2004). According to the World Urbanization Prospects
reported by the United Nations (UN, 2012), from 1965 to 2010, the global population increased
from 3.3 billion to 6.9 billion, and the total amount of population will exceed 9.3 billion by 2050.
Along with the population growth, more and more people chose to live in urban areas. The
percentage of the world‟s population residing in urban areas increased from 35.5% in 1965 to
51.6% in 2010 and this number will reach at 67% in 2015 (UN, 2012).
Although the level of urbanization in developing countries is low, its rate of urbanization is one of
the fastest in the world. Approximately 25% of Africa's population lived in towns and cities in
1975. In 2000, 38% of the continent's population lived in urban areas and the proportion is
expected to increase to 47% by 2015 and to be double by 2050 (Thuo, 2010). Conversion of
farmland and vegetation land cover into urban built-up areas reduces the amount of lands available
for food and crop production. Urban expansion has created high pressure on the agricultural land.
Subsequently, it brings negative impacts on socio-economic conditions to the communities. These

2
socio-economic problems are: reduce land quality and agricultural productivity, Soil erosion,
deforestation, reduce the amount of open space, desertification (Raddad et al., 2010).
According to Redman and Jones (2004), basically urban growth is a combination of three basic
Processes. First, rural-urban migration: It is a key source of urban growth since the origin of cities.
Rural-Urban migration is driven from perceived economic opportunities, insecurity in rural areas,
climate or economic problems etc. Second, natural increase: This is a combination of increased
fertility and decreased mortality rate. Third, re-classification of land from rural to urban categories.
As described by (Siciliano, 2012), the process of determining and implementing compensation are
illogical, ad-hoc and lacking clearness and created widespread social and political tensions more
importantly exposing the rural migrants for getting risk of increasing social vulnerability to
unemployment and food insecurity. Since compensation paid to the displaced people and evicted
from farm land ownership is usually inadequate, it is advisable and advantageous to accompany
money compensation with alternative development program plans to rehabilitate economically and
socially the evicted farmers (Siciliano, 2012).
A livelihood comprises the capabilities, assets (including both material and social resources) and
activities required for a means of living. A livelihood is sustainable when it can cope with and
recover from stresses and shocks and maintain or enhance its capabilities and assets both now and
in the future, while not undermining the natural resource bases" (Krantz, 2001). Livelihoods can be
made up of a range of on-farm and off-farm activities that together provide a variety of
procurement strategies for improving household life (Drinkwater and McEwan, 1992).
Kutaber is one of the rapidly expanding town in the Amhara Regional State. The economic bases
of the people in the district are the rain fed farming practices and free range livestock rearing.
Mixed agriculture remains to be the main livelihood activity. Urban expansion has been its own
impact on the livelihood of the surrounding farm households. Thus, the purpose of this study is
assess Urban Expansion and its Impact on Peripheral Farming Communities by taking Kutaber
town as a case study, Amhara Regional state, Ethiopia.

3
1.2. Statement of the Problem
In developing countries, where urbanization rates are high, urban sprawl is a significant contributor
of the land use change. Sprawl generally infers to some type of uncoordinated development with
impacts such as loss of agricultural land, open space and ecologically sensitive habitats in and
around urban areas (Sudhira et al., 2007). Now urban expansion is increasing at an alarming rate in
developing countries. This is due to fastest growth rate of world's population and change in human
settlement preferences. This urbanization process was manifested through the urban
physical/horizontal expansion to their peripheral agricultural farmlands. Such urban expansion
affects more of the farmers in per- urban territory, especially in developing countries and more of
the agrarian economy countries like, Ethiopia (G/Hiwot, 2006).
Generally, urban expansion is one of the basic problems that affect the living standard and food
security of many agrarian economy peoples in developing countries. This invasion process leads to
the loss of agricultural farm lands, grazing land, bare land and reduction of crops/food
productivity (Fekadu, 2015).
Kutaber town is, one of the towns of South Wollo zone of Amhara region, affected by urban
expansion due to the existence of high population growth and being flat in land scape make it
suitable for urban expansion. Since, the expansion of the town is becoming fast, irregular and
uncontrolled, it creates displacement to the farming community. There are different problems
associated with this expansion. like: loss of agricultural farm lands, reduction of grazing lands and
bare lands. Kutaber woreda is one of the woreda found in this region which is affected with these
problems. Some research have been done in this woreda with land use and land cover change. For
example, Kassaw (2010), by analyzing the long term dynamics of Landuse/landcover change and
developing the susceptibility of land degradation map, concluded that agricultural land increases
from 1973 to 2010, with mainly at the expense of grass land, forest land and Shrub land
respectively.
However this study didn't touch urban expansion and how it affects household livelihoods in the
woreda as well as in the town. Therefore, the researcher of this thesis assessed urban expansion
and its impact on the livelihood of peripheral farming communities by giving special attention to
three kebeles of the town by applying the GIS and remote sensing as well descriptive statistics.

4
1.3. Objectives of the Study
1.3.1. General Objective
The general objective of this study is to assess socio economic impact of urban expansion on the
livelihood of peripheral farming community of Kutaber town.
1.3.2. Specific Objectives
The specific objectives of this study are:-
To analyze the extent of horizontal expansion of Kutaber town using remote sensing and
GIS techniques between 1986 and 2016.
To identify the land use /land cover change of the study area.
To identify the major impacts of urban expansion on the displaced farmers livelihood in the
last 10 years in terms of financial, social, physical and natural capitals in the study area.
To Explore factors that contributed to rapid expansion of study area.
1.4. Research Questions
The aim of the proposed research is to answer the following basic research questions.
What are the major impacts of urban expansion on farmers livelihood in the last 10 years in
terms of financial, social, physical and natural capitals in the study area?
What changes occurred in land use /land cover in the period of 1986 – 2016 in the
Periphery of Kutaber town?
What are the most important factors that contributed to rapid expansion of study area?
1.5. Significance of the Study
Urbanization and Urban expansion in the developing countries like Ethiopia is an issue given due
attention by scholars, state administration, NGOs, governments, partners and other stakeholders for
various reasons. One of the reasons is the need to minimize negative impacts of urban expansion in
economic, social and environmental impacts, to bring mutual development and symbiotic
integration of the rural and urban life that foster social and economic development (Abdissa,
2005).
One of the major impacts of urban expansion is a shrinking amount of cultivated and grazing land
through the development of infrastructures and various development projects. Therefore, urban

5
land use change studies are important tools for urban or regional planners and decision makers to
consider the impact of urban expansion. The finding of this study is significant in providing
realistic information and initial input for urban planning experts, decision makers, urban managers,
researchers, policy makers, governmental and non-governmental organizations and academicians.
1.6. Scope of the Study
This study was limited geographically, thematically and methodologically. Geographically, this
study emphasis only on three peri-urban rural kebeles that are found surrounding Kutaber town as
these are the only kebeles which are affected in the process of urban expansion. These kebeles are
Alasha, Beshilo and Doshigni. Thematically, the scope of this study was limited to assessment of
the impact of urban expansion on the farmer's livelihood specially on financial, social, physical
and natural capitals by giving attention to income, livestock holdings, infrastructures and farm land
that were affected because of urban expansion in the study area. To make it convention to hold that
the study in time and coverage, it focused on the farmers that are displaced in the last 10 years.
Methodologically, the spatial extent of the study was limited to the available satellite image of
three points in time. This study used both qualitative and quantitative approaches and the methods
used in the collection of data were key informant interview, questionnaires and field observations.
1.7. Limitation of Study
Shortage of time and limited network connection to down load images are some of the challenges
that were facing the researcher in the course of the study.
1.8. Organization of the Thesis
This research was organized into five chapters. The first chapter contains background of the study,
statement of the problem, objectives, research questions, significance, scope and limitation of the
thesis. The second chapter is devoted to review of related literature. The third chapter deals with
the description of the study area and methodology of the study and the fourth chapter deals with
the results and discussion parts of the thesis. Finally, the last chapter presents the conclusion and
recommendations of the study.

6
CHAPTER TWO: REVIEW OF RELATED LITERATURE
2.1. Operational Definition of Related Words and Concepts
Urban (as opposite to rural) refers to areas characterized by denser population settlement per-unit
of land, higher heterogeneity of in habitants (in terms of ethnic background, religious adhere-ship,
livelihood strategies and sources, educational levels etc…), greater organizational complexities as
well as higher formal social control (Bekele, 2010).
Urbanization is the process of urban expansion, may involve both horizontal and vertical
expansion of the physical structure of urban areas. And it can result in loss of agricultural land,
natural beauties, range lands, parks and sceneries (Melesse, 2004)
Urban expansion is synonymous with urban sprawl, is the extension of the attentiveness of people
of urban settlement to the surrounding area whose function are non agricultural. Urban expansion
is a common phenomenon in both developed and developing countries. However, in developing
countries urban expansions are known with negative effect. The major effects contributing for
rapid urban expansion in Ethiopia are higher natural population growth, rural to urban migration
and spatial urban development (Fekadu, 2015).
Urban periphery is an open country side including peri-urban areas largely occupied by
Agricultural communities in rural settlement pattern to which urban settlement expands and
Peripheral farming communities is agricultural community in rural settlement pattern to which
urban set elements expands (Bekele, 2010).
Agricultural communities are inhabitants of rural settlements that are mainly engaged in
agriculture both crop and livestock production as well as forestry, fisheries and the development of
land and water resource (Ciparisse, 2003).
Livelihood the most habitually employed definition of livelihood which the researcher agrees is „A
livelihood comprises the capabilities, assets (including both material and social resources) and
activities required for a means of living. A livelihood is sustainable when it can cope with and
recover from stresses and shocks and maintain or enhance its capabilities and assets both now and
7
in the future, while not undermining the natural resource base (Chambers and Conway, 1992).
Livelihood assets can be understood by the notion of five main capitals:-human capital, social
capital, physical capital, natural capital, and financial capital (Ellis, 2000).
Natural capital: consists of land, water and biological resources such as trees, pasture and
biodiversity.
Financial capital: consists of stocks of money or other savings in liquid form. In this study
context, it includes not only financial assets but also it does easily disposable assets such as
livestock, which in other senses may be considered as natural capital. It includes income levels,
variability over time, and distribution within society of financial savings, access to credit, and debt
levels.
Physical capital: is that created by economic production. It includes infrastructure such as roads,
irrigation works, electricity, reticulated equipment and housing.
Human capital: is constituted by the quantity and quality of labor available. At household level,
therefore, it is determined by household size, but also by education, nutrition, skills, capacity and
health of household members.
Social capital: any assets such as rights or claims that are derived from membership of a group.
This includes the ability to call on friends or kin for help in times of need, support from trade or
professional associations (e.g. farmers‟ associations) and political claims on chiefs or politicians to
provide assistance. In one way or in another the social capital is a function of power a given
individual or group assumes and a kind and a level of the relationship that exists in a given societal
structure.
Compensation: according to Proclamation # 455/2005, compensation is a means of payment for
the property that is expropriated by the respective executing body of government both either in
cash or kind. The process of compensating for the evicted house hold should include all forms of
asset ownership or use right among the affected population and provided a detailed strategy for
partial or complete loss of assets.

8
2.2. Urbanization and Urban Sprawl
Urbanization refers to a process in which an increasing proportion of an entire population lives in
cities and the suburbs of cities. It is the movement of population from rural to urban areas and the
resulting in increasing proportion of a population that resides in urban rather than rural places.
Urbanization is a form of metropolitan growth that is a response to often bewildering sets of
economic, social, and political forces and to the physical geography of an area. Population increase
as well as immigration from rural area towards larger cities, particularly in developing countries
results in considerable increase in urban areas. Sprawl is a pattern and pace of land development in
which the rate of land consumed for urban purposes exceeds the rate of population growth which
results in an inefficient and consumptive use of land and its associated resources Meles and Vanum
(2012).
2.3. Urbanization in Africa
Urbanization is increasing in both developed and developing countries. However, rapid
urbanization, particularly the growth of large cities, and the associated problems of unemployment,
poverty, inadequate health, poor sanitation, urban slums and environmental degradation pose a
formidable challenge in many developing countries. Although urbanization is the driving force for
modernization, economic growth and development, there is increasing concern about the effects of
expanding cities, principally on human health, livelihoods and the environment (UNCED,1992).
Natural population increase (high births than death) and migration are significant factors in the
growth of cities in the developing countries. The natural increase is fuelled by improved medical
care, better sanitation and improved food supplies, which reduce death rates and cause populations
to grow. In many developing countries, it is rural poverty that drives people from the rural areas
into the city in search of employment, food, shelter and education.
In Africa, most people move into the urban areas because they are pushed out by factors such as
poverty, environmental degradation, religious strife, political persecution, food insecurity and lack
of basic infrastructure and services in the rural areas or because they are pulled into the urban areas
by the advantages and opportunities of the city including education, electricity, water etc. Even
though in many African countries the urban areas offer few jobs for the youth, they are often
attracted there by the amenities of urban life (Tarver, 1996).

9
2.4. Urbanization in Ethiopia
The urban population in Ethiopia is increasing rapidly. Estimated at only 17.3 percent in 2012,
Ethiopia‟s urban population share is one of the lowest in the world, well below the Sub-Saharan
Africa average of 37 percent. But this is set to change dramatically. According to official figures
from the Ethiopian Central Statistics Agency, the urban population is projected to nearly triple
from 15.2 million in 2012 to 42.3 million in 2037, growing at 3.8 percent a year. Analysis for this
report indicates that the rate of urbanization will be even faster, at about 5.4 percent a year. That
would mean a tripling of the urban population even earlier by 2034, with 30 percent of the
country‟s people in urban areas by 2028 (World Bank, Ethiopia Economic Update II (2013).
2.5. Urbanization in Kutaber
Kutaber town is one of the rapidly expanding town. The reason is that, the area is suitable for
settlement and other infrastructure purposes. Because of this reason, the expansion is increasing at
an alarming rate.
2.6. Causes of Urban Expansion
Urbanization in worldwide has resulted in cities that are rapidly growing and expanding to be able
to host their increasing population and this expansion is termed as urban sprawl. The expansion of
urban to the neighbouring rural environment is caused by two major factors, namely spatial urban
growth and increase in urban population due to high birth rate and in-migration (both rural to
urban and urban to urban) migration. The first source of urban expansion-urban development is
induced by the economic advancement, urban clearance and/ or industrialization (Kedir, 2010).
Hence, places or sites that are adjacent to urban areas might be needed for social, economic,
industrial and communication, road construction and for other infrastructure and investment that
may in turn need resettlement and displacement of the neighboring rural farming community
(Cernea, 2000).
2.7. Consequences of Urban Expansion
The rapid urban expansion in developing countries is usually associated with unplanned
development in the periphery that requires high cost of infrastructure. It is also evident that even in
planned activity the development of infrastructure usually does not correspond to the large tract of

10
land that develops in a low-density pattern. Thus urban expansion consequently results in social,
environmental and economic problems to the society (Bhatta, 2010).
2.7.1. Positive Impacts of Urban Expansion
Urban centers have positive impact on the development of their surrounding peri- urban areas
through different ways. According to Satterthwiate and Tacoli (2004), the surrounding area of
urban centers are mostly engaged in agricultural production either for local consumers or as links
to national and export markets, urban centers act as access to market which is the pre-requisite to
increasing rural agricultural incomes. Proximity also contributes to minimize the risks of
perishable products to produce timely to market areas and to get affordable transportation.
According to (G/Egziabher,1998) and other, the practical activities approved that people who live
in the surrounding urban centers can have possible access to both private and public services such
as health, education, banking, postal & telephone and services of different professionals (lawyers)
and private services like wholesale and retail, sales of manufactured goods.
As to the view of Kamete and Tvedten (2006) in order to assure that people who live around urban
centers, because of their proximity, have a better access to employment and modern way of living
than those who far rural dwellers. Besides, urban centers create employment opportunities through
the development of small and micro enterprises and cooperatives.
Fekadu (2015), in his study on urban expansion and its effect on peripheral farming community in
Hosanna town pointed out that, physical capital i.e. number of house rooms- buildings- increased
in percentage.
2.7.2. Negative Impacts of Urban Expansion
Urbanization has also some negative effects to its surrounding peri-urban areas in different aspects
especially, in relation to displacement of farmers from their farmland and to degradation of
valuable agricultural land. This is because as the nation‟s population increase, cities must grow
spatially to their peri-urban areas to accommodate more people and to serve different services for
them. In Ethiopia, the urbanization was increased from 5% in 1950 to 16% in 2000, on average
4.3% per year. Furthermore, it is estimated that by 2025 the World‟s, African‟s and Ethiopian‟s
population rate will reach 58%, 52%, and 32% respectively (Webster, 2005 as cited in Mahari,

11
2011).The reason for an optimistic prediction towards the urbanization growth is that, it will have
the following negative effects of urban expanding on their peri-urban areas.
As pointed out by (Dayong, 2004) uneven urban expansion will occupy considerable valuable
farmland around urban centers, which causes to sensitive contradiction and conflicts with the
farmers who are displaced from their farm land. Urbanization negatively affects the peri-urban
areas in different ways. As urban centers, expand by occupying fertile farm land and displacing
farmers cause to reduce the amount of production and number of family farmers and move to the
nearby urban centers.
As a result, the farmers with their large family size will be exposed to unemployment and poverty
(food insecure) for the reason that they are not well educated and skilled rather depending on their
agricultural production. It is understood that, people without basic qualification or literally skilled
are unable to compete and get job in the labor market G/Egziabher and Solomon (1997).
According to Mc Granahan et al. (2004), rapid urbanization leads to over exploitation of renewable
and non-renewable resources of their peri-urban areas (especially, land). Because people who live
in urban areas have vary and different consumption pattern than these who live in the peri-urban
areas. The demands made by urban centers greatly exceed the carrying capacity of their own
territory.
According to G/Egziabher and Solomon (1997), urbanization causes for enormous conflicts
associated with land acquisition. The most sources of conflict are found at the borders of the urban
and rural, common and private, smallholder and investors land.
The research conducted by Feyera (2005), that mainly focuses urban expansion effect on the
livelihood of the dislocated farming community indicated that the rapid urbanization process in
Addis Ababa towards the peripheral rural farmlands have displaced 4,390 agricultural
communities estimated of 1232.96 hectares of farmland changed to urban use in 5 kebeles in three
years time (1997-1999).
12
According to Adugna (2016), urban expansion led to loss of farmland and displacement of the
households who had been involved in farming activity.
As pointed out by Fekadu (2015), natural assets mainly land and permanent forest declined. Also,
the study by him found out that there was inadequate food, poor nutrition, poor health, poor
education and very limited marketable skills and knowledge.
2.8. Rural- Urban Linkage
Rural-urban interactions are important elements of the livelihood strategies of both rural and urban
households, either in the form of flows of people (migration), natural resources, products, goods
and services, information and money, or in the form of income diversification such as urban
agriculture and non-farm rural employment. However, mostly rural and urban development has
been considered in isolation in most developing countries. Their inherent linkage with each other‟s
development is less considered or reduced to only market linkages. Although market linkages play
significant role, Rural-Urban Linkage (RUL) is beyond this linear kind of assumption and it
encompasses many complex interactions and processes. Rather it is important to recognize the
close relation between urban and rural systems. This is due to fact that efforts and initiatives in one
area, when properly conceived and planned, can have a positive spillover effects in the other
(Tacoli, 2002).
Urban-rural linkages have the potential to transform sustainable human development for the
benefit of all. Integral to this is knowledge generation and management as well as capacity
development, which can provide an enhanced understanding of how functions and flows operate. It
is critical to understand existing parameters that exacerbate the dichotomy between urban and rural
areas and those that promote linkages. Globally, there is insufficient knowledge on the dynamics
of small and intermediate cities where half of the world‟s urban people live, making them a
missing link in understanding the dynamic of urban-rural interactions (Brian et al., 2014).

13
CHAPTER THREE: DESCRIPTION OF THE STUDY AREA AND THE RESEARCH
METHODS
3.1. Description of the Study Area
3.1.1. Location
Kutaber town is found in Amhara Regional State in South Wollo Zone of North-central part of
Ethiopia. The town was established in 1837 (KWARDO, 2007). It is 495km far from the regional
capital city Bahir Dar in the East, 419km far from Addis Ababa in the North, and 18km far from
Dessie town in the North. It is enclosed by Dessie zuria on the South, Tenta on the West, Ambassel
on the North, and Tehulederie on the East. The geographic location extends from 39°18′ E –39°38′
E Latitude and 11°8′ N –11°29′ N, Longitude and an elevation of about 2501m above sea level. Its
total area 86.486 km2 (Kassaw, 2010).
Figure 3.1. Location map of the study area.
Source: CSA, (2007)
14
3.1.2. Population
The total population of the town is to reach 8,220 and rural population is 96,247. Average family
size is 5-6. The town is totally inhabited by Amhara people and the people are predominantly
followers of the Christians and Muslim faith (CSA. 2010).
3.1.3. Climate
The agro climatic zone of the woreda varies from Kolla, Woina Dega and Dega. The average
annual rainfall of the woreda is 1110.57 mm per year. The woreda high rainfall season is during
Kiremt that starts in June and ends in September and short rain season is in Belg in January and
ends in February. Temperature is the major determinant factor for Climate in Ethiopian. The mean
minimum temperature for the woreda is 6.56°c during October and November to mean maximum
temperature of 23.13°c during May (kutaber woreda Agricultural and Rural Development Office
(KWARDO, 2007).
3.1.4. Soil
The soils for the study area are predominantly Lithic Leptosols and Eutric Vertisols. The general
slope ranges on from 0 to 79.85 % in which these soils occur. The area is usually found in
landscapes of mountain and major scraps, uplands and bottomlands, and minor valleys (FAO,
1997).
3.1.5. Socio-economic Conditions
The economic bases of the community in the woreda are the rain fed farming practices and
livestock rearing. Mixed agriculture remains to be the main livelihood activity. The major
cultivated crops include Teff, Barley, Wheat, Bean, Field peas, Maize, Chickpeas, and sorghum. In
general, activities other than agriculture seem to be very limited. Agriculture is an important
household resource that plays significant role to household food security, income generation.
Cattle, sheep, goat, cow and ox are the most common domestic animals raised in the rural area and
in the urban area, main activities are trade, cattle raring, daily labour, employees in the government
and non government organization (KWARDO, 2007).

15
3.2. Materials and Methodology
3.2.1 Research Design
The method of research for this study was survey research design. The reason for this researcher
choose this design was that it enabled to describe the intended study to the impacts of urban
expansion on the peripheral farming community. In order to address the stated objectives the
researcher was use both qualitative and quantitative types. This is because the proposed study
needs the collection of statistical (numerical) data for the quantitative approach. Qualitative
method applied to describe the existing conditions of expansion of the town and by using
qualitative data, options that are hold and processes that are going on regarding to the urban
expansion to periphery of Kutaber town.
3.2.2. Data Acquisition
Reliable data is necessary to realize the designed objectives and hence the study is based on both
primary and secondary data.
3.2.2.1. Primary Data Sources
Important sources of primary data for this study were key informant interview, questionnaires,
field observations and Ground Control Points (GCP). Those generated during geophysical survey
and the number of Ground Control Points measure by GPS (Global Position System) from field.
i. Key informant interview
The researcher prepared an interview guides for displaced farmers, experts of the municipality,
kebele administration and elders of the community. Because experts and office head who are
directly working on the issue believed to have rich data than the others. In addition, it helps to get
required information from community elders could describe changes resulted over time than other
existing young people. Hence, purposive sampling was used to select participants for key
informant interviews. Finally, 12 people participated in the key informants interviews. More
specifically, three from Municipality of the town, two from Office of Land Management of
Kutaber, five from Community elders, two from kebele Administration.
ii. Questionnaire
The researcher used similarly questionnaire for all respondents of the selected sample. The
questionnaire was primarily prepared in English languages and then translated to Amharic

16
language. Finally it was translated to English language and then been analyzed. The items of
questionnaire was both closed ended and open ended questions.
iii. Field observation
Ground truth data‟s on the field were collected by direct observation on the selected area for this
study. The researcher observed and collected the necessary visual information with the help of
hand held GPS and camera from the existence of urban expansion. Observation used by the
researcher in order to get more information to accurate the information gets from the other tools.
Observation checklist was used by researcher to conduct field survey systematically.
3.2.2.2. Secondary Data Sources
The secondary sources of data were also collected from books, journals, official reports, websites,
legal documents, satellite images, previous study documents, meteorological data, population data,
aerial photograph and topographic map 1:50,000 of Kutaber from Ethiopian Mapping
Agency(EMA) data's were widely used.
3.2.2.2.1. Satellite Imageries
In order to assess the urban expansion in the study area, Landsat imagery of (1986, 2000 and 2016)
cloud free image for Kutaber, path 168 and row 52 were acquired from website. These data's were
used to produce the historical land use/ land cover maps of the study area and urban expansion
changes. The images were downloaded from the United States Geological Survey (USGS) Earth
explorer website and spatially referenced in the Universal Transverse Mercator (UTM) projection
with datum World Geodetic System (WGS) 1984 UTM zone 37N. The images were extracted to
Tiff formats for processing and the detail of image properties are summarized in (table 3.1) below.
Table 3.1. The characteristics of landsat satellite data used in this study
No Sensor Date of Acquisition Spatial resolution Source Path/Raw
1 Landsat TM 26/02/1986 30 m USGS website 168/52
2 Landsat ETM+ 05/02/2000 30 m USGS website 168/52
3 Landsat ETM+ 23/01/2016 30 m USGS website 168/52
Satellite bands were composed in different ways in order to identify surface features in the study
area. True color composite usually known by RGB 321 combination where band 3 reflects red

17
color, band 2 reflects green and band 1 reflects blue color. Another composite called "false color
composite" which uses an RGB combination of 432. In this band combination band 4 represents
the NIR infrared, band 3 belongs to red and band 2 to green. This combination gives better
visualization in identifying vegetation which looks red in 432 combinations. Figure 3 below
illustrated maps of the study area generated using the false color (432) combination of the year
1986 and 2000, false color (543) combination of the year 2016 and vegetation is seen as red and
darkred.
Figure 3.2. False color composite of landsat image of 1986, 2000 and 2016.

18
3.3. Materials and Software’s
Table 3.2. Materials and Software‟s were used.
Materials and Software’s Function
ERDAS Imagine 2013 To image pre-processing, layer stacking single bands, supervised
classification of land classes and accuracy assessment of the
classification.
ArcGIS 10.3 To create study area shape file, identify path and row of the study
area, data analysis, management, geo-referencing, the study area
delineation and clipping and make layout for final mapping.
Micro-soft excel To perform different statistical calculations.
Micro-soft word To write the research paper.
SPSS To process, manage and analyze the data's collected.
GPS To collect ground control points (GCPs) used to conduct ground
accuracy assessment.
Digital camera To capture urban expansion images in the study area.
3.4. Sampling Techniques
3.4.1. Sampling Frame
The sampling frame to identify respondents was the list of 4,410 households who were displaced
farmers from their land. In each peripheral kebeles, a list of the displaced households would be
generated from roasters of the kebele administration.
Table 3.3. Sampling frame used to identify sample households
Kebele Total number of households Population displaced in household
Alasha 8,532 1,950
Beshilo 2,519 600
Doshingi 8,449 1,860
Total 19,500 4,410
Source: Kutaber Town Administration, 2017.
3.4.2. Sample Size Determination
In the process of realization this study, a purposive sampling technique was employed to assure the
representativeness of samples on-target group-households that are faced with problem in the
peripheral part of Kutaber town. In this regard, the researcher purposively selected three kebeles

19
from twenty one kebeles as they are kebeles which are affected with urban expansion, by
considering distance from the district town, have road accessibility and these kebeles are found
relatively on flat areas that make them suitable for settlement and other infrastructure purposes.
These kebeles are; Alasha, Beshilo and Doshigni.
Representative samples from the households of selected kebeles were based on scientific formula
at required degree of confidence. Therefore, representative sample of these households have been
calculated based on formula for sample size determination and for finite population. According to
(Dirribsa and Tassew, 2015). The formula is given as:
𝑛 =z2 .p.q.N
𝑒2 . 𝑁−1 +𝑧2 .𝑃.𝑞 =
1.962∗0.5∗0.5∗4410
0.082∗ 4410−1 +1.962∗0.5∗0.5 =
3.8416∗0.25∗4410
0.0064∗ 4409 +3.8416∗0.25
=4235.364
29.178=145.
Where n= required sample size=145, N=Population=4,410, Z= Confidence interval at 95% which
is 1.96, e=8%, P= 0.5, q= 0.5, Z=95% confidence interval under normal curve 1.95. The samples
of respondent are taken from each kebeles on the basis of the formula given above). e= acceptable
error term(0.08), P and q are estimates of the proportion of population to be sampled and N=total
population.
The following is the detail about the sample respondents from each kebele which is computed as
total population of each kebele or portion/total population*total calculated sample using the above
formula: Alasha: displaced,1950/4410*145=64, Beshilo: displaced, 600/4410*145=20, and
Doshigni: displaced, 1860/4410*145=61. Total= 64+20+61=145. This is summarized with the
following (table 3.3).
Table 3.4. Sample size determination proportionality
Kebeles
Displaced Household Size
Sample Size based on Proportionality Sampling
Alasha 1,950 64
Beshilo 600 20
Doshigni 1,860 61
Total 4,410 145
Source: Own competition, March, 2017

20
3.5. Data Processing and Analysis Method
3.5.1. Data Processing
The study area was selected from Ethio- GIS using arc map and export as a shape file. In order to
identify path and raw of the project area and define project and re-projection was performed. The
image processing task was carried out using (Earth Resource Data Analysis System) ERDAS
Imagine 2013 software. Prior to data analysis, initial processing on the raw data is usually carried
out to correct for any distortion due to the characteristics of the imaging system and imaging
conditions. Land cover map was prepare after the images have been download, project and stack
(pre-process) to be displayed in ERDAS IMAGINE software interface (Jensen, 2004).
3.5.2. Data Analysis
The primary data obtained from interview to government office experts and elder person
community members selected in the pre-urban evicted farmers was analyzed qualitatively. With
regard to the data gathered from household survey, field supervisor checks every completed
questionnaire, the pre-coded questionnaires were processed, managed and analyzed by using the
Statistical Package for Social Sciences (SPSS) software and Micro-soft excel program. Variables
such as, sex, age, households size, education status, their attitude on the effects of urban expansion
on their farmland and livelihood were analyzed using descriptive statistic mainly percentage and
mean as well as graphs. The acquired land use statistics data were presented and analyzed by using
tables, figures, charts and reports.
Depending on the scope of the study and visual interpretation of various environmental features of
the study area was done based on the visual elements or characteristics of satellite image, i.e. tone,
texture, shape, Pattern, shadow, association and aspect of the features with the support of field
verification of each land use/land cover features.
To get a land cover/land use map at reasonable accuracy, training areas have been chosen with the
help of different sources such as high resolution images (Aerial photography) and Google Earth.
Aerial photography image was used to access the low resolution Landsat image. Google Earth
provides an access of high resolution image on the internet. The study area has a high resolution
Google Earth image, dated 2016. Clearly recognized objects on Google earth image were digitized
and taken as AOI (Area Of Interest) and used to classify Landsat images.

21
GPS points and digital camera were used to locate some sample ground cover situation at the time
of field visit. Some land use/land covers in urban area, like water body, woodlots, and built-up
area stay for long time without change to other land use/land covers. in this study totally 40
samples were collected from field, whereas the remaining 90 points taken from Google earth map.
Therefore, some GPS points collected from the field and some Google Earth image were used to
minimize the processes of land use/land cover classification and as the same time used to validate
the accuracy of land use/land cover results. Then, from the satellite imageries, seven classes were
chosen. These were built-up area, forest, bare land, water body, shrub land, farm land and grass
land.
Figure 3.3. Land use/Land cover classification.
Source: Own computation, 2017.

22
Figure 3.4. High resolution images (Google earth). Source: Google earth, (2016).

23
Figure 3.5. Ground truth data from field observations.
Source: Photo by author, 2017.
Description of Land Use/Land Cover Classes
The classification process, it is rare to find clearly defined classes that one would like. Before
collecting training samples, the land cover classes should be known so as to make the classification
easier(Bekalo, 2009).This paper established its own classification scheme based on visual
interpretation of satellite images.
Table 3.5. Land use/land cover classes descriptions.
No. Land use/land cover Descriptions
1 Built-up areas Continuous and discontinuous urban fabric, residential, industrial
and commercial units, road and other associated lands.
2 Forest Areas covered by trees forming closed or nearly closed canopies
3 Bare lands Open spaces with little or no vegetation, sands and rocky areas
4 Water body including river, stream and lake
5 Shrub lands Scattered trees and bush land
6 Farm lands Irrigated and rain fed arable lands, crop land with permanent crops,
farming and fallow fields
7 Grass lands Areas with permanent grass cover along ridges steep slopes and
plain areas used for grazing; usually private as well as communal.
Source: Own classification scheme, 2017.

24
There are two methods of image classification. Supervised image classification involves selecting
pixels that represents land cover classes that are recognized by the analyst. This requires, however,
prior knowledge of the area by the analyst. Unsupervised image classification is more computer-
automated. It enables the analyst to specify some parameters that the computer uses to reveal
statistical patterns that are inherent in the data. These patterns are simply clusters of pixels with
similar spectral characteristics. This method used when less is known about the data before
classification (Tadesse et al., 2001). Due to similar spectral characteristics of grass, crop and bush
lands, which was been determined to be independent classes before classification, the application
of unsupervised classification may not give good results. As a result, supervised image
classification was been used.
3.6. Output
3.6.1. Land cover / Land use Change Detection
After determining the land cover features the next step was land cover change detection. Land
cover change detection is the process of assessing the spatial and temporal land use/ land cover
change in the study area. Land use/land covers has been consecutively analyzed using datasets
from remotely sensed landsat imageries of 1986, 2000, and 2016 years a given land cover feature.
This was done through overlaying the classified satellite imageries and analyzing by image
differencing.
There are varies techniques in land use/ land cover change detection. From these the most common
one is post classification comparative analysis of independently produced classifications from
different dates map to map and image to image comparison (Alebachew, 2011). In the case of the
post classification method, imageries from different archives in different year interval are
classified and labeled individually.
The former employed to image classification and change detection while the later was used to
finalize the mapping exercises and layout preparations from the classified images. Furthermore,
the outputs of image classification were verified by conducting ground truth. And the primary data
gathered from household interview, field supervisor were check every completed questionnaire
then to analysis by using the Statistical Package for Social Sciences (SPSS) version 20 software
and Micro-soft excel program.

25
Figure 3.6. Flow chart of the Methodology
Source:- Owen competition, 2017
Data Sets and Methodology
Field Survey (Ground
Control Points) GCP
Land sat Imagery data
(1986, 2000 & 2016)
Ground Positional
system (GPS) Image
Interpretation
Image Pre-processing
Image Classification
Qualitative and
Quantitative Ground-truth
verification
Ground truth data Accuracy Assessment
Data Processing LULC change detection
map of each years
Tool (SPSS)
Image to image comparison
Data Analysis
Out Put
Data in table, charts &diagrams Urban expansion change map
Land holdings, income, built-up area, asset
ownership, infrastructure.
Out Come Variables
Topographic map
(1:50000) &
Aerial Photograph
Socio-economic
data
Points) GCP
Interview and
Questionnaires
Geo-database

26
3.7. Reliability and Validity of Methods and Materials
The reliability and validity of the outcome of the thesis report was ensure as much as possible by
taking the following precautions. The insights were obtained from the combined use of
quantitative and qualitative methods simultaneously increase the strength of the conclusion.
Consulting knowledgeable persons (experts and researchers) on issues that require expertise and
crosschecking information was obtain through interviewing with information gathered from public
records and published materials on the issue.
3.8. Ethical Considerations
All research studies present a number of ethical and moral dilemmas which must be identified and
addressed prior to carrying out any research study in order to protect all participants from potential
harm. Also the privacy and confidentiality of study‟s subjects was maintain, all findings are
portrayed in a confidential manner so that no personal or identifiable information is record or print
in the study. Thus, the name of participants was not record during the data collection process.
Therefore, before data collection, a formal letter was given to the researcher from Addis Ababa
University and the researcher show to the concerned organization and explained the general
objective of the study. Then, the researcher gathers the required data for the study after getting
permission from the concerned organizations.

27
CHAPTER FOUR: RESULTS AND DISCUSSIONS
4. Introduction
This chapter presents the main findings of the study concerning urban expansion and its impact on
the livelihoods of peripheral farming community. The results presented in this chapter seek to
achieve objective of the study, which is to assess urban expansion and its impact on livelihood of
peripheral farming community of Kutaber town. This part of the thesis deals with the description
of general characteristics of sample respondents and then information's are presenting, analyzing
and interpreting collected/gathered from; farmers who were displaced from their land between
2006 -2016, from key informants who are interviewed such as formal and informal leaders and
influential elders, municipal experts and official documents through conducting questionnaires,
interviews and document analysis. Generally, it contains three cooperated or mutually coexisted,
parts i.e. some deals with farmer's responses, others deal with the official administrative experts
response to the questionnaires and interviews and some others also deal with the official
(municipal) document analysis.
4.1. Demographic Characteristics
The demographic variables of the respondents such as sex, age, education status, household size
and marital status were collected and the results presented as follows.
4.1.1. Sex Structure of the Respondents
Sex of the household head is an important variable influencing participation and decision making
that in intern to influence the entire livelihood of the community. Table 4.1. displayed that the
majority (82.07%) of the respondents are male headed and the rest(17.93%) were female.
Table 4.1. Sex of household head.
Sex of household head Frequency Percent
Male 119 82.1
Female 26 17.9
Total 145 100
Source: Own survey, 2017
4.1.2. Households’ Family Size
In (table 4.2) shows us, the sample household's respondents, 58 (40%) of the respondents have 1-3
family size, 72(49.7%) remain that 4-6 family sizes and 15 (10.3%) indicated 7-9 of family sizes of

28
the town. Therefore, the majority of the respondents were 4-6 family sizes in the area. An average
family size is 5-6. From this, we can learn that those farmers in per-urban areas and whose land
had been expropriated have a large family size burden under the narrower income source
condition.
Table 4.2. Households‟ family size
Households’ Family Size Frequency Percent
1-3 58 40.0
4-6 72 49.7
7-9 15 10.3
Total 145 100.0
Source: Own survey, 2017
4.1.3. Marital Status of the Respondents
As it shown on (Table 4.3.), the majority of the respondents 87(60%) are married followed by
single, divorced and widowed with 25(17.2%), 14(9.7% and 19(13.1%) respectively. Hence, the
respondents could give their answer from their experience of administering family and caring
responsibility.
Table 4.3. Marital status of households
Marital Status Frequency Percent
Married 87 60.0
Single 25 17.2
Divorced 14 9.7
Widowed 19 13.1
Total 145 100.0
Source: Own survey, 2017
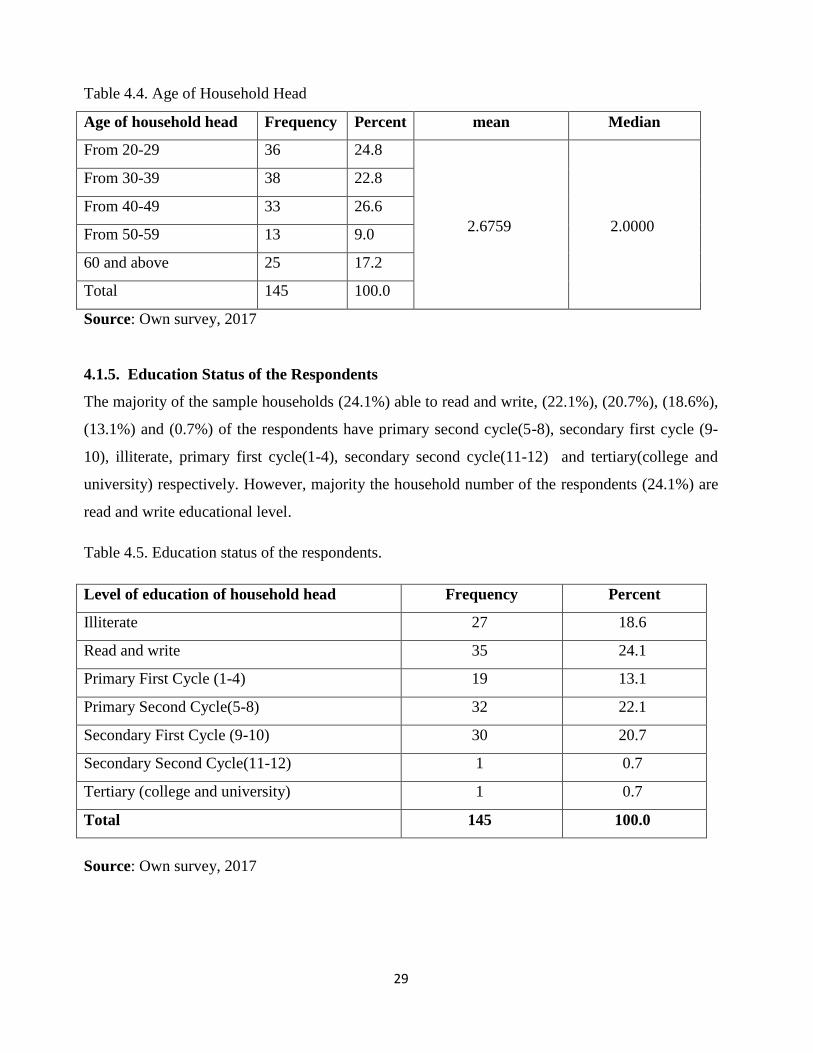
4.1.4. Age of Household Heads
As we can see from the (Table 4.4.), the majority respondents of the sample households were 40-
49 age groups in the study area with mean of 2.6759 and median of 2.0000.
29
Table 4.4. Age of Household Head
Age of household head Frequency Percent mean Median
From 20-29 36 24.8
2.6759 2.0000
From 30-39 38 22.8
From 40-49 33 26.6
From 50-59 13 9.0
60 and above 25 17.2
Total 145 100.0
Source: Own survey, 2017
4.1.5. Education Status of the Respondents
The majority of the sample households (24.1%) able to read and write, (22.1%), (20.7%), (18.6%),
(13.1%) and (0.7%) of the respondents have primary second cycle(5-8), secondary first cycle (9-
10), illiterate, primary first cycle(1-4), secondary second cycle(11-12) and tertiary(college and
university) respectively. However, majority the household number of the respondents (24.1%) are
read and write educational level.
Table 4.5. Education status of the respondents.
Level of education of household head Frequency Percent
Illiterate 27 18.6
Read and write 35 24.1
Primary First Cycle (1-4) 19 13.1
Primary Second Cycle(5-8) 32 22.1
Secondary First Cycle (9-10) 30 20.7
Secondary Second Cycle(11-12) 1 0.7
Tertiary (college and university) 1 0.7
Total 145 100.0
Source: Own survey, 2017

30
4.2. Current Land Ownership of the Respondents
It is indicated in (table 4.6), that all of the respondents have their land in the study area. However,
different in size.
Table 4.6. Whether the respondents have land or not
Response Number of respondents Percent
Yes 145 100
No 0 0
Total 145 100
Source: Own survey, 2017
4.2.1. Respondents Land size in Hectare
As it is indicated in (table 4.7), the average land holdings of the respondents is 2.56 Timad1.
However, there are respondents who have a minimum of 1timad land and maximum of 5 timad
land.
Table 4.7. Land holding size of respondents
Landholding size (ha) N Minimum Maximum Mean Std. Deviation
145 1 5 2.56 1.005
Source: Own survey, 2017
4.2.2. Respondents’ Land Allotment Purposes
The respondents are also using their land for different purposes. Out of their total land, crop land
23.4%, grazing land 10.3%, fruits and vegetables 18.6%, crop land and grazing land 2.8% and the
remaining 44.8% is used for all of the above purposes . Hence, the land of the farmers is serving
for means of livelihood for the farmers. This implies losing the land they hold directly affect their
means of living unless replaced by another means of earning. Most of respondents are claiming
that their land is serving for all purposes followed by crop and fruits and vegetation.
1 1 Hectare=4Timad=4 Gemmed in local measurement.

31
Table 4.8. Respondents‟ land allotment purposes
Land use type Number of respondents Percent
Crop land 34 23.4
Grazing land 15 10.3
Fruits and vegetation 27 18.6
Crop land and Grazing land 4 2.8
All purposes 65 44.8
Total 145 100
Source: Own survey, 2017
4.3. Urban Expansion impacts on Farmers’ Financial Capital in 2006-2016
According to (table 4.9), the sample households of respondents, 1(0.7%), 8(5.5%), 29(20%), 64
(44.1%) and 43(29.7%) reported that these households used to earn total annual income of 41-50
quintal, 31-40quintal, 21-30quintal, 11-20quintal and below 10quintals respectively before urban
expansion. After urban expansion, they reported that to have earned 0(0%), 1(0.7%), 10(6.9%),
51(35.2%) and 83(57.2%) for 41-50quintal, 31-40quintal, 21-30quintal, 11-20quintal and below 10
quintals respectively. This indicates that annual production/ income decreased after urban
expansion in the study area.
This can be seen from the following table that number of respondents who produced 41-50quintal
decreased from 0.7% to 0%, 31-40quintal from 5.5% to 0.7%, 21-30quintal from 20% to 6.9%
and 11-20quintal from 44.1% to 35.2%. But number of respondents who produce less than
10quintals increased their income from 29.7% to 57.2%. This is to mean that, the majority of the
population produces fewer amounts less amount of quintals after urban expansion. This
corresponds to the study by (Dayong, 2004) as displacing farmers cause to reduce the amount of
production.

32
Table 4.9. Annual income before and after Urban Expansion in quintal and percent in 2006-2016
Before urban expansion After urban expansion
Quintal Number of respondents Percent Quintal Number of respondents Percent
Below 10
43
29.7
Below 10
83 57.2
From11-20 64 44.1 From11-20 51
35.2
From21-30 29 20.0 From21-30 10
6.9
From31-40 8 5.5 From31-40 1
0.7
From41-50 1 0.7 From41-50 0
0
Total 145 100 Total 145
100
Source: Own survey, 2017
4.4. Awareness of the house holds about Urban Expansion
As (table 4.10) shows us, about 106(73.1%) households agreed that they had awareness on the
expansion program. The expansion program through the means of orientation, seminars and both
by the town administration, while the rest, 39(26.9%) households believe that they were not aware.
On the other hand, the key informants inform us that this community had been informed via
different means that the land was to be taken for the town's development.
Table 4.10. Community‟s awareness on Urban Expansion
Community’s awareness on urban expansion
Number of respondents Percent
Yes 106 73.1
No 39 26.9
Total 145 100
Source: Own survey, 2017

33
4.4.1. Ways of Households’ Awareness about Urban Expansion
With regard to the ways of awareness of respondents,43(30%) were through public orientation,
22(15.2%) through official meeting training and 41(28%) with both of the two ways. This
indicated that the most respondents or about 106 (73.1%) were aware through different means of
awareness (table 4.11).
Table 4.11. Means of awareness of Urban Expansion
Means of awareness Number of respondents Percent
Through public orientation 43 30.0
Through official meeting training 22 15.2
Both (public orientation and official meeting training) 41 28.0
Total 106 73.1
Neither public orientation nor official meeting trainings 39 26.9
Total 145 100.0
Source: Own survey, 2017
4.5. Farmers’ Participate in Decision making and Implementation of Expansion Program
As we can see from the (table 4.12) below, 55.9% agreed as they participate in the expansion
program. While 44.1% said as they did not participate. This was organized by woreda
administration in the last 10 years.
Table 4.12. Farmers‟ participate in decision making and implementation of expansion program?
Participate Number of respondents Percent
Yes 81 55.9
No 64 44.1
Total 145 100.0
Source: Own survey, 2017
4.5.1. Benefits Farmers Gained as a Result of their Participation
As (table 4.13) shows us, about 44.8% of a farming community claimed that they had not participate in
a benefit packages‟ and compensation decision making processes. On the other hand, about 55.2% of
the farmers whose livelihood was affected agreed that they had participated in the program through
different participation benefit packages.

34
Table 4.13. Benefits farmers gained from participation
Participation benefit Number of respondents Percent
Raised own interest 28 19.3
Expressed own opinion 12 8.3
Created access to benefit packages 14 9.7
All above benefit 26 17.9
Total 80 55.2
Missing System 65 44.8
Total 145 100.0
Source: Own survey, 2017
4.6. The Impact of Urban Expansion on the Land holding of Farming Community
As we can see from the (table 4.14) below, 102(70.3%) said they lose their land while 43(29.7%)
said they did not lose their land. This indicates that majority of farmers loosed their land. So, the
expansion has an impact on household livelihood.
Table 4.14. The Impact of Urban Expansion on the land holding of farming community
Lose of land Number of respondents Percent
Yes 102 70.3
No 43 29.7
Total 145 100.0
Source: Own survey, 2017
4.6.1. Amount of Land the Farmers Vacated
Table (4.15), depicts that farmers in the study area lose the mean of 1.45 with minimum of 1
timad and maximum of 2 timad.
Table 4.15. Amount of land the farmers vacated
Hectare Vacated N Minimum Maximum Mean Standard deviation
102 1 2 1.45 0.5
Source: Own survey, 2017
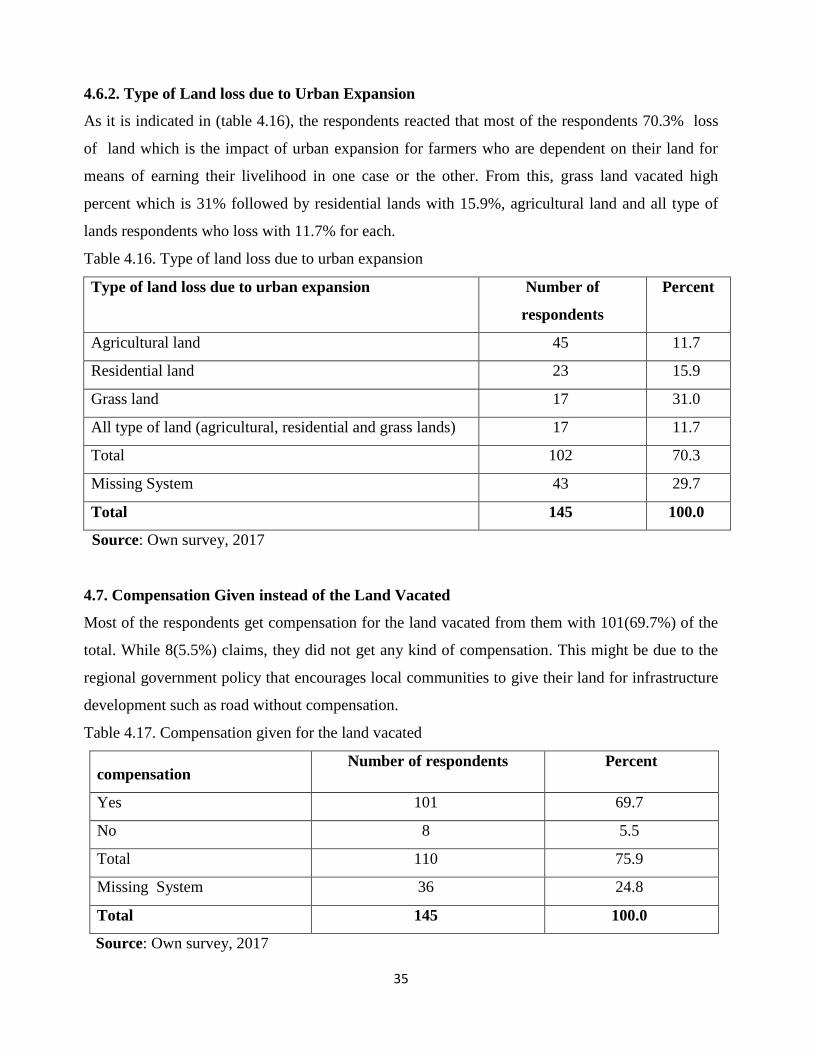
35
4.6.2. Type of Land loss due to Urban Expansion
As it is indicated in (table 4.16), the respondents reacted that most of the respondents 70.3% loss
of land which is the impact of urban expansion for farmers who are dependent on their land for
means of earning their livelihood in one case or the other. From this, grass land vacated high
percent which is 31% followed by residential lands with 15.9%, agricultural land and all type of
lands respondents who loss with 11.7% for each.
Table 4.16. Type of land loss due to urban expansion
Type of land loss due to urban expansion Number of
respondents
Percent
Agricultural land 45 11.7
Residential land 23 15.9
Grass land 17 31.0
All type of land (agricultural, residential and grass lands) 17 11.7
Total 102 70.3
Missing System 43 29.7
Total 145 100.0
Source: Own survey, 2017
4.7. Compensation Given instead of the Land Vacated
Most of the respondents get compensation for the land vacated from them with 101(69.7%) of the
total. While 8(5.5%) claims, they did not get any kind of compensation. This might be due to the
regional government policy that encourages local communities to give their land for infrastructure
development such as road without compensation.
Table 4.17. Compensation given for the land vacated
compensation Number of respondents Percent
Yes 101 69.7
No 8 5.5
Total 110 75.9
Missing System 36 24.8
Total 145 100.0
Source: Own survey, 2017

36
4.7.1. Kinds of Compensation Paid
Compensation paid for land vacated was 61(42.1%) money, 25(17.2%) housing plots, 2(1.4). This
implies, unless required care and training given for those displaced farmers, it might be difficult to
liquid money asset for lifelong livelihood or shift from the work they adopted which is farming to
other income generating activity.
Table 4.18. Kinds of compensation paid
kind of compensation Number of respondents Percent
Compensation (money) 76 52.4
Housing plots 25 17.2
Total 101 69.7
Missing System 44 30.3
Total 145 100.0
Source: Own survey, 2017
4.7.2. Levels of Farmers’ Satisfaction with Compensation Served
In a relation with this, these households also had been asked whether they had been satisfied or not
with the compensation given to them and benefits they had gained as a result of urban expansion
towards their vicinity. As we can read from (table 4.19) below, 62.1% of the households had
responded as they had not satisfied with the compensation they had been given and benefits these
households whose livelihood had been affected cause of urban expansion had gained. 37.9% were
satisfied. Most of the sampled households were not satisfied with compensation obtained. Their
reason for the dissatisfaction is that the compensation provided were not enough to sustain their
livelihood and replace their income that was previously earned from agricultural land.
Table 4.19. The recipients‟ satisfaction condition towards a served compensation
farmers’ satisfaction with compensation served Number of respondents Percent
Satisfied 55 37.9
Dissatisfied 90 62.1
Total 145 100
Source: Own survey, 2017

37
4.8. Whether or not required training was delivered to the evicted households
As it is indicated in (table 4.20) below, 100(69.0%) of the respondents get training after land was
taken from them and 45(31.0%) of the respondents claimed that no any training was given for
them when government took their land for different purposes. Hence, the concerned body is not
working properly on farmers displaced because of urban expansion, which is at expense of their
land.
Table 4.20. Whether or not required training was delivered to the evicted households
Training Number of respondents Percent
Yes 101 69.7
No 44 30.3
Total 145 100.0
Source: Own survey, 2017
4.8.1. Types of Training on which the households Participated
Table (4.21) presents that only 100(69.0%) of the respondents get required training while evicted
from their land. Hence, these segment of respondents asked type of training they get 25(17.3%) on
private business development and management, 27(18.6%) on financial management or saving
and the rest 4(2.8%), 2(1.4%), 13(9.0%), 29(20.0%) on basic entrepreneurship, social adjustment
skill, technical training and all type training respectively. Although the training coverage is very
small compared to the respondents' size. Training delivered is more or less important for farmers to
cope up with change of livelihood or means of their earning.
Table 4.21. Types of training on which the households participated
Type of training Number of Respondents Percent
private business development and management 25 17.3
Financial management or saving 27 18.6
Basic entrepreneurship 4 2.8
Social adjustment skill training 3 2.0
Technical training 13 9.0
All type of training 29 20.0
Total 101 69.7
Missing System (No training) 44 30.3
Total 145 100
Source: Own survey, 2017

38
4.9. The Impact of Urban Expansion on Livestock Production
Livestock productions that are commonly practiced by local farmers include Oxen, Cows, Sheep,
Goats etc. Farmers in the area commonly use their livestock for farming activity, for
transportation, for beef production and earn income.
4.9.1. Oxen Possessed before and after Urban Expansion in Number
As we can see from (Table 4.22) below, before the urban expansion, most (38.6%) of the
respondents had 3 oxen. But after then, currently, (Table 4.25) shows us, that most(69.7%) of the
respondents had 1 ox.
Table 4.22. Oxen Possessed before and after Urban Expansion in Number
Before urban expansion After urban expansion
Number of oxen Frequency Percent Number of oxen Frequency Percent
1 43 29.7 0 29 20.0
2 20 13.8 1 101 69.7
3 56 38.6 2 12 8.3
4 23 15.9 3 3 2.1
5 3 2.1 Total 145 100.0
Total 145 100.0
Source: Own survey, 2017
4.9.2. Cows Household Possessed before and after Urban Expansion in Number
As we can see from (Table 4.23) below, before the urban expansion, most (32.0%) of the
respondents had 3 cows. But after then, currently, (Table 4.23) shows us, that most(52.4%) of the
respondents had 1 cow.
Table 4.23 Cows Household Possessed before and after Urban Expansion in Number
Before urban expansion After urban expansion
Number of cows Frequency Percent Number of cows Frequency Percent
1 12 8.3 0 39 26.9
2 44 30.0 1 76 52.4
3 46 32.0 2 28 19.3
4 41 28.3 3 2 1.4
5 2 1.4 Total 145 100.0
Total 145 100.0
Source: Own survey, 2017

39
4.9.3. Sheep Possessed before and after Urban Expansion in Number
As we can see from (Table 4.24) below, before the urban expansion, majority (16.6%) of the
respondents had 12 sheep. But after then, currently, (Table 4.24) shows us, that majority (20.7%)
of the respondents had not sheep.
Table 4.24. Sheep Possessed before and after Urban Expansion in Number
Before urban expansion After urban expansion
Number of sheep Frequency Percent Number of sheep Frequency Percent
8 1 0.7 0 30 20.7
9 2 1.4 1 26 17.9
10 22 15.2 2 22 15.2
11 16 11.0 3 21 14.5
12 24 16.6 4 15 10.3
13 14 9.7 5 11 7.6
14 12 8.3 6 3 2.1
15 16 11.0 7 4 2.8
16 7 4.8 8 3 2.1
17 7 4.8 9 2 1.4
18 7 4.8 10 2 1.4
19 7 4.8 11 1 0.7
20 10 6.9 13 1 0.7
Total 145 100.0 Total 145 100.0
Source: Own survey, 2017
4.9.4. Goats Possessed before and after Urban Expansion in Number
As we can see from (Table 4.25) below, before the urban expansion, majority (17.6%) of the
respondents had 10 goats. But after then, currently, (Table 4.25) shows us, that majority (25.5%)
of the respondents had not goats.
The implication was that the peri- urban agrarian community‟s average goats stock as a financial
capital diminished. Generally, from all of these we can deduce that urban expansion has a negative
impact on livestock holdings in the study area.

40
Table 4.25. Goats Possessed before and after Urban Expansion in Number
Before urban expansion After urban expansion
Number of sheep Frequency Percent Number of sheep Frequency Percent
5 1 .7 0 37 25.5
6 3 2.1 1 35 24.1
7 11 7.6 2 21 14.5
8 18 12.1 3 13 9.0
9 21 14.5 4 14 9.7
10 24 17.6 5 9 6.2
11 19 12.4 6 5 3.4
12 20 13.8 7 1 0.7
13 8 5.5 8 3 2.1
14 10 6.9 9 1 .7
15 8 5.5 10 3 2.1
16 2 1.4 11 2 1.4
Total 145 100.0 Total 145 100.0
Source: Own survey, 2017
4.10. Urban Expansion Impact on Farmers’ housing Status
I employed number of rooms the house of these households had before urban expansion and latter
on after the expansion as the measuring tool for physical capital of the peri-urban agricultural
community livelihood. As (Table 4.26) shows us, this community majority(63.4%) had 3 rooms of
house before urban expansion over there. However, (Table 4.26) shows us majority of respondents
had 8 rooms of house after the expansion of the town then by showing the difference 5. On the
other hand, data from the key informants, as well as own observation show that, the number of
rooms the houses these households had after urban expansion of their area has shown a significant
increased in quantity as well these households are getting the income from renting these houses.
From this we can concluded that urban expansion has positive impact on livelihood of peripheral
farming community in the study area in terms of physical capital which is housing in rooms.

41
Table 4.26. House in room Possessed before and after Urban Expansion
Before urban expansion After urban expansion
Number of rooms
the house
Frequency Percent Number of rooms
the house
Frequency Percent
2 3 2.1 3 1 0.7
3 44 30.3 4 3 2.1
4 92 63.4 5 5 3.4
5 6 4.1 6 46 31.7
Total 145 100.0
7 28 19.3
8 47 32.4
9 15 10.3
Total 145 100.0
Source: Own survey, 2017
4.11. Impact of Urban Expansion on Infrastructure of households
As we can see from the following (Table 4.27) below, 33 out of 145 respondents answered that
they got all infrastructures followed by clinic and health institution with 25, school with 18, water
supply with 17, credit service with 16, recreation with 15, road with 11, electricity with 6 and
market accessibility with 4 respondents respectively and at least 33(23%) respondents answered as
they got all infrastructures. Therefore, from this we can concluded that urban expansion has
positive impact on peripheral farming community in terms of physical capital which is measured in
terms of infrastructure in the study area.
Table 4.27 Impact of Urban Expansion on Infrastructure of households
Types of infrastructures Frequency Percent
Road 11 7.6
Electricity 6 4.1
Water supply 17 11.7
School 18 12.4
Clinic & other health institution 25 17.2
Credit service 16 11.0
Recreation 15 10.3
Market 4 2.8
All types of infrastructures 33 22.8
Total 145 100.0
Source: Own survey, 2017

42
4.12. Job and Related condition of the Affected households in Post Expansion Periods
As (table 4.28) shows us, 101(69.7%) of households answered as they did not get job before urban
expansion. While the rest, only 44(30.3%) did rather. Currently, 39(26.9%) of all households not
have the job while the rest, 106(73.1%) answered as they are getting the job as depicted in (table
4.28). Among those who have job currently, those who have been employed by the government
organization represented the least proportion, only 4(2.8%), while those employed in others
represent 34(23.4%), 32(22.1%), 26(17.9%) and 11(7.6%) respectively were a daily laborers,
employment in factory, employment in non-government organization and self employment in
cottage industries, such as hand crafts etc, as can be seen from the (table 4.29).
Table 4.28. Whether these households believe that they get jobs before urban expansion
Alternatives Frequency Percent
Yes 44 30.3
No 101 69.7
Total 145 100
Source: Own survey, 2017
Table 4.29. Whether these households have a job currently.
Alternatives Frequency Percent
Yes 106 73.1
No 39 26.9
Total 145 100
Source: Own survey, 2017
Table 4.30. Job types the households have currently
Job types Frequency Percent
Daily laborer 34 23.4
Employment in factory 32 22.1
Self employment in cottage industries, such as hand crafts, etc 11 7.6
Employment in government organization 4 2.8
Employment in non-government 26 17.9
Total 107 73.8
Missing system 38 26.2
Total 145 100
Source: Own survey, 2017

43
4.13. Land use/Land cover Change Detection
4.13.1. Land use/Land cover in 1986
Table (4.31) and figure (4.1) shows us, land use/land cover (LULC) of the study area in quantity
and thematic map respectively. In this year farm land and grass land cover were the highest
coverage of the total area of the study area. Each of them constituted relatively larger proportions
which was 31.984km2(36.981%) and 26.861km
2 (31.058%) of the total area. Besides, a relatively
considerable amount of the area was covered by built-up areas 0.295km2(0.341%), forest land
22.299km2 (25.783%), bare land 0.140km
2 (0.161%) and shrub land 4.882km
2(5.644%). In this
year water body covered the smallest share of the total area which was 0.025km2(0.028%). These
conditions were considered as a baseline for change detection over the study years.
Table 4.31. Absolute area and percentage coverage land use/land cover of 1986
Class Name Area in km2 Area %
Built-up areas 0.295 0.341
Farm land 31.984 36.981
Forest land 22.299 25.783
Grass land 26.861 31.058
Water body 0.025 0.028
Shrub land 4.882 5.644
Bare land 0.140 0.161
Total 86.486 100
Source: Analysis of satellite imageries.

44
Figure 4.1. Land use/ land cover map of the study area in 1986
Source: Author‟s Analysis, March, 2017
4.13.2. Land use/Land cover in 2000
In this year after 14 years (in 2000), the land use/land cover classes that covered the highest share
of total area were built-up area and farm land. The shares of each of them land coverage were
33.182km2
(33.182%) and 28.865km2
(33.375%) respectively. Water body coverage the smallest
one which was 0.003km2(0.003%). When it was compared with that of 1986 land use/land cover,
the study area has undergone significant modifications and changes in this study year. Because
grass land and water body were changed in to other LULC classes. In general in this year, the
remain land use/land cover classes showed considerable decreased, while built-up area and farm
land showed increased compared to the land use/land cover (LULC) setting of 1986.

45
Table 4.32. Absolute area and percentage coverage land use/ land cover of 2000
Class Name Area in km2 Area %
Built-up area 33.182 38.366
Farm land 28.865 33.375
Forest land 11.124 12.862
Grass land 10.786 12.471
Water body 0.003 0.003
Shrub land 1.384 1.600
Bare land 1.152 1.332
Total 86.486 100
Source: Analysis of satellite imageries.
Figure 4.2. Land use/ land cover map of the study area in 2000
Source: Author‟s Analysis, March, 2017

46
4.13.3. Land use/ Land cover in 2016
After 30 years the land use/land cover (LULC) of the study area dramatically changed. Built-up
area constituted more than half of the total area of land use/land cover arrangement. In this year
51.542km2 (59.595%) of the total area of the town were covered by built-up area. The remaining
portion of the area was covered by other LULC classes.
This year was the year at which considerable land use/land cover change dynamics was
experienced in the study area. Grass land severely declined to 5.2011km2(6.013%). On the
contrary, built-up area showed the highest rate of increased by 59.595%. The remain land use/land
cover classes showed dramatically decreased and changed in to built-up areas over these 30 years.
The accelerated increment of built-up area at the expense of other land use/land covers was
attributed to the alarming rate growth of population resulted from natural increase, rural-urban and
urban-urban migrations in the study area.
Table 4.33. Absolute area and percentage coverage land use /land cover of 2016
Class Name Area in km2 Area %
Built-up areas 51.542 59.595
Farm land 17.357 20.069
Forest land 10.337 11.952
Grass land 5.201 6.013
Water body 0.001 0.001
Shrub land 1.776 2.053
Bare land 0.203 0.234
Total 86.486 100
Source: Analysis of satellite imageries.

47
Figure 4.3. Land use/ land cover map of the study area in 2016
Source: Author‟s Analysis, March, 2017
4.13.4. Land use/Land cover Change in (km2) and Percent (%) between 1986, 2000 and 2016.
The main target for generating classification maps from images of three different time periods was
to determine how past and present human activities have been changing the landscape. These
thematic maps were further used as inputs in a change analysis, which land cover/land use classes
are changing in to other land cover/land use classes.

48
Table 4.34. Land use/land cover Change in (km2) and Percent (%) between 1986 and 2000.
Class
Name
1986 2000 Change 1986-2000
Area in km2 Area % Area in km
2 Area % Area in km
2 Area %
Built-up
areas 0.295 0.341 33.182 38.366
+32.887 +38.025
Farm land 31.984 36.981 28.865 33.375 -3.128 -3.616
Forest land 22.299 25.783 11.124 12.862 -11.175 -12.921
Grass land 26.861 31.058 10.786 12.471 -16.075 -18.586
Water body 0.025 0.028 0.003 0.003 -2.2 -2.543
Shrub land 4.882 5.644 1.384 1.600 -3.498 -4.044
Bare land 0.140 0.161 1.152 1.332 1.012 1.170
Total 86.486 100 86.486 100 0 0
Table 4.35. Land use/land cover Change in (km2) and Percent (%) between 2000 and 2016.
Class Name 2000 2016 Change 2000-2016
Area in km2 Area % Area in km
2 Area % Area in km
2 Area %
Built-up
areas 33.182 38.366 51.542 59.595 +18.36 +21.228
Farm land 28.865 33.375 17.357 20.069 -11.508 -13.306
Forest land 11.124 12.862 10.337 11.952 -0.787 -0.909
Grass land 10.786 12.471 5.201 6.013 -5.585 -6.457
Water body 0.003 0.003 0.001 0.001 -0.002 -0.0023
Shrub land 1.384 1.600 1.776 2.053 -0.392 -0.453
Bare land 1.152 1.332 0.203 0.234 -0.949 -1.097
Total 86.486 100 86.486 100 0 0

49
Table 4.36. Land use/land cover Change in (km2) and Percent (%) between 1986 and 2016.
Class
Name
1986 2016 Change 1986-2016
Area in km2 Area % Area in km
2 Area % Area in km
2 Area %
Built-up
areas 0.295 0.341 51.542 59.595 +51.247 +59.254
Farm land 31.984 36.981 17.357 20.069 -14.627 -16.912
Forest land 22.299 25.783 10.337 11.952 -11.962 -13.831
Grass land 26.861 31.058 5.201 6.013 -21.66 -25.044
Water body 0.025 0.028 0.001 0.001 -0.024 -0.027
Shrub land 4.882 5.644 1.776 2.053 -3.106 -3.591
Bare land 0.140 0.161 0.203 0.234 -0.063 -0.072
Total 86.486 100 86.486 100 0 0
Source: Analysis of satellite imageries.
As we can see from the above (tables 4.34, 4.35, 4.36), the land use/land cover in the study area
have significant modifications and changes in the course of the study years. Built-up area have
shown fast increment from 0.295km2 to 33.182km
2 by 32.887km
2 in the first analysis period
(1986-2000) and it shown moderate increment from 33.182km2 to 51.542km
2 by 18.36km
2 in the
second analysis period (2000-2016), showing a total gain of built-up area 51.247km2
within 30
years(1986-2016). On the other hand, other land use/land cover classes are decreased the first, the
second and the entire study period. The total loss of farm, forest, grass, shrub, bare lands and
water body are 16.912 km2, 13.831km
2, 25.044km
2, 3.591km
2, 0.072 km
2and 0.027km
2
respectively within 30 years.

50
Figure 4.4. Land use/land cover map of the years 1986, 2000 and 2016.
Source: Author‟s Analysis, March, 2017
4.14. Accuracy Assessment of the Image Classification Validation
Accuracy assessment is a process used to validate the accuracy of image classification by
comparing the classified map with a reference data (Caetano et al., 2005). It is critical for a map
generated from any remote sensing data. Although accuracy assessment is important for traditional
photographic remote sensing techniques, with the advent of more advanced digital satellite remote
sensing the necessity and possibility of performing advanced accuracy assessment have received
new interest (Congalton, 1991). Currently, accuracy assessment is considered as an integral part of
any image classification. This is because image classification using different classification
algorithms may classify pixels or group of pixels to the wrong classes. The most obvious types of
error that occurs in image classifications.

51
In order to use the derived land use/land cover map for further change analysis, the errors need to
be quantified and evaluated in terms of classification accuracy. This might help users and readers to
understand some level of inaccuracy and imprecision during image classification. Hence, an
accuracy assessment was carried out to assess the quality of the land cover maps.
One of the commonly used methods to assess the accuracy of classified image is the Confusion
Matrix, a technique that provides some statistical and analytical approaches to explain the accuracy
of the classification. In this study Confusion Matrix was applied with some quality measures like
user, producer accuracy, overall accuracy and Kappa analysis. The reference data used for
accuracy assessment are usually obtained from aerial photographs, high resolution images (Google
earth) and field observations. The researcher has examined the test sample plots and assigned a
class value to each.
The overall, user‟s and producer‟s accuracies, and the Kappa statistic were then calculated from
the error matrices (table 4.37, 4.38, 4.39) and followed by a brief explanation of each type of
accuracies and Kappa statistic.
Table 4.37. Confusion matrix for land cover map of 1986
C
l
a
s
s
i
f
i
e
d
Class
Name
Reference
Built-
up area
Bare
land
Farm
land
Forest
land
Grass
land
Shrub
land
Water
body
Row
Total
User
accuracy
Built-up
Area
14 1 0 0 0 1 0 16 87.5%
Bare land 1 15 1 0 0 0 1 17 88.24%
Farm land 4 0 56 1 1 1 2 65 86.15%
Forest land 0 0 1 24 0 0 1 26 92.31%
Grass land 0 0 0 0 26 0 1 27 96.30%
Shrub land 1 0 0 0 0 29 0 30 96.67%
Water body 0 0 0 0 2 2 23 27 85.19%
Column
Total
20 16 58 25 29 32 28 208
producer
Accuracy
70.0% 93.75% 96.55% 96.00% 89.66% 90.63% 82.14%

52
Where, Xii = Number of correctly classified pixels, or the diagonal value and
N= entire number of pixels in the matrix.
Overall accuracy = (the sum of diagonal matrix)/ (total pixel) *100
=(14+15+56+24+26+29+23)/(239) *100
= 91.21%
(Adopted from Congalton, 1991)
Where: r = is the number of rows in the matrix; Xii = is the number of observations in rows i and
column i (along the major diagonal); Xi+ = the marginal total of row i (right of the matrix); Xi+1
are the marginal totals of column i (bottom of the matrix); N is the total number of observations.
Kappa coefficient(K) = 0.4368
Table 4.38. Confusion matrix for land cover map of 2000
C
l
a
s
s
i
F
i
e
d
Class Name
Reference
Built-
up area
Bare
land
Farm
land
Forest
land
Grass
land
Shrub
land
Water
body
Row
Total
User
accuracy
Built-up
area
14 1 2 0 0 0 0 17 82.35%
Bare land 0 9 0 0 0 0 2 11 81.82%
Farm land 1 0 43 4 3 0 2 53 81.13%
Forest land 0 0 0 31 1 0 0 32 96.88%
Grass land 0 0 0 2 25 0 0 27 92.59%
Shrub land 0 0 1 0 0 7 0 8 87.50%
Water body 0 0 0 0 0 1 23 24 95.83%
Column
Total
15 10 46 37 29 8 27 172
producer
Accuracy
93.33% 90.00% 93.18% 83.78% 86.21% 87.50% 85.19%

53
Where, Xii = Number of correctly classified pixels, or the diagonal value and
N= entire number of pixels in the matrix.
Overall accuracy = (the sum of diagonal matrix)/ (total pixel) *100
=(14+9+43+31+25+7+23)/(172) *100
= 88.37%
Kappa coefficient(K)= 0.8573
Table 4.39. Confusion matrix for land cover map of 2016
C
l
a
s
s
i
f
i
e
d
Class
Name
Reference
Built-
up area
Bare
land
Farm
land
Forest
land
Grass
land
Shrub
land
Water
body
Row
Total
User
accuracy
Built-up
area
58 1 0 2 1 0 0 62 93.55%
Bare land 1 14 0 0 0 0 0 15 93.33%
Farm land 1 1 64 4 1 0 0 71 90.14%
Forest land 0 0 1 29 0 1 0 31 93.55%
Grass land 0 0 0 0 10 0 1 11 90.91%
Shrub land 1 0 1 0 0 9 0 11 81.82%
Water body 0 0 0 1 0 0 9 11 81.83%
Column
Total
61 16 67 36 12 10 10 212
producer
Accuracy
95.08% 87.50% 95.02% 80.56% 83.33% 90.00% 90.00%
Where, Xii = Number of correctly classified pixels, or the diagonal value and
N= entire number of pixels in the matrix.
Overall accuracy = (the sum of diagonal matrix)/ (total pixel) *100

54
= (58+14+64+29+10+9+9) / (212) *100
= 91.04%
Kappa coefficient(K) = 0.8839
4.14.1. Overall Accuracy
This is computed by dividing the total correct number of pixels (i.e. summation of the diagonal) to
the total number of pixels in the matrix (grand total). In some empirical studies (Anderson et al.,
1976), it is noted that the maximum accuracy value of 91.21%, where as the minimum accuracy
value of 88.37% is required for effective and reliable land cover change analysis. Depending upon
the purpose of the land cover map, different people use different accuracy levels. The present
study‟s confusion matrix of all the derived land use/land cover maps has revealed the overall
accuracy levels of more than the minimum accuracy threshold defined by Anderson.
4.14.2. Producer Accuracy
Producer's accuracy refers to the number of correctly classified pixels in each class (category)
divided by the total number of pixels in the reference data to be of that category (column total).
This value represents how well reference pixels of the ground cover type are classified. As showed
in (table 4.40), in 1986 the maximum class accuracy was farm land which is 96.55%, where as the
minimum class accuracy was water body which is 82.14%. Similarly, showed in (table 4.41), in
2000 the maximum class accuracy was built-up area which is 93.33% , where as the minimum
class accuracy was forest land which is 83.78%. As showed in (table 4.42), in 2016 the maximum
class accuracy was built-up areas which is 95.08%, where as the minimum class accuracy was
forest land which is 80.56% , where as the other classes within each year has a good accuracy.
4.14.3. User Accuracy
Users accuracy refers to the number of correctly classified pixels in each class (category) divided
by the total number of pixels that were classified in that category of the classified image (row
total). It represents the probability that a pixel classified into a given category actually represents
that category on the ground. Results of user's accuracy in this study showed that in 1986 the

55
maximum class accuracy was shrub land 96.67%, the minimum class accuracy was water body
with accuracy of 85.19%. In 2000 the maximum class accuracy was forest land 96.88%; the
minimum class accuracy was farm land with accuracy of 81.13%. Similarly, in 2016 the maximum
class accuracy was built-up areas and forest land, which have the same accuracy 93.55%, where as
the minimum was shrub land class with accuracy of 81.82%.
4.14.4. Kappa Analysis
Kappa coefficient, which is one of the most popular measures in addressing the difference
between the actual agreement and change agreement, was also calculated. The kappa was a
discrete multivariate's technique used in accuracy assessment (Fan et al., 2007). The kappa
coefficients obtained for the classified imageries 0.4368(43.68%), 0.8573(85.73%) and
0.8839(88.39) for the year 1986, 2000 and 2016 respectively.
4.14.5. Factors that contributed for the expansion of Kutaber Town
As we can see from table 4.32, majority of the respondents 50(34.5%) answered from the
mentioned factors, demographic dynamics (high birth & low death rate), contribute more for urban
expansion followed by in-migration 45(31.0%), All 24(16.2%) and reclassification 17(11.7%).
Table 4.40: Factors that contributed for the expansion of Kutaber Town
Factors Frequency Percent
Demographic dynamics (high birth &low death rate) 50 34.5
In-migration (rural to urban) 45 31.0
Reclassification 17 11.7
All factors 24 16.6
Total 136 93.8
Missing System 9 6.2
Total 145 100.0

56
CHAPTER FIVE: CONCLUSIONS AND RECOMMENDATIONS
5.1. Conclusions
Kutaber has been experiencing horizontal urban expansion that follows comfortable land scape,
suitable for settlement and other infrastructure development, and then its impact is clear to the
peripheral farming communities. During the town's expansion, despite of the communitys'
awareness of the expansion through public orientation and official meeting training, all farming
community was not made participant on the decisions about the kinds and amount of
compensations and related benefits to them for the their land displaced vacated, for the property
they lost and hence for their livelihood interruption and the resulting impact on their family. In
fact, In most developing countries like Ethiopia participation of stock holders on the decision about
urban expansion compensation is not customary. As a result dissatisfaction about the land
compensation become goes from bad to worse. With the same vein, for most of the households in
the study area, the town administration did compensation calculation of money and/or housing
plots to the displaced placed without the agreement between the compensation taker and the
responsible bodies.
Even though most of the households agreed, but with higher dissatisfaction, that they had been
given 25(17.2%) housing plot and 76(52.4%) money. The urban expansion, that was carried out in
this manner had brought a significant negative impact on the livelihood strategies of the peripheral
farming community in terms of financial capital ( i.e. income and livestock holdings), natural
capital (i.e. farming land, grazing land, forest and shrub lands).
While the physical capital i.e. housing or built up area and human capital i.e. education, health and
other training skill, it has positive impact on them. This was examined with this study in the
descriptive statistics and land use/land cover analysis. Therefore, this study had assessed and
found that the urban expansion has an impact on the financial, natural, physical and human asset
of the peripheral farming community's live livelihood.
Before the urban expansions considered in this study, an average annual income these households
used to earn per year was varying from 10 quintals -50 quintals, where the yield of the majority
was in the range of 11-20 quintals.

57
However, after urban expansion then, this study had scanned that there was no a single households
earning above 40 quintals and the yield of the majority fell below 10 quintals per year. Similarly,
the livestock holdings, before urban expansion these households had the an average oxen 2.22,
cows 2.83, sheep 13.72, and goats 10.47. But after then, currently, these households had the
average oxen 0.92, cows 0.95, sheep 3.01 and goats 2.42 as financial asset and land as natural
asset/capital like farm land, forest land, grass land, water body, shrub land and bare land had
shown a significant decline by 14.627km2, 11.962km
2, 21.66km
2, 0.024km
2, 3.106km
2 and
0.063km2
respectively.
As a copping mechanism, the households engaged in different livelihood strategies. Some shifted
their strategies from farming to different job types, i.e. 34(23.4%) employment in daily laborer,
32(22.1%) employment in factory, 4(2.8%) employment in government organization, 26(17.9%)
employment in non-government organization and 11(7.6%) self employment in cottage industries
such as hand crafts, etc.
The post-classification analysis for the dynamics of land use/land cover changes using satellite
data together with GIS indicates the increased land use/land cover changes due to rapid population
growth resulted from natural increase, rural-urban and urban-urban migrations of the study area
between 1986 and 2016. The analyses conducted for 1986 – 2016 have revealed that built-up areas
has expanded significantly leading to removal of shrub land, forest land, agricultural land and
grass land. Whereas the extent of water body, agricultural, grass, forest and shrub lands decreased.
The study showed that the different land use/land cover classes has changed into built-up areas.
Even though many changes have observed between 1986 and 2016, the highest negative rates of
changes were seen in grass land and farm land which was averagely decreased by
21.66km2(25.044 %) and 14.627km
2(16.912%) respectively. Whereas the highest positive rate of
changes were seen in built up areas which were averagely increased by 51.247km2 (59.254%).

58
5.2. Recommendations
Based on the designed objectives and the conclusion of this study; the following
recommendations have been forwarded:
One of the causes of horizontal expansion of the town is rapid population growth resulted
from natural increase, rural-urban and urban-urban migrations; therefore improvements in
national, regional, family planning, the spatial planning and urban planning should get
considerable attention.
Moreover, follow up needs to be made for displaced farming communities in general and
for female headed households and not educated in particular, by creating and enlarging job
opportunities and access to education and services.
The government shall be revised compensation policies that serve on the side of displaced
people & become best alternatives.
Sustainable use of land resources and avoiding agricultural land loss by uncontrolled
horizontal urban expansion.

59
References
Abdissa, F. (2005). Urban Expansion and Livelihood of the Peri-urban Agricultural Community.
Addis Ababa University.
Alebachew, Z. (2011). Urban sprawl mapping and land use change analysis using remote sensing
and geographic information system. Debre Birhan.
Ambaye, A. (2012). Assessment of urban expansion in the case of Dukem town,using Remote
sensing and GIS techniques. Addis Ababa University.
Anderson, J., Hardy, E., Roach, J. and Witner, R. (1976) A land use and land cover classification
system for use with remote sensor data. Geological Survey Professional Paper 964.
Bekalo, M. T. (2009). Spatial metrics and Landsat data for urban land use change detection: case
of Addis Ababa, Msc thesis, University of Tewente.
Bekele, F. (2010).The Impact of Horizontal Urban Expansion on Sub-Urban Agricultural
Community Livelihood. Hawassa.
Bhatta,B.(2010).Causes & Consequences of Urban Growth and Sprawl.In Analysis of Urban
Growth and Sprawl from Remote Sensing Data. SPringer Heidelberg , Dordrecht
London,17-18.
Brian H., Hohmann, Roberts and Rene Peter, (2014). The Neglected Drivers of Urbanizing
Economies.
Caetano, M., Mata, F., Freire, S. and Campagnolo, M. (2005) "Accuracy assessment of the
Portuguese CORINE Land cover map." Global Developments in Environmental Earth
Observation from Space, Milpress.
Cernea, M. (2000). Risks, safeguards and reconstruction: A model for population displacement and
resettlement. Risk and reconsraction :Experiences of re settlers and refugees , 11-55.
Chambers, R. and Conway, Gordon R.,1992. Sustainable Rural Livelihoods: Practical Concepts for
the 21st Century, Institute of Development Studies: Discussion Papers, 296. Cambridge.
Ciparisse, G. (2003). Multilingual Thesaurus on Land Tenure, English Version. Food and
Agricultural Organization of the United Nations .
CSA. (2010). Report on the National population and housing census of Ethiopia. Addis Ababa:
CSA Ethiopia.
Congalton, R. (1991) A review of assessing the accuracy of classifications of remotely sensed data.
Int. Journal of Remote sensing, 37, 35-46.
Dayong, N. (2004). Several Acute Issues in China’s Urban Planning.

60
Dirribsa, S. and Tassew B.,2015. Analysis of Livelihood Diversification Strategy of Rural
Household: A Case study of Ambo District, Oromiya Regional State, Ethiopia. vol. 3
(8),pp. 406-426.
Drinkwater, M. and McEwan M., 1992. Household food security and environmental sustainability
in farming systems research: developing sustainable livelihoods, Paper presented to the
Adaptive Planning Research Team Bi-annual Review Meeting, April 13- 16 Mangu,
Zambia.
Ellis F., 2000. Rural Livelihoods and Diversity in Developing Countries, Oxford University Press.
Fan, F., Weng, Q. and Wang, Y. (2007). Land use and land cover change in Guangzhou, China,
from 1998 to 2003, based on Landsat TM/ETM+ imagery.Sensors,7,1323-1342
FAO.(1997).Improving client oriented extension training in Ethiopia: project findings and
recommendations. Terminal report.
Fekadu, T. (2015).Urban Expansion and Its Effects on Peripheral Farming Community. Hossana
Ethiopia.
Abdissa .F (2005).Urban Expansion and the Livelihood of the Peri-Urban Agricultural
Community. A Master‟s Thesis. Institution of Regional and Local Development, Addis
Ababa University.
G/Egziabher, T.(1998). Urban poverty and the environmental. Ethiopian Development forum ,1,76-84.
G/Hiwot, B. (2006). Urban growth and its impact on land use.
G/Egziabher and Solomon (1997). Urban and Regional Development Planning and
Implementation in Ethiopia. Urban and Reginal Development Planning and
Implementation in Ethiopia. Addis Ababa: National Urban Institute.
Jensen, J. (2004). Introduction digital image processing. New York.
Kamete and Tvedten (2001). From Global village to urban globe,urbanization and poverty in
Africa. implication for Norwegian Aia Policy.
Kassaw, M. (2010). Landuse/Landcover Dynamics and Land Degradation Susceptibility Analyses
in Kutaber Wereda using Geospatial Tools. Addis Ababa University.
Kedir, A. (2010). Urban expansion and the neighbourhoods: The Case of Bishoftu Town, East
Shewa Zone, Oromia Regional State. Addis Ababa University.
Kidane, D., Mekonnen, A. and Teketay, D.,2014. Contributions of Tendaho Irrigation Project to
the Improvement of Livelihoods of Agropastoralists in the Lower Awash Basin, No

61
theastern Ethiopia . Ethiopian e-journal For Research and Innovation Foresight.Vol. 6, No.
2, pp.1-19.
Krantz, L., 2001. The Sustainable Livelihood Approach to Poverty Reduction, division for Policy
and Socio-Economic Analysis, Swedish international development cooperation agency,
February, Stockholm, Sweden.
KWARDO. (2007). Socio-economic profile of Kutaber town. Kutaber, Ethiopia.
Lin Li.,Y.S & H. Z.(2003). Simulating spatial urban expansion based on a physical process. 64,
67-76.
Mc Granahan G., SatterThwait D.D. and Tacoli C. (2004).Urban-Rural change, boundary
problems and environmental burdens, International Institute for Environment and
Development.
Mehari, S. (2011). The Impacts of Urban Built-Up Area Expansion on the Livelihood of Farm
Households. Mekelle Ethiopia.
Melesse, M. (2004). City Expansion, Squatter Settlements and Policy Implications in Addis
Ababa. Addis Ababa University.
Meles and Vanum (2012). GIS and Remote Sensing Based Urban Sprawl Detection and its
Implications on Sustainable Development. 2 (9), 454-455.
Raddad,S.H.,Salleh, G.&Samat, N.(2010). Determinants of Agriculture Land Use Change in
Palestinian Urban Environment. American- Eurasian Journal of Sustainable Agriculture,
4,30-38.
Redman and Jones . (2004). The Environmental, Social, and Health Dimensions of Urban
Expansion. Arizona State University.
Satterthwaite and Tacoli C. (2004). The urban Part of Rural Development.
Shlomo A., Stephen C. S. and Daniel L. C. (2005). The Dynamics of Global Urban Expansion.5-6.
Siciliano, G. (2012), Rural-Urban Migration and Domestic Land Grabbing in China: Drivers,
Impacts and Trade-offs, presented at the International Conference on Global Land,
Grabbing II, October 17‐19, 2012, Ethiopia.
Sudhira, T. V. and Ramachandra (2007). “Characterizing Urban Sprawl from Remote Sensing
Data and Using Landscape Metrics. 10th International Conference on Computers in Urban
Planning and Urban Management. Brazil.
Tadesse W., Tsegaye, T. D.and Coleman, T.L., 2001. Land use/cover change detection of the city
of Addis Ababa, Ethiopia using remote sensing and GIS technology. Addis Ababa.

62
Tacoli, C. (2002). Changing Rural-Urban Interactions in Sub-Saharan Africa and Their Impact on
Livelihoods: A summary Rural-urban working paper 7, IIED, London,
Tarver, J. (1996). Demography of Africa, Westport, CT. Praeger , 91-98.
The World Bank. Ethiopia Economic Update II: Laying the Foundation for Achieving Middle
Income Status. Washington, DC: The World Bank, 2013.
Thuo, T. (2010). Community response to land use transformation in Nairobi rural-urban fringe,
Kenya. Field Action Report, University of Waikato.
UN.(2012).World Urbanization Prospects: the 2011 Revision. Retrieved from
http://esa.un.org/unup/CD-RO M/Urban-Rural-Population.htm
UNCED (1992). Land use change analysis in the Zhujiang Delta of China using satellite remote
sensing, GIS and stochastic modeling. 64, 273-284.

63
Appendex-1
Addis Ababa University
College of Social Science
Department of Geography and Environmental study
Questionnaire for Sample Household
Dear respondent: -
The main aim of this questionnaire is to collect data as input for the study titled Urban Expansion
and its Impact on the Livelihood of Peripheral Farming Communities: the case of Kutaber Town,
Amhara Region, Ethiopia. The sole purpose is to qualify the requirement for awarding the Masters
of Art degree (M. A) at Addis Ababa University. Dear respondents, you are expected to provide
genuine, accurate and balanced information with respect to urban expansion and displacement
process. Your accurate information is highly valuable as it determines the success of this study.
Therefore, the researcher is very much grateful for the sacrifice you pay to this end and the
information gathered will be highly confidential and will be only for the purpose of this research.
Please note that:
There is no need to write your name.
Each question has its own instruction to follow.
Thank you!
Part I. Respondent Background information
Note: - Circle the answer that meets your choice.
1. Kebele - a) Alasha b) Beshilo c) Doshigni
2. Sex - a) Male b) Female
3. Age - a) 20 -29 b) 30-39 c) 40-49 d) 50-59 e) 60 and above
4. Marital status - a) Single b) Married c) Divorced d) Widowed
5. Level of Education - a) Illiterate b) Read and write
c) Primary First Cycle (1-4) d) Primary Second Cycle (5-8)
e) Secondary First Cycle (9-10) f) Secondary Second Cycle (11-12)
g) Tertiary (college and university)
6. Family size (in number) - a) 1-3 b) 4-6 c) 7-9 d) 10-12 e) 13 above

64
7. Religion- a) Christianity b) Muslim c) If any other specify________
Part II. Socio- Economic Profile
8. Do you have land? a) Yes b) No
9. If your answer for question No 8 is yes, how many Hectare2/Timad of land do you have?
_______________
10. For what purposes have you been using your land?
a) Crop b) Grazing c) Fruits and vegetation d) all e) If any other please mention_____
11. Before urban expansion how many quintals you produced in a year?
a) above 51 b) 41-50 c) 31-40
d) 21-30 e)11-20 f) below 10 quintals
12. After urban expansion how many quintals you produced in a year?
a) above 51 b) 41-50 c) 31-40
d) 21-30 e) 11-20 f) below 10 quintals
13. Were you aware of the urban expansion program in your former vicinity?
a)Yes b) No
14. If your answer for the question No 13 is yes, how?
a) Through public orientation b) Through official meeting training
c) Both d) Other specify ________________
15. Did you participate in decision making process in the implementation of expansion program?
a) Yes b) No
16. If your answer for the question No 15 is yes, what are benefits you obtained because of
participation? a) Raised own interest b) Expressed own opinion
c) Created access to benefit packages d) All e) other specify_______
17. Did you have lose your land due to an expansion of Kutaber town?
a) Yes b) No
18. If yes, how much hectare/Timad did you lose? ______________
19. What type of land did you lose due to urban expansion?
a) Agricultural land b) Residential land
c) Grass land d) If any other please mention_______________
20. If a plot of land has been taken from you because of urban expansion, when was it taken?
2 1 hactare=4 Timade=4 Gemed in local measurement.

65
a) Over the previous 5 years (2006-2010) b) Over the last 5 years (2011 – 2016)
21. If your land is taken, for what purpose was it used?
a) Industrial b) Residential c) Road d) Office construction e) All
22. Did you get compensation from the authority in place of the taken land?
a) Yes b) No
23. If your answer for the question No 22 is yes, what kind of compensation did you get?
a) Compensation (money) b) Housing plots c) Access to services
d) Job opportunities e) training to develop skill f) If any other please mention_____
24. Did you get any training how to use the benefit packages provided to you while you move to
new way of urban life? a) Yes b) No
25. If your answer for the question No 24 is yes, in which of the following training did you
participate? a) private business development and management b) Financial management or
saving c) Basic entrepreneurship d) Social adjustment skill
training e) Technical training
26. Indicate what you possessed/possess before and after displacement/expansion from among the
following?
Before After
A. land (in ha)
B. Oxen (#)
C. Cows (#)
D. Sheep (#)
E. Goat (#)
F. Horse (#)
G. Donkey (#)
H. Mule (#)
I. House (in room #)
J. Others specify
Part III. Factors that contributed for the expansion of Kutaber Town
27. Do you perceive the expansion of Kutaber town to the surrounding rural farmlands?
a) Yes b) No

66
28. If your answer for the question No 27 is yes, what do you think are the factors that contributed
to such expansion of the town?
a) Demographic dynamics (high birth &low death rate) b) In-migration (rural to urban)
c) Reclassification d) All e) If any other please mention___________
Part IV. Impacts of the expansion on the surrounding farm stead's
29. What was the base of your livelihood before the coming reclassification of your land to urban
area? a) Farming on land b) Raising cattle c) Fodder production
d) a and b e) All f) Others specify __________
30. Do you think that the expansion of the town has an impact on your privileges?
a) Yes b) No
31. If your answer for question No 30 is yes, what are the impacts?
a) Loss of land b) Loss off farm activity c) Loss of homestead
d) Loss of clean environment e) All f) If any other please specify______
32. What have you gained as a result of the expansion of Kutaber that you do not have before?
A. Road F. Telephone
B. Electricity G. Credit service
C. Water supply H. Recreation
D. School I. Market
E. Clinic & other health institution J.Other, specify__________
33. Do you have any other source of income today?
a) Yes b) No
34. If “Yes”, which of these? a) Rental income b) Remittances
c) Supplementary small and micro enterprises d) Other, specify______
Part v. Livelihood strategies
35. Have you modified your previous occupation due to the town expansion?
a) Yes b) No
36. If your answer for the question No 35 is yes, indicate the area of the modification
Previous income earning activities Current income earning activities
------------------------------------------- ------------------------------------------
------------------------------------------- -------------------------------------------
-------------------------------------------- -------------------------------------------

67
37. What are the reasons that forced you to modify your previous income earning activities?
a) Due to reduction in production from your current land size
b) Present occupation is pleasant and higher in payment than the previous one
c) Both d) Other reasons, specify______
38. Were you practicing off-farm activities before the town's expansion?
a)Yes b) No
39. If yes, indicate the area of activity you engaged in.
a) Daily laborer
b) Employment in factory
c) Self employment in cottage industries, such as hand crafts, etc
d) Employment in government organization
e) Employment in non-government organization
f) Others( specify)________________
40. Were you practicing off-farm activities after the town's expansion?
a)Yes b)No
41. If yes, indicate the area of activity you engaged in.
a) Daily laborer
b) Employment in factory
c) Self employment in cottage industries, such as hand crafts, etc
d) Employment in government organization
e) Employment in non-government organization
f) Others( specify)________________

68
Appendex-2
Addis Ababa University
College of Social Science
Department of Geography and Environmental Study
Interview Questions for key informants
Dear respondent: -
The main aim of this questionnaire is to collect data as input for the study titled Urban Expansion
and its Impact on the Livelihood of Peripheral Farming Communities: the case of Kutaber Town,
Amhara Region, Ethiopia. The sole purpose is to qualify the requirement for awarding the Masters
of Art degree (M. A) at Addis Ababa University. Dear respondents, you are expected to provide
genuine, accurate and balanced information with respect to urban expansion and displacement
process. Your accurate information is highly valuable as it determines the success of this study.
Therefore, the researcher is very much grateful for the sacrifice you pay to this end and the
information gathered will be highly confidential and will be only for the purpose of this research.
Thank you!!
Part I: - Background of Respondent
1. Address __________________________
2. Kebele___________________________
3. Sex
4. Age _______________
5. Level of education___________________________
6. Occupation
7. Your position in this organization______________________
8. Year of services in this organization _____________________
Part II: - Interviews about Kutaber town expansion
9. What do you think are the factors that contributed for rapid expansion of the town in:-
a)1986____________________________________________________________________
b) 2000_________________________________________________________________and
c) 2016__________________________________________________________________
10. What is your view about the positive impacts of urban expansion on social and economic
conditions of the households?
11. What is your view about the negative impacts of urban expansion on social and economic
conditions of households?
12. What are the solutions you propose for the challenge faced as a result of expansion of the
town?

69
Appendex-3
Original Aerial photographs and topographic map of the study area
Figure 4.18. Topographic map of the study area
Source: Ethiopian Mapping Agency
Figure 4.19. Aerial photograph map of the study area(1987)
Source: Ethiopian Mapping Agency

70
Appendex-4
Partial view of Urban Expansion in study Area
Urban Expansion in study Area (Photo by Ahlam Yimam March, 2017)

71