
Prepared for:1/25/2021 Document dates - City of Palo Alto
149
701-32 DOCUMENTS IN THIS PACKET INCLUDE: LETTERS FROM CITIZENS TO THE MAYOR OR CITY COUNCIL RESPONSES FROM STAFF TO LETTERS FROM CITIZENS ITEMS FROM MAYOR AND COUNCIL MEMBERS ITEMS FROM OTHER COMMITTEES AND AGENCIES ITEMS FROM CITY, COUNTY, STATE, AND REGIONAL AGENCIES Prepared for:1/25/ 2021 Document dates: 1/6/2021 – 1/13/2021 Set 1 Note: Documents for every category may not have been received for packet reproduction in a given week.
-
Upload
khangminh22 -
Category
Documents
-
view
0 -
download
0
Transcript of Prepared for:1/25/2021 Document dates - City of Palo Alto

701-32
DOCUMENTS IN THIS PACKET INCLUDE:
LETTERS FROM CITIZENS TO THE MAYOR OR CITY COUNCIL
RESPONSES FROM STAFF TO LETTERS FROM CITIZENS
ITEMS FROM MAYOR AND COUNCIL MEMBERS
ITEMS FROM OTHER COMMITTEES AND AGENCIES
ITEMS FROM CITY, COUNTY, STATE, AND REGIONAL AGENCIES
Prepared for: 1/25/
2021 Document dates: 1/6/2021 – 1/13/2021
Set 1 Note: Documents for every category may not have been received for packet
reproduction in a given week.

1
Brettle, Jessica
From: Brettle, JessicaSent: Friday, January 8, 2021 5:08 PMTo: Tom DuBois; DuBois, Tom; Kou, Lydia; Cormack, Alison; Filseth, Eric (Internal); Filseth, Eric (external);
Greer Stone; Stone, Greer; Greg Tanaka; Tanaka, Greg; Pat Burt; Pat Burt ([email protected]); Burt, Patrick
Cc: Minor, Beth; Shikada, Ed; Stump, Molly; Lait, JonathanSubject: Forwarded from Council Member Kou: RHNA Double Counting!Attachments: 2020FEB Freddie Mac report - Housing Supply Shortage.pdf; 2020OCT EI Double-counting-in-the-
Latest-Housing-Needs-Assessment.pdf; 2020 DOF population growth report (2020_07_28 16_54_47 UTC).pdf
Mayor and City Council,
Please see below and attached from Council Member Lydia Kou. Thank you.
Sincerely,Jessica
Jessica BrettleAssistant City Clerk250 Hamilton Avenue | Palo Alto, CA 94301Phone: (650) 329 2630Email: [email protected]
From: Kou, Lydia <[email protected]>Sent: Friday, January 8, 2021 5:04 PMTo:Minor, Beth <[email protected]>; Brettle, Jessica <[email protected]>Subject: RHNA Double Counting!
Dear Beth and Jessica,
Please forward the enclosed email referenced as "Subject: Addressing questions about the EmbarcaderoInstitute and its report" and the three attachments to the Council Members to prepare for our Councilmeeting on January 11, 2021, in particular Action item no. 8.
Attachments enclosed:
Freddie Mac Housing Supply reportEmbarcadero Institute analysisDOF Demographic report
Thank you,
COUNCIL MEETING
✔ 81-11-21

2
Lydia Kou Council Member
Contact Info: https://goo.gl/BcgCQS
From: Gab Layton <[email protected]>Sent: Thursday, November 19, 2020 4:15 PMTo: Council, City <[email protected]>; City Mgr <[email protected]>; Lait, Jonathan<[email protected]>; City Attorney <[email protected]>Cc:Waldfogel, Asher <[email protected]>Subject: Addressing questions about the Embarcadero Institute and its report
CAUTION: This email originated from outside of the organization. Be cautious of opening attachments and clicking on links.
Dear Mayor, council members, and city staff,
After attending the city council meeting on Monday, November 16, I felt I should clarify a couple of questions raised about the Embarcadero Institute and respond to Mr. Levy’s criticism of our report.
To the question of who we are:
Asher Waldfogel and I co-founded Embarcadero Institute (EI) almost five years ago. We founded the nonprofit with the intention of providing data-driven analysis on matters affecting housing and transportation policy. You will already be familiar with Asher and his background - founding three venture capital-backed start-ups in networks and high-performance computing and his service on Palo Alto’s Planning and Transportation Committee for several years.
I am currently serving on the board of Stanford’s Institute for Economic Policy Research. I have a Ph.D. in Aerospace Engineering and worked in scramjet engine design before working at McKinsey & Company. I have lived in Palo Alto since 2012.
To the suggestion that we are anti-housing:
Asher and I have both supported candidates locally who we think will do the best job of moving the dial on affordable housing and achieving a better job/housing balance. We are pro-housing, particularly pro-affordable housing. We're also pro-transparency. Wanting to understand the real size of the problem should not be

3
conflated with an anti-housing position. We want to understand the real size of the problem to better understand the causes, so when we make progress against real targets we will know what's working. Inflating the numbers doesn't help anyone. Labels don’t help either. Housing is a complex problem with many stakeholders; as a result, solutions will likely require compromise. Painting people into corners with labels like “pro” and “anti” isn’t particularly helpful.
Re criticism of our report:
EI recently produced a report on the Regional Housing Needs Assessments in which we identified a series of double-counting errors in the Dept. of Housing and Community Development’s new 6th cycle methodology that nearly double the housing targets over the 5th cycle methodology. I understand you all received a copy of the report. In preparing the report, we had the opportunity to speak to both Dr. Walter Schwarm, Chief Economist at the Department of Finance (DOF), and Tom Brinkhuis, Housing Policy Specialist at the Dept. of Housing and Community Development (HCD).
I noted Mr. Levy’s email of November 8 in which he stated, “The EI report is wrong in both of its major claims” and wished to respond to his statement.
1. 2. Mr. Levy argues that: 3.
“The first claim was that the HCD vacancy assumption is too high because it does not use the recent vacancy trend for owner-occupied housing.” To which he adds,
“as the HCD letter points out 5% is their normal assumption for the total housing stock”.
Response: To be clear, we did not argue that the vacancy assumption was too high because of recent vacancy trends in owner-occupied housing. Instead, our point was that HCD had deviated from their standard practice for the last two decades of separating owner-occupied and renter housing and applying two separate benchmarks to the different housing stocks. In the past, they have applied a benchmark of 1.5% for owner-occupied housing and 5% for renter-housing. This approach of treating the two types of housing as essentially two different markets is consistent with work produced by Harvard’s Joint Center for Housing Studies and consistent with the approach used by the American Housing Survey (AHS) managed by the Census Bureau.
There is an abundance of official documentation on the HCD website to show that 5% is not the HCD’s “normal assumption for total housing stock”. The HCD staff themselves would not argue this point. I’ve attached a copy of the relevant page in HCD’s official letter to ABAG for the 5th cycle Housing Need Determination in which they outline the methodology used then - you’ll notice that they separate out owner-occupied and rental housing and separately apply a 1.5% and 5% benchmark.

4
2. 3. Mr. Levy states: 4.
“Their second claim is that DOF already accounts for mitigating existing housing shortages. Their "evidence" for this is a quote from an ABAG staff member in 2006. The claim is false. DOF has published their housing projection methodology this year and notes a) that it does not reflect pent-up demand and starts with recent household headship rates (that reflect doubling up and overcrowding as a result of growing housing unaffordability for many residents).”
EI Response:
Mr. Levy is correct that the Dept of Finance’s (DOF) past approach did not adjust for household formation rates depressed by the Great Recession. However, he is incorrect in saying that the DOF starts with recent household headship rates. They start with 20-year household headship trends. Furthermore, since 2015, the DOF made a subsequent adjustment to their methodology. They were concerned that the impacts of the Great Recession would disproportionately affect their 20-year trend data. They convened a household formation expert panel and, out of those discussions, decided to include a recession adjustment that counteracted the overcrowding and cost-burdening effects of the economy. That adjustment added an explicit return to household formation rates of the early 2000s, that, as the DOF describes it, reflected socio-cultural norms of home-ownership and household size - this adjustment results in higher household projections. I spoke to Dr. Walter Schwarm at the DOF in July shortly after he had updated the “read me” notes that documented these household formation adjustments. They can be found with the Dept of Finance’s Household Projection Table -P4.

5
Per Dr. Walter Schwarm, June 2020, paragraph 5 (highlighted below)
“Age- and race/ethnicity-specific headship rates were calculated based on 1990, 2000, and 2010 census information. Trends in headship rates over time by age and county are modeled and used to project future headship rates. In addition to trends, there is an explicit return to an average of 2000 and 2010 headship rates built into the model. This average of rates was the result of deliberations made by the expert panel during the previous HCD Statewide Housing Plan in 2015. The argument was that the Great Recession and the affordability crisis which impact recent trends in headship should not be allowed to dominate the projection, rather some return to underlying socio-cultural norms of homeownership/fewer roommates is a beneficial assumption that reflects the fact that those conditions were temporary”.
In Summary:
1. 2. Mr. Levy argued that the Dept. of Housing and Community 3. Development (HCD) has always treated the total housing stock with a 5% rental vacancy rate. 4.
That is not true and that fact is not in dispute. And since the owner-occupied vacancy barely reached 3% during the foreclosure crisis, a 5% benchmark for owner-occupancy seems high by any measure.
2. 3. Mr. Levy argued that 4. the Dept. of Finance household projections do not include an adjustment for overcrowding and cost-
burdening. 5.
In fact, they do, and the adjustment was authorized by a panel of experts following the HCD statewide Housing Plan in 2015. Mr. Levy may argue that the panel of experts got it wrong but he would have to take that up with the DOF and HCD.
I hope that clarifies any misunderstandings. Please feel free to contact us if you have any further questions. Thanks for your service and time.

6
Sincerely
Gab Layton
https://embarcaderoinstitute.com/

© 2020 Freddie Mac www.freddiemac.com
Economic & Housing Research Insight
FEBRUARY 2020
The Housing Supply Shortage: State of the States
The United States suffers from a severe housing shortage. In a recent
study, The Major Challenge of Inadequate U.S. Housing Supply, we
estimated that 2.5 million additional housing units will be needed to make
up this shortage. Our earlier study used national statistics, treating the
United States as a single market. What happens when we look closer,
basing the analysis at the state level?
When we account for state-level variations, the estimated
housing deficit is even greater in some states because
housing is a fixed asset. A surplus of housing in one
area can do little to help faraway places. For example,
vacant homes in Ohio make little difference to the housing
markets in Texas. We estimate that there are currently
29 states that have a housing deficit, and when we
consider only these states, the housing shortage grows
from 2.5 million units to 3.3 million units.
Unsurprisingly, the states with the most severe housing
shortage are the states that have recently attempted to
loosen zoning policy regulations. States like California,
Oregon, and others have undertaken policy action to
address this issue. California, for example, has been
working on chipping away at single-use zoning while Texas has passed a density bonus
program, an ordinance which amends the city code by loosening site restrictions and
promoting construction of more units in affordable and mixed-income housing developments.
Oregon was one of the first states to pass legislation to eliminate exclusive single-family zoning
in much of the state. The Minneapolis City Council voted to get rid of single-family zoning
and started allowing residential structures with up to three dwelling units in every neighborhood.
We took a deep dive into the supply/demand dynamics to analyze state-level variations.
We estimate that there are
currently 29 states that have a
housing deficit, and when we
consider only these states, the
housing shortage grows from
2.5 million units to 3.3 million units.
February 2020 2
Economic & Housing Research Insight
Accounting for housing supply/demand conditions
To estimate housing supply, we rely on U.S. Census Bureau estimates of the total number of housing
units in each state. These estimates include single-family homes, apartments, and manufactured
housing. We compare supply to our estimates of housing demand. We first focus on static estimates
of housing demand, and then we consider the impact of interstate migration.
Our estimate of housing demand relies on two components. First, we need an estimate of long-term
vacancy rates ( ). Second, we need an estimate of the target number of households ( ).1
The estimates of and give an estimate of housing demand ( ) using the formula:
=
Vacancy rates
As we discussed in our earlier study, for the housing market to function smoothly, year-round vacant
units are needed. Vacancy rates are often used to track the vitality of the housing market. Too high
of a vacancy rate reflects a moribund market, while too low of a rate means demand is outstripping
supply. Our previous research estimated the average U.S. vacancy rate to be around 13%.
For long-term vacancy rates ( ), we use historical estimates of vacancy rates in each state as
well as the share of the state in the housing stock to obtain the state weight. We compute the
weighted average national vacancy rate for the U.S. and then estimate the deviation of the state
vacancy rate from the average national vacancy rate (see Appendix 1.1 for a detailed methodology).
We use each state's average from 1970 to 2000 as the estimate for because this was the
period before the boom and the bust in the housing market began. Historical vacancy rates vary
dramatically by state. States like Vermont and Maine tend to have high vacancy rates because a
large fraction of the housing stock serves as vacation/second homes. On the other hand, states
like California tend to have very low vacancy rates.
1 The target number of households is the number of unconstrained households that would have formed if households did
not face any constraints related to housing costs.

February 2020 3
Economic & Housing Research Insight
It is interesting to compare each state’s long-term vacancy rate ( ) to recent estimates ( ).
This measure estimates the number of housing units needed to close the gap between the
current vacancy rate and long-term average rates. Exhibit 1 shows the difference between the
estimated vacancy rate in 2018 and the long-term vacancy rate for each state. States like Oregon,
California, and
Minnesota have much
lower current vacancy
rates compared to their
historical averages,
while states like West
Virginia, Alabama, North
Dakota, and Ohio have
witnessed an increase
in the vacancy rates as
the populations of these
states have decreased.
Source: Author’s calculations based on CPS, HVS, and Moody’s Analytics estimated data.
CA-4.02
OR-6.50
WA-0.77
MT-0.51
ND4.69
MN-3.79
IA3.17
MO2.42
KY1.59
TN3.17
DC -7.01
MD -2.26
NH-1.57VT
2.13
CT -1.27
DE 1.09
NC-2.16
AR6.32
LA0.65
CO-3.40
ID-2.21
NV-0.20
UT-0.83
AZ-2.28 NM
0.14
TX-3.14
GA0.74
FL-3.43
SC0.85
VA-0.62
PA2.55
NY-1.10
ME1.20
WV6.72
AK-0.91
WY2.11
SD1.89
NE2.74
KS0.90
OK1.92
MA -2.98
NJ 0.96
MS1.01
IL1.06
WI0.88 MI
0.59
IN0.04
OH4.17
AL4.69
HI0.58
RI 0.37
< -3.00
-3.00 to 0.00
0.00 to 3.00
> 3.00
Exhibit 1
Difference between 2018 vacancy rate and historical vacancy rate
States that are losing (gaining) population have high (low) vacancy rates.

February 2020 4
Economic & Housing Research Insight
Target households
Our previous research has shown that high housing costs have constrained household formation.
These high housing costs have hit the Millennial generation particularly hard. To overcome these
cost barriers, some young adults have turned to shared living arrangements. Others have moved
back home with parents. As a result, there are more than 400,000 missing households headed by
25- to 34-year-olds (households that would have formed except for higher housing costs).
While high housing costs have hit young adults hardest, they have affected all age groups.
If housing costs were lower, more households would form. We use our model estimates of the
number of households reduced due to unusually high housing costs and add them back.
We do this for each age group (see Appendix 1.2 for more details.)
Due to different age
profiles, the share
of missing households
varies by state.
Exhibit 2 plots the share
of missing households
due to housing costs for
each state. In general,
states with relatively
lower vacancy rates
have proportionally more
missing households.
Source: Author’s calculations based on American Community Survey data.
CA-0.16
OR-0.02
WA-0.03
MT0.00
ND0.00
MN-0.02
IA-0.01
MO-0.02
KY-0.02
TN-0.03
DC -0.02
MD -0.02
NH-0.01VT
0.00
CT -0.01
DE 0.00
NC-0.04
AR-0.01
LA-0.02
CO-0.02
ID-0.01
NV-0.01
UT-0.01
AZ-0.03 NM
-0.01
TX-0.11
GA-0.04
FL-0.08
SC-0.02
VA-0.03
PA-0.05
NY-0.08
ME-0.01
WV-0.01
AK0.00
WY0.00
SD0.00
NE-0.01
KS-0.01
OK-0.02
MA -0.03
NJ -0.04
MS-0.01
IL-0.05
WI-0.02 MI
-0.04
IN-0.03
OH
AL-0.02
HI-0.01
RI 0.00
-0.02 to 0.00
-0.04 to -0.02
-0.06 to -0.04
-0.08 to -0.06
< -0.08
Exhibit 2
Missing households due to high housing costs (millions) States with relatively lower (higher) vacancy rates have proportionally more (fewer) missing households.

February 2020 5
Economic & Housing Research Insight
Static estimate of housing deficit
We combine our target vacancy rate and target households to estimate housing demand.
Subtracting our estimated housing demand from the Census estimate of housing supply gives us
the estimated housing deficit. Exhibit 3 shows our results by state.
As a percent of the
housing stock, the state
housing supply deficit
varies from -7 to 10%.
Excluding the District
of Columbia, Oregon
has the largest deficit
(nearly 9%) followed by
California (nearly 6%).2
Some states have a
negative deficit, meaning
they are oversupplied.
According to our
estimate, 21 states are
oversupplied, the largest
being West Virginia,
at more than 7%.
2 The District of Columbia had the highest deficit as a share of the existing housing stock at 9.7%.
Source: Author’s calculations.
CA5.74
OR8.80
WA1.93
MT0.77
ND-3.82
MN5.37
IA-2.44
MO-1.86
KY-0.89
TN-2.46
DC 9.55
MD 3.40
NH3.47VT
-0.88
CT 2.49
DE 0.23
NC3.66
AR-6.23
LA0.17
CO5.09
ID3.13
NV1.55
UT2.48
AZ3.71 NM
0.60
TX4.81
GA0.28
FL5.13
SC-0.22
VA1.65
PA-1.96
NY2.33
ME-0.13
WV-7.12
AK3.00
WY-0.98
SD-0.51
NE-2.61
KS0.00
OK-1.27
MA 4.44
NJ -0.03
MS-0.21
IL-0.16
WI0.13 MI
0.37
IN1.04
OH-3.63
AL-4.45
HI1.34
RI 1.09
< -5.0
-5.0 to 0.00
0.00 to 5.00
> 5.00
Exhibit 3
Housing stock deficit as proportion of a state’s housing stock (static estimate not considering interstate migration flows)
A static view suggests that 29 states have a housing undersupply.

February 2020 6
Economic & Housing Research Insight
Impact of migration on the housing deficit of the states
While houses stay in place, people do not. Job growth attracts in-migrants, while a dearth
of opportunity drives out-migration. High housing costs also contribute to migration patterns.
When the rents get too high, people move away. This dynamic can impact our estimates.
It's helpful to consider the case of California. Our estimates indicate that California has a shortage
of 820,000 housing units. But history suggests that California's shortage may be overestimated if
interstate migration is considered. For more than four decades, California's state population has
grown, but this increase has been driven primarily by international migration. High housing costs
have driven many U.S. citizens and households out of California, driving housing demand higher
in their destination states.
A robust model of
domestic migration flows
between states is beyond
the scope of this study.
But we can approximate
how migration may affect
our estimates. We can
use the historical average
of state-to-state migration
flows as a forecast of
future flows. If the future
interstate migration
exactly matches past
flows since 2001, we
can create a rough, but
useful approximation
(Exhibit 4).3
3 We used the average net migration flows between states from 2001 to 2017 for the past flows.
Source: Author’s calculations.
CA5.42
OR9.23
WA2.28
MT1.13
ND-3.63
MN5.30
IA-2.29
MO-1.89
KY-0.84
TN-2.16
DC 9.69
MD 3.26
NH3.51VT
-1.11
CT 2.01
DE 0.54
NC4.11
AR-6.11
LA-0.28
CO5.55
ID3.65
NV2.21
UT2.76
AZ4.31 NM
0.15
TX5.16
GA0.60
FL5.51
SC0.33
VA1.65
PA-1.04
NY1.51
ME-0.09
WV-7.76
AK2.36
WY-0.88
SD-0.39
NE-2.64
KS-0.57
OK-1.16
MA 4.10
NJ -0.47
MS-0.46
IL-0.72
WI0.08 MI
-0.11
IN0.96
OH-3.97
AL-4.34
HI1.08
RI 0.06
< -5.0
-5.0 to 0.00
0.00 to 5.00
> 5.00
Exhibit 4
Housing stock deficit as proportion of state’s housing stock (dynamic estimate considering interstate migration flows)
A dynamic view indicates that some states’ deficit is overestimated, like California, while others’ is underestimated, like Texas. Some states, like Michigan, move from a deficit to a surplus.

February 2020 7
Economic & Housing Research Insight
For example, when considering migration flows, the estimated housing demand in Michigan
changes from deficit to surplus; Ohio's surplus increases; and Florida’s deficit increases (see
Appendix 1.3 for details on our estimation method).
Given the severity of the problem, states have started addressing the issue of supply shortages by
taking legislative action. Some of these states such as California, Oregon, Minnesota, and North
Carolina have passed legislation to eliminate exclusive single-family zoning. Removing these zoning
restrictions will provide builders with the flexibility to build a range of housing options which could
help alleviate some of the shortage.
Conclusion
A shortage of housing remains a major issue for the United States. Years of underbuilding has
created a large deficit, particularly for states with strong economies that have attracted a lot of
people from other states. The issue of undersupply will be further exacerbated as Millennials and
younger generations enter the housing markets, especially as housing costs become more favorable.
Dynamic estimates suggest that contrary to expectations, it isn’t only the larger states that have
a higher housing supply shortage. Some of the smaller states, which have been attracting a lot of
migrants from other states, also need to build more housing units to accommodate the needs of
their growing population.

February 2020 8
Economic & Housing Research Insight
Appendix
1.1 Vacancy rate calculations
We calculate the vacancy rate based on the historical vacancy rate. For this purpose, we obtain
the historical vacancy rates by state from Moody’s analytics for the period from 1970 to 20004 and
estimate the average vacancy rate for this period for each state.
= for 1970–2000,
where is the state.
We then obtain the housing stock information by state from the Housing Stock (HVS) ('000s)
U.S. Census Bureau (BOC): Housing Vacancies and Homeownership–Table 8–Quarterly Estimates
of the Housing Inventory. From these data, the share of the state in the total housing stock is
calculated to get the state weights.
=
The sum product of the vacancy rate of the state and the state’s weight in the housing stock gives
us the U.S. average vacancy rate.
U.S. average vacancy rate: = .
We then compute the difference between the state vacancy rate and the average U.S. vacancy rate
to see how far away the state is from the U.S. average.
= .
This deviation for the states is then applied to the long-run vacancy rate for the United States
(which we estimated earlier to be 13%) to get the state-wise vacancy rate.
State-wise Vacancy Rate = 13% + for each state.
1.2 Estimating target households
We obtain the headship rates5 for the year 2018 by state and by age for all the 50 states and District
of Columbia.6 We then estimate target households using this headship rate and adding back housing
4 Data is available from 1970:Q2 onward. We estimate the average for the period up to 2000:Q4. This corresponds to the
period before the boom and bust in the housing market began.
5 Headship Rate = Number of Head of Households/Total Households.
6 Data source: Current Population Survey–Annual Social and Economic Supplement (CPS-ASEC) using the Integrated
Public Use Microdata Series (IPUMS) (Steven Ruggles, Sarah Flood, Ronald Goeken, Josiah Grover, Erin Meyer, Jose
Pacas and Matthew Sobek. IPUMS USA: Version 9.0 [dataset]. Minneapolis, MN: IPUMS, 2019.)

February 2020 9
Economic & Housing Research Insight
costs assuming that housing costs become more favorable for household formation.
The target headship rate would be
= + .
We then use this target headship rate and the population by five-year age buckets to compute
the households in each state.
= ,
where is the state and is the five-year age buckets.
The product of headship rate and population by age gives the households by age group.
Summing it up over all the ages gives the total households in the state.7
1.3 Domestic migration flows between states
For the estimate of the states’ share of the deficit, we need to obtain the share of the migration flows
between states by age. To get detailed age-wise distribution of population, we use the ACS data
from 2001 to 2017. We obtain the population by age and by state for these years. We identify people
who had a different state of residence from a year ago, which indicates that they migrated
to a different state. We then get estimates of the in-migrants and out-migrants by state and age.
We then estimate the net domestic migrants for each state as the difference between the in-migrants
and out-migrants.
=
where i is the state, j is the five-year age buckets, I is the in-migrants, and is the outmigrants.
To estimate the net outmigrants from states that have a < , we obtain the Moody’s historical
net domestic migration data. We then apply these shares by state and age to the net migration data
for 2018 to obtain the number of people leaving a state by the five-year age bucket.
=,
where is the total change in population (net out-migrants) for states that have net outmigration,
7 These households would be based on the Current Population survey (CPS). To make them consistent with estimates of
housing supply from HVS, we apply a multiplier to this gap that is proportional to the gap between the CPS-ASEC and
HVS household counts. The CPS-ASEC household estimate for 2018 was 127.6 million. The HVS estimate for that year
was 121.3 million. We deflate our target households by a factor equal to 121.3/127.6, or 0.95.

February 2020 10
Economic & Housing Research Insight
is the net out-migrants by age group and state,
is the sum of the total out-migrants for the state, and
is the historical net domestic migration data from Moody.
The ratio of gives the share of the five-year age group in the total out-migrants from
the state.
This pool of out-migrants ( ) is then divided among the in-migrating states, given that the net
flows for the country are .
We distribute these migrants according to the share of the state in the total in-migrants as well as by
the share of the age group in the total in-migrants to the state.
=
where is the in-migrants to the state i from the outmigrants pool,
is the share of the state in total in-migrants,
is the share of the five-year age bucket in the total in-migrants, and
is the total out-migrants.
The population of each state is then adjusted according to the change in the
population estimated above.
= + <
= + <
The households are then computed based on this adjusted population for each state by applying
the headship rates by age group. Then the housing stock is estimated as per equation (1).

© 2020 Freddie Mac www.freddiemac.com
Economic & Housing Research Insight
Prepared by the Economic & Housing Research group
Sam Khater, Chief Economist
Len Kiefer, Deputy Chief Economist
Venkataramana Yanamandra, Macro Housing Economics Senior
www.freddiemac.com/finance
Opinions, estimates, forecasts, and other views contained in this document are those of
Freddie Mac's Economic & Housing Research group, do not necessarily represent the views
of Freddie Mac or its management, and should not be construed as indicating Freddie Mac's
business prospects or expected results. Although the Economic & Housing Research group
attempts to provide reliable, useful information, it does not guarantee that the information or
other content in this document is accurate, current or suitable for any particular purpose.
All content is subject to change without notice. All content is provided on an “as is” basis,
with no warranties of any kind whatsoever. Information from this document may be used
with proper attribution. Alteration of this document or its content is strictly prohibited.
© 2020 by Freddie Mac.

Do the Math: The state has ordered more than350 cities to prepare the way for more than 2 million homes by 2030. But what if the math is wrong?
Senate Bill 828, co-sponsored by the Bay Area Council and Silicon Valley Leadership Group, and authored by state Sen. Scott Wiener in 2018, has inadvertently doubled the “Regional Housing Needs Assessment” in California.Use of an incorrect vacancy rate and double counting, inspired by SB-828, caused the state’s Department of Housing and Community Development (HCD) to exaggerate by more than 900,000 the units needed in SoCal, the Bay Area, and the Sacramento area.
The state’s approach to determining the housing need must be defensible and reproducible if cities are to be held accountable. Inaccuracies on this scale mask the fact that cities and counties are surpassing the state’s market-rate housing targets but falling far short in meeting affordable housing targets. The inaccuracies obscure the real problem and the associated solution to the housing crisis—the funding of affordable housing.
Author : Gab Layton PhD, President of the Embarcadero Institute

Sierra
DelNorte
HumboldtTrinity Shasta Lassen
TehamaPlumas
Butte
Nevada
Placer
Sonoma NapaYolo
Solano
Stanislaus
SantaClara
SanBenito
SanJoaquinContra
Costa
Alameda
Marin
San Francisco
San Mateo
Santa Cruz
Monterey
San LuisObispo
Santa Barbara
VenturaLos Angeles
Orange
San Bernardino
Riverside
San Diego Imperial
Yuba
GlennMendocino
LakeColusa
Sutter
Sacra-mento
El Dorado
Alpine
CalaverasTuolumne
Mono
Mariposa
Madera
Fresno
Kings
Kern
Tulare
Inyo
Merced
Amador
SiskiyouModoc
Double counting (not surprisingly) doubled the assessed housing need for the four major planning regions.
Four Regions Contain 80% of the State’s HousingHousing Units Needed According to the State, (1996–2030)
0
0.5M
1.0M
1.5M
2.0M
2.5M
Sacramento AreaCouncil of Governments(SACOG)
1996–2006 2005–2014 2013–2022 2021–2030
Associationof Bay Area
Governments(ABAG)
San DiegoAssociation ofGovernments
(SANDAG)
Greater Sacramento
San Diego Region
Greater Bay Area
Six SoCal Counties
Southern CaliforniaAssociation ofGovernments
(SCAG)
1
Impacted by Great Recession
foreclosure crisis
Made before COVID impact

0
500,000
1,000,000
Cost burdening double-count
Overcrowding double-count
Extra units needed to replace demolished units
Extra units needed to achieve healthy vacancy rate
Households needed as determined by the Dept. of Finance(factors in overcrowding and cost burdening)
ConventionalEconomist Approach
Conventional Economist Approach
Conventional Economist Approach
ConventionalEconomistApproach
Six SoCal Counties Greater Bay Area San Diego Region Greater Sacramento
The double count, an unintended consequence of Senate Bill 828, has exaggerated the housing need by more than 900,000 units in the four regions below.
Num
ber o
f Hou
sing
Uni
ts
(1,341,827)
(153,512)(122,000)(112,000)
(283,000)
(441,176)
(171,687)
(651,000)
SB-828 DoubleCount
SB-828DoubleCount
SB-828 DoubleCount
SB-828 DoubleCount
2

Senate Bill 828 was drafted absent a detailed understanding of the Department of Finance’s methodology for developing household forecasts, and absent an understanding of the difference between rental and home-owner vacancies. These misunderstandings have unwittingly ensured a series of double counts.
State’s erroneous benchmark of 5%
Annual Homeowner Vacancy Rates for the United States and Regions: 1968º2019
Long term benchmarkis 1.5%
3
1. SB-828 wrongly assumed ‘existing housing need’ was not evaluated as part of California’s previous Regional Housing Need Assessments, or RHNA. There was an assumption that only future need had been taken into account in past assess-ments. (In fact, as detailed in The Reality section, the state’s existing housing need was fully evaluated in previous RHNA assessment cycles).
2. SB-828 wrongly assumed a 5% vacancy rate in owner-occupied housing is healthy (as explained in the column on the right, 5% vacancy in owner-occupied homes is never desir-able, and contradicts Government Code
5% vacancy rate applies only to the rental housing market).
3. SB-828 wrongly assumed overcrowding and cost-burdening had not been considered in Department of Finance projections of housing need. The bill sought to redress what it mistaken-ly thought had been left out by requiring regional planning agencies to report overcrowding and cost-burdening data to the Dept. of Housing and Community Development (as explained in the right column).
SB-828 MISTAKENLY ASSUMED: THE REALITY IS:1. Existing housing need has long been incorporated in California’s planning cycles. It has been evaluated by comparing existing vacancy rates with widely accepted benchmarks for healthy market vacancies (rental and owner-occupied). The difference between actual and benchmark is the measure of housing need/surplus in a housing market. Confusion about the inclusion of “existing need” may have arisen because vacancy rates at the time of the last assessment of housing need (”the 5th cycle”) were unusually high (higher than the healthy benchmarks) due to the foreclosure crisis of 2007–2010, and in fact, the vacancy rates suggested a surplus of housing. So, in the 5th cycle, the vacancy adjustment had the effect of lowering the total housing need. Correctly seeing the foreclosure crisis as temporary, the state Department of Finance did not apply the full weight of the surplus but instead assumed a percentage of the vacant housing would be absorbed by the time the 5th cycle began. The adjustment appears in the 5th cycle determinations, not as ‘Existing Housing Need’ but rather as “Adjustment for Absorption of Existing Excess Vacant Units.”
2. While 5% is a healthy benchmark for rental vacancies, it is unhealthy for owner-occupied housing (which typically represents half of existing housing). In the U.S. homeowner vacancy has hovered around 1.5% since
3% during the foreclosure crisis. However, 5% is well outside any healthy norm, and thus does not appear on the Census chart (to the right) showing Annual Homeowner Vacancy Rates for the United States and Regions: 1968–2019.
3. Unknown to the authors of SB-828, the Department of Finance (DOF) has for years factored overcrowding and cost-burdening into their household projections. These projections are developed by multiplying the estimated population by the headship rate (the proportion of the population who will be head of a household). The Department of Finance (DOF), in conjunction with the Department of Housing and Community
conditions and intentionally “alleviate the burdens of high housing cost and overcrowding.” Unfortunately, SB-828 has caused the state to double count these important numbers.
Five Percent

1. Incorrect use of a 5% benchmark vacancy rate for owner-occupied housing.The vacancy rate was incorrectly used for both existing and projected owner-occupied households.
2. Current vacancies were assumed to exist in household projections. This error is unrelated to SB-828, but is an accounting error introduced by HCD methodology.
3. Overcrowding and cost-burdening were double counted.** In addition to the household projection methodology outlined by the Department of Finance (shown to account for overcrowding and cost-burdening), the matter is also mentioned in meeting notes available on the Association of Bay Area Government’s (ABAG) website.***
Quote from ABAG’s Housing Methodology Committee Agenda Packet for the 4th RHNA Cycle, July 2006
“There was also a lot of discussion about the headship rates used by HCD/DOF. Several people commented that headship rates in the Bay Area are generally lower than the State’s estimates because the region’s high housing costs limit household formation. In response, Mr. Fassinger noted that HCD uses these higher headship rates because the RHNA process is intended to alleviate the burdens of high housing cost and overcrowding.”
Despite this, overcrowding and cost-burdening were counted a second time as adjustment factors required by SB-828.
+ 229,000 housing units
+ 734,000 housing units
– 22,000 housing units
+ 941,000 housing units
4
*
TOTAL:

5th Cycle Targets (as of April 2019)
500K
250K
Permit Progress in the 5th Cycle (2013-2022)*
(all 4 regions)
Very low +low income
Market rate
Permits Issued (as of April 2019)
Affordable Housing Languishes as Market-Rate Housing Overachieves (Bay Area only)*
4th Cycle2007–2014
5th Cycle2014–2022
3rd Cycle1996–2006
+150%
+100%
+50%
-50%
0%
Very-low + Low Income PermitsMarket-Rate Permits
5
The state’s exaggerated targets unfortunately mask the real story: Decades of overachieving in market-rate housing has not reduced housing costs for lower income households.
Great Recession (2007–2010) impacted housing. Market-rate meets but does not exceed state target
in the 4th cycle.
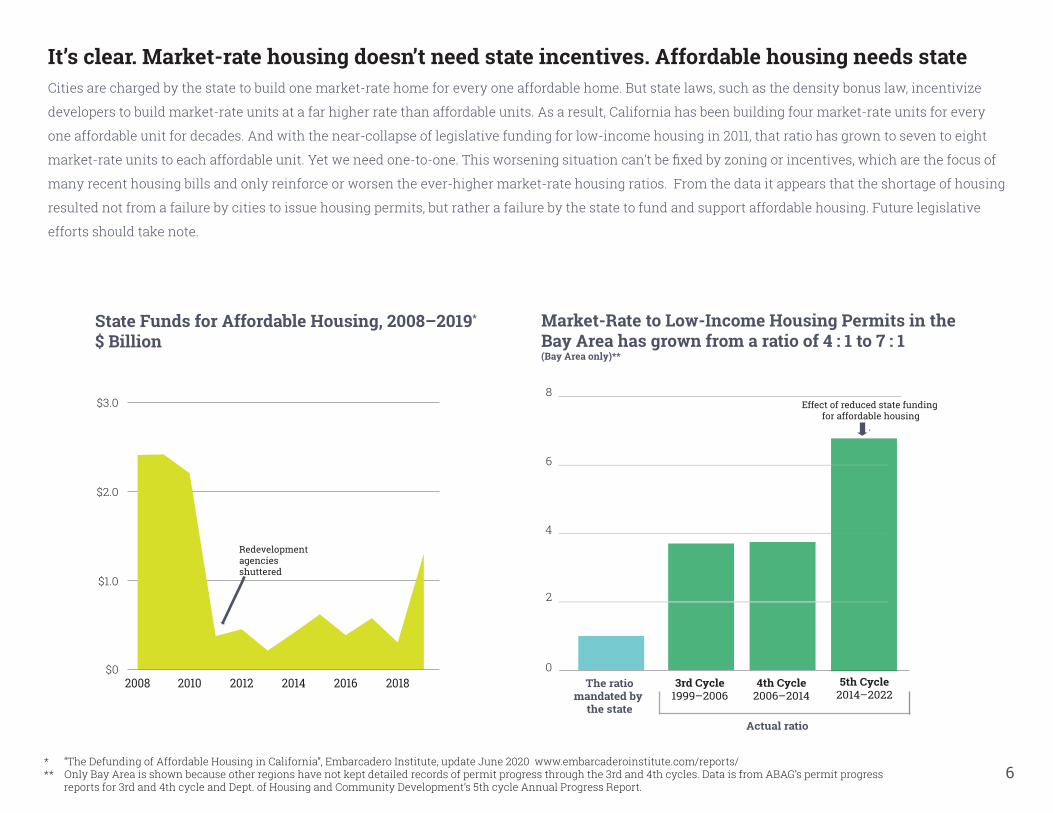
Market-Rate to Low-Income Housing Permits in the Bay Area has grown from a ratio of 4 : 1 to 7 : 1 (Bay Area only)**
4th Cycle2006–2014
5th Cycle2014–2022
3rd Cycle1999–2006
6
Effect of reduced state funding for affordable housing
.
2008 2010 2012 2014 2016 2018 The ratiomandated by
the state
State Funds for Affordable Housing, 2008–2019*
$ Billion
Actual ratio
Redevelopmentagenciesshuttered
6
It’s clear. Market-rate housing doesn’t need state incentives. Affordable housing needs state
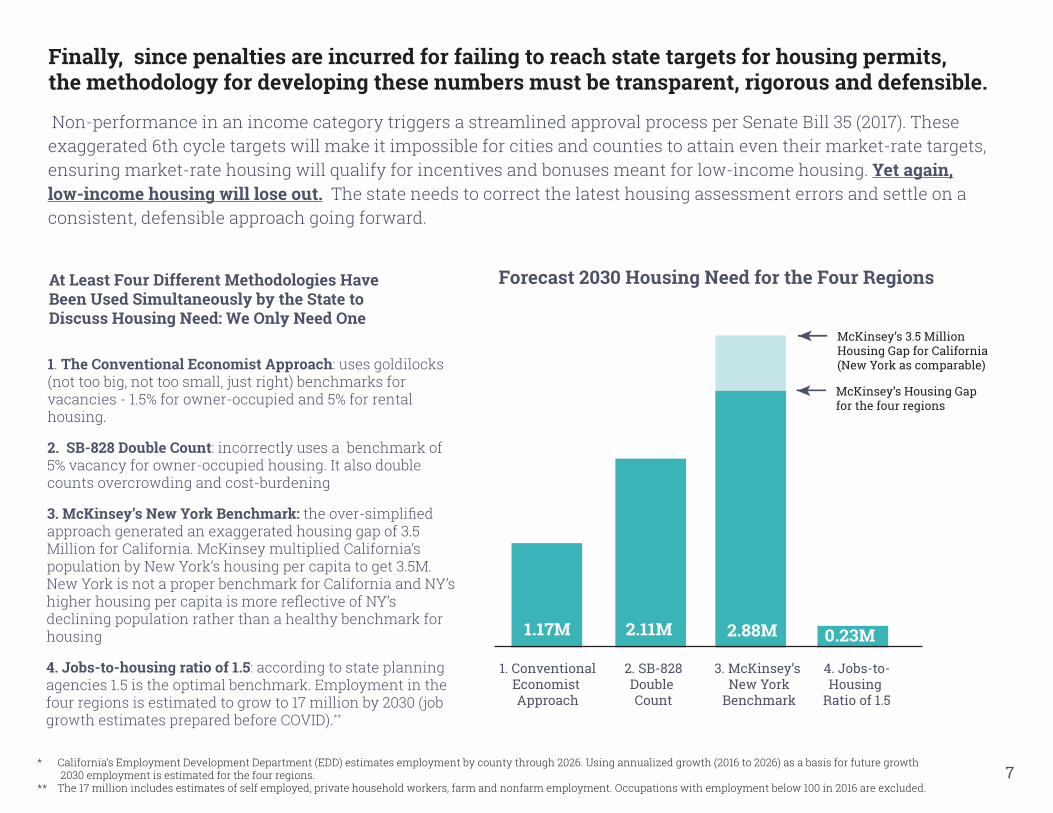
Finally, since penalties are incurred for failing to reach state targets for housing permits,the methodology for developing these numbers must be transparent, rigorous and defensible.
Yet again, low-income housing will lose out.
1. ConventionalEconomist Approach
2. SB-828Double Count
3. McKinsey’s New York
Benchmark
4. Jobs-to-Housing
Ratio of 1.5
1.17M 2.11M 2.88M 0.23M
1 The Conventional Economist Approach
2. SB-828 Double Count
3. McKinsey’s New York Benchmark:
4. Jobs-to-housing ratio of 1.5
**
Forecast 2030 Housing Need for the Four RegionsAt Least Four Different Methodologies Have Been Used Simultaneously by the State to Discuss Housing Need: We Only Need One McKinsey’s 3.5 Million
Housing Gap for California(New York as comparable)
7
McKinsey’s Housing Gap for the four regions

Dept. of Finance (DOF)
How it Works: A multi-agency collaborative effort has generated past state housing targets. However,
STEP 1
STEP 2
STEP 3
STEP 4
Dept. of Housing and Community Development (HCD)
APPENDIX
A-1
The Dept. of Finance (DOF) generates household forecasts by county based on population growth and headship rates. This is the step where overcrowding and cost-burdening are factored in . The Dept. of Housing and Community
Development (HCD) then takes the DOF household projections and adds in a healthy vacancy level (1.5% for owner-occupied, 5% for rental housing) to determine the number of housing units needed to comfortably accommodate the DOF household projections.
Cities and Counties report annual progress on housing permits to the Dept. of Housing and Community Development (HCD)
The regional agencies allocate housing targets to cities and counties in their jurisdiction. These allocations collectively meet their RHNA assessments and are based on algorithms that may include employment, transit accessibility and local housing patterns

+ 229,000 housing units
+ 734,000 housing units
– 22,000 housing units
Six SoCal Counties = +578,000Greater Bay Area = +104,000San Diego Area = +39,000Greater Sacramento = +13,000
Six SoCal Counties = -13,000Greater Bay Area = -4,000San Diego Area = -2,000Greater Sacramento = -3,000
Six SoCal Counties = +126,000Greater Bay Area = +59,000San Diego Area = +23,000Greater Sacramento = +21,000
A-2
APPENDIX
SB-828 introduced errors in Step 2 (when the Dept. of Housing and Community Development made adjustments to the Dept. of Finance’s household projections).
1. Used a benchmark of 5% vacancy rate for BOTH owner-occupied and rental housing.
The Department of Housing and Community and Development
2. Assumed vacancies in household projections *
3. Double counted overcrowding and cost-burdening

(10,000)
(39,000)
EXISTING HOUSING: Six SoCal Counties
*
**
1.2%Home-owned (3.3 Million)
Vacant Housing Units
Actual Vacancies (40,000)
Healthy Benchmark (50,000) 1.5%
3.7%
5.0%
Existing Need
Rentals (3 Million)
Occupied Housing Units
Actual Vacancies (111,000)
Healthy Benchmark (150,000)
Seasonal Vacancies (500,000)***
1 circle = 10,000 households
A-3
APPENDIX
Detailed explanation of the errors using SoCal Counties as an example: First—the correct approach.

PROJECTED HOUSING NEED: Six SoCal Counties
Healthy Vacancy
New Housing:
Replacement
Adjustment:
Existing NeedAdditional HH by 2030
Home-owned (290,000)
Rentals (261,000)
Total Housing Need
by 2030
1.5% (4,000) (10,000)
5.0% (13,000) (39,000)
(34,000)
*
**
651,000housing units
1 circle = 10,000 households
A-4
APPENDIX
The housing need also takes into account for future growth.
(125,000)
(39 ,000)
EXISTING HOUSING: Six SoCal Counties
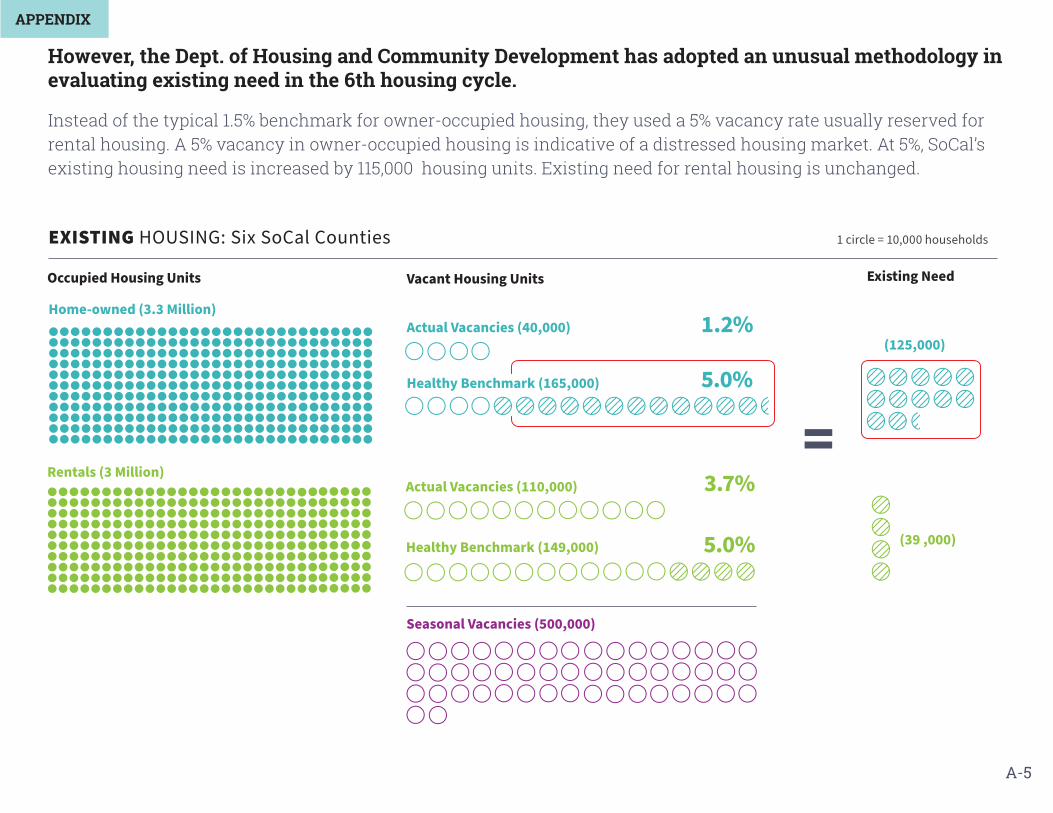
However, the Dept. of Housing and Community Development has adopted an unusual methodology in evaluating existing need in the 6th housing cycle.
1.2%Home-owned (3.3 Million)
Vacant Housing Units
Actual Vacancies (40,000)
Healthy Benchmark (165,000) 5.0%
3.7%
5.0%
Existing Need
Rentals (3 Million)
Occupied Housing Units
Actual Vacancies (110,000)
Healthy Benchmark (149,000)
Seasonal Vacancies (500,000)
1 circle = 10,000 households
A-5
APPENDIX

(34,000)
PROJECTED HOUSING NEED: Six SoCal Counties
Healthy Vacancy
New Housing:
Assumed Vacancy
New Housing
Replacement
Adjustment:
Existing
Need
Additional HH by 2030
Home-owned(290,000)
Rentals (261,000)
5% (15,000) 1.2%(3,000)
(125,000)
5.0% (13,000) (39,000)3.7%(10,000)
764,000housing units
1 circle = 10,000 households
A-6
APPENDIX
The Dept. of Housing and Community Development have also taken an unusual approach in evaluating projected housing need.

(460,000)
PROJECTED HOUSING NEED: Six SoCal Counties
Overcrowding
Adjustment*
Additional HH by 2030
Home-owned(290,000)
Rentals (261,000)
(118,000)
Cost Burdening
Adjustment**Projected Households
already factors in
overcrowding
and cost-burdening
From the Department of Finance
“The argument was that the Great Recession and the
affordability crisis which impact recent trends in headship
should not be allowed to solely dominate the projection,
rather some return to underlying socio-cultural norms
A DOUBLE COUNT
1 circle = 10,000 households
A-7
APPENDIX
Lastly, the Dept. of Housing and Community Development double counted by adding two new factors that had already been factored into household forecasts made by the Dept. of Finance (DOF).

(34,000) (460,000)
HCD 6TH CYCLE METHODOLOGY
Healthy Vacancy New Housing:
Assumed VacancyNew Housing
ReplacementAdjustment:
OvercrowdingAdjustment
ExistingNeed
Additional HH by 2030
Home-owned(290,000)
Rentals (261,000)
(118,000)
Cost BurdeningAdjustment
Total Housing Needby 2030
5% (15,000) 1.2%(3,000)
(125,000)
5.0% (13,000) (39,000)
1,342,000housing units
TYPICAL METHODOLOGY
Healthy Vacancy
New Housing:
Replacement
Adjustment:
Existing NeedAdditional HH by 2030
Home-owned (290,000)
Rentals (261,000)
Total Housing Need
by 2030
1.5% (4,000) (10,000)
5.0% (13,000) (39,000)
(34,000)
651,000housing units
3.7%(10,000)
1 circle = 10,000 households
A-8
APPENDIX
The vacancy errors and double counting resulted in a doubling of the housing needs assessment for the six counties of SoCal.

Complete data tables: ������������� �������������� www.embarcaderoinstitute.com
References used in the analysis : Dept. of Housing and Community Development (HCD) https://www.hcd.ca.gov Regional Housing Needs Allocation and Housing Elements Regional Housing Needs Allocations for 6th Cycle Housing Elements:
Allocations for 5th Cycle Housing Elements:
Annual Progress Reports
Allocations for Earlier Cycles and Housing Element
Department of Finance Methodology for Household Forecasts
Other Housing Assessment Methodologies“Mckinsey & Company
Jobs to Housing
END NOTES
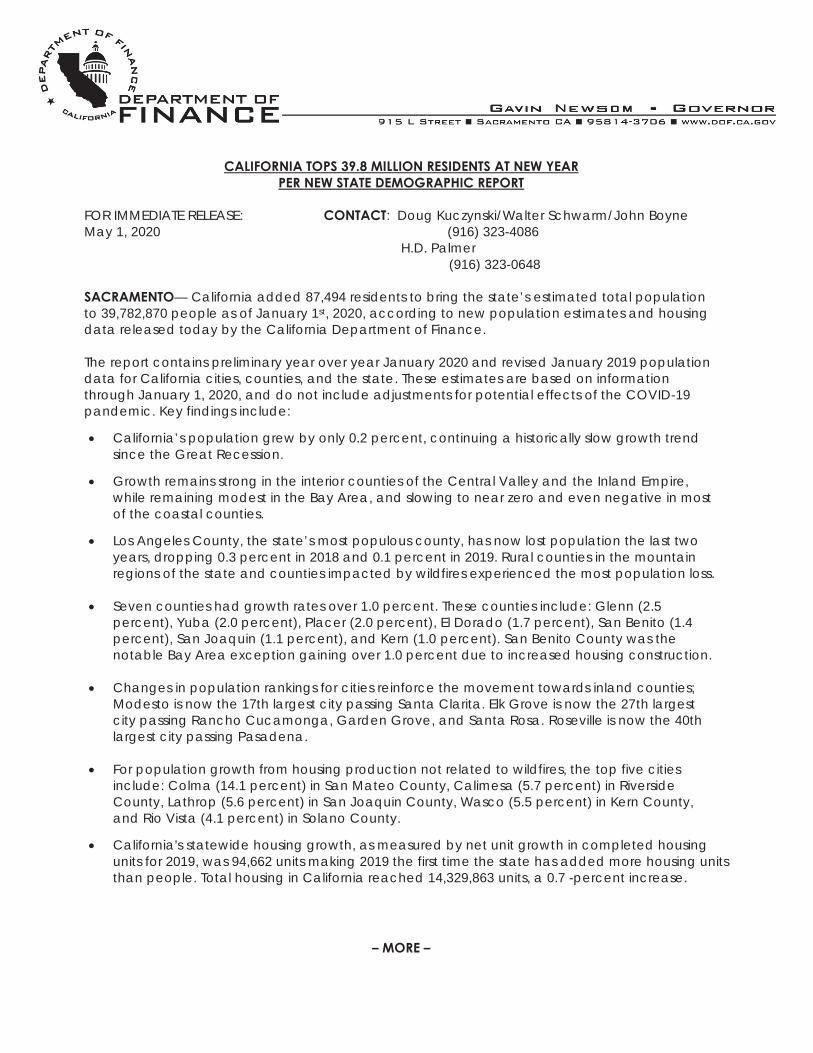
CALIFORNIA TOPS 39.8 MILLION RESIDENTS AT NEW YEAR PER NEW STATE DEMOGRAPHIC REPORT
FOR IMMEDIATE RELEASE: CONTACT: Doug Kuczynski/Walter Schwarm/John Boyne May 1, 2020 (916) 323-4086 H.D. Palmer (916) 323-0648 SACRAMENTO— California added 87,494 residents to bring the state’s estimated total population to 39,782,870 people as of January 1st, 2020, according to new population estimates and housing data released today by the California Department of Finance. The report contains preliminary year over year January 2020 and revised January 2019 population data for California cities, counties, and the state. These estimates are based on information through January 1, 2020, and do not include adjustments for potential effects of the COVID-19 pandemic. Key findings include:
California’s population grew by only 0.2 percent, continuing a historically slow growth trend since the Great Recession.
Growth remains strong in the interior counties of the Central Valley and the Inland Empire, while remaining modest in the Bay Area, and slowing to near zero and even negative in most of the coastal counties.
Los Angeles County, the state’s most populous county, has now lost population the last two years, dropping 0.3 percent in 2018 and 0.1 percent in 2019. Rural counties in the mountain regions of the state and counties impacted by wildfires experienced the most population loss.
Seven counties had growth rates over 1.0 percent. These counties include: Glenn (2.5 percent), Yuba (2.0 percent), Placer (2.0 percent), El Dorado (1.7 percent), San Benito (1.4 percent), San Joaquin (1.1 percent), and Kern (1.0 percent). San Benito County was the notable Bay Area exception gaining over 1.0 percent due to increased housing construction.
Changes in population rankings for cities reinforce the movement towards inland counties;
Modesto is now the 17th largest city passing Santa Clarita. Elk Grove is now the 27th largest city passing Rancho Cucamonga, Garden Grove, and Santa Rosa. Roseville is now the 40th largest city passing Pasadena.
For population growth from housing production not related to wildfires, the top five cities
include: Colma (14.1 percent) in San Mateo County, Calimesa (5.7 percent) in Riverside County, Lathrop (5.6 percent) in San Joaquin County, Wasco (5.5 percent) in Kern County, and Rio Vista (4.1 percent) in Solano County.
California's statewide housing growth, as measured by net unit growth in completed housing units for 2019, was 94,662 units making 2019 the first time the state has added more housing units than people. Total housing in California reached 14,329,863 units, a 0.7 -percent increase.
– MORE –

-2-
Also of note in the report:
256 cities gained population, 225 lost population and 1 had no change.
Of the ten largest cities in California, Bakersfield had the largest percentage gain in population (1.4 percent, or 5,500) with Sacramento (1.1 percent, or 5,700) a distant second.
Ranked by net housing gains, Los Angeles (17,533), San Francisco (4,792), San Diego (3,425), Irvine (2,964) and Oakland (2,717) added the most housing units in 2019.
Of the 14,329,863 housing units in California, 9,228,303 are single family and 4,540,850 are
multi-family with 560,817 mobile homes. Multi-family housing growth outpaced single family housing by almost 8,695 net units (“net” refers to new construction minus demolition), continuing an eight-year trend.
Larger densely populated urban areas are building most of the multi-family housing throughout the state. Los Angeles led the state gaining 18,385 multi-family units, comprising 100 percent of their net housing growth, followed by San Francisco (4,708 for 98.3 percent), San Diego (3,013 for 88.0 percent), and Oakland (2,645 for 97.4 percent).
Conversely, single family housing is more likely to be built further inland in typically more suburban cities. Examples of cities with a high ratio of single family to multi-family growth include: Sacramento (73.2 percent single family), Bakersfield (99.0 percent single family), Fresno (81.1 percent single family), and Menifee (99.8 percent single family).
Group quarters account for about 2 percent of the total state population (853,000). This
population includes, among others, those living in college dorms (243,000) and in correctional facilities (213,000). In 2019, the group quarters population grew by almost 2,500 people or 0.3 percent. The college dormitory population dropped for the first time since July 2016, losing a modest 504 (0.2 percent) due to renovations and remodeling from the University of California system at San Diego, Santa Barbara, and Davis. The military group quarters population increased by 4,200 (7.8 percent), local jails decreased by 364 (less than 1 percent), state prisons decreased by 1,307 (1.0 percent), and federal prisons decreased by 522 (2.9 percent).
State prisons are generally located in remote areas; as a result, increases or decreases in
this population can account for significant changes in their respective locations. For example, state prison declines led to population decreases in McFarland, Taft, and California City in Kern County, while driving population increases in Norco in Riverside County, Victorville in San Bernardino County, Soledad in Monterey County, and Vacaville in Solano County.
– MORE –

-3-
Background Information: These population estimates are produced annually by the Department of Finance for use by local areas to calculate their annual appropriations limit. The State Controller’s Office uses Finance's estimates to update their population figures for distribution of state subventions to cities and counties, and to comply with various state codes. Additionally, estimates are used for research and planning purposes by federal, state, and local agencies, the academic community, and the private sector. Changes to the housing stock are used in the preparation of the annual city population estimates. Estimated occupancy of housing units and the number of persons per household further determine population levels. Changes in city housing stock result from new construction, demolitions, housing unit conversions, and annexations. The sub-county population estimates are then adjusted to be consistent with independently produced county estimates. Domestic migration data has been updated for the 2017-2019 data series with the latest release from the Internal Revenue Service for data years 2016-17 and 2017-18. International student migration is grouped with overall net international migration for 2010-19, due to discontinuation of the data series previously provided by the Department of Homeland Security. All Finance population and housing estimates are benchmarked to the latest decennial census. The estimates in this report are benchmarked to the 2010 decennial census. The 2020 decennial census will produce a new Finance benchmark when the data are available for the 2022 estimates series. Related population reports are available on the Department’s website: http://www.dof.ca.gov/Forecasting/Demographics/
# # #

Department of Finance Demographic Research Unit
Population Estimates for California Cities
10 Largest Cities City Population Percent Change January 1, 2020 2019-20 1. Los Angeles 4,010,684 -0.06 2. San Diego 1,430,489 0.1 3. San Jose 1,049,187 0.1 4. San Francisco 897,806 0.8 5. Fresno 545,769 0.7 6. Sacramento 510,931 1.1 7. Long Beach 472,217 -0.1 8. Oakland 433,697 0.7 9. Bakersfield 392,756 1.4 10. Anaheim 357,325 0.2
10 Fastest Growing Cities with Populations Over 30,000
City Population Percent Change January 1, 2020 2019-20 1. Beaumont 51,475 3.7 2. Folsom 81,610 3.1 3. Roseville 145,163 2.7 4. Menifee 97,093 2.5 5. Dublin 65,716 2.5 6. Merced 88,120 2.4 7. Los Gatos 31,439 2.3 8. Milpitas 77,961 2.3 9. Rocklin 70,350 2.2 10. Clovis 119,175 2.2
10 Cities Under 300,000 with the Largest Numeric Change
City Population Numeric Change January 1, 2020 2019-20 1. Irvine 281,707 4,245 2. Roseville 145,163 3,864 3. Elk Grove 176,154 2,984 4. Clovis 119,175 2,566 5. Folsom 81,610 2,439 6. Ontario 182,871 2,377 7. Menifee 97,093 2,361 8. Modesto 222,335 2,209 9. Merced 88,120 2,039 10. Beaumont 51,475 1,845

E-1: City/County/State Population Estimates with Annual Percent Change January 1, 2019 and 2020
Total Population Percent Total Population Percent JURISDICTION 1/1/19 1/1/20 Change JURISDICTION 1/1/19 1/1/20 Change
CALIFORNIA 39,695,376 39,782,870 0.2
Alameda 1,664,783 1,670,834 0.4 Alameda 81,618 81,312 -0.4 Albany 18,961 18,937 -0.1 Berkeley 122,358 122,580 0.2 Dublin 64,132 65,716 2.5 Emeryville 12,041 12,298 2.1 Fremont 233,404 234,220 0.3 Hayward 160,197 160,311 0.1 Livermore 91,436 91,861 0.5 Newark 48,164 48,966 1.7 Oakland 430,753 433,697 0.7 Piedmont 11,468 11,453 -0.1 Pleasanton 79,392 79,464 0.1 San Leandro 88,296 87,930 -0.4 Union City 73,661 73,637 0.0 Balance of County 148,902 148,452 -0.3
Alpine 1,149 1,142 -0.6
Amador 37,820 37,676 -0.4 Amador 168 166 -1.2 Ione 7,905 8,008 1.3 Jackson 4,844 4,860 0.3 Plymouth 1,006 998 -0.8 Sutter Creek 2,492 2,470 -0.9 Balance of County 21,405 21,174 -1.1
Butte 221,521 210,291 -5.1 Biggs 2,053 1,852 -9.8 Chico 109,688 110,326 0.6 Gridley 7,058 6,402 -9.3 Oroville 21,311 19,440 -8.8 Paradise 4,485 4,631 3.3 Balance of County 76,926 67,640 -12.1
Calaveras 45,085 45,023 -0.1 Angels City 4,095 4,123 0.7 Balance of County 40,990 40,900 -0.2
Colusa 21,990 21,902 -0.4 Colusa 6,227 6,175 -0.8 Williams 5,392 5,426 0.6 Balance of County 10,371 10,301 -0.7
Contra Costa 1,150,621 1,153,561 0.3 Antioch 112,423 112,520 0.1 Brentwood 64,365 65,118 1.2 Clayton 11,347 11,337 -0.1 Concord 130,435 130,143 -0.2
Danville 43,923 43,876 -0.1 El Cerrito 24,852 24,953 0.4 Hercules 25,488 25,530 0.2 Lafayette 25,644 25,604 -0.2 Martinez 37,424 37,106 -0.8 Moraga 16,939 16,946 0.0 Oakley 41,979 42,461 1.1 Orinda 18,911 19,009 0.5 Pinole 19,563 19,505 -0.3 Pittsburg 73,565 74,321 1.0 Pleasant Hill 34,286 34,267 -0.1 Richmond 110,793 111,217 0.4 San Pablo 31,481 31,413 -0.2 San Ramon 82,100 83,118 1.2 Walnut Creek 70,958 70,860 -0.1 Balance of County 174,145 174,257 0.1
Del Norte 27,127 27,298 0.6 Crescent City 6,605 6,673 1.0 Balance of County 20,522 20,625 0.5
El Dorado 190,018 193,227 1.7 Placerville 10,836 10,980 1.3 South Lake Tahoe 22,304 22,525 1.0 Balance of County 156,878 159,722 1.8
Fresno 1,015,195 1,023,358 0.8 Clovis 116,609 119,175 2.2 Coalinga 16,944 17,199 1.5 Firebaugh 7,980 7,981 0.0 Fowler 6,220 6,454 3.8 Fresno 542,012 545,769 0.7 Huron 7,302 7,299 0.0 Kerman 15,767 15,950 1.2 Kingsburg 12,551 12,883 2.6 Mendota 12,278 12,514 1.9 Orange Cove 9,460 9,456 0.0 Parlier 15,658 15,890 1.5 Reedley 25,873 25,917 0.2 Sanger 27,005 27,185 0.7 San Joaquin 4,144 4,142 0.0 Selma 24,402 24,436 0.1 Balance of County 170,990 171,108 0.1
Glenn 28,695 29,400 2.5 Orland 8,113 8,323 2.6 Willows 6,080 6,208 2.1 Balance of County 14,502 14,869 2.5

E-1: City/County/State Population Estimates with Annual Percent Change January 1, 2019 and 2020
Total Population Percent Total Population Percent JURISDICTION 1/1/19 1/1/20 Change JURISDICTION 1/1/19 1/1/20 Change
Humboldt 133,996 133,302 -0.5 Arcata 18,223 17,963 -1.4 Blue Lake 1,285 1,277 -0.6 Eureka 26,820 26,699 -0.5 Ferndale 1,378 1,382 0.3 Fortuna 12,112 12,123 0.1 Rio Dell 3,308 3,287 -0.6 Trinidad 339 337 -0.6 Balance of County 70,531 70,234 -0.4
Imperial 188,821 188,777 0.0 Brawley 27,229 27,349 0.4 Calexico 41,032 40,896 -0.3 Calipatria 7,141 6,843 -4.2 El Centro 45,774 45,657 -0.3 Holtville 6,366 6,359 -0.1 Imperial 19,364 19,907 2.8 Westmorland 2,356 2,346 -0.4 Balance of County 39,559 39,420 -0.4
Inyo 18,572 18,584 0.1 Bishop 3,815 3,821 0.2 Balance of County 14,757 14,763 0.0
Kern 908,405 917,553 1.0 Arvin 21,314 21,677 1.7 Bakersfield 387,236 392,756 1.4 California City 14,423 14,161 -1.8 Delano 52,422 53,032 1.2 Maricopa 1,122 1,127 0.4 McFarland 14,984 14,388 -4.0 Ridgecrest 29,067 29,350 1.0 Shafter 19,849 20,441 3.0 Taft 9,417 8,680 -7.8 Tehachapi 13,054 12,758 -2.3 Wasco 27,548 28,884 4.8 Balance of County 317,969 320,299 0.7
Kings 152,995 153,608 0.4 Avenal 13,214 13,189 -0.2 Corcoran 21,595 21,302 -1.4 Hanford 58,907 59,349 0.8 Lemoore 26,254 26,509 1.0 Balance of County 33,025 33,259 0.7
Lake 64,268 64,040 -0.4 Clearlake 14,363 14,297 -0.5 Lakeport 4,698 4,677 -0.4 Balance of County 45,207 45,066 -0.3
Lassen 29,173 28,833 -1.2 Susanville 14,206 13,717 -3.4 Balance of County 14,967 15,116 1.0 Los Angeles 10,184,378 10,172,951 -0.1 Agoura Hills 20,622 20,566 -0.3 Alhambra 86,793 86,792 0.0 Arcadia 57,262 57,212 -0.1 Artesia 16,534 16,490 -0.3 Avalon 3,939 3,929 -0.3 Azusa 49,537 49,658 0.2 Baldwin Park 76,311 76,252 -0.1 Bell 36,510 36,531 0.1 Bellflower 78,239 78,110 -0.2 Bell Gardens 42,579 42,449 -0.3 Beverly Hills 33,926 33,775 -0.4 Bradbury 1,056 1,052 -0.4 Burbank 105,496 105,861 0.3 Calabasas 24,185 24,193 0.0 Carson 93,153 93,108 0.0 Cerritos 49,995 49,994 0.0 Claremont 35,872 35,807 -0.2 Commerce 12,929 12,868 -0.5 Compton 98,206 98,032 -0.2 Covina 48,683 48,846 0.3 Cudahy 24,227 24,172 -0.2 Culver City 39,493 39,705 0.5 Diamond Bar 57,308 57,177 -0.2 Downey 113,863 113,529 -0.3 Duarte 21,681 21,673 0.0 El Monte 116,563 116,675 0.1 El Segundo 16,812 16,777 -0.2 Gardena 60,892 60,937 0.1 Glendale 204,883 205,331 0.2 Glendora 51,840 52,067 0.4 Hawaiian Gardens 14,685 14,649 -0.2 Hawthorne 87,071 86,903 -0.2 Hermosa Beach 19,641 19,614 -0.1 Hidden Hills 1,862 1,868 0.3 Huntington Park 59,642 59,515 -0.2 Industry 427 427 0.0 Inglewood 112,345 111,971 -0.3 Irwindale 1,443 1,434 -0.6 La Canada Flintridge 20,497 20,461 -0.2
La Habra Heights 5,470 5,461 -0.2 Lakewood 80,168 79,919 -0.3 La Mirada 49,007 48,877 -0.3 Lancaster 161,505 161,699 0.1 La Puente 40,532 40,568 0.1 La Verne 33,289 33,300 0.0

E-1: City/County/State Population Estimates with Annual Percent Change January 1, 2019 and 2020
Total Population Percent Total Population Percent JURISDICTION 1/1/19 1/1/20 Change JURISDICTION 1/1/19 1/1/20 Change
Lawndale 32,879 32,799 -0.2 Lomita 20,614 20,549 -0.3 Long Beach 472,802 472,217 -0.1 Los Angeles 4,013,170 4,010,684 -0.1 Lynwood 71,549 71,269 -0.4 Malibu 11,784 11,720 -0.5 Manhattan Beach 35,419 35,250 -0.5 Maywood 27,988 27,904 -0.3 Monrovia 37,956 37,935 -0.1 Montebello 63,742 63,544 -0.3 Monterey Park 60,943 60,734 -0.3 Norwalk 105,881 105,717 -0.2 Palmdale 157,117 156,737 -0.2 Palos Verdes Estates 13,230 13,190 -0.3
Paramount 55,569 55,461 -0.2 Pasadena 144,686 144,842 0.1 Pico Rivera 63,390 63,374 0.0 Pomona 154,675 154,817 0.1 Rancho Palos Verdes 41,838 41,731 -0.3
Redondo Beach 67,154 66,994 -0.2 Rolling Hills 1,880 1,874 -0.3 Rolling Hills Estates 8,035 8,066 0.4 Rosemead 54,198 54,363 0.3 San Dimas 34,042 33,945 -0.3 San Fernando 24,798 25,207 1.6 San Gabriel 40,194 40,104 -0.2 San Marino 13,106 13,087 -0.1 Santa Clarita 221,703 221,932 0.1 Santa Fe Springs 18,348 18,295 -0.3 Santa Monica 92,480 92,357 -0.1 Sierra Madre 10,843 10,816 -0.2 Signal Hill 11,744 11,712 -0.3 South El Monte 20,792 21,204 2.0 South Gate 97,211 97,003 -0.2 South Pasadena 25,524 25,458 -0.3 Temple City 36,098 36,150 0.1 Torrance 145,922 145,546 -0.3 Vernon 298 297 -0.3 Walnut 29,977 29,929 -0.2 West Covina 106,313 105,999 -0.3 West Hollywood 36,335 36,203 -0.4 Westlake Village 8,227 8,212 -0.2 Whittier 87,073 86,801 -0.3 Balance of County 1,039,878 1,034,689 -0.5
Madera 158,216 158,147 0.0 Chowchilla 18,553 18,196 -1.9 Madera 65,117 65,415 0.5 Balance of County 74,546 74,536 0.0
Marin 262,240 260,831 -0.5 Belvedere 2,139 2,124 -0.7 Corte Madera 10,138 10,114 -0.2 Fairfax 7,443 7,399 -0.6 Larkspur 12,331 12,253 -0.6 Mill Valley 14,743 14,674 -0.5 Novato 54,062 53,702 -0.7 Ross 2,548 2,550 0.1 San Anselmo 12,845 12,757 -0.7 San Rafael 60,207 59,807 -0.7 Sausalito 7,301 7,252 -0.7 Tiburon 9,581 9,540 -0.4 Balance of County 68,902 68,659 -0.4
Mariposa 18,066 18,067 0.0
Mendocino 88,388 87,946 -0.5 Fort Bragg 7,471 7,427 -0.6 Point Arena 441 451 2.3 Ukiah 16,029 16,061 0.2 Willits 5,117 5,072 -0.9 Balance of County 59,330 58,935 -0.7
Merced 280,735 283,521 1.0 Atwater 31,370 31,378 0.0 Dos Palos 5,549 5,546 -0.1 Gustine 5,867 5,875 0.1 Livingston 14,709 15,052 2.3 Los Banos 41,287 41,923 1.5 Merced 86,081 88,120 2.4 Balance of County 95,872 95,627 -0.3
Modoc 9,637 9,570 -0.7 Alturas 2,849 2,826 -0.8 Balance of County 6,788 6,744 -0.6
Mono 13,517 13,464 -0.4 Mammoth Lakes 7,887 7,859 -0.4 Balance of County 5,630 5,605 -0.4
Monterey 441,304 441,143 0.0 Carmel-by-the-Sea 3,939 3,949 0.3 Del Rey Oaks 1,674 1,662 -0.7 Gonzales 8,566 8,506 -0.7 Greenfield 18,109 18,284 1.0 King City 14,540 14,797 1.8 Marina 22,688 22,321 -1.6 Monterey 27,992 28,170 0.6 Pacific Grove 15,360 15,265 -0.6 Salinas 162,353 162,222 -0.1 Sand City 383 385 0.5

E-1: City/County/State Population Estimates with Annual Percent Change January 1, 2019 and 2020
Total Population Percent Total Population Percent JURISDICTION 1/1/19 1/1/20 Change JURISDICTION 1/1/19 1/1/20 Change
Seaside 33,047 33,537 1.5 Soledad 25,745 25,301 -1.7 Balance of County 106,908 106,744 -0.2
Napa 139,970 139,088 -0.6 American Canyon 21,000 20,837 -0.8 Calistoga 5,378 5,348 -0.6 Napa 79,730 79,278 -0.6 St Helena 6,101 6,073 -0.5 Yountville 2,763 2,685 -2.8 Balance of County 24,998 24,867 -0.5
Nevada 97,820 98,114 0.3 Grass Valley 12,851 12,865 0.1 Nevada City 3,160 3,140 -0.6 Truckee 16,136 16,228 0.6 Balance of County 65,673 65,881 0.3
Orange 3,192,987 3,194,332 0.0 Aliso Viejo 49,815 50,044 0.5 Anaheim 356,669 357,325 0.2 Brea 44,879 45,629 1.7 Buena Park 82,422 81,998 -0.5 Costa Mesa 114,634 114,778 0.1 Cypress 48,976 49,272 0.6 Dana Point 33,212 33,146 -0.2 Fountain Valley 56,099 55,878 -0.4 Fullerton 141,931 141,863 0.0 Garden Grove 175,052 174,801 -0.1 Huntington Beach 201,239 201,281 0.0 Irvine 277,462 281,707 1.5 Laguna Beach 22,445 22,343 -0.5 Laguna Hills 31,674 31,508 -0.5 Laguna Niguel 65,363 65,316 -0.1 Laguna Woods 16,329 16,243 -0.5 La Habra 63,319 63,371 0.1 Lake Forest 84,576 84,711 0.2 La Palma 15,572 15,492 -0.5 Los Alamitos 11,576 11,567 -0.1 Mission Viejo 94,766 94,267 -0.5 Newport Beach 85,706 85,780 0.1 Orange 140,410 140,065 -0.2 Placentia 51,750 51,494 -0.5 Rancho Santa Margarita 49,051 48,793 -0.5
San Clemente 64,541 64,581 0.1 San Juan Capistrano 36,149 36,318 0.5
Santa Ana 337,639 335,052 -0.8 Seal Beach 25,080 24,992 -0.4 Stanton 39,097 39,077 -0.1 Tustin 80,491 80,382 -0.1
Villa Park 5,786 5,766 -0.3 Westminster 92,737 92,421 -0.3 Yorba Linda 68,458 68,650 0.3 Balance of County 128,082 128,421 0.3
Placer 395,978 403,711 2.0 Auburn 14,440 14,594 1.1 Colfax 2,121 2,152 1.5 Lincoln 48,679 49,317 1.3 Loomis 6,828 6,888 0.9 Rocklin 68,806 70,350 2.2 Roseville 141,299 145,163 2.7 Balance of County 113,805 115,247 1.3
Plumas 18,242 18,260 0.1 Portola 2,017 2,016 0.0 Balance of County 16,225 16,244 0.1
Riverside 2,422,146 2,442,304 0.8 Banning 31,142 31,125 -0.1 Beaumont 49,630 51,475 3.7 Blythe 19,256 19,255 0.0 Calimesa 8,830 9,329 5.7 Canyon Lake 10,995 11,000 0.0 Cathedral City 53,320 53,580 0.5 Coachella 46,885 47,186 0.6 Corona 166,723 168,248 0.9 Desert Hot Springs 29,683 29,660 -0.1 Eastvale 65,611 66,413 1.2 Hemet 85,159 85,175 0.0 Indian Wells 5,379 5,403 0.4 Indio 90,087 90,751 0.7 Jurupa Valley 106,115 107,083 0.9 Lake Elsinore 63,154 63,453 0.5 La Quinta 40,389 40,660 0.7 Menifee 94,732 97,093 2.5 Moreno Valley 207,181 208,838 0.8 Murrieta 114,193 115,561 1.2 Norco 26,426 27,564 4.3 Palm Desert 52,911 52,986 0.1 Palm Springs 47,296 47,427 0.3 Perris 79,856 80,201 0.4 Rancho Mirage 18,886 19,114 1.2 Riverside 326,427 328,155 0.5 San Jacinto 50,431 51,028 1.2 Temecula 111,879 111,970 0.1 Wildomar 37,126 37,183 0.2 Balance of County 382,444 385,388 0.8
Sacramento 1,541,301 1,555,365 0.9 Citrus Heights 87,731 87,811 0.1

E-1: City/County/State Population Estimates with Annual Percent Change January 1, 2019 and 2020
Total Population Percent Total Population Percent JURISDICTION 1/1/19 1/1/20 Change JURISDICTION 1/1/19 1/1/20 Change
Elk Grove 173,170 176,154 1.7 Folsom 79,171 81,610 3.1 Galt 25,655 25,849 0.8 Isleton 827 828 0.1 Rancho Cordova 77,438 78,381 1.2 Sacramento 505,230 510,931 1.1 Balance of County 592,079 593,801 0.3
San Benito 61,513 62,353 1.4 Hollister 39,998 40,646 1.6 San Juan Bautista 2,098 2,112 0.7 Balance of County 19,417 19,595 0.9
San Bernardino 2,168,964 2,180,537 0.5 Adelanto 35,504 35,663 0.4 Apple Valley 74,140 74,394 0.3 Barstow 24,210 24,268 0.2 Big Bear Lake 5,191 5,206 0.3 Chino 87,594 89,109 1.7 Chino Hills 82,310 82,409 0.1 Colton 53,862 54,118 0.5 Fontana 212,304 213,000 0.3 Grand Terrace 12,362 12,426 0.5 Hesperia 95,509 96,393 0.9 Highland 55,222 55,323 0.2 Loma Linda 24,405 24,535 0.5 Montclair 39,452 39,490 0.1 Needles 5,289 5,248 -0.8 Ontario 180,494 182,871 1.3 Rancho Cucamonga 175,201 175,522 0.2
Redlands 70,700 70,952 0.4 Rialto 104,334 104,553 0.2 San Bernardino 217,642 217,946 0.1 Twentynine Palms 28,478 29,258 2.7 Upland 78,564 78,814 0.3 Victorville 124,642 126,432 1.4 Yucaipa 55,629 55,712 0.1 Yucca Valley 22,205 22,236 0.1 Balance of County 303,721 304,659 0.3
San Diego 3,340,312 3,343,355 0.1 Carlsbad 113,635 114,463 0.7 Chula Vista 271,032 272,202 0.4 Coronado 23,814 21,381 -10.2 Del Mar 4,275 4,268 -0.2 El Cajon 104,104 104,393 0.3 Encinitas 62,096 62,183 0.1 Escondido 152,391 153,008 0.4 Imperial Beach 27,934 28,055 0.4 La Mesa 59,827 59,966 0.2
Lemon Grove 26,426 26,526 0.4 National City 62,254 62,099 -0.2 Oceanside 177,242 177,335 0.1 Poway 49,298 49,338 0.1 San Diego 1,428,600 1,430,489 0.1 San Marcos 96,651 97,209 0.6 Santee 57,780 57,999 0.4 Solana Beach 13,786 13,838 0.4 Vista 102,098 102,928 0.8 Balance of County 507,069 505,675 -0.3
San Francisco 891,021 897,806 0.8 San Joaquin 765,556 773,632 1.1 Escalon 7,442 7,478 0.5 Lathrop 25,401 26,833 5.6 Lodi 67,430 67,930 0.7 Manteca 83,395 84,800 1.7 Ripon 15,688 15,930 1.5 Stockton 317,271 318,522 0.4 Tracy 94,586 95,931 1.4 Balance of County 154,343 156,208 1.2 San Luis Obispo 278,355 277,259 -0.4 Arroyo Grande 17,839 17,687 -0.9 Atascadero 30,348 30,057 -1.0 El Paso de Robles 31,136 31,221 0.3 Grover Beach 13,320 13,214 -0.8 Morro Bay 10,269 10,188 -0.8 Pismo Beach 8,237 8,139 -1.2 San Luis Obispo 45,937 45,920 0.0 Balance of County 121,269 120,833 -0.4 San Mateo 774,231 773,244 -0.1 Atherton 7,044 7,031 -0.2 Belmont 26,983 26,813 -0.6 Brisbane 4,659 4,633 -0.6 Burlingame 30,320 30,118 -0.7 Colma 1,516 1,729 14.1 Daly City 109,710 109,142 -0.5 East Palo Alto 30,979 30,794 -0.6 Foster City 33,211 33,033 -0.5 Half Moon Bay 12,480 12,431 -0.4 Hillsborough 11,421 11,418 0.0 Menlo Park 35,454 35,254 -0.6 Millbrae 22,983 22,832 -0.7 Pacifica 38,579 38,331 -0.6 Portola Valley 4,623 4,607 -0.3 Redwood City 86,139 86,754 0.7 San Bruno 45,542 45,454 -0.2 San Carlos 29,652 30,145 1.7

E-1: City/County/State Population Estimates with Annual Percent Change January 1, 2019 and 2020
Total Population Percent Total Population Percent JURISDICTION 1/1/19 1/1/20 Change JURISDICTION 1/1/19 1/1/20 Change
San Mateo 103,569 103,087 -0.5 South San Francisco 67,221 67,879 1.0 Woodside 5,663 5,676 0.2 Balance of County 66,483 66,083 -0.6 Santa Barbara 450,839 451,840 0.2 Buellton 5,407 5,464 1.1 Carpinteria 13,366 13,335 -0.2 Goleta 31,920 32,223 0.9 Guadalupe 7,769 8,081 4.0 Lompoc 43,849 43,786 -0.1 Santa Barbara 93,108 93,511 0.4 Santa Maria 106,969 107,407 0.4 Solvang 5,575 5,562 -0.2 Balance of County 142,876 142,471 -0.3 Santa Clara 1,954,833 1,961,969 0.4 Campbell 42,168 42,288 0.3 Cupertino 59,504 59,549 0.1 Gilroy 56,854 57,084 0.4 Los Altos 30,881 30,876 0.0 Los Altos Hills 8,394 8,413 0.2 Los Gatos 30,720 31,439 2.3 Milpitas 76,211 77,961 2.3 Monte Sereno 3,586 3,594 0.2 Morgan Hill 45,745 46,454 1.5 Mountain View 81,639 82,272 0.8 Palo Alto 69,109 69,226 0.2 San Jose 1,047,871 1,049,187 0.1 Santa Clara 127,401 129,104 1.3 Saratoga 31,002 31,030 0.1 Sunnyvale 155,766 156,503 0.5 Balance of County 87,982 86,989 -1.1 Santa Cruz 272,501 271,233 -0.5 Capitola 10,130 10,108 -0.2 Santa Cruz 65,241 64,424 -1.3 Scotts Valley 11,646 11,693 0.4 Watsonville 51,672 51,515 -0.3 Balance of County 133,812 133,493 -0.2 Shasta 177,891 178,045 0.1 Anderson 10,604 10,671 0.6 Redding 91,756 91,743 0.0 Shasta Lake 10,593 10,657 0.6 Balance of County 64,938 64,974 0.1 Sierra 3,210 3,201 -0.3 Loyalton 784 781 -0.4 Balance of County 2,426 2,420 -0.2
Siskiyou 44,592 44,461 -0.3 Dorris 1,001 996 -0.5 Dunsmuir 1,641 1,634 -0.4 Etna 747 745 -0.3 Fort Jones 676 673 -0.4 Montague 1,370 1,363 -0.5 Mount Shasta 3,386 3,375 -0.3 Tulelake 914 910 -0.4 Weed 2,762 2,747 -0.5 Yreka 7,832 7,786 -0.6 Balance of County 24,263 24,232 -0.1
Solano 438,832 440,224 0.3 Benicia 27,263 27,175 -0.3 Dixon 19,920 19,972 0.3 Fairfield 116,319 116,981 0.6 Rio Vista 9,594 9,987 4.1 Suisun City 29,211 29,119 -0.3 Vacaville 98,066 98,855 0.8 Vallejo 119,349 119,063 -0.2 Balance of County 19,110 19,072 -0.2
Sonoma 496,947 492,980 -0.8 Cloverdale 9,279 9,213 -0.7 Cotati 7,628 7,533 -1.2 Healdsburg 12,166 12,089 -0.6 Petaluma 62,195 61,873 -0.5 Rohnert Park 43,134 43,069 -0.2 Santa Rosa 175,183 173,628 -0.9 Sebastopol 7,826 7,745 -1.0 Sonoma 11,164 11,050 -1.0 Windsor 28,596 28,248 -1.2 Balance of County 139,776 138,532 -0.9
Stanislaus 554,018 557,709 0.7 Ceres 48,027 48,430 0.8 Hughson 7,232 7,298 0.9 Modesto 220,126 222,335 1.0 Newman 11,860 11,912 0.4 Oakdale 22,838 22,997 0.7 Patterson 22,974 23,074 0.4 Riverbank 24,867 25,030 0.7 Turlock 73,874 74,297 0.6 Waterford 8,806 8,894 1.0 Balance of County 113,414 113,442 0.0 Sutter 102,914 100,750 -2.1 Live Oak 9,164 9,200 0.4 Yuba City 72,005 70,458 -2.1 Balance of County 21,745 21,092 -3.0

E-1: City/County/State Population Estimates with Annual Percent Change January 1, 2019 and 2020
Total Population Percent Total Population Percent JURISDICTION 1/1/19 1/1/20 Change JURISDICTION 1/1/19 1/1/20 Change
Tehama 64,643 65,129 0.8 Corning 7,534 7,620 1.1 Red Bluff 14,166 14,245 0.6 Tehama 442 445 0.7 Balance of County 42,501 42,819 0.7
Trinity 13,637 13,548 -0.7
Tulare 476,588 479,977 0.7 Dinuba 25,689 25,994 1.2 Exeter 11,009 11,030 0.2 Farmersville 11,396 11,399 0.0 Lindsay 13,153 13,154 0.0 Porterville 59,490 59,655 0.3 Tulare 66,457 67,834 2.1 Visalia 137,696 138,649 0.7 Woodlake 7,691 7,773 1.1 Balance of County 144,007 144,489 0.3
Tuolumne 54,532 54,917 0.7 Sonora 4,725 4,717 -0.2 Balance of County 49,807 50,200 0.8
Ventura 846,050 842,886 -0.4 Camarillo 70,024 70,261 0.3 Fillmore 15,680 15,566 -0.7 Moorpark 36,649 36,278 -1.0 Ojai 7,591 7,557 -0.4 Oxnard 206,221 206,352 0.1 Port Hueneme 23,457 23,607 0.6 San Buenaventura 107,021 106,276 -0.7 Santa Paula 30,573 30,389 -0.6 Simi Valley 125,664 125,115 -0.4 Thousand Oaks 127,610 126,484 -0.9 Balance of County 95,560 95,001 -0.6
Yolo 220,896 221,705 0.4 Davis 69,179 69,183 0.0 West Sacramento 53,995 54,328 0.6 Winters 7,169 7,279 1.5 Woodland 60,068 60,742 1.1 Balance of County 30,485 30,173 -1.0
Yuba 77,342 78,887 2.0 Marysville 12,333 12,424 0.7 Wheatland 3,620 3,641 0.6 Balance of County 61,389 62,822 2.3

Top 10 Cities Based on Housing Unit Growth Total Numeric Housing Unit Growth
Rank City County Total HU 1 Los Angeles Los Angeles 17,533 2 San Francisco San Francisco 4,792 3 San Diego San Diego 3,425 4 Irvine Orange 2,964 5 Oakland Alameda 2,717 6 Sacramento Sacramento 2,081 7 Chico Butte 1,360 8 Fresno Fresno 1,346 9 Chula Vista San Diego 1,250
10 Bakersfield Kern 1,241 Numeric Single-Family Housing Unit Growth
Rank City County Total HU 1 Irvine Orange 1,680 2 Sacramento Sacramento 1,524 3 Bakersfield Kern 1,229 4 Fresno Fresno 1,092 5 Menifee Riverside 904 6 Chico Butte 901 7 Roseville Placer 813 8 Elk Grove Sacramento 799 9 Clovis Fresno 750
10 Beaumont Riverside 629 Numeric Multi-Family Housing Unit Growth
Rank City County Total HU 1 Los Angeles Los Angeles 18,385 2 San Francisco San Francisco 4,708 3 San Diego San Diego 3,013 4 Oakland Alameda 2,645 5 Irvine Orange 1,284 6 Anaheim Orange 998 7 Chula Vista San Diego 803 8 Santa Clara Santa Clara 751 9 Oxnard Ventura 578
10 Ontario San Bernardino 567

Percent Total Housing Unit Growth
Rank City County Total HU 1 Colma San Mateo 14.89% 2 Calimesa Riverside 5.80% 3 Lathrop San Joaquin 5.64% 4 Wasco Kern 4.94% 5 Rio Vista Solano 4.47% 6 Guadalupe Santa Barbara 4.34% 7 Beaumont Riverside 3.86% 8 Fowler Fresno 3.83% 9 Point Arena Mendocino 3.51%
10 Imperial Imperial 3.46% Percent Single-Family Housing Unit Growth
Rank City County Total HU 1 Calimesa Riverside 5.82% 2 Lathrop San Joaquin 5.74% 3 Guadalupe Santa Barbara 5.39% 4 Rio Vista Solano 4.63% 5 Point Arena Mendocino 4.37% 6 Beaumont Riverside 4.28% 7 Imperial Imperial 4.18% 8 Chico Butte 3.58% 9 Paradise Butte 3.49%
10 Live Oak Sutter 3.46% Percent Multi-Family Housing Unit Growth
Rank City County Total HU 1 Hillsborough San Mateo 133.33% 2 Colma San Mateo 55.93% 3 Villa Park Orange 50.00% 4 Wasco Kern 21.59% 5 Monte Sereno Santa Clara 21.05% 6 South El Monte Los Angeles 18.51% 7 Fowler Fresno 16.17% 8 Oakley Contra Costa 14.82% 9 Los Altos Hills Santa Clara 14.29%
10 Piedmont Alameda 12.64%

1
Baumb, Nelly
From: [email protected]: Monday, January 11, 2021 1:17 PMTo: Council, City; Planning CommissionCc: Lait, Jonathan; Shikada, EdSubject: January 11, 2021 council item 8Attachments: Jan 11, 2021 RHNA Item.doc; abag_draft_rhna_methodology_release_december2020.pdf
CAUTION: This email originated from outside of the organization. Be cautious of opening attachments and clicking on links.
My comments and ABAG RHNA document
nbaumb
Example1

ABAG Draft RHNA Methodology Release | December 18, 2020 | Page 1
RELEASE OF ABAG DRAFT RHNA METHODOLOGY AND FINAL SUBREGIONAL SHARES December 18, 2020 What is RHNA? The Regional Housing Needs Allocation (RHNA) is the state-mandated1 process to identify the share of the statewide housing need for which each community must plan. As the Council of Governments (COG) for the Bay Area, the Association of Bay Area Governments (ABAG) is responsible for developing a methodology for allocating a share of the Regional Housing Need Determination (RHND) the Bay Area received from the California Department of Housing and Community Development (HCD)2 to every local government in the Bay Area. The RHNA methodology is a formula that quantifies the number of housing units, separated into four income categories,3 that will be assigned to each city, town, and county in the region. The allocation must meet the statutory objectives identified in Housing Element Law4 and be consistent with the forecasted development pattern from Plan Bay Area 2050.5 Each local government must then update the Housing Element of its General Plan and its zoning to show how it can accommodate its RHNA allocation. How was the Draft RHNA Methodology for the 2023-2031 RHNA Cycle Developed? ABAG convened an ad hoc Housing Methodology Committee (HMC) from October 2019 to September 2020 to advise staff on the methodology for allocating a share of the region’s total housing need to every local government in the Bay Area. The HMC included local elected officials and staff as well as regional stakeholders to facilitate sharing of diverse viewpoints across multiple sectors.6 At its final meeting on September 18, the HMC voted to recommend Option 8A: High Opportunity Areas Emphasis & Job Proximity with the 2050 Households baseline allocation as the Proposed RHNA Methodology. On October 1, the ABAG Regional Planning Committee voted to recommend this methodology for approval by the Executive
1 See California Government Code Section 65584. 2 In a letter dated June 9, 2020, HCD provided ABAG with a total RHND of 441,176 units for the 2023-2031 RHNA. 3 State law defines the following RHNA income categories:
• Very Low Income: households earning less than 50 percent of Area Median Income (AMI) • Low Income: households earning 50 - 80 percent of AMI • Moderate Income: households earning 80 - 120 percent of AMI • Above Moderate Income: households earning 120 percent or more of AMI
4 See California Government Code Section 65584(d). 5 See Government Code Section 65584.04(m)(1). 6 The HMC roster is available at https://abag.ca.gov/sites/default/files/hmc_roster_06_16_2020_0.pdf.

ABAG Draft RHNA Methodology Release | December 18, 2020 | Page 2
Board, and the Board approved its release as the Proposed RHNA Methodology for public comment on October 15, 2020. Materials related to the Proposed RHNA Methodology have been posted on ABAG’s website since October 24 (https://abag.ca.gov/our-work/housing/rhna-regional-housing-needs-allocation). As required by law, ABAG held a public comment period from October 25 to November 27 and conducted a public hearing at the November 12 meeting of the ABAG Regional Planning Committee. ABAG heard 29 oral comments and received 106 written comments on the Proposed Methodology during the public comment period. These comments provided perspectives from over 200 local government staff and elected officials, advocacy organizations, and members of the public, as some letters represented multiple signatories. Appendix 1 summarizes the public comments received and initial staff responses. What is the Draft RHNA Methodology for the 2023-2031 RHNA Cycle? ABAG-MTC staff considered the comments received during the public comment period and is not proposing to make any adjustments to the baseline allocation or factors and weights in the Draft RHNA Methodology. The components of the Draft RHNA Methodology are the same as the Proposed RHNA Methodology (Figure 1). However, the Draft RHNA Methodology incorporates future year 2050 households data generated from the Plan Bay Area 2050 Final Blueprint, which is being released concurrently with the Draft RHNA Methodology. As noted in the Proposed Methodology, the illustrative allocations reflected baseline data on 2050 households from the Plan Bay Area 2050 Draft Blueprint, with updates slated throughout fall 2020 to reflect the revised Strategies and Growth Geographies approved by the ABAG Executive Board and Commission in September 2020 for the Final Blueprint. Integrating the updated data about future year 2050 households from the Final Blueprint into the Draft RHNA Methodology results in changes to the illustrative allocations to local jurisdictions.

ABAG Draft RHNA Methodology Release | December 18, 2020 | Page 3
Figure 1: Proposed RHNA Methodology Overview7
There are two primary components to the Draft RHNA Methodology:
1. Baseline allocation: 2050 Households (Blueprint) The baseline allocation is used to assign each jurisdiction a beginning share of the RHND. The baseline allocation is based on each jurisdiction’s share of the region’s total households in the year 2050 from the Plan Bay Area 2050 Blueprint.8 Using the 2050 Households baseline takes into consideration the number of households that are currently living in a jurisdiction as well as the number of households expected to be added over the next several decades.
2. Factors and weights for allocating units by income category:
Table 1 shows the factors and weights in the Draft RHNA Methodology. Each factor represents data related to the methodology’s policy priorities: access to high opportunity areas and proximity to jobs. The factors and weights adjust a jurisdiction’s baseline allocation
7 The RHNA Proposed Methodology Report provides more details about the methodology. 8 Plan Bay Area 2050 is the Regional Transportation Plan/Sustainable Communities Strategy for the Bay Area.
Table 1: Factors and Weights for Proposed RHNA Methodology
Very Low and Low Units Moderate and Above Moderate Units
70% Access to High Opportunity Areas 15% Job Proximity – Auto 15% Job Proximity – Transit
40% Access to High Opportunity Areas 60% Job Proximity – Auto

ABAG Draft RHNA Methodology Release | December 18, 2020 | Page 4
up or down, depending on how a jurisdiction scores on a factor compared to other jurisdictions in the region. The weight assigned to each factor (i.e., the percentages shown in Table 1) determines the share of the region’s housing need that will be assigned by a factor.
How do the Results from the Draft RHNA Methodology Compare to those from the Proposed RHNA Methodology? As noted above, the Draft RHNA Methodology uses data from the Plan Bay Area 2050 Final Blueprint. Whereas the Plan Bay Area 2050 Draft Blueprint featured 25 strategies that influenced the location of future growth, the Final Blueprint features 35 revised strategies adopted by the ABAG Executive Board and Commission in fall 2020. These strategies shift the regional growth pattern, with generally small to moderate impacts on RHNA allocations. Additionally, the Final Blueprint features updated baseline data based on consultation with local jurisdictions in summer and fall 2020. Therefore, incorporating the Final Blueprint into the Draft RHNA Methodology results in changes to the illustrative allocations to local jurisdictions. ABAG-MTC staff has developed several resources to help local jurisdictions, stakeholders, and members of the public better understand how the illustrative allocations from the Draft RHNA Methodology (which uses the Final Blueprint as the baseline allocation) compare to those from the Proposed RHNA Methodology (which used the Draft Blueprint as the baseline allocation). The maps in Appendix 2 show each jurisdiction’s growth rate and total allocation and Appendix 3 shows illustrative allocations for each jurisdiction. Note: the allocation results for jurisdictions are only illustrative. Local governments will receive their final allocations in late 2021. As noted previously, Housing Element Law requires that the RHNA methodology meet the five statutory objectives of RHNA and that it be consistent with the forecasted development pattern from Plan Bay Area 2050. ABAG-MTC staff developed a set of performance metrics to evaluate how well a methodology does in meeting the RHNA objectives. Evaluation of the Draft RHNA Methodology shows that it furthers all of the RHNA objectives. Appendix 4 compares the results for the Draft RHNA Methodology and Proposed RHNA Methodology. ABAG-MTC staff also developed a framework for evaluating consistency between RHNA and Plan Bay Area 2050. RHNA and Plan Bay Area 2050 are determined to be consistent if the 8-year growth level from RHNA does not exceed the 35-year growth level at the county and sub-county geographies used in the Plan. Staff evaluated the Draft RHNA Methodology using this approach and determined that RHNA and Plan Bay Area 2050 remain consistent.9
9 The Draft RHNA Methodology and Plan Bay Area 2050 are consistent for all nine counties and in 33 of 34 superdistricts (i.e., sub-county areas) using the methodology developed during the HMC process. In the one superdistrict flagged during the consistency check, the Final Blueprint reflects the loss of more than 1,000 homes in

ABAG Draft RHNA Methodology Release | December 18, 2020 | Page 5
Final Subregional Shares Housing Element Law allows two or more neighboring jurisdictions to form a “subregion” to conduct a parallel RHNA process to allocate the subregion’s housing need among its members.10 ABAG must assign each subregion a share of the Bay Area’s RHND, which represents the total number of units, by income category, the subregion must allocate to its member jurisdictions. The ABAG Executive Board approved the release of Draft Subregional Shares for public comment on October 15, 2020. ABAG received no comments on the Draft Subregional Shares during the public comment period. The Final Subregional Shares have been updated based on the integration of the Final Blueprint into the Draft RHNA Methodology. Appendix 5 provides more details about the Final Subregional Shares. Winter Office Hours Local jurisdiction staff and partner organizations are invited to book office hours with MTC-ABAG planners to discuss the Final Blueprint outcomes and the Draft RHNA Methodology updates in more detail. Winter Office Hour appointments are available for booking from December 21, 2020 to January 15, 2021. Visit bit.ly/2VpczrC to book your appointment.
Please note Winter Office Hour appointments are limited to local jurisdiction staff and partner organizations. Individual members of the public are encouraged to submit questions or comments via email to [email protected].
RHNA Next Steps The ABAG Regional Planning Committee will consider the Draft RHNA Methodology and make a recommendation to the ABAG Executive Board at its meeting on January 14, 2021. The ABAG Executive Board is slated to take action on the Draft RHNA Methodology at the January 21, 2021 meeting. After a Draft RHNA Methodology is adopted by the Executive Board, ABAG will submit the methodology to HCD for review and then use the state agency’s feedback to develop a final methodology and draft RHNA allocation in spring 2021. Release of the draft allocation will be followed by an appeals period in the summer of 2021, with the final RHNA allocation assigned to each of the Bay Area’s local governments in late 2021.
wildfires since 2015. Anticipated reconstruction of these units during the RHNA period does not yield significant net growth in housing units, making these allocations consistent with the Final Blueprint long-range projections. 10 Government Code Section 65584.03.

ABAG Draft RHNA Methodology Release | Appendix 1 | December 18, 2020 | Page 1
Appendix 1: Summary of Public Comments Received and Preliminary Responses from ABAG-MTC Staff Public Comment Period for the Proposed RHNA Methodology Housing Element Law requires ABAG to hold a public comment period and conduct at least one public hearing to receive oral and written comments on the Proposed RHNA Methodology1 and Draft Subregional Shares2 prior to adoption of the Draft RHNA Methodology and Final Subregional Shares. The written public comment period began on October 25 and ended on November 27 per the Notice of Public Hearing published in newspapers and an ABAG press release. Additionally, ABAG held a public hearing at the November 12 meeting of the Regional Planning Committee, where 29 local government representatives, advocacy organizations, and members of the public provided oral comments on the proposed methodology. Geographic Representation and Respondent Types for Comments Received During the public comment period, ABAG received 106 written comments on the Proposed RHNA Methodology. These letters provided perspectives from over 200 local government staff and elected officials, advocacy organizations, and members of the public, as some letters represented multiple signatories. In total, 42 of ABAG’s 109 jurisdictions were signatories on letters received during the public comment period. Table 1 shows the number of written and oral comments received from advocacy organizations, members of the public, and various public agencies across the nine-county Bay Area.3 ABAG received no comments on the Draft Subregional Shares.
1 California Government Code 65584.04 (d) 2 California Government Code 65584.03 (c) 3 The sum of the number of letters received in Table 1 exceeds 106, as two letters had signatories from public agencies across multiple counties. Similarly, the sum of the number of oral comments in Table 1 exceeds 29 because one of comments came from a special district that represents both San Mateo and Santa Clara Counties.

ABAG Draft RHNA Methodology Release | Appendix 1 | December 18, 2020 | Page 2
Table 1. Share of public comments received from different types of respondents
Type of Respondent Number of Letters Received
Number of Oral Comments from Public Hearing
Public Agency – Alameda 5 0 Public Agency – Contra Costa 3 0 Public Agency – Marin 11 1 Public Agency – Napa 2 0 Public Agency – San Francisco 0 0 Public Agency – San Mateo 11 2 Public Agency – Santa Clara 8 2 Public Agency – Solano 1 0 Public Agency – Sonoma 1 0 Advocacy Organizations 9 8 Members of the Public 57 17
Most Common Themes from Comments Received Table 2 below summarizes the key themes that are most prevalent across the comments received about the Proposed RHNA Methodology. The themes are ordered roughly in terms of how many letters and oral comments mentioned them, though it is worth noting that some letters represented comments from multiple jurisdictions, advocacy organizations, and/or individual members of the public. The table also includes a brief, preliminary response about the Draft RHNA Methodology (which incorporates data from the Plan Bay Area 2050 Final Blueprint) from ABAG staff responding to the different topics in the comment letters. Comment letters on the Proposed RHNA Methodology will receive a more specific response in the coming weeks, with responses to local jurisdictions slated prior to the January ABAG Executive Board meeting. Table 2. Most common themes from written comments received
1. Jurisdiction is built out and/or lacks infrastructure to accommodate its allocation: Comments noted a lack of developable land and the inability to provide the services and infrastructure that would be needed as a result of growth from RHNA. Some residents objected to any new housing growth.
Preliminary ABAG Response: Housing Element Law requires RHNA to increase the housing supply and mix of housing types for all jurisdictions. ABAG-MTC staff worked with local governments to gather information about local plans, zoning, physical characteristics and potential development opportunities and constraints. This information was used as an input into the Plan Bay Area 2050 Blueprint, which is used as the baseline allocation in the Draft RHNA Methodology. The Final Blueprint that was integrated into the Draft RHNA Methodology includes a number of updates based on corrections to local data provided by jurisdiction staff. The Blueprint allows additional feasible growth within the urban footprint by increasing allowable residential densities and expanding housing into select areas currently
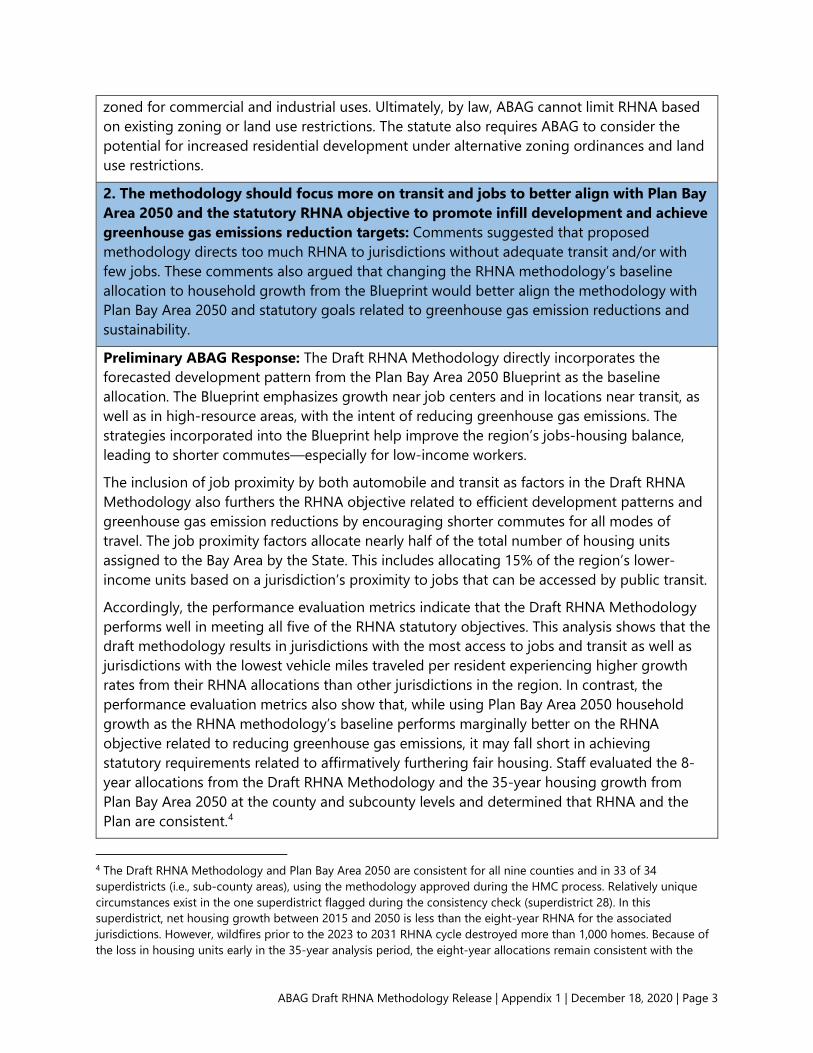
ABAG Draft RHNA Methodology Release | Appendix 1 | December 18, 2020 | Page 3
zoned for commercial and industrial uses. Ultimately, by law, ABAG cannot limit RHNA based on existing zoning or land use restrictions. The statute also requires ABAG to consider the potential for increased residential development under alternative zoning ordinances and land use restrictions.
2. The methodology should focus more on transit and jobs to better align with Plan Bay Area 2050 and the statutory RHNA objective to promote infill development and achieve greenhouse gas emissions reduction targets: Comments suggested that proposed methodology directs too much RHNA to jurisdictions without adequate transit and/or with few jobs. These comments also argued that changing the RHNA methodology’s baseline allocation to household growth from the Blueprint would better align the methodology with Plan Bay Area 2050 and statutory goals related to greenhouse gas emission reductions and sustainability.
Preliminary ABAG Response: The Draft RHNA Methodology directly incorporates the forecasted development pattern from the Plan Bay Area 2050 Blueprint as the baseline allocation. The Blueprint emphasizes growth near job centers and in locations near transit, as well as in high-resource areas, with the intent of reducing greenhouse gas emissions. The strategies incorporated into the Blueprint help improve the region’s jobs-housing balance, leading to shorter commutes—especially for low-income workers.
The inclusion of job proximity by both automobile and transit as factors in the Draft RHNA Methodology also furthers the RHNA objective related to efficient development patterns and greenhouse gas emission reductions by encouraging shorter commutes for all modes of travel. The job proximity factors allocate nearly half of the total number of housing units assigned to the Bay Area by the State. This includes allocating 15% of the region’s lower-income units based on a jurisdiction’s proximity to jobs that can be accessed by public transit.
Accordingly, the performance evaluation metrics indicate that the Draft RHNA Methodology performs well in meeting all five of the RHNA statutory objectives. This analysis shows that the draft methodology results in jurisdictions with the most access to jobs and transit as well as jurisdictions with the lowest vehicle miles traveled per resident experiencing higher growth rates from their RHNA allocations than other jurisdictions in the region. In contrast, the performance evaluation metrics also show that, while using Plan Bay Area 2050 household growth as the RHNA methodology’s baseline performs marginally better on the RHNA objective related to reducing greenhouse gas emissions, it may fall short in achieving statutory requirements related to affirmatively furthering fair housing. Staff evaluated the 8-year allocations from the Draft RHNA Methodology and the 35-year housing growth from Plan Bay Area 2050 at the county and subcounty levels and determined that RHNA and the Plan are consistent.4
4 The Draft RHNA Methodology and Plan Bay Area 2050 are consistent for all nine counties and in 33 of 34 superdistricts (i.e., sub-county areas), using the methodology approved during the HMC process. Relatively unique circumstances exist in the one superdistrict flagged during the consistency check (superdistrict 28). In this superdistrict, net housing growth between 2015 and 2050 is less than the eight-year RHNA for the associated jurisdictions. However, wildfires prior to the 2023 to 2031 RHNA cycle destroyed more than 1,000 homes. Because of the loss in housing units early in the 35-year analysis period, the eight-year allocations remain consistent with the

ABAG Draft RHNA Methodology Release | Appendix 1 | December 18, 2020 | Page 4
3. Methodology needs to directly incorporate hazard risk: Comments suggested the methodology allocated too much growth near areas with high wildfire risk and exposure to other natural hazards such as sea-level rise. Others felt the Blueprint needs to better incorporate hazard data, particularly related to wildland-urban interface (WUI) maps and FEMA floodways.
Preliminary ABAG Response: Including the Blueprint in the RHNA methodology addresses concerns about natural hazards, as the Blueprint excludes areas with unmitigated high hazard risk from Growth Geographies. The Blueprint Growth Geographies exclude CAL FIRE designated “Very High” fire severity areas as well as county-designated WUIs where applicable. The Blueprint strategies focus future growth away from the highest fire risk zones, support increased wildland management programs, and support residential building upgrades that reduce the likelihood for damage when fires occur in the wildland urban interface.
The Blueprint incorporates strategies to mitigate the impacts of sea level rise, protecting nearly all communities at risk from two feet of permanent inundation. Riverine flooding is not yet integrated into the Blueprint because existing research does not provide guidance on how to model impacts of temporary riverine flooding to buildings and land value. Communities can choose to take these risks into consideration with where and how they site future development, either limiting growth in areas of higher hazard or by increasing building standards to cope with the hazard.
4. Support for proposed methodology: Comments from residents, local jurisdictions, and a diverse range of advocacy organizations supporting the methodology emphasized its importance for furthering regional equity.
Preliminary ABAG Response: Staff’s analysis aligns with these comments and indicates the Draft RHNA Methodology successfully furthers all five of the statutory objectives of RHNA, including requirements related to affirmatively furthering fair housing.
5. Need to account for impacts from COVID-19: Comments generally focused on the effects of the pandemic and suggest either delaying RHNA or reconsidering the focus on proximity to jobs.
Preliminary ABAG Response: Staff appreciates concerns about the significant economic and societal changes resulting from COVID-19, and these concerns were relayed to the State in early summer. However, the Regional Housing Need Determination (RHND) from HCD has been finalized at this point in time. ABAG is obligated by state law to move forward with the RHNA process so jurisdictions can complete updates to their Housing Elements on time.
Additionally, the eight-year RHNA cycle (which starts in 2023) represents a longer-term outlook than the current impacts of the pandemic in 2020 and 2021. The potential impacts of the trend toward telecommuting in the longer term are incorporated into the RHNA methodology through the integration of the Plan Bay Area 2050 Blueprint, which includes
long-range projections for this portion of the Bay Area, as the reconstruction of units during the RHNA period does not lead to significant net growth from 2015 levels.

ABAG Draft RHNA Methodology Release | Appendix 1 | December 18, 2020 | Page 5
strategies to expand commute trip reduction programs through telecommuting and other sustainable modes of travel.
6. Concerns about allocation to unincorporated areas: Comments argued that the methodology allocates too much growth to unincorporated areas that are rural and lack infrastructure to support development.
Preliminary ABAG Response: The Plan Bay Area 2050 Blueprint forecasts very little growth in unincorporated county areas, and that growth is focused inside urban growth boundaries. The RHNA allocations to these areas are driven, largely, by the number of existing households in unincorporated county areas, since the 2050 Households baseline in the Draft RHNA Methodology is the sum of existing households and forecasted household growth. Use of the Final Blueprint as the baseline allocation in the RHNA methodology resulted in smaller allocations for most of the counties in the region compared to the Proposed RHNA Methodology, which relied on the Draft Blueprint. ABAG-MTC will continue discussions with local jurisdictions about opportunities to direct additional RHNA units to incorporated areas, including the use of the provisions in Housing Element Law that allow a county to transfer a portion of its RHNA allocation to a city or town after it receives its RHNA allocation from ABAG.5
7. Support for adding the “equity adjustment” proposed by some HMC members to the methodology: Comments were generally supportive of the methodology but noted the HMC-proposed equity adjustment should be included to advance the statutory requirement to affirmatively further fair housing.
Preliminary ABAG Response: Staff notes the importance of meeting all statutory requirements, including the mandate to affirmatively further fair housing. However, staff’s analysis indicates the Draft RHNA Methodology does successfully achieve all five statutory objectives of RHNA. At the final HMC meeting, staff recommended that the HMC not move forward with the proposed equity adjustment as this change would increase the complexity of the methodology for minimal impact on RHNA allocations. The proposed equity adjustment would shift less than 2 percent of the region’s lower-income RHNA to the jurisdictions identified by an HMC-proposed composite score as exhibiting above-average racial and socioeconomic exclusion. However, the underlying methodology for the composite score and adjustment approach would make it more difficult for local policy makers and members of the public to understand the RHNA methodology. Ultimately, the HMC chose not to move forward with the proposed equity adjustment in its recommended RHNA methodology.
8. Concern that HCD’s Regional RHND calculation was inaccurate and too high: Comments from several members of the public and one local jurisdiction expressed the belief that HCD’s RHND calculations may have been flawed and resulted in ABAG receiving an allocation from the state that was too large.
Preliminary ABAG Response: The determination provided by HCD is based on a population forecast from the California Department of Finance (DOF), which is then modified by staff at DOF and HCD to tackle overcrowding and make other adjustments as specified in law. The
5 Government Code Section 65584.07.

ABAG Draft RHNA Methodology Release | Appendix 1 | December 18, 2020 | Page 6
procedures for calculating the RHND are clearly specified in state law and the grounds for an appeal were narrowly designed by the Legislature. ABAG staff have reviewed HCD’s calculation methodology and believe it adheres to applicable legal requirements. The ABAG Board ultimately decided not to appeal the RHND in June 2020. At this time, the window of appeal of the RHND is now closed. Further feedback on this element of the process is most appropriately provided to HCD, rather than ABAG.
9. Jurisdiction-specific issues with Plan Bay Area 2050 Blueprint: Some jurisdictions had concerns about the accuracy of the Blueprint’s underlying data. Others felt the Blueprint needs to better incorporate hazard data, particularly related to wildland-urban interface (WUI) maps and FEMA floodways.
Preliminary ABAG Response: Local jurisdiction staff were provided with several months to comment on the BASIS data used as the input for the Blueprint, as well as the additional public comment period on the Draft Blueprint during Summer 2020. ABAG-MTC staff appreciates jurisdictions’ feedback on Blueprint data and has worked directly with local jurisdiction staff to address these concerns.
Next Steps Staff will consider comments and will recommend any necessary adjustments for integration into the Draft RHNA Methodology, which is scheduled for release in the next week. The ABAG Regional Planning Committee will consider the Draft RHNA Methodology and make a recommendation to the ABAG Executive Board the Draft RHNA Methodology at its meeting on January 14, 2021 and the ABAG Executive Board is slated to take action on the Draft RHNA Methodology at the January 21, 2021 meeting. After a Draft RHNA Methodology is adopted by the Executive Board, ABAG will submit the methodology to HCD for review and then use the state agency’s feedback to develop a final methodology and draft RHNA allocation in spring 2021. Release of the draft allocation will be followed by an appeals period in the summer of 2021, with the final RHNA allocation assigned to each of the Bay Area’s local governments in late 2021.

Frfx16%
Unc Snm10%
Mll Vlly13%
Lrkspr17%
Sn Anslm14%
Unc Mrn14%
Sbstpl12%
Hldsbrg8%
Hlf MnBy8%
Pcfc14%
Clm37%
SnFrncsc
19%
Sslt18%
Crt Mdr17%
Rss14%
Nvt10%
Ctt9%
Snt Rs10%
Clvrdl9%
Wdsd16%
Mllbr29%
Sth SnFrncsc
19%
Dly Cty15%
Blvdr17%
Tbrn16%
Sn Rfl12%
Ptlm9%
RhnrtPrk8%
Wndsr8%
Unc SnMt14%
PrtlVlly14%
Sn Mt17%
Hllsbrgh16%
Sn Brn14%
Brsbn149%
Snm7%
St. Hln7%
Ls AltsHlls19%
Athrtn13%
Rdwd Cty17%
Brlngm28%
Fstr Cty16%
Albny18%
Rchmnd11%
AmrcnCnyn8%
Yntvll7%
Clstg10%
Srtg19%
Ls Alts20%
Mnl Prk24%
Sn Crls20%
Blmnt17%
Almd15%
Emryvll22%
El Crrt11%
Sn Pbl9%
Vllj8%
Np7%
Unc Np9%
Mnt Srn15%
Cprtn31%
Pl Alt36%
Est PlAlt12%
Oklnd17%
Brkly16%
Lfytt17%
Pnl8%
Hrcls8%
Bnc8%
Frfld9%
Unc Sln15%
Ls Gts15%
Cmpbll24%
Snnyvl22%
Mntn Vw33%
Unn Cty11%
Sn Lndr10%
Pdmnt15%
Mrg19%
Ornd17%
Mrtnz9%
Ssn Cty7%
Vcvll6%
Mrgn Hll8%
Sn Js20%
Snt Clr26%
Nwrk13%
Frmnt19%
Hywrd9%
Dnvll14%
PlsntHll14%
Cncrd9%
Pttsbrg7%
R Vst5%
Dxn6%
Unc SntClr16%
Glry9%
Mlpts30%
Plsntn18%
Dbln16%
Sn Rmn17%
Wlnt Crk18%
Clytn15%
Antch7%
Unc Almd9%
Lvrmr13%
Unc CntrCst10%
Brntwd7%
Okly8%
Frfx15%
Unc Snm7%
Mll Vlly13%
Lrkspr16%
Sn Anslm16%
Unc Mrn13%
Sbstpl6%
Hldsbrg7%
Hlf MnBy8%
Pcfc14%
Clm41%
SnFrncsc
22%
Sslt17%
Crt Mdr18%
Rss13%
Nvt10%
Ctt8%
Snt Rs7%
Clvrdl8%
Wdsd16%
Mllbr27%
Sth SnFrncsc
19%
Dly Cty14%
Blvdr17%
Tbrn16%
Sn Rfl14%
Ptlm8%
RhnrtPrk10%
Wndsr7%
Unc SnMt13%
PrtlVlly14%
Sn Mt18%
Hllsbrgh15%
Sn Brn20%
Brsbn85%
Snm6%
St. Hln6%
Ls AltsHlls17%
Athrtn14%
Rdwd Cty15%
Brlngm27%
Fstr Cty15%
Albny17%
Rchmnd10%
AmrcnCnyn8%
Yntvll7%
Clstg6%
Srtg16%
Ls Alts18%
Mnl Prk23%
Sn Crls23%
Blmnt17%
Almd17%
Emryvll27%
El Crrt14%
Sn Pbl8%
Vllj7%
Np7%
Unc Np9%
Mnt Srn15%
Cprtn23%
Pl Alt22%
Est PlAlt11%
Oklnd16%
Brkly19%
Lfytt22%
Pnl7%
Hrcls9%
Bnc8%
Frfld8%
Unc Sln13%
Ls Gts16%
Cmpbll18%
Snnyvl21%
Mntn Vw33%
Unn Cty11%
Sn Lndr13%
Pdmnt15%
Mrg20%
Ornd20%
Mrtnz9%
Ssn Cty7%
Vcvll6%
Mrgn Hll7%
Sn Js19%
Snt Clr25%
Nwrk13%
Frmnt17%
Hywrd10%
Dnvll14%
PlsntHll12%
Cncrd11%
Pttsbrg9%
R Vst10%
Dxn5%
Unc SntClr12%
Glry8%
Mlpts31%
Plsntn22%
Dbln17%
Sn Rmn18%
Wlnt Crk18%
Clytn14%
Antch9%
Unc Almd10%
Lvrmr14%
Unc CntrCst13%
Brntwd8%
Okly9%
5.0% 10.0% 15.0% 20.0% 25.0% 30.0% 150.0%
Jurisdiction Growth Rate (Compared to 2020 Households)
ABAG Draft RHNA Methodology Release | Appendix 2 | December 18, 2020
Proposed RHNA Methodology (Baseline: 2050 Households (Draft Blueprint))
Draft RHNA Methodology(Baseline: 2050 Households (Final Blueprint))
Appendix 2: Illustrative Results of Proposed RHNA Methodology (Draft Blueprint) and Draft RHNA Methodology (Final Blueprint)
Note: the jurisdiction-specific allocations shown are for illustrative purposes only. ABAG will issue Final Allocations by the end of 2021.

Almd4.9k
Albny1.2k
AmrcnCnyn0.5k
Antch2.5k
Athrtn0.3k
Blmnt1.8k
Blvdr0.2k
Bnc0.9k
Brkly7.7k
Brntwd1.5k
Brsbn2.8k
Brlngm3.4k
Clstg0.2k
Cmpbll4.0k
Clytn0.6k
Clvrdl0.3k
Clm0.2k
Cncrd3.9kCrt Mdr
0.7k
Ctt0.3k
Cprtn6.2k
Dly Cty4.8k
Dnvll2.2k
Dxn0.4k
Dbln3.6k
Est PlAlt
0.9k
El Crrt1.2k
Emryvll1.5k
Frfx0.5k
Frfld3.6k
Fstr Cty2.0k
Frmnt14.3k
Glry1.5k
Hlf MnBy
0.3k
Hywrd4.2k
Hldsbrg0.4k
Hrcls0.7k
Hllsbrgh0.6k
Lfytt1.7k
Lrkspr1.0k
Lvrmr4.0k
Ls Alts2.3kLs Alts
Hlls0.5k
Ls Gts1.9k
Mrtnz1.4k
Mnl Prk3.1k
Mll Vlly0.8k
Mllbr2.4k
Mlpts6.6k
Mnt Srn0.2k
Mrg1.1k
Mrgn Hll1.1k
Mntn Vw11.4k
Np2.1k
Nwrk1.8k
Nvt2.1k
Oklnd27.3k
Okly0.9k
Ornd1.1k
Pcfc1.9k
Pl Alt10.1k
Ptlm2.1k
Pdmnt0.6k
Pnl0.6k
Pttsbrg1.6k
PlsntHll
1.9k
Plsntn4.8k
PrtlVlly0.3k
Rdwd Cty5.2k
Rchmnd4.2k
R Vst0.2k
RhnrtPrk1.3k
Rss0.1k
Sn Anslm0.7k
Sn Brn2.1k
Sn Crls2.4k
SnFrncsc72.1k
Sn Js66.5k
Sn Lndr3.1k
Sn Mt6.7k
Sn Pbl0.8k
Sn Rfl2.8k
Sn Rmn4.7k
Snt Clr12.0k
Snt Rs6.5k
Srtg2.1k
Sslt0.7k
Sbstpl0.4k
Snm0.3k
Sth SnFrncsc4.0k
St. Hln0.2k
Ssn Cty0.6k
Snnyvl13.0k
Tbrn0.6k
Unc Almd4.5k
Unc CntrCst5.8k
Unc Mrn3.8k
Unc Np0.8k
Unc SnMt
2.9k
Unc SntClr
4.1k
Unc Sln1.0k
Unc Snm5.3k
Unn Cty2.2k
Vcvll2.0k
Vllj3.2k
Wlnt Crk5.7k
Wndsr0.7k
Wdsd0.3k
Yntvll0.1k
Almd5.4k
Albny1.1k
AmrcnCnyn0.5k
Antch3.0k
Athrtn0.3k
Blmnt1.8k
Blvdr0.2k
Bnc0.8k
Brkly9.0k
Brntwd1.5k
Brsbn1.6k
Brlngm3.3k
Clstg0.1k
Cmpbll3.0k
Clytn0.6k
Clvrdl0.3k
Clm0.2k
Cncrd5.1kCrt Mdr
0.7k
Ctt0.2k
Cprtn4.6k
Dly Cty4.4k
Dnvll2.2k
Dxn0.4k
Dbln3.7k
Est PlAlt
0.8k
El Crrt1.4k
Emryvll1.8k
Frfx0.5k
Frfld3.1k
Fstr Cty1.9k
Frmnt12.9k
Glry1.3k
Hlf MnBy
0.3k
Hywrd4.7k
Hldsbrg0.3k
Hrcls0.7k
Hllsbrgh0.6k
Lfytt2.1k
Lrkspr1.0k
Lvrmr4.4k
Ls Alts2.0kLs Alts
Hlls0.5k
Ls Gts2.0k
Mrtnz1.4k
Mnl Prk2.9k
Mll Vlly0.8k
Mllbr2.2k
Mlpts6.7k
Mnt Srn0.2k
Mrg1.1k
Mrgn Hll1.0k
Mntn Vw11.2k
Np2.0k
Nwrk1.9k
Nvt2.1k
Oklnd26.5k
Okly1.1k
Ornd1.4k
Pcfc1.9k
Pl Alt6.1k
Ptlm1.9k
Pdmnt0.6k
Pnl0.5k
Pttsbrg2.0k
PlsntHll
1.6k
Plsntn6.0k
PrtlVlly0.2k
Rdwd Cty4.6k
Rchmnd3.6k
R Vst0.5k
RhnrtPrk1.6k
Rss0.1k
Sn Anslm0.8k
Sn Brn3.2k
Sn Crls2.7k
SnFrncsc82.8k
Sn Js62.8k
Sn Lndr3.9k
Sn Mt7.1k
Sn Pbl0.8k
Sn Rfl3.3k
Sn Rmn5.1k
Snt Clr11.7k
Snt Rs4.7k
Srtg1.7k
Sslt0.7k
Sbstpl0.2k
Snm0.3k
Sth SnFrncsc4.0k
St. Hln0.2k
Ssn Cty0.6k
Snnyvl12.0k
Tbrn0.6k
Unc Almd4.8k
Unc CntrCst7.7k
Unc Mrn3.5k
Unc Np0.8k
Unc SnMt
2.9k
Unc SntClr
3.2k
Unc Sln0.9k
Unc Snm3.9k
Unn Cty2.3k
Vcvll1.9k
Vllj3.0k
Wlnt Crk5.9k
Wndsr0.7k
Wdsd0.3k
Yntvll0.1k
0 2,500 5,000 7,500 10,000 15,000 20,000 100,000
Jurisdiction Growth (Units)
Proposed RHNA Methodology (Baseline: 2050 Households (Draft Blueprint))
Draft RHNA Methodology(Baseline: 2050 Households (Final Blueprint))
ABAG Draft RHNA Methodology Release | Appendix 2 | December 18, 2020
Appendix 2: Illustrative Results of Proposed RHNA Methodology (Draft Blueprint) and Draft RHNA Methodology (Final Blueprint)
Note: the jurisdiction-specific allocations shown are for illustrative purposes only. ABAG will issue Final Allocations by the end of 2021.
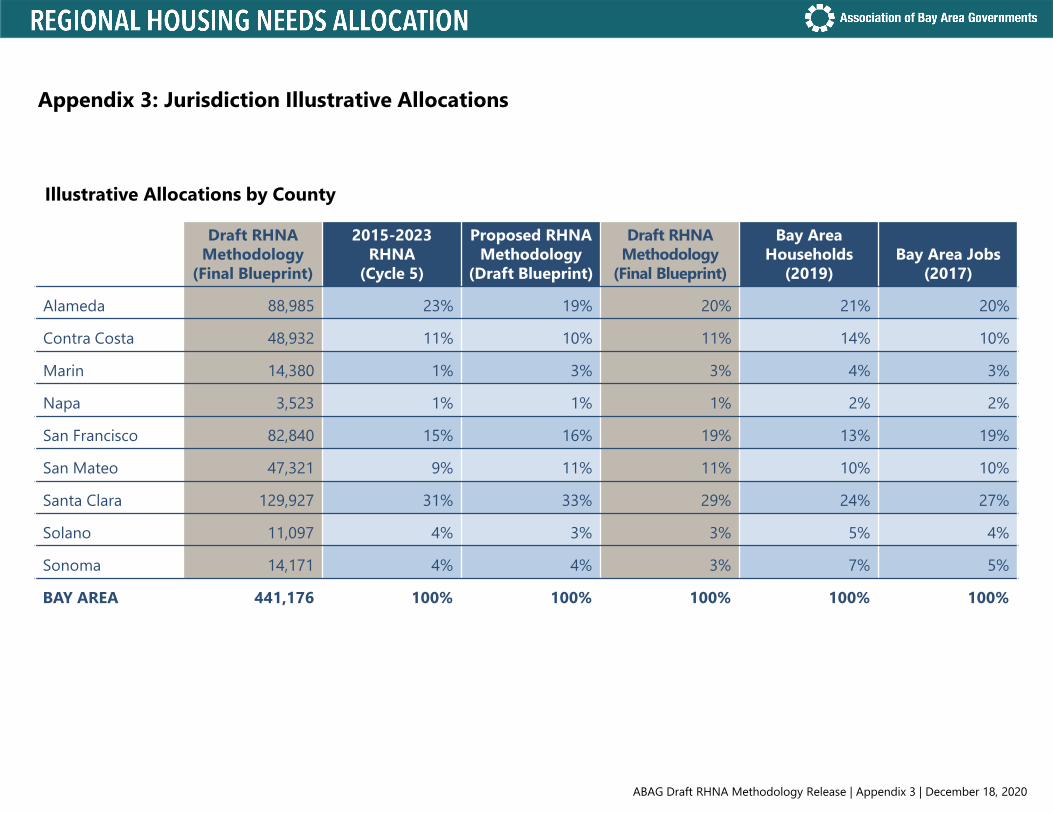
Appendix 3: Jurisdiction Illustrative Allocations
Draft RHNA Methodology
(Final Blueprint)
2015-2023 RHNA
(Cycle 5)
Proposed RHNA Methodology
(Draft Blueprint)
Draft RHNA Methodology
(Final Blueprint)
Bay Area Households
(2019)Bay Area Jobs
(2017)
Alameda 88,985 23% 19% 20% 21% 20%
Contra Costa 48,932 11% 10% 11% 14% 10%
Marin 14,380 1% 3% 3% 4% 3%
Napa 3,523 1% 1% 1% 2% 2%
San Francisco 82,840 15% 16% 19% 13% 19%
San Mateo 47,321 9% 11% 11% 10% 10%
Santa Clara 129,927 31% 33% 29% 24% 27%
Solano 11,097 4% 3% 3% 5% 4%
Sonoma 14,171 4% 4% 3% 7% 5%
BAY AREA 441,176 100% 100% 100% 100% 100%
ABAG Draft RHNA Methodology Release | Appendix 3 | December 18, 2020
Illustrative Allocations by County

Jurisdiction Illustrative Allocations by Income CategoryNote: the jurisdiction-specific allocations shown are for illustrative purposes only. ABAG will issue Final Allocations by the end of 2021.
Draft Blueprint
Final Blueprint
Very Low Income
Low Income
Moderate Income
Above Moderate
Income TotalVery Low Income
Low Income
Moderate Income
Above Moderate
Income Total
Unit Change from Proposed
to Draft
Percent Change from Proposed
to DraftAlameda 0.994% 1.100% 1,318 759 786 2,033 4,896 1,455 837 868 2,246 5,406 510 10%Albany 0.211% 0.206% 324 187 180 464 1,155 315 182 175 453 1,125 (30) -3%Berkeley 1.452% 1.701% 2,148 1,237 1,211 3,134 7,730 2,504 1,441 1,416 3,664 9,025 1,295 17%Dublin 0.687% 0.705% 1,060 611 547 1,413 3,631 1,085 625 560 1,449 3,719 88 2%Emeryville 0.399% 0.493% 377 217 249 646 1,489 462 265 308 797 1,832 343 23%Fremont 2.694% 2.434% 4,040 2,326 2,214 5,728 14,308 3,640 2,096 1,996 5,165 12,897 (1,411) -10%Hayward 1.393% 1.571% 980 564 726 1,880 4,150 1,100 632 817 2,115 4,664 514 12%Livermore 1.130% 1.269% 1,109 639 620 1,606 3,974 1,240 714 696 1,799 4,449 475 12%Newark 0.578% 0.609% 453 260 303 784 1,800 475 274 318 824 1,891 91 5%Oakland 6.503% 6.338% 6,880 3,962 4,584 11,860 27,286 6,665 3,838 4,457 11,533 26,493 (793) -3%Piedmont 0.099% 0.098% 166 96 94 243 599 163 94 92 238 587 (12) -2%Pleasanton 0.909% 1.135% 1,405 810 717 1,855 4,787 1,750 1,008 894 2,313 5,965 1,178 25%San Leandro 0.913% 1.137% 713 411 561 1,451 3,136 882 507 696 1,802 3,887 751 24%Unincorporated Alameda 1.347% 1.419% 1,221 704 726 1,879 4,530 1,281 738 763 1,976 4,758 228 5%Union City 0.702% 0.727% 565 326 370 957 2,218 582 335 382 988 2,287 69 3%Alameda County 20.011% 20.942% 22,759 13,109 13,888 35,933 85,689 23,599 13,586 14,438 37,362 88,985 3,296 4%Antioch 1.032% 1.270% 661 380 402 1,038 2,481 811 467 493 1,275 3,046 565 23%Brentwood 0.618% 0.647% 395 228 237 614 1,474 411 237 247 641 1,536 62 4%Clayton 0.115% 0.111% 176 102 87 227 592 170 97 84 219 570 (22) -4%Concord 1.306% 1.725% 1,006 579 643 1,662 3,890 1,322 762 847 2,190 5,121 1,231 32%Danville 0.410% 0.424% 632 365 328 848 2,173 652 376 338 875 2,241 68 3%El Cerrito 0.339% 0.405% 289 166 203 524 1,182 342 197 241 624 1,404 222 19%Hercules 0.240% 0.264% 164 95 115 297 671 179 104 126 327 736 65 10%Lafayette 0.297% 0.382% 468 269 255 659 1,651 599 344 326 845 2,114 463 28%Martinez 0.381% 0.383% 357 205 220 569 1,351 358 206 221 573 1,358 7 1%Moraga 0.193% 0.204% 302 174 163 422 1,061 318 183 172 445 1,118 57 5%Oakley 0.395% 0.450% 251 145 152 393 941 286 165 172 446 1,069 128 14%Orinda 0.197% 0.235% 313 180 181 468 1,142 372 215 215 557 1,359 217 19%Pinole 0.209% 0.183% 142 82 99 256 579 124 71 87 223 505 (74) -13%Pittsburg 0.630% 0.787% 419 242 273 707 1,641 518 298 340 880 2,036 395 24%Pleasant Hill 0.423% 0.368% 522 300 293 758 1,873 451 261 254 657 1,623 (250) -13%Richmond 1.403% 1.227% 988 569 731 1,891 4,179 860 496 638 1,651 3,645 (534) -13%San Pablo 0.261% 0.248% 187 108 139 359 793 177 102 132 341 752 (41) -5%San Ramon 0.898% 0.975% 1,382 796 708 1,830 4,716 1,497 862 767 1,985 5,111 395 8%Unincorporated Contra Costa 1.658% 2.203% 1,609 928 917 2,373 5,827 2,131 1,227 1,217 3,147 7,722 1,895 33%Walnut Creek 1.118% 1.148% 1,655 954 869 2,247 5,725 1,696 976 890 2,304 5,866 141 2%Contra Costa County 12.124% 13.638% 11,918 6,867 7,015 18,142 43,942 13,274 7,646 7,807 20,205 48,932 4,990 11%
Proposed RHNA Methodology (Baseline: 2050 Households - Draft Blueprint)
Draft RHNA Methodology (Baseline: 2050 Households - Final Blueprint) Comparison of Total RHNA
Jurisdiction Share of 2050 Households*
Jurisdiction
ABAG Draft RHNA Methodology Release | Appendix 3 | December 18, 2020

Jurisdiction Illustrative Allocations by Income CategoryNote: the jurisdiction-specific allocations shown are for illustrative purposes only. ABAG will issue Final Allocations by the end of 2021.
Draft Blueprint
Final Blueprint
Very Low Income
Low Income
Moderate Income
Above Moderate
Income TotalVery Low Income
Low Income
Moderate Income
Above Moderate
Income Total
Unit Change from Proposed
to Draft
Percent Change from Proposed
to Draft
Proposed RHNA Methodology (Baseline: 2050 Households - Draft Blueprint)
Draft RHNA Methodology (Baseline: 2050 Households - Final Blueprint) Comparison of Total RHNA
Jurisdiction Share of 2050 Households*
JurisdictionBelvedere 0.033% 0.032% 49 28 23 61 161 49 28 23 60 160 (1) -1%Corte Madera 0.135% 0.138% 209 121 106 274 710 213 123 108 281 725 15 2%Fairfax 0.104% 0.098% 158 91 75 195 519 149 86 71 184 490 (29) -6%Larkspur 0.197% 0.189% 303 175 150 390 1,018 291 168 145 375 979 (39) -4%Mill Valley 0.161% 0.164% 248 142 124 320 834 252 144 126 326 848 14 2%Novato 0.669% 0.672% 582 335 332 858 2,107 583 336 332 860 2,111 4 0%Ross 0.023% 0.022% 35 20 17 44 116 33 19 16 41 109 (7) -6%San Anselmo 0.149% 0.167% 226 130 108 280 744 253 145 121 314 833 89 12%San Rafael 0.895% 1.048% 752 433 446 1,154 2,785 877 504 521 1,350 3,252 467 17%Sausalito 0.125% 0.125% 200 115 115 296 726 200 115 114 295 724 (2) 0%Tiburon 0.123% 0.126% 186 107 91 236 620 193 110 93 243 639 19 3%Unincorporated Marin 0.893% 0.822% 1,157 666 557 1,440 3,820 1,063 611 512 1,324 3,510 (310) -8%Marin County 3.507% 3.605% 4,105 2,363 2,144 5,548 14,160 4,156 2,389 2,182 5,653 14,380 220 2%American Canyon 0.190% 0.176% 124 72 81 209 486 115 67 75 194 451 (35) -7%Calistoga 0.090% 0.052% 58 32 33 86 209 32 19 19 50 120 (89) -43%Napa 0.815% 0.769% 550 317 339 876 2,082 516 298 319 825 1,958 (124) -6%St. Helena 0.073% 0.068% 46 27 27 71 171 43 24 26 66 159 (12) -7%Unincorporated Napa 0.288% 0.279% 218 126 125 323 792 210 121 120 312 763 (29) -4%Yountville 0.031% 0.029% 20 12 12 32 76 19 11 12 30 72 (4) -5%Napa County 1.487% 1.373% 1,016 586 617 1,597 3,816 935 540 571 1,477 3,523 (293) -8%San Francisco 12.394% 14.304% 18,637 10,717 11,910 30,816 72,080 21,359 12,294 13,717 35,470 82,840 10,760 15%Atherton 0.065% 0.072% 74 43 51 130 298 81 47 56 144 328 30 10%Belmont 0.302% 0.305% 485 280 282 728 1,775 488 281 283 733 1,785 10 1%Brisbane 0.742% 0.423% 573 330 534 1,382 2,819 324 187 303 785 1,599 (1,220) -43%Burlingame 0.572% 0.546% 926 534 555 1,434 3,449 883 509 529 1,368 3,289 (160) -5%Colma 0.047% 0.052% 40 24 33 86 183 45 26 37 96 204 21 11%Daly City 1.040% 0.945% 1,150 661 841 2,175 4,827 1,039 598 762 1,971 4,370 (457) -9%East Palo Alto 0.219% 0.206% 179 104 169 437 889 169 97 159 410 835 (54) -6%Foster City 0.349% 0.327% 556 320 321 831 2,028 520 299 300 777 1,896 (132) -7%Half Moon Bay 0.147% 0.149% 93 54 54 141 342 93 54 54 141 342 - 0%Hillsborough 0.107% 0.097% 169 97 95 245 606 153 88 87 223 551 (55) -9%Menlo Park 0.500% 0.481% 773 445 517 1,340 3,075 740 426 496 1,284 2,946 (129) -4%Millbrae 0.375% 0.350% 618 356 386 999 2,359 575 331 361 932 2,199 (160) -7%Pacifica 0.359% 0.356% 557 321 294 761 1,933 551 317 291 753 1,912 (21) -1%Portola Valley 0.045% 0.045% 70 41 39 101 251 70 40 39 99 248 (3) -1%Redwood City 1.102% 0.984% 1,284 739 885 2,291 5,199 1,141 658 789 2,041 4,629 (570) -11%San Bruno 0.486% 0.730% 481 278 382 989 2,130 721 415 573 1,483 3,192 1,062 50%San Carlos 0.398% 0.455% 647 372 383 991 2,393 739 425 438 1,133 2,735 342 14%San Mateo 1.338% 1.419% 1,722 991 1,111 2,873 6,697 1,819 1,047 1,175 3,040 7,081 384 6%South San Francisco 0.923% 0.929% 892 513 717 1,856 3,978 892 514 720 1,863 3,989 11 0%Unincorporated San Mateo 0.827% 0.809% 852 490 443 1,148 2,933 830 479 433 1,121 2,863 (70) -2%Woodside 0.057% 0.058% 90 52 51 133 326 90 52 52 134 328 2 1%San Mateo County 10.002% 9.740% 12,231 7,045 8,143 21,071 48,490 11,963 6,890 7,937 20,531 47,321 (1,169) -2%
ABAG Draft RHNA Methodology Release | Appendix 3 | December 18, 2020

Jurisdiction Illustrative Allocations by Income CategoryNote: the jurisdiction-specific allocations shown are for illustrative purposes only. ABAG will issue Final Allocations by the end of 2021.
Draft Blueprint
Final Blueprint
Very Low Income
Low Income
Moderate Income
Above Moderate
Income TotalVery Low Income
Low Income
Moderate Income
Above Moderate
Income Total
Unit Change from Proposed
to Draft
Percent Change from Proposed
to Draft
Proposed RHNA Methodology (Baseline: 2050 Households - Draft Blueprint)
Draft RHNA Methodology (Baseline: 2050 Households - Final Blueprint) Comparison of Total RHNA
Jurisdiction Share of 2050 Households*
JurisdictionCampbell 0.741% 0.563% 1,017 585 659 1,703 3,964 770 444 499 1,292 3,005 (959) -24%Cupertino 0.980% 0.724% 1,619 932 1,023 2,648 6,222 1,193 687 755 1,953 4,588 (1,634) -26%Gilroy 0.523% 0.461% 410 236 228 590 1,464 359 207 200 519 1,285 (179) -12%Los Altos 0.348% 0.301% 580 333 377 977 2,267 501 288 326 843 1,958 (309) -14%Los Altos Hills 0.084% 0.076% 139 81 91 234 545 125 72 82 210 489 (56) -10%Los Gatos 0.326% 0.335% 523 301 311 804 1,939 537 310 320 826 1,993 54 3%Milpitas 1.228% 1.257% 1,653 952 1,108 2,866 6,579 1,685 970 1,131 2,927 6,713 134 2%Monte Sereno 0.032% 0.032% 51 30 31 80 192 51 30 31 79 191 (1) -1%Morgan Hill 0.444% 0.410% 291 168 189 488 1,136 268 155 174 450 1,047 (89) -8%Mountain View 1.772% 1.754% 2,876 1,656 1,909 4,939 11,380 2,838 1,635 1,885 4,880 11,238 (142) -1%Palo Alto 1.541% 0.935% 2,573 1,482 1,673 4,330 10,058 1,556 896 1,013 2,621 6,086 (3,972) -39%San Jose 15.242% 14.426% 16,391 9,437 11,344 29,350 66,522 15,444 8,892 10,711 27,714 62,761 (3,761) -6%Santa Clara 2.184% 2.135% 3,020 1,739 2,031 5,257 12,047 2,940 1,692 1,981 5,126 11,739 (308) -3%Saratoga 0.343% 0.280% 556 321 341 882 2,100 454 261 278 719 1,712 (388) -18%Sunnyvale 2.262% 2.088% 3,227 1,858 2,206 5,707 12,998 2,968 1,709 2,032 5,257 11,966 (1,032) -8%Unincorporated Santa Clara 1.065% 0.815% 1,113 641 664 1,719 4,137 848 488 508 1,312 3,156 (981) -24%Santa Clara County 29.114% 26.591% 36,039 20,752 24,185 62,574 143,550 32,537 18,736 21,926 56,728 129,927 (13,623) -9%Benicia 0.286% 0.271% 222 127 143 370 862 208 120 135 351 814 (48) -6%Dixon 0.159% 0.146% 103 58 62 159 382 93 54 57 146 350 (32) -8%Fairfield 1.438% 1.226% 938 540 596 1,544 3,618 796 458 508 1,314 3,076 (542) -15%Rio Vista 0.098% 0.207% 62 36 36 94 228 130 75 76 197 478 250 110%Suisun City 0.242% 0.246% 158 91 101 260 610 160 92 101 264 617 7 1%Unincorporated Solano 0.420% 0.381% 270 155 165 426 1,016 243 140 149 385 917 (99) -10%Vacaville 0.828% 0.775% 535 308 328 848 2,019 498 286 305 791 1,880 (139) -7%Vallejo 1.190% 1.117% 794 457 535 1,385 3,171 741 426 501 1,297 2,965 (206) -6%Solano County 4.662% 4.368% 3,082 1,772 1,966 5,086 11,906 2,869 1,651 1,832 4,745 11,097 (809) -7%Cloverdale 0.126% 0.120% 80 46 47 121 294 76 44 45 116 281 (13) -4%Cotati 0.105% 0.092% 68 39 44 116 267 61 35 39 101 236 (31) -12%Healdsburg 0.145% 0.121% 93 54 59 153 359 78 45 49 128 300 (59) -16%Petaluma 0.781% 0.716% 560 323 342 885 2,110 511 295 313 810 1,929 (181) -9%Rohnert Park 0.492% 0.625% 322 186 209 541 1,258 408 235 265 686 1,594 336 27%Santa Rosa 2.404% 1.745% 1,727 993 1,064 2,754 6,538 1,247 718 771 1,995 4,731 (1,807) -28%Sebastopol 0.163% 0.086% 106 61 67 175 409 56 32 35 92 215 (194) -47%Sonoma 0.143% 0.133% 91 53 54 140 338 85 49 50 130 314 (24) -7%Unincorporated Sonoma 2.058% 1.540% 1,424 820 840 2,173 5,257 1,060 610 627 1,622 3,919 (1,338) -25%Windsor 0.283% 0.260% 184 106 118 305 713 168 97 108 279 652 (61) -9%Sonoma County 6.700% 5.440% 4,655 2,681 2,844 7,363 17,543 3,750 2,160 2,302 5,959 14,171 (3,372) -19%
100.000% 100.000% 114,442 65,892 72,712 188,130 441,176 114,442 65,892 72,712 188,130 441,176
* Jurisdiction-level forecasts from Plan Bay Area 2050 Final Blueprint are intended solely for use in crafting the RHNA baseline allocation; official Plan Bay Area 2050 growth pattern focuses on county- and subcounty-level forecasts.
ABAG Draft RHNA Methodology Release | Appendix 3 | December 18, 2020

ABAG Draft RHNA Methodology Release | Appendix 4 | December 18, 2020
Appendix 4: Performance Evaluation Metrics The RHNA allocation methodology must meet five objectives identified in Housing Element Law.1 To help ensure that any proposed methodology will meet the statutory RHNA objectives and receive approval from the California Department of Housing and Community Development (HCD), ABAG-MTC staff developed a set of evaluation metrics to assess different methodology options. These metrics are based largely on the analytical framework used by HCD in evaluating the draft methodologies completed by other regions in California, as evidenced by the approval letters HCD provided to the Sacramento Area Council of Governments (SACOG), San Diego Association of Governments (SANDAG), and Southern California Association of Governments (SCAG).2 Other metrics reflect input from members of the Housing Methodology Committee (HMC).
In the evaluation metrics, each statutory objective has been reframed as a question that reflects the language Housing Element Law uses to define the objectives. Each statutory objective is accompanied by quantitative metrics for evaluating the allocation produced by a methodology. The metrics are structured as a comparison between the allocations to the top jurisdictions in the region for a particular characteristic – such as jurisdictions with the most expensive housing costs – and the allocations to the rest of the jurisdictions in the region.
Metrics Based on Lower-Income Unit Percentage vs. Metrics Based on Total Allocation Several of the metrics focus on whether jurisdictions with certain characteristics receive a significant share of their RHNA as lower-income units. These metrics reflect HCD’s analysis in its letters evaluating RHNA methodologies from other regions. However, HMC members advocated for metrics that also examine the total number of units assigned to a jurisdiction. These HMC members asserted that it is ultimately less impactful if a jurisdiction receives a high share of its RHNA as lower-income units if that same jurisdiction receives few units overall. Accordingly, each metric that focuses on the share of lower-income units assigned to jurisdictions with certain characteristics is paired with a complementary metric that examines whether those jurisdictions also receive a share of the regional housing need that is at least proportional to their share of the region’s households. A value of 1.0 for these complementary metrics means that the group of jurisdictions’ overall share of RHNA is proportional relative to its overall share of households in 2019, while a value below 1.0 is less than proportional.
Evaluation of Draft RHNA Methodology Compared to Proposed RHNA Methodology The graphs below compare the performance of the Draft RHNA Methodology and Proposed RHNA Methodology in achieving the five statutory RHNA objectives based on the evaluation metrics. Although there are some variations on individual metrics, the results indicate that both the Proposed RHNA Methodology and the Draft RHNA Methodology perform well in advancing all of the statutory objectives.
1 See California Government Code Section 65584(d). 2 For copies of letters HCD sent to other regions, see this document from the January 2020 HMC meeting agenda packet.

METRIC 1a.1: Do jurisdictions with the most expensivehousing costs receive a significant percentage of
their RHNA as lower−income units?
Percent of RHNA as lower income units
METRIC 1a.2: Do jurisdictions with the most expensivehousing costs receive a share of the region's housing
need that is at least proportional to their share ofthe region's households?
Ratio of share of total RHNA to share ofregion's households
Proposed RHNA Methodology(2050 Households − Draft Blueprint)
Draft RHNA Methodology(2050 Households − Final Blueprint)
0.000 0.050 0.100 0.150 0.200 0.250 0.300 0.350 0.400 0.450 0.00 0.20 0.40 0.60 0.80 1.00
25 jurisdictions with mostexpensive housing costs
All Other Jurisdictions
25 jurisdictions with mostexpensive housing costs
All Other Jurisdictions
GroupAll Other Jurisdictions25 jurisdictions with mostexpensive housing costs
Comparison between the top 25 jurisdictions with the most expensive housingcosts and the rest of the region
OBJECTIVE 1: Does the allocation increase the housing supply and the mix of housing types, tenure,and affordability in all cities and counties within the region in an equitable manner?
ABAG Draft RHNA Methodology Release | Appendix 4 | December 18, 2020

METRIC 2a: Do jurisdictions with the largest share ofthe region's jobs have the highest growth rates
resulting from RHNA?
Average growth rate resulting from RHNA
Proposed RHNA Methodology(2050 Households − Draft Blueprint)
Draft RHNA Methodology(2050 Households − Final Blueprint)
0.000 0.050 0.100 0.150
25 jurisdictions with the largestshare of regional jobs
All Other Jurisdictions
25 jurisdictions with the largestshare of regional jobs
All Other Jurisdictions
GroupAll Other Jurisdictions25 jurisdictions with the largestshare of regional jobs
Comparison between the top 25 jurisdictions with the most jobs and the rest ofthe region
OBJECTIVE 2: Does the allocation promote infill development and socioeconomic equity, the protectionof environmental and agricultural resources, the encouragement of efficient development patterns,
and the achievement of the region's greenhouse gas reductions targets?
ABAG Draft RHNA Methodology Release | Appendix 4 | December 18, 2020

METRIC 2b: Do jurisdictions with the largest share ofthe region's Transit Priority Area acres have the
highest growth rates resulting from RHNA?
Average growth rate resulting from RHNA
Proposed RHNA Methodology(2050 Households − Draft Blueprint)
Draft RHNA Methodology(2050 Households − Final Blueprint)
0.000 0.050 0.100 0.150
25 jurisdictions with largestshare of the regional Transit
Priority Area acres
All Other Jurisdictions
25 jurisdictions with largestshare of the regional Transit
Priority Area acres
All Other Jurisdictions
Group
All Other Jurisdictions25 jurisdictions with largestshare of the regional TransitPriority Area acres
Comparison between the top 25 jurisdictions with the most transit access and therest of the region
OBJECTIVE 2: Does the allocation promote infill development and socioeconomic equity, the protectionof environmental and agricultural resources, the encouragement of efficient development patterns,
and the achievement of the region's greenhouse gas reductions targets?
ABAG Draft RHNA Methodology Release | Appendix 4 | December 18, 2020

METRIC 2c: Do jurisdictions whose residents drive theleast have the highest growth rates resulting from
RHNA?
Average growth rate resulting from RHNA
Proposed RHNA Methodology(2050 Households − Draft Blueprint)
Draft RHNA Methodology(2050 Households − Final Blueprint)
0.000 0.050 0.100 0.150
25 jurisdictions with lowest VMTper resident
All Other Jurisdictions
25 jurisdictions with lowest VMTper resident
All Other Jurisdictions
GroupAll Other Jurisdictions25 jurisdictions with lowest VMTper resident
Comparison between the top 25 jurisdictions with the lowest VMT per resident therest of the region
OBJECTIVE 2: Does the allocation promote infill development and socioeconomic equity, the protectionof environmental and agricultural resources, the encouragement of efficient development patterns,
and the achievement of the region's greenhouse gas reductions targets?
ABAG Draft RHNA Methodology Release | Appendix 4 | December 18, 2020

METRIC 3a.1: Do jurisdictions with the most low−wageworkers per housing unit affordable to low−wage
workers receive a significant percentage of their RHNAas lower−income units?
Percent of RHNA as lower income units
METRIC 3a.2: Do jurisdictions with the most low−wageworkers per housing unit affordable to low−wage
workers receive a share of the region's housing needthat is at least proportional to their share of the
region's households?
Ratio of share of total RHNA to share ofregion's households
Proposed RHNA Methodology(2050 Households − Draft Blueprint)
Draft RHNA Methodology(2050 Households − Final Blueprint)
0.000 0.050 0.100 0.150 0.200 0.250 0.300 0.350 0.400 0.00 0.20 0.40 0.60 0.80 1.00 1.20
25 jurisdictions with most low−wage jobs per housing unit
affordable to low−wage workers
All Other Jurisdictions
25 jurisdictions with most low−wage jobs per housing unit
affordable to low−wage workers
All Other Jurisdictions
Group
All Other Jurisdictions25 jurisdictions with most low−wage jobs per housing unitaffordable to low−wage workers
Comparison between the top 25 jurisdictions with the most unbalanced jobs−housing fit and the rest of the region
OBJECTIVE 3: Does the allocation promote an improved intraregional relationship between jobs andhousing, including an improved balance between the number of low−wage jobs and the number of housing
units affordable to low−wage workers in each jurisdiction?
ABAG Draft RHNA Methodology Release | Appendix 4 | December 18, 2020

METRIC 4: Do jurisdictions with the largest percentageof high−income residents receive a larger share of
their RHNA as lower−income units than jurisdictionswith the largest percentage of low−income residents?
Percent of RHNA as lower income units
Proposed RHNA Methodology(2050 Households − Draft Blueprint)
Draft RHNA Methodology(2050 Households − Final Blueprint)
0.000 0.050 0.100 0.150 0.200 0.250 0.300 0.350 0.400 0.450
25 jurisdictions with largest % ofhouseholds above 120% Area Median
Income
25 jurisdictions with largest % ofhouseholds below 80% Area Median
Income
25 jurisdictions with largest % ofhouseholds above 120% Area Median
Income
25 jurisdictions with largest % ofhouseholds below 80% Area Median
Income
Group
25 jurisdictions with largest % ofhouseholds below 80% Area MedianIncome25 jurisdictions with largest % ofhouseholds above 120% Area MedianIncome
Comparison between the top 25 most disproportionately high−income jurisdictionsand top 25 most disproportionately low−income jurisdictions
OBJECTIVE 4: Does the allocation direct a lower proportion of housing need to an income categorywhen a jurisdiction already has a disproportionately high share of households in that income
category?
ABAG Draft RHNA Methodology Release | Appendix 4 | December 18, 2020

METRIC 5a.1: Do jurisdictions with the largestpercentage of households living in High or HighestResource tracts receive a significant percentage of
their RHNA as lower−income units?
Percent of RHNA as lower income units
METRIC 5a.2: Do jurisdictions with the largestpercentage of households living in High or Highest
Resource tracts receive a share of the region'shousing need that is at least proportional to their
share of the region's households?
Ratio of share of total RHNA to share ofregion's households
Proposed RHNA Methodology(2050 Households − Draft Blueprint)
Draft RHNA Methodology(2050 Households − Final Blueprint)
0.000 0.050 0.100 0.150 0.200 0.250 0.300 0.350 0.400 0.450 0.00 0.20 0.40 0.60 0.80 1.00 1.20
25 jurisdictions with largest %of households in High Resource or
Highest Resource Tracts
All Other Jurisdictions
25 jurisdictions with largest %of households in High Resource or
Highest Resource Tracts
All Other Jurisdictions
Group
All Other Jurisdictions25 jurisdictions with largest %of households in High Resource orHighest Resource Tracts
Comparison between the top 25 jurisdictions with the most access to resourcesand the rest of the region
OBJECTIVE 5: Does the allocation affirmatively further fair housing?
ABAG Draft RHNA Methodology Release | Appendix 4 | December 18, 2020

METRIC 5b: Do jurisdictions exhibiting racial andeconomic exclusion receive a share of the region'shousing need that is at least proportional to their
share of the region's households?
Ratio of share of total RHNA to share ofregion's households
Proposed RHNA Methodology(2050 Households − Draft Blueprint)
Draft RHNA Methodology(2050 Households − Final Blueprint)
0.00 0.20 0.40 0.60 0.80 1.00
31 Jurisdictions with above−average divergence scores and % of
households above 120% Area MedianIncome
All Other Jurisdictions
31 Jurisdictions with above−average divergence scores and % of
households above 120% Area MedianIncome
All Other Jurisdictions
Group
All Other Jurisdictions31 Jurisdictions with above−average divergence scores and % ofhouseholds above 120% Area MedianIncome
Comparison between jurisdictions that have both above−average divergence scoresand disproportionately large shares of high−income residents and the rest of the
region
OBJECTIVE 5: Does the allocation affirmatively further fair housing?
ABAG Draft RHNA Methodology Release | Appendix 4 | December 18, 2020

METRIC 5c: Do jurisdictions with the largestpercentage of high−income residents receive a share of
the region's housing need that is at leastproportional to their share of the region's
households?
Ratio of share of total RHNA to share ofregion's households
Proposed RHNA Methodology(2050 Households − Draft Blueprint)
Draft RHNA Methodology(2050 Households − Final Blueprint)
0.00 0.20 0.40 0.60 0.80 1.00 1.20
25 jurisdictions with largest % ofhouseholds above 120% Area Median
Income
All Other Jurisdictions
25 jurisdictions with largest % ofhouseholds above 120% Area Median
Income
All Other Jurisdictions
Group
All Other Jurisdictions25 jurisdictions with largest % ofhouseholds above 120% Area MedianIncome
Comparison between the top 25 most disproportionately high−income jurisdictionsand the rest of the region
OBJECTIVE 5: Does the allocation affirmatively further fair housing?
ABAG Draft RHNA Methodology Release | Appendix 4 | December 18, 2020

METRIC 5d.1: Do jurisdictions with levels of racialand socioeconomic exclusion above the regional average
receive a total share of the region's very low− andlow−income housing need that is at least proportional
to their total share of the region's households?
Ratio of share of lower−income RHNA to shareof region's households
METRIC 5d.2: Does each jurisdiction exhibiting racialand socioeconomic exclusion above the regional average
receive a share of the region's very low− andlow−income housing need that is at least proportional
to its total share of the region's households?
Jurisdictions receiving at least aproportional lower−income allocation
Proposed RHNA Methodology(2050 Households − Draft Blueprint)
Draft RHNA Methodology(2050 Households − Final Blueprint)
0.00 0.20 0.40 0.60 0.80 1.00 1.20 0.00 0.10 0.20 0.30 0.40 0.50 0.60
49 Jurisdictions with levels ofracial and socioeconomic exclusion
above the regional average
All Other Jurisdictions
49 Jurisdictions with levels ofracial and socioeconomic exclusion
above the regional average
All Other Jurisdictions
Group
All Other Jurisdictions49 Jurisdictions with levels ofracial and socioeconomic exclusionabove the regional average
Comparison between the top 49 jurisdictions exhibiting above average racial andsocioeconomic exclusion and the rest of the region
OBJECTIVE 5: Does the allocation affirmatively further fair housing?
ABAG Draft RHNA Methodology Release | Appendix 4 | December 18, 2020

ABAG Draft RHNA Methodology Release | Appendix 5 | December 18, 2020 | Page 1
Appendix 5: Final Subregional Shares State Housing Element Law allows two or more neighboring jurisdictions to form a “subregion” to conduct a parallel RHNA process to allocate the subregion’s housing need among its members.1 A subregion is responsible for conducting its own RHNA process that meets all of the statutory requirements related to process and outcomes, including developing its own RHNA methodology, allocating a share of need to each member jurisdiction, and conducting its own appeals process. For the 2023–31 RHNA, subregions were formed in:
1. Napa County: includes City of American Canyon, City of Napa, Town of Yountville, and the County of Napa (does not include City of Calistoga or City of St. Helena)
2. Solano County: includes City of Benicia, City of Dixon, City of Fairfield, City of Rio Vista, City of Suisun City, City of Vacaville, City of Vallejo, and County of Solano
ABAG must assign each subregion a share of the Bay Area’s Regional Housing Need Determination (RHND), which represents the total number of units, by income category, the subregion must allocate to its member jurisdictions. Each subregion’s portion of the RHND has been removed from the units allocated by ABAG’s process for the rest of the region’s jurisdictions. On May 21, 2020, the ABAG Executive Board adopted the methodology for assigning a subregion its share of the RHND. The adopted methodology stipulates that the share of the RHND for each subregion will be based on the sum of the default allocations, by income category, from the ABAG RHNA methodology for each jurisdiction in the subregion. Using ABAG’s RHNA methodology as the input into the subregion shares ensures every jurisdiction that is a member of a subregion receives the same allocation it would have received if it were not part of a subregion. This approach ensures that formation of a subregion does not confer any harm or benefit to member jurisdictions or to other jurisdictions in the region. On October 15, 2020, the ABAG Executive Board approved release of the Draft Subregional Shares.2 The Draft Subregional Shares were based on the Proposed RHNA Methodology, which reflected baseline data on 2050 households from the Plan Bay Area 2050 Draft Blueprint. Applying the subregional share methodology to the Bay Area’s RHND of 441,176, the Draft Subregional Share for the Napa County subregion is 0.78 percent of the region’s housing needs and the Draft Subregional Share for the Solano County subregion is 2.7 percent of the region’s housing needs. Table 1 shows each subregion’s draft share by income category.
1 Government Code Section 65584.03. 2 For more information, see https://mtc.legistar.com/LegislationDetail.aspx?ID=4665721&GUID=6B565EC3-A706-4695-8A87-277F6791A1DB&Options=&Search=

ABAG Draft RHNA Methodology Release | Appendix 5 | December 18, 2020 | Page 2
Table 1: Draft Subregional Shares, Total Units by Income Category
Subregion Very Low Low Moderate Above
Moderate TOTAL
Napa County 912 527 557 1,440 3,436
Solano County 3,082 1,772 1,966 5,086 11,906
Housing Element Law requires ABAG to hold a public comment period and conduct at least one public hearing to receive comments on the Draft Subregional Shares3 prior to adoption of the Final Subregional Shares. The written public comment period began on October 25 and ended on November 27 per the Notice of Public Hearing published in newspapers and an ABAG press release. Additionally, ABAG held a public hearing at the November 12 meeting of the Regional Planning Committee. ABAG received no comments on the Draft Subregional Shares. The Final Subregional Shares are based on the Draft RHNA Methodology, which incorporates updates made throughout fall 2020 to reflect the revised Strategies and Growth Geographies approved by the ABAG Executive Board and Commission in September 2020 for the Final Blueprint. Integrating the updated data about future year 2050 households from the Final Blueprint into the Draft RHNA Methodology results in changes to the allocations to local jurisdictions, and thus the subregional shares. In December 2020, the jurisdictions who were members of the Napa Subregion decided to dissolve their subregion. As a result, these jurisdictions will participate in the RHNA process ABAG is conducting and will receive allocations based on the RHNA methodology adopted by ABAG. Accordingly, ABAG-MTC staff has only identified a Final Subregional Share for the Solano County subregion. Applying the subregional share methodology to the Bay Area’s RHND of 441,176, the Final Subregional Share for the Solano County subregion is 2.52 percent of the region’s housing needs. Table 2 shows the subregion’s final share by income category. Table 2: Final Subregional Shares, Total Units by Income Category
Subregion Very Low Low Moderate Above
Moderate TOTAL
Solano County 2,869 1,651 1,832 4,745 11,097
3 California Government Code 65584.03 (c)

1
CENTER FOR CONTINUING STUDY OF THE CALIFORNIA ECONOMY
385 HOMER AVENUE • PALO ALTO • CALIFORNIA • 94301
TELEPHONE: (650) 321-8550 FAX: (650) 321-5451 www.ccsce.com DATE: January 11, 2021 TO: Palo Alto City Council, Planning Commissio and Staff FROM: Stephen Levy SUBJECT: Agenda Item 8 on PBA 2050 and RHNA
• I recommend that staff reach out and brief council and the PTC on the following items relevant to RHNA evaluation and enforcement: --The focus by HCD on units approved versus a good faith effort to identify sufficient sites and policies to support achieving the RHNA unit goal. My impression is that Housing Element sites and policies wil be the critical HCD evaluation foci. --What are current and newly planned (through the legislature enforcement tools available to HCD. --HCD’s position with regard to the implications of COVID and work from home on the RHNA targets and enforcement --What current actions by council if any wiol be taken into account by HCD in evaluating good faith efforts with regard to RHNA implementation.
• With regard to the proposed staff letters, I make the following points:
--The good news is that staff provided an accurage picture of the ABAG RHNA process and findings AND that recent council actions on housing will in my opinion be giewed positively by HCD. --However, many of the points raised in the letters were addressed by ABAG in the same document cited by staff in prearing their memo for tonight. Everyone should review the response to comments by ABAg staff starting on page 2 of the attached document. --The response to comment 5 addresses the impacts of COVID and telecommuting. It is important to remember that the RHNA implementation period for Palo Alto starts in 2023, well past the time when economic forecasts and vaccine implementation expect that the pandemic will be

2
behinf us. With regard to telecommuting, the future is uncertain past 2021 and it is the ABAG position that the PBA accounts for increasing telecommuting. Council and staff may wish to argue with ABAG but should in my opinion acknowledge that the city’s concerns have bveen addressed.
• Residents in Palo Alto and other communitieds continue to raise
objections to expanding housing supply and affordability that ai believie have already been dismissed by HCD and ABAG. Council and staff should pay particular attention to response 1 in the attached document. While this is not directly relevant to the proposed letters, it is directly relevant to objections normally raised in the planning, and project review priocess in Palo Alto. In this regard council and PTC will address two housing isssues this week and next that concern sites that will be in the new Housing Element revied by HCD.
1. Jurisdiction is built out and/or lacks infrastructure to accommodate its allocation: Comments noted a lack of developable land and the inability to provide the services and infrastructure that would be needed as a result of growth from RHNA. Some residents objected to any new housing growth. Preliminary ABAG Response: Housing Element Law requires RHNA to increase the housing supply and mix of housing types for all jurisdictions. ABAG-MTC staff worked with local governments to gather information about local plans, zoning, physical characteristics and potential development opportunities and constraints. This information was used as an input into the Plan Bay Area 2050 Blueprint, which is used as the baseline allocation in the Draft RHNA Methodology. The Final Blueprint that was integrated into the Draft RHNA Methodology includes a number of updates based on corrections to local data provided by jurisdiction staff. The Blueprint allows additional feasible growth within the urban footprint by increasing allowable residential densities and expanding housing into select areas currently ABAG Draft RHNA Methodology Release | Appendix 1 | December 18, 2020 | Page 3 zoned for commercial and industrial uses. Ultimately, by law, ABAG cannot limit RHNA based on existing zoning or land use restrictions. The statute also requires ABAG to consider the potential for increased residential development under alternative zoning ordinances and land use restrictions

1
Baumb, Nelly
From: mark weiss <[email protected]>Sent: Friday, January 8, 2021 12:13 AMTo: Shikada, EdCc: Filseth, Eric (external); Council, City; Alison Cormack; Tom DuBois [email protected]: 445 Bryant
CAUTION: This email originated from outside of the organization. Be cautious of opening attachments and clicking on links.
Gentlemen and Madames‐ I was noticing in the digital version of the council packet there is an item coming up about a closed negotiation regarding 445 Bryant St. in Palo alto and Tesla. I live on Bryant Street and in fact worked briefly in the automobile industry as my family for two generations from 1919 to 1988 sold Chevy.* I noticed on the radio and then again here on the Internet that the market cap of this local corporation is $795 billion with a B and that its founder Mr. musk is now worth about 190 billion with a B and is therefore the worlds best driver. So having neglected to tax his company for many years as we have with easily $1 trillion worth of other companies why don’t we give them a hard “no” on renting our garage or whatever it is. Or maybe to show our progressiveness charging him $1 billion a year which would help us not have to lay off librarians and the like. Or maybe he could buy small homes for the homeless people who currently sleep there. I hope you get a charge out of my idea. There was a guy named “doc” who was in the fraternity I was blackballed from – – for my support of gay rights—at our small liberal arts college who is director of marketing there —I hope this makes his way to him —no offense, bro (imagine me flashing our secret handshakes...) Mark Weiss Bryant Street Sometimes wears a Manchester United jersey and or rides a bike— I am solar powered too *Permit me 30 more seconds and I am imagining myself calling in on my magic handheld Captain Kirk device—the one summer I sold cars one of my customers was the silicon Valley legend Bill Campbell — bought the ultimate middle‐management car a four‐door maroon Chevy celebrity. it was his first week in town from Rochester and yes we compared our secret frat bro handshakes.... https://www.google.com/amp/s/www.bloomberg.com/amp/news/articles/2021‐01‐06/musk‐close‐to‐surpassing‐bezos‐as‐world‐s‐richest‐person ← Lower East Side part II
Memoir from the bygone five minutes →
‘Coach: how one footballer shaped 5 Billion Cellphones’ by Mark Bennett Weiss, with help from The Leon Levy Center Posted on December 2, 2018by markweiss86
To help protect you r privacy, Micro so ft Office prevented au tomatic download of this pictu re from the Internet.E8906CC6-4E03-48A7-86EC-9143ED71E05A
In addition to advising Steve Jobs and other high tech CEOs, former Columbia University Center and Linebacker and Coach William Campbell ‘61 also funded The Old Pro in Palo Alto where thousands of beers also fueled thousands more ideas: Facebook had a mixer there just this week, Friday, December 1, 2018.

2
I met Bill summer, 1983, his first week in Silicon Valley, when he bought a maroon Chevy Celebrity, from my dads lot, Key Chevrolet, 2 miles from Apple.
The last time I spoke to him was at The Old Pro; I suggested a prize in honor of coach Ben Parks.
I did not know him well enough to attend his wake but stood on the sidewalk outside the event, on Ramona Street and traded “good luck” with Al Gore, The would be President, as he slipped out after his eulogy.
It would be interesting to get 100 takes on the Bill Campbell story and legend.
I told a version of this yesterday to Mark and Will, two Northwestern /GSBs, there to watch Big Ten title game. We noted a similarity between Campbell and Pat Fitzgerald, the Wildcat living legend and coach. Their crew were camped under the Jim “Soupy” Campbell shrine.
edit to add, the next day: if not Bill Campbell, how about a book about Paul J. Cohen?
Sent from my iPhone

1
Baumb, Nelly
From: Clive Hallatt <[email protected]>Sent: Tuesday, January 12, 2021 12:10 PMTo: Council, CityCc: Greg TanakaSubject: fees for local residents for Foothills park
CAUTION: This email originated from outside of the organization. Be cautious of opening attachments and clicking on links.
Council members, I saw in the press the potential for the city to charge local residents for using foothills park. Don’t we already pay access fees in the form of local taxes? Why don’t you figure out the per capita cost to run the park and charge nonresidents a similar fee? I look forward to your comments. Regards Clive Hallatt Palo Alto resident since 1984 Cell 650 740 5909

2
Baumb, Nelly
From: Mashhood Rassam <[email protected]>Sent: Monday, January 11, 2021 7:47 PMTo: Council, CitySubject: Foothills Park
CAUTION: This email originated from outside of the organization. Be cautious of opening attachments and clicking on links.
Dear City Council. I am writing to you regarding Foothills Park. I have hiked the park's trails since 2009, including on Jan. 9 and 10, 2021. Since being opened to non‐Palo Alto residents the Park has been much busier than normal, with maybe 3, 4, or even 5 times more cars than I have normally seen. I don't think anyone can dispute that this surge of visitors to the park is having a negative environmental effect. Please take immediate action to reduce capacity at the Park. I realize this means that fewer people will be able to visit the Park (including perhaps me), but I think environmental considerations must be paramount. I would suggest the following two‐pronged approach: 1. Shutting Park gates between 10 am and 3 pm. This approach worked very well on Jan. 9, and I am disappointed that it was not implemented again on Jan. 10. Shutting the gates at 10 am reduced the number of visitors by noon and also reduced traffic on Page Mill, making that road safer for all. 2. Please charge a parking fee. This action may again reduce the number of visitors to the Park, and it will no doubt defray from the increased cost of maintaining the Park given all the new visitors. Best regards, Mashhood Rassam Palo Alto, CA

3
Baumb, Nelly
From: Kat Adams Shannon <[email protected]>Sent: Monday, January 11, 2021 3:44 PMTo: Council, CitySubject: Re: Consider reducing capacity at Foothills Park
CAUTION: This email originated from outside of the organization. Be cautious of opening attachments and clicking on links.
Hello, Per this recent article on Palo Alto Online regarding capacity of Foothills Park and other proposals, I would like to voice my support for reducing capacity from 750 to 500 and implementing fees/annual passes or a reservation system. I would also like to suggest for your consideration adding one weekend a month/every few months that lifts the fees (as many museums do) so those who are deterred by the fee can also go at these specific times, but I would suggest a reservation system or some other mechanism to allow this to happen smoothly. This "open" day should of course be implemented with the reduced capacity in place. I also think it would be critical to implement online real time estimates of the park visitation numbers, so folks can see when it is near capacity. I will not be going back to Foothills Park, a place I dearly want others to experience as the peaceful nature preserve it has been for so many years, for a few months at least because I do not want to contribute to the congestion. I would feel much better about trying to go if I could see that my attendance wouldn't contribute to overcrowding (additional limits on capacity would certainly help with that). My sincere thanks for your careful consideration of these issues to ensure Foothills Park is not impacted too much by these changes in usage. Sincerely, Kat On Sun, Dec 20, 2020 at 6:10 PM Kat A <[email protected]> wrote: Hello, I hope this email finds you well. I recognize this weekend is a time of transition for Foothills Park. But I write asking the governing body that supports the park to reduce the capacity. I went today at 3pm or so and the ranger told me that they had just reached capacity (I guess this is currently 750) and would likely close the gate to newcomers. I drove a lap around the park but left with a strong feeling that I’d much rather be denied entry than see it so crowded. Perhaps you could get data about what the typical use numbers were before (I’m sure it wasn’t remotely close to 750‐1000 at any given time for the vast majority of days) and set up capacity rules with that overarching ballpark in mind to preserve the park. I think the low (realized) capacity is what has made it an incredible nature preserve. I understand the number of folks visiting will go up quite a bit, but hopefully this can be flexibly monitored by the rangers, etc. with the goal of maintaining the health of the park as closely as possible as it has been. Also, new signage is needed to make sure folks don’t walk on the roads as it is quite unsafe. Families were getting stuck

4
trying to pass a line of cars on the vary narrow, winding road. Best wishes, Kat

5
Baumb, Nelly
From: Brenda Jamrus <[email protected]>Sent: Sunday, January 10, 2021 10:02 AMTo: Council, CitySubject: Foothills Park Parking Suggestion
CAUTION: This email originated from outside of the organization. Be cautious of opening attachments and clicking on links. ________________________________ Dear Members of the Palo Alto City Council, I am writing regarding the recently expanded access to Foothills Park, and the challenges that has brought to the park itself, the park staff, community and visitors. I am not a resident of Palo Alto. I am a native Californian and have resided in the Bay Area for nearly 60 years. Change isn’t always easy, especially when it involves the transformation of one’s existence. Foothills Park is a beautiful place with hiking trails, wildlife and nice views. For years the residents of Palo Alto have had the exclusive privilege of its enjoyment. I am sure the opening of the park to non residents feels intrusive to some, but as a non resident, responsible adult who truly values and appreciates the opportunity to now visit the park I hope that soon guidelines are put in place that make everyone who visits feel welcomed, and that allow for a good experience to be had by all. When I recently visited the park there were many people and the park was near capacity. I am fortunate to be able to return during the week and so do not have to restrict my visits to weekends and holidays. That said, I visited the park on a busy Saturday and I was still able to find a designated parking place within the park grounds. What I would like to suggest is that the occupancy of the park be limited to the number of designated parking spots within the park grounds. Since it seemed there was designated parking in several areas this seems reasonable. If I am mistaken then perhaps some additional parking could be added. To help facilitate bicycle safety do not permit parking along the road inside the park boundaries, and count cars that enter and exit the park. Nearby streets outside the park boundaries where overflow parking was occurring could be designated and clearly marked as no parking areas, and these designations would need to be enforced. I would also note that since this is very early on in the process of offering expanded access, it’s likely things will settle down a bit. I hope the park will remain open without admission fees. I pay for a Santa Clara County Park’s annual parking pass, because even as a resident of Santa Clara County parking access to the county parks is not free. I also pay for a California State Park’s annual parking pass, because even as a resident of California parking access to the State Parks is not free. Both of these passes permit me paid access to a number of parks, and those parks are part of a much larger system. Best regards, Brenda Jamrus

1
Baumb, Nelly
From: Lik Roper <[email protected]>Sent: Tuesday, January 12, 2021 2:15 PMTo: Stretch Brian (USACAN); [email protected]; [email protected];
[email protected]; [email protected]; [email protected]; [email protected]; [email protected]; [email protected]; [email protected]; [email protected]; [email protected]; [email protected]; [email protected]; [email protected]; [email protected]; [email protected]; [email protected]; [email protected]; [email protected]; [email protected]; [email protected]; [email protected]; Human Relations Commission; [email protected]; [email protected]; [email protected]; [email protected]; [email protected]; [email protected]; [email protected]; [email protected]; [email protected]; [email protected]; [email protected]; [email protected]; [email protected]; [email protected]; [email protected]; [email protected]; [email protected]; [email protected]; [email protected]; [email protected]; [email protected]; [email protected]; [email protected]; [email protected]; [email protected]; [email protected]; [email protected]; [email protected]; [email protected]; [email protected]; Council, City; [email protected]; [email protected]; [email protected]; [email protected]; [email protected]; [email protected]; [email protected]; [email protected]; [email protected]; [email protected]; [email protected]; [email protected]; [email protected]; [email protected]; [email protected]; [email protected]; [email protected]; [email protected]; [email protected]; [email protected]; Be Judged; Jeremy Schmidt; [email protected]; [email protected]; [email protected]; [email protected]; [email protected]; [email protected]; [email protected]; [email protected]; [email protected]; [email protected]; [email protected]; [email protected]; [email protected]
Subject: Re: KNOW JUSTICE ~ KNOW PEACE #14
CAUTION: This email originated from outside of the organization. Be cautious of opening attachments and clicking on links.
BTW: If anyone should be held accountable for incitement of insurrection; perhaps it should be John Lydon working conspiratorially with the Sex Pistols... On Tuesday, January 12, 2021, 1:30:43 PM PST, Lik Roper <[email protected]> wrote: Whether it is real or not it tells the truth in a roundabout way...And remember that my dad and I have been frustrated with SJ Mercury content being biased and full of outright lies for awhile now; what's the difference? On Tuesday, January 12, 2021, 1:28:06 PM PST, Lik Roper <[email protected]> wrote: Here's Nancy Pelosi's letter to Tom Wheeler:

2
On Monday, January 11, 2021, 3:30:04 PM PST, Lik Roper <[email protected]> wrote: MESSAGE JUST SENT TO THE DOJ: "Between the democrats starting a race war last summer with violence and riots ensuing thereafter; starting an insurrection long before democrats were willing to use that term...Then trying to blame Mister Trump for the ball democrats started rolling long before last week...Then going after Trump regarding Russia when China loomed over the horizon waiting to destroy our culture -- when Hunter Biden was guilty...Years after the Obiden administration allowed $3.7 million US tax dollars to be given to China to create Covid back in 2012 before backing out...I'm done...I'm almost 60 years old now and I was always the smartest guy at the top of my class until dropping out to play drums in high school; and I obviously remain one of the smartest guys in the room to this day even without further education...So you may be able to fool many other dumb fools; but you can't fool this fool; and I've had just about enough of this liberal Tom Foolery for one lifetime...No matter how clever and intelligent think they are; I know better and have know better for a long long time..." On Monday, January 11, 2021, 1:14:30 PM PST, Lik Roper <[email protected]> wrote: From Facebook just now: "As far as I am concerned democrats have already blown it right out of the gates with the massive censorship/purge on Twitter that occurred last week...Not only are there major antitrust issues involving the subjugation of Parler by tech giants; but also obvious class-action First Amendment issues as well since the ACLU is now involved...And the statute of limitations for these new violations caused by emboldened democrats who just shot themselves in the foot again by telling people they disagree with to shut the fuck up is more than 4 years at the federal level as well...Therefore; since yet another illegal lawless enterprise has now been created with the latest highly questionable actions against Parler; the antitrust case against tech companies just expanded outward exponentially in a completely actionable fashion...Bottom line: Microsoft had a grip on power in the 1990s and it took moving mountains to come up with a competitive product from a corporation that could outsell it; and Apple was that corporation...So the way I see it is Parler is next in line for being the next big social media site; helped along by democrats...But big tech companies with monopolies on power and influence are trying desperately much like Microsoft did back in the 1990s to stem the exodus from their relatively restrictive social media sites...It's like Van Halen going on their first big tour and Richie Blackmore being jealous of Eddie Van Halen's abilities and turning his back on him when he offered to shake hands with Richie; when Van Halen went on to be as big or bigger than Deep Purple in the end..." On Monday, January 11, 2021, 8:02:24 AM PST, Lik Roper <[email protected]> wrote: "...this will backfire like banning alice cooper in the 70s trust me...that old "banning is good" law doesn't apply to many but it still does to trump...for instance; i recently migrated my account...it's a common thing...there are servers all over the world they just need to find a new home...all this will do is increase parler popularity as that old law applies to them too...this will affect amazon as well...they have many users...it's all connected to wearing masks i think believe it or not...when silence = violence for many desperate and left with no other choices...but maybe that's what 'they' want...other than that; antitrust laws are being broken here regardless or manufactured consent and there are statutes of limitations and these companies are under investigation right now whether there is a change of power or not...even if we are the main investigators as the watchful and financially reactive public...the media has already been impeached in the powerful high court of public opinion; with me acting as head justice of that high court of public opinion...i'm really high up right now...like a joint chief of staff..."

3
On Monday, January 11, 2021, 7:58:26 AM PST, Lik Roper <[email protected]> wrote: From Facebook today: "I'm an old fucker who has been watching this liberal democrat shit show for many years now...And since the beginning of the rise of decentralization of power with the world wide web; the democrats have liked to feel like they are the gatekeepers of truth...Back in the 1990s when children suddenly lost their civil rights and got night time curfews for gang violence they had absolutely zero connection to; Hillary Clinton was saying "What about the children!?"...Then when the democrats returned again it was Obama abridging speech based upon race...And there was always some incident and/or incidents the media used to generate consent for that speech abridgement...While Obama followers were often shit talking racists themselves; hate crime laws were and still are rarely applied to minorities by liberals in general...When whites are in fact minorities in many regions...Then part two of the Obiden shit show is now returning with night time curfews for adults now; and even more heavily-manufactured consent for speech abridgement once again; this time based upon boots on the ground liberal democratic operatives Antifa stirring the pot at the US Capitol last week causing pre-planned chaos and unrest to make the opposition look bad and allow Soros' media to have a fake news field day...I swear to God it's the same old shit show ramped up a notch or two with greater consequences than ever; but like I said it's better than NFL football right now and I know in my heart that truth always wins out in the end and that justice will prevail whether it is speedy or not regarding the real truth behind election results and many other pressing issues..." On Sunday, January 10, 2021, 7:49:26 PM PST, Lik Roper <[email protected]> wrote: "Big things are going down my friend...Since the media refuses to cover any of the things that have happened today, I’m happy to oblige. The FBI is raiding legislative offices and homes in Tennessee as we speak. Stay tuned for that. Google is censoring you from seeing what everyone is talking about on the other side of the world. An affidavit was handed to Congress at 1:12pm Wednesday (just before the breach) that proved our election WAS rigged. If you use DuckDuckGo and search for yourself, it is plastered all over the world. Billions of our tax dollars was sent to Italy to hack dominion and change Trump votes to Biden. ITALY rigged our election. They ADMITTED AND TESTIFIED. Check for yourself #italydidit One hour ago, Lindsey Graham was escorted out of an airport because patriots in the airport were chanting “traitor” at him. Poor Lindsey Lin Wood exposed extremely sensitive information on his Parler yesterday. Some examples include “a treasure trove” of video files that are most likely what got Isaac Kappy killed. He tried exposing everyone with these files, he then was found dead. Also, emails between Pence and Paul discussing Pence’s plot to take over as president. And James Bulger & Hunter Biden making deals with CCP company...a case for the FBI for sure lol But feel free to check those out on Parler. There is video evidence that Trump supporters were trying to stop ANTIFA from breaking into the capital. ANTIFA was trying to smash an emergency door and a patriot stepped in to stop it. There is also video evidence that police were in on the breach. They opened the gates and stepped aside to let “protestors” in. Witnesses all have matching stories of what happened but the media will not share it. A few witnesses heard antifa’s plan to “shake things up”. It was ANTIFA who stormed the capital, they were not Trump supporters. You can find this on Parler or in Facebook groups like ThePatriotParty. It’s all there on video that Facebook and YouTube keep trying to remove. Parler won’t delete them tho, try there. During the breach at the US capital building, 11 laptops were stolen. One of them was Nancy Pelosi’s. Safe to assume that the military and/or Trump has those laptops. Could explain why she’s trying so hard to invoke the 25th amendment and have Trump removed from office. She’s frantic. As soon as the lockdown was over and they realized the laptops were stolen, numerous members of the administration resigned. More continue to resign. With 12 days left, why wouldn’t they wait? That’s curious. Roughly 6000 troops were just deployed to DC. They are there as we speak, for the next 28
4
days or so. Also curious. None of this is speculation. This is all out there for you to check yourself. Proof. Evidence. But most people are lazy and won’t. The media knows that and takes advantage by covering whatever fits their agenda. MSM is biased and corrupt and fake. They aren’t telling us the truth. Google and social media are censoring what you can see. So it’s easy to believe what they want because they’re controlling what you see. With a little digging, it’s not hard to find the truth. The real truth. Use DuckDuckGo, oann news, RSBN, Parler, etc..." -- Anonymous On Saturday, January 9, 2021, 6:13:59 PM PST, Lik Roper <[email protected]> wrote: I'm an unstoppable force of nature... KNOW JUSTICE ~ KNOW PEACE # 14
KNOW JUSTICE ~ KNOW PEACE # 14 Staying on point: "FOLLOW THE MONEY! The Wuhan Lab has been demolished? The Chinese biological laboratory in Wuh...
On Saturday, January 9, 2021, 4:57:00 PM PST, Lik Roper <[email protected]> wrote: Umm one last thing...let's see...70 year old Biden is now saying Trump is unfit for office while my 94 year old Dad ihas been saying the exact same thing about Biden...But he did also say that people need to pray for Biden to have good health to avoid Kamala possibly becoming president...Remember that everything is relative and that everyone has an opinion just like everyone has a toilet or a refrigerator... On Saturday, January 9, 2021, 4:42:44 PM PST, Lik Roper <[email protected]> wrote: FOR INSTANCE; here's yet another essentially illegal, racist, divisive and just plain STUPID democratic party idea that not only goes against the will of the voters and common sense in general; but mainly aims to discriminate against high performing employees who truly deserve promotion over someone promoted for their gender or race...
Race, gender would factor in promotions for California state workers under proposed law

5
Race, gender would factor in promotions for California state workers und... Allegations of racism at state departments led to a proposal to change hiring and promotions, lawmaker says.
On Saturday, January 9, 2021, 4:18:08 PM PST, Lik Roper <[email protected]> wrote: You couldn't shut me up if you tried and I promise to not only outlive all of you artistically; but to also keep disrupting and dismantling the corporate/government monopoly I live underneath here in mono culturally dead Silicon Valley...Republicans allow democrats and/or liberals to say whatever they damn well please while democrats in control generally want to subjugate minds with forced silence and division and/or selective calculated social hatred...And the CEOs who do business with evil foreign dictators who set a lower bar of expectation end up in turn influencing CEO conduct ~ along with like-minded censoring democrats (What about the children? What if someone is offended? Who cares if you are offended? Fuck you! etc etc etc -- typical democratic shit -- what a fucking joke liberals are...) censoring the opposition with the same basic emotion that used to cause people to kill others for merely saying what they considered to be wrong...They used to be killed; now they are blocked on social media etc...And this is why I left the POS democratic political party long ago... Modern democrats are more often than not arrogant ideological elitists; delusional; violent; speech censoring; sexually emasculating; financially unrestrained; gun grabbing; globalist as opposed to decidedly American; half-truth telling; shifty; lying ass; 'classist' racist and/or 'genderist'; militarily de-funding (therefore a threat to national security); and a Covid-19 threat to international security as well by allowing the CCP to turn America into the socialist state that it has become and/or allowing Biden to be in financial cahoots with Chinese interests etc etc etc... On Saturday, January 9, 2021, 3:57:50 PM PST, Lik Roper <[email protected]> wrote:
Other than all of that...
It's good that I had an outlet to write about the events of the tumultuous last 20 years of my life...After being so radicalized by police misconduct; misfeasance and overarching multifarious class/race/gender-based discrimination and multi-feasance with unrestrained RPF/BLM/ANTIFA violence etc etc etc...I can almost guarantee that if I did not have the safe outlet of this kind of legal Fisrt Amendment-protected government sanctioned free expression and/or federally protected online website/blogger journalism I would have likely perhaps resorted to some other very rash measures that could have been worse than any uncomfortable thought I might have conveyed through writing...As silence leads to violence...And remember that Mark Twain made some people uncomfortable too...Along with the fired Google engineer who was not totally correct all the time but made some great points regarding Darwin and random DNA distribution...It comes with the territory and it's old as the hills as people have a general tendency to want to kill the messenger...That is precisely why my next album will be the most controversial and hard-hitting protest recording in the history of inhumankind...There is nothing the techie geeks running local corporations can do about that...As art and music is the greatest form of balance and revenge that never dies even after the demise of the artist... On Saturday, January 9, 2021, 3:10:59 PM PST, Lik Roper <[email protected]> wrote:

6
Note: We are all judges in the court of public opinion; therefore this particular segment of the judiciary strongly believes the unrelenting hostilities of the last 6 months show a clear pattern and practice not only of unrestrained covert sedition through "smart justice" and/or allowed public violence and unrest threatening public safety and order -- but also of deep politically motivated cognitively dissonant denial regarding this axiomatic truth...The verdict is in; and the guilty are in a 'deep state' of denial...pardon the pun... On Saturday, January 9, 2021, 1:05:32 PM PST, Lik Roper <[email protected]> wrote: Remember: The Great Roper once wrote: One who is controls ~ controls oneself..." And this applies directly over to the current situation as his wisdom is far-reaching and endless; spanning all generations and all time periods...So stop blaming others for your own actions democrats; your actions are your own and you all need to own up to this FACT... On Saturday, January 9, 2021, 1:00:49 PM PST, Lik Roper <[email protected]> wrote: Ok this last message was called spam so I changed accounts and will add a huge email list provided by a friend that includes the Queen of England to get my message out even further...Demorats are back! The selfish silencing games have begun! Incitement of violence didn't matter 6 months ago with BLM/Antifa but now it does! When silencing people is what really incites violence more than anything else and I think democrats know this! Making me SO FUCKING GLAD Mister Trump held back you Free Speech Nazi motherfuckers for 4 years!
Best of the last thread will go to blog! Stay tuned! Hahahaha...
"For instance; I was the one who told Trump to start his own web site on Twitter right before he got illegally ejected (lawsuit pending no doubt) as he has been listening to me for awhile...And Twitter banned him right after that...HOW POWERFUL AM ?!?! :D I figured out Trump was paying attention right after I posted a used LA Guns CD called "cocked and loaded" haha...Trump totally cracks me up...I roadied for Jetboy playing a show with LA Guns once and they are still good friends of the band...Thanks for not taxing my poor ass Mister Trump! You saved my life! Slave driving demorats would have turned the screw and kept on allowing me to be tortured!..."

Mt T «I Whcdn Ill! S\\' ~lh lht • .HI\ l'Ml:&no.l. llR 97J(H
n..., Mr \ \ 'httkr
I hJ•'t o«n l""'""'I""'"" 101ht riot~ In )\>Urtky Jnd I""'
"'1111111 , ..... In .Clo.It ,,,,ht""""" ~•h< l'by i,...i..
f ,.,...JJ It~• M ''""" t11I• "nfl )'111 '"'"
I Ocnytb<tt1u rn-N. ..... (rr-v.•U "'A"'" 1hi•l
l lldcr 10.-<rl'tlWlil"' pa<dul .uidcala. err-"Ill heir hm: "'""l I Whm .U hdl hml• ""-."'..,amen .-I """' 1-"'1'1"'" lar .&ll)Ndy hmJ.lnilthr "'" . (""6 .. 111 flD'lC ,, .... 1«1tw.. )>'II v.\11 bu ""' hno. tt\bl me l ~ \\'bm ,, ... - Mi«wtrl<tttiltl)' ard<r1\LA\IE lllU\ll'r
(I onnte "'"' rmph.tu:r ... ,,,, ...... "'°"""''"Cl) Um<"'" ...... u...J It .tnd~1hc ln-lu.u,,ldmtlhcy\\1ll Mlf!l'M .....d C..1chttk1111 cl.tun"< nl.l~tft THI~ IS l'Ol ITlCAI C:OI 00!1 ) C"'nn ldC\hh,..anJCrocktnn TilUMPand n:lu.c•ll)'•"lu•n«'
W<C'.ANN<ll 11hc 1 RUM11 ••1 •1<1ory l:>tfort th.: tb-tkMI

1
Baumb, Nelly
From: Keith Ferrell <[email protected]>Sent: Wednesday, January 13, 2021 11:14 AMTo: Hur, Mark; Police; Perron, Zachary; Planning Enforcement; City Mgr; Eggleston, Brad; Council, CityCc: Baird, Nathan; [email protected]: Re: El Camino RV's
All, Yesterday I saw both Community Officers and the PAPD on El Camino talking with RV owners. It is a good first step, but also one that needs to be done on a regular basis in order to ensure that the laws are being enforced. This morning, however, when I drove along El Camino I saw many RV's still parked on the sidewalk hampering access to the sidewalk, as well as a variety of items being stored on the sidewalk. According to Palo Alto City Code Ordinance 9.48.020 Unlawful acts - Exceptions. (a) No person shall place or cause to be placed anywhere upon any street or sidewalk, and no person owning, occupying or having control of any premises, shall suffer to remain in front thereof upon the sidewalk of the street next to such premises, anything which shall restrict the public use thereof. Please note that in order for a sidewalk to be ADA compliant, there needs to be 36 inches of "clear width". (ADA 403.5.1 Clear Width) If, for some reason, you are unwilling to enforce local parking laws and enforce city codes, you are required to abide by federal ADA regulations. I will contact the Santa Clara County ADA office today in order to inform them of the ongoing violations. Finally, one week ago, I sent photos of the RV's parked between Churchill and Park/Serra. Today, three of those RV's are still there despite violating the 72-hour parking ordinance. The community service officer was talking with the owner of two of the RV's yesterday morning. The other RV is the one parked on the sidewalk (CA license 5KDB841). Note that the pair of RV's to the north have now installed a "Slow Children At Play" statue in the slow lane of El Camino.
I expect that the city will be actively addressing these situations going forward. Keith On Wed, Jan 6, 2021 at 11:47 AM Keith Ferrell <[email protected]> wrote:

2
Today, I tried to walk down El Camino from Churchill to Serra. I have attached photos of what I encountered. There are, as you can see, many issues. RV's parked on the sidewalk, trash and other "non‐vehicles" in the street and items blocking passage on the sidewalk. In order to get to Serra, I had to walk in the traffic lane on El Camino as the sidewalk was completely blocked. I called PAPD to report both the illegally parked vehicles and the sidewalk, however, they moved me on to Code Enforcement despite the fact that illegally parked cars is, I believe, under their umbrella of responsibility. But, as has been the case for many years, no one seems to want to claim responsibility for this area. I did see a few Stanford contractors out cleaning up some of the debris. Why hasn't Palo Alto sent a clean‐up crew out there to deal with the conditions that they are allowing to occur? This is what you have allowed the city to become. Ed Shikada, this is Palo Alto under your management. This is the road that the city wants to turn into a "Grand Boulevard" to rival the great streets of Europe. Does it really take residents to complain about something like this in order for city staff to act? Where is the leadership? As the saying goes, " A fish rots from the head down." Why isn't Ed Shikada doing anything to care for the city that he's being paid to manage? Keith
On Tue, Jan 5, 2021 at 5:47 PM Keith Ferrell <[email protected]> wrote: FYI, Two posts I just saw on Nextdoor in response to a women who was screamed at by a homeless man downtown: Rachel Mortimore • Downtown North Did you file a report to keep on police radar? Someone living in the RVs tried to pull a young woman from a bike a few weeks ago. Reports lead to awareness and… See more 2 hr ago Thank Reply
To help protect you r privacy, Micro so ft Office prevented au tomatic download of this pictu re from the Internet.
1

3
To help protect you r priv acy, Microsoft Office prevented automatic download of this picture from the Internet.August Mozart
August Mozart • Crescent Park I just drove down `El Camino and it's getting worse...old bikes, litter, people camping on the road ....police just sitting there. I'll retype that last part. POLICE JUST SITTING THERE. That's unacceptable. Keith
On Tue, Jan 5, 2021 at 1:19 PM Keith Ferrell <[email protected]> wrote: Mark, Thanks for the response. A few follow up questions. Anyone on this email is free to respond: 1) You stated that the city paused "most of our timed and permit restrictions throughout the City until further notice." Which areas were not paused? 2) I contacted Caltrans and they told me that they could sweep the roadways in order to clean it. My question to you then is how can they clean the roadway if the city allows the vehicles to remain parked for weeks and months at a time? Given the city's lack of oversight, it is allowing the garbage to pile up and the unsanitary conditions to continue. The state can't do its job until the city does theirs. 3) Lydia Kou and Tom DuBois brought up safe parking options to city council in June of 2019. The RV issue has been around for 8‐10 years, at a minimum. What work exactly is staff doing to expedite this issues. Other cities, including neighboring Mountain View and East Palo Alto have already soared past City of Palo Alto staff in finding solutions, even if they are not 100% ideal. Most any option would be better than what the RV owners and community are currently experiencing. 4) Why do residents have to inform PAPD of an issue that both the city and the police know are issues on a case by case basis? Why isn't the city and PAPD actively addressing the situation? 5) Caltrans has also told me that the City of Palo Alto is in charge of the conditions of the sidewalks. Why are these not being cleared so pedestrians can safely walk down the streets of Palo Alto? Again, the residents should not need to inform the city of every issue they see, especially when the city and the police are well aware that the conditions exist. At some point we, as community members, expect our government to take care of both the citizens within the city as well as the conditions that exist within that city. I'm sure many city employees have seen the conditions on El Camino, are aware that something needs to be done, and then proceed along and look the other way. It's time to send people out and take care of the situation, both as a social service venture and an environmental cleanup. I look forward to your response. Keith On Tue, Jan 5, 2021 at 6:22 AM Hur, Mark <[email protected]> wrote:

4
Mr. Ferrell,
Thank you for bringing this to our attention. Your feedback is crucial in helping staff address immediate concerns in our community.
Due to the ongoing and new stay‐at‐home orders, we have paused most of our timed and permit restrictions throughout the City until further notice. Please note that enforcement continues for concerns that present an immediate hazard. Restrictions for red curbs, spaces designated for persons with disabilities, and any other locations prohibited by law are always in effect.
City Staff is working closely with the City Council to establish safe parking solutions and avenues to reduce the number of oversized vehicles city‐wide. Currently, we do not have the policies in place to remove these types of vehicles as they are parking on public and state‐owned roadways.
There is a city‐wide ordinance that requires all vehicles to move within 72 hours; where PD is responding on a case by case basis. If you notice a vehicle parking for an extended period or present a public safety concern, please contact the Palo Alto Police Department.
Mark Hur
Operations Lead
Office of Transportation
(650) 329‐2453 | [email protected]
www.cityofpaloalto.org/gov/depts/trn/parking
www.cityofpaloalto.org
Please think of the environment before printing this email
Use Palo Alto 311 to report items you’d like the City to fix!! Download the app or click here to make a service request.

5
From: Keith Ferrell <[email protected]> Sent: Monday, January 4, 2021 10:31 AM To: Hur, Mark <[email protected]>; Baird, Nathan <[email protected]> Subject: El Camino RV's
CAUTION: This email originated from outside of the organization. Be cautious of opening attachments and clicking on links.
Mark and Nathan,
Are parking regulations being enforced on El Camino Real in Palo Alto? The is a continuing issues. It seems that nothing happens until people complain about the issue. The RV's parked along El Camino have become essentially a health hazard.
However, taking that out of the equation, we expect our city government to enforce the laws that have been adopted by the elected officials. This would include active enforcement of parking regulations. The cars and RV's on El Camino park there for weeks/months at a time without any enforcement. At some point, they will be able to claim that they can't be moved because they've been "allowed" to stay for such an extended period.
In addition, the area between Churchill and Park/Serra is part of the Southgate RPP and is a 2‐hour parking zone. There has been no enforcement of this area and due to that, cars and RV's are now entrenched there, as well.
What does the city plan to do? I'm happy to show you pictures of the garbage and waste that litters the streets and blocks the sidewalks. I assume that you are well aware of the situation, but choose to look the other way. We expect the city staff to do what they are being paid to do and that includes enforcing parking regulations.
Thanks Keith

6
Baumb, Nelly
From: Arlene Goetze <[email protected]>Sent: Wednesday, January 13, 2021 11:10 AMTo: The Office of Mayor Sam Liccardo; Sara CodySubject: Shots Don't Stop Transmission
CAUTION: This email originated from outside of the organization. Be cautious of opening attachments and clicking on links.
Be Informed -- before or after you vaccinate: (See last paragraph on may be 50 x worse than flu shot
In Rush to Create Magic-Bullet COVID Vaccines, Have We Made Matters Worse? Study that found vaccines that don’t prevent viral transmission may accelerate evolution of more virulent strains could mean leading vaccine candidates may make COVID crisis worse. IN BRIEF: * These vaccinated hosts, while infected, shed and spread virus, causing further transmission of the disease. * Neither of the current COVID-19 vaccines in distribution (Pfizer and Moderna) has been shown to 'prevent transmission.' * More infectious forms of COVID-19, may prolong pandemic, rather than stop it * Without vaccination, most virulent strains die out; it's how natural selection works. * Rather than pathogenic subtypes dying naturally, their survival spreads and vaccination is worse than useless. ByBrian Hooker, Ph.D, P.E. (from childrenshealthdefense.org, The Defender Natural selection is the phenomenon where only the fittest individuals in an nvironment will survive. “Individuals” in this context can refer to any type of organism — from humans to bacteria and viruses — but the context here is the survival of viruses. When a virus infects a population of humans, only those viruses that have a living human host will survive. If a virus is so pathogenic that it kills the human it infected, it dies too.Therefore, mortality of the host kills the most severe forms of any virus over time. Infection rates may go up, but mortality goes down. In a 2015 study published in PLOS Biology, researchers hypothesized that vaccination can subvert this process by allowing more virulent (i.e., more pathogenic and potentially deadly) strains of viruses to live in vaccinated hosts for prolonged time periods without killing the hosts. These vaccinated hosts, while infected, shed and spread virus, causing further transmission of the disease. The researchers demonstrated this hypothesis with experiments on chickens vaccinated for a disease called Marek’s Disease, a viral pathogen known to

7
decimate poultry facilities. Vaccinated chickens infected with more virulent strains of Marek’s Disease virus became infected and carried the infection over longer time periods. They also became “super spreaders” of the virus and transmitted the virus to unvaccinated chickens co-housed with those that received the vaccine. Because of the higher virulence of the Marek’s Disease that was spread by the vaccinated chickens, the unvaccinated chickens usually died soon after infection. However, the partial immunity afforded to the vaccinated chickens prolonged their survival and extended the period in which they were infectious and could continue to spread the disease. Without vaccination, these more virulent strains of Marek’s Disease would die off with their host and would no longer circulate the virus in the population. Instead, vaccinated chickens became the perfect host to harbor the virus, allowing it to multiply and spread. This begs the question regarding the use of vaccines that do not prevent virus transmission or are not known to prevent virus transmission. Neither of the current COVID-19 vaccines in distribution (Pfizer and Moderna) has been shown to prevent transmission. In fact, this type of testing was not done in their rushed “warp speed” clinical studies. Instead, both vaccines were tested for their ability to prevent more severe ymptoms. In both instances, some vaccinated patients were still infected. Without prevention of transmission, these individuals spread the virus that was intended to be eradicated. As the authors of the 2015 research state in their summary: “When vaccines prevent transmission, as is the case for nearly all vaccines used in humans, this type of evolution towards increased virulence is blocked. But when vaccines leak, allowing at least some pathogen transmission, they could create the ecological conditions that would allow hot strains to emerge and persist.” With the emergence of more infectious forms of COVID-19 circulating in Europe, it seems we may have created the perfect storm to prolong the pandemic, rather than curtail it — because the vaccines were developed and tested based on the original form of circulating COVID-19, not the new strains. In our rush to create magic-bullet vaccines, have we instead created a scenario to cause more pain and suffering? Let’s play this out. Many mutants of COVID-19 are circulating in the population today. We hear the news regarding new strains every day. Without vaccination, the most virulent strains die out — this is just how natural selection works. However, now comes a vaccinated army of human hosts, primed and ready to fight off the original version of COVID-19 but not the more virulent strains. Will they survive these new types of virus — yes, probably? However, in the process, they experience prolonged infections where they shed the more virulent strain to other human hosts. Rather than allowing these pathogenic subtypes of COVID-19 to die naturally, we enhance their survival and spread and vaccination becomes worse than

8
useless. The views and opinions expressed in this article are those of the authors and do not necessarily reflect the views of Children's Health Defense. SUGGEST A CORRECTION Sign up for free news and updates from Robert F. Kennedy, Jr. and the Children’s Health Defense. CHD is implementing many strategies, including legal, in an effort to defend the health of our children and obtain justice for those already injured. Your support is essential to CHD’s successful mission. -----------------
COVID Vaccine Adverse Reactions Are 50 Times Higher Than the Flu Shot * January 06, 2021 Reports of serious adverse reactions to the new COVID-19 vaccines are coming in — and some include deaths. In fact, early reports from the CDC’s Vaccine Adverse Event Reporting System (VAERS) indicate that these reactions may be as much as 50 times higher than those for flu shots. In a series of tweets, Alex Berenson, former New York Times reporter and author of numerous books, calls attention to VAERS data showing that COVID vaccine reports are steadily coming in at rates much higher than those the CDC is acknowledging. Even so, U.S. and British health authorities continue to insist the shots are “100% safe.” To show how safe they are, officials are busy shutting down anyone who dares to ask questions about it. “Everyone claiming otherwise is not only wrongheaded, but acting in a deliberately malicious manner,” is the message officials are sending to anyone expressing doubts about the vaccine’s safety, ZeroHedge said. VAERS. Vaccine Averse Event Report System (governmental gorup) has paid $4 billion in 10 yrs time to adults badly damaged by the flu shot. SOURCE: ZeroHedge January 5, 2021 Previous Article Professor Predicts: People Will Die After COVID-19 Vaccine Next Article The Deception of PCR Tests Artificially Inflates COVID-19 Numbers FORWARDED BY Arlene at No Toxins for Children-- or Adults

9
Baumb, Nelly
From: Jennifer Landesmann <[email protected]>Sent: Wednesday, January 13, 2021 10:47 AMTo: [email protected]: [email protected]; [email protected]; Council, City; Shikada, Ed; Stump,
Molly; [email protected]; [email protected]; [email protected]: Long awaited Neighborhoods study is finally out
CAUTION: This email originated from outside of the organization. Be cautious of opening attachments and clicking on links.
Dear SCSC Roundtable, In my public comment at the SCSC recent NEPA 101 meeting, I highlighted that FAA's NEPA thresholds of significance were in question and under challenge awaiting the results of FAA's Neighborhoods Study. You may also recall the time I brought in a Monopoly board to express how unrealistic the estimates were for communities farther from the airport which you represent. We don't need to wait anymore, see today's Federal Register about the NES here: https://www.govinfo.gov/content/pkg/FR‐2021‐01‐13/pdf/2021‐00564.pdf I would like to note that thanks to Representative Anna Eshoo, the Select Committee on South Bay Arrivals and the extraordinary efforts by Midpen cities ‐ from the day the FAA came to meet us in Palo Alto City Chambers in July 2015 committing to "research to make changes to understand where that (gap) is" in their noise standards, the study has been under way. It has taken too long to release this but now we must all work together to follow up. Please take a look at the implications for SCSC communities very closely. and when you respond I urge you to also please respond to FAA's generalizations about social media or that people suddenly like the outdoors more. You must please respond with our experience with what it means to brutally transform a previously quiet area to an airport runway. I also ask that you please solicit input from all cities and interested parties before you formulate a final response. Thank you Jennifer

10

11
Baumb, Nelly
From: Aram James <[email protected]>Sent: Wednesday, January 13, 2021 10:35 AMTo: Constantino, MaryCc: Minor, Beth; Van Der Zwaag, Minka; Human Relations Commission; Council, City; Rebecca EisenbergSubject: Re: HRC Meeting on Thursday, January 14, 2021
CAUTION: This email originated from outside of the organization. Be cautious of opening attachments and clicking on links.
Hi Mary, Thanks for sending out the attached letter. I have printed it out to review for Thursday’s meeting. I have also printed out the agenda with includes the meeting ID and a phone number to call in. I attend a fair number of Zoom meeting, legal meeting, legal seminars, etc. I have zero problem accessing these meetings. With both city council meeting and HRC meetings my ability to be recognized, even when my hand is raised, has consistently been problematic. Mary, is there a phone number I can call on Thursday if I am unable to be recognized by zoom or the 1‐(669)900‐6833 ? Ok, thanks to you ( Mary), Beth, and Minka in working with me in an effort to allow me equal access to city meetings on a regular basis. If you have additional suggestions re how I can consistently be recognized at city meeting, please let me know. It has been a very frustrating experience for me( to obtain consistent zoom access to city meetings ) and I am sure the experience is equally frustrating to each of you. I hope we can work together to solve this ongoing problem. Thanks to each of for your efforts on my behalf. Sincerely, Aram James
Good Morning Aram, The attached document is the letter for Item #2. It was just uploaded to the agenda. Mary
<image001.jpg> Mary Constantino | Program Assistant II | Office of Human Services Cubberley Community Center | 4000 Middlefield Road, T2 | Palo Alto, CA 94303 D: 650.463.4906 | E: [email protected] Please think of the environment before printing this email – Thank you!

12
<01‐14‐21 HRC Agenda ‐ Letter for Item 2.pdf>

13
Baumb, Nelly
From: Martin J Sommer <[email protected]>Sent: Wednesday, January 13, 2021 9:59 AMTo: [email protected]: Board (@caltrain.com); Council, City; Pat BurtSubject: Re: University Ave Beige Pole Color
CAUTION: This email originated from outside of the organization. Be cautious of opening attachments and clicking on links.
Hi Brent, Thanks for talking this morning. Yes, please try to put a number on repainting the top half of one or more poles at the University Ave station. Once we have this number, I will reach out to the City Of Palo Alto, for potential funding sources. Best regards, Martin
On 12/22/20 7:49 PM, Martin J Sommer wrote:
+cc: Pat Bert Brent, please take a look at the attached photo. I don't think this is what the City, nor the design engineers, had in mind. Please tell me, how I can help correct this situation. Thank you, Martin
On 11/25/20 10:05 AM, [email protected] wrote:
Hi Brent,
Perhaps your new funding source obtained on Nov 3rd can help this situation. Can you please look into this, and let me know? The visual impacts you are creating, are not good.
Thank you,
Martin
-- Martin Sommer 650-346-5307 [email protected] http://www.linkedin.com/in/martinsommer

14
"Turn technical vision into reality."
On 2020‐11‐25 09:50, [email protected] wrote:
Hi Martin, Unfortunately, the project budget does not accommodate camouflaging of the poles. Caltrain worked with Cities and regulatory agencies to mitigate the impacts of the infrastructure through the Project's Environmental Impact Report in 2014. Thanks, Brent Tietjen, Government and Community Relations Officer SamTrans | Caltrain | TA 1250 San Carlos Ave. San Carlos, CA 94070-1306 [email protected] From: [email protected] [mailto:[email protected]] Sent: Friday, November 13, 2020 1:55 PM To: [email protected] Cc: Board (@caltrain.com) <[email protected]>; [email protected] Subject: Re: University Ave Beige Pole Color
Thanks Brent,
What about the idea of camouflaging the upper part of the poles, similar to what is done with cell towers? For some reason, these poles have been created with an extremely hard industrial look. This is nothing like, the esthetics put into other electrified rails systems throughout the world.
Martin
-- Martin Sommer 650-346-5307 [email protected] http://www.linkedin.com/in/martinsommer "Turn technical vision into reality."
On 2020-11-13 10:09, [email protected] wrote:

15
Hi Martin, Thank you again for contacting Caltrain on this question. As Jim previously mentioned, the selection of the pole color was done in coordination with the City of Palo Alto and the Historic Resources Board and Architectural Review Board in 2019. These color selections are final and poles cannot be replaced or painted a different color after installation. Thanks, Brent Tietjen, Government and Community Relations Officer SamTrans | Caltrain | TA 1250 San Carlos Ave. San Carlos, CA 94070-1306 [email protected] From: [email protected] [mailto:[email protected]] Sent: Friday, November 6, 2020 10:20 AM To: [email protected]; Board (@caltrain.com) <[email protected]> Cc: [email protected] Subject: Re: University Ave Beige Pole Color
Dear Caltrain Board,
The more beige poles that go up at University Ave station, the more unsightly it becomes. At ground level, you might think the beige color matches the station, but from the view of local buildings, you are completely destroying the view of our Santa Cruz Mountains, and local green vegetation on Stanford campus.
Can you please look into a way to fix this? Perhaps, painting any height above 10 feet, to be the standard forest green? Telecom poles can be camouflaged, the same applies here.
Please look in to it, and let me know some options.
Thank you,
Martin
-- Martin Sommer 650-346-5307 [email protected] http://www.linkedin.com/in/martinsommer "Turn technical vision into reality."
On 2020-09-30 12:05, [email protected] wrote:

16
Dear Martin, Thank you for contacting Caltrain Electrification. The selection of the beige color was done in coordination with the City of Palo Alto and is a common color for poles located near stations. Most poles are a neutral chrome color along the project area but in some cases, such as near stations, Caltrain staff worked with local cities to identify pole colors that aligned with certain station areas. Once the poles have been procured and placed, we are not able to change the colors of those poles. Thank you again for reaching out to us. Best, The Caltrain Team On 2020-09-25T10:17:50-07:00, Martin J Sommer <[email protected]> wrote: Good morning, Please see the attached picture, of a beige pole placed last night. This creates a real eye sore!! Questions: 1) Why are you using a beige color vs the std forest green (that blends with the trees), and 2) can these beige poles please be painted forest green, before electrification occurs? I know that this is a "big ask". Thank you, Martin -- Martin Sommer 650-346-5307 [email protected] <mailto:[email protected]>www.linkedin.com/in/martinsommer <http://www.linkedin.com/in/martinsommer> "Turn technical vision into reality."
-- Martin Sommer 650-346-5307 [email protected] www.linkedin.com/in/martinsommer

17
"Turn technical vision into reality."
-- Martin Sommer 650-346-5307 [email protected] www.linkedin.com/in/martinsommer "Turn technical vision into reality."
18
Baumb, Nelly
From: Keith Ferrell <[email protected]>Sent: Wednesday, January 13, 2021 9:30 AMTo: Hur, MarkCc: Baird, Nathan; Council, City; Police; Perron, Zachary; [email protected]; City MgrSubject: Re: El Camino RV's
Mark, I have yet to receive any responses to my questions. If you are not the proper person to address the questions, please let me know who at the city I can speak to in order to get my questions answered. Thanks Keith On Tue, Jan 5, 2021 at 1:19 PM Keith Ferrell <[email protected]> wrote: Mark, Thanks for the response. A few follow up questions. Anyone on this email is free to respond: 1) You stated that the city paused "most of our timed and permit restrictions throughout the City until further notice." Which areas were not paused? 2) I contacted Caltrans and they told me that they could sweep the roadways in order to clean it. My question to you then is how can they clean the roadway if the city allows the vehicles to remain parked for weeks and months at a time? Given the city's lack of oversight, it is allowing the garbage to pile up and the unsanitary conditions to continue. The state can't do its job until the city does theirs. 3) Lydia Kou and Tom DuBois brought up safe parking options to city council in June of 2019. The RV issue has been around for 8‐10 years, at a minimum. What work exactly is staff doing to expedite this issues. Other cities, including neighboring Mountain View and East Palo Alto have already soared past City of Palo Alto staff in finding solutions, even if they are not 100% ideal. Most any option would be better than what the RV owners and community are currently experiencing. 4) Why do residents have to inform PAPD of an issue that both the city and the police know are issues on a case by case basis? Why isn't the city and PAPD actively addressing the situation? 5) Caltrans has also told me that the City of Palo Alto is in charge of the conditions of the sidewalks. Why are these not being cleared so pedestrians can safely walk down the streets of Palo Alto? Again, the residents should not need to inform the city of every issue they see, especially when the city and the police are well aware that the conditions exist. At some point we, as community members, expect our government to take care of both the citizens within the city as well as the conditions that exist within that city. I'm sure many city employees have seen the conditions on El Camino, are aware that something needs to be done, and then proceed along and look the other way. It's time to send people out and take care of the situation, both as a social service venture and an environmental cleanup. I look forward to your response. Keith On Tue, Jan 5, 2021 at 6:22 AM Hur, Mark <[email protected]> wrote:
Mr. Ferrell,

19
Thank you for bringing this to our attention. Your feedback is crucial in helping staff address immediate concerns in our community.
Due to the ongoing and new stay‐at‐home orders, we have paused most of our timed and permit restrictions throughout the City until further notice. Please note that enforcement continues for concerns that present an immediate hazard. Restrictions for red curbs, spaces designated for persons with disabilities, and any other locations prohibited by law are always in effect.
City Staff is working closely with the City Council to establish safe parking solutions and avenues to reduce the number of oversized vehicles city‐wide. Currently, we do not have the policies in place to remove these types of vehicles as they are parking on public and state‐owned roadways.
There is a city‐wide ordinance that requires all vehicles to move within 72 hours; where PD is responding on a case by case basis. If you notice a vehicle parking for an extended period or present a public safety concern, please contact the Palo Alto Police Department.
Mark Hur
Operations Lead
Office of Transportation
(650) 329‐2453 | [email protected]
www.cityofpaloalto.org/gov/depts/trn/parking
www.cityofpaloalto.org
Please think of the environment before printing this email
Use Palo Alto 311 to report items you’d like the City to fix!! Download the app or click here to make a service request.
From: Keith Ferrell <[email protected]> Sent: Monday, January 4, 2021 10:31 AM

20
To: Hur, Mark <[email protected]>; Baird, Nathan <[email protected]> Subject: El Camino RV's
CAUTION: This email originated from outside of the organization. Be cautious of opening attachments and clicking on links.
Mark and Nathan,
Are parking regulations being enforced on El Camino Real in Palo Alto? The is a continuing issues. It seems that nothing happens until people complain about the issue. The RV's parked along El Camino have become essentially a health hazard.
However, taking that out of the equation, we expect our city government to enforce the laws that have been adopted by the elected officials. This would include active enforcement of parking regulations. The cars and RV's on El Camino park there for weeks/months at a time without any enforcement. At some point, they will be able to claim that they can't be moved because they've been "allowed" to stay for such an extended period.
In addition, the area between Churchill and Park/Serra is part of the Southgate RPP and is a 2‐hour parking zone. There has been no enforcement of this area and due to that, cars and RV's are now entrenched there, as well.
What does the city plan to do? I'm happy to show you pictures of the garbage and waste that litters the streets and blocks the sidewalks. I assume that you are well aware of the situation, but choose to look the other way. We expect the city staff to do what they are being paid to do and that includes enforcing parking regulations.
Thanks Keith

21
Baumb, Nelly
From: Michelle Long Held <[email protected]>Sent: Wednesday, January 13, 2021 8:43 AMTo: Council, CitySubject: Digital Needs Review
CAUTION: This email originated from outside of the organization. Be cautious of opening attachments and clicking on links.
Members of the City Council and Mayors Office for Palo Alto, Recently it looks like Palo Alto has left the San Mateo County CVB. Wanted to see if we could provide any technology support and connect with you on your upcoming digital needs for your next budget cycle. We create interactive maps for your existing website, mobile apps with push-messaging and we recently released our popular kiosk technology - great for the Visitor Centers, hotels, airports, festivals, etc. And can develop most anything you might be considering. Another great tool we design includes Augmented Reality, which is a great tool to help engage and entertain the visitor when they are in your area - maybe just let us show how that works on a quick demo. Who is the best person to contact to get a preliminary review to see if we can get a meeting with the hoteliers and the city council? Michelle
To help protect you r privacy, Micro so ft Office prevented au tomatic download of this pictu re from the Internet.
To help protect you r privacy, Micro so ft Office prevented au tomatic download of this pictu re from the Internet.
Michelle Long Held | Business Development P: 512.608.3399 | E: [email protected] Here is a link to our apps that are part of the trip planning solution and a link about our visitor kiosk option. https://visitwidget.com/clients/ https://visitwidget.com/interactive-kiosk/ We are currently working with over 120 destinations in 21 states, and this includes 4 statewide instances. Check out our website at www.visitwidget.com Also, 2 case studies we created in the past:
https://visitwidget.com/brenham-case-study/ https://visitwidget.com/travelok-case-study/
Here is a live client example: Widget: https://www.visitflorida.com/en-us.html (Click "Plan your visit" in bottom right) iOS: https://apps.apple.com/us/app/visit-florida/id1468501064 Android: https://play.google.com/store/apps/details?id=com.visitwidget.visitflorida (These applications can run in airplane mode; which is great for international visitors!)

22
To help protect you r privacy, Micro so ft Office prevented au tomatic download of this pictu re from the Internet.
To help protect you r privacy, Micro so ft Office prevented au tomatic download of this pictu re from the Internet.
MichelleLong|BusinessDevelopment P: 512.608.3399 | E: [email protected]

23
Baumb, Nelly
From: Loran Harding <[email protected]>Sent: Wednesday, January 13, 2021 2:33 AMTo: Loran Harding; [email protected]; [email protected]; David Balakian;
beachrides; bballpod; Leodies Buchanan; Council, City; Cathy Lewis; Chris Field; Doug Vagim; dennisbalakian; [email protected]; [email protected]; [email protected]; [email protected]; [email protected]; Steven Feinstein; [email protected]; [email protected]; [email protected]; huidentalsanmateo; hennessy; Irv Weissman; Joel Stiner; jerry ruopoli; [email protected]; kfsndesk; Mark Kreutzer; [email protected]; Mayor; Mark Standriff; [email protected]; newsdesk; david pomaville; [email protected]; Dan Richard; Daniel Zack; leager; Steve Wayte; tsheehan; terry; [email protected]; [email protected]
Subject: Fwd: Dr. John Campbell in UK on Tues. Jan. 12, 2021
CAUTION: This email originated from outside of the organization. Be cautious of opening attachments and clicking on links.
‐‐‐‐‐‐‐‐‐‐ Forwarded message ‐‐‐‐‐‐‐‐‐ From: Loran Harding <[email protected]> Date: Wed, Jan 13, 2021 at 1:59 AM Subject: Fwd: Dr. John Campbell in UK on Tues. Jan. 12, 2021 To: Loran Harding <[email protected]>
‐‐‐‐‐‐‐‐‐‐ Forwarded message ‐‐‐‐‐‐‐‐‐ From: Loran Harding <[email protected]> Date: Wed, Jan 13, 2021 at 1:41 AM Subject: Fwd: Dr. John Campbell in UK on Tues. Jan. 12, 2021 To: Loran Harding <[email protected]>
‐‐‐‐‐‐‐‐‐‐ Forwarded message ‐‐‐‐‐‐‐‐‐ From: Loran Harding <[email protected]> Date: Wed, Jan 13, 2021 at 1:31 AM Subject: Fwd: Dr. John Campbell in UK on Tues. Jan. 12, 2021 To: Loran Harding <[email protected]>
‐‐‐‐‐‐‐‐‐‐ Forwarded message ‐‐‐‐‐‐‐‐‐ From: Loran Harding <[email protected]> Date: Tue, Jan 12, 2021 at 10:31 PM

24
Subject: Fwd: Dr. John Campbell in UK on Tues. Jan. 12, 2021 To: Loran Harding <[email protected]>
‐‐‐‐‐‐‐‐‐‐ Forwarded message ‐‐‐‐‐‐‐‐‐ From: Loran Harding <[email protected]> Date: Tue, Jan 12, 2021 at 9:53 PM Subject: Dr. John Campbell in UK on Tues. Jan. 12, 2021 To: Loran Harding <[email protected]>
Late Tues. Jan. 12, 2021 To all‐ Dr. Campbell in the UK for Tues. Jan. 12, 2021. 31:23 Update ‐ YouTube He said yesterday, or someone said, the following: In the Oxford vaccine trials, only 12% were over the age of 55, and they enrolled later in the trials. The only possible glitch re the Oxford vaccine I've heard of. So what to do as soon as Biden clears out the FDA and its vaccine advisory committee and gets the Oxford vaccine approved in the U.S.? I suggest giving the Oxford vaccine in the U.S. to persons under the age of 55 and giving the Pfizer and Moderna vaccines to persons above that age. We know that the Pfizer and Moderna vaccines are effective on pts. over 55. We do NOT know that Oxford vaccine is not effective in those over 55, we just know that they were not well‐represented in the trials of the Oxford vaccine and that they enrolled later in the trials. Two items in the news in the U.S. today. 1) We are FINALLY, finally, requiring arrivals by air from the UK, I guess, and other places(?) to present evidence of having tested negative for Covid within some number of days of departure. By now both the Kent variant, for sure, in California, Florida, Colorado, New York and Texas, and the So. Africa variant, probably, are circulating in the U.S. due to the criminal stupidity of federal authorities in allowing flights from the UK and So. Africa into the U.S. since the variants were discovered. China barred flights outright from the UK as soon as the Kent variant was identified, at least two weeks ago. They barred flights from S. Africa about a week ago. No dicey test results permitted. Here is the U.S. State Department page saying that as of Dec. 28, 2020, persons arriving from the UK must provide evidence of having tested negative for Covid19 within three days of their departure from the UK: Dr. Campbell commented a few days ago that 72 hours is plenty of time to then get infected after having tested negative. So in they come with the Kent variant. We should bar all flights from the UK and from So. Africa. China did. COVID‐19 Information | U.S. Embassy & Consulates in the United Kingdom 2) Big news!!!!!!!! Finally, some common sense from the really big‐gun authorities in the U.S. re vaccine distribution. Secretary of HHS Azar, and that is a big‐gun authority, announced today that the federal government will release to the States all of its stockpile of Covid vaccines. None will be held back to be used as a second shot. This is what the UK has been doing, and I have stated the logic of that over and over in these mails. The feds are confident that we can produce enough vaccine to provide the second shots within the time frame when they will still be effictive. The Brits are saying 12 weeks is an OK time frame for that. Now we need another example of common sense and that will apparently require a good house‐cleaning of the FDA by Pres. Biden as soon as he lowers his right hand: Approve the Oxford‐Astrazeneca vaccine for use in the U.S.! It
25
has been in use in the UK for nine days now. Dr. Campbell expresses his utter disbelief in today's video at the stupidity of the FDA Vaccine Advisory Committee in not even considering the Oxford vaccine at this point. I have cautioned repeatedly that anyone accepting bribes for keeping the Oxford vaccine out of the U.S. should expect to be charged criminally since their action is costing lives. I further recommend that they have a private jet ready to get them out of the country as soon as they are being investigated. The criminal charges might be the least of their problems if I know the American people. Keeping the Oxford vaccine out is killing some huge multiple of the number of people that the Manson gang killed. Now some things to note in Dr. Campbell's discussion today: At 11:00 minutes, It is now a race between the new variant‐ the Kent variant and the vaccines. At 12:00‐‐Why will the FDA not even comment on the Oxford vaccine? What is the delay? He can't believe it, and neither can I. Trump could earn some well‐needed points with the American people if he stepped in with the FDA here. Fly the British regulators over and have them tell him how they based their decision to approve the Oxfore vaccine for use in the UK. Have them tell that to Congress too, with good TV coverage. At 13:00 He lauds the decision to release all of the vaccine stockpile to the States by the feds now. Also, the feds now recommend that persons age 65 and over be given the vaccines now. This is a major change in tack, he says. At 23:00 he details the terrible situaton in Ireland and he uses that as a warning to the U.S. Ireland, BTW, is still part of the EU. The Kent variant is 55% more transmissible than the original Covid 19 virus. The U.S. is now in a crisis, he said yesterday. Yesterday the Astrazeneca‐Oxford vaccine people requested that the EU authorities authorize the use of their vaccine in the EU. The news said that those authorities may do so "as early as late January". Let them eat cake. At 27:00 he beats up good on Sweden! Stay home! Wear a mask, wash hands. Do social distancing. Avoid crowds. Lay into Congress via emails re the FDA delaying the Oxford vaccine for months into the future when people are dying in the parking lots of hospitals. L. William Harding Fresno, Ca.

1
Baumb, Nelly
From: Heidi Yauman <[email protected]>Sent: Monday, January 11, 2021 9:39 PMTo: Susan DavisCc: Be Judged
CAUTION: This email originated from outside of the organization. Be cautious of opening attachments and clicking on links.
dear Susan Davis a man named Daniel found a pile of bones at Markham plaza and rhondi ophiem paid rent for the bones NI apartment 418 at 2010 Monterey road and they took the bones away in a bag and kept it a secret but Daniel toldpeple aBOUT The bones and investigators useD secret tape recorders and Special For ensic tools and tags fto mark things Down for what they mean and tracking why ky le got promoted to deputee county executive when vagobond inn attacks and fraud by Robert Rocco

2

3
' ,,....-----· - . - -· :" . - ,-
MARKHAM PLAZA 2000 MONTEREY ROAD
1 1 0 0
• 0
• • • . .. . . - - ----·- - _ "• . ..-~~ - - - - · --

4
Baumb, Nelly
From: Loran Harding <[email protected]>Sent: Monday, January 11, 2021 7:16 PMTo: Loran Harding; [email protected]; [email protected]; David Balakian;
beachrides; bballpod; Leodies Buchanan; [email protected]; boardmembers; paul.caprioglio; Council, City; Cathy Lewis; Chris Field; Doug Vagim; dennisbalakian; Daniel Zack; Dan Richard; david pomaville; [email protected]; [email protected]; [email protected]; [email protected]; [email protected]; Steven Feinstein; [email protected]; [email protected]; [email protected]; huidentalsanmateo; hennessy; Irv Weissman; Joel Stiner; jerry ruopoli; [email protected]; kfsndesk; Mark Kreutzer; [email protected]; Mayor; Mark Standriff; [email protected]; newsdesk; nick yovino; [email protected]; Steve Wayte; tsheehan; [email protected]; terry; leager; [email protected]
Subject: Fwd: B some Synopsis today. Opened way down, so I got it, then rose.
CAUTION: This email originated from outside of the organization. Be cautious of opening attachments and clicking on links.
‐‐‐‐‐‐‐‐‐‐ Forwarded message ‐‐‐‐‐‐‐‐‐ From: Loran Harding <[email protected]> Date: Mon, Jan 11, 2021 at 4:37 PM Subject: Fwd: B some Synopsis today. Opened way down, so I got it, then rose. To: Loran Harding <[email protected]>
‐‐‐‐‐‐‐‐‐‐ Forwarded message ‐‐‐‐‐‐‐‐‐ From: Loran Harding <[email protected]> Date: Mon, Jan 11, 2021 at 4:33 PM Subject: B some Synopsis today. Opened way down, so I got it, then rose. To: Loran Harding <[email protected]>
Monday, January 11, 2021 To all‐ I B some Synopsys today, SNPS. It fell like a rock right at the open, my limit price was higher than the open, so my limit order executed. I paid $258.16 per share, the low for the day, and then the stock rose a little, giving me a small gain the first day I owned it. It c. at $260.50 today. Trade Notification ‐ Account ending in 130 ‐ [email protected] ‐ Stanford Alumni Mail (google.com)

5
I have been watching SNPS for months. I paid $258.16 per share today. It closed at $227.50 on 11‐30‐20, for a gain since then of 14.5% in five weeks. WEEKS. It closed at $197 93 on Friday, Sept. 17, 2020, for a gain since then of 31.6% in four months. It closed at $189.6258 in mid‐July, for a gain of 33.36% in six months. It closed in March, 2020 at $104.90, for a gain of 75.42% in less than a year. That was after the crash in late February. I should have B then. Geez, 150 years of bank interest in less than a year. By today it became irresistable. SNPS is rated "B" by Schwab. Large cap‐ $40 billion mkt cap. Schwab is pretty stingy with "B" ratings. A narrow moat, better than no moat. No div. EPS $4.2599. No div. but plenty of earnings. Better than a large div,. and no earnings. Headquartered in Mountain View, Calif. Read on Schwab, et.al. about what they do. You won't rent space on Wednesday and go into competition with them. Here is their website. Plenty to look at there. A giant chip and software maker like Nvidia would know them well. If Nvidia has a future, then so does SNPS. BTW, I paid $204 per share for NVDA last March and it closed last Friday at $531.07, well over doubling in ten months. Synopsys | EDA Tools, Semiconductor IP and Application Security Solutions I foresee continuing great things for SNPS. I paid $57.443 per share for Square, SQ, on April 8, 2020. It closed last Friday at $241.45, an easy quadrupling of my investment nine months. Almost makes me feel guilty. L. William Harding Fresno, Ca.

6
Baumb, Nelly
From: Bahram Atashband <[email protected]>Sent: Monday, January 11, 2021 7:12 PMTo: Council, CitySubject: Message from the City Council Home Page
CAUTION: This email originated from outside of the organization. Be cautious of opening attachments and clicking on links. ________________________________ I am one of those people that council member Tanaka was talking about. My printed notice clearly says 250 Hamilton ave. At 6pm. I was at the doors of city hall from 5:55pm looking for an unlocked entry. Checking every entrance from garage to entrance on the surface. I intended to plead for exclusion but due to faulty communication, I failed. I don’t know when the other gentleman says “outreach” what is he referring to. I had no other communication from the city. The outreach was faulty from my standpoint. By the time I drove back home and got to watch the proceedings, the council was almost done with the matter. I congratulate council member Tanaka for his keen sense of reality and care. When only three people out of 119 object (and under abnormal situation) it should indicate a problem, the council failed to recognize. Bahram Atashband 443 Wilton Ave. Palo Alto

7
Baumb, Nelly
From: Rebecca Eisenberg <[email protected]>Sent: Monday, January 11, 2021 6:59 PMTo: Council, City; Pat Burt; Tom DuBoisCc: Aram JamesSubject: Factual Backup to Dispute Pat Burt's out of order and ad hominem comments
CAUTION: This email originated from outside of the organization. Be cautious of opening attachments and clicking on links.
Dear Pat:
You spoke out of order at this meeting in order to discredit my research -- research which I already had vetted with numerous experts in the field. You spoke disrespectfully, attacking my character, which served in strong contrast to my
criticisms - I criticized only your actions. When it comes to women, you inevitably attack character, having no actual wrongdoings to criticize. That is unprofessional and demonstrates an entrenched discriminatory attitude towards women --
an attitude backed also by your long record of pushing women out of leadership roles, like you have done with Alison Cormack, and failing to appoint women to leadership roles. Your bias is showing.
In addition, despite the fact that this was your first "real" meeting as a city council member, your temper and need to
attack the truth-teller was so strong that you spoke out of turn to attack me in the same unprofessional and unbecoming style that you have made famous. The fact that you could not go even a partial meeting without being able to restrain
yourself from breaking the rules reflects your most common way of operating - out of control emotionally, and unable to follow very simple, fairly-applied rules - the same rules I adhered to when I followed the time limit and waited until I had an
opportunity to speak. As an attorney for three decades and the daughter of a federal judge, I believe that rules serve a purpose. To see elected leadership act in disregard of the rules is something we all hoped to avoid in 2021. Please try to
control your temper.
Pat, you accused me of making claims that are unsubstantiated. I hope what I provide below shows a small portion of how well substantiated my claims are. They are so substantiated that I was willing to state these for the record.
Pat, you are no environmentalist. Your company created 11 tons of unnecessary toxic waste and did not manage it. You
created this waste just a few miles north of Palo Alto, in mostly Hispanic neighborhoods of Redwood City and San Carlos. I have personally visited these sites. Your accolades were a marketing sham of your own creation. You know well that
metal plating is one of the most toxic industries on the planet. You said so on the public record when you drove your direct competitor out of Palo Alto, on the grounds that metal plating as an *industry* causes unmanageable pollution that should not be near residences. You may not have owned Acteron shares at the time that you drove CPI from Palo Alto, but did
you have any interest in the company with which Acteron merged, Flextronics?
Regardless, given the many millions of dollars that you made by operating a company that harmed our groundwater, especially those of the Hispanic factories that live near your plants, any reasonable person would expect you to mention
this potential conflict when you led the campaign to drive a competitor out of town on toxic waste grounds.
Finally, the information on the EPA website and elsewhere, only some of which is quoted below, makes it clear that you never even claimed to operate a clean company. You claimed to operate the most clean company that metal plating can
be. You failed to mention that metal plating serves no economic, financial, industrial, or other purpose. The best you could say is that the 11 tons of deadly waste you dumped into the earth was LESS than any other company in an industry that
was rendered obsolete decades ago. I do not applaud you.
Warm regards,
Rebecca Eisenberg
[email protected] www.linkedin.com/in/eisenberg
415-235-8078

8
BACKUP SOURCES
TOPLINE: https://nepis.epa.gov/Exe/ZyPDF.cgi/P1009602.PDF?Dockey=P1009602.PDF
RCRA HAZARDOUS WASTE GENERATION The EPA Report states that Acteron dumps 11 tons of hazardous waste into the environment a year
And manages zero Resource Conservation and Recovery Act of 1976 (RCRA) (defined below).
BACKUP SOURCES.
Burt’s Bio:
https://ngn.org/channels/user/1278/ Patrick Burt
School/Organization : |UNAFF|SwiftMile Inc.|Palo Alto Mayor| Title : Advisory Board Member
Bio : Pat Burt has an extensive career as an entrepreneur, elected official and environmental policy advocate. He served for a decade as a city council member in Palo Alto, California and two terms as mayor. He led Palo Alto’s cutting-edge environmental initiatives, including their 100% carbon neutral electricity portfolio and leading Climate Action Plan. Pat
founded and for over 20 years was CEO of Acteron, a prominent Silicon Valley provider of advanced technology manufacturing services, acquired by Flextronics in 2010. Pat served as an advisor on environmental policy at the regional,
state and national levels. Subsequently, he was CEO of Vascular Access Technologies, acquired by Merit Medical, and was co-founder/CEO of Theradep Technologies. He is also an angel investor and an advisor to early stage companies.
LOOKING AT ACTERON. Acteron has 2 facilities:
(1) NXEDGE San Carlos (NOW FLEXTRONICS, the parent company):
https://ofmpub.epa.gov/frs_public2/fii_query_dtl.disp_program_facility?p_registry_id=110000861023
Section 4. Facility Identification
TRI Facility ID: 94070CTRNC1000C 4.1 Facility Name and Address.
Facility Information
If you scroll down, you do see that Pat Burt is creating tons of toxic waste. He claims he is treating it at his facility. There is reference to it entering the water. Most of the good stuff is at the bottom. And there are many places where he reports
“Yes” but then “No data.” (Not a lot of enforcement by the EPA).
It is unlikely that he broke the law. That said, the law allows for a HUGE amount of pollution and is very tolerant of risks to the surrounding communities, which in the case of Pat Burt — both of his facilities were located in majority-Latinx
communities.
This is his other facility: https://echo.epa.gov/detailed-facility-report?fid=110000784125
ACTERON CORP
851 SHASTA STREET, REDWOOD CITY, CA 94063
FRS ID: 110000784125 EPA Region: 09
Latitude: 37.47907 Longitude: -122.22226
Locational Data Source: FRS Industry:
Indian Country: N
ACTERON INDUSTRY: METAL PLATING - CONSIDERED ONE OF THE MOST TOXIC OF ALL INDUSTRIES

9
This report gives a recent overview: https://www.epa.gov/sites/production/files/2018-05/documents/metal-finishing_prelim-review_april-2018.pdf
Key Takeaways: 1 - Metal plating creates huge amounts of toxic waste
2 - Metal plating creates so many different kinds of toxic waste that it exceeded the EPA’s budget to find out 3 - Almost all data is self-reported by the industry (and not double-checked)
4 - According to the EPA, almost no metal platers effectively treat their waste 5 - According to the EPA, it’s too expensive for the metal platers to treat their waste effectively
6 - Given the cost, rather than fund the cleanup or create payment plans, the EPA just lets them pollute (based on self-reports that it’s too expensive to comply with the law (sound familiar? Like how Palo Alto lets commercial developer avoid
paying impact fees and also allows them to avoid building affordable housing) 7 - Obviously metal plating is extremely lucrative — Burt sold his company for a ton of money (I heard $30 million but that is not confirmed) and after that sale (per above), he diversified into real estate investment and venture capital. Given how
much money this business made for Burt, query whether Acteron could not afford to clean up their toxic messes? 8 - To the extent that Pat Burt claims to have been one of the “best in the metal plating industry on environmental issues”
that is like saying that he is the cleanest rat in the world’s most contaminated sewer. 9 - Query what kind of person chooses this industry - an industry known for its toxic waste. In Silicon Valley, home of the
information industry, what kind of person chooses one of the most (if not the very most) toxicity-producing business?
PAT BURT’S CONFLICT OF INTEREST WITH A METAL PLATING COMPETITOR: https://www.mercurynews.com/2015/11/17/new-laws-could-force-cpi-out-of-palo-alto/
The City Council wanted to take action on CPI’s toxic waste. Burt is quoted as saying the following :
"Councilman Pat Burt acknowledged that the council’s plan of action likely won’t sit well with either CPI or residents: The city is taking an aggressive approach that pushes the boundaries of what is legally permissible to reduce risk at the
location more than any other time in the past 60 years, he said. Although CPI has reduced the volume of hazardous materials at the location, Burt said he still
wouldn’t want to live next door." See also:
https://patch.com/california/paloalto/toxic-showdown-at-city-hall -
[ WHERE PAT BURT MAKES CLEAR THAT THE KIND OF ENVIRONMENTAL HAZARDS HIS OWN COMPANY CREATES ARE FINE FOR THE HISPANICS WHO LIVE NEAR HIS FACILITY BUT NOT FINE FOR THE WHITE
PEOPLE WHO LIVE NEAR CPI -- Hence he even *introduced* the ordinance to get rid of his competitor in Palo Alto:
Council Member Pat Burt introduced a motion calling on City staff to put together a budget and hire a consultant who will look at what options the City has for amortizing the plating facility. The motion passed unanimously with Mayor Yiaway
Yeh absent.
https://www.paloaltoonline.com/news/2015/11/17/palo-alto-firms-up-rules-for-toxic-chemicals (council vote against CPI was unanimous, no one recused or abstaining)
and https://www.thereporter.com/2016/03/01/palo-alto-cpis-metal-plating-shop-must-go-by-2031-council-decides/
(where Pat Burt successfully kicked his competitor out of Palo Alto, on the grounds that plating creates unacceptable health hazards for residents)
TO NAVIGATE THE EPA WEBSITE, I RECOMMEND WATCHING THIS VIDEO: https://www.youtube.com/watch?v=5QQVJ6v53ZQ&feature=youtu.be
RCRA HAZARDOUS WASTE GENERATION The EPA Report states that Acteron dumps 11 tons of hazardous waste into the environment a year

10
And manages zero https://nepis.epa.gov/Exe/ZyPDF.cgi/P1009602.PDF?Dockey=P1009602.PDF
Resource Conservation and Recovery Act of 1976 (RCRA),
INTRODUCTION The United States Environmental Protection Agency (EPA), in partnership with the States1 , biennially collects information regarding the generation, management, and final disposition of hazardous wastes regulated under the
Resource Conservation and Recovery Act of 1976 (RCRA), as amended. The purpose of this 2009 National Biennial Report is to communicate the findings of EPA’s 2009 hazardous waste reporting data collection efforts to the public, government agencies, and the regulated community. The 2009 National Biennial Report consists of three volumes of
data: • The National Analysis data presents a detailed look at waste-handling practices in the States, and largest facilities nationally, including (1) the quantity of waste generated, managed, shipped, and received, and interstate shipments and receipts, and (2) the number of generators and managing facilities, • The State Detail Analysis data is a detailed look at each State’s waste handling practices, including overall totals for generation, management, shipments, and receipts, as
well as totals for the largest fifty facilities, and • The List of Reported RCRA Sites identifies every hazardous waste facility in the United States that submitted a hazardous waste report in 2009. RCRA HAZARDOUS WASTE Throughout this
Report, the term RCRA hazardous waste refers to solid waste assigned a Federal Hazardous Waste Code and regulated by RCRA. Some States elect to regulate wastes not specifically regulated by EPA; these wastes are assigned State
Hazardous Waste Codes. For this Report, EPA asked States to exclude data for waste with only State Hazardous Waste Codes (the waste description does not include any Federal Hazardous Waste Codes). The reader can find a more
detailed explanation in the RCRA Orientation Manual (www.epa.gov/wastes/inforesources/pubs/orientat/index.htm) and in the Code of Federal Regulations in 40 CFR Parts 260 and 261. Please refer to Appendix D of the National Analysis Report for a complete list of EPA Hazardous Waste Codes used by the regulated community for their 2009 Biennial Report submissions. Details about the information submitted by the regulated community can be found in the 2009
Hazardous Waste Report Instructions and Forms (www.epa.gov/waste/inforesources/data/biennialreport/index.htm). Guidance provided to the regulated community regarding information to include or exclude from the National Report can
be found in Appendix E of the National Analysis Report.
CAR000014126 ACTERON CORPORATION
SAN CARLOS 11 RCRA Tons Generated
0 RCRA Tons Managed
https://www.lion.com/lion-news/july-2017/epa-may-delist-electroplating-sludge-from-rcra-haz
What is Electroplating?
Used since the 1800’s, electroplating is the process by which manufacturers add a layer of metal to a product, like jewelry, using electricity. In essence, the product is placed in an electrolyte bath with the plating metal, with both connected to charged electrodes. An electric current is applied, oxidizing and effectively dissolving the metal atoms in the bath. The
dissolved metal is then reduced and placed on the piece.
While on City Council made fellow plating company CPI move:
https://www.mercurynews.com/2016/03/23/palo-alto-cpi-must-move-metal-plating-shop-by-2026-or-close/
PALO ALTO — A settlement agreement leaves Communications & Power Industries with two options for the future of its metal plating shop, which has been a safety concern of nearby residents for years.
The agreement, which City Council members approved Monday, allows CPI to continue using non-conforming hazardous materials integral to its plating shop at 811 Hansen Way as long as it moves the shop to an area of its property at least
300 feet away from the nearest homes in the Barron Park neighborhood. If CPI chooses to relocate the plating shop and associated chemical storage area to another part of the property, it must
establish the new building by 2026 or face an injunction to cease operations. City officials and residents have said they would rather see CPI stop using such hazardous altogether on its property or
anywhere else in the city.

11
If CPI agrees to do so, it can keep operating the plating shop as its current location until 2031 and then must stop using the non-conforming hazardous materials anywhere within city limits. CPI has until Dec. 31, 2021 to notify the city which option it chooses.
CPI President Bob Fickett has said that moving the plating shop 300 feet from homes would add “non-efficiencies and take away our competitiveness.” And phasing out the hazardous materials essentially would shutter the entire operation,
he added. Resident Art Liberman urged the council to approve the agreement.
“While we residents, understandably, are not entirely thrilled with the settlement, we will now have the assurance that the ‘clock is ticking’ on the presence of the toxic and highly toxic materials in CPI’s plating shop near our homes, and that
brings us significant comfort,” Liberman said in an email to city officials.
Residents’ safety concerns stem from an accidental release of nitric acid gas in 2005 and a hydrochloric acid and copper-and nickel-infused wastewater spill in 2008.
Email Jacqueline Lee at [email protected] or call her at 650-391-1334; follow her at twitter.com/jleenews.
https://p2infohouse.org/ref/32/31534.pdf In the file - a report about his toxic waste dumping
https://nepis.epa.gov/Exe/ZyNET.exe/P1009602.TXT?ZyActionD=ZyDocument&Client=EPA&Index=2006+Thru+2010&Docs=&Query=&Time=&EndTime=&SearchMethod=1&TocRestrict=n&Toc=&TocEntry=&QField=&QFieldYear=&QFieldMonth=&QFieldDay=&IntQFieldOp=0&ExtQFieldOp=0&XmlQuery=&File=D%3A%5Czyfiles%5CIndex%20Data%5C06thru10
%5CTxt%5C00000022%5CP1009602.txt&User=ANONYMOUS&Password=anonymous&SortMethod=h%7C-&MaximumDocuments=1&FuzzyDegree=0&ImageQuality=r75g8/r75g8/x150y150g16/i425&Display=hpfr&DefSeekPage=x&SearchBack=ZyActionL&Back=ZyActionS&BackDesc=Results%20page&MaximumPages=1&ZyEntry=1&SeekPage=x
&ZyPURL
https://www.purchasingnetwork.com/doc/acteron-corporation-0001
CEO Acteron Corporation
Acteron Corporation. As the leading supplier of specialty plating and anodizing for high technology applications, Acteron is qualified to surpass your most exacting requirement. ... Our new 30,000 square foot state-of-the-
art facility located in Silicon Valley includes computer controlled anodizing.
Company Profile | March 14, 2001
Acteron Corporation Source: Acteron Corporation
As the leading supplier of specialty plating and anodizing for high technology applications, Acteron is qualified to surpass
your most exacting requirement. For over 15 years, we have responded to the need for rigid quality control plating and anodizing which exceeds military and commercial specifications. Our new 30,000 square foot state-of-the-art facility
located in Silicon Valley includes computer controlled anodizing. We have developed unique and innovative proprietary processes for your critical applications. These processes enhance
product value by improving life and performance while reducing costs. Acteron's Total Quality Management approach incorporates Statistical Process Control throughout.
https://www.themetalmark.com/content/what-difference-between-plating-anodizing-and-enameling
https://www.thomasnet.com/articles/custom-manufacturing-fabricating/anodizing-environmental/
The process of anodizing with a sulfuric acid bath produces two byproducts: degraded sulfuric acid and aluminum
hydroxide. Aluminum hydroxide is a compound of aluminum from the anodized part, and hydrogen and oxygen from the acid. Classified by the EPA as hazardous, aluminum hydroxide wastewater cannot simply be dumped into a municipal
wastewater system. The EPA has strict standards for the highest allowable aluminum concentration level upon disposal; degraded sulfuric acid must also be neutralized before disposal to a ph of between six and eight.

12
Through give and take between the industry and the EPA, the EPA sets up guidelines and standards called Best Available Technology Economically Achievable (BAT). BAT standards are then mandated for waste disposal. Some very innovative solutions to waste management have since been introduced that not only reduce the waste that needs disposal, but also
reclamation and recycling of the aluminum metal itself.
https://www.pfonline.com/articles/is-your-electroplating-waste-hazardous
Processing of hazardous waste that contains precious metals is a challenge and responsibility that many electroplating companies face. Cyanide- and acid-based solutions, and materials such as plating bath filters and resins, all have the
potential to cause injury and harm to our environment if not disposed of properly. Many companies may not realize that they are liable for how their precious-metal-bearing waste is handled and,
ultimately, for the repercussions if a spill or similar incident were to occur. Because of the inherent risks associated with the processing of hazardous waste, a comprehensive processing plan is essential to protect the environment and
individuals handling the materials, and to avoid potential fines or lawsuits.
https://waste.zendesk.com/hc/en-us/articles/212352857
Wastes - Frequent Questions Hazardous Waste Hazardous Waste Identification The hazardous waste listing for F006 includes wastewater treatment sludge from
electroplating operations. What types of electroplating operations are included in this listing? The F006 listing includes the wastewater treatment sludges from the following processes: (1) common and precious metals electroplating, except tin, zinc (segregated basis), aluminum and zinc-aluminum plating on carbon steel; (2)
anodizing, except sulfuric anodizing of aluminum; (3) chemical etching and milling, except when performed on aluminum; and (4) cleaning and stripping, except when associated with tin, zinc, and aluminum plating on carbon steel. Accordingly,
the following processes are not included under the F006 listing: chemical conversion coating, electroless plating and printed circuit board manufacturing. However, wastewater treatment sludges from printed circuit board manufacturing that include any of the processes which are within the scope of the F006 listing (e.g., chemical etching) would be regulated as a F006 waste. Electroplating operations do not include electrowhinning and electrofinishing, electroless plating, chemical
conversion coating, and printed circuit board manufacturing (51 FR 43350; December 2, 1986). Also, wastewater treatment sludges from the chemical conversion coating of aluminum are listed as F019 hazardous waste. See FR 43350,
43551: December 2, 1986.
Additional guidance regarding the applicability of the F006 listing is available in the following documents:
Memo, Dellinger to Zirch; February 12, 2004 (RCRA Online #14691) Memo, Bussard to Pucci; August 18, 1998 (RCRA Online #14482)
Monthly Call Center Report Questions; June 1997 (RCRA Online #14108) Memo, Bussard to Dufour, January 21; 1997 (RCRA Online #14017)
Memo, Shapiro to Rhodes; July 12, 1994 (RCRA Online #11851) Memo, Lowrance to Duprey; January 15, 1992 (RCRA Online #11663)
Memo, Clay to Schafer; June 7, 1991 (RCRA Online #14322) Memo, Lowrance to Hopkins; August 15, 1990 (RCRA Online #11551)
Memo, Barnes to Evans; August 21, 1989 (RCRA Online #11458) Memo, Lowrance to Meeks; April 14, 1988 (RCRA Online #11340)
Memo, Williams to Lovgren; January 11, 1988 (RCRA Online #11315) Memo, Straus to Schiffman; July 28, 1987 (RCRA Online #11269) Memo, Abrams to Duncan; May 5, 1987 (RCRA Online #11244)
These documents are available at the following URL:
https://rcrapublic.epa.gov/rcraonline
https://www.triumvirate.com/blog/the-sludgy-semantics-of-f006-waste-characterization
13
F006 Isn't Just About Electroplating, Here's Why You Should Double Check the Rule to Ensure Compliance
POSTED BY PAT DOYLE DECEMBER 1, 2015
The RCRA F006 rule provides a list of exceptions to wastewater treatment sludge from electroplating operations (40 CFR
260.11).
The list exempts sulfuric acid anodizing or tin-plating of steel, among other chemicals. This rule does a great job of explaining what is not F006 waste, but is pretty vague in regards to what is indeed covered under the F006 rule.
Larger definitions of electroplating include any process that coats a metal in another metal, usually by chemical and
electrical means according to the EPA definition. This seems straightforward enough, but this broad definition of electroplating might cover more processes than you think. Many businesses in the metal treating, finishing, and
processing fields are subject to this regulation, even those that might not explicitly be involved in electroplating by common definitions.
Overlooking or ignoring this regulation and subsequent improper disposal of waste can land you in hot water with the EPA, and can lead to fines if it's found you are out of compliance. In addition, waste that fits under this regulation is typically designated for special processing to recover the metals in that waste, and your business could benefit from
certain compliance incentives if you can show the EPA that you're properly dealing with this waste.
Here are some other processes that aren't electroplating by some definitions, but still generate waste which falls under the umbrella of F006:
Alkaline Surface Cleaning Zinc Plating on Carbon Steel using Cyanides Zinc Plating on Gray Cast Iron Iron
Plating on Aluminum PreCleaning activities prior to electroplating Ion-exchange resins from rinsewater treatment (assuming F006 precursor) Photoresist Stripping Cleaning and Stripping in the printing industry Bright
Dipping Silicon water etching Spent Activated Carbon from rinse water treatment (assuming F006 precursor) If any of these processes occur onsite and the wastewater from the process is treated in a wastewater treatment system, then sludge from this treatment would be regulated under F006. Whether or not you can characterize your waste as F006 will determine how much you can keep onsite at a time, how you are required to dispose of this waste, and what kinds of provisions you are required to implement in order to stay compliant, like an additional level of pollution control or waste
processing, for example. Proper characterization of your waste also helps your receiving facility deal with it in a way that is safe and environmentally conscious, ensuring they will continue to accept your waste rather than rejecting it because it
hasn't been properly characterized.
As a general rule of thumb, it is always better to over-code your waste system than risk overlooking an important regulation for a specific type of waste. One way to ensure compliance without completely restructuring your waste
management plan is to minimize or eliminate generation of F006 if at all possible. A couple of ideas for minimizing or eliminating your F006 waste and being able to bypass these regulations are:
Cleaning and drying your electroplated or etched components in a separate step to eliminate contaminants being carried into the waste water treatment system. If your company only generates low levels of these contaminants,
you might be eligible to get your F006 de-listed or the requirement for 'timely removal' eased. Click the link below to learn more about how we can help you achieve 100% wastewater compliance.
Case not closed

14
Baumb, Nelly
From: Neilson Buchanan <[email protected]>Sent: Monday, January 11, 2021 6:52 PMTo: Council, City; Shikada, Ed; Clerk, CitySubject: council efficiency
CAUTION: This email originated from outside of the organization. Be cautious of opening attachments and clicking on links.
I support the concept of early 5pm council meetings with a provision that special issues such as leading non-profit organizations can deliver concise reports on their activities. Investment of limited, but productive council time during the course of a year will create time efficiency and public understanding for mutual benefit of these organizations and citizens. I would like to nominate a topic which could expedite true affordable housing in Palo Alto. True affordable housing faces high hurdles. One of those hurdles is lack of funds for construction and operating expenses. Another hurdle is community acceptance of sites for this housing. This region has two positive forces in greater play now. First is philanthropic support. The potential for greater support is very high. The second force is the wealth of proven affordable housing developers and operators. I propose that City Manager and Mayor select expert affordable housing operators and "funders" to present semi-annual regional successes in process, outcomes and hurdles to overcome. This knowledge delivered by a series of proven, expert "hand-on" leaders could frame affordable housing very favorably to the general public. I believe success is contagious. Attached is a link to one of several organizations which can highlight new flows of capital which have been so challenging in the past. A pdf document is attached. Noni Ramos ready to embrace challenging times ahead as new Housing Trust CEO - San José Spotlight
Noni Ramos ready to embrace challenging times ahead as new Housing Trust... Noni Ramos has some pretty big shoes to fill — and that may be the least of the challenges facing her. Ramos is ...

15
Neilson Buchanan 155 Bryant Street Palo Alto, CA 94301 650 329-0484 650 537-9611 cell [email protected]

16
Baumb, Nelly
From: ANDREA B SMITH <[email protected]>Sent: Monday, January 11, 2021 6:41 PMTo: Council, CitySubject: weed abatement
CAUTION: This email originated from outside of the organization. Be cautious of opening attachments and clicking on links. ________________________________ The “gardeners” were allowed to return in April 2020 so the people who were not mowing their lawn could have borrowed a lawn mower from a neighbor or even rented one. unles they were so old and crippled. So, those people who got a citation May 1 should pay their fine. I did my gardening during that time. Andrea Smith AGE: 79 1/2 years old

17
Baumb, Nelly
From: Cari Templeton <[email protected]>Sent: Monday, January 11, 2021 4:59 PMTo: Council, CitySubject: Street safety improvements to crosswalk on Middlefield at Walgreens
CAUTION: This email originated from outside of the organization. Be cautious of opening attachments and clicking on links.
January 11, 2021 Dear Mr. Mayor, Mr. Vice Mayor, and honored Council Members, Although I am Chair of the Planning and Transportation Commission, I am writing tonight in my personal capacity to advocate for safety improvements to the crosswalk on Middlefield at Walgreens in Midtown. Last Friday, a boy was struck by a vehicle that did not stop for the red light while he was using the crosswalk, and the force of the car threw his body into the street, causing painful injuries from which he is thankfully expected to heal physically. I have known this boy and his family for over 10 years now, and they are a loving, vibrant part of our community. It’s painful to imagine what they have gone through and what they will go through over the coming months as they recover both physically and emotionally. Having experienced a collision on my home street a few years back, I know it will be a long time before they feel safe on our streets again. When my two children and I were hit by another car while we were driving to school, the one thing that gave me solace after the incident was the speed with which safety improvements were implemented by the City at the site of the collision. I am here tonight to encourage City leadership to consider urgent safety improvements at the site of this accident, too: Middlefield at Walgreens. Upon reaching out to Staff on Friday, I learned that visibility is a known issue at this site, especially this time of year when the sun is at a certain angle. Due to COVID related staffing issues, we do not yet have the exact collision history or statistics. Staff said that it would be most helpful if we report the incident through the Palo Alto 311 service so that we can track it, which I have done (#9360804). As of today, 30 comments have been added by members of the public who shared their anecdotes, near‐misses, concerns, ideas, and support for improvements to this site. Many of you campaigned on improving street safety, and that’s why I am confident that you will be allies in this endeavor to make shopping at Midtown by foot and by bike safer as soon as possible. Staff has the expertise and experience to advise the City on how best to address the visibility issues on this site, including how to account for visibility during winter light, a phenomenon that happens yearly. I’d also like to thank members of the community who aided this young man during the incident, and everyone who has taken the time and effort to share their experiences so that together we can make Palo Alto a little safer for our children. Sincerely, Cari Templeton

18
Baumb, Nelly
From: Jennifer Landesmann <[email protected]>Sent: Monday, January 11, 2021 12:48 PMTo: Evan WassermanCc: SCSC Roundtable; Chris Sequeira; Steven Alverson; Council, CitySubject: Re: SCSC Roundtable - GBAS Information - Soliciting comments and questions
CAUTION: This email originated from outside of the organization. Be cautious of opening attachments and clicking on links.
Dear all, I would like to add some further references to JO 7100.41A, "dot 41" please see the following: Video replay of FAA presentation on procedure implementation and dot 41 June 2019 https://youtu.be/vOHVhSJsDu0?t=1546 Note that at the beginning of the presentation Favi refers to the Phase Two report to the Select Committee. Phase Two (Page 8) report is the first time we were given this info. The second time we were given info was in a presentation by FAA Julie Marks (joined at that meeting by the head of Airports). We reported on that meeting in this Sky Posse Update The Sky Posse March 2018 Update - Special Edition. BTW - at the 2018 FAA presentation to communities, I spoke with the head of airports and Julie and shared that this information has apparently not reached our area (others also said this is not working this way), and the airports person committed to let airports know. I believe the name of the person from airports whom I spoke with is Elliot Black. Thank you, Jennifer On Wed, 23 Dec 2020 at 16:28, Jennifer Landesmann <[email protected]> wrote: Hi Evan, SCSC, Steve, Chris, Thank you for soliciting input as the SCSC prepares to do outreach to SFO about GBAS. I have submitted various comments and questions which I hope will be considered.
11/19/20 GBAS Follow Up 12/15/20 GBAS and Environmental Review
I have two additional questions

19
1) Will the eventual answers from SFO be discussed with Raquel Girvin who in her role as Ombudsman (pursuant to FAA Reauthorization 2018) should be facilitating answers and help us with our concerns? The most important answers we need of course is how the FAA declared a CATEX (if that is confirmed) ‐ we need to know everything, what calculations were used, methodology, and assumptions. Who and what informed that decision. 2) What role does the airport have in the JO 7100.41A process? Am sharing a video replay of my question to SFO at the SF Roundtable about this back in February 0f 2018. February 7, 2018 public comment on transparency and role of airport in JO 7100.41A? Again, thank you and wishing all Happy Holidays! Jennifer On Fri, 18 Dec 2020 at 18:47, Evan Wasserman <[email protected]> wrote:
Dear SCSC Roundtable Members and Interested Parties,
On behalf of SCSC Roundtable Chairperson Bernald, and as discussed at the SCSC Roundtable Technical Working Group (TWG) meeting on 12/15/2020, the following information is being provided as a notification to SCSC Roundtable members, and members of the public regarding the use of the Ground Based Augmentation System (GBAS) procedure at the San Francisco International Airport (SFO).
This material on GBAS may be of interest to member jurisdictions of the SCSC Roundtable for future consideration as additional information becomes available. Please submit any comments or questions to the SCSC Roundtable regarding clarification from SFO on GBAS. The SCSC Roundtable will then submit to SFO. Please provide your comments and questions to the [email protected] email address by Wednesday 12/23 for review and incorporation into a consolidated list of questions to be sent to SFO.
The following information is being provided for your reference regarding GBAS.
The link below is to the GBAS presentation given at the TWG of the SFO Roundtable on October 7, 2020. The video of the GBAS presentation can be found at this link starting approximately at video timestamp 1:10:50. For your information we suggest all members and interested parties to please review the recording of the presentation.
Additional info is available on the SFO Community Roundtable website with a video recording from the November 19, 2020 meeting, and agenda materials. The GBAS presentation starts at approximately the 00:9:10 mark of the video timestamp and continues until about 01:33:30. Again, we suggest all members and interested parties to please review the materials/recording of these presentations for reference.

20
Thank you,
Evan Wasserman
Senior Associate - Community Development Group
ESA | Environmental Science Associates
Celebrating 50 Years of Work that Matters!
2600 Capitol Avenue, Suite 200
Sacramento, CA 95816
916.564.4500 main
916.231.1166 direct
[email protected] | esassoc.com
Follow us on LinkedIn | Facebook | Twitter | Instagram | Vimeo

21
Baumb, Nelly
From: [email protected]: Monday, January 11, 2021 11:56 AMCc: [email protected]; [email protected]; [email protected]; [email protected];
[email protected]; [email protected]; [email protected]; [email protected]; [email protected]; [email protected]; [email protected]; [email protected]; [email protected]; [email protected]; [email protected]; [email protected]; [email protected]; [email protected]; [email protected]; [email protected]; [email protected]; [email protected]; [email protected]; [email protected]; [email protected]; [email protected]; [email protected]; [email protected]; [email protected]; [email protected]; [email protected]; [email protected]; [email protected]; [email protected]; [email protected]; [email protected]; Kasey.O'[email protected]; [email protected]; [email protected]; [email protected]; [email protected]; [email protected]; [email protected]; [email protected]; [email protected]; [email protected]; [email protected]; Office of the CIO; Council, City; Yang, Albert; Patel, Raj; Auzenne, Tom
Subject: Fwd: Herbalife Nutrition 7/25/2019 - Herbalife Summary 8.26.2019
CAUTION: This email originated from outside of the organization. Be cautious of opening attachments and clicking on links.
Warning to all: Refer to the below email trail. Only arrogant idiots would overlook or attempt to disregard numerous emails documenting [AS 3 ‐ Audit documentation standards, SOX] hitting IT systems and interfaces around the world. While the political circus in DC continues, so does an Audit an intelligence operation. Warning: only idiots would attempt to dismiss that elite lawyers inside/outside the DOJ and the SEC colluding to circumvent all oversight of US corporations and the crippled the entire US legal system in the process [Encroached in Auditors turf]. Let me guess..... why would the DOJ or supreme court (lawyers) would be engaging in bureaucratic red tape to delay and disregard actual investigations and real crimes. Auditors not lawyers would be the ones to confirm there was electoral fraud. I am a fraud Auditor and I am stating writing there not only was fraud, but the crimes are called Treason, Genocide and Domestic Terrorism. Regards, Nancy Begin forwarded message:
From: "." <[email protected]> Date: January 11, 2021 at 2:44:12 AM PST Cc: urgent‐[email protected], [email protected], [email protected], [email protected],

22
[email protected], [email protected], [email protected], [email protected], [email protected], [email protected], [email protected], [email protected], [email protected], [email protected], [email protected], [email protected], [email protected], [email protected], [email protected], [email protected], [email protected], [email protected], [email protected], [email protected], [email protected], [email protected], [email protected], [email protected], [email protected], [email protected], [email protected], [email protected], [email protected], [email protected], [email protected], [email protected], [email protected], [email protected], [email protected], [email protected], [email protected], [email protected], [email protected], [email protected], [email protected], [email protected], [email protected], [email protected], [email protected], [email protected], [email protected], [email protected], [email protected], [email protected], [email protected] Subject: Fwd: Herbalife Nutrition 7/25/2019 ‐ Herbalife Summary 8.26.2019
Begin forwarded message:
From: "." <[email protected]> Date: January 11, 2021 at 2:42:25 AM PST To: Sebastian Barragan <[email protected]>, [email protected], Marc Wells <[email protected]>, WikiL <[email protected]>, [email protected], [email protected], [email protected], [email protected], [email protected], [email protected], [email protected], [email protected], [email protected], [email protected], [email protected], [email protected], charles@russia‐insider.com, moderator@russia‐insider.com, [email protected], [email protected], [email protected], [email protected], [email protected], [email protected], [email protected], [email protected], [email protected], [email protected], [email protected], [email protected], [email protected], [email protected], [email protected], [email protected], [email protected], [email protected], [email protected], [email protected], [email protected], [email protected], [email protected], [email protected], [email protected], [email protected], [email protected], [email protected], [email protected], [email protected], [email protected], [email protected], [email protected], [email protected], [email protected], caritas.info@caritas‐sy.com, [email protected], [email protected], [email protected], [email protected], [email protected], [email protected], [email protected], [email protected], [email protected], [email protected], [email protected], [email protected], [email protected],

23
[email protected], [email protected], secretaria@communication‐caritashaiti.org, [email protected], [email protected], [email protected], [email protected], [email protected], info@caritas‐europa.org, [email protected], [email protected], coord@caritas‐africa.org, [email protected], [email protected], [email protected], [email protected], [email protected], [email protected], [email protected], [email protected], [email protected], [email protected], [email protected], [email protected], [email protected], [email protected], [email protected], [email protected], [email protected] Subject: Fwd: Herbalife Nutrition 7/25/2019 ‐ Herbalife Summary 8.26.2019
Los Refiero al correo al calce. Con exception de las partes con texto recalcado o El texto no el correo no ha sido modificado. Les hago notar la fecha del correo. Les reitero que un Auditor Publico no es un reportero, abogado o burócrata. Yo no estoy haciendo algo fuera de donde yo soy la experta global o estoy perdiendo el tiempo quejándome de tonterías. Estar alegando entre abogados, dando opiniones secretas, espiado y saboteando mis comunicaciones haciéndose pasar por los inteligentes u los expertos en entender y manejar riesgos para beneficio propio y otra que este documentado [AS ‐3 Audit Evidence Documentation Standards. Leyes Federales Sarbanes ‐Oxley, PCAOB). Como he mencionado en varios correos en el el proceso de globalizacion y estandarización se convirtieron las empresas corporativas en copias exactas en varios procesos i.e. esquemas para evasion de impuestos, lavado de dinero, desfalcar al erario publico, pensiones, etc. Ojo con el lenguaje que uso Replica Companies = Copy Cat Corporate Structure Empresas replica = copias fotostaticas de structuras corporativas Systemic Material Weakness in internal controls = Significan System vulnerabilities in IT systems and infrastructure Yo no estoy negando las cosas, o que soy parte del gobierno global. Lo que esta ocurriendo con los ejecutivos altamente educados, crema y nata de silicon valley que viven en el edificio de San Francisco donde esta el problema relacionado al seguro con mi propiedad me apena hasta a mi misma. Ojo somos los Carteles de contadores y abogados elite quienes les vendemos copias fotostaicas de las mismas "estrategias y servicios" que se desarrollan en Walmart u otras empresas a Herbalife, Uber etc. y nivel global y manejan el sistema global. El esquema de la condonación de impuestos = evasión de impuestos Nadie que lava dinero va a reportar impuestos. Estarian delatando sus crimenes.

24
La evidencia es publica y les recuerdo que publique la clave/password a esta cuenta de correo electrónico el cual contiene documentos, investigaciones y correos con este tipo de conversaciones no solo acerca de Herbalife. Ojo con el lenguaje que utilizo en correo al calce. No les vaya a explotar en la cara como el ataque cibernético masivo a los sistemas de instituciones de govierno y privadas de USA e Israel.... o el desplome de un avión Boeing en Indonesia. Les recuerdo que Walmart resolvio su investigacion en Agosto del 2019, la firma de abogados Irell & Manella, LLP se desbarato en Septiembre del 2019, Las autoridades financieras admitieron que existia un problema systemic en Septiembre del 2019, La SEC y otros reguladores abrieron una investigaciones en Septiembre y Octubre, Me destruyeron la propiedad de San Francisco el 23 de Octubre, etc.... Slds, Nancy Alfaro Begin forwarded message:
From: Nancy Alfaro <[email protected]> Date: August 26, 2019 at 6:33:49 PM PDT To: Julia Bailey <[email protected]> Cc: Henry Wang <[email protected]>, Patti Sabel <[email protected]>, [email protected] Subject: Herbalife Nutrition 7/25/2019
Dear Julia, First of all, happy anniversary. Is been a year since we came to a stand still on one of the most significant FCPA violations related to whistleblowers on the Mexican VAT tax audits which resulted on: 1) significant tax assessments in Mexico going back to 2005; 2) lobbying of Mexican Tax Officials to overturn HB’s the legal cases pending in the supreme court and 300 other legal VAT cases pending just in Mexico;
3) international money flows through HB’s offshore structures to the intermediaries secretly lobbying Senior Mexican Tax Officials and ultimately president PenaNieto; 4) the web of advisors structuring and facilitating the international money flows for such payments;
5) IT systems/entity work to avoid a)detection by the Mexican Tax Authorities and b) impacting the Mexican “budget” (segment reporting) on SEC filings. I believe HB’s primary focus has been to avoid discussing not just the FCPA violations inadvertently disclosed to me by Veronica Orijuela, Mexico’s Regulatory Affairs, with respect to the JV’s, Nutrition clubs and MoH, which was a similar scheme just disclosed on SEC filings about the ongoing SEJ/DOJ/Others investigations in China.

25
Before Herbalife, Ms. Orijuela was the Mexican IRS sub‐secretary‐ VAT, custom taxes. She is the Sister in law of the campaign manager that was running Meade PRI (presidential campaign), which President Obrador won. Veronica’s sister in law was also running and won a Senate position starting 2019 in addition to having direct access to president former PenaNieto. Mr. Riley, SVP Internal Audit, and Jarrell were present at the meetings where the secrecy around how Mrs. Orijuela was hired was discussed, the vendors that HB had engaged and that had structured a similar tax scheme for Walmart was also discussed. Mexican Executives discussed having brought up the issues to both CEO’s and being dismissed.
Mr Riley was also present when the issues around customs tax problems were discussed. Mr. Riley kept dismissing significant red flags in the first two days of my fieldwork. There was an earnings call the third day of fieldwork. Mr. Riley and I discussed my previous experience working on companies where Mr. Icahn had a significant investment and typical exit strategies, which HB had announced prior to the earnings call. The above matters became the background of the work that culminated with US Senior executives whistleblowing, specifically, SVP of internal audit allegations against Henry, Mark, both CEO’s and “every one” else knowing about it too. Unfortunately, my work at HB is now conflicting with other projects in my industry. I have shared and discussed the situation around this matters, IT systems, internal audit reports, memos, e‐mails, invoices, entities and payments that were provided to me and other specific items with relevant EY National Executives/EY’s legal counsel given my involvement with entities that are impacted by this matter. I intend to work with Ernst & Young on this matter given other work I am engaged in with them. I have been forthcoming about my concerns that Herbalife’s approach to my work impacting my clients in the private equity or government projects.
I have also been forthcoming about my understanding of PE’s offshore entity structuring, fraud investigations and specifically my familiarity with the Mexican culture around bribery and corruption. EY should be able to elaborate on my continuous focus on worldwide tax issues, systems and my involvement in training the Mexican Tax Authorities. The issue remains the negotiation of a severance package and the correction of my employment records at Herbalife. [READ: Whistle‐blower is Non‐negotiable]

26
Regards, Nancy
Initial Recipients [This section was added on January 11, 2021] [email protected], [email protected], [email protected], [email protected], [email protected], [email protected], [email protected], [email protected], [email protected], [email protected], [email protected], [email protected], [email protected], [email protected], [email protected], [email protected], charles@russia‐insider.com, moderator@russia‐insider.com, [email protected], [email protected], [email protected], [email protected], [email protected], [email protected], [email protected], [email protected], [email protected], [email protected], [email protected], [email protected], [email protected], [email protected], [email protected], [email protected], [email protected], [email protected], [email protected], [email protected], [email protected], [email protected], [email protected], [email protected], [email protected], [email protected], [email protected], [email protected], [email protected], [email protected], [email protected], [email protected], [email protected], [email protected], [email protected], caritas.info@caritas‐sy.com, [email protected], [email protected], [email protected], [email protected], [email protected], [email protected], [email protected], [email protected], [email protected], [email protected], [email protected], [email protected], [email protected], [email protected], [email protected], secretaria@communication‐caritashaiti.org, [email protected], [email protected], [email protected], [email protected], [email protected], info@caritas‐europa.org, [email protected], [email protected], coord@caritas‐africa.org, [email protected], [email protected], [email protected], [email protected], [email protected], [email protected], [email protected], [email protected], [email protected], [email protected], [email protected], [email protected], [email protected], [email protected], [email protected], [email protected], [email protected] urgent‐[email protected], [email protected], [email protected], [email protected], [email protected], [email protected], [email protected], [email protected], [email protected], [email protected], [email protected], [email protected],

27
[email protected], [email protected], [email protected], [email protected], [email protected], [email protected], [email protected], [email protected], [email protected], [email protected], [email protected], [email protected], [email protected], [email protected], [email protected], [email protected], [email protected], [email protected], [email protected], [email protected], [email protected], [email protected], [email protected], [email protected], [email protected], [email protected], [email protected], [email protected], [email protected], [email protected], [email protected], [email protected], [email protected], [email protected], [email protected], [email protected], [email protected], [email protected], [email protected], [email protected], [email protected], [email protected], [email protected]
Second List of recipients added on January 11, 2021 at 9:41 AM [email protected], [email protected], [email protected], [email protected], [email protected], [email protected], [email protected], [email protected], [email protected], [email protected], [email protected], [email protected], [email protected], [email protected], [email protected], [email protected], [email protected], [email protected], [email protected], [email protected], [email protected], [email protected], [email protected], [email protected], [email protected], [email protected], [email protected], [email protected], [email protected], [email protected], [email protected], [email protected], [email protected], [email protected], [email protected], [email protected], [email protected], [email protected], [email protected], [email protected], [email protected], [email protected], [email protected], poldep‐[email protected], [email protected], [email protected], margaret.varela‐[email protected], [email protected], [email protected], [email protected], [email protected], [email protected], [email protected], [email protected], [email protected], [email protected] [email protected], [email protected], [email protected], [email protected], [email protected], [email protected], [email protected], [email protected], [email protected], [email protected], [email protected], [email protected], [email protected], [email protected], [email protected], [email protected], [email protected], [email protected], [email protected], [email protected], [email protected], [email protected], [email protected], [email protected], [email protected], [email protected], [email protected], [email protected], [email protected], [email protected], [email protected], [email protected], [email protected], [email protected], [email protected], [email protected], [email protected], [email protected], [email protected], [email protected], [email protected], [email protected], [email protected], [email protected], [email protected], ed‐del‐[email protected],

28
[email protected], secy‐[email protected], [email protected], [email protected], [email protected], registrar‐[email protected], [email protected], [email protected] [email protected], [email protected], [email protected], [email protected], [email protected], [email protected], [email protected], [email protected], [email protected], [email protected], [email protected], [email protected], [email protected], [email protected], [email protected], [email protected], [email protected], [email protected], [email protected], [email protected], [email protected], [email protected], [email protected], [email protected], [email protected], [email protected], [email protected], [email protected], [email protected], [email protected], [email protected], [email protected], [email protected], [email protected], [email protected], [email protected], [email protected], [email protected], [email protected], [email protected], [email protected], [email protected], [email protected], [email protected], [email protected], [email protected], [email protected], [email protected], [email protected], [email protected], [email protected], [email protected], [email protected], SIGTARP‐[email protected], [email protected], [email protected], [email protected], [email protected], [email protected], [email protected], [email protected], [email protected], [email protected], USACAC.CV‐[email protected], [email protected], [email protected], [email protected], [email protected], [email protected], [email protected], [email protected], [email protected], [email protected], [email protected], [email protected], [email protected], [email protected], [email protected], [email protected], [email protected], [email protected], [email protected], [email protected], [email protected], [email protected], [email protected], [email protected], [email protected], [email protected], [email protected], [email protected], [email protected], [email protected], [email protected], [email protected], [email protected], [email protected], [email protected], [email protected], [email protected], [email protected], [email protected], [email protected], [email protected], [email protected], [email protected], [email protected], [email protected], [email protected], [email protected], [email protected], [email protected], [email protected], [email protected], [email protected], [email protected], [email protected], [email protected], [email protected], [email protected], [email protected], [email protected], [email protected], [email protected], [email protected], [email protected], [email protected], [email protected], [email protected], [email protected], [email protected], [email protected], [email protected], [email protected], [email protected], [email protected], [email protected], [email protected], [email protected], [email protected], [email protected], [email protected], [email protected], [email protected], [email protected], [email protected], [email protected], [email protected], [email protected], [email protected], [email protected], [email protected], [email protected], [email protected], [email protected], [email protected], [email protected], [email protected], [email protected], [email protected], [email protected], [email protected], [email protected], [email protected], [email protected], [email protected], [email protected], [email protected], [email protected], [email protected], [email protected], [email protected], [email protected], [email protected], [email protected], [email protected], [email protected], [email protected], [email protected], [email protected], [email protected], [email protected], [email protected], [email protected], [email protected], [email protected], [email protected], [email protected], [email protected], [email protected], [email protected], [email protected], [email protected], [email protected], [email protected],

29
[email protected], [email protected], [email protected], [email protected], [email protected], [email protected], [email protected], [email protected], [email protected], [email protected], [email protected], [email protected], [email protected], [email protected], [email protected], [email protected], [email protected] [email protected], [email protected], [email protected], [email protected], [email protected], [email protected], [email protected], [email protected], [email protected], [email protected], [email protected], [email protected], [email protected], mmatsumoto@pico‐rivera.org, [email protected], [email protected], [email protected], [email protected], [email protected], [email protected], [email protected], [email protected], [email protected], [email protected], [email protected], [email protected], [email protected], [email protected], [email protected], [email protected], [email protected], [email protected], [email protected], [email protected], [email protected], [email protected], Kasey.O'[email protected], [email protected], [email protected], [email protected], [email protected], [email protected], [email protected], [email protected], [email protected], [email protected], RA‐[email protected], [email protected], [email protected], [email protected], [email protected], [email protected], [email protected], [email protected], [email protected], [email protected], [email protected], [email protected], [email protected], [email protected], [email protected], [email protected], [email protected], [email protected], [email protected], [email protected], [email protected], [email protected], [email protected], [email protected], [email protected], [email protected], [email protected], [email protected], [email protected], [email protected], [email protected], [email protected], [email protected], [email protected], [email protected], [email protected], [email protected], [email protected], [email protected], [email protected], [email protected], [email protected], [email protected], [email protected], [email protected], [email protected], [email protected], [email protected], [email protected], [email protected], [email protected], [email protected], [email protected], edwin.k‐[email protected], REA_Finance_‐[email protected], [email protected], [email protected], [email protected], [email protected], [email protected], [email protected], [email protected], [email protected], [email protected], [email protected], [email protected]