Process Stability, Microstructure and Mechanical Properties of ...
Upload
independentCategory
view
1download
0
ARTICLE IN PRESS
0022-4596/$ - se
doi:10.1016/j.jss
�CorrespondE-mail addr
Journal of Solid State Chemistry 181 (2008) 685–692
www.elsevier.com/locate/jssc
Preparation of thin layer materials with macroporousmicrostructure for SOFC applications
D. Marrero-Lopeza, J.C. Ruiz-Moralesa, J. Pena-Martıneza, J. Canales-Vazquezb, P. Nuneza,�
aDepartment of Inorganic Chemistry, University of La Laguna, 38200 La Laguna, Tenerife, SpainbRenewable Energy Research Institute, Albacete Science & Technology Park, 02006 Albacete, Spain
Received 1 September 2007; received in revised form 24 November 2007; accepted 4 January 2008
Available online 11 January 2008
Abstract
A facile and versatile method using polymethyl methacrylate (PMMA) microspheres as pore formers has been developed to prepare
thin layer oxide materials with controlled macroporous microstructure. Several mixed oxides with fluorite and perovskite-type structures,
i.e. doped zirconia, ceria, ferrites, manganites, and NiO–YSZ composites have been prepared and characterised by X-ray diffraction
(XRD), scanning electron microscopy (SEM), transmission electron microscopy (TEM), nitrogen adsorption and mercury porosimetry.
The synthesised materials are nanocrystalline and present a homogeneous pore distribution and relatively high specific surface area,
which makes them interesting for SOFC and catalysis applications in the intermediate temperature range.
r 2008 Elsevier Inc. All rights reserved.
Keywords: SOFC; Electrolytes; Electrodes; PMMA; Macroporous materials
1. Introduction
One of the major targets for the development of solidoxide fuel cell (SOFCs) is the reduction of the operatingtemperatures [1–3]. Thus, different strategies have beenenvisaged as the development of thin film configurations[4], alternative electrolytes with higher conductivity thanthe stabilised zirconia [5–9] and new electrode materials[10–13]. Another key issue is the electrode microstructureas pore size, morphology and electrode porosity govern thetransport of gaseous species through the electrodes, henceaffecting the electrode performance [14]. Nowadays, theelectrodes are commonly deposited by screen-printing onthe electrolyte and the porosity is controlled using poreformers, which are generally organic compounds and/orgraphite [1,15]. However, it is difficult to control the poredistribution using this method, giving rise to microstruc-tures with non-uniform geometry and low specific surfaceareas. A precise control of the porosity and a larger specificsurface area of the electrode may improve the cell
e front matter r 2008 Elsevier Inc. All rights reserved.
c.2008.01.008
ing author. Fax: +3492 2318461.
ess: [email protected] (P. Nunez).
performance as a consequence of an increase in theconcentration of active sites where the electrochemicalreactions occur. Ruiz-Morales et al. [16] have recentlyreported that the performance of a cell with YSZelectrolyte, LSM–YSZ composite as cathode andNiO–YSZ as anode is improved by up to 30% using acombination of nanometric oxide powders and polymermicrospheres as pore former to control the porosity of theelectrodes. Previously, Zhang et al. [17] found that theelectrochemical performance of Ni–YSZ anode was nota-bly improved by optimising the porosity, using a similarprocedure. However, this method is only applicable whenthe starting oxide powders have a particle size distributionin the nanometric range, which is not always possible.Furthermore, the high firing temperatures required toensure good contact between particles causes a significantdecrease in the specific surface area of the startingnanoparticles due to particle agglomeration and sintering.Porous materials with high relative surface area can also
be obtained by using a colloidal crystal templating method[18–20]. In this case, a colloidal crystal template is preparedvia a regular arrangement of organic microspheres (e.g.polymethyl methacrylate PMMA). The interstices in the
ARTICLE IN PRESS
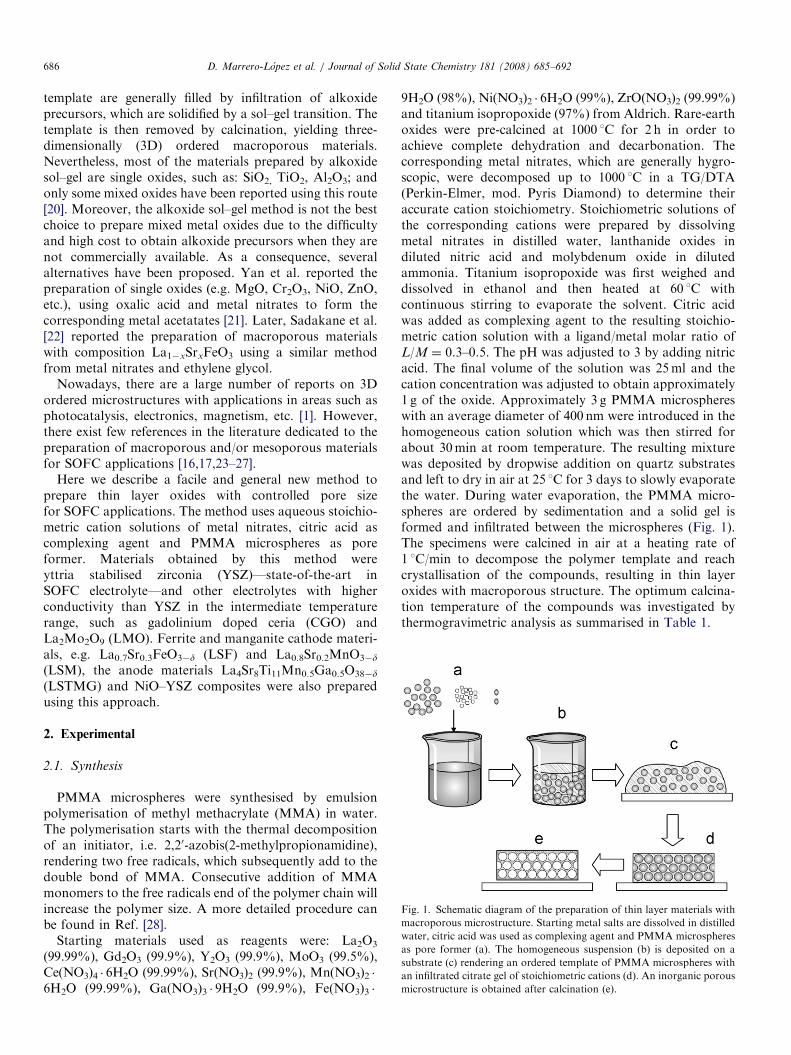
Fig. 1. Schematic diagram of the preparation of thin layer materials with
macroporous microstructure. Starting metal salts are dissolved in distilled
water, citric acid was used as complexing agent and PMMA microspheres
as pore former (a). The homogeneous suspension (b) is deposited on a
substrate (c) rendering an ordered template of PMMA microspheres with
an infiltrated citrate gel of stoichiometric cations (d). An inorganic porous
microstructure is obtained after calcination (e).
D. Marrero-Lopez et al. / Journal of Solid State Chemistry 181 (2008) 685–692686
template are generally filled by infiltration of alkoxideprecursors, which are solidified by a sol–gel transition. Thetemplate is then removed by calcination, yielding three-dimensionally (3D) ordered macroporous materials.Nevertheless, most of the materials prepared by alkoxidesol–gel are single oxides, such as: SiO2, TiO2, Al2O3; andonly some mixed oxides have been reported using this route[20]. Moreover, the alkoxide sol–gel method is not the bestchoice to prepare mixed metal oxides due to the difficultyand high cost to obtain alkoxide precursors when they arenot commercially available. As a consequence, severalalternatives have been proposed. Yan et al. reported thepreparation of single oxides (e.g. MgO, Cr2O3, NiO, ZnO,etc.), using oxalic acid and metal nitrates to form thecorresponding metal acetatates [21]. Later, Sadakane et al.[22] reported the preparation of macroporous materialswith composition La1�xSrxFeO3 using a similar methodfrom metal nitrates and ethylene glycol.
Nowadays, there are a large number of reports on 3Dordered microstructures with applications in areas such asphotocatalysis, electronics, magnetism, etc. [1]. However,there exist few references in the literature dedicated to thepreparation of macroporous and/or mesoporous materialsfor SOFC applications [16,17,23–27].
Here we describe a facile and general new method toprepare thin layer oxides with controlled pore sizefor SOFC applications. The method uses aqueous stoichio-metric cation solutions of metal nitrates, citric acid ascomplexing agent and PMMA microspheres as poreformer. Materials obtained by this method wereyttria stabilised zirconia (YSZ)—state-of-the-art inSOFC electrolyte—and other electrolytes with higherconductivity than YSZ in the intermediate temperaturerange, such as gadolinium doped ceria (CGO) andLa2Mo2O9 (LMO). Ferrite and manganite cathode materi-als, e.g. La0.7Sr0.3FeO3�d (LSF) and La0.8Sr0.2MnO3�d
(LSM), the anode materials La4Sr8Ti11Mn0.5Ga0.5O38�d
(LSTMG) and NiO–YSZ composites were also preparedusing this approach.
2. Experimental
2.1. Synthesis
PMMA microspheres were synthesised by emulsionpolymerisation of methyl methacrylate (MMA) in water.The polymerisation starts with the thermal decompositionof an initiator, i.e. 2,20-azobis(2-methylpropionamidine),rendering two free radicals, which subsequently add to thedouble bond of MMA. Consecutive addition of MMAmonomers to the free radicals end of the polymer chain willincrease the polymer size. A more detailed procedure canbe found in Ref. [28].
Starting materials used as reagents were: La2O3
(99.99%), Gd2O3 (99.9%), Y2O3 (99.9%), MoO3 (99.5%),Ce(NO3)4 � 6H2O (99.99%), Sr(NO3)2 (99.9%), Mn(NO3)2 �6H2O (99.99%), Ga(NO3)3 � 9H2O (99.9%), Fe(NO3)3 �
9H2O (98%), Ni(NO3)2 � 6H2O (99%), ZrO(NO3)2 (99.99%)and titanium isopropoxide (97%) from Aldrich. Rare-earthoxides were pre-calcined at 1000 1C for 2 h in order toachieve complete dehydration and decarbonation. Thecorresponding metal nitrates, which are generally hygro-scopic, were decomposed up to 1000 1C in a TG/DTA(Perkin-Elmer, mod. Pyris Diamond) to determine theiraccurate cation stoichiometry. Stoichiometric solutions ofthe corresponding cations were prepared by dissolvingmetal nitrates in distilled water, lanthanide oxides indiluted nitric acid and molybdenum oxide in dilutedammonia. Titanium isopropoxide was first weighed anddissolved in ethanol and then heated at 60 1C withcontinuous stirring to evaporate the solvent. Citric acidwas added as complexing agent to the resulting stoichio-metric cation solution with a ligand/metal molar ratio ofL/M ¼ 0.3–0.5. The pH was adjusted to 3 by adding nitricacid. The final volume of the solution was 25ml and thecation concentration was adjusted to obtain approximately1 g of the oxide. Approximately 3 g PMMA microsphereswith an average diameter of 400 nm were introduced in thehomogeneous cation solution which was then stirred forabout 30min at room temperature. The resulting mixturewas deposited by dropwise addition on quartz substratesand left to dry in air at 25 1C for 3 days to slowly evaporatethe water. During water evaporation, the PMMA micro-spheres are ordered by sedimentation and a solid gel isformed and infiltrated between the microspheres (Fig. 1).The specimens were calcined in air at a heating rate of1 1C/min to decompose the polymer template and reachcrystallisation of the compounds, resulting in thin layeroxides with macroporous structure. The optimum calcina-tion temperature of the compounds was investigated bythermogravimetric analysis as summarised in Table 1.
ARTICLE IN PRESS
Table 1
Composition, structural parameters of the synthesised macroporous materials
Composition Notation Ts (1C) Dcr (nm) s.g. Cell parameters (A) V (A3)
Ce0.8Gd0.2O2�d CGO 450 9 Fm-3m a ¼ 5.423(5) 159.35(3)
Zr0.8Y0.2O2�d YSZ 650 12 Fm-3m a ¼ 5.1435(4) 136.08(2)
La0.7Sr0.3FeO3�d LSF 650 20 Pbnm a ¼ 5:512ð4Þ
b ¼ 5:551ð4Þ
c ¼ 7:795ð5Þ
8><>:
238.57(3)
La0.8Sr0.2 MnO3�d LSM 600 22 R-3c a ¼ 5:482ð6Þ
b ¼ 13:32ð2Þ
(357.9(1)
La4Sr8Ti11Mn0.5Ga0.5O38�d LSTMG 650 22 Pm-3m a ¼ 3.903(3) 59.47(7)
La2Mo2O9 LMO 550 60 P21 a ¼ 7:043ð2Þ
b ¼ 7:131ð9Þ
c ¼ 7:12ð1Þ
b ¼ 89:68ð7Þ
8>>>><>>>>:
346.75(7)
NiO–YSZ NiO–YSZ 650 DYSZ ¼ 11 Fm-3m aYSZ ¼ 5.114(9) VYSZ ¼ 133.7(4)
DNi ¼ 18 aNi ¼ 4.177(8) VNi ¼ 72.8(2)
Note: Ts: firing temperature; Dcr: crystallite size; s.g.: space group.
0
0
0
20
40
60
80
100
TG(%
)
T(°C)
PMMA
YSZ
LMO
0
40
60
80
100
0
20
40
60
80
100
TG(%
)T(°C)
LMOsol-gel
200 400 600 800
150 300 450 600
DTA
(μV
)
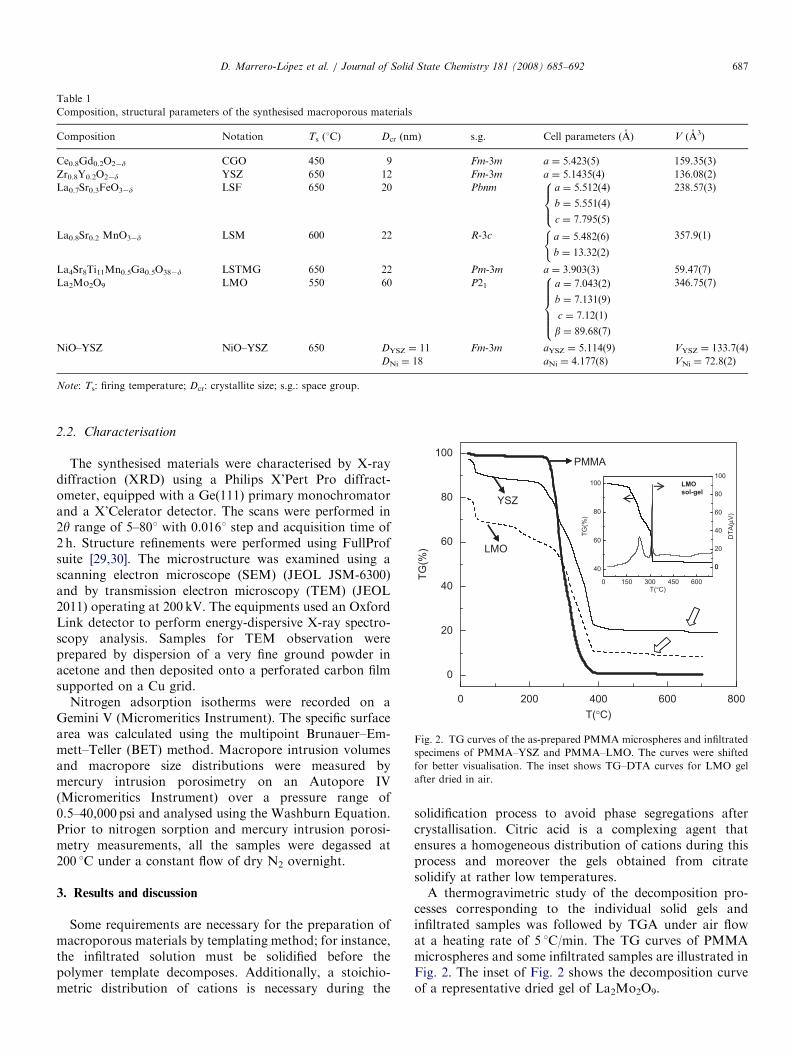
Fig. 2. TG curves of the as-prepared PMMA microspheres and infiltrated
specimens of PMMA–YSZ and PMMA–LMO. The curves were shifted
for better visualisation. The inset shows TG–DTA curves for LMO gel
after dried in air.
D. Marrero-Lopez et al. / Journal of Solid State Chemistry 181 (2008) 685–692 687
2.2. Characterisation
The synthesised materials were characterised by X-raydiffraction (XRD) using a Philips X’Pert Pro diffract-ometer, equipped with a Ge(111) primary monochromatorand a X’Celerator detector. The scans were performed in2y range of 5–801 with 0.0161 step and acquisition time of2 h. Structure refinements were performed using FullProfsuite [29,30]. The microstructure was examined using ascanning electron microscope (SEM) (JEOL JSM-6300)and by transmission electron microscopy (TEM) (JEOL2011) operating at 200 kV. The equipments used an OxfordLink detector to perform energy-dispersive X-ray spectro-scopy analysis. Samples for TEM observation wereprepared by dispersion of a very fine ground powder inacetone and then deposited onto a perforated carbon filmsupported on a Cu grid.
Nitrogen adsorption isotherms were recorded on aGemini V (Micromeritics Instrument). The specific surfacearea was calculated using the multipoint Brunauer–Em-mett–Teller (BET) method. Macropore intrusion volumesand macropore size distributions were measured bymercury intrusion porosimetry on an Autopore IV(Micromeritics Instrument) over a pressure range of0.5–40,000 psi and analysed using the Washburn Equation.Prior to nitrogen sorption and mercury intrusion porosi-metry measurements, all the samples were degassed at200 1C under a constant flow of dry N2 overnight.
3. Results and discussion
Some requirements are necessary for the preparation ofmacroporous materials by templating method; for instance,the infiltrated solution must be solidified before thepolymer template decomposes. Additionally, a stoichio-metric distribution of cations is necessary during the
solidification process to avoid phase segregations aftercrystallisation. Citric acid is a complexing agent thatensures a homogeneous distribution of cations during thisprocess and moreover the gels obtained from citratesolidify at rather low temperatures.A thermogravimetric study of the decomposition pro-
cesses corresponding to the individual solid gels andinfiltrated samples was followed by TGA under air flowat a heating rate of 5 1C/min. The TG curves of PMMAmicrospheres and some infiltrated samples are illustrated inFig. 2. The inset of Fig. 2 shows the decomposition curveof a representative dried gel of La2Mo2O9.
ARTICLE IN PRESSD. Marrero-Lopez et al. / Journal of Solid State Chemistry 181 (2008) 685–692688
As shown in Fig. 2, the PMMA microspheres begin todecompose from 275 1C and they are completely calcinedabove 385 1C. The infiltrated samples show differentdecomposition steps. A small weight loss is observed below50 1C corresponding to removal of residual water. Beforestarting the degradation of the polymer template a weightchange is observed, which is ascribed to dehydration and afirst decomposition step of the gel, possibly due to removalof NOx and carbon species. This is easier to observe in theinset of Fig. 2, where the weight loss for the gel ofLa2Mo2O9 occurs mainly below 300 1C, as suggested bytwo exothermic peaks observed at 225 and 300 1C, i.e.before the combustion of the PMMA microspheres. Thisresult indicates that solidification and partial decomposi-tion of the citrate gels occur before the PMMA templatedegradation; hence this method is suitable to obtainmacroporous materials. The complete decomposition ofthe infiltrated samples occurs between 450 and 700 1C as asmall weight loss observed at higher temperatures indi-cates, which may be ascribed to the elimination of residualcarbon species. The decomposition temperatures ofthe different macroporous materials are summarised inTable 1.
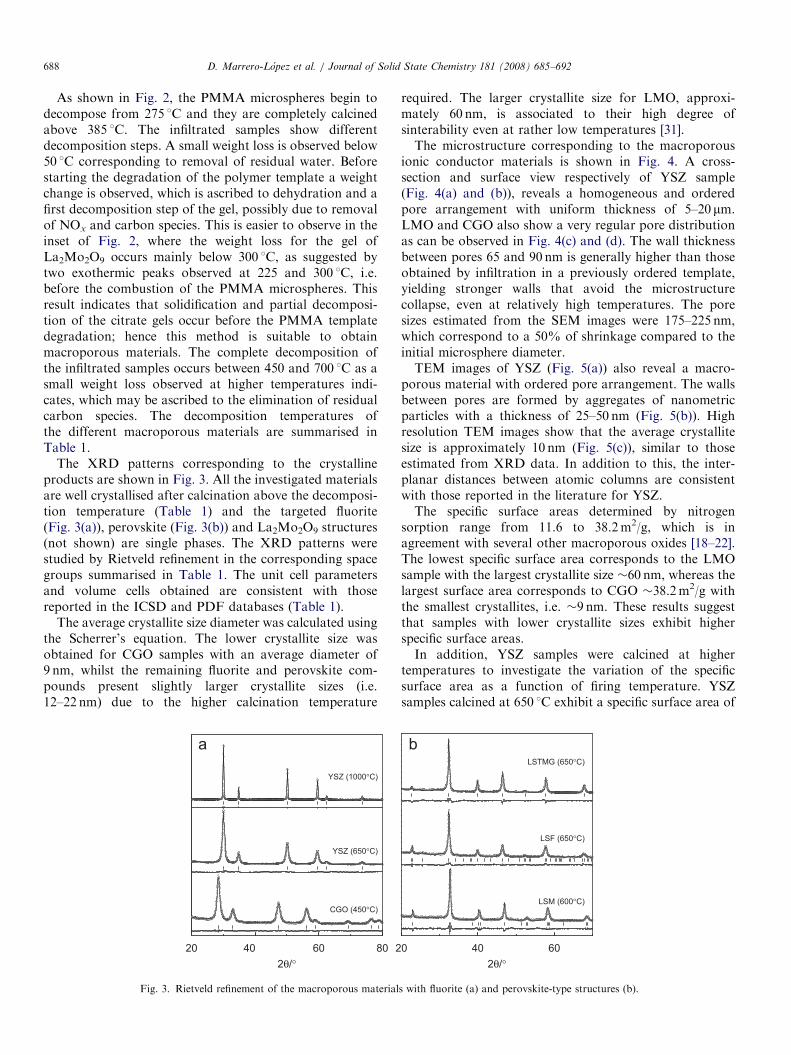
The XRD patterns corresponding to the crystallineproducts are shown in Fig. 3. All the investigated materialsare well crystallised after calcination above the decomposi-tion temperature (Table 1) and the targeted fluorite(Fig. 3(a)), perovskite (Fig. 3(b)) and La2Mo2O9 structures(not shown) are single phases. The XRD patterns werestudied by Rietveld refinement in the corresponding spacegroups summarised in Table 1. The unit cell parametersand volume cells obtained are consistent with thosereported in the ICSD and PDF databases (Table 1).
The average crystallite size diameter was calculated usingthe Scherrer’s equation. The lower crystallite size wasobtained for CGO samples with an average diameter of9 nm, whilst the remaining fluorite and perovskite com-pounds present slightly larger crystallite sizes (i.e.12–22 nm) due to the higher calcination temperature
202θ/°
2
CGO (450°C)
YSZ (650°C)
YSZ (1000°C)
40 60 80
Fig. 3. Rietveld refinement of the macroporous material
required. The larger crystallite size for LMO, approxi-mately 60 nm, is associated to their high degree ofsinterability even at rather low temperatures [31].The microstructure corresponding to the macroporous
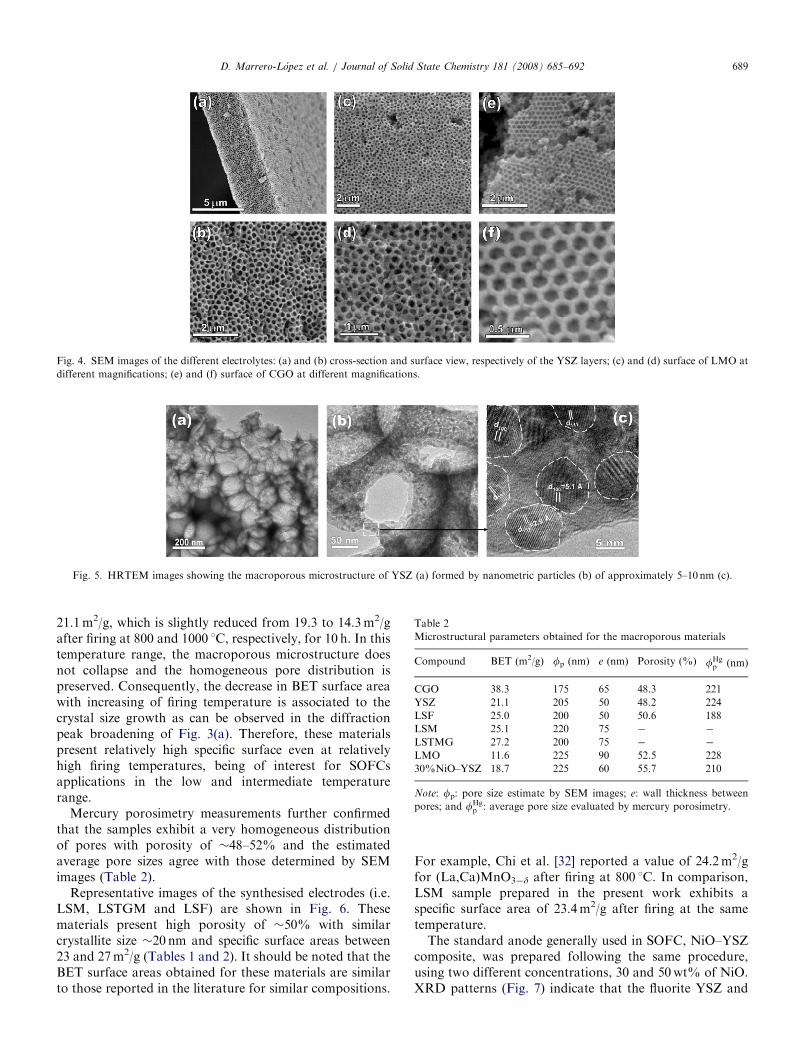
ionic conductor materials is shown in Fig. 4. A cross-section and surface view respectively of YSZ sample(Fig. 4(a) and (b)), reveals a homogeneous and orderedpore arrangement with uniform thickness of 5–20 mm.LMO and CGO also show a very regular pore distributionas can be observed in Fig. 4(c) and (d). The wall thicknessbetween pores 65 and 90 nm is generally higher than thoseobtained by infiltration in a previously ordered template,yielding stronger walls that avoid the microstructurecollapse, even at relatively high temperatures. The poresizes estimated from the SEM images were 175–225 nm,which correspond to a 50% of shrinkage compared to theinitial microsphere diameter.TEM images of YSZ (Fig. 5(a)) also reveal a macro-
porous material with ordered pore arrangement. The wallsbetween pores are formed by aggregates of nanometricparticles with a thickness of 25–50 nm (Fig. 5(b)). Highresolution TEM images show that the average crystallitesize is approximately 10 nm (Fig. 5(c)), similar to thoseestimated from XRD data. In addition to this, the inter-planar distances between atomic columns are consistentwith those reported in the literature for YSZ.The specific surface areas determined by nitrogen
sorption range from 11.6 to 38.2m2/g, which is inagreement with several other macroporous oxides [18–22].The lowest specific surface area corresponds to the LMOsample with the largest crystallite size �60 nm, whereas thelargest surface area corresponds to CGO �38.2m2/g withthe smallest crystallites, i.e. �9 nm. These results suggestthat samples with lower crystallite sizes exhibit higherspecific surface areas.In addition, YSZ samples were calcined at higher
temperatures to investigate the variation of the specificsurface area as a function of firing temperature. YSZsamples calcined at 650 1C exhibit a specific surface area of
2θ/°0
LSM (600°C)
LSF (650°C)
LSTMG (650°C)
40 60
s with fluorite (a) and perovskite-type structures (b).
ARTICLE IN PRESS
Fig. 4. SEM images of the different electrolytes: (a) and (b) cross-section and surface view, respectively of the YSZ layers; (c) and (d) surface of LMO at
different magnifications; (e) and (f) surface of CGO at different magnifications.
Fig. 5. HRTEM images showing the macroporous microstructure of YSZ (a) formed by nanometric particles (b) of approximately 5–10nm (c).
Table 2
Microstructural parameters obtained for the macroporous materials
Compound BET (m2/g) fp (nm) e (nm) Porosity (%) fHgp (nm)
CGO 38.3 175 65 48.3 221
YSZ 21.1 205 50 48.2 224
LSF 25.0 200 50 50.6 188
LSM 25.1 220 75 � �
LSTMG 27.2 200 75 � �
LMO 11.6 225 90 52.5 228
30%NiO–YSZ 18.7 225 60 55.7 210
Note: fp: pore size estimate by SEM images; e: wall thickness between
pores; and fHgp : average pore size evaluated by mercury porosimetry.
D. Marrero-Lopez et al. / Journal of Solid State Chemistry 181 (2008) 685–692 689
21.1m2/g, which is slightly reduced from 19.3 to 14.3m2/gafter firing at 800 and 1000 1C, respectively, for 10 h. In thistemperature range, the macroporous microstructure doesnot collapse and the homogeneous pore distribution ispreserved. Consequently, the decrease in BET surface areawith increasing of firing temperature is associated to thecrystal size growth as can be observed in the diffractionpeak broadening of Fig. 3(a). Therefore, these materialspresent relatively high specific surface even at relativelyhigh firing temperatures, being of interest for SOFCsapplications in the low and intermediate temperaturerange.
Mercury porosimetry measurements further confirmedthat the samples exhibit a very homogeneous distributionof pores with porosity of �48–52% and the estimatedaverage pore sizes agree with those determined by SEMimages (Table 2).
Representative images of the synthesised electrodes (i.e.LSM, LSTGM and LSF) are shown in Fig. 6. Thesematerials present high porosity of �50% with similarcrystallite size �20 nm and specific surface areas between23 and 27m2/g (Tables 1 and 2). It should be noted that theBET surface areas obtained for these materials are similarto those reported in the literature for similar compositions.
For example, Chi et al. [32] reported a value of 24.2m2/gfor (La,Ca)MnO3�d after firing at 800 1C. In comparison,LSM sample prepared in the present work exhibits aspecific surface area of 23.4m2/g after firing at the sametemperature.The standard anode generally used in SOFC, NiO–YSZ
composite, was prepared following the same procedure,using two different concentrations, 30 and 50wt% of NiO.XRD patterns (Fig. 7) indicate that the fluorite YSZ and
ARTICLE IN PRESS
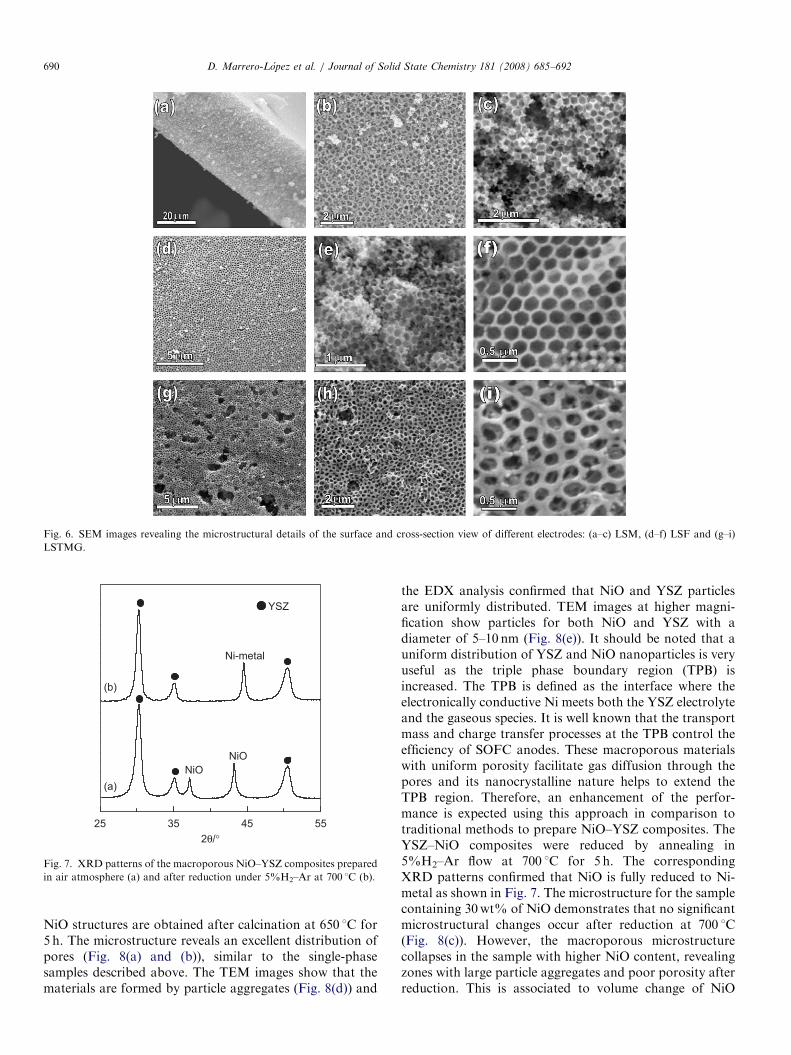
Fig. 6. SEM images revealing the microstructural details of the surface and cross-section view of different electrodes: (a–c) LSM, (d–f) LSF and (g–i)
LSTMG.
NiONiO
YSZ
(a)
(b)
252θ/°
Ni-metal
35 45 55
Fig. 7. XRD patterns of the macroporous NiO–YSZ composites prepared
in air atmosphere (a) and after reduction under 5%H2–Ar at 700 1C (b).
D. Marrero-Lopez et al. / Journal of Solid State Chemistry 181 (2008) 685–692690
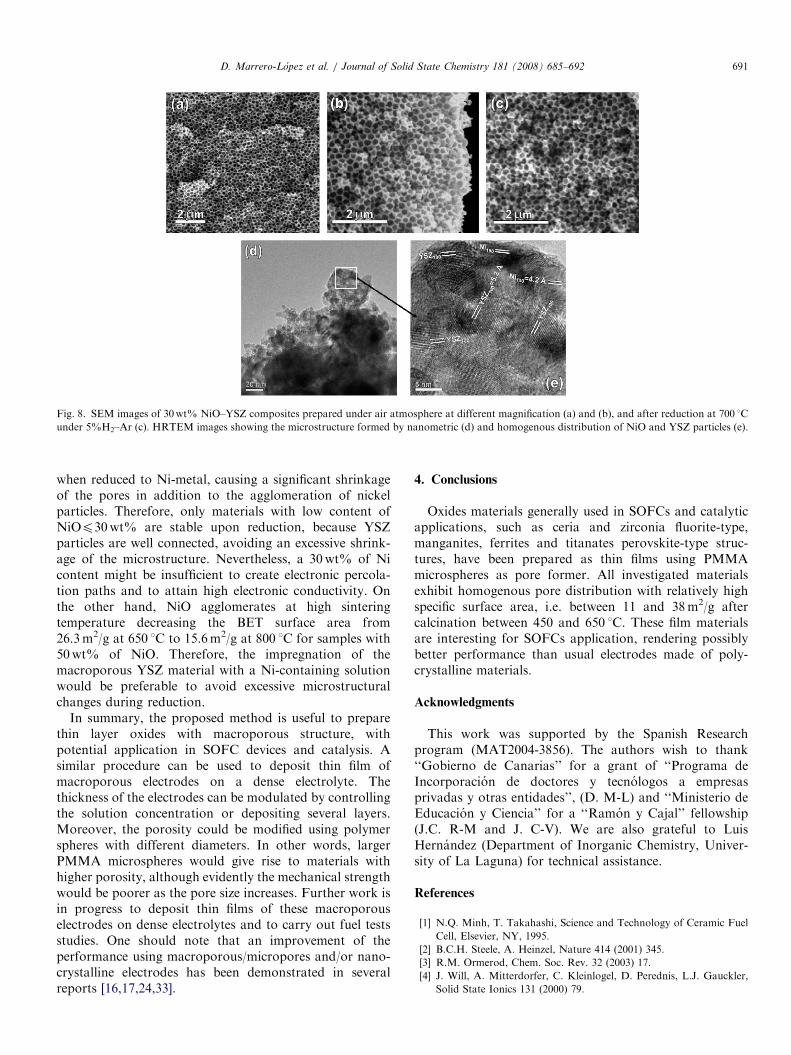
NiO structures are obtained after calcination at 650 1C for5 h. The microstructure reveals an excellent distribution ofpores (Fig. 8(a) and (b)), similar to the single-phasesamples described above. The TEM images show that thematerials are formed by particle aggregates (Fig. 8(d)) and
the EDX analysis confirmed that NiO and YSZ particlesare uniformly distributed. TEM images at higher magni-fication show particles for both NiO and YSZ with adiameter of 5–10 nm (Fig. 8(e)). It should be noted that auniform distribution of YSZ and NiO nanoparticles is veryuseful as the triple phase boundary region (TPB) isincreased. The TPB is defined as the interface where theelectronically conductive Ni meets both the YSZ electrolyteand the gaseous species. It is well known that the transportmass and charge transfer processes at the TPB control theefficiency of SOFC anodes. These macroporous materialswith uniform porosity facilitate gas diffusion through thepores and its nanocrystalline nature helps to extend theTPB region. Therefore, an enhancement of the perfor-mance is expected using this approach in comparison totraditional methods to prepare NiO–YSZ composites. TheYSZ–NiO composites were reduced by annealing in5%H2–Ar flow at 700 1C for 5 h. The correspondingXRD patterns confirmed that NiO is fully reduced to Ni-metal as shown in Fig. 7. The microstructure for the samplecontaining 30wt% of NiO demonstrates that no significantmicrostructural changes occur after reduction at 700 1C(Fig. 8(c)). However, the macroporous microstructurecollapses in the sample with higher NiO content, revealingzones with large particle aggregates and poor porosity afterreduction. This is associated to volume change of NiO
ARTICLE IN PRESS
Fig. 8. SEM images of 30wt% NiO–YSZ composites prepared under air atmosphere at different magnification (a) and (b), and after reduction at 700 1C
under 5%H2–Ar (c). HRTEM images showing the microstructure formed by nanometric (d) and homogenous distribution of NiO and YSZ particles (e).
D. Marrero-Lopez et al. / Journal of Solid State Chemistry 181 (2008) 685–692 691
when reduced to Ni-metal, causing a significant shrinkageof the pores in addition to the agglomeration of nickelparticles. Therefore, only materials with low content ofNiOp30wt% are stable upon reduction, because YSZparticles are well connected, avoiding an excessive shrink-age of the microstructure. Nevertheless, a 30wt% of Nicontent might be insufficient to create electronic percola-tion paths and to attain high electronic conductivity. Onthe other hand, NiO agglomerates at high sinteringtemperature decreasing the BET surface area from26.3m2/g at 650 1C to 15.6m2/g at 800 1C for samples with50wt% of NiO. Therefore, the impregnation of themacroporous YSZ material with a Ni-containing solutionwould be preferable to avoid excessive microstructuralchanges during reduction.
In summary, the proposed method is useful to preparethin layer oxides with macroporous structure, withpotential application in SOFC devices and catalysis. Asimilar procedure can be used to deposit thin film ofmacroporous electrodes on a dense electrolyte. Thethickness of the electrodes can be modulated by controllingthe solution concentration or depositing several layers.Moreover, the porosity could be modified using polymerspheres with different diameters. In other words, largerPMMA microspheres would give rise to materials withhigher porosity, although evidently the mechanical strengthwould be poorer as the pore size increases. Further work isin progress to deposit thin films of these macroporouselectrodes on dense electrolytes and to carry out fuel testsstudies. One should note that an improvement of theperformance using macroporous/micropores and/or nano-crystalline electrodes has been demonstrated in severalreports [16,17,24,33].
4. Conclusions
Oxides materials generally used in SOFCs and catalyticapplications, such as ceria and zirconia fluorite-type,manganites, ferrites and titanates perovskite-type struc-tures, have been prepared as thin films using PMMAmicrospheres as pore former. All investigated materialsexhibit homogenous pore distribution with relatively highspecific surface area, i.e. between 11 and 38m2/g aftercalcination between 450 and 650 1C. These film materialsare interesting for SOFCs application, rendering possiblybetter performance than usual electrodes made of poly-crystalline materials.
Acknowledgments
This work was supported by the Spanish Researchprogram (MAT2004-3856). The authors wish to thank‘‘Gobierno de Canarias’’ for a grant of ‘‘Programa deIncorporacion de doctores y tecnologos a empresasprivadas y otras entidades’’, (D. M-L) and ‘‘Ministerio deEducacion y Ciencia’’ for a ‘‘Ramon y Cajal’’ fellowship(J.C. R-M and J. C-V). We are also grateful to LuisHernandez (Department of Inorganic Chemistry, Univer-sity of La Laguna) for technical assistance.
References
[1] N.Q. Minh, T. Takahashi, Science and Technology of Ceramic Fuel
Cell, Elsevier, NY, 1995.
[2] B.C.H. Steele, A. Heinzel, Nature 414 (2001) 345.
[3] R.M. Ormerod, Chem. Soc. Rev. 32 (2003) 17.
[4] J. Will, A. Mitterdorfer, C. Kleinlogel, D. Perednis, L.J. Gauckler,
Solid State Ionics 131 (2000) 79.
ARTICLE IN PRESSD. Marrero-Lopez et al. / Journal of Solid State Chemistry 181 (2008) 685–692692
[5] M. Goedickemeier, L.J. Gauckler, J. Electrochem. Soc. 145 (1998)
414.
[6] M. Mogensen, N.M. Sammes, G.A. Tompsett, Solid State Ionics 129
(2000) 63.
[7] T. Ishihara, H. Matsuda, Y. Takita, J. Am. Chem. Soc. 116 (1994)
3801.
[8] P. Lacorre, F. Goutenoire, O. Bohnke, R. Retoux, Y. Laligant,
Nature 404 (2000) 856.
[9] V.V. Kharton, F.M.B. Marques, A. Atkinson, Solid State Ionics 174
(2004) 135.
[10] A. Atkinson, S. Barnett, R.J. Gorte, J.T.S. Irvine, A.J. McEvoy,
M. Mogensen, S.C. Singhal, J. Vohs, Nat. Mater. 3 (2004) 17.
[11] J.C. Ruiz-Morales, J. Canales-Vazquez, C. Savaniu, D. Marrero-
Lopez, W. Zhou, J.T.S. Irvine, Nature 439 (2006) 568.
[12] S.W. Tao, J.T.S. Irvine, Nat. Mater. 2 (2003) 320.
[13] Y.H. Huang, R.I. Dass, Z.L. Xing, J.B. Goodenough, Science 312
(2006) 254.
[14] A.S. Joshi, K.N. Grew, A.A. Peracchio, W.K.S. Chiu, J. Power
Sources 164 (2007) 631.
[15] R.M.C. Clemmer, S.F. Corbin, Solid State Ionics 166 (2004) 251.
[16] J.C. Ruiz-Morales, J. Canales-Vazquez, J. Pena-Martınez, D. Mar-
rero-Lopez, J.T.S. Irvine, P. Nunez, J. Mater. Chem. 16 (2006) 540.
[17] Y.L. Zhang, S.W. Zha, M.L. Liu, Adv. Mater. 17 (2005) 487.
[18] R.C. Schroden, A. Stein, in: F. Caruso (Ed.), 3D Ordered
Macroporous Material, Colloids and Colloid Assemblies, Willey-
VCH Verlag KgaA, Weinhein, Germany, 2004, pp. 465–493.
[19] A. Stein, Microporous Mesoporous Mater. 44 (2001) 227.
[20] M.C. Carbajo, A. Gomez, M.J. Torralvo, E. Enciso, J. Mater. Chem.
12 (2002) 2740.
[21] H. Yan, C. Christopher, F. Blandford, B.T. Holland, W.H. Smyrl,
A. Stein, Chem. Mater. 12 (2000) 1134.
[22] M. Sadakane, T. Asanuma, J. Kubo, W. Ueda, Chem. Mater. 17
(2005) 3546.
[23] M. Boaro, J.M. Vohs, R.J. Gorte, J. Am. Ceram. Soc. 86 (2003) 395.
[24] M. Mamak, N. Coombs, G.A. Ozin, Chem. Commun. 20 (2002)
2300.
[25] M. Mamak, N. Coombs, G.A. Ozin, J. Am. Chem. Soc. 122 (2000)
8932.
[26] Y.-H. Koh, J.-J. Sun, H.-E. Kim, Mater. Lett. 61 (2007) 1283.
[27] I.M. Hung, H.P. Wang, W.H. Lai, K.Z. Fung, M.H. Hon,
Electrochim. Acta 50 (2004) 745.
[28] D. Zou, J.J. Aklonis, R. Salovey, J. Polym. Sci. Part A: Polym.
Chem. 30 (1992) 2443.
[29] J. Rodrıguez-Carvajal, Phys. B: Condens. Matter 192 (1993) 55.
[30] T. Roisnel, J. Rodrıguez-Carvajal, WinPLOTR, Laboratoire Leon
Brillouin-LCSI, France, 2005.
[31] D. Marrero-Lopez, J. Pena-Martınez, D. Perez-Coll, P. Nunez,
J. Alloys Compd. 422 (2006) 249.
[32] E.O. Chi, Y.N. Kim, J.C. Kim, N.H. Hur, Chem. Mater. 15 (2003)
1929.
[33] J.M. Serra, S. Uhlenbruck, W.A. Meulenberg, H.P. Buchkremer,
D. Stover, Top. Catal. 40 (2006) 123.
Copyright © 2022 FDOKUMEN