Surface characterization of macroporous glycidyl methacrylate based copolymers by inverse gas...
9
Surface characterization of macroporous glycidyl methacrylate based copolymers by inverse gas chromatography A.B. Nastasovic ´ a, * , A.E. Onjia b , S.K. Milonjic ´ b , S.M. Jovanovic ´ c a Institute for Chemistry, Technology and Metallurgy, Center for Chemistry, Studentski trg 12–16, 11001 Belgrade, Serbia and Montenegro b Vinc ˇa Institute of Nuclear Sciences, Chemical Dynamics Laboratory, P.O. Box 522, 11001 Belgrade, Serbia and Montenegro c Faculty of Technology and Metallurgy, Karnegijeva 4, 11001 Belgrade, Serbia and Montenegro Received 21 October 2004; received in revised form 21 December 2004; accepted 22 December 2004 Available online 26 January 2005 Abstract Two samples of macroporous crosslinked poly(glycidyl methacrylate-co-ethylene glycol dimethacrylate), PGME, with different porosity parameters were synthesized by suspension copolymerization and modified by ring-opening reac- tion of the pendant epoxy groups with ethylene diamine, EDA. Inverse gas chromatography at infinite dilution was used for the determination of adsorption properties of PGME, and copolymer modified with ethylene diamine, PGME-en. Thermodynamic parameters of adsorption, dispersive components of the surface free energies, and the acid/base constants for the copolymer samples were calculated. The calculated dispersive surface energy values, c d S , for PGME and PGME-en are comparable with the literature data for nonconductive polymers. Ó 2005 Elsevier Ltd. All rights reserved. Keywords: Thermodynamic parameters; Adsorption; Inverse gas chromatography; Glycidyl methacrylate based copolymers 1. Introduction Inverse gas chromatography (IGC) has been used for investigations of the structure of polymers, interactions of various liquids and gases with polymeric materials, and polymer–polymer miscibility [1–17]. The method being simple, relatively rapid, with good accuracy, low cost and available equipment provides valuable ther- modynamic information for physico-chemical character- ization of polymers. The analysis of the adsorption properties of macroporous crosslinked poly(glycidyl methacrylate-co-ethylene glycol dimethacrylate), [abbre- viated PGME] and copolymer with attached ethylene diamine, [abbreviated PGME-en] is particularly interest- ing, bearing in mind their use in biotechnological and biomedical applications, heavy and platinum metal sorption, catalysis, etc. [18–23]. Yet, only a few data regarding surface properties of PGME were published [24]. However, no data have been found in the literature on PGME-en surface properties, in terms of the Lewis acid/base properties and surface free energy. This paper reports investigations of the surface properties of PGME and PGME-en by IGC at infinite dilution. Retentions of ten organic compounds of different chem- ical nature and polarity (non-polar, donor or acceptor) 0014-3057/$ - see front matter Ó 2005 Elsevier Ltd. All rights reserved. doi:10.1016/j.eurpolymj.2004.12.020 * Corresponding author. Tel./fax: +38 111 635 839. E-mail address: [email protected] (A.B. Nastasovic ´). EUROPEAN POLYMER JOURNAL European Polymer Journal 41 (2005) 1234–1242 www.elsevier.com/locate/europolj
Transcript of Surface characterization of macroporous glycidyl methacrylate based copolymers by inverse gas...
EUROPEAN
POLYMERJOURNALEuropean Polymer Journal 41 (2005) 1234–1242
www.elsevier.com/locate/europolj
Surface characterization of macroporous glycidylmethacrylate based copolymers by inverse gas chromatography
A.B. Nastasovic a,*, A.E. Onjia b, S.K. Milonjic b, S.M. Jovanovic c
a Institute for Chemistry, Technology and Metallurgy, Center for Chemistry, Studentski trg 12–16, 11001 Belgrade,
Serbia and Montenegrob Vinca Institute of Nuclear Sciences, Chemical Dynamics Laboratory, P.O. Box 522, 11001 Belgrade, Serbia and Montenegro
c Faculty of Technology and Metallurgy, Karnegijeva 4, 11001 Belgrade, Serbia and Montenegro
Received 21 October 2004; received in revised form 21 December 2004; accepted 22 December 2004
Available online 26 January 2005
Abstract
Two samples of macroporous crosslinked poly(glycidyl methacrylate-co-ethylene glycol dimethacrylate), PGME,
with different porosity parameters were synthesized by suspension copolymerization and modified by ring-opening reac-
tion of the pendant epoxy groups with ethylene diamine, EDA. Inverse gas chromatography at infinite dilution was
used for the determination of adsorption properties of PGME, and copolymer modified with ethylene diamine,
PGME-en. Thermodynamic parameters of adsorption, dispersive components of the surface free energies, and the
acid/base constants for the copolymer samples were calculated. The calculated dispersive surface energy values, cdS,for PGME and PGME-en are comparable with the literature data for nonconductive polymers.
� 2005 Elsevier Ltd. All rights reserved.
Keywords: Thermodynamic parameters; Adsorption; Inverse gas chromatography; Glycidyl methacrylate based copolymers
1. Introduction
Inverse gas chromatography (IGC) has been used for
investigations of the structure of polymers, interactions
of various liquids and gases with polymeric materials,
and polymer–polymer miscibility [1–17]. The method
being simple, relatively rapid, with good accuracy, low
cost and available equipment provides valuable ther-
modynamic information for physico-chemical character-
ization of polymers. The analysis of the adsorption
0014-3057/$ - see front matter � 2005 Elsevier Ltd. All rights reserv
doi:10.1016/j.eurpolymj.2004.12.020
* Corresponding author. Tel./fax: +38 111 635 839.
E-mail address: [email protected] (A.B.
Nastasovic).
properties of macroporous crosslinked poly(glycidyl
methacrylate-co-ethylene glycol dimethacrylate), [abbre-
viated PGME] and copolymer with attached ethylene
diamine, [abbreviated PGME-en] is particularly interest-
ing, bearing in mind their use in biotechnological and
biomedical applications, heavy and platinum metal
sorption, catalysis, etc. [18–23]. Yet, only a few data
regarding surface properties of PGME were published
[24]. However, no data have been found in the literature
on PGME-en surface properties, in terms of the Lewis
acid/base properties and surface free energy. This paper
reports investigations of the surface properties of
PGME and PGME-en by IGC at infinite dilution.
Retentions of ten organic compounds of different chem-
ical nature and polarity (non-polar, donor or acceptor)
ed.
A.B. Nastasovic et al. / European Polymer Journal 41 (2005) 1234–1242 1235
were measured in the temperature range 333–363 K. The
thermodynamic parameters of adsorption (enthalpy and
entropy), the dispersive and specific interactions of var-
ious organics, as well as the KD and KA values which
describe the ability of a polymer surface to act as elec-
tron acceptor or donor, were calculated for the initial
and the modified macroporous copolymer samples and
compared.
2. Experimental
Two macroporous PGME samples with different
porosity parameters were synthesized by a radical sus-
pension copolymerization [25]. The monomer phase
(80.9 g) containing a monomer mixture (24.2 g GMA
and 10.3 g EGDMA), azobisisobytironitrile (AIBN) as
an initiator (0.8 g), and 45.6 g of inert component (cyclo-
hexanol and tetradecanol) was suspended in the aqueous
phase consisting of 237.6 g of water and 2.4 g of poly(N-
vinyl pyrrolidone), Kollidone 90. The copolymerization
was carried out at 70 �C for 2 h and at 80 �C for 6 h at a
stirring rate of 200 rpm. After completion of the reac-
tion, the copolymer particles were washed with water
and ethanol, kept in ethanol for 12 h and dried in vac-
uum at 40 �C. The synthesized samples were purified
by the Soxhlet extraction with ethanol. The samples pre-
pared in this way were labeled as 1 (10 wt% of dodecanol
in the inert component) and 2 (20 wt% of dodecanol in
the inert component). For further investigations, a frac-
tion with particle size of 150–500 lm was used.
Synthesized copolymer samples were modified with
tenfold excess of ethylene diamine in toluene at 70 �Cfor 7 h. Modified samples were filtered, washed with eth-
anol, dried, and labeled as 1a and 2a.
Specific surface areas of obtained copolymers were
determined by the BET method from the low-tempera-
ture nitrogen adsorption isotherms obtained at 77 K
using a high-vacuum volumetric apparatus. The samples
were degassed at 373 K and 1 mPa for 2 h. The values
found for PGME samples 1 and 2 were 46.7 and
27.6 m2/g, respectively. The specific surface areas of
PGME-en samples 1a and 2a were 57.6 and 48.6 m2/g,
respectively.
Adsorption properties of the prepared copolymer
samples were examined using a Hewlett Packard 5890
Series II gas chromatograph, with a flame ionization
detector (FID) maintained at 250 �C. The detector oper-ated in its maximum sensitivity mode and Varian Star
4.5 software was employed to collect the data. To ensure
flash vaporization of the adsorbate vapor, the injector
was set at 220 �C. Dry nitrogen at a flow rate in the
range from 24 to 28 cm3/min was used as the carrier
gas, while methane as an unretained compound, was
used to determine the dead volume. The column flow
was controlled by a soap-bubble flowmeter and the out-
let pressure, assumed to be atmospheric, measured by a
precision barometer. Appropriate corrections to the
pressure drop through the column were made on the
basis of the pressure at the inlet and outlet ports.
A stainless steel column, 50 cm long and 2.2 mm i.d.,
was cleaned with both polar (C2H5OH) and nonpolar
(C6H14) solvents prior to packing. After each packing,
the column was conditioned overnight in a stream of
nitrogen (flow rate 5 cm3/min) at 363 K.
The organic adsorbates (obtained from various com-
mercial sources) were of analytical grade and injected
into the chromatograph by means of a 1 ll Hamilton
microsyringe. Each adsorbate was injected at least three
times and retention times were averaged. These mean
retention times were used in further calculations of the
net retention volumes. Retention times for each adsor-
bate with all copolymer samples were measured in the
temperature range from 333 to 363 K, at 10 K interval.
To ensure a valid approximation of zero coverage, min-
imum detectable amounts of adsorbate vapor were in-
jected. Relevant IGC results from the retention data
collected were calculated by a program developed for
the purpose [26].
3. Results and discussion
The sorption properties of macroporous copolymer
samples were investigated at infinite dilution conditions
(Henry�s law region), where lateral interactions between
the molecules adsorbed at the surface can be neglected.
Well-defined Gaussian peaks for the same retention
volumes of repeated injections of various small quanti-
ties of adsorbate vapor indicate that the measurements
were performed at the linear part of the adsorbate
isotherms.
The theory relating IGC data to the surface proper-
ties of solids is given in details elsewhere [27,28]. In
IGC at infinite dilution, the thermodynamic functions
of adsorption of organic compounds onto an adsorbent,
packed into a chromatographic column, may be calcu-
lated from the adsorbate net retention volume, VN, as
follows:
V N ¼ ðtR � t0ÞF f
TT f
� �p0 � pW
p0
� �j; ð1Þ
where tR is the adsorbate retention time, t0 is the reten-
tion time of an unretained compound (in our case meth-
ane), Ff, is the flow rate measured with a soap bubble
flowmeter at temperature Tf, T is the column tempera-
ture, p0 is the column outlet pressure (taken as baromet-
ric), pW is the vapor pressure of water at Tf, and j is the
James–Martin gas compressibility correction factor.
The surface partition coefficient, KS, defined as the
net retention volume per unit of the adsorbent surface
area, was calculated as:
1236 A.B. Nastasovic et al. / European Polymer Journal 41 (2005) 1234–1242
KS ¼V N
mSa
; ð2Þ
where Sa, is the specific surface area of polymer and m is
the mass of polymer in the column.
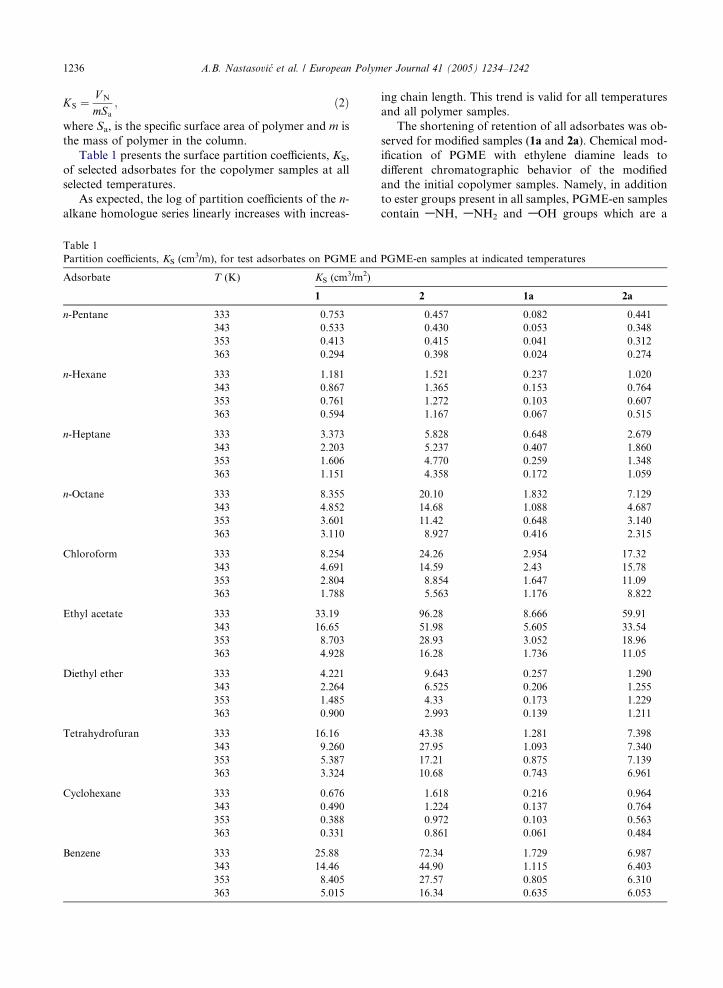
Table 1 presents the surface partition coefficients, KS,
of selected adsorbates for the copolymer samples at all
selected temperatures.
As expected, the log of partition coefficients of the n-
alkane homologue series linearly increases with increas-
Table 1
Partition coefficients, KS (cm3/m), for test adsorbates on PGME and
Adsorbate T (K) KS (cm3/m2)
1
n-Pentane 333 0.753
343 0.533
353 0.413
363 0.294
n-Hexane 333 1.181
343 0.867
353 0.761
363 0.594
n-Heptane 333 3.373
343 2.203
353 1.606
363 1.151
n-Octane 333 8.355
343 4.852
353 3.601
363 3.110
Chloroform 333 8.254
343 4.691
353 2.804
363 1.788
Ethyl acetate 333 33.19
343 16.65
353 8.703
363 4.928
Diethyl ether 333 4.221
343 2.264
353 1.485
363 0.900
Tetrahydrofuran 333 16.16
343 9.260
353 5.387
363 3.324
Cyclohexane 333 0.676
343 0.490
353 0.388
363 0.331
Benzene 333 25.88
343 14.46
353 8.405
363 5.015
ing chain length. This trend is valid for all temperatures
and all polymer samples.
The shortening of retention of all adsorbates was ob-
served for modified samples (1a and 2a). Chemical mod-
ification of PGME with ethylene diamine leads to
different chromatographic behavior of the modified
and the initial copolymer samples. Namely, in addition
to ester groups present in all samples, PGME-en samples
contain ANH, ANH2 and AOH groups which are a
PGME-en samples at indicated temperatures
2 1a 2a
0.457 0.082 0.441
0.430 0.053 0.348
0.415 0.041 0.312
0.398 0.024 0.274
1.521 0.237 1.020
1.365 0.153 0.764
1.272 0.103 0.607
1.167 0.067 0.515
5.828 0.648 2.679
5.237 0.407 1.860
4.770 0.259 1.348
4.358 0.172 1.059
20.10 1.832 7.129
14.68 1.088 4.687
11.42 0.648 3.140
8.927 0.416 2.315
24.26 2.954 17.32
14.59 2.43 15.78
8.854 1.647 11.09
5.563 1.176 8.822
96.28 8.666 59.91
51.98 5.605 33.54
28.93 3.052 18.96
16.28 1.736 11.05
9.643 0.257 1.290
6.525 0.206 1.255
4.33 0.173 1.229
2.993 0.139 1.211
43.38 1.281 7.398
27.95 1.093 7.340
17.21 0.875 7.139
10.68 0.743 6.961
1.618 0.216 0.964
1.224 0.137 0.764
0.972 0.103 0.563
0.861 0.061 0.484
72.34 1.729 6.987
44.90 1.115 6.403
27.57 0.805 6.310
16.34 0.635 6.053

2
3
4
1 n-C5
n-C6
n-C7
n-C8
A.B. Nastasovic et al. / European Polymer Journal 41 (2005) 1234–1242 1237
result of modification with EDA. Moreover, for macro-
porous copolymers, an additional explanation was sug-
gested in the literature. Shorten n-alkane retention
times for macroporous PGME modified with ethanol
amine compared with those for the initial copolymer,
Lukas et al. [29] explain by the change in internal struc-
ture, i.e. pore distribution, caused by chemical modifica-
tion. The fact that our values of specific surface area for
modified samples are higher than those for the corre-
sponding initial ones, substantiates our assumption that
internal structure actually changes due to modification
with EDA. Different chromatographic behavior of
poly(methyl methacrylate-co-ethylene glycol dimethac-
rylate), PMME, and PGME was observed by Onjia et
al. [24]. The higher KS values for PMME for all adsor-
bates, with the exception of methanol and phenol, they
explained by the presence of epoxy groups in PGME,
which made it more polar than PMME.
Longer retention of benzene in comparison with that
of n-hexane, observed for all samples, can be ascribed to
the contribution of three p-bonds in the benzene ring,
which are capable of interacting specifically with the
polymer surfaces.
In gas/solid partition chromatography (GSC), lower
KS values for c-C6H12 than for the corresponding n-al-
kane (n-C6H14) are commonly observed [26]. For geo-
metric reasons, the six C-atoms can simultaneously
approach the plane in the case of n-C6H14, whereas only
three or four of them in the case of c-C6H12. This is a
consequence of the existence of both ‘‘boat’’ and ‘‘chair’’
isomers of cyclohexane causing a steric effect on
adsorption.
2.75 2.80 2.85 2.90 2.95 3.00 3.05
-1
0
1lnK
s
T-1 103, K-1
CHCl3
EtAcDEETHFc-C
6
Benzene
2.75 2.80 2.85 2.90 2.95 3.00 3.05-4
-3
-2
-1
0
1
2
31a
lnK
s
T-1 10
3, K
-1
n-C5
n-C6
n-C7
n-C8
CHCl3
EtAcDEETHFc-C6
Benzene
(a)
(b)
Fig. 1. Plots of lnKS vs. 103/T for indicated adsorbates with
samples 1 and 1a.
3.1. Enthalpy and entropy of adsorption
The thermodynamic data describing adsorption can
be derived from the partition coefficients and their tem-
perature dependence. The standard free energy change
of adsorption, DG0a, was calculated from the relation
[30,31]:
DG0a ¼ �RT ln
KSpS;gPS
� �ð3Þ
or
DG0a ¼ �RT ln V N þ C; ð4Þ
where R is the gas constant, T is the column tempera-
ture, pS,g is the adsorbate standard state vapor pressure,
and PS is the two-dimensional standard-state (surface)
spreading pressure of the adsorbed gas. The standard
reference state is taken as pS,g = 101 kN/m2 (101 kPa)
and PS = 0.338 mN/m [32]. The constant C takes into
account the mass and specific area of the adsorbent in
the column and the standard states of adsorbates in
the mobile and adsorbed states [33].
The differential heats of adsorption of the adsorbates,
qd, at zero coverage, i.e. the standard-state enthalpies of
adsorption, �DH 0a, were obtained from the temperature
dependence of KS, viz.
dðlnKSÞdð1=T Þ ¼ �DH 0
a
R: ð5Þ
Plots of lnKS vs. 1/T of the used compounds with
copolymer samples are shown in Figs. 1 and 2. The val-
ues of �DH 0a, calculated from the least-squares determi-
nation of the corresponding slopes, according to Eq. (5),
are compiled in Table 2. The heats of vaporization,
�Hvap, for the investigated adsorbates (taken from
Ref. [34]) are also presented for comparison. For all
copolymer samples �DH 0a of n-alkanes increases linearly
with the number of carbon atoms. The more negative
�DH 0a, the greater the interaction between the adsorbate
and adsorbent. The slope of the linear function �DH 0a
vs. number of carbon atoms (for n-alkanes) may be ta-
ken to represent an increment in the enthalpy of adsorp-
tion contributed by each CH2 group.
The corresponding standard-state entropy changes of
adsorption, �DS0a, were calculated from:
DS0a ¼
DH 0a � DG0
a
T: ð6Þ
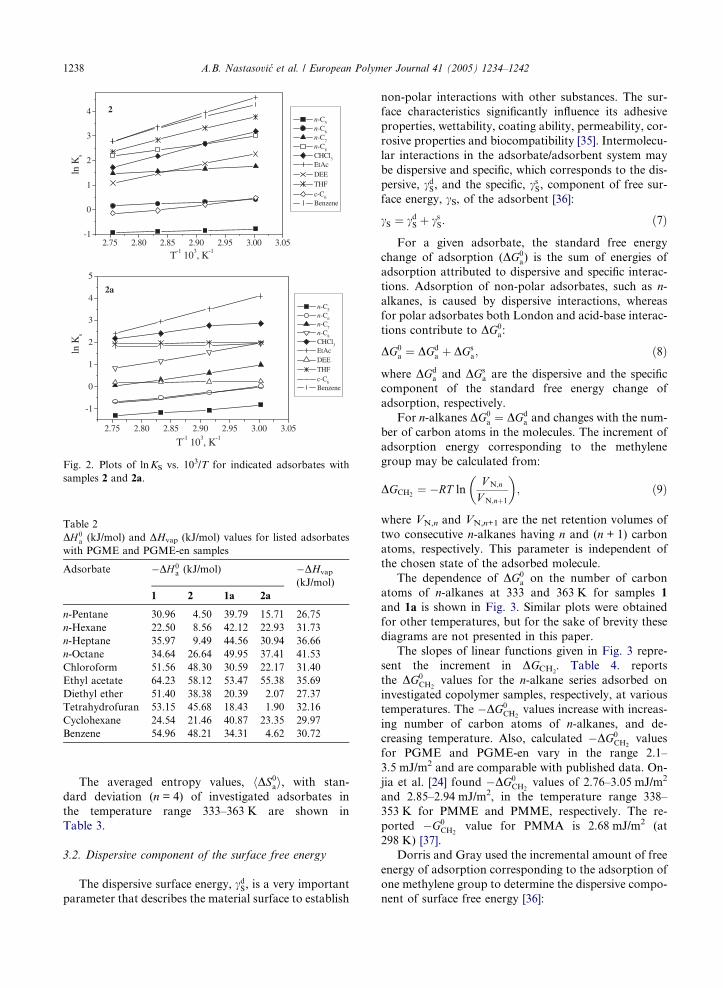
Table 2
DH 0a (kJ/mol) and DHvap (kJ/mol) values for listed adsorbates
with PGME and PGME-en samples
Adsorbate �DH0a (kJ/mol) �DHvap
(kJ/mol)
1 2 1a 2a
n-Pentane 30.96 4.50 39.79 15.71 26.75
n-Hexane 22.50 8.56 42.12 22.93 31.73
n-Heptane 35.97 9.49 44.56 30.94 36.66
n-Octane 34.64 26.64 49.95 37.41 41.53
Chloroform 51.56 48.30 30.59 22.17 31.40
Ethyl acetate 64.23 58.12 53.47 55.38 35.69
Diethyl ether 51.40 38.38 20.39 2.07 27.37
Tetrahydrofuran 53.15 45.68 18.43 1.90 32.16
Cyclohexane 24.54 21.46 40.87 23.35 29.97
Benzene 54.96 48.21 34.31 4.62 30.72
2.75 2.80 2.85 2.90 2.95 3.00 3.05-1
0
1
2
3
4 2
lnK
s
T-1 103, K-1
n-C5
n-C6
n-C7
n-C8
CHCl3
EtAcDEETHFc-C6
Benzene
2.75 2.80 2.85 2.90 2.95 3.00 3.05
-1
0
1
2
3
4
5
2a
lnK
s
T-1 103, K-1
n-C5
n-C6
n-C7
n-C8
CHCl3
EtAcDEETHFc-C6
Benzene
Fig. 2. Plots of lnKS vs. 103/T for indicated adsorbates with
samples 2 and 2a.
1238 A.B. Nastasovic et al. / European Polymer Journal 41 (2005) 1234–1242
The averaged entropy values, hDS0ai, with stan-
dard deviation (n = 4) of investigated adsorbates in
the temperature range 333–363 K are shown in
Table 3.
3.2. Dispersive component of the surface free energy
The dispersive surface energy, cdS, is a very important
parameter that describes the material surface to establish
non-polar interactions with other substances. The sur-
face characteristics significantly influence its adhesive
properties, wettability, coating ability, permeability, cor-
rosive properties and biocompatibility [35]. Intermolecu-
lar interactions in the adsorbate/adsorbent system may
be dispersive and specific, which corresponds to the dis-
persive, cdS, and the specific, csS, component of free sur-
face energy, cS, of the adsorbent [36]:
cS ¼ cdS þ csS: ð7Þ
For a given adsorbate, the standard free energy
change of adsorption (DG0a) is the sum of energies of
adsorption attributed to dispersive and specific interac-
tions. Adsorption of non-polar adsorbates, such as n-
alkanes, is caused by dispersive interactions, whereas
for polar adsorbates both London and acid-base interac-
tions contribute to DG0a:
DG0a ¼ DGd
a þ DGsa; ð8Þ
where DGda and DGs
a are the dispersive and the specific
component of the standard free energy change of
adsorption, respectively.
For n-alkanes DG0a ¼ DGd
a and changes with the num-
ber of carbon atoms in the molecules. The increment of
adsorption energy corresponding to the methylene
group may be calculated from:
DGCH2¼ �RT ln
V N;n
V N;nþ1
� �; ð9Þ
where VN,n and VN,n+1 are the net retention volumes of
two consecutive n-alkanes having n and (n + 1) carbon
atoms, respectively. This parameter is independent of
the chosen state of the adsorbed molecule.
The dependence of DG0a on the number of carbon
atoms of n-alkanes at 333 and 363 K for samples 1
and 1a is shown in Fig. 3. Similar plots were obtained
for other temperatures, but for the sake of brevity these
diagrams are not presented in this paper.
The slopes of linear functions given in Fig. 3 repre-
sent the increment in DGCH2. Table 4. reports
the DG0CH2
values for the n-alkane series adsorbed on
investigated copolymer samples, respectively, at various
temperatures. The �DG0CH2
values increase with increas-
ing number of carbon atoms of n-alkanes, and de-
creasing temperature. Also, calculated �DG0CH2
values
for PGME and PGME-en vary in the range 2.1–
3.5 mJ/m2 and are comparable with published data. On-
jia et al. [24] found �DG0CH2
values of 2.76–3.05 mJ/m2
and 2.85–2.94 mJ/m2, in the temperature range 338–
353 K for PMME and PMME, respectively. The re-
ported �G0CH2
value for PMMA is 2.68 mJ/m2 (at
298 K) [37].
Dorris and Gray used the incremental amount of free
energy of adsorption corresponding to the adsorption of
one methylene group to determine the dispersive compo-
nent of surface free energy [36]:

Table 3
Averaged entropy values (in kJ/mol) with standard deviation (n = 4) of investigated adsorbates in the temperature range 333–363 K
Adsorbate 1 2 1a 2a
h�DS0ai SD h�DS0ai SD h�DS0ai SD h�DS0ai SD
n-Pentane 47.9 0.18 27.3 0.05 92.8 0.49 6.81 0.24
n-Hexane 18.9 0.29 25.1 0.06 91.0 0.12 21.5 0.20
n-Heptane 50.6 0.17 33.5 0.04 90.0 0.03 37.5 0.19
n-Octane 39.4 0.81 7.8 0.11 97.6 0.08 48.8 0.19
Chloroform 90.0 0.12 71.2 0.19 35.1 0.47 4.8 0.56
Ethyl acetate 116.4 0.11 89.3 0.24 94.9 0.48 85.0 0.23
Diethyl ether 95.2 0.31 49.1 0.19 25.1 0.10 43.3 0.02
Tetrahydrofuran 89.1 0.05 58.3 0.32 5.81 0.13 58.4 0.06
Cyclohexane 29.7 0.31 13.3 0.28 88.0 0.43 23.1 0.26
Benzene 90.4 0.01 61.8 0.33 51.3 0.36 49.6 0.13
5 6 7 85
10
15
20
25
Sample 1333 K363 K
Sample 1a333 K363 K-∆
Ga0 ,k
J/m
ol
nC
Fig. 3. Variation of DG0a vs. number of carbon atoms of n-
alkanes at 333 and 363 K on samples 1 and 1a.
A.B. Nastasovic et al. / European Polymer Journal 41 (2005) 1234–1242 1239
cdS ¼DG2
CH2
4cCH2N 2
AaCH2
; ð10Þ
where cCH2is the surface free energy of a solid contain-
ing only methylene groups such as polyethylene
(cCH2= 36.8 � 0.058T (�C) mJ/m2), NA is Avogadro�s
number, and aCH2is the cross-sectional area of an ad-
sorbed CH2 group (0.06 nm2).
The calculated cdS values are reported in Table 4. For
all samples, the cdS values gradually decrease with
increasing temperature, which is consistent with the
literature data [35]. The calculated dispersive surface
energy values (with exception of sample 2) are compara-
ble to those found in literature for non-conductive
Table 4
The DGCH2(kJ/mol) and cdS (mJ�1) values for investigated copolymer
T (K) 1 2
�DGCH2cdS �DGCH2
cdS
333 2.29 30.14 2.86 46.91
343 2.15 27.19 2.87 48.11
353 2.12 26.91 2.71 43.88
363 2.34 28.12 2.87 42.17
polymers. For example, the cdS values of analogous
poly(dimethacrylate)s differing by the presence and the
type of the heteroatom in the ester group are relatively
low and lie in the range 24.8–39.8 mJ/m2 at 323 K, while
for PMMA, the cdS value at 333 K is 35.9 mJ/m2 [35].
Surprisingly, we obtained considerably higher values in
the whole temperature range for PGME sample 2. At
333 K, the cdS value for sample 2 is 71.03 mJ/m2, which
is comparable to that of 80 mJ/m2 reported by Papirer
et al. [38] for silica, or values for conducting polypyr-
roles in the range 30–60 mJ/m2 at 323 K, found by
Chehimi et al. [39]. Generally, IGC method provides
cdS values for polymers, fillers and fibers over a wide
range of temperatures, which is advantageous over, for
example, contact angle measurements. Nevertheless, in
some cases, IGC yields the dispersive surface energy val-
ues higher than other techniques, like for heterogeneous
high-energy surfaces, microporous and lamellar materi-
als, in the presence of impurities, etc. Bearing in mind
that sample 2 has the lowest SS value of all samples,
the overestimated cdS value might be attributed to differ-
ent internal structure and possible microporosity.
The dispersive surface energy differs even for the
polymers of similar chemical composition. Onjia et al.
[24] reported cdS values of 50.1 mJ/m2 for PGME and
53.9 mJ/m2 for PMME at 338 K. The lower cdS value
found for PGME was explained by the enhanced polar-
ity, caused by the epoxy groups, which were not present
in PMME. It is consistent with the literature data, i.e.
samples
1a 2a
�DGCH2cdS �D GCH2
cdS
3.51 71.03 2.58 38.24
3.40 67.86 2.48 35.99
3.34 65.14 2.27 30.60
3.21 62.70 2.15 28.10

300 320 340 360 380 400
15
20
25
Tb, K
-∆G
a0 ,kJm
ol-1
1an-AlkanesCHCl
3
EtAcDEETHFBenzene
Fig. 4. Plots of �DGsa versus Tb for sample 1a.
0 10 20 30 40
0
5
10
15
20
25
30
351
2a
1a
2
THF
DEE
EtAc
CHCl3
-∆HaS /A
N*
DN/AN*
Fig. 5. Plots of �DH sa=AN
� versus DN/AN* for PGME and
PGME-en samples.
Table 5
Acid/base constants PGME and PGME-en samples
Copolymer sample KD KA KD/KA
1 1.25 0.61 2.04
2 1.41 0.68 2.06
1a 2.67 0.30 8.95
2a 1.07 0.07 14.58
1240 A.B. Nastasovic et al. / European Polymer Journal 41 (2005) 1234–1242
that the increase in the polar functional groups reduces
the values of cdS [35]. However, based on our results,
an unambiguous conclusion regarding the influence of
the chemical modification of PGME with ethylenedia-
mine on the dispersive surface energy cannot be drawn.
However, if we rule out data for sample 2, chemical
modification of sample 1 leads to the increase of cdS val-
ues in the sample 1a. Voelkel [35] also observed higher cdSvalue for the polymer with a nitrogen atom in the ester
group, poly(N-methyl diethanolamine dimethacrylate),
PNDM (38.9 mJ/m2) compared with analogous poly-
(dimethacrylate)s.
3.3. Acid/base interactions
A comprehensive insight in the Lewis acid/base sur-
face interactions provides better understanding of the
influence of the physical and mechanical properties of
the polymers, as well as their ability to change via chem-
ical modifications, which is of great importance for their
applications [36]. The presence of acid and base sites on
the polymer surface enhances the possibility of specific
intermolecular interactions with solvents, plasticizers,
other polymers or fillers, which is of significance to the
composite or blend performances [39]. According to
Brookman and Sawyer, the specific standard free energy
change of adsorption, DGsa, corresponding to the acid-
base surface interactions, may be described as the differ-
ence between the point of the specific polar adsorbate
and the reference n-alkane having the same boiling
point, Tb [40]. Consequently, VN data are related to
DGsa by the following equation:
DGsa ¼ RT ln
V N
V refN
� �: ð11Þ
For the sake of clarity, �DGsa vs. Tb plots for only
one copolymer sample are presented (Fig. 4).
The DGsa values for the polar probes located above
the n-alkane line, indicate that the surfaces have both
donor and acceptor character resulting from their spe-
cific interactions with both the strong base (THF) and
the strong acid (CHCl3).
Following the Saint Flour and Papirer approach, the
base constant, KD, and the acid constant, KA, of the
copolymer may be obtained as a slope and intercept
from the relationship [41]:
�DH sa
AN � ¼ DNAN � KA þ KD; ð12Þ
where AN* and DN are Gutmann�s electron-acceptor
and electron-donor numbers of the adsorbates [42].
Fig. 5 shows the dependencies of �DH sa=AN
� on DN/
AN*, plotted for all copolymer samples. The calculated
KD and KA constants are summarized in Table 5.
The overall acid/base character of PGME and
PGME-en can be evaluated from the KD/KA ratio.
Namely, for KD/KA > 1, the surface is considered to be
basic, and for KD/KA > 1 acidic. Consequently, as seen
from the data in Table 4, the surface of PGME (samples
1 and 2) exhibits a basic character. Furthermore, the
resulting KD/KA values for PGME-en (samples 1a and
2a) imply that copolymer modified with ethylene dia-
mine has a much more pronounced basic character.
The obtained results are in agreement with the literature
data, according to which the introduction of amino,
ether or sulfo groups into the polymer leads to a sig-
nificant increase in surface affinity for nucleophilic inter-
actions [6]. Dieckmann et al. [43] also reported
exceptionally high KD/KA values of 20.7 and 17.2 for

A.B. Nastasovic et al. / European Polymer Journal 41 (2005) 1234–1242 1241
polyester and polyether with pyridine groups, respec-
tively. Also, our results agree very well with expectation
from the analysis of the repeating units in the PGME
and PGME-en. The basic sites identified in PGME are
ester functionality in the side chain and epoxy group.
Weak Lewis acidic sites are localized on the ACH3
groups and on H atoms in the AOACH2 groups. On
the other hand, the basic sites in PGME-en are ester
functionality in the side chain, O atom in the hydroxyl
group as well as N atom in the primary and secondary
group. The weak Lewis acidic sites in PGME-en are also
localized on the ACH3 groups and on H atoms in the
AOACH2 groups. Interestingly, though 1a and 2a have
the same chemical structure, the KD/KA values for
PGME-en samples differ noticeably. Namely, for the
assessment of the acid/base character of the polymer
surface, besides KD and KA values for polymer and
adsorbate, numerous factors must be taken into consid-
eration, such as accessibility of the acidic and basic sites
in the polymer, due to steric hindrance, molecular con-
formation and morphology [17]. For example, Hamieh
et al. [17] showed an important effect of the PMMA tac-
ticity on the acid/base properties, i.e. basic character of
PMMA decreased in the order atactic > syndiotac-
tic > isotactic. A considerable change in surface area is
noticed for sample 2a (27.6 m2/g), compared with the
initial one, and sample 2 (48.6 m2/g), suggesting a
change of the internal structure during modification.
Therefore, in the case of crosslinked macroporous
copolymers, porosity parameters, i.e., specific surface
area and pore diameter also influence the degree of mod-
ification reactions, accessibility of the acidic and basic
sites, and consequently, the Lewis acid/base properties
of the copolymer.
IGC at infinite dilution was widely studied to get a
better understanding of the influence of the Lewis acid-
ity-basicity on the adhesion, rheological properties, as
well as the mechanical properties of polymers [14].
The importance of the method is that it allows the
examination of different porous materials, which surface
properties can hardly be determined by other methods,
like contact angle measurements [44]. Also, informations
gathered by IGC, concerning the Lewis acid/base prop-
erties and dispersive surface energy, cdS, can be useful to
follow the changes in surface properties occurring as a
result of modification of poly(glycidyl methacrylate-co-
ethylene glycol dimethacrylate), PGME, with EDA.
Among other possibilities of applications, macropo-
rous crosslinked poly(glycidyl methacrylate-co-ethylene
glycol dimethacrylate), PGME, and copolymer modified
with ethylene diamine, PGME-en, proved very useful as
column packings in gas chromatography (GC) [29]. As
the separation ability of PGME and PGME-en depends
on the porous properties of the copolymer and its polar-
ity, the knowledge of surface properties in terms of the
copolymer ability to undergo dispersive interactions (de-
scribed by the dispersive component of surface free en-
ergy, cdS) and to act as electron donor or acceptor
(described by parameters KD and KA) gathered by
IGC, are of great importance for elucidation of the rela-
tionship between surface properties and chromato-
graphic performances of the initial and the modified
copolymer.
4. Conclusions
Adsorption properties of macroporous poly(glycidyl
methacrylate-co-ethylene glycol dimethacrylate), PGME,
and copolymer modified with ethylene diamine, PGME-
en, have been investigated by means of inverse gas chro-
matography at infinite dilution, in the temperature range
from 333 to 363 K. Chemical modification of PGME
with ethylene diamine leads to different chromato-
graphic behavior of the modified and the initial copoly-
mer samples, i.e. to the shortening of retention of all
adsorbates for modified samples. The calculated values
for the entropy changes of adsorption of the investigated
adsorbates are of the same order as those obtained
experimentally for all copolymer samples. Differences
observed between the experimental and the predicted en-
tropy changes, i.e. the additional entropy loss found
experimentally, may result from the restricted rotational
and vibrational freedom of adsorbates on the copolymer
surfaces. The calculated dispersive surface energy values,
cdS, for PGME and PGME-en are comparable with the
literature data for nonconductive polymers. According
to KD/KA ratio, both the initial and modified copolymers
have basic character, which is much more pronounced in
the case of PGME-en. Porosity parameters of cross-
linked macroporous copolymers influence the accessibil-
ity of the acidic and basic sites, and consequently, the
Lewis acid/base properties of the copolymer.
Acknowledgements
This work was supported by the Serbian Ministry of
Science and Environmental Protection (Projects No.
1948 and 1978). The authors are grateful to Novartis
Pharma AG (Basel, Switzerland) for the donation of
the HP5890II gas chromatograph used in this work.
References
[1] Smisrod O, Guillet JE. Macromolecules 1969;2:272.
[2] Lloyd DR, Ward TC, Schreiber HP. Inverse gas chroma-
tography, characterization of polymers and other materi-
als, ACS Symposium Series, vol. 391. Washington; 1989.
[3] Bogillo VI, Voelkel A. J Chromatogr A 1995;715:127.

1242 A.B. Nastasovic et al. / European Polymer Journal 41 (2005) 1234–1242
[4] Kaya I, Ozdemir E. Macromol Rep A 1995;32(39):377.
[5] Taylor AM, Watts JF, Abel M, Chehimi MM. Int J Adhes
Adhes 1995;15:3.
[6] Andrzejewska E, Voelkel A, Andrzejewski M, Maga R.
Polymer 1996;37(19):4333.
[7] Andrzejewska E, Voelkel A, Maga R, Andrzejewski M.
Polymer 1998;39(15):3499.
[8] Al-Saigh ZY. Polymer 1999;40(15):3479.
[9] Kaya I, Ilter Z, Senol D. Polymer 2000;43:6455.
[10] Kaya I, Demirelli K. J Polym Eng 2001;21(1):1.
[11] Demirelli K, Kaya I, Ilter Z, Coskun M. Polymer 2001;
42:5181.
[12] Ilter Z, Kaya I, Acikses A. J Polym Eng 2002;22(1):45.
[13] Santos JMRCA, Fagelman K, Guthrie JT. J Chromatogr
A 2002;969:111.
[14] Santos JMRCA, Fagelman K, Guthrie JT. J Chromatogr
A 2002;969:119.
[15] Hamieh T, Shultz J. J Chromatogr A 2002;969:17.
[16] Hamieh T, Shultz J. J Chromatogr A 2002;969:27.
[17] Hamieh T, Fadlallah MB, Shultz J. J Chromatogr A 2002;
969:37.
[18] Sherrington DC. In: Hodge P, editor. Synthesis and
separations using functional polymers. London: Wiley;
1988.
[19] Herault D, Saluzzo C, Duval R, Lemaire M. J Mol Cat A:
Chem 2002;182:249.
[20] Rolland A, Herault D, Touchard F, Saluzzo C, Duval R,
Lemaire M. Tet: Asymmetry 2001;12:811.
[21] Van Berkel PM, Driessen WL, Parlevliet FJ, Reedijk J,
Sherrington DC. Eur Polym J 1997;33:129.
[22] Senkal B, Bicak N. React Funct Polym 2001;49:151.
[23] Hentze HP, Antoinetti M. Rev Mol Biotechnol 2002;90:27.
[24] Onjia AE, Milonjic SK, Jovanovic NN, Jovanovic SM.
React Funct Polym 2000;43:269.
[25] Jovanovic S, Nastasovic A, Jovanovic N, Jeremic K, Savic
Z. Angew Makromol Chem 1994;19:161.
[26] Onjia AE, Milonjic SK, Rajakovic LJV. J Serb Chem Soc
2001;66(4):259.
[27] Conder J, Young C. Physicochemical measurement
by gas chromatography. New York: Wiley-Interscience;
1979.
[28] Laub R, Pecsok R. Physicochemical applications by gas
chromatography. New York: Wiley-Interscience; 1978.
[29] Lukas J, Bleha M, Svec F, Kalal J. React Funct Polym
1981;95:129.
[30] Katz S, Gray DG. J Colloid Interface Sci 1981;82:318.
[31] Milonjic SK, Kopecni MM. Chromatographia 1984;19:
342.
[32] De Boer JH. The dynamical character of adsorp-
tion. Oxford: Clarendon; 1953. p. 49.
[33] Meyer EF. J Chem Educ 1980;57:120.
[34] Majer V, Svoboda V. Enthalpies of vaporization of organic
compounds, a critical review and data compila-
tion. Oxford: Blackwell Scientific Publication; 1985. p. 300.
[35] Voelkel A, Andrzejewska E, Maga R, Andrzejewski M.
Polymer 1996;37(3):455.
[36] Dorris G, Gray D. J Colloid Interface Sci 1980;77:353.
[37] Chehimi MM, Abel ML, Sahraoui Z. J Adhes Sci Technol
1996;10(4):287.
[38] Papirer E, Balard H, Sidqi M. J Colloid Interface Sci
1993;159:258.
[39] Chehimi MM. In: Mittal KL, Pizzi A, editors. Adhesion
promotion techniques technological applications. New
York: Marcel Dekker; 1999. p. 27.
[40] Brookman D, Sawyer D. Anal Chem 1986;40:106.
[41] Saint Flour C, Papirer E. J Colloid Interface Sci 1983;91:
69.
[42] Riddle FL, Fowkes FM. J Am Chem Soc 1990;112:
3259.
[43] Dieckmann F, Pospiech D, Uhlmann P, Bohme F,
Kricheldorf HR. Polymer 1999;40:983.
[44] Voelkel A. Chemom Intel Lab Syst 2004;72:205.