Lateral Water Diffusion in an Artificial Macroporous System: Modeling and Experimental Evidence
10
Lateral Water Diffusion in an Artificial Macroporous System: Modeling and Experimental Evidence P. Castiglione,* B. P. Mohanty, P. J. Shouse, J. Simunek, M. Th. van Genuchten, and A. Santini ABSTRACT used to interpret results from solute transport experi- ments. For certain conditions (e.g., negligible matrix In two-domain schematizations of macroporous soils or fractured domain flux, steady-state water flow and instantaneous rock systems, lateral mass exchange between macropores and the soil matrix is generally modeled as an apparent first-order process. With adsorption), the transfer rate coefficients for solute ( s ) respect to lateral diffusion, the system is thus characterized by a single can be determined from moment analysis of the concen- parameter, the transfer rate coefficient, which is difficult to estimate tration breakthrough curve (BTC) (e.g., Valocchi, 1990). a priori. We conducted water infiltration experiments in a laboratory This methodology was tested by Hu and Brusseau (1995) column with an artificial macropore. The novel design of the experi- in a series of leaching experiments through artificial soil mental setup allowed us to discriminate between matrix flow and columns. The authors explored different aggregate ge- macropore flow, from which we could estimate the water exchange flux ometries, for which theoretical expressions of the trans- between the two domains. Most of the parameters in a dual-permeabil- fer coefficients are available, and with most of the pa- ity model could be determined independently of the experimental rameters of the two-region Mobile–Immobile Model data. In particular, a theoretical expression for the transfer rate coeffi- (MIM) (van Genuchten and Wierenga, 1976) deter- cient was derived by assuming lateral water and solute diffusion to be similar processes. Numerical analysis of the water exchange process mined independently of the data. revealed that the transfer coefficient depended also on the macropore In more general cases, for example when water moves conductivity. When this dependency was taken into account, the model through both the matrix and the macropore regions, reproduced the experimental data reasonably well. experimental measurements of the mass exchange are difficult to make since more complex models with a large number of parameters are generally required. Ma- M ost deterministic approaches for modeling pref- trix and macropore flows cannot be easily discriminated erential flow in macroporous soils or unsaturated during water flow experiments, thus making the hydrau- fractured rock rely on two- or multidomain continuum lic characterization of the two domains very uncertain. assumptions (Smettem and Kirkby, 1990; Cushman, On the basis of an analogy between water and solute 1990; Othmer et al., 1991; Pruess, 1999; National Re- transfer processes, Gerke and van Genuchten (1993b) source Council, 2001). Typically, heterogeneous media suggested that the transfer rate coefficient for water are modeled as two overlapping porous systems, a high ( w ) can be derived from the corresponding coefficient permeability domain associated with the macropore or for solute ( s ), as determined using the MIM hypothe- fracture network and a low permeability domain associ- ses. To date, this assumption has not been validated ated with the matrix blocks. Exchange of mass (water by experimental evidence, mostly because of technical and/or solute) between the two systems will occur in limitations in monitoring the lateral exchange process. response to nonequilibrium conditions, thus reproduc- We present results from infiltration experiments con- ing lateral exchange phenomena often recognized in ducted on a soil column with an artificial macropore. structured media (Beven and Germann, 1982). Inter- Detailed knowledge of the geometry of the system and domain transfer processes are diffusion based and as soil matrix properties, as well as the controlled labora- such depend on the diffusivity of the matrix blocks and tory conditions, allowed us to address some of the uncer- the geometric configuration of the preferred flow paths. tainties mentioned above. For instance, we were able When these processes are modeled by means of a first- to discriminate matrix flow from macropore flow, and order approximation (FOA), the system can be char- to measure the depth-integrated water exchange flux acterized by one unique parameter, the mass transfer between the two domains. The experimental results rate coefficient. Despite extensive efforts in the past two were described reasonably well with a dual-permeability decades, how closely the actual mass exchange process model, with most of the parameters determined inde- is captured by the first-order approximation and how pendently of the data. A numerical analysis of the water to determine the transfer rate coefficients remain transfer process also allowed us to determine the trans- poorly understood. fer rate coefficient for water, which otherwise would be First-order mass transfer models have been widely a fitting parameter. P. Castiglione, B.P. Mohanty, P.J. Shouse, J. Simunek, M.Th. van THEORY Genuchten, George E. Brown, Jr. Salinity Laboratory, 450 W. Big Springs Road, USDA, ARS, Riverside, CA; and A. Santini, Depart- The dual-permeability model (DPM) used in this ment of Agricultural Engineering, University of Naples “Federico study to simulate vertical water flow through a single- II”, Italy. B.P. Mohanty, currently, Biological and Agricultural Engi- macropore column was described in detail by Gerke neering, Texas A&M University, College Station, TX. Received 14 June 2002. Original Research Paper. *Corresponding author (paoloc@ Abbreviations: BTC, breakthrough curve; DPM, dual-permeability uidaho.edu). model; FOA, first-order approximation; MIM, mobile–immobile model; PAM, polyacrylamide. Published in Vadose Zone Journal 2:212–221 (2003). 212
Transcript of Lateral Water Diffusion in an Artificial Macroporous System: Modeling and Experimental Evidence

Lateral Water Diffusion in an Artificial Macroporous System:Modeling and Experimental Evidence
P. Castiglione,* B. P. Mohanty, P. J. Shouse, J. Simunek, M. Th. van Genuchten, and A. Santini
ABSTRACT used to interpret results from solute transport experi-ments. For certain conditions (e.g., negligible matrixIn two-domain schematizations of macroporous soils or fractureddomain flux, steady-state water flow and instantaneousrock systems, lateral mass exchange between macropores and the soil
matrix is generally modeled as an apparent first-order process. With adsorption), the transfer rate coefficients for solute (�s)respect to lateral diffusion, the system is thus characterized by a single can be determined from moment analysis of the concen-parameter, the transfer rate coefficient, which is difficult to estimate tration breakthrough curve (BTC) (e.g., Valocchi, 1990).a priori. We conducted water infiltration experiments in a laboratory This methodology was tested by Hu and Brusseau (1995)column with an artificial macropore. The novel design of the experi- in a series of leaching experiments through artificial soilmental setup allowed us to discriminate between matrix flow and columns. The authors explored different aggregate ge-macropore flow, from which we could estimate the water exchange flux
ometries, for which theoretical expressions of the trans-between the two domains. Most of the parameters in a dual-permeabil-fer coefficients are available, and with most of the pa-ity model could be determined independently of the experimentalrameters of the two-region Mobile–Immobile Modeldata. In particular, a theoretical expression for the transfer rate coeffi-(MIM) (van Genuchten and Wierenga, 1976) deter-cient was derived by assuming lateral water and solute diffusion to
be similar processes. Numerical analysis of the water exchange process mined independently of the data.revealed that the transfer coefficient depended also on the macropore In more general cases, for example when water movesconductivity. When this dependency was taken into account, the model through both the matrix and the macropore regions,reproduced the experimental data reasonably well. experimental measurements of the mass exchange are
difficult to make since more complex models with alarge number of parameters are generally required. Ma-
Most deterministic approaches for modeling pref- trix and macropore flows cannot be easily discriminatederential flow in macroporous soils or unsaturated during water flow experiments, thus making the hydrau-
fractured rock rely on two- or multidomain continuum lic characterization of the two domains very uncertain.assumptions (Smettem and Kirkby, 1990; Cushman, On the basis of an analogy between water and solute1990; Othmer et al., 1991; Pruess, 1999; National Re- transfer processes, Gerke and van Genuchten (1993b)source Council, 2001). Typically, heterogeneous media suggested that the transfer rate coefficient for waterare modeled as two overlapping porous systems, a high (�w) can be derived from the corresponding coefficientpermeability domain associated with the macropore or for solute (�s), as determined using the MIM hypothe-fracture network and a low permeability domain associ- ses. To date, this assumption has not been validatedated with the matrix blocks. Exchange of mass (water by experimental evidence, mostly because of technicaland/or solute) between the two systems will occur in limitations in monitoring the lateral exchange process.response to nonequilibrium conditions, thus reproduc- We present results from infiltration experiments con-ing lateral exchange phenomena often recognized in ducted on a soil column with an artificial macropore.structured media (Beven and Germann, 1982). Inter- Detailed knowledge of the geometry of the system anddomain transfer processes are diffusion based and as soil matrix properties, as well as the controlled labora-such depend on the diffusivity of the matrix blocks and tory conditions, allowed us to address some of the uncer-the geometric configuration of the preferred flow paths. tainties mentioned above. For instance, we were ableWhen these processes are modeled by means of a first- to discriminate matrix flow from macropore flow, andorder approximation (FOA), the system can be char- to measure the depth-integrated water exchange fluxacterized by one unique parameter, the mass transfer between the two domains. The experimental resultsrate coefficient. Despite extensive efforts in the past two were described reasonably well with a dual-permeabilitydecades, how closely the actual mass exchange process model, with most of the parameters determined inde-is captured by the first-order approximation and how pendently of the data. A numerical analysis of the waterto determine the transfer rate coefficients remain transfer process also allowed us to determine the trans-poorly understood. fer rate coefficient for water, which otherwise would be
First-order mass transfer models have been widely a fitting parameter.
P. Castiglione, B.P. Mohanty, P.J. Shouse, J. Simunek, M.Th. van THEORYGenuchten, George E. Brown, Jr. Salinity Laboratory, 450 W. BigSprings Road, USDA, ARS, Riverside, CA; and A. Santini, Depart- The dual-permeability model (DPM) used in thisment of Agricultural Engineering, University of Naples “Federico study to simulate vertical water flow through a single-II”, Italy. B.P. Mohanty, currently, Biological and Agricultural Engi-
macropore column was described in detail by Gerkeneering, Texas A&M University, College Station, TX. Received 14June 2002. Original Research Paper. *Corresponding author (paoloc@
Abbreviations: BTC, breakthrough curve; DPM, dual-permeabilityuidaho.edu).model; FOA, first-order approximation; MIM, mobile–immobile model;PAM, polyacrylamide.Published in Vadose Zone Journal 2:212–221 (2003).
212

www.vadosezonejournal.org 213
and van Genuchten (1993a). The governing equationsfor one-dimensional flow are
��f
�t�
�
�z �Kf�hf
�z� Kf� �
�w
wf
[1]
��m
�t�
�
�z �Km�hm
�z� Km� �
�w
1 � wf
[2]
in which the subscript “f” refers to the macropore do-main, and “m” to the matrix domain; h (L) is the matricpotential, K (L T�1) the hydraulic conductivity, z (L) isthe spatial coordinate, t (T) is time, �w (T�1) is thewater transfer term, representing the flux of water beingexchanged between macropores and the soil matrix perunit volume of bulk soil, and wf is a dimensionlessweighting factor. The volumetric water content �f in Eq.[1] is defined as the ratio of the volume of water of thefracture domain (Vw,f ) to the total volume of fractures(Vt,f ) �f � Vw,f /Vt,f . Analogously, �m � Vw,m /Vt,m . Thevolumetric weighting factor (wf) is defined as the ratioof the fracture domain volume relative to the total soilvolume (Vt):
wf � Vt,f /Vt [3]
While some macroscopic quantities, such as water Fig. 1. Scheme of the soil column with a vertical cylindrical macropore.content or flux, for a dual-permeability medium aredefined as weighted averages of the corresponding prop- where H is a dimensionless geometry-dependent coeffi-erties of the individual domains, this cannot be done cient and � (L) is the characteristic length of the matrixfor the hydraulic conductivity, since in general no unique
structure (e.g., the radius for spherical or cylindricalpressure head gradient exists (Beven and Germann,aggregates, or one-half of the fracture spacing for paral-1982). When the system is in hydraulic equilibrium (hf �lel rectangular matrix blocks); Da,m (L2 T�1) is the effec-hm), however, it is possible to define the hydraulic con-tive diffusion coefficient of solute in the soil matrixductivity as (Peters and Klavetter, 1988):(notice that the subscript “m” represents here the soil
K � wf Kf � (1 � wf)Km [4] “matrix,” not the “mobile” domain as is commonly donein literature). For simple geometries of the aggregates,Equation [4] holds in particular for saturated conditionstheoretical values for the geometrical parameters in Eq.and thus permits us to estimate the macropore saturated[7] can be derived (Valocchi, 1990; van Genuchten andconductivity (Kf,sat) from Ksat , Km,sat , and wf .Dalton, 1986). In particular, several expressions are re-The interdomain water exchange flux is modeled byported in literature for cylindrical macropores (vanmeans of the first-order approximation (FOA):Genuchten and Dalton, 1986; Gerke and van Genuch-
�w � �w(hf � hm) [5] ten, 1996; Young and Ball, 1995), which we found toin which hf and hm are averaged over some representa- give very similar results. Below we adopt the expressiontive elementary volume, and �w (L�1 T�1) is the mass proposed by Young and Ball (1995) to be used in Eq. [7]:transfer rate coefficient for water. Assuming analogy
� � b � a [8]between water and solute lateral exchange processes,Gerke and van Genuchten, (1993b) derived �w from the
H �8�� 2
0 � 1��� 0 � 1�2
4� 40ln� 0 � 3� 4
0 � 4� 20 � 1
, with � 0 �ba
. [9]equivalent transfer rate coefficient for solute. The FOAfor solute exchange flux (�s) is expressed as:
In Eq. [8] and [9], a is the radius of the macropore,�s � �s(cf � cm) [6]and b is the radius of the soil mantle surrounding the
where �s (T�1) is the transfer rate coefficient for solute, macropore (see Fig. 1).and cf and cm (M L�3) are the solute concentrations Due to their common diffusive nature, lateral waterfor the fracture and the matrix domain, respectively. and solute transfers are often considered similar processAssuming applicability of MIM (van Genuchten and (Dykhuizen, 1990; Gerke and van Genuchten, 1993a;Wierenga, 1976), �s is fully determined by geometry
Zimmerman et al., 1990). Assuming that the water fluxand diffusivity of the soil aggregates, and is generallydivergence is zero within the soil matrix, Gerke andapproximated by the expression (van Genuchten andvan Genuchten (1993b) found that the geometry of theDalton, 1986):aggregates affects water and solute mass transfers inthe same way. They therefore proposed the following�s �
H�2
�mDa,m [7]expression for the transfer rate coefficient for water:

214 VADOSE ZONE J., VOL. 2, MAY 2003
ary. In our simulation we explicitly considered vertical�w �
H�2
Kaw [10] water flow in the soil matrix.
which is derived from Eq. [7] with the term Kaw replac-Two-Dimensional Simulationsing �mDa,m. In Eq. [10], w is a dimensionless scaling
factor and Ka (L T�1) the effective hydraulic conductiv- The HYDRUS-2D code solves the axial-symmetricity function of the macropore–matrix interface, evalu- flow equations in the r–z plane using a mass lumpedated in terms of both hm and hf as follows: Galerkin finite element scheme. The flow domain con-
sisted of two connecting porous media: a single mac-Ka � 0.5[Ka(hm) � Ka(hf)] [11]ropore (r 0.5 mm) at the center and the surrounding
In the absence of organic matter or other deposits along matrix region. A very fine finite element grid, as wellthe macropore wall (which may alter the permeability as small time steps (�tmin was 10�9 h), were used toof the aggregates at the interface), Ka is best represented increase the accuracy of the calculations. We initiallyby the matrix conductivity function Km (Gerke and van experienced some numerical problems, even with a veryGenuchten, 1993a). fine discretization near the macropore–matrix interface.
Gerke and van Genuchten (1993b) and Gerke and This was caused by the fact that in HYDRUS-2D thevan Genuchten (1996) tested the applicability of Eq. [10] independent variables and hydraulic properties are as-for several aggregate geometries (spherical, rectangular signed to nodes, and smoothed linearly between neigh-slab, and cylindrical macropores) by comparing simula- boring nodes, as is traditionally done in finite elementtion results of the one-dimensional DPM with those schemes. This approach causes flow and transport prop-generated using equivalent two-dimensional geometry- erties to be smoothed across the interfaces betweenbased transport models. For simplicity, the effects of different materials. Most of the numerical problemsgravity were neglected in their calculations. These nu- were solved by modifying the code to allow assignmentmerical studies revealed that, in general, Eq. [10] per- of material properties to elements, rather than to indi-forms well as long as the dimensions of the matrix blocks vidual nodes.are not too large. Their results also suggest that, pro- The van Genuchten–Mualem model (van Genuchten,vided Eq. [11] is used, an average value of 0.4 for the 1980) was used to describe the retention and conductiv-scaling factor w should be reasonably applicable to all ity functions of both the matrix and the macropore do-of the geometries investigated. This value, however, may main:not be appropriate for describing water exchange whenthe vertical water flow in the matrix is considered, or
h(Se) �1� �1 � �S�1/m
e � 1�1/n� [12]for initial and boundary conditions different from thoseused in the original studies of Gerke and van Genuchten(1993b). To take this scenario-related dependency into K(Se) � KaS l
e �1 � �1 � S 1/me �m�
2
[13]account, we performed a numerical analysis of the waterexchange process in a single macropore system for the where Se � (� � �r)/(�s � �r) is the effective saturation, �same initial and boundary conditions reproduced in our (L�1), n and l are empirical parameters, �r is the residualexperiments. Our calculations allowed us to determine water content, �s is the saturated water content, and Ksan optimal value for the scaling factor w, which subse- (L T�1) is the saturated hydraulic conductivity. We usedquently will be used in the analysis of our experimen- the m � 1 � 1/n constraint so that each domain istal data. characterized by a total of six parameters (hereafter
referred to as “VGM parameters”). For our calcula-Numerical Analysis of the Water Transfer Process tions, the matrix domain was assigned the VGM param-
eters estimated (as will be shown later) through inverseWe generated series of synthetic data for lateral wateranalysis of data from an infiltration experiment withoutexchange by simulating water infiltration through a soila macropore (�s � 0.38; Ks � 0.08 cm h�1; l � 0.5; �r �column with a single macropore, as depicted in Fig. 1.0.20, � � 0.005, and n � 1.664). In contrast, three differ-Since the process is axial-symmetric, a modified versionent hydraulic functions were considered for the mac-of the two-dimensional HYDRUS-2D code (Simunekropore domain. The saturated conductivity (Kf,sat) waset al., 1999) could be used. The synthetic water transferchosen equal to 2000, 20 000, and 100 000 cm h�1, whiledata were subsequently compared with results of the one-the remaining parameters were in all cases fixed at �r �dimensional dual-permeability model to test the appli-0, �s � 0.5, � � 0.1, n � 2, and l � 0.5. Two somewhatcability of Eq. [8], and to determine a value of the scalingconflicting requirements were considered when choos-factor w that best describes the exchange process for theing the VGM parameters for the macropore domain:initial and boundary conditions used in our experiments.(i) having a small air-entry tension (high � value), belowFor both the two- and the one-dimensional simulations,which the hydraulic conductivity drops sharply to negli-and for both the matrix and macropore domain, thegible values (high n value), and (ii) facilitating a stableinitial pressure head profile varied linearly from �155numerical solution of the flow equations. Each simula-cm at the top to �135 cm at the bottom. The pressuretion was repeated for three different soil mantle radii:head was equal to zero at the top of the column, while
seepage conditions were imposed at the bottom bound- 1.7, 2.7, and 12 cm.

www.vadosezonejournal.org 215
Fig. 3. Partitioning of the bottom of the column in six pie sectors.The metal dividers are 15 cm high. The stainless-steel nets supportthe soil when the ceramics are removed.
within the outflow tubes. A 3-cm layer of diatomaceous earthmaterial (having a negligible hydraulic resistance) was placedin each chamber between the soil and the ceramic plates.Fig. 2. Experimental setup.
Collecting drainage effluent from each chamber indepen-dently allowed us to detect horizontal heterogeneities in theOne-Dimensional Simulations wetting front. In particular, we were able to verify the stabilityof the matrix flux in the absence of macropores. Most impor-Infiltration processes were simulated for the sametantly, when a single artificial macropore was made and con-scenarios (geometry, hydraulic properties, initial andnected to one outflow chamber, separate measurements ofboundary conditions) considered in the previous sectionthe matrix and macropore fluxes could be obtained by con-using the one-dimensional DPM (as incorporated into trasting the effluent fluxes from the different chambers. This
HYDRUS-1D; Simunek et al., 1998). We next performed methodology is applicable assuming preferential flow is fullyone-dimensional inverse analyses of the synthetic data confined within the artificial macropore. We prevented prefer-to optimize w, using cumulative mass transfer data in ential flow along the column walls by inserting small glue ringsthe objective function. Since optimized values for the (“wall flow dams”; see Fig. 3) at several depths on the internaltransfer coefficient depend somewhat on the character- wall of the column. The rings acted like a series of dams forc-
ing any wall flow to reenter the soil matrix. Soil water pressureistic time scale of the synthetic data (Young and Ball,heads were measured using pencil-size tensiometers placed at1995), we homogenized the different series by extending5-cm depth increments, while horizontal heterogeneities ineach set of data to well after equilibrium was reached.the soil water pressure head were monitored using two setsof six tensiometers placed around the circumference of the
MATERIALS AND METHODS soil column at depths of 50 and 75 cm below the soil surface.We also installed six time domain reflectometry three-rodExperimental Setup probes (10 cm long) at 10-cm depth increments to measurethe matrix water content profile.A sandy loam (Typic Haploxeralf) with a small clay fraction
(6%, mostly kaolinite) was used in this study because of itslow shrink–swell capacity. The soil, collected from the Angeles Artificial MacroporesNational Forest (California) at 20 to 40 cm depth, was air-dried, sieved (2 mm), and packed into a large column in 3-cm Different techniques for creating artificial macropores are
described in the literature, depending on the objectives of theincrements to a dry bulk density of 1.56 g cm�3. The column(Fig. 2) was made from an acrylic cylinder (75 cm deep; i.d. � research, soil type, and column dimensions (Hu and Brusseau
1995; Li and Ghodrati, 1997; Czapar et al., 1992). In our study24 cm), resting on a specifically designed support for control-ling the bottom boundary condition and collecting the drain- we created a single macropore by inserting a hollow stainless-
steel tube (1-mm o.d.) from the surface into the soil matrix.age effluent (Fig. 3). The lower portion of the column waspartitioned into six pie-shaped chambers using vertical divid- The macropore was located approximately at the center of
the column and reached the diatomaceous earth layer at theers (Fig. 3). The dividers were made of 15-cm-high stainless-steel sheets, glued into grooves in the base plate and held bottom of one of the chambers.
To help stabilize the artificial macropore, we applied arigidly by means of a vertical support placed in the center ofthe base plate. The base plate, also made of acrylic, housed water-soluble polymer (polyacrylamide, PAM) along the mac-
ropore walls. This was done by pouring a PAM solution (75 gsix ceramic plates (bubbling pressure � 5 � 104 Pa), one ineach of the six chambers (Fig. 3). The ceramic plates were L�1) into the stainless-steel tube once it was fully inserted into
the soil. The tube was subsequently slowly removed from thesealed into place with a system of rubber gaskets and remov-able cover panels. Drainage effluent from each chamber was soil such that the PAM left a coating on the macropore walls.
To enhance diffusion into the surrounding matrix, the PAMcollected separately in a system of six acrylic tubes (Fig. 2) thatpermitted automated measurement of the cumulative outflow was applied when the column was dry. After application, the
column was left for 48 h before a new experiment was per-using pressure transducers. The pressure head at the bottomof the soil column was regulated by adjusting the air pressure formed. While the technique proved effective, the macropore

216 VADOSE ZONE J., VOL. 2, MAY 2003
itself was not always perfectly stable, and new applicationsof the polymer were needed periodically between separateflow experiments.
Experimental Procedure
Using a 0.33 g L�1 CaCl2 solution, several infiltration anddrainage experiments were performed before making the arti-ficial macropore. These initial experiments were used to testthe functionality of the experimental setup, especially the ac-tive drainage system, and to verify the uniformity of waterflow through the soil column. A first-type boundary conditionwas imposed at the soil surface during the infiltration experi-ments by means of a tension infiltrometer (Ankeny et al.,1988; Perroux and White, 1988); this also permitted us tomeasure the infiltration rate. We used a disk (Soil Measure-ment Systems, Tucson, AZ) with the same diameter as thecolumn, so that flow was always one-dimensional. A thin sandlayer was placed on the soil surface to ensure perfect contactbetween soil and the infiltrometer. The head loss through thesand was measured by means of a very small tensiometerplaced at the sand–soil interface.
Fig. 4. Two dimensional simulations of pressure head distributionOne major challenge of the experimental setup was accurateduring infiltration processes for a 2.7-cm soil mantle. All figurescontrol of the bottom boundary condition. When a tension isshow snapshots at 0.05 h.imposed through the ceramic plates, the presence of entrapped
air, as well as the existence of fluxes greater than the conductiv-matrix. This lateral exchange process is evident in Fig. 4,ity of the ceramic plates, may cause the effective bottom ten-which shows snapshots (t � 0.05 h) of the infiltrationsion to diverge from the applied one. Such a situation couldprocess simulated for three values of Kf,sat. Notice thatlead to misinterpretations of the experimental results, particu-
larly since the magnitude of the flux through the artificial the relative position of the two wetting fronts deter-macropore is not known a priori. We therefore designed the mined the longitudinal extent of the region affected bybase of the column to allow us to remove or install different transfer process (indicated with d in Fig. 4). Since thisceramic plates as needed. For example, to facilitate drainage region is large for highly conductive macropores, thefrom the column we applied tension at the bottom, whereas depth-integrated water exchange rate is higher for largerthe ceramics were removed during the infiltration experiments Kf,sat values. This result is also evident from Fig. 5, whereto produce a seepage-type bottom boundary condition.
the cumulative transfer flux integrated over the entireWe present results for two infiltration experiments, one withcolumn is shown for the different scenarios. For eachand one without the artificial macropore, performed underradius of the soil mantle, the water exchange rate isidentical initial and boundary conditions. The effects of thehigher for higher macropore conductivity. Notice alsomacropore on the overall flow regime were deduced by con-
trasting the measured inflow and outflow rates. In both experi- that the total amount of exchanged water depends onlyments, the column was initially drained by applying suction on the size of the soil mantle for the smallest radiusat the bottom (h � �250 cm). Pressure head profiles during (Fig. 5b), whereas for larger mantles it also depends onthe drainage showed fairly uniform values in the upper three- Kf,sat (Fig. 5a). This is due to vertical flow of water enter-quarters of the column, and a steep decrease in the pressure ing the matrix region from the top. In general, the maxi-head in the lower portion. Once a nearly uniformly dry profile mum value of the cumulative transfer rate is smallerwas obtained in the upper three-quarters of the column, the
when vertical flow in the matrix is relatively fast com-ceramic plates were removed and the column was left to equili-pared with that of the macropore (smaller Kf,sat), sincebrate for about 1 wk. Having a relatively low initial waterthe pressure difference between the two domains (i.e.,content distribution favored extensive lateral exchange of wa-the driving force for water exchange) will vanish sooner.ter during the macropore infiltration experiment. In both ex-
periments, the top pressure head equaled zero, while a seepage This effect is negligible for the smallest radii, for whichboundary condition was applied at the bottom by removing equilibrium is reached only in a relatively short time.the ceramic plates. Comparing the results from two- and one-dimen-
sional simulations, we found that when the scaling factorw in Eq. [8] was set equal to 1, water transfer ratesRESULTS AND DISCUSSIONpredicted with the dual-permeability model were higherResults from Numerical Simulations than those calculated with the two-dimensional simula-tions, as shown in Fig. 6 for a 12-cm soil mantle andResults from the two-dimensional simulations high-
lighted several factors affecting the water exchange be- Kf,sat � 100 000 cm h�1. These results are consistent withthose obtained by Gerke and van Genuchten (1993b).tween the macropore and matrix. In general, water flow
in the two regions did not evolve independently (i.e., When optimized values of the scaling factor were used,the DPM reproduced the synthetic data more closely,based on their specific hydraulic properties), but were
very much affected by each other. For example, the not only in terms of the cumulative water exchange(Fig. 6), but also for the inflow and outflow rates. Thewetting front in the macropore had a tendency to slow
down because of diffusion of water into the surrounding optimized scaling factors are listed in Table 1 for the

www.vadosezonejournal.org 217
Fig. 6. Cumulative water exchange predicted by the one-dimensionaldual-permeability model (DPM) compared with the transfer calcu-lated by HYDRUS 2-D.
the scaling factor w is correlated to the ratio of the twodomain’s conductivities.
Infiltration Experiment without MacroporesWater flow during infiltration without the macropore
appeared to occur under equilibrium conditions. Thiswas evident from visual inspection of the sharp wettingfront and from the analysis of the data, which were welldescribed using the Richards equation (see Fig. 8 and 9).The cumulative inflow curve displayed a pronounced sorp-tion phase at the beginning of the infiltration (Fig. 8).During this stage, the infiltration rate was high, beingdriven by both capillary and gravity forces. As the wet-ting front moves down, pressure head gradients eventu-ally become negligible and the infiltration rate approachesa constant value, roughly equal to the saturated hydrau-lic conductivity. Outflow started about 13 h later andrapidly became constant and equal to the inflow rate.The total effluent was evenly distributed among the sixchambers (data not shown), and the column at this time
Fig. 5. Summary of the cumulative water transfer for nine two-dimen- appeared thoroughly saturated (Fig. 9).sional simulations.Data from the infiltration experiment were used to
characterize the soil matrix hydraulic properties. Wedifferent scenarios considered. In particular, data for the used the HYDRUS-1D code (Simunek at al., 1998) for12-cm soil mantle radius (the radius of our experimental inverse analysis (e.g., Hopmans et al., 2002) using inflow,column) allowed us to determine an appropriate value outflow, and tension data. Of the six VGM parameters,for the transfer coefficient in subsequent analyses of we measured �s independently of the infiltration experi-the experimental results. The data are plotted in Fig. 7 ment (�s � 0.38), determined Ks from the steady-stateagainst Kf,sat. The dependency of the scaling factor on themacropore saturated conductivity appears pronounced Table 1. Optimized values of the scaling factor �w for different soil
mantle radii and macropore saturated hydraulic conductivities.for the lowest Kf,sat, whereas w approaches a fairly con-stant value for high Kf,sat values. We note that Gerke and Mantle radius Kf,sat Optimized �w
van Genuchten (1993b), who explored different hydrau- cm cm h�1
lic properties for the matrix domain in their numerical 1.7 2 000 0.048720 000 0.1991analysis, also found a slight variability of w with the
100 000 0.6062matrix hydraulic conductivity. Although our results can- 2.7 2 000 0.1008not be directly compared with the findings of Gerke 20 000 0.2402
100 000 0.6874and van Genuchten (1993b) (since different boundary12 2 000 0.1026conditions were adopted in the two studies, and since 8 000 0.2792
20 000 0.4033we explicitly took into account the vertical water move-100 000 0.6348ment in the matrix domain), it appears that, in general,
218 VADOSE ZONE J., VOL. 2, MAY 2003
Fig. 7. Scaling factor dependency on the macropore saturated conduc-tivity.
infiltration rate (Ks � 0.08 cm h�1), and fixed l to 0.5,whereas the remaining three parameters were optimized(�r � 0.20, � � 0.005, and n � 1.664). Good correspon-dence was obtained between the fitted and measureddata (Fig. 8 and 9). The uniqueness of the solution wasempirically verified by repeating the inverse analysiswith different initial values of the unknown parameters. Fig. 9. Pressure head profiles during the infiltration experiments with-
out the macropore. Simulated results are obtained using Rich-We note, however, that the estimated hydraulic proper-ards’ equation.ties probably were somewhat biased by a lack of infor-
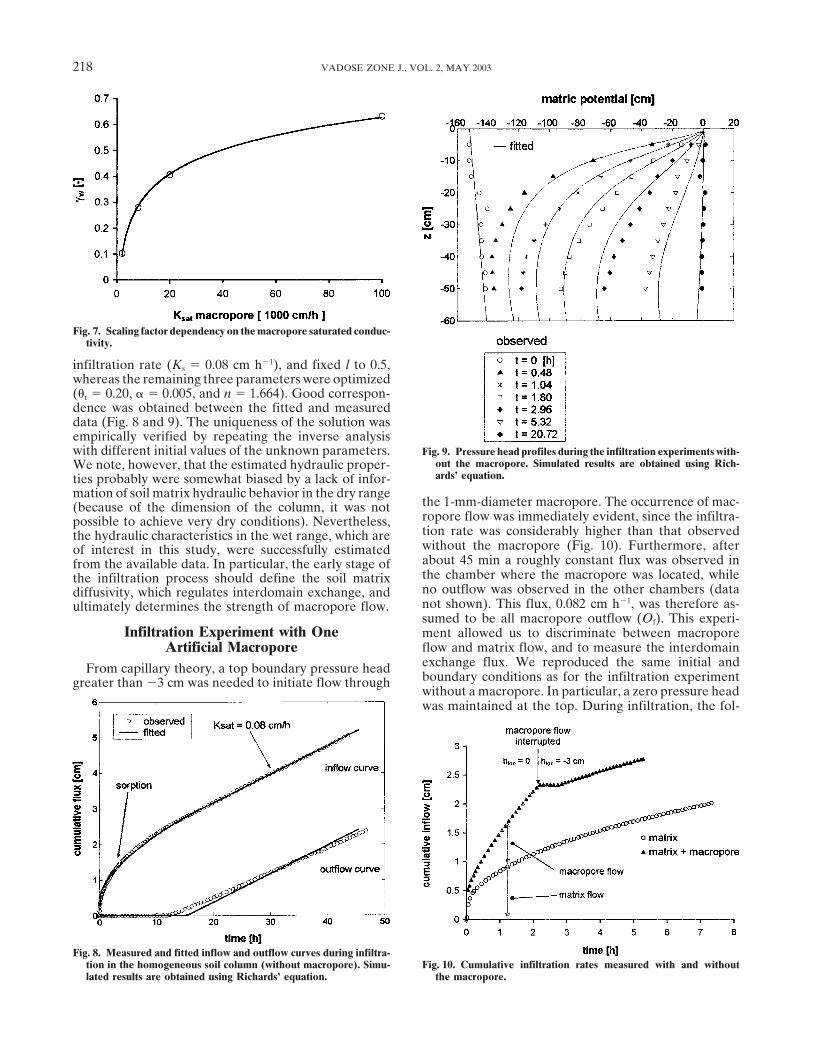
mation of soil matrix hydraulic behavior in the dry rangethe 1-mm-diameter macropore. The occurrence of mac-(because of the dimension of the column, it was notropore flow was immediately evident, since the infiltra-possible to achieve very dry conditions). Nevertheless,tion rate was considerably higher than that observedthe hydraulic characteristics in the wet range, which arewithout the macropore (Fig. 10). Furthermore, afterof interest in this study, were successfully estimatedabout 45 min a roughly constant flux was observed infrom the available data. In particular, the early stage ofthe chamber where the macropore was located, whilethe infiltration process should define the soil matrixno outflow was observed in the other chambers (datadiffusivity, which regulates interdomain exchange, andnot shown). This flux, 0.082 cm h�1, was therefore as-ultimately determines the strength of macropore flow.sumed to be all macropore outflow (Of). This experi-
Infiltration Experiment with One ment allowed us to discriminate between macroporeflow and matrix flow, and to measure the interdomainArtificial Macroporeexchange flux. We reproduced the same initial andFrom capillary theory, a top boundary pressure headboundary conditions as for the infiltration experimentgreater than �3 cm was needed to initiate flow throughwithout a macropore. In particular, a zero pressure headwas maintained at the top. During infiltration, the fol-
Fig. 8. Measured and fitted inflow and outflow curves during infiltra-Fig. 10. Cumulative infiltration rates measured with and withouttion in the homogeneous soil column (without macropore). Simu-
lated results are obtained using Richards’ equation. the macropore.

www.vadosezonejournal.org 219
lowing relationship holds:
Itot(t) � Im(t) � If(t) [14]
where Im is the flux of water infiltrating into the soilmatrix, If is the flux entering the macropore, and Itot
represents the total infiltration rate, as measured withthe tension infiltrometer. An analogous relationship canbe written for the outlet flux:
Otot(t) � Om(t) � Of(t) [15]
where Om and Of are the contributions of matrix andmacropore, respectively, to the total outflow (Otot). Be-cause of lateral diffusion, in general If Of, the differ-ence between the two fluxes representing the total waterflux exchanged between macropore and matrix:
Fig. 11. Cumulative infiltration curves measured in the soil column�w(t) � If(t) � Of(t) [16] with a macropore, and calculated using the dual permeability
model, for �w optimized and �w � 1.Note the different symbols for the local (�w) and the
depth-integrated exchange flux (�w). The flux enteringComparisons of Model Results withthe macropore (If) could not be measured directly.
Experimental DataNonetheless, assuming that Im in Eq. [14] equals theinfiltration rate measured during the experiment with- Application of the DPM involves two sets of VGMout the macropore, and hence that the presence of the parameters, one for each domain, plus the mass transfermacropore does not affect the matrix flux, If could be rate coefficient (�w) and the volumetric weighting factorestimated from the difference between the inflow rates (wf). In our case, wf is known from the geometry of theobserved during the two experiments (Fig. 10). This system (wf � 1.8 � 10�5). The characteristics of theassumption seems very reasonable at the early stage of matrix domain were determined from an analysis of thethe process, when lateral diffusion is still confined to infiltration data without the macropore. Estimation ofonly a relatively small portion of the column. As the the macropore parameters was much more uncertain,infiltration process proceeds, however, the assumption even for the controlled conditions of our experiment.will become unrealistic, especially if lateral equilibration A single macropore remains either completely full oris relatively fast. The validity of the above assumption nearly empty, except possibly for some film flow, sowas tested by suddenly interrupting the macropore flow that its behavior during variably saturated flow cannotprocess (before steady-state conditions were reached) be easily investigated. Still, this behavior suggests thatand verifying that the cumulative infiltration curve pro- the macropore conductivity function, Kf(hf), should beceeded parallel to the corresponding nonmacropore characterized by a sharp drop to negligible values aftercurve (see Fig. 10). Macropore flow was interrupted by a very small air-entry suction is exceeded. This represen-reducing the top pressure head to below the macropore tation of a cylindrical macropore as an equivalent po-air-entry-value (�3 cm). Several steady-state experi- rous medium reduced the range of possible values forments without macropores had previously revealed that the macropore domain hydraulic parameters.such a small pressure drop did not affect the matrix Since it was not possible to maintain macropore flowflow rate. Following the interruption, bubbling in the until steady-state conditions were reached, Eq. [4] couldMariotte and the reservoir towers of the tension infiltro- not be used to estimate the saturated hydraulic conduc-meter stopped for several minutes until the new pressure tivity. We optimized Kf,sat by fitting this parameter tohead was established at the top boundary. During this the inflow data using the parameter estimation featureperiod the instrument could not record the matrix water of HYDRUS-1D. Cumulative infiltration rates wereflow, which explains the short horizontal segment in the found to be sensitive to Kf,sat, but not affected by thecumulative infiltration data shown in Fig. 10. The total other hydraulic parameters. Our measured data wereexchange flux during the macropore infiltration process closely reproduced when using Kf,sat � 25 000 cm h�1
can therefore be measured as (Fig. 11). The contribution of the macropore to thecomposite soil saturated conductivity (Ksat) can now be�w � (Itot � Im) � Of [17]estimated from Eq. [4]: for Kf,sat � 25 000 cm h�1 andwf � 1.8 � 10�5, Ksat was found to be equal to 0.45 cmThe cumulative lateral flux measured in this way is
shown in Fig. 11, and will be discussed in more detail h�1, as compared with a value of only 0.08 cm h�1 asobserved in the absence of the macropore. The scalingbelow. The experiment was repeated three times, with
the three replications giving nearly identical results (not factor corresponding to this value was obtained fromFig. 7 (w � 0.441). Three of the six VGM parametersshown here). We emphasize here that steady-state con-
ditions could never be reached completely because of for the macropore domain were fixed (�r � 0, �s � 0.5,l � 0.5), while the remaining parameters were deter-slow, yet persistent clogging of the macropore during in-
filtration. mined by fitting lateral exchange and outflow data, on

220 VADOSE ZONE J., VOL. 2, MAY 2003
Fig. 12. Observed vs. predicted cumulative water transfer between Fig. 13. Observed vs. predicted cumulative outflow. In the dual per-meability model, both �w optimized and �w � 1 were used.the macropore and matrix. In the dual permeability model, both
�w optimized and �w � 1 were used.
we discriminate macropore flow and matrix flow. Inwhich they appear to have the largest impact. Least addition, the water exchange flux integrated over thesquares fitting gave � � 0.1 cm�1; n � 2. column was measured. The experimental data were de-To highlight the model sensitivity to the scaling factor, scribed reasonably well with the dual-permeabilitywe compared the experimental data with the model model, with most of the parameters determined inde-results obtained with both the optimized value of the w pendently of the observations. For the investigated ge-parameter, and for w � 1. In both cases, the cumulative ometry, the first-order approximation closely describedwater exchange predicted with the DPM did not match the water transfer data as long as an appropriate valuethe experimental data perfectly (Fig. 12). However, the for the transfer rate coefficient (or equivalently for thecalculated water transfer rate (given by the slope of the correcting scaling factor w) was used.cumulative curve) reproduced the observations reason- Similarly to the previous study by Gerke and vanably well when using the optimized scaling factor, while Genuchten (1993b), we derived the transfer rate coeffi-it persistently overestimated the experimental results cient for water from the equivalent coefficient for solutewith w � 1. Even with the optimized w, an offset of transfer through numerical simulations of the lateralabout 80 cm3 was still observed between the experimen- diffusion process. Our analysis showed that the scalingtal and simulated cumulative curves. Assuming a poros- factor w, in general, is dependent on the hydraulic con-ity of 0.45 for the fine sand placed on top of the column, ductivity of the macropore domain.this amount corresponds to water adsorbed in about0.4 cm of sand after infiltration started. Therefore, the
ACKNOWLEDGMENTSdisagreement between measured and calculated data inFig. 12 may be attributed to a slight difference in the The research was conducted at the George E. Brown Jr.
Salinity Laboratory, Riverside, CA. P. Castiglione would likethickness of the sand layer between macropore and non-to acknowledge the financial support from the University ofmacropore experiments.Naples, Italy, during his stay at Riverside as part of his Ph.D.Finally, we show in Fig. 13 the impact of the scalingresearch. The authors also acknowledge the technical supportfactor on cumulative outflow. The relative poor compar-of J. Fargerlund and J.A. Jobes. This study was partially sup-ison with the experimental results indicates several limi-ported by NSF grant EAR-0106956.tations of the DPM model. For example, we observed
a constant effluent flux until the preferential flow wasREFERENCESinterrupted, whereas the simulation predicted a progres-
Ankeny, M.D., T.C. Kaspar, and A.A. Hussen. 1988. Designed for ansively increasing outflow rate. This behavior resultedautomated tension infiltrometer. Soil Sci. Soc. Am. J. 52:893–895.from having a constant flux at the inlet and progressively
Beven, K.J., and P. Germann. 1982. Macropores and water flow inless exchange of water between the macropore and the soils. Water Resour. Res. 18:1311–1325.matrix as equilibrium is approached. An excellent match Cushman, J.H. 1990. An introduction to hierarchical porous media.
p. 1–6. In J.H. Cushman (ed.) Dynamics of fluids in hierarchicalwas obtained between the experimental and simulatedporous media. Academic Press, London.(with optimized w) time intervals between the begin-
Czapar, G.F., R. Horton, and R.S. Fawcett. 1992. Herbicide and tracerning of the infiltration process and the appearance of movement in soil columns containing an artificial macropore. J.the first outflow. For w � 1, the DPM failed to predict Environ. Qual. 21:110–115.
Dykhuizen, R.C. 1990. A new coupling term for dual-porosity models.the breakthrough time.Water Resour. Res. 26:351–356.
Gerke, H.H., and M.Th. van Genuchten. 1993a. A dual-porosity modelCONCLUSIONS for simulating the preferential movement of water and solutes in
structured porous media. Water Resour. Res. 29:305–319.Experiments in artificial macroporous systems pro- Gerke, H.H., and M.Th. van Genuchten. 1993b. Evaluation of a 1st-vide insight into preferential flow phenomena that order water transfer term for variably saturated dual-porosity flow
models. Water Resour. Res. 29:1225–1238.would be difficult to achieve otherwise. In this study

www.vadosezonejournal.org 221
Gerke, H.H., and M.Th. van Genuchten. 1996. Macroscopic represen- of water, heat, and multiple solutes in variably-saturated media.Version 2.0. IGWMC-TPS-70. International Ground Water Model-tation of structural geometry for simulating water and solute move-
ment in dual-porosity media. Adv. Water Resour. 19:343–357. ing Center, Colorado School of Mines, Golden, CO.Simunek, J., M. Sejna, and M.Th. van Genuchten. 1999. The HYDRUS-Hopmans, J.W., J. Simunek, N. Romano, and W. Durner. 2002. Inverse
modeling of transient water flow. p. 963–1008. In J.H. Dane and 2D software package for simulating two-dimensional movementof water, heat, and multiple solutes in variably saturated media.G.C. Topp (ed.) Methods of soil analysis. Part 4. SSSA Book Ser. 5.
SSSA, Madison, WI. Version 2.0. IGWMC-TPS-53. International Ground Water Model-ing Center, Colorado School of Mines, Golden, CO.Hu, Q.H., and M.L. Brusseau. 1995. Effect of solute size on transport
in structured porous media. Water Resour. Res. 31:1637–1646. Smettem, K.R.J., and C. Kirkby. 1990. Measuring the hydraulic prop-erties of a stable aggregated soil. J. Hydrol. (Amsterdam) 117:1–13.Li, Y.M., and M. Ghodrati. 1997. Preferential transport of solute
through soil columns containing constructed macropores. Soil Sci. Valocchi, A.J. 1990. Use of temporal moment analysis to study re-active solute transport in aggregated porous media. Geoderma 46:Soc. Am. J. 61:1308–1317.
National Research Council. 2001. Conceptual models of flow and 233–247.van Genuchten, M.Th., and P.J. Wierenga. 1976. Mass transfer studiestransport in the fractured vadose zone. National Academy Press,
Washington, DC. in sorbing porous media. I. Analytical solutions. Soil Sci. Soc. Am.J. 40:473–480.Othmer, H., B. Diekkruger, and M. Kutilek. 1991. Bimodal porosity
and unsaturated hydraulic conductivity. Soil Sci. 152:139–150. van Genuchten, M.Th. 1980. A closed-form equation for predictingthe hydraulic conductivity of unsaturated soils. Soil Sci. Soc. Am.Perroux, K.M., and I. White. 1988. Designs for disc permeameters.
Soil Sci. Soc. Am. J. 52:1205–1214. J. 44:892–898.van Genuchten, M.Th., and F.N. Dalton. 1986. Models for simulatingPeters, R.R., and E.A. Klavetter. 1988. A continuum model for water
movement in an unsaturated fractured rock mass. Water Resour. salt movement in aggregated field soils. Geoderma 38:165–183.Young, D.F., and W.P. Ball. 1995. Effects of column conditions on theRes. 24:416–430.
Pruess, K. 1999. A mechanistic model for water seepage through thick first-order rate modeling of non-equilibrium solute breakthrough.Water Resour. Res. 31:2181–2192.unsaturated zones in fractured rocks of low matrix permeability.
Water Resour. Res. 34:1039–1051. Zimmerman, R.W., G.S. Bodvarsson, and E.M. Kwicklis. 1990. Ab-sorption of water into porous blocks of various shapes and sizes.Simunek, J., M. Sejna, and M.Th. van Genuchten. 1998. The HYDRUS-
1D software package for simulating the one-dimensional movement Water Resour. Res. 26:2797–2806.