Preparation, Luminescent Properties and Bioimaging Application of Quantum Dots Based on Si and SiC
26
Preparation, Luminescent Properties and Bioimaging Application of Quantum Dots Based on Si and SiC Valeriy A. Skryshevsky, Tetiana Serdiuk, Yuriy E. Zakharko, Sergei A. Alekseev, Alain Géloën and Vladimir Lysenko Abstract Well-known, the interest to the colloidal solution with quantum dots (QDs) lies in their fluorescence properties. Among the advantages of QDs are the high resistance to photooxidation, the size and composition variation allowing to obtain the narrow emission spectra with high quantum yield from the ultraviolet to the near infrared region. In this chapter we present the last achievements in forming and bio-medical applications of luminescent Si and SiC QDs. It is shown that a broad size distribution of Si QDs are obtained at electrochemical etching. The dimensions of the Si QDs undergone filtering in colloidal solution vary discretely with a radius quantum equal to 0.12 nm. Existing of this quantum may correspond to step-like increasing of Si QDs radius on one new shell at the surface of Si QDs. The formed QDs show intense luminescent in visual region. However, one of the major drawbacks of Si QDs for bio-medical application is instability over time in water or buffer solutions. To overcome this drawback the several methods of sur- face functionalization are discussed. The SiC QDs are stable in water solutions and do not require supplementary surface functionalisation for bioimaging. A strong fluorescence from the SiC QDs, which undoubtedly penetrate into the cell, has been V.A. Skryshevsky (&) T. Serdiuk Institute of High Technologies, Taras Shevchenko National University of Kyiv, 64 Volodymyrska Str, Kyiv 01601, Ukraine e-mail: [email protected] T. Serdiuk Y.E. Zakharko V. Lysenko Nanotechnology Institute of Lyon (INL), University of Lyon, UMR-5270, CNRS, INSA de Lyon, 69621 Villeurbanne, France S.A. Alekseev Chemistry Faculty, Taras Shevchenko National University of Kyiv, 64 Volodymyrska Str, Kyiv 01601, Ukraine T. Serdiuk A. Géloën CarMeN Laboratory, U 1060 INSERM, INSA de Lyon, 69621, Villeurbanne, France Ó Springer International Publishing Switzerland 2014 A. Nazarov et al. (eds.), Functional Nanomaterials and Devices for Electronics, Sensors and Energy Harvesting, Engineering Materials, DOI 10.1007/978-3-319-08804-4_15 323
-
Upload
independent -
Category
Documents
-
view
0 -
download
0
Transcript of Preparation, Luminescent Properties and Bioimaging Application of Quantum Dots Based on Si and SiC
Preparation, Luminescent Propertiesand Bioimaging Application of QuantumDots Based on Si and SiC
Valeriy A. Skryshevsky, Tetiana Serdiuk, Yuriy E. Zakharko,Sergei A. Alekseev, Alain Géloën and Vladimir Lysenko
Abstract Well-known, the interest to the colloidal solution with quantum dots(QDs) lies in their fluorescence properties. Among the advantages of QDs are thehigh resistance to photooxidation, the size and composition variation allowing toobtain the narrow emission spectra with high quantum yield from the ultraviolet tothe near infrared region. In this chapter we present the last achievements in formingand bio-medical applications of luminescent Si and SiC QDs. It is shown that abroad size distribution of Si QDs are obtained at electrochemical etching. Thedimensions of the Si QDs undergone filtering in colloidal solution vary discretelywith a radius quantum equal to 0.12 nm. Existing of this quantum may correspondto step-like increasing of Si QDs radius on one new shell at the surface of Si QDs.The formed QDs show intense luminescent in visual region. However, one of themajor drawbacks of Si QDs for bio-medical application is instability over time inwater or buffer solutions. To overcome this drawback the several methods of sur-face functionalization are discussed. The SiC QDs are stable in water solutions anddo not require supplementary surface functionalisation for bioimaging. A strongfluorescence from the SiC QDs, which undoubtedly penetrate into the cell, has been
V.A. Skryshevsky (&) � T. SerdiukInstitute of High Technologies, Taras Shevchenko National University of Kyiv,64 Volodymyrska Str, Kyiv 01601, Ukrainee-mail: [email protected]
T. Serdiuk � Y.E. Zakharko � V. LysenkoNanotechnology Institute of Lyon (INL), University of Lyon, UMR-5270, CNRS,INSA de Lyon, 69621 Villeurbanne, France
S.A. AlekseevChemistry Faculty, Taras Shevchenko National University of Kyiv, 64 Volodymyrska Str,Kyiv 01601, Ukraine
T. Serdiuk � A. GéloënCarMeN Laboratory, U 1060 INSERM, INSA de Lyon, 69621, Villeurbanne, France
� Springer International Publishing Switzerland 2014A. Nazarov et al. (eds.), Functional Nanomaterials and Devices for Electronics,Sensors and Energy Harvesting, Engineering Materials,DOI 10.1007/978-3-319-08804-4_15
323
observed. The studying of health and cancer cells using SiC QDs shows that simplemodification of surface charge of QDs gives strong opportunity to target the sameQDs in intracellular space with their preferential localisation inside or outside thecell nucleus.
1 Introduction
Quantum dots (QDs) are semiconductor nanoparticles in which ‘‘quantum con-finement’’ effect is observed [1]. Quantum confinement of electrons in semicon-ductor nanoparticles is observed when a crystallite radius less than the Bohrexciton radius (5 nm for silicon) and results in specific optical and electronicproperties—size dependent bandgaps and thus a Stokes shift with high quantumyield photoluminescence.
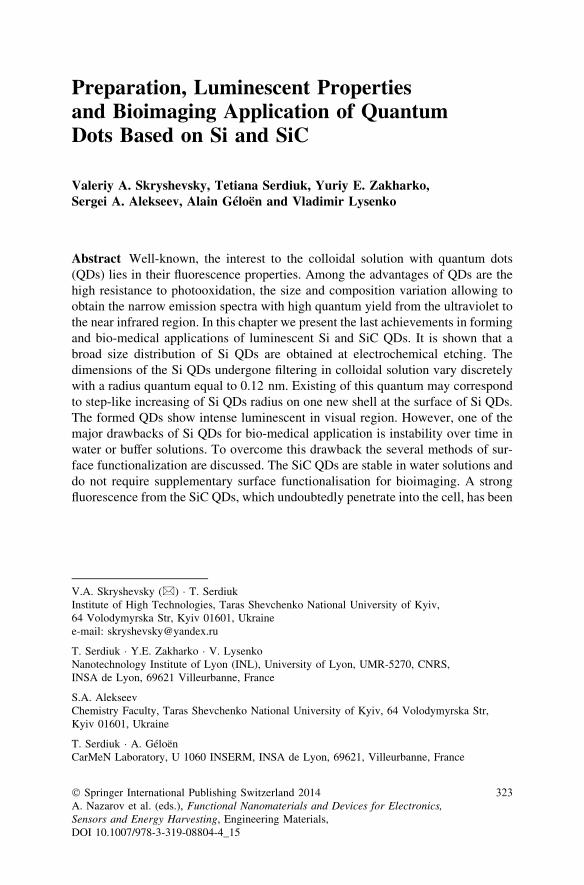
Structurally, the central part of QDs consists of a core composed of a variety ofsubstances such as AIV, A2B6, A3B5 and more complex semiconductors which canbe amorphous or crystalline, doped and undoped [2]. The core can be covered byother semiconductor shell and stabilizing layer. Depending on functional appli-cation of QDs this layer can be hydrophilic or hydrophobic. The linkers andligands can be attached to these layers allowing formation of different complex.The examples of possible materials for core, doping ions, shell, stabilizing layer,linkers and ligands are presented in Fig. 1.
Due to their specific photophysical, magnetic, electronic and biological prop-erties quantum dots are widely applied in electronics and optoelectronics (lightemission diodes, memory devices, displays), photochemistry (hydrogen genera-tion, sensitizes, photoelectrodes), analytical chemistry (chemical analysis),molecular biology and medicine (biosensors, fluorescent labels, photodynamictherapy, drug biotracking), etc. [1–4].
In the last few decades, the emergence of nanotechnology gave rise to excitingdevelopments in the field of cell biology. Indeed, the ability to control matter at thenanoscale length paves the way for the sensing of biological systems at the level ofsingle molecules by optical or electrical detection. The implementation of QDs foruse in cell labeling has been one of the fastest growing areas in this field. Thereason for this intense research activity, in particular fluorescence labeling, lies inthe considerable advantages of semiconductor QDs over the classically usedorganic dye molecules or fluorescent proteins. Numerous reviews have beendevoted to these QDs [1–9] including the method of QDs formation and possibleapplication to bioimaging. Here we review the last achievements in the branch ofSi and SiC QDs formation by electrochemical etching, their surface functionali-zation, analysis of luminescent properties of QDs colloidal solutions, and differentbio-medical application.
324 V.A. Skryshevsky et al.
2 Properties and Advantages of Colloidal Solutionswith QDs
The interest in colloidal solution with QDs lies in their fluorescence properties.Among the advantages of QDs, the principal one is the higher resistance of QDs tolight-induced reactions such as photooxidation. This photochemical inertnessknown as the photobleaching phenomenon prevents the degradation of lumines-cence properties with time. Another important feature of QDs is their size andcomposition-induced tunable emission spanning from the ultraviolet to the nearinfrared (UV to NIR) with a narrow emission spectra and high quantum yield. Theconjugation of a narrow emission with a large effective Stokes shift [8, 10], aconstant emission wavelength no matter what excitation wavelength is used [11],and a broad absorption spectrum are key parameters to achieve multiplexedimaging as the fluorescence signal of each QD can be readily separated andindividually analyzed using a single excitation source. This multicolor imagingpotentiality is particularly interesting for the monitoring of intracellular processes[3, 12]. As the last advantage, it is also important to note that QDs have orders ofmagnitude larger cross sections for two-photon excitation compared to the organicchromophore. Thanks to this property, infrared excitation in the transparencywindow of tissues (700–900 nm) can be used with visible radiation to performfluorescence detection.
Fig. 1 Scheme of quantum dot structure (from [2])
Preparation, Luminescent Properties and Bioimaging Application… 325
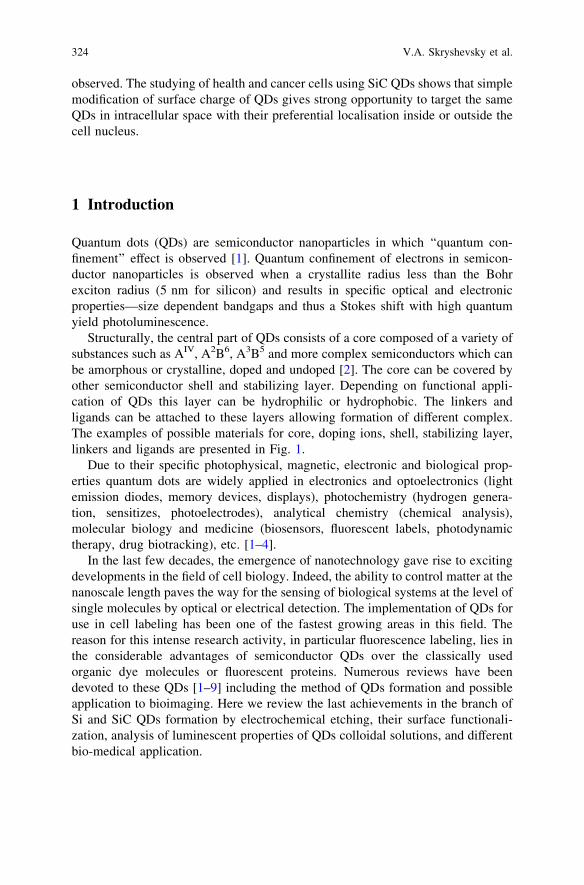
Besides fluorescence (one photon and two-photon excited) we can note othereffects like linear scattering, second harmonic generation, sequential absorption andupconverted emission. The schemes in Fig. 2 summarize emission effects in QDsthat can be applied to bio-medical applications (see detailed explanation in [7]).
QDs present also two important drawbacks. The first one is that most QDs, assynthesized, have hydrophobic organic ligands coating their surface [13]. To makethe QDs water soluble, their organophilic surface species have to be exchangedwith more polar species. A complex multilayer [14] ligand shell has then to berealized, which leads in some cases of nonspecific optical absorption. The secondand the major drawback concerns cytotoxicity. For example, the widely used II–VIsemiconductor QDs (e.g. CdSe) were found to be cytotoxic through the release offree cadmium ions [15, 16]. As the result, these QDs strongly influence biologicalcell function and their application in efficient cell imaging is limited. Therefore, aprotective shell (ZnS or a polymer, for example) must be systematically added toprevent cell death when using these types of QDs. To completely avoid thisproblem, one has to use QDs on the basis of more benign materials such as groupIV semiconductors, first of all Si and SiC QDs.
3 Technology of Colloidal Solution of Si QDs
Different approaches have been proposed and described in literature to create Sinanoparticles and QDS. The isolated particles were obtained from a gas-phasepreparation using silanes or other Si sources via thermal decomposition, thermalannealing, reactive sputtering, thermal vaporization, microwave plasma, gas-evaporation, chemical vapour deposition [1, 9, 17–20].
Fig. 2 a One-photon excited fluorescence. b Linear scattering. c Two-photon-excited fluores-cence. d Second harmonic generation. e Sequential absorption and upconverted emission.f Principle of molecular bleaching showing intersystem crossing upon one- or two-photonabsorption (from [7])
326 V.A. Skryshevsky et al.

‘‘Wet chemistry’’ route to Si QDs typically involves the reaction of Zintl salts(KSi/NaSi) or reductive organometallic Si compounds with SiCl4 or NH4Br [21,22]. Chemical reduction of silicon halogenides (SiX4; X = Cl or Br) by LiAlH4 inwater-free reverse-micelle solutions gives Si QDs with narrow size distribution[23]. However, comparing to chemical route, electrochemical anodization is muchmore reproducible and simple technique for the fabrication of Si QDs emittinglight in a large spectral range at room temperature under photoexcitation. Visiblelight emitting colloidal Si QDs are extensively studied [1]. Otherwise UV emittingSi QDs were only mentioned in a few papers [24–26], because it is relativelydifficult to control fabrication of stable and homogeneously distributed Si QDswith dimensions less than 1.5 nm having the energy band gaps larger than 3 eV.
Commonly the anodization to prepare Si QDs as well as porous silicon (PS)takes place in the mixtures of HF (able to transform silicon into soluble H2SiF6
under anodization) and organic solvent (commonly ethanol) decreasing the wettingangle and thus allowing the penetration of electrolyte inside pores of PS. Anexperimental protocol for the preparation of Si QDs with desired emissionwavelength (from NIR to UV) was described in details in the works [26, 27]. Atthe first stage, highly porous ([90 %) 300 lm thick PS layer was prepared byanodization (current density j = 55 mA/cm2) of p-type (1–10 X cm) boron-doped(100)-oriented Si wafers with a backside Al ohmic contact in 1:1 (v:v) mixture of48 % aqueous HF and absolute ethanol during 2 h. To remove all HF traces thelayer was washed several times in absolute ethanol and naturally dried, whichresulted in its self-transformation into a strongly hydrogenated PS micropowderwith about 6.5 % mass content of H [27]. Finally the micropowder wasmechanically grinded and dispersed in absolute ethanol, giving Si QDs saturatedcolloidal solution with 5 mg/ml concentration.
Transmission Electron Microscopy (TEM) pictures shown in Fig. 3 give ageneral view of quasi-spherical Si particles constituting the nanopowder suspen-sion into the initial colloidal solution. As one can see, the general size distributionof the shown particles is relatively large. In particular, the initial nanopowderconsists of large ([10 nm) porous particles (Fig. 3 b) and numerous small denser
Fig. 3 TEM pictures of Si NPs constituting the initial strongly hydrogenated PS nanopowder:a general view; b large porous NPs; c small dense Si NPs with dimensions less than 5 nm (from[26])
Preparation, Luminescent Properties and Bioimaging Application… 327

(\10 nm) particles (Fig. 3c). Total absence of clearly defined electron diffractionfeatures indicates an amorphous-like state of the studied particles [27]. Clear anddark spots of the large porous particles (Fig. 3b) correspond to the pits and solid Siphase, respectively. In general, their shape was already described in terms offractal geometry [28]. As for the small (\10 nm) particles (Fig. 3c), they are wellknown to exhibit highly efficient luminescence in a large spectral range due toquantum and spatial confinements of photogenerated charge carriers and theseparticles can be considered as SiQDs.
Figure 4 shows normalized photoluminescence (PL) spectra of the Si QDs inethanol solutions [26]. First, the PL signal of the initial saturated solution isrepresented by spectrum 1. It is very similar to a usual PL spectrum of a redemitting PS layer. The spectra blueshifting in comparison to the initial PL isobserved after sedimentation in the dark during 1 day (curve 2). Associating bothPL spectra to particular size distributions of SiQDs and taking into account that theemission energy for the smaller QDs is higher, the observed sedimentation-induced evolution of the PL signal can be explained by the removal of the largestsubmicron PS QDs from the ethanol solution. Thus, the observed green-blue PLmaxima of spectrum 2 may correspond to luminescence of the smaller porous QDsas those shown in Fig. 3b, for example. Further centrifugation leads to almostcomplete elimination of the QDs with dimensions larger than 2 nm from thecolloidal solution. The PL spectrum 4 of this doubly centrifuged solution has amain maximum at 3.5 eV and a set of other UV peaks at the high energy wingsituated in the spectral region between 3.5 and 4.5 eV.
In [29, 30] we proposed a new method allowing more precise size selection ofcolloidal Si QDs. This approach is based on the use of meso-porous Si (meso-PS)free standing membranes as QDs filters (Fig. 5). In particular, due to auto-filtrationphenomenon an efficient filtering was achieved and size quantization of theamorphous Si QDs was brought to the fore. Via variation of the porosity andthickness of meso-porous layer it is possible to obtain PL spectra with maxima
Fig. 4 PL spectrum of theinitial PS nanopowder inethanol solution and itsevolution upon sedimentationand moderate centrifugation(from [26])
328 V.A. Skryshevsky et al.
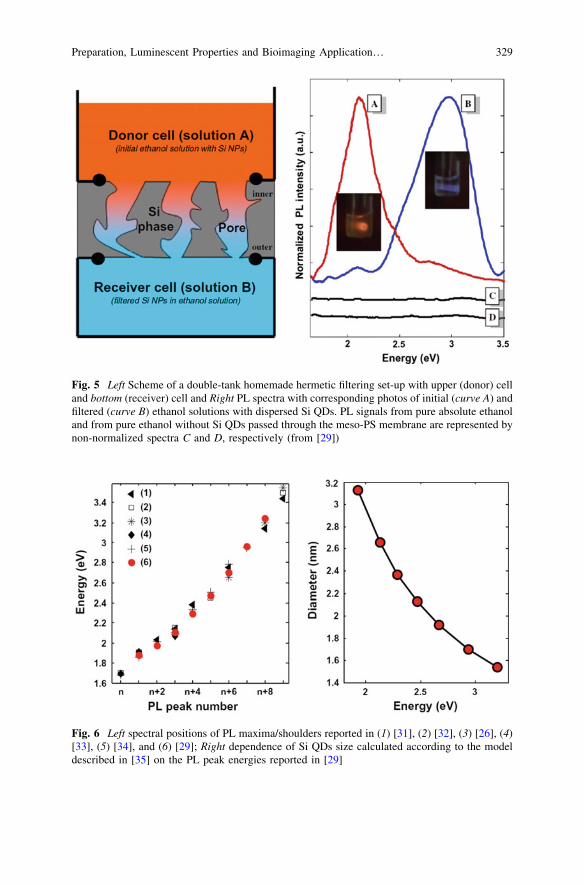
Fig. 5 Left Scheme of a double-tank homemade hermetic filtering set-up with upper (donor) celland bottom (receiver) cell and Right PL spectra with corresponding photos of initial (curve A) andfiltered (curve B) ethanol solutions with dispersed Si QDs. PL signals from pure absolute ethanoland from pure ethanol without Si QDs passed through the meso-PS membrane are represented bynon-normalized spectra C and D, respectively (from [29])
Fig. 6 Left spectral positions of PL maxima/shoulders reported in (1) [31], (2) [32], (3) [26], (4)[33], (5) [34], and (6) [29]; Right dependence of Si QDs size calculated according to the modeldescribed in [35] on the PL peak energies reported in [29]
Preparation, Luminescent Properties and Bioimaging Application… 329
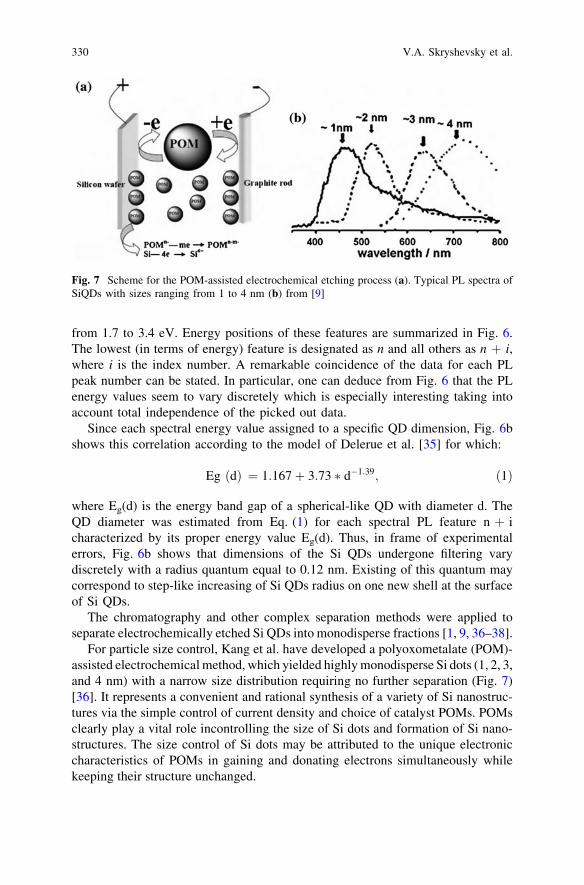
from 1.7 to 3.4 eV. Energy positions of these features are summarized in Fig. 6.The lowest (in terms of energy) feature is designated as n and all others as n + i,where i is the index number. A remarkable coincidence of the data for each PLpeak number can be stated. In particular, one can deduce from Fig. 6 that the PLenergy values seem to vary discretely which is especially interesting taking intoaccount total independence of the picked out data.
Since each spectral energy value assigned to a specific QD dimension, Fig. 6bshows this correlation according to the model of Delerue et al. [35] for which:
Eg dð Þ ¼ 1:167þ 3:73 � d�1:39; ð1Þ
where Eg(d) is the energy band gap of a spherical-like QD with diameter d. TheQD diameter was estimated from Eq. (1) for each spectral PL feature n + icharacterized by its proper energy value Eg(d). Thus, in frame of experimentalerrors, Fig. 6b shows that dimensions of the Si QDs undergone filtering varydiscretely with a radius quantum equal to 0.12 nm. Existing of this quantum maycorrespond to step-like increasing of Si QDs radius on one new shell at the surfaceof Si QDs.
The chromatography and other complex separation methods were applied toseparate electrochemically etched Si QDs into monodisperse fractions [1, 9, 36–38].
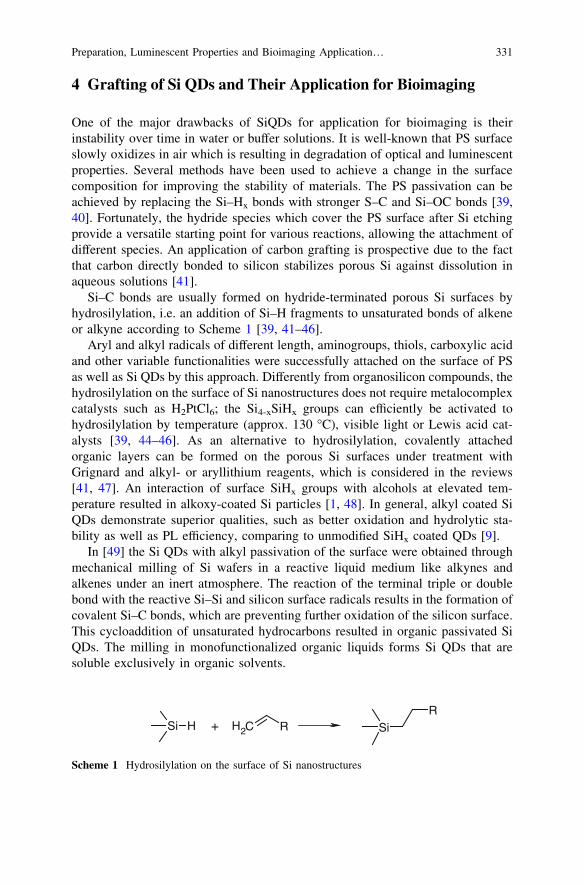
For particle size control, Kang et al. have developed a polyoxometalate (POM)-assisted electrochemical method, which yielded highly monodisperse Si dots (1, 2, 3,and 4 nm) with a narrow size distribution requiring no further separation (Fig. 7)[36]. It represents a convenient and rational synthesis of a variety of Si nanostruc-tures via the simple control of current density and choice of catalyst POMs. POMsclearly play a vital role incontrolling the size of Si dots and formation of Si nano-structures. The size control of Si dots may be attributed to the unique electroniccharacteristics of POMs in gaining and donating electrons simultaneously whilekeeping their structure unchanged.
Fig. 7 Scheme for the POM-assisted electrochemical etching process (a). Typical PL spectra ofSiQDs with sizes ranging from 1 to 4 nm (b) from [9]
330 V.A. Skryshevsky et al.
4 Grafting of Si QDs and Their Application for Bioimaging
One of the major drawbacks of SiQDs for application for bioimaging is theirinstability over time in water or buffer solutions. It is well-known that PS surfaceslowly oxidizes in air which is resulting in degradation of optical and luminescentproperties. Several methods have been used to achieve a change in the surfacecomposition for improving the stability of materials. The PS passivation can beachieved by replacing the Si–Hx bonds with stronger S–C and Si–OC bonds [39,40]. Fortunately, the hydride species which cover the PS surface after Si etchingprovide a versatile starting point for various reactions, allowing the attachment ofdifferent species. An application of carbon grafting is prospective due to the factthat carbon directly bonded to silicon stabilizes porous Si against dissolution inaqueous solutions [41].
Si–C bonds are usually formed on hydride-terminated porous Si surfaces byhydrosilylation, i.e. an addition of Si–H fragments to unsaturated bonds of alkeneor alkyne according to Scheme 1 [39, 41–46].
Aryl and alkyl radicals of different length, aminogroups, thiols, carboxylic acidand other variable functionalities were successfully attached on the surface of PSas well as Si QDs by this approach. Differently from organosilicon compounds, thehydrosilylation on the surface of Si nanostructures does not require metalocomplexcatalysts such as H2PtCl6; the Si4-xSiHx groups can efficiently be activated tohydrosilylation by temperature (approx. 130 �C), visible light or Lewis acid cat-alysts [39, 44–46]. As an alternative to hydrosilylation, covalently attachedorganic layers can be formed on the porous Si surfaces under treatment withGrignard and alkyl- or aryllithium reagents, which is considered in the reviews[41, 47]. An interaction of surface SiHx groups with alcohols at elevated tem-perature resulted in alkoxy-coated Si particles [1, 48]. In general, alkyl coated SiQDs demonstrate superior qualities, such as better oxidation and hydrolytic sta-bility as well as PL efficiency, comparing to unmodified SiHx coated QDs [9].
In [49] the Si QDs with alkyl passivation of the surface were obtained throughmechanical milling of Si wafers in a reactive liquid medium like alkynes andalkenes under an inert atmosphere. The reaction of the terminal triple or doublebond with the reactive Si–Si and silicon surface radicals results in the formation ofcovalent Si–C bonds, which are preventing further oxidation of the silicon surface.This cycloaddition of unsaturated hydrocarbons resulted in organic passivated SiQDs. The milling in monofunctionalized organic liquids forms Si QDs that aresoluble exclusively in organic solvents.
Si H H C2 R SiR
+
Scheme 1 Hydrosilylation on the surface of Si nanostructures
Preparation, Luminescent Properties and Bioimaging Application… 331
Very stable and bright emitting amine-terminated Si QDs with different alkylchain lengths between the Si core and amine end-group were synthesized in [50].The obtained Si QDs have a spherical shape and homogeneous size distribution(1.6 nm). Their emission can be tuned from the UV to the blue spectral region, in acontrollable fashion, by only changing the alkyl spacer length. The emissionquantum yields are 12 % for all synthesized Si QDs. Excited state lifetimes are inthe ns range and point to a direct band gap excitation. NH2-terminated Si QDsexhibit an exceptional stability over a wide pH range (1–13) and high temperatures(120 �C).
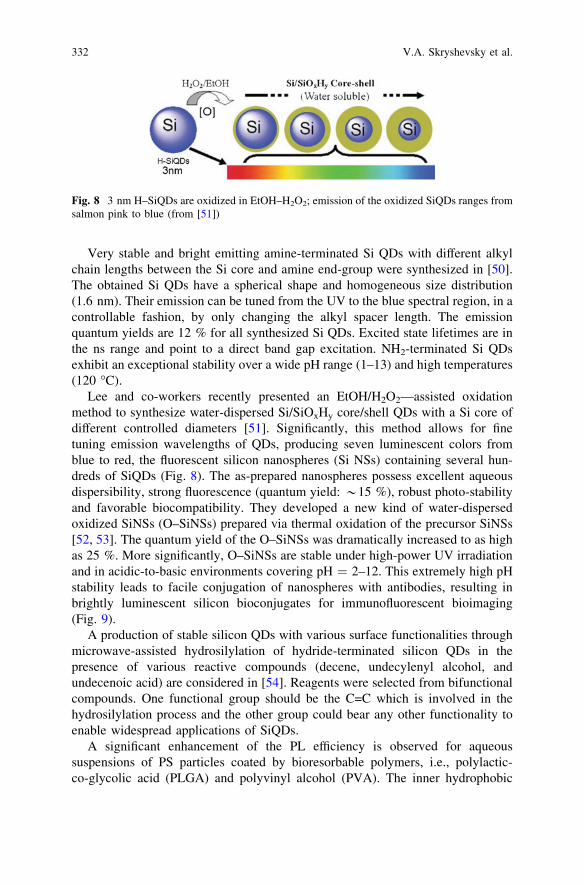
Lee and co-workers recently presented an EtOH/H2O2—assisted oxidationmethod to synthesize water-dispersed Si/SiOxHy core/shell QDs with a Si core ofdifferent controlled diameters [51]. Significantly, this method allows for finetuning emission wavelengths of QDs, producing seven luminescent colors fromblue to red, the fluorescent silicon nanospheres (Si NSs) containing several hun-dreds of SiQDs (Fig. 8). The as-prepared nanospheres possess excellent aqueousdispersibility, strong fluorescence (quantum yield: *15 %), robust photo-stabilityand favorable biocompatibility. They developed a new kind of water-dispersedoxidized SiNSs (O–SiNSs) prepared via thermal oxidation of the precursor SiNSs[52, 53]. The quantum yield of the O–SiNSs was dramatically increased to as highas 25 %. More significantly, O–SiNSs are stable under high-power UV irradiationand in acidic-to-basic environments covering pH = 2–12. This extremely high pHstability leads to facile conjugation of nanospheres with antibodies, resulting inbrightly luminescent silicon bioconjugates for immunofluorescent bioimaging(Fig. 9).
A production of stable silicon QDs with various surface functionalities throughmicrowave-assisted hydrosilylation of hydride-terminated silicon QDs in thepresence of various reactive compounds (decene, undecylenyl alcohol, andundecenoic acid) are considered in [54]. Reagents were selected from bifunctionalcompounds. One functional group should be the C=C which is involved in thehydrosilylation process and the other group could bear any other functionality toenable widespread applications of SiQDs.
A significant enhancement of the PL efficiency is observed for aqueoussuspensions of PS particles coated by bioresorbable polymers, i.e., polylactic-co-glycolic acid (PLGA) and polyvinyl alcohol (PVA). The inner hydrophobic
Fig. 8 3 nm H–SiQDs are oxidized in EtOH–H2O2; emission of the oxidized SiQDs ranges fromsalmon pink to blue (from [51])
332 V.A. Skryshevsky et al.

PLGA layer protects the QDs from the reaction with water, while the outer PVAlayer makes the QDs hydrophilic [55]. UV-induced graft polymerization of acrylicacid on the surface of silicon nanoparticles was used to prepare a stable aqueousluminescent silicon QDs solution. By grafting a water-soluble polymer on theparticle surface, the dispersions in water of the silicon nanoparticles became verystable and clear aqueous solutions could be obtained as in [56]. Hydrogen-cappedsilicon QDs with strong blue PL were synthesized by the metathesis reaction ofsodium silicide, NaSi, with NH4Br. The hydrogen-capped Si QDs were furtherterminated with octyl groups and then coated with a polymer to render them water-soluble [57]. Silicon QDs were prepared and functionalized with alkene-terminatedpoly (ethylene oxide) to impart amphiphilic solution properties to the particles [58].The alkyl-passivated Si nanocolloids were obtained via thermally-initiatedhydrosilylation of the hydrogenated Si nanoparticles, formed by electrochemicaletching of Si wafer, with 1-undecene [59].
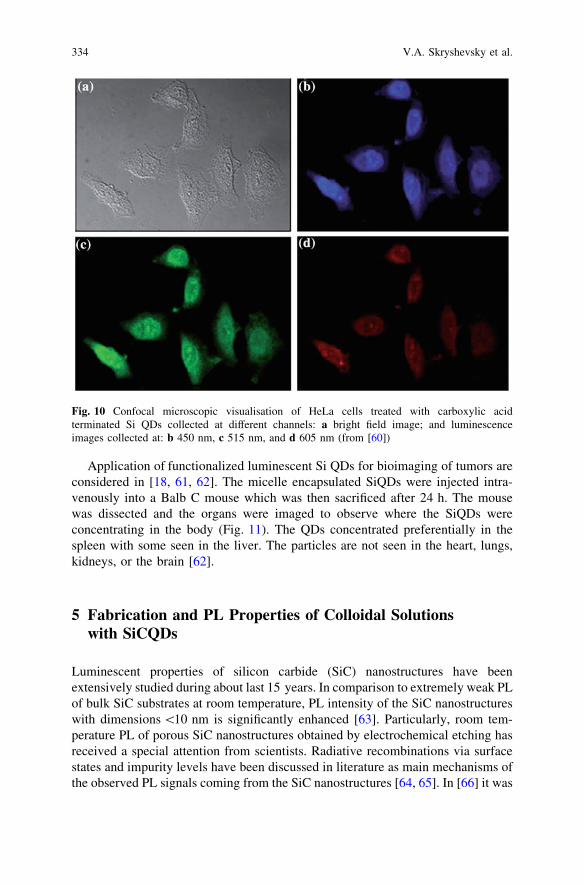
The carboxylic acid functionalized Si QDs (with the using of short alkyl chainorganic peroxide, succinic acid peroxide) were applied for HeLa cells imaging[60] in several emission ranges. HeLa or heLa cell, is an immortalized cell typeused in scientific research in vitro. The HeLa cells treated the carboxylic acidterminated Si QDs demonstrate the fluorescence with wide emission spectraarising from Si QDs (Fig. 10b–d). The bright blue fluorescence (450 nm) from theSi QDs is distributed uniformly and shows that the Si QDs were taken up into thecytoplasm (Fig. 10b). Remarkably, when the image for the 515 nm channel wascollected, a bright green fluorescence from the internalized Si–QDs was clearlyobserved from the robust optical signal of the cells (Fig. 10c). Red fluorescencefrom the internalized Si QDs was also observed for the 605 nm channel (Fig. 10d).This behavior indicates that it might be possible to use hydrophilic Si QDs aschromophores for biological fluorescence imaging.
Fig. 9 a Schematic illustration of silicon nanospheres conjugating with goat-anti-mouse IgG.The carboxylic acid groups of nanospheres readily reacted with the amino groups of IgG by usingEDC and NHS as zero-length cross-linkers (Figure is not to scale). b Optical micrographs of theprepared silicon bioconjugates under UV (365 nm) irradiation. The prepared bioconjugatespreserve stable and bright fluorescent intensity for over 1 month (right) (from [53])
Preparation, Luminescent Properties and Bioimaging Application… 333
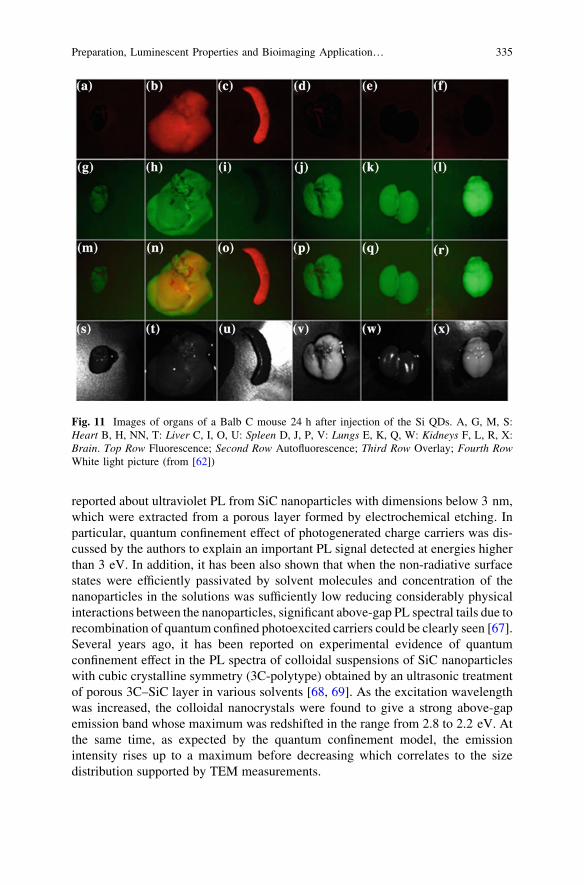
Application of functionalized luminescent Si QDs for bioimaging of tumors areconsidered in [18, 61, 62]. The micelle encapsulated SiQDs were injected intra-venously into a Balb C mouse which was then sacrificed after 24 h. The mousewas dissected and the organs were imaged to observe where the SiQDs wereconcentrating in the body (Fig. 11). The QDs concentrated preferentially in thespleen with some seen in the liver. The particles are not seen in the heart, lungs,kidneys, or the brain [62].
5 Fabrication and PL Properties of Colloidal Solutionswith SiCQDs
Luminescent properties of silicon carbide (SiC) nanostructures have beenextensively studied during about last 15 years. In comparison to extremely weak PLof bulk SiC substrates at room temperature, PL intensity of the SiC nanostructureswith dimensions \10 nm is significantly enhanced [63]. Particularly, room tem-perature PL of porous SiC nanostructures obtained by electrochemical etching hasreceived a special attention from scientists. Radiative recombinations via surfacestates and impurity levels have been discussed in literature as main mechanisms ofthe observed PL signals coming from the SiC nanostructures [64, 65]. In [66] it was
Fig. 10 Confocal microscopic visualisation of HeLa cells treated with carboxylic acidterminated Si QDs collected at different channels: a bright field image; and luminescenceimages collected at: b 450 nm, c 515 nm, and d 605 nm (from [60])
334 V.A. Skryshevsky et al.
reported about ultraviolet PL from SiC nanoparticles with dimensions below 3 nm,which were extracted from a porous layer formed by electrochemical etching. Inparticular, quantum confinement effect of photogenerated charge carriers was dis-cussed by the authors to explain an important PL signal detected at energies higherthan 3 eV. In addition, it has been also shown that when the non-radiative surfacestates were efficiently passivated by solvent molecules and concentration of thenanoparticles in the solutions was sufficiently low reducing considerably physicalinteractions between the nanoparticles, significant above-gap PL spectral tails due torecombination of quantum confined photoexcited carriers could be clearly seen [67].Several years ago, it has been reported on experimental evidence of quantumconfinement effect in the PL spectra of colloidal suspensions of SiC nanoparticleswith cubic crystalline symmetry (3C-polytype) obtained by an ultrasonic treatmentof porous 3C–SiC layer in various solvents [68, 69]. As the excitation wavelengthwas increased, the colloidal nanocrystals were found to give a strong above-gapemission band whose maximum was redshifted in the range from 2.8 to 2.2 eV. Atthe same time, as expected by the quantum confinement model, the emissionintensity rises up to a maximum before decreasing which correlates to the sizedistribution supported by TEM measurements.
Fig. 11 Images of organs of a Balb C mouse 24 h after injection of the Si QDs. A, G, M, S:Heart B, H, NN, T: Liver C, I, O, U: Spleen D, J, P, V: Lungs E, K, Q, W: Kidneys F, L, R, X:Brain. Top Row Fluorescence; Second Row Autofluorescence; Third Row Overlay; Fourth RowWhite light picture (from [62])
Preparation, Luminescent Properties and Bioimaging Application… 335
The method of forming SiC QDs obtained by electrochemical etching of bulksubstrates of 3C polytype was described in [70, 71]. Firstly, 3C–SiC nano-porouslayer was formed by means of electrochemical anodization of a low resistivitygrade (\1 X cm) bulk 3C–SiC polycrystalline wafer. The etching process tookplace for 2–3 h at a current density of 25 mA/cm2 using a 1:1 HF(50 %)/ethanolelectrolyte. After the etching, a highly porous network constituted by numerousinterconnected 3C–SiC nanocrystals was formed. The ultra-porous layer waswashed with water, naturally dried in ambient air and then removed from thewafer. An intense mechanical dry grinding of the formed free nano-porous layertransformed it into a nano-powder state. The as-prepared 3C–SiC nanopowder canbe dispersed in various polar solutions. To change surface charges, the suspendedQDs are treated in different surfactants like cetyl-tri-methyl-ammonium bromide(CTMA) and sodium lauryl sulphate (SLS) which are added to the colloidalsolutions to communicate positive and negative surface charges to the QDs,respectively.
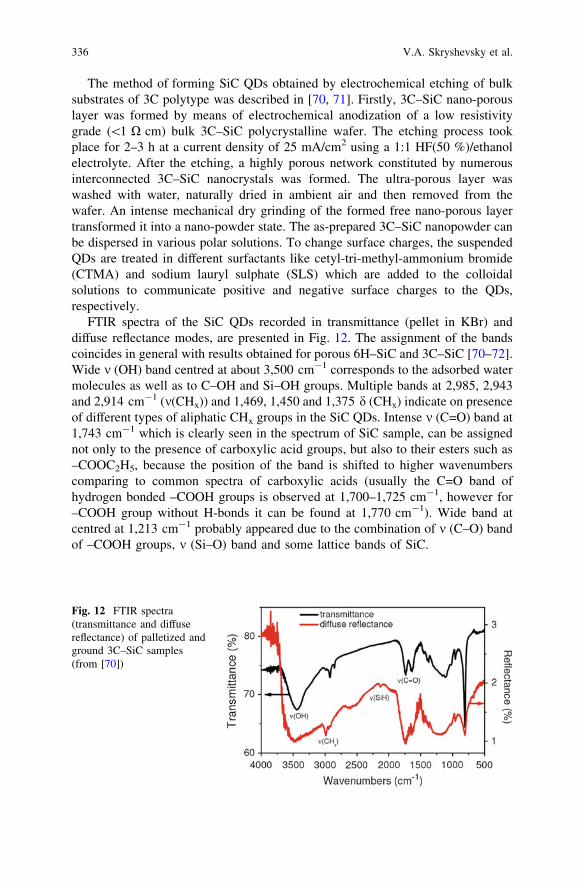
FTIR spectra of the SiC QDs recorded in transmittance (pellet in KBr) anddiffuse reflectance modes, are presented in Fig. 12. The assignment of the bandscoincides in general with results obtained for porous 6H–SiC and 3C–SiC [70–72].Wide m (OH) band centred at about 3,500 cm-1 corresponds to the adsorbed watermolecules as well as to C–OH and Si–OH groups. Multiple bands at 2,985, 2,943and 2,914 cm-1 (m(CHx)) and 1,469, 1,450 and 1,375 d (CHx) indicate on presenceof different types of aliphatic CHx groups in the SiC QDs. Intense m (C=O) band at1,743 cm-1 which is clearly seen in the spectrum of SiC sample, can be assignednot only to the presence of carboxylic acid groups, but also to their esters such as–COOC2H5, because the position of the band is shifted to higher wavenumberscomparing to common spectra of carboxylic acids (usually the C=O band ofhydrogen bonded –COOH groups is observed at 1,700–1,725 cm-1, however for–COOH group without H-bonds it can be found at 1,770 cm-1). Wide band atcentred at 1,213 cm-1 probably appeared due to the combination of m (C–O) bandof –COOH groups, m (Si–O) band and some lattice bands of SiC.
Fig. 12 FTIR spectra(transmittance and diffusereflectance) of palletized andground 3C–SiC samples(from [70])
336 V.A. Skryshevsky et al.

The surface groups of the 3C–SiC nano-powder are very similar to those ofrecently studied 6H–SiC porous nanostructures and schematically represented by ascheme in Fig. 13a. According to [73], the 3C–SiC QDs surface contains carbon-enriched layer appeared mainly due to the preferential removing of Si atomsduring the electrochemically assisted nano-powder formation. Dissociation of thecarboxylic (Si–COOH) and/or silanol (Si–OH) acid groups in polar solvents leadsto appearance of negative electric charges at the nanoparticle surface as it isillustrated by scheme in Fig. 13b. In particular, these charges are responsible forextremely stable and optically homogeneous colloidal solutions obtained with the3C–SiC QDs dispersed in solvents.
Electrostatic screening of the radiative band gap states by highly polar solventmedia leads to a blue shift and a decrease in the width at half maximum of the PLspectra of the QDs. As for the surface charges, they govern band bending slope andthus influence strongly the radiative transitions via energy states in the band gap.
Transmission electron microscopy (TEM) image of the spherical-like SiC QDsis given in Fig. 14a. An example of a daylight photo of the centrifuged opticallyhomogeneous colloidal suspension of the 3C–SiC is shown by the inset inFig. 14a. Typical size distribution of the 3C–SiC QDs is presented in Fig. 14b. Asone can see, the majority of the QDs dimensions are found to be below 5 nm withthe most probable size value being around 2.5 nm. The inset in Fig. 14b showstypical PL spectrum of the 3C–SiC QDs dispersed in aqueous solutions under UVexcitation. Since the mean size value of the SiC QDs are smaller then the Bohr’sdiameter of the exciton in bulk SiC substrate (*5.4 nm), they exhibit highlyefficient luminescence with energies higher than bandgap energy of bulk SiC dueto spatial and quantum confinement effects [71].
Well defined spherical colloidal cubic SiC QDs with average diameter of 5 nmwere synthesized using the reactive bonding and wet chemical etching method in[74, 75]. These QDs show strong violet-blue PL emission. ATR–IR measurementsrevealed the surface structure of the SiC QDs which consists of Si–O–Si, C–O–C,CH, COOH, and COO-surface terminations as for electrochemically prepared QDs.
There are only few reports on surface functionalization of SiC nanoparticles[4, 75–79]. Polymerization of the conducting polyaniline in the presence of cam-phorsulfonic acid and SiC nanoparticles results in the formation of polyaniline-camphorsulfonic acid shell with a thickness in the range from 0.5 nm to a few
Fig. 13 Schematic representation of: a general surface chemistry and b surface charges of 3C–SiC nanoparticles [70]
Preparation, Luminescent Properties and Bioimaging Application… 337

nanometers at the surface of SiC nanocrystals [79]. Zhang et al. [76] reports on PLand light reabsorption in the SiC QDs embedded in the binary poly(allylaminehydrochloride)-sodium poly(styrene sulfonate) polyelectrolytes solid matrix. Theemission maximum wavelength can be tuned over a wide blue-violet spectralregion indicating the quantum confinement as the origin of light emission.
6 SiC QDs as Fluorescent Bio-Labels
The highly luminescent 3C–SiC QDs was successfully explored as fluorescentagents for living cell imaging. By using fluorescent microscope we studied thecells of different plants, mouse fibroblast, healthy and cancer epithelial humancells with SiC QDs [8, 71, 80, 81]. Covalent grafting of amino groups onto thecarboxylic acid functionalities, naturally covering the surface of fluorescentnanoparticles produced from silicon carbide, allowed tuning of their surfacecharge from negative to highly positive (Fig. 15). Grafting of aminogroups wasperformed by the reaction of SiC QDs surface carboxylic acid groups with ethy-lenediamine (En, H2N–CH2CH2–NH2) (Fig. 15).
Incubating 3T3-L1 fibroblast cells with differently charged SiC QDs demon-strates the crucial role of the charge in cell fluorescent targeting [71]. Negativelycharged SiC QDs concentrate inside the cell nuclei. Close to neutrally charged SiCQDs are present in both cytoplasm and nuclei while positively charged SiC QDsare present only in the cytoplasm and are not able to move inside the nuclei(Fig. 16). This effect opens the door for the use of SiC QDs for easy and fastvisualization of long-lasting biological processes taking place in the cell cytosol ornucleus as well as providing a new long-term cell imaging tool. Moreover, here we
Fig. 14 Left The general TEM image of the SiC QDs. Inset shows a colloidal solution with thedispersed SiC QDs; Right size distribution of the SiC QDs. Inset shows a typical PL spectrum ofthe colloidal 3C–SiC QDs (from [81])
338 V.A. Skryshevsky et al.

have shown that the interaction between charged QDs and nuclear pore complexplays an essential role in their penetration into the nuclei. The importance ofelectrostatic interactions was more recently strengthened by authors studying themolecular structure of the yeast nuclear pore complex (NPC) and the translocationof model particles [82].
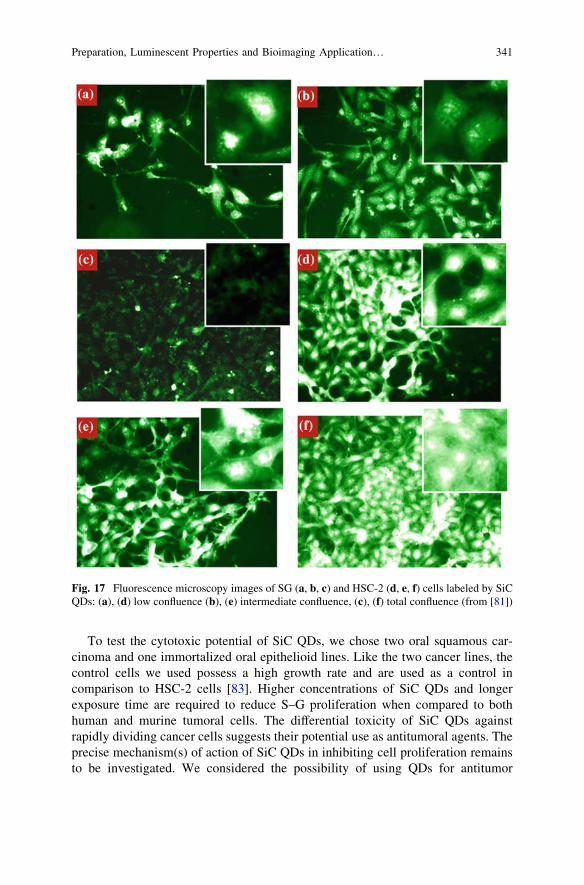
The uptake of QDs and its intra-nuclei concentration is dependant to cellproliferation (Fig. 17). This has been shown by two different ways, first in healthycells and second in cancer cells [81]. In healthy SG cells (a human immortalizedgingival epithelioid cell line), the labeling is altered by the state of confluence, atconfluence the labeling is low and absent in the nuclei (c) while it is strong andpresent in the nuclei when cells divide (a and b). In cancer cells HSC-2 (a humanoral squamous carcinoma line), that proliferate even at confluence, the labeling isnot influence by confluence (d, e and f). Although the mechanism linking intra-nuclear accumulation of SiC QDs and cell proliferation has not been yet identified,this observation is important for at least two reasons. Firstly, it brings evidence ofa specificity of SiC QDs to be uptaken by proliferating cells that are promising togive specificity for cancer treatment or drug delivery with SiC QDs.
Fig. 15 Top Grafting of amino groups on the surface of as-prepared SiC QDs; Bottom Zeta-potential measurements performed on colloidal solutions of SiC–CO2 H(–30), SiC–NH2 (+4) andSiC–NH2 (+100) (from [71])
Preparation, Luminescent Properties and Bioimaging Application… 339

Secondly, a majority of studies on QDs are done on proliferating cells,according to the present results, the behaviour of QDs may be not the same for nonconfluent (proliferating) and confluent (non proliferating) cells.
Fig. 16 Fluorescence and visible microscopy images of 3T3-L1 cells: a without SiC QDs;b labeled with negatively charged SiC–CO2H(–30) QDs; c labeled with quasineutral SiC–NH2
(+4) QDs and d labeled with positively charged SiC–NH2 (+100) QDs (from [71])
340 V.A. Skryshevsky et al.
To test the cytotoxic potential of SiC QDs, we chose two oral squamous car-cinoma and one immortalized oral epithelioid lines. Like the two cancer lines, thecontrol cells we used possess a high growth rate and are used as a control incomparison to HSC-2 cells [83]. Higher concentrations of SiC QDs and longerexposure time are required to reduce S–G proliferation when compared to bothhuman and murine tumoral cells. The differential toxicity of SiC QDs againstrapidly dividing cancer cells suggests their potential use as antitumoral agents. Theprecise mechanism(s) of action of SiC QDs in inhibiting cell proliferation remainsto be investigated. We considered the possibility of using QDs for antitumor
Fig. 17 Fluorescence microscopy images of SG (a, b, c) and HSC-2 (d, e, f) cells labeled by SiCQDs: (a), (d) low confluence (b), (e) intermediate confluence, (c), (f) total confluence (from [81])
Preparation, Luminescent Properties and Bioimaging Application… 341

therapy. When SiC QDs concentration of 2 mg/mL kills 100 % of the cancer cellsHSC-2 is already at 6:00 incubation and almost no effect on the survival of theculture of healthy cells that have stopped cell division through a mechanism ofcontact inhibition. This means that toxic effects, as well as the total amount ofnanoparticles in the cell decreases dramatically when the cell stops proliferation(division) [8].
SiC QDs have, however, few disadvantages preventing their use in complexbio-imaging applications. This includes low quantum yield and rather broademission band, which makes multicolour imaging difficult. Low quantum yieldalso influences concentration at which labeling effect is detectable. Therefore, tocompete with usual fluorophores, a strong PL enhancement of SiC QDs may beensured by their nearfield coupling with multipolar plasmons [84]. In order toachieve a high PL enhancement factors, an approach based on: (1) localization ofSiC QDs in the vicinity of randomly arranged silver (Ag) nanoparticles (NPs)chemically formed on silicon nitride (SiNX)/glass substrates and (2) careful tuningof the multipolar plasmon bands of the nanoparticles to overlap the excitation andemission spectral bands of SiC QDs, has been developed.
Fluorescence images of fibroblast cells on glass and plasmonic substrates withor without SiC QDs can be seen in Fig. 18. All images were obtained under thesame observation conditions in terms of excitation (UV/violet excitation band(k = 350–460 nm) and an observation spectral range corresponding to thewavelengths k[ 470 nm) and acquisition time. Natural fluorescence of the cellsgrown on the usual glass cover slip substrates is too weak to be observed in suchexperimental conditions (Fig. 18a). On the other hand, the cells grown on the glasssubstrates and labeled with the SiC QDs can be better seen in Fig. 18b. Strongauto-fluorescence enhancement of the fibroblast cells grown onto the nano-Ag/SiNX/glass substrates is shown in Fig. 18c. This label-free natural green cell auto-fluorescence is significantly increased in comparison with the cells grown on asimple glass substrate (Fig. 18a). The cells with the up-taken SiC QDs grown ontothe nano-Ag/SiNX/glass substrates show a drastic fluorescence enhancement(Fig. 18d) in comparison to the cells containing the same quantity of the SiC QDsand grown on a usually-used glass cover slips (Fig. 18b).
Different mechanisms can be responsible for the observed fluorescenceenhancement of the cells. Firstly, the localized plasmons appearing in the Ag NPsleads to an increase of excitation/absorption and photostimulated auto-emission ofthe cell membranes due to their close proximity to the Ag NPs. The fluorescenceenhancement can be only observable when the plasmons are localized in veryclose vicinity to the cell membrane. Moreover, the cell membrane thickness isestimated to be around a few nanometers which allows plasmon-induced PLenhancement of the NPs up-taken by the cells and localized near the membraneafter the dehydration and the subsequent fixation of the cells on the plasmonicnano-Ag/SiNX/glass substrate. All these factors can explain the detectedenhancement of cell auto-fluorescence and PL of the up-taken SiC QDs (seeFig. 18c and d, respectively).
342 V.A. Skryshevsky et al.
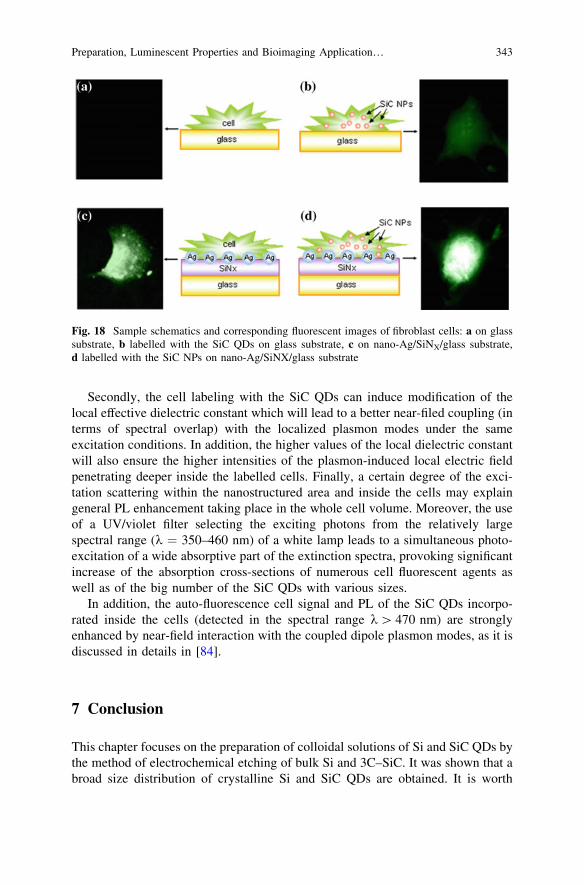
Secondly, the cell labeling with the SiC QDs can induce modification of thelocal effective dielectric constant which will lead to a better near-filed coupling (interms of spectral overlap) with the localized plasmon modes under the sameexcitation conditions. In addition, the higher values of the local dielectric constantwill also ensure the higher intensities of the plasmon-induced local electric fieldpenetrating deeper inside the labelled cells. Finally, a certain degree of the exci-tation scattering within the nanostructured area and inside the cells may explaingeneral PL enhancement taking place in the whole cell volume. Moreover, the useof a UV/violet filter selecting the exciting photons from the relatively largespectral range (k = 350–460 nm) of a white lamp leads to a simultaneous photo-excitation of a wide absorptive part of the extinction spectra, provoking significantincrease of the absorption cross-sections of numerous cell fluorescent agents aswell as of the big number of the SiC QDs with various sizes.
In addition, the auto-fluorescence cell signal and PL of the SiC QDs incorpo-rated inside the cells (detected in the spectral range k[ 470 nm) are stronglyenhanced by near-field interaction with the coupled dipole plasmon modes, as it isdiscussed in details in [84].
7 Conclusion
This chapter focuses on the preparation of colloidal solutions of Si and SiC QDs bythe method of electrochemical etching of bulk Si and 3C–SiC. It was shown that abroad size distribution of crystalline Si and SiC QDs are obtained. It is worth
Fig. 18 Sample schematics and corresponding fluorescent images of fibroblast cells: a on glasssubstrate, b labelled with the SiC QDs on glass substrate, c on nano-Ag/SiNX/glass substrate,d labelled with the SiC NPs on nano-Ag/SiNX/glass substrate
Preparation, Luminescent Properties and Bioimaging Application… 343
noting that the dimensions the dimensions of the Si QDs undergone filtering incolloidal solution vary discretely with a radius quantum equal to 0.12 nm. Existingof this quantum may correspond to step-like increasing of Si QDs radius on onenew shell at the surface of Si QDs. The formed QDs show intense luminescence invisual region that is promising for fluorescent labeling of biomaterials. However,one of the major drawbacks of SiQDs for application for bioimaging is instabilityover time in water or buffer solutions. To overcome this drawback the severalmethods of surface functionalization are proposed and discussed. From the otherside, the SiC QDs are stable in water solutions and do not require supplementarysurface functionalisation for bioimaging. A strong fluorescence from the SiC QDs,which undoubtedly penetrate into the cell, has been observed. The studying ofhealth and cancer cells using SiC QDs show that simple modification of surfacecharge of QDs give strong opportunity to target the same QDs in intracellularspace with their preferential localisation inside or outside the cell nucleus. Elec-trostatic interaction between QDs and positively charged chromatin gives platformto completely switch-open penetration or it blocking corresponding to the surfacecharge of QDs that plays role of key to open/close nucleus membrane doors. Theseeffects open wide perspectives for understanding and discovering nucleus transportmechanisms and give possibility for their bright imaging. Moreover, the uptake ofQDs and its intra-nuclei concentration is strongly dependant on cell proliferation.
References
1. Kumar, V. (ed.): Nanosilicon. Elsevier Ltd, Amsterdam (2007)2. Geszke-Moritz, M., Moritz, M.: Quantum dots as versatile probes in medical sciences:
Synthesis, modification and properties. Mater. Sci. Eng., C 33, 1008–1021 (2013)3. Michalet, X., Pinaud, F.F., Bentolila, L.A., Tsay, J.M., Doose, S., Li, J.J., Sundaresan, G.,
Wu, A.M., Gambhir, S.S., Weiss, S.: Quantum dots for live cells, in vivo imaging, anddiagnostics. Science 307, 538–544 (2005)
4. Fan, J., Chu, P.K.: Group IV nanoparticles: synthesis, properties, and biological applications.Small 6, 2080–2098 (2010)
5. Alivisatos, A.P.: The use of nanocrystals in biological detection. Nat. Biotechnol. 22, 47–52(2004)
6. Parak, W.J., Pellegrino, T., Plank, C.: Labelling of cells with quantum dots. Nanotechnology16, R9–R25 (2005)
7. Bonacina, L.: Nonlinear nanomedecine: harmonic nanoparticles toward targeted diagnosisand therapy. Mol. Pharm. 10, 783–792 (2013)
8. Bluet, J.-M., Botsoa, J., Zakharko, Y., Géloën, A., Alekseev, S., Marty, O., Mognetti, B.,Patskovsky, S., Rioux, D., Lysenko, V.: SiC as a biocompatible marker for cell labeling,Chapter 11. In: Silicon Carbide Biotechnology, Saddow, S (ed) Elsevier Inc., pp. 327–429.2012
9. Kang, Z., Liu, Y., Lee, S.-T.: Small-sized silicon nanoparticles: new nanolights andnanocatalysts. Nanoscale 3, 777–791 (2011)
10. Dabbousi, B.O., Rodriguez-Viejo, J., Mikulec, F.V., Heine, J.R., Mattoussi, H., Ober, R.,Jensen, K.F., Bawendi, M.G.: CdSe-ZnS core-shell quantum dots: synthesis andcharacterization of a size series of highly luminescent nanocrystallites. J. Phys. Chem. B.101, 9463–9475 (1997)
344 V.A. Skryshevsky et al.
11. Nozik, A.J.: Spectroscopy and hot electron relaxation dynamics in semiconductor quantumwells and quantum dots. Annu. Rev. Phys. Chem. 52, 193–231 (2001)
12. Giljohann, D.A., Mirkin, C.A.: Drivers of biodiagnostic development. Nature 462, 461–464(2009)
13. Hines, M.A., Guyot-Sionnest, P.: Synthesis and characterization of strongly luminescingZnS-capped CdSe nanocrystals. J. Phys. Chem. 100, 468–471 (1996)
14. Bruchez Jr, M., Moronne, M., Gin, P., Weiss, S., Alivisatos, A.P.: Semiconductornanocrystals as fluorescent biological labels. Science 281, 2013–2016 (1998)
15. Derfus, A.M., Chan, W.C.W.: Bhatia SN, Probing the cytotoxicity of semiconductor quantumdots. Nano Lett. 4, 11–18 (2004)
16. Kirchner, C., Liedl, T., Kudera, S., Pellegrino, T., Munoz Javier, A., Gaub, H.E., Stölzle, S.,Fertig, N., Parak, W.J.: Cytotoxicity of colloidal CdSe and CdSe/ZnS nanoparticles. NanoLett. 5, 331–338 (2005)
17. Fojtik, A., Henglein, A.: Luminescent colloidal silicon particles. Chem. Phys. Lett. 221,363–367 (1994)
18. Erogbogbo, F., Yong, K.-T., Roy, I., Hu, R., Law, W.-C., Zhao, W., Ding, H., Wu, F., Kumar,R., Swihart, M.T., Prasad, P.N. In Vivo Targeted Cancer Imaging, Sentinel Lymph NodeMapping and Multi-Channel Imaging with Biocompatible Silicon Nanocrystals, ACS NANO.5, 413–423 (2011)
19. Knipping, J., Wiggers, H., Rellinghaus, B., Roth, P., Konjhodzic, D., Meier, C.: Synthesis ofhigh purity silicon nanoparticles in a low pressure microwave reactor. J. Nanosci. Nanotechn.4, 1039–1044 (2004)
20. Sankaran, R.M., Holunga, D., Flagan, R.C., Giapis, K.P.: Synthesis of blue luminescent sinanoparticles using atmospheric-pressure microdischarges. Nano Lett. 5, 537–541 (2005)
21. Rowsell, B.D., Veinot, J.G.C.: Reductive thermolysis of a heterocyclic precursor: aconvenient method for preparing luminescent, surfactant-stabilized silicon nanoparticles.Nanotechnology 16, 732–736 (2005)
22. Baldwin, R.K., Pettigrew, K.A., Ratai, E., Augustine, M.P. Kauzlarich, S.M.: Solutionreduction synthesis of surface stabilized silicon nanoparticles, Chem. Commun. 17,1822–1823 (2002)
23. Zou, J., Baldwin, R.K., Pettigrew, K.A., Kauzlarich, S.M.: Solution synthesis of ultrastableluminescent siloxane-coated silicon nanoparticles. Nano Lett. 4, 1181–1186 (2004)
24. Rao, S., Sutin, J., Clegg, R., Gratton, E., Nayfeh, M.H., Habbal, S., Tsolakidis, A., Martin,R.M. Excited states of tetrahedral single-core Si29 nanoparticles. Phys. Rev. B . 69,art.205319 (2004)
25. Tanaka, A., Saito, R., Kamikake, T., Imamura, M., Yasuda, H.: Electronic structures andoptical properties of butyl-passivated Si nanoparticles. Solid State Commun. 140, 400–403(2006)
26. Lysenko, V., Onyskevych, V., Marty, O., Skryshevsky, V.A., Chevolot, Y., Bru-Chevallier,C.: Extraction of ultraviolet emitting silicon species from strongly hydrogenated nanoporoussilicon, App. Phys. Let. 92, art.251910 (2008)
27. Lysenko, V., Bidault, F., Alekseev, S., Turpin, C., Geobaldo, F., Rivolo, P., Garrone, E.,Zaitsev, V., Barbier, D.: Study of porous silicon nanostructures as hydrogen reservoirs.J. Phys. Chem. B. 109, 19711–19718 (2005)
28. Nychyporuk, T., Lysenko, V., Barbier, D. Fractal nature of porous silicon nanocrystallites,Phys. Rev. B. 71, art. 115402 (2005)
29. Serdiuk, T., Lysenko, V., Alekseev, S., Skryshevsky, V.A.: Size tuning of luminescent siliconnanoparticles with meso-porous silicon membranes. J. Colloid Interface Sci. 364, 65–70(2011)
30. Serdiuk, T., Skryshevsky, V.A., Ivanov, I.I., Lysenko, V.: Storage of luminescentnanoparticles in porous silicon: Toward a solid state golden fleece. Mater. Lett. 65,2514–2517 (2011)
Preparation, Luminescent Properties and Bioimaging Application… 345
31. Belomoin, G., Therrien, J., Smith, A., Rao, S., Twesten, R., Chaieb, S., Nayfeh, M.H.,Wagner, L., Mitas, L.: Observation of a magic discrete family of ultrabright Si nanoparticles,Appl. Phys. Lett. 80, art. 841 (2002)
32. Patrone, L., Nelson, D., Safarov, V.I., Sentis, M., Marine, W.: Photoluminescence of siliconnanoclusters with reduced size dispersion produced by laser ablation, J. Appl. Phys. 87, art.3829 (2000)
33. Ledoux, G., Guillois, O., Porterat, D., Reynaud, C.: Photoluminescence properties of siliconnanocrystals as a function of their size. Phys. Rev. B. 62, 15942–15951 (2000)
34. Feng, Z.C., Tsu, R. (eds.): Porous Silicon. World Scientific, Singapore (1994)35. Delerue, C., Allan, G., Lannoo, M.: Theoretical aspects of the luminescence of porous
silicon. Phys. Rev. B. 48, 11024–11036 (1993)36. Kang, Z.H., Tsang, C.H.A., Zhang, Z.D., Zhang, M.L., Wong, N.B., Zapien, J.A., Shan, Y.Y.,
Lee, S.T.: A polyoxometalate-assisted electrochemical method for silicon nanostructurespreparation: from quantum dots to nanowires. J. Am. Chem. Soc. 129, 5326–5327 (2007)
37. Kang, Z.H., Tsang, C.H.A., Wong, N.B., Zhang, Z.D., Lee, S.T.: Silicon quantum dots: ageneral photocatalyst for reduction, decomposition, and selective oxidation reactions. J. Am.Chem. Soc. 129, 12090–12091 (2007)
38. Heinrich, J.L., Curtis, C.L., Credo, G.M., Kavanagh, K.L., Saylor, M.J.: Luminescentcolloidal silicon suspensions from porous silicon. Science 255, 66–68 (1992)
39. Buriak, J.M., Allen, M.J.: Lewis acid mediated functionalization of porous silicon withsubstituted alkenes and alkynes. J. Am. Chem. Soc. 120, 1339–1340 (1998)
40. Manilov, A.I., Skryshevsky, V.A.: Hydrogen in porous silicon—a review. Mater. Sci. Eng., B178, 942–955 (2013)
41. Anglin, E.J., Cheng, L., Freeman, W.R., Sailor, M.J.: Porous silicon in drug delivery devicesand materials. Adv. Drug Deliv. Rev. 60, 1266–1277 (2008)
42. Boukherroub, R., Petit, A., Loupy, A., Chazalviel, J.N., Ozanam, F.: Microwave-assistedchemical functionalization of hydrogen-terminated porous silicon surfaces. J. Phys. Chem. B.107, 13459–13462 (2003)
43. Wu, E.C., Park, J.-H., Park, J., Segal, E., Cunin, F., Sailor, M.J.: Oxidation-triggered releaseof fluorescent molecules or drugs from mesoporous Si microparticles. ACS Nano. 2,2401–2409 (2008)
44. Stewart, M.P., Buriak, J.M.: Photopatterned hydrosilylation on porous silicon. Angew. Chem.Int. Ed. 37, 3257–3260 (1998)
45. Sam, S., Chazalviel, J.N., Gouget-Laemmel, A.C., Ozanam, F., Etcheberry, A., Gabouze, N.:Peptide immobilisation on porous silicon surface for metal ions detection. Nanoscale Res.Lett. 6, art.412 (2011)
46. Hua, F., Swihart, M.T., Ruckenstein, E.: Efficient surface grafting of luminescent siliconquantum dots by photoinitiated hydrosilylation. Langmuir 21, 6054–6062 (2005)
47. Ruizendaal, L., Pujari, S.P., Gevaerts, V., Paulusse, J.M.J., Zuilhof, H.: Biofunctional siliconnanoparticles by means of thiol-ene click chemistry. Chem. Asian J. 6, 2776–2786 (2011)
48. Sweryda-Krawiec, B., Cassagneau, T., Fendler, J.H.: Surface modification of siliconnanocrystallites by alcohols. J. Phys. Chem. B. 103, 9524–9529 (1999)
49. Hallmann, S., Fink, M.J.: Mechanochemical synthesis of functionalized silicon nanoparticleswith terminal chlorine groups. J. Mater. Res. 26, 1052–1060 (2011)
50. Rosso-Vasic, M., Spruijt, E., Popovic, Z., Overgaag, K., Lagen, B., Grandidier, B.,Vanmaekelbergh, D., Dominguez-Gutierrez, D., De Cola, L., Zuilhof, H.: Amine-terminatedsilicon nanoparticles: synthesis, optical properties and their use in bioimaging. J. Mater.Chem. 19, 5926–5933 (2009)
51. Kang, Z.H., Liu, Y., Tsang, C.H.A., Ma, D.D.D., Fan, X., Wong, N.B., Lee, S.T.: Water-soluble silicon quantum dots with wavelength-tunable photoluminescence. Adv. Mater. 21,661–664 (2009)
52. He, Y., Su, Y.Y., Yang, X.B., Kang, Z.H., Xu, T.T., Zhang, R.Q., Fan, C., Lee, S.T.: Photoand pH stable, highly-luminescent silicon nanospheres and their bioconjugates forimmunofluorescent cell imaging. J. Am. Chem. Soc. 131, 4434–4438 (2009)
346 V.A. Skryshevsky et al.

53. He, Y., Fan, C., Lee, S.-T.: Silicon nanostructures for bioapplications. Nano Today 5,282–295 (2010)
54. Wang, J., Liu, Y., Peng, F., Chen, C., He, Y., Ma, H., Cao, L., Sun, S.: A general route to efficient functionalization of silicon quantum dots for high-performance fluorescent probes.Small 8, 2430–2435 (2012)
55. Gongalsky, M.B., Yu, K.A., Osminkina, L.A., Yu, T.V., Jeong, J., Lee, H. Chung, B.H.:Enhanced photoluminescence of porous silicon nanoparticles coated by bioresorbablepolymers, Nanoscale Res. Lett. 7, art.446 (2012)
56. Li, Z.F., Ruckenstein, E.: Water-soluble poly (acrylic acid) grafted luminescent siliconnanoparticles and their use as fluorescent biological staining labels. Nano Lett. 4, art.14631467 (2004)
57. Zhang, X., Neiner, D., Wang, S., Louie, A.Y., Kauzlarich, S.M.: A new solution route tohydrogen-terminated silicon nanoparticles: synthesis, functionalization and water stability.Nanotechnology. 18, art. 095601 (2007)
58. Sudeep, P.K., Page, Z., Emrick, T.: PEGylated silicon nanoparticles: synthesis andcharacterization. Chem. Commun. 46, 6126–6127 (2008)
59. Wang, K., Wang, Q., Chao, Y.: Simple fabrication of nanostructured silicon andphotoluminescence. Appl. Phys. A 109, 437–440 (2012)
60. Ge, J., Liu, W., Zhao, W., Zhang, H., Zhuang, X., Lan, M., Wang, P., Li, H., Ran, G., Lee, S.-T.: Preparation of highly stable and water-dispersible silicon quantum dots by using anorganic peroxide. Chem. Eur. J. 17, 12872–12876 (2011)
61. Erogbogbo, F., Chang, C.-W., May, J.L., Liu, L., Kumar, R., Law, W.-C., Ding, H., Yong,K.T., Roy, I., Sheshadri, M., Swihart, M.T., Prasad, P.N.: Bioconjugation of luminescentsilicon quantum dots to gadolinium ions for bioimaging applications. Nanoscale 4,5483–5489 (2012)
62. May, J.L., Erogbogbo, F., Yong, K.-T., Ding, H., Law, W.-C., Swihart, M.T., Prasad, P.N.:Enhancing silicon quantum dot uptake by pancreatic cancer cells via pluronic� encapsulationand antibody targeting. J. Solid Tumors 2, 24–37 (2012)
63. Fan, J.Y., Wu, X.L., Chu, P.K.: Low-dimensional SiC nanostructures: fabrication,luminescence, and electrical properties. Prog. Mat. Sci. 51, 983–1031 (2006)
64. Matsumoto, T., Takahashi, J., Tamaki, T., Futagi, T,. Mimura, H., Kanemitsu, Y.A.:Bluegreen luminescence from porous silicon carbide. Appl. Phys. Lett. 64, art. 226 (1994)
65. Petrova-Koch, V., Sreseli, O., Polisski, G., Kovalev, D., Muschik, T., Koch, F.:Luminescence enhancement by electrochemical etching of SiC(6H). Thin Solid Films 255,107–110 (1995)
66. Rossi, A.M., Murphy, Th.E., Reipa, V.: Ultraviolet photoluminescence from 6H siliconcarbide nanoparticles. Appl. Phys. Lett. 92, art.253112 (2008)
67. Botsoa, J., Bluet, J.-M., Lysenko, V., Marty, O., Barbier, D., Guillot, G.: Photoluminescenceof 6H–SiC nanostructures fabricated by electrochemical etching. J. Appl. Phys. 102, art.083526 (2007)
68. Wu, X.L., Fan, J.Y., Qiu, T., Yang, X., Siu, G.G., Chu, P.K.: Experimental evidence for thequantum confinement effect in 3C-SiC Nanocrystallites. Phys. Rev. Lett. 94, art. 026102(2005)
69. Fan, J.Y., Wu, X.L., Li, H.X., Liu, H.W., Siu, G.G., Chu, P.K.: Luminescence from colloidal3C-SiC nanocrystals in different solvents. Appl. Phys. Lett. 88, art. 041909 (2006)
70. Zakharko, Y., Botsoa, J., Alekseev, S., Lysenko, V., Bluet, J.-M., Marty, O., Skryshevsky,V.A., Guillot, G.: Influence of the interfacial chemical environment on the luminescence of3C- SiC nanoparticles. J. Appl. Phys. 107, art. 013503 (2010)
71. Serdiuk, T., Alekseev, S.A., Lysenko, V., Skryshevsky, V.A., Géloën, A.: Charge-drivenselective localization of fluorescent nanoparticles in live cells. Nanotechnology 23,art.315101 (2012)
72. Alekseev, S., Botsoa, J., Zaitsev, V.N., Barbier, D.: Fourier transform infrared spectroscopyand temperature programmed desorption mass spectrometry study of surface chemistry ofporous 6H-SiC. Chem. Mater. 19, 2189–2194 (2007)
Preparation, Luminescent Properties and Bioimaging Application… 347

73. Shin, W., Seo, W., Takai, O., Koumoto, K.: Surface chemistry of porous silicon carbide.J. Electron. Mater. 27, 304–307 (1998)
74. Beke, D., Szekre’nyes, Z., Balogh, I., Veres, M., Fazakas, E., Varga, L.K., Kamara’s, K.,Cziga’ny, Z., Gali, A.: Characterization of luminescent silicon carbide nanocrystals preparedby reactive bonding and subsequent wet chemical etching, Appl. Phys. Lett. 99, art. 213108(2011)
75. Li, Y., Chen, C., Li, J.-T., Yang, Y., Lin, Z.-M.: Surface charges and optical characteristic ofcolloidal cubic SiC nanocrystals. Nanoscale Res. Lett. 6, art. 454 (2011)
76. Zhang, N., Dai, D., Zhang, W., Fan, J.: Photoluminescence and light reabsorption in SiCquantum dots embedded in binary-polyelectrolyte solid matrix. J. Appl. Phys. 112, art.094315 (2012)
77. Che, J., Wang, X., Xiao, Y., Wu, X., Zhou, L., Yuan, W.: Effect of inorganic–organiccomposite coating on the dispersion of silicon carbide nanoparticles in non-aqueous medium.Nanotechnology 18, art.135706 (2007)
78. Iijima, M., Kamiya, H.: Surface modification of silicon carbide nanoparticles by azo radicalinitiators. J. Phys. Chem. C 112, 11786–11790 (2008)
79. Pud, A.A., Noskov, Y.V., Kassiba, A., Fatyeyeva, K.Y., Ogurtsov, N.A., Makowska-Janusik,M., Bednarski, W., Tabellout, M., Shapoval, G.S.: New aspects of the low-concentratedaniline Polymerization in the solution and in SiC nanocrystals dispersion. J. Phys. Chem. B.111, 2174–2180 (2007)
80. Serdiuk, T., Lysenko, V., Skryshevsky, V.A., Géloën, A.: Vapor phase mediated cellularuptake of sub 5 nm nanoparticles. Nanoscale Res. Lett. 7: art. 212 (2012)
81. Serdiuk, T., Lysenko, V., Mognetti, B., Skryshevsky, V., Géloën, A.: Impact of cell divisionon intracellular uptake and nuclear targeting with fluorescent SiC-based nanoparticles.J. Biophotonics 6, 291–297 (2013)
82. Tagliazucchi, M., Peleg, O., Kroger, M., Rabin, Y., Szleifer, I.: Effect of charge,hydrophobicity, and sequence of nucleoporins on the translocation of model particlesthrough the nuclear pore complex. PNAS 110, 3363–3368 (2013)
83. Weisburg, J.H., Weissman, D.B., Sedaghat, T., Babich, H.: In vitro cytotoxicity ofepigallocat echin gallate and tea extracts to cancerous and normal cells from the human oralcavity, Basic Clin. Pharmacol. Toxicol. 95, 191–200 (2004)
84. Zakharko, Yu., Serdiuk, T., Nychyporuk, T., Geloen, A., Lemiti, M., Lysenko, V.: Plasmon-enhanced photoluminescence of SiC quantum dots for cell imaging applications. Plasmonics7, 725–732 (2012)
348 V.A. Skryshevsky et al.