Interfacial characterization of 2D woven SiC/SiC and cross-ply 0° 90° CAS/SiC composites
6
ELSEVIER 81359-835X(%)00021-8 Composites Part A 21A (1996) 787-792 Copyright 0 1996 Elsevier Science Limited Printed in Great Britain. All rights reserved 1359-835X/96/$1 5.00 Interfacial characterization of 20 woven SiC/SiC and cross-ply 0°/900 CAS/SiC composites J. M. S6nchez”. M. R. Elizalde, A. M. Daniel and J. M. Martinet-Esnaola CEIT, Department of Materials, P” Manuel de Lardiza’bal 15, 20009 San Sebastian, Spain and I. Puente and A. Martin Escuela Superior de Ingenieros, Universidad de Navarra, PO Box 1674, 20080 San Sebastizin, Spain A study has been made on the micromechanical behaviour of the interfaces present in two silicon carbide fibre (Nicalon) reinforced ceramic matrix composites: a cross-ply 0”/90” composite with a calcium- aluminium silicate (CAS) glass matrix and a 2D woven composite with a chemical vapour infiltrated silicon carbide matrix. The interfacial properties were determined from fibre push-down tests performed with a nano-indentation system. Several micromechanical models have been fitted to the experimental data to obtain the interfacial mechanical parameters of sliding resistance, debond energy and residual stress. For both materials, the validity of the assumptions of these models is discussed. (Keywords: interfaces; ceramic matrix composites; fibre pushdown tests; micromechanical models) INTRODUCTION The tough mechanical response of continuous fibre- reinforced ceramic matrix composites (CFCMCs) relies upon their interfacial mechanical behaviour. Knowledge and control of the main interfacial parameters are the basis for the design of new CFCMCs for specific applications where their high specific strength and ability to withstand high temperatures are required. The interfacial mechanical properties are usually characterized by three parameters: the interfacial debonding energy (Gi), the interfacial frictional stress (7) and the residual axial stress in the fibre (Do). Particular attention has been paid to the determination of these interfacial parameters in ceramic matrix composites by using nano-indentation test methods’ -3. In these experiments, an increasing load is applied to a single fibre by means of a diamond indentor to produce debonding and sliding at the interface. The load and the tip displacement are recorded simultaneously during the experiment. The aim of this work was to characterize the interfacial properties of a cross-ply 0”/90” calcium-aluminium *To whom correspondence should be addressed silicate glass matrix (CAS)/Nicalon fibre-reinforced composite and a 2D woven chemical vapour infiltrated silicon carbide (CVI P-SIC) matrix/Nicalon fibre com- posite by means of the push-down nano-indentation technique. Several models have been selected from the literature to derive T, Gi and OR for these two materialslm7. EXPERIMENTAL Materials The CASjSiC composite selected for this study was a cross-ply commercial grade provided by Rolls Royce plc (UK). The 2D woven Sic/Sic composite was provided by the SociCtl Europbenne de Propulsion (SEP, France) in three different conditions: as-fabricated and heat- treated at 1000°C for 4 h and at 1500°C for 2 h. Some microstructural details for these two materials are gathered in Table I. Push-down test In a push-down test, an increasing load is applied to a single fibre cross-section in the axial direction to produce debonding and sliding. After a maximum load is reached, 787
Transcript of Interfacial characterization of 2D woven SiC/SiC and cross-ply 0° 90° CAS/SiC composites

ELSEVIER 81359-835X(%)00021-8
Composites Part A 21A (1996) 787-792 Copyright 0 1996 Elsevier Science Limited Printed in Great Britain. All rights reserved
1359-835X/96/$1 5.00
Interfacial characterization of 20 woven SiC/SiC and cross-ply 0°/900 CAS/SiC composites
J. M. S6nchez”. M. R. Elizalde, A. M. Daniel and J. M. Martinet-Esnaola CEIT, Department of Materials, P” Manuel de Lardiza’bal 15, 20009 San Sebastian, Spain
and I. Puente and A. Martin Escuela Superior de Ingenieros, Universidad de Navarra, PO Box 1674, 20080 San Sebastizin, Spain
A study has been made on the micromechanical behaviour of the interfaces present in two silicon carbide fibre (Nicalon) reinforced ceramic matrix composites: a cross-ply 0”/90” composite with a calcium- aluminium silicate (CAS) glass matrix and a 2D woven composite with a chemical vapour infiltrated silicon carbide matrix. The interfacial properties were determined from fibre push-down tests performed with a nano-indentation system. Several micromechanical models have been fitted to the experimental data to obtain the interfacial mechanical parameters of sliding resistance, debond energy and residual stress. For both materials, the validity of the assumptions of these models is discussed.
(Keywords: interfaces; ceramic matrix composites; fibre pushdown tests; micromechanical models)
INTRODUCTION
The tough mechanical response of continuous fibre- reinforced ceramic matrix composites (CFCMCs) relies upon their interfacial mechanical behaviour. Knowledge and control of the main interfacial parameters are the basis for the design of new CFCMCs for specific applications where their high specific strength and ability to withstand high temperatures are required.
The interfacial mechanical properties are usually characterized by three parameters: the interfacial debonding energy (Gi), the interfacial frictional stress (7) and the residual axial stress in the fibre (Do). Particular attention has been paid to the determination of these interfacial parameters in ceramic matrix composites by using nano-indentation test methods’ -3. In these experiments, an increasing load is applied to a single fibre by means of a diamond indentor to produce debonding and sliding at the interface. The load and the tip displacement are recorded simultaneously during the experiment.
The aim of this work was to characterize the interfacial properties of a cross-ply 0”/90” calcium-aluminium
*To whom correspondence should be addressed
silicate glass matrix (CAS)/Nicalon fibre-reinforced composite and a 2D woven chemical vapour infiltrated silicon carbide (CVI P-SIC) matrix/Nicalon fibre com- posite by means of the push-down nano-indentation technique. Several models have been selected from the literature to derive T, Gi and OR for these two materialslm7.
EXPERIMENTAL
Materials
The CASjSiC composite selected for this study was a cross-ply commercial grade provided by Rolls Royce plc (UK). The 2D woven Sic/Sic composite was provided by the SociCtl Europbenne de Propulsion (SEP, France) in three different conditions: as-fabricated and heat- treated at 1000°C for 4 h and at 1500°C for 2 h. Some microstructural details for these two materials are gathered in Table I.
Push-down test
In a push-down test, an increasing load is applied to a single fibre cross-section in the axial direction to produce debonding and sliding. After a maximum load is reached,
787

Interfacial characterization of Sic/Sic and CASISiC: J. M. Sa’nchez et al.
TaMe 1 Material properties
GAS/Sic”
without HT
without HT
SiC/SiC”
HT lOOO”C, 4 h
HT 15OO”C, 2 h
Interface (thickness) Carbon (0.15 pm) Matrix CAS (hot-pressed) Fibre radius @m) 4-11
Carbon (0.125 pm) Sic (CVI) 7.5-10.5
b
Sic (CVI) 7.5-10s
SiOr (0.7 pm) Sic (CVI) 7.5-10.5
’ Nicalon NL 207@ b Microstructural analysis of this interface is under way
the fibre is subjected to several unloading-reloading cycles, the load and the displacement being recorded simultaneously during the experiment.
Before fibre debonding occurs, the push-down test is a hardness test on the fibre. Therefore, to obtain the real fibre displacement (u), the tip displacement correspond- ing to the elastic-plastic deformation of the fibre surface under the diamond tip (uk) must be subtracted from the total tip displacement. The value of uh is obtained by indenting fibres that do not slide. This can be achieved by three different routes:
1) indenting fibres that are perpendicular to the loading direction;
2) indenting fibres with high fibre radius in the axial direction; and/or
3) indenting fibres with oxidized interfaces that form a strong silica bond with the matrix.
For all the specimens, 10 hardness calibration tests were performed in 0” fibres and in 90” fibres. To subtract these curves from the load versus total tip displacement curves, analytical fitting of the experimental results is required. For the loading segment the following expression is used:
q,=aF lf3 + bF’12 (1)
where F is the load and r& the penetration. The unloading and reloading curves are fitted with sixth- order polynomials.
At least 10 identical fibre-push down tests were carried out for each material by using a Nanoindenter II (Nano Instruments, Inc., Knoxville, TN, USA), an ultralow- load indentation system which allows forces and displacements to be measured with resolutions of 0.3 PN and 0.1 nm. In these experiments, loads of up to 0.6 N were applied to the fibres under load control at an indentation speed of 10 mN s-l.
Prior to testing, the samples were mounted in Bakelite and polished down to 1 pm finish. After testing, precise fibre radius measurements were carried out using scanning electron microscopy (SEM) (Figure I).
RESULTS
CASjSiC interfacial properties
Figure 2u shows the load verslLs tip displacement curve for indentation on a non-moving Nicalon fibre of the CAS/SiC composite. No hysteresis is observed on
FIgare 1 SEM micrograph of CAS/SiC specimen showing an indented Nicalon fibre (push-down test)
300 1 A
(a) O 200 400 TIP DISPL%ENT(am~w ‘WO
ml 1
loo
0
0 200 400 600 800 lOOil 1200 1400 16Oa 1800
(b) TIPDISPLACEMENT
Figure 2 Results for CAS/SiC specimen: (a) typical indentation response of a fibre that does not move under applied load and (b) variation in hardness response of fibres when indented; the difference in displacement can be 15% at high loads
788

lnterfacial characterization of SiCfSiC and CAS/SiC: J. M. Scinchez et al.
unloading and reloading, hence no fibre sliding during indentation is ensured. In Figure 2b the intial loading cycles of all the hardness tests on CAS/SiC Nicalon fibres are presented, showing a large scatter of results. A maximum difference of 15% is measured for the indentor displacement at maximum load. A trend with fibre orientation has not been observed.
As described in the Experimental section, the applied load (F) versus real fibre displacement (u) curve is obtained by subtracting the hardness response of the fibre (u,.,) at each load value [given by equation (l)] from the displacement given in the push-down data. The use of an average hardness curve, proposed by other authors’, was not applied in this work owing to the large dispersion observed in the Nicalon hardness values. A solution has been proposed based on the selection of the hardness curve that better fits the intial loading segment for each push-down test.
In Figure 3, the typical load versus tip displacement curve is observed. The sudden decrease of slope observed in the first loading segment is the point where debonding occurs. The hysteresis observed on the loading/unload- ing cycles results from the frictional sliding of the interface. As shown in Figure 4, the result is a trace where no fibre displacement is observed until debonding occurs.
300 ,
50 ̂
Od
0 ml loa0 1500 2L-m TlPDlSPLAXMENT(nm)
Figure 3 Typical load versus tip displacement trace obtained from an indentation test on a CASjSiC specimen
0 loo 200 300 400 500 600 lcm FlFlREDISPLACEMEM(nm)
Figure 4 Typical load WYSUS fibre displacement trace obtained after subtraction of the fibre hardness response for a CASjSiC specimen
80
I 0t - - - ~ ~ - - _ - . I
0 loo zoo 3w 4cQ 500 600 1QQ FBREDlSPLACEMENT(nn)
Figure 5 (Load)2 ~ersw fibre displacement for the initial loading segment of the cycle showing the straight-line behaviour predicted by the Marshall and Oliver model’ for a CAS/SiC specimen
Marshall and Oliver model I. This basic model assumes the presence of a large debond crack at the interface and a constant value of sliding friction between fibre and matrix, and does not take into account any residual stresses either axially along the fibre or radially across the interface. It is detailed elsewhere’, but predicts a linear behaviour for the plot of squared applied load (F2) versus fibre displacement (u) (Figure 5). Its intercept with the F2-axis determines Gi and the gradient determines 7:
Intercept at (U = 0) = 4r2r3EfGi (2)
Gradient = 4r2r3 E f T (3)
where Et is the fibre modulus and r is the radius of the fibre being pushed. This analysis applies only to the initial loading segment. Before stable sliding occurs, CASjSiC shows a non-stable crack growth zone, characterized by a low gradient. These points are not taken into account for the sliding stress calculations.
The fitting of this model to the 10 experimental curves gives the following results: Gi := 8 f 1 JmW2 and 7 = 30 f 3 MPa (average values are shown with 95% confidence limits).
However, the value obtained for the interfacial frictional stress is systematically higher than others reported in the literature2s. This could be due to the presence of high residual stresses in the fibres. This possibility was analysed by means of another push-down model.
Marshall model’. The application of this model requires analysis of the initial loading, unloading and reloading data of a push-down test. The model is based on the work of Hutchinson and Jensen6.
This approach assumes that the interfacial frictional shear stress (7) is constant along the interface length that is debonded and sliding, and also takes into account the debonding process and the presence of residual stresses in the fibre prior to testing. These fibre residual stresses are calculated by assuming they are due solely to the coefficient of thermal expansion mismatch between fibre and matrix, so that the stresses are induced on cooling
789
interfacial characterization of Sic/Sic and CASISiC: J. il.4 Sa’nchez et al.
from the processing temperature of the material. This stress is calculated using the expression6,‘:
a, = -u2Em(ar - a,)AT (4)
where a, is the axial stress in the fibre, a2 is a non- dimensional scaling factor6, E,,, is the matrix modulus, Q, and or are the thermal expansion coefficients for the matrix and fibre, respectively, and AT is the change in temperature over which the stresses are introduced.
For CAS/Nicalon, the following properties were obtained from the literature’: E, = 80GPa; a2 = 1.15; AT = -800°C (taken from estimated glass transition temperature); or = 3.2 x 10e6 “C-i; and o, = 4.5x lop6 “C-‘. From these, a, = -95MPa, the negative sign indicating a compressive stress.
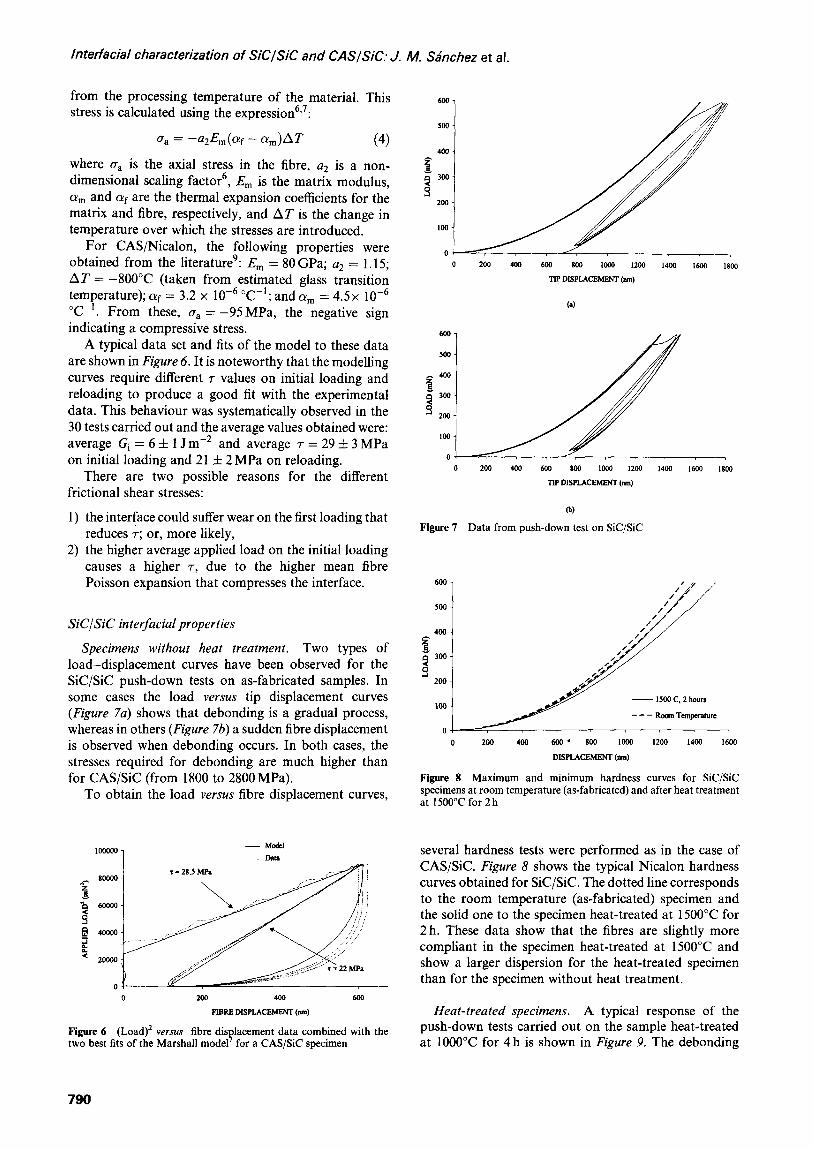
A typical data set and fits of the model to these data are shown in Figure 6. It is noteworthy that the modelling curves require different r values on initial loading and reloading to produce a good fit with the experimental data. This behaviour was systematically observed in the 30 tests carried out and the average values obtained were: average Gi = 6 f 1 Jme2 and average 7 = 29 f 3 MPa on initial loading and 21 f 2 MPa on reloading.
There are two possible reasons for the different frictional shear stresses:
1) the interface could suffer wear on the first loading that reduces ;; or, more likely,
2) the higher average applied load on the initial loading causes a higher 7, due to the higher mean fibre Poisson expansion that compresses the interface.
Sic/Sic interfacial properties
Specimens without heat treatment. Two types of load-displacement curves have been observed for the Sic/Sic push-down tests on as-fabricated samples. In some cases the load versus tip displacement curves (Figure 7~) shows that debonding is a gradual process, whereas in others (Figure 7b) a sudden fibre displacement is observed when debonding occurs. In both cases, the stresses required for debonding are much higher than for CAS/SiC (from 1800 to 2800 MPa).
To obtain the load versus fibre displacement curves,
0
0 200 400 600
FDRE DISPLACEMENT (MI)
Figure 6 (Load)’ versus fibre displacement data combined with the two best fits of the Marshall model for a CAS/SiC specimen
790
200 400 600 800 lOGi3 1200 1400 I600 1800
TIF DISPLACEMENT (am)
(a)
600
500
,400
g 300
3 200
100
0 600 800 lOOa 1200
TIP DISPLACEMENT (rim)
W
Figure 7 Data from push-down test on Sic/Sic
0 200 400 600 ?? 800 IOWl 1200 1400 16Oa
DISPLACEMENT (MI)
Figure 8 Maximum and minimum hardness curves for Sic/Sic specimens at room temperature (as-fabricated) and after heat treatment at 1500°C for 2h
several hardness tests were performed as in the case of CAS/SiC. Figure 8 shows the typical Nicalon hardness curves obtained for Sic/Sic. The dotted line corresponds to the room temperature (as-fabricated) specimen and the solid one to the specimen heat-treated at 1500°C for 2 h. These data show that the fibres are slightly more compliant in the specimen heat-treated at 1500°C and show a larger dispersion for the heat-treated specimen than for the specimen without heat treatment.
Heat-treated specimens. A typical response of the push-down tests carried out on the sample heat-treated at 1000°C for 4 h is shown in Figure 9. The debonding

Interfacial characterization of SiClSiC and CASlSiC: J. M. Srinchez et al.
loads (ao) measured for this specimen are extremely low (about 249 MPa). However, in the sample heat-treated at 15OO”C, no debonding was observed up to the indentor load limit, even for the smallest diameter fibres (below 14 pm). Preliminary microstructural observations have confirmed that the material heat-treated at 1500°C has a thick layer of SiOz that results in strong fibre-matrix bonding. However, this silica bridge did not develop at the interface in the sample heat-treated at 1000°C.
Modelling of push-down tests for as-fabricated Sic/ Sic. The results obtained for Sic/Sic confirmed that this material does not fulfil any of the basic assumptions of the Marshall models”’ . Therefore a different model- that of Hsueh and Ferber’-was used. This approach takes account of the fact that the debonding stresses are high compared with the maximum applied stress.
As observed in Figure 10, the Hsueh and Ferber model’ gives good results for the loading segment of the curves. Nevertheless, neither the changing slope for the initial loading segment nor the unloading segment is predicted by this model. The mean values of the main interfacial parameters corresponding to two different test-pieces are gathered in Table 2.
0 500 1000 I500
DISPLACEMENT (nm)
mm 2500 20 40 60 80 100
FlBREDISPLACEMENT(nm)
Figure 9 Data from push-down test for Sic/Sic specimen heat-treated Figure 10 Load versus displacement data combined with the best fit of at 1000°C for 4 h the Hsueh and Ferber model5 for an SiCjSiC specimen
Note that the Hsueh and Ferber model gives the stress of debonding instead of the debonding fracture surface energy of the Marshall model. A considerable variation is observed for the debonding and the sliding stresses from one specimen to another. More tests are in progress to study the statistical nature of these parameters.
Modeiling of push-down tests for SiCjSiC heat-treated at 1000°C for 4 h. The debonding stress and the sliding stress for this material are much lower than for the mate- rial without heat treatment. Hence, in this case, the Marshall and Oliver model4 can be applied to estimate the interfacial properties. The very low debonding energy suggests that there is no bonding between fibre and matrix. The Hsueh and Ferber model’ has also been fitted to these experimental data. As observed in Table 2. very similar values of interfacial shear stress have been obtained with these two models.
CONCLUSIONS
Although the CAS/SiC composite shows moderate values of debonding energy and frictional shear stress,
Table 2 CAS/SiC and Sic/Sic interfacial properties (average values of at least 10 tests with 95% confidence limits) ____ _____
Model ___ _____ Material (Mia) (IGa)
Marshall & Oliver’ Marshall’
Hsueh & Ferber’
Marshall & Oliver4
Hsueh & Ferber’
CAS/SiC CAS/SiC
Sic/Sic (without HT) (specimen A) Sic/Sic (without HT) (specimen B) Sic/Sic (HT) lOOo”C, 4h Sic/Sic (HT) IOOOC, 4 h
30 f 3 8fl 29 f 3” 21 fZh 6&l -95
89f 14 -288 i 126 1761 f 169
112524 -1OOf31 2785 f 513
3.5 f 1 0.07 f 0.07 -298 f 65
3.3 f 2 _ -139 i 105 249 f 34
’ Loading ’ Reloading
791

Interfacial characterization of Sic/Sic and CASISiC: J. M. Sa’nchez et al.
the fitting of the Marshall model7 to the experimental data requires two different values of sliding stress for first loading and reloading. This is believed to be due to the higher Poisson expansion of the fibre on initial loading.
As-fabricated Sic/Sic shows a much higher debond- ing stress than CAS/SiC. Consistent interfacial para- meters have been obtained by applying the Hsueh and Ferber model’ to the load versus fibre displacement curves. However, a large variation has been observed for these parameters.
The heat treatments completely change the mechan- ical behaviour of the interface. For the sample heat- treated at 1500°C for 2 h, no debonding was observed up to the load limit of the indentation system. On the other hand, the sample heat-treated at 1000°C for 2 h presents an interface even weaker than that of the CAS/SiC composite.
ACKNOWLEDGEMENTS
This work was carried out in the framework of the Brite- EuRam BE-5462 project, supported by the European Community, led by Rolls-Royce plc (UK) and in collaboration with SNECMA (France) and SEP (France).
The funding received from the Spanish ‘Comision Interministkrial de Ciencia y Tecnologia’ (CICYT) and from the ‘Viceconsejeria de Education, Universidades e Investigation of the Basque government made possible the purchase of equipment.
M.R.E., I.P. and A.M.D. are grateful to the Spanish
Ministry of Education and Science, to the Department of Education, Universities and Research of the Basque Government, and to the Commission of the European Communities Directorate-General XII for Science, Research and Development, respectively, for grants received.
REFERENCES
Marshall, D.B. and Oliver, W.C. Measurement of interfacial mechanical properties in fiber reinforced ceramic composites. J. Am. Ceram. Sot. 1987,70(8), 542 Daniel, A.M. and Lewis M.H. Measurements of interfacial micromechanics in fibre reinforced ceramic matrix composites. Ceram. Eng. Sci. Proc. 1993, 1*7-g), 131 Wereszczak, A.A., Ferber, M.K. and Lowden, R.A. Develop- ment of an interfacial test system for the determination of inter- facial properties in fiber reinforced ceramic composites. Ceram. Eng. Sci. Proc. 1993, 14(7-8), 156 Marshall, D.B. and Oliver, W. C. An indentation method for measuring residual stresses in fiber reinforced ceramics. Mater. Sci. Eng. 1990, A126, 95 Hsueh, C.H. and Ferber, M.K. Evaluations of residual axial stresses and interfacial friction in Nicalon fibre-reinforced macro-defect-free cement composites. J. Mater. Sci. 1993, 28, 2551 Hutchinson, J.W. and Jensen, H.M. Models of fiber debonding and pullout in brittle composites with friction. Mech. Mater. 1990,9, 139 Marshall, D.B. Analysis of fiber debonding and sliding experi- ments in brittle matrix composites. Acta MetaN. Mafer. 1992, 40(3), 427 Dannemann, K.A. and Madell, J.F. Tensile damage develop- ment in fiber-reinforced ceramic matrix composites. Mater Sci. Eng. 1994, A177, 95 Daniel, A.M. Interfacial properties of fibre reinforced ceramic matrix composites. Doctoral Thesis, University of Warwick, UK, 1994
792