INFLUENCE OF WOVEN FABRIC WIDTH AND HUMAN ...
13
INFLUENCE OF WOVEN FABRIC WIDTH AND HUMAN BODY TYPES ON THE FABRIC EFFICIENCIES IN THE APPAREL MANUFACTURING Tayyab Naveed 1,2 , Yueqi Zhong 1,3, *, Yu Zhicai 1 , Muhammad Awais Naeem 4 , Lu Kai 1 , Xie Haoyang 1 , Amjad Farooq 1 , Zamir Ahmed Abro 1 1 College of Textiles, Donghua University, Shanghai 201620, China 2 Department of Textile Engineering & Technology, University of the Punjab, Lahore 54590, Pakistan 3 Key Laboratory of Textile Science & Technology, Ministry of Education, College of Textiles, Donghua University, Shanghai 201620, China 4 Key Laboratory of Eco-textiles, Jiangnan University, Wuxi 214122, China *Corresponding author. Email: [email protected] 1. Introduction In the apparel manufacturing, fabric efficiency is the percentage of the total fabric actually utilized in the garment component parts [1]. The fabric utilization and its cost difference in the total product cost depend on the item and production situation [2]. However, it is the single largest element in the total cost of the garment product [3]. Therefore, an improvement in fabric utilization results in many savings [4]. For instance, a saving of two million dollars per year was achieved through a 0.1% improvement in fabric utilization [5]. Thus, companies have substantial apprehensions in fabric consumption reduction through effectual resource utilization [6]. To control the fabric efficiencies, fabric widths and human body shapes are particularly imperious, since minute variations in pattern shapes led to the enormous consumption of fabric [7]. The efficient fabric consumption and controlling its cost have remained an unresolved issue in the apparel industries. The body shapes with the dissimilarity in dimensions and morphological appearances are generalized into few figure types (triangle, square, oval, and circle) [8]. Additionally, the body shape classifications, both in women and men, play a deceive role in the fabric consumption and always contribute to the issue of production cost in the fabric cutting-room of an apparel firm [9]. This often occurs with reiterated similar garment style production orders, nevertheless proceeding with different body shapes. The significant part of fabric consumption is caused during the making of marker cutting plans that are based on a technical drawing of pattern and markers (a two-dimensional placement of a set of pattern pieces on a rectangular fabric lay) [10]. Since the fabric is cut based on the pattern marker, marker losses and marker efficiencies have an imperative role in fabric consumption [11]. Marker loss is the wastage (fabric wastage) which consists of those proportions (non-useable areas) of the marker that do not become the part of garment components in the rectangular sheet [12]. Marker loss (wastage) is measured according to the marker area and the value of maker efficiency [1]. Marker efficiency is the percentage of the total area actually used in the garment component parts [13]. Higher the marker efficiency, lower the marker loss and vice versa [14]. There have been several studies [15–22] accomplished with the aim of improving fabric consumptions. However, with the different effect of fabric widths and human body shapes, there is a lack of research analysis on marker losses and wastages through marker cutting plans. The approach proposed in this study is to investigate the effect of different fabric widths in the preparation of marker plans for fabric consumption in different human body shapes. In this scope, fabric widths and body types are deliberated as independent (predictors) variables, whereas marker Abstract: In the apparel manufacturing, the fabric is the single largest element in the cost of the garment. Therefore, effectual fabric consumption causes a reduction in cost and exertions. The purpose of this research is to study the effects of fabric width on the efficiency of marker (cutting) plans. Fabric consumption is in four types for human body shapes, that is, triangle, oval, square, and circle, in both genders to control the fabric utilization. Two clothing styles, fitted trousers and fitted shirts, are manufactured in an apparel manufacturing industry. The marker plans produced through Garment Gerber Technology software are accomplished in 36 different fabric widths (independent variables). The evaluation of dependent variables, that is, marker efficiency, marker loss, and fabric consumption efficiency relevant to four body shapes in variable fabric widths is analyzed for both women and men. The statistical analysis indicates that there is a linear relationship between marker efficiency and fabric width (sig <0.05). The regression analysis (p-value) between dependent variables and predictor variables (body types and fabric width) is also statistically significant. Also, the result implies that markers are more productive with larger fabric widths in all styles in both genders. Keywords: Apparel manufacturing, body shapes, fabric width, fabric efficiency, marker AUTEX Research Journal, Vol. 20, No 4, December 2020, DOI 10.2478/aut-2019-0044 © 2020 by the authors. This article is an open access article distributed under the terms and conditions of the Creative Commons Attribution (CC BY) license (http://creativecommons.org/licenses/by/4.0/).
-
Upload
khangminh22 -
Category
Documents
-
view
2 -
download
0
Transcript of INFLUENCE OF WOVEN FABRIC WIDTH AND HUMAN ...

INFLUENCE OF WOVEN FABRIC WIDTH AND HUMAN BODY TYPES ON THE FABRIC EFFICIENCIES IN THE APPAREL MANUFACTURING
Tayyab Naveed1,2, Yueqi Zhong1,3,*, Yu Zhicai1, Muhammad Awais Naeem4, Lu Kai1, Xie Haoyang1, Amjad Farooq1, Zamir Ahmed Abro1
1 College of Textiles, Donghua University, Shanghai 201620, China2 Department of Textile Engineering & Technology, University of the Punjab, Lahore 54590, Pakistan
3 Key Laboratory of Textile Science & Technology, Ministry of Education, College of Textiles, Donghua University, Shanghai 201620, China4 Key Laboratory of Eco-textiles, Jiangnan University, Wuxi 214122, China
*Corresponding author. Email: [email protected]
1. Introduction
In the apparel manufacturing, fabric effi ciency is the percentage of the total fabric actually utilized in the garment component parts [1]. The fabric utilization and its cost difference in the total product cost depend on the item and production situation [2]. However, it is the single largest element in the total cost of the garment product [3]. Therefore, an improvement in fabric utilization results in many savings [4]. For instance, a saving of two million dollars per year was achieved through a 0.1% improvement in fabric utilization [5]. Thus, companies have substantial apprehensions in fabric consumption reduction through effectual resource utilization [6]. To control the fabric effi ciencies, fabric widths and human body shapes are particularly imperious, since minute variations in pattern shapes led to the enormous consumption of fabric [7]. The effi cient fabric consumption and controlling its cost have remained an unresolved issue in the apparel industries.
The body shapes with the dissimilarity in dimensions and morphological appearances are generalized into few fi gure types (triangle, square, oval, and circle) [8]. Additionally, the body shape classifi cations, both in women and men, play a deceive role in the fabric consumption and always contribute to the issue of production cost in the fabric cutting-room of an apparel fi rm [9]. This often occurs with reiterated similar garment style production orders, nevertheless proceeding with different body
shapes. The signifi cant part of fabric consumption is caused during the making of marker cutting plans that are based on a technical drawing of pattern and markers (a two-dimensional placement of a set of pattern pieces on a rectangular fabric lay) [10]. Since the fabric is cut based on the pattern marker, marker losses and marker effi ciencies have an imperative role in fabric consumption [11].
Marker loss is the wastage (fabric wastage) which consists of those proportions (non-useable areas) of the marker that do not become the part of garment components in the rectangular sheet [12]. Marker loss (wastage) is measured according to the marker area and the value of maker effi ciency [1]. Marker effi ciency is the percentage of the total area actually used in the garment component parts [13]. Higher the marker effi ciency, lower the marker loss and vice versa [14]. There have been several studies [15–22] accomplished with the aim of improving fabric consumptions. However, with the different effect of fabric widths and human body shapes, there is a lack of research analysis on marker losses and wastages through marker cutting plans.
The approach proposed in this study is to investigate the effect of different fabric widths in the preparation of marker plans for fabric consumption in different human body shapes. In this scope, fabric widths and body types are deliberated as independent (predictors) variables, whereas marker
Abstract:
In the apparel manufacturing, the fabric is the single largest element in the cost of the garment. Therefore, effectual fabric consumption causes a reduction in cost and exertions. The purpose of this research is to study the effects of fabricwidthon theefficiencyofmarker (cutting) plans.Fabric consumption is in four types for humanbodyshapes, that is, triangle, oval, square, and circle, in both genders to control the fabric utilization. Two clothing styles,fittedtrousersandfittedshirts,aremanufacturedinanapparelmanufacturingindustry.ThemarkerplansproducedthroughGarmentGerberTechnologysoftwareareaccomplishedin36differentfabricwidths(independentvariables).Theevaluationofdependentvariables,thatis,markerefficiency,markerloss,andfabricconsumptionefficiencyrelevanttofourbodyshapesinvariablefabricwidthsisanalyzedforbothwomenandmen.Thestatisticalanalysis indicates that there isa linearrelationshipbetweenmarkerefficiencyandfabricwidth(sig<0.05).Theregressionanalysis(p-value)betweendependentvariablesandpredictorvariables(bodytypesandfabricwidth)isalsostatisticallysignificant.Also,theresultimpliesthatmarkersaremoreproductivewithlargerfabricwidthsinallstyles in both genders.
Keywords:
Apparelmanufacturing,bodyshapes,fabricwidth,fabricefficiency,marker
AUTEX Research Journal, Vol. 20, No 4, December 2020, DOI 10.2478/aut-2019-0044
© 2020 by the authors. This article is an open access article distributed under the terms and conditions of the Creative Commons Attribution (CC BY) license (http://creativecommons.org/licenses/by/4.0/).

effi ciencies, marker losses, and fabric consumption effi ciencies are considered as dependent variables. Fabric widths and body shapes (pattern shapes) are substantial criteria affecting the fabric effi ciency. The results are also statistically verifi ed and validated through the neural network. This study will make the apparel industries better decision-making and more cost-effective.
2. Materials and Methods
2.1. Materials and equipment
Four different human body shapes, in both genders, that is, women and men, were chosen as shown in Figure 1 (different body shapes with similar size). In Figure 2, the technical features of the fi tted shirt and trouser manufactured for these body shapes are shown. In Figures A1 and A2 in Appendix, the patterns of the fi tted shirt and fi tted trouser are shown. These graded patterns were used for drawing marker plans for fabric cutting. 100% cotton woven fabrics (construction parameters of trouser fabric: 66 x 36/10 x 10: 50 to 85, whereas construction parameters of shirt fabric were 100 x 80/40 x 40: 50 to 85), with shrinkage 2% in warp and weft, were selected.
The research was consummated on close-fi tted (following the body curves, outlining the fi gure) garment styles, that is, trousers and shirts, for both women and men. The tools and equipment used in this research were pattern-making kit, paper roll, Minitab 17, and Garment Gerber Technology (GGT; V10.351) software for making graded patterns and marker cutting plans.
2.2 Experimental work
The experimental work was performed in the fabric cutting-room of an apparel fi rm. The work was conducted in the early hours of the day (morning between 9 AM and 12 PM) to avoid mental tiredness in the individuals since earlier research revealed that individuals were effi cient in the dawn and non-effi cient at the time of sunset [24,25]. The fabric cutting-room temperature was kept at 25°C. The study was accomplished with close-fi tted garments, that is, trousers and shirts, for women and men. The garment styles (shown in Figure 2) were
selected for the assessment of fabric utilization comparative to each body shape in 36 different fabric widths, 127–216 cm (50–85 inches).
Figure 3 has shown the conceptual model of the impact of body shapes and fabric widths on the effi ciencies. These two critical impacting components in the conceptual model have an infl uence on marker and fabric effi ciencies due to the variation of pattern shapes and fabric widths. Since body types have the key impact on product development in the traditional apparel manufacturing approaches, they have a substantial effect on the textile material (fabric) consumptions.
The triangle body was considered as a reference shape in our experiments because, in the world of fashion beauty and fi tness, triangle-shaped body is also considered as an ideal (highest symmetry) and best in all situations [26]. The anthropometric measurements of an ideal triangle female body were 91.5 cm (36 inches) bust, 66 cm (26 inches) waist, and 91.5 cm (36 inches) hips and ideal triangle male body measurements
Figure 1. Four different body shapes in women and men [23]. (a) Four different body shapes in women. (b) Four different body shapes in men.
Figure 2. Technical features of the fi tted shirt and fi tted trouser.
AUTEX Research Journal, Vol. 20, No 4, December 2020, DOI 10.2478/aut-2019-0044
http://www.autexrj.com/ 485

were 96.5 cm (38 inches) chest, 81.3 cm (32 inches) waist, and 99 cm (39 inches) hips [27]. Proportional grading skills among corresponding sizes, such as extra small (XS), small (S), medium (M), large (L), and extra large (XL), were applied by subtraction and addition of one measurement from another as per rule of ASTM D5585-95 standard (shown in Table A1 for women and Table A2 for men in Appendix). The medium size (M), also named “Size 12” in the garment industry, is commonly used for grading [28]. The female triangle body drop (waist girth minus bust girth) was kept –25 cm and male triangle body drop (waist girth minus chest girth) was kept –15 cm.
Fitted patterns of trousers and shirts were drawn and cut conventionally in both genders to have the optimal relationship between the body shape and the cloth measurements, that is, accomplished on close fi tted (following the body curves, outlining the fi gure). The similar method was applied to other body shapes, that is, oval, circle, and square in both styles for women and men. The size ratios (XS:S:M:L:XL; 1:1:1:1:1) for cutting order were kept constant in all body shapes to explore the effects on clothing effi ciencies. In total, 160 patterns (each shape and fi ve sizes) were prepared before the marker making process in both styles of women and men. The garment pieces
were cut optimally in markers (lay) relative to each shape, which contained all the sizes (XS, S, M, L and XL) in an equal quantity. Moreover, the pattern markers were accomplished through the GGT software for the evaluation of fabric consumption and effi ciencies. Figure 4 has shown the pattern markers of trouser and shirt against the given styles of a female triangle body shape as for an example. The pattern marker effi ciency values are detailed in Tables A3 and A4 in Appendix for both styles of women and men.
To verify the dissimilarities in the fabric effi ciencies at different fabric widths in two different styles, fi tted trousers and fi tted shirts, in four different body shapes of women and men, the results were observed by factors including marker effi ciency, marker loss, and fabric consumption effi ciency. The factors, such as fabric construction, fabric widths, four different body shapes, fabric shrinkage, the total number of pattern pieces of each shape, the total number of patterns in each marker (number of cut-able pieces), and number of fabric plies, were kept constant. The analysis of variance (ANOVA) and correlation were applied to determine the level of signifi cance of difference and the predictive relationship between the variables.
Figure 3. A conceptual model of the impact of body shapes and fabric widths on effi ciencies.
Figure 4. Fitted trouser marker and fi tted shirt marker of female triangle body.
AUTEX Research Journal, Vol. 20, No 4, December 2020, DOI 10.2478/aut-2019-0044
http://www.autexrj.com/ 486

Moreover, the statistical consequences were validated through neural network analysis.
3. Results and discussion
3.1 The result of marker effi ciency (%)
The marker is a diagram of a precise arrangement of garment patterns. Marker effi ciency is the percentage of the total area actually used in the placement of the garment patterns. Tables A3 and A4 in Appendix have compiled the results of marker effi ciency generated through GGT software at 36 different fabric widths. It was accomplished by analyzing ideal fabric width appropriate for maximum utilization of fabric for a specifi c shape. Figure 5 has shown the fi tted trouser and fi tted shirt marker effi ciencies (variations in a bar graph) of four body shapes both in women and men at different fabric widths. The
fi gure illustrates that the general trend in the marker effi ciency increases with the increase in fabric widths in all body shapes both in women and men.
3.1.1. The result of marker effi ciency of fi tted trouser in both genders
In Figure 5(a), in women fi tted trouser, the triangle-shaped body has the most marker effi ciency (89.4%) at 193 cm (76 inches) fabric width, the circle shape has (89.7%) at 210.8 cm (83 inches), the oval shape has the most marker effi ciency (89.8%) at 213.4 cm (84 inches) fabric width, and the square-shaped body has (89.8%) at 213.4 cm (84 inches) fabric width. Thus, in manufacturing the women fi tted trouser, triangle-shaped body was the best type since it consumed the fabric effi ciently with smaller fabric width. While in men fi tted trouser, that is, in Figure 5(b), the triangle-shaped body was found most effi cient (89.3%) at 213.4 cm (84 inches) width, the circle-shaped body
Figure 5. Fitted trouser and shirt marker effi ciencies of women and men at different fabric width.
AUTEX Research Journal, Vol. 20, No 4, December 2020, DOI 10.2478/aut-2019-0044
http://www.autexrj.com/ 487
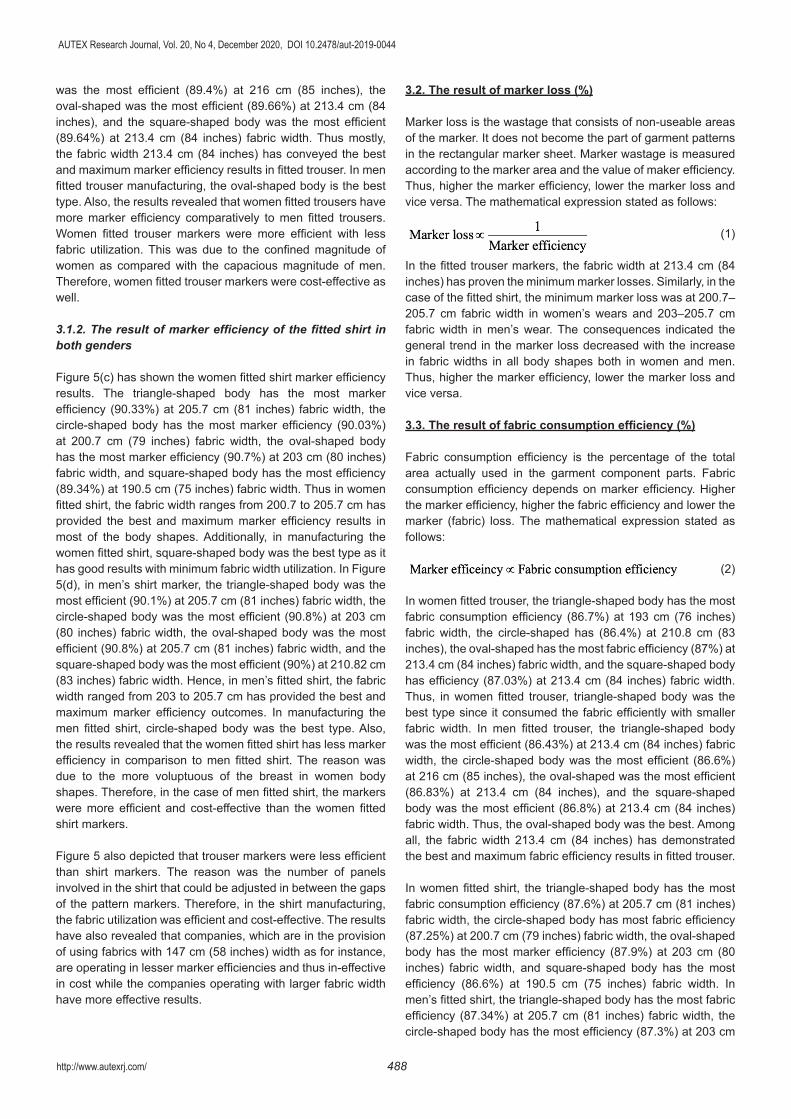
was the most effi cient (89.4%) at 216 cm (85 inches), the oval-shaped was the most effi cient (89.66%) at 213.4 cm (84 inches), and the square-shaped body was the most effi cient (89.64%) at 213.4 cm (84 inches) fabric width. Thus mostly, the fabric width 213.4 cm (84 inches) has conveyed the best and maximum marker effi ciency results in fi tted trouser. In men fi tted trouser manufacturing, the oval-shaped body is the best type. Also, the results revealed that women fi tted trousers have more marker effi ciency comparatively to men fi tted trousers. Women fi tted trouser markers were more effi cient with less fabric utilization. This was due to the confi ned magnitude of women as compared with the capacious magnitude of men. Therefore, women fi tted trouser markers were cost-effective as well.
3.1.2. The result of marker effi ciency of the fi tted shirt in both genders
Figure 5(c) has shown the women fi tted shirt marker effi ciency results. The triangle-shaped body has the most marker effi ciency (90.33%) at 205.7 cm (81 inches) fabric width, the circle-shaped body has the most marker effi ciency (90.03%) at 200.7 cm (79 inches) fabric width, the oval-shaped body has the most marker effi ciency (90.7%) at 203 cm (80 inches) fabric width, and square-shaped body has the most effi ciency (89.34%) at 190.5 cm (75 inches) fabric width. Thus in women fi tted shirt, the fabric width ranges from 200.7 to 205.7 cm has provided the best and maximum marker effi ciency results in most of the body shapes. Additionally, in manufacturing the women fi tted shirt, square-shaped body was the best type as it has good results with minimum fabric width utilization. In Figure 5(d), in men’s shirt marker, the triangle-shaped body was the most effi cient (90.1%) at 205.7 cm (81 inches) fabric width, the circle-shaped body was the most effi cient (90.8%) at 203 cm (80 inches) fabric width, the oval-shaped body was the most effi cient (90.8%) at 205.7 cm (81 inches) fabric width, and the square-shaped body was the most effi cient (90%) at 210.82 cm (83 inches) fabric width. Hence, in men’s fi tted shirt, the fabric width ranged from 203 to 205.7 cm has provided the best and maximum marker effi ciency outcomes. In manufacturing the men fi tted shirt, circle-shaped body was the best type. Also, the results revealed that the women fi tted shirt has less marker effi ciency in comparison to men fi tted shirt. The reason was due to the more voluptuous of the breast in women body shapes. Therefore, in the case of men fi tted shirt, the markers were more effi cient and cost-effective than the women fi tted shirt markers.
Figure 5 also depicted that trouser markers were less effi cient than shirt markers. The reason was the number of panels involved in the shirt that could be adjusted in between the gaps of the pattern markers. Therefore, in the shirt manufacturing, the fabric utilization was effi cient and cost-effective. The results have also revealed that companies, which are in the provision of using fabrics with 147 cm (58 inches) width as for instance, are operating in lesser marker effi ciencies and thus in-effective in cost while the companies operating with larger fabric width have more effective results.
3.2. The result of marker loss (%)
Marker loss is the wastage that consists of non-useable areas of the marker. It does not become the part of garment patterns in the rectangular marker sheet. Marker wastage is measured according to the marker area and the value of maker effi ciency. Thus, higher the marker effi ciency, lower the marker loss and vice versa. The mathematical expression stated as follows:
(1)
In the fi tted trouser markers, the fabric width at 213.4 cm (84 inches) has proven the minimum marker losses. Similarly, in the case of the fi tted shirt, the minimum marker loss was at 200.7–205.7 cm fabric width in women’s wears and 203–205.7 cm fabric width in men’s wear. The consequences indicated the general trend in the marker loss decreased with the increase in fabric widths in all body shapes both in women and men. Thus, higher the marker effi ciency, lower the marker loss and vice versa.
3.3. The result of fabric consumption effi ciency (%)
Fabric consumption effi ciency is the percentage of the total area actually used in the garment component parts. Fabric consumption effi ciency depends on marker effi ciency. Higher the marker effi ciency, higher the fabric effi ciency and lower the marker (fabric) loss. The mathematical expression stated as follows:
(2)
In women fi tted trouser, the triangle-shaped body has the most fabric consumption effi ciency (86.7%) at 193 cm (76 inches) fabric width, the circle-shaped has (86.4%) at 210.8 cm (83 inches), the oval-shaped has the most fabric effi ciency (87%) at 213.4 cm (84 inches) fabric width, and the square-shaped body has effi ciency (87.03%) at 213.4 cm (84 inches) fabric width. Thus, in women fi tted trouser, triangle-shaped body was the best type since it consumed the fabric effi ciently with smaller fabric width. In men fi tted trouser, the triangle-shaped body was the most effi cient (86.43%) at 213.4 cm (84 inches) fabric width, the circle-shaped body was the most effi cient (86.6%) at 216 cm (85 inches), the oval-shaped was the most effi cient (86.83%) at 213.4 cm (84 inches), and the square-shaped body was the most effi cient (86.8%) at 213.4 cm (84 inches) fabric width. Thus, the oval-shaped body was the best. Among all, the fabric width 213.4 cm (84 inches) has demonstrated the best and maximum fabric effi ciency results in fi tted trouser.
In women fi tted shirt, the triangle-shaped body has the most fabric consumption effi ciency (87.6%) at 205.7 cm (81 inches) fabric width, the circle-shaped body has most fabric effi ciency (87.25%) at 200.7 cm (79 inches) fabric width, the oval-shaped body has the most marker effi ciency (87.9%) at 203 cm (80 inches) fabric width, and square-shaped body has the most effi ciency (86.6%) at 190.5 cm (75 inches) fabric width. In men’s fi tted shirt, the triangle-shaped body has the most fabric effi ciency (87.34%) at 205.7 cm (81 inches) fabric width, the circle-shaped body has the most effi ciency (87.3%) at 203 cm
AUTEX Research Journal, Vol. 20, No 4, December 2020, DOI 10.2478/aut-2019-0044
http://www.autexrj.com/ 488

(80 inches) fabric width, the oval-shaped body has the most efficiency (88.07%) at 205.7 cm (81 inches) fabric width, and the square-shaped body has the most fabric efficiency (87.2%) at 210.8 cm (83 inches) fabric width. Therefore, in women fitted shirt, the fabric width ranges from 200.7 to 205.7 cm (79–81 inches) and in men’s fitted shirt, the fabric width ranges from 203 to 205.7 cm (80–81 inches) has provided the best and maximum fabric efficiency results. The results also revealed that the fabric efficiency depends upon the marker efficiency. However, the fabric consumption efficiency always remained less than the marker efficiency. The reason was the more fabric losses including internal and external losses (selvedge loss, end loss, width loss, etc.).
3.4. Analysis of variance
Table 1 presents the results of one-way analysis between groups for different variables. It was found that there was a statistically significant effect on the marker efficiency, fabric consumption efficiency, and fabric width, given the significant value (<0.05) in the ANOVA table. The regression analysis (p-value) between dependent variables (marker efficiency, marker loss, and fabric consumption efficiency) and predictor variables (body types and fabric width) was also statistically significant. Similarly, Tables 2 and 3 have also shown the significant p values of all body shapes. However, triangle shape in women fitted trouser (0.858), oval shape in men fitted trouser (0.886), square shape in women fitted shirt (0.714), and circle shape in men fitted shirt (0.880) have a stronger effect due to the higher standardization coefficient beta values as compared to the other body shapes respectively.
Table 1. One-way ANOVA analysis of triangle, circle, oval, and square body shapes
One-way ANOVA analysis df Sum of squares Mean square F Significance (p)
Women fitted trouserME 3 1.724 0.5747 3.74 0.013
FCE 3 1.841 0.6138 4 0.009
Men fitted trouserME 3 3.488 1.1625 8.59 0.00
FCE 3 4.038 1.346 9.95 0.00
Women fitted shirtME 3 3.317 1.1057 3.15 0.027
FCE 3 3.654 1.2181 3.47 0.018
Men fitted shirtME 3 6.25 2.0835 4.8 0.003
FCE 3 6.422 2.1405 4.93 0.003
Fabric widthME 15 21.42 1.4278 5.32 0.00
FCE 15 21.42 1.4278 5.32 0.00
ME, marker efficiency; FCE, fabric consumption efficiency.
Table 2. Regression analysis between fabric efficiency and fabric width for each body types of women and men in fitted trouser
Statistical analysisWomen fitted trouser Men fitted trouser
Triangle Circle Oval Square Triangle Circle Oval Square
R square 0.736 0.669 0.558 0.514 0.602 0.721 0.785 0.465
Standardization beta 0.858 0.818 0.747 0.717 0.776 0.849 0.886 0.682
F statistics 94.821 68.592 43.009 36.022 51.482 88.051 123.942 29.497
p-value p < 0.000 p < 0.000 p < 0.000 p < 0.000 p < 0.000 p < 0.000 p < 0.000 p < 0.000
Table 3. Regression analysis between fabric efficiency and fabric width for each body types of women and men in fitted shirt
Statistical analysisWomen fitted shirt Men fitted shirt
Triangle Circle Oval Square Triangle Circle Oval Square
R square 0.492 0.321 0.335 0.510 0.485 0.653 0.676 0.729
Standardization beta 0.702 0.566 0.579 0.714 0.696 0.880 0.822 0.854
F statistics 32.978 16.055 17.143 35.43 31.972 64.085 70.934 91.343
p-value p < 0.000 p < 0.000 p < 0.000 p < 0.000 p < 0.000 p < 0.000 p < 0.000 p < 0.000
AUTEX Research Journal, Vol. 20, No 4, December 2020, DOI 10.2478/aut-2019-0044
http://www.autexrj.com/ 489

and hyper-parameters settings are presented in Table 5. The cost function was designed in the manner of mean squared error (MSE) to evaluate the difference between the ground truth and the predicted output. We use stochastic gradient descent (SGD) method to minimize the cost.
In Table 6, MSE values obtained from the number of test results, MSE results, and absolute change values have been provided. Closer the absolute error to zero, better the system reflects the truth. R square value for training, validation and test datasets were 99.8, 99.7, 99.8, and MSE 0.01372, 0.0157, 0.0142, respectively. The training and validating as a function of epoch was also performed. The network was trained within 10 epochs met the goal of error. The best validation performance was 0.0157 at epoch 7. Hence, we have chosen the strategy of “Early Stop” to learn the best parameters (weights) for the prediction. Thus, the results, as illustrated in Table 6, are satisfactorily reasonable in terms of prediction accuracy.
The research was processed and complied with only two styles (trousers and shirts). For more strengthening the knowledge, there is a need to explore a number of different production orders which would be highly expensive study. This study makes capable the apparel firms which are producing garments for different body shapes of women and men to make their strategies better for competing for different markets in top-wears and bottom-wears. The same experimental analysis should be conducted in more garments to benchmark the approaches, techniques, and production management capabilities.
3.5 Correlation analysis
Table 4 has shown a linear relationship between marker efficiency and fabric width (sig <0.05). Pearson correlation coefficient is 0.858. The results have been similar in fabric consumption efficiency as well. Thus, both have a strong and positive relationship with marker efficiency and fabric consumption efficiency and are affected by the variations in fabric width. There was also sufficient evidence that there exists a linear relationship between both efficiencies and styles of body shapes (sig <0.05). Pearson correlation coefficient ranges from 0.716 to 0.767 in both marker efficiency and fabric consumption efficiency. However, women body shapes have stronger and positive (positive medium) relationship comparative with the men (positive week).
3.6. Neural network analysis
The marker efficiency and the fabric consumption efficiency were further predicted through the fully connected neural network with back propagation (BP). From our observation, this machine learning tool validated and reaffirmed the outcomes of ANOVA table with high prediction accuracy. In practice, our BP network has three layers, that is, an input layer, a hidden layer, and an output layer. The input layer consisted of 36 neurons that represent the features under concern, that is, different fabric widths (50–85 inches). The single hidden layer has 10 neurons and the Sigmoid function was used for nonlinear activation. The output layer contained two neurons for the prediction of maker efficiency and fabric consumption efficiency. The parameters
Table 4. Correlation analysis of variables
Correlation analysis Fabric widthWomen fitted
trouserMen fitted
trouserWomen fitted
shirt Men fitted shirt
Marker efficiency (%)
p-value 0.00 0.00 0.00 0.00 0.00
Correlation coefficient 0.858 0.767 0.723 0.762 0.716
Fabric consumption efficiency (%)
p-value 0.00 0.00 0.00 0.00 0.00
Correlation coefficient 0.858 0.767 0.723 0.762 0.716
Correlation Strong Not quite strong Medium Not quite strong Medium
Linear relationship Positive Positive medium Positive weak Positive medium Positive weak
Table 5. Neural network parameters
Item Parameter
1 Input layer NormalizationNumber of neurons
Standard36
2 Hidden layer Activation functionNumber of neurons
Sigmoid10
3 Output layer NormalizationNumber of neurons
Standard2
4 Weight Initialization Random
5 Learning rule Algorithm Stochastic gradient descent (SGD)
AUTEX Research Journal, Vol. 20, No 4, December 2020, DOI 10.2478/aut-2019-0044
http://www.autexrj.com/ 490

Table 6. Neural network Analysis
1 MSE (training) 0.01372
2 MSE (testing) 0.0142
3 R2 (absolute change) 0.9942
4 Validation performance (at epoch 7) 0.0157
4. Conclusion
The objective of this research was to study the effect of different fabric widths on marker efficiencies and fabric consumption efficiencies in correspondence with four different human body shapes, that is, oval, circular, square, and triangular (ideal body) in the apparel industry. Two order styles, fitted trousers and fitted shirts, were selected and transformed on to four body shapes of women and men. The results of the study under discussion can be summarized as follows:
• There is a linear relationship between marker efficiency and fabric width (sig <0.05). The regression analysis (p-value) between dependent variables (marker efficiency, marker loss, and fabric consumption efficiency) and predictor variables (four body types in both genders and fabric width) is also statistically significant.
• The markers are more productive with larger fabric widths in all styles in both genders.
• In manufacturing the fitted trousers, the fabric width 213.4 cm has conveyed the best and maximum marker efficiency results in both genders while in the fitted shirt, fabric width ranges from 200.7 to 205.7 cm in women and 203 to 205.7 cm fabric width in men has provided the best and maximum marker efficiency results in most of the body shapes.
• Fabric consumption efficiency depends upon the marker efficiency. However, it always remains less than the marker efficiency.
• Women fitted trouser markers are efficient and cost-effective compared to men fitted trouser markers.
• Women fitted shirt has less marker efficiency as compared to men fitted shirt. Therefore less cost-effective.
• In both genders, shirt markers were more efficient and cost-effective than trouser markers.
• In manufacturing the fitted trousers, triangle-shaped body is the best in women while oval-shaped body in men. In the case of fitted shirts, square-shaped body is the best in women and circle-shaped body is the best in men.
Funding
The authors disclosed receipt of the following financial support for the research, authorship, and/or publication of this article. The work was supported by Natural Science Foundation of China (61572124).
Conflict of interest
Author has no conflict of interest.
References
[1] Glock,R.E.,Kunz,G. I. (2005).Apparelmanufacturing:
Sewn product analysis, 4th ed., (Prentice Hall, Upper
SaddleRiver,NJ),173.[2] Wong,W.K.,Leung,S.Y.S.,Au,K.F.(2005).Real-time
GA-basedreschedulingapproachforthepre-sewingstageof an apparel manufacturing process. The International JournalofAdvancedManufacturingTechnology,25(1-2),180-188.
[3] Bilgic,H.,Baykal,P.D.(2016).TheEffectsofWidthoftheFabric,FabricandModelTypeontheEfficiencyofmarkerPlan in Terms ofApparel. TEKSTIL veKONFEKSIYON,26(3).
[4] Rose, D.M., Shier, D. R. (2007). Cut scheduling in theapparelindustry.ComputerOperationResearch,34,3209-3228.
[5] Li,Z.,Milenkovic,V. (1995).Compactionandseparationalgorithmsfornon-convexpolygonsandtheirapplications.EuropeanJournalofOperationResearch,84,539-561.
[6] Li, S. W., Guo, L. W., Li, C. H. (2009). Proceedings,EighthInternationalConferenceonMachineLearningandCybernetics,(Baoding,China),July2009,p.2560-2563.
[7] Burke, E. K., et al. (2007). Complete and robust no-fitpolygongenerationfortheirregularstockcuttingproblem.EuropeanJournalofOperationalResearch,179(1),27-49.
[8] Chung, M. -J., Lin, H. -F., Wang, M. -J. J. (2007). ThedevelopmentofsizingsystemsforTaiwaneseelementary-andhigh-schoolstudents.InternationalJournalofIndustrialErgonomics,37(8),707-716.
[9] Hsu, C. -H. (2009). Data mining to improve industrialstandards and enhance production and marketing: Anempirical study in apparel industry.ExpertSystemswithApplications,36(3),4185-4191.
[10]Wong,W.K.,Leung,S.Y.S.(2008).Geneticoptimizationof fabric utilization in apparel manufacturing, International JournalofProductionEconomy,,114:p.376-387.
[11]Kayar,M.,Ozel,Y.(2008).Usingneuralnetworkmethodto solve marker making ‘‘calculation of fabric laysquantities’’efficiency for optimum result in the apparelindustry. In: 8th WSEAS international conferenceon simulation, modeling and optimization (SMO ‘08)Santander,Cantabria,Spain,23–25September2008,p.219–223.
[12]Ng, S., et al. (2001). Fabric Loss during Spreading: AComparative Study of theActual Loss in ManufacturingMen’sShirts. Journal of the Textile Institute, 92(3), 269-279.
AUTEX Research Journal, Vol. 20, No 4, December 2020, DOI 10.2478/aut-2019-0044
http://www.autexrj.com/ 491

[13]Pamuk, O., Yildiz, E. Z. (2016). A study aboutparameters affecting the marker plan efficiency. TEKSTKONFEKSIYON,26,430-435.
[14]Wong,W.K.,etal.(2013).7-Optimizingfabricspreadingand cutting schedules in apparel production using genetic algorithms and fuzzy set theory, in Optimizing DecisionMaking in the Apparel Supply Chain Using ArtificialIntelligence(AI),W.K.Wong,Z.X.Guo,andS.Y.S.Leung,Editors.2013,WoodheadPublishing.p.132-152.
[15]Milenkovic, V. J. (1998). Rotational polygon overlapminimization and compaction. Computational Geometry,10(4),305-318.
[16]Mok,P.Y.,Kwong,C.K.,Wong,W.K.(2007).Optimisationof fault-tolerant fabric-cutting schedules using geneticalgorithms and fuzzy set theory. European Journal ofOperationalResearch,177(3),1876-1893.
[17]Bennell,J.A.,Oliveira,J.F.(2008).Thegeometryofnestingproblems: A tutorial. European Journal of OperationalResearch,184(2),397-415.
[18]Hsu,C.H.(2009).Developingaccurateindustrialstandardsto facilitate production in apparel manufacturing based on anthropometric data.HumanFactorsandErgonomics inManufacturing&ServiceIndustries,19(3),199-211.
[19]Ondogan,Z.,Erdogan,M.(2006).TheComparisonoftheManualandCADSystemsforPatternMaking,GradingandMarkerMakingProcesses.FibresAndtextilesinEasternEurope,14(1),62.
[20]Czarnecki,C. (1995). Integrating the cutting and sewingroom of garment manufacture using mechatronic techniques.Mechatronics,5(2),295-308.
[21]Naveed,T.,Hussain,A.,Zhong,Y.(2017).Reducingfabricwastage through image projected virtualmarker (IPVM).TextileResearchJournal,88(14),1571-1580.
[22]Guo,Z.X.,etal.(2006).Mathematicalmodelandgeneticoptimization for the job shop scheduling problem in a mixed- and multi-product assembly environment: Acase studybasedon theapparel industry.Computers&IndustrialEngineering,50(3),202-219.
[23]IreneeR.(2015).Thescienceofpersonaldresscompletestudy:Bodyshapes.Amazaon.com.
[24]Hutton,W.C.,Malko,J.A.,Fajman,W.A.(2003).Lumbardisc volume measured by MRI: effects of bed rest,horizontalexercise,andverticalloading.Aviation,Space,andEnvironmentalMedicine,74(1),73-78.
[25]Goel, S., Tashakkori, R. (2015). Correlation BetweenBody Measurements of Different Genders and Races,in Collaborative Mathematics and Statistics Research.Springer,p.7-17.
[26]AGBO,D.D.A. (2013).DeterminationofBodySizeandShape Using Wasit, Bust, and Hip Measurements forEffectiveGarmentDesigningforAdultFemales inBenueState.Volume4April,p.1.
[27]Awoh,D.K.(2017).BodySizeandShapeCategorizationofSomeEthnicGroupsinBenueStateUsingWaist,BustandHipMeasurements.InternationalJournalofScientificResearch in Information Systems and Engineering(IJSRISE),1(1).
[28]Bye, E., et al. (2008). Optimized pattern grading.InternationalJournalofClothingScienceandTechnology,20(2),79-92.
[29]Naveed.T.,etal.Acomparativestudyonfabricefficienciesfor different human body shapes in the apparel industry. AutexResearchJournal.DOI:10.1515/aut-2018-0027.
AUTEX Research Journal, Vol. 20, No 4, December 2020, DOI 10.2478/aut-2019-0044
http://www.autexrj.com/ 492

Appendix
Figure A1. Shirt patterns of four body shapes in women and men [29]. (a) Shirt front graded panels of body shapes in women. (b) Shirt front graded of body shapes in men. (c) Shirt back graded panels of body shapes in women. (d) Shirt back graded panels of body shapes in men.
Figure A2. Trouser patterns of four body shapes in women and men. (a) Trouser graded front panels of body shapes in women (b) Trouser graded front panels of body shapes in men. (c) Trouser graded back panels of body shapes in women. (d) Trouser graded back panels of body shapes on men.
AUTEX Research Journal, Vol. 20, No 4, December 2020, DOI 10.2478/aut-2019-0044
http://www.autexrj.com/ 493

Table A1. Graded size chart of an ideal female body
Sr. No Description Extra small (XS) Small (S) Medium (M) Large (L) Extra-large (XL)
Sizes 2–20 2–4 6–8 10–12 14–16 18–20
1 Bust/chest 30 inch (76 cm) 32 inch (81 cm) 36 inch (91.5 cm) 40 inch (102 cm) 42 inch (107 cm)
2 Waist 20 inch (51 cm) 22 inch (56 cm) 26 inch (66 cm) 30 inch (76 cm) 32 inch (81 cm)
3 Hips 30 inch (76 cm) 32 inch (81 cm) 36 inch (91.5 cm) 40 inch (102 cm) 42 inch (107 cm)
4 Body height 63 inch (157.5 cm) 65.5 inch (164 cm) 68 inch (170 cm) 70.5 inch (176 cm) 73 inch (183 cm)
Table A2. Graded size chart of an ideal male body
Sr. No
Description Extra-small (XS) Small (S) Medium (M) Large (L) Extra-large (XL)
Sizes 2–20 2–4 6–8 10–12 14–16 18–20
1 Chest 32 inch (81 cm) 34 inch (86.5 cm) 38 inch (96.5 cm) 42 inch (107 cm) 44 inch (112 cm)
2 Waist 26 inch (66 cm) 28 inch (71 cm) 32 inch (81 cm) 36 inch (91.5 cm) 38 inch (96.5 cm)
3 Hips 33 inch (84 cm) 35 inch (89 cm) 39 inch (99 cm) 43 inch (109 cm) 45 inch (114 cm)
4 Body height 65.5 inch (164 cm) 67.5 inch (169 cm) 70 inch (178 cm) 72.5 inch (181 cm) 74.5 inch (186 cm)
AUTEX Research Journal, Vol. 20, No 4, December 2020, DOI 10.2478/aut-2019-0044
http://www.autexrj.com/ 494
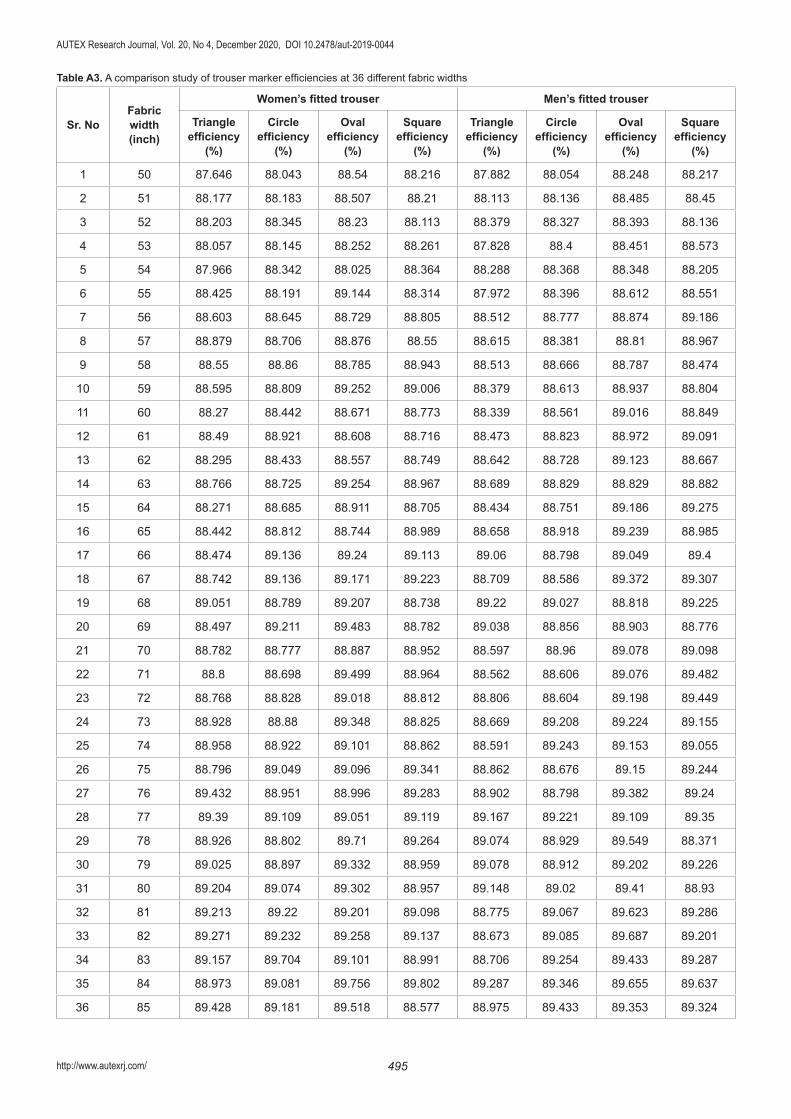
Table A3. A comparison study of trouser marker efficiencies at 36 different fabric widths
Sr. NoFabric width (inch)
Women’s fitted trouser Men’s fitted trouser
Triangle efficiency
(%)
Circle efficiency
(%)
Oval efficiency
(%)
Square efficiency
(%)
Triangle efficiency
(%)
Circle efficiency
(%)
Oval efficiency
(%)
Square efficiency
(%)
1 50 87.646 88.043 88.54 88.216 87.882 88.054 88.248 88.217
2 51 88.177 88.183 88.507 88.21 88.113 88.136 88.485 88.45
3 52 88.203 88.345 88.23 88.113 88.379 88.327 88.393 88.136
4 53 88.057 88.145 88.252 88.261 87.828 88.4 88.451 88.573
5 54 87.966 88.342 88.025 88.364 88.288 88.368 88.348 88.205
6 55 88.425 88.191 89.144 88.314 87.972 88.396 88.612 88.551
7 56 88.603 88.645 88.729 88.805 88.512 88.777 88.874 89.186
8 57 88.879 88.706 88.876 88.55 88.615 88.381 88.81 88.967
9 58 88.55 88.86 88.785 88.943 88.513 88.666 88.787 88.474
10 59 88.595 88.809 89.252 89.006 88.379 88.613 88.937 88.804
11 60 88.27 88.442 88.671 88.773 88.339 88.561 89.016 88.849
12 61 88.49 88.921 88.608 88.716 88.473 88.823 88.972 89.091
13 62 88.295 88.433 88.557 88.749 88.642 88.728 89.123 88.667
14 63 88.766 88.725 89.254 88.967 88.689 88.829 88.829 88.882
15 64 88.271 88.685 88.911 88.705 88.434 88.751 89.186 89.275
16 65 88.442 88.812 88.744 88.989 88.658 88.918 89.239 88.985
17 66 88.474 89.136 89.24 89.113 89.06 88.798 89.049 89.4
18 67 88.742 89.136 89.171 89.223 88.709 88.586 89.372 89.307
19 68 89.051 88.789 89.207 88.738 89.22 89.027 88.818 89.225
20 69 88.497 89.211 89.483 88.782 89.038 88.856 88.903 88.776
21 70 88.782 88.777 88.887 88.952 88.597 88.96 89.078 89.098
22 71 88.8 88.698 89.499 88.964 88.562 88.606 89.076 89.482
23 72 88.768 88.828 89.018 88.812 88.806 88.604 89.198 89.449
24 73 88.928 88.88 89.348 88.825 88.669 89.208 89.224 89.155
25 74 88.958 88.922 89.101 88.862 88.591 89.243 89.153 89.055
26 75 88.796 89.049 89.096 89.341 88.862 88.676 89.15 89.244
27 76 89.432 88.951 88.996 89.283 88.902 88.798 89.382 89.24
28 77 89.39 89.109 89.051 89.119 89.167 89.221 89.109 89.35
29 78 88.926 88.802 89.71 89.264 89.074 88.929 89.549 88.371
30 79 89.025 88.897 89.332 88.959 89.078 88.912 89.202 89.226
31 80 89.204 89.074 89.302 88.957 89.148 89.02 89.41 88.93
32 81 89.213 89.22 89.201 89.098 88.775 89.067 89.623 89.286
33 82 89.271 89.232 89.258 89.137 88.673 89.085 89.687 89.201
34 83 89.157 89.704 89.101 88.991 88.706 89.254 89.433 89.287
35 84 88.973 89.081 89.756 89.802 89.287 89.346 89.655 89.637
36 85 89.428 89.181 89.518 88.577 88.975 89.433 89.353 89.324
AUTEX Research Journal, Vol. 20, No 4, December 2020, DOI 10.2478/aut-2019-0044
http://www.autexrj.com/ 495

Table A4. A comparison study of shirt marker efficiencies at 36 different fabric widths
Women’s fitted shirt Men’s fitted shirt
Sr. No
Fabric width (inch)
Triangle efficiency
(%)
Circle efficiency
(%)
Oval efficiency
(%)
Square efficiency
(%)
Triangle efficiency
(%)
Circle efficiency
(%)
Oval efficiency
(%)
Square efficiency
(%)
1 50 87.591 87.431 88.136 88.216 86.974 87.898 88.424 87.962
2 51 87.537 88.428 88.026 88.21 86.979 87.663 87.939 88.1
3 52 87.842 88.797 88.759 88.113 88.848 87.671 88.062 88.054
4 53 88.525 88.192 88.921 88.361 88.411 88.67 88.45 88.11
5 54 88.057 88.111 89.238 88.364 88.426 88.653 88.997 88.755
6 55 88.794 88.581 89.015 88.314 88.953 88.311 88.647 88.064
7 56 88.705 88.392 88.077 88.805 88.015 88.786 88.591 88.339
8 57 88.506 88.335 88.64 88.55 88.653 88.737 89.164 88.353
9 58 90.041 89.417 89.647 88.943 89.192 89.033 89.158 88.825
10 59 89.247 89.373 89.461 89.006 89.381 89.144 90.154 89.642
11 60 88.974 88.431 88.861 88.773 88.658 89.064 89.569 88.961
12 61 88.169 88.199 89.113 88.716 88.285 89.25 89.703 88.934
13 62 88.249 87.801 88.82 88.749 87.884 89.053 89.076 88.586
14 63 88.246 87.827 88.389 88.976 88.239 88.664 89.061 88.347
15 64 89.417 89.073 89.617 88.705 89.589 88.965 88.867 88.535
16 65 88.744 89.123 88.954 88.989 88.815 89.126 89.347 88.886
17 66 88.763 88.595 89.107 89.113 88.711 88.74 89.906 89.11
18 67 89.243 88.253 88.59 89.223 88.312 88.683 89.436 89.096
19 68 88.855 88.679 88.205 88.738 88.897 89.158 89.403 89.056
20 69 89.057 88.155 88.974 88.782 89.163 88.855 89.074 89.292
21 70 89.134 88.598 89.628 88.952 89.241 89.301 89.365 88.416
22 71 89.512 88.487 89.424 88.964 89.327 89.341 89.786 88.944
23 72 89.602 89.385 89.613 88.812 89.053 89.786 90.033 89.083
24 73 89.784 88.962 89.606 88.825 89.759 89.685 89.859 89.425
25 74 89.373 88.375 89.249 88.862 88.95 89.419 89.499 89.406
26 75 89.156 89.616 89.265 89.341 89.275 89.294 89.613 89.627
27 76 88.978 88.923 89.253 89.283 88.938 89.261 89.917 89.651
28 77 90.089 89.207 89.119 89.119 88.643 89.165 89.712 89.448
29 78 89.907 89.041 89.707 89.264 88.815 90.063 90.152 89.364
30 79 90.078 90.029 90.142 88.959 89.754 90.101 89.763 89.55
31 80 90.194 89.874 90.652 88.957 90.253 90.073 90.157 89.485
32 81 90.329 89.975 89.731 89.098 90.111 89.749 90.827 89.669
33 82 89.669 89.453 89.95 89.137 89.995 89.961 90.616 89.86
34 83 89.208 89.275 89.548 88.991 89.206 89.267 90.487 89.953
35 84 89.313 88.638 89.308 89.802 90.106 89.34 89.953 89.567
36 85 88.724 88.585 88.626 88.577 89.148 89.434 89.828 89.473
AUTEX Research Journal, Vol. 20, No 4, December 2020, DOI 10.2478/aut-2019-0044
http://www.autexrj.com/ 496