Prediagnostic body-mass index, plasma C-peptide concentration, and prostate cancer-specific...
16
A long-term survival analysis of prediagnostic body mass index, plasma C-peptide concentration, and prostate cancer-specific mortality among men with prostate cancer Jing Ma, PhD 1 , Haojie Li, PhD 2 , Ed Giovannucci, DSc [full professor] 1,3 , Lorelei Mucci, ScD 1,4 , Weiliang Qiu, PhD 1 , Paul L. Nguyen, MD 5 , J. Michael Gaziano, MD 6 , Michael Pollak, MD [full professor] 7,* , and Meir Stampfer, DrPH [full professor] 1,3,* 1 Channing Laboratory, Department of Medicine, Brigham and Women’s Hospital and Harvard Medical School, Boston, MA 02115, USA 2 GlaxoSmithKline R&D, Worldwide Epidemiology (Oncology), Collegeville, PA 19426, USA 3 Departments of Nutrition & Epidemiology, Harvard School of Public Health, Boston, MA 02115, USA 4 Department of Epidemiology, Harvard School of Public Health, Boston, MA 02115, USA 5 Harvard Radiation Oncology Program, Boston, MA 02115, USA 6 Division of Preventive Medicine, Brigham and Women’s Hospital and Harvard Medical School, Boston, MA 02115 and Massachusetts Veterans Epidemiology Research and Information Center (MAVERIC), VA Boston Healthcare System, MA 7 Cancer Prevention Research Unit, Departments of Medicine and Oncology, Lady Davis Research Institute of the Jewish General Hospital and McGill University, Montreal, Canada H3T1E2 Abstract Background—Excess body mass index (BMI) has been associated with adverse outcomes in prostate cancer, and hyperinsulinemia is a candidate mediator, but prospective data are sparse. We assessed the influence of prediagnostic BMI and plasma C-peptide (reflecting insulin secretion) on prostate cancer-specific mortality after diagnosis. Corresponding Author: Jing Ma, MD, PhD, 181 Longwood Avenue, Boston, MA 02115, Tel: (617) 525-2708, Fax: (617) 525-2008, E- mail: [email protected]. * With shared senior authorship Author contributions Jing Ma, PhD - Study concept, design, literature search, design of data analysis, data interpretation, and paper writing. Haojie Li, PhD - Data analysis Ed Giovannucci, DSc - Data interpretation Lorelei Mucci, ScD - Data collection Weiliang Qiu, PhD - Data analysis and interpretation Paul L. Nguyen, MD - Data collection J. Michael Gaziano, - MD Study population and data collection Michael Pollak, - MD Study concept, assay measurement, data interpretation, and paper editing. Meir Stampfer, DrPH - Study concept, data collection, interpretation, and paper editing. Conflict of Interest Statement The authors state no conflict of interest. Publisher's Disclaimer: This is a PDF file of an unedited manuscript that has been accepted for publication. As a service to our customers we are providing this early version of the manuscript. The manuscript will undergo copyediting, typesetting, and review of the resulting proof before it is published in its final citable form. Please note that during the production process errors may be discovered which could affect the content, and all legal disclaimers that apply to the journal pertain. NIH Public Access Author Manuscript Lancet Oncol. Author manuscript; available in PMC 2009 November 1. Published in final edited form as: Lancet Oncol. 2008 November ; 9(11): 1039–1047. doi:10.1016/S1470-2045(08)70235-3. NIH-PA Author Manuscript NIH-PA Author Manuscript NIH-PA Author Manuscript
-
Upload
independent -
Category
Documents
-
view
0 -
download
0
Transcript of Prediagnostic body-mass index, plasma C-peptide concentration, and prostate cancer-specific...
A long-term survival analysis of prediagnostic body mass index,plasma C-peptide concentration, and prostate cancer-specificmortality among men with prostate cancer
Jing Ma, PhD1, Haojie Li, PhD2, Ed Giovannucci, DSc [full professor]1,3, Lorelei Mucci,ScD1,4, Weiliang Qiu, PhD1, Paul L. Nguyen, MD5, J. Michael Gaziano, MD6, Michael Pollak,MD [full professor]7,*, and Meir Stampfer, DrPH [full professor]1,3,*
1 Channing Laboratory, Department of Medicine, Brigham and Women’s Hospital and Harvard MedicalSchool, Boston, MA 02115, USA
2 GlaxoSmithKline R&D, Worldwide Epidemiology (Oncology), Collegeville, PA 19426, USA
3 Departments of Nutrition & Epidemiology, Harvard School of Public Health, Boston, MA 02115, USA
4 Department of Epidemiology, Harvard School of Public Health, Boston, MA 02115, USA
5 Harvard Radiation Oncology Program, Boston, MA 02115, USA
6 Division of Preventive Medicine, Brigham and Women’s Hospital and Harvard Medical School, Boston,MA 02115 and Massachusetts Veterans Epidemiology Research and Information Center (MAVERIC), VABoston Healthcare System, MA
7 Cancer Prevention Research Unit, Departments of Medicine and Oncology, Lady Davis Research Instituteof the Jewish General Hospital and McGill University, Montreal, Canada H3T1E2
Abstract
Background—Excess body mass index (BMI) has been associated with adverse outcomes inprostate cancer, and hyperinsulinemia is a candidate mediator, but prospective data are sparse. Weassessed the influence of prediagnostic BMI and plasma C-peptide (reflecting insulin secretion) onprostate cancer-specific mortality after diagnosis.
Corresponding Author: Jing Ma, MD, PhD, 181 Longwood Avenue, Boston, MA 02115, Tel: (617) 525-2708, Fax: (617) 525-2008, E-mail: [email protected].*With shared senior authorshipAuthor contributionsJing Ma, PhD - Study concept, design, literature search, design of data analysis, data interpretation, and paper writing.Haojie Li, PhD - Data analysisEd Giovannucci, DSc - Data interpretationLorelei Mucci, ScD - Data collectionWeiliang Qiu, PhD - Data analysis and interpretationPaul L. Nguyen, MD - Data collectionJ. Michael Gaziano, - MD Study population and data collectionMichael Pollak, - MD Study concept, assay measurement, data interpretation, and paper editing.Meir Stampfer, DrPH - Study concept, data collection, interpretation, and paper editing.Conflict of Interest StatementThe authors state no conflict of interest.Publisher's Disclaimer: This is a PDF file of an unedited manuscript that has been accepted for publication. As a service to our customerswe are providing this early version of the manuscript. The manuscript will undergo copyediting, typesetting, and review of the resultingproof before it is published in its final citable form. Please note that during the production process errors may be discovered which couldaffect the content, and all legal disclaimers that apply to the journal pertain.
NIH Public AccessAuthor ManuscriptLancet Oncol. Author manuscript; available in PMC 2009 November 1.
Published in final edited form as:Lancet Oncol. 2008 November ; 9(11): 1039–1047. doi:10.1016/S1470-2045(08)70235-3.
NIH
-PA Author Manuscript
NIH
-PA Author Manuscript
NIH
-PA Author Manuscript
Methods—BMI was available at baseline (1982) and in 1990 among 2,546 men who developedprostate cancer (281 prostate cancer deaths). Baseline C-peptide concentration were available in 827men (117 prostate cancer deaths). We used Cox proportional hazards regression models controllingfor age, smoking, time between BMI measurement and prostate cancer diagnosis, and competingcauses of death.
Findings—Compared with men of normal weight (BMI<25 kg/m2) at baseline, overweight men(BMI 25–29.9 kg/m2) and obese men (BMI≥30 kg/m2) had significantly higher risk of prostate cancermortality; the proportional hazard ratio (HR)s (95% confidence interval, CI) were 1.47 (1.16–1.88)for overweight and 2.66 (1.62–4.39; Ptrend<0.0001) for obesity. The trend remained significant aftercontrolling for clinical stage and Gleason grade and was stronger for prostate cancer diagnosed duringthe PSA screening era (1991–2007) or using BMI obtained in 1990. Men with C-peptideconcentrations in the highest quartile (high), versus the lowest quartile (low), also had higher risk(HR=2.38; 1.31–4.30). Compared with men with BMI<25 kg/m2 and low C-peptide concentrations,those with BMI≥25 kg/m2 and high C-peptide concentration had a four times higher risk (HR=4.12;1.97–8.61; Pinteraction=0.001) independent of clinical predictors.
Interpretation—Excess body weight and high plasma concentration of C-peptide each predisposemen with a subsequent diagnosis of prostate cancer to increased likelihood of dying of this disease;those with both factors have the worst outcome.
IntroductionProstate cancer and obesity are major public health concerns for middle aged and older men.Excess body weight, as measured by body mass index (BMI, kg/m2), has been associated withincreased prostate cancer progression, although it appears to be unrelated to risk of incidentprostate cancer in most prospective studies.(1–5) Some studies found that higher BMI,measured before disease onset, was associated with a lower risk of localized prostate cancerbut a higher risk of lethal cancer.(5) Most,(6–13) but not all (14,15) studies suggest that obesityat the time of prostate cancer diagnosis is associated with higher risk of biochemical failure.In one study, retrospectively assessed obesity (BMI≥30 kg/m2) at ages 25 and 40 were strongerpredictors for risk of biochemical failure than obesity assessed at diagnosis.(10) To date, amongfive studies that have examined the risk of prostate cancer-specific mortality (11,16–18) threereported a positive association with BMI at time of treatment or recall of BMI in the year beforediagnosis.(11,17,19) Taken together, these data suggest that obesity prior to a prostate cancerdiagnosis predisposes men to increased risk of dying of the disease.(20) However, no long-term prospective study of prostate cancer-specific mortality has been conducted, and aconcomitant assessment of biological mechanism(s) is lacking.
Obesity causes many metabolic changes that may mediate the association with increasedprostate cancer mortality. Hyperinsulinemia is a candidate mediator. In a recent laboratorystudy, mice fed a high energy diet had increased weight gain, hyperinsulinemia, acceleratedgrowth of prostate cancer xenografts, and increased signaling downstream of the insulinreceptor in neoplastic prostate tissue.(21) In addition, we recently observed abundantexpression of the insulin receptor in human prostate cancer tissue.(22) To our knowledge, nostudies have reported the association of plasma concentrations of insulin or C-peptide, a markerof insulin secretion, (23) prior to prostate cancer diagnosis with risk of prostate cancermortality.
We examined the role of prediagnostic BMI and plasma C-peptide concentration in prostatecancer-specific mortality in a well-defined cohort of US male physicians diagnosed withprostate cancer during the 24 years of follow-up. We also evaluated the potential influences ofknown clinical predictors of prostate cancer progression, including age at diagnosis, Gleasongrade, and clinical stage, on these associations.
Ma et al. Page 2
Lancet Oncol. Author manuscript; available in PMC 2009 November 1.
NIH
-PA Author Manuscript
NIH
-PA Author Manuscript
NIH
-PA Author Manuscript
MethodsStudy population and baseline questionnaire
This study is based on 2,546 men diagnosed with prostate cancer during the 24-years of follow-up (median follow-up between diagnosis and death or end of follow-up was 7 years, rangefrom 1 day to 24 years) in the Physicians’ Health Study, a randomized trial of aspirin and betacarotene among 22,071 U.S. male physicians, aged 40–84 in 1982, without a history of heartdisease, cancer, or major chronic diseases.(24) At baseline, participants reported height andbody weight and, at the 8th year of follow-up, the participants reported body weight again, fromwhich baseline and the 8th year body mass index (BMI, kg/m2) were calculated and categorizedas normal (BMI<25 kg/m2), overweight (BMI 25 to 29.9 kg/m2) or obese (BMI≥30 kg/m2).Cigarette smoking (never, past, current) and history of diabetes were also ascertained atbaseline. Between the fall of 1982 and the end of 1984, 14,916 men provided blood samples.In a subgroup selected for nested case-control biomarker studies, we assayed plasma C-peptideconcentrations for 827 men and PSA concentration for 718, using baseline blood samples. Allpatients provided written informed consent for inclusion in this study. This study was approvedby the Human Subjects Committee of the Brigham and Women’s Hospital and Harvard Schoolof Public Health.
Follow-up and confirmation of prostate cancer deathFollow-up questionnaires to ascertain disease outcomes were mailed at 6 and 12 months afterrandomization and yearly thereafter. Of 2,751 reported prostate cancer diagnoses, 2,549 wereconfirmed by medical records and pathology reports; all except 3 (who had BMI < 18.5 kg/m2) of the confirmed cases were included in the analysis. Prostate cancer stage is recordedaccording to the TNM staging system or converted from a modified Whitmore-Jewettclassification scheme (for prostate cancer diagnosed during the early years of follow-up). Weused clinical stage and Gleason grade whenever the information were available. PSAconcentrations at diagnosis were also extracted from medical records. Deaths are ascertainedthrough repeated mailings, telephone calls to non-respondents, and searches of the NationalDeath Index. We seek medical records to assess cause of death, and assignment of prostatecancer specific death is blinded to questionnaire and laboratory data and is based on consensusof the three physicians (Drs. Meir J Stampfer, Samuel Goldhaber and James Taylor) of the EndPoint Committee using medical records and all available information. Follow-up for morbidityand mortality to March 30, 2007 is 97% complete.
C-peptide assayPlasma C-peptide concentrations were measured in blood that had been frozen at −82 °C, usingstandard ELISA methodology and a single production lot of reagents (Diagnostic SystemsLimited, Webster, TX) at Dr. M Pollak’s laboratory. Blinded embedded quality control samplesshowed within assay CV of 5% and a between assay variability of 9%.
Statistical AnalysisWe characterized the clinical predictors of lethal prostate cancer and other potentialconfounding variables according to the three BMI categories using Chi-square tests andanalysis of covariance. A competing risk analysis using Cox proportional hazards regression(25) was used to evaluate associations of baseline and the 8th year follow-up BMI (threecategories as the major exposure) with risk of prostate cancer-specific mortality (the majoroutcome) using proportional hazard ratios (HR) and 95% confidence intervals (95% CI). Thiscompeting risk model is a semi-parametric multiplication hazard model assuming that the logrelative hazard is linearly related to covariates. The implementation of the model is based ona stacked data set technique that allows some covariates have the identical effects for several
Ma et al. Page 3
Lancet Oncol. Author manuscript; available in PMC 2009 November 1.
NIH
-PA Author Manuscript
NIH
-PA Author Manuscript
NIH
-PA Author Manuscript
causes. In our analysis, we assume that no covariates have identical effects on the two failuretypes (prostate cancer death and death due to other causes).(26) Person-years were countedfrom the date of prostate cancer diagnosis until the date of prostate cancer death (event), deathdue to other causes, or the end of follow-up (March 31, 2007) (censored), whichever camefirst. We also estimated the HR in association with a one unit incremental increase in BMI andpresent the P-values of the tests for trend.
We controlled in the basic model for age at diagnosis, baseline cigarette smoking status, andtime between BMI measurement and prostate cancer diagnosis in all analyses. Controlling forthe randomized trial components, aspirin and beta-carotene, had no influence so these werenot included in the analyses. To assess the independent effect of BMI, we further controlledfor clinical stage and Gleason grade in some analyses. To further assess the impact of PSAscreening, we stratified the analysis by year of diagnosis (before or after 1990, when PSAscreening became widespread). In subgroup analyses, we also controlled for baseline PSA (<4,4–9, 10+ ng/mL) (n=718) or PSA at diagnosis (n=1869). To further reduce the potentialinfluence of obesity/overweight on PSA screening or treatment options, we conductedsensitivity analyses by excluding stage T1 or stage N1/M1 cancer. We also evaluated modelsexcluding current smokers, men with history of diabetes, non-Caucasians (less than 6% of thecohort), or men who died of any cause within the first five years of follow-up.
All analyses of plasma C-peptide concentrations (in quartiles) were controlled for baseline ageand time since last meal, and subsequent analyses controlled for baseline BMI, or clinical stageand Gleason grade to assess the independent association of C-peptide. Tests for trend wereconducted by treating median concentration of quartiles as a continuous variable. We alsoexamined the joint association between BMI (<25 kg/m2 vs. ≥25 kg/m2) and quartile of C-peptide concentration and tested the significance of the interaction by including a product termof the two variables with the main exposures. Because excluding 11 men with history ofdiabetes at baseline did not change the results materially, we presented data including all menwith plasma C-peptide levels. We used Cox proportional hazards regression models adjustingfor age at diagnosis and smoking categories to produce plots of prostate cancer-specific survivalcurves for the three BMI categories or for the quartiles of C-peptide concentration. In addition,we conducted log rank tests controlling for age at diagnosis and smoking status to test if thesurvival curves estimated via Kaplan-Meier method for the three BMI categories or for thequartiles of C-peptide concentration are equal. All statistics were calculated using SAS (version9.1.3; SAS Institute Inc, Cary, NC), with a two-sided significance level of 0.05.
Role of the funding sourceThe sponsors of the study had no role in study design, data collection, data analysis, datainterpretation, or writing of the report. The corresponding author had full access to all the datain the study and had final responsibility for the decision to submit for publication.
ResultsOf the 2,546 men diagnosed with prostate cancer during the follow-up, 989 (39%) wereoverweight (BMI 25–29.9 kg/m2) and 87 (3.4%) were obese (BMI≥30 kg/m2) at baseline(Table 1). Overweight men had characteristics similar to men of normal weight. Greaterproportions of obese men were past smokers, and were more likely to have extraprostatic,metastatic, or high Gleason grade (8–10) cancer at diagnosis. BMI was unrelated to PSAconcentration, with spearman correlation coefficients between BMI and baseline PSAconcentrations of 0.06 (P=0.09, n=718) and −0.03 between BMI and PSA concentration atdiagnosis (P=0.25, n=1869). As expected, baseline plasma C-peptide concentrations wereweakly positively correlated with age (spearman partial correlation r=0.12, P = 0.001,
Ma et al. Page 4
Lancet Oncol. Author manuscript; available in PMC 2009 November 1.
NIH
-PA Author Manuscript
NIH
-PA Author Manuscript
NIH
-PA Author Manuscript
controlling for fasting status and assay batch) and BMI (r=0.25, P <0.0001, controlling forfasting, batch, and age).
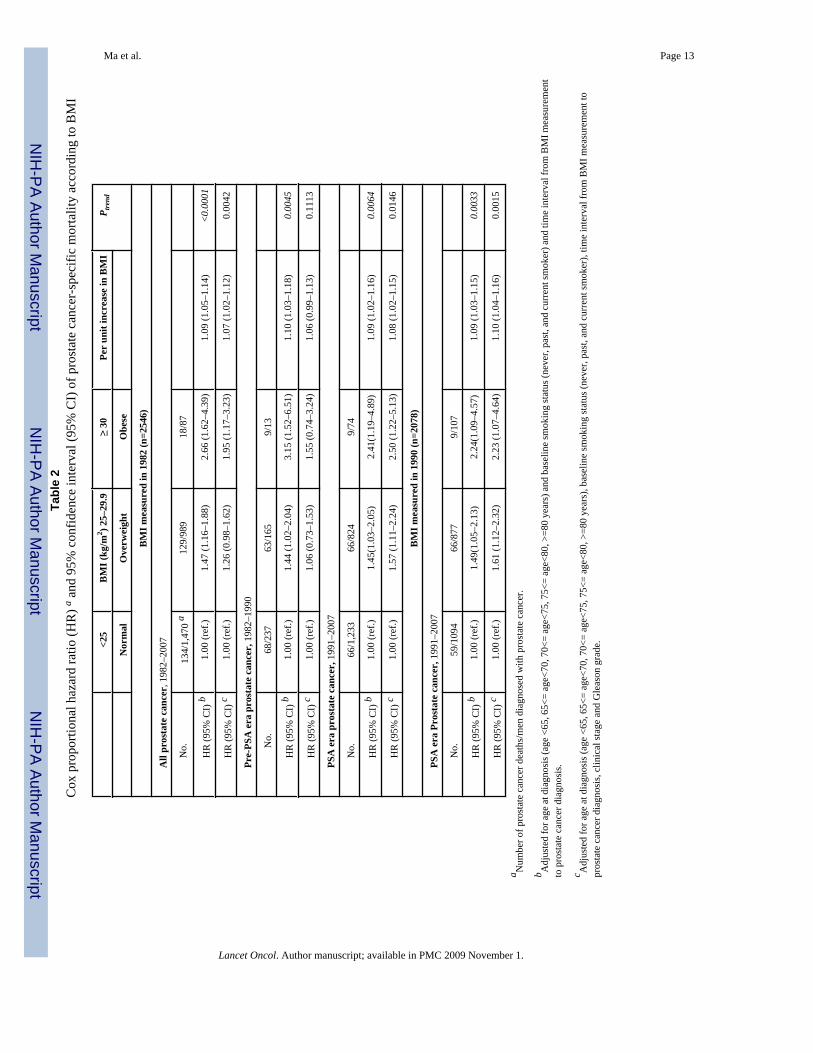
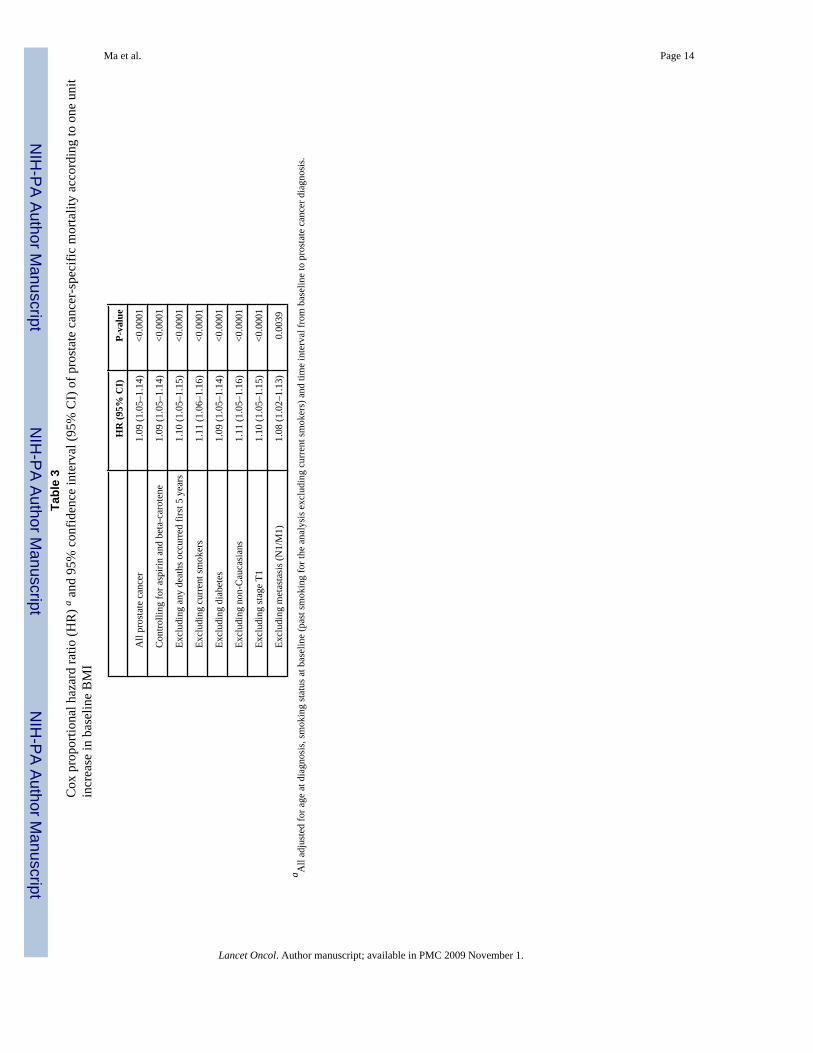
During the 24 years of follow-up, 281 (11.0%) men subsequently died of prostate cancer and485 (19%) men died of other causes. Higher baseline BMI was significantly associated withhigher risk of prostate cancer-specific mortality, independent of age at diagnosis and baselinesmoking status (Table 2, Figure 1A). Compared with men of normal weight, the HRs were1.47 (1.16–1.88) for overweight men and 2.66 (1.62–4.39) for obese men (Ptrend < 0.0001).Controlling for the two trial components, aspirin and beta-carotene, did not change the results(Table 3).
We further included clinical stage and Gleason grade in the multivariate model to assess theindependent association between baseline BMI and fatal prostate cancer. Controlling for theseclinical predictors somewhat attenuated the magnitude of the association; the HRs were 1.26(0.98–1.62) for overweight men and 1.95 (1.17–3.23) for obese men. However, the positivetrend of increase in risk for each unit increase in BMI remained statistically significant (HR=1.07, 1.02–1.12; Ptrend = 0.004, Table 2). As expected, high Gleason score (7 or 8–10) andregional (clinical stageT3/T4/N0/M0) and metastatic disease (N1/M1) at diagnosis were strongpredictors of lethal prostate cancer. The HRs were 2.25 (1.62–3.12) for Gleason grade 7 tumors(80 prostate cancer deaths) and 4.70 (3.37–6.56) for Gleason 8–10 tumors (93 prostate cancerdeaths), compared with Gleason 2–6 (73 prostate cancer deaths). The HRs were 3.62 (2.61–5.02) for stage T3/T4/N0/M0 (78 prostate cancer deaths) and 10.62 (7.45–15.14) for stage N1/M1 disease (67 prostate cancer deaths) compared with localized (stage T1/T2/N0/M0) disease(105 prostate cancer deaths). Further controlling for PSA at diagnosis (<4, 4–9,≥10 ng/mL) ina subgroup of 1869 men (diagnosed in PSA era) strengthened the association for overweight(HR=1.80, 1.15–2.83) but attenuated the association for obesity (HR=1.61, 0.56–4.58).Controlling for baseline PSA (<4, 4–9,≥10 ng/mL, n=718 cases, most of whom were diagnosedduring the pre-PSA era) in the multivariate model with clinical predictors did not materiallychange the results (HR=1.61, 1.11–2.34 for overweight and HR=2.83, 1.31–6.11 for obese).
Widespread PSA screening since early 1990s has significantly changed the clinicalpresentation of prostate cancer. Because information on screening was not uniformly available,we used the period of 1982–1990 and 1991–2007 as a surrogate of the pre-PSA and PSAscreening era. Among the 415 men diagnosed with prostate cancer during 1982–1990 (pre-PSA era), 140 (33.7%) died of prostate cancer. Among the 2,131 men diagnosed with prostatecancer during 1991–2007 (PSA screening era), 141 (6.6%) died of the disease. Although theoverall prostate cancer-specific mortality was dramatically different between the two periods(Figure 1B and 1C), the relative risk of prostate cancer-specific mortality in association withbaseline BMI remained similar in age- and smoking-adjusted model (Table 2). Furthercontrolling for clinical stage and Gleason grade significantly attenuated the association forprostate cancer diagnosed during 1982–1990. However, for prostate cancer diagnosed duringthe PSA screening era, excess body weight many years before diagnosis was a strong andsignificant predictor of poor survival.
The median time between baseline BMI and prostate cancer diagnosis was 13 to 14 years (Table1), we therefore controlled for time between BMI measurements to prostate cancer diagnosisin all the analyses. In addition, BMI obtained in the 8th year of follow-up (in 1990) was highlycorrelated with baseline BMI in 1982 (correlation coefficient = 0.8), suggesting strong trackingover time. The prospective association between prediagnostic BMI and prostate cancer-specificmortality in the PSA screening era (1991–2007) was quite similar using BMI obtained in 1982or in 1990 (Table 2), with or without controlling for clinical stage and Gleason grade, furtherdemonstrating the robust relationship.
Ma et al. Page 5
Lancet Oncol. Author manuscript; available in PMC 2009 November 1.
NIH
-PA Author Manuscript
NIH
-PA Author Manuscript
NIH
-PA Author Manuscript
To evaluate potential confounding factors, we conducted a series of subgroup sensitivityanalyses with baseline BMI as a continuous variable, which gives more statistical power (Table3), and controlling for age and smoking status. Compared with the overall risk of prostatecancer-specific mortality with a one unit increase in BMI (HR = 1.09, 95% CI: 1.05–1.14), theassociation remained virtually unchanged after each of the following exclusions: men who diedof any cause during the first five years of follow-up, current smokers, men with history ofdiabetes, or non-Caucasians. This suggests that these factors cannot explain the strong positiveassociation between baseline BMI and prostate cancer mortality. In addition, excluding menwith stage T1 or stage N1/M1 prostate cancer at diagnosis did not materially change the resultssuggesting that early cancer detection by PSA (stage T1) or delayed diagnosis (metastasis) hadlittle impact on the association.
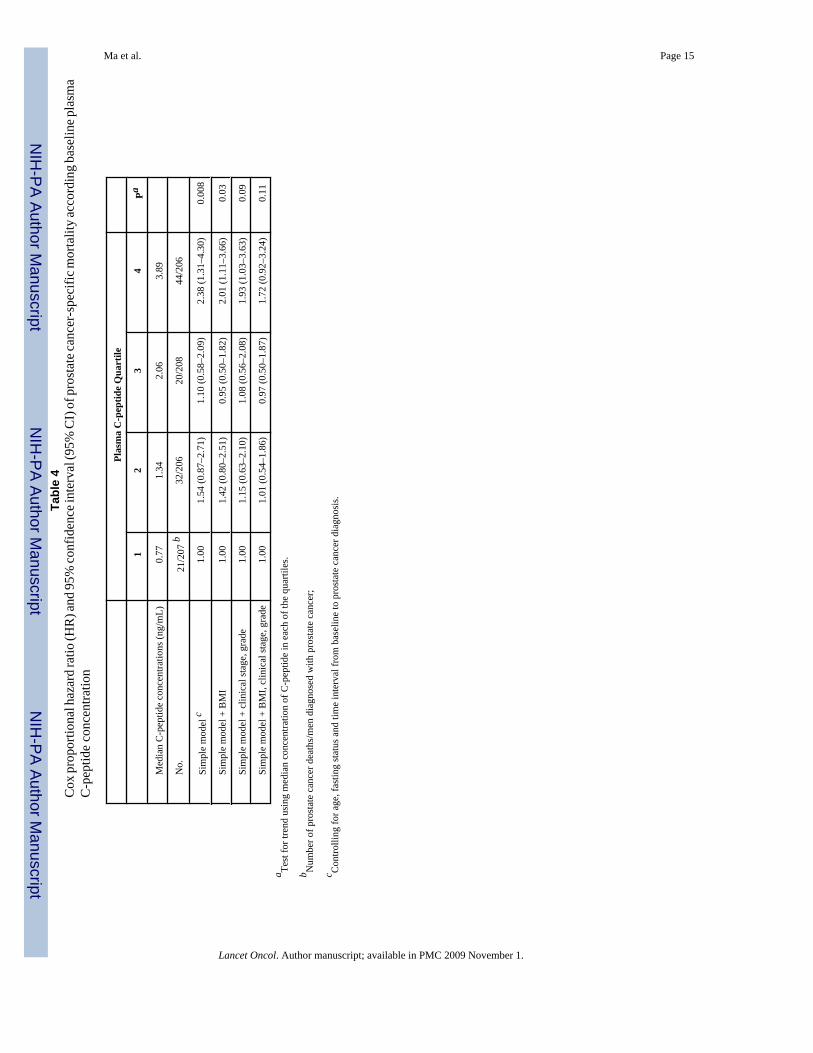
We have baseline blood available in a subgroup of 827 men; 634 of these blood samples werecollected less than 8 hours since last meal (nonfasting). We therefore measured plasma C-peptide as a surrogate for insulin secretion, and assessed the link between C-peptideconcentration and prostate cancer-specific mortality, adjusting for time between last meal andblood draw. Baseline characteristics and clinical features in this subgroup of men were similarto those in the overall study population (data shown in Supplemental Webtable 1). Among the117 prostate cancer deaths, a significantly higher proportion (44, 21%) had baseline C-peptideconcentrations in the highest quartile compared to those in the lowest quartile (21, 10%). Aftercontrolling for age, fasting status, and time interval from baseline to prostate cancer diagnosis,men with baseline C-peptide concentration in the highest quartile had an HR of 2.38 (1.31–4.30) for prostate cancer mortality compared with the lowest quartile, Ptrend=0.008 (Figure1D, Table 4). The increased risk was mainly among men in the highest quartile suggesting athreshold effect (Table 4). Including BMI in the model slightly attenuated the association forC-peptide (inter-quartile HR = 2.01, 95% CI: 1.11–3.66; Ptrend=0.03) but BMI remained astrong predictor (HR = 1.61, 95% CI: 1.10–2.35, for overweight, HR = 2.37, 95% CI: 1.04–5.37, for obesity; Ptrend=0.023). The HR for the highest quartile of C-peptide remainedstatistically significant (HR = 1.93; 95% CI: 1.03–3.63; Ptrend=0.09) after controlling forclinical stage and Gleason grade. However, including both BMI and clinical predictors in thesame model attenuated the associations for both BMI (HR=1.76, 95%CI: 1.19–2.61, foroverweight and HR=1.87, 95%CI: 0.80–4.37, for obesity) and C-peptide (inter-quartile HR =1.72, 95% CI: 0.92–3.24, Ptrend=0.11). This finding suggests that part of the impact of BMIon prostate cancer prognosis is mediated through insulin (Table 4).
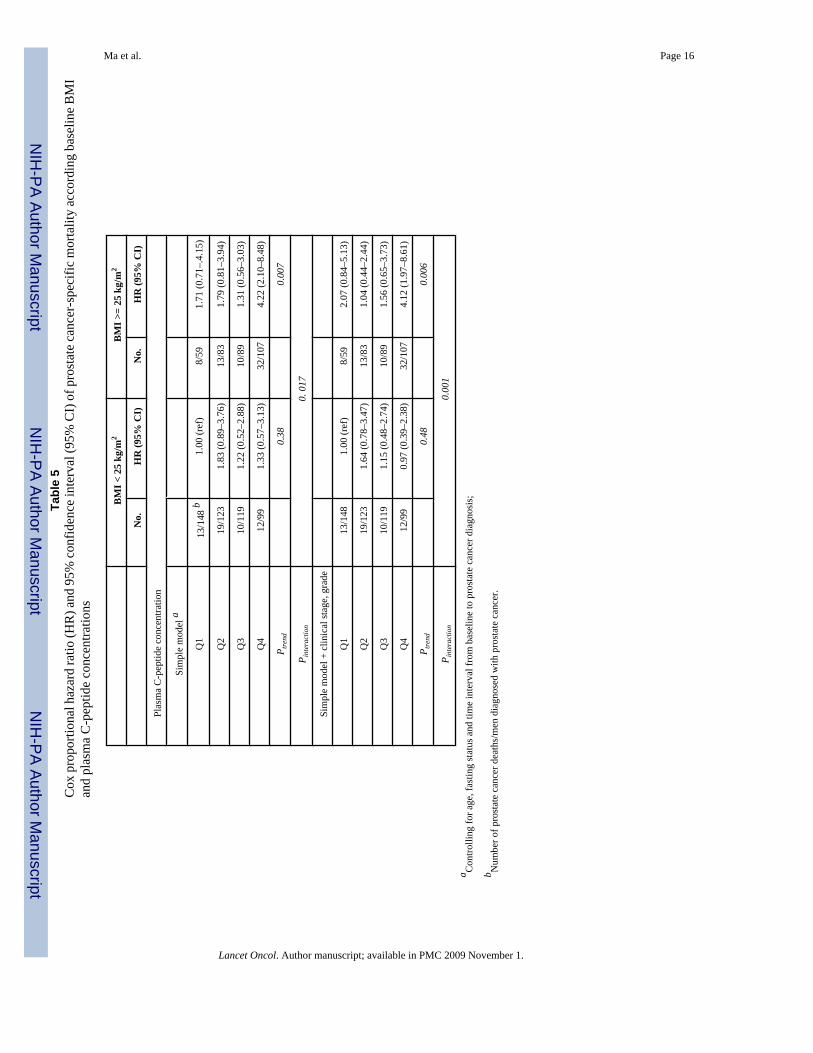
When assessing the joint association between BMI and C-peptide, we found that the increasedrisk of prostate cancer mortality associated with higher concentrations of C-peptide wasstatistically significant among men with BMI≥25 kg/m2 (Ptrend=0.007) but not among menwith BMI<25 kg/m2 (Ptrend=0.38) (Table 5). Overweight men with C-peptide in the highestquartile were over four times (the multivariate-adjusted HR=4.22, 95% CI: 2.10–8.48,Pinteraction=0.017) more likely to die of prostate cancer compared to men of normal weight andwith C-peptide in the lowest quartile. Further controlling for clinical stage and Gleason gradedid not change the result (the multivariate-adjusted HR=4.12, 95% CI: 1.97–8.61,Pinteraction=0.001).
DiscussionIn this large cohort with long-term follow-up, men who are overweight or obese and who havea subsequent diagnosis of prostate cancer are at increased risk of prostate cancer-specific death.Compared to those of normal weight at baseline in 1982, overweight men and obese men hadsignificant higher risk of dying of prostate cancer after initial cancer diagnosis. The magnitudeof the association increased monotonically; the HR was 1.09 (95% CI: 1.05–1.14) for each unitincrease in BMI (Ptrend <0.0001); the results remained largely unchanged after further
Ma et al. Page 6
Lancet Oncol. Author manuscript; available in PMC 2009 November 1.
NIH
-PA Author Manuscript
NIH
-PA Author Manuscript
NIH
-PA Author Manuscript
excluding current smokers at baseline, men with history of diabetes, non-Caucasians, or thosewho died of any cause within five years of follow-up. Moreover, we found that men withbaseline C-peptide concentration in the top quartile had a 2.4-time higher risk of dying ofprostate cancer than those in the lowest quartile.
In the PSA screening era, obesity may delay prostate cancer diagnosis because higher BMI hasbeen associated with lower serum PSA concentrations.(27) A less sensitive PSA test in obesemen could delay diagnosis and treatment, perhaps leading to worse prognosis. However, weobserved no correlation between baseline BMI and PSA concentrations measured at baselineor PSA concentration recorded at diagnosis. We further evaluated the association separatelyby pre-PSA and PSA screening eras, controlling for clinical predictors (stage, Gleason grade,and PSA concentration at diagnosis), or excluding stage T1 or stage N1/M1 prostate cancerfrom the analysis, and found that the significant association between BMI and prostate cancermortality remained largely unchanged. Thus, the positive associations between high BMI andpoor prostate cancer outcomes are unlikely to be attributable to differences in cancer detectionthrough PSA screening.
Another concern is whether the association between obesity and high prostate cancer mortalitycould be due to different choice of treatment among obese men that affected the outcome.Although we cannot fully address this issue given limited treatment information, our findingsare in line with many previous clinical studies showing that, among patients either receivingprostatectomy or radiotherapy, obesity at diagnosis predicts subsequent PSA failure.(6–13) Inaddition to the relation with obesity, which accounts for only 3.4% of our study population,we found that overweight men (38.9% of the study population) also had a significant 47%higher risk of prostate cancer specific mortality. Although one may argue that obesity leads totreatment differences, this seems less plausible for overweight men with BMI under 30.
In our study, higher prediagnostic BMI and plasma C-peptide concentrations were bothindependent positive predictors of prostate cancer-specific mortality and men with both factorshad the worst outcome. High insulin concentration may promote tumor progression via insulinreceptor, and/or the insulin-like growth factor type I receptor and downstream pathways.(28)Significantly elevated insulin concentrations were observed in prostate cancer cases versushealthy controls in a Chinese case-control study,(29) among men with high risk prostate cancerversus those with low risk cancer,(30) and among men who died of prostate cancer (n=20patients) versus survivors.(31) As these retrospective studies measured insulin concentrationafter the cancer diagnosis, it is unclear whether insulin concentrations were influenced bydisease severity or hormonal therapy, which affects hyperinsulinemia or insulin resistance.(32,33) Two recent prospective studies reported a null association between fasting insulin orplasma C-peptide concentration and risk of incident prostate cancer,(34,35) but neitherspecifically addressed the association with prostate cancer progression or survival.
Major strengths of this study are the prospective design which minimizes possible recall biasof BMI or influences of disease severity and treatment on blood biomarkers. The long follow-up allows us to examine independently the influence of both baseline BMI and BMI at 8th yearof follow-up on prostate cancer mortality. Additionally, we conducted a series of sensitivityanalyses to evaluate potential biases and confounding factors. One limitation is that we had nodetailed information about PSA screening and cancer treatment. However, given theprospective design and the homogenous study population of US physicians, confounding byPSA screening and treatment is unlikely to explain our findings Another limitation is that,although plasma C-peptide is a more reliable measurement of insulin secretion than insulinitself,(23) especially using nonfasting samples, we have only one C-peptide measure atbaseline, taken years before prostate cancer diagnosis. C-peptide is relatively stable; the within-person correlation coefficient for C-peptide measured 4 years apart in a similar cohort of men
Ma et al. Page 7
Lancet Oncol. Author manuscript; available in PMC 2009 November 1.
NIH
-PA Author Manuscript
NIH
-PA Author Manuscript
NIH
-PA Author Manuscript
was 0.57, a correlation similar to blood cholesterol measurement.(36) Participants are not arepresentative sample of prostate cancer patients in general population. All are physicians ingood health at baseline, and further selected by being trial participants. However, we believethat studying this more homogenous population can avoid many unknown confounding factorssuch as socioeconomic status that may influence obesity, access to medical care, and cancertreatment options. Moreover, the biological relations of overweight and prostate cancerprognosis observed in this population are broadly generalizable.
Our findings, taken together with other evidence, are consistent with the hypothesis that insulinand obesity-related metabolic factors influence prostate cancer prognosis. The observationsfurther suggest that the “seed/soil” hypothesis proposed by Stephen Paget more than 100 yearsago(37) may apply to metabolic aspects of host-tumor interactions, and imply that theoverweight/obese, hyperinsulinemic host may provide a host environment that favorsaggressive neoplastic behavior. The association of high C-peptide concentrations with prostatecancer mortality is also of interest in the context of evidence that the androgen ablation leadsto hyperinsulinimia, and might increase diabetic and cardiovascular morbidity in long-termprostate cancer survivors.(32,33) Our findings raise the speculative possibility thathyperinsulinemia may also favor aggressive androgen-independent disease progression.
Findings from this study have several implications for prostate cancer risk prediction,prevention, and treatment. First, men living in affluent societies are facing two epidemics,obesity and prostate cancer. In parallel with the obesity epidemic, the prevalence ofhyperinsulinemia has increased remarkably among nondiabetic U.S. adults.(38) The over-treatment of prostate cancer detected by PSA screening is a well recognized issue, and the needto identify prognostic factors that will improve our ability to identify men with life threateningprostate cancer who may benefit from novel and more aggressive treatment is clear. Ifconfirmed, our prospective data provide evidence that overweight/obesity and high C-peptideconcentration are adverse prognostic factors, and that they operate independently of clinicalpredictors. This provides further impetus for men to avoid overweight and to reduce risk ofmetabolic syndrome through physical activity and diet. Second, our data suggest that the recentprogress in prostate cancer control may be attenuated by increased prevalence of obesity andhyperinsuliniemia. It also adds to the rationale for investigation of novel therapeutic andprevention strategies such as using insulin-lowering or antidiabetic drugs,(39) as well as novelagents that target the insulin/IGF-I receptor family as an adjuvant therapy for prostate cancer.
Supplementary MaterialRefer to Web version on PubMed Central for supplementary material.
AcknowledgementsThe authors thank Haiyan Zhang and Manyee To for their assistance in data management and technical assistance.The authors are also indebted to the participants in the Physicians’ Health Study.
Funding: The National Institutes of Health research grants CA 42182, CA90598, CA58684, CA34944, CA40360,HL26490, HL34595 and the National Cancer Institute of Canada.
References1. MacInnis RJ, English DR. Body size and composition and prostate cancer risk: systematic review and
meta-regression analysis. Cancer Causes Control 2006 Oct;17(8):989–1003. [PubMed: 16933050]2. Littman AJ, White E, Kristal AR. Anthropometrics and prostate cancer risk. Am J Epidemiol 2007 Jun
1;165(11):1271–9. [PubMed: 17395597]
Ma et al. Page 8
Lancet Oncol. Author manuscript; available in PMC 2009 November 1.
NIH
-PA Author Manuscript
NIH
-PA Author Manuscript
NIH
-PA Author Manuscript
3. Rodriguez C, Freedland SJ, Deka A, et al. Body mass index, weight change, and risk of prostate cancerin the Cancer Prevention Study II Nutrition Cohort. Cancer Epidemiol Biomarkers Prev 2007 Jan;16(1):63–9. [PubMed: 17179486]
4. Wright ME, Chang SC, Schatzkin A, et al. Prospective study of adiposity and weight change in relationto prostate cancer incidence and mortality. Cancer 2007 Feb 15;109(4):675–84. [PubMed: 17211863]
5. Giovannucci E, Liu Y, Platz EA, Stampfer MJ, Willett WC. Risk factors for prostate cancer incidenceand progression in the health professionals follow-up study. Int J Cancer 2007 Oct 1;121(7):1571–8.[PubMed: 17450530]
6. Amling CL, Riffenburgh RH, Sun L, et al. Pathologic variables and recurrence rates as related to obesityand race in men with prostate cancer undergoing radical prostatectomy. J Clin Oncol 2004 Feb 1;22(3):439–45. [PubMed: 14691120]
7. Bassett WW, Cooperberg MR, Sadetsky N, et al. Impact of obesity on prostate cancer recurrence afterradical prostatectomy: data from CaPSURE. Urology 2005 Nov;66(5):1060–5. [PubMed: 16286124]
8. Freedland SJ, Aronson WJ, Kane CJ, et al. Impact of obesity on biochemical control after radicalprostatectomy for clinically localized prostate cancer: a report by the Shared Equal Access RegionalCancer Hospital database study group. J Clin Oncol 2004 Feb 1;22(3):446–53. [PubMed: 14691122]
9. Mallah KN, DiBlasio CJ, Rhee AC, Scardino PT, Kattan MW. Body mass index is weakly associatedwith, and not a helpful predictor of, disease progression in men with clinically localized prostatecarcinoma treated with radical prostatectomy. Cancer 2005 May 15;103(10):2030–4. [PubMed:15822118]
10. Strom SS, Wang X, Pettaway CA, et al. Obesity, weight gain, and risk of biochemical failure amongprostate cancer patients following prostatectomy. Clin Cancer Res 2005 Oct 1;11(19 Pt 1):6889–94.[PubMed: 16203779]
11. Efstathiou JA, Bae K, Shipley WU, et al. Obesity and mortality in men with locally advanced prostatecancer: analysis of RTOG 85-31. Cancer 2007 Dec 15;110(12):2691–9. [PubMed: 17999404]
12. Strom SS, Kamat AM, Gruschkus SK, et al. Influence of obesity on biochemical and clinical failureafter external-beam radiotherapy for localized prostate cancer. Cancer 2006 Aug 1;107(3):631–9.[PubMed: 16802288]
13. Stroup SP, Cullen J, Auge BK, L’Esperance JO, Kang SK. Effect of obesity on prostate-specificantigen recurrence after radiation therapy for localized prostate cancer as measured by the 2006Radiation Therapy Oncology Group-American Society for Therapeutic Radiation and Oncology(RTOG-ASTRO) Phoenix consensus definition. Cancer 2007 Sep 1;110(5):1003–9. [PubMed:17614338]
14. Chun FK, Briganti A, Graefen M, et al. Body mass index does not improve the ability to predictbiochemical recurrence after radical prostatectomy. Eur J Cancer 2007 Jan;43(2):375–82. [PubMed:17141497]
15. Gallina A, Karakiewicz PI, Hutterer GC, et al. Obesity does not predispose to more aggressive prostatecancer either at biopsy or radical prostatectomy in European men. Int J Cancer 2007 Aug 15;121(4):791–5. [PubMed: 17455251]
16. Merrick GS, Galbreath RW, Butler WM, Wallner KE, Allen ZA, Adamovich E. Obesity is notpredictive of overall survival following permanent prostate brachytherapy. Am J Clin Oncol 2007Dec;30(6):588–96. [PubMed: 18091052]
17. Palma D, Pickles T, Tyldesley S. Obesity as a predictor of biochemical recurrence and survival afterradiation therapy for prostate cancer. BJU Int 2007 Aug;100(2):315–9. [PubMed: 17617138]
18. Siddiqui SA, Inman BA, Sengupta S, et al. Obesity and survival after radical prostatectomy: A 10-year prospective cohort study. Cancer 2006 Aug 1;107(3):521–9. [PubMed: 16773619]
19. Gong Z, Agalliu I, Lin DW, Stanford JL, Kristal AR. Obesity is associated with increased risks ofprostate cancer metastasis and death after initial cancer diagnosis in middle-aged men. Cancer 2007Mar 15;109(6):1192–202. [PubMed: 17311344]
20. Freedland SJ, Giovannucci E, Platz EA. Are findings from studies of obesity and prostate cancerreally in conflict? Cancer Causes Control 2006 Feb;17(1):5–9. [PubMed: 16411047]
21. Venkateswaran V, Haddad AQ, Fleshner NE, et al. Association of diet-induced hyperinsulinemiawith accelerated growth of prostate cancer (LNCaP) xenografts. J Natl Cancer Inst 2007 Dec 5;99(23):1793–800. [PubMed: 18042933]
Ma et al. Page 9
Lancet Oncol. Author manuscript; available in PMC 2009 November 1.
NIH
-PA Author Manuscript
NIH
-PA Author Manuscript
NIH
-PA Author Manuscript
22. Cox M, Gleave M, Zakikhani M, et al. Insulin receptor expression by human prostate cancers. TheProstate. 2008in press
23. Little RR, Rohlfing CL, Tennill AL, et al. Standardization of C-Peptide Measurements. Clin Chem.2008 Apr 17;
24. Final report on the aspirin component of the ongoing Physicians’ Health Study. Steering Committeeof the Physicians’ Health Study Research Group. N Engl J Med 1989 Jul 20;321(3):129–35.[PubMed: 2664509]
25. Andersen, PK.; Borgan, O.; Gill, RD.; Keidling, N. Statistical Models Based on Counting Processes.New York: Springer-Verlag; 1993.
26. Cheng SC, Fine JP, Wei LJ. Prediction of cumulative incidence function under the proportionalhazards model. Biometrics 1998 Mar;54(1):219–28. [PubMed: 9544517]
27. Banez LL, Hamilton RJ, Partin AW, et al. Obesity-related plasma hemodilution and PSAconcentration among men with prostate cancer. JAMA 2007 Nov 21;298(19):2275–80. [PubMed:18029831]
28. Frasca F, Pandini G, Sciacca L, et al. The role of insulin receptors and IGF-I receptors in cancer andother diseases. Arch Physiol Biochem 2008 Feb;114(1):23–37. [PubMed: 18465356]
29. Hsing AW, Chua S Jr, Gao YT, et al. Prostate cancer risk and serum levels of insulin and leptin: apopulation-based study. J Natl Cancer Inst 2001 May 16;93(10):783–9. [PubMed: 11353789]
30. Lehrer S, Diamond EJ, Stagger S, Stone NN, Stock RG. Serum insulin level, disease stage, prostatespecific antigen (PSA) and Gleason score in prostate cancer. Br J Cancer 2002 Sep 23;87(7):726–8.[PubMed: 12232754]
31. Hammarsten J, Hogstedt B. Hyperinsulinaemia: a prospective risk factor for lethal clinical prostatecancer. Eur J Cancer 2005 Dec;41(18):2887–95. [PubMed: 16243513]
32. Keating NL, O’Malley AJ, Smith MR. Diabetes and cardiovascular disease during androgendeprivation therapy for prostate cancer. J Clin Oncol 2006 Sep 20;24(27):4448–56. [PubMed:16983113]
33. Basaria S, Muller DC, Carducci MA, Egan J, Dobs AS. Hyperglycemia and insulin resistance in menwith prostate carcinoma who receive androgen-deprivation therapy. Cancer 2006 Feb 1;106(3):581–8. [PubMed: 16388523]
34. Chen C, Lewis SK, Voigt L, Fitzpatrick A, Plymate SR, Weiss NS. Prostate carcinoma incidence inrelation to prediagnostic circulating levels of insulin-like growth factor I, insulin-like growth factorbinding protein 3, and insulin. Cancer 2005 Jan 1;103(1):76–84. [PubMed: 15540247]
35. Stocks T, Lukanova A, Rinaldi S, et al. Insulin resistance is inversely related to prostate cancer: aprospective study in Northern Sweden. Int J Cancer 2007 Jun 15;120(12):2678–86. [PubMed:17278097]
36. Ma J, Giovannucci E, Pollak M, et al. A prospective study of plasma C-peptide and colorectal cancerrisk in men. J Natl Cancer Inst 2004 Apr 7;96(7):546–53. [PubMed: 15069117]
37. Steeg PS. Tumor metastasis: mechanistic insights and clinical challenges. Nat Med 2006 Aug;12(8):895–904. [PubMed: 16892035]
38. Li C, Ford ES, McGuire LC, Mokdad AH, Little RR, Reaven GM. Trends in hyperinsulinemia amongnondiabetic adults in the U.S. Diabetes Care 2006 Nov;29(11):2396–402. [PubMed: 17065674]
39. Shaw RJ, Lamia KA, Vasquez D, et al. The kinase LKB1 mediates glucose homeostasis in liver andtherapeutic effects of metformin. Science 2005 Dec 9;310(5754):1642–6. [PubMed: 16308421]
Ma et al. Page 10
Lancet Oncol. Author manuscript; available in PMC 2009 November 1.
NIH
-PA Author Manuscript
NIH
-PA Author Manuscript
NIH
-PA Author Manuscript
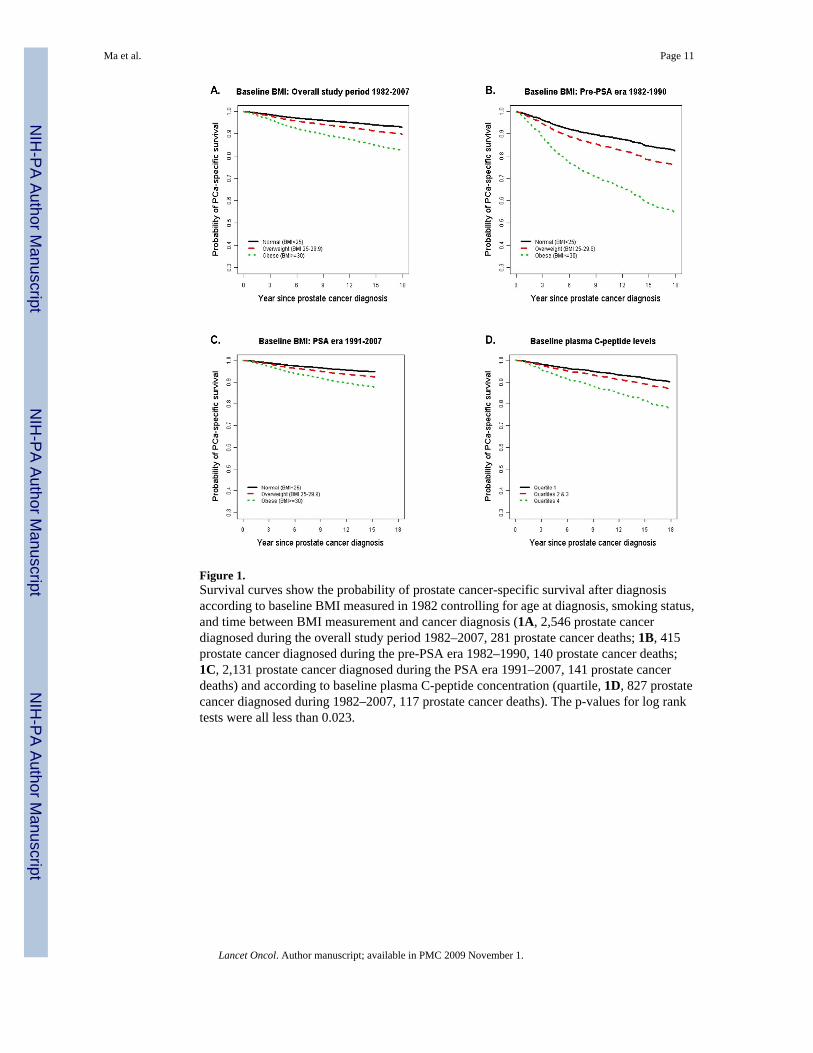
Figure 1.Survival curves show the probability of prostate cancer-specific survival after diagnosisaccording to baseline BMI measured in 1982 controlling for age at diagnosis, smoking status,and time between BMI measurement and cancer diagnosis (1A, 2,546 prostate cancerdiagnosed during the overall study period 1982–2007, 281 prostate cancer deaths; 1B, 415prostate cancer diagnosed during the pre-PSA era 1982–1990, 140 prostate cancer deaths;1C, 2,131 prostate cancer diagnosed during the PSA era 1991–2007, 141 prostate cancerdeaths) and according to baseline plasma C-peptide concentration (quartile, 1D, 827 prostatecancer diagnosed during 1982–2007, 117 prostate cancer deaths). The p-values for log ranktests were all less than 0.023.
Ma et al. Page 11
Lancet Oncol. Author manuscript; available in PMC 2009 November 1.
NIH
-PA Author Manuscript
NIH
-PA Author Manuscript
NIH
-PA Author Manuscript
NIH
-PA Author Manuscript
NIH
-PA Author Manuscript
NIH
-PA Author Manuscript
Ma et al. Page 12
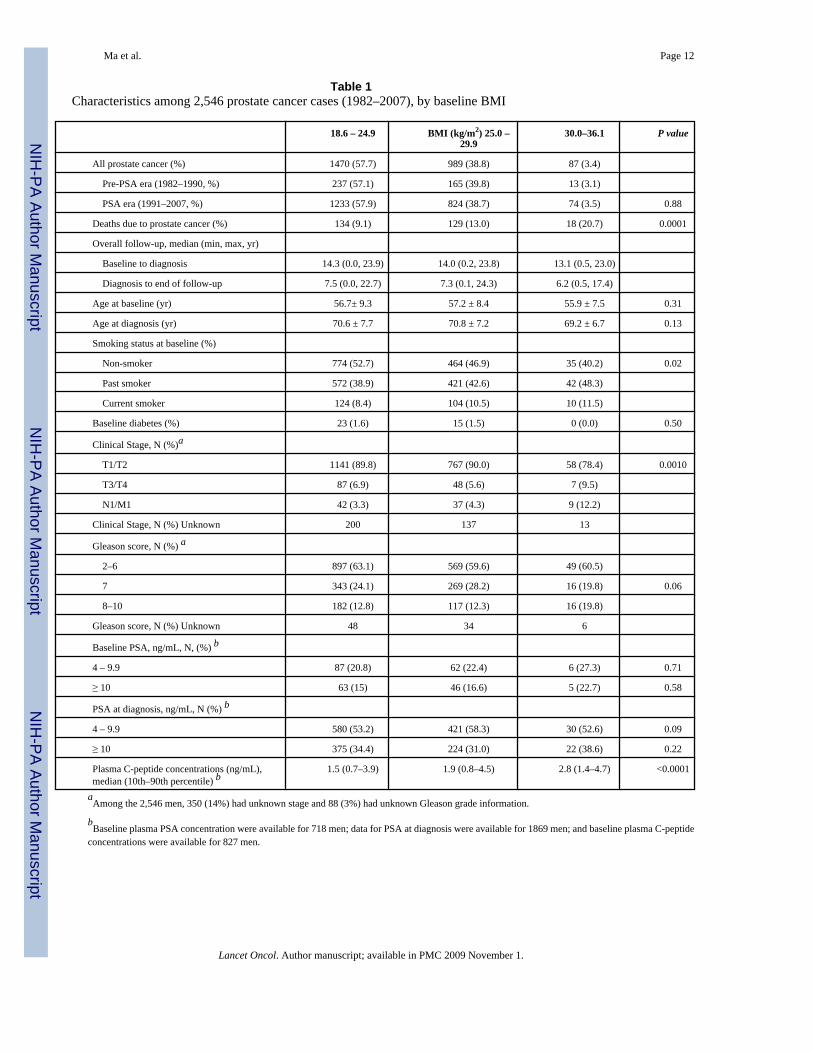
Table 1Characteristics among 2,546 prostate cancer cases (1982–2007), by baseline BMI
18.6 – 24.9 BMI (kg/m2) 25.0 –29.9
30.0–36.1 P value
All prostate cancer (%) 1470 (57.7) 989 (38.8) 87 (3.4)
Pre-PSA era (1982–1990, %) 237 (57.1) 165 (39.8) 13 (3.1)
PSA era (1991–2007, %) 1233 (57.9) 824 (38.7) 74 (3.5) 0.88
Deaths due to prostate cancer (%) 134 (9.1) 129 (13.0) 18 (20.7) 0.0001
Overall follow-up, median (min, max, yr)
Baseline to diagnosis 14.3 (0.0, 23.9) 14.0 (0.2, 23.8) 13.1 (0.5, 23.0)
Diagnosis to end of follow-up 7.5 (0.0, 22.7) 7.3 (0.1, 24.3) 6.2 (0.5, 17.4)
Age at baseline (yr) 56.7± 9.3 57.2 ± 8.4 55.9 ± 7.5 0.31
Age at diagnosis (yr) 70.6 ± 7.7 70.8 ± 7.2 69.2 ± 6.7 0.13
Smoking status at baseline (%)
Non-smoker 774 (52.7) 464 (46.9) 35 (40.2) 0.02
Past smoker 572 (38.9) 421 (42.6) 42 (48.3)
Current smoker 124 (8.4) 104 (10.5) 10 (11.5)
Baseline diabetes (%) 23 (1.6) 15 (1.5) 0 (0.0) 0.50
Clinical Stage, N (%)a
T1/T2 1141 (89.8) 767 (90.0) 58 (78.4) 0.0010
T3/T4 87 (6.9) 48 (5.6) 7 (9.5)
N1/M1 42 (3.3) 37 (4.3) 9 (12.2)
Clinical Stage, N (%) Unknown 200 137 13
Gleason score, N (%) a
2–6 897 (63.1) 569 (59.6) 49 (60.5)
7 343 (24.1) 269 (28.2) 16 (19.8) 0.06
8–10 182 (12.8) 117 (12.3) 16 (19.8)
Gleason score, N (%) Unknown 48 34 6
Baseline PSA, ng/mL, N, (%) b
4 – 9.9 87 (20.8) 62 (22.4) 6 (27.3) 0.71
≥ 10 63 (15) 46 (16.6) 5 (22.7) 0.58
PSA at diagnosis, ng/mL, N (%) b
4 – 9.9 580 (53.2) 421 (58.3) 30 (52.6) 0.09
≥ 10 375 (34.4) 224 (31.0) 22 (38.6) 0.22
Plasma C-peptide concentrations (ng/mL),median (10th–90th percentile) b
1.5 (0.7–3.9) 1.9 (0.8–4.5) 2.8 (1.4–4.7) <0.0001
aAmong the 2,546 men, 350 (14%) had unknown stage and 88 (3%) had unknown Gleason grade information.
bBaseline plasma PSA concentration were available for 718 men; data for PSA at diagnosis were available for 1869 men; and baseline plasma C-peptide
concentrations were available for 827 men.
Lancet Oncol. Author manuscript; available in PMC 2009 November 1.
NIH
-PA Author Manuscript
NIH
-PA Author Manuscript
NIH
-PA Author Manuscript
Ma et al. Page 13Ta
ble
2C
ox p
ropo
rtion
al h
azar
d ra
tio (H
R) a a
nd 9
5% c
onfid
ence
inte
rval
(95%
CI)
of p
rost
ate
canc
er-s
peci
fic m
orta
lity
acco
rdin
g to
BM
I
<25
BM
I (kg
/m2 ) 2
5–29
.9≥
30Pe
r un
it in
crea
se in
BM
IP t
rend
Nor
mal
Ove
rwei
ght
Obe
se
BM
I mea
sure
d in
198
2 (n
=254
6)
All
pros
tate
can
cer,
198
2–20
07
N
o.13
4/1,
470
a12
9/98
918
/87
H
R (9
5% C
I) b
1.00
(ref
.)1.
47 (1
.16–
1.88
)2.
66 (1
.62–
4.39
)1.
09 (1
.05–
1.14
)<0
.000
1
H
R (9
5% C
I) c
1.00
(ref
.)1.
26 (0
.98–
1.62
)1.
95 (1
.17–
3.23
)1.
07 (1
.02–
1.12
)0.
0042
Pre-
PSA
era
pro
stat
e ca
ncer
, 198
2–19
90
No.
68/2
3763
/165
9/13
H
R (9
5% C
I) b
1.00
(ref
.)1.
44 (1
.02–
2.04
)3.
15 (1
.52–
6.51
)1.
10 (1
.03–
1.18
)0.
0045
H
R (9
5% C
I) c
1.00
(ref
.)1.
06 (0
.73–
1.53
)1.
55 (0
.74–
3.24
)1.
06 (0
.99–
1.13
)0.
1113
PSA
era
pro
stat
e ca
ncer
, 199
1–20
07
N
o.66
/1,2
3366
/824
9/74
H
R (9
5% C
I) b
1.00
(ref
.)1.
45(1
.03–
2.05
)2.
41(1
.19–
4.89
)1.
09 (1
.02–
1.16
)0.
0064
H
R (9
5% C
I) c
1.00
(ref
.)1.
57 (1
.11–
2.24
)2.
50 (1
.22–
5.13
)1.
08 (1
.02–
1.15
)0.
0146
BM
I mea
sure
d in
199
0 (n
=207
8)
PSA
era
Pro
stat
e ca
ncer
, 199
1–20
07
N
o.59
/109
466
/877
9/10
7
H
R (9
5% C
I) b
1.00
(ref
.)1.
49(1
.05–
2.13
)2.
24(1
.09–
4.57
)1.
09 (1
.03–
1.15
)0.
0033
H
R (9
5% C
I) c
1.00
(ref
.)1.
61 (1
.12–
2.32
)2.
23 (1
.07–
4.64
)1.
10 (1
.04–
1.16
)0.
0015
a Num
ber o
f pro
stat
e ca
ncer
dea
ths/
men
dia
gnos
ed w
ith p
rost
ate
canc
er.
b Adj
uste
d fo
r age
at d
iagn
osis
(age
<65
, 65<
= ag
e<70
, 70<
= ag
e<75
, 75<
= ag
e<80
, >=8
0 ye
ars)
and
bas
elin
e sm
okin
g st
atus
(nev
er, p
ast,
and
curr
ent s
mok
er) a
nd ti
me
inte
rval
from
BM
I mea
sure
men
tto
pro
stat
e ca
ncer
dia
gnos
is.
c Adj
uste
d fo
r age
at d
iagn
osis
(age
<65
, 65<
= ag
e<70
, 70<
= ag
e<75
, 75<
= ag
e<80
, >=8
0 ye
ars)
, bas
elin
e sm
okin
g st
atus
(nev
er, p
ast,
and
curr
ent s
mok
er),
time
inte
rval
from
BM
I mea
sure
men
t to
pros
tate
can
cer d
iagn
osis
, clin
ical
stag
e an
d G
leas
on g
rade
.
Lancet Oncol. Author manuscript; available in PMC 2009 November 1.
NIH
-PA Author Manuscript
NIH
-PA Author Manuscript
NIH
-PA Author Manuscript
Ma et al. Page 14Ta
ble
3C
ox p
ropo
rtion
al h
azar
d ra
tio (H
R) a a
nd 9
5% c
onfid
ence
inte
rval
(95%
CI)
of p
rost
ate
canc
er-s
peci
fic m
orta
lity
acco
rdin
g to
one
uni
tin
crea
se in
bas
elin
e B
MI
HR
(95%
CI)
P-va
lue
All
pros
tate
can
cer
1.09
(1.0
5–1.
14)
<0.0
001
Con
trolli
ng fo
r asp
irin
and
beta
-car
oten
e1.
09 (1
.05–
1.14
)<0
.000
1
Excl
udin
g an
y de
aths
occ
urre
d fir
st 5
yea
rs1.
10 (1
.05–
1.15
)<0
.000
1
Excl
udin
g cu
rren
t sm
oker
s1.
11 (1
.06–
1.16
)<0
.000
1
Excl
udin
g di
abet
es1.
09 (1
.05–
1.14
)<0
.000
1
Excl
udin
g no
n-C
auca
sian
s1.
11 (1
.05–
1.16
)<0
.000
1
Excl
udin
g st
age
T11.
10 (1
.05–
1.15
)<0
.000
1
Excl
udin
g m
etas
tasi
s (N
1/M
1)1.
08 (1
.02–
1.13
)0.
0039
a All
adju
sted
for a
ge a
t dia
gnos
is, s
mok
ing
stat
us a
t bas
elin
e (p
ast s
mok
ing
for t
he a
naly
sis e
xclu
ding
cur
rent
smok
ers)
and
tim
e in
terv
al fr
om b
asel
ine
to p
rost
ate
canc
er d
iagn
osis
.
Lancet Oncol. Author manuscript; available in PMC 2009 November 1.
NIH
-PA Author Manuscript
NIH
-PA Author Manuscript
NIH
-PA Author Manuscript
Ma et al. Page 15Ta
ble
4C
ox p
ropo
rtion
al h
azar
d ra
tio (H
R) a
nd 9
5% co
nfid
ence
inte
rval
(95%
CI)
of p
rost
ate c
ance
r-sp
ecifi
c mor
talit
y ac
cord
ing
base
line p
lasm
aC
-pep
tide
conc
entra
tion
Plas
ma
C-p
eptid
e Q
uart
ile
12
34
Pa
Med
ian
C-p
eptid
e co
ncen
tratio
ns (n
g/m
L)0.
771.
342.
063.
89
No.
21/2
07 b
32/2
0620
/208
44/2
06
Sim
ple
mod
el c
1.00
1.54
(0.8
7–2.
71)
1.10
(0.5
8–2.
09)
2.38
(1.3
1–4.
30)
0.00
8
Sim
ple
mod
el +
BM
I1.
001.
42 (0
.80–
2.51
)0.
95 (0
.50–
1.82
)2.
01 (1
.11–
3.66
)0.
03
Sim
ple
mod
el +
clin
ical
stag
e, g
rade
1.00
1.15
(0.6
3–2.
10)
1.08
(0.5
6–2.
08)
1.93
(1.0
3–3.
63)
0.09
Sim
ple
mod
el +
BM
I, cl
inic
al st
age,
gra
de1.
001.
01 (0
.54–
1.86
)0.
97 (0
.50–
1.87
)1.
72 (0
.92–
3.24
)0.
11a Te
st fo
r tre
nd u
sing
med
ian
conc
entra
tion
of C
-pep
tide
in e
ach
of th
e qu
artil
es.
b Num
ber o
f pro
stat
e ca
ncer
dea
ths/
men
dia
gnos
ed w
ith p
rost
ate
canc
er;
c Con
trolli
ng fo
r age
, fas
ting
stat
us a
nd ti
me
inte
rval
from
bas
elin
e to
pro
stat
e ca
ncer
dia
gnos
is.
Lancet Oncol. Author manuscript; available in PMC 2009 November 1.
NIH
-PA Author Manuscript
NIH
-PA Author Manuscript
NIH
-PA Author Manuscript
Ma et al. Page 16Ta
ble
5C
ox p
ropo
rtion
al h
azar
d ra
tio (H
R) a
nd 9
5% c
onfid
ence
inte
rval
(95%
CI)
of p
rost
ate
canc
er-s
peci
fic m
orta
lity
acco
rdin
g ba
selin
e B
MI
and
plas
ma
C-p
eptid
e co
ncen
tratio
ns
BM
I < 2
5 kg
/m2
BM
I >=
25 k
g/m
2
No.
HR
(95%
CI)
No.
HR
(95%
CI)
Plas
ma
C-p
eptid
e co
ncen
tratio
n
Sim
ple
mod
el a
Q1
13/1
48 b
1.00
(ref
)8/
591.
71 (0
.71–
.4.1
5)
Q2
19/1
231.
83 (0
.89–
3.76
)13
/83
1.79
(0.8
1–3.
94)
Q3
10/1
191.
22 (0
.52–
2.88
)10
/89
1.31
(0.5
6–3.
03)
Q4
12/9
91.
33 (0
.57–
3.13
)32
/107
4.22
(2.1
0–8.
48)
P tre
nd0.
380.
007
P int
erac
tion
0. 0
17
Sim
ple
mod
el +
clin
ical
stag
e, g
rade
Q1
13/1
481.
00 (r
ef)
8/59
2.07
(0.8
4–5.
13)
Q2
19/1
231.
64 (0
.78–
3.47
)13
/83
1.04
(0.4
4–2.
44)
Q3
10/1
191.
15 (0
.48–
2.74
)10
/89
1.56
(0.6
5–3.
73)
Q4
12/9
90.
97 (0
.39–
2.38
)32
/107
4.12
(1.9
7–8.
61)
P tre
nd0.
480.
006
P int
erac
tion
0.00
1
a Con
trolli
ng fo
r age
, fas
ting
stat
us a
nd ti
me
inte
rval
from
bas
elin
e to
pro
stat
e ca
ncer
dia
gnos
is;
b Num
ber o
f pro
stat
e ca
ncer
dea
ths/
men
dia
gnos
ed w
ith p
rost
ate
canc
er.
Lancet Oncol. Author manuscript; available in PMC 2009 November 1.