Large-scale proteomic identification of S100 proteins in breast cancer tissues
Upload
independentCategory
view
0download
0
Quantitative Proteomic Profiling of ProstateCancer Reveals a Role for miR-128 in ProstateCancer*□S
Amjad P. Khan,a,b,c Laila M. Poisson,c,d Vadiraja B. Bhat,e,f Damian Fermin,b
Rong Zhao,a,b Shanker Kalyana-Sundaram,a,b George Michailidis,g
Alexey I. Nesvizhskii,b,h Gilbert S. Omenn,h,i,j Arul M. Chinnaiyan,a,b,h,j,k,l
and Arun Sreekumara,b,j,m
Multiple, complex molecular events characterize cancerdevelopment and progression. Deciphering the molecularnetworks that distinguish organ-confined disease frommetastatic disease may lead to the identification of bio-markers of cancer invasion and disease aggressiveness.Although alterations in gene expression have been exten-sively quantified during neoplastic progression, comple-mentary analyses of proteomic changes have been lim-ited. Here we interrogate the proteomic alterations in acohort of 15 prostate-derived tissues that included fiveeach from adjacent benign prostate, clinically localizedprostate cancer, and metastatic disease from distantsites. The experimental strategy couples isobaric tags forrelative and absolute quantitation with multidimensionalliquid phase peptide fractionation followed by tandemmass spectrometry. Over 1000 proteins were quantifiedacross the specimens and delineated into clinically local-ized and metastatic prostate cancer-specific signatures.Included in these class-specific profiles were both pro-teins that were known to be dysregulated during prostatecancer progression and new ones defined by this study.Enrichment analysis of the prostate cancer-specific pro-teomic signature, to gain insight into the functional con-sequences of these alterations, revealed involvement ofmiR-128-a/b regulation during prostate cancer progres-sion. This finding was validated using real time PCR anal-ysis for microRNA transcript levels in an independent setof 15 clinical specimens. miR-128 levels were elevated inbenign prostate epithelial cell lines compared with inva-sive prostate cancer cells. Knockdown of miR-128 in-duced invasion in benign prostate epithelial cells,whereas its overexpression attenuated invasion in pros-tate cancer cells. Taken together, our profiles of the pro-
teomic alterations of prostate cancer progression re-vealed miR-128 as a potentially important negativeregulator of prostate cancer cell invasion. Molecular &Cellular Proteomics 9:298–312, 2010.
Prostate cancer is the second most common cause ofcancer-related death in America and afflicts one of nine menover the age of 65. The American Cancer Society estimatesthat 186,320 American men will be diagnosed with prostatecancer and 28,660 will die this year (1). The advent of pros-tate-specific antigen (PSA)1 screening has led to earlier de-tection of prostate cancer (2). Coincident with increased se-rum PSA testing, there has been a dramatic increase in thenumber of prostate needle biopsies performed (3). This hasresulted in a surge of equivocal prostate needle biopsies (4)and men with the looming threat of prostate cancer. However,the stage shift associated with the advent of PSA screeningmay also be associated with diagnosis of a substantial num-ber of prostate cancer cases that may have non-aggressiveclinical natural history or so-called “indolent” prostate cancers(5, 6). Even before the advent of PSA screening, it was notedthat up to 70–80% of Gleason score 6 cancers and as manyas 20% of Gleason score 7 cancers may have a non-aggres-sive course without cancer death if observed without inter-vention for more than 15 years (7). With the population ofmales 65 years and older expected to increase from 14 millionin year 2000 to 31 million by 2030 (8), it will be increasinglyimportant to discern such indolent prostate cancer from ag-gressive cancers that warrant intervention.
From aThe Michigan Center for Translational Pathology, kHowardHughes Medical Institute, hCenter for Computational Medicine andBiology, Departments of bPathology, dBiostatistics, gStatistics, andiInternal Medicine, and the jComprehensive Cancer Center, Universityof Michigan Medical School, Ann Arbor, Michigan 48109 andeDepartment of Pathology, Scott and White Hospital, Temple,Texas 76508
Received, March 24, 2009, and in revised form, October 21, 2009Published, MCP Papers in Press, November 9, 2009, DOI 10.1074/
mcp.M900159-MCP200
1 The abbreviations used are: PSA, prostate-specific antigen; BPH,benign prostatic hyperplasia; PCA, prostate cancer; OCM, OncomineConcepts Map; Benign, benign adjacent prostate; Mets, metastaticprostate tumor; iTRAQ, isobaric tags for relative and absolute quan-titation; Q-PCR, quantitative RT-PCR; PHB, Prohibitin; SCX, strongcation exchange; IPI, International Protein Index; FDR, false discoveryrate; ID, identification; PrEC, prostate epithelial cells; GOLM1, Golgimembrane protein 1; TMSB10, Thymosin �10; VIM, Vimentin; APRIL,A Proliferation Inducing Ligand; VCP, Valosin Containing Protein;LPP, Lipoma Preferred Partner; TROVE, Telomerase RO and Vault; CT,threshold cycle.
Research
© 2010 by The American Society for Biochemistry and Molecular Biology, Inc.298 Molecular & Cellular Proteomics 9.2This paper is available on line at http://www.mcponline.org

Prostate cancer, like other cancers, develops in the back-ground of diverse genetic and environmental factors (9). Mul-tiple, complex molecular events characterize prostate cancerinitiation, unregulated growth, invasion, and metastasis. Dis-tinct sets of genes, proteins, and metabolites dictate progres-sion from precursor lesion, to localized disease, and finally tometastatic disease. Clinically localized prostate cancer can beeffectively ablated using surgical or radiation treatments. An-drogen ablation is the most common therapy for advancedprostate cancer, leading to massive apoptosis of androgen-dependent malignant cells and temporary tumor regression.In most cases, however, the tumor re-emerges, can prolifer-ate independently of androgen or antiandrogen signals, anddevelops into a metastatic disease that is invariably incurable.With the advent of global profiling strategies, a systematicanalysis of molecular alterations involved in prostate cancer isnow possible.
Importantly, deciphering the molecular networks that dis-tinguish progressive disease from non-progressive diseasewill shine light on the biology of aggressive prostate cancer aswell as lead to the identification of biomarkers that will aid inthe selection of patients who should be treated (10). To beginto understand prostate cancer progression with a systemsperspective, we need to characterize and integrate the mo-lecular components involved (11–14). A number of groupshave used gene expression microarrays to profile prostatecancer tissues (15–23) as well as other tumors (24–27) at thetranscriptome level, but much less work has been done at theprotein level.
Proteins, as opposed to nucleic acids, represent the func-tional effectors of cancer progression and thus serve as ther-apeutic targets as well as markers of disease. Proteomicsapproaches will facilitate the identification of proteins andbiochemical pathways involved in tumor development. Pro-teomics studies will also facilitate identification of differentialpost-translational modifications that play a major role in cel-lular functions. Nelson et al. (28) carried out protein expres-sion profiles of androgen-stimulated prostate cancer cellsusing two-dimensional electrophoresis. Ahram et al. (29) iden-tified cellular proteomes of matched normal prostate epithelialcells and high grade prostate cancer cells using a combina-tion of tissue microdissection, two-dimensional electrophore-sis, and mass spectrometry. Multiple technologies have beenused to identify proteomic alterations in the serum of prostatecancer patients including protein microarray and SELDI (13,30). However, studies quantifying proteomic alterations intumor specimens in an unbiased manner have been limited(31–35). Recently Garbis et al. (32) and Ralhan et al. (35) haveused iTRAQ-based quantification to assess global alterationsin the proteome using tissues from prostate cancer and headand neck cancer patients, respectively. We used a similarapproach to quantify global changes associated with theprostate cancer proteome in the stages of progression fromorgan-confined to metastatic disease. Additionally, we ex-
tended our analysis beyond delineation of tumor-specific pro-teomic signatures to nominate and confirm the miR-128 path-way as a critical intermediary in tumor invasion.
EXPERIMENTAL PROCEDURES
Patient Population and Sample Selection
The Institutional Review Board of the University of Michigan Med-ical School approved this study on discovery of proteomic alterationsof prostate cancer progression. Tissue samples obtained postsurgeryfrom clinically localized prostate cancer patients (PCA; n � 5), ad-vanced prostate cancer patients (Mets; n � 5), and benign adjacentcontrols (Benign; n � 5) were procured in a frozen state from theUniversity of Michigan Specialized Research Program in ProstateCancer (Specialized Program of Research Excellence) tissue bank.Two men provided both tumor and benign tissue samples. All othertissue samples were from unique patients. Deidentified numeric spec-imen codes were used to protect the identity of the men. Detailedclinical and pathology data for this study are available in supplementalTable 1. The histological diagnosis of each sample was confirmed bymicroscopic examination of hematoxylin- and eosin-stained frozensections by a board-certified pathologist.
Chemicals and Reagents
All chemicals were purchased from Sigma unless otherwisementioned.
Antibodies
Mouse monoclonal antibodies directed to Vimentin (VIM), Ezrin,RAN, and fatty-acid synthase and polyclonal antibodies to SLC25A3,Thymosin �10 (TMSB10), and Prohibitin (PHB) were purchased fromBD Biosciences and Novus Biologicals (Littleton, CO), respectively.Goat polyclonal antibodies against ARF1, APRIL (ANP32B), and glyc-eraldehyde-3-phosphate dehydrogenase were procured from AbcamInc. (Cambridge, MA), and VCP antibodies were purchased fromSanta Cruz Biotechnology (Santa Cruz, CA). Antibodies to RAP1Band TROVE domain family member 2 (TROVE2) were purchased fromCell Signaling Technologies (Danvers, MA) and Genway (San Diego,CA), respectively. Rabbit polyclonal antibodies to Golgi membraneprotein 1 (GOLM1) were a kind gift from Dr. Claus J. Fimmel (EdwardHines Veterans Affairs Medical Center, Hines, IL).
Protein Extraction
For protein extraction, the tissue samples were resuspended inlysis buffer consisting of 7 M urea, 2 M thiourea, 100 mM DTT, 0.5%Bio-Lyte pH 3–10 (Bio-Rad), 2% octyl glucoside, and 1 mM PMSF.Samples were lysed at room temperature for 30 min followed bycentrifugation at 35,000 rpm at 4 °C for 1 h. The protein solution wasexchanged into 50 mM triethylammonium bicarbonate, pH 9 using aPD-10 column according to the manufacturer’s instruction (GEHealthcare). Total protein content was measured using the Bradfordassay (Bio-Rad), and the lysates were stored at �80 °C for future use.
Protein Digestion and iTRAQ Labeling
200 �g of total protein from each tissue sample were used togenerate iTRAQ-labeled peptides according to the manufacturer’sprotocol. Specifically, the proteins were first subjected to reductionand alkylation using DTT and iodoacetamide provided in the iTRAQlabeling kit (iTRAQ� Reagents Multiplex kit, Applied Biosystems, Fos-ter City, CA). They were then digested to peptides using porcinetrypsin (1:50; Promega, Madison, WI) in 50 mM triethylammoniumbicarbonate, pH 9. The digestion was performed for 24 h at 37 °C. At
Quantitative Proteomic Profiling of Prostate Cancer
Molecular & Cellular Proteomics 9.2 299
the end of 24 h, the trypsin activity was stopped using 3% formicacid. The digested peptides were subjected to iTRAQ labeling ac-cording to the protocol described previously (36). The iTRAQ exper-iments were performed in five sets, each containing four samples.Specifically, for labeling, 100 �g of protein each from Benign, PCA,and Mets were labeled with isobaric tags 114, 115, and 116, respec-tively (Fig. 1). A reference pool containing 67 �g of protein from eachof the tissue samples (n � 5 each of Benign, PCA, and Mets) used inthe study was created (total protein amount in the pool, 1 mg) andlabeled with isobaric tag 117 (see Fig. 1). 50 �g of peptides labeledwith each of the four isobaric labels were combined and subjected totwo-dimensional fractionation coupled to tandem mass spectrometry(Fig. 1).
SCX Fractionation
200 �g of iTRAQ-labeled peptide samples described above werecompletely dried in a SpeedVac, resuspended in 40 �l of 0.1% formicacid in 5% acetonitrile (mobile phase A), and directly loaded onto a1 � 150-mm polysulfoethyl aspartamide strong cation exchangecolumn (Michrom Bioresources, Auburn, CA) using an Agilent 1200auto sampler. Buffer containing 1 M ammonium formate, 10% formicacid in 5% acetonitrile (mobile phase B) was used to create a linearchromatographic gradient at a flow rate of 50 �l/min. A total of 10fractions were collected over a 40-min gradient encompassing a saltconcentration of 0–100 mM ammonium formate. An additional fivefractions were generated over the next 10 min at a higher salt con-centration range of 100–1000 mM. Fractionated peptides were com-pletely dried and reconstituted in 10 �l of 0.1% TFA prior to LC-MS/MS analysis.
HPLC-Chip/Mass Spectrometry Analysis
Refer to Fig. 1 for an outline. A total of 3 �l of reconstituted peptidemixture (�30% of SCX fraction) was injected onto an LC-MS systemconsisting of a 1200 Series liquid chromatograph, HPLC-Chip CubeMS interface, and 6510 Q-TOF mass spectrometer (all Agilent Tech-nologies, Santa Clara, CA). The system was equipped with an HPLC-Chip (Agilent Technologies) that incorporated either a 40-nl enrich-ment column and a 43 mm � 5 �m reverse phase column (lowcapacity chip) or a 160-nl enrichment column and a 150 mm � 75 �mreverse phase column (high capacity chip). In both cases, the reversephase column was packed with Zorbax 300SB-C18 5-�m particles.Three analytical replicates of each of the five iTRAQ sets were ana-lyzed by mass spectrometry. This included duplicate analysis on thehigh capacity chip (henceforth termed high capacity 1 and high ca-pacity 2) and a single run on a low capacity chip (henceforth termedlow capacity). Overall the experimental design resulted in a total of 15independent mass spectrometry data points or experiments (n � 3 foreach iTRAQ set) for the entire study.
For each mass spectrometry experiment, peptides were loadedonto the enrichment column with 97% solvent A (water with 0.1%formic acid). A two-step gradient generated at a flow rate 0.3 �l/minwas used for peptide elution. This included a linear gradient from 3%B (acetonitrile with 0.1% formic acid) to 45% B over 25 min followedby a sharp increase to 90% B within 5 min. The total run time,including column reconditioning, was 40 min. The column effluent inall cases was directly analyzed by the 6510 Q-TOF mass spectrom-eter that was interfaced in tandem through an HPLC-Chip Cubenanospray source. The latter was operated at a capillary voltage of1900 V with a capillary current of 1.1 �A in 1 GHz. The MS data wereacquired in the positive ionization mode using Agilent MassHunterWorkstation Q-TOF B.01.03. During the course of data acquisition,the fragmentor voltage, skimmer voltage, and octopole RF were set to175, 65, and 750 V, respectively. Auto-MS/MS was performed with a
total cycle time of 1.97 s. In each cycle, MS spectra were acquired at3 Hz (three spectra/s) (m/z 450–1500), and the four most abundantions (with charge states 2�, 3�, and �3�) exceeding 2000 countswere selected for MS/MS at 3 Hz (three spectra/s) (m/z 50–2000). Amedium isolation (4 m/z) window was used for precursor isolation. Acollision energy with slope of 3.9 V/100 Da and offset of 2.9 V wasused for fragmentation. Reference mass correction was activatedusing a reference mass of 1221.99. Precursors were set in an exclu-sion list for 0.5 min after two MS/MS spectra.
Mass Spectral Data Analysis
MS/MS spectra generated above were extracted from the raw datain mzXML file format using a converter from the Institute for SystemsBiology (trapper). The mzXML files were searched using SEQUESTagainst the human International Protein Index (IPI) database version3.26 (containing 67,655 entries) appended with an equal number ofdecoy sequences (reversed sequences from the original database).The following search parameters were selected: 0.5-Da precursormass tolerance, monoisotopic mass, semitryptic search with two orfewer missed cleavages, oxidized methionine specified as a variablemodification, and iTRAQ label on Lys and at the peptide N terminus asfixed modifications. In total, 1,155,545 SEQUEST search results(mostly from doubly and triply charged spectra) were obtained. Thesearch results were further processed using the Trans-ProteomicPipeline (TPP), which includes the PeptideProphet and Protein-Prophet tools for peptide and protein level analysis and LIBRA forpeptide quantification using iTRAQ signature ions (37). Default set-tings were used for each of these programs. A weighted average ofthe peptide intensities per protein was used to quantify the protein.Proteins were referenced by IPI number. Gene symbol information forthe IPI numbers was taken from the EMBL-EBI database for humanIPI numbers on March 7, 2008.
As the next step, data from the 15 mass spectrometry measure-ments were merged into a single file. To align proteins with their mostlikely counterparts across the experiments (supplemental Fig. S1) the15 individual PeptideProphet files were run together through Protein-Prophet, and the combined protein file was generated (master proteinidentification list). In-house written software was then applied toextract, for each protein group in the master list, information from theindividual ProteinProphet files (probability, number of spectra, andquantitative information). For each protein group in the master file, theIPI accession with the most evidence across the 15 iTRAQ experi-ments (i.e. reported in the most XML files) was retained. Then, themaximum probability score (Pw), provided by Protein Prophet, acrossthe 15 iTRAQ experiments was calculated and taken as the primaryscore for filtering the data. We chose to threshold the data, retainingonly proteins (i.e. IPI accessions) whose maximum protein probabilitywas at least 0.955. This threshold amounted to an estimated falsediscovery rate (FDR) of 2%, calculated as the number of reverseproteins identified divided by the number of forward proteins identi-fied (37) (supplemental Fig. S2). We further limited the data by remov-ing all proteins with a single peptide identification resulting in anestimated FDR of 1.4%.
Statistical Analysis
For the purpose of this analysis, we are interested in comparingprotein expression between local tumor and benign tissues (PCAversus Benign, ratio 115/114) and between metastatic tumor and localtumor tissues (Mets versus PCA, ratio 116/115). These relative quan-tities are used on a log scale (base 2). Given the three MS runs orscanners (high capacity 1 and 2 and low capacity; see above fordetails) used to evaluate the samples (each quadruplex iTRAQ), eachprotein (i.e. IPI accession) can be measured up to three times per
Quantitative Proteomic Profiling of Prostate Cancer
300 Molecular & Cellular Proteomics 9.2

sample. For analysis, we combine these replicate measures using aweighted average where the inverse sample variance is the weight.Specifically, let the mass spectrometer assessments be labeled A, B,and C. For each sample i and protein j, we calculate the weightedaverage yij by Equation 1. Note that only measured samples contrib-ute to this weighted average. If, say, a protein k was measured by onlyscanner A for sample i, then yik � xAik as in Equation 2.
yij �
�d�A,B,C
xdij
var�xdi�
�d�A,B,C
1var�xdi�
�
xAij
var�xAi��
xBij
var�xBi��
xCij
var�xCi�
1var�xAi�
�1
var�xBi��
1var�xCi�
(Eq. 1)
yij �
xAij
var�xAi�
1var�xAi�
� xAij (Eq. 2)
Given that the same set of proteins was not measured in each ITRAQexperiment and that the quantification is relative, we chose to analyzeeach of the five ITRAQ experiments separately. Specifically, we as-sume that each experiment is composed of a mixture of three distri-butions: 10% up-regulated, 10% down-regulated, and 80% un-changed. We assume that on the log2 scale the unchangedmeasurements form a symmetric distribution and thus trim the upper10% and lower 10% of the data points to arrive at a trimmed distri-bution representing the null or unchanged measurements. We chosethe threshold for dysregulation as the mean of the trimmed data 1.5times the standard deviation of the trimmed data. To reduce spuriousresults, for localized tumor tissue compared with benign adjacenttissue, we required that the protein be detected in at least twosamples and that at least two of these samples showed dysregulationin the same direction to be considered further. Proteins with discord-ant expression patterns within samples of a given diagnostic classwere not considered among those dysregulated.
For metastatic tumors versus localized tumors, we expected to seemore dysregulation so we assumed 20% of the proteins were up-regulated, 20% were down-regulated, and 60% were unchanged.Again, the sample trimmed mean and trimmed standard deviationwere used to construct the thresholds. However, as we expect morespurious results due to differences in the site of metastasis, werequire the protein to be detected in at least three samples and haveconcordant results in at least 60% of the samples detected for furtherconsideration.
Heat Map Plots
Heat maps were drawn using the image function in R (38). The colorcoding is derived using the ranking of the log ratio in the distributionof measures for that sample. Shades of green represent down-regu-lation, and shades of red represent up-regulation. The intensity of thecolor is determined by the distance (in standard deviations) from themean of the trimmed distribution.
Oncomine Concept Map Analyses
Mapping of Proteomics Data to Common Identifier—Protein iden-tifications (IPI numbers) belonging to PCA-specific or Mets-specificsignatures were converted to Human Genome Organisation genesymbols and batch-loaded to Oncomine Concepts Map (OCM) foranalysis as described below. The conversion to gene symbol requiresthat potential isoforms, i.e. multiple IPI numbers associated with asingle gene symbol, contribute only once in the enrichment analysis.
Enrichment of Molecular Concepts—To explore the network ofinter-relationships among various molecular concepts and our pro-teomics data, we used the Oncomine Concepts Map bioinformaticstool developed and widely published by our group (39–43). Oncom-ine Concept Map (OCM) is the largest compendia of gene sets forassociation analysis. By computing the pairwise association amongall the gene sets in the database, OCM allows for identification andvisualization of “enrichment networks” of linked concepts. Such anal-ysis enables us to link the class-specific protein profiles to over14,000 molecular concepts, validating earlier observations and gen-erating new hypothesis. Prior to performing the enrichment analysisfor the proteomics data, a list of gene IDs was generated from theproteins that were determined to be differential (see “Statistical Anal-ysis” above). This signature was used to seed the analysis. Onceseeded, each pair of molecular concepts was tested for associationusing Fisher’s exact test. Each concept was then analyzed independ-ently, and the most significant concept was reported. Results werestored if a given test had an odds ratio �1.25 and a p value 0.01.Adjustment for multiple comparisons was made by computing Qvalues for all enrichment analyses (39). We are confident that theintegrative analyses coupled to enrichment using OCM will generatea number of testable hypotheses on molecular events leading todevelopment of cancer and its progression to advanced disease. Forthe analysis of class-specific proteomic profiles, all concepts that hada p value less than 0.001 were considered significant. A similarenrichment analysis of miR-128a gene expression profiles (see Fig.4e) was carried out wherein the gene signature was determined by aQ value threshold of 5% on tests of differential expression. Allconcepts that had a p value less than 1 � 10�5 were consideredsignificant.
Immunoblot Analysis
Proteins for immunoblotting were resolved by 4–12% NuPAGEgels (Invitrogen) and transferred to PVDF membranes (GE Health-care). The membranes were blocked with 5% skimmed milk inTBS-T (20 mM Tris�Cl, pH 7.4, 150 mM NaCl, 0.1% Tween 20)overnight. Antibodies (indicated under “Antibodies”) were added inTBS-T containing 2.5% skimmed milk, and the blots were washedwith TBS-T. Immunoblot signals were developed using ECL reagent(GE Healthcare).
RNA Interference
Prostate epithelial cells (PrEC) or RWPE cells were treated withnon-targeting small interfering RNA (D-001210-01, Dharmacon, La-fayette, CO) or small interfering RNA specific to miR-128 (D-003886-01, Dharmacon) according to published protocols (42, 43).
Quantitative RT-PCR
Q-PCR was performed using Power SYBR Green Mastermix on a7300 Real Time PCR machine (both Applied Biosystems) as de-scribed previously (42). All primers were designed using Primer 3 andsynthesized by Integrated DNA Technologies and are listed in sup-plemental Table 8. All PCR experiments were performed in triplicate.
MicroRNA Q-PCR
For microRNA quantitative PCR, total RNA including small RNAwas isolated from prostate tissues and PrEC and DU145 cells thatwere transfected either with miR-128a (precursor human microRNA-128a), antagomiR-128a (44), or controls. Total RNA was used at 10ng/�l. For RT, Mastermix was prepared using 0.15 �l of 100 mM
dNTPs, 1.00 �l of MultiScribe reverse transcriptase (50 units/�l), 1.50�l of 10� Reverse Transcription Buffer, 0.188 �l of RNase inhibitor
Quantitative Proteomic Profiling of Prostate Cancer
Molecular & Cellular Proteomics 9.2 301

(20 units/�l), and 4.192 �l of nuclease-free water. Each 15-�l RTreaction mixture contained 7 �l of Mastermix, 5 �l of RNA samples(10 ng/�l), and 3 �l of 5� specific RT primer. The thermal cycler wasprogrammed as follows: 16 °C for 30 min, 42 °C for 30 min, and 85 °Cfor 5 min. Each PCR mixture contained 10 �l of TaqMan 2� UniversalPCR Master Mix (No AmpErase UNG), 6.67 �l of nuclease-free water,1 �l of 20� specific PCR primer, and 1.33 �l of RT products. Thrthermal cycler was programmed as follows: 95 °C for 10 min and 40cycles of 95 °C for 15 s and 60 °C for 60 s. Using the comparative CT
method, we used endogenous control (RNU68) to normalize the ex-pression levels of target microRNA by correcting differences in theamount of RNA loaded into Q-PCRs.
Cell Invasion Assay
Cell invasion was carried out using a modified basement mem-brane chamber assay as described previously (42). Briefly, equalnumbers of the indicated cells were seeded onto the basementmembrane matrix (extra cellular matrix, Chemicon) present in theinsert of a 24-well culture plate with fetal bovine serum added to thelower chamber as a chemoattractant. After 48 h, non-invading cellsand the endothelial cell matrix were removed by a cotton swab.Invaded cells were stained with crystal violet and photographed.The inserts were treated with 10% acetic acid, and absorbance wasmeasured at 560 nm.
Cell Proliferation Assay
Cells were plated in 24-well plates at the desired cell concentrationand transfected with precursor microRNA, antagomiR, or controls.After 48 h of transfection, cell counts were estimated by trypsinizingcells and analyses by Coulter counter (Beckman Coulter, Fullerton,CA) at the indicated time points in triplicate.
Gene Expression Analysis of Benign Prostate Epithelial CellsAttenuated for miR-128a Expression
Expression profiling of PrEC transfected (n � 3) with either controlantagomiR (44) or antagomiR-128a was performed using the IlluminaWhole Human Genome Bead Chip (Illumina, Hayward, Ca) accordingto the manufacturer’s instructions. Total RNA isolated using TRIzolfrom the treated cells was purified using the Qiagen RNeasy Micro kit(Valencia, CA). Total RNA from control antagomiR-transfected PrECwas used as the reference. 1 �g of total RNA was converted to cRNAand hybridized according to the manufacturer’s protocol (Illumina).Hybridizations were performed for 16 h at 65 °C, and arrays werescanned on an Agilent DNA microarray scanner. Images were ana-lyzed, and data were extracted using Agilent Feature Extraction Soft-ware 9.1.3.1 with linear and lowess normalization performed for eacharray. A biological replicate was included for each of the two treat-ments. Correlation between the replicates was estimated using Pear-son’s correlation. A two-sided t test per probe followed by FDRcalculation (Q value) was used to cull genes that were differentialacross the two treatment groups. Specifically, at a Q value thresh-old of 5%, 262 genes were found to be differential of which 181were up-regulated upon miR-128a knockdown and the rest weredown-regulated.
RESULTS
Quantitative Assessment of Prostate Cancer Proteome—Anoverview of the approach we took in quantifying proteomicalterations in prostate cancer is depicted in Fig. 1. In an effortto profile the proteome in the stages of prostate cancer pro-gression, we used a combination of iTRAQ labeling and two-
dimensional liquid chromatography coupled with mass spec-trometry to interrogate the relative levels of proteins across 15prostate-related biospecimens. The two-dimensional frac-tionation of the labeled peptides involved the use of an off-lineSCX-based separation in the first dimension followed by anon-line reverse phase fractionation (Fig. 1). Each iTRAQ sam-ple set was analyzed in three independent mass spectrometerruns (refer to “Experimental Procedures” for details). At aprotein probability threshold of 0.955 (2% FDR), across thefive iTRAQ sample sets, a total of 1221 and 1085 proteinswere identified by two or more peptides using the two highcapacity mass spectrometry runs, respectively, whereas thelow capacity run yielded 967 proteins (supplemental Table 2and Fig. S3). Among these, 777 proteins (56.6%) were sharedacross the three measurements (supplemental Fig. S3). Therewas 72.2% overlap in the proteins identified between the twohigh capacity runs and 66–69% overlap between any of thehigh capacity and the low capacity measurements (supple-mental Fig. S3). Data from the three independent runs werefirst combined on a per sample basis using a weighted aver-age, and the resulting compendium for each of the five iTRAQsample sets was used for further analysis as described above.Overall, 1374 proteins were quantified across the biospeci-mens (refer to “Experimental Procedures” and supplementalFigs. S2 and S3 for analysis details) and identified by at leasttwo unique peptides (in terms of amino acid sequence). Sup-plemental Fig. S4 shows a heat map representation of the 971proteins that were measured in at least three of five iTRAQexperiments.
To delineate an organ-confined prostate cancer-specificproteomic signature, the data were first normalized by cen-tering the trimmed mean of proteins in localized prostatecancer samples at 1 (upper and lower 10% of intensity valueswere excluded). Differentials were identified using a thresholdset at 1.5 trimmed standard deviations from the trimmedmean. The final list of differentials was restricted to proteinsthat were concordantly differential in at least two or moresamples in a given diagnostic class (see “Experimental Pro-cedures” for details). A similar approach was used to definethe metastatic prostate cancer-specific proteome relative tothe localized prostate cancer except that in this case thesample trimmed mean and trimmed standard deviation werecalculated by excluding 20% of the outliers in either direction.Furthermore, as we expect more spurious results due todifferences in the site of metastasis, we required concordantresults in at least 60% of the samples in which the protein wasdetected for further consideration. These class specific pro-teomic alterations are presented in a heat map format asdescribed above (Fig. 2, a and b).
A total of 80 proteins was found to be elevated in PCAcompared with Benign (Fig. 2a, left panel, and supplementalTable 3). Included among these were previously known alter-ations for prostate cancer, namely GOLM1 (45), transcriptionelongation factor B (SIII), polypeptide 1 (15 kDa; elongin C or
Quantitative Proteomic Profiling of Prostate Cancer
302 Molecular & Cellular Proteomics 9.2

FIG. 1. iTRAQ-based quantitative proteomic profiling of prostate cancer progression. A flow chart of the steps involved in quantitativeproteomic profiling of prostate-derived tissues is shown. This includes tissue procurement, histopathological examination, proteinextraction, reduction, alkylation, trypsin digestion, iTRAQ labeling, peptide fractionation, and mass spectrometry-based detection andquantification. Each iTRAQ experiment consisted of tissues derived from Benign (B), localized cancer (PCA; P), and metastatic disease(Mets; M) labeled with isobaric tags 114, 115, and 116, respectively, whereas a pool containing equal amounts of tissue from all 15prostate-derived samples used in the study was labeled using isobaric tag 117. The 4-plex mixture of peptides was separated using strongcation exchange chromatography, and the fractions were analyzed using MS/MS on a 6510 Agilent Q-TOF instrument after on-line reversephase prefractionation on an HPLC-Chip. The spectral data were searched by X!Tandem using the human IPI database appended withreverse sequences. Statistical assessment of the search results used PeptideProphet and ProteinProphet. Quantitation was obtainedusing LIBRA.
Quantitative Proteomic Profiling of Prostate Cancer
Molecular & Cellular Proteomics 9.2 303

Quantitative Proteomic Profiling of Prostate Cancer
304 Molecular & Cellular Proteomics 9.2

TCEB1) (46), neuropeptide Y (47), Parkinson disease (autoso-mal recessive, early onset) 7 (PARK7 or DJ-1) (48), anteriorgradient homolog-2 (AGR2) (49), growth differentiation factor15 (GDF15, MIC-1, or NAG-1) (50), ferritin heavy chain (FTH1)(51), tumor necrosis factor, �-induced protein 9 (STAMP2 orSTEAP4) (52), fatty acid-binding protein (FABP5) (53), and VIM(54). A similar analysis for down-regulated proteins revealed81 proteins whose expression was decreased in PCA com-pared with Benign (Fig. 2a, right panel, and supplementalTable 4). Prominent among these were lactotransferrin (55),�2-glycoprotein (AZGP1) (56), microseminoprotein � (pros-tatic secretory protein of 94 amino acids, PSP94, or MSMB)(57), isoforms of glutathione transferase (GSTP1 and GSTM3)(58–60), lactate dehydrogenase B (61), and N-myc down-stream regulated gene (NDRG1) (62), all of which have beenreported earlier to be down-regulated in organ-confineddisease.
Furthermore, our analysis revealed, for the first time, addi-tional proteins that were dysregulated in organ-confined dis-ease (PCA) compared with Benign controls. These includedelevated levels of the leucine-rich proteins Asporin and acidic(leucine-rich) nuclear phosphoprotein 32 family, member B(ANP32B or APRIL); GTP-binding proteins like RAB10, Ran-binding protein 1 (RANBP1), and RAP1B; and DNA-bindingproteins like Y-box-binding protein 1 (YBX1) and chromoboxhomolog 3 (CBX3; Fig. 2a, left panel). Similarly, the quantita-tive approach revealed tumor-associated down-regulation ofmultiple cytoskeletal and extracellular matrix-associated pro-teins like Desmuslin, Actinin �1 (ACTN1), Tropomyosin 1(TPM1), Filamin A, and Nidogen A (NID2) and LIM domain-containing proteins like LPP and PDLIM7 (Fig. 2a, right panel).
Likewise, 141 and 165 proteins were found to be elevatedand down-regulated, respectively, in metastatic disease(Mets) compared with organ-confined cancer (PCA; Fig. 2band supplemental Tables 5 and 6). Included in these wereproteins that have been previously reported to be perturbed inadvanced disease as well those found to be dysregulated byour study (Fig. 2b). Included in the former were enzymes likephosphoglycerate kinase 1 (PGK1) (63), hydroxysteroid (17-�)dehydrogenase (HSD17B) (64), enolase 1� (ENO1/MBP1) (65),acetyl-coenzyme A acetyltransferase 1 (ACAT1) (66), andfructose-1,6-bisphosphatase 1 (FBP1) (67); oncogenes likestathmin 1/oncoprotein 18 (STMN1) (68); and signaling mole-cules like 14�3�3 protein (YWHAZ) (65) and a member of theRAS oncogene family (RAN) (69) among others (Fig. 2b, leftpanel). Additionally, our profiling study, for the first time, re-
vealed elevated levels of proteins belonging to solute carrierfamily like SLC25A3 and SLC25A5; splicing factors, namelyarginine/serine-rich 2 (SFRS2) and splicing factor, arginine/serine-rich 7 (SFRS7); and chaperonins containing TCP1complex like CCT2, CCT3, CCT5, and CCT8 in metastaticdisease compared with organ-confined tumors (Fig. 2b, leftpanel). Included among the proteins that were down-regu-lated and reported previously were S100A6 (70), superoxidedismutase 3 (SOD3) (71), transforming growth factor, �1(TGFB-1) (72), destrin (73), gelsolin (74), and the lectin galac-toside-binding, soluble, 3 (LGALS3) (75) (Fig. 2b, right panel,and supplemental Table 6).
We further validated some of these proteomic alterationsusing immunoblot analysis carried out on independent pros-tate-related specimens (five each of Benign, PCA and Mets;Fig. 2c). As shown in Fig. 2c, elevated levels of fatty-acidsynthase, Ezrin, VCP1, APRIL (ANP32B), RAN, RAP1B, andARF1 were validated in localized tumors and metastatic dis-ease. Also, VIM, which was largely down-regulated in meta-static samples, was confirmed using independent clinicalspecimens (Fig. 2c). Having validated our mass spectrometryresults, we were interested in delineating the biological nu-ance associated with these proteomic alterations. Towardthis, we carried out an enrichment analysis of the localizedprostate cancer-specific proteomic signature.
Analysis of Prostate Cancer-associated Biological Pro-cesses and Pathways by OCM—To determine the ability ofour PCA-specific signature to identify pathways that are de-regulated during prostate cancer development and progres-sion, we performed an OCM analysis on the group of proteinsthat were identified to be up-regulated in organ-confined dis-ease (PCA) compared with Benign (see “Experimental Proce-dures” and supplemental Table 3 for a list of proteins used).Our laboratory’s recent work in the enrichment analysis ofbiologically related gene sets allows for the discovery of pat-terns of shared behavior over a vast database of high through-put experimental data and biological annotation (40). The 80proteins that were elevated in PCA mapped to 72 gene sym-bols that were analyzed by OCM. The enrichment analysiswas performed against a null set containing 1143 gene sym-bols associated with the 1374 proteins identified across the15 iTRAQ experiments, allowing the selection of specific con-cepts enriched by the differential predictor. The OCM analysisof the “PCA-specific protein” signature (center green node)showed enrichment for multiple Oncomine gene signatures(blue nodes) describing an increase in prostate cancer (p �
FIG. 2. Class-specific proteomic profiles of prostate cancer progression. a, heat map showing differential proteins in PCA relative tobenign samples (see “Experimental Procedures” for details). Gene symbols are listed when known. Rows represent the proteins, and columnsrepresent the five iTRAQ experiments. Up-regulated and down-regulated proteins are indicated in shades of red and green, respectively, wherethe intensity of the color is determined by the distance (in standard deviations) from the mean of the trimmed distribution. Black indicatesunchanged protein expression, and gray indicates no measurement. b, same as in a but for differential proteins in metastatic disease comparedwith localized tumors. c, immunoblot validation of candidate proteins in an independent set of prostate-derived samples (n � 5 from eachclass). FASN, fatty-acid synthase; GAPDH, glyceraldehyde-3-phosphate dehydrogenase.
Quantitative Proteomic Profiling of Prostate Cancer
Molecular & Cellular Proteomics 9.2 305
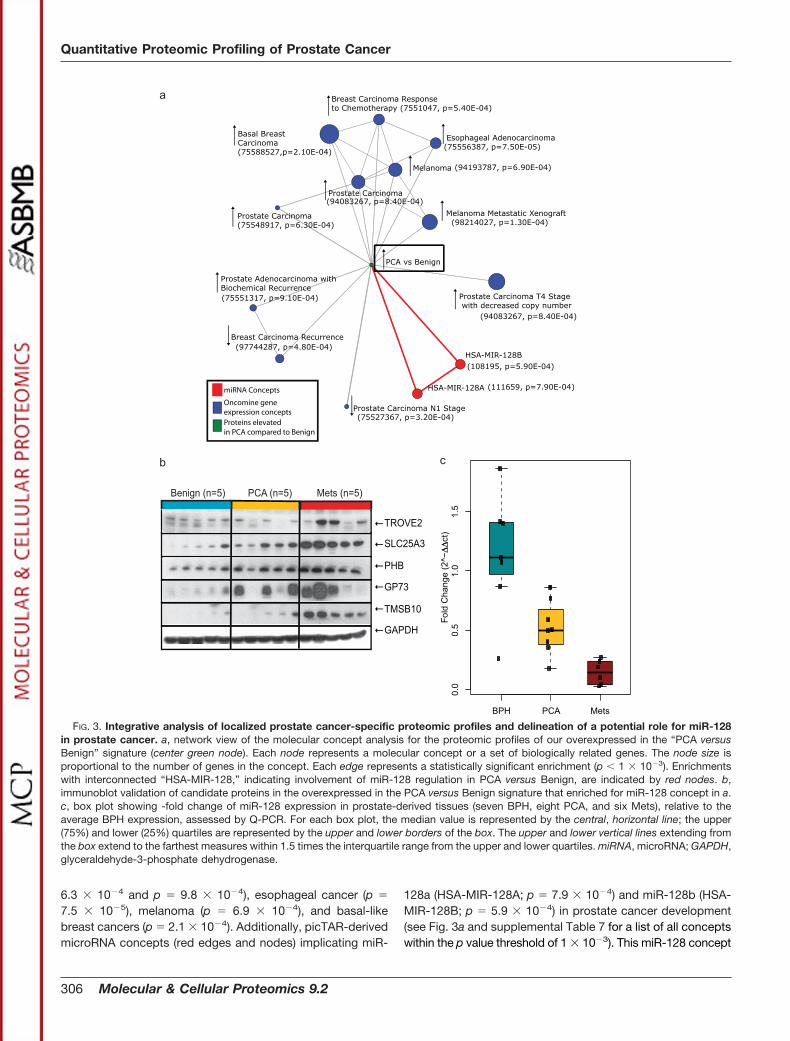
6.3 � 10�4 and p � 9.8 � 10�4), esophageal cancer (p �
7.5 � 10�5), melanoma (p � 6.9 � 10�4), and basal-likebreast cancers (p � 2.1 � 10�4). Additionally, picTAR-derivedmicroRNA concepts (red edges and nodes) implicating miR-
128a (HSA-MIR-128A; p � 7.9 � 10�4) and miR-128b (HSA-MIR-128B; p � 5.9 � 10�4) in prostate cancer development(see Fig. 3a and supplemental Table 7 for a list of all conceptswithin the p value threshold of 1 � 10�3). This miR-128 concept
FIG. 3. Integrative analysis of localized prostate cancer-specific proteomic profiles and delineation of a potential role for miR-128in prostate cancer. a, network view of the molecular concept analysis for the proteomic profiles of our overexpressed in the “PCA versusBenign” signature (center green node). Each node represents a molecular concept or a set of biologically related genes. The node size isproportional to the number of genes in the concept. Each edge represents a statistically significant enrichment (p 1 � 10�3). Enrichmentswith interconnected “HSA-MIR-128,” indicating involvement of miR-128 regulation in PCA versus Benign, are indicated by red nodes. b,immunoblot validation of candidate proteins in the overexpressed in the PCA versus Benign signature that enriched for miR-128 concept in a.c, box plot showing -fold change of miR-128 expression in prostate-derived tissues (seven BPH, eight PCA, and six Mets), relative to theaverage BPH expression, assessed by Q-PCR. For each box plot, the median value is represented by the central, horizontal line; the upper(75%) and lower (25%) quartiles are represented by the upper and lower borders of the box. The upper and lower vertical lines extending fromthe box extend to the farthest measures within 1.5 times the interquartile range from the upper and lower quartiles. miRNA, microRNA; GAPDH,glyceraldehyde-3-phosphate dehydrogenase.
Quantitative Proteomic Profiling of Prostate Cancer
306 Molecular & Cellular Proteomics 9.2

Quantitative Proteomic Profiling of Prostate Cancer
Molecular & Cellular Proteomics 9.2 307

was intriguing in the context of a recent study that predicted adecrease in the expression of this microRNA in breast cancer(76). However, the functional consequence of this down-regu-lation has not been described thus far. This motivated us toextend our investigation to understand the consequence ofmiR-128 deregulation in the context of prostate cancer.
Assessment of miR-128 Expression in Prostate-derived Tis-sues and Cell Lines—miR-128 concepts were enriched in ourOCM analysis by eight high confidence proteins (all identifiedby at least two peptides), namely GOLM1, TROVE2, PHB,solute carrier family 25 (SLC25A3), myristoylated alanine-richprotein kinase C substrate, heteronuclear ribonucleoprotein(HNRPF), TMSB10, and a member of RAS oncogene family(RAP1B), all of which were elevated in localized prostatecancer and further were predicted to be targets of themicroRNA by picTAR. Toward characterizing the role of miR-128, we first validated the expression of GOLM1, PHB,TROVE2, TMSB10, and SLC25A3 in independent clinicalspecimens (n � 5 each of Benign, PCA, and Mets) usingimmunoblot analysis (Fig. 3b). Next, we confirmed deregula-tion of miR-128 expression in independent clinical specimensusing real time PCR analysis (refer to supplemental Table 8 forthe sequences of primers used). Analysis of 21 independentclinical specimens (seven benign prostatic hyperplasia/BPH,eight PCA, and six Mets) revealed significant reduction inexpression of miR-128 in a progressive fashion from BPH toPCA to metastatic disease (Fig. 3c; p � 0.0163 PCA versusBPH, p � 0.0017 PCA versus Mets).
Specifically, transcript levels for miR-128 were significantlydecreased in PCA compared with BPH samples (t test withSatterthwaite correction for unequal variances, p � 0.016).Additionally, miR-128 transcript levels displayed an evengreater down-regulation in the metastatic samples comparedwith organ-confined disease (Fig. 3c; p � 0.0017).
To determine whether miR-128 down-regulation in prostatecancer has biological relevance, we used prostate cancer cellline DU145 and its benign epithelial counterpart, primary be-
nign PrEC. Using these cell lines, we assessed their transcriptlevels for miR-128 using Q-PCR. As shown in Fig. 4a, theprostate cancer cell line DU145 displayed lower levels ofmiR-128 (one-sample t test, p � 0.0002, n � 3) comparedwith their benign epithelial counterparts. This was in line withour earlier observation with prostate tissues wherein a de-crease in expression of the microRNA correlated with aggres-sivity of the disease.
This finding motivated us to interrogate the functional roleof miR-128 in prostate cancer development/progression. Weperformed transient overexpression or knockdown of themicroRNA in prostate cancer and benign prostate epithelialcells, respectively, and looked for changes in cell proliferation/invasion. Cell proliferation and cellular invasion were corre-spondingly measured using cell counting and a modified Boy-den chamber matrigel invasion assay (77). Interestingly,transient overexpression of miR-128a in the invasive prostatecancer cell line DU145 resulted in �50% attenuation of inva-sion (Fig. 4b), confirming our earlier prediction of a role formiR-128 in regulating prostate cancer aggressivity. Nochange in cell numbers was detected between treatments(see supplemental Fig. S5). Furthermore, these attenuatedcells showed decreased expression for four of the sevenpredicted target genes (GOLM1, PHB, TROVE2, andTMSB10) that nominated the miR-128 in our enrichment anal-ysis (Fig. 4c). Importantly, this observation suggests the as-sociated proteins as genuine targets of miR-128, althoughadditional study is necessary for confirmation. To furtherconfirm the role of miR-128 in regulating cancer aggressiv-ity, we knocked down its expression using specific an-tagomiR in benign PrEC. As shown in Fig. 4d, transienttransfection of antagomiR resulted in an �80% reduction inmiR-128 transcript levels compared with non-target control(Fig. 4d, black bars). Furthermore, this attenuation of miR-128 was accompanied by induction of the invasive pheno-type in these benign epithelial cells (Fig. 4d, gray bars).Invasion was not induced by control or mock antagomiR
FIG. 4. miR-128 is associated with prostate cancer invasion and aggressivity. a, assessment of miR-128 expression in a benign prostateepithelial cell line (PrEC) and a prostate cancer cell line (DU145) by Q-PCR (n � 3; fold change relative to PrEC expression per experiment).b, assessment of invasion in prostate cancer cells (DU145) upon overexpression of miR-128a. Transcript levels (black bars) and invasion (graybars) were assessed by Q-PCR and a Boyden chamber assay, respectively. Error bars are derived from two biological replicate measures.Overexpression of miR-128a in invasive DU145 cells resulted in a �2-fold decrease in invasiveness compared with control miR-transfectedcells (see inset for photomicrograph of invasion). c, assessment of relative levels of transcripts for seven of the eight genes that enriched forthe miR-128 concept in Fig. 3a upon overexpression of the microRNA in invasive DU145 cells (n � 3). Overexpression of miR-128a in DU145cells resulted in a concomitant down-regulation of GOLM1, TROVE2, TMSB10, and PHB, further suggesting them as downstream targets ofthe microRNA. Levels of RAP1B, SLC25A3, and myristoylated alanine-rich protein kinase C substrate (MARCKS) were unchanged. d, same asin b but for knockdown of miR-128a in primary PrEC compared with antagomiR control. Attenuation of miR-128a levels (black bars) resultedin a concomitant induction of an invasive phenotype (gray bars and inset) in primary prostate epithelial cells. Error bars are derived from threebiological replicates. e, network view of the molecular concept analysis for the gene expression profiles of our up-regulated upon “mir-128aknockdown” signature (miR-128a_KD). Each node represents a molecular concept or a set of biologically related genes. The node size isproportional to the number of genes in the concept. Each edge represents a statistically significant enrichment (p 1 � 10�5). Multipleenrichments for aggressive/metastatic cancers (red bridges) confirm a role for miR-128a in regulating invasiveness/aggressivity of tumors.Also, multiple enrichments of cell cycle-related concepts (green bridges) confirm earlier findings for a role of miR-128a in regulation of thisbiological process (78). GAPDH, glyceraldehyde-3-phosphate dehydrogenase; HRPD, Human Protein Reference Database; KEGG, KyotoEncyclopedia of Genes and Genomes; GO, Gene Ontology; MCM, Mini-chromosome Maintenance.
Quantitative Proteomic Profiling of Prostate Cancer
308 Molecular & Cellular Proteomics 9.2

treatments (see supplemental Fig. S6). Similar induction ofthe invasive phenotype accompanying an attenuation ofmiR-128 levels was also observed using an independentbenign transformed epithelial cell line (RWPE; data notshown). These validated a role for miR-128 in regulatingtumor invasion.
To get additional insights, we carried out gene expressionanalysis of benign PrEC upon overexpression of miR-128a.Genes that were down-regulated upon the overexpression ofthe microRNA were used for enrichment analysis using On-comine Concepts Map (39, 40) (refer to Fig. 4e and supple-mental Table 9 for a list of all concepts within the p valuethreshold of 1 � 10�5). Included in the list of concepts en-riched by the “miR-128a targets” (Fig. 4e, miR-128a_KD) werethose that described regulation of cell cycle (Fig. 4e, greenbridges). Notably, this served as a reference for our analysisas earlier reports have confirmed a role for miR-128 in cellcycle regulation through its control of E2F3 expression (78).Of more interest to us, however, was the enrichment ofmultiple concepts, all of which described invasive tumors orthose with poor outcome (Fig. 4e, red bridges). These in-cluded gene expression-derived concepts for aggressivetumors of breast, lung, liver, and ovary (Fig. 4e, red bridges).This observation further strengthened our in vitro findingsimplicating miR-128 in cancer aggressivity, especially theprocess of tumor invasion.
DISCUSSION
By coupling multidimensional protein fractionation andquantitative mass spectrometry with bioinformatics-basedenrichment analysis, we demonstrate the involvement of miR-128 in the stages of prostate cancer progression. The pro-teomic signatures quantified in both organ-confined and met-astatic samples contained proteins that have been previouslyimplicated in this disease. Significant among these were mul-tiple proteins belonging to the secretory or endocytic path-ways. This included the Golgi-associated antigen GOLM1,which has been recently reported from our laboratory to beelevated both at the transcript and protein levels in localizedtumors (45). Similarly, STEAP4, known to be androgen-regu-lated and involved in endocytic trafficking (52), was elevatedin localized tumors. An important finding from our profilingdata was the elevation in levels of multiple proteins that con-tain leucine-rich protein-interacting motifs (Asporin and APRILor ANP32B). The protein PP32R1, a member of the ANP32family, has been shown to be oncogenic with very high levelsof expression in prostate adenocarcinoma cell lines (79). Ad-ditional findings from our data included elevated levels ofDNA-binding and GTP-binding proteins, confirming increasedtranscriptional activity and signaling, respectively, during earlycancer development. The metastatic signature, on the otherhand, showed elevated levels of multiple arginine-serine-richpre-mRNA splicing factors. This is relevant in the context ofexisting knowledge that implicates these in cancer develop-
ment (80). Also our “Up in Metastatic” signature revealedelevated levels of solute carrier proteins, namely SLC25A5and SLC25A3. The former has been implicated earlier to beelevated in lymph node metastasis associated with hepato-cellular carcinoma (81), whereas SLC25A3 serves as the mi-tochondrial transporter for phosphate (82). Interestingly, inde-pendent metabolomics data for prostate cancer progressiongenerated by our laboratory revealed significantly elevatedlevels of inorganic phosphate in tumors, corroborating withthe finding of elevated levels of phosphate carrier in meta-static prostate cancer (83).
Importantly, extending beyond revealing single moleculealterations, we interrogated the biological significance ofthese alterations in the context of prostate cancer develop-ment/progression using OCM. An enrichment of miR-128concepts by the tumor-specific signature was revealed. Thiswas exciting because studies from our laboratory and othershave implicated microRNAs in regulating tumor progression(84) and invasiveness (85). Remarkably, to our knowledge,this is one of the first studies wherein mass spectrometry-based protein profiling has been combined with bioinfor-matics-driven enrichment to nominate a microRNA in tu-mors. Importantly, our study, for the first time, implicatesmiR-128 in prostate cancer. Our results from in vitro tran-sient overexpression and knockdown systems indicate arole for miR-128 in prostate cancer invasion. This is furtherstrengthened by the OCM analysis of miR-128-regulatedgenes that showed enrichment for multiple concepts de-scribing aggressive tumors or those having poor outcome.Taken together, we combined quantitative protein massspectrometry, bioinformatics, and a cell-based functionalassay to delineate a role for miR-128 in prostate cancerprogression.
Acknowledgment—We thank Dr. Kenneth Pienta for access tometastatic prostate cancer samples from the University of MichiganProstate Specialized Project of Research Excellence rapid autopsyprogram.
* This work was supported, in whole or in part, by National Insti-tutes of Health Grants R01CA13345 (to A. S. and A. M. C.),R03CA139489 (to A. S.), and R01CA126239 (to A. I. N.); SpecializedProject of Research Excellence Grant P50 CA69568 (to A. M. C.); andEarly Detection Research Network Grant U01 CA113913 (to A. M. C.)from the NCI. This work was also supported by Department of De-fense Grant W81XWH-06-1-0224 (to A. M. C.) and Michigan Technol-ogy Tri-Corridor Grant MTTC-687 (to A. S. and G. S. O.).
□S The on-line version of this article (available at http://www.mcponline.org) contains supplemental Figs. S1–S6 and Tables 1–9.
c Both authors contributed equally to this work.f Present address: Agilent Technologies, Wilmington, DE 19808.l Supported by a clinical translational science award from the Bur-
roughs Welcome Foundation and Doris Duke Charitable Foundation.m Supported by a Georgia cancer research distinguished scientist
award. To whom correspondence should be addressed: MedicalCollege of Georgia Cancer Center, CN3130, 1420 Laney Walker Blvd.,Augusta, GA 30912. Tel.: 706-721-0097; Fax: 706-721-1670; E-mail:[email protected].
Quantitative Proteomic Profiling of Prostate Cancer
Molecular & Cellular Proteomics 9.2 309
REFERENCES
1. American Cancer Society (2008) How Many Men Get Prostate Cancer?,American Cancer Society, Atlanta, GA
2. Catalona, W. J. (1994) Management of cancer of the prostate. N. Engl.J. Med. 331, 996–1004
3. Jacobsen, S. J., Katusic, S. K., Bergstralh, E. J., Oesterling, J. E., Ohrt, D.,Klee, G. G., Chute, C. G., and Lieber, M. M. (1995) Incidence of prostatecancer diagnosis in the eras before and after serum prostate-specificantigen testing. JAMA 274, 1445–1449
4. Epstein, J. I., and Potter, S. R. (2001) The pathological interpretation andsignificance of prostate needle biopsy findings: implications and currentcontroversies. J. Urol. 166, 402–410
5. Andriole, G. L., Crawford, E. D., Grubb, R. L., 3rd, Buys, S. S., Chia, D.,Church, T. R., Fouad, M. N., Gelmann, E. P., Kvale, P. A., Reding, D. J.,Weissfeld, J. L., Yokochi, L. A., O’Brien, B., Clapp, J. D., Rathmell, J. M.,Riley, T. L., Hayes, R. B., Kramer, B. S., Izmirlian, G., Miller, A. B., Pinsky,P. F., Prorok, P. C., Gohagan, J. K., and Berg, C. D. (2009) Mortalityresults from a randomized prostate-cancer screening trial. N. Engl.J. Med. 360, 1310–1319
6. Schroder, F. H., Hugosson, J., Roobol, M. J., Tammela, T. L., Ciatto, S.,Nelen, V., Kwiatkowski, M., Lujan, M., Lilja, H., Zappa, M., Denis, L. J.,Recker, F., Berenguer, A., Maattanen, L., Bangma, C. H., Aus, G., Villers,A., Rebillard, X., van der Kwast, T., Blijenberg, B. G., Moss, S. M., deKoning, H. J., and Auvinen, A. (2009) Screening and prostate-cancermortality in a randomized European study. N. Engl. J. Med. 360,1320–13208
7. Albertsen, P. C., Hanley, J. A., Gleason, D. F., and Barry, M. J. (1998)Competing risk analysis of men aged 55 to 74 years at diagnosis man-aged conservatively for clinically localized prostate cancer. JAMA 280,975–980
8. Brown, C., Sauvageot, J., Kahane, H., and Epstein, J. I. (1996) Cell prolif-eration and apoptosis in prostate cancer—correlation with pathologicstage? Mod. Pathol. 9, 205–209
9. Abate-Shen, C., and Shen, M. M. (2000) Molecular genetics of prostatecancer. Genes Dev. 14, 2410–2434
10. Kumar-Sinha, C., and Chinnaiyan, A. M. (2003) Molecular markers to iden-tify patients at risk for recurrence after primary treatment for prostatecancer. Urology 62, Suppl. 1, 19–35
11. Hood, L., Heath, J. R., Phelps, M. E., and Lin, B. (2004) Systems biologyand new technologies enable predictive and preventative medicine. Sci-ence 306, 640–643
12. Grubb, R. L., Calvert, V. S., Wulkuhle, J. D., Paweletz, C. P., Linehan, W. M.,Phillips, J. L., Chuaqui, R., Valasco, A., Gillespie, J., Emmert-Buck, M.,Liotta, L. A., and Petricoin, E. F. (2003) Signal pathway profiling ofprostate cancer using reverse phase protein arrays. Proteomics 3,2142–2146
13. Petricoin, E. F., 3rd, Ornstein, D. K., Paweletz, C. P., Ardekani, A., Hackett,P. S., Hitt, B. A., Velassco, A., Trucco, C., Wiegand, L., Wood, K.,Simone, C. B., Levine, P. J., Linehan, W. M., Emmert-Buck, M. R.,Steinberg, S. M., Kohn, E. C., and Liotta, L. A. (2002) Serum proteomicpatterns for detection of prostate cancer. J. Natl. Cancer Inst. 94,1576–1578
14. Paweletz, C. P., Charboneau, L., Bichsel, V. E., Simone, N. L., Chen, T.,Gillespie, J. W., Emmert-Buck, M. R., Roth, M. J., Petricoin, E. F., 3rd,and Liotta, L. A. (2001) Reverse phase protein microarrays which capturedisease progression show activation of pro-survival pathways at thecancer invasion front. Oncogene 20, 1981–1989
15. Dhanasekaran, S. M., Barrette, T. R., Ghosh, D., Shah, R., Varambally, S.,Kurachi, K., Pienta, K. J., Rubin, M. A., and Chinnaiyan, A. M. (2001)Delineation of prognostic biomarkers in prostate cancer. Nature 412,822–826
16. Lapointe, J., Li, C., Higgins, J. P., van de Rijn, M., Bair, E., Montgomery, K.,Ferrari, M., Egevad, L., Rayford, W., Bergerheim, U., Ekman, P., De-Marzo, A. M., Tibshirani, R., Botstein, D., Brown, P. O., Brooks, J. D., andPollack, J. R. (2004) Gene expression profiling identifies clinically rele-vant subtypes of prostate cancer. Proc. Natl. Acad. Sci. U.S.A. 101,811–816
17. LaTulippe, E., Satagopan, J., Smith, A., Scher, H., Scardino, P., Reuter, V.,and Gerald, W. L. (2002) Comprehensive gene expression analysis ofprostate cancer reveals distinct transcriptional programs associated withmetastatic disease. Cancer Res. 62, 4499–4506
18. Luo, J., Duggan, D. J., Chen, Y., Sauvageot, J., Ewing, C. M., Bittner, M. L.,Trent, J. M., and Isaacs, W. B. (2001) Human prostate cancer and benignprostatic hyperplasia: molecular dissection by gene expression profiling.Cancer Res. 61, 4683–4688
19. Luo, J. H., Yu, Y. P., Cieply, K., Lin, F., Deflavia, P., Dhir, R., Finkelstein, S.,Michalopoulos, G., and Becich, M. (2002) Gene expression analysis ofprostate cancers. Mol. Carcinog. 33, 25–35
20. Magee, J. A., Araki, T., Patil, S., Ehrig, T., True, L., Humphrey, P. A.,Catalona, W. J., Watson, M. A., and Milbrandt, J. (2001) Expressionprofiling reveals hepsin overexpression in prostate cancer. Cancer Res.61, 5692–5696
21. Singh, D., Febbo, P. G., Ross, K., Jackson, D. G., Manola, J., Ladd, C.,Tamayo, P., Renshaw, A. A., D’Amico, A. V., Richie, J. P., Lander, E. S.,Loda, M., Kantoff, P. W., Golub, T. R., and Sellers, W. R. (2002) Geneexpression correlates of clinical prostate cancer behavior. Cancer Cell 1,203–209
22. Welsh, J. B., Sapinoso, L. M., Su, A. I., Kern, S. G., Wang-Rodriguez, J.,Moskaluk, C. A., Frierson, H. F., Jr., and Hampton, G. M. (2001) Analysisof gene expression identifies candidate markers and pharmacologicaltargets in prostate cancer. Cancer Res. 61, 5974–5978
23. Yu, Y. P., Landsittel, D., Jing, L., Nelson, J., Ren, B., Liu, L., McDonald, C.,Thomas, R., Dhir, R., Finkelstein, S., Michalopoulos, G., Becich, M., andLuo, J. H. (2004) Gene expression alterations in prostate cancer predict-ing tumor aggression and preceding development of malignancy. J. Clin.Oncol. 22, 2790–2799
24. Golub, T. R., Slonim, D. K., Tamayo, P., Huard, C., Gaasenbeek, M.,Mesirov, J. P., Coller, H., Loh, M. L., Downing, J. R., Caligiuri, M. A.,Bloomfield, C. D., and Lander, E. S. (1999) Molecular classification ofcancer: class discovery and class prediction by gene expression moni-toring. Science 286, 531–537
25. Hedenfalk, I., Duggan, D., Chen, Y., Radmacher, M., Bittner, M., Simon, R.,Meltzer, P., Gusterson, B., Esteller, M., Kallioniemi, O. P., Wilfond, B.,Borg, A., Trent, J., Raffeld, M., Yakhini, Z., Ben-Dor, A., Dougherty, E.,Kononen, J., Bubendorf, L., Fehrle, W., Pittaluga, S., Gruvberger, S.,Loman, N., Johannsson, O., Olsson, H., and Sauter, G. (2001) Gene-expression profiles in hereditary breast cancer. N. Engl. J. Med. 344,539–548
26. Perou, C. M., Sørlie, T., Eisen, M. B., van de Rijn, M., Jeffrey, S. S., Rees,C. A., Pollack, J. R., Ross, D. T., Johnsen, H., Akslen, L. A., Fluge, O.,Pergamenschikov, A., Williams, C., Zhu, S. X., Lønning, P. E., Børresen-Dale, A. L., Brown, P. O., and Botstein, D. (2000) Molecular portraits ofhuman breast tumours. Nature 406, 747–752
27. Alizadeh, A. A., Eisen, M. B., Davis, R. E., Ma, C., Lossos, I. S., Rosenwald,A., Boldrick, J. C., Sabet, H., Tran, T., Yu, X., Powell, J. I., Yang, L., Marti,G. E., Moore, T., Hudson, J., Jr., Lu, L., Lewis, D. B., Tibshirani, R.,Sherlock, G., Chan, W. C., Greiner, T. C., Weisenburger, D. D., Armitage,J. O., Warnke, R., Levy, R., Wilson, W., Grever, M. R., Byrd, J. C.,Botstein, D., Brown, P. O., and Staudt, L. M. (2000) Distinct types ofdiffuse large B-cell lymphoma identified by gene expression profiling.Nature 403, 503–511
28. Nelson, P. S., Han, D., Rochon, Y., Corthals, G. L., Lin, B., Monson, A.,Nguyen, V., Franza, B. R., Plymate, S. R., Aebersold, R., and Hood, L.(2000) Comprehensive analyses of prostate gene expression: conver-gence of expressed sequence tag databases, transcript profiling andproteomics. Electrophoresis 21, 1823–1831
29. Ahram, M., Best, C. J., Flaig, M. J., Gillespie, J. W., Leiva, I. M., Chuaqui,R. F., Zhou, G., Shu, H., Duray, P. H., Linehan, W. M., Raffeld, M.,Ornstein, D. K., Zhao, Y., Petricoin, E. F., 3rd, and Emmert-Buck, M. R.(2002) Proteomic analysis of human prostate cancer. Mol. Carcinog. 33,9–15
30. Sreekumar, A., Laxman, B., Rhodes, D. R., Bhagavathula, S., Harwood, J.,Giacherio, D., Ghosh, D., Sanda, M. G., Rubin, M. A., and Chinnaiyan,A. M. (2004) Humoral immune response to alpha-methylacyl-CoA race-mase and prostate cancer. J. Natl. Cancer Inst. 96, 834–843
31. Comuzzi, B., and Sadar, M. D. (2006) Proteomic analyses to identify noveltherapeutic targets for the treatment of advanced prostate cancer. Cell-science 3, 61–81
32. Garbis, S. D., Tyritzis, S. I., Roumeliotis, T., Zerefos, P., Giannopoulou,E. G., Vlahou, A., Kossida, S., Diaz, J., Vourekas, S., Tamvakopoulos, C.,Pavlakis, K., Sanoudou, D., and Constantinides, C. A. (2008) Search forpotential markers for prostate cancer diagnosis, prognosis and treatment
Quantitative Proteomic Profiling of Prostate Cancer
310 Molecular & Cellular Proteomics 9.2

in clinical tissue specimens using amine-specific isobaric tagging(iTRAQ) with two-dimensional liquid chromatography and tandem massspectrometry. J. Proteome Res. 7, 3146–3158
33. Glen, A., Gan, C. S., Hamdy, F. C., Eaton, C. L., Cross, S. S., Catto, J. W.,Wright, P. C., and Rehman, I. (2008) iTRAQ-facilitated proteomic analysisof human prostate cancer cells identifies proteins associated with pro-gression. J. Proteome Res. 7, 897–907
34. Matta, A., DeSouza, L. V., Shukla, N. K., Gupta, S. D., Ralhan, R., and Siu,K. W. (2008) Prognostic significance of head-and-neck cancer biomar-kers previously discovered and identified using iTRAQ-labeling and mul-tidimensional liquid chromatography-tandem mass spectrometry. J. Pro-teome Res. 7, 2078–2087
35. Ralhan, R., Desouza, L. V., Matta, A., Chandra Tripathi, S., Ghanny, S.,Datta Gupta, S., Bahadur, S., and Siu, K. W. (2008) Discovery andverification of head-and-neck cancer biomarkers by differential proteinexpression analysis using iTRAQ labeling, multidimensional liquid chro-matography, and tandem mass spectrometry. Mol. Cell. Proteomics 7,1162–1173
36. Keshamouni, V. G., Michailidis, G., Grasso, C. S., Anthwal, S., Strahler,J. R., Walker, A., Arenberg, D. A., Reddy, R. C., Akulapalli, S., Thannickal,V. J., Standiford, T. J., Andrews, P. C., and Omenn, G. S. (2006) Differ-ential protein expression profiling by iTRAQ-2DLC-MS/MS of lung can-cer cells undergoing epithelial-mesenchymal transition reveals a migra-tory/invasive phenotype. J. Proteome Res. 5, 1143–1154
37. Nesvizhskii, A. I., Vitek, O., and Aebersold, R. (2007) Analysis and validationof proteomic data generated by tandem mass spectrometry. Nat. Meth-ods 4, 787–797
38. R Development Core Team (2008) R: a Language and Environment forStatistical Computing, R Foundation for Statistical Computing, Vienna
39. Rhodes, D. R., Kalyana-Sundaram, S., Tomlins, S. A., Mahavisno, V.,Kasper, N., Varambally, R., Barrette, T. R., Ghosh, D., Varambally, S.,and Chinnaiyan, A. M. (2007) Molecular concepts analysis links tumors,pathways, mechanisms, and drugs. Neoplasia 9, 443–454
40. Tomlins, S. A., Mehra, R., Rhodes, D. R., Cao, X., Wang, L., Dhanasekaran,S. M., Kalyana-Sundaram, S., Wei, J. T., Rubin, M. A., Pienta, K. J., Shah,R. B., and Chinnaiyan, A. M. (2007) Integrative molecular concept mod-eling of prostate cancer progression. Nat. Genet. 39, 41–51
41. Taylor, B. S., Pal, M., Yu, J., Laxman, B., Kalyana-Sundaram, S., Zhao, R.,Menon, A., Wei, J. T., Nesvizhskii, A. I., Ghosh, D., Omenn, G. S.,Lubman, D. M., Chinnaiyan, A. M., and Sreekumar, A. (2008) Humoralresponse profiling reveals pathways to prostate cancer progression. Mol.Cell. Proteomics 7, 600–611
42. Yu, J., Cao, Q., Mehra, R., Laxman, B., Yu, J., Tomlins, S. A., Creighton,C. J., Dhanasekaran, S. M., Shen, R., Chen, G., Morris, D. S., Marquez,V. E., Shah, R. B., Ghosh, D., Varambally, S., and Chinnaiyan, A. M.(2007) Integrative genomics analysis reveals silencing of beta-adrenergicsignaling by polycomb in prostate cancer. Cancer Cell 12, 419–431
43. Yu, J., Yu, J., Rhodes, D. R., Tomlins, S. A., Cao, X., Chen, G., Mehra, R.,Wang, X., Ghosh, D., Shah, R. B., Varambally, S., Pienta, K. J., andChinnaiyan, A. M. (2007) A polycomb repression signature in metastaticprostate cancer predicts cancer outcome. Cancer Res. 67, 10657–10663
44. Krutzfeldt, J., Rajewsky, N., Braich, R., Rajeev, K. G., Tuschl, T., Manoha-ran, M., and Stoffel, M. (2005) Silencing of microRNAs in vivo with‘antagomirs’. Nature 438, 685–689
45. Varambally, S., Laxman, B., Mehra, R., Cao, Q., Dhanasekaran, S. M.,Tomlins, S. A., Granger, J., Vellaichamy, A., Sreekumar, A., Yu, J., Gu,W., Shen, R., Ghosh, D., Wright, L. M., Kladney, R. D., Kuefer, R., Rubin,M. A., Fimmel, C. J., and Chinnaiyan, A. M. (2008) Golgi protein GOLM1is a tissue and urine biomarker of prostate cancer. Neoplasia 10,1285–1294
46. Jalava, S. E., Porkka, K. P., Rauhala, H. E., Isotalo, J., Tammela, T. L., andVisakorpi, T. (2009) TCEB1 promotes invasion of prostate cancer cells.Int. J. Cancer 124, 95–102
47. Ruscica, M., Dozio, E., Motta, M., and Magni, P. (2007) Modulatory actionsof neuropeptide Y on prostate cancer growth: role of MAP kinase/ERK1/2 activation. Adv. Exp. Med. Biol. 604, 96–100
48. Hod, Y. (2004) Differential control of apoptosis by DJ-1 in prostate benignand cancer cells. J. Cell. Biochem. 92, 1221–1233
49. Zhang, Y., Forootan, S. S., Liu, D., Barraclough, R., Foster, C. S., Rudland,P. S., and Ke, Y. (2007) Increased expression of anterior gradient-2 issignificantly associated with poor survival of prostate cancer patients.
Prostate Cancer Prostatic Dis. 10, 293–30050. Hood, B. L., Darfler, M. M., Guiel, T. G., Furusato, B., Lucas, D. A.,
Ringeisen, B. R., Sesterhenn, I. A., Conrads, T. P., Veenstra, T. D., andKrizman, D. B. (2005) Proteomic analysis of formalin-fixed prostate can-cer tissue. Mol. Cell. Proteomics 4, 1741–1753
51. Grzmil, M., Voigt, S., Thelen, P., Hemmerlein, B., Helmke, K., and Burfeind,P. (2004) Up-regulated expression of the MAT-8 gene in prostate cancerand its siRNA-mediated inhibition of expression induces a decrease inproliferation of human prostate carcinoma cells. Int. J. Oncol. 24, 97–105
52. Korkmaz, C. G., Korkmaz, K. S., Kurys, P., Elbi, C., Wang, L., Klokk, T. I.,Hammarstrom, C., Troen, G., Svindland, A., Hager, G. L., and Saatcioglu,F. (2005) Molecular cloning and characterization of STAMP2, an andro-gen-regulated six transmembrane protein that is overexpressed in pros-tate cancer. Oncogene 24, 4934–4945
53. Adamson, J., Morgan, E. A., Beesley, C., Mei, Y., Foster, C. S., Fujii, H.,Rudland, P. S., Smith, P. H., and Ke, Y. (2003) High-level expression ofcutaneous fatty acid-binding protein in prostatic carcinomas and itseffect on tumorigenicity. Oncogene 22, 2739–2749
54. Wu, M., Bai, X., Xu, G., Wei, J., Zhu, T., Zhang, Y., Li, Q., Liu, P., Song, A.,Zhao, L., Gang, C., Han, Z., Wang, S., Zhou, J., Lu, Y., and Ma, D. (2007)Proteome analysis of human androgen-independent prostate cancer celllines: variable metastatic potentials correlated with vimentin expression.Proteomics 7, 1973–1983
55. Shaheduzzaman, S., Vishwanath, A., Furusato, B., Cullen, J., Chen, Y.,Banez, L., Nau, M., Ravindranath, L., Kim, K. H., Mohammed, A., Chen,Y., Ehrich, M., Srikantan, V., Sesterhenn, I. A., McLeod, D., Vahey, M.,Petrovics, G., Dobi, A., and Srivastava, S. (2007) Silencing of lactotrans-ferrin expression by methylation in prostate cancer progression. CancerBiol. Ther. 6, 1088–1095
56. Henshall, S. M., Horvath, L. G., Quinn, D. I., Eggleton, S. A., Grygiel, J. J.,Stricker, P. D., Biankin, A. V., Kench, J. G., and Sutherland, R. L. (2006)Zinc-alpha2-glycoprotein expression as a predictor of metastatic pros-tate cancer following radical prostatectomy. J. Natl. Cancer Inst. 98,1420–1424
57. Beke, L., Nuytten, M., Van Eynde, A., Beullens, M., and Bollen, M. (2007)The gene encoding the prostatic tumor suppressor PSP94 is a target forrepression by the Polycomb group protein EZH2. Oncogene 26,4590–4595
58. Medeiros, R., Vasconcelos, A., Costa, S., Pinto, D., Ferreira, P., Lobo, F.,Morais, A., Oliveira, J., and Lopes, C. (2004) Metabolic susceptibilitygenes and prostate cancer risk in a southern European population: therole of glutathione S-transferases GSTM1, GSTM3, and GSTT1 geneticpolymorphisms. Prostate 58, 414–420
59. Bostwick, D. G., Meiers, I., and Shanks, J. H. (2007) Glutathione S-trans-ferase: differential expression of alpha, mu, and pi isoenzymes in benignprostate, prostatic intraepithelial neoplasia, and prostatic adenocarci-noma. Hum. Pathol. 38, 1394–1401
60. Meiers, I., Shanks, J. H., and Bostwick, D. G. (2007) Glutathione S-trans-ferase pi (GSTP1) hypermethylation in prostate cancer: review 2007.Pathology 39, 299–304
61. Leiblich, A., Cross, S. S., Catto, J. W., Phillips, J. T., Leung, H. Y., Hamdy,F. C., and Rehman, I. (2006) Lactate dehydrogenase-B is silenced bypromoter hypermethylation in human prostate cancer. Oncogene 25,2953–2960
62. Segawa, T., Nau, M. E., Xu, L. L., Chilukuri, R. N., Makarem, M., Zhang, W.,Petrovics, G., Sesterhenn, I. A., McLeod, D. G., Moul, J. W., Vahey, M.,and Srivastava, S. (2002) Androgen-induced expression of endoplasmicreticulum (ER) stress response genes in prostate cancer cells. Oncogene21, 8749–8758
63. Wang, J., Wang, J., Dai, J., Jung, Y., Wei, C. L., Wang, Y., Havens, A. M.,Hogg, P. J., Keller, E. T., Pienta, K. J., Nor, J. E., Wang, C. Y., andTaichman, R. S. (2007) A glycolytic mechanism regulating an angiogenicswitch in prostate cancer. Cancer Res. 67, 149–159
64. He, X. Y., Yang, Y. Z., Peehl, D. M., Lauderdale, A., Schulz, H., and Yang,S. Y. (2003) Oxidative 3alpha-hydroxysteroid dehydrogenase activity ofhuman type 10 17beta-hydroxysteroid dehydrogenase. J. Steroid Bio-chem. Mol. Biol. 87, 191–198
65. Ghosh, A. K., Steele, R., and Ray, R. B. (2005) c-myc Promoter-bindingprotein 1 (MBP-1) regulates prostate cancer cell growth by inhibitingMAPK pathway. J. Biol. Chem. 280, 14325–14330
66. Locke, J. A., Wasan, K. M., Nelson, C. C., Guns, E. S., and Leon, C. G.
Quantitative Proteomic Profiling of Prostate Cancer
Molecular & Cellular Proteomics 9.2 311

(2008) Androgen-mediated cholesterol metabolism in LNCaP and PC-3cell lines is regulated through two different isoforms of acyl-coenzymeA:cholesterol acyltransferase (ACAT). Prostate 68, 20–33
67. Weber, A., Kristiansen, I., Johannsen, M., Oelrich, B., Scholmann, K.,Gunia, S., May, M., Meyer, H. A., Behnke, S., Moch, H., and Kristiansen,G. (2008) The FUSE binding proteins FBP1 and FBP3 are potential c-mycregulators in renal, but not in prostate and bladder cancer. BMC Cancer8, 369
68. Saal, L. H., Johansson, P., Holm, K., Gruvberger-Saal, S. K., She, Q. B.,Maurer, M., Koujak, S., Ferrando, A. A., Malmstrom, P., Memeo, L., Isola,J., Bendahl, P. O., Rosen, N., Hibshoosh, H., Ringner, M., Borg, A., andParsons, R. (2007) Poor prognosis in carcinoma is associated with agene expression signature of aberrant PTEN tumor suppressor pathwayactivity. Proc. Natl. Acad. Sci. U.S.A. 104, 7564–7569
69. Harada, N., Ohmori, Y., Yamaji, R., Higashimura, Y., Okamoto, K., Isohashi,F., Nakano, Y., and Inui, H. (2008) ARA24/Ran enhances the androgen-dependent NH2- and COOH-terminal interaction of the androgen recep-tor. Biochem. Biophys. Res. Commun. 373, 373–377
70. Cross, S. S., Hamdy, F. C., Deloulme, J. C., and Rehman, I. (2005) Expres-sion of S100 proteins in normal human tissues and common cancersusing tissue microarrays: S100A6, S100A8, S100A9 and S100A11 are alloverexpressed in common cancers. Histopathology 46, 256–269
71. Bostwick, D. G., Alexander, E. E., Singh, R., Shan, A., Qian, J., Santella,R. M., Oberley, L. W., Yan, T., Zhong, W., Jiang, X., and Oberley, T. D.(2000) Antioxidant enzyme expression and reactive oxygen species dam-age in prostatic intraepithelial neoplasia and cancer. Cancer 89, 123–134
72. Niu, Y., Altuwaijri, S., Lai, K. P., Wu, C. T., Ricke, W. A., Messing, E. M., Yao,J., Yeh, S., and Chang, C. (2008) Androgen receptor is a tumor suppres-sor and proliferator in prostate cancer. Proc. Natl. Acad. Sci. U.S.A. 105,12182–12187
73. Papadopoulou, N., Charalampopoulos, I., Alevizopoulos, K., Gravanis, A.,and Stournaras, C. (2008) Rho/ROCK/actin signaling regulates mem-brane androgen receptor induced apoptosis in prostate cancer cells.Exp. Cell Res. 314, 3162–3174
74. Nishimura, K., Ting, H. J., Harada, Y., Tokizane, T., Nonomura, N., Kang,H. Y., Chang, H. C., Yeh, S., Miyamoto, H., Shin, M., Aozasa, K.,Okuyama, A., and Chang, C. (2003) Modulation of androgen receptortransactivation by gelsolin: a newly identified androgen receptor coregu-lator. Cancer Res. 63, 4888–4894
75. Ellerhorst, J., Troncoso, P., Xu, X. C., Lee, J., and Lotan, R. (1999) Galec-tin-1 and galectin-3 expression in human prostate tissue and prostatecancer. Urol. Res. 27, 362–367
76. Lowery, A. J., Miller, N., McNeill, R. E., and Kerin, M. J. (2008) MicroRNAsas prognostic indicators and therapeutic targets: potential effect on
breast cancer management. Clin. Cancer Res. 14, 360–36577. Kleer, C. G., Cao, Q., Varambally, S., Shen, R., Ota, I., Tomlins, S. A.,
Ghosh, D., Sewalt, R. G., Otte, A. P., Hayes, D. F., Sabel, M. S., Livant,D., Weiss, S. J., Rubin, M. A., and Chinnaiyan, A. M. (2003) EZH2 is amarker of aggressive breast cancer and promotes neoplastic transfor-mation of breast epithelial cells. Proc. Natl. Acad. Sci. U.S.A. 100,11606–11611
78. Zhang, Y., Chao, T., Li, R., Liu, W., Chen, Y., Yan, X., Gong, Y., Yin, B., Liu,W., Qiang, B., Zhao, J., Yuan, J., and Peng, X. (2009) MicroRNA-128inhibits glioma cells proliferation by targeting transcription factor E2F3a.J. Mol. Med. 87, 43–51
79. Kochevar, G. J., Brody, J. R., Kadkol, S. S., Murphy, K. M., and Pasternack,G. R. (2004) Identification of a functional mutation in pp32r1 (ANP32C).Hum. Mutat. 23, 546–551
80. Shi, J., Hu, Z., Pabon, K., and Scotto, K. W. (2008) Caffeine regulatesalternative splicing in a subset of cancer-associated genes: a role forSC35. Mol. Cell. Biol. 28, 883–895
81. Lee, C. F., Ling, Z. Q., Zhao, T., Fang, S. H., Chang, W. C., Lee, S. C., andLee, K. R. (2009) Genomic-wide analysis of lymphatic metastasis-asso-ciated genes in human hepatocellular carcinoma. World J. Gastroenterol.15, 356–365
82. Alcala, S., Klee, M., Fernandez, J., Fleischer, A., and Pimentel-Muinos, F. X.(2008) A high-throughput screening for mammalian cell death effectorsidentifies the mitochondrial phosphate carrier as a regulator of cyto-chrome c release. Oncogene. 27, 44–54
83. Sreekumar, A., Poisson, L. M., Rajendiran, T. M., Khan, A. P., Cao, Q., Yu,J., Laxman, B., Mehra, R., Lonigro, R. J., Li, Y., Nyati, M. K., Ahsan, A.,Kalyana-Sundaram, S., Han, B., Cao, X., Byun, J., Omenn, G. S., Ghosh,D., Pennathur, S., Alexander, D. C., Berger, A., Shuster, J. R., Wei, J. T.,Varambally, S., Beecher, C., and Chinnaiyan, A. M. (2009) Metabolomicprofiles delineate potential role for sarcosine in prostate cancer progres-sion. Nature 457, 910–914
84. Varambally, S., Cao, Q., Mani, R. S., Shankar, S., Wang, X., Ateeq, B.,Laxman, B., Cao, X., Jing, X., Ramnarayanan, K., Brenner, J. C., Yu, J.,Kim, J. H., Han, B., Tan, P., Kumar-Sinha, C., Lonigro, R. J., Palanisamy,N., Maher, C. A., and Chinnaiyan, A. M. (2008) Genomic loss of mi-croRNA-101 leads to overexpression of histone methyltransferase EZH2in cancer. Science 322, 1695–1699
85. Evangelisti, C., Florian, M. C., Massimi, I., Dominici, C., Giannini, G., Ga-lardi, S., Bue, M. C., Massalini, S., McDowell, H. P., Messi, E., Gulino, A.,Farace, M. G., and Ciafre, S. A. (2009) MiR-128 up-regulation inhibitsReelin and DCX expression and reduces neuroblastoma cell motility andinvasiveness. FASEB J. 23, 4276–4287
Quantitative Proteomic Profiling of Prostate Cancer
312 Molecular & Cellular Proteomics 9.2
Copyright © 2022 FDOKUMEN