Large-scale proteomic identification of S100 proteins in breast cancer tissues
12
RESEARCH ARTICLE Open Access Large-scale proteomic identification of S100 proteins in breast cancer tissues Patrizia Cancemi 1,3 , Gianluca Di Cara 1 , Nadia Ninfa Albanese 1 , Francesca Costantini 1 , Maria Rita Marabeti 1 , Rosa Musso 1 , Carmelo Lupo 2 , Elena Roz 2 , Ida Pucci-Minafra 1,3* Abstract Background: Attempts to reduce morbidity and mortality in breast cancer is based on efforts to identify novel biomarkers to support prognosis and therapeutic choices. The present study has focussed on S100 proteins as a potentially promising group of markers in cancer development and progression. One reason of interest in this family of proteins is because the majority of the S100 genes are clustered on a region of human chromosome 1q21 that is prone to genomic rearrangements. Moreover, there is increasing evidence that S100 proteins are often up-regulated in many cancers, including breast, and this is frequently associated with tumour progression. Methods: Samples of breast cancer tissues were obtained during surgical intervention, according to the bioethical recommendations, and cryo-preserved until used. Tissue extracts were submitted to proteomic preparations for 2D-IPG. Protein identification was performed by N-terminal sequencing and/or peptide mass finger printing. Results: The majority of the detected S100 proteins were absent, or present at very low levels, in the non-tumoral tissues adjacent to the primary tumor. This finding strengthens the role of S100 proteins as putative biomarkers. The proteomic screening of 100 cryo-preserved breast cancer tissues showed that some proteins were ubiquitously expressed in almost all patients while others appeared more sporadic. Most, if not all, of the detected S100 members appeared reciprocally correlated. Finally, from the perspective of biomarkers establishment, a promising finding was the observation that patients which developed distant metastases after a three year follow-up showed a general tendency of higher S100 protein expression, compared to the disease-free group. Conclusions: This article reports for the first time the comparative proteomic screening of several S100 protein members among a large group of breast cancer patients. The results obtained strongly support the hypothesis that a significant deregulation of multiple S100 protein members is associated with breast cancer progression, and suggest that these proteins might act as potential prognostic factors for patient stratification. We propose that this may offer a significant contribution to the knowledge and clinical applications of the S100 protein family to breast cancer. Background Breast cancer is still one of the most frequent forms of cancer in women. Unfortunately, the biological and clin- ical evolution of this type of cancer is not easily predict- able since there are several types that behave differently among patients. This biological heterogeneity is consis- tent with observed varied responses to therapies across patient populations. For this reason the search for new biological markers to support prognosis and therapeutic options remains an open field in oncology research. One class of proteins that is emerging as a potentially important group of markers in cancer development and progression is the S100 family. S100 are small, acidic- Ca 2+ binding proteins, found exclusively in vertebrates. The first member was identified in the nervous system by Moore in 1965 [1]. The S100 name is based on the observation that they are soluble in 100% saturated ammonium sulfate at neutral pH; at least 25 members of the S100 protein family are recognized in human. Twenty one of them (S100A1-S100A18, trichohylin, fil- lagrin, repetin) are coded by genes clustered at * Correspondence: [email protected] 1 Dipartimento di Oncologia Sperimentale e Applicazioni Cliniche (DOSAC) Università di Palermo, Palermo, Italy Full list of author information is available at the end of the article Cancemi et al. BMC Cancer 2010, 10:476 http://www.biomedcentral.com/1471-2407/10/476 © 2010 Cancemi et al; licensee BioMed Central Ltd. This is an Open Access article distributed under the terms of the Creative Commons Attribution License (http://creativecommons.org/licenses/by/2.0), which permits unrestricted use, distribution, and reproduction in any medium, provided the original work is properly cited.
-
Upload
independent -
Category
Documents
-
view
5 -
download
0
Transcript of Large-scale proteomic identification of S100 proteins in breast cancer tissues

RESEARCH ARTICLE Open Access
Large-scale proteomic identification of S100proteins in breast cancer tissuesPatrizia Cancemi1,3, Gianluca Di Cara1, Nadia Ninfa Albanese1, Francesca Costantini1, Maria Rita Marabeti1,Rosa Musso1, Carmelo Lupo2, Elena Roz2, Ida Pucci-Minafra1,3*
Abstract
Background: Attempts to reduce morbidity and mortality in breast cancer is based on efforts to identify novelbiomarkers to support prognosis and therapeutic choices. The present study has focussed on S100 proteins as apotentially promising group of markers in cancer development and progression. One reason of interest in thisfamily of proteins is because the majority of the S100 genes are clustered on a region of human chromosome1q21 that is prone to genomic rearrangements. Moreover, there is increasing evidence that S100 proteins are oftenup-regulated in many cancers, including breast, and this is frequently associated with tumour progression.
Methods: Samples of breast cancer tissues were obtained during surgical intervention, according to the bioethicalrecommendations, and cryo-preserved until used. Tissue extracts were submitted to proteomic preparations for2D-IPG. Protein identification was performed by N-terminal sequencing and/or peptide mass finger printing.
Results: The majority of the detected S100 proteins were absent, or present at very low levels, in the non-tumoraltissues adjacent to the primary tumor. This finding strengthens the role of S100 proteins as putative biomarkers.The proteomic screening of 100 cryo-preserved breast cancer tissues showed that some proteins were ubiquitouslyexpressed in almost all patients while others appeared more sporadic. Most, if not all, of the detected S100members appeared reciprocally correlated. Finally, from the perspective of biomarkers establishment, a promisingfinding was the observation that patients which developed distant metastases after a three year follow-up showeda general tendency of higher S100 protein expression, compared to the disease-free group.
Conclusions: This article reports for the first time the comparative proteomic screening of several S100 proteinmembers among a large group of breast cancer patients. The results obtained strongly support the hypothesis thata significant deregulation of multiple S100 protein members is associated with breast cancer progression, andsuggest that these proteins might act as potential prognostic factors for patient stratification. We propose that thismay offer a significant contribution to the knowledge and clinical applications of the S100 protein family to breastcancer.
BackgroundBreast cancer is still one of the most frequent forms ofcancer in women. Unfortunately, the biological and clin-ical evolution of this type of cancer is not easily predict-able since there are several types that behave differentlyamong patients. This biological heterogeneity is consis-tent with observed varied responses to therapies acrosspatient populations. For this reason the search for new
biological markers to support prognosis and therapeuticoptions remains an open field in oncology research.One class of proteins that is emerging as a potentially
important group of markers in cancer development andprogression is the S100 family. S100 are small, acidic-Ca2+ binding proteins, found exclusively in vertebrates.The first member was identified in the nervous systemby Moore in 1965 [1]. The S100 name is based on theobservation that they are soluble in 100% saturatedammonium sulfate at neutral pH; at least 25 membersof the S100 protein family are recognized in human.Twenty one of them (S100A1-S100A18, trichohylin, fil-lagrin, repetin) are coded by genes clustered at
* Correspondence: [email protected] di Oncologia Sperimentale e Applicazioni Cliniche (DOSAC)Università di Palermo, Palermo, ItalyFull list of author information is available at the end of the article
Cancemi et al. BMC Cancer 2010, 10:476http://www.biomedcentral.com/1471-2407/10/476
© 2010 Cancemi et al; licensee BioMed Central Ltd. This is an Open Access article distributed under the terms of the CreativeCommons Attribution License (http://creativecommons.org/licenses/by/2.0), which permits unrestricted use, distribution, andreproduction in any medium, provided the original work is properly cited.

chromosome locus 1q21 (known as the epidermal differ-entiation complex), while the other genes belonging tothe subfamilies of S100B, S100P, S100Z and S100G, arerespectively located at chromosome loci 21q22, 4p16,5q14 and Xp22 [2]. S100 proteins form homo- and het-erodimers, and even oligomers, and are expressed in tis-sue and cell-specific manner, suggesting that each S100protein may perform different functions [3]. Indeed, it iswell documented that S100 proteins are involved in sev-eral biological processes, such as cell cycle regulation,cell growth, cell differentiation and motility through abroad range of intracellular and extracellular activities[4-6]. Intracellular functions include regulation of pro-tein calcium homeostasis, phosphorylation, regulation ofcytoskeletal components and regulation of transcrip-tional factors. Extracellularly they act in a cytokine likemanner through the receptor for advanced glycationend products (RAGE) [7].The association between S100 family members and
tumors may be explained by several observations: firstly,the region of human chromosome 1q21, where most ofS100 genes are clustered, is prone to genomic rearrange-ments, likely supporting the tumor progression [8];secondly, several S100 members show altered expressionlevels in cancer cells compared to normal cells and aredifferentially expressed in various malignancies, accord-ing to types and stages of cancer [9-15]. Finally, a num-ber of S100 proteins have been shown to interact withand to regulate various proteins involved in cancer andexert different effects on p53 activity [16-20]. However,the occurrence, the role and the possible coordinationof this group of proteins in breast cancer is still poorlyknown. In this study we describe a large-scale proteomicinvestigation performed on breast cancer patients for thescreening of multiple forms of S100 proteins. Theresults have shown that the majority of S100 proteinswere present at very low levels, if not absent, in thenon-tumoral tissues adjacent to the primary tumor. Theproteomic screening, extended to 100 cryo-preservedbreast cancer tissues, showed that some S100 proteinmembers were ubiquitously expressed in almost allpatients, while others appeared more sporadic amongthe same group of patients. Most, if not all, of thedetected S100 members appeared reciprocally correlated.More interestingly, patients which developed distantmetastases after a three year follow-up showed a generaltendency of higher S100 protein expression, comparedto the disease-free group.
MethodsClinical specimensThe present study was conducted on 100 surgical tissuesof ductal infiltrating breast cancer collected between2003 and 2007 in the Breast Unit of the La Maddalena
Hospital. Research was carried out in compliance withthe Helsinki Declaration with the patients’ written con-sent and with the approval of the Institutional ReviewBoard (N°515/2008) from the La Maddalena Hospital.The study used leftover specimens, that is, aliquots ofspecimens collected for routine clinical care, and imme-diately frozen at -80°C until used. The specimens werenot individually identifiable.The patients of this study did not receive any cyto-
toxic/endocrine treatment prior to surgery. Diagnosisof ductal breast cancer (G2/G3) was confirmedhistopathologically.Post-operative monitoring to define whether or not dis-
tant metastases were present, was performed by conven-tional imaging follow-up, consisting of chest radiography,bone scintigraphy, magnetic resonance imaging (MRI)and positron emission tomography using 2-[fluorine-18]fluoro-2-deoxy-D-glucose (FDG-PET), as clinically indi-cated at La Maddalena Hospital.
Sample preparationsThe frozen breast tissue samples were washed severaltimes with phosphate-buffered saline and homogenizedin RIPA buffer (50 mM Tris pH 7.5, 0.1% Nonidet P-40,0.1% deoxycholate, 150 mM NaCl, 4 mM EDTA) con-taining a mixture of protease inhibitors (0.01% aprotinin,10 mM sodium pyrophosphate, 2 mM sodium orthova-nadate, 1 mM PMSF). The extraction was carried outovernight at 4°C with the same buffer. The total cellularlysate was centrifuged to remove tissue debris, and theresulting supernatant dialysed against ultrapure distilledwater, lyophilized and stored at -80°C until use. The totalprotein concentration was determined by the Bradfordmethod using bovine serum albumin as a standard [21].
Two Dimensional Gel ElectrophoresisThe proteins extracted from breast cancer tissue andnormal adjacent tissue were solubilised in a buffer con-taining 4% CHAPS, 40 mM Tris, 65 mM DTE in 8 Murea. Aliquots of 45 μg (analytical gels) or 1.5 mg (pre-parative gels) of total proteins were separately mixedwith 350 μL of rehydration solution containing 8 Murea, 2% CHAPS, 10 mM DTE and 0.5% carrier anpho-lytes (Resolyte 3.5-10), and applied for IEF using com-mercial sigmoidal IPG strips, 18 cm long with pH range3.0-10. The second dimension was carried out on 9-16%linear gradient polyacrylamide gels (SDS-PAGE), andthe separated proteins were visualized by ammoniacalsilver staining. Stained gels were digitized using a com-puting densitometer and analyzed with Image Mastersoftware (Amersham Biosciences, Sweden). Gel calibra-tion was carried out using an internal standard and thesupport of the ExPaSy molecular biology server, asdescribed [22].
Cancemi et al. BMC Cancer 2010, 10:476http://www.biomedcentral.com/1471-2407/10/476
Page 2 of 12

Protein identificationN-Terminal microsequencing was performed by auto-mated Edman degradation in a protein sequencer (Procise,419 Applied Biosystems), as previously described [23].Mass spectrometric sequencing was performed by
Voyager DE-PRO (Applied Biosystems) mass spectro-meter as described [24]. Briefly, proteins were digestedusing sequencing-grade trypsin (20 μg/vial). The trypticpeptide extracts were dried and redissolved in 10 μL of0.1% trifluoroacetic acid (TFA). The matrix, R-cyano-4-hydroxycinnamic acid (HCCA), was purchased fromSigma-Aldrich. A saturated solution of HCCA (1 μL) at2 mg/200 μL in CH3CN/H2O (50:50 (v/v)) containing0.1% TFA was mixed with 1 μL of peptide solution onthe MALDI plate and left to dry. MALDI-TOF massspectra were recorded in the 500-5000 Da mass range,using a minimum of 100 shots of laser per spectrum.Delayed extraction source and reflector equipmentallowed sufficient resolution to consider MH+ of mono-isotopic peptide masses. Internal calibration was doneusing trypsin autolysis fragments at m/z 842.5100,1045.5642, and 2211.1046 Da. Peptide mass fingerprint-ing was compared to the theoretical masses from theSwiss-Prot or NCBI sequence databases using Mascothttp://www.matrixscience.com/. Typical search para-meters were as follows: (50 ppm of mass tolerance, car-bamidomethylation of cysteine residues, one missedenzymatic cleavage for trypsin, a minimum of four pep-tide mass hits was required for a match, methionineresidues could be considered in oxidized form.
Western BlottingFor immune detection the 1D-gels were electrotrans-ferred onto nitrocellulose membrane (HyBond ECL,Amersham) and stained with Ponceau S (Sigma). Themembranes were then probed with one of the followingmonoclonal antibodies: anti-actin (Oncogene), anti-S100A2, anti-S100A4, anti-S100A6, anti-S100A7, antiS100A8 (Santa Cruz), or polyclonal antibodies: anti-S100A11, anti-S100A13 (SantaCruz). Following incuba-tion with the appropriate peroxidase-linked antibody,the reaction was revealed by the ECL detection system,using high performance films (Hyperfilm ECL,Amersham).
Quantification and normalization methodsQuantitative expression levels were calculated as thevolume of the spots (i.e. integration of optical densityover the spot area). In order to correct for differences ingel staining, spot volumes relative to the sum of thevolume of all spots an each gel (%Vol) were calculatedby the software.Since the cell densities within an area of the surgical
sample, may be very variable among the different
patients, measurements of relative expression levels ofindividual protein spots were normalized in each mapfor actin content [24] and the final value was designatedas N%V. The relative abundance of silver stained actinwas validated by western blot assays on the same tissueextract (Fig. 1).For statistical analyses Ms Excel and Graph Pad Prism
4 software were used. Correlation of S100 protein mem-bers for breast cancer patients was performed using thePearson correlation test. The difference in S100 expres-sion between metastatic versus disease free patients wasanalyzed by unpaired F test. In all cases, p < 0.05 wasconsidered significant (*), p < 0.01 highly significant (**)and p < 0.001 very highly significant (***).
ResultsProteomic identification of S100 proteinsIn a previous work we reported the comparative pro-teomic profiles of proteins from 37 breast cancer sur-gical tissues [24]. Fig. 2 shows an updated proteomicmap representative of a breast surgical tissue. Theidentified proteins are marked with labels correspond-ing to the access number of the Swiss-Prot database:
Figure 1 Representative group of tissue extracts proteomicsassayed for the actin content. A) Experimental windows croppedfrom Image-Master 2 D Platinum software containing the sectionsof actin spots from the silver stained 2D-IPG. B) 1D-western blotvalidation of the actin content on corresponding tissue extractswith the same gel-loading.
Cancemi et al. BMC Cancer 2010, 10:476http://www.biomedcentral.com/1471-2407/10/476
Page 3 of 12

205 protein spots, corresponding to 114 distinct pro-teins, were identified in the maps. The protein identitywas assessed by Maldi-Tof or N-Terminalmicrosequencing.Fig. 3A shows the image of a gel window comprising
an area covering a pI/kDa range of 4.5-7/15-9 kDa,where the majority of known members of S100 proteinsare expected to localize.After a comprehensive screening of protein spots
included in this area, in different proteomic maps, weidentified the following S100 protein members: S100A2(protein S-100L), S100A4 (metastasin), S100A6 (Calcy-clin, Prolactin receptor-associated protein), two iso-forms, S100A7 (psoriasin), two isoforms, S100A8(Calgranulin-A), S100A11 (Calgizzarin), three isoformsand S100A13 (S100 calcium-binding protein A13). Dif-ferent isoforms of the same protein were labelled byalphabetic letters starting from the more acidic one.Fig. 3B illustrates the Maldi-Tof mass spectra of the cor-responding spots shown in Fig. 3A. The list of identifiedproteins is shown in Table 1.
S100 proteins are preferentially expressed in the tumor massA group of 10 breast cancer tissues and their matchednon tumoral counterparts were analyzed for comparativeproteomic expression of the S100 proteins. Fig. 4 shows apanel of the cropped images from 2-D matched gels ofthe 10 selected patients. The S100 proteins are almostexclusively present in the tumor extracts, even thoughsome S100 members are expressed at low, or very lowlevels, for example S100A2, S100A4 and S100A8. Fig 5shows box-plot graphs illustrating the quantitative varia-tion of S100 protein expression levels between breastcancer and normal adjacent tissues. Significant differ-ences were observed for all S100 protein members,except for S100A4 (expressed only in 5 patients) and forS100A6 (expressed also in normal tissues). Thereforethese two proteins were not included in Fig. 5.
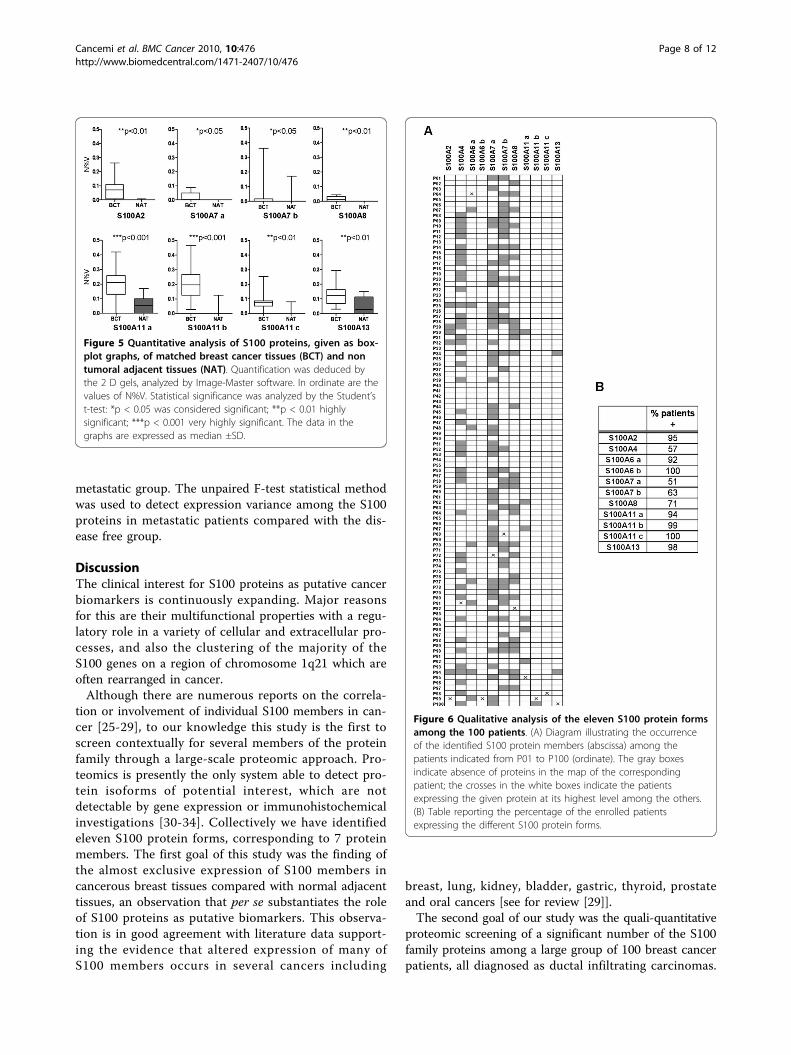
Proteomic distribution of S100 proteins within a cohortof 100 breast cancer patientsFig. 6A shows a diagram illustrating the occurrence ofthe identified S100 protein members (abscissa) among
Figure 2 Representative gel image of a breast cancer tissue. 2-D separation was performed on IPG gel strips (18 cm, 3.0-10 NL) followed bythe SDS-PAGE on a vertical linear-gradient slab gel (9-16%T). Protein spots of known identity are marked with the Swiss-prot accession number.When present, different isoforms of the same protein were jointly labelled.
Cancemi et al. BMC Cancer 2010, 10:476http://www.biomedcentral.com/1471-2407/10/476
Page 4 of 12

Figure 3 Identification of S100 proteins. A) Gel window comprising an area covering a pI/kDa range of 4.5-7/15-9 kDa, where the majority ofknown members of non-keratin associated S100 proteins, are expected to localize. The protein spots localizing in this area were picked from thegels and digested with trypsin. The resulting fragments were analyzed by mass spectrometry. Eleven spots were identified as S100 proteinmembers. The numbers indicate the eleven spots corresponding to S100 proteins, whose spectra are shown in B). The mass peaks marked withan asterisk match the theoretical spectrum of the assigned proteins.
Cancemi et al. BMC Cancer 2010, 10:476http://www.biomedcentral.com/1471-2407/10/476
Page 5 of 12

the 100 patients indicated from P01 to P100 (ordinate).The gray boxes indicate the absence of proteins in themap of the corresponding patient and the crosses indi-cate the patient expressing the given protein at its high-est level. Interestingly, some proteins are expressed inalmost all patients (S100A6, S100A11, S100A2 andS100A13); while others are expressed in a variable num-ber of patients, i.e.: S100A8 in 71% of the patients,S100A4 in 57% and S100A7 in 51% (isoform a) and 63%(isoform b) (Fig. 6B).In order to quantify the relative expression levels of
individual S100 protein members the intensity of eachprotein spot was normalized for the actin content of thecorresponding map. Fig. 7 shows the expression levelsof each S100 protein, including isoforms, within thecohort of 100 patients. Except for S100A6, the averagevalue of expression for each protein form (evaluated asN%V) does not exceed the relative abundance value of0.25. The expression range of each S100 member isquite variable among patients: for instance, while thebasic form of S100A6 ranges from 0.009 to 1.7, S100A4ranges from 0.005 to 0.35.
Relationship between expression levels of S100 membersThe expression level of each S100 protein was cross-tabulated with the other protein members and statisticalsignificance was assessed by the Pearson test. A signifi-cant association was observed for a high percentage of
them (Fig. 8). More analytically, for S100 protein spotspresent as multiple isoforms, the more basic ones, hav-ing the closest pI to the theoretical values and likelyrepresenting the primary gene product, showed positivecorrelations with the other S100 members, except forS100A7 b and S100A8 that showed no correlation withthe b-isoform of the S100A6 and with the S100A13.
Western blot validation of S100 proteinsImmunological assays were performed to confirm thedifferential expression of all the S100 proteins identifiedin 2D-IPG. Validation with the appropriate antibodies,was performed on patient couples, chosen among theones indicated by P01-P100 in the diagram in Fig. 5A,having high and low levels of the S100 proteins, respec-tively. Fig. 9 shows a panel of cropped 2 D gels contain-ing the silver stained S100 protein spots, paired with the1D-western blot image on the same tissue extract.
Association of S100 members with tumor variablesThe expression levels of S100 proteins were correlatedwith current clinical-pathological parameters whichincluded age, tumor size, nodal status, immuno-cyto-chemical presence of HER-2, oestrogen receptors, pro-gesterone receptor, and Ki67 (Table 2). The resultsshowed no significant correlations of the different S100protein forms with tumor variables, except for S100A6(isoform b) and S100A13 correlating with Ki67 (p =
Table 1 Synopsis of the information on the identified S100 proteins
SPOTNUMBER
ENTRYNAME
SPOTNAME
AC PROTEINNAME
MOWSESCORE
NUMBER OF MASSVALUES SEARCHED
NUMBER OF MASSVALUES MATCHED
(%)SEQUENCECOVERAGE
THEORETICALMW (Da) - pI
1 S10A2 S100A2 P29034 S100-A2 229 18 16 59 11337-4.68
7 S10A4 S100A4 P26447 S100-A4Metastasin
129 16 10 51 11949-5.85
2 S10A6 S100A6 a P06703 S100-A6Calcyclin
77 4 4 28 10230-5.33
4 S10A6 S100A6b
P06703 S100-A6Calcyclin
68 5 4 40 10230-5.33
8 S10A7 S100A7 a P31151 S100-A7Psoriasin
80 8 5 39 11470-6.27
10 S10A7 S100A7b
P31151 S100-A7Psoriasin
101 6 6 35 11470-6.27
11 S10A8 S100A8 P05109 S100-A8Calgranulin
76 36 8 49 10885-6.51
3 S10AB S100A11a
P31949 S100-A11Calgizzarin
82 5 5 42 11847-6.56
5 S10AB S100A11b
P31949 S100-A11Calgizzarin
127 11 11 61 11847-6.56
9 S10AB S100A11c
P31949 S100-A11Calgizzarin
73 6 5 34 11847-6.56
6 S10AD S100A13 Q99584 S100-A13 226 19 13 89 11464-5.91
Entry names, protein names, accession numbers and theoretical MW and pI are from the Swiss-Prot database. Mowse score represent -10* Log (P), where P is theprobability that the observed match is a random event. Number of mass value matched and the % of sequence coverage are given by Mascot database in theprotein view session.
Cancemi et al. BMC Cancer 2010, 10:476http://www.biomedcentral.com/1471-2407/10/476
Page 6 of 12

0.043; p = 0.041) and for S100A11 (isoform a) correlat-ing with nodal status (p = 0.021).
Association of S100 members with metastasesFrom several reports, individual S100 proteins have beenfound to correlate with metastasis; however a wide-ranging pattern of S100 protein members in a largescale of breast cancer patients was never screened
before. Therefore, we analyzed our data set concerningthe expression level of S100 proteins with respect totheir association with the development of distant metas-tases. Patients with 3-year follow-up were fifty seven, 22had developed distant metastases while 35 were disease-free. As shown in Fig. 10 the expression level of eachS100 protein (expressed as average among patients ofeach group) was 1.07 to 2.13 fold higher in the
Figure 4 Panel of cropped areas of individual S100 protein spots from matched breast cancer tissues (BCT) and non tumoral adjacenttissues (NAT). The experiments were conducted on a pilot group of 10 patients, selected for the present study.
Cancemi et al. BMC Cancer 2010, 10:476http://www.biomedcentral.com/1471-2407/10/476
Page 7 of 12
metastatic group. The unpaired F-test statistical methodwas used to detect expression variance among the S100proteins in metastatic patients compared with the dis-ease free group.
DiscussionThe clinical interest for S100 proteins as putative cancerbiomarkers is continuously expanding. Major reasonsfor this are their multifunctional properties with a regu-latory role in a variety of cellular and extracellular pro-cesses, and also the clustering of the majority of theS100 genes on a region of chromosome 1q21 which areoften rearranged in cancer.Although there are numerous reports on the correla-
tion or involvement of individual S100 members in can-cer [25-29], to our knowledge this study is the first toscreen contextually for several members of the proteinfamily through a large-scale proteomic approach. Pro-teomics is presently the only system able to detect pro-tein isoforms of potential interest, which are notdetectable by gene expression or immunohistochemicalinvestigations [30-34]. Collectively we have identifiedeleven S100 protein forms, corresponding to 7 proteinmembers. The first goal of this study was the finding ofthe almost exclusive expression of S100 members incancerous breast tissues compared with normal adjacenttissues, an observation that per se substantiates the roleof S100 proteins as putative biomarkers. This observa-tion is in good agreement with literature data support-ing the evidence that altered expression of many ofS100 members occurs in several cancers including
breast, lung, kidney, bladder, gastric, thyroid, prostateand oral cancers [see for review [29]].The second goal of our study was the quali-quantitative
proteomic screening of a significant number of the S100family proteins among a large group of 100 breast cancerpatients, all diagnosed as ductal infiltrating carcinomas.
Figure 5 Quantitative analysis of S100 proteins, given as box-plot graphs, of matched breast cancer tissues (BCT) and nontumoral adjacent tissues (NAT). Quantification was deduced bythe 2 D gels, analyzed by Image-Master software. In ordinate are thevalues of N%V. Statistical significance was analyzed by the Student’st-test: *p < 0.05 was considered significant; **p < 0.01 highlysignificant; ***p < 0.001 very highly significant. The data in thegraphs are expressed as median ±SD.
Figure 6 Qualitative analysis of the eleven S100 protein formsamong the 100 patients. (A) Diagram illustrating the occurrenceof the identified S100 protein members (abscissa) among thepatients indicated from P01 to P100 (ordinate). The gray boxesindicate absence of proteins in the map of the correspondingpatient; the crosses in the white boxes indicate the patientsexpressing the given protein at its highest level among the others.(B) Table reporting the percentage of the enrolled patientsexpressing the different S100 protein forms.
Cancemi et al. BMC Cancer 2010, 10:476http://www.biomedcentral.com/1471-2407/10/476
Page 8 of 12

Qualitative analysis showed that some of the S100 proteinmembers are ubiquitously expressed in all patients whileothers appeared more sporadic. Among the first, are:S100A2, S100A6, S100A11 and S100A13 (all isoforms,when present); the members with more or less sporadicappearance are: S100A8 (71%), S100A4 (57%) andS100A7 (51%, isoform a and 63%, isoform b).The quantitative evaluation showed that the expres-
sion levels of each S100 member was different amongpatients, but collectively, most of the S100 proteinforms were statistically correlated. This adds complexityto the role of this protein category in breast cancer andsuggests a possible common pathway of (dys-)regulation.Finally, we investigated the prognostic potential of
S100 proteins to predict distant metastatic relapse dur-ing a time lapse of three years from the surgical inter-vention. The most robust correlation with metastasisregarded primarily the protein S100A4, and secondlythe protein S100A7. The S100A4, also named metastasinfor its presumed role in metastasis promotion, is one ofthe most investigated in the recent literature [see forreview [35]], as a promising biomarker of breast metas-tasis. Our results are in agreement with this hypothesis,since S100A4 expression level shows an increase ofmore than 2 fold in the metastatic group.
Figure 7 Diagram of the relative intensities of the eleven S100protein forms among the 100 patients. In abscissa are indicatedthe protein names and in the ordinate the density values. Barsindicate the mean of each protein expression level among patients.
Figure 8 Association analysis of expression levels of S100 members evaluated as N%V. Statistical significance of the S100 memberscorrelation was assessed by Pearson test and considered as significant, highly significant and very highly significant (*p < 0.05; **p < 0.01; ***p< 0.001). Correlation is indicated as Yes.
Cancemi et al. BMC Cancer 2010, 10:476http://www.biomedcentral.com/1471-2407/10/476
Page 9 of 12

ConclusionsPresent data strongly support the hypothesis that a sig-nificant deregulation of multiple S100 family membersis associated with breast cancer progression, and suggestthat these proteins might act as potential prognosticfactors for patient stratification. Although the patho-
Figure 9 Western Blot validation of S100 proteins detected bysilver stain proteomics. The panel shows the cropped areas of 2D gels containing the silver stained S100 protein spots (left), pairedwith the 1D-western blot image on the same selected breast cancertissue (right). The validation was performed on two surgical samplesfor each S100-antibody, chosen among the 100 patient tissuesshowing respectively high and low levels of each S100 protein.
Table 2 Clinical-pathological characteristics of patients and correlation with S100 protein expression
S100A2 S100A4 S100A6a
S100A6 b S100A7a
S100A7b
S100A8 S100A11a
S100A11b
S100A11c
S100A13
Age (n = 100) p > 0.05 p > 0.05 p > 0.05 p > 0.05 p > 0.05 p > 0.05 p > 0.05 p > 0.05 p > 0.05 p > 0.05 p > 0.05
≤ 56 42%
> 56 58%
T (n = 73) p > 0.05 p > 0.05 p > 0.05 p > 0.05 p > 0.05 p > 0.05 p > 0.05 p > 0.05 p > 0.05 p > 0.05 p > 0.05
1 33%
2 56%
3 5%
4 6%
N (n = 76) p > 0.05 p > 0.05 p > 0.05 p > 0.05 p > 0.05 p > 0.05 p > 0.05 p =0.0210*
p > 0.05 p > 0.05 p > 0.05
Neg 39%
Pos 61%
HER-2 (n = 80) p > 0.05 p > 0.05 p > 0.05 p > 0.05 p > 0.05 p > 0.05 p > 0.05 p > 0.05 p > 0.05 p > 0.05 p > 0.05
0 45%
1 24%
2 14%
3 17%
ER (n = 90) p > 0.05 p > 0.05 p > 0.05 p > 0.05 p > 0.05 p > 0.05 p > 0.05 p > 0.05 p > 0.05 p > 0.05 p > 0.05
Neg 31%
Pos 69%
PR (n = 89) p > 0.05 p > 0.05 p > 0.05 p > 0.05 p > 0.05 p > 0.05 p > 0.05 p > 0.05 p > 0.05 p > 0.05 p > 0.05
Neg 42%
Pos 58%
Ki67% (n = 77) p > 0.05 p > 0.05 p > 0.05 p = 0.043* p > 0.05 p > 0.05 p > 0.05 p > 0.05 p > 0.05 p > 0.05 p =0.041*
≤ 15% 23%
16-30% 29%
> 30% 48%
Pearson t-test was used to evaluate the association among age, T, N, HER-2, ER, PR and Ki67 and S100 proteins expression. *p < 0.05 was considered significantand marked in bold.
Figure 10 Changes in S100 expression levels betweenmetastases and disease free -related patients. Data arerepresented as ratio of metastatic group to disease free group.P-values, calculated by F-test were considered as significant, highlysignificant and very highly significant (*p < 0.05; **p < 0.01;***p < 0.001).
Cancemi et al. BMC Cancer 2010, 10:476http://www.biomedcentral.com/1471-2407/10/476
Page 10 of 12

physiologic implications of the S100 proteins in cancerstill require further clarification, the description of theirdifferential occurrence in a large group of breast cancerpatients, at proteomic levels, is a further important steppromoting advancement of scientific knowledge for bio-marker application in clinical practice.
AcknowledgementsThis research is part of the project DIAMOL (Por Sicilia misura 3.4). Financialsupport was also given by 5x1000 contribution to COBS.Authors wish to thank Dr. I. Riili of the Breast Unit at La Maddalena Hospital,for providing clinical data.
Author details1Dipartimento di Oncologia Sperimentale e Applicazioni Cliniche (DOSAC)Università di Palermo, Palermo, Italy. 2Ospedale La Maddalena D.O. III livello,Palermo, Italy. 3Centro di Oncobiologia Sperimentale (COBS), Palermo, Italy.
Authors’ contributionsAll authors participated in the interpretation and elaboration of the findings.IPM and PC were responsible for the conception and design of the studyand drafted the manuscript. GDC performed the protein identification. NNAperformed protein analysis. FC, MRM, RM carried out 2D-IPG. CL and ERcontributed with clinical information. All authors have read and approvedthe final manuscript.
Competing interestsThe authors declare that thet have no competing interests.
Received: 3 March 2010 Accepted: 3 September 2010Published: 3 September 2010
References1. Moore BW: A soluble protein characteristic of the nervous system.
Biochem Biophys Res Commun 1965, 19:739-744.2. Santamaria-Kisiel L, Rintala-Dempsey AC, Shaw GS: Calcium-dependent and
-independent interactions of the S100 protein family. Biochem J 2006,396:201-214.
3. Donato R: Functional roles of S100 proteins, calcium-binding proteins ofthe EF-hand type. Biochim Biophys Acta 1999, 1450:191-231.
4. Donato R: Intracellular and extracellular roles of S100proteins. Microsc ResTech 2003, 6:540-51.
5. Donato R: S100: A multigenic family of calcium-modulated proteins ofthe EF-hand type with intracellular and extracellular functional roles. IntJ Biochem Cell Biol 2001, 33:637-68.
6. Heizmann CW, Fritz G, Schafer BW: S100 proteins: Structure, functions andpathology. Front Biosci 2002, 7:1356-68.
7. Leclerc E, Fritz G, Vetter SW, Heizmann CW: Binding of S100 proteins toRAGE: an update. Biochim Biophys Acta 2009, 1793:993-1007.
8. Salama I, Malone PS, Mihaimeed F, Jones JL: A review of the S100 proteinsin cancer. Eur J Surg Oncol 2008, 34:357-64.
9. Zhang H, Zhao Q, Chen Y, Wang Y, Gao S, Mao Y, Li M, Peng A, He D,Xiao X: Selective expression of S100A7 in lung squamous cellcarcinomas and large cell carcinomas but not in adenocarcinomas andsmall cell carcinomas. Thorax 2008, 63:352-9.
10. Wang G, Wang X, Wang S, Song H, Sun H, Yuan W, Cao B, Bai J, Fu S:Colorectal cancer progression correlates with upregulation of S100A11expression in tumor tissues. Int J Colorectal Dis 2008, 23:675-82.
11. Yang YQ, Zhang LJ, Dong H, Jiang CL, Zhu ZG, Wu JX, Wu YL, Han JS,Xiao HS, Gao HJ, Zhang QH: Upregulated expression of S100A6 in humangastric cancer. J Dig Dis 2007, 8:186-93.
12. Ohuchida K, Mizumoto K, Miyasaka Y, Yu J, Cui L, Yamaguchi H, Toma H,Takahata S, Sato N, Nagai E, Yamaguchi K, Tsuneyoshi M, Tanaka M: Over-expression of S100A2 in pancreatic cancer correlates with progressionand poor prognosis. J Pathol 2007, 213:275-82.
13. Yao R, Davidson DD, Lopez-Beltran A, MacLennan GT, Montironi R, Cheng L:The S100 proteins for screening and prognostic grading of bladdercancer. Histol Histopathol 2007, 22:1025-32.
14. Ohuchida K, Mizumoto K, Yu J, Yamaguchi H, Konomi H, Nagai E,Yamaguchi K, Tsuneyoshi M, Tanaka M: S100A6 is increased in a stepwisemanner during pancreatic carcinogenesis: clinical value of expressionanalysis in 98 pancreatic juice samples. Cancer Epidemiol Biomarkers Prev2007, 16:649-54.
15. Moubayed N, Weichenthal M, Harder J, Wandel E, Sticherling M, Gläser R:Psoriasin (S100A7) is significantly up-regulated in human epithelial skintumours. J Cancer Res Clin Oncol 2007, 133:253-61.
16. Kennedy RD, Gorski JJ, Quinn JE, Stewart GE, James CR, Moore S,Mulligan K, Emberley ED, Lioe TF, Morrison PJ, Mullan PB, Reid G,Johnston PG, Watson PH, Harkin DP: BRCA1 and c-Myc associate totranscriptionally repress psoriasin, a DNA damage-inducible gene. CancerRes 2005, 65:10265-72.
17. Emberley ED, Niu Y, Curtis L, Troup S, Mandal SK, Myers JN, Gibson SB,Murphy LC, Watson PH: The S100A7-c-Jun activation domain bindingprotein 1 pathway enhances prosurvival pathways in breast cancer.Cancer Res 2005, 65:5696-702.
18. van Dieck J, Fernandez-Fernandez MR, Veprintsev DB, Fersht AR:Modulation of the oligomerization state of p53 by differential binding ofproteins of the S100 family to p53 monomers and tetramers. J Biol Chem2009, 284:13804-11.
19. Słomnicki ŁP, Nawrot B, Leśniak W: S100A6 binds p53 and affects itsactivity. Int J Biochem Cell Biol 2009, 41:784-90.
20. Fernandez-Fernandez MR, Rutherford TJ, Fersht AR: Members of the S100family bind p53 in two distinct ways. Protein Sci 2008, 17:1663-70.
21. Bradford MM: A rapid and sensitive method for the quantitation ofmicrogram quantities of protein utilizing the principle of protein-dyebinding. Anal Biochem 1976, 7:248-254.
22. Pucci-Minafra I, Fontana S, Cancemi P, Alaimo G, Minafra S: Proteomicpatterns of cultured breast cancer cells and epithelial mammary cells.Ann N Y Acad Sci 2002, 963:122-39.
23. Pucci-Minafra I, Fontana S, Cancemi P, Basiricò L, Caricato S, Minafra S: Acontribution to breast cancer cell proteomics: detection of newsequences. Proteomics 2002, 2:919-27.
24. Pucci-Minafra I, Cancemi P, Albanese NN, Di Cara G, Marabeti MR,Marrazzo A, Minafra S: New protein clustering of breast cancer tissueproteomics using actin content as a cellularity indicator. J Proteome Res2008, 7:1412-8.
25. Wang H, Zhang Z, Li R, Ang KK, Zhang H, Caraway NP, Katz RL, Jiang F:Overexpression of S100A2 protein as a prognostic marker for patientswith stage I non small cell lung cancer. Int J Cancer 2005, 116:285-90.
26. Semov A, Moreno MJ, Onichtchenko A, Abulrob A, Ball M, Ekiel I,Pietrzynski G, Stanimirovic D, Alakhov V: Metastasis-associated proteinS100A4 induces angiogenesis through interaction with Annexin II andaccelerated plasmin formation. J Biol Chem 2005, 280:20833-41.
27. El-Rifai W, Moskaluk CA, Abdrabbo MK, Harper J, Yoshida C, Riggins GJ,Frierson HF Jr, Powell SM: Gastric cancers overexpress S100A calcium-binding proteins. Cancer Res 2002, 62:6823-6.
28. Wang G, Zhang S, Fernig DG, Martin-Fernandez M, Rudland PS,Barraclough R: Mutually antagonistic actions of S100A4 and S100A1 onnormal and metastatic phenotypes. Oncogene 2005, 24:1445-54.
29. Sedaghat F, Notopoulos A: S100 protein family and its application inclinical practice. Hippokratia 2008, 12:198-204.
30. Cross SS, Hamdy FC, Deloulme JC, Rehman I: Expression of S100 proteinsin normal human tissues and common cancers using tissue microarrays:S100A6, S100A8, S100A9 and S100A11 are all overexpressed in commoncancers. Histopathology 2005, 46:256-69.
31. Hsieh HL, Schafer BW, Sasaki N, Heizmann CW: Expression analysis of S100proteins and RAGE in human tumors using tissue microarrays. BiochemBiophys Res Commun 2003, 307:375-381.
32. Jassem E, Serkies K, Dziadziuszko R, Drozdowska A, Kobierska-Gulida G,Skokowski J, Góźdź S, Urbaniak A, Sygut J, Jassem J: Prognostic value of S-100 immunostaining in tumour cells of non-small cell lung cancer.Biomarkers 2006, 11:262-9.
33. Ohuchida K, Mizumoto K, Ishikawa N, Fujii K, Konomi H, Nagai E,Yamaguchi K, Tsuneyoshi M, Tanaka M: The role of S100A6 in pancreaticcancer development and its clinical implication as a diagnostic markerand therapeutic target. Clin Cancer Res 2005, 11:7785-93.
34. Ohuchida K, Mizumoto K, Ohhashi S, Yamaguchi H, Konomi H, Nagai E,Yamaguchi K, Tsuneyoshi M, Tanaka M: S100A11, a putative tumor
Cancemi et al. BMC Cancer 2010, 10:476http://www.biomedcentral.com/1471-2407/10/476
Page 11 of 12

suppressor gene, is overexpressed in pancreatic carcinogenesis. ClinCancer Res 2006, 12:5417-22.
35. Boye K, Maelandsmo GM: S100A4 and metastasis: a small actor playingmany roles. Am J Pathol 2010, 176:528-35.
Pre-publication historyThe pre-publication history for this paper can be accessed here:http://www.biomedcentral.com/1471-2407/10/476/prepub
doi:10.1186/1471-2407-10-476Cite this article as: Cancemi et al.: Large-scale proteomic identificationof S100 proteins in breast cancer tissues. BMC Cancer 2010 10:476.
Submit your next manuscript to BioMed Centraland take full advantage of:
• Convenient online submission
• Thorough peer review
• No space constraints or color figure charges
• Immediate publication on acceptance
• Inclusion in PubMed, CAS, Scopus and Google Scholar
• Research which is freely available for redistribution
Submit your manuscript at www.biomedcentral.com/submit
Cancemi et al. BMC Cancer 2010, 10:476http://www.biomedcentral.com/1471-2407/10/476
Page 12 of 12