Distinct proteomic profiles of amphetamine self-administration transitional states
Upload
khangminh22Category
view
4download
0
Proteomic analysis of acclimation in the Arabidopsis thaliana thylakoid
membrane
Sarah Elizabeth Flannery
Faculty of Science
Department of Molecular Biology and Biotechnology
A thesis submitted for the degree of Doctor of Philosophy
March 2021

i
Abstract
Photosynthetic acclimation is the ability of photosynthetic organisms to respond to light irradiance by
adjusting the composition of the thylakoid membrane to maintain photosynthetic efficiency. The work
described in this thesis utilises mass spectrometry-based proteomics to quantify the changes in thylakoid
protein abundance that occur during acclimation in Arabidopsis thaliana. A novel strategy for label-
free quantitative thylakoid proteomics was developed and combined with electron microscopy,
structured illumination microscopy, and various biochemical and spectroscopic analyses to further our
understanding of thylakoid proteome remodelling in response to environmental conditions. First, the
thylakoid proteomes of Arabidopsis plants grown under low, moderate and high light intensity were
compared. Arabidopsis grown outdoors in naturally fluctuating light conditions were then investigated
to identify mechanisms particularly important for photosynthesis in the field. Finally, the
phosphorylation mutants stn7 and tap38, the former previously reported as defective in long term
acclimation, grown under different light irradiances were subjected to proteomic analysis, as well as the
proton gradient regulation mutant pgr5. The results of this thesis revealed changes in protein abundance
associated with light harvesting, electron transfer, thylakoid architecture and photoprotection. STN7 is
not essential for acclimation but the effects of perturbed LHCII (de)phosphorylation on grana size and
light harvesting are compensated for by alterations to photosystem stoichiometry. While
phosphorylation regulates dynamic thylakoid stacking, proteomic analysis revealed changes in CURT1
and RIQ1/2 protein abundance associated with long term alterations in grana size. Low light plants
maintain fast relaxation of quenching whereas plants acclimated to high light intensity increase their
capacity for linear electron transfer and rapid induction of quenching. Constant light acclimated plants
favour PGR5/PGRL1-mediated cyclic electron transfer while those in a natural environment focus on
increasing NDH. While individual changes in thylakoid protein abundance have been studied
extensively in the past, this data, which includes many regulatory proteins not previously quantified,
provides a view of thylakoid proteome remodelling in unprecedented detail.

ii
Acknowledgements
First, I would like to thank my supervisor, Matt, for the opportunity to undertake this PhD. His ongoing
support and enthusiasm, as well as the fun and friendly culture of the lab group, has kept me motivated
throughout the project. I would also like to thank my second supervisor, Mark, and the rest of the
Dickman group for welcoming me into their lab meetings and, of course, pub trips.
I would like to thank all past and present members of the E6 office for being a great bunch of people
and for consistently improving my day with your silliness, and to give another thanks to everyone else
in the wider Hunter/Johnson lab for the hilarious pub trips, games nights and prosecco-fuelled office
celebrations. Particularly, thank you to Will Wood for helping me get started at the beginning of my
PhD. I would also like to thank both Will and Tommy Emrich-Mills for their contributions to this work
through SIM, as well as Dr Chris Hill at the Electron Microscopy facility for the EM images of
chloroplasts. For her contributions to the field Arabidopsis project of Chapter 5 and for being a fantastic
summer student, I would like to thank Federica Pastorelli. To Mo and Liz, thank you for keeping the
Hunter/Johnson lab running like a well-oiled machine.
Next, I would like to say a huge thank you to Phil Jackson. None of the work in this thesis would have
happened without the time and effort he has invested in my mass spectrometry training, which ignited
my enthusiasm for the technique and led to me carrying out my PIPS in a mass spec facility. I also
learned about various other tangentially related topics like brewing, grammar pedantry, being a DJ in
the 80s, and how operating a mass spectrometer is similar to flying a plane. Another big thank you is to
Holger, Alex and Joao at the LMS Biological Mass Spectrometry Facility for teaching me so much and
for helping me to really make the most of my time in London.
Finally, I would like to thank my friends and family for supporting me over the course of my PhD and
throughout my time in Sheffield. Thank you to all past and present members of ‘The House’ at
Heavygate and St Barnabas for all the good times, especially to Dave, who has been a constant source
of sanity and stability for the past eight years. A last thank you goes to my mum and dad for their love
and support. While they may not manage to read much of this thesis, I know they are very proud of me
and that is more than enough.

iii
Declaration
I, the author, confirm that the Thesis is my own work. I am aware of the University’s Guidance on the
Use of Unfair Means (www.sheffield.ac.uk/ssid/unfair-means). This work has not been previously been
presented for an award at this, or any other, university.
The work described in this Thesis contributed to the following research publication:
Flannery, S.E., Hepworth, C., Wood, W.H.J., Pastorelli, F., Neil Hunter, C., Dickman, M.J., Jackson,
P.J., and Johnson, M.P. (2021). Developmental acclimation of the thylakoid proteome to light intensity
in Arabidopsis. Plant J. 105, 223–244.

iv
Contents Abstract .................................................................................................................................................... i
Acknowledgements ................................................................................................................................. ii
Declaration ............................................................................................................................................. iii
Figures ................................................................................................................................................. viii
Tables ..................................................................................................................................................... xi
Abbreviations ........................................................................................................................................ xii
1 Introduction ..................................................................................................................................... 1
1.1 Photosynthesis in higher plants ............................................................................................... 1
1.2 Structure and function of the key photosynthetic complexes ................................................. 6
1.2.1 The photosystems and their light-harvesting antennas ................................................... 6
1.2.2 Cytochrome b6f ............................................................................................................... 9
1.2.3 ATP synthase ................................................................................................................ 11
1.2.4 NDH .............................................................................................................................. 11
1.3 Thylakoid architecture .......................................................................................................... 14
1.4 Adaptation of photosynthesis to the light environment ........................................................ 16
1.4.1 PSII damage and repair ................................................................................................. 17
1.4.2 Short term responses to light intensity .......................................................................... 17
1.4.3 The link between short and long term responses .......................................................... 22
1.4.4 Long term acclimation to light intensity ....................................................................... 23
1.5 Arabidopsis thaliana as a photosynthetic model organism ................................................... 26
1.6 Proteomics as a tool for studying photosynthesis ................................................................. 27
1.7 Principles of mass spectrometry-based proteomics .............................................................. 31
1.8 Aims ...................................................................................................................................... 33
2 Experimental procedures............................................................................................................... 34
2.1 Growth of Arabidopsis thaliana ........................................................................................... 34
2.1.1 Conditions for growth of Arabidopsis........................................................................... 34
2.2 Materials, buffers and reagents ............................................................................................. 35
2.3 Preparation of thylakoid membranes .................................................................................... 36

v
2.4 Spectroscopic analysis of pigments ...................................................................................... 36
2.4.1 Chlorophyll analysis ..................................................................................................... 36
2.4.2 Low temperature fluorescence spectroscopy ................................................................ 37
2.5 Protein assay ......................................................................................................................... 37
2.6 BN-PAGE ............................................................................................................................. 37
2.7 SDS-PAGE and immunoblotting .......................................................................................... 38
2.8 Imaging of chloroplasts ......................................................................................................... 38
2.8.1 Electron microscopy of leaf thin sections ..................................................................... 38
2.8.2 Structured illumination microscopy .............................................................................. 39
2.9 Mass spectrometry ................................................................................................................ 39
2.9.1 Protein digestion in 60% methanol ............................................................................... 39
2.9.2 In-gel protein digestion ................................................................................................. 40
2.9.3 In-solution protein digestion ......................................................................................... 40
2.9.4 Protein digestion in sodium laurate ............................................................................... 40
2.9.5 Peptide desalting ........................................................................................................... 41
2.9.6 Hypercarb fractionation of peptides .............................................................................. 41
2.9.7 Analysis of peptides by mass spectrometry .................................................................. 41
2.9.8 Identification of proteins from mass spectrometry data ................................................ 42
2.9.9 Mass spectrometry-based protein quantification .......................................................... 42
3 Developing a method for proteomic analysis of the Arabidopsis thylakoid membrane ............... 44
3.1 Introduction ........................................................................................................................... 44
3.2 Selection of a digestion method for thylakoid protein mass spectrometry ........................... 45
3.3 Label-free relative quantification of the thylakoid proteome................................................ 51
3.4 Discussion ............................................................................................................................. 54
4 Acclimation of the photosynthetic machinery to light environment in Arabidopsis .................... 57
4.1 Introduction ........................................................................................................................... 57
4.2 Growth of Arabidopsis thaliana and characterisation of the light-acclimated thylakoid
membrane .......................................................................................................................................... 58
4.3 Proteomic analysis of key photosynthetic complexes and their antenna .............................. 61

vi
4.4 Thylakoid architecture changes in light acclimation ............................................................ 66
4.5 Electron transfer and photoprotection in light acclimation ................................................... 68
4.6 Repair of photosystem II in the light-acclimated thylakoid membrane ................................ 73
4.7 Discussion ............................................................................................................................. 76
5 Proteomic analysis of the thylakoid membrane in Arabidopsis in the laboratory and in the field 80
5.1 Introduction ........................................................................................................................... 80
5.2 Field-grown Arabidopsis experienced dramatically different light and temperature conditions
to those grown in the laboratory ....................................................................................................... 81
5.3 Morphological changes in field-grown Arabidopsis are accompanied by biochemical and
spectroscopic differences .................................................................................................................. 83
5.4 Proteomic analysis of Arabidopsis grown in a natural light environment reveals changes in
key photosynthetic complexes and their antenna .............................................................................. 86
5.5 Thylakoid architecture is altered in a natural light environment .......................................... 90
5.6 The thylakoid proteome of field grown plants implies a greater capacity for linear electron
transfer, cyclic electron transfer and photoprotection ....................................................................... 93
5.7 Upregulation of PSII repair machinery in the field ............................................................... 96
5.8 Proteins specific for acclimation to a fluctuating natural light environment ........................ 98
5.9 Discussion ............................................................................................................................. 99
6 Thylakoid proteome analysis of photosynthetic mutants: LHCII phosphorylation and proton
gradient regulation .............................................................................................................................. 102
6.1 Introduction ......................................................................................................................... 102
6.2 Growth and acclimation of stn7 and tap38 to varying light intensity ................................. 104
6.3 Phosphorylation mutants stn7 and tap38 are capable of long term acclimation to light intensity
106
6.4 Long term changes in thylakoid architecture in stn7 and tap38 ......................................... 109
6.5 Electron carrier protein abundance is affected in stn7 and tap38 ....................................... 112
6.6 Candidate proteins for an STN7-mediated signalling pathway .......................................... 115
6.7 The pgr5 mutant is comparable to wild type in supercomplex formation and grana diameter
116
6.8 Widespread downregulation of thylakoid protein abundance in pgr5 ................................ 118
6.9 Downregulation of PSII repair machinery in pgr5 ............................................................. 121

vii
6.10 Discussion ........................................................................................................................... 123
7 Final summary ............................................................................................................................ 125
Bibliography ....................................................................................................................................... 132
Appendices .......................................................................................................................................... 158

viii
Figures
Figure 1: Electron transfer through the thylakoid membrane. ................................................................ 4
Figure 2: Structural organisation of the photosystems and their antenna ............................................... 8
Figure 3: Structural arrangement of the chloroplast ATP synthase. ..................................................... 11
Figure 4: Electron micrographs of Arabidopsis chloroplasts. ............................................................... 15
Figure 5: Emission spectrum of fluorescent lighting used for Arabidopsis growth. ............................. 35
Figure 6. Assessment of digestion methods by SDS-PAGE.. ............................................................... 46
Figure 7: Analysis of strategies to increase thylakoid proteome coverage ........................................... 48
Figure 8: Method selection for preparation of thylakoid membranes for MS analysis by digestion .... 50
Figure 9: Processing of MS data from light-acclimated thylakoids. ..................................................... 53
Figure 10: Growth of light-acclimated Arabidopsis plants.. ................................................................. 59
Figure 11: Characterisation of acclimated thylakoid membranes. ........................................................ 61
Figure 12: Acclimation involves changes in the relative abundance of key photosynthetic complexes.
.............................................................................................................................................................. 64
Figure 13: Acclimation involves changes in the relative abundance of antenna proteins .................... 65
Figure 14: Thylakoid membrane stacking changes associated with acclimation are paralleled by changes
in the relative abundance of CURT1A, B and RIQ1, 2 proteins. .......................................................... 67
Figure 15: Acclimation to high light causes upregulation of proteins involved in LET and CET ....... 69
Figure 16: The relative abundance of proteins involved in light harvesting regulation changes in
acclimation ............................................................................................................................................ 71
Figure 17: Acclimation to high light leads increased abundance of the PSII repair cycle machinery. . 75
Figure 18: A comparison of high light versus low light acclimation in the thylakoid membrane
proteome. .............................................................................................................................................. 77
Figure 19: Arabidopsis plants grown outdoors are exposed to highly variable light and temperature
conditions and exhibit very different morphologies to controlled environment plants ........................ 82
Figure 20: Lab and field thylakoid membranes have different spectroscopic properties and reduced
formation of supercomplexes. ............................................................................................................... 85

ix
Figure 21: Adaptation to a natural environment involves changes in the relative abundance of key
photosynthetic complexes.. ................................................................................................................... 87
Figure 22: Thylakoids from field Arabidopsis have altered levels of minor antenna subunits. ............ 89
Figure 23: Thylakoid architecture changes in Field thylakoids are associated with increases in CURT1
and RIQ proteins but not STN7 or TAP38.. ......................................................................................... 92
Figure 24: Acclimation to a natural environment causes upregulation of proteins involved in LET and
CET ....................................................................................................................................................... 94
Figure 25: Arabidopsis in a natural environment have increases in the relative abundance of proteins
involved in light harvesting regulation ................................................................................................. 96
Figure 26: Upregulation of the PSII repair machinery in a natural environment ................................. 97
Figure 27: A comparison of natural versus controlled environment adaptation in the thylakoid
membrane proteome. ............................................................................................................................. 99
Figure 28: Phosphorylation mutant Arabidopsis plants acclimated to low, moderate and high light
intensity ............................................................................................................................................... 104
Figure 29: Clear native PAGE analysis of phosphorylation mutants ................................................. 106
Figure 30: Principle component analysis of MS data to compare phosphorylation mutants .............. 107
Figure 31: Abundance of STN7 and TAP38 in phosphorylation mutants .......................................... 108
Figure 32: Acclimation-related changes in the abundance of key photosynthetic complexes in
phosphorylation mutants ..................................................................................................................... 109
Figure 33: Long-term changes in thylakoid architecture are affected by LHCII phosphorylation ..... 110
Figure 34: Abundance of proteins involved in thylakoid architecture in phosphorylation mutants ... 112
Figure 35: Abundance of electron transfer proteins in phosphorylation mutants ............................... 114
Figure 36: Abundance of potential phosphorylation targets of STN7 ................................................ 115
Figure 37: The pgr5 mutant has similar supercomplex formation and thylakoid architecture to wild type
............................................................................................................................................................ 117
Figure 38: Downregulation of key complexes in pgr5. ...................................................................... 118
Figure 39: A comparison of the thylakoid proteome in pgr5 to gl-1 .................................................. 120

x
Figure 40: Depletion of PSII repair machinery in pgr5 ...................................................................... 122

xi
Tables
Table 1: Subunits of photosystem II ....................................................................................................... 7
Table 2: Subunits of the PSI reaction centre. .......................................................................................... 9
Table 3: Subunits of cytochrome b6f ..................................................................................................... 10
Table 4: Subcomplexes of the NDH complex and their subunits. ........................................................ 13
Table 5: Arabidopsis thaliana strains ................................................................................................... 34
Table 6: Buffers and solutions .............................................................................................................. 35
Table 7: Software and database versions .............................................................................................. 42
Table 8: Stoichiometry of key photosynthetic complexes and antenna ................................................ 63
Table 9: Stoichiometry electron transfer proteins ................................................................................. 70
Table 10: Stoichiometry of regulatory and photoprotective proteins ................................................... 73
Table 11: Chlorophyll a/b ratios of phosphorylation mutants following light acclimation ................ 105
Table 12: Relative abundance of thylakoid-associated proteins in acclimation ................................. 158
Table 13: Relative abundance of thylakoid-associated proteins in the Field versus the Lab .............. 174
Table 14: Relative abundance of thylakoid-associated proteins in light-acclimated phosphorylation
mutants ................................................................................................................................................ 188
Table 15: Relative abundance of thylakoid-associated proteins in pgr5 ............................................ 205
xii
Abbreviations
ACN acetonitrile
ANOVA analysis of variance
ATP adenosine triphosphate
CBB cycle Calvin-Benson-Bassham cycle
CET cyclic electron transfer
Chl chlorophyll
Cytb6f cytochrome b6f
Fd ferredoxin
FNR ferredoxin-NADP+ reductase
FQR ferredoxin-plastoquinone oxidoreductase
FRET Förster resonance energy transfer
G3P glyceraldehyde-3-phosphate
HL high light
LET linear electron transfer
LL low light
MAP Mehler-ascorbate peroxidase pathway
MDH malate dehydrogenase
ML moderate light
MS mass spectrometry
MS/MS tandem mass spectrometry
NADP+ nicotinamide adenine dinucleotide phosphate
NADPH reduced nicotinamide adenine dinucleotide phosphate
nanoLC nano liquid chromatography
OEC oxygen evolving complex
PCA principle component analysis
PGA glycerate-3-phosphate
PQ/PQH2 plastoquinone/plastoquinol
PSI photosystem I
PSII photosystem II
PTOX plastid terminal oxidase
RuBP ribulose-1,5-bisphosphate
TCEP tris(carboxyethyl)phosphine-HCl
ΔpH proton gradient
1
1 Introduction
1.1 Photosynthesis in higher plants
Photosynthesis evolved 3.5 billion years ago and now sustains nearly all life on Earth. In its earliest
form, bacteria gained the ability to construct an assembly of light-absorbing pigments and other
cofactors for oxidation/reduction on a protein scaffold in a lipid bilayer: a reaction centre. Protons
transferred across a membrane, powered by reaction centres, created a chemiosmotic gradient, which
could be used to generate adenosine triphosphate (ATP), used in biosynthesis. Evolution of increasingly
complex photosynthetic systems gave rise to their divergence into two main reaction centre types: those
that use iron-sulphur clusters, similar to photosystem I (PSI), and those that transfer electrons through
pheophytin and quinone molecules, similar to photosystem II (PSII) of plants. These are termed type I
and type II reaction centres, respectively. Cyanobacteria contain both reaction centre types, along with
an enzyme capable of harvesting protons and electrons from the splitting of a water molecule using a
manganese cluster. This enzyme is known as the oxygen evolving complex (OEC) because of the
oxygen released as part of the water-splitting reaction. The evolution of oxygenic photosynthesis
resulted in a dramatic change in the Earth’s atmosphere and eventually lead to the appearance of the
first eukaryotic organisms. An endosymbiotic event, 600-2000 million years ago (McFadden and Van
Dooren, 2004), whereby a cyanobacterium was taken up by a eukaryotic cell led to the evolution of the
chloroplast, the site of oxygenic photosynthesis in algae and higher plants. While the chloroplast retains
its own small circular genome, endosymbiotic gene transfer over time means that the majority of
chloroplast proteins are now encoded by the nucleus.
Integral to human life, plant photosynthesis provides us with all of our food and much of our fuel,
making it a vital area of research within the context of a changing environment, an increasing world
population, and the consequent strain on agriculture. Photosynthesis in the plant chloroplast involves
the capture of light energy from the sun to produce ATP and reduced nicotinamide adenine dinucleotide
phosphate (NADPH) in order to convert atmospheric CO2 into complex organic compounds. The
structure of the chloroplast consists of a double envelope surrounding another continuous enclosed
membrane structure known as the thylakoid membrane in an aqueous environment called the stroma.
The stroma contains the enzymes that carry out the ‘dark reactions’ of the Calvin-Benson-Bassham
cycle (CBB cycle) for CO2 fixation whereas the thylakoid membrane is the site of the ‘light reactions’.
It is important to note that both the light and the dark reactions – also known as the ‘light-independent’
reactions – occur during daylight hours. In higher plants, chloroplasts are mostly located in specialised
mesophyll cells in the leaves – organs specialised for photosynthesis by their large surface area for light
absorption and efficient gas exchange through pores known as stomata (Smith et al., 1997). Some plant
species use specialised chloroplasts in separate tissues to physically segregate the light and dark
reactions and reduce the inhibitory effect of oxygen on CO2 fixation. Ribulose-1,5-bisphosphate

2
carboxylase/oxygenase, or Rubisco, is the enzyme responsible for CO2 fixation, the first step of the dark
reactions where atmospheric CO2 is used to carboxylate ribulose-1,5-bisphosphate (RuBP) and produce
two molecules of glycerate-3-phosphate (PGA). Using NADPH as a reductant, the PGA is then
converted to glyceraldehyde-3-phosphate (G3P), which is used for both glucose synthesis and the
regeneration of RuBP (Stirbet et al., 2019).
The light reactions of photosynthesis function to generate ATP and NADPH, which feed into the dark
reactions to fix atmospheric CO2. To power the light reactions, solar energy is absorbed by pigments
such as chlorophyll and carotenoids held on a protein scaffold embedded in the thylakoid membrane.
Pigments with different absorbance spectra are arranged in different environments to broaden the
absorbance cross-section and maximise the number of photons absorbed. Chlorophylls are the main
pigments involved in chloroplast light absorption and photochemistry and feature a phytol tail and a
tetrapyrrole ring chelated with a magnesium ligand. The two types of chlorophyll in higher plants are
chlorophyll a and b, which absorb light energy from the violet and red, and the blue and orange regions
of the visible light spectrum, respectively. While only chlorophyll a is involved in the chemistry of the
photosynthetic reaction centres, chlorophyll b is found mostly in the light-harvesting antenna
complexes. Antenna complexes collect light energy, which is transferred between pigment molecules
by Förster resonance energy transfer (FRET) (transfer of excitation energy from one electron to another)
or Dexter energy transfer (exchange of electrons with different excitation energies) and funnelled into
the reaction centres of either photosystem I (PSI) or photosystem II (PSII). Here, a special pair of
chlorophyll molecules becomes excited resulting in electron transfer and charge separation. These are
P700 (in PSI) and P680 (in PSII), named for the wavelength of their absorption peak. The differences
in the absorption spectra of the two photosystems broaden the spectrum of light available for use in
photosynthesis. However, when there is preferential excitation from variations in the spectral quality of
absorbed light, these differences make the system susceptible to imbalances in the relative amounts of
ATP and NADPH produced (Johnson, 2016).
PSII regenerates its special pair chlorophylls using electrons released from splitting a water molecule,
a process that also releases two protons into the thylakoid lumen. PSII then reduces a plastoquinone
(PQ) molecule from the ‘PQ pool’ within the thylakoid membrane. The reduced PQ
(plastoquinol/PQH2) diffuses back out into the PQ pool, where it can be taken up by the cytochrome b6f
complex (cytb6f) and oxidised. Using these electrons from PQ, cytb6f then reduces the small soluble
protein plastocyanin (PC) in the thylakoid lumen while transferring two more protons from the stroma
to the lumen. Absorption of light energy by PSI results in excitation of the P700 special pair, electron
transfer and charge separation. Reduced plastocyanin supplies electrons to regenerate P700+ and PSI
uses the energy-boosted electrons to reduce the stromal iron-sulphur protein ferredoxin (Fd). This
protein works with ferredoxin-NADP+ reductase (FNR), to produce NADPH. As the lateral transfer of
electrons through the thylakoid membrane is coupled to uptake of protons from the stroma and release

3
of protons into the thylakoid lumen, a transmembrane proton gradient (ΔpH) accumulates, which
powers the synthesis of ATP by ATP synthase. Chloroplastic ATP synthase produces one molecule of
ATP for every 4.67 protons that pass through it (Hahn et al., 2018; Petersen et al., 2012). Since the
photolysis of one water molecule results in the transfer of 6 protons into the thylakoid lumen, the process
has a net output of 1.28 ATP and one NADPH. This route of electron transfer is termed linear electron
transfer (LET) or the ‘Z scheme’ and is shown on the top panel of Figure 1.
The CBB cycle uses 1.5 ATP for every NADPH. Therefore, if linear electron transfer were the only
way to generate substrates for the CBB cycle, there would be a shortfall in the amount of ATP produced.
Instead, there is an additional, alternative route termed cyclic electron transfer (CET), which involves
only PSI, where electrons from Fd are returned to the PQ pool by a ferredoxin-plastoquinone
oxidoreductase (FQR) instead of continuing on to the CBB cycle. This process allows additional proton
motive force generation and ATP synthesis without any net NADPH production (Johnson, 2007). CET
may be triggered when there is not enough NADP+ available to accept electrons, or when the cell has a
particularly high demand for ATP. Since the relative demand for ATP and NADPH is affected by a
range of environmental and developmental factors, flexibility in the balance of LET and CET is critical
for maintaining photosynthetic efficiency. ATP demand is elevated during high levels of biosynthesis,
such as in young leaves, and in photorespiration, where Rubisco oxygenates, rather than carboxylates,
RuBP. Instead of one of the two PGA molecules, phosphoglycolate, which cannot be productively
utilised by the CBB cycle, is produced and the extensive process of converting it back to PGA requires
ATP. Conversely, nitrogen assimilation decreases ATP/NADPH demand, thus requiring less CET.
Another function of CET may be to decrease lumenal pH for the activation of photoprotective
quenching mechanisms and photosynthetic control (Nawrocki et al., 2019).

4
Figure 1: Electron transfer through the thylakoid membrane.
Two routes of CET are thought to exist, and are shown on the bottom panel of Figure 1: The NDH-
dependent pathway and the PGR5/PGRL1-dependent pathway. The NADH dehydrogenase-like
complex (NDH), now increasingly referred to as ‘Photosynthetic Complex I’, is a large but low-
abundance multi-subunit protein complex, which shares at least 11 subunits with the mitochondrial and
bacterial respiratory Complex I and is thought to be a direct FQR (Nawrocki et al., 2019). It forms a
supercomplex with PSI via LHCA5 and LHCA6 of the PSI antenna (Peng et al., 2009). The structure
and function of the NDH complex is discussed further in Section 1.2.4. As shown in Figure 1, PSI

5
receives electrons from cytb6f via plastocyanin (PC) and reduces Fd, but these electrons are then
returned to the PQ pool via NDH, coupled to the transfer of protons into the thylakoid lumen.
The second route, involving PGR5/PGRL1, is suggested to play an important role in protection of PSI
under high or fluctuating light. Figure 1 shows the transfer of electrons from the reduced Fd generated
by PSI to cytb6f via FNR and PGR5, which is tethered to the thylakoid membrane on the stromal side
by PGLR1 (Nawrocki et al., 2019). As well as forming a complex with PGR5, PGRL1 has been shown
to interact with FNR, Fd, cytb6f, and PSI (DalCorso et al., 2008). Despite evidence of the ability of the
PGRL1/PGR5 complex to accept electrons from Fd and reduce PQ (Hertle et al., 2013), there remains
discussion about the function of these proteins, whether they are direct FQR’s, mostly act in a regulatory
role, and about the presence of an additional FQR (Nawrocki et al., 2019; Suorsa, 2015). However, it
was recently demonstrated that PGR5 is necessary for the switching of cytb6f between the LET Q-cycle
(Section 1.2.2) and a modified Q-cycle for CET (Buchert et al., 2020).
Aside from LET and CET, other more minor electron transfer routes exist. In higher plants and algae,
one of these pathways is chlororespiration. In this process, NDH reduces PQ, which is then oxidised by
the plastid terminal oxidase (PTOX) and the electrons used to produce water (Kanervo et al., 2005).
The Mehler-ascorbate peroxidase pathway (MAP), or water-water cycle, involves the reduction of O2
to make water. Various functions are proposed for the MAP pathway, including ROS scavenging and
as an electron sink. Two water molecules are split by the PSII OEC, releasing O2, which is then reduced
by PSI in the Mehler reaction. Superoxide dismutase uses the resulting ROS to make H2O2, which is in
turn reduced and converted to back to water by ascorbate peroxidase using electrons from ascorbate.
The MAP pathway also contributes to ∆pH and, therefore, ATP synthesis (Kanervo et al., 2005; Miyake,
2010).
High levels of flux through the electron transfer chain can cause a build-up of excess reducing
equivalent such as NADPH, resulting in ROS production, known to cause oxidative damage to the
photosynthetic machinery and trigger regulatory networks (Foyer, 2018). Because, unlike NADP+,
NADPH cannot be transferred across membranes to meet demands elsewhere in the cell, a mechanism
known as the ‘malate valve’ is necessary to maintain redox homeostasis in the chloroplast. Under redox
stress, reduced Fd from the electron transport chain can reduce thioredoxin in a system referred to as
the ferredoxin-thioredoxin system, which reduces disulphide bonds within a number of enzymes to
regulate their activity. One of these enzymes is malate dehydrogenase (MDH), which is activated upon
disulphide bond reduction and catalyses the reversible NADPH-dependent conversion of oxaloacetate
to malate, releasing NADP+. Malate may then leave the chloroplast via dicarboxylate translocators and
be taken up elsewhere where reducing equivalent is needed, such as the mitochondria, and be
dehydrogenated by MDH to produce NADPH or NADH (Selinski and Scheibe, 2019; Zhao et al.,
2020b).
6
1.2 Structure and function of the key photosynthetic complexes
1.2.1 The photosystems and their light-harvesting antennas
Photosystem II, the first complex of the LET chain, reduces plastoquinone (PQ) to plastoquinol (PQH2)
and replenishes the lost electrons by splitting a water molecule (Kern and Renger, 2007). The reaction
centre of the complex consists of a heterodimer of the proteins D1 and D2, which hold the P680 special
pair chlorophylls, one of which becomes the highly oxidising P680+ chlorophyll capable of splitting
water. Two other core proteins, CP43 and CP47, bind the OEC, which is stabilised by an additional
protein, PSBO. The OEC, coordinated in the lumenal side of the thylakoid membrane by residue side
chains of CP43 and D1, is a cubane cluster of manganese ions, a calcium ion, and oxygen atoms with
the formula Mn4O5Ca. The cluster binds and splits two water molecules, extracting two oxygen atoms
to be released as O2, 4 protons for release into the thylakoid lumen to generate a proton gradient, and 4
electrons which are transferred sequentially to a tyrosine residue of D1 (Tyr-Z). Oxidation of the D1
P680 chlorophyll by an absorbed photon is reversed by the electron from this tyrosine residue. Electrons
from P680 transfer to pheophytin then to a plastoquinone in D2 (QA) then to a second plastoquinone in
D1 (QB). This QB plastoquinol leaves the reaction centre and diffuses into the lipid bilayer. The subunits
of the PSII reaction centre are shown in Table 1.

7
Table 1: Subunits of photosystem II
Bound to the PSII reaction centre are additional chlorophyll-containing proteins – the light-harvesting
antenna complexes (Figure 2). These exist as the monomeric antenna proteins LHCB4/CP29,
LHCB5/CP26, and LHCB6/CP24, and LHCII trimers consisting of LHCB1, LHCB2 and LHCB3 in
different combinations. The reaction centre subunits D1 and D2 are linked to the monomeric antenna
via CP47 and CP43, and a number of low molecular weight subunits span the membrane and stabilise
the core. Monomeric antenna proteins link the PSII core to the peripheral LHCII trimers, controlling
the formation of supercomplexes and directing excitation energy into the reaction centre. PSII is mostly
present in the thylakoid membrane as a dimer, in supercomplexes containing variable numbers of LHCII
trimers. These trimers are named according to the strength of their interaction with the PSII core (C):
strongly bound (S), moderately bound (M), and loosely bound (L) trimers. Single particle cryo-electron
microscopy (cryo-EM) has revealed the structure of the C2S2M2 supercomplex from plant thylakoids
(van Bezouwen et al., 2017; Su et al., 2017). However, while PSII supercomplexes are also thought to

8
exist in the forms C2S2, C2S2M, C2S2M2L, and C2S2M2L2 (Sheng et al., 2019), the most abundant in
physiologically relevant conditions varies according to species. Early work in barley plants grown in
greenhouse conditions identified LHCII as the most abundant protein in the thylakoid membrane,
constituting around 30% of all protein (Peter and Thornber, 1991), though this value likely varies
substantially in response to environmental conditions. The composition of the LHCII trimers, whether
homotrimeric or heterotrimeric, determines their position in the supercomplex and functional role.
LHCB1, of which there are five isoforms LHCB1.1-1.5 in Arabidopsis, is the most abundant component
and is able to form homotrimers. Between 20 and 30% of LHCII trimers contain two LHCB1 and one
LHCB2 (Vener, 2007), which is the main target of phosphorylation by the kinase STN7 (Leoni et al.,
2013). LHCB2 is present as three nearly identical isoforms in Arabidopsis: LHCB2.1, 2.2 and 2.4. The
third component of LHCII trimers, LHCB3, forms heterotrimers with LHCB1 and is only present in the
M trimers (Damkjær et al., 2009). Complexes lacking M trimers, i.e. the C2S2 complex, lack both
LHCB3 and the monomeric antenna LHCB6, which acts as a linker to the PSII core (Pagliano et al.,
2014). The S trimer, on the other hand, is linked to the core by LHCB5.
Figure 2: Structural organisation of the photosystems and their antenna. Schematic diagrams to represent A, the positions of
PSII reaction centre proteins and its antenna subunits, B, the positions of PSI reaction centre subunits and its antenna, C, the
arrangement of the PSII C2S2M2 supercomplex, and D, the arrangement of the PSI-LHCI-LHCII supercomplex. Antenna
proteins are shown in bright green, whereas reaction centres are light green.
The second photosystem of the LET chain and the only photosystem involved in CET is PSI, the
reaction centre of which consists of 14 subunits shown in Table 2. The two main subunits of the PSI

9
reaction centre are PSAA and PSAB, which hold the P700 special chlorophyll pair. When the P700
special chlorophyll pair absorbs light energy, an electron is promoted to a higher energy level and
transfers to a modified chlorophyll a molecule termed A0 and is replaced by an electron from
plastocyanin, which binds at the PSAF subunit. The high-energy electron from P700 passes from A0 to
the phylloquinone A1, then through a series of iron-sulphur centres coordinated by the subunits PSAB
and PSAC. These electrons are then used for the reduction of Fd on the stromal side of the membrane,
at the PSAE subunit (Erik et al., 2007). Fd interacts with FNR and its electrons are directed to either
NADPH synthesis or CET to increase ATP synthesis. The reaction centre of PSI is flanked by a row of
at least 4 monomeric antenna proteins: LHCA1, LHCA2, LHCA3 and LHCA4 (Figure 2). In
Arabidopsis there are two more isoforms, LHCA5 and LHCA6, which are proposed to bind NDH (Peng
et al., 2009). The PSAH and PSAL subunits are capable of binding a LHCII trimer (Erik et al., 2007)
via its LHCB2 subunit, when phosphorylated, to direct more energy to PSI in a process known as state
transitions (Section 0).
Table 2: Subunits of the PSI reaction centre.
1.2.2 Cytochrome b6f
The second protein complex and rate-limiting step of the LET chain is cytb6f, which links PSII to PSI
by accepting electrons from PQH2 and transferring electrons to plastocyanin in the lumen. Cytb6f also

10
functions to transfer protons into the thylakoid lumen and contributes to the formation of ΔpH for ATP
synthesis. The four main subunits (Table 3) of cytb6f are cytochrome f (PETA), cytochrome b6 (PETB),
the Rieske iron-sulphur protein (PETC), and subunit IV (PETD). Four smaller subunits (PETG, PETL,
PETM and PETN) surround the periphery of the complex, which is found as a dimer. The complex
contains various cofactors including a 2Fe-2S cluster (known as the Rieske iron-sulphur cluster), four
haems, of which two are b-type and two are c-type, as well as chlorophyll a and β-carotene. Recently,
the cryo-EM structure of the spinach cytb6f complex revealed a role for the chlorophyll a molecule as
a ‘gating’ mechanism for PQH2 access to its binding site, dependent on the redox state of the PQ pool
(Malone et al., 2019).
Table 3: Subunits of cytochrome b6f
The process by which cytb6f catalyses the oxidation of PQH2 and the reduction of PQ is termed the
quinol cycle (Q-cycle). When a PQH2 molecule binds and is oxidised, at a location known as the Qp site
on the lumenal side of the complex, two protons are released into the thylakoid lumen and the two
electrons bifurcate into separate redox potential pathways. One is the high potential pathway leading to
plastocyanin via the Rieske iron-sulphur cluster, while the other, the low potential pathway, leads to a
bound PQ molecule at the Qn site on the stromal side via the b-type haems. A second PQH2 is oxidised
and used, along with two protons from the stroma, to regenerate the bound PQ molecule at the Qn site
to PQH2 via the low potential pathway. In this way, cytb6f doubles the number of protons transferred
into the thylakoid lumen for each PQH2 that is oxidised. PQH2 oxidation at the Qp site is the rate-limiting
step of the LET chain, rather than the reduction of PQ and diffusion of PQH2 to cytb6f (Tikhonov, 2014).
When cytb6f senses reduction of the PQ pool through PQH2 binding at the Qp site, it signals to activate
the LHCII kinase STN7 through binding at the Rieske subunit, making this complex important as a
redox-sensing hub in addition to its role in electron transfer (Shapiguzov et al., 2016; Vener et al., 1997).

11
1.2.3 ATP synthase
ATP synthase utilises the ΔpH generated by the light reactions of photosynthesis. Protons flowing
across the thylakoid membrane into the stroma power a rotational motor mechanism for ATP
production. Cryo-EM was used recently to determine the structure of chloroplast ATP synthase from
spinach at a resolution of 2.9 to 3.4 Å (Hahn et al., 2018). In total, the enzyme is made up of 26 subunits,
divided between two regions; the arrangement of which is shown in Figure 3. The hydrophilic head
region (cF1), which catalyses the phosphorylation of ADP to ATP, contains three α and three β subunits
alternating in a ring around a γ and an ε subunit making up the central stalk of the hydrophobic motor
region (cF0). The peripheral stalk of cF0, made up of the b, b′ and δ subunits, connects to the proton-
translocating, membrane-embedded c-ring. The c-ring of chloroplast ATP synthase contains 14
monomers, compared to the yeast mitochondrial ATP synthase with 10 c subunits. The size of the c-
ring in plant mitochondrial ATP synthase is currently unknown (Zancani et al., 2020). Chloroplast ATP
synthase has features specific to photosynthesis that are not present in respiratory forms. To prevent
ATPase activity – the reverse reaction of ATP synthase where ATP hydrolysis powers pumping of
protons into the thylakoid lumen - in the dark when photosynthesis is not occurring, chloroplast ATP
synthase is inhibited by a redox switch. In the dark, when conditions in the chloroplast are more
oxidising, a redox loop located in the γ subunit forms a disulphide bond and interacts with a β subunit
to block rotation.
Figure 3: Structural arrangement of the chloroplast ATP synthase.
1.2.4 NDH
In Arabidopsis, NDH is a very large but low-abundance complex comprises five subcomplexes. While
NDH was first named for its supposed NADPH dehydrogenase activity, the complex is now
increasingly referred to as ‘photosynthetic complex I’ as it is highly homologous to the respiratory
complex I but, unlike the mitochondrial complex, NDH does not actually appear to function as such.

12
Rather, it is now thought to catalyse the Fd-dependent reduction of PQ (Munekage et al., 2004;
Shikanai, 2016). Through this activity, NDH mediates CET to augment ATP production by diverting
electrons from PSI into the PQ pool. The NDH complex is more efficient for enhancing ATP synthesis
than other routes of CET, transferring eight protons into the thylakoid lumen for every PQ molecule it
reduces. Interestingly, mutants lacking NDH components, at least in C3 plants, do not have dramatic
photosynthetic or growth phenotypes so the biological significance and redundancy of this complex is
uncertain. Possibly, under some conditions where there is a surplus of ATP, NDH may function in
reverse to generate more reduced Fd, powered by ΔpH (Strand et al., 2019). Another proposed role is
that the complex functions in chlororespiration alongside PTOX, similarly to complex I in the
respiratory chain. NDH forms supercomplexes with PSI, whereby up to 6 PSI monomers may associate
with one NDH complex to improve the localised efficiency of NDH-dependent CET (Yadav et al.,
2017). The minor PSI antenna proteins LHCA5 and LHCA6, present at substoichiometric amounts
relative to PSI (Ganeteg et al., 2004), are required for the formation of these supercomplexes, which
are proposed to link PSI and NDH to one another (Peng et al., 2009).

13
Table 4: Subcomplexes of the NDH complex and their subunits.
NDH shares evolutionary origins with NDH-1 in cyanobacteria. However, NDH features additional
subdomains absent in cyanobacteria and is encoded from a mixture of nuclear and plastid genes. The
five subdomains of NDH in chloroplasts are subcomplex A and the membrane subcomplex
(subcomplex M), both of which are also found in cyanobacteria, subcomplex B, the lumenal
subcomplex (subcomplex L), and the electron donor binding subcomplex (EDB subcomplex). The
individual subunits and their corresponding subcomplexes are shown in Table 4. Subcomplex A
corresponds to the Q module in respiratory complex I and functions to reduce PQ. It is not required for
interaction of NDH with PSI. Subcomplex A forms a Fd binding site along with the EDB subcomplex,

14
which also contains J proteins (NDHT and NDHU), a type of molecular chaperone. The function of
subcomplex B is currently unclear, but it is required for stability of the complex. Subcomplex B contains
an Fe-S cluster but is unlikely to be involved in electron transfer between Fd and PQ because it is
missing in the cyanobacterial equivalent complex NDH-1. Subcomplex M is comparable to the P
module in complex I, functioning in proton translocation into the thylakoid lumen. Subcomplex L in
the thylakoid lumen is required for stability of the complex. It contains proteins homologous to those
of the OEC of PSII, PSBP and PSBQ, as well as proteins with peptidyl-prolyl cis-trans isomerase
activity, thought to be involved in protein folding (Shikanai, 2016).
1.3 Thylakoid architecture
The thylakoid membrane of higher plants is one of the most complicated membrane superstructures
known. It has a heterogeneous and dynamic three dimensional structure, which is divided into densely
packed cylinders of stacked membranes, called the grana, and connecting sections of membrane called
the stroma lamellae. PSI and ATP synthase are found only in the stroma lamellae whereas PSII is
located mostly in the grana stacks (Andersson and Anderson, 1980). Another region, known as the grana
margins, is thought to contain a mixture of the two photosystems and may have roles in PSII repair,
although its existence as a distinct domain remains contentious. The two photosystems are physically
separated primarily to prevent energy spillover from PSII into PSI, which acts as an energy sink, and to
separate linear and cyclic electron transfer. CET takes place in the stroma lamellae only (Albertsson,
2001). Segregation and balance of activity from the two photosystems is important for maximum
efficiency of electron transfer, while tight stacking of thylakoid membranes allows more chlorophyll-
containing proteins to be packed into a given volume of chloroplast. An electron micrograph of an
Arabidopsis chloroplast is shown in Figure 4. While negative stain EM of leaf thin sections can be used
to observe and analyse thylakoid membrane structure within a chloroplast, cryo-electron tomography
has revealed a number of additional features of its three dimensional structure (Austin and Staehelin,
2011; Daum et al., 2010; Kowalewska et al., 2016). Firstly, the darker colour of the stroma indicates a
higher protein density than in the lumenal space. The grana form cylinders, around which the stroma
lamellae protrude and wrap helically. Between the grana and stroma lamellae are the grana margin
connecting regions, which are staggered between grana membrane layers. ATP synthase is located only
in the stroma lamellae regions and the flat regions of stroma-exposed end membranes at the top and
bottom of the grana. While cytb6f dimers are distributed throughout both the grana and stroma lamellae,
in the grana they have been found to be located in close proximity to PSII to increase the efficiency of
PQ transfer between the complexes (Johnson et al., 2014). The physical basis for membrane stacking
in the grana comes from multiple factors and protein-protein interactions. Granal LHCII trimers interact
with one another between membrane layers (Day et al., 1984) through non-specific but complementary
positively and negatively changed areas on the stromal side. Another important factor to consider
regarding thylakoid structure is its lipid composition. Lipids make up around 20% of the dry mass of

15
chloroplasts and are integral to protein complex formation. Around 50% of the lipid in the thylakoid
membrane is monogalactosyldiacylglycerol, followed by digalactosyldiacylglycerol at around 30%
(Garab et al., 2000), and the galactolipid composition of the thylakoid membrane contributes
significantly to its complex structure (Kowalewska et al., 2019).
Figure 4: Electron micrographs of Arabidopsis chloroplasts at A, 2900× and B, 9300× magnification.
A less well-studied feature of the thylakoid membrane, highlighted in Figure 4A, is the plastoglobule.
Initially viewed as passive storage spaces for thylakoid lipids and carotenoids, proteomic analysis has
revealed plastoglobules as crucial participants in chloroplast metabolism, redox regulation, and
remodelling of the photosynthetic machinery to adapt to environmental stresses (Nacir and Bréhélin,
2013). Plastoglobules are contiguous with the thylakoid membrane, formed from the outer leaflet of the

16
thylakoid membrane both constitutively at lower levels and at higher levels as a stress response and
during chloroplast senescence, comprising a membrane microdomain for the recruitment and
concentration of metabolic enzymes and products (Lundquist et al., 2013). They contain various lipids
including phylloquinone (also found in PSI), PQ, triacylglycerol, α-tocopherol, and the enzymes for
their synthesis such as VTE1 for tocopherol synthesis and phytyl esterases. NDC1 is capable of reducing
PQ, while the ABC1 kinase PGR6 phosphorylates and possibly regulates the activity of VTE1 (Martinis
et al., 2014). None of the proteins in the plastoglobule are membrane proteins, structurally, and some
may associate with the hydrophilic heads of lipids on the outside of the globule. For example,
plastoglobules contain structural proteins called fibrillins, many of which contain lipocalin domains,
suggesting additional or alternative roles in metabolite transport. A proteomic analysis by Lundquist et
al., 2012, assigned 30 proteins to the plastoglobule proteome, with seven fibrillins and six ABC1 kinases
making up over 70% of the total protein. Plastoglobules may also play a role in the regulation of starch
synthesis, since the starch synthase SS4 associates with plastoglobular fibrillins (Gamez-Arjona et al.,
2014).
1.4 Adaptation of photosynthesis to the light environment
Plants have evolved to survive and flourish in a wide range of light environments from arid sun-soaked
deserts to the deep shade of the rainforest floor. Even within particular environmental niches, the
intensity and spectral quality of irradiance can fluctuate dramatically according to the season, time of
day, meteorological conditions and because of dynamic shading within plant canopies. Changing light
intensity affects the balance between solar energy absorption and its utilisation in photosynthesis,
potentially leading to metabolic imbalances that trigger photooxidative stress and/or slower growth and
development (Foyer and Noctor, 2005; Li et al., 2009). In low light, the rate of photosynthesis is limited
primarily by the efficiency of light capture by antenna complexes and delivery of energy to the reaction
centres. In high light, the rate of photosynthesis is limited by factors within both the light and dark
reactions. The slow rate of carboxylation by Rubisco limits sink capacity in the stroma, while high light
intensity reaching the thylakoid membrane, as well as the difference in the rate of energy capture and
transfer compared to the relatively slower rate of electron transport, causes saturation and damage to
reaction centres (Mann, 1999; Ruban, 2009). Therefore, being mostly immobile, land plants must react
to changing light levels to maximise their photosynthetic efficiency. Plants have evolved a complex
network of short and long-term responses to optimise photosynthesis to the prevailing light environment
allowing them to control the amount of light absorbed as well as those that help them to manage that
energy. The short-term responses take place on a timescale of seconds to minutes and involve regulatory
mechanisms that alter the structure and function of existing proteins (Ruban, 2016; Theis and Schroda,
2016; Tikkanen and Aro, 2014; Yamori and Shikanai, 2016). In contrast, long-term responses involve
both de novo synthesis and specific degradation of proteins that lead to changes in leaf morphology,
number of chloroplasts per cell, organisation of the chloroplast thylakoid membranes, their protein
17
composition and that of the surrounding stroma that contains the enzymes of the CBB cycle (Adams et
al., 2007; Anderson et al., 1988; Boardman, 1977; Schöttler and Tóth, 2014; Walters, 2005). The long-
term response to growth light irradiance of an individual plant is termed ‘acclimation’ and is controlled
by multiple regulatory mechanisms to produce distinct reactions to low light and high light (Bailey et
al., 2001; Kouřil et al., 2013).
1.4.1 PSII damage and repair
The reaction centre of PSII is highly susceptible to damage from excess light, termed photoinhibition.
Excess excitation arising from high irradiance leads to production of more electrons than the
photosynthetic machinery has the capacity to utilise. Reactive oxygen species are generated, aided by
triplet chlorophyll and lipid peroxidation, and can damage protein structure and electron transport
components. Visible light can also damage the Mn4Ca cluster, which can then lead to further damage
through the formation the P680+· and Tyr-Z+· oxidising radicals (Johnson, 2007). Most damage to PSII
occurs at the D1 reaction centre subunit, at a level directly proportional to light intensity. In barley
plants grown at 500 μmol m−2 s−2, D1 has a half-life of 2.4 h (Nelson et al., 2014). In order to repair this
component, the whole of the PSII complex – containing 28 subunits – must be disassembled. Before
the complex is disassembled, damaged PSII must be moved from the grana to the stoma lamellae, where
many components of the repair machinery are enriched. Phosphorylation of D1, D2, CP43 and PSBH
by kinases including STN8 and, to a lesser extent, STN7 facilitates monomerisation of PSII and
movement out of the grana into the non-appressed stroma lamellae regions. Once mobilised, PSII is
dephosphorylated by PBCP and other phosphatases. The damaged D1 protein is degraded by the FTSH
and DEG proteases then a new D1 is inserted into the complex. PSII is reassembled and migrates back
to the grana where it dimerises and forms active PSII-LHCII supercomplexes. Whilst the PSII repair
machinery is subject to complex regulation in response to high light, the damage and repair process
occurs continually in all light conditions (Järvi et al., 2015; Nath et al., 2013). It was previously assumed
that photoinhibition by PSII damage was a fault of the system, which was compensated for by the
extensive repair machinery. However, a recently proposed theory is that there is a physiological purpose
for PSII damage and repair, in that it reduces damage to PSI, which lacks the extensive repair machinery
of PSII and takes much longer to replace (Järvi et al., 2015).
1.4.2 Short term responses to light intensity
To deal with faster fluctuations in light intensity such as changing cloud cover and the movement of
leaves in the wind, plants have short-term responses, occurring on a timescale of seconds to minutes,
that are readily reversible. These responses occur on various levels, from leaf movement to physically
reach or avoid light, opening and closing of stomata to control gas exchange, Rubisco activation in
control of CO2 fixation, down to the regulation of light harvesting and electron transfer in the thylakoid
membrane. The aim of short-term high light responses in the thylakoid membrane is generally
photoprotection through downregulation of light harvesting and electron transfer (Gjindali et al., 2021),

18
whereas the long-term aim is to restore homeostasis by adjusting the sink capacity of the system to
better utilise the increased light level. The aim of short-term low light responses is generally to manage
and divert absorbed light energy to balance the ATP and NADPH output to maintain efficient CO2
fixation. Although proteins involved in these processes are generally regulated by post-translational
modifications such as protonation or phosphorylation, rather than by alterations in transcription or
translation, the capacity for these responses may be affected by long-term acclimation.
Short-term mechanisms are activated not by the intensity of light that the leaf is exposed to but by
mismatches in the electron transfer rate and sink capacity of the photosynthetic machinery. When there
is an increase in electron flux that exceeds the sink capacity for those electrons, the system must
decrease electron transfer to avoid damage. Likewise, when electron flux is lower than is optimal for
the system, energy absorption and transfer is maximised. Therefore, the activation of short-term
mechanisms depends on the position of the photosynthetic ‘steady state’ arising from long-term
acclimation to the light environment. Plants adapted to different light environments will initiate short-
term responses at different light intensities from one another.
1.4.2.1 Non-photochemical quenching
Photoinhibition is the loss of PSII electron transfer activity through photooxidative damage to the
reaction centre induced by light. To avoid photoinhibition, plants possess several mechanisms of
photoprotective energy dissipation. The dissipation of excess excitation energy as heat can be measured
as the non-photochemical quenching (NPQ) of chlorophyll a fluorescence (Schreiber, 1986). Several
different components of NPQ exist that can be distinguished on the basis of their temporal evolution.
The major component is energy (i.e. ΔpH)-dependent quenching (qE), which forms and relaxes on a
timescale of seconds to minutes. qE is triggered by a decrease in the lumenal pH resulting in the
protonation of the violaxanthin de-epoxidase enzyme (VDE) and the PSBS protein. VDE converts
LHCII-bound violaxanthin to zeaxanthin and this together with the protonation induced
monomerisation of PSBS allosterically promotes a conformational change in LHCII, from a light
harvesting mode to a dissipative mode, leading to its the reversible aggregation (Johnson et al., 2011;
Murchie and Ruban, 2020). Part of the NPQ induced during the excess light period is maintained for
several hours afterwards due to the slow reconversion of zeaxanthin back to violaxanthin by the enzyme
zeaxanthin epoxidase and is known as qZ. Depending on the efficiency of qE induction, some
photoinhibition of PSII may still occur leading to another persistent form of NPQ known as qI, which
involves damage to the RC and requires PSII repair (Matsubara and Chow, 2004). A third form of
sustained quenching known as qH, recently discovered, involves the lumenal located lipocalin protein
(LCNP) (Malnoë et al., 2018). Reversal of qH occurs through the action of the SOQ1 and ROQH1
proteins, though the exact mechanisms involved remain to be elucidated (Amstutz et al., 2020; Brooks
et al., 2013).

19
1.4.2.2 Photosynthetic control
While considered less susceptible to photooxidative damage than the reaction centre of PSII, damage
to and inactivation of PSI is costly. Unlike PSII, PSI does not have the extensive machinery for
disassembly, storage of non-damaged peripheral subunits, and reassembly, so the entire complex must
be replaced. The main source of damage to the PSI reaction centre is electron transfer to the acceptor
side, where over-reduction of the electron transfer chain causes oxidative damage to Fe-S clusters on
the stromal side of PSI. Therefore, photoprotection of PSI is linked to the downregulation of LET, which
is in turn controlled by PSII activity. For this reason, photoprotection of PSI is connected to that of PSII.
Mechanisms that control energy transfer to and activity of PSII, such as NPQ and state transitions,
indirectly protect PSI. However, the primary photoprotective mechanism of PSI is ‘photosynthetic
control’ (Rumberg et al., 1968; West and Wiskich, 1968). Photosynthetic control is the regulation of
electron transfer through the thylakoid membrane to account for changing demands and capacity for
ATP production, while also protecting PSI by limiting the build-up of electrons on the acceptor side
(Suorsa et al., 2013).
When plants are exposed to high light irradiance, the increased ∆pH slows the turnover of the cytb6f
complex via protonation of the His-ligands of the 2Fe-2S cluster of PETC, which normally acts as H-
bond acceptor during PQH2 oxidation (Jahns et al., 2002; Malone et al., 2021; Suorsa et al., 2013). By
regulating the rate of electron delivery to plastocyanin, photosynthetic control promotes the oxidation
of P700, the PSI special pair. P700+ is then available for photoprotective charge recombination if the
downstream electron acceptors are saturated. The importance of photosynthetic control to plant fitness
is illustrated by the phenotype of the Arabidopsis pgr5 mutant, which lacks the proton gradient
regulation protein PGR5. The absence of PGR5 leads to diminished ∆pH and over-reduction and photo-
damage to PSI, particularly in fluctuating light (Suorsa et al., 2012). As with NPQ, photosynthetic
control is critical in a fluctuating light environment and warrants significant consideration as a target
for engineering crops to improve yields (Chaux et al., 2015; Tikkanen et al., 2014).
1.4.2.3 State transitions
‘State transitions’ are a short or medium term response to changing light conditions, either in the
intensity or spectral quality of the light environment or to the metabolic state of the leaf. The spectrum
of light reaching a particular chloroplast may be affected by the diurnal cycle or filtration through other
leaves, creating unbalanced excitation of PSI and PSII, which absorb slightly different wavelengths of
light. In addition, the variable demand for ATP compared to NADPH may require fine adjustment of
the CET/LET ratio and thus relative activities of PSI compared to PSII. In both cases, state transitions
serve to optimise the excitation balance between PSI and PSII through control of their relative antenna
sizes (Ruban and Johnson, 2009). In state transitions, a subset of LHCII trimers are thought to be fulfil
this role as the ‘mobile’ antenna (Galka et al., 2012).

20
Dissociation of LHCII from PSI is triggered by phosphorylation by the kinase STN7, which is essential
for state transitions (Bellafiore et al., 2005). STN7 acts as a redox sensor and is activated upon binding
of plastoquinol to cytb6f. Far red light, which preferentially excites PSI, or darkness causes the PQ pool
to become more oxidised. The oxidised PQ pool does not activate STN7, so LHCII is maintained in a
dephosphorylated state by the constitutively active phosphatase TAP38 and associates with PSII; this
is ‘state 1’. Low light irradiance or red light, which preferentially excites PSII, causes the PQ pool to
become more reduced and activates STN7. Phosphorylated LHCII associates with PSI; this is ‘state 2’.
While both LHCB1 and LHCB2 are phosphorylation targets of STN7, LHCB2 is phosphorylated faster
and is essential for state transitions (Leoni et al., 2013; Pietrzykowska et al., 2014). Sequence
differences around the phosphorylation sites of LHCB1 and LHCB2, located at the N terminus, regulate
the rate of phosphorylation (Liu et al., 2016). The third trimer component, LHCB3, is not directly
involved in state transitions as it lacks the necessary phosphorylation site but may function to slow
down or regulate the process (Damkjær et al., 2009). Phosphorylated LHCII associates with PSI via the
PSAH, PSAI, PSAL and PSAO subunits. However, in the grana margins additional LHCII trimers may
associate with PSI in an interaction mediated by LHCA proteins (Benson et al., 2015; Crepin and
Caffarri, 2015; Erik et al., 2007; Galka et al., 2012; Pan et al., 2018).
Recently it was discovered that, in addition to phosphorylation, lysine acetylation is critical for state
transitions (Koskela et al., 2018, 2020). Arabidopsis mutants lacking the chloroplast lysine
acetyltransferase NSI are unable to perform state transitions and cannot form LHCII-PSI complexes,
despite LHCII phosphorylation remaining at wild type levels, suggesting an import role for lysine
acetylation in the regulation of light harvesting. It is proposed either that acetylated lysine residues on
LHCII and PSAH are necessary for the interaction of phosphorylated LHCII with PSI, or that acetylated
lysine residues on PSBP and LHCII are necessary for dissociation of L trimers from PSII. Lysine
acetylation has been found as a post-translational modification of Arabidopsis proteins in a wide range
of different biological processes, including many in photosynthesis (Wu et al., 2011).
Earlier studies of mutants lacking STN7 indicated that state transitions are of limited importance in a
natural light environment, since the particular fluctuating light regimes used produced plants that are
only very slightly developmentally and photosynthetically impaired (Bellafiore et al., 2005; Frenkel et
al., 2007). Later work, however, showed that a broad spectrum of stn7 phenotypes could be produced
depending on growth conditions and that LHCII phosphorylation was indeed crucial under fluctuating
light (Grieco et al., 2012; Tikkanen et al., 2010). Mutant Arabidopsis lacking STN7 shows slower
growth only under fluctuating light, whereas under constant light intensity, it is able to counter the loss
of LHCII phosphorylation and hence the association of LHCII with PSI by increasing the number of
PSI reaction centres. In stn7 grown in fluctuating light, the lack of antenna for PSI causes a steady-state
imbalance in photosystem activity that led to damage to PSI.

21
1.4.2.4 Dynamic thylakoid stacking
In Arabidopsis plants grown at a moderate light intensity, grana size changes rapidly in response to
changes in light intensity and spectral quality in an STN7/TAP38-dependent way via control of LHCII
phosphorylation (Hepworth et al., 2021; Kyle et al., 1983; Pietrzykowska et al., 2014; Wood et al.,
2018, 2019). Under low light conditions when LHCII phosphorylation by STN7 is at a maximum, grana
have fewer membrane layers and narrower diameters, whereas there are more membrane layers per
granum and wider diameters when LHCII is dephosphorylated by TAP38 in both high light and
darkness upon inactivation of STN7. These changes occur on a timescale of around 10 min (Wood et
al., 2019). The mechanism of short term granal unstacking may involve repulsion between layers and
fission of connecting regions between layers, followed by rotation and further separation, resulting in
the generation of multiple smaller grana from one large granum (Chuartzman et al., 2008). Since
dynamic thylakoid stacking is governed by LHCII phosphorylation level, it was originally proposed to
facilitate the exchange of LHCII between PSII in the grana and PSI in the stromal lamellae (Kyle et al.,
1983). However, dynamic thylakoid stacking has been shown to occur in the absence of phospho-LHCII
binding to PSI (Wood et al., 2019). Recent work has showed that state transitions and dynamic thylakoid
stacking work synergistically to optimise the LET/CET balance under variable light conditions
(Hepworth et al., 2021; Wood et al., 2018). Under low light, LHCII phosphorylation promotes the
interaction of LHCII with PSI and thus enhances CET, while simultaneously the smaller grana that
ensue enhance the oxidation of PQH2 by shortening the diffusion distance between PSII and stromal
cytb6f, thereby promoting LET. In contrast, upon high light exposure when LHCII is dephosphorylated
and returns to PSII, the resulting larger grana increase the diffusion distances for PQH2 and plastocyanin
to travel to reach stromal cytb6f and PSI. This is suggested to simultaneously promote redox poising of
the CET pathway in high light by preventing rapid reduction of the stromal PQ pool by PSII and help
to maintain PSI in an oxidised state for photoprotection by decreasing its equilibrium constant with
plastocyanin (Hepworth et al., 2021; Wood et al., 2018).
PSII phosphorylation, governed by STN8 kinase and PBCP phosphatase, has also been shown to
modulate grana size in response to light intensity (Herbstova et al., 2012; Puthiyaveetil et al., 2014).
Under photoinhibitory conditions PSII phosphorylation increases, initiating repair of PSII while
simultaneously provoking a reduction in grana size that increases contact between the grana and stroma
lamellae to facilitate faster diffusion of damaged PSII complexes out of the grana for repair (Goral et
al., 2010). In the absence of the PSII kinase STN8, constitutively larger grana are observed (Fristedt et
al., 2009a).
A recently discovered factor in thylakoid stacking is the CURT1 family of proteins, located at the grana
margins, which oligomerise to induce membrane curvature. Chloroplasts lacking these proteins form
very large, elongated grana with no margins, while overexpressors feature enhanced stacking
(Armbruster et al., 2013; Wood et al., 2019). Dynamic thylakoid stacking in fluctuating light may be

22
regulated by phosphorylation and acetylation of CURT1 proteins (Trotta et al., 2019). Two other
contributors to thylakoid stacking are the reduced induction of non-photochemical quenching (RIQ)
proteins, RIQ1 and RIQ2, the absence of which enhances grana stacking. In chloroplasts lacking both
CURT1A and either RIQ1 or RIQ2, grana were elongated as in the curt1a mutant but contained more
membrane layers (Yokoyama et al., 2016).
While less extensively studied as a contributor to thylakoid architecture, the plastoglobules also appear
to play a significant role in remodelling of the thylakoid membrane under high light. A complex formed
by the plastoglobule kinases PGR6 and ABC1K3 functions in lipid metabolism, stress responses and
thylakoid remodelling in response to high light intensity. The chloroplasts of mutants lacking these
proteins produced hyperstacked grana under high light irradiance, accompanied by dramatic losses in
PSII, NDH and the calcium sensor phosphoprotein, CAS (Lundquist et al., 2013). The antioxidant
compound α-tocopherol, synthesised in the plastoglobules by VTE1, is also induced in high light (Piller
et al., 2014). The plastoglobule-associated fibrillins are required for proper acclimation to high light
and cold stress. Under stress, the absence of these proteins causes growth retardation, deficiencies in
anthocyanin accumulation and altered thylakoid architecture with fewer plastoglobules and swollen
thylakoids. Jasmonic acid plays a role in long-term acclimation and its biosynthesis is associated with
accumulation of plastoglobules and fibrillin proteins therein (Youssef et al., 2010).
1.4.3 The link between short and long term responses
Arabidopsis mutants lacking STN7 are deficient in both state transitions and long term acclimation
(Bonardi et al., 2005). While the two processes are linked, state transitions themselves are not essential
for long term acclimation. Instead, STN7 appears to activate a signalling pathway leading to
acclimation-related changes in the thylakoid proteome (Pesaresi et al., 2009a). STN7 kinase activity is
triggered by the redox state of the PQ pool. It then phosphorylates both LHCII, inducing short term
responses including state transitions, and another unknown protein, which leads to long term
acclimation responses. One candidate for this unknown substrate of STN7 is TSP9. TSP9 is an
intrinsically disordered peripheral thylakoid membrane protein on the stromal side with no known
homologues outside of plant species. Light irradiance induces phosphorylation in a stepwise fashion at
three threonine residues and subsequent release of TSP9 from the thylakoid membrane, a feature that
implies a role in signalling and regulation of gene expression during acclimation to light intensity
(Carlberg et al., 2003). Transcriptomic data of mutant Arabidopsis lacking TSP9 supports the
suggestion of a role for TSP9 in the high light acclimation response, and the mutants are also defective
in state transitions (Fristedt et al., 2009b). Pesaresi et al. (2009) sought to further investigate the role of
TSP9 in acclimation and state transitions. In their study, acclimation was to either PSI light or PSII light
rather than high or low irradiance and the extent of acclimation was recorded as chlorophyll a/b to
indicate the proportion of Chl b in LHCII. The mutant lacking TSP9 behaved similarly to wild type in
terms of chlorophyll a/b ratios, suggesting that the signalling pathway for long term acclimation does

23
not involve TSP9. However, if there are separate mechanisms for acclimation to high light and low light
(Bailey et al., 2001), or different pathways exist for responding to light with different spectral qualities
rather than intensity, a regulatory role for TSP9 cannot be completely ruled out. Another candidate for
STN7-induced signalling in acclimation is the chloroplast sensor kinase (CSK) (Puthiyaveetil et al.,
2008), however its specific role is as yet unclear.
1.4.4 Long term acclimation to light intensity
Long-term acclimation can be categorised as either dynamic or developmental. Dynamic acclimation is
the process by which fully mature leaves undergo de novo synthesis and degradation of specific
proteins, leading to changes in the organisation of the chloroplast thylakoid membranes, their protein
composition, and that of the surrounding stroma containing the enzymes of the CBB cycle (Athanasiou
et al., 2010; Suorsa et al., 2012; Walters and Horton, 1994; Yin and Johnson, 2000). Developmental
acclimation, which is the focus of the work in this thesis, is the alteration of leaf development and
morphology in addition to these changes in chloroplast composition (Anderson, 1986; Anderson et al.,
1988; Bailey et al., 2001, 2004; Boardman, 1977; Schöttler and Tóth, 2014; Vialet-Chabrand et al.,
2017; Walters, 2005). The ability to acclimate to light intensity varies not only between species
(Murchie and Horton, 1997), but also between different accessions within single species (Athanasiou
et al., 2010). The signalling pathways that trigger acclimation are not yet fully understood. However,
significant roles have been described for the redox state of the electron carrier PQ (Huner et al., 1996;
Pfannschmidt et al., 1999; Rosso et al., 2009), the activity of the LHCII kinase STN7 (Pesaresi et al.,
2009a), and the glucose-6-phosphate/phosphate translocator GPT2 (Athanasiou et al., 2010). Recent
findings demonstrate that acclimation is vital to plant fitness in terms of seed production in fluctuating
light environments (Athanasiou et al., 2010; Townsend et al., 2018).
When plants are exposed to high or low light in the long term, they alter their proteome through
transcriptional, translational and post-translational regulation of gene expression on a timescale of
minutes to hours. Changes may be observed on the level of growth and development speed, leaf
morphology, pigment content, number of chloroplasts per cell, and thylakoid superstructure. Long term
acclimation to different growth light intensities has been studied at the level of chloroplast organisation
and composition in a wide range of different plant species (Bailey et al., 2001; Ballottari et al., 2007;
Chow and Anderson, 1987; Chow and Hope, 1987; Chow et al., 1988; Miller et al., 2017; Petersen et
al., 2011; Schumann et al., 2017). The process of acclimation is controlled by multiple regulatory
mechanisms, as demonstrated by the separate responses seen in chloroplast composition to high and
low light (Bailey et al., 2001; Kouřil et al., 2013). Two key features of the acclimation response are
adjustment of photosystem antenna size and alteration of the PSI to PSII ratio. In low light, plants
increase the amount of thylakoid membrane stacking and the ratio of light harvesting LHCII and PSI to
PSII. Low light acclimated plants may run their metabolism at a lower overall energy cost (Boardman,
1977), growing slower and taking longer to reach maturity, to balance levels of respiration with limited

24
carbon fixation. High light, on the other hand, leads to decreased stacking, reduction in the LHCII/PSII
and PSI/PSII ratios and increased levels of ATP synthase, cytb6f and Rubsico relative to total
chlorophyll (Bailey et al., 2001; Ballottari et al., 2007; Chow and Anderson, 1987; Chow and Hope,
1987; Chow et al., 1988; Miller et al., 2017; Petersen et al., 2011; Schumann et al., 2017). Consequently,
while high light grown plants have a higher overall capacity for LET and CO2 assimilation coupled with
an increased resistance to photoinhibition, adaptations to low light intensity allow the plant to utilise
low irradiance more effectively (Anderson et al., 1988; Boardman, 1977; Gray et al., 1996).
Acclimation to light intensity is thought to be primarily triggered by changes in the redox state of the
PQ pool (Huner et al., 1996; Pesaresi et al., 2009a; Pfannschmidt et al., 1999; Rosso et al., 2009). The
redox-triggered signalling pathway leading to long term acclimation branches into separate pathways
for regulation of chloroplast and nuclear gene expression, where chloroplast gene regulation is
controlled on the transcript level while nuclear gene regulation control happens on multiple levels
(Pesaresi et al., 2009a).
It has been widely demonstrated that the abundance of PSI increases relative to PSII under low light
(Anderson et al., 1988; Fan et al., 2007; Melis, 1991). Under low light conditions, when the proton
motive force is lower, basal leakage of protons across the membrane has a more significant effect on
net proton movement (Berry and Rumberg, 1996). The increase in PSI may compensate for this by
increasing CET to maintain the correct ratio of ATP to NADPH production. The NDH complex and its
associated route of CET is proposed to have an important role under low growth light, as rice mutants
lacking this complex in the thylakoid membrane have impaired growth under low light but not high
light (Yamori et al., 2015). Another possible reason for changes in PSI abundance may be that filtering
of light through canopy leaves may affect the spectral quality of light reaching plants grown in the
shade, since the two photosystems have different absorption spectra. However, a recent acclimation
study of pea plants using quantitative proteomics showed no change in the PSII/PSI ratio (Albanese et
al., 2018), although this experiment may not accurately reflect their behaviour in a natural environment
since artificial low and high lighting will be spectrally similar.
Previous acclimation studies have highlighted how, in low light, plants generally expand their light
harvesting antenna system relative to the PSII reaction centre, but have a generally lower maximum
LET capacity (Adams et al., 2007; Bailey et al., 2001; Ballottari et al., 2007; Chow and Anderson, 1987;
Chow and Hope, 1987; Chow et al., 1988; Miller et al., 2017; Petersen et al., 2011; Schumann et al.,
2017). The antenna size of PSI and PSII behave differently in response to light acclimation. Whilst the
expression of some LHCII peptides increases under low light, the amounts of the LHCI antenna proteins
relative to the core PSI proteins appear to remain the same. PSI light harvesting efficiency may be
regulated only by the ratio of PSI to PSII, which increases under low light, and by association or
dissociation of mobile LHCII trimers during state transitions (Ballottari et al., 2007).

25
Despite lower relative abundance of PSII under low light, there is generally a large increase in
expression of LHCII trimer subunits LHCB1 and LHCB2 as well as smaller increases in the core PSII
antenna peptides LHCB5 and LHCB6. The number of ‘L’ and ‘M’ trimers changes to a different extent
during low and high light acclimation, suggesting that specific regulatory mechanisms must exist for
both ‘bound’ and ‘mobile’ LHCII (Kouřil et al., 2013). Changes in expression in response to high or
low light can be seen in specific components of the PSI and PSII core antenna, including isoforms which
may have important protective or regulatory roles (Bailey et al., 2001). Previous work has determined
that PSII efficiency declines as its antenna cross section increases, since the additional peripheral L-
type LHCII trimers are less efficiently coupled to the reaction centre (Ware et al., 2015; Wientjes et al.,
2013a). However, the loss in efficiency is offset by the overall increase in absorption cross-section such
that the number of pigment molecules per reaction centre times the quantum yield is higher (Wientjes
et al., 2013a). The grana of low light acclimated plants may have large areas containing LHCII but no
PSII and generally, plant species adapted to low light environments have chloroplasts containing fewer
grana with more membrane layers (Anderson et al., 2012).
High light acclimation requires an increase in capacity for LET, so electron carriers and photosynthetic
machinery must be adjusted together to maintain efficiency. Cytb6f and FNR, complexes that both have
a substantial impact on LET flux (Hajirezaei et al., 2002; Kirchhoff et al., 2000), are likely upregulated
in plants adapted to high light intensity. Indeed, overexpression and increased abundance of cytb6f in
the thylakoid membrane increases electron transfer rate and results in a greater capacity for CO2
assimilation, increased biomass and seed yield (Ermakova et al., 2019; Simkin et al., 2017), making
this complex a target for genetic manipulation of agriculturally-relevant plant species. Plastocyanin is
another component reported to undergo significant regulation in response to changing light intensity.
Expression of this electron carrier has been shown to increase under high light intensity, possibly to
prevent photosynthetic rate being limited by electron transfer to and from cytb6f (Burkey, 1993).
However, Arabidopsis mutants with a 90% reduction in plastocyanin levels displayed no LET-related
phenotype but were more susceptible to copper (Cu) stress, suggesting another role for plastocyanin in
Cu storage (Pesaresi et al., 2009b). High light intensity increases susceptibility to photoinhibition, so
high light acclimation requires readjustment of protein stoichiometries of the short-term photoprotective
mechanisms, including state transitions and NPQ. Another photoprotective strategy affected by high
light acclimation is chlororespiration, which aims to protect reaction centres by minimising production
of ROS (Kanervo et al., 2005). It involves NDH and the PTOX, which can oxidise plastoquinol to
prevent over-reduction of the PQ pool and has been found to increase in abundance under high light
irradiance (Carol et al., 1999; Kanervo et al., 2005; Miyake, 2010). Despite an enhanced electron
transfer and photoprotective capacity in high light acclimated plants, increased PSII activity raises the
risk of reaction centre damage resulting in a high rate of turnover for this complex. Therefore, high light
acclimation likely also involves upregulation of the extensive PSII repair machinery.

26
Much work has been carried out to investigate protein expression changes during acclimation in the
thylakoid membrane. However, many of the techniques commonly used for protein detection and
quantification are inaccurate, time-consuming and require specific, well-characterised target proteins,
or are limited to proteins containing light-absorbing cofactors, as is the case with absorbance-based
spectrophotometric assays. Important regulatory proteins may be present at relatively low levels,
making changes in expression hard to detect. Immunoblotting is commonly used to detect proteins and,
whilst being qualitatively informative, is subject to several limitations (Ghosh et al., 2014). Firstly, it is
generally restricted to a single target protein for which a commercially-available antibody has been
produced or requires the protein to be isolated and purified for production of specific serum in-house.
Additionally, immunoblotting is only accurate for relative quantification over a very narrow range
specific to a single target protein and antibody, and absolute quantification can only be carried out using
purified target protein at a known amount as a standard. Cross-reactivity, low sensitivity, and poor
reproducibility also affect the reliability of quantification. In recent years, there have been significant
developments in high-resolution mass spectrometry and processing of proteomic datasets (Van
Oudenhove and Devreese, 2013). Mass spectrometry can be used to analyse highly complex protein
mixtures and enables the identification and quantification of potentially thousands of proteins from a
single sample, making this technique an attractive alternative to single-protein quantitative techniques.
We know that the thylakoid membrane undergoes significant remodelling in response to environmental
conditions with many interlinked regulatory processes. Therefore, mass spectrometry-based
quantification is a highly valuable tool for the study of photosynthetic acclimation.
1.5 Arabidopsis thaliana as a photosynthetic model organism
Arabidopsis thaliana is a small flowering plant, which became the first plant species to be used as a
model organism. It grows in a wide range of climates throughout the world as several ecotypes,
originating in Europe, Africa and Asia. The species was first described in 1577 by Johannes Thal, after
whom it was eventually named, and was adopted as a model system in the mid-20th century with the
first International Arabidopsis Symposium taking place in 1965 (Somerville and Koornneef, 2002). A
number of features of Arabidopsis physiology make it ideal for its role as a model organism. One of
these is the small size of the plant and its ability to grow at high density in the restricted space of a
laboratory or growth chamber. Arabidopsis seeds, which may be harvested in the thousands from a
single self-pollinating plant, are simple to sow and take around 6 weeks to reach maturity and go to
seed. Leaves grow outwards in a rosette, from the centre of which the flowering stem emerges.
Arabidopsis has a relatively small and simple genome compared to other plants, in that it is diploid and
has a length of around 140 Mb across five chromosomes. Genetic transformation of Arabidopsis is a
relatively simple procedure compared to other multicellular organisms. The process involves dipping
the flowers into a suspension of Agrobacterium tumefaciens and collection of resulting transgenic seeds.
Widespread use in plant research lead to Arabidopsis being the first plant species to have its genome
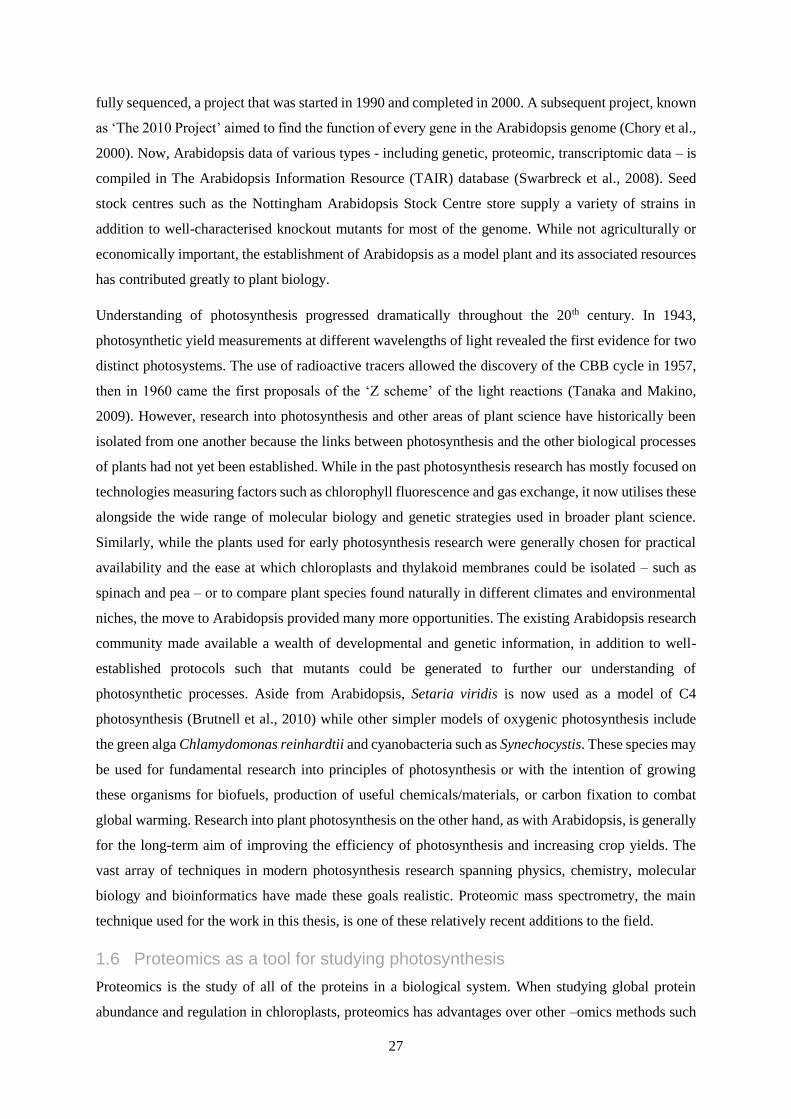
27
fully sequenced, a project that was started in 1990 and completed in 2000. A subsequent project, known
as ‘The 2010 Project’ aimed to find the function of every gene in the Arabidopsis genome (Chory et al.,
2000). Now, Arabidopsis data of various types - including genetic, proteomic, transcriptomic data – is
compiled in The Arabidopsis Information Resource (TAIR) database (Swarbreck et al., 2008). Seed
stock centres such as the Nottingham Arabidopsis Stock Centre store supply a variety of strains in
addition to well-characterised knockout mutants for most of the genome. While not agriculturally or
economically important, the establishment of Arabidopsis as a model plant and its associated resources
has contributed greatly to plant biology.
Understanding of photosynthesis progressed dramatically throughout the 20th century. In 1943,
photosynthetic yield measurements at different wavelengths of light revealed the first evidence for two
distinct photosystems. The use of radioactive tracers allowed the discovery of the CBB cycle in 1957,
then in 1960 came the first proposals of the ‘Z scheme’ of the light reactions (Tanaka and Makino,
2009). However, research into photosynthesis and other areas of plant science have historically been
isolated from one another because the links between photosynthesis and the other biological processes
of plants had not yet been established. While in the past photosynthesis research has mostly focused on
technologies measuring factors such as chlorophyll fluorescence and gas exchange, it now utilises these
alongside the wide range of molecular biology and genetic strategies used in broader plant science.
Similarly, while the plants used for early photosynthesis research were generally chosen for practical
availability and the ease at which chloroplasts and thylakoid membranes could be isolated – such as
spinach and pea – or to compare plant species found naturally in different climates and environmental
niches, the move to Arabidopsis provided many more opportunities. The existing Arabidopsis research
community made available a wealth of developmental and genetic information, in addition to well-
established protocols such that mutants could be generated to further our understanding of
photosynthetic processes. Aside from Arabidopsis, Setaria viridis is now used as a model of C4
photosynthesis (Brutnell et al., 2010) while other simpler models of oxygenic photosynthesis include
the green alga Chlamydomonas reinhardtii and cyanobacteria such as Synechocystis. These species may
be used for fundamental research into principles of photosynthesis or with the intention of growing
these organisms for biofuels, production of useful chemicals/materials, or carbon fixation to combat
global warming. Research into plant photosynthesis on the other hand, as with Arabidopsis, is generally
for the long-term aim of improving the efficiency of photosynthesis and increasing crop yields. The
vast array of techniques in modern photosynthesis research spanning physics, chemistry, molecular
biology and bioinformatics have made these goals realistic. Proteomic mass spectrometry, the main
technique used for the work in this thesis, is one of these relatively recent additions to the field.
1.6 Proteomics as a tool for studying photosynthesis
Proteomics is the study of all of the proteins in a biological system. When studying global protein
abundance and regulation in chloroplasts, proteomics has advantages over other –omics methods such

28
as genomics and transcriptomics. This is because the chloroplast proteome is transcribed from a mixture
of nuclear- and chloroplast-encoded genes (Martin et al., 1998). Environmental changes, such as the
intensity or spectral quality of light, may be detected in the chloroplast then this information must be
sent to the nucleus to regulate transcription of photosynthetic components, which are then transported
back to the chloroplast and imported. Therefore, quantification of photosynthetically relevant mRNA
transcripts could be misleading and may not accurately reflect stoichiometry changes in the thylakoid
membrane. Proteomic mass spectrometry (detailed in Section 1.7), on the other hand, informs about the
‘end product’ of transcriptional and translational regulation rather than the process, and is more
appropriate when investigating photosynthetic function. However, one caveat is the regulation of the
proteome by post-translational modification, either transient or permanent, such that quantity of a
protein will not directly reflect the amount of activity from that protein. While some in vivo
modifications, such as protonation, will not be detectable by mass spectrometry, others such as
phosphorylation and acetylation have the potential to be quantified and provide more detail about the
regulatory state of a protein than just its quantity. While mass spectrometry-based proteomics was
applied to the analysis of the thylakoid membrane fairly extensively in the 2000s, more recent studies
of this type are relatively limited despite significant advances in instrumentation and data processing.
The aim of some of the first proteomic analyses of chloroplasts was simply to identify as many
chloroplast-specific proteins as possible, assign proteins to their specific sub-organellar location, and
infer functions and processes of those locations based on the types of proteins found within them. One
of these first studies was of the Arabidopsis thylakoid lumen, where protein separation on 2-D
electrophoretic gels and MS identification of spots identified a novel plastocyanin and an ascorbate
peroxidase (Kieselbach et al., 2000). Two more analyses of the thylakoid lumen by a similar strategy
determined more functions of lumenal proteins and assigned 81 proteins to the lumenal proteome
(Peltier et al., 2002; Schubert et al., 2002). MS identification of separated thylakoid proteins highlighted
the thylakoid membrane as a site of protein synthesis and assembly, with many new protein functions
identified in translation and protein folding as well as proteolysis. Many known low-abundance and
very hydrophobic proteins were also identified and the data were compiled to produce a resource named
the Plastid Proteome Database (PPDB) and annotated (Friso et al., 2004). A different strategy was
employed by Peltier et al. (2004) to analyse the thylakoid proteome, where the membranes were
thoroughly purified and proteins were either fractionated and digested with trypsin or separated by SDS-
PAGE and digested in-gel. Tryptic peptides were analysed by nanoLC-MS/MS, as is most commonly
done in more recent proteomic analyses, and proteins were identified using the PPDB. Of the 242
proteins identified, at least 40% (around 97) were predicted to be integral membrane proteins and the
fractionation method allowed detection of additional lower abundance proteins, such as those involved
in tetrapyrrole synthesis and protein translocation. In another study, proteomics of the whole chloroplast
proteome with a similar MS method revealed more detail about the functions of stromal and envelope

29
proteins (Kleffmann et al., 2004). Other early uses of thylakoid protein MS included the identification
of phosphosites on a number of key photosynthetic proteins including those from PSII, LHCII, and PSI
by trypsin treatment of thylakoid membranes to release surface peptides (Hansson and Vener, 2003;
Vener et al., 2001).
Progressing from initial descriptions of the thylakoid proteome, later analyses aimed to detect or
quantify global changes in protein abundance occurring in response to developmental or environmental
factors, or to reveal more structural detail about photosynthetic proteins. Giacomelli et al. (2006)
compared the high light acclimation response of the Arabidopsis thaliana wild type thylakoid proteome
to that of an ascorbate-deficient mutant. This study involved a time course experiment where the plants
were acclimated to 1000 µmol.m-2.s-1 for 5 days. Protein samples from the plants were separated by 2-
D electrophoresis and the spots that changed in intensity were identified by MS. In this case,
quantification of changes in protein abundance was performed by analysis of gel spot intensity rather
than by MS. Only 45 proteins were shown to change in abundance due to either high light, genotype,
or both. The response of the thylakoid membrane to iron deficiency has been analysed by this gel spot
quantification and identification strategy (Andaluz et al., 2006), but also by a combination of 2-D
electrophoresis with in-gel digestion and intact protein LC-MS from sucrose density gradient bands,
with relative quantification performed using extracted ion chromatograms (Timperio et al., 2007). LC-
MS analysis of intact thylakoid proteins for quantification, with additional tryptic digestion to validate
protein identities, was used again to study iron deficiency (Laganowsky et al., 2009) and to investigate
specific features of LHCII isoform constituents, revealing oxidation and N-terminal acetylation as
common modifications of these proteins (Galetskiy et al., 2008).
With improvements in instrumentation, such as high-resolution Fourier transform-based mass
analysers, came more attempts to quantify the thylakoid proteome and map proteins to more specific
structures and complexes. Zybailov et al. (2008) performed in-gel digestion and label free quantification
of the chloroplast proteome in the form of spectral counting, resulting in the identification of 1325
chloroplast proteins with measured abundances spanning four orders of magnitude, and the abundance
data were deposited in the PPDB. Later, another chloroplast proteome database, AT_CHLORO, was
produced by Ferro et al. (2010) containing information about the properties of 1323 proteins and their
localisation within the chloroplast, determined by spectral counting. Further studies aimed to find
proteins localised within the plastoglobules (Lundquist et al., 2012), and within the grana, the grana
margins and the stroma lamellae (Tomizioli et al., 2014; Yin et al., 2015). MS has also been combined
with structural analysis to determine the contents of isolated complexes from pea thylakoids to assess
the compositional differences between the PSII supercomplexes, C2S2M2 and C2S2 (Pagliano et al.,
2014).

30
Relative and absolute quantification of the thylakoid proteome in recent work has been performed
through a range of strategies and there is no definite consensus on the correct or optimum method. The
thylakoid membrane is a particularly challenging system to work with through mass spectrometry-based
proteomics because of the physicochemical properties of integral membrane proteins as well as the
abundance distribution of its proteome; thylakoids are dominated by the light harvesting apparatus and
core photosynthetic machinery, obscuring many of the less abundant regulatory proteins (Whitelegge,
2003). Earlier strategies, such as 2-D electrophoresis and relative quantification of gel spots between
conditions followed by in-gel digestion and MS identification, are still used, as in an analysis by Wang
et al., (2016b) of thylakoids at different developmental stages. Isobaric labelling is also used, as in a
relative quantification of chloroplast proteins from dark-treated Arabidopsis against a control by TMT
labelling (Wang et al., 2016a). However, label-free proteomics was recently used for absolute
quantification of proteins of the thylakoid membrane to determine stoichiometries of complexes and
subunits to one another by McKenzie et al., 2020. Thylakoids were isolated from Arabidopsis plants
grown at a single moderate light intensity and the proteins subjected to in-solution digestion. Label-free
protein quantification indicated that for every PSII core complex there were 0.58 PSI cores, 0.35 cytb6f
complexes, 0.7 ATP synthases, while NDH was much less abundant at 0.013 per PSII. Total LHCII
was not calculated, but the analysis determined LHCB1.5 to be the most abundant trimer component
compared to the other two identified, LHCB1.4 and LHCB3. The label-free absolute quantification
method used for this work accounts for differences in protein size. However, it does not account for the
tendency of hydrophobic membrane proteins such as those of thylakoids to resist tryptic digestion, so
either relative quantification between conditions or the use of known isobaric protein standards may be
regarded as more accurate and precise.
Albanese et al. (2018) carried out the first study using label-free relatively quantitative MS to quantify
the changes in the thylakoid membrane proteome that occur during long term acclimation. The plant
investigated was pea, a non-model organism for which there was no full genome sequence known and
therefore, no proteome database available. Protein sequences were determined from transcriptomic data,
increasing the number of proteins that could be identified and quantified. Contrary to previous studies,
no difference in the PSII/PSI ratio was found between thylakoid membranes from plants acclimated to
low, moderate and high light intensity. Compared to plants grown under high light, low light thylakoids
contained around half as much of each of LHCB1, 2 and 3, but the LHCI components identified were
constant between conditions. Proteins increasing in abundance with growth light intensity included
plastoglobular and ribosomal proteins and those of the cytb6f complex, NDH and ATP synthase. Many
proteins with roles in electron transfer increased with light intensity, such as FNR and PGR5, whereas
plastocyanin was constant in all conditions. While these abundance changes are informative about long-
term acclimation of the thylakoid membrane of pea, a number of proteins were absent from the analysis

31
and the data may not translate directly to Arabidopsis, which is more widely used for photosynthesis
research.
1.7 Principles of mass spectrometry-based proteomics
In mass spectrometry, molecules are ionised then sorted according to their mass to charge ratio (m/z)
to give a mass spectrum. The technique can be used for biological applications such as analysis of
proteins and metabolites. Proteomic mass spectrometry is the analysis of the ‘proteome’, or total set of
proteins in a biological system, by detecting constituent peptides from a sample. Proteins are first
prepared from a biological sample then chemically modified by reduction and alkylation of cysteine
residues to prevent the formation of unwanted covalent bonds between proteins. The modified proteins
are then digested by an enzyme, usually trypsin, to give a mixture of peptide fragments (Dittrich et al.,
2015). Trypsin is a serine protease that cleaves peptide bonds on the C-terminal side of lysine or arginine
residues with high specificity to give suitably sized peptide fragments for analysis by mass
spectrometry. During mass spectrometric analysis, peptide fragments are usually separated by nano
liquid chromatography (nanoLC) before being ionised and detected in a peptide ion (MS1) scan. The
most intense peptide ions in the MS1 scan are selected and fragmented to produce a product ion (MS2)
spectrum. Information from the two spectra combined to determine the amino acid sequences of the
peptides, which are then searched against the organism’s proteome database to determine which
proteins were present in the original sample.
Proteomic mass spectrometry can be used for a wide range of tasks. Primarily, these tasks include:
identification of new proteins and generation of proteomic databases; mapping the localisation of
proteins within a cell or organelle; investigation of post-translational modifications to study regulatory
mechanisms; calculation of changes in relative amounts of proteins in response to different
environmental conditions or drugs, and; determination of absolute amounts of a protein or proteins in a
proteome as they are in a natural biological context (Aebersold and Mann, 2003).
Relative quantification of a peptide requires two or more conditions and can give information in terms
of ‘fold’ changes in amounts of protein. This can be useful for looking at the effect of an environmental
condition or treatment with a drug on protein expression and regulation. Relative quantification can be
simpler, does not require known targets or a specific hypothesis, and can be used to investigate more
proteins at once. This is known as ‘bottom-up’ or ‘shotgun’ proteomics. However, relative
quantification gives results without units and does not give information about the absolute amounts of
each protein, i.e. the number of protein molecules per cell (Drissi et al., 2013).
While relative quantification compares the abundance of one protein in different samples, absolute
quantification compares the abundance of different proteins in the same sample. It can also be used to
calculate the absolute molar amount of a protein. Differences in detectability and ionisation efficiency
of distinct peptides mean that their peak intensity does not indicate how much of a given peptide is

32
present. However, when the intensity of a peptide is compared to that of an identical but isotopically
labelled peptide with a known mass-shift, the difference in intensity between the two peptides will
accurately reflect the difference in their amounts. Stable isotope labelling by amino acids in cell culture
(SILAC) exploits this for accurate relative quantification. It involves the growth of two populations of
organisms in otherwise identical conditions, where one is grown on stable isotope-labelled substrate.
Peptide samples from the two populations are analysed together to determine their relative amounts for
proteomic analysis (Drissi et al., 2013). Alternatively, a known quantity of that peptide may be used to
determine the relationship between peak intensity and the amount of peptide. Therefore, absolute
quantification can be achieved using identical but isotopically-labelled peptides at known amounts. A
QconCAT (Swainston et al., 2011) is a recombinant artificial protein made up of concatenated target
peptides for quantification. It is produced in E. coli or yeast grown in stable isotope-labelled media and
purified, then a known amount is added to the protein mixture for digestion and use in mass
spectrometry analysis. The QconCAT method is time-consuming and requires specific target proteins.
Other methods for quantification include peptide labelling methods such as isobaric tag for relative and
absolute quantification (iTRAQ). In this strategy, protein samples are labelled with different reagents,
then the labelled samples are pooled together. All of these tags give peptides the same additional mass
and therefore the peptides are indistinguishable in the MS1 scan. Upon fragmentation, the differentially-
labelled product ions have distinguishable mass to charge ratios, so relative amounts of the peptides can
be calculated (Wiese et al., 2007).
More recently, absolute quantification of proteins has been more frequently performed in the absence
of mass labelling strategies. In label-free quantitative proteomics, absolute quantification of proteins is
based either on MS1 peptide intensities or on the number of MS2 spectra associated with a particular
peptide, termed spectral counting. There exists a number of methods for MS1 intensity-based absolute
quantification, which have been extensively compared for accuracy and precision (Fabre et al., 2014;
Välikangas et al., 2018; Zhang et al., 2015; Zhao et al., 2020a), available in a range of both commercial
and freely-available software. Some quantification strategies aim to relate total protein intensity (the
sum of all peptide intensities for that protein) to molar amounts by dividing protein intensity by a value
representing that protein’s size, such as its molecular weight. One of these methods is intensity-based
absolute quantification (iBAQ), whereby protein intensity is divided by the number of peptides that
would theoretically be released upon digestion of that protein (Schwanhäusser et al., 2011). Other
strategies normalise peptide or protein intensities across multiple MS experiments to adjust protein
intensities such that they can act as proxies for molar quantities. One of these methods is MaxLFQ (Cox
et al., 2014), implemented in the freely-available software MaxQuant (Cox and Mann, 2008), which
normalises protein intensity using peptide intensity ratios between experiments under the assumption
of an unchanging ‘background’ proteome. While there have been significant advances in label-free
absolute quantification, relative quantification is generally considered more robust and precise.

33
1.8 Aims
There has yet been no quantitative or semi-quantitative analysis of the proteome of the Arabidopsis
thaliana thylakoid membrane under high and low light conditions. Rather than investigating changes in
protein expression, most existing proteomic studies on the plant thylakoid membrane have focused on
increasing the number of membrane protein identifications or determining the localisation of proteins
within the chloroplast or within the thylakoid membrane (Tomizioli et al., 2014). Quantitative analysis
of plant proteomes through SILAC is challenging because of the need for isotope-labelled media, and
a QconCAT-based approach requires specific target proteins. Advances in the sensitivity and accuracy
of modern mass spectrometers (Scheltema et al., 2014) mean that labelling methods such as iTRAQ are
no longer essential for relative quantification. A label-free global analysis of the thylakoid membrane
proteome under different light environments will allow semi-quantitative comparative analysis of light
acclimation. This approach has the potential to identify important low-abundance regulatory proteins
that were not previously known to have roles in acclimation. The work presented in this thesis aims,
firstly, to develop a reliable method for relative quantification of the proteins of the thylakoid membrane
using label-free quantitative mass spectrometry-based proteomics. The method is then applied to
Arabidopsis plants grown in a controlled environment to investigate remodelling of the thylakoid
proteome in response to different light intensities and is combined with structural and biochemical
analyses to relate these changes to biological processes. However, since plants grown in a natural light
and temperature environment are exposed to very different conditions to those in a controlled
environment, it is important to view any observations and conclusions about light acclimation in the
context of a natural environment. Therefore, a comparison of the thylakoid proteome from Arabidopsis
grown in a natural environment to that from a controlled environment is performed using the same
method. Finally, to take the investigation further than a descriptive account of acclimative changes, the
strategy is applied to photosynthetic mutants to investigate how the thylakoid proteome is remodelled
to account for missing proteins or processes and to assess the relationship between phenotype and
proteome in these mutants. The final results chapter first describes a large comparative proteomic
analysis to determine the roles of the proteins STN7 and TAP38 in long term light acclimation. This is
followed by an analysis of the pgr5 Arabidopsis mutant in order to speculate on what changes in the
thylakoid proteome may contribute to the lethality of this mutation in a natural or fluctuating light
environment.

34
2 Experimental procedures
2.1 Growth of Arabidopsis thaliana
Table 5: Arabidopsis thaliana strains
Strain Description
col-0 Columbia ecotype
stn7 T-DNA insertion in intron (SALK 073254)
tap38 T-DNA insertion in 5' UTR (SALK 025713)
gl-1 Spontaneous mutant defective in trichome development
pgr5 Point mutation in gl-1 background (Munekage et al., 2002; Shikanai et al., 1999)
2.1.1 Conditions for growth of Arabidopsis
Arabidopsis thaliana seeds were sown on M3 compost and stored at 4˚C for 48 h before germination
by transferring to a Conviron plant growth room with day/night temperatures of 21˚C/18˚C. Seedlings
were transplanted to individual pots containing a mixture of M3 compost, perlite, and vermiculite at a
ratio of 4:1:1, respectively. Between 10 and 15 plants per condition were grown under fluorescent bulbs
(emission spectrum in Figure 5) at 150 μmol photons m-2 s-1 with either a 12 h photoperiod (Chapters
3, 4, and 5) or an 8 h photoperiod (Chapter 6). Light intensity was measured as photosynthetically active
radiation (PAR) on a LI-190 light meter. After 2 weeks, or until rosettes reached a diameter of around
3 cm, plants were transferred to their respective environmental conditions to be compared, either in a
controlled environment growth chamber or to an outdoor growth facility (Arthur Willis Environment
Facility, University of Sheffield) where the pots were positioned above ground on tables and watered
regularly to avoid drought stress. Plants were acclimated for different lengths of time prior to harvesting
to account for variable maturation rate depending on day length and light intensity (Cho et al., 2017).
Local weather data for the acclimation period of outdoor-grown plants was provided by the Weston
Park Weather Station, Sheffield, which recorded minimum and maximum temperatures of each day
along with sunshine hours. Sunshine hours were defined as the number of hours per day at which the
light intensity exceeded 120 W/m2. The approximate conversion of W/m2 to μmol photons m-2 s-1 was
performed as follows: 1 W/m2 = 4.57 μmol photons m-2 s-1 (Thimijan and Heins, 1983).

35
Figure 5: Emission spectrum of fluorescent lighting used for Arabidopsis growth.
2.2 Materials, buffers and reagents
Unless otherwise stated, reagents and chemicals from Fisher Scientific UK Ltd (Loughborough, UK)
or Sigma-Aldrich Company Ltd. (Dorset, UK). Solutions were made up in Milli-Q® Integral
ultrapure water produced by a Milli-Q® Integral Water Purification System (Millipore (UK) Ltd.,
Watford, UK) with a purity of 18.2 mΩ cm at 25ºC, unless otherwise stated (as in Section 2.9).
Table 6: Buffers and solutions
Experiment Solution Reagent concentration
Thylakoid membrane
preparation, structured
illumination microscopy, low
temperature fluorescence
spectroscopy
Preparation medium 50 mM sodium phosphate
buffer pH 7.4
5 mM MgCl2
300 mM sucrose
10 mM NaF
Break medium 5 mM MgCl2
10 mM Tricine pH 7.4
10 mM NaF
Double osmotic medium 5 mM MgCl2
10 mM Tricine pH 7.4
400 mM sucrose
10 mM NaF
Thylakoid storage buffer 10 mM sodium phosphate
buffer pH 7.4
5 mM MgCl2
5 mM NaCl

36
200 mM sucrose
10 mM NaF
Immunoblotting Transfer buffer 10 mM NaCO3
3 mM Na2CO3
10% (v/v) methanol
Tris buffered saline (TBS) 50 mM Tris HCl pH 7.6
150 mM NaCl
Blocking buffer 0.2% (w/v) TWEEN 20
50 mM Tris HCl pH 7.6
150 mM NaCl
5% (w/v) milk powder
Antibody buffer 0.05% (w/v) TWEEN 20
50 mM Tris HCl pH 7.6
150 mM NaCl
Mass spectrometry Loading solvent 0.5% (v/v) trifluoroacetic acid
3% (v/v) acetonitrile (ACN)
2.3 Preparation of thylakoid membranes
Arabidopsis thylakoid membranes were prepared according to Albertsson et al., 1994, with the addition
of 10 mM NaF to all buffers (Table 6). Leaves were blended in cold preparation medium in a waring
blender. The leaf homogenate was filtered through two layers of muslin followed by another two layers
of muslin with absorbent cotton wool in between. Chloroplasts were pelleted by centrifugation of the
cell lysate for 15 min at 3750 rpm on a Thermo Scientific Sorvall ST 16R centrifuge at 4˚C. To lyse
chloroplast envelopes, the pellet was resuspended in break medium and incubated on ice for 1 min. An
equal volume of double osmotic medium was added before centrifugation for 10 min at 3750 rpm at
4˚C. Pelleted membranes were resuspended and washed in thylakoid storage buffer before a final 10
min centrifugation step. The pelleted thylakoid membranes were then resuspended in approximately 1
mL of thylakoid buffer. Thylakoid membranes were stored in aliquots at -80˚C after flash freezing, with
the addition of ethylene glycol at 5% sample volume.
2.4 Spectroscopic analysis of pigments
2.4.1 Chlorophyll analysis
Absorption spectra were taken on an Agilent Technologies Cary 60 UV-VIS spectrophotometer. For
analysis of chlorophyll content, 4 µL of thylakoids were vortexed with 2 mL of 80% (v/v) acetone then
the mixture was centrifuged at 13000 × g for 2 min. The absorption of the supernatant at 750, 663 and
645 nm was used to calculate the chlorophyll concentration and chlorophyll a to b ratios of the thylakoid

37
samples according to Porra et al. (1989). The equations for calculation of concentrations and ratios are
shown below.
Chl a = 0.01225(A663-A750) – 0.00255(A645-A750)
Chl b = 0.02031(A645-A750) – 0.00491(A663-A750)
Chls a + b = 0.01776(A645-A750) + 0.00734(A663-A750)
2.4.2 Low temperature fluorescence spectroscopy
Thylakoids were diluted in thylakoid storage buffer to A680 = 0.1 and transferred to a 1 cm polymethyl
methacrylate cuvette. The fluorescence of samples plunged into liquid nitrogen was measured using a
FluoroLog FL3–22 spectrofluorimeter (Jobin Yvon). Emission spectra from excitation at 435 nm were
normalised to the peak at 684 nm emission. PSII excitation spectra (emission at 695 nm) were
normalised to the peak at 675 nm excitation. PSI excitation spectra (emission at 735 nm) were
normalised either to 705 nm excitation or to the maximum value between 550 and 720 nm.
2.5 Protein assay
For calculation of protein concentration in thylakoid membranes, sodium laurate (SL) was added to a
concentration of 1% (w/v). The sample was subject to two rounds of sonication for 10 min followed by
shaking at 1500 rpm for 5 min at 20˚C, then starch granules were removed by centrifugation at 10,000
× g for 2 min. The Bio-Rad DC protein assay was used to determine protein concentration of the
solubilised thylakoids with absorbance read at 750 nm. Sample concentration was calculated using a
standard curve of bovine serum albumin (BSA) standards at 0.2, 0.5, 0.8, 1.2 and 1.5 mg/mL in 1%
(w/v) SL. Ratios of protein:Chl were produced by calculating the protein concentration of thylakoids
solubilised at a known Chl concentration (0.1 mg/mL).
2.6 BN-PAGE
Stromal lamellae were solubilised at 0.5 mg/mL Chl in 2% (w/v) digitonin, 50 mM Bis Tris pH 7.2, 10
mM NaF, 10% (v/v) glycerol, for 1 h on ice. Grana membranes were solubilised in 0.5% (w/v) n-
hexadecyl β-D-maltoside, 0.2% (w/v) n-dodecyl α-D-maltoside, 50 mM Bis-Tris pH 7.2, 10 mM NaF,
10% (v/v) glycerol, for 1 h on ice. For comparison of lab and field grown plants, the granal fractions
were instead solubilised in 1% (w/v) n-dodecyl α-D-maltoside, 50 mM Bis-Tris pH 7.2, 10 mM NaF,
10% (v/v) glycerol. Complexes solubilised from the stromal lamellae were separated by centrifugation
at 15,000 × g at 4˚C, with the supernatant collected. Granal complexes were solubilised from the pellet
and separated by centrifugation at 15,000 × g at 4˚C. The two supernatants were centrifuged at 15,000
× g at 4˚C for a second time, and the supernatants collected. Solubilised complexes were mixed with
100 mM Bis Tris pH 7.2, 30% (w/v) sucrose, 50 mg/mL Coomassie Blue G250, 0.5 M aminocaproic
acid at a ratio of 9:1, respectively, and centrifuged for 2 min at 13,000 × g at room temperature and the
supernatant was loaded on Invitrogen Bis-Tris NativePAGE 3 to 12% precast gels. Complexes were

38
separated by electrophoresis at 160 V for 120 min at 4˚C in Invitrogen NativePAGE running buffer,
with the addition of 2 mL of cathode buffer to the inner chamber. Gels were stained with Coomassie
Brilliant Blue G250 for protein visualisation.
2.7 SDS-PAGE and immunoblotting
Thylakoid membranes were solubilised in NuPAGE lithium dodecyl sulphate sample buffer for 1 h at
ambient temperature then centrifuged at 10,000 × g. The supernatant was then separated by SDS-PAGE
on Invitrogen 12% Bis-Tris NuPage precast gels (Thermo Fisher Scientific) in MES running buffer
(Life technologies) for 80 min at 150 V. Precision Plus unstained protein marker was used for molecular
weight indication and thylakoid sample loading was normalised to equal amounts of chlorophyll. Gels
were stained with Coomassie Brilliant Blue G250 for protein visualisation. For SDS-PAGE gels
intended for use in immunoblotting, Precision Plus pre-stained protein marker was used and the gel was
not Coomassie Blue stained.
Immunoblots were carried out with primary antibodies raised against PSBD, PSBA, PETA, and ATPH
(Agrisera). A poly(vinylidene difluoride) membrane (PVDF, Novex) was activated by soaking in
MeOH for 1 min. The membrane was washed in transfer buffer, along with the gel, two sheets of filter
paper and sponges, then assembled in a transfer tank. Transfer was carried out at 4˚C in transfer buffer
either overnight at 35 mM or for 1 h at 350 mM. At room temperature with mixing, the membrane was
subject to three 5 min washes in TBS then incubated with blocking buffer for 1 h. Blocking buffer was
removed before addition of antibody buffer containing primary antibody serum at the dilution
recommended by the manufacturer. After 4 h, the primary antibody buffer was removed and the
membrane was subject to three 5 min washes in antibody buffer. Secondary antibody (horseradish
peroxidase-conjugated anti-rabbit, Sigma-Aldrich) was diluted 1:10,000 in antibody buffer and
incubated with the membrane for 1 h. The secondary antibody buffer was discarded and the membrane
washed in antibody buffer three times for 5 min. The membrane was allowed to dry slightly before
application of 1 mL of WESTAR SUN chemiluminescence substrate (Cyanagen) and imaging using an
Amersham Imager 600 (GE Healthcare).
2.8 Imaging of chloroplasts
2.8.1 Electron microscopy of leaf thin sections
Leaf discs of 1 cm diameter were taken at the point of harvest from positions in the centre of exposed
leaves. Leaf thin sections were prepared and imaged by Dr Chris Hill (Electron Microscopy Facility,
University of Sheffield) as in Wood et al. (2018). The leaf discs were first infiltrated with 3%
glutaraldehyde/0.1 M sodium cacodylate overnight then washed and fixed with 2% osmium tetroxide.
The samples were washed briefly with water then dehydrated with serial ethanol treatments.
Epoxypropane was used to clear the samples before infiltration with a mixture of araldite resin and
epoxypropane at a 1:1 ratio. This mixture was replaced twice over 8 h before curing at 60˚C for 48-72

39
h. A Leica UC 6 ultramicrotome was used to cut ultrathin sections to around 85 nm, which were
mounted onto copper grids and stained with aqueous uranyl acetate for 30 min, followed by Reynold’s
lead citrate for 5 min. Leaf thin sections were imaged at an accelerating voltage of 80Kv with a FEI
Tecnai Transmission Electron Microscope, with micrographs recorded using a Gatan Orius 1000 digital
camera and Digital Micrograph software.
2.8.2 Structured illumination microscopy
Samples were prepared, imaged and analysed according to Wood et al., 2019. Leaf discs of 1 cm
diameter were ground using a (pre-cooled) pestle and mortar in 1 mL cold preparation medium.
Chloroplasts in leaf homogenate were imaged on a DeltaVision OMX V4 microscope (GE Healthcare)
with a Blaze-3D SIM module and a 603 1.42 oil planapochromat lens. Chlorophyll was excited with a
642 nm wavelength laser and emission collected through a bandpass filter of 683/40 nm. The structured
illumination pattern was projected onto the sample at 3 angles in a series of 5 phases (15 images per
axial slice). Image reconstruction was performed with Soft-WoRxOMX 6.0 software (GE Healthcare).
The SIMcheck ImageJ plugin was used to threshold and 16-bit convert the reconstructed images before
grana FWHM measurements in the same software.
2.9 Mass spectrometry
All solutions were made in LC grade water (Sigma-Aldrich).
The mass spectrometer (Q Exactive HF, Thermo Scientific) was regularly calibrated and quality control
assessments were carried out with HeLa cell tryptic digest standards before and after every experiment.
Blank injections of loading solvent were spaced at least every 5 sample injections with an identical
nanoLC gradient but full MS scan mode was set to centroid rather than profile. Where data was to be
used for protein quantification, running order of samples was randomised to reduce the impact of batch
effects.
Protein identifications were assigned as being associated with the thylakoid membrane, lumen or
plastoglobules using a combination of SUBA4 (Hooper et al., 2017), GO annotations, and manual
annotation based on literature and online resources such as UniProtKB.
2.9.1 Protein digestion in 60% methanol
Thylakoid membranes containing 10 µg of Chl (approximately 50 µg protein) were diluted to 10 µL in
HPLC-grade water. Proteins were reduced by addition of 1.5 µL 100 mM tris(2-
carboxyethyl)phosphine-HCl (TCEP) and 5 µL MeOH and incubation at 37˚C for 30 min. Protein
alkylation was performed with the addition of 1.5 µL 200 mM iodoacetamide in 100 mM
triethylammonium bicarbonate (TEAB) pH 8.5 and incubation in the dark at ambient temperature for
30 min. Samples were adjusted to 50 µL volume before addition of 2 µg trypsin (Promega) for

40
proteolytic digestion overnight at 37˚C. Peptide samples were dried by vacuum centrifugation, then
resuspended in loading solvent (Table 6) by sonication and desalted (see Section 2.9.5).
2.9.2 In-gel protein digestion
Thylakoid membranes containing 5 µg Chl were separated by SDS-PAGE as described earlier (see
Section 2.7) with the modification that thylakoids were heated to 95˚C with 10 µL SDS loading dye for
3 min. After staining with Coomassie Blue, the gel lane was excised and divided into sections. Each
section was cut into 1 mm cubes and subject to in-gel reduction, S-alkylation and tryptic digestion as
described by Pandey et al. (2000). The peptide extracts were dried by vacuum centrifugation and stored
at -20˚C.
2.9.3 In-solution protein digestion
Thylakoid membranes containing 10 µg Chl (approximately 50 µg of protein) were diluted to 20 µL in
LC-MS grade water. The protein samples were precipitated and cleaned up using the GE Healthcare 2D
Cleanup Kit according to the manufacturer’s instructions. The resulting protein pellets were solubilised
in 10 µL 8 M urea, 100 mM Tris-HCl pH 8.5. For the reduction reaction, 1 µL 50 mM
tris(carboxyethyl)phosphine-HCl (TCEP) was added and incubated at 37 °C for 30 min. The samples
were allowed to cool to room temperature then the proteins were alkylated by addition of 1 µL 100 mM
iodoacetamide in 100 mM Tris-HCl pH 8.5 and incubation at room temperature in the dark for 30 min.
Proteolytic digestion was started by addition of 2 µg of pre-mixed trypsin/endoproteinase Lys-C (eLys-
C, Promega) and incubation at 37°C for 2 h. The sample was then diluted with 75 µL 50 mM Tris-HCl
pH 8.5, 10 mM CaCl2 and incubated at 37°C overnight. Finally, 5 µL 10% trifluoroacetic acid was
added to the samples then the peptides were dried by vacuum centrifugation and stored at -20˚C.
2.9.4 Protein digestion in sodium laurate
Thylakoid membranes were solubilised in 1% (w/v) sodium laurate (SL) by two rounds of sonication
for 10 min followed by 1 min shaking as described previously (Lin et al., 2013). Starch granules were
then removed by centrifugation at 10,000 x g for 2 min. Aliquots of the supernatant containing 50 µg
protein (Bio-Rad DC assay) were adjusted to 15 µL with 1% (w/v) SL, 100 mM triethylammonium
bicarbonate (TEAB) pH 8.5 then reduced by the addition of 1.5 µL 100 mM TCEP and incubation at
37˚C for 30 min. Proteins were S-alkylated by the addition of 1.5 µL of 200 mM iodoacetamide in 100
mM TEAB pH 8.5 and incubation at ambient temperature in the dark for 30 min. Samples were adjusted
to 50 µL with 1% (w/v) SL, 100 mM TEAB pH 8.5 and proteolytic digestion was carried out after the
addition of 2 µg pre-mixed trypsin/eLys-C (Promega) and incubation for 3 h at 37˚C. Extraction of SL
was performed as previously described (Lin et al., 2013) by adding an equal volume of ethyl acetate
and acidification with 10 µL 10% (v/v) trifluoroacetic acid (TFA). The samples were vortexed for 1
min then centrifuged at 15,700 x g for 5 min to accelerate phase separation. The peptide-containing
lower phase was isolated, dried by vacuum centrifugation and dissolved in 50 µL 0.5% (v/v) TFA, 3%

41
(v/v) ACN before desalting with C18 spin columns (Thermo Scientific) as described in Section 2.9.5.
The peptides were again dried by vacuum centrifugation and stored at -20 °C.
2.9.5 Peptide desalting
Vacuum dried digested peptides were dissolved in loading solvent by sonication then desalted using
reversed-phase chromatography C18 spin columns (Thermo Scientific) with 30 µg capacity.
Centrifugation steps were carried out at 500 rpm in a microcentrifuge. The spin columns were first
activated by two 200 µL washes with 50% (v/v) MeOH before two equilibration washes with loading
solvent. The sample was applied to a spin column and the flow-through was collected for a second pass
through the column. Another two washes with loading solvent were performed before elution of the
peptides in 70% (v/v) ACN followed by vacuum centrifugation.
2.9.6 Hypercarb fractionation of peptides
Desalted peptides were first dissolved in loading solvent by sonication. Centrifugation steps were
carried out at 1000 rpm in a microcentrifuge. Hypercarb spin columns (Thermo Scientific) were
activated by two 200 µL washes with 70% (v/v) MeOH then equilibrated with two 200 µL washes with
loading solvent. The sample was applied to a spin column and the flow-through was collected for a
second pass through the column. A further two washes were carried out with 200 µL loading solvent.
Peptides were eluted sequentially with 50 µL 0.1% (v/v) TFA containing 10, 20, 30, 40, 50 and 70%
(v/v) ACN and the fractions collected separately. The fractions eluted at 10% and 70% (v/v) ACN were
pooled then all fractions were dried by vacuum centrifugation.
2.9.7 Analysis of peptides by mass spectrometry
For analysis by nano-flow liquid chromatography coupled to mass spectrometry (nanoLC-MS/MS), the
peptides were dissolved in loading solvent by 5 min sonication and 5 min mixing at 1500 rpm at room
temperature. Samples were centrifuged at 10,000 x g for 5 min to remove any precipitate before 400 ng
peptides from each of three replicate digests were analysed in triplicate in randomised order. Peptides
were resolved on an EASY-Spray PepMap RSLC C18 column (Thermo Scientific, 50 cm x 75 μm ID,
2 μm, 40 °C) with the following gradient profile delivered at 300 nL/min by a Dionex RSLCnano
chromatography system (Thermo Scientific): 97% solvent A (0.1% (v/v) formic acid in water) to 10%
solvent B (0.08% (v/v) formic acid in 80% (v/v) ACN) over 5 min, then 10% to 50% solvent B over 3
h. For prefractionated samples, solvent B was instead delivered from 10% to 50% over 75 min. The
mass spectrometer was a Q Exactive HF hybrid quadrupole-Orbitrap system (Thermo Scientific)
programmed for data dependent acquisition with profile full MS scans at 120,000 resolution and a
maximum of 10 centroid product ion scans at 30,000 resolution per cycle. For analysis of in-gel digests
the MS was programmed to exclude the trypsin autoproteolytic peptide sequences VATVSLPR and
LSSPATLNSR.

42
2.9.8 Identification of proteins from mass spectrometry data
MS data files were searched using either MaxQuant (Cox and Mann, 2008) or Mascot Daemon (Perkins
et al., 1999) against the most recent Arabidopsis thaliana UniProtKB reference proteome database
(www.uniprot.org/proteomes/UP000006548). MS raw files were converted to mgf files using
MSConvert prior to processing in Mascot, the method for such was as follows: enzyme = trypsin; max
missed cleavages = 2; peptide charge = 2+ and 3+; peptide tolerance = 0.01; variable modifications =
M oxidation; fixed modifications = C carbimidomethyl. For label-free quantification, MS raw files were
processed by MaxQuant with the intensity-based absolute quantification (iBAQ) (Cox and Mann, 2008;
Schwanhäusser et al., 2011) option selected. MaxLFQ (Cox et al., 2014) was enabled with the minimum
peptide ratio set to 2. Search parameters were: carbamidomethyl-Cys (fixed modification), Met
oxidation, protein N-terminal acetylation, Lys acetylation and Gln to pyro-Glu conversion (variable
modifications) with a maximum of two missed cleavages. The enzyme was set to Trypsin/P.
Table 7: Software and database versions
Database/software Date downloaded/version
uniprot-proteome_UP000006548.fasta 24/10/2016
10/12/2018
17/12/2019
11/03/2020
MaxQuant v1.6.3.4
v1.6.10.43
v1.6.11.0
Perseus v1.6.0.7
v1.6.2.3
v1.6.10.50
Mascot Daemon v2.5.1.0
2.9.9 Mass spectrometry-based protein quantification
Quantification results in the form of iBAQ (Cox and Mann, 2008; Schwanhäusser et al., 2011)
intensities, as generated by MaxQuant (Cox and Mann, 2008) for the identified proteins, were processed
and statistically analysed using Perseus (Tyanova et al., 2016). To compensate for variation due to
sample loading and MS spectral acquisition timing, iBAQ intensities for the target proteins were
normalised to the intra-analysis sum of iBAQ intensities of key photosynthetic complexes PSII (PSBA,
PSBB, PSBC, PSBD, PSBE, PSBF, PSBH, PSBO1, PSBO2, PSBP1, PSBP2, PSBQ1, PSBQ2, PSBR),
PSI (PSAA, PSAB, PSAC, PSAD, PSAE1, PSAE2, PSAF, PSAG, PSAH, PSAK, PSAL, PSAN,
PSAO), Cytb6f (PETA, PETB, PETC, PETD), and ATP synthase (ATPA, ATPB, ATPC, ATPD, ATPE,

43
ATPF, ATPH, ATPI). In Perseus, filtering was performed to remove identifications arising from the
contaminants database, reverse sequences, and proteins only identified by a modification site. MS data
from repeat injections was averaged (mean) with missing values excluded. Statistical analyses to
identify significant changes in protein abundance by ANOVA (analysis of variance) and/or t-test were
performed in Perseus (Tyanova et al., 2016) with additional truncation by permutation-based FDR (false
discovery rate) of 5% based on a null distribution generated by 250 randomisations, with significance
reported as q value (q < 0.05). Where more than two conditions were compared, significant proteins
were determined by one-way ANOVA prior to identification of significant pairs of conditions. The
significance of changes in protein expression between plant growth conditions was determined using
Welch’s t-test. Protein intensities were displayed graphically as a percentage of the mean value of the
control condition. Ratios of protein abundance between conditions were calculated using the median
value from triplicate analyses and assigned colours for summary diagrams using Microsoft Excel.
Calculation of protein stoichiometries was performed using MaxLFQ-normalised datasets by dividing
protein LFQ intensity of one protein with that of another. Ratio calculations involving multi-subunit
complexes were performed using a stoichiometry-adjusted mean of the LFQ intensities of all subunits
quantified in 3 replicates.

44
3 Developing a method for proteomic analysis of the
Arabidopsis thylakoid membrane
3.1 Introduction
Until recently, there was no published relative quantification of the plant thylakoid proteome by mass
spectrometry. Much of the early proteomic analysis of thylakoid membranes was performed using 1D
or 2D gel electrophoresis followed by in-gel digestion of specific spots or bands for the purpose of
identification or mapping to a particular subcellular location rather than quantification (Friso et al.,
2004; Kieselbach et al., 2000; Peltier et al., 2002, 2006; Schubert et al., 2002; Timperio et al., 2004).
More recently, thylakoid sub-compartments were isolated by Tomizioli et al., 2014 and the protein
concentrated in an SDS-PAGE gel between the stacking and separating region of the gel, before
excision of the band and in-gel digestion. Gomez et al. (2002) used an alternative method for
identification of thylakoid proteins, where they performed LC-MS to separate and analyse the intact
mass of PSII-enriched thylakoid membrane proteins with the aim of assigning proteins to the grana.
Relative quantification of proteins in acclimation or other conditions has also been performed by first
measuring intensity of spots on 2D gels then identifying spots with differential regulation by LC-MS
(Andaluz et al., 2006; Giacomelli et al., 2006; Timperio et al., 2007). Many laboratory methods used
for proteomic analysis of thylakoid membrane proteins in the past focused on fractionation to increase
coverage (Peltier et al., 2004) but have been superseded by improvements in high resolution MS. These
advances were accompanied by developments in and increased availability of bioinformatics tools for
processing of MS data. Quantitative proteomics without the need for metabolic labelling or isobaric
mass tags is now commonplace in biomedical fields such as cancer biomarker discovery. However,
studies involving relative quantification of proteomes within a sub-organellar fraction such as the
thylakoid membrane are lacking. For this reason, it was not possible to rely on existing protocols and
some consideration was required for the choice of method for sample preparation, data processing,
normalisation and quantification.
A recent MS study provided the first relative quantification of the thylakoid proteome in pea grown
under low, moderate and high light intensity, at 30, 150 and 800 µmol photons m-2 s-1, respectively
(Albanese et al., 2018). This study used an in-solution digestion method employing both eLys-C and
trypsin in urea. The MS data used for quantification of proteins was acquired using a time-of-flight
(TOF) MS in a data independent acquisition (DIA) mode, rather than the Orbitrap in data dependent
acquisition (DDA) mode used in this work. Another caveat of their work was the absence of a pre-
existing proteome database for Pisum sativum. Although this issue was overcome by the use of protein
sequences deduced from transcriptomic data, there was poorer coverage of the proteome with only 194
proteins quantified, not all of which were thylakoid-associated.

45
Overall, very little work has been carried out with the aim of using MS-based proteomics to quantify
abundance changes in the thylakoid proteome and much of the existing literature came prior to
significant technological enhancements. This gap presented the opportunity for development and
optimisation of each stage of the analysis rather than repetition of previous methods and has resulted in
a straightforward and reliable procedure, which is readily applicable to other photosynthetic
membranes.
3.2 Selection of a digestion method for thylakoid protein mass spectrometry
Arabidopsis thaliana was chosen for proteomic analysis of the thylakoid membrane because, as a model
organism, it is of wide interest to the plant biology community with a vast array of mutants available
for follow-up studies. Most importantly, Arabidopsis has a fully-sequence genome and accompanying
proteome databases that are well-annotated and updated with functional data. While proteomic analysis
of Arabidopsis is well established in areas of plant biology other than photosynthesis, there are limited
numbers of studies specifically investigating the thylakoid membrane. Rather than proceeding with a
whole-cell approach, preparation of protein samples for MS analysis was carried out on isolated
thylakoid membranes in order to maximise in-depth coverage of the thylakoid proteome. A particular
emphasis of this study was to identify and provide relative quantification of those more low-abundance,
hydrophobic or low molecular weight protein components of the thylakoid that were absent from
previous studies. Thylakoid membranes were isolated from Arabidopsis leaf tissue by mechanical cell
lysis followed by a series of centrifugation steps. Following homogenisation of leaf tissue, insoluble,
structural leaf material was filtered out and the cell lysate was centrifuged to pellet chloroplasts. The
chloroplasts were then lysed by osmotic shock and the thylakoid membranes, along with starch granules
that pellet alongside them, were centrifuged and washed in a gentle purification procedure. A known
inhibitor of thylakoid membrane phosphatases, sodium fluoride (NaF), was used throughout to freeze
the phosphorylation state and hence maintain phosphorylation-dependent interactions within
photosynthetic supercomplexes. Additionally, magnesium chloride (MgCl2) was used throughout the
procedure to maintain stacking interactions between membrane layers in the grana. Whilst the
maintenance of native interactions is not relevant to protein digestion for MS, this meant that the isolated
thylakoid membranes were suitable for various spectroscopic analyses in addition to proteomics.
The hydrophobic nature of membranes means that analysis of their proteomes can be challenging
(Alfonso-garrido et al., 2015), so a number of preparation strategies were trialled and assessed for their
efficacy when applied to thylakoids. The thylakoid proteins needed to be extracted from the membrane
and unfolded sufficiently to allow proteolytic cleavage without simultaneously denaturing or
inactivating the protease. One strategy tested utilises the ability of trypsin to digest proteins in the
presence of up to 65% methanol (MeOH) (Simon et al., 2001). Digestion of protein samples in 60%
MeOH has been found to increase the number of membrane proteins identified in MS experiments
compared to when solubilised in 1% sodium dodecyl sulphate (SDS) (Zhang et al., 2007) making this

46
a popular strategy for increasing coverage of membrane proteomes (Moore et al., 2016). However, when
this method was applied to Arabidopsis thylakoid membranes, a total of only 185 proteins were
identified (Figure 6A). To determine whether this very low number of protein identifications was a
result of incomplete protein digestion, a time course analysis was carried out with fractions taken at 1
h, 3 h and 20 h following addition of trypsin and analysed by SDS-PAGE (Figure 6A). At each time
point, even after 20 h incubation, bands were visible at ~60 kDa and ~25 kDa with additional Coomassie
Blue staining in the higher molecular weight region of the gel. This confirms that solubilisation of
thylakoid membranes in 60% MeOH does not allow complete tryptic digestion of thylakoid membrane
protein.
Figure 6. Assessment of digestion methods by SDS-PAGE. A, Thylakoid membranes before (T=0) and after solubilisation in
60% methanol and incubation with trypsin at 37˚C before quenching at 1 h (T=1), 3 h (T=3) and 20 h (T=20). B, Gel slices
excised and subject to separate in-gel digestion with post-digestion pooling group indicated (A-F). C, Thylakoid membranes
solubilised in 1% SL before (1) and after (2) removal of starch granules by centrifugation. D, Thylakoid membranes solubilised
in 1% SL before (T=0) and after incubation with trypsin at 37˚C before quenching at 1 h (T=1), 2 h (T=2) and 16 h (T=16).
E, Overnight-digested peptides before (1) and after (2) extraction of SL in ethyl acetate.
A B C
D E

47
An important aspect of MS-based proteomics is sample fractionation to increase sensitivity and
proteome coverage. In addition to the chromatographic separation of peptides coupled to the mass
spectrometer, additional, prefractionation can be carried out at various stages of sample preparation,
before or after protein digestion. A well-established and widely-used method of prefractionation is SDS-
PAGE followed by in-gel digestion (Aebersold and Mann, 2003). The SDS-PAGE gel, either one or
two-dimensional, containing the denatured protein of interest is cut into 1 mm cubes and subject to
reduction, alkylation and digestion. Following digestion, peptides can diffuse out of the gel pieces ready
for desalting and MS analysis. In-gel digestion was applied to Arabidopsis thylakoid membranes
separated in one dimensional SDS-PAGE and divided into sections as shown in Figure 6B. Each of the
30 gel strips was subject to in-gel digestion independently then the eluted peptides were pooled into 6
fractions (A-F) to be analysed independently by nanoLC-MS/MS. This resulted in the identification of
681 proteins, much higher than by digestion in MeOH. However, despite the apparent increase in
identifications, coverage of specifically thylakoid-associated proteins was poor, with several proteins
of interest missing from the dataset. One issue with in-gel digestion is contamination by exogenous
proteins as a result of the considerable amount sample handling involved with processing the gel.
Indeed, when looking at the MS data for this experiment, common contaminants – such as keratin –
contributed 29% of the total protein intensity.
A third digestion method trialled was in-solution digestion with eLys-C and trypsin in 8 M urea. For
the protein sample to be solubilised in 8 M urea, it must first be precipitated in acetone and cleaned up
to remove other membrane components such as lipids and pigments. The cleaned and precipitated
protein pellet was resuspended in 8 M urea and subject to reduction and alkylation before the addition
of the two-enzyme mixture. The enzyme eLysC is active in 8 M urea and cleaves after lysine residues
so it can cleave the unfolded protein into large but more accessible peptides. The mixture was then
diluted to bring the urea concentration down to 2 M urea and allow trypsin to refold and complete the
digestion. However, one issue arising from this method was poor solubility of the precipitated protein
pellet in 8 M urea following the clean-up step. Despite this difficulty, the initial in-solution digestion
experiment resulted in the identification of 422 proteins (Figure 6A).
Strategies to increase detection of lower-abundance proteins and improve proteome coverage focus on
simplifying the mixture of peptides to be analysed. Prefractionation of the digested peptide mixture
before analysis by LC-MS can facilitate detection and identification of peptides previously obscured by
more intense peptide ions eluting at the same time. Fractionation of tryptic peptides generated from in-
solution digestion, as described above, was performed using columns containing a porous graphitic
carbon stationary phase (Hypercarb), where the peptides were bound then eluted sequentially with
increasing concentrations of ACN. The retention mechanisms of this material differ to those of the
reversed phase chromatography system used to separate peptides prior to elution onto the MS. To
determine whether these mechanistic differences were reflected in the separation of peptides, fractions

48
eluted from the Hypercarb columns were analysed separately by LC-MS and a selection of peptides
was used to generate an orthogonality plot (Figure 7A). When retention time was plotted against
Hypercarb elution fraction, it was observed that there was only weak correlation, and particularly
peptides from the 40% and 50% ACN fraction were retained on the LC for variable lengths of time.
This suggests that Hypercarb fractionation may be an effective way to increase identifications.
However, prefractionation in this way did not translate into increased numbers of protein identifications
(Figure 7B).
Figure 7: Analysis of strategies to increase thylakoid proteome coverage. A, Orthogonality plot of peptide ion (n = 50) nanoLC
retention time against acetonitrile (ACN) concentration required for elution from Hypercarb spin columns. B, Table to show
the number of proteins identified (Identifications), the number of thylakoid proteins identified (Thylakoid protein
identifications), and the percentage of total MS intensity arising from known contaminant proteins (Contaminant %) for
thylakoid membranes digested in-solution. Samples compared were thylakoid membranes without extra clean up steps or
prefractionation (Control), with an additional wash in thylakoid storage buffer (Control wash), an additional wash with
thylakoid storage buffer supplemented with 2 mM EDTA (EDTA wash), further purified on a Percoll gradient, and digested
peptides fractionated by sequential elution from Hypercarb spin columns at increasing concentrations of ACN.
When prefractionation proved ineffective at increasing identifications, the focus was turned instead to
the purity of the thylakoid membrane sample prior to digestion. If the sample could be simplified by
reducing contamination of the thylakoids by other cellular components then, in theory, more low-
abundance proteins would be raised above the detection threshold. To increase purity, thylakoid
membranes were either given an additional wash with storage buffer (control wash) or washed with
storage buffer supplemented with EDTA to disrupt metal ion-mediated interactions. Thylakoids were
also further purified on a Percoll gradient to separate the membranes from other cellular components
pelleting alongside them during preparation. The further-purified thylakoid membranes were digested
in-solution as described earlier and analysed by MS to assess whether additional steps affected the
number of proteins identified and, more importantly, coverage of the thylakoid proteome. Surprisingly,
there was no increase in the number of identifications resulting from additional purification steps
(Figure 7B). In fact, they resulted in fewer thylakoid protein identifications, possibly due to the loss of
loosely associated peripheral membrane proteins and more transient interactions. Notably, many
lumenal proteins such as plastocyanin were absent from the EDTA-washed dataset. This could suggest

49
that washing with EDTA damages the thylakoid membrane such that soluble proteins in the lumen are
able to leak out. More stringent purification strategies and prefractionation do not appear to compensate
for poor digestion efficiency or poor suitability of a digestion technique for this type of sample.
When commonly used protein digestion methods proved suboptimal for analysis of the thylakoid
membrane proteome, a less well-established method was tested. The detergent sodium laurate (SL) was
proposed by Lin et al. (2013) as an effective reagent for extraction, solubilisation, and digestion of
membrane proteins by trypsin. This study demonstrated that digestion in SL was superior with respect
to the number of membrane proteins identifications obtained relative to Rapigest and sodium dodecyl
cholate, two detergents commonly used in tryptic digestion. These findings suggest that digestion in SL
may be an appropriate method for thylakoid protein analysis, so a number of experiments were
performed to assess its efficacy.
Firstly, detergent solubilisation of thylakoids presented an opportunity to separate protein from starch
granules. To determine whether SL could be used for this purpose without losing thylakoid proteins,
solubilised protein was analysed by SDS-PAGE before and after removal of starch by centrifugation
(Figure 6C). The similar profile of bands from the starch-containing and starch-free samples indicated
that there was not a substantial loss of protein resulting from centrifugation. To test the method for
efficiency of digestion when applied to thylakoid proteins, a time course experiment was performed
with aliquots quenched at 1 h, 2 h and 16 h after the addition of trypsin/endo-LysC mix and analysed
by SDS-PAGE (Figure 6D). Aside from one band at ~60 kDa which resisted digestion even after 16 h,
digestion of thylakoid protein appeared complete after 2 h. At 16 h some aggregation of digested
peptides was observed in the higher molecular weight region of the gel. Another reported advantage is
the ease with which the detergent may be extracted from the peptide sample following digestion.
Briefly, an equal volume of ethyl acetate is added following acidification by TFA, and the peptide-
containing, detergent-free aqueous phase is collected. To determine whether there was a significant loss
of peptides into the organic phase following detergent extraction, thylakoid proteins were digested in
1% SL overnight and another SDS-PAGE analysis was performed with digested peptides before and
after detergent removal (Figure 6E). The profile of Coomassie Blue staining in the two lanes was very
similar, suggesting that the ethyl acetate-based extraction of SL does not dramatically affect the
composition of the peptide sample. Interestingly, no band was visible at ~60 kDa indicating more
complete digestion.
Once each step of this method had been validated, digestion in SL was used to prepare thylakoids for
proteomic analysis. Since longer incubation times caused peptide aggregation, thylakoid proteins were
digested for just 3 h in 1% SL and the cleaned-up peptides were analysed by LC-MS. This resulted in
the identification of 900 proteins (Figure 8A), including 370 thylakoid-associated proteins. Because of
the simplicity, speed, and high proteome coverage of this method, digestion in SL was selected as the

50
protocol for thylakoid proteome analysis and quantification for the proteomics experiments described
in this thesis (Figure 8B).
Figure 8: Method selection for preparation of thylakoid membranes for MS analysis by digestion. A, Venn diagram showing
proteins identified from MS analysis following processing of thylakoid membrane proteins by in-gel digestion (In-gel),
digestion in 60% methanol (MeOH), digestion in 1% sodium laurate (SL), and digestion in solution in urea (In-solution). MS
files were processed in Mascot Daemon. B, Schematic diagram outlining the method for proteomic analysis of thylakoid
membranes in SL.

51
3.3 Label-free relative quantification of the thylakoid proteome
Once chosen, the SL-based digestion method and MS analysis was applied to thylakoid membrane from
Arabidopsis plants acclimated to low, moderate and high light intensity. The results of this experiment
are discussed in Chapter 4. In order to use this MS data to quantify the differences in thylakoid protein
abundance between samples, an appropriate normalisation and quantification strategy must be applied.
The processing of raw MS files to sequence peptides, search the Arabidopsis proteome database and
quantify identified proteins was performed in the software MaxQuant. This software features MaxLFQ,
a widely-used inbuilt algorithm which normalises between MS experiments accounting for differences
in the amount of sample injected and random variations in spectral acquisition patterns. MaxLFQ also
functions to quantify proteins and may be used as a proxy for molar amounts (Cox et al., 2014;
McKenzie et al., 2020; Zhao et al., 2020a). MaxLFQ bases protein quantification on an unchanging
‘background’ proteome, aiming to minimise the differences within this protein subset using ratios of
peptide intensity values in different experiments. This algorithm, and indeed most proteomics
platforms, were generally designed for whole-cell or whole-tissue analysis where the aim is to identify
proteins which are significantly up- or downregulated but where most proteins will be relatively
unchanging. For example, a disease biomarker may be detected from a sample at a level many orders
of magnitude above its normal abundance while thousands of other proteins are unchanging. In contrast,
this study of the thylakoid proteome involves a very different sample type, a subcellular fraction, and
the aim of the experiment is instead to quantify a large number of relatively small changes (likely within
the same order of magnitude) which together result in remodelling of the entire system. Since there is
no set of ‘housekeeping’ proteins within the thylakoid membrane known to remain at a constant level
under the environmental conditions tested, this lack of a ‘background’ proteome may prohibit accurate
quantification by MaxLFQ and distort the data. Therefore, factors such as the sample type, data
distribution and specific experimental aims must be considered when selecting an appropriate strategy
for normalisation and quantification of proteomic datasets.
Mass spectra were searched through the UniProtKB Arabidopsis thaliana proteome database in
MaxQuant (Cox and Mann, 2008) to map peptide sequences to proteins. Peptides with molecular mass
alterations arising from the posttranslational modification by Lysine acetylation were included in the
search because this modification is widespread in Arabidopsis (Wu et al., 2011) and is found as a feature
of light harvesting proteins (Michel et al., 1991) in addition to N-terminal acetylation (Galetskiy et al.,
2008). The MaxLFQ algorithm was enabled, as was intensity-based absolute quantification (iBAQ)
(Schwanhäusser et al., 2011). The iBAQ method compensates for either molecular mass or the number
of detectable peptides generated by proteolysis and is unaffected by variable sample complexity. It does
not normalise between MS experiments, but adjusts raw intensities by dividing by the number of
theoretical tryptic peptides released upon digestion of that protein. Therefore, iBAQ data is suitable for

52
and requires normalisation to either an internal standard present at constant levels – a ‘housekeeping’
protein or set of proteins – or to total protein.
To determine which relative quantification method is most appropriate, it is important to assess the
distribution of the raw MS intensity data within each experiment and the differences between sample
types. The first noticeable difference between MS data from different plant growth light intensities was
the overall number of proteins identified. Indeed, there were significant differences in the number of
non-zero values between sample types, with the number of identifications increasing with light intensity
(Figure 9A). To investigate these differences further, the median raw intensity of each protein was taken
from each light intensity and used to plot histograms of LL (Figure 9B), ML (Figure 9C) and HL (Figure
9D). The data does not show a normal distribution in any light intensity, rather one that is right-skewed
and possibly multi-modal. Protein identifications that were determined to be thylakoid-associated by
SUBA4, GO annotation and manual curation (see Section 2.9) appeared to have a similar intensity
distribution in different light intensities. However, in LL compared to HL, there were more thylakoid
proteins in the lower and upper ranges of protein intensity. Non-thylakoid proteins made up a substantial
portion of total protein identifications in each light condition, although their place in the overall
distribution of intensities differed according to light condition. In LL (Figure 9B), non-thylakoid
proteins were shifted further towards the lower-intensity region than in HL (Figure 9D), suggesting that
the LL thylakoids contained a lesser degree of contamination from other cellular components. A scatter
plot of protein raw intensities in HL vs LL (Figure 9E) also showed differences in the distribution of
thylakoid and non-thylakoid proteins. To confirm whether these differences reflected inconsistencies in
the ‘purity’ of the isolated thylakoids, the proportion of thylakoid protein intensity relative to total
intensity was calculated (Figure 9F). For LL data, thylakoid proteins contributed around 98% of the
total raw intensity whereas in HL this figure was about 10% lower. This discrepancy was also seen in
data processed by both MaxLFQ and iBAQ, although in the latter the difference was narrowed slightly.
The total intensity of each MS experiment with and without MaxLFQ normalisation is shown in Figure
9G. While MaxLFQ appears to normalise data well between MS experiments from the same light
condition, it puts the total intensity in HL to half that of LL.
53
Figure 9: Processing of MS data from light-acclimated thylakoids. A, The number of proteins identified in each MS experiment,
grouped by acclimation growth light. B, C, D, Histograms to show the intensity distribution of protein identifications from
median values from low (B), moderate (C) and high (D) light conditions. Distribution of thylakoid proteins within all
identifications is highlighted in green. E, Median intensity values of proteins in high light (HL) versus those in low light (LL).
Thylakoid proteins are green, while non-thylakoid proteins are blue. The grey line indicates LL log2(intensity) = HL
log2(intensity). F, Intensity of all thylakoid proteins divided by total intensity for raw MS data (Raw), MaxLFQ-normalised

54
data (LFQ), and iBAQ, grouped by plant growth light condition. Significance (P) was determined by one-way ANOVA, n = 9.
G, Total intensity of MS experiments without normalisation (Raw) and with MaxLFQ normalisation (LFQ). H, Raw data from
MS experiments, filtered to remove non-thylakoid proteins, subject to principle PCA as implemented in Perseus. I, iBAQ data
normalised to the intra-analysis sum of key photosynthetic component PSII, PSI, Cytb6f and ATP synthase from MS
experiments, filtered to remove non-thylakoid proteins, subject to PCA as implemented in Perseus.
Together, this data suggests that MaxLFQ is not a suitable method for normalisation and relative
quantification of MS data from thylakoid membranes from different light conditions. However, this
method may be appropriate for normalisation between data from a single light condition or between
datasets which do not differ substantially in purity. The differences in purity also preclude normalisation
to total protein intensity as this would bias all thylakoid protein intensity values towards LL. The
differences in the distribution of thylakoid protein intensities also discourage normalisation to total
thylakoid protein, which could see changes in highly abundant proteins such as the light harvesting
antenna having undue influence on the rest of the data. Instead, a strategy was chosen where
normalisation is based on the four main complexes of the linear electron transfer chain: PSII, Cytb6f,
PSI and ATP synthase. The sum of the iBAQ values for the constituent proteins of these complexes
was summed and used for normalisation of the whole dataset. A principle component analysis (PCA)
of thylakoid protein intensities from raw data (Figure 9H) and normalised iBAQ data (Figure 9I) showed
an improvement in grouping of light intensities in two dimensions. This normalisation and
quantification method was chosen as the standard for relative quantification of thylakoid proteins in this
thesis.
3.4 Discussion
Efficient digestion of membrane proteomes is not as straightforward as that of soluble protein fractions
due to their hydrophobicity, poor solubility, and lower frequency of trypsin cleavage sites compared to
cytosolic proteins. There may also be too frequent cleavage sites for chymotrypsin, specific for aromatic
residues, within transmembrane helices such that digestion yields peptides too small for identification
(Alfonso-garrido et al., 2015; Fischer and Poetsch, 2006). For these reasons, isolated Arabidopsis
thaliana thylakoids were subject to a range of methods to select a strategy that achieved the most
efficient digestion and the best proteome coverage. Despite the reported suitability for membrane
proteins, tryptic digestion in 60% MeOH proved ineffective for solubilisation and digestion of thylakoid
proteins and it was demonstrated that some proteins remained intact, even after overnight digestion. In-
gel digestion gave good coverage of the thylakoid proteome but the lengthy sample handling involved
introduced a substantial amount of keratin contamination and made the technique less favourable for
multiple samples and replicate digestions. In-solution digestion in urea gave reasonably good proteome
coverage, although some difficulty was encountered prior to digestion when the precipitated thylakoid
protein solubilised poorly in 8 M urea. This poor solubilisation following precipitation is likely to
reduce the digestion efficiency and MS detection of hydrophobic proteins, which are more prone to

55
aggregation when removed from a lipid bilayer. Despite this issue, in-solution digested peptides were
subject to prefractionation in an attempt to increase detection of low-abundance proteins. Thylakoids
were also subject to more stringent purification prior to digestion. When neither of these strategies
proved effective for increasing sensitivity, an alternative and less well-established digestion method
was explored. Digestion of thylakoid membranes in SL detergent (Lin et al., 2013) proved superior to
other methods in both simplicity and in the number of proteins identified.
Once MS data was obtained from digestion of light-acclimated thylakoids in SL, database searching
and protein quantification was carried out in MaxQuant (Cox and Mann, 2008). For quantitative MS,
particularly in label-free methods, protein intensity values are not inherently quantitative and require
strategies to account for random variations in digestion efficiency and spectral acquisition. Raw
intensity values are often highly variable, sometimes across more than one order of magnitude, for
subunits which are highly likely based on structural determination to be present at or near equimolar
amounts within the same complex. The explanation for this lies in the tendency for larger proteins to
produce more peptides upon digestion, so a very abundant but low molecular weight protein could give
rise to the same MS intensity as a very large but low-abundance protein. Similarly, very hydrophobic
proteins of high abundance can be underrepresented due to their failure to release the number of MS-
compatible peptides which would be expected for its size. The MaxLFQ algorithm aims to normalise
between MS experiments and operates under the assumption that the samples are of a similar complexity
and feature an unchanging background proteome, from which dramatically up- or down-regulated
proteins can be identified (Cox et al., 2014). An assessment of the data distribution in thylakoids isolated
from different light environments was performed to determine whether the in-built MaxLFQ algorithm
was appropriate for normalisation and quantification of the proteins in this sample type. The differences
in the protein profiles of the samples such as complexity, distribution and purity of the isolated thylakoid
membranes suggested that MaxLFQ would skew the data and would not be useful for relative
quantification between light environments. However, MaxLFQ may be appropriate when applied to a
single light intensity for estimation of absolute stoichiometries. This approach was used by McKenzie
et al. (2020) for the calculation of relative abundance of the photosynthetic machinery in Arabidopsis
thaliana grown at a single moderate light condition. However, because of the poor accessibility of
trypsin cleavage sites in membrane proteins, intensity values of membrane proteins may not be truly
representative of molar amounts. Therefore, label-free proteomics is more reliable when used for
relative quantification between biological conditions and absolute stoichiometries calculated this way
should be treated with caution.
Relative quantification between light conditions was carried out using protein iBAQ values. Because
iBAQ accounts for how differences in the molecular weight of proteins affect the number of peptides
released and, therefore, the MS intensity, iBAQ values for proteins of the same complex can be summed
to give a value for the abundance of that complex. Therefore, iBAQ enabled normalisation to the intra-

56
analysis sum of key photosynthetic complexes PSII, PSI, ATP synthase and cytb6f, which together
contributed around 50% of the total iBAQ intensity. This method of normalisation is not affected by
differences in sample complexity and avoids reliance on a single ‘housekeeping’ protein. Relative
quantification of thylakoid proteins by this SL digestion, mass /MS and iBAQ normalisation shows
thylakoid proteome remodelling in an unprecedented level of detail and can be combined with other
biochemical techniques to gain a more complete understanding of how these changes relate to biological
functions.

57
4 Acclimation of the photosynthetic machinery to light
environment in Arabidopsis
The work described in this chapter contributed to the following research publication:
Flannery, S.E., Hepworth, C., Wood, W.H.J., Pastorelli, F., Neil Hunter, C., Dickman, M.J., Jackson,
P.J., and Johnson, M.P. (2021). Developmental acclimation of the thylakoid proteome to light intensity
in Arabidopsis. Plant J. 105, 223–244.
4.1 Introduction
As sessile organisms, plants are subject to differences in light intensity in the long term depending on
their growth environment. The intensity of sunlight reaching the leaves will differ depending on the
season, climate, and shading by other plants or structures, and has a profound effect on photosynthesis.
To grow successfully, plants must tailor the composition of the thylakoid membrane in a process known
as acclimation to optimally utilise available light energy, maintain photosynthetic efficiency, and
minimise damage to photosynthetic reaction centres. Long-term acclimation may be categorised as
either ‘dynamic’ or ‘developmental’. Dynamic acclimation takes place in fully mature leaves and
involves de novo synthesis and degradation of specific proteins, leading to changes in the organisation
of the chloroplast thylakoid membranes, their protein composition and that of the surrounding stroma
that contains the enzymes of the CO2-fixing CBB cycle (Athanasiou et al., 2010; Suorsa et al., 2012;
Walters and Horton, 1994; Yin and Johnson, 2000). Developmental acclimation, which is the focus of
this work, is the alteration of leaf development and morphology in addition to the changes in chloroplast
composition (Anderson, 1986; Anderson et al., 1988; Bailey et al., 2001, 2004; Boardman, 1977;
Schöttler and Tóth, 2014; Vialet-Chabrand et al., 2017; Walters, 2005). Vital to plant fitness, it is
unclear whether acclimation is fully optimised in many species, presenting an opportunity for future
manipulation in agriculturally relevant species.
Long-term acclimation to the light environment has been studied extensively in the past but much of
this work was done prior to the discovery of the vast array of regulatory proteins that support the light
reactions. There is little information on how the relative abundance of these regulatory proteins is
affected by light intensity. Whilst valuable, previous studies tended to use techniques that quantify just
a single protein at once, such as immunoblotting, or focus on parts of the photosynthetic apparatus that
contain light harvesting pigments and can be quantified spectroscopically. Mass spectrometry (MS)-
based proteomics, on the other hand, allows relative quantification of the entire proteome and does not
rely on the subset of thylakoid proteins that absorb visible light. By determining how the thylakoid
proteome is remodelled in response to a long term change in light intensity, a more complete
understanding can be gained of how the photosynthetic machinery operates and how different
regulatory and photoprotective mechanisms are integrated. Unlike in many other techniques, small

58
differences in the amino acid sequences of minor isoforms of very similar proteins, such as antenna
proteins, can be distinguished in a MS analysis, allowing these isoforms to be independently quantified
and providing clues to their different functions. The data can be combined with other spectroscopic,
structural and functional analyses to determine how changes in abundance relate to changes in function.
Mass spectrometry also has the potential to identify proteins previously not known to have roles in long-
term acclimation without generation of mutants and reveal possible targets for genetic manipulation.
Because photosynthetic acclimation is an area of research with implications for agricultural crop yields,
a better understanding could eventually facilitate the design of strains more suited to particular climates.
Here, a novel protein extraction and digestion method (discussed in Chapter 3) was used to prepare
thylakoid membranes for label-free proteomic analysis by nano liquid chromatography mass
spectrometry (LC-MS). A total of 402 thylakoid-associated proteins were relatively quantified between
low (LL), moderate (ML) and high growth light intensity (HL) to investigate the effect on the key
photosynthetic complexes, light-harvesting antenna proteins, electron transfer routes, structural
components and many regulatory proteins not previously quantified. The proteomic analysis was
combined with various other techniques such as blue-native polyacrylamide gel electrophoresis (BN-
PAGE), electron microscopy (EM) and structured illumination microscopy (SIM).
4.2 Growth of Arabidopsis thaliana and characterisation of the light-acclimated
thylakoid membrane
Arabidopsis plants were grown for 2 weeks at a moderate light intensity (150 μmol photons m-2 s-1,
ML), typical of that used by a large number of research groups, to a rosette diameter of around 3 cm.
Following this 2-week period, plants were either maintained for a further 3 weeks at ML or alternatively
transferred to low light (25 μmol photons m-2 s-1, LL) or high light (800 μmol photons m-2 s-1, HL)
(Figure 10). All mature leaf material was formed under acclimation light, producing developmental
rather than dynamic acclimation, and the amount of time the plants were exposed to acclimation light
conditions was adjusted to account for faster maturation under higher light intensity, with plants
exposed to LL for 5 weeks, plants exposed to HL for just 2 weeks. All plants were harvested prior to
flowering to minimise the effects of senescence on thylakoid composition. The different growth light
intensities had a profound effect on leaf morphology with LL plants displaying elongated petioles, while
HL plants showed truncated petioles and wrinkled leaves compared to ML plants, as observed
previously (Schumann et al., 2017). Outwardly, the HL plants displayed no obvious signs of light stress
such as accumulation of anthocyanins. Corresponding gas exchange and chlorophyll fluorescence data
reported elsewhere (Flannery et al., 2021) demonstrated acclimation-related differences in
photosynthetic function between plants grown at the three light intensities, with higher growth light
being associated with greater maximum capacity for CO2 assimilation and PSII electron transfer rates.

59
For experiments requiring isolated thylakoids, leaf material from 15 plants was combined and used to
produce a pooled sample from which technical replicates could be generated.
Figure 10: Growth of light-acclimated Arabidopsis plants. Seedlings were grown at ML (150 μE) until they reached a diameter
of around 3 cm (Step 1) then transferred to LL (25 μE), ML (150 μE) or HL (800 μE) and harvested on the day of photographing
(Step 2). Here, μE = μmol photons m-2 s-1.
Ratios of chlorophyll a to chlorophyll b in the thylakoids were calculated as an indicator of acclimation
to the light environment (Dale and Causton, 1992) since PSII, PSI and LHCII differ in their chlorophyll
composition. The chlorophyll a/b ratio of the thylakoids increased slightly with growth light intensity,
as did the protein to chlorophyll ratios (Figure 11A). Relative to PSII and its core antenna, LHCII
contains a higher ratio of chlorophyll b whereas PSI contains more chlorophyll a, so it is still possible
for the stoichiometry of the three complexes to change without a net change in the a/b ratio. However,
the relative increase in chlorophyll a observed would imply a decrease in antenna size under higher
light. Protein to chlorophyll ratios in isolated thylakoids, on the other hand, were used to indicate how
much of the thylakoid proteome is dedicated to light harvesting and photochemistry and suggest that in
LL a greater proportion of total protein is for the purpose of light absorption.
To confirm that changes in thylakoid protein abundance have arisen from growing the plants under the
chosen acclimation conditions, immunoblotting was performed for components of some of the key
complexes. In Figure 11B, immunoblots against the D2 (PSII), PSAA (PSI), PETA (cytb6f) and ATPH
(ATP synthase) proteins from an SDS-PAGE of total thylakoid proteins loaded on an equal chlorophyll
basis are shown. Consistent with previous reports, the PSI level was somewhat constant, while PSII,

60
cytb6f and ATP synthase levels increased with growth light intensity relative to total chlorophyll
(Anderson et al., 1988). The expected acclimation-related changes were also clearly observed in the
blue native polyacrylamide gel electrophoresis (BN-PAGE) analysis at the whole complex level in
Figure 11C. Here, thylakoid membranes were solubilised at equal chlorophyll concentration from LL,
ML and HL plants stepwise, first with digitonin to remove the unstacked PSI-enriched stromal lamellae
domain of the thylakoids, then the stacked PSII-enriched grana were solubilised with a mixture of n-
hexadecyl β-D-maltoside and n-dodecyl α-D-maltoside (Wood et al., 2018). Native gels can show
qualitative changes in supercomplex formation as well as changes in the amounts of particular
complexes. The ATP synthase complex, recovered in the stromal lamellae fraction, increased with
growth light intensity as did that of cytb6f. Changes in the amounts of LHCII were also clearly seen in
the BN-PAGE with fewer free L-type trimers observed with increasing growth light intensity in both
grana and stromal lamellae. Changes in the amounts of the PSII-LHCII supercomplexes and their sizes
were also observed with growth light intensity consistent with previous results (Albanese et al., 2016;
Ballottari et al., 2007; Kouřil et al., 2013). Within the grana fraction there are larger C2S2M2 type PSII-
LHCII supercomplexes, composed of a dimeric PSII RC linked to two copies each of the minor
monomeric antenna complexes CP29 (LHCB4), CP26 (LHCB5) and CP24 (LHCB6), and to four
LHCII trimers, two of which are strongly attached ‘S’ -trimers composed of a mixture LHCB1 and
LHCB2 (Caffarri et al., 2009). The level of these supercomplexes decreased with increasing growth
irradiance. Levels of the smaller C2S2M-type supercomplex (lacking one CP24 and one M-trimer) and
C2S2-type supercomplex (lacking both CP24 and both M-trimers) were more constant. Additionally, the
fraction of C2S2M2 and C2S2M supercomplexes recovered from the stromal lamellae actually increased
in ML and HL compared to LL, suggesting that some redistribution of components between domains
occurs with acclimation, or that they are more easily liberated from the grana by digitonin solubilisation.
In the stromal lamellae, the amount of PSI-LHCII supercomplexes declined with increasing growth
light intensity. While qualitatively informative, this BN-PAGE analysis may not be truly representative
of the absolute amounts of these complexes since normalisation is done on a chlorophyll, not protein,
basis and properties of the membranes such as protein interactions, density and lipid profile may affect
the solubility of complexes.
Native thylakoid membranes were used for low temperature (77K) fluorescence experiments to further
assess antenna size and relative abundance of complexes. At room temperature, emission from PSI is
very weak and is not comparable with that of PSII, whereas a distinct and strong PSI emission band can
be detected at 77K. Light absorption from both photosystems peaks with excitation at a wavelength of
435 nm, which is used to compare their (and their linked antenna’s) absorption cross sections by
measuring their emission spectra. The larger ratio of the PSI to PSII emission bands observed in the
77K emission spectrum (Figure 11D) is consistent with the increased antenna cross-section of PSI in
LL seen in BN-PAGE. To measure excitation spectra from PSII and PSI, emission is recorded from 695

61
nm and 735 nm, respectively, and normalised to the Soret region so that the relative spectral contribution
of chlorophyll b may be used to infer changes in antenna size. The 77K PSII and PSI excitation spectra
(Figure 11E, F) also showed that the antenna cross-section of each photosystem decreased with
increasing growth irradiance.
Figure 11: Characterisation of acclimated thylakoid membranes. A, Ratio of chlorophyll a to chlorophyll b and of protein to
chlorophyll in isolated thylakoid membranes from low (L), moderate (M) and high (H) light intensity. B, Immunoblots of LL,
ML and HL thylakoids, with loading normalised to chlorophyll, to qualitatively assess the abundance of PSII (D2), PSI (PsaA),
Cytb6f (PetA) and ATP synthase (AtpH). C, BN-PAGE of solubilised stromal lamellae (SL) and granal (G) thylakoid fractions.
D, 77 K fluorescence emission spectra of LL (green), ML (blue) and HL (orange) thylakoids using 435 nm excitation. E, 77 K
fluorescence excitation spectra of PSII (695 nm) from LL (green), ML (blue) and HL (orange) thylakoids. F, 77 K fluorescence
excitation spectra of PSI (735 nm) from LL (green), ML (blue) and HL (orange) thylakoids.
4.3 Proteomic analysis of key photosynthetic complexes and their antenna
Three sets of thylakoid proteins from the LL, ML and HL plants were prepared for proteomic analysis
by solubilisation in 1% SL and proteolytic digestion with a combination of eLysC and trypsin. The
resulting peptide fragments were desalted and analysed by nanoLC-MS/MS with data dependent
acquisition in triplicate. Mass spectra were searched against the UniProtKB Arabidopsis proteome
database to identify and quantify a total of 1,082 proteins present across all light conditions, of which
402 were positively identified as being thylakoid-associated. The stoichiometry of the major
photosynthetic complexes (Table 8) was compared between each light condition using the MaxLFQ

62
label free protein quantification option (Cox et al., 2014) within MaxQuant (Cox and Mann, 2008) to
generate normalised intensity values for the individual subunits. The stoichiometry-adjusted mean
MaxLFQ intensity value of the component subunits of each photosynthetic complex was used as the
abundance score for that complex, the same approach as described by McKenzie et al. (2020). Table 8
shows that the PSII:PSI ratio changed from 2.2 under LL to 2.4 under ML and 3.2 under HL. Similarly,
and consistent with the BN-PAGE and immunoblots discussed above, the stoichiometry of cytb6f and
ATP synthase also increased relative to PSI. The cytb6f:PSI ratio increased from 0.34 in LL to 0.66 in
HL, while ATP synthase:PSI increased from 0.47 in LL to 0.71 in HL. These values for cytb6f and ATP
synthase were broadly consistent with those previously reported for Arabidopsis (e.g. McKenzie et al.,
2020; Pribil et al., 2014). PSII:PSI ratios for Arabidopsis were more variable depending on the method
used, with electron paramagnetic resonance (EPR) based quantification giving a PSII:PSI of ~0.89 for
ML (Suorsa et al., 2015), while absorption spectroscopy gave a ratio of ~1.5 (Chow et al., 2012;
Wientjes et al., 2013; McKenzie et al., 2020). The stoichiometries reported here and by McKenzie et
al. (2020), ranging from 2.2 to 3.2, are considerably higher. One explanation for this difference is that
MS detects not only functional PSII as in absorption spectroscopy and EPR but also non-functional
PSII being assembled/disassembled during the PSII repair cycle. The stoichiometries calculated here
for LHCII were 1.9 trimers per PSII in LL, 1.66 in ML and 1.44 in HL, unexpectedly low given the
high abundance of PSII-LHCII supercomplexes and free LHCII trimers observed by BN-PAGE (Figure
11C). Indeed a previous study using SDS-PAGE showed that in LL in Arabidopsis the number of LHCII
trimers per PSII was 3.1 in LL, 2.4 in ML and 1.7 in HL (Wientjes et al., 2013a). When the same method
is applied to the data published recently by McKenzie et al (2020), the calculated stoichiometry in their
study is just 1.15 LHCII trimers per PSII core. The potential limitations of absolute label-free
quantification of protein stoichiometries when applied to membrane protein samples are discussed in
Chapter 3.

63
Table 8: Stoichiometry of key photosynthetic complexes and antenna
In order to utilise peptide ion intensities as a proxy for protein molar amounts, processing methods that
compensate for either molecular mass or the number of detectable peptides generated by proteolysis
such as ‘intensity-based absolute quantification’ or iBAQ (Schwanhäusser et al., 2011) are required
(Fabre et al., 2014). Using this approach, each dataset was first normalised to the intra-analysis sum of
the total subunit iBAQ values from PSI, PSII, ATP synthase and cytb6f. Using Perseus software
(Tyanova et al., 2016), normalised iBAQ values for the three technical repeats were averaged and
protein abundances affected by light intensity at q < 0.05 were identified by a modified one-way
ANOVA (Section 2.9.9). Significant proteins were subjected to a modified Welch’s t-test (Section
2.9.9, q < 0.05) to identify pairs of significant differences for relative quantification of proteins between
light conditions. For relative quantification of multi-subunit protein complexes, the sum of iBAQ
intensities from all identified subunits of that complex was used. The normalised iBAQ values of the
major photosynthetic complexes are presented in Figure 12 and displayed relative to ML at 100% for

64
clarity. When normalised to protein iBAQ the level of PSII is only very slightly different between LL,
ML and HL in contrast to the data in Figure 11B and C, which are normalised on a chlorophyll basis.
Similarly, while on a chlorophyll basis PSI is largely unchanging, on an iBAQ basis it increases by
~30% in LL and decreases by ~15% in HL. LHCII increases in LL by ~10% and decreases by ~15% in
HL, cytb6f decreases by 15% in LL and increases by 20% in HL and ATP synthase decreases by 45%
in LL and increases by ~20% in HL. Using the MS data in the form of normalised iBAQ values is
arguably more relevant to determining how the relative protein composition of the thylakoid changes
between light conditions since the chlorophyll/protein ratio clearly declines with light intensity (Figure
11A), thus chlorophyll-based normalisation is skewed by this.
Figure 12: Acclimation involves changes in the relative abundance of key photosynthetic complexes. MS analysis showing the
relative abundance in low (L), moderate (M), and high (H) light-acclimated thylakoids of key photosynthetic complexes PSII,
PSI, LHCII, cytb6f and ATP synthase, expressed as a percentage of the mean at ML. The bars represent the average of three
independent peptide preparations (n = 3), derived from a pooled thylakoid sample from 15 plants, which were subject to MS
analysis in triplicate in a randomised order and the values averaged. Error bars indicate mean ± SD. Significant differences
between light conditions were determined by a modified Welch’s t-test (Section 2.9.9, *q < 0.05).
The change in the relative abundance of the major trimer LHCII subunits LHCB1, 2, 3 and minor
monomeric antenna subunits 4, 5, and 6 is presented in Figure 13A. Of the five LHCB1 isoforms
(LHCB1.1-1.5) in the Arabidopsis genome (Pietrzykowska et al., 2014), LHCB1.1, 1.2 and 1.3 did not
produce unique tryptic peptides to allow them to be individually distinguished so the relative abundance
in Figure 13A is representative of their collective level, which decreased ~25% in HL but was
unchanged in LL compared to ML. LHCB1.4 did release unique peptides and so could be separately
quantified, increasing by ~10% in LL relative to ML and HL, whereas LHCB1.5 was not identified in
the MS analysis. The sequence similarities of the LHCB2.1, 2.2 and 2.4 isoforms prevent differentiation
but collectively they increased by 10% in LL and decreased by 20% in HL. LHCB3, the less abundant
LHCII trimer constituent found solely in the M-type trimer, remained constant in each light condition.
Similarly, the levels of the minor monomeric antenna complex LHCB6 that is most closely associated

65
with the M-trimer were also relatively constant across the three light intensities. These results contrast
with studies on Arabidopsis (Ballottari et al., 2007; Kouřil et al., 2013) which showed LHCB3 and 6
both decrease under high growth light (Bailey et al., 2001; Ballottari et al., 2007), but consistent with
another study which showed it was relatively unchanged (Bailey et al., 2001). The levels of LHCB5
increased markedly in LL, a result previously seen in Arabidopsis (Bailey et al., 2001). The content of
LHCB4.1 and 4.2 showed a 15% and 5% decrease in HL respectively, and both a 15% increase in LL.
In contrast, the minor LHCB4.3 isoform increased dramatically (+255%) in HL consistent with
observations of Miller et al. (2017) and Albanese et al. (2018) and decreased by 95% in LL.
Figure 13: Acclimation involves changes in the relative abundance of antenna proteins. A, MS analysis showing the relative
abundance of LHCII subunits. B, MS analysis showing the abundance of LHCI. Sampling details are as stated in Figure 12.
The change in the relative abundance of the LHCI subunits LHCA1, 2, 3 and 4 is presented in Figure
13B. The high resolution PSI complexes from maize (Pan et al., 2018) and pea (Mazor et al., 2015; Qin
et al., 2015) show a stoichiometry of 1:1:1:1 for PSI relative to LHCA1, 2, 3 and 4. Unlike PSII, where
changes in antenna size have been consistently observed, the LHCI antenna size of PSI has been
reported to be unaffected by changes in light intensity in some studies (Albanese et al., 2018; Ballottari
et al., 2007), but altered in another (Bailey et al., 2001). Indeed, a recent study showed that PSI in
Arabidopsis can bind additional copies of LHCA1 and 4 (Crepin et al., 2020) suggesting the antenna
size can undergo acclimation. When normalised to protein iBAQ, there is a 40% and 10% increase in
LHCA1 and 3, respectively, in LL compared to ML but no significant change in HL. However, since
PSI itself increases in LL by around 30% these changes in LHCA proteins may not actually reflect
changes in antenna size for each PSI core. Since LHCA4 remains constant despite these changes in PSI
abundance this may suggest that there are more LHCA proteins associated with PSI in HL relative to
LL. The stoichiometries calculated for LHCI/PSI varied between 3.27 and 4.06, which are broadly
consistent with those expected from the high resolution structures (Mazor et al., 2015) (Table 8). In this

66
MS analysis the minor LHCA5 and 6 proteins, which are involved in binding the NDH complex to PSI
(Peng et al., 2009; Yadav et al., 2017), were not detected.
4.4 Thylakoid architecture changes in light acclimation
Using thin section electron microscopy (EM) increased grana thylakoid stacking (membrane layers per
granum) was observed in plants grown in LL compared to ML, while HL plants showed a significant
decrease (Figure 14A, B), consistent with observations in a number of different plant species (Bailey et
al., 2001; Ballottari et al., 2007; Chow and Anderson, 1987; Chow and Hope, 1987; Chow et al., 1988;
Miller et al., 2017; Petersen et al., 2011; Schumann et al., 2017). More recently, changes in grana
stacking have been found to be accompanied by changes in grana diameter (Pietrzykowska et al., 2014;
Wood et al., 2018, 2019). Consistent with these changes, analysis of chloroplast ultrastructure by
structured illumination microscopy (SIM) revealed that increased grana stacking in LL leaves was
paralleled by an increase in the grana diameter (measured as the full width half maximum of the
chlorophyll fluorescence signal from each granum) (Figure 14C, D). Similarly, decreased grana
stacking in HL leaves was accompanied by a reduction in grana diameter. Previously, changes in the
degree of grana stacking have largely been attributed to alterations in the content of LHCII proteins,
since cationic interactions between their stromal faces are known to mediate this phenomenon (Day et
al., 1984). However, more recently the thylakoid curvature protein family (CURT1) was shown to exert
a major influence on thylakoid structure with the curt1abcd mutant showing grossly enlarged pseudo-
grana up to 1.3 μm in diameter, compared to 0.4-0.5 μm for the wild-type, despite similar levels of
LHCII (Armbruster et al., 2013). In contrast, Arabidopsis plants overexpressing CURT1A showed
smaller grana than the wild-type with a diameter of just 0.3 μm (Armbruster et al., 2013). This MS
analysis allowed, for the first time, quantification of how the levels of these key proteins changed upon
light acclimation (Figure 14E). The relative abundance of CURT1A and B increased by 30% and 40%
respectively in HL compared to ML, while in LL both decreased by ~10%. There were small increases
of ~10% in the level of CURT1C in both LL and HL relative to ML and CURT1D was not detected.
The reduced induction of quenching (RIQ) proteins RIQ1 and 2 have been shown to negatively regulate
grana size (Yokoyama et al., 2016). Consistent with this earlier finding, the relative abundance of RIQ1
and 2 increased by 75% and 50% respectively in HL compared to ML, while RIQ2 decreased by ~20%
in LL. There is evidence that phosphorylation of PSII and LHCII also strongly influences grana
stacking, with mutants lacking the PSII (STN8) and LHCII (STN7) kinases showing larger grana, while
those lacking the LHCII (TAP38) phosphatase show smaller grana (Armbruster et al., 2013; Fristedt et
al., 2009a). The iBAQ analysis also revealed that the relative abundances of STN7 and STN8 were
similar in ML and LL but both increased slightly in HL acclimated plants. In contrast, the relative
abundance of TAP38 decreased to a similar extent in both LL and HL plants compared to ML. The
stoichiometry data indicated that the ratio of STN7 to TAP38 increased with light intensity, ranging
from half as much TAP38 as STN7 in LL to only one TAP38 to every 6 STN7 in HL (Table 10). The

67
calcium sensor kinase protein, CAS, which also plays a role in regulating photo-acclimation in high
light by promoting dephosphorylation of LHCII (Cutolo et al., 2019), also increased in abundance in
HL by ~70% and decreased in LL by ~30%.
Figure 14: Thylakoid membrane stacking changes associated with acclimation are paralleled by changes in the relative
abundance of CURT1A, B and RIQ1, 2 proteins. A, Thin-section electron micrographs of chloroplasts in plants acclimated to
LL (top row, L), ML (middle row, M), and HL (bottom row, H) (scale bar: 0.5 µm). B, Number of membrane layers per grana
stack calculated from electron microscopy images of chloroplasts in LL (n = 379 grana stacks), ML (n = 354), and HL (n =

68
507) leaves (One-way ANOVA with Tukey’s multiple comparisons. ****P < 0.0001). Error bars indicate mean ± SD. C, 3D-
SIM images (shown as Max Projections on the z-axis with tricubic sharp interpolation) of chloroplasts in plants acclimated to
LL (top row, L), ML (middle row, M), and HL (bottom row, H). D, Full width at half-maximum (FWHM) fluorescence intensity
of the fluorescent spots (grana) in three-dimensional SIM images of chloroplasts in LL (n = 97), ML (n = 100), and HL (n =
100) leaves (One-way ANOVA with Tukey’s multiple comparisons. ****P < 0.0001). Error bars indicate mean ± SD. E, MS
analysis showing the relative abundance of proteins involved in modulation of thylakoid membrane architecture, expressed as
a percentage of the mean at ML. Sampling details are as stated in Figure 12.
4.5 Electron transfer and photoprotection in light acclimation
The MS analysis showed that increasing light intensity was associated with significant increases in the
abundance of many proteins involved in LET or its regulation. One of these proteins was cytb6f (Figure
12), which has been shown in previous studies to have a LET flux control coefficient of 0.8 (Kirchhoff
et al., 2000) under high light conditions, meaning that it has a large effect on electron transfer rates
through the whole chain. Another protein which may affect LET flux is PGR6, a protein kinase
associated with the plastoglobules which functions to regulate the number of PQ molecules in the
photoactive pool of the thylakoid membrane rather than stored in the plastoglobules. Mutants lacking
PGR6 are unable to adapt to high light irradiance (Pralon et al., 2019). Indeed, the MS analysis shows
a dramatic increase in PGR6 with light intensity, doubling from LL to ML and ML to HL. Another
limiting step for LET under high irradiance is the step involving transfer of electrons from Fd to NADP+
via FNR at the PSI acceptor side. Indeed, antisense inhibition of FNR in tobacco strongly reduced LET
(Hajirezaei et al., 2002). This provides the rationale for the 50-60% increases in the abundance of FNR1
and 2 with high growth light intensity (Figure 15A); the stoichiometry relative to PSI rises from 0.15 in
LL to 0.34 in HL for FNR1 and 0.18 in LL to 0.6 in HL for FNR2 (Table 9), values slightly lower than
those reported by McKenzie et al. (2020). FNR can exist in two states, either soluble in the stroma or
bound to the thylakoid membrane via the TIC62 (Benz et al., 2009) or TROL (Jurić et al., 2009)
tethering proteins. The trol mutant showed strong perturbation in LET under HL conditions (Benz et
al., 2009), whereas the tic62 mutant showed no obvious electron transfer related phenotype (Jurić et al.,
2009). Nevertheless, it was TIC62 that showed the largest change in relative abundance; a ~50%
increase was observed in HL, whereas there was no significant effect of light intensity on levels of the
TROL protein (Figure 15A). The effect of these changes on the TROL and TIC62/FNR stoichiometries
can be seen in Table 9; while TROL/FNR declines the TIC62/FNR ratio is steady. Interestingly, the
relative abundance of the PSI electron donor plastocyanin (PC) was significantly higher (+160%) in LL
than in ML and HL plants (Figure 15A) but there was still a 40% increase in HL relative to LL. The
explanation for increased plastocyanin in LL plants may relate to their increased grana size. A
disadvantage of larger grana diameter is the slowing of LET, resulting from increased diffusion distance
for the mobile electron carriers PQ and plastocyanin (Kirchhoff, 2014; Wood et al., 2018); the increase
in plastocyanin in LL may be necessary to mitigate this effect.

69
Figure 15: Acclimation to high light causes upregulation of proteins involved in LET and CET. A, MS analysis showing the
relative abundance of LET related proteins, expressed as a percentage of the mean at ML. B, MS analysis showing the relative
abundance of CET related proteins, expressed as a percentage of the mean at ML. Sampling details are as stated in Figure
12.

70
Table 9: Stoichiometry electron transfer proteins
While LET produces ATP and NADPH, which is mostly consumed by the CBB cycle in the stroma for
CO2 fixation, CET produces only ATP and as such may play a key role in balancing the ATP/NADPH
budget in the chloroplast under different light conditions (Kramer and Evans, 2011). Since CET
increases proton flux into the lumen it may also be important for the down-regulation of PSII and PSI
activity by NPQ and photosynthetic control, respectively (Ruban, 2016; Theis and Schroda, 2016;
Yamori and Shikanai, 2016). Two pathways of CET, which involve the recycling of electrons from Fd
at the PSI acceptor side to the PQ pool, are thought to exist. The first involves the NADPH
dehydrogenase-like complex (NDH) a multi-subunit proton-pumping Fd-PQ oxidoreductase (FQR),

71
while the second involves proton gradient regulation complex proteins PGR5 and PGRL1, which may
act directly as an FQR or regulate putative CET activity of a Fd-FNR-cytb6f complex (Joliot and
Johnson, 2011; Yamori and Shikanai, 2016). The MS analysis showed contrasting light acclimation
responses for these CET proteins (Figure 15B). The relative abundance of NDH complex decreased by
~50% in LL and increased by ~10% in HL relative to ML (Figure 15B). The NDH complex is a much
less abundant component of the thylakoid membrane and it is not obvious in the BN-PAGE gel (Figure
11C). Indeed, the stoichiometry data shows it is present at just 2.2% of the level of PSI in HL and only
0.6% in LL (Table 8). In contrast, the relative abundance of the PGR5 protein of the second CET
pathway was similar in LL and ML but increased by ~50% HL (Figure 15B). Despite their high
sequence similarity, PGRL1A and PGRL1B showed contrasting behaviour. The relative abundance of
PGRL1B increased by 150% in HL whereas PGRL1A showed no significant increase, suggesting their
expression may be differentially regulated. Neither protein decreased in LL relative to ML, suggesting
that upregulation is triggered by high light irradiance. Unfortunately, in the MaxLFQ analysis used for
calculation of stoichiometries, the sequence similarity of PGRL1A and B prevented individual
quantification. The stoichiometries confirmed earlier reports that PGRL1 (A + B) is significantly more
abundant relative to PSI than the NDH complex with ratios of 0.079 in LL increasing to 0.12 in HL
similar to the values reported by McKenzie et al. (2020) for ML plants, which is consistent with the
notion that the PGR5-PGRL1 dependent CET pathway is dominant in Arabidopsis (Strand et al., 2017)
(Table 8). As found previously PGR5 was substoichiometric relative to PGRL1, with a ratio of 0.02 per
PSI in LL and 0.032 in HL (Table 9).
Figure 16: The relative abundance of proteins involved in light harvesting regulation changes in acclimation. MS analysis
showing the relative abundance of NPQ related proteins, expressed as a percentage of the mean at ML. Sampling details are
as stated in Figure 12.
As light intensity rises, the increased electron transfer activity results in an increased transfer of protons
from the stroma to the lumen. The influx of protons via coupled LET and CET activity is balanced by

72
proton efflux via the ATP synthase and H+/K+ anti-porter KEA3 (Armbruster et al., 2014). Where proton
influx exceeds efflux, the increasing ΔpH triggers the activation of photoprotective energy dissipation
in the PSII antenna system to reduce the excitation pressure on PSII reaction centres. The dissipation
of excess excitation energy as heat can be measured by NPQ of chlorophyll fluorescence and is triggered
by the protonation of both violaxanthin de-epoxidase (VDE), which converts LHCII bound violaxanthin
to zeaxanthin, and the PSBS protein (Ruban, 2016). Together PSBS and zeaxanthin induce
conformational changes in LHCII that result in the formation of dissipative chlorophyll-carotenoid or
chlorophyll-chlorophyll interactions, protecting PSII from photooxidative damage (Li et al., 2009;
Ruban, 2016). Using stoichiometry data, it was calculated that in ML there is one PSBS protein for
every 5 LHCII trimers and this ratio is doubled in HL (Table 10). The MS analysis also showed that
abundance of PSBS increased markedly with light intensity (Figure 16), whereas VDE was constant
between ML and HL but decreased in LL. The abundance of zeaxanthin epoxidase (ZEP), which
catalyses the reconversion of zeaxanthin to violaxanthin, increased in both LL and HL (Figure 16).
Together these results suggest an increased capacity for NPQ in HL plants. In contrast with ZEP, the
K+/H+ antiporter protein KEA3, which modulates the relaxation of ΔpH upon high to low light
transitions by releasing protons into the stroma (Armbruster et al., 2014), was downregulated in LL
(Figure 16) but remained constant in ML and HL. The LCNP protein, which is involved in promoting
the sustained slowly-relaxing component of NPQ termed qH (Malnoë et al., 2018), showed the highest
abundance in LL while SOQ1 and ROQH1, which suppress qH, were most abundant in HL. Therefore,
the HL grown plants appear to reduce their capacity for the slow-relaxing qH form of NPQ, while
increasing their capacity for the fast-relaxing qE form compared to LL.

73
Table 10: Stoichiometry of regulatory and photoprotective proteins
4.6 Repair of photosystem II in the light-acclimated thylakoid membrane
In high light, PSII is prone to photooxidative damage, particularly to the reaction centre D1 subunit
(reviewed in Theis and Schroda, 2016). Photodamaged PSII is repaired via a complex repair cycle
involving the migration of PSII from the grana to stromal lamellae, partial disassembly of the PSII core
and associated OEC, proteolytic excision of D1, de novo synthesis of D1, its reinsertion into the PSII
complex, and the subsequent reassembly of the dimeric PSII before it is returned to the grana (Aro et
al., 1993). This MS analysis was used to determine the effect of growth light intensity on the relative
abundance of proteins involved in the repair cycle (Figure 17A, B). Phosphorylation of the PSII core
proteins D1, D2, PSBH and CP43 by STN8 is thought to promote the migration of photodamaged PSII
to the stromal lamellae for repair (Tikkanen et al., 2008) and its relative abundance was increased in
HL plants (Figure 14). However, prior to repair PSII must be dephosphorylated by PBCP and possibly
TL18.3; the former was not detected in this study but relative abundance of the latter underwent small

74
changes in abundance, increasing by 25% in LL and 10% in HL relative to ML (Figure 17A). This
process may be instead enhanced via decreases in the level of the immunophilin CYP38, which
negatively regulates PSII core phosphatase activity (Vener et al., 1999), and indeed its relative
abundance significantly decreased in HL compared to LL (Figure 17B). The abundance of HHL1 and
LQY1, which mediate the release of CP43 from photodamaged PSII prior to D1 proteolysis (Jin et al.,
2014), behaved differently; the former was significantly increased in ML and HL compared to LL,
while the relative abundance of the latter was increased in both LL and HL compared to ML (Figure
17A). Consistent with a greater role for the repair cycle, the relative abundance of the DEGP1 protease
was markedly increased in ML and HL (Figure 17A). The behaviour of the FTSH zinc
metalloproteinase subunits was more complex; FTSH2 and FTSH5 increased as expected in ML and
HL, but there was no observed change in FTSH1 (Figure 17A). FTSH8 showed the same behaviour as
LQY1 increasing under both LL and HL compared to ML. The content of the membrane insertase ALB3
(Schneider et al., 2014) significantly decreased in ML and HL compared to LL, while VIPP1 which is
involved in the formation of lipidic microdomains to assist insertase activity increased with growth light
intensity (Liu et al., 2005) (Figure 17B). The MPH1 protein has been implicated in the protection of
PSII from photodamage rather than in PSII repair (Theis and Schroda, 2016) and accordingly its relative
abundance increased in ML and HL. The LPA1 and MET1 proteins, which function as chaperones in
PSII assembly (Theis and Schroda, 2016), also showed significant increases with growth light intensity.
The lumenal protein PPL1, which has an as-yet undefined role in the PSII repair cycle decreased in HL
and ML relative to LL (Figure 17B), despite the fact that Arabidopsis mutants lacking this protein show
slower PSII recovery following excess illumination (Ishihara et al., 2007). Proteins involved in the
reassembly of the Mn cluster, such as PSB27, were lowest in ML, while there was no significant change
in FKBP20-2, which is involved in reassembly of PSII supercomplexes (Theis and Schroda, 2016). The
collective changes of the PSII repair cycle machinery proteins in HL relative to LL are illustrated by
the schematic diagram in Figure 17C.

75
Figure 17: Acclimation to high light leads increased abundance of the PSII repair cycle machinery. A, B, MS analysis showing
the relative abundance of proteins involved in PSII repair, expressed as a percentage of the mean at ML. Sampling details are
as stated in Figure 12. C, Diagram indicating the abundance of PSII repair proteins in HL versus LL. Blue proteins are more
abundant in LL, whereas red/pink proteins are more abundant in HL. For quantified proteins where no significant difference
was detected, they are displayed in white.

76
4.7 Discussion
In this study, quantitative mass spectrometry was combined with biochemical and structural analyses
to provide novel insights into the mechanisms of light acclimation in the model organism Arabidopsis.
The MS analysis reveals how the relative abundance of over 400 thylakoid-associated proteins,
including a range of recently discovered regulatory and structural proteins, change in response to altered
growth irradiance. These findings, summarised in Figure 18, show familiar patterns long associated
with photosynthetic acclimation, such as the decrease of LHCII and the increase in cytb6f and ATPase
levels (Anderson, 1986; Anderson et al., 1988; Schöttler and Tóth, 2014; Walters, 2005) with growth
irradiance, as well as previously unreported changes in key regulatory proteins such as PGR6, PGR5,
PGRL1, CURT1, RIQ and STN7/8. A relatively quantitative approach was used, normalising each
dataset to the intra-analysis sum of iBAQ intensities for the combination of PSI, PSII, cytb6f and ATP
synthase, which represent 50-60% of total protein iBAQ. The data presented here thus offer an
interesting counterpoint to previous acclimation studies where, generally, protein abundance is
normalised on a chlorophyll basis. Arguably, since the protein/chlorophyll ratio changes considerably,
normalisation to these core photosynthetic complexes provides a more straightforward and meaningful
view of differences in the thylakoid proteome.

77
Figure 18: A comparison of high light versus low light acclimation in the thylakoid membrane proteome. Schematic diagram
indicating the relative abundance of thylakoid proteins in HL versus LL. Blue proteins are more abundant in LL, whereas
red/pink proteins are more abundant in HL. Where no significant difference was detected for a quantified protein it is displayed
in white. Proteins not identified by MS analysis are shown in grey.
A key issue with mass spectrometry data is that of normalisation to compensate for random variations
in sample loading and spectral acquisition patterns. One widely-used normalisation strategy, MaxLFQ,
was recently applied in the MS study of McKenzie et al. (2020) to calculate the stoichiometries of the
major photosynthetic complexes in ML grown Arabidopsis plants. For comparison, that same approach
was applied to this data to assess stoichiometries of thylakoid proteins in light acclimation. Some of the
stoichiometries produced are very similar to those in McKenzie et al. (2020), such as a PSII/PSI ratio
of ~2 in ML and a cytb6f/PSI ratio of 0.5 in ML. However, the stoichiometries generated for LHCII
trimers/PSII were significantly lower than expected: 1.7 LHCII trimers per PSII in ML, compared to

78
values between 3 and 5 in the literature (Kouřil et al., 2013; Wientjes et al., 2013a). This supports the
notion that MaxLFQ-generated stoichiometries should be treated with caution, and that the method is
unsuited to absolute protein quantification when applied to a membrane proteome such as this one.
Relative quantification using iBAQ, on the other hand, is appropriate and reliable for the investigation
of changes in the thylakoid proteome and will be applied throughout the rest of this thesis.
Previous acclimation studies have highlighted how, in low light, plants generally expand their light
harvesting antenna system relative to the PSII reaction centre, but have a generally lower maximum
LET capacity (Adams et al., 2007; Bailey et al., 2001; Ballottari et al., 2007; Chow and Anderson, 1987;
Chow and Hope, 1987; Chow et al., 1988; Miller et al., 2017; Petersen et al., 2011; Schumann et al.,
2017). Consistent with these findings, this MS analysis of the light harvesting proteins in Arabidopsis
showed an increased relative abundance of the major trimeric LHCII complex components LHCB1 and
2 in LL compared to HL (Figure 13A), consistent with the Chl a/b ratios and biochemical analysis
(Figure 11). The increased LHCII content in LL plants is also associated with wider diameter thylakoid
grana with an increased number of membrane layers per stack (Figure 14). The relative decrease in
CURT1A, B and RIQ2 proteins in LL also likely contributes to this increase given their known effect
on grana size (Armbruster et al., 2013). Another change observed in LL plants is an increase in the
PSI/PSII ratio in LL (Figure 12), in contrast to that seen in pea (Albanese et al., 2018) but in line with
previous work in Arabidopsis (Bailey et al., 2001). A reason for light limitation in a natural environment
may be filtering by the leaves of other plants, altering the spectral quality of the light environment such
that it contains a greater proportion of far-red wavelengths. Since PSII is more efficient at absorbing
red and blue light, the increased PSI content, as well as an increased PSI antenna size by augmentation
with LHCII (Figure 11), could reflect an attempt to balance the relative excitation level of the
photosystems to optimise LET when light is limiting. Previously it has been suggested that in LL, when
ATP when proton deposition by LET into the lumen is low or when there is an ATP shortfall arising
from lower respiratory activity, LL acclimated plants increase their PSI levels in order to enhance CET
and maintain ΔpH at a level sufficient for generation of ATP (Bailey et al., 2001). However, the
abundance of NDH decreases significantly in LL, contrary to the suggestion that this complex plays a
crucial role in LL (Yamori et al., 2015), and there is no change in the abundance of the other CET
proteins PGR5, PGRL1A or PGRL1B.
In HL, the preference for the PGR5/PGRL1B pathway, which shows a lower e-/H+ coupling ratio of 2
compared to 4 for the NDH pathway (Strand et al., 2017), may reflect a priority of CET in HL to
alleviate inhibition of electron acceptance in PSI, rather than to augment the ATP/NADPH ratio.
However, in each case it is noteworthy that the stoichiometries calculated for these proteins relative to
PSI are very low with NDH only present at 2.2% the level of PSI, even in HL, and PGRL1 at 10%
(Table 8). In HL, the excitation levels of the reaction centres can exceed the capacity of downstream
electron sinks, potentially leading to the generation of ROS that damage the photosynthetic machinery.

79
One of the primary photoprotective mechanisms is NPQ, which functions to protect PSII from
photooxidative damage. The increased relative abundance of VDE, which accelerates zeaxanthin
synthesis, and PSBS, both of which have been shown to adjust the ΔpH sensitivity of NPQ (Ruban,
2016), indicate a greater capacity for NPQ in HL plants. Finally, HL plants appear to greatly increase
their capacity for PSII repair, with several proteins know to be involved in the repair cycle found to be
upregulated in these plants (Figure 17). The replacement of LHCB4.1 and LHCB4.2 with the third
isoform, LHCB4.3, which lacks a stromal-side ‘anchor’ present in the isoforms, may facilitate faster
PSII supercomplex disassembly before PSII repair.
To bring the current understanding of photosynthetic acclimation closer to agricultural applications,
work must be done to assess how its mechanisms differ in natural environments where light,
temperature and water availability can be much more variable than the growth room conditions used
here (Schumann et al., 2017). Previous studies have indicated that plants adopt some of the features of
both low and high light plants in such environments (Schumann et al., 2017; Vialet-Chabrand et al.,
2017), so an analysis of the thylakoid proteome of Arabidopsis grown in natural light would help to
contextualise these acclimation-related changes.

80
5 Proteomic analysis of the thylakoid membrane in Arabidopsis
in the laboratory and in the field
5.1 Introduction
Most of the current understanding of photosynthesis and acclimation is based on studies of the model
organism Arabidopsis thaliana under controlled laboratory conditions. However, Arabidopsis plants
grown in their natural environment show a very different phenotype to plants grown under controlled
conditions, differing substantially in thylakoid membrane protein composition and pigment content as
well as leaf morphology (Mishra et al., 2012). Various fitness-related traits, such as seed size and
germination rate, vary greatly in the field (Malmberg et al., 2005), while many mutant phenotypes in
Arabidopsis cannot be observed under low-stress controlled environmental conditions (Frenkel et al.,
2008). The use of a constant light intensity, temperature and humidity in the laboratory growth chamber
improves reproducibility of results but hinders our understanding of acclimation in the plant’s natural
environment. Stress responses in the thylakoid membrane have been studied extensively but
independently, limiting understanding of how different protective mechanisms are integrated together.
Plants grown in the field – such as crops – are continually exposed to multiple stresses from day/night
cycles, moving cloud cover, shading by leaves, and weather. All of these factors can affect the rate of
damage to photosynthetic machinery, the rate of electron transport, and demand for water, leading to
decreased photosynthetic efficiency and lower crop yields (Poorter et al., 2016).
Despite the discrepancies between photosynthesis in a controlled environment and in the field, only a
few studies have directly compared plants from the two environments. Using Arabidopsis mutants,
Külheim et al. (2002) found that NPQ is beneficial for plant fitness in a natural environment with
fluctuating light intensity rather than high light per se; it does not give a significant advantage to plants
grown in a controlled environment. Norén et al. (2003) identified that the ELIP proteins are specifically
upregulated in pea plants grown outdoors. When grown in the field, mutants deficient in enzymes of
tocopherol synthesis were found by Semchuk et al. (2009) to experience increased oxidative stress and
have reduced chlorophyll accumulation. Similarly to the work described in this thesis, Mishra et al.
(2012) compared phenotypes of light-acclimated wild type lab-grown Arabidopsis to that of those
grown in the field. Plants were grown under controlled moderate light, then either transferred to low,
moderate or high light intensity, or moved outdoors. Leaf measurements, pigment analysis,
immunoblot- and spectroscopy-based protein quantification, and photosynthetic parameter
measurements showed that the field plants were generally more distinct than any of the controlled
environment plants were from one another. Wituszyńska et al. (2013) also germinated Arabidopsis
seeds in a controlled environment then transferred half of the seedlings to the field. This study measured
various photosynthetic parameters such as NPQ and CO2 assimilation, and combined this information
with pigment analysis and transcriptomics. A study by Schumann et al. (2017) analysed photosynthesis

81
in low, moderate, high and natural light-grown Arabidopsis by measuring CO2 assimilation, grana size,
and relative abundance of some key proteins, among other parameters. They revealed, in the outdoor
plants, dynamic and flexible adaptations to fluctuating light and a high capacity for energy dissipation.
Arabidopsis mutants grown in both controlled and field conditions have been used further to study
photoprotection in natural light, such as those lacking the PSII repair protein MPH2 (Liu and Last,
2017). Kono et al. (2017) used NDH-deficient mutants grown in the lab and the field to study the effect
of far-red light – as present in sunlight – on PSI photoinhibition in fluctuating light. While Wituszyńska
et al. (2013) had proposed that the higher and more variable light irradiances were the main cause of
differences observed between indoor and outdoor plants, a one-year field study of Arabidopsis plants
from seeds sown in the field found that temperature was as influential as light intensity on plant fitness
and pigment content (Pescheck and Bilger, 2019). Recently, mass spectrometry-based proteomics was
used to analyse acclimation to fluctuating controlled light in Arabidopsis leaves (Niedermaier et al.,
2020). However, no proteomic analysis has yet been performed to study the thylakoid membrane of
plants grown under field conditions.
Here, mass spectrometry was used to perform a quantitative proteomic comparison of the thylakoid
membranes of outdoor and laboratory-grown Arabidopsis thaliana plants to further our understanding
of acclimation and photoprotection in the thylakoid membrane. Such an analysis highlights those
proteins and regulatory mechanisms that are particularly important in developmental adaptation of
Arabidopsis to natural light conditions, providing context for the work on constant light acclimation
described in Chapter 4.
5.2 Field-grown Arabidopsis experienced dramatically different light and
temperature conditions to those grown in the laboratory
Arabidopsis seedlings were grown for 2 weeks in a controlled environment at a moderate light intensity
(150 μmol photons m-2 s-1) under fluorescent artificial lighting (Figure 19A). Plants were subject to 12
h of light per day with a daytime temperature of 21˚C and a night time temperature of 18˚C (Figure
19B, C). Following this 2-week period, plants were either maintained for a further 3 weeks in the growth
chamber (lab, or ‘L’ plants) or moved outdoors (Arthur Willis Environment Centre, University of
Sheffield). The outdoor, or field (F) plants, were positioned such that there was minimal shading of
sunlight from buildings or other structures so that the intensity of sunlight reaching the plants would be
more representative of the weather conditions and of the gradual increases and decreases in light
intensity of the day/night cycle. The emission spectra of the fluorescent lights in the growth chamber
and of sunlight are shown in Figure 19A. The spectrum of sunlight was broader and more consistent
across a wide range of wavelengths than that of the fluorescent lamps. In particular, sunlight showed a
much greater relative emission at the longer wavelengths, around the far-red region, which
preferentially excites PSI (Johnson and Wientjes, 2020). Both lab and field grown plants were watered

82
regularly to avoid drought stress, and precautions were taken to reduce predation of the field plants,
without the use of pesticides.
Figure 19: Arabidopsis plants grown outdoors are exposed to highly variable light and temperature conditions and exhibit
very different morphologies to controlled environment plants. A, Graph to compare the spectral composition of light from the
sun and from fluorescent lamps. B, Weather data (provided by Western Park weather station, Sheffield, UK) in the form of
daily maximum temperature, minimum temperature and hours of sunshine for the 25-day period from 21st May to the 14th June
2018. Sunshine hours were defined as the number of hours during that day in which the light intensity exceeded 120 W/m2.
The pale red and blue lines indicated the daytime and nighttime temperatures, respectively, of the growth chamber for
comparison. C, Minimum and maximum daily temperatures experienced by Field (F) Arabidopsis compared to Lab (L)
Arabidopsis (pale blue and red lines). Asterisks indicate significance from two-tailed one-sample t-tests comparing minimum
Field temperature to minimum Lab temperature (****P < 0.0001) and maximum Field temperature to maximum Lab
temperature (*P < 0.05). D, Representative images of Lab Arabidopsis plants and Field (E) plants.
The field plants were grown outdoors for a 25-day period from the 21st May to the 14th June 2018 before
harvesting. Weather data for this period, provided by the Weston Park Weather Station, Museums
Sheffield, is shown in Figure 19B. The data recorded by the weather station consists of daily minimum
temperature, maximum temperature, and sunshine hours, defined as the number of hours per day in
which the light intensity exceeded 120 W/m2. With the conversion of 1 W/m2 = 4.57 μmol photons m-2
s-1 (Thimijan and Heins, 1983), this means that ‘sunlight hours’ were those that exceeded approximately
548 μmol photons m-2 s-1. While this comparison is only a rough estimate because of the differences in

83
the spectra of the light sources, the intensity during ‘sunlight hours’ is much higher than in the growth
chamber. If so, the field plants were exposed to a light intensity exceeding that of the growth chamber
on all but 4 of the days, and on one day were exposed to 14.8 h of sunshine. This means that, overall,
the field plants experienced a great deal more light than those grown in the lab. The outdoor temperature
was also extremely variable compared to the controlled environment (Figure 19B, C). While the
temperature of the growth chamber only varied by 3˚C, on the hottest day outdoors there was a
difference of 13.8˚C between the minimum and maximum temperature. On average, both the maximum
and the minimum temperatures outdoors were significantly lower than those of the growth chamber
(Figure 19C). High light intensity combined with low temperature is particularly stressful for
photosynthetic processes, more so than one or the other. High light intensity causes a build-up of
excitation energy, while low temperature reduces the rate of electron transfer reactions, reducing the
capacity of the photosynthetic machinery to utilise this energy and increasing the risk of photooxidative
damage to the reaction centres. Low temperature also slows down the reactions of the CBB cycle,
reducing the electron sink capacity of the system such that NADP+ is regenerate less efficiently. In a
one-year study of Arabidopsis grown in the field, Pescheck and Bilger (2019) found that temperature
had a comparable effect on various developmental parameters to light intensity.
Arabidopsis plants showed dramatic morphological differences when grown in a controlled
environment (Figure 19D) compared to those grown in the field (Figure 19E) as previously reported
(Mishra et al., 2012; Schumann et al., 2017). The leaves of the field plants were smaller, fewer, and less
curled compared to the lab plants. Previously, Arabidopsis grown under natural light were shown to
have significantly thicker leaves than those grown under moderate constant light, but very similar
morphology to those grown under high intensity constant light (Schumann et al., 2017). One caveat of
these observations is the difference in day length, which has a greater impact on leaf size than the growth
light intensity (Mishra et al., 2012). The growth chamber was set to a 12 h day, whereas daylight can
last 16-17 h in the location and time of year in which the Field plants were grown. The field plants
showed little indication of anthocyanin accumulation in the form of purple pigmentation, suggesting
they had acclimated to their environment and were not significantly stressed (Kovinich et al., 2014).
The lab-grown plants had a much larger rosette diameter with much more vegetative growth and, like
the field plants, did not show signs of anthocyanin accumulation or stress.
5.3 Morphological changes in field-grown Arabidopsis are accompanied by
biochemical and spectroscopic differences
Thylakoid membranes were isolated from Lab and Field Arabidopsis from leaf tissue pooled from at
least 15 plants per condition. Despite clear phenotypic differences, calculated ratios of chlorophyll a to
b (Figure 20A) were very similar between plants from the different environments. However, this
similarity not necessarily indicate a similar antenna size, since Chl a/b ratios are affected by both

84
antenna size and by the ratio of PSI/PSII. Other analyses have found an increase in the relative amount
of chlorophyll a in natural light compared to a controlled environment with a moderate light intensity
(Mishra et al., 2012; Schumann et al., 2017). Although the Lab plants were grown under very similar
conditions to those used for the moderate light (ML) acclimated plants in Chapter 4, the Chl a/b ratio
of isolated thylakoids was lower in this analysis (3.13) than for the ML thylakoids (3.37). The ratio of
protein to chlorophyll of the Field and Lab thylakoids was determined and was found to be higher in
the Field plants. Analysis of the thylakoid membranes by BN-PAGE revealed greater differences
(Figure 20B). Digitonin solubilisation of the stromal lamellae fraction demonstrated that the PSI-LHCI-
LHCII supercomplex was absent in the field thylakoids, a result that contrasts with the findings of
Wientjes et al. (2013b), where the amount of the supercomplex was comparable to that of the lab-grown
plants. The abundance of the Cytb6f complex appeared to increase in abundance in the Field plants.
Unlike in the comparison of controlled environment thylakoids described in Chapter 4, the granal
fraction from Field thylakoids was very poorly solubilised in the mixture of n-hexadecyl β-D-maltoside
and n-dodecyl α-D-maltoside (Wood et al., 2018) and very few complexes were visible. Because of
this, the granal fraction was instead solubilised in a higher concentration (1%, rather than 0.2%) of only
n-dodecyl α-D-maltoside, which was more successful in liberation of complexes from the membranes.
Different detergents produce different micelle sizes, which affects migration of complexes in native
PAGE. The observed differences in solubility of complexes from Lab and Field thylakoids could
indicate altered lipid-protein and lipid-lipid interactions. A reduction in the number of ‘free’ or L-type
LHCII trimers was observed in the Field plants, in addition to all observable PSII-LHCII
supercomplexes. However, since the apparent abundance of the C2S2 supercomplex decreases to a
similar extent as the larger PSII supercomplexes, this may reflect differences in membrane solubility or
redistribution of complexes between domains rather than absolute abundance. These differences in
membrane solubility may reflect changes in the lipid profile in addition to those of the proteome. Both
glycolipid and phospholipid content has been shown to differ depending on the light environment, at
different constant light regimes and in natural light (Schumann et al., 2017). Cold stress has also been
shown to reduce the amounts of some galactolipids (Liu et al., 2018).

85
Figure 20: Lab and field thylakoid membranes have different spectroscopic properties and reduced formation of
supercomplexes. A, Ratio of chlorophyll a to chlorophyll b and of protein to chlorophyll in isolated thylakoid membranes from
Lab and Field Arabidopsis. B, BN-PAGE of solubilised stromal lamellae (SL) and granal (G) thylakoid fractions from Lab
(L) and Field (F) plants. C, 77 K fluorescence emission spectra of Lab (blue) and Field (purple) thylakoids using 435 nm
excitation. D, 77 K fluorescence excitation spectra of PSII (695 nm) from Lab (blue) and Field (purple) thylakoids. E, 77 K
fluorescence excitation spectra of PSI (735 nm) from Lab (blue) and Field (purple) thylakoids.
Clear differences between the Lab and Field plants were observed when their native thylakoid
membranes were analysed by 77K fluorescence. Upon excitation at 435 nm (Figure 20C), Field
thylakoids showed a dramatic reduction in the relative emission from PSI, consistent with its reduced
antenna size seen in the BN-PAGE (Figure 20B). While there was slightly more emission from the PSI
band in the Lab thylakoids, this band was substantially lower than that of PSII in the Field thylakoids.
The antenna size of PSII also was also reduced in the Field thylakoids, as observed in the PSII excitation
spectrum (Figure 20D), but perhaps to a lesser extent to that of PSI (Figure 20E). The PSI (735 nm)
excitation spectrum of the Field thylakoids shows reduced relative fluorescence at 710 nm and 650 nm,
suggesting fewer LHCI and LHCII proteins, respectively. Together, these results shown in Figure 20
demonstrate that, similarly to high light acclimation in a controlled environment (Chapter 4), the higher
light intensity experienced by the Field plants (Figure 19C) caused them to reduce their capacity for

86
light absorption by both photosystems. The difference in the spectral quality of light from the sun, rather
than fluorescent bulbs (Figure 19A), also had profound effects on the relative emission from the two
photosystems. The increased amount of far-red light in sunlight, which preferentially excites PSI
(Johnson and Wientjes, 2020), resulted in a significant reduction of the PSI antenna.
5.4 Proteomic analysis of Arabidopsis grown in a natural light environment
reveals changes in key photosynthetic complexes and their antenna
Thylakoid membranes from Lab and Field Arabidopsis were prepared for proteomic analysis in
triplicate by solubilisation in 1% SL and digestion by trypsin/eLysC. Desalted peptides were analysed
by nanoLC-MS/MS in triplicate with data dependent acquisition. MS data were searched against the
UniProtKB proteome database to identify and quantify a total of 2,926 proteins across both conditions,
of which 460 were identified as being thylakoid-associated. As discussed in Chapter 4, relative
quantification based on normalisation to equal amounts of chlorophyll may not give a realistic picture
of changes in protein abundance when the ratio of protein to chlorophyll changes significantly. Indeed,
as in plants acclimated to high light intensity in a controlled environment, Field thylakoids have an
increased amount of protein relative to chlorophyll. Relative quantification of proteins from MS data
was performed using iBAQ values (Cox and Mann, 2008; Schwanhäusser et al., 2011) normalised to
the intra-analysis sum of proteins from the key photosynthetic complexes PSII, PSI, cytb6f and ATP
synthase. Using Perseus software (Tyanova et al., 2016), normalised iBAQ values for the three technical
repeats were averaged and protein abundances with significant differences between Lab and Field
conditions at q < 0.05 were identified by a modified Welch’s t-test (Section 2.9.9). For relative
quantification of multi-subunit protein complexes, the sum of iBAQ intensities from all identified
subunits of that complex was used. The normalised iBAQ values of the major photosynthetic complexes
are presented in Figure 21 and displayed with the mean Lab value set to 100% for clarity. Consistent
with data from plants acclimated to constant light intensity described in Chapter 4 and with a previous
study of natural light Arabidopsis by Schumann et al., 2017, PSII remained at a constant level relative
to the other key photosynthetic complexes. Field plants had 25% less PSI compared to those grown in
the lab, similarly to results reported previously (Schumann et al., 2017). Given the massive reduction
in 77K relative emission of PSI (Figure 20C), this would seem quite a small change. However, with the
absence of the PSI-LHCI-LHCII supercomplex seen in the BN-PAGE (Figure 20B), the accompanying
loss of energetically connected LHCII trimers may contribute to the magnitude of this difference.
Previously, downregulation of antenna proteins has been observed in Arabidopsis grown outdoors
(Wituszyńska et al., 2013). Consistent with this, and with the reduction in antenna size observed in the
77K excitation spectra, MS analysis revealed a dramatic decrease in the number of LHCII trimers in
Field thylakoids (Figure 21). This 30% decrease was significantly larger than that observed in the HL
thylakoids in Chapter 4, which was only around 15%. This dramatic reduction in antenna size of Field
thylakoids appears to be contradicted by the ratio of Chl a to b, which did not change substantially

87
(Figure 20). However, the reduction in the relative amount of Chl b in the antenna may be mitigated by
the decrease in PSI, enriched in Chl a. The MS data shows that cytb6f increases by 50% in Field
thylakoids – a much more dramatic increase than the 20% increase seen in HL plants (Figure 12) and
contrary to the 16% reduction described previously by Schumann et al. (2017). Since the amount of
cytb6f has a significant effect on photosynthetic rate, i.e. it is a rate-limiting step (Kirchhoff et al., 2000),
this enhanced response may be a result of overall colder temperatures in the field (Figure 19C). The
change in the amount of ATP synthase (+40%) is also greater than that of constant HL plants.
Figure 21: Adaptation to a natural environment involves changes in the relative abundance of key photosynthetic complexes.
MS analysis showing the relative abundance in Lab (L) and Field (F) thylakoids of key photosynthetic complexes PSII, PSI,
LHCII, Cytb6f and ATP synthase, expressed as a percentage of the mean in the Lab. The bars represent the average of three
independent peptide preparations (n = 3), derived from a pooled thylakoid sample, which were subject to MS analysis in
triplicate in a randomised order and the values averaged. Error bars indicate mean ± SD. Significant differences between
conditions were determined by a modified Welch’s t-test (Section 2.9.9, *q < 0.05).
The MS analysis indicated varying behaviours of different LHCII constituent isoforms, shown in Figure
22A, in both trimeric and monomeric antenna proteins in the field. In this analysis, additional peptides
were identified which allowed more isoforms of LHCB1 to be differentiated and quantified individually
than in the experiment described in Chapter 4. Of the five LHCB1 isoforms in the Arabidopsis genome
(Pietrzykowska et al., 2014), LHCB1.1 and 1.2 could not be distinguished from one another because
they have identical amino acid sequences but LHCB1.3, LHCB1.4 and LHCB1.5 were quantified
separately. While the total number of LHCII trimers decreased by 30% and there were substantial
reductions in the amounts of LHCB1.1,1.2 (40%), LHCB1.4 (80%) and LHCB2 (25%), the LHCB1.3
isoform actually increased by 20%. This could imply a role for this less-abundant isoform in adaptation
to fluctuating light or temperature. LHCB1.3 differs from LHCB1.1 and 1.2 by one residue near the N-
terminus, where an asparagine is replaced by a lysine, creating an additional trypsin cleavage site and
producing one peptide unique to LHCB1.3. This lysine may have a biological function and may be
subject to posttranslational modification by acetylation, a common means of regulation of thylakoid
membrane proteins (Wu et al., 2011). Lysine acetylation by the acetyltransferase NSI is essential for
state transitions, and mutants lacking this protein had reduced acetylation in other isoforms of LHCB1

88
(Koskela et al., 2018). However, the position of another lysine, 3 residues earlier in LHCB1.3, prevents
the detection of the tryptic peptide containing this residue so the acetylation state cannot be determined.
Similarly to results reported previously comparing field and lab plants (Mishra et al., 2012) and to its
behaviour under constant light acclimation described in Chapter 4, LHCB3, which is only present in M
trimers (Caffarri et al., 2009), remained at a fairly constant level. This could suggest that the reduction
in the amount of LHCII arises mostly from fewer L trimers. However, LHCB6 (CP24), which links M
trimers to the PSII core via LHCB3, showed a small decrease of around 10% in Field plants, while
LHCB5 (CP26) remained constant. Isoforms of another monomeric antenna protein associated with
PSII, LHCB4 (CP29), also underwent some stoichiometric changes as a result of outdoor acclimation.
For this protein, a 20% reduction in the LHCB4.2 isoform was countered by increases in LHCB4.1
(10%), and LHCB4.3 (400%). The latter is missing the stromal C-terminal domain, which interacts with
both M-trimers and LHCB6 (Pagliano et al., 2014) and mediates the interaction of PSII supercomplexes
between granal membrane layers (Su et al., 2017). The 5-fold increase seen in the amount of LHCB4.3
in Field thylakoids may play a photoprotective role, by decreasing the affinity of PSII supercomplexes
for M-trimers or by disrupting interactions of PSII supercomplexes between membrane layers
(Albanese et al., 2019), possibly to ease the disassembly of PSII during repair. The 10% increase in
LHCB4.1 in the field compares to the response of this isoform to low light acclimation described in
Chapter 4.

89
Figure 22: Thylakoids from field Arabidopsis have altered levels of minor antenna subunits. A, MS analysis showing the
relative abundance of LHCII subunits. B, Diagram representing relative number of LHCII trimers as dots in Lab and Field
thylakoids and the distribution of trimer types. The number of trimers in Lab thylakoids is set to 100, and the trimers are
categorised into trimers containing LHCB3 (blue dots), containing LHCB2 (red dots), or only LHCB1 (green). MS data for
all LHCB1 isoforms (LHCB1.1, 1.2, 1.3, 1.4, 1.5) was summed. C, MS analysis showing the abundance of LHCI. MS data
sampling details are as stated in Figure 21.
A simplified visualisation of differences in the composition of the LHCII trimers calculated from the
MS data is shown in Figure 22B. Each dot represents one trimer, with the total number of dots
representing the difference in the number of trimers between Lab and Field thylakoids: for every 100
trimers in Lab thylakoids there are 70 trimers in Field thylakoids. An assumption was made that there
are three possible combinations of LHCB1/2/3, such that the trimers may be composed of 2(LHCB1) +
LHCB3 (blue dots, mostly M-trimers), 2(LHCB1) + LHCB2 (red dots, mostly trimers capable of
performing state transitions), and trimers containing only LHCB1 (green dots). This diagram shows that
the Field thylakoids have very similar numbers of M-trimers and a modest reduction in the number of
trimers containing LHCB2, but that the main difference between the two samples is the number of
trimers containing only LHCB1. The LHCB1 isoform contributes more significantly than the other
isoforms to large grana stacks (Pietrzykowska et al., 2014), which may be less desirable for the Field
plants in their high-light low-temperature environment. Compared to the LHCB1-only trimers, those
containing LHCB2 may have a greater importance in variable light and temperature conditions because
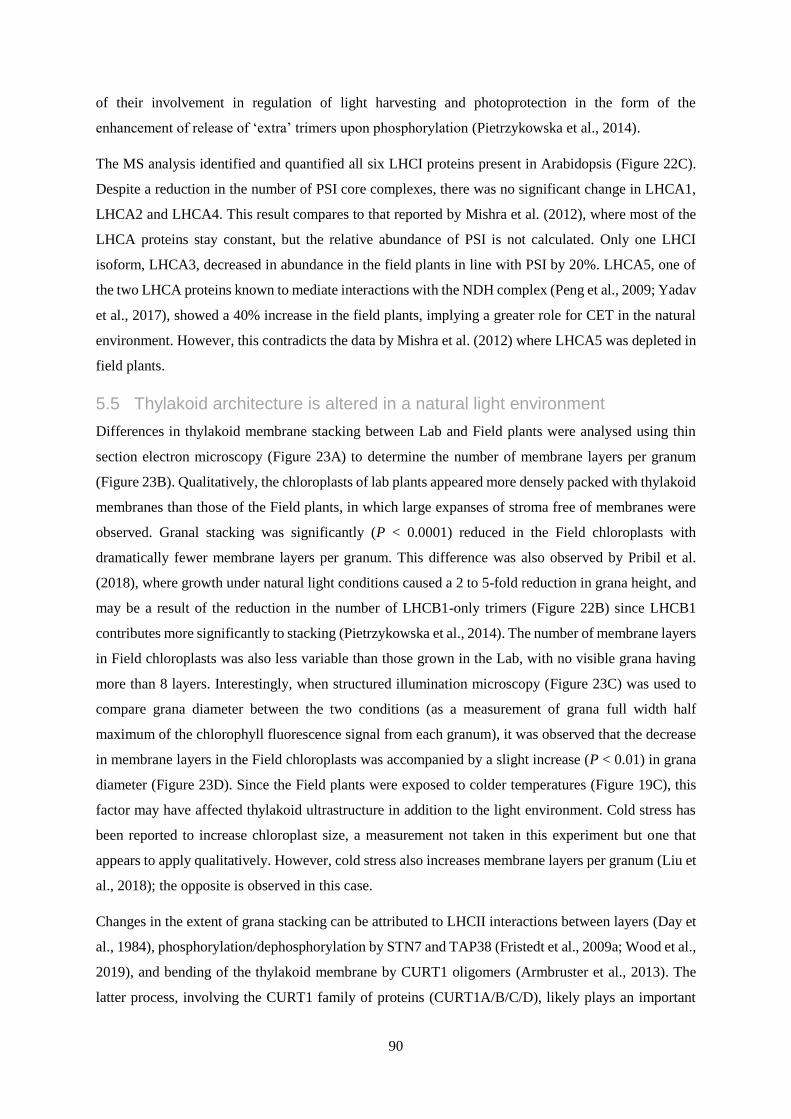
90
of their involvement in regulation of light harvesting and photoprotection in the form of the
enhancement of release of ‘extra’ trimers upon phosphorylation (Pietrzykowska et al., 2014).
The MS analysis identified and quantified all six LHCI proteins present in Arabidopsis (Figure 22C).
Despite a reduction in the number of PSI core complexes, there was no significant change in LHCA1,
LHCA2 and LHCA4. This result compares to that reported by Mishra et al. (2012), where most of the
LHCA proteins stay constant, but the relative abundance of PSI is not calculated. Only one LHCI
isoform, LHCA3, decreased in abundance in the field plants in line with PSI by 20%. LHCA5, one of
the two LHCA proteins known to mediate interactions with the NDH complex (Peng et al., 2009; Yadav
et al., 2017), showed a 40% increase in the field plants, implying a greater role for CET in the natural
environment. However, this contradicts the data by Mishra et al. (2012) where LHCA5 was depleted in
field plants.
5.5 Thylakoid architecture is altered in a natural light environment
Differences in thylakoid membrane stacking between Lab and Field plants were analysed using thin
section electron microscopy (Figure 23A) to determine the number of membrane layers per granum
(Figure 23B). Qualitatively, the chloroplasts of lab plants appeared more densely packed with thylakoid
membranes than those of the Field plants, in which large expanses of stroma free of membranes were
observed. Granal stacking was significantly (P < 0.0001) reduced in the Field chloroplasts with
dramatically fewer membrane layers per granum. This difference was also observed by Pribil et al.
(2018), where growth under natural light conditions caused a 2 to 5-fold reduction in grana height, and
may be a result of the reduction in the number of LHCB1-only trimers (Figure 22B) since LHCB1
contributes more significantly to stacking (Pietrzykowska et al., 2014). The number of membrane layers
in Field chloroplasts was also less variable than those grown in the Lab, with no visible grana having
more than 8 layers. Interestingly, when structured illumination microscopy (Figure 23C) was used to
compare grana diameter between the two conditions (as a measurement of grana full width half
maximum of the chlorophyll fluorescence signal from each granum), it was observed that the decrease
in membrane layers in the Field chloroplasts was accompanied by a slight increase (P < 0.01) in grana
diameter (Figure 23D). Since the Field plants were exposed to colder temperatures (Figure 19C), this
factor may have affected thylakoid ultrastructure in addition to the light environment. Cold stress has
been reported to increase chloroplast size, a measurement not taken in this experiment but one that
appears to apply qualitatively. However, cold stress also increases membrane layers per granum (Liu et
al., 2018); the opposite is observed in this case.
Changes in the extent of grana stacking can be attributed to LHCII interactions between layers (Day et
al., 1984), phosphorylation/dephosphorylation by STN7 and TAP38 (Fristedt et al., 2009a; Wood et al.,
2019), and bending of the thylakoid membrane by CURT1 oligomers (Armbruster et al., 2013). The
latter process, involving the CURT1 family of proteins (CURT1A/B/C/D), likely plays an important

91
role in dynamic thylakoid stacking in natural environments, as evidenced by Pribil et al. (2018). They
found that when grown outdoors, mutants lacking all four CURT1 proteins were significantly impaired
in a number of photosynthetic parameter measurements but those overexpressing CURT1A were
comparable to wild type. They suggest that the amount of CURT1 does not change in response to short
term changes in light intensity; rather, its regulation occurs at the posttranslational level. This MS
analysis showed that Field plants had around 60% more CURT1A compared to those grown in the Lab.
Similarly, Pribil et al., 2018 observed a 2-fold increase in the abundance of CURT1A in field-grown
plants compared to those grown in a controlled environment. They found that the amount of CURT1B
increased 4-fold, contrary to this proteomic analysis, which saw a smaller response in this protein of
just 25%. No significant difference was found between Lab and Field thylakoids for the proteins
CURT1C and CURT1D. Mutants lacking CURT1A and RIQ1/2 show opposite phenotypes with respect
to the number of stacks per granum (Armbruster et al., 2013; Yokoyama et al., 2016). According to the
MS analysis, both RIQ1 and RIQ2, the absence of which results in an increased number of membrane
layers per granum (Yokoyama et al., 2016), increased by around 60% in Field thylakoids in line with
CURT1A and with the changes observed during acclimation to HL (Chapter 4).
Phosphorylation of LHCII and PSII by STN7 and STN8, respectively, decreases grana stacking by
through repulsion on the stromal side of the membrane while dephosphorylation by TAP38 increases
stacking (Fristedt et al., 2009a). Interestingly, the MS analysis shows contrasting behaviour of STN7
and STN8 (Figure 23E). STN8, which phosphorylates PSII to initiate its repair cycle (Järvi et al., 2015;
Nath et al., 2013) was 60% more abundant in the Field thylakoids, whereas STN7 and its paired
phosphatase, TAP38, both decreased by around 40%. The reduction in these enzymes involved in
phosphorylation of LHCII, as well as the decrease in the amount of LHCB2 (Figure 22A), supports the
loss of the PSI-LHCI-LHCII supercomplex observed in the BN-PAGE gel (Figure 20B) and suggests a
reduced role for state transitions in the natural environment. However, while Mishra et al. (2012) also
reported reduced LHCB2, they found the field plants were capable of performing state transitions at a
similar level to indoor plants. Long term changes in stacking or capacity for dynamic remodelling may
relate to faster turnover of PSII. The lower levels of STN7 seen in the Field plants must not relate solely
to the higher light intensity experienced because the opposite effect is seen under controlled light
acclimation to high light (Figure 14). CAS, a regulatory calcium sensor which promotes
dephosphorylation of LHCII (Cutolo et al., 2019), is raised by 25% in Field thylakoids. This is a smaller
increase than that observed in controlled high light (70%, Figure 14) which may reflect a reduced need
for LHCII dephosphorylation since there is less STN7.

92
Figure 23: Thylakoid architecture changes in Field thylakoids are associated with increases in CURT1 and RIQ proteins but
not STN7 or TAP38. A, Thin-section electron micrographs of chloroplasts in plants from a controlled environment (Lab, top
row) and outdoors (Field, bottom row) (scale bar: 0.5 µm). B, Number of membrane layers per grana stack calculated from
electron microscopy images of chloroplasts in Lab (n = 354 grana stacks) and Field (n = 317) leaves (Welch’s t-test. ****P
< 0.0001). Error bars indicate mean ± SD. C, 3D-SIM images (shown as Max Projections on the z-axis with tricubic sharp
interpolation) of chloroplasts from Lab (top row) and Field (bottom row) plants. D, Full width at half-maximum (FWHM)
fluorescence intensity of the fluorescent spots (grana) in three-dimensional SIM images of chloroplasts from Lab (n = 100)
and Field (n = 88) plants (Welch’s t-test. **P < 0.01). Error bars indicate mean ± SD. E, MS analysis showing the relative

93
abundance of proteins involved in modulation of thylakoid membrane architecture, expressed as a percentage of the mean in
Lab thylakoids. Sampling details are as stated in Figure 21.
5.6 The thylakoid proteome of field grown plants implies a greater capacity for
linear electron transfer, cyclic electron transfer and photoprotection
The MS analysis showed differences in the relative amounts of proteins involved in LET arising from
growth in a natural light environment, which were not equivalent to the differences seen in constant
light acclimation. As shown in Figure 21, Field thylakoids had 50% more cytb6f than those from plants
in a controlled environment, a larger increase than that seen from constant high light, whereas FNR1
and FNR2 increased to a lesser extent (25% and 20%, respectively) than in controlled high light. This
could suggest that LET in the Field plants is constrained more by transfer of electrons through the chain
than by the sink capacity. The FNR tethering proteins TIC62 and TROL were both upregulated similarly
to one another by 40-50% in the Field thylakoids, in contrast with the results described in Chapter 4,
where TROL was present at a constant level in every light condition. This discrepancy indicates a role
for TROL in fluctuating light specifically. PGR6, the plastoglobule-associated regulator of the
photoactive PQ pool (Pralon et al., 2019) whose relative abundance increases with growth light
intensity, increased dramatically (+250%) in Field thylakoids. In constant HL plants (Chapter 4), PGR6
increases to a much lesser extent (+100%). Acclimation to cold can be triggered by redox sensing of
PSII and the PQ pool and increases cold-adapted plants’ resistance to photoinhibition by increasing the
amount of PQ relative to PSII (Gray et al., 1996; Huner et al., 1996). Therefore, this difference in the
magnitude of the response of PGR6 is likely a result of the lower temperatures experiences by the Field
plants. Interestingly, plastocyanin (PC), the electron donor for PSI, was unchanging between Lab and
Field thylakoids. However, since PSI decreases in abundance in the Field thylakoids, this constant level
of plastocyanin overall may represent an increase relative to PSI. While the behaviour of these LET
proteins in Field thylakoids does not directly compare to high light acclimation, this MS data contradicts
the idea proposed previously that the electron transport machinery of natural light acclimated plants is
most similar to that of constant low light acclimated plants (Schumann et al., 2017).
94
Figure 24: Acclimation to a natural environment causes upregulation of proteins involved in LET and CET. A, MS analysis
showing the relative abundance of LET related proteins, expressed as a percentage of the mean Lab thylakoids. B, MS analysis
showing the relative abundance of CET related proteins, expressed as a percentage of the mean in Lab thylakoids. Sampling
details are as stated in Figure 21.
The MS analysis shows an increase in the relative abundance of proteins involved in cyclic electron
transfer in Field thylakoids (Figure 24B). In particular, there is a significant upregulation of NDH (60%)
and the LHCA5 subunit of LHCI (Figure 22C), which links NDH to PSI (Peng et al., 2009; Yadav et
al., 2017). NDH is necessary for rapid induction of P700 oxidation – a mechanism for reducing ROS
formation – under light fluctuating at a high frequency (Shimakawa and Miyake, 2018). PGR5 and
PGRL1B increase in abundance by 30% and 70%, respectively – a smaller difference than that seen in
plants acclimated to constant high light (Figure 15B). This is surprising, given that the pgr5 mutation
is lethal under fluctuating light (Tikkanen et al., 2010), suggesting a greater importance in fluctuating
light. The behaviour of PGRL1A, a phosphorylation target of STN8 (Reiland et al., 2011), differed to
that of PGRL1B, the former remaining constant in all light environments analysed. Despite previous
reports that the two proteins are functionally redundant (DalCorso et al., 2008) but as seen in previous
work where PGRL1B changed differently to PGRL1A (Jin et al., 2017), the two proteins appear to be
differentially regulated, suggesting they may fulfil different roles in regulation of CET. Shown to form
a stable complex with both PGRL1A and B (Endow and Inoue, 2013), the chloroplast processing
peptidase PLSP1 increases in abundance 2-fold in the Field (Figure 27). Together, the MS data from
constant light acclimation (Chapter 4) and natural light adaptation suggest a greater role for NDH-
dependent cyclic electron transfer in the natural environment than cyclic electron transfer via PGR5.
Indeed, under both artificial and natural fluctuating light, mutants deficient in NDH-mediated CET are
more susceptible to PSI photoinhibition than those deficient in PGR5-mediated CET (Kono et al.,
2017).
Since energy-dependent NPQ (qE) is probably more important for fluctuations in light intensity than
for high light specifically (Külheim et al., 2002), MS analysis was used to determine the relative
amounts of proteins involved in the short term regulation of light harvesting in Arabidopsis from the

95
Lab and the Field (Figure 25). In a sudden transition to high light, where increased proton pumping by
PSII and cytb6f exceeds the immediate capacity for ATP generation by ATP synthase, protons build up
and cause a pH decrease in the thylakoid lumen. The pH change results in protonation of VDE and
consequent conversion of LHCII-associated violaxathin to zeaxanthin via the antheraxanthin
intermediate. Zeaxanthin promotes aggregation of LHCII trimers and dissipation of energy as heat
through chlorophyll-chlorophyll and carotenoid-chlorophyll interactions (Li et al., 2009; Ruban, 2016).
The MS analysis shows Field plants have a higher level of both VDE and ZEP, the latter of which
converts zeaxanthin back to violaxanthin in the transition to the light harvesting state. VDE increases
to a greater extent (60%) than ZEP (30%), with both proteins responding differently to fluctuating light
than to acclimation to constant light intensities as described in Chapter 4. Constant high light
acclimation did not affect the abundance of VDE, whereas ZEP increased by around 50% (Figure 16),
suggesting VDE is more important for fluctuating light than for constant high light irradiance where
long term acclimation has reduced the need for rapid initiation of quenching. High light induced low
lumenal pH also triggers protonation of lumenal glutamate residues of PSBS, triggering
monomerisation of this protein and reorganisation of the PSII antenna network into a dissipative state
(Bergantino et al., 2003; Correa-Galvis et al., 2016; Sacharz et al., 2017). According to the MS analysis,
PSBS increases 2-fold in the field – a greater increase than the 1.34-fold increase previously reported
(Schumann et al., 2017). The difference in the relative abundances of the proteins VDE, ZEP and PSBS
agrees with the observation of Mishra et al., 2012, that field-grown plants have a much greater capacity
for NPQ. After quenching of excess light, the K+/H+ antiporter KEA3 responds to sudden reductions in
light intensity by releasing protons into the stroma, speeding up the return of LHCII to its light
harvesting state in fluctuating light (Armbruster et al., 2014). Indeed, this protein showed an
approximate increase of 45% in Field plants. The change measured in the amount of KEA3 in a natural
light environment, but not upon acclimation to constant high light (Figure 16), supports the importance
of its role in a natural environment.

96
Figure 25: Arabidopsis in a natural environment have increases in the relative abundance of proteins involved in light
harvesting regulation. MS analysis showing the relative abundance of NPQ related proteins, expressed as a percentage of the
mean in the Lab. Sampling details are as stated in Figure 21.
While much work has been done to study quenching involving PSBS and zeaxanthin, less is known
about the sustained slowly relaxing form of NPQ (qH) which involves SOQ1, ROQH1 and LCNP.
SOQ1 and ROQH1 both function to suppress qH. The mutant lacking SOQ1 (suppressor of quenching
1) was found to suppress the NPQ phenotype of mutants lacking PSBS (Brooks et al., 2013), increasing
this form of NPQ despite the absence of qE. When this mutant was combined with the mutation to
inactivate ROQH1 (Amstutz et al., 2020) Arabidopsis growth under low light intensity was severely
limited due to constitutive high levels of qH. The chloroplastic lipocalin LCNP, on the other hand,
promotes this sustained form of quenching (Malnoë et al., 2018). Therefore, it is interesting that Field
thylakoids contain elevated levels of all of these proteins (Figure 25), a result which differs from that
seen in constant light acclimation described in Chapter 4. Constant low light acclimated plants appear
to increase their capacity for qH, observed as the upregulation of LCNP, whereas high light acclimated
plants suppress it by increasing their levels of SOQ1 and ROQH1 (Figure 16). In the natural
environment, the expression patterns of proteins involved in regulation of light harvesting and
quenching do not compare directly to those described in Chapter 4 of either low light or high light.
Instead, these proteins show a mixture of behaviours from both.
5.7 Upregulation of PSII repair machinery in the field
The relative amounts of proteins of the PSII repair machinery in Field versus Lab thylakoids calculated
from MS data is shown in Figure 26. As would be expected for a natural environment with significant
stress from high, variable light irradiance and cold temperatures, the majority of the proteins involved
in PSII repair are upregulated in the Field. However, there are some exceptions. One is MPH2
(maintenance of PSII under high light 2), a lumenal protein required for normal growth under natural
fluctuating light and temperature conditions (Liu and Last, 2017). It was observed to interact with PSII
core subunits in a way that suggests a role in the disassembly of PSII upon initiation of repair. MPH1
was proposed by Liu and Last (2017) to fill a regulatory role for PSII repair in long term acclimation to

97
fluctuating light rather than just maintenance of PSII under high light. Therefore, it is surprising that in
the MS analysis no significant difference in the amount of MPH2 was observed between Lab and Field
thylakoids. Another protein present at constant levels was the immunophilin CYP38. Since this protein
negatively regulates phosphatase activity on the PSII core (Vener et al., 1999), increased abundance of
this protein under stress might negatively impact PSII repair. In this analysis, the detection of multiple
isoforms of proteins with different behaviour is notable. One possible model of PSII repair (Weisz et
al., 2019) involves the storage of PSII subunits CP47, CP43, PSBH, several lower molecular weight
subunits and the assembly factor PSB27 in a stable complex lacking a reaction centre to avoid harmful
photochemical reactions during the repair cycle. The identification of two isoforms of PSB27, only one
of which is upregulated in Field thylakoids, implies varied roles or regulation of this factor. Additional
proteins behaving unexpectedly in Field thylakoids are the one-helix proteins OHP1 and OHP2. They
are thought to interact with HCF244, another factor involved in PSII biogenesis, and parts of the PSII
reaction centre to form a complex that aids in the cotranslational assembly of new D1 (Hey and Grimm,
2018; Li et al., 2019). Therefore, it is surprising that one of these proteins, OHP2, is less abundant in
the Field thylakoids since OHP2 has previously been shown to increase its expression in response to
high light intensity (Andersson et al., 2003) and the Field Arabidopsis were grown in a higher light
environment than the Lab plants. OHP2 has been shown to associate with PSI (Andersson et al., 2003),
the decrease of which in Field thylakoids could explain the reduced need for OHP2. However, analysis
of mutant Arabidopsis lacking OHP1 also suggested roles for this protein in assembly of both PSII and
PSI (Myouga et al., 2018) so this explanation seems inadequate.
Figure 26: Upregulation of the PSII repair machinery in a natural environment. Schematic diagram indicating the relative
abundance of PSII repair proteins in Field versus Lab thylakoids. Blue proteins are more abundant in the Lab, whereas

98
red/pink proteins are more abundant in the Field. Where no significant difference was detected for a quantified protein, it is
displayed in white.
5.8 Proteins specific for acclimation to a fluctuating natural light environment
Previously it has been shown that the early light induced proteins (ELIPs) are significantly upregulated
in or only detectable from plants grown in a natural light environment (Mishra et al., 2012; Norén et
al., 2003). The expression of ELIPs is also upregulated as a response to low temperature (Norén et al.,
2003). The MS analysis confirmed this with the identification of both ELIP1 and ELIP2 in Field
thylakoids only (Figure 27). Constant high light and low temperature causes accumulation of ELIP1
and 2 in wild type but does not cause a dramatic phenotype in mutants lacking these proteins (Rossini
et al., 2006). Although the precise biological function or mechanism of these proteins is not currently
known, ELIPs may function to prevent photooxidative damage in high light stress through sequestration
of free chlorophyll molecules or stabilisation of complexes during turnover of chlorophyll-containing
proteins (Hutin et al., 2003).
One notable protein that increased in abundance in Field thylakoids but in response to constant light
acclimation was TSP9, which showed a 2-fold increase in the natural environment. TSP9 is found
mostly in the grana and associates with LHCII but also with peripheral subunits of both PSII and PSI
(Hansson et al., 2007). It is a phosphorylation target of STN7 and its absence affects both state
transitions and NPQ, and it has been suggested that TSP9 aids in the dissociation of antenna proteins
from the PSII core under fluctuating light irradiance (Fristedt et al., 2008, 2009b). Therefore, more
TSP9 in Field plants may have contributed to reduced supercomplex formation seen by BN-PAGE
(Figure 20B). Another protein significant for fluctuating light intensity is the FLAP1 (fluctuating light
acclimation protein 1) protein. FLAP1 is located in both the thylakoid membrane and the chloroplast
envelope and has a role in the regulation of NPQ. Mutants lacking this protein have higher levels of
NPQ and a pale green phenotype, resulting from lower leaf chlorophyll content, under fluctuating light
(Sato et al., 2017). FLAP1 has been proposed to regulate NPQ through energy dependent quenching
(qE) involving PSBS and zeaxanthin (Trinh et al., 2019). Consistent with other NPQ-related proteins,
MS analysis showed it increased by around 50% in Field plants (Figure 27).

99
Figure 27: A comparison of natural versus controlled environment adaptation in the thylakoid membrane proteome. Schematic
diagram indicating the relative abundance of thylakoid proteins in the Field versus the Lab. Blue proteins are more abundant
in the Lab, whereas red/pink proteins are more abundant in the Field. Where no significant difference was detected for a
quantified protein, it is displayed in white. Proteins only detected in Field thylakoids are yellow, whereas those not identified
by MS analysis are shown in grey.
5.9 Discussion
In this study, Arabidopsis plants were grown outdoors during summertime in the UK and the weather
for that period was recorded and compared to the environment of a growth chamber commonly used
for the growth and study of these plants. Mass spectrometry-based relative quantification of thylakoid
membrane-associated proteins was performed to compare the thylakoid proteomes of Arabidopsis
plants grown in a controlled environment to those grown in the field. The data were combined with

100
fluorescence spectroscopy, BN-PAGE and microscopy to analyse how changes in protein abundance
relate to structural and functional differences necessary for growth under increased environmental
stress.
The reason for maintenance and recording of controlled environmental conditions in plant science is
the extreme variability of the natural environment and its effects on reproducibility of results. Therefore,
an obvious caveat of this experiment is that it can never be reproduced exactly. The recording of weather
data is important to contextualise any observations made but also comes with caveats, in that the light
intensity data recorded here is not directly comparable to that of the growth chamber in its format and
because of the differences in the spectral cross section of fluorescent lighting and sunlight (Figure 19A).
However, if the ultimate aim of photosynthetic research is to improve photosynthesis and yield in crops,
generally grown in fields and subject to the variations and stresses of the natural environment, then it is
vitally important to place our current understanding of photosynthetic mechanisms in the context of the
field. Comparisons of plants grown in the lab and in the field can reveal which photosynthetic processes
are of greatest importance for crops and direct further research towards these. Although Arabidopsis is
not an agriculturally relevant species, the time and location used for the outdoor growth of the plants in
this experiment were chosen so as to closely replicate a field; the plants were watered regularly to mimic
irrigation, grown during summer, and with minimal shading from buildings or canopy. Additional
experiments of this kind with Arabidopsis grown at different times of year, under canopy, or with a
species currently used in agriculture would surely give greater and more useful insights into
photosynthesis in a natural environment. Another angle would be to assess the effect of the spectral
quality of growth light in an otherwise controlled environment on the thylakoid proteome. A
comparative gene expression analysis of Arabidopsis plants grown under different artificial light
environments (Seiler et al., 2017), including fluorescent bulbs and LEDs of various intensities and
spectral qualities, demonstrated that spectral composition affected RNA levels for proteins involved in
a wide range of different processes. However, the observed gene expression changes were only loosely
correlated with phenotype, suggesting the need for a proteomic analysis.
The application of the MS method developed in Chapter 3 and used in Chapter 4, whereby protein iBAQ
(Schwanhäusser et al., 2011) is normalised to the intra-analysis sum of the key photosynthetic
complexes (PSII, cytb6f, PSI and ATP synthase), to a further analysis has provided further assurance of
its validity. Again, while the current understanding of thylakoid proteome remodelling in response to
environmental conditions is that PSII is subject to differential regulation and that PSI remains constant
(Anderson et al., 1988), this MS analysis suggests the opposite. Therefore, it appears that normalisation
to chlorophyll content, as is frequently used in photosynthesis research, may be outdated and misleading
when calculating changes in relative amounts of proteins. The general impression of the Field thylakoid
proteome is one of increased complexity with a greater capacity for NPQ, cyclic electron transfer and
PSII repair, a lower requirement for PSI and the light harvesting antenna, and possibly a reduced

101
capacity for state transitions. It may be that the relatively high contribution of far red light to the
spectrum of sunlight means that while less PSI is needed, a greater proportion of the existing PSI is
associated with NDH and participating in CET to meet the high ATP demands of rapid protein and
pigment turnover arising from increased environmental stress. Schumann et al. (2017) proposed that
the electron transport machinery of natural light acclimated plants is most similar to that of constant
low light acclimated plants, while proteins involved in photoprotective mechanisms are present at
comparable levels to in constant high light. The MS analysis described here contradicts this idea of
Field plants having a mixture of low and high light responses, pointing towards a more extreme version
of the constant high light response, in general. However, their study involves several photosynthetic
parameter measurements providing more detail on how the changes in the stoichiometry of thylakoid
proteins relate to functional differences. To combine thylakoid proteome analysis of Field plants with
direct measurements of CET, CO2 assimilation, photoprotective quenching and other parameters would
help to validate these ideas. Overall, the data described here demonstrates that regulation and
remodelling of the thylakoid proteome is highly intricate and flexible. Therefore, in order to gain further
insights into photosynthetic mechanisms beyond what can be observed from plant phenotypes and
spectroscopic measurements, this method of mass spectrometry-based relative quantification of
thylakoid proteins should be applied to Arabidopsis mutants in addition to changes in environmental
conditions.

102
6 Thylakoid proteome analysis of photosynthetic mutants:
LHCII phosphorylation and proton gradient regulation
6.1 Introduction
The bottom-up proteomics strategy used for the work in this thesis allows a descriptive comparison of
protein abundance in the thylakoid membrane under different environmental conditions. However, the
use of mutants defective in certain photosynthetic processes can help to provide further insights, even
when the mutation produces no immediately observable phenotype. Mutants without or with minimal
phenotypes may remodel the proteome to compensate for missing proteins or processes, and these
changes may be analysed by MS-based proteomics. Proteomics can also be used to study conditionally
lethal mutants to find changes that may explain or contribute to the lethality of the mutation under
certain conditions. For example, the loss of one protein may cause plant death either by disruption of a
single vital process or by dysregulation of signalling pathways leading to broader changes in the
proteome.
In Chapter 4, MS-based proteomics was used to quantify the changes in the thylakoid proteome during
long-term acclimation to low, moderate and high growth light intensity. Previously it has been reported
that the kinase STN7 is required for long term acclimation in Arabidopsis, with the stn7 mutant unable
to adjust the PSI/PSII ratio and LHCII/PSII ratio in response to light spectral quality expression
(Bonardi et al., 2005; Pesaresi et al., 2009a). The stn7 plants presented a slightly impaired growth
phenotype only when exposed to changing light conditions and a more reduced PQ pool was observed
(Grieco et al., 2012; Pesaresi et al., 2009a). Most importantly, stn7 was incapable of performing state
transitions. The phosphatase responsible for state 2 to state 1 transitions – the dissociation of LHCII
from PSI and its association with PSII – was later identified as TAP38, also known as PPH1, through
generation of tap38 mutants (Pribil et al., 2010; Shapiguzov et al., 2010). These mutants were impaired
in state transitions, being locked in state 2 with an increase in PSI antenna size. However, since the psal
mutant, which lacks state transitions due to the loss of the major LHCII binding site on PSI, still showed
long-term acclimation, the authors speculated that STN7 activity may also be crucial for the operation
of a separate signalling pathway that leads to changes in photosynthetic gene expression (Pesaresi et
al., 2009a). In addition to LHCB1 and 2, STN7 is also known to phosphorylate a range of other
chloroplast proteins including FNR1, ribosomal protein S7, CLPP3 and TSP9 (Fristedt et al., 2008;
Schönberg et al., 2017), though which of these targets is involved in the putative signalling mechanism
remains unclear.
In Chapter 4, MS analysis found that the abundance of STN7 increased by around 20% in HL while
TAP38 decreased by around 30% (Figure 14E). This is a curious result since STN7-dependent
phosphorylation of LHCB1 and 2 peaks under short-term low intensity white light exposure, where the
excitation imbalance between PSI and PSII is greater (Rintamäki et al., 1997). In addition, under short-

103
term higher light intensities STN7 becomes inhibited by elevated ΔpH and/or stromal reduction via
thioredoxin (Fernyhough et al., 1984; Rintamäki et al., 2000), leading to dephosphorylation of LHCII
by TAP38 and increased grana diameters and stacking (Rintamäki et al., 1997; Wood et al., 2019). Yet,
as observed in Chapter 4, grana stacking and diameter is reduced under long-term acclimation
suggesting plants acclimated to high light maintain LHCII phosphorylation. The increased abundance
of STN7 in high light observed in Chapter 4 would be consistent with this, or alternatively, it may reflect
the crucial role of STN7 in phosphorylating its other targets.
In Chapter 5, the thylakoid proteome of Arabidopsis grown in an outdoor environment was compared
to that of those from a controlled environment growth chamber. Arabidopsis mutants lacking the CET
protein PGR5, which increased in abundance by 25% in field thylakoids (Figure 24B), grow normally
under constant light but die when grown under fluctuating light intensity or in the field (Suorsa et al.,
2012). Despite a normal growth phenotype at low light, the pgr5 mutant showed a low ΔpH phenotype
in high light, and thus NPQ and photosynthetic control (Section 1.4.2.2) were strongly impaired,
suggesting PGR5-dependent CET plays a crucial role in lumen acidification under these conditions
(Munekage et al., 2002). Plants lacking PGRL1A and B (pgrl1ab) also show the same phenotype as the
pgr5 mutant (DalCorso et al., 2008) and the two were suggested to function as a ferredoxin-quinone
reductase (FQR) (Hertle et al., 2013). Later work (Nandha et al., 2007) revealed that pgr5 plants were
ultimately capable of CET at the same level as wild type, but were less readily switched into a CET
mode, suggesting the PGR5 and PGRL1 proteins may instead play an indirect regulatory role.
Overexpression of PGR5 does not produce changes in electron transfer at steady state but results in
delayed chloroplast development and greater induction of NPQ upon high light exposure (Okegawa et
al., 2007). Plants overexpressing PGR5 have also showed impaired growth initially upon germination
and under very low light intensity but once mature, they had greatly increased tolerance to very high
light intensity and drought stress (Long et al., 2008). These observations suggest that PGR5 may be
involved in sensing the redox poise of the chloroplast stroma, which is in turn linked to both short- and
long-term acclimation.
The aim of this chapter is to use the established proteomic strategy, along with microscopy and native
PAGE, to investigate the effect of the absence of TAP38 and STN7 on long-term developmental
acclimation to varying light intensity. Relative quantification of the thylakoid proteome is used to
investigate differences in the light acclimation strategy in the phosphorylation mutants stn7 and tap38
to explore the link between short- and long-term responses to light intensity. Then, the proteome of the
pgr5 mutant is analysed in order to speculate on contributing factors to its lethality in fluctuating light
and their relationship to plant survival in a natural environment.

104
6.2 Growth and acclimation of stn7 and tap38 to varying light intensity
Col-0 (wild type) and two phosphorylation mutants of this background, stn7 and tap38, Arabidopsis
plants were grown with an 8 h photoperiod for 2 weeks under moderate light (ML) then either moved
to low light (25 µmol photons m-2 s-1, LL) or high light (600 µmol photons m-2 s-1, HL), or kept at ML
(130 µmol photons m-2 s-1). Representative images of the plants at 6 weeks are shown in Figure 28.
Figure 28: Phosphorylation mutant Arabidopsis plants acclimated to low, moderate and high light intensity. Col-0, stn7, and
tap38 Arabidopsis grown for 2 weeks at 130 μmol photons m-2 s-1 then 4 weeks at LL (25 μmol photons m-2 s-1), ML (130 μmol
photons m-2 s-1) or HL (600 μmol photons m-2 s-1). Photographs were taken on the day on which the HL plants were harvested.
Calculated ratios of chlorophyll a to chlorophyll b in isolated thylakoids are shown in Table 11.
Similarly to the wild type thylakoids acclimated to different light intensities in Chapter 4, the Chl a/b
ratios of Col-0 plants increased slightly with light intensity. The Chl a/b ratios of stn7 thylakoids, by
contrast, increased dramatically from 2.62 in LL to 3.20 in ML. Lack of phosphorylated LHCII
associating with PSI in LL may have resulted in low PSI activity, causing increased LHCII synthesis
relative to PSII, decreasing the Chl a/b ratio. However, the ML Chl a/b ratio of stn7 is similar to that of

105
Col-0, indicating either fewer LHCII trimers or a lower ratio of PSII to PSI. Surprisingly, the HL stn7
thylakoids had lower Chl a/b ratios than those from the ML plants. The Chl a/b ratios of the tap38
thylakoids, on the other hand, were consistently higher than those from Col-0 and stn7 plants,
suggesting lower levels of LHCII overall and/or a change in PSII/PSI ratio. ML tap38 thylakoids had
the highest Chl a/b ratio.
Table 11: Chlorophyll a/b ratios of phosphorylation mutants following light acclimation. Ratio of chlorophyll a to chlorophyll
b in isolated Col-0, stn7 and tap38 thylakoid membranes from low (LL), moderate (ML) and high (HL) light intensity.
Since the stn7 and tap38 mutations are known to affect the formation of the PSI-LHCI-LHCII
supercomplex, clear native PAGE was performed – without Coomassie Blue staining – to better
visualise chlorophyll-containing complexes and supercomplexes. For Col-0 plants, the digitonin-
solubilised stroma lamellae fractions of the thylakoid samples (Figure 29A) showed less LHCII
associating with PSI in HL. In stn7, since phosphorylation of LHCII is low, no PSI-LHCI-LHCII
supercomplexes were visible, aside from a very faint band in the LL thylakoids. The tap38 mutant, on
the other hand, appeared to contain a much larger number of PSI-LHCI-LHCII supercomplexes than
Col-0 in every light condition, presumably arising from constitutively high levels of LHCII
phosphorylation seen in this mutant (Pribil et al., 2010). Complexes solubilised from the granal fraction
(Figure 29B) were separated by clear native PAGE to visualise PSII supercomplexes. Each genotype
appeared capable of forming all of the C2S2, C2S2M, and C2S2M2 supercomplexes, with LL thylakoids
presenting an additional band, corresponding to C2S2M2L. PSII supercomplex formation did not appear
to be altered dramatically in the phosphorylation mutants. Comparison of the two gels shows that in LL
thylakoids there were fewer complexes solubilised from the stroma lamellae fraction and more
complexes solubilised from the grana, suggesting changes in thylakoid stacking. Therefore, unlike the
study of Pesaresi et al. (2009), here stn7 showed changes in the Chl a/b ratio and distribution of
complexes between the grana and the stroma lamellae that are consistent with an operational, albeit
modified, light acclimation response.

106
Figure 29: Clear native PAGE analysis of phosphorylation mutants. Clear native PAGE separation of (A) stroma lamellae
and (B) grana complexes from Col-0, stn7, tap38 thylakoids from plants acclimated to low (L), moderate (M) and high (H)
growth light intensity.
6.3 Phosphorylation mutants stn7 and tap38 are capable of long term
acclimation to light intensity
Thylakoid membranes from Col-0, stn7 and tap38 plants grown in LL, ML and HL conditions were
prepared for MS analysis as described previously (Chapter 4). Protein digests and MS analyses were
performed in three randomised-order batches, grouped by light condition, then all mass spectra were
processed together in one batch using MaxQuant. As before, relative protein abundance was calculated
using iBAQ, with values normalised to the sum of the core photosynthetic machinery: PSII, PSI, cytb6f
and ATP synthase. Since MS spectra were acquired at different times, there is greater potential for
peptide LC retention time instability or other sources of variability. However, since all other aspects of
the procedure such as digestion, LC and MS acquisition methods were consistent for each light
condition, the combined data may be used to observe patterns and changes in protein abundance across
the entire dataset. Following normalisation and averaging of replicates, proteins identified from the MS
data were filtered to include only those thought to be associated with the thylakoid membrane with no
missing values and the proteomes were subject to a PCA, implemented in Perseus (Figure 30). Grouping
of samples in the PCA showed high similarity between thylakoids acclimated to HL, suggesting that
the phosphorylation mutants responded to the high light intensity similarly to the wild type. The
proteomes of Col-0 and tap38 thylakoids grown under LL grouped very closely in the PCA, suggesting
that they may respond to low light in a similar way to one another, whereas LL stn7 was more distinct.
The loosest grouping was that of the ML plants. Possibly, the absence of acclimation responses in ML
plants may mean that imbalances arising from perturbed LHCII phosphorylation in the mutants have a
greater impact on the system.

107
Figure 30: Principle component analysis of MS data to compare phosphorylation mutants. Circles indicate grouping by low
light (LL), moderate light (ML) and high light (HL) of Col-0 (blue), stn7 (pink) and tap38 (teal) proteomes.
An important consideration is the extent of protein depletion caused by a mutation, so the relative
amounts of STN7 and TAP38 compared to the wild type are shown in (Figure 31). The stn7 mutant
contained undetectable amounts of STN7 at ML and only around 2% of its wild-type level at HL. At
LL, STN7 was present at a level of around 20% of that seen in Col-0; this may explain the appearance
of a faint band corresponding to the PSI-LHCI-LHCII supercomplex seen by clear native PAGE (Figure
29A). The location of the T-DNA insertion in an intron of stn7 may allow some residual expression in
the mutant. Notably, given the proposed role of STN7 in signalling and regulation, STN7 was also
significantly depleted in tap38, being present at around 35% of wild type levels in all light conditions.
If STN7 does indeed act in a signalling cascade to induce changes in gene expression, its depletion in
tap38 could produce similar effects to those of the stn7 mutation. The same effect was observed, albeit
to a much lesser extent, in stn7; the loss of STN7 caused a 20-30% reduction in the amount of TAP38.
In tap38, where the T-DNA insertion is located within the 5′ of the gene, the phosphatase was depleted
to less than 10% of wild type levels in all light conditions.
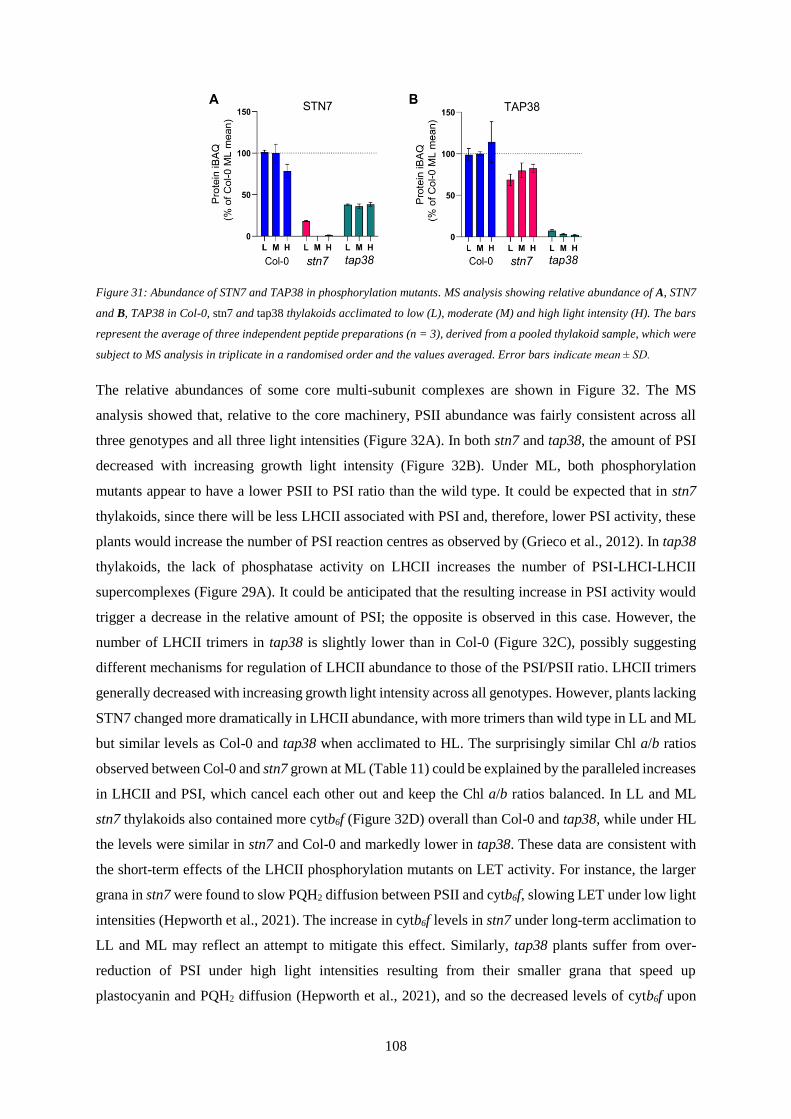
108
Figure 31: Abundance of STN7 and TAP38 in phosphorylation mutants. MS analysis showing relative abundance of A, STN7
and B, TAP38 in Col-0, stn7 and tap38 thylakoids acclimated to low (L), moderate (M) and high light intensity (H). The bars
represent the average of three independent peptide preparations (n = 3), derived from a pooled thylakoid sample, which were
subject to MS analysis in triplicate in a randomised order and the values averaged. Error bars indicate mean ± SD.
The relative abundances of some core multi-subunit complexes are shown in Figure 32. The MS
analysis showed that, relative to the core machinery, PSII abundance was fairly consistent across all
three genotypes and all three light intensities (Figure 32A). In both stn7 and tap38, the amount of PSI
decreased with increasing growth light intensity (Figure 32B). Under ML, both phosphorylation
mutants appear to have a lower PSII to PSI ratio than the wild type. It could be expected that in stn7
thylakoids, since there will be less LHCII associated with PSI and, therefore, lower PSI activity, these
plants would increase the number of PSI reaction centres as observed by (Grieco et al., 2012). In tap38
thylakoids, the lack of phosphatase activity on LHCII increases the number of PSI-LHCI-LHCII
supercomplexes (Figure 29A). It could be anticipated that the resulting increase in PSI activity would
trigger a decrease in the relative amount of PSI; the opposite is observed in this case. However, the
number of LHCII trimers in tap38 is slightly lower than in Col-0 (Figure 32C), possibly suggesting
different mechanisms for regulation of LHCII abundance to those of the PSI/PSII ratio. LHCII trimers
generally decreased with increasing growth light intensity across all genotypes. However, plants lacking
STN7 changed more dramatically in LHCII abundance, with more trimers than wild type in LL and ML
but similar levels as Col-0 and tap38 when acclimated to HL. The surprisingly similar Chl a/b ratios
observed between Col-0 and stn7 grown at ML (Table 11) could be explained by the paralleled increases
in LHCII and PSI, which cancel each other out and keep the Chl a/b ratios balanced. In LL and ML
stn7 thylakoids also contained more cytb6f (Figure 32D) overall than Col-0 and tap38, while under HL
the levels were similar in stn7 and Col-0 and markedly lower in tap38. These data are consistent with
the short-term effects of the LHCII phosphorylation mutants on LET activity. For instance, the larger
grana in stn7 were found to slow PQH2 diffusion between PSII and cytb6f, slowing LET under low light
intensities (Hepworth et al., 2021). The increase in cytb6f levels in stn7 under long-term acclimation to
LL and ML may reflect an attempt to mitigate this effect. Similarly, tap38 plants suffer from over-
reduction of PSI under high light intensities resulting from their smaller grana that speed up
plastocyanin and PQH2 diffusion (Hepworth et al., 2021), and so the decreased levels of cytb6f upon

109
long-term acclimation to HL could represent a ameliorative strategy. ATP synthase increased with
growth light intensity, behaving similarly in stn7 and tap38.
Figure 32: Acclimation-related changes in the abundance of key photosynthetic complexes in phosphorylation mutants. MS
analysis showing the relative abundance of A, PSII, B, PSI, C, LHCII, D, cytb6f, and E, ATP synthase from Col-0, stn7 and
tap38 thylakoids acclimated to low (L), moderate (M) and high light intensity (H). MS data sampling details are as stated in
Figure 31.
6.4 Long term changes in thylakoid architecture in stn7 and tap38
Dynamic, short-term changes in thylakoid stacking are controlled primarily by LHCII
phosphorylation/dephosphorylation by STN7/TAP38 to balance LET and CET (Wood et al., 2018,
2019). Long-term changes in stacking, as found in Chapter 4, are a result of changes in abundance of
CURT1 proteins rather than arising solely from LHCII abundance or phosphorylation. Mutants lacking
STN7 or TAP38 are impaired in their short-term thylakoid stacking responses to light intensity,
although it is not yet known what effect LHCII phosphorylation has on long-term changes in grana size.
Therefore, Col-0, stn7 and tap38 Arabidopsis were subjected to EM analysis (Figure 33A-D), to
compare the number of membrane layers per granum in LL and HL, and SIM (Figure 33E, F), to
determine their grana diameter (measured as grana FWHM) after acclimation to LL, ML and HL.

110
Figure 33: Long-term changes in thylakoid architecture are affected by LHCII phosphorylation. A, Thin-section electron
micrographs of chloroplasts from Col-0 (top row), stn7 (middle row) and tap38 (bottom row) plants acclimated to LL (scale
bar: 0.5 µm). B, Number of membrane layers per grana stack calculated from electron microscopy images of chloroplasts in
Col-0 (n = 116), stn7 (n = 121) and tap38 (n = 102) leaves acclimated to LL (Welch’s t-test. ****P < 0.0001, ns > 0.05). C,
Thin-section electron micrographs of chloroplasts from Col-0 (top row), stn7 (middle row) and tap38 (bottom row) plants
acclimated to HL (scale bar: 0.5 µm). D, Number of membrane layers per grana stack calculated from electron microscopy

111
images of chloroplasts in Col-0 (n = 322), stn7 (n = 192) and tap38 (n = 185) leaves acclimated to HL (Welch’s t-test, ns >
0.05). E, SIM images of chloroplasts from a representative 3D SIM image slice from Col-0 (top row), stn7 (middle row) and
tap38 (bottom row) Arabidopsis grown at LL (left column), ML (middle column) and HL (right column). F, Box and whisker
plots of full width at half-maximum (FWHM) fluorescence intensity of the fluorescent spots (grana, n ≥ 80) in three-
dimensional SIM images of chloroplasts from Col-0, stn7 and tap38 Arabidopsis grown at low (L), moderate (M) and high
light intensity (H).
In wild type Arabidopsis, grana decrease in size with increasing growth light intensity, both in grana
diameter (Figure 33F) and in the number of membrane layers per granum (Figure 33B, D). In LL, stn7
chloroplasts contained very large grana with many more layers and a larger diameter than the wild type.
This may be explained by the MS data, which showed that the thylakoid membranes of stn7 plants
contained more LHCII trimers (Figure 32C) at LL and ML than the wild type. Since these trimers are
unable to form PSI-LHCI-LHCII supercomplexes in the stroma lamellae (Figure 29A), they will
accumulate in the grana and increase their size even further. At HL, the stn7 grana are no different to
the wild type in terms of membrane layers (Figure 33D) but they have significantly larger diameters
than Col-0 and tap38 grana. In contrast to the short-term response to light intensity (Wood et al., 2019),
grana from tap38 chloroplasts were no smaller than the wild type at any growth light tested, in terms of
either diameter or number of layers. One possible explanation for this may be that changes in the amount
of CURT1 (Figure 34A-D) proteins compensate for high levels of LHCII phosphorylation in tap38. In
HL, tap38 thylakoids contain around 20% less CURT1A and CURT1B (Figure 34A, B), proteins known
to induce membrane curvature and increase stacking. Overall, however, either the CURT1 proteins
behave in a similar way in the phosphorylation mutants to in the wild type, or any observed differences
are minimal. In contrast to the findings of Chapter 4, neither grana diameter nor membrane layers appear
to change in line with CURT1 protein abundance. This suggests that the differences in grana size in
stn7 are mostly a result of LHCII and its phosphorylation state. HL stn7 plants contain a similar number
of LHCII trimers to the wild type, have similar numbers of layers per granum, but have larger grana
diameters. Therefore, the larger grana diameter likely result from LHCII phosphorylation specifically.
However, the RIQ proteins may reduce the number of layers per granum (Yokoyama et al., 2016).
Thylakoids of stn7 plants grown in HL contained 50% more RIQ1 (Figure 34E) than the wild type, a
change that may constrain grana height. They also contained more RIQ2 (Figure 34F) at both LL and
HL. Two other proteins with roles in grana stacking, STN8 and CAS (Figure 34G, H), were relatively
unaffected in the phosphorylation mutants.

112
Figure 34: Abundance of proteins involved in thylakoid architecture in phosphorylation mutants. MS analysis showing relative
abundance of A-H, CURT1A, CURT1B, CURT1C, CURT1D, RIQ1, RIQ2, STN8 and CAS in Col-0, stn7 and tap38 thylakoids
acclimated to low (L), moderate (M) and high light intensity (H). Sampling details are as stated in Figure 31.
6.5 Electron carrier protein abundance is affected in stn7 and tap38
In addition to the effects of STN7 and TAP38 dependent LHCII (de)phosphorylation on short-term
regulation of LET described in Section 6.4, these proteins also affect CET function (Hepworth et al.,
2021). LHCII phosphorylation enhances CET under low light conditions where PSI excitation is
limiting. Under high light, on the other hand, where the supply of oxidised PQ limits CET,
dephosphorylation of LHCII and the larger grana that ensue promote isolation of the stromal pool from
PSII. Therefore, changes in thylakoid architecture in stn7 and tap38 may be accompanied by differences
in the amounts of proteins associated with CET and/or LET. In the wild type, plastocyanin abundance
is increased in both LL and HL (Figure 35A), similarly to in Chapter 4. The wild type plants have larger
grana in LL so they may increase the amount of plastocyanin to compensate for the longer diffusion
distance. HL may also lead to an increase in plastocyanin abundance because of a need for greater

113
electron transfer capacity. In ML, both phosphorylation mutants have dramatically more plastocyanin
than the wild type. They also form larger grana, which could explain the increase in plastocyanin.
However, stn7 and tap38 plants grown under LL have less plastocyanin than the LL wild type, despite
having larger grana. Therefore, grana diameter must not be the only factor determining plastocyanin
abundance in LL. Another important electron transfer protein, which was not identified in the MS
experiments of the previous chapters, is ferredoxin (Fd). Both isoforms of Fd identified, FD1 (Figure
35B) and FD2 (Figure 35C), also increased dramatically in abundance in the mutants when grown under
ML. However, FD1 was not detected at LL conditions in any of the genotypes. The dramatic increase
in abundance of these electron carriers in ML may also be linked to grana size, in that it may help to
compensate for LET limitation. However, since ferredoxin is a soluble stromal protein that may not be
tethered to the thylakoid membrane – as FNR is by TROL and TIC62 – the observed changes may not
represent differences in absolute quantities of protein. Rather, the association of ferredoxin with the
thylakoid membrane may vary. FNR may better indicate differences in electron transfer in the
phosphorylation mutants than Fd, since it may be more consistently associated with the thylakoid
membrane. FNR1, which is a target of STN7-dependent phosphorylation (Schönberg et al., 2017),
generally increases with light intensity in all genotypes (Figure 35D). Higher FNR1 levels in stn7
compared to tap38 suggest phosphorylation of this protein may affect its abundance. In Col-0, contrary
to the results of Chapter 4, FNR2 was less abundant in HL than in ML but the phosphorylation mutants
increased their FNR2 with growth light intensity (Figure 35E). However, in the wild type, contrary to
the results of Chapter 4, FNR2 was less abundant in HL than in ML but the phosphorylation mutants
increased their FNR2 with growth light intensity (Figure 35E). The fact that (non-phosphorylated)
FNR2 levels were also higher in stn7 than in tap38 thylakoids suggests that factors other than FNR
phosphorylation related to the altered LET/CET balance in these mutants may regulate FNR1 and 2
abundance. The FNR tethering proteins TIC62 and TROL also generally increase in abundance with
growth light intensity in all genotypes (Figure 35F, G) with the highest levels seen in stn7, consistent
with the elevated FNR1 and 2 levels. Therefore, thylakoids from stn7 plants generally present increases
in the amount of LET proteins, while tap38 has a slight overall decrease. Since stn7 has very large
grana, and presumably more efficient CET, the slight increase in apparent LET capacity may be an
attempt to balance the two electron transfer routes. While tap38 plants did not have smaller grana, as
might be expected, hyperphosphorylation of LHCII and subsequent decrease in the amount of LHCII
associated with PSII may reduce PSII activity such that there is less need for a high electron transfer
capacity.

114
Figure 35: Abundance of electron transfer proteins in phosphorylation mutants. MS analysis showing the relative abundance
of A-J, Plastocyanin, ferredoxin 1 (FD1), ferredoxin 2 (FD2), FNR1, FNR2, TIC62, TROL, PGR5, PGRL1 and NDH from
Col-0, stn7 and tap38 thylakoids acclimated to low (L), moderate (M) and high light intensity (H). MS data sampling details
are as stated in Figure 31.
For the CET-related proteins PGR5, PGRL1 and NDH (Figure 35H-J), protein abundance changed with
growth light intensity similarly in the phosphorylation mutants to in the wild type. While stn7 appears
to slightly increase its capacity for LET, indicated by slight overall increases in associated proteins,
there is no obvious trend with the CET proteins. The abundance of proteins involved in the PGRL1-

115
mediated pathway of CET does not appear to be affected by LHCII phosphorylation, despite the
imbalance this would presumably cause. However, slightly more NDH is present in the stn7 thylakoids
compared to the wild type at each light condition.
6.6 Candidate proteins for an STN7-mediated signalling pathway
As in the phosphorylation mutant stn7, plants lacking TSP9 are deficient in state transitions. TSP9 is
another identified phosphorylation target of STN7 and has been proposed as a link between STN7 and
long term acclimation (Fristedt et al., 2008). In particular, it may play a role in acclimation to high light
intensity, since exposing mutants lacking TSP9 to high light does not induce expression of a group of
signalling proteins that are normally upregulated after high light treatment (Fristedt et al., 2009b). The
MS analysis found that TSP9 abundance is influenced by growth light intensity and genotype (2-way
ANOVA, p = 3.25E-12). In the wild type plants, TSP9 decreased by 30% in HL but was unchanged
between LL and ML (Figure 36A). When grown at ML, stn7 and tap38 thylakoids contained around
45% and 75% less TSP9, respectively, whereas at LL there was a 30% increase relative to the wild type.
At HL, thylakoids of the phosphorylation mutants contained around 60% more TSP9 than the wild type.
However, since phosphorylation of TSP9 induces its dissociation from the stromal surface of the
thylakoid membrane (Carlberg et al., 2003), these values may represent binding of the protein rather
than absolute abundance. If STN7 is responsible for this phosphorylation that leads to release of TSP9
from the membrane, a lack of STN7 in the stn7 mutant might cause more TSP9 to be retained on the
membrane and vice versa for tap38. However, both mutations produce a similar effect on the amount
of TSP9 quantified.
Figure 36: Abundance of potential phosphorylation targets of STN7. MS analysis showing the relative abundance of A, TSP9
and B, PTAC16 from Col-0, stn7 and tap38 thylakoids acclimated to low (L), moderate (M) and high light intensity (H). MS
data sampling details are as stated in Figure 31.
Another protein whose abundance was significantly affected by growth light and genotype in an
interactive way (2-way ANOVA, p = 4.99E-15) was PTAC16 (Figure 36B). Phosphorylation of this
protein is dependent on STN7 but it is unclear whether STN7 phosphorylates PTAC16 directly.
PTAC16 contains a Rossman fold motif for nucleotide binding and may function in the regulation of
chloroplast gene expression by mediating interactions between the thylakoid membrane and the

116
chloroplast nucleoid (Adamiec et al., 2018; Ingelsson and Vener, 2012). Despite being found to be
located on the stromal side of the thylakoid membrane, PTAC16 has also been reported to co-localise
with PSII repair-associated lumenal proteins DEGP1 and TL18.3 (Zienkiewicz et al., 2012). In wild
type plants, PTAC16 decreases with increasing light intensity. However, in stn7 plants PTAC16
behaves very differently, being present at around 40% less in ML but around 60% higher than the wild
type in HL. The tap38 thylakoids also contained more PTAC16 in HL, but its LL abundance was not
affected substantially in either of the mutants. If this protein really is part of a signalling pathway
involving STN7, it would appear that other factors are capable of regulating its expression.
6.7 The pgr5 mutant is comparable to wild type in supercomplex formation and
grana diameter
Arabidopsis mutants lacking the proton gradient regulation protein PGR5 are highly susceptible to
photoinhibition and are unable to grow in a fluctuating light environment. The pgr5 mutant was subject
to proteomic analysis to assess whether this conditional phenotype resulted predominantly from the
disruption of a single, essential process, or from dysregulation of signalling pathways leading to more
widespread changes in the thylakoid proteome. The pgr5 mutant used in this experiment is from the gl-
1 genetic background rather than Col-0, so this strain is used as the ‘wild type’ comparison.

117
Figure 37: The pgr5 mutant has similar supercomplex formation and thylakoid architecture to wild type. A, BN-PAGE analysis
of solubilised stromal lamellae (SL) and granal (G) thylakoid fractions from gl-1 and pgr5 plants. B, SIM images of
chloroplasts from a representative 3D SIM image slice from gl-1 (top row) and pgr5 (bottom row) plants. C, Full width at
half-maximum (FWHM) fluorescence intensity of the fluorescent spots (grana) in three-dimensional SIM images of
chloroplasts from gl-1 (n = 81) and pgr5 (n = 104) plants (Welch’s t-test. ns > 0.05).
The pgr5 and wild type plants were grown at 150 µmol photons m-2 s-1 with an 8 h photoperiod for 6
weeks before chloroplasts were prepared for analysis by SIM and thylakoids were isolated for analysis
by BN-PAGE and MS. The BN-PAGE (Figure 37A) did not reveal any obvious changes in the
stoichiometry of photosynthetic complexes aside from a possible reduction in the number of free LHCII
trimers, which fits with the similar Chl a/b ratios of the gl-1 and pgr5 thylakoids, of 2.94 and 3.05,
respectively. The granal fractions of both the mutant and the wild type solubilized poorly in 1% α-
DDM, resulting in poor visualisation of the PSII supercomplexes C2S2 and C2S2M and an absence of
the C2S2M2 supercomplex. However, there does appear to be a slight difference in the distribution of
complexes between domains; in the pgr5 thylakoids, a greater proportion of complexes were solubilised
from the stroma lamellae than in the wild type. This could suggest a decrease in grana stacking.
However, analysis of grana diameter by SIM (Figure 37B, C) did not reveal a significant difference in
pgr5.

118
Figure 38: Downregulation of key complexes in pgr5. MS analysis showing the relative abundance in gl-1 (g) and pgr5 (p)
thylakoids of key photosynthetic complexes PSII, PSI, LHCII, Cytb6f, ATP synthase and NDH, expressed as a percentage of
the mean in gl-1. The bars represent the average of three independent peptide preparations (n = 3), derived from a pooled
thylakoid sample, which were subject to MS analysis in triplicate and the values averaged. Error bars indicate mean ± SD.
Significant differences between conditions were determined by a modified Welch’s t-test (Section 2.9.9, *q < 0.05).
MS analysis of the key photosynthetic complexes (Figure 38) confirmed the decrease in LHCII
abundance observed by BN-PAGE. The number of LHCII trimers in pgr5 was around 40% less than
the wild type, a difference comparable to that of the Field thylakoids (Chapter 5) and more extreme than
the LHCII decrease seen in constant HL (Chapter 4). Previously it has been reported (Suorsa et al.,
2012) that pgr5 plants have a 50% reduction in the amount of PSI, even under constant light. This MS
analysis, however, found only a very small decrease in the amount of PSI, of only 10%. Suorsa et al.
(2012) did not observe any change in the amount of cytb6f or NDH. However, this MS analysis reveals
a modest (15%) reduction in the amount of cytb6f and a 25% decrease in the NDH complex. This is
surprising since, as pgr5 is unable to perform CET via the PGRL1-mediated pathway, one might expect
that CET via NDH would be upregulated. Consistent with Suorsa et al. (2012), no difference in the
amount of ATP synthase was observed in pgr5.
6.8 Widespread downregulation of thylakoid protein abundance in pgr5
A schematic diagram indicating the ratio of thylakoid proteins in pgr5 compared to the wild type is
shown in (Figure 39). In pgr5, where a single amino acid substitution results in instability and
degradation of the PGR5 protein (Munekage et al., 2002), the amount of PGR5 detected was depleted
to 4% of its wild type level. Overall, this loss of the PGR5 protein results in widespread decreases in
proteins related to electron transfer, both linear and cyclic, as well as many related to the regulation of
grana stacking, such as CURT1B, CURT1C and CAS. The abundance of RIQ1 and 2 is also lower in
the pgr5 plants. These proteins are thought to decrease grana stacking (Yokoyama et al., 2016), so a
lower abundance in the pgr5 mutant may result in more membrane layers per granum; this has yet to be
demonstrated. The dramatic decrease in CP29.3 in pgr5 is reminiscent of a response to low light, as
seen in the previous chapters. A possible function of this protein is to disrupt interactions between PSII

119
supercomplexes in adjacent membrane layers and facilitate more efficient PSII disassembly and repair,
or to reduce binding of M-trimers (Albanese et al., 2017, 2019). However, the overall decrease in LHCII
trimer proteins more closely resembles a high light response. In contrast to wild type plants, which keep
LHCB3 constant during acclimation to constant high or low light or to natural light (Chapters 4 and 0),
pgr5 had only half as much LHCB3 as gl-1. PSI does not dramatically shrink its core antenna, the
LHCA proteins, but it may have a reduced ability to bind LHCII trimers. While overall PSI decreases
slightly in pgr5, there is a more substantial decrease specifically in the amount of PSAH (-65%), the
subunit responsible for the interaction between PSI and phosphorylated LHCII. Concomitant loss of
LHCB2, which is 50% lower in pgr5, and PSAH may represent a compensatory attempt to lower PSI
excitation to avoid reaction centre damage.

120
Figure 39: A comparison of the thylakoid proteome in pgr5 to gl-1. Schematic diagram indicating the relative abundance of
thylakoid proteins in pgr5 versus in gl-1. Blue proteins are more abundant in gl-1, whereas red/pink proteins are more
abundant in pgr5. Where no significant difference was detected for a quantified protein it is displayed in white. Proteins not
identified by MS analysis are shown in grey.
The electron carrier protein plastocyanin (PC) is around 20% less abundant in pgr5, and two out of the
three Fd isoforms identified are also depleted. FNR decreases by 30-40%, with smaller reductions in its
tethering proteins TIC62 and TROL of 15 and 10%, respectively. The loss of PGR5 is also associated
with less PGRL1. Since mutants lacking the PGRL1 protein have a similar phenotype to pgr5 and the
two form a complex (DalCorso et al., 2008), PGRL1 is likely redundant in the absence of PGR5. There
is no increase in the NDH complex - in fact, there is a decrease – to compensate for the loss of one CET

121
pathway, which would imply that pgr5 has very low CET capacity. The depletion of proteins associated
with LET to a greater extent, even, than in wild type plants acclimated to LL (Chapter 4) suggests these
plants have a very low electron transfer capacity. One might expect that LL levels of electron transfer
proteins might delay growth similarly to light restriction. However, previous work on this mutant found
it to have wild type levels of both CET and LET under continuous light (Nandha et al., 2007; Okegawa
et al., 2007) and a similar growth phenotype (Munekage et al., 2002). Therefore, wild type plants grown
at constant ML, and possibly even those acclimated to LL, must have a surplus of electron transfer
machinery. These electron transfer proteins must be present at levels higher than is necessary for
efficient utilisation of their growth light.
One category of proteins that does not seem particularly affected by the loss of PGR5 is of those
involved in the regulation of light harvesting. VDE, PSBS, SOQ1, KEA3 and ROQH1 are present at
wild type levels, which would suggest that pgr5 plants have a normal capacity for NPQ. However, since
pgr5 is deficient in NPQ (Munekage et al., 2002), this supports the idea that it is the inability of pgr5
to generate sufficient lumen acidification upon high light exposure that impedes NPQ induction.
6.9 Downregulation of PSII repair machinery in pgr5
One striking result observed is the substantial decrease (around 40%) in the amount of the D1 protein
relative to the other transmembrane subunits of the PSII core, which change minimally. The
accumulation of PSII subunits without D1 might indicate defects in the PSII repair process. To
determine whether depletion of the D1 protein is associated with changes in PSII repair, proteins
associated with the PSII repair machinery were quantified and their ratio in pgr5 to the wild type is
shown in Figure 40. The very low relative abundance of the D1 protein would suggest defects in PSII
assembly, rather than degradation. In general, however, PSII assembly proteins appear to be present at
wild type levels. This includes LPA1 (Peng et al., 2006), LQY1 (Lu et al., 2011), LTO1 (Karamoko et
al., 2011), and HCF173, which plays an important role in D1 synthesis (Schult et al., 2007).

122
Figure 40: Depletion of PSII repair machinery in pgr5. Schematic diagram indicating the relative abundance of PSII repair
proteins in pgr5 versus gl-1 thylakoids. Blue proteins are more abundant in gl-1, whereas red/pink proteins are more abundant
in the pgr5. Where no significant difference was detected for a quantified protein, it is displayed in white. Proteins not detected
in the MS analysis are shown in grey.
DEGP, or Protease Do-like, proteins are serine proteases peripherally associated with the thylakoid
membrane (Itzhaki et al., 1998) with roles in the processing of damaged PSII reaction centres. DEGP1,
DEGP5 and DEGP8 are located on the lumenal side, the latter two forming a heterocomplex. These
lumenal DEGP proteins increased by 2 to 4-fold in Field plants (Chapter 5) so are likely to be important
in fluctuating light. DEGP5, which acts on PSBF, and DEGP8 are most important under stress
conditions, whereas DEGP1, the most abundant of these proteases, is most important for normal growth
and its absence has a more detrimental effect on growth phenotype (Butenko et al., 2018; Lucinski et
al., 2011a). The CTPA protease, also located in the lumen, degrades D1 in PSII repair and is required
for normal growth in high light (Shuming et al., 2008). All of these lumenal proteases are depleted by
between 40 and 60% in pgr5 thylakoids. DEGP2, located on the stromal side of the thylakoid
membrane, is responsible for the initial cleavage of the D1 protein and is upregulated under stress
conditions, under which it also degrades the PSII antenna protein LHCB6 (Haußuhl et al., 2001;
Lucinski et al., 2011b) whose function is to link the PSII reaction centre to LHCII M trimers. DEGP2
was greatly depleted in the pgr5 thylakoids, being present at only 25% of the wild type level. Together,
these significant decreases in abundance of proteases responsible for D1 degradation suggest a greatly
reduced ability of the mutant to disassemble damaged PSII.

123
6.10 Discussion
It is clear from these MS data that neither STN7 nor TAP38 are essential for long term acclimation to
low or high light intensity. Bonardi et al. (2005) first reported an association between the LHCII kinase
STN7 and acclimation-related changes in photosystem stoichiometry when they exposed plants to light
preferentially exciting either PSI or PSII; this treatment induces state transitions, but likely produces
different effects than the light intensity changes used in this work. They found that Chl a/b ratios of the
thylakoids acclimated to these different light qualities were altered in wild type Arabidopsis but not in
stn7 mutants. Transcriptomics of stn7 and wild type plants grown in a greenhouse was also performed
and revealed widespread downregulation of gene expression in stn7. A later study by Pesaresi et al.
(2009) also used light preferentially exciting PSI or PSII to assess acclimation-related changes, with
immunoblotting, transcription analysis and Chl a/b ratios. Plants lacking STN7 did not change their
photosystem stoichiometry when exposed to the different light qualities, while the wild type did. To
reconcile these studies with the results described in this thesis, it could be that STN7-mediated gene
regulation is triggered only by the spectral quality of light, rather than its intensity. However, Tikkanen
et al. (2006) did grow stn7 plants under low, moderate and high light intensity, making their study more
comparable to this one. They found that the stn7 plants did indeed differ in their acclimation responses,
with low light stn7 thylakoids containing less LHCB1 and more PSBS than the wild type. No difference
was observed in the transcriptomes of the stn7 plants, leading the authors to conclude that the STN7-
mediated regulation of protein abundance occurred post-transcriptionally. With this new information
about how the thylakoid proteomes of these phosphorylation mutants change in response to growth light
intensity, it seems unlikely that STN7 plays a major role in adjusting the thylakoid proteome during
long-term acclimation. However, a proteomic comparison of thylakoids from stn7 and tap38 plants
acclimated specifically to PSII or PSI-exciting light wavelengths could reveal a role for STN7 in
acclimation to light quality. Since the proteins TSP9 and PTAC16, thought to possibly be involved in
gene regulation, behave unexpectedly in the phosphorylation mutants, a signalling role for STN7 cannot
be ruled out. However, the data shows that any STN7 involvement in long term acclimation is likely
indirect, in that the loss of dynamic grana stacking changes and state transitions perturbs redox-triggered
signals, leading to a slightly modified response. It is clear that STN7 is not a key component of the
signalling pathway, as suggested by Pesaresi et al. (2009a).
The thylakoid proteome of the pgr5 mutant was characterised by widespread downregulation of proteins
involved in electron transfer, light harvesting and PSII repair. This mutation is lethal in fluctuating light,
and the reason for this is understood to be that pgr5 plants cannot generate sufficient thylakoid lumen
acidification upon transition to high light to induce NPQ and photosynthetic control, leading to PSI
damage. To preserve PSI, the response of pgr5 is to downregulate electron transfer. However, these MS
data suggests that the loss of proton gradient control has much broader effects. As seen in Chapter 5,
plants adapted to fluctuating light massively increase the abundance of proteins involved in PSII repair

124
and electron transfer – the opposite behaviour to pgr5. In addition to the excessive photosystem damage
suffered by pgr5 in fluctuating light, resulting from an absence of NPQ, recovery from that damage is
likely to be significantly impaired. Since there is so much disruption to gene regulation even in stress-
free conditions, it would be interesting to see whether pgr5 is capable of acclimating to high or low
light in the long term, or whether the induction of these changes in gene expression is dependent on
lumenal pH regulation that cannot be achieved in pgr5. Considering the normal growth phenotype and
the apparently normal electron transfer capacity of pgr5 under moderate, constant light (Munekage et
al., 2002; Nandha et al., 2007; Okegawa et al., 2007), despite its significantly depleted light harvesting
and electron transfer machinery, wild type plants must carry out the light reactions at a rate far below
their capacity. A surplus of electron transfer proteins likely provides a buffer for changes in
environmental conditions, such as sudden increases in light intensity, with photosynthesis ultimately
limited by the dark reactions.
Taken together, these quantitative proteomic analyses of photosynthetic mutants highlight the flexibility
of photosynthetic gene regulation. It seems clear that even under environmental conditions that do not
induce stress responses, the loss of a single protein can result in systemic changes to maintain steady
state photosynthesis. When the ability to sense environmental changes is disrupted, as in pgr5,
signalling and gene expression dysregulation can have unexpected and wide-ranging effects. When
studying mutants, combining quantitative proteomics with other techniques can further our
understanding of a biological process beyond what can be observed from phenotypes.

125
7 Final summary
The aim of the work described in this thesis was to use mass spectrometry-based proteomics to quantify,
for the first time, changes that occur in the Arabidopsis thylakoid membrane proteome upon long-term
acclimation to environmental conditions. Proteomics, the study of all proteins in a biological system, is
well established in its application to soluble proteomes but less so for membrane proteins because of
inherent challenges arising from their biochemical properties. The hydrophobicity of transmembrane
domains impedes their extraction and solubilisation, concealing large sections of protein from
enzymatic digestion, and a reduced number of lysine and arginine residues means there are fewer
cleavage sites for trypsin, the most commonly used protease in proteomics. Digested peptides from
transmembrane domains also tend to contain fewer charged residues and thus have poor ionisation
efficiency, resulting in low rates of MS detection (Kar et al., 2017). Unsuccessful tryptic digestion and
MS analysis of the thylakoid membrane proteome with two well-established methods – in-gel digestion
and urea in-solution digestion – and one less common method – digestion in 60% methanol – led to the
development of a novel protocol for thylakoid proteomics. Solubilisation of isolated thylakoid
membranes and tryptic digestion in the ionic detergent sodium laurate (Lin et al., 2013) facilitated MS
identification and relative quantification of a large number of thylakoid proteins investigated in this
thesis.
An obvious caveat of MS-based proteomics is that changes in the relative abundance of proteins or lack
thereof do not automatically feed into changes in activity, since changes in regulation by post-
translational modification or interaction-triggered conformational changes may also play a role. High
levels of post-translational modification of a peptide that persist throughout MS sample preparation
have the potential to prevent its identification and affect the accuracy of protein quantification.
However, inclusion in the database search parameters of as many relevant chemical modifications as
computationally feasible should reduce this impact. Regulatory modifications are often present at low
levels, and several peptides often contribute to protein quantification. Despite generally broad coverage,
some proteins were missing from the dataset, either consistently or occasionally. One of these missing
proteins is PBCP, the antagonistic phosphatase of STN8 (Samol et al., 2012). The kinase STN8, which
was consistently identified by MS, phosphorylates a number of thylakoid proteins including those
within the PSII core and plays a role in the initiation of PSII repair. Quantification of changes in PBCP
abundance in response to environmental conditions, as well as in the LHCII phosphorylation mutants
stn7 and tap38, could provide further insights into the regulation of PSII phosphorylation and repair.
Other proteins, such as CURT1D and LHCB1.5, were identified from MS datasets inconsistently,
probably because of high sequence identity with their isoforms limiting the number of peptides that can
be used for differentiation. Relative quantification of a protein based on, for example, a single unique
peptide is likely to be less reliable than that of a protein with no shared tryptic peptide sequences. To
improve thylakoid proteome coverage in future experiments, or to increase the quality of the data by

126
increasing the sequence coverage of already-identified membrane proteins, alternative proteases could
be used. Proteases that cleave around hydrophobic residues such as chymotrypsin, which is specific for
aromatic residues, have been shown to increase membrane protein identification rate (Fischer and
Poetsch, 2006).
Another key issue with mass spectrometry data is that of normalisation to compensate for random
variations in sample loading and spectral acquisition patterns. Intensity-based absolute quantification
(iBAQ), which relates protein MS intensity to copy number by dividing by the number of theoretical
tryptic peptides for that protein (Schwanhäusser et al., 2011), enabled normalisation to the core
photosynthetic machinery as well as relative quantification of multi-subunit complexes. The MaxLFQ
algorithm (Cox et al., 2014), while used successfully for stoichiometry calculations of the Arabidopsis
photosynthetic machinery (McKenzie et al., 2020), was determined to be unsuitable for relative
quantification of the thylakoid proteome between light conditions because of differences in data
distribution. The method used here, of normalisation to the iBAQ of core photosynthetic complexes, is
unaffected by sample complexity, provides a meaningful internal reference for changes in abundance
of regulatory proteins, and offers an alternative to immunoblot-based quantification of photosynthetic
proteins normalised on a chlorophyll basis.
A focus of the proteomic analysis and key factor in photosynthetic regulation is thylakoid architecture
and the proteins that control it. Imaging of chloroplasts by EM and SIM enabled speculation on the
relationship between these proteins and thylakoid stacking, both in terms of the number of membrane
layers in each granum and the grana diameter, measured as the FWHM of fluorescence intensity of the
grana. Larger grana allow more chlorophyll to be packed into a given chloroplast, which creates greater
efficiencies in the amount of CBB cycle enzymes and other metabolic machinery associated with a
given amount of chlorophyll. A disadvantage of larger grana is the increased diffusion distance for the
mobile electron carriers PQ and plastocyanin which slows LET (Wood et al., 2018). In plants acclimated
to low light intensity, where grana diameter was larger, the abundance of plastocyanin increased to
mitigate this effect. The MS analysis also allowed, for the first time, recognition of the contributions of
increased amounts of the CURT1A, CURT1B (Armbruster et al., 2013), RIQ1 and RIQ2 proteins
(Yokoyama et al., 2016), which negatively regulate grana size, to the reduced thylakoid stacking seen
in plants acclimated to high light intensity in both the growth chamber and the field. Previously, the
decreased grana size has generally been solely attributed to the lower levels of LHCII trimers (Anderson
et al., 1988; Schöttler and Tóth, 2014; Walters, 2005).
Reducing the distance between the centre of a granum and the stroma lamellae may promote LET, since
plastocyanin must diffuse through the densely packed lumen to reach PSI. Damaged PSII also needs to
diffuse out into the stroma lamellae to be disassembled and repaired, a process that will benefit from
smaller grana diameter. Interestingly, field-grown plants had grana with very few layers but slightly

127
wider diameters, on average, than those grown at moderate light in a growth chamber. Since the field
plants were exposed to much more light, there is likely no need for space efficiency and maximisation
of light-harvesting. The slight increase in grana diameter in these plants may not be related to light
intensity specifically, since plants grown in constant high light had grana with smaller diameters.
Instead, wider grana may promote CET in the field plants, which have substantially more NDH than
the plants grown at any constant light intensity. The widespread upregulation of the PSII repair
machinery in the outdoor plants may mitigate any detrimental effect of wider grana on PSII repair.
The long-term acclimation-related changes in grana size appear to be somewhat independent of
dynamic stacking on the short-term and have different aims. In the short-term, grana size dynamically
responds to light intensity in an STN7/TAP38-dependent way via control of LHCII phosphorylation
(Wood et al., 2019). Accordingly, grana size is reduced under low/moderate light conditions, when
LHCII phosphorylation is at a maximum, whereas it is increased when LHCII is dephosphorylated, in
both high light and darkness. It is clear, therefore, that this short-term response to high light exposure
behaves quite oppositely to the long-term acclimation response seen here, since low light acclimated
plants have larger grana than plants grown under high light. This is not surprising, since the aim of
short-term high light responses is generally photoprotection through downregulation of light harvesting
and electron transfer, whereas the long-term aim is to restore homeostasis by adjusting the sink capacity
of the system to better utilise the increased light level. Indeed, while the phosphorylation mutants stn7
and tap38 are unable to adjust grana size on the short term (Wood et al., 2019), they are clearly capable
of changing both grana diameter and membrane layers in the long term. Interestingly, field-grown plants
had significant reductions in both STN7 and TAP38. Therefore, a comparison of dynamic stacking in
outdoor-grown plants to those grown in a controlled environment could reveal whether the field plants
are less flexible in their thylakoid architecture.
The MS analysis of the thylakoid proteome in different environmental conditions can be used to infer
electron transfer capacity and the balance of LET and CET by relative quantification of the protein
components of those pathways. Arabidopsis plants acclimated to constant low light intensity featured
grana with larger diameters and increased amounts of PSI, suggesting a greater need for CET relative
to LET. However, PGR5 and PGRL1 were no different in abundance to the moderate light plants and
NDH was dramatically depleted, despite its purported significance in low light (Yamori et al., 2015). It
could be expected that in low light, since there would be less energy going into PSII and fewer electrons
moving through the thylakoid membrane, plants would downregulate expression of proteins involved
in LET to conserve resources. However, low light plants generally had similar levels of many LET
proteins such as FNR1, TIC62 and TROL, and higher plastocyanin abundance. This suggests that the
low light plants need to maintain a certain level of LET and hence CO2 assimilation, as well as
PGR5/PGRL1-mediated CET at the expense of ATP production by ATP synthase, which was
considerably lower. Downregulation of ATP synthase, along with moderate levels of PGR5/PGRL1,

128
may be a mechanism to maintain control of lumenal pH, such that induction of photoprotection is not
impaired and the dark reactions are provided with enough NADPH.
In terms of electron transfer capacity/requirement, it is interesting to compare the response of the
thylakoid proteome to constant high light to that of naturally fluctuating light, which likely reaches
intensities much higher than the 800 and 600 µmol photons m-2 s-1 growth lights used for the data of
Chapters 4 and 6, respectively. The constant high light plants appeared to favour LET, with dramatic
upregulation of many LET-related proteins and grana with smaller diameters. They also appear to have
substantially more CET via PGR5/PGRL1, and favour this route over the NDH pathway. If PGR5
serves a regulatory role, as suggested by Johnson and Joliot (2011), then an increase in CET capacity
could be instead mediated by the higher amounts of FNR and its membrane tethering proteins TIC62
and TROL. Membrane tethering of FNR has been suggested to regulate the balance between LET and
CET by increasing electron flow from Fd to cytb6f, with enhanced amounts of tethered FNR found in
C4 bundle sheath cells that perform CET (Goss and Hanke, 2014). NDH either increases very slightly
in high light plants or is downregulated. In contrast, plants grown in the field have substantially more
NDH, increasing the abundance of this complex to a greater extent than PGR5/PGRL1, which increase
to a lesser extent than under constant high light. While both routes are important in fluctuating light
(Yamori et al., 2016), it would appear that NDH-mediated CET is specifically important in fluctuating
light and is not part of a response to high light intensity. Surprisingly, the field plants upregulated
expression of LET proteins to a lesser extent than the constant high light plants, despite the higher light
irradiances of natural sunlight. It may be that it is more economical for the outdoor plants to invest in
protective and regulatory mechanisms, CET included, than to increase electron sink capacity. Indeed,
Arabidopsis plants in a natural environment do not benefit from massive vegetative growth; their aim,
which is reflected in their growth phenotype, is to flower and reproduce.
The abundance of VDE and ZEP, the enzymes of the xanthophyll cycle that catalyse the interconversion
of violaxanthin and zeaxanthin to aid aggregation of LHCII into a dissipative state, appears to be
regulated depending on environmental conditions. Plants acclimated to constant light, high or low,
favour increasing ZEP relative to VDE and by implication, enhancing de-aggregation of LHCII to
quickly restore light harvesting. The plants grown in the field, however, increase the amount of VDE
to a greater extent than ZEP. While both the constant high light plants and the field plants upregulate
expression of both enzymes, the preference for VDE in the field plants highlights the importance of fast
induction of quenching to prevent damage in fluctuating light rather than fast relaxation to restore light
harvesting capacity. For low light plants, the doubling of ZEP abundance paired with half as much VDE
suggests that fast relaxation of quenching is very important when light is limiting. Increasing both
enzymes and, therefore, enhancing zeaxanthin and violaxanthin interconversion in both directions, must
be highly beneficial for outdoor-grown plants exposed to variable and rapidly changing light intensities
(Hubbart et al., 2018; Kromdijk et al., 2016). While the increase in VDE observed in the field plants is

129
smaller than that observed in the plants acclimated to constant high light, the lower amount of its
substrate – contained within the LHCII trimers – may enhance the effect of this change.
In addition to an enhanced photoprotective capacity via NPQ, many of the key components of the PSII
repair cycle also increased in plants acclimated to constant and fluctuating light intensity. An important
factor that may enhance PSII repair under high light in the long term is the replacement of LHCB4.1
and 4.2 with the third isoform of CP29, LHCB4.3, which lacks the large C-terminal domain present in
the former two isoforms. This isoform increases dramatically in both constant high light and in a natural
environment, and decreases in low light acclimated plants and in the pgr5 mutant. The cryo-EM
structure of the C2S2M2 supercomplex from spinach shows that the C-terminal domains of LHCB4.1
and 4.2 interact on the stromal side of the complex with CP47, suggesting a role as an anchor (Su et al.,
2017). Replacement by LHCB4.3 in the supercomplex would remove this interaction, perhaps allowing
more straightforward disassembly of the PSII supercomplex to facilitate either PSII repair or NPQ.
These changes in PSII structure and PSII repair cycle machinery may act synergistically with the smaller
thylakoid grana and reduced stacking seen in high light plants to enhance the speed of PSII repair, or in
the field plants, they may compensate for the detrimental impact of the slightly wider grana on PSII
repair.
When comparing the PSII repair machinery of constant high light plants to the field plants, the most
obvious difference is that the field plants broadly upregulate PSII repair, whereas the behaviour of the
PSII repair machinery of the constant high light plants is more variable, with some decreases observed.
While most tended to increase in abundance with growth light intensity, several proteins associated
with the repair cycle were upregulated in the low light plants, such as LQY1, PPL1 and FTSH8. This
raises questions about what signals lead to their expression to be induced, since it would seem
counterintuitive for the plants to produce an incomplete repair machinery or to increase PSII repair
capacity under conditions where the risk of reaction centre damage is low. The pgr5 plants, on the other
hand, presented widespread decreases in many PSII repair proteins, while some were unaffected. The
expression of proteins that were depleted in this mutant, such as the DEGP proteins and CTPA, may be
induced by lumenal pH, which is dysregulated in the absence of PGR5. Similarly to a wild type low
light response, LHCB4.3 decreased substantially, despite a decrease in LHCII reminiscent of a high
light response. Overall, the broad range of protein depletions seen in pgr5 does hint at a more complex
function of PGR5. An investigation of the thylakoid proteome of pgr5 plants acclimated to different
light intensities, or other non-lethal environmental conditions know to affect photosynthetic gene
expression, could determine whether the mutant is able to perform long term acclimation. A comparison
with mutants lacking PGRL1 – or another protein that perturbs the proton gradient – could reveal
whether the disruption observed here is a result of lumenal pH or whether PGR5 has a specific signalling
or regulatory role.

130
Given the demonstrable importance of acclimation to plant fitness in nature (Athanasiou et al., 2010),
work of this kind could be used to inform future efforts to manipulate this process for crop improvement.
Several of the proteins up-regulated in high light and in the field, such as VDE, PSBS and cytb6f, have
recently been targeted for overexpression in crop plants with the aim of increasing yield to augment
global food production (Kromdijk et al., 2016; Simkin et al., 2017). Extension of this approach to
include some of the other proteins identified here that change in abundance may open up new avenues
for yield improvement. If the end goal of plant photosynthesis research is its translation into positive
outcomes for agriculture and biotechnology, any hypotheses surrounding photosynthetic mechanisms
should be considered within the context of natural or agricultural environmental conditions. The
comparison of the thylakoid proteomes of Arabidopsis plants grown in a controlled, growth chamber
environment to a ‘field’ environment aimed to contextualise the features of the long-term response to
light intensity. While thylakoids isolated from the field plants most closely resembled the constant high
light acclimated thylakoids in terms of proteome remodelling, several differences in the response were
observed. These range from the FNR tethering protein TROL, which was upregulated only in the field,
to the electron carrier plastocyanin, which was present in the field thylakoids at the same level as in
constant moderate light but upregulated in constant high light. More work is required to unravel which
specific environmental factors produce these differences, be they fluctuating light from moving cloud
cover, differences between the light spectrum of artificial lighting and the sun, the gradual transition
between night and daylight, low temperatures, variable humidity, and/or simply a higher maximum
light intensity. However, these massively variable factors are also the reason for the use of controlled
environment growth chambers, and the reason why this field experiment can never be reproduced
exactly. Another caveat of this experiment is the structural and size differences between Arabidopsis
and most crop plants. While the leaves of Arabidopsis, arranged in a characteristic rosette shape, will
absorb a largely similar amount of light to one another, the leaves of maize or rice plants will form a
canopy as they grow, shading most of the plant from direct sunlight. Understory leaves, and the
chloroplasts within them, will experience a very different light environment to those in full sun, dealing
with both low light and intense sunflecks from leaf movement in the wind. Any genetic manipulation
of a crop plant would ideally enhance photosynthesis in the whole plant if it were to improve yields.
However, despite these factors complicating photosynthetic research in a field environment, proteomics
seems a good option since it takes a snapshot of the abundance of all quantifiable proteins involved in
many different processes. A whole-system analysis, rather than measurement of a single protein or
process, has the potential to inform about the integration of all photosynthetic mechanisms. If this kind
of proteomic approach can be widened to include stromal photosynthetic proteins involved in carbon
assimilation, combined with transcriptomics and metabolomics, we can begin to unravel the complex
regulatory networks that lead to optimisation of photosynthesis in a changing environment.

131
In conclusion, the work described in this thesis shows that relative quantification by label-free MS-
based proteomics can be used to study photosynthetic acclimation, providing detailed insight into how
the many interconnected regulatory and photoprotective processes work together. Arabidopsis plants
grown in light limiting conditions prioritise economics, with a simplified photosynthetic machinery
focusing on light harvesting, fast relaxation of NPQ, and PGR5/PGRL1-mediated CET. High light
acclimated plants focus on increasing their capacity for LET flux, NPQ induction and PSII repair.
Constant, controlled high light causes plants to preferentially enhance CET via the PGR5/PGRL1
pathway, whereas the NDH-dependent CET pathway is favoured in plants grown in natural light and
weather conditions. The data also show that the LHCII kinase STN7 is not required for long-term
acclimation to light intensity. While STN7 and TAP38 control thylakoid architecture in the short term
by LHCII (de)phosphorylation, long term changes in grana size are determined by the abundance of the
CURT1 proteins and LHCII. Ultimately, the proteomic strategy used here could be applied to many
more questions to further our understanding of the complex and dynamic system that is the thylakoid
membrane, revealing targets for future genetic manipulation to improve crop yields and increase global
food production.

132
Bibliography
Adamiec, M., Misztal, L., Kosicka, E., Paluch-Lubawa, E., and Luciński, R. (2018). Arabidopsis
thaliana egy2 mutants display altered expression level of genes encoding crucial photosystem II
proteins. J. Plant Physiol. 231, 155–167.
Adams, W.W., Watson, A.M., Mueh, K.E., Amiard, V., Turgeon, R., Ebbert, V., Logan, B.A., Combs,
A.F., and Demmig-Adams, B. (2007). Photosynthetic acclimation in the context of structural constraints
to carbon export from leaves. Photosynth. Res. 94, 455–466.
Aebersold, R., and Mann, M. (2003). Mass spectrometry-based proteomics. Nature 422, 198–207.
Albanese, P., Manfredi, M., Meneghesso, A., Marengo, E., Saracco, G., Barber, J., Morosinotto, T., and
Pagliano, C. (2016). Dynamic reorganization of photosystem II supercomplexes in response to
variations in light intensities. Biochim. Biophys. Acta - Bioenerg. 1857, 1651–1660.
Albanese, P., Melero, R., Engel, B.D., Grinzato, A., Manfredi, M., Chiodoni, A., Vargas, J., Sánchez,
C.Ó., Marengo, E., Saracco, G., et al. (2017). Pea PSII-LHCII supercomplexes form pairs by making
connections across the stromal gap. Sci. Rep. 7, 1–16.
Albanese, P., Manfredi, M., Re, A., Marengo, E., Saracco, G., and Pagliano, C. (2018). Thylakoid
proteome modulation in pea plants grown at different irradiances: quantitative proteomic profiling in a
non-model organism aided by transcriptomic data integration. Plant J. 96, 786–800.
Albanese, P., Manfredi, M., Marengo, E., Saracco, G., and Pagliano, C. (2019). Structural and
functional differentiation of the light-harvesting protein Lhcb4 during land plant diversification.
Physiol. Plant. 166, 336–350.
Albertsson, P.Å. (2001). A quantitative model of the domain structure of the photosynthetic membrane.
Trends Plant Sci. 6, 349–354.
Albertsson, P.A., Andreasson, E., Stefansson, H., and Wollenberger, L. (1994). Fractionation of
Thylakoid Membrane. Methods Enzymol. 228, 469–482.
Alfonso-garrido, J., Garcia-calvo, E., and Luque-garcia, J.L. (2015). Sample preparation strategies for
improving the identification of membrane proteins by mass spectrometry. Anal. Bioanal. Chem. 407,
4893–4905.
Amstutz, C.L., Fristedt, R., Schultink, A., Merchant, S.S., Niyogi, K.K., and Malnoë, A. (2020). An
atypical short-chain dehydrogenase–reductase functions in the relaxation of photoprotective qH in
Arabidopsis. Nat. Plants 6, 154–166.
Andaluz, S., López-Millán, A.-F., De las Rivas, J., Aro, E.-M., Abadía, J., and Abadía, A. (2006).
Proteomic profiles of thylakoid membranes and changes in response to iron deficiency. Photosynth.

133
Res. 89, 141–155.
Anderson, J.M. (1986). Photoregulation of the composition, function and structure of thylakoid
membranes. Annu. Rev. Plant. Physiol 37, 93–136.
Anderson, J., Chow, W., and Goodchild, D. (1988). Thylakoid Membrane Organisation in Sun/Shade
Acclimation. Aust. J. Plant Physiol. 15, 11–26.
Anderson, J.M., Horton, P., Kim, E.-H., and Chow, W.S. (2012). Towards elucidation of dynamic
structural changes of plant thylakoid architecture. Philos. Trans. R. Soc. Lond. B. Biol. Sci. 367, 3515–
3524.
Andersson, B., and Anderson, J.M. (1980). Lateral heterogeneity in the distribution of chlorophyll-
protein complexes of the thylakoid membranes of spinach chloroplasts. Biochim. Biophys. Acta 593,
427–440.
Andersson, U., Heddad, M., and Adamska, I. (2003). Light stress-induced one-helix protein of the
chlorophyll a/b-binding family associated with photosystem I. Plant Physiol. 132, 811–820.
Armbruster, U., Labs, M., Pribil, M., Viola, S., Xu, W., Scharfenberg, M., Hertle, A.P., Rojahn, U.,
Jensen, P.E., Rappaport, F., et al. (2013). Arabidopsis CURVATURE THYLAKOID1 Proteins Modify
Thylakoid Architecture by Inducing Membrane Curvature. Plant Cell 25, 2661–2678.
Armbruster, U., Carrillo, L.R., Venema, K., Pavlovic, L., Schmidtmann, E., Kornfeld, A., Jahns, P.,
Berry, J.A., Kramer, D.M., and Jonikas, M.C. (2014). Ion antiport accelerates photosynthetic
acclimation in fluctuating light environments. Nat. Commun. 5, 1–8.
Aro, E.M., Virgin, I., and Andersson, B. (1993). Photoinhibition of Photosystem II. Inactivation, protein
damage and turnover. BBA - Bioenerg. 1143, 113–134.
Athanasiou, K., Dyson, B.C., Webster, R.E., and Johnson, G.N. (2010). Dynamic acclimation of
photosynthesis increases plant fitness in changing environments. Plant Physiol. 152, 366–373.
Austin, J.R., and Staehelin, L.A. (2011). Three-Dimensional Architecture of Grana and Stroma
Thylakoids of Higher Plants as Determined by Electron Tomography. Plant Physiol. 155, 1601–1611.
Bailey, S., Walters, R.G., Jansson, S., and Horton, P. (2001). Acclimation of Arabidopsis thaliana to
the light environment: The existence of separate low light and high light responses. Planta 213, 794–
801.
Bailey, S., Horton, P., and Walters, R.G. (2004). Acclimation of Arabidopsis thaliana to the light
environment: The relationship between photosynthetic function and chloroplast composition. Planta
218, 793–802.

134
Ballottari, M., Dall’Osto, L., Morosinotto, T., and Bassi, R. (2007). Contrasting behavior of higher plant
photosystem I and II antenna systems during acclimation. J. Biol. Chem. 282, 8947–8958.
Bellafiore, S., Barneche, F., Peltier, G., and Rochaix, J.-D. (2005). State transitions and light adaptation
require chloroplast thylakoid protein kinase STN7. Nature 433, 892–895.
Benson, S.L., Maheswaran, P., Ware, M.A., Hunter, C.N., Horton, P., Jansson, S., Ruban, A. V., and
Johnson, M.P. (2015). An intact light harvesting complex I antenna system is required for complete
state transitions in Arabidopsis. Nat. Plants 1, 15176.
Benz, J.P., Stengel, A., Lintala, M., Lee, Y.-H., Weber, A., Philippar, K., Gügel, I.L., Kaieda, S.,
Ikegami, T., Mulo, P., et al. (2009). Arabidopsis Tic62 and Ferredoxin-NADP(H) Oxidoreductase Form
Light-Regulated Complexes That Are Integrated into the Chloroplast Redox Poise. Plant Cell 21, 3965–
3983.
Bergantino, E., Segalla, A., Brunetta, A., Teardo, E., Rigoni, F., Giacometti, G.M., and Szabò, I. (2003).
Light- and pH-dependent structural changes in the PsbS subunit of photosystem II. Proc. Natl. Acad.
Sci. U. S. A. 100, 15265–15270.
Berry, S., and Rumberg, B. (1996). H+/ATP coupling ratio at the unmodulated CF0CF1-ATP synthase
determined by proton flux measurements. Biochim. Biophys. Acta - Bioenerg. 1276, 51–56.
van Bezouwen, L.S., Caffarri, S., Kale, R.S., Kouřil, R., Thunnissen, A.-M.W.H., Oostergetel, G.T.,
and Boekema, E.J. (2017). Subunit and chlorophyll organization of the plant photosystem II
supercomplex. Nat. Plants 3, 1–11.
Boardman, N.K. (1977). Comparative Photosynthesis of Sun and Shade Plants. Annu. Rev. Plant
Physiol. 28, 355–377.
Bonardi, V., Pesaresi, P., Becker, T., Schleiff, E., Wagner, R., Pfannschmidt, T., Jahns, P., and Leister,
D. (2005). Photosystem II core phosphorylation and photosynthetic acclimation require two different
protein kinases. Nature 437, 1–4.
Brooks, M.D., Sylak-Glassman, E.J., Fleming, G.R., and Niyogi, K.K. (2013). A thioredoxin-like/β-
propeller protein maintains the efficiency of light harvesting in Arabidopsis. Proc. Natl. Acad. Sci. U.
S. A. 110, E2733–E2740.
Brutnell, T.P., Wang, L., Swartwood, K., Goldschmidt, A., Jackson, D., Zhu, X.G., Kellogg, E., and
van Eck, J. (2010). Setaria viridis: A model for C4 photosynthesis. Plant Cell 22, 2537–2544.
Buchert, F., Mosebach, L., Gäbelein, P., and Hippler, M. (2020). PGR5 is required for efficient Q cycle
in the cytochrome b6f complex during cyclic electron flow. Biochem. J. 477, 1631–1650.
Burkey, K.O. (1993). Effect of growth irradiance on plastocyanin levels in barley. Photosynth. Res. 36,

135
103–110.
Butenko, Y., Lin, A., Naveh, L., Kupervaser, M., Levin, Y., Reich, Z., and Adam, Z. (2018). Differential
Roles of the Thylakoid Lumenal Deg Protease. Plant Physiol. 178, 1065–1080.
Caffarri, S., Kouřil, R., Kereïche, S., Boekema, E.J., and Croce, R. (2009). Functional architecture of
higher plant photosystem II supercomplexes. EMBO J. 28, 3052–3063.
Carlberg, I., Hansson, M., Kieselbach, T., Schro, W.P., Andersson, B., and Vener, A. V (2003). A novel
plant protein undergoing light-induced phosphorylation and release from the photosynthetic thylakoid
membranes. Proc. Natl. Acad. Sci. 100, 757–762.
Carol, P., Stevenson, D., Bisanz, C., Breitenbach, J., Sandmann, G., Mache, R., Coupland, G., Kuntz,
M., Moléculaire, D.G., Fourier, U.J., et al. (1999). Mutations in the Arabidopsis Gene IMMUTANS
Cause a Variegated Phenotype by Inactivating a Chloroplast Terminal Oxidase Associated with
Phytoene Desaturation. Plant Cell 11, 57–68.
Chaux, F., Peltier, G., and Johnson, X. (2015). A security network in PSI photoprotection: regulation
of photosynthetic control, NPQ and O2 photoreduction by cyclic electron flow. Front. Plant Sci. 6, 1–
7.
Cho, L.-H., Yoon, J., and An, G. (2017). The control of flowering time by environmental factors. Plant
J. 90, 708–719.
Chory, J., Ecker, J.R., Briggs, S., Caboche, M., Coruzzi, G.M., Cook, D., Dangl, J., Grant, S., Guerinot,
M. Lou, Henikoff, S., et al. (2000). National Science Foundation-Sponsored Workshop Report: “The
2010 Project” Functional Genomics and the Virtual Plant. A Blueprint for Understanding How Plants
Are Built and How to Improve Them. Plant Physiol. 123, 423–425.
Chow, W., and Anderson, J. (1987). Photosynthetic Responses of Pisum sativum to an Increase in
Irradiance During Growth II. Thylakoid Membrane Components. Aust. J. Plant Physiol. 14, 9–19.
Chow, W., and Hope, A. (1987). The Stoichiometries of Supramolecular Complexes in Thylakoid
Membranes From Spinach Chloroplasts. Funct. Plant Biol. 14, 21–28.
Chow, W., Qian, L., Goodchild, D., and Anderson, J.M. (1988). Photosynthetic acclimation of Alocasia
macrorrhiza (L.) G. Don to growth irradiance: Structure, function and composition of chloroplasts.
Aust. J. Plant Physiol. 15, 107–122.
Chuartzman, S.G., Nevo, R., Shimoni, E., Charuvi, D., Kiss, V., Ohad, I., Brumfeld, V., and Reich, Z.
(2008). Thylakoid membrane remodeling during state transitions in Arabidopsis. Plant Cell 20, 1029–
1039.
Correa-Galvis, V., Poschmann, G., Melzer, M., Stühler, K., and Jahns, P. (2016). PsbS interactions

136
involved in the activation of energy dissipation in Arabidopsis. Nat. Plants 2, 1–8.
Cox, J., and Mann, M. (2008). MaxQuant enables high peptide identification rates, individualized
p.p.b.-range mass accuracies and proteome-wide protein quantification. Nat. Biotechnol. 26, 1367–
1372.
Cox, J., Hein, M.Y., Luber, C.A., Paron, I., Nagaraj, N., and Mann, M. (2014). Accurate proteome-
wide label-free quantification by delayed normalization and maximal peptide ratio extraction, termed
MaxLFQ. Mol. Cell. Proteomics 13, 2513–2526.
Crepin, A., and Caffarri, S. (2015). The specific localizations of phosphorylated Lhcb1 and Lhcb2
isoforms reveal the role of Lhcb2 in the formation of the PSI-LHCII supercomplex in Arabidopsis
during state transitions. Biochim. Biophys. Acta - Bioenerg. 1847, 1539–1548.
Crepin, A., Kučerová, Z., Kosta, A., Durand, E., and Caffarri, S. (2020). Isolation and characterization
of a large photosystem I–light-harvesting complex II supercomplex with an additional Lhca1–a4 dimer
in Arabidopsis. Plant J. 3, 1–12.
Cutolo, E., Parvin, N., Ruge, H., Pirayesh, N., Roustan, V., Weckwerth, W., Teige, M., Grieco, M.,
Larosa, V., and Vothknecht, U.C. (2019). The High Light Response in Arabidopsis Requires the
Calcium Sensor Protein CAS, a Target of STN7- and STN8-Mediated Phosphorylation. Front. Plant
Sci. 10, 1–15.
DalCorso, G., Pesaresi, P., Masiero, S., Aseeva, E., Schünemann, D., Finazzi, G., Joliot, P., Barbato,
R., and Leister, D. (2008). A Complex Containing PGRL1 and PGR5 Is Involved in the Switch between
Linear and Cyclic Electron Flow in Arabidopsis. Cell 132, 273–285.
Dale, A.M.P., and Causton, D.R. (1992). Use of the Chlorophyll a/b Ratio as a Bioassay for the Light
Environment of a Plant. Funct. Ecol. 6, 190–196.
Damkjær, J.T., Kereı, S., Johnson, M.P., Kovacs, L., Kiss, A.Z., Boekema, E.J., Ruban, A. V, Horton,
P., and Jansson, S. (2009). The Photosystem II Light-Harvesting Protein Lhcb3 Affects the
Macrostructure of Photosystem II and the Rate of State Transitions in Arabidopsis. 21, 3245–3256.
Daum, B., Nicastro, D., McIntosh, J.R., and Kuhlbrandt, W. (2010). Arrangement of Photosystem II
and ATP Synthase in Chloroplast Membranes of Spinach and Pea. Plant Cell 22, 1299–1312.
Day, D.A., Ryrie, I.J., and Fuad, N. (1984). Investigations of the role of the main light-harvesting
chlorophyll-protein complex in thylakoid membranes. Reconstitution of depleted membranes from
intermittent-light-grown plants with the isolated complex. J. Cell Biol. 98, 163–172.
Dittrich, J., Becker, S., Hecht, M., and Ceglarek, U. (2015). Sample preparation strategies for targeted
proteomics via proteotypic peptides in human blood using liquid chromatography tandem mass

137
spectrometry. Proteomics - Clin. Appl. 9, 5–16.
Drissi, R., Dubois, M.L., and Boisvert, F.M. (2013). Proteomics methods for subcellular proteome
analysis. FEBS J. 280, 5626–5634.
Endow, J.K., and Inoue, K. (2013). Stable complex formation of thylakoidal processing peptidase and
PGRL1. FEBS Lett. 587, 2226–2231.
Erik, P., Bassi, R., Boekema, E.J., Dekker, J.P., Jansson, S., Leister, D., Robinson, C., and Vibe, H.
(2007). Structure, function and regulation of plant photosystem I. Biochim. Biophys. Acta 1767, 335–
352.
Ermakova, M., Lopez-Calcagno, P.E., Raines, C.A., Furbank, R.T., and Caemmerer, S. von (2019).
Overexpression of the Rieske FeS protein of the Cytochrome b6f complex increases C4 photosynthesis.
Commun. Biol. 314, 1–12.
Fabre, B., Lambour, T., Bouyssié, D., Menneteau, T., Monsarrat, B., Burlet-Schiltz, O., and Bousquet-
Dubouch, M.P. (2014). Comparison of label-free quantification methods for the determination of
protein complexes subunits stoichiometry. EuPA Open Proteomics 4, 82–86.
Fan, D.Y., Hope, A.B., Smith, P.J., Jia, H., Pace, R.J., Anderson, J.M., and Chow, W.S. (2007). The
stoichiometry of the two photosystems in higher plants revisited. Biochim. Biophys. Acta - Bioenerg.
1767, 1064–1072.
Fernyhough, P., Horton, P., and Foyer, C. (1984). Regulation of Light Harvesting Chlorophyll a/b
Binding Protein (LHCP) Phosphorylation in Intact Maize Mesophyll Chloroplasts. In Advances in
Photosynthesis Research, (Springer Netherlands), pp. 299–302.
Ferro, M., Brugière, S., Salvi, D., Seigneurin-Berny, D., Court, M., Moyet, L., Ramus, C., Miras, S.,
Mellal, M., Le Gall, S., et al. (2010). AT_CHLORO, a Comprehensive Chloroplast Proteome Database
with Subplastidial Localization and Curated Information on Envelope Proteins. Mol. Cell. Proteomics
9, 1063–1084.
Fischer, F., and Poetsch, A. (2006). Protein cleavage strategies for an improved analysis of the
membrane proteome. Proteome Sci. 4, 1–12.
Flannery, S.E., Hepworth, C., Wood, W.H.J., Pastorelli, F., Hunter, C.N., Dickman, M.J., Jackson, P.J.,
and Johnson, M.P. (2021). Developmental acclimation of the thylakoid proteome to light intensity in
Arabidopsis. Plant J. 105, 223–244.
Foyer, C.H. (2018). Reactive oxygen species, oxidative signaling and the regulation of photosynthesis.
Environ. Exp. Bot. 154, 134–142.
Foyer, C., and Noctor, G. (2005). Redox Homeostasis and Antioxidant Signaling: A Metabolic Interface

138
between Stress Perception and Physiological Responses. Plant Cell 17, 1866–1875.
Frenkel, M., Bellafiore, S., Rochaix, J., and Jansson, S. (2007). Hierarchy amongst photosynthetic
acclimation responses for plant fitness. Physiol. Plant. 129, 455–459.
Frenkel, M., Johansson Jänkänpää, H., Moen, J., and Jansson, S. (2008). An illustrated gardener’s guide
to transgenic Arabidopsis field experiments. New Phytol. 180, 545–555.
Friso, G., Giacomelli, L., Ytterberg, A.J., Peltier, J., Rudella, A., Sun, Q., and Wijk, K.J. Van (2004).
In-Depth Analysis of the Thylakoid Membrane Proteome of Arabidopsis thaliana Chloroplasts: New
Proteins, New Functions, and a Plastid Proteome Database. Plant Cell 16, 478–499.
Fristedt, R., Carlberg, I., Zygadlo, A., Scheller, H.V., and Vener, A. V. (2008). Involvement of TSP9
Phosphoprotein in Balancing the Photosynthetic Light Harvesting Process in Arabidopsis thaliana.
Photosynth. Energy from Sun 1009–1012.
Fristedt, R., Willig, A., Granath, P., Crèvecoeur, M., Rochaix, J.-D., and Vener, A. V. (2009a).
Phosphorylation of Photosystem II Controls Functional Macroscopic Folding of Photosynthetic
Membranes in Arabidopsis. Plant Cell 21, 3950–3964.
Fristedt, R., Carlberg, I., Zygadlo, A., Piippo, M., Nurmi, M., Aro, E.M., Scheller, H.V., and Vener, A.
V. (2009b). Intrinsically unstructured phosphoprotein TSP9 regulates light harvesting in Arabidopsis
thaliana. Biochemistry 48, 499–509.
Galetskiy, D., Susnea, I., Reiser, V., Adamska, I., and Przybylski, M. (2008). Structure and Dynamics
of Photosystem II Light-Harvesting Complex Revealed by High-Resolution FTICR Mass Spectrometric
Proteome Analysis. J. Am. Soc. Mass Spectrom. 19, 1004–1013.
Galka, W.P., Santabarbara, S., Thu, T., Khuong, H., Degand, H., Morsomme, P., Jennings, R.C.,
Boekema, E.J., Caffarri, S., Galka, P., et al. (2012). Functional Analyses of the Plant Photosystem I–
Light-Harvesting Complex II Supercomplex Reveal That Light-Harvesting Complex II Loosely Bound
to Photosystem II Is a Very Efficient Antenna for Photosystem I in State II. Plant Cell 24, 2963–2978.
Gamez-Arjona, F.M., Raynaud, S., Ragel, P., and Mérida, Á. (2014). Starch synthase 4 is located in the
thylakoid membrane and interacts with plastoglobule-associated proteins in Arabidopsis. Plant J. 80,
305–316.
Garab, G., Lohner, K., Laggner, P., and Farkas, T. (2000). Self-regulation of the lipid content of
membranes by non-bilayer lipids: A hypothesis. Trends Plant Sci. 5, 489–494.
Ghosh, R., Gilda, J.E., and Gomes, A. V (2014). Accuracy of Western Blots. Expert Rev. Proteomics
11, 549–560.
Giacomelli, L., Rudella, A., and Wijk, K.J. Van (2006). High Light Response of the Thylakoid

139
Proteome in Arabidopsis Wild Type and the Ascorbate-Deficient Mutant vtc2-2. A Comparative
Proteomics Study. Plant Physiol. 141, 685–701.
Gjindali, A., Herrmann, H.A., Schwartz, J.M., Johnson, G.N., and Calzadilla, P.I. (2021). A Holistic
Approach to Study Photosynthetic Acclimation Responses of Plants to Fluctuating Light. Front. Plant
Sci. 12, 1–20.
Gomez, S.M., Nishio, J.N., Faull, K.F., and Whitelegge, J.P. (2002). The Chloroplast Grana Proteome
Defined by Intact Mass Measurements from Liquid Chromatography Mass Spectrometry. Mol. Cell.
Proteomics 1, 46–59.
Goral, T.K., Johnson, M.P., Brain, A.P.R., Kirchhoff, H., Ruban, A. V, and Mullineaux, C.W. (2010).
Visualizing the mobility and distribution of chlorophyll proteins in higher plant thylakoid membranes:
effects of photoinhibition and protein phosphorylation. Plant J. 62, 948–959.
Goss, T., and Hanke, G. (2014). The End of the Line: Can Ferredoxin and Ferredoxin NADP(H)
Oxidoreductase Determine the Fate of Photosynthetic Electrons? Curr. Protein Pept. Sci. 15, 385–393.
Gray, G.R., Savitch, L. V., Ivanov, A.G., and Huner, N.P.A. (1996). Photosystem II excitation pressure
and development of resistance to photoinhibition: II. Adjustment of photosynthetic capacity in winter
wheat and winter rye. Plant Physiol. 110, 61–71.
Grieco, M., Tikkanen, M., Paakkarinen, V., Kangasjarvi, S., and Aro, E.-M. (2012). Steady-state
phosphorylation of light-harvesting complex II proteins preserves Photosystem I under fluctuating
white light. Plant Physiol. 160, 1896–1910.
Hahn, A., Vonck, J., Mills, D.J., Meier, T., and Kuhlbrandt, W. (2018). Structure, mechanism, and
regulation of the chloroplast ATP synthase. Science (80-. ). 360, 1–8.
Hajirezaei, M.R., Peisker, M., Tschiersch, H., Palatnik, J.F., Valle, E.M., Carrillo, N., and Sonnewald,
U. (2002). Small changes in the activity of chloroplastic NADP+-dependent ferredoxin oxidoreductase
lead to impaired plant growth and restrict photosynthetic activity of transgenic tobacco plants. Plant J.
29, 281–293.
Hansson, M., and Vener, A. V (2003). Identification of Three Previously Unknown in Vivo Protein
Phosphorylation Sites in Thylakoid Membranes of Arabidopsis thaliana. Mol. Cell. Proteomics 2, 550–
559.
Hansson, M., Dupuis, T., Strömquist, R., Andersson, B., Vener, A. V., and Carlberg, I. (2007). The
mobile thylakoid phosphoprotein TSP9 interacts with the light-harvesting complex II and the
peripheries of both photosystems. J. Biol. Chem. 282, 16214–16222.
Haußuhl, K., Andersson, B., and Adamska, I. (2001). A chloroplast DegP2 protease performs the

140
primary cleavage of the photodamaged D1 protein in plant photosystem II. EMBO J. 20, 713–722.
Hepworth, C., Wood, W.H.J., Emrich-Mills, T.Z., Proctor, M.S., Casson, S., and Johnson, M.P. (2021).
Dynamic thylakoid stacking and state transitions work synergistically to avoid acceptor-side limitation
of photosystem I. Nat. Plants 7, 87–98.
Herbstova, M., Tietz, S., Kinzel, C., Turkina, M. V., and Kirchhoff, H. (2012). Architectural switch in
plant photosynthetic membranes induced by light stress. Proc. Natl. Acad. Sci. 109, 20130–20135.
Hertle, A.P., Blunder, T., Wunder, T., Pesaresi, P., Pribil, M., Armbruster, U., and Leister, D. (2013).
PGRL1 Is the Elusive Ferredoxin-Plastoquinone Reductase in Photosynthetic Cyclic Electron Flow.
Mol. Cell 49, 511–523.
Hey, D., and Grimm, B. (2018). ONE-HELIX PROTEIN2 (OHP2) is required for the stability of OHP1
and assembly factor HCF244 and is functionally linked to PSII biogenesis. Plant Physiol. 177, 1453–
1472.
Hooper, C.M., Castleden, I.R., Tanz, S.K., Aryamanesh, N., and Millar, A.H. (2017). SUBA4: The
interactive data analysis centre for Arabidopsis subcellular protein locations. Nucleic Acids Res. 45,
D1064–D1074.
Hubbart, S., Smillie, I.R.A., Heatley, M., Swarup, R., Foo, C.C., Zhao, L., and Murchie, E.H. (2018).
Enhanced thylakoid photoprotection can increase yield and canopy radiation use efficiency in rice.
Commun. Biol. 1, 1–12.
Huner, N.P.A., Maxwell, D.P., Gray, G.R., Savitch, L. V., Kroi, M., Ivanov, A.G., and Falk, S. (1996).
Sensing environmental temperature change through imbalances between energy supply and energy
consumption: Redox state of photosystem II. Physiol. Plant. 98, 358–364.
Hutin, C., Nussaume, L., Moise, N., Moya, I., Kloppstech, K., and Havaux, M. (2003). Early light-
induced proteins protect Arabidopsis from photooxidative stress. Proc. Natl. Acad. Sci. U. S. A. 100,
4921–4926.
Ingelsson, B., and Vener, A. V (2012). Phosphoproteomics of Arabidopsis chloroplasts reveals
involvement of the STN7 kinase in phosphorylation of nucleoid protein pTAC16. FEBS Lett. 586,
1265–1271.
Ishihara, S., Takabayashi, A., Ido, K., Endo, T., Ifuku, K., and Sato, F. (2007). Distinct Functions for
the Two PsbP-Like Proteins PPL1 and PPL2 in the Chloroplast Thylakoid Lumen of Arabidopsis. Plant
Physiol. 145, 668–679.
Itzhaki, H., Naveh, L., Lindahl, M., Cook, M., and Adam, Z. (1998). Identification and Characterization
of DegP, a Serine Protease Associated with the Luminal Side of the Thylakoid Membrane. J. Biol.

141
Chem. 273, 7094–7098.
Jahns, P., Graf, M., Munekage, Y., and Shikanai, T. (2002). Single point mutation in the Rieske iron-
sulfur subunit of cytochrome b6/f leads to an altered pH dependence of plastoquinol oxidation in
Arabidopsis. FEBS Lett. 519, 99–102.
Järvi, S., Suorsa, M., and Aro, E.M. (2015). Photosystem II repair in plant chloroplasts - Regulation,
assisting proteins and shared components with photosystem II biogenesis. Biochim. Biophys. Acta -
Bioenerg. 1847, 900–909.
Jin, H., Liu, B., Luo, L., Feng, D., Wang, P., Liu, J., Da, Q., He, Y., Qi, K., Wang, J., et al. (2014).
HYPERSENSITIVE TO HIGH LIGHT1 Interacts with LOW QUANTUM YIELD OF
PHOTOSYSTEM II1 and Functions in Protection of Photosystem II from Photodamage in Arabidopsis.
Plant Cell 26, 1213–1229.
Jin, Y., Chen, S., Fan, X., Song, H., Li, X., Xu, J., and Qian, H. (2017). Diuron treatment reveals the
different roles of two cyclic electron transfer pathways in photosystem II in Arabidopsis thaliana.
Pestic. Biochem. Physiol. 137, 15–20.
Johnson, G.N. (2007). Cyclic Electron Transport. Encycl. Life Sci. 1–5.
Johnson, M.P. (2016). An overview of photosynthesis. Essays Biochem. 60, 255–273.
Johnson, M.P., and Wientjes, E. (2020). The relevance of dynamic thylakoid organisation to
photosynthetic regulation. Biochim. Biophys. Acta - Bioenerg. 1861, 148039.
Johnson, M.P., Goral, T.K., Duffy, C.D.P., Brain, A.P.R., Mullineaux, C.W., and Ruban, A. V. (2011).
Photoprotective Energy Dissipation Involves the Reorganization of Photosystem II Light-Harvesting
Complexes in the Grana Membranes of Spinach Chloroplasts. Plant Cell 23, 1468–1479.
Johnson, M.P., Vasilev, C., Olsen, J.D., and Hunter, C.N. (2014). Nanodomains of Cytochrome b6f and
Photosystem II Complexes in Spinach Grana Thylakoid Membranes. Plant Cell 26, 3051–3061.
Joliot, P., and Johnson, G.N. (2011). Regulation of cyclic and linear electron flow in higher plants. Proc.
Natl. Acad. Sci. 108, 13317–13322.
Jurić, S., Hazler-Pilepić, K., Tomašić, A., Lepeduš, H., Jeličić, B., Puthiyaveetil, S., Bionda, T., Vojta,
L., Allen, J.F., Schleiff, E., et al. (2009). Tethering of ferredoxin:NADP+ oxidoreductase to thylakoid
membranes is mediated by novel chloroplast protein TROL. Plant J. 60, 783–794.
Kanervo, E., Suorsa, M., and Aro, E. (2005). Functional flexibility and acclimation of the thylakoid
membrane. Photochem. Photobiol. Sci. 4, 1072–1080.
Kar, U.K., Simonian, M., and Whitelegge, J.P. (2017). Integral membrane proteins: bottom-up, top-

142
down and structural proteomics. Expert Rev. Proteomics 14, 715–723.
Karamoko, M., Cline, S., Redding, K., Ruiz, N., and Hamel, P.P. (2011). Lumen Thiol
Oxidoreductase1, a Disulfide Bond-Forming Catalyst, Is Required for the Assembly of Photosystem II
in Arabidopsis. Plant Cell 23, 4462–4475.
Kern, J., and Renger, G. (2007). Photosystem II: Structure and mechanism of the water:plastoquinone
oxidoreductase. Photosynth. Res. 94, 183–202.
Kieselbach, T., Bystedt, M., Hynds, P., Robinson, C., and Schroder, W.P. (2000). A peroxidase
homologue and novel plastocyanin located by proteomics to the Arabidopsis chloroplast thylakoid
lumen. FEBS Lett. 480, 271–276.
Kirchhoff, H. (2014). Diffusion of molecules and macromolecules in thylakoid membranes. Biochim.
Biophys. Acta - Bioenerg. 495–502.
Kirchhoff, H., Horstmann, S., and Weis, E. (2000). Control of the photosynthetic electron transport by
PQ diffusion microdomains in thylakoids of higher plants. Biochim. Biophys. Acta - Bioenerg. 1459,
148–168.
Kleffmann, T., Russenberger, D., Von Zychlinski, A., Christopher, W., Sjölander, K., Gruissem, W.,
and Baginsky, S. (2004). The Arabidopsis thaliana chloroplast proteome reveals pathway abundance
and novel protein functions. Curr. Biol. 14, 354–362.
Kono, M., Yamori, W., Suzuki, Y., and Terashima, I. (2017). Photoprotection of PSI by far-red light
against the fluctuating light-induced photoinhibition in Arabidopsis thaliana and field-grown plants.
Plant Cell Physiol. 58, 35–45.
Koskela, M.M., Brünje, A., Ivanauskaite, A., Grabsztunowicz, M., Lassowskat, I., Neumann, U., Dinh,
T. V, Sindlinger, J., Schwarzer, D., Wirtz, M., et al. (2018). Chloroplast Acetyltransferase NSI Is
Required for State Transitions in Arabidopsis. Plant Cell 30, 1695–1709.
Koskela, M.M., Brünje, A., Ivanauskaite, A., Lopez, L.S., Schneider, D., Detar, R.A., Henning, H., Iris,
K., and Paula, F. (2020). Comparative analysis of thylakoid protein complexes in state transition
mutants nsi and stn7: focus on PSI and LHCII. Photosynth. Res.
Kouřil, R., Wientjes, E., Bultema, J.B., Croce, R., and Boekema, E.J. (2013). High-light vs. low-light:
Effect of light acclimation on photosystem II composition and organization in Arabidopsis thaliana.
Biochim. Biophys. Acta - Bioenerg. 1827, 411–419.
Kovinich, N., Kayanja, G., Chanoca, A., Riedl, K., Otegui, M.S., and Grotewold, E. (2014). Not all
anthocyanins are born equal: distinct patterns induced by stress in Arabidopsis. Planta 240, 931–940.
Kowalewska, Ł., Suski, S., Garstka, M., and Mostowska, A. (2016). Three-Dimensional Visualization

143
of the Tubular-Lamellar Transformation of the Internal Plastid Membrane Network during Runner Bean
Chloroplast Biogenesis. Plant Cell 28, 875–891.
Kowalewska, Ł., Bykowski, M., and Mostowska, A. (2019). Spatial organization of thylakoid network
in higher plants. Bot. Lett. 166, 326–343.
Kramer, D.M., and Evans, J.R. (2011). The Importance of Energy Balance in Improving Photosynthetic
Productivity. Plant Physiol. 155, 70–78.
Kromdijk, J., Glowacka, K., Leonelli, L., Gabilly, S.T., Iwai, M., Niyogi, K.K., and Long, S.P. (2016).
Improving photosynthesis and crop productivity by accelerating recovery from photoprotection.
Science. 354, 857–862.
Külheim, C., Ågren, J., and Jansson, S. (2002). Rapid regulation of light harvesting and plant fitness in
the field. Science. 297, 91–93.
Kyle, D.J., Staehelin, L.A., and Arntzen, C.J. (1983). Lateral Mobility of the Light-Harvesting Complex
in Chloroplast Membranes Controls Excitation Energy Distribution in Higher Plants. Arch. Biochem.
Biophys. 222, 527–541.
Laganowsky, A., Gómez, S.M., Whitelegge, J.P., and Nishio, J.N. (2009). Hydroponics on a chip:
Analysis of the Fe deficient Arabidopsis thylakoid membrane proteome. J. Proteomics 72, 397–415.
Leoni, C., Pietrzykowska, M., Kiss, A.Z., Suorsa, M., Ceci, L.R., and Aro, E. (2013). Very rapid
phosphorylation kinetics suggest a unique role for Lhcb2 during state transitions in Arabidopsis. 236–
246.
Li, Y., Liu, B., Zhang, J., Kong, F., Zhang, L., Meng, H., Li, W., Rochaix, J.D., Li, D., and Peng, L.
(2019). OHP1, OHP2, and HCF244 form a transient functional complex with the photosystem II
reaction center. Plant Physiol. 179, 195–208.
Li, Z., Wakao, S., Fischer, B.B., and Niyogi, K.K. (2009). Sensing and Responding to Excess Light.
Annu. Rev. Plant Biol. 60, 239–260.
Lin, Y., Huo, L., Liu, Z., Li, J., Liu, Y., He, Q., Wang, X., and Liang, S. (2013). Sodium Laurate, a
Novel Protease- and Mass Spectrometry-Compatible Detergent for Mass Spectrometry-Based
Membrane Proteomics. PLoS One 8.
Liu, J., and Last, R.L. (2017). A chloroplast thylakoid lumen protein is required for proper
photosynthetic acclimation of plants under fluctuating light environments. Proc. Natl. Acad. Sci. U. S.
A. 114, E8110–E8117.
Liu, C., Willmund, F., Whitelegge, J.P., Hawat, S., Knapp, B., Lodha, M., and Schroda, M. (2005). J-
Domain Protein CDJ2 and HSP70B Are a Plastidic Chaperone Pair That Interacts with Vesicle-

144
Inducing Protein in Plastids 1. Mol. Biol. Cell 16, 1165.
Liu, W., Tu, W., Liu, Y., Sun, R., Liu, C., and Yang, C. (2016). The N-terminal domain of Lhcb proteins
is critical for recognition of the LHCII kinase. BBA - Bioenerg. 1857, 79–88.
Liu, X., Zhou, Y., Xiao, J., and Bao, F. (2018). Effects of chilling on the structure, function and
development of chloroplasts. Front. Plant Sci. 871, 1–10.
Long, T.A., Okegawa, Y., Shikanai, T., Schmidt, G.W., and Covert, S.F. (2008). Conserved role of
PROTON GRADIENT REGULATION 5 in the regulation of PSI cyclic electron transport. Planta 228,
907–918.
Lu, Y., Hall, D.A., and Last, R.L. (2011). A Small Zinc Finger Thylakoid Protein Plays a Role in
Maintenance of Photosystem II in Arabidopsis thaliana. Plant Cell 23, 1861–1875.
Lucinski, R., Misztal, L., Samardakiewicz, S., and Jackowski, G. (2011a). Involvement of Deg5
protease in wounding-related disposal of PsbF apoprotein. Plant Physiol. Biochem. 49, 311–320.
Lucinski, R., Misztal, L., Samardakiewicz, S., and Jackowski, G. (2011b). The thylakoid protease Deg2
is involved in stress-related degradation of the photosystem II light-harvesting protein Lhcb6 in
Arabidopsis thaliana. New Phytol. 192, 74–86.
Lundquist, P.K., Poliakov, A., Bhuiyan, N.H., Zybailov, B., Sun, Q., and Wijk, K.J. Van (2012). The
Functional Network of the Arabidopsis Plastoglobule Proteome Based on Quantitative Proteomics and
Genome-Wide Coexpression Analysis. Plant Physiol. 158, 1172–1192.
Lundquist, P.K., Poliakov, A., Giacomelli, L., Friso, G., Appel, M., Mcquinn, R.P., Krasnoff, S.B.,
Rowland, E., Ponnala, L., Sun, Q., et al. (2013). Loss of Plastoglobule Kinases ABC1K1 and ABC1K3
Causes Conditional Degreening, Modified Prenyl-Lipids, and Recruitment of the Jasmonic Acid
Pathway. Plant Cell 25, 1818–1839.
Malmberg, R.L., Held, S., Waits, A., and Mauricio, R. (2005). Epistasis for fitness-related quantitative
traits in Arabidopsis thaliana grown in the field and in the greenhouse. Genetics 171, 2013–2027.
Malnoë, A., Schultink, A., Shahrasbi, S., Rumeau, D., Havaux, M., and Niyogi, K.K. (2018). The
Plastid Lipocalin LCNP Is Required for Sustained Photoprotective Energy Dissipation in Arabidopsis.
Plant Cell 30, 196–208.
Malone, L.A., Qian, P., Mayneord, G.E., Hitchcock, A., Farmer, D.A., Thompson, R.F., Swainsbury,
D.J.K., Ranson, N.A., Hunter, C.N., and Johnson, M.P. (2019). Cryo-EM structure of the spinach
cytochrome b6f complex at 3.6 Å resolution. Nature 575, 535–542.
Malone, L.A., Proctor, M.S., Hitchcock, A., Hunter, C.N., and Johnson, M.P. (2021). Cytochrome b6f
– Orchestrator of photosynthetic electron transfer. Biochim. Biophys. Acta - Bioenerg. 1862, 148380.

145
Mann, C.C. (1999). Genetic Engineers Aim to Soup Up Crop Photosynthesis. Science. 283, 314–316.
Martin, W., Goremykin, V., and Hansmann, S. (1998). Gene transfer to the nucleus and the evolution
of chloroplasts. 393, 162–165.
Martinis, J., Glauser, G., Valimareanu, S., Stettler, M., Zeeman, S.C., and Yamamoto, H. (2014).
ABC1K1/PGR6 kinase: a regulatory link between photosynthetic activity and chloroplast metabolism.
Plant J. 77, 269–283.
Matsubara, S., and Chow, W.S. (2004). Populations of photoinactivated photosystem II reaction centers
characterized by chlorophyll a fluorescence lifetime in vivo. Proc. Natl. Acad. Sci. 101, 18234–18239.
Mazor, Y., Borovikova, A., and Nelson, N. (2015). The structure of plant photosystem I super-complex
at 2.8 Å resolution. Elife 4, 1–18.
McFadden, G.I., and Van Dooren, G.G. (2004). Evolution: Red algal genome affirms a common origin
of all plastids. Curr. Biol. 14, 514–516.
McKenzie, S.D., Ibrahim, I.M., Aryal, U.K., and Puthiyaveetil, S. (2020). Stoichiometry of protein
complexes in plant photosynthetic membranes. Biochim. Biophys. Acta - Bioenerg. 1861, 148141.
Melis, A. (1991). Dynamics of photosynthetic membrane composition and function. BBA - Bioenerg.
1058, 87–106.
Michel, H., Griffin, P.R., Shabanowitz, J., Hunt, D.F., and Bennett, J. (1991). Tandem mass
spectrometry identifies sites of three post-translational modifications of spinach light-harvesting
chlorophyll protein II: Proteolytic cleavage, acetylation, and phosphorylation. J. Biol. Chem. 266,
17584–17591.
Miller, M.A.E., O’Cualain, R., Selley, J., Knight, D., Karim, M.F., Hubbard, S.J., and Johnson, G.N.
(2017). Dynamic Acclimation to High Light in Arabidopsis thaliana Involves Widespread
Reengineering of the Leaf Proteome. Front. Plant Sci. 8, 1–15.
Mishra, Y., Johansson Jänkänpää, H., Kiss, A.Z., Funk, C., Schröder, W.P., and Jansson, S. (2012).
Arabidopsis plants grown in the field and climate chambers significantly differ in leaf morphology and
photosystem components. BMC Plant Biol. 12, 6.
Miyake, C. (2010). Alternative Electron Flows (Water–Water Cycle and Cyclic Electron Flow Around
PSI) in Photosynthesis: Molecular Mechanisms and Physiological Functions. Plant Cell Physiol. 51,
1951–1963.
Moore, S.M., Hess, S.M., and Jorgenson, J.W. (2016). Extraction, Enrichment, Solubilization, and
Digestion Techniques for Membrane Proteomics. J. Proteome Res. 15, 1243–1252.

146
Munekage, Y., Hojo, M., Endo, T., Tasaka, M., and Shikanai, T. (2002). PGR5 Is Involved in Cyclic
Electron Flow around Photosystem I and Is Essential for Photoprotection in Arabidopsis. Cell 110, 361–
371.
Munekage, Y., Hashimoto, M., Miyake, C., Tomizawa, K.-I., Endo, T., Tasaka, M., and Shikanai, T.
(2004). Cyclic electron flow around photosystem I is essential for photosynthesis. Nature 579–582,
361–371.
Murchie, E.H., and Horton, P. (1997). Acclimation of photosynthesis to irradiance and spectral quality
in British plant species: Chlorophyll content, photosynthetic capacity and habitat preference. Plant, Cell
Environ. 20, 438–448.
Murchie, E.H., and Ruban, A. V. (2020). Dynamic non-photochemical quenching in plants: from
molecular mechanism to productivity. Plant J. 101, 885–896.
Myouga, F., Takahashi, K., Tanaka, R., Nagata, N., Kiss, A.Z., Funk, C., Nomura, Y., Nakagami, H.,
Jansson, S., and Shinozaki, K. (2018). Stable accumulation of photosystem II requires ONE-HELIX
PROTEIN1 (OHP1) of the light harvesting-like family. Plant Physiol. 176, 2277–2291.
Nacir, H., and Bréhélin, C. (2013). When proteomics reveals unsuspected roles: the plastoglobule
example. Front. Plant Sci. 4, 1–8.
Nandha, B., Finazzi, G., Joliot, P., Hald, S., and Johnson, G.N. (2007). The role of PGR5 in the redox
poising of photosynthetic electron transport. BBA 1767, 1252–1259.
Nath, K., Jajoo, A., Sharma, R., Timilsina, R., Shin, Y., Aro, E., Gil, H., and Lee, C. (2013). Towards
a critical understanding of the photosystem II repair mechanism and its regulation during stress
conditions. FEBS Lett. 587, 3372–3381.
Nawrocki, W.J., Bailleul, B., Picot, D., Cardol, P., Rappaport, F., Wollman, F.A., and Joliot, P. (2019).
The mechanism of cyclic electron flow. Biochim. Biophys. Acta - Bioenerg. 1860, 433–438.
Nelson, C.J., Alexova, R., Jacoby, R.P., and Harvey Millar, A. (2014). Proteins with high turnover rate
in barley leaves estimated by proteome analysis combined with in planta isotope labeling. Plant Physiol.
166, 91–108.
Niedermaier, S., Schneider, T., Bahl, M.O., Matsubara, S., and Huesgen, P.F. (2020). Photoprotective
Acclimation of the Arabidopsis thaliana Leaf Proteome to Fluctuating Light. Front. Genet. 11, 1–15.
Norén, H., Svensson, P., Stegmark, R., Funk, C., Adamska, I., and Andersson, B. (2003). Expression
of the early light-induced protein but not the PsbS protein is influenced by low temperature and depends
on the developmental stage of the plant in field-grown pea cultivars. Plant, Cell Environ. 26, 245–253.
Okegawa, Y., Long, T.A., Iwano, M., Takayama, S., Kobayashi, Y., Covert, S.F., and Shikanai, T.

147
(2007). A Balanced PGR5 Level is Required for Chloroplast Development and Optimum Operation of
Cyclic Electron Transport Around Photosystem I. Plant Cell Physiol. 48, 1462–1471.
Van Oudenhove, L., and Devreese, B. (2013). A review on recent developments in mass spectrometry
instrumentation and quantitative tools advancing bacterial proteomics. Appl. Microbiol. Biotechnol. 97,
4749–4762.
Pagliano, C., Nield, J., Marsano, F., Pape, T., Barera, S., Saracco, G., and Barber, J. (2014). Proteomic
characterization and three-dimensional electron microscopy study of PSII-LHCII supercomplexes from
higher plants. Biochim. Biophys. Acta - Bioenerg. 1837, 1454–1462.
Pan, X., Ma, J., Su, X., Cao, P., Chang, W., Liu, Z., Zhang, X., and Li, M. (2018). Structure of the
maize photosystem I supercomplex with light-harvesting complexes I and II. Science (80-. ). 360, 1109–
1113.
Pandey, A., Andersen, J.S., and Mann, M. (2000). Use of Mass Spectrometry to Study Signaling
Pathways. Sci. Signal. 2000, 1–12.
Peltier, J.-B., Emanuelsson, O., Kalume, D.E., Ytterberg, A.J., Friso, G., Rudella, A., Liberles, D.A.,
Soderberg, L., Roepstorff, P., von Heijne, G., et al. (2002). Central Functions of the Lumenal and
Peripheral Thylakoid Proteome of Arabidopsis Determined by Experimentation and Genome-Wide
Prediction. Plant Cell 14, 211–236.
Peltier, J.-B., Ytterberg, A.J., Sun, Q., and Wijk, K.J. Van (2004). New Functions of the Thylakoid
Membrane Proteome of Arabidopsis thaliana Revealed by a Simple, Fast, and Versatile Fractionation
Strategy. J. Biol. Chem. 279, 49367–49383.
Peltier, J., Cai, Y., Sun, Q., Zabrouskov, V., Giacomelli, L., Rudella, A., Ytterberg, A.J., Rutschow, H.,
and Wijk, K.J. Van (2006). The Oligomeric Stromal Proteome of Arabidopsis thaliana Chloroplasts.
114–133.
Peng, L., Ma, J., Chi, W., Guo, J., Zhu, S., Lu, Q., Lu, C., and Zhang, L. (2006). LOW PSII
ACCUMULATION1 Is Involved in Efficient Assembly of Photosystem II in Arabidopsis thaliana.
Plant Cell 18, 955–969.
Peng, L., Fukao, Y., Fujiwara, M., Takami, T., and Shikanai, T. (2009). Efficient operation of NAD(P)H
dehydrogenase requires supercomplex formation with photosystem I via minor LHCI in Arabidopsis.
Plant Cell 21, 3623–3640.
Perkins, D.N., Pappin, D.J.C., Creasy, D.M., and Cottrell, J.S. (1999). Probability-based protein
identification by searching sequence databases using mass spectrometry data. Electrophoresis 20, 3551–
3567.
148
Pesaresi, P., Hertle, A., Pribil, M., Kleine, T., Wagner, R., Strissel, H., Lhnatowicz, A., Bonardi, V.,
Scharfenberg, M., Schneider, A., et al. (2009a). Arabidopsis STN7 kinase provides a link between short-
and long-term photosynthetic acclimation. Plant Cell 21, 2402–2423.
Pesaresi, P., Scharfenberg, M., Weigel, M., Granlund, I., Schroder, W.P., Finazzi, G., Rappaport, F.,
Masiero, S., Furini, A., Jahns, P., et al. (2009b). Mutants, Overexpressors, and Interactors of
Arabidopsis Plastocyanin Isoforms: Revised Roles of Plastocyanin in Photosynthetic Electron Flow and
Thylakoid Redox State. Mol. Plant 2, 236–248.
Pescheck, F., and Bilger, W. (2019). High impact of seasonal temperature changes on acclimation of
photoprotection and radiation-induced damage in field grown Arabidopsis thaliana. Plant Physiol.
Biochem. 134, 129–136.
Peter, G.F., and Thornber, J.P. (1991). Biochemical Composition and Organization of Higher Plant
Photosystem II Light-harvesting Pigment-Proteins. J. Biol. Chem. 266, 16745–16754.
Petersen, J., Förster, K., Turina, P., and Gräber, P. (2012). Comparison of the H+/ATP ratios of the H+-
ATP synthases from yeast and from chloroplast. Proc. Natl. Acad. Sci. 109, 11150–11155.
Petersen, K., Schöttler, M.A., Karcher, D., Thiele, W., and Bock, R. (2011). Elimination of a group II
intron from a plastid gene causes a mutant phenotype. Nucleic Acids Res. 39, 5181–5192.
Pfannschmidt, T., Nilsson, A., Tullberg, A., Link, G., and Allen, J.F. (1999). Direct transcriptional
control of the chloroplast genes psbA and psaAB adjusts photosynthesis to light energy distribution in
plants. IUBMB Life 48, 271–276.
Pietrzykowska, M., Suorsa, M., Semchonok, D.A., Tikkanen, M., Boekema, E.J., Aro, E.-M., and
Jansson, S. (2014). The Light-Harvesting Chlorophyll a/b Binding Proteins Lhcb1 and Lhcb2 Play
Complementary Roles during State Transitions in Arabidopsis. Plant Cell 26, 3646–3660.
Piller, L.E., Glauser, G., Kessler, F., and Besagni, C. (2014). Role of plastoglobules in metabolite repair
in the tocopherol redox cycle. Front. Plant Sci. 5, 1–10.
Poorter, H., Fiorani, F., Pieruschka, R., Wojciechowski, T., van der Putten, W.H., Kleyer, M., Schurr,
U., and Postma, J. (2016). Pampered inside, pestered outside? Differences and similarities between
plants growing in controlled conditions and in the field. New Phytol. 212, 838–855.
Porra, R.J., Thompson, W.A., and Kriedemann, P.E. (1989). Determination of accurate extinction
coefficients and simultaneous equations for assaying chlorophylls a and b extracted with four different
solvents: verification of the concentration of chlorophyll standards by atomic absorption spectroscopy.
Biochim. Biophys. Acta 975, 384–394.
Pralon, T., Shanmugabalaji, V., Longoni, P., Glauser, G., Ksas, B., Collombat, J., Desmeules, S.,

149
Havaux, M., Finazzi, G., and Kessler, F. (2019). Plastoquinone homoeostasis by Arabidopsis proton
gradient regulation 6 is essential for photosynthetic efficiency. Commun. Biol. 2, 1–11.
Pribil, M., Pesaresi, P., Hertle, A., Barbato, R., and Leister, D. (2010). Role of plastid protein
phosphatase TAP38 in LHCII dephosphorylation and thylakoid electron flow. PLoS Biol. 8.
Pribil, M., Sandoval-ibáñez, O., Xu, W., Sharma, A., Labs, M., Liu, Q., Galgenmuller, C., Schneider,
T., Wessels, M., Matsubara, S., et al. (2018). Fine-Tuning of Photosynthesis Requires CURVATURE
THYLAKOID1-Mediated Thylakoid Plasticity. Plant Physiol. 176, 2351–2364.
Puthiyaveetil, S., Kavanagh, T.A., Cain, P., Sullivan, J.A., Newell, C.A., Gray, J.C., Robinson, C.,
Giezen, M. Van Der, Rogers, M.B., and Allen, J.F. (2008). The ancestral symbiont sensor kinase CSK
links photosynthesis with gene expression in chloroplasts. Proc. Natl. Acad. Sci. 105, 10061–10066.
Puthiyaveetil, S., Tsabari, O., Lowry, T., Lenhert, S., Lewis, R.R., Reich, Z., and Kirchhoff, H. (2014).
Compartmentalization of the protein repair machinery in photosynthetic membranes. Proc. Natl. Acad.
Sci. 111, 15839–15844.
Qin, X., Suga, M., Kuang, T., and Shen, J.R. (2015). Structural basis for energy transfer pathways in
the plant PSI-LHCI supercomplex. Science. 348, 989–995.
Reiland, S., Finazzi, G., Endler, A., Willig, A., Baerenfaller, K., Grossmann, J., Gerrits, B., Rutishauser,
D., Gruissem, W., Rochaix, J.D., et al. (2011). Comparative phosphoproteome profiling reveals a
function of the STN8 kinase in fine-tuning of cyclic electron flow (CEF). Proc. Natl. Acad. Sci. U. S.
A. 108, 12955–12960.
Rintamäki, E., Salonent, M., Suoranta, U.M., Carlberg, I., Andersson, B., and Aro, E.M. (1997).
Phosphorylation of light-harvesting complex II and photosystem II core proteins shows different
irradiance-dependent regulation in vivo. J. Biol. Chem. 272, 30476–30482.
Rintamäki, E., Martinsuo, P., Pursiheimo, S., and Aro, E.M. (2000). Cooperative regulation of light-
harvesting complex II phosphorylation via the plastoquinol and ferredoxin-thioredoxin system in
chloroplasts. Proc. Natl. Acad. Sci. U. S. A. 97, 11644–11649.
Rossini, S., Casazza, A.P., Engelmann, E.C.M., Havaux, M., Jennings, R.C., and Soave, C. (2006).
Suppression of Both ELIP1 and ELIP2 in Arabidopsis Does Not Affect Tolerance to Photoinhibition
and Photooxidative Stress. Plant Physiol. 141, 1264–1273.
Rosso, D., Bode, R., Li, W., Krol, M., Saccon, D., Wang, S., Schillaci, L.A., Rodermel, S.R., Maxwell,
D.P., and Hüner, N.P.A. (2009). Photosynthetic redox imbalance governs leaf sectoring in the
Arabidopsis thaliana variegation mutants immutans, spotty, var1, and var2. Plant Cell 21, 3473–3492.
Ruban, A. V. (2016). Nonphotochemical Chlorophyll Fluorescence Quenching: Mechanism and

150
Effectiveness in Protecting Plants from Photodamage. Plant Physiol. 170, 1903–1916.
Ruban, A. V (2009). Plants in light. Commun. Integr. Biol. 2, 50–55.
Ruban, A. V., and Johnson, M.P. (2009). Dynamics of higher plant photosystem cross-section
associated with state transitions. Photosynth. Res. 99, 173–183.
Ruban, A. V., Johnson, M.P., and Duffy, C.D.P. (2012). The photoprotective molecular switch in the
photosystem II antenna. Biochim. Biophys. Acta - Bioenerg. 1817, 167–181.
Rumberg, B., Reinwald, E., Schröder, H., and Siggel, U. (1968). Correlation between Electron Flow,
Proton Translocation and Phosphorylation in Chloroplasts. Naturwissenschaften 55, 77–79.
Sacharz, J., Giovagnetti, V., Ungerer, P., Mastroianni, G., and Ruban, A. V. (2017). The xanthophyll
cycle affects reversible interactions between PsbS and light-harvesting complex II to control non-
photochemical quenching. Nat. Plants 3, 16225.
Samol, I., Shapiguzov, A., Ingelsson, B., Fucile, G., Crèvecoeur, M., Vener, A. V., Rochaix, J.D., and
Goldschmidt-Clermont, M. (2012). Identification of a photosystem II phosphatase involved in light
acclimation in Arabidopsis. Plant Cell 24, 2596–2609.
Sato, R., Kono, M., Harada, K., Ohta, H., Takaichi, S., and Masuda, S. (2017). Fluctuating-Light-
Acclimation Protein1, conserved in oxygenic phototrophs, regulates H+ homeostasis and non-
photochemical quenching in chloroplasts. Plant Cell Physiol. 58, 1622–1630.
Scheltema, R.A., Hauschild, J.-P., Lange, O., Hornburg, D., Denisov, E., Kuehn, A., Makarov, A.,
Mann, M., Performance, H., Chromatography, L., et al. (2014). The Q Exactive HF, a Benchtop Mass
Spectrometer with a Pre-filter, High Performance Quadrupole and an Ultra-High Field Orbitrap
Analyzer. Mol. Cell. Proteomics 3698–3708.
Schneider, A., Steinberger, I., Strissel, H., Kunz, H.H., Manavski, N., Meurer, J., Burkhard, G.,
Jarzombski, S., Schünemann, D., Geimer, S., et al. (2014). The Arabidopsis Tellurite resistance C
protein together with ALB3 is involved in photosystem II protein synthesis. Plant J. 78, 344–356.
Schönberg, A., Rödiger, A., Mehwald, W., Galonska, J., Christ, G., Helm, S., Thieme, D., Majovsky,
P., Hoehenwarter, W., and Baginsky, S. (2017). Identification of STN7/STN8 kinase targets reveals
connections between electron transport, metabolism and gene expression. Plant J. 90, 1176–1186.
Schöttler, M.A., and Tóth, S.Z. (2014). Photosynthetic complex stoichiometry dynamics in higher
plants: environmental acclimation and photosynthetic flux control. Front. Plant Sci. 5, 188.
Schreiber, U. (1986). Detection of rapid induction kinetics with a new type of high-frequency
modulated chlorophyll fluorometer. Photosynth. Res. 9, 261–272.

151
Schubert, M., Petersson, U.A., Haas, B.J., Funk, C., Schröder, W.P., and Kieselbach, T. (2002).
Proteome map of the chloroplast lumen of Arabidopsis thaliana. J. Biol. Chem. 277, 8354–8365.
Schult, K., Meierhoff, K., Paradies, S., Toller, T., Wolff, P., and Westhoff, P. (2007). The Nuclear-
Encoded Factor HCF173 Is Involved in the Initiation of Translation of the psbA mRNA in Arabidopsis
thaliana. Plant Cell 19, 1329–1346.
Schumann, T., Paul, S., Melzer, M., Dörmann, P., and Jahns, P. (2017). Plant Growth under Natural
Light Conditions Provides Highly Flexible Short-Term Acclimation Properties toward High Light
Stress. Front. Plant Sci. 8, 1–18.
Schwanhäusser, B., Busse, D., Li, N., Dittmar, G., Schuchhardt, J., Wolf, J., Chen, W., and Selbach,
M. (2011). Global quantification of mammalian gene expression control. Nature 473, 337–342.
Seiler, F., Soll, J., and Bölter, B. (2017). Comparative Phenotypical and Molecular Analyses of
Arabidopsis Grown under Fluorescent and LED Light. Plants 6, 24.
Selinski, J., and Scheibe, R. (2019). Malate valves: old shuttles with new perspectives. Plant Biol. 21,
21–30.
Semchuk, N.M., Lushchak, O. V., Falk, J., Krupinska, K., and Lushchak, V.I. (2009). Inactivation of
genes, encoding tocopherol biosynthetic pathway enzymes, results in oxidative stress in outdoor grown
Arabidopsis thaliana. Plant Physiol. Biochem. 47, 384–390.
Shapiguzov, A., Ingelsson, B., Samol, I., Andres, C., Kessler, F., Rochaix, J.-D., Vener, A. V, and
Goldschmidt-Clermont, M. (2010). The PPH1 phosphatase is specifically involved in LHCII
dephosphorylation and state transitions in Arabidopsis. Proc. Natl. Acad. Sci. U. S. A. 107, 4782–4787.
Shapiguzov, A., Chai, X., Fucile, G., Longoni, P., Zhang, L., and Rochaix, J.D. (2016). Activation of
the Stt7/STN7 Kinase through dynamic interactions with the cytochrome b6f complex. Plant Physiol.
171, 82–92.
Sheng, X., Watanabe, A., Li, A., Kim, E., Song, C., Murata, K., Song, D., Minagawa, J., and Liu, Z.
(2019). Structural insight into light harvesting for photosystem II in green algae. Nat. Plants 5, 1320–
1330.
Shikanai, T. (2016). Chloroplast NDH: A different enzyme with a structure similar to that of respiratory
NADH dehydrogenase. Biochim. Biophys. Acta - Bioenerg. 1857, 1015–1022.
Shikanai, T., Munekage, Y., Shimizu, K., Endo, T., and Hashimoto, T. (1999). Identification and
characterization of Arabidopsis mutants with reduced quenching of chlorophyll fluorescence. Plant Cell
Physiol. 40, 1134–1142.
Shimakawa, G., and Miyake, C. (2018). Changing frequency of fluctuating light reveals the molecular

152
mechanism for P700 oxidation in plant leaves. Plant Direct 2, 1–11.
Shuming, Y.I.N., Xuwu, S.U.N., and Lixin, Z. (2008). An Arabidopsis ctpA homologue is involved in
the repair of photosystem II under high light. Chinese Sci. Bull. 53, 1021–1026.
Simkin, A.J., McAusland, L., Lawson, T., and Raines, C.A. (2017). Overexpression of the rieskeFeS
protein increases electron transport rates and biomass yield. Plant Physiol. 175, 134–145.
Simon, L.M., Kotormán, M., Garab, G., and Laczkó, I. (2001). Structure and Activity of α-
Chymotrypsin and Trypsin in Aqueous Organic Media. Biochem. Biophys. Res. Commun. 280, 1367–
1371.
Smith, W.K., Vogelmann, T.C., DeLucia, E.H., Bell, D.T., and Shepherd, K.A. (1997). Leaf Form and
Photosynthesis. Bioscience 47, 785–793.
Somerville, C., and Koornneef, M. (2002). A fortunate choice: the history of Arabidopsis as a model
plant. Nat. Rev. 3, 3–9.
Stirbet, A., Lazár, D., Guo, Y., and Govindjee (2019). Photosynthesis: Basics, History, and Modeling.
Ann. Bot. 1–27.
Strand, D.D., Fisher, N., and Kramer, D.M. (2017). The higher plant plastid NAD(P)H dehydrogenase-
like complex (NDH) is a high efficiency proton pump that increases ATP production by cyclic electron
flow. J. Biol. Chem. 292, 11850–11860.
Strand, D.D., D’Andrea, L., and Bock, R. (2019). The plastid NAD(P)H dehydrogenase-like complex:
Structure, function and evolutionary dynamics. Biochem. J. 476, 2743–2756.
Su, X., Ma, J., Wei, X., Cao, P., Zhu, D., Chang, W., Liu, Z., Zhang, X., and Li, M. (2017). Structure
and assembly mechanism of plant C2S2M2-type PSII-LHCII supercomplex. Science. 357, 815–820.
Suorsa, M. (2015). Cyclic electron flow provides acclimatory plasticity for the photosynthetic
machinery under various environmental conditions and developmental stages. Front. Plant Sci. 6, 1–8.
Suorsa, M., Järvi, S., Grieco, M., Nurmi, M., Pietrzykowska, M., Rantala, M., Kangasjärvi, S.,
Paakkarinen, V., Tikkanen, M., Jansson, S., et al. (2012). PROTON GRADIENT REGULATION5 is
essential for proper acclimation of Arabidopsis photosystem I to naturally and artificially fluctuating
light conditions. Plant Cell 24, 2934–2948.
Suorsa, M., Grieco, M., Järvi, S., Gollan, P.J., Kangasjärvi, S., Tikkanen, M., and Aro, E. (2013). PGR5
ensures photosynthetic control to safeguard photosystem I under fluctuating light conditions. Plant
Signal. Behav. 8, 167–172.
Suorsa, M., Rantala, M., Mamedov, F., Lespinasse, M., Trotta, A., Grieco, M., Vuorio, E., Tikkanen,

153
M., Järvi, S., and Aro, E.M. (2015). Light acclimation involves dynamic re-organization of the pigment-
protein megacomplexes in non-appressed thylakoid domains. Plant J. 84, 360–373.
Swainston, N., Jameson, D., and Carroll, K. (2011). A QconCAT informatics pipeline for the analysis,
visualization and sharing of absolute quantitative proteomics data. Proteomics 11, 329–333.
Swarbreck, D., Wilks, C., Lamesch, P., Berardini, T.Z., Garcia-Hernandez, M., Foerster, H., Li, D.,
Meyer, T., Muller, R., Ploetz, L., et al. (2008). The Arabidopsis Information Resource (TAIR): Gene
structure and function annotation. Nucleic Acids Res. 36, 1009–1014.
Tanaka, A., and Makino, A. (2009). Photosynthetic Research in Plant Science. Plant Cell Physiol. 50,
681–683.
Theis, J., and Schroda, M. (2016). Revisiting the photosystem II repair cycle. Plant Signal. Behav. 11,
1–8.
Thimijan, R.W., and Heins, R.D. (1983). Photometric, Radiometric, and Quantum Light Units of
Measure: A Review of Procedures for Interconversion. HortScience 18, 818–820.
Tikhonov, A.N. (2014). Plant Physiology and Biochemistry The cytochrome b6f complex at the
crossroad of photosynthetic electron transport pathways. Plant Physiol. Biochem. 81, 163–183.
Tikkanen, M., and Aro, E.M. (2014). Integrative regulatory network of plant thylakoid energy
transduction. Trends Plant Sci. 19, 10–17.
Tikkanen, M., Piippo, M., Suorsa, M., Sirpiö, S., Mulo, P., Vainonen, J., Vener, A. V., Allahverdiyeva,
Y., and Aro, E.-M. (2006). State transitions revisited - A buffering system for dynamic low light
acclimation of Arabidopsis. Plant Mol. Biol. 62, 779–793.
Tikkanen, M., Nurmi, M., Kangasjärvi, S., and Aro, E.M. (2008). Core protein phosphorylation
facilitates the repair of photodamaged photosystem II at high light. Biochim. Biophys. Acta - Bioenerg.
1777, 1432–1437.
Tikkanen, M., Grieco, M., Kangasjärvi, S., and Aro, E.-M. (2010). Thylakoid Protein Phosphorylation
in Higher Plant Chloroplasts Optimizes Electron Transfer under Fluctuating Light. Plant Physiol. 152,
723–735.
Tikkanen, M., Mekala, N.R., and Aro, E. (2014). Photosystem II photoinhibition-repair cycle protects
Photosystem I from irreversible damage. BBA - Bioenerg. 1837, 210–215.
Timperio, A.M., Huber, C.G., and Zolla, L. (2004). Separation and identification of the light harvesting
proteins contained in grana and stroma thylakoid membrane fractions. J. Chromatogr. A 1040, 73–81.
Timperio, A.M., D’Amici, G.M., Barta, C., Loreto, F., and Zolla, L. (2007). Proteomics, pigment

154
composition, and organization of thylakoid membranes in iron-deficient spinach leaves. J. Exp. Bot.
58, 3695–3710.
Tomizioli, M., Lazar, C., Brugie, S., Burger, T., Salvi, D., Gatto, L., Moyet, L., Breckels, L.M., Hesse,
A., Lilley, K.S., et al. (2014). Deciphering Thylakoid Sub-compartments using a Mass Spectrometry-
based Approach. Mol. Cell. Proteomics 13, 2147–2167.
Townsend, A.J., Retkute, R., Chinnathambi, K., Randall, J.W.P., Foulkes, J., Carmo-Silva, E., and
Murchie, E.H. (2018). Suboptimal acclimation of photosynthesis to light in wheat Canopies. Plant
Physiol. 176, 1233–1246.
Trinh, M.D.L., Sato, R., and Masuda, S. (2019). Genetic characterization of a flap1 null mutation in
Arabidopsis npq4 and pgr5 plants suggests that the regulatory role of FLAP1 involves the control of
proton homeostasis in chloroplasts. Photosynth. Res. 139, 413–424.
Trotta, A., Bajwa, A.A., Mancini, I., Paakkarinen, V., Pribil, M., and Aro, E.M. (2019). The role of
phosphorylation dynamics of curvature thylakoid 1B in plant thylakoid membranes. Plant Physiol. 181,
1615–1631.
Tyanova, S., Temu, T., Sinitcyn, P., Carlson, A., Hein, M.Y., Geiger, T., Mann, M., and Cox, J. (2016).
The Perseus computational platform for comprehensive analysis of (prote)omics data. Nat. Methods 13,
731–740.
Välikangas, T., Suomi, T., and Elo, L.L. (2018). A systematic evaluation of normalization methods in
quantitative label-free proteomics. Brief. Bioinform. 19, 1–11.
Vener, A. V (2007). Environmentally modulated phosphorylation and dynamics of proteins in
photosynthetic membranes. 1767, 449–457.
Vener, A. V., Van Kan, P.J.M., Rich, P.R., Ohad, I., and Andersson, B. (1997). Plastoquinol at the
quinol oxidation site of reduced cytochrome bf mediates signal transduction between light and protein
phosphorylation: Thylakoid protein kinase deactivation by a single-turnover flash. Proc. Natl. Acad.
Sci. U. S. A. 94, 1585–1590.
Vener, A. V., Rokka, A., Fulgosi, H., Andersson, B., and Hermann, R.G. (1999). A cyclophilin-
regulated PP2A-like protein phosphatase in thylakoid membranes of plant chloroplasts. Biochemistry
38, 14955–14965.
Vener, A. V, Harms, A., Sussman, M.R., and Vierstra, R.D. (2001). Mass Spectrometric Resolution of
Reversible Protein Phosphorylation in Photosynthetic Membranes of Arabidopsis thaliana. J. Biol.
Chem. 276, 6959–6966.
Vialet-Chabrand, S., Matthews, J.S.A., Simkin, A.J., Raines, C.A., and Lawson, T. (2017). Importance

155
of Fluctuations in Light on Plant Photosynthetic Acclimation. Plant Physiol. 173, 2163–2179.
Walters, R.G. (2005). Towards an understanding of photosynthetic acclimation. J. Exp. Bot. 56, 435–
447.
Walters, R.G., and Horton, P. (1994). Acclimation of Arabidopsis thaliana to the light environment:
Changes in composition of the photosynthetic apparatus. Planta 195, 248–256.
Wang, J., Yu, Q., Xiong, H., Wang, J., Chen, S., Yang, Z., and Dai, S.D. (2016a). Proteomic insight
into the response of Arabidopsis chloroplasts to darkness. PLoS One 11, 1–24.
Wang, Y., Ji, K., Shen, S., and Chen, H. (2016b). Probing molecular events associated with early
development of thylakoid membranes by comparative proteomics and low temperature fluorescence. J.
Proteomics 143, 401–415.
Ware, M.A., Belgio, E., and Ruban, A. V. (2015). Photoprotective capacity of non-photochemical
quenching in plants acclimated to different light intensities. Photosynth. Res. 126, 261–274.
Weisz, D.A., Johnson, V.M., Niedzwiedzki, D.M., Shinn, M.K., Liu, H., Klitzke, C.F., Gross, M.L.,
Blankenship, R.E., Lohman, T.M., and Pakrasi, H.B. (2019). A novel chlorophyll protein complex in
the repair cycle of photosystem II. Proc. Natl. Acad. Sci. U. S. A. 116, 21907–21913.
West, K.R., and Wiskich, J.T. (1968). Photosynthetic Control by Isolated Pea Chloroplasts. Biochem.
J. 109, 527–532.
Whitelegge, J.P. (2003). Thylakoid membrane proteomics. Photosynth. Res. 78, 265–277.
Wientjes, E., Van Amerongen, H., and Croce, R. (2013a). Quantum yield of charge separation in
photosystem II: Functional effect of changes in the antenna size upon light acclimation. J. Phys. Chem.
B 117, 11200–11208.
Wientjes, E., Van Amerongen, H., and Croce, R. (2013b). LHCII is an antenna of both photosystems
after long-term acclimation. Biochim. Biophys. Acta - Bioenerg. 1827, 420–426.
Wiese, S., Reidegeld, K.A., Meyer, H.E., and Warscheid, B. (2007). Protein labeling by iTRAQ: A new
tool for quantitative mass spectrometry in proteome research. Proteomics 7, 340–350.
Wituszyńska, W., Gałazka, K., Rusaczonek, A., Vanderauwera, S., Van Breusegem, F., and Karpiński,
S. (2013). Multivariable environmental conditions promote photosynthetic adaptation potential in
Arabidopsis thaliana. J. Plant Physiol. 170, 548–559.
Wood, W.H.J., Mayneord, G.E., Hobbs, J.K., Barnett, S.F.H., Huang, X., MacGregor-Chatwin, C.,
Hunter, C.N., and Johnson, M.P. (2018). Dynamic thylakoid stacking regulates the balance between
linear and cyclic photosynthetic electron transfer. Nat. Plants 4, 116–127.

156
Wood, W.H.J., Barnett, S.F.H., Flannery, S., Hunter, C.N., and Johnson, M.P. (2019). Dynamic
Thylakoid Stacking Is Regulated by LHCII Phosphorylation but Not Its interaction with PSI. Plant
Physiol. 180, 2152–2166.
Wu, X., Oh, M.H., Schwarz, E.M., Larue, C.T., Sivaguru, M., Imai, B.S., Yau, P.M., Ort, D.R., and
Huber, S.C. (2011). Lysine acetylation is a widespread protein modification for diverse proteins in
Arabidopsis. Plant Physiol. 155, 1769–1778.
Yadav, K.N.S., Semchonok, D.A., Nosek, L., Kouřil, R., Fucile, G., Boekema, E.J., and Eichacker, L.A.
(2017). Supercomplexes of plant photosystem I with cytochrome b6f, light-harvesting complex II and
NDH. Biochim. Biophys. Acta - Bioenerg. 1858, 12–20.
Yamori, W., and Shikanai, T. (2016). Physiological Functions of Cyclic Electron Transport Around
Photosystem I in Sustaining Photosynthesis and Plant Growth. Annu. Rev. Plant Biol. 67, 81–106.
Yamori, W., Shikanai, T., and Makino, A. (2015). Photosystem i cyclic electron flow via chloroplast
NADH dehydrogenase-like complex performs a physiological role for photosynthesis at low light. Sci.
Rep. 5, 1–9.
Yamori, W., Makino, A., and Shikanai, T. (2016). A physiological role of cyclic electron transport
around photosystem I in sustaining photosynthesis under fluctuating light in rice. Sci. Rep. 6, 1–12.
Yin, Z.H., and Johnson, G.N. (2000). Photosynthetic acclimation of higher plants to growth in
fluctuating light environments. Photosynth. Res. 63, 97–107.
Yin, L., Vener, A. V., and Spetea, C. (2015). The membrane proteome of stroma thylakoids from
Arabidopsis thaliana studied by successive in-solution and in-gel digestion. Physiol. Plant. 154, 433–
446.
Yokoyama, R., Yamamoto, H., Kondo, M., Takeda, S., Ifuku, K., Fukao, Y., Kamei, Y., Nishimura,
M., and Shikanai, T. (2016). Grana-Localized Proteins, RIQ1 and RIQ2, Affect the Organization of
Light-Harvesting Complex II and Grana Stacking in Arabidopsis. Plant Cell 28, 2261–2275.
Youssef, A., Laizet, Y., Block, M.A., Maréchal, E., Alcaraz, J., Larson, T.R., Pontier, D., Gaffe, J., and
Kuntz, M. (2010). Plant lipid-associated fibrillin proteins condition jasmonate production under
photosynthetic stress. Plant J. 61, 436–445.
Zancani, M., Braidot, E., Filippi, A., and Lippe, G. (2020). Mitochondrion Structural and functional
properties of plant mitochondrial F-ATP synthase. Mitochondrion 53, 178–193.
Zhang, N., Chen, R., Young, N., Wishart, D., Winter, P., Weiner, J.H., and Li, L. (2007). Comparison
of SDS- and methanol-assisted protein solubilization and digestion methods for Escherichia coli
membrane proteome analysis by 2-D LC-MS/MS. Proteomics 7, 484–493.

157
Zhang, Y., Wen, Z., Washburn, M.P., and Florens, L. (2015). Improving label-free quantitative
proteomics strategies by distributing shared peptides and stabilizing variance. Anal. Chem. 87, 4749–
4756.
Zhao, L., Cong, X., Zhai, L., Hu, H., Xu, J.Y., Zhao, W., Zhu, M., Tan, M., and Ye, B.C. (2020a).
Comparative evaluation of label-free quantification strategies. J. Proteomics 215, 103669.
Zhao, Y., Yu, H., Zhou, J.M., Smith, S.M., and Li, J. (2020b). Malate Circulation: Linking Chloroplast
Metabolism to Mitochondrial ROS. Trends Plant Sci. 25, 446–454.
Zienkiewicz, M., Ferenc, A., Wasilewska, W., and Romanowska, E. (2012). High light stimulates
Deg1-dependent cleavage of the minor LHCII antenna proteins CP26 and CP29 and the PsbS protein
in Arabidopsis thaliana. Planta 235, 279–288.
Zybailov, B., Rutschow, H., Friso, G., Rudella, A., Emanuelsson, O., Sun, Q., and van Wijk, K.J.
(2008). Sorting signals, N-terminal modifications and abundance of the chloroplast proteome. PLoS
One 3, 1–19.

158
Appendices
Table 12: Relative abundance of thylakoid-associated proteins in acclimation. Details of the 401 MS-quantified thylakoid proteins from Arabidopsis plants acclimated to LL, ML and HL, including
functional category, protein/gene name, description, UniProtKB identifier, TAIR ID and abundance ratios. Proteins with altered abundance in different light irradiances were identified by a
modified one-way ANOVA (q < 0.05). Significant proteins were subjected to further statistical analysis to determine significant changes between light conditions by a modified Welch’s t-test (q
< 0.05). Median protein iBAQ values for each light condition were used for the calculation of ratios in ML versus LL, HL versus ML, and HL versus LL.
Category Protein/
gene name
Description UniProtKB accession
TAIR ID ANOVA
Sig. ANOVA q-value
ML vs LL HL vs ML HL vs LL
Ratio Sig. q-value Ratio Sig. q-value Ratio Sig. q-value
Assembly At4g28740 LOW PSII ACCUMULATION-like protein F4JM22 At4g28740 + 0 1.89 + 0.00425714 1.47 + 0.0138269 2.77 + 0.00190354
Assembly At5g48790 LOW PSII ACCUMULATION protein Q94F50;Q9FKB7
AT5G48790 + 0.000548246 2.45 + 0.0146449 1.23 + 0.521021 3.02 0.0037861
Assembly CCB1 Protein COFACTOR ASSEMBLY OF COMPLEX C SUBUNIT B CCB1
Q9LSE4 AT3G26710 + 0 1.73 + 0.00211236 1.74 + 0.00124771 3.01 + 0.00048
Assembly CCB2 Protein COFACTOR ASSEMBLY OF COMPLEX C SUBUNIT B CCB2
Q9FJ81 At5g52110 0.144816 0.94 1.05 0.99
Assembly CCS1 Cytochrome c biogenesis protein CCS1 Q9XIA4 AT1G49380 + 0.00100103 1.70 + 0.00616034 0.92 + 0.8618 1.57 0.00757212
Assembly DAC AT3g17930/MEB5_15 Q94BY7 At3g17930 0.18787 1.35 0.61 0.82
Assembly FFC Signal recognition particle 54 kDa protein P37107 AT5G03940 + 0 3.68 + 0.0024381 1.51 + 0.0166541 5.57 + 0.00265502
Assembly HCF101 Fe-S cluster assembly factor HCF101 Q6STH5 AT3G24430 + 0 4.82 + 0.00064 1.91 + 0.00754515 9.20 + 0.00155634
Assembly HCF136 Photosystem II stability/assembly factor HCF136 A0A1P8BG37;O82660
AT5G23120 + 3.31492E-05 1.15 + 0.0176034 1.21 + 0.012017 1.39 + 0.00279595
Assembly HCF164 Thioredoxin-like protein HCF164 O23166 AT4G37200 + 0 0.22 + 0.00217822 0.48 + 0.16094 0.10 0
Assembly HCF244 NAD(P)-binding Rossmann-fold superfamily protein O65502 AT4G35250 + 0.000228723 1.08 + 0.0328889 1.34 + 0.0111622 1.44 + 0.00330579
Assembly LPA2 Protein LOW PSII ACCUMULATION 2 F4KDA6 At5g51545 + 0 0.33 + 0.00138365 0.66 + 0.0620043 0.22 0.00067080
7
Assembly LPA3 Protein LOW PSII ACCUMULATION 3 Q8H0W0 AT1G73060 + 0 2.00 + 0.00714911 1.18 + 0.0416115 2.37 + 0.00058064
5
Assembly MPH2 Thylakoid lumenal 16.5 kDa protein A0A1P8B5G9;A0A1P8B5H3;O22773
AT4G02530 + 0 1.74 + 0 0.84 + 0.00568935 1.47 + 0.00167851
Assembly PPD1 PsbP domain-containing protein 1 O23403 AT4G15510 + 0 5.16 + 0 1.35 + 0.00083018
9 6.96 + 0
Assembly SECE1 Preprotein translocase subunit SECE1 O23342 AT4G14870 + 0.00276625 1.37 + 0.0145155 1.00 + 0.874498 1.38 0.00556074
Assembly Y3IP1 Ycf3-interacting protein 1 Q9LU01 AT5G44650 + 0.00058661 1.77 + 0.0135187 1.12 + 0.442039 1.98 0.00492193
Assembly YCF4 Photosystem I assembly protein Ycf4 P56788 ATCG00520 + 0 1.48 + 0.00277778 1.35 + 0.00469691 2.01 + 0.00090756
3
ATP synthase ATPA ATP synthase subunit alpha P56757 ATCG00120 + 0 1.80 + 0.001375 1.07 + 0.12719 1.92 0.00219092
ATP synthase ATPB ATP synthase subunit beta P19366 ATCG00480 + 0 1.51 + 0.00294118 1.17 + 0.0217596 1.76 + 0.00216718

159
ATP synthase ATPC1 ATP synthase gamma chain 1 Q01908 AT4G04640 + 0 1.41 + 0.00679675 1.29 + 0.0120511 1.82 + 0.00074598
1
ATP synthase ATPD ATP synthase subunit delta Q9SSS9 AT4G09650 + 0 1.97 + 0.00207353 1.01 + 0.595902 1.99 0.00190048
ATP synthase ATPE ATP synthase epsilon chain P09468 ATCG00470 + 0 2.01 + 0.00813043 1.21 + 0.355931 2.44 0.00218409
ATP synthase ATPF ATP synthase subunit b P56759 ATCG00130 + 0 1.59 + 0.00289947 1.38 + 0.0246682 2.18 + 0.00307475
ATP synthase ATPH ATP synthase subunit c P56760 ATCG00140 + 0.00752636 95.78 0.0683314 0.78 + 0.58236 75.00 0.00192208
ATP synthase ATPI ATP synthase subunit a P56758 ATCG00150 + 0.014835 0.92 0.781644 1.39 0.0803954 1.28 0.0603482
ATP synthase PDE334 AT4g32260/F10M6_100 Q42139 AT4G32260 + 0.000264591 0.73 + 0.0123134 1.52 + 0 1.11 + 0.0153777
Carbon fixation BCA1 Beta carbonic anhydrase 1 A0A1I9LQB3;P27140
AT3G01500 + 0 2.22 + 0.00066666
7 3.44 + 0 7.64 + 0.00062069
Carbon fixation GAPA2 Glyceraldehyde-3-phosphate dehydrogenase GAPA2 A0A1P8APR6;Q9LPW0;F4HNZ6
AT1G12900 + 0 1.53 0.054043 2.78 + 0 4.25 + 0.0005625
Carbon fixation RBCL Ribulose bisphosphate carboxylase large chain O03042 ATCG00490 + 0 1.60 + 0.00740713 2.97 + 0 4.77 + 0.00057446
8
Carbon fixation RBCS-1A Ribulose bisphosphate carboxylase small chain 1A P10795 AT1G67090 + 0 3.95 + 0.00399038 2.25 + 0 8.91 + 0.00070129
9
Carbon fixation RBCS-2B Ribulose bisphosphate carboxylase small chain B3H5S2;F4KA76;P10797;P10798
AT5G38410 + 0 2.01 + 0.0043653 3.87 + 0 7.76 + 0.00072483
2
Carbon fixation RCA Ribulose bisphosphate carboxylase/oxygenase activase
F4IVZ7;P10896
AT2G39730 + 0 3.65 + 0 3.45 + 0 12.62 + 0.00055958
5
Chloroplast replication
FTSZ1 Cell division protein FtsZ homolog 1 Q42545 AT5G55280 + 0 2.57 + 0.00293834 2.77 + 0 7.12 + 0
Chloroplast replication
FTSZ2-1 Cell division protein FtsZ homolog 2-1 A0A1P8AXD8;O82533
AT2G36250 + 0.000518349 10.34 + 0.0184518 1.02 + 0.596157 10.55 0.00169283
Chloroplast replication
FTSZ2-2 Cell division protein FtsZ homolog 2-2 A0A1I9LSJ8;Q9LXJ0
AT3G52750 + 0 3.18 + 0.00706641 3.18 + 0 10.11 + 0.00054
Chloroplast replication
GC1 Epimerase family protein SDR39U1 homolog A0A1P8B167;Q9SJU9
AT2G21280 + 0 3.93 + 0.0070397 2.33 + 0.0159285 9.16 + 0.00342156
Chlororespiration
PIFI Post-illumination chlorophyll fluorescence increase
B3H4M0;F4J037;F4J034;Q9LVZ5;F4J036
At3g15840 + 0.000970954 1.77 + 0.00418735 0.60 0.0227909 1.06 + 0.85156
Cytochrome b6f PETA Cytochrome f P56771 ATCG00540 + 0.000229947 1.20 + 0.0205413 1.18 + 0.00863422 1.42 + 0.00065322
6
Cytochrome b6f PETB Cytochrome b6 P56773 ATCG00720 + 0 2.54 + 0.0011828 1.25 + 0.0153567 3.18 + 0
Cytochrome b6f PETC Cytochrome b6-f complex subunit 4 P56774 ATCG00730 + 3.27869E-05 1.53 + 0.004 0.97 + 0.508149 1.48 0.00073417
7
Cytochrome b6f PETD Cytochrome b6-f complex iron-sulfur subunit Q9ZR03 AT4G03280 + 0.00964253 0.90 0.741347 1.17 + 0.0206618 1.05 + 0.0446101
DNA/RNA At1g07660 Histone H4 P59259;A8MRV1
AT1G07660 + 0 3.65 + 0.00199293 1.96 + 0.00467148 7.15 + 0.00164007
DNA/RNA At2g21530 SMAD/FHA domain-containing protein Q8GWP4 AT2G21530 + 0 5.28 + 0.0181538 1.55 + 0.0188235 8.21 + 0.00164925
DNA/RNA At2g24420 DNA repair ATPase-like protein Q9ZQ26 AT2G24420 + 0 3.91 + 0.0126 3.08 + 0.00203261 12.07 + 0.00044081
6

160
DNA/RNA At4g02725 Spindle pole body-associated protein Q6DBF6 AT4G02725 + 0.00423041 1.22 + 0.00955184 0.53 0.0382787 0.65 + 0.221794
DNA/RNA CCR1 Glycine-rich RNA-binding protein 8 Q03251 AT4G39260 + 0 2.82 + 0.00259941 2.86 + 0.00182336 8.06 + 0.00077697
8
DNA/RNA CCR2 Glycine-rich RNA-binding protein 7 F4IHK9;Q03250
AT2G21660 + 0 4.91 + 0.00085714
3 1.19 + 0.311099 5.83 0.00239403
DNA/RNA CP29A 29 kDa ribonucleoprotein F4JAF3;Q43349
AT3G53460 + 0.000545852 8.61 + 0.0155762 1.48 + 0.0187371 12.76 + 0.00766427
DNA/RNA CP29B RNA-binding protein CP29B Q9ZUU4 AT2G37220 + 0 2.15 + 0.00130178 1.42 + 0.00129524 3.05 + 0.00092307
7
DNA/RNA CP31A 31 kDa ribonucleoprotein Q04836 AT4G24770 + 0 1.24 0.367297 7.01 + 0 8.67 + 0.00037762
2
DNA/RNA GYRA Probable DNA gyrase subunit A/mitochondrial Q9CAF6 AT3G10690 + 0.000033195 2.90 + 0.0214252 4.77 + 0.00587175 13.83 + 0.00240841
DNA/RNA H2B Histone H2B.9
Q9LZ45;Q9ZUS0;Q9LZT0;Q9FFC0;Q9LQQ4;P40283;O23629;Q9SI96;Q9SF55;Q9LFF6
AT1G07790 + 0 2.66 + 0.00112941 1.98 + 0 5.27 + 0
DNA/RNA IF3-2 Translation initiation factor IF-3 O82234 AT2G24060 + 0 3.98 0.953134 1.78 0.00338767 7.09 + 0.963258
DNA/RNA IF3-4 Translation initiation factor IF-3 F4JQD8;Q94B52
AT4G30690 + 0.00270439 1.83 + 0.0101735 1.84 + 0.0305968 3.38 + 0.00724364
DNA/RNA MFP1 MAR-binding filament-like protein 1 Q9LW85 AT3G16000 + 0.00658867 1.03 0.431332 1.25 + 0.131651 1.29 0.0036875
DNA/RNA PTAC16 Protein PLASTID TRANSCRIPTIONALLY ACTIVE 16 Q9STF2 AT3G46780 + 0.0218533 1.09 0.0915348 0.96 + 0.849131 1.05 0.0408654
DNA/RNA RAT5 Probable histone H2AXb
Q9S9K7;O04848;Q9LD28;O81826;Q9LHQ5;Q9C681;Q9C944;Q9FJE8;Q94F49
AT1G51060 + 0 2.24 + 0.00412933 2.12 + 0 4.77 + 0
DNA/RNA rpoA DNA-directed RNA polymerase subunit alpha P56762 ATCG00740 + 0 3.09 + 0.0013913 2.19 + 0 6.75 + 0
DNA/RNA TUFA Elongation factor Tu P17745 AT4G20360 + 0 3.13 + 0.00097959
2 2.46 + 0.00214536 7.68 + 0.00080798
Electron transfer
LFNR1 Ferredoxin--NADP reductase, leaf isozyme 2 C0Z2A8;Q8W493
AT1G20020 + 0 1.04 0.431486 1.47 + 0 1.53 + 0.00071523
2
Electron transfer
LFNR2 Ferredoxin--NADP reductase, leaf isozyme 1 F4JZ46;Q9FKW6
AT5G66190 + 0 1.31 + 0.012543 1.72 + 0.00101608 2.25 + 0.00060335
2
Electron transfer
NDC1 Alternative NAD(P)H-ubiquinone oxidoreductase C1/mitochondrial
Q8GXR9 AT5G08740 + 0 1.83 + 0.00124675 1.58 + 0.00103607 2.89 + 0
Electron transfer
PC Plastocyanin major isoform P42699 AT1G20340 + 0 0.38 + 0.0024 1.40 + 0.00435229 0.53 + 0.0009
Electron transfer
PGR5 Protein PROTON GRADIENT REGULATION 5 Q9SL05 AT2G05620 + 0.00327831 1.04 0.469274 1.29 + 0.0278794 1.34 + 0.0287396

161
Electron transfer
PGR6 Uncharacterized aarF domain-containing protein kinase At4g31390
A0A1P8B7P6;Q8RWG1
AT4G31390 + 0 2.13 + 0.00195708 2.07 + 0.00426565 4.42 + 0.00161314
Electron transfer
PGRL1A PGR5-like protein 1A A0A2H1ZEN5;Q8H112
AT4G22890 0.0712756 1.10 1.00 1.10
Electron transfer
PGRL1B PGR5-like protein 1B F4JPU9;Q8GYC7
AT4G11960 + 0 0.97 0.904894 2.09 + 0.00279263 2.03 + 0.00164618
Electron transfer
TIC62 Protein TIC 62 Q8H0U5 AT3G18890 + 0 1.13 0.169821 1.73 + 0.00875272 1.96 + 0.00075
Electron transfer
TROL Rhodanese-like domain-containing protein 4 A0A1P8B8J7;Q9M158
AT4G01050 0.190312 1.00 1.08 1.08
Ion channel BASS2 Sodium/pyruvate cotransporter BASS2 Q1EBV7 AT2G26900 + 0 1.91 + 0.0124227 1.85 + 0.00463799 3.54 + 0.00037370
2
Ion channel DIT2-1 Dicarboxylate transporter 2.1 Q9FMF7 AT5G64290 + 0.000562836 1.78 + 0.0149123 6.79 + 0.0284954 12.11 + 0.0134322
Ion channel KEA3 K(+) efflux antiporter 3 Q9M0Z3 At4g04850 + 0.00411742 1.10 0.135338 1.43 + 0.345159 1.58 0.00277586
Ion channel MNJ8.18 LOW protein: ammonium transporter 1-like protein Q93Z11 AT5G37360 + 0.0417981 1.29 0.233213 1.03 0.951605 1.33 0.0546197
Ion channel TIC110 Protein TIC110 Q8LPR9 AT1G06950 + 0 6.86 + 0.00140127 3.38 + 0 23.15 + 0
Kinase/phosphatase
At3g59780 Rhodanese/Cell cycle control phosphatase superfamily protein
F4J9G2 At3g59780 + 0.00264453 1.11 + 0.01023 1.02 + 0.480317 1.13 0.0152551
Kinase/phosphatase
At5g35170 Adenylate kinase 5 F4JYC0;Q8VYL1
AT5G35170 + 0.00042623 1.05 0.841712 1.98 + 0.0153316 2.07 + 0.00469479
Kinase/phosphatase
PGK1 Phosphoglycerate kinase Q9LD57;F4I3L1;P50318
AT1G56190 + 0 2.21 + 0.00419718 2.37 + 0 5.22 + 0.00069669
7
LHCI LHCA1 Chlorophyll a-b binding protein 6 A8MS75;F4JE43;F4JE46;Q01667
AT3G54890 + 0.000299492 0.75 + 0.00375979 0.99 + 0.85363 0.74 0.00179242
LHCI LHCA2 Photosystem I chlorophyll a/b-binding protein 2 Q9SYW8 AT3G61470 + 0.0146161 0.64 0.171294 1.02 0.55719 0.66 0.0596132
LHCI LHCA3 Photosystem I chlorophyll a/b-binding protein 3-1 Q9SY97 AT1G61520 + 0.0496279 0.89 0.479397 0.97 0.521503 0.86 0.133689
LHCI LHCA4 Chlorophyll a-b binding protein 4 P27521 AT3G47470 0.0519547 1.07 0.90 0.96
LHCI LHCA6 Photosystem I chlorophyll a/b-binding protein 6 Q8LCQ4 AT1G19150 0.107135 0.80 1.18 0.94
LHCII LHCB1.1;LHCB1.2;LHCB1.3
Chlorophyll a-b binding protein 1 P04778 AT1G29910 + 0.000936524 1.00 1 0.71 + 0.0111787 0.71 + 0.00249633
LHCII LHCB1.4 Chlorophyll a-b binding protein Q39142 AT2G34430 + 0.00412133 0.90 0.0603084 0.90 + 0.308081 0.82 0.00446231
LHCII LHCB2 Chlorophyll a-b binding protein 2
A0A1I9LMB4;A0A1P8AZ91;Q9S7J7;Q9SHR7;Q9XF87
AT2G05070 + 3.33333E-05 0.91 0.0700303 0.81 + 0.00552014 0.73 + 0.00102326
LHCII LHCB3 Chlorophyll a-b binding protein 3 Q9S7M0 AT5G54270 + 0.0471068 0.92 0.0923777 1.23 0.220176 1.13 1
LHCII LHCB4.1 (CP29.1)
Chlorophyll a-b binding protein CP29.1 Q07473 AT5G01530 + 0.00022842 0.79 + 0.0166331 0.84 + 0.0240475 0.66 + 0.00043373
5
LHCII LHCB4.2 (CP29.2)
Chlorophyll a-b binding protein CP29.2 Q9XF88 AT3G08940 + 0 0.84 + 0.00128655 0.89 + 0 0.75 + 0.00078260
9
LHCII LHCB4.3 (CP29.3)
Chlorophyll a-b binding protein CP29.3 F4IGY6;Q9S7W1
AT2G40100 + 0 59.88 + 0.00493246 3.36 + 0 200.9
0 +
0.000822335

162
LHCII LHCB5 (CP26)
Chlorophyll a-b binding protein CP26 Q9XF89 AT4G10340 + 0 0.58 + 0.00165714 0.96 + 0.409292 0.56 0.00164784
LHCII LHCB6 (CP24)
Chlorophyll a-b binding protein Q9LMQ2 AT1G15820 + 0.00166499 1.04 + 0.0321802 0.87 + 0.0114875 0.90 + 0.0470835
LHC-like Lil3.1 Light-harvesting complex-like protein 3 isotype 1 Q9SYX1 AT4G17600 + 0 1.45 + 0.00435535 1.51 + 0.00255158 2.18 + 0.00085039
4
LHC-like Lil3.2 Light-harvesting complex-like protein 3 isotype 2 Q6NKS4 AT5G47110 + 0.000448075 1.17 + 0.0180533 1.30 + 0.0196655 1.53 + 0.00191276
LHC-like OHP1 High-light-induced protein O81208 AT5G02120 + 0.00323151 1.49 + 0.00709333 0.79 + 0.833783 1.17 0.0329187
LHC-like OHP2 Light-harvesting complex-like protein OHP2 Q9FEC1 AT1G34000 0.0975212 1.06 0.97 1.03
Light harvesting regulation
PSBS Photosystem II 22 kDa protein F4IEG8;Q9XF91
AT1G44575 + 0 1.40 + 0.010764 1.55 + 0.00221189 2.18 + 0.00076065
6
Light harvesting regulation
SOQ1 Protein SUPPRESSOR OF QUENCHING 1 Q8VZ10 AT1G56500 + 0 0.96 0.794043 1.43 + 0.00226455 1.37 + 0.00039130
4
Light harvesting regulation
STN7 Serine/threonine-protein kinase STN7 Q9S713 AT1G68830 + 0.0013885 1.02 0.905568 1.12 + 0.0303242 1.14 + 0.00045762
7
Light harvesting regulation
STN8 Serine/threonine-protein kinase STN8 Q9LZV4 AT5G01920 + 0.00133741 1.04 1 1.23 + 0.00755779 1.27 + 0.00602927
Light harvesting regulation
TAP38 Protein phosphatase 2C 57 P49599 AT4G27800 + 0.0146029 1.09 0.359691 0.68 0.0779103 0.74 0.0586
Light harvesting regulation
TSP9 Thylakoid soluble phosphoprotein Q9SD66 AT3G47070 0.0785744 1.01 0.98 0.99
Light harvesting regulation
VDE1 Violaxanthin de-epoxidase Q39249 AT1G08550 + 0 2.39 + 0.00112245 0.98 + 0.418534 2.35 0.00078260
9
Light harvesting regulation
ZEP Zeaxanthin epoxidase Q9FGC7 AT5G67030 + 0 0.48 + 0.00210448 1.48 + 0.0161818 0.71 + 0.0032967
NDH NDHC NAD(P)H-quinone oxidoreductase subunit 3 P56751 ATCG00440 + 0 3.54 + 0.00765441 0.81 + 0.447727 2.87 0.00063157
9
NDH NDHE NAD(P)H-quinone oxidoreductase subunit 4L P26289 ATCG01070 + 0.00534836 0.81 0.38303 0.89 + 0.0738824 0.72 0.0244846
NDH NDHF NAD(P)H-quinone oxidoreductase subunit 5 P56752 ATCG01010 + 7.57781E-05 2.95 + 0.0042673 0.87 + 0.390894 2.56 0.00085714
3
NDH NDHH NAD(P)H-quinone oxidoreductase subunit H P56753 ATCG01110 + 0.000390129 3.61 + 0.012788 1.23 + 0.766953 4.44 0.00342623
NDH NDHI NAD(P)H-quinone oxidoreductase subunit I P56755 ATCG01090 + 0 1.43 + 0.00167308 1.32 + 0.0335169 1.89 + 0.002526
NDH NDHJ NAD(P)H-quinone oxidoreductase subunit J P56754 ATCG00420 + 0.000546448 1.40 + 0.00963238 1.34 + 0.0524017 1.87 0.00367792
NDH NDHK NAD(P)H-quinone oxidoreductase subunit K P56756 ATCG00430 + 0.000513636 1.25 0.172554 1.33 + 0.0256835 1.67 + 0.00067638
5
NDH NDHM NAD(P)H-quinone oxidoreductase subunit M Q2V2S7 AT4G37925 + 0.00984644 1.53 + 0.0329415 0.85 + 0.962763 1.30 0.0298237
NDH NDHN NAD(P)H-quinone oxidoreductase subunit N Q9LVM2 AT5G58260 + 0 2.19 + 0.00261493 0.93 + 0.99029 2.03 0.000648
NDH NDHO NAD(P)H-quinone oxidoreductase subunit O Q9S829 AT1G74880 + 0 2.35 + 0.00117073 1.26 + 0.00081481
5 2.96 + 0
NDH NDHS NAD(P)H-quinone oxidoreductase subunit S Q9T0A4 AT4G23890 + 0.000525967 0.92 0.989479 2.08 + 0.00822967 1.91 + 0.0030575
NDH NDHT NAD(P)H-quinone oxidoreductase subunit T Q9SMS0 AT4G09350 + 0.0458405 0.89 0.801725 1.58 0.183754 1.41 0.137611
NDH NDHU NAD(P)H-quinone oxidoreductase subunit U Q84VQ4 AT5G21430 + 3.32871E-05 1.66 + 0.00168116 1.23 + 0.0284041 2.05 + 0.0028
NDH PNSB1 Photosynthetic NDH subunit of subcomplex B 1 Q9S9N6 AT1G15980 + 0.000511312 1.12 0.135382 1.23 + 0.0196416 1.38 + 0.00079217
6

163
NDH PNSB2 Photosynthetic NDH subunit of subcomplex B 2 F4I890;F4I891;Q94AQ8
AT1G64770 + 0.0348127 1.15 0.0623793 1.17 0.75782 1.34 0.111569
NDH PNSB3 Photosynthetic NDH subunit of subcomplex B 3 Q9LU21 AT3G16250 + 0.000107817 1.67 + 0.0123847 1.35 + 0.0190465 2.25 + 0.00083505
2
NDH PNSB4 Photosynthetic NDH subunit of subcomplex B 4 A0A1P8AS98;F4ICC6;Q8RXS1
AT1G18730 + 0.0022549 2.03 + 0.0152642 0.69 + 0.19433 1.41 0.028854
NDH PNSB5 Photosynthetic NDH subunit of subcomplex B 5 Q9FG89 AT5G43750 + 0.0315784 0.77 0.171105 1.24 0.126785 0.96 0.900314
NDH PNSL1 Photosynthetic NDH subunit of lumenal location 1 O80634 AT2G39470 + 0.000488479 1.22 + 0.00914286 1.05 + 0.328525 1.29 0.0015536
NDH PNSL2 Photosynthetic NDH subunit of lumenal location 2 Q9XI73 AT1G14150 + 0 2.67 + 0.00164151 1.05 + 0.148598 2.79 0
NDH PNSL3 Photosynthetic NDH subunit of lumenal location 3 Q9SGH4 AT3G01440 + 0.00137652 1.44 + 0.00157466 1.09 + 0.668601 1.56 0.0129725
NDH PNSL4 Photosynthetic NDH subunit of lumenal location 4 F4JW56;Q9SCY3
AT4G39710 + 0 1.58 + 0.00115663 1.17 + 0.062831 1.85 0.00303621
NDH PNSL5 Photosynthetic NDH subunit of lumenal location 5 Q9ASS6 AT5G13120 + 0.0442667 0.74 0.613749 1.31 0.0990709 0.97 0.355345
Other/unknown AAC1 ADP,ATP carrier protein 1 P31167 AT3G08580 + 0 6.58 + 0 2.97 + 0 19.54 + 0
Other/unknown AAC2 ADP,ATP carrier protein 2 P40941 AT5G13490 1 5.38 10.25 55.19
Other/unknown accD Acetyl-coenzyme A carboxylase carboxyl transferase subunit beta
P56765 ATCG00500 + 0 2.32 + 0.00375 2.65 + 0 6.15 + 0.00086631
Other/unknown AOC2 Allene oxide cyclase 2 Q9LS02 AT3G25770 + 0 7.76 + 0.00067132
9 1.01 + 0.652621 7.83 0.00072809
Other/unknown APG3 Peptide chain release factor APG3 Q8RX79 AT3G62910 + 0 3.30 + 0.0101252 2.73 + 0.00185507 9.01 + 0.00045188
3
Other/unknown APXT L-ascorbate peroxidase T A0A1P8APU0;Q42593
AT1G77490 0.067934 1.08 1.05 1.13
Other/unknown At1g24360 3-oxoacyl-[acyl-carrier-protein] reductase P33207 AT1G24360 + 0 10.90 + 0 10.36 + 0 112.9
6 +
0.000415385
Other/unknown At1g33810 Zinc finger/BTB domain protein Q8L9M8 AT1G33810 + 0 11.69 + 0.00883099 2.90 + 0.00440074 33.94 + 0.00166164
Other/unknown At1g52510 Alpha/beta-Hydrolases superfamily protein Q8VZ57;F4ICZ4
AT1G52510 + 0 4.89 + 0.0012973 1.41 + 0 6.88 + 0
Other/unknown At1g54520 Myelin-associated oligodendrocyte basic protein Q8RWI0 At1g54520 + 0.000302177 2.03 + 0.014956 1.44 + 0.0739581 2.93 0.00049315
1
Other/unknown At1g72640 NAD(P)-binding Rossmann-fold superfamily protein
A0A1P8AVW7;F4IDE8;Q6NMC1;A0A1P8AW09
AT1G72640 + 0.000370192 6.10 + 0.0103694 2.04 + 0.0108546 12.43 + 0.00187639
Other/unknown At1g73110 p-loop containing nucleoside triphosphate hydrolases superfamily protein
A0A1P8ATD8;Q9AST9
AT1G73110 + 0.000227213 5.35 + 0.00374026 2.69 + 0.0166332 14.36 + 0.004595
Other/unknown At1g78915 Tetratricopeptide repeat (TPR)-like superfamily protein Q8GWV1;F4IBX4;F4IBX5
AT1G78915 + 0.00271081 1.94 + 0.00947119 1.16 + 0.351733 2.24 0.0182405
Other/unknown At2g05310 Expressed protein Q9SJ31 AT2G05310 + 0.00593657 0.68 + 0.0244265 1.04 + 0.882871 0.71 0.0213909
Other/unknown At2g17972 Transmembrane protein Q8S8K0 AT2G17972 + 0.00164257 1.32 0.0501988 1.26 + 0.12011 1.65 0.0214146
Other/unknown At2g27290 FAM210B-like protein, putative (DUF1279) Q9XIN6 AT2G27290 + 0.00349285 0.42 + 0.00280899 1.24 0.278379 0.52 0.0686667
Other/unknown At2g27680 NAD(P)-linked oxidoreductase superfamily protein Q9ZUX0 AT2G27680 + 0 4.11 + 0.00076190
5 1.66 + 0.00788852 6.84 + 0.00143667

164
Other/unknown At2g41040 Uncharacterized methyltransferase At2g41040 Q0WPT7 AT2G41040 + 0 2.97 + 0.0021283 2.57 + 0.00217259 7.63 + 0.00072
Other/unknown At3g43540 Initiation factor 4F subunit F4IZ56;Q9M236
AT3G43540 + 0 1.97 + 0.00652066 1.81 + 0.00206763 3.58 + 0.00051674
6
Other/unknown At3g61870 Plant/protein F4IX01;Q9M277
AT3G61870 + 0.000854167 1.02 0.720525 1.32 + 0.0159277 1.35 + 0.00250368
Other/unknown At4g28025 Uncharacterized protein At4g28025 F4JKG2;Q9C5F3
AT4G28025 + 0.0054794 1.53 + 0.0477639 1.39 + 0.265525 2.12 0.0047182
Other/unknown At5g08680 ATP synthase subunit beta-2 P83484;P83483;Q9C5A9
AT5G08670 + 0 1.79 + 0.0214821 3.18 + 0.00841762 5.69 + 0.00157857
Other/unknown At5g14910 Heavy metal transport/detoxification superfamily protein
Q93VK7 AT5G14910 + 0 3.27 + 0.00110553 1.67 + 0.0028186 5.45 + 0.00064804
5
Other/unknown At5g51010 Rubredoxin-like superfamily protein Q9FI47 AT5G51010 + 0 0.26 + 0.00069565
2 4.31 0 1.12 + 0.652608
Other/unknown CAC3 Acetyl-coenzyme A carboxylase carboxyl transferase subunit alpha
Q9LD43 AT2G38040 + 0 2.99 + 0.00189262 2.41 + 0 7.19 + 0.00042023
3
Other/unknown CAS Calcium sensing receptor A0A1P8BCX7;Q9FN48
AT5G23060 + 0 1.40 + 0.00168421 1.66 + 0.00448393 2.32 + 0.00064541
8
Other/unknown CHL Chloroplastic lipocalin, AtCHL Q9STS7 AT3G47860 + 0.000509009 0.66 + 0.0036 0.58 + 0.161876 0.38 0.005164
Other/unknown DiT1 Dicarboxylate transporter 1 B3H4S6;Q9LXV3
AT5G12860 + 0 1.57 + 0.00491106 3.27 + 0 5.15 + 0
Other/unknown EMB3003 Dihydrolipoyllysine-residue acetyltransferase component 5 of pyruvate dehydrogenase complex
Q9C8P0 AT1G34430 + 0.0377319 0.74 0.498675 1.61 0.214549 1.20 0.310207
Other/unknown F13A11.2 Inner membrane localized protein Q9C7S3 AT1G42960 + 0.000566486 4.28 + 0.00397129 3.87 + 0.0332262 16.57 + 0.0116536
Other/unknown F16M2_10 AT3g63160/F16M2_10 Q9M1X3 AT3G63160 + 0.0246916 0.89 0.984318 1.31 0.127187 1.16 0.0720168
Other/unknown F1N21.10 Probable lactoylglutathione lyase, chloroplast Q8W593 AT1G67280 + 0 2.46 + 0 1.65 + 0.0086072 4.06 + 0.00085544
6
Other/unknown F24J8.11 F24J8.11 protein Q9LPK9 AT1G21500 + 0.00643494 0.41 0.103184 0.39 + 0.0924256 0.16 0.0430065
Other/unknown F26O13.150
Transmembrane protein Q9SCZ8 AT3G51510 0.0688361 0.77 1.52 1.16
Other/unknown F4P12_170
2,3-bisphosphoglycerate-independent phosphoglycerate mutase
Q9LFH1;F4JAF4
AT3G53470 + 0 1.32 + 0.0193279 1.40 + 0.00975191 1.85 + 0
Other/unknown F6N7.27 Uncharacterized protein PAM68-like Q9LTD9 AT5G52780 + 0.004377 2.87 0.0912511 1.03 + 0.673104 2.97 0.0376466
Other/unknown FAB2 Acyl-[acyl-carrier-protein] desaturase F4IS32;O22832;Q9LF04;Q9M879
AT2G43710 + 0 9.58 + 0.00720309 4.14 + 0 39.68 + 0.00037630
7
Other/unknown FBA1 Fructose-bisphosphate aldolase F4IGL5;F4IGL7;Q9SJU4
AT2G01140 + 0 1.76 + 0.00312632 2.96 + 0 5.20 + 0
Other/unknown FBA2 Fructose-bisphosphate aldolase F4JUJ5;Q944G9
AT4G38970 + 0 2.06 + 0.00096 1.76 + 0.00453818 3.63 + 0.00064929
9
Other/unknown GDCST Aminomethyltransferase A0A2H1ZEA9;O65396
AT1G11860 + 0 13.84 + 0.0036272 3.66 + 0 50.63 + 0.00064088
4
Other/unknown GER3 Germin-like protein subfamily 3 member 3 P94072 AT5G20630 + 0 2.71 + 0.00420706 2.28 + 0.0166751 6.19 + 0.00355435
Other/unknown GLDP1 Glycine dehydrogenase (decarboxylating) 1 Q94B78;B3H5Y8
AT4G33010 + 0 16.49 + 0.00222047 3.18 + 0.00432847 52.39 + 0.00157295

165
Other/unknown GLN2 Glutamine synthetase/mitochondrial Q43127 AT5G35630 + 0 1.17 0.156391 2.21 + 0.00260993 2.58 + 0.00065987
8
Other/unknown GLO1 (S)-2-hydroxy-acid oxidase GLO1 Q2V3V9;Q9LRR9;A8MS37;B3H4B8
AT3G14420 + 0 3.80 + 0.00274608 3.39 + 0.00125153 12.90 + 0.00077512
Other/unknown LOX2 Lipoxygenase 2 P38418;A0A1I9LPH1
AT3G45140 + 0 7.09 + 0.00162712 1.53 + 0 10.86 + 0
Other/unknown LTA2 Dihydrolipoyllysine-residue acetyltransferase component 4 of pyruvate dehydrogenase complex
Q9SQI8 AT3G25860 + 0 1.43 0.225062 1.98 + 0.00126316 2.82 + 0.00081203
Other/unknown LTA3 Dihydrolipoyllysine-residue acetyltransferase component 1 of pyruvate dehydrogenase complex
F4J5T2;Q0WQF7
AT3G52200 + 0 2.39 + 0.00208118 2.58 + 0.0055493 6.18 + 0.00167003
Other/unknown MBB18.5 Alpha/beta-Hydrolases superfamily protein Q9FFW9;F4KBJ3
AT5G38520 + 0.00333906 1.17 + 0.0125122 1.13 + 0.26276 1.32 0.0137904
Other/unknown MJC20.18 Uncharacterized protein At5g42070 Q8RWR9 AT5G42070 + 0 1.71 + 0.0108312 2.77 + 0 4.73 + 0
Other/unknown TL17 Thylakoid lumenal 17.4 kDa protein A0A1P8BAQ0;F4JX83;P81760
AT5G53490 + 0.000560428 0.35 + 0.0211322 0.87 + 0.135101 0.30 0.00806198
Other/unknown MQB2.4 Integral membrane HPP family protein F4K7S5;Q8GZ51
AT5G62720 + 0.0013591 7.79 + 0.00063576
2 1.49 + 0.275996 11.59 0.0287808
Other/unknown MRO11.7 GPI-anchored adhesin-like protein A0A1P8BAU8;Q9FF91
AT5G23890 + 0 14.32 + 0 2.67 + 0.00466306 38.20 + 0.00100763
Other/unknown MTG13.11 Low-density receptor-like protein A8MS48;Q8H0X5
AT5G16660 + 0.00128425 1.43 + 0.0264481 2.48 + 0.0572805 3.54 0.0134629
Other/unknown MVA3.2 Alpha/beta-Hydrolases superfamily protein Q9FN84 AT5G17670 + 0.0132826 5.02 + 0.0214536 0.73 0.516409 3.66 0.0619767
Other/unknown NAGK Acetylglutamate kinase Q9SCL7 AT3G57560 + 0 2.51 + 0.00074418
6 1.45 + 0.00849289 3.65 +
0.000731377
Other/unknown OEP161 Outer envelope pore protein 16-1 Q9ZV24 AT2G28900 + 0.000107962 0.89 0.998102 2.05 + 0.00334118 1.82 + 0.00178654
Other/unknown PLGG1 Plastidal glycolate/glycerate translocator 1 Q9FVQ4 AT1G32080 + 0 5.20 + 0.00187654 2.34 + 0.00216162 12.18 + 0.00073303
2
Other/unknown PLR1 Pyridoxal reductase Q56Y42 AT5G53580 + 0.000301405 2.67 + 0.00569492 0.97 + 0.806618 2.58 0.00372142
Other/unknown PMDH2 Malate dehydrogenase
F4KDZ4;Q9ZP05;A0A1P8BBQ0;A8MRP1;B3H560
AT5G09660 + 0 5.55 + 0.00204484 6.20 + 0.00177778 34.38 + 0.0008
Other/unknown PTAC5 Protein disulfide isomerase pTAC5 A0A1P8B4I3;A1A6M1
AT4G13670 + 0.000371084 1.59 0.0808037 1.85 + 0.0133388 2.93 + 0.00450761
Other/unknown RPI3 Probable ribose-5-phosphate isomerase 3 Q9S726 AT3G04790 + 0 2.15 + 0.00881547 2.40 + 0.00100958 5.16 + 0.00045569
6
Other/unknown STR10 Rhodanese-like domain-containing protein 10 Q9SR92 AT3G08920 + 0.00323773 1.19 + 0.0124037 0.72 0.0157873 0.86 + 0.895821
Other/unknown STR11 Rhodanese-like domain-containing protein 11 Q0WWT7 At4g24750 + 0 1.15 + 0.00213636 1.25 + 0.0153516 1.44 + 0.00245636
Other/unknown STR14 Rhodanese-like domain-containing protein 14 Q94A65 AT4G27700 + 0.000392435 1.37 + 0.0102736 1.10 + 0.0426534 1.50 + 0.00161609
Other/unknown STR4A Rhodanese-like domain-containing protein 4A Q56XR7 AT3G25480 + 0.000378844 1.74 + 0.00109091 1.23 + 0.173032 2.14 0.00517037
Other/unknown STR9 Rhodanese-like domain-containing protein 9 O48529 AT2G42220 + 0.000346299 0.77 + 0.00195156 0.96 + 0.993986 0.74 0.0030661
Other/unknown T10O22.3 Microbial collagenase Q9LM40 AT1G18060 + 0 2.32 + 0 2.21 + 0.0118486 5.13 + 0.0025

166
Other/unknown T4M8.15 Uncharacterized protein At2g03420/T4M8.15 Q9ZQ78 AT2G03420 + 0.000389215 1.63 + 0.00780987 0.80 + 0.0279398 1.30 + 0.00759036
Other/unknown T6G15.50 Transmembrane protein Q9T0H1 AT4G13500 + 0.0304206 0.88 0.0756678 1.21 0.135547 1.06 0.891633
Other/unknown TIC214 Protein TIC 214 P56785 ATCG01130 + 0.000559232 0.03 + 0.0240783 2.84 + 0.016819 0.10 + 0.016528
Other/unknown TIC55 Protein TIC 55 Q9SK50 AT2G24820 + 0 1.94 + 0.00472566 2.84 + 0 5.50 + 0.00065454
5
Other/unknown TL15A Thylakoid lumenal 15 kDa protein 1 O22160 AT2G44920 + 0.0152793 1.58 0.0617851 1.00 + 0.982024 1.58 0.0356757
Other/unknown TL17.9 Thylakoid lumenal 17.9 kDa protein Q9SW33 AT4G24930 + 0.000298734 1.97 + 0.0105455 1.10 + 0.898362 2.17 0.00241203
Other/unknown TL19 Thylakoid lumenal 19 kDa protein P82658 At3g63540 0.05655 1.39 0.80 1.10
Other/unknown TL20.3 Thylakoid lumenal protein TL20.3 A0A178W1Q3;B6EUA5;Q8H1Q1
AT1G12250 + 0.000570806 1.55 + 0.0124932 1.06 + 1 1.65 0.00170154
Other/unknown TPT Triose phosphate/phosphate translocator TPT
A0A219HYB6;A0A219HZH3;A0A219I0W9;Q9ZSR7
AT5G46110 + 0 0.86 0.0972318 2.36 + 0 2.03 + 0
Other/unknown YCF37 Homolog of Synechocystis YCF37 O64835 AT2G23670 + 0 1.03 0.38867 1.24 + 0.00291959 1.28 + 0.00070948
Pigment synthesis
CAO Chlorophyllide a oxygenase Q9MBA1 AT1G44446 + 0.00240313 1.31 + 0.0124552 1.26 0.947679 1.65 0.864886
Pigment synthesis
CHLD Magnesium-chelatase subunit ChlD Q9SJE1 AT1G08520 + 0 8.04 + 0.00417757 3.53 + 0 28.35 + 0
Pigment synthesis
CHLG Chlorophyll synthase Q38833 AT3G51820 + 0.0224486 1.03 0.65232 1.61 0.0603415 1.65 0.222501
Pigment synthesis
CHLH Magnesium-chelatase subunit ChlH A8MR05;Q9FNB0
AT5G13630 + 0 4.11 + 0.00197403 2.11 + 0.0012439 8.68 + 0.00085039
4
Pigment synthesis
CHLI1 Magnesium-chelatase subunit ChlI P16127;Q5XF33
AT4G18480 + 0 3.52 + 0 2.01 + 0 7.07 + 0
Pigment synthesis
CHLM Magnesium protoporphyrin IX methyltransferase A0A1P8B4G1;Q9SW18
AT4G25080 + 0 0.69 + 0.00290698 0.91 + 0.317456 0.63 0.00068644
1
Pigment synthesis
CHLP Geranylgeranyl diphosphate reductase Q9CA67 AT1G74470 + 0 2.16 + 0.00157377 1.29 + 0.00222917 2.79 + 0.00051428
6
Pigment synthesis
CRD1 Magnesium-protoporphyrin IX monomethyl ester [oxidative] cyclase
F4J0U9;Q9M591
AT3G56940 + 0 1.98 + 0.00120879 1.26 + 0.0053975 2.49 + 0.00051923
1
Pigment synthesis
CYP97B3 Cytochrome P450 97B3 O23365 AT4G15110 + 0 2.39 + 0.00289855 1.50 + 0.0109021 3.59 + 0.00074121
4
Pigment synthesis
CYP97C1 Carotene epsilon-monooxygenase Q6TBX7 At3g53130 + 0 3.18 + 0.00133333 1.30 + 0.0158074 4.12 + 0.00084816
8
Pigment synthesis
DVR Divinyl chlorophyllide a 8-vinyl-reductase Q1H537 AT5G18660 + 0 1.94 + 0.00364557 1.42 + 0.00278621 2.75 + 0.00075348
8
Pigment synthesis
FC2 Ferrochelatase F4IMT3;O04921
AT2G30390 + 0.000230254 2.54 + 0.00366412 0.72 + 0.0257136 1.84 + 0.00314365
Pigment synthesis
GUN4 Tetrapyrrole-binding protein Q9LX31 AT3G59400 + 0 3.24 + 0.00271739 1.44 + 0.00970898 4.65 + 0.00069230
8
Pigment synthesis
HCAR 7-hydroxymethyl chlorophyll a reductase Q8GS60 AT1G04620 + 0.00335187 0.60 0.10381 0.60 + 0.126912 0.36 0.00460652

167
Pigment synthesis
LUT5 Protein LUTEIN DEFICIENT 5 Q93VK5 AT1G31800 + 0.00034717 3.93 0.0571116 1.86 + 0.0122297 7.30 + 0.00239046
Pigment synthesis
PAO Pheophorbide a oxygenase Q9FYC2 AT3G44880 + 0.00056833 1.36 + 0.00612159 1.04 + 0.351328 1.42 0.00314799
Pigment synthesis
PDS 15-cis-phytoene desaturase/chromoplastic Q07356 AT4G14210 + 0.000564655 1.06 0.383086 1.24 + 0.0317098 1.31 + 0.00050704
2
Pigment synthesis
PORB Protochlorophyllide reductase B P21218 AT4G27440 + 0 1.87 + 0.00265455 0.59 + 0.00441713 1.11 + 0.0458435
Pigment synthesis
PORC Protochlorophyllide reductase C F4I2F8;O48741
AT1G03630 + 0.000571429 1.65 + 0.0213968 1.08 + 0.991948 1.78 0
Pigment synthesis
PPOX1 Protoporphyrinogen oxidase 1 P55826 AT4G01690 + 0 1.60 + 0.00069064
7 1.15 + 0.0485109 1.84 + 0.0024048
Pigment synthesis
YCF54 EMBRYO DEFECTIVE 3143 Q9LVM3 AT5G58250 + 0 2.79 + 0.00164929 1.22 + 0.0263823 3.39 + 0.00069379
Plastoglobule ABC1K3 Uncharacterized aarF domain-containing protein kinase At1g79600
Q9MA15 AT1G79600 + 0 1.77 + 0.0275792 2.49 + 0 4.40 + 0.00083076
9
Plastoglobule At1g06690 Uncharacterized oxidoreductase At1g06690 Q94A68 AT1G06690 + 0 8.61 + 0.00234146 1.63 + 0.0235244 14.04 + 0.00248175
Plastoglobule At1g32220 Uncharacterized protein At1g32220 Q9FVR6 AT1G32220 + 0 1.27 0.30756 2.52 + 0.00213466 3.19 + 0.0019252
Plastoglobule At1g54570 Acyltransferase-like protein At1g54570 Q9ZVN2 AT1G54570 + 0 1.88 + 0.0211604 3.61 + 0.00445028 6.77 + 0.00101538
Plastoglobule At1g71810 Uncharacterized aarF domain-containing protein kinase At1g71810
Q94BU1 AT1G71810 + 0 3.22 + 0.00065306
1 1.73 + 0.00254622 5.58 +
0.000738041
Plastoglobule At2g34460 Uncharacterized protein At2g34460 Q8H124 AT2G34460 + 0 1.46 + 0.00901718 1.46 + 0.00322244 2.13 + 0
Plastoglobule At4g13200 Uncharacterized protein At4g13200 Q8LDV3 AT4G13200 + 0 0.96 0.117342 2.13 + 0 2.04 + 0.001625
Plastoglobule At5g05200 Uncharacterized aarF domain-containing protein kinase At5g05200
Q9ASX5 AT5G05200 + 0 2.58 0.546423 10.51 + 0.00976687 27.16 + 0.00375597
Plastoglobule CCD4 Probable carotenoid cleavage dioxygenase 4 O49675 AT4G19170 + 0.00833119 0.80 0.657728 1.55 + 0.0519135 1.24 0.00849763
Plastoglobule CSP41B Chloroplast stem-loop binding protein of 41 kDa b A0A1P8ATL2;Q9SA52
AT1G09340 + 0 1.59 + 0.0037555 3.20 + 0 5.07 + 0
Plastoglobule CYP74A Allene oxide synthase Q96242 AT5G42650 + 0 1.06 + 0.0405617 1.94 + 0 2.06 + 0.00040909
1
Plastoglobule PAP1 Probable plastid-lipid-associated protein 1 O81439 AT4G04020 + 0 1.14 + 0.0496595 5.13 + 0 5.83 + 0.00053731
3
Plastoglobule PAP10 Probable plastid-lipid-associated protein 10 Q8W4F1 AT2G46910 + 0 3.10 + 0.00438532 2.29 + 0 7.09 + 0.00068842
7
Plastoglobule PAP11 Probable plastid-lipid-associated protein 11 O81304 AT4G00030 + 0.000448598 3.07 + 0.031609 1.12 + 0.177779 3.44 0.00070282
Plastoglobule PAP12 Probable plastid-lipid-associated protein 12 Q8LAP6 AT1G51110 + 0 1.24 + 0.00213592 1.46 + 0.0020271 1.80 + 0.00074311
9
Plastoglobule PAP13 Probable plastid-lipid-associated protein 13 A8MRU9;F4IM05;Q8S9M1
AT2G42130 + 0.000972973 0.26 + 0.0181285 4.29 0.0118832 1.13 + 0.884335
Plastoglobule PAP2 Probable plastid-lipid-associated protein 2 O49629 AT4G22240 + 0 2.06 + 0.00075 4.11 + 0 8.46 + 0
Plastoglobule PAP3 Probable plastid-lipid-associated protein 3 O82291 AT2G35490 + 0 1.40 + 0.0027027 2.23 + 0.00209291 3.12 + 0.00074141
9
Plastoglobule PAP4 Probable plastid-lipid-associated protein 4 Q9LU85 AT3G26070 + 0 0.89 0.430368 1.79 + 0.00102597 1.59 + 0.00068354
4

168
Plastoglobule PAP5 Probable plastid-lipid-associated protein 5 A0A1I9LP70;Q6DBN2
AT3G26080 + 0.000382609 1.30 0.457346 1.53 + 0.117468 1.98 0.00062427
7
Plastoglobule PAP6 Probable plastid-lipid-associated protein 6 A0A1I9LQU3;A0A1I9LQU5;Q9LW57
AT3G23400 + 0 1.44 + 0.00271207 1.21 + 0.0026755 1.74 + 0.000675
Plastoglobule PAP8 Probable plastid-lipid-associated protein 8 F4K2P2;Q941D3
AT5G19940 + 0.00572123 1.25 + 0.0125619 0.96 + 0.579242 1.19 0.0302826
Plastoglobule PAP9 Probable plastid-lipid-associated protein 9 Q9M2P7 AT3G58010 + 0.000819328 0.60 + 0.0204858 0.87 + 0.226697 0.52 0.00143396
Plastoglobule PLAT1 PLAT domain-containing protein 1 O65660 AT4G39730 + 0 2.27 + 0.007192 3.02 + 0 6.85 + 0.00066858
8
Plastoglobule PSY PHYTOENE SYNTHASE F4KGX7;P37271
AT5G17230 + 0.00081761 5.97 + 0.0163699 0.52 + 0.066836 3.13 0.00073650
8
Plastoglobule T22K18.4 Heme-binding-like protein At3g10130 Q9SR77 AT3G10130 + 0 2.42 + 0.002256 1.78 + 0.0193382 4.29 + 0.00303199
Plastoglobule VTE1 Tocopherol cyclase Q94FY7 AT4G32770 + 0 1.95 + 0.00717534 1.98 + 0 3.88 + 0.00079411
8
Protease ARASP2 Probable membrane metalloprotease ARASP2 O23053 AT1G05140 + 0.000262211 2.28 + 0.00712046 0.41 0.00436832 0.93 + 0.769658
Protease At2g21960 Expressed protein Q9SJ03 AT2G21960 + 0.000517755 1.44 + 0.010612 0.97 + 0.388234 1.40 0.00304045
Protease CLPP4 ATP-dependent Clp protease proteolytic subunit 4 Q94B60 AT5G45390 + 0 3.60 + 0.00088888
9 2.72 + 0.0159072 9.80 + 0.00375099
Protease EGY2 Probable zinc metalloprotease EGY2 F4K0T6;F4K0T7;Q9FFK3
AT5G05740 + 0.00348952 1.69 + 0.032415 0.81 + 0.802079 1.37 0.00914151
Protease SPPA Serine protease SPPA A0A1P8AUG2;Q9C9C0
AT1G73990 + 0.00334545 1.11 0.756751 1.26 + 0.0478554 1.41 + 0.0229392
Protein folding At3g12345 FKBP-type peptidyl-prolyl cis-trans isomerase Q9LHH3 AT3G12345 + 0.00195432 1.52 0.0617116 1.33 + 0.051632 2.02 0.0117878
Protein folding CLPB3 Chaperone protein ClpB3 Q9LF37 AT5G15450 + 0 4.34 + 0.00918291 8.43 + 0.00633616 36.60 + 0.00250737
Protein folding CLPC1 Chaperone protein ClpC1 Q9FI56;F4JF64;Q9SXJ7
AT3G48870 + 0 3.37 + 0.00219455 2.54 + 0 8.57 + 0.00044628
1
Protein folding CLPP5 ATP-dependent Clp protease proteolytic subunit 5 Q9S834 AT1G02560 + 0.0005 2.51 + 0.00378325 2.13 + 0.0384811 5.35 + 0.00885478
Protein folding CPN21 20 kDa chaperonin O65282 AT5G20720 + 0 4.49 + 0.00216092 2.08 + 0.00216709 9.34 + 0.00073636
4
Protein folding CPN60A1 Chaperonin 60 subunit alpha 1 P21238 AT2G28000 + 0 2.65 + 0.00952 4.46 + 0.00152663 11.82 + 0.00068789
8
Protein folding CYP26-2 Peptidyl-prolyl cis-trans isomerase CYP26-2 A0A1P8APN5;F4HTT6
At1g74070 + 0 1.93 + 0.00080672
3 1.51 + 0.0121582 2.91 + 0.00165886
Protein folding CYP28 Peptidyl-prolyl cis-trans isomerase CYP28 A0A1P8B9P2;O65220
At5g35100 + 0 2.55 + 0.00107843 1.78 + 0 4.53 + 0.00187937
Protein folding CYP37 Peptidyl-prolyl cis-trans isomerase CYP37 A0A1I9LQ22;A0A1I9LQ23;P82869
AT3G15520 + 0.000515393 1.54 + 0.00857754 1.17 + 0.0538578 1.81 0.00602192
Protein folding DJA5 AT4g39960/T5J17_130 Q940V1 AT4G39960 + 0.000449123 3.45 + 0.00199127 1.55 + 0.0493739 5.34 + 0.00759952
Protein folding DJA7 Molecular chaperone Hsp40/DnaJ family protein A0A1P8ART2;Q0WN54
AT1G80030 0.125866 0.56 1.59 0.89
Protein folding FKBP16-3 Peptidyl-prolyl cis-trans isomerase FKBP16-3 A0A1P8B252;O22870
AT2G43560 0.398858 1.26 1.12 1.42
Protein folding FKBP16-4 Peptidyl-prolyl cis-trans isomerase FKBP16-4 Q9SR70 AT3G10060 + 0.000376068 1.98 + 0.00432579 0.93 + 0.457923 1.84 0.001631

169
Protein folding FKBP17-2 Peptidyl-prolyl cis-trans isomerase FKBP17-2 Q9LDY5 AT1G18170 + 0.000469767 0.68 + 0.0181793 1.77 0.00153571 1.20 + 0.787775
Protein folding HSP70-3 Heat shock 70 kDa protein 3 O65719 AT1G16030 + 0 3.25 + 0.00121519 3.31 + 0 10.78 + 0
Protein folding HSP70-6 Heat shock 70 kDa protein 6 Q9STW6 AT4G24280 + 0 2.24 + 0.00216923 2.61 + 0.00104636 5.84 + 0.00083076
9
Protein folding TIG Trigger factor-like protein TIG Q8S9L5 AT5G55220 + 0.000503902 2.70 + 0.00755473 2.60 + 0.0339978 7.02 + 0.00910928
Protein translocation
SCY1 Preprotein translocase subunit SCY1 Q38885 AT2G18710 + 0.000505593 0.55 + 0.0145799 2.15 0.00560854 1.18 + 0.0645497
Protein translocation
SECA1 Protein translocase subunit SecA A0A1P8B485;F4JG57;Q9SYI0
AT4G01800 + 0 2.42 + 0.00372816 1.95 + 0 4.72 + 0
Protein translocation
TATB Sec-independent protein translocase protein TATB Q9XH75 AT5G52440 + 0.0256527 0.86 0.0667556 1.08 0.949121 0.93 0.0668596
Protein translocation
TATC Sec-independent protein translocase protein TATC Q9SJV5 AT2G01110 + 0 1.58 + 0.00961616 1.48 + 0.00775658 2.34 + 0
PSI PSAA Photosystem I P700 chlorophyll a apoprotein A1 P56766 ATCG00350 + 0 0.69 + 0.00476786 0.97 + 0.801698 0.67 0.00165333
PSI PSAB Photosystem I P700 chlorophyll a apoprotein A2 P56767 ATCG00340 + 0 0.65 + 0.00226506 0.83 + 0.00175824 0.54 + 0.00078072
3
PSI PSAC Photosystem I iron-sulfur center P62090 ATCG01060 + 0.000470314 0.74 + 0.00294624 1.24 + 0.0121373 0.92 + 0.0215088
PSI PSAD Photosystem I reaction center subunit II Q9S7H1;Q9SA56
AT1G03130 + 0.000507295 1.01 0.83935 0.79 + 0.0153717 0.80 + 0.00081
PSI PSAE1 Photosystem I reaction center subunit IV A Q9S831 AT4G28750 + 0 0.59 + 0.00277008 0.72 + 0.00271749 0.42 + 0.00068210
5
PSI PSAE2 Photosystem I reaction center subunit IV B Q9S714 AT2G20260 + 0.000510158 0.70 + 0.0101415 1.09 + 0.95443 0.76 0.00472409
PSI PSAF Photosystem I reaction center subunit III Q9SHE8 AT1G31330 0.111129 1.04 0.96 1.00
PSI PSAG Photosystem I reaction center subunit V Q9S7N7 AT1G55670 + 0.000268068 0.80 + 0.00716335 0.96 + 0.376987 0.77 0.00243399
PSI PSAH Photosystem I reaction center subunit VI Q9SUI6;Q9SUI7
AT1G52230 0.143118 1.01 0.98 0.99
PSI PSAK Photosystem I reaction center subunit psaK Q9SUI5 AT1G30380 + 0 0.45 + 0.00196516 1.02 + 0.580263 0.46 0
PSI PSAL Photosystem I reaction center subunit XI A0A1P8B6D0;Q9SUI4
AT4G12800 + 0 0.67 + 0.00193151 0.82 + 0.0155607 0.55 + 0
PSI PSAN Photosystem I reaction center subunit N P49107 AT5G64040 + 0 0.60 + 0.0011 0.86 + 0.0284368 0.52 + 0.00072160
4
PSI PSAO Photosystem I subunit O Q949Q5 AT1G08380 + 0.00281897 2.05 + 0.0186137 0.68 0.0223866 1.40 + 0.16226
PSII PSB33 Rieske (2Fe-2S) domain-containing protein Q9C9I7 AT1G71500 + 0.00198419 1.20 0.0664338 1.10 + 0.529311 1.32 0.00038028
2
PSII PSBA (D1) Photosystem II protein D1 P83755 ATCG00020 0.0606603 1.10 1.30 1.43
PSII PSBB (CP47)
Photosystem II CP47 reaction center protein P56777 ATCG00680 + 0 1.69 + 0.0019322 0.94 + 0.0453025 1.59 + 0.00069527
9
PSII PSBC (CP43)
Photosystem II CP43 reaction center protein P56778 ATCG00280 + 0 0.80 + 0.00224701 0.95 + 0.210432 0.76 0.00066122
4
PSII PSBD (D2) Photosystem II D2 protein P56761 ATCG00270 0.0588452 0.86 1.09 0.94
PSII PSBE Cytochrome b559 subunit alpha P56779 ATCG00580 + 0.00194851 1.03 + 0.0263806 0.92 0.0082825 0.95 + 0.189118
PSII PSBF Cytochrome b559 subunit beta P62095 ATCG00570 + 0.000511891 1.66 + 0.00570701 0.74 0.0072605 1.23 + 0.449161
PSII PSBH Photosystem II reaction center protein H P56780 ATCG00710 + 0.0124646 0.84 0.0774759 1.05 + 0.964663 0.88 0.0139158

170
PSII PSBO1 Oxygen-evolving enhancer protein 1-1 P23321 AT5G66570 + 0.00981153 0.96 + 0.0195477 0.95 + 0.784429 0.91 0.0337965
PSII PSBO2 Oxygen-evolving enhancer protein 1-2 Q9S841 AT3G50820 + 0.00195045 0.98 0.792399 1.13 + 0.0284245 1.11 + 0.0159059
PSII PSBP1 Oxygen-evolving enhancer protein 2-1 Q42029 AT1G06680 + 0.01266 0.95 0.742237 0.84 0.139161 0.80 0.0575522
PSII PSBQ1 Oxygen-evolving enhancer protein 3-1 Q9XFT3 AT4G21280 + 0.000393832 0.81 + 0.00468421 1.16 + 0.0127308 0.94 + 0.0208657
PSII PSBQ2 Oxygen-evolving enhancer protein 3-2 Q41932 AT4G05180 + 0 0.48 + 0 0.62 + 0.00082397 0.30 + 0
PSII PSBR Photosystem II 10 kDa polypeptide P27202 AT1G79040 0.0508935 1.06 0.95 1.01
PSII PSBT Photosystem II 5 kDa protein A0A1I9LS90;Q39195
AT3G21055 + 0.000262887 0.64 + 0.0120247 0.70 + 0.0160515 0.45 + 0.00304895
PSII repair ALB3 Inner membrane protein ALBINO3 F4IJM1;Q8LBP4
AT2G28800 + 0.00548968 0.52 0.0665761 1.01 + 0.587055 0.53 0.0286769
PSII repair CYP38 Peptidyl-prolyl cis-trans isomerase CYP38 Q9SSA5 AT3G01480 + 0 1.04 0.988442 0.65 + 0.00127103 0.68 + 0.00037241
4
PSII repair DEGP1 Protease Do-like 1 O22609 AT3G27925 + 0 2.22 + 0.00171429 1.05 + 0.723816 2.32 0.00073469
4
PSII repair FKBP20-2 Peptidyl-prolyl cis-trans isomerase FKBP20-2 A0A1I9LRJ6;Q0WRJ7
AT3G60370 0.0562962 2.56 0.39 1.00
PSII repair FTSH1 ATP-dependent zinc metalloprotease FTSH 1 Q39102 AT1G50250 0.111556 0.73 1.23 0.90
PSII repair FTSH2 ATP-dependent zinc metalloprotease FTSH 2 A0A1P8AXC1;O80860
AT2G30950 + 0 1.81 + 0.00147692 1.10 + 0.0401644 1.98 + 0
PSII repair FTSH5 ATP-dependent zinc metalloprotease FTSH 5 Q9FH02 AT5G42270 + 0 1.59 + 0.00263855 1.12 + 0.0557728 1.78 0.00217391
PSII repair FTSH8 ATP-dependent zinc metalloprotease FTSH 8 Q8W585 AT1G06430 + 0.00133878 0.73 + 0.00475724 1.33 0.0158475 0.97 + 0.871393
PSII repair FTSY Cell division protein FtsY homolog O80842 AT2G45770 + 0 3.79 + 0.0101742 3.47 + 0.00260086 13.17 + 0.00065060
2
PSII repair HHL1 Protein HHL1 Q8LDL0 At1g67700 + 0 1.89 0.0852815 2.14 + 0.0134497 4.06 + 0.00065191
1
PSII repair HSP70-7 Heat shock 70 kDa protein 7 Q9LTX9 AT5G49910 + 0 2.82 + 0.00127907 2.35 + 0.00289571 6.64 + 0.00078640
8
PSII repair LPA1 Protein LOW PSII ACCUMULATION 1 Q9SRY4 AT1G02910 + 0.000265971 1.99 + 0.0027375 1.00 + 0.356319 2.00 0.00192834
PSII repair LQY1 Protein disulfide-isomerase LQY1 Q8GSJ6 AT1G75690 + 0.000857741 0.63 + 0.00104348 1.42 0.0480131 0.90 + 0.323332
PSII repair MET1 Protein MET1 Q94BS2 AT1G55480 + 0.000266667 2.16 + 0.0089863 1.81 + 0.0254782 3.91 + 0.00368606
PSII repair MPH1 Protein MAINTENANCE OF PSII UNDER HIGH LIGHT 1
Q9FL44 AT5G07020 + 0 1.47 + 0.0122945 1.32 + 0.0147632 1.93 + 0.00165058
PSII repair PPL1 PsbP-like protein 1 P82538 AT3G55330 + 0.00422642 0.65 + 0.00118919 1.23 0.370068 0.80 0.0999916
PSII repair PSB27-1 Photosystem II repair protein PSB27-H1 Q9LR64 AT1G03600 + 0.000302564 0.59 + 0.00289182 1.19 + 0.294315 0.70 0.0030618
PSII repair TL18.3 UPF0603 protein At1g54780 Q9ZVL6 AT1G54780 + 0.00194659 0.85 + 0.0205876 1.14 0.0142563 0.97 + 0.0612839
PSII repair VIPP1 Membrane-associated protein VIPP1 A0A178W0D3;O80796
AT1G65260 + 0.00277162 1.47 + 0.0382266 1.18 + 0.203054 1.75 0.0080716
Redox regulation
At1g14345 NAD(P)-linked oxidoreductase superfamily protein Q949S6 AT1G14345 + 0.00114933 1.48 + 0.00267073 1.22 + 0.34957 1.80 0.0103063
Redox regulation
At1g50450 Saccharopine dehydrogenase Q94BZ0 AT1G50450 + 0.000374241 1.37 + 0.00204348 1.81 + 0.0259626 2.49 + 0.00555392
Redox regulation
At3g02730 Thioredoxin F1 Q9XFH8 AT3G02730 + 0 1.68 + 0.0163463 1.96 + 0 3.30 + 0.00045957
4
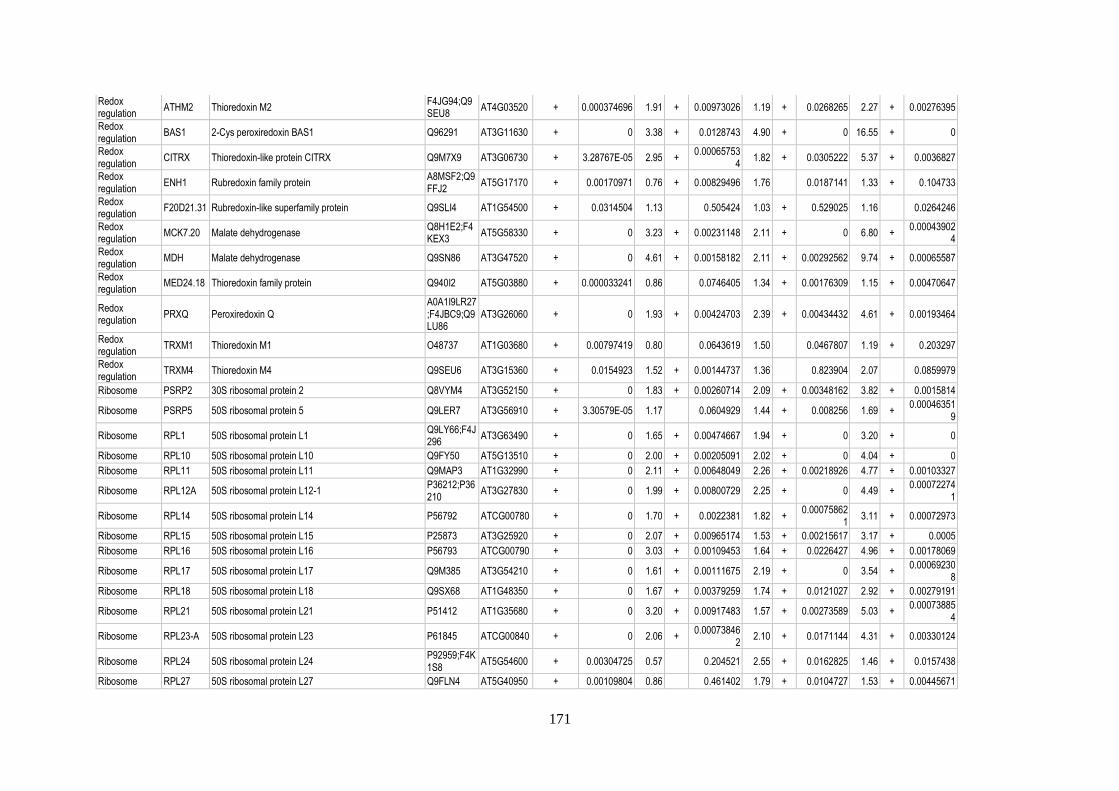
171
Redox regulation
ATHM2 Thioredoxin M2 F4JG94;Q9SEU8
AT4G03520 + 0.000374696 1.91 + 0.00973026 1.19 + 0.0268265 2.27 + 0.00276395
Redox regulation
BAS1 2-Cys peroxiredoxin BAS1 Q96291 AT3G11630 + 0 3.38 + 0.0128743 4.90 + 0 16.55 + 0
Redox regulation
CITRX Thioredoxin-like protein CITRX Q9M7X9 AT3G06730 + 3.28767E-05 2.95 + 0.00065753
4 1.82 + 0.0305222 5.37 + 0.0036827
Redox regulation
ENH1 Rubredoxin family protein A8MSF2;Q9FFJ2
AT5G17170 + 0.00170971 0.76 + 0.00829496 1.76 0.0187141 1.33 + 0.104733
Redox regulation
F20D21.31 Rubredoxin-like superfamily protein Q9SLI4 AT1G54500 + 0.0314504 1.13 0.505424 1.03 + 0.529025 1.16 0.0264246
Redox regulation
MCK7.20 Malate dehydrogenase Q8H1E2;F4KEX3
AT5G58330 + 0 3.23 + 0.00231148 2.11 + 0 6.80 + 0.00043902
4
Redox regulation
MDH Malate dehydrogenase Q9SN86 AT3G47520 + 0 4.61 + 0.00158182 2.11 + 0.00292562 9.74 + 0.00065587
Redox regulation
MED24.18 Thioredoxin family protein Q940I2 AT5G03880 + 0.000033241 0.86 0.0746405 1.34 + 0.00176309 1.15 + 0.00470647
Redox regulation
PRXQ Peroxiredoxin Q A0A1I9LR27;F4JBC9;Q9LU86
AT3G26060 + 0 1.93 + 0.00424703 2.39 + 0.00434432 4.61 + 0.00193464
Redox regulation
TRXM1 Thioredoxin M1 O48737 AT1G03680 + 0.00797419 0.80 0.0643619 1.50 0.0467807 1.19 + 0.203297
Redox regulation
TRXM4 Thioredoxin M4 Q9SEU6 AT3G15360 + 0.0154923 1.52 + 0.00144737 1.36 0.823904 2.07 0.0859979
Ribosome PSRP2 30S ribosomal protein 2 Q8VYM4 AT3G52150 + 0 1.83 + 0.00260714 2.09 + 0.00348162 3.82 + 0.0015814
Ribosome PSRP5 50S ribosomal protein 5 Q9LER7 AT3G56910 + 3.30579E-05 1.17 0.0604929 1.44 + 0.008256 1.69 + 0.00046351
9
Ribosome RPL1 50S ribosomal protein L1 Q9LY66;F4J296
AT3G63490 + 0 1.65 + 0.00474667 1.94 + 0 3.20 + 0
Ribosome RPL10 50S ribosomal protein L10 Q9FY50 AT5G13510 + 0 2.00 + 0.00205091 2.02 + 0 4.04 + 0
Ribosome RPL11 50S ribosomal protein L11 Q9MAP3 AT1G32990 + 0 2.11 + 0.00648049 2.26 + 0.00218926 4.77 + 0.00103327
Ribosome RPL12A 50S ribosomal protein L12-1 P36212;P36210
AT3G27830 + 0 1.99 + 0.00800729 2.25 + 0 4.49 + 0.00072274
1
Ribosome RPL14 50S ribosomal protein L14 P56792 ATCG00780 + 0 1.70 + 0.0022381 1.82 + 0.00075862
1 3.11 + 0.00072973
Ribosome RPL15 50S ribosomal protein L15 P25873 AT3G25920 + 0 2.07 + 0.00965174 1.53 + 0.00215617 3.17 + 0.0005
Ribosome RPL16 50S ribosomal protein L16 P56793 ATCG00790 + 0 3.03 + 0.00109453 1.64 + 0.0226427 4.96 + 0.00178069
Ribosome RPL17 50S ribosomal protein L17 Q9M385 AT3G54210 + 0 1.61 + 0.00111675 2.19 + 0 3.54 + 0.00069230
8
Ribosome RPL18 50S ribosomal protein L18 Q9SX68 AT1G48350 + 0 1.67 + 0.00379259 1.74 + 0.0121027 2.92 + 0.00279191
Ribosome RPL21 50S ribosomal protein L21 P51412 AT1G35680 + 0 3.20 + 0.00917483 1.57 + 0.00273589 5.03 + 0.00073885
4
Ribosome RPL23-A 50S ribosomal protein L23 P61845 ATCG00840 + 0 2.06 + 0.00073846
2 2.10 + 0.0171144 4.31 + 0.00330124
Ribosome RPL24 50S ribosomal protein L24 P92959;F4K1S8
AT5G54600 + 0.00304725 0.57 0.204521 2.55 + 0.0162825 1.46 + 0.0157438
Ribosome RPL27 50S ribosomal protein L27 Q9FLN4 AT5G40950 + 0.00109804 0.86 0.461402 1.79 + 0.0104727 1.53 + 0.00445671
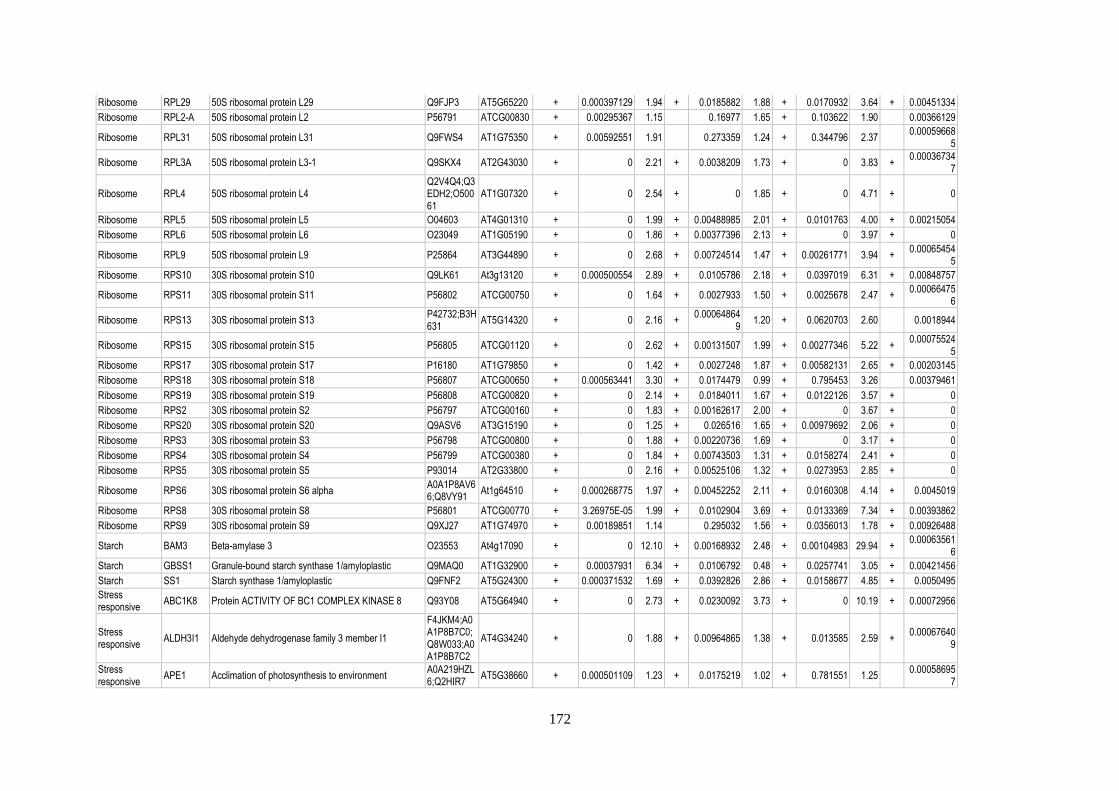
172
Ribosome RPL29 50S ribosomal protein L29 Q9FJP3 AT5G65220 + 0.000397129 1.94 + 0.0185882 1.88 + 0.0170932 3.64 + 0.00451334
Ribosome RPL2-A 50S ribosomal protein L2 P56791 ATCG00830 + 0.00295367 1.15 0.16977 1.65 + 0.103622 1.90 0.00366129
Ribosome RPL31 50S ribosomal protein L31 Q9FWS4 AT1G75350 + 0.00592551 1.91 0.273359 1.24 + 0.344796 2.37 0.00059668
5
Ribosome RPL3A 50S ribosomal protein L3-1 Q9SKX4 AT2G43030 + 0 2.21 + 0.0038209 1.73 + 0 3.83 + 0.00036734
7
Ribosome RPL4 50S ribosomal protein L4 Q2V4Q4;Q3EDH2;O50061
AT1G07320 + 0 2.54 + 0 1.85 + 0 4.71 + 0
Ribosome RPL5 50S ribosomal protein L5 O04603 AT4G01310 + 0 1.99 + 0.00488985 2.01 + 0.0101763 4.00 + 0.00215054
Ribosome RPL6 50S ribosomal protein L6 O23049 AT1G05190 + 0 1.86 + 0.00377396 2.13 + 0 3.97 + 0
Ribosome RPL9 50S ribosomal protein L9 P25864 AT3G44890 + 0 2.68 + 0.00724514 1.47 + 0.00261771 3.94 + 0.00065454
5
Ribosome RPS10 30S ribosomal protein S10 Q9LK61 At3g13120 + 0.000500554 2.89 + 0.0105786 2.18 + 0.0397019 6.31 + 0.00848757
Ribosome RPS11 30S ribosomal protein S11 P56802 ATCG00750 + 0 1.64 + 0.0027933 1.50 + 0.0025678 2.47 + 0.00066475
6
Ribosome RPS13 30S ribosomal protein S13 P42732;B3H631
AT5G14320 + 0 2.16 + 0.00064864
9 1.20 + 0.0620703 2.60 0.0018944
Ribosome RPS15 30S ribosomal protein S15 P56805 ATCG01120 + 0 2.62 + 0.00131507 1.99 + 0.00277346 5.22 + 0.00075524
5
Ribosome RPS17 30S ribosomal protein S17 P16180 AT1G79850 + 0 1.42 + 0.0027248 1.87 + 0.00582131 2.65 + 0.00203145
Ribosome RPS18 30S ribosomal protein S18 P56807 ATCG00650 + 0.000563441 3.30 + 0.0174479 0.99 + 0.795453 3.26 0.00379461
Ribosome RPS19 30S ribosomal protein S19 P56808 ATCG00820 + 0 2.14 + 0.0184011 1.67 + 0.0122126 3.57 + 0
Ribosome RPS2 30S ribosomal protein S2 P56797 ATCG00160 + 0 1.83 + 0.00162617 2.00 + 0 3.67 + 0
Ribosome RPS20 30S ribosomal protein S20 Q9ASV6 AT3G15190 + 0 1.25 + 0.026516 1.65 + 0.00979692 2.06 + 0
Ribosome RPS3 30S ribosomal protein S3 P56798 ATCG00800 + 0 1.88 + 0.00220736 1.69 + 0 3.17 + 0
Ribosome RPS4 30S ribosomal protein S4 P56799 ATCG00380 + 0 1.84 + 0.00743503 1.31 + 0.0158274 2.41 + 0
Ribosome RPS5 30S ribosomal protein S5 P93014 AT2G33800 + 0 2.16 + 0.00525106 1.32 + 0.0273953 2.85 + 0
Ribosome RPS6 30S ribosomal protein S6 alpha A0A1P8AV66;Q8VY91
At1g64510 + 0.000268775 1.97 + 0.00452252 2.11 + 0.0160308 4.14 + 0.0045019
Ribosome RPS8 30S ribosomal protein S8 P56801 ATCG00770 + 3.26975E-05 1.99 + 0.0102904 3.69 + 0.0133369 7.34 + 0.00393862
Ribosome RPS9 30S ribosomal protein S9 Q9XJ27 AT1G74970 + 0.00189851 1.14 0.295032 1.56 + 0.0356013 1.78 + 0.00926488
Starch BAM3 Beta-amylase 3 O23553 At4g17090 + 0 12.10 + 0.00168932 2.48 + 0.00104983 29.94 + 0.00063561
6
Starch GBSS1 Granule-bound starch synthase 1/amyloplastic Q9MAQ0 AT1G32900 + 0.00037931 6.34 + 0.0106792 0.48 + 0.0257741 3.05 + 0.00421456
Starch SS1 Starch synthase 1/amyloplastic Q9FNF2 AT5G24300 + 0.000371532 1.69 + 0.0392826 2.86 + 0.0158677 4.85 + 0.0050495
Stress responsive
ABC1K8 Protein ACTIVITY OF BC1 COMPLEX KINASE 8 Q93Y08 AT5G64940 + 0 2.73 + 0.0230092 3.73 + 0 10.19 + 0.00072956
Stress responsive
ALDH3I1 Aldehyde dehydrogenase family 3 member I1
F4JKM4;A0A1P8B7C0;Q8W033;A0A1P8B7C2
AT4G34240 + 0 1.88 + 0.00964865 1.38 + 0.013585 2.59 + 0.00067640
9
Stress responsive
APE1 Acclimation of photosynthesis to environment A0A219HZL6;Q2HIR7
AT5G38660 + 0.000501109 1.23 + 0.0175219 1.02 + 0.781551 1.25 0.00058695
7

173
Stress responsive
AT5g02160
Transmembrane protein Q9FPH2 AT5G02160 + 0 0.36 + 0.00084210
5 0.71 + 0.0128098 0.26 +
0.000637363
Stress responsive
CLH1 Chlorophyllase-1 O22527 AT1G19670 + 0 1.19 0.449178 8.88 + 0.00559858 10.54 + 0.00248902
Stress responsive
F11M15.26
At1g51400/F5D21_10 Q9SYE2 AT1G51400 + 0 0.35 + 0.00101053 0.81 + 0.0496555 0.28 + 0.00082442
7
Stress responsive
FLU Protein FLUORESCENT IN BLUE LIGHT F4JFR1;F4JFR2;Q940U6
AT3G14110 + 0.000606955 0.97 1 1.35 + 0.00906667 1.31 + 0.00307042
Stress responsive
LIR1 Light-regulated protein 1 Q96500 At3g26740 + 0.000489607 1.19 + 0.00275472 0.75 0.00776936 0.89 + 0.924333
Stress responsive
PPD3 PsbP domain-containing protein 3 Q9S720 AT1G76450 + 0.000394299 1.63 + 0.0172023 1.10 + 0.0750972 1.80 0.00203465
Stress responsive
PPD4 PsbP domain-containing protein 4 O49292 AT1G77090 + 0 1.11 0.485389 1.67 + 0.00324194 1.86 + 0.00064986
Stress responsive
PPD6 PsbP domain-containing protein 6 Q9LXX5 AT3G56650 + 0.00889991 1.57 + 0.0102403 1.00 0.75297 1.57 0.106364
Stress responsive
SHM1 Serine hydroxymethyltransferase 1 Q9SZJ5;Q94C74
AT4G37930 + 0 9.90 + 0.00487931 4.42 + 0 43.75 + 0.00072727
3
Stress responsive
TL29 Thylakoid lumenal 29 kDa protein
A0A1P8B8W6;A0A1P8B8Y3;P82281
AT4G09010 + 0 1.86 + 0.000768 1.10 + 0.0909659 2.06 0.0021875
Thylakoid architecture
CURT1A Protein CURVATURE THYLAKOID 1A O04616 AT4G01150 + 0.000508436 1.01 0.507067 1.38 + 0.0141481 1.40 + 0.00066393
4
Thylakoid architecture
CURT1B Protein CURVATURE THYLAKOID 1B Q8LCA1 AT2G46820 + 0.0021063 1.14 0.572179 1.27 + 0.0230263 1.45 + 0.00304469
Thylakoid architecture
CURT1C Protein CURVATURE THYLAKOID 1C Q9M812 AT1G52220 0.107072 0.92 1.02 0.93
Thylakoid architecture
FZL Probable transmembrane GTPase FZO-like
A0A1P8AUL2;A0A1P8AUL4;Q1KPV0
AT1G03160 + 0.000264935 0.95 0.890851 2.11 + 0.00274214 2.00 + 0.00159855
Thylakoid architecture
PLSP1 Chloroplast processing peptidase A0A1I9LMR3;Q8H0W1
AT3G24590 + 0.01092 1.15 + 0.0421871 1.22 0.227251 1.41 0.0586624
Thylakoid architecture
RIQ1 Reduced induction of non-photochemical quenching1 Q9SD79 AT5G08050 + 0 1.14 0.336925 1.67 + 0.00567944 1.91 + 0.00038989
2
Thylakoid architecture
RIQ2 Reduced induction of non-photochemical quenching2 Q94F10 AT1G74730 + 0.000390588 0.74 + 0.0118949 2.31 + 0.0121446 1.71 + 0.0118802
Thylakoid architecture
THF1 Protein THYLAKOID FORMATION 1 Q9SKT0 AT2G20890 + 0.0132706 1.12 0.077565 1.22 + 0.644534 1.36 0.0274342

174
Table 13: Relative abundance of thylakoid-associated proteins in the Field versus the Lab. Details of the 439 MS-quantified thylakoid proteins from Arabidopsis plants grown outdoors versus in
a controlled environment, including functional category, protein/gene name, description, UniProtKB identifier, TAIR ID and abundance ratios. Significant changes were identified by a modified
Welch’s t-test (q < 0.05). Median protein iBAQ values were used for the calculation of ratios.
Category Protein/
gene name Description
UniProtKB accession
TAIR ID Ratio Field vs
Lab Welch's t-test
sig. Welch's t-test
q-value
Assembly ALB4 ALBINO3-like protein 1 F4I9A9;Q9FYL3 AT1G24490 1.80 + 0.00208295
Assembly At4g28740 LOW PSII ACCUMULATION-like protein F4JM22 AT4G28740 2.12 + 0
Assembly At5g48790 LOW PSII ACCUMULATION protein Q94F50;Q9FKB7 AT5G48790 1.41 + 0.0216884
Assembly CCB1 Protein COFACTOR ASSEMBLY OF COMPLEX C SUBUNIT B CCB1 Q9LSE4 AT3G26710 1.43 + 0.0278453
Assembly CCB2 Protein COFACTOR ASSEMBLY OF COMPLEX C SUBUNIT B CCB2 Q9FJ81 AT5G52110 1.30 0.173796
Assembly CCS1 Cytochrome c biogenesis protein CCS1 Q9XIA4 AT1G49380 1.19 0.39718
Assembly DAC Q94BY7 AT3G17930 1.21 + 0.0396022
Assembly FFC P37107 AT5G03940 2.10 + 0
Assembly HCF101 Fe-S cluster assembly factor HCF101 Q6STH5 AT3G24430 5.16 + 0
Assembly HCF136 Photosystem II stability/assembly factor HCF136 A0A1P8BG37;O82660
AT5G23120 1.96 + 0
Assembly HCF164 Thioredoxin-like protein HCF164 O23166 AT4G37200 1.22 + 0.00867532
Assembly HCF244 NAD(P)-binding Rossmann-fold superfamily protein O65502 AT4G35250 1.64 + 0.00481967
Assembly LPA2 Protein LOW PSII ACCUMULATION 2 F4KDA6 AT5G51545 0.72 + 0.00178
Assembly LPA3 Protein LOW PSII ACCUMULATION 3 Q8H0W0 AT1G73060 1.27 + 0.0215662
Assembly MPH2 Thylakoid lumenal 16.5 kDa protein A0A1P8B5H3;O22773;A0A1P8B5G9
AT4G02530 0.97 0.995271
Assembly PPD1 PsbP domain-containing protein 1 O23403 AT4G15510 1.57 + 0.00457588
Assembly Y3IP1 Ycf3-interacting protein 1 Q9LU01 AT5G44650 1.58 + 0.00131915
Assembly YCF4 Photosystem I assembly protein Ycf4 P56788 AtCg00520 1.47 + 0
ATP synthase ATPA ATP synthase subunit alpha P56757 ATCG00120 1.43 + 0
ATP synthase ATPB ATP synthase subunit beta P19366 ATCG00480 1.35 + 0
ATP synthase ATPC1 ATP synthase gamma chain 1 Q01908 AT4G04640 1.25 + 0.000898551
ATP synthase ATPD ATP synthase subunit delta Q9SSS9 AT4G09650 1.33 + 0.00494118
ATP synthase ATPE ATP synthase epsilon chain P09468 ATCG00470 1.41 + 0.00146746
ATP synthase ATPF ATP synthase subunit b P56759 ATCG00130 1.45 + 0.00110714
ATP synthase ATPH ATP synthase subunit c P56760 ATCG00140 0.43 0.930208
ATP synthase ATPI ATP synthase subunit a P56758 ATCG00150 1.40 + 0.00149398
ATP synthase PDE334 Q42139 AT4G32260 1.35 + 0.00802649
Carbon fixation BCA1 Beta carbonic anhydrase 1 P27140;A0A1I9LQB3
AT3G01500 2.82 + 0
Carbon fixation RBCL Ribulose bisphosphate carboxylase large chain O03042 AtCg00490 2.42 + 0
Carbon fixation RBCS-1A Ribulose bisphosphate carboxylase small chain 1A P10795 AT1G67090 3.60 + 0
Carbon fixation RBCS-1B Ribulose bisphosphate carboxylase small chain 1B P10796 AT5G38430 3.30 + 0

175
Carbon fixation RBCS-2B Ribulose bisphosphate carboxylase small chain 3B P10798;P10797;F4KA76;B3H5S2
AT5G38410;AT5G38420
3.77 + 0
Carbon fixation RCA Ribulose bisphosphate carboxylase/oxygenase activase P10896;F4IVZ7 AT2G39730 3.51 + 0
Chloroplast replication FTSZ1 Cell division protein FtsZ homolog 1 Q42545 AT5G55280 2.28 + 0.00571429
Chloroplast replication FTSZ2-1 Cell division protein FtsZ homolog 2-1 A0A1P8AXD8;O82533
AT2G36250 2.41 + 0
Chloroplast replication FTSZ2-2 Cell division protein FtsZ homolog 2-2 Q9LXJ0;A0A1I9LSJ8
AT3G52750 10.94 + 0.00100813
Chlororespiration PIFI Post-illumination chlorophyll fluorescence increase B3H4M0;F4J037;F4J034;Q9LVZ5;F4J036
AT3G15840 1.37 + 0.00474194
Cytochrome b6f PETA Cytochrome f P56771 ATCG00540 1.64 + 0.00642807
Cytochrome b6f PETB Cytochrome b6 P56773 ATCG00720 1.49 + 0.007125
Cytochrome b6f PETC Cytochrome b6-f complex subunit 4 P56774 ATCG00730 1.42 + 0
Cytochrome b6f PETD Cytochrome b6-f complex iron-sulfur subunit Q9ZR03 AT4G03280 1.38 + 0
DNA/RNA At2g21530 Q8GWP4 AT2G21530 2.65 + 0.00797368
DNA/RNA At2g24420 Q9ZQ26 AT2G24420 1.74 + 0.000918519
DNA/RNA CCR1 Q03251;F4JVC0;F4JVC1;F4JVB9
AT4G39260 3.20 + 0
DNA/RNA CCR2 F4IHK9;Q03250 AT2G21660 4.07 + 0.00145029
DNA/RNA CP29A 29 kDa ribonucleoprotein F4JAF3;Q43349 AT3G53460 1.68 + 0.00565056
DNA/RNA CP29B RNA-binding protein CP29B Q9ZUU4 AT2G37220 1.79 + 0.00536882
DNA/RNA CP31A 31 kDa ribonucleoprotein Q04836 AT4G24770 1.49 + 0
DNA/RNA F16M2_10 Q9M1X3 AT3G63160 1.82 + 0
DNA/RNA PTAC16 Protein PLASTID TRANSCRIPTIONALLY ACTIVE 16 Q9STF2 AT3G46780 0.90 + 0.00216268
DNA/RNA rpoA DNA-directed RNA polymerase subunit alpha P56762 AtCg00740 1.25 + 0.00455814
DNA/RNA TUFA Elongation factor Tu P17745 AT4G20360 2.83 + 0
Electron transfer LFNR1 Ferredoxin--NADP reductase, leaf isozyme 2 Q8W493;C0Z2A8 AT1G20020 1.14 + 0.00111712
Electron transfer LFNR2 Ferredoxin--NADP reductase, leaf isozyme 1 Q9FKW6;F4JZ46 AT5G66190 1.30 + 0.00213208
Electron transfer NDC1 Alternative NAD(P)H-ubiquinone oxidoreductase C1/mitochondrial Q8GXR9 AT5G08740 2.60 + 0
Electron transfer PC Plastocyanin major isoform P42699 AT1G20340 0.89 0.104465
Electron transfer PETE Plastocyanin minor isoform A0A1P8APR2;P11490
AT1G76100 1.94 0.974821
Electron transfer PGR5 Protein PROTON GRADIENT REGULATION 5 Q9SL05 AT2G05620 1.25 + 0.00206393
Electron transfer PGR6 Uncharacterized aarF domain-containing protein kinase At4g31390 Q8RWG1;A0A1P8B7P6
AT4G31390 3.41 + 0
Electron transfer PGRL1A PGR5-like protein 1A Q8H112;A0A2H1ZEN5
AT4G22890 1.14 + 0.0301978
Electron transfer PGRL1B PGR5-like protein 1B F4JPU9;Q8GYC7 AT4G11960 1.65 + 0.00445763
Electron transfer TIC62 Protein TIC 62 Q8H0U5 AT3G18890 1.40 + 0.00412444
Electron transfer TROL Rhodanese-like domain-containing protein 4 A0A1P8B8J7;Q9M158
AT4G01050 1.44 + 0.0100685
Ion channel DIT2-1 Dicarboxylate transporter 2.1 Q9FMF7 AT5G64290 2.45 + 0.00487967

176
Ion channel KEA3 K(+) efflux antiporter 3 Q9M0Z3 AT4G04850 1.51 + 0
Ion channel MNJ8.18 LOW protein: ammonium transporter 1-like protein Q93Z11 AT5G37360 0.85 0.0633439
Kinase/phosphatase At3g59780 Rhodanese/Cell cycle control phosphatase superfamily protein F4J9G2 AT3G59780 1.43 + 0.00150303
Kinase/phosphatase At5g35170 Adenylate kinase 5 F4JYC0;Q8VYL1 AT5G35170 1.68 + 0
Kinase/phosphatase PGK1 Phosphoglycerate kinase F4I3L1;P50318 AT1G56190 3.47 + 0
Kinase/phosphatase PGK1 Phosphoglycerate kinase 1 Q9LD57 AT3G12780 2.39 + 0
LHCI LHCA1 Chlorophyll a-b binding protein 6 A8MS75;Q01667;F4JE46;F4JE43
AT3G54890 1.02 0.867552
LHCI LHCA2 Photosystem I chlorophyll a/b-binding protein 2 Q9SYW8 AT3G61470 0.97 0.876333
LHCI LHCA3 Photosystem I chlorophyll a/b-binding protein 3-1 Q9SY97 AT1G61520 0.83 + 0.0120356
LHCI LHCA4 Chlorophyll a-b binding protein 4 P27521 AT3G47470 0.90 + 0.0252661
LHCI LHCA6 Photosystem I chlorophyll a/b-binding protein 6 Q8LCQ4 AT1G19150 0.67 1
LHCII LHCB1.1;LHCB1.2
Chlorophyll a-b binding protein 2 Q8VZ87;P0CJ48 AT1G29910 0.67 + 0
LHCII LHCB1.3 Chlorophyll a-b binding protein 1 P04778 AT1G29930 1.13 + 0.021812
LHCII LHCB1.4 Chlorophyll a-b binding protein Q39142 AT2G34430 0.23 + 0
LHCII LHCB1.5 Chlorophyll a-b binding protein Q39141 AT2G34420 1.12 1
LHCII LHCB2 Chlorophyll a-b binding protein 2 Q9S7J7;Q9SHR7;Q9XF87;A0A1I9LMB4;A0A1P8AZ91
AT2G05070;AT2G05100;AT3G27690
0.79 + 0.0109235
LHCII LHCB3 Chlorophyll a-b binding protein 3 Q9S7M0 AT5G54270 0.95 0.104436
LHCII LHCB4.1 (CP29.1)
Chlorophyll a-b binding protein CP29.1 Q07473 AT5G01530 1.11 + 0.00144186
LHCII LHCB4.2 (CP29.2)
Chlorophyll a-b binding protein CP29.2 Q9XF88 AT3G08940 0.80 + 0
LHCII LHCB4.3 (CP29.3)
Chlorophyll a-b binding protein CP29.3 Q9S7W1;F4IGY6 AT2G40100 5.43 + 0.00913924
LHCII LHCB5 (CP26) Chlorophyll a-b binding protein CP26 Q9XF89 AT4G10340 0.98 0.104166
LHCII LHCB6 (CP24) Chlorophyll a-b binding protein Q9LMQ2 AT1G15820 0.89 + 0
LHC-like Lil3.1 Light-harvesting complex-like protein 3 isotype 1 Q9SYX1 AT4G17600 1.40 + 0.00187368
LHC-like Lil3.2 Light-harvesting complex-like protein 3 isotype 2 Q6NKS4 AT5G47110 1.21 + 0.00623656
LHC-like OHP1 High-light-induced protein O81208 AT5G02120 1.57 + 0.00476113
LHC-like OHP2 Light-harvesting complex-like protein OHP2 Q9FEC1 AT1G34000 0.85 + 0.00209259
Light harvesting regulation
LCNP Q9STS7 AT3G47860 1.25 + 0.00260633
Light harvesting regulation
PSBS Photosystem II 22 kDa protein Q9XF91;F4IEG8 AT1G44575 1.93 + 0
Light harvesting regulation
ROQH1 Q8GYZ0;F4JSP1 AT4G31530 2.14 + 0
Light harvesting regulation
SOQ1 Protein SUPPRESSOR OF QUENCHING 1 Q8VZ10 AT1G56500 1.37 + 0
Light harvesting regulation
STN7 Serine/threonine-protein kinase STN7 Q9S713 AT1G68830 0.61 + 0.00408811

177
Light harvesting regulation
STN8 Serine/threonine-protein kinase STN8 Q9LZV4 AT5G01920 1.64 + 0.00455411
Light harvesting regulation
TAP38 Protein phosphatase 2C 57 P49599 AT4G27800 0.70 + 0.00466667
Light harvesting regulation
TSP9 Thylakoid soluble phosphoprotein Q9SD66 AT3G47070 1.79 + 0.00210233
Light harvesting regulation
VDE1 Violaxanthin de-epoxidase Q39249 AT1G08550 1.60 + 0.00207339
Light harvesting regulation
ZEP Zeaxanthin epoxidase Q9FGC7 AT5G67030 1.28 + 0.00794754
NDH NDHC NAD(P)H-quinone oxidoreductase subunit 3 P56751 ATCG00440 3.92 + 0.0260559
NDH NDHE NAD(P)H-quinone oxidoreductase subunit 4L P26289 ATCG01070 1.33 + 0.004704
NDH NDHF NAD(P)H-quinone oxidoreductase subunit 5 P56752 ATCG01010 1.62 0.135282
NDH NDHH NAD(P)H-quinone oxidoreductase subunit H P56753 ATCG01110 1.67 + 0.000843537
NDH NDHI NAD(P)H-quinone oxidoreductase subunit I P56755 ATCG01090 1.93 + 0.00816162
NDH NDHJ NAD(P)H-quinone oxidoreductase subunit J P56754 ATCG00420 1.08 0.799712
NDH NDHK NAD(P)H-quinone oxidoreductase subunit K P56756 ATCG00430 1.28 + 0.00810702
NDH ndhL Q9CAC5 AT1G70760 1.72 + 0.00114815
NDH NDHM NAD(P)H-quinone oxidoreductase subunit M Q2V2S7 AT4G37925 1.17 + 0.0119294
NDH NDHN NAD(P)H-quinone oxidoreductase subunit N Q9LVM2 AT5G58260 1.43 + 0.00534848
NDH NDHO NAD(P)H-quinone oxidoreductase subunit O Q9S829 AT1G74880 2.52 + 0.0109571
NDH NDHS NAD(P)H-quinone oxidoreductase subunit S Q9T0A4 AT4G23890 2.65 + 0.000826667
NDH NDHT NAD(P)H-quinone oxidoreductase subunit T Q9SMS0 AT4G09350 2.20 + 0.0309699
NDH NDHU NAD(P)H-quinone oxidoreductase subunit U Q84VQ4 AT5G21430 1.35 + 0
NDH PNSB1 Photosynthetic NDH subunit of subcomplex B 1 Q9S9N6 AT1G15980 1.58 + 0.00501538
NDH PNSB2 Photosynthetic NDH subunit of subcomplex B 2 Q94AQ8;F4I891;F4I890
AT1G64770 1.29 + 0.00459389
NDH PNSB3 Photosynthetic NDH subunit of subcomplex B 3 Q9LU21 AT3G16250 1.47 + 0.00258296
NDH PNSB4 Photosynthetic NDH subunit of subcomplex B 4 A0A1P8AS98;F4ICC6;Q8RXS1
AT1G18730 0.73 + 0.00585507
NDH PNSB5 Photosynthetic NDH subunit of subcomplex B 5 Q9FG89 AT5G43750 1.42 0.586973
NDH PNSL1 Photosynthetic NDH subunit of lumenal location 1 O80634 AT2G39470 1.42 + 0.00186387
NDH PNSL2 Photosynthetic NDH subunit of lumenal location 2 Q9XI73 AT1G14150 1.82 + 0.010759
NDH PNSL3 Photosynthetic NDH subunit of lumenal location 3 Q9SGH4 AT3G01440 1.04 0.225556
NDH PNSL4 Photosynthetic NDH subunit of lumenal location 4 F4JW56;Q9SCY3 AT4G39710 1.46 + 0.00567164
NDH PNSL5 Photosynthetic NDH subunit of lumenal location 5 Q9ASS6 AT5G13120 0.76 + 0.00173659
Other/unknown AAC1 P31167 AT3G08580 2.88 + 0.000946565
Other/unknown AAC2 P40941 AT5G13490 4.05 1
Other/unknown AOC2 Q9LS02 AT3G25770 2.21 + 0
Other/unknown APG3 Peptide chain release factor APG3 Q8RX79 AT3G62910 4.06 + 0.00569288
Other/unknown APXT L-ascorbate peroxidase T A0A1P8APU0;Q42593
AT1G77490 1.09 + 0.0109908

178
Other/unknown At1g07660 P59259;A8MRV1 AT2G28740 2.73 + 0
Other/unknown At1g18060 Q9LM40 AT1G18060 2.49 + 0.00705155
Other/unknown At1g24360 P33207 AT1G24360 1.97 + 0.0119646
Other/unknown At1g33810 Zinc finger/BTB domain protein Q8L9M8 AT1G33810 2.19 + 0.00096875
Other/unknown At1g52510 Q8VZ57;F4ICZ4 AT1G52510 2.08 + 0.00112727
Other/unknown At1g73110 Q9AST9;A0A1P8ATD8
AT1G73110 4.43 + 0.00105085
Other/unknown At1g78915 Q8GWV1;F4IBX4;F4IBX5
AT1G78915 1.34 + 0.00459375
Other/unknown At2g03420 Q9ZQ78 AT2G03420 0.76 0.656275
Other/unknown At2g27290 FAM210B-like protein, putative (DUF1279) Q9XIN6 AT2G27290 1.09 0.0664737
Other/unknown At2g27680 Q9ZUX0 AT2G27680 2.23 + 0
Other/unknown At3g14420 Q9LRR9;A8MS37;B3H4B8;Q2V3V9
AT3G14420 3.39 + 0
Other/unknown At3g61870 Plant/protein F4IX01;Q9M277 AT3G61870 1.63 + 0
Other/unknown At4g02725 Q6DBF6 AT4G02725 3.78 + 0.00925641
Other/unknown At5g14910 Heavy metal transport/detoxification superfamily protein Q93VK7 AT5G14910 1.92 + 0.000861111
Other/unknown At5g16660 A8MS48;Q8H0X5 AT5G16660 1.25 + 0.00556777
Other/unknown At5g42070 Q8RWR9 AT5G42070 1.23 0.192904
Other/unknown At5g51010 Q9FI47 AT5G51010 2.54 + 0.00461176
Other/unknown BASS2 Q1EBV7 AT2G26900 2.16 + 0.00171154
Other/unknown CAC3 Q9LD43 AT2G38040 1.82 + 0
Other/unknown CAS Calcium sensing receptor Q9FN48;A0A1P8BCX7
AT5G23060 1.25 + 0.00181633
Other/unknown F11M15.26 Q9SYE2 AT1G51400 0.58 + 0
Other/unknown F13A11.2 Q9C7S3 AT1G42960 2.33 + 0
Other/unknown F24J8.11 Q9LPK9 AT1G21500 2.37 0.262458
Other/unknown FAB2 Acyl-[acyl-carrier-protein] desaturase F4IS32;O22832 AT2G43710 3.36 + 0.00710035
Other/unknown FBA1 Fructose-bisphosphate aldolase Q9ZU52 AT2G01140 2.23 + 0.0212457
Other/unknown FBA1 Fructose-bisphosphate aldolase Q9SJU4;F4IGL5;F4IGL7
AT2G21330 2.69 + 0
Other/unknown FBA2 Probable fructose-bisphosphate aldolase 2 Q944G9;F4JUJ5 AT4G38970 2.12 + 0
Other/unknown FLAP1 Fluctuating light acclimation protein 1 Q8RWI0 AT1G54520 1.52 + 0.00782313
Other/unknown GAPA2 A0A1P8APR6;Q9LPW0;F4HNZ6
AT1G12900 1.92 + 0
Other/unknown GC1 A0A1P8B167;Q9SJU9
AT2G21280 2.67 + 0
Other/unknown GDCST A0A2H1ZEA9;O65396
AT1G11860 1.41 + 0.000905109
Other/unknown GER3 P94072 AT5G20630 2.86 + 0.00113761
Other/unknown GLDP1 Q94B78;B3H5Y8 AT4G33010 2.92 + 0.00483951
Other/unknown GLN2 Glutamine synthetase/mitochondrial Q43127 AT5G35630 2.10 + 0.00183505
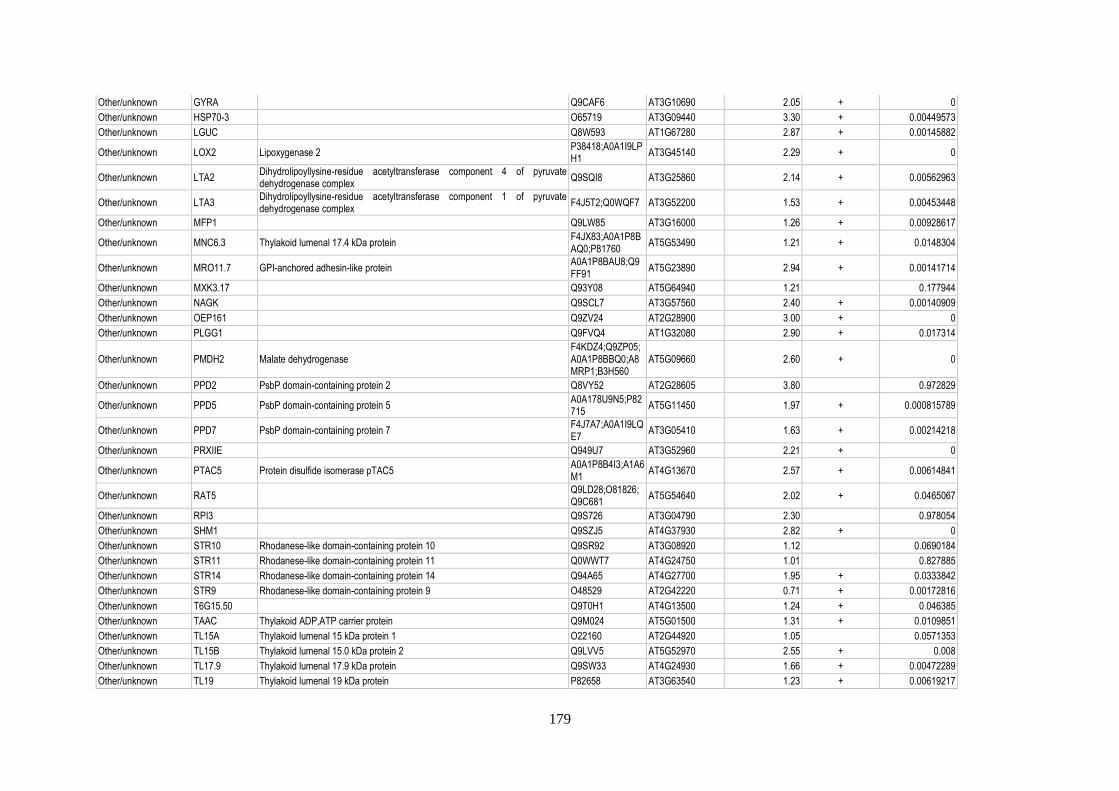
179
Other/unknown GYRA Q9CAF6 AT3G10690 2.05 + 0
Other/unknown HSP70-3 O65719 AT3G09440 3.30 + 0.00449573
Other/unknown LGUC Q8W593 AT1G67280 2.87 + 0.00145882
Other/unknown LOX2 Lipoxygenase 2 P38418;A0A1I9LPH1
AT3G45140 2.29 + 0
Other/unknown LTA2 Dihydrolipoyllysine-residue acetyltransferase component 4 of pyruvate dehydrogenase complex
Q9SQI8 AT3G25860 2.14 + 0.00562963
Other/unknown LTA3 Dihydrolipoyllysine-residue acetyltransferase component 1 of pyruvate dehydrogenase complex
F4J5T2;Q0WQF7 AT3G52200 1.53 + 0.00453448
Other/unknown MFP1 Q9LW85 AT3G16000 1.26 + 0.00928617
Other/unknown MNC6.3 Thylakoid lumenal 17.4 kDa protein F4JX83;A0A1P8BAQ0;P81760
AT5G53490 1.21 + 0.0148304
Other/unknown MRO11.7 GPI-anchored adhesin-like protein A0A1P8BAU8;Q9FF91
AT5G23890 2.94 + 0.00141714
Other/unknown MXK3.17 Q93Y08 AT5G64940 1.21 0.177944
Other/unknown NAGK Q9SCL7 AT3G57560 2.40 + 0.00140909
Other/unknown OEP161 Q9ZV24 AT2G28900 3.00 + 0
Other/unknown PLGG1 Q9FVQ4 AT1G32080 2.90 + 0.017314
Other/unknown PMDH2 Malate dehydrogenase F4KDZ4;Q9ZP05;A0A1P8BBQ0;A8MRP1;B3H560
AT5G09660 2.60 + 0
Other/unknown PPD2 PsbP domain-containing protein 2 Q8VY52 AT2G28605 3.80 0.972829
Other/unknown PPD5 PsbP domain-containing protein 5 A0A178U9N5;P82715
AT5G11450 1.97 + 0.000815789
Other/unknown PPD7 PsbP domain-containing protein 7 F4J7A7;A0A1I9LQE7
AT3G05410 1.63 + 0.00214218
Other/unknown PRXIIE Q949U7 AT3G52960 2.21 + 0
Other/unknown PTAC5 Protein disulfide isomerase pTAC5 A0A1P8B4I3;A1A6M1
AT4G13670 2.57 + 0.00614841
Other/unknown RAT5 Q9LD28;O81826;Q9C681
AT5G54640 2.02 + 0.0465067
Other/unknown RPI3 Q9S726 AT3G04790 2.30 0.978054
Other/unknown SHM1 Q9SZJ5 AT4G37930 2.82 + 0
Other/unknown STR10 Rhodanese-like domain-containing protein 10 Q9SR92 AT3G08920 1.12 0.0690184
Other/unknown STR11 Rhodanese-like domain-containing protein 11 Q0WWT7 AT4G24750 1.01 0.827885
Other/unknown STR14 Rhodanese-like domain-containing protein 14 Q94A65 AT4G27700 1.95 + 0.0333842
Other/unknown STR9 Rhodanese-like domain-containing protein 9 O48529 AT2G42220 0.71 + 0.00172816
Other/unknown T6G15.50 Q9T0H1 AT4G13500 1.24 + 0.046385
Other/unknown TAAC Thylakoid ADP,ATP carrier protein Q9M024 AT5G01500 1.31 + 0.0109851
Other/unknown TL15A Thylakoid lumenal 15 kDa protein 1 O22160 AT2G44920 1.05 0.0571353
Other/unknown TL15B Thylakoid lumenal 15.0 kDa protein 2 Q9LVV5 AT5G52970 2.55 + 0.008
Other/unknown TL17.9 Thylakoid lumenal 17.9 kDa protein Q9SW33 AT4G24930 1.66 + 0.00472289
Other/unknown TL19 Thylakoid lumenal 19 kDa protein P82658 AT3G63540 1.23 + 0.00619217

180
Other/unknown TL20.3 Thylakoid lumenal protein TL20.3 B6EUA5;Q8H1Q1;A0A178W1Q3
AT1G12250 1.30 0.0875521
Other/unknown TPT A0A219HYB6;A0A219HZH3;A0A219I0W9;Q9ZSR7
AT5G46110 2.40 + 0.000855172
Other/unknown TRL22 Q8LCT3 AT4G29670 4.56 + 0.0199075
Other/unknown YCF37 Homolog of Synechocystis YCF37 O64835 AT2G23670 1.66 + 0
Pigment synthesis CHLD Magnesium-chelatase subunit ChlD Q9SJE1 AT1G08520 3.46 + 0
Pigment synthesis CHLG Chlorophyll synthase Q38833 AT3G51820 1.04 0.729631
Pigment synthesis CHLH Magnesium-chelatase subunit ChlH Q9FNB0;A8MR05 AT5G13630 1.81 + 0.00178894
Pigment synthesis CHLI1 Magnesium-chelatase subunit ChlI P16127 AT4G18480 3.58 + 0.00259459
Pigment synthesis CHLI1 Magnesium-chelatase subunit ChlI Q5XF33 AT5G45930 1.65 + 0.0357065
Pigment synthesis CHLM Magnesium protoporphyrin IX methyltransferase A0A1P8B4G1;Q9SW18
AT4G25080 1.03 0.969714
Pigment synthesis CHLP Geranylgeranyl diphosphate reductase Q9CA67 AT1G74470 1.32 + 0.00177114
Pigment synthesis CRD1 Magnesium-protoporphyrin IX monomethyl ester [oxidative] cyclase Q9M591;F4J0U9 AT3G56940 1.13 + 0.00873203
Pigment synthesis CYP97B3 Cytochrome P450 97B3 O23365 AT4G15110 1.27 + 0.012
Pigment synthesis CYP97C1 Carotene epsilon-monooxygenase Q6TBX7 AT3G53130 1.28 0.0660686
Pigment synthesis DVR Divinyl chlorophyllide a 8-vinyl-reductase Q1H537 AT5G18660 1.03 0.7156
Pigment synthesis FC2 Ferrochelatase-2 F4IMT3;O04921 AT2G30390 1.89 + 0.0147872
Pigment synthesis HCAR 7-hydroxymethyl chlorophyll a reductase Q8GS60 AT1G04620 1.52 + 0.0048
Pigment synthesis LUT5 Protein LUTEIN DEFICIENT 5 Q93VK5 AT1G31800 1.18 + 0.018342
Pigment synthesis NOL Chlorophyll(ide) b reductase NOL Q8LEU3 AT5G04900 1.37 + 0.0216271
Pigment synthesis PAO Pheophorbide a oxygenase Q9FYC2 AT3G44880 3.48 + 0.000992
Pigment synthesis PDS 15-cis-phytoene desaturase/chromoplastic Q07356 AT4G14210 1.08 0.950155
Pigment synthesis PORB Protochlorophyllide reductase B P21218 AT4G27440 0.28 + 0.00096124
Pigment synthesis PORC Protochlorophyllide reductase C F4I2F8;O48741 AT1G03630 0.84 + 0.00671777
Pigment synthesis PPOX1 Protoporphyrinogen oxidase 1 P55826 AT4G01690 1.10 0.105082
Pigment synthesis PPOX2 Protoporphyrinogen oxidase 2/mitochondrial Q8S9J1;A0A1P8BE58;A0A1P8BE27
AT5G14220 4.46 + 0.00784983
Pigment synthesis VTE3 Q9LY74 AT3G63410 2.70 + 0
Pigment synthesis YCF54 Q9LVM3 AT5G58250 1.29 + 0.011018
Pigment synthesis ZDS1 Q38893 AT3G04870 4.04 + 0.00621429
Plastoglobule ABC1K3 Uncharacterized aarF domain-containing protein kinase At1g79600 Q9MA15 AT1G79600 2.86 + 0
Plastoglobule At1g06690 Q94A68 AT1G06690 5.87 + 0.00468526
Plastoglobule At1g26090 Q6DYE4 AT1G26090 4.53 + 0.00587636
Plastoglobule At1g32220 Uncharacterized protein At1g32220 Q9FVR6 AT1G32220 3.33 + 0.000953846
Plastoglobule At1g54570 Acyltransferase-like protein At1g54570 Q9ZVN2 AT1G54570 8.89 + 0.00134054
Plastoglobule At1g71810 Uncharacterized aarF domain-containing protein kinase At1g71810 Q94BU1 AT1G71810 3.25 + 0.00162092
Plastoglobule At1g78140 Q8LBV4 AT1G78140 4.00 + 0.0044766
Plastoglobule At2g34460 Uncharacterized protein At2g34460 Q8H124 AT2G34460 1.99 + 0

181
Plastoglobule At2g41040 Q0WPT7 AT2G41040 4.69 + 0.00464822
Plastoglobule At3g07700 B9DGY1;F4JFM1 AT3G07700 5.67 + 0.000832215
Plastoglobule At3g24190 Q9LRN0 AT3G24190 6.51 + 0.00157962
Plastoglobule At3g27110 A0A178VFN4;Q9LSC4;A0A1I9LM40;A0A1I9LM41
AT3G27110 5.00 + 0.00707586
Plastoglobule At4g13200 Uncharacterized protein At4g13200 Q8LDV3 AT4G13200 2.15 + 0
Plastoglobule At5g05200 Uncharacterized aarF domain-containing protein kinase At5g05200 Q9ASX5 AT5G05200 6.55 + 0.00133333
Plastoglobule CCD4 Probable carotenoid cleavage dioxygenase 4 O49675 AT4G19170 1.60 + 0
Plastoglobule CSP41B Chloroplast stem-loop binding protein of 41 kDa b A0A1P8ATL2;Q9SA52
AT1G09340 1.80 + 0.00179798
Plastoglobule CYP74A Allene oxide synthase Q96242 AT5G42650 1.29 + 0
Plastoglobule PAP1 Probable plastid-lipid-associated protein 1 O81439 AT4G04020 5.19 + 0.00103333
Plastoglobule PAP10 Probable plastid-lipid-associated protein 10 Q8W4F1 AT2G46910 3.51 + 0.0070274
Plastoglobule PAP11 Probable plastid-lipid-associated protein 11 O81304 AT4G00030 1.68 + 0.00813423
Plastoglobule PAP12 Probable plastid-lipid-associated protein 12 Q8LAP6 AT1G51110 1.60 + 0.0107245
Plastoglobule PAP13 Probable plastid-lipid-associated protein 13 Q8S9M1;F4IM05;A8MRU9
AT2G42130 2.13 + 0.00153086
Plastoglobule PAP2 Probable plastid-lipid-associated protein 2 O49629 AT4G22240 5.76 + 0.00142529
Plastoglobule PAP3 Probable plastid-lipid-associated protein 3 O82291 AT2G35490 2.55 + 0.0013262
Plastoglobule PAP4 Probable plastid-lipid-associated protein 4 Q9LU85 AT3G26070 1.93 + 0
Plastoglobule PAP5 Probable plastid-lipid-associated protein 5 A0A1I9LP70;Q6DBN2
AT3G26080 2.44 0.108206
Plastoglobule PAP6 Probable plastid-lipid-associated protein 6 Q9LW57;A0A1I9LQU5;A0A1I9LQU3
AT3G23400 2.03 + 0
Plastoglobule PAP8 Probable plastid-lipid-associated protein 8 Q941D3;F4K2P2 AT5G19940 0.54 + 0.000932331
Plastoglobule PAP9 Probable plastid-lipid-associated protein 9 Q9M2P7 AT3G58010 1.90 + 0
Plastoglobule PLAT1 PLAT domain-containing protein 1 O65660 AT4G39730 2.36 + 0
Plastoglobule PSY PHYTOENE SYNTHASE F4KGX7;P37271 AT5G17230 1.05 0.957052
Plastoglobule VTE1 Tocopherol cyclase Q94FY7 AT4G32770 3.39 + 0.00140113
Plastoglobule Q9SR77 AT3G10130 2.72 + 0.000976378
Plastoglobule Q9LW26 AT3G26840 4.31 + 0.0049
Plastoglobule Q9M236;F4IZ56 AT3G43540 2.73 + 0.0108571
Protease ARASP2 O23053 AT1G05140 1.05 0.378496
Protease At2g21960 Q9SJ03 AT2G21960 1.55 + 0.00184456
Protease CLPP4 Q94B60 AT5G45390 1.39 + 0.0230225
Protease CLPP5 Q9S834 AT1G02560 2.98 + 0.0319891
Protease EGY2 F4K0T6;F4K0T7;Q9FFK3
AT5G05740 1.30 + 0.0107578
Protease FTSH11 ATP-dependent zinc metalloprotease FTSH 11/mitochondrial Q9FGM0 AT5G53170 3.14 + 0

182
Protease FTSH12 ATP-dependent zinc metalloprotease FTSH 12 A0A1P8ARD2;Q9SAJ3;A0A1P8ARE4
AT1G79560 4.65 + 0
Protease FTSH9 ATP-dependent zinc metalloprotease FTSH 9 Q9FIM2 AT5G58870 6.80 + 0.00185417
Protease SPPA Serine protease SPPA Q9C9C0;A0A1P8AUG2
AT1G73990 4.27 + 0.00451502
Protein folding At3g12345 FKBP-type peptidyl-prolyl cis-trans isomerase Q9LHH3 AT3G12345 1.49 + 0.00138547
Protein folding CLPB3 Chaperone protein ClpB3 Q9LF37 AT5G15450 5.07 + 0.00161039
Protein folding CPN21 20 kDa chaperonin O65282 AT5G20720 1.92 + 0.00410619
Protein folding CPN60A1 Chaperonin 60 subunit alpha 1 P21238 AT2G28000 3.44 + 0
Protein folding CYP26-2 Peptidyl-prolyl cis-trans isomerase CYP26-2 F4HTT6;A0A1P8APN5
AT1G74070 1.61 + 0.0108902
Protein folding CYP28 Peptidyl-prolyl cis-trans isomerase CYP28 A0A1P8B9P2;O65220
AT5G35100 2.56 + 0.00155975
Protein folding CYP37 Peptidyl-prolyl cis-trans isomerase CYP37 P82869;A0A1I9LQ22;A0A1I9LQ23
AT3G15520 1.80 + 0.00573585
Protein folding DJA5 Q940V1;Q9SJZ7 AT4G39960 2.10 + 0.00589781
Protein folding DJA7 A0A1P8ART2;Q0WN54
AT1G80030 2.06 + 0.00478049
Protein folding FKBP13 Peptidyl-prolyl cis-trans isomerase FKBP13 Q9SCY2 AT5G45680 2.90 + 0.00107826
Protein folding FKBP16-3 Peptidyl-prolyl cis-trans isomerase FKBP16-3 A0A1P8B252;O22870
AT2G43560 1.23 + 0.00908176
Protein folding FKBP16-4 Peptidyl-prolyl cis-trans isomerase FKBP16-4 Q9SR70 AT3G10060 1.52 + 0.00215238
Protein folding FKBP17-2 Peptidyl-prolyl cis-trans isomerase FKBP17-2 Q9LDY5 AT1G18170 1.17 0.482104
Protein folding FKBP18 Peptidyl-prolyl cis-trans isomerase FKBP18 A0A1P8APZ5;Q9LM71
AT1G20810 2.84 + 0.00104202
Protein folding FKBP19 Peptidyl-prolyl cis-trans isomerase FKBP19 Q9LYR5;A0A1R7T3F4
AT5G13410 3.04 + 0
Protein folding HSP70-6 Heat shock 70 kDa protein 6 Q9STW6 AT4G24280 1.86 0.0862768
Protein folding TIG Trigger factor-like protein TIG Q8S9L5 AT5G55220 3.13 + 0.0017451
Protein translocation CLPC1 Q9FI56 AT5G50920 3.34 + 0
Protein translocation SCY1 Preprotein translocase subunit SCY1 Q38885 AT2G18710 1.44 + 0.00777027
Protein translocation SECA1 Protein translocase subunit SecA A0A1P8B485;Q9SYI0;F4JG57
AT4G01800 1.88 + 0.0049205
Protein translocation TATA Sec-independent protein translocase protein TATA Q9LKU2 AT5G28750 0.85 0.764232
Protein translocation TATB Sec-independent protein translocase protein TATB Q9XH75 AT5G52440 1.22 + 0.0148739
Protein translocation TATC Sec-independent protein translocase protein TATC Q9SJV5 AT2G01110 1.48 + 0.00176238
Protein translocation TIC110 Q8LPR9 AT1G06950 3.54 + 0.0016
Protein translocation TIC55 Q9SK50 AT2G24820 3.33 + 0
PSI PSAA Photosystem I P700 chlorophyll a apoprotein A1 P56766 ATCG00350 0.79 + 0
PSI PSAB Photosystem I P700 chlorophyll a apoprotein A2 P56767 ATCG00340 0.72 + 0.00134783
PSI PSAC Photosystem I iron-sulfur center P62090 ATCG01060 0.67 + 0.00105983

183
PSI PSAD Photosystem I reaction center subunit II-2 Q9SA56;Q9S7H1 AT1G03130;AT4G02770
0.72 + 0.00560886
PSI PSAE1 Photosystem I reaction center subunit IV A Q9S831 AT4G28750 0.65 + 0
PSI PSAE2 Photosystem I reaction center subunit IV B Q9S714 AT2G20260 0.89 0.212192
PSI PSAF Photosystem I reaction center subunit III Q9SHE8 AT1G31330 0.82 + 0.00135519
PSI PSAG Photosystem I reaction center subunit V Q9S7N7 AT1G55670 0.80 + 0
PSI PSAH Photosystem I reaction center subunit VI-1 Q9SUI7;Q9SUI6 AT1G52230;AT3G16140
0.90 + 0.0408257
PSI PSAK Photosystem I reaction center subunit psaK Q9SUI5 AT1G30380 0.82 + 0.0107915
PSI PSAL Photosystem I reaction center subunit XI A0A1P8B6D0;Q9SUI4
AT4G12800 0.81 + 0
PSI PSAN Photosystem I reaction center subunit N P49107 AT5G64040 0.72 + 0
PSI PSAO Photosystem I subunit O Q949Q5 AT1G08380 0.85 0.683176
PSII PSB28 Photosystem II reaction center PSB28 protein F4JM05;Q8W0Y8 AT4G28660 2.23 + 0
PSII PSB33 Rieske (2Fe-2S) domain-containing protein Q9C9I7 AT1G71500 1.60 + 0
PSII PSBA (D1) Photosystem II protein D1 P83755 ATCG00020 1.01 0.13957
PSII PSBB (CP47) Photosystem II CP47 reaction center protein P56777 ATCG00680 1.12 0.835847
PSII PSBC (CP43) Photosystem II CP43 reaction center protein P56778 ATCG00280 0.98 0.896823
PSII PSBD (D2) Photosystem II D2 protein P56761 ATCG00270 1.05 0.883602
PSII PSBE Cytochrome b559 subunit alpha P56779 ATCG00580 1.00 0.728399
PSII PSBF Cytochrome b559 subunit beta P62095 ATCG00570 0.95 + 0.0106914
PSII PSBH Photosystem II reaction center protein H P56780 ATCG00710 1.13 0.296312
PSII PSBO1 Oxygen-evolving enhancer protein 1-1 P23321 AT5G66570 0.97 + 0.00808
PSII PSBO2 Oxygen-evolving enhancer protein 1-2 Q9S841 AT3G50820 1.01 0.55003
PSII PSBP1 Oxygen-evolving enhancer protein 2-1 Q42029 AT1G06680 1.00 0.615862
PSII PSBQ1 Oxygen-evolving enhancer protein 3-1 Q9XFT3 AT4G21280 1.08 + 0.00462992
PSII PSBQ2 Oxygen-evolving enhancer protein 3-2 Q41932 AT4G05180 0.56 + 0
PSII PSBR Photosystem II 10 kDa polypeptide P27202 AT1G79040 0.23 0.731128
PSII PSBT Photosystem II 5 kDa protein A0A1I9LS90;Q39195
AT3G21055 0.90 + 0.0262507
PSII repair ALB3 Inner membrane protein ALBINO3 F4IJM1;Q8LBP4 AT2G28800 1.21 + 0.0207564
PSII repair CTPA1 F4KHG6 AT5G46390 1.89 + 0.00870358
PSII repair CYP38 Peptidyl-prolyl cis-trans isomerase CYP38 Q9SSA5 AT3G01480 1.02 0.789096
PSII repair DEG5 A0A1P8B644;A0A1P8B643;Q9SEL7
AT4G18370 2.49 + 0.00108772
PSII repair DEG8 F4KFV6;Q9LU10 AT5G39830 3.77 + 0.00583394
PSII repair DEGP1 Protease Do-like 1 O22609 AT3G27925 2.16 + 0.00137778
PSII repair DEGP2 Protease Do-like 2 B3H581;O82261 AT2G47940 0.85 0.999228
PSII repair F17F16.7 Protein HIGH CHLOROPHYLL FLUORESCENCE PHENOTYPE 173 A0A1P8AWY1;Q8W4D6;A0A1P8AWU9
AT1G16720 2.01 + 0.00136264

184
PSII repair FKBP20-2 Peptidyl-prolyl cis-trans isomerase FKBP20-2 A0A1I9LRJ6;Q0WRJ7
AT3G60370 1.83 + 0.00617021
PSII repair FTSH1 ATP-dependent zinc metalloprotease FTSH 1 Q39102 AT1G50250 1.72 + 0
PSII repair FTSH2 ATP-dependent zinc metalloprotease FTSH 2 A0A1P8AXC1;O80860
AT2G30950 1.75 + 0.00457391
PSII repair FTSH5 ATP-dependent zinc metalloprotease FTSH 5 Q9FH02 AT5G42270 1.66 + 0
PSII repair FTSH8 ATP-dependent zinc metalloprotease FTSH 8 Q8W585 AT1G06430 2.20 + 0.00261818
PSII repair FTSY O80842 AT2G45770 3.81 + 0
PSII repair HHL1 Protein HHL1 Q8LDL0 AT1G67700 1.40 + 0.0270444
PSII repair HSP70-7 Q9LTX9 AT5G49910 2.34 + 0
PSII repair LPA1 Protein LOW PSII ACCUMULATION 1 Q9SRY4 AT1G02910 1.23 + 0.0109524
PSII repair LQY1 Protein disulfide-isomerase LQY1 Q8GSJ6 AT1G75690 1.54 + 0.0107267
PSII repair LTO1 Thiol-disulfide oxidoreductase LTO1 A0A1P8B950;Q8L540
AT4G35760 1.62 + 0
PSII repair MET1 Protein MET1 Q94BS2 AT1G55480 1.97 + 0.00461404
PSII repair MPH1 Protein MAINTENANCE OF PSII UNDER HIGH LIGHT 1 Q9FL44 AT5G07020 1.26 + 0.000849315
PSII repair PAM68 Protein PAM68 A0A1P8B8D1;O49668
AT4G19100 1.48 + 0.00106897
PSII repair PDI6 Protein disulfide isomerase-like 1-2 Q9SRG3 AT1G77510 1.99 + 0.0275789
PSII repair PPL1 PsbP-like protein 1 P82538 AT3G55330 1.79 + 0.000879433
PSII repair PSB27-1 Photosystem II repair protein PSB27-H1 Q9LR64 AT1G03600 1.16 0.436786
PSII repair PSB27-2 Photosystem II D1 precursor processing protein PSB27-H2 A0A1P8ASY3;Q9ZVZ9
AT1G05385 1.93 + 0.00503475
PSII repair ROC4 F4IX28;F4IX26;P34791
AT3G62030 1.07 0.715257
PSII repair RubA Rubredoxin-like superfamily protein Q9SLI4 AT1G54500 1.43 + 0.0395772
PSII repair SRP-54A A8MSA9;P49967 AT1G48900 1.66 + 0.00911041
PSII repair TERC A0A1P8BDK4;F4JZG9
AT5G12130 1.41 + 0.000867133
PSII repair TL18.3 UPF0603 protein At1g54780 Q9ZVL6 AT1G54780 1.20 + 0
PSII repair VIPP1 Membrane-associated protein VIPP1 A0A178W0D3;O80796
AT1G65260 1.43 + 0.00805316
Redox regulation At1g14345 NAD(P)-linked oxidoreductase superfamily protein Q949S6 AT1G14345 1.62 + 0.0015122
Redox regulation At1g50450 Saccharopine dehydrogenase Q94BZ0 AT1G50450 2.95 + 0.00155
Redox regulation ATHM2 Thioredoxin M2 Q9SEU8;F4JG94 AT4G03520 1.82 + 0
Redox regulation BAS1 2-Cys peroxiredoxin BAS1 Q96291 AT3G11630 2.47 + 0.000821192
Redox regulation BAS1B Q9C5R8;A0A1P8BD74
AT5G06290 3.10 + 0.0202075
Redox regulation CITRX Thioredoxin-like protein CITRX Q9M7X9 AT3G06730 1.44 + 0.00182564
Redox regulation ENH1 Rubredoxin family protein Q9FFJ2;A8MSF2 AT5G17170 1.89 + 0.0048595
Redox regulation FSD3 Superoxide dismutase [Fe] 3 Q9FMX0 AT5G23310 0.94 1
Redox regulation MCK7.20 Malate dehydrogenase Q8H1E2;F4KEX3 AT5G58330 2.36 + 0

185
Redox regulation MDH Malate dehydrogenase Q9SN86 AT3G47520 2.39 + 0
Redox regulation MED24.18 Thioredoxin family protein Q940I2 AT5G03880 1.22 + 0.00945455
Redox regulation NTRC NADPH-dependent thioredoxin reductase 3 O22229 AT2G41680 4.84 + 0
Redox regulation PRXQ Peroxiredoxin Q A0A1I9LR27;F4JBC9;Q9LU86
AT3G26060 2.47 + 0
Redox regulation TRXF1 Q9XFH8 AT3G02730 56.14 0.970862
Redox regulation TRXM1 Thioredoxin M1 O48737 AT1G03680 1.66 + 0.00357143
Redox regulation TRXM4 Thioredoxin M4 Q9SEU6 AT3G15360 1.76 + 0
Ribosome PSRP2 30S ribosomal protein 2 Q8VYM4 AT3G52150 2.22 + 0
Ribosome PSRP5 50S ribosomal protein 5 Q9LER7 AT3G56910 1.90 + 0.00558824
Ribosome PSRP6 A0A1P8BCP6;Q9FKP0
AT5G17870 3.52 + 0.0205057
Ribosome RPL1 50S ribosomal protein L1 Q9LY66;F4J296 AT3G63490 2.06 + 0.00115888
Ribosome RPL10 50S ribosomal protein L10 Q9FY50 AT5G13510 2.10 + 0
Ribosome RPL11 50S ribosomal protein L11 Q9MAP3 AT1G32990 2.20 + 0.000984127
Ribosome RPL12A 50S ribosomal protein L12-3 P36212;P36210 AT3G27830;AT3G27850
2.77 + 0.00102479
Ribosome RPL13 Q9SYL9 AT1G78630 1.22 + 0.0394703
Ribosome RPL14 50S ribosomal protein L14 P56792 AtCg00780 1.84 + 0
Ribosome RPL15 50S ribosomal protein L15 P25873 AT3G25920 2.06 + 0
Ribosome RPL16 50S ribosomal protein L16 P56793 AtCg00790 2.45 + 0.000892086
Ribosome RPL17 50S ribosomal protein L17 Q9M385 AT3G54210 1.71 + 0.00499617
Ribosome RPL18 50S ribosomal protein L18 Q9SX68 AT1G48350 1.71 + 0
Ribosome RPL19-1 Q8W463 AT4G17560 2.33 0.0513404
Ribosome RPL21 50S ribosomal protein L21 P51412 AT1G35680 1.80 + 0.00101639
Ribosome rpl22 50S ribosomal protein L22 P56795 AtCg00810 0.99 0.981351
Ribosome RPL23-A 50S ribosomal protein L23 P61845 AtCg00840 2.12 + 0.00137017
Ribosome RPL24 50S ribosomal protein L24 P92959 AT5G54600 1.53 + 0.009425
Ribosome RPL27 50S ribosomal protein L27 Q9FLN4 AT5G40950 2.06 + 0.000911765
Ribosome RPL29 50S ribosomal protein L29 Q9FJP3 AT5G65220 1.78 + 0.00212207
Ribosome RPL2-A 50S ribosomal protein L2 P56791 AtCg00830 1.94 + 0
Ribosome RPL31 50S ribosomal protein L31 Q9FWS4 AT1G75350 1.74 + 0.00922684
Ribosome RPL3A 50S ribosomal protein L3-1 Q9SKX4 AT2G43030 1.97 + 0
Ribosome RPL4 50S ribosomal protein L4 Q2V4Q4;Q3EDH2;O50061
AT1G07320 1.71 + 0.00901935
Ribosome RPL5 50S ribosomal protein L5 O04603 AT4G01310 2.15 + 0.000925373
Ribosome RPL6 50S ribosomal protein L6 O23049 AT1G05190 2.13 + 0
Ribosome RPL9 50S ribosomal protein L9 P25864 AT3G44890 2.47 + 0
Ribosome RPS10 30S ribosomal protein S10 Q9LK61 AT3G13120 2.56 + 0.00180711
Ribosome RPS11 30S ribosomal protein S11 P56802 AtCg00750 1.83 + 0.000939394

186
Ribosome rps12-A 30S ribosomal protein S12 P62126 AtCg00065;AtCg01230;AtCg00905
2.00 + 0.00175369
Ribosome RPS13 30S ribosomal protein S13 P42732 AT5G14320 1.99 + 0
Ribosome rps14 30S ribosomal protein S14 P56804 AtCg00330 2.31 + 0.0290909
Ribosome RPS15 30S ribosomal protein S15 P56805 AtCg01120 1.86 + 0.00919745
Ribosome RPS17 30S ribosomal protein S17 P16180 AT1G79850 2.24 + 0
Ribosome RPS18 30S ribosomal protein S18 P56807 AtCg00650 1.95 + 0
Ribosome RPS19 30S ribosomal protein S19 P56808 AtCg00820 2.03 + 0.00779661
Ribosome RPS2 30S ribosomal protein S2 P56797 AtCg00160 1.93 + 0.00147619
Ribosome RPS20 30S ribosomal protein S20 Q9ASV6 AT3G15190 2.16 + 0.00158974
Ribosome RPS3 30S ribosomal protein S3 P56798 AtCg00800 1.62 + 0.00674126
Ribosome RPS4 30S ribosomal protein S4 P56799 AtCg00380 1.78 + 0.000885714
Ribosome RPS5 30S ribosomal protein S5 P93014 AT2G33800 1.50 + 0.0049771
Ribosome RPS6 30S ribosomal protein S6 alpha A0A1P8AV66;Q8VY91
AT1G64510 1.89 + 0.00916825
Ribosome RPS7 Ribosomal protein S7 A0A2P2CLF5;P92557
AT2G07696 1.94 0.987819
Ribosome rps7-A 30S ribosomal protein S7 P61841 AtCg00900;AtCg01240
1.92 + 0.001
Ribosome RPS8 30S ribosomal protein S8 P56801 AtCg00770 1.82 + 0.00156962
Ribosome RPS9 30S ribosomal protein S9 Q9XJ27 AT1G74970 1.62 + 0
Ribosome RRP31 30S ribosomal protein 3-1 A8MQL0;Q9SX22 AT1G68590 2.40 + 0.00581295
Starch BAM3 Beta-amylase 3 O23553 AT4G17090 3.28 + 0.00148503
Starch GBSS1 Granule-bound starch synthase 1/amyloplastic Q9MAQ0 AT1G32900 32.99 + 0.00139326
Starch SS1 Starch synthase 1/amyloplastic Q9FNF2 AT5G24300 4.99 + 0
Starch SS2 Starch synthase 2/amyloplastic Q9MAC8 AT3G01180 30.27 + 0.000837838
Starch SS3 Starch synthase 3/amyloplastic F4IAG1;F4IAG2 AT1G11720 2.11 + 0.02175
Stress responsive APE1 Acclimation of photosynthesis to environment Q2HIR7;A0A219HZL6
AT5G38660 1.36 + 0
Stress responsive AT5g02160 Q9FPH2 AT5G02160 0.57 + 0.00109735
Stress responsive CLH1 Chlorophyllase-1 O22527 AT1G19670 15.85 + 0.000873239
Stress responsive FLU Protein FLUORESCENT IN BLUE LIGHT F4JFR2;F4JFR1;Q940U6
AT3G14110 1.28 + 0.0397089
Stress responsive LIR1 Light-regulated protein 1 Q96500 AT3G26740 1.04 0.0709843
Stress responsive PPD3 PsbP domain-containing protein 3 Q9S720 AT1G76450 1.65 + 0.00143353
Stress responsive PPD4 PsbP domain-containing protein 4 O49292 AT1G77090 1.82 + 0.00152147
Stress responsive PPD6 PsbP domain-containing protein 6 Q9LXX5 AT3G56650 1.29 + 0.00864725
Stress responsive TL29 Thylakoid lumenal 29 kDa protein A0A1P8B8W6;A0A1P8B8Y3;P82281
AT4G09010 1.27 + 0.00612676
Thylakoid architecture CURT1A Protein CURVATURE THYLAKOID 1A O04616 AT4G01150 1.76 + 0.00211215
Thylakoid architecture CURT1B Protein CURVATURE THYLAKOID 1B Q8LCA1 AT2G46820 1.22 + 0.00154037

187
Thylakoid architecture CURT1C Protein CURVATURE THYLAKOID 1C Q9M812 AT1G52220 1.03 0.787229
Thylakoid architecture CURT1D Protein CURVATURE THYLAKOID 1D A0A1P8B4V5;Q8LDD3
AT4G38100 1.38 0.397845
Thylakoid architecture FZL Probable transmembrane GTPase FZO-like A0A1P8AUL4;Q1KPV0;A0A1P8AUL2
AT1G03160 1.59 + 0.00496203
Thylakoid architecture PLSP1 Chloroplast processing peptidase A0A1I9LMR3;Q8H0W1
AT3G24590 2.20 + 0.0108242
Thylakoid architecture RIQ1 Reduced induction of non-photochemical quenching1 Q9SD79 AT5G08050 1.61 + 0.0018836
Thylakoid architecture RIQ2 Reduced induction of non-photochemical quenching2 Q94F10 AT1G74730 1.71 + 0.00171981
Thylakoid architecture THF1 Protein THYLAKOID FORMATION 1 Q9SKT0 AT2G20890 1.60 + 0

188
Table 14: Relative abundance of thylakoid-associated proteins in light-acclimated phosphorylation mutants. Details of the 447 MS-quantified thylakoid proteins from Col-0, stn7 and tap38
Arabidopsis plants grown at LL, ML and HL, including functional category, protein/gene name, description, UniProtKB identifier, TAIR ID and abundance ratios relative to Col-0 at ML. Proteins
with altered abundance light irradiance (Light) or Genotype were identified by two-way ANOVA (p < 0.05). Median protein iBAQ values were used for the calculation of ratios.
Category Protein/
gene name Description
UniProtKB accession
TAIR ID
Ratio relative to ML Col-0 Two-way ANOVA p-
value Genotype
Two-way ANOVA p-
value Light
Two-way ANOVA p-
value Interaction
LL Col-0
ML Col-0
HL Col-0
LL stn7
ML stn7
HL stn7
LL tap38
ML tap38
HL tap38
Assembly ALB4 ALBINO3-like protein 1 F4I9A9;Q9FYL3 AT1G24490 1.24 1 1.48 1.17 1.72 2.03 1.03 1.67 1.22 0.0090376
1 0.0022592 0.0117548
Assembly At3g17930 Q94BY7 AT3G17930 0.79 1 1.55 0.61 1.20 1.78 0.87 1.59 1.30 0.120806 9.44E-08 0.0008925
73
Assembly At4g28740 F4JM22 AT4G28740 0.67 1 1.41 0.84 1.17 1.77 0.69 0.86 1.06 5.65E-05 1.43E-08 0.0250456
Assembly At5g48790 Q94F50;Q9FKB7 AT5G48790 0.98 1 1.24 1.28 0.89 1.20 1.25 0.93 1.22 0.654362 0.0002790
06 0.142975
Assembly CCB1 Q9LSE4 AT3G26710 0.65 1 1.13 0.77 1.03 1.37 0.64 0.85 1.06 2.95E-05 2.80E-11 0.0160635
Assembly CCS1 Cytochrome c biogenesis protein CCS1 Q9XIA4 AT1G49380 0.90 1 2.07 1.34 1.91 1.88 1.28 1.82 1.15 0.0037224
2 0.0001605
2 0.0014810
5
Assembly CEST Q9LU01 AT5G44650 0.62 1 1.71 0.69 1.28 2.04 0.63 1.22 1.48 5.21E-06 6.01E-16 4.31E-06
Assembly F23E12.190 O65502 AT4G35250 0.87 1 0.97 1.05 1.13 1.24 0.91 0.99 0.92 1.47E-06 0.0211402 0.0388592
Assembly FFC Signal recognition particle 54 kDa protein P37107 AT5G03940 0.81 1 1.35 1.06 0.94 2.51 0.62 1.12 1.34 4.47E-09 7.22E-14 3.54E-09
Assembly HCF101 Fe-S cluster assembly factor HCF101 Q6STH5 AT3G24430 0.32 1 1.17 0.77 0.46 1.73 0.48 0.53 0.57 2.02E-05 2.23E-07 3.62E-06
Assembly HCF136 Photosystem II stability/assembly factor HCF136 O82660;A0A1P8BG37
AT5G23120 1.04 1 1.53 1.31 1.62 1.74 1.26 1.24 1.48 2.90E-11 3.77E-12 3.00E-06
Assembly HCF164 Thioredoxin-like protein HCF164 O23166 AT4G37200 0.73 1 0.95 0.86 1.22 1.11 0.72 1.09 0.81 0.0329372 1.58E-05 0.335606
Assembly HCF208 Q9FJ81 AT5G52110 0.98 1 1.32 1.05 1.25 1.11 0.82 1.05 1.01 0.037713 0.0625774 0.108695
Assembly LPA2 Protein LOW PSII ACCUMULATION 2 F4KDA6 AT5G51545 0.53 1 0.74 0.51 1.53 0.83 0.50 1.44 0.75 0.0433447 3.68E-07 0.0213195
Assembly LPA3 Protein LOW PSII ACCUMULATION 3 Q8H0W0 AT1G73060 1.29 1 1.21 1.48 1.02 2.36 1.31 0.94 2.10 0.0044505
9 1.33E-06 0.0380471
Assembly PPD1 PsbP domain-containing protein 1 O23403 AT4G15510 0.71 1 3.76 1.12 3.49 5.93 0.77 2.44 4.31 7.20E-05 7.93E-10 0.026366
Assembly ycf4 Photosystem I assembly protein Ycf4 P56788 AtCg00520 0.70 1 1.32 0.81 1.25 1.81 0.86 1.08 1.39 8.22E-06 6.74E-13 0.0004472
98
Assembly TL16.5 Thylakoid lumenal 16.5 kDa protein A0A1P8B5H3;O22773;A0A1P8B5G9
AT4G02530 1.03 1 0.76 1.07 0.46 0.97 0.95 0.54 0.75 0.0045477 5.40E-07 6.87E-06
ATP synthase atpA ATP synthase subunit alpha P56757 ATCG00120 0.58 1 1.22 0.59 1.00 1.31 0.60 0.99 1.15 0.114644 3.51E-15 0.198899
ATP synthase atpB ATP synthase subunit beta P19366 ATCG00480 0.59 1 0.99 0.61 0.99 1.12 0.57 0.99 0.97 1.21E-05 1.87E-19 7.75E-05
ATP synthase ATPC1 ATP synthase gamma chain 1 Q01908 AT4G04640 0.65 1 0.86 0.70 1.12 1.01 0.63 0.92 1.02 0.0171392 3.26E-09 0.654635
ATP synthase ATPD ATP synthase subunit delta Q9SSS9 AT4G09650 0.62 1 0.92 0.69 0.75 1.08 0.70 0.71 0.86 0.0760841 7.47E-08 0.0002455
4
ATP synthase atpE ATP synthase epsilon chain P09468 ATCG00470 0.63 1 1.14 0.70 1.12 1.27 0.68 1.01 1.10 0.0003587
08 1.87E-13 0.143885
ATP synthase atpF ATP synthase subunit b P56759 ATCG00130 0.53 1 1.31 0.61 1.34 1.67 0.51 1.13 1.18 0.557403 4.33E-05 0.752902

189
ATP synthase atpH ATP synthase subunit c P56760 ATCG00140 0.03 1 0.16 0.42 0.68 0.25 0.26 0.18 0.27 0.505542 0.0541759 0.0498448
ATP synthase atpI ATP synthase subunit a P56758 ATCG00150 0.73 1 0.34 0.95 0.80 0.82 0.72 0.85 0.63 0.0870473 0.0035816
1 0.0360638
ATP synthase F10M6.100 Q42139 AT4G32260 0.55 1 1.14 0.56 0.57 1.24 0.56 0.59 1.02 0.0223413 8.18E-09 0.0015893
1
Carbon fixation BCA1 Beta carbonic anhydrase 1 A0A1I9LQB3;P27140
AT3G01500 0.48 1 1.29 0.93 0.99 1.73 0.44 0.84 1.12 2.31E-12 2.26E-16 1.41E-07
Carbon fixation rbcL Ribulose bisphosphate carboxylase large chain O03042 ATCG00490 0.74 1 2.68 0.49 2.49 3.20 0.53 2.08 2.39 2.23E-11 1.73E-21 9.59E-13
Carbon fixation RBCS-1A Ribulose bisphosphate carboxylase small chain 1A P10795 AT1G67090 0.72 1 2.91 0.62 2.93 4.34 0.62 1.94 3.94 0.0127518 1.82E-09 0.0859096
Carbon fixation RBCS-3B Ribulose bisphosphate carboxylase small chain 3B P10798;P10797;B3H5S2;F4KA76
AT5G38410;AT5G38420
0.78 1 2.45 0.54 2.34 3.56 0.55 1.89 2.60 2.28E-10 4.46E-19 1.32E-09
Carbon fixation RCA Ribulose bisphosphate carboxylase/oxygenase activase
P10896;F4IVZ7 AT2G39730 0.29 1 1.35 0.69 0.50 1.69 0.34 0.67 0.93 1.60E-14 4.09E-22 2.43E-16
Chloroplast replication
FTSZ1 Cell division protein FtsZ homolog 1 Q42545 AT5G55280 0.71 1 1.25 1.35 0.30 2.78 1.00 0.65 1.01 0.0001865
99 4.30E-06
0.000118921
Chloroplast replication
FTSZ2-1 Cell division protein FtsZ homolog 2-1 A0A1P8AXD8;O82533
AT2G36250 0.77 1 2.08 1.33 0.33 2.44 0.93 0.73 1.24 6.92E-05 2.98E-11 1.04E-06
Chlororespiration
PIFI B3H4M0;F4J037;F4J034;Q9LVZ5;F4J036
AT3G15840 0.91 1 1.08 1.23 1.45 1.38 0.89 1.44 1.25 0.0006404
46 0.0036178
9 0.171208
Cytochrome b6f petA Cytochrome f P56771 ATCG00540 0.66 1 1.15 0.79 1.21 1.07 0.66 1.03 1.03 5.00E-06 2.03E-14 0.0002085
64
Cytochrome b6f petB Cytochrome b6 P56773 ATCG00720 0.80 1 1.06 1.10 0.99 1.41 0.79 1.09 1.10 0.0014277
6 0.0003759
68 0.195827
Cytochrome b6f petC Cytochrome b6-f complex iron-sulfur subunit Q9ZR03 AT4G03280 0.75 1 1.15 0.87 1.33 1.24 0.72 1.11 0.99 0.0001529
65 1.83E-08 0.0844564
Cytochrome b6f petD Cytochrome b6-f complex subunit 4 P56774 AT4G03280 0.79 1 1.28 0.83 1.05 1.31 0.74 1.20 1.32 0.3186 1.51E-06 0.501627
DNA/RNA At1g08880 Probable histone H2AXb Q9S9K7;O04848 At1g08880 0.77 1 4.96 0.92 1.14 3.44 0.59 2.20 4.59 0.291725 1.71E-08 0.160714
DNA/RNA At2g21530 Q8GWP4 AT2G21530 0.41 1 0.81 0.48 1.82 1.19 0.95 0.98 0.53 2.92E-07 6.79E-09 7.64E-08
DNA/RNA At2g24420 Q9ZQ26 AT2G24420 0.59 1 2.79 0.54 0.52 2.35 0.44 0.92 1.96 0.0002746
93 3.32E-16
0.000218605
DNA/RNA At5g22880 Histone H2B.10 Q9FFC0 At5g22880 1.26 1 7.08 1.32 1.43 6.10 1.10 2.66 6.55 0.0132685 1.88E-16 0.0006488
48
DNA/RNA At5g27670 Probable histone H2A.5 Q94F49 At5g27670 0.96 1 4.85 1.14 3.41 3.26 0.66 3.41 5.14 0.426846 3.31E-05 0.0621754
DNA/RNA CP29A 29 kDa ribonucleoprotein Q43349;F4JAF3 AT3G53460 2.65 1 10.72 6.12 15.05 14.18 3.43 11.92 9.75 4.02E-07 5.77E-08 9.06E-06
DNA/RNA CP29B RNA-binding protein CP29B Q9ZUU4 AT2G37220 0.62 1 1.14 1.37 2.58 1.72 0.89 1.61 0.90 4.47E-12 2.17E-10 1.65E-06
DNA/RNA CP31A 31 kDa ribonucleoprotein Q04836 AT4G24770 0.20 1 1.07 0.24 1.25 1.75 0.21 2.47 1.38 4.07E-11 4.84E-18 9.80E-13
DNA/RNA GYRA Probable DNA gyrase subunit A/mitochondrial Q9CAF6 AT3G10690 0.99 1 6.68 1.43 1.99 7.42 1.13 2.92 5.13 0.0022221
5 4.48E-16 2.65E-06
DNA/RNA H2AV Probable histone H2A variant 3 Q9C944;Q9SII0;O23628;F4JT33;Q9T0H7
AT1G52740 1.16 1 5.87 1.14 1.74 4.49 0.65 3.99 4.46 0.0387322 1.09E-11 5.54E-06
DNA/RNA H2B Histone H2B.7 Q9LZT0;O23629;Q9LZ45
At5g02570 1.01 1 8.59 1.47 2.59 15.71 1.10 2.80 14.54 0.832065 0.0001495
4 0.976384
DNA/RNA RBG7 Glycine-rich RNA-binding protein 7 Q03250;F4IHK9 AT2G21660 1.75 1 8.44 2.24 2.44 6.69 2.25 3.93 4.60 0.352227 9.12E-17 6.67E-12

190
DNA/RNA RBG8 Glycine-rich RNA-binding protein 8 Q03251;F4JVC0;F4JVC1;F4JVB9
AT4G39260 0.64 1 3.59 0.55 1.36 3.16 0.53 2.86 1.84 0.644783 2.54E-10 8.67E-07
DNA/RNA rpoA DNA-directed RNA polymerase subunit alpha P56762 AtCg00740 1.16 1 3.56 1.22 1.88 4.05 1.11 2.34 3.38 0.0018409
9 3.45E-14
0.000418985
DNA/RNA T10C21.40 Translation initiation factor IF-3 Q94B52;F4JQD8 At4g30690 0.75 1 0.66 0.66 1.21 0.94 0.61 1.43 1.15 0.0365418 0.0001699
92 0.107588
DNA/RNA T6H20.190 Q9STF2 AT3G46780 1.54 1 0.71 1.77 0.65 1.57 1.68 1.04 1.38 2.73E-12 3.02E-19 4.99E-15
DNA/RNA TUFA Elongation factor Tu P17745 AT4G20360 0.50 1 0.94 0.82 1.03 1.48 0.49 1.02 1.09 1.24E-10 4.41E-15 1.19E-07
Electron transfer DRT112 Plastocyanin major isoform P42699 AT1G20340 4.86 1 4.90 2.94 24.97 6.38 2.90 13.68 5.29 1.38E-12 1.46E-14 1.99E-14
Electron transfer FD2 Ferredoxin-2 P16972 AT1G60950 0.35 1 0.57 0.67 5.94 0.49 0.67 2.64 2.71 0.0075580
1 4.35E-05
0.000377691
Electron transfer LFNR1 Ferredoxin--NADP reductase, leaf isozyme 1 Q9FKW6;F4JZ46 AT5G66190 0.69 1 1.03 0.90 1.04 1.21 0.73 0.93 0.98 4.98E-06 2.65E-10 0.131695
Electron transfer LFNR2 Ferredoxin--NADP reductase, leaf isozyme 2 Q8W493;C0Z2A8
AT1G20020 0.53 1 0.79 0.67 0.88 0.97 0.51 0.61 0.81 1.41E-08 9.32E-12 4.43E-07
Electron transfer NDC1 Alternative NAD(P)H-ubiquinone oxidoreductase C1/mitochondrial
Q8GXR9 AT5G08740 0.64 1 2.46 0.86 1.10 2.51 0.72 1.15 2.58 0.0578948 4.60E-17 0.488565
Electron transfer PGR5 Protein PROTON GRADIENT REGULATION 5 Q9SL05 AT2G05620 1.04 1 1.57 1.02 1.01 1.73 1.04 0.85 1.74 0.509359 4.01E-10 0.505547
Electron transfer PGR6 Uncharacterized aarF domain-containing protein kinase At4g31390
Q8RWG1;A0A1P8B7P6
AT4G31390 0.86 1 3.62 1.03 1.65 3.37 1.09 1.55 3.04 0.108657 1.11E-13 0.0190423
Electron transfer PGRL1A PGR5-like protein 1A Q8H112;A0A2H1ZEN5
AT4G22890 0.75 1 0.93 0.90 1.03 0.94 0.77 0.91 0.84 0.0023973
3 0.0001745
98 0.185758
Electron transfer PGRL1B PGR5-like protein 1B Q8GYC7;F4JPU9
AT4G11960 2.57 1 3.99 2.45 2.03 2.76 2.45 2.20 3.09 0.757931 3.21E-07 0.0013572
6
Electron transfer STR4 Rhodanese-like domain-containing protein 4 A0A1P8B8J7;Q9M158
AT4G01050 0.98 1 1.21 0.97 0.99 1.30 0.88 0.85 1.00 0.0004690
03 0.0001591
21 0.167979
Electron transfer TIC62 Protein TIC 62 Q8H0U5 AT3G18890 0.60 1 1.07 0.70 1.08 1.29 0.62 0.86 1.05 2.40E-06 2.87E-13 0.0106738
Ion channel At5g37360 Q93Z11 AT5G37360 0.64 1 0.99 0.76 0.98 1.22 0.72 0.90 0.81 0.646428 0.0143895 0.728811
Ion channel DIT2-1 Dicarboxylate transporter 2.1 Q9FMF7 AT5G64290 0.56 1 1.16 0.63 1.10 2.00 0.42 1.07 0.80 0.0179034 1.05E-05 0.0772914
Ion channel KEA3 K(+) efflux antiporter 3 Q9M0Z3 AT4G04850 1.28 1 2.68 1.14 1.27 2.76 1.41 0.95 2.32 0.0533837 1.38E-12 0.0053462
7
Kinase/phosphatase
At3g59780 F4J9G2 AT3G59780 1.06 1 1.33 1.13 1.15 1.40 1.09 1.07 1.11 2.93E-05 8.73E-08 9.73E-05
Kinase/phosphatase
At5g35170 Adenylate kinase 5 F4JYC0;Q8VYL1 AT5G35170 0.04 1 0.13 0.02 0.76 0.34 0.03 0.85 0.09 0.332231 3.84E-11 0.0213068
Kinase/phosphatase
PGK1 Phosphoglycerate kinase 1 Q9LD57 AT3G12780 0.60 1 1.02 1.29 0.93 1.24 0.67 0.90 0.70 4.77E-10 0.0003530
05 5.46E-08
LHCI LHCA1 Chlorophyll a-b binding protein 6 A8MS75;Q01667 AT3G54890 1.33 1 1.03 1.25 1.23 1.03 1.19 1.30 0.90 0.0676009 2.78E-08 6.22E-06
LHCI Lhca2 Q9SYW8 AT3G61470;AT5G28450
1.29 1 1.05 1.35 1.09 0.83 1.07 0.80 0.67 0.106166 0.0003230
37 0.423524
LHCI LHCA3 Q9SY97 AT1G61520 1.10 1 0.88 1.10 0.41 0.84 1.05 0.43 0.88 4.22E-07 8.81E-12 7.78E-08
LHCI LHCA4 Chlorophyll a-b binding protein 4 P27521 AT3G47470 0.94 1 0.68 1.07 0.88 0.78 0.95 0.79 0.67 0.214458 1.47E-06 0.170655
LHCI LHCA5 Photosystem I chlorophyll a/b-binding protein 5 Q9C639 At1g45474 0.41 1 0.78 2.33 1.35 1.12 2.40 1.17 0.82 0.0811702 0.0150423 0.211182
LHCI LHCA6 Q8LCQ4 AT1G19150 0.42 1 0.42 0.47 1.22 0.44 0.75 1.02 0.46 0.472531 9.80E-05 0.355015
LHCII Lhb1B1 Q39142 AT2G34430 1.93 1 0.43 2.13 0.81 0.45 1.39 0.96 0.37 8.34E-07 1.03E-17 1.84E-07

191
LHCII Lhb1B2 Q39141 AT2G34420 0.94 1 0.58 1.27 1.22 0.65 0.91 0.88 0.57 9.20E-06 1.90E-09 0.0377002
LHCII LHCB1.2;LHCB1.1
Chlorophyll a-b binding protein 3 Q8VZ87;P0CJ48 AT1G29910 0.83 1 0.92 1.30 1.26 0.64 0.96 0.88 0.89 0.0780214 0.0050128
1 0.027888
LHCII LHCB1.3 Chlorophyll a-b binding protein 1 P04778 AT1G29930 1.20 1 1.17 1.92 1.66 1.76 1.06 0.97 0.81 1.13E-12 0.0028232
8 0.0068623
1
LHCII LHCB2.2
Q9S7J7;Q9SHR7;Q9XF87;A0A1I9LMB4;A0A1P8AZ91
AT2G05070;AT2G05100;AT3G27690
1.27 1 0.83 1.54 0.98 0.78 1.20 0.98 0.69 0.0012394
8 1.68E-12
0.00237087
LHCII LHCB3*1 Q9S7M0 AT5G54270 0.99 1 0.69 1.14 1.12 0.73 0.86 1.06 0.60 0.0252179 9.28E-07 0.724102
LHCII LHCB4.1 Chlorophyll a-b binding protein CP29.1 Q07473 AT5G01530 1.11 1 0.97 1.13 1.00 1.08 1.12 0.96 1.00 0.146833 0.0005601
5 0.195216
LHCII LHCB4.2 Chlorophyll a-b binding protein CP29.2 Q9XF88 AT3G08940 1.23 1 0.88 1.17 0.90 0.90 1.18 0.83 0.90 0.113556 7.15E-10 0.0355893
LHCII LHCB4.3 Chlorophyll a-b binding protein CP29.3 Q9S7W1;F4IGY6 AT2G40100 0.02 1 2.63 0.02 1.64 3.14 0.01 1.23 3.53 0.37777 1.55E-09 0.871757
LHCII LHCB5 Chlorophyll a-b binding protein CP26 Q9XF89 AT4G10340 0.65 1 0.78 0.74 0.93 0.79 0.65 1.13 0.64 0.986901 7.42E-06 0.336285
LHCII LHCB6 Q9LMQ2 AT1G15820 1.16 1 1.00 1.28 1.07 1.05 1.05 1.00 0.85 1.63E-05 4.34E-07 0.0344755
LHC-like At5g47110 Q6NKS4 AT5G47110 0.96 1 1.08 1.33 1.44 1.59 1.20 1.17 1.12 0.0034529
5 0.623602 0.734225
LHC-like HLIP High-light-induced protein O81208 AT5G02120 1.28 1 0.80 1.84 2.05 1.59 1.60 1.33 1.09 0.0002852
27 0.329519 0.504836
LHC-like Lil3:1 Q9SYX1 AT4G17600 0.68 1 1.61 0.89 1.71 1.67 0.78 1.57 1.29 7.80E-05 3.89E-10 0.0001260
39
LHC-like T15K4.5 Q9FEC1 AT1G34000 0.96 1 0.78 1.06 0.83 1.08 1.00 0.77 0.83 0.0223813 0.0457448 0.254377
Light harvesting regulation
At1g56500 Q8VZ10 AT1G56500 0.90 1 1.20 1.04 1.36 1.45 0.91 1.19 1.23 2.63E-06 6.68E-09 0.144565
Light harvesting regulation
At4g31530 Q8GYZ0;F4JSP1 AT4G31530 0.65 1 1.35 1.18 0.67 1.73 0.77 0.69 0.89 1.19E-07 6.46E-10 8.44E-08
Light harvesting regulation
CHL Chloroplastic lipocalin Q9STS7 AT3G47860 1.62 1 1.92 1.93 0.97 1.72 1.63 1.19 1.46 0.154168 4.81E-10 0.0022415
6
Light harvesting regulation
PPH1 Protein phosphatase 2C 57 P49599 AT4G27800 0.97 1 1.14 0.72 0.83 0.80 0.07 0.04 0.02 5.25E-14 0.231996 0.27269
Light harvesting regulation
PSBS Photosystem II 22 kDa protein Q9XF91;F4IEG8 AT1G44575 0.84 1 1.43 1.03 1.13 1.79 0.88 0.92 1.33 1.02E-10 2.02E-16 7.17E-05
Light harvesting regulation
STN8 Serine/threonine-protein kinase STN8 Q9LZV4 AT5G01920 0.86 1 1.24 0.84 0.94 1.34 0.82 0.88 1.21 0.42916 2.97E-07 0.732281
Light harvesting regulation
TSP9 Thylakoid soluble phosphoprotein Q9SD66 AT3G47070 0.97 1 0.80 1.35 0.63 1.90 1.29 0.26 1.79 3.08E-07 1.37E-13 3.25E-12
Light harvesting regulation
VDE1 Violaxanthin de-epoxidase Q39249 AT1G08550 1.68 1 2.89 1.57 3.74 2.96 1.35 2.31 2.32 1.60E-10 4.19E-12 1.57E-11
Light harvesting regulation
ZEP Zeaxanthin epoxidase Q9FGC7 AT5G67030 0.75 1 0.69 0.84 1.15 0.83 0.76 1.10 0.57 0.0019379
7 8.83E-11 0.105383
NDH FKBP16-2 Photosynthetic NDH subunit of lumenal location 4 F4JW56;Q9SCY3
AT4G39710 0.61 1 1.08 0.79 1.16 1.40 0.70 0.95 1.20 2.59E-07 9.93E-13 0.0105867
NDH NDF6 Photosynthetic NDH subunit of subcomplex B 4 A0A1P8AS98;F4ICC6;Q8RXS1
AT1G18730 0.37 1 1.23 0.68 1.17 1.16 0.59 1.02 1.01 0.0068542
3 3.10E-10 0.0896358

192
NDH ndhA NAD(P)H-quinone oxidoreductase subunit 1 Q37165 AtCg01100 0.45 1 0.48 0.59 0.75 0.76 0.55 0.73 0.50 0.515621 0.0010037
2 0.354756
NDH ndhC NAD(P)H-quinone oxidoreductase subunit 3 P56751 ATCG00440 0.61 1 1.06 1.12 0.98 1.50 0.96 1.46 1.27 0.0424713 0.0055928
1 0.598243
NDH ndhE NAD(P)H-quinone oxidoreductase subunit 4L P26289 ATCG01070 0.40 1 0.87 0.46 1.22 1.02 0.39 1.04 0.83 1.70E-05 2.36E-14 0.156161
NDH ndhF NAD(P)H-quinone oxidoreductase subunit 5 P56752 ATCG01010 0.31 1 0.54 0.43 0.71 0.83 0.31 0.46 0.45 0.0161426 0.0003083
32 0.0396594
NDH ndhH NAD(P)H-quinone oxidoreductase subunit H P56753 ATCG01110 0.48 1 1.08 0.64 1.03 1.54 0.50 1.03 0.98 0.0004302
02 1.24E-10 0.0018788
NDH ndhI NAD(P)H-quinone oxidoreductase subunit I P56755 ATCG01090 0.42 1 0.84 0.58 1.44 1.14 0.43 1.17 0.56 3.38E-05 3.43E-10 0.0099787
9
NDH ndhJ NAD(P)H-quinone oxidoreductase subunit J P56754 ATCG00420 0.59 1 0.96 0.68 1.74 1.30 0.61 1.29 0.83 2.21E-07 4.08E-11 0.0002554
34
NDH ndhK NAD(P)H-quinone oxidoreductase subunit K P56756 ATCG00430 0.44 1 0.86 0.56 1.47 1.00 0.41 1.13 0.79 1.02E-07 1.38E-14 0.0005279
67
NDH ndhL NAD(P)H-quinone oxidoreductase subunit L Q9CAC5 AT1G70760 0.72 1 1.10 0.91 1.03 1.48 0.79 1.16 1.00 0.0001094
11 2.18E-07
0.00242256
NDH ndhM NAD(P)H-quinone oxidoreductase subunit M Q2V2S7 AT4G37925 0.42 1 0.72 0.49 1.44 1.05 0.36 1.23 0.62 2.56E-07 1.60E-13 0.0001570
98
NDH ndhN NAD(P)H-quinone oxidoreductase subunit N Q9LVM2 AT5G58260 0.53 1 1.13 0.75 1.47 1.37 0.58 1.24 1.06 2.82E-07 1.55E-12 0.0570438
NDH ndhO NAD(P)H-quinone oxidoreductase subunit O Q9S829 AT1G74880 0.48 1 0.65 0.56 1.20 0.81 0.46 1.09 0.71 0.0027049 7.09E-10 0.555166
NDH ndhS NAD(P)H-quinone oxidoreductase subunit S Q9T0A4 AT4G23890 0.57 1 0.73 0.59 1.02 0.99 0.54 1.17 0.73 0.372521 2.21E-06 0.267926
NDH ndhT NAD(P)H-quinone oxidoreductase subunit T Q9SMS0 AT4G09350 0.28 1 1.18 0.68 2.26 1.98 0.30 1.15 1.02 0.0004789
94 4.01E-05 0.381194
NDH ndhU NAD(P)H-quinone oxidoreductase subunit U Q84VQ4 AT5G21430 0.49 1 0.89 0.65 1.15 1.22 0.51 0.95 0.83 5.43E-05 9.25E-10 0.162424
NDH PNSB1 Photosynthetic NDH subunit of subcomplex B 1 Q9S9N6 AT1G15980 0.48 1 1.00 0.63 1.16 1.21 0.53 1.05 0.91 2.70E-06 5.70E-13 0.0708959
NDH PNSB2 Photosynthetic NDH subunit of subcomplex B 2 Q94AQ8;F4I891;F4I890
AT1G64770 0.37 1 0.42 0.54 1.29 0.79 0.49 0.85 0.35 4.56E-05 1.84E-09 0.0701517
NDH PNSB3 Photosynthetic NDH subunit of subcomplex B 3 Q9LU21 AT3G16250 0.35 1 1.03 0.42 1.65 1.07 0.34 1.28 0.87 0.0010928
2 8.43E-12
0.00571268
NDH PNSB5 Photosynthetic NDH subunit of subcomplex B 5 Q9FG89 AT5G43750 0.56 1 0.76 0.77 1.30 0.76 0.55 1.26 0.60 0.0019257
5 2.74E-09 0.0281667
NDH PNSL1 Photosynthetic NDH subunit of lumenal location 1 O80634 AT2G39470 0.44 1 0.74 0.62 0.97 0.83 0.48 0.77 0.76 0.0055828
8 5.78E-09 0.0445443
NDH PNSL2 Photosynthetic NDH subunit of lumenal location 2 Q9XI73 AT1G14150 0.47 1 0.93 0.62 1.01 1.08 0.57 0.80 0.85 1.26E-05 5.79E-12 0.0011670
9
NDH PNSL3 Photosynthetic NDH subunit of lumenal location 3 Q9SGH4 AT3G01440 0.33 1 1.02 0.55 1.04 1.58 0.36 0.69 0.92 1.09E-06 1.36E-11 0.0041104
8
NDH PNSL5 Photosynthetic NDH subunit of lumenal location 5 Q9ASS6 AT5G13120 0.60 1 0.78 0.64 1.41 1.07 0.53 1.27 0.63 5.97E-06 8.17E-11 0.0038492
7
Other/unknown AAC1 ADP,ATP carrier protein 1 P31167 AT3G08580 0.78 1 4.35 0.73 0.85 3.72 0.61 1.03 3.47 3.21E-07 1.05E-23 3.68E-07
Other/unknown AAC2 ADP,ATP carrier protein 2 P40941 AT5G13490 0.56 1 3.23 0.43 2.55 3.29 0.39 3.05 2.67 0.053128 2.28E-09 0.0167767
Other/unknown accD Acetyl-coenzyme A carboxylase carboxyl transferase subunit beta
P56765 AtCg00500 1.40 1 3.28 2.67 1.69 4.05 1.37 2.47 3.10 0.123486 0.0001663
26 0.0544717

193
Other/unknown ALDH3I1 Aldehyde dehydrogenase family 3 member I1 A0A1P8B7C0;Q8W033;A0A1P8B7C2;F4JKM4
At4g34240 0.81 1 1.57 1.01 1.48 2.09 0.84 0.83 1.35 7.08E-05 1.64E-07 0.136693
Other/unknown AOC2 Allene oxide cyclase 2 Q9LS02 AT3G25770 0.16 1 1.54 0.14 1.31 2.03 0.21 1.07 1.15 7.72E-07 8.90E-18 3.23E-07
Other/unknown APG3 Peptide chain release factor APG3 Q8RX79 AT3G62910 0.38 1 2.27 0.94 0.77 2.86 0.49 0.90 1.60 2.26E-05 8.80E-12 2.46E-05
Other/unknown APXT L-ascorbate peroxidase T A0A1P8APU0;Q42593
AT1G77490;AT2G18140;AT2G18150
0.90 1 1.11 1.28 1.42 1.13 1.10 1.45 0.96 3.56E-05 9.74E-05 0.0009723
05
Other/unknown At1g07660 Histone H4 P59259;A8MRV1 AT2G28740 2.05 1 9.10 2.02 1.49 7.75 1.60 1.48 8.17 0.0855903 8.83E-21 0.0021918
7
Other/unknown At1g12250 Thylakoid lumenal protein At1g12250 Q8H1Q1;B6EUA5;A0A178W1Q3
AT1G12250 0.86 1 0.82 0.78 1.80 1.16 0.72 1.02 0.91 3.75E-09 2.68E-10 3.18E-07
Other/unknown At1g18060 Q9LM40 AT1G18060 0.36 1 1.51 0.29 0.90 1.75 0.42 0.75 1.47 0.170274 1.29E-12 0.017731
Other/unknown At1g52510 Q8VZ57;F4ICZ4 AT1G52510 0.23 1 1.08 0.52 0.83 1.34 0.33 0.87 0.90 2.15E-05 1.47E-14 2.43E-06
Other/unknown At1g54520 Q8RWI0 AT1G54520 1.00 1 1.05 1.47 1.61 1.59 1.07 1.15 1.21 5.13E-07 0.415831 0.820405
Other/unknown At1g72640 NAD(P)-binding Rossmann-fold superfamily protein F4IDE8;Q6NMC1;A0A1P8AVW7;A0A1P8AW09
At1g72640 0.78 1 3.15 1.20 1.58 3.49 0.80 1.44 2.82 0.171899 1.25E-09 0.648691
Other/unknown At1g78915 Q8GWV1;F4IBX4;F4IBX5
AT1G78915 0.95 1 1.50 0.97 0.90 2.06 1.07 0.87 1.45 0.0254132 5.68E-10 0.0016535
Other/unknown At2g05310 Q9SJ31 At2g05310 1.46 1 1.08 1.56 0.86 0.99 1.24 0.97 0.72 0.117846 8.62E-06 0.167522
Other/unknown At2g27290 Q9XIN6 AT2G27290 1.71 1 1.60 1.60 0.99 1.70 1.62 0.91 1.45 0.320876 5.83E-06 0.787473
Other/unknown At2g27680 Q9ZUX0 AT2G27680 0.32 1 0.84 0.85 0.33 1.34 0.44 0.53 0.40 2.15E-05 3.23E-05 1.67E-08
Other/unknown At4g02725 Q6DBF6 AT4G02725 1.75 1 1.92 1.51 1.66 1.69 1.68 1.91 1.87 0.0012300
5 0.0017027
8 0.0001162
84
Other/unknown At4g28025 F4JKG2;Q9C5F3 At4g28025 0.34 1 2.25 0.42 1.47 2.18 0.98 0.92 1.93 0.740531 6.94E-08 0.0729771
Other/unknown At5g08680 ATP synthase subunit beta-1 P83483;P83484;Q9C5A9
At5g08680 0.48 1 1.53 0.46 1.00 1.02 0.46 0.96 1.46 0.40535 8.16E-05 0.852129
Other/unknown At5g14910 Q93VK7 AT5G14910 0.60 1 1.76 0.75 2.32 2.37 0.53 2.31 1.71 3.03E-07 6.52E-12 4.63E-06
Other/unknown At5g16660 A8MS48;Q8H0X5
AT5G16660 1.74 1 2.21 1.45 1.40 2.84 1.02 1.32 1.87 0.0127918 2.52E-06 0.0148315
Other/unknown At5g23890 Q9FF91;A0A1P8BAU8
AT5G23890 1.30 1 12.66 1.55 3.26 10.20 0.85 3.78 8.05 0.0170821 2.14E-18 3.02E-08
Other/unknown At5g38520 Alpha/beta-Hydrolases superfamily protein Q9FFW9;F4KBJ3
At5g38520 0.51 1 0.77 0.60 1.07 0.80 0.51 0.90 0.71 0.0406624 2.83E-08 0.378313
Other/unknown At5g42070 Q8RWR9 AT5G42070 0.61 1 1.94 0.70 2.28 2.15 0.46 1.36 1.91 1.10E-05 5.35E-12 0.0003722
11
Other/unknown At5g51010 Q9FI47 AT5G51010 2.45 1 1.91 2.38 1.88 1.93 1.89 1.59 2.08 0.0054013
7 1.82E-08 7.24E-05
Other/unknown At5g52780 Uncharacterized protein PAM68-like Q9LTD9 At5g52780 0.76 1 1.24 0.81 1.22 1.36 0.70 1.15 0.93 0.0094238
9 0.0001588
88 0.153898
Other/unknown At5g53490 Thylakoid lumenal 17.4 kDa protein A0A1P8BAQ0;F4JX83;P81760
AT5G53490 2.65 1 1.33 2.12 3.08 1.72 2.04 1.11 1.37 7.96E-10 4.55E-09 1.70E-10
Other/unknown BASS2 Sodium/pyruvate cotransporter BASS2 Q1EBV7 AT2G26900 1.67 1 3.59 2.08 1.61 4.23 1.49 1.75 2.92 0.0096921
6 4.41E-11
0.00180229

194
Other/unknown CAC3 Acetyl-coenzyme A carboxylase carboxyl transferase subunit alpha
Q9LD43 AT2G38040 1.22 1 2.27 1.58 1.65 2.92 1.04 1.79 2.20 1.43E-07 5.89E-14 4.25E-06
Other/unknown CAS Calcium sensing receptor Q9FN48;A0A1P8BCX7
AT5G23060 0.70 1 1.38 0.71 0.98 1.47 0.67 0.93 1.29 0.0169075 3.57E-13 0.154082
Other/unknown DiT1 Dicarboxylate transporter 1 B3H4S6;Q9LXV3 AT5G12860 0.79 1 1.87 1.36 0.72 1.82 0.83 0.60 1.93 0.634112 0.0017327
7 0.765257
Other/unknown EMB3003 Dihydrolipoyllysine-residue acetyltransferase component 5 of pyruvate dehydrogenase complex
Q9C8P0 AT1G34430 0.84 1 1.28 1.49 1.49 2.12 1.10 1.28 1.41 2.64E-07 7.93E-05 0.0522718
Other/unknown F11M15.26 Q9SYE2 AT1G51400 1.14 1 0.64 0.90 0.80 0.69 0.93 0.74 0.74 0.0103685 8.53E-06 0.0071959
3
Other/unknown F13A11.2 Q9C7S3 AT1G42960 0.62 1 2.98 0.77 1.25 3.53 0.59 1.81 2.12 0.0505255 2.24E-12 6.66E-05
Other/unknown F16M2_10 Q9M1X3 AT3G63160 0.34 1 0.83 0.47 0.66 0.90 0.37 0.74 0.52 7.50E-05 2.84E-09 3.92E-05
Other/unknown F17F16.7 A0A1P8AWY1;Q8W4D6;A0A1P8AWU9
AT1G16720 0.94 1 1.44 1.16 1.86 1.94 0.96 1.75 1.61 1.01E-07 2.65E-09 0.0003763
22
Other/unknown F21F14.40 Q9M277;F4IX01 AT3G61870 1.63 1 2.06 1.59 1.39 2.11 1.47 1.22 1.83 0.0013580
7 1.26E-11
0.00546634
Other/unknown F24J8.11 Q9LPK9 AT1G21500 0.01 1 0.11 0.01 0.73 0.25 0.02 0.73 0.16 0.981834 1.27E-09 0.353395
Other/unknown F26O13.150 Q9SCZ8 AT3G51510 0.68 1 0.76 0.57 0.99 0.71 0.52 0.62 0.41 0.0025372 0.0001671
94 0.567515
Other/unknown F4P12_170 2,3-bisphosphoglycerate-independent phosphoglycerate mutase
Q9LFH1;F4JAF4 At3g53470 0.85 1 1.13 1.04 0.75 1.27 0.89 1.03 1.03 0.55618 0.0710758 0.210937
Other/unknown FBA1 Probable fructose-bisphosphate aldolase 1 Q9SJU4;F4IGL5;F4IGL7
AT2G21330 0.36 1 2.66 0.62 2.40 2.72 0.38 1.76 2.27 9.97E-13 3.15E-22 1.00E-11
Other/unknown FBA2 Probable fructose-bisphosphate aldolase 2 Q944G9;F4JUJ5 AT4G38970 0.41 1 1.85 0.89 1.45 1.89 0.47 1.12 1.59 1.00E-10 3.00E-18 5.13E-05
Other/unknown FBA3 Probable fructose-bisphosphate aldolase 3 Q9ZU52 AT2G01140 1.92 1 16.28 1.17 3.65 11.55 1.04 5.14 12.56 0.586589 1.20E-13 0.0016673
7
Other/unknown GAPA2 Glyceraldehyde-3-phosphate dehydrogenase GAPA2 Q9LPW0;A0A1P8APR6;F4HNZ6
AT1G12900 0.89 1 3.57 0.62 3.65 4.35 0.65 1.93 3.74 4.25E-13 2.08E-21 4.54E-13
Other/unknown GC1 Epimerase family protein SDR39U1 homolog A0A1P8B167;Q9SJU9
AT2G21280 0.63 1 2.96 0.96 1.41 3.41 0.59 1.53 2.22 0.0081988
8 1.65E-13
0.00383257
Other/unknown GDCST Aminomethyltransferase A0A2H1ZEA9;O65396
AT1G11860 2.56 1 6.78 1.30 3.94 5.76 1.04 3.21 8.06 0.0038452
4 2.29E-16 7.87E-09
Other/unknown GLDP1 Glycine dehydrogenase (decarboxylating) 1 Q94B78;B3H5Y8 AT4G33010 0.56 1 7.73 0.37 3.93 6.58 0.32 2.40 7.43 3.09E-05 5.09E-23 2.73E-11
Other/unknown GLN2 Glutamine synthetase/mitochondrial Q43127 AT5G35630 0.60 1 0.67 1.40 0.60 0.86 0.58 0.56 0.45 8.20E-15 1.29E-09 3.22E-15
Other/unknown GLO1 Peroxisomal (S)-2-hydroxy-acid oxidase GLO1 Q9LRR9;A8MS37;B3H4B8;Q2V3V9
AT3G14420 1.76 1 4.13 1.38 2.95 4.48 0.85 2.19 4.86 7.61E-06 2.54E-17 5.26E-08
Other/unknown HSP70-3 Heat shock 70 kDa protein 3 O65719 AT3G09440 1.48 1 3.30 1.63 0.66 3.04 1.16 1.59 2.35 0.0013455 1.05E-17 5.26E-10
Other/unknown LOX2 Lipoxygenase 2 P38418;A0A1I9LPH1
AT3G45140 0.18 1 1.25 0.17 1.15 1.38 0.17 0.96 1.06 1.32E-10 5.98E-25 4.42E-08
Other/unknown LTA2 Dihydrolipoyllysine-residue acetyltransferase component 4 of pyruvate dehydrogenase complex
Q9SQI8 AT3G25860 2.35 1 2.00 3.25 1.44 3.11 2.34 1.20 2.79 4.84E-07 1.61E-11 0.0100709
Other/unknown LTA3 Dihydrolipoyllysine-residue acetyltransferase component 1 of pyruvate dehydrogenase complex
F4J5T2;Q0WQF7
AT3G52200 3.31 1 7.42 2.73 1.96 6.13 2.09 2.00 8.07 0.0073141
1 1.16E-16 1.96E-05
Other/unknown MFP1 MAR-binding filament-like protein 1 Q9LW85 AT3G16000 1.21 1 1.43 1.17 0.89 2.00 1.06 1.19 1.53 0.015496 1.36E-11 2.22E-06

195
Other/unknown MVA3.2 Alpha/beta-Hydrolases superfamily protein Q9FN84 At5g17670 0.36 1 1.98 0.61 1.23 2.61 0.57 0.70 2.62 0.0449738 2.65E-10 0.238555
Other/unknown MXK3.17 Q93Y08 AT5G64940 1.07 1 3.44 1.25 1.39 3.64 1.09 1.36 2.38 0.0002587
75 1.26E-14 2.08E-05
Other/unknown OEP161 Outer envelope pore protein 16-1 Q9ZV24 AT2G28900 1.09 1 2.36 1.24 0.54 2.07 1.01 0.75 1.76 0.0095773 8.27E-12 0.0038119
3
Other/unknown PLGG1 Plastidal glycolate/glycerate translocator 1 Q9FVQ4 AT1G32080 0.33 1 2.31 0.72 0.94 2.81 0.33 1.24 1.62 5.17E-08 1.46E-18 1.13E-09
Other/unknown PMDH2 Malate dehydrogenase F4KDZ4;Q9ZP05;A0A1P8BBQ0;A8MRP1;B3H560
AT5G09660 0.46 1 1.85 0.53 1.11 2.41 0.33 0.94 1.68 5.68E-09 1.27E-19 3.42E-06
Other/unknown PPD5 PsbP domain-containing protein 5 A0A178U9N5;P82715
AT5G11450 0.84 1 1.15 1.01 1.80 1.79 0.77 1.64 1.51 0.0064814
7 3.39E-05 0.0230847
Other/unknown PPD7 PsbP domain-containing protein 7 F4J7A7 AT3G05410 1.07 1 1.21 0.92 0.89 1.76 1.03 1.10 1.09 0.227649 0.0123615 0.0369155
Other/unknown PRXIIE Peroxiredoxin-2E Q949U7 AT3G52960 0.90 1 0.77 1.20 2.01 1.04 0.73 0.91 0.80 7.24E-06 0.0001386
32 0.0005859
7
Other/unknown PTAC5 A1A6M1;A0A1P8B4I3
AT4G13670 0.36 1 1.98 0.56 2.21 4.03 0.43 1.79 1.60 5.77E-07 1.01E-10 4.06E-06
Other/unknown RAT5 Histone H2A.6 Q9LD28;O81826;Q9C681
AT5G54640 1.50 1 6.88 1.57 1.23 5.48 1.28 2.19 6.03 0.0228474 1.75E-18 3.26E-05
Other/unknown RPI3 Probable ribose-5-phosphate isomerase 3 Q9S726 AT3G04790 0.85 1 1.45 1.54 1.52 1.73 0.96 1.56 0.77 0.0329181 0.64544 0.0140254
Other/unknown SHM1 Serine hydroxymethyltransferase 1 Q9SZJ5 AT4G37930 0.53 1 5.53 0.35 3.29 5.66 0.27 2.04 5.14 3.68E-09 1.90E-23 8.65E-11
Other/unknown STR10 Rhodanese-like domain-containing protein 10 Q9SR92 AT3G08920 1.45 1 0.88 1.43 1.19 1.21 1.28 1.02 1.05 0.0007838
75 1.95E-07 0.0175735
Other/unknown STR11 Rhodanese-like domain-containing protein 11 Q0WWT7 AT4G24750 1.18 1 1.08 1.10 0.84 1.03 1.14 0.83 0.89 0.0011409
9 1.95E-05 0.0464787
Other/unknown STR4A Rhodanese-like domain-containing protein 4A Q56XR7 At3g25480 1.57 1 1.98 1.73 1.36 2.50 1.74 1.21 1.71 0.0107987 1.44E-05 0.0656255
Other/unknown STR9 Rhodanese-like domain-containing protein 9 O48529 AT2G42220 1.23 1 1.40 1.16 1.05 1.17 1.17 1.27 1.35 0.0005573
37 9.99E-06
0.000168061
Other/unknown T6G15.50 Q9T0H1 AT4G13500 1.27 1 1.17 1.58 1.13 0.84 1.19 1.03 0.65 0.0038721
5 5.18E-05 0.0327247
Other/unknown TIC110 Protein TIC110 Q8LPR9 AT1G06950 0.62 1 3.78 0.94 1.32 4.93 0.59 1.79 2.49 1.16E-07 2.15E-17 4.10E-09
Other/unknown TIC214 Protein TIC 214 P56785 AtCg01000;AtCg01130
2.02 1 6.35 1.71 0.77 3.98 1.17 1.34 3.78 0.0180589 2.47E-07 0.05762
Other/unknown TIC55 Protein TIC 55 Q9SK50 AT2G24820 0.68 1 2.78 0.89 1.07 2.80 0.60 1.23 1.78 9.24E-07 1.59E-17 1.38E-07
Other/unknown TL15 Thylakoid lumenal 15 kDa protein 1 O22160 AT2G44920 6.29 1 3.01 2.87 26.45 6.24 3.35 8.19 4.61 1.22E-13 1.36E-13 2.69E-15
Other/unknown TL17.9 Thylakoid lumenal 17.9 kDa protein Q9SW33 AT4G24930 2.30 1 2.12 2.05 4.77 3.31 1.90 2.58 3.24 5.75E-05 0.0236887 0.0003614
93
Other/unknown TL19 Thylakoid lumenal 19 kDa protein P82658 AT3G63540 3.13 1 2.34 2.28 3.47 2.76 2.03 2.07 2.38 1.73E-05 0.503323 6.69E-08
Other/unknown TPT Triose phosphate/phosphate translocator TPT A0A219HYB6;A0A219HZH3;A0A219I0W9;Q9ZSR7
AT5G46110 1.36 1 1.95 1.65 0.69 2.06 0.97 0.85 1.53 9.21E-05 3.34E-11 0.0002855
47
Other/unknown YCF37 O64835 AT2G23670 0.97 1 1.77 1.06 0.76 1.73 0.97 0.38 1.53 1.43E-06 1.02E-14 6.44E-05
Other/unknown 3-oxoacyl-[acyl-carrier-protein] reductase P33207 AT1G24360 5.90 1 5.73 4.12 2.77 5.72 3.02 3.21 6.08 0.866121 2.75E-10 3.17E-06
Other/unknown Q8L9M8 AT1G33810 0.93 1 3.66 1.44 0.70 6.15 0.84 1.43 4.06 0.0054825
6 4.01E-13
0.000885226
Other/unknown Probable lactoylglutathione lyase, chloroplast Q8W593 AT1G67280 0.63 1 1.66 1.28 0.91 1.89 0.67 0.68 0.81 3.36E-09 2.63E-10 8.01E-07

196
Other/unknown Q9AST9;A0A1P8ATD8
AT1G73110 0.33 1 4.02 0.59 0.61 4.66 0.40 0.94 2.17 0.0016106
2 5.01E-13
0.000182211
Other/unknown Q9ZQ78 AT2G03420 1.09 1 1.49 1.21 0.74 2.18 1.24 0.49 1.49 0.0040203
5 7.74E-10
0.00690946
Other/unknown Rhodanese-like domain-containing protein 14 Q94A65 AT4G27700 0.90 1 1.09 0.60 1.01 1.07 0.69 1.04 0.98 0.0311066 3.57E-08 0.0028677
Other/unknown Thioredoxin-like 2-2 Q8LCT3 AT4G29670 0.43 1 1.17 0.86 0.42 1.15 0.47 0.52 0.56 3.42E-06 2.46E-06 7.04E-07
Pigment synthesis
At5g58250 Q9LVM3 AT5G58250 0.99 1 1.71 1.39 1.84 2.00 1.23 2.09 1.44 9.42E-06 1.89E-06 2.08E-05
Pigment synthesis
CAO Chlorophyllide a oxygenase Q9MBA1;A0A1P8ARR2
AT1G44446 1.61 1 4.12 3.60 2.36 3.14 1.95 1.66 1.27 0.0004642
66 0.0061899
5 0.0019610
8
Pigment synthesis
CHLD Magnesium-chelatase subunit ChlD Q9SJE1 AT1G08520 0.46 1 3.32 2.06 1.31 4.81 0.66 1.50 2.96 0.0001396
68 1.90E-09
0.00435009
Pigment synthesis
CHLG Chlorophyll synthase Q38833 AT3G51820 1.11 1 0.98 1.19 1.65 1.02 1.13 1.20 0.67 0.578517 0.0096651
3 0.650403
Pigment synthesis
CHLI1 Magnesium-chelatase subunit ChlI-1 P16127 AT4G18480 0.27 1 0.62 1.65 0.23 1.25 0.96 0.62 0.28 9.13E-07 8.44E-05 4.51E-10
Pigment synthesis
CHLM Magnesium protoporphyrin IX methyltransferase A0A1P8B4G1;Q9SW18
AT4G25080 1.21 1 1.37 1.27 1.26 1.39 1.20 1.35 1.46 0.0002137
18 1.17E-06
0.00283261
Pigment synthesis
CHLP Geranylgeranyl diphosphate reductase Q9CA67 AT1G74470 0.81 1 1.49 1.00 1.53 1.76 0.93 1.54 1.35 1.07E-07 2.62E-13 1.36E-06
Pigment synthesis
CRD1 Magnesium-protoporphyrin IX monomethyl ester [oxidative] cyclase
Q9M591;F4J0U9 AT3G56940 0.66 1 1.55 0.82 1.52 1.82 0.72 1.53 1.27 3.08E-07 1.32E-14 2.12E-07
Pigment synthesis
CYP97A3 Protein LUTEIN DEFICIENT 5 Q93VK5 AT1G31800 0.68 1 2.55 0.87 3.14 4.41 0.80 2.30 2.63 4.48E-05 2.63E-08 0.011154
Pigment synthesis
CYP97B3 Cytochrome P450 97B3 O23365 AT4G15110 1.53 1 2.65 2.06 2.69 2.99 1.31 2.37 2.64 0.0001264
35 3.73E-06
0.00320937
Pigment synthesis
CYP97C1 Carotene epsilon-monooxygenase Q6TBX7 AT3G53130 1.13 1 2.07 1.14 1.95 2.85 0.95 1.78 2.29 5.62E-05 7.19E-10 0.0039119
6
Pigment synthesis
DVR Divinyl chlorophyllide a 8-vinyl-reductase Q1H537 AT5G18660 0.88 1 1.11 1.20 1.16 1.32 1.12 1.11 1.31 0.0026847
6 0.0230393 0.68891
Pigment synthesis
FC2 Ferrochelatase F4IMT3;O04921 AT2G30390 0.73 1 2.30 0.95 1.84 2.62 0.83 1.80 1.79 0.0029001
8 1.69E-09
0.00271285
Pigment synthesis
GUN4 Tetrapyrrole-binding protein Q9LX31 AT3G59400 1.24 1 2.08 1.79 1.44 3.99 1.13 1.80 2.34 0.0001162
86 1.55E-07
0.000531901
Pigment synthesis
GUN5 Magnesium-chelatase subunit ChlH A8MR05;Q9FNB0
AT5G13630 0.71 1 3.89 0.93 2.37 5.65 0.56 2.87 2.49 4.34E-11 1.70E-18 1.14E-12
Pigment synthesis
HCAR 7-hydroxymethyl chlorophyll a reductase Q8GS60 AT1G04620 1.48 1 2.11 1.66 1.42 2.20 1.51 1.56 1.92 0.0098834
5 4.88E-09 0.0102375
Pigment synthesis
NOL Chlorophyll(ide) b reductase NOL Q8LEU3 AT5G04900 1.17 1 1.27 0.89 1.18 1.47 0.72 1.17 1.21 0.309263 9.76E-05 0.0871969
Pigment synthesis
PAO Pheophorbide a oxygenase Q9FYC2 AT3G44880 1.20 1 1.29 1.02 1.30 1.29 1.14 1.39 0.92 0.428084 0.182195 0.0092623
5
Pigment synthesis
PDS 15-cis-phytoene desaturase/chromoplastic Q07356 AT4G14210 1.08 1 1.32 1.17 1.28 1.32 1.13 1.23 1.23 0.0038118
9 0.0024475
5 0.0056417
9
Pigment synthesis
POR C Protochlorophyllide reductase C F4I2F8;O48741 AT1G03630 0.83 1 1.48 0.90 1.72 1.69 0.69 1.62 1.38 7.60E-11 2.22E-17 5.92E-11

197
Pigment synthesis
PORB Protochlorophyllide reductase B P21218 AT4G27440;AT5G54190
1.22 1 2.55 1.50 2.64 2.49 1.12 3.21 2.43 5.82E-10 2.07E-13 6.66E-11
Pigment synthesis
PPOX1 Protoporphyrinogen oxidase 1 P55826 AT4G01690 0.87 1 1.33 0.91 1.55 1.62 0.94 1.46 1.33 0.0004618
74 1.75E-08 0.0356063
Pigment synthesis
PPOX2 Protoporphyrinogen oxidase 2/mitochondrial Q8S9J1;A0A1P8BE58;A0A1P8BE27
AT5G14220 1.74 1 4.60 1.49 0.90 3.90 1.04 1.50 3.46 0.0025211
8 1.85E-16 2.60E-05
Pigment synthesis
VTE3 2-methyl-6-phytyl-1,4-hydroquinone methyltransferase
Q9LY74 AT3G63410 0.67 1 2.63 0.93 0.90 3.00 0.67 0.87 2.09 1.91E-06 2.45E-19 5.39E-06
Pigment synthesis
VTE4 Tocopherol O-methyltransferase Q9ZSK1 At1g64970 1.87 1 5.94 1.37 3.43 5.15 1.51 2.82 5.75 0.74656 2.41E-10 0.0614094
Pigment synthesis
ZDS1 Zeta-carotene desaturase/chromoplastic Q38893 AT3G04870 5.32 1 1.07 5.92 1.01 2.27 4.38 0.82 1.29 0.0003549
73 4.65E-15
0.00431617
Pigment synthesis
Z-ISO 15-cis-zeta-carotene isomerase Q9SAC0 At1g10830 2.36 1 2.10 2.51 2.01 2.70 2.13 1.81 2.30 0.0517968 0.0080429
4 0.282248
Plastoglobule At3g07700 B9DGY1;F4JFM1
AT3G07700 1.32 1 7.24 1.49 1.40 8.55 1.60 0.84 8.32 0.028272 1.05E-17 0.072412
Plastoglobule At3g24190 Q9LRN0 AT3G24190 1.07 1 4.55 1.00 1.67 6.54 1.14 1.90 4.76 0.0098345
4 3.29E-13 0.0155339
Plastoglobule At4g39730 O65660 AT4G39730 0.92 1 2.38 0.82 0.77 2.23 0.78 1.09 1.81 0.0361657 8.16E-14 0.0033629
2
Plastoglobule CCD4 Probable carotenoid cleavage dioxygenase 4 O49675 AT4G19170 0.67 1 0.70 0.75 1.16 1.03 0.59 1.13 0.96 5.74E-07 4.79E-13 9.17E-06
Plastoglobule CSP41B Chloroplast stem-loop binding protein of 41 kDa b A0A1P8ATL2;Q9SA52
AT1G09340 0.65 1 1.81 0.99 2.25 2.37 0.44 1.26 1.82 3.67E-09 6.06E-13 0.0001604
3
Plastoglobule CYP74A Allene oxide synthase Q96242 AT5G42650 0.98 1 1.36 0.92 0.93 1.22 0.81 0.69 1.23 5.71E-08 1.73E-12 0.0160622
Plastoglobule PAP1 Probable plastid-lipid-associated protein 1 O81439 AT4G04020 0.49 1 2.67 0.61 1.14 2.44 0.48 0.99 2.30 0.141923 9.56E-16 0.227606
Plastoglobule PAP10 Probable plastid-lipid-associated protein 10 Q8W4F1 AT2G46910 0.80 1 2.44 1.04 1.28 2.80 0.80 1.25 2.71 0.488236 3.99E-09 0.767761
Plastoglobule PAP11 Probable plastid-lipid-associated protein 11 O81304 AT4G00030 1.65 1 43.99 1.40 0.85 2.99 1.40 1.11 40.17 0.599151 0.0006118
08 0.731785
Plastoglobule PAP12 Probable plastid-lipid-associated protein 12 Q8LAP6 AT1G51110 0.50 1 0.96 0.60 1.12 1.28 0.54 0.99 0.94 7.40E-07 9.84E-15 0.0072874
3
Plastoglobule PAP13 Probable plastid-lipid-associated protein 13 Q8S9M1;F4IM05;A8MRU9
AT2G42130 0.89 1 1.98 1.28 1.10 2.29 0.82 1.04 2.00 0.0019275
8 6.95E-12 0.409725
Plastoglobule PAP2 Probable plastid-lipid-associated protein 2 O49629 AT4G22240 1.28 1 7.22 1.35 2.07 5.70 1.17 1.87 5.28 0.102846 1.55E-18 1.31E-06
Plastoglobule PAP3 Probable plastid-lipid-associated protein 3 O82291 AT2G35490 0.83 1 2.07 0.95 1.45 2.13 0.79 1.24 1.94 4.10E-05 1.96E-15 0.028219
Plastoglobule PAP4 Probable plastid-lipid-associated protein 4 Q9LU85 AT3G26070 0.78 1 1.33 0.74 0.78 1.42 0.72 0.77 1.34 0.0300552 5.40E-12 0.0096865
7
Plastoglobule PAP5 Probable plastid-lipid-associated protein 5 A0A1I9LP70;Q6DBN2
AT3G26080 1.11 1 2.23 0.72 1.29 1.92 0.76 1.00 1.79 0.146906 1.87E-08 0.018819
Plastoglobule PAP6 Probable plastid-lipid-associated protein 6 Q9LW57;A0A1I9LQU5;A0A1I9LQU3
AT3G23400 1.16 1 1.51 1.15 1.33 1.98 1.05 1.27 1.56 0.0008926
81 1.09E-08
0.00341678
Plastoglobule PAP8 Probable plastid-lipid-associated protein 8 Q941D3;F4K2P2 AT5G19940 1.17 1 1.01 1.11 0.93 1.44 1.15 1.31 0.79 0.112989 0.149835 2.27E-07
Plastoglobule PAP9 Probable plastid-lipid-associated protein 9 Q9M2P7 AT3G58010 1.39 1 1.52 1.34 1.14 1.60 1.36 1.10 1.26 0.130816 1.63E-06 0.055797
Plastoglobule PSY Phytoene synthase F4KGX7;P37271 AT5G17230 1.21 1 4.74 1.28 1.63 5.38 1.27 1.62 3.49 0.0011561
6 3.08E-15 4.10E-05

198
Plastoglobule T18D12_110 Q9M236;F4IZ56 AT3G43540 1.65 1 2.97 1.86 0.99 4.14 1.48 1.59 3.77 0.187972 9.27E-08 0.195898
Plastoglobule VTE1 Tocopherol cyclase Q94FY7 AT4G32770 0.56 1 1.83 0.89 1.53 2.11 0.71 1.06 1.64 4.16E-05 2.11E-11 0.358249
Plastoglobule Uncharacterized oxidoreductase At1g06690 Q94A68 AT1G06690 0.19 1 3.02 0.33 1.08 3.36 0.26 0.96 2.23 2.55E-05 1.78E-17 1.17E-05
Plastoglobule Uncharacterized protein At1g32220 Q9FVR6 AT1G32220 0.72 1 1.85 0.92 1.13 2.07 0.77 1.04 2.11 6.63E-05 3.27E-17 0.0401971
Plastoglobule Acyltransferase-like protein At1g54570 Q9ZVN2 AT1G54570 0.60 1 5.71 1.41 2.07 4.61 1.54 1.84 3.59 0.0041676 1.43E-13 9.04E-06
Plastoglobule Uncharacterized aarF domain-containing protein kinase At1g71810
Q94BU1 AT1G71810 0.76 1 6.34 0.69 1.86 7.68 1.18 2.81 5.22 0.173111 1.39E-10 0.0066467
6
Plastoglobule Uncharacterized methyltransferase At1g78140 Q8LBV4 AT1G78140 0.62 1 1.76 0.50 1.57 2.80 0.44 1.25 2.08 0.0003703
06 1.13E-10
0.00285545
Plastoglobule Uncharacterized aarF domain-containing protein kinase At1g79600
Q9MA15 AT1G79600 0.74 1 3.71 0.88 1.41 3.75 0.96 1.23 3.33 0.32132 3.70E-12 0.108198
Plastoglobule Uncharacterized protein At2g34460 Q8H124 AT2G34460 0.86 1 1.40 0.94 1.18 1.60 0.89 1.11 1.44 1.79E-05 2.25E-14 0.180071
Plastoglobule Uncharacterized methyltransferase At2g41040 Q0WPT7 AT2G41040 0.76 1 3.68 0.66 1.12 4.08 0.45 0.66 3.29 0.0064485
3 4.45E-14 0.150831
Plastoglobule Heme-binding-like protein At3g10130 Q9SR77 AT3G10130 1.97 1 6.09 1.83 2.31 4.04 1.17 1.67 4.79 0.763648 4.56E-07 0.152891
Plastoglobule Uncharacterized protein At4g13200 Q8LDV3 AT4G13200 1.13 1 2.59 1.01 0.71 2.31 1.06 0.98 2.12 0.0042606
6 7.36E-14 0.0672904
Plastoglobule Uncharacterized aarF domain-containing protein kinase At5g05200
Q9ASX5 AT5G05200 0.88 1 6.65 0.46 1.81 5.52 0.63 2.11 5.99 0.0237313 5.78E-17 0.0012420
6
Protease ARASP2 Probable membrane metalloprotease ARASP2 O23053 AT1G05140 1.00 1 1.99 1.11 2.09 2.37 1.23 1.72 1.68 0.0016985
9 1.15E-06
0.00395586
Protease At2g21960 Q9SJ03 AT2G21960 0.54 1 1.02 0.64 0.89 1.19 0.66 0.76 0.95 0.0005962
95 1.20E-11 8.88E-05
Protease CLPP4 ATP-dependent Clp protease proteolytic subunit 4 Q94B60 AT5G45390 0.88 1 3.48 0.97 1.55 4.45 0.66 1.65 2.71 7.69E-09 2.66E-19 3.29E-09
Protease CLPP5 ATP-dependent Clp protease proteolytic subunit 5 Q9S834 AT1G02560 0.92 1 2.19 1.07 1.54 2.80 0.49 1.82 1.65 7.06E-05 1.00E-10 1.81E-05
Protease EGY2 Probable zinc metalloprotease EGY2 F4K0T6;F4K0T7;Q9FFK3
AT5G05740 0.81 1 1.26 0.79 1.16 1.22 0.76 1.26 1.00 0.507076 6.73E-08 0.0118932
Protease FTSH11 ATP-dependent zinc metalloprotease FTSH 11/mitochondrial
Q9FGM0 AT5G53170 1.19 1 8.49 1.26 2.87 9.08 0.85 2.84 5.23 2.78E-06 2.39E-17 3.26E-08
Protease FTSH12 ATP-dependent zinc metalloprotease FTSH 12 A0A1P8ARE4;A0A1P8ARD2;Q9SAJ3
AT1G79560 0.62 1 6.56 1.18 1.83 8.75 0.47 1.94 3.96 4.15E-08 3.75E-18 1.04E-09
Protease SPPA Serine protease SPPA Q9C9C0;A0A1P8AUG2
AT1G73990 0.78 1 3.00 0.90 1.73 3.25 0.72 1.32 2.24 0.0003042
03 4.96E-14
0.00298129
Protein folding At1g80030 A0A1P8ART2;Q0WN54
AT1G80030 1.17 1 2.20 1.17 1.74 3.55 0.77 1.47 2.37 0.048154 3.35E-06 0.233119
Protein folding At3g12345 Q9LHH3 AT3G12345 0.85 1 0.31 1.11 1.11 0.88 0.79 0.95 0.44 0.0078165
3 0.0005789
13 0.938356
Protein folding At4g39960 Q940V1 AT4G39960 1.64 1 3.48 1.55 1.51 5.94 1.05 1.88 3.57 0.0091689
7 5.68E-11
0.00308183
Protein folding CLPB3 Chaperone protein ClpB3 Q9LF37 AT5G15450 0.36 1 4.32 0.79 0.58 3.76 0.40 0.46 2.50 1.47E-08 2.18E-20 4.54E-08
Protein folding CPN21 20 kDa chaperonin O65282 AT5G20720 1.82 1 2.91 1.49 0.98 4.30 1.31 0.65 3.57 1.41E-06 4.00E-20 2.27E-09
Protein folding CPN60A1 Chaperonin 60 subunit alpha 1 P21238 AT2G28000 0.67 1 3.49 0.76 3.40 5.13 0.63 2.07 3.54 1.63E-06 1.24E-12 0.0012154
8

199
Protein folding CYP26-2 Peptidyl-prolyl cis-trans isomerase CYP26-2 F4HTT6;A0A1P8APN5
AT1G74070 0.55 1 1.37 0.67 1.22 1.91 0.67 0.98 1.58 0.0054892
7 1.99E-11 0.475341
Protein folding CYP28 Peptidyl-prolyl cis-trans isomerase CYP28 A0A1P8B9P2;O65220
AT5G35100 1.00 1 5.98 2.18 6.43 7.09 1.39 3.10 4.96 9.85E-11 1.16E-14 4.85E-08
Protein folding CYP37 Peptidyl-prolyl cis-trans isomerase CYP37 P82869;A0A1I9LQ22;A0A1I9LQ23
AT3G15520 0.95 1 1.05 1.11 1.63 1.76 1.16 1.32 1.86 6.01E-10 1.33E-09 4.17E-06
Protein folding FKBP16-3 Peptidyl-prolyl cis-trans isomerase FKBP16-3 A0A1P8B252;O22870
AT2G43560 1.89 1 2.29 1.59 4.15 2.84 1.36 1.66 2.24 6.73E-09 1.19E-05 9.30E-08
Protein folding FKBP16-4 Peptidyl-prolyl cis-trans isomerase FKBP16-4 Q9SR70 AT3G10060 0.77 1 1.19 0.88 1.30 1.36 1.06 0.93 1.31 2.40E-05 1.50E-09 2.88E-05
Protein folding FKBP17-2 Peptidyl-prolyl cis-trans isomerase FKBP17-2 Q9LDY5 AT1G18170 1.29 1 1.39 1.38 1.06 1.33 1.11 0.81 1.11 0.0008308
15 0.0001107
08 0.69728
Protein folding FKBP18 Peptidyl-prolyl cis-trans isomerase FKBP18 A0A1P8APZ5;Q9LM71
AT1G20810 1.59 1 1.45 1.74 1.64 1.68 1.91 1.08 1.60 0.0087626
7 1.18E-05 0.0283767
Protein folding FKBP19 Peptidyl-prolyl cis-trans isomerase FKBP19 Q9LYR5;A0A1R7T3F4;A0A1R7T3F3
AT5G13410 7.34 1 5.67 7.32 4.01 5.71 4.50 3.00 6.60 0.577542 0.0038147
8 0.119508
Protein folding HSP70-6 Heat shock 70 kDa protein 6 Q9STW6 AT4G24280 0.93 1 2.73 1.07 2.58 3.47 0.84 1.71 2.80 1.68E-14 1.39E-21 7.85E-11
Protein folding TIG Trigger factor-like protein TIG Q8S9L5 AT5G55220 0.39 1 1.94 0.75 0.96 2.82 0.42 1.15 1.68 1.23E-08 1.09E-17 5.35E-09
Protein translocation
CLPC1 Chaperone protein ClpC1 Q9FI56 AT5G50920 0.59 1 2.32 0.91 0.89 2.95 0.60 1.18 1.79 1.24E-10 1.53E-21 1.64E-12
Protein translocation
CLPC2 Chaperone protein ClpC2 Q9SXJ7;F4JF64 AT3G48870 1.65 1 4.72 3.64 5.36 8.22 3.04 6.57 5.76 0.0006948
92 3.11E-05 0.116238
Protein translocation
SCY1 Preprotein translocase subunit SCY1 Q38885 AT2G18710 0.78 1 0.60 0.86 0.69 0.79 0.89 0.66 0.87 0.814035 0.436607 0.157335
Protein translocation
SECA1 Protein translocase subunit SECA1 Q9SYI0;A0A1P8B485;F4JG57
AT4G01800 0.58 1 2.87 0.94 1.22 3.39 0.57 1.44 2.16 3.12E-07 6.38E-18 2.23E-07
Protein translocation
SECE1 Preprotein translocase subunit SECE1 O23342 At4g14870 0.53 1 0.91 0.69 1.29 1.14 0.58 1.10 0.72 0.0029025
2 3.62E-09 0.202419
Protein translocation
TATA Sec-independent protein translocase protein TATA Q9LKU2 AT5G28750 1.44 1 1.14 1.58 0.62 1.54 1.14 0.83 1.17 0.555771 0.0003677
77 0.208983
Protein translocation
TATB Sec-independent protein translocase protein TATB Q9XH75 AT5G52440 0.95 1 1.15 1.03 1.44 1.07 0.96 1.24 0.95 0.110903 0.0025130
3 0.0403187
Protein translocation
TATC Sec-independent protein translocase protein TATC Q9SJV5 AT2G01110 0.79 1 1.43 1.06 1.21 1.59 0.84 1.37 1.06 0.0290312 0.0002679
43 0.0164034
PSI psaA Photosystem I P700 chlorophyll a apoprotein A1 P56766 ATCG00350 1.41 1 1.03 1.33 1.14 0.98 1.14 1.23 0.81 0.0001528
81 1.31E-12 3.70E-08
PSI psaB Photosystem I P700 chlorophyll a apoprotein A2 P56767 ATCG00340 1.28 1 1.11 1.27 1.25 1.01 1.05 1.47 0.89 0.219257 2.28E-06 7.98E-07
PSI psaC Photosystem I iron-sulfur center P62090 ATCG01060 1.49 1 1.09 1.39 1.95 0.89 1.25 1.78 0.88 0.0006726
15 2.03E-10 1.77E-08
PSI psaD1 Photosystem I reaction center subunit II-1 Q9S7H1;Q9SA56
AT1G03130;AT4G02770
0.98 1 0.80 0.93 1.11 0.74 0.91 1.11 0.68 0.841764 1.54E-14 1.03E-05
PSI PSAE1 Photosystem I reaction center subunit IV A Q9S831 AT4G28750 1.51 1 0.93 1.43 1.13 0.84 1.38 1.08 0.86 0.0678846 6.11E-11 0.072354
PSI PSAE2 Photosystem I reaction center subunit IV B Q9S714 AT2G20260 1.78 1 1.43 1.61 1.25 1.43 1.71 1.35 1.27 0.991358 6.23E-09 0.0002957
8
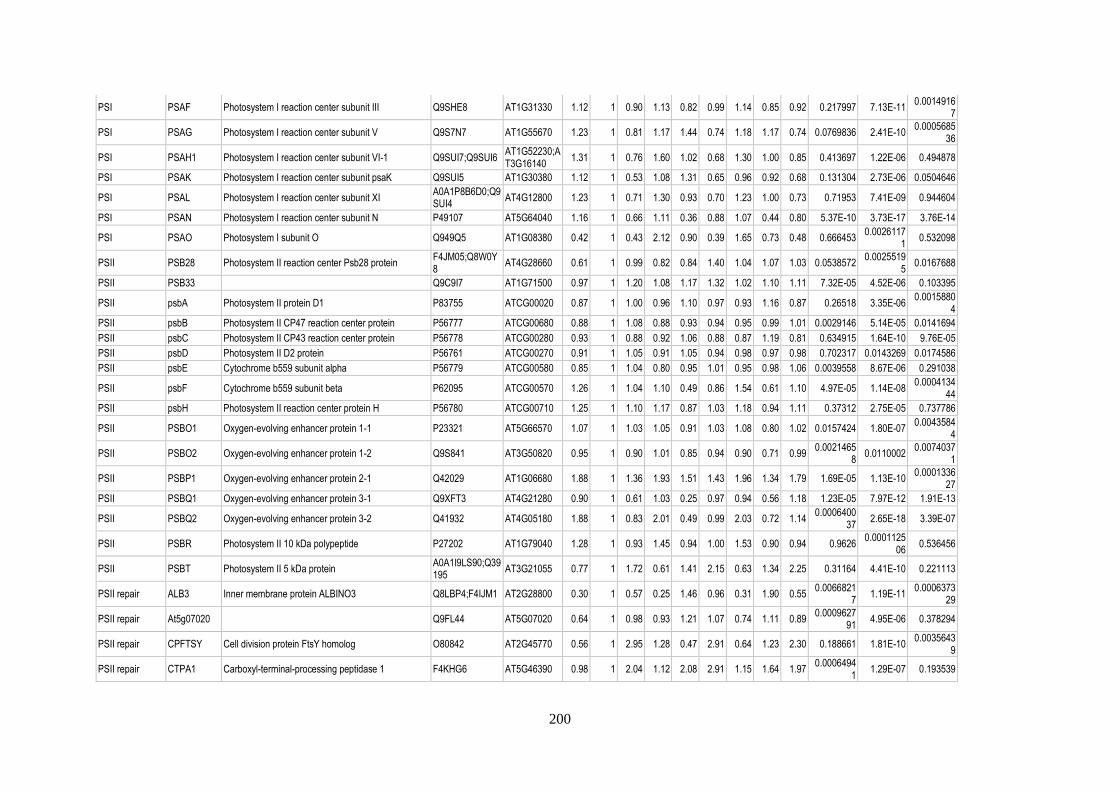
200
PSI PSAF Photosystem I reaction center subunit III Q9SHE8 AT1G31330 1.12 1 0.90 1.13 0.82 0.99 1.14 0.85 0.92 0.217997 7.13E-11 0.0014916
7
PSI PSAG Photosystem I reaction center subunit V Q9S7N7 AT1G55670 1.23 1 0.81 1.17 1.44 0.74 1.18 1.17 0.74 0.0769836 2.41E-10 0.0005685
36
PSI PSAH1 Photosystem I reaction center subunit VI-1 Q9SUI7;Q9SUI6 AT1G52230;AT3G16140
1.31 1 0.76 1.60 1.02 0.68 1.30 1.00 0.85 0.413697 1.22E-06 0.494878
PSI PSAK Photosystem I reaction center subunit psaK Q9SUI5 AT1G30380 1.12 1 0.53 1.08 1.31 0.65 0.96 0.92 0.68 0.131304 2.73E-06 0.0504646
PSI PSAL Photosystem I reaction center subunit XI A0A1P8B6D0;Q9SUI4
AT4G12800 1.23 1 0.71 1.30 0.93 0.70 1.23 1.00 0.73 0.71953 7.41E-09 0.944604
PSI PSAN Photosystem I reaction center subunit N P49107 AT5G64040 1.16 1 0.66 1.11 0.36 0.88 1.07 0.44 0.80 5.37E-10 3.73E-17 3.76E-14
PSI PSAO Photosystem I subunit O Q949Q5 AT1G08380 0.42 1 0.43 2.12 0.90 0.39 1.65 0.73 0.48 0.666453 0.0026117
1 0.532098
PSII PSB28 Photosystem II reaction center Psb28 protein F4JM05;Q8W0Y8
AT4G28660 0.61 1 0.99 0.82 0.84 1.40 1.04 1.07 1.03 0.0538572 0.0025519
5 0.0167688
PSII PSB33 Q9C9I7 AT1G71500 0.97 1 1.20 1.08 1.17 1.32 1.02 1.10 1.11 7.32E-05 4.52E-06 0.103395
PSII psbA Photosystem II protein D1 P83755 ATCG00020 0.87 1 1.00 0.96 1.10 0.97 0.93 1.16 0.87 0.26518 3.35E-06 0.0015880
4
PSII psbB Photosystem II CP47 reaction center protein P56777 ATCG00680 0.88 1 1.08 0.88 0.93 0.94 0.95 0.99 1.01 0.0029146 5.14E-05 0.0141694
PSII psbC Photosystem II CP43 reaction center protein P56778 ATCG00280 0.93 1 0.88 0.92 1.06 0.88 0.87 1.19 0.81 0.634915 1.64E-10 9.76E-05
PSII psbD Photosystem II D2 protein P56761 ATCG00270 0.91 1 1.05 0.91 1.05 0.94 0.98 0.97 0.98 0.702317 0.0143269 0.0174586
PSII psbE Cytochrome b559 subunit alpha P56779 ATCG00580 0.85 1 1.04 0.80 0.95 1.01 0.95 0.98 1.06 0.0039558 8.67E-06 0.291038
PSII psbF Cytochrome b559 subunit beta P62095 ATCG00570 1.26 1 1.04 1.10 0.49 0.86 1.54 0.61 1.10 4.97E-05 1.14E-08 0.0004134
44
PSII psbH Photosystem II reaction center protein H P56780 ATCG00710 1.25 1 1.10 1.17 0.87 1.03 1.18 0.94 1.11 0.37312 2.75E-05 0.737786
PSII PSBO1 Oxygen-evolving enhancer protein 1-1 P23321 AT5G66570 1.07 1 1.03 1.05 0.91 1.03 1.08 0.80 1.02 0.0157424 1.80E-07 0.0043584
4
PSII PSBO2 Oxygen-evolving enhancer protein 1-2 Q9S841 AT3G50820 0.95 1 0.90 1.01 0.85 0.94 0.90 0.71 0.99 0.0021465
8 0.0110002
0.00740371
PSII PSBP1 Oxygen-evolving enhancer protein 2-1 Q42029 AT1G06680 1.88 1 1.36 1.93 1.51 1.43 1.96 1.34 1.79 1.69E-05 1.13E-10 0.0001336
27
PSII PSBQ1 Oxygen-evolving enhancer protein 3-1 Q9XFT3 AT4G21280 0.90 1 0.61 1.03 0.25 0.97 0.94 0.56 1.18 1.23E-05 7.97E-12 1.91E-13
PSII PSBQ2 Oxygen-evolving enhancer protein 3-2 Q41932 AT4G05180 1.88 1 0.83 2.01 0.49 0.99 2.03 0.72 1.14 0.0006400
37 2.65E-18 3.39E-07
PSII PSBR Photosystem II 10 kDa polypeptide P27202 AT1G79040 1.28 1 0.93 1.45 0.94 1.00 1.53 0.90 0.94 0.9626 0.0001125
06 0.536456
PSII PSBT Photosystem II 5 kDa protein A0A1I9LS90;Q39195
AT3G21055 0.77 1 1.72 0.61 1.41 2.15 0.63 1.34 2.25 0.31164 4.41E-10 0.221113
PSII repair ALB3 Inner membrane protein ALBINO3 Q8LBP4;F4IJM1 AT2G28800 0.30 1 0.57 0.25 1.46 0.96 0.31 1.90 0.55 0.0066821
7 1.19E-11
0.000637329
PSII repair At5g07020 Q9FL44 AT5G07020 0.64 1 0.98 0.93 1.21 1.07 0.74 1.11 0.89 0.0009627
91 4.95E-06 0.378294
PSII repair CPFTSY Cell division protein FtsY homolog O80842 AT2G45770 0.56 1 2.95 1.28 0.47 2.91 0.64 1.23 2.30 0.188661 1.81E-10 0.0035643
9
PSII repair CTPA1 Carboxyl-terminal-processing peptidase 1 F4KHG6 AT5G46390 0.98 1 2.04 1.12 2.08 2.91 1.15 1.64 1.97 0.0006494
1 1.29E-07 0.193539

201
PSII repair CYP38 Peptidyl-prolyl cis-trans isomerase CYP38 Q9SSA5 AT3G01480 1.33 1 1.11 1.30 1.86 1.55 1.16 1.13 1.22 4.11E-11 0.0657539 1.18E-07
PSII repair DEG8 Protease Do-like 8 F4KFV6;Q9LU10 AT5G39830 0.83 1 2.08 1.14 2.54 2.29 0.84 1.47 1.68 6.92E-08 9.71E-10 6.93E-06
PSII repair DEGP1 Protease Do-like 1 O22609 AT3G27925 1.49 1 1.91 1.35 2.02 2.46 1.19 1.71 2.03 4.25E-07 1.43E-10 7.05E-07
PSII repair DEGP5 Protease Do-like 5 Q9SEL7;A0A1P8B643;A0A1P8B644
AT4G18370 2.84 1 8.57 2.89 10.03 5.57 1.87 7.21 5.73 0.0175227 4.63E-05 0.0001021
21
PSII repair FKBP20-2 Peptidyl-prolyl cis-trans isomerase FKBP20-2 A0A1I9LRJ6;Q0WRJ7
AT3G60370 3.82 1 1.97 4.38 2.48 4.01 3.35 0.52 2.32 8.01E-08 2.65E-11 0.103187
PSII repair FTSH1 ATP-dependent zinc metalloprotease FTSH 1 Q39102 AT1G50250 0.96 1 0.94 1.25 1.11 1.01 1.08 1.04 0.73 0.0115749 0.0031582
2 0.620582
PSII repair FTSH2 ATP-dependent zinc metalloprotease FTSH 2 A0A1P8AXC1;O80860
AT2G30950 0.68 1 1.08 0.88 1.33 1.22 0.72 1.03 1.05 2.28E-05 7.49E-09 0.214495
PSII repair FTSH5 ATP-dependent zinc metalloprotease FTSH 5 Q9FH02 AT5G42270 0.75 1 1.44 0.84 1.17 1.71 0.76 1.08 1.19 6.15E-06 5.55E-12 0.0006571
14
PSII repair FTSH8 ATP-dependent zinc metalloprotease FTSH 8 Q8W585 AT1G06430 0.40 1 1.16 0.42 1.10 1.14 0.36 0.76 0.90 4.60E-05 9.03E-13 0.0353453
PSII repair HHL1 Protein HHL1 Q8LDL0 AT1G67700 0.45 1 1.10 0.67 0.77 1.41 0.32 0.66 1.05 0.0001373
09 6.15E-10
0.00957819
PSII repair HSP70-7 Heat shock 70 kDa protein 7 Q9LTX9 AT5G49910 0.73 1 3.08 1.01 1.81 3.37 0.96 1.39 2.86 0.0003343
12 2.80E-13
0.00728604
PSII repair LPA1 Protein LOW PSII ACCUMULATION 1 Q9SRY4;A0A1P8ANG6
AT1G02910 1.03 1 1.53 1.05 1.13 1.81 1.07 1.20 1.62 0.0416679 1.69E-07 0.343433
PSII repair LQY1 Protein disulfide-isomerase LQY1 Q8GSJ6 AT1G75690 0.93 1 1.52 0.98 1.55 1.62 0.85 1.71 1.57 0.0076242
4 2.02E-06
0.00558975
PSII repair LTO1 Thiol-disulfide oxidoreductase LTO1 A0A1P8B950;Q8L540
AT4G35760 1.08 1 1.41 1.18 1.01 1.34 1.18 1.10 1.37 0.828622 0.0001565
6 0.914207
PSII repair PBF1 Proteasome subunit beta type F4JD01;P42742 AT3G60820 0.98 1 5.60 0.79 0.78 6.12 0.75 2.48 3.85 0.45106 6.20E-16 8.79E-08
PSII repair PDIL1-2 Protein disulfide isomerase-like 1-2 Q9SRG3 AT1G77510 5.92 1 9.31 1.92 1.13 6.65 2.96 2.54 6.99 0.0001449
04 3.60E-12 7.02E-05
PSII repair PPL1 PsbP-like protein 1 P82538 AT3G55330 1.14 1 1.17 1.47 1.29 1.32 1.25 1.09 1.34 8.04E-06 0.0006095
23 0.0060913
3
PSII repair PSB27-1 Photosystem II repair protein PSB27-H1 Q9LR64 AT1G03600 0.77 1 0.80 0.74 0.57 0.87 0.77 0.45 1.00 0.0073099
4 3.25E-06 2.23E-06
PSII repair PSB27-2 Photosystem II D1 precursor processing protein PSB27-H2
A0A1P8ASY3;Q9ZVZ9
AT1G05385 4.10 1 2.64 4.56 2.23 5.80 2.54 1.83 2.76 0.0134876 0.0003808
75 0.204629
PSII repair VIPP1 Membrane-associated protein VIPP1 A0A178W0D3;O80796
AT1G65260 0.76 1 1.69 0.67 1.41 2.06 0.49 1.17 1.48 4.40E-07 8.20E-16 1.48E-05
PSII repair ZKT Q94BS2 AT1G55480 0.93 1 1.97 1.24 1.62 2.31 0.67 1.45 2.00 1.40E-07 2.04E-15 5.40E-05
PSII repair UPF0603 protein At1g54780 Q9ZVL6 AT1G54780 1.13 1 0.88 1.23 0.91 1.00 1.16 0.83 0.92 0.00106 8.25E-11 0.0012527
5
Redox regulation At1g14345 Q949S6 AT1G14345 0.58 1 1.06 0.83 1.20 1.40 0.62 0.82 1.12 8.32E-05 2.56E-08 0.379895
Redox regulation At1g50450 Q94BZ0 AT1G50450 0.98 1 1.31 0.89 1.09 1.37 1.07 1.26 1.31 0.171315 8.01E-07 0.132865
Redox regulation At5g58330 Malate dehydrogenase Q8H1E2;F4KEX3
AT5G58330 0.44 1 0.66 1.20 0.40 0.82 0.60 0.48 0.41 2.94E-10 0.0029416
5 9.87E-13
Redox regulation ATHM2 Thioredoxin M2 Q9SEU8;F4JG94 AT4G03520 0.77 1 0.97 1.12 1.06 1.19 0.79 0.89 1.06 5.84E-08 5.49E-06 0.0024805
4

202
Redox regulation ATPRX Q Peroxiredoxin Q A0A1I9LR27;F4JBC9;Q9LU86
AT3G26060 2.72 1 1.70 2.82 1.84 2.59 1.60 2.29 2.04 3.66E-09 2.16E-09 2.07E-11
Redox regulation BAS1 2-Cys peroxiredoxin BAS1 Q96291 AT3G11630 2.08 1 2.76 1.63 3.93 3.20 1.02 2.60 3.24 2.59E-08 1.48E-11 3.28E-10
Redox regulation CITRX Thioredoxin-like protein CITRX Q9M7X9 AT3G06730 0.92 1 1.78 1.10 1.40 2.25 0.85 1.59 1.75 1.56E-05 3.93E-13 3.40E-05
Redox regulation ENH1 Q9FFJ2;A8MSF2 AT5G17170 1.20 1 1.51 1.28 1.36 1.63 1.11 1.11 1.53 2.73E-05 1.54E-10 0.0517906
Redox regulation F20D21.31 Q9SLI4 AT1G54500 1.21 1 1.35 1.23 1.58 1.42 1.14 1.46 1.28 0.0086597
3 0.0315632
0.00815537
Redox regulation FSD3 Superoxide dismutase [Fe] 3 Q9FMX0 AT5G23310 1.04 1 1.65 1.20 1.60 1.59 1.16 1.64 1.56 0.259267 0.0472032 0.463294
Redox regulation MED24.18 Q940I2 AT5G03880 0.56 1 1.06 0.58 0.97 1.03 0.54 0.88 0.79 1.90E-05 4.01E-13 0.0029346
5
Redox regulation NTRC NADPH-dependent thioredoxin reductase 3 O22229 AT2G41680 1.27 1 4.47 2.80 3.19 5.89 1.07 1.67 2.96 1.26E-09 3.02E-12 0.0056817
4
Redox regulation Thioredoxin M1 O48737 AT1G03680 0.81 1 0.60 1.34 0.95 0.68 0.83 0.61 0.46 2.72E-11 2.89E-12 7.34E-08
Redox regulation Thioredoxin F1 Q9XFH8 AT3G02730 0.32 1 0.61 0.76 0.64 0.91 0.33 0.56 0.54 0.0001576
38 0.0008346
93 0.0001248
9
Redox regulation Thioredoxin M4 Q9SEU6 AT3G15360 0.56 1 0.80 0.84 0.95 0.89 0.67 0.84 0.94 0.0001069
11 2.23E-09 1.52E-06
Redox regulation Malate dehydrogenase Q9SN86 AT3G47520 1.05 1 3.48 0.94 1.92 3.94 0.74 1.56 3.27 0.128797 9.76E-12 0.0391197
Redox regulation 2-Cys peroxiredoxin BAS1-like Q9C5R8;A0A1P8BD74
AT5G06290 1.87 1 2.15 1.27 3.43 2.92 0.86 2.35 2.69 6.55E-08 1.13E-10 2.25E-09
Ribosome At1g68590 30S ribosomal protein 3-1 A8MQL0;Q9SX22
AT1G68590 0.50 1 0.75 0.51 1.14 2.18 0.25 1.32 1.44 0.0502466 0.0001614
83 0.137371
Ribosome At3g52150 Q8VYM4 AT3G52150 0.53 1 1.34 0.62 1.78 2.09 0.50 1.43 1.57 8.51E-09 2.63E-14 0.0001033
18
Ribosome PSRP5 50S ribosomal protein 5 Q9LER7 AT3G56910 0.76 1 1.89 0.77 1.48 2.67 0.49 1.48 1.62 2.49E-05 2.70E-11 2.88E-05
Ribosome PSRP6 50S ribosomal protein 6 A0A1P8BCP6;Q9FKP0
AT5G17870 0.55 1 1.36 0.81 1.13 2.53 0.48 1.44 2.11 0.0009577
16 1.90E-09
0.00708473
Ribosome RPL1 50S ribosomal protein L1 Q9LY66;F4J296 AT3G63490 0.68 1 1.76 0.92 1.60 2.26 0.60 1.39 1.66 1.10E-12 1.83E-19 6.37E-08
Ribosome RPL10 50S ribosomal protein L10 Q9FY50 AT5G13510 0.73 1 2.36 1.08 1.71 3.04 0.76 1.47 2.06 6.68E-08 5.12E-15 0.0002519
75
Ribosome RPL11 50S ribosomal protein L11 Q9MAP3 AT1G32990 0.80 1 1.78 1.02 1.73 3.66 0.70 1.94 2.30 3.24E-07 2.55E-11 1.32E-05
Ribosome RPL12C 50S ribosomal protein L12-3 P36212;P36210 AT3G27830;AT3G27850
0.45 1 1.38 0.48 0.67 3.56 0.33 1.21 2.06 0.0089215
6 1.47E-07
0.000212789
Ribosome RPL13 50S ribosomal protein L13 Q9SYL9 AT1G78630 4.21 1 3.02 1.81 1.65 3.81 1.33 1.31 2.51 0.0194609 0.0005344
52 0.0196048
Ribosome rpl14 50S ribosomal protein L14 P56792 AtCg00780 0.79 1 1.63 1.02 1.97 2.74 0.70 1.84 1.69 4.52E-10 1.20E-13 5.27E-07
Ribosome RPL15 50S ribosomal protein L15 P25873 AT3G25920 0.70 1 2.37 0.79 1.98 2.80 0.57 1.79 2.29 1.85E-08 1.19E-17 8.32E-07
Ribosome rpl16 50S ribosomal protein L16 P56793 AT2G28830 0.82 1 2.36 1.01 2.00 3.07 0.66 1.95 2.08 2.28E-06 6.54E-13 2.84E-05
Ribosome RPL17 50S ribosomal protein L17 Q9M385 AT3G54210 0.53 1 1.88 0.66 1.79 2.68 0.48 1.58 1.89 4.73E-10 2.49E-17 1.18E-06
Ribosome RPL18 50S ribosomal protein L18 Q9SX68 AT1G48350 1.08 1 2.04 1.12 2.31 3.02 0.79 1.96 2.16 7.10E-08 1.21E-11 1.71E-05
Ribosome rpl20 50S ribosomal protein L20 P56794 AtCg00660 0.66 1 2.24 0.87 2.38 3.54 0.51 1.30 2.86 0.0022396
8 1.34E-07 0.21718
Ribosome RPL21 50S ribosomal protein L21 P51412 AT1G35680 0.96 1 2.66 1.15 1.67 3.45 0.85 1.82 2.74 7.02E-05 1.01E-12 0.0025944
5

203
Ribosome rpl22 50S ribosomal protein L22 P56795 AtCg00810 0.65 1 1.60 0.66 2.17 2.04 0.48 1.87 1.55 0.0004412
6 2.87E-09
0.00121294
Ribosome rpl23-A 50S ribosomal protein L23 P61845 AtCg00840 0.46 1 1.02 0.59 1.86 1.49 0.52 1.30 1.04 3.94E-07 4.29E-12 0.0018549
Ribosome RPL24 50S ribosomal protein L24 P92959;F4K1S8 AT5G54600 0.43 1 1.39 0.51 1.71 1.87 0.25 1.52 1.25 3.72E-07 1.04E-13 3.73E-06
Ribosome RPL27 50S ribosomal protein L27 Q9FLN4 AT5G40950 0.78 1 3.52 0.94 1.43 4.47 0.63 1.64 2.63 0.138836 1.70E-09 0.185726
Ribosome RPL29 50S ribosomal protein L29 Q9FJP3 AT5G65220 0.71 1 2.09 0.79 1.83 3.11 0.55 1.54 1.85 2.33E-06 6.53E-13 0.0003672
Ribosome rpl2-A 50S ribosomal protein L2 P56791 AtCg00830 0.68 1 2.54 0.78 2.26 4.28 0.53 2.52 2.74 2.75E-05 1.03E-11 2.26E-05
Ribosome RPL31 50S ribosomal protein L31 Q9FWS4 AT1G75350 0.56 1 1.24 0.60 1.34 2.31 0.37 1.46 1.46 1.07E-07 2.04E-14 3.95E-07
Ribosome rpl32 50S ribosomal protein L32 P61847 AtCg01020 0.37 1 0.92 0.37 1.70 1.97 0.41 1.73 1.68 0.0013167
5 1.05E-07 0.135996
Ribosome rpl33 50S ribosomal protein L33 P56796 AtCg00640 0.88 1 2.37 1.11 1.39 2.31 0.75 1.99 2.84 0.0312664 7.97E-10 0.022061
Ribosome RPL3A 50S ribosomal protein L3-1 Q9SKX4 AT2G43030 1.23 1 2.84 1.42 2.20 3.45 0.96 2.19 2.52 1.44E-06 3.34E-13 1.69E-06
Ribosome RPL4 50S ribosomal protein L4 O50061;Q2V4Q4;Q3EDH2
AT1G07320 0.80 1 1.61 0.88 0.89 2.52 0.58 1.21 1.94 2.63E-06 1.90E-17 3.51E-09
Ribosome RPL5 50S ribosomal protein L5 O04603 AT4G01310 0.72 1 1.84 0.86 1.59 2.69 0.62 1.48 1.80 8.89E-11 1.76E-17 1.23E-07
Ribosome RPL6 50S ribosomal protein L6 O23049 AT1G05190 0.63 1 1.37 0.73 1.75 2.33 0.53 1.41 1.58 6.35E-09 6.55E-14 1.21E-05
Ribosome RPL9 50S ribosomal protein L9 P25864 AT3G44890 0.96 1 2.15 1.15 1.99 2.77 0.87 1.86 2.17 1.31E-09 2.41E-15 1.12E-06
Ribosome RPS10 30S ribosomal protein S10 Q9LK61 AT3G13120 1.27 1 4.29 0.87 2.80 6.06 0.80 2.25 4.28 0.0032865
6 2.92E-09 0.0800561
Ribosome rps11 30S ribosomal protein S11 P56802 AtCg00750 1.08 1 2.74 1.28 2.13 3.77 0.89 2.25 2.75 9.18E-08 1.13E-14 5.20E-06
Ribosome rps12-A 30S ribosomal protein S12 P62126 AtCg01230;AtCg00065;AtCg00905
0.38 1 1.46 0.46 2.58 2.43 0.33 2.28 1.88 1.86E-05 1.76E-10 0.0023335
3
Ribosome RPS13 30S ribosomal protein S13 P42732;B3H631 AT5G14320 0.59 1 1.60 0.81 2.23 2.13 0.40 2.28 1.49 6.73E-09 2.72E-14 1.30E-07
Ribosome rps15 30S ribosomal protein S15 P56805 AtCg01120 0.68 1 2.11 0.91 2.16 3.24 0.66 1.38 2.51 3.56E-11 4.22E-17 5.49E-06
Ribosome RPS17 30S ribosomal protein S17 P16180 AT1G79850 0.59 1 1.96 0.73 2.36 2.36 0.53 1.79 1.99 5.09E-09 7.95E-15 2.71E-06
Ribosome rps18 30S ribosomal protein S18 P56807 AtCg00650 0.44 1 1.92 0.47 1.77 3.09 0.42 1.07 1.97 0.0008150
34 1.00E-09 0.0755039
Ribosome rps19 30S ribosomal protein S19 P56808 AtCg00820 1.03 1 2.08 1.21 1.44 2.85 0.89 1.23 2.00 2.07E-05 9.15E-12 0.0861068
Ribosome rps2 30S ribosomal protein S2 P56797 AtCg00160 0.58 1 1.76 0.81 1.65 2.33 0.61 1.22 1.85 2.87E-06 1.19E-12 0.120559
Ribosome RPS20 30S ribosomal protein S20 Q9ASV6 AT3G15190 0.82 1 1.86 0.96 1.77 2.44 0.66 1.54 1.98 7.16E-09 4.48E-15 4.30E-05
Ribosome rps3 30S ribosomal protein S3 P56798 AtCg00800 0.58 1 1.83 0.75 2.15 2.33 0.54 1.76 2.04 2.70E-08 1.76E-14 2.61E-05
Ribosome RPS31 30S ribosomal protein S31 O80439 At2g38140 1.93 1 7.30 1.05 1.63 7.58 0.67 7.59 7.89 0.511262 0.0007992
9 0.141184
Ribosome rps4 30S ribosomal protein S4 P56799 AtCg00380 0.67 1 2.76 0.79 2.73 3.37 0.58 2.40 2.93 3.72E-07 1.19E-14 6.92E-06
Ribosome rps5 30S ribosomal protein S5 P93014 AT2G33800 0.44 1 1.31 0.54 2.10 1.80 0.31 1.65 1.25 2.83E-10 2.33E-15 5.88E-08
Ribosome RPS6 30S ribosomal protein S6 alpha A0A1P8AV66;Q8VY91
AT1G64510 0.49 1 1.90 0.79 1.20 3.45 0.54 1.73 2.15 0.0001906
31 9.55E-10
0.000526349
Ribosome rps7-A 30S ribosomal protein S7 P61841 AtCg00900;AtCg01240
0.64 1 2.02 0.87 1.97 2.30 0.47 1.61 2.08 3.45E-06 6.85E-14 0.0008907
49
Ribosome rps8 30S ribosomal protein S8 P56801 AtCg00770 0.58 1 2.23 0.69 2.70 3.23 0.47 2.15 3.58 0.0018405 2.82E-08 0.0945155
Ribosome RPS9 30S ribosomal protein S9 Q9XJ27 AT1G74970 0.69 1 1.13 0.84 1.99 1.56 0.52 1.69 1.31 7.13E-06 1.26E-09 0.0030106
9
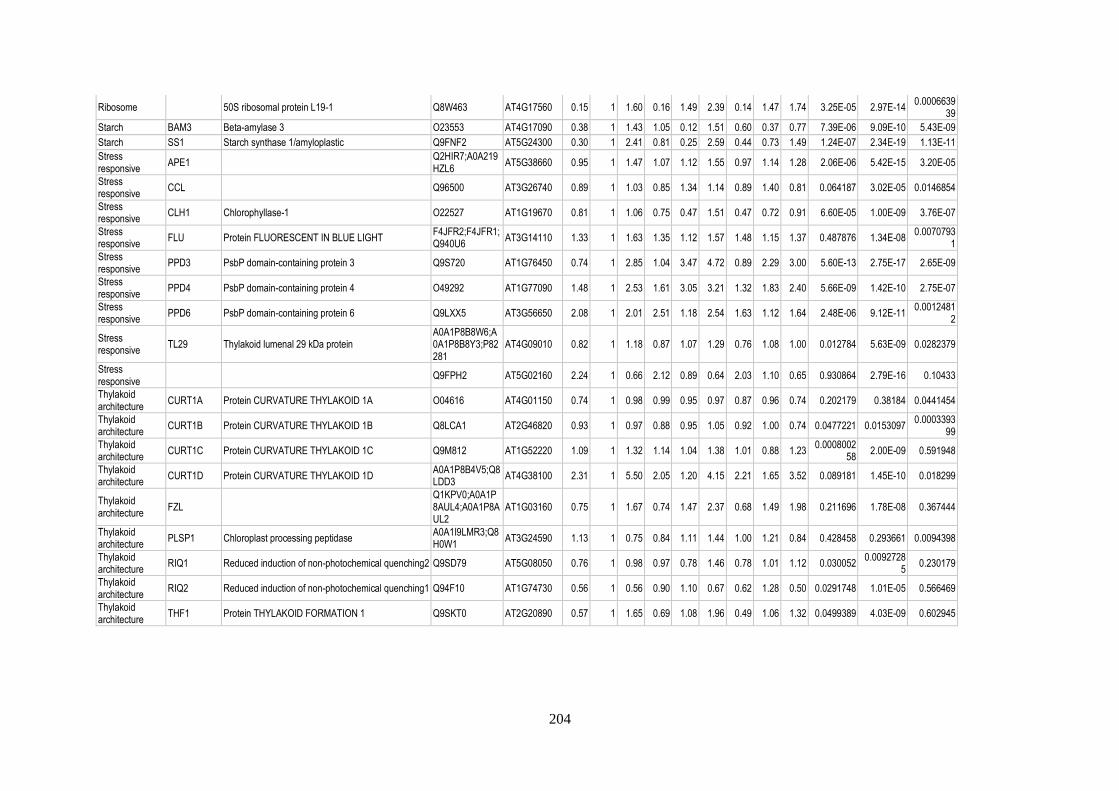
204
Ribosome 50S ribosomal protein L19-1 Q8W463 AT4G17560 0.15 1 1.60 0.16 1.49 2.39 0.14 1.47 1.74 3.25E-05 2.97E-14 0.0006639
39
Starch BAM3 Beta-amylase 3 O23553 AT4G17090 0.38 1 1.43 1.05 0.12 1.51 0.60 0.37 0.77 7.39E-06 9.09E-10 5.43E-09
Starch SS1 Starch synthase 1/amyloplastic Q9FNF2 AT5G24300 0.30 1 2.41 0.81 0.25 2.59 0.44 0.73 1.49 1.24E-07 2.34E-19 1.13E-11
Stress responsive
APE1 Q2HIR7;A0A219HZL6
AT5G38660 0.95 1 1.47 1.07 1.12 1.55 0.97 1.14 1.28 2.06E-06 5.42E-15 3.20E-05
Stress responsive
CCL Q96500 AT3G26740 0.89 1 1.03 0.85 1.34 1.14 0.89 1.40 0.81 0.064187 3.02E-05 0.0146854
Stress responsive
CLH1 Chlorophyllase-1 O22527 AT1G19670 0.81 1 1.06 0.75 0.47 1.51 0.47 0.72 0.91 6.60E-05 1.00E-09 3.76E-07
Stress responsive
FLU Protein FLUORESCENT IN BLUE LIGHT F4JFR2;F4JFR1;Q940U6
AT3G14110 1.33 1 1.63 1.35 1.12 1.57 1.48 1.15 1.37 0.487876 1.34E-08 0.0070793
1
Stress responsive
PPD3 PsbP domain-containing protein 3 Q9S720 AT1G76450 0.74 1 2.85 1.04 3.47 4.72 0.89 2.29 3.00 5.60E-13 2.75E-17 2.65E-09
Stress responsive
PPD4 PsbP domain-containing protein 4 O49292 AT1G77090 1.48 1 2.53 1.61 3.05 3.21 1.32 1.83 2.40 5.66E-09 1.42E-10 2.75E-07
Stress responsive
PPD6 PsbP domain-containing protein 6 Q9LXX5 AT3G56650 2.08 1 2.01 2.51 1.18 2.54 1.63 1.12 1.64 2.48E-06 9.12E-11 0.0012481
2
Stress responsive
TL29 Thylakoid lumenal 29 kDa protein A0A1P8B8W6;A0A1P8B8Y3;P82281
AT4G09010 0.82 1 1.18 0.87 1.07 1.29 0.76 1.08 1.00 0.012784 5.63E-09 0.0282379
Stress responsive
Q9FPH2 AT5G02160 2.24 1 0.66 2.12 0.89 0.64 2.03 1.10 0.65 0.930864 2.79E-16 0.10433
Thylakoid architecture
CURT1A Protein CURVATURE THYLAKOID 1A O04616 AT4G01150 0.74 1 0.98 0.99 0.95 0.97 0.87 0.96 0.74 0.202179 0.38184 0.0441454
Thylakoid architecture
CURT1B Protein CURVATURE THYLAKOID 1B Q8LCA1 AT2G46820 0.93 1 0.97 0.88 0.95 1.05 0.92 1.00 0.74 0.0477221 0.0153097 0.0003393
99
Thylakoid architecture
CURT1C Protein CURVATURE THYLAKOID 1C Q9M812 AT1G52220 1.09 1 1.32 1.14 1.04 1.38 1.01 0.88 1.23 0.0008002
58 2.00E-09 0.591948
Thylakoid architecture
CURT1D Protein CURVATURE THYLAKOID 1D A0A1P8B4V5;Q8LDD3
AT4G38100 2.31 1 5.50 2.05 1.20 4.15 2.21 1.65 3.52 0.089181 1.45E-10 0.018299
Thylakoid architecture
FZL Q1KPV0;A0A1P8AUL4;A0A1P8AUL2
AT1G03160 0.75 1 1.67 0.74 1.47 2.37 0.68 1.49 1.98 0.211696 1.78E-08 0.367444
Thylakoid architecture
PLSP1 Chloroplast processing peptidase A0A1I9LMR3;Q8H0W1
AT3G24590 1.13 1 0.75 0.84 1.11 1.44 1.00 1.21 0.84 0.428458 0.293661 0.0094398
Thylakoid architecture
RIQ1 Reduced induction of non-photochemical quenching2 Q9SD79 AT5G08050 0.76 1 0.98 0.97 0.78 1.46 0.78 1.01 1.12 0.030052 0.0092728
5 0.230179
Thylakoid architecture
RIQ2 Reduced induction of non-photochemical quenching1 Q94F10 AT1G74730 0.56 1 0.56 0.90 1.10 0.67 0.62 1.28 0.50 0.0291748 1.01E-05 0.566469
Thylakoid architecture
THF1 Protein THYLAKOID FORMATION 1 Q9SKT0 AT2G20890 0.57 1 1.65 0.69 1.08 1.96 0.49 1.06 1.32 0.0499389 4.03E-09 0.602945

205
Table 15: Relative abundance of thylakoid-associated proteins in pgr5. Details of the 447 MS-quantified thylakoid proteins from pgr5 thylakoids relative to gl-1, including functional category,
protein/gene name, description, UniProtKB identifier, TAIR ID and abundance ratios relative to gl-1. Significant changes were identified by a modified Welch’s t-test (q < 0.05). Median protein
iBAQ values were used for the calculation of ratios.
Category Protein/
gene name Description UniProtKB accession TAIR ID
Ratio pgr5 vs
gl-1
Welch's t-test sig.
Welch's t-test q-value
Assembly ALB4 ALBINO3-like protein 1 F4I9A9;Q9FYL3 AT1G24490 0.85 0.798683
Assembly At4g28740 LOW PSII ACCUMULATION-like protein F4JM22 AT4G28740 0.84 + 0.0139178
Assembly At5g48790 LOW PSII ACCUMULATION protein Q94F50;Q9FKB7 AT5G48790 1.86 0.20055
Assembly CCB1 Protein COFACTOR ASSEMBLY OF COMPLEX C SUBUNIT B CCB1 Q9LSE4 AT3G26710 0.82 0.14523
Assembly CCB2 Protein COFACTOR ASSEMBLY OF COMPLEX C SUBUNIT B CCB2 Q9FJ81 AT5G52110 0.77 + 0.0439641
Assembly CCS1 Cytochrome c biogenesis protein CCS1 Q9XIA4 AT1G49380 0.55 + 0.037198
Assembly DAC Q94BY7 AT3G17930 0.42 0.421672
Assembly HCF101 Fe-S cluster assembly factor HCF101 Q6STH5 AT3G24430 0.94 0.645855
Assembly HCF136 Photosystem II stability/assembly factor HCF136 A0A1P8BG37;O82660 AT5G23120 0.85 + 0.0070303
Assembly HCF164 Thioredoxin-like protein HCF164 O23166 AT4G37200 0.98 0.897908
Assembly HCF244 NAD(P)-binding Rossmann-fold superfamily protein O65502 AT4G35250 0.73 + 0.0165085
Assembly LPA2 Protein LOW PSII ACCUMULATION 2 F4KDA6 AT5G51545 1.00 0.748162
Assembly LPA3 Protein LOW PSII ACCUMULATION 3 Q8H0W0 AT1G73060 0.47 + 0.0133333
Assembly MPH2 Thylakoid lumenal 16.5 kDa protein A0A1P8B5H3;O22773;A0A1P8B5G9
AT4G02530 0.89 0.528952
Assembly PPD1 PsbP domain-containing protein 1 O23403 AT4G15510 0.66 + 0.0135354
Assembly Y3IP1 Ycf3-interacting protein 1 Q9LU01 AT5G44650 0.97 0.145101
Assembly YCF4 Photosystem I assembly protein Ycf4 P56788 AtCg00520 1.16 0.0998491
ATP synthase ATPA ATP synthase subunit alpha P56757 ATCG00120 1.20 + 0.0434444
ATP synthase ATPB ATP synthase subunit beta P19366 ATCG00480 0.93 0.0526076
ATP synthase ATPC1 ATP synthase gamma chain 1 Q01908 AT4G04640 0.96 0.1841
ATP synthase ATPD ATP synthase subunit delta Q9SSS9 AT4G09650 0.84 + 0.0309733
ATP synthase ATPE ATP synthase epsilon chain P09468 ATCG00470 0.95 0.478177
ATP synthase ATPF ATP synthase subunit b P56759 ATCG00130 0.94 0.118553
ATP synthase ATPH ATP synthase subunit c P56760 ATCG00140 0.35 + 0.0138113
ATP synthase ATPI ATP synthase subunit a P56758 ATCG00150 1.10 0.897256
ATP synthase PDE334 Q42139 AT4G32260 1.22 + 0.0206494
Carbon fixation BCA1 Beta carbonic anhydrase 1 A0A1I9LQB3;P27140 AT3G01500 0.77 + 0.0138182
Carbon fixation RBCL Ribulose bisphosphate carboxylase large chain O03042 AtCg00490 0.70 + 0.0102545
Carbon fixation RBCS-1A Ribulose bisphosphate carboxylase small chain 1A P10795 AT1G67090 0.69 + 0.0135467
Carbon fixation RBCS-1B Ribulose bisphosphate carboxylase small chain 1B P10796 AT5G38430 0.72 + 0.00989474
Carbon fixation RBCS-2B Ribulose bisphosphate carboxylase small chain 3B P10798;P10797;B3H5S2;F4KA76
AT5G38410;AT5G38420
0.85 + 0.01128

206
Carbon fixation RCA Ribulose bisphosphate carboxylase/oxygenase activase P10896;F4IVZ7 AT2G39730 0.81 + 0.0136822
Chloroplast replication
FTSZ1 Cell division protein FtsZ homolog 1 Q42545 AT5G55280 0.32 + 0.033886
Chloroplast replication
FTSZ2-1 Cell division protein FtsZ homolog 2-1 A0A1P8AXD8;O82533 AT2G36250 0.81 0.152792
Chloroplast replication
FTSZ2-2 Cell division protein FtsZ homolog 2-2 Q9LXJ0;A0A1I9LSJ8 AT3G52750 0.46 + 0.0143099
Chlororespiration PIFI Post-illumination chlorophyll fluorescence increase B3H4M0;F4J037;F4J034;Q9LVZ5;F4J036
AT3G15840 0.54 + 0.00459259
Cytochrome b6f PETA Cytochrome f P56771 ATCG00540 0.91 0.116129
Cytochrome b6f PETB Cytochrome b6 P56773 ATCG00720 0.53 + 0.0138144
Cytochrome b6f PETC Cytochrome b6-f complex subunit 4 P56774 ATCG00730 0.97 0.925665
Cytochrome b6f PETD Cytochrome b6-f complex iron-sulfur subunit Q9ZR03 AT4G03280 0.87 + 0.0309508
DNA/RNA At2g21530 Q8GWP4 AT2G21530 0.33 0.0698167
DNA/RNA At2g24060 O82234 AT2G24060 0.41 0.243821
DNA/RNA At2g24420 Q9ZQ26 AT2G24420 0.88 0.381061
DNA/RNA CP29A 29 kDa ribonucleoprotein Q43349;F4JAF3 AT3G53460 0.90 0.0614815
DNA/RNA CP29B RNA-binding protein CP29B Q9ZUU4 AT2G37220 0.87 0.153556
DNA/RNA CP31A 31 kDa ribonucleoprotein Q04836 AT4G24770 1.48 + 0
DNA/RNA PTAC16 Protein PLASTID TRANSCRIPTIONALLY ACTIVE 16 Q9STF2 AT3G46780 0.70 + 0
DNA/RNA rpoA P56762 AtCg00740 1.21 + 0.0203846
DNA/RNA TUFA Elongation factor Tu P17745 AT4G20360 1.07 + 0.0205161
Electron transfer FD1 Ferredoxin-1 O04090 AT1G10960 0.16 + 0.0229701
Electron transfer FD2 Ferredoxin-2 P16972 AT1G60950 0.14 0.996359
Electron transfer FD3 Ferredoxin-3 Q9ZQG8 AT2G27510 0.78 + 0.0315106
Electron transfer LFNR1 Ferredoxin--NADP reductase, leaf isozyme 2 Q8W493;C0Z2A8 AT1G20020 0.71 + 0
Electron transfer LFNR2 Ferredoxin--NADP reductase, leaf isozyme 1 Q9FKW6;F4JZ46 AT5G66190 0.62 + 0.013679
Electron transfer NDC1 Alternative NAD(P)H-ubiquinone oxidoreductase C1/mitochondrial Q8GXR9 AT5G08740 0.89 + 0.0435733
Electron transfer PC Plastocyanin major isoform P42699 AT1G20340 0.79 + 0.0183235
Electron transfer PETE Plastocyanin minor isoform A0A1P8APR2;P11490 AT1G76100 0.94 0.851277
Electron transfer PGR5 Protein PROTON GRADIENT REGULATION 5 Q9SL05 AT2G05620 0.04 + 0.0053913
Electron transfer PGR6 Uncharacterized aarF domain-containing protein kinase At4g31390 Q8RWG1;A0A1P8B7P6 AT4G31390 1.06 0.170153
Electron transfer PGRL1A PGR5-like protein 1A Q8H112;A0A2H1ZEN5 AT4G22890 0.52 + 0.008
Electron transfer PGRL1B PGR5-like protein 1B Q8GYC7;F4JPU9 AT4G11960 0.58 + 0.018597
Electron transfer TIC62 Protein TIC 62 Q8H0U5 AT3G18890 0.86 + 0.0193714
Electron transfer TROL Rhodanese-like domain-containing protein 4 A0A1P8B8J7;Q9M158 AT4G01050 0.89 + 0.0129362
Ion channel DIT2-1 Dicarboxylate transporter 2.1 Q9FMF7 AT5G64290 1.04 0.868088
Ion channel KEA3 K(+) efflux antiporter 3 Q9M0Z3 AT4G04850 1.07 0.336362
Ion channel MNJ8.18 LOW protein: ammonium transporter 1-like protein Q93Z11 AT5G37360 0.71 + 0.0268671
Kinase/phosphatase
At3g59780 Rhodanese/Cell cycle control phosphatase superfamily protein F4J9G2 AT3G59780 1.00 0.930081
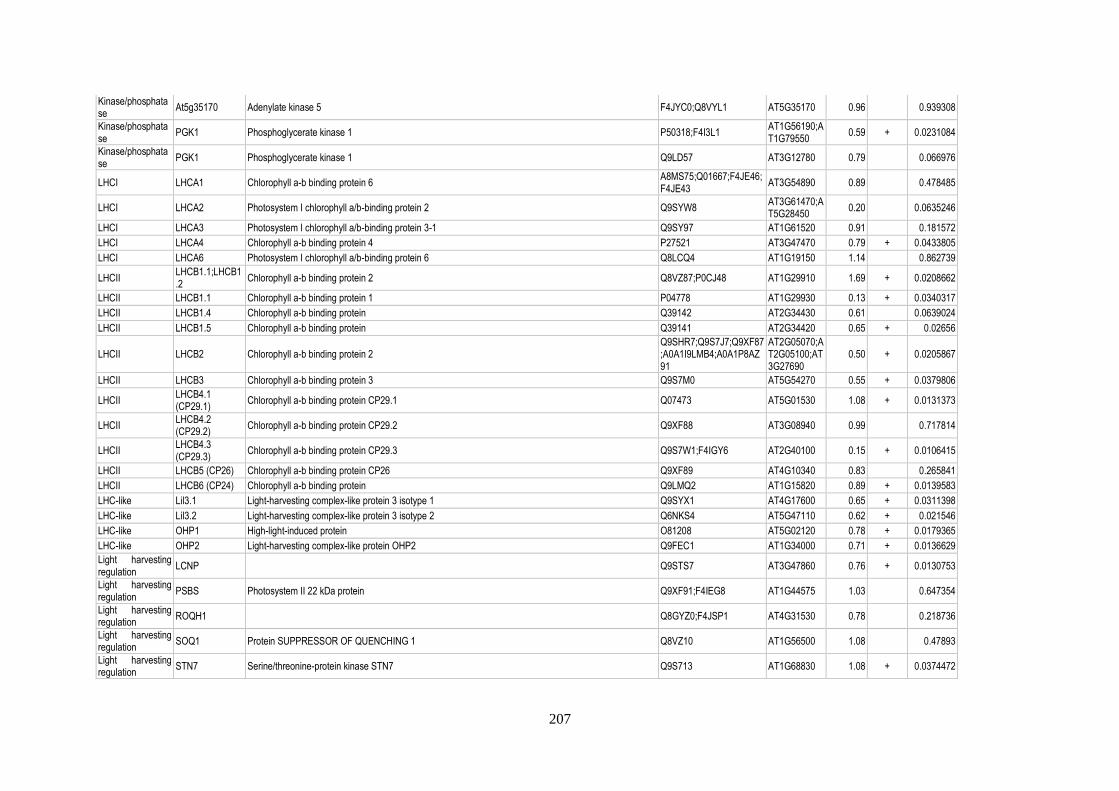
207
Kinase/phosphatase
At5g35170 Adenylate kinase 5 F4JYC0;Q8VYL1 AT5G35170 0.96 0.939308
Kinase/phosphatase
PGK1 Phosphoglycerate kinase 1 P50318;F4I3L1 AT1G56190;AT1G79550
0.59 + 0.0231084
Kinase/phosphatase
PGK1 Phosphoglycerate kinase 1 Q9LD57 AT3G12780 0.79 0.066976
LHCI LHCA1 Chlorophyll a-b binding protein 6 A8MS75;Q01667;F4JE46;F4JE43
AT3G54890 0.89 0.478485
LHCI LHCA2 Photosystem I chlorophyll a/b-binding protein 2 Q9SYW8 AT3G61470;AT5G28450
0.20 0.0635246
LHCI LHCA3 Photosystem I chlorophyll a/b-binding protein 3-1 Q9SY97 AT1G61520 0.91 0.181572
LHCI LHCA4 Chlorophyll a-b binding protein 4 P27521 AT3G47470 0.79 + 0.0433805
LHCI LHCA6 Photosystem I chlorophyll a/b-binding protein 6 Q8LCQ4 AT1G19150 1.14 0.862739
LHCII LHCB1.1;LHCB1.2
Chlorophyll a-b binding protein 2 Q8VZ87;P0CJ48 AT1G29910 1.69 + 0.0208662
LHCII LHCB1.1 Chlorophyll a-b binding protein 1 P04778 AT1G29930 0.13 + 0.0340317
LHCII LHCB1.4 Chlorophyll a-b binding protein Q39142 AT2G34430 0.61 0.0639024
LHCII LHCB1.5 Chlorophyll a-b binding protein Q39141 AT2G34420 0.65 + 0.02656
LHCII LHCB2 Chlorophyll a-b binding protein 2 Q9SHR7;Q9S7J7;Q9XF87;A0A1I9LMB4;A0A1P8AZ91
AT2G05070;AT2G05100;AT3G27690
0.50 + 0.0205867
LHCII LHCB3 Chlorophyll a-b binding protein 3 Q9S7M0 AT5G54270 0.55 + 0.0379806
LHCII LHCB4.1 (CP29.1)
Chlorophyll a-b binding protein CP29.1 Q07473 AT5G01530 1.08 + 0.0131373
LHCII LHCB4.2 (CP29.2)
Chlorophyll a-b binding protein CP29.2 Q9XF88 AT3G08940 0.99 0.717814
LHCII LHCB4.3 (CP29.3)
Chlorophyll a-b binding protein CP29.3 Q9S7W1;F4IGY6 AT2G40100 0.15 + 0.0106415
LHCII LHCB5 (CP26) Chlorophyll a-b binding protein CP26 Q9XF89 AT4G10340 0.83 0.265841
LHCII LHCB6 (CP24) Chlorophyll a-b binding protein Q9LMQ2 AT1G15820 0.89 + 0.0139583
LHC-like Lil3.1 Light-harvesting complex-like protein 3 isotype 1 Q9SYX1 AT4G17600 0.65 + 0.0311398
LHC-like Lil3.2 Light-harvesting complex-like protein 3 isotype 2 Q6NKS4 AT5G47110 0.62 + 0.021546
LHC-like OHP1 High-light-induced protein O81208 AT5G02120 0.78 + 0.0179365
LHC-like OHP2 Light-harvesting complex-like protein OHP2 Q9FEC1 AT1G34000 0.71 + 0.0136629
Light harvesting regulation
LCNP Q9STS7 AT3G47860 0.76 + 0.0130753
Light harvesting regulation
PSBS Photosystem II 22 kDa protein Q9XF91;F4IEG8 AT1G44575 1.03 0.647354
Light harvesting regulation
ROQH1 Q8GYZ0;F4JSP1 AT4G31530 0.78 0.218736
Light harvesting regulation
SOQ1 Protein SUPPRESSOR OF QUENCHING 1 Q8VZ10 AT1G56500 1.08 0.47893
Light harvesting regulation
STN7 Serine/threonine-protein kinase STN7 Q9S713 AT1G68830 1.08 + 0.0374472

208
Light harvesting regulation
STN8 Serine/threonine-protein kinase STN8 Q9LZV4 AT5G01920 0.83 + 0.0447671
Light harvesting regulation
TAP38 Protein phosphatase 2C 57 P49599 AT4G27800 0.62 + 0.00516667
Light harvesting regulation
TSP9 Thylakoid soluble phosphoprotein Q9SD66 AT3G47070 0.77 + 0.0133091
Light harvesting regulation
VDE1 Violaxanthin de-epoxidase Q39249 AT1G08550 0.87 0.106007
Light harvesting regulation
ZEP Zeaxanthin epoxidase Q9FGC7 AT5G67030 0.82 + 0.0131892
NDH NDHC NAD(P)H-quinone oxidoreductase subunit 3 P56751 ATCG00440 NaN 1
NDH NDHE NAD(P)H-quinone oxidoreductase subunit 4L P26289 ATCG01070 0.97 0.265701
NDH NDHF NAD(P)H-quinone oxidoreductase subunit 5 P56752 ATCG01010 0.23 + 0.0110588
NDH NDHH NAD(P)H-quinone oxidoreductase subunit H P56753 ATCG01110 0.62 0.10645
NDH NDHI NAD(P)H-quinone oxidoreductase subunit I P56755 ATCG01090 0.81 + 0.0194688
NDH NDHJ NAD(P)H-quinone oxidoreductase subunit J P56754 ATCG00420 0.48 0.0509153
NDH NDHK NAD(P)H-quinone oxidoreductase subunit K P56756 ATCG00430 0.68 + 0.0184593
NDH ndhL Q9CAC5 AT1G70760 0.78 0.170696
NDH NDHM NAD(P)H-quinone oxidoreductase subunit M Q2V2S7 AT4G37925 0.88 + 0.021679
NDH NDHN NAD(P)H-quinone oxidoreductase subunit N Q9LVM2 AT5G58260 0.68 + 0.0201633
NDH NDHO NAD(P)H-quinone oxidoreductase subunit O Q9S829 AT1G74880 0.33 0.0923089
NDH NDHS NAD(P)H-quinone oxidoreductase subunit S Q9T0A4 AT4G23890 0.88 + 0.0204414
NDH NDHT NAD(P)H-quinone oxidoreductase subunit T Q9SMS0 AT4G09350 1.07 0.721985
NDH NDHU NAD(P)H-quinone oxidoreductase subunit U Q84VQ4 AT5G21430 0.70 + 0
NDH PNSB1 Photosynthetic NDH subunit of subcomplex B 1 Q9S9N6 AT1G15980 0.73 + 0.0146506
NDH PNSB2 Photosynthetic NDH subunit of subcomplex B 2 Q94AQ8;F4I891;F4I890 AT1G64770 0.67 + 0.0211429
NDH PNSB3 Photosynthetic NDH subunit of subcomplex B 3 Q9LU21 AT3G16250 0.60 0.0927231
NDH PNSB4 Photosynthetic NDH subunit of subcomplex B 4 A0A1P8AS98;F4ICC6;Q8RXS1
AT1G18730 0.76 0.0855969
NDH PNSB5 Photosynthetic NDH subunit of subcomplex B 5 Q9FG89 AT5G43750 0.61 + 0.0381659
NDH PNSL1 Photosynthetic NDH subunit of lumenal location 1 O80634 AT2G39470 0.83 + 0.0298242
NDH PNSL2 Photosynthetic NDH subunit of lumenal location 2 Q9XI73 AT1G14150 0.90 + 0.0349072
NDH PNSL3 Photosynthetic NDH subunit of lumenal location 3 Q9SGH4 AT3G01440 0.78 0.0560335
NDH PNSL4 Photosynthetic NDH subunit of lumenal location 4 F4JW56;Q9SCY3 AT4G39710 0.68 + 0.00955932
NDH PNSL5 Photosynthetic NDH subunit of lumenal location 5 Q9ASS6 AT5G13120 0.65 + 0.0108462
Other/unknown AAC1 P31167 AT3G08580 0.95 0.551821
Other/unknown AAC2 P40941 AT5G13490 0.89 0.198785
Other/unknown AOC2 Q9LS02 AT3G25770 0.64 + 0
Other/unknown APG3 Peptide chain release factor APG3 Q8RX79 AT3G62910 0.74 0.165974
Other/unknown APXT L-ascorbate peroxidase T A0A1P8APU0;Q42593 AT1G77490;AT2G18140;AT2G18150
0.83 0.139592

209
Other/unknown At1g07660 P59259;A8MRV1 AT2G28740 1.25 + 0.00773333
Other/unknown At1g18060 Q9LM40 AT1G18060 0.70 + 0.0257076
Other/unknown At1g24360 P33207 AT1G24360 0.45 + 0.0131429
Other/unknown At1g33810 Zinc finger/BTB domain protein Q8L9M8 AT1G33810 1.02 0.469643
Other/unknown At1g52510 Q8VZ57;F4ICZ4 AT1G52510 0.83 + 0.00442857
Other/unknown At1g73110 Q9AST9;A0A1P8ATD8 AT1G73110 2.97 0.0504103
Other/unknown At1g78915 Q8GWV1;F4IBX4;F4IBX5 AT1G78915 0.52 + 0.0207342
Other/unknown At2g27290 FAM210B-like protein, putative (DUF1279) Q9XIN6 AT2G27290 0.63 0.173873
Other/unknown At2g27680 Q9ZUX0 AT2G27680 0.31 + 0.013977
Other/unknown At3g14420 Q9LRR9;A8MS37;B3H4B8;Q2V3V9
AT3G14420 1.75 + 0.0105846
Other/unknown At3g61870 Plant/protein F4IX01;Q9M277 AT3G61870 0.83 0.094023
Other/unknown At4g02725 Q6DBF6 AT4G02725 0.82 + 0.0340625
Other/unknown At5g14910 Heavy metal transport/detoxification superfamily protein Q93VK7 AT5G14910 1.13 0.175508
Other/unknown At5g16660 A8MS48;Q8H0X5 AT5G16660 0.76 + 0.0166496
Other/unknown At5g42070 Q8RWR9 AT5G42070 0.56 + 0.044362
Other/unknown At5g51010 Q9FI47 AT5G51010 0.86 0.269959
Other/unknown BASS2 Q1EBV7 AT2G26900 1.33 + 0.0115102
Other/unknown CAC3 Q9LD43 AT2G38040 1.02 0.40389
Other/unknown CAS Calcium sensing receptor Q9FN48;A0A1P8BCX7 AT5G23060 0.63 + 0
Other/unknown CCR1 F4JVC0;F4JVC1;Q03251;F4JVB9
AT4G39260 1.80 + 0
Other/unknown CCR2 F4IHK9;Q03250 AT2G21660 1.34 + 0.0128182
Other/unknown CPP1 Q9FN50 AT5G23040 0.74 0.195938
Other/unknown EGY2 F4K0T6;F4K0T7;Q9FFK3 AT5G05740 0.89 0.132382
Other/unknown F11M15.26 Q9SYE2 AT1G51400 1.02 0.722554
Other/unknown F13A11.2 Q9C7S3 AT1G42960 0.77 + 0.0290056
Other/unknown F16M2_10 Q9M1X3 AT3G63160 1.33 + 0.0370101
Other/unknown F17F16.7 A0A1P8AWY1;Q8W4D6;A0A1P8AWU9
AT1G16720 0.99 0.859842
Other/unknown F24J8.11 Q9LPK9 AT1G21500 1.11 + 0.0188788
Other/unknown FAB2 Acyl-[acyl-carrier-protein] desaturase F4IS32;O22832;Q9LF04;Q9M879
AT2G43710;AT3G02630;AT5G16240
0.72 0.120937
Other/unknown FBA1 Fructose-bisphosphate aldolase Q9ZU52 AT2G01140 0.81 0.160647
Other/unknown FBA1 Fructose-bisphosphate aldolase Q9SJU4;F4IGL5;F4IGL7 AT2G21330 0.74 + 0.00590476
Other/unknown FBA2 Probable fructose-bisphosphate aldolase 2 Q944G9;F4JUJ5 AT4G38970 0.54 + 0.0198926
Other/unknown FFC P37107 AT5G03940 0.96 0.95383
Other/unknown FLAP1 Fluctuating light acclimation protein 1 Q8RWI0 AT1G54520 0.98 0.715969
Other/unknown GAPA2 Q9LPW0;A0A1P8APR6;F4HNZ6
AT1G12900 0.56 + 0

210
Other/unknown GC1 A0A1P8B167;Q9SJU9 AT2G21280 0.54 + 0.00972414
Other/unknown GDCST A0A2H1ZEA9;O65396 AT1G11860 1.25 + 0.0280226
Other/unknown GLDP1 Q94B78;B3H5Y8 AT4G33010 1.25 + 0.0207843
Other/unknown GLN2 Glutamine synthetase/mitochondrial Q43127 AT5G35630 0.47 + 0.0100714
Other/unknown GYRA Q9CAF6 AT3G10690 1.13 0.45418
Other/unknown H2AV Q9C944;Q9SII0;O23628;F4JT33;Q9T0H7
AT1G52740 0.98 0.784715
Other/unknown HSP70-3 O65719 AT3G09440 0.92 + 0.0441622
Other/unknown LGUC Q8W593 AT1G67280 0.54 0.0936641
Other/unknown LOX2 P38418;A0A1I9LPH1 AT3G45140 0.84 + 0.0140769
Other/unknown LTA2 Dihydrolipoyllysine-residue acetyltransferase component 4 of pyruvate dehydrogenase complex Q9SQI8 AT3G25860 0.87 0.125417
Other/unknown LTA3 Dihydrolipoyllysine-residue acetyltransferase component 1 of pyruvate dehydrogenase complex F4J5T2;Q0WQF7 AT3G52200 1.00 0.274023
Other/unknown MFP1 Q9LW85 AT3G16000 1.05 0.164271
Other/unknown MNC6.3 Thylakoid lumenal 17.4 kDa protein A0A1P8BAQ0;F4JX83;P81760
AT5G53490 0.72 + 0.0139429
Other/unknown MRO11.7 GPI-anchored adhesin-like protein A0A1P8BAU8;Q9FF91 AT5G23890 1.13 0.47671
Other/unknown MXK3.17 Q93Y08 AT5G64940 0.93 0.867304
Other/unknown NAGK Q9SCL7 AT3G57560 0.79 + 0.0167931
Other/unknown OEP161 Q9ZV24 AT2G28900 1.19 + 0.0133684
Other/unknown PLGG1 Q9FVQ4 AT1G32080 0.94 0.188137
Other/unknown PMDH2 F4KDZ4;Q9ZP05;A0A1P8BBQ0;A8MRP1;B3H560
AT5G09660 0.71 + 0.01
Other/unknown PPD5 PsbP domain-containing protein 5 A0A178U9N5;P82715 AT5G11450 0.83 + 0.0169917
Other/unknown PRXIIE Q949U7 AT3G52960 1.14 0.0809255
Other/unknown PRXIIE Q949U7 AT3G52960 2.21177 + 0
Other/unknown PTAC5 Protein disulfide isomerase pTAC5 A0A1P8B4I3;A1A6M1 AT4G13670 0.74 + 0.0133626
Other/unknown RAT5 Q9LD28;O81826;Q9C681 AT5G54640 0.87 0.119237
Other/unknown RAT5 Q9LD28;O81826;Q9C681 AT5G54640 2.02448 + 0.0465067
Other/unknown RPI3 Q9S726 AT3G04790 1.12 0.916278
Other/unknown RPI3 Q9S726 AT3G04790 2.3028 0.978054
Other/unknown SHM1 Q9SZJ5 AT4G37930 1.30 + 0.0336754
Other/unknown STR10 Rhodanese-like domain-containing protein 10 Q9SR92 AT3G08920 0.78 + 0.0386351
Other/unknown STR11 Rhodanese-like domain-containing protein 11 Q0WWT7 AT4G24750 0.63 0.0660645
Other/unknown STR14 Rhodanese-like domain-containing protein 14 Q94A65 AT4G27700 1.09 0.328374
Other/unknown STR9 Rhodanese-like domain-containing protein 9 O48529 AT2G42220 0.77 + 0.0104444
Other/unknown T6G15.50 Q9T0H1 AT4G13500 0.76 0.181743
Other/unknown TL15A Thylakoid lumenal 15 kDa protein 1 O22160 AT2G44920 1.17 0.129699
Other/unknown TL17.9 Thylakoid lumenal 17.9 kDa protein Q9SW33 AT4G24930 0.93 0.645323
Other/unknown TL19 Thylakoid lumenal 19 kDa protein P82658 AT3G63540 0.44 + 0.0195108
Other/unknown TL20.3 Thylakoid lumenal protein TL20.3 Q8H1Q1;B6EUA5;A0A178W1Q3
AT1G12250 1.40 + 0.0163697

211
Other/unknown TPT A0A219HYB6;A0A219HZH3;A0A219I0W9;Q9ZSR7
AT5G46110 1.34 + 0.0140531
Other/unknown YCF37 Homolog of Synechocystis YCF37 O64835 AT2G23670 1.11 + 0.0204503
Pigment synthesis CAO Chlorophyllide a oxygenase Q9MBA1;A0A1P8ARR2 AT1G44446 0.59 + 0.0150526
Pigment synthesis CHLD Magnesium-chelatase subunit ChlD Q9SJE1 AT1G08520 0.91 0.280046
Pigment synthesis CHLG Chlorophyll synthase Q38833 AT3G51820 0.59 + 0.0450526
Pigment synthesis CHLH Magnesium-chelatase subunit ChlH A8MR05;Q9FNB0 AT5G13630 0.73 + 0
Pigment synthesis CHLI1 Magnesium-chelatase subunit ChlI-1 P16127 AT4G18480 1.24 0.127614
Pigment synthesis CHLI1 Magnesium-chelatase subunit ChlI-1 Q5XF33 AT5G45930 1.10 0.25116
Pigment synthesis CHLM Magnesium protoporphyrin IX methyltransferase A0A1P8B4G1;Q9SW18 AT4G25080 0.79 + 0.0162333
Pigment synthesis CHLP Geranylgeranyl diphosphate reductase Q9CA67 AT1G74470 0.87 + 0.0131163
Pigment synthesis CRD1 Magnesium-protoporphyrin IX monomethyl ester [oxidative] cyclase Q9M591;F4J0U9 AT3G56940 0.67 + 0.0142051
Pigment synthesis CYP97B3 Cytochrome P450 97B3 O23365 AT4G15110 1.00 0.612597
Pigment synthesis CYP97C1 Carotene epsilon-monooxygenase Q6TBX7 AT3G53130 0.97 0.521825
Pigment synthesis DVR Divinyl chlorophyllide a 8-vinyl-reductase Q1H537 AT5G18660 0.81 0.120589
Pigment synthesis FC2 F4IMT3;O04921 AT2G30390 0.66 0.154528
Pigment synthesis GUN4 Tetrapyrrole-binding protein Q9LX31 AT3G59400 0.32 0.0636571
Pigment synthesis HCAR 7-hydroxymethyl chlorophyll a reductase Q8GS60 AT1G04620 0.66 + 0.0267126
Pigment synthesis LUT5 Protein LUTEIN DEFICIENT 5 Q93VK5 AT1G31800 0.82 0.23658
Pigment synthesis NOL Chlorophyll(ide) b reductase NOL Q8LEU3 AT5G04900 0.60 + 0.0136735
Pigment synthesis PAO Pheophorbide a oxygenase Q9FYC2 AT3G44880 0.93 0.15339
Pigment synthesis PDS 15-cis-phytoene desaturase/chromoplastic Q07356 AT4G14210 0.58 + 0.0232485
Pigment synthesis PORB Protochlorophyllide reductase B P21218 AT4G27440;AT5G54190
0.73 + 0.0135556
Pigment synthesis PORC Protochlorophyllide reductase C F4I2F8;O48741 AT1G03630 0.76 + 0.01175
Pigment synthesis PPOX1 Protoporphyrinogen oxidase 1 P55826 AT4G01690 0.72 + 0.0134286
Pigment synthesis PPOX2 Protoporphyrinogen oxidase 2/mitochondrial Q8S9J1;A0A1P8BE58;A0A1P8BE27
AT5G14220 1.18 0.896922
Pigment synthesis VTE3 Q9LY74 AT3G63410 0.79 + 0.017312
Pigment synthesis YCF54 Q9LVM3 AT5G58250 0.55 + 0.00652632
Pigment synthesis ZDS1 Q38893 AT3G04870 0.98 1
Plastoglobule ABC1K3 Uncharacterized aarF domain-containing protein kinase At1g79600 Q9MA15 AT1G79600 1.50 + 0.00748387
Plastoglobule At1g06690 Q94A68 AT1G06690 0.53 + 0.0137313
Plastoglobule At1g26090 Q6DYE4 AT1G26090 0.71 + 0.00682353
Plastoglobule At1g32220 Uncharacterized protein At1g32220 Q9FVR6 AT1G32220 0.69 + 0.038819
Plastoglobule At1g54570 Acyltransferase-like protein At1g54570 Q9ZVN2 AT1G54570 0.93 0.235867
Plastoglobule At1g71810 Uncharacterized aarF domain-containing protein kinase At1g71810 Q94BU1 AT1G71810 0.97 0.295885
Plastoglobule At1g78140 Q8LBV4 AT1G78140 0.56 0.113165
Plastoglobule At2g34460 Uncharacterized protein At2g34460 Q8H124 AT2G34460 1.02 0.489202
Plastoglobule At2g41040 Q0WPT7 AT2G41040 0.72 + 0.03788

212
Plastoglobule At3g24190 Q9LRN0 AT3G24190 1.38 + 0.0244941
Plastoglobule At4g13200 Uncharacterized protein At4g13200 Q8LDV3 AT4G13200 0.96 0.732355
Plastoglobule At5g05200 Uncharacterized aarF domain-containing protein kinase At5g05200 Q9ASX5 AT5G05200 0.92 0.865887
Plastoglobule CCD4 Probable carotenoid cleavage dioxygenase 4 O49675 AT4G19170 0.81 0.144741
Plastoglobule CSP41B Chloroplast stem-loop binding protein of 41 kDa b A0A1P8ATL2;Q9SA52 AT1G09340 0.51 + 0
Plastoglobule CYP74A Allene oxide synthase Q96242 AT5G42650 0.79 + 0
Plastoglobule PAP1 Probable plastid-lipid-associated protein 1 O81439 AT4G04020 0.80 + 0.012303
Plastoglobule PAP10 Probable plastid-lipid-associated protein 10 Q8W4F1 AT2G46910 0.37 0.0827969
Plastoglobule PAP11 Probable plastid-lipid-associated protein 11 O81304 AT4G00030 0.70 0.10594
Plastoglobule PAP12 Probable plastid-lipid-associated protein 12 Q8LAP6 AT1G51110 1.19 + 0.00688889
Plastoglobule PAP13 Probable plastid-lipid-associated protein 13 F4IM05;Q8S9M1;A8MRU9
AT2G42130 0.51 + 0.0134312
Plastoglobule PAP2 Probable plastid-lipid-associated protein 2 O49629 AT4G22240 1.10 + 0.0417488
Plastoglobule PAP3 Probable plastid-lipid-associated protein 3 O82291 AT2G35490 0.72 + 0.00947368
Plastoglobule PAP4 Probable plastid-lipid-associated protein 4 Q9LU85 AT3G26070 0.86 + 0.038488
Plastoglobule PAP5 Probable plastid-lipid-associated protein 5 A0A1I9LP70;Q6DBN2 AT3G26080 0.81 0.0563333
Plastoglobule PAP6 Probable plastid-lipid-associated protein 6 Q9LW57;A0A1I9LQU5;A0A1I9LQU3
AT3G23400 0.92 0.27007
Plastoglobule PAP8 Probable plastid-lipid-associated protein 8 Q941D3;F4K2P2 AT5G19940 0.81 + 0.0187368
Plastoglobule PAP9 Probable plastid-lipid-associated protein 9 Q9M2P7 AT3G58010 0.66 + 0.0125333
Plastoglobule PLAT1 PLAT domain-containing protein 1 O65660 AT4G39730 1.15 0.142644
Plastoglobule PSY PHYTOENE SYNTHASE F4KGX7;P37271 AT5G17230 1.05 1
Plastoglobule VTE1 Tocopherol cyclase Q94FY7 AT4G32770 0.54 + 0.00923077
Plastoglobule B9DGY1;F4JFM1 AT3G07700 1.50 0.402259
Plastoglobule Q9SR77 AT3G10130 0.76 0.994908
Plastoglobule Q9LW26 AT3G26840 0.80 0.103521
Plastoglobule Q9LSC4 AT3G27110 0.79 0.358734
Plastoglobule F4IZ56;Q9M236 AT3G43540 0.46 + 0.0381188
Protease ARASP2 O23053 AT1G05140 0.86 + 0.0501126
Protease At2g21960 Q9SJ03 AT2G21960 0.94 0.130144
Protease CLPP4 Q94B60 AT5G45390 0.46 + 0.0228333
Protease CLPP5 Q9S834 AT1G02560 0.53 + 0.0135111
Protease FTSH11 ATP-dependent zinc metalloprotease FTSH 11/mitochondrial Q9FGM0 AT5G53170 0.91 0.924914
Protease FTSH12 ATP-dependent zinc metalloprotease FTSH 12 A0A1P8ARE4;A0A1P8ARD2;Q9SAJ3
AT1G79560 0.80 0.29976
Protease FTSH9 ATP-dependent zinc metalloprotease FTSH 9 Q9FIM2;Q9SD67 AT5G58870 0.76 + 0.037931
Protease SPPA Serine protease SPPA Q9C9C0;A0A1P8AUG2 AT1G73990 0.88 0.118817
Protein folding At3g12345 FKBP-type peptidyl-prolyl cis-trans isomerase Q9LHH3 AT3G12345 0.78 0.125301
Protein folding CLPB3 Chaperone protein ClpB3 Q9LF37 AT5G15450 1.05 0.961496
Protein folding CPN21 20 kDa chaperonin O65282 AT5G20720 1.09 0.41909

213
Protein folding CPN60A1 Chaperonin 60 subunit alpha 1 P21238 AT2G28000 0.85 0.100227
Protein folding CYP26-2 Peptidyl-prolyl cis-trans isomerase CYP26-2 F4HTT6;A0A1P8APN5 AT1G74070 0.50 + 0.0132174
Protein folding CYP28 Peptidyl-prolyl cis-trans isomerase CYP28 A0A1P8B9P2;O65220 AT5G35100 0.60 + 0.009
Protein folding CYP37 Peptidyl-prolyl cis-trans isomerase CYP37 P82869;A0A1I9LQ22;A0A1I9LQ23
AT3G15520 0.60 0.0506266
Protein folding DJA5 Q940V1 AT4G39960 0.90 0.113986
Protein folding DJA7 A0A1P8ART2;Q0WN54 AT1G80030 0.86 + 0.0469043
Protein folding FKBP16-4 Peptidyl-prolyl cis-trans isomerase FKBP16-4 Q9SR70 AT3G10060 0.72 + 0.0062
Protein folding FKBP17-2 Peptidyl-prolyl cis-trans isomerase FKBP17-2 Q9LDY5 AT1G18170 0.79 + 0.0168525
Protein folding FKBP18 Peptidyl-prolyl cis-trans isomerase FKBP18 A0A1P8APZ5;Q9LM71 AT1G20810 0.29 + 0.0122609
Protein folding FKBP19 Peptidyl-prolyl cis-trans isomerase FKBP19 Q9LYR5;A0A1R7T3F4;A0A1R7T3F3
AT5G13410 0.99 0.725306
Protein folding HSP70-6 Heat shock 70 kDa protein 6 Q9STW6 AT4G24280 0.84 0.199397
Protein folding TIG Trigger factor-like protein TIG Q8S9L5 AT5G55220 0.79 + 0.0206038
Protein translocation
CLPC1 Q9FI56 AT5G50920 0.91 + 0.0208732
Protein translocation
SCY1 Preprotein translocase subunit SCY1 Q38885 AT2G18710 1.17 0.0837977
Protein translocation
SECA1 Protein translocase subunit SecA Q9SYI0;A0A1P8B485;F4JG57
AT4G01800 1.09 0.0782205
Protein translocation
TATA Sec-independent protein translocase protein TATA Q9LKU2 AT5G28750 0.90 0.819005
Protein translocation
TATB Sec-independent protein translocase protein TATB Q9XH75 AT5G52440 1.08 0.944842
Protein translocation
TATC Sec-independent protein translocase protein TATC Q9SJV5 AT2G01110 1.09 0.352552
Protein translocation
TIC110 Q8LPR9 AT1G06950 0.89 0.0968213
Protein translocation
TIC55 Q9SK50 AT2G24820 0.93 0.238982
PSI PSAA Photosystem I P700 chlorophyll a apoprotein A1 P56766 ATCG00350 0.94 + 0.0130714
PSI PSAB Photosystem I P700 chlorophyll a apoprotein A2 P56767 ATCG00340 0.82 + 0.0110968
PSI PSAC Photosystem I iron-sulfur center P62090 ATCG01060 0.65 + 0.0307826
PSI PSAD Photosystem I reaction center subunit II-2 Q9SA56;Q9S7H1 AT1G03130;AT4G02770
0.97 + 0.0190229
PSI PSAE1 Photosystem I reaction center subunit IV A Q9S831 AT4G28750 1.03 0.152289
PSI PSAE2 Photosystem I reaction center subunit IV B Q9S714 AT2G20260 0.95 0.380676
PSI PSAF Photosystem I reaction center subunit III Q9SHE8 AT1G31330 0.89 + 0.0440367
PSI PSAG Photosystem I reaction center subunit V Q9S7N7 AT1G55670 1.11 0.265424
PSI PSAH Photosystem I reaction center subunit VI-1 Q9SUI7;Q9SUI6 AT1G52230;AT3G16140
0.35 + 0.0275682
PSI PSAK Photosystem I reaction center subunit psaK Q9SUI5 AT1G30380 1.12 0.898867
PSI PSAL Photosystem I reaction center subunit XI A0A1P8B6D0;Q9SUI4 AT4G12800 1.06 + 0.0471092

214
PSI PSAN Photosystem I reaction center subunit N P49107 AT5G64040 0.91 + 0.0368367
PSI PSAO Photosystem I subunit O Q949Q5 AT1G08380 0.17 0.105615
PSII PSB28 Photosystem II reaction center PSB28 protein F4JM05;Q8W0Y8 AT4G28660 1.15 0.381089
PSII PSB33 Rieske (2Fe-2S) domain-containing protein Q9C9I7 AT1G71500 0.96 0.108759
PSII PSBA (D1) Photosystem II protein D1 P83755 ATCG00020 0.62 + 0.0400566
PSII PSBB (CP47) Photosystem II CP47 reaction center protein P56777 ATCG00680 0.82 0.0737302
PSII PSBC (CP43) Photosystem II CP43 reaction center protein P56778 ATCG00280 0.95 0.1104
PSII PSBD (D2) Photosystem II D2 protein P56761 ATCG00270 1.15 + 0.0210213
PSII PSBE Cytochrome b559 subunit alpha P56779 ATCG00580 1.11 + 0.020475
PSII PSBF Cytochrome b559 subunit beta P62095 ATCG00570 1.32 + 0.0498966
PSII PSBH Photosystem II reaction center protein H P56780 ATCG00710 1.20 + 0.0291685
PSII PSBO1 Oxygen-evolving enhancer protein 1-1 P23321 AT5G66570 1.09 + 0.00563636
PSII PSBO2 Oxygen-evolving enhancer protein 1-2 Q9S841 AT3G50820 0.39 + 0.00496
PSII PSBP1 Oxygen-evolving enhancer protein 2-1 Q42029 AT1G06680 0.76 + 0.0144762
PSII PSBQ1 Oxygen-evolving enhancer protein 3-1 Q9XFT3 AT4G21280 0.75 + 0.0112787
PSII PSBQ2 Oxygen-evolving enhancer protein 3-2 Q41932 AT4G05180 0.62 + 0.012
PSII PSBR Photosystem II 10 kDa polypeptide P27202 AT1G79040 1.11 + 0.0207273
PSII PSBT Photosystem II 5 kDa protein A0A1I9LS90;Q39195 AT3G21055 0.66 0.066332
PSII repair ALB3 Inner membrane protein ALBINO3 Q8LBP4;F4IJM1 AT2G28800 1.25 0.300809
PSII repair CTPA1 F4KHG6 AT5G46390 0.37 + 0.0338526
PSII repair CYP38 Peptidyl-prolyl cis-trans isomerase CYP38 Q9SSA5 AT3G01480 0.71 + 0.00725
PSII repair DEG5 A0A1P8B644;A0A1P8B643;Q9SEL7
AT4G18370 0.41 + 0.0203158
PSII repair DEG8 F4KFV6;Q9LU10 AT5G39830 0.57 + 0.0141111
PSII repair DEGP1 Protease Do-like 1 O22609 AT3G27925 0.59 + 0.0134
PSII repair DEGP2 Protease Do-like 2 B3H581;O82261 AT2G47940 0.24 + 0.0191692
PSII repair FKBP20-2 Peptidyl-prolyl cis-trans isomerase FKBP20-2 A0A1I9LRJ6;Q0WRJ7 AT3G60370 0.74 0.99859
PSII repair FTSH1 ATP-dependent zinc metalloprotease FTSH 1 Q39102 AT1G50250 0.92 0.297777
PSII repair FTSH2 ATP-dependent zinc metalloprotease FTSH 2 A0A1P8AXC1;O80860 AT2G30950 0.73 + 0.0352821
PSII repair FTSH5 ATP-dependent zinc metalloprotease FTSH 5 Q9FH02 AT5G42270 0.92 + 0.0131948
PSII repair FTSH8 ATP-dependent zinc metalloprotease FTSH 8 Q8W585 AT1G06430 0.98 0.151243
PSII repair FTSY O80842 AT2G45770 0.65 + 0.0193178
PSII repair HHL1 Protein HHL1 Q8LDL0 AT1G67700 0.68 + 0.0255581
PSII repair HSP70-7 Q9LTX9 AT5G49910 0.96 0.967427
PSII repair LPA1 Protein LOW PSII ACCUMULATION 1 Q9SRY4;A0A1P8ANG6 AT1G02910 0.91 0.155896
PSII repair LQY1 Protein disulfide-isomerase LQY1 Q8GSJ6 AT1G75690 0.51 0.0564979
PSII repair LTO1 Thiol-disulfide oxidoreductase LTO1 A0A1P8B950;Q8L540 AT4G35760 0.91 0.172737
PSII repair MET1 Protein MET1 Q94BS2 AT1G55480 0.77 + 0.0228293
PSII repair MPH1 Protein MAINTENANCE OF PSII UNDER HIGH LIGHT 1 Q9FL44 AT5G07020 0.75 + 0.020027
PSII repair PAM68 Protein PAM68 A0A1P8B8D1;O49668 AT4G19100 1.19 + 0.0226982

215
PSII repair PBF1 F4JD01;P42742 AT3G60820 0.67 0.0547731
PSII repair PDI6 Protein disulfide isomerase-like 1-2 Q9SRG3 AT1G77510 0.96 0.151747
PSII repair PPL1 PsbP-like protein 1 P82538 AT3G55330 0.77 + 0
PSII repair PSB27-1 Photosystem II repair protein PSB27-H1 Q9LR64 AT1G03600 0.94 0.97971
PSII repair ROC4 F4IX28;F4IX26;P34791 AT3G62030 0.96 0.646816
PSII repair RubA Rubredoxin-like superfamily protein Q9SLI4 AT1G54500 0.88 0.187553
PSII repair TL18.3 UPF0603 protein At1g54780 Q9ZVL6 AT1G54780 0.82 + 0.01385
PSII repair VIPP1 Membrane-associated protein VIPP1 A0A178W0D3;O80796 AT1G65260 1.06 0.730501
Redox regulation At1g14345 NAD(P)-linked oxidoreductase superfamily protein Q949S6 AT1G14345 1.03 1
Redox regulation At1g50450 Saccharopine dehydrogenase Q94BZ0 AT1G50450 0.61 + 0
Redox regulation ATHM2 Thioredoxin M2 Q9SEU8;F4JG94 AT4G03520 0.61 + 0.0137561
Redox regulation BAS1 2-Cys peroxiredoxin BAS1 Q96291 AT3G11630 0.60 + 0.0148293
Redox regulation BAS1B Q9C5R8;A0A1P8BD74 AT5G06290 0.79 0.0511319
Redox regulation CITRX Thioredoxin-like protein CITRX Q9M7X9 AT3G06730 1.46 + 0.0306162
Redox regulation ENH1 Rubredoxin family protein Q9FFJ2;A8MSF2 AT5G17170 0.92 0.244119
Redox regulation FSD3 Superoxide dismutase [Fe] 3 Q9FMX0 AT5G23310 0.92 0.352472
Redox regulation MCK7.20 Malate dehydrogenase F4KEX3;Q8H1E2 AT5G58330 0.67 + 0
Redox regulation MDH Malate dehydrogenase Q9SN86 AT3G47520 0.95 0.375598
Redox regulation MED24.18 Thioredoxin family protein Q940I2 AT5G03880 0.88 0.0600826
Redox regulation NTRC NADPH-dependent thioredoxin reductase 3 O22229 AT2G41680 0.39 + 0.0109206
Redox regulation PRXQ Peroxiredoxin Q A0A1I9LR27;F4JBC9;Q9LU86
AT3G26060 0.70 + 0.0141395
Redox regulation TRXF1 Q9XFH8 AT3G02730 0.53 + 0.01075
Redox regulation TRXM1 Thioredoxin M1 O48737 AT1G03680 0.54 + 0.00729412
Redox regulation TRXM4 Thioredoxin M4 Q9SEU6 AT3G15360 0.91 + 0.0386731
Ribosome PSRP2 30S ribosomal protein 2 Q8VYM4 AT3G52150 1.09 0.103143
Ribosome PSRP5 50S ribosomal protein 5 Q9LER7 AT3G56910 1.09 0.237297
Ribosome PSRP6 A0A1P8BCP6;Q9FKP0 AT5G17870 0.23 0.066747
Ribosome RPL1 50S ribosomal protein L1 Q9LY66;F4J296 AT3G63490 1.06 + 0.0301556
Ribosome RPL10 50S ribosomal protein L10 Q9FY50 AT5G13510 1.17 + 0.00476923
Ribosome RPL11 50S ribosomal protein L11 Q9MAP3 AT1G32990 0.92 0.458547
Ribosome RPL12A 50S ribosomal protein L12-3 P36212;P36210 AT3G27830;AT3G27850
0.67 + 0.0177953
Ribosome RPL13 Q9SYL9 AT1G78630 0.75 0.471321
Ribosome RPL14 50S ribosomal protein L14 P56792 AtCg00780 1.19 + 0.00972973
Ribosome RPL15 50S ribosomal protein L15 P25873 AT3G25920 0.91 0.237453
Ribosome RPL16 50S ribosomal protein L16 P56793 AT2G28830 0.96 0.804549
Ribosome RPL17 50S ribosomal protein L17 Q9M385 AT3G54210 1.09 0.106059
Ribosome RPL18 50S ribosomal protein L18 Q9SX68 AT1G48350 1.01 0.543251
Ribosome RPL19-1 Q8W463 AT4G17560 0.52 0.113574

216
Ribosome RPL21 50S ribosomal protein L21 P51412 AT1G35680 1.22 + 0.0442396
Ribosome rpl22 P56795 AtCg00810 1.58 + 0
Ribosome RPL23-A 50S ribosomal protein L23 P61845 AtCg00840 1.16 0.313148
Ribosome RPL24 50S ribosomal protein L24 P92959 AT5G54600 0.93 0.381192
Ribosome RPL27 50S ribosomal protein L27 Q9FLN4 AT5G40950 1.16 + 0.0205833
Ribosome RPL29 50S ribosomal protein L29 Q9FJP3 AT5G65220 1.17 + 0.0140253
Ribosome RPL2-A 50S ribosomal protein L2 P56791 AtCg00830 1.11 + 0.0377971
Ribosome RPL31 50S ribosomal protein L31 Q9FWS4 AT1G75350 0.80 0.80213
Ribosome rpl33 50S ribosomal protein L33 P56796 AtCg00640 0.72 + 0.0137297
Ribosome RPL3A 50S ribosomal protein L3-1 Q9SKX4 AT2G43030 1.11 0.107458
Ribosome RPL4 50S ribosomal protein L4 O50061;Q2V4Q4;Q3EDH2
AT1G07320 0.87 + 0.0437679
Ribosome RPL5 50S ribosomal protein L5 O04603 AT4G01310 1.02 0.88071
Ribosome RPL6 50S ribosomal protein L6 O23049 AT1G05190 0.98 0.458
Ribosome RPL9 50S ribosomal protein L9 P25864 AT3G44890 1.08 0.610997
Ribosome RPS10 30S ribosomal protein S10 Q9LK61 AT3G13120 0.88 0.852308
Ribosome RPS11 30S ribosomal protein S11 P56802 AtCg00750 1.23 + 0.0187536
Ribosome rps12-A 30S ribosomal protein S12 P62126 AtCg01230;AtCg00065;AtCg00905
1.31 + 0.0181898
Ribosome RPS13 30S ribosomal protein S13 P42732;B3H631 AT5G14320 1.17 0.114681
Ribosome rps14 30S ribosomal protein S14 P56804 AtCg00330 1.19 + 0.0398685
Ribosome RPS15 30S ribosomal protein S15 P56805 AtCg01120 1.07 0.873854
Ribosome RPS17 30S ribosomal protein S17 P16180 AT1G79850 1.19 + 0.029989
Ribosome RPS18 30S ribosomal protein S18 P56807 AtCg00650 1.13 0.246255
Ribosome RPS19 30S ribosomal protein S19 P56808 AtCg00820 0.88 0.194415
Ribosome RPS2 30S ribosomal protein S2 P56797 AtCg00160 1.02 0.281353
Ribosome RPS20 30S ribosomal protein S20 Q9ASV6 AT3G15190 1.19 + 0.0114667
Ribosome RPS3 30S ribosomal protein S3 P56798 AtCg00800 1.08 0.151478
Ribosome RPS4 30S ribosomal protein S4 P56799 AtCg00380 1.38 + 0
Ribosome RPS5 30S ribosomal protein S5 P93014 AT2G33800 1.28 + 0.0203014
Ribosome RPS6 30S ribosomal protein S6 alpha A0A1P8AV66;Q8VY91 AT1G64510 0.92 0.901712
Ribosome RPS7 Ribosomal protein S7 A0A2P2CLF5;P92557 AT2G07696 1.25 0.123512
Ribosome rps7-A 30S ribosomal protein S7 P61841 AtCg00900 1.23 + 0.0102857
Ribosome RPS8 30S ribosomal protein S8 P56801 AtCg00770 0.88 0.604115
Ribosome RPS9 30S ribosomal protein S9 Q9XJ27 AT1G74970 1.11 0.923456
Ribosome RRP31 30S ribosomal protein 3-1 A8MQL0;Q9SX22 AT1G68590 0.47 0.297644
Starch BAM3 Beta-amylase 3 O23553 AT4G17090 0.91 0.727288
Starch SS1 Starch synthase 1/amyloplastic Q9FNF2 AT5G24300 1.14 0.152331
Starch SS3 Starch synthase 3/amyloplastic F4IAG1;F4IAG2 AT1G11720 NaN 1

217
Starch SS4 Probable starch synthase 4/amyloplastic Q0WVX5 AT4G18240 2.16 1
Stress responsive APE1 Acclimation of photosynthesis to environment Q2HIR7;A0A219HZL6 AT5G38660 0.97 0.116171
Stress responsive AT5g02160 Q9FPH2 AT5G02160 0.66 + 0.0141053
Stress responsive CLH1 Chlorophyllase-1 O22527 AT1G19670 0.82 0.202939
Stress responsive FLU Protein FLUORESCENT IN BLUE LIGHT F4JFR2;F4JFR1;Q940U6 AT3G14110 1.00 0.797003
Stress responsive LIR1 Light-regulated protein 1 Q96500 AT3G26740 0.46 + 0.0169391
Stress responsive PPD3 PsbP domain-containing protein 3 Q9S720 AT1G76450 0.21 + 0.0445636
Stress responsive PPD4 PsbP domain-containing protein 4 O49292 AT1G77090 0.62 + 0.0165806
Stress responsive PPD6 PsbP domain-containing protein 6 Q9LXX5 AT3G56650 0.60 0.0743557
Stress responsive TL29 Thylakoid lumenal 29 kDa protein A0A1P8B8W6;A0A1P8B8Y3;P82281
AT4G09010 0.70 + 0.0135294
Thylakoid architecture
CURT1A Protein CURVATURE THYLAKOID 1A O04616 AT4G01150 0.95 0.166508
Thylakoid architecture
CURT1B Protein CURVATURE THYLAKOID 1B Q8LCA1 AT2G46820 0.84 + 0.0383085
Thylakoid architecture
CURT1C Protein CURVATURE THYLAKOID 1C Q9M812 AT1G52220 1.09 + 0.0413645
Thylakoid architecture
CURT1D Protein CURVATURE THYLAKOID 1D A0A1P8B4V5;Q8LDD3 AT4G38100 0.66 + 0.0142136
Thylakoid architecture
FZL Probable transmembrane GTPase FZO-like Q1KPV0;A0A1P8AUL4;A0A1P8AUL2
AT1G03160 0.77 + 0.0431894
Thylakoid architecture
PLSP1 Chloroplast processing peptidase A0A1I9LMR3;Q8H0W1 AT3G24590 0.55 + 0.0143059
Thylakoid architecture
RIQ1 Reduced induction of non-photochemical quenching1 Q9SD79 AT5G08050 0.68 + 0.0167154
Thylakoid architecture
RIQ2 Reduced induction of non-photochemical quenching2 Q94F10 AT1G74730 0.58 + 0.0377451
Thylakoid architecture
THF1 Protein THYLAKOID FORMATION 1 Q9SKT0 AT2G20890 0.80 + 0.0132673
Copyright © 2022 FDOKUMEN