Lower Triassic bryozoan beds from Ellesmere Island, High Arctic, Canada
Upload
independentCategory
view
2download
0
Estuarine, Coastal and Shelf Science 64 (2005) 347e356
www.elsevier.com/locate/ECSS
Morphometric variations as acclimation mechanismsin Zostera noltii beds
G. Peralta*, F.G. Brun, I. Hernandez, J.J. Vergara, J.L. Perez-Llorens
Department of Biology, Faculty of Marine and Environmental Sciences, University
of Cadiz, 11510 Puerto Real (Cadiz), Spain
Received 4 October 2004; accepted 25 February 2005
Available online 25 April 2005
Abstract
The use of morphometric variations as acclimation mechanisms was tested in natural populations of the intertidal seagrass
Zostera noltii in Ria Formosa (Algarve, southern Portugal). To achieve the objective, two populations of Z. noltii were studied;a bed exposed and physically impacted by the artificial opening of a new inlet, and a second bed protected from dynamic impacts. Ateach meadow, morphometry and other plant-key variables such as tissue composition, photosynthetic parameters and dynamic
properties (i.e. modules and whole plant growth rates) were monitored. After severe physical impacts in winter 1998, the newlyappeared plants in the exposed meadow showed permanent morphometric changes. This new morphotype (small-leavedmorphotype, SLM) had shorter (65%) and narrower leaves (25%) with longer internodes (4 times), than the large-leavedmorphotype (LLM) found in the protected meadow or in the exposed meadow prior to the large disturbance. The SLM also had
a larger non-photosynthetic biomass fraction, but increased photosynthetic capacity compared with the LLM. The morphometricand physiological changes were related to the fast recovery (!6 months) exhibited in the exposed meadow. In the protectedmeadow, morphometric changes (minor and short term) were associated with seasonal patterns. After the recovery, exposed and
protected meadows gave similar production estimates supporting the hypothesis that a new stable state had been established in theexposed meadow. From these results, it can be concluded that Z. noltii has a remarkable phenotypic plasticity supported bycoordinated changes in dynamic variables (i.e. leaf and internodal elongation rates and plastochrone index). Phenotypic plasticity
seems to be the main mechanism by which this species is able to cope with short and long term environmental changes.� 2005 Elsevier Ltd. All rights reserved.
Keywords: growth; hydrodynamics; morphometry; phenotypic plasticity; Ria Formosa; seagrass
1. Introduction
Acclimation and adaptation are different processes,but both are important for the understanding andpredicting the short and large-scale effects of environ-mental changes on biota. For plants, acclimation refersto reversible physiological or structural changes inresponse to extreme values of environmental variablescausing stress, while the term adaptation includes all
* Corresponding author.
E-mail address: [email protected] (G. Peralta).
0272-7714/$ - see front matter � 2005 Elsevier Ltd. All rights reserved.
doi:10.1016/j.ecss.2005.02.027
irreversible genetic changes that enhance the perfor-mance of the plant in a specific environment (Lamberset al., 1998; Sultan, 2000). For seagrasses, examplesof acclimation are mostly physiological changes inresponse to light availability (i.e. photoacclimation,Evans et al., 1986; Major and Dunton, 2002), temper-ature (Zimmerman et al., 1989), or salinity (Benjaminet al., 1999). Only a few studies have shown thatacclimation may also involve ultrastructural changes inseagrass modules (i.e. leaves, rhizome and roots) (Iyerand Barnabas, 1993; Benjamin et al., 1999). However,none of these structural changes have been related to

348 G. Peralta et al. / Estuarine, Coastal and Shelf Science 64 (2005) 347e356
morphometric responses at the whole plant level, sincesuch morphometric responses are commonly interpretedas irreversible genetic adaptations to the local environ-mental constraints (Yabe et al., 1995; Hemminga andDuarte, 2000; van Katwijk, 2000).
Inter- and intraspecific divergences in seagrassmorphometry have been associated with the highcapacity of seagrasses to colonize different environ-ments, explaining also differences in productivity andecological strategies (Duarte, 1991). Currently, morpho-types are considered as genetic adaptations to localenvironmental conditions (Perez-Llorens and Niell,1993; Masini and Manning, 1997; van Katwijk, 2000).However, such thought disagrees with the seasonalpatterns in module morphometry described for numer-ous seagrass species (Marba et al., 1996). The existenceof seasonal patterns in morphometry and physiologicalrates, together with references on physiological diver-gences between seagrass morphotypes (Drew, 1979;McMillan, 1984; Perez-Llorens and Niell, 1993; Peraltaet al., 2000), supports the hypothesis that morphometricand physiological characteristics may be linked and actas reversible and dynamic acclimation mechanisms.
The objective of this work was to show that naturalbeds of Zostera noltii use morphometric changes (i.e.phenotypic variation) as an acclimation mechanism. Toachieve this objective, changes in a natural populationaffected by dynamic disturbances (i.e. coastal engineer-ing works and storms) were monitored. To discriminateseasonal changes from acclimation to episodic impacts,a second meadow close to the first station that wasnaturally protected from the dynamic disturbances wassimultaneously monitored.
2. Materials and methods
2.1. Sampling site
The Natural Park of Ria Formosa is a tidal lagoonsited in the South coast of Portugal with an extensiveintertidal area (O50 km2; Machas and Santos, 1999).The lagoon is a complex system of creeks and channelsprotected by a set of barrier islands (Morris et al., 2001).The inlets between these islands allow a high waterexchange with the coastal waters (50e75%) at everytidal cycle. This ecosystem is mainly dominated byperennial beds of Cymodocea nodosa, Zostera marinaand Zostera noltii (Machas and Santos, 1999). However,the intertidal flats, which are highly exposed to thehydrodynamic forces, are mainly occupied by Z. noltii.
In 1997, an artificial inlet was opened in the westernmost sand island (Williams et al., 2003). The openingaffected a nearbymeadow ofZostera noltii. This situationoffered an excellent opportunity to study the capacityof this species to cope with anthropogenic-induced
environmental changes. Therefore, the present studywas focused on aZ. noltiimeadow sited in the major tidalchannel, close to the opening of the new inlet (exposedmeadow, Fig. 1). To discern between seasonal variationsand effects caused by the environmental impact, a secondZ. noltii population, sited in a more protected area, notfar from the first studied meadow was also monitored(protected meadow, Fig. 1).
2.2. Plant analysis
Every 3 months, from November 1997 to September1999, three random samples of biomass (400 cm2),including shoots and root/rhizome systems, were care-fully harvested at low tide and transported in ice chests.In the laboratory, plants were separated into above andbelowground parts. Subsequently, biomass (g DWm�2),shoot density (no. shoots m�2) and tissue composition(% DW) were estimated.
Additionally, architectural and dynamic properties ofZostera noltii (Figs. 3, 5 and 6) were studied usinga modification of the method described by Zieman(1974) (more details in Peralta et al. (2000)). Except forNovember 1997, when only leaves were studied, thismethod was used to estimate growth and morphometryof leaves, internodes and roots. At each sampling site,19e21 terminal shoots (i.e. those showing apical
Fig. 1. Geographical location of Ria Formosa, the new inlet and the
two studied Zostera noltii meadows.

349G. Peralta et al. / Estuarine, Coastal and Shelf Science 64 (2005) 347e356
dominance) were marked and collected after 8e14 days,depending on the season. Plant dynamic properties wereestimated according to the following equations:
LERZ
PniZ1
��LLi;f �LLi;o
�O0
�tf � to
ð1Þ
LARZ
PNL
tf � toð2Þ
PIZtf � toPNLa
ð3Þ
LLRZ
PniZ1
��LLi; f �LLi;o
�!0
��
PmiZ1
LLi;o
tf � toð4Þ
IERZ
PniZ1
�ILi; f � ILi;o
�tf � to
ð5Þ
IARZ
PNI
tf � toð6Þ
RERZ
PniZ1
�RLi;f �RLi;o
�tf � to
ð7Þ
RARZ
PNR
tf � toð8Þ
where:
LER: leaf elongation rate (cm plant�1 d�1), LL is theleaf length (cm) and n the number of leaves at end ofthe studied period (tf� to).LAR: leaf appearance rate, (leaves plant�1 d�1), NLis every new leaf appeared during the studied period.PI: plastochrone index (d), calculated as the numberof days elapsed between the appearance of twoconsecutive leaves from the apical meristem (NLa).LLR: leaf loss rate (cm plant�1 d�1), where m is thenumber of leaves lost during the studied period.IER: internodal elongation rate (mm plant�1 d�1),where IL is the internodal length and n the numberof internodes between the punched leaf and theapical meristem.
IAR: internodal appearance rate (internodesplant�1 d�1), where NI is every new internode ap-peared during the period of study.RER: root elongation rate (mm plant�1 d�1), whereRL is the root length resulting from the sum of allroots presents at the node i, and n the number ofnodes between the punched leaf and the apicalmeristem.RAR: root appearance rate (roots plant�1 d�1), whereNR is each new root appeared during the studiedperiod.
Elongation rates of leaves, rhizome and roots (LER,IER, and RER) were transformed in biomass growthrate (GR, mg DWplant�1 d�1, Eq. (9)), using thelength/dry weight ratio of each marked plant.
GRZ
�LER
DW
LL
�C
�IER
DW
IL
�C
�RER
DW
RL
�ð9Þ
where DW/LL, DW/IL and DW/RL are the dry weight/length ratio for leaves, internodes and roots, respectively.
Finally, theproductionof themeadow (gDWm�2 d�1)was estimated for each sampling date according to Eq.(10).
ProductionZGRm!DENSITYm ð10Þ
where GRm is the averaged growth rate of Zostera noltiiplants, DENSITYm is the averaged shoot density.
2.3. Photosynthesis
To reduce the variability due to age-dependent effectson photosynthesis (Alcoverro et al., 1998), photosyn-thetic measurements were always performed on 2 cmfragments of the second outer leaf. Leaf pieces wereexcised some hours before measurements to minimizewounding effects (Mazzella et al., 1981; Dunton andTomasko, 1994). Fresh weight, length and width weredetermined before the gas exchange measurements.Oxygen evolution was recorded at 17 �C with a Hansa-tech polarographic O2 electrode (Hansatech Ltd.).Photosynthesis-irradiance (PeI ) curves were performedin triplicate at 9 light intensities from 0 to 1700 mmolphotons m�2 s�1. PeI curve parameters were estimatedby fitting biomass-normalized data to a rectangularhyperbola model (Baly, 1935), according to Eq. (11).
PBNZ
PBmaxa
BI
PBmaxCðaBIÞ �RB ð11Þ
where PBN is net photosynthesis (mmol O2 g DW�1
s�1), PBmax is photosynthetic capacity (mmol O2 g
DW�1 s�1), aB is photosynthetic efficiency (mmolO2 m
�2 mmol�1 photons g DW�1) and RB dark respira-tion rate (mmol O2 g DW�1 s�1).

350 G. Peralta et al. / Estuarine, Coastal and Shelf Science 64 (2005) 347e356
Photosynthetic photon flux density (PPFD) wasmeasured within the incubation chamber using a Quan-titherm light sensor (Hansatech Ltd.). After measure-ments, the chlorophyll concentration of plant tissueswas measured spectrophotometrically according toJeffrey and Humphrey (1975) after extraction in acetone(24 h in darkness).
2.4. Statistical analysis
Except for LLR, due to the lack of belowgroundinformation from punched plants, data from November1997 were excluded from the statistical analysis ofdynamic variables (i.e. GR, LER, and LAR). For eachmeadow, the temporal effects were tested using a one-wayANOVA, followed by the Fisher LSD test for multiplecomparisons when necessary (Sokal, 1981) (Table 1).Heterocedastic data were log-transformed. For persistentheterocedastic data, a KruskaleWallis one-way analysisof variance by ranks was applied, followed by a multiplecomparison (Siegel and Castellan, 1988). In all cases, thesignificance level was set at 5% probability.
3. Results
During the winter of 1997e1998, increased sandmovement due to persistent storms was clearly fed andaggravated by the opening of a new inlet within thebarrier island of Ancao (June 1997). These eventsseriously affected the nearby Zostera noltii beds. Conse-quently, the exposedmeadow showed large and abundantgaps due to plant removal or plant burial (our personalobservations). After the stormy period (i.e. March 1998),the remaining plants in the exposed site exhibited a strongpeak in leaf loss rate (O2.8 cm plant�1 d�1, Fig. 2).Despite this strong impact, the exposed population wasable to recover efficiently in a period of 6 months. Theprocess of recovery was coupled with large changes inplant morphometry and photosynthetic parameters.These responses are detailed in the following sectionsand compared with the results from a meadow, situatedclose to the exposed area, but protected from externalhydrodynamic impacts.
3.1. Morphometric changes as an acclimative response
Large changes in plant morphometry were notreflected in annual patterns of biomass or shoot density.In the exposed and the protected meadows, biomass andshoot density exhibited unimodal annual patterns witha maximum in summer and minimum in winter (Fig. 2).However, when the exposed meadow was examined inmore detail, a divergence between shoot density andbiomass was observed after the disturbance, that wasnot observed in the protected site. In the exposed
meadow, the shoot density doubled while the biomassremained unvaried (100 g DWm�2, Fig. 2) betweenMarch and May 1998. Such uncoupling coincided witha remarkable morphometric change in plants within theexposed meadow (Fig. 3). Thus, plants at the exposedsite had leaves 65% shorter (averaged leaf lengthdecreased permanently from 25 to 7e10 cm) and 25%narrower than plants at the protected site (Table 1,Fig. 3A and B), as well as longer internodes and roots(Table 1, Fig. 3C and D). The leaf size of plants from theprotected bed also varied during this period (Fig. 3Aand B). However, the changes in the protected site weresmall and short-lived compared with those observed inthe exposed site.
In the protected meadow, leaf morphometric changescoincided with a reduction in leaf N content (Fig. 3A and4A) reaching values below the 1.8%DW, level consideredcritical for nutrient limitation in seagrass leaves (Duarte,1990). During the same period (May 1998), no significant
Fig. 2. Temporal variation of (A) biomass, (B) shoot density and (C)
leaf loss rate of Zostera noltii in the two studied meadows. In Fig. 2A,
the pie diameters are proportional to the corresponding values
(reference in top black line). White and grey areas represent leaf
biomass of exposed and the protected meadow, respectively, and
patterned ones the root/rhizome systems. Significant differences among
samplings are indicated by the alphabetic code. For each graph, capital
letters correspond to the exposed meadow (white circles), and minor
letters to the protected one (grey squares) (see Table 1 for statistical
analysis).

351G. Peralta et al. / Estuarine, Coastal and Shelf Science 64 (2005) 347e356
Fig. 3. Temporal variation of leaf (A and B) and root/rhizome morphometry (C and D) of Zostera noltii plants in the two studied meadows.
Significant differences among samplings are indicated by alphabetic codes. For each graph, capital letter codes correspond to the exposed meadow
(white circles), and minor letter ones to the protected one (grey squares) (see Table 1 for statistical analysis).
Table 1
One-way ANOVA on different variables of Z. noltii on the exposed and the protected meadows (effect:time)
Variables Exposed meadow Protected meadow
F, df p F, df p
Biomass 5.078, 7 * 2.662, 7 *
Shoot density 3.092, 7 * 2.677, 7 *
Leaf length T 22.2, 7 ** T 11.43, 7 **
Leaf width 4.434, 7 ** KW 20.63, 7, 121 *
Internodal length 4.166, 6 ** 13.03, 6 **
Root length 3.139, 6 n.s. 3.63, 6 *
Cleaf KW 12.94, 7, 24 n.s. KW 14.43, 7, 23 *
Croot/rhizome KW 11.63, 7, 24 n.s. KW 9.38, 7, 2 n.s.
Nleaf KW 20.90, 7, 24 * KW 18.18, 7, 23 *
Nroot/rhizome KW 18.85, 7, 24 * KW 15.48, 7, 2 *
Chlorophyll T 15.63, 7 ** 24.56, 7 **
Pmax T 10.34, 7 ** T 10.72, 7 **
a 1.225, 7 n.s. T 0.586, 7 n.s.
Isat 0.832, 7 n.s. KW 10.49, 7, 23 n.s.
GR T 17.50, 6 ** KW 29.40, 6, 112 **
LER 4.254, 6 * 1.253, 6 n.s.
LAR T 6.741, 6 ** KW 43.28, 7, 117 **
IER 12.20, 6 ** T 8.893, 6 **
IAR T 8.577, 6 ** 8.117, 6 **
RER T 3.503, 6 * T 2.643, 6 *
RAR T 3.605, 6 * T 1.769, 6 n.s.
PI 10.62, 6 ** T 5.47, 6 **
LLR T 8.581, 7 ** KW 18.33, 7, 129 *
*p! 0.05, **p! 0.001, n.s. not significant.
The F value, degrees of freedom (df) and probability ( p) for each particular ANOVA are included. Log-transformed data are indicated by the letter
T. When necessary, a KruskaleWallis analysis of variance by ranks (KW) was applied. In those cases, data are H, df, n, and p. Cleaf, leaf carbon
content; Croot/rhizome, root/rhizome carbon content; Nleaf, leaf nitrogen content; Nroot/rhizome, root/rhizome nitrogen content; Chlorophyll, total
chlorophyll content; Pmax, photosynthetic capacity; a, photosynthetic efficiency; Isat, saturation irradiance; GR, growth rate; LER, leaf elongation
rate; LAR, leaf appearance rate; IER, internodal elongation rate; IAR, internodal appearance rate; RER, root elongation rate; RAR, root
appearance rate; PI, plastochrone index; LLR, leaf loss rate.

352 G. Peralta et al. / Estuarine, Coastal and Shelf Science 64 (2005) 347e356
Fig. 4. Temporal variation of N content in leaves and root/rhizome of Zostera noltii plants (A and B), total chlorophyll (C) and photosynthetic
capacity (D) of Z. noltii leaves in the two studied meadows. Significant differences among samplings are indicated by alphabetic codes. For each
graph, capital letter codes correspond to the exposed meadow (white circles), and minor letter ones to the protected one (grey squares) (see Table 1
for statistical analysis).
reduction in the leaf N content of the exposed plants wasobserved and N content values were always higher thanthe critical level for seagrasses (Fig. 4A, Table 1).
Temporal variations in chlorophyll and photosyn-thetic parameters did not reveal any clear seasonalpattern in none of the meadows (Fig. 4C and D).However, after the morphometric change, plants fromthe exposed site showed an increasing temporal trend inchlorophyll content and photosynthetic capacity (PB
max)(Fig. 4C and D, Table 1).
3.2. Dynamic acclimation
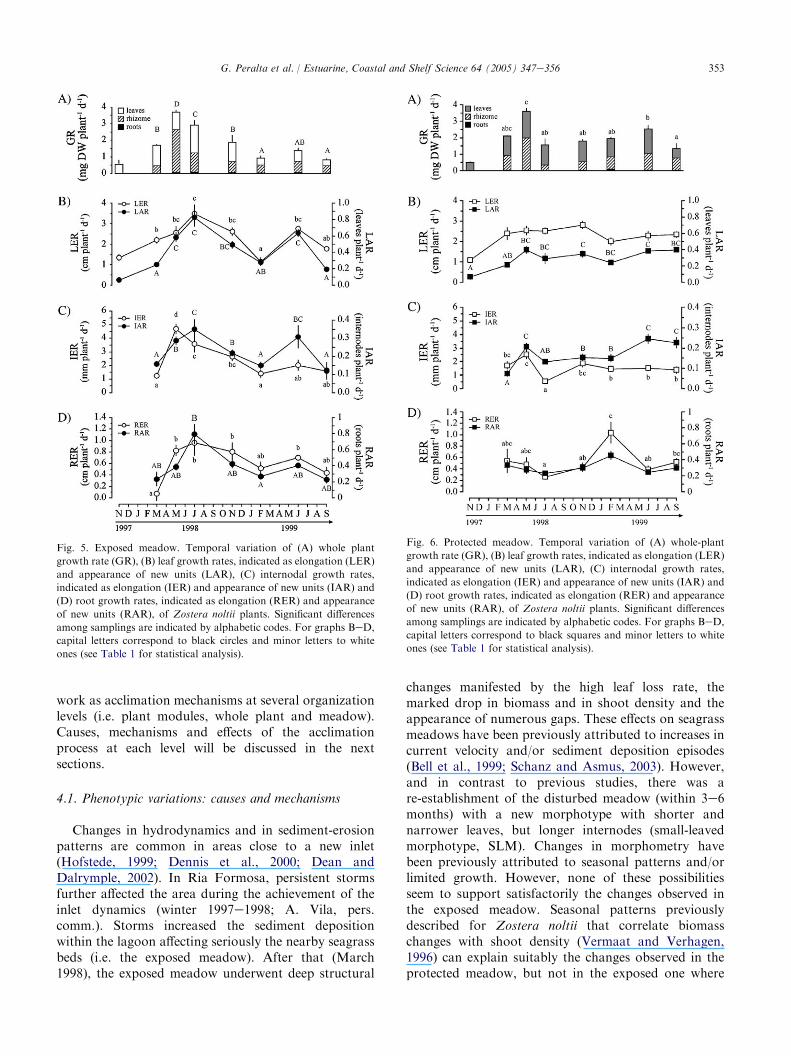
The range of variability in growth rate (GR) ofZostera noltii was unaffected by the morphometricdifferences detected between plants from the twosampling sites (1e4 mg DWplant�1 d�1, Fig. 5A andFig. 6A). However, the relative contribution of photo-synthetic and non-photosynthetic tissues to the wholeplant growth diverged considerably between the popula-tions. GR of exposed plants peaked inMay and July 1998(3.7 and 2.9 mg DWplant�1 d�1, respectively, Fig. 5A,Table 1). In May 1998, GR was mainly supported by theinternodal and root growth (Fig. 5), with belowgroundproduction accounting for more than 70%of whole plantgrowth. By contrast, GR in July 1998 was largelymaintained by increased leaf growth. The high pro-duction of the photosynthetic tissues lasted untilNovember 1998. After that, GR remained about 1 mgDWplant�1 d�1 with a comparable contribution ofphotosynthetic and non-photosynthetic tissues. In theprotected meadow, GR also peaked in May 1998
(O3.5 mg DWplant�1 d�1, Fig. 6A) although the rela-tive contribution of belowground parts to the whole plantgrowth was always below 55%, with a minimum in July1998 (Fig. 6). In summary, although GR were similar inplants from both populations, recruitment rates (i.e.LAR, IAR and RAR) were higher in the exposedpopulation (Figs. 5 and 6). Despite the maximum GR(on biomass basis) of the exposed meadow occurred inMay 1998, the recruitment of newmodules peaked in July1998, when PI was extraordinarily short (4 days, Fig. 7).
3.3. Consequences at the whole meadow level
Consequences of plant morphometry and dynamicdivergences at the whole meadow level can be summa-rized in estimations of the seasonal production (Fig. 8).Large differences between meadows were detectedduring 1998. Production in the exposed meadow in-creased markedly from winter 1998 (5.8 g DWm�2 d�1)to spring 1998 (26.6 g DWm�2 d�1). The latter value,mainly supported by internodal production (O70%),was much higher than the estimated for the protectedsite. The same was observed in summer 1998, but in thiscase, production was largely supported by leaves. Fromsummer 1998 onwards, similar production estimateswere obtained at both meadows.
4. Discussion
The present study shows that morphometric varia-tions (i.e. phenotypic variations) in Zostera noltii beds
353G. Peralta et al. / Estuarine, Coastal and Shelf Science 64 (2005) 347e356
work as acclimation mechanisms at several organizationlevels (i.e. plant modules, whole plant and meadow).Causes, mechanisms and effects of the acclimationprocess at each level will be discussed in the nextsections.
4.1. Phenotypic variations: causes and mechanisms
Changes in hydrodynamics and in sediment-erosionpatterns are common in areas close to a new inlet(Hofstede, 1999; Dennis et al., 2000; Dean andDalrymple, 2002). In Ria Formosa, persistent stormsfurther affected the area during the achievement of theinlet dynamics (winter 1997e1998; A. Vila, pers.comm.). Storms increased the sediment depositionwithin the lagoon affecting seriously the nearby seagrassbeds (i.e. the exposed meadow). After that (March1998), the exposed meadow underwent deep structural
Fig. 5. Exposed meadow. Temporal variation of (A) whole plant
growth rate (GR), (B) leaf growth rates, indicated as elongation (LER)
and appearance of new units (LAR), (C) internodal growth rates,
indicated as elongation (IER) and appearance of new units (IAR) and
(D) root growth rates, indicated as elongation (RER) and appearance
of new units (RAR), of Zostera noltii plants. Significant differences
among samplings are indicated by alphabetic codes. For graphs BeD,
capital letters correspond to black circles and minor letters to white
ones (see Table 1 for statistical analysis).
changes manifested by the high leaf loss rate, themarked drop in biomass and in shoot density and theappearance of numerous gaps. These effects on seagrassmeadows have been previously attributed to increases incurrent velocity and/or sediment deposition episodes(Bell et al., 1999; Schanz and Asmus, 2003). However,and in contrast to previous studies, there was are-establishment of the disturbed meadow (within 3e6months) with a new morphotype with shorter andnarrower leaves, but longer internodes (small-leavedmorphotype, SLM). Changes in morphometry havebeen previously attributed to seasonal patterns and/orlimited growth. However, none of these possibilitiesseem to support satisfactorily the changes observed inthe exposed meadow. Seasonal patterns previouslydescribed for Zostera noltii that correlate biomasschanges with shoot density (Vermaat and Verhagen,1996) can explain suitably the changes observed in theprotected meadow, but not in the exposed one where
Fig. 6. Protected meadow. Temporal variation of (A) whole-plant
growth rate (GR), (B) leaf growth rates, indicated as elongation (LER)
and appearance of new units (LAR), (C) internodal growth rates,
indicated as elongation (IER) and appearance of new units (IAR) and
(D) root growth rates, indicated as elongation (RER) and appearance
of new units (RAR), of Zostera noltii plants. Significant differences
among samplings are indicated by alphabetic codes. For graphs BeD,
capital letters correspond to black squares and minor letters to white
ones (see Table 1 for statistical analysis).

354 G. Peralta et al. / Estuarine, Coastal and Shelf Science 64 (2005) 347e356
shoot size and shoot density changed simultaneously.Similar LER during March and May 1998 was observedin exposed plants, even when the whole GR doubled.Consequently, leaf production decreased when the entireplant production increased. This change in relativegrowth between photosynthetic and non-photosynthetictissues cannot be explained only by increases in lightavailability or by nutrient limitation. Enhanced lightavailability may explain increases in root-rhizome GR,but only as a proportion of the whole plant growth(Peralta et al., 2002). On the other hand, the patternobserved in the exposed meadow could be driven bynutrient limitation (Short, 1983; Short et al., 1985; Shortet al., 1995; Brun et al., 2002). However, the high leaf Ncontent (O2.5% DW) together with the high GR(O3.5 mg DWplant�1 d�1) makes this hypothesis un-likely. Another cause that could trigger this responsewas the environmental disturbance suffered after thenew inlet opening. Previous studies have also suggestedthat seagrasses exposed to high currents tend to decrease
Fig. 7. Temporal variation of the plastochrone index (PI) in Zostera
noltii plants from the exposed and the protected meadows. Significant
differences among samplings are indicated by the alphabetic code.
Capital letters correspond to the exposed meadow (white circles) and
minor letters to the protected one (grey squares) (see Table 1 for
statistical analysis).
Fig. 8. Seasonal production estimations for exposed and protected
meadows of Zostera noltii during the sampling period. The pie
diameter is proportional to the corresponding value of production
(reference value is indicated on the top black line). The compartments
in each pie represent the root (black sections) and rhizome
contribution (patterned sections). Plain sections represent the leaf
contribution on the exposed meadow (white sections) and the sheltered
one (grey sections).
the leaf size (Schanz and Asmus, 2003) and increase therelative proportion of belowground tissues (Fonseca andKenworthy, 1987; Peralta et al., 2000). Nevertheless,these studies (including ours) are based on descriptiveobservations and further research would be necessary toquantify any relationship between hydrodynamics andseagrass growth patterns.
The mechanisms responsible for the morphometricchange of Zostera noltii in a short period (!3 months)may involve either external recruitment, genetic varia-tion (i.e. adaptation) or reversible acclimation. On onehand, external recruitment requires the washing out ofpropagules from neighborhood populations and theirsettlement in the host area. Since the storms onlyoccurred during the first winter and the exposed meadowwas also affected by washing out, the settling of externalshoots would be rather unlikely. On the other hand, theannual recruitment of Z. noltii depends largely onvegetative growth due to limited seed germination(Vermaat and Verhagen, 1996; Hemminga and Duarte,2000; Brun et al., 2003). Therefore, the genetic variabilityin Z. noltii populations must be restricted to increases inthe abundance of existing genotypes. Even in such case,phenotypic variations must result from simultaneouschanges in PI, LER and IER (as observed fromMarch toMay 1998 in plants from the exposed site) (Brun, pers.comm.). Hence, the results indicate that plants from theexposed meadow were affected by physical impacts (i.e.hydrodynamics and sediment deposition) that triggeredcoordinated changes in plant dynamic variables, favour-ing a phenotypic change.
4.2. Consequences of morphometric changesat the module level
Diversity in plant size has been previously related tointerspecific ecophysiological differences (Duarte, 1991).Moreover, it has been reported that small-leaved mor-photypes of Zostera noltii have higher PB
max than large-leaved ones (Perez-Llorens and Niell, 1993; Peralta et al.,2000). It suggests an inverse relationship between leaf sizeand photosynthetic capacity in Z. noltii, in agreementwith the inverse correlation found between the leaf widthand the photosynthetic capacity observed in this study(Fig. 9), Thus, in small leaves, with increased surface tovolume ratio, chlorophyll could be distributed moreefficiently, requiring less DW for the same photosyntheticsurface, as described for steppe plants (Voronin et al.,2003). This hypothesis could largely explain the high GRmeasured in the present study for the SLM that appearedafter the disturbance, as well as the lack of seasonalityin pigment content and photosynthetic parameters.Unfortunately, experimental or even descriptive studiescombining leaf width with photosynthetic performanceare uncommon in literature and more detailed studies arenecessary to test this dependence.

355G. Peralta et al. / Estuarine, Coastal and Shelf Science 64 (2005) 347e356
4.3. Consequences of morphometric changesat the plant level
Changes in biomass partitioning (i.e. aboveebelow-ground ratio) may modify the whole plant C-balance,by alteration of the photosynthesis/respiration ratio(Hemminga, 1998). It has been demonstrated that theoxygen consumption for leaves is 2.4e5 times higherthan for roots/rhizomes in several seagrass species(Fourqurean and Zieman, 1991; Kraemer and Alberte,1993; Dunton and Tomasko, 1994; Masini et al., 1995;Dunton, 1996). This suggests that total plant respirationmust in part be dependent on the biomass allocationbetween leaves and roots/rhizome system (Hemminga,1998). Therefore, enhanced belowground biomass, asobserved in exposed plants in May 1998, may havebenefited the acclimation process by reducing the bio-mass-normalized respiration rate. Nevertheless, theadvantage of an increased roots/rhizome system shouldbe carefully judged. A large rooterhizome system can beconsidered an asset only when light availability exceedsplant demands (Hemminga, 1998). Therefore, for theexposed meadow, the timing of the impact (winter) mayhavebeen critical in the success of the acclimation (spring).The success of recovery by increasing belowground tissueswould probably be lower if the acclimation did start in latesummer. Accordingly, the study of the appropriatedtemporal planning for coastalworks as an early protectingmethod for nearby seagrass beds is suggested.
4.4. Consequences of morphometric changesat the population level
The present results show that phenotypic changescontributed to the re-establishment of the exposed
Fig. 9. Correlation between leaf width and photosynthetic capacity
(Pmax) in Zostera noltii plants from exposed (white circles) and
protected (grey squares) meadow.
meadow. Firstly, shoots that appeared after the dis-turbance were smaller (SLM) than the previous ones(LLM, identical to that of the protected site) but withsimilar growth capacity (see previous sections). Secondly,the shoot density increased considerably. As a result,production increased in the exposed meadow. Morpho-metric and demographic differences between plants fromprotected and exposed meadows still persisted even whenthe latter was re-established in 1999. After the recovery,the SLM exhibited lower plant growth rates than theLLM from protected site. Feedback effects (i.e. self-shading and reduced hydrodynamic stress) could largelyaccount for the reduction in growth rate observed in SLMafter the meadow recovery (Gambi et al., 1990; Koch,2001). Nevertheless, in 1999, differences in plant growthrate and shoot density resulted in similar productionvalues for the two meadows. These results show that thephenotypic plasticity of Zostera noltii may favor theformation of new stable states in a disturbed meadow.
Acknowledgments
The authors thank Dr. Rui Santos and Dr. MartinSprung for field assessment and to the volunteers whohelped during the intensive fieldwork. G. Peralta wouldlike to thank Dr. T.J. Bouma for his advice at the earlystage of this manuscript, to Dr. Ana Vila for hercomments about the INDIA project and to E.P. Morrisfor helping with the grammar. This study was supportedby the project 12/REGII/6/96; INTERREG II/Mediafrom the European Project INTERREG II. This paperis dedicated to Dr. Martin Sprung, who died in a tragicaccident.
References
Alcoverro, T., Manzanera, M., Romero, J., 1998. Seasonal and age-
dependent variability of Posidonia oceanica (L.) Delile photosyn-
thetic parameters. Journal of Experimental Marine Biology and
Ecology 230, 1e13.
Baly, E.C.C., 1935. The kinetics of photosynthesis. Proceedings of the
Royal Society Section B e Biological Sciences 117, 218e239.Bell, S.S., Robbins, B.D., Jensen, S.L., 1999. Gap dynamics in
a seagrass landscape. Ecosystems 2, 493e504.
Benjamin, K.J., Walker, D.I., McComb, A.J., Kuo, J., 1999. Structural
responses of marine and estuarine plants ofHalophila ovalis (R-Br.)
Hook. f. to long-term hyposalinity. Aquatic Botany 64, 1e17.
Brun, F.G., Hernandez, I., Vergara, J.J., Peralta, G., Perez-
Llorens, J.L., 2002. Assessing the toxicity of ammonium pulses to
the survival and growth of Zostera noltii. Marine Ecology Progress
Series 225, 177e187.
Brun, F.G., Perez-Llorens, J.L., Hernandez, I., Vergara, J.J., 2003.
Patch distribution within-patch dynamics of the seagrass Zostera
noltii Hornem. at los Torunos salt-marsh (Cadiz Bay, Natural
Park, Spain). Botanica Marina 46, 513e524.
Dean, R.G., Dalrymple, R.A., 2002. Coastal Processes with Engineer-
ing Applications. Cambridge University Press, Cambridge, 487 pp.

356 G. Peralta et al. / Estuarine, Coastal and Shelf Science 64 (2005) 347e356
Dennis, J.M., Spearman, J.R., Dearnaley, M.P., 2000. The develop-
ment of a regime model for prediction of the long-term effects of
civil engineering activities on estuaries. Physical Chemistry of the
Earth 25, 45e50.Drew, E.D., 1979. Physiological aspects of primary production in
seagrasses. Aquatic Botany 7, 139e150.
Duarte, C.M., 1990. Seagrass nutrient content. Marine Ecology
Progress Series 67, 201e207.Duarte, C.M., 1991. Allometric scaling of seagrass form and
productivity. Marine Ecology Progress Series 77, 289e300.
Dunton, K.H., 1996. Photosynthetic production and biomass of the
subtropical seagrass Halodule wrightii along an estuarine gradient.
Estuaries 19, 436e447.
Dunton, K.H., Tomasko, D.A., 1994. In situ photosynthesis in the
seagrass Halodule wrightii in a hypersaline subtropical lagoon.
Marine Ecology Progress Series 107, 281e293.
Evans, A.S., Webb, K.L., Penhale, P.A., 1986. Photosynthetic
temperature acclimation in two coexisting seagrasses, Zostera
marina L., and Ruppia maritima L. Aquatic Botany 24, 185e197.Fonseca, M.S., Kenworthy, W.J., 1987. Effects of current on photosyn-
thesis and distribution of seagrasses. Aquatic Botany 27, 59e78.
Fourqurean, J.W., Zieman, J.C., 1991. Photosynthesis, respiration and
whole plant carbon budget of the seagrass Thalassia testudinum.
Marine Ecology Progress Series 69, 161e170.
Gambi, M.C., Nowell, A.R.M., Jumars, P.A., 1990. Flume observa-
tions on flow dynamics in Zostera marina (eelgrass) beds. Marine
Ecology Progress Series 61, 159e169.Hemminga, M.A., 1998. The root/rhizome system of seagrasses: and
asset and a burden. Journal of Sea Research 39, 183e196.
Hemminga, M.A., Duarte, C.M., 2000. Seagrass Ecology. Cambridge
University Press, Cambridge, 298 pp.
Hofstede, J.L.A., 1999. Process-response analysis for Hornum tidal
inlet in the German sector of the Wadden Sea. Quaternary
International 60, 107e117.Iyer, V., Barnabas, A.D., 1993. Effects of varying salinity on leaves of
Zostera capensis Setchell. 1. Ultrastructural changes. Aquatic
Botany 46, 141e153.
Jeffrey, S.W., Humphrey, G.F., 1975. New spectrophotometric
equations for determining chlorophylls a, b, c1 and c2 in higher
plants, algae and natural phytoplankton. Biochemie und Physi-
ologie der Pflanzen 167, 191e194.Koch, E.M., 2001. Beyond light: physical, geological, and geochemical
parameters as possible submersed aquatic vegetation habitat
requirements. Estuaries 24, 1e17.
Kraemer, G.P., Alberte, R.S., 1993. Age-related patterns of metabo-
lism and biomass in subterranean tissues of Zostera marina
(eelgrass). Marine Ecology Progress Series 95, 193e203.
Lambers, H., Chapin III, F.S., Pons, T.L., 1998. Plant Physiological
Ecology. Springer-Verlag, New York, 540 pp.
Machas, R., Santos, R., 1999. Sources of organic matter in Ria
Formosa revealed by stable isotope analysis. Acta Oecologica/
International Journal of Ecology 20, 463e469.
Major, K.M., Dunton, K.H., 2002. Variations in light-harvesting
characteristics of the seagrass, Thalassia testudinum: evidence for
photoacclimation. Journal of Experimental Marine Biology and
Ecology 275, 173e189.Marba, N., Cebrian, J., Enrıquez, S., Duarte, C.M., 1996. Growth
patterns of western Mediterranean seagrasses: species-specific re
sponses to seasonal forcing. Marine Ecology Progress Series 133,
203e215.Masini, R.J., Cary, J.L., Simpson, C.J., McComb, A.J., 1995. Effects
of light and temperature on the photosynthesis of temperate
meadow-forming seagrasses in Western Australia. Aquatic Botany
49, 239e254.Masini, R.J., Manning, C.R., 1997. The photosynthetic responses to
irradiance and temperature of four meadow-forming seagrasses.
Aquatic Botany 58, 21e36.
Mazzella, L., Mauzerall, D.C., Lyman, H., Alberte, R.S., 1981.
Protoplast isolation and photosynthetic characteristics of Zostera
marina L. (eelgrass). Botanica Marina 23, 285e289.
McMillan, C., 1984. The distribution of tropical seagrasses with
relation to their tolerance of high temperatures. Aquatic Botany 19,
369e379.
Morris, B.D., Davidson, M.A., Huntley, D.A., 2001. Measurements of
the response of a coastal inlet using video monitoring techniques.
Marine Geology 175, 251e272.
Peralta, G., Perez-Llorens, J.L., Hernandez, I., Brun, F., Vergara, J.J.,
Bartual, A., Galvez, J.A., Garcıa, C.M., 2000. Morphological and
physiological differences between two morphotypes of Zostera
noltii Hornem. from the south-western Iberian peninsula. Helgo-
lander Marine Research 54, 80e86.
Peralta, G., Perez-Llorens, J.L., Hernandez, I., Vergara, J.J., 2002.
Effects of light availability on growth, architecture and nutrient
content of the seagrass Zostera noltii Hornem. Journal of
Experimental Marine Biology and Ecology 269, 9e26.
Perez-Llorens, J.L., Niell, F.X., 1993. Temperature and emergence on
the net photosynthesis of two Zostera noltiiHornem. morphotypes.
Hydrobiologia 254, 53e64.
Schanz, A., Asmus, H., 2003. Impact of hydrodynamics on de-
velopment and morphology of intertidal seagrasses in the Wadden
Sea. Marine Ecology Progress Series 261, 123e134.
Short, F.T., 1983. The seagrass, Zostera marina L.: plant morphology
and bed structure in relation to sediment ammonium in Izembek
lagoon, Alaska. Aquatic Botany 16, 149e161.Short, F.T., Davis, M.W., Gibson, R.A., Zimmermann, C.F., 1985.
Evidence for phosphorus limitation in carbonate sediments of the
seagrass Syrigodium filiforme. Estuarine, Coastal and Shelf Science
20, 419e430.
Short, F.T., Budick, D.M., Kaldy III, J.E., 1995. Mesocosm experi-
ments quantify the effects of eutrophication on eelgrass, Zostera
marina. Limnology and Oceanography 40, 740e749.Siegel, S., Castellan, N.J., 1988. Nonparametric Statistics for the
Behavioral Sciences. McGraw-Hill, New York, 399 pp.
Sokal, R.R., 1981. Biometry: The Principles and Practice of Statistics in
Biological Research, second ed. W.H. Freeman, New York, 859 pp.
Sultan, S.E., 2000. Phenotypic plasticity for plant development,
function and life history. Trends in Plant Science 5, 537e542.
van Katwijk, M.M., 2000. Possibilities for Restoration of Zostera
marina Beds in the Dutch Wadden Sea. Katholieke Universiteit
Nijmegen, Nijmegen. 151 pp.
Vermaat, J.E., Verhagen, F.C.A., 1996. Seasonal variation in the
intertidal seagrass Zostera noltii Hornem: coupling demographic
and physiological patterns. Aquatic Botany 52, 259e281.
Voronin, P.Y., Ivanova, L.A., Ronzhina, D.A., Ivanov, L.A.,
Anenkhonov, O.A., Black, C.C., Gunin, P.D., P’yankov, V.I.,
2003. Structural and functional changes in the leaves of plants from
steppe communities as affected by aridization of the Eurasian
climate. Russian Journal of Plant Physiology 50, 604e611.
Williams, J.J., O’Connor, B.A., Arens, S.M., Abadie, S., Bell, P.,
Balouin, Y., Van Boxel, J.H., Do Carmo, A.J., Davidson, M.,
Ferreira, O., Heron, M., Howa, H., Hughes, Z., Kaczmarek, L.M.,
Kim, H., Morris, B., Nicholson, J., Pan, S., Salles, P., Silva, A.,
Smith, J., Soares, C., Vila-Concejo, A., 2003. Tidal inlet function:
field evidence and numerical simulation in the INDIA project.
Journal of Coastal Research 19, 189e211.
Yabe, T., Ikusima, I., Tsuchiya, T., 1995. Production and population
ecology of Phyllospadix iwatensis Makino. I. Leaf growth and
biomass in an intertidal zone. Ecological Research 10, 291e299.
Zieman, J.C., 1974. Methods for the study of the growth and
production of the turtlegrass Thalassia testudinum Koning.
Aquaculture 4, 139e143.
Zimmerman, R.C., Smith, R.D., Alberte, R.S., 1989. Thermal acclima-
tion and whole plant carbon balance inZostera marina L. (eelgrass).
Journal of Experimental Marine Biology and Ecology 130, 93e109.
Copyright © 2022 FDOKUMEN