
Proteomic analysis of human osteoprogenitor response to disordered nanotopography

J O U R N A L O F P R O T E O M I C S 7 2 ( 2 0 0 9 ) 6 9 5 – 7 0 7
ava i l ab l e a t www.sc i enced i rec t . com
www.e l sev i e r. com/ loca te / j p ro t
Proteomic response of human neuroblastoma cellsto azaspiracid-1
Ralf Kellmanna, Carlos A.M. Schaffnera, Toril A. Grønseta, Masayuki Satakeb,Mathias Zieglera, Kari E. Fladmarka,⁎aDepartment of Molecular Biology, University of Bergen, NorwaybFaculty of Agriculture, Tohoku University, Tsutsumidori-Amamiya, Japan
A R T I C L E I N F O
⁎ Corresponding author. Department of MolecE-mail address: [email protected]
1874-3919/$ – see front matter © 2009 Elsevidoi:10.1016/j.jprot.2009.02.008
A B S T R A C T
Article history:Received 26 June 2008Accepted 16 February 2009
Azaspiracid-1 is a novel algal toxin, which causes an instantaneous rise of intracellularmessengers, and an irreversible disarrangement of the actin cytoskeleton. Little is knownregarding the molecular mechanisms that are involved in azaspiracid-1 toxicity. This studyinvestigated global changes in protein expression by stable-isotope labelling with aminoacids in culture and mass spectrometry, following exposure of human neuroblastoma cellsto azaspiracid-1. The most highly upregulated proteins were involved in cellular energymetabolism, followed by cytoskeleton regulating proteins. The majority of downregulatedproteins were involved in transcription, translation and protein modification. In addition,two proteins, component of oligomeric Golgi complex 5 and ras-related protein RAB1, whichare involved in the maintenance of the Golgi complex and vesicle transport, respectively,were downregulated. Electron microscopy revealed a disruption of the Golgi complex byazaspiracid-1, and an accumulation of vesicles. In this study, the differential proteinexpression was examined prior to changes of the cytoskeleton structure in order to capturethe primary effects of azaspiracid-1, however the observed changes were of unexpectedcomplexity. Azaspiracid-1 caused a pronounced, but temporary depletion of ATP, whichmay be the reason for the observed complexity of cellular changes.
© 2009 Elsevier B.V. All rights reserved.
Keywords:Azaspiracid-1NeuroblastomaEnergy metabolismCytoskeletonSILACQuantitative proteomics
1. Introduction
Over the past three decades, the frequency and globaldistribution of toxic algal blooms has increased, and humanintoxications from novel algal sources have regularly occurred[1]. Azaspiracids represent the most recently discoveredfamily of algal toxins. Themolecular backbone of azaspiracidsconsists of two spiro ring assemblies, a cyclic amine, and acarboxylic acid, and differs from other nitrogen-containingtoxins isolated from shellfish or toxic algae [2]. So far, 32different analogues of azaspiracid have been detected [3–5]. Atpresent, the producer organism is not known [6], however thecyclic polyether structure of azaspiracid suggests that it ismost probably a dinoflagellate species.
ular Biology, P.O. Box 780(K.E. Fladmark).
er B.V. All rights reserved
Azaspiracid has caused shellfish poisoning in the Nether-lands in 1995 after the consumption of cultivated musselsfrom Killary Harbor, Ireland [2]. The symptoms of poisoningwere similar to diarrhetic shellfish poisoning (DSP), howevershellfish extracts did not contain okadaic acid or dinophysistoxins, which prompted research into the identification andstructural elucidation of azaspiracid. Studies on animals andtissue cultures have shown that this new toxin is a neuro- andcytotoxin [7–9], which does not act on the targets of other algaltoxins, such as voltage-gated sodium channels, and proteinphosphatases 1 and 2A. Azaspiracid-1 is cytotoxic at nanomolarlevels toa broad rangeof cell lines, andevokesan instantaneousincrease of intracellular levels of calcium and cAMP [10]. Afterapproximately 24–72 h of exposure, it invariably causes a
3, 5020 Bergen, Norway. Tel.: +47 5558 4514; fax: +47 5558 9683.
.

696 J O U R N A L O F P R O T E O M I C S 7 2 ( 2 0 0 9 ) 6 9 5 – 7 0 7
disarrangement of the actin cytoskeleton, followed by anecrotic-like cell death [10]. Exposure times of only 2 min weresufficient to cause the same cytoskeletal changes as describedabove, indicating that this toxin may bind permanently to itstarget [11]. Whereas the rise in intracellular calcium andcAMP could be modulated by protein kinase C activation andadenylate cyclase inhibition, respectively, they were indepen-dent events of each other, and not required for the disruption ofthe actin cytoskeleton [10]. Research indicates that this toxinmodulates signalling pathways that regulate the cytoskeleton[9,11–13]. Azaspiracid-1 was shown to activate mitogen-acti-vated protein kinases (MAPKs), and lead to the phosphorylationof c-Jun N-terminal kinase and MAPK p38. The cytotoxic effectsof azaspiracid-1 were abolished in the presence of MAPKsinhibitors, however they did not inhibit the cytoskeletal andmorphological changes [12,14], suggesting that activation ofMAPKswasadown-streameffect. Several othermajor signallingpathways have also been ruled out by using specific inhibitors[9,11], but the mechanism of toxicity of azaspiracid-1 remainselusive. The rationale of the present study was to identifycellular and subcellular mechanisms that are related toazaspiracid-1 toxicity by determining proteins that are differ-entially expressed in response toazaspiracid. Proteinexpressionwas quantitated using stable isotope labelling with amino acidsin culture (SILAC) in conjunction with mass spectroscopicanalysis of SDS-PAGE separated and trypsin-digested proteins.Because of the observed neurotoxicity of azaspiracid, a humanneuroblastoma cell line, SH-SY5Y, was used.
2. Materials and methods
2.1. Stable isotope labelling with amino acids in culture(SILAC)
Human neuroblastoma cells (SH-SY5Y) were metabolicallylabelled by SILAC according to Mann [15]. Custom-made SILACmediumwas based on Dulbecco's Modified Eagle's medium [16](Invitrogen Cat. No. 52100) with the omission of L-glutamine, L-arginine, andL-lysine. The finalmediumwaspreparedbyadding10% dialyzed FBS (Invitrogen Cat.-No. 26400–044), 1% penicillinand streptomycin mixture (BioWhittaker DE 17-603E), 3.7 g/lsodium bicarbonate, and 580 mg/l glutamine. “Heavy” mediumwas supplemented with 13C6-labelled L-arginine and L-lysine(Sigma Cat.-Nos. 643440 and 643459) to final concentrations of0.138 mM and 0.798 mM, respectively. Cells grown in “heavy”medium were treated with azaspiracid-1, as described below.“Light”mediumwas supplementedwith 12C6-labelled L-arginineand L-lysine (Sigma Cat.-Nos. A8094 and L9037) to the same finalconcentrations as for “heavy” medium. Cells grown in “light”mediumwere used for treatmentwithDMSOvehicle, and servedasacontrol. Cellsweresubcultured five timeswith freshmediumat an inoculum ratio of 1:10 after they reached approximately80% confluency, to ensure complete incorporation of isotope-labelled amino acids.
2.2. Azaspiracid-1 treatment of SH-SY5Y cells
Azaspiracid-1 was purified according to Satake et al. [2], anddissolved in DMSO at a concentration of 10 µM. Stable isotope-
labelled SH-SY5Y cell cultures (as described above) weresupplemented with azaspiracid-1 to a final concentration of15 nM, or the corresponding volume of DMSO for the control,and incubated for 12 h under culturing conditions, asdescribed above. Cells were washed twice with ice-cold PBSupon treatment, harvested by scraping into fresh PBS, andpelleted by centrifugation (5 min at 1000 ×g). Cell pellets weresnap-frozen in liquid nitrogen, and stored at −80 °C untilfurther use.
2.3. Light and electron microscopy
For light microscopy, cells were grown in 12-well microtitreplates until they reach a confluency of approximately 80%. Cellswere treatedwithazaspiracid-1 at a concentrationof 15nM for 0,12, 24 and 48 h, washed twice with PBS and fixed with 4%formaldehyde. For transmission electronmicroscopy, cellswerecultured in 6-well trays, and treatedwith 15nMazaspiracid-1 for12, 24 or 48 h, or left untreated. The cells were washed in 0.1 Msodium cacodylate buffer, and fixed in 1.5% glutaraldehyde in0.1 M Na-cacodylate buffer pH 7.4 for 20 min at RT. Cells werethenwashed in 0.1Msodiumcacodylate buffer andpost-fixed in1% osmium tetroxide in 0.1 M sodium cacodylate buffer for40 min. Cells were washed twice for 10 min in 0.1 M sodiumcacodylate buffer, and dehydrated in graded solutions ofethanol. The monolayered cells were then embedded in plasticusing Agar 100 resin capsules, cut into 60 nm thin sections(Reichert Ultracut S Ultra microtome), and stained in uranyl/lead. The cells were examined using a Jeol JEM-1230 transmis-sionelectronmicroscopeat theFUGENational ImagingPlatform.
2.4. Protein extraction and SDS-PAGE
Cell pellets from 175 cm2 flasks were suspended in 100 µl ice-cold RIPA buffer, and lysed with 8 pulses for 5 s withsonication. Lysates were centrifuged for 10 min at 4 °C at13,000 ×g, and the supernatant, representing the whole-cellprotein extract, was collected. Protein extracts from controland azaspiracid-treated cells were mixed at a protein con-centration ratio of 1:1. Proteins were then separated by SDS-PAGE on a 5–15% acrylamide gradient gel, and stained withCoomassie blue upon electrophoresis. A total of 34 slices wereexcised from the gel, and proteins in-gel digestedwith trypsin,as follows.
Gel slices were macerated with a scalpel blade, anddestained in 50% acetonitrile with 25 mM ammoniumbicarbonate solution, followed by a wash with 100% acetoni-trile, and dried under vacuum. Protein cysteine residues werereduced by incubating the gel pieces in 10 mM dithiothreitolwith 100 mM ammonium bicarbonate for 45 min at 56 °C,followed by alkylation with 55 mM iodoacetamide in 100 mMammonium bicarbonate at ambient temperature for 30 min inthe dark. Gel pieces were then washed with acetonitrile andvaccuum-dried. Proteins were then digested with 125 µl of6 ng/µl porcine trypsin (Promega) overnight at 37 °C. Subse-quently, the digests were centrifuged and the gel pieces andsupernatants collected in separate tubes. Peptides wereextracted from gel pieces with 60% acetonitrile and 5% formicacid for 30 min. Extracts were centrifuged at 12.000 ×g for10 min, and the supernatant pooled with that from the

697J O U R N A L O F P R O T E O M I C S 7 2 ( 2 0 0 9 ) 6 9 5 – 7 0 7
previous step. Peptide extracts were dried in vacuum centri-fuge, and peptides re-dissolved in 10 µl 1% formic acid.
2.5. Liquid chromatography coupled online to a Q–TOFmassspectrometer
Peptide analysis was carried out using an Ultimate 3000 nano-HPLC (Dionex) thatwas coupledonline toanUltimaGlobalQ–TOFmass spectrometer (Micromass). The nano-HPLC was fitted witha Dionex C18 Pepmap 100 column (5 µm particle size, 100 Å poresize, 0.3×5 mm) for peptide enrichment, and a Dionex C18
Pepmap100 analytical column (3 µmparticle size, 100Åpore size,0.075×175 mm). Mobile phases A and B consisted of 2%acetonitrile with 0.2% formic acid, and 90% acetonitrile with0.2% formic acid, respectively. The flow-rate was adjusted to300 nl/min. Injected peptides were trapped on the enrichmentcolumn under isocratic conditions at 0% mobile phase B for11min. The flow through the trap columnwas then reversed andswitched online with the analytical column. Peptides wereseparated over a linear 5 to 50% mobile phase B gradient over43 min, followed by a 3 min gradient from 50 to 95% mobilephase B. Eluate was electro-sprayed into electrospray ionization(ESI) Q–ToF mass spectrometer. The Q–TOF was using anautomatic MS to MS/MS switch, where each full MS scan wasfollowed by three MS/MS scans of the twomost intense peaks inthe full MS spectrum. Dynamic exclusion enabled to allowdetection of less-abundant peptide ions. MS scan events andHPLC solvent gradients were controlled by the Chromeleonsoftware from Dionex.
Fig. 1 – Lightmicrograph of SH-SY5Y cells. Cells were grown inmi(B), 24 (C) and 48 (D) h. The cells were fixed with 4% formaldehyd
2.6. Data analysis
The software VEMS 3.0 (http://yass.sdu.dk/Doc/VEMSv3.doc)was used to identify and quantify peptides from LC-MS dataobtained as described above. Peptide MS/MS spectra weresearched against the non-redundant SwissProt human pro-teome database. The threshold scores for identification andquantification were set to 40 for peptides and proteins. Fixedmodifications were set to methionine oxidation and carbami-domethylated cysteine (CAM), whereas variable modificationsfor the entire databasewere set to 13C6-arginine and 13C6-lysine.Peptidequantificationwasexpressedas aper cent ratio (Qvems)of peak heights from 13C- and 12C-labelled peptides (C13/[C12+C13]·100). Themean per cent ratio with standard deviation wascalculated using the first three isotopic peaks. Protein quantita-tion was based on themean Qvems of peptides assigned to thecorresponding protein. VEMS results were then exported toMicrosoft Excel and MySQL. Identified proteins were classifiedaccording to their molecular and biological function, as well asby their involvement in signalling pathways, using Panther(http://www.pantherdb.org/) database searches.Annotatedpro-tein lists were then compared between the two experiments,through MySQL database queries.
A list of quantitated proteins was generated in descendingorder with regard to Qvems, and each protein was numberedaccording to its position in the list. The protein number wasplotted versus Qvems (Fig. 2). Themid section of the graphwaslinear, and comprised proteins that did not change in theirexpression levels. The linear range was arbitrarily set from
crotitre plates and exposed to 15 nM azaspiracid-1 for 0 (A), 12e in the wells prior to examination by light microscopy.
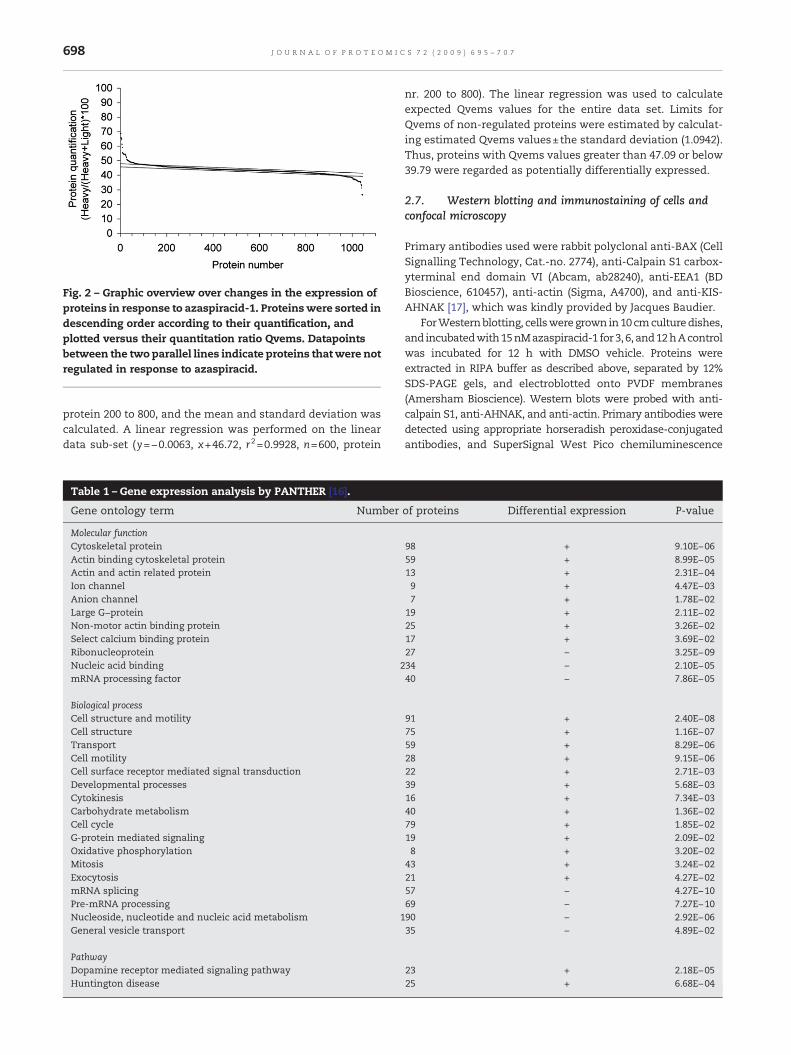
Fig. 2 – Graphic overview over changes in the expression ofproteins in response to azaspiracid-1. Proteinswere sorted indescending order according to their quantification, andplotted versus their quantitation ratio Qvems. Datapointsbetween the two parallel lines indicate proteins thatwere notregulated in response to azaspiracid.
698 J O U R N A L O F P R O T E O M I C S 7 2 ( 2 0 0 9 ) 6 9 5 – 7 0 7
protein 200 to 800, and the mean and standard deviation wascalculated. A linear regression was performed on the lineardata sub-set (y=−0.0063, x+46.72, r2=0.9928, n=600, protein
Table 1 – Gene expression analysis by PANTHER [16].
Gene ontology term Number
Molecular functionCytoskeletal proteinActin binding cytoskeletal proteinActin and actin related proteinIon channelAnion channelLarge G−proteinNon-motor actin binding proteinSelect calcium binding proteinRibonucleoproteinNucleic acid binding 2mRNA processing factor
Biological processCell structure and motilityCell structureTransportCell motilityCell surface receptor mediated signal transductionDevelopmental processesCytokinesisCarbohydrate metabolismCell cycleG-protein mediated signalingOxidative phosphorylationMitosisExocytosismRNA splicingPre-mRNA processingNucleoside, nucleotide and nucleic acid metabolism 1General vesicle transport
PathwayDopamine receptor mediated signaling pathwayHuntington disease
nr. 200 to 800). The linear regression was used to calculateexpected Qvems values for the entire data set. Limits forQvems of non-regulated proteins were estimated by calculat-ing estimated Qvems values±the standard deviation (1.0942).Thus, proteins with Qvems values greater than 47.09 or below39.79 were regarded as potentially differentially expressed.
2.7. Western blotting and immunostaining of cells andconfocal microscopy
Primary antibodies used were rabbit polyclonal anti-BAX (CellSignalling Technology, Cat.-no. 2774), anti-Calpain S1 carbox-yterminal end domain VI (Abcam, ab28240), anti-EEA1 (BDBioscience, 610457), anti-actin (Sigma, A4700), and anti-KIS-AHNAK [17], which was kindly provided by Jacques Baudier.
ForWesternblotting, cellsweregrown in10cmculturedishes,and incubatedwith15nMazaspiracid-1 for 3, 6, and12hAcontrolwas incubated for 12 h with DMSO vehicle. Proteins wereextracted in RIPA buffer as described above, separated by 12%SDS-PAGE gels, and electroblotted onto PVDF membranes(Amersham Bioscience). Western blots were probed with anti-calpain S1, anti-AHNAK, and anti-actin. Primary antibodies weredetected using appropriate horseradish peroxidase-conjugatedantibodies, and SuperSignal West Pico chemiluminescence
of proteins Differential expression P-value
98 + 9.10E−0659 + 8.99E−0513 + 2.31E−049 + 4.47E−037 + 1.78E−02
19 + 2.11E−0225 + 3.26E−0217 + 3.69E−0227 – 3.25E−0934 – 2.10E−0540 – 7.86E−05
91 + 2.40E−0875 + 1.16E−0759 + 8.29E−0628 + 9.15E−0622 + 2.71E−0339 + 5.68E−0316 + 7.34E−0340 + 1.36E−0279 + 1.85E−0219 + 2.09E−028 + 3.20E−02
43 + 3.24E−0221 + 4.27E−0257 – 4.27E−1069 – 7.27E−1090 – 2.92E−0635 – 4.89E−02
23 + 2.18E−0525 + 6.68E−04

Table 2 – Proteins involved in energymetabolism that were upregulated after 12 h exposure of SH-SY5Y cells to azaspiracid-1.
Protein name Symbol Qvems STD Score Peptides Accession
Translocase of outer mitochondrial membrane 40 TOMM40 65.81 1.12 97 1 O96008Voltage-dependent anion-selective channel protein 1 VDAC-1 64.32 1.61 365 6 P21796Cytochrome c oxidase subunit 5A COX5A 61.32 1.93 178 2 P20674Cytochrome c oxidase polypeptide VIIa CX7A2 61.04 3.91 108 2 P14406Cytochrome c oxidase subunit 2 COX2 59.07 0.53 182 1 P00403Mitochondrial carrier homolog 2 MTCH2 55.49 0.96 57 1 Q9Y6C9NADH dehydrogenase 1 alpha subcomplex subunit 13 NDUFA13 55.13 2.49 115 2 Q9P0J0NADH dehydrogenase flavoprotein 2 NDUFV2 54.92 2.78 47 1 P194046-phosphofructokinase PFK-C 54.47 4.30 80 1 Q01813Mitochondrial aspartate-glutamate carrier protein SLC25A13 47.82 0.30 195 3 Q546F9Calcium-binding mitochondrial carrier protein Aralar1 47.39 1.55 148 1 O75746ADP/ATP translocase 3 ANT3 46.50 4.67 736 12 P12236
Abbreviations used were Qvems: quantitation ratio in per cent; and STD: standard deviation.
699J O U R N A L O F P R O T E O M I C S 7 2 ( 2 0 0 9 ) 6 9 5 – 7 0 7
substrate (Pierce Cat.-No. 34080). Chemiluminescence wasdetectedusinga FujifilmLAS-1000 luminescence imageanalyzer.
For immunostaining, cells were grown in 12 well plates oncover slips until they reached a confluency of approximately50%. The cells were treatedwith 15 nMazaspiracid-1 and DMSOvehicle, respectively, for 12h and fixedwith2% formaldehyde inPBS. Cells were permeabilised with 0.1% Triton X-100 in PBS,blockedwith1mg/mlBSA inPBSwith0.5%NP-40, and incubatedat 4 °C overnight with primary antibody in blocking solution.Primary antibodies were detected using appropriate Cy3-con-jugated secondary antibodies, and nuclei were stained withDAPI. Confocal laser scanning microscopy was performed on aZeiss LMS 510 Meta confocal laser scanning microscope. Cy3was visualized using the 543 nm laser line and the BP560-615emission filter. DAPI was visualized using the 405 nm laser lineand the BP420-480 emission filter.
2.8. Mitochondrial membrane potential
The potential-dependent cationic dye, 5,5′,6,6′-tetrachloro-1,1′,3,3′-tetraethylbenzimidazolylcarbocyanine iodide (JC-1,Invitrogen Cat. No. T3168) was used to determine the effect
Table 3 – Proteins involved in cytoskeleton organisation that wazaspiracid-1.
Protein name Symbol Qvems
Actin-related protein 3 ARP3 54.34AHNAK AHNAK 52.56Protein S100-A10 S100-A10 52.41Annexin AII ANXA2 50.56Caldesmon CDM 50.20Microtubule-associated protein 1B MAP1B 49.33Neural cell adhesion molecule 1 NCAM1 48.81Vimentin VIM 48.61Kinectin KTN1 48.54Vinculin VCL 48.40Tubulin, beta 6 TUBB3 48.14Lamin-A/C LMNA 48.06Calpain small subunit 1 CSS1 47.57Cytoskeleton-associated protein 4 CKAP4 47.39Tubulin, alpha 1 TUBA1 47.26Filamin-A FLNA 47.16
Abbreviations used were Qvems: quantitation ratio in per cent; and STD:
of azaspiracid-1 on the mitochondrial membrane potential[18]. SH-SY5Y cells were grown to approximately 80% con-fluency in round 10 cm dishes, and incubated for 1 h with 6 mlDMEM medium containing azaspiracid-1at final concentra-tions of 0, 1, 10, 50, and 100 nM. As a positive control, cells wereincubated for the same duration with the ionophore carbonylcyanide-p-trifluoromethoxyphenylhydrazone (FCCP) at finalconcentrations of 0, 1, 10, and 100 µM. After the first 30 min ofincubation, a final concentration of 5 µg/ml of JC-1 was added.Cells were washed with PBS, trypsin-treated to transfer theminto suspension, washed with 10 ml PBS, and finally resus-pended in 5 ml PBS. JC-1 fluorescence was measured at anexcitation wavelength of 485 nm, and an emission range from500 to 600 nm. The ratio of emissions at 595 nm and 535 nmrepresented the ration of J-aggregate versus monomer.
2.9. Lactate production
The accumulation of lactate in growth media was measuredaccording to Vahsen et al. [19]. SH-SY5Y cells were grown toapproximately 80% confluency in 10 cm dishes, and incubatedfor 0, 3, 6, 12, and 24 h with 6 ml DMEM medium containing
ere up-regulated after 12 h exposure of SH-SY5Y cells to
STD Score Peptides Accession
4.44 94 1 P611581.15 1005 10 Q096664.39 81 1 P609032.70 2180 23 Q6N0B32.29 163 2 Q056822.40 214 3 P468214.34 98 1 P135911.51 2283 23 P086701.69 87 1 Q86UP22.44 948 11 P182064.87 968 8 Q2NKY52.11 1760 18 P025452.44 219 1 P046320.545 98 2 Q070652.67 174 3 Q9H8532.12 4219 53 P21333
standard deviation.

Table 4 – Proteins that were down-regulated after 12 h exposure of SH-SY5Y cells to azaspiracid-1.
Protein name Symbol Qvems STD Score Peptides Accession BP
Matrin-3 MATR3 38.8 3.30 599 8 P43243 mRNA metabolismSR140 protein SR140 37.3 4.83 93 1 Q2NKQ7 mRNA metabolismArginine/serine-rich-splicing factor 10 HTRA2-beta 26.7 4.59 49 1 P62995 mRNA splicingHeterogeneous nuclear ribonucleoproteinC-like 1
hnRCL 32.8 2.27 286 1 O60812 mRNA splicing
RNA-binding protein Raly RALY 35.6 2.83 137 2 Q9UKM9 mRNA splicingHeterogeneous nuclear ribonucleoproteinsC1/C2
hnRNP C1/C2 35.9 2.21 505 3 P07910 mRNA splicing
Small nuclear ribonucleoprotein G snRNP-G 36.3 2.76 421 5 P62308 mRNA splicingHeterogeneous nuclear ribonucleoproteinH3
hnRNP H3 36.6 3.88 146 1 P31942 mRNA splicing
Heterogeneous nuclear ribonucleoproteinsA2/B1
hnRNP A2/B1 37.1 1.73 976 7 P22626 mRNA splicing
Heterogeneous nuclear ribonucleoproteinD-like
JKTBP2 37.3 2.02 175 4 O14979 mRNA splicing
Heterogeneous nuclear ribonucleoproteinA3
hnRNP A3 38.0 0.98 674 9 P51991 mRNA splicing
Splicing factor 3B subunit 2 SAP 145 38.2 1.02 368 4 Q13435 mRNA splicingHeterogeneous nuclear ribonucleoproteinA0
hnRNP A0 38.6 0.87 341 3 Q13151 mRNA splicing
Small nuclear ribonucleoprotein Sm D3 Sm-D3 38.7 4.11 165 2 P62318 mRNA splicingPolypyrimidine tract-binding protein 1 PTBP1 38.8 0.76 233 2 P26599 mRNA splicingHeterogeneous nuclear ribonucleoproteinD0
hnRNP D0 39.0 2.42 655 4 Q14103 mRNA splicing
Heterogeneous nuclear ribonucleoproteinH
hnRNP H 39.1 3.10 756 8 P31943 mRNA splicing
Heterogeneous nuclear ribonucleoproteinA1
hnRNP A1 39.4 2.23 1595 9 P09651 mRNA splicing
General transcription factor II-I GTFII-I 31.3 1.79 87 2 P78347 mRNA transcription initiationFACT complex subunit SSRP1 FACTp80 37.4 4.46 106 2 Q08945 mRNA transcription regulationPterin-4-alpha-carbinolamine dehydratase PHS 36.5 3.34 50 1 P61457 mRNA transcriptionImportin alpha-2 subunit SRP1-alpha 38.2 0.62 286 4 P52292 Nuclear transportDeoxyuridine 5′-triphosphatenucleotidohydrolase
dUTPase 38.6 0.95 121 2 P33316 Nucleoside, nucleotide andnucleic acid metabolism
Heterogeneous nuclear ribonucleoproteinU
hnRNP U 39.1 2.43 1210 27 Q00839 Other nucleoside, nucleotideand nucleic acid metabolism
Enhance of yellow 2 homolog DC6 39.7 2.94 85 1 Q9NPA8 Transcriptional regulationCore histone macro-H2A.1 mH2A1 26.5 1.45 63 1 O75367 Chromatin packaging
and remodelingHistone H4 H4 39.4 3.62 1557 29 P62805 Chromatin packaging and
remodelingN-acetyltransferase ESCO2 ECO1 homolog 2 38.9 6.41 93 1 Q56NI9 Chromosome segregationDNA mismatch repair protein MSH6 GTBP 39.4 0.58 130 5 P52701 DNA repairPoly [ADP-ribose] polymerase 1 PARP-1 36.9 0.90 278 5 P09874 DNA repairPolypyrimidine tract-binding protein 1 PTBP1 38.8 0.76 233 2 P26599 Protein biosynthesis60S ribosomal protein L12 RL12 39.4 3.40 55 1 P30050 Protein biosynthesisEukaryotic translation initiation factor 3subunit 2
eIF-3 beta 39.5 0.81 127 2 Q13347 Protein biosynthesis
60S ribosomal protein L23 RL23 39.6 2.31 184 2 P62829 Protein biosynthesisFK506-binding protein 4 PPIase 38.9 0.53 207 2 Q02790 Protein foldingHeat shock 70 kDa protein 6 HSP76 39.1 1.60 598 5 P17066 Protein foldingHeat shock 70-like, ER HSP70 39.6 2.90 4517 35 Q2KHP4 Protein metabolism and
modificationCell division protein kinase 6 CDK6 38.8 1.51 137 1 Q00534 Protein phosphorylationProteasome activatorcomplex subunit 1
PA28alpha 39.5 2.01 79 1 Q06323 Proteolysis
RAB1A, member RAS oncogenefamily
RAB1A 38.7 1.72 384 5 Q5U0I6 General vesicle transport
Conserved oligomeric golgi complexcomponent 5
COG5 39.6 2.29 110 1 Q9UP83 Intracellular protein traffic
Conserved nuclear protein NHN1 ZC3H18 38.3 4.76 146 1 Q86VM9 Biological process unclassifiedMyristoylated alanine-rich C-kinasesubstrate
MARCKS 38.6 0.61 565 3 P29966 Calcium mediated signaling
Melanoma-associated antigen D2 MAGE-D 35.7 2.46 115 1 Q9UNF1 Cell adhesionThymidylate synthase TSase 39.4 1.70 131 2 P04818 Pyrimidine metabolism
700 J O U R N A L O F P R O T E O M I C S 7 2 ( 2 0 0 9 ) 6 9 5 – 7 0 7

701J O U R N A L O F P R O T E O M I C S 7 2 ( 2 0 0 9 ) 6 9 5 – 7 0 7
azaspiracid-1 at final concentration of 15 nM or DMSO vehicle,Table 4 (continued)
Protein name Symbol Qvems STD Score Peptides Accession BP
Farnesyl diphosphate synthase FDPS 38.9 1.62 91 1 Q96G29 Cholesterol metabolismBiliverdin reductase A BVR A 35.8 7.02 227 1 P53004 Electron transport
Abbreviations used were Qvems: quantitation ratio in per cent; and STD: standard deviation; BP: biological process.
respectively. The lactate assay consisted of 10 mM KH2PO4, pH7.8, 2 mM EDTA, 1 mg/ml BSA, 0.06 mM 2,6-dichlorophenol-indophenol, 0.5 mM phenazine methosulfate, 0.8 mM NAD+,1.5 mM glutamate, 10 U/ml glutamate-pyruvate-transaminase,and 25 U/ml lactate dehydrogenase. 40 µl of 1:100 diluted growthmedium or lactate calibration standard at concentrations of 25,50, 100, 200 and 500 µM were mixed with 160 µl lactate assaybuffer. The assay was incubated at 37 °C, and the absorbance at595 nmwasmeasured at 5 min intervals.
2.10. Measurement of purine nucleotides
Adenosine triphosphate (ATP), adenosine diphosphate (ADP)were measured by HPLC. SH-SY5Y cells were grown to approxi-mately 80% confluency in 10 cm dishes, and incubated for 0, 3, 6,12, and24hwith6mlDMEMmediumcontainingazaspiracid-1atfinal concentration of 15 nMor DMSO vehicle, respectively. Afterincubation, the mediumwas discarded and cells were extractedwith 0.5 ml ice-cold perchloric acid and scraping. Lysates weretransferred to microfuge tubes, and precipitating proteins werepelletbycentrifugationat 16,000×g for5min.Proteinpelletswereused forproteinquantificationusing theBioradDCproteinassay.The supernatant was transferred to a new tube, and neutralisedwith 21.5 µl 4 M K2CO3. Precipitating potassium perchlorate wasremoved by centrifugation. 50 µl extract were then injected intoan Agilent 1200 series HPLC, fitted with a Zorbax Eclipse C-18column (4.6×150 mm, 5 µm particle size). Mobile phase Aconsisted of 25mMNaH2PO4, pH 7.0, 10mM tributyl ammoniumbromide in water, and mobile phase B consisted of 25 mMNaH2PO4, pH 7.0, 10 mM tributyl ammonium bromide in 50%acetonitrile. The flow-rate was 1 ml/min, and the columntemperaturewaskeptat 35 °C.Thegradient startedwith isocraticelution at 14% mobile phase B over 30 min, which was thenfollowed by a linear gradient from 14% to 100% mobile phase Bover 30 min. The gradient was kept at 100% mobile phase Bfor 10min, followed by 10min at 14%mobile phase B prior to the
Fig. 3 – Validation of protein expression by Western blotting.Cell cultureswere treated for3h (lane2), 6h (lane3), 12h (lane4)with 15 nM azaspiracid-1, whereas a control was treated for12 h with DMSO vehicle (lane 1). Total cellular proteins fromSH-SY5Y cells were separated by SDS-PAGE, transferred toPVDF membranes and probed with anti-KIS-AHNAK,anti-calpain S1, and anti-actin, as indicated.
next injection. UV absorption was monitored at 260 nm. next
next injection. UV absorption was monitored at 260 nm. Solu-tions of 0.1mMATP andADPwere used as calibration standards.Nucleotides were quantified from peak areas.
3. Results
3.1. Morphology of SH-SY5Y cells exposed to azaspiracid-1
Cells were exposed to 15 nM azaspiracid-1 for 0, 12, 24 and48 h, and examined for morphological changes by lightmicroscopy (Fig. 1). Cells exposed for 12 to 24 h did not showany marked changes in morphology compared to the control(Fig. 1A to C), however after 48 h the cells rounded up and lostcell–cell contact (Fig. 1D). Because treatment with 15 nMazaspiracid-1 for 12 h did not result inmorphological changes,as evident by lightmicroscopy, it was assumed that these cellswere at an early stage in their toxic response. A 12 h treatmentwas therefore chosen to investigate the effects of azaspiracid-1 on global protein expression.
3.2. Identification of differentially expressed proteins
The SILAC experiment yielded a list of 6921 identified andquantified peptides, which corresponded to 1046 proteins. Thelist of proteinswas sorted in descending order according to theirquantitation ratio (Qvems), and proteins were numbered con-secutively. A plot of protein number versus Qvems, as shown inFig. 2, revealed a sigmoid curve, which contained a linear regionin its mid section. The linear mid section was regarded asproteins that were not differentially expressed in response toazaspiracid-1. A linear regression was performed on the midsection, and the limit for up- and down-regulated proteins wasdetermined as 47.09 and 39.79, respectively. Using this method,59 proteins were determined as up-regulated, and 47 proteinswere determined as down-regulated in response to azaspiracid-1. The entire list of proteinswithQvemsvalueswassubmitted toPANTHER for gene expression analysis. Analysiswas performedfor gene ontologies according to biological process, molecularfunction, and signalling pathway. Categories, where significantchanges (P-value≤0.05) were detected are listed in Table 1.
The largest proportion of the 20 most highly upregulatedproteins consisted of mitochondrial proteins (Table 2), andproteins involved in the regulation of the cytoskeleton (Table 3).A key apoptosis regulatory protein, BAX, was moderatelyupregulated. The largest proportion (22 proteins) of down-regulatedproteinsconsistedofmRNAsplicingand transcriptionfactors, followed by those involved in protein biosynthesis andmodification (9 proteins), and nucleotide metabolism (8 pro-teins). The remainder consisted of proteins involved in generalvesicle and protein transport, and other biological processes(Table 4).

Fig. 4 – Immunofluorescencemicrographs of SH-SY5Y cells showing the subcellular locations of calpain, AHNAK and BAX. Panelsmarked “AZA” represent cells thatwere treatedwith 15 nM azaspiracid-1 for 12 h; Panels marked “Control” represent cells that were treated with DMSO vehicle for 12 h. Primary antibodies are visualised by Cy3-labelledsecondary antibody (left panels), nuclei are stained with DAPI (right panels).
702JO
UR
NA
LO
FPR
OT
EO
MIC
S72
(2009)
695–707

Fig. 5 – Transmission electronmicrographs of SH-SY5Y cells treated with DMSO vehicle (A) and 15 nM azaspiracid-1 (B) for 12 h.An enlarged view of a vacuoule is given in an insert. Mitochondria are indicated by an arrow head. A star indicate the Golgicomplex. Scale bar represents distance in µm as indicated.
703J O U R N A L O F P R O T E O M I C S 7 2 ( 2 0 0 9 ) 6 9 5 – 7 0 7
3.3. Verification of differentially expressed proteins byWestern blotting and immunostaining
Azaspiracid-1 is known to cause a re-arrangement of the actincytoskeleton, most probably by modulating proteins thatregulate the actin cytoskeleton structure, rather than bybinding to actin or changing its polymerisation state [11].Two proteins, AHNAK and calpain, which may affect actincytoskeleton structure were found to be highly upregulated in
Fig. 6 – Immunofluorescencemicrographs of SH-SY5Y cells showEEA1. Cells were treated for 12 h with DMSO vehicle (A and B), 15secondary antibodies. Panels B and D show composites of Cy3-la
response to azaspiracid-1. Western blotting was used tovalidate their differential expression as determined bySILAC. Calpain and AHNAK showed a time-dependentincrease in expression levels, which became evident after3 h of treatment with azaspiracid-1 (Fig. 3). The expressionlevel of α-actin, on the other hand, did not change (Fig. 3).
SH-SY5Y cells treated with DMSO or azaspiracid-1, wereimmunostained with anti-AHNAK, anti-calpain S1 or anti-BAX antibodies (Fig. 4). In control cells, calpain was present in
ing the subcellular locations of the endosomal marker proteinnM azaspiracid-1 (C and D). Panels A and C show Cy3-labeledbeled secondary antibody and DAPI-stained nuclei.

Fig. 7 – Effect of azaspiracid-1 on energymetabolism. Cellsweregrown to 80% confluency in 10 cm dishes with 6 ml growthmedium,and incubatedwithazaspiracid-1orDMSOvehicle asacontrol. A. The mitochondrial membrane potential wasmeasured in cells that were treated with differentconcentrations of azaspiracid-1 for 1 h. JC-1was added to a finalconcentration of 5 µg/ml, and cells were incubated for a further30 min. Cells were washed with PBS, trypsin treated, washed,and resuspended in 10 ml PBS. Fluorescence intensity wasmeasured using an excitation wavelength of 485 nm andemission wavelengths at 535 and 595 nm. The observed valueswere within the normal variation of measurements and did notrepresent a significant change. B. Lactate levels in culturemediumweremeasured by an enzymatic assay as described byVahsen et al. [19], after cells were treated with 15 nMazaspiracid-1. The observed lactate levels did not changesignificantly over time. C. Concentrations ofATP (dark grey bars)and ADP (light grey bars) were measured by HPLC, andnormalised to theprotein content of each culture dish. Error barsrepresent thestandarddeviationof fourexperimental replicates.
704 J O U R N A L O F P R O T E O M I C S 7 2 ( 2 0 0 9 ) 6 9 5 – 7 0 7
the cytoplasm, mainly in the form of aggregates. It was alsodiffusely present in the cytosol, and to lesser extent in thenuclei. The calpain signal showed amarked increase after 12 hof exposure with 15 nM azaspiracid-1. The increase was mostevident in nuclear regions, which were stained as strongly asthe cytosol, in addition to regions along the periphery ofcells, where calpain appeared to accumulate. AHNAK levelsincreased in the cytosol after azaspiracid-1 treatment, how-ever levels in the nuclear region remained constant. Thecellular localisation of BAX was investigated, because of itsimportant regulatory function in apoptosis, and because itwas found to be moderately upregulated by azaspiracid-1treatment. The levels of BAX were near the detection limit incontrol cells, where it was located in nuclear regions.Azaspiracid-1 treatment caused an increase of BAX in thenuclei, however cytosolic concentrations remained low, and atranslocation to mitochondria, which occurs during inductionof apoptosis, was not evident.
3.4. Azaspiracid-induced vacuolarisation of SH-SY5Y cells
The SILAC data indicated that the ras-related protein RAB1and component of the oligomeric Golgi complex 5 weredownregulated in azaspiracid-1-treated cells. These proteinsare involved in vesicle transport and maintenance of thestructure of the Golgi complex, respectively. To investigate,whether the observed downregulation may have affected theGolgi complex, cells were treatedwith 15 nM azaspiracid-1 for12 h, and ultrastructural changes were examined by trans-mission electron microscopy. Treated cells showed anaccumulation of vesicles that were filled with a granularsubstance (Fig. 5). In addition, tubular membrane-boundorganelles that were not seen in control cells became visible(marked by an asterisk in Fig. 5). They representedmost likelythe Golgi complex. In azaspiracid-1-treated cells, vesicleswere located between the tubular structures and the cellsurface, and appeared to increase in size the further awaythey were located from the tubular structures. To testwhether the observed vesicles might represent endosomes,cells were exposed to azaspiracid-1 for 12 h and thenimmunostained with antibody specific for early endosomeautoantigen 1 (EEA1), which is an endosomal marker protein[20]. Azaspiracid-1 treated cells showed an aggregation ofEEA1-positive vesicles, which were fewer in number, butlarger in size as compared to control cells (Fig. 6).
3.5. Effect of azaspiracid-1 on energy metabolism
Because azaspiracid-1 caused an upregulation of proteinsinvolved in energy production, its effects on the mitochondrialmembrane potential, the levels of lactate, ATP and ADP weremeasured. Azaspiracid-1 did not affect the mitochondrialmembrane potential after treatment for 1 h at concentrationsranging from 1 to 100 nM (Fig. 7A), or after 12 h of treatment at15 nM (data not shown). On the other hand, the ionophore FCCP,which served as a positive control, abolished themitochondrialmembranepotential. A significant change in the concentrationsof lactate in the growth medium was not detected duringtreatment with 15 nM azaspiracid-1 over 24 h (Fig. 7B). Inter-estingly, the levels of ATP and ADP dropped to approximately

705J O U R N A L O F P R O T E O M I C S 7 2 ( 2 0 0 9 ) 6 9 5 – 7 0 7
20% as compared to the control after 3 h of treatment, butrecovered to original levels after 6 h (Fig. 7C).
4. Discussion
The major observation of the present study was a strongupregulation of energy metabolism in response to azaspir-acid-1 treatment. Upregulated proteins included members ofthe mitochondrial electron transport chain as well as the keyregulatory enzyme of glycolysis, phosphofruktokinase-1.Although cellular energy metabolism was upregulated, intra-cellular levels of ATP and ADP were temporarily depleted. Inaddition to energy metabolism, proteins that regulate thestructure of the actin cytoskeleton were strongly upregulated,whereas those involved in processing of mRNA and vesicletransport were downregulated.
Human neuroblastoma cells (SH-SY5Y) that were treatedwith 15 nM azaspiracid-1, did not reveal any morphologicalchanges, as judged by light microscopy, until after 48 h oftreatment (Fig. 1), when they started to retract cell protrusions.The types of morphological changes and the length of timethey took to appear in SH-SY5Y cells were consistent withother studies [9–11,21]. Because of the long time (48 h) requiredfor morphological changes to appear, it was assumed thatcells were at an early state in their response to azaspiracid-1after 12 h of treatment, when the differential expression ofproteins was investigated, using SILAC in conjunction withmass spectrometric analysis of tryptic peptides. A total of 6921peptides, which corresponded to 1046 proteins, were identi-fied and quantified. Although this represented a low coverageof the entire proteome, it was sufficient to detect major trendsin the differential expression of functionally related proteins.Gene expression analysis by PANTHER [22] was performedaccording to molecular function, biological process, andsignalling pathway (Table 1). Statistically the most significantupregulated molecular functions were those related to thecytoskeleton, and in particular to actin-binding. On the otherhand, the most significantly down-regulated molecular func-tions were ribonucleoproteins. In terms of biological function,the most significantly upregulated processes were cell struc-ture and motility, in addition to transport. On the other hand,mRNA-splicing and processing, as well as vesicle transportwere significantly down-regulated. Finally, two pathwayswere statistically significantly upregulated, which were dopa-mine receptor-mediated signalling, and a signalling pathwaythat is affected by Huntington disease (Table 1).
A total of 16 cytoskeleton-associated proteins, with diversebiological functions were upregulated in response to azaspir-acid-1 (Table 3). Among the most highly upregulated proteinswere actin related protein 3, AHNAK, annexin A2, proteinS100-A10, and caldesmon. Actin related protein 3 is an essen-tial subunit of the seven subunit actin related protein 2/3complex that is involved in actin filament nucleation andbranching, and a central player in regulating the structure ofthe actin cytoskeleton [23–26]. This complex is regulated bythe CDC42/N-WASP/ARP signalling pathway [25]. Caldesmoncompetes with actin related protein 2/3 complex for actinbinding [27], and inhibits actin filament branching, but it doesnot affect actin related protein 2/3-mediated filament elonga-
tion [28]. Overexpression of caldesmonhas been shown to leadto the formation of straight, thick stress fibres [29]. Theazaspiracid-induced formation of stress-fibres [21] may thusbe related to an upregulation of caldesmon and actin-relatedprotein 3.
The biological function of AHNAK is not known [30]. In vitrostudies have shown that AHNAK binds to the annexin A2/protein S100-A10 (At2) complex upon stimulation by elevatedcytosolic calcium levels. The complex then translocates to theplasmamembrane, where it modulates the structure of thecortical actin cytoskeleton [31]. Western blotting revealed atime-dependent upregulation of AHNAK after only 3 h oftreatment with azaspiracid-1 (Fig. 3). Immunostaining showedthat AHNAK was predominantly located in the cytosol, and toa minor°in the nucleus of SH-SY5Y cells (Fig. 4). After 12 h ofazaspiracid-1 treatment, cytosolic levels of AHNAK wereincreased, however a translocation to the plasmamembranewas not evident. The short time period that was required foran increased expression of AHNAK and the coordinatedupregulation of AHNAK, Annexin A2 and protein S100-A10may suggest that they are early targets of azaspiracid,however it was not clear what their roles in the cellularresponse to azaspiracid-1 were. These data demonstrated thatprofound changes in the expression of cytoskeleton-asso-ciated proteins took place well in advance of morphologicalchanges observed in this and other studies [9–11,21]. Thesechanges were complex and the underlying mechanismsremain undetermined.
Interestingly, among the most highly upregulated proteinswere several directly involved in cellular energy metabolism(Table 2). They were subunits of complexes I (NADH dehy-drogenase) and IV (cytochrome c oxidase) of themitochondrialelectron transport chain, several mitochondrial carrier pro-teins, which facilitate the transport of small metabolites thatare required for ATP production in mitochondria, as well as ofphosphofructokinase-1, the key regulatory enzyme of glyco-lysis. Apart from phosphofructokinase-1, these proteins havealso been implicated in intrinsic or mitochondria-mediatedapoptosis [32,33], which is initiated by the translocation ofBAX to the outer mitochondrial membrane, and activation ofBAK [34]. Because BAX plays an important role in regulatingapoptosis, and was moderately upregulated in the presentstudy, its expression and cellular location was furtherinvestigated. Levels of apoptosis regulator BAX increased at12 h of treatment with azaspiracid-1 (Fig. 4), however BAXwasmainly located in the nuclei, whereas a translocation to mito-chondria was not evident. Transmission electronmicrographsof SH-SY5Y cells revealed a normal morphology of mitochon-dria at 12 h of azaspiracid-1 treatment (Fig. 5). The upregula-tion of mitochondrial proteins was therefore unlikely relatedto apoptosis, which is in agreement with other studies on theeffect of azaspiracid-1 [9,11]. On the other hand, it appearedthat azaspiracid-1 caused a general upregulation of energymetabolism. The mitochondrial membrane potential was notaffected by azaspiracid-1 exposure within 1 hour using up to100 nM (Fig. 7A), or after 12 h of treatment with 15 nMazaspiracid-1 (data not shown), suggesting that azaspiracid-1does not disrupt oxidative phosphorylation. This in agree-ment with other studies, which found that azaspiracid-1 doesnot affect the mitochondrial membrane potential [9,12],

706 J O U R N A L O F P R O T E O M I C S 7 2 ( 2 0 0 9 ) 6 9 5 – 7 0 7
however the upregulation of both oxidative phosphorylationand glycolysis was indicative of a general energy deficit. Eventhough phosphofructokinase-1 was upregulated an increasein lactate formation was not observed. Since oxidative phos-phorylation was also upregulated, the pyruvate was mostlikely efficiently used for oxidative phosphorylation ratherthan converted to lactate. Remarkably, the levels of ATPnevertheless dropped to approximately 20% of the controlafter three h of treatment, and returned to original values after6 h (Fig. 7C). A decrease in the levels of ATP of this magnitudefollowed by a recovery to normal levels is unusual, however aglutamate-induced drop of ATP levels in cerebellar granulecells below 40% with subsequent recovery to normal valuesand cell survival has been reported [35]. A 3-fold drop inintracellular ATP levels is known to induce apoptosis [36],whereas further depletion of ATP may cause a switch fromapoptotic to necrotic cell death [37,38]. Azaspiracid-1 causesnecrotic cell death, however it is uncertain whether it may bedue to the observed temporary depletion of ATP. Reasons forthe temporary depletion of ATP are unclear. The fact that ATPand ADP decrease in a similar manner, whereas an accumula-tion of AMP was not observed (data not shown), indicated thatthe supply of adenosine might have been limiting. Azaspir-acid-1may thus impair the biosynthesis of adenosine, and theobserved upregulation of energy metabolism could reflect acompensatory mechanism to maintain ATP levels.
The majority (39 protein) of down-regulated proteins wereinvolved in biological processes related to mRNA and DNAprocessing, aswell as protein biosynthesis (Table 4), whereas aminor proportion (8 proteins) was involved in a variety ofother biological processes. These data suggest that the cells,upon azaspiracid-1 exposure, downregulate general transla-tion and transcription, which is consistent with the observa-tion that azaspiracid-1 inhibits cell growth.
Transmission electronmicroscopy revealed that azaspiracid-1 leads toanaccumulationandswellingof vesicles, aswell as toadisruption of the Golgi complex (Fig. 5). Vesicles located inproximity of the Golgi complex were small, however their sizeincreased with increasing distance from the Golgi complex. Thesmaller vesicles may represent secretory vesicles, whereas thelarger vesicles may be of endosomal origin. Immunostainingagainst the endosomal marker EEA1 protein revealed that thenumber of endosomal vesicles was reduced in azaspiracid-1-treated cells, however their sizes were increased. The mechan-isms leading to the azaspiracid-1-induced accumulation andswelling of vesicles and the disruption of the Golgi complexremain uncertain. Two proteins, ras-related protein RAB1 andcomponent of the oligomeric Golgi complex 5 (COG5), that areinvolved in vesicle transport and maintenance of the Golgicomplex structure, respectively,were found tobedownregulatedby azaspiracid-1-treatment. RAB1 is involved in the trafficking ofvesicles between the ER and the Golgi complex [39], whereasCOG5 plays a central role in maintaining the structure andfunction of the Golgi complex [40]. Several members of the RABprotein family were detected (RAB2, RAB5, RAB6, RAB10, RAB11),however only RAB1wasdifferentially expressed. Othermembersof the COG complex were not detected. It is possible that thedownregulation of RAB1 and COG5may be one of the causes fortheaccumulationofvesiclesanddisruptionof theGolgi complex.However, theGolgi complex and vesicle transport are dependent
on the cytoskeleton, which is disorganised by the actions ofazaspiracid-1, and could be responsible for the observed effectsof vesicles and the Golgi complex.
In conclusion, this is the first study to demonstrate aneffect of azaspiracid-1 on cellular energymetabolism. Proteinsthat were most highly upregulated were involved in theproduction of ATP by oxidative phosphorylation and glyco-lysis. Azaspiracid-1 caused a pronounced temporary depletionof ATP, which may have triggered the upregulation of energyproduction. The ATP depletion, in turn, may be due to aninterference of azaspiracid-1 with adenosine biosynthesis,since ATP and ADP decreased in a similarmanner, whereas anaccumulation of AMP was not observed. Azaspiracid-1 alsocaused an upregulation of actin-binding proteins, whichoccurred prior to changes in the cytoskeleton structure.These proteins included actin related protein 2/3 complex,caldesmon, and AHNAK-At2 complex, which may mediateazaspiracid-1 induced changes of the actin cytoskeleton.Finally, electronmicroscopy revealed profound ultrastructuralchanges, which occurred prior to changes of the cytoskeleton,such as increased vesiculation and swelling of the Golgicomplex, which occurred concomitant with a downregulationof RAB1 and COG5. The complexity of cellular and subcellularchangeswas unexpected, and obscured the search for primaryeffects of azaspiracid-1. On the other hand, this may be a clue.Wiskostatin was believed to be a specific N-WASP inhibitor,however a recent study showed that it induced unexpectedcomplex and unrelated cellular changes [41]. The latter studyconcluded that these changes may be due to a wiskostatin-induced depletion of ATP. In analogy, the complex changesinduced by azaspiracid, may be related to ATP depletion. Itwould be interesting, therefore, to examine the effects ofazaspiracid-1 on nucleotide metabolism.
Acknowledgments
The authors wish to thank Prof Jaakko Saraste for his adviceon Golgi complexes seen in electron micrographs, andJacque Baudiers for providing anti-KIS-AHNAK. Mass spec-trometry analysis was performed at the FUGE supportedNational Proteomics Platform. Electron and confocal micro-scopy was performed at the FUGE supported NationalImaging Platform. Method development was supported byFUGE (grant number 175242/S10) (KEF) and the MeltzerFoundation (KEF and RK).
R E F E R E N C E S
[1] Van Dolah FM. Marine algal toxins: origins, health effects, andtheir increased occurrence. Environ Health Perspect2000;108:133–41.
[2] SatakeM,Ofuji K,NaokiH, JamesKJ, FureyA,McMahonT, et al.Azaspiracid, a new marine toxin having unique spiro ringassemblies, isolated from Irish mussels, mytilus edulis. J AmChem Soc 1998;120:9967–8.
[3] Rehmann N, Hess P, QuilliamMA. Discovery of new analogs ofthemarine biotoxin azaspiracid in bluemussels (mytilus edulis) byultra-performance liquid chromatography/tandemmassspectrometry. Rapid Commun Mass Spectrom 2008;22:549–58.

707J O U R N A L O F P R O T E O M I C S 7 2 ( 2 0 0 9 ) 6 9 5 – 7 0 7
[4] Ofuji K, Satake M, McMahon T, James KJ, Naoki H, Oshima Y,et al. Structures of azaspiracid analogs, azaspiracid-4 andazaspiracid-5, causative toxins of azaspiracid poisoning ineurope. Biosci Biotechnol Biochem 2001;65:740–2.
[5] Ofuji K, Satake M, McMahon T, Silke J, James KJ, Naoki H, et al.Two analogs of azaspiracid isolated from mussels, mytilusedulis, involved in human intoxication in ireland. Nat Toxins1999;7:99–102.
[6] Twiner MJ, Rehmann N, Hess P, Doucette GJ. Azaspiracidshellfish poisoning: a review on the chemistry, ecology, andtoxicology with an emphasis on human health impacts. MarDrugs 2008;6:39–72.
[7] Ito E, Satake M, Ofuji K, Kurita N, McMahon T, James K, et al.Multiple organ damage caused by a new toxin azaspiracid,isolated from mussels produced in ireland. Toxicon2000;38:917–30.
[8] Kulagina NV, Twiner MJ, Hess P, McMahon T, Satake M,Yasumoto T, et al. Azaspiracid-1 inhibits bioelectrical activityof spinal cord neuronal networks. Toxicon 2006;47:766–73.
[9] Roman Y, Alfonso A, Louzao MC, de la Rosa LA, Leira F, VieitesJM, et al. Azaspiracid-1, a potent, nonapoptotic new phycotoxinwith several cell targets. Cell Signal 2002;14:703–16.
[10] Twiner MJ, Hess P, Dechraoui MY, McMahon T, Samons MS,SatakeM, et al. Cytotoxic and cytoskeletal effects of azaspiracid-1on mammalian cell lines. Toxicon 2005;45:891–900.
[11] Vilarino N, Nicolaou KC, Frederick MO, Vieytes MR, Botana LM.Irreversible cytoskeletal disarrangement is independent ofcaspase activationduring in vitro azaspiracid toxicity inhumanneuroblastoma cells. Biochem Pharmacol 2007;74:327–35.
[12] Vale C, Gomez-Limia B, Nicolaou KC, Frederick MO, VieytesMR, Botana LM. The c-jun-n-terminal kinase is involved in theneurotoxic effect of azaspiracid-1. Cell Physiol Biochem2007;20:957–66.
[13] Vale C, Nicolaou KC, Frederick MO, Gomez-Limia B, Alfonso A,Vieytes MR, et al. Effects of azaspiracid-1, a potent cytotoxicagent, on primary neuronal cultures. A structure-activityrelationship study. J Med Chem 2007;50:356–63.
[14] Vilarino N. Marine toxins and the cytoskeleton: azaspiracids.FEBS J 2008;275:6075–81.
[15] Mann M. Functional and quantitative proteomics using silac.Nat Rev 2006;7:952–8.
[16] Dulbecco R, Freeman G. Plaque production by the polyomavirus. Virology 1959;8:396–7.
[17] Gentil BJ, Delphin C, Benaud C, Baudier J. Expression of thegiant protein ahnak (desmoyokin) in muscle and liningepithelial cells. J Histochem Cytochem 2003;51:339–48.
[18] Reers M, Smith TW, Chen LB. J-aggregate formation of acarbocyanine as a quantitative fluorescent indicator ofmembrane potential. Biochemistry 1991;30:4480–6.
[19] VahsenN,CandeC,Briere JJ, Benit P, JozaN, LarochetteN, etal.Aifdeficiency compromises oxidative phosphorylation. EMBO J2004;23:4679–89.
[20] Dumas JJ, Merithew E, Sudharshan E, Rajamani D, Hayes S,Lawe D, et al. Multivalent endosome targeting byhomodimeric eea1. Mol Cell 2001;8:947–58.
[21] Vilarino N, Nicolaou KC, Frederick MO, Cagide E, Ares IR,LouzaoMC, et al. Cell growth inhibition and actin cytoskeletondisorganization induced by azaspiracid-1 structure-activitystudies. Chem Res Toxicol 2006;19:1459–66.
[22] Thomas PD, Kejariwal A, Campbell MJ, Mi H, Diemer K, Guo N,et al. Panther: a browsable database of gene productsorganized by biological function, using curated protein familyand subfamily classification. Nucleic Acids Res2003;31:334–41.
[23] Qualmann B, Kessels MM. Actin nucleation: putting thebrakes on arp2/3. Curr Biol 2008;18:R420–423.
[24] MartinAC, XuXP, Rouiller I, KaksonenM, SunY, Belmont L, et al.Effects of arp2 andarp3nucleotide-bindingpocketmutations onarp2/3 complex function. J Cell Biol 2005;168:315–28.
[25] Matas OB, Martinez-Menarguez JA, Egea G. Association ofcdc42/n-wasp/arp2/3 signaling pathway with golgimembranes. Traffic 2004;5:838–46.
[26] Higgs HN, Pollard TD. Regulation of actin filament networkformation through arp2/3 complex: activation by a diversearray of proteins. Annu Rev Biochem 2001;70:649–76.
[27] Morita T, Mayanagi T, Yoshio T, Sobue K. Changes in thebalance between caldesmon regulated by p21-activatedkinases and the arp2/3 complex govern podosome formation.J Biol Chem 2007;282:8454–63.
[28] Yamakita Y, Oosawa F, Yamashiro S,Matsumura F. Caldesmoninhibits arp2/3-mediated actin nucleation. J Biol Chem2003;278:17937–44.
[29] Mayanagi T, Morita T, Hayashi K, Fukumoto K, Sobue K.Glucocorticoid receptor-mediated expression of caldesmonregulates cell migration via the reorganization of the actincytoskeleton. J Biol Chem 2008;283:31183–96.
[30] Amagai M. A mystery of ahnak/desmoyokin still goes on.J Invest Dermatol 2004;123:xiv–xv.
[31] Bernaud C, Gentil BJ, AssardN, CourtM, Garin J, Delphin C, et al.Ahnak interaction with the annexin 2/s100a10 complexregulates cell membrane cytoarchitecture. J Cell Biol2004;164:133–44.
[32] Zamzami N, Kroemer G. The mitochondrion in apoptosis:How Pandora's box opens. Nat Rev 2001;2:67–71.
[33] Schwarz M, Andrade-Navarro MA, Gross A. Mitochondrialcarriers and pores: key regulators of the mitochondrialapoptotic program? Apoptosis 2007;12:869–76.
[34] Youle RJ, Strasser A. The bcl-2 protein family: opposingactivities that mediate cell death. Nat Rev 2008;9:47–59.
[35] Sorokina EG, Reutov VP, Senilova YE, Khodorov BI, Pinelis VG.Changes in atp content in cerebellar granule cellsduring hyperstimulation of glutamate receptors: possiblerole of no and nitrite ions. Bull Exp Biol Med2007;143:442–5.
[36] Izyumov DS, Avetisyan AV, Pletjushkina OY, Sakharov DV,Wirtz KW, Chernyak BV, et al. Wages of fear Transientthreefold decrease in intracellular atp level imposesapoptosis. Biochim biophys acta 2004;1658:141–7.
[37] Leist M, Single B, Castoldi AF, Kuhnle S, Nicotera P.Intracellular adenosine triphosphate (atp) concentration: aswitch in the decision between apoptosis and necrosis. J ExpMed 1997;185:1481–6.
[38] Eguchi Y, Shimizu S, Tsujimoto Y. Intracellular atp levelsdetermine cell death fate by apoptosis or necrosis. Cancer Res1997;57:1835–40.
[39] Cooper AA, Gitler AD, Cashikar A, Haynes CM, Hill KJ, BhullarB, et al. Alpha-synuclein blocks er-golgi traffic and rab1rescues neuron loss in Parkinson's models. Science2006;313:324–8.
[40] Oka T, Vasile E, Penman M, Novina CD, Dykxhoorn DM, UngarD, et al. Genetic analysis of the subunit organization andfunction of the conserved oligomeric golgi (cog) complex:studies of cog5- and cog7-deficient mammalian cells. J BiolChem 2005;280:32736–45.
[41] Guerriero CJ, Weisz OA. N-wasp inhibitor wiskostatinnonselectively perturbs membrane transport by decreasingcellular atp levels. Am J Pjysiol Cell Physiol 2007;292:C1562–1566.
Copyright © 2022 FDOKUMEN