The Architecture of a Proteomic Network in the Yeast
12
The Architecture of a Proteomic Network in the Yeast Emad Ramadan 1 , Christopher Osgood 2 , and Alex Pothen 1 1 Computer Science Department, Old Dominion University, Norfolk, VA 23529, USA {eramadan, pothen}@cs.odu.edu 2 Biological Sciences Department, Old Dominion University, Norfolk, VA 23529, USA [email protected] Abstract. We describe an approach to clustering the yeast protein-protein inter- action network in order to identify functional modules, groups of proteins form- ing multi-protein complexes accomplishing various functions in the cell. We have developed a clustering method that accounts for the small-world nature of the net- work. The algorithm makes use of the concept of k-cores in a graph, and employs recursive spectral clustering to compute the functional modules. The computed clusters are annotated using their protein memberships into known multi-protein complexes in the yeast. We also dissect the protein interaction network into a global subnetwork of hub proteins (connected to several clusters), and a local network consisting of cluster proteins. 1 Introduction Systems biology involves the study of complex biological structures and processes by identifying their molecular components and the interactions among them. Looking across the evolutionary landscape, biological subsystems performing discrete functions are capable of being linked together in different ways without lethality to an organ- ism, and often with positive gains in complexity and adaptation. Among the properties that are now recognized in multiple biological systems are: modularity (sets of semi- autonomous molecules that perform specific functions); robustness (the ability of bio- logical systems to tolerate perturbations and noise); and emergence (new properties that emerge from the interaction of functional modules) [14]. One of the challenges in computational systems biology is to create tools that enable biologists to identify functional modules and the interactions among them from large- scale genomic and proteomic data. We report the results of a study on an organism-scale protein-protein interaction network in the yeast with the goal of identifying proteins that form functional modules, (i.e., multiple proteins involved that have identical or related biological function), by clustering techniques. Furthermore, we propose a hierarchical organization of the proteomic network. Research supported by NSF grant CCR0306334, by subcontract B542604 from the Lawrence Livermore National Laboratory, and by a grant from the Office of Research at Old Dominion University. M.R. Berthold et al. (Eds.): CompLife 2005, LNBI 3695, pp. 265–276, 2005. c Springer-Verlag Berlin Heidelberg 2005
Transcript of The Architecture of a Proteomic Network in the Yeast

The Architecture of a Proteomic Network in the Yeast�
Emad Ramadan1, Christopher Osgood2, and Alex Pothen1
1 Computer Science Department, Old Dominion University,Norfolk, VA 23529, USA
{eramadan, pothen}@cs.odu.edu2 Biological Sciences Department, Old Dominion University,
Norfolk, VA 23529, [email protected]
Abstract. We describe an approach to clustering the yeast protein-protein inter-action network in order to identify functional modules, groups of proteins form-ing multi-protein complexes accomplishing various functions in the cell. We havedeveloped a clustering method that accounts for the small-world nature of the net-work. The algorithm makes use of the concept of k-cores in a graph, and employsrecursive spectral clustering to compute the functional modules. The computedclusters are annotated using their protein memberships into known multi-proteincomplexes in the yeast. We also dissect the protein interaction network into aglobal subnetwork of hub proteins (connected to several clusters), and a localnetwork consisting of cluster proteins.
1 Introduction
Systems biology involves the study of complex biological structures and processesby identifying their molecular components and the interactions among them. Lookingacross the evolutionary landscape, biological subsystems performing discrete functionsare capable of being linked together in different ways without lethality to an organ-ism, and often with positive gains in complexity and adaptation. Among the propertiesthat are now recognized in multiple biological systems are: modularity (sets of semi-autonomous molecules that perform specific functions); robustness (the ability of bio-logical systems to tolerate perturbations and noise); and emergence (new properties thatemerge from the interaction of functional modules) [14].
One of the challenges in computational systems biology is to create tools that enablebiologists to identify functional modules and the interactions among them from large-scale genomic and proteomic data. We report the results of a study on an organism-scaleprotein-protein interaction network in the yeast with the goal of identifying proteins thatform functional modules, (i.e., multiple proteins involved that have identical or relatedbiological function), by clustering techniques. Furthermore, we propose a hierarchicalorganization of the proteomic network.
� Research supported by NSF grant CCR0306334, by subcontract B542604 from the LawrenceLivermore National Laboratory, and by a grant from the Office of Research at Old DominionUniversity.
M.R. Berthold et al. (Eds.): CompLife 2005, LNBI 3695, pp. 265–276, 2005.c© Springer-Verlag Berlin Heidelberg 2005

266 E. Ramadan, C. Osgood, and A. Pothen
Methods for clustering proteomic networks have to cope with several features spe-cific to protein interaction data. High-throughput experiments such as the yeast 2-hybridsystem and the tagged affinity purification (TAP) [1,15,16], have high error rates, near-ing 50% in some instances. Proteomic networks are modified power-law networks andsmall-world networks [6]. That is, the distribution of the fraction of vertices with a givendegree follows a modified power-law; and the average path length between vertices is ofthe order of ln n (or smaller), where n is the number of vertices in the network. Hencethere is a large number of low degree proteins, and a significant number of high degreeproteins. The latter make it harder to discover clusters in the data, while the former in-crease the computational requirements. Cluster validation is hampered by the fact thatthere is often little overlap between different experimental studies due to the limitedcoverage of the interactome [13]. Finally, the predicted clusters must be biologicallysignificant: e.g., functionally homogeneous.
In spite of these difficulties, we believe that we have successfully clustered a yeastproteomic network, with the predicted clusters overlapping well with multi-proteincomplexes and organelles. Our approach is based on identifying hub proteins, pro-teins that connect to a large number of clusters, and low-shell proteins (defined in thenext section), and clustering the residual network. Low-shell proteins can be added tothe cluster network at a later stage. We validate the clusters by comparing the clustersagainst experimental data on multi-protein complexes.
The hub proteins carry interesting information about the architecture of proteomicnetwork, and are organized into a subnetwork of their own. Thus we propose a twolevel architecture for the yeast proteomic network, consisting of a global subnetworkof hubs, and a local subnetwork of clusters and low-shell proteins. A schematic ofthis architecture is shown in Fig. 1, where the top level corresponds to the global hubnetwork, and the lower level corresponds to the local cluster network.
Fig. 1. A schematic representation of the yeast proteomic network as a hub-cluster interactionnetwork. The top level corresponds to a global network of hub proteins, and the bottom level to alocal network of cluster proteins.

The Architecture of a Proteomic Network in the Yeast 267
2 Materials and Methods
2.1 k-Cores and k-Shells in Graphs
We begin by describing the concepts of a k-core and a k-shell in a graph, since ourclustering method makes use of these.
Given a natural number k, the k-core of a graph G is the maximal subgraph of G inwhich every vertex has degree at least k in the subgraph (provided it is not the emptygraph). The k-cores in a graph are nested: the (k + 1)-core is contained in the k-core,for k = 0, 1, . . ., K − 1, where K is the value of the maximum core in the graph.The k-core of a graph need not be a connected subgraph even if the original graph isconnected. Note that if a graph contains a k-vertex connected component or a clique onk + 1 vertices, then it is contained in a k-core; however, the k-core need not contain ak-connected subgraph or a clique on k + 1 vertices.
The k-shell of a graph is the set of vertices that belong to the k-core, but not to the(k+1)-core. The k-shell includes vertices with degree k from the k-core, but also othervertices whose degree in the residual graph becomes less than (k +1) when low degreevertices are removed.
There is a well-known linear-time algorithm, in the number of edges, for computingthe k-core (indeed, for finding all k-cores, for k = 0 to the maximum core value) of agraph. The idea is to repeatedly remove vertices v of degree less than k from the graphand all edges incident on v, updating the degrees of the neighbors of v in the residualgraph as edges are deleted. The algorithm repeats this step until all vertices that remainhave degree k or higher in the residual subgraph.
We have extended the concept of a k-core to a hypergraph in earlier work [19].k-cores have been used earlier for clustering proteomic networks as a way of identi-fying highly connected subnetworks and for removing proteins belonging to low shellvalues [4].
We claim that clustering the k-core of a network removes noise in the data, in thesame spirit as computing a shared nearest neighbor similarity (SNN) network. In anSNN network, two vertices are joined by an edge with weight equal to the number oftheir common neighbors at a distance less than or equal to d, where d is a natural numberparameter. The SNN network includes only those edges that have weight higher than athreshold, and clustering algorithms have been designed to work with this network [17].Unfortunately for large networks of small average path lengths, the computation of theSNN network can be prohibitively expensive. We suggest that the k-core is an efficientway to compute a network that approximates an SNN network. Every vertex in a k-coreis adjacent to at least k other vertices in the subgraph, each of which is adjacent to kvertices with high core values.
2.2 Clustering Algorithms
Three major clustering approaches have been employed to identify functional mod-ules in proteomic networks. The first approach searches for subgraphs with specifiedconnectivities, called network motifs, and characterizes these as functional modules orparts of them. A complete subgraph (clique) is one such candidate, but other network
268 E. Ramadan, C. Osgood, and A. Pothen
motifs on small numbers of vertices have been identified through exhaustive searchingor statistical methods [21]. This approach is not scalable for finding larger clusters inlarge-scale networks. The second approach, recently proposed in this context by Baderand Hogue [4], computes a weight for each vertex (depending on the density of a max-imum core in the neighborhood of the vertex); it then grows a cluster around a seedvertex, a vertex with the largest weight in the currently unclustered graph. A vertexin the neighborhood of a cluster is added to it as long as its weight is close (within athreshold) to the weight of the seed vertex. Once a cluster has been identified, the pro-cedure is repeated with a vertex of largest weight that currently does not belong to acluster as the seed vertex. However, our experience comparing this approach with thespectral algorithms that we describe next shows that this method is less stable than thelatter (i.e., the clusters depend on the seed vertices chosen).
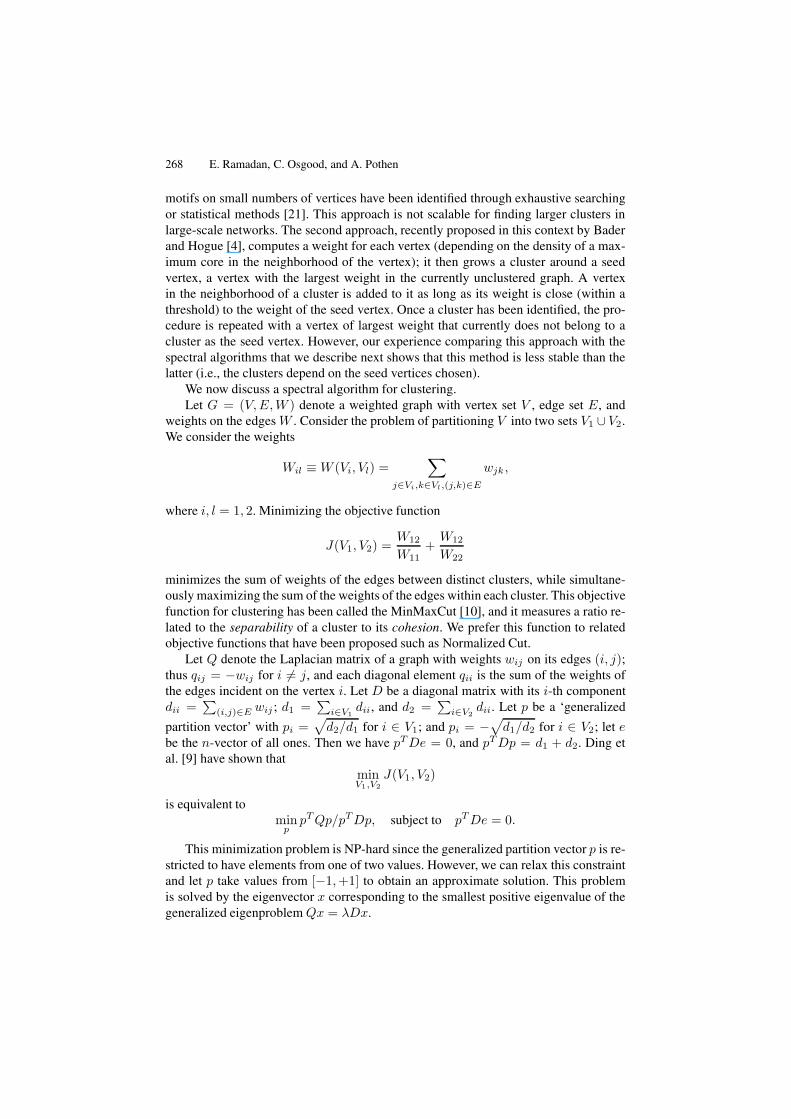
We now discuss a spectral algorithm for clustering.Let G = (V, E, W ) denote a weighted graph with vertex set V , edge set E, and
weights on the edges W . Consider the problem of partitioning V into two sets V1 ∪ V2.We consider the weights
Wil ≡ W (Vi, Vl) =∑
j∈Vi,k∈Vl,(j,k)∈E
wjk ,
where i, l = 1, 2. Minimizing the objective function
J(V1, V2) =W12
W11+
W12
W22
minimizes the sum of weights of the edges between distinct clusters, while simultane-ously maximizing the sum of the weights of the edges within each cluster. This objectivefunction for clustering has been called the MinMaxCut [10], and it measures a ratio re-lated to the separability of a cluster to its cohesion. We prefer this function to relatedobjective functions that have been proposed such as Normalized Cut.
Let Q denote the Laplacian matrix of a graph with weights wij on its edges (i, j);thus qij = −wij for i �= j, and each diagonal element qii is the sum of the weights ofthe edges incident on the vertex i. Let D be a diagonal matrix with its i-th componentdii =
∑(i,j)∈E wij ; d1 =
∑i∈V1
dii, and d2 =∑
i∈V2dii. Let p be a ‘generalized
partition vector’ with pi =√
d2/d1 for i ∈ V1; and pi = −√d1/d2 for i ∈ V2; let e
be the n-vector of all ones. Then we have pT De = 0, and pT Dp = d1 + d2. Ding etal. [9] have shown that
minV1,V2
J(V1, V2)
is equivalent tomin
ppT Qp/pT Dp, subject to pT De = 0.
This minimization problem is NP-hard since the generalized partition vector p is re-stricted to have elements from one of two values. However, we can relax this constraintand let p take values from [−1, +1] to obtain an approximate solution. This problemis solved by the eigenvector x corresponding to the smallest positive eigenvalue of thegeneralized eigenproblem Qx = λDx.
The Architecture of a Proteomic Network in the Yeast 269
The partition is obtained by choosing the vertices in one part to consist of verticeswith eigenvector components smaller than a threshold value, while the other part hasthe remaining vertices. The threshold value could be chosen so as to locally minimizethe MinMaxCut objective function. For details, see [8,10].
A clustering method is obtained by recursively applying the spectral partitioningmethod, by splitting each current cluster into two subclusters. The MinMaxCut objec-tive function can be used to determine if a given cluster should be split further.
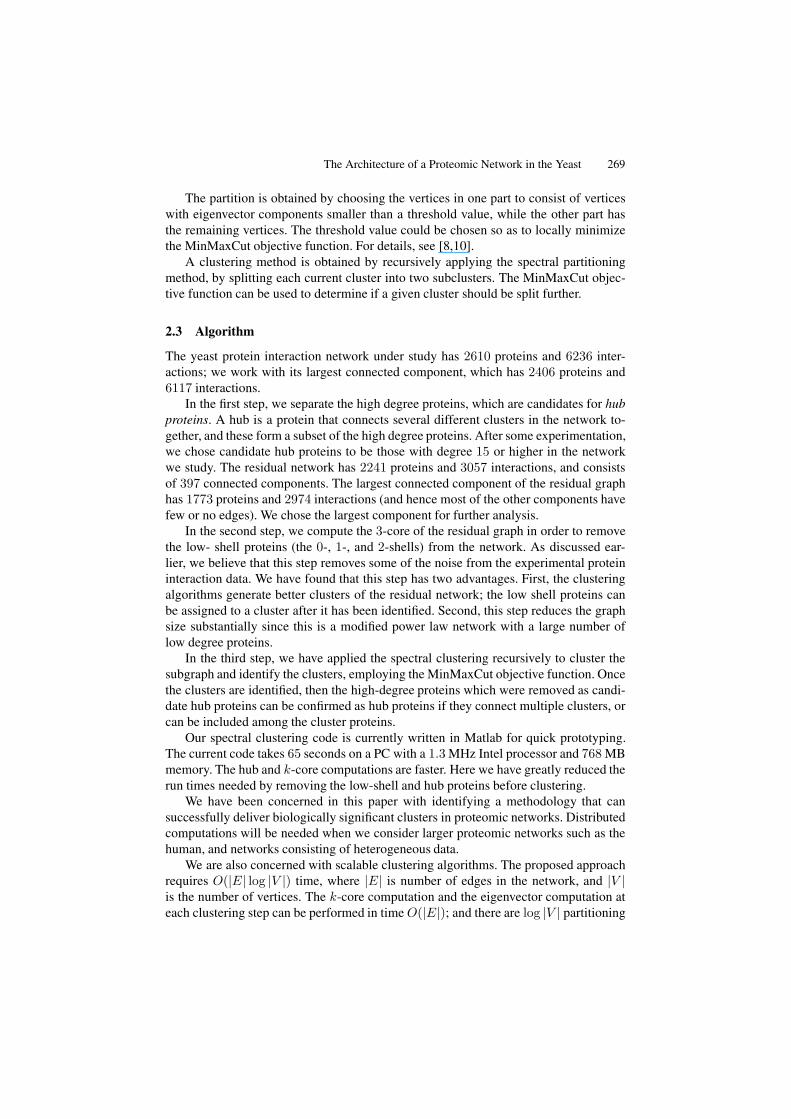
2.3 Algorithm
The yeast protein interaction network under study has 2610 proteins and 6236 inter-actions; we work with its largest connected component, which has 2406 proteins and6117 interactions.
In the first step, we separate the high degree proteins, which are candidates for hubproteins. A hub is a protein that connects several different clusters in the network to-gether, and these form a subset of the high degree proteins. After some experimentation,we chose candidate hub proteins to be those with degree 15 or higher in the networkwe study. The residual network has 2241 proteins and 3057 interactions, and consistsof 397 connected components. The largest connected component of the residual graphhas 1773 proteins and 2974 interactions (and hence most of the other components havefew or no edges). We chose the largest component for further analysis.
In the second step, we compute the 3-core of the residual graph in order to removethe low- shell proteins (the 0-, 1-, and 2-shells) from the network. As discussed ear-lier, we believe that this step removes some of the noise from the experimental proteininteraction data. We have found that this step has two advantages. First, the clusteringalgorithms generate better clusters of the residual network; the low shell proteins canbe assigned to a cluster after it has been identified. Second, this step reduces the graphsize substantially since this is a modified power law network with a large number oflow degree proteins.
In the third step, we have applied the spectral clustering recursively to cluster thesubgraph and identify the clusters, employing the MinMaxCut objective function. Oncethe clusters are identified, then the high-degree proteins which were removed as candi-date hub proteins can be confirmed as hub proteins if they connect multiple clusters, orcan be included among the cluster proteins.
Our spectral clustering code is currently written in Matlab for quick prototyping.The current code takes 65 seconds on a PC with a 1.3 MHz Intel processor and 768 MBmemory. The hub and k-core computations are faster. Here we have greatly reduced therun times needed by removing the low-shell and hub proteins before clustering.
We have been concerned in this paper with identifying a methodology that cansuccessfully deliver biologically significant clusters in proteomic networks. Distributedcomputations will be needed when we consider larger proteomic networks such as thehuman, and networks consisting of heterogeneous data.
We are also concerned with scalable clustering algorithms. The proposed approachrequires O(|E| log |V |) time, where |E| is number of edges in the network, and |V |is the number of vertices. The k-core computation and the eigenvector computation ateach clustering step can be performed in time O(|E|); and there are log |V | partitioning
270 E. Ramadan, C. Osgood, and A. Pothen
steps needed to cluster. The spectral clustering could be replaced with a multi-levelclustering approach that can also be implemented in time O(|E|).
3 Results
3.1 Data Source and Analysis
Among the protein interactions produced by high-throughput methods such as the yeast2-hybrid experiment or tagged affinity purification (TAP) [1,15,16], there are manyfalse positives due to experimental limitations as well as biological factors (proteinsthat are not expressed at the same time or in the same cellular locale) [13]. In or-der to reduce the interference by false positives, we focused on the protein interac-tion network from the Database of Interacting Proteins (DIP), circa. April 2004 (URL:dip.doe-mbi.ucla.edu/dip/), consisting of the reliable dataset, which includesonly data determined by a small-scale experiment, confirmed by independent high-throughput experiments, or scored highly by a probabilistic method that estimates thereliability of an interaction. This dataset has 2610 proteins that involve 6236 interac-tions considered to be reliable with high confidence.
3.2 The Cluster and Hub Networks
The local network computed by the clustering algorithm on the yeast protein inter-action network, from which high degree proteins (hubs) and low-shell proteins havebeen removed, is shown in Fig. 2. Colors are used to distinguish the proteins belong-ing to a cluster, although some colors are reused to color proteins belonging to clustersthat are drawn sufficiently far from each other. Thirty-eight clusters are displayed; forclearer presentation, we have omitted the edges joining two clusters when fewer thanthree edges join a cluster to another. All edges joining proteins within each cluster areshown.
The sum of the numbers of within-cluster edges is 984, while the sum of the between-cluster edges is 239, and the largest number of edges joining one cluster to another is9. These measures are related to the concepts of cohesion and separation of the cluster-ing [22], and thus we believe that our method has been able to cluster the residual net-work well. Each of the clusters is assigned to multi-protein complexes using the MunichInformation Center for Protein Sequences (MIPS) database (URL: mips.gsf.de), asdescribed in the next subsection. Each low-shell protein can now be easily assigned toa cluster with whose proteins it has the most number of interactions.
From a topological point of view, our approach to clustering helps to uncover thehidden topological structure of a proteomic network. We found that there are two majorsubnetworks within the protein-protein interaction network. In addition to the clusternetwork, we also construct a hub network, the subnetwork formed by the hub proteinsin the protein interaction network; a subnetwork formed by the 5-core of the hub net-work is shown in Fig. 3. Four ‘super-clusters’ are clearly evident in the hub interactionnetwork: from top to bottom, these correspond to the spliceosome, proteins involved inmRNA export and the nuclear pore complex, the regulatory subunit of the proteasome,and proteins that are transcription factors.

The Architecture of a Proteomic Network in the Yeast 271
We now consider various subnetworks of the yeast protein interaction network toillustrate the differences between the ‘global’ hub network, and the local ‘cluster’ net-work. Table 3.2 lists the sizes of these networks, the average path lengths, the diameters,and the cluster coefficients. (The cluster coefficient measures how likely two neighborsof a vertex are to be adjacent to each other in the network, on the average.) The row ‘C+ S’ denotes the ‘cluster and shell’ subnetwork obtained by removing the hub proteinsfrom the whole network. Note that this subnetwork has the highest diameter and averagepath length, due to the presence of the large number of low-shell proteins. Once theyare removed, the cluster network exhibits the highest clustering coefficient, supportingour premise that this is a local network. The hub network has the lowest diameter andaverage path length due to the edges joining the hub proteins to each other (cf. Fig. 3).The tight clustering seen in the hub network was surprising to us, but it is clear that hubproteins preferentially interact with cluster proteins and with each other, rather than thelow shell proteins. We discuss the hub subnetwork and clusters in it in more detail inthe next subsection.
The average path lengths in these networks are compared against ln n, where n isthe number of vertices in each subnetwork. Random power-law networks with exponent
Fig. 2. Clusters in the yeast proteomic network from which hub and low-shell proteins have beenremoved. When fewer than three edges join a pair of clusters, such edges have not been drawn inthis figure, for clarity in presentation.

272 E. Ramadan, C. Osgood, and A. Pothen
Table 1. Properties of various subnetworks of the yeast protein interaction network
Subnetwork No. of Average Path Diameter Clustervertices edges Length (ln n) coefficient
Hub 165 507 3.5 (5.1) 7 0.37Cluster 495 1223 6.5 (6.2) 16 0.43C +S 1773 2974 7.6 (7.5) 19 0.15Whole 2406 6117 5.1 (7.8) 13 0.21
β satisfying 2 < β < 3 have expected average path lengths of order ln lnn, while if theexponent β > 3, it is ln n [7]. We see that ln n is a good approximation for the averagepath length of the cluster and cluster-shell networks; but any network that includes thehub proteins has an even lower average path length.
3.3 Functional Annotation of Clusters
One way to validate the clusters we discovered is to check how homogeneous the pro-teins in each cluster are with respect to function or the biological process that theyare involved in. Each cluster should consist of one or more multi-protein complexes,which are molecular machines responsible for various cellular functions. We compared38 clusters that we found with multi-protein complexes listed in the MIPS database. Wefound that in thirteen of the MIPS protein complexes, every protein in the complex wasalso identified in a cluster corresponding to it; for nine more complexes, we found morethan half the proteins involved in the complex in a corresponding cluster. These resultsare despite the facts that hub and low-shell proteins are not included in this comparison,
Fig. 3. The 5-core of the global hub network. The four clusters evident in this figure correspondto the spliceosome, mRNA export, the proteasome, and various transcription factors.
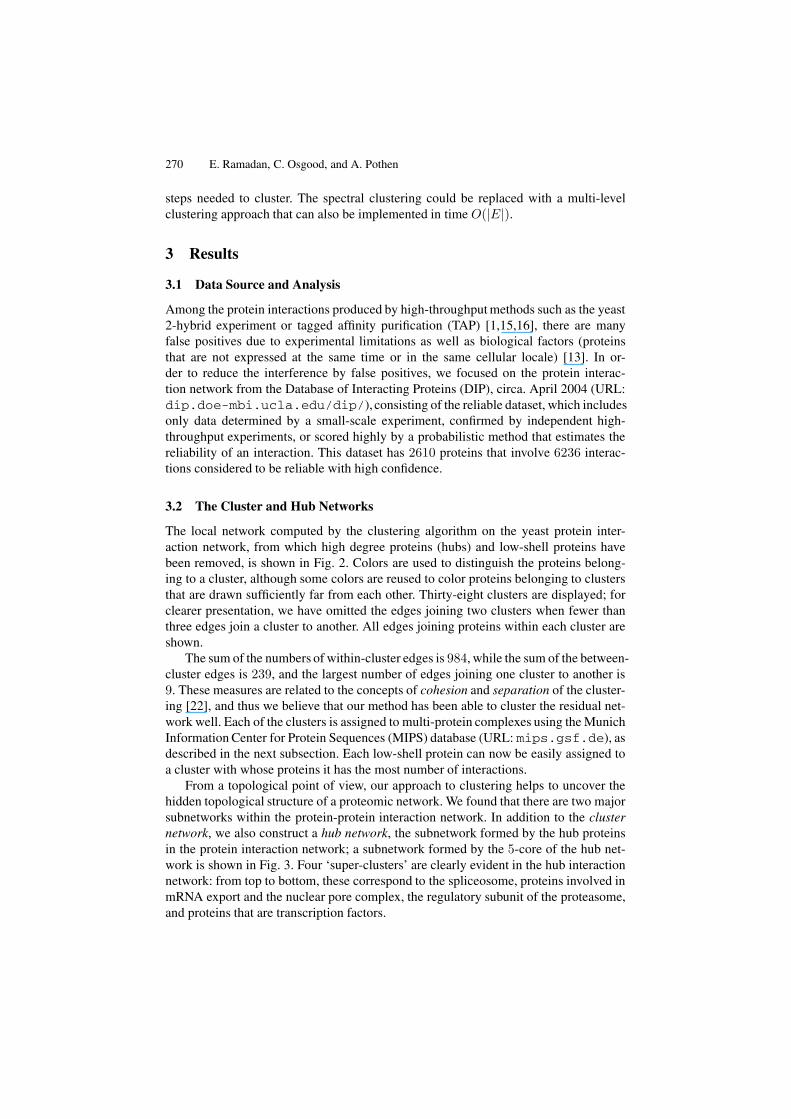
The Architecture of a Proteomic Network in the Yeast 273
and that many proteins in the MIPS database are not included in the DIP protein networkunder study here. When the hubs and low-shell proteins are included, the coverage willincrease further. A table containing the number of each cluster, a corresponding MIPScomplex name and its MIPS ID, the number of proteins the cluster and the complexhave in common, and the names of these proteins, is included in file table1.xls,see the Supplementary Materials atwww.cs.odu.edu/˜pothen/Papers/Cluster/DIP/.
We should note that, in general, the clusters that we have discovered contain moreproteins than those reported to belong to a corresponding MIPS complex. This suggestspossible biological roles and functional assignments for such proteins, many of whichare not currently functionally annotated.
The protein interaction graph of each cluster and a biological process annotation forit, using a directed acyclic subgraph (DAG) derived from the Gene Ontology(URL: www.geneontology.org), are also included in the Supplementary Materi-als. The cluster subgraphs are included in the jpg files, while GO DAGs are listed inthe png files. While some of the cluster graphs are near-cliques or subgraphs with highedge connectivity, many of them are not. We believe that this validates our approach offinding complexes by a general clustering approach rather than searching for specificsubgraph motifs.
3.4 Interactions Between the Hub and the Local Networks
We now consider the hub protein subnetwork and its interaction with the local networkin more detail.
One of the complexes in cluster 8, the U4/U6 x U5 tri-snRNP complex, (listed in thefile table1.xls in the Supplementary Materials), is comprised of a group of proteinsinvolved in spliceosome processing of mRNA. This is the top-most cluster representedin Fig. 3. The spliceosome is required for the ordered and accurate removal of intronicsequences from pre-mRNA and thus plays a key role in alternative splicing, a processof great importance in higher eukaryotes whereby a single gene can generate multipletranscripts (alternatively spliced mRNAs) and thus multiple proteins [12]. The PRP(pre-mRNA processing) and Sm family proteins make up most of the proteins foundin cluster 8. Some of the key proteins involved in mRNA processing, including thosebelonging to the LSM family, are not found in that cluster, but among the hub proteinsthat interact with multiple clusters.
One of the complexes in cluster 24, the first mRNA cleavage factor complex (rep-resented in the file cl24.jpg in the Supplementary Materials), includes five proteinsinvolved in mRNA cleavage in preparation for the addition of the eukaryotic signaturepoly-A tail. Thus, proteins including CLP1 (involved in cleavage of the 3′ end of themRNA prior to tailing), and RNA 14 and 15 (two proteins that participate with CLP1 information of the 3′ end of mRNA), are collectively implicated in alternative selectionof the poly-A addition site [18].
Now we focus our attention on the single protein-protein edge which joins the top-most hub cluster in the figure, corresponding to mRNA splicing, to a second hub clusterinvolving mRNA export and nuclear pore formation proteins, corresponding to mRNAexport, in Fig. 3. The two hub proteins that form the bridge between these clusters are

274 E. Ramadan, C. Osgood, and A. Pothen
PRP6, a component of the mRNA splicing machinery, and PAB1, the poly-A bindingprotein involved in the final step in mRNA processing. We note that PRP6 is involved inthe later stages of mRNA splicing and is in that sense the penultimate step prior to poly-A tailing. Thus, the overall logic of joining these two complexes by these particular hubproteins is compelling.
We now examine the connections formed by these two hub proteins with the localclusters that we picture as lying below them in the hierarchy of global (hub) and local(cluster) networks (see Fig. 1). PRP6 interacts with a single cluster (cluster 8) throughthe protein SMD1. SMD1 further interacts with splicing proteins PRP3 and SMD3 inthe hub complex that includes PRP6. SMD1 is involved in the early stages of mRNAsplicing and is highly conserved, showing greater than 40% amino acid identity betweenyeast and human [20]. PRP6 interacts with PAB1 in the second hub complex. PAB1 inturn interacts with three clusters, 22, 24 and 34. As noted above, cluster 24 includesRNA14 and RNA15, both involved in mRNA cleavage, and it is these proteins that in-teract with PAB1. PAB1 also forms connections with cluster 22 (via its interaction withTIF4632 = eIF4F, file cl22.jpg), and with cluster 34 (via PKC1, file cl34.jpg).These latter interactions (eIF4F and PKC1) are at first glance puzzling, but in fact theyare entirely consistent with emerging evidence of interactions and regulatory loops thatexist between distinct components in the gene expression machinery. The poly-A ter-minus of mRNA, and the associated PAB1, not only interacts with the 5′ end of themRNA, ensuring structural integrity of the transcript prior to its participation in proteintranslation [5] , but the PAB1 terminus also interacts with the translation machineryitself, and specifically with eIF4 initiation factors. Finally, PKC1, a protein kinase cru-cial to cell signaling pathways, is also implicated in functional interactions with PAB1and eIFs [3], suggesting global level regulation of protein synthesis from metabolitesthrough mRNA processing.
At the global level of our network model, we find key proteins involved in rate-limiting steps of gene expression, linked in logical order; these are connected to thelocal network consisting of clusters of proteins involved in execution level functions.Whether this overall pattern is typical of the proteome organizational structure we haveidentified here, remains to be further investigated.
3.5 Incorporation of Protein Domain Data
Proteins interact with each other through regions that have a specific sequence andfold, called domains. Here we further validate the protein complexes predicted fromour clustering approach using information on the domain structure of proteins.
The study of proteins involved in processing eukaryotic mRNAs indicate thatvirtually all steps involved in gene expression are coordinated and integrated via protein-protein interactions. The LSM proteins provide an informative example of theintegration of cellular protein machinery to couple synthesis and quality control ingene expression [2,11]. LSM proteins form heptameric complexes that bind to RNAmolecules; one such complex is found primarily in the nucleus where it coordinatessplicing of mRNAs, while a second, related, complex of LSM proteins assembles in thecytoplasm to monitor mRNA quality control. LSM proteins have been extensively char-acterized and include two highly conserved protein interaction domains, SM1 and SM2.
The Architecture of a Proteomic Network in the Yeast 275
It is proposed that these conserved domains permit each LSM protein to interact withtwo other LSM proteins in forming the heptameric, doughnut shaped ring structure thatis implicated in mRNA splicing. LSM proteins comprise a gene family in which suc-cessive rounds of gene duplication have increased LSM copy numbers. LSM proteinshave also been shown to form stable interactions with other protein types, including thePRP proteins discussed below.
The PRP proteins similarly carry a protein-protein interaction motif, the tetratricopeptide repeat (TPR) [23]. PRP proteins typically contain multiple copies of the 34amino acid repeat; Prp1 for example contains 19 repeats of the TPR (ibid). Some PRPproteins contain a second conserved site at the C-terminus of the protein that facilitatesinteractions between them and LSM proteins, thus coupling two complexes with keyroles in mRNA splicing. Our hub network predicts the formation of a complex contain-ing LSM proteins 1-5, 7 and 8, as well as PRP proteins 4, 6, 8, and 31. The specificinteractions implicated in our sub-network are, to our knowledge, the first explicit as-signments of interactions between these two families of proteins.
We were surprised to find that the hub proteins form a highly interconnected sub-network. Biological evidence indicates that LSM proteins do indeed form multi-proteincomplexes in the course of performing their key cellular functions. The fact that eachLSM protein has at least two protein-protein interaction domains helps us understandhow the complexes are formed. Whether similar binding interactions can account forother closely knit hub networks is under investigation.
4 Conclusions
We have proposed a two-level architecture for a yeast protein-protein interaction net-work. We place a small set of hub proteins, each with at least fifteen interaction partnersand involved in gene expression, mRNA export, the proteasome, and transcription fac-tors, into a global subnetwork. A local subnetwork of proteins is organized into clustersthat correspond well with multi-protein complexes in the MIPS database. We used thecomputed clustering to examine the biological significance of some of the interactionsobserved between the hub and local subnetworks. If the proposed two-level architectureexists in other proteomic networks, then it would be interesting to discover propertiesthat distinguish hub proteins from the proteins in the local network.
In future work, we will consider the computation of an overlapping clustering ratherthan the exclusive clustering approach considered in this paper, so that a protein couldbe included in more than one cluster in the local network. We will also investigateadditional clustering approaches and biological networks involving heterogeneous data.
References
1. A-C. Gavine, M. Bosche, and R. Krause et al. Functional organization of the yeast proteomeby systematic analysis of protein complexes. Nature, 415:141–147, 2002.
2. T. Achsel et al. The Sm domain is an ancient RNA-binding motif with oligo(U) specificity.Procs. Natl. Acad. Sci., 98:3685–3689, 2001.
3. F. Angenstein et al. A receptor for activated C kinase is part of messenger ribonucleoproteincomplexes associated with polyA-mRNA in neurons. J. Neurosci., 22:8827–37, 2002.
276 E. Ramadan, C. Osgood, and A. Pothen
4. G. D. Bader and C. W. Hogue. An automated method for finding molecular complexes inlarge protein interaction networks. BMC Bioinformatics, 4(2):27 pp., 2003.
5. X. Bi and D. Goss. Wheat germ poly (A)-binding protein increases ATPase and the RNAhelicase activity of translation initiation factors eIF4A, eIF4B and eIF-iso-4F. J. Biol. Chem.,275:17740–6, 2000.
6. S. Bornholdt and H. G. Schuster, editors. Handbook of Graphs and Networks. Wiley VCH,2003.
7. F. Chung and L. Lu. The average distances in random graphs with given expected degrees.Procs. Natl. Acad. Sci., 99(25):15879–15882, 2002.
8. I. S. Dhillon. Co-clustering documents and words using bipartite spectral graph partitioning.In Procs. ACM Internatl. Conf. Knowledge Discovery in Data Mining (KDD), 2001.
9. C. Ding, X. He, R. F. Meraz, and S. R. Holbrook. A unified representation of multi-proteincomplex data for modeling interaction networks. Proteins: Structure, Function, and Genet-ics, 2004. To appear.
10. C. Ding, X. He, H. Zha, M. Gu, and H. Simon. A MinMaxCut spectral method for dataclustering and graph partitioning. In Procs. IEEE Internatl. Conf. Data Mining (ICDM),pages 107–114, 2001.
11. M. Fromont-Racine et al. Genome-wide protein interaction screens reveal functional net-works involving Sm-like proteins. Yeast, 17:95–110, 2000.
12. F. Galisson and P. Legrain. The biochemical defects of PRP4-1 and PRP6-1 yeast splicingmutants reveal that the PRP6 protein is required for the accumulation of the [U4/U6.U5]tri-snRNP. Nucl. Acids Res., 21:1555–62, 1993.
13. J. D. J. Han, D. Dupuy, N. Bertin, et al. Effect of sampling on topology predictions ofprotein-protein interaction networks. Nature Biotechnology, 23:839–844, 2005.
14. L. H. Hartwell, J. J. Hopfeld, S. Leibler, and A. W. Murray. From molecular to modular cellbiology. Nature, 402:C47–C52, 1999.
15. Y. Ho, A. Gruhler, and A. Heilbut et al. Systematic identification of protein complexes inSaccharomyces cerevisiae by mass spectrometry. Nature, 415:180–193, 2002.
16. T. Ito, T. Chiba, and R. Ozawa et al. A comprehensive two hybrid analysis to explore theyeast protein interactome. Procs. Natl. Acad. Sci., 98:4569–4574, 2001.
17. A. A. Jarvis and E. A. Patrick. Clustering based on a similarity measure based on sharednearest neighbors. IEEE Trans. Computers, C-22:1025–1034, 1973.
18. C. Noble et al. Rna14-Rna15 assembly mediates the RNA-binding capability of Saccha-romyces cerevisiae cleavage factor IA. Nucl. Acids Res., 32:3364–75, 2004.
19. E. Ramadan, A. Tarafdar, and A. Pothen. A hypergraph model for the yeast protein complexnetwork. In Procs. Workshop High Performance Computational Biology (HICOMB). IEEE /ACM, 2004. 8 pp., (CDROM).
20. B. C. Rymond. Convergent transcripts of the yeast PRP38-SMD1 locus encode two essen-tial splicing factors, including the D1 core polypeptide of small nuclear ribonucleoproteinparticles. Procs. Natl. Acad. Sci., 90:848–52, 1993.
21. V. Spirin and L. A. Mirny. Protein complexes and functional modules in molecular networks.Procs. Natl. Acad. Sci., 100:12123–12128, 2003.
22. P. Tan, M. Steinbach, and V. Kumar. Introduction to Datamining. Addison Wesley, 2005.23. S. Urushiyama et al. The prp1+ gene required for pre-mRNA splicing in Schizosaccha-
romyces pombe encodes a protein that contains TPR motifs and is similar to Prp6p of buddingyeast. Genetics, 147:101–115, 1997.