Effect of varying conditions of exposure to an aggressive ...
Hormonal Activity May Predict AggressiveBehavior in Neuroblastoma
EDUARDO ZAMBRANO AND MIGUEL REYES-MUGICA*Department of Pathology, Yale University School of Medicine, 310 Cedar Street, Lauder Hall, CB20, P.O. Box208023, New Haven, CT 06520-8023, USA
Received August 27, 2001; accepted November 13, 2001.
ABSTRACTOverproduction of catecholamines (dopamine [DA], nor-epinephrine [NE]) and their metabolites (homovanillic[HVA] and vanillylmandelic [VMA] acids) characterizesneuroblastoma (NB). In previous studies, increased uri-nary DA/NE, and DA/VMA ratios have been associatedwith poor prognosis, whereas low DA/NE ratios havebeen associated with longer disease-free survival. Higherurinary VMA, HVA, and NE levels have been found inassociation with low MYCN amplification, in contrast tocases with high MYCN amplification in which normallevels have been found. It is then believed that an “im-mature” catecholamine pattern indicates poor progno-sis. We correlated urinary DA, NE, VMA, and HVA levelswith age, clinical tumor stage, histological features (fa-vorable [FH]/unfavorable [UH]) and MYCN status of 33patients with NB. DA/VMA and DA/HVA ratios were alsocalculated. Wilcoxon rank sum and chi-squared testswere performed to determine statistical significance.Eighty-eight percent (15/17) of stage 3–4 cases had DAlevels �2 times the upper limit of normal, but only 8%(1/12) of stage 1–2 cases had DA levels twice the upperlimit of normal. In 61% (11/18) of stage 3–4 cases, theVMA level was �10 times the upper limit of normal, incontrast to stage 1–2 cases, in which only one patient(1/15) had a VMA level �10 times the upper limit ofnormal. Similar findings were obtained with urinaryHVA and NE. Patients older than 12 months of age atdiagnosis also had higher urinary levels of DA, VMA,HVA, and NE than those of patients younger than 12months of age at diagnosis. Eighty-two percent (14/17)of stage 3–4 cases had DA/VMA ratios �0.78, with the
other 18% (3/17) showing ratios between 1.4 and 8.82(all stage 4 and �12 months of age). In contrast, all stage1–2 cases (12) had ratios �1.4. All (12/12) non–MYCN-amplified cases had DA/VMA ratios �1.4 (0.06–0.84),while one MYCN-amplified case (1/3) had a ratio of 8.82;the other two MYCN-amplified cases had DA/VMA ratiosof 0.09–0.11. Twenty-nine percent (2/7) of cases withUH had a DA/VMA ratio �1.4, but in all FH cases (14/14)the DA/VMA ratio was �1.4 (0.08–0.084). Similar toprevious studies, we found that aggressive NB is associ-ated with higher urinary levels of DA, VMA, HVA, andNE. We also confirmed the previous observation thatthere appears to be a subset of NB in which a possibleblockade in DA metabolism is associated with poor prog-nostic features (�12 months, stage 4, UH, and MYCNamplification). A seemingly novel observation in ourstudy is that all high DA/HVA and DA/VMA ratios wereobtained in stage 4 tumors, suggesting an associationbetween the inability to metabolize DA and the acquisi-tion of metastatic potential. On the basis of our results, wewould like to emphasize the importance of determiningnot only DA, HVA, and VMA urinary levels, to support thediagnosis of NB, but also DA/HVA and DA/VMA ratios as arapid initial assessment of prognosis in these patients.
Key words: catecholamines, neuroblastoma, pediatricneoplasia, prognosis
INTRODUCTIONNeuroblastomas are metabolically active tumorsderived from primordial neural crest cells. In-creased production of catecholamines (dopamine,norepinephrine) and their metabolites (ho-movanillic acid, vanillylmandelic acid) is a hall-mark of neuroblastomas. Dopamine (DA) is con-
This study was presented in part at the Annual Meeting of the Societyfor Pediatric Pathology, March 3–4, 2001, Atlanta, GA.*Corresponding author
Pediatric and Developmental Pathology 5, 190–199, 2002
DOI: 10.1007/s10024-001-0145-8
© 2002 Society for Pediatric Pathology

verted primarily to norepinephrine (NE) andhomovanillic acid (HVA), whereas NE is convertedprimarily to vanillymandelic acid (VMA)[1] (Fig.1). Detection of these products in urine is an im-portant step in the diagnosis of these tumors.When sensitive techniques are used, approximately90% of tumors can be detected by measuring thesecompounds [2,3]. These tests are also commonlyused to follow response to treatment or to diagnoserelapse [4].
Different clinical and biological factors areknown to affect prognosis in patients with neuro-
blastoma. Of these, stage of disease is the mostimportant prognostic factor: stages 1, 2, and 4S areconsidered to have a favorable prognosis, whereasstages 3 and 4 have an unfavorable prognosis. Ageat diagnosis remains the only other independentclinical factor, with infants �1 year of age usuallyhaving significantly better disease-free survival[5–7]. Other factors routinely taken into consider-ation for the prognostic evaluation and treatmentof these tumors include the Shimada histopatho-logical classification (favorable versus unfavor-able) [8] and MYCN status (amplified versus non-
Figure 1. Pathways of synthesis and metabolism of cat-echolamines with enzymes catalyzing various reactions:(1) tyrosine hydroxylase, (2) aromatic amino acid decar-boxylase, (3) dopamine �-hydroxylase, (4) phenylethano-lamine N-methyltransferase (PNMT), (5) monoamino ox-idase (MAO) plus aldehyde dehydrogenase, (6) catechol-O-methyltransferase (COMT), (7) conjugating enzymes—about 95% phenolsulfotransferase and 5% phenol-glucuronotransferase (in humans), (8) nonspecific dopa-
mine �-hydroxylase, (9) N-methyltransferase, (10) MAOplus aldehyde reductase, (11) alcohol dehydrogenaseplus aldehyde dehydrogenase. DHPG, dihydroxyphenyl-glycol; DOPA, dihydroxyphenylalanine; DOPAC, dihy-droxyphenylacetic acid; HVA, homovanillic acid; MHPG,methoxyhydroxyphenylglycol; VMA, vanillylmandelicacid. (Modified from Manger and Gifford [18], with per-mission.)
HORMONAL ACTIVITY IN NEUROBLASTOMA 191

amplified). It is commonly accepted that MYCNamplification is associated with advanced-stagedisease and rapid tumor progression [9,10].
Previous studies have found a correlation be-tween urinary catecholamine levels and their me-tabolites with certain prognostic factors, such astumor stage and MYCN amplification status. Someof these studies suggest that increased MYCN copy
number (poor prognosis) correlates with normalurinary VMA and NE, whereas non-amplifiedMYCN (good prognosis) is associated with in-creased urinary VMA and NE [11]. Other studieshave shown that increased urinary DA/NE ratios(�1.8) and high urinary DA/VMA ratio (�1.1) cor-relate with poor prognosis [12]. Similarly, muchhigher levels of VMA, HVA, and NE have been seen
Table 1. Clinicopathological features and urinary catecholamine and metabolite levels in patientswith neuroblastoma
Patient Stage Age (months) Shimada N-MYC
DA VMA
Total Ratio Total Ratio
1 1 0 U Single copy 0.34 (1.29) 0.26 14.7 (15) 0.98
2 1 0 U ND 0.76 (1.29) 0.59 27.8 (15) 1.85
3 1 0.03 F ND 2.44 (1.29) 1.89 50 (15) 3.33
4 1 0.1 F Single copy 0.62 (1.29) 0.48 112 (15) 7.47
5 1 0.4 F Single copy 0.8 (1.29) 0.62 16.1 (15) 1.07
6 1 1 F Single copy 0.15 (1.29) 0.12 11.9 (15) 0.79
7 1 1 F Single copy 2.40 (1.29) 1.86 33.2 (15) 2.21
8 1 2 U ND 2.17 (1.29) 1.68 29.2 (15) 1.95
9 1 11 U ND ND ND 44.4 (15) 2.96
10 1 12 F Single copy 0.97 (1.29) 0.75 15.6 (15) 1.04
11 1 15 F ND 1.81 (1.22) 1.48 50.4 (8) 6.30
12 1 15 F Single copy 1.34 (1.22) 1.10 73.8 (8) 9.23
13 1 15 F ND ND ND 15.7 (8) 1.96
14 1 144 F ND 0.99 (0.45) 2.20 52.2 (3.25) 16.06
15 2 2 F ND ND ND 25 (15) 1.67
16 3 0.75 U ND 3.13 (1.29) 2.43 267 (15) 17.80
17 3 5 U Single copy 2.71 (1.29) 2.10 135 (15) 9.00
18 3 13 F Single copy 3.37 (1.22) 2.76 152 (8) 19.00
19 3 15 Chemo Single copy 1.19 (1.22) 0.98 50.2 (11) 4.56
20 3 24 F Single copy 7.29 (1.22) 5.98 518 (7.5) 69.07
21 4 5 F Single copy 3.54 (1.29) 2.74 �500 (15) 33.33
22 4 9 F Amplified 3.75 (1.29) 2.91 494 (15) 32.93
23 4 14 F ND 13 (1.29) 10.08 746 (15) 49.73
24 4 15 F Single copy 2.84 (1.22) 2.33 117 (8) 14.63
25 4 19 U ND 13.8 (1.22) 11.31 27.8 (8) 3.48
26 4 24 Chemo Amplified 14.4 (1.22) 11.80 10.7 (8) 1.34
27 4 24 U ND 4.69 (1.22) 3.84 20.3 (7.5) 2.71
28 4 24 NA ND 2.55 (1.22) 2.09 178 (7.5) 23.73
29 4 24 Chemo ND ND ND 14.7 (7.5) 1.96
30 4 48 NA ND 8.1 (0.72) 11.25 155 (7.5) 20.67
31 4 48 Chemo Amplified 4.14 (1.22) 3.39 232 (7.5) 30.93
32 4 96 NA ND 0.39 (0.45) 0.87 3.6 (3.25) 1.11
33 4 168 NA ND 1.11 (0.45) 2.47 73.9 (3.25) 22.74
192 E. ZAMBRANO AND M. REYES-MUGICA
in association with low MYCN copy numbers (1–10copies), not high copy numbers of MYCN (�10)[13]. High NE/DA ratios have also been associatedwith increased disease-free survival [14]. All thesefindings suggest that immaturity of catecholamine
metabolism may correlate with poor prognosis[15,16].
In the present study we analyzed the correla-tion between urinary catecholamines levels, theirmetabolites, and their ratios with tumor stage, age
Table 1. (Continued)
HVA NE
DA/VMA DA/HVA DA/NETotal Ratio Total Ratio
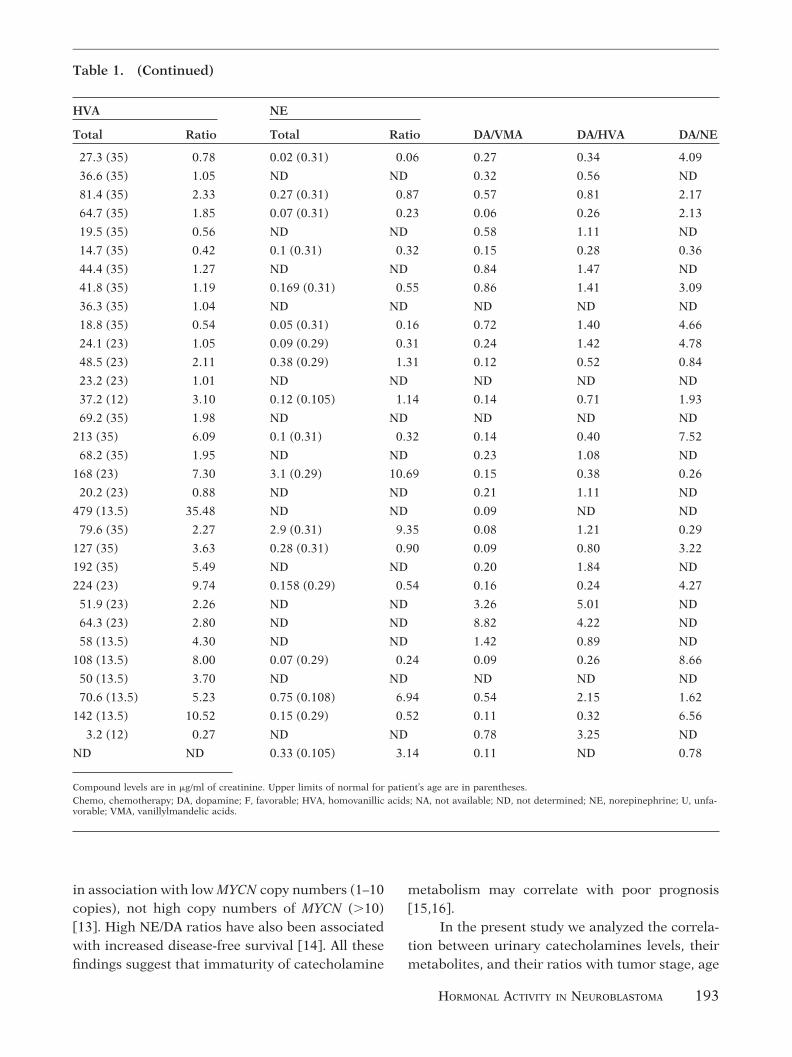
27.3 (35) 0.78 0.02 (0.31) 0.06 0.27 0.34 4.09
36.6 (35) 1.05 ND ND 0.32 0.56 ND
81.4 (35) 2.33 0.27 (0.31) 0.87 0.57 0.81 2.17
64.7 (35) 1.85 0.07 (0.31) 0.23 0.06 0.26 2.13
19.5 (35) 0.56 ND ND 0.58 1.11 ND
14.7 (35) 0.42 0.1 (0.31) 0.32 0.15 0.28 0.36
44.4 (35) 1.27 ND ND 0.84 1.47 ND
41.8 (35) 1.19 0.169 (0.31) 0.55 0.86 1.41 3.09
36.3 (35) 1.04 ND ND ND ND ND
18.8 (35) 0.54 0.05 (0.31) 0.16 0.72 1.40 4.66
24.1 (23) 1.05 0.09 (0.29) 0.31 0.24 1.42 4.78
48.5 (23) 2.11 0.38 (0.29) 1.31 0.12 0.52 0.84
23.2 (23) 1.01 ND ND ND ND ND
37.2 (12) 3.10 0.12 (0.105) 1.14 0.14 0.71 1.93
69.2 (35) 1.98 ND ND ND ND ND
213 (35) 6.09 0.1 (0.31) 0.32 0.14 0.40 7.52
68.2 (35) 1.95 ND ND 0.23 1.08 ND
168 (23) 7.30 3.1 (0.29) 10.69 0.15 0.38 0.26
20.2 (23) 0.88 ND ND 0.21 1.11 ND
479 (13.5) 35.48 ND ND 0.09 ND ND
79.6 (35) 2.27 2.9 (0.31) 9.35 0.08 1.21 0.29
127 (35) 3.63 0.28 (0.31) 0.90 0.09 0.80 3.22
192 (35) 5.49 ND ND 0.20 1.84 ND
224 (23) 9.74 0.158 (0.29) 0.54 0.16 0.24 4.27
51.9 (23) 2.26 ND ND 3.26 5.01 ND
64.3 (23) 2.80 ND ND 8.82 4.22 ND
58 (13.5) 4.30 ND ND 1.42 0.89 ND
108 (13.5) 8.00 0.07 (0.29) 0.24 0.09 0.26 8.66
50 (13.5) 3.70 ND ND ND ND ND
70.6 (13.5) 5.23 0.75 (0.108) 6.94 0.54 2.15 1.62
142 (13.5) 10.52 0.15 (0.29) 0.52 0.11 0.32 6.56
3.2 (12) 0.27 ND ND 0.78 3.25 ND
ND ND 0.33 (0.105) 3.14 0.11 ND 0.78
Compound levels are in �g/ml of creatinine. Upper limits of normal for patient’s age are in parentheses.Chemo, chemotherapy; DA, dopamine; F, favorable; HVA, homovanillic acids; NA, not available; ND, not determined; NE, norepinephrine; U, unfa-vorable; VMA, vanillylmandelic acids.
HORMONAL ACTIVITY IN NEUROBLASTOMA 193

at diagnosis, histopathological classification, andMYCN amplification status of patients with neuro-blastoma.
METHODSPatients diagnosed with neuroblastoma at Yale–New Haven Hospital from 1982 to 2000 were iden-tified by SNOMED search and review of medicalrecords. Data collected included age, stage of dis-ease, and MYCN status. Shimada histopathologicalfeatures were reassessed in all cases when possible.A computer search of our laboratory database wasperformed and information was collected, includ-ing urinary levels of DA, VMA, HVA, and NE. Thelevels of these compounds were originally deter-mined using high-performance liquid chromatog-raphy (HPLC).
Patients in whom urinary catecholaminesand/or metabolites determined at the time of initialdiagnosis were not available were excluded fromour study. Only patients who had at least two ofthese tests performed at the time of initial diagno-sis were included. At least one of these tests had tobe either VMA or HVA. Thirty-three patients wereidentified and included in our study.
Cases were stratified according to the differ-ent variables of prognostic significance: stage ofdisease (stages 1–2 versus stages 3–4), age of pa-tient at diagnosis (�12 months versus �12months), Shimada histopathological features (fa-vorable versus unfavorable), and MYCN status (notamplified versus amplified). The ratios of urinaryDA, VMA, HVA, and NE to normal were deter-mined by dividing the urinary levels from eachpatient by the standard upper limit of normal forthe patient’s age. Statistical means of each com-pound’s ratio to normal were calculated for allgroups. Percentages and ranges were calculated.Wilcoxon rank sum and chi-squared tests were per-formed to determine statistical significance.
RESULTSIn Table 1 the different clinicopathological fea-tures analyzed, as well as the urinary catechol-amine and metabolite levels and their ratios aresummarized. The means of all urinary com-pounds were significantly higher in stages 3– 4than in stages 1–2 (P � 0.05; Fig. 2). Further-more, 88% (15/17) of patients with stages 3– 4
had urinary DA levels that were higher thantwice the upper limit of normal (up to 12 times).By contrast, only 8% (1/12) of patients with tu-mor stages 1–2 had DA levels twice the upperlimit of normal (2.20 times), and 92% (11/12) ofthese patients had lower levels, ranging from0.12 to 1.89 times the upper limit of normal.Urinary VMA was higher than 10 times the upperlimit of normal (up to 70 times) in 61% (11/18) ofpatients with tumor stages 3– 4, in contrast to thestage 1–2 group, in which only 7% of patients(1/15) had urinary VMA levels higher than 10times the upper limit of normal (16.06 timeshigher). Analysis of urinary HVA showed similarresults, with 65% (11/17) of patients with stages3– 4 having levels 3.5 times higher than the upperlimit of normal (up to 35.48 times), and no pa-tients (0/15) with stages 1–2 having urinary HVAlevels 3.5 times higher than the upper limit ofnormal (range: 0.42–3.10). Similarly, 44% (4/9)of patients with stages 3– 4 had urinary NE levelsthat were higher than 3 times the upper limit ofnormal (up to 10.60 times), in contrast to thestage 1–2 group, in which no patients (0/9) hadurinary NE levels higher than 3 times the upperlimit of normal. Urinary NE levels in this groupranged from 0.23 to 1.31 times the upper limit ofnormal.
Similar results were obtained when age atdiagnosis was analyzed. Patients older than 12months of age were found to have significantlyhigher means for urinary DA, HVA, and VMA thanthose of patients younger than 12 months of age(P � 0.05; Fig. 3). Although the urinary NE meanwas also higher in patients older than 12 months ofage than in patients younger than 12 months of age(2.76 versus 1.42), this difference was not statisti-cally significant.
When the urinary DA/VMA ratio was calcu-lated, only 18% of patients (3/17) with stages 3–4had a ratio higher than 1.4 (range: 1.42–8.82). Allother 14 patients in this stage 3–4 group (82%) hadurinary DA/VMA ratios lower than 1.4, rangingfrom 0.15 to 0.78 (Table 2). By contrast, all patientswith tumor stages 1–2 (12/12) had urinary DA/VMAratios lower than 1.4 (range: 0.06–0.86). Althoughthis difference between the stage 1–2 and stage 3–4groups was not statistically significant (P �
0.124), all patients (3/3) with urinary DA/VMA ra-
194 E. ZAMBRANO AND M. REYES-MUGICA
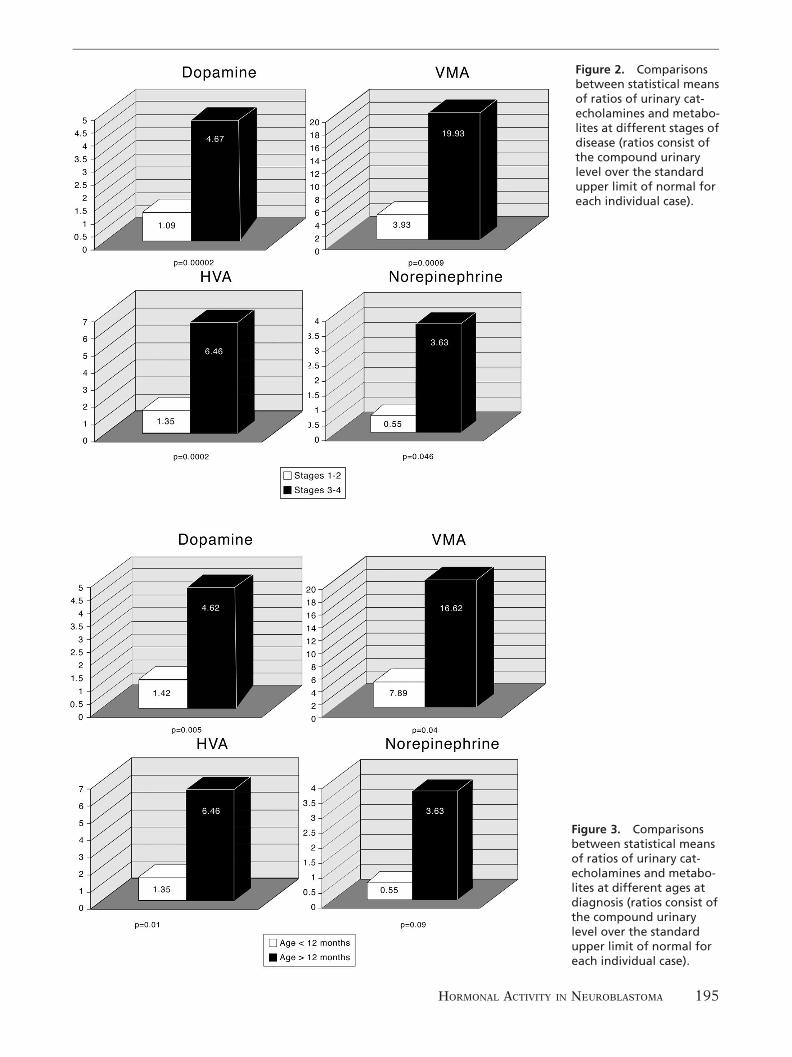
Figure 2. Comparisonsbetween statistical meansof ratios of urinary cat-echolamines and metabo-lites at different stages ofdisease (ratios consist ofthe compound urinarylevel over the standardupper limit of normal foreach individual case).
Figure 3. Comparisonsbetween statistical meansof ratios of urinary cat-echolamines and metabo-lites at different ages atdiagnosis (ratios consist ofthe compound urinarylevel over the standardupper limit of normal foreach individual case).
HORMONAL ACTIVITY IN NEUROBLASTOMA 195

tios higher than 1.4 had stage 4 disease and wereolder than 12 months (range: 19–24 months). Oneof these patients also had MYCN amplification.MYCN status was not determined in the other twopatients. Similarly, two of these patients had unfa-vorable Shimada histopathology features, whilethe third patient had previously received chemo-therapy and therefore histopathological classifica-tion was not determined.
A similar trend was observed when the DA/HVA ratio was calculated (Table 3). In this case,33% (5/15) of patients with stages 3–4 had a DA/HVA ratio higher than 1.5 (up to 5.01), whereas nopatients (0/12) in the stage 1–2 group had DA/HVAratios higher than 1.5 (range: 0.28–1.47); this dif-ference was statistically significant (P � 0.027).All patients with high DA/HVA ratios were stage 4and older than 12 months (range: 14–96 months).Similar results were observed when DA/VMA andDA/HVA ratios were analyzed relative to age (Ta-bles 4, 5).
When MYCN status was analyzed, all patients(12/12) with single copies had urinary DA/VMAratios lower than 1.4 (range: 0.06–0.84). On thecontrary, 33% (1/3) of patients with amplifiedMYCN had urinary DA/VMA ratios higher than 1.4
(8.82); the other 2 patients with amplified MYCNhad urinary DA/VMA ratios of 0.09 and 0.11. Sim-ilarly, all patients with single copies of MYCN (12/12) had DA/HVA ratios lower than 1.5 (range:0.24–1.47), whereas 33% (1/3) of patients withMYCN amplification had a DA/HVA ratio higherthan 1.5 (4.22). This is the same patient (patient26) who had a high DA/VMA ratio. The other twopatients with MYCN amplification had DA/HVAratios of 0.32 and 0.80. These results were statisti-cally significant (Table 6).
When Shimada histopathology was analyzed,29% of patients (2/7) with unfavorable histologyhad urinary DA/VMA ratios higher than 1.4 (1.42and 3.26). All patients with favorable histology (14/14) had urinary DA/VMA ratios lower than 1.4(range: 0.08–0.84). These results were statisticallysignificant (Table 7).
DISCUSSIONNeuroblastomas are metabolically active tumorsderived from primordial neural crest cells, whichcharacteristically produce increased amounts ofcatecholamines (DA, NE) and their metabolites(HVA, VMA). Detection of these products in urineis an important step in the diagnosis of these tu-
Table 2. Correlation of DA/VMA ratios withstage of disease
Stage
DA/VMA
>1.4 <1.4
1–2 0 12
3–4 3 14
P � 0.124.
Table 3. Correlation of DA/HVA ratios withstage of disease
Stage
DA/HVA
>1.5 <1.5
1–2 0 12
3–4 5 10
P � 0.027.
Table 4. Correlation of DA/VMA ratios withage at diagnosis
Age
DA/VMA
>1.4 <1.4
�12 months 0 13
�12 months 3 13
P � 0.099.
Table 5. Correlation of DA/HVA ratios withage at diagnosis
Age
DA/HVA
>1.5 <1.5
�12 months 0 12
�12 months 5 9
P � 0.021.
196 E. ZAMBRANO AND M. REYES-MUGICA

mors and is also used to follow response to treat-ment or to diagnose relapse [2–4].
Previous studies have found a correlation be-tween urinary catecholamine levels and their me-tabolites with certain prognostic factors, such astumor stage and MYCN amplification status. Thesestudies suggest that immaturity of catecholaminesmetabolism may correlate with poor prognosis[11–16]. In the present study we analyzed the cor-relation between levels of urinary catecholaminesand their metabolites with tumor stage, age at di-agnosis, histopathological classification, andMYCN amplification status in 33 patients with neu-roblastoma.
Similar to previous studies, we found a di-rect correlation between advanced tumor stages(stages 3 and 4) and increased urinary DA, NE,VMA, and HVA levels, as compared to levels atstages 1 and 2 [15,16]. In our series, 88% ofpatients with stages 3– 4 had urinary DA levelsthat were higher than twice the upper limit ofnormal, whereas only 8% of patients with tumorstages 1–2 had DA levels twice the upper limit ofnormal. Urinary VMA was significantly higher(more than 10 times the upper limit of normal)
in 61% of patients with tumor stages 3– 4 than inthe stage 1–2 group, in which only 7% of patientshad urinary VMA at that level. Similarly, 44% ofpatients with tumor of stages 3– 4 had urinaryNE levels that were higher than 3 times the upperlimit of normal, in contrast to the stage 1–2group, in which no patients had urinary NE atthat level. Analysis of urinary HVA showed sim-ilar results, with 65% of patients with stages 3– 4having levels 3.5 times higher than the upperlimit of normal, and no patients in stages 1–2having urinary HVA in that range. As previouslysuggested, this increased net amount of cat-echolamines and their metabolites in patientswith advanced-stage disease presumably reflectsgreater absolute tumor burden [16].
Similar results were obtained when age atdiagnosis was analyzed. Patients older than 12months of age were found to have significantlyhigher means for all urinary compounds thanthose of patients younger than 12 months of age.
To assess if there is a difference in the me-tabolism of DA between the two groups, we com-pared the ratios of DA to VMA and DA to HVA forthe stage 1–2 and stage 3– 4 groups. When theurinary DA/VMA ratio was calculated, 18% ofpatients with stages 3– 4 had a ratio higher than1.4. However, all patients with tumor stages 1–2had urinary DA/VMA ratios lower than 1.4. In-terestingly, all patients with urinary DA/VMA ra-tios higher than 1.4 had stage 4 disease and wereolder than 12 months; both factors associatedwith poor prognosis. One of these patients alsohad MYCN amplification and two had unfavor-able Shimada histopathologic features. A similartrend was observed when the DA/HVA ratio wascalculated. In this case, 33% of patients withstages 3– 4 had a DA/HVA ratio higher than 1.5,whereas no patients in the stage 1–2 group hadDA/HVA ratios in that level. Once again, all thesepatients with high DA/HVA ratios were stage 4and older than 12 months. Similar results wereobserved when DA/VMA and DA/HVA ratios wereanalyzed relative to age.
When MYCN status was analyzed, all pa-tients with single copies had urinary DA/VMAratios lower than 1.4. Of the three patients withamplified MYCN, only one had a very elevatedurinary DA/VMA ratio. Similarly, all patients
Table 6. Correlation of DA/VMA and DA/HVAratios with MYCN status
MYCN
DA/VMA and DA/HVA
High Low
Not amplified 0 12
Amplified 1 2
P � 0.038.
Table 7. Correlation of DA/VMA ratios withhistology
Histology
DA/VMA
>1.4 <1.4
Favorable 0 14
Unfavorable 2 5
P � 0.035.
HORMONAL ACTIVITY IN NEUROBLASTOMA 197

with single copies of MYCN had DA/HVA ratioslower than 1.5, whereas the same patient withMYCN amplification had a very high DA/HVAratio. Interestingly, this patient with very highDA/VMA and DA/HVA ratios presented with par-ticularly poor prognostic features, includingMYCN amplification, stage 4, and 24 months ofage at diagnosis.
When histopathologic features were ana-lyzed, 29% of patients with unfavorable histologyhad urinary DA/VMA ratios higher than 1.4,whereas all patients with favorable histology hadurinary DA/VMA ratios lower than 1.4.
These findings confirm previous observationsthat in neuroblastomas with very poor prognosticfeatures, there appears to be a blockade in themetabolism of DA. It is particularly interesting thatin the present study, all tumors with high DA/HVAand DA/VMA ratios, which point to a blockade inthe metabolism of DA, are stage 4. This suggests apossible correlation between a loss in the ability tometabolize DA by these tumors and their acquisi-tion of metastatic potential. Also, according to ourresults, in some of these cases this metabolic block-ade might be at the monoamine oxidase (MAO),aldehyde dehydrogenase, and/or catechol-O-meth-yltransferase (COMT) level, rather than at the DA�-hydroxylase level (Fig. 1), which has been sug-gested by previous studies [15,16]. In accordancewith our findings, such an inability to metabolizeDA into HVA and NE into VMA has been previ-ously observed, suggesting a possible alteration ofthe enzymes COMT and MAO as a causative role[14,17].
In conclusion, our results confirm previousobservations suggesting that aggressive neuro-blastomas are associated with higher urinary lev-els of DA, VMA, HVA, and NE. We have alsoconfirmed that a subset of neuroblastomas withparticularly unfavorable features (tumor stage 4,age older than 12 months, unfavorable histology,and MYCN amplification) shows a blockade inthe metabolism of DA. According to the presentstudy, in some cases this blockade might be atthe level of MAO, aldehyde dehydrogenase,and/or COMT enzymes. The determination ofurinary DA, VMA, and HVA, and particularly theDA/VMA and DA/HVA ratios, may be used as a
valuable and rapid initial assessment of progno-
sis in patients with neuroblastoma.
A C K N O W L E D G M E N T
We thank Dr. W.M. Manger for his help with the
schematic description of the catecholamines path-
way.
R E F E R E N C E S
1. LaBrosse EH, Comoy E, Bohuon C, Zucker JM, Schweis-guth O. Catecholamine metabolism in neuroblastoma.J Natl Cancer Inst 1976;57:633–638.
2. Barontini de Gutierrez, Bergada C, Becu L. Catecholamineexcretion in forty children with sympathoblastoma. J Pe-diatr 1970;77:239–244.
3. Henry JB, Alexander DR, Eng CE. Evaluation of endocrinefunction. In: Henry JB, Davey FR, Nakamura RM, et al.,eds. Clinical Diagnosis and Management by LaboratoryMethods. 19th ed. Philadelphia: W.B. Saunders, 1996;342–344.
4. Barontini de Gutierrez, Bergada C, Becu L. Significance ofcatecholamine excretion in the follow-up of sympathoblas-tomas. Cancer 1971;27:228–232.
5. Brodeur GM, Seeger RC, Barrett A, Berthold IF, et al.International criteria for diagnosis, staging, and responseto treatment in patients with neuroblastoma. J Clin Oncol1988;6:1874–1881.
6. Brodeur GM, Pritchard J, Berthold JF, et al. Revisions ofthe international criteria for neuroblastoma diagnosis,staging, and response to treatment. J Clin Oncol 1993;11:1466–1477.
7. Katzenstein HM, Cohn SL. Advances in the diagnosis andtreatment of neuroblastoma. Curr Opin Oncol 1998;10:43–51.
8. Shimada H, Chatten J, Newton WA, et al. Histopathologicprognostic factors in neuroblastic tumors: definition ofsubtypes of ganglioneuroblastoma and an age-linked clas-sification of neuroblastomas. J Natl Cancer Inst 1984;73:405–416.
9. Brodeur GM, Seeger RC, Schwab M, Varmus HE, BishopJM. Amplification of N-myc in untreated human neuro-blastomas correlates with advanced disease stage. Science1984;224:1121–1124.
10. Seeger RC, Brodeur GM, Sather H, et al. Association ofmultiple copies of the N-myc oncogene with rapid progres-sion of neuroblastomas. N Engl J Med 1985;313:1111–1116.
11. Barontini M, Gutierrez MI, Levin G, Mur N, Diez B.N-myc oncogene and urinary catecholamines in chil-dren with neuroblastoma. Med Pediatr Oncol 1993;21:499 –504.
12. Izbicki T, Bozek J, Perek D, Wozniak W. Urinary dopa-mine/noradrenaline and dopamine/vanillylmandelic acidratios as a reflection of different biology of adrenergicclones in children’s neuroblastic tumors. J Pediatr Surg1991;26:1230–1234.
13. Nakagawara A, Ikeda K, Higashi K, Sasazuki T. Inversecorrelation between N-myc amplification and catechol-amine metabolism in children with advanced neuroblas-toma. Surgery 1990;107:43–49.
198 E. ZAMBRANO AND M. REYES-MUGICA
14. Nakagawara A, Ikeda K, Tasaka H. Dopaminergic neuro-blastoma as a poor prognostic subgroup. J Pediatr Surg1988;23:346–349.
15. Laug WE, Siegel SE, Shaw KN, Landing B, Baptista J,Gutenstein M. Initial urinary catecholamine metaboliteconcentrations and prognosis in neuroblastoma. Pediat-rics 1978;62:77–83.
16. Graham-Pole J, Salmi T, Anton AH, Abramowsky C, Gross
S. Tumor and urine catecholamines (CATs) in neurogenictumors. Correlations with other prognostic factors andsurvival. Cancer 1983;51:834–839.
17. Voorhess ML, Gardner U. Studies of catecholamine excre-tion by children with neural tumors. J Clin EndocrinolMetab 1962;22:126–133.
18. Manger WM, Gifford RW Jr. Pheochromocytoma. NewYork: Springer-Verlag, 1977.
HORMONAL ACTIVITY IN NEUROBLASTOMA 199
Copyright © 2022 FDOKUMEN