Corporate Loss Utilisation through Aggressive Tax ... - USCIB
Upload
khangminh22Category
view
2download
0
HAL Id: hal-01024706https://hal.archives-ouvertes.fr/hal-01024706
Submitted on 16 Jul 2014
HAL is a multi-disciplinary open accessarchive for the deposit and dissemination of sci-entific research documents, whether they are pub-lished or not. The documents may come fromteaching and research institutions in France orabroad, or from public or private research centers.
L’archive ouverte pluridisciplinaire HAL, estdestinée au dépôt et à la diffusion de documentsscientifiques de niveau recherche, publiés ou non,émanant des établissements d’enseignement et derecherche français ou étrangers, des laboratoirespublics ou privés.
Effect of varying conditions of exposure to an aggressivemedium on the corrosion behavior of the 2050 Al–Cu–Li
alloyMathilde Guérin, Eric Andrieu, Grégory Odemer, Joël Alexis, Christine Blanc
To cite this version:Mathilde Guérin, Eric Andrieu, Grégory Odemer, Joël Alexis, Christine Blanc. Effect of varyingconditions of exposure to an aggressive medium on the corrosion behavior of the 2050 Al–Cu–Li alloy.Corrosion Science, Elsevier, 2014, vol. 85, pp. 455-470. �10.1016/j.corsci.2014.04.042�. �hal-01024706�

Any correspondence concerning this service should be sent to the repository administrator: [email protected]
Identification number: DOI : 10.1016/j.corsci.2014.04.042 fficial URL: http://dx.doi.org/10.1016/j.corsci.2014.04.042
This is an author-deposited version published in: http://oatao.univ-toulouse.fr/ Eprints ID: 11782
To cite this version: Guérin, Mathilde and Andrieu, Eric and Odemer, Grégory and Alexis, Joël and Blanc, Christine Effect of varying conditions of exposure to an aggressive medium on the corrosion behavior of the 2050 Al--Cu--Li alloy. (2014) Corrosion Science, vol. 85 . pp. 455-470. ISSN 0010-938X
Open Archive Toulouse Archive Ouverte (OATAO) OATAO is an open access repository that collects the work of Toulouse researchers and makes it freely available over the web where possible.

Effect of varying conditions of exposure to an aggressive mediumon the corrosion behavior of the 2050 Al–Cu–Li alloy
Mathilde Guérin a,b, Eric Andrieu a, Grégory Odemer a, Joël Alexis b, Christine Blanc a,⇑
aUniversité de Toulouse, Institut CARNOT CIRIMAT, UPS/CNRS/INPT, ENSIACET, 4 allée Emile Monso, 31030 Toulouse Cedex 04, FrancebUniversité de Toulouse, LGP, ENIT/INPT, 47 Avenue d’Azereix, 65016 Tarbes, France
Keywords:
A. Aluminum
A. Intermetallics
B. EIS
C. Intergranular corrosion
C. Hydrogen embrittlement
a b s t r a c t
The corrosion behavior of aluminum alloy 2050 was studied as a function of varying conditions of
exposure to an aqueous NaCl solution. Two metallurgical states were considered, i.e., an as-received alloy
(NHT) and aged samples (HT). After continuous immersion tests, the NHT samples were susceptible to
intergranular corrosion, whereas intragranular corrosion was observed for the HT samples. For the
NHT samples, cyclic corrosion tests, with alternate immersion – emersion periods, induced subgrain
boundary dissolution, and for the HT samples, grain and/or subgrain boundary sensibilization was
induced. Hydrogen content measurements suggested a hydrogen enrichment of the alloy under cyclic
corrosion tests.
1. Introduction
Corrosion is considered a major threat to the structural integrity
of aircraft structures and may significantly reduce the lifetime of
such structures. To improve the corrosion resistance of aircraft
metallic structures and to reduce their weight, new aluminum
alloys, called 3rd generation aluminum–copper–lithium alloys,
were developed. The 2050 alloy is one of the most promising solu-
tions because this material combines low density, good mechanical
properties and good corrosion resistance. Indeed, the addition of Li
results in the reduction of the weight of the alloy because the den-
sity is reduced by 3% for each 1 wt% Li added to Al, whereas the
elastic modulus is increased by almost 6% [1–3]. However, the
presence of copper-rich second phases can produce micro-galvanic
coupling, which leads to a decrease of the corrosion resistance of
the alloy.
Previous studies focused on the corrosion behavior of Al–Cu–Li
alloys demonstrated that these alloys were susceptible to different
types of corrosion according to the thermomechanical treatments
applied [4–8]. Thus, depending on their thermomechanical history,
the Al–Cu–Li alloys may be susceptible to pitting and to intragran-
ular or intergranular corrosion in relation to the distribution and to
the type of intermetallic precipitates or dispersoids controlling the
local electrochemical potentials. Galvanic coupling, which occurs
between second phases, usually rich in copper, and the matrix is
a common mechanism responsible for pitting [9–12]. As an exam-
ple, Al–Cu–Fe–Mn intermetallic particles, which are encountered
in Al–Cu–Li alloys, cause the dissolution of the surrounding matrix
because of their nobler electrochemical potential. The effect of the
precipitation of hardening phases in Al–Cu–Li alloys on their corro-
sion behavior has also been thoroughly studied [4,9,13–16]. The
results of these studies indicated that the electrochemical potential
of T1–Al2CuLi precipitates, which are the most common hardening
precipitates encountered in these alloys, differed from that of the
matrix, leading to a galvanic coupling phenomenon. For a low
immersion time in chloride media, the corrosion potential of T1precipitates was found to be more cathodic than that of the matrix,
whereas for a longer immersion time, the corrosion potential of T1precipitates evolves, as well as that of the matrix, leading to an
inversion in polarity [14]. The coupling between T1 phases and
the matrix was then primarily considered responsible for the cor-
rosion susceptibility of Al–Cu–Li alloys, with intergranular and/or
intragranular corrosion, depending on the thermomechanical
treatment applied to the material [7]. Furthermore, Smith and
Scully proposed that hydrogen could be trapped at the incoherent
interfaces of T1 particles [17,18]; these authors considered that T1particles are likely to be one of the high-energy trapping states in
Al–Li–Cu–Zr alloys and pointed out the error in assuming that
hydrogen cannot play a major role in cracking of Al-based alloys
due to the low lattice solubility. Therefore, it was of interest to
consider the hydrogen – T1 particles interactions to explain the
http://dx.doi.org/10.1016/j.corsci.2014.04.042
⇑ Corresponding author. Address: Université de Toulouse, CIRIMAT, UPS/CNRS/
INPT, 4 allée Emile Monso, BP 44362, 31030 Toulouse Cedex 4, France. Tel.: +33 (0)5
34 32 34 07; fax: +33 (0)5 34 32 34 98.
E-mail address: [email protected] (C. Blanc).

properties of corroded samples when hydrogen was produced dur-
ing the corrosion processes. Of course, this was dependent on the
quantity of hydrogen produced and therefore on the exposure
conditions.
Indeed, the conditions of exposure to an aggressive medium are
another major factor affecting the corrosion susceptibility of
metallic alloys [19–24]; cyclic corrosion tests with wet and dry
phases modified the corrosion susceptibility of aluminum alloys
compared with continuous immersion tests [24]. Larignon et al.
showed that, after cyclic corrosion tests, a high hydrogen amount
was detected inside a corroded 2024 aluminum alloy [24]. The
influence of the exposure conditions to the aggressive medium is
particularly true for aircraft structures because they are cyclically
exposed to corrosive environments throughout their life. Indeed,
when the plane is on the tarmac, the plane is exposed to a corrosive
environment and sometimes to high temperatures; however, dur-
ing a flight, the exposure duration to the corrosive environment
decreases. Additionally, for some parts of the structure, the tem-
perature falls to roughly ÿ50 °C, whereas other parts of the struc-
ture are maintained at room temperature.
The aim of this work is to study the effect of varying conditions
of exposure to an aggressive medium on the corrosion susceptibil-
ity of the 2050 alloy. To apply testing conditions similar to real
exposure conditions, corrosion tests with alternate immersion
and emersion phases were performed in the laboratory. Because
the corrosion susceptibility of the alloy strongly depends on its
precipitation state, the 2050 alloy was studied in both its as-
received state, which is associated with a low volume fraction of
precipitates, and in an aged state, which is characterized by a large
precipitation of T1 phases. Comparison of the results obtained for
the two metallurgical states will help in understanding the influ-
ence of T1 precipitates on the corrosion morphology depending
on the exposure conditions to the aggressive medium and will be
helpful to obtain data about hydrogen trapping at T1 precipitates.
Therefore, these two metallurgical states were exposed to contin-
uous immersion and to cyclic corrosion tests to study the effect
of environmental exposure conditions on their corrosion behavior.
2. Experimental
2.1. Material
The material for this study was an aluminum–copper–lithium
AW (Airware) 2050 alloy (Al base, 3.86% Cu, 0.86% Li; wt%) pro-
vided by Constellium (France). The material was received as a
50 mm thick plate obtained by hot rolling, followed by solutioning,
water quenching, stretching and natural ageing at room tempera-
ture, leading to the T34 metallurgical state. In this metallurgical
state, according to the literature [25], hardening T1 precipitates
were not present in the grains. Therefore, to promote the formation
of hardening T1 precipitates in the grains, a piece of the plate
received a heat treatment corresponding to an artificial ageing
treatment at 155 °C for 30 h. In the following text, samples in the
T34 metallurgical state and aged samples are called NHT (non-heat
treated) and HT (heat-treated), respectively. The two metallurgical
states are of interest from an industrial point of view. Friction stir
welding (FSW) joints of Al–Cu–Li alloys constitute promising solu-
tions to replace the riveted structures of aluminum alloys. The
welded joints could be obtained by welding two plates in the
T34 metallurgical states; after the welding process, the joints
are submitted to an artificial ageing, without solutioning
before the ageing, to increase their mechanical properties [7].
Therefore, the HT alloy corresponds to the metallurgical state of
the base metal after the post-welding heat-treatment. Due to the
rolling process, the microstructure of the material presented grains
strongly elongated in the rolling (longitudinal) direction. The aver-
age grain sizes in the longitudinal (L), transversal (LT) and short
transversal (ST) directions were 500, 350 and 60 lm, respectively.
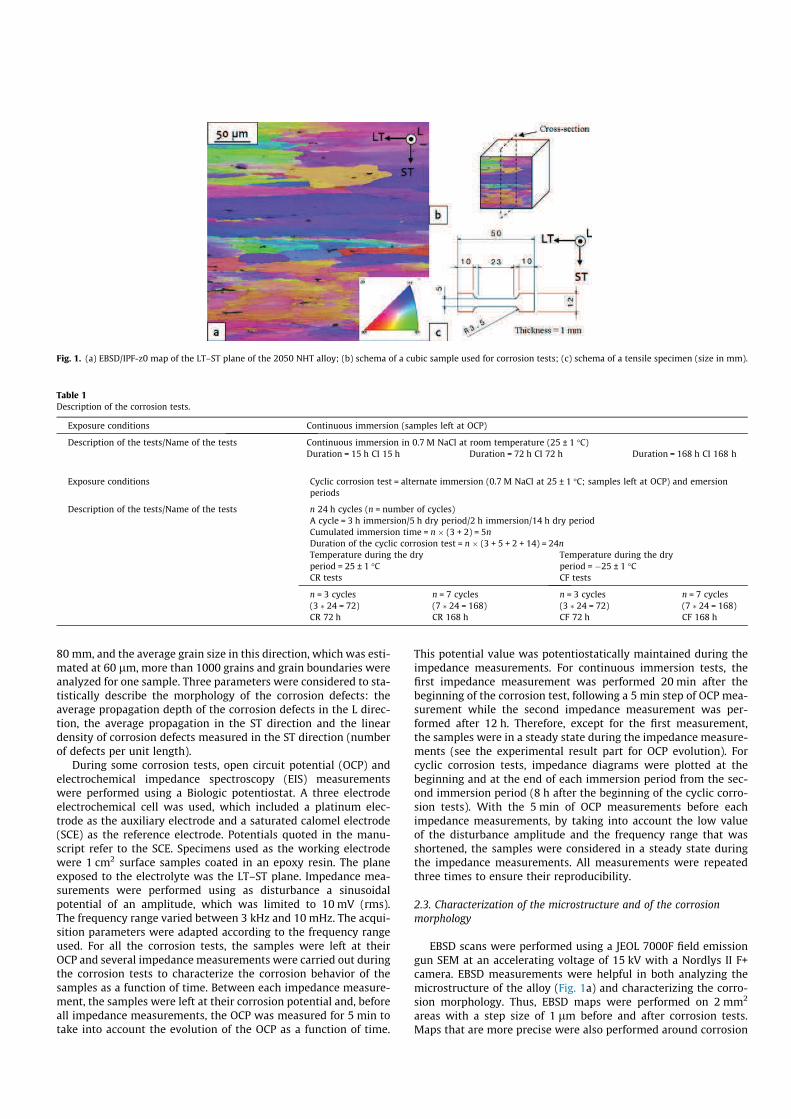
Electron backscattered diffraction (EBSD) observations (Fig. 1a; see
the experimental section below for EBSD explanations) showed the
strong morphological anisotropy of the material. Scanning Electron
Microscope (SEM), using a JEOL 7000F field emission gun SEM,
allowed coarse Al–Cu–Mn–Fe particles to be observed both for
NHT and HT samples. Their density and distribution (both in the
grains and at the grain boundaries) were similar for the two met-
allurgical states because the artificial ageing at 155 °C could not
change the distribution of coarse particles. These particles were
not studied with more details because they mainly influence the
susceptibility to pitting corrosion of the alloy. The finer precipita-
tion, i.e. the distribution of T1 precipitates, was described in the
experimental results and discussion part.
2.2. Corrosion tests
All corrosion tests were performed in a 0.7 M NaCl solution
maintained at a temperature of 25 °C using a Julabo refrigerated
circulator in a laboratory room at a controlled temperature
(25 °C ± 1 °C). This chloride concentration is representative of the
chloride content for the solutions used during Mastmaasis Wet
Bottom test, an industrial corrosion test used by Constellium. For
the most part, corrosion tests corresponded to four exposure con-
ditions with two cyclic corrosion tests and two continuous immer-
sion tests (Table 1). For all the tests, during the immersion periods,
the samples were hanged in the corrosion cell by using a thin nylon
yarn. Cyclic corrosion tests (CR 72 h and CF 72 h) consisted of three
24 h cycles; each cycle was composed of a 3 h immersion in the
electrolyte, which was followed by a 5 h dry period in air, then a
2 h immersion period and, finally, a 14 h dry period in air. During
the air exposure periods (emersion phase), the samples were
hanged by using the nylon yarn in a sample glass store placed in
the laboratory room (25 °C ± 1 °C) for the CR 72 h tests and, for
the CF 72 h tests, the samples were hanged in a container main-
tained at a negative temperature equal to ÿ25 °C ± 1 °C. For com-
parison, two continuous immersion tests (CI 15 h and CI 72 h)
were also performed with durations of 15 h and 72 h. The pH
was monitored during the continuous immersion tests. It was
equal to 5.7 at the beginning of the test and became equal to
7.65 after 72 h for both NHT and HT samples. The duration of the
first continuous immersion test represented the cumulated immer-
sion time for cyclic corrosion tests, and the duration of the second
one represented the total duration for the cyclic tests. For a few
tests, to amplify the corrosion damage, cyclic tests consisted of
seven 24 h cycles; these tests were called CR 168 h and CF 168 h
(Table 1). For these tests, a 168 h continuous immersion test (CI
168 h) was considered as a reference. All corrosion tests were per-
formed on cubic samples (10 mm edge) extracted from the core of
the plate. The plane exposed to the aggressive mediumwas the LT–
ST plane to observe the propagation of the corrosion defects in the
rolling direction, which is the most critical direction for corrosion
propagation because of the morphological texture of the material.
Before corrosion tests, the samples were mechanically abraded up
to 4000 grade, then polished with 3 lm and 1 lm diamond paste,
rinsed in distilled water and air-dried. After corrosion tests, the
samples were cut along the L–ST plane to obtain cross-sections
for the analysis of the propagation of the corrosion in the bulk of
the samples (Fig. 1b). Cross-sections were polished and then
observed using optical (OM) and scanning electron microscopes
(SEM; see experimental part below). To quantify the corrosion
damage, a statistical analysis was performed from many polished
cross-sections. Considering the cumulative length of the corroded
surface observed in the ST direction, which was estimated at
80 mm, and the average grain size in this direction, which was esti-
mated at 60 lm, more than 1000 grains and grain boundaries were
analyzed for one sample. Three parameters were considered to sta-
tistically describe the morphology of the corrosion defects: the
average propagation depth of the corrosion defects in the L direc-
tion, the average propagation in the ST direction and the linear
density of corrosion defects measured in the ST direction (number
of defects per unit length).
During some corrosion tests, open circuit potential (OCP) and
electrochemical impedance spectroscopy (EIS) measurements
were performed using a Biologic potentiostat. A three electrode
electrochemical cell was used, which included a platinum elec-
trode as the auxiliary electrode and a saturated calomel electrode
(SCE) as the reference electrode. Potentials quoted in the manu-
script refer to the SCE. Specimens used as the working electrode
were 1 cm2 surface samples coated in an epoxy resin. The plane
exposed to the electrolyte was the LT–ST plane. Impedance mea-
surements were performed using as disturbance a sinusoidal
potential of an amplitude, which was limited to 10 mV (rms).
The frequency range varied between 3 kHz and 10 mHz. The acqui-
sition parameters were adapted according to the frequency range
used. For all the corrosion tests, the samples were left at their
OCP and several impedance measurements were carried out during
the corrosion tests to characterize the corrosion behavior of the
samples as a function of time. Between each impedance measure-
ment, the samples were left at their corrosion potential and, before
all impedance measurements, the OCP was measured for 5 min to
take into account the evolution of the OCP as a function of time.
This potential value was potentiostatically maintained during the
impedance measurements. For continuous immersion tests, the
first impedance measurement was performed 20 min after the
beginning of the corrosion test, following a 5 min step of OCP mea-
surement while the second impedance measurement was per-
formed after 12 h. Therefore, except for the first measurement,
the samples were in a steady state during the impedance measure-
ments (see the experimental result part for OCP evolution). For
cyclic corrosion tests, impedance diagrams were plotted at the
beginning and at the end of each immersion period from the sec-
ond immersion period (8 h after the beginning of the cyclic corro-
sion tests). With the 5 min of OCP measurements before each
impedance measurements, by taking into account the low value
of the disturbance amplitude and the frequency range that was
shortened, the samples were considered in a steady state during
the impedance measurements. All measurements were repeated
three times to ensure their reproducibility.
2.3. Characterization of the microstructure and of the corrosion
morphology
EBSD scans were performed using a JEOL 7000F field emission
gun SEM at an accelerating voltage of 15 kV with a Nordlys II F+
camera. EBSD measurements were helpful in both analyzing the
microstructure of the alloy (Fig. 1a) and characterizing the corro-
sion morphology. Thus, EBSD maps were performed on 2 mm2
areas with a step size of 1 lm before and after corrosion tests.
Maps that are more precise were also performed around corrosion
Fig. 1. (a) EBSD/IPF-z0 map of the LT–ST plane of the 2050 NHT alloy; (b) schema of a cubic sample used for corrosion tests; (c) schema of a tensile specimen (size in mm).
Table 1
Description of the corrosion tests.
Exposure conditions Continuous immersion (samples left at OCP)
Description of the tests/Name of the tests Continuous immersion in 0.7 M NaCl at room temperature (25 ± 1 °C)
Duration = 15 h CI 15 h Duration = 72 h CI 72 h Duration = 168 h CI 168 h
Exposure conditions Cyclic corrosion test = alternate immersion (0.7 M NaCl at 25 ± 1 °C; samples left at OCP) and emersion
periods
Description of the tests/Name of the tests n 24 h cycles (n = number of cycles)
A cycle = 3 h immersion/5 h dry period/2 h immersion/14 h dry period
Cumulated immersion time = n � (3 + 2) = 5n
Duration of the cyclic corrosion test = n � (3 + 5 + 2 + 14) = 24n
Temperature during the dry
period = 25 ± 1 °C
Temperature during the dry
period = ÿ25 ± 1 °C
CR tests CF tests
n = 3 cycles n = 7 cycles n = 3 cycles n = 7 cycles
(3 � 24 = 72) (7 � 24 = 168) (3 � 24 = 72) (7 � 24 = 168)
CR 72 h CR 168 h CF 72 h CF 168 h

defects with a step size of 0.5 lm. The orientation data were post-
processed with the commercial orientation imaging software pack-
age Oxford Channel 5. The inverse pole figure (IPF) maps represent
the crystal orientation parallel to the normal sample surface. More-
over, a Nikon ECLIPSE MA200 OM and a SEM (ZEISS EVO HD LS15;
incident electron beam kept at 15 kV) were used to carefully exam-
ine the microstructure of the material and the corrosion defects.
Transmission electron microscopy (TEM) using a JEOL-JEM-2010
microscope also allowed various types of precipitates to be
observed. Specifically, 300-lm slices were removed from the
samples and were ground to a thickness of 100 lm. A dimple
was machined in the central region using a South Bay Technology
dimpler with a methanol (900 mL)/nitric acid (300 mL) mixture.
2.4. Mechanical tests and hydrogen measurements
Mechanical tests were performed to evaluate the residual
mechanical properties of the corroded samples. Tensile tests were
performed on tensile specimens (Fig. 1c) at a strain rate of 10ÿ3 sÿ1
using an Instron testing machine equipped with a 10 kN load cell.
Mechanical tests were performed on unexposed samples and on
pre-corroded samples prepared according to the corrosion testing
conditions previously described. The LT–ST planes of the tensile
specimens were exposed to the medium, with the other planes
protected by a varnish, and the samples were strained along the
LT direction. To amplify the corrosion effects on the mechanical
behavior, pre-corrosion tests corresponded to CR 168 h and CF
168 h (7 cycles). Therefore, CI 168 h tests were compared with
the cyclic tests CR 168 h and CF 168 h in terms of the residual
mechanical properties of the tensile specimens (Table 1). Hydrogen
content measurements were performed using a Horiba EMGA-
621W and a Brüker Galileo HMat Instrumental Gas Analyzers
(IGA) in which the sample was heated until 1200 °C. Before per-
forming measurements, the corrosion products were removed
from the surface by mechanical polishing, and the samples were
cut into small pieces of approximately 0.1 g. Both tensile tests
and hydrogen content measurements were repeated three times
for each condition.
3. Experimental results and discussion
3.1. Corrosion susceptibility of the 2050 alloy during continuous
immersion tests
To study the effect of environmental exposure conditions on the
corrosion susceptibility of the 2050 alloy, first, continuous immer-
sion tests were performed in chloride solution for both NHT and HT
alloys. Fig. 2a and b show optical micrographs of corrosion defects
for a NHT sample after 15 h and 72 h of continuous immersion. The
NHT alloy was found to be susceptible to intergranular corrosion.
By comparing the EBSD analysis (Fig. 2c) and SEM observations
(Fig. 2d) of the same corrosion defects, the dissolution of grain
boundaries was evidenced. This result seems to be consistent with
another study [25] in which the authors explained the susceptibil-
ity of the 2050 alloy to intergranular corrosion by the presence of
T1 phases at grain boundaries. Because of the more negative poten-
tial of T1 precipitates compared with that of the matrix, a galvanic
coupling occurs at the expense of T1, which leads to grain boundary
dissolution [25]. Furthermore, Li et al. show that the potential of T1precipitates was shifted to a more positive value for a long immer-
sion time due to the preferential dissolution of Li from T1 and to
the resulting copper enrichment of the particles [15]. Conse-
quently, the intergranular corrosion associated with the presence
of T1 phases at grain boundaries might be due to the alternate ano-
dic dissolution of the T1 precipitates and to that of the surrounding
matrix. However, in the present work, unlike observations in the
literature, no T1 precipitation was observed at grain boundaries
for the NHT alloy (Fig. 2e). TEM observation along [011] zone axis
clearly showed the absence of T1 precipitate on the micrograph and
the absence of characteristic strikes on the selected area diffraction
pattern. It was assumed that intergranular susceptibility should be
caused by a preferential segregation of alloying elements, i.e., most
likely Cu and/or Li, at grain boundaries. Further analyses are in pro-
gress to assess the relevancy of this hypothesis. However, notably,
this work shows that the presence of T1 precipitates at grain
boundaries is not required to obtain intergranular corrosion for
the 2050 alloy. A comparison of Fig. 2a and b shows a widening
of corrosion defects when the corrosion time increases. During
the first hours of immersion, the corrosion defects corresponded
to thin grooves limited to grain boundary areas, whereas, after a
longer immersion time, corrosion grooves are quite wide and
extend in the grain. Furthermore, the observations (Fig. 2a–d)
show that the propagation paths are nearly linear and that most
of the defects corresponded to the dissolution of one or two con-
nected grain boundaries.
To better describe the corrosion damage, a statistical analysis
was performed. Fig. 3 shows the average propagation depth of the
corrosion defects in the L direction and their average propagation
width in the ST direction for both NHT and HT samples after differ-
ent corrosion tests. It can be added that, when several corroded
grain boundaries were connected, these boundaries were consid-
ered only one corrosion defect. Therefore, when the alloy is suscep-
tible to intergranular corrosion, the last criterion, i.e., the
propagation width in the ST direction, allows the evaluation of
the branching of the corrosion defects, assuming that, for a cor-
roded grain boundary considered individually, its average width
in the ST direction was less than 1 lm and approximately 2–3 lm
after CI 15 h and CI 72 h, respectively. The 3rd parameter is the
number of corrosion defects observed permmof cross sections ana-
lyzed and is called the ‘‘linear density of corrosion defects’’. For NHT
samples, after continuous immersion tests, the quantification of the
corrosion susceptibility, according to the corrosion exposure time,
shows an increase in the defects size when the corrosion exposure
time increases. Considering the propagation along the L direction,
after a CI 72 h corrosion test, corrosion defects are longer than for
a CI 15 h corrosion test, with propagation depths equal to 100 and
160 lm, respectively. Surprisingly, the linear density of corrosion
defects was smaller after CI 72 h compared with CI 15 h tests. This
result could be explained by the stronger density of pits in the CI
72 h samples compared with CI 15 h samples. For the CI 15 h sam-
ples, no pit was observed in the L–ST plane for a cumulative length
observed in the ST direction of 80 mm. On the contrary, for the CI
72 h samples, 19 pits were observed in the L–ST plane for a cumu-
lative length observed in the ST direction of 40 mm. Their mean
depth in the L direction was 17 lm with values between 11 and
25 lm. Many intergranular corrosion defects were assumed to ini-
tiate after CI 72 h tests; however, these defects did not propagate
enough to be detected due to pit propagation in their surroundings.
This hypothesis suggested that the interactions between the two
types of corrosion, i.e., pitting and intergranular corrosion, signifi-
cantly affected intergranular corrosion propagation.
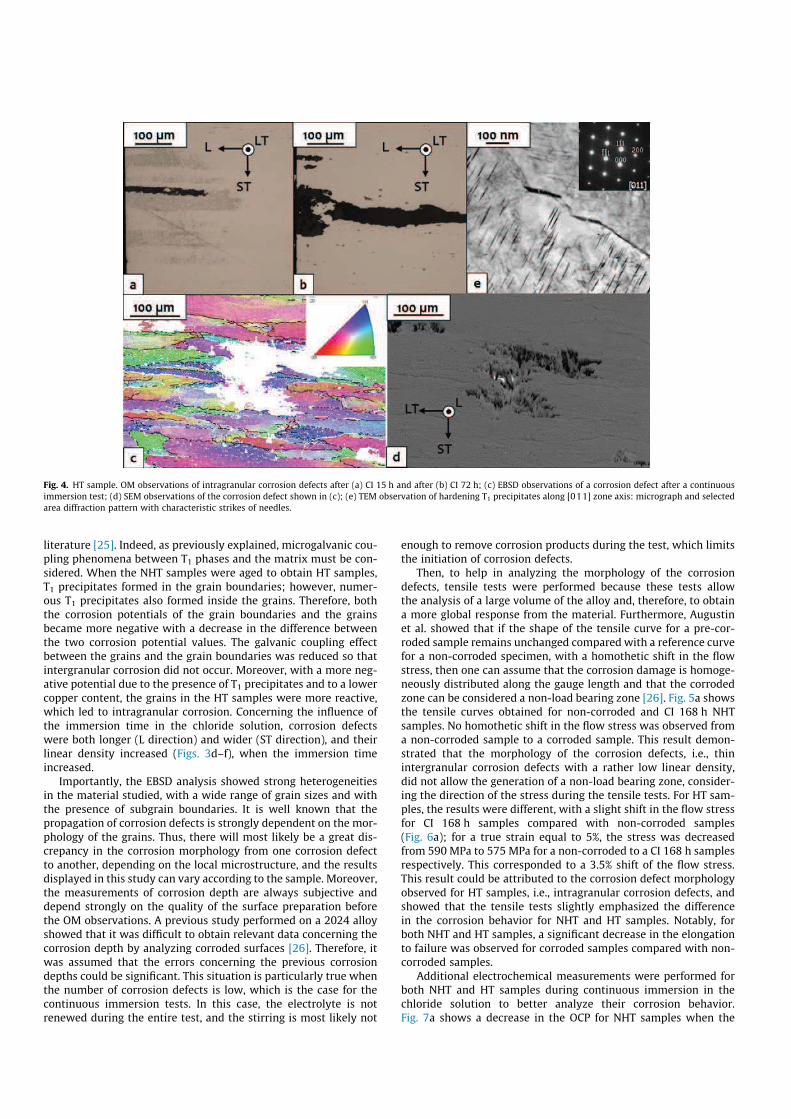
For the HT alloy, the material was susceptible to intragranular
corrosion (Fig. 4a and b). The EBSD analysis (Fig. 4c), which was
combined with SEM observations (Fig. 4d) of the same corrosion
defect confirmed this corrosion morphology. TEM observations
along [011] zone axis (Fig. 4e) showed the presence of T1 precipi-
tates both in the grains and at the grain boundaries with character-
istic strikes of needles observed on the selected area diffraction
pattern. The susceptibility of the HT alloy to intragranular corro-
sion was due to the precipitation of T1 phases both in the grain
and at the grain boundaries, which is in agreement with the

Fig. 2. NHT sample. OM observations of intergranular corrosion defects after (a) CI 15 h and after (b) CI 72 h; (c) EBSD observations of a corrosion defect after a continuous
immersion test; (d) SEM observations of the corrosion defect shown in (c); (e) TEM observation along [011] zone axis: no T1 precipitate visible on the micrograph and absence
of characteristic strikes on the selected area diffraction pattern.
Fig. 3. Average propagation depth of corrosion defects for NHT samples in (a) L and (b) ST directions and for HT samples in (d) L and (e) ST directions. Linear density of
corrosion defects in the ST direction for (c) NHT and (f) HT samples. The data are given for both continuous immersion tests and cyclic corrosion tests.
literature [25]. Indeed, as previously explained, microgalvanic cou-
pling phenomena between T1 phases and the matrix must be con-
sidered. When the NHT samples were aged to obtain HT samples,
T1 precipitates formed in the grain boundaries; however, numer-
ous T1 precipitates also formed inside the grains. Therefore, both
the corrosion potentials of the grain boundaries and the grains
became more negative with a decrease in the difference between
the two corrosion potential values. The galvanic coupling effect
between the grains and the grain boundaries was reduced so that
intergranular corrosion did not occur. Moreover, with a more neg-
ative potential due to the presence of T1 precipitates and to a lower
copper content, the grains in the HT samples were more reactive,
which led to intragranular corrosion. Concerning the influence of
the immersion time in the chloride solution, corrosion defects
were both longer (L direction) and wider (ST direction), and their
linear density increased (Figs. 3d–f), when the immersion time
increased.
Importantly, the EBSD analysis showed strong heterogeneities
in the material studied, with a wide range of grain sizes and with
the presence of subgrain boundaries. It is well known that the
propagation of corrosion defects is strongly dependent on the mor-
phology of the grains. Thus, there will most likely be a great dis-
crepancy in the corrosion morphology from one corrosion defect
to another, depending on the local microstructure, and the results
displayed in this study can vary according to the sample. Moreover,
the measurements of corrosion depth are always subjective and
depend strongly on the quality of the surface preparation before
the OM observations. A previous study performed on a 2024 alloy
showed that it was difficult to obtain relevant data concerning the
corrosion depth by analyzing corroded surfaces [26]. Therefore, it
was assumed that the errors concerning the previous corrosion
depths could be significant. This situation is particularly true when
the number of corrosion defects is low, which is the case for the
continuous immersion tests. In this case, the electrolyte is not
renewed during the entire test, and the stirring is most likely not
enough to remove corrosion products during the test, which limits
the initiation of corrosion defects.
Then, to help in analyzing the morphology of the corrosion
defects, tensile tests were performed because these tests allow
the analysis of a large volume of the alloy and, therefore, to obtain
a more global response from the material. Furthermore, Augustin
et al. showed that if the shape of the tensile curve for a pre-cor-
roded sample remains unchanged compared with a reference curve
for a non-corroded specimen, with a homothetic shift in the flow
stress, then one can assume that the corrosion damage is homoge-
neously distributed along the gauge length and that the corroded
zone can be considered a non-load bearing zone [26]. Fig. 5a shows
the tensile curves obtained for non-corroded and CI 168 h NHT
samples. No homothetic shift in the flow stress was observed from
a non-corroded sample to a corroded sample. This result demon-
strated that the morphology of the corrosion defects, i.e., thin
intergranular corrosion defects with a rather low linear density,
did not allow the generation of a non-load bearing zone, consider-
ing the direction of the stress during the tensile tests. For HT sam-
ples, the results were different, with a slight shift in the flow stress
for CI 168 h samples compared with non-corroded samples
(Fig. 6a); for a true strain equal to 5%, the stress was decreased
from 590 MPa to 575 MPa for a non-corroded to a CI 168 h samples
respectively. This corresponded to a 3.5% shift of the flow stress.
This result could be attributed to the corrosion defect morphology
observed for HT samples, i.e., intragranular corrosion defects, and
showed that the tensile tests slightly emphasized the difference
in the corrosion behavior for NHT and HT samples. Notably, for
both NHT and HT samples, a significant decrease in the elongation
to failure was observed for corroded samples compared with non-
corroded samples.
Additional electrochemical measurements were performed for
both NHT and HT samples during continuous immersion in the
chloride solution to better analyze their corrosion behavior.
Fig. 7a shows a decrease in the OCP for NHT samples when the
Fig. 4. HT sample. OM observations of intragranular corrosion defects after (a) CI 15 h and after (b) CI 72 h; (c) EBSD observations of a corrosion defect after a continuous
immersion test; (d) SEM observations of the corrosion defect shown in (c); (e) TEM observation of hardening T1 precipitates along [011] zone axis: micrograph and selected
area diffraction pattern with characteristic strikes of needles.

immersion time increases from 0 to 72 h. Two steps can be defined
in the OCP variation: during the first day of immersion, an impor-
tant drop in the OCP is observed, whereas during the next two
days, the OCP progressively decreases and becomes nearly con-
stant after 3 days of immersion, reaching a value of ÿ0.78 V/SCE.
The rate of the OCP drop was calculated for four different tests; this
Fig. 5. (a) Tensile curves obtained for the NHT samples of a 2050 aluminum alloy. The curves are plotted for non-corroded samples and for samples pre-corroded during CI
168 h, CR 168 h and CF 168 h tests; (b) Hydrogen embrittlement index; (c) Hydrogen content measurements for corroded samples according to exposure conditions.
Fig. 6. (a) Tensile curves obtained for the HT samples of a 2050 aluminum alloy. The curves are plotted for non-corroded samples and for samples pre-corroded during CI
168 h, CR 168 h and CF 168 h tests; (b) Hydrogen embrittlement index; (c) Hydrogen content measurements for corroded samples according to exposure conditions.
Fig. 7. Evolution of the electrochemical parameters during continuous immersion in 0.7 M NaCl. (a) Open circuit potential (OCP) as a function of immersion time for NHT and
HT samples. (b) Impedance diagrams (Nyquist plots) for NHT and HT alloys after 24 h of continuous immersion in the electrolyte. (c) Rt versus immersion time for NHT and HT
samples.

rate decreased by a factor of ten between the two steps
(5.6 � 10ÿ3 mV/h for the first 24 h of immersion compared with
5.6 � 10ÿ4 mV/h during the second step). The OCP drop at the
beginning of the test could be linked to the dissolution of the pro-
tective oxide [27]. Importantly, Hagyard et al. showed that the
potential rose to a peak at the beginning of the immersion and that
this increase was attributed to the dissolution of aluminum and to
the formation of the protective oxide [28,29]. This reaction was
very quick and, thus, is rarely observed, which was the case in this
study because no peak was visible in Fig. 7a. After reaching the
peak potential, only a small fraction of the electrode surface
remains actively anodic, whereas the hydrogen release process
and oxygen reduction occur over most of the metal surface. The
evolution of the OCP in Fig. 7a suggests a strong dissolution of
the alloy during the first step (between 0 and 24 h) and then,
due to the accumulation of corrosion products, the potential pro-
gressively becomes constant to reach a minimum (between 24
and 72 h). Corrosion processes in the second step may be mini-
mized compared with the first period. The effect of the immersion
time could be explained by referring to the literature. By perform-
ing polarization curves in an old and in a fresh EXCO corrosion test
solution for the 2024 alloy, Keddam et al. showed that both the
corrosion potential and the corrosion current were lower in the
old solution than in the new solution [30]. The drop in these vari-
ables was attributed to a decrease in the cathodic reaction rate.
Because the cathodic reaction was the limiting step for the corro-
sion processes, it was assumed that for a long immersion time, cor-
responding to an old solution, the dissolution of the material was
slowed. This assumption could be related to the size of the corro-
sion defects. For a short immersion time, although the anodic reac-
tion corresponded to aluminum oxidation, the cathodic reactions
most likely corresponded to oxygen reduction on the alloy surface
and, when the intergranular corrosion propagated, due to the local
acidification at the tip of the corrosion defect, to H+ reduction
inside the corrosion defect. However, oxygen reduction on the
walls of the corrosion defects was also a possibility. After a long
immersion time, long corrosion defects were primarily observed,
with the accumulation of corrosion products inside these defects
and on the surface of the sample. These defects could be rapidly
considered an occluded zone characterized by a chloride-enriched
electrolyte and by H+ reduction as the major cathodic reaction. No
oxygen reaction could occur inside the corrosion defects; this reac-
tion was also limited on the sample surface, which led to a
decrease in the electrochemical reaction rate. This hypothesis
was supported by the electrochemical impedance spectroscopy
measurements reported in Fig. 7b and c for both NHT and HT sam-
ples. The measurements were performed every 12 h during the CI
tests. All the impedance diagrams presented a similar shape; there-
fore, for more clarity, only the impedance diagram plotted after
24 h of continuous immersion was plotted in Fig. 7b for the two
alloys. Independent of the time, the impedance diagrams showed
two well-defined time constants, which were most likely due to
electrochemical corrosion reaction (capacitive loop) and mass
transport controlled processes [31]. To describe the corrosion
behavior versus time for the two alloys, the charge-transfer resis-
tance Rt, characteristic of the corrosion processes, was extrapolated
from the capacitive loop (see the dashed semi-circle plotted in
Fig. 7b). Fig. 7c shows that Rt significantly decreased during the
first 12 h of immersion, indicating that a fast corrosion process
occurred, with a fast evolution of the sample surface. Rt then
slightly increased after 24 h of immersion and, for longer immer-
sion times, Rt stabilized to a higher value. It seems relevant to
relate the variation in Rt to that of the OCP. Both the OCP and
impedance measurements show a strong dissolution of the mate-
rial during the first step, which is related to a defective layer due
to the aggressiveness of chloride ions. In the second step, the
stabilization of both the OCP and impedance values suggests min-
imized electrochemical processes due to the accumulation of cor-
rosion products, which leads to the isolation of long corrosion
defects from the electrolyte and to the minimization of the electro-
chemical processes. The accumulation of corrosion products inside
the corrosion defects was perceived as the corrosion defects heal-
ing and contributed, with the oxide film formed on the sample sur-
face, to artificially and slightly hinder the corrosion damage on the
Nyquist plots. For the HT alloy, due to the presence of T1 phases in
the matrix and to the lower copper content of the solid solution
(due to T1 precipitation), the initial OCP was found to be lower
compared with the NHT alloy (Fig. 7a). Furthermore, for the HT
samples, the OCP was quite stable versus the immersion time, in
contrast to the NHT alloy. This difference in electrochemical behav-
ior could be attributed to the greater homogeneity of the potential
distribution in the HT sample due to the presence of T1 phases both
in the grain and at the grain boundaries compared with NHT sam-
ples. Concerning the evolution of the impedance diagrams when
the immersion time increased, for HT samples, Rt decreased after
12 h of immersion, then slightly increased and finally stabilized;
notably, the amplitude of the variation during the 12 first h was
lower compared with NHT samples, which could be related to
the stability of the OCP versus the immersion time for HT samples,
in contrast to NHT samples. The stabilization of the Rt values for
long immersion times was explained, as for NHT samples, by an
artificial ‘‘healing’’ of the corrosion defects due to the accumulation
of corrosion products.
3.2. Corrosion susceptibility of the 2050 alloy during cyclic corrosion
tests with immersion and emersion steps at room temperature (CR
tests)
Global observations of NHT corroded samples after CR tests
show corrosion susceptibility similar to NHT samples after contin-
uous immersion, with the presence of intergranular corrosion
defects (Fig. 8). However, the observations highlighted significant
differences in the morphology of the corrosion defects. After a CR
test (Fig. 8a and b), intergranular corrosion defects are thinner
and more branched than after continuous immersion (Fig. 2). The
branching of the corrosion defects is clearly visible in Fig. 3b, with
the high value of the average propagation depth along ST for CR
samples. The fact that intergranular corrosion defects were thinner
might be explained by the low duration of immersion for a CR test,
which is only equal to 15 h for a total test duration of 72 h. How-
ever, a comparison of the corrosion defect morphology with that
of CI 15 h samples (Fig. 2a) shows that this explanation is not con-
vincing or sufficient; after a cyclic corrosion test, the corrosion
defects are thinner than after continuous immersion for an equiv-
alent duration of immersion in the electrolyte. To help to explain
this result, continuous immersion tests with a higher chloride con-
centration, i.e., 5 M, were performed (Fig. 8c and d); the results
show that the intergranular defect morphology moves toward that
observed after cyclic corrosion tests, with clearly thinner defects
than those defects observed after the same immersion time in a
0.7 M chloride solution. This result was consistent with results in
the literature. For a 2024 alloy during continuous immersion tests,
by testing chloride solutions with different chloride concentra-
tions, Augustin et al. showed that the higher the chloride concen-
tration of the electrolyte is, the thinner the intergranular
corrosion defects [26]. Larignon et al. completed this study for
the 2024 alloy and compared the corrosion defect morphology
after continuous immersion and after cyclic corrosion tests. These
authors showed the existence of a chloride concentration gradient
inside the intergranular corrosion defects formed during continu-
ous immersion and during cyclic corrosion tests. During a CR test,
the chloride concentration could reach a value equal to 5 M at the

tip of the corrosion defect due to the evaporation of the electrolyte,
which led to a partial drying of the corrosion products during the
emersion period [24]. Therefore, for CR corrosion tests during the
immersion period and for short defects, the cathodic reaction
was primarily oxygen reduction on the sample surface, whereas
the anodic reaction was the dissolution of aluminum inside the
corrosion defects; the high chloride concentration inside the corro-
sion defects promoted their propagation based on an autocatalytic
process because the more the aluminum ions were produced, the
more the chloride ions penetrated into the corrosion defects, which
generated a more aggressive solution. Corrosion products accumu-
lated inside the corrosion defects so that there was rapidly little
connection between the tip of the corrosion defects and the exter-
nal electrolyte. Therefore, not only during the air exposure periods
but also for long corrosion defects during the immersion period,
the main reaction was H+ reduction inside the corrosion defects,
and the propagation rate of the corrosion defects primarily
depended on local chemical conditions. In this case, there was no
limitation by H+ transport processes, which led to extensive prop-
agation of the corrosion defects compared with continuous immer-
sion tests. Such an explanation, which was proposed to explain the
corrosion behavior of the 2024 alloy, was also convincing for the
2050 alloy and explained that the corrosion defects observed for
NHT samples for CR tests were deeper (Fig. 3a) and that their linear
density was higher (Fig. 3c), which could be attributed to the fact
that the cathodic reduction was not a limiting reaction. To confirm
this assertion, a continuous immersion test for which the solution
was renewed each 24 h was performed on a NHT sample. The
results showed that the density of corrosion defects was multiplied
by five compared with a continuous immersion test in the same
solution. Additionally, some grain boundaries connected to the
tip of the first corroded grain boundary were also corroded, leading
to a branching of the intergranular corrosion defects. Therefore, it
was evidenced that a similar behavior for the 2050 alloy as for
the 2024 alloy was observed during CR tests. Furthermore, a preli-
minary EBSD analysis performed on 2050 corroded samples
showed that the corrosion also propagated at subgrain boundaries
after CR tests (Fig. 8e), whereas the corrosion of subgrain bound-
aries was not observed after continuous immersion. This result
was also comparable to observations performed for the 2024 alloy
after CR tests [24]. To confirm this observation, a more accurate
EBSD analysis of the corrosion defects was performed. Fig. 9 illus-
trates the methodology used (the example concerns a CI sample).
In the first step, several zones were accurately localized. For each
zone, IPF-z0 were plotted to reveal the grain and subgrains
(Fig. 9c), and the misorientations were calculated to differentiate
grain boundaries and subgrain boundaries. Interfaces were consid-
ered grain boundaries for misorientations higher than 10° and sub-
grain boundaries for misorientations from 2° to 10°. Then, the
sample was slightly polished, submitted to the corrosion test,
rinsed and dried. All the previously localized zones were observed
using a SEM in the backscattered electron mode (Fig. 9a) to easily
determine the corrosion defects due to the presence of corrosion
products. Then, SEM micrographs were analyzed using an image
analysis software (Image J), and the corrosion defects were high-
lighted (Fig. 9b) to obtain a ‘corrosion map’. This map was superim-
posed on the IPF-z0 (Fig. 9c and d) to determine the nature of the
corroded ‘object’ (grain or interface) and of the corroded interface
(grain boundaries or subgrain boundaries). This methodology was
applied for NHT samples after CI and CR tests. The results showed
that the corrosion defects were localized at the grain boundaries
for NHT samples after CI tests, which is consistent with the obser-
vations shown in Fig. 2. These results also confirmed that cyclic cor-
rosion tests led to a modification of the corrosion morphology
compared with continuous immersion tests. After CR tests, for
NHT samples, corrosion extended to the subgrain boundaries
(Fig. 10a–c). The explanations previously provided, i.e., the high
chloride concentration reached at the tip of the corrosion defects
during CR tests and the corrosion rate controlled at a local scale
(H+ reduction) could explain the dissolution of subgrain boundaries.
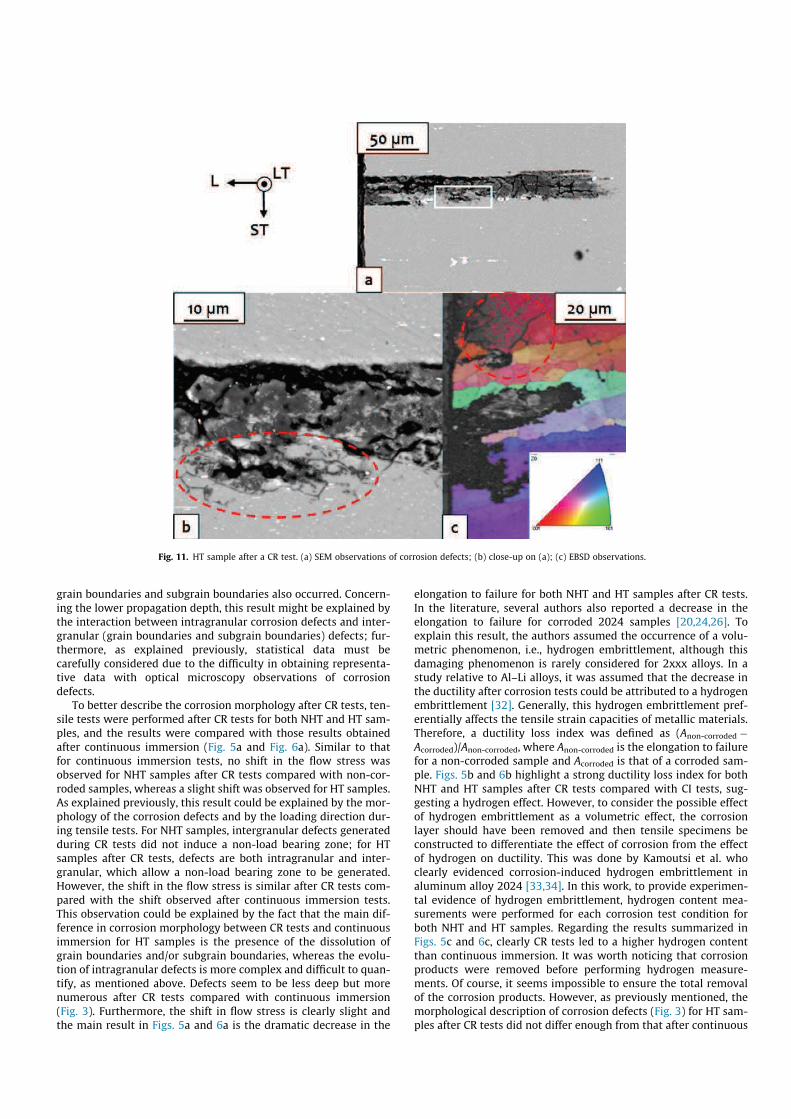
For the HT samples after CR tests, the corrosion morphology
was intragranular (Fig. 11), which is similar to that for samples
Fig. 8. (a) SEM observations of intergranular corrosion defects for NHT samples after a CR test; (b) close-up of (a). OM observations of intergranular corrosion defects for NHT
samples after CI 72 h in NaCl 5 M (c) in cross-section; (d) of the surface. (e) EBSD observations of intergranular corrosion defects of NHT samples after a CR test.

exposed to continuous immersion tests. However, corrosion at
grain and/or subgrain boundaries was also observed in cross-
sections observed by SEM (Fig. 11b) but particularly for those
cross-sections observed using EBSD (Fig. 11c). Further EBSD analy-
sis, which was performed according to the methodology described
in Fig. 9, confirmed that intragranular corrosion remained
observed for HT samples after CR tests; however, a few grain
boundaries and many subgrain boundaries were found to be
corroded (Fig. 10d–f). This change in the corrosion morphology
correlated with a lower propagation depth in the L direction for
the corrosion defects after CR tests compared with CI 15 h and CI
72 h (Fig. 3d). However, similar to that for NHT samples, the linear
density of the corrosion defects increased for CR tests (Fig. 3f). This
evolution could be explained, similar to that for NHT samples, by
the increase in the chloride concentration at the tip of the corro-
sion defects during the emersion period. Due to the increased
aggressiveness of the electrolyte trapped inside the corrosion
defects, new corrosion defects initiated, and the dissolution of
Fig. 9. Analysis of a NHT sample after a CI test in a well-identified zone. (a) SEM observation of the corrosion defect, backscattered electron image (b) ‘corrosion map’; (c) IPF-
z0; (d) identification of the interfaces (grain boundaries in black or in color and subgrain boundaries in grey). (For interpretation of the references to color in this figure legend,
the reader is referred to the web version of this article.)
Fig. 10. SEM observations of (a), (b) NHT and (d), (e) HT samples after CR tests. (a) and (d) are secondary electron images; (b) and (e) are electron backscattered images.
Superimposition of IPF-zo, identification of the interfaces and ‘corrosion map’ for (c) NHT and for (f) HT samples.
grain boundaries and subgrain boundaries also occurred. Concern-
ing the lower propagation depth, this result might be explained by
the interaction between intragranular corrosion defects and inter-
granular (grain boundaries and subgrain boundaries) defects; fur-
thermore, as explained previously, statistical data must be
carefully considered due to the difficulty in obtaining representa-
tive data with optical microscopy observations of corrosion
defects.
To better describe the corrosion morphology after CR tests, ten-
sile tests were performed after CR tests for both NHT and HT sam-
ples, and the results were compared with those results obtained
after continuous immersion (Fig. 5a and Fig. 6a). Similar to that
for continuous immersion tests, no shift in the flow stress was
observed for NHT samples after CR tests compared with non-cor-
roded samples, whereas a slight shift was observed for HT samples.
As explained previously, this result could be explained by the mor-
phology of the corrosion defects and by the loading direction dur-
ing tensile tests. For NHT samples, intergranular defects generated
during CR tests did not induce a non-load bearing zone; for HT
samples after CR tests, defects are both intragranular and inter-
granular, which allow a non-load bearing zone to be generated.
However, the shift in the flow stress is similar after CR tests com-
pared with the shift observed after continuous immersion tests.
This observation could be explained by the fact that the main dif-
ference in corrosion morphology between CR tests and continuous
immersion for HT samples is the presence of the dissolution of
grain boundaries and/or subgrain boundaries, whereas the evolu-
tion of intragranular defects is more complex and difficult to quan-
tify, as mentioned above. Defects seem to be less deep but more
numerous after CR tests compared with continuous immersion
(Fig. 3). Furthermore, the shift in flow stress is clearly slight and
the main result in Figs. 5a and 6a is the dramatic decrease in the
elongation to failure for both NHT and HT samples after CR tests.
In the literature, several authors also reported a decrease in the
elongation to failure for corroded 2024 samples [20,24,26]. To
explain this result, the authors assumed the occurrence of a volu-
metric phenomenon, i.e., hydrogen embrittlement, although this
damaging phenomenon is rarely considered for 2xxx alloys. In a
study relative to Al–Li alloys, it was assumed that the decrease in
the ductility after corrosion tests could be attributed to a hydrogen
embrittlement [32]. Generally, this hydrogen embrittlement pref-
erentially affects the tensile strain capacities of metallic materials.
Therefore, a ductility loss index was defined as (Anon-corroded ÿ
Acorroded)/Anon-corroded, where Anon-corroded is the elongation to failure
for a non-corroded sample and Acorroded is that of a corroded sam-
ple. Figs. 5b and 6b highlight a strong ductility loss index for both
NHT and HT samples after CR tests compared with CI tests, sug-
gesting a hydrogen effect. However, to consider the possible effect
of hydrogen embrittlement as a volumetric effect, the corrosion
layer should have been removed and then tensile specimens be
constructed to differentiate the effect of corrosion from the effect
of hydrogen on ductility. This was done by Kamoutsi et al. who
clearly evidenced corrosion-induced hydrogen embrittlement in
aluminum alloy 2024 [33,34]. In this work, to provide experimen-
tal evidence of hydrogen embrittlement, hydrogen content mea-
surements were performed for each corrosion test condition for
both NHT and HT samples. Regarding the results summarized in
Figs. 5c and 6c, clearly CR tests led to a higher hydrogen content
than continuous immersion. It was worth noticing that corrosion
products were removed before performing hydrogen measure-
ments. Of course, it seems impossible to ensure the total removal
of the corrosion products. However, as previously mentioned, the
morphological description of corrosion defects (Fig. 3) for HT sam-
ples after CR tests did not differ enough from that after continuous
Fig. 11. HT sample after a CR test. (a) SEM observations of corrosion defects; (b) close-up on (a); (c) EBSD observations.

immersion to justify a higher amount of corrosion products after
CR tests. The results from tensile tests corroborated this assertion
(Fig. 6a), with an identical shift in the flow stress after CR tests
and after CI tests. Therefore, such high values of the hydrogen con-
tent suggested a significant penetration of hydrogen inside the
material during CR tests (thus, the ductility loss index was called
the hydrogen embrittlement index). Hydrogen was generated by
the cathodic reduction of H+ present inside the corrosion defects
following the hydrolysis of the metallic cations produced by the
anodic reaction. Then, hydrogen penetrated inside the material,
and a hydrogen-affected zone was assumed to exist at the tip of
the corrosion defects, which could explain the results of the tensile
tests. The amount of hydrogen inside the material after the corro-
sion tests, i.e., the size of the hydrogen-affected zone, depended on
not only the amount of hydrogen produced at the tip of the corro-
sion defects but also the fraction of the surface accessible for
hydrogen penetration. Hydrogen trapping and transport by dislo-
cations could also be helpful in explaining a high hydrogen con-
tent, as well as the presence of hydrogen traps. Regarding
hydrogen trapping, Kamoutsi et al. showed, for a 2024 aluminum
alloy, that hydrogen could be trapped at S-phase, vacancies and
dislocations [34]. Meletis and Huang showed that T1 facilitates
hydrogen entry into the Al–Cu–Li alloys and that hydrogen could
be trapped at T1 matrix interfaces [35]. For Al–Cu–Li–Zr alloys,
Smith and Scully identified several metallurgical hydrogen trap-
ping states, i.e. solid solution lithium, d0 phases, dislocations, T1precipitates and high angle boundaries [17,18]. Furthermore, Mele-
tis and Huang showed that hydrogen from the T1-matrix interface
may be swept relatively easily by dislocations since the T1 phase
precipitates on {111} planes which are the matrix slip planes
[35]. The authors provided some indication in support of the
hydrogen-enhanced dislocation mobility by the softening (lower
ultimate tensile strength) that was exhibited by the hydrogen-
embrittled alloys. Zohdi and Meletis showed that, in the presence
of a crack, hydrogen penetration in front of the crack tip can occur
mainly by stress assisted diffusion and dislocation transport [36].
In the present work, for the NHT samples, the increase in the cor-
rosion defect depths and densities after CR tests compared with
continuous immersion tests could explain much hydrogen produc-
tion at the tip of the corrosion defects. The presence of hydrogen
inside the corroded samples could then be explained by stress
assisted diffusion and dislocation transport as suggested by Zohdi
and Meletis [36]. No hydrogen trapping at T1 was assumed because
no T1 was observed in NHT alloys. For the HT alloys, hydrogen
embrittlement was most likely associated with the occurrence of
intergranular corrosion after CR tests. Indeed, during CR tests, it
was assumed not only that the penetration of hydrogen was linked
to a diffusion process but also that this penetration was promoted
by a transport phenomenon due to the stress imposed by the cor-
rosion products trapped inside the intergranular corrosion defects
on the intergranular defect walls. It seemed irrelevant to propose a
stress state favorable for the penetration of hydrogen in intragran-
ular corrosion defects. Therefore, the hydrogen content in the alloy
after the CR tests was linked to both the local stress state at the tip
of the intergranular corrosion defects and the hydrogen volume
produced inside the defects. For HT alloys, intergranular corrosion
propagated from intragranular defects after CR tests; intragranular
corrosion was associated with a significant dissolution rate and,
therefore, to high H+ production. Therefore, the amount of hydro-
gen in the intergranular corrosion defects developed in HT samples
after CR tests was most likely higher than that for NHT samples,
explaining the higher amount of hydrogen in HT samples after
CR tests compared with NHT samples. Furthermore, the high
amount of T1 precipitates in HT samples could also explain the
results because of hydrogen trapping at T1 precipitates. To provide
experimental evidence regarding hydrogen trapping at T1
precipitates, desorption experiments were performed. NHT and
HT samples were submitted to CI 72 h and CR 72 h tests. Immedi-
ately after the corrosion tests, the corrosion products were
removed from the sample surface and the samples were submitted
to desorption treatments. To take into account the discrepancy in
the corrosion extent from one sample to another, only one sample
was used for each corrosion test. The size of the samples was cho-
sen so that they could be cut in several specimens. Each specimen
was immediately submitted to a desorption treatment. The tem-
perature for the desorption treatment was 25 °C, 200 °C, 340 °C
and 490 °C, as suggested by Smith and Scully [17,18]. The duration
for the desorption treatment varied between 15 min and 24 h.
Immediately after the desorption treatment, the hydrogen content
was measured. Results are reported in Fig. 12. For the NHT alloy,
the results clearly showed that, for both CI 72 h and CR 72 h, the
hydrogen content decreased when the desorption temperature
increased from 25 °C to 490 °C. This showed that hydrogen desorp-
tion occurred and, therefore, that hydrogen was trapped inside the
corroded material. Furthermore, independent of the desorption
temperature, the hydrogen content was higher for the CR 72 h
samples than for CI 72 h samples which was in good agreement
with previous hydrogen content measurements (Fig. 5). However,
except for the decrease of the hydrogen content when the desorp-
tion temperature increased from 25 to 490 °C, no significant ten-
dency was observed when hydrogen content versus desorption
time for a given desorption temperature or hydrogen content ver-
sus desorption temperature for a given desorption time were plot-
ted. For NHT alloy, hydrogen trapping at T1 precipitates did not
occur because of the absence of T1 in this metallurgical state.
Hydrogen could then be trapped at dislocations or grain bound-
aries but with the methodology used, it was not possible to differ-
entiate these trapping sites maybe due to the low hydrogen
content compared to corrosion products that remained inside the
corrosion defects. On the contrary, for HT samples, Fig. 12 clearly
showed significant variation regarding the hydrogen content ver-
sus the temperature desorption and the hydrogen content versus
desorption time. The tendency was the same for both CI 72 h and
CR 72 h samples with, for all the desorption temperatures and all
the desorption times, higher hydrogen contents for CR 72 h sam-
ples compared to CI 72 h samples in agreement with results shown
in Fig 6. Differences between the results shown in Figs. 6 and 12
were related to the discrepancy in corrosion extent from one sam-
ple to another. As explained before, the desorption treatments
were performed for the same corroded sample (cut in small pieces)
to allow comparison between the different desorption times and
temperatures. Independent of the desorption time, the hydrogen
content progressively decreased when the desorption temperature
increased from 25 °C to 490 °C which allowed to reveal the differ-
ent trapping sites identified by Smith and Scully [17,18]. Further-
more, for a long desorption time (24 h) at 490 °C, a significant
decrease of the hydrogen content was observed, in particular for
the CR 72 h samples. The hydrogen content reached a value around
20 ppm corresponding to the hydrogen content measured for a
non-corroded sample. Such a desorption treatment led to the
release of hydrogen from T1 precipitates showing that hydrogen
trapping at T1 precipitates was a major phenomenon for HT
samples.
3.3. Effect of the temperature during the emersion step of the cyclic
corrosion tests on the corrosion susceptibility of the 2050 alloy
To further analyze the effect of exposure conditions on the cor-
rosion susceptibility of the 2050 alloy, additional cyclic corrosion
tests were performed with emersion steps at a negative tempera-
ture (CF tests). For both NHT and HT samples, the morphology of
the corrosion did not seem to be dependent on the temperature

of the emersion phase. However, the decrease in the elongation to
failure was lower after CF tests than after CR tests for both NHT
(Fig. 5a and b) and HT samples (Fig. 6a and b). The results corre-
lated well with a lower hydrogen content (Figs. 5c and 6c) for CF
samples compared with CR samples. Again, the amount of hydro-
gen present inside the material after the corrosion tests was par-
tially explained by the kinetics of proton reduction inside the
corrosion defects. For both NHT and HT samples, the statistical
data (Fig. 3) concerning the morphology of the corrosion defects
did not provide a reliable analysis of the kinetics of the aluminum
dissolution and, therefore, of the proton reduction; a comparison of
the data obtained after CR and CF tests showed that some morpho-
logical parameters increased, whereas other parameters decreased,
from one exposure condition to another. However, one could
assume that when the sample was emerged at room temperature,
once the surface dried, the corrosion defects were the primary sites
of electrochemical activity due the electrolyte trapped inside the
corrosion defects. The main cathodic reaction was H+ reduction,
which explained the high hydrogen content measured for CR sam-
ples. In contrast, during emersion phases at negative temperatures,
the electrolyte was frozen, and therefore, the electrochemical reac-
tions were limited, leading to a lower hydrogen content after CF
tests compared with CR tests. Furthermore, as previously
explained, the hydrogen content inside the material after the cor-
rosion tests could also be partially explained considering the sur-
face, which allowed hydrogen penetration. During the emersion
phase at negative temperatures, it can be assumed that the stress
generated by the solidification of the electrolyte trapped inside
the corrosion defects led to the local failure of the oxide film cov-
ering the walls of the corrosion defects, leading to an oxide layer
less protective than the layer developed at room temperature
[37]. This hypothesis was corroborated by electrochemical mea-
surements performed for both NHT and HT samples at the begin-
ning and at the end of each immersion period for CR and CF
tests. Because the shape of the impedance diagrams was the same
for all the measurements, only the diagrams plotted after 48 h of
cyclic corrosion tests were plotted for CR (Fig. 13a) and CF
(Fig. 13b) tests respectively. For the two alloys and for the two cor-
rosion tests, the shape of the impedance diagrams was similar to
that observed during CI tests with two time constants; therefore
the same analysis was performed by extrapolating the Rt value
from the capacitive loop. For both CR and CF samples, and for both
NHT and HT samples, Rt decreased during immersion, revealing the
degradation of the samples (Fig. 13c and d). However, during each
emersion phase at room temperature (Fig. 13c), Rt increased. This
observation corresponded to an artificial healing phenomenon
due to the formation of an oxide film on the sample surface during
the air exposure and to the accumulation of corrosion products
inside the corrosion defects. In contrast, the continuous decrease
of Rt for CF samples (Fig. 13d) suggested a defective oxide layer,
as previously proposed, which could be related to the high linear
density of corrosion defects (Fig. 3c and f), despite questions con-
cerning the reliability of such data. Notably, the amplitude of the
variations for the Rt values was higher for NHT samples compared
with HT samples; in particular, for HT samples and CF tests, Rt only
slightly varied during the entire duration of the test. The OCP mea-
surements confirmed these results. Fig. 14 shows the evolution of
the OCP during continuous immersion and during each immersion
phase of CR and CF tests for both NHT (Fig. 14a) and HT alloys
(Fig. 14b). For the NHT alloy, the OCP continuously decreased dur-
ing continuous immersion, whereas for cyclic corrosion tests, the
variation in the OCP was more complex (Fig. 14a). Considering
the entire duration of the corrosion tests, the OCP globally
decreased for both CR and CF tests, with a stronger decrease for
CF tests. Examining the variations during each step of the corrosion
tests, the OCP decreased during the immersion period; however,
after each air exposure, the potential recovered to a value close
to the potential value at the beginning of the corrosion test. The
growth of an oxide layer on the alloy surface or the accumulation
of corrosion products inside the corrosion defects during the emer-
sion phase could be perceived as a healing of the corroded surface
and could explain this result. However, the artificial healing of the
oxide layer quickly disappeared during CF tests, as shown by the
OCP decrease during the immersion period, which confirmed that
the oxide layer was defective. In contrast, the OCP slightly dropped
during the immersion period for CR tests, showing a more efficient
healing phenomenon and a more protective oxide layer. Therefore,
for NHT samples, the results showed that emersion periods at a
negative temperature significantly influenced the properties of
the oxide layer on the sample surface and inside the corrosion
defects. Due to the stress developed by the electrolyte solidifica-
tion trapped inside the intergranular corrosion defects during the
emersion periods, the oxide layer was defective, which allowed
hydrogen penetration. The increase in the surface, which allowed
hydrogen penetration, compensated the reduced amount of hydro-
gen produced during CF tests compared with CR tests, which
explained the slight differences in the hydrogen content between
CF and CR samples. For HT samples, the OCP variations during
the cyclic corrosion tests were extremely low, which could be
related to the highly stable OCP measured during continuous
immersion tests. This result was consistent with the impedance
measurements and with the low amplitude of the variations in
the Rt values. Such a behavior could be explained by the corrosion
morphology. For HT samples, during the emersion period at
Fig. 12. Hydrogen content versus desorption time for desorption treatments at 25, 200, 340 and 490 °C. Results are given for corroded NHT and HT samples after (a) CI 72 h
and (b) CR 72 h corrosion tests.

negative temperatures for CF tests, the solidification of the electro-
lyte and the resulting volume increase could not generate a stress
state, which allowed a significant failure of the oxide layer,
considering the morphology of the corrosion defects, i.e., intra-
granular defects with a high curvature radius. Therefore, for HT
samples during CF tests, the amount of hydrogen produced was
reduced compared with CR tests, and the effect of the electrolyte
solidification was insufficient to increase the surface, allowing
the hydrogen penetration. Thus, the difference in the hydrogen
content between CR and CF tests was strong.
4. Conclusions
The corrosion behavior of the 2050 alloy was studied according
to its microstructure and considering the influence of varying
Fig. 13. Impedance diagrams (Nyquist plots) plotted at the beginning of the 5th immersion period of cyclic corrosion tests (48 h after the beginning of the cyclic corrosion
test) for NHT and HT alloys (a) CR sample; (b) CF sample. Rt versus time for NHT and HT alloys for (c) CR samples and (d) CF samples.
Fig. 14. Evolution of the open circuit potential (OCP) as a function of immersion time for CI, CR and CF tests (for cyclic corrosion tests, OCP is recorded during the immersion
periods). (a) NHT sample; (b) HT sample.

conditions of exposure to an aggressive environment. The main
conclusions are as follows:
1. NHT and HT states differ by distinctive corrosion morphol-
ogies, intergranular and intragranular corrosion, respec-
tively, during continuous immersion tests. Their corrosion
behavior is linked to the presence of T1 hardening phases;
however, the results showed that the presence of T1 precip-
itates is not mandatory for sensibilizing the 2050 alloy to
intergranular corrosion.
2. The corrosion susceptibility of the 2050 alloy is strongly
dependent on the condition of the exposure to an aggres-
sive medium. The morphology, corrosion extension, and,
consequently, the residual mechanical properties of cor-
roded samples are significantly influenced by the exposure
conditions. The main results are the extension of corrosion
from grain boundaries to subgrain boundaries for the NHT
alloy and the sensitization to intergranular corrosion for
the HT alloy when cyclic corrosion tests were performed.
The results suggest a hydrogen effect.
3. Depending on the morphology of the corrosion, i.e., inter-
granular or intragranular corrosion, therefore, depending
on the microstructural state of the 2050 alloy, the hydrogen
effect can play a predominant role in the corrosion process.
The amount of hydrogen trapped inside the material pri-
marily depends on three parameters: (i) the amount of
hydrogen produced during the corrosion processes, which
is linked to the morphology of the corrosion; (ii) the surface
allowing hydrogen penetration inside the material. Sur-
faces for hydrogen entrance are created by the failure of
oxide films developed on the corrosion defects walls. This
failure is promoted by the solidification of the electrolyte
trapped inside the intergranular corrosion defects during
the emersion period at a negative temperature for cyclic
corrosion tests; and (iii) the density of hydrogen traps
inside the material, with T1 precipitates as efficient traps.
4. The temperature during the emersion periods for cyclic
corrosion tests plays a significant role in the corrosion sus-
ceptibility of the 2050 alloy. Negative temperatures could
induce the failure of the oxide film due to a volume
increase in the electrolyte trapped inside the corrosion
defects and therefore promoted hydrogen penetration.
However, negative temperatures stopped the electrochem-
ical processes and therefore decreased the amount of
hydrogen produced inside the corrosion defects. The corro-
sion susceptibility of the 2050 alloy results from the com-
petition between these two phenomena.
Acknowledgments
This work was financially supported by the ‘‘Conseil Régional de
la Région Midi-Pyrénées’’. The authors thank Constellium for the
material supplied and M.-C. Lafont for TEM observations. The
authors thank Nadine Pébère for fruitful discussions about electro-
chemical impedance spectroscopy measurements.
References
[1] E.J. Lavernia, N.J. Grant, Aluminium-lithium alloys, J. Mater. Sci. 22 (1987)1521–1529.
[2] V.K. Jain, K.V. Jata, R.J. Rioja, J.T. Morgan, A.K. Hopkins, Processing of anexperimental aluminium-lithium alloy for controlled microstructure, J. Mater.Process. Technol. 73 (1998) 108–118.
[3] R.J. Rioja, J. Liu, Evolution of Al–Li base products for aerospace and spaceapplications, Metall. Mater. Trans. A 43A (2012) 3325–3337.
[4] J.E. Kertz, P.I. Gouma, R.G. Buchheit, Localized corrosion susceptibility of Al–Li–Cu–Mg–Zn alloy AF/C458 due to interrupted quenching from solutionizingtemperatures, Metall. Mater. Trans. A 33 (2001) 2561–2573.
[5] N. Jiang, J.F. Li, Z.Q. Zheng, Effect of aging on mechanical properties andlocalized corrosion behavior of Al–Cu–Li alloy, Trans. Nonferr. Met. Soc. China15 (2005) 23–29.
[6] H.Y. Li, Y. Tang, Z.D. Zeng, F. Zheng, Exfoliation corrosion of T6- and T3-agedAlxCuyLiz alloy, Trans. Nonferr. Mater. Soc. of China 18 (2008) 778–783.
[7] V. Proton, J. Alexis, E. Andrieu, C. Blanc, J. Delfosse, L. Lacroix, G. Odemer,Influence of post-welding heat treatment on the corrosion behavior of a 2050-T3 aluminum–copper–lithium alloy friction stir welding joint, J. Electrochem.Soc. 158 (2011) C139–C147.
[8] Y. Xu, X. Wang, Z. Yan, J. Li, Corrosion properties of light-weight and high-strength 2168 Al–Li alloy, Chin. J. Aeronaut. 24 (2011) 681–686.
[9] R.G. Buchheit, J.P. Moran, G.E. Stoner, Localized corrosion behavior ofalloy 2090-the role of microstructure heterogeneity, Corrosion 46 (1990)610–617.
[10] R. Scully, T.O. Knight, R.G. Buchheit, D.E. Peebles, Electrochemicalcharacteristics of Al2Cu, Al3Ta and intermetallics phases and their relevancyto the localized corrosion of Al, Corros. Sci. 35 (1993) 185–195.
[11] F. Viejo, A.E. Coy, F.J. Garcia-Garcia, Z. Liu, P. Skeldon, G.E. Thompson,Relationship between microstructure and corrosion performance of AA2050-T3 aluminium alloy after excimer laser surface melting, Corros. Sci. 52 (2010)2179–2187.
[12] H. Amar, V. Vignal, H. Krawiec, C. Josse, P. Peyre, S.N. Da Silva, L.F. Dick,Influence of the microstructure and laser shock processing (LSP) on thecorrosion behaviour of the AA2050-T3 aluminium alloy, Corros. Sci. 53 (2011)3215–3221.
[13] R.G. Buchheit, J.P. Moran, G.E. Stoner, Electrochemical behavior of T1(Al2CuLi)intermetallic compound and its role in localized corrosion of Al–2%Li–3%Cualloys, Corrosion 50 (1994) 120–130.
[14] J.F. Li, Z.Q. Zheng, N. Jiang, S.C. Li, Study on localized corrosion mechanism of2195 Al–Li alloy in 4.0% NaCl solution (pH 6.5) using a three-electrodecoupling system, Mater. Corros. 56 (2005) 192–196.
[15] J.F. Li, C.X. Li, Z.W. Peng, W.J. Chen, Z.Q. Zheng, Corrosion mechanismassociated with T1 and T2 precipitates of Al–Cu–Li alloys in NaCl solution, J.Alloys Compd. 460 (2008) 688–693.
[16] F. Viejo, Z. Aburas, A.E. Coy, F.J. Garcia-Garcia, Z. Liu, P. Skeldon, Performance ofAl alloys following excimer LSM-anodising approaches, Surf. Interface Anal. 42(2010) 252–257.
[17] S.W. Smith, J.R. Scully, Hydrogen trapping and its correlation to the hydrogenembrittlement susceptibility of Al–Li–Cu–Zr Alloys, in: A.W. Thompson, N.R.Moody (Eds.), Hydrogen Effects in Materials (Fifth International Conference):TMS, 1994, pp. 131–141.
[18] S.W. Smith, J.R. Scully, Identification of hydrogen trapping states in an Al–Li–Cu–Zr alloy using thermal desorption spectroscopy, Metall. Mat. Trans. A:Phys. Metall. Mater. Sci. 31 (2000) 179–193.
[19] R.P. Vera Cruz, A. Nishikita, T. Tsuru, Corrosion mechanism of stainless steelsunder wet & dry exposure, Corros. Sci. 40 (1998) 125–139.
[20] Sp.G. Pantelakis, P.G. Daglaras, Ch.Alk. Apostolopoulos, Tensile and energydensity properties of 2024, 6013, 8090 and 2091 aircraft aluminium alloy aftercorrosion exposure, Theor. Appl. Fract. Mech. 33 (2000) 117–134.
[21] G.A. El-Mahdy, K.B. Kim, AC impedance study on the atmospheric corrosion ofaluminum under periodic wet-dry conditions, Electrochim. Acta 49 (2004)1937–1948.
[22] A.P. Yadav, A. Nishikita, T. Tsuru, Electrochemical impedance study ongalvanized steel corrosion under cyclic wet-dry conditions-influence of timeof wetness, Corros. Sci. 46 (2004) 169–181.
[23] M.-C. Zhao, P. Schmutz, S. Brunner, M. Liu, G.-L. Song, A. Atrens, An exploratorystudy of the corrosion of Mg alloys during interrupted salt spray testing,Corros. Sci. 51 (2009) 1277–1292.
[24] C. Larignon, J. Alexis, E. Andrieu, C. Blanc, G. Odemer, J.-C. Salabura, Corrosiondamages induced by cyclic exposure of 2024 aluminum alloy in chloride-containing environments, J. Electrochem. Soc. 158 (2011) 284–295.
[25] V. Proton, J. Alexis, E. Andrieu, J. Delfosse, A. Deschamps, F. De Geuser, M.-C.Lafont, C. Blanc, The influence of artificial ageing on the corrosion behaviour ofa 2050 aluminium–copper–lithium alloy, Corros. Sci. 80 (2014) 494–502.
[26] C. Augustin, E. Andrieu, C. Blanc, J. Delfosse, G. Odemer, Empirical propagationlaws of intergranular corrosion defects affecting 2024 T351 alloy in chloridesolutions, J. Electrochem. Soc. 157 (2010) 428–436.
[27] R.E. Lobnig, D.J. Siconolfi, J. Maisano, G. Grundmeier, H. Streckel, R.P.Frankenthal, M. Stratmann, J.D. Sinclair, Atmospheric corrosion of aluminumin the presence of ammonium sulfate particles, J. Electrochem. Soc. 143 (1996)1175–1182.
[28] T. Hagyard, W.B. Earl, K.J. Kirkpatrick, I.G. Watson, The electrode potential ofevaporated aluminum films in chloride solution, J. Electrochem. Soc. 113(1966) 962–963.
[29] T. Hagyard, W.B. Earl, Potential of aluminum in aqueous chloride solutions, J.Electrochem. Soc. 114 (1967) 694–698.
[30] M. Keddam, C. Kuntz, H. Takenouti, D. Schuster, D. Zuili, Exfoliation corrosionof aluminium alloys examined by electrode impedance, Electrochim. Acta 42(1997) 87–97.
[31] J. Tedim,M.L. Zheludkevich,A.C. Bastos,A.N. Salak, A.D. Lisenkov,M.G.S. Ferreira,Influence of preparation conditions of layered double hydroxide conversionfilms on corrosion protection, Electrochim. Acta 117 (2014) 164–171.

[32] Sp.G. Pantelakis, N.I. Vassilas, P.G. Daglaras, Effects of corrosive environmenton the mechanical behaviour of the advanced Al–Li alloys 2091 and 8090 andthe conventional aerospace alloy 2024, Metallurgy 47 (1993) 135–141.
[33] H. Kamoutsi, G.N. Haidemenopoulos, V. Bontozoglou, S. Pantelakis, Corrosion-induced hydrogen embrittlement in aluminum alloy 2024, Corros. Sci. 48(2006) 1209–1224.
[34] H. Kamoutsi, G.N. Haidemenopoulos, V. Bontozoglou, P.V. Petroyiannis, S.Pantelakis, Effect of prior deformation and heat treatment on the corrosion-induced hydrogen embrittlement in aluminum alloy 2024, Corros. Sci. 80(2014) 139–142.
[35] E.I. Meletis, W. Huang, The role of the T1 phase in the pre-exposure andhydrogen embrittlement of Al–Li–Cu alloys, Mater. Sci. Eng. A 148 (1991)197–209.
[36] T.I. Zohdi, E.I. Meletis, On the intergranular hydrogen embrittlementmechanism of Al–Li alloys, Scripta Metall. Mater. 26 (1992) 1615–1620.
[37] C. Larignon, J. Alexis, E. Andrieu, G. Odemer, C. Blanc, The contributionof hydrogen to the corrosion of 2024 aluminium alloy exposed tothermal and environmental cycling in chloride media, Corros. Sci. 69 (2013)211–220.
Copyright © 2022 FDOKUMEN