
Prostate-Specific Antigen Modulates the Expression of Genes ...
Upload
khangminh22Category
view
1download
0
�����������������
Citation: Khan, M.M.; Mohsen, M.T.;
Malik, M.Z.; Bagabir, S.A.; Alkhanani,
M.F.; Haque, S.; Serajuddin, M.;
Bharadwaj, M. Identification of
Potential Key Genes in Prostate
Cancer with Gene Expression, Pivotal
Pathways and Regulatory Networks
Analysis Using Integrated
Bioinformatics Methods. Genes 2022,
13, 655. https://doi.org/10.3390/
genes13040655
Academic Editor: Stefania
Bortoluzzi
Received: 18 February 2022
Accepted: 28 March 2022
Published: 8 April 2022
Publisher’s Note: MDPI stays neutral
with regard to jurisdictional claims in
published maps and institutional affil-
iations.
Copyright: © 2022 by the authors.
Licensee MDPI, Basel, Switzerland.
This article is an open access article
distributed under the terms and
conditions of the Creative Commons
Attribution (CC BY) license (https://
creativecommons.org/licenses/by/
4.0/).
genesG C A T
T A C G
G C A T
Article
Identification of Potential Key Genes in Prostate Cancer withGene Expression, Pivotal Pathways and Regulatory NetworksAnalysis Using Integrated Bioinformatics MethodsMohd Mabood Khan 1,2, Mohammad Taleb Mohsen 1,3, Md. Zubbair Malik 4,5 , Sali Abubaker Bagabir 6,Mustfa F. Alkhanani 7, Shafiul Haque 8 , Mohammad Serajuddin 2 and Mausumi Bharadwaj 1,*
1 Division of Molecular Genetics & Biochemistry, National Institute of Cancer Prevention &Research (ICMR-NICPR), I-7, Sector-39, Noida 201301, India; [email protected] (M.M.K.);[email protected] (M.T.M.)
2 Department of Zoology, University of Lucknow, Lucknow 226007, India; [email protected] Department of Biosciences, Jamia Millia Islamia (A Central University), New Delhi 110025, India4 School of Computational and Integrative Sciences, Jawaharlal Nehru University, New Delhi 110067, India;
[email protected] Department of Biotechnology, Jamia Hamdard University, New Delhi 110062, India6 Department of Medical Laboratory Technology, Faculty of Applied Medical Sciences, Jazan University,
Jazan 45142, Saudi Arabia; [email protected] Emergency Medical Service Department, College of Applied Sciences, AlMaarefa University,
Riyadh 11597, Saudi Arabia; [email protected] Research and Scientific Studies Unit, College of Nursing and Allied Health Sciences, Jazan University,
Jazan 45142, Saudi Arabia; [email protected]* Correspondence: [email protected]
Abstract: Prostate cancer (PCa) is the most prevalent cancer (20%) in males and is accountable fora fifth (6.8%) cancer-related deaths in males globally. Smoking, obesity, race/ethnicity, diet, age,chemicals and radiation exposure, sexually transmitted diseases, etc. are among the most commonrisk factors for PCa. However, the basic change at the molecular level is the manifested confirmationof PCa. Thus, this study aims to evaluate the molecular signature for PCa in comparison to benignprostatic hyperplasia (BPH). Additionally, representation of differentially expressed genes (DEGs)are conducted with the help of some bioinformatics tools like DAVID, STRING, GEPIA, Cytoscape.The gene expression profile for the four data sets GSE55945, GSE104749, GSE46602, and GSE32571was downloaded from NCBI, Gene Expression Omnibus (GEO). For the extracted DEGs, differenttypes of analysis including functional and pathway enrichment analysis, protein–protein interaction(PPI) network construction, survival analysis and transcription factor (TF) prediction were conducted.We obtained 633 most significant upregulated genes and 1219 downregulated genes, and a sumtotal of 1852 DEGs were found from all four datasets after assessment. The key genes, includingEGFR, MYC, VEGFA, and PTEN, are targeted by TF such as AR, Sp1, TP53, NF-KB1, STAT3, RELA.Moreover, miR-21-5p also found significantly associated with all the four key genes. Further, TheCancer Genome Atlas data (TCGA) independent database was used for validation of key genesEGFR, MYC, VEGFA, PTEN expression in prostate adenocarcinoma. All four key genes were foundto be significantly correlated with overall survival in PCa. Therefore, the therapeutic target may bedetermined by the information of these key gene’s findings for the diagnosis, prognosis and treatmentof PCa.
Keywords: prostate cancer; benign prostate hyperplasia; differentially expressed genes; keygenes; bioinformatics
1. Introduction
Prostate cancer (PCa) is the most prevalent cancer (20%) in males and accountablefor a fifth (6.8%) cancer-related deaths in males globally [1]. According to the World
Genes 2022, 13, 655. https://doi.org/10.3390/genes13040655 https://www.mdpi.com/journal/genes

Genes 2022, 13, 655 2 of 18
Cancer Survey Statistics (GLOBOCAN), the number of newly diagnosed cases of PCa was~1.41 million in 2020, with ~375 thousand new deaths [2,3]. By 2040, the global PCa burdenis expected to increase to 2.43 million new cases and 740 thousand new deaths due topopulation growth and ageing [2,3]. On the other hand, PCa incidence has been steadilyincreasing in India. According to India’s population-based cancer registries, PCa is thesecond most common cause of cancer in men living in metropolitan areas [4,5].
Smoking, obesity, race/ethnicity, diet, age, chemicals and radiation exposure, sexuallytransmitted diseases, etc., are among the most common risk factors for prostate cancer [6].However, the basic change at the molecular level is the manifested confirmation of PCa.Although prostate specific antigen (PSA) level is the most frequently used screening toolfor prostate cancer detection, it doesn’t stand as an absolute method to predict diseasemalignancy. Furthermore, the use of genetic profiling may provide additional benefits forearly PCa detection [7–10]. Prostate cancer may be rectified at an early stage of cancer bysurgery or radiation therapy, but patients with advanced or metastatic disease may have nocurative therapeutic options [11,12]. Consequently, there is an urgent need for treatmentscapable of preventing or combating PCa.
Currently, gene expression data mining and bioinformatics microarray analysis arewidely used to find key genes for disease severity, pathogenesis, complexity, recognition ofsuitable biomarkers, miRNA targets, transcription factor (TF) recognition and drug targets.The gene expression is a molecular signature used as a diagnostic and prognostic markerin cancer research. Gene expression profiling reveals several differentially expressed genes(DEGs) in patient samples, but many genes cannot be related by the prevailing methods.Protein-protein interaction (PPI) network research plays a great role in understanding themolecular function; and any malfunctioning pathway linked to the disease network mayresult from changes in the PPI network locality. PPI gives elaboration on protein function,molecular magnitude, gene ontology (GO), disease regulator genes, miRNA and noveldrug targets.
Previous PCa meta-analysis studies have revealed mostly one type of molecularmarkers, like genetic molecular markers by Zhao et al., (2014) who reported Ki-67, Bcl-2,CD147, COX-2, ALDH1A1 and FVIII genes [13]. Or miRNAs as reported by Song et al.,(2017) of up/down regulated miRNAs like miR-18a, miR-34a, miR-129, miR-145, etc. [14]However, limited studies have reported different types of biomarkers in the same study [15].This study aims to evaluate the molecular-signature for PCa in comparison to benignprostatic hyperplasia (BPH). Additionally, in this study, identification and classification ofDEGs were conducted with the help of some bioinformatics tools like DAVID (to knowabout the functional annotation of a gene), STRING (to find out PPI network functionalenrichment analysis), GEPIA (to find differential gene expression analysis and profilingplotting), and Cytoscape (to make an interaction map). Furthermore, to find key genesassociated with pathogenesis, the degree of network interaction as well as the moduleof the most related gene; are used to discover hub genes that may work as key targetsfor treatment.
2. Materials and Methods2.1. Microarray Data Extraction
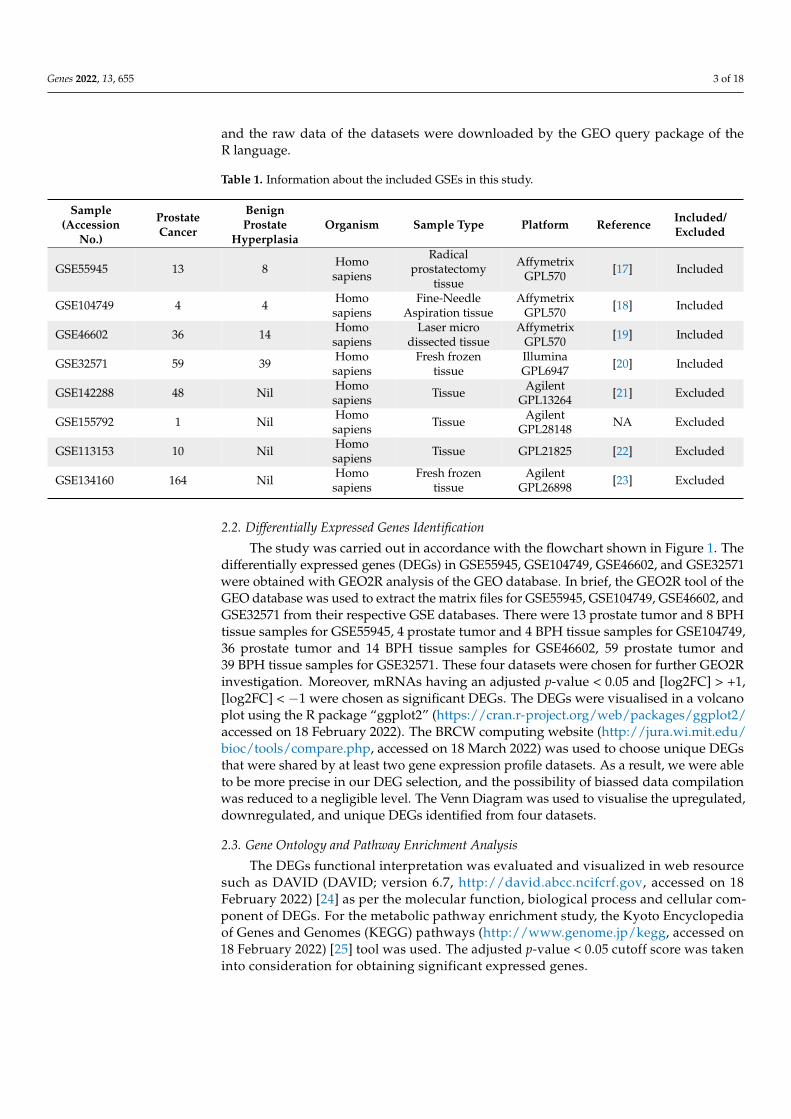
The National Centre for Biotechnology Information (NCBI)-Gene Expression Omnibus(GEO) (https://www.ncbi.nlm.nih.gov/geo/, accessed on 11 March 2022) [16] is a globalpublic domain for gene expression database from which we have retrieved the four datasets (GSE55945, GSE104749, GSE46602, GSE32571) belonging to the prostate tumor (n = 112)and the BPH tissue (n = 65). Only datasets that met the following inclusion and exclusioncriteria for PCa datasets were incorporated in this study. First, inclusion criteria take in(i) datasets with expression data for PCa tissue and BPH tissue samples; (ii) datasets with atleast four samples’ gene expression data (both PCa tumor and BPH) and (iii) homo sapiensdatasets. Table 1 summarizes all of the information regarding the datasets that were chosen.The matrix files of GSE55945, GSE104749, GSE46602, GSE32571 were obtained by GEO2R,
Genes 2022, 13, 655 3 of 18
and the raw data of the datasets were downloaded by the GEO query package of theR language.
Table 1. Information about the included GSEs in this study.
Sample(Accession
No.)
ProstateCancer
BenignProstate
HyperplasiaOrganism Sample Type Platform Reference Included/
Excluded
GSE55945 13 8 Homosapiens
Radicalprostatectomy
tissue
AffymetrixGPL570 [17] Included
GSE104749 4 4 Homosapiens
Fine-NeedleAspiration tissue
AffymetrixGPL570 [18] Included
GSE46602 36 14 Homosapiens
Laser microdissected tissue
AffymetrixGPL570 [19] Included
GSE32571 59 39 Homosapiens
Fresh frozentissue
IlluminaGPL6947 [20] Included
GSE142288 48 Nil Homosapiens Tissue Agilent
GPL13264 [21] Excluded
GSE155792 1 Nil Homosapiens Tissue Agilent
GPL28148 NA Excluded
GSE113153 10 Nil Homosapiens Tissue GPL21825 [22] Excluded
GSE134160 164 Nil Homosapiens
Fresh frozentissue
AgilentGPL26898 [23] Excluded
2.2. Differentially Expressed Genes Identification
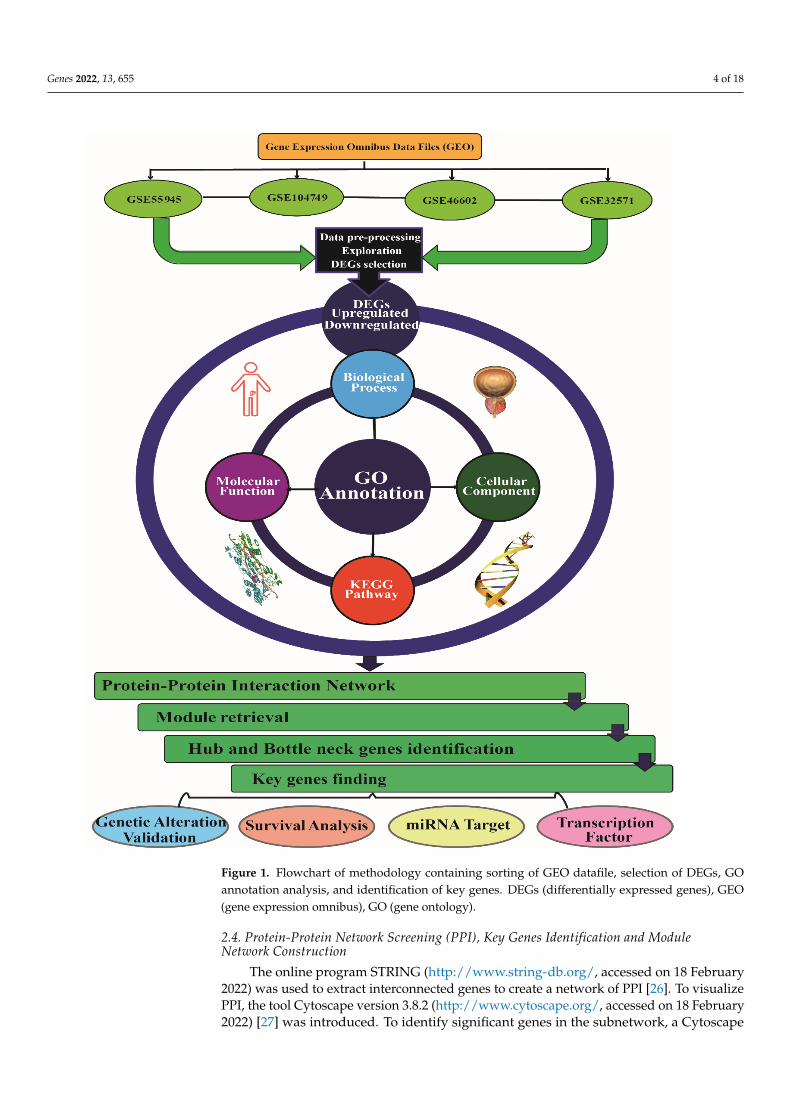
The study was carried out in accordance with the flowchart shown in Figure 1. Thedifferentially expressed genes (DEGs) in GSE55945, GSE104749, GSE46602, and GSE32571were obtained with GEO2R analysis of the GEO database. In brief, the GEO2R tool of theGEO database was used to extract the matrix files for GSE55945, GSE104749, GSE46602, andGSE32571 from their respective GSE databases. There were 13 prostate tumor and 8 BPHtissue samples for GSE55945, 4 prostate tumor and 4 BPH tissue samples for GSE104749,36 prostate tumor and 14 BPH tissue samples for GSE46602, 59 prostate tumor and39 BPH tissue samples for GSE32571. These four datasets were chosen for further GEO2Rinvestigation. Moreover, mRNAs having an adjusted p-value < 0.05 and [log2FC] > +1,[log2FC] < −1 were chosen as significant DEGs. The DEGs were visualised in a volcanoplot using the R package “ggplot2” (https://cran.r-project.org/web/packages/ggplot2/accessed on 18 February 2022). The BRCW computing website (http://jura.wi.mit.edu/bioc/tools/compare.php, accessed on 18 March 2022) was used to choose unique DEGsthat were shared by at least two gene expression profile datasets. As a result, we were ableto be more precise in our DEG selection, and the possibility of biassed data compilationwas reduced to a negligible level. The Venn Diagram was used to visualise the upregulated,downregulated, and unique DEGs identified from four datasets.
2.3. Gene Ontology and Pathway Enrichment Analysis
The DEGs functional interpretation was evaluated and visualized in web resourcesuch as DAVID (DAVID; version 6.7, http://david.abcc.ncifcrf.gov, accessed on 18February 2022) [24] as per the molecular function, biological process and cellular com-ponent of DEGs. For the metabolic pathway enrichment study, the Kyoto Encyclopediaof Genes and Genomes (KEGG) pathways (http://www.genome.jp/kegg, accessed on18 February 2022) [25] tool was used. The adjusted p-value < 0.05 cutoff score was takeninto consideration for obtaining significant expressed genes.
Genes 2022, 13, 655 4 of 18Genes 2022, 13, x FOR PEER REVIEW 4 of 20
Figure 1. Flowchart of methodology containing sorting of GEO datafile, selection of DEGs, GO an-notation analysis, and identification of key genes. DEGs (differentially expressed genes), GEO (gene expression omnibus), GO (gene ontology).
2.3. Gene Ontology and Pathway Enrichment Analysis The DEGs functional interpretation was evaluated and visualized in web resource
such as DAVID (DAVID; version 6.7, http://david.abcc.ncifcrf.gov, accessed on 18 Febru-ary 2022) [24] as per the molecular function, biological process and cellular component of DEGs. For the metabolic pathway enrichment study, the Kyoto Encyclopedia of Genes and Genomes (KEGG) pathways (http://www.genome.jp/kegg, accessed on 18 February 2022) [25] tool was used. The adjusted p-value < 0.05 cutoff score was taken into consider-ation for obtaining significant expressed genes.
Figure 1. Flowchart of methodology containing sorting of GEO datafile, selection of DEGs, GOannotation analysis, and identification of key genes. DEGs (differentially expressed genes), GEO(gene expression omnibus), GO (gene ontology).
2.4. Protein-Protein Network Screening (PPI), Key Genes Identification and ModuleNetwork Construction
The online program STRING (http://www.string-db.org/, accessed on 18 February2022) was used to extract interconnected genes to create a network of PPI [26]. To visualizePPI, the tool Cytoscape version 3.8.2 (http://www.cytoscape.org/, accessed on 18 February2022) [27] was introduced. To identify significant genes in the subnetwork, a Cytoscape

Genes 2022, 13, 655 5 of 18
plugin Molecular Complex Detection (MCODE) was implemented with the parametersK-score (2), degree cutoff score (2), node cutoff score (0.2) and 100 maximum depths. Tofind the most intersected key genes and modules, the Cytohubba plugin tool (http://hub.iis.sinica.edu.tw/cytohubba/, accessed on 18 February 2022) [28] was used in Cytoscapeand the PPI-MCODE modules were also merged. Multiple topological characteristics suchas Maximal Clique Centrality, Density of Maximum Neighborhood, Betweenness Centrality,Closeness Centrality, Degree, Stress and Bottleneck were also added to the network foridentification of key genes and modules.
2.5. Genetic Alteration and Validation of Key Genes Expression Paradigm
As per the manual, examination of genetic alteration for key genes was performed bythe cBioportal for Cancer Genomics [29]. The oncoplot for key genes was created by thecBioPortal for Cancer Genomics. Further, the GEPIA (Gene Expression Profiling InteractiveAnalysis) online software (http://gepia.cancer-pku.cn, accessed on 18 February 2022)was used for investigation of key genes expression in PCa. The verification of key geneexpression was conducted by GEPIA between 492 PCa and 152 non-cancer tissues. GEPIAhas synergetic and adjustable features such as analysis of differential expression, analysis ofcorrelation and analysis of patient survival and can provide rapid results from The CancerGenome Atlas (TCGA) data [30]. The values greater than the transcripts median wereclassified as increased expressions, and the values lower than the transcripts median wereclassified as decreased expressions.
2.6. Survival Analysis of Key Genes
The online web UALCAN based on the TCGA database was used for the survivalanalysis of key genes expression in PCa [31]. The transcript per million (TPM) enrichmentanalysis was used for classification of PCa patients’ expression into high and medium/lowexpression. The Kaplan-Meier (KM) survival analysis (p < 0.05) was used for the evaluationof key genes prognostic value along with Gleason Score.
2.7. miRNA and Transcription Factor Associated Network with Key Genes
Multiple experimentally verified online miRNA network software’s are availableto estimate the miRNA interaction with genes. The miRNA selection was done throughEnrichr (https://maayanlab.cloud/Enrichr/, accessed on 18 February 2022) [32] and theTRRUST online database (https://www.grnpedia.org/trrust/, accessed on 18 February2022) [33] was used to identify transcription factors. Selection of putative target miRNAand transcription factor of key genes was done on the basis of a selected online tool.Additionally, the TransmiR v2.0 database (http://www.cuilab.cn/transmir, accessedon 18 February 2022) [34] was used to see the association between transcription factorsand miRNAs. Further validation of miRNA along with TF for key genes was done bythe online public database miRNet (https://www.mirnet.ca/, accessed on 18 February2022) visual interaction platform [35]. The Cytoscape was used for the formation of anintegrative network of key genes, miRNAs, and transcription factors on the basis ofsource and target association.
3. Result3.1. Deferentially Expressed Genes Discovery
A total number of 164,526 annotated transcripts were obtained from the includedGSEs evaluated in the study, 132 upregulated and 387 downregulated DEGs were se-lected in the GSE55945 data files on the basis of selection criteria (adjusted p-value < 0.05and [log2FC] > +1, [log2FC] < −1) as compared between prostate cancer and BPH pa-tients. Subsequently, 98 upregulated and 122 downregulated DEGs were identifiedin the GSE104749 data files, 501 upregulated and 892 downregulated DEGs in theGSE46602 data files, 60 upregulated and 166 downregulated DEGs in the GSE32571 datafiles from the same criteria selection. The most significant upregulated and downregu-

Genes 2022, 13, 655 6 of 18
lated genes for the GSE55945, GSE46602, GSE104749, GSE32571 data set are shown inthe Supplementary file S1. The Volcano plots showed upregulated and downregulatedgenes for all datasets by implementing upper and lower limit criteria [logFC] > +1,[logFC] < −1 (Figure 2). Pre raw value and post normalized value is indicated by allfour-dataset box plots (Supplementary file S2). A comparison of the complete geneand top 100 genes expression profile of prostate cancer versus benign prostate hyper-plasia (BPH) was further demonstrated in a graded manner by heatmap construction(Supplementary file S3).
Genes 2022, 13, x FOR PEER REVIEW 6 of 20
3. Result 3.1. Deferentially Expressed Genes Discovery
A total number of 164526 annotated transcripts were obtained from the included GSEs evaluated in the study, 132 upregulated and 387 downregulated DEGs were selected in the GSE55945 data files on the basis of selection criteria (adjusted p-value < 0.05 and [log2FC] > +1, [log2FC] < −1) as compared between prostate cancer and BPH patients. Sub-sequently, 98 upregulated and 122 downregulated DEGs were identified in the GSE104749 data files, 501 upregulated and 892 downregulated DEGs in the GSE46602 data files, 60 upregulated and 166 downregulated DEGs in the GSE32571 data files from the same cri-teria selection. The most significant upregulated and downregulated genes for the GSE55945, GSE46602, GSE104749, GSE32571 data set are shown in the Supplementary file S1. The Volcano plots showed upregulated and downregulated genes for all datasets by implementing upper and lower limit criteria [logFC] > +1, [logFC] < −1 (Figure 2). Pre raw value and post normalized value is indicated by all four-dataset box plots (Supplementary file S2). A comparison of the complete gene and top 100 genes expression profile of pros-tate cancer versus benign prostate hyperplasia (BPH) was further demonstrated in a graded manner by heatmap construction (Supplementary file S3).
Figure 2. (A–D) Volcano plots showing DEGs between prostate cancer and benign prostate hyper-plasia patients in GSE32571, GSE46602, GSE55945 and GSE104749 datafiles. The log2FC value > 1, log2FC value < −1 and p < 0.05 are the cutoff value for significant upregulated (red color), non-sig-nificant (black color) and downregulated (cyan color) DEGs.
Figure 2. (A–D) Volcano plots showing DEGs between prostate cancer and benign prostatehyperplasia patients in GSE32571, GSE46602, GSE55945 and GSE104749 datafiles. The log2FCvalue > 1, log2FC value < −1 and p < 0.05 are the cutoff value for significant upregulated (redcolor), non-significant (black color) and downregulated (cyan color) DEGs.
3.2. DEGs Functional Annotation and KEGG Pathway Analysis
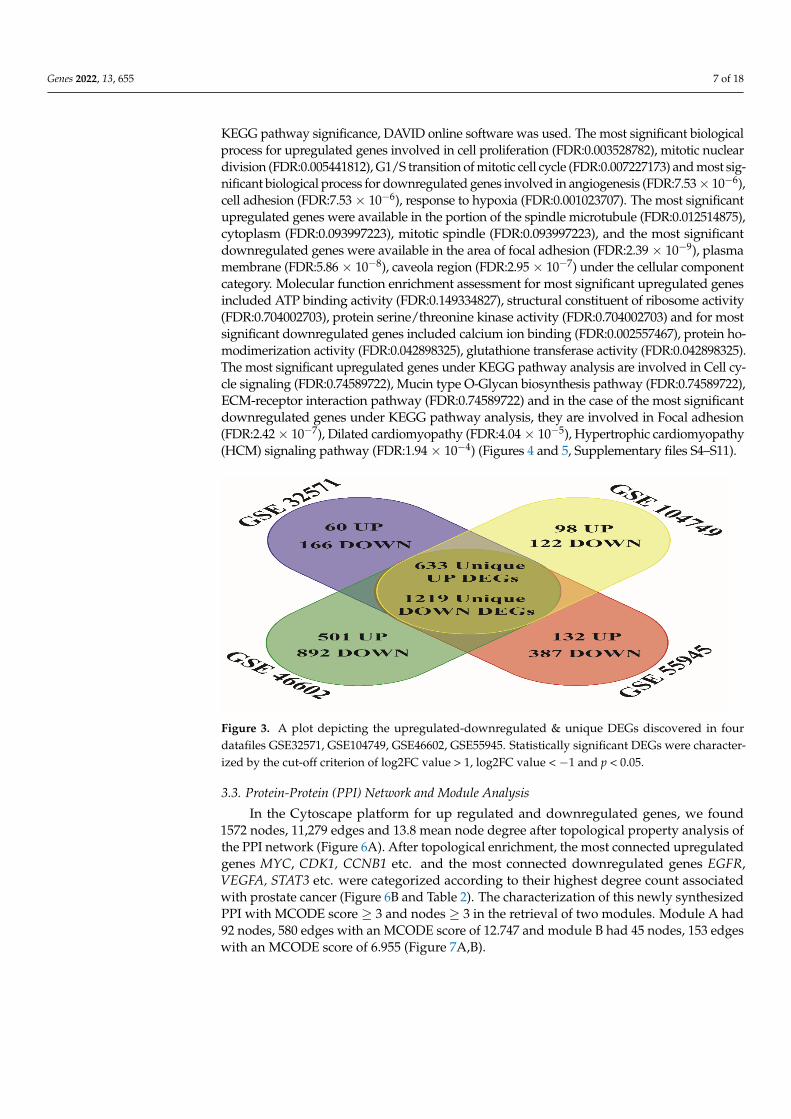
To classify unique upregulated and downregulated of all four data sets GSE55945,GSE104749, GSE46602 and GSE32571 the bioinformatics and research computing online tool(http://barc.wi.mit.edu/tools/, accessed on 18 March 2022) was used. We obtained 633 mostsignificant unique upregulated genes and 1219 unique downregulated genes from all fourdatasets after assessment (Figure 3). In order to evaluate the gene-ontology functional analysisof selected DEGs for biological process (BP), cellular process (CC), molecular function (MF) and
Genes 2022, 13, 655 7 of 18
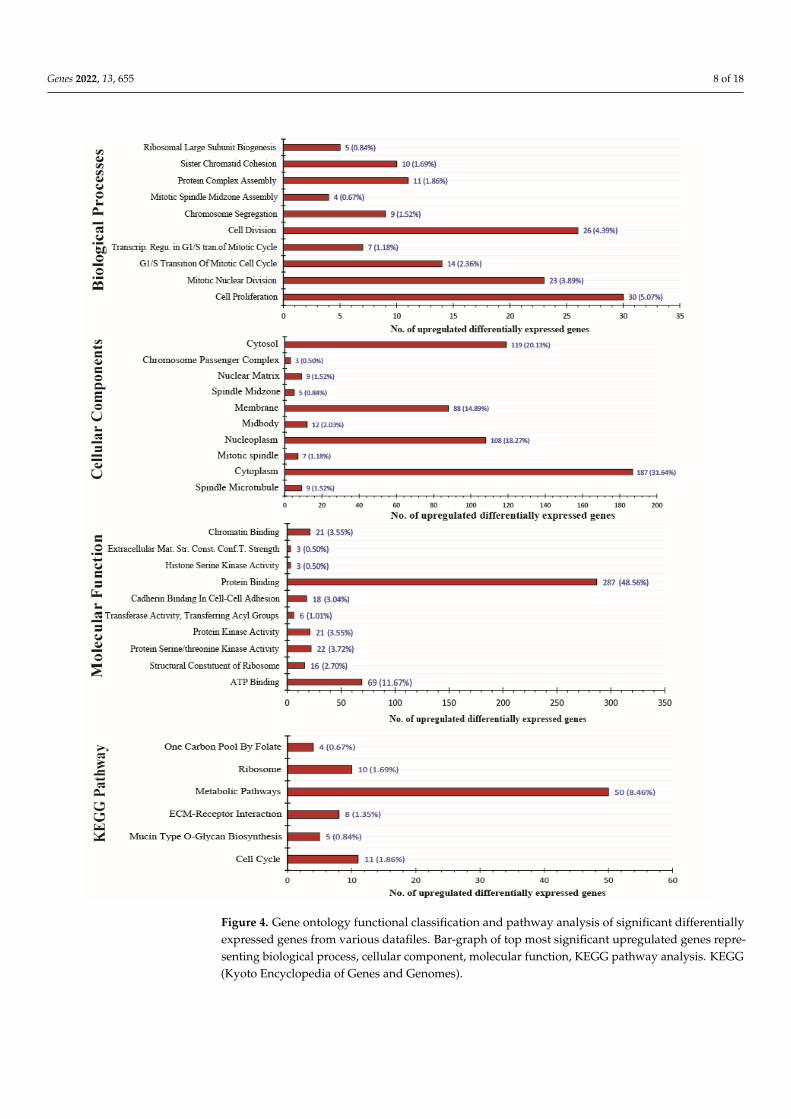
KEGG pathway significance, DAVID online software was used. The most significant biologicalprocess for upregulated genes involved in cell proliferation (FDR:0.003528782), mitotic nucleardivision (FDR:0.005441812), G1/S transition of mitotic cell cycle (FDR:0.007227173) and most sig-nificant biological process for downregulated genes involved in angiogenesis (FDR:7.53× 10⁻⁶),cell adhesion (FDR:7.53 × 10⁻⁶), response to hypoxia (FDR:0.001023707). The most significantupregulated genes were available in the portion of the spindle microtubule (FDR:0.012514875),cytoplasm (FDR:0.093997223), mitotic spindle (FDR:0.093997223), and the most significantdownregulated genes were available in the area of focal adhesion (FDR:2.39 × 10⁻⁹), plasmamembrane (FDR:5.86 × 10⁻⁸), caveola region (FDR:2.95 × 10⁻⁷) under the cellular componentcategory. Molecular function enrichment assessment for most significant upregulated genesincluded ATP binding activity (FDR:0.149334827), structural constituent of ribosome activity(FDR:0.704002703), protein serine/threonine kinase activity (FDR:0.704002703) and for mostsignificant downregulated genes included calcium ion binding (FDR:0.002557467), protein ho-modimerization activity (FDR:0.042898325), glutathione transferase activity (FDR:0.042898325).The most significant upregulated genes under KEGG pathway analysis are involved in Cell cy-cle signaling (FDR:0.74589722), Mucin type O-Glycan biosynthesis pathway (FDR:0.74589722),ECM-receptor interaction pathway (FDR:0.74589722) and in the case of the most significantdownregulated genes under KEGG pathway analysis, they are involved in Focal adhesion(FDR:2.42 × 10⁻⁷), Dilated cardiomyopathy (FDR:4.04 × 10⁻⁵), Hypertrophic cardiomyopathy(HCM) signaling pathway (FDR:1.94 × 10⁻⁴) (Figures 4 and 5, Supplementary files S4–S11).
Genes 2022, 13, x FOR PEER REVIEW 7 of 20
3.2. DEGs Functional Annotation and KEGG Pathway Analysis To classify unique upregulated and downregulated of all four data sets GSE55945,
GSE104749, GSE46602 and GSE32571 the bioinformatics and research computing online tool (http://barc.wi.mit.edu/tools/, accessed on 18 March 2022) was used. We obtained 633 most significant unique upregulated genes and 1219 unique downregulated genes from all four datasets after assessment (Figure 3). In order to evaluate the gene-ontology func-tional analysis of selected DEGs for biological process (BP), cellular process (CC), molec-ular function (MF) and KEGG pathway significance, DAVID online software was used. The most significant biological process for upregulated genes involved in cell prolifera-tion (FDR:0.003528782), mitotic nuclear division (FDR:0.005441812), G1/S transition of mi-totic cell cycle (FDR:0.007227173) and most significant biological process for downregu-lated genes involved in angiogenesis (FDR:7.53 × 10⁻⁶), cell adhesion (FDR:7.53 × 10⁻⁶), re-sponse to hypoxia (FDR:0.001023707). The most significant upregulated genes were avail-able in the portion of the spindle microtubule (FDR:0.012514875), cytoplasm (FDR:0.093997223), mitotic spindle (FDR:0.093997223), and the most significant downreg-ulated genes were available in the area of focal adhesion (FDR:2.39 × 10⁻⁹), plasma mem-brane (FDR 5.86 × 10⁻⁸), caveola region (FDR:2.95 × 10⁻⁷) under the cellular component category. Molecular function enrichment assessment for most significant upregulated genes included ATP binding activity (FDR:0.149334827), structural constituent of ribo-some activity (FDR:0.704002703), protein serine/threonine kinase activity (FDR:0.704002703) and for most significant downregulated genes included calcium ion binding (FDR:0.002557467), protein homodimerization activity (FDR:0.042898325), gluta-thione transferase activity (FDR:0.042898325). The most significant upregulated genes un-der KEGG pathway analysis are involved in Cell cycle signaling (FDR:0.74589722), Mucin type O-Glycan biosynthesis pathway (FDR:0.74589722), ECM-receptor interaction path-way (FDR:0.74589722) and in the case of the most significant downregulated genes under KEGG pathway analysis, they are involved in Focal adhesion (FDR:2.42 × 10⁻⁷), Dilated cardiomyopathy (FDR:4.04 × 10⁻⁵), Hypertrophic cardiomyopathy (HCM) signaling path-way (FDR:1.94 × 10⁻⁴) (Figures 4 and 5, Supplementary files S4–S11).
Figure 3. A plot depicting the upregulated-downregulated & unique DEGs discovered in four da-tafiles GSE32571, GSE104749, GSE46602, GSE55945. Statistically significant DEGs were character-ized by the cut-off criterion of log2FC value > 1, log2FC value < −1 and p < 0.05.
Figure 3. A plot depicting the upregulated-downregulated & unique DEGs discovered in fourdatafiles GSE32571, GSE104749, GSE46602, GSE55945. Statistically significant DEGs were character-ized by the cut-off criterion of log2FC value > 1, log2FC value < −1 and p < 0.05.
3.3. Protein-Protein (PPI) Network and Module Analysis
In the Cytoscape platform for up regulated and downregulated genes, we found1572 nodes, 11,279 edges and 13.8 mean node degree after topological property analysis ofthe PPI network (Figure 6A). After topological enrichment, the most connected upregulatedgenes MYC, CDK1, CCNB1 etc. and the most connected downregulated genes EGFR,VEGFA, STAT3 etc. were categorized according to their highest degree count associatedwith prostate cancer (Figure 6B and Table 2). The characterization of this newly synthesizedPPI with MCODE score ≥ 3 and nodes ≥ 3 in the retrieval of two modules. Module A had92 nodes, 580 edges with an MCODE score of 12.747 and module B had 45 nodes, 153 edgeswith an MCODE score of 6.955 (Figure 7A,B).
Genes 2022, 13, 655 8 of 18Genes 2022, 13, x FOR PEER REVIEW 8 of 20
Figure 4. Gene ontology functional classification and pathway analysis of significant differentially expressed genes from various datafiles. Bar-graph of top most significant upregulated genes repre-senting biological process, cellular component, molecular function, KEGG pathway analysis. KEGG (Kyoto Encyclopedia of Genes and Genomes).
Figure 4. Gene ontology functional classification and pathway analysis of significant differentiallyexpressed genes from various datafiles. Bar-graph of top most significant upregulated genes repre-senting biological process, cellular component, molecular function, KEGG pathway analysis. KEGG(Kyoto Encyclopedia of Genes and Genomes).

Genes 2022, 13, 655 9 of 18Genes 2022, 13, x FOR PEER REVIEW 9 of 20
Figure 5. Gene ontology functional classification and pathway analysis of significant differentially expressed genes from various datafiles. Bar-graph of top most significant downregulated genes rep-resenting biological process, cellular component, molecular function, KEGG pathway analysis. KEGG (Kyoto Encyclopedia of Genes and Genomes).
Figure 5. Gene ontology functional classification and pathway analysis of significant differentiallyexpressed genes from various datafiles. Bar-graph of top most significant downregulated genesrepresenting biological process, cellular component, molecular function, KEGG pathway analysis.KEGG (Kyoto Encyclopedia of Genes and Genomes).

Genes 2022, 13, 655 10 of 18
Genes 2022, 13, x FOR PEER REVIEW 10 of 20
3.3. Protein-Protein (PPI) Network and Module Analysis In the Cytoscape platform for up regulated and downregulated genes, we found 1572
nodes, 11,279 edges and 13.8 mean node degree after topological property analysis of the PPI network (Figure 6A). After topological enrichment, the most connected upregulated genes MYC, CDK1, CCNB1 etc. and the most connected downregulated genes EGFR, VEGFA, STAT3 etc. were categorized according to their highest degree count associated with prostate cancer (Figure 6B and Table 2). The characterization of this newly synthe-sized PPI with MCODE score ≥ 3 and nodes ≥ 3 in the retrieval of two modules. Module A had 92 nodes, 580 edges with an MCODE score of 12.747 and module B had 45 nodes, 153 edges with an MCODE score of 6.955 (Figure 7A,B).
Table 2. Top 10 highly connected up and downregulated gene.
Status Gene Symbol Degree Status Gene Symbol Degree Upregulated MYC 166 Downregulated EGFR 190
CDK1 111
VEGFA 178 CCNB1 97 STAT3 117 EZH2 95 CD44 113 AURKA 89 PTEN 110 UBE2C 82 VCL 86 AURKB 80 IGF1 84 COL1A1 76 CAV1 82 MKI67 76 KDR 79 TOP2A 75 PIK3R1 72
Figure 6. (A) Most significant upregulated and downregulated genes PPI network map. (upregu-lated genes represented by red colour and downregulated genes represented by blue colour) (B) Top 10 most connected upregulated and downregulated genes according to their highest degree Figure 6. (A) Most significant upregulated and downregulated genes PPI network map. (upregulatedgenes represented by red colour and downregulated genes represented by blue colour) (B) Top10 most connected upregulated and downregulated genes according to their highest degree scoreassociated with prostate cancer. (upregulated genes represented by red colour and downregulatedgenes represented by blue colour) (C) Top 10 hub significant genes extracted by PPI Cyto-hubbanetwork & (D) Top 10 bottleneck significant genes excavated from PPI Cyto-hubba network. Higherscore is represented by colour intensity in hub and bottleneck genes both. (upregulated genesrepresented by red colour and downregulated genes represented by blue colour) (E) Deep networkextraction showing the key genes, TF and miRNA interaction with each other. (upregulated genesrepresented by red colour, downregulated genes represented by blue colour, miRNA represented bygreen colour & TFs represented by violet colour).
Table 2. Top 10 highly connected up and downregulated gene.
Status GeneSymbol Degree Status Gene
Symbol Degree
Upregulated MYC 166 Downregulated EGFR 190CDK1 111 VEGFA 178CCNB1 97 STAT3 117EZH2 95 CD44 113AURKA 89 PTEN 110UBE2C 82 VCL 86AURKB 80 IGF1 84COL1A1 76 CAV1 82MKI67 76 KDR 79TOP2A 75 PIK3R1 72

Genes 2022, 13, 655 11 of 18
Genes 2022, 13, x FOR PEER REVIEW 11 of 20
score associated with prostate cancer. (upregulated genes represented by red colour and downreg-ulated genes represented by blue colour) (C) Top 10 hub significant genes extracted by PPI Cyto-hubba network & (D) Top 10 bottleneck significant genes excavated from PPI Cyto-hubba network. Higher score is represented by colour intensity in hub and bottleneck genes both. (upregulated genes represented by red colour and downregulated genes represented by blue colour) (E) Deep network extraction showing the key genes, TF and miRNA interaction with each other. (upregulated genes represented by red colour, downregulated genes represented by blue colour, miRNA repre-sented by green colour & TFs represented by violet colour).
Figure 7. Identification of modules from PPI network. (A) Most significant module-A & (B) mod-ules-B in the MCODE-PPI network analysis. DEGs is represented by nodes and interaction between them represented by edges.
Figure 7. Identification of modules from PPI network. (A) Most significant module-A & (B) modules-B in the MCODE-PPI network analysis. DEGs is represented by nodes and interaction between themrepresented by edges.
3.4. Hub-Bottle Neck Genes and Key Genes Identification
A Cytoscape plug-in, Cytohubba was applied to the established PPI network togetherwith the decreasing score of the Degree algorithm to deduce the top most hub genes. Theshortest path, centrality algorithm along with bottle neck score were used in Cytohubbasoftware to discover the top most bottle neck genes. For further investigation, the top10 hub genes (Figure 6C) and the top 10 bottle neck genes were selected (Figure 6D). Afterstudy, EGFR, MYC, VEGFA, PTEN, STAT3, CDK1, a total of six were found common in both

Genes 2022, 13, 655 12 of 18
hub and bottleneck genes, along with the most connected genes were EGFR and VEGFA.There were four unique hub genes including CCNB1, EZH2, AURKA and CD44, and fourunique bottleneck genes, including PIK3R1, GART, PITGS2 and RHOC (Supplementary fileS12). After taking certain topological algorithms such as betweenness centrality, closenessCentrality, degree score, stress, bottleneck score, we identified four key regulator genesincluding EGFR, MYC, VEGFA, PTEN. According to our findings, common TFs such AR,Sp1, TP53, NF-KB1, STAT3, and RELA are targeted by all identified four key genes. Also,miR-21-5p has a strong connection to each of the four key genes investigated in this study(Figure 6E). The genes follow more than one criterion such as (or including?) STAT3, CAT,VCL, EZH2, CD44, CAV1; unique genes C11or f96, TMEM106C, DMKN, PRELID2, UBXN10,ZNF613, CCNB1, AURKA, GART, PTGS2, RHOC, PIK3R1 were revealed after integratedanalysis (Supplementary file S12).
3.5. Genetic Alteration and Validation of Four Key Genes Expression Paradigm
After statistical analysis by cBioPortal for Cancer Genomics, we observed that 1766(26%) of the 6875 prostate cancer patients documented genetic alteration in the four keygenes. Deletion and amplification were the utmost prevalent genetic variations. (Figure 8A).Further, the GEPIA tool (http://gepia.cancer-pku.cn, accessed on 18 February 2022) wasused for the evaluation of key genes EGFR, MYC, VEGFA, PTEN expression in The CancerGenome Atlas data. As per the GEO dataset findings, the key genes EGFR, VEGFA, PTENexpression level in prostate adenocarcinoma (PRAD) was significantly lower (p < 0.05)compared to non-tumor prostate tissue and the MYC expression level was significantlyhigher (p < 0.05) in prostate adenocarcinoma (PRAD) compared to non-tumor prostatetissue verified by the TCGA database (Figure 8B–E).
3.6. Survival Analysis of Key Genes
The TCGA based UALCAN transcriptomic cancer data was used for the survivalassessment of PCa patients and gene expression analysis. The four key regulator genesexpression were analyzed in the UALCAN database using the Kaplan Meier method. Theclassification of PCa tumor tissue is based on the Gleason Score (GS) method, accordingto this grading system, gleason score GS ≤ 6, 3 + 4, 4 + 3, 8, 4 + 5, 5 + 4, 10 is related toGleason Grading Group 1, 2, 3, 4, and 5 respectively [36]. It was noted that all the fourkey genes were found significantly correlated with overall survival in PCa. The overallsurvival of the low/medium expression group was observed to be significantly lowerthan the high expression group for EGFR, VEGFA, PTEN genes and the overall survival ofthe high expression group was observed to be significantly lower than the low/mediumexpression group for MYC genes in PCa patients after integrated analysis with the GleasonScore system (Figure 8F–I).
3.7. miRNA and Transcription Factor Associated Network with Key Genes
The miRNAs play an important role in gene expression regulation at multiple stagesafter RNA synthesis. miRNA up and downregulation defects are linked with prostate can-cer and they have an ability to differentiate between benign and malignant tumors [37]and the disease complexity can be more readable by miRNA changes. The four key iden-tified genes were connected to approximately 394 miRNAs (Supplementary file S13) and233 transcription factors (Supplementary file S14), which could be responsible for control-ling key genes. Further results demonstrated EGFR-associated 38 miRNAs, MYC-associated115 miRNAs, VEGFA-associated 121 miRNAs, PTEN-associated 120 miRNAs. Moreover, TFanalysis revealed the following: EGFR-associated 32 transcription factors, MYC-associated95 transcription factors, VEGFA-associated 83 transcription factors and PTEN-associated23 transcription factors. In addition, the AR transcription factor associated with 13111 miR-NAs possible binding sites, STAT3 transcription factor associated with 72 miRNAs and RELAtranscription factor associated with 227 miRNAs in PCa (Supplementary file S15).

Genes 2022, 13, 655 13 of 18
Genes 2022, 13, x FOR PEER REVIEW 13 of 20
Figure 8. Genetic alteration, validation and survival analysis of four key genes expression paradigm related to PCa using TCGA data. (A) The oncoplot of four key genes. (B–E) The validation of four key genes expression paradigm in PRAD (n = 492) tumor and non-tumor (n = 152). (F–I) Survival analysis of four key genes associated with PCa using Kaplan Meier method, * Significant p-value < 0.05.
3.6. Survival Analysis of Key Genes The TCGA based UALCAN transcriptomic cancer data was used for the survival as-
sessment of PCa patients and gene expression analysis. The four key regulator genes ex-pression were analyzed in the UALCAN database using the Kaplan Meier method. The classification of PCa tumor tissue is based on the Gleason Score (GS) method, according to this grading system, gleason score GS ≤ 6, 3 + 4, 4 + 3, 8, 4 + 5, 5 + 4, 10 is related to Gleason Grading Group 1, 2, 3, 4, and 5 respectively [36]. It was noted that all the four key genes were found significantly correlated with overall survival in PCa. The overall sur-vival of the low/medium expression group was observed to be significantly lower than the high expression group for EGFR, VEGFA, PTEN genes and the overall survival of the high expression group was observed to be significantly lower than the low/medium ex-pression group for MYC genes in PCa patients after integrated analysis with the Gleason Score system (Figure 8F–I).
3.7. miRNA and Transcription Factor Associated Network with Key Genes
Figure 8. Genetic alteration, validation and survival analysis of four key genes expressionparadigm related to PCa using TCGA data. (A) The oncoplot of four key genes. (B–E) Thevalidation of four key genes expression paradigm in PRAD (n = 492) tumor and non-tumor(n = 152). (F–I) Survival analysis of four key genes associated with PCa using Kaplan Meiermethod, * Significant p-value < 0.05.
4. Discussion
Prostate cancer is a widely spread one across the world among males. PCa canmetastasize through the circulatory system reaching distant parts of the body [38]. Thedisease’s pathogenicity, magnitude detection, ambiguity, predictive and clinical biomarkerscarcity are the main barriers in the path of PCa care [6,39]. As a result, the integratedPCa key regulatory genes profiling may help to achieve more successful treatment of PCapatients. This research has highlighted the DEGs related to PCa out of 112 tumor samplesand 65 BPH tissues, pooled from GSE 55945, GSE 104749, GSE46602, GSE32571 datasets,with the help of bioinformatic techniques. As a result, a total number of 1866 significantlyDEGs were found, in which there were 638 up and 1228 downregulated genes. In order todemonstrate the relationship between up and down DEGs with PPI network formation,two modules were found to be significantly crucial in this PPI network study. Taking thisinto the account, the highest ranked genes were screened by Cytohubba in terms of hub andbottle neck genes. These techniques of gene ontology (GO) and KEGG pathways were used

Genes 2022, 13, 655 14 of 18
to describe the role of DEGs. The top characterized and screened genes including EGFR,MYC, VEGFA, PTEN which are involved in prostate cancer progression, cell proliferationand division, cell cycle signaling, metabolic and signaling pathway regulation, angiogenesis,focal adhesion etc. [40–44] Which makes them further as molecular candidates involvedin treatment. Furthermore, various hub genes and bottle neck genes linked to prostatecancer were uncovered through this study. In addition to that, identification of miRNAsand screening of the transcription factors revealed molecular markers for prostate cancerprogression control.
The Epidermal Growth Factor Receptor (EGFR) is involved in many biological pro-cesses, such as proliferation, vitality, migration, progression and cell signaling [40,41]. Bycontrast, EGFR under expression has been reported with tumor progression [42]. In the Pak-istani population, Hashmi and his colleagues have shown that EGFR under expression waslinked to prostatic adenocarcinoma, suggesting it as clinical biomarker in cases with higherGleason score, high grade and perineural association with prostate carcinoma [43]. Recentevidence has shown that EGFR and the related AKT pathway are effectively associatedwith AR phosphorylation [44], but it has been observed in PCa that an inverse relationshiphas been seen in terms of EGFR and AR protein/expression [45]. The regulators for EGFR,TF and microRNAs included miRNA-145 which is boosted by TF p53 (TP53) and inhibitsEGRF expression [46–48]. Also, miR-199a-3p which targets EGFR as well as c-Myc [49,50].
In the light of PCa progression, MYC is another significant gene. C-Myc, N-mycand L-myc are MYC subtypes that encode similar MYC protein which have the samefunction [51,52]. The level of expression is contrasted in various tissues, such as N-mycupregulated in solidified tumor glioma and neuroblastoma, c-Myc upregulated in solidifiedcancer and blood-related cancer, acting as proto-oncogene as well as transcription factorwhile L-myc upregulated in lung carcinoma [53]. C-Myc is a critical factor in PCa progressionand related to cell expansion [54,55] which goes together with our findings. Inhibitionof c-Myc could be carried by multiple miRNAs, including miR-let-7a which also has atumor suppression function in PCa cells through downregulating AR expression [56].Also, miRNA-34a plays a critical role as a tumor suppressor along with p53 arbitratoractivity, which has been down expressed in PCa; it lacks the capability to suppress c-Mycin PCa cells [57]. Also, miR-23b can play the same role as miR-34a, but other oncogenictranscription factors like NF-KB and Sp1 can activate the alternative way in MYC-dependentmiR-23b inhibition, for cell survival and growth [58] which is shown in our TF data.
The VEGF family’s key role is to facilitate angiogenesis in malignant cancer, makingit an effective therapeutic candidate for tumor disease cure. Bender and co-workers spec-ulated that primary prostate tumors experiencing VEGFA (vascular endothelial growthfactor-A) low expression [59,60]. The VEGF level could be regulated by EGFR’s action viathe signaling network of mitogen-activated protein kinase (MAPK) as well as phosphoinosi-tide 3-kinase (PI3K) [61] which has been observed in our finding for EGFR. In this study,the obtained final TFs and microRNAs have a direct connection with VEGFA, like AR, TP53,SP1, miR-299-3p [62,63] which have been found and reported in our supplementary file.
PTEN (Phosphatase and Tensin Homolog) belongs to the phosphatase group thatregulates the signaling pathway of PI3K as well as AKT [64]; PTEN has tumor suppressoractivity and is generally found idle connected to PCa [65]. Downregulated PTEN expressionin our findings goes in line with the previously reported results in Iranian PCa patients [66].PTEN plays a reverse role in the signaling effect of PI3K/AKT and dephosphorylatesPIP3 [64,67]. Also, PTEN has the capability to inhibit AR in a clinical manner through ARnuclear translocation blocking as well as depletion of AR protein, and this matches AR overexpression as per our findings [68–70]. Regulation of PTEN was targeted by miRNA-let-7band miR-548 and down expression of miR-let-7b (tumor suppressor) was detected in ourfindings, but PTEN was not correlated with miR-548 in terms of expression [62]. Anotherfinding indicated that miR-21 and miR-181b-1 both repressed PTEN as well as CYLD, whichwere subsequently turned on by STAT3 in the signaling [71].

Genes 2022, 13, 655 15 of 18
In addition, the examined PPI network was strongly correlated with the rest of thehub and bottleneck genes which are essential genes in the network pathway operations.In this study, DEGs were obtained through a comparison between PCa and BPH samples.After that, the PPI network was established and chosen for further analysis. The signifi-cance of this study lies in detecting and revealing unique key hub genes including EGFR,MYC, VEGFA, PTEN from different sources collectively and their regulation by commontranscription factors. Besides, Androgen receptor (AR), Sp1, TP53, NF-KB1, STAT3, RELAand signature microRNAs such as miR-21-5p, miR-125a-5p, miR145-5p and miR-155-5phave been reported jointly in the same study for the first time in PCa tissue samples astumor markers and clinical targets.
5. Conclusions
In comparison to BPH, our bioinformatics combined enrichment analysis revealed thatkey genes EGFR, MYC, VEGFA, and PTEN were identified as potent molecular biomarkersof PCa from gene expression profiling. We found that all four key genes are targeted bycommon transcription factors such as AR, Sp1, TP53, NF-KB1, STAT3 and RELA. Moreover,MYC as a transcription factor has a target for TP53 and shares a target with it as well.MYC shares a target with other transcription factors such as NF-KB1, STAT3 and RELA.Additionally, our analysis determined that miR-21-5p was significantly associated withall four key genes while miR-125a-5p and miR145-5p were significantly associated withEGFR, MYC, VEGFA, but not with PTEN; and miR-155-5p was significantly associated withEGFR, MYC, PTEN. Furthermore, we found that miR-21 is also connected with AR, STAT3transcription factor and miR-155 is connected with AR. The clinical therapeutic target ofPCa can be determined by the information in these findings as well as by giving clinicalinsight clues for the development of new novel PCa therapies. However, this study hasa limitation of absent confirmatory experimental validation but provides a new door forfuture study.
Supplementary Materials: The following are available online at https://www.mdpi.com/article/10.3390/genes13040655/s1, Supplementary file S1: List of the most significant upregulated and downregulatedgenes for the GSE55945, GSE46602, GSE104749, GSE32571 dataset. Supplementary file S2: GEO datasetprocessing. Boxplots show the expression intensity of each sample for the dataset GSE55945, GSE46602,GSE104749, GSE32571 before (upper panel) and after (lower panel) normalization. Supplementary file S3:The heatmap of gene expression depicts the expression levels of several genes that have undergoneconsiderable up- or down-regulation. Upregulation (red) and down-regulation (green) are indicated bythe colour. (For interpretation of the references to colour in this figure legend, the reader is referred to theweb version of this article). Supplementary files S4–S7: Significant upregulated differentially expressedgenes involved in GO Biological Process, Cellular Component, Molecular Function, KEGG Pathway.Supplementary files S8–S11: Significant downregulated differentially expressed genes involved in GOBiological Process, Cellular Component, Molecular Function, KEGG Pathway. Supplementary file S12:List of the key genes, hub genes, bottleneck genes, hub & bottleneck genes, unique genes, genes with morethan one criterion. Supplementary file S13: List of the key genes connected to miRNAs. Supplementaryfile S14: List of the key genes connected to transcription factor. Supplementary file S15: List of thetranscription factor connected to miRNAs.
Author Contributions: M.Z.M. & M.B. conceptualized and designed the model. M.M.K. wroteoriginal draft. M.M.K. did Data curation, Formal analysis, Methodology, Validation. M.M.K. &M.T.M. did the investigation & resources. Critical evaluation of the manuscript M.B. & M.M.K.M.M.K., M.T.M., S.A.B., M.F.A., S.H., did review & editing. M.S. and M.B. were jointly supervised thestudy. All authors have read and agreed to the published version of the manuscript.
Funding: The ‘Indian Council of Medical Research (ICMR)’ has generously supported MMK fi-nancially. The National Institute of Cancer Prevention and Research (ICMR-NICPR) providedinfrastructure and core funds to M.B. for this study. M.Z.M. is grateful for financing from the Indiangovernment’s Department of Health Research, Ministry of Health and Family Welfare, as part ofthe Young Sci-entist scheme (Sanction File No. R.12014/01/2018-HR, FTS No. 3146887). Mustfa F

Genes 2022, 13, 655 16 of 18
Alkhanani would like to express his gratitude to AlMaarefa University, Riyadh, Saudi Arabia, forproviding funding (TUMA-2021-53) to do this research.
Institutional Review Board Statement: Not applicable.
Informed Consent Statement: Not applicable.
Data Availability Statement: The data used in the current study available from the correspondingauthor on reasonable request.
Conflicts of Interest: The authors declare no conflict of interest.
References1. Stuopelyte, K.; Daniunaite, K.; Bakavicius, A.; Lazutka, J.R.; Jankevicius, F.; Jarmalaite, S. The utility of urine-circulating miRNAs
for detection of prostate cancer. Br. J. Cancer 2016, 115, 707–715. [CrossRef] [PubMed]2. Sung, H.; Ferlay, J.; Siegel, R.L.; Laversanne, M.; Soerjomataram, I.; Jemal, A.; Bray, F. Global cancer statistics 2020: GLOBOCAN
estimates of incidence and mortality worldwide for 36 cancers in 185 countries. CA Cancer J. Clin. 2021, 71, 209–249. [CrossRef][PubMed]
3. Ferlay, J.; Colombet, M.; Soerjomataram, I.; Mathers, C.; Parkin, D.M.; Piñeros, M.; Znaor, A.; Bray, F. Estimating the global cancerincidence and mortality in 2018: GLOBOCAN sources and methods. Int. J. Cancer 2019, 144, 1941–1953. [CrossRef] [PubMed]
4. Jain, S.; Saxena, S.; Kumar, A. Epidemiology of prostate cancer in India. Meta Gene 2014, 2, 596–605. [CrossRef] [PubMed]5. Center, M.M.; Jemal, A.; Lortet-Tieulent, J.; Ward, E.; Ferlay, J.; Brawley, O.; Bray, F. International variation in prostate cancer
incidence and mortality rates. Eur. Urol. 2012, 61, 1079–1092. [CrossRef]6. Shen, M.M.; Abate-Shen, C. Molecular genetics of prostate cancer: New prospects for old challenges. Genes Dev. 2010, 24,
1967–2000. [CrossRef]7. Kuriyama, M.; Wang, M.C.; Papsidero, L.D.; Killian, C.S.; Shimano, T.; Valenzuela, L.; Nishiura, T.; Murphy, G.P.; Chu, T.M.
Quantitation of prostate-specific antigen in serum by a sensitive enzyme immunoassay. Cancer Res. 1980, 40, 4658–4662.8. Herget, K.A.; Patel, D.P.; Hanson, H.A.; Sweeney, C.; Lowrance, W.T. Recent decline in prostate cancer incidence in the United
States, by age, stage, and Gleason score. Cancer Med. 2016, 5, 136–141. [CrossRef]9. Deng, J.; Tang, J.; Wang, G.; Zhu, Y.S. Long non-coding RNA as potential biomarker for prostate cancer: Is it making a difference?
Int. J. Environ. Res. Public Health 2017, 14, 270. [CrossRef]10. Liu, Y.; Liu, Y.; Yuan, B.; Yin, L.; Peng, Y.; Yu, X.; Zhou, W.; Gong, Z.; Liu, J.; He, L.; et al. FOXM1 promotes the progression of
prostate cancer by regulating PSA gene transcription. Oncotarget 2017, 8, 17027. [CrossRef]11. Albertsen, P. Predicting survival for men with clinically localized prostate cancer: What do we need in contemporary practice?
Cancer 2008, 112, 1–3. [CrossRef] [PubMed]12. So, A.; Gleave, M.; Hurtado-Col, A.; Nelson, C. Mechanisms of the development of androgen independence in prostate cancer.
World J. Urol. 2005, 23, 1–9. [CrossRef] [PubMed]13. Zhao, L.; Yu, N.; Guo, T.; Hou, Y.; Zeng, Z.; Yang, X.; Hu, P.; Tang, X.; Wang, J.; Liu, M. Tissue biomarkers for prognosis of prostate
cancer: A systematic review and meta-analysis. Cancer Epidemiol. Prev. Biomark. 2014, 23, 1047–1054. [CrossRef] [PubMed]14. Song, C.J.; Chen, H.; Chen, L.Z.; Ru, G.M.; Guo, J.J.; Ding, Q.N. The potential of microRNAs as human prostate cancer biomarkers:
A meta-analysis of related studies. J. Cell. Biochem. 2018, 119, 2763–2786. [CrossRef] [PubMed]15. Filella, X.; Fernández-Galan, E.; Fernández Bonifacio, R.; Foj, L. Emerging biomarkers in the diagnosis of prostate cancer. Pharm.
Pers. Med. 2018, 11, 83–94. [CrossRef] [PubMed]16. Barrett, T.; Wilhite, S.E.; Ledoux, P.; Evangelista, C.; Kim, I.F.; Tomashevsky, M.; Marshall, K.A.; Phillippy, K.H.;
Sherman, P.M.; Holko, M.; et al. NCBI GEO: Archive for functional genomics data sets—Update. Nucleic Acids Res.2013, 41, D991–D995. [CrossRef]
17. Arredouani, M.S.; Lu, B.; Bhasin, M.; Eljanne, M.; Yue, W.; Mosquera, J.M.; Bubley, G.J.; Li, V.; Rubin, M.A.; Libermann, T.A.; et al.Identification of the transcription factor single-minded homologue 2 as a potential biomarker and immunotherapy target in prostatecancer. Clin. Cancer Res. 2009, 15, 5794–5802. [CrossRef]
18. Shan, M.; Xia, Q.; Yan, D.; Zhu, Y.; Zhang, X.; Zhang, G.; Guo, J.; Hou, J.; Chen, W.; Zhu, T.; et al. Molecular analyses of prostatetumors for diagnosis of malignancy on fine-needle aspiration biopsies. Oncotarget 2017, 8, 104761–104771. [CrossRef]
19. Mortensen, M.M.; Høyer, S.; Lynnerup, A.S.; Ørntoft, T.F.; Sørensen, K.D.; Borre, M.; Dyrskjøt, L. Expression profiling of prostatecancer tissue delineates genes associated with recurrence after prostatectomy. Sci. Rep. 2015, 5, 16018. [CrossRef]
20. Kuner, R.; Fälth, M.; Pressinotti, N.C.; Brase, J.C.; Puig, S.B.; Metzger, J.; Gade, S.; Schäfer, G.; Bartsch, G.; Steiner, E.; et al. Thematernal embryonic leucine zipper kinase (MELK) is upregulated in high-grade prostate cancer. J. Mol. Med. 2013, 91, 237–248.[CrossRef]
21. Ostano, P.; Mello-Grand, M.; Sesia, D.; Gregnanin, I.; Peraldo-Neia, C.; Guana, F.; Jachetti, E.; Farsetti, A.; Chiorino, G. GeneExpression Signature Predictive of Neuroendocrine Transformation in Prostate Adenocarcinoma. Int. J. Mol. Sci. 2020, 21, 1078.[CrossRef] [PubMed]

Genes 2022, 13, 655 17 of 18
22. Yang, Z.; Qu, C.B.; Zhang, Y.; Zhang, W.F.; Wang, D.D.; Gao, C.C.; Ma, L.; Chen, J.S.; Liu, K.L.; Zheng, B.; et al. Dysregulation ofp53-RBM25-mediated circAMOTL1L biogenesis contributes to prostate cancer progression through the circAMOTL1L-miR-193a-5p-Pcdha pathway. Oncogene 2019, 38, 2516–2532. [CrossRef] [PubMed]
23. Kreuz, M.; Otto, D.J.; Fuessel, S.; Blumert, C.; Bertram, C.; Bartsch, S.; Loeffler, D.; Puppel, S.H.; Rade, M.; Buschmann, T.; et al.ProstaTrend—A Multivariable Prognostic RNA Expression Score for Aggressive Prostate Cancer. Eur. Urol. 2020, 78, 452–459.[CrossRef] [PubMed]
24. Huang, D.W.; Sherman, B.T.; Lempicki, R.A. Systematic and integrative analysis of large gene lists using DAVID bioinformaticsresources. Nat. Protoc. 2009, 4, 44–57. [CrossRef] [PubMed]
25. Kanehisa, M.; Goto, S. KEGG: Kyoto encyclopedia of genes and genomes. Nucleic Acids Res. 2000, 28, 27–30. [CrossRef] [PubMed]26. Szklarczyk, D.; Franceschini, A.; Wyder, S.; Forslund, K.; Heller, D.; Huerta-Cepas, J.; Simonovic, M.; Roth, A.; Santos, A.;
Tsafou, K.P.; et al. STRING v10: Protein–protein interaction networks, integrated over the tree of life. Nucleic Acids Res. 2015, 43,D447–D452. [CrossRef]
27. Saito, R.; Smoot, M.E.; Ono, K.; Ruscheinski, J.; Wang, P.L.; Lotia, S.; Pico, A.R.; Bader, G.D.; Ideker, T. A travel guide to Cytoscapeplugins. Nat. Methods 2012, 9, 1069–1076. [CrossRef]
28. Chin, C.H.; Chen, S.H.; Wu, H.H.; Ho, C.W.; Ko, M.T.; Lin, C.Y. cytoHubba: Identifying hub objects and sub-networks fromcomplex interactome. BMC Syst. Biol. 2014, 8, 1–7. [CrossRef]
29. Gao, J.; Aksoy, B.A.; Dogrusoz, U.; Dresdner, G.; Gross, B.; Sumer, S.O.; Sun, Y.; Jacobsen, A.; Sinha, R.; Larsson, E.; et al.Integrative analysis of complex cancer genomics and clinical profiles using the cBioPortal. Sci. Signal. 2013, 6, pl1. [CrossRef]
30. Tang, Z.; Li, C.; Kang, B.; Gao, G.; Li, C.; Zhang, Z. GEPIA: A web server for cancer and normal gene expression profiling andinteractive analyses. Nucleic Acids Res. 2017, 45, W98–W102. [CrossRef]
31. Chandrashekar, D.S.; Bashel, B.; Balasubramanya, S.A.; Creighton, C.J.; Ponce-Rodriguez, I.; Chakravarthi, B.V.; Varambally, S.UALCAN: A portal for facilitating tumor subgroup gene expression and survival analyses. Neoplasia 2017, 19, 649–658. [CrossRef][PubMed]
32. Kuleshov, M.V.; Jones, M.R.; Rouillard, A.D.; Fernandez, N.F.; Duan, Q.; Wang, Z.; Koplev, S.; Jenkins, S.L.; Jagodnik, K.M.;Lachmann, A.; et al. Enrichr: A comprehensive gene set enrichment analysis web server 2016 update. Nucleic Acids Res. 2016, 44,W90–W97. [CrossRef] [PubMed]
33. Han, H.; Cho, J.W.; Lee, S.; Yun, A.; Kim, H.; Bae, D.; Yang, S.; Kim, C.Y.; Lee, M.; Kim, E.; et al. TRRUST v2: An expandedreference database of human and mouse transcriptional regulatory interactions. Nucleic Acids Res. 2018, 46, D380–D386. [CrossRef][PubMed]
34. Tong, Z.; Cui, Q.; Wang, J.; Zhou, Y. TransmiR v2.0: An updated transcription factor-microRNA regulation database. Nucleic AcidsRes. 2019, 47, D253–D258. [CrossRef] [PubMed]
35. Chang, L.; Zhou, G.; Soufan, O.; Xia, J. miRNet 2.0: Network-based visual analytics for miRNA functional analysis and systemsbiology. Nucleic Acids Res. 2020, 48, W244–W251. [CrossRef] [PubMed]
36. Epstein, J.I.; Zelefsky, M.J.; Sjoberg, D.D.; Nelson, J.B.; Egevad, L.; Magi-Galluzzi, C.; Vickers, A.J.; Parwani, A.V.; Reuter, V.E.;Fine, S.W.; et al. A contemporary prostate cancer grading system: A validated alternative to the Gleason score. Eur. Urol. 2016, 69,428–435. [CrossRef]
37. Kojima, S.; Goto, Y.; Naya, Y. The roles of microRNAs in the progression of castration-resistant prostate cancer. J. Hum. Genet.2017, 62, 25–31. [CrossRef]
38. Lee, K.C.; Bradley, D.A.; Hussain, M.; Meyer, C.R.; Chenevert, T.L.; Jacobson, J.A.; Johnson, T.D.; Galban, C.J.; Rehemtulla, A.;Pienta, K.J.; et al. A feasibility study evaluating the functional diffusion map as a predictive imaging biomarker for detection oftreatment response in a patient with metastatic prostate cancer to the bone. Neoplasia 2007, 9, 1003–1011. [CrossRef]
39. Perabo, F.G.; Von Löw, E.C.; Ellinger, J.; Von Rücker, A.; Müller, S.C.; Bastian, P.J. Soy isoflavone genistein in prevention andtreatment of prostate cancer. Prostate Cancer Prostatic Dis. 2008, 11, 6–12. [CrossRef]
40. Guérin, O.; Fischel, J.L.; Ferrero, J.M.; Bozec, A.; Milano, G. EGFR targeting in hormone-refractory prostate cancer: Currentappraisal and prospects for treatment. Pharmaceuticals 2010, 3, 2238–2247. [CrossRef]
41. Di Lorenzo, G.; Tortora, G.; D’Armiento, F.P.; De Rosa, G.; Staibano, S.; Autorino, R.; D’Armiento, M.; De Laurentiis, M.;De Placido, S.; Catalano, G.; et al. Expression of epidermal growth factor receptor correlates with disease relapse and progressionto androgen-independence in human prostate cancer. Clin. Cancer Res. 2002, 8, 3438–3444. [PubMed]
42. Roepstorff, K.; Grøvdal, L.; Grandal, M.; Lerdrup, M.; van Deurs, B. Endocytic downregulation of ErbB receptors: Mechanismsand relevance in cancer. Histochem. Cell Biol. 2008, 129, 563–578. [CrossRef] [PubMed]
43. Hashmi, S.K.; Irfan, M.; Asif, H.; Nisar, L.; Naeem, M.; Khan, E.Y.; Baloch, S.; Faridi, N. Prognostic utility of epidermal growthfactor receptor (EGFR) expression in prostatic acinar adenocarcinoma. Appl. Cancer Res. 2019, 39, 1–8. [CrossRef]
44. Mandel, A.; Larsson, P.; Sarwar, M.; Semenas, J.; Syed Khaja, A.S.; Persson, J.L. The interplay between AR, EGF receptor andMMP-9 signaling pathways in invasive prostate cancer. Mol. Med. 2018, 24, 1–3. [CrossRef] [PubMed]
45. Baek, K.H.; Hong, M.E.; Jung, Y.Y.; Lee, C.H.; Lee, T.J.; Park, E.S.; Kim, M.K.; Yoo, J.H.; Lee, S.W. Correlation of AR, EGFR, andHER2 expression levels in prostate cancer: Immunohistochemical analysis and chromogenic in situ hybridization. Cancer Res.Treat. Off. J. Korean Cancer Assoc. 2012, 44, 50. [CrossRef] [PubMed]
46. Sachdeva, M.; Zhu, S.; Wu, F.; Wu, H.; Walia, V.; Kumar, S.; Elble, R.; Watabe, K.; Mo, Y.Y. p53 represses c-Myc through inductionof the tumor suppressor miR-145. Proc. Natl. Acad. Sci. USA 2009, 106, 3207–3212. [CrossRef]
Genes 2022, 13, 655 18 of 18
47. Suzuki, H.I.; Yamagata, K.; Sugimoto, K.; Iwamoto, T.; Kato, S.; Miyazono, K. Modulation of microRNA processing by p53. Nature2009, 460, 529–533. [CrossRef]
48. Cho, W.C.; Chow, A.S.; Au, J.S. MiR-145 inhibits cell proliferation of human lung adenocarcinoma by targeting EGFR and NUDT1.RNA Biol. 2011, 8, 125–131. [CrossRef]
49. Liu, R.; Liu, C.; Zhang, D.; Liu, B.; Chen, X.; Rycaj, K.; Jeter, C.; Calhoun-Davis, T.; Li, Y.; Yang, T.; et al. miR-199a-3p targetsstemness-related and mitogenic signaling pathways to suppress the expansion and tumorigenic capabilities of prostate cancerstem cells. Oncotarget 2016, 7, 56628. [CrossRef]
50. He, S.; Huang, Y.; Dong, S.; Qiao, C.; Yang, G.; Zhang, S.; Wang, C.; Xu, Y.; Zheng, F.; Yan, M. MiR-199a-3p/5p participated inTGF-β and EGF induced EMT by targeting DUSP5/MAP3K11 in pterygium. J. Transl. Med. 2020, 18, 1–9. [CrossRef]
51. Nesbit, C.E.; Grove, L.E.; Yin, X.; Prochownik, E.V. Differential apoptotic behaviors of c-myc, N-myc, and L-myc oncoproteins.Cell Growth Differ. Publ. Am. Assoc. Cancer Res. 1998, 9, 731–742.
52. Barrett, J.; Birrer, M.J.; Kato, G.J.; Dosaka-Akita, H.; Dang, C.V. Activation domains of L-Myc and c-Myc determine theirtransforming potencies in rat embryo cells. Mol. Cell. Biol. 1992, 12, 3130–3137. [PubMed]
53. Tansey, W.P. Mammalian MYC proteins and cancer. New J. Sci. 2014, 2014, 757534. [CrossRef]54. Koh, C.M.; Bieberich, C.J.; Dang, C.V.; Nelson, W.G.; Yegnasubramanian, S.; De Marzo, A.M. MYC and prostate cancer. Genes
Cancer 2010, 1, 617–628. [CrossRef]55. Gorrini, C.; Donzelli, M.; Torriglia, A.; Supino, R.; Brison, O.; Bernardi, R.; Negri, C.; Denegri, M.; Counis, M.F.; Ranzani, G.N.; et al.
Effect of apoptogenic stimuli on colon carcinoma cell lines with a different c-myc expression level. Int. J. Mol. Med. 2003, 11, 737–742.[CrossRef]
56. Nadiminty, N.; Tummala, R.; Lou, W.; Zhu, Y.; Zhang, J.; Chen, X.; White, R.W.D.; Kung, H.J.; Evans, C.P.; Gao, A.C.; et al.MicroRNA let-7c suppresses androgen receptor expression and activity via regulation of Myc expression in prostate cancer cells.J. Biol. Chem. 2012, 287, 1527–1537. [CrossRef]
57. Yamamura, S.; Saini, S.; Majid, S.; Hirata, H.; Ueno, K.; Deng, G.; Dahiya, R. MicroRNA-34a modulates c-Myc transcriptionalcomplexes to suppress malignancy in human prostate cancer cells. PLoS ONE 2012, 7, e29722. [CrossRef]
58. Fulciniti, M.; Amodio, N.; Bandi, R.L.; Cagnetta, A.; Samur, M.K.; Acharya, C.; Prabhala, R.; D’Aquila, P.; Bellizzi, D.;Passarino, G.; et al. miR-23b/SP1/c-myc forms a feed-forward loop supporting multiple myeloma cell growth. Blood CancerJ. 2016, 6, e380. [CrossRef]
59. Bender, R.J.; Mac Gabhann, F. Dysregulation of the vascular endothelial growth factor and semaphorin ligand-receptor families inprostate cancer metastasis. BMC Syst. Biol. 2015, 9, 55. [CrossRef]
60. Lu, W.; Ding, Z. Identification of key genes in prostate cancer gene expression profile by bioinformatics. Andrologia 2019,51, e13169. [CrossRef]
61. Song, Z.Y.; Wang, F.; Cui, S.X.; Qu, X.J. Knockdown of CXCR4 inhibits CXCL12-induced angiogenesis in HUVECs throughdownregulation of the MAPK/ERK and PI3K/AKT and the Wnt/β-catenin pathways. Cancer Investig. 2018, 36, 10–18. [CrossRef][PubMed]
62. Wang, J.Y.; Jiang, J.B.; Li, Y.; Wang, Y.L.; Dai, Y. MicroRNA-299-3p suppresses proliferation and invasion by targeting VEGFA inhuman colon carcinoma. Biomed. Pharmacother. 2017, 93, 1047–1054. [CrossRef] [PubMed]
63. Östling, P.; Leivonen, S.K.; Aakula, A.; Kohonen, P.; Mäkelä, R.; Hagman, Z.; Edsjö, A.; Kangaspeska, S.; Edgren, H.; Nicorici, D.; et al.Systematic analysis of microRNAs targeting the androgen receptor in prostate cancer cells. Cancer Res. 2011, 71, 1956–1967. [CrossRef][PubMed]
64. Saffari, M.; Ghaderian, S.M.; Omrani, M.D.; Afsharpad, M.; Shankaie, K.; Samadaian, N. The Association of miR-let 7b andmiR-548 with PTEN in Prostate Cancer. Urol. J. 2019, 16, 267–273.
65. Morais, C.E.; Gurgel, D.C.; Teixeira, A.C.; Mattos, T.V.A.; Silva, A.V.A.D.; Tavora, F. Prevalence of ERG expression and PTEN lossin a Brazilian prostate cancer cohort. Braz. J. Med. Biol. Res. 2019, 52, e8483. [CrossRef]
66. Nodouzi, V.; Nowroozi, M.; Hashemi, M.; Javadi, G.; Mahdian, R. Concurrent down-regulation of PTEN and NKX3. 1 expressionin Iranian patients with prostate cancer. Int. Braz. J. Urol. 2015, 41, 898–905. [CrossRef]
67. Song, M.S.; Salmena, L.; Pandolfi, P.P. The functions and regulation of the PTEN tumour suppressor. Nat. Rev. Mol. Cell Biol. 2012,13, 283–296. [CrossRef]
68. Mangangcha, I.R.; Malik, M.Z.; Kucuk, O.; Ali, S.; Singh, R.B. Kinless hubs are potential target genes in prostate cancer network.Genomics 2020, 112, 6. [CrossRef]
69. Mangangcha, I.R.; Malik, M.; Küçük, Ö.; Ali, S.; Singh, R.K. Identification of key regulators in Prostate cancer from gene expressiondatasets of patients. Sci. Rep. 2019, 9, 16420. [CrossRef]
70. Lin, H.K.; Hu, Y.C.; Lee, D.K.; Chang, C. Regulation of androgen receptor signaling by PTEN (phosphatase and tensin homologdeleted on chromosome 10) tumor suppressor through distinct mechanisms in prostate cancer cells. Mol. Endocrinol. 2004, 18,2409–2423. [CrossRef]
71. Iliopoulos, D.; Jaeger, S.A.; Hirsch, H.A.; Bulyk, M.L.; Struhl, K. STAT3 activation of miR-21 and miR-181b-1 via PTEN and CYLDare part of the epigenetic switch linking inflammation to cancer. Mol. Cell 2010, 39, 493–506. [CrossRef] [PubMed]
Copyright © 2022 FDOKUMEN