Prostate-Specific Antigen Modulates the Expression of Genes ...
12
Prostate-Specific Antigen Modulates the Expression of Genes Involved in Prostate Tumor Growth 1 B. Bindukumar * ,y , Stanley A. Schwartz y , Madhavan P. N. Nair y , Ravikumar Aalinkeel y , Elzbieta Kawinski * and Kailash C. Chadha * *Department of Molecular and Cellular Biology, Roswell Park Cancer Institute, Buffalo, NY 14263, USA; y Division of Allergy, Immunology and Rheumatology, Department of Medicine, State University of New York at Buffalo, Buffalo General Hospital, Buffalo, NY 14203, USA Abstract Prostate-specific antigen (PSA) is a serine protease that is widely used as a surrogate marker in the early diagnosis and management of prostate cancer. The physiological relevance of tissue PSA levels and their role in prostate tumor growth and metastasis are not known. Free-PSA (f-PSA) was purified to homogeneity from human seminal plasma by column chromato- graphy, eliminating hk2 and all known PSA complexes and retaining its protease activity. Confluent mono- layers of prostate cancer cell lines, PC-3M and LNCaP, were treated with f-PSA in a series of in vitro experi- ments to determine the changes in expression of various genes that are known to regulate tumor growth and metastasis. Gene array, quantitative polymerase chain reaction (QPCR), and enzyme-linked immuno- sorbent assay (ELISA) results show significant changes in the expression of various cancer-related genes in PC-3M and LNCaP cells treated with f-PSA. In a gene array analysis of PC-3M cells treated with 10 mM f-PSA, 136 genes were upregulated and 137 genes were downregulated. In LNCaP cells treated with an identical concentration of f-PSA, a total of 793 genes was regulated. QPCR analysis reveals that the genes for urokinase-type plasminogen activator (uPA), VEGF, and Pim-1 oncogene, known to promote tumor growth, were significantly downregulated, whereas IFN- g, known to be a tumor-suppressor gene, was significantly upregulated in f-PSA–treated PC-3M cells. The effect of f-PSA on VEGF and IFN- g gene expression and on protein release in PC-3M cells was distinctly dose-dependent. In vivo studies showed a significant reduction (P = .03) in tumor load when f- PSA was administered in the tumor vicinity of PC-3M tumor-bearing BALB/c nude mice. Our data support the hypothesis that f-PSA plays a significant role in prostate tumor growth by regulating various proangio- genic and antiangiogenic growth factors. Neoplasia (2005) 7, 241–252 Keywords: Prostate cancer, prostate-specific antigen, f-MRI, gene array, angiogenic growth factors. Introduction Prostate cancer is the most frequently diagnosed malignancy in men in North America and Northwestern Europe, with an estimated 230,110 new cases and 29,900 deaths occurring in the United States during the year 2004 [1]. In prostate cancer, the identification of high-risk patients and the prediction of tumor aggressiveness have great importance for prognosis. Prostate-specific antigen (PSA), a member of the kallikrein protein family, is widely used as a surrogate marker in the early diagnosis and management of prostate cancer [2]. PSA is a serine protease with chymotrypsin-like activity [3] and is largely found in prostatic tissue and seminal plasma. In prostate cancer, excess PSA spills into circulation where it exists as a mixture of various molecular forms, including free-PSA (f-PSA) and several PSA – protease inhibitor complexes [4]. At present, there is no consensus as to whether PSA has any role in prostate tumor growth and metastasis. The only well-known physiological function of PSA is to liquefy seminal clot [5]. PSA and/or its gene expression has been detected at low concen- trations in the endometrium [6], normal breast tissue, breast milk [7], breast tumors, female serum [8], renal cell carcinoma [9], and ovarian cancer [10]. The PSA gene is known to be regulated by androgen and progestin [11]. Angiogenesis is a tightly regulated process modulated by the dynamic interplay between angiogenic stimulators and inhibitors, which control endothelial cell proliferation, migration, and invasion [12,13]. Tumor neovascularization contributes to cancer progression, facilitating its growth and metastasis. The initiation of secretion of angiogenic proteins by tumor cells is important in vascular hyperpermeability, protease secretion, capillary basement membrane breakdown, and endothelial cell migration and proliferation [12]. Several reports in the literature suggest that PSA has anti- angiogenic activity [14,15]. PSA is downregulated in prostate Abbreviations: PSA, prostate-specific antigen; f-MRI, functional magnetic resonance imaging; ROS, reactive oxygen species Address all correspondence to: Kailash Chadha, PhD, Department of Molecular and Cellular Biology Department, Roswell Park Cancer Institute, Elm and Carlton Street, Buffalo, NY 14263. E-mail: [email protected] 1 This work was supported by the Alliance Foundation, Roswell Park Cancer Institute (Buffalo, NY), and the Margaret Duffy and Cameron Troup Memorial Fund for Cancer, Buffalo General Hospital (Buffalo, NY). Received 3 August 2004; Revised 24 September 2004; Accepted 28 September 2004. Copyright D 2005 Neoplasia Press, Inc. All rights reserved 1522-8002/05/$25.00 DOI 10.1593/neo.04529 Neoplasia . Vol. 7, No. 3, March 2005, pp. 241 – 252 241 www.neoplasia.com RESEARCH ARTICLE
-
Upload
khangminh22 -
Category
Documents
-
view
2 -
download
0
Transcript of Prostate-Specific Antigen Modulates the Expression of Genes ...

Prostate-Specific Antigen Modulates the Expression of GenesInvolved in Prostate Tumor Growth1
B. Bindukumar*,y, Stanley A. Schwartz y, Madhavan P. N. Nair y, Ravikumar Aalinkeel y, Elzbieta Kawinski*and Kailash C. Chadha*
*Department of Molecular and Cellular Biology, Roswell Park Cancer Institute, Buffalo, NY 14263, USA; yDivisionof Allergy, Immunology and Rheumatology, Department of Medicine, State University of New York at Buffalo,Buffalo General Hospital, Buffalo, NY 14203, USA
Abstract
Prostate-specific antigen (PSA) is a serine protease
that is widely used as a surrogate marker in the early
diagnosis and management of prostate cancer. The
physiological relevance of tissue PSA levels and their
role in prostate tumor growth and metastasis are not
known. Free-PSA (f-PSA) was purified to homogeneity
from human seminal plasma by column chromato-
graphy, eliminating hk2 and all known PSA complexes
and retaining its protease activity. Confluent mono-
layers of prostate cancer cell lines, PC-3M and LNCaP,
were treated with f-PSA in a series of in vitro experi-
ments to determine the changes in expression of
various genes that are known to regulate tumor growth
and metastasis. Gene array, quantitative polymerase
chain reaction (QPCR), and enzyme-linked immuno-
sorbent assay (ELISA) results show significant
changes in the expression of various cancer-related
genes in PC-3M and LNCaP cells treated with f-PSA. In
a gene array analysis of PC-3M cells treated with 10 mM
f-PSA, 136 genes were upregulated and 137 genes
were downregulated. In LNCaP cells treated with an
identical concentration of f-PSA, a total of 793 genes
was regulated. QPCR analysis reveals that the genes
for urokinase-type plasminogen activator (uPA),
VEGF, and Pim-1 oncogene, known to promote tumor
growth, were significantly downregulated, whereas
IFN-g, known to be a tumor-suppressor gene, was
significantly upregulated in f-PSA–treated PC-3M
cells. The effect of f-PSA on VEGF and IFN-g gene
expression and on protein release in PC-3M cells was
distinctly dose-dependent. In vivo studies showed a
significant reduction (P = .03) in tumor load when f-
PSA was administered in the tumor vicinity of PC-3M
tumor-bearing BALB/c nude mice. Our data support
the hypothesis that f-PSA plays a significant role in
prostate tumor growth by regulating various proangio-
genic and antiangiogenic growth factors.
Neoplasia (2005) 7, 241–252
Keywords: Prostate cancer, prostate-specific antigen, f-MRI, gene array, angiogenic
growth factors.
Introduction
Prostate cancer is the most frequently diagnosed malignancy
in men in North America and Northwestern Europe, with an
estimated 230,110 new cases and 29,900 deaths occurring in
the United States during the year 2004 [1]. In prostate cancer,
the identification of high-risk patients and the prediction of
tumor aggressiveness have great importance for prognosis.
Prostate-specific antigen (PSA), a member of the kallikrein
protein family, is widely used as a surrogate marker in the early
diagnosis and management of prostate cancer [2]. PSA is a
serine protease with chymotrypsin-like activity [3] and is largely
found in prostatic tissue and seminal plasma. In prostate
cancer, excess PSA spills into circulation where it exists as a
mixture of various molecular forms, including free-PSA (f-PSA)
and several PSA–protease inhibitor complexes [4]. At present,
there is no consensus as to whether PSA has any role in
prostate tumor growth and metastasis. The only well-known
physiological function of PSA is to liquefy seminal clot [5]. PSA
and/or its gene expression has been detected at low concen-
trations in the endometrium [6], normal breast tissue, breast
milk [7], breast tumors, female serum [8], renal cell carcinoma
[9], and ovarian cancer [10]. The PSA gene is known to be
regulated by androgen and progestin [11].
Angiogenesis is a tightly regulated process modulated by
the dynamic interplay between angiogenic stimulators and
inhibitors, which control endothelial cell proliferation, migration,
and invasion [12,13]. Tumor neovascularization contributes to
cancer progression, facilitating its growth and metastasis. The
initiation of secretion of angiogenic proteins by tumor cells is
important in vascular hyperpermeability, protease secretion,
capillary basement membrane breakdown, and endothelial cell
migration and proliferation [12].
Several reports in the literature suggest that PSA has anti-
angiogenic activity [14,15]. PSA is downregulated in prostate
Abbreviations: PSA, prostate-specific antigen; f-MRI, functional magnetic resonance imaging;
ROS, reactive oxygen species
Address all correspondence to: Kailash Chadha, PhD, Department of Molecular and Cellular
Biology Department, Roswell Park Cancer Institute, Elm and Carlton Street, Buffalo, NY
14263. E-mail: [email protected] work was supported by the Alliance Foundation, Roswell Park Cancer Institute (Buffalo,
NY), and the Margaret Duffy and Cameron Troup Memorial Fund for Cancer, Buffalo General
Hospital (Buffalo, NY).
Received 3 August 2004; Revised 24 September 2004; Accepted 28 September 2004.
Copyright D 2005 Neoplasia Press, Inc. All rights reserved 1522-8002/05/$25.00
DOI 10.1593/neo.04529
Neoplasia . Vol. 7, No. 3, March 2005, pp. 241 – 252 241
www.neoplasia.com
RESEARCH ARTICLE

cancer tissue compared to hyperplastic tissue [16,17]. Lower
tissue PSA level is often associated with a more aggressive
form of prostate cancer [18]. PSA has been shown to reduce
melanoma lesions in lungs of mice [14]. Transfection of PSA
c-DNA into PC-3 prostate carcinoma cells prolongs their
doubling time, and reduces their tumorigenicity and metas-
tasis in nude mice [19]. Furthermore, it is reported that breast
cancer patients with high levels of PSA in the tumor tissue
had a better prognosis than patients whose tumor tissue had
lower PSA levels [20]. One study has shown that ‘‘the PSA
bounce’’ phenomenon is not associated with a higher rate of
disease progression [21]. High expression of PSA in prostate
cancer cells is often associated with low microvessel density
[22]. PSA has been shown to cleave plasminogen to produce
the antiangiogenic protein ‘‘angiostatin,’’ which is known to
suppress angiogenesis [23]. More recently, Fortier et al. [15]
reported that recombinant PSA has antiangiogenic activity
both in in vitro and in vivo. PSA also has been shown to
stimulate reactive oxygen species (ROS) generation in the
prostate cancer cell lines, PC-3, Du145, and LNCaP [24].
Although the intact PSA molecule is necessary for stimulat-
ing ROS, its proteolytic activity is not required [18]. ROS has
been linked to the activation of transcriptional factors as well
as signal transduction in apoptosis [25]. In a recent study,
we have shown that LNCaP cells that are known to express
PSA have lower invasive potential in a cell invasion assay
compared to non–PSA-expressing cell lines DU-145 and
PC3 [26].
Several studies have used microarray technology as a
‘‘gene discovery tool’’ to identify genetic markers that dis-
criminate between normal and cancerous tissues. In other
investigations, gene expression profiles of thousands of
genes in normal and prostate tumor tissues were used in
hierarchical clustering analysis [27,28]. Dhanasekaran et al.
[28] could distinguish normal prostate, benign prostatic hy-
perplasia (BPH), localized prostate cancer, and metastatic
prostate cancer samples with spotted microarrays using
hierarchical clustering analysis. Luo et al. [29] also were
able to differentiate 16 prostate cancer tissue specimens
from nine BPH specimens on the basis of differences in gene
expression profiles using cDNA microarrays.
In the present study, we examined the effect of enzymat-
ically active f-PSA in modulating gene expression in prostate
cancer cell lines using gene array analysis and real-time
quantitative polymerase chain reaction (QPCR). We also
documented, for the first time, that f-PSA administered to
nude mice inoculated with prostate cancer PC-3M cells
effectively reduces overall tumor growth. Gene array analy-
sis of control and PSA-treated tumor tissues also revealed
significant differences in expression of genes that are known
to be involved in tumor growth and metastasis.
Materials and Methods
Purification and Characterization of Enzymatically
Active f-PSA
f-PSA was purified from human seminal plasma by a sim-
ple two-step column chromatography procedure [30–32].
The Institutional Review Board at Roswell Park Cancer
Institute approved the procurement and use of human sem-
inal plasma. Initially, all known forms of PSA, including f-PSA
and various PSA complexes, were isolated from the seminal
plasma by thiophilic interaction chromatography and, subse-
quently, f-PSA was separated from other PSA complexes by
‘‘molecular size’’ chromatography. Briefly, seminal plasma
dialyzed against buffer containing 25 mM Hepes and 1 M
sodium sulfate, pH 7.0, was applied to a column packed with
T-gel. The column was washed with the buffer and the bound
proteins were eluted with 25 mM Hepes buffer, pH 7.0, con-
taining no sodium sulfate. The T-gel column eluates con-
taining some semino proteins and all forms of PSA (f-PSA
and complexed PSA) were pooled, concentrated, and ap-
plied to a column packed with Ultrogel AcA-54 having a
fractionation range of 5000 to 70,000 kDa. The column was
equilibrated with 10 mM sodium acetate buffer containing
0.15 M sodium chloride, pH 5.6. PSA was monitored in var-
ious column eluates ranging in molecular weight between
25 and 40 kDa by Western blot analysis. The column eluates
containing f-PSA were concentrated, filter-sterilized, and
stored at �70jC. Details of the f-PSA purification procedure
are described elsewhere [31,32].
The final quantitation of PSA was based on double-
determined enzyme-linked immunosorbent assay (ELISA)
using polyclonal and monoclonal anti-PSA antibodies. The
f-PSA was characterized for purity by SDS-PAGE/Western
blot analysis using anti-PSA and anti-PSA complex mono-
clonal antibodies, and by 2-D gel electrophoresis with silver
and antibody staining. Purified f-PSA was assayed for enzy-
matic activity using a fluorogenic substrate (Mu-His-Ser-Ser-
Lys-Leu-Gln-AFC; Calbiochem, San Diego, CA). The assay
is based on the hydrolysis of this fluorogenic substrate and is
specific for PSA enzymatic activity [33]. Fluorescence was
monitored using an Aminco-Bowman spectrophotofluorom-
eter (American Instrument Co., Silver Spring, MD).
Prostate Cancer Cell Lines
PC-3M cells were obtained from Dr. Isaiah Fidler (The
University of Texas M. D. Anderson Cancer Center, Houston,
TX). PC-3M is a subline of PC3 isolated from a liver metas-
tasis that originally formed a solid tumor in a nude mouse [34].
PC-3M cells are androgen-independent and do not produce
any PSA in the culture medium [35]. The LNCaP cell line was
initially established from a metastatic lesion of human pros-
tatic adenocarcinoma [36]. LNCaP cells are androgen-
sensitive but their growth is independent of androgen. LNCaP
cells are known to produce low levels of PSA in the culture
medium [36]. Both cell lines were maintained in RPMI
1640 medium containing 10% fetal bovine serum at 37jC
and 5% CO2.
Treatment of Prostate Cancer Cells with f-PSA
PC-3M and LNCaP cells were grown in six-well tissue
culture plates at 37jC in a humidified atmosphere with 5%
CO2. When the cells reached 80% confluency, the culture
medium was removed and different concentrations of f-PSA
(0–10 mM) in the growth medium were added to duplicate
242 Modulation of Gene Expression by f-PSA Bindukumar et al.
Neoplasia . Vol. 7, No. 3, 2005

wells for 48 hours. Control cells were treated with growth
medium alone. The culture supernates were collected and
used for determination of levels of different cytokines by
ELISA. RNA was extracted from f-PSA–treated and control
cells (3 � 106) for the gene expression studies. All samples
were frozen at �70jC until processed.
RNA Extraction and Real-Time QPCR
Cytoplasmic RNA was extracted by the acid guanidinium
thiocyanate–phenol–chloroform (AGPC) method of Chomc-
zynski and Sacchi [37]. The RNA pellet was dissolved in
DEPC water, quantified, and checked for its integrity using
agarose gel electrophoresis and stored at �70jC . Real-time
QPCR [38] was performed with the GeneAmp 5700 se-
quence detection system using SYBR green reagents
according to the manufacturer’s instructions (Applied Bio-
systems, Foster City, CA). Equal amounts of RNA from cells
treated with f-PSA at different concentrations and controls
were reverse-transcribed into first-strand cDNA and used as
PCR templates in reactions to obtain the threshold cycle (Ct).
Ct was normalized using the known Ct from the housekeep-
ing gene (b-actin) to obtain DCt. To compare the relative
levels of gene expression of VEGF, uPA, Pim-1 oncogene,
and IFN-c, DDCt values were calculated using gene expres-
sion from the untreated control cells. The DDCt values were
expressed as the real-fold increase in gene expression.
ELISA
VEGF and IFN-g protein levels in the culture supernates
were quantitated by highly sensitive and specific ELISA kits
from R&D Systems (Minneapolis, MN) according to the
manufacturer’s protocol. The assay performance and inter-
assay and intra-assay variations were within the limits de-
fined by the manufacturer.
Gene Array
The genes selected for the ‘‘cancer array’’ included
several cytokine genes, apoptotic genes, cell cycle regula-
tors, oncogenes, etc. Cloned cDNA were printed in triplicate
using a MicroGridII TAS arrayer and MicroSpot 2500 split
pins (Apogent Discoveries, Hudson, NH). From PSA-treated
cells, total RNA was extracted and labeled with Cy5 and
the untreated reference total RNA with Cy3. For each
reverse transcription reaction, 2.5 mg of RNA was mixed with
2ml random primers (Invitrogen, Carlsbad, CA) in a total
volume of 10 ml, heated to 70jC for 5 minutes, and cooled
to 42jC. To this sample was added an equal volume of
reaction mix (4 ml of 5� first-strand buffer, 2 ml of 10� dNTP
mix, 2 ml of DTT, 1 ml of deionized H2O, and 1 ml of Power-
script reverse transcriptase) according to the manufacturer’s
instructions. After 1-hour incubation at 42jC, the RNA–
cDNA complex was denatured by incubating at 70jC for
5 minutes. The mixture was cooled to 37jC and incubated for
15 minutes with 0.2 ml of RNase H (10 U/ml). The resultant
amino-modified cDNA was purified, precipitated, and fluo-
rescently labeled.
Prior to hybridization, the two separate probes were
resuspended in 10 ml of dH2O, combined, and mixed with
2 ml of human Cot1 (20 mg/ml; Invitrogen) and 2 ml of poly A
(20 mg/ml; Sigma, St. Louis, MO). The probe mixture was
denatured at 95jC for 5 minutes, placed on ice for 1 minute,
and prepared for hybridization by addition of 110 ml of pre-
heated (65jC) SlideHyb no. 3 buffer (Ambion, Austin, TX).
After a 5-minute incubation at 65jC, the probe solution was
placed on the array in an assembled GeneTAC hybridization
station module (Genomic Solutions, Inc., Ann Arbor, MI). The
slides were incubated overnight at 55jC for 16 to 18 hours
with occasional pulsation of the hybridization solution. After
hybridization, the slides were spun dry and scanned imme-
diately on an Affymetrix 428 scanner to generate high-
resolution images for both Cy3 and Cy5 channels. Two
hybridizations for each RNA sample were performed, switch-
ing the dyes in the second hybridization to account for
possible dye bias.
The hybridized slides were scanned using an Axon
GenePix 4200A Scanner. The background-corrected signal
for each cDNA spot is the mean signal (of all the pixels in the
region) minus the mean local background. The ratios were
then normalized on the log scale across the entire slide. For
each clone on the slide, the expression ratio is the mean of
all of its replicates on the log scale. The results from the two
slides that make up the dye flip were then averaged on the
log scale, and this became the final expression ratio of that
clone generated along with a spreadsheet detailing expres-
sion ratios of all normalized spots.
Inoculation of PC-3M Cells Into Nude Mice
Male athymic BALB/c nude mice, 5 weeks old, were used
in the study. For prostate tumor cell inoculation, nearly
confluent PC-3M cells were harvested with 0.01% trypsin.
The cells were suspended in sterile PBS at a concentration
of 1 � 107 cells/ml. The cell suspension (100 ml) was injected
subcutaneously into the right shoulder region of the mouse.
Treatment of Nude Mice with f-PSA
From the second day of tumor cell inoculation, mice were
randomly divided into two groups of six mice each. One
group received 50 mM of f-PSA (100 ml) injected subcutane-
ously in the vicinity of tumor cell inoculation three times a
week. The dose of f-PSA was selected to mimic the actual
level of PSA, the human prostate tissue, which is in the range
of 50 to 150 mM [39]. The second group served as a control
and received only physiological saline solution. Tumor vol-
umes were measured with a vernier caliper three times a
week for a total of 4 weeks. The small animal functional
magnetic resonance imaging (f-MRI) facility at the Roswell
Park Cancer Institute was used several times to carry out
MRI during period of tumor development in control and in
PSA treated mice.
Results
In Vitro Studies
Microarray gene expression analysis Microarray gene
expression analysis used to study the effect of f-PSA
Modulation of Gene Expression by f-PSA Bindukumar et al. 243
Neoplasia . Vol. 7, No. 3, 2005

treatment on prostate cancer cell lines, PC-3M and LNCaP,
was performed at Roswell Park Cancer Institute Micro-
array and Genomics Core Facility. Gene expression in
PC-3M and LNCaP cells, grown in six-well tissue culture
plates and treated with 10 mM f-PSA for 48 hours, was
compared with the untreated controls. Various genes were
grouped according to the role they play in tumor progres-
sion and/or metastasis.
Tables 1 and 2 show some of the genes involved in
angiogenesis, tumor growth, and metastasis that were sig-
nificantly regulated in PC-3M and LNCaP cells in response
to f-PSA treatment. In PC-3M cells, 237 genes were modu-
lated to approximately two-fold. Out of these 237 genes,
136 genes were upregulated (two-fold to seven-fold) and
137 genes were downregulated (range 2-fold to 30-fold).
With regard to LNCaP cells, the effect of PSA treatment
was much greater than with PC-3M cells. In LNCaP cells,
PSA treatment modulated as many as 793 genes by more
than two-fold, out of which 433 genes were downregu-
lated (range 2-fold to 131-fold) and 360 genes were upregu-
lated (range 2-fold to 128-fold). Some of the genes such
as Epha2, uPA, uPAR, and Pim-1 oncogene are known
to be highly expressed in prostate cancer [28,40–42]. In
PC-3M cells, uPA, uPAR, EphA2, and Pim-1 oncogene
were downregulated by 12.4-, 2.8-, 2.2-, and 8.4-fold, re-
spectively, in response to f-PSA treatment. The same genes
were downregulated in LNCaP cells by 131-, 77-, 25-, and
3.6-fold, respectively. In PC-3M cells, maximum down-
regulation was observed for the cysteine-rich, angiogenic
inducer 61 (CYR61) gene [43], whereas in LNCaP cells,
it was the uPA gene that was downregulated the most
(131-fold).
Other genes downregulated in PC-3M cells by f-PSA
treatment include the antiapoptotic gene Bcl-xl (2.3-fold);
the proangiogenic genes TGF-b2 (2.9-fold) and VEGF
(1.9-fold); the cell cycle genes cyclin A2 (2.34-fold) and
C-src tyrosine kinase (2.3-fold); the cell adhesion gene
N-cadherin (2.1-fold); and the transcription gene metalothio-
nin-1H (6.6-fold).
As shown in Table 2, more than 30 genes were upregu-
lated in PC-3M cells to nearly two-fold in response to f-PSA
treatment. These genes are involved in angiogenesis, apo-
ptosis, and cell cycle. We observed upregulation of the
apoptotic gene, Fas-activated serine kinase (2.1-fold),
and the cell cycle gene Mad4 homolog (4.4-fold). In addition,
IFN-c induced protein-16 gene (2.1-fold) and IFN c-induced
protein-30 gene (2.5-fold) were also upregulated in PC-3M
cells treated with f-PSA. Interferon-related genes are known
to be involved in tumor suppression [44]. In LNCaP cells,
the following genes were upregulated: 2–5 oligoadenylate
synthetase 2 (15.5-fold), TGF-�1 (3.4-fold), p-53–induced
protein (15.4-fold), and CD 10 (18-fold).
Our preliminary data on gene array analysis document
that PSA can significantly modulate the expression of nu-
merous genes that are known to be involved in apoptosis,
cell cycle, angiogenesis, cell growth, etc. Because there is no
literature on genes that are affected by PSA, it is premature
to speculate on the role of these genes, affected by PSA, in
prostate tumor growth beside those genes that are known
to be involved in prostate cancer or cancer growth at large.
Real-time QPCR To further validate our findings with gene
array analysis, we selected a panel of genes that are known
for their involvement in tumor growth and metastasis, and
carried out gene expression studies using QPCR. These
include VEGF, uPA, and Pim-1 oncogene, which are known
to promote tumor growth, and the IFN-c gene, which is
known to suppress tumor growth. We examined the relative
expression of these genes in PC-3M cells treated with 10 mM
f-PSA. For these studies, RNA was reverse-transcribed and
cDNA-amplified by QPCR using primers specific for the
genes of interest and the housekeeping gene, b-actin.
Experiments were repeated three times and the results are
shown in Figure 1. Treatment of PC-3M cells with 10 mM PSA
for 48 hours significantly downregulates uPA, VEGF, and
Pim-1 gene expression and upregulates IFN-c gene expres-
sion. The gene expression of uPA, VEGF, and Pim-1 was
downregulated by 80% (P < .001), 65% (P < .001), and 52%
(P = .01), respectively. However, IFN-c gene expression was
upregulated by 102% (P < .001) (Figure 1).
Effect of different concentrations of f-PSA on VEGF and
IFN-c gene expression and production in PC-3M cells Be-
cause there is no literature to provide guidelines for the
optimal dose of f-PSA for a maximal biologic response, we
were compelled to investigate the effect of a range of f-PSA
concentrations on production and gene expression of some
of the genes that regulate tumor growth. We selected two
cytokines—VEGF, a proangiogenic factor, and IFN-g, an
antiangiogenic factor—and studied the effect of a range of
f-PSA concentrations on gene expression and production of
these two cytokines. PC-3M cells were treated for 48 hours
with f-PSA at concentrations ranging from 0 to 10 mM. Culture
supernates were collected from treated and control cells to
determine the amounts of VEGF and IFN-g released into the
culture medium, and total RNA was extracted from the cells.
For gene expression studies, RNA was reverse-transcribed
and cDNA-amplified by QPCR using primers specific for
VEGF and IFN-c and the housekeeping gene, b-actin. The
experiment was repeated three times and results are shown
in Figure 2. A distinct dose–response curve was seen with
VEGF gene expression in the range of 0.05 to 10 mM f-PSA.
Concentrations in the range of 0.006 to 0.05M did not show
any significant effect on VEGF gene expression. However,
at concentrations of 0.1 to 5 mM, f-PSA treatment resulted in
a significant inhibition of VEGF gene expression (Figure 2A;
P < .001). In our experiments, maximal downregulation of
VEGF gene expression in PC-3M cells was seen at 10 mM
f-PSA (Figure 2A). On the contrary, IFN-c gene expres-
sion was upregulated in PC-3M cells treated with f-PSA,
again in a dose-dependent manner. The maximal enhance-
ment of IFN-c gene expression was seen at 10 mM f-PSA
(P < .001; Figure 2B).
Protein levels of VEGF and IFN-g were determined in the
culture supernates using ELISA kits. The experiment was
repeated three times with essentially identical results. The
244 Modulation of Gene Expression by f-PSA Bindukumar et al.
Neoplasia . Vol. 7, No. 3, 2005

results are shown in Figure 3. The culture supernates
from untreated control PC-3M cells contained an average of
3155 pg/ml VEGF protein compared to 2014 pg/ml from cells
treated with 0.1 mM f-PSA. This is a significant reduction
(36.2%; P < .001). Treating PC-3M cells with higher concen-
trations of f-PSA (up to 10 mM) did not result in further
reduction in the amount of VEGF released into the culture
medium (Figure 3A). The culture supernates from control
cells had an average of 2.4 pg/ml IFN-g protein. This
constitutive expression of IFN-g was not affected when cells
were treated with f-PSA in the range of 0.006 to 0.025 mM.
However, when cells were treated with 0.1 mM f-PSA,
an increase of 66.7% in IFN-g synthesis was observed
(P < .001; Figure 3B). At a higher concentration of f-PSA
(5 mM), IFN-g protein release was increased by 175%
(P < .001). No further increases in IFN-g protein release
Table 1. (continued)
Gene ID Gene Name PC-3M (Fold) LNCaP (Fold)
AA630120 Vascular endothelial growth
factor B
NC 2.7
H07899 Vascular endothelial growth
factor C
NC 26.7
Cell cycle
AA598974 Cell division cycle 2, G1 to S
and G2 to M
3.42 NC
AA995402 Colony-stimulating factor 2
(granulocyte – macrophage)
4.84 NC
AA079775 c-src tyrosine kinase 2.32 4.4
AA608568 Cyclin A2 2.34 NC
AA774665 Cyclin B2 2.22 NC
AA444049 Dual-specificity phosphatase 4 4.56 5.6
AA460152 Serum-inducible kinase 13.18 NC
AA504348 Topoisomerase (DNA) II a(170 kDa)
3.32 2.1
R80790 Ubiquitin carrier protein E2-C 3.44 NC
AA457034 v-myb avian myeloblastosis
viral oncogene homolog-like 2
2.27 NC
Cell adhesion and cell junction
AA418564 Cadherin 12, type 2
(N-cadherin 2)
2.12 5.3
AI336940 CD6 antigen 3.08 NC
AA485668 Integrin, b4 1.91 80.4
AA490238 Mitogen-inducible 2 3.75 NC
Signal transduction
AA521232 HSPC022 protein 2.12 20.6
AA128153 Interleukin 1 receptor-like 1 2.96 NC
AA890663 p21/Cdc42/Rac1-activated
kinase 1
2.2 17.4
AA447730 Pim-1 oncogene 8.35 3.6
AI375353 Serum/glucocorticoid –
regulated kinase
3.46 3.8
Transcription
AA496678 B-cell CLL/lymphoma 3 3.98 NC
W84868 Cytochrome P450,
subfamily IVA, polypeptide 11
4 NC
H82442 Inhibitor of DNA binding 2,
helix – loop – helix protein
2.26 NC
H77597 Metallothionein 1H 6.65 NC
AA496628 Nonmetastatic cells 2,
protein (NM23B) expressed
2.37 NC
*PC-3M and LNCaP cells were treated with 10 mM f-PSA for 48 hours.yNC = no significant change.
Table 1. PSA Downregulates Cancer Gene Expression in PC-3M and
LNCaP Cells*.
Gene ID Gene Name PC-3M (Fold) LNCaP (Fold)
Apoptosis
AA931820 BCL2-like 1 2.25 NCy
pBcl-xl bcl-xl 2.31 NC
W45688 Caspase 6, apoptosis-related
cysteine protease
3.05 5.1
AA457705 Immediate early response 3 5.17 14.7
H74007 Serum/glucocorticoid –
regulated kinase
3 NC
Angiogenesis/growth factor
AA478543 A kinase (PRKA) anchor
protein (gravin) 12
3.62 48.9
AA446120 Adrenomedullin 5.32 2.1
AA857163 Amphiregulin
(schwannoma-derived
growth factor)
2.49 34.8
AA678160 CD-55 1.87 42.7
T62636 Chemokine (C – X– C motif),
receptor 4 (fusin)
2.99 3.4
AA101875 Chondroitin sulfate
proteoglycan 2 (versican)
2.11 4.5
AA598794 Connective tissue growth factor 8.66 11.5
AA777187 Cysteine-rich,
angiogenic inducer, 61
30.54 2.7
R09561 Decay-accelerating factor for
complement (CD55)
1.72 58.9
R45640 Diphtheria toxin receptor
(heparin-binding epidermal
growth factor-like growth factor)
2.71 2.9
R63623 Dual-specificity tyrosine
phosphorylation – regulated
kinase 2
2.28 9.7
H84481 EphA2 2.17 25.7
H13623 Epidermal growth factor
receptor pathway substrate 8
3.36 NC
N47214 fms-related tyrosine kinase 1
(vascular endothelial growth
factor/vascular
permeability factor receptor)
NC 36.8
H96643 FOS-like antigen-1 5.58 21.4
W46900 GRO1 oncogene
(melanoma growth – stimulating
activity, a)
3.06 NC
AA911832 Homo sapiens cDNA:
FLJ22182 fis, clone
HRC00953
2.05 27.5
T62547 Insulin-like growth factor 2
receptor
2.1 NC
AA598601 Insulin-like growth
factor –binding protein 3
3.77 NC
AA479795 Interferon-stimulated gene
(20 kDa)
2.27 NC
W47101 Interleukin 1b 8.66 2.2
N69322 Matrix metalloproteinase 13
(collagenase 3)
2.17 5.9
AA284669 Plasminogen activator,
urokinase
12.49 131.0
AA454879 Plasminogen activator,
urokinase receptor
2.86 77.4
AA453759 Sprouty (Drosophila) homolog 2 3.57 8.1
AA001219 STAT-induced STAT inhibitor 3 4.21 2.3
AA464532 Thrombospondin 1 3.35 NC
AA399473 Tissue factor pathway
inhibitor 2
8.41 6.0
AA233738 Transforming growth factor, b2 3.94 12.1
W92764 Tumor necrosis factor,
a-induced protein 6
2.17 34.2
AA430504 Ubiquitin carrier protein E2-C 3.3 NC
AA099568 Uridine phosphorylase 5.45 12.4
R45059 Vascular endothelial
growth factor
1.9 2.13
Modulation of Gene Expression by f-PSA Bindukumar et al. 245
Neoplasia . Vol. 7, No. 3, 2005

were seen when f-PSA concentrations higher than 5 mM were
used (Figure 3B).
Our data demonstrate that in PC-3M cells treated with
f-PSA, the release of VEGF protein, a potent proangiogenic
factor, is downregulated, whereas the release of IFN-g
protein, a well-known antiangiogenic factor, is upregulated.
In Vivo Studies
Effect of f-PSA treatment on growth of PC-3M tumors in nude
mice The results of in vitro studies, both gene array and
QPCR, strongly support the notion that PSA significantly
modulates the gene expression and production of many
growth factors that are known to be involved in angiogenesis,
tumor growth, and metastasis. However, it is not known if
exogenously administered PSA can significantly modulate
prostate tumor growth in vivo. In our studies, we observed
that PSA administered to nude mice inoculated with PC-3M
prostate tumor cells indeed can significantly suppress tumor
growth. Five-week–old athymic BALB/c nude mice were
inoculated subcutaneously with 1 � 106 PC-3M cells in the
neck region. After 48 hours of tumor cell inoculation, a group
of animals was treated with 150 mg of f-PSA in PBS,
administered subcutaneously within the vicinity of tumor cell
inoculation. PSA was administered on alternate days for a
total of 4 weeks. In our preliminary studies, we were able to
detect circulating levels of PSA up to 48 hours postadminis-
tration when it was given either subcutaneously or intrave-
nously by tail vein (data not shown). The dose of PSA was
selected to attain a PSA level in the tumor vicinity compa-
rable to physiological PSA levels known to be present in
the human prostate gland (50–150 mM) [39]. Furthermore,
there are no data available with regard to PSA dose, fre-
quency, and duration of administration in any experimental
situation. Tumors began to grow in control animals at the
inoculated site by the second week, whereas no palpable
tumors were seen in animals treated with f-PSA by this time
period. Tumor growth was followed for 4 weeks until termi-
nation of the experiment. Tumor volumes in f-PSA–treated
mice were monitored periodically either by measuring with a
caliper or f-MRI, and were found to be significantly lower than
untreated control animals. At termination of the experiments
after 4 weeks, tumors were removed, weighed, and snap-
frozen for RNA extraction.
Administration of f-PSA to PC-3M tumor-bearing mice
produced a significant reduction in the extent of tumor growth
(Figure 4). The mean tumor weight of the treated mice
Table 2. (continued)
Gene ID Gene Name PC-3M (Fold) LNCaP (Fold)
R98936 Membrane metalloendopeptidase
(neutral endopeptidase,
enkephalinase, CALLA, CD10)
2.33 18.1
T53431 Nucleophosmin
(nucleolar phosphoprotein B23,
numatrin)
2.19 15.3
*PC-3M and LNCaP cells were treated with 10 mM f-PSA for 48 hours.yNC = no significant change.
Table 2. PSA Upregulates Cancer Gene Expression in PC-3M and LNCaP
Cells*.
Gene ID Gene Name PC-3M (Fold) LNCaP (Fold)
Apoptosis
W72310 Fas-activated serine/threonine
kinase
2.07 NCy
R72244 2– 5 Oligoadenylate
synthetase 2
2.3 15.5
Angiogenesis/growth factor
AA148548 Fatty acid binding protein 3
mammary-derived
growth inhibitor
2.66 NC
AA490996 Interferon c– inducible protein 16 2.13 NC
AA630800 Interferon c– inducible protein 30 2.48 NC
AA489640 Interferon-induced protein,
tetratricopeptide repeats 1
2.82 NC
AA291389 Interferon-stimulated transcription
factor 3 (48 kDa)
2.23 NC
AA487020 Isoprenylcysteine carboxyl
methyltransferase
2.44 NC
AA283030 Methionine aminopeptidase;
eIF-2 –associated p67
2.07 NC
AA443284 Myeloid/lymphoid or
mixed-lineage
leukemia (trithorax homolog)
2.46 NC
AA490213 Transducer of ERBB2, 1 1.92 NC
AA486088 Transducer of ERBB2, 2 1.71 2.1
R36467 Transforming growth factor, b 1 1.91 3.4
Cell cycle
AI360334 Carbamoyl-phosphate
synthetase 2 aspartate
transcarbamylase
2.4 NC
AA029997 Collagen, type IV, a 5 2.48 NC
AA504844 DKFZp434J1813 protein 2.02 NC
AA478479 Heat shock protein
(hsp110 family)
2.01 NC
AA456636 RAN, member RAS
oncogene family
2.33 2.3
AA487492 Retinoblastoma-binding protein 2 2.47 NC
N66132 rTS b protein 2.1 NC
AA419177 Solute carrier family 7
(cationic amino acid transporter,
member 5)
2.7 NC
AA425853 Splicing factor
proline/glutamine rich
2.26 NC
AA447515 Mad4 homolog 4.37 NC
AA456636 RAN, member RAS
oncogene family
2.33 2.3
AA487492 Retinoblastoma-binding protein 2 2.47 NC
N66132 rTS b protein 2.1 NC
AA419177 Solute carrier family 7
(cationic amino acid transporter,
member 5)
2.7 NC
AA425853 Splicing factor
proline/glutamine – rich
2.26 NC
Signal transduction
AA676453 CD37 antigen 2.45 NC
AI345015 g-Glutamyltransferase 2 2.03 NC
H58953 Nuclear factor
(erythroid-derived 2), 45 kDa
2.42 NC
AA485731 Phosphoinositide-3-kinase
(p85 b)
2.04 NC
AA291742 Promyelocytic leukemia 2.12 NC
AA057378 RAB32, member of RAS
oncogene family
2.57 NC
AA916836 Small inducible cytokine
subfamily A (Cys –Cys),
member 23
2.46 NC
Transcription
H11660 p53-induced protein 1.96 15.3
246 Modulation of Gene Expression by f-PSA Bindukumar et al.
Neoplasia . Vol. 7, No. 3, 2005

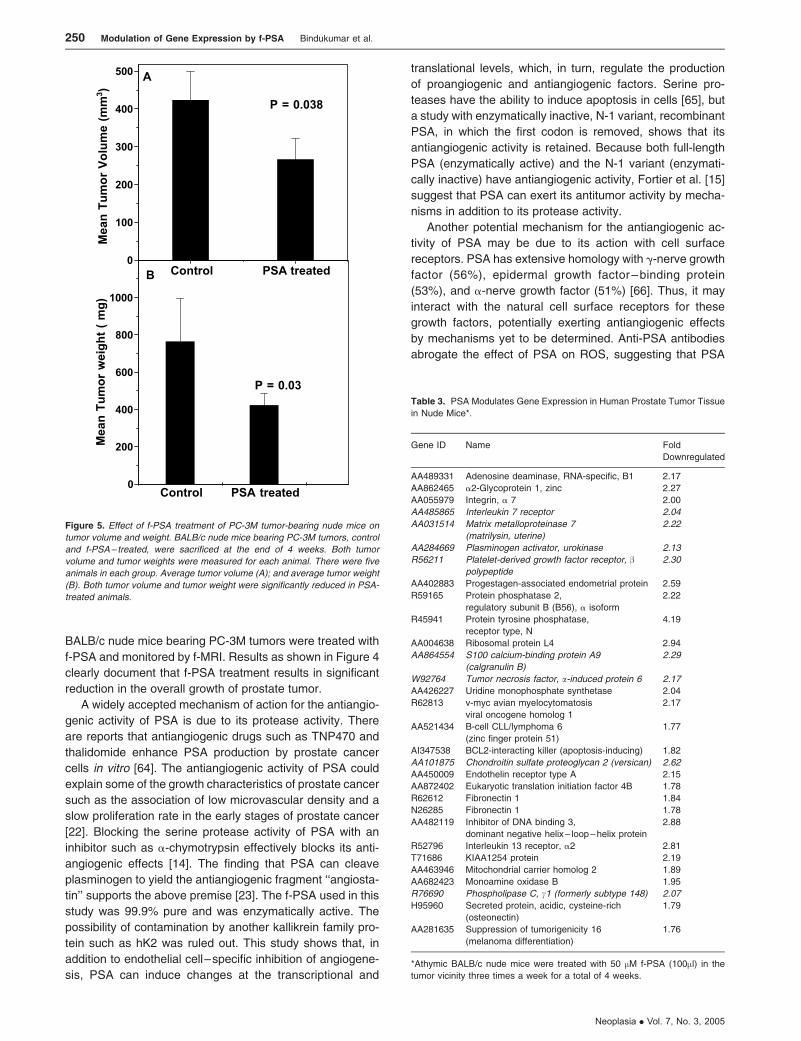
was 420 ± 37.8 mg, whereas that of the untreated control
animals was 767 ± 69 mg (P = .03; Figure 5A). Mean tumor
volumes measured using f-MRI [45] also were significantly
lower in f-PSA–treated mice (Figure 5B). The mean tumor
volume of the treated animals by the end of 4 weeks
was 267.2 ± 24 mm3, whereas that of control animals was
423.9 ± 38 mm3 (P = .029). The suppression of the tumor
growth as observed may be, in part, due to the changes in
the expression of various growth factors in response to
PSA treatment.
Gene array analysis of PC-3M tumors in nude mice treated
with PSA Gene array profiling of the effect of f-PSA
treatment on growth of PC-3M tumors in nude mice was
also carried out. Table 3 shows the effect of f-PSA treatment
on the expression of various genes in prostate tumor tissues
when PC-3M tumor cells were implanted in nude mice. Of the
downregulated genes, uPA (2.1-fold) and platelet-derived
growth factor receptor gene (2.3-fold) are known to have
important role(s) in prostate cancer progression [46]. In
addition, others such as MMP-7, S100 calcium-binding pro-
tein A9 gene, TNF-a–induced protein 6, and IL-7 receptor
genes were also downregulated to a minimum of two-fold.
Among the upregulated genes, chondrotin sulfate proteogly-
can 2 and phospholipase C gamma-1 genes are known to be
involved in the inhibition of tumor progression (Table 3).
Discussion
For the past 20 years, PSA has been an important biomarker
for the early diagnosis and management of prostate cancer
[2]. Despite the importance of PSA as a surrogate marker for
early diagnosis of prostate cancer, relatively little is known
about its biological/physiological function(s). There are sev-
eral observations that suggest that PSA may have tumor-
promoting and/or tumor-suppressing activities. PSA is a
serine protease that, through its proteolytic activity, can
release free bioactive IGF-1 previously bound to IGFPB-3.
Figure 1. Gene expression levels of Pim-1 oncogene, uPA, VEGF, and IFN-c in PC 3M cells treated with f-PSA in vitro. The cells were treated with 10 �M F-PSA
for 48 hours. RNA was extracted and reverse-transcribed. The c-DNA was amplified by real-time QPCR using specific primers. The results shown are the average
of three experiments. (A) Pim-1 oncogene; (B) VEGF; (C) uPA; and (D) IFN-c.
Modulation of Gene Expression by f-PSA Bindukumar et al. 247
Neoplasia . Vol. 7, No. 3, 2005

[47]. IGF-1, being a mitogen, may constitute a risk factor
for prostate carcinoma. However, there are several recent
reports suggesting that circulating free IGF-1, total IGF-1,
and IGFPB-3 do not predict the future risk to development of
prostate cancer [48,49]. On the contrary, there are several
reports suggesting that PSA may act as an antiangiogenic
molecule or as an inducer of apoptosis [50]. Lower tissue
PSA levels are associated with a more aggressive form of
prostate cancer [18]. Transfection of PSA c-DNA in PC-3
prostate carcinoma cells prolongs their doubling time,
reduces their tumorigenicity and metastasis in nude mice,
and induces apoptosis [19]. PSA is also able to convert Lys-
plasminogen to biologically active "angiostatin" such as frag-
ments that are known to inhibit angiogenesis [23]. More
recently, PSA purified from seminal plasma and recombinant
PSA protein produced in the Pichia pastoris expression
system were shown to inhibit angiogenesis both in vitro and
in vivo [15]. In this report, we provide further evidence that f-
PSA has antiangiogenic/antitumor activities both in vitro and
in vivo. Treatment of prostate tumor cells with f-PSA resulted
in significant modulation of several genes that are known to
be involved in angiogenesis, tumor growth, and metastasis.
We performed gene array profiling of genes that are
modulated in human prostate cancer cells, PC-3M and
LNCaP, that vary significantly in their metastatic potential
and in PC-3M tumors growing in nude mice treated with
f-PSA. In both studies, treatment with f-PSA resulted in a
significant modulation of the expression of various cancer-
related genes. The response of prostate tumor cells to f-PSA
treatment varied significantly. Treatment of PC-3M (highly
metastatic) and LNCaP (poorly metastatic) cells with f-PSA
resulted in both upregulation and downregulation of 273 and
793 cancer-related genes, respectively (Tables 1 and 2).
Although the expression of cancer genes in LNCaP cells is
influenced to a greater magnitude compared to PC-3M cells,
it is premature to speculate the relevance of such changes. It
is also known that LNCaP cells produce low levels of PSA
in the culture medium (30–100 ng/ml); the concentration of
PSA in prostate tissue is significantly higher. Consequently,
low levels of PSA produced by LNCaP cells may not be of
any consequence.
The modulation of gene expression in PC-3M cells treated
with f-PSA varied between 2-fold and 30-fold. Among the
downregulated genes, VEGF [51], uPA [52], uPAR [53],
Figure 3. Dose – response effects of f-PSA treatment of PC-3M cells on
secretion of VEGF and IFN-c proteins. Cells were treated with indicated
concentrations of f-PSA for 48 hours. The culture medium was collected
and quantitated for VEGF (A) and IFN-c (B) protein by sandwich ELISA. The
results shown are the average of three experiments.
Figure 2. Dose– response effects of f-PSA treatment of PC-3M cells on gene
expression of VEGF and IFN-c. Cells were treated for 48 hours with f-PSA
concentrations as shown. RNA was extracted and reverse-transcribed. Real-
time QPCR using specific primers amplified the c-DNA for VEGF (A) and
IFN-c (B). The experiment was repeated three times.
248 Modulation of Gene Expression by f-PSA Bindukumar et al.
Neoplasia . Vol. 7, No. 3, 2005
Pim-1 oncogene [28], and EphA2 [40] have already been
implicated in prostate cancer progression. In addition, Bcl-x
[54], MMP13 [55], and CYR61 [43] genes, also known to
promote tumor growth, were downregulated in response to
f-PSA treatment. On the other hand, the Mad4 [56] gene
and several interferon-related genes that are known to have
antitumor properties were significantly upregulated in PC-
3M cells treated with f-PSA (Table 2).
Treatment of LNCaP cells with f-PSA modulated the
expression of as many as 793 genes in the range of 2-fold
to 131-fold, wherein 433 genes were downregulated and
360 genes were upregulated. In the group of downregulated
genes, uPA showed the greatest suppression (131-fold).
VEGF-C gene, a well-known tumor promoter, was down-
regulated 26-fold (Table 1). In addition, the MMP13 gene
that has protumor activity was downregulated in LNCaP
cells. Other genes such as EphA2, uPAR, and Pim-1 onco-
gene were also significantly downregulated in LNCaP cells
(Table 1).
Several cancers overexpress tyrosine kinases [57] and
these kinases have been exploited for cancer diagnosis and
therapy. In prostate cancer, tyrosine kinases are known to be
overexpressed [58]. EphA2 is a transmembrane receptor
tyrosine kinase of the Eph family [59]. EphA2 is also over-
expressed in adult epithelial malignancies of the colon and
esophagus [60]. It has been reported that EphA2 is overex-
pressed in metastatic prostate cancer [40]. One of the
important molecules involved in cancer metastasis is uPA.
An elevated concentration of uPA is a strong indicator of poor
prognosis. It is known that uPA binds to its receptor, uPAR,
on the cell surface, resulting in conversion of plasminogen
to plasmin. Plasmin then digests fibrin, which subsequently
allows endothelial tube formation. uPAR gene expression
was inhibited in LNCaP cells as well as in PC-3M cells. PSA
treatment also downregulated CYR61 gene in PC-3M cells.
CYR61 is a prototypical member of the CCN family. This
protein functions as extracellular matrix (ECM)–associated
signaling molecule. It is transcriptionally activated in endo-
thelial cells in response to bFGF or VEGF, and can interact
with various cellular integrins [61]. Purified Cyr61 protein has
been reported to mediate cell adhesion, stimulate chemo-
taxis, augment growth factor– induced DNA synthesis, foster
cell survival, and enhance angiogenesis in vivo [61].
Because there is no literature available regarding the
dosage, duration, and frequency of PSA treatment for opti-
mal response(s), we investigated the effect of PSA dosage
on VEGF and IFN-g gene and protein expression in PC-3M
cells. VEGF gene expression was maximally suppressed
(>60%) at 10 mM f-PSA (Figure 2A). With regard to IFN-cgene, maximal upregulation was observed at concentrations
of 5 mM f-PSA (Figure 2B ). VEGF protein release was
downregulated with increasing concentrations of f-PSA. At
0.3 mM f-PSA, VEGF protein release was suppressed by
over 40% compared to untreated control cells (Figure 3A).
Similarly, the release of IFN-g protein was maximal at f-PSA
concentration of 0.3 mM (Figure 3B ). INF-g is a pleiotropic
cytokine that plays a central role in innate and adaptive
immunity [62]. IFN-g acts in various ways on host and tumor
cells to favor tumor regression. IFN-g is known to have a
significant role in tumor surveillance [63]. In our in vivo study,
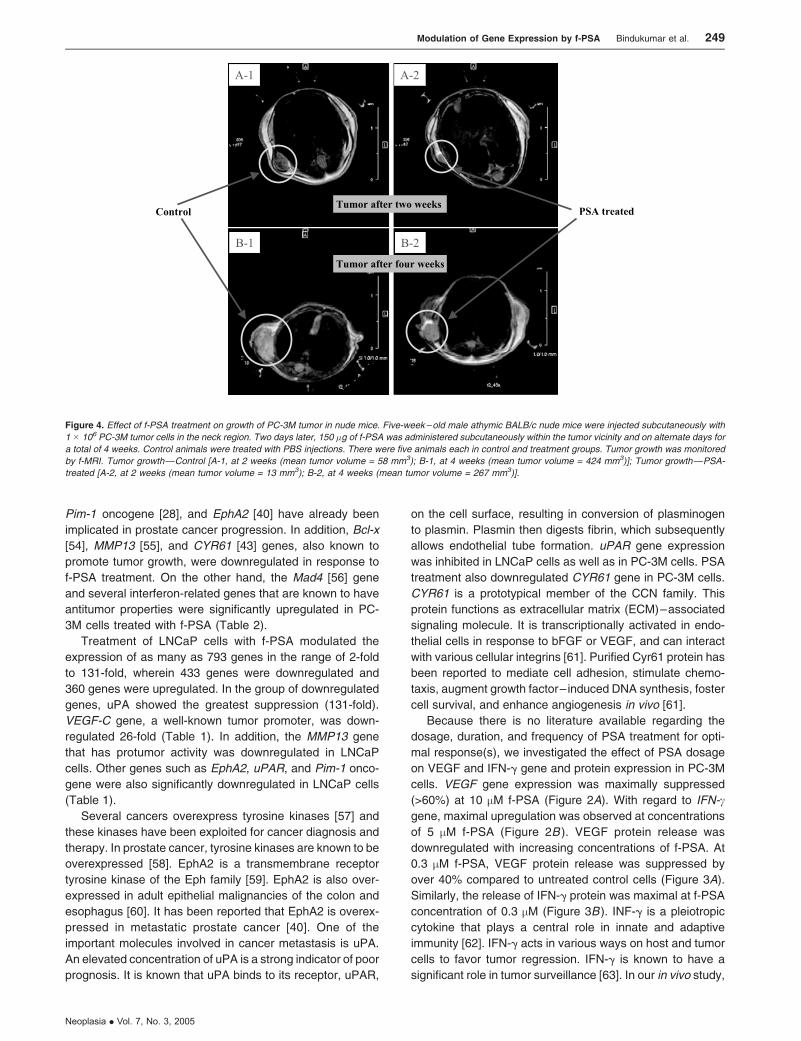
Figure 4. Effect of f-PSA treatment on growth of PC-3M tumor in nude mice. Five-week – old male athymic BALB/c nude mice were injected subcutaneously with
1 � 106 PC-3M tumor cells in the neck region. Two days later, 150 �g of f-PSA was administered subcutaneously within the tumor vicinity and on alternate days for
a total of 4 weeks. Control animals were treated with PBS injections. There were five animals each in control and treatment groups. Tumor growth was monitored
by f-MRI. Tumor growth—Control [A-1, at 2 weeks (mean tumor volume = 58 mm3); B-1, at 4 weeks (mean tumor volume = 424 mm3)]; Tumor growth—PSA-
treated [A-2, at 2 weeks (mean tumor volume = 13 mm3); B-2, at 4 weeks (mean tumor volume = 267 mm3)].
Modulation of Gene Expression by f-PSA Bindukumar et al. 249
Neoplasia . Vol. 7, No. 3, 2005
BALB/c nude mice bearing PC-3M tumors were treated with
f-PSA and monitored by f-MRI. Results as shown in Figure 4
clearly document that f-PSA treatment results in significant
reduction in the overall growth of prostate tumor.
A widely accepted mechanism of action for the antiangio-
genic activity of PSA is due to its protease activity. There
are reports that antiangiogenic drugs such as TNP470 and
thalidomide enhance PSA production by prostate cancer
cells in vitro [64]. The antiangiogenic activity of PSA could
explain some of the growth characteristics of prostate cancer
such as the association of low microvascular density and a
slow proliferation rate in the early stages of prostate cancer
[22]. Blocking the serine protease activity of PSA with an
inhibitor such as a-chymotrypsin effectively blocks its anti-
angiogenic effects [14]. The finding that PSA can cleave
plasminogen to yield the antiangiogenic fragment ‘‘angiosta-
tin’’ supports the above premise [23]. The f-PSA used in this
study was 99.9% pure and was enzymatically active. The
possibility of contamination by another kallikrein family pro-
tein such as hK2 was ruled out. This study shows that, in
addition to endothelial cell–specific inhibition of angiogene-
sis, PSA can induce changes at the transcriptional and
translational levels, which, in turn, regulate the production
of proangiogenic and antiangiogenic factors. Serine pro-
teases have the ability to induce apoptosis in cells [65], but
a study with enzymatically inactive, N-1 variant, recombinant
PSA, in which the first codon is removed, shows that its
antiangiogenic activity is retained. Because both full-length
PSA (enzymatically active) and the N-1 variant (enzymati-
cally inactive) have antiangiogenic activity, Fortier et al. [15]
suggest that PSA can exert its antitumor activity by mecha-
nisms in addition to its protease activity.
Another potential mechanism for the antiangiogenic ac-
tivity of PSA may be due to its action with cell surface
receptors. PSA has extensive homology with g-nerve growth
factor (56%), epidermal growth factor – binding protein
(53%), and a-nerve growth factor (51%) [66]. Thus, it may
interact with the natural cell surface receptors for these
growth factors, potentially exerting antiangiogenic effects
by mechanisms yet to be determined. Anti-PSA antibodies
abrogate the effect of PSA on ROS, suggesting that PSA
Figure 5. Effect of f-PSA treatment of PC-3M tumor-bearing nude mice on
tumor volume and weight. BALB/c nude mice bearing PC-3M tumors, control
and f-PSA – treated, were sacrificed at the end of 4 weeks. Both tumor
volume and tumor weights were measured for each animal. There were five
animals in each group. Average tumor volume (A); and average tumor weight
(B). Both tumor volume and tumor weight were significantly reduced in PSA-
treated animals.
Table 3. PSA Modulates Gene Expression in Human Prostate Tumor Tissue
in Nude Mice*.
Gene ID Name Fold
Downregulated
AA489331 Adenosine deaminase, RNA-specific, B1 2.17
AA862465 a2-Glycoprotein 1, zinc 2.27
AA055979 Integrin, a 7 2.00
AA485865 Interleukin 7 receptor 2.04
AA031514 Matrix metalloproteinase 7
(matrilysin, uterine)
2.22
AA284669 Plasminogen activator, urokinase 2.13
R56211 Platelet-derived growth factor receptor, bpolypeptide
2.30
AA402883 Progestagen-associated endometrial protein 2.59
R59165 Protein phosphatase 2,
regulatory subunit B (B56), a isoform
2.22
R45941 Protein tyrosine phosphatase,
receptor type, N
4.19
AA004638 Ribosomal protein L4 2.94
AA864554 S100 calcium-binding protein A9
(calgranulin B)
2.29
W92764 Tumor necrosis factor, a-induced protein 6 2.17
AA426227 Uridine monophosphate synthetase 2.04
R62813 v-myc avian myelocytomatosis
viral oncogene homolog 1
2.17
AA521434 B-cell CLL/lymphoma 6
(zinc finger protein 51)
1.77
AI347538 BCL2-interacting killer (apoptosis-inducing) 1.82
AA101875 Chondroitin sulfate proteoglycan 2 (versican) 2.62
AA450009 Endothelin receptor type A 2.15
AA872402 Eukaryotic translation initiation factor 4B 1.78
R62612 Fibronectin 1 1.84
N26285 Fibronectin 1 1.78
AA482119 Inhibitor of DNA binding 3,
dominant negative helix – loop – helix protein
2.88
R52796 Interleukin 13 receptor, a2 2.81
T71686 KIAA1254 protein 2.19
AA463946 Mitochondrial carrier homolog 2 1.89
AA682423 Monoamine oxidase B 1.95
R76690 Phospholipase C, c1 (formerly subtype 148) 2.07
H95960 Secreted protein, acidic, cysteine-rich
(osteonectin)
1.79
AA281635 Suppression of tumorigenicity 16
(melanoma differentiation)
1.76
*Athymic BALB/c nude mice were treated with 50 mM f-PSA (100ml) in the
tumor vicinity three times a week for a total of 4 weeks.
250 Modulation of Gene Expression by f-PSA Bindukumar et al.
Neoplasia . Vol. 7, No. 3, 2005
acts at an extracellular site [24]. We have shown that block-
ing the enzymatic activity of f-PSA with the protease inhibitor,
aprotinin, resulted in an incomplete reversal of its ability to
regulate the expression of VEGF (data not shown). Our data
support the notion that the antiangiogenic activity of PSA
may be mediated by more than one mechanism including its
enzymatic activity.
Ours are the first observations to document that treatment
of prostate cancer cells with f-PSA significantly modulates
the expression of various growth factors involved in tumor
growth. Such a change may be responsible for the suppres-
sion of growth of prostate tumor xenograft in nude mice as
observed. Our findings are in general agreement with an-
other report that documents the antiangiogenic effect of
PSA in murine melanoma model [14]. In view of our current
findings that PSA may have tumor-protective activities in
vivo, it is interesting to speculate that increased expression
of PSA may also be an adaptive host antitumor response.
Further research in this area is warranted.
Acknowledgements
We are grateful to Richard Mazurchuck for f-MRI, and Norma
Novak and Devin McQuaid for the gene array analysis.
References[1] ACS (2004). Cancer Figures and Facts 2004, American Cancer Soci-
ety, Atlanta, GA.
[2] Diamandis EP (1998). Prostate-specific antigen: its usefulness in clin-
ical medicine. Trends Endocrinol Metab 9, 310 – 316.
[3] Armbruster DA (1993). Prostate-specific antigen: biochemistry, analyt-
ical methods, and clinical application. Clin Chem 39, 181 –195.
[4] Zhang WM, Finne P, Leinonen J, Vesalainen S, Nordling S, and
Stenman UH (1999). Measurement of the complex between prostate-
specific antigen and alpha1-protease inhibitor in serum. Clin Chem 45,
814 – 821.
[5] Lilja H, Oldbring J, Rannevik G, and Laurell CB (1987). Seminal
vesicle – secreted proteins and their reactions during gelation and lique-
faction of human semen. J Clin Invest 80, 281 –285.
[6] Clements J and Mukhtar A (1994). Glandular kallikreins and prostate-
specific antigen are expressed in the human endometrium. J Clin En-
docrinol Metab 78, 1536 – 1539.
[7] Diamandis EP (1995). New diagnostic applications and physiological
functions of prostate-specific antigen. Scand J Clin Lab Invest Suppl
221, 105 – 112.
[8] Hautmann S, Huland E, Grupp C, Haese A, and Huland H (2000).
Super-sensitive prostate-specific antigen (PSA) in serum of women
with benign breast disease or breast cancer. Anticancer Res 20,
2151 – 2154.
[9] Pummer K, Wirnsberger G, Purstner P, Stettner H, and Wandschneider
G (1992). False positive prostate-specific antigen values in the sera of
women with renal cell carcinoma. J Urol 148, 21 –23.
[10] Kucera E, Kainz C, Tempfer C, Zeillinger R, Koelbl H, and Sliutz G
(1997). Prostate-specific antigen (PSA) in breast and ovarian cancer.
Anticancer Res 17, 4735 – 4737.
[11] Zarghami N, Grass L, Sauter ER, and Diamandis EP (1997). Prostate-
specific antigen in serum during the menstrual cycle. Clin Chem 43,
1862 – 1867.
[12] Folkman J, Watson K, Ingber D, and Hanahan D (1989). Induction
of angiogenesis during the transition from hyperplasia to neoplasia.
Nature 339, 58– 61.
[13] Folkman J and Shing Y (1992). Angiogenesis. J Biol Chem 267,
10931 – 10934.
[14] Fortier AH, Nelson BJ, Grella DK, and Holaday JW (1999). Antian-
giogenic activity of prostate-specific antigen. J Natl Cancer Inst 91,
1635 – 1640.
[15] Fortier AH, Holaday JW, Liang H, Dey C, Grella DK, Holland-Linn J,
Vu H, Plum SM, and Nelson BJ (2003). Recombinant prostate-specific
antigen inhibits angiogenesis in vitro and in vivo. Prostate 56, 212 – 219.
[16] Pretlow TG, Pretlow TP, Yang B, Kaetzel CS, Delmoro CM, Kamis SM,
Bodner DR, Kursh E, Resnick MI, and Bradley EL Jr (1991). Tissue
concentrations of prostate-specific antigen in prostatic carcinoma and
benign prostatic hyperplasia. Int J Cancer 49, 645 –649.
[17] Magklara A, Scorilas A, Stephan C, Kristiansen GO, Hauptmann S,
Jung K, and Diamandis EP (2000). Decreased concentrations of pros-
tate-specific antigen and human glandular kallikrein 2 in malignant
versus nonmalignant prostatic tissue. Urology 56, 527 – 532.
[18] Stege R, Grande M, Carlstrom K, Tribukait B, and Pousette A (2000).
Prognostic significance of tissue prostate-specific antigen in endocrine-
treated prostate carcinomas. Clin Cancer Res 6, 160 – 165.
[19] Balbay MD, Juang P, Ilansa N, Williams SD, Fidler IJ, et al. (1999).
Stable transfection of human prostate cancer cell line PC-3 with pros-
tate-specific antigen induced apoptosis both in vivo and in vitro. Proc
Am Assoc Cancer Res 49, 225 – 228(Abstract).
[20] Yu H, Levesque MA, Clark GM, and Diamandis EP (1998). Prognostic
value of prostate-specific antigen for women with breast cancer: a large
United States cohort study. Clin Cancer Res 4, 1489 – 1497.
[21] Rosser CJ, Kuban DA, Levy LB, Chichakli R, Pollack A, Lee AK, and
Pisters LL (2002). Prostate-specific antigen bounce phenomenon after
external beam radiation for clinically localized prostate cancer. J Urol
168, 2001 – 2005.
[22] Papadopoulos I, Sivridis E, Giatromanolaki A, and Koukourakis MI
(2001). Tumor angiogenesis is associated with MUC1 overexpression
and loss of prostate-specific antigen expression in prostate cancer. Clin
Cancer Res 7, 1533 – 1538.
[23] Heidtmann HH, Nettelbeck DM, Mingels A, Jager R, Welker HG, and
Kontermann RE (1999). Generation of angiostatin-like fragments from
plasminogen by prostate-specific antigen. Br J Cancer 81, 1269 – 1273.
[24] Sun XY, Donald SP, and Phang JM (2001). Testosterone and prostate-
specific antigen stimulate generation of reactive oxygen species in
prostate cancer cells. Carcinogenesis 22, 1775 – 1780.
[25] Polyak K, Xia Y, Zweier JL, Kinzler KW, and Vogelstein B (1997). A
model for p53-induced apoptosis. Nature 389, 300 –305.
[26] Aalinkeel R, Nair MP, Sufrin G, Mahajan SD, Chadha KC, Chawda RP,
and Schwartz SA (2004). Gene expression of angiogenic factors cor-
relates with metastatic potential of prostate cancer cells. Cancer Res
64, 5311 – 5321.
[27] Bull JH, Ellison G, Patel A, Muir G, Walker M, Underwood M, Khan F,
and Paskins L (2001). Identification of potential diagnostic markers
of prostate cancer and prostatic intraepithelial neoplasia using cDNA
microarray. Br J Cancer 84, 1512 –1519.
[28] Dhanasekaran SM, Barrette TR, Ghosh D, Shah R, Varambally S,
Kurachi K, Pienta KJ, Rubin MA, and Chinnaiyan AM (2001). De-
lineation of prognostic biomarkers in prostate cancer. Nature 412,
822 – 826.
[29] Luo J, Duggan DJ, Chen Y, Sauvageot J, Ewing CM, Bittner ML, Trent
JM, and Isaacs WB (2001). Human prostate cancer and benign pro-
static hyperplasia: molecular dissection by gene expression profiling.
Cancer Res 61, 4683 – 4688.
[30] Bindukumar B, Kawinski E, Cherrin C, Gambino ML, Nair PM, Schwartz
SA, Chadha KC. Two step procedure for purification of enzymatically
active Prostate-specific antigen from seminal plasma. J Chromatogr B,
in press.
[31] Kawinski E, Levine E, and Chadha K (2002). Thiophilic interaction
chromatography facilitates detection of various molecular complexes
of prostate-specific antigen in biological fluids. Prostate 50, 145– 153.
[32] Chadha KC, Kawinski E, and Sulkowski E (2001). Thiophilic interaction
chromatography of prostate-specific antigen. J Chromatogr B Biomed
Sci Appl 754, 521 –525.
[33] Denmeade SR, Lou W, Lovgren J, Malm J, Lilja H, and Isaacs JT
(1997). Specific and efficient peptide substrates for assaying the
proteolytic activity of prostate-specific antigen. Cancer Res 57,
4924 – 4930.
[34] Pettaway CA, Pathak S, Greene G, Ramirez E, Wilson MR, Killion JJ,
and Fidler IJ (1996). Selection of highly metastatic variants of different
human prostatic carcinomas using orthotopic implantation in nude
mice. Clin Cancer Res 2, 1627 –1636.
[35] Stephenson RA, Dinney CP, Gohji K, Ordonez NG, Killion JJ, and
Fidler IJ (1992). Metastatic model for human prostate cancer using
orthotopic implantation in nude mice. J Natl Cancer Inst 84, 951 – 957.
[36] Horoszewicz JS, Leong SS, Kawinski E, Karr JP, Rosenthal H, Chu
TM, Mirand EA, and Murphy GP (1983). LNCaP model of human pro-
static carcinoma. Cancer Res 43, 1809 – 1818.
Modulation of Gene Expression by f-PSA Bindukumar et al. 251
Neoplasia . Vol. 7, No. 3, 2005

[37] Chomczynski P and Sacchi N (1987). Single-step method of RNA iso-
lation by acid guanidinium thiocyanate – phenol – chloroform extraction.
Anal Biochem 162, 156 –159.
[38] Mahajan SD, Schwartz SA, and Nair MP (2003). Immunological assays
for chemokine detection in in vitro culture of CNS cells. Biol Proc Online
5, 90 – 102.
[39] Sensabaugh GF and Blake ET (1990). Seminal plasma protein p30:
simplified purification and evidence for identity with prostate-specific
antigen. J Urol 144, 1523 –1526.
[40] Walker-Daniels J, Coffman K, Azimi M, Rhim JS, Bostwick DG, Snyder
P, Kerns BJ, Waters DJ, and Kinch MS (1999). Overexpression of
the EphA2 tyrosine kinase in prostate cancer. Prostate 41, 275 – 280.
[41] Hollas W, Hoosein N, Chung LW, Mazar A, Henkin J, Kariko K,
Barnathan ES, and Boyd D (1992). Expression of urokinase and its
receptor in invasive and non-invasive prostate cancer cell lines. Thromb
Haemost 68, 662 –666.
[42] Vassalli JD and Pepper MS (1994). Tumour biology. Membrane pro-
teases in focus. Nature 370, 14 –15.
[43] Brigstock DR (2002). Regulation of angiogenesis and endothelial cell
function by connective tissue growth factor (CTGF) and cysteine-rich
61 (CYR61). Angiogenesis 5, 153 – 165.
[44] Xin H, Curry J, Johnstone RW, Nickoloff BJ, and Choubey D (2003).
Role of IFI 16, a member of the interferon-inducible p200-protein family,
in prostate epithelial cellular senescence. Oncogene 22, 4831 – 4840.
[45] Wu M, Mazurchuk R, Chaudhary ND, Spernyak J, Veith J, Pera P,
Greco W, Hoffman RM, Kobayashi T, and Bernacki RJ (2003). High-
resolution magnetic resonance imaging of the efficacy of the cytosine
analogue 1-[2-C-cyano-2-deoxy-beta-D-arabino-pentofuranosyl]-N(4)-
palmitoyl cytosine (CS-682) in a liver-metastasis athymic nude mouse
model. Cancer Res 63, 2477 –2482.
[46] Ustach CV, Taube ME, Hurst NJ Jr, Bhagat S, Bonfil RD, Chel ML,
Schuger L, and Kim HR (2004). A potential oncogenic activity of plate-
let-derived growth factor D in prostate cancer progression. Cancer Res
64, 1722 – 1729.
[47] Cohen P, Peehl DM, Lamson G, and Rosenfeld RG (1991). Insulin-like
growth factors (IGFs), IGF receptors, and IGF-binding proteins in pri-
mary cultures of prostate epithelial cells. J Clin Endocrinol Metab 73,
401 – 407.
[48] Lopez JB, Sahabudin RM, and Chin LP (2004). Are plasma insulin-like
growth factor I (IGF-I) and IGF-binding protein 3 (IGFBP-3) useful
markers of prostate cancer? Int J Biol Markers 19, 164 – 167.
[49] Janssen JA, Wildhagen MF, Ito K, Blijenberg BG, Van Schaik RH,
Roobol MJ, Pols HA, Lamberts SW, and Schroder FH (2004). Circulat-
ing free insulin-like growth factor (IGF)-I, total IGF-I, and IGF-I, and IGF
binding protein-3 levels do not predict the future risk to develop prostate
cancer: results of a case– control study involving 201 patients within a
population-based screening with a 4-year interval. J Clin Endocrinol
Metab 89, 4391 – 4396.
[50] Diamandis EP (2000). Prostate-specific antigen: a cancer fighter and
a valuable messenger? Clin Chem 46, 896 – 900.
[51] Nicholson B and Theodorescu D (2004). Angiogenesis and prostate
cancer tumor growth. J Cell Biochem 91, 125 – 150.
[52] Pakneshan P, Xing RH, and Rabbani SA (2003). Methylation status of
uPA promoter as a molecular mechanism regulating prostate cancer
invasion and growth in vitro and in vivo. FASEB J 17, 1081 – 1088.
[53] Gallicchio MA, Kaun C, Wojta J, Binder B, and Bach LA (2003). Uroki-
nase type plasminogen activator receptor is involved in insulin-like
growth factor – induced migration of rhabdomyosarcoma cells in vitro.
J Cell Physiol 197, 131 – 138.
[54] Lebedeva IV, Sarkar D, Su ZZ, Kitada S, Dent P, Stein CA, Reed
JC, and Fisher PB (2003). Bcl-2 and Bcl-x(L) differentially protect
human prostate cancer cells from induction of apoptosis by mela-
noma differentiation associated gene-7, mda-7/IL-24. Oncogene 22,
8758 – 8773.
[55] Freije JM, Diez-Itza I, Balbin M, Sanchez LM, Blasco R, Tolivia J, and
Lopez-Otin C (1994). Molecular cloning and expression of collagenase-
3, a novel human matrix metalloproteinase produced by breast carci-
nomas. J Biol Chem 269, 16766 –16773.
[56] Hurlin PJ, Queva C, Koskinen PJ, Steingrimsson E, Ayer DE, Copeland
NG, Jenkins NA, and Eisenman RN (1996). Mad3 and Mad4: novel
Max-interacting transcriptional repressors that suppress c-myc depen-
dent transformation and are expressed during neural and epidermal
differentiation. EMBO J 15, 2030.
[57] Patarca R (1996). Protein phosphorylation and dephosphorylation in
physiologic and oncologic processes. Crit Rev Oncogen 7, 343 – 432.
[58] Kondapaka BS and Reddy KB (1996). Tyrosine kinase inhibitor as a
novel signal transduction and antiproliferative agent: prostate cancer.
Mol Cell Endocrinol 117, 53 –58.
[59] Lindberg RA and Hunter T (1990). cDNA cloning and characterization
of eck, an epithelial cell receptor protein-tyrosine kinase in the eph/elk
family of protein kinases. Mol Cell Biol 10, 6316 –6324.
[60] Rosenberg IM, Goke M, Kanai M, Reinecker HC, and Podolsky DK
(1997). Epithelial cell kinase-B61: an autocrine loop modulating
intestinal epithelial migration and barrier function. Am J Physiol 273,
G824– G832.
[61] Xie D, Yin D, Tong X, Kelly O’J, Mori A, Miller C, Black K, Gui D,
Said JW, and Koeffler HP (2004). Cyr61 is overexpressed in gliomas
and involved in integrin-linked kinase-mediated Akt and beta-catenin –
TCF/Lef signaling pathways. Cancer Res 64, 1987 – 1996.
[62] Farrar MA and Schreiber RD (1993). The molecular cell biology of
interferon-gamma and its receptor. Annu Rev Immunol 11, 571 – 611.
[63] Dighe AS, Richards E, Old LJ, and Schreiber RD (1994). Enhanced
in vivo growth and resistance to rejection of tumor cells expressing
dominant negative IFN gamma receptors. Immunity 1, 447 –456.
[64] Dixon SC, Kruger EA, Bauer KS, and Figg WD (1999). Thalidomide up-
regulates prostate-specific antigen secretion from LNCaP cells. Cancer
Chemother Pharmacol Suppl 43, S78 – S84.
[65] Torriglia A, Perani P, Brossas JY, Altairac S, Zeggai S, Martin E, Treton
J, Courtois Y, and Counis MF (1999). A caspase-independent cell
clearance program. (2000) The LEI/L-DNase II pathway. Ann NY Acad
Sci 926, 192 –203.
[66] Watt KW, Lee PJ, M’Timkulu T, Chan WP, and Loor R (1986). Human
prostate-specific antigen: structural and functional similarity with serine
proteases. Proc Natl Acad Sci USA 83, 3166 –3170.
252 Modulation of Gene Expression by f-PSA Bindukumar et al.
Neoplasia . Vol. 7, No. 3, 2005