Relapse Prevention Therapy Clinical Guidelines for delivery in substance abuse treatment.
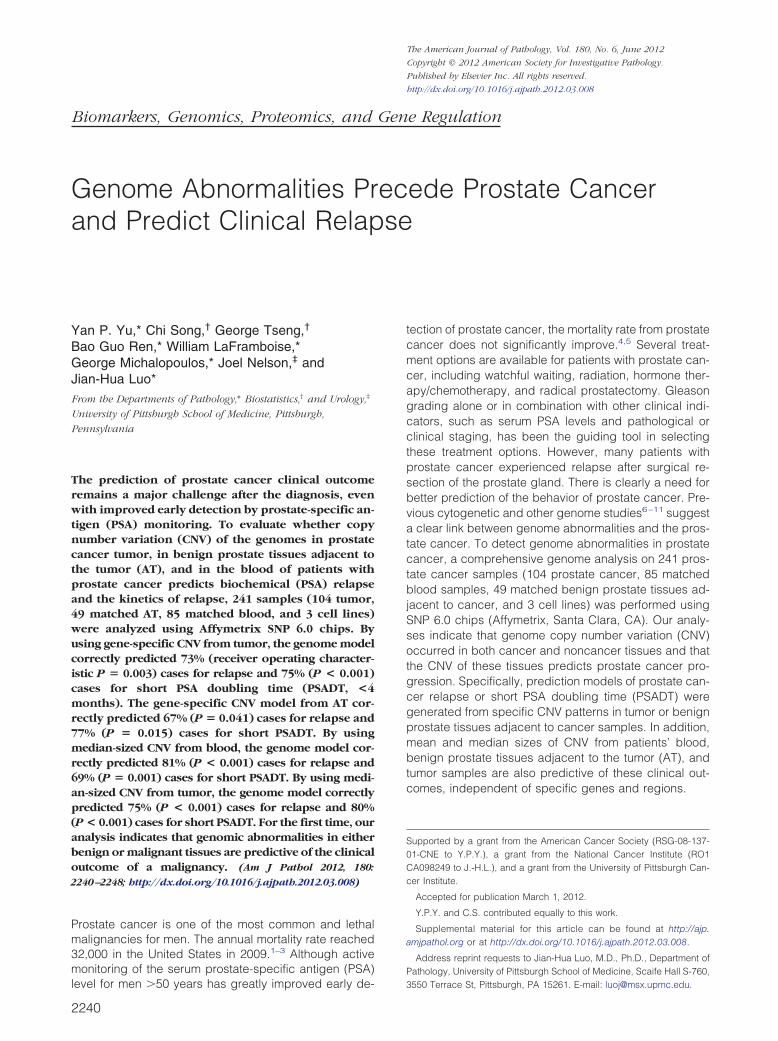
The American Journal of Pathology, Vol. 180, No. 6, June 2012
Copyright © 2012 American Society for Investigative Pathology.
Published by Elsevier Inc. All rights reserved.
http://dx.doi.org/10.1016/j.ajpath.2012.03.008
Biomarkers, Genomics, Proteomics, and Gene Regulation
Genome Abnormalities Precede Prostate Cancer
and Predict Clinical RelapseYan P. Yu,* Chi Song,† George Tseng,†
Bao Guo Ren,* William LaFramboise,*George Michalopoulos,* Joel Nelson,‡ andJian-Hua Luo*From the Departments of Pathology,* Biostatistics,† and Urology,‡
University of Pittsburgh School of Medicine, Pittsburgh,
Pennsylvania
The prediction of prostate cancer clinical outcomeremains a major challenge after the diagnosis, evenwith improved early detection by prostate-specific an-tigen (PSA) monitoring. To evaluate whether copynumber variation (CNV) of the genomes in prostatecancer tumor, in benign prostate tissues adjacent tothe tumor (AT), and in the blood of patients withprostate cancer predicts biochemical (PSA) relapseand the kinetics of relapse, 241 samples (104 tumor,49 matched AT, 85 matched blood, and 3 cell lines)were analyzed using Affymetrix SNP 6.0 chips. Byusing gene-specific CNV from tumor, the genome modelcorrectly predicted 73% (receiver operating character-istic P � 0.003) cases for relapse and 75% (P < 0.001)cases for short PSA doubling time (PSADT, <4months). The gene-specific CNV model from AT cor-rectly predicted 67% (P � 0.041) cases for relapse and77% (P � 0.015) cases for short PSADT. By usingmedian-sized CNV from blood, the genome model cor-rectly predicted 81% (P < 0.001) cases for relapse and69% (P � 0.001) cases for short PSADT. By using medi-an-sized CNV from tumor, the genome model correctlypredicted 75% (P < 0.001) cases for relapse and 80%(P < 0.001) cases for short PSADT. For the first time, ouranalysis indicates that genomic abnormalities in eitherbenign or malignant tissues are predictive of the clinicaloutcome of a malignancy. (Am J Pathol 2012, 180:
2240–2248; http://dx.doi.org/10.1016/j.ajpath.2012.03.008)
Prostate cancer is one of the most common and lethalmalignancies for men. The annual mortality rate reached32,000 in the United States in 2009.1–3 Although activemonitoring of the serum prostate-specific antigen (PSA)
level for men �50 years has greatly improved early de-2240
tection of prostate cancer, the mortality rate from prostatecancer does not significantly improve.4,5 Several treat-ment options are available for patients with prostate can-cer, including watchful waiting, radiation, hormone ther-apy/chemotherapy, and radical prostatectomy. Gleasongrading alone or in combination with other clinical indi-cators, such as serum PSA levels and pathological orclinical staging, has been the guiding tool in selectingthese treatment options. However, many patients withprostate cancer experienced relapse after surgical re-section of the prostate gland. There is clearly a need forbetter prediction of the behavior of prostate cancer. Pre-vious cytogenetic and other genome studies6–11 suggesta clear link between genome abnormalities and the pros-tate cancer. To detect genome abnormalities in prostatecancer, a comprehensive genome analysis on 241 pros-tate cancer samples (104 prostate cancer, 85 matchedblood samples, 49 matched benign prostate tissues ad-jacent to cancer, and 3 cell lines) was performed usingSNP 6.0 chips (Affymetrix, Santa Clara, CA). Our analy-ses indicate that genome copy number variation (CNV)occurred in both cancer and noncancer tissues and thatthe CNV of these tissues predicts prostate cancer pro-gression. Specifically, prediction models of prostate can-cer relapse or short PSA doubling time (PSADT) weregenerated from specific CNV patterns in tumor or benignprostate tissues adjacent to cancer samples. In addition,mean and median sizes of CNV from patients’ blood,benign prostate tissues adjacent to the tumor (AT), andtumor samples are also predictive of these clinical out-comes, independent of specific genes and regions.
Supported by a grant from the American Cancer Society (RSG-08-137-01-CNE to Y.P.Y.), a grant from the National Cancer Institute (RO1CA098249 to J.-H.L.), and a grant from the University of Pittsburgh Can-cer Institute.
Accepted for publication March 1, 2012.
Y.P.Y. and C.S. contributed equally to this work.
Supplemental material for this article can be found at http://ajp.amjpathol.org or at http://dx.doi.org/10.1016/j.ajpath.2012.03.008.
Address reprint requests to Jian-Hua Luo, M.D., Ph.D., Department ofPathology, University of Pittsburgh School of Medicine, Scaife Hall S-760,
3550 Terrace St, Pittsburgh, PA 15261. E-mail: [email protected].
Benign and Cancer CNVs Predict Outcomes 2241AJP June 2012, Vol. 180, No. 6
Materials and Methods
Tissue Processing, DNA Extraction, AmpliconGeneration, Labeling, Hybridization, Washing,and Scanning of SNP 6.0 Chips
Prostate cancer samples were obtained from the Univer-sity of Pittsburgh Medical Center Tissue Bank, Pittsburgh,PA. These samples were collected from 1998 to 2009. Tomake the analysis balance, samples of short PSADT (�4months), long PSADT (�15 months), and no relapse(cancer free for �5 years after radical prostatectomy)each were made to constitute approximately one third ofthe total number. Whenever possible, nonrelapse sam-ples were chosen to match pathological stages andGleason grades of relapse samples. A total of 214 sam-ples were from whites, whereas 5 samples were fromAfrican Americans and 19 samples were from patientswith an unknown race. The patients whom these sampleswere obtained from either experienced relapse or had norelapse for at least 5 years, based on chemical (serumPSA) and radiological evidence. Frozen tissues wereused for blood, prostate cancer, and benign prostatetissue adjacent to cancer. Clinical follow-up was con-ducted by office examination record, blood PSA survey,and radiographical follow-up. These follow-up visits wereperformed for up to a 10-year period after the patientunderwent a radical prostatectomy. The protocol wasapproved by the Institutional Review Board. For prostatecancer, microdissection was performed to achieve tumorpurity �80%. For benign prostate tissues adjacent tocancer, benign tissues away from prostate cancer (atleast 3 mm) were microdissected. Whenever available,
Table 1. Clinical and Pathological Characteristics of ProstateCancer Samples
Relapse statusNone
(n � 28)
LongPSADT
(n � 42)
ShortPSADT
(n � 33)
Mean age (P � 0.0783) 56.07 59.29 56.06Cancer stage (P � 0.0224)
pT1 3 (2.9) 1 (1.0) 0 (0)pT2 10 (9.7) 9 (8.7) 7 (6.8)pT3a 7 (6.8) 18 (17.5) 6 (5.8)pT3b 8 (7.8) 14 (13.6) 20 (19.4)
Gleason grade (P � 0.6569)6 6 (5.8) 8 (7.8) 3 (2.9)7 16 (15.5) 26 (25.2) 21 (20.4)8–10 6 (5.8) 8 (7.8) 9 (8.7)
Race (P � 0.2349)Black 1 2 0Unknown 4 1 2White 23 39 31
Median follow-up (months) 154 124.8 54.8Median time to progression
(months)NA 47.355 1.87
Median PSADT (months) NA 23.2 3.21Mean preoperative PSA
(P � 0.42)8.61 12.31 10.79
Data are given as number (percentage) of the 103 samples unlessotherwise indicated.
NA, not applicable.
whole blood or buffy coat from the same patients was
used as a normal control. PC3, DU145, and LNCaP cellswere obtained from American Type Culture CollectionInc. (Manassas, VA) in 2000, 2001, and 2007, respec-tively. The genomes of these cell lines were tested for shorttandem repeat DNA profiling on eight different loci (CSF1PO,D13S317, D16S539, D5S818, D7S820, THO1, TPOX, andvWA) of the genomes by PCR using the following sets ofprimers: CSF1PO, 5=-AACCTGAGTCTGCCAAGGAC-TAGC-3= and 5=-TTCCACACACCACTGGCCATCTTC-3=;D13S317, 5=-ACAGAAGTCTGGGATGTGGA-3= and 5=-GCC-CAAAAAGACAGACAGAA-3=; D16S539, 5=-GATCCCAA-GCTCTTCCTCTT-3= and 5=-ACGTTTGTGTGTGCATCTGT-3=;D5S818, 5=-GGGTGATTTTCCTCTTTGGT-3= and 5=-TGATTC-CAATCATAGCCACA-3=; D7S820, 5=-TGTCATAGTTTAGA-ACGAACTAACG-3= and 5=-CTGAGGTATCAAAAACTCA-GAGG-3=; TH01, 5=-GTGGGCTGAAAAGCTCCCGATTAT-3=and 5=-ATTCAAAGGGTATCTGGGCTCTGG-3=; TPOX, 5=-ACTGGCACAGAACAGGCACTTAGG-3= and 5=-GGAGGA-ACTGGGAACCACACAGGT-3=; and vWA, 5=-CCCTAGTG-GATGATAAGAATAATCAGTATG-3= and 5=-GGACAGAT-GATAAATACATAGGATGGATGG-3=. These cell lines wereauthenticated because the short tandem repeat profiles of thecell lines have a perfect match with those published by Amer-ican Type Culture Collection Inc. DNA was then extractedusing a Qiagen tissue kit (Qiagen, Valencia, CA). Detailedcase information is shown in Tables 1, 2, and 3 and Supple-mental Table S1 (available at http://ajp.amjpathol.org). GenomeDNA (500 ng), was digested with StyI and Nsp1 for 2 hours at37°C. The digested DNA was purified and ligated with primer/adaptors at 16°C for 12 to 16 hours. Amplicons were gener-ated by performing PCR using primers provided by the man-ufacturer (Affymetrix, Santa Clara, CA) on the ligation productsusing the following program: 94°C for 3 minutes and then 35cycles of 94°C for 30 seconds, 60°C for 45 seconds, and 65°C
Table 2. Clinical and Pathological Characteristics of ProstateTissues Adjacent to Tumor
Relapse statusNone
(n � 28)
LongPSADT
(n � 13)
ShortPSADT(n � 8)
Mean age (P � 0.554) 55 57.69 56.06Cancer stage (P � 0.541)
pT1 3 (6.1) 0 (0) 0 (0)pT2 11 (22.4) 4 (8.2) 3 (6.1)pT3a 7 (14.3) 6 (12.2) 1 (2.0)pT3b 7 (14.3) 3 (6.1) 4 (8.2)
Gleason grade (P � 0.9849)5 1 (2.0) 0 (0) 0 (0)6 7 (14.3) 3 (6.1) 2 (4.1)7 16 (32.7) 7 (14.3) 5 (10.2)8–10 4 (8.2) 3 (6.1) 1 (2.0)
Race (P � 0.08387)Black 0 1 0Unknown 6 0 0White 22 12 8
Median follow-up (months) 155 149 29.205Median time to progression
(months)NA 54.6 3.09
Median PSADT (months) NA 26.9 2.46Mean preoperative PSA
(P � 0.074)8.23 12.98 6.3
Data are given as number (percentage) of the 49 samples unless
otherwise indicated.NA, not applicable.

2242 Yu et alAJP June 2012, Vol. 180, No. 6
for 1 minute. This was followed by extension at 68°C for 7minutes. The PCR products were then purified and digestedwith DNaseI for 35 minutes at 37°C to fragment the amplifiedDNA. The fragmented DNA was then labeled with biotinylatednucleotide through terminal deoxynucleotide transferase for 4hours at 37°C. Fragmented DNA, 250 �g, was hybridized witha pre-equilibrated Affymetrix SNP 6.0 chip at 50°C for 18hours. Procedures of washing and scanning of SNP 6.0 chipsfollowed the manuals provided by Affymetrix.
SYBR Green Real-Time qPCR
A LightCycler FastStart DNA Master SYBR Green I Kit(Hoffman-La Roche, Inc., Nutley, NJ) was used forreal-time PCR amplification. The reaction was per-formed in a MasterCycler Realplex (Eppendorf, Haup-pauge, NY). A quantitation standard curve of normalmale DNA, from 50,000 to 500,000 copies of genome,was generated using known amounts of template cop-ies. Genomic DNA, 20 ng, was used for all of theexperimental and control samples. TaqDNA polymer-ase was activated with a 2-minute pre-incubation stepat 94°C. Amplification of the following primers wasperformed: ARL17B, 5=-ACTGTCATAGCAGTGCTGA-GG-3= and 5=-ACTTACCTACTGTAGGGACGG-3=; SCAPER,5=-AGGAAGGCCTATTCGTTCTCG-3= and 5=-GAACAG-TATGGGAGGAGTTCG-3=; WWOX, 5=-GCCAGTTGATGTGA-CAACTGC-3= and 5=-CAGCTGAGAGTGGTTTCTTTGC-3=;EPHA3, 5=-ATCAGGACTTACCAGGTGTGC-3= and 5=-ACC-GTGTCTGGAAACATAGCC-3=; and ERBB4, 5=-AGTGGCCT-GTCCTTGCTTATC-3= and 5=-CAGAGCAACAATTCTGAC-CGG-3=. There were 35 cycles of the following program: 94°Cfor 30 seconds, 62°C for 30 seconds, and 68°C for 3 minutes.
Table 3. Clinical and Pathological Characteristics of BloodSamples from Patients with Prostate Cancer
Relapse statusNone
(n � 18)
LongPSADT
(n � 35)
ShortPSADT
(n � 31)
Mean age (P � 0.268) 58.33 59.43 56.77Cancer stage (P � 0.003893)
pT1 5 (6.0) 1 (1.2) 0 (0)pT2 6 (7.1) 12 (14.3) 6 (7.1)pT3a 1 (1.2) 10 (11.9) 5 (6.0)pT3b 6 (7.1) 12 (14.3) 20 (23.8)
Gleason grade (P � 0.2248)6 5 (6.0) 8 (9.5) 3 (3.6)7 7 (8.3) 21 (25.0) 18 (21.4)8–10 6 (7.1) 6 (7.1) 10 (11.9)
Race (P � 0.08387)Black 0 1 0Unknown 3 1 2White 15 33 29
Median follow-up (months) 152 109.14 54.8Median time to progression
(months)NA 47.27 3.23
Median PSADT (months) NA 26 3.21Mean preoperative PSA
(P � 0.868)10.48 12.17 10.87
Data are given as number (percentage) of the 84 samples unlessotherwise indicated.
NA, not applicable.
Realplex data software (Eppendorf, Inc., Hauppauge, NY) was
used to quantify and fit the data with a standard curve. Aseparate �-actin (5=-TCTTTGCACTTTCTGCATGTCCCC-3=and 5=-GTCCATCACGATGCCAGTGGTAC-3=) DNA quantifi-cation was also performed as an internal control for eachanalysis.
Statistical Analysis
A total of 241 cel files were analyzed with Genotyping con-sole (Affymetrix) for quality control analysis. Samples with aquality control call of �80% and a quality control contrastratio of �0.4 were admitted into the analysis. To analyzeCNV, cel files were imported into Partek Genome Suite 6.6(Partek, Inc., St. Louis, MO) to generate copy number fromraw intensity. To plot the histograms, deletion or amplifica-tion of genomes was analyzed by first limiting to the regionswith P � 0.05/total number of regions detected (ie, thefamilywise error rate is controlled using Bonferroni’s correc-tion).12 The selected regions were subsequently filtered bylimiting to the regions with at least 100 markers and 10 kb.The regions were then mapped to known genes. The fre-quencies of amplification and deletions were plotted to thegenome corresponding to the gene locations.
Prediction Analysis and ROC Curve
The following prediction analysis for the comparison ofnonrelapse versus fast relapse plus slow relapse andnonrelapse plus slow relapse versus fast relapse wasperformed. A test sample was first left out from predictionmodel construction. The remaining samples were usedas the training set. Loci with more than r% amplification orr% deletion in the case group but no locus aberration inthe control group were selected as predictive loci. Topredict the left-out test sample, the percentage of locusaberration (amplification or deletion) among the identifiedpredictive loci was calculated. The test sample was pre-dicted as a case if the percentage of aberration is greaterthan p% threshold, and control otherwise. The leave-one-out cross validation was repeated until each sample wasleft out and predicted. In this prediction scheme, r is aparameter that determines the number of predictive lociused in the model. For a given r, the threshold p% wasvaried to locus rate an receiver operating characteristic(ROC) curve with sensitivity/specificity trade-off. We se-lected r that produced the best area under the curve(AUC).13 To report the best sensitivity and specificitytrade-off and overall accuracy rate, we chose the thresh-old p% such that the Youden index (sensitivity � speci-ficity � 1) is maximized. This criterion gave equal impor-tance to sensitivity and specificity. To further evaluatewhether the prediction result is better than obtained byrandom, AUC was used as a test statistic, and permuta-tion analysis was performed to assess the statistical sig-nificance. Specifically, class labels (case and control)were randomly shuffled and AUC calculation was per-formed. Such permutations were repeated for 1000 timesto generate the null distribution. The P value was calcu-lated as the percentage that the 1000 null AUCs frompermutation are greater than the observed AUC. The
genes that are overlapped with the loci used in the test and
Benign and Cancer CNVs Predict Outcomes 2243AJP June 2012, Vol. 180, No. 6
the frequency of use are listed in Supplemental Tables S2through S5 (available at http://ajp.amjpathol.org). For Glea-son score prediction, the ROC curve was generated byvarying the Gleason score threshold. AUC and its associ-ated P value were similarly calculated. For CNV size pre-diction, CNV was limited to �2 kb, P � 0.001, and �10markers. The ROC curve was generated by varying sizes ofCNV threshold. AUC and its associated P value were sim-ilarly calculated.
Prediction Analysis for Blood versus Tumor
To predict blood versus tumor, the total number of aberra-tions in each sample was counted instead of the predictivelocus selection previously described. The ROC curve, AUC,and the associated P value were similarly generated.
Results
The SNP 6.0 chip hybridization results were analyzed usingPartek Genome Suite 6.6, with blood samples as normalreferences. As shown in the histograms of Figure 1A, ab-normalities of genome in copy number can be found in allchromosomes in prostate cancer. An average of 91.6 loci(minimum, 10 kb) per sample involving 1092 genes were
A
eque
ncy
Fre
1 2 3 4 5 6 7 8
Chrom
B CT
7000
6000
5000
4000
3000
2000
1000
B AT T0
Figure 1. Deletion and amplification of segments of genomes in blood,amplification (red) of blood (B), AT, and tumor (T) in 23 pairs of human chromin blood and AT samples are indicated. C: Venn diagram of deleted or amplifie
D: The spectrum of genes that are amplified or deleted in blood, AT, and tumors th15 months of radical prostatectomy (Tslow), and tumors that relapsed and had a PSAidentified as either amplified or deleted in prostate can-cer genomes, as determined by �100 markers (P �5.5 � 10�9; Bonferroni correction, Figure 1B). Deletionsof large segments, more than three megabases, of chro-mosomes 8p, 13p, 16q, and 17p occurred with highfrequencies, whereas amplification of 8q and X chromo-somes occurred in a subset of prostate cancer samples.Similar amplification and deletion of the same regionsalso occurred in benign prostate tissues adjacent to can-cer, albeit with smaller sizes and a lower frequency. Theblood of patients with prostate cancer contains signifi-cant CNVs in genomes (1329 genes total, or 4.4 loci and32.6 genes/sample). Most of these CNVs are not uniqueand are overlapped with those of prostate cancer sam-ples (Figure 1C). Prostate cancers were then subdividedbased on clinical behavior: those with no relapse after pros-tatectomy, those with a relapse and a slow increase inserum PSA level (doubling in �15 months), and those witha relapse and a rapid increase in serum PSA level (doublingin �4 months). The kinetics of PSA increase after prosta-tectomy are predictive of prostate cancer-specific death,with rapid increases highly associated with lethal prostatecancer.14 The spectrum of CNVs increases from blood toprostate cancer in an incremental manner: the least in bloodto the most in rapidly progressive prostate cancer (doublingin �4 months) (Figure 1D).
B
AT
T
11 12 13 14 15 16 17 18 19202122X Y
e
AT
15000
20000
25000
er o
f Loc
i
D
0
5000
10000
B AT Tnone Tslow Tfast
Num
be
d prostate cancer samples. A: Histograms of genome deletion (blue) ors. B: Box plot of number of genes overlapping with CNV per sample. Outliersoccurring in at least one sample overlapping between blood, AT, and tumor.
9 10
osom
BB
AT, anosomed genes
at did not relapse (Tnone), tumors that relapsed and had a PSADT at or afterDT within 4 months of radical prostatectomy (Tfast).

2244 Yu et alAJP June 2012, Vol. 180, No. 6
To assess the reproducibility of these analyses, a largeset of reference normal samples (n � 800) available tothe public through Partek, Inc., was used. This re-analy-sis showed that genome segment CNVs of blood, AT,and tumor overlapped by at least 93% between these twoanalyses (see Supplemental Figure S1A at http://ajp.amjpathol.org). In addition, a third analysis using a differ-ent set of normal samples (GeneSpring GX11, n � 265)was performed, showing that 94% to 99% of the amplifiedor deleted genome segments from blood, AT, and tumoroverlap with those obtained from Partek Genome Suiteanalyses using blood as baseline (see Supplemental Fig-ure S1A at http://ajp.amjpathol.org). Affymetrix SNP 6.0contains separate probe sets for SNP and CNV detection.Most large genome deletions are accompanied by loss ofheterozygosity (LOH). Profiles of LOH for blood, AT, andtumor samples were generated to validate the deletionsdetected by CNV analysis. Genome deletion frequentlyaccompanied LOH (91% to 98%), with average matchesfor blood, AT, and tumor ranging from 93% to 96% (seeSupplemental Figure S1B at http://ajp.amjpathol.org). Thissuggests that the analyses are reproducible and robust.
Five loci from chromosomes 2, 3, and 15 through 17,with deletions of at least 10 kb and overlap with nearbygenes, were selected for quantitative PCR (qPCR) anal-ysis. As shown in Supplemental Figure S1C (available athttp://ajp.amjpathol.org), a deletion by qPCR was found infour of five samples predicted to have a deletion in theregion overlapping with ARL17B, a gene homologous toADP-ribosylation factor located at 17q21.15 Similar con-firmation was found in qPCR of SCAPER, the S-phasecyclin A–associated protein in the endoplasmic reticulumlocated at 15q2416 (five of five samples); of WWOX, WWdomain containing oxidoreductase located at 16q2317–19
(five of five samples); of EPHA3 or ephrin receptor 3, aprotein tyrosine receptor frequently mutated in a variety
0.2-
0.0-
-0.2-
A
-0.4-
0.2-
0.0-
-0.2-
0 4Freq
uenc
y
-0.4-
0.2-
0.0-
-0.2-
-0.4-
F
1 2 3 4 5 6 7 8 9 10 11 12 13 14 1
Chromosome
CB
1
.0
8
1.0
100.0<p300.0=p
0.2
0.4
0
.6
0
.8
Sens
i�vi
ty
0.
2
0.4
0.6
0.8
Sens
i�vi
ty
TT
0.0
0.0
0.0 0.2 0.
0.0 0.2 0.4 0.6 0.8 1.01-Specificity 1-Specificity
of human cancers20–22 (four of five samples); and ofERBB4 or v-erb-a erythroblastic leukemia viral oncogenehomolog 423,24 (five of five samples) in blood samplesfrom patients with prostate cancer. The concordance rateof qPCR and copy number analysis was 92%. Our anal-ysis indicates that CNV is not limited to prostate cancer orbenign prostate tissue adjacent to cancer but is alsofound in blood from patients with prostate cancer.
To investigate whether the CNV profiles of blood, AT,and tumor are distinct from each other, classificationanalysis was performed to predict genomes of bloodversus those of prostate cancer, by aggregating genomeloci that have differential amplification or deletion propor-tion between blood and prostate cancer (see Materialsand Methods for more detail). The prediction accuracyunder unbiased leave-one-out cross validation25 was89% (76/85) for blood and 94% (98/104) for prostatecancer. The overall accuracy was 92% (174/189; seeSupplemental Figure S1D at http://ajp.amjpathol.org). Toinvestigate whether AT is genetically more related to canceror normal tissues, the CNV profiles of blood and tumorsamples were constructed into a logistic regression modelas normal and prostate cancer training sets, respectively.This model was then used to classify each of the 49 ATsamples as either normal or prostate cancer. Such analysispredicts 42 (86%) of 49 benign prostate tissue as cancer,whereas only seven AT tissues were classified as normal.All prostate cancer cell lines were classified as cancer.These analyses clearly indicate that most AT samples havecopy number profiles similar to those of prostate cancer,rather than those of normal, resembling a field effect simi-larly found for gene expression profiling.26
Most prostate cancers are not lethal.27 Prediction analy-sis with leave-one-out cross validation, based on loci thathave a significant proportion of amplification or deletion inthe group of relapse but none in the nonrelapsed group,
Tnone
Tslow
Tfast
8 19202122X Y
0.8 1.0
Figure 2. Genome copy variation in prostatecancer predicts relapse. A: Histograms of ge-nome deletion (blue) or amplification (red) oftumors that did not relapse (Tnone), tumors thatrelapsed and had a PSADT at or after 15 monthsof radical prostatectomy (Tslow), and tumors thatrelapsed and had a PSADT within 4 months ofradical prostatectomy (Tfast) in 23 pairs of hu-man chromosomes. B: ROC curves of predictingprostate cancer relapse. The prostate cancer wasseparated into a group that relapsed within 5years of prostatectomy (n � 75) and a group thatdid not relapse (n � 27). Prediction using genedeletions or amplifications unique to the relaps-ing group, generated through leave-one-outanalysis, was performed to produce the ROCchart. C: ROC curves of predicting prostate can-cer short PSADT. The prostate cancer was sep-arated into a group that had a PSADT within 4months of prostatectomy (n � 33) and a groupthat did not (n � 69). Prediction using genedeletions or amplifications unique to the fast-relapsing group, generated through leave-one-out analysis, was performed to produce the ROCchart. Dotted line, random prediction baseline;broken line, prediction generated from Gleasongrading.
5 16 17 1
4 0.6

Benign and Cancer CNVs Predict Outcomes 2245AJP June 2012, Vol. 180, No. 6
was performed. The resulting ROC curves were generatedby varying sensitivity-specificity trade-off (Figure 2, A and B).The cutoff that generates the best Youden index (ie, sensi-tivity � specificity � 1) has an accuracy of 73% (74/102;ROC P � 0.003), a positive prediction of 76% (57/75), anda negative prediction of 63% (17/27) for relapse prediction.Gleason grading has been a strong predictor of recurrence;however, in this analysis, it was statistically insignificant frombaseline (ROC P � 0.32) and much worse than CNV anal-ysis. When stratifying CNV prediction rate on each Gleasoncategory, it appears that CNV prediction for relapse is sta-tistically significant at Gleason grade 7 (Table 4, Fisher’sexact test P � 0.002).
Prostate cancers with rapid progression, as defined byrates of PSA increase, are lethal.14,28 Those with a PSADT of�4 months after relapse and those who died of prostate
A
ncy
Freq
ue
1 2 3 4 5 6 7 8 9 10 11 12 13 14 15 16 17 18 192021B
eque
ncy
1 2 3 4 5 6 7 8 9 10 11 12 13 14 15 16 17 18192021
Fre
0.4
0
.6
0
.8
1.
0
ensi
�vi
ty
DC
4
0.6
0.8
1.0
ensi
�vi
ty p=0.015p=0.041
ATAT
0.0
0
.2
0Se
0.0
0
.2
0.
4
Se
Table 4. Prediction of Relapse or Short PSADT of ProstateCancer by CNV in Each Gleason Grade
Gleason gradeCorrect for
relapse statusCorrect for
short PSADT status
6 70.6 (12/17) 88.2 (15/17)7 75.8 (47/62)* 71.0 (44/62)*8 76.9 (10/13) 84.6 (11/13)9 42.9 (3/7) 71.4 (5/7)
10 66.7 (2/3) 33.3 (1/3)
Data are given as percentage (number/total). The analysis excludedsamples that did not have clinical follow-up.
*P � 0.01.
0.0 0.2 0.4 0.6 0.8 1.0
1-Specificity0.0 0.2 0.4 0.6 0.8 1.0
1-Specificity
cancer were compared with those with PSADT of �15months or having no relapse. A similar prediction with leave-one-out cross-validation analysis was performed to exam-ine the accuracy of CNV profiling in predicting rapidly pro-gressing prostate cancer. As shown in Figure 2C, theaccuracy of predicting rapid progression was 75% (P �0.001), with positive and negative predictive values of 58%and 83%, respectively. In contrast, the histological charac-teristics of the cancer, as defined by Gleason grading,failed to achieve �50% predictive values simultaneously onpositive and negative predictions (ROC P � 0.074). Whenstratifying the CNV prediction rate on each Gleason cate-gory, it appears that CNV prediction is statistically signifi-cant at Gleason grade 7 (Table 4, P � 0.007) and combinedGleason grades 8 through 10 (P � 0.042).
Because the genome alterations in AT are most similarto those of tumor, the CNV of AT to predict relapse wasexamined using cross validation. As shown in Figure 3, Aand C, the CNV profile of AT is moderately predictive ofprostate cancer relapse: sensitivity of 76% and specificityof 56% (ROC P � 0.041). Surprisingly, the CNV profile ofAT is more accurate in predicting short PSADT (88%sensitivity and 75% specificity, P � 0.015; Figure 3, B andD). By using the same approach, the CNV profiles fromblood failed to generate an ROC statistically differentfrom baseline in predicting relapse or short PSADT. How-ever, our analysis showed that the average and mediansizes of CNV are significantly larger in blood samples (70and 23 kb, respectively) from patients with relapse than
AT no relapse
AT relapseAT relapse
AT no relapse or AT PSADT>15 months
AT PSADT<4 months
Figure 3. Genome copy variation in benignprostate tissues adjacent to cancer predicts pros-tate cancer relapse. A: Histograms of genomedeletion (blue) or amplification (red) of AT norelapse, AT relapse, AT not short PSADT, and ATshort PSADT in 23 pairs of human chromo-somes. B: ROC curves of AT predicting prostatecancer relapse. The AT samples were separatedinto a group that relapsed within 5 years ofprostatectomy (n � 21) and a group that did notrelapse (n � 28). Prediction using gene dele-tions or amplifications unique to the relapsinggroup, generated through leave-one-out analy-sis, was performed to produce the ROC chart.ROC curves of AT predicting prostate cancershort PSADT (C and D). The AT samples wereseparated into a group that had PSADT within 4months of prostatectomy (n � 8) and a groupthat did not (n � 41). Prediction using genedeletions or amplifications unique to the fast-relapsing group, generated through leave-one-out analysis, was performed to produce the ROCchart. Dotted line, random prediction baseline.
22X Y
22X Y

s perfor
2246 Yu et alAJP June 2012, Vol. 180, No. 6
those without relapse (40 and 17 kb, respectively). Basedon the sizes of CNV, highly statistically significant ROCswere generated (Figure 4, A and B), predicting 81%(P � 0.001) relapse and 69% (P � 0.001) short PSADT cor-rectly through median CNV sizes. The CNV size correla-tion with relapse was also found in tumor (817-kb meanand 647-kb median for relapse versus 385-kb mean and185-kb median for nonrelapse) and AT (246-kb mean and18-kb median for relapse versus 95-kb mean and 16-kbmedian for nonrelapse) samples, suggesting that a largerCNV size is a common feature for prostate cancer re-lapse regardless of tissues. Both median and mean sizesof CNV from tumor and blood, and mean size of CNV fromAT, predict prostate cancer relapse, whereas mean andmedian sizes of CNV from tumor and blood predict shortPSADT (Figure 4, C and D; see also Supplemental FigureS2, A–D, and Supplemental Figure S3, A and B, at http://ajp.amjpathol.org). Interestingly, similar relapse predic-tion results were also replicated using the sizes of eitheramplified or deleted loci of blood (see Supplemental Fig-ure S4, A–D, and Supplemental Figure S5, A–D, at http://ajp.amjpathol.org). To exclude aging being a factor in ouranalysis, correlation analyses between our gene-specificor size-based model and the patient age were per-formed; these analyses revealed no significant correla-tion between age and our prediction methods. Age didnot predict relapse or short PSADT (see SupplementalFigure S6, A and B, at http://ajp.amjpathol.org).
To investigate the reproducibility of our predictionmodels, we collected an additional 25 samples, including10 tumors, 10 benign tissues adjacent to tumors, and 5blood samples from patients with prostate cancer. Theseexperiments and analyses were performed in a separatetime period and by different personnel. By using a gene-specific model, we correctly predicted 7 of 10 relapseand 8 of 10 short PSADT from tumor samples, whereaswe correctly predicted 7 of 10 for both relapse and shortPSADT from AT samples. By using mean size of CNVfrom tumor, we correctly predicted 7 of 10 cases of bothrelapse and short PSADT, 7 of 10 for relapse from AT,
.8
1.0
0.8
1.0
p < p100.0 = 0.001A B4
0.6
0.
nsi�
vity
0.4
0.6
0
ensi
�vi
ty
BloodBlood
0
0
.2
0.Se
.0
0
.2
0Se
0.0 0.2 0.4 0.6 0.8 1.01-Specificity
0.0
0.0 0.2 0.4 0.6 0.8 1-Specificity
0Figure 4. Median size variation of CNV of blood and tumor samples predicblood samples predicting prostate cancer relapse. The blood samples were semodel are 86% (57/66) sensitivity and 61% (11/18) specificity. B: ROC curvesamples were separated into a group that had PSADT within 4 months of profor CNV median size of blood model are 68% (21/31) sensitivity and 70% (3sizes of CNV from tumor samples. The prostate cancer was separated into anot relapse (n � 27). The optimal prediction rates for CNV median size of tof predicting prostate cancer short PSADT using CNV median sizes from tum4 months of prostatectomy (n � 33) and a group that did not (n � 69). The opand 90% (62/69) specificity. Prediction using various CNV median sizes wabroken line, prediction generated from Gleason grading.
and 4 of 5 for relapse and 4 of 5 for short PSADT from
blood. By using median size of CNV from tumors, wecorrectly predicted 6 of 10 for relapse and 7 of 10 forshort PSADT, whereas from blood, we correctly predicted5 of 5 for relapse and 4 of 5 for short PSADT. Takentogether, the gene-specific CNV model has an overallprediction rate of 72.5% in the replication data set (seeSupplemental Table S6 at http://ajp.amjpathol.org), simi-lar to those found in the first set of data. The mean CNVsizes of blood, tumor, and benign prostate tissues havean overall prediction rate of 72% for relapse, and themean CNV sizes of blood and tumor samples have anoverall prediction rate of 73% for short PSADT, whereasthe median CNV sizes of blood and tumor have overallprediction rates of 73% for relapse and 80% for shortPSADT (see Supplemental Table S6 at http://ajp.amjpathol.org). These results are also similar to those found in theoriginal study, reflecting good consistency and reproduc-ibility of our prediction models.
Discussion
Genome-wide analyses of prostate cancer and matchedtissues using other methods were previously per-formed.29–34 However, there was no attempt to constructa model to predict the prognosis of prostate cancer.Although a tiny amount (�0.1% of the blood cell popula-tion) of circulating tumor cells may exist in the bloodsample,35,36 the stringency of CNV analysis (�30% con-tamination to be detected) excluded contamination oftumor cells in the blood as a contending interpretation forCNV in the blood. Similarly, the similarity of AT and tumorsamples in CNV profiling is unlikely because of the smallamount of contaminated tumor cells in normal tissues; itwill be well beyond the sensitivity of CNV analysis. Ananalysis of some of the previously published matchednormal samples of other malignancies37,38 also revealssignificant CNV. This suggests that CNV is widely presentin tissues of patients carrying malignancies. However, itis unclear whether healthy individuals carry these CNVs.
1
.0
1
.0Dp< <p100.0 0.001
0.
6
0
.8
0
.6
0
.8
tivi
ty
Tumor Tumor
0.2
0.
4
0.
2
0
.4
Sens
it
0.0 0.2 0.4 0.6 0.8 1.01-Specificity
0.0
0.0 0.2 0.4 0.6 0.8 1.01-Specificity
0.0
ate cancer relapse and short PSADT. A: ROC curves of CNV median size ofas described in A. The optimal prediction rates for CNV median size of bloodV median size of blood predicting prostate cancer short PSADT. The bloodmy (n � 31) and a group that did not (n � 53). The optimal prediction ratesecificity. C: ROC curves of predicting prostate cancer relapse using medianhat relapsed within 5 years of prostatectomy (n � 75) and a group that didodel are 71% (53/75) sensitivity and 89% (24/27) specificity. D: ROC curvesles. The prostate cancer was separated into a group that had PSADT within
ediction rates for CNV median size of tumor model are 61% (20/33) sensitivitymed to produce the ROC charts. Dotted line, random prediction baseline;
1.0
C
tivi
tySe
nsit
ts prostparateds of CNstatecto7/53) spgroup t
umor mor samptimal pr
The CNV of blood may be somatic and acquired through

Benign and Cancer CNVs Predict Outcomes 2247AJP June 2012, Vol. 180, No. 6
aging; this alteration would tend to be random and spon-taneous. Alternatively, genome copy number abnormali-ties may occur at the germ-line level. To distinguish thesetwo possibilities, longitudinal blood samples of the sameaging individual could identify if CNV is accumulated.Independent of the mechanism, however, genome CNVcorrelates with the eventual behavior of prostate cancer:This is observed in the primary prostate cancer, in thehistologically normal tissue from a prostate gland con-taining cancer, and in the blood of a patient with prostatecancer.
Conceivably, CNV analysis offers a better option thanGleason grading in predicting the behavior of prostatecancer because of a better prediction rate on the tumorsamples and its applicability to nontumor tissues. Thereare several salient potentials for clinical application usingthe CNV tests. For a patient being diagnosed as havingprostate cancer, CNV analysis performed on the blood orperhaps other normal tissues from the patient would elim-inate the need for an additional invasive procedure todecide a treatment mode. For a patient already undergo-ing a radical prostatectomy, the CNV analysis on a tumoror blood sample may help to decide whether additionaltreatment is warranted to prevent relapse. When the mor-phological characteristics become indeterminate in a bi-opsy sample, the gene-specific CNV field effect in benignprostate tissues may help to obtain a firmer diagnosis.The main limitation of the genome CNV analysis for aclinical test is its requirement of high-quality genomeDNA. Formalin-fixed, paraffin-embedded tissues may notbe suitable. When gene-specific CNV prediction is per-formed, a training set containing samples with knownoutcome is required for the prediction (there is no needfor a training set when the size of CNV analysis is per-formed). Despite these limitations, CNV analysis on thegenome of blood, normal prostate, or tumor tissues of thepatients with prostate cancer holds promise to become amore efficient and accurate way to predict the behavior ofprostate cancer.
Acknowledgments
We thank Jeffrey Romoff for his constructive commentsand support for the project and Chia-Yueh Yen for hertechnical support.
References
1. Jemal A, Siegel R, Ward E, Hao Y, Xu J, Murray T, Thun MJ: Cancerstatistics, 2008. CA Cancer J Clin 2008, 58:71–96
2. Jemal A, Siegel R, Ward E, Hao Y, Xu J, Thun MJ: Cancer statistics,2009. CA Cancer J Clin 2009, 59:225–249
3. Jemal A, Siegel R, Xu J, Ward E: Cancer statistics, 2010. CA CancerJ Clin 2011, 60:277–300
4. Andriole GL, Crawford ED, Grubb RL 3rd, Buys SS, Chia D, ChurchTR, Fouad MN, Gelmann EP, Kvale PA, Reding DJ, Weissfeld JL,Yokochi LA, O’Brien B, Clapp JD, Rathmell JM, Riley TL, Hayes RB,Kramer BS, Izmirlian G, Miller AB, Pinsky PF, Prorok PC, Gohagan JK,Berg CD: Mortality results from a randomized prostate-cancerscreening trial. N Engl J Med 2009, 360:1310–1319
5. Schroder FH, Hugosson J, Roobol MJ, Tammela TL, Ciatto S, Nelen V,Kwiatkowski M, Lujan M, Lilja H, Zappa M, Denis LJ, Recker F,
Berenguer A, Maattanen L, Bangma CH, Aus G, Villers A, Rebillard X,van der Kwast T, Blijenberg BG, Moss SM, de Koning HJ, Auvinen A:Screening and prostate-cancer mortality in a randomized Europeanstudy. N Engl J Med 2009, 360:1320–1328
6. Pang ST, Weng WH, Flores-Morales A, Johansson B, Pourian MR,Nilsson P, Pousette A, Larsson C, Norstedt G: Cytogenetic and ex-pression profiles associated with transformation to androgen-resis-tant prostate cancer. Prostate 2006, 66:157–172
7. Matsui S, LaDuca J, Rossi MR, Nowak NJ, Cowell JK: Molecularcharacterization of a consistent 4.5-megabase deletion at 4q28 inprostate cancer cells. Cancer Genet Cytogenet 2005, 159:18–26
8. Bettendorf O, Schmidt H, Eltze E, Gockel I, Semjonow A, Burger H,Bocker W, Brandt B: Cytogenetic changes and loss of heterozygosityin atypical adenomatous hyperplasia, in carcinoma of the prostateand in non-neoplastic prostate tissue using comparative genomichybridization and multiplex-PCR. Int J Oncol 2005, 26:267–274
9. Teixeira MR, Ribeiro FR, Eknaes M, Waehre H, Stenwig AE, GierckskyKE, Heim S, Lothe RA: Genomic analysis of prostate carcinomaspecimens obtained via ultrasound-guided needle biopsy may be ofuse in preoperative decision-making. Cancer 2004, 101:1786–1793
10. Macoska JA, Paris P, Collins C, Andaya A, Beheshti B, Chaib H, KantR, Begley L, MacDonald JW, Squire JA: Evolution of 8p loss intransformed human prostate epithelial cells. Cancer Genet Cytogenet2004, 154:36–43
11. Kraus J, Pantel K, Pinkel D, Albertson DG, Speicher MR: High-resolution genomic profiling of occult micrometastatic tumor cells.Genes Chromosomes Cancer 2003, 36:159–166
12. Strassburger K, Bretz F: Compatible simultaneous lower confidencebounds for the Holm procedure and other Bonferroni-based closedtests. Stat Med 2008, 27:4914–4927
13. Hanczar B, Hua J, Sima C, Weinstein J, Bittner M, Dougherty ER:Small-sample precision of ROC-related estimates. Bioinformatics2010, 26:822–830
14. Hanks GE, Hanlon AL, Lee WR, Slivjak A, Schultheiss TE: Pretreat-ment prostate-specific antigen doubling times: clinical utility of thispredictor of prostate cancer behavior. Int J Radiat Oncol Biol Phys1996, 34:549–553
15. Strausberg RL, Feingold EA, Grouse LH, Derge JG, Klausner RD,Collins FS, et al: Generation and initial analysis of more than 15,000full-length human and mouse cDNA sequences. Proc Natl Acad SciU S A 2002, 99:16899–16903
16. Tsang WY, Wang L, Chen Z, Sanchez I, Dynlacht BD: SCAPER, anovel cyclin A-interacting protein that regulates cell cycle progres-sion. J Cell Biol 2007, 178:621–633
17. Yang J, Cogdell D, Yang D, Hu L, Li H, Zheng H, Du X, Pang Y, TrentJ, Chen K, Zhang W: Deletion of the WWOX gene and frequent lossof its protein expression in human osteosarcoma. Cancer Lett 2010,291:31–38
18. Nunez MI, Rosen DG, Ludes-Meyers JH, Abba MC, Kil H, Page R,Klein-Szanto AJ, Godwin AK, Liu J, Mills GB, Aldaz CM: WWOXprotein expression varies among ovarian carcinoma histotypes andcorrelates with less favorable outcome. BMC Cancer 2005, 5:64
19. Yakicier MC, Legoix P, Vaury C, Gressin L, Tubacher E, Capron F,Bayer J, Degott C, Balabaud C, Zucman-Rossi J: Identification ofhomozygous deletions at chromosome 16q23 in aflatoxin B1 exposedhepatocellular carcinoma. Oncogene 2001, 20:5232–5238
20. Blackford A, Parmigiani G, Kensler TW, Wolfgang C, Jones S, ZhangX, Parsons DW, Lin JC, Leary RJ, Eshleman JR, Goggins M, JaffeeEM, Iacobuzio-Donahue CA, Maitra A, Klein A, Cameron JL, Olino K,Schulick R, Winter J, Vogelstein B, Velculescu VE, Kinzler KW,Hruban RH: Genetic mutations associated with cigarette smoking inpancreatic cancer. Cancer Res 2009, 69:3681–3688
21. Clifford N, Smith LM, Powell J, Gattenlohner S, Marx A, O’Connor R:The EphA3 receptor is expressed in a subset of rhabdomyosarcomacell lines and suppresses cell adhesion and migration. J CellBiochem 2008, 105:1250–1259
22. Bae HJ, Song JH, Noh JH, Kim JK, Jung KH, Eun JW, Xie HJ, Ryu JC,Ahn YM, Kim SY, Lee SH, Yoo NJ, Lee JY, Park WS, Nam SW: Lowfrequency mutation of the Ephrin receptor A3 gene in hepatocellularcarcinoma. Neoplasma 2009, 56:331–334
23. Koutras AK, Fountzilas G, Kalogeras KT, Starakis I, Iconomou G,Kalofonos HP: The upgraded role of HER3 and HER4 receptors in
breast cancer. Crit Rev Oncol Hematol 2010, 74:73–78
2248 Yu et alAJP June 2012, Vol. 180, No. 6
24. Lee SY, Kim MJ, Jin G, Yoo SS, Park JY, Choi JE, Jeon HS, Cho S, LeeEB, Cha SI, Park TI, Kim CH, Jung TH, Park JY: Somatic mutations inepidermal growth factor receptor signaling pathway genes in non-small cell lung cancers. J Thorac Oncol 2010, 5:1734–1740
25. Golub TR, Slonim DK, Tamayo P, Huard C, Gaasenbeek M, Mesirov JP,Coller H, Loh ML, Downing JR, Caligiuri MA, Bloomfield CD, Lander ES:Molecular classification of cancer: class discovery and class predictionby gene expression monitoring. Science 1999, 286:531–537
26. Yu YP, Landsittel D, Jing L, Nelson J, Ren B, Liu L, McDonald C,Thomas R, Dhir R, Finkelstein S, Michalopoulos G, Becich M, Luo JH:Gene expression alterations in prostate cancer predicting tumor ag-gression and preceding development of malignancy. J Clin Oncol2004, 22:2790–2799
27. Isaacs JT: Molecular markers for prostate cancer metastasis: devel-oping diagnostic methods for predicting the aggressiveness of pros-tate cancer. Am J Pathol 1997, 150:1511–1521
28. Stephenson AJ, Shariat SF, Zelefsky MJ, Kattan MW, Butler EB, TehBS, Klein EA, Kupelian PA, Roehrborn CG, Pistenmaa DA, PacholkeHD, Liauw SL, Katz MS, Leibel SA, Scardino PT, Slawin KM: Salvageradiotherapy for recurrent prostate cancer after radical prostatec-tomy. JAMA 2004, 291:1325–1332
29. Kim JH, Dhanasekaran SM, Mehra R, Tomlins SA, Gu W, Yu J,Kumar-Sinha C, Cao X, Dash A, Wang L, Ghosh D, Shedden K,Montie JE, Rubin MA, Pienta KJ, Shah RB, Chinnaiyan AM: Integrativeanalysis of genomic aberrations associated with prostate cancerprogression. Cancer Res 2007, 67:8229–8239
30. Zhao H, Kim Y, Wang P, Lapointe J, Tibshirani R, Pollack JR, BrooksJD: Genome-wide characterization of gene expression variations andDNA copy number changes in prostate cancer cell lines. Prostate2005, 63:187–197
31. Ren B, Yu G, Tseng GC, Cieply K, Gavel T, Nelson J, MichalopoulosG, Yu YP, Luo JH: MCM7 amplification and overexpression are as-
sociated with prostate cancer progression. Oncogene 2006, 25:1090–109832. Liu W, Laitinen S, Khan S, Vihinen M, Kowalski J, Yu G, Chen L, EwingCM, Eisenberger MA, Carducci MA, Nelson WG, YegnasubramanianS, Luo J, Wang Y, Xu J, Isaacs WB, Visakorpi T, Bova GS: Copynumber analysis indicates monoclonal origin of lethal metastaticprostate cancer. Nat Med 2009, 15:559–565
33. Taylor BS, Schultz N, Hieronymus H, Gopalan A, Xiao Y, Carver BS,Arora VK, Kaushik P, Cerami E, Reva B, Antipin Y, Mitsiades N,Landers T, Dolgalev I, Major JE, Wilson M, Socci ND, Lash AE, HeguyA, Eastham JA, Scher HI, Reuter VE, Scardino PT, Sander C, SawyersCL, Gerald WL: Integrative genomic profiling of human prostate can-cer. Cancer Cell 2010, 18:11–22
34. Penney KL, Pyne S, Schumacher FR, Sinnott JA, Mucci LA, Kraft PL,Ma J, Oh WK, Kurth T, Kantoff PW, Giovannucci EL, Stampfer MJ,Hunter DJ, Freedman ML: Genome-wide association study of pros-tate cancer mortality. Cancer Epidemiol Biomarkers Prev 2010, 19:2869–2876
35. Cristofanilli M, Budd GT, Ellis MJ, Stopeck A, Matera J, Miller MC,Reuben JM, Doyle GV, Allard WJ, Terstappen LW, Hayes DF: Circu-lating tumor cells, disease progression, and survival in metastaticbreast cancer. N Engl J Med 2004, 351:781–791
36. Moreno JG, Croce CM, Fischer R, Monne M, Vihko P, Mulholland SG,Gomella LG: Detection of hematogenous micrometastasis in patientswith prostate cancer. Cancer Res 1992, 52:6110–6112
37. Green MR, Monti S, Rodig SJ, Juszczynski P, Currie T, O’Donnell E,Chapuy B, Takeyama K, Neuberg D, Golub TR, Kutok JL, Shipp MA:Integrative analysis reveals selective 9p24.1 amplification, increasedPD-1 ligand expression, and further induction via JAK2 in nodularsclerosing Hodgkin lymphoma and primary mediastinal large B-celllymphoma. Blood 2010, 116:3268–3277
38. Parkin B, Erba H, Ouillette P, Roulston D, Purkayastha A, Karp J,Talpaz M, Kujawski L, Shakhan S, Li C, Shedden K, Malek SN:Acquired genomic copy number aberrations and survival in adult
acute myelogenous leukemia. Blood 2010, 116:4958–4967Copyright © 2022 FDOKUMEN