Metabolic abnormalities in women who have had gestational ...
370
University of Wollongong University of Wollongong Research Online Research Online University of Wollongong Thesis Collection 1954-2016 University of Wollongong Thesis Collections 1996 Metabolic abnormalities in women who have had gestational diabetes Metabolic abnormalities in women who have had gestational diabetes mellitus (GDM) one year previously mellitus (GDM) one year previously Shahin Yarahmadi University of Wollongong Follow this and additional works at: https://ro.uow.edu.au/theses University of Wollongong University of Wollongong Copyright Warning Copyright Warning You may print or download ONE copy of this document for the purpose of your own research or study. The University does not authorise you to copy, communicate or otherwise make available electronically to any other person any copyright material contained on this site. You are reminded of the following: This work is copyright. Apart from any use permitted under the Copyright Act 1968, no part of this work may be reproduced by any process, nor may any other exclusive right be exercised, without the permission of the author. Copyright owners are entitled to take legal action against persons who infringe their copyright. A reproduction of material that is protected by copyright may be a copyright infringement. A court may impose penalties and award damages in relation to offences and infringements relating to copyright material. Higher penalties may apply, and higher damages may be awarded, for offences and infringements involving the conversion of material into digital or electronic form. Unless otherwise indicated, the views expressed in this thesis are those of the author and do not necessarily Unless otherwise indicated, the views expressed in this thesis are those of the author and do not necessarily represent the views of the University of Wollongong. represent the views of the University of Wollongong. Recommended Citation Recommended Citation Yarahmadi, Shahin, Metabolic abnormalities in women who have had gestational diabetes mellitus (GDM) one year previously, Doctor of Philosophy thesis, Medical Research Unit, University of Wollongong, 1996. https://ro.uow.edu.au/theses/1897 Research Online is the open access institutional repository for the University of Wollongong. For further information contact the UOW Library: [email protected]
-
Upload
khangminh22 -
Category
Documents
-
view
0 -
download
0
Transcript of Metabolic abnormalities in women who have had gestational ...

University of Wollongong University of Wollongong
Research Online Research Online
University of Wollongong Thesis Collection 1954-2016 University of Wollongong Thesis Collections
1996
Metabolic abnormalities in women who have had gestational diabetes Metabolic abnormalities in women who have had gestational diabetes
mellitus (GDM) one year previously mellitus (GDM) one year previously
Shahin Yarahmadi University of Wollongong
Follow this and additional works at: https://ro.uow.edu.au/theses
University of Wollongong University of Wollongong
Copyright Warning Copyright Warning
You may print or download ONE copy of this document for the purpose of your own research or study. The University
does not authorise you to copy, communicate or otherwise make available electronically to any other person any
copyright material contained on this site.
You are reminded of the following: This work is copyright. Apart from any use permitted under the Copyright Act
1968, no part of this work may be reproduced by any process, nor may any other exclusive right be exercised,
without the permission of the author. Copyright owners are entitled to take legal action against persons who infringe
their copyright. A reproduction of material that is protected by copyright may be a copyright infringement. A court
may impose penalties and award damages in relation to offences and infringements relating to copyright material.
Higher penalties may apply, and higher damages may be awarded, for offences and infringements involving the
conversion of material into digital or electronic form.
Unless otherwise indicated, the views expressed in this thesis are those of the author and do not necessarily Unless otherwise indicated, the views expressed in this thesis are those of the author and do not necessarily
represent the views of the University of Wollongong. represent the views of the University of Wollongong.
Recommended Citation Recommended Citation Yarahmadi, Shahin, Metabolic abnormalities in women who have had gestational diabetes mellitus (GDM) one year previously, Doctor of Philosophy thesis, Medical Research Unit, University of Wollongong, 1996. https://ro.uow.edu.au/theses/1897
Research Online is the open access institutional repository for the University of Wollongong. For further information contact the UOW Library: [email protected]
UNIVERSITY OF WOLLONGONG
MEDICAL RESEARCH UNIT
Metabolic abnormalities in women who have had gestational
diabetes mellitus (GDM) one year previously
Thesis submitted in fulfilment of the requirement
for the award of the degree of
Doctor of Philosophy
By:
Shahin Yarahmadi
(MD)
1996

&

Imam Mahdi, who will rise and make the world a paradise
My dear husband, Habib,
My lovely sons, Mohammad, Reza, and Saeed,
and my devoted parents.

A CKNO WLEDGMENT
The author would like to thank all those people and the organisation who have
supported her during the last few years. In particular, special thanks go to the
following:
Professor Dennis Calvert whose supervision, dedication and enthusiasm over the last
three and half years has been invaluable,
Dr Irene Kreis, from University of Wollongong, who provided additional advice and
encouragement in the writing of the thesis,
The Ministry of Health and Medical Education, Iran, who provided the scholarship to
continue her education towards the PhD degree in Australia,
Dr Mohammad taghi Iman, from University of Shiraz, Iran, for his effective statistical
advice,
Mrs Aliya Hussain Bukhari for her effective help and encouragement,
Mrs Roza Dimeska, who accompanied her in all tears and smiles during her study
period,
M rRajeev Daniel, who did Cobas work, for providing an excellent research assistance,
Miss Lina Baytieh and Mrs Wendy Braddock, who did anthropometry measurements,
for their excellent job,
Mrs Elaine Knight, the administrative officer at Medical Research Unit, University of
Wollongong, in checking the linguistic aspects of this thesis,
Her parents, husband, and children for their patience, understanding, and encouragement.
The author recall the dedicated efforts of her family and particularly her parents for their
devote over her life.
I

CONTENTS
ACKNOWLEDGMENT I
TABLE OF CONTENTS II
UST OF FIGURES VII
LIST OF TABLES VIII
ABBREVIATIONS X
SUMMARY XI
1. CHAPTER ONE
INTRODUCTION
1.1 Background 1
1.2 Etiology of Gestational Diabetes Mellitus 2
1.3 Pathogenesis of NIDDM 4
1.3.1 Impaired glucose tolerance 4
1.3.2 Insulin Resistance 5
1.4 The Cause of NIDDM Development 6
1.4.1 The Development of Insulin Resistance 7
1.4.2 The Development of Impaired Insulin Secretion 7
1.5 Significance of the Thesis 8
1.6 Aims of the Study 9
2. CHAPTER TWO
LITERATURE REVIEW
2.1 Introduction H
2.2 Gestational Diabetes Mellitus 12
2.2.1 Screening 13
2.2.2 Diagnostic Criteria 14
II

2.2.3 Medical Management 14
2.2.4 Diet Therapy 15
2.2.5 Exercise 16
2.2.6 Oral Hypoglycemic Agents 16
2.2.7 Insulin Therapy 16
2.3 Complications of GDM 17
2.4 Long-term Follow-up 18
2.5 Metabolic Changes in Normal Pregnancy and GDM 19
2.6 Metabolic Abnormalities in Women With Previous GDM 20
2.7 Lipid and Lipoprotein Metabolism 21
2.7.1 Endogenous and Exogenous Pathways of Lipoprotein Metabolism 21
2.7.2 Cholesterol 24
2.7.3 Triglyceride 24
2.7.4 Non-esterified Fatty Acids (NEFA) 26
2.7.5 VLDL 27
2.7.6 IDL 27
2.7.7 LDL 28
2.7.8 HDL 30
2.7.9 Lp(a) 31
2.7.10 CETP 32
2.7.11 Apolipoproteins A-I and B 33
2.8 Carbohydrate Metabolism 33
2.8.1 Factors Influencing Rates of Glucose Uptake 33
2.8.2 Insulin 34
2.8.3 Glucose Tolerance 34
2.8.4 Insulin Resistance 36
2.8.5 Insulin Resistance Syndrome 37
2.8.6 HbAlc 38
2.9 Raised Blood Pressure 392.9.1 Essential Hypertension and Insulin Resistance 39
2.10 Microalbuminuria 41
2.10.1 Pathophysiology of Microalbuminuria 42
2.11 Obesity and Androgen Status 43
2.11.1 Obesity
III
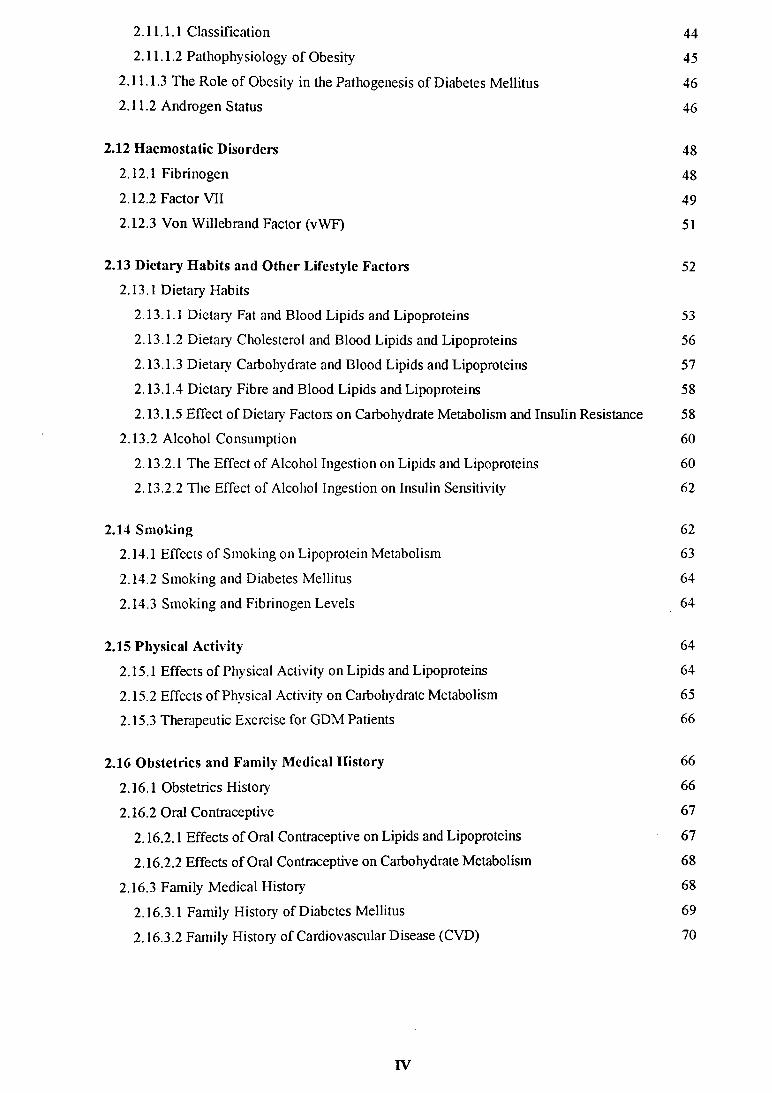
2.11.1.1 Classification 44
2.11.1.2 Pathophysiology of Obesity 45
2.11.1.3 The Role of Obesity in the Pathogenesis of Diabetes Mellitus 46
2.11.2 Androgen Status 46
2.12 Haemostatic Disorders 48
2.12.1 Fibrinogen 48
2.12.2 Factor VII 49
2.12.3 Von Willebrand Factor (vWF) 51
2.13 Dietary Habits and Other Lifestyle Factors 52
2.13.1 Dietary Habits
2.13.1.1 Dietary Fat and Blood Lipids and Lipoproteins 53
2.13.1.2 Dietary Cholesterol and Blood Lipids and Lipoproteins 56
2.13.1.3 Dietary Carbohydrate and Blood Lipids and Lipoproteins 57
2.13.1.4 Dietary Fibre and Blood Lipids and Lipoproteins 58
2.13.1.5 Effect of Dietary Factors on Carbohydrate Metabolism and Insulin Resistance 58
2.13.2 Alcohol Consumption 60
2.13.2.1 The Effect of Alcohol Ingestion on Lipids and Lipoproteins 60
2.13.2.2 The Effect of Alcohol Ingestion on Insulin Sensitivity 62
2.14 Smoking 622.14.1 Effects of Smoking on Lipoprotein Metabolism 63
2.14.2 Smoking and Diabetes Mellitus 64
2.14.3 Smoking and Fibrinogen Levels 64
2.15 Physical Activity 64
2.15.1 Effects of Physical Activity on Lipids and Lipoproteins 64
2.15.2 Effects of Physical Activity on Carbohydrate Metabolism 65
2.15.3 Therapeutic Exercise for GDM Patients 66
2.16 Obstetrics and Family Medical History 66
2.16.1 Obstetrics History 66
2.16.2 Oral Contraceptive 67
2.16.2.1 Effects of Oral Contraceptive on Lipids and Lipoproteins 67
2.16.2.2 Effects of Oral Contraceptive on Carbohydrate Metabolism 68
2.16.3 Family Medical History 68
2.16.3.1 Family History of Diabetes Mellitus 69
2.16.3.2 Family History of Cardiovascular Disease (CVD) 70
IV
3. CHAPTER THREE
MATERIALS AND METHODS
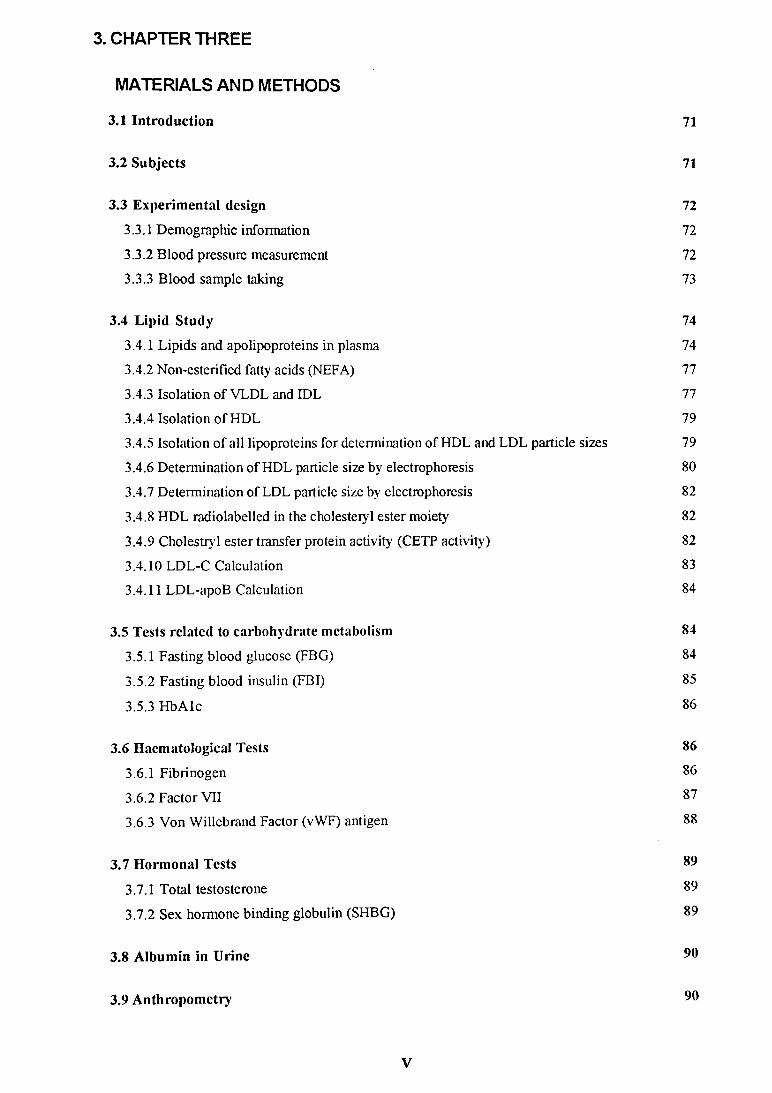
3.1 Introduction 71
3.2 Subjects 71
3.3 Experimental design 72
3.3.1 Demographic information 72
3.3.2 Blood pressure measurement 72
3.3.3 Blood sample taking 73
3.4 Lipid Study 74
3.4.1 Lipids and apolipoproteins in plasma 74
3.4.2 Non-esterified fatty acids (NEFA) 77
3.4.3 Isolation of VLDL and IDL 77
3.4.4 Isolation of HDL 79
3.4.5 Isolation of all lipoproteins for determination of HDL and LDL particle sizes 79
3.4.6 Determination of HDL particle size by electrophoresis 80
3.4.7 Determination of LDL particle size by electrophoresis 82
3.4.8 HDL radiolabelled in the cholesteryl ester moiety 82
3.4.9 Cholestiyl ester transfer protein activity (CETP activity) 82
3.4.10 LDL-C Calculation 833.4.11 LDL-apoB Calculation 84
3.5 Tests related to carbohydrate metabolism 84
3.5.1 Fasting blood glucose (FBG) 84
3.5.2 Fasting blood insulin (FBI) 85
3.5.3 HbAlc 86
3.6 Haematological Tests 86
3.6.1 Fibrinogen 86
3.6.2 Factor VII 873.6.3 Von Willebrand Factor (vWF) antigen 88
3.7 Hormonal Tests 89
3.7.1 Total testosterone 89
3.7.2 Sex hormone binding globulin (SHBG) 89
3.8 Albumin in Urine 90
3.9 Anthropometry 90
V

3.10 The Dietary and Health Questionnaire Booklet 92
3.11 Data collection - validity 93
3.12 Statistical Analysis 94
4. CHAPTER FOUR
RESULTS
4.1 Comparison of Study and Control Populations 98
4.1.1 Demographic Data of the Study 98
4.1.2 Physiological Data of the Study 103
4.1.3 Categorical Data of the Study 118
4.1.4 Cross-correlation Between Different Variables 122
4.1.5 Multiple Regression Analysis 135
4.2 Sub-population Analysis: 137
4.2.1 The Definition of Subgroups 137
4.2.2 Subgroup (A) Results 138
4.2.3 Subgroup (B) Results 142
4.2.4 Hyperinsulinémie subgroup (Subgroup C) Results 146
5. CHAPTER FIVE
DISCUSSION
5.1 Family Medical History in Women with Previous GDM 150
5.2 Obstetrics History' in Women with Previous GDM One Year after Delivery 152
5.3 Oral Contraceptive Use in Women with Previous GDM One Year after Delivery 152
5.4 Obesity in Women with Previous GDM One Year after Delivery 153
5.5 Carbohydrate Metabolism in Women with Previous GDM One Year after Delivery 158
5.6 Lipoprotein Metabolism in Women with Previous GDM One Year after Delivery 161
5.7 Hypcrandrogenicity in Women with Previous GDM One Year after Delivery 172
5.8 Raised Blood Pressure in Women with Previous GDM One Year after Delivery 175
5.9 Microalbuminuria in Women with Previous GDM One Year after Delivery 181
VI
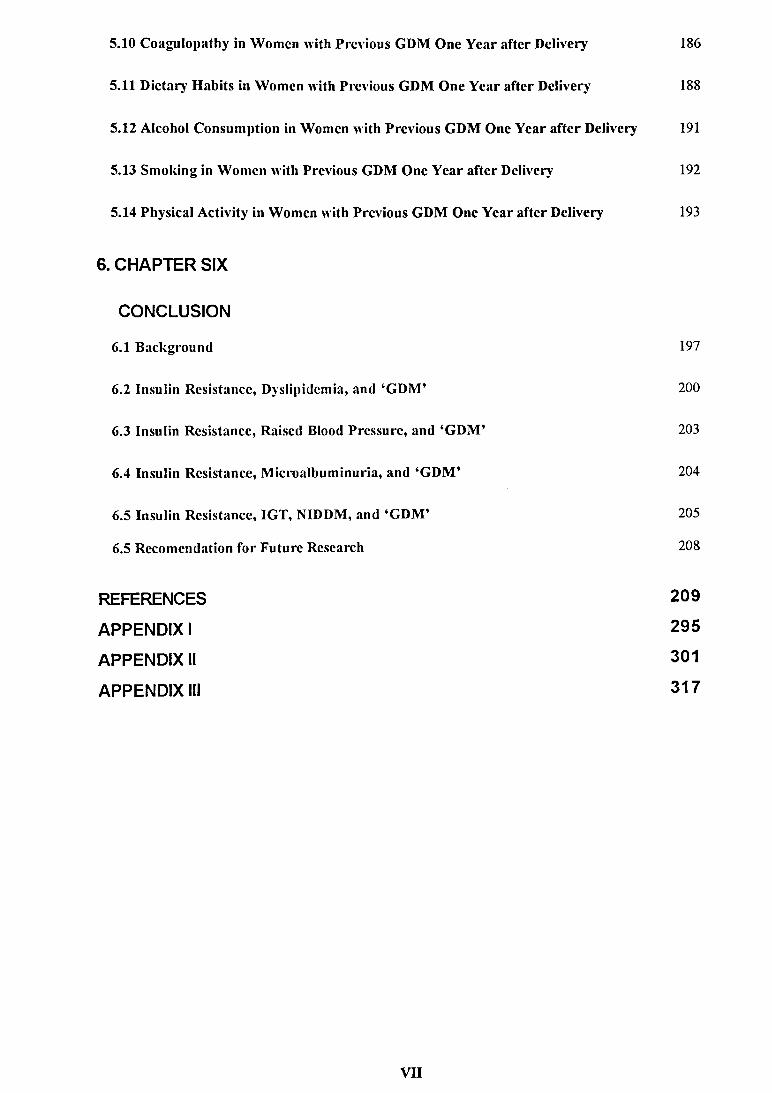
5.10 Coagulopathy in Women with Previous GDM One Year after Delivery 186
5.11 Dietary Habits in Women with Previous GDM One Year after Delivery 188
5.12 Alcohol Consumption in Women with Previous GDM One Year after Delivery 191
5.13 Smoking in Women with Previous GDM One Year after Delivery 192
5.14 Physical Activity in Women with Previous GDM One Year after Delivery 193
6. CHAPTER SIX
CONCLUSION
6.1 Background 197
6.2 Insulin Resistance, Dvslipidemia, and ‘GDM’ 200
6.3 Insulin Resistance, Raised Blood Pressure, and ‘GDM’ 203
6.4 Insulin Resistance, Microalbuminuria, and ‘GDM’ 204
6.5 Insulin Resistance, IGT, NIDDM, and ‘GDM’ 205
6.5 Recomcndation for Future Research 208
REFERENCES 209
APPENDIX I 295
APPENDIX II 301
APPENDIX III 317
VII

List o f Figures
Figure 2-1 Exogenous pathway of lipoprotein metabolism 22
Figure 2-2 Endogenous pathway of lipoprotein metabolism 22
Figure 2-3 Sources and sinks for plasma glucose 35
Figure 2-4 Classical view of two independent pathways (intrinsic and extrinsic),
leading to the generation of thrombin 50
Figure 2-5 Pathway linking hyperglycaemia and thrombosis in diabetes mellitus. 52
Figure 3-1 Pattern of sample loading in 3-30% gel for identifying HDL sub-populations 80
Figure 3-2 Pattern of samples loading in 3-13% gel for identifying LDL particles 82
Figure 4-1 Means comparison of age in GDM and control subjects 100
Figure 4-2 Means comparison of baby birth-weight between GDM and controls 100
Figure 4-3 Means comparison of pre-pregnancy BMI in GDM and control subjects 101
Figure 4-4 Means comparison of BMI in GDM and control subjects 101
Figure 4-5 Means comparison of WHR in GDM and control subjects 102
Figure 4-6 Means comparison of body fat % in GDM and control subjects 102
Figure 4-7 Means comparison for plasma cholesterol concentration between GDM and
control groups 106
Figure 4-8 Means comparison for plasma triglyceride concentration between GDM and
control groups 107
Figure 4-9 Comparison between mean values of plasma apoB concentrations in GDM and
control groups 107
Figure 4-10 Comparison between mean values of plasma NEFA concentrations in GDM and
control groups 108
Figure 4-11 Means comparison for VLDL composition levels between GDM and controls 108
Figure 4-12 Means comparison for IDL-C, IDL-TG, and IDL FC concentrations between the
GDM subjects and controls 109
Figure 4-13 Comparison of means of plasma LDL-C concentration between GDM and control
subjects 109
Figure 4-14 Comparison of means of LDL-apoB between GDM and control subjects 110
Figure 4-15 Comparison of means of LDL-I (size) between GDM and control subjects 110
vm
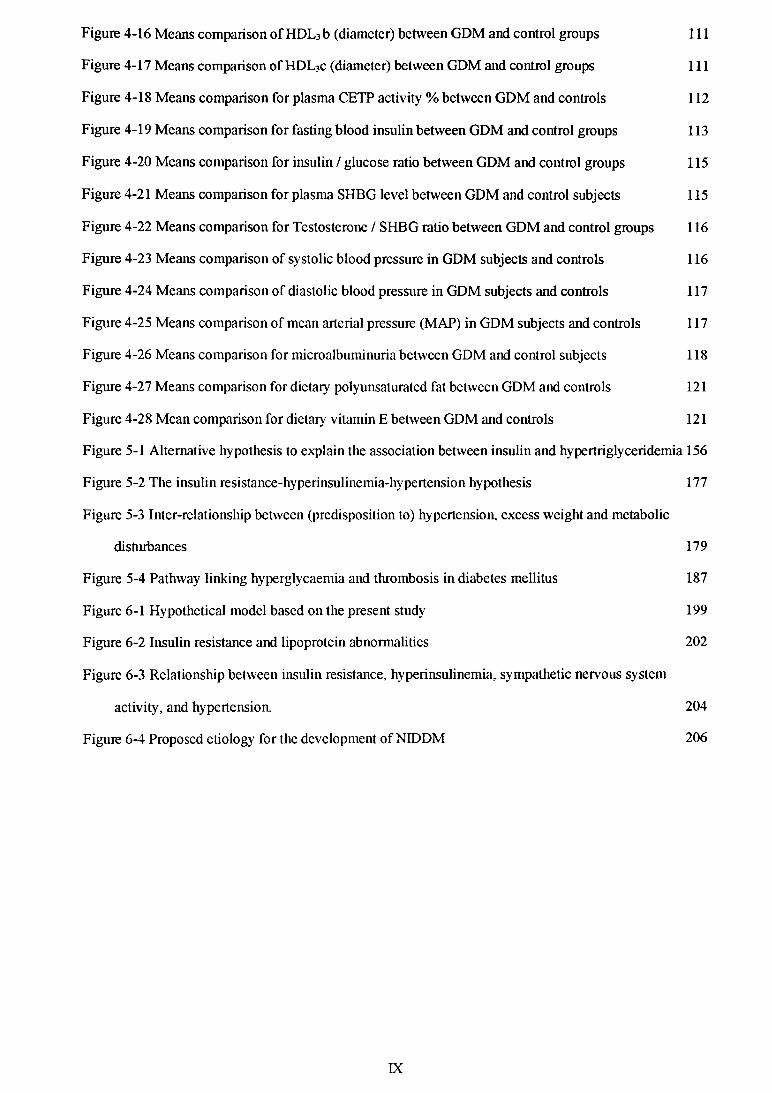
Figure 4-16 Means comparison of HDL3 b (diameter) between GDM and control groups 111
Figure 4-17 Means comparison of HDL3c (diameter) between GDM and control groups 111
Figure 4-18 Means comparison for plasma CETP activity % between GDM and controls 112
Figure 4-19 Means comparison for fasting blood insulin between GDM and control groups 113
Figure 4-20 Means comparison for insulin / glucose ratio between GDM and control groups 115
Figure 4-21 Means comparison for plasma SHBG level between GDM and control subjects 115
Figure 4-22 Means comparison for Testosterone / SHBG ratio between GDM and control groups 116
Figure 4-23 Means comparison of systolic blood pressure in GDM subjects and controls 116
Figure 4-24 Means comparison of diastolic blood pressure in GDM subjects and controls 117
Figure 4-25 Means comparison of mean arterial pressure (MAP) in GDM subjects and controls 117
Figure 4-26 Means comparison for microalbuminuria between GDM and control subjects 118
Figure 4-27 Means comparison for dietary polyunsaturated fat between GDM and controls 121
Figure 4-28 Mean comparison for dietary vitamin E between GDM and controls 121
Figure 5-1 Alternative hypothesis to explain the association between insulin and hypertriglyceridemia 156
Figure 5-2 The insulin resistance-hyperinsulinemia-hypertension hypothesis 177
Figure 5-3 Inter-relationship between (predisposition to) hypertension, excess weight and metabolic
disturbances 179
Figure 5-4 Pathway linking hyperglycaemia and thrombosis in diabetes mellitus 187
Figure 6-1 Hypothetical model based on the present study 199
Figure 6-2 Insulin resistance and lipoprotein abnormalities 202
Figure 6-3 Relationship between insulin resistance, hyperinsulinemia, sympathetic nervous system
activity, and hypertensioa 204
Figure 6-4 Proposed etiology for the development of NIDDM 206
IX
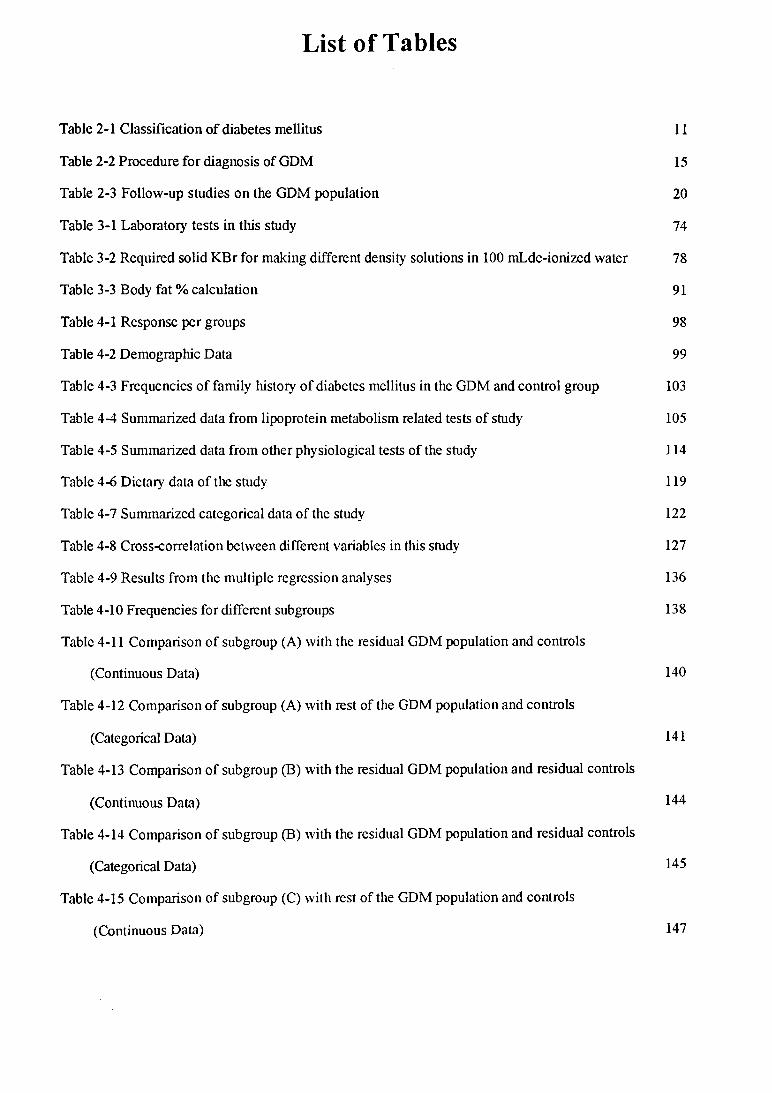
List o f Tables
Table 2-1 Classification of diabetes mellitus 11
Table 2-2 Procedure for diagnosis of GDM 15
Table 2-3 Follow-up studies on the GDM population 20
Table 3-1 Laboratory tests in this study 74
Table 3-2 Required solid KBr for making different density solutions in 100 mLde-ionized water 78
Table 3-3 Body fat % calculation 91
Table 4-1 Response per groups 98
Table 4-2 Demographic Data 99
Table 4-3 Frequencies of family history of diabetes mellitus in the GDM and control group 103
Table 4-4 Summarized data from lipoprotein metabolism related tests of study 105
Table 4-5 Summarized data from other physiological tests of the study 114
Table 4-6 Dietary data of the study 119
Table 4-7 Summarized categorical data of the study 122
Table 4-8 Cross-correlation between different variables in this study 127
Table 4-9 Results from the multiple regression analyses 136
Table 4-10 Frequencies for different subgroups 138
Table 4-11 Comparison of subgroup (A) with the residual GDM population and controls
(Continuous Data) 140
Table 4-12 Comparison of subgroup (A) with rest of the GDM population and controls
(Categorical Data) 141
Table 4-13 Comparison of subgroup (B) with the residual GDM population and residual controls
(Continuous Data) 144
Table 4-14 Comparison of subgroup (B) with the residual GDM population and residual controls
(Categorical Data) 145
Table 4-15 Comparison of subgroup (C) with rest of the GDM population and controls
(Continuous Data) 147

Table 4-16 Comparison of subgroup (C) with the residual GDM population and controls
(Categorical Data)
Table 5-1 Alterations in lipid metabolism commonly associated with insulin resistance
147
161

Abbreviations
GDM = Gestational diabetes mellitus
OGTT = Oral glucose tolerance test
C = Cholesterol
FC = Free cholesterol
CE Cholesteryl ester
TG = Triglyceride
VLDL = Very-low-density lipoprotein
DDL = Intermediate-density lipoprotein
LDL = Low-density lipoprotein
HDL = High-density lipoprotein
NEFA = Non-esterified fatty acid
Lp(a) = Lipoprotein (a)
CETP = Cholesteryl ester transfer protein
HTG = Hypertriglyceridemia
LPL = Lipoprotein lipase
HPL = Hepatic lipase
SHBG = Sex hormone binding globulin
CVD = Coronary vascular disease
PVD = Peripheral vascular disease
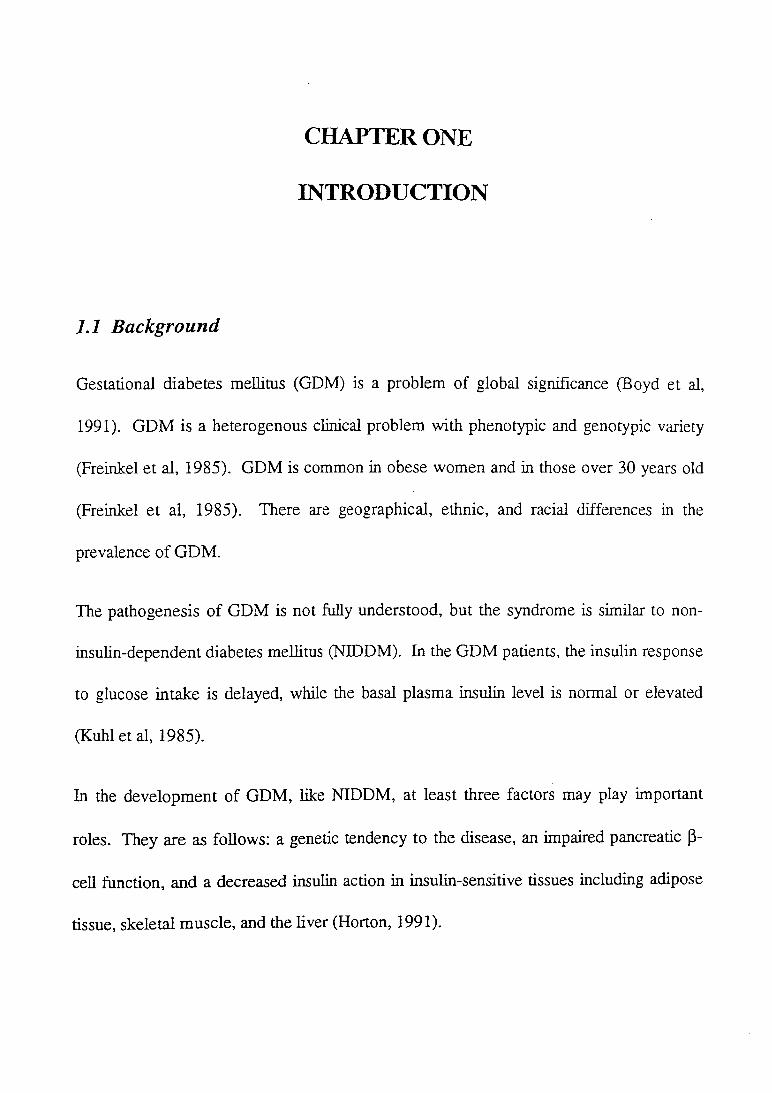
SUMMARY
Subjects who have had gestational diabetes mellitus (GDM) are, by definition, not
hyperglycemic after pregnancy and do not usually receive the benefit o f detailed follow
up of their metabolic status. We examined the metabolic status o f 65 women who had
had a diagnosis o f GDM and 65 women who had had a normal non-diabetic pregnancy
(control women) approximately one year after delivery. We hypothesised that the
women who had had GDM would on the whole have more abdominal obesity than
control women, that they would be relatively hyperinsulinemic and hyperglycemic, and
that they would have a characteristic dyslipidemia on fasting (high VLDL, IDL and LDL
and low HDL concentrations, high plasma non-esterified fatty acid (NEFA) concentration
and cholesteryl ester transfer protein (CETP) activity in plasma, more small LDL and
HDL particles). It was expected that these women would have been more likely to have a
family history of NIDDM. We hypothesised also that the women who had had GDM
would have a high plasma testosterone and low plasma sex hormone binding globulin
(SHBG) concentration, would have higher blood pressure, and be more likely to have
microalbuminuria than control women. Many of these predictions were borne out.
The study shows that the population of women who have had GDM are overall far from
normal one year after the end of pregnancy. They are likely to have a set of abnormalities
which our current knowledge suggests are precursors of the insulin resistance syndrome
such as obesity, a positive family of diabetes mellitus, dyslipidemia, hyperinsulinemia,
hyperandrogenicity, raised blood pressure, and microalbuminuria.

Many of these abnormalities are found in a subgroup of GDM subjects who appear to
have developed the insulin resistance syndrome.
CHAPTER ONE
INTRODUCTION
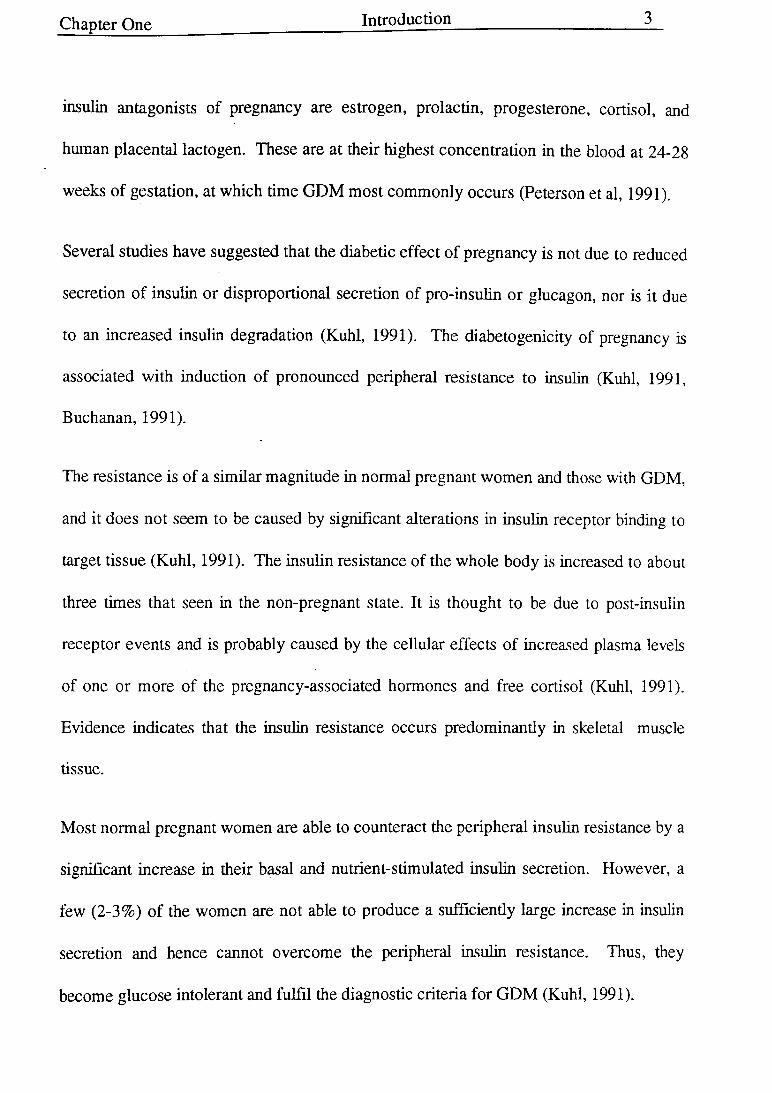
1.1 Background
Gestational diabetes mellitus (GDM) is a problem of global significance (Boyd et al,
1991). GDM is a heterogenous clinical problem with phenotypic and genotypic variety
(Freinkel et al, 1985). GDM is common in obese women and in those over 30 years old
(Freinkel et al, 1985). There are geographical, ethnic, and racial differences in the
prevalence of GDM.
The pathogenesis of GDM is not fully understood, but the syndrome is similar to non
insulin-dependent diabetes mellitus (NIDDM). In the GDM patients, the insulin response
to glucose intake is delayed, while the basal plasma insulin level is normal or elevated
(Kuhlet al, 1985).
In the development of GDM, like NIDDM, at least three factors may play important
roles. They are as follows: a genetic tendency to the disease, an impaired pancreatic (3
cell function, and a decreased insulin action in insulin-sensitive tissues including adipose
tissue, skeletal muscle, and the liver (Horton, 1991).

Chapter One Introduction 2
Maternal obstetric complications of GDM include hydramnios, pregnancy-induced
hypertension, chronic hypertension, pyelonephritis, and delivery by caesarean section
(Goldman et al, 1991).
The Third International Workshop-Conference on GDM noted that the neonates of
GDM mothers are at increased risk of macrosomia, neonatal hypoglycaemia,
hypokalaemia, polycythemia, and hyperbilirubinemia (Metzger and The Organizing
Committee, 1991). Macrosomia can cause birth trauma to both mother and neonate and
it is thought that it may increase the risk of obesity and diabetes mellitus in later life in
the offspring of mothers with GDM (Hod et al, 1991).
Mestman et al (1972) have reported that 30-50% of women with prior GDM develop
diabetes mellitus during 3-5 years after delivery and the proportion is 60-100% after 12
18 years (Mestman, 1987).
1.2 Etiology of Gestational Diabetes Mellitus
O'Sullivan (1978) reported that up to 60% of women who had had GDM eventually
developed diabetes. Oats et al (1988) have reported that 9.1% of women who had had
GDM were found to be diabetic and 16.9% had impaired glucose tolerance using the
WHO criteria at intervals from 1-15 years following diagnosis in Australia.
The etiology of GDM is poorly understood. The predisposing causes are probably the
same as for NIDDM, clearly precipitated by the metabolic and hormonal changes of
pregnancy (Brinkman HI, 1987).
Glucose tolerance normally deteriorates in human pregnancy. It is known that plasma
levels of the anti-insulin hormones rise in pregnancy (Peterson et al, 1991). The major
Chapter One Introduction 3
insulin antagonists of pregnancy are estrogen, prolactin, progesterone, cortisol, and
human placental lactogen. These are at their highest concentration in the blood at 24-28
weeks of gestation, at which time GDM most commonly occurs (Peterson et al, 1991).
Several studies have suggested that the diabetic effect of pregnancy is not due to reduced
secretion of insulin or disproportional secretion of pro-insulin or glucagon, nor is it due
to an increased insulin degradation (Kuhl, 1991). The diabetogenicity of pregnancy is
associated with induction of pronounced peripheral resistance to insulin (Kuhl, 1991,
Buchanan, 1991).
The resistance is of a similar magnitude in normal pregnant women and those with GDM,
and it does not seem to be caused by significant alterations in insulin receptor binding to
target tissue (Kuhl, 1991). The insulin resistance of the whole body is increased to about
three times that seen in the non-pregnant state. It is thought to be due to post-insulin
receptor events and is probably caused by the cellular effects of increased plasma levels
of one or more of the pregnancy-associated hormones and free cortisol (Kuhl, 1991).
Evidence indicates that the insulin resistance occurs predominantly in skeletal muscle
tissue.
Most normal pregnant women are able to counteract the peripheral insulin resistance by a
significant increase in their basal and nutrient-stimulated insulin secretion. However, a
few (2-3%) of the women are not able to produce a sufficiendy large increase in insulin
secretion and hence cannot overcome the peripheral insulin resistance. Thus, they
become glucose intolerant and fulfd the diagnostic criteria for GDM (Kuhl, 1991).

Chapter One Introduction 4
Recent studies suggest that a high percentage of pregnant women who screen positive
for glucose intolerance have serological evidence of an autoimmune response against the
pancreatic islets, in spite of the state of relative immune tolerance during pregnancy.
These data suggest that autoimmune phenomena may play a role in GDM and that the
presence of islet cell antibodies can predict insulin-requiring gestational diabetes
(McEvoy et al, 1991). It might be an explanation for those GDM subjects who will
develop IDDM but the finding requires confirmation.
1.3 Pathogenesis ofNIDDM
By definition, diabetes mellitus is characterized by a rise in glycemia above normal
concentrations which is a consequence of an inability of body tissue to dispose of
glucose, an excess production of glucose by the liver or both (Felber et al, 1993). Non
insulin-dependent diabetes mellitus (NIDDM) is thought to be caused by an imbalance
between insulin sensitivity and insulin secretion (DeFronzo et al, 1992).
1.3.1 Impaired glucose tolerance
Glucose tolerance, as estimated by the oral glucose tolerance test (OGTT), depends on
complex iteration among several physiological processes, including first-phase and
second phase insulin secretion, insulin removal, insulin sensitivity, and the tendency of
high glucose concentration (independent of insulin) to increase glucose utilisation
(Martin et al, 1992).
Subjects with insulin resistance may be euglycemic maintained by hypersecretion of
insulin, with hyperinsulinemia both in the fasting and postprandial states (Beck-Nielsen et
al, 1990).
Chapter One Introduction 5
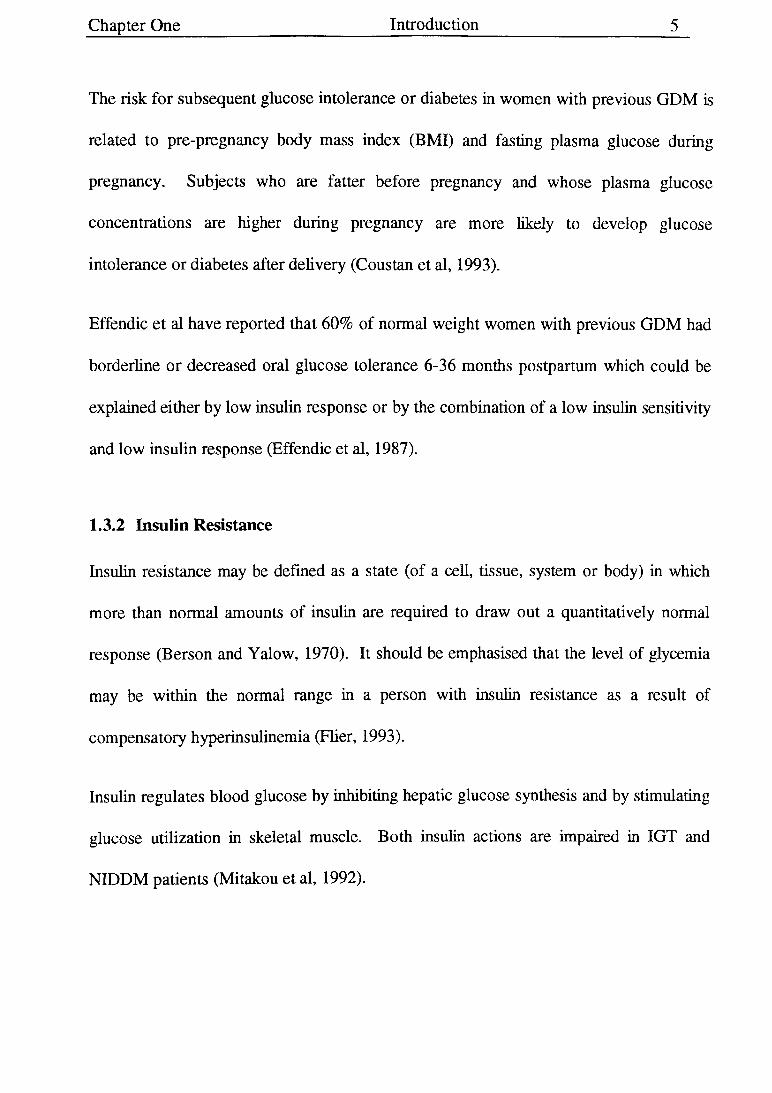
The risk for subsequent glucose intolerance or diabetes in women with previous GDM is
related to pre-pregnancy body mass index (BMI) and fasting plasma glucose during
pregnancy. Subjects who are fatter before pregnancy and whose plasma glucose
concentrations are higher during pregnancy are more likely to develop glucose
intolerance or diabetes after delivery (Coustan et al, 1993).
Effendic et al have reported that 60% of normal weight women with previous GDM had
borderline or decreased oral glucose tolerance 6-36 months postpartum which could be
explained either by low insulin response or by the combination of a low insulin sensitivity
and low insulin response (Effendic et al, 1987).
1.3.2 Insulin Resistance
Insulin resistance may be defined as a state (of a cell, tissue, system or body) in which
more than normal amounts of insulin are required to draw out a quantitatively normal
response (Berson and Yalow, 1970). It should be emphasised that the level of glycemia
may be within the normal range in a person with insulin resistance as a result of
compensatory hyperinsulinemia (Flier, 1993).
Insulin regulates blood glucose by inhibiting hepatic glucose synthesis and by stimulating
glucose utilization in skeletal muscle. Both insulin actions are impaired in IGT and
NIDDM patients (Mitakou et al, 1992).
Chapter One Introduction 6
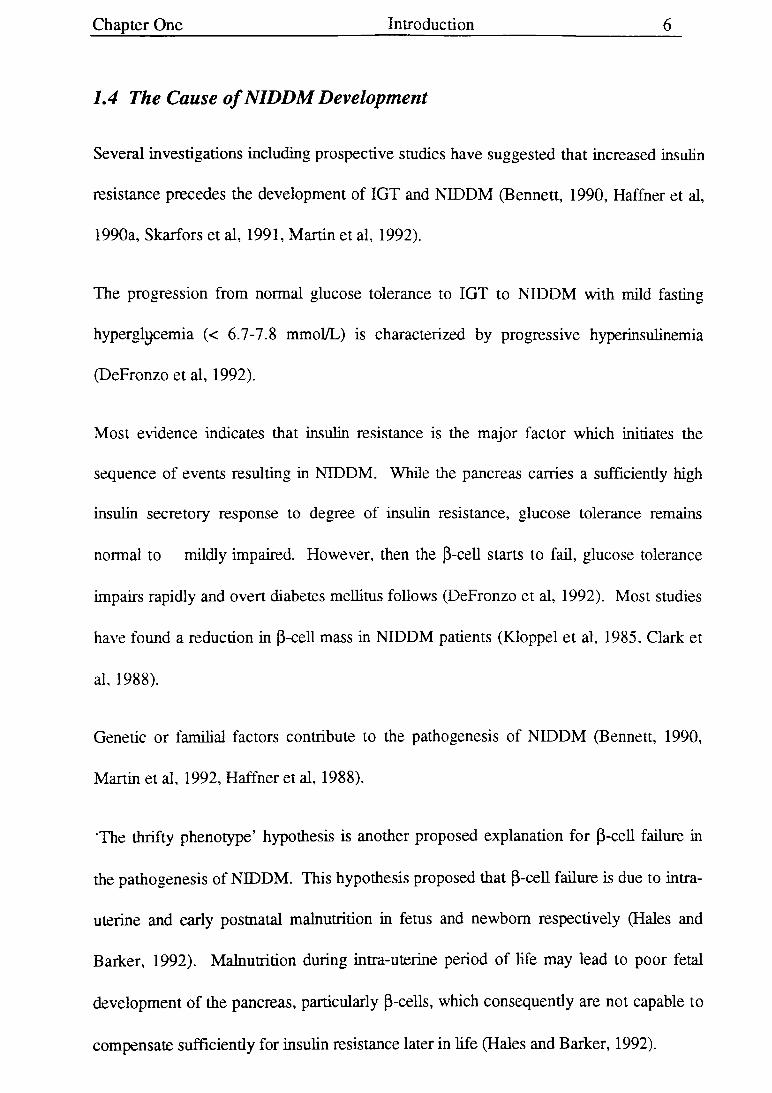
1.4 The Cause of NIDDM Development
Several investigations including prospective studies have suggested that increased insulin
resistance precedes the development of IGT and NIDDM (Bennett, 1990, Haffner et al,
1990a, Skarfors et al, 1991, Martin et al, 1992).
The progression from normal glucose tolerance to IGT to NIDDM with mild fasting
hyperglycemia (< 6.7-7.8 mmol/L) is characterized by progressive hyperinsulinemia
(DeFronzo et al, 1992).
Most evidence indicates that insulin resistance is the major factor which initiates the
sequence of events resulting in NIDDM. While the pancreas carries a sufficiently high
insulin secretory response to degree of insulin resistance, glucose tolerance remains
normal to mildly impaired. However, then the ß-cell starts to fail, glucose tolerance
impairs rapidly and overt diabetes mellitus follows (DeFronzo et al, 1992). Most studies
have found a reduction in ß-cell mass in NIDDM patients (Klöppel et al, 1985, Clark et
al, 1988).
Genetic or familial factors contribute to the pathogenesis of NIDDM (Bennett, 1990,
Martin et al, 1992, Haffner et al, 1988).
'The thrifty phenotype’ hypothesis is another proposed explanation for ß-cell failure in
the pathogenesis of NIDDM. This hypothesis proposed that ß-cell failure is due to intra
uterine and early postnatal malnutrition in fetus and newborn respectively (Hales and
Barker, 1992). Malnutrition during intra-uterine period of life may lead to poor fetal
development of the pancreas, particularly ß-cells, which consequently are not capable to
compensate sufficiently for insulin resistance later in life (Hales and Barker, 1992).

Chapter One Introduction 7
1.4.1 The Development of Insulin Resistance
Sedentary life-style is associated with obesity and physical inactivity, and these are
causes of insulin resistance (Yki-Jarvinen, 1994). The distribution of fat within the body
is an important factor in developing insulin resistance in individuals. Upper body
(android) obesity is more common in NIDDM patients than in equally obese non-diabetic
men and women (Bjomtorp, 1988). Helmrich et al (1991) have reported that physical
activity even without weight loss plays an important role in the prevention of NIDDM,
even in genetically susceptible people.
Furthermore, epidemiological studies have suggested that a high intake of dietary fat
(Tsunehara et al, 1990, Marshall et al, 1991), an excessive consumption of refined
carbohydrates particularly sucrose (Baird, 1972, Freskens and Kromhout, 1989), and a
low dietary fibre intake (Truswell, 1975) play roles in the etiology of NIDDM.
1.4.2 The Development of Impaired Insulin Secretion
Several hypothesis have been proposed to account for the defect in insulin secretion in
NIDDM.
Several studies have suggested that chronic hyperglycemia is deleterious to insulin
secretion and also persuades insulin resistance. It may eventually result in progressive
loss of P-cell function and in the NIDDM state (Yki-Jarvinen, 1992).
Amyloid deposition has been found frequently in NIDDM patents and amylin was shown
to be its precursor (Clark, 1989, Nishi et al, 1990). Recently, amylin was suggested as a
contributor to the defect in insulin secretion in isolated rat pancreatic islets (Ohsawa et
Chapter One Introduction 8
al, 1989). Galanin is the newest hormone that has been proposed to be involved in
impaired insulin secretion in NIDDM (Dunning and Taborsky, 1988).
1.5 Significance of the Thesis
The identification of subjects at risk for diabetes mellitus has been a goal for physicians
and scientists (Stem and Haffner, 1986, Nelson et al, 1988). The hope is that
identification may lead to action which may help to prevent new cases or at least delay
the onset of disease. Furthermore, early detection of diabetes in subjects who have the
disease will enable the physician to initiate early treatment well before the onset of long
term complications such as atherosclerosis.
GDM is a strong predictor of glucose intolerance or NIDDM later in the life of the
mother (O’Sullivan, 1989, Persson et al, 1991). Several studies have suggested that
normoglycemic obese and non-obese women with previous GDM exhibit abnormalities
of insulin response to glucose administration and evidence of increased insulin resistance
(Ward et al, 1985, Catalano et al, 1986, Effendic et al, 1987).
The factors responsible for development of impaired glucose tolerance and NIDDM in
subjects with previous GDM are unclear (Persson et al, 1991). Effendic et al (1987)
have reported a significantly decreased early insulin response and insulin sensitivity in
women of normal weight who previously had GDM and who have had normal and
abnormal oral glucose tolerance test (OGTT) postpartum. Abnormal glucose tolerance
arising in women who have had GDM within the first postpartum year has been reported
by several researchers (Metzger et al, 1985, Catalano et al, 1986).
Chapter One Introduction 9
Although several studies have shown that women have a severe risk of developing
diabetes mellitus if they have had GDM, these have been few studies of metabolic
abnormalities in a population of women who have had GDM.
A strategy to prevent or delay the development of NIDDM in women with previous
GDM has the potential to save millions of health care dollars and to prevent substantial
suffering caused by the disease (Gregory et al, 1993).
This study is of a group of such women one year after delivery, compared with a control
group.
It is a population-based study, which should form the basis for a later longitudinal study.
1.6 Aims of the Study
The aim of this study is to test the following hypotheses:
1. We hypothesise that women who have had GDM are more likely to have known or
postulated risk factors for NIDDM, namely age, a maternal history of diabetes mellitus
and central obesity than controls.
2. Women who have had GDM are more likely (than controls) to have developed a high
blood concentration of non-esterified fatty acids (NEFA) in the context of a disordered
lipid metabolism. These are thought to be factors which predict the early development of
NIDDM. Dyslipidemia includes moderate hypercholesterolemia, hypertriglyceridemia,
and a low HDL-cholesterol concentration. Furthermore, correlates of dyslipidemia
include higher plasma concentrations of apolipoprotein B, VLDL, and IDL, and lower

Chapter One Introduction 10
apolipoprotein A-I concentrations. Other correlates include denser and smaller LDL and
HDL particles and increased cholesteryl ester transfer protein (CETP) activity in plasma.
3. We hypothesise that women with previous GDM are more likely (than controls) to
have accelerated insulin resistance (evidenced by fasting hyperinsulinemia).
4. We hypothesise that women with previous GDM are more likely (than controls) to
have developed elements of the insulin resistance syndrome (obesity, associated with
hyperandrogenesity, dyslipidemia, hyperinsulinemia, high diurnal plasma glucose
excursion, high blood pressure).
5. We hypothesise that women with previous GDM are more likely (than controls) to
have high dietary intake of saturated fat and lack of exercise.
6. We hypothesise that women with previous GDM are more likely (than controls) to
have microalbuminuria, suggesting organ damage associated with diabetes.
CHAPTER TWO
LITERATURE REVIEW
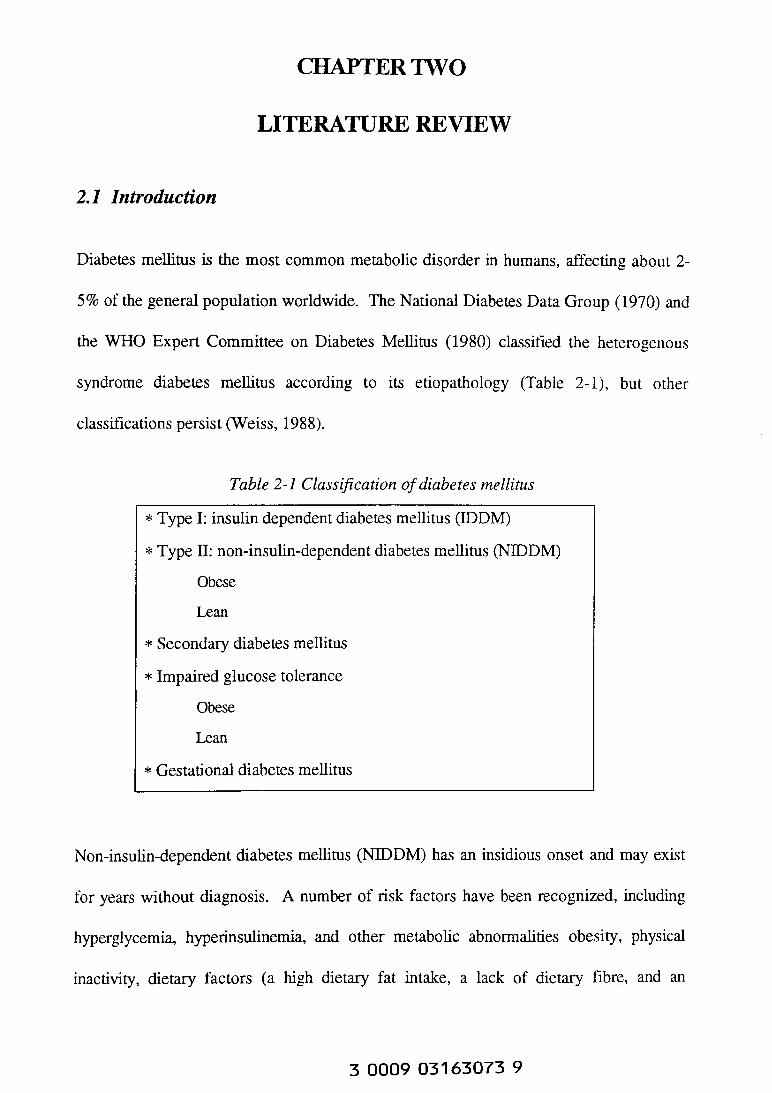
2.1 Introduction
Diabetes mellitus is the most common metabolic disorder in humans, affecting about 2
5% of the general population worldwide. The National Diabetes Data Group (1970) and
the WHO Expert Committee on Diabetes Mellitus (1980) classified the heterogenous
syndrome diabetes mellitus according to its etiopathology (Table 2-1), but other
classifications persist (Weiss, 1988).
Table 2-1 Classification of diabetes mellitus
* Type I: insulin dependent diabetes mellitus (IDDM)
* Type II: non-insulin-dependent diabetes mellitus (NIDDM)
Obese
Lean
* Secondary diabetes mellitus
* Impaired glucose tolerance
Obese
Lean
* Gestational diabetes mellitus
Non-insulin-dependent diabetes mellitus (NIDDM) has an insidious onset and may exist
for years without diagnosis. A number of risk factors have been recognized, including
hyperglycemia, hyperinsulinemia, and other metabolic abnormalities obesity, physical
inactivity, dietary factors (a high dietary fat intake, a lack of dietary fibre, and an
3 0009 03163073 9

Chapter Two Literature Review 12
excessive consumption of sucrose and other refined carbohydrates), and low socio
economic status, (Knowler et al, 1988).
Some risk factors such as hyperinsulinemia may be recognized many years before the
onset of NIDDM (Sicree et al, 1987, Saad et al, 1988, Lundgren et al, 1990, Haffner et
al, 1990 b, Warram et al, 1990,Charles et al, 1991)
2.2 Gestational Diabetes Mellitus
Gestational diabetes mellitus (GDM) is the most common metabolic disorder in
pregnancy. About 90% of all pregnant diabetic patients have GDM, and, IDDM and
NIDDM together account for the remaining 10% (Hagay et al, 1992).
It is defined as carbohydrate intolerance of variable severity with onset or first
recognition during pregnancy (Hunter et al, 1990). The onset is usually recognized in
the latter part of the second and early part of the third trimester (24-36 weeks)
(Brinkman HI, 1987).
The incidence of GDM has been reported to be 2-13% of all pregnancies (Hadden, 1980,
Sepe et al, 1985).
The majority of women who develop GDM will return to normal glucose tolerance
during the puerperium. However, a significant number of these women, variously
estimated to be between 30%-60% will progress to type II (NIDDM), within 5-10 years
(Brinkman III, 1987).
Beischer et al have studied women living in Australia and reported that there are
significant increases in the incidence of the more severe grades of GDM in women born
in the Mediterranean region, Asia, the Indian subcontinent, Egypt, and Arabic countries.
Chapter Two Literature Review 13
The incidence of GDM increased significantly with time in all racial groups, rising from
3.3% during 1979-1983 to 7.5% during 1984-1988 (Beischer et al, 1991).
GDM is considered to be associated with increased perinatal morbidity and mortality
which may be reduced by adequate diagnosis and management (Backx et al, 1989). In
addition, women who develop GDM have an increased risk of permanent diabetes which
increases with time of follow-up (Martin, 1991).
2.2.1 Screening
Currently, most obstetricians screen all of their pregnant women for gestational diabetes.
The simplest screening test for GDM is the taking of a history. Historic risk factors such
as the presence of a family history of diabetes, a previous perinatal loss, or the previous
birth of a macrosomic baby clearly identify individuals at increased risk for GDM in their
current pregnancies. Unfortunately, the taking of a history is a relatively insensitive
screening test, identifying only half of women who proceed to develop GDM (Coustan,
1993).
The likelihood of GDM is increased with advancing maternal age (Coustan et al, 1989).
Additionally, as hormonally produced insulin resistance in pregnancy is apparent by the
end of the second trimester, testing is best performed between 26-30 weeks’ gestation.
Renal glycosuria is common in pregnancy and is hard to evaluate. However, women with
unrecognized pre-existing diabetes may become pregnant and the presence of glycosuria
on routine testing in the first 12 weeks of pregnancy may then be significant. Such
women would be regarded as having pre-existing diabetes, not GDM (Martin, 1991).
Chapter Two Literature Review 14
A modified oral glucose tolerance test (OGTT) is used to screening for GDM. A 75 g
oral glucose load is given to all pregnant women at between 26-30 weeks’ gestation in
the non-fasting state.
The plasma glucose level is then measured one hour later and women who ‘screen
positive’ should have a 75g OGTT before 30 weeks’ gestation (Martin, 1991). For a
75g glucose load the cut-off plasma glucose value at 1 hour is 8.0 mmol/L and for 50g it
is 7.8 mmol/L (Martin, 1991).
These recommendations must not prevent the recognition and testing for diabetes at any
stage of pregnancy if suggestive clinical features are present (Martin, 1991).
Serum fructosamine and glycosylated haemoglobin (HbAlc) give similar clinical
information, and may be used interchangeably for the metabolic control of diabetes
mellitus patients. Neither have diagnostic value as screening test for GDM. It may be
because fructosamine originates mainly from the nonenzymatic glycation of albumin, so,
its concentration depends therefore not only on the concentration of glucose but also on
albumin (Vermes et al, 1989).
2.2.2 Diagnostic Criteria
Oral glucose tolerance tests have been used for diagnosing GDM for many years (Hunter
et al, 1990). The Procedure for the diagnosis of GDM is shown in Table 2-2.
2.2.3 Medical Management
The goal of medical management of GDM is the prevention of perinatal mortality and
morbidity (Coustan, 1993). Several treatment strategies have been proposed: diet,

Chapter Two Literature Review 15
exercise, pharmacologic intervention using oral hypoglycemic agents, and insulin therapy
(Langer, 1993).
Table 2-2 Procedure for diagnosis o f GDM (Martin, 1991 ).
Indication Optimal
gestation
(weeks)
Test performed Diagnostic criteria-plasma
glucose level (mmoi/L)
Clinical suspicion of
GDM
any time 75 g OGTT (fasting) 0 hours > 5.5
2 hours > 8.0
Screening 26-28 50 g glucose load
(non-fasting)
1 hour > 7.8
Confirmation of
diagnosis after positive
screening test
26-30 75 g OGTT (fasting) 0 hours > 5.5
2 hours > 8.0
The majority of GDM patients can be managed by diet alone (Hoolysworth et al, 1992)
or exercise and diet (Horton, 1991), and a small percentage may require insulin to
achieve euglycemia (Brinkman III, 1987). These patients are not prone to develop
ketosis (Hoolysworth et al, 1992).
2.2.4 Diet Therapy
The diet therapy mainly improves the body’s sensitivity to insulin. Diet therapy may
include caloric restriction. It is currently recommended that diet should include 50-55%
carbohydrate, mainly complex carbohydrate with an emphasis on reduced intake of
simple sugars because of their high absorption rate. Fat consumption should be limited
to 20-30%, with decreased saturated fats and cholesterol and increased polyunsaturated
fats. The diet should include a modest 20-30% protein. This diet approach will usually
Chapter Two Literature Review 16
result in a 0.83-1.1 mmol / L decline in maternal glucose level (Langer, 1993). Diet
program must provide a caloric intake sufficient to avoid ketonuria (30 kcal / kg in
women 80-12% ideal body weight) (Peterson et al, 1991). In addition, even a small
weight loss will improve maternal glucose levels (Langer, 1993).
2.2.5 Exercise
GDM patients should be encouraged to walk 2-3 miles an hour for 20-30 minutes, 4 days
a week or engage in any other equivalent activity that they enjoy (Langer, 1993).
Cardiovascular conditioning exercise for 20 minutes three times per week has also been
shown to be useful in lowering both fasting and post-prandial glucose levels (Mulford et
al, 1993). Exercise has a major effect on glucose metabolism and reduction in lipid levels
(Peterson et al, 1991).
2.2.6 Oral Hypoglycemic Agents
Oral hypoglycemic agents play a limited role in diabetes in pregnancy. The main
objection to their use in pregnancy is the fear of congenital anomalies or fetal
compromise through direct stimulation of the fetal pancreas (Langer, 1993). Langer et al
recently have reported that second-generation oral hypoglycemic agents (glyburide) do
not cross the placenta. It suggests that second-generation hypoglycemic agents may play
a role in the management of type II and GDM in the future (Langer, 1993).
2.2.7 Insulin Therapy
If diet and exercise do not achieve the requisite glucose levels (glucose levels < 4 . 4
mmol/L or < 7.8 mmol/L 1 hour after meals), insulin therapy based on body weight and
Chapter Two Literature Review 17
gestational age is required (Peterson et al, 1991). Insulin is generally discontinued at
delivery (Peterson et al, 1991).
2.3 Complications of GDM
The rationale for treatment of GDM is to prevent diabetic complications. Poor glycemic
control in early pregnancy is associated with an increased risk of major congenital
abnormalities in the fetus (Gregory et al, 1992). In managing the pregnant diabetic
patients, two patients are being treated, the mother and fetus (Lieb, 1987). Studies both
in vivo and in v itro using animal models have provided data suggesting that
hyperglycemia, hyperketonemia, and reduced glucolysis are, under certain conditions and
circumstances, all potentially teratogenic, particularly when they occur in the earliest
stages of pregnancy (Baird, 1986).
Most neonatal complications such as macrosomia, hypoglycemia, hyperbilirubinemia,
hypokalaemia, polycythemia, major congenital anomalies (Hod et al, 1991), intra-uterine
death, prematurity, and respiratory distress syndrome are readily avoided if GDM
diagnosed and treated early and promptly (Lieb, 1987).
The adult female offspring of GDM mothers may exhibit impaired glucose tolerance and
develop GDM when they become pregnant (Van Assche et al, 1991).
Obstetric management centers around surveillance to detect potential fetal compromise
and the establishment of the proper time for delivery. Other goals are the diagnosis of
fetal macrosomia and the avoidance of shoulder dystocia. Sudden fetal death, most
likely is related to suboptimal metabolic control, is well documented in diabetic
Chapter Two Literature Review 18
pregnancies, but is less likely in GDM (Coustan, 1993). Antepartum fetal surveillance
should begin at 28 weeks gestation (Landon et al, 1985).
Goldman et al reported that polyhydramnios, pre-term labor, and pyelonephritis were not
more frequent in GDM, but hypertension without proteinuria and pre-eclampsia were
more frequent in GDM patients. Despite this, cesarean delivery was more common in
GDM (Goldman et al, 1991).
2.4 Long-term Follow-up
Women with history of GDM are at increased risk for future development of NIDDM.
Follow-up studies have estimated that 30-50% of these women develop diabetes during
the first 3-5 years after a pregnancy complicated by GDM, which after 12-18 years the
proportion is 60-100% (Gregory et al, 1993). For this reason, the American Diabetes
Association (ADA) has recommended that at the first postpartum visit, subjects who
have had GDM should have a standard 75g 2-hours OGTT.
The high prevalence of subsequent diabetes may serve to make women with previous
GDM an ideal group on which to attempt interventions designed to prevent the
development of diabetes in the future (Coustan, 1993).
Persson et al speculate that an elevated proinsulin / insulin ratio in women with previous
GDM could be a marker for later development of NIDDM (Persson et al, 1991). The
usefulness of this measurement in follow-up is unclear.
Chapter Two Literature Review 19
2.5 Metabolic Changes in Normal Pregnancy and GDM
In normal pregnancy insulin secretion increases throughout gestation whereas peripheral
insulin sensitivity is decreased. Fasting plasma glucose levels are decreased by
approximately 10% during the first trimester. Maternal amino acid levels are also
reduced.
On the other hand, plasma lipids are increased. As gestation advances, progressively
increasing concentrations of insulin antagonistic hormones are secreted by the placenta
(Reece et al, 1994). In addition, the fasting insulin/ glucagon ratio is increased in both
normal and gestational diabetic pregnancy (Reece et al, 1994). Plasma total cholesterol,
LDL-cholesterol, and triglyceride concentrations are higher in pregnancy compared with
non pregnancy (Loke et al, 1991).
GDM patients exhibit an increased insulin response to oral glucose and amino acids
during pregnancy when compared with the postpartum period (Kuhl et al, 1985).
Fasting insulin concentration, plasma glucose, and free fatty acids are higher in obese
GDM women compared with normal non-obese pregnant women, whereas 3-
hydroxybutyrate levels are similar (Carpenter, 1993). Non-obese GDM patients have
fasting insulin levels similar to non-diabetic pregnants. Fasting plasma glucagon is
probably not increased in GDM.
Lipids and amino acids levels are significantly elevated in GDM subjects compared with
normal control subjects (Carpenter, 1993). The postpartum fall in insulin sensitivity
measured by the euglycemic clam technique is also more marked in GDM than in normal
pregnancy (Carpenter, 1993).

Chapter Two Literature Review 20
2.6 Metabolic Abnormalities in Women With Previous GDM
Considerable research has been done on GDM subjects during pregnancy in the last two
decades.
Subjects with histories of GDM, particularly those with fasting hyperglycemia, are at
high risk for developing subsequent overt diabetes mellitus (Metzger et al, 1985, Kjos et
al, 1990).
Several follow-up studies have been conducted on the populations with previous GDM.
Those indicated a high prevalence of overt diabetes mellitus years after the onset of
GDM (Table 2-3) (Mestman, 1988).
Table 2-3 Follow-up studies on the GDM population (Mestman, 1988)
Author Total subjects Follow-up period
(years)
Overt DM
O’Sullivan (1984) 615 22-28 25%
Stowers et al (1985) 112 22 7
Metzger et al (1985) 113 1 38%
Mestman et al (1972) 232 5 23%
On the other hand, Kjos et al (1991) have reported that lipid abnormalities are
uncommon at 36 months postpartum in women with previous GDM and manifest
predominantly as a mild elevation in the plasma TG level.
Our current understanding of the development of metabolic disorders in women with
previous GDM until they develop diabetes mellitus is incomplete.
Chapter Two Literature Review 21
2.7 Lipid and Lipoprotein Metabolism
GDM is a potentially serious disease. Evidence from autopsy, clinical, and
epidemiological studies indicates that atherosclerosis more readily becomes advanced in
diabetic than in non-diabetic subjects (Stout, 1992). A group of 89 women were studied
12-18 years after the diagnosis of GDM. The results showed that the incidence of overt
diabetes was 65.2%. 8.6% of the subjects who developed overt diabetes mellitus had
had a cerebral vascular accident, 6.8% had suffered a myocardial infarct, and 3.4% were
on dialysis therapy (Mestman, 1988).
Lipid and lipoprotein abnormalities have been implicated in the pathogenesis of
atherosclerosis in both diabetic and non-diabetic individuals (Assmann et al, 1988, Stern
et al, 1989). Kjos et al (1991) have studied women with recent GDM for a period of 36
months after delivery. They have reported that plasma TG level was elevated and HDL
C was decreased in women with previous GDM at 3-11 months after delivery but not
thereafter (Kjos et al, 1991).
These findings prompted us to examine the lipid and lipoprotein levels of women with
recent GDM, to determine whether they have lipid and lipoprotein profiles indicative of
increased risk for atherosclerosis in particular hypercholesterolemia and
dyslipoproteinemia (characterized by hypertriglyceridemia and low plasma HDL-C
concentrations).
2.7.1 Endogenous and Exogenous Pathways of Lipoprotein Metabolism
Dietary lipids are transported from the intestine to the liver via the exogenous pathway
(Figure 2-1), and lipids synthesised by the liver are transported from the liver to

Chapter Two Literature Review 22
peripheral tissues via the endogenous pathway (Figure 2-2) (Trimble and McDowell,
1992).
Dietary cholesterol, mostly as cholesteryl ester, is absorbed in the intestine. Esters are
hydrolyzed by cholesterol esterase to release free cholesterol and fatty acids. TG are
hydrolyzed by pancreatic and intestinal lipase and absorbed mainly as free fatty acids and
monoglycerides. TG, cholesterol, and apolipoproteins are assembled into chylomicrons,
lipoprotein particles which are secreted into the lymph and enter plasma thorough the
thoracic duct. Chylomicrons are normally found post-prandially in plasma (Dominiczak,
1994).
Intestine
DietaryFat
Figure 2-1 Exogenous pathway of lipoprotein metabolism
(Trimble and McDowell, 1992).
Liver
VLDL Remnant
other pathways
Figure 2-2 Endogenous pathway o f lipoprotein metabolism
(Trimble and McDowell, 1992)

Chapter Two Literature Review 23
The exogenous pathway of lipoprotein metabolism (Figure 4-1) begins with secretion of
chylomicrons by the intestine following absorption of dietary fat. Lipoprotein lipase
(LPL) acts on chylomicron particles to produce chylomicron remnants. Chylomicron
remnants are removed from plasma by the liver (Trimble and McDowell, 1992). The
nature of the receptor is unclear (Trimble and McDowell, 1992).
The endogenous pathway of lipoprotein metabolism (Figure 4-2) begins with hepatic
secretion of the triglyceride-rich lipoprotein (VLDL) into the plasma. This apoB-100
containing lipoprotein is converted to IDL and subsequently to LDL in the plasma
compartment.
In the process, the particles’ core is hydrolysed by lipolytic enzymes (Trimble and
McDowell, 1992). Both of the major plasma lipolytic enzymes, lipoprotein lipase and
hepatic lipase (HLP) have been implicated in the metabolism of apoBlOO containing
particles. It seems that the affinity of LPL is higher for large triglyceride-rich lipoprotein
particles than for smaller remnants, whereas HLP, which expresses both triglyceride
lipase and phospholipase activities, seems to have higher affinity for smaller VLDL and
IDL particles (Nicoll and Lewis, 1980).
CETP also is involved in these processes. LPL hydrolyses TG and CETP exchanges TG
for cholesteryl ester from HDL.
Subsequently, LDL is cleared from plasma by the LDL receptor. Chemically modified
LDL may be cleared by other pathways such as the scavenger receptor on macrophages
Brown and Goldstein (1990) have suggested that the macrophage scavenger pathway
may be involved in the formation of foam cells and initiation of the atherosclerosis
process.

Chapter Two Literature Review 24
2.7.2 Cholesterol
Numerous epidemiological and genetic studies have shown that hyperlipoproteinemia, in
particular hypercholesterolemia, is one of the principal risk factors for coronary heart
disease (Douste-Blazy and Kloer, 1989).
2.7.3 Triglyceride
Primary and secondary hypertriglyceridemias (HTG) are the commonest lipid transport
disorders found in patients obesity and diabetes mellitus (Eisenberg, 1987).
In obese individuals with upper body obesity appear to have a higher lipolytic activity
adipocytes compared with obese subjects with peripheral obesity (fat distribution in the
hips, buttocks, and thighs), resulting in a greater flux of FFAs toward the liver (Kissebah
and Peiris, 1989). High FFA concentrations have been reported to decrease the hepatic
extraction of insulin, resulting in systemic hyperinsulinemia (Kissebah and Peiris, 1989).
HTG in obesity is associated with increase in the hepatic production of VLDL (Howard
et al, 1987).
Hepatic lipase is an enzyme that contains triglyceride lipase, monoglyceride lipase, and
phospholipase activity. Hepatic lipase catalyzes the degradation HDL particles, more
specifically HDL2 (Tikkanen, 1989). Despres et al (1990 b) have suggested that LPL
activity is decreased and hepatic triglyceride lipase activity is increased in abdominal
obesity. Low LPL activity results in the reduction in the catabolic rate of TG-rich
lipoproteins and high hepatic triglyceride lipase activity causes a reduction in plasma
HDL2 concentration.
Chapter Two Literature Review 25
Thus, hypertriglyceridemia and a low concentration of HDL-C, particularly HDL2, are
common in abdominal obesity (Despres et al, 1990 a, Kissebah and Peiris, 1989,
Despres, 1991).
The apo CIII gene is a part of a cluster with apo A-I and apo A-IV on chromosome 11,
and variation in this cluster has been implicated in hypertriglyceridemia. Apo CIII has
been suggested as candidate for a rate limiting mediator in the control of plasma TG
levels since apo CIII inhibits LPL (Talmud, 1993). Whether other factors such as diet,
alcohol consumption, obesity, smoking, exercise and oral contraceptive use significantly
aggravate hypertriglyceridemia (NIH Consensus Conference, 1993) via increasing apo
CIII activity is uncertain.
In western countries, plasma TG concentrations usually are inversely related to plasma
HDL-C (Marmot, 1993). The PROCAM study has shown that plasma TG and LDL-C
are independent predictors of coronary heart disease (CHD) incidence, but the predictive
effect of TG for the development of CHD is observed only where the LDL-C/ HDL-C
ratio is high (greater than 5) (Marmot, 1993).
The association of hypertriglyceridemia with premature atherosclerosis may not be due
to the direct effects of the TG itself, but may be associated with changes in the
concentration and composition of lipoproteins such as IDL, LDL and HDL.
HTG may result in an alteration in CETP activity which has an important role in lipid
transport (Deckelbaum et al, 1984). The presence of an increased mass of circulating
VLDL and chylomicrons promotes plasma lipid transfer activity with loss of cholesteryl
ester from HDL and production of TG-enriched HDL particles. This TG-enriched HDL

Chapter Two Literature Review 26
particle is susceptible to lipolysis by hepatic lipase resulting in further HDL degradation
and the generation of smaller HDL3 particles (Tikkanen, 1989).
Postprandial hypertriglyceridemia may be more important than the high fasting TG
levels, but little is known about this at present (NIH Consensus Conference, 1993).
2.7.4 Non-esterified Fatty Acids (NEFA)
In human, ~ 200 g of NEFAs (often termed free fatty acids) are mobilized from adipose
tissue each day and transported in the circulation at concentrations ~ 100-1000 fold
higher than their monomer solubility limit (Cistola and Small, 1991). They principally
consist of oleic (about 38%), palmitic (28%), stearic (15%) and linoleic (9%) acids
(Fruchart et al, 1989).
Solubilization and transport is mediated primarily by serum albumin. Albumin prevents
the combination of fatty acids into liquid-crystalline or crystalline aggregates at neutral
pH (Cistola et al, 1988) and supplies a source of fatty acid for lipid synthesis and energy
production (Cistola and Small, 1991).
Under normal circumstances, approximately 99% of the circulating NEFAs are bond to
serum albumin. However, cellular membrane and plasma lipoproteins have a high affinity
for NEFAs and under some circumstances (eg high NEFA concentration in plasma) they
may compete with albumin for NEFA binding (Cistola and Small, 1991).
In NIDDM patients, the action of insulin in both suppressing hepatic glucose output
(HGO) and stimulating peripheral glucose uptake into skeletal muscle is impaired, and
the combination of these defects is the principal cause of postprandial hyperglycaemia
(Walker et al, 1993). In addition, the action of insulin in suppressing adipose tissue
Chapter Two Literature Review 27
lipolysis and increasing re-esterification is impaired, leading to increased plasma NEFA
levels and rates of lipid oxidation in the insulin-stimulated state in both obese and non
obese patients with NIDDM (Walker et al, 1993).
Elevated plasma NEFA concentration in NIDDM may contribute to insulin insensitivity
(Walker et al, 1993). Studies on rat liver have shown that NEFA stimulates
gluconeogenesis (Williamson et al, 1966). An increased NEFA concentration in plasma
diminishes the suppressive action of insulin on hepatic glucose output (HGO) and also
decreases peripheral insulin-mediated glucose disposal in healthy man (Lee et al, 1988).
Glucocorticoid induced insulin resistance in normal rats has been shown to be due to
excessive NEFA oxidation; possibly via an increase in the glucose-fatty acid cycle
ultimately inhibiting glucose transport, or via decreased glycogen synthesis, or by a direct
effect on glucose transporter translocation or activity (Guillaume-Genil et al, 1993).
2.7.5 VLDL
VLDL is the primary lipoprotein product of the liver and the carrier of endogenous
triglycerides. Most of the TG in the plasma is carried in VLDL, whereas LDL carries
most of the cholesterol (Chappell and Spector, 1991).
Because of the essential role played by VLDL in lipoprotein metabolism and substrate
flux and the possibility that VLDL may (indirectly) induce atherosclerosis (Howard et al,
1987), its concentration was measured in this study.
2.7.6 IDL
Epidemiological studies in humans suggest that plasma concentration of IDL or remnant
lipoproteins are predictors of the severity or progression of atherosclerosis.
Chapter Two Literature Review 28
Nordestgaard and Tybjaery-Hassan (1992) have suggested that IDL or remnant
lipoprotein concentrations were better predictors of the extent of atherosclerosis than
were LDL or VLDL. Cholesterol-fed animals also demonstrate accumulation of IDL
and rapid development of atherosclerosis (Nordestgaard and Lewis, 1991).
Analysis of human plasma by gradient gel electrophoresis (GGE) has shown the IDL
fraction from normal subjects consist of two major subspecies with particle diameters in
the range of 27.5 to 30.0 nm. The larger, usually predominant, subspecies has been
designated IDL-1, and the smaller, IDL-2 (Musliner et al, 1986).
The IDL subfractions differ in their cholesterol enrichment, with IDL-2 being more
cholesterol enriched than IDL-1. The plasma triglyceride level influences the
predominant IDL subfraction present in the circulation. With higher plasma TG
concentrations, IDL-1 is predominant and may facilitate lipid transfer by CETP action to
a greater extent. Greater CETP activity is thought to result in the formation of smaller
and denser LDL particles (Krauss, 1987).
2.7.7 LDL
In vivo studies of the metabolism of human VLDL and IDL subfractions in a rat model
system have suggested pathways for production of two of the major LDL subclasses,
LDL-I and LDL-II. Small VLDL and the larger IDL species (IDL-1) are specifically
converted by lipolysis in the absence of CETP activity to particles of size and density
similar to LDL-II, while IDL-2 appears to be a precursor of larger, more buoyant LDL-I
particle. However, it is not known how the two major, discrete IDL size subspecies
originate (Musliner et al, 1991).

Chapter Two Literature Review 29
Several studies in animals and in humans have shown that the preferential substrates of
hepatic triglyceride lipase are chylomicrons and VLDL remnants (Nicoll and Lewis,
1980). The decreased hepatic triglyceride lipase activity may results in the accumulation
of IDL and the TG-enrichment of LDL (Robert et al, 1989).
Austin et al (1988) identified two distinct human phenotypes (denoted A and B) by non
denaturing gradient gel electrophoretic analysis of plasma LDL. Phenotype A was
characterized by predominance of large, buoyant LDL particles, and phenotype B by a
major peak of small, dense LDL particles. Phenotype B appeared to be inherited as a
single-gene trait with a dominant mode of inheritance (Austin et al, 1988), although later
studies revealed a more complex picture.
Pattern A is defined as an LDL subclass pattern with the major gradient gel peak at a
particle diameter of 25.5 nm or greater and the presence of a secondary peak of smaller
LDL particles. Pattern B has the major peak at a particle diameter of less than 25.5 nm,
with skewing of the curve toward larger particle diameters (Austin et al, 1988).
Later the same researchers reported that LDL subclass phenotypes are related to other
lipoproteins and also apolipoproteins (Austin et al, 1990). Phenotype B is positively
related to plasma TG and apoB levels, and VLDL and IDL mass. In addition, there is a
negative correlation between phenotype B and HDL-C, HDL2 mass, and plasma apoA-I
concentration (Austin et al, 1990).
LDL subclass phenotype B is related to relatively increased plasma TG, apoB, VLDL,
and IDL concentrations, decreased HDL and plasma apoA-I levels, and increased risk of
coronary artery disease in comparison with subjects with LDL subclass phenotype A
(Feingold et al, 1992). It is possible, therefore, that the initial observation by Austin et al

Chapter Two Literature Review 30
suggesting a single gene trait with dominant inheritace may need to be revised, in the
light of these more complex associations.
2.7.8 HDL
HDL appears to be associated with ‘reverse cholesterol transport’, the delivery of
peripheral tissue cholesterol back to the liver for recycling or for excretion from the body
(Barter, 1993).
HDL appears to protect against the development of premature coronary atherosclerosis
probably through the reverse cholesterol transport process (Miller and Miller, 1975).
The Framingham Study has provided evidence that HDL-C is inversely related to the
development of a myocardial infarction in both men and women (Miller and LaRosa,
1991). Elevated HDL levels have been shown to lead to regression of atherosclerosis in
animal models (Johnson, et al, 1991).
In addition, Schmitz and Williamson (1991) suggested that HDL metabolism plays a
major role in cell membrane protection. Another interesting reason for the anti
atherogenic properties of HDL may be that HDL prevents the oxidation of LDL (Tribble
and Krauss, 1993).
HDL3 is the major substrate for the esterification of plasma cholesterol by the enzymes
CETP and LCAT, and therefore plays an important role in the transport of cholesterol
through the plasma (Barter et al, 1985). The reason for the increased substrate reactivity
of smaller HDL3 particles with LCAT is not clear.
Several hypotheses have been suggested, for instance that the phospholipid / FC and
apoA-I / apoA-II ratios in same way affect substrate reactivity (Fielding et al, 1972).
Chapter Two Literature Review 31
The increasing amount of CE in particles causes enlargement and enlargement may
reduce their ability to act as substrate for LCAT (Fielding et al, 1972).
2.7.9 Lp(a)
Lp(a) was first reported in human plasma as a genetic variant of LDL by Berg in 1963
(Berg, 1963). Like LDL, CE is the major constituent of Lp(a), but the particle contains
more TG than LDL (Fless et al, 1986). Lp(a) particles contain two proteins, apo(a) and
apoB, linked together by a single di-sulfide bond (Gaubatz et al, 1983). Apo(a) is
thought to be synthesized mainly in the liver (Tomlinson et al, 1989).
Elevated plasma Lp(a) concentration is a risk factor for coronary artery disease (CAD)
(Loscalzo, 1990) and peripheral vascular disease (PVD) (Widmann and Sumpio, 1993).
James et al (1995) have suggested that Lp(a) concentrations greater than 30 mg / dl are
independently correlated with vascular disease in IDDM and NIDDM patients.
Apo(a) seems to be little affected by age, sex, and diet (Nestel et al, 1993), although a
recent study has reported that the apo(a) level was increased 25% by the trans fatty acid,
elaidic acid in the diet (Nestel et al, 1993). Haffner et al (1992) reported that Lp(a)
levels were significantly higher in diabetic patients who had higher total and LDL
cholesterol levels.
Apo(a) levels are higher in both IDDM (Jenkins et al, 1991) and NIDDM (Jenkins et al,
1992) patients with microalbuminuria and may contribute to their tendency to
macrovascular disease and early mortality. Apo(a) is elevated in active diabetic
retinopathy (Maioli et al, 1993) and renal failure (Black and Wilcken, 1992). Whether
elevated Lp(a) is a consequence or a cause of diabetic microvascular disease need further
study (Jenkins et al, 1992).
Chapter Two Literature Review 32
The physiological functions of apo(a) or Lp(a) are not clear. The structural homology of
Lp(a) with LDL and plasminogen suggests that Lp(a) may be involved in both atheroma
formation and thrombosis which are most important mechanisms in the pathogenesis of
atherosclerosis (Campbell et al, 1992). Lp(a) may promote thrombosis through
interference with plasminogen activation, but it does not interfere with thrombolytic
therapy during acute myocardial infarction (Simons, 1993).
2.7.10 CETP
Human plasma contains a lipid transfer protein commonly called cholesteryl ester transfer
protein (CETP). CETP facilitates the transfer of cholesteryl ester, triglyceride, and
phospholipid among lipoproteins (Albers et al, 1990). The major function of CETP in
human plasma is believed to be the transfer of LCAT-derived cholesteryl ester to
lipoprotein acceptors, LDL, VLDL, or lipoprotein remnants. During this process, the
acceptor lipoproteins donate triglyceride and phospholipid to HDL. Thus, CETP play a
key role in the ’reverse cholesterol transport’ pathway (Albers et al, 1990).
HDL cholesteryl ester also can be delivered to the liver by other mechanisms such as
selective uptake of CE from HDL without particle endocytosis, and uptake of CE
mediated by apoE on the hepatocyte membrane (McPherson, 1993).
A diet high in cholesterol content increases the plasma CETP concentration in man
(Martin et al, 1991). Marcel et al (1990) reported that the levels of CETP are 25%
higher in women compared with men.
CETP is synthesized in a number of tissues, mainly in the liver and adipose tissue
(McPherson, 1993).

Chapter Two Literature Review 33
2.7.11 Apolipoproteins A-I and B
In patients with coronary heart disease, total plasma apoB levels is often significantly
elevated in the presence or absence of a reduction of total plasma apoA-I (Douste-Blazy
and Kloer, 1989).
Many studies have reported that plasma apolipoprotein A-I, the major protein of HDL, is
a good negative predictor for coronary heart disease (Fruchart, 1990).
These are at least two main lipoprotein subclasses containing apo A-I: those which
contain, as the main protein components apoA-I and apoA-II, designated Lp A-I:A-II,
and those contain apoA-I but not apoA-II, designated Lp A-I (Fruchart, 1990). These
subclasses can be separated immunochemically.
Fruchart et al recently reported that cholesterol efflux from cells is mediated by Lp A-I
and not by Lp A-IiA-II, and that the lower HDL concentrations in coronary artery
disease were linked with lower Lp A-I levels, while Lp A-LA-II was unchanged
(Fruchart et al, 1990).
2.8 Carbohydrate Metabolism
2.8.1 Factors Influencing Rates of Glucose Uptake
There are three major sources of plasma glucose (Figure 2-3), diet and hepatic
gluconeogenesis and glycogenolysis (Owen et al, 1969).
Several factors influence the rate of glucose uptake. These are: plasma glucose level,
free fatty acids, muscular work, and hormonal effects. A high concentration of available
Chapter Two Literature Review 34
NEFA will result in a decrease in the rate of glucose uptake by skeletal and cardiac
muscle at any given level of insulin (Randel et al, 1963).
2.8.2 Insulin
Insulin is secreted by the pancreas. Insulin acts in two major ways: (1) it has a key role
in the metabolism of carbohydrate, lipid, and proteins, and (2) it has growth-promoting
effects on DNA synthesis, cell division, and cell differentiation (Vander et al, 1994 c).
Insulin and glucagon play a major role in the regulation of glucose homeostasis. Insulin
stimulates anabolic processes and favours energy storage, whereas glucagon stimulates
catabolic processes, which consume energy substrates. Thus, their effects on
glyconeogenesis, glycogenolysis and gluconeogenesis are opposed, and their activities in
relation to these multi-enzyme systems are complex (Freychet, 1990).
The major sites of action of these hormones are the liver, adipose tissue, and skeletal
muscles. Insulin and glucagon act via specific membrane receptors in their target cells
(Freychet, 1990).
2.8.3 Glucose Tolerance
Glucose tolerance, as estimated by the oral glucose tolerance test (OGTT), depends

Chapter Two Literature Review 35
Sources
Figure 2-3 Sources and sinks for plasma glucose (Steinberg, 1990)
on complex iteration among several physiological processes, including first-phase and
second phase insulin secretion, insulin removal, insulin sensitivity, and the tendency of
high glucose concentration (independent of insulin) to increase glucose utilisation
(Martin et al, 1992). Subjects with insulin resistance may be euglycemic with normal
blood glucose concentrations, maintained by hypersecretion of insulin. In these case,

Chapter Two Literature Review 36
hyperinsulinemia may be noted both in the fasting and postprandial states (Beck-Nielsen
et al, 1990).
The risk of subsequent glucose intolerance or diabetes in women with previous GDM is
related to pre-pregnancy body mass index (BMI) and fasting plasma glucose during
pregnancy (as well as current BMI). Subjects who are fatter before pregnancy and
whose plasma glucose concentrations are higher during pregnancy are more likely to
develop glucose intolerance or diabetes during pregnancy and/or after delivery (Coustan
et al, 1993).
Effendic et al have reported that 60% of normal weight women with previous GDM had
borderline or decreased oral glucose tolerance 6-36 months postpartum which could be
explained either by low insulin response or by the combination of a low insulin sensitivity
and low insulin response (Effendic et al, 1987).
2.8.4 Insulin Resistance
Insulin resistance may be defined as a state (of a cell, tissue, system or body) in which
more than normal amounts of insulin are required to draw out a quantitatively normal
response (Berson and Yalow, 1970). It should be emphasised that the level of glycemia
may be within the normal range in a person with insulin resistance as a result of
compensatory hyperinsulinemia (Flier, 1993).
During last two decades, several possible mechanism have been suggested for the
pathogenesis of insulin resistance.
The classification of insulin resistance:

Chapter Two Literature Review 37
(1) Circulating anti-insulin antibodies and excess insulin degrading enzymes have been
suggested, but those have not been shown to be important causes.
(2) A primary (ie. genetically determined) defects in the ability of insulin to signal its
target cells (ie. receptor mutations) is again not an important cause.
(3) The major category of mechanisms for insulin resistance involves post-receptor
mechanisms. These include the mediation of local or circulating factors on target cells to
increase resistance to one or more pathway of insulin action. This category may include
primary genetic defects and cellular consequence of metabolic changes (Flier, 1993).
2.8.5 Insulin Resistance Syndrome
Insulin resistance is a common and multifaceted syndrome which occurs with high
frequency in the general population. Much attention has recently been focused on the
insulin resistance syndrome, also referred to as ‘syndrome X ’. The syndrome of insulin
resistance may include a cluster of several common metabolic disorders:
hyperinsulinemia, obesity, NIDDM, hypertension, dyslipidemia, and as a complication of
these, atherosclerotic vascular disease (DeFronzo and Ferrannini, 1991). Central obesity
also has been added to the cluster (Zammet, 1989).
The evidence suggests that hyperinsulinemia plays a major role in the development of the
features of syndrome X. While hyperinsulinemia appears to be crucial for the
development of syndrome X, it must usually develop secondary to a decrease in insulin
sensitivity. In terms of etiology, therefore, a decrease in insulin sensitivity may be the
primary event in syndrome X (Walker and Alberti, 1993).

Chapter Two Literature Review 38
Insulin sensitivity has been shown to vary considerably in the normal population and be
influenced by many different factors such as dietary composition and intake, physical
activity, and endocrine status (Walker and Alberti, 1993).
Studies have suggested that genetic factors also may play role in the development of
insulin insensitivity and hence syndrome X. Studies on the Pima Indian have shown that
insulin resistance in this population may be due to an important genetic effect related to
the fatty acid binding protein gene on chromosome 4 (Prochazka et al, 1992). In
addition, studies on persons with a positive family history of diabetes in first degree
relatives have suggested that these persons have insulin resistance which probably has a
genetic basis (Eriksson et al, 1989).
Thus, it seems the likely sequence is that a combination of both environmental and
genetic factors influence the overall insulin resistance state, then hypednsulinemia occurs,
and then phenotypic features of syndrome X occur (Walker and Alberti, 1993).
NIDDM is the disease classically associated with insulin resistance (Seely and Olefsky,
1993). Impaired glucose tolerance is a common clinical feature in all types of insulin
resistance syndrome and hyperinsulinemia occurs in compensation for this defect in
affected subjects (Moller and O’Rahilly, 1993).
2.8.6 HbAlc
Haemoglobin can combine non-enzymatically with glucose, and the haemoglobin
conjugate, haemoglobin A le, can be measured in blood. It increases in concentration
roughly in proportion to the degree of sustained hyperglycaemia and is used clinically as
a tool to indicate the degree of control of the hyperglycaemia in people with diabetes
(Steinberg, 1990).
Chapter Two Literature Review 39
Other plasma proteins and a number of tissue proteins are also glycated in diabetes.
Whether such glycation of proteins contributes to clinical complications is still not clear
(Steinberg, 1990).
The Framingham Heart Study has reported that the plasma HbAlc levels are significantly
above normal in non-diabetic women with an early cardiovascular event (Singer et al,
1992).
Giugliano et al (1992) also reported a significant correlation between HbAlc and classic
risk factors of cardiovascular disease such as hypertension, and cholesterol in diabetic
patients.
2.9 Raised Blood Pressure
Hypertension is defined as a chronically elevated systemic arterial pressure. The dividing
line between normal blood pressure and hypertension is an arbitrary one, set at
approximately 140 /90 mm Hg.
Hypertension may be due to increased total peripheral resistance or increase in cardiac
output or both. Increased total peripheral resistance may be the result of increased
arteriolar constriction (Vander et al, 1994 b). About 95% of people with hypertension
have essential hypertension (primary hypertension) in that the cause of hypertension is
unknown (Ross, 1990).
2.9.1 Essential Hypertension and Insulin Resistance
The association between NIDDM, obesity, and essential hypertension has been known
for many years (Kannell and McGhee, 1979, reporting data from the Framingham Heart
Study).
Chapter Two Literature Review 40
Others have linked high blood pressure to insulin resistance. Modan et al reported that
postprandial insulin concentrations were higher in both treated and untreated
hypertensive patients than in normotensive controls. This finding was independent of the
presence of obesity and diabetes (Modan et al, 1985). Parillo et al reported greater
serum insulin and glucose levels 60 to 180 minutes after a glucose tolerance test in
hypertensive patients than in controls (Parillo et al, 1988).
The CARDIA study reported that high fasting insulin concentration was associated with
elevation in both systolic and diastolic blood pressure in 5115 participants, aged 18-30
years, of different sex, race, and education levels. The strength of these associations
decreased (but the association were still significant) after adjustment for age, sex, race,
BMI, alcohol consumption, smoking, physical activity, and exercise (Manolio et al,
1990).
Studies on hypertensive subjects using the euglycemic hyperinsulinémie clamp and
minimal model techniques indicated that the increased insulin levels are a compensatory
response to impaired insulin-stimulated glucose uptake (Ferrannini et al, 1987, Pollare et
al, 1990).
Istfan et al (1992) have reported that obese hypertensive subjects had greater insulin
resistance compared with obese non-hypertensive subjects. It is thought that the
relationship between primary hypertension and insulin resistance is independent of
obesity (Pollare et al, 1990).
The association between insulin resistance and high blood pressure has not been
determined in all populations. Insulin level was correlated with blood pressure in young
Caucasians but not in a black American population or in the Pima Indians (Saad et al,

Chapter Two Literature Review 41
1991). Pima Indians have a higher prevalence of insulin resistance and hyperinsulinemia
than other American (non- Indian American) populations but not a higher prevalence of
hypertension (Saad et al, 1991).
It should be emphasized that the relationship between hyperinsulinemia and high blood
pressure is not found in renal disease. Hypertension secondary to renal disease is not an
insulin resistant state and is not associated with hyperinsulinemia (Marigliano et al,
1990).
An abnormal lipoprotein profile has been demonstrated in patients with essential
hypertension similar to the dyslipidemia of diabetes (hypertriglyceridemia and a low level
of HDL-c) (Shieh et al, 1987), suggesting that a number of patients with essential
hypertension, in fact, have hypertension associated with the insulin resistance syndrome.
It is not known whether hyperinsulinemia is a cause of high blood pressure or is
secondary to high blood pressure, or if both hyperinsulinemia and high blood pressure
result from other factors. Shen et al reported that the reduction of blood pressure in
hypertensive subjects is not related to normalisation of the plasma insulin levels (Shen et
al, 1988), suggesting that hyperinsulinemia may be a causal factor for high blood
pressure, or both may be caused by another factor or factors.
2.10 Microalbuminuria
Qualitative and quantitative analyses of urinary protein excretion are used to diagnose
renal disease. A urinary albumin excretion rate (UAER) of 200 |ig / min termed
microalbuminuria (Jensen et al, 1993).
Chapter Two Literature Review 42
The UAER is increased in variety of renal and urinary tract diseases. UAER also
appears to be elevated after prolonged upright posture and vigorous muscular exercise
(Waller et al, 1989).
2.10.1 Pathophysiology of Microalbuminuria
Healthy adults normally excrete small amounts (less than 150 mg / day) of protein in the
urine including mainly albumin and Tamm-Horsfall protein. Excretion of greater than
150 mg / day is termed proteinuria (Wilson, 1992).
Increased protein excretion may happen whenever there is an increased filtered load
secondary to an increase in glomerular permeability (glomerular proteinuria), an increase
in the plasma concentration of a protein (overflow proteinuria), or an increase in
glomerular filtration rate (GFR).
Proteinuria will also result from a decrease in the tubular absorption of normally
absorbed proteins (tubular or low molecular weight proteinuria) or an increase in protein
secretion or non-specific addition of protein to the fluid in the urinary tract such as
increase in secretory IgA during inflammation (urogenic or secretory proteinuria)
(Beetham and Cattell, 1993).
Albuminuria associated with diabetes is usually a consequence of increased glumerular
permeability. Diabetic nephropathy evidenced by hypertension, macroalbuminuria, and
renal dysfunction, develops in about 40% of IDDM patients approximately 10-20 years
after the onset of disease (Harris et al, 1987, Selby et al, 1990) and also in 25% of
NIDDM patients 5-10 years after their diagnosis (Selby et al, 1990).
Chapter Two Literature Review 43
The pathogenesis of diabetic nephropathy is not completely clear. The relative
contributions of hypertension, dietary protein, glucose control, dyslipidemia and other
factors in the initiation and continuation of renal injury are not fully known. Strict blood
pressure control and protein restriction are important treatment strategies in both early
and established diabetic kidney disease (Carella et al, 1994). More than 25% of all cases
of end-stage renal disease in the United Statesare due to diabetes mellitus (Krolewski et
al, 1985).
Microalbuminuria independently predicts decrease in renal function (Mogensen, 1986)
and atherosclerotic cardiovascular disease in diabetic patients (Messent et al, 1992). It
occurs before overt nephropathy in both IDDM (Harris et al, 1987, Selby et al, 1990,
Mogensen and Christensen, 1984) and NIDDM (Harris et al, 1987). Microalbuminuria is
thus considered to be a predictor for the development of nephropathy (Harris et al, 1987,
Selby et al, 1990, Mogensen and Christensen, 1984).
The Pittsburgh Epidemiology of Diabetes Complications Study (PEDCS) suggested that
glycémie control, age or duration of IDDM, dyslipidemia, and possibly hypertension all
may contribute to the development of microalbuminuria. In addition, PEDCS proposed
that the adverse cardiovascular risk profile exist in subjects with overt nephropathy may
begin to develop even before the discovery of microalbuminuria (Coonroo et al, 1993).
2.11 Obesity and Androgen Status
2.11.1 Obesity
Obesity is a major problem for developed nations, affecting approximately 10-50% or
more of the adult population (Bray, 1985). A useful measure of obesity is the body mass
index (BMI), which is the weight in kilograms divided by the height in meters squared
Chapter Two Literature Review 44
2(kg/m ) (Redmond, 1991). Obesity is associated with premature mortality, morbidity,
and social disadvantage (Pi-Sunyer, 1991).
The reference range for BMI is 20 to 25 kg/m2 for men and 19 to 24 kg/m2 for women.
Above 25 kg/m2 for men and 24 kg/m2 for women is considered ‘overweight’ and above
30 kg/m2 for both men and women regarded as ‘obese’ (Egger, 1992). According data
from the National Heart Foundation Risk Factor Prevalence Survey in Australia (No 3,
1989), approximately 48% of men and 34% of women aged 20-69 years have a BMI
more than 25 kg/m2 (Calvert, 1991).
The health risks of obesity increase with its severity and reach significance at a weight >
20% above optimal weight in individuals. Mortality risk begins to increase when the
BMI exceeds 30 in adults (Redmond, 1991).
2.11.1.1 Classification
Obesity can be classified into categories. The most common classification divides
subjects into two categories: upper body (android) and lower body (gynoid) obesity
(Kissebah et al, 1989). Subjects with upper body obesity present a higher waist / hip
ratio (WHR), increased deposition of mesenteric or visceral adipose tissue,
hyperinsulinemia, with greater insulin resistance, and dyslipidemia in comparison with
subjects with lower body obesity (Kissebah et al, 1989).
Abdominal obesity may be calculated by subscapular / triceps skinfold ratio (Centrality
Index) or waist / hip ratio (WHR). WHR has been suggested as an independent risk
factor for several diseases (ie diabetes mellitus, hypertension, cardiac events stroke,
dyslipidemia, varicose veins, and arthritis), and also for mortality. WHR of more than
0.9 in males and 0.8 in females should be taken as representing increased risk (Egger,
Chapter Two Literature Review 45
1992). Kalkhoff et al (1983) suggested that women with WHR = 0.83-0.99 should be
considered to have upper body segment obesity and women with WHR = 0.50-0. .73
should be considered to have lower body segment obesity.
Recently, Fujioka et al (1987) have proposed that there are two different types of obesity
with respect to metabolic and clinical features: one is the ‘visceral type’, characterised by
marked fat accumulation in the abdominal cavity and an association with metabolic
alterations such as glucose intolerance, hyperlipidemia, and the other one is the
‘subcutaneous type’ in which fat accumulates predominantly in the subcutis and is rarely
associated with metabolic disorders.
Both men and women with abdominal subcutaneous or visceral obesity tend to have
large fat cells, increased LPL activity, increased lipolysis, and low antilipolytic effect of
insulin.
High plasma sex steroid, glucocorticoid, catecholamine, and growth hormone
concentrations are associated with the amount of visceral fat, and the association may be
somewhat different in men and women (Bouchard, 1994)
2.11.1.2 Pathophysiology of Obesity
The causes of obesity are multiple. Energy expenditure is an important factor in
determining weight gain or loss. Daily energy expenditure can be divided into three
major components: basal metabolic rate, which represents 50-70% of daily energy
expenditure, the thermic effect of food which represents about 10%, and the energy cost
of physical activity which represents 20-40% of daily energy expenditure (Ravussin and
Swinbum, 1992).

Chapter Two Literature Review 46
Dietary factors play an important role in the regulation of body weight. Diets high in fat,
sugar, or both are the most effective promoter of obesity in animal investigations
(Sclafani, 1986, Lucas and Scla fani, 1990).
In addition, the endocrine system plays an important role in the etiology and maintenance
of obesity. Abnormalities in insulin secretion and function are probably the most
important factors in metabolic changes in the obese subjects (Heber, 1994).
2.11.1.3 The Role of Obesity in the Pathogenesis of Diabetes Mellitus
The relationship between obesity and insulin resistance and NIDDM is very complex.
Most patients with NIDDM are obese. Fujioka et al (1987) have reported that the
fasting plasma glucose and area under the plasma glucose concentration curve after oral
glucose loading (plasma glucose area) were significantly greater in obese than non-obese
patients.
Subjects with excess intra-abdominal (visceral) fat have more insulin resistance related to
obesity (Bjomtorp, 1989). Abdominal obesity is considered as a risk factor for the
development of insulin resistance and its metabolically related abnormalities (Bjorntorp,
1990).
2.11.2 Androgen Status
Sex-hormone-binding globulin (SHBG) is a steroid-binding globulin which binds to
oestradiol and testosterone. In normal women, about 65% of the circulating testosterone
is tightly bound to SHBG, while most of the remaining hormone is loosely bound to
albumin. Only 1-2% of the total testosterone is free. It is generally accepted that
Chapter Two Literature Review 47
testosterone bound to SHBG is not readily available to intracellular androgen receptors
in target tissues and thus has little biologic activity (Goldfien and Monroe, 1994).
Women with overall or central obesity exhibit a lower plasma SHBG (Lindstedt et al,
1991, Haffner et al, 1991). SHBG shows a much higher affinity to testosterone than
oestradiol and therefore any changes in SHBG concentrations cause a greater change in
the free testosterone fraction than the free oestradiol fraction (Reed et al, 1993).
Some studies have reported that low plasma levels of SHBG and central obesity are
correlated with higher plasma concentrations of free testosterone (Haffner et al, 1989).
Thus, a low plasma concentration of SHBG results in hyperandrogenicity in women
(Rosenfield, 1975).
Preziosi et al (1993) found a significant and negative relationship between SHBG and
insulin level in healthy pre-menopausal and post-menopausal women. This relationship
was independent of age, BMI, subscapular skinfold, and fasting and 2-h plasma glucose.
Studies have shown that excess sex steroid and glucocorticoid concentrations in the body
may be associated with regional fat distribution (upper body segment) and related
metabolism disorders and have suggested that this relationship may be causal (Kissebah
et al, 1989). Hyperandrogenicity may decrease insulin sensitivity in pre-menopausal
women (Evans et al, 1983).
Tikkanen and Nikkila (1987) have reported that sex steroids demonstrate significant
effects on lipoprotein metabolism. Steroids with androgenic activity increase hepatic
triglyceride lipase activity and decrease plasma HDL2-C levels. This phenomenon was
also reported in obese women with a high abdominal adiposity (Despers et al, 1989).
Chapter Two Literature Review 48
2.12 Haemostatic Disorders
Diabetes mellitus is a common endocrine disease which exhibit an increased risk of
atherosclerosis. The classic risk factors predict only 30% of all cardiovascular events
(Heller et al, 1984). Several prospective epidemiological investigations suggest that
plasma fibrinogen concentration is an independent cardiovascular risk factor (Meade et
al, 1986, Kannel et al, 1987, Yarnel et al, 1991, Resch et al, 1992).
2.12.1 Fibrinogen
The Framingham Study has reported that fibrinogen levels independently are associated
with cardiovascular disease and increase with age in both women and men (Kannel et al,
1987, Wilhelmsen et al, 1984).
Plasma fibrinogen concentration seems to be related to hyperlipoproteinemia,
hypertension, smoking, and several life style factors such as dietary habits (Koenig and
Ernst, 1992). Several studies have reported that the fatty acid composition of the dietary
lipids is an important factor in the athero-thrombotic process (Berg-Schmidt et al, 1990,
Grundy and Denke, 1990). Cigolini et al (1994) examined the fatty acid composition of
adipose tissue as an objective index of dietary fat intake in healthy men and they found
no correlation between fibrinogen level and adipose tissue fatty acids.
Baxter et al (1988) suggested hyperfibrinogenemia may be an important risk factor for
peripheral arterial disease in men. Cigolini et al (1994) suggested that
hyperfibrinogenemia may be considered as an integral part of syndrome X and that it may
contribute along with impaired fibrinolytic activity to a ‘procoagulanf state.
Chapter Two Literature Review 49
The exact mechanism underlying hyperfibrinogenemia and risk of CHD is not clear.
There are several hypotheses. Hyperfibrinogenemia can adversely influence platelet
aggregability and plasma viscosity, and thus predispose (perhaps) to thrombosis. In
addition, atherosclerosis can cause hyperfibrinogenemia as fibrinogen is an acute-phase
protein (Heinrich et al, 1994).
2.12.2 Factor VII
Factor VII is a vitamin K-dependent glycoprotein with a molecular weight of 50,000
dalton composed of a single polypeptide chain, synthesized in the liver. The
physiologically important activator of factor VII is factor Xa which, in the presence of
calcium and phospholipids, rapidly converts factor VII to factor Vila. In the presence of
thromboplastin, factor V ila activates factor IX and factor X very rapidly. The coagulant
pathway proceeds, ending in the production of thrombin (Vander et al, 1994 d). Figure
9-1 shows the classical view of the intrinsic and extrinsic pathways of the clotting
cascade in humans (Vander et al, 1994 d).
Factor VII levels increase with age in both men and women, and may be higher in
women. Factor VII levels increase in late pregnancy, with use of oral contraceptives,
obesity, and in post-menopausal women (Bloom and Thomas, 1987, Poller et al, 1990).
Factor VII coagulant activity is also increased in hyperlipidemia (Miller et al, 1985),
diabetes (Fuller et al, 1979), and with high dietary fat intake (Miller et al, 1986).
High levels of factor VTIc have been shown to be associated with ischaemic heart disease
in men (Meade et al, 1986, Wilhelmsen et al, 1984). Increased factor VII levels have
been reported in NIDDM patients with microalbuminuria and cardiovascular disease
(Stehouwer et al, 1992).
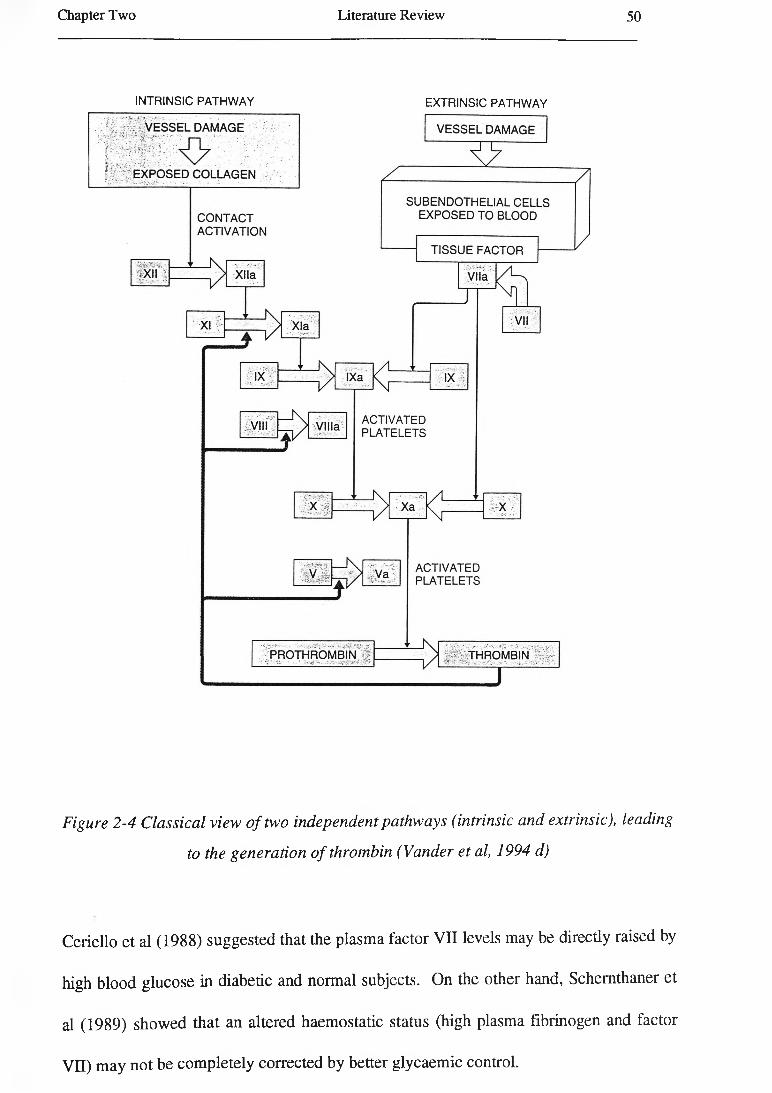
Chapter Two Literature Review 50
INTRINSIC PATHWAY EXTRINSIC PATHWAY
Figure 2-4 Classical view o f two independent pathways (intrinsic and extrinsic), leading
to the generation o f thrombin (Vander et al, 1994 d)
Ceriello et al (1988) suggested that the plasma factor VII levels may be directly raised by
high blood glucose in diabetic and normal subjects. On the other hand, Schernthaner et
al (1989) showed that an altered haemostatic status (high plasma fibrinogen and factor
VII) may not be completely corrected by better glycaemic control.
Chapter Two Literature Review 51
2.12.3 Von Willebrand Factor (vWF)
vWF is a complex glycoprotein synthesized by vascular endothelium (Bloom et al, 1973)
and megakaryocytes (Nachman et al, 1977).
The initial response to blood-vessel damage is vasoconstriction and this is facilitated by
formation of a platelet plug, then blood coagulation in the damaged blood vessels. vWF,
secreted by the endothelial cells, is necessary for platelet aggregation (Vander et al, 1994
d).
High plasma levels of vWF, indicating endothelial cell dysfunction, have been found in
diabetic patients with retinopathy (Stehouwer et al, 1992, Porta et al, 1987, Coller et al,
1978). In addition, Silveira et al (1992) have suggested that abnormal degradation of
vWF occurs in kidneys in IDDM patients with and without nephropathy.
The role of vWF in the pathogenesis of diabetic nephropathy is not clear. It is probably a
marker of endothelial dysfunction, without being directly involved in the pathogenesis of
diabetic nephropathy. Alternatively, vWF may stimulate adhesion of platelets to exposed
subendothelium in the kidney (Stehouwer et al, 1991).
Cross-sectional studies have suggested that raised plasma factor VIII and vWF level is
associated with clinical coronary artery disease (Sugrue et al, 1985). However, Myreng
et al (1986) and Hamsten et al (1986) have reported no correlation between plasma vWF
level and either clinical or angiographical findings of coronary artery disease.
Chetty et al (1988) found that race is a major determinant of vWF and factor VIII.
Black people in the USA have higher factor VIII and vWF levels than whites.
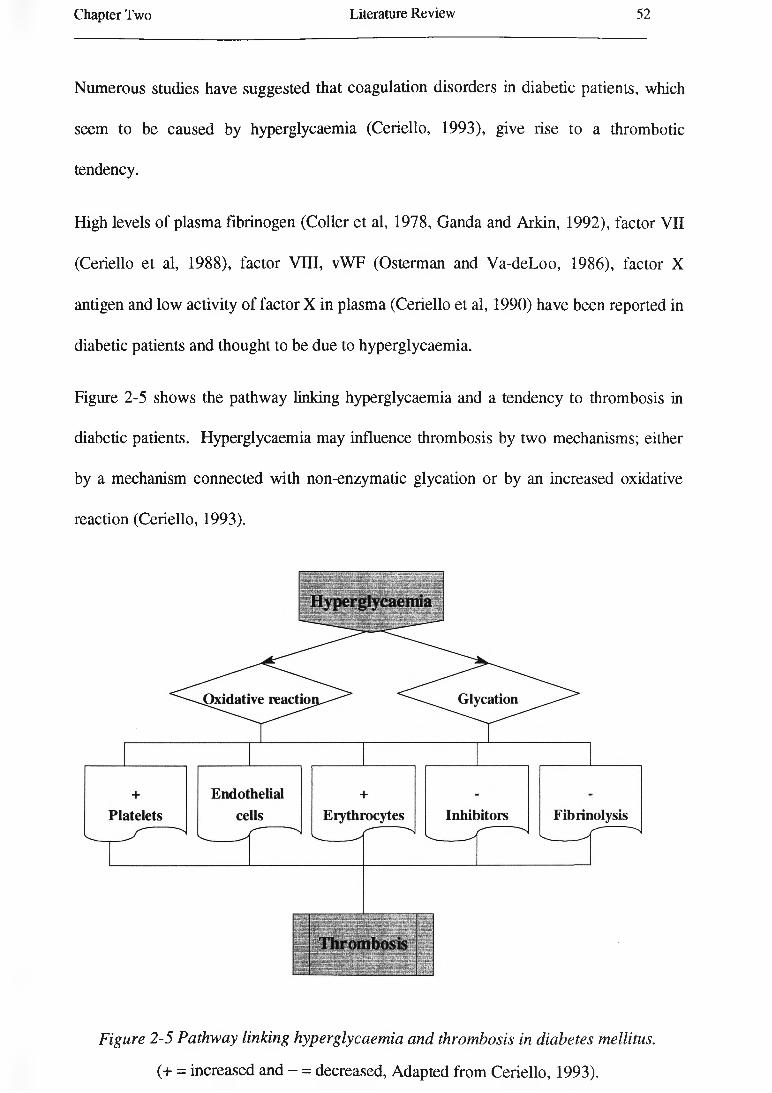
Chapter Two Literature Review 52
Numerous studies have suggested that coagulation disorders in diabetic patients, which
seem to be caused by hyperglycaemia (Ceriello, 1993), give rise to a thrombotic
tendency.
High levels of plasma fibrinogen (Coller et al, 1978, Ganda and Arkin, 1992), factor VII
(Ceriello et al, 1988), factor VIII, vWF (Osterman and Va-deLoo, 1986), factor X
antigen and low activity of factor X in plasma (Ceriello et al, 1990) have been reported in
diabetic patients and thought to be due to hyperglycaemia.
Figure 2-5 shows the pathway linking hyperglycaemia and a tendency to thrombosis in
diabetic patients. Hyperglycaemia may influence thrombosis by two mechanisms; either
by a mechanism connected with non-enzymatic glycation or by an increased oxidative
reaction (Ceriello, 1993).
Figure 2-5 Pathway linking hyperglycaemia and thrombosis in diabetes mellitus.
(+ = increased and - = decreased, Adapted from Ceriello, 1993).
Chapter Two Literature Review 53
2.13 Dietary Habits and Other Lifestyle Factors
2.13.1 Dietary Habits
Recently, there has been much interest in elucidating the underlying links between
NIDDM and genetics, obesity, nutrition, physical activity, and other factors. Diet plays a
significant role in determining plasma concentrations of TG, cholesterol, TG-rich
lipoproteins, and also HDL-C.
The relationship between lipids and lipoproteins and atherosclerosis also encourages
investigators to pay more attention to dietary factors related to disease.
2.13.1.1 Dietary Fat and Blood Lipids and Lipoproteins
The type and amount of fat in the diet influences blood lipid and lipoprotein
concentrations. Keys et al (1965) have shown that dietary polyunsaturated fatty acids
decrease and saturated fatty acids increase total plasma cholesterol concentrations.
However, the mono-unsaturated oleic acid and saturated stearic acid are neutral. Many
researchers have reported that monounsaturated fatty acids have no significant influence
on serum cholesterol concentrations (Thomson et al, 1967, McGandy and Hegsted,
1975).
Grundy and Denke (1990) recently reported that only saturated fatty acids with chain
lengths of 12, 14, and 16 carbon atoms in the diet increase total plasma cholesterol levels
mainly by elevating the LDL levels, and the other fatty acids (such as stearic acid) have
less effect on plasma LDL levels. Both polyunsaturated and monounsaturated fat reduce
LDL levels when replacing saturated fat (Grundy and Denke, 1990).

Chapter Two Literature Review 54
The plasma TG concentrations change with diet. Postprandially, the plasma TG
concentration increases due to the appearance of chylomicrons and their remnants in
plasma. The concentration of TG depends on both the amount and the type of fat in the
diet. Saturated fat in the diet produces a longer postprandial plasma triglyceride than
polyunsaturated fat. The type and amount of fat in the diet also influence the fasting
levels of TG, mainly by increasing the concentrations of VLDL (Norum, 1992).
The fasting TG concentration in plasma decreases when monounsaturated fat is
substituted for carbohydrates (Grundy, 1986). Polyunsaturated fatty acids (n-6 type)
also decrease the fasting TG concentrations in plasma (Chait et al, 1974).
Diet affects LPL activity. In the fasting state the LPL activity increases in muscle,
however, in the postprandial state, the activity increases in adipose tissue. The activity
of LPL seems to be mediated by insulin and the insulin sensitivity of the muscle and
adipose cells (Kiens et al, 1989).
Dietary unsaturated fatty acids tend to cause larger chylomicrons than saturated fatty
acids intake (Ockner et al, 1969 and Ockner and Jones, 1970). Larger chylomicrons are
cleared from plasma faster than smaller chylomicrons.
Saturated fatty acids in the diet increase the plasma VLDL concentrations. However,
dietary fish oil decreases the plasma VLDL concentration resulting a small effect on
plasma cholesterol (Harris, 1989, Sullivan et al, 1986). The main effect of marine fish oil
on plasma lipids is a reduction in plasma TG level (Sanders, 1987, Schmidt et al, 1993).
The proposed mechanisms for the VLDL-lowering effect of fish oil might be due to
reduced plasma FFA concentrations resulting from decreased peripheral lipolysis of TG
(Singer et al, 1990), increased oxidation of fatty acids in the liver, or because saturated
Chapter Two Literature Review 55
and monosaturated fatty acids stimulate VLDL synthesis and n-3 polyunsaturated fatty
acids do not have this effect (Harris et al, 1990, Dixon et al, 1991). In addition dietary
marine fish oil tends to increase HDL-C (Schmidt et al, 1993).
LDL concentration is increased by using saturated fats in the diet, probably through
effects on hepatic LDL receptors (a decrease in LDL receptor activity and thus a
reduction in the LDL catabolism rate), but the mechanism is not clear (Norum, 1992).
Dietary fatty acids do not appear to alter the rate of plasma cholesterol synthesis.
Alteration in the plasma cholesterol concentrations may be due to an increase in the
output of faecal neutral sterols and of faecal bile acids (Durrington, 1995).
On the other hand, saturated fat in the diet tends to produced smaller VLDL particles
than polyunsaturated fat. It seems that smaller VLDL particles are more prone to
convert to LDL particles than large VLDL particles are. This may be a possible
mechanism underlying increased LDL levels by using saturated fat (Norum, 1992).
Bonanome et al (1992) have found that a diet rich in monounsaturated fatty acids
(MUFA) compared with polyunsaturated fatty acids increases the resistance of plasma
LDL to oxidative modification, independent of their content of antioxidant. This effect
might lower the atherogenicity of these lipoproteins.
Thus, a low fat, monounsaturated fatty acid-rich diet is as effective as a low fat,
polyunsaturated fatty acid rich diet in lowering total and LDL-C, but both also lower
HDL-C concentrations (Wahrburg et al, 1992). Wahrburg et al (1992) suggested that
the monounsaturated fatty acid-rich diet may be more advantageous than the
polyunsaturated fatty acid-rich diet because it does not lower plasma apoA-I
concentration as much as the polyunsaturated fatty acid rich diet.
Chapter Two Literature Review 56
Because of the anti-atherogenic effect of HDL-C, the effect of dietary fat on HDL-C has
been investigated intensively. Diets low in fat cause both low plasma HDL and LDL
concentrations, however a diet high in saturated fat results in high HDL and LDL
concentrations. Dietary polyunsaturated fat, but not monounsaturated fat, leads to lower
HDL-C levels (Grundy and Denke, 1990).
Animal studies have suggested that a diet rich in cholesterol and saturated fat (an
atherogenic diet) enhances the plasma CETP activity (Stein et al, 1990, Quinet et al,
1990). Increased CETP activity may result in decreased levels of HDL-C and increased
levels of VLDL-C and LDL-C (Grundy and Denke, 1990).
Trans-isomers of fatty acids, formed by the partial hydrogenation of vegetable oils to
produce margarine and vegetable shortening, increase the LDL-C / HDL-C ratio. As a
result, consumption of partially hydrogenated vegetable oils may contribute to the
occurrence of coronary heart disease (Willett et al, 1993).
2.13.1.2 Dietary Cholesterol and Blood Lipids and Lipoproteins
Fungwe et al (1992) have reported that increasing dietary cholesterol intake increase the
concentrations of TG and cholesteryl ester in liver and plasma in rat. This is
accompanied by reduced fatty acid oxidation and increased incorporation of exogenous
fatty acid into hepatic TG and increased secretion of VLDL (Fungwe et al, 1992).
Interestingly, Fungwe et al (1994) have recentiy suggested that dietary cholesterol
stimulates the biosynthesis of FFA, while the addition of TG to the diet stimulates
production of cholesterol.

Chapter Two Literature Review 57
Dietary cholesterol intake causes elevation in the plasma total cholesterol and LDL-C
(Erickson et al, 1964, Hegsted et al, 1965). Studies have shown that the serum
cholesterol response to dietary cholesterol tends to plateau at high cholesterol intakes
(Keys, 1984, Hegsted, 1986).
Riccardi et al (1987) suggested that the most effective dietary change to reduce plasma
cholesterol concentrations in human is to decrease the consumption of saturated fat and
cholesterol.
2.13.1.3 Dietary Carbohydrate and Blood Lipids and Lipoproteins
A high carbohydrate diet increases plasma TG concentration but not that of cholesterol.
The effects of dietary carbohydrates depend on the type of carbohydrate. Intake of
sucrose or fructose within the range usually found in the population does not have any
elevating effect on plasma triglycerides in most normal and diabetic subjects (Truswell,
1994). While the plasma TG levels increase, HDL-C levels decrease (Gonen et al, 1981,
Brinton et al, 1990).
In human, increased fasting TG levels are observed with very high carbohydrate intake, >
35% of energy from sucrose or > 20% of energy from fructose, more commonly in men
and in conjunction with saturated fat intake (Truswell, 1994).
The Lipid Research Clinics Study Prevalence Programme reported that there is a positive
correlation between dietary cholesterol intake and the serum HDL-C in school-age white
boys (Glueck et al, 1982). However, another study reported that serum HDL-C
concentration was relatively unaffected by increases in dietary cholesterol (Mahley et al,
1978).
Chapter Two Literature Review 58
2.13.1.4 Dietary Fibre and Blood Lipids and Lipoproteins
Wheat bran and cellulose (insoluble polysaccharides) do not decrease plasma cholesterol
concentration. In contrast, pectin, guar gum, oat bran, psyllium husk, bean (legumes),
fruit and vegetables decrease plasma cholesterol and LDL-C concentrations (Schneeman
and Tietyen, 1994, Riccardi and Rivellese, 1991). There is a negative correlation
between plasma total cholesterol concentrations and dietary fibre intake (Kirby et al,
1981).
In general, evidence that fibre in fruits and vegetables has some hypocholesterolemic
effect is better than for most of the cereals so far studied. One aim of a lipid-lowering
diet must be to decrease saturated fat consumption and increase fibre intake (Durrington,
1995). Therefore, in practice, the consumption of legumes, vegetables, and fruit should
be encouraged (Riccardi and Rivellese, 1991).
The mechanisms by which dietary fibre acts as a hypoglycemic and hypolipidemic agent
are not clear. Several mechanisms have been proposed including increasing the faecal
excretion of bile acids and decreasing the rate of lipid absorption in the large intestine
(Schneeman and Tietyen, 1994).
The ability of dietary fibre to delay food digestion and nutrient absorption clearly has an
important effect on lipid and carbohydrate metabolism (Riccardi and Rivellese, 1991).
2.13.1.5 Effect of Dietary Factors on Carbohydrate Metabolism and Insulin
Resistance
Diet is an environmental factor that has changed in those populations with changing
prevalence of non-insulin (type II) diabetes (Kawate et al, 1979), suggesting that diet is a
causative factor for diabetes.
Chapter Two Literature Review 59
The San Luis Valley Diabetes Study has suggested that high fat / low-carbohydrate diets
are correlated with the onset of NIDDM in humans (Marshall et al, 1991). Thus, fat
consumption significantly predicts NIDDM risk in subjects with IGT after controlling for
obesity and markers of glucose metabolism (Marshall et al, 1994).
Several hypotheses have been proposed on the mechanisms relating high fat intake to the
etiology of NIDDM. A diet rich in fat causes obesity (Dreon et al, 1988, Romieu et al,
1988) and increased body fat and altered fat distribution (Storlien et al, 1986). These
abnormalities lead to altered glucose metabolism (Leibel et al, 1989). Impaired fat
oxidation and / or glycogen storage accompanying a diet rich in fat may increase FFA
concentration in blood and lead to insulin resistance (Randle, 1989).
Another possible explanation for the correlation between fat consumption and NIDDM
can be impaired insulin action due to altered cell membrane composition and (possibly)
altered signal transduction across the cell membrane (Olefsky et al, 1988, Storlien et al,
1989) .
Animal studies have revealed that a high fat diet leads to the induction of insulin
resistance and hyperinsulinemia (Storlien et al, 1986). In addition, The Normative Aging
Study has suggested that a diet high in saturated fatty acids is an independent factor for
both fasting and postprandial insulin concentrations (Parker et al, 1993). Diets with high
saturated fat content decrease insulin response and insulin resistance in isolated rat
adipocytes (Van Amelsvoort et al, 1988, Chattaway et al, 1990).
Dietary treatment of diabetes remains a controversial area and the ideal diet remains to
be defined. The specific diet and approach chosen will depend on the patient, the degree

Chapter Two Literature Review 60
of obesity and the extent of metabolic compensations and complications present (Griver
and Henry, 1994).
The American Diabetes Association (1987) has recommended a the suitable diet for
diabetic patients should provide 55-60% of energy as carbohydrates and < 30% as fat.
The high amount of complex carbohydrates may cause an increase in insulin sensitivity.
Smith (1994) suggested the diet for diabetic people should contain food with low
glycemic index and be high in dietary fibre, particularly soluble fibres. Diet containing
food with low glycemic index and high in dietary fibre appears to increase insulin
sensitivity and may well reduce the problem of increased TG and decreased HDL-C levels.
2.13.2 Alcohol Consumption
Ethanol is a source of energy and it also has potent pharmacologic and biochemical
properties that may influence other aspect of nutrition and metabolism (Mitchell, 1990).
Ethanol is metabolized in the liver to form acetaldehyde, which in turn is oxidized to
acetate. Acetaldehyde (in excess) may cause liver damage by decreasing mitochondrial
functions. In heavy alcohol consumers, alcohol becomes a preferred fuel for the liver and
displaces fat as a source of energy. Oxidation of fatty acids is decreased and the
production of TG is increased. If this processes continues a fatty liver may develop
(Lieber and Pignon, 1989).
2.13.2.1 The Effect of Alcohol Ingestion on Lipids and Lipoproteins
The interaction of ethanol with lipid metabolism is complex. Alcohol intake may affect
all lipid components of the plasma.
Chapter Two Literature Review 61
A number of studies have reported that alcohol consumption increases plasma TG levels
(Ostrander et al, 1971, Castelli et al, 1977). The consumption of enough ethanol to give
a blood concentration over 1 g/L and mild intoxication results in a rise in TG
concentration in the plasma of normal subjects (Lieber and Pignon, 1989). Ethanol
consumption leads to an increase in VLDL synthesis and limitation of alcohol may
markedly decrease plasma TG concentrations (Ginsberg et al, 1974, NIH Consensus
Conference, 1984).
There is a positive correlation between alcohol intake and HDL-C levels in population
studies (Moore and Pearson, 1986). Several studies have found alcohol consumption
may lead to increase in both HDL2 (the putative atherogenic protective fraction) and
HDL3 (Lieber, 1987), however other researchers have reported that only the HDL3
fraction is increased (Haskell et al, 1984). ApoA-I and apoA-II are increased by alcohol
(Camargo et al, 1985). Studies have reported that alcohol-related HDL-C elevation may
be due to increased hepatic apoA-I synthesis (Taskinen et al, 1987, Okamoto et al,
1988).
Sillanaukee et al (1993) have reported that moderate to heavy intake of alcohol had no
effect on HDL2 but increased the HDL3 fraction. The mechanism of elevated VLDL,
HDL2, and HDL3 levels after ethanol intake was described by Lieber (1987).
Overproduction of VLDL particles by the liver occurs, resulting from increased activities
of synthetic enzymes and ready availability of precursors such as TG, cholesterol, and
apolipoproteins. At the same time, HDL3 synthesis will increase in association with
moderate alcohol intake. The degradation of VLDL and chylomicrons by LPL is
associated with conversion of HDL3 to HDL2. As a result, an increased synthesis of

Chapter Two Literature Review 62
VLDL by the liver and increased LPL activity will cause increased HDL2 levels (Lieber,
1987).
A reduction in LDL-C level may be seen in alcohol drinkers (Taskinen et al, 1982). The
modification of LDL-apoB by acetaldehyde (the first metabolite of ethanol) increases
the catabolic rate of LDL particles in the rat, resulting in lower LDL-C levels
(Savolainen et al, 1987, Kesaniemi et al, 1987). It can be an explanation for decreased
LDL-C concentrations in alcohol users.
2.13.2.2 The Effect of Alcohol Ingestion on Insulin Sensitivity
Women drinking a moderate amount of alcohol had lower plasma insulin concentrations
and higher HDL-C levels than non-drinking women (Razay et al, 1992).
In addition, Facchini et al (1994) reported that light to moderate alcohol intake is
correlated with increased insulin-mediated glucose uptake, lower plasma glucose and
insulin levels in response to oral glucose, and a higher HDL-C level. The changes in
insulin and glucose metabolism may contribute to the lower risk of coronary heart
disease described in light to moderate drinkers.
2.14 Smoking
Smoking may be an important contributors to both glucose level and diabetes risk
(Bjorntorp, 1988, Pederson, 1989). Smoking is a risk factor for ischaemic heart disease
(IHD) (Meade et al, 1987).
Chapter Two Literature Review 63
2.14.1 Effects of Smoking on Lipoprotein Metabolism
Epidemiological studies have shown that smoking is associated with a number of
abnormalities in plasma lipoproteins particularly decreased HDL-C (Criqui et al, 1980,
Wilson et al, 1983). The correlation between smoking and decreased HDL-C was also
confirmed by using multivariate analysis (Craig et al, 1989, Maede et al, 1991, Muscat et
al, 1991). However, some researchers rejected the independent effect of smoking on
HDL-C after correction for lifestyle factors (lack of exercise, obesity, alcohol intake, etc)
(Wallentin and Sundin, 1985, Manttari et al, 1991).
Plasma HDL-C rises within 2-8 weeks to the normal range after smoking cessation
(Fortman et al, 1986, Stamford et al, 1986, Moffatt, 1988). Some investigators consider
it uncertain whether increased HDL-C level is due to stopping smoking or dietary
changes (Quensel et al, 1989, Maida and Howlett, 1990). Quensel et al (1989) believe
that the changes in HDL result from increased dietary fat and carbohydrate intake after
stopping smoking.
Smokers have been reported to have lower plasma concentration of HDL2 (Shennan et
al, 1985), HDL3 (Haffner et al, 1985, Moriguchi et al, 1990), and HDL2 and HDL3
(Robinson et al, 1987).
Craig et al (1989) also have found that apo A-I concentration is low in smokers. In
addition, plasma levels of TG (Simons et al, 1984), VLDL (Freedman et al, 1986) and
LDL-C have been reported to be higher in smokers compared with non-smokers (Craig
et al, 1989, Freedman et al, 1986, Muscat et al, 1991).
Dullaart et al (1991) have reported that the CETP activity is elevated in ID DM patients
who smoke. The concentrations of tissue LPL are elevated in smokers and this seems to
Chapter Two Literature Review 64
be associated with their lower body weight (Brunzell et al, 1980 and Chajek-Shaul et al,
1987). LCAT activity is decreased in smokers (Haffner et al, 1985, Moriguchi et al,
1990), however hepatic lipase activity is increased (Moriguchi et al, 1990).
2.14.2 Smoking and Diabetes Mellitus
Cigarette smoking favours the development and progression of diabetic nephropathy.
Several large prospective cohort studies have reported that the relative risk for all-cause
mortality is approximately twice as high for smoking compared to non-smoking diabetic
patients. Stopping smoking is probably the most cost-effective risk factor intervention
for diabetic patients (Muhlhauser, 1994).
2.14.3 Smoking and Fibrinogen Levels
Data from several studies have suggested that the plasma levels of fibrinogen are higher
in smokers than non-smokers (Balleisen et al, 1985, Kannel et al, 1987) and this may be
one reason why smokers are more prone to ischaemic heart disease (Meade et al, 1987).
2.15 Physical Activity
Sedentary lifestyle is related to increased coronary atherosclerosis and physical activity
decreases the risk of coronary atherosclerosis (Paffenbarger et al, 1986).
Physical activity tend to be associated with lower body fat, lower blood pressure, and
beneficial effects on glucose, insulin, lipids, and lipoproteins (Bush, 1991).
2.15.1 Effects of Physical Activity on Lipids and Lipoproteins
It is well accepted that physical activity improves lipoprotein metabolism (Huttunen et al,
1979, Berg and Keul, 1985).
Chapter Two Literature Review 65
Researchers have reported decreased LDL levels in human (Wood et al, 1977, Goldberg
et al, 1984, Hurley et al, 1986). Plasma TG concentration is reduced in both sexes
(Wood et al, 1977, Farrell and Barboriak, 1980). Endurance exercise decreases VLDL-
TG and LDL-C levels (Thompson et al, 1988, W ood et al, 1988). These changes are
due to increased LPL activity and plasma TG clearance (Thompson et al, 1988).
Moreover, exercise increase the plasma concentration of HDL-C fractions (Gordon and
Rifkind, 1989, McHenry et al, 1990).
Exercise programs with moderate intensity seem to modify the effects of a hypocaloric,
fat-restricted diet on HDL-C (Taylor and Ward, 1993).
2.15.2 Effects of Physical Activity on Carbohydrate Metabolism
In low to moderate intensity exercise, rapid adjustment in the supply of energy is the
result of a fall in plasma insulin, and steady or increased glucagon production to maintain
euglycemia. Hepatic glucose synthesis in moderate exercise is regulated mainly by the
glucagon / insulin ratio (Purdon et al, 1993).
In contrast, intense exercise is related to a marked stimulation of glucose synthesis with
resulting hyperglycemia, marked increases in plasma catecholamines, and moderate
hyperglucagonemia. The hyperglycemia increases in recovery and is accompanied by
hyperinsulinemia (Purdon et al, 1993).
King et al (1988) have reported that the reversal of increased insulin action that occurs
within a few days after stopping exercise is due to a decrease in insulin sensitivity, not to
a decrease in insulin secretion.

Chapter Two Literature Review 66
2.15.3 Therapeutic Exercise for GDM Patients
Besides diet and insulin therapy, exercise is important in the treatment of people with
diabetes (Wasserman and Vranic, 1987).
Exercise is known to increased glucose utilization by several mechanisms, and regular
exercise has been recommended since early time as an addition therapy (Bung et al,
1993).
Bung et al (1993) suggested that in the absence of ominous fetal heart rate changes or
significant alterations in uterine activity following the exercise sessions or diabetes-
related peri- and neonatal morbidity, regular physical activity appears to be a safe
therapeutic method for the fetus of GDM mothers.
2.16 Obstetrics and Family Medical History
Subjects with GDM may present more frequent obstetric complications, affected both
baby and mother (Beydoun, 1987). They also are more likely to have a positive family
history of diabetes mellitus (Henry and Beischer, 1991).
2.16.1 Obstetrics History
Obstetric complications are more likely to occur in diabetic pregnancies and may increase
both mortality and morbidity (Beydoun, 1987).
Women with GDM exhibit more frequent and severe obstetric complications. Cousins
(1987) reported that subjects with GDM had a higher frequency of maternal
complications such as polyhydramnios (5.3%), preeclampsia (10%), chronic hypertension

Chapter Two Literature Review 67
(9.9%), pyelonephritis (4%), and delivery by cesarean section (20.4%) than women with
non-GDM pregnancies.
The fetus of the diabetic mother runs an increased risk of major congenital
malformations, complications related to macrosomia, intra-uterine growth retardation,
and biochemical abnormalities resulting from fetal hyperinsulinemia (Barret, 1987). The
Third International Workshop Conference on GDM (1991) reported that the infant of the
mother with GDM is also more likely to develop these morbidities.
Fetal macrosomia is a potentially dangerous complication of diabetic pregnancy, may be
caused by hyperinsulinemia, a response to fetal hyperglycaemia following maternal
hyperglycaemia. This and other complications can be prevented by strict control of
maternal blood glucose levels, particularly in late pregnancy (Barret, 1987).
2.16.2 Oral Contraceptive
The most widely used contraceptive method is the combined-type oral contraceptive
containing an estrogen and a progesterone steroid. Oral contraceptive intake causes
alterations in glucose, lipid and protein metabolism (Molsted-Pedresen et al, 1991).
2.16.2.1 Effects of Oral Contraceptive on Lipids and Lipoproteins
Estrogen increases LDL receptor activity, so increasing the rate of clearance of both
LDL and remnant particles (Knopp et al, 1993).
Estrogen also increases the amount of apoA-I in HDL particles by increasing synthesis
and / or decreasing the catabolism of apoA-I, resulting in an increased number of HDL
particles and increased plasma HDL-C levels including the HDL2 subfraction (Knopp et
al, 1993). It also increases TG and VLDL-C levels. The mechanisms by which these

Chapter Two Literature Review 68
changes occur are not clear but probably related to the effect on estrogen in reducing
hepatic triglyceride lipase activity and inhibiting HDL catabolism (Miller and LaRosa,
1991).
The progestin component of oral contraceptives reduces glucose tolerance, increases
insulin resistance, and tends to increase cholesterol concentration (Kjos et al, 1990).
Dyslipidemia characterised by elevated LDL and VLDL and also reduction of HDL
particles has been reported during use of the combination-type oral contraceptive. This
would increase the risk of atherosclerosis complications (Molsted-Pedersen et al, 1991).
2.16.2.2 Effects of Oral Contraceptive on Carbohydrate Metabolism
Exogenous oestrogen has an antagonistic effect to insulin (Spelsberg and Manson,
1993).
A combination of estrogens and progesterones has been reported to decrease insulin
sensitivity at the cellular level in peripheral tissue (Skouby et al, 1987).
Eschwege et al (1990) reported that women who are using currently oral contraceptives
have higher plasma glucose and insulin levels after a standard glucose challenge.
Rimm et al (1992) have found only a slightly increased in risk of NIDDM among women
who have used oral contraceptives compared with those who have never used oral
contraceptive. However, another study showed no increased risk of NIDDM in post
menopausal oral contraceptive users (past or present) in comparison to those who had
never used oral contraceptives (Manson et al, 1992).

Chapter Two Literature Review 69
2.16.3 Family Medical History
A family history of diabetes and cardiovascular disease is often found in subjects who
develop diabetes and cardiovascular disease.
Studies have suggested that genetic factors play a major role in the development of
NIDDM (Newman et al, 1987, Fajan, 1989).
In the rare cases single genes alone can lead to NIDDM, but in the most cases it seems
that NIDDM is results from combined defects of (3-cell function and insulin action, either
of which can in principle have a genetic or environmental basis (McCarthy and Hitman,
1993).
2.16.3.1 Family History of Diabetes Mellitus
Several studies on populations at high risk for developing NIDDM have showed that
history of diabetes in a first degree relative is a powerful predictive factor for the
development of diabetes and impaired glucose tolerance preceding NIDDM is more
prevalent in non-diabetic offspring of diabetic patients than in control subjects without a
positive family history of diabetes (Leslie et al, 1986, Haffner et al, 1988, Eriksson et al,
1989).
Warram et al (1990) have reported that decreased glucose clearance may be
demonstrated one or two decades before NIDDM is diagnosed. This decreased glucose
clearance is accompanied by compensatory hyperinsulinemia, suggesting that the primary
defect in development of NIDDM is in the peripheral tissue response to insulin and
glucose.

Chapter Two Literature Review 70
2.16.3.2 Family History of Cardiovascular Disease (CVD)
Bell et al (1990) have reported that black women with GDM have a higher incidence of
family history of CVD.
Diabetic patients have an increased chance to develop ischaemic heart disease (Barret-
Conner et al, 1985) and black women have a 70% greater risk of CVD and mortality
than white women (Johnson et al, 1986). However, the relationship of CVD and
development of GDM is unclear.

CHAPTER THREE
MATERIALS AND METHODS
3.1 Introduction
This chapter introduces the data collection techniques, levels of measurements, and
statistical techniques for analyzing data.
3.2 Subjects
This is a cross-sectional study. The study was performed on 65 women who had had
GDM in their last pregnancy (the GDM group), studied approximately one year after
delivery, and 65 wom en who gave birth at the same time as the women with GDM and
who did not have GDM (the control group).
All women who have had GDM diagnosed and treated in the Mawarra Health Service
(IAHS) in June 1992-January 1993 (80 subjects) were contacted and were offered a
check which was centred on those factors thought to increase the chance of developing
diabetes mellitus. O f the GDM group, 65 agreed to join the study (81%).
A control group of 90 individuals was chosen at random from the list of women
presenting for labour at the same time as the patients with GDM. Of women from the
control group, 65 also agreed to join to the study (72%).
Subjects received a full description of the study and gave informed consent. All subjects
received a detailed information sheet and consent form were signed by all participants.

Chapter Three Materials and Methods 72
Those enrolled in the study were examined at the Outpatient Clinics, Illawarra Regional
Hospital (Wollongong Campus), at the Medical Research Unit (MRU), and for 4
subjects at their homes by the investigator. This study was approved by the University of
Wollongong Human Research Ethics Committee (HR 92/213).
3.3 Experimental design
Subjects were examined after an overnight (~12 h) fast. All subjects received a clinical
examination and were interviewed before blood and urine sampling.
3.3.1 Demographic information
Demographic information was obtained including age, country of birth, details of
obstetric and medical history and family history of diabetes mellitus, coronary heart
disease, other inherited disease, peripheral vascular disease (PVD) and kidney disorders,
smoking status, alcohol consumption, medication and oral contraceptive use (Appendix
I).
3.3.2 Blood pressure measurement
Blood pressure measurement was done after 5 minutes rest in the sitting position, using a
standard desk mercurial sphygmomanometer. Two blood pressure measurements were
obtained and the mean was accepted as the blood pressure. Systolic blood pressure was
defined by the appearance of sound, and diastolic blood pressure by the disappearance of
sound.
Mean arterial pressure (MAP) was calculated by adding the sum of two thirds of the
diastolic pressure and one third of the systolic pressure (Konen et al, 1993).

Chapter Three Materials and Methods 73
The pulse pressure was calculated as systolic blood pressure minus diastolic blood
pressure (Vander et al, 1994 a).
3.3.3 Blood sample taking
A blood sample (40 mL) was obtained from the left antecubital vein of seated subjects
after approximately 5 minutes rest in the sitting position after blood pressure
measurement.
A tourniquet was used but was released before collection of the blood sample to avoid
artifactual increases in the concentration of plasma proteins and lipids.
Blood samples were divided into several types of tubes: (1) tubes containing di
potassium EDTA (1 mg/mL), (2) 3 mL tubes containing 0.3 mL sodium citrate solution
(109 mM, 3.2%), and (3) plastic tubes containing gel (SARSTEDT Momovette, Serum
Gel S/7.5 mL)) for separation of serum.
All blood samples were mixed thoroughly and cooled immediately (by placing in fridge
or ice box).
The plasma was separated from the blood samples collected in the EDTA tubes by
centrifugation (2300 rpm for 20 minutes) and stored at 4°C for lipid studies. Other
blood samples (citrated plasma and serum) had analyses performed in the Pathology
Laboratories, Illawarra Regional Hospital.
Remaining plasma or serum samples were frozen at -85°C, in 2 mL snap-top plastic
tubes within a few hours for further study.

Chapter Three Materials and Methods 74
Some tests were carried out on fresh plasma and the others on frozen plasma (after
approximately 5-6 months at -85 °C) as listed in Table-3-1.
Table 3-1 L a b o ra to ry tests in this study
Fresh plasma or urine Frozen plasma
TC, TG, apoA-I, and apoB in plasma NEFA in plasma
VLDL isolation (Cholesterol, FC, TG, apoB, measurement)
Factor VII
IDL isolation (Cholesterol, FC, TG, apoB, measurement)
von Willebrand factor (vWF)
HDL isolation (Cholesterol and apoA-I measurement)
Lipoprotein (a)
HbAl-c CETP activity %
Fasting blood glucose
Insulin
Testosterone
Fibrinogen
Albumin in urine
TC = total cholesterol, TG = triglycerides, apo = apolipoprotein, NEFA = non-esterified fatty acids, CETP = cholesterol ester transfer protein.
3.4 Lipid Study
EDTA plasma was used for lipid studies. Blood was cooled rapidly, briefly stored at
4°C, and standard lipid laboratory procedures were initiated within 0.5-2 hours after
venipuncture.
3.4.1 Lipids and apolipoproteins in plasma
Total cholesterol, free (non-esterified) cholesterol (FC), and triglycerides were measured
on a Cobas-Fara automated centrifugal analyzer (Roche Centrifugal Analyzer, France).
Chapter Three Materials and Methods 75
Total cholesterol concentrations in plasma and different lipoproteins were measured by
CHOD-PAP method (a standard enzymatic colorimetric method) based on Siedel et al,
1983 and Kattermann et al 1984) (Appendix II) with reagents supplied by Boehringer
Mannheim, Germany (Q C materials: Precinorm L, Cat No: L 781827 and Precipath Cat
No: L 128574). Cholesterol was determined by enzymatic hydrolysis with subsequent
determination of the liberated cholesterol (Test principle is presented in Appendix II) by
colorimetry. The reaction product was read optically at 546 nm and compared to a
known standard curve. Six reference points (254, 508, 1016, 2032, 4065, and 8130
(imol/L) and 2 quality controls, one low (range 3635-5585 fimol/L) and one high (7350
11250 |imol/L) for total cholesterol (Roche Control Serum Lipid Cat No 2023624) were
used.
Boehringer-Mannheim Diagnostic kits for lipid standards, calibrators, and controls are
traceable to Centers for Disease Control (CDC) (Myers et al, 1994).
As reference ranges 750-1070 ^imol/L (calibrator or standard) for free cholesterol (FC),
the Boehringer Mannheim standard (Preciset Cat No: 125512) was used.
TG concentrations in plasma and lipoproteins were measured by Triglyceride GPO-PAP
(a standard enzymatic colorimetric method) based on Wahlefeld (1974) and Trinder
(1969) (Appendix II) with reagents supplied by Boehringer Mannheim, Germany (Q C
materials: Precinorm L, Cat No: L 781827 and Precipath Cat No: L 128574). Enzymatic
hydrolysis of triglycerides was determined with subsequent determination of the liberated
glycerol by colorimetry. The reaction product was read optically at 500 nm and
compared to a known triglyceride standard curve.
Quality Control Values: Precinorm L (1650 |imol/L)
Precipath L (4650 pmol/L)
Chapter Three Materials and Methods 76
ApoB, and apoA-I concentrations were measured in fresh plasma on a Cobas-Fara by
Apolipoprotein B, T Antiserum (standard immunoturbidimetric method) (Roche
Diagnostics, France) (Appendix II). Turbidity of the antigen-antibody reaction was
measured at 340 nm. As quality control (QC) for apo B and apo A-I, the apolipoprotein
T Control (art. 0730696, Roche Diagnostics, France) was used.
Reference Values: ApoA-I ApoB
Male 1.15 -1.90 g/L 0.70-1.60 g/L
Female 1.15-2.20 g/L 0.60-1.50 g/L
Lipoprotein (a) concentration in plasma was measured by an immunoturbidimetric
method based on Levine et al (1992) by using SPQ TM kit, SPQ Calibration / Control:
includes Standards 1-5 and Controls Levels 1 and 2, (INCSTAR Corportion, Stillwater,
Minnesota, USA) on a Cobas-Fara analyzer. The immunoturbidimetric method is based
on the formation of insoluble antigen-antibody complexes, light scattering is measured,
following an 10 minutes incubation of sample and reagents, compared to a known
standard curve at 340 nm.
A calibration curve is produced by a series of standards with known concentrations of
lipoprotein (a) and using the instrument’s data reduction capability or manually plotting
the change in absorbance versus concentration.
Reference Values: Control Level 1 19 mg/dL
Control Level 2 46 mg/dL
Chapter Three Materials and Methods 77
3.4.2 Non-esterified fatty acids (NEFA)
Concentrations of non-esterified fatty acids in plasma were measured by the Wako
enzymatic method with reagent from Wako Pure Chemical Industries, Osaka, Japan.
Oleic acid 1.0 mM was used as the NEFA standard solution (Wako Pure Chemical
Industries, Ltd, Japan).
The method relies upon the acylation of co-enzyme A (Co-A) by the fatty acids in the
presence of added acyl Co-A synthetase. The acyl Co-A is oxidized by added acyl Co-A
oxidase with generation of hydrogen peroxide. Then, hydrogen peroxide in the presence
of peroxidase permits the oxidative condensation of 3-methyl-N-p hydroxyethylene
aniline (MEHA). MEHA condenses with 4 amino antipyrine to form a purple colored
product which can be measured colorimetrically at 550 nm.
Reference Values: Plasma NEFA Concentration
0.20-1.08 mEq/L
3.4.3 Isolation of VLDL and IDL
VLDL and IDL were isolated from fresh plasma by sequential ultracentrifugation after
progressively raising the solvent density according to Havel et al (1955). KBr solutions
were made in 100 ml of deionized water and contained 0.02% sodium azide.
1.0 mL normal saline (0.15M NaCl, density 1.006 g/mL) was added to 4 mL of fresh
plasma in a quick-seal polyallomer ultracentrifuge tube (100.4, Beckman Instruments
Inc, USA).
Normal saline was added very carefully on top of plasma to avoid mixing (a syringe was
used) and then the tube was sealed.
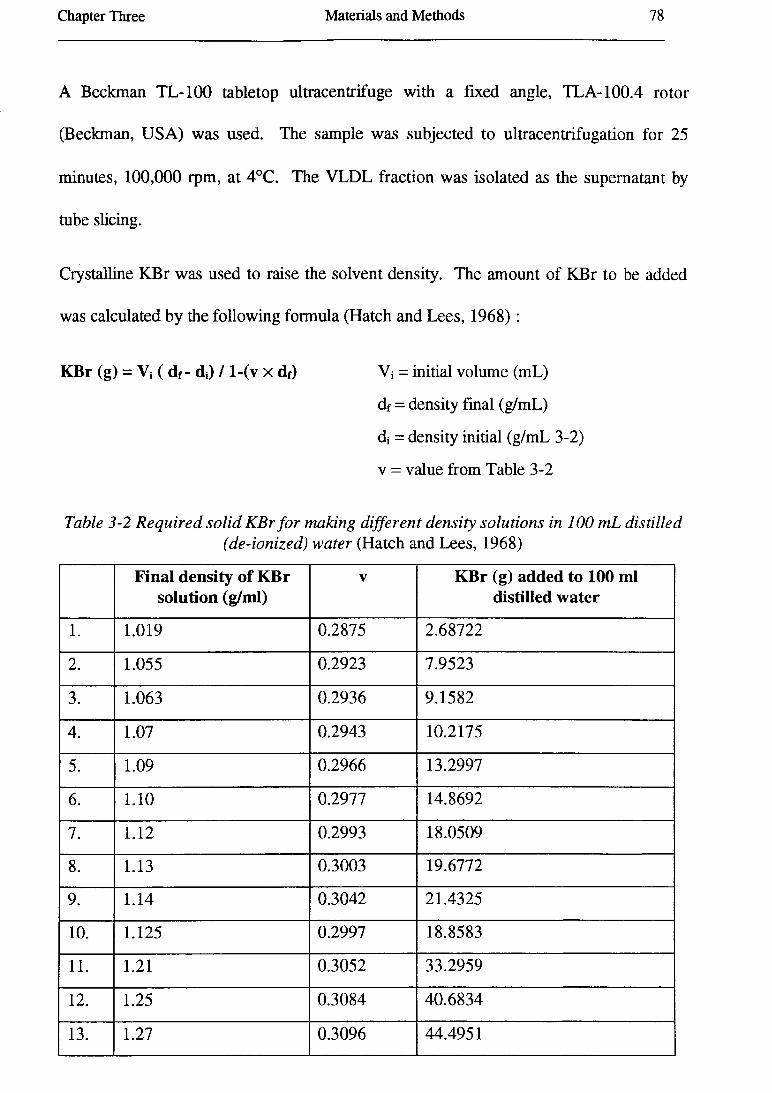
Chapter Three Materials and Methods 78
A Beckman TL-100 tabletop ultracentrifuge with a fixed angle, TLA-100.4 rotor
(Beckman, USA) was used. The sample was subjected to ultracentrifugation for 25
minutes, 100,000 rpm, at 4°C. The VLDL fraction was isolated as the supernatant by
tube slicing.
Crystalline KBr was used to raise the solvent density. The amount of KBr to be added
was calculated by the following formula (Hatch and Lees, 1968) :
KBr (g) = Vi ( df- dj) / l-(v x df) Vi = initial volume (mL)
df = density final (g/mL)
dj = density initial (g/mL 3-2)
v = value from Table 3-2
Table 3-2 R eq u ired so lid K B r f o r making d ifferen t den sity so lu tion s in 100 m L d is tilled(de-ion ized) w a ter (Hatch and Lees, 1968)
Final density of KBr solution (g/ml)
V KBr (g) added to 100 ml distilled water
1. 1.019 0.2875 2.68722
2. 1.055 0.2923 7.9523
3. 1.063 0.2936 9.1582
4. 1.07 0.2943 10.2175
5. 1.09 0.2966 13.2997
6. 1.10 0.2977 14.8692
7. 1.12 0.2993 18.0509
8. 1.13 0.3003 19.6772
9. 1.14 0.3042 21.4325
10. 1.125 0.2997 18.8583
11. 1.21 0.3052 33.2959
12. 1.25 0.3084 40.6834
13. 1.27 0.3096 44.4951
Chapter Three Materials and Methods 79
The infranatant was collected in a cylinder and the volume was measured. The sample
was then adjusted to a density of 1.19 g/mL by adding solid KBr, according to the
formula in Table 3-2. After adjustment, the sample was poured into a quick-seal
centrifuge tube and filled by KBr solution density 1.019 g/mL. The IDL fraction was
isolated as the supernatant after centrifugation at 65,000 rpm for 16 hours at 4°C. The
infranatant was frozen immediately at -85°C.
Estimation of total cholesterol (TC), triglycerides (TG), and free cholesterol (FC)
concentrations were carried out on fresh VLDL and the IDL fraction.
Cholesterol ester (CE) was calculated in both VLDL and IDL as the difference between
total cholesterol and free (non-esterified) cholesterol. Apo B concentration was
measured immunoturbidimetrically.
3.4.4 Isolation of HDL
ApoB-containing lipoproteins were precipitated with dextran sulfate-Mg2+ (Wamick et
al, 1982) and HDL-C and HDL-apoA-I concentrations were measured in the
supernatant. The procedure for isolation of HDL from plasma lipoproteins is described
in detail in Appendix II.
3.4.5 Isolation of all lipoproteins for determination of HDL and LDL particle sizes
Plasma samples were adjusted to density 1.25 g/mL for isolation of all lipoproteins.
0.5 mL. fresh plasma was added to 0.1985 g KBr in a T L-100.1 Beckman centrifuge
tube. It was mixed well and subjected to ultracentrifugation in a TLA -100.1 rotor at
100,000 rpm for 16 hours at 4°C.

Chapter Three Materials and Methods 80
After ultracentrifugation, 50|iL (yellow-top layer) was recovered and collected in a snap-
top plastic tube and stored at 4°C for electrophoresis of lipoproteins. It was diluted 1:4
with TBS buffer (Appendix II) for electrophoresis.
Electrophoresis was carried out on a M icrograd II Electrophoresis Apparatus (Gradipore
Ltd Australia) using non-denaturing gradient gels (3-30% and 3-13%, Gradipore Ltd
Australia) and a 24 slot comb. 3-30% gel and 3-13% gels were used for identification of
HDL and LDL sub-populations, respectively.
3.4.6 Determination of HDL particle size by electrophoresis
HDL sub-populations were identified by electrophoresis using non-denaturing 3-30%
polyacrylamide gradient gels. Samples were applied in a volume of 10|iL containing 4
parts by volume of the density = 1.25 g/mL fraction and 1 part of a solution consisting of
sucrose and bromphenyl blue (Appendix II).
A reference protein mixture was used for calibrating particle size radius. Each gel
contained the reference protein mixture in 3 lanes and 6 samples (Figure 3-1). The
reference protein mixture used for calibrating particle size radius included thyroglobulin
(8.5 nm radius), apo-ferritin (6.10 nm radius), lactate dehydrogenase (4.08 nm radius),
and bovine serum albumin (3.55 nm radius) (High molecular weight (HMW) Calibration
Kit, Pharmacia LKB, Biotechnology AB, Uppsala).
Figure 3-1 Pattern of sample loading in 3-30% gel for identifyingHDL sub-populations
aaHMW a 1 a2 a3 aHMW a4 a5 a6 aHMW a a

Chapter Three Materials and Methods 81
Samples were electrophoresed at 170 V (constant voltage), 10°C for 17 hours in a buffer
containing 90 mM Tris base, 80 mM boric acid, 3 mM Na2EDTA and 3 mM sodium
azide (pH = 8.35).
Gels were fixed in 10% sulfosalicylic acid (Appendix II) for 0.5 hour immediately after
electrophoresis. After fixation, gels were stained for 3 hours in Coomassie Brilliant Blue
dye (R-250) (Appendix II) and then destained in 5% acetic acid (Appendix II). Gels were
rotated during fixing, staining, and destaining procedures,. Each gel was then put in a
small plastic bag with a few mL of 0.02% sodium azide solution (Appendix II) and
sealed.
Stained gradient gels were scanned with an Ultrascan XL Enhanced Laser Densitometer
(LKB Bromma Sweden) at wavelength 663 nm. The migration distances (peak Rf
values) of the reference proteins of known radius were measured and a standard curve of
particle radius (nm) against Rf was constructed. The particle radius of the samples was
determined by reference to the standard curve.
The software package (LKB 2400 Gel Scan XL, Bromma) determined the peaks, and
calculated position (mm), and relevant area under the curve as a % of the total % for
each protein.
Gradient gel electrophoresis resolves human HDL into five subfractions. Two of the
subfractions (HDL2b and HDL2a) correspond to HDL2 and three of the subfractions
(HDL3a, HDL3b, and HDL3c) correspond to HDL3 isolated by ultracentrifugation
(Converse and Skinner, 1992). HDL sub-populations were identified according to the
size ranges suggested by Nichols et al (1987).

Chapter Three Materials and Methods 82
3.4.7 Determination of LDL particle size by electrophoresis
The procedure for identifying LDL particle size by electrophoresis is identical with that
for HDL, except that 3-13% non-denaturing polyacrylamide was used and calibration
was performed using 19 nm (radius) calibrated latex microspheres (carboxylated latex
beads, Duke Scientific Palo Alto, CA) as well as the HMW calibration kit (Pharmacia
LKB, Biotechnology AB, Uppsala, Sweden) for construction of the standard curve. The
calibration mixture was applied at the beginning of gels and after loading three samples
(Figure 3-2).
Figure 3-2 Pattern of samples loading in 3-13% gel for identifyingLDL particles
AAHMWABeadsAlA2A3AHMW/\BeadsA4A5A6AA
Fixation, staining and destaining procedures were the same as with 3-30% gels and the
same equipment was used for scanning.
3.4.8 HDL radiolabelled in the cholesteryl ester moiety
Radiolabelled HDL3 was prepared in the density range of 1.13-1.21 g/mL by using
tritium [3H] cholesterol ester as described by Albers and Tollefson (1984) (procedure in
Appendix II). One preparation of radiolabelled HDL3 was used for all CETP activity
assays.
3.4.9 Cholestryl ester transfer protein activity (CETP activity)
CETP activity was measured in plasma (thawed after storage at -85°C for 6 months) by
using the Abbey and Nestel method (1993). The assays were done in duplicate. All
assays contained as quality controls a positive control (a plasma sample from a normal
Chapter Three Materials and Methods 83
healthy person) and a control for the estimation of non-specific transfer (not mediated by
CETP).
The CETP assay was done three times with and without (5,5-dithiobis [2-nitrobenzoic
acid]) but the results were not statistically different. As a result DTNB was not used
routinely for this assay. The procedure is presented in Appendix II.
3.4.10 LDL-C Calculation
LDL-C was calculated according the modified Friedewald equation.
The m odified F riedew a ld equation:
LDL-C (mmol/L) = Total cholesterol (mmol/L) - HDL-C (mmol/L) - TG (mmol/L) /
2.18
TG is an estimate of the concentration of cholesterol in VLDL particles in fasting
plasma. This is based on the assumption that all the plasma TG is associated with VLDL
and that the molar ratio of TG to cholesterol in VLDL is 2.18:1 (Samman and Truswell,
1993).
There are three restrictions in the use of the method presented by Friedewald et al for
estimating plasma LDL concentrations.
Firstly, it is not applicable to the fed state, when the ratio of TG to cholesterol in VLDL
and chylomicrons is likely to be higher, so that the standardised molar ratio of TG to
cholesterol in VLDL is not 2.18:1, and if the formula is used in these circumstances, it
results in overestimation of VLDL-C and hence an underestimation of the LDL-C
concentration. All participating subjects in this study were in the fasting state.

Chapter Three Materials and Methods 84
Secondly, the technique gives erroneously high results in patients with type III
hyperlipoproteinemia, because the Friedewald equation assumes that IDL-C is negligible.
The lipid results did not suggest type HI hyperproteinemia in any subjects.
Thirdly, LDL-C can not be accurately estimated when the plasma triglyceride
concentration is more than 4.5 mmol/L (Samman and Truswell, 1993). None of the
subjects had a plasma triglyceride concentration more than 4.5 mmol/L.
3.4.11 LDL-apoB Calculation
LDL-apoB values were calculated according to this formula:
LDL-apoB = total apoB - (VLDL-apoB + IDL-apoB).
3.5 Tests related to carbohydrate metabolism
Fasting blood glucose, fasting blood insulin and HbAlc were measured by standard
procedures described as follow:
3.5.1 Fasting blood glucose (FBG)
FBG was determined by a colorimetric method based on Trinder, 1969 and Curme et al,
1978 on an Ektachem 700 XR analyzer (Kodak, NY, USA) using the Kodak Ektachem
Clinical Chemistry Slide (GLU).
The Kodak Ektachem Clinical Chemistry Slide (GLU) is a dry, multilayered analytical
element coated on a clear polyester support. Kodak Ektachem Calibrators 1, 2, and 3
were used as calibrator. Kodac Ektachem Control was also used (Range for serum =
1.11-34.69 mmol/L).
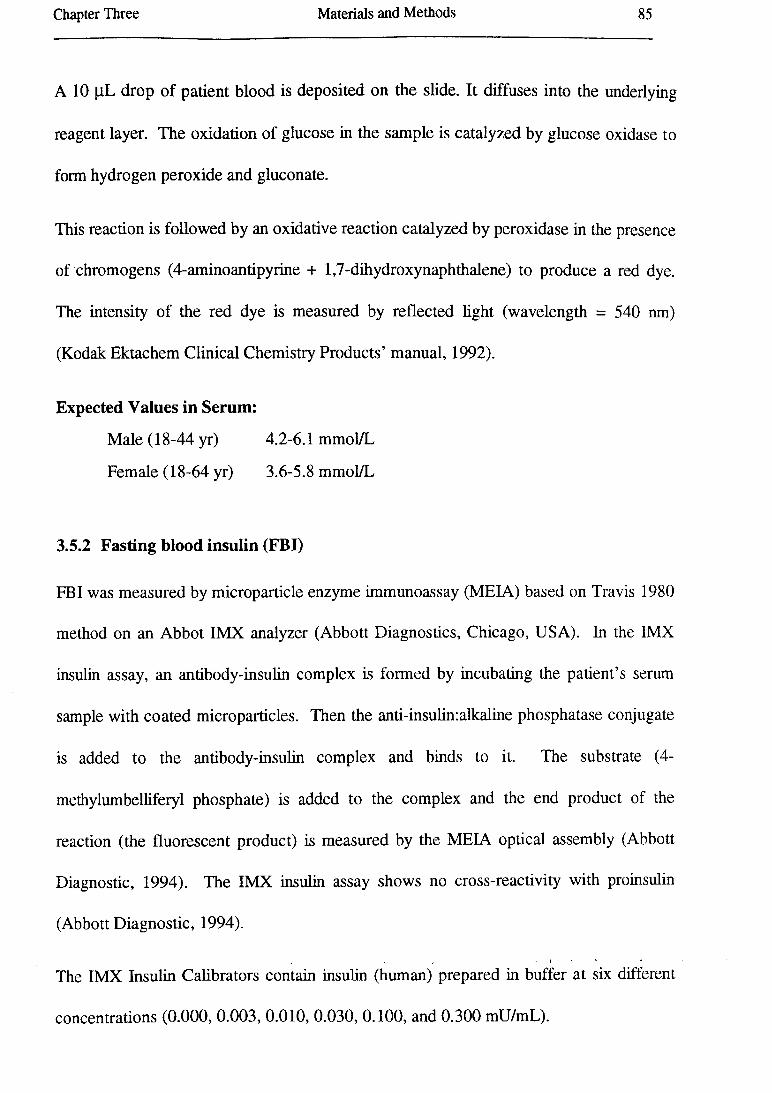
Chapter Three Materials and Methods 85
A 10 (iL drop of patient blood is deposited on the slide. It diffuses into the underlying
reagent layer. The oxidation of glucose in the sample is catalyzed by glucose oxidase to
form hydrogen peroxide and gluconate.
This reaction is followed by an oxidative reaction catalyzed by peroxidase in the presence
of chromogens (4-aminoantipyrine + 1,7-dihydroxynaphthalene) to produce a red dye.
The intensity of the red dye is measured by reflected light (wavelength = 540 nm)
(Kodak Ektachem Clinical Chemistry Products’ manual, 1992).
Expected Values in Serum:
Male (18-44 yr) 4.2-6.1 mmol/L
Female (18-64 yr) 3.6-5.8 mmol/L
3.5.2 Fasting blood insulin (FBI)
FBI was measured by microparticle enzyme immunoassay (MEIA) based on Travis 1980
method on an Abbot IMX analyzer (Abbott Diagnostics, Chicago, USA). In the IMX
insulin assay, an antibody-insulin complex is formed by incubating the patient’s serum
sample with coated microparticles. Then the anti-insulin:alkaline phosphatase conjugate
is added to the antibody-insulin complex and binds to it. The substrate (4-
methylumbelliferyl phosphate) is added to the complex and the end product of the
reaction (the fluorescent product) is measured by the MEIA optical assembly (Abbott
Diagnostic, 1994). The IMX insulin assay shows no cross-reactivity with proinsulin
(Abbott Diagnostic, 1994).
The IMX Insulin Calibrators contain insulin (human) prepared in buffer at six different
concentrations (0.000, 0.003, 0.010, 0.030, 0.100, and 0.300 mU/mL).
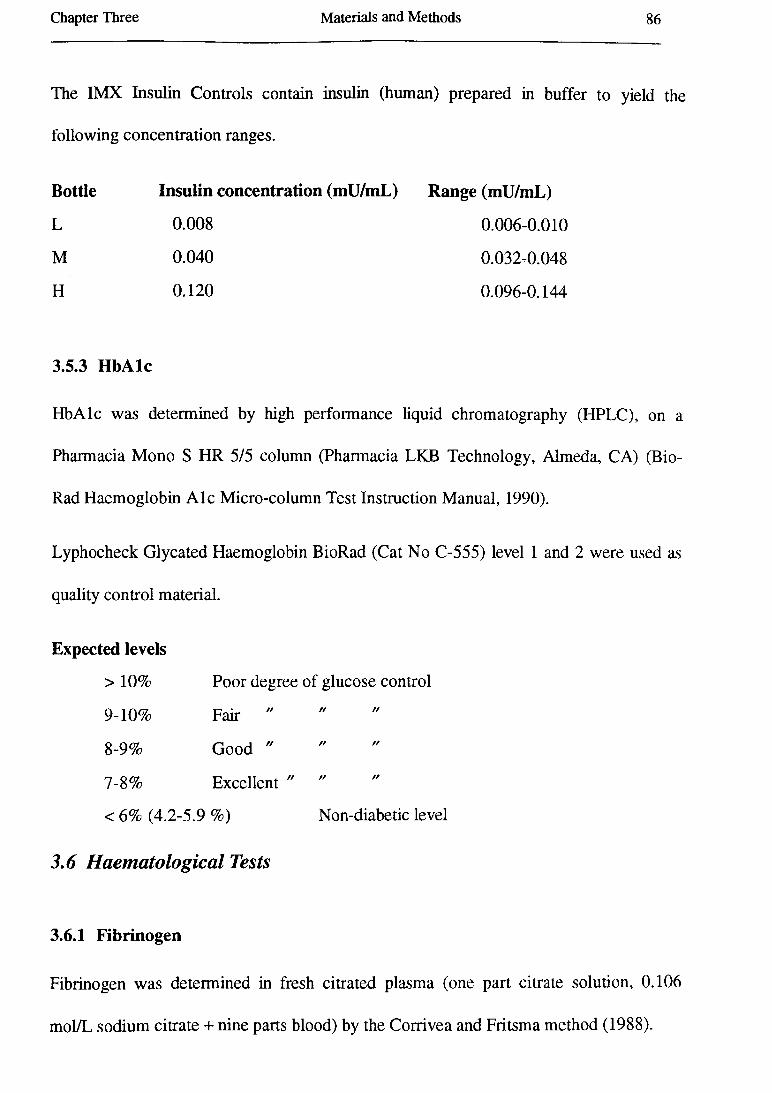
Chapter Three Materials and Methods 86
The IMX Insulin Controls contain insulin (human) prepared in buffer to yield the
following concentration ranges.
Bottle Insulin concentration (mU/mL) Range (mU/mL)
L 0.008 0.006-0.010
M 0.040 0.032-0.048
H 0.120 0.096-0.144
3.5.3 HbAlc
HbAlc was determined by high performance liquid chromatography (HPLC), on a
Pharmacia Mono S HR 5/5 column (Pharmacia LKB Technology, Almeda, CA) (Bio
Rad Haemoglobin A le Micro-column Test Instruction Manual, 1990).
Lyphocheck Glycated Haemoglobin BioRad (Cat No C-555) level 1 and 2 were used as
quality control material.
Expected levels
> 10% Poor degree of glucose control
9-10% Fair " " "
8-9% Good " " "
7-8% Excellent " " "
< 6% (4.2-5.9 %) Non-diabetic level
3.6 Haematological Tests
3.6.1 Fibrinogen
Fibrinogen was determined in fresh citrated plasma (one part citrate solution, 0.106
mol/L sodium citrate + nine parts blood) by the Corrivea and Fritsma method (1988).

Chapter Three Materials and Methods 87
Principle of test: In the presence of a high concentration of thrombin, the thrombin
clotting time is inversely proportional to the fibrinogen concentration of plasma.
The reference range for fibrinogen is 2.0-4.0 mg/L at all ages, including full-term and
premature newborn.
ARP or Uniplasmatrol Normal is used as control plasma. Calibration: CSL Human
Thrombin (dried) 2500 U is mixed with 5 mL of distilled water to give a resulting
concentration of 500 U/mL. 4 mL Owems buffer is added to 1 mL of thrombin 500
U/mL to make a final concentration of thrombin of 100 U/mL. Six different dilutions
(1:5, 1:7.5, 1:10, 1:15, 1:20, and 1:30) are assayed directly on the MLA and the
corresponding thrombin times used in the construction of a standard curve.
3.6.2 Factor V n
Factor VII activity assay was performed on the MLA 1000C automated coagulation
analyzer (Baxter Diagnostics, MLA 1000C) on citrated plasma. This assay is based on
Seegers and Walz, 1986, Bajaj et al, 1981. Factor VII activity was measured by a
clotting method utilizing the prothrombin time test (Baxter Diagnostic, MLA 1000C
operator’s manual, USA, 1988).
Immuno ads orbed Factor VII Deficient Plasma (human) with different concentrations
(1:10, 1:20, ..., 1:160, 1:320) was used in the construction of a standard curve. Factor
Assay Reference Plasma (Cat No B4234-30) and Ci-Trol Coagulation Control Level 1
(Cat No B4224-10) also were used. The result was calculated as % of activity. Factor
VII activities over 100% is considered as higher than normal.

Chapter Three Materials and Methods 88
Note: There are several different methods available to evaluate plasma factor VII level
such as factor VII coagulant activity (measurement of factor VII activity via a clotting
method utilising the prothrombin time test), activated factor VII (factor Vila)
(quantitation of activated factor VII levels in plasma by using a tissue factor mutant
selectively deficient in promoting factor VII activation), and factor VII antigen (factor
VIIAg) (Baxter Diagnostic, Manual, 1988, Morrissey et al, 1993, respectively). We
used factor VH coagulant activity method, because this method is commonly used in the
region pathology laboratories.
This method is traceable to Centers of Disease Control (CDC).
3.6.3 Von Willebrand Factor (vWF) antigen
vWF antigen was measured in frozen citrated plasma by the ELISA method based on
Cejka (1982) using Dakopatts rabbit’s anti-human von Willebrand Factor (Cat No.
A082). Dakopatts rabbit anti-human von Willebrand Factor conjugated with horseradish
peroxidase (Cat No. P 226) supplied by Bio Scientific Pty Ltd was used in the
construction of a standard curve.
Principle of method: Dilutions of patients and pool reference plasma are incubated in
micro wells that have been coated with antibody to human vWF antigen raised in rabbits.
The vWF antigen in the diluted samples and reference plasma is bound by the
immobilized antibody. The microwells are then washed and a second antibody to human
vWf antigen conjugated to horseradish peroxidase is added and the samples incubated.
A peroxidase substrate (TMB) was added after post-incubation washing. The substrate
developed colour in the presence of conjugated enzyme. The absorbency of each well
was read at 450 nm using the MR 5000 microtitre plate reader.

Chapter Three Materials and Methods 89
The vWf antigen concentration of the unknown patient sample is determined by reading
off the standard curve the value corresponding to each patient’s absorbance.
3.7 Hormonal Tests
3.7.1 Total testosterone
Total testosterone was determined in fresh serum using a solid phase 125I
radioimmunoassay based on testosterone-specific antibody immobilized to the wall of a
polypropylene tube (Coat-A-Count, Total testosterone, Diagnostic Products Corporation
Los Angeles, CA).
125I-labelled testosterone competes for a fixed time with testosterone in the patient
sample for antibody sites. The tube is then decanted, to separate bound from free, and
counted in a gamma counter. The amount of testosterone present in the patient sample is
determined from a calibration curve (DPC manual, 1995).
Human serum-based calibrators (TTC3-8) having testosterone concentrations ranging
from 0.2-16 ng/mL (which is equivalent to 0.7-55 nmol/L or 20-1600 ng/dL) were used.
These were provided by Diagnostic Products Corporation (DPC).
Reference Values: 4-1600 ng/dL = 0.7-55 nmol/L.
3.7.2 Sex hormone binding globulin (SHBG)
SHBG was measured in fresh serum using the Farmos SHBG IRMA test procedure
based on the principles of a non-competitive ‘liquid-phase’ immunoradiometric assay Sex
Hormone Binding Globulin [125I] Immunoradiometric Assay Kit (Farmos Group Ltd,
Oulunsalo, Finland).

Chapter Three Materials and Methods 90
SHBG Standards (A-F) contain 6.25, 12.5, 25, 50, 100, and 200 nmol SHBG/L (Farmos
Group Ltd, Finland) were used. SHBG standard was made from human pregnancy
serum diluted in bovine serum.
Two SHBG controls (low and high) were used and expected values are as follows:
Reference Values: Quality Control L (Low) Quality Control H (high)
9.0-12.2 nmol/L 81.0-106 nmol/L
3.8 Albumin in Urine
The amount of albumin in urine was measured by rate nephelometry (micro ALBUMIN
(MA), Reagent, P/N 441450) on a Beckman Array 360 analyzer. The method measures
the rate of increase in light scattered from particles suspended in solution as a results of
complexes formed during an antigen-antibody reaction (Beckman MA micro ALBUMIN
manual, 1990).
It is recommended that pooled urine or commercially available nephelometric quality
control material with known concentrations of albumin be included in each set of
determinations. In this test, pooled urine with known concentration of albumin was
used.
Expected Value for Albumin in Urine: < 20 mg/dl
3.9 Anthropometry
All anthropometric measurements were carried out in accordance with the WHO
standards (WHO, 1987).
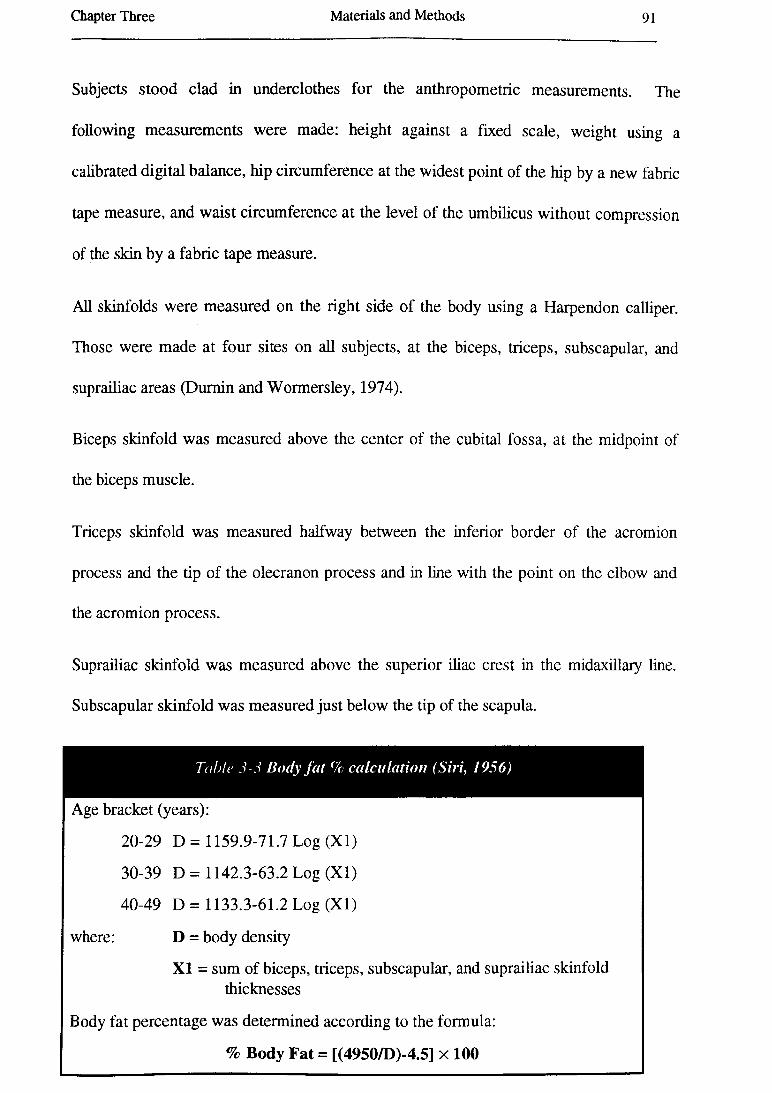
Chapter Three Materials and Methods 91
Subjects stood clad in underclothes for the anthropometric measurements. The
following measurements were made: height against a fixed scale, weight using a
calibrated digital balance, hip circumference at the widest point of the hip by a new fabric
tape measure, and waist circumference at the level of the umbilicus without compression
of the skin by a fabric tape measure.
All skinfolds were measured on the right side of the body using a Harpendon calliper.
Those were made at four sites on all subjects, at the biceps, triceps, subscapular, and
suprailiac areas (Dumin and Wormersley, 1974).
Biceps skinfold was measured above the center of the cubital fossa, at the midpoint of
the biceps muscle.
Triceps skinfold was measured halfway between the inferior border of the acromion
process and the tip of the olecranon process and in line with the point on the elbow and
the acromion process.
Suprailiac skinfold was measured above the superior iliac crest in the midaxillary line.
Subscapular skinfold was measured just below the tip of the scapula.
Table 5-5 Body fat % calculation (Siri, 1956)
Age bracket (years):
20-29 D = 1159.9-71.7 Log (XI)
30-39 D = 1142.3-63.2 Log (XI)
40-49 D = 1133.3-61.2 Log (XI)
where: D = body density
XI = sum of biceps, triceps, subscapular, and suprailiac skinfold thicknesses
Body fat percentage was determined according to the formula:
% Body Fat = [(4950/D)-4.5] x 100

Chapter Three Materials and Methods 92
Body mass index (BMI) as a measure of body adiposity was calculated as BMI = weight
(kg)/ height (m)2 (Quetelet, 1869).
The ratio of waist to hip circumferences (W/H ratio) was calculated as a measure of
central or abdominal adiposity and the skinfold ratio (subscapular / triceps ratio) was
employed as a measure of upper-body fat (Cassano et al, 1992).
Body fat % was calculated by using Siri’s equation (1956).
3.10 The Dietary and Health Questionnaire Booklet
The booklet was explained completely to subjects. The subjects was asked to fill it
carefully (at home) and return it by post as soon as possible.
Dietary intake was assessed using a self-administered, semi-quantitative food frequency
questionnaire. This questionnaire has been used frequently in previous dietary intake
studies in Australia and has been shown to have high repeatability (Baghurst et al, 1988).
This questionnaire was open-ended both with respect to the foods included and the usual
serve size of the respondent. Subjects were instructed to indicate how often they usually
have each of the foods and beverage (ie never, rarely, or so many times per day, per
week, and per month). For most of the foods listed in the questionnaire, standard serve
sizes were assumed (Baghurst et al, 1988).
In addition to these food frequency questions, there were a number of questions dealing
with their health, family medical history, current medication, their dietary changes,
physical activity, smoking, age, occupation status, income, country of birth, and marital
status (Appendix III).
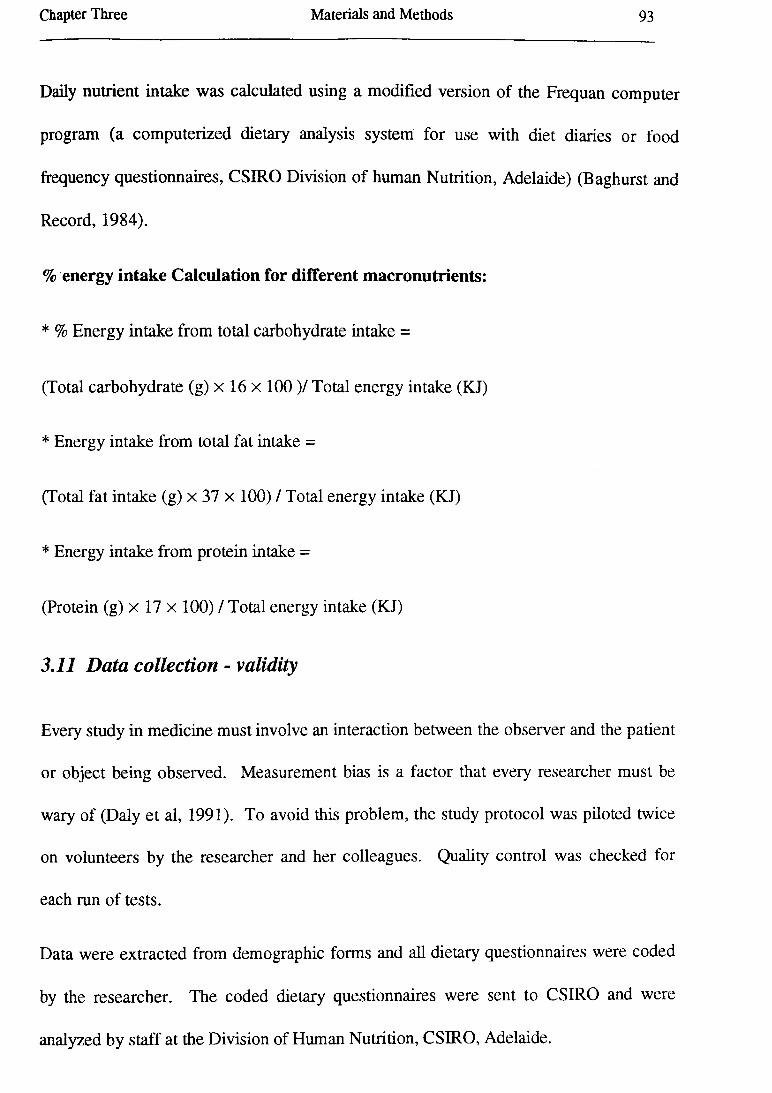
Chapter Three Materials and Methods 93
Daily nutrient intake was calculated using a modified version of the Frequan computer
program (a computerized dietary analysis system for use with diet diaries or food
frequency questionnaires, CSIRO Division of human Nutrition, Adelaide) (Baghurst and
Record, 1984).
% energy intake Calculation for different macronutrients:
* % Energy intake from total carbohydrate intake =
(Total carbohydrate (g) x 16 x 100 )/ Total energy intake (KJ)
* Energy intake from total fat intake =
(Total fat intake (g) x 37 x 100) / Total energy intake (KJ)
* Energy intake from protein intake =
(Protein (g) x 17 x 100) / Total energy intake (KJ)
3.11 Data collection - validity
Every study in medicine must involve an interaction between the observer and the patient
or object being observed. Measurement bias is a factor that every researcher must be
wary of (Daly et al, 1991). To avoid this problem, the study protocol was piloted twice
on volunteers by the researcher and her colleagues. Quality control was checked for
each run of tests.
Data were extracted from demographic forms and all dietary questionnaires were coded
by the researcher. The coded dietary questionnaires were sent to CSIRO and were
analyzed by staff at the Division of Human Nutrition, CSIRO, Adelaide.

Chapter Three Materials and Methods 94
Then all results were entered on a spreadsheet associated with the JMP statistical
package (SAS Institute Inc) on a Macintosh Quadra 650 computer. The data were
checked several times to detect any mistakes and then statistical analysis was carried out.
3.12 Statistical Analysis
Statistical analysis were performed using the ‘JM P’ statistical package (SAS Institute
Inc, NC, USA, Version 3). All statistical comparisons were two tailed. Variables were
tested for normality (a Gaussian distribution) using the Shapiro-Wilk W test (because n <
2000). Several variables were not distributed normally and data transformation,
commonly to the logarithm, was used to reduce skewness.
A significant cut-off level for the p value of 0.05 was used for all statistical analysis. The
0.05 level means that an obtained result that is significant at the 0.05 level should occur
by chance only 5 times in 100 trials. The 0.05 level corresponds fairly well to two
standard deviations from the mean of a normal probability distribution.
Student’s t-test (unpaired) was employed to assess the significance of differences in
group means. The data were presented as mean ± standard deviation.
The chi-square (Pearson) test was used in this research for determining the relationship
between nominal variables.
Cross-correlation used to determine the possible correlations between variables.
Simple and multiple regression analysis is a method of analyzing the variability of a
dependent variable on one or more independent variables. These statistical techniques
were used in this study.
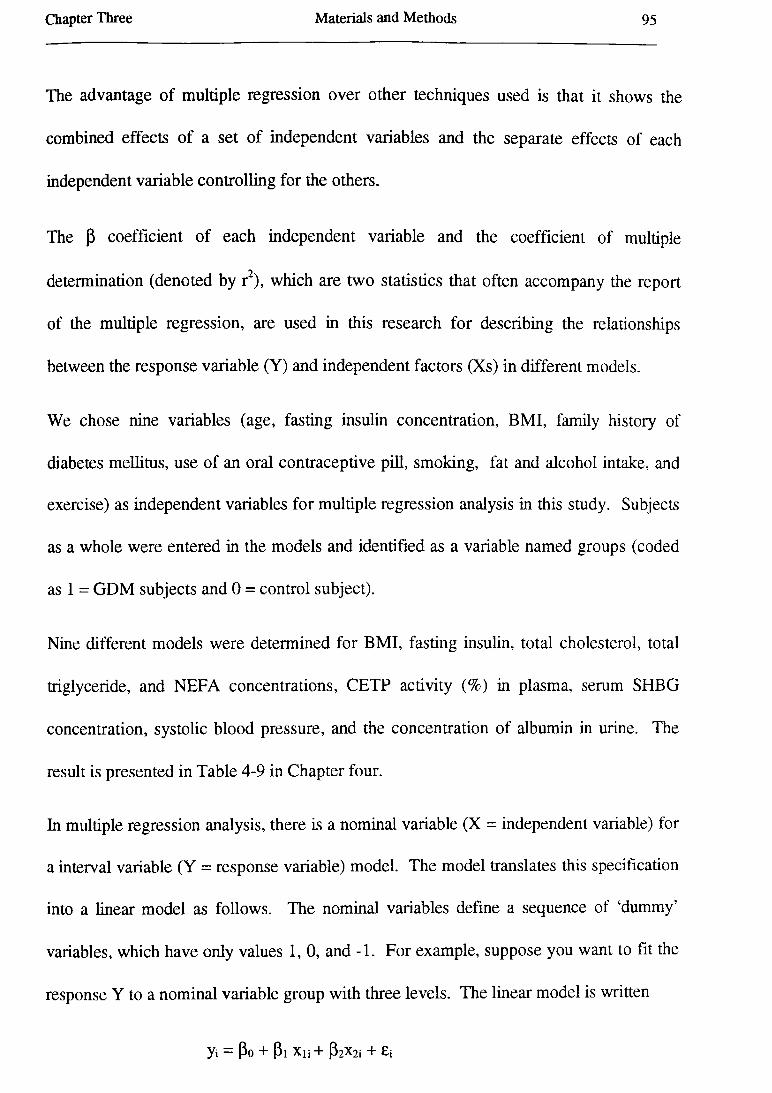
Chapter Three Materials and Methods 95
The advantage of multiple regression over other techniques used is that it shows the
combined effects of a set of independent variables and the separate effects of each
independent variable controlling for the others.
The P coefficient of each independent variable and the coefficient of multiple
determination (denoted by r2), which are two statistics that often accompany the report
of the multiple regression, are used in this research for describing the relationships
between the response variable (Y) and independent factors (Xs) in different models.
We chose nine variables (age, fasting insulin concentration, BMI, family history of
diabetes mellitus, use of an oral contraceptive pill, smoking, fat and alcohol intake, and
exercise) as independent variables for multiple regression analysis in this study. Subjects
as a whole were entered in the models and identified as a variable named groups (coded
as 1 = GDM subjects and 0 = control subject).
Nine different models were determined for BMI, fasting insulin, total cholesterol, total
triglyceride, and NEFA concentrations, CETP activity (%) in plasma, serum SHBG
concentration, systolic blood pressure, and the concentration of albumin in urine. The
result is presented in Table 4-9 in Chapter four.
In multiple regression analysis, there is a nominal variable (X = independent variable) for
a interval variable (Y = response variable) model. The model translates this specification
into a linear model as follows. The nominal variables define a sequence of ‘dummy’
variables, which have only values 1, 0, and -1. For example, suppose you want to lit the
response Y to a nominal variable group with three levels. The linear model is written
yi — Po + Pi Xn + P2X2i + £i

Chapter Three Materials and Methods 96
The first dummy variable is labeled group [1-3] in the report, which denotes that group =
1 contributes a value 1 and group = 3 contributes a value -1 to the dummy variable.
x ii
1
<0
1-1
if group = 1
if group = 2
if group = 3
The second dummy variable is labeled group [2-3] in the report and is given values
0
1
-1
if group = 1
if group = 2
if group = 3
The last level does not need a dummy variable because in this model its level is found by
substracting all the other parameters. Therefore, the coefficients sum to one across all
the levels.
The estimates of the means for the three levels in terms of this parameterization are
M-i = Po + Pi
fii-po + P2
M-3=Po — Pi — P2
Solving for P yields
p0 = ((J.J+ (i2 + p.3) / 3 = |d (the average over levels)
p2 = H2 “ H
p3 - Pi - P2 = Us - M-
Thus, if the indicator coding is each level minus the previous level, the parameter coding
is each level minus the mean of all levls (JMP Package Manual, 1994).
Chapter Three Materials and Methods 97
Each model will be fully described in their own sections.
Subgroups determination:
We determined several subgroups. We used a cut-off point of fasting insulin
concentration > 1 1 , BMI > 25 kg/m2 for overweight persons, NEFA > 0.6 mmol/L, and
family history of diabetes mellitus as positive (+) and negative (-) to determine the
subgroups. ).
Subjects who had plasma NEFA levels > 0 .6 mmol/L, positive family history of diabetes,
and BMI > 25 kg/m2 determined as subgroup (A).
Subjects who had plasma NEFA levels > 0 .6 mmol/L, positive family history of diabetes,
and BMI < 25 kg/m2 determined as subgroup (B).
The GDM group with fasting plasma insulin < 10 IU/L were distinguished from those
with fasting insulin > 10 IU/L and named as hyperinsulinémie subgroup or subgroup C.
Each subgroup were compared with the residual GDM group and residual control group
using Student’s t test.

CHAPTER FOUR
RESULTS
4.1 Comparison o f Study and Control Populations
The overall response rate was 81.25% in the GDM group and 72.22% in the control
group (Table 4-1). The uncorrected chi square test indicated that there is no significant
difference between the response rate in the GDM and the control groups (Table 4-1).
Table 4-1 Response per groups
GDM C ontrols
Expected 80 90
Responded 65 65
X2 = 6.26
p = 0.61
4.1.1 Demographic Data of the Study
The results showed there is no significant difference in age between the GDM and the
control groups (Table 4-2 and Figure 4-1).
Subjects who had had GDM were more likely to have a positive history of diabetes in
their first degree relatives (mother, father, sister, and brother) (Table 4-2). The
frequency of familial diabetes mellitus in the maternal side (17%) was not significantly
more than paternal side (18.5%) between the GDM subjects (Table 4-3).
The GDM individuals also were more likely to have a positive history of cardiovascular
disease (CVD) in their first degree relatives (Table 4-2).
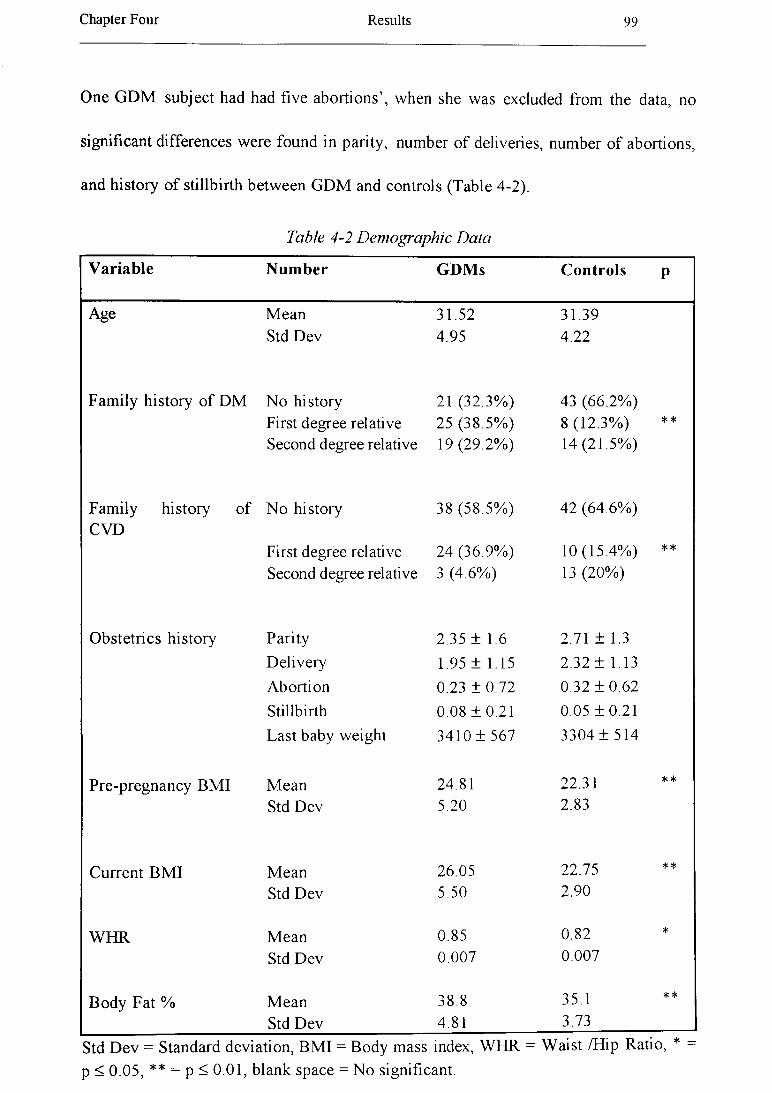
Chapter Four Results 99
One G D M subject had had five abortions’, when she was excluded from the data, no
significant differences were found in parity, number o f deliveries, number o f abortions,
and history o f stillbirth betw een G D M and controls (Table 4-2).
Table 4-2 Demographic Data
Variable Number GDMs Controls P
Age M ean 31.52 31.39Std D ev 4.95 4.22
Fam ily history o f D M N o history 21 (32.3% ) 43 (66.2% )First degree relative 25 (38.5% ) 8 (12.3% ) **
Second degree relative 19(29.2% ) 14(21.5%)
Fam ily history o f N o history 38 (58.5% ) 42 (64.6% )CVD
First degree relative 24 (36.9% ) 10(15.4% ) **
Second degree relative 3 (4.6% ) 13 (20% )
O bstetrics history Parity 2.35 ± 1.6 2.71 ± 1.3
D elivery 1.95 ± 1.15 2.32 ± 1.13
Abortion 0.23 ± 0.72 0.32 ± 0 .6 2
Stillbirth 0.08 ± 0 .2 1 0.05 ± 0 .2 1
Last baby weight 3410 ± 567 3304 ± 514
Pre-pregnancy BM I M ean 24.81 22.31 **
Std D ev 5.20 2.83
Current BM I M ean 26.05 22.75 **
Std D ev 5.50 2.90
W H R M ean 0.85 0.82 *
Std D ev 0.007 0.007
B ody Fat % M ean 38.8 35.1 **
Std D ev 4.81 3.73
Std D ev = Standard deviation, BM I = Body mass index, W HR - W aist /Hip Ratio, * -
p < 0 .05, ** = p < 0.01, blank space = N o significant.
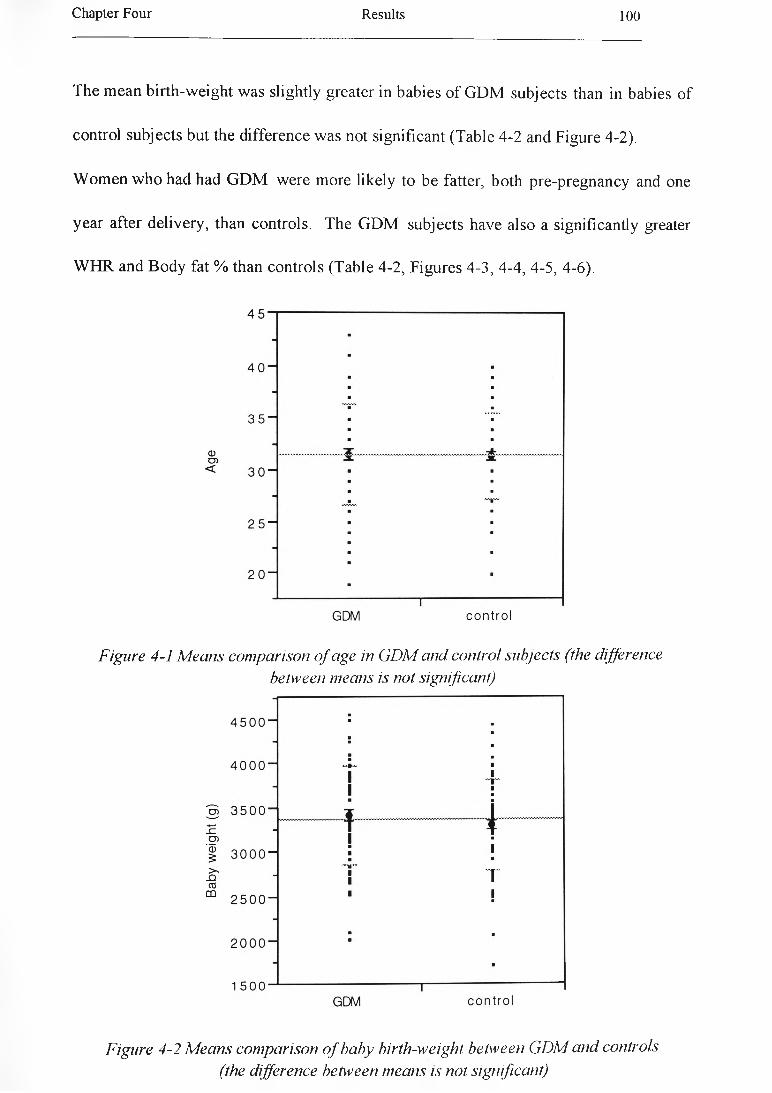
Chapter Four Results 100
The m ean birth-weight w as slightly greater in babies o f GDM subjects than in babies o f
control subjects but the difference was not significant (Table 4-2 and Figure 4-2).
W om en w ho had had G D M were more likely to be fatter, both pre-pregnancy and one
year after delivery, than controls. The G D M subjects have also a significantly greater
W H R and B ody fat % than controls (Table 4-2, Figures 4-3, 4-4, 4-5, 4-6).
Figure 4-1 Means comparison o f age in GDM and control subjects (the differencebetween means is not significant)
Figure 4-2 Means comparison o f baby birth-weight between GDM and controls (the difference between means is not significant)

Chapter Four R esults 101
Figure 4-3 M eans comparison o f pre-pregnancy BM I in GDM and control subjects
(the difference between means is significant)
Figure 4-4 M eans comparison o f BM I in GDM and control subjects (the difference
between means is significant)

Chapter Four R esults 102
Figure 4-5 M eans comparison o f WHR in GDM and control subjects
(the difference between means is significant)
Figure 4-6 M eans comparison o f body fa t % in GDM and control subjects
(the difference between means is significant)

Chapter Four Results 103
Table 4-3 Frequencies offamily history o f diabetes mellitus in the GDM and controlgroup
Frequency of DM in relatives GDM Controls
N o p ositive fam ily history 21 (32.3% ) 43 (66.2% )
M other 11 (16.9% ) 2 (3 .1 % )
Father 12(18 .5% ) 3 (4.6% )
Sister 2 (3 .1 % ) 2 (3 .1 % )
Brother 0 (0.0% ) 1 (1.5% )
Grandmother (m other side) 11 (16.9% ) 2 (3 .1 % )
Grandmother (father side) 0 (0.0% ) 1 (1.5% )
Grandfather (m other side) 1 (1.5% ) 2 (3 .1 % )
Grandfather (father side) 2 (3 .1 % ) 2 (3 .1 % )
U ncle (m other side) 2 (3.1% ) 2 (3 .1 % )
U ncle (father side) 0 (0.0% ) 2 (3 .1 % )
A unt (m other side) 0 (0.0% ) 0 (0.0% )
A unt (father side) 1 (1.5% ) 1 (3.1% )
Cousin (mother side) 0 (0.0% ) 2 (3.1% )
Cousin (father side) 2 (3 .1 % ) 0 (0.0% )
4.1.2 Physiological Data of the Study
Plasm a cholesterol concentrations were significantly higher in the G D M group than in
the control group (Table 4-4 and Figure 4-7). The G DM subjects had significantly
higher plasm a TG levels than controls (Table 4-4 and Figure 4-8).
The plasm a apoB levels w ere significantly higher in the G D M group than in the control
group (Table 4-4 and Figure 4-9), but there w as no significant difference betw een the
G D M and control group m eans o f plasm a apo A-I concentrations (Table 4-4).
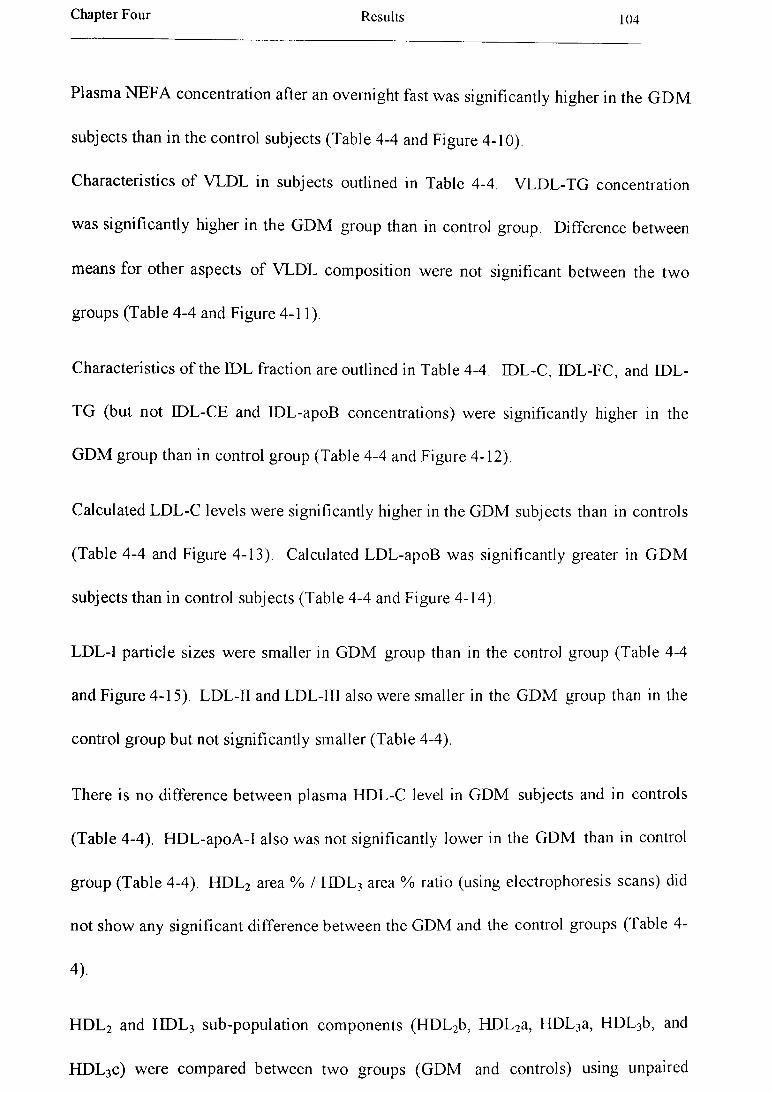
Chapter Four Results 104
Plasm a N E F A concentration after an overnight fast was significantly higher in the G D M
subjects than in the control subjects (Table 4-4 and Figure 4-10).
Characteristics o f VLDL in subjects outlined in Table 4-4. V LDL-TG concentration
w as significantly higher in the G D M group than in control group. Difference between
means for other aspects o f VLDL com position were not significant betw een the tw o
groups (Table 4-4 and Figure 4-11).
Characteristics o f the EDL fraction are outlined in Table 4-4. IDL-C, IDL-FC, and IDL-
TG (but not IDL-CE and IDL-apoB concentrations) were significantly higher in the
G D M group than in control group (Table 4-4 and Figure 4-12).
Calculated LDL-C levels were significantly higher in the GDM subjects than in controls
(Table 4-4 and Figure 4-13). Calculated LDL-apoB w as significantly greater in G D M
subjects than in control subjects (Table 4-4 and Figure 4-14).
LDL-I particle sizes were smaller in G DM group than in the control group (Table 4-4
and Figure 4-15). LDL-II and LDL-III also were smaller in the G D M group than in the
control group but not significantly smaller (Table 4-4).
There is no difference betw een plasma HDL-C level in G DM subjects and in controls
(Table 4-4). H D L -apoA -I also was not significantly lower in the GDM than in control
group (Table 4-4). H D L 2 area % / H D L 3 area % ratio (using electrophoresis scans) did
not show any significant difference betw een the GDM and the control groups (Table 4
4).
H D L 2 and H D L 3 sub-population com ponents (H D L 2b, H D L 2a, H D L3a, H D L 3b, and
H D L 3c) w ere compared betw een tw o groups (G D M and controls) using unpaired
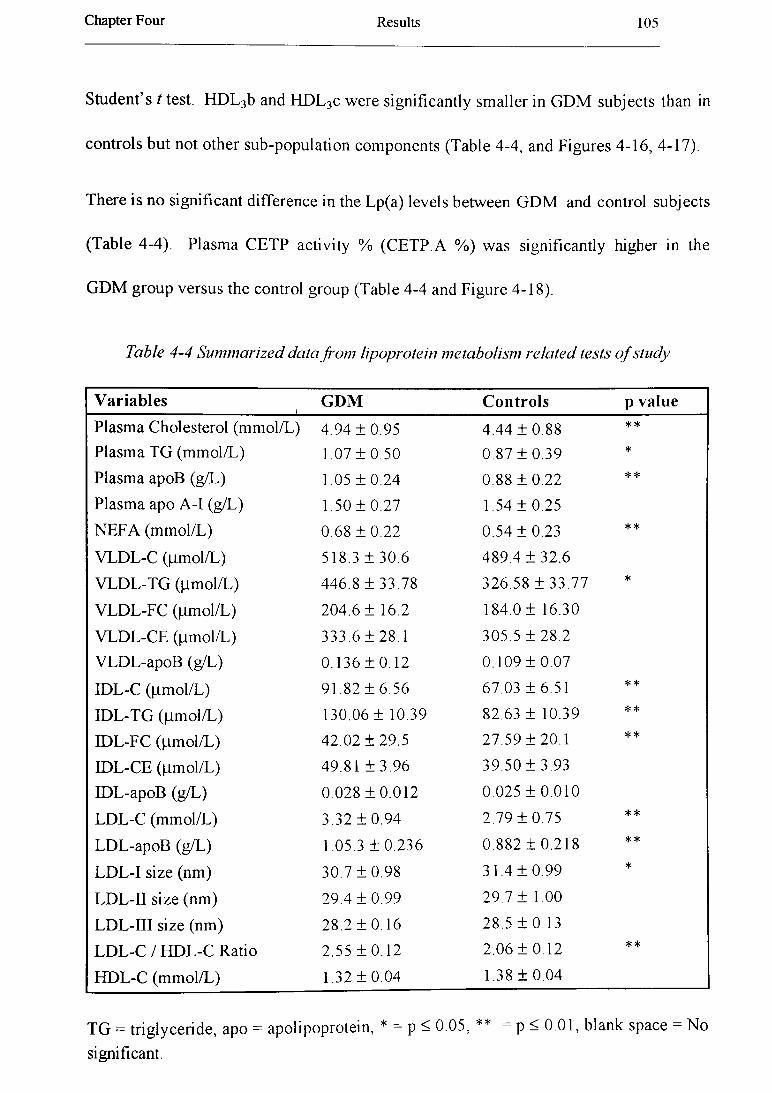
Chapter Four Results 105
Student’s t test. H D L 3b and H D L 3c w ere significantly sm aller in G D M subjects than in
controls but not other sub-population com ponents (Table 4-4, and Figures 4-16 , 4-17).
There is no significant difference in the Lp(a) levels betw een G D M and control subjects
(Table 4-4). Plasm a CETP activity % (C ETP.A %) w as significantly higher in the
G D M group versus the control group (Table 4-4 and Figure 4-18).
Table 4-4 Summarized data from lipoprotein metabolism related tests o f study
V a ria b le s i G D M C o n tro ls p va lu e
Plasm a Cholesterol (m m ol/L) 4.94 ± 0 .9 5 4 .44 ± 0 .8 8 **
Plasm a TG (m m ol/L) 1.07 ± 0 .5 0 0.87 ± 0 .3 9 *
Plasm a apoB (g/L) 1.05 ± 0 .2 4 0.88 ± 0 .2 2 **
Plasm a apo A -I (g/L) 1.50 ± 0 .2 7 1.54 ± 0 .2 5
N E F A (m m ol/L) 0.68 ± 0 .2 2 0.54 ± 0 .2 3 **
VLDL-C Ounol/L) 518.3 ± 30.6 489.4 ± 3 2 .6
V LD L -T G (|im ol/L ) 446.8 ± 3 3 .7 8 326.58 ± 3 3 .7 7 *
VLDL-FC (|jinol/L) 204.6 ± 16.2 184.0 ± 16.30
VLDL-CE (fim ol/L) 333.6 ± 28.1 305.5 ± 2 8 .2
V LDL-apoB (g/L) 0.136 ± 0.12 0.109 ± 0 .0 7
IDL-C (jim ol/L) 91 .82 ± 6.56 67.03 ± 6 .5 1 **
ID L-TG (Mmol/L) 130.06 ± 10.39 82.63 ± 10.39 **
IDL-FC (Mmol/L) 42 .02 ± 2 9 .5 27.59 ± 2 0 .1 **
IDL-CE (ttm ol/L) 49.81 ± 3 .9 6 39.50 ± 3 .9 3
IDL-apoB (g/L) 0.028 ± 0 .0 1 2 0.025 ± 0 .0 1 0
LDL-C (m m ol/L) 3.32 ± 0 .9 4 2.79 ± 0 .7 5 **
LD L-apoB (g/L) 1.05.3 ± 0 .236 0.882 ± 0 .2 1 8 * *
L D L-I size (nm) 30.7 ± 0 .9 8 31.4 ± 0 .9 9 *
LDL-II size (nm ) 29.4 ± 0 .9 9 29.7 ± 1.00
LDL-III size (nm) 28.2 ± 0 .16 28.5 ± 0 .1 3
LD L-C / H D L-C Ratio 2.55 ± 0.12 2.06 ± 0 .1 2 **
H D L-C (m m ol/L) 1.32 ± 0 .0 4 1.38 ± 0 .0 4
TG = triglyceride, apo = apolipoprotein, * = p < 0 05, ** = p < 0.01, blank space = N o
significant.

Chapter Four R esults 106
Table 4-5 (continued)
V ariables GDM C ontro ls p value
H D L -apoA -I (g /L ) 1.39 ± 0 . 0 3 1.41 ± 0 . 0 3
H D L 2 (%) / H D L 3 (% ) 0.81 ± 0 . 0 9 0.97 ± 0 . 1 0
H D L 2b s ize (nm ) 10.91 ± 0 . 0 4 11.0 ± 0 . 0 4
H D L 2a s ize (nm ) 9 .28 ± 0 . 0 4 9.34 ± 0 . 0 4
H D L 3a s ize (nm ) 8 .46 ± 0 . 0 3 8.54 ± 0 . 0 3
H D L 3b size (nm ) 7.92 ± 0 . 0 1 7.98 ± 0 . 0 1 **
H D L 3c s ize (nm ) 7.59 ± 0 . 0 2 7 .66 ± 0 . 0 2 **
Plasm a Lp (a) (m g/dl) 19.64 ± 16.8 23.71 ± 2 2 . 9
CETP activity (%) 19.51 ± 1.07 15.78 ± 1.06 *
Lp = lipoprotein , * = p < 0 .05, ** = p < 0.01, blank space = N o significant.
7 -
6 -
5 “
4 “
3 “
GDM control
Figure 4-7 M eans comparison for plasma cholesterol concentration between GDM and
control groups (difference between means is significant\ p = 0.0021)

Chapter Four R esults 107
Figure 4-8 M eans comparison for plasma triglyceride concentration between GDM and
control groups (difference between means is significant, p = 0.0153)
Figure 4-9 Comparison between mean values o f plasma apoB concentrations in GDM
and confrol groups (difference between means is significant, p = 0.0000)

Chapter Four R esults 108
Figure 4-10 Comparison between mean values o f plasma NEFA concentrations in GDM
and control groups (difference between means is significant, p = 0.0013)
Mean(VLDL-C(|amol/L))
Mean(VLDL-TG(|j.mol/L))
Mean(VLDL-FC(|amol/L))
Mean(VLDL-CE(|imol/L))
Figure 4-11 Means comparison fo r VLDL composition levels between GDM and
controls (there is only a significant difference between means o f VLDL-TG)

Chapter Four R esults 109
0 50I
100
Mean(IDL-C(pmol/L))
Mean(IDL-TG(jumol/L))
Mean(IDL-FC(pmol/L))
Mean(IDL-CE(pmol/L))
1 50
Figure 4-12 M eans comparison fo r 1DL-C, IDL-TG, and IDL FC concenfrations
between the GD M subjects and controls (means are significantly different)
Figure 4-13 Comparison o f means o f plasm a LDL-C concentration between GDM and
confrol subjects (there is a significant difference between means, p = 0.0006)

Chapter Four R esults 110
1 .4
1 . 3 “
1 . 2 “
1 . 1 “
1 . o -
3 0.9 —
■■■■ ■
---# -- ■ B ■ ■ ■1
1^ t
<§ 0 .8 -Q_ [7 0 . 7 “_i ■- i 0 . 6 “
0 . 5
0 . 4 -
1
0 . 3
0.2 ^
■
----------------- ------------------ ------------------GDM control
Figure 4-14 Comparison o f means o f LDL-apoB between GDM and control subjects
(there is a significant difference between means, p = 0.0000)
Figure 4-15 Comparison o f means ofLDL-1 (size) between GDM and control subjects
(there is a significant difference between means, p = 0.0006)
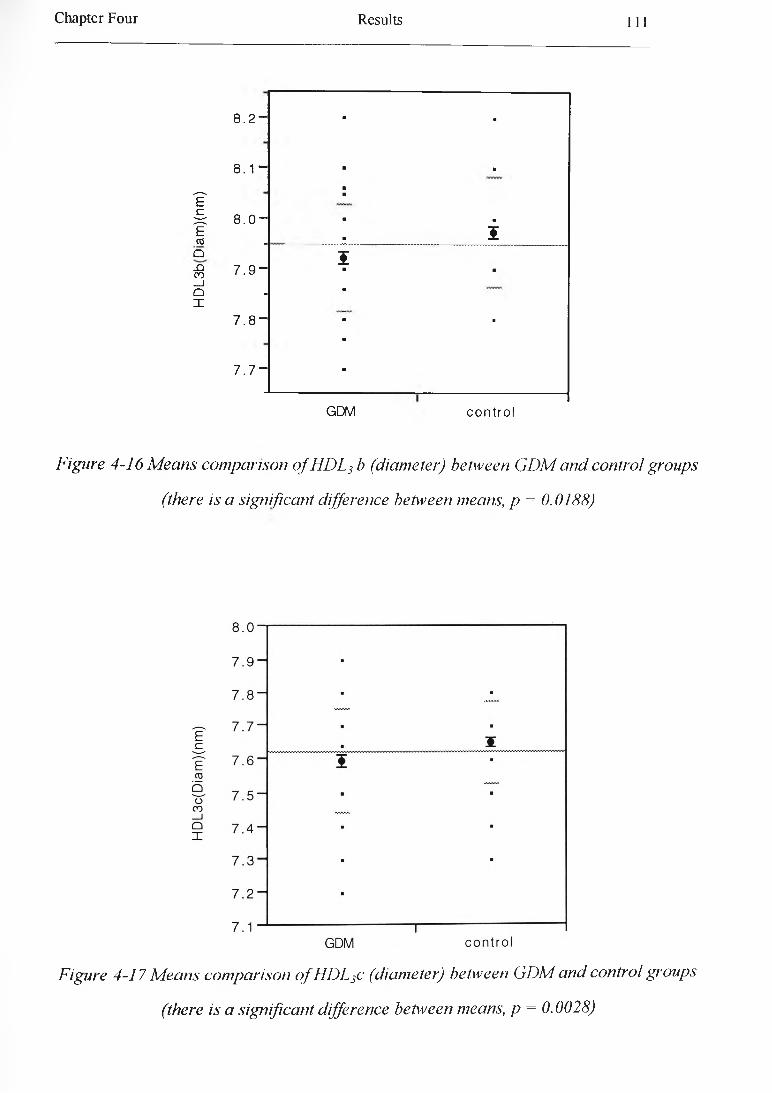
Chapter Four R esults 111
8 . 2 “
8 . 1 “
I ff f 8 . 0 ECO .
■ ■
■ ■
■ ■ . 5
Q I-Q 7 9 “ co ' •a ■ ■_iO -X
7 . 8 - ■ ■
7 . 7 “
GDM control
Figure 4-16 M eans comparison o f HDL3 b (diameter) between GDM and control groups
(there is a significant difference between means, p = 0.0188)
Figure 4-17 M eans comparison o f HDL3c (diameter) between GDM and control groups
(there is a significant difference between means, p = 0.0028)

Chapter Four R esults 112
Figure 4-18 M eans comparison for plasma CETP activity % between GDM and controls
(there is a significant difference between means, p - 0.0190)
The fasting b lood glucose concentration w as not significantly higher in G D M subjects
than in controls (Table 4-5).
Fasting insulin level w as significantly higher in G D M patients than in controls (Table 4
5 and Figure 4-19). In addition, the ratio o f fasting insulin level / fasting g lucose level (as
a marker o f insulin resistance) w as significantly higher in G D M subjects (Table 4-5 and
Figure 4-20).
G lycosylated haem oglobin (H b A lc ) levels w ere similar in the G D M and control groups
(Table 4-5).
The m ean p lasm a fibrinogen concentration, factor VII coagulant activity (factor V ile),
and vonW illebrand factor (vW F ) activity (%) were slightly higher in the G D M than in
controls but did not differ sign ificantly (Table 4-5).
Chapter Four Results 113
The tw o groups (G D M and Controls) had significantly different plasma SHBG
concentrations (Table 4-5 and Figure 4-21).
The G D M group w ith a low er concentration o f SH BG had a slightly but not
significantly higher plasm a testosterone concentration than the control group (Table 4
5)-
The testosterone / SH B G ratio w as significantly greater in G D M than in control
subjects (Table 4-5 , Figure 4-22).
B oth systo lic and diastolic blood pressures were significantly higher in the G D M group
than in the control subjects (Table 4-5 and Figures 4-23, 4-24). M ean arterial pressure
(M A P) w as significantly higher in G DM subjects than in controls (Table 4-5 and Figure
4-25). H ow ever, the pulse pressure was similar in G DM subjects and in controls (Table
4-5). The amount o f albumin in urine (m g/L) was significantly greater in G D M subjects
than in controls (Table 4-5 and Figure 4-26).
Figure 4-19 Means comparison for fasting blood insulin between GDM and control groups (there is a significant difference between means, p = 0.0008)
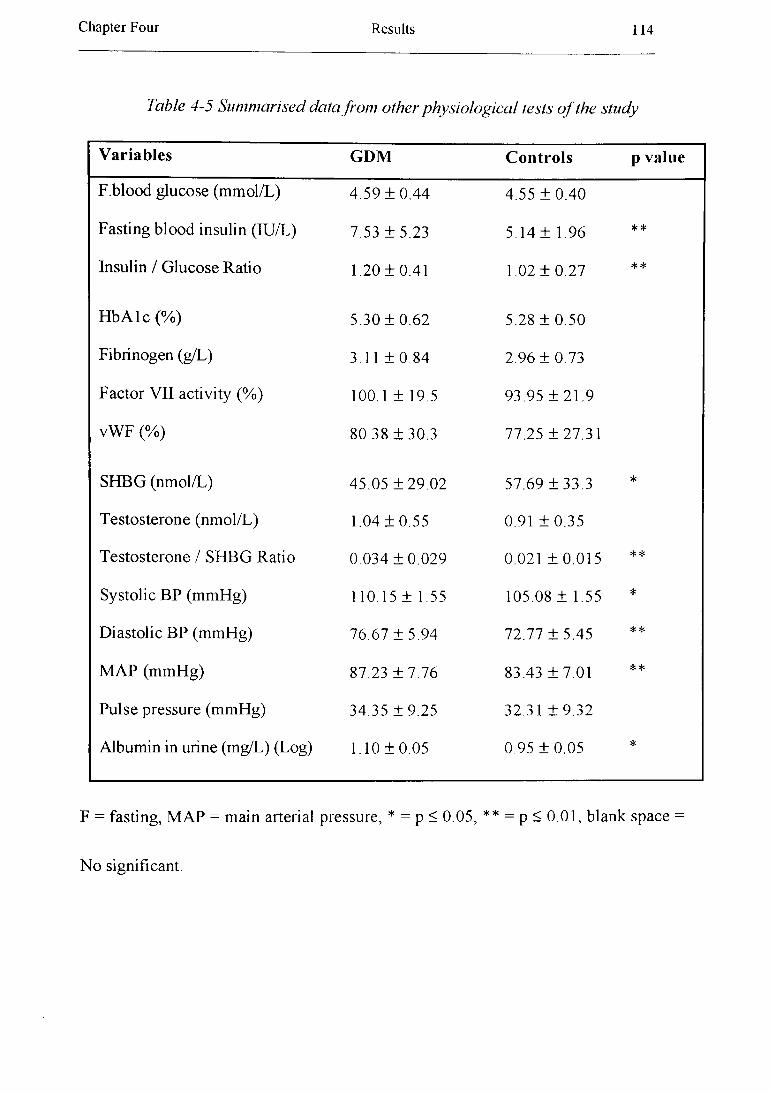
Chapter Four Results 114
Table 4-5 Summarised data from other physiological tests o f the study
Variables G D M Controls p value
F.blood glucose (m m ol/L) 4 .59 ± 0 .4 4 4.55 ± 0 .4 0
Fasting b lood insulin (IU/L) 7.53 ± 5 .2 3 5.14 ± 1.96 **
Insulin / G lucose Ratio 1.20 ± 0 .4 1 1.02 ± 0 .2 7 **
H b A lc (%) 5.30 ± 0 .6 2 5.28 ± 0 .5 0
Fibrinogen (g/L) 3.11 ± 0 .8 4 2.96 ± 0 .7 3
Factor VII activity (%) 100.1 ± 19.5 93.95 ± 2 1 .9
vW F (%) 80.38 ± 3 0 .3 77.25 ± 2 7 .3 1
SH BG (nm ol/L) 45.05 ± 2 9 .0 2 57.69 ± 3 3 .3 *
T estosterone (nm ol/L) 1.04 ± 0 .5 5 0.91 ± 0 .3 5
T estosterone / SH BG Ratio 0 .034 ± 0 .0 2 9 0.021 ± 0 .0 1 5 **
Systolic BP (m m H g) 110.15 ± 1.55 105.08 ± 1.55 *
D iastolic BP (m m H g) 76.67 ± 5 .9 4 72.77 ± 5.45 **
M A P (m m H g) 87.23 ± 7 .7 6 83.43 ± 7 .0 1 **
P ulse pressure (m m H g) 34.35 ± 9 .2 5 32.31 ± 9 .3 2
Albumin in urine (m g/L) (Log) 1.10 ± 0.05 0.95 ± 0 .0 5 *
F = fasting, M A P = main arterial pressure, * = p < 0.05, ** = p < 0.01, blank space =
N o significant.
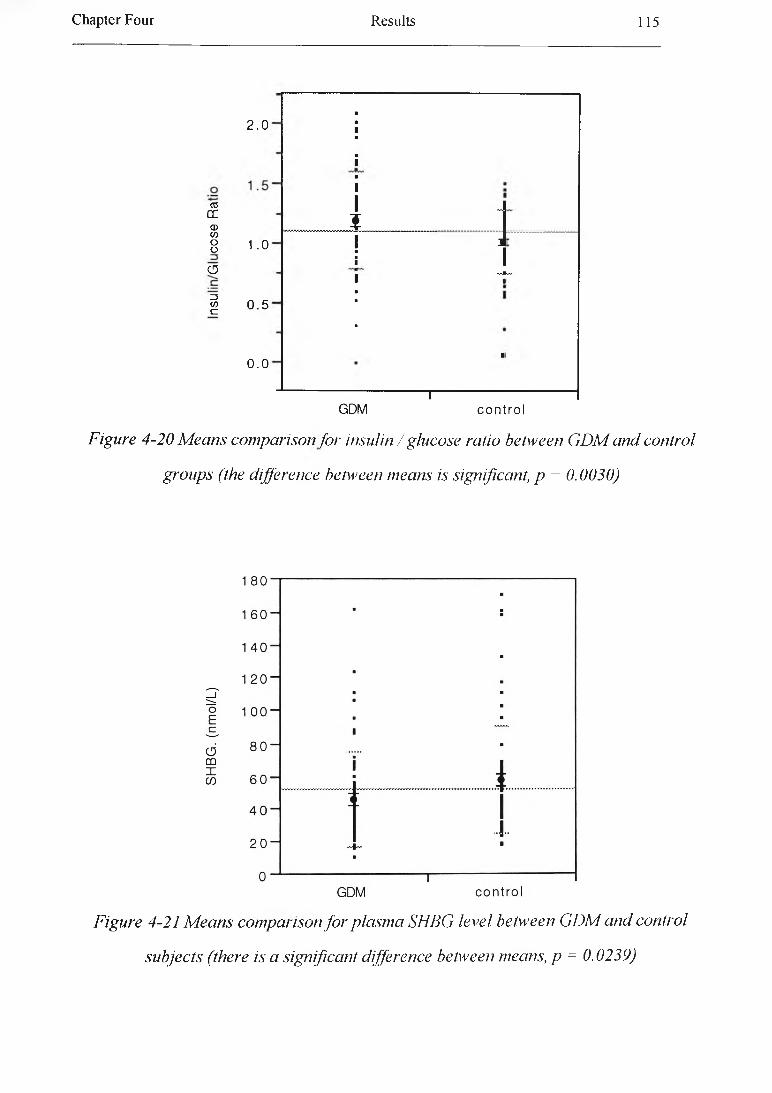
Chapter Four R esults 115
2.0
03OCCD</)8 1.0
o
I 0 . 5
0.0
Figure 4-20 M eans comparison for insulin / glucose ratio between GDM and control
groups (the difference between means is significant, p = 0.0020)
■■1■■1■11 J
?1 i ■■■1 1 ■■
■
■
kv
----------------- 1------------------GDM control
Figure 4-21 M eans comparison fo r plasma SHBG level between GDM and control
subjects (there is a significant difference between means, p = 0.0239)
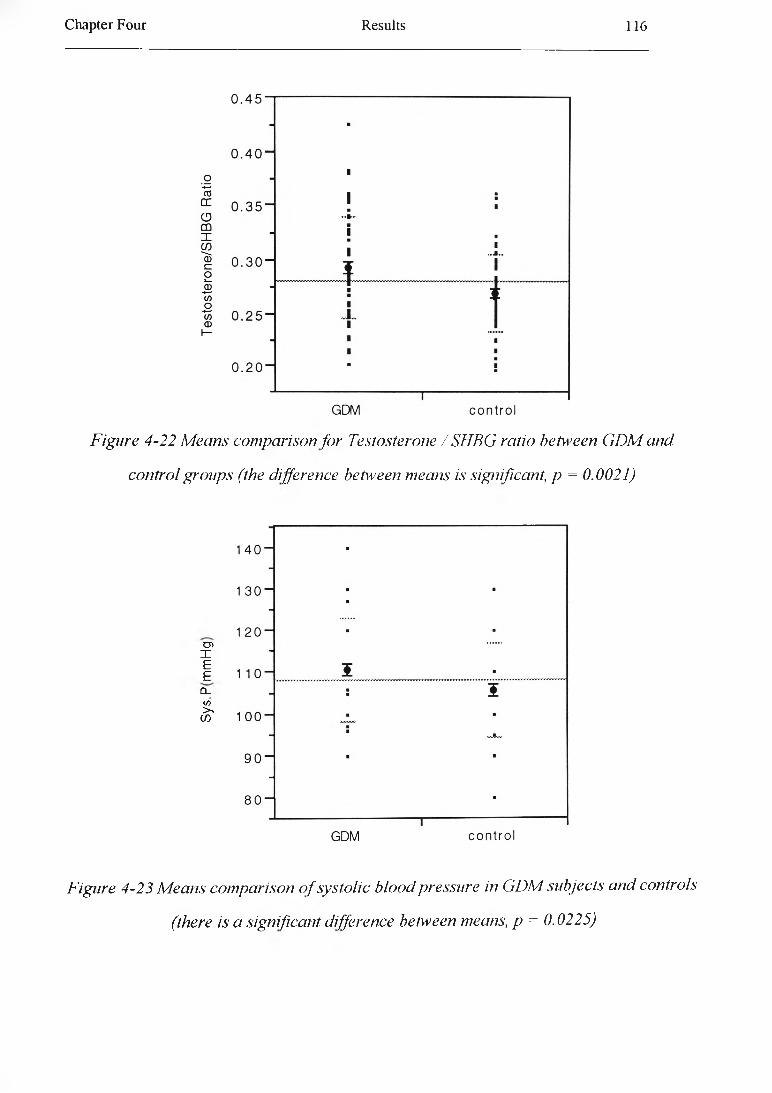
Chapter Four R esults 116
Figure 4-22 Means comparison for Testosterone / SHBG ratio between G D M and
control groups (the difference between means is significant, p = 0.0021)
cnIEE
CLCO > cn
Figure 4-23 Means comparison o f systolic blood pressure in GDM subjects and controls
(there is a significant difference between means, p = 0.0225)

Chapter Four R esults 117
Figure 4-24 M eans comparison o f diastolic blood pressure in GDM subjects and
controls (there is a significant difference between means, p = 0.0026)
Figure 4-25 M eans comparison o f mean arterial pressure (MAP) in GDM subjects and
controls (there is a significant difference between m eansp = 0.0045)
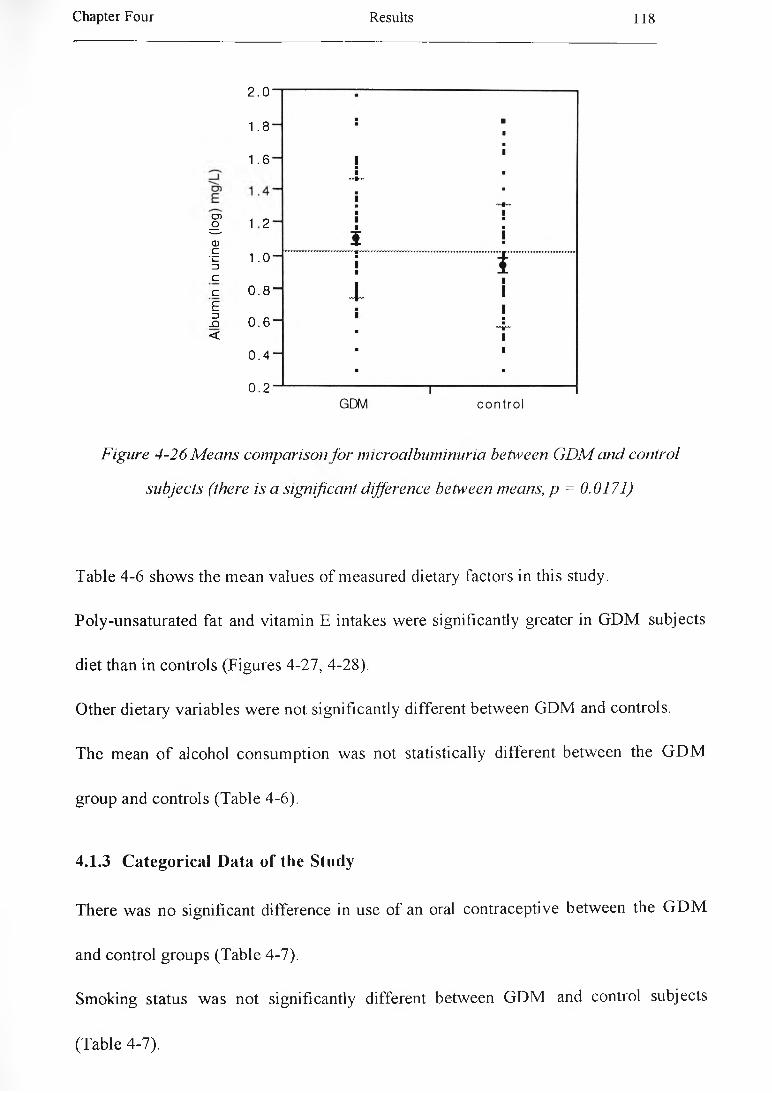
Chapter Four Results 118
2.0
1.8
1.6
I 1 2CD
•§ 1.0 3Cc 0.8Ef 0.6 <
0 . 4
0.2
Figure 4-26 M eans comparison for microalbuminuria between GDM and control
subjects (there is a significant difference between means, p = 0.0171)
Table 4 -6 show s the m ean values o f measured dietary factors in this study.
Poly-unsaturated fat and vitam in E intakes w ere significantly greater in G D M subjects
diet than in controls (Figures 4-27 , 4-28).
Other dietary variables w ere not significantly different betw een G D M and controls.
The mean o f alcohol consum ption w as not statistically different betw een the G D M
group and controls (Table 4-6).
4.1.3 C ategorical D ata of the Study
There w as no significant difference in use o f an oral contraceptive betw een the G D M
and control groups (Table 4-7).
Sm oking status w as not significantly different betw een G D M and control subjects
(Table 4-7).
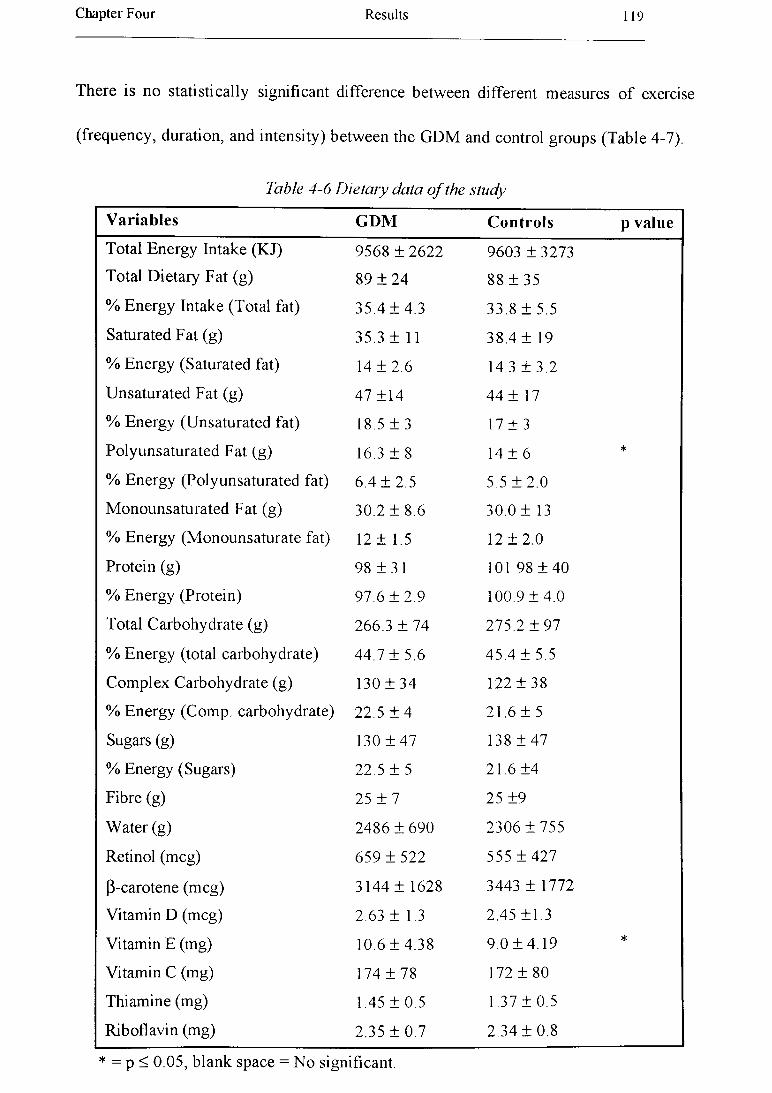
Chapter Four Results 119
There is no statistically significant difference between different measures of exercise
(frequency, duration, and intensity) between the GDM and control groups (Table 4-7).
Table 4-6 Dietary data o f the study
Variables GDM Controls p valueTotal Energy Intake (KJ) 9568 ± 2622 9603 ± 3273
Total D ietary Fat (g) 89 ± 2 4 88 ± 3 5
% Energy Intake (Total fat) 35.4 ± 4 .3 33.8 ± 5.5
Saturated Fat (g) 35.3 ± 11 38.4 ± 19
% Energy (Saturated fat) 14 ± 2 .6 14.3 ± 3 .2
Unsaturated Fat (g) 47 ±14 44 ± 17
% Energy (Unsaturated fat) 18.5 ± 3 17 ± 3
Polyunsaturated Fat (g) 16.3 ± 8 14 ± 6 *
% Energy (Polyunsaturated fat) 6.4 ± 2 .5 5.5 ± 2 .0
M onounsaturated Fat (g) 30.2 ± 8.6 30.0 ± 13
% Energy (M onounsaturate fat) 12 ± 1.5 12 ± 2 .0
Protein (g) 98 ± 3 1 101 98 ± 40
% Energy (Protein) 97.6 ± 2 .9 100.9 ± 4 .0
Total Carbohydrate (g) 266.3 ± 74 275.2 ± 9 7
% Energy (total carbohydrate) 44,7 ± 5.6 45.4 ± 5.5
C om plex Carbohydrate (g) 130 ± 34 122 ± 3 8
% Energy (Comp, carbohydrate) 22.5 ± 4 21.6 ± 5
Sugars (g) 130 ± 4 7 138 ± 47
% Energy (Sugars) 22.5 ± 5 21.6 ±4
Fibre (g) 25 ± 7 25 ±9
Water (g) 2486 ± 690 2306 ± 7 5 5
Retinol (m eg) 659 ± 5 2 2 555 ± 4 2 7
p-carotene (m eg) 3144 ± 1628 3443 ± 1772
Vitamin D (m eg) 2.63 ± 1.3 2.45 ±1.3
Vitamin E (mg) 10.6 ± 4 .3 8 9.0 + 4.19 *
Vitamin C (mg) 174 ± 7 8 172 ± 80
Thiamine (mg) 1.45 ± 0 .5 1.37 ± 0.5
Riboflavin (mg) 2.35 ± 0 .7 2.34 + 0.8
* = p < 0.05, blank space = No significant.

Chapter Four Results 120
Table 4 -6 (continued)
Variables GDM Controls p value
Vitam in B -6 (m g) 1.88 ± 0 .6 1.84 ± 0 .7
N icotin ic A cid (m g) 21 .9 ± 6.6 21.11 ± 6 .1
Vitam in B -12 (m g) 4 .4 ± 2 .1 4.37 ± 2 .2
F olic A cid (m eg) 253 ± 8 0 252 ± 10
Biotin (m eg) 22.55 ± 8 23 .10 ± 10
Pantothenic A cid (m g) 6.6 ± 1.7 5.8 ± 2 .3
Sodium (m g) 2865 ± 7 1 3 2657 ± 790
Chloride (m g) 4793 ± 1340 4641 ± 1735
Potassium (mg) 3582 ± 9 9 6 3 9 0 6 ± 110
M agnesium (m g) 331 ± 8 8 330 ± 9 5
Calcium (mg) 1089 ± 3 7 6 1064 ± 4 0 4
Phosphorus (m g) 1582 ± 5 2 1 1560 ± 6 0 9
Iron (m g) 14 ± 4 14 ± 5
Zinc (m g) 13.4 ± 4.3 13.8 ± 6 .1
Copper (m g) 1.9 ± 0.6 2.0 ± 0 .7
Sulphur (m g) 785 ± 2 8 7 826 ± 423
A lcohol (g) 2 .06 ± 3 .6 2.64 ± 3 .5
D ata is presented as mean ± standard deviation. There is no significant difference
betw een tw o groups in the above dietary variables.
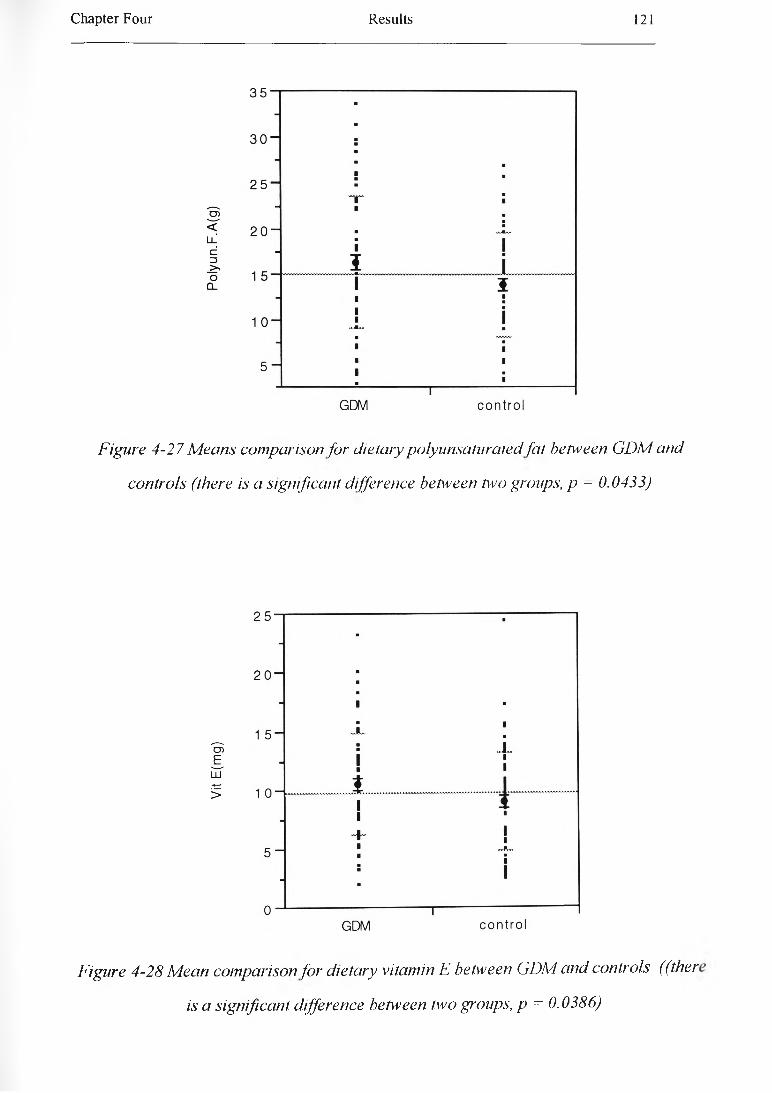
Chapter Four R esults 121
Figure 4-27 Means comparison for dietary polyunsaturated fat between GDM and
controls (there is a significant difference between two groups, p - 0.0433)
Figure 4-28 M ean comparison for dietary vitamin E between GDM and confrols ((ther
is a significant difference between two groups, p = 0.0386)

Chapter Four Results 122
Table 4-7 Summarized categorical data o f the study
Variable Category GDMs Controls p valueOral contraceptive 1 = Current use 28 (22% ) 2 0 (1 5 % )
2 = Former or Never use 37 (28% ) 45 (35% )
Smoking 0 = Non smoker 38 (29% ) 36 (28% )1 - Smoker 10(8% ) 14(11% )2 = Ex-smoker 17(1 3 % ) 15 (12% )
Freq o f E xercise 0 = Not at all 18(1 4 % ) 1 6(12% )1 = Less than once a week 1 7 (13% ) 11 (9% )2 = Once or twice a week 14(1 1 % ) 17(13% )3 = Three times a week 1 6 (12% ) 20(16%)
Dura o f E xercise 0 = Not at all 18(14% ) 16(12% )1 = Less than 20 minutes 16(12% ) 12(9% )2 = 20-30 minutes 19(15% ) 14(11% )3 = More than 30 minutes 12 (9% ) 2 2 (1 7 % )
Inten o f Exercise 0 = No exercise 18 (14% ) 16(12% )1 = None of exercise session 6 (5% ) 4(4% )2 = Some of exercise session 30 (23% ) 33 (26% )3 = Most or all of exercise session
11 (11% ) 10(8% )
L D L P henotype A 44 (72% ) 37 (62% )B 17(28% ) 23 (38% )
Freq — frequency, D ura = duration, Inten — intensity. There is no significant difference
b etw een the G D M and control groups in the above variables.
4.1.4 Cross-correlation Between Different Variables
Table 4-8 show s correlation coeffic ien ts betw een different variables in the G D M group
in this study. The underlined values have significant correlation (p < 0.05).
Age show ed only a negative and significant correlation with concentration o f albumin in
urine in the G D M group.
Chapter Four Results 123
Total cholesterol concentration w as p ositive ly and significantly correlated with plasma
TG, apoA -I, apoB , L D L -C , V L D L -T G concentrations, and CETP activity in plasma.
Plasm a cholesterol w as also p ositive ly and significantly correlated w ith factor V ile,
diastolic b lood pressure, and markers o f obesity (BM I, body fat %), but the correlation
betw een plasm a cholesterol concentration and W H R did not reach significance level.
Total cholesterol level w as also significantly and positively correlated with pre
pregnancy BM I. Plasm a cholesterol concentration w as not significantly related to
plasma insulin level, fasting blood glucose, H b A lc , exercise, smoking, cholesterol intake
or total fat intake (T able 4-8).
Fasting plasm a insulin, apo B concentrations, factor V ile , BM I, body fat %, and CETP
activity in plasm a w ere positively and significantly related to plasm a TG concentration.
Plasma TG level w as negatively and significantly correlated with H D L-C and LDL1
particle size (Table 4-8).
Plasma apo A-I concentration was significantly related to plasma H D L-C , N E FA ,
SH BG concentrations and alcohol consum ption. Plasm a apoB level w as positively and
significantly related to L D L-C , ID L-C , and V L D L -T G concentrations and CETP
activity in plasm a as one m ight expected and negatively to H D L-C . Plasm a apoB level
also w as p ositively correlated w ith fasting insulin level, factor VII, BM I, and body fat
% (Table 4-8).
Plasm a N E F A concentration w as negatively and significantly correlated with blood
pressure, alcohol intake, and am ount o f albumin in urine. Plasm a N E F A concentration
w as also negatively correlated with CETP activity in plasm a (Table 4-8).
Chapter Four Results 124
H D L-C w as negatively and significantly correlated with plasm a TG, apoB, VLDL-TG ,
IDL-C concentration, and CETP activity in plasma. There is a positive and significant
association betw een H D L -C level and alcohol consumption. H D L 3c w as positively and
significantly correlated w ith H b A lc (Table 4-8).
Data show ed a relationship betw een LDL-C concentration and V LD L-TG level and
CETP activity in plasm a, as one might expect. LDL-C also is correlated with fasting
plasm a insulin level, BM I, and body fat %. There are several dietary factors which are
negatively related to LDL-C. A negative linear relationship w as betw een LDL-I
(particle size) and a set o f variables including plasm a TG and apoB, VLDL-TG , IDL,
insulin concentrations, BM I, and body fat %, how ever LDL-I had a positive correlation
w ith H D L -C (Tables 4-8).
Statistical analysis show ed that V LD L-TG was positively correlated with CETP
activity in plasm a, fasting plasm a insulin concentration, BM I, and body fat %, while
there w as a negative correlation between V LD L-TG and LDL1 particle size (Table 4-8).
IDL-C has positive correlation with CETP activity in plasma, BM I, and body fat.
There w as a positive correlation betw een IDL-C level and fasting plasma insulin level,
but it w as not significant (Table 4-8).
Plasm a Lp (a) concentration w as negatively and significantly correlated with
concentration o f albumin in urine (Table 4-8).
Plasm a C ETP.A % w as related to total cholesterol, TG, apoA-I, apoB, VLDL-TG ,
ID L-C , LD L-C and N E F A concentrations. CETP activity in plasma w as correlated
positively and significantly with fasting insulin level, BM I, body fat. The relationship
Chapter Four R esults 125
b etw een C ETP activity in plasm a and alcohol intake w as negative and significant (Table
4-8). -
There is a p o sitiv e and significant association betw een fasting blood glucose level and
factor Vile. Fasting insulin concentration w as p o sitiv e ly and significantly with total
cholesterol, TG , apoB , L D L -C , V L D L -T G , testosterone concentrations, CETP activity
in plasm a, factor V ile , b lood pressure, microalbuminuria, and obesity. There is a
negative and significant association betw een plasm a insulin level and LDL1 particle size
(Table 4-8). _
Plasm a fibrinogen level w as p o sitiv e ly and significantly associated with obesity ,
diastolic b lood pressure, and negatively and significantly with fiber intake. Plasma
fibrinogen level also w as correlated p ositive ly with IDL-C. There is a positive and
significant correlation betw een factor V ile and BM I. Factor V ile w as positively and
significantly correlated with plasm a cholesterol, TG, apoB, glucose, insulin
concentrations. V on willebrand factor w as p ositively and significantly associated w ith
total fat intake (Table 4-8).
SH B G level in serum w as negatively and significantly correlated with fasting apoA -I,
insulin , testosterone concentrations and obesity. Serum testosterone concentration w as
positively and sign ificantly associated w ith fasting insulin level, and obesity (Table 4-8).
B lood pressure w as p ositively and significantly correlated with lipids and lipoprotein
(total ch olestero l, TG, N E F A , and LD L -C levels), insulin concentrations, and B M I
(Table 4 - 8).
Chapter Four R esults 126
M arkers o f ob esity (B M I, W H R , and body fat %) w ere significantly associated w ith
plasm a lip ids and lipoproteins (p lasm a cholesterol, TG, apoB, V L D L -T G , IDL-C , and
L D L -C levels), insulin, fibrinogen, factor V ile , and testosterone concentrations, blood
pressure, and CETP activ ity in plasma. O besity also w as negatively and significantly
correlated w ith plasm a SH B G , LD L particle s ize (Table 4-8).
The concentration o f albumin in urine w as significantly and p ositive ly correlated w ith
plasm a N E F A and insulin concentrations, how ever, The concentration o f albumin in
urine w as sign ificantly and negatively correlated with age (Table 4-8).
There is on ly a significant and p ositive correlation betw een baby w eight and pre
pregnancy B M I (T able 4-8).
A lcohol consum ption w as p ositive ly and significantly associated with plasm a apoA -I,
N E F A , H D L -C concentration. The correlation betw een alcohol consum ption and CETP
activity in plasm a w as negative and significant (Table 4-8).
The am ount o f fibre in d iet w as negatively and significantly correlated w ith both
systo lic and d iastolic b lood pressure, plasm a fibrinogen concentration, and BM I.
D ietary fibre intake w as a lso correlated w ith plasm a total cholesterol, apo B , and LD L-
C concentrations, but the correlation did not reach the sign ificance level (Table 4-8).
D ietary fat intake w as not correlated w ith any o f biochem ical tests except vW F .
D ietary fat intake and all other dietary factors w ere correlated with W HR, but not other
variables (T able 4-8).

Chapter Four Results 127
Table 4-8 Cross-correlation beh\ een different variables in this study
r .---- ;-----C o r r e l a t i o n s__________________ /
V a r ia b le A g e T C TG A p o A - i ApoB NEFA HDL-CA geTC 0.0592TG 0.1075 0.3388A p o A - I 0.0758 0.4416 -0.0294ApoB 0.1428 0.8571 0.4769 0.2231NEFA 0.1038 0.0367 0.1142 0.2335 0.0278HDL-C 0.1541 0.0597 -0.2996 0.6166 -0.2512 0.1292LDL-C 0.0582 0.9983 0.3015 0.4398 0.8499 0.0392 0.0635VLDL-TG 0.1213 0.3242 0.7365 -0.0204 0.5042 -0.0860 -0.3485ID L -C 0.0700 0.1821 0.6313 0.0073 0.3395 -0.0700 -0.2762Lp(a) 0.1022 0.0781 0.1176 0.0120 0.0564 -0.1396 0.1206CETP 0.0407 0.3997 0.4108 -0.2282 0.5930 -0.2372 -0.4782HDL3b 0.0555 0.0197 -0.0149 0.2140 -0.0251 0.0023 0.2175H D L3c 0.0402 -0.0876 -0.0078 0.0207 -0.1331 -0.0271 0.1729HDL2/HDL3 0.0309 -0.0430 -0.0750 0.1864 -0.1365 0.0554 0.2995LDLI 0.0182 -0.1588 -0.2261 -0.0410 -0.2109 -0.1316 0.2479FBG 0.0307 0.0702 0.0702 0.0550 -0.0033 0.1705 0.1975Insu lin 0.1315 0.2247 0.4143 -0.0936 0.2798 0.1070 -0.1288Hb A1 c 0.0089 0.0393 0.0517 -0.0798 0.0457 -0.1080 0.063“F ib 0.0268 0.1183 0.2160 0.0492 0.1647 0.0677 0.056“F a cV II 0.1259 0.2230 0.2346 0.0641 0.2692 -0.1794 0.0457
vWF 0.1119 -0.0691 0.1307 -0.0357 -0.0605 0.1274 -0.0345SHBG -0.0116 -0.0231 -0.0749 0.3637 0.0398 0.0355 0 .16KT e s to s 0.0956 0.0816 0.0765 -0.1383 0.0004 0.0373 -0.0327SBP 0.1157 0.2218 0.2078 0.1253 0.2653 0.3467 • 0.026CDBP 0.1448 0.2970 0.2106 0.1098 0.3470 0.3325 . -0.004CPB Ml 0.1082 0.2823 0.2418 0.0340 0.3235 0.0383 -0.1237BM I 0.0895 0.3723 0.3808 -0.0164 0.4178 0.0094 -0.1 982WHR 0.1389 0.0933 0.1901 0.0190 0.0260 0.0588 -0.0043
B . F a t % 0.0787 0.3479 0.3120 0.0738 0.3331 0.1052 -0.148C
A lb u -0.2380 0.1067 0.1432 0.0417 -0.0243 0.4049 -0.0792
Baby W (q) 0.0030 0.1338 0.0492 0.0396 0.0794 0.0959 -0.0147
A lco h o l 0.0607 0.0405 0.0868 0.3363 0.0103 0.2801 0.2556
F ib e r 0.1425 -0.1655 -0.0424 -0.0664 -0.1759 -0.0148 0.0213
Na 0.0986 0.0889 0.0267 0.0042 0.1363 0.1163 0.0180
E n e r . ln 0.0886 0.1581 -0.0743 0.0637 0.1964 0.0183 0.0050
F a t. In 0.1013 0.1160 0.0404 0.0142 0.1968 0.0319 0.0454
C h o i.In 0.0330 0.1372 0.0328 -0.0647 0.1818 0.0184 0.0002,
S Fa t 0.0574 -0.1121 0.0428 -0.0590 0.1491 0.0251 -0.0068
U S Fat 0.1584 0.0382 0.0725 0.0201 0.1279 0.0269 0.0660
C a rb .In 0.0271 0.1654 0.0935 0.0950 0.1671 0.0493 0.0885
P r o te in 0.0822 0.2204 0.0453 0.1500 -0.2593 -0.0487 0.0129

Chapter Four Results 128
Table 4-8 (Continued)
V a r ia b le LD L-C VLD L-TG ID L -C Lp(a) CETPA g e T C TGA p o A - IApoBNEFAHDL-CLDL-CVLDL-TG .0.2923ID L -C 0.1304 0.6469Lp(a) 0.0739 0.0602 0.0528CETP 0.3872 0.4892 0.3800 0.0085HDL3b 0.0208 0.0215 -0.0646 0.1025 -0.0809H D L3c -0.0868 -0.0127 -0.1252 0.0113 -0.1161HDL2/HDL3 -0.0455 -0.1674 -0.0577 0.0643 -0.1906LDLI -0.1549 -0.2290 -0.2151 0.0713 -0.2098FBG 0.0670 0.0353 -0.0085 -0.0689 -0.0929In su lin 0.2165 0.3331 0.1945 0.1154 0.2679Hb A1 c 0.0387 0.0476 -0.0358 -0.0500 0.0810F ib 0.1027 0.0785 0.2260 0.1236 0.0228Fac V II 0.2096 0.2301 0.1122 0.1384 0.1598
vWF -0.0762 -0.0779 0.0835 0.0592 -0.0769SHBG -0.0267 -0.0972 0.0715 -0.0128 -0.0939T e s to s 0.0821 0.0813 -0.0034 0.0289 0.0780SBP 0.2256 0.1483 -0.0163 0.1655 0.0506DBP 0.3010 0.1963 0.0019 -0.0004 0.0925PB MI 0.2804 0.3142 0.1571 0.0388 0.2322B M i 0.3655 0.4064 0.2265 0.0806 0.2994
WHR 0.0883 0.0775 0.0878 0.1311 0.1410
B . F a t % 0.3376 0.3246 0.2472 0.0155 0.2747
A lb u -0.1 110 0.0476 0.1107 -0.2740 -0.1821
Baby W (q) 0.1375 0.1200 -0.0520 0.0694 0.0770
A lco h o l 0.0362 -0.0493 0.0115 0.1998 -0.2699
F ib e r -0.1 690 -0.0529 -0.0402 0.0421 -0.0492
Na 0.0910 0.0199 0.0343 0.1005 -0.0256
E n e r.In 0.1528 0.0446 •0.0905 0.1102 0.0114
F a t.I n 0.1135 0.1290 0.0578 0.1155 0.0324
C h o i.In 0.1351 0.0104 0.0813 0.0450 0.0012
S Fat 0.1111 0.0582 0.0309 0.0996 0.0335
U S F a t 0.0326 0.0874 0.0897 0.1152 -0.0103
Ca rb . ln -0.1570 0.0090 0.1049 0.1296 0.0356
P r o te in -0.2188 0.0163 0.0615 0.0514 0.0044
Fib = fibrinogen, Albu = albumin, W = weight, S = saturated, US - un-saturated, Carb
carbohydrate.
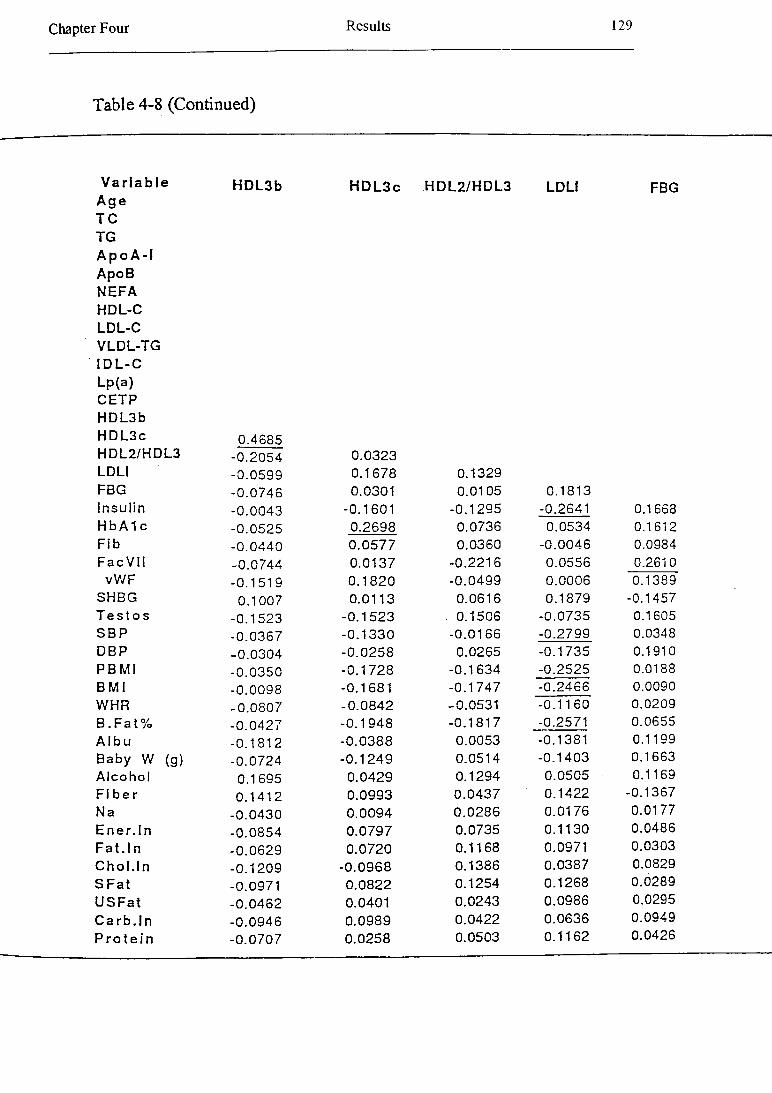
Chapter Four Results 129
Table 4-8 (Continued)
V a r ia b le H D L3bA g e T C TGA p o A - lApoBNEFAHDL-CLDL-CVLDL-TGID L -C
H D L 3 c H D L 2 /H D L 3 LDLi FBG
Lp(a)CETPHDL3bH D L3c 0.4685H D L2/H D L3 -0.2054 0.0323LDLI -0.0599 0.1678 0.1329FBG -0.0746 0.0301 0.0105 0.1813In s u lin -0.0043 -0.1601 -0.1295 -0.2641 0.1668H bA1 c -0.0525 0.2698 0.0736 0.0534 0.1612F ib -0.0440 0.0577 0.0360 -0.0046 0.0984Fac VII -0.0744 0.0137 -0.2216 0.0556 0.2610
vW F -0.1519 0.1820 -0.0499 0.0006 0.1389SHBG 0.1007 0.0113 0.0616 0.1879 -0.1457T e s to s -0.1523 -0 .1523 . 0.1506 -0.0735 0.1605SBP -0.0367 -0 .1330 -0.0166 -0.2799 0.0348DBP -0.0304 -0.0258 0.0265 -0.1735 0.1910PB Ml -0.0350 -0.1728 -0.1634 -0.2525 0.0188B M I -0.0098 -0.1681 -0.1747 -0.2466 0.0090WHR -0.0807 -0 .0842 -0.0531 -0.11 60 0.0209B . F a t % -0.0427 -0.1948 -0.1817 -0.2571 0.0655A lb u -0.1812 -0 .0388 0.0053 -0.1381 0.1199Baby W (g) -0.0724 -0 .1249 0.0514 -0.1403 0.1663A lc o h o l 0.1695 0.0429 0.1294 0.0505 • 0.1169F ib e r 0.1412 0.0993 0.0437 0.1422 -0.1367Na -0.0430 0.0094 0.0286 0.0176 0.0177E n e r .In -0.0854 0.0797 0.0735 0.1130 0.0486F a t . In -0.0629 0.0720 0.1168 0.0971 0.0303C h o i. In -0.1209 -0.0968 0.1386 0.0387 0.0829
S F a t -0.0971 0.0822 0.1254 0.1268 0.0289
U S F a t -0.0462 0.0401 0.0243 0.0986 0.0295
C a rb . In -0.0946 0.0989 0.0422 0.0636 0.0949
P r o te in -0.0707 0.0258 0.0503 0.1162 0.0426
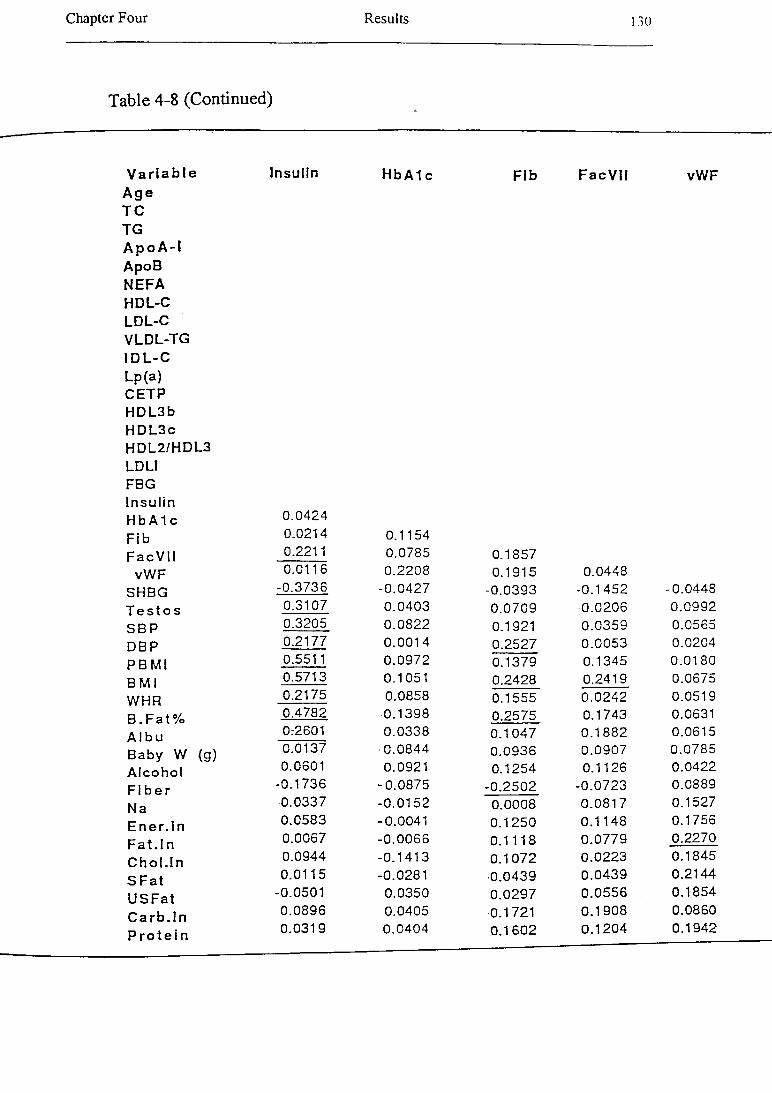
Chapter Four R esults I 30
Table 4-8 (Continued)
V a r ia b le In s u lin Hb A1 c F ib F a c V I l vW FA g e T C TGA p o A - lA poBN EFAHDL-CLD L-CV LD L-TGID L -CLp(a)CETPHDL3bH D L 3 cH D L2 /H D L3LDLIFBGIn s u linHb A1 c 0.0424
F ib 0.0214 0.1154
F a c V II 0.2211 0.0785 0.1857vW F 0.0116 0.2208 0.1915 0.0448
SHBG -0.3736 -0.0427 -0.0393 -0.1452 -0.0448
T e s to s 0.3107 0.0403 0.0709 0.0206 0.0992
S B P 0.3205 0.0822 0.1921 0.0359 0.0565
DB P 0.2177 0.0014 0.2527 0.0053 0.0204
P B M l 0.5511 0.0972 0.1379 0.1345 0.0180
B M I 0.5713 0.1051 0.2428 0.2419 0.0675
WHR 0.2175 0.0858 0.1555 0.0242 0.0519
B . F a t % 0.4782 0.1398 0.2575 0.1743 0.0631
A l b u 0:2601 0.0338 0.1047 0.1882 0.0615
B aby W (g) 0.0137 0.0844 0.0936 0.0907 0.0785
A lc o h o l 0.0601 0.0921 0.1254 0.1126 0.0422
F ib e r -0.1736 -0.0875 -0.2502 -0.0723 0.0889
N a 0.0337 -0.0152 0.0008 0.0817 0.1527
En e r . I n 0.0583 -0.0041 0.1250 0.1148 0.1756
F a t . I n 0.0067 -0.0066 0.1118 0.0779 0.2270
C h o l. In 0.0944 -0.1413 0.1072 0.0223 0.1845
S F a t 0.0115 -0.0281 •0.0439 0.0439 0.2144
U S F a t -0.0501 0.0350 0.0297 0.0556 0.1854
C a rb . In 0.0896 0.0405 0.1721 0.1908 0.0860
P r o te in 0.0319 0.0404 0.1602 0.1204 0.1942
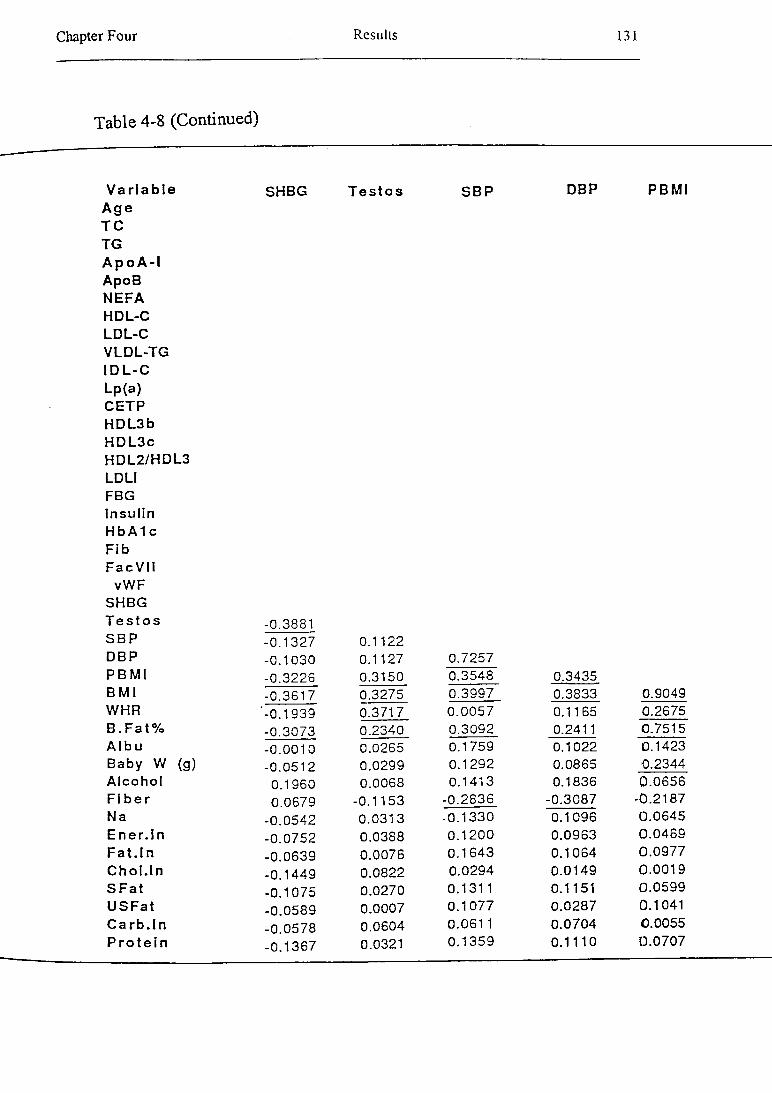
Chapter Four Results 131
Table 4-8 (Continued)
V a r ia b le SHBGA g e T C TGA p o A - IA poBN EFAHDL-CLD L-CV LD L-TGID L -CLp(a)CETPH D L3bH D L 3 cH D L2 /H D L3LDLIFBGin s u linHb A1 cF ibF a c V II
vW FSHBGT e s to s -0.3881S B P -0.1327DBP -0.1030P B M I -0.3226B M I -0.3617WHR '-0.1939B . F a t % -0.3073A lb u -0.0010B aby W (g) -0.0512A lc o h o l 0.1960F ib e r 0.0679Na -0.0542E n e r . ln -0.0752F a t . I n -0.0639C h o i. In -0.1449S F a t -0.1075U S F a t -0.0589Ca r b . In -0.0578P r o te in -0.1367
T e s to s S B P DBP
0.1122 0.1127 0.3150
0.72570.3548 0.3435
0.3275 0.3997 0.38330.3717 0.0057 0.11650.2340 0.3092 0.24110.0265 0.1759 0.10220.0299 0.1292 0.08650.0068 0.1413 0.1836
-0.1153 -0.2836 -0.30870.0313 -0.1330 0.10960.0388 0.1200 0.09630.0076 0.1643 0.10640.0822 0.0294 0.01490.0270 0.1311 0.11510.0007 0.1077 0.02870.0604 0.0611 0.07040.0321 0.1359 0.1110
PB M l
0.90490.26750,75150.14230,23440.0656
-0.21870.06450.04690.09770.00190.05990.10410.00550.0707
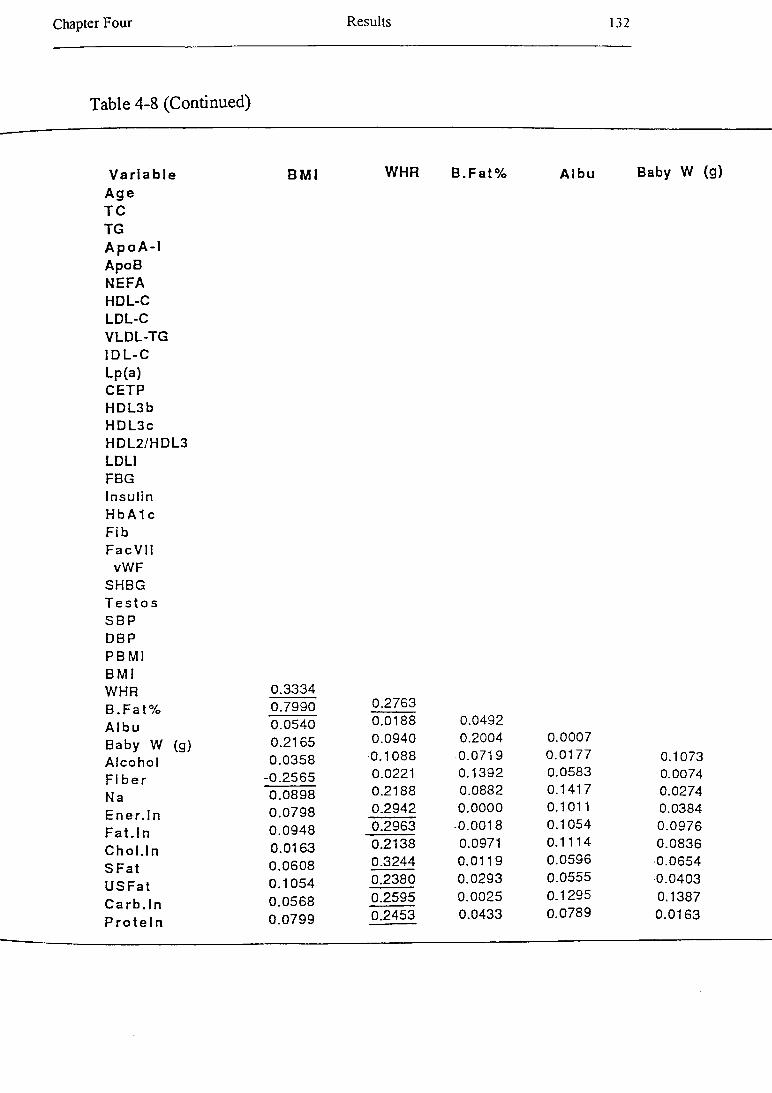
Chapter Four Results 132
Table 4-8 (Continued)
V a r ia b le B M IA g e T C TGA p o A -1ApoBNEFAHDL-CLDL-CVLDL-TGID L -CLp(a)CETPH DL3bH D L3cHDL2/HDL3LDLIFBGIn su linHb A1 cF ibF a c V ll
vWFSHBGT e s to sSB PDBPP B MlB M IWHR 0.3334B . F a t % 0.7990A lb u 0.0540Baby W (g) 0.2165A lco h o l 0.0358F ib e r -0.2565Na 0.0898E n e r . ln 0.0798F a t. In 0.0948C h o i.In 0.0163S F a t 0.0608
U S F a t 0.1054
C a rb . ln 0.0568
P r o te in 0.0799
WHR B .F a t% A lb u
0.27630.0188 0.04920.0940 0.2004 0.00070.1088 0.0719 0.01770.0221 0.1392 0.05830.2188 0.0882 0.14170.2942 0.0000 0.10110.2963 -0.0018 0.10540.2138 0.0971 0.11140.3244 0.0119 0.05960.2380 0.0293 0.05550.2595 0.0025 0.12950.2453 0.0433 0.0789
Baby W (g)
0.10730.00740.02740.03840.09760.0836
-0.0654•0.04030.13870.0163

Chapter Four Results 133
Table 4-8 (Continued)
V a r ia b le A lc o h o l F ib e rA g e T C TGA p o A - IApoBNEFAHDL-CLDL-CVLDL-TGID L -CLp(a)CETPH D L3bH D L3cH D L2/H D L3LDLIFBGIn s u linHb A1 cF ibF ac V II
vWF SHBG T e s to s S B P DBP P B M I B M l WHR B . F a t %A Ib u
Na Ene r . ln
Baby W (g) A lc o h o lF ib e r -0.0503Na -0.0499 0.5736E n e r .In -0.0930 0.6341 0.8775
F a t . In -0.0779 0.4900 0.8126 0.8949
C h o i. In -0.1615 0.2802 0.4913 0.6180
S F a t -0.1550 0.4293 0.7788 0.8934
U S F a t -0.0295 0.4976 0.8173 0.8674
C a rb . ln -0.1043 0.6344 0.7737 0.9235
P r o te in -0.1963 0.6137 0.7706 0.8706
F a t . In
0.58580,90300,84990.72140,7889

Chapter Four Results 134
Table 4-8 (Continued)
V a r ia b leA g eT CTG .A p o A - IA p o BN E F AH D L-CL D L -CV L D L -T GID L - CL p (a )C E T PH D L 3 bH D L 3 cH D L 2 /H D L 3LD LIFBGIn s u linH b A1 cF ibF a c V II
vW F SH B G T e s t o s S B P D B P P B M I B M I W H R B . F a t % A lb uB a b y W (g) A lc o h o l F ib e r N aE n e r . In F a t . I n C h o i. I n S F a t U S F a t C a r b . In P r o t e in
C ho4 In S F a t U S F a t C a r b . In P r o t e i n
0.66210.47390.4835
0.78770.7273 0.70720.7907 0.71820.7487 0.7206
Chapter Four Results 135
Most of the correlations between plasma lipoprotein and lipoprotein constituents could
be predicted with a knowledge of the physiology of plasma lipid and lipoprotein
metabolism.
Note: Other correlations indicated that relationships could be further explored by two
techniques, multiple regression analysis of a group of apparently related variables, and
subgroup analysis (eg of a subgroup with particularly well-developed insulin resistance
syndrome).
4.1.5 M ultiple Regression Analysis
Multiple regression was used to investigate relationships between BMI, fasting insulin,
total cholesterol and triglyceride, NEFA, and SHBG concentrations, CETP activity in
plasma, systolic blood pressure, and microalbuminuria and their possible determinants.
Age, Groups (1= GDM group and 0 = control group), fasting plasma insulin
concentration, BMI, family history of diabetes mellitus, use of a contraceptive pill,
alcohol, fat, and protein intake, and exercise were chosen as independent variables in
different multiple regression model. The results are presented in Table 4-9.
The multiple regression model for BMI showed that group (as 1 - GDM subjects and 0
= controls) and fasting insulin concentrations are significant determinants of BMI in this
study (Table 4-9).
The multiple regression model for fasting insulin concentration indicated that BMI is the
most important determinant in the variance of fasting insulin concentration in this
investigation (Table 4-9).

Chapter Four Results 136
Regression analysis showed that group (as 1 - GDM subjects and 0 = controls), BMI,
family history of diabetes, and exercise are the significant determinants for the total
cholesterol levels (Table 4-9).
Table 4-9 R esults fro m the m ultiple r e c e s s io n an a lyses
BMI Insulin TC TG NEFA CETP SHBG SBP AlbuN 130 130 130 130 130 130 130 130 130
Adj R2 0.28 0.24 0.17 0.24 0.16 0.12 0.35 0.18 0.12
Intercept 25.33 -2.65 3.57 0.063 0.59 2.299 4.22 85.56 1.53
Age -0.10 -0.02 -0.003 0.01 -0.002 -0.0003 0.01 0.01 -0.02*
Groups [0-1] -1.03* -0.66 -0.23* -0.03 -0.07* -0.10 0.13* 0.48 0.05*
Insulin 0.48* (-) 0.01 0.04* 0.01 0.03 -0.003 0.62* 0.03*
BMI (-) 0.39* 0.05* 0.02 -0.004 0.01 -0.03* 0.73* -0.01*
FH.DM [0-2] 0.08 0.55 0.14 0.02 -0.14 0.11 0.03 -0.36 -0.03
FH.DM [1-2] -0.25 0.36 -0.22* 0.04 -0.0003 -0.07 -0.05 0.01 0.03
C.Pill [0-2] -0.18 0.38 -0.12 0.14 -0.05 0.08 -0.23* -3.41 -0.04
C.Pill [1-2] -0.11 -0.19 0.15 -0.01 0.05 0.01 0.39* 2.34 0.09
Smoking [0-2] -0.23 0.01 -0.01 0.013 0.02 0.08 -0.11 0.50 -0.03
Smoking [1-2] -0.08 0.03 -0.06 0.05 0.05 -0.012 0.17* 0.05 0.10
Alcohol 0.32 0.03 0.28 0.15 0.20* -0.25* 0.15 5.21* 0.02
Fat in -0.01 -0.001 -0.002 0.0001 0.001 -0.0004 -0.001 -0.03 0.001
Fre.Exer [0-3] 0.67 0.72 0.31* -0.06 -0.05 0.13 0.08 0.41 0.02
Fre.Exer [1-3] 0.29 0.32 0.16 0.10 0.004 -0.06 0.02 -2.22 0.02
Fre.Exer [2-3] 0.02 -0.77 0.01 -0.06 0.02 0.07 -0.10 3.23 -0.05
The regression coefficients and their significant level of the relevant variables in the regression model are presented. N = number of observations, FH.DM = family history of diabetes mellitus, C.Pill = contraceptive pill, in = intake, Fre = frequency, Exer = exercise, Dur = duration, Int = intensity, (-) = not included in the model, albu = Albuminuria. “Note: the explanation of [ ] is in Chapter Three”.
In the final regression analysis, fasting insulin concentration was shown significantly
associated with plasma TG concentration (Table 4-9).

Chapter Four Results 137
Multiple regression analysis showed that group (as 1 = GDM subjects and 0 = controls)
and alcohol consumption are significant independent variables in the plasma NEFA
levels (Table 4-9).
CETP activity (%) in plasma was significantly associated with alcohol consumption in
the multiple regression analysis (Table 4-9).
The multiple regression model for serum SHBG concentration indicated that group (as
1= the GDM subjects and 0 = controls), BMI, use of an oral contraceptive, and smoking
are the significant determinants for serum SHBG model (Table 4-9).
Fasting insulin concentration, BMI, and alcohol consumption were significantly
associated with systolic blood pressure in the multiple regression analysis (Table 4-9).
Regression analysis showed that age, group (as 1 = GDM subjects and 0 = controls),
fasting insulin concentration, and BMI are the most important determinants of the
amount of albumin in urine (Table 4-9).
4.2 Sub-population Analysis:
4.2.1 The Definition of Subgroups
The multiple regression models suggested that sub-populations with sub-clinical or
overt disease may exist.
The populations (both GDM and controls) were categorised according to three factors:
plasma NEFA concentration, family history of diabetes, and BMI. The frequencies are
presented in Table 4-10).
In addition, another subgroup was determined according to fasting insulin concentration
(hyperinsulinemic subgroup or subgroup C). Data suggested that a number of subjects
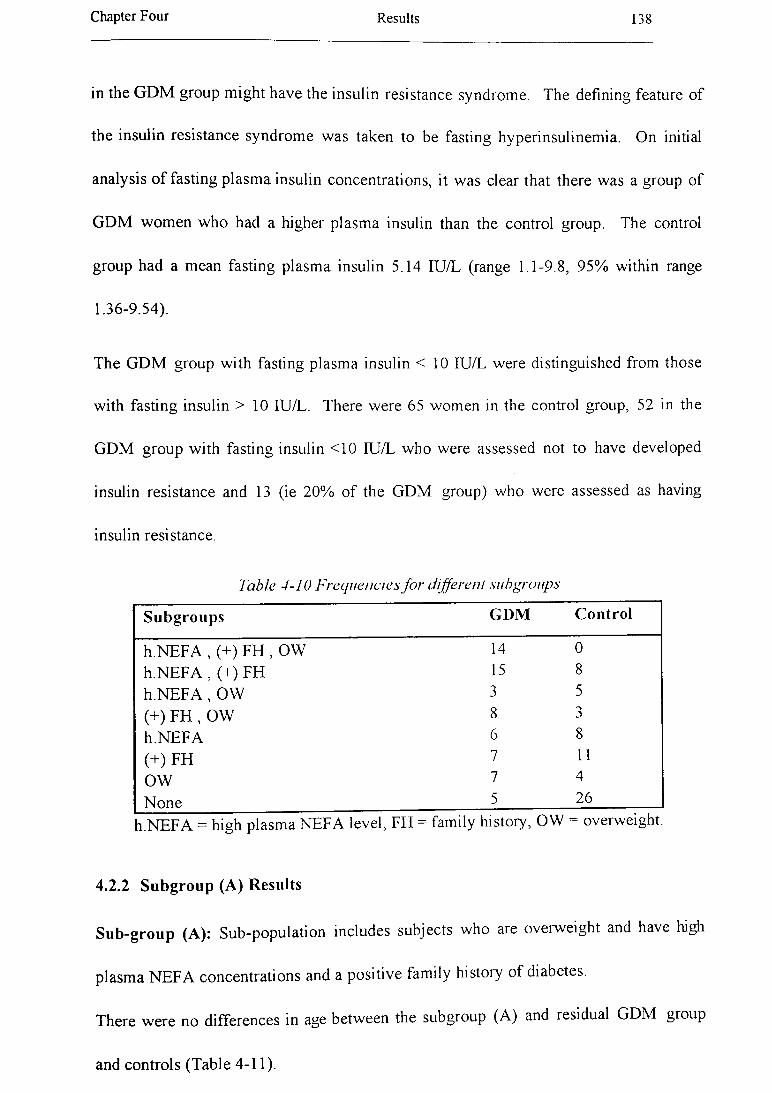
Chapter Four Results 138
in the GDM group might have the insulin resistance syndrome. The defining feature of
the insulin resistance syndrome was taken to be fasting hyperinsulinemia. On initial
analysis of fasting plasma insulin concentrations, it was clear that there was a group of
GDM women who had a higher plasma insulin than the control group. The control
group had a mean fasting plasma insulin 5.14 IU/L (range 1.1-9.8, 95% within range
1.36-9.54).
The GDM group with fasting plasma insulin < 10 IU/L were distinguished from those
with fasting insulin > 1 0 IU/L. There were 65 women in the control group, 52 in the
GDM group with fasting insulin <10 IU/L who were assessed not to have developed
insulin resistance and 13 (ie 20% of the GDM group) who were assessed as having
insulin resistance.
Table 4-10 Frequencies for different subgroups
Subgroups GDM Control
h.NEFA , (+) FH , OW 14 0h.NEFA , (+) FH 15 8h.N EFA , OW 3 5(+) FH , OW 8 3h.NEFA 6 8(+) FH 7 11OW 7 4
None 5 26
h.NEFA = high plasma NEFA level, FH - family history, OW = overweight.
4.2.2 Subgroup (A) Results
Sub-group (A): Sub-population includes subjects who are overweight and have high
plasma NEFA concentrations and a positive family history of diabetes.
There were no differences in age between the subgroup (A) and residual GDM group
and controls (Table 4-11).

Chapter Four Results 139
The subgroup (A) had slightly higher plasma cholesterol and apoB than residual GDM
subjects, but significantly higher than controls (Table 4-11).
The subgroup (A) tended to have higher plasma TG, VLDL-TG, and IDL-C
concentrations than the residual GDM or control groups. There was a tendency for the
subgroup (A) to have a slightly higher LDL-C than the residual GDM group, and a
significantly higher LDL-C than controls (Table 4-11).
All three subgroups were similar in the HDL-C concentrations. HDL particle sizes and
the HDL2 /HDL3 ratio were similar in the three groups (Table 4-11).
The subgroup (A) tended to have slightly smaller LDL-I then the residual GDM group
and significantly smaller than the control group (Table 4-11).
The subgroup (A) also tended to have slightly higher CETP activity in plasma then the
residual GDM group, but CETP activity in plasma was significantly higher in the
subgroup (A) than controls (Table 4-11).
Fasting blood glucose means were similar in the three groups. However, fasting insulin
levels were significantly higher in the subgroup (A) than other two groups (Table 4-11).
The mean systolic and diastolic blood pressures were slightly higher in subgroup (A)
compared with the residual GDM subjects, and significantly higher in subgroup (A)
than controls (Table 4-11).
The subgroup (A) showed a greater concentration of albumin in urine than both the
residual GDM group and controls. The subgroup (A) had slightly greater amount of
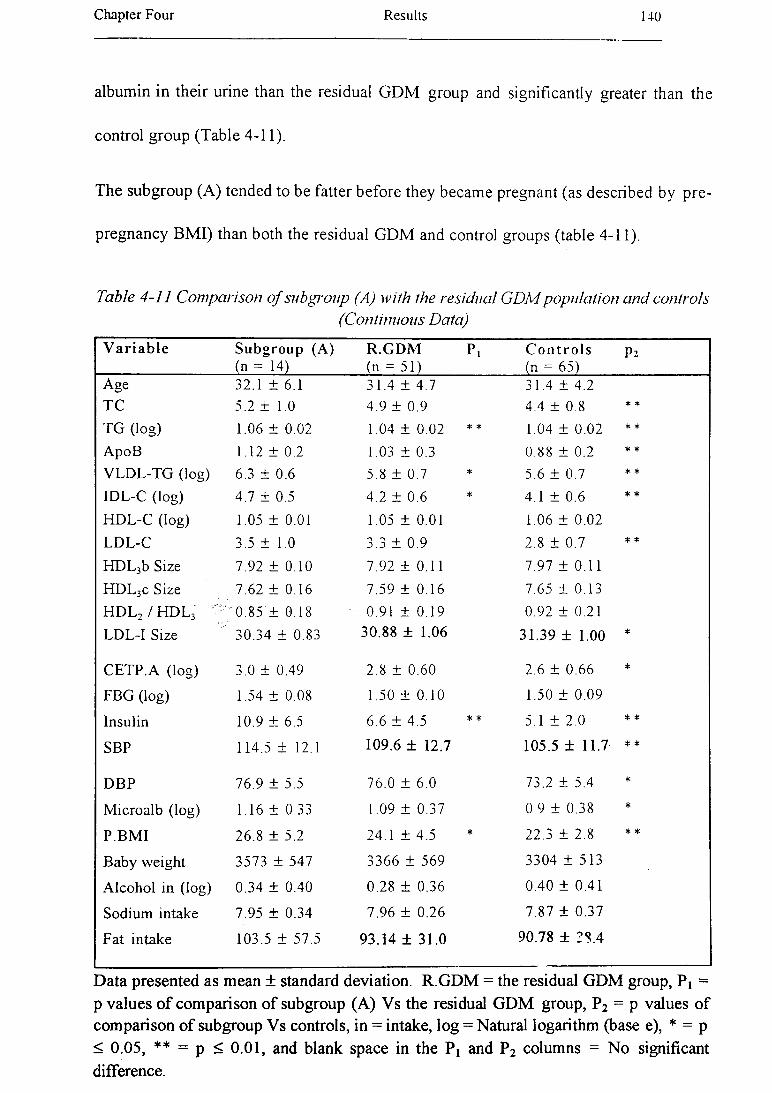
Chapter Four Results 140
albumin in their urine than the residual GDM group and significantly greater than the
control group (Table 4-11).
The subgroup (A) tended to be fatter before they became pregnant (as described by pre
pregnancy BMI) than both the residual GDM and control groups (table 4-11).
Table 4-11 C om parison o f subgroup (A) Math the residual G D M popu la tion an d controls(Continuous Data)
V a ria b le Subgroup (A)(n - 14)
R.GDM(n - 51)
Pi C o n tro ls(n = 65)
P2
Age 32.1 ± 6.1 31.4 ± 4 .7 31.4 ± 4.2TC 5.2 ± 1.0 4.9 ± 0.9 4.4 ± 0.8 * *
TG (log) 1.06 ± 0.02 1.04 ± 0.02 * * 1.04 ± 0.02 * *
ApoB 1.12 ± 0.2 1.03 ± 0.3 0.88 ± 0.2 * *
VLDL-TG (log) 6.3 ± 0.6 5.8 ± 0.7 * 5.6 ± 0.7 * *
IDL-C (log) 4.7 ± 0.5 4.2 ± 0.6 * 4.1 ± 0.6 * *
HDL-C (log) 1.05 ± 0.01 1.05 ± 0.01 1.06 ± 0.02LDL-C 3.5 ± 1.0 3.3 ± 0.9 2.8 ± 0.7 * *
HDL3b Size 7.92 ± 0.10 7.92 ± 0.11 7.97 ± 0.11HDL3c Size 7.62 ± 0.16 7.59 ± 0.16 7.65 ± 0.13HDL2 /H D L 3 ‘ 0.85 ± 0.18 0.91 ± 0.19 0.92 ± 0.21LDL-I Size 30.34 ± 0.83 30.88 ± 1.06 31.39 ± 1.00 *
CETP.A (log) 3.0 ± 0.49 2.8 ± 0.60 2.6 ± 0.66 *
FBG (log) 1.54 ± 0.08 1.50 ± 0.10 1.50 ± 0.09
Insulin 10.9 ± 6.5 6.6 ± 4.5 * * 5.1 ± 2.0 * *
SBP 114.5 ± 12.1 109.6 ± 12.7 105.5 ± 11.7 * *
DBP 76.9 ± 5.5 76.0 ± 6.0 73.2 ± 5.4 *
Microalb (log) 1.16 ± 0.33 1.09 ± 0.37 0.9 ± 0.38 *
P.BMI 26.8 ± 5.2 24.1 ± 4.5 * 22.3 ± 2.8 * *
Baby weight 3573 ± 547 3366 ± 569 3304 ± 5 1 3
Alcohol in (log) 0.34 ± 0.40 0.28 ± 0.36 0.40 ± 0.41
Sodium intake 7.95 ± 0.34 7.96 ± 0.26 7.87 ± 0.37
Fat intake 103.5 ± 57.5 93.14 ± 31.0 90.78 ± 28.4
Data presented as mean ± standard deviation. R.GDM = the residual GDM group, P! = p values of comparison of subgroup (A) Vs the residual GDM group, P2 = p values of comparison of subgroup Vs controls, in = intake, log = Natural logarithm (base e), * = p < 0.05, ** = p < 0.01, and blank space in the P x and P2 columns = No significant difference.

Chapter Four Results 141
The babies o f the subgroup (A ) m others tended to be slightly heavier than the babies o f
the other tw o groups. Fat, alcohol and sodium consum ption were similar in three
groups.(T able 4-11). There w ere no significant differences betw een use o f an oral
contraceptive, sm oking, and exercise betw een the subgroup (A ) and other tw o groups
(Table 4 -12).
Table 4 -12 C om parison o f su bgrou p (A) w ith re s t o f the G D M p o p u la tio n a n d controls(C a teg o rica l D a ta )
V ariable Subgroup(n = 14)
(A) R.GDM(n = 51)
Pj C o n tr o ls P2(n = 65)
C.Pill Current use 7 (50%) 22 (43%) 21 (32%)F or N use 7 (50%) 29 (57%) 44 (68%)
Smoking Non-sm oke 9 (64%) 29 (57%) 36 (55%)Smoker 0 (0%) 10 (20%) 14 (22%)Ex-sm oke 5 (36%) 12 (24%) 15 (23%)
Fre.Exer 0 5 (36%) 13 (26%) 16 (25%)1 3 (21%) 14 (27%) 12 (19%)2 2 (14%) 12 (24%) 17 (26%)3 4 (29%) 12 (24%) 20 (31%)
Dur.Exer 0. 5 (36%) 13 (26%) 16 (25%)1. 4 (29%) 12 (24%) 13 (20%)2. 3 (21%) 16 (31%) 14 (22%)3. 2 (14%) 10 (20%) 22 (34%)
Int.Exer 0- 5 (36%) 13 (26%) 17 (26%)1- 0 (0%) 6 (12%) 5 (8%)2- 7 (50%) 23 (45%) 33 (51%)3- 2 (14%) 9 (18%) 10 (15%)
R .G D M = rest o f the G D M group, Pi - p values o f com parison o f subgroup (A ) versus rest o f G D M group, P 2 = p values o f com parison o f subgroup versus controls, F =former, N = never, Sm oke = smoker, 0 = N ot at all, 1 = L ess than once a w eek, 2 = Once or tw ice a w eek , 3 = Three tim es a w eek, 0. = N ot at all, 1. = L ess than 20 m inutes, 2. = 2 0 -3 0 m inutes, 3. = M ore than 30 m inutes, 0- = N o exercise, 1- = N on e o f exercise session , 2- = Som e o f exercise session , 3- = M ost or all o f exercise, and blank space in
the P i and P 2 colum ns = N o significant difference.

Chapter Four R esults 142
4.2.3 Subgroup (B) Results
Sub-group (B): Sub-population includes subjects w ho have high plasma N E F A
concentrations and positive fam ily history o f diabetes.
There w ere no significant difference for age betw een subgroup (B ) and other tw o groups
(the residual G D M and control groups) (T able 4-13).
The subgroup (B ) had slightly low er plasm a cholesterol than the residual G D M group,
but not significantly. Plasm a cholesterol m eans w ere similar betw een the subgroup (B)
and controls (Table 4-13).
The subgroup (B ) had significantly low er plasm a TG, V LD L-TG , and IDL-C
concentration than the residual G D M group. T hose three variables were similar
betw een the subgroup (B) and controls (Table 4-13).
There w as a tendency for the subgroup (B ) to have a slightly low er LDL-C than the
residual G D M group, and a similar mean o f LDL-C concentration with controls (Table
4-13).
A ll three subgroup were similar in the H D L -C concentrations. H D L 3c particle sizes
were significantly smaller in the subgroup (B ) than the control group, but were not
sign ificantly sm aller compared w ith the residual G D M subjects (Table 4-13).
The H D L 2 / H D L3 ratio w ere sim ilar in the three groups. LD L-I particle size also were
sim ilar betw een three groups (Table 4 -13).
The subgroup (B ) also tended to have slightly low er CETP activity in plasma then the
residual G D M and control groups, but not sign ificantly low er (Table 4-13).

Chapter Four Results 143
Fasting blood g lu cose means were similar in the three groups. H ow ever, fasting insulin
levels w ere significantly low er in the subgroup (B ) than the residual G D M group, and
slightly low er than the control group (Table 4-13).
The m ean systo lic and diastolic blood pressures w ere slightly higher in the subgroup (B)
compared w ith the residual G D M , but the subgroup (B ) tended to have significantly
higher d iastolic b lood pressure than the control group (Table 4-13).
Subgroup (B ) tended to have similar SH BG concentration with the control group and to
have significantly higher SHBG concentration than the residual G D M group (Table 4
13).
T estosterone concentration were significantly low er in the subgroup (B ) than in the
residual G D M group, but there is no significant difference betw een testosterone
concentrations in the subgroup (B) and controls (Table 4-13).
The subgroup (B ) showed significantly greater concentration o f albumin in urine than
the controls, but the difference betw een means for concentration o f albumin in urine
betw een the subgroup (B) and the residual G D M were not significant (Table 4-13).
The subgroup (B ) tended to be slimmer before they became pregnant (as described by
pre-pregnancy B M I) than both the residual G D M and control groups. The difference
betw een m eans o f the residual G D M group and subgroup (B ) w as significant (Table 4
13).
The babies o f the subgroup (B ) mothers tended to be slightly lighter than the babies o f
the other two groups (Table 4-13).

Chapter Four Results 144
Fat, alcohol and sodium consum ption w ere sim ilar in three groups.(Table 4-13).
Table 4 -1 3 C om parison o f su bgrou p (B) w ith the res id u a l G D M pop u la tio n a n d residu a lco n tro ls ( C ontinuous D ata)
V a r ia b le Subgroup (B ) (n = 15)
R.GDM(n = 50)
p, R .C o n tro ls(n = 57)
p 2
Age 29.7 ± 4.4 32.1 ± 5.0 31.5 ± 4.0TC ± 1.1 5.0 ± 0.9 4.4 ± 0.8
TG 0.84 ± 0.4 1.13 ± 0.5 * 0.87 ± 0.4
ApoB 0.10 ± 0.3 1.1 ± 0.3 0.88 ± 0.2
VLDL-TG (log) 5.47 ± 0.7 6.01 ± 0.6 * * 5.55 ± 0.7
IDL-C (log) 3.9 ± 0.6 4.4 ± 0.60 * * 4.1 ± 0.60
HDL-C (log) 1.06 ± 0.01 1.05 ± 0.01 1.06 ± 0.01
LDL-C 3.11 ± 1.12 3.38 ± 0.88 2.79 ± 1.12
HDL3b Size 7.92 ± 0.11 7.92 ± 0.11 7.97 ± 0.11
HDL3c Size 7.57 ± 0.14 7.60 ± 0.16 7.64 ± 0.13
HDL2 / h d l 3 0.90 ± 0.15 0.89 ± 0.20 0.92 ± 0.21
LDL-1 Size 30.9 ± 0.95 30.7 ± 1.06 31.4 ± 1.00
CETP.A (log) 2.48 ± 0.73 2.94 ± 0.49 * * 2.58 ± 0.66
FBG (log) 1.50 ± 0.14 1.51 ± 0.07 1.52 ± 0.09
Insulin 4.51 ± 2.39 8.45 ± 5.52 * * 5.15 ± 1.96
SBP 111.1 ± 10.9 110.5 ± 13.2 105.5 ± 11.7
DBF 77.1 ± 4.7 75.9 ± 6.1 73.2 ± 5.4 *
SHBG (log) 3.92 ± 0.63 3.59 ± 0.54 * 3.92 ± 0.50
Testostero (log) 1.03 ± 0.02 1.05 ± 0.02 * 1.04 ± 0.01
Microalb (log) 1.19 ± 0.37 1.08 ± 0.36 0.95 ± 0.38 *
P.BMI 22.03 ± 2.36 25.64 ± 5.5 * 22.31 ± 2.8
Current BMI 22.07 ± 2.20 27.15 ± 5.66 * * 22.75 ± 2.95
WHR 0.81 ± 0.05 0.86 ± 0.07 * 0.82 ± 0.06
Baby weight 3202 ± 530 3473 ± 567 3304 ± 514
Alcohol in (log) 0.24 ± 0.30 0.31 ± 0.38 0.40 ± 0.40
Sodium intake 8.07 ± 0.26 7.93 ± 0.28 7.87 ± 0.37
Fat intake 92.82 ± 32.9 96.14 ± 39.6 90.78 ± 38.4
R = residual, Testostero = testosterone, M icroalb = m icroalbuminuria , * = p < 0.05, **
= p < 0 .01 , blank space = N o significant. Data presented as mean ± standard deviation.
M ost (60% ) o f subjects in the subgroup (B ) were using oral contraceptive pill, at time o f study, com pared w ith other tw o groups, but only the difference betw een the
subgroup (B ) and controls w as sign ificant (Table 4 -14), log = natural logarithm (base e).

Chapter Four Results 145
Table 4 -1 4 C om parison o f subgroup (B) w ith the residu a l G D M popu la tion a n d residualcontrols (C a tegorica l D ata)
V a ria b le Subgroup (B)(n = 15)
R.GDM(n = 50)
Pi R .C on tro ls P 2(n - 57)
C.Pill Current use 9 (60%) 20 (40%) 16 (28%) *F or N use 6 (40%) 30 (60%) 41 (72%)
Smoking Non-sm oke 7 (47%) 31 (62%) 29 (50%)Smoker 6 (40%) 4 (8%) * 14 (25%)Ex-smoke 2 (13%) 15 (30%) 14 (25%)
Fre.Exer 0 2 (13%) 16 (32%) 14 (25%)1 1 (7%) 16 (32%) * 10 (18%)2 7 (47%) 7 (14%) 17 (30%)3 5 (33%) 11 (22%) 16 (28%)
Dur.Exer 0 . 2 (13%) 16 (32%) 14 (25%)1. 2 (13%) 14 (28%) 11 (19%)2. 5 (33%) 14 (33%) 13 (23%)3. 6 (40%) 6 ( 12%) * 19 (33%)
Int.Exer 0 - 2 (13%) 16 (32%) 15 (26%)1- 0 (0%) 6 (12%) 3 (5%)2- 9 (60%) 21 (42%) 31 (54%)3- 4 (27%) 7 (14%) 8 (14%)
R .G D M = rest o f the G DM group, Pj = p values o f comparison o f subgroup B versus rest o f G D M group, P2 = p values o f comparison o f subgroup B versus controls, F = former, N = never, Sm oke = smoker, 0 - Not at all, 1 = Less than once a week, 2 - Once or tw ice a w eek, 3 = Three tim es a week, 0. = Not at all, 1. = Less than 20 minutes, 2. = 20-30 minutes, 3. = M ore than 30 minutes, 0- = N o exercise, 1- = N one o f exercise
session , 2- = Some o f exercise session, 3- = M ost or all o f exercise, * - p < 0.05, and
blank space in the and P2 colum ns = N o significant difference.
The subgroup (B ) tended to sm oke more than both other groups, but only the difference
betw een subgroup (B) and the residual G D M group was statistically significant (Table
4-14).
The three com ponents o f exercise (frequency, duration, and intensity) were similar
betw een the subgroup (B) and controls. H ow ever, the subgroup (B ) tended to do more
exercise than the residual GDM group (Table 4-14).

Chapter Four Results 146
4.2.4 Hyperinsulinemic subgroup (Subgroup C) Results
There w ere no d ifferences in age betw een the three groups.
The insulin resistant group had significantly higher plasm a cholesterol level than the
other tw o groups. The insulin resistant group tended to be m ildly hypertriglyceridem ic
(range 0 .8 -2 .8 m m ol/L , median 1.4 m m ol/L), and as a group, they had higher plasm a TG
values than residual G D M or control groups.
Plasm a apoB, V L D L -T G , ID L-C , LD L-C , and N E F A were higher in insulin resistant
group then other tw o groups.
There w as a tendency for the insulin resistant group to have a slightly low er H D L-C
than the other tw o groups, but this w as not significant. CETP activity w as significantly
higher in the insulin resistant group than in other tw o groups.
H D L 3 particle s izes w ere similar in three groups, how ever LDLI particle size slightly
sm aller in the insulin resistant group than in the residual G D M group and significantly
sm aller than in controls (Table 4-15).
The m ean systo lic and diastolic blood pressures w ere significantly higher in the insulin
resistant group than in the other tw o groups (Table 4 -15).
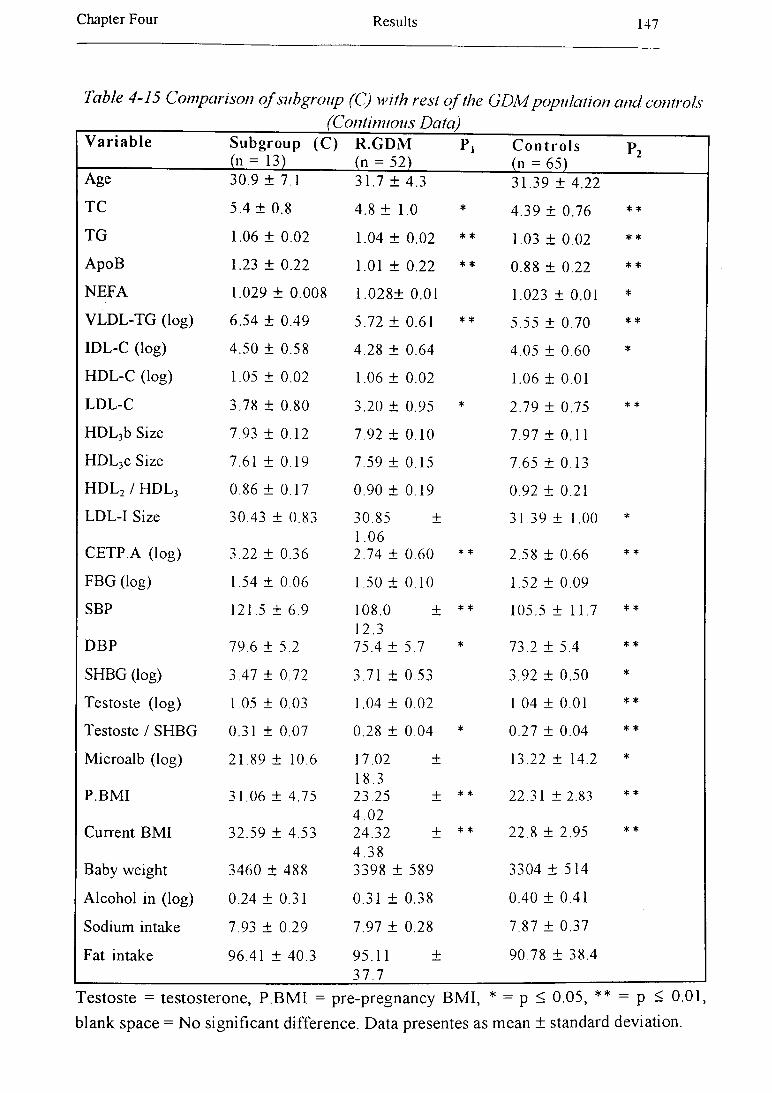
Chapter Four Results 147
Table 4 -15 C om parison o f subgrou p (C) w ith re s t o f the G D M p o p u la tio n a n d con tro ls _______________________________ (C ontinuous D a ta )______V ariable Subgroup (C ) R .G D M p. C o n tr o ls P2
(" = 13) _(" = 52) (n = 65)Age 30.9 ± 7,1 31.7 ± 4.3 31.39 ± 4.22
TC 5.4 ± 0.8 4.8 ± 1.0 * 4.39 ± 0.76 * *
TG 1.06 ± 0.02 1.04 ± 0.02 * * 1.03 ± 0.02 * *
ApoB 1.23 ± 0.22 1.01 ± 0.22 * * 0.88 ± 0.22 * *
NEFA 1.029 ± 0.008 1.028± 0.01 1.023 ± 0.01 *
VLDL-TG (log) 6.54 ± 0.49 5.72 ± 0.61 * * 5.55 ± 0.70 * *
IDL-C (log) 4.50 ± 0.58 4.28 ± 0.64 4.05 ± 0.60 *
HDL-C (log) 1.05 ± 0.02 1.06 ± 0.02 1.06 ± 0.01
LDL-C 3.78 ± 0.80 3.20 ± 0.95 * 2.79 ± 0.75 * *
HDL3b Size 7.93 ± 0.12 7.92 ± 0.10 7.97 ± 0.11
HDL3c Size 7.61 ± 0.19 7.59 ± 0.15 7.65 ± 0.13
HDL2 / h d l 3 0.86 ± 0.17 0.90 ± 0.19 0.92 ± 0.21
LDL-I Size 30.43 ± 0.83 30.85 ± 1.06
31.39 ± 1.00 *
CETP.A (log) 3.22 ± 0.36 2.74 ± 0.60 * * 2.58 ± 0.66 * *
FBG (log) 1.54 ± 0.06 1.50 ± 0.10 1.52 ± 0.09
SBP 121.5 ± 6.9 108.0 ± 12.3
* * 105.5 ± 11.7 * *
DBP 79.6 ± 5.2 75.4 ± 5.7 * 73.2 ± 5.4 * *
SHBG (log) 3.47 ± 0.72 3.71 ± 0.53 3.92 ± 0.50 *
Testoste (log) 1.05 ± 0.03 1.04 ± 0.02 1.04 ± 0.01 * *
Testoste / SHBG 0.31 ± 0.07 0.28 ± 0.04 * 0.27 ± 0.04 * *
Microalb (log) 21.89 ± 10.6 17.02 ±18.3
13.22 ± 14.2 *
P.BMI 31.06 ± 4.75 23.25 ± 4 .02
* * 22.31 ± 2.83 * *
Current BMI 32.59 ± 4.53 24.32 ± 4 .38
* * 22.8 ± 2.95 * *
Baby weight 3460 ± 488 3398 ± 589 3304 ± 514
Alcohol in (log) 0.24 ± 0.31 0.31 ± 0.38 0.40 ± 0.41
Sodium intake 7.93 ± 0.29 7.97 ± 0.28 7.87 ± 0.37
Fat intake 96.41 ± 40.3 95.11 ± 37.7
90.78 ± 38.4
Testoste = testosterone, P.BMI = pre-pregnancy BMI, * = p < 0.05, ** - p < 0.01, blank space = No significant difference. Data presentes as mean ± standard deviation.
Chapter Four Results 148
N o study subject w as hypertensive: in the insulin resistant group the highest sy sto lic
blood pressure w as 130 mm Hg, in the residual G D M group it w as 140 mm H g and in
the control group it w as 130 mm H g. T he h ighest d iastolic b lood pressure in the insulin
resistant and the residual G D M groups w as 90 mm H g and in the control group it w as
80 m m H g. Fasting blood g lu cose leve ls w ere sim ilar in three groups.
The group w ith insulin resistance tended to be fatter than either the control or the
residual G D M group, w ith all being overw eight (BM I > 25) or obese (BM I > 30) (Table
4-15). The m inim um B M I in the insulin resistant group w as 26 .6 , and 9 o f the 13 in
this group (about 70% ) w ere obese. On the other hand, only one o f the 65 control
subjects w as ob ese (B M I = 34) and 11 (17% ) w ere overw eight. O f the residual (non
insulin resistant) G D M group 16 (31% ) w ere overw eight and 3 (6% ) w ere obese.
Pre-pregnancy B M I w as significantly higher in the insulin resistant group than other
tw o groups (T able 4 -15).
The insulin resistant group show a greater am ount o f albumin in urine (Table 4-15).
A lcohol, sodium , and fat intake w ere not significantly different betw een three groups
(Table 4-15).
There w ere no sign ificant differences betw een use o f an oral contraceptive, smoking, and
exercise b etw een the subgroup (C) and other tw o groups (Table 4 -16).

Chapter Four R esults 149
Table 4 -1 6 C o m p a riso n o f su b g ro u p (C) w ith the re s id u a l G D M p o p u la tio n a n d co n tro ls(C a te g o rica l D a ta )
V a r ia b le Subgroup (C ) (n = 13)
R.GDM(n = 52)
p , C o n tr o ls(n = 65)
p 2
C.Pill Current use 7 (54%) 22 (42 %) 21 (32%)F or N use 6 (46%) 30 (58%) 44 (68%)
Smoking N on-sm oke 8 (62%) 29 (56%) 36 (55%)Smoker 0 (0.0%) 10 (19 %) 14 (22%)E x-sm oke 6 (46%) 13 (25%) 15 (23%)
Fre.Exer 0 5 (39%) 13 (25%) 16 (25%)1 2 (15%) 14 (27%) 12 (19%)2 3 (23%) 13 (25%) 17 (26%)3 3 (23%) 12 (23%) 20 (31%)
Dur.Exer 0 . 5 (39%) 13 (25%) 16 (25%)1 . 3 (23%) 13 (25%) 12 (19%)2. 3 (23%) 16 (31%) 14 (22%)3. 2 (15%) 10 (19%) 22 (34%)
Int.Exer 0- 5 (39%) 13 (25%) 17 (26%)1- 1 (8%) 6 (12%) 5 (8%)2- 6 (46%) 23 (44%) 33 (51%)3- 1 (8%) 10 (19%) 10 (15%)
R .G D M = rest o f the G D M group, Pj = p values o f com parison o f subgroup C versusrest o f G D M group, P 2 - p values o f com parison o f subgroup C versus controls, F = former, N = never, Sm oke — sm oker, 0 = N ot at all, 1 = L ess than once a w eek , 2 = O nce or tw ice a w eek , 3 = Three tim es a w eek , 0. = N ot at all, 1. — L ess than 20 m inutes, 2. = 20-30 m inutes, 3. = M ore than 30 m inutes, 0- = N o exercise, 1- = N o n e o f exercise session , 2 - = Som e o f exercise session , 3- = M ost or all o f exercise, blank space in the P t
and P2 co lum ns = N o significant difference.
CHAPTER FIVE
DISCUSSION
The objective of this chapter is to discuss the finding of the present study on women with
previous GDM one year after delivery compared with controls.
In this study, age was not significantly different between the GDM and control groups.
GDM is most common in women over 30 years old (Wiess, 1988). This discrepancy
may be due to sample size of this study.
5.1 Family Medical History in Women with Previous GDM
GDM subjects gave a history of diabetes mellitus (n = 25, 38.5%) and / or CVD (n = 24,
36.9%) in their first degree relatives more often than in controls (n = 8, 12.3% and n =
10,15.4%, respectively).
Haffner et al (1988) have suggested that fasting insulin concentrations are significantly
higher in normoglycemic persons who have diabetic parents than in persons with no
diabetic relatives. In addition, Eriksson et al (1988) have found that persons with
positive family history of diabetes have decreased non-oxidative glucose disposal
compared with persons with no family history of diabetes.
Weisser et al (1993) have reported that there is a correlation between insulin and blood
pressure in subjects with a positive family history of diabetes or hypertension and this
genetic influence may be related to insulin resistance.
Aerts et al (1990) have reported that 35% of patients with GDM are offspring of diabetic
mothers versus only 5% of normoglycemic women, and GDM occurs more frequently in
the offspring of diabetic mothers (35%) than in offspring of diabetic fathers (7%).
Chapter Five Discussion 151
A history of diabetes on the m other’s side has been reported to be a more important and
frequent factor for developing diabetes in offspring than a history of diabetes in the
father’s side. Our finding are in agreement with these reports.
Several metabolic abnormalities may occur in adulthood including NIDDM and obesity
in the offspring of mothers with GDM (Pettitt et al, 1988, Pettitt et al, 1987,
respectively). Our finding in GDM subjects in this study is consistent with these
findings.
Van Assche et al (1991) suggested that even mild diabetes mellitus induces an abnormal
intra-uterine milieu that causes morphological and functional changes in fetal
development with consequences for later life. Intra-uterine factors may be responsible
for the transmission of diabetes mellitus from one generation to another. The incidence
of NIDDM is much higher in the offspring of diabetic mothers than in normal mothers
(Aerts et al, 1990).
GDM subjects had more frequently significant and positive family histories of CVD in
comparison with control subjects. Bell et al (1990) previously reported a similar finding
in GDM subjects.
Our findings also indicate that the GDM subjects are more likely to have a diabetic
mother than controls and that the GDM subjects are more likely to have history of
diabetes in the mother side in father side. The GDM subjects also are more likely to
have a first degree relative with CVD.
Chapter Five Discussion 152
5.2 Obstetrics History in Women with Previous GDM One Year after Delivery
Fetal risks accompanying diabetes in the mother include spontaneous abortion, prenatal
death, and malformation (Crandall, 1987). In our study, there is a similar incidence of
those and other complications in patient who have had GDM and controls.
This good outcome is possibly due to intensive diet management and insulin therapy to
maintain euglycemia. Caesarean delivery was more common in GDM but not
statistically different between two groups. Our finding is in agreement with similar
findings by Goldman et al (1991).
GDM subjects did not have greater parity than controls; our findings in this agree with
those of Molsted-Pedersen et al (1989).
Three GDM subjects had had GDM in previous gestations. They were obese, and they
required insulin to achieve normoglycemia in their most recent and previous pregnancies.
Gaudier et al (1992) reported that women with a history of GDM and BMI > 35 kg / m2,
if they required insulin therapy during pregnancy, were at increased risk (52%) of
recurrence of GDM.
5.3 Oral Contraceptive Use in Women with Previous GDM One Year after Delivery
There is no significant difference in use of an oral contraceptive between the GDM and
control groups.
In our study, current use of oral contraceptive was not significantly associated with
plasma cholesterol, LDL-C, HDL-C, NEFA, and insulin concentrations. Our results are
consistent with those of Kjos et al (1990) who reported that low-dose oral
Chapter Five Discussion 153
contraceptives in women with prior GDM did not seem to have any adverse effect on
carbohydrate or lipid metabolism.
Current oral contraceptive use was positively and significantly correlated with plasma
cholesterol, apoB, and apo A-I concentrations. Lussier-Cacan et al (1991) reported that
apoB and apoA-I both were higher during oral contraceptive therapy.
The serum concentration of SHBG is known to be increased by estrogen, tamoxifen,
phenytoin, or thyroid hormone administration and by hyperthyroidism and cirrhosis.
SHBG also is decreased by exogenous androgen, glucocorticoids or growth hormone
and by hypothyroidism. Only one GDM subject was excluded from analysis, because she
was taking replacement thyroxine (Braunstein, 1994). There is a positive and significant
correlation between oral contraceptive pill and SHBG in our study. SHBG is
synthesized in the liver, and its synthesis is stimulated by estrogens and inhibited by
androgen (Goldfien and Monroe, 1994).
Normal and healthy women taking oral contraceptive pills have a slightly increased risk
of cerebrovascular and cardiovascular disease, and the risk is higher for the diabetic
patients (Rapkin, 1987).
5.4 Obesity in Women with Previous GDM One Year after Delivery
In our study, subjects who have had GDM have significantly greater WHR, BMI, and
body fat % than control subjects. WHR seems to be the simplest and most reproducible
measure of central obesity (Haffner et al, 1987) and it is strongly associated with visceral
fat mass (Ashwell et al, 1985).
Chapter Five Discussion 154
Factors affecting percent body fat include age, gender, level of energy balance,
composition of the diet, level of physical activity, and a variety of social factors including
smoking and alcohol intake (Bouchard et al, 1990). In this study, we examined these
factors in GDM populations.
Metabolic disorders in obesity have been shown to be correlated with abdominal obesity
(Kalkhoff et al, 1983, Larsson et al, 1984, Ohlson et al, 1985). In addition, Ashwell et al
(1985) have found a strong correlation between the intra-abdominal fat:subcutaneous fat
area ratio and WHR by using CT scanning at an umbilical level. Shimokata et al (1989)
have reported that WHR is strongly affected by age and BMI. WHR has a positive
correlation with age and BMI. Our data also indicates that WHR has a positive
correlation with age and BMI, too.
Central obesity is positively associated with overall adiposity, particularly in females. In
our study, GDM subjects also represent a higher BMI in company with higher WHR
and body fat %.
Insulin resistance occurs in both NIDDM and obesity, and most NIDDM patients are
obese. In fact, obesity precedes the development of NIDDM in more than 80% of cases
in Pima Indians (Seely and Olefsky, 1993). In the present study, GDM subjects had
higher BMI and higher insulin levels leading to dyslipidemia (Table 4-8).
Multiple regression analysis showed that fasting insulin concentration is the strongest
determinant of BMI in the GDM subjects (Table 4-9).
WHR, BMI, and body fat % showed a positive and significant correlation with fasting
plasma insulin level and insulin / glucose ratio. Baynes et al (1991) reported a similar
result in both diabetic males and females. Hyperinsulinemia may develop through
Chapter Five Discussion 155
progressive development of insulin resistance, presumably due to post-receptor site
alterations (Lillioja and Bogardus, 1988, Olefsky et al, 1988).
Women are resistant to insulin action at an average body fat % of 37.7% (in GDM
subjects mean was 38.79 %), while men develop an equivalent condition at an average
body fat % of 23.9% (Plaisted and Istfan, 1994).
In mildly hyperinsulinemic obese subjects, only a decrease in insulin sensitivity exists. As
the hyperinsulinemia worsen, a post-receptor defect also occurs. Furthermore, there is a
direct association between degree of insulin resistance or hyperinsulinemia and the
magnitude of the post binding defect (Seely and Olefsky, 1993).
Glucose oxidation is lower in obese subjects than normo-weight controls, but lipid
oxidation is 30% higher in obese subjects than controls in the fasting state. Thus, there
is a negative correlation between glucose oxidation and lipid oxidation which may be
explained by the glucose-fatty acid cycle (Seely and Olefsky, 1993).
The association between insulin and hypertriglyceridemia has been shown in Figure 5-1.
Insulin resistance causes increased insulin secretion, and increased flux of NEFA to the
liver (where they stimulate TG synthesis), and increasing hyperinsulinemia (Durrington,
1995). Hyperinsulinemia, in turn, can be a cause of overproduction of hepatic TG and
increased hepatic VLDL secretion, and as a result cause hypertriglyceridemia (Olefsky et
al, 1974) (Figure 5-1).
GDM subjects in this investigation have a significantly higher plasma NEFA
concentration than controls. NEFAs are thought to increase insulin resistance in muscle
and liver and increase hepatic gluconeogenesis and lipoprotein synthesis and perhaps
decrease hepatic removal of insulin (Bjomtorp, 1992). NEFAs are a determinant of
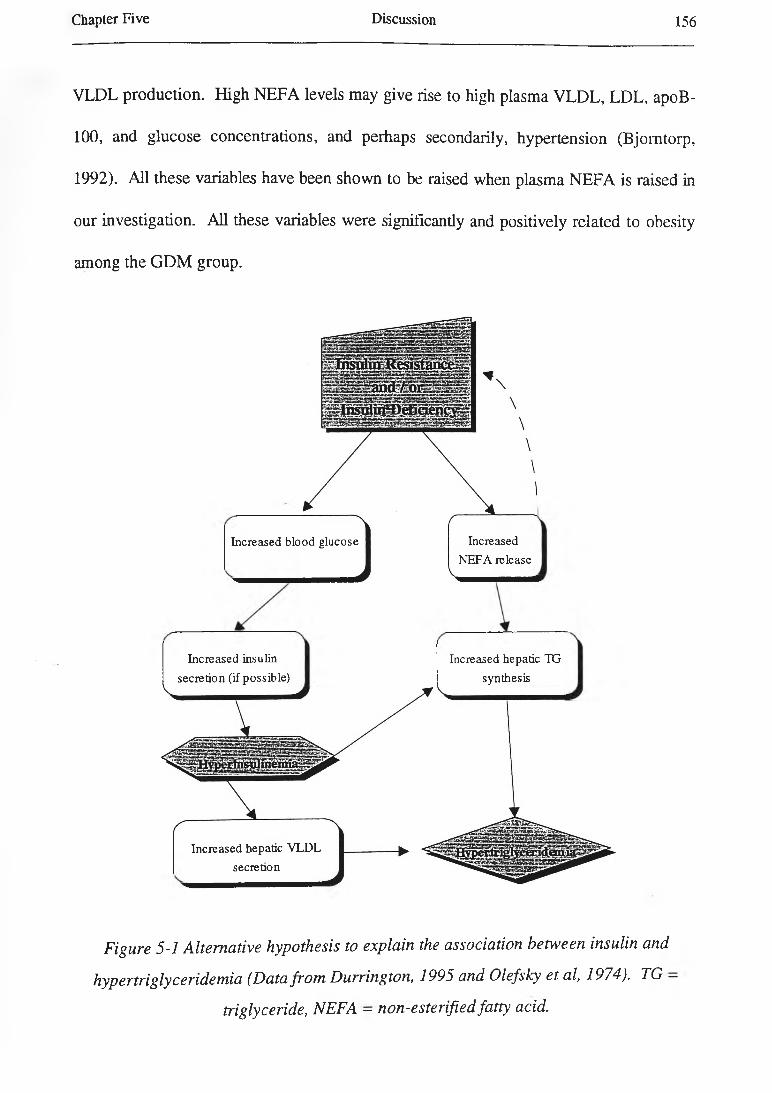
Chapter Five D iscussion 156
VLDL production. High N EFA levels may give rise to high plasma V L D L , LDL, apoB-
100, and g lucose concentrations, and perhaps secondarily, hypertension (Bjom torp,
1992). A ll these variables have been show n to be raised when plasma N E FA is raised in
our investigation. A ll these variables w ere significantly and positively related to obesity
among the G D M group.
Increased blood glucose Increased NEFA release
Increased insulin secretion (if possible)
Increased hepatic VLDL secretion
Increased hepatic TG synthesis
Figure 5-1 Alternative hypothesis to explain the association between insulin and
hypertriglyceridemia (Data from Durrington, 1995 and Olefsky et al, 1974). TG —
triglyceride, NEFA - non-esterified fatty acid.
Chapter Five Discussion 157
Grundy and Barnett (1990) have suggested two basic mechanisms for the
hypertriglyceridemia of obesity: overproduction of VLDL-TG and impaired lipolysis of
the TG-rich lipoproteins. The high plasma TG concentrations in subjects (GDM) may be
due to a reduction in VLDL catabolism, through the decreased plasma post-heparin LPL
activity, and / or an increased VLDL synthesis (Despres et al, 1990 b).
Stromblad and Bjomtorp (1986) have reported that high FFA concentrations in portal
blood are associated with reduced hepatic insulin clearance in rat with dietary-induced
obesity.
In addition, Svedberg et al (1990) have demonstrated that elevated FFA levels inhibit
insulin binding and degradation in isolated rat hepatocytes. Thus, central obesity and
high FFA concentrations may increase insulin resistance and thus hyperinsulinemia.
BMI showed a significant and negative correlation with LDL particle size in this study.
The correlation of abdominal obesity with denser and smaller LDL was reported
previously (Harris-Peeples et al, 1989). BMI and WHR were positively associated with
LDL-C but it did not reach significant level.
HDL-C may be decreased in obese subjects, either through direct clearance of HDL-C
from circulation by the adipose tissue or through separation of the lipid from its apo A-I
or its cholesterol ester (Grundy and Barnett, 1990). In the present study, BMI was not
significantly correlated to HDL-C but WHR was significantly and negatively associated
with plasma HDL-C concentration.
CETP was a significandy and positively correlated with BMI and body fat % in the
GDM group. Increased CETP activity is associated with increased lipid exchanged
between VLDL and HDL in abdominal obesity (Despres et al, 1992).
Chapter Five Discussion 158
There was a significant and positive correlation between BMI and systolic blood
pressure, diastolic blood pressure, and mean arterial pressure. Previous studies have
reported a similar correlation between obesity and both systolic and diastolic blood
pressure in obese subjects (Van Gaal et al, 1988, Peiris et al, 1989).
Obesity is a strong predictor for the development of hypertension (Sowers et al, 1991).
Although the mechanisms by which obesity cause hypertension are not fully understood,
hypercaloric intake, hyperinsulinemia, insulin resistance, enhanced metabolic activity of
visceral adipose tissue, enhanced sympathetic activity, and even the greater body mass
present in obese patients are all thought to be involved mechanisms (Plaisted and Istfan,
1994).
5.5 Carbohydrate Metabolism in Women with Previous GDM One Year after
Delivery
Data from a study on Nauruans indicated that subjects with higher post-load serum
insulin levels, presumably indicative of insulin resistance, at base line tended to develop
IGT or diabetes over a six year period (Sicree et al, 1987). It is generally accepted that
insulin resistance plays an important role in the pathogenesis of NIDDM (Alzaid and
Rizza, 1993).
Reduced glucose clearance, accompanied by compensatory hyperinsulinemia, is present
one or two decades before NIDDM is diagnosed in the offspring of diabetic parents. It
indicates that the primary defect is in the peripheral tissue response to insulin and
glucose, not in the pancreatic cell (Warram et al, 1990). The same authors suggested
that a low glucose clearance rate and hyperinsulinemia are the best predictors of the

Chapter Five Discussion 159
subsequent development of diabetes in the offspring of diabetic parents (Warram et al,
1990).
Several studies have showed that fasting hyperinsulinemia is a good predictor for the
development of NIDDM in different populations such as in Nauruans (Sicree et al,
1987), Pima Indians (Knowler et al, 1990, Saad et al, 1988, Lillioja et al, 1988), Mexican
Americans (Haffner et al, 1990 b), Swedish women (Lundgren et al, 1990), the offspring
of diabetic parents in America (Warram et al, 1990), and French policemen (Charles et
al, 1991). The cellular mechanisms involved in the alteration of insulin function are still
unclear (Knowler et al, 1993). It may be applicable for GDM subjects and say that high
fasting insulin level is a predictor of the development of diabetes mellitus in these
population.
The current hypothesis is that as a result of chronic insulin resistance, compensatory
hypersecretion of insulin develops to maintain glucose homeostasis and that eventually
diabetes mellitus develops when pancreatic hypersecretion fails (Haffner et al, 1990 b).
The present study showed that 20% of the GDM subjects had developed insulin
resistance (as defined by fasting hyperinsulinemia) one year post-partum. They were
overweight or obese and they tended to have mild dyslipidemia. They also tended to
have a higher blood pressure, lower SHBG concentration, and microalbuminuria.
BMI was the unique determinant factor in the insulin multiple regression model (Table 4
9).
There is considerable evidence to suggest that insulin resistance is caused (at least in
part) by excess availability of fatty acids. Randle has suggested that elevated plasma
FFA levels impair glucose metabolism. Increased uptake of free fatty acids and
Chapter Five Discussion 160
subsequent oxidation inhibits glucose oxidation and glycogen synthesis (Randle et al,
1963).
Infusion of FFA into normal subjects using the insulin clamp technique to measure insulin
resistance and indirect calorimetry showed that increased FFA concentrations may result
in mild insulin resistance, reduction in glucose transport, and a reduction in both glucose
oxidative and non-oxidative metabolism (Ferrannini et al, 1983, Yki-Jarvinen et al,
1991).
Haffner et al (1992) have demonstrated that increased fasting insulin concentrations
predict a cluster of metabolic disorders including dyslipidemia, hypertension, and
NIDDM, and other have previously shown that fasting insulin predicts NIDDM (Saad et
al, 1988, Haffner et al, 1990 a, Charles et al, 1991, Zimmet et al, 1992).
Subjects who have GDM have an increased risk of developing NIDDM later in life and
more than 50% of these women develop NIDDM within 25 years (O’Sullivan, 1975).
Women with GDM who need insulin treatment during pregnancy have a higher risk of
later development of diabetes mellitus than those who have been controlled by diet alone
(Henry and Beischer, 1991).
In our study, 17% (11 cases) of GDM patients have received insulin for control their
blood glucose levels during pregnancy and 83% (54 cases) have been treated only by diet
to achieve an acceptable level of glucose. GDM subjects who received insulin treatment
during pregnancy had a higher BMI before and after pregnancy and dyslipidemia (higher
plasma cholesterol and LDL-C).
None of the GDM subjects including those with insulin resistance were sufficiently
hyperglycaemic to elevate glycosylated haemoglobin (as % of blood haemoglobin).
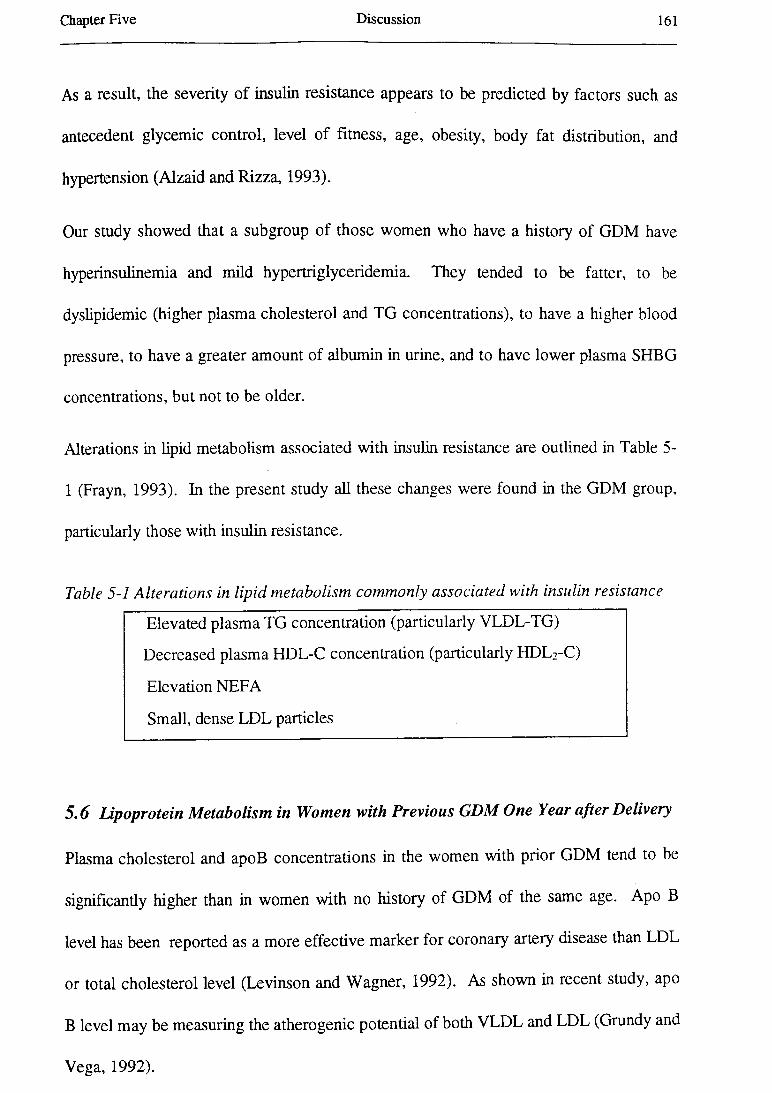
Chapter Five Discussion 161
As a result, the severity of insulin resistance appears to be predicted by factors such as
antecedent glycemic control, level of fitness, age, obesity, body fat distribution, and
hypertension (Alzaid and Rizza, 1993).
Our study showed that a subgroup of those women who have a history of GDM have
hyperinsulinemia and mild hypertriglyceridemia. They tended to be fatter, to be
dyslipidemic (higher plasma cholesterol and TG concentrations), to have a higher blood
pressure, to have a greater amount of albumin in urine, and to have lower plasma SHBG
concentrations, but not to be older.
Alterations in lipid metabolism associated with insulin resistance are outlined in Table 5
1 (Frayn, 1993). In the present study all these changes were found in the GDM group,
particularly those with insulin resistance.
Table 5-1 A ltera tion s in lip id m etabolism com m only a ssocia ted with insulin resistance
Elevated plasma TG concentration (particularly VLDL-TG)
Decreased plasma HDL-C concentration (particularly HDL2-C)
Elevation NEFA
Small, dense LDL particles
5.6 Lipoprotein Metabolism in Women with Previous GDM One Year after Delivery
Plasma cholesterol and apoB concentrations in the women with prior GDM tend to be
significantly higher than in women with no history of GDM of the same age. Apo B
level has been reported as a more effective marker for coronary artery disease than LDL
or total cholesterol level (Levinson and Wagner, 1992). As shown in recent study, apo
B level may be measuring the atherogenic potential of both VLDL and LDL (Grundy and
Vega, 1992).
Chapter Five Discussion 162
The plasma cholesterol concentration was not related to cholesterol intake and
cholesterol intake was similar between two groups.
Elevated TG levels may result from overproduction or defective removal. The latter may
be due to genetic or acquired deficiency of LPL or apoC-II (the activator of LPL), or an
excess of apoC-IH which inhibits apoC-II activity and (3-VLDL uptake (Kashyap, 1991).
A clinically important aspect of HTG is that it signals the presence of other metabolic
disorders (Vergani et al, 1990). In addition to HTG and low level of HDL, affected
subjects frequently have one or more of the following: overweight, insulin resistance
with fasting hyperinsulinemia and glucose intolerance, hypertension, and hyperuricemia.
Different terms have been used to define this syndrome: ‘plurimetabolic syndrome’,
‘overweight-hyperlipidemic-hyperuricemic syndrome’, ‘glucose intolerance-obesity-
hypertension condition’, and ‘symptom complex’ (Vergani et al, 1990). The name most
used now is ‘insulin resistance syndrome’. The syndrome is strongly related to coronary
heart disease (Vergani et al, 1990).
According to Zavaroni and Reaven, an increase in the plasma triglyceride concentration
and a decrease in the plasma HDL-C concentration are the expected results of insulin
resistance and hyperinsulinemia (Vergani et al, 1990).
In the current investigation, GDM subjects have HTG, but not a low level of HDL-C
compared with controls. In these subjects HTG seems statistically to be related with
hyperinsulinemia, high plasma NEFA concentration, NEFA, and smoking. Interestingly,
BMI and alcohol consumption were not strong predictors in the subjects. This lack of
correlation might be due to considerable homogeneity in the subjects.
Chapter Five Discussion 163
Reaven and Greenfield have suggested that HTG associated with insulin resistance is
related to plasma insulin concentration and / or free fatty acids (Reaven and Greenfield,
1981). In impaired glucose tolerance states, subjects exhibit insulin resistance and a
compensatory hyperinsulinemia. The hyperinsulinemia causes an increased rate of
synthesis and secretion of VLDL-TG and perhaps HTG due to impaired clearance
capacity (Nikkila, 1984). On the other hand, high plasma FFA concentration derived
from VLDL metabolism give rise to hypertriglyceridemia (Galton and Krone, 11991).
Genetic studies have suggested that the high concentration of apoB in circulation can be
a strong coronary risk factor (Douste-Blazy and Kloer, 1989). In human, apoBlOO is a
protein constituent of VLDL, IDL, and LDL. Each of these lipoprotein particles
contains but a single copy of apoBlOO (Innerarity, 1990). In our study, the GDM
subjects exhibited a higher level of plasma apoB and LDL-apoB concentrations than
controls, and they also had slightly higher levels of VLDL-apoB and IDL-apoB than
controls but not to an exact that was statistically significant.
Plasma FFA (NEFA) concentration is a function of rates of both input and removal from
the plasma concentration. Inflow of FFA is governed by the rate of lipolysis in adipose
tissue and also the release of FFA during the hydrolysis of circulating TG-rich particles,
particularly in the postabsorptive state (Taskinen et al, 1985). The rate of FFA removal
is determined by both esterification (or re-esterification) and lipid oxidation. It has been
generally accepted that plasma FFA concentration is controlled mainly by FFA
production (ie by the rate of lipolysis), whereas the efflux rate of FFA is secondary to
changes in plasma FFA concentration. This concept implies that the removal of FFA
from plasma is not controlled independently (Taskinen et al, 1985).
Chapter Five Discussion 164
As is shown by simple regression, intensity of exercise is related positively to NEFA
level. The activation of lipase and subsequent lipolysis and mobilization of FFA from
adipose tissue is increased by the hormones epinephrine, norepinephrine, glucagon, and
growth hormone. Because plasma concentrations of these hormones are increased
during exercise, this mechanism for lipase activation provides the muscle with a supply of
a potent energy substrate. Alterations in lipase activity may partly explain the enhanced
utilization of fat observed with aerobic exercise training (McArdle et al, 1991 a).
The most substrates used by the heart for energy are glucose, fatty acids, and lactic
acids. During exercise the myocardial metabolism of FFAs rises to approximately 70%
of the total energy requirement (McArdle et al, 1991 a).
Emphasis has recendy been placed on abnormalities not only in lipid and apolipoprotein
concentrations but also in lipid and apoprotein composition of different lipoproteins in
diabetic as well as in non-diabedc individuals (Steinberg et al, 1989).
Compared with non-diabetic people, diabetic patients have decreased clearance of both
VLDL-apoB and VLDL-TG, and increased production of VLDL-TG. Obese subjects
have increased production of both VLDL-apoB and VLDL-TG and more VLDL of
normal composition (Howard et al, 1987). Study on VLDL turnover showed that
production of both VLDL-apoB and VLDL-TG were significantly correlated with insulin
concentrations, and the rates of clearance of both were significantly correlated with
plasma glucose levels (Howard et al, 1987).
In GDM subjects, it may be said that clearance of both VLDL-TG and VLDL-apoB are
decreased and also the production of VLDL-TG is increased. It explains significant
elevation in the level of VLDL-TG and a slightly higher (but not significantly higher)
Chapter Five Discussion 165
concentration of VLDL-apoB but not significant in the GDM group compared with
controls. Saheki et al (1993) reported that VLDL from diabetic patients are a poor
substrate for LPL compared with normal VLDL.
IDL particles are thought to be associated with increased atherosclerosis risk (Tatami et
al, 1981, Steiner, 1981). This supposition is supported by the observation that particles
with size and flotation similar to those of human cholesterol-enriched IDL have been
associated with a predisposition to coronary atherosclerosis in the cholesterol-fed
monkey and that elevated levels of IDL mass and IDL-C have been related to increased
risk of coronary disease in human (Krauss, 1987).
On this basis, Fielding et al (1984) have suggested that the block to cholesteryl ester
transfer to VLDL and LDL in NIDDM patients is mediated by their increased free
cholesterol (FC) content and may be related to the increased risk of these patients for
developing atherosclerosis.
In the GDM group as a whole, the plasma LDL-C and LDL-apoB concentrations were
significantly greater in the GDM subjects than in controls.
Elevated levels of LDL-C might be secondary to either an increase in the synthesis rate
of LDL-C or a decrease in the rate of its catabolism and clearance from plasma (Barter,
1994). A down-regulation of the B/E receptor may be involved in the decreased rate of
LDL-C catabolism (Barter, 1994). On this basis, a defect in VLDL degradation possibly
due to LPL activity disorders and an enhanced synthesis of VLDL from the liver can be a
cause of HTG and combined HTG and hypercholesterolemia (Barter, 1994), and thus a
greater level of LDL-C in plasma.

Chapter Five Discussion 166
Deckelbaum et al have suggested that transformation of IDL and larger LDL to smaller,
denser LDL subspecies can result from the combined effects of TG hydrolysis and lipid
transfer (Musliner et al, 1991).
The factors that determine the size and composition of LDL are not fully known.
Investigations have shown that genetic factors are involved in the size of LDL. Studies
have demonstrated that environmental factors or other disease states may also influence
the size and composition of IDL (Feingold et al, 1992). Firstly, age has a positive
correlation with LDL phenotype B. Secondly, weight loss induced by exercise decreases
the concentration of small, dense LDL, and thirdly, studies have recently found that in
subjects with acquired immunodeficiency syndrome (AIDS) the prevalence of the LDL B
phenotype B is increased 2.5 fold (Feingold et al, 1992).
Krauss and Burke (1982) suggested that the TG-enriched LDL found in the larger and
less dense subfractions may give rise to smaller, dense LDL subspecies via lipolysis and
loss of core TG and other lipids. However, in the smallest and most dense LDL
subspecies, LDL-TG is increased, suggesting that another metabolic pathway is involved
in their formation. Some of the smaller, denser subspecies may also conceivably be
precursors of larger, less dense LDL subspecies formed as a result of transfers of lipid
and protein components to and from these particles (Krauss and Burke, 1982).
McNamara et al (1987) have found that the presence of small LDL particle is associated
with increased age, plasma cholesterol and TG concentrations, and lower HDL-C and
apoA-I levels. On the other hand, Barakat et al (1990) have found that LDL particles
are smaller and denser in patients with IGT and NIDDM. LDL size was correlated with
plasma insulin concentrations independent of plasma TG level, age and BMI. In addition,

Chapter Five Discussion 167
this does not necessarily testify a causal relationship and it is difficult to identify the
mechanisms that govern the alterations in LDL particle size. It may be a link between
hyperinsulinemia and atherosclerosis (Barakat et al, 1990).
Smaller LDL particle size is prevalent in subjects with IGT and NIDDM but not in
normoglycemic obese subjects whose plasma insulin concentrations are normal. It seems
the presence of small LDL may be related to the degree of resistance of tissues to insulin
action. LPL also may play a role in the alteration in LDL size (Barakat et al, 1990),
because adipose tissue and lipoprotein metabolism are associated with insulin (Eckel,
1989).
Feingold et al believe that whether HTG itself leads to the formation of small, dense
LDL or whether those who inherit the LDL B phenotype are more susceptible to the
development of HTG is unresolved (Feingold et al, 1992).
HDL consists of a heterogenous group of particles defined either by size or by their
apolipoproteins (Silverman et al, 1993).
Data from this study suggests that HDL-C is not significantly lower in GDM subjects
and also the HDL2 %:HDL3 % mass ratio (the HDL2 area %:HDL3 area % ratio
measured after gel electrophoresis separate the HDL subfractions) is not increased,
resulting in no evidence for impaired LCAT activity. Silverman et al suggested that
transfer of CE via CETP, followed by lipolysis of TG by HPL, results in the conversion
of HDL2 into HDL3 (Silverman et al, 1993).
It is thought both HDL2 and HDL3 are acceptors of phospholipid, FC, and apoCs from
VLDL and chylomicrons, but the major acceptor particles are probably HDL3. With
Chapter Five Discussion 168
higher substrate concentrations the HDL3 decreases and may be completely transformed
to the density of HDL2 (Nikkila et al, 1987).
Deckelbaum et al (19884) have reported that there is a positive correlation between
plasma TG concentrations and TG content of HDL in normolipidemic and
hypertriglyceridemic subjects.
TG-enriched HDL3 particles show a positive relationship with posprandial lipemia and
the evidence suggests that they serve also as substrate for hepatic lipase and are
converted to particularly small, dense HDL3 (Patsch et al, 1987).
Behr et al (1981) have reported that an immunologically mediated blockage of the effect
of LPL (by influencing antibodies to LPL) in the chicken resulted in accumulation of TG-
rich lipoproteins, a higher TG content of HDL, and the replacement of the larger HDL2
by smaller, denser HDL3.
Largost (1992) have suggested that CETP promotes a reduction in the size of HDL3
when HDL3 was incubated with purified CETP at 37°C for 24 hours. In addition,
NEFAs have been reported to modulate the redistribution of particle size in HDL3 by
CETP even in the absence of any other lipoprotein classes (Largost and Barter, 1991).
In hypertriglyceridemia, the fractional catabolic rate (FCR) for apoA-I is increased, and
low plasma concentrations of apoA-I and HDL-C are presumed secondary to the
increased FCR (Tribble and Krauss, 1993). In present study, GDM subjects were
moderately hypertriglyceridemic in comparison with controls and their HDL-C and HDL
apoA-I levels were slighdy lower than controls but not to a statistically significant extent.
In the GDM group Lp (a) concentration in plasma was not significantly different
between GDM and control subjects. Plasma Lp (a) concentration was not associated
Chapter Five Discussion 169
with plasma cholesterol, TG, VLDL-C, IDL-C, LDL-C, apoB, smoking, blood pressure,
and dietary factors, these being other risk factors for atherosclerosis, but it was
significandy correlated with plasma insulin concentration and markers of obesity in this
study. Lp (a) also was associated with amount of albumin in urine (Table 4-8). It seems
likely that obesity and hyperinsulinemia are associated with higher plasma Lp (a)
concentrations, but the underlying mechanisms are not clear. Steinmetz et al (1993)
reported that Lp(a) and atherosclerosis are associated, but the underlying mechanism is
not clear.
In conclusion, it can be said that a number of metabolic and pathophysiological
mechanisms may modulate the concentration of Lp (a) and that these are not yet fully
understood.
In this investigation, CETP activity % was higher in the GDM group than in control
group. Studies have suggested that increased CETP activity may promote atherogenesis
by stimulating enhanced transfer of CE to LDL in patients with low plasma HDL
concentrations (Sparks et al, 1991).
The CETP mediated transfer of cholesteryl esters from HDL to apoB-containing
lipoproteins can be potentially atherogenic, particularly in circumstances when plasma
concentrations of apoB-containing particles are elevated, a circumstance perhaps in
which the cholesteryl ester-rich apoB-containing lipoproteins are more likely to transfer
cholesterol to peripheral cells in the arterial wall (Albers et al, 1990).
The activity of CETP has been shown to be positively related to adiposity (Dullaart et al,
1994). The data in this study suggest that there is a positive relationship between higher
CETP activity and markers of obesity, BMI and body fat %. In addition, CETP activity

Chapter Five Discussion 170
showed a significant and negative correlation with exercise in the present study. It is
possible that obese subjects may have greater plasma CETP activity because of their lack
of physical activity, but that needs to be practically examined.
CETP plays a major role in modifying the composition of lipoproteins in the plasma
compartment (Albers et al, 1990). For example, CETP facilitates the exchange of LDL
cholesteryl ester for VLDL triglyceride. By this process, the TG-enriched LDL formed
can then subsequendy undergo lipolysis, leading to the formation of smaller, dense LDL
(Albers et al, 1990).
McPherson et al (1991) have reported that plasma CETP concentrations are elevated in
patients with hypercholesterolemia, sometimes in combination with HTG and
hyperchylomicronemia. Correction of the abnormal lipoprotein phenotype by dietary
therapy caused significant reductions in plasma CETP concentrations in patients with
hypercholesterolemia (McPherson et al, 1991).
In light of the above information, it seems a number of the GDM group demonstrate a
syndrome of dyslipidemia compared with controls. The dyslipidemic syndrome in the
GDM subjects includes hypercholesterolemia, hypertriglyceridemia, higher plasma apo B
and NEFA concentrations, alterations in VLDL, IDL, and LDL compositions (ie higher
VLDL, IDL-C, IDL-C, LDL-C, and LDL-apoB in the GDM subjects compared with
controls), greater CETP activity in plasma, and denser and smaller HDL and LDL
particles.
Approximately 37% of the GDM group in the current study have the dyslipidemic
syndrome. The results showed that subjects with dyslipidemia had hyperinsulinemia and
Chapter Five Discussion 171
insulin / glucose ratio, greater BMI and body fat %, higher blood pressure (both systolic
and diastolic), and lower plasma SHBG concentration.
Plasma cholesterol and LDL-C concentrations were positively associated with insulin
levels in men but not in women (Haffner et al, 1988). Plasma insulin concentration has
been reported to be associated with smaller and denser LDL particles which seem to be
more atherogenic (Barakat et al, 1990). In this investigation, plasma insulin
concentration and insulin / glucose ratio, as a marker of insulin resistance, were
positively correlated to plasma cholesterol and LDL-C concentrations in GDM subjects.
Gary et al (1988) have reported that insulin-mediated glucose disposal is negatively
correlated with fasting TG concentration as well as VLDL-C, VLDL-TG, and LDL-C /
HDL-C ratio. Laakso et al (1990) have found insulin resistance is associated with low
HDL-C and high total TG and VLDL-TG levels in subjects with normal and impaired
glucose tolerance and NIDDM. In our investigation, the GDM subjects with
hypertriglyceridemia had higher fasting plasma insulin concentrations and insulin /
glucose ratio, and VLDL-TG levels, they also had slightly lower HDL-C levels but not
to a statistically significant extent.
Over all, it seems that abnormalities founded in this study in LDL composition and size
can be due to HTG and a high activity of CETP in plasma (GDM subjects represent
higher plasma TG levels and CETP activity compared with controls). These changes
may be due to insulin resistance.
In addition, LDL composition was altered ( higher LDL-C and LDL-apoB levels) in
women who had had GDM in comparison with controls. LDL phenotype was not
significantly different in women who had had GDM than control women.
Chapter Five Discussion 172
As a result, based on the results of our study, it is possible to say that subjects with
previous GDM exhibit a complex of lipid and lipoprotein disorders which can be risk
factors for atherosclerosis. Subjects with history of GDM presented mild
hypercholesterolemia, hypertriglyceridemia, higher apoB and NEFA levels, and greater
CETP activity. Additionally, they had abnormal VLDL, IDL, and LDL compositions
and they possessed denser and smaller LDL-I and HDL3b and HDL3c particles.
Subjects with dyslipidemia were overweight or obese and had hyperinsulinemia. It may
be that the dyslipidemic syndrome in a number of the GDM subjects is secondary to
insulin resistance.
Many studies recently have suggested that a profile of plasma apolipoprotein values may
be useful in the evaluation of coronary heart disease risk, although the final goal should
be to identify by means of their apolipoprotein components atherogenic and non
atherogenic lipoprotein particles (Douste-Blazy and Kloer, 1989).
Thus, abnormalities in lipid metabolism may be very important in GDM patients and
should be considered carefully by those caring for them. Lipids and lipoproteins should
be checked in following these patients up and action taken where appropriate.
5.7 H y p era n d ro g e n ic ity in W om en w ith P re v io u s G D M O n e Y ear a fte r D elivery
In the present study, GDM patients exhibited lower plasma SHBG levels than controls
but the plasma levels of testosterone were not significantly elevated in GDM subjects.
On the other hand, total testosterone / SHBG ratio (the free androgen index) was
significandy higher in women with previous GDM than in women with history of a
normal pregnancy (p = 0.0048).
Chapter Five Discussion 173
GDM subjects demonstrated a significant negative correlation between plasma SHBG
concentration and the plasma level of testosterone. Rosenfield (1975) reported the same
linkage between low level of SHBG and higher level of free testosterone in pre
menopausal and post-menopausal women. It is considered a marker of
hyperandrogenicity in women. A small increase in total testosterone in the blood (as
exist in GDM subjects) accompanied by a decrease in the concentration of SHBG may
result in a significant increase in circulating biologically active hormone (Goldfien and
Monroe, 1994).
Studies have reported an inverse relationship between body weight and the plasma
SHBG concentration (Demoore and loosens 1970), BMI and upper body obesity in pre
menopausal women (Haffner et al, 1989). In our study, we found an inverse relationship
between the plasma SHBG concentration and WHR, BMI, and body fat % in the GDM
patients.
Evans et al (1983) reported that abdominal obesity causes low SHBG and high free
testosterone levels in women. In addition, Kirschner et al (1990) demonstrated that sex
hormone production and metabolism are different in women with upper body
(abdominal) and lower body obesity. Women with upper body obesity exhibit higher
androgen production rates, higher testosterone and estradiol (E2) levels and lower
SHBG levels. However, women with lower body obesity make increased amounts of E2
from peripheral aromatization.
Use of an oral contraceptive was strongly related to the plasma SHBG concentration.
Estrogen therapy is one of the factors which increased SHBG synthesis (Goldfien and
Monroe, 1994). The mechanism of this effect will be discussed later in this Chapter.
Chapter Five Discussion 174
Data from the present investigation showed that SHBG has significant and positive
correlations with plasma apoA-I and HDL-apoA-I concentrations but the relationship
between SHBG and HDL-C was not significant.
Previously, Haffner et al (1989) reported that SHBG is positively correlated with HDL
C in pre-menopausal women and Longcope et al (1990) found that SHBG is significantly
related to HDL-C and apoA-I in women. The numbers of subjects in our study may not
have been great enough to demonstrate statistical significance for the relation of SHBG
and HDL-C.
Longcope et al (1990) suggested that the positive associations between SHBG and
HDL-C, HDL2, and apoA-I are related to the fact that these proteins are synthesized in
the liver, and their syntheses may be stimulated through similar mechanisms.
Insulin is known as a regulator of SHBG production in v itro and in v ivo (Peiris et al,
1993). Insulin is capable of suppressing SHBG production in a hepatic cell line and may
also promote hepatic secretion of TG-rich VLDL (Longcope et al, 1990). It is possible
therefore that hyperinsulinemia in the GDM patients decreases the production of SHBG
and has an independent effect on lipoprotein synthesis.
Lindstedt et al (1991) have suggested that low plasma SHBG concentration is a strong
independent risk factor for the development of NIDDM in women.
Whether the low plasma SHBG concentration or the high testosterone / SHBG ratio we
have found in women who have had GDM can be regarded in any way as a causative
factor for GDM is uncertain.
Chapter Five Discussion 175
In conclusion, epidemiological studies have suggested that obesity is an independent risk
factor for cardiovascular disease and related mortality (Bray and Gray, 1988 and Manson
etal, 1990).
Most studies have shown that there is a positive correlation between obesity and
prevalence of NIDDM (Ashley and Kannel, 1974, Knowler et al, 1981, Stem et al,
1983). Finally, it can be said that GDM patients are more likely to develop NIDDM than
controls. In addition, hyperandrogenicity, as assessed by decreased SHBG
concentrations, is an important independent risk factor for NIDDM in women (Haffner
et al, 1993 b).
In general, obesity is a heterogenous condition. The regional fat distribution seems to be
an important determinant of the metabolic complications that have been associated with
obesity.
In this study, women with previous GDM exhibit higher WHR, BMI, and body fat % and
several abnormalities in lipids and lipoproteins, hyperinsulinemia and insulin resistance,
higher blood pressure, and a low level of SHBG.
5.8 Raised Blood Pressure in Women with Previous GDM One Year after Delivery
In this study, the GDM group exhibited higher systolic and diastolic blood pressure and
higher MAP than the control group.
Blood pressure was significandy correlated with BMI, plasma insulin, and insulin
resistance index (insulin / glucose ratio). It confirms previous findings by other
researchers such as Sechi et al (1992). However, this is the first report of raised blood
pressure in subjects who have had GDM which suggests that hyperinsulinemia due to
Chapter Five Discussion 176
insulin resistance may be the possible underlying mechanism. Fasting insulin
concentration, BM I, and alcohol consum ption were the significant independent variables
in multiple regression analysis for systolic blood pressure.
The pathogenic role of hyperinsulinemia is currently unclear. The insulin resistance-
hyperinsulinemia-hypertension hypothesis was shown in Figure 4-2. Insulin has been
found to play an important role in the regulation of sodium reabsorption in the distal
tubules of the kidney (Skott et al, 1989, DeFronzo, 1981). W ater is also reabsorbed
with sodium (Feldt-Rasmussen et al, 1987). The mechanism could be that insulin
activates sodium-potassium-adenosine triphosphatase activity in the distal tubules of the
kidney (Skott et al, 1989) and thus elevates plasma levels of noradrenaline and hence the
sympathetic tone (Feldt-Rasmussen et al, 1987). In the pathogenesis of hypertension,
impaired vasoconstriction due to imbalance of vasoactive substances and / or raised
cytosolicCa2+ and / or a structural vasculopathy is thought to be an important causative
event. Insulin resistance in certain trans-membranous cation exchange systems may
increasecytosolicCa2+ (W eidmann et al, 1993).
Another possible mechanism for raised blood pressure in hyperinsulinémie subjects may
be based on some alteration in their sm ooth muscle cells. Intracellular sodium content is
increased in erythrocytes from hypertensive patients. If this also occurs in their smooth
muscle cells, it may cause narrowing of the lumen of small arteries and therefore explain
the peripheral resistance existed in hypertensive patients (Beck-Nielson et al, 1990).
Figure 5-2 schematically shows the possible mechanisms for raised blood pressure in the
insulin resistance state (Meehan et al, 1993).
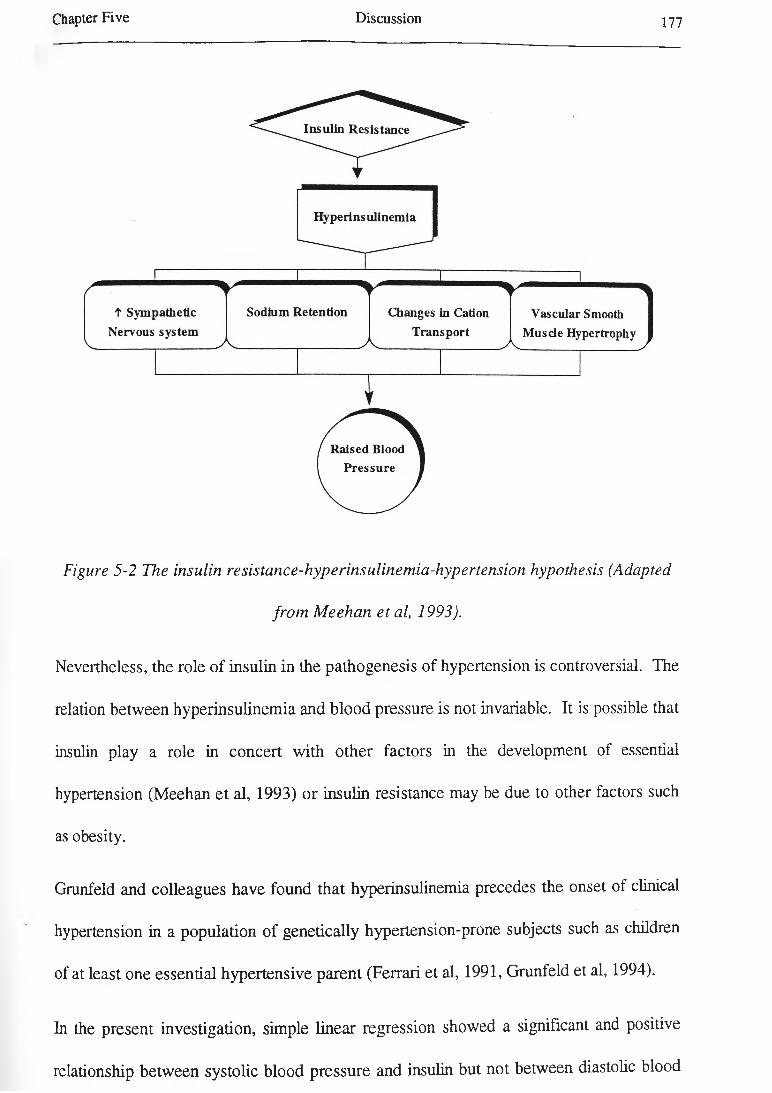
Chapter F ive D iscussion 177
Figure 5-2 The insulin resistance-hyperinsulinemia-hypertension hypothesis (Adapted
from Meehan et al, 1993).
Nevertheless, the role of insulin in the pathogenesis of hypertension is controversial. The
relation between hyperinsulinemia and blood pressure is not invariable. It is possible that
insulin play a role in concert with other factors in the development of essential
hypertension (Meehan et al, 1993) or insulin resistance may be due to other factors such
as obesity.
Grunfeld and colleagues have found that hyperinsulinemia precedes the onset of clinical
hypertension in a population of genetically hypertension-prone subjects such as children
of at least one essential hypertensive parent (Ferrari et al, 1991, Grunfeld et al, 1994).
In the present investigation, simple linear regression showed a significant and positive
relationship between systolic blood pressure and insulin but not between diastolic blood

Chapter Five Discussion 178
pressure and insulin. However, multiple linear regression indicated that BMI and the
plasma NEFA level are two strong contributors of the variance of both systolic and
diastolic blood pressure. As a result BM I and hyperlipidemia and perhaps other factors
may cause insulin resistance and insulin resistance could be the precursor mechanisms for
other factors in Figure 5-2
A possible explanation for finding BM I as a strong predictor of hypertension (both
systolic and diastolic ) can be found in the San Antonio Heart Study which showed that
insulin was a risk factor for hypertension predominantly in a lean group, with increasing
risk associated with rising plasma insulin level. However, no such association was seen
in an obese group. Conceivably, hypertension is heterogeneous and insulin plays a role
in its development only in lean individuals (Stem, 1983). In our study, GDM subjects
had significantly greater BMI and body fat % than controls.
From the frequently noted relation between diabetes mellitus, obesity, and hypertension,
the following pathogenic inter-relationships may be proposed (Figure 5-3) (Weidmann et
al, 1993).
Several possible mechanisms may be involved in raised blood pressure in obesity,
including an increased sympathetic tone, hyperaldosteronism, enhanced blood pressure
sensitivity to salt intake, increased cardiac output due to hypervolemia, and also an
increased in cystosolic free calcium (Ca2+) and decreased magnesium (M g'+) levels
(Weidmann et al, 1993 b).

Chapter F ive Discussion 179
♦Different factors
Figure 5-3 Inter-relationship between (predisposition to) hypertension, excess weight
and metabolic disturbances (Weidmann et al, 1993.a)
Most studies of insulin resistance have concentrated on the regulation of glucose
metabolism by insulin. A few researchers have reported impaired fatty acid regulation in
the insulin resistance state (Fraze et al, 1986, Swislocki et al, 1987).- Plasma NEFA and
TG concentrations were higher and HDL-C lower in a hypertensive group than a
normotensive group (Pollare et al, 1990).
Singer et al (1985) have reported that 24-hour metabolic profiles of patients with
hypertension suggested that insulin, glucose, and NEFA concentrations were increased,

Chapter Five Discussion 180
suggesting an impaired sensitivity to insulin for both glucose homeostasis and
antilipolysis.
Furthermore, Swislocki and Tsuzuki have reported that the serum FFA (NEFA) level is
elevated both in the fasting state and in response to feeding in the spontaneously
hypertensive rat (SHR) and they have suggested that this interesting finding is another
potential locus of insulin resistance in hypertension (Swislocki and Tsuzuki, 1993). It
may be a model for the relationship between NEFA and blood pressure in the present
study.
An important link existsbetween obesity, NIDDM, and hypertension. Hypertension is
understood to contribute to the increased cardiovascular morbidity and mortality in
patients with obesity and NIDDM (Daly and Landsberg, 1991).
Hypertension in obese individuals with or without NIDDM is clearly related to
hyperinsulinemia and hyperinsulinemia excites sympathetic nervous system (SNS)
activity. Both hyperinsulinemia and increased SNS activity cause decreased sodium
excretion, thus elevating blood pressure (Daly and Landsberg, 1991). This is an possible
explanation for raised blood pressure in women with previous GDM.
In conclusion, based on the present information, it may be said that there are several
possible explanation for the relationship between insulin resistance or hyperinsulinemia
and hypertension.
Firstly, insulin resistance and hypertension may be causally independent but have a
common underlying mechanism, such as altered cellular electrolyte metabolism,
increased vascular resistance or decreased capacity to vasodilate (especially in skeletal

Chapter Five Discussion 181
muscles), increased sympathetic nervous system activity and, once it occurs, obesity
(Weidmann et al, 1993). It may be an explanation for our finding.
Secondly, insulin resistance may occur as a secondary modification during the
development of hypertension, not affecting its pathogenesis. Insulin resistance and / or
hyperinsulinemia, regardless of their underlying mechanism and time of occurrence, may
cause or worsen hypertension (Weidmann et al, 1993).
5.9 Microalbuminuria in Women with Previous GDM One Year after Delivery
GDM subjects exhibit a significant microalbuminuria compared to controls based upon
spot urine.
Arterial hypertension causes increased UAER. The possible mechanism for this effect is
thought an increase in hydrostatic pressure in the glomerular capillaries or a change in
permeability in the glomerular basement membrane (Parving et al, 1974, Ljungman,
1990).
Several investigations have suggested that microalbuminuria is strongly related to
increased cardiovascular disease risk (Haffner et al, 1990 a, Winocour et al, 1992) and
predicts increased mortality rate (Yudkin et al, 1988, Damsgaard et al, 1990). Ross
hypothesised that increased UAER is a marker of endothelial dysfunction, including
increased trans-endothelial permeability of different macromolecules such as albumin
(Ross, 1986). According to the ‘response-to-injury’ hypothesis, endothelial dysfunction
is one of the early steprin the atherogenesis process (Ross, 1986).
We found a negative correlation between microalbuminuria and age and it confirms the
results reported by Watts et al (1988). The underlying mechanism is not clear.
Chapter Five Discussion 182
Microalbuminuria was also related to fasting insulin concentration and insulin / glucose
ratio (as a marker of insulin resistance) in women with previous GDM. This association
between microalbuminuria and insulin resistance was reported previously by Nosadini et
al (1992) in NIDDM or essential hypertension patients with microalbuminuria.
In this study, there is a positive and significant correlation between BMI and
microalbuminuria in GDM subjects. Hasslacher et al (1993) also have reported a
correlation between BMI and decline of kidney function in proteinuric NIDDM patients.
Subjects with microalbuminuria have higher arterial pressure than diabetic patients
without microalbuminuria (Feldt-Rasmussen et al, 1982). We also found that
microalbuminuric GDM patients have a higher systolic blood pressure than
normoalbuminuric GDM patients.
Approximately 75% of IDDM patients with nephropathy are hypertensive and 25% of
them could be normotensive. It is thought that serious morphologic injury might be
independent of hypertension in IDDM patients (Sherman and Gosking, 1988, Mauer et
al, 1992). _
In animal models of IDDM, increased glomerular capillary pressure generally precedes
the development of both systemic hypertension and microalbuminuria. There are no
comparable data on NIDDM patients. Thus, increased arterial pressure may not be a
causal factor but rather the process that provokes a different underlying process (Abott
et al, 1994).
Recently, microalbuminuria was reported to be associated with hyperinsulinemia in non
diabetic subjects (Haffner et al, 1990 a). Our study showed an association between

Chapter Five Discussion 183
microalbuminuria and increased fasting insulin level in subjects with past medical history
of GDM.
The microalbuminuric GDM subjects had significantly elevated plasma cholesterol than
normoalbuminuric subjects. Metacalf et al (1992) recently reported the same finding in
non-diabetic subjects.
Moreover, the microalbuminuric group demonstrated higher plasma TG levels than the
normoalbuminuric group, it confirming W oo’s report (Woo et al, 1992). In the present
study, microalbuminuric GDM patients had significantly higher concentrations of VLDL-
C and VLDL-TG than normoalbuminuric GDM patients.
Jones et al have reported higher concentration of VLDL-C in EDDM patients and they
believe prolonged exposure to dyslipidemia and blood pressure and other risk factors
may result the increased risk of coronary heart disease (Jones et al, 1989). The reasons
for the apparent effect of hyperlipidemia on kidney function are not fully known.
Animal experiments indicate an increased uptake of lipoproteins by ‘mesangial’ and
‘epithelial’ cells of the glomerulus are a cause of the negative effect of
hyperlipoproteinemia on kindney function (Wassermann et al, 1989, Kasiske et al, 1990,
Grone et al, 1990, Raner et al, 1990). Secondary to increased uptake of lipoproteins by
mesangial and epithelial cells, proliferation of mesangial cells and increased production of
mesangial matrix occurs. This promotes the development of glomerulosclerosis
(Hasslacher et al, 1993).
Several investigations were performed on humans to study the effect of treatment of
hypercholesterolemia with HMG-CoA reductase inhibitors on proteinuria. Rabelmk et al
(1990) reported a decrease in protein secretion in nephrotic syndrome patients treated by

Chapter Five Discussion 184
simvastatin. However, Hommel et al (1992) reported no difference in plasma lipoprotein
and renal function during simvastatin treatment in diabetic nephropathy. Further
experiments are necessary to clarify this.
Factor VII was significantly and positively related to microalbuminuria in the GDM
group. A significant positive correlation was found between urinary albumin excretion
rate and factor VII, by us and by Knobl et al (1993). It may suggest that
microalbuminuria might be the expression of vascular endothelial damage associated with
a hypofibrinolytic and hypercoagulative circumstance (Gruden et al, 1994).
In the present study, fasting insulin level presents a significandy contribution in a multiple
regression model to the development of microalbuminuria in the GDM group. In this
study, our finding is similar to that of Winocour et al (1992). Nosadini et al have
suggested that extrahepatic defects in insulin sensitivity seem to precede the development
of hypertension and microalbuminuria in NIDDM patients (Nosadini et al, 1994).
It may be hypothesised that the relationship between hyperinsulinemia as a causal factor
and microalbuminuria indicate microalbuminuria as part of the pre-diabetic state.
Subsequently, hyperinsulinemia and insulin resistance are the strong predictors of the
development of NIDDM (Bogardus et al, 1987, Saad et al, 1988). Also, raised blood
pressure and dyslipidemia precede the onset of diabetes (McPhillips et al, 1990, Medalie
et al, 1975).
The exact mechanism involved in the role of insulin in microalbuminuria is not
completely clear. Nestler et al have reported that transcapillary escape rate of albumin is
increased in non-diabetic men in response to marked pharmacological hyperinsulinemia
(Nestier et al, 1990). Another possible mechanism behind hyperinsulinemia and
Chapter Five Discussion 185
microalbuminuria was suggested by Niskanen and Laakso (1993). They suggested that
impaired insulin action or hyperinsulinemia at the kidney level could lead intra
glomerular pathology and subsequent albuminuria.
Animal and human studies in renal disease other than diabetic nephropathy have shown
that dietary sodium intake influences urinary albumin excretion rate (Donson et al,
1989, Tuck et al, 1990, Lax et al, 1992). Insulin influences renal sodium handling,
which causes the sodium retention in diabetic patients (DeFronzo et al, 1992). Sodium
intake did not show a significant correlation with microalbuminuria in this study.
The existence of microalbuminuria in non-diabetic subjects indicates that hyperglycaemia
cannot be an essential condition for its development. The relationship between
microalbuminuria and ischaemic heart disease in both diabetic and non-diabetic subjects
propose that a similar, non-glucose related mechanism underlies this relationship in both
groups, with the role of hyperglycaemia only to increase renal protein loss and thus
progression of glomerulosclerosis to renal failure (Yudkin, 1993).
Haffner et al (1993 a) suggested that microalbuminuria may be a feature of the pre
diabetic state. This may also be the case in this population of women with history of
GDM, but follow up studies will be required to see if this is the case
Based on Stiegler’s suggestion, increased albuminuria may be a marker of early and
accelerated atherosclerosis (Stiegler, 1993).
Microalbuminuria is correlated to a hypercoagulative and hypofibrinolytic state.
Haemostatic dysfunctions could be a pathogenic link between microalbuminuria and
cardiovascular disease (Gruden et al, 1994).

Chapter Five Discussion 186
5.10 Coagulopathy in Women with Previous GDM One Year after Delivery
Numerous studies have suggested that coagulation disorders in diabetic patients, which
seem to be caused by hyperglycaemia (Ceriello, 1993), give rise to a thrombotic
tendency.
High levels of plasma fibrinogen (Coller et al, 1978, Ganda and Arkin, 1992), factor VII
(Ceriello et al, 1988), factor VIII, vWF (Osterman and Va-deLoo, 1986), factor X
antigen and low activity of factor X in plasma (Ceriello et al, 1990) have been reported
in diabetic patients and thought be due to hyperglycaemia.
The figure 5-5 shows the pathway linking hyperglycaemia and a tendency to thrombosis
in diabetic patients. Hyperglycaemia may influence thrombosis by two mechanisms;
either by a mechanism connected with non-enzymatic glycation or by an increased
oxidative reaction (Ceriello, 1993).
Hyperfibrinogenemia was correlated with body fat % and BMI in the GDM group. A
similar result was found by Cigolini et al (1994). In addition, dietary fibre intake showed
an independent and negative correlation with fibrinogen in GDM subjects. The
mechanism of this association is unclear.
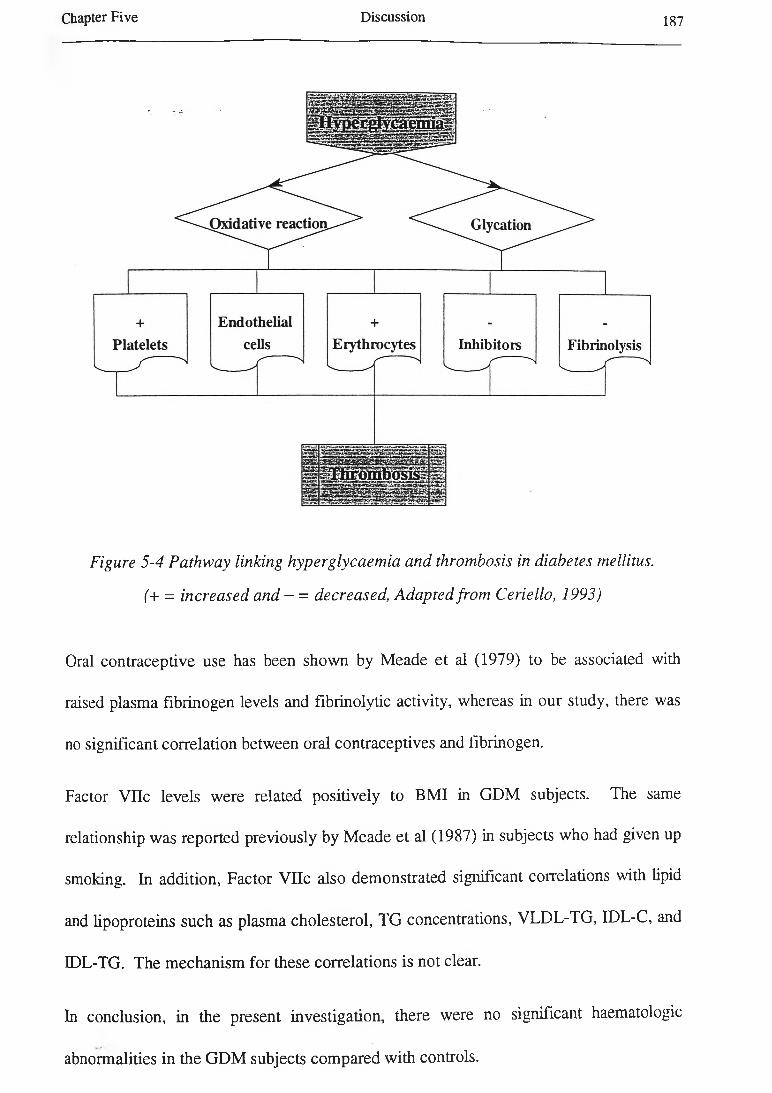
Chapter F ive D iscussion 187
Figure 5-4 Pathway linking hyperglycaemia and thrombosis in diabetes mellitus.
(+ = increased and - = decreased, Adapted from Ceriello, 1993)
Oral contraceptive use has been shown by Meade et al (1979) to be associated with
raised plasma fibrinogen levels and fibrinolytic activity, whereas in our study, there was
no significant correlation between oral contraceptives and fibrinogen.
Factor Vile levels were related positively to BMI in GDM subjects. The same
relationship was reported previously by Meade et al (1987) in subjects who had given up
smoking. In addition, Factor Vile also demonstrated significant correlations with lipid
and lipoproteins such as plasma cholesterol, TG concentrations, VLDL-TG, IDL-C, and
IDL-TG. The mechanism for these correlations is not clear.
In conclusion, in the present investigation, there were no significant haematologic
abnormalities in the GDM subjects compared with controls.
Chapter Five Discussion 188
Statistical analysis using simple regression indicates that abnormalities in the coagulation
system are correlated with aspects of lipid and carbohydrate metabolisms in the GDM
subjects.
5.11 Dietary Habits in Women with Previous GDM One Year after Delivery
GDM subjects had significantly higher PUFA and apoE intake in comparison with
controls.
Mensink and Katan (1992) have proposed that dietary fatty acids are not the sole or even
most important determinant of serum lipid concentrations. Age, genetic background,
and degree of obesity are stronger determinants.
In our study, total energy and all macronutrients (fat, carbohydrates, and proteins) intake
were associated with WHR as a marker of obesity particularly central obesity (p < 0.001
for total energy, fat and carbohydrate intake and p < 0.01 for protein intake). Studies
indicated that weight gain resulting in obesity occurs when energy intake chronically
exceeds energy expenditure (Jequier and Schütz, 1983, Woo et al, 1985, Prentice et al,
1986).
Dietary cholesterol intake did not represent an association with plasma cholesterol in this
study. Several studies reported no linear relationship between dietary cholesterol intake
and total cholesterol levels (Shekelle et al, 1981, Katan et al, 1988), whereas others
report a positive correlation between those two (Lamon-Fava et al, 1994).
Our data demonstrated the negative correlation of dietary fibre intake and total
cholesterol, apoB, LDL-C, blood pressure, BMI and body fat %. Rouse et al (1983)
reported that both systolic and diastolic blood pressure were lower in a vegetarian

Chapter Five Discussion 189
population than a meat eating population. The major differences in dietary intake
between two groups were that the vegetarian population had a higher intake of
polyunsaturated fat, fibre, potassium, magnesium, and calcium and less protein and
saturated fat intake.
In addition, other investigators have reported a negative correlation between increased
fibre from fruit and vegetables and blood pressure (Kestin et al, 1989). Our findings are
consistent with this result.
Soluble dietary fibre such as pectin and oat-bran increases faecal bile-acid excretion and
often the excretion of other faecal steroids, causing increased concentrations of hepatic
lipoprotein B/E receptors. As a result, circulating cholesterol ester-rich lipoproteins are
removed more rapidly (Williams et al, 1986), resulting in decreased plasma total
cholesterol. This is an explanation for the negative correlation between fibre intake and
total plasma cholesterol.
Dietary fibre intake was shown as an independent variable in simple regression analysis
for BMI. The mechanism by which dietary fibre influences obesity are thought to be due
to its physiological effects. Dietary fibre fills the stomach and provides a sense of satiety,
normalizes intestinal transit time, delay gastric emptying and slow the rate of digestion
and absorption of nutrients (Mahan and Arlin, 1992).
In addition, dietary fibre intake was negatively correlated with plasma fibrinogen level
and factor Vile. The mechanisms of this associations (if confirmed) are unclear.
Subjects with > 53% of energy intake as carbohydrates in their diet exhibited
significandy lower HDL-C and apoA-I levels than did subjects with lower carbohydrate
intake (Lamon-Fava et al, 1994). In the present study, subjects had ~ 45% of energy

Chapter Five Discussion 190
intake as carbohydrate. We found a negative correlation between carbohydrate intake
and plasma total cholesterol, apoB, LDL-C, and CETP activity in plasma in GDM
subjects, and perhaps this was because of their relatively low carbohydrate and high fat
intake.
There were positive correlations between all types of energy intake (fatty acids, protein,
and carbohydrate) and markers of obesity. It is generally accepted that all sources of
energy can be stored as adipose tissue in the body.
Micronutrients are the small quantities of vitamins and minerals that play highly specific
roles in facilitating energy transfer. Vitamins contain no useful energy for the body, but
generally serve as essential links to help regulate the chain of metabolic reactions that
facilitate the release of energy bound in the food molecules and control the process of
tissue synthesis (McArdle et al, 1991 c). The GDM subjects included significantly
greater quantity of vitamin E in their diet. It is difficult to relate this finding to NIDDM
and it may be a chance effect.
There was a suggestion that the intake of green leafy vegetables was lower in the insulin
resistant group of people who had had GDM than in others. Whether this observation is
a result of chance or whether it reflects reality is notclear. Nevertheless, it seems clear
that those women who are overweight and who have insulin resistance are not following
current dietary recommendations.
It may be said that the first step to improve the metabolic abnormalities in the GDM or
NIDDM subjects who are overweight or obese is weight reduction. The weight loss is
an effective tool in improving abnormalities in both carbohydrate and lipid metabolism in

Chapter Five Discussion 191
those subjects. A high carbohydrate, low-fat diet such as the Mediterranean diet, is
correlated with a reduced risk of CHD (Keys et al, 1986).
The reduction in risk of CHD probably is due to contribution in lipid and lipoprotein
metabolism by these diets. A WHO study group has suggested that less than 30% of
food energy should be provided by fat and no more than 10% of energy from saturated
fat.
5.12 Alcohol Consumption in Women with Previous GDM One Year after Delivery
The significant correlation between alcohol intake and apo A-I and HDL-C levels has
previously been observed by other researchers, but this is the first report in a GDM
population.
Many studies have observed that alcohol use raised HDL-C both in males (Hubert et al,
1987, Contaldo et al, 1989, Linn et al, 1989) and in females (Linn et al, 1989, Hubert et
al, 1987, Bush et al, 1988). The positive correlation between alcohol use and plasma
apo A-I which we found is consistent with other investigators’ findings (Camargo et al,
1985, Moore et al, 1988). Alcohol-related HDL-C elevations may be due to increased
hepatic apo A-I production (Okamoto et al, 1988).
The mechanism by which ethanol influences HDL concentration remains unknown.
The mechanisms underlying the effect of ethanol on FFA is complex. The effects may
occur through several mechanisms.
(1) Increased mobilization of peripheral fat. These actions are depends on the dose of
alcohol intake and the dietary factors.
(2) Decreased hepatic fatty acid oxidation.

Chapter Five Discussion 192
(3) Increased hepatic fatty acid production.
(4) Increased formation of fatty acyl esters. A clinical study, using some makers of
lipolysis, showed an increase of hepatic FFAs with progression of alcoholic liver injury.
Usually the free fatty acids are bound to the fatty acyl binding protein (FABP) and this
protein increase by ethanol use. Increased formation of fatty acyl esters tends to
counteract the accumulation of free fatty acids (Lieber and Pignon, 1989).
5.13 Smoking in Women with Previous GDM One Year after Delivery
In the present study, smoking was not correlated with plasma HDL concentration.
Subjects were not heavy smokers.
Current smoking was correlated with increased plasma TG, IDL-TG, IDL-FC, and
NEFA concentrations in our investigation. Steiner et al (1987) reported that the men
who currently smoked had higher levels of IDL-apoB and of IDL-TG in comparison
with men who never smoked or had not smoked for at least 2 years.
It has previously been postulated that smoking may play a role in the development of
atherosclerosis and it may be through elevated VLDL remnants levels due to smoking
(Topping and Turner, 1975, Topping et al, 1977). Other investigators reported a
correlation between TG and smoking (Simons et al, 1984, Cowan et al, 1985). Our
findings support all previous findings
Smoking was associated independently with plasma insulin levels (corrected for age,
BMI, use of contraceptive pill, etc) in GDM subjects. The influence of smoking on
insulin sensitivity was first studied by Helve et al (1986). They suggested that smoking
has a negative effect on insulin sensitivity. Facchini et al (1992) have reported that non
Chapter Five Discussion 193
diabetic smokers are more insulin resistant, hyperinsulinémie, and dyslipidémie than non
diabetic non-smokers. Attval et al (1993) have found that smoking results in impaired
insulin action mainly due to decreased peripheral glucose uptake. This results support
the Facchini et al study.
Some studies have revealed that glycaemic control is worse among diabetic patients who
smoke than diabetic patients who do not smoke (Lundman et al, 1990, Bott et al, 1994).
Cigarette smoking has been identified as a risk factor for diabetic nephropathy
(Muhlhauser et al, 1986, Stegmayr and Lithner, 1987).
Heavy smoking (a packet or more per day) increases the risk of diabetes (NIDDM) in
women (Rimm et al, 1993), it has also been associated with higher HbAlc levels among
subjects with normal glucose tolerance (Modan et al, 1988).
The mechanism for any changes in lipids and lipoproteins by smoking is uncertain
5.14 Physical Activity in Women with Previous GDM One Year after
Delivery
Physical activity was related to plasma insulin levels and WHR in this study. Regular
physical activity improves glucose tolerance and may induces weight loss (Rauramaa,
1984) and increases insulin sensitivity (Soman et al, 1979). In addition, short periods of
exercise can increase plasma glucose concentrations by increasing peripheral and
splanchnic insulin sensitivity (Delvin et al, 1987).
Both cross-sectional and prospective studies have suggested an increase in the HDL-C
following exercise training especially after aerobic exercise (McCrory et al, 1994).
There is no significant correlation between HDL-C and exercise in our study. This

Chapter Five Discussion 194
discrepancy might be due to a dose response relation between the amount of habitual
exercise and HDL-C elevation (Lakka and Salonen, 1992). It may be said the GDM
subjects should exercise more to achieve the beneficial metabolic effects of exercise, or it
is due to sample size.
The significant correlations between exercise and CETP activity, plasma apoA-I, VLDL-
TG, and NEFA may support the beneficial influence of exercise on lipoprotein
metabolism
The significant correlation between exercise and CETP activity indicates that exercise is
associated with an increase in reverse cholesterol transport (Gupta et al, 1993).
There was a significant and negative correlation between exercise and WHR. Horton
and Geissler (1994) have found that habitual exercise leads to increases daily energy
expenditure by 8-14% and increase lean body mass (and results loss of body fat and thus
WHR). Alternatively, fat persons might not like to take exercise, resulting in increased
obesity. .
Long et al (1994) have suggested that weight loss in patients with clinically severe
obesity prevents the progression of impaired glucose tolerance to NIDDM by > 30-fold.
Both frequency and intensity of exercise were related to systolic blood pressure in GDM
subjects. Systolic blood pressure increases in proportion to oxygen consumption and
cardiac output during physical activity, whereas diastolic blood pressure remains
relatively unchanged or slightly increased. Following exercise blood pressure falls below
pre-exercise levels, and may remain lower for several hours (McArdle et al, 1991 b).
Physical activity is an effective, non-dietary, non-pharmacological option for the
management of mild hypertension. Physical activity produced average falls in blood

Chapter Five Discussion 195
pressure of 11 mmHg systolic and 6 mmHg diastolic respectively in reported series of
hypertensive patients subjected to various forms of isotonic exercise such as walking,
running, cycling, swimming and cross-country skiing (Stokes, 1992).
The beneficial effects of physical activity on serum lipids seem to be mediated partially by
a decreased serum insulin level and body adiposity (Lakka and Salonen, 1992).
In addition, regular physical activity is effective in preventing NIDDM, and the
protective benefit is particularly pronounced in subjects at the highest risk for developing
NIDDM (Helmrich et al, 1991).
Results from subgroups analysis showed that the GDM subjects who had positive family
history of diabetes mellitus, high plasma NEFA concentrations, and were overweight or
obese (BMI > 25 kg / m2) (subgroup A) had several metabolic abnormalities compared
with the residual GDM group and controls.
Subgroup A of the GDM group (those who are overweight, have high plasma NEFA
concentrations, and a positive family history of diabetes mellitus) tended to be
hyperinsulinémie and hyperlipidémie (significantly higher plasma TG, VLDL-TG, and
IDL-C concentrations) compared with the residual GDM group.
Subgroup A also tended to be more hyperinsulinémie, hyperlipidémie (significantly
higher plasma cholesterol, TG, apoB, VLDL-TG, IDL-C, and LDL-C concentrations,
and greater CETP activity in plasma) compared with controls.
The GDM subjects who had positive family history of diabetes and high plasma levels of
NEFA but not overweight (BMI < 25 kg / m2) (subgroup B) tended to have better
metabolic status than the residual GDM group and similar to controls.
Chapter Five Discussion 196
Subgroup B tended to have less insulin resistance (lower fasting insulin concentrations)
than the residual GDM group but similar to the residual controls.
In addition, subgroup B tended to have significantly lower lipids and lipoprotein
concentrations (plasma cholesterol, TG, VLDL-TG, and IDL-C concentrations) than the
residual GDM group but similar to the residual controls.
The subgroup B also had significantly lower BMI and WHR than the residual GDM, but
similar to the residual controls.
As a result, a comparison of subgroup A and B suggests that being overweight or obese
is an important factor in developing metabolic disorders in women who have positive
family history of diabetes mellitus.

CHAPTER SIX
CONCLUSION
6.1 Background
The purpose of our investigation was to test the hypothesis that certain factors are
altered in patients who have been diagnosed with GDM compared with controls.
Identification, treatment, and follow-up of women with GDM are very important because
GDM subjects are at the risk of adverse maternal, fetal, and neonatal outcomes.
Subjects who have had GDM are at a high risk of later development of NIDDM.
The present study showed that the GDM subjects (ie subjects who had had GDM in then-
last pregnancy one year previously) were more overweight or obese than controls. The
GDM subjects had a family history of diabetes mellitus in first and second degree of
relatives, particularly in the maternal side.
Obesity like NIDDM is commonly characterized by insulin resistance with increased
plasma NEFA concentrations. Distribution of excessive fat on the upper body segment
or abdomen, as measured by WHR is correlated with decreased insulin sensitivity and
increased risk for developing diabetes (Park, 1993).
The links between insulin resistance and obesity might be multifactorial and bi
directional. Insulin resistance may precede the obesity or insulin resistance may be due
to obesity (Park, 1993).
Conclusion 198Chapter Six
NEFA may have an important role in the metabolic influence of obesity. Plasma NEFA
concentration is elevated and fatty acid turnover rate is increased in obesity, and these
abnormalities are more pronounced in upper body obesity than lower body obesity
(Jensen et al, 1989).
Increased NEFA concentrations result in increased fatty acid oxidation, and this may lead
to decreased glucose oxidation and thus decreased glycogen synthetase activity.
Decreased glycogen synthetase activity associates result in development of insulin
resistance in both liver and muscle. Therefore, increased availability of NEFA is an
important link between insulin resistance and obesity (Park, 1993).
Upper body obesity is associated with large fat cells which in turn tend to be insulin
resistant. Fat localization (upper body or central) is related to increased activity of
androgens, as manifest by lower SHBG and higher free testosterone. In turn, increased
activity of androgens is also associated with increasing WHR, increasing plasma glucose
and insulin concentrations in both fasting and in response to oral glucose challenge, and
decreased insulin sensitivity in obese pre-menopausal women (Evans et al, 1983).
Low SHBG and high testosterone concentration are caused by abdominal obesity (Evans
et al, 1983). In the present study, BMI was independently correlated with SHBG levels
in multiple regression analysis. In addition, low serum SHBG level has been suggested
as strong independent risk factor for the development of NIDDM in women (Lindstedt et
al, 1991).
The GDM subjects were overweight or obese, had family history of diabetes, high
plasma NEFA concentration, and low SHBG level. As a result, the GDM subjects were
more likely to have hyperinsulinemia and insulin resistance. The GDM subjects exhibited
higher plasma insulin levels than controls.
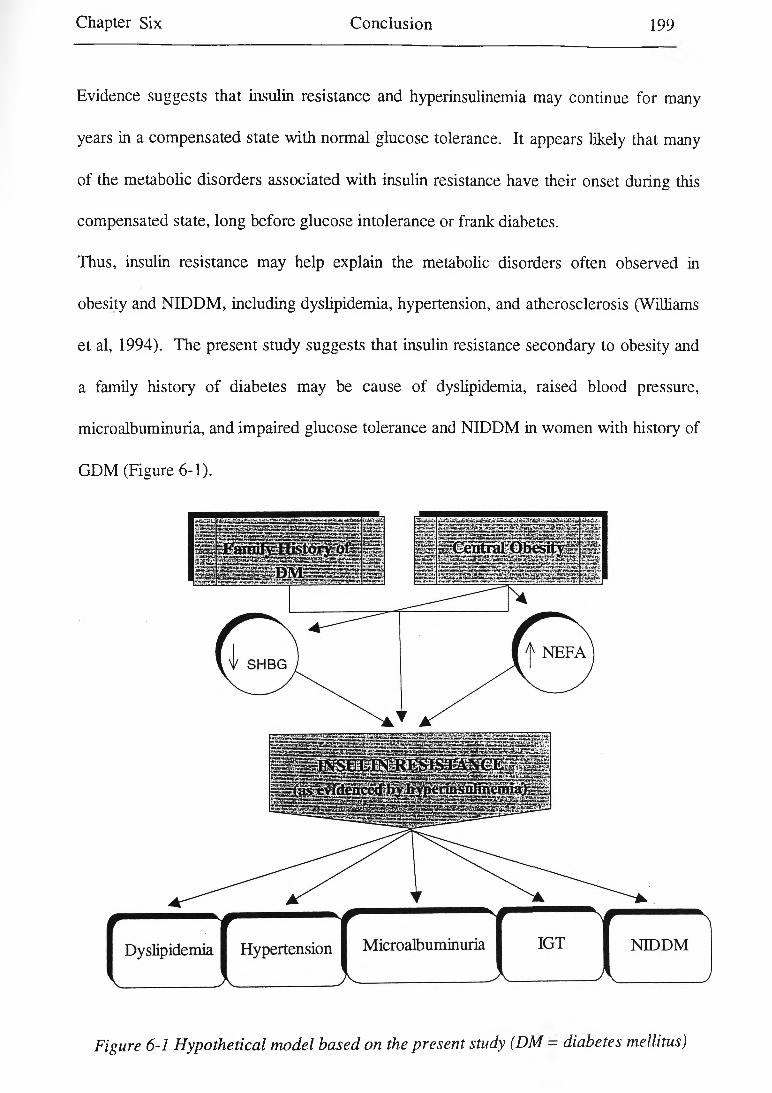
Chapter Six Conclusion 199
Evidence suggests that insulin resistance and hyperinsulinemia may continue for many
years in a compensated state with normal glucose tolerance. It appears likely that many
of the metabolic disorders associated with insulin resistance have their onset during this
compensated state, long before glucose intolerance or frank diabetes.
Thus, insulin resistance may help explain the metabolic disorders often observed in
obesity and NIDDM, including dyslipidemia, hypertension, and atherosclerosis (Williams
et al, 1994). The present study suggests that insulin resistance secondary to obesity and
a family history of diabetes may be cause of dyslipidemia, raised blood pressure,
microalbuminuria, and impaired glucose tolerance and NIDDM in women with history of
GDM (Figure 6-1).
Figure 6-1 Hypothetical model based on the present study (DM - diabetes mellitus)
Chapter Six Conclusion 2 0 0
6.2 Insulin Resistance, Dyslipidemia, and ‘GDM’
Increased availability of FFA is an important link between insulin resistance and obesity.
The possible mechanism for hyperlipoproteinemia and its related abnormalities found
with insulin resistant might be that hyperlipoproteinemia may be caused by enhanced
FFAs flux on the insulin-resistance liver, perhaps resulting from central obesity (Park,
1993).
Most causes of insulin resistance including diet, central obesity, and physical activity
result in increased flux of FFAs and (probably) glucose to the liver. Cambien et al
(1987) reported that hyperinsulinemia insulin is associated with elevated VLDL-TG
concentrations positively and decreased HDL-C concentration. This appears to be a
consistent relationship between hyperinsulinemia and hypertriglyceridemia in healthy,
normal-weight subjects (Zavaroni et al, 1989). The possible underlying mechanism is
outlined in Figure 6-2.
Incubation of cell lines with VLDL causes insulin resistance due to either a decrease in
insulin receptors or a post-binding defect (Hunt et al, 1989). Thus, it seems insulin
resistance promotes dyslipidemia and dyslipidemia may induce insulin resistance.
Winocour et al (1992) have found that hyperinsulinemia is associated with a higher TG /
apoB ratio and lower HDL-C / apoA-I ratio after adjustment for BMI in women.
Despite a higher apoA-I and HDL synthetic rate in NIDDM patients than controls,
plasma HDL-C is reduced in NIDDM patients because of an increased apoA-I and HDL
fractional clearance rate (Golay et al, 1987).

Chapter Six Conclusion 201
LDL is synthesized from hepatic-derived VLDL. DDL particles are produced during the
conversion of VLDL to LDL, and IDL particles are thought to be atherogenic
((Nordestgaard and Tybjaerg-Hassan, 1992).
Impaired LPL activity can reduce VLDL removal and therefore indirectly influence the
flux of material to HDL particles. Additionally, insulin resistance might inhibit CETP or
LCAT activity. Alterations in the lipolytic cascade may cause more dense LDL particles
(Howard, 1993).
From the results of this study, it may be concluded that the GDM subjects who have a
positive family history of diabetes and also are overweight or obese exhibit
hyperinsulinemia (as a compensatory response to the insulin resistance), resulting in
dyslipidemia in this population.
Dyslipidemia in the GDM subjects is characterized by hypertriglyceridemia and high
plasma concentrations of VLDL-TG, high plasma total cholesterol, IDL-C, and LDL-C
levels, slightly lower HDL-C, higher CETP activity in plasma, and smaller and denser
LDL and HDL3 particles. There is abundant evidence that hyperinsulinemia and insulin
resistance appear to be associated with frequency of atherosclerosis (Stout, 1993).

Chapter Six Conclusion 2 0 2
Central Obesity
Inactivity 1— r - i V jrC I
/ ____________________
Diet
Figure 6-2 Insulin resistance and lipoprotein abnormalities
(data from Howard, 1993, Hunt et al, 1989)

Chapter Six Conclusion 203
6.3 Insulin Resistance, Raised Blood Pressure, and <GDM>
It has been recognized for many years that hypertension is common in people who are
obese (Havlik et al, 1983, Modan et al, 1985) and those who have NIDDM (Modan et
al, 1985, Turner, 1985). On the other hand, exercise (Maiorano et al, 1989) and weight
loss (MacMahon et al, 1985) has been reported to be effective in lowering the blood
pressure in obese and diabetic patients by improving insulin sensitivity.
DeFronzo (1982) has reported that improvement of insulin sensitivity, resulting in lower
plasma insulin concentration is correlated with a reduction in both systolic and diastolic
blood pressure in ono-diabetic obese patients. Thus, it might be said that insulin
resistance per se, or through compensated hyperinsulinemia, results in raised systolic and
diastolic blood pressure (Manicardi et al, 1986).
Studies have proposed that hyperinsulinemia and / or insulin resistance assist sodium
retention, which plays a n important role in the development of hypertension. Sodium
retention in turn, results in water reabsorption in the kidney tubules (Sharma et al, 1991,
DeFronzo, 1981, Kolanowski, 1981).
Hyperinsulinemia may lead to the development of hypertension through activation of the
sympathetic nervous system (O’Dea et al, 1982, Sowers et al, 1982).
The possible mechanisms underlying raised blood pressure in the GDM subjects are
summarized in Figure 6-3.

Chapter Six Conclusion 204
Figure 6-3 Relationship between insulin resistance, hyperinsulinemia, sympathetic nervous system activity, and hypertension.
(CNS = central nervous system, DeFronzo and Ferrannini, 1991)
6.4 Insulin Resistance, Microalbuminuria, and ‘GDM’
It is thought that there is link between microalbuminuria and insulin resistance.
Angiotensin converting enzyme inhibitor agents such as captopril cause an increase in
insulin sensitivity (Pollare et al, 1989) and use of these drugs decreases microalbuminuria
irrespective of their antihypertensive effects (Parving et al, 1989).
Chapter Six Conclusion 205
Haffner et al (1990 a) have reported that there is an association between
microalbuminuria and a number of cardiovascular risk factors such as hyperinsulinemia,
hypertension, and hypertriglyceridemia in non-diabetic subjects.
Nestler et al (1990) have reported an increased trans-capillary escape of albumin in non
diabetic subjects. It may be a possible link between microalbuminuria and
hyperinsulinemia. Insulin resistance and or hyperinsulinemia at kidney level may result in
intraglomerular pathology and subsequent albuminuria (Niskanen and Laasko, (1993).
In our study, microalbuminuria was correlated with plasma insulin concentration.
6.5 Insulin Resistance, IGT, NIDDM, and ‘GDM’
The pathogenesis of NIDDM can be divided into four phases: genetic susceptibility,
insulin resistance, IGT, and NIDDM itself (Bennett et al, 1988). Figure 6-4
demonstrates briefly the pathogenesis of NIDDM.
People who have had GDM with a positive family history of diabetes mellitus have a
genetic or inherited susceptibility to NIDDM. In addition, they are significantly fatter
and hyperinsulinémie than controls in the present investigation.
Defects in insulin action may be exist in some subjects years before the onset of overt
diabetes mellitus. Impaired insulin action is present in individuals at risk for developing
NIDDM (pre-diabetic), including relatives of NIDDM patients, people with impaired
glucose tolerance, and in ethnic populations with a high prevalence of NIDDM such as
Pima Indians (Alzaid and Rizza, 1993).
As a result, we may say that women with previous GDM are likely to develop NIDDM
later and hyperinsulinemia is its hallmark.
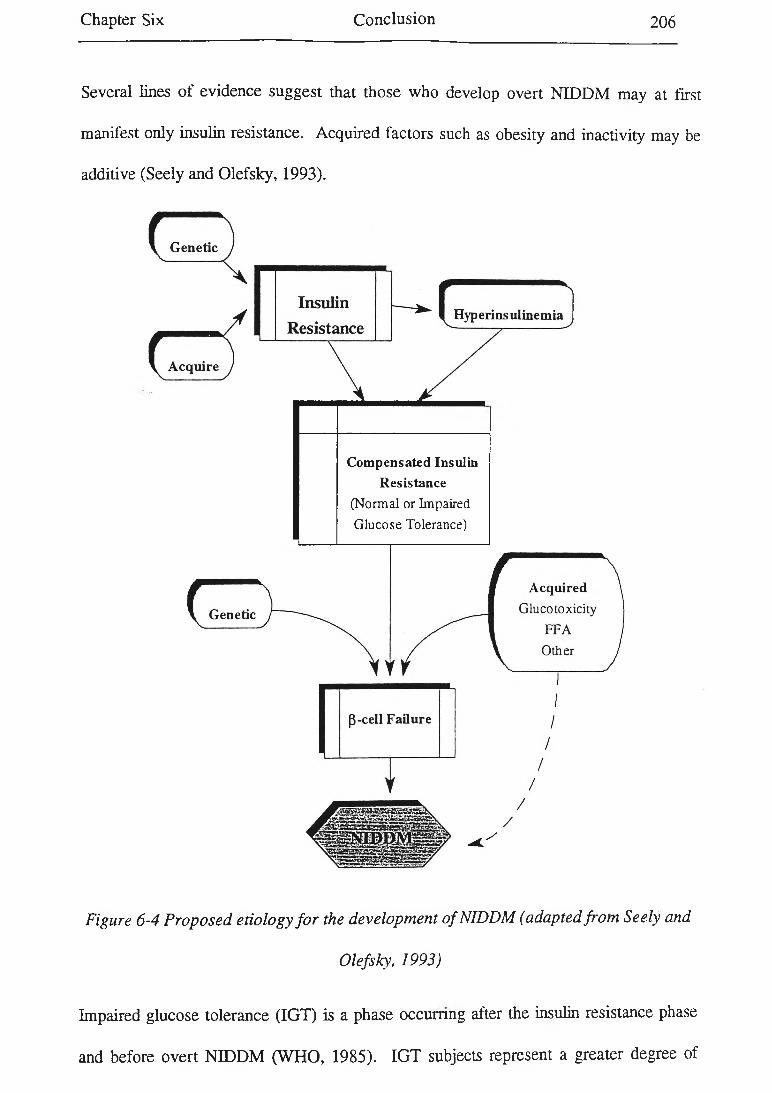
Chapter Six Conclusion 206
Several lines of evidence suggest that those who develop overt NIDDM may at first
manifest only insulin resistance. Acquired factors such as obesity and inactivity may be
additive (Seely and Olefsky, 1993).
Compensated Insulin Resistance
(Normal or Impaired Glucose Tolerance)
Figure 6-4 Proposed etiology fo r the development o f NIDDM (adapted from Seely and
Olefsky, 1993)
Impaired glucose tolerance (IGT) is a phase occurring after the insulin resistance phase
and before overt NIDDM (WHO, 1985). IGT subjects represent a greater degree of
Chapter Six Conclusion 207
insulin resistance compared with subjects with normal glucose tolerance. Among IGT
subjects those with the greater insulin resistance are most likely to develop overt
NIDDM (Bennett et al, 1988).
NIDDM in obese subjects seems to be the end result of a series of changes that occur
over many years that culminate in the failure to maintain glucose homostasis (Bennett,
1988).
The proposed pathogenic mechanisms for NIDDM include a primary defect relating to
the development of insulin resistance and a secondary defect relating to pancreatic insulin
secretory failure (Bennett, 1988).
It seems NIDDM can be delayed or even prevented if somehow the pancreas could be
protected from failure. It seems likely this may be achieved by diminishing insulin
resistance. Weight loss in obese and overweight subjects, regular exercise, a healthy diet
with low saturated fat and adequate fruit and vegetables, stopping smoking, and
correction of the medical problems can reduce the degree of insulin resistance degree
and may delay or prevent NIDDM in GDM subjects.
In conclusion, this study revealed that women with previous GDM are more likely to
have a family history of diabetes mellitus and be fatter than controls, resulting in
hyperinsulinemia. Obesity causes higher plasma NEFA concentration and
hyperandrogenicity and these abnormalities may cause insulin resistance and
hyperinsulinemia. The GDM subjects demonstrated a cluster of abnormalities related to
insulin resistance and hyperinsulinemia including dyslipidemia (high cholesterol, TG,
VLDL-TG, IDL-C, and LDL concentrations, smaller and denser LDL, and greater CETP
activity in plasma), raised blood pressure, and microalbuminuria.

Chapter Six Conclusion 208
Recommendations for Future Research
This study has investigated the metabolic abnormalities in subjects with previous G D M
(post-GDM ) one year after delivery. In light o f this study, there are several areas in
which future research could be conducted:
The major areas o f interest will be to determine the crucial factors determining the
development o f diabetes in these women who have demonstrated a predisposition to
diabetes, and determining ways in which this slide into diabetes could be arrested.
Two particular study areas are suggested by the work described in this thesis:
* Subgroup analysis showed that being overweight appears to be a very important
factor in the development o f metabolic disorders in the GDM group. A study based on
weight reduction in both post-GDM women and also in women who are at risk of
development o f GDM (women who have a positive family history o f diabetes and high
plasma N EFA concentrations) may show that the abnormalities associated with the
insulin resistance syndrome can be reversed.
* Another intervention study may examine the effects o f a low fat-high fibre diet and
enough exercise in the post-GDM subjects. A low fat-high fibre diet (more fruit and
vegetable consumption) and physical activity may induce more insulin sensitivity and
thus reduce the risk o f development o f diabetes mellitus and cardiovascular disease in
the GDM group.

REFERENCES
Abbot KC, Sanders LR, and Bakris GL, (1994), Microalbuminuria in non-insulin
dependent diabetes mellitus: implications for renal survival, A rch ives o f In ternal
M ed ic in e , 154: 146-153.
A bbo tt D ia g n o s tic s ’ M an u a l, (1994), Insulin Test, List No: 2A10, Chicago, USA, pp 2-3.
Aerts L, Holemans K, and van Assche FA, (1990), Maternal diabetes during pregnancy:
Consequences for the offspring, D ia b e te s / M eta b o lism R ev iew s, 6 (No 3): 147-167.
Albers JJ, Faust RA, and Tollefson JH, (1990), Characterization and regulation of plasma
lipid transfer proteins, in B io tech n o logy o f dyslipopro te in em ias: a pp lica tion s in
diagn osis a n d co n tro l, Lenfanti C, et al (editors), Raven Press, New York, pp 189
197.
Albers JJ, Tolefson JH, Chen C, and Steinmetz A, (1984), Isolation and characterization
of human lipid transfer proteins, A rterio sc lero sis , 50: 261-271.
Alzaid A, and Rizza RA, (1993), Insulin resistance and its role in the pathogenesis of
impaired glucose tolerance and non-insulin-dependent diabetes mellitus: perspective
gained from invivo studies, in Insulin R esis ta n ce , Moller DE (editor), John Willey &
Sons Ltd, pp 143-186.
American Diabetes Association, (1987), Nutritional recommendations and principles for
individuals with diabetes mellitus, D ia b e tes C a re , 10: 126-132.
Ashley FW, and Kannel WB, (1974), Relationship of weight changes to changes in
atherogenic traits: the Framingham study, Jou rn a l o f C hronic D ise a se , 103-114.
References 2 1 0
Ashwell M, Cole TJ, and Dixon AK, (1985), New insight into the anthropometric
classification of fat distribution shown by computed tomography, B ritish M edica l
Journal, 290: 1692-1694.
Assmann G, and Schulte H, (1988), The prospective cardiovascular munster (PROCAM)
study: prevalence of hyperlipidemia in persons with hypertension and/or diabetes
mellitus and the relationship to coronary heart disease, A m erican H eart Journal, 116:
1713-24.
Assmann G, and Schulte H, (1992), Relation of high-density lipoprotein cholesterol and
triglycerides to incidence of atherosclerotic coronary artery disease (The PROCAM
Experience), A m erican Journal o f C ard io logy, 70: 733-737.
Attavall S, Fowelin J, Lager I, Schenck H, and Smith U, (1993), Smoking induces insulin
resistance: a potential link with the insulin resistance syndrome, Journal o f Internal
M edicine, 233 (No 4): 327-332.
Austin MA, Breslow JL, Hennekens CH, Buring E, Willett WC, and Krauss RM, (1988),
Low-density lipoprotein subclasses, pattern and risk of myocardial infarction, JAM A ,
260: 1917-1921.
Austin MA, King MC, Vranizan KM, and Krauss RM, (1990), Atherogenic lipoprotein
phenotype: proposed genetic marker for coronary heart disease risk, C irculation , 82:
495-506.
Backx CJM, Lotgering FK, Comelis H, and Nallenburg S, (1989), Oral glucose tolerance
test is a poor predictor of hyperglycemia during pregnancy, Journal o f P erinatal
M edicine 17: 253-257.

References 211
Bagdade JD, Lane JT, Subbaiah PV, Otto ME, and Ritter MC, (1993), Accelerated
cholesteryl ester transfer in non-insulin-dependent diabetes mellitus, A therosclerosis,
104: 67-77.
Baghurst KI, and Record S, (1984), A computerized dietary analysis system for use with
diet diaries or food frequency questionaries, C om m unity H ealth Studies, VIII: 11-18.
Baghurst KI, Crawford D, Worsley A, Syrette JA, Record S, and Baghurst P, (1988), The
Victorian nutrition survey: a profile of the energy, macronutrient, and sodium intakes
of the population, C om m unity H ealth S tu d ies , XII (No 1): 42-54.
Baird JD (1986), Some aspects of the metabolic and hormonal adaptation to pregnancy.
A cta-E ndocrinol-Suppl-C openh, 277: 11-8.
Baird JD, (1972), Diet and the development of clinical diabetes, A cta D iabeto log ia
Latina, 9 (supple 1): 621-639.
Balleisen L, Bailey PH, Schulte H, and van de Loo J, (1985), Epidemiological study on
factor VII, factor VIII, and fibrinogen in an industrial population. I. Baseline data on
the relation to age, gender, body weight, smoking, alcohol, pill using and menopause,
Throm bosis & H aem ostasis, 54: 475-479.
Barakat HA, Carpenter JW, McLendon VD, Khazanie P, Leggett N, Heath J, and Marks
R, (1990), Influence of obesity, impaired glucose tolerance, and NIDDM on LDL
structure and composition: possible link between hyperinsulinemia and
atherosclerosis, D ia b e tes , 39: 1527-1533.
Barbieri RL, Smith S, and Ryan KJ, (1988), The role of hyperinsulinemia in the
pathogenesis of ovarian hyperandrogenism, F ertility an d S terility , 50: 197-212.
References 2 1 2
Barret-Conner E, and Orchard T, (1984), Diabetes and heart disease in D ia b e tes in
A m erica , Diabetes data compiled in 1984, Harris MI, and Hamman RF (editors),
Washington, US Govt Printing Office, (NIH Publication No 85-1468), pp 1-22.
Barrett CT, (1987), Management of infants of diabetic mothers, in M anagem en t o f the
d ia b e tic p reg n a n cy , Nuwayhid BS, Brinkman III CR, and Lieb SM (editors), Elsevier
Science Publishing Co Inc, pp 120-127.
Barter PJ, (1994), Cholesterol and cardiovascular disease: basic science, A ustra lian and
N ew Z ea la n d Journal o f M edicine, 24: 83-88.
Barter PJ, Hopkins GJ, and Gorjatschko L, (1985), Lipoprotein substrates for plasma
cholesterol esterification: influence of particle size and composition of the high-
density lipoprotein subfraction 3, A th ero sc lero s is , 58: 97-107.
Barter PJ, Rajaram OV, Liang HQ, and Rye KA, (1993), Relationship between the size
and phospholipid content of low-density lipoproteins, B ioch im ica B iophysica A c ta ,
1166 (No 1): 135-137.
Baxter Diagnostics, M LA 1 0 0 0 C o p e ra to r ’s m anu al, USA, (1988).
Baxter K, Wiseman S, Powell J, and Greenhalgh R, (1988), Pilot study of a screening test
for peripheral arterial disease in middle aged men: Fibrinogen as a possible risk factor,
C ard iovascu lar R esearch , 22 (No 4), 300-302.
Baynes C, Henderson AD, Anyaoku V, Richmond W, Johnston DG, and Elkeles RS,
(1991), The influence of regional adiposity on atherogenic risk factors in men and
women with type 2 diabetes, D ia b e tic M ed ic in e , 8: 458-463.
References 213
Beck-Nielsen H, Nielsen OH, Damsbo P, Vaage A, Handberg A, and Henriksen JE,
(1990), Impairment of glucose tolerance: mechanism of action and impact on the
cardiovascular system, A m erica n Journal o f O bste tr ics a n d G yn eco lo g y , 163: 292
295.
Beckman M A M icro A L B U M IN M anual, (1990), Beckman Instructions, Inc, Galway,
Ireland, pp 1-4.
Beetham R, and Cattell WR, (1993), Proteinuria: pathophysiology, significance, and
recommendations for measurement in clinical practice, A n n als o f C lin ica l
B io ch em istry , 30: 425-434.
Behr SR, Patsch JR, Forte T, and Bensadoun A, (1981), Plasma lipoprotein changes
resulting from immunologically blocked lipolysis, Journal o f L ip id R esea rch , 22 (No
3): 443-451.
Beischer NA, Oats JN, Henry OA, Sheedy MT, and Walstab JE, (1991), Incidence and
severity of gestational diabetes mellitus according to country of birth in women living
in Australia, D ia b e tes , 40 (supple 2): 35-38.
Bell DSH, Barger BO, Go RCP, Goldenberg RL, Perkins LL, Vanichanan CJ, Roseman
T, and Acton RT, (1990), Risk factors for gestational diabetes in black population,
D ia b e te s C are, 13 (supple 4): 1196-1201.
Bennet PH, (1990), Epidemiology of diabetes mellitus, in E llenberg a n d R ifk in s d iabetes
m ellitus, Rifkin H, and Porte D Jr (editors), New York, Elsevier, pp 363-377.
Bennett PH, Bogardus C, Knowler WC, and Lillioja S, (1988), Antecedent events for
non-insulin-dependent diabetes mellitus in pre-diabetes, A dvan ces in E xperim enta l

References 214
M ed ic in e a n d B io lo g y , Camerini-Davalos RA, and Cole HS (editors), Reavan Press
New York Volum e 246, pp 25-28.
Berg A, Keul J, (1985), Influence of maximum aerobic capacity and relative body weight
on the lipoprotein profile in athletes, A th e ro sc le ro s is , 55: 225-231.
Berg K, (1963), A new serum type system in man: the lipoprotein system, A cta
P a th o lo g ic a e t M ic ro h ilo g ic a S ca n d in a v ica , 59, 369-382.
Berg-Schmidt E, Vanning K, Ernst E, Madsen P, and Dyerberg J, (1990), Dose-response
studies on the effects of n-3 fatty polyunsaturated acids on lipids and haemostasis,
T h rom bosis a n d H a e m o s ta s is , 63: 1-5.
Bergman RN, (1989), Toward physiological understanding of glucose tolerance.
Minimal-model approach, D ia b e te s , 38: 1512-1527.
Berson SA, and Yalow RS, (1970), Insulin antagonists and insulin resistance, in D ia b e tes
m ellitu s: th eo ry a n d p r a c t ic e , Ellenberg M, and Rifkin H (editors), McGraw Hill,
New York, pp 388-423.
Betteridge DJ, (1993), Triglyceride metabolism, LDL, and atherosclerosis, Report of a
meeting of physicians and scientists, university college, London, Medical school, The
L a n ce t, 342: 782-783.
Beydoun SN, (1987), Avoidance of obstetric complications, in M a n a g em en t o f the
d ia b e tic p reg n a n c y , Nuwayhid BS, Brinkman III CR, and Lieb SM (editors), Elsevier
Science Publishing CO Inc, pp 91-104.
Bieri JG, (1990), Vitamin E, in P re se n t K n o w le d g e in n u tritio n , 6th edition, International
Life Sciences Institute Nutrition Foundation, pp 117-121.
References 215
Bio-Rad Haemoglobin A le Micro-column Test Instruction Manual, (1990).
Bjomtorp P, (1988), Abdominal obesity and the development of non-insulin-dependent
diabetes mellitus, D ia b e te s / M eta b o lism R ev iew s, 4: 615-622.
Bjomtorp P, (1989), Abdominal obesity and the development of non-insulin-dependent
diabetes mellitus, D ia b e te s / M eta b o lism R e v ie w s , 4: 615-622.
Bjomtorp P, (1990), Obesity and adipose tissue distribution as risk factors for the
development of disease. A review, Infusions th e ra p ie , 17 (No 1): 24-27.
Bjomtorp P, (1992), Metabolic implications of body fat distribution, D ia b e te s C are, 14
(No 12): 1132-1143.
Black IW, and Wilchen DEL, (1992), Increased in apolipoprotein (a) after renal
transplantation: implications for lipoprotein (a) metabolism, C lin ica l C h em istry , 38:
353-357.
Blair SN, Kohl HW, Paffenbarger RS, Clark DG, Cooper KH, and Gibbons LW, (1989),
Physical fitness and all cause of mortality: a prospective study of healthy men and
women, JA M A , 262 (No 17): 2395-2401.
Bloom AL, and Thomas DP, (1987), H a em o sta sis a n d T h rom bosis , Second edition,
Churchill, Livingstone, Melbourne.
Bloom AL, Giddins JC, and Wilks CJ, (1973), Factor VE on the vascular intima: possible
importance in haemostasis and thrombosis, N a tu re , 241: 217-219.
Bogardus C, Lillioja S, Foley L, Christin L, Freymond D, Nyomba B, Bennett PH, Reaven
GM, Salans L, and Phoenix AZ, (1987), Insulin resistance predicts the development
References 216
of non-insulin-dependent diabetes mellitus in Pima Indians, D ia b e te s , 36 (supple 1):
47 A (Abstract No 186).
Bonanome A, Pagnan A, Biffanti S, Opportuno A, Sorgato F, Dorella M, Maiorino M,
and Ursini F, (1992), Effects of dietary mono-unsaturated and polyunsaturated fatty
acids on the susceptibility of plasma low-density lipoproteins to oxidative
modification, A rte r io sc le ro s is a n d T h ro m b o sis , 12: 529-533.
Bott U, Jorgens V, Gruber M, Bender R, Muhlhauser I, and Berger M, (1994), Predictors
of glycemic control in type I diabetic patients after participation in an intestified
treatment and teaching program, D ia b e tic M ed ic in e, 11: 362-371.
Bouchard C, (1994), Genetic of human obesities: Introductory notes, in The g en e tic s o f
O b e sity , Bouchard C (editor), by CRC Press Inc, pp 1-16.
Bouchard C, Bray GA, and Hubbard VS, (1990), Basic and clinical aspects of regional fat
distribution, A m erica n Jou rn a l o f C lin ica l N u tr itio n , 52: 946-950.
Boyd E, M etzger BE, and The Organizing Committee, (1991), Summary and
Recommendations of the Third International workshop Conference on Gestational
Diabetes Mellitus, D ia b e tes , 40 (supple 2): 197-201.
Braunstein GD, (1994), Testes, in B a sic a n d C lin ica l E n d o crin o lo g y , 4th edition,
Greenspan FS, and Baxter JD (editors), Appleton & Lance, USA, pp = 391-418.
Bray GA, (1985), Obesity, definition, diagnosis, and disadvantages, The M ed ic a l Journal
o f A u stra lia , 142 (Special supplement): S2-S8.
Bray GA, Gray DS, (1988), Treatment of obesity: An overview, D ia b e te s / M eta b o lism
R eview s, 4: 653-679.
References 217
Brinkman III GR, (1987), Classification and screening of diabetes mellitus during
pregnancy, in M a n a g em en t o f d ia b e tic p re g n a n c y , Nuwayhid BS et al (editors),
Elsevier Science Publishing Co Inc, New York, pp 1-10.
Brinton EA, Eisenberg S, and Breslow JL, (1990), A low-fat diet decreases high-density
lipoprotein (HDL)-cholesterol level by decreasing HDL-apolipoproteins transport
rates, Jou rn a l o f C lin ica l In vestiga tion , 85:144-151.
Brown MS, and Goldstein JL, (1990), Scavenging for receptors, N a tu re , 343: 508-509.
Brunzell JD, Goldberg AP, and Schwartz RS, (1980), Cigarette smoking and adipose
tissue lipoprotein lipase, In tern a tio n a l Jou rn a l o f O besity , 4: 101-103.
Buchanan TA, (1991), Glucose metabolism during pregnancy: normal physiology and
implications for diabetes mellitus, Isra e l Jou rn a l o f M ed ica l Science, 27 (No 8-9):
432-441.
Bung P, Bun C, Artal R, Khodiguian N, Fallenstein F, and Spading L, (1993), Therapeutic
exercise for insulin-requiring gestational diabetes: effects on the fetus- results of a
randomized prospective longitudinal study, Journal o f P erin a ta l M edicine, 21: 125
137.
Bush TL, (1991), Epidemiology of cardiovascular disease in women, in L ip ids and
w om en 's health, Redmond GP (editor), Spring-Verlay, New York Inc, pp 6-20.
Bush TL, Fried LP, and Barrett-Connor E, (1988), Cholesterol, lipoproteins, and coronary
heart disease in women, C lin ica l C h em is try , 34 (No 8B): B60-B70.
Calvert GD, (1991), W a is t: Hip ratio or abdominal obesity as a risk factor for coronary
heart disease, A u stra lia n Jou rn a l o f N u trition a n d D ie te tic s , 48 (No 4). 111-112.

References 218
Camargo Ca, Williams PT, Vranizan KM, Albers JJ, and Wood PD, (1985), The effect of
moderate alcohol intake on serum apolipoprotein A-I and A-II: a controlled study,
JAM A, 253 (No 19): 2854-2857.
Cambien F, W am et JM, Eschwege E, Jacqueson A, Richard JL, and Rosselin G, (1987),
Body mass, blood pressure, glucose, and lipids. Does plasma insulin explain their
relationships? A rte r io sc le ro s is , 7 (No 2): 197-202.
Campbell B, Tate J, Lepre F, and Hickman P, (1992), Lipoprotein (a): Biology, clinical
utility and measurement, C lin ica l B ioch em istry R ev ie w s , 13: 55-59.
Carella MJ, Gossain VD, and Rovner DR, (1994), Early diabetic nephropathy emerging
treatment options, A rch ives o f In tern al M ed ic in e , 154: 625-630.
Carpenter MW, (1993), Metabolic changes in gestational diabetes mellitus, C lin ics in
P erin a to lo g y , 20: 583-591.
Carr BR, and Griffin JE, (1985), Fretility control and its complications, in W illiam s’
Textbook o f E n docrin o logy , Seventh edition, Wilson J, and Foster DW (editors), pp
452-475.
Cassano PA, Rosner B, Vokonas PS, and Weiss S, (1992), Obesity and body fat
distribution in relation to the incidence of non-insulin dependent diabetes mellitus,
A m erican Jou rn a l o f E p id em io lo g y , 136 (No 12): 1474-1486.
Castelli WP, (1986), The triglyceride issue: A view from Framingham, A m erican H eart
Journal, 112: 432-437.

References 219
Castelli W P, Gordon T, Hjortland MG, Kagan A, Doyle JT, Hames CG, Hulley SB, and
WJ, (1977), Alcohol and blood lipids, the cooperative lipoprotein phenotyping study,
The L a n ce t, 2: 153-155.
Catalano PM, Bernstein IM, Wolfe RR, Sirkanta S, Tyzbir E, and Sims EA, (1986),
Subclinical abnormalities of glucose metabolism in subjects with previous gestational
diabetes, A m erica n Jou rn a l o f O b ste tr ic s a n d G yn a eco lo g y , 155: 1255-1262.
Cejka J, (1982) Enzyme immunoassay for factor VII-related antigen, C lin ica l Chem istry,
28 (No 6): 1356-1358.
Ceriello A, (1993), Coagulation activation in diabetes mellitus: the role of hyperglycemia
and therapeutic prospects, D ia b e to lo g ia , 36: 1119-1125.
Ceriello A, Giugliano D, Qutraro A, Delio-Russo P, and Torella R, (1988), Blood glucose
may condition factor VII levels in diabetic and normal subjects, D ia b e to lo g ia , 31 (No
12): 889-891.
Ceriello A, Quatraro A, Marchi E, Barbanti M, Delio-Russo P, and Lefebvre PJ, (1990),
The role of hyperglycemia-induced alterations of antithrombin III and factor X
activation in the thrombin hyperactivity of diabetes mellitus, D ia b e tic M ed ic in e , 7:
343-348.
Chait A, Onitiri A, Nicholl A, Rabaya E, Davies J, and Lewis B, (1974), Reduction of
serum triglyceride levels by polyunsaturated fat. Studies on the mode action and
very-low-density lipoprotein composition, A th ero sc lero s is , 20: 347-364.
References 2 2 0
Chajek-Shaul T, Friedman G, Dabach Y, Hollander G, Bardach E, Biber A, Stein O, and
Stein Y, (1987), The effect of acute and chronic administration of nicotinic on
lipoprotein lipase activity, In te rn a tio n a l A n g io lo g y , 6 (No 1): 29-36.
Chappie DA, and Spector AA, (1991), Lipoprotein and lipid metabolism: Basic and
clinical aspects, in L ip id s a n d w o m en 's h e a lth , Redmond GP (editor), Spring-Verlay,
New York Inc, pp 21-38.
Charles MA, Fontbonne A, Thibult N, W am et JM, Rosselin GE, and Eschwege E, (1991),
Risk factors for NIDDM in white population: Paris Prospective Study, D ia b e te s , 40:
796-799.
Chattaway JA, Elliott KRF, Smith SA, (1990), Differential sensitivity of 2-deoxy-glucose
transport into cardiac myocytes and adipocytes isolated from high-fat-fed rats,
B io ch em ica l S o c ie ty T ran saction s, 18: 1240-1241.
Chetty N, Reavis S, Solomons HD, Pienaar N, Baynes R, Meriwethes D, and Athinson
PM, (1988), Platelet aggregations, fatty acids, clotting factors, and serum lipids in
rural and urban blacks and urban whites in South Africa, A rtery , 15: 234-243.
Cigolini M, Targher G, DeSandre G, Muggeo M, and Seidell JC, (1994), Plasma
fibrinogen in relation to serum insulin, smoking habits, and adipose tissue fatty acids
in healthy men, E u ropean J o u rn a l o f C lin ic a l In v es tig a tio n , 24 (No 2): 126-130.
Cistolla DP, and Small DM, (1991), Fatty acid distribution in systems modeling the normal
and diabetic human circulation, The J o u rn a l o f C lin ica l In ves tig a tio n , 87: 1431-1441.
References 221
Cistolla DP, Hamilton JA, Jackson DJ, and small DM, (1988), The ionization and phase
behaviour of fatty acids in water: application of the Gibbs phase rule, B ioch em istry ,
27: 1881-1888.
Clark A, (1989), Islet amyloid and type 2 diabetes, D ia b e tic M ed ic in e , 6: 561-567.
Clark A, Wells CA, Buley ID, Cruickshand JK, Vanhegan RI, Matthews DR, Cooper GJS,
Holman RR, and Tem er RC, (1988), Islet amyloid, increased alpha-cells, reduced
beta-cells and exocrine fibrosis: quantitative changes in the pancreas in type 2
diabetes, D ia b e te s R esearch , 9: 151-159.
Coller BS, Frank RN, Milton RC, and Gralinck HR, (1978), Plasma co-factors of platelet
function: correlation with diabetic retinopathy and haemoglobins A la-c, Studies in
diabetic patients and normal persons, A n n a ls o f In tern al M ed ic in e , 88: 311-316.
Conlan MG, Folsom AR, Finch A, Davis CE, Sorlie P, Marcucci G, and Wu KK, (1993),
Association of factor VIII and von Willebrand factor with age, race, sex, and risk
factors for atherosclerosis: the atherosclerosis risk in communities (AR ± C) study,
T hrom bosis a n d H a em o sta sis , 70 (No 3): 380-385.
Contaldo F, D ’Arrigo E, Carandente V, Cortese C, Coltorti A, Mancini M, Taskinen MR,
and Nikkila EA, (1989), Short-term effects of moderate alcohol consumption on lipid
metabolism and energy balance in normal men, M etabo lism , 32 (No 2): 166-171.
Converse CA, and Skinner ER, (1992), Lipoprotein analysis: A practical approach, The
Practical Approach Series, Rickwood D, and Hames BD (editors), IRL Press, Oxford
University Press, New York, pp 18-24.
References 2 2 2
Coonroo BA, Ellis D, Becker D, Bunker CH, Kelsey SF, Lioyd CE, Darsh AL, Kuller LH,
and Orchard TJ, (1993), Predictors of microalbuminuria in individuals with EDDM,
D ia b e tes C a re , 16 (No 10): 1376-1383.
Corriveau DM, Fristma GA, (1988), H aem ostasis a n d Throm bosis in The clin ica l
L a b o ra to ry , JB Lippincott Company, pp 4-25.
Cousins (1987), Pregnancy complications among diabetic women, review 1965-1985,
O bstetrics a n d G yn eco lo g y Survey, 42 (No 3): 140-149.
Coustan DR, (1993), Methods for screening and diagnosing of gestational diabetes,
C linics in P erin a to lo g y , 20: 593-602.
Coustan DR, Nelson C, Carpenter MW, Garr SR, Rotondo L, and Widness JA, (1989),
Maternal age and screening for gestational diabetes: A population Based study,
O bstetrics a n d G yn eco lo g y , 73: 557-561.
Cowan LD, Wilcosky T, Criqui MH, Barrett-Connor E, Suchindran CM, Wallace R,
Laskarzewski P, and Walden C, (1985), Demographic, behavioural, biochemical and
dietary correlates of plasma triglyceride, A rte r io sc le ro s is , 5: 466-480.
Craig WY, Pulmoki CE, Haddow JE, (1989), Cigarette smoking and serum lipid and
lipoproteins concentrations analysis of published data, B ritish M ed ica l Journal, 298:
784-788.
Crandall BF, (1987), Risks to children of diabetic mothers, in M anagem en t o f the d iabetic
pregn ancy, Nuwayhid BS, Brinkman III CR, and Lieb SM (editors), Elsevier Science
Publishing Co Inc, pp 11-20.

References 223
Crinqui MH, Wallace RB, Heiss G, Mishkel M, Schonfeld G, and Jones GTL, (1980),
Cigarette smoking and plasma high-density lipoprotein cholesterol, C irculation , 62
(supple IV), IV 70-IV 76.
Daly LE, Bourke GJ, and McGilvray J, (1991), In terpreta tion a n d uses o f m ed ica l
s ta tis tic s , (4th edition), Blackwell Scientific Publications, Australia, Pty Ltd, Victoria,
pp 14-15.
Daly PA, Lands berg L, (1991), Hypertension in obesity and NIDDM: the role of insulin
and sympathetic nervous system, D ia b e tes C a re , 14: 240-248.
Damm P, kuhl C, Berrtelse A, and Moisted PL, (1992), Predictive factors for the
development of diabetes in women with previous gestational diabetes mellitus,
A m erican Journal o f O besity , 167 (No 3): 607-616.
Damsgaard EM, Froland A, Jorgensen OD, and Mogensen CE, (1990), Microalbuminuria
as predictor of increased mortality in eldery people, B ritish M ed ica l Journal, 300:
297-300.
Deckelbaum RJ, Granot E, Orschy Y, Rose L, and Eisenberg S, (1984), Plasma
triglyceride determines structure-composition in low and high density lipoproteins,
A rte r io sc le ro sis , 4 (No 3): 225-231.
DeFronzo R, Bonodonna RC, and Ferrannini E, (1992), Pathogenesis of NIDDM: a
balanced overview, D ia b e tes C a re , 15: 318-346.
DeFronzo RA, (1981), Insulin and renal sodium handling: Clinical implications,
In tern a tion a l Journal o f O besity , 5 (supple 1): 93-104.

References 224
DeFronzo RA, (1981), The effect of insulin on renal sodium metabolism, D ia b e to lo g ia ,
21: 165-171.
DeFronzo RA, (1982), Insulin secretion, insulin resistance, and obesity, In tern a tion a l
Journal o f O b esity , 6 (supple 1): 72-82.
DeFronzo RA, and Ferrannin E, (1991), Insulin resistance: a multifaceted syndrome:
responsible for NIDDM, obesity, hypertension, dyslipidemia, and atherosclerotic
cardiovascular disease, D ia b e te s C a re , 14 (No 3): 173-194.
DeFronzo RA, Bonadonna RC, and Ferrannini E, (1992), Pathogenesis of NIDDM: A
balanced overview, D ia b e te s C a re , 15(No 3): 315-368.
Delvin JT, Hirshman M, Horton ED, and Horton ES, (1987), Enhanced peripheral and
splanchnic insulin sensitivity in NIDDM men after a single bout of exercise, D iabetes,
36: 434-439.
Demoor P, and loosens JV, (1970), An inverse relation between body weight and the
activity of the steroid binding P globulin in human plasma, S te ro id o lo g ia , 1: 129-136.
Despres JP, (1991), Obesity and lipid metabolism: relevance of body fat distribution,
C u rren t O pin ion in L ip id o lo g y , 2: 5-15.
Despres JP, (1994), Metabolic dysfunction and exercise, in exercise a n d o b e s ity , Hills AP,
and Wahlquist (editors), Smith-Gordon and Company Limited, pp 71-84.
Despres JP, Ferland M, and Moorinani S, Nadeau A, Tremblay A, Lupien PJ, Theriault G,
and Bouchard C, (1989), Role of hepatic triglyceride lipase activity in the association
between intra-abdominal fat and plasma HD-cholesterol in obese women,
A rte r io sc le ro s is , 9: 485-492.

References 225
Despres JP, Moorjani S, Lupien PJ, Tremblay A, Nadeau A, and Bouchard C, (1992),
Genetic aspects of susceptibility to obesity and related dyslipidemias, M olecu lla r an d
C ellu lar B ioch em istry , 113: 151-169.
Despres JP, Moorjani S, Lupien PJ, Tremblay A, Nedeau A, Bouchard C, (1990),
Regional distribution of body fat, plasma lipoprotein and cardiovascular disease,
A rte r io sc le ro s is , 10 (No 4): 497-511.
Despres JP, Moorjani S, Pouliot MC, Tremblay A, Nadeau A, Lupien PJ, and Bouchard
C, (1990), Correlates of plasma very-low-density lipoprotein concentration and
composition in pre-menopausal women, M etabo lism , 39 (No 6): 577-583.
Dixon JL, Furukawa S, and Ginsberg HN, (1991), Oleate stimulates secretion of
apolipoprotein B-containing lipoproteins from Hep G2 cells by inhibiting early
intracellular degradation of apolipoprotein, B ritish Journal o f B io logy an d Chem istry,
266: 5080-5086.
Dominiczak MH, (1994), Apolipoproteins and lipoproteins in human plasma, in
L abora tory m easu rem en t o f lip ids, lipopro te in s, a n d apo lip o p ro te in s , Rifai N, and
Warnic RG (editors), pp 1-20.
Donson P, Beevers M, Hallworth R, Webberly M, Fletcher R, and Taylow K, (1989),
Sodium restriction and blood pressure in hypertensive type II diabetics: randomized
blind controlled and cross-over studies of moderate sodium restriction and sodium
supplementation, B ritish M edic in e Journal, 298: 227-230.
References 226
Domer G, Plagemann A, and Reinagel H, (1987), Familial diabetes aggregation in type 2
diabetes: gestational diabetes as apparent risk factor for increased diabetes
susceptibility in the offspring, E x p erim en ta l a n d C lin ica l E n docrin o logy , 89: 84-90.
Domer G, Steindel E, Thoelke H, and Shliak V, (1984), Evidence for decreasing
prevalence of diabetes mellitus in childhood apparently by prevention of
hyperinsulinism in the foetus and newborn, E xperim en ta l a n d C lin ica l
E ndocrin o logy, 84: 134-142.
Douste-Blazy PH, and Kloer HU, (1989), Hyperlipoproteinemia and coronary heart
disease, in H um an p la sm a lip o p ro te in s , Fruchart JC and Sheperd J (editors), Walter
deGruyter, Berlin-New York, pp 378-389.
DPC (Diagnostic Products Corporation), (1995), C oat-A -C ou n t T ota l T estosterone
m anual, Los Angles, pp 1-2.
Dreon DM, Frey-Hewitt B, Ellsworth N, Williams PT, Terry RB, and Wood PD, (1988),
Dietary f a t : carbohydrate ratio and obesity in middle-aged men, A m erican Journal o f
C lin ica l N u trition , 47 (No 6): 995-1000.
Dullaart RPF, Groener JEM, Dikkeschei BD, Erkelens DW, and Doorenbos H, (1991),
Elevated cholesteryl ester transfer protein activity in IDDM men who smoke,
D ia b e tes C a re , 14: 338-341.
Dullaart RPF, Sluiter W J, Dikkesche LD, Hoogenberg K, and VanTol A, (1994), Effect of
adiposity on plasma lipid transfer protein activity: a possible link between insulin
resistance and high-density lipoprotein metabolism, E uropean Journal o f C lin ica l
In ves tig a tio n , 24: 188-194.
References 227
Dunning BE, and Taborsky GJ, (1988), Galanin-sympathetic neurotransmitter in
endocrine pancreas, D ia b e tes , 37: 1157-1162. -
Dumin JVGA, and Womersley J, (1974), Body fat assessed from total body density and its
estimation from skinfold tickness: measurements on 481 men and women aged from
16-72 years, B ritish Jou rn a l o f N utrition , 32: 77-97.
Durrington PN, (1995), Diet, in H yp erlip id em ia : D ia g n o sis a n d Treatm ent, 2nd edition,
Durrington PN (editor), Butterworth-Heinemann, pp 225-257.
Durrington PN, (1995), Secondary hyperlipidemia, in H yp erlip id em ia : D ia g n o sis an d
Treatm ent, 2nd edition, Durrington PN (editor), Butteworth-Heinemann Ltd, pp 291
361.
Eckel RH, (1989), Lipoprotein lipase: A multi-functional enzyme relevant to common
metabolic disease, N ew E n glan d Journal o f M edicin e, 320: 1060-1068.
Efendic S, Hanson U, Persson B, Wajngot A, and Luft R, (1987), Glucose tolerance,
insulin release, and insulin sensitivity in normal-weight women with previous
gestational diabetes mellitus, D iabe tes , 36: 413-419.
Egger G, (1992), The case for using waist to hip ratio measurements in routine medical
checks, The m ed ica l Journal o f A u stra lia , 156: 280-284.
Eisenberg S, (1987), Lipoprotein abnormalities in hypertriglyceridemia: significance in
atherosclerosis, A m erican H e a rt Journal, 113 (No 2, Part 2): 555-561.
Erickson BA, Coots RH, Mattson FH, et al, (1964), The effect of partial hydrogenation
on dietary fats, of the ratio of polyunsaturated fatty acids, and to dietary cholesterol
upon plasma lipids in men, Jou rn a l o f C lin ica l Investiga tion , 43: 2017-2025.
References 228
Eriksson J, Fransilla-Kallunki A, Ekstrand A, Saloranta C, Widen E, Schalin C, and Groop
L, (1989), Early metabolic defects in persons at increased risk for non-insulin
dependent diabetes mellitus, N ew E n g la n d Jou rn a l o f M edicin e, 321 (No 6): 337
343.
Eschwege E, Fontbonne A, Simon D, Thibult N, Balkan B, Saint-Paul M, Gamier P,
Senan C, and Papor L, (1990), Oral contraceptives, insulin resistance and ischemic
vascular disease, In tern a tion a l Journal o f G yn eco lo g y & O b ste tr ic s , 31 (No 3): 263
269.
Evans DJ, Hoffman RG, Kalkhoff RK, and Kissebah AH, (1983), Relationship of
aderogenic activity to body fat topography, fat cell morphology and metabolic
aberrations in pre-menopausal women, Journal o f C lin ica l E ndocrin o logy &
M etabolism , 57: 304-310.
Facchini F, Ida-Chen YD, and Reaven GM, (1994), Light to moderate alcohol intake is
associated with enhanced insulin sensitivity, D ia b e tes C a re , 17 (No 2): 115-119.
Facchini FS, Hollenback CB, Jeppesen J, Chen UDI, and Reaven GM, (1992), Insulin
resistance and cigarette smoking, The L a n ce t, 339: 1128-1130.
Factor VII assay, Baxter Diagnostics, M LA 1 0 0 0 C o p e ra to r ’s m anual, (1988).
Fajan SS, (1989), Maturity-onset diabetes of the young (mody), D ia b e tes / M etabo lism
R eview s, 5: 579-606.
Farrell PA, and Barboriak J, (1980), The time course of alterations in plasma lipid and
lipoprotein concentrations during eight weeks of endurance training, A therosclerosis,
37: 231-238.

References 229
Feingold KR, Grunfeld C, Pang M, Doerrkr W, and Krauss RM, (1992), LDL subclasses
phenotypes and triglyceride metabolism in non-insulin-dependent diabetes mellitus,
A th ero sc lero s is a n d T hrom bosis, 12 (No 12): 1496-1502.
Felber J-P, Acheson K J, and Tappy L, (1993), Obesity and Diabetes, in F rom O besity to
D ia b e tes , Felber et al (editors), John Wiley and Sons Ltd, England, pp 155-212.
Feldt-Rasmussen B, Borch-Johnsen K, and Mathiesen E, (1982), Hypertension in diabetes
as related to nephropathy: Early blood pressure changes, H yperten sion , 7 (supple II):
II-18-11-20.
Felt-Rasmussen B, Mathiesen ER, Deckert T, Giese J, Christensen NJ, Bent-Hansen L,
and Nielsen MD, (1987), Central role for sodium in the pathogenesis of blood
pressure changes independent of angiotensin, aldosterone and catecholamines in type
1 (insulin-dependent) diabetes mellitus, D ia b e to lo g ia , 30 (No 8): 610-617.
Ferrannini E, Barrett EJ, Bevilacqua S, and Defronzo RA, (1983), Effect of fatty acids on
glucose production and utilization in man, Journal o f C lin ica l Investiga tion , 72:
1737-1747.
Ferrannini E, Buzzicoli G, Bonadonna R, Giorico MA, Oleggini M, Graziadei L, Pedrinell
R, Brandi L, and Bevilacqua S, (1987), Insulin resistance in essential hypertension,
N ew E n glan d Jou rn a l o f M ed icin e, 317: 350-357.
Ferrari P, Weidmann P, Shaw S, Giachino D, Riesen W, Allemann Y, and Heynen G,
(1991), Altered insulin sensitivity, hyperinsulinemia, and dyslipidemia in individuals
with a hypertensive parent, A m erican Journal o f M ed ic in e, 91: 589-596.
References 230
Feskens JM, and Kromhout D, (1989), Cardiovascular risk factors and 25-years incidence
of diabetes mellitus in middle-aged men. The Zutphen Study, A m erican Jou rn a l o f
E p id e m io lo g y , 130: 1101-1108.
Fielding CJ, Reaven GM, Liu G, and Fielding PE, (1984), Increased free cholesterol in
plasma low and very-low density lipoproteins in non-insulin-dependent diabetes
mellitus: its role in the inhibition of cholesteryl ester transfer, P ro ceed in g o f the
N a tio n a l A c a d e m y o f S c ien ces , USA, 81: 2512-2516.
Fielding CS, Shore VG, and Fielding PE, (1972), Lecithin-acyltransferase: effects of
substrate composition up on enzyme activity, B ioch em ica e t B ioph ysics A c ta , 270:
513-518.
Fless GM, ZumMallen ME, and Scanu AM, (1986), Physicochemical properties of
apoprotein (a) and lipoprotein (a) derived from the dissociation of human plasma
lipoprotein (a), J o u rn a l o f B io lo g ic a l C hem istry , 261: 8712-8718.
Flier JS, (1993), An overview of insulin resistance, in Insulin R esis ta n ce , Moller DE
(editor), John W illey & Sons Ltd, pp 1-8.
Fortman SP, Haskell WL, and Williams PT, (1986), Changes in plasma high-density
lipoprotein cholesterol after changes in cigarette use, A m erican Jou rn a l o f
E p id e m io lo g y , 124 (No 4): 706-710.
Franceschini G, M adema P, and Sirtori CR, (1991), Reverse cholesterol transport:
physiology and pharmacology, A th e ro sc le ro s is , 88: 99-107.
Frayn KN, (1993), Insulin resistance and lipid metabolism, C urren t O pin ion in L ip id o lo g y ,
4: 199-204.

References 231
Fraze E, Donner CC, Swislocki ALM, Chiou YAM, Chen YDI, and Reaven GM, (1986),
Ambient plasma free fatty acid concentrations in non-insulin-dependent diabetes
mellitus: evidence of insulin resistance, Jou rn a l C lin ica l E n docrin o logy &
M eta b o lism , 61: 807-811.
Freedman DS, Srinivasan SR, Shear CL, Hunter SM, Croft JB, Webber LS, and Berson
GS, (1986), Cigarette smoking initiation and longitudinal changes in serum lipids and
lipoproteins in early adulthood: the Bogalusa Heart Study, A m erican Journal o f
E p id e m io lo g y , 124 (No 2): 207-219.
Freinkel N, M etzger BE, Phelps RL, Dooley SL, Ogata ES, and Radvany RM, (1985),
Heterogeneity of maternal age, weight, insulin secretion, HDL antigens, and islet cell
antibodies and the impact of maternal metabolism on pancreatic P-cell and somatic
development in the offspring, D ia b e te s , 34 (supple): 2: 1-7.
Freychet P, (1990), Pancreatic hormones, in H orm on es fro m m olecu les to d isea se ,
Baulieu EE, and Kelly PA (editors), by Hermann publishers in arts & Science, pp =
489-532.
Friedewald W T, Levy RI, and Fredrickson DS, (1972), Estimation of the concentration of
low-density lipoprotein cholesterol in plasma without use of the preparative
ultracentrifuge, C lin ica l C h em is try , 18 (No 6): 499-502.
Fruchart JC, (1990), Immunochemical determination of apo A-I-containing lipoproteins
particles, in B io tech n o lo g y o f d y slip o p ro te in em ia s: a p p lica tio n s in d iagn osis an d
co n tro l, Lenfanti C, et al (editors), Raven Press, New York, pp 233-238.
References 232
Fruchart JC, Marcovina S, and Puchois P, (1989), Laboratory measurement of plasma
lipids and lipoproteins in H um an p la sm a lip o p ro te in s , Fruchart JC and Shepherd J
(editors), W alter deGrugter, Berlin, New York, p 79-107.
Fujioka S, Matsuzawa Y, Tokuuaga K, and Tarui S, (1987), Contribution of intra
abdominal fat accumulation to the impaired glucose and lipid metabolism in human
obesity, M e ta b o lism , 36 (No 1): 54-59.
Fuller JH, Keen H, Jarrett RJ, Omer T, Meade TW, Chakrabarti R, North WR, and
Stirling Y, (1979), Haemostatic variables associated with diabetes and its
complications, B ritish M ed ica l Jou rn a l, 2: 964-966.
Fungwe TV, Cangen LM, Wilox HG, and Heimberg M, (1992), Regulation of hepatic
secretion of the very-low-density lipoprotein by dietary cholesterol, Journal o f L ip id
R esearch , 33: 179-191.
Fungwe TV, Fox JE, Cagen LM, Wilox HG, and Heimberg M, (1994), Stimulation of
fatty acid biosynthesis by dietary cholesterol and of cholesterol synthesis by dietary
fatty acids, Jou rn a l o f L ip id R esea rch , 35: 311-318.
Ganda PO, and Arkin CF, (1992), Hyperfibrinogenemia: an important risk factor for
vascular compilations in diabetes, D ia b e tes C are 15: 1245-1250.
Gary A, Helderman JH, Koffler M, Ayuso R, Rosenstock J, and Roskin P, (1988),
Relationship between lipoprotein levels and invitro insulin action in normal young
white men, M e ta b o lism , 37: 982-987.
References 233
Gaubatz Jw, Heideman C, Gotto AM, M orisett JD, and Dahlen GA, (1983), Human
lipoprotein (a) structural properties, Jou rn a l o f B io lo g ica l C h em istry , 258: 4582
4589.
Gaudier FL, Hauth JC, Poist M, Corbett D, and Cliver SP, (1992), Recurrence of
gestational diabetes mellitus, O b ste tr ic s a n d G yn eco lo g y , 80: 755-758.
Ginsberg D, Handin RI, Bouthron DI, Doulon TA, Bruns GAP, Latt SA, and Orkin SH,
(1985), Human von willebrand factor (vWF): isolation of complementary DNA
(cDNA) clones and chromosomal localization, Science, 228: 1401-1406.
Ginsberg H, Olefsky J, Fraquhar JW, and Reaven GM, (1974), Moderate ethanol ingestion
and plasma triglyceride levels, A nnals o f In tern a l M ed ic in e , 80: 143-149.
Giugliano D, Quatraro A, Minei A, et al, (1992), Does a positive family history of diabetes
convey a more atherogenic blood profile?, D iabe to log ia , 35 (supple 1): A 93
(Abstract).
Glueck CJ, Waldman G, McClish DK, Morrison JA, Khoury P, Larsen R, Salz K, Rifkind
BM, and Mattson FH, (1982), Relationship of nutrient intake of lipids and
lipoproteins in 1234 white children, A rterio sc lero sis , 2: 523-536.
Golay A, Felber JP, Jequier E, DeFronzo RA, and Frrannini E, (1988), Metabolic basis of
obesity and non-insulin-dependent diabetes mellitus, D ia b e tes / M etabo lism R eview s,
4: 727-747.
Golay A, Zech L, Shi MZ, Chiou Y-AM, and Reaven GM, (1987), High-density
lipoprotein (HDL) metabolism in non-insulin-dependent diabetes mellitus:
References 234
Measurement of HDL turnover using tritiated HDL, Journal o f C lin ica l
E n d o crin o lo g y & M eta b o lism , 65: 512-518.
Goldberg L, Elliot DL, Schütz RW, and Kolster FE, (1984), Changes in lipid and
lipoprotein levels after weight training, JAM A, 252 (No 4): 504-506.
Goldfien A, and Monroe SE, (1994), Ovaries, in B a sic a n d C lin ica l E n docrin o logy , 4th
edition, Greenspan FS, and Baxter JD (editors), Appleton & Lance, USA, pp 450
461.
Goldman MC, Kitzmiller JL, Abrams B, Cawan RM, Russell K, and Laros JR, (1991),
Obstetric complications with GDM: Effects of Maternal weight, D iabe tes, 40 (supple
2): 79-82.
Goldsland IF, Walton C, Felton C, Proudler A, Petal A, and Wynn V, (1992), Insulin
resistance, secretion, and metabolism in users of oral contraceptive, Journal o f
C lin ica l E n d o crin o lo g y & M etabo lism , 74: 64-70.
Gonen B, Patsch W, Kuisk I, and Schonfeld G, (1981), The effect of short-term feeding a
high-carbohydrate diet on HDL subclasses in normal subjects, M eta b o lism , 30: 1125
1129.
Gordon DJ, and Rifkind BM, (1989), High-density lipoprotein: the clinical implication of
recent studies, N ew E n g la n d Jou rn a l o f M ed ic in e, 321: 1311-1316.
Gregory KD, Kojo S, Siri L, and Peter RK, (1993), Cost of non-insulin-dependent
diabetes mellitus in women with a history of gestational diabetes: implications for
prevention, O b ste tr ic s a n d G y n a e co lo g y , 81 (No 5, part 1): 782-786.
References 235
Gregory R, and Tattersall RB, (1992), Are diabetic pre-pregnancy clinics worthwhile? The
Lancet, 340: 656-658.
Griver K, Henry RR, (1984), Nutritional management of obesity and diabetes, N utrition
R esearch, 14 (No 3): 465-483.
Grone HJ, Walli AK, Grone E, Kramer A, Clemens MR, and Sedel D, (1990), Receptor
medicated uptake of apoB- and apoE-rich lipoprotein by human glomerular epithelial
cells, K idn ey In tern ational, 37: 1449-1459.
Gruden G, Cavallo-Perin P, Bazzan M, Stella S, Vuolo A, and Pagano G, (1994), PAI-1
and factor VII activity are higher in NIDDM patients with microalbuminuria,
D ia b e tes , 43: 426-429.
Grundy SM, (1986), Comparison of monounsaturated fatty acids and carbohydrates for
lowering plasma cholesterol, N ew E n glan d Journal o f M edicine, 314: 745-748.
Grundy SM, and Barnett JP, (1990), Metabolic and health complications of obesity,
D isease a M onth , 36 (No 12): 641-731.
Grundy SM, and Denek MA, (1990), Dietary influences on serum lipids and lipoproteins,
Journal o f L ip id R esearch , 31:1149-1172.
Grundy SM, and Vega GL, (1992), Two different views on the relationship of
hypertriglyceridemia to coronary heart disease, A rch ive o f In ternal M edicine, 152:
28-34.
Grunfeld B, Balzareti M, Romo M, Gimenez M, and Gutman R, (1994), Hyperinsulinemia
in normotensive offspring of hypertensive parents, H ypertension , 23 (supple I): I 12-1
15.
References 236
Guillume-Gentil C, Assimacopoulos J, and Jeanrenand B, (1993), Involvement of non-
esterified fatty acid oxidation in glucocorticoid-induced peripheral insulin resistance in
v ivo in rats, D ia b e to lo g ia , 36: 899-906.
Gupta AK, Ross EA, Myers JN, and Kashyapa ML, (1993), Increased reverse cholesterol
transport in athletes, M eta b o lism , 42 (No 6): 684-690.
Hadden DR, (1980), Screening for abnormalities of carbohydrate metabolism in
pregnancy, 1966-1967: the Belfast experience, D ia b e te s C a re , 3: 440-446.
Haffner MS, Valdez RA, Hazuda HP, Mitchell BD, Morales PA, and Atem MP, (1992),
Perspective analysis of insulin resistance (syndrome X), D ia b e te s , 41: 715-722.
Haffner SM, Applebaum-Bowden D, Wahl PW, Hoover JJ, Wamick GR, Albers JJ, and
Hazzard WR, (1985), Epidemiological correlation of high density lipoprotein
subfractions, apolipoproteins A-I, A-II, and D, and lecithin-cholesterol acyl
transferase, A rte r io sc le ro s is , 5 (No 2): 169-177.
Haffner SM, Fong D, Hazuda HP, Pugh HA, and Patterson JK, (1988), Hyperinsulinemia,
upper body adiposity, and cardiovascular risk factors in non-diabetics, M eta b o lism ,
37: 338-345.
Haffner SM, Gnzales C, Valdez RA, Mykkanen L, Hazuda HP, Mitchell BD, Monterrosa
A, and Stem MP, (1993), Is microalbuminuria parts of the prediabetic state? The
Mexico City Diabetes Study, D ia b e to lo g ia , 36: 1002-1006.
Haffner SM, Gruber MKK, Hazuda HP, Mitcheü BD, and Patterson JK, (1990),
Microalbuminuria: potential marker for increased cardiovascular risk factors in non
diabetic subjects?, A rte r io sc le ro s is , 10 (No 5): 727-731.

References 237
Haffner SM, Katz MS, Dunny F, (1991), Increased upper body and overall adiposity is
associated with decreased sex hormone binding globulin in post-menopausal women,
In tern a tion a l J o u rn a l o f O b esity , 15: 471-478.
Haffner SM, Katz MS, Stem MP, and Dunn JF, (1989), Relationship of sex hormone
binding globulin overall adiposity and body fat distribution in a biethnic population,
In tern a tion a l Jou rn a l o f O b esity , 13: 1-9.
Haffner SM, Morales PA, Gruber K, Hazuda HP, and Stem MP, (1993), Cardiovascular
risk factors in non-insulin-dependent diabetes mellitus subjects with microalbuminuria,
A rte r io sc le ro sis a n d T h rom bosis , 13: 205-210.
Haffner SM, Morales PA, Stem MP, and Gruber MK, (1992), Lipoprotein (a)
concentrations in NIDDM, D ia b e tes , 41: 1267-1272.
Haffner SM, Stern MP, Hazuda HP, Mitchell BD, and Patersson JK, (1988), Increased
insulin concentrations in non-diabetic offspring of diabetic parents, N ew E ngland
Journal o f M ed ic in e, 319: 1297-1301.
Haffner SM, Stem MP, Hazuda HP, Pugh J, and Patterson JK, (1987), Do upper body
and centralized adiposity measure different aspects of regional body fat distribution?
Relationship to non-insulin-dependent diabetes mellitus, lipids, and lipoproteins,
D ia b e tes 36: 43-51.
Haffner SM, Stem MP, Mitchell BD, Hazuda HP, and Petterson JK, (1990), Incidence of
type II diabetes in Mexican Americans predicted by fasting insulin and glucose levels,
obesity, and body-fat distribution, D ia b e te s , 39: 283-288.
References 238
Haffner SM, Valdez RA, Morales PA, Hazuda HP, and Stem MP, (1993), Decreased sex
hormone-binding globulin predicts non-insulin-dependent diabetes mellitus in women
but not in men, Jou rn a l o f C lin ica l E n d o crin o lo g y & M eta b o lism , 77: 56-60.
Hagay Z, and Reeg ED, (1992), Diabetes mellitus in pregnancy and peri-conceptional
genetic counselling, A m erican Journal o f P er in a to lo g y , 9 (No 2): 87-93.
Hales CN, and Barker DJP, (1992), Type 2 (non-insulin-dependent) diabetes mellitus: the
thrifty phenotype hypothesis, D ia b e to lo g ia , 35: 595-601.
Halvik RJ, Hubert HB, Fabsitz RR, and Feinleib M, (1983), Weight and hypertension,
A nnals o f In tern a l M ed ic in e , 98: 855-859.
Hamsten A, Blomback M, Wiman B, Svensson J, Szamosi A, DeFaire U, and Mettinger L,
(1986), Haemostatic function in myocardial infarction, B ritish H ea rt Journal, 55: 58
66.
Harris MI, Hadden WC, Knowler WC, and Bennett PH, (1987), Prevalence of diabetes
and impaired glucose tolerance and plasma glucose levels in US population aged 20
74 years, D ia b e te s , 36: 53-534.
Harris WS, (1989), Fish oils and plasma lipid and lipoprotein metabolism in humans: a
critical review, Journal of Lipid Research, 30 (No 6): 785-807.
Harris WS, Connor WE, Illingworth DR, Rothrock DW, and Foster DM, (1990), Effects
of fish oil on VLDL-triglyceride kinetics in humans, Journal o f L ip id research , 31:
1549-1558.
Harris-Peeples L, Carpenter JW, Israel RG, and Barakat HA, (1989), Alterations in low-
density lipoproteins in subjects with abdominal obesity, M etabolism , 38: 1029-1036.
References 239
Haskell WL, Camargo PT, Williams PT, Vrazan KM, Krauss RM, Lindgren FT, and
Wood PD, (1984), The effect of cessation and resumption of alcohol intake upon
high-density lipoprotein subfractions: A controlled study, N ew E nglan d Journal o f
M edicine, 310 (No 13): 805-810.
Hasslacher C, Bostedt-kiesel A, Kempe HP, and Wahl P, (1993), Effects of metabolic
factors and blood pressure on kidney function in proteinuric type 2 (non-insulin
dependent) diabetic patients, D ia b e to lo g ia , 36 (No 10): 1051-1056.
Hatch FT, and Lees RS, (1968), Practical methods for plasma lipoprotein analysis,
A d va n ced L ip id R esearch , 6: 1-68.
Havel RJ, Eder HA, and Bragdon JH, (1955), The distribution and chemical composition
of ultracentrifugally separated lipoproteins in human serum, The Journal o f C lin ical
in vestig a tio n , 34: 1345-1353.
Heber D, (1994), The endocrinology of obesity, in O besity in E u rope , Ditschuneit H,
Gries FA, Hauner H, Schusdizarra V, and Wechsler JG (editors), John Libbey &
Company Ltd, pp 99-109.
Heeg JE, Dejong PE, Van der Hem GK, and de-Zeeuw D, (1989), Efficacy and variability
of the antiproteinuric effect of ACE inhibition by Lisinopril, K idney International, 36:
272-279.
Hegsted DM, (1986), Serum cholesterol response to dietary cholesterol: a re-evaluation,
A m erican Jou rn a l o f C lin ica l N utrition , 44: 299-305.
Hegsted DM, McGandy RR, Myers ML, (1965), Quantitative effects of dietary factors on
serum cholesterol in men, Journal o f C lin ica l In vestiga tion , 17: 281-295.

References 240
Heinrich J, Balleisen L, Schulte H, Assmann G, and Van de-Loo J, (1994), Fibrinogen and
factor VII in the prediction of coronary risk in healthy men: Results from the
PROCAM study, A rte r io sc le ro sis a n d T h rom bosis , 14: 54-59.
Heller RF, Chinn S, Tunstall-Pedoe HD, and Rose G, (1984), How well can we predict
coronary heart disease? Finding in the United Kingdom Heart Disease Project, British
M edica l Journal, 288: 1409-1411.
Helmirch SP, Ragland DR, Leung RW, and Paffenbarger JR Jr, (1991), Physical activity
and reduced occurrence of non-insulin-dependent diabetes mellitus, N ew E ngland
Journal o f M edicin e, 325: 147-152.
Helve E, Yki-Jarvinen H, Koivisto VA, (1986), Smoking and insulin-sensitivity in type I
diabetic patients, M eta b o lism , 35: 874-877.
Henry OA, and Beischer NA, (1991), Long-term implication of gestational diabetes for
mother, B a illie r ’s C lin ica l O bste tr ics a n d G yn eco lo g y , 5 (No 2): 461-483.
Heshka A, Buhl K, and Heymsfield SB, (1994), Obesity, clinical evaluation of body
composition and energy expenditure, in O besity , pa th oph ysio logy , p sychology, and
trea tm en t, Blackburn GL, and Kanders BS (editors), Chapman & Hall Inc, pp = 39
79.
Hod M, Merlob p, Friedman S, Schoenfeld A, and Ovadia J, (1991), Gestational diabetes
mellitus: A survey of perinatal complications in the 1980s, D iabetes, 40 (supple 2):
74-78.
References 241
Hommel E, Andersen P, Gall MA, Nielsen F, Jensen B, Rossing P, Dyerberg J, and
Parving HH, (1992), Plasma lipoproteins and renal function during simvastatin
treatment in diabetic nephropathy, D ia b e to lo g ia , 35: 447-451.
Hoogwerf BJ, (1991), Dietary treatment of lipids and lipoprotein disorders, in L ip id s an d
w o m e n ’s h ea lth , Redmond GP (editor), Spring-Verlay, New York Inc, pp 160-174.
Hoolysworth DR, and Ney DM, (1992),Caloric restriction in pregnant diabetic women: a
review of maternal obesity, glucose and insulin relationships are investigated at the
University of California Sandiago, Journal o f A m erican C o lla g e o f N utrition , 11 (No
3): 251-258.
Horton ES, (1991), Exercise in the treatment of NIDDM: Applications for GDM?,
D iabe tes , 40 (supple 2): 175-178.
Horton TJ, and Geissler CA, (1994), Effect of habitual exercise on daily energy
expenditure and metabolic rate during standardized activity, A m erican Journal o f
C lin ica l N utrition , 59: 13-19.
Howard BV, (1993), Insulin, insulin resistance, and dyslipidemia, A n n als o f N ew York
A ca d em y o f Sc ien ces, 683: 1-8.
Howard BV, Abott WG, Egusa G, and Taskinen MR, (1987), Co-ordination of very-low-
density lipoproteins, triglyceride and apolipoprotein B metabolism in humans: effects
of obesity and non-insulin-dependent diabetes mellitus, A m erican H ea rt Journal, 113:
522-526.
Howard-BV, (1987), Lipoprotein metabolism in diabetes mellitus, Journal of lip id
Research, 28 (No 6): 613-28.

References 242
Hubert HB, Eaker ED, Garrison RJ, and Castelli WP, (1987), Life-style correlates of risk
factor changes in young adults: an eight years study of coronary heart disease risk
factors in Framingham offspring, A m erican Jou rn a l o f E p idem io logy , 125 (No 5):
812-831.
Hunt SC, W u LL, Hopkins PN, Stults BM, Kuida H, Ramirer ME, Lalouel JM, and
Williams RR, (1989), Apolipoprotein, low-density lipoprotein subtraction, and insulin
associations with familial combined hyperlipidemia: study of Utah patients with
familial dyslipidémie hypertension, A rter io sc le ro sis , 9 (No 3): 335-344.
Hunter A, Doery JCG, and Miranda V, (1990), Diagnosis of gestational diabetes in
Australia: a national survey of current practice, The M ed ica l Journal o f A u stra lia ,
153: 290-292.
Hurley BF, Hagberg JM, and Seals DR, (1986), Circuit weight training reduces coronary
artery disease risk factors independent of changes in Vo max, M edicin e an d Science
in S p o rts a n d E xercise , 18 (supple 2 ):, S68-S69.
Huttunen JK, Lansimies E, Voutilainen E, Ehnholm C, Hietanen E, Penttila I, Sitonen O,
and Rauramaa R, (1979), Effects of moderate physical exercise on serum lipoproteins,
C ircu la tion , 60 (No 6): 1220-1229.
Innerarity TL, (1990), Low-density lipoprotein receptor-ligand interactions, in
B io tech n o lo g y o f d y slip o p ro te in em ia s: a p p lica tio n s in d iagn osis an d con tro l,
Lenfant C et al (editors), Raven Press, New York, pp 91-102.
Istfan NW, Plaisted CS, Bistrian BR, and Blackburn GL, (1992), Insulin resistance versus
insulin secretion in the hypertension of obesity, H ypertension , 19: 385-392.
References 243
James RW, Boemi M, Sirolla C, Amadio A, Fumelli P, and Pometta, (1995), Lipoprotein
(a) and vascular disease in diabetic patients, D ia b e to lo g ia , 38: 711-714.
Jenkins AJ, Steel JS, Janus ED, and Best JD, (1991), Increased plasma apolipoprotein (a)
levels in IDDM patients with microalbuminuria, D ia b e te s , 40: 787-790.
Jenkins AJ, Steele JS, Janus ED, Santamaria JD, and Best JD, (1992), Plasma
apolipoprotein is increased in type 2 (non-insulin-dependent) diabetic patients with
microalbuminuria, D ia b e to lo g ia , 35: 1055-1059.
Jensen JSB, Feld-Rasmussen B, Borch-Johnsen K, and Jensen G, (1993), Urinary albumin
excretion in a population based sample of 1011 middle-aged non-diabetic subjects,
Scandinavian Journal o f C lin ica l a n d L a b o ra to ry Investigation , 53: 867-872.
Jensen MD, Haymond MW, Rizza R, Cryer PE, and Miles JM, (1989), Influences of body
fat on free fatty acid metabolism in obesity, Journal o f C lin ica l Investigation , 83 (No
4): 1168-1173.
Jequier E, and Schütz Y, (1983), Long-term measurement of energy expenditure in human
using a respiration chamber, A m erican Journal o f C lin ica l N u trition , 38: 989-998.
JMP Statistical Package’s Manual, (1994), Statistics and Graphic Guide, Version three,
SAS Institute Inc, NC, USA, pp 159
Johnson JL, Heineman EF, Heiss G, Hames CG, and Tyroler HA, (1986), Cardiovascular
disease risk factors and mortality among black women and white aged 40-65 years in
Evan country, Georgia, Journal o f E p idem io logy , 123: 209-220.

References 244
Johnson WJ, Mahlberg FH, Rothblat GH, and Phillips MC, (1991), Cholesterol transport
between cells and high-density lipoproteins, B io ch em ica e t B io p h ysica A c ta , 1085:
273-298.
Jones SL, Close CF, M attock MB, Jarrett RJ, Keen H, Viberti GC, (1989), Plasma lipid
and coagulation factor concentrations in insulin-dependent diabetics with
microalbuminuria, B ritish M e d ic a l J o u rn a l, 298: 487-490.
Kalkoff RK, Hartz AH, Rupley D, Kissebah AH, and Kelber S, (1983), Relationship of
body fat distribution to blood pressure, carbohydrate tolerance and plasma lipids in
healthy obese women, Jou rn a l o f L a b o ra to ry a n d C lin ica l M e d ic in e , 102: 621-627.
Kannel WB, D ’Agostino RB, and Belanger AJ, (1987), Fibrinogen, cigarette smoking and
risk of cardiovascular disease: Insights from Framingham Study, A m erican H ea rt
Jou rn a l, 113: 1006-1010.
Kannel WB, W olf PA, Castelli WP, and D ’Agostino RB, (1987), Fibrinogen and risk of
cardiovascular disease: the Framingham Study, JA M A , 258: 1183-1186.
Kannell WB, and McGhee DL, (1979), Diabetes and cardiovascular risk factors: The
Framingham Study, C ircu la tio n , 59: 8-13.
Kashyap ML, (1991), Clinical utility and methods for assessing triglyceride-rich
lipoprotein metabolism, C u rren t O p in ion in L ip id o lo g y , 2: 379-384.
Kasiske BL, O’Donnell MP, and Schmitz PG, (1990), Renal injury of diet-induced
hypercholesterolemia in rats, K id n ey In te rn a tio n a l, 37:880-891.

References 245
Katan MB, Bums MAM, Glatz JFC, Knuiman JT, Nobels A, and de Vrie JHM, (1988),
Congmence of individual responsiveness to dietary cholesterol and to saturated fat in
humans, J o u rn a l o f L ip id R e se a rc h , 29: 883-892.
Kawate R, Yamakido M, Nishimoto Y, Bennett PH, Hamman RF, and Knowler WC,
(1979), Diabetes mellitus and its vascular complications in Japanese migrants on the
island of Hawaii, D ia b e te s C a re , 2: 161-170.
Kensaniemi YA, Kervinen K, and Miettinen TA, (1987), Acetaldehyde modification of
Low-density lipoprotein accelerates its catabolism in men, E u ropean Journal o f
C lin ica l In vestig a tio n , 17: 29-36.
Kestin M, Rouse IL, Correll RA, and Nestel PJ, (1989), Cardiovascular disease risk
factors in free-living men: Comparisons of two prudent diets, one based on lacto-ovo-
vegetarianism and the other allowing lean meat, A m erican Jou rn a l o f C lin ica l
N u tr itio n , 50: 280-287.
Keys A, (1984), Serum cholesterol response to dietary cholesterol, A m erican Journal o f
C lin ica l N u trition , 40: 351-359.
Keys A, Menotti A, Karvonen MJ, Aravanis C, Blackburn H, Buzina R, Djordjevic BS,
Dontas AS, Fidanza F, and Keys MH, (1986), The diet and 15-years death rate in the
seven countries, A m erica n Jou rn a l o f E p id e m io lo g y , 124: 903-915.
Keys AJ, Anderson JT, and Grande F, (1965), Serum cholesterol response to changes in
the diet. IV. Particular saturated fatty acids in the diet, M eta b o lism , 14: 776-787.

References 246
Kiens B, Lithell H, Mikines KJ, and Richter EA, (1989), Effects of insulin and exercise on
muscle lipoprotein lipase activity in men and its relation to insulin action, Journal of
Clinical Investigation, 84 (No 4): 1124-1129.
King DS, Dalsky GP, Clutter W E, Young DA, Staten MA, Cryer PE, and Holloszy JO,
(1988), Effects of exercise and lack of exercise on insulin sensitivity and
responsiveness, J o u rn a l o f A p p lie d P h ys io lo g y , 64 (No 5): 1942-1946.
Kirby RW, Anderson JW, Gieling B, Rees ED, Chen WJ, Miller RE, and Kay RM, (1981),
Oat-bran intake selectivity lowers serum low-density lipoprotein cholesterol
concentrations of hypercholesterolemic men, A m erica n Journal o f C lin ica l N utrition ,
34 (No 5): 824-829.
Kirschner MA, Samojlik E, Drejka M, Szmal E, Schneider G, and Ertel N, (1990)
Androgen-estrogen metabolism in women with upper body versus lower body
obesity, J o u rn a l o f C lin ica l E n d o crin o lo g y & M e ta b o lism , 70 (No 2): 473-479.
Kissebah AH, and Peins AN, (1989), Biology of body fat distribution: Relationship to
non-insulin-dependent diabetes mellitus, D ia b e te s / M eta b o lism R ev ie w s , 5: 83-109.
Kissebah AH, Freedman DS, and Peiris AN, (1989), Health risks of obesity, in The
M e d ic a l c lin ics o f N o rth A m erica , Bray GA (editor), Philadelphia, Harcourt Brace
Jovanovich, pp = 111-138.
Kissebah AH, Peiris AN, and Evans DJ, (1988), Mechanisms associating body fat
distribution to glucose intolerance and diabetes mellitus. Window with a view, A cta
M e d ic ic a S ca n d in a v ica , S723: 79-89.
References 247
Kjos SL, Buchanan TA, Greenspan JS, Montoro M, Bernstein GS, and Mestman JH,
(1990), Gestational diabetes mellitus in the first two months postpartum, A m erican
Journal o f O b s te tr ic s a n d G ynecology, 163: 93-97.
Kjos SI, Buchanan TA, Montoro M, Coulson A, and Mestman JH, (1991), Serum lipids
within 36 months of delivery in women with recent gestational diabetes, D iabetes, 40
(supple 2): 142-146.
Kjos SL, Shoupe Douyan S, Friedman Rl, Bernstein GS, Mestman JH, and Mishell DR,
(1990), Effect of low-dose oral contraceptive on carbohydrate and lipid metabolism in
women with recent gestational diabetes: results of a controlled, randomized, and
prospective study, A m erican Journal o f O b ste tr ics a n d G yn eco logy , 163: 1822-1827.
Kloppel G, Lohr M, Habich K, Oberholzer M, and Heitz PU, (1985), Islet pathology and
the pathogenesis of type 1 and 2 diabetes mellitus, Survey an d Synthesis o f P a th o logy
R esearch , 4: 110-125.
Knobl P, Schemthaner G, Schnack C, Pietschmann P, Griesmacher A, Prager R, and
Muller M, (1993), Thrombogenic factors are related to urinary albumin excretion rate
in type I (insulin-dependent) and type II (non-insulin-dependent) diabetic patients,
D ia b e to lo g ia , 36: 1045-1050.
Knopp RH, La Rosa JC, and Burkman RT, (1993), Contraception and dyslipidemia,
A m erican Jou rn a l o f O b ste tr ic s a n d G yn ecology, 168: 1994-2005.
Knowler WC, McCance DR, Nagi DK, and Pettitt DJ, (1993), Epidemiological studies of
the causes of non-insulin dependent diabetes mellitus, in Causes of Diabetes, Leslie
RDG (editor), John Wiley and Sons Ltd, England, pp 187-218.

References 248
Knowler WC, Pettitt DJ, Savage PJ, and Bennett PH, (1981), Diabetes incidence in Pima
Indians: contribution of obesity and parental diabetes, A m erican Journal o f
E p id e m io lo g y , 113: 144-156.
Kodak Ektachem Clinical Chemistry Productions Manual,(1992), Glucose Colorimetric
Test, K o d a k C lin ic a l D ia g n o s is P u b lica tio n , No: MP2-8, USA, New York, pp = 1-2.
Koenig W, and Ernst E, (1992), The possible role of haemorheology in athero-
thrombogenesis, A th ero sc le ro s is , 94: 93-107.
Kolanowski J, (1981), Influence of insulin and glucagon on sodium balance in obese
subjects during fasting and feeding, In tern a tion a l Journal o f O besity , 5 (supple 1):
105-114.
Konen J, Shihabi Z, and Newman J, (1993), The association of non-insulin-dependent
diabetes mellitus, and hypertension with urinary excretion of albumin and transferrin,
A m erican J o u rn a l o f K id n ey D isease , 22 (No 6), 791-797.
Konwler WC, Pettitt DJ, Saad MF, and Bennett PH, (1990), Diabetes mellitus in the Pima
Indians: incidence, risk factors, and pathogenesis, D ia b e te s /M e ta b o lis m R ev iew s , 6:
1-27.
Krauss RM, (1987), Relationship of intermediate and low-density lipoprotein subspecies
to risk of coronary artery disease, A m erican H e a r t J ou rn a l, 113: 578-582.
Krauss RM, and Burke DJ, (1982), Identification of multiple subclasses of plasma low-
density lipoproteins in normal human, Jou rn a l o f L ip id resea rch , 23: 97-104.

References 249
Krolewski AS, Warram JH, Christlieb AR, Busick EJ, and Kahn CR, (1985), The
changing natural history of nephropathy in type I diabetes, Am erican Journal o f
M edicine , 78: 785-794.
Kuhl C, (1991), Etiology of Gestational diabetes, B aillier’s Clinical O bstetrics and
G ynecology , 5 (No 2): 279-292.
Kuhl C, Homnes PJ, and Anderson O, (1985), Etiology and pathophysiology of
gestational diabetes mellitus, D iabetes, 34 (supple 2): 66-70.
La Port R, Valvo-Gerard L, Kuller L, Dai W, Bates M, Cresanta J, Williams K, and Palkin
D, (1981), The relationship between alcohol consumption, liver, enzyme, and high-
density lipoprotein cholesterol, Circulation, 64 (supple III, Part 2): III 67-III 72.
Laaka TA, and Salonen JT, (1992), Physical activity and serum lipids: A cross-sectional
population study in Estem Finnish men, Am erican Journal o f Epidem iology, 136:
806-818.
Laasko M, Sarlund H, and Mykkanen L, (1990), Insulin resistance is associated with lipid
and lipoprotein abnormalities in subjects with varying degrees of glucose tolerance,
A therosclerosis, 10: 223-231.
Lamon-Fava S, Jenner LJ, Jacques PF, and Schaefer EJ, (1994), Effects of dietary intakes
on plasma lipids in free-living eldery men and women, Am erican Journal o f Clinical
N utrition, 59: 32-41.
Landon MB, and Gabbe SG, (1985), Antepartum fetal surveillance in gestational diabetes
mellitus, D ia b e tes , 34 (supple 2): 50-54.
References 250
Langer O, (1993), Management of gestational diabetes, C lin ics in P erin a to lo g y , 20: 603
617.
Largost L, (1992), Effect of the human cholesteryl ester transfer protein on the particles
size redistribution of specific subpopulations of high-density lipoproteins-3,
B ioch im ica e t B ioph ysica A cta , 1126: 143-150.
Largost L, and Barter PJ, (1991), Effects of various non-esterified fatty acids on the
particle size redistribution of high-density lipoproteins induced by the human
cholesteryl ester transfer protein, B ioch im ica e t B iophysica A c ta , 1082: 204-210.
Larsson B, Svardsudd K, Welin L, Wilhelmsen L, Bjoumtorp P, and Tibblin G, (1984),
Abdominal adipose tissue distribution, obesity, and risk of cardiovascular disease and
death. 13 years follow-up of participants in the study of men bom in 1913, B ritish
M ed ica l Journal, 288: 1401-1404.
Lascalzo J, (1990), Lipoprotein (a) unique risk factor for athero-thrombotic disease,
A th ero sc lero sis , 10: 672-679.
Lax D, Benstein J, Tolbert E, and Dorkin L, (1992), Effect of salt restriction on renal
growth and glomerular injury in rats with remnant kidneys, K idney International, 41:
1527-1534.
Lee KU, Lee HK, Koh CS, and Min HK, (1988), Artificial induction of intra-vascular
lipolysis by lipid-heparin infusion leads to insulin resistance in man, D ia b e to lo g ia , 31:
285-290.
Leible RL, Edens NK, and Fried SK, (1989), Physiological basis for the control of body
fat distribution in humans, A nnals R eview s o f N utrition , 9: 417-443.
References 251
Leslie RDG, Volkmann HP, Poncher M, Hanning I, Oeskov H, and Alberti KG, (1986),
Metabolic abnormalities in children of non-insulin-dependent diabetes, B ritish
M ed ic a l Jou rn a l, 293: 840-842.
Levine DM, Sloan BJ, Donner JE, Lorenz JD, and Heinzerling RH, (1992), Automated
measurement of lipoprotein (a) by immunoturbidimetric analysis, In tern a tion a l
Jou rn a l o f C lin ica l L a b o ra to ry R esearch , 22:173-178.
Levinson SS, and W agner SG, (1992), Measurement of apolipoprotein B-containing
lipoprotein for routine clinical laboratory use in cardiovascular disease, A rch ives o f
P a th o lo g y a n d L a b o ra to ry M ed ic in e , 116: 1350-1354.
Lieb SM, (1987), Achieving euglycemia: Rational, in M an agem en t o f the d ia b e tic
p regn an cy, Nuywahid BS et al (editors), Elsevier Science Publishing Co Inc, New
York, pp 21-31.
Lieber CS, (1987), Alcohol and the liver, in L ive r A n n a ls (VI), Arias IM, Frenkel MS, and
Wilson JHP (editors), Excerpta Medica, Amsterdam, Oxford, pp 163-240.
Lieber CS, and Pignon JP, (1989), Ethanol and dyslipoproteinemia in H um an p la sm a
lip o p ro te in s Fruchart JC, and Shepherd J (editors), W alter de Gruyter, Berlin, New
York, pp = 245-272.
Lillioja S, and Bogardus C, (1988), Obesity and insulin resistance: lessons learned from
the Pima Indians, D ia b e te s / M eta b o lism R ev ie w s , 4 (No 5): 517-540.
Lillioja S, M ott DM, Howard BV, Bennett PH, Yki-Jarvinen H, Freymond D, Nyomba
BL, Zurlo F, Swinbum B, and Bogardus C, (1988), Impaired glucose tolerance as a

References 252
disorder of insulin action: longitudinal and cross-sectional studies in Pima Indians,
N ew E n g la n d J o u rn a l o f M ed ic in e , 318: 1217-1225.
Lindstedt G, Lundberg PA, Lapidus L, Lundgren H, Bengtsson C, and Bjomtorp P,
(1991), Low sex hormone-binding globulin concentrations as independent risk factor
for development of NIDDM, D ia b e te s , 40: 123-128.
Linn S, Falwood R, Rifkind B, et al, (1989), High-density lipoprotein cholesterol levels
among US adults by selected demographic and socio-economic variables, A m erican
Jou rn a l o f E p id e m io lo g y , 129: 281-294.
Ljungman S, (1990), Microalbuminuria in essential hypertension, A m erican Jou rn a l o f
H y p er te n s io n , 3: 956-960.
Loke DFM, Viegas OAC, Kek LP, Rauff M, Thai AC, Ratnam SS, (1991). Lipid profiles
during and after normal pregnancy, G yn eco lo g y a n d O b ste tr ic s In ves tig a tio n s , 32
(No 3): 144-147.
Long SD, O ’Brien K, McDonald KG, Laggett-Frazier N, Swanson MS, Pories WJ, and
Caro JF, (1994), W eight loss in severely obese subjects prevents the progression of
impaired glucose tolerance to type II diabetes, D ia b e te s C are, 17 (No 5): 372-375.
Longcope C, Herbert PN, McKinlay SM, and Goldfield SRW, (1990), The relationship of
total and free estrogen and sex hormone-binding globulin with lipoproteins in women,
Jou rn a l o f C lin ic a l E n d o crin o lo g y & M eta b o lism , 71: 67-72.
Loscalzo-J, Weinfeld M, Fless GM, and Scanu-AM, (1990), Lipoprotein (a), fibrin
binding, and plasminogen activation, A r te r io sc le ro s is , 10 (No 2): 240-245.

References 253
Lucas F, and Sclafani A, (1990), Hyperphagia in rats produced by a mixture of fat and
sugar, P h ysio lo g y a n d B eh aviou r , 47 (No 1): 51-55.
Lundgren H, Bengtsson G, Blohme G, Lapidus L, and Wldenstrom J, (1990), Fasting
serum insulin concentration and early insulin response as risk determinants for
developing diabetes, D ia b e tic M ed ic in e , 7: 407-413.
Lundman BM, Asplund K, and Norberg A, (1990), Smoking and metabolic control in
patients with insulin-dependent diabetes mellitus, Journal o f In ternal M ed ic in e , 221:
101-106.
Lussier-Cacan S, Xhignesse M, Demarais JL, Davignon J, Kafrissen ME, and Chapdelaine
A, (1991), Cyclic fluctuations in human serum lipid and apolipoprotein levels during
the normal menstrual cycle: comparison with changes occurring during oral
contraceptive therapy, M etabolism , 40 (No 8): 849-854.
Maede K, Hashimoto S, Okamoto K,Saito Y, Ohosuka T, Ohtsuka S, Takahashi A,
Okamoto N, Ohno K, and Hattori Y, (1991), The effects of drinking , smoking, and
physical constitution on high-density lipoprotein cholesterol and apolipoproteins A-I
and A-II levels, Japanese Journal H ygyne, 46 (No 2): 699-708.
Mahan LK, Arlin M, (1992), Carbohydrates, K ra u se ’s fo o d , nutrition, an d d ie t therapy,
8th edition, WB Saunders Company, pp 29-44.
Mahley RW, Innerarity TL, Bersot TP, Lipson A, and Margolis S, (1978), Alterations in
human high-density lipoproteins with or without increased plasma cholesterol,
induced by diet high in cholesterol, The L a n ce t, ii: 807-809.
References 254
Maida V, Howlett GJ, (1990), Effects of cigarette smoking and dietary lipids on rat
lipoprotein metabolism, A th ero sc le ro s is , 80: 209-216.
Maioli M, Tonolo G, Pacifico A, Ciccarese M, Brizzi P, Kohner EM, and Porta M,
(1993), Raised serum apolipoprotein (a) in active diabetic retinopathy, D iabeto log ia ,
36: 88-90.
Maiorano G, Contursi V, Saracino E, and Ricapito M, (1989), Physical exercise and
hypertension: New insights and clinical implications, A m erican Journal o f
H ypertension , 2 (supple 1), 60-64.
Manicardi V, Camdlini L, Bellodi G, Coscelli C, and Ferrannini E, (1986), Evidence for an
association of high blood pressure and hyperinsulinemia in obese men, Journal o f
C lin ica l E n d o crin o lo g y & M etabo lism , 62: 1302-1304.
Manolio TA, Savage PJ, Bruke GL, Liu k, Wagenknecht LE, Sidney S, Jacobs DR Jr,
Roseman JM, Donahue RP, and Oberman A, (1990), Association of fasting insulin
with blood pressure and lipids in young adults: the CARDIA Study, A rterio sc le ro sis ,
10: 430-436.
Manson JE, Colditz GA, Stampfer MJ, Willett WC, Rosner B, Monson RR, Speizer FE,
and Hennekens CH, (1990), A prospective study of obesity and risk of coronary heart
disease in women, N ew E n g lan d Journal o f M ed ic in e , 322 (No 13): 882-889.
Manson JE, Rimm EB, Colditz GA, Willett WC, Nathan DM, Arky RA, Rosner B,
Hennekens CH, Speizer FE, and Stampfer MJ, (1992), A prospective study of post
menopausal estrogen therapy and subsequent incidence of non-insulin-dependent
diabetes mellitus, A n n a ls o f E p id em io lo g y , 2 (No 5): 665-673.

References 255
Manttari M, Koskinen P, Manninen V, Tenkanen L, and Huttenen JK, (1991), Life-style
determinants of HDL2- and HDL3-cholesterol levels in a hypercholesterolemic male
population, A th erosc lerosis, 87: 1-8.
Marcel YL, McPherson R, Hoque M, Czanecka H, Zawadzki Z, Weech PK, Whitlock
ME, Tall A, and Milne RW, (1990), Distribution and concentration of cholesteryl
ester transfer protein in plasma in normolipidemic subjects, Journal o f C linical
Investiga tion , 85: 10-17.
Marigliano A, Tedde R, Sechi LA, Pala A, Pisanu G, and Pacific A, (1990), Insulinemia
and blood pressure, A m erican Journal o f H ypertension , 3: 521-526.
Marmot MG, (1993), Epidemiology of triglycerides and coronary heart disease, Report of
a meeting of physicians and scientists, university college, London, Medical school,
The L an cet, 342: 781-782
Marshall J, Hamman RF, and Baxter J, (1991), High-fat, low-carbohydrate diet and the
etiology of non-insulin-dependent diabetes mellitus: The San Luis Valley Diabetes
Study, A m erican Journal o f E pidem iology, 134: 590-603.
Marshall JA, Hoag S, Shetterly S, and Hamman RF, (1994), Dietary fat predicts
conversion from impaired glucose tolerance to NIDDM. The San Luis Valley
Diabetes Study, Diabetes-Care, 17 (No 1): 50-56.
Martin BC, Warrant JH, Krolewski AS, Bergman RN, Soeldner JS, and Khan CR, (1992),
Role of glucose and insulin resistance in development of type 2 diabetes mellitus:
results of a 25 years follow-up study, The L ancet, 340: 925-929.
References 256
Martin FIR, (1991), The diagnosis of gestational diabetes, The M ed ica l Journal o f
A u stra lia , 155: 112.
Martin L, Connolly PW, Nancoo D, W ood N, Zhang ZJ, Maguie G, Quinet E, Tall AR,
Marcel YL, and McPherson R, (1991), Cholesteryl ester transfer protein and high-
density lipoprotein responses to cholesterol feeding in men: relationship to apoE
phenotype, Jou rn a l o f L ip id R esea rch , 34: 437-446.
Mauer S, Sutherland D, and Steffes M, (1992), Relationship of systemic blood pressure to
nephropathy in insulin-dependent diabetes mellitus, K idn ey In tern a tion a l, 41: 736
740.
McArdel WD, Katch FI, and Katch VL, (1991 a), Introduction to energy transfer, in
E xercise, p h ys io lo g y , energy, nutrition , a n d hum an p erfo rm a n ce , Third edition, by
Lea & Febiger, USA, pp 92-122.
McArdel WD, Katch FI, and Katch VL, (1991 b), The cardiovascular system, in Exercise,
p h ysio lo g y , energy, nu trition , a n d hum an p erfo rm a n ce , Third edition, by Lea &
Febiger, USA, pp 292-312.
McArdel WD, Katch FI, and Katch VL, (1991 c), Vitamins, Minerals, and Water, in
E xercise, p h ys io lo g y , energy, nutrition , a n d hum an p erfo rm a n ce , Third edition, by
Lea & Febiger, USA, pp 44-67.
McCarthy M, and Hitman GA, (1993), The genetic aspects of non-insulin-dependent
diabetes mellitus, in C auses o f d ia b e tes: gen e tic a n d environm ental fa c to r s , Lesile
RDG (editor), John Willey & Sons Ltd, pp 157-183.
References 257
McCrory P, Strauss B, and Wahlquist ML, (1994), Energy balance, food intake, and
obesity, in E xercise a n d O b esity , Hills AP, and Wahlquist Ml (editors), by Smith-
Gordon, Printed in Great Britain, pp 115-130.
McEvoy RC, Franklin B, and Ginsberg-Fellner F, (1991), Gestational diabetes mellitus:
evidence for autoimmunity against the pancreatic beta cells, D ia b e to lo g ia , 34: 507
510.
McGandy RB, and Hegsted DM, (1975), Quantitative effects of dietary fat and cholesterol
in man, in The R o le o f F ats in H um an N utrition , Vergroesen AJ (editor), Academic
Press, London, pp 211-230.
McHenry PL, Ellestad MH, and Fletcher, GF, (1990), Statement on exercise: a position
statement for health professionals by the committee on exercise and cardiac
rehabilitation of the council on clinical cardiology. American Heart Association,
C irculation , 81 (No 1): 396-398.
McMohan SW, McDonald GJ, Bernstein L, Andrews G, and Blacket RB, (1985),
Comparison of weight reduction with metropolol in treatment of hypertension in
young overweight patients, The L an cet, 1: 1233-1236.
McNamara JR, Campos J, Ordovas JM, Peterson J, Wilson PW, and Schaefer EJ, (1987),
Effects of gender, age, and lipid status on low-density lipoprotein subfraction: results
from Framingham offspring study, A th erosc lerosis , 7: 489-490.
McPherson R, (1993), Function of cholesteryl ester transfer protein in reverse cholesterol
transport, Canadian M ed ica l A ssoc ia tion Journal, 148 (No 12): 2165-2166.
References 258
McPherson R, Mann CJ, Tall AR, Hogue M, Martin L, Miline RW, and Marcel YL,
(1991), Plasma concentrations of cholesteryl ester transfer protein in
hyperlipoproteinemia: relation to cholesteryl ester transfer protein activity and other
lipoprotein variables, A rte r io sc le ro sis a n d T h rom bosis , 11: 797-804.
McPhillipis JB, Barret-Connor E, and Wingard DL, (1990),Cardiovascular disease risk
factors prior to the diagnosis of impaired glucose tolerance and non-insulin-dependent
diabetes mellitus. A community of older adults, A m erican Journal o f E p idem io logy,
131:443-453.
Meade TW, Brozovic M, Chakrabarti RR, North WR, Haines AP, Stirling Y, Imeson JD,
and Thompson SG, (1986), Haemostatic function and ischemic heart disease:
principal results of the Northwick Park Heart Study, The L a n ce t, 2: 533-537.
Meade TW, Chakrabarti R, Haines AP, North WRS, and Stirling Y, (1979),
Characteristics affecting fibrinolytic activity and plasma fibrinogen concentrations,
B ritish M e d ic a l Journal, 1: 153-156.
Meade TW, Imeson J, and Stirling Y, (1987), Effects of changes in smoking and other
characteristics on clotting factors and the risk of ischemic heart disease, The Lancet,
2: 986-988.
Medalie JH, Papier CM, Goldbourt U, and Herman JB, (1978), Major factors in the
development of NIDDM in 10000 men, A rch ives o f In tern a l M ed ic in e, 135: 811-817.
Mensink RPB, and Katan MB, (1992), Effects of dietary fatty acids on serum lipids and
lipoproteins: A meta-analysis of 27 trials, A rte r io sc le ro s is a n d T hrom bosis, 12: 911-
919.

References 259
Messent JWC, Elliot TG, Hill RD, Jarret RJ, Keen, H, and Uiberti GC, (1992), Prognostic
significance of microalbuminuria in insulin-dependent diabetes mellitus: A twenty-
three year of follow-up study, K idn ey In tern a tion a l, 41: 386-839.
Mestman JH, (1987), Follow-up studies in women with gestational diabetes mellitus: the
experience at Los Angels Country / University of Southern California Medical Center,
in G esta tion a l D iabe tes, Weiss PAM, and Coustan DR (editors), Springer-Verlag,
New York, pp 191-198.
@@@@@@@Mestman JH, (1988), Follow-up studies in women with gestational
diabetes mellitus. The experience at Los Angels country/ university of Southern
California Medical center, in G esta tion a l D ia b e te s , Weiss PAM and Coustan DR
(editors), Springer-Verlag / Wien, pp 191-207.
Mestman JH, Anderson GV, and Guadalupe V, (1972), Follow-up study of 369 subjects
with abnormal carbohydrate metabolism during pregnancy, O bstetrics and
G yn aeco logy , 39: 421-425.
Metacalf B, Baker J, Scott A, Wild C, Scragg R, and Dryson E, (1992), Albuminuria in
people at least 40 years old: effect of obesity, hypertension, and hyperlipidemia,
C lin ica l C hem istry, 38: 1802-1808.
Metzger BE, Bybee DE, Freinkel N, Phelphs RL, Radvang RM, and Vaisrub N, (1985),
Gestational Diabetes Mellitus: correlations between the phenotypic and genotypic
characteristics of the mother and abnormal glucose tolerance during the first year
postpartum, D iabe tes , 43 (supple 2): 111-115.

References 260
Miller GJ, and Miller NE, (1975), Plasma high-density concentration and development of
ischemic heart disease, The L a n ce t, i: 16-19.
Miller GJ, Martin JC, Webster J, Wilkes H, Miller NE, Wikinson WH, and Meade TW,
(1986), Association between dietary fat intake and plasma factor VII coagulant
activity: a predictor of cardiovascular mortality, A therosclerosis, 60 (No 3): 269-277.
Miller GJ, Walter SJ, Stirling Y, Thompson SG, Esnouf MP, and Meade TW, (1985),
Assay for factor VII activity by two techniques: evidence for increased conversion of
VII to V ila in hyperlipidemia, with possible implications for ischemic heart disease,
B ritish Jou rn a l o f H aem ato logy , 59: 249-258.
Miller VT, and La Rosa JC, (1991), Sex steroids and lipoproteins, in L ip ids an d wom en s
H ealth , Redmond GP (editor), Springer-Verlag Inc, New York, pp 48-65.
Mitchell BD, Haffner SM, Hazuda HP, Valder R, and Stern MP, (1992), The relation
between serum insulin levels and 8 years changes in lipid and lipoprotein, and blood
pressure levels, A m erican Journal o f E p id em io lo g y , 136: 12-22.
Mitchell MC, (1990), Alcohol, in P resen t know ledge in nu trition , 6th edition,
International Life Science Institute Nutrition Foundation, Washington, DC, pp 457
462.
Mitrakou A Kelley D, Mokan M, Veneman T, Pangbum T, Reilly J, and Gerigh J, (1992),
Role of reduced suppression of glucose production and diminished early insulin
release in impaired glucose tolerance, N ew E nglan d Journal o f M edicine, 326.22-29.

References 261
Modan M, Halkin H, Almog S, Lusky A, Eshkol A, Shefi M, Shitrit A, and Fuchs Z,
(1985), Hyperinsulinemia: A link between hypertension, obesity, and glucose
intolerance, Jou rn a l o f C lin ica l In ves tig a tio n , 75: 809-817.
Modan M, Meytes D, Rozeman P, Yosef SB, Sehayek E, Yosef NB, Lusky A, and Halkin
H, (1988), Significance of high HbA lc levels in normal glucose tolerance, D iabe tes
C a re , 11 (No 5): 422-428.
Moffatt RJ, (1988), Effects of cessation of smoking on serum lipids and high-density
lipoprotein cholesterol, A th ero sc lero sis , 74: 85-89.
Mogensen CE, (1986), Microalbuminuria predicts clinical proteinuria and early mortality
in maturity-onset diabetes, N ew E nglan d Journal o f M edicin e, 310: 356-360.
Mogensen CE, and Christensen CK, (1984), Predicting diabetic nephropathy in insulin
dependent patients, N ew E nglan d Journal o f M ed ic in e, 311: 89-93.
Moller DE, and O’Rahilly S, (1993), Syndromes of sever insulin resistance: clinical and
pathophysiological features, in Insulin R esistan ce , Moller DE (editor), John Willey &
Sons Ltd, pp 49-81.
Molsted-Pedersen L, Damm P, and Buschard K, (1989), Diabetes diagnosis during
pregnancy: Follow-up studies in C arboh ydra te m etabolism in pregn an cy and
new born . IV, Sutherland HW, Stowers JM, and Pearson DWM (editors), Springer
Verlag, London, pp 277-286.
Molsted-Pedersen L, Skouby SO, and Damm P, (1991), Preconception counselling and
contraception after gestational diabetes, D ia b e tes , 40 (supple 2): 147-150.

References 262
Moore RD, and Pearson TA, (1986), Moderate alcohol consumption and coronary artery
disease: a review, M ed ic in e , 65: 242-267.
Moore RD, Smith CR, Kwiterovich PO, Kwiterovich PO, and Pearson TA, (1986), Effect
of low-dose alcohol versus abstention on apolipoprotein A-I and B, A m erican
Journal o f M ed ic in e , 84: 884-890.
Moriguchi EH, Fusegawa Y, Tamachi H, and Goto Y, (1990), Effects of smoking on
HDL-subfractions in myocardial infarction patients: effects on lecithin-cholesterol acyl
transferase and hepatic lipase, C linica C h e m ic a A c ta , 195: 139-144.
Morrissing JH, Macik BG, Neuenschwander PF, and Comp PC, (1993), Quantitation of
activated factor VII levels in plasma using a tissue factor mutant selectivity deficient
in promoting factor VII activation, B lood , 81: 734-744.
Muhlhauser I, (1994), Cigarette smoking and diabetes: an update, D ia b e tic M edicine, 11:
336-343.
Muhlhauser I, Sawicki P, and Berger M, (1986), Cigarette smoking as a risk factor for
macroproteinuria and prolifrative retinopathy in type I (insulin-dependent) diabetes,
D ia b e to lo g ia , 29: 500-502.
Mulford MI, peterson LJ, and Peterson CM, (1993), Alternative therapies for the
management of gestational diabetes mellitus, C lin ics in P erinato logy, 20: 619-634.
Muscat JE, Harris RE, Haley NJ, and Wynder El, (1991), Cigarette smoking and plasma
cholesterol, A m erican H ea rt Journal, 121: 141-147.
Musliner TA, Giotas C, and Krauss RM, (1986), Presence of multiple subpopulations of
lipoproteins of intermediate density in normal subjects, A rteriosclerosis, 6: 79-87.
References 263
Musliner TA, Long MD, Forte TM, and Krauss RM, (1991), Size transformations of
intermediate and low-density lipoproteins induced by unesterified fatty acids, Journal
o f L ip id R esearch , 32: 903-915.
Myers GL, Cooper GR, Henderson LO, Hassemer DJ, and Kimberly MM, (1994),
Standardization of lipid and lipoprotein measurements, in L abora tory m easurem ent o f
lip ids, lipopro te in s, a n d apolipoproteins, Rifai N, and Wamick GR (editors),
American Association for Clinical Chemistry, Inc, pp 177-206.
Myreng Y, Awsnes I, Hjermann I, Stormorken H, Sund T, and Hellem A, (1986), Von
willebrand factor and cardiovascular risk, Throm bosis R esearch , 41: 867-871.
Nachman R, Levine R, and Jaffe EA, (1977), Synthesis of factor VIII antigen by cultured
guinea pig megakaryocyte, Journal o f C lin ica l In vestiga tion , 60 (No 4): 914-921.
Nelson RG, Everhart JE, Knowler JC, and Bennett PH, (1988), Incidence, prevalence, and
risk factors for non-insulin-dependent diabetes mellitus, P rim ary Care, 15: 227-250.
Nestel P, Noakes M, Belling B, McArthur R, Clifton P, Janus E, and Abbey M, (1993),
Plasma lipoprotein lipid and Lp[a] changes with substitution of elaidic acid for oleic
acid in the diet, Journal of Lipid Research, 33 (No 7): 1029-1036.
Nestel PJ, Schreibman PH, and Ahrens EH, (1973), Cholesterol metabolism in human
obesity, Journal o f C lin ica l Investiga tion , 52: 2389-2397.
Nestler JE, Barlascini CO, M att DW, Steingold KA, Plymate SR, Clore JN, and Blackard
WG, (1989), Suppression of serum insulin by diazoxide reduces serum testosterone
levels in obese women with polycystic ovary syndrome, Journal o f C linical
E ndocrin o logy & M etabo lism , 68 (No 6): 1027-1032.

References 264
Nestler JE, Barlascini CO, Tertrauh GA, Fratkin MJ, Clore JN, and Blackard WG, (1990),
Increased transcapillary escape rate of albumin in non-diabetic men in response to
hyperinsulinemia, D ia b e te s , 39: 1212-1217.
Newman B, Selby JV, and King MC, Slemenda C, Fabsitz R, and Friedman GD, (1987),
Concordance for type 2 (non-insulin-dependent) diabetes mellitus in male twins,
D ia b e to lo g ia , 30: 763-768.
Nichols AV, Gong EL, Blanch PJ, Forte TM, and Shore VG, (1986), Pathways in the
formation of human plasma high-density subfractions containing apolipoprotein A-I
without apolipoprotein A-II, Journal o f L ip id R esearch , 28: 719-732.
Nicoll A, and Lewis B, (1980), Evaluation of the roles of lipoprotein lipase and hepatic
lipase in lipoprotein metabolism: in v ivo and in v itro studies in men, E uropean
Journal o f C lin ica l In vestig a tio n , 10: 487-495.
NIH Consensus Conference, (1993), Triglyceride, high-density lipoprotein, and coronary
heart disease, JA M A , 269 (No 4): 505-510.
NIH Consensus Conferences, (1984), Treatment of hypertriglyceridemia, JAM A, 251:
1196-1200.
Nikkila EA, (1984), D ia b e te s a n d H e a rt d isease , Jarrett RJ (editor), Elsevier
Amesterdam, New York, Oxford, pp 133-167.
Nikkila EA, Taskinen MR, and Sane TA, (1987), Plasma high-density lipoprotein
concentration and subfraction distribution in relation to triglyceride metabolism,
A m erican H e a r t Journal, 113 (No 2, Part 2): 543-548.

References 265
Nishi M, Sanke T, Nagamatsu S, Bell GI, and Steiner DF, (1990), Iselt amyloid
polypeptide: a new beta-cell secretory product related to islet amyloid deposits,
Journal B io lo g ica l C hem istry, 265: 4173-4176.
Niskanen L, and Laakso M, (1993), Insulin resistance is related to albuminuria in patients
with type II (non-insulin-dependent) diabetes mellitus, M etabo lism , 42 (No 12):
1541-1545.
Nordestgaard BG, and Lewis B, (1991), Intermediate density lipoprotein levels are strong
predictors of the extent of aortic atherosclerosis in the St. Thomas's Hospital rabbit
strain, A th erosc lerosis, 87 (No 1): 39-46
Nordestgaard BG, and Tybjaerg-Hassen, (1992), IDL, VLDL, chylomicrons and
atherosclerosis, E uropean Journal o f C lin ica l Investiga tion , 8 (supple 1): 92-98.
Norum KR, (1992), Dietary fat and blood lipids, N utrition R eview s, 50 (No 4, Part 2): 30
37.
Nosadini R, Cipollina MR, Solini A, Sambataro M, Morocutti A, Doria A, Fioretto P,
Brocco E, Muollo B, and Frigato F, (1992), Close relationship between
microalbuminuria and insulin resistance in essential hypertension and non-IDDMs,
Journal o f the A m erican S ocie ty o f N ephrology, 3: s56-s63.
Nosadini R, Solini A, Veussi M, Muollo B, Frigato F, Sambataro M, Cipollina MR,
DeRiva F, and Brocco E, (1994), Impaired insulin-induced glucose uptake by
extrahepatic tissue is hallmark of NIDDM patients who have or will develop
hypertension and microalbuminuria, D ia b e te s , 43: 491-499.

References 266
O Dea K, Esler M, Leonard P, Stockigt JR, and Nestel P, (1982), Noradrenaline turnover
during under-and over-eating in normal weight subjects, M etabolism , 31: 896-899.
O’sullivan JB (1975), Long-term follow-up of gestational diabetes in Early Diabetes,
Camerini Davalos RA, and Cloe HS (editors), Academic Press, New York, pp 1009
1027.
O’Sullivan JB, (1978), Gestational diabetes: factors influencing the rates of subsequent
diabetes, in Carbohydrate metabolism in pregnancy and the newborn, Sutherland
HW and Stowers JM (editors), Springer-Verlag, Berlin Heidenberg New York, pp
425.
O’Sullivan JB, (1989), The Boston Gestational Diabetes Studies: review and perspective,
in Carbohydrate metabolism in pregnancy and the newborn, Sutherland HW,
Stowers JM, and Pearson DWM (editors), Springer-Verlag, London, pp 287-294.
Oats JN, Beischer NA, and Grant PT, (1988), The emergence of diabetes and impaired
glucose tolerance in women who had gestational diabetes, in Gestational D iabetes,
Weiss PAM and Coustan DR (editors), Springer-Verlag / Wien, pp 199-207.
Ockner RK, and Jones AL, (1970), An electron microscopic and functional study of very-
low-density lipoproteins in intestinal lymph, Journal o f L ipid Research , 11: 284-292.
Ockner RK, Hughes FB, and Isselbacher KJ, (1969), Very-low-density lipoprotein in
intestinal lymph: role in triglyceride and cholesterol transport during fat absorption,
Journal o f Clinical Investigation, 48: 2367-2373.
Oh TG, Park KS, Kim SY, Cho BY, Lee HK, Koh CS, and Min HK, (1993), Insulin
sensitivity in non-diabetic offspring of Korean NIDDM patients, in Insulin Resistance

References 267
in H um an D isea se , Kap Bun Huh, et al (editors), Elsevier Science Publishers BV, pp
359-362.
Ohlson LO, Larsson B, Svardsudd K, Welin L, Eriksson H, Wilhelmsen L, Bjomtrop P,
and Tibblin G, (1985), The influence of body fat distribution on the incidence of
diabetes mellitus. 13.5 years of follow-up of the participants in the study of men born
in 1913, D ia b e te s , 34 (No 10): 1055-1058.
Ohsawa H, Kanatsuka A, Yamaguchi T, Makino H, and Yoshino S, (1989), Islet amyloid
polypeptide inhibits glucose-stimulated insulin secretion from isolated rat pancreatic
islets, B ioch em ica l a n d B iophysica l R esearch C om m unication 160: 961-967.
Okamoto Y, Fujimori Y, Nakan OH, and Tsujii T, (1988), Role of the liver in alcohol-
induced alteration of high-density lipoprotein metabolism, Journal o f L abora tory and
C lin ica l M edicin e, 111 (No 4): 482-485.
Olefsky J, Crap PA, Ginsberg H, and Reaven GM, (1975), Metabolic effects of increased
caloric intake in men, M etabolism , 24: 495-503.
Olefsky JM, Farquhar JW, and Reaven GM, (1974), Reappraisal of the role of insulin in
hypertriglyceridemia, A nnals o f In ternal M ed ic in e , 57: 551-560.
Olefsky JM, Gravey WT, Henry RR, Brillon D, Matthaei S, and Friednberg GR, (1988),
Cellular mechanisms of insulin resistance in non-insulin-dependent (type II) diabetes
mellitus, A m erican Journal o f M edicin e, 85 (supple 5A): 86-105.
Osterman H, and Van de Loo J, (1986), Factors of the haemostatic system in diabetic
patients: A survey of controlled studies, H aem ostasis , 16: 386-416.

References 268
Owen OE, Felig P, Morgan AP, Wahren J, and Cahill GF, (1969), Liver and kidney
metabolism during prolonged starvation, Jou rn a l o f C lin ica l In ves tig a tio n , 48: 574
583.
Paffenbarger RS, Hude Rt, Wing AL, and Hsieh CC, (1986), Physical activity, all cause
mortality and longevity of college alumni, N ew E n g lan d Journal o f M ed ic in e, 413
(No 10): 605-613.
Parillo M, Coulston A, Hollenbeck C, and Reaven GM, (1988), Effect of a low fat diet on
carbohydrate metabolism in patients with essential hypertension, H yp erten sio n , 11:
244-248.
Park KS, (1993), Insulin resistance and obesity, in Insulin R esis tan ce in H um an D isea se ,
Kap Bun Huh, et al (editors), Elsevier Science Publishers BV, pp 25-28.
Parker DR, Weiss ST, Troisi R, Cassano PA, Vokonas PS, and Landsberg L, (1993),
Relationship of dietary saturated fatty acid and body habitus to serum insulin
concentrations: The Normative Aging Study, A m erican Journal o f C lin ica l N u trition
58: 129-136.
Parving HH, Hommel E, Damkjear-Nielsen M, and Giese J, (1989), Effect of captoprill on
blood pressure and kidney function in normotensive insulin-dependent diabetes with
nephropathy, B ritish M e d ic a l J o u rn a l, 299: 533-536.
Parving HH, Jensen HE, Mogensen CE, and Evrin PE, (1974), Increased urinary albumin
excretion rate in benign essential hypertension, The L a n ce t, 1 (868): 1190-1192.
Patsch JR, Prasad S, Gotto AM, and Patsch W, (1987), High-density lipoprotein:
Relationship of the plasma levels of this lipoprotein species to its composition to the

References 269
magnitude of postprandial lipidemia, and to the activities of lipoprotein lipase and
hepatic lipase, J o u rn a l o f C lin ica l In v es tig a tio n , 80: 341-347.
Pederson O, (1998), The impact of obesity on the pathogenesis of non-insulin-dependent
diabetes mellitus: a review of current hypothesis, D ia b e te s / M eta b o lism R eview s, 5:
495-509.
Peiris AN, Southmann Ms, Haffman RG, Hennes MI, Wilson CR, Gustafson AB, and
Kissebah AH, (1989), Adiposity, fat distribution and cardiovascular risk, A nnals o f
In tern a l M ed ic in e , 110 (No 11): 867-872.
Peiris AN, Stanger JI, Plymate SR, Vogel RL, Heck M, and Samols E, (1993),
Relationship of insulin pulses to sex hormone binding globulin in normal men, Journal
o f C lin ica l E n d o crin o lo g y & M etabo lism , 76: 279-282.
Persson B, Hanson U, Hartling SG, and Binder C, (1991), Follow-up of women with
previous GDM: insulin, C-peptide, and pro-insulin response to oral glucose load,
D ia b e te s , 40 (supple 2): 136-141.
Peterson LJ, and Peterson CM, (1991), New strategies for the treatment of gestational
diabetes, Isra e l Jou rn a l o f M ed ic a l Science, 27: 510-515.
Pettitt DJ, Aleck KA, Baird HR, Caraher MJ, Bennett PH, and Knowler WC, (1988),
Congenital susceptibility to NIDDM: Role of intra-uterine environment, D iabetes, 37
(No 5): 622-628.
Pettitt DJ, Knowler WC, Bennett PH, Aleck KA, and Baird HR, (1987), Obesity in
offspring of diabetic Pima Indian women despite normal birth-weight, D ia b e te s Care,
10: 76-80.
References 270
Pi-Sunyer FX, (1991), Health implications of obesity, A m erican Journal o f C lin ical
N u trition , 53: 1595S-1603S.
Plaisted Cs, and Istfan NW, (1994), Metabolic abnormalities of obesity, in O besity ,
p a th o p h ysio lo g y , p sych o lo g y , a n d trea tm en t, Blackburn GL, and Kanders BS
(editors), Chapman & Hall Series in Clinical Nutrition, Series editor: Chernoff R, pp =
80-87.
Pollare T, Lithell H, and Berne C, (1989), A comparison of the effects of
hydroclorothiazide on glucose and lipid metabolism in patients with hypertension,
N ew E n g lan d Journal o f M edicine, 321: 868-873.
Pollare T, Lithell H, and Berne C, (1990), Insulin resistance is a characteristic feature of
primary hypertension independent of obesity, M eta b o lism , 39: 167-174.
Poller L, McCallum PK, Thomson JM, and Kerns W, (1990), Reduction of factor VII
coagulant activity (VDC), a risk factor for ischaemic heart disease, by fixed dose
warfarin: a double blind crossover study, British Heart Journal, 63 (No 4): 231-233.
Porta M, LaSelva M. Molinatti P, and Molinatti GM, (1987), Endothelial cell function in
diabetic microangiopathy, D ia b e to lo g ia , 30: 601-609.
Prentice AM, Black AE, Coward WA, Davies HL, Goldberg GR, Murgatroyd PR,
Ashford J, Sawyer M, and Whitehead RG, (1986), High-level of energy expenditure
in obese women, B ritish M ed ica l Jou rn a l, 292: 983-987.
Preziosi P, Barrett-Connor E, Papoz L, Roger M, Saint-Paul M, Nahoul K, and Simon
CM, (1993), Interrelation between plasma sex hormone-binding globulin and plasma

References 271
insulin in healthy adult women: the telecom study, Journal o f C lin ica l E ndocrin o logy
a n d M eta b o lism , 76 (No 2):283-287.
Prochazka M, Lillioja S, Knowler WC, Tait J, and Bogardus C, (1992), Confirmation of
genetic linkage between markers on choromosome 4q and a gene for insulin
resistance in obese Pima Indians, Diabetes, 41: 9A.
Purdon C, Brousson M, Nyveen L, Miles PD, Halter JB, Vamic M, and Marliss E, (1993),
The role of insulin and catecholamines in the glucoregulatory response during intense
exercise and early recovery in insulin-dependent diabetic and control subjects, Journal
o f C lin ica l E n d o crin o lo g y & M etabolism , 76: 566-573.
Quensell M, Soserstrom A, Agardh CD, and Nisson-Ehle P, (1989), High-density
lipoprotein concentrations after cessation of smoking: the importance of alteration in
diet, A th ero sc lero s is , 75: 189-193.
Quetelet LAJ, (1869), P h ysigue S o c ia le , Brussels, Belgium: C Muquardt, Volume: 2.
Quinet EM, Angellon LB, Kroon PA, Marcel YL, Lee YC, Whitlock ME, and Tall AR,
(1990), Atherogenic diet increases cholesteryl ester transfer protein messenger RNA
levels in rabbit liver, Jou rn a l o f C lin ica l Investiga tion , 85 (No 2): 357-363.
Rabelink AJ, Hene RJ, Erkelens DW, Joles JA, and Koomants HA, (1990), Partial
remission of nephrotic syndrome in patients on long-term simvastatin, The Lancet,
335: 1045-1046.
Randle PJ, (1988), Interactions of fatty acid and glucose metabolism: biochemistry, in
D ia b e tes , Larkins R, Zimett P, and Chisholm D (editors), Elsevier Science Publishers
BY, Amsterdam, pp 163-166.

References 272
Randle PJ, Garland PB, Hales LN, and Newsholme EA, (1963), The glucose-fatty acid
cycle, its role in insulin sensitivity and the metabolic disturbances of diabetes mellitus,
The L a n ce t, I: 785-789.
Rapkin A, (1987), Contraception in the diabetic patients, in M anagem en t o f the d iabetic
pregn an cy, Nuwayhid BS, Brinkman III CR, and Lieb SM (editors), Elsevier Science
Publishing CO Inc, pp 128-135.
Rauramaa R, (1984), Relationship of physical activity, glucose tolerance and weight
management, P reven tive M edicine, 13: 37-46.
Ravussin E, and Swinbum BA, Pathophysiology of obesity, The L an ce t, 340: 404-408.
Rayner HD, Ross-Gilbertson VL, and Walls J, (1990), The role of lipids in the
pathogenesis of glomerulosclerosis in the rat following subtotal nephrectomy,
E uropean Jou rn a l o f C lin ica l Investigation , 20: 97-104.
Razay G, Heaton KW, Bolton CH, and Hughes AO, (1992), Alcohol consumption and its
relation to cardiovascular risk factors in British women, B ritish M ed ica l Journal,
301: 80-83.
Reaven GM, and Greenfield MS, (1981), Diabetic hypertriglyceridemia: evidence for three
clinical syndromes, D ia b e te s , 30 (Supple 2): 66-75.
Redmond GP, (1991), Obesity in women, in L ip ids a n d w o m en ’s hea lth , Redmond GP
(editor), Springer-Verlag, New York, pp 119-131.
Reece EA, Homko C, and Wiznitzer A, (1994), Metabolic changes in diabetic and non
diabetic subjects during pregnancy, O bste tr ica l a n d G yn eco log ica l Survey, 49: 64-71.

References 273
Reed MJ, Dunkley SA, Singh A, Thomas BS, Haines AP, and Cruickshank JK, (1993),
The role of free fatty acid in regulating the tissue availability and synthesis of sex
steroid, P ro sta g la n d in s, L eukotrienes, a n d E ssen tia l F a tty A c id s , 48: 111-116.
Resch KL, Ernest E, Matrai A, and Paulsen HF, (1992), Fibrinogen and viscosity as risk
factors for subsequent cardiovascular events in stroke survivors, A n n als o f In ternal
M edicin e, 221: 365-372.
Rhoades R, and Pflanzer R, (1992), H um an p h y s io lo g y , Second edition, by Saunders
College Publishing, Harcourt Brace Jovanovich College Publishers, pp 223-500.
Riccardi G, and Rivellese AA, (1991), Effects of dietary fibre and carbohydrate on glucose
and lipoproteins metabolism in diabetic patients, D ia b e te s C a re , 14: 1115-1125.
Riccardi G, Rivellese AA, and Mancini M, (1987), The use of diet to lower plasma
cholesterol levels, E uropean H e a rt Journal, 8 (supple E): 79-85.
Rimm EB, Manson JE, Stampfer MJ, Colditz GA, Willett WC, Rosner B, Hennekens CH,
and Speizer FE, (1993), Cigarette smoking and the risk of diabetes in women,
A m erican Jou rn a l o f P u b lic H ealth , 83 (No 2): 211-214.
Rimm EB, Manson JE, Stampfer MJ, Clodtiz GA, Willett WC, Rosner B, Hennekens CH,
and Speizer FE, (1992), Oral contraceptive use and the risk of clinical diabetes in
large prospective study of women, D ia b e to lo g ia , 35 (No 10): 967-972.
Robert D, Mordasini RC, and Riesen W, (1989), Dyslipoproteinemia in renal disease, in
H um an p la sm a lipopro te in s, Fruchar JC and Shepherd J (editors), Walter deGruyter,
Berlin New York, pp 207-218.

References 274
Robinson D, Ferns GAA, Bevan EA, Stocks J, Williams PT, and Galton DJ, (1987), High-
density lipoprotein subfractions and coronary risk factors in normal men,
A rte r io sc le ro s is , 7: 341-346.
Romieu I, Willett WC, Stampfer MJ, Colditz GA, Sampson L, Rosner B, Hennkens CH,
and Speizer FE, (1988), Energy intake and other determinants of relative weight,
A m erica n J o u rn a l o f C lin ica l N u tritio n , 47 (No 7): 406-412.
Rosenfield RL, (1975), Studies of the relation of plasma androgen levels to androgen
action in women, Jou rn a l o f S te ro id B ioch em istry a n d M o lec u la r B io logy, 6: 695
702.
Ross J, (1990), Heart failure, hypertrophy, and other abnormal cardio-circulatory tests, in
B est a n d ta y lo r ’s p h y s io lo g ic a l basis o f m ed ica l p r a c tic e , 12th edition, West JB
(editor), Williams & Wilkins, USA, pp 307-330.
Ross R, (1986), The pathogenesis of atherosclerosis: an update, N ew E n g lan d Journal o f
M edicin e, 314: 488-500.
Rouse IL, Armstrong BK, and Beilin LJ, (1983), The relationship of blood pressure to diet
and life style in two religious populations, Journal o f H yperten sion , 1: 65-71.
Saad MF, Knowler WC, Pettitt DJ, Nelson RG, M ott DM, and Bennett PH, (1988), The
natural history of impaired glucose tolerance in the Pima Indians, N ew E ngland
Jou rn a l o f M ed ic in e, 31: 1500-1506.
Saad MF, Lillioja S, Nyomba BL, Castillo C, Ferraro R, DeGregorio M, Ravussin M,
Knowler WC, Bennett PH, and Howard BY, (1991), Racial differences in the relation
References 275
between blood pressure and insulin resistance, N ew E n glan d Journal o f M edicin e ,
324: 733-739.
Saheki S, Hitsumoto Y, Murase M, Takeuchi N, and Uchida K, (1993), Invitro
degradation of very-low-density lipoprotein from diabetic patients by lipoprotein
lipase, C lin ica C h e m ic a A c ta , 217: 108-114.
Samman S and Truswell, (1993), The Friedewald equation for the determination of low-
density lipoprotein cholesterol: a special case, A m erican Journal o f C lin ical
N u trition , 58: 928-929.
Sandars TAB, (1987), Fish and coronary artery disease, B ritish H ea rt Journal, 57: 214
219.
Savolainen MJ, Baraona E, and Lieber CG, (1987), Acetaldehyde binding increases the
catabolism of LDL-particles in the rats, Life S c ien ces , 40: 481-486.
Schalin C, Harkonen, M, and Groop L, (1992), Impaired action of glycogen synthease in
people at increased risk for developing NIDDM, D ia b e te s , 41 (No 5): 598-604.
Schemthaner G, Vukovich T, Knobl P, Hay U, and Muller MM, (1989), The effect of
near-normoglycaemic control on plasma levels of coagulation factor VII and the
anticoagulant protein C and S in insulin-dependent diabetes mellitus patients, British
Journal o f H aem ato logy , 73 (No 3): 356-359.
Schmidt EB, Kristensen SD, Caterina RD, and Illingworth DR, (1993), The effects of n-3
fatty acids on plasma lipids and lipoproteins and other cardiovascular risk factors in
patients with hyperlipidemia, A therosclerosis, 103: 107-121.
References 276
Schmitz G, and Williamson E, (1991), High-density lipoprotein metabolism and reverse
cholesterol transport and membrane protection, C urren t O pin ion in L ip id o lo g y , 2:
177-189.
Schneeman BD, and Tietyen j, (1994), Dietary fibre, in M o d e m N utrition in H ealth an d
D ise a se , 8th edition, Shils ME, Olson JA, and Shike M (editors), by Lea & Febiger,
pp 89-100.
Sclafani A, (1986), Animal models of obesity: Classification and characterization,
In tern a tio n a l Jou rn a l o f O besity , 8 (No 5): 491-508.
Sechi LA, Melis A, and Tedde R, (1992), Insulin hypersecretion: A distinctive feature
between essential and secondary hypertension, M eta b o lism , 41 (No 11): 1261-1266.
Seely BL, and Olefsky JM, (1993), Potential cellular and genetic mechanisms for insulin
resistance, in Insulin R esis ta n ce , Moller DE (editor), John Willey & Sons Ltd, pp
187-252.
Selby JV, Fitz-Simmons SC, Newman JM, Katz PP, Sep S, and Showstack J, (1990), The
natural history of epidemiology of diabetic nephropathy: implications for prevention
and control, JA M A , 263: 1954-1960.
Sepe SJ, Connell FA, Geiss LS, and Teutsch SM, (1985), Gestational diabetes: incidence,
maternal characteristics, and perinatal outcome, Diabetes, 34 (Supple 2): 13-@ @ @ @
Sharma AM, Ruland K, Spies KP, and Distler A, (1991), Salt sensitivity in young
normotensive subjects is associated with a hyperinsulinémie response to oral glucose,
Jou rn a l o f H yperten sion , 9 (No 4): 329-335.
References 277
SHBG [125I] Immunoradiometric Assay manual, (1989), Farmos Group Ltd, Oulunsalo,
Finland, pp 1-15.
Shekelle BR, Shyrock A, Paul O Lepper M, Stanler J, Liu S, and Raynor, (1981), Diet,
serum cholesterol, and death from coronary heart disease, N ew E n g lan d Journal o f
M edicin e, 304 (No 2): 65-70.
Shen DC, shieh SM, Fuh MT, Wu DA, Chen YDI, and Reaven GD, (1988), Resistance to
insulin stimulated glucose uptake in patients with hypertension, Journal o f C lin ical
E n docrin o logy & M eta b o lism , 66: 580-583.
Shennan NM, Seed M, and Wynn V, (1985), Variations in serum lipid and lipoproteins
levels associated with changes in smoking behaviour in non-obese Caucasian males,
A th erosc lerosis, 58: 17-25.
Sherman C, and Gosling P, (1988), Microalbuminuria and vascular permeability, The
Lancet, 2: 906-907.
Shieh SM, Shen M, Fuh MMI, Chen YDI, and Reaven GM, (1987), Plasma lipid and
lipoprotein concentrations in Chinese males with coronary artery disease with and
without hypertension, A th ero sc lero s is , 67: 49-55.
Shimokata H, Tobin JD, Muller DC, Elahi D, Coon PJ, and Andres R, (1989), Studies in
the distribution of body fat. Effects of age, sex, and obesity, Journal o f G eron to logy ,
44: M66-M73.
Sicree RA, Zimmet PZ, King HOM, and Conventry JS, (1987), Plasma insulin response
among Nauruans: prediction of distribution in glucose tolerance over 6 years,
D ia b e te s , 36: 179-186.

References 278
Siedel J, Hagele EO, Ziegenhom, and Wahlefeld AW, (1983), Reagent for enzymatic
determination of serum total cholesterol with improved lipolytic efficiency, C lin ica l
C h em istry , 29: 1075-80.
Sillanaukee P, Koivula T, Jokela H, Myllyhaiju H, and Seppa K, (1993), Relationship of
alcohol consumption to changes in HDL-subfractions, E uropean Journal o f C lin ica l
In vestiga tion , 23: 486-491.
Silveira AM, Sjoberg S, Blomback M, and Ostman J, (1992), Von willebrand factor
antigen in plasma and urine in patients with type I (insulin-dependent) diabetes
mellitus with and without nephropathy, Journal o f D ia b e tic C o m p lica tio n s , 6 (No 2):
89-95.
Silverman DI, Ginsburg GS, and Pasternak RC, (1993), High-density lipoprotein
subfractions, The A m erica n Journal o f M ed ic in e , 94: 636-645.
Simons LA, (1993), Lipoprotein (a): important risk factor or passing fashion? The
M ed ica l Jou rn a l o f A u stra lia , 158: 512-513.
Simons LA, Simons J, and Jones AS, (1984), The interactions of body weight, age,
cigarette smoking, and hormone usage with blood pressure and plasma lipids in
Australian community, A u stra lia n a n d N ew Z ea la n d Journal o f M edicin e, 14: 215
221.
Singer DE, Nathan DM, Anderson KM, Wilson PWF, and Evans JC, (1992), Association
of H bA lc with prevalent cardiovascular disease in the original cohort of the
Framingham Heart Study, D ia b e tes , 41: 202-208.

References 279
Singer P, Godicke W, Voigt S, Hajdu I, and Weiss M, (1985), Postprandial
hyperinsulinemia in patients with mild essential hypertension, H ypertension , 7: 182
186.
Singer P, Writhe M, and Berger I, (1990), Apossible contribution of decreased in free
fatty acids to low serum triglyceride levels after diets supplemented with n-6 and n-3
polyunsaturated fatty acids, A th erosc lerosis, 83: 167-175.
Siri WE, (1956), Donner Laboratory of Biophysics and Medical Physics, U niversity o f
C aliforn ia P u blica tions, Report of 19 March (No 3349).
Skarfors ET, Selinius KI, and Lithell H, (1991), Risk factors for developing non-insulin
diabetes: a 10 years follow-up of men in Uppsala, B ritish M edica l Journal, 303: 755
760.
Skott P, Hother-Nielson O, Braun NE, Giese J, and Nielsen MD, (1989), Effects of insulin
on kidney function and sodium excretion in healthy subjects, D ia b e to lo g ia , 32 (No 9):
694-699.
Skouby SO, Andersen O, Saurbrey N, and Kuhl C, (1987), Oral contraception and insulin
sensitivity: in v ivo assessment in normal women and in subjects with previous
gestational diabetes, Journal o f C lin ica l E ndocrinology & M etabolism , 64: 519-523.
Smith U, (1994), Carbohydrates, fat, and insulin action, Am erican Journal o f C linical
N utrition, 59 (supple): 686S-689S.
Soman VR, Koivisto VA, Deibert D, Felig P, and DeFronzo RA, (1979), Increased insulin
sensitivity and sensitivity and insulin binding to monocytes after physical training, New
E ngland Jou rn a l o f M edicine, 301: 1200-1204.
References 280
Sowers JR, Nyby M, Stem N, Beek F, Baron S, Cantania R, and Vlachis N, (1982), Blood
pressure and hormone changes associated with weight reduction in the obese,
hypertension , 4 (No 5): 686-691.
Sowers JR, Standley PR, Kam JL, Ram JL, Zemel MB, and Resnick LM, (1991), Insulin
resistance, carbohydrate metabolism, and hypertension, A m erican Journal o f
H yperten sion , 4 (No 7, Part 2), 466S-472S.
Sparks D, and Prichard H, (1991), Lipid transfer proteins, hypertriglyceridemia, and
reduced high-density lipoprotein cholesterol, A m erican H ea rt Journal, 122 (No 2):
601-607.
Spelsberg A, and Manson JE, (1993), Towards prevention of non-insulin-dependent
diabetes mellitus, in C auses o f d iabetes: gen etic an d environm ental fa c to r s , Lesile
RDG (editor), John Willey & Sons Ltd, pp 319-345.
Stamford BA, Matter S, Fell RD, and Papenek P, (1986), Effects of smoking cessation on
weight gain, metabolic rate, caloric consumption, and blood lipids, A m erican Journal
o f C lin ica l N u trition , 43: 486-494.
Staut RW, (1993), Insulin resistance, hyperinsulinemia, dyslipidemia and atherosclerosis,
in Insulin R esistance, Moller DE (editor), John Wiley and Sons Ltd, pp 355-384.
Stegmayr B, and Lithner F, (1987), Tobacco and end stage diabetic nephropathy, British
M ed ica l Journal, 295: 581-582.
Stehouwer CD, Stroes RS, Hackeng WH, Mulder PG, and den-Ottolander G, (1991),
Von willebrand factor and development of diabetic nephropathy in IDDM, D iabetes,
40: 971-976.

References 281
Stehouwer CD, Zellenrath P, Polak BC, Baarsma GS, Nauta JJ, Doker AJ, and den-
Ottolander GJ, (1992), Von willebrand factor and rarely diabetic retinopathy: no
evidence for a relationship in patients with type I (insulin-dependent) diabetes mellitus
and normal urinary albumin excretion, D ia b e to lo g ia , 35 (No 6): 555-559.
Stehouwer CDA, Nauta JJP, Zeldenrust GO, Hackeng WH, Donker AJ, and den-
Ottalander GJ, (1992), Urinary albumin excretion, cardiovascular disease, and
endothelial dysfunction in non-insulin-dependent diabetes mellitus, The L an cet, 340:
319-323.
Stein Y, Dabachy Y, Hollander G, and Stein O, (1990), Cholestryl ester transfer activity in
hamster plasma, increases by fat and cholesterol rich diets, B iochem ica e t B iophysica
A cta, 1042: 138-141.
Steinberg D, (1990), Regulation of carbohydrate metabolism, in B est a n d T ylor’s
p h ysio lo g y b a sis o f m ed ica l p ra c tice , 12th edition, West JB (editor), Williams &
Wilkins (publisher), USA, pp 728-740.
Steinberg D, Parthasarathy S, Carew TE, Khoo JC, and Witztum JL, (1989), Beyond
cholesterol modifications of low-density lipoprotein that increase its atherogenicity,
N ew E n glan d Journal o f M ed icin e, 14: 915-924.
Steiner G, (1981), Diabetes and atherosclerosis, D iabetes, 30 (Supple 2): 1-4.
Steiner G, (1986), Hypertriglyceridemia and carbohydrate intolerance: interrelations and
therapeutic implications, A m erican Journal o f C ard io logy, 57: 27G-30G.

References 282
Steiner G, Schwartz L Shumak S, and Poapst M, (1987), The association of increased
levels of intermediate-density lipoproteins with smoking and with coronary artery
disease, C ircu la tio n , 75 (No 1): 124-130.
Steinmetz A, Kirklies A, Schlosser G, Cassel W, Peter JH, Ehlemz K, Schafer JR, Wiehert
PV, and Kaffamik H, (1993), Lipoprotein (a), low-density, intermediate-density
lipoproteins and blood pressure in young male population, C lin ica l a n d Investiga tive
M edicin e, 71: 145-149.
Stem MP, and Haffner SM, (1986), Body fat distribution and hyperinsulinemia as risk
factors for diabetes and cardiovascular disease, A rte r io sc le ro s is , 6: 123-130.
Stem MP, Gaskill SP, Hazuda HP, Gardner LI, and Haffner SM, (1983), Does obesity
explain excess prevalence of diabetes among Mexican Americans? Results of the San
Antonio Heart Study, D ia b e to lo g ia , 24: 272-277.
Stem MP, Patterson JK, Haffner SM, Hazuda HP, and Mitchell BD, (1989), Lack of
awareness and treatment of hyperlipidemia in type II diabetes in community survey.
JA M A , 262 (No 3): 360-364.
Stiegler ESH, (1993), Microalbuminuria in a random cohort of recently diagnosed type II
(non-insulin-dependent) diabetic patients living in the Greater Munich Area,
D ia b e to lo g ia , 36: 1017-1020.
Stokes G, (1992), Recent advances in hypertension, F ellow sh ip A ffairs, Australia, June,
pp = 19-20 and continued on page 25.

References 283
Storlien LH, James DE, Burleigh KM, Chisholm DJ, and Kraegen EW, (1986), Fat
feeding causes widespread in v ivo insulin resistance, decreased energy expenditure,
and obesity in rats, A m erican Journal o f P h ysio lo g y , 251 (No 5, Part 1): E576-E583.
Storlien LH, Jenkins AB, and Chisholm JD, (1989), Role of specific nutrients in
determining hepatic and peripheral insulin sensitivity : effects of subtypes of fats and
simple sugars, in D iabetes, Larkins R, Zimett P, and Chisholm D (editors), Elsevier
Science Publishers, New York, pp 593-596.
Stout RW, (1992),.Risk factors for atherosclerosis in diabetes mellitus, in D iabetes
m ellitu s a n d a th erosc lerosis , Kluwer. Academic Publishers, Printed in the
Netherlands, pp 53-87.
Stout RW, (1993), insulin resistance, hyperinsulinemia, dyslipidemia, and atherosclerosis,
in Insulin res is ta n ce , Moller DE (editor), John Wiley & Sons Ltd, pp 355-384.
Stramblad G, and Bjomtorp P, (1986), Reduced hepatic insulin clearance in rats with
dietary-induced obesity, M etabo lism , 35: 323-327.
Sugrue DD, Trayner I, Thompson GR, Vere VJ, Imeson, JD, Stirling Y, and Meade TW,
(1985), Coronary artery disease in heterozygous familial hypercholesterolemia,
B ritish H e a rt Journal, 53: 265-268.
Sullivan DR, Sandars TAB, Trayner IM, Thompson GR, (1986), Paradoxical elevation of
LDL apoprotein B levels in hypertriglyceridemic patients and normal subjects
ingesting fish oil, A th erosc lerosis, 61: 129-134.
Summary and recommendation of the Third International Workshop Conference on
Gestational Diabetes Mellitus,(1991) D iabe tes , 40 (Supple 2): 197-201.

References 284
Svedberg J, B jom torp P, Smith V, and Lonnroth P, (1990), Free fatty acid inhibition of
insulin binding, degradation, and action in isolated rat hepatocytes, D ia b e te s , 39: 570
574.
Swislocki A, and Tsuzuki A, (1993), Glucose intolerance, hyperinsulinemia, and elevated
free fatty acids in the lean spontaneously hypertensive rat, The A m erican Journal o f
the M ed ic in e S c ie n c e , 306 (No 5): 282-286.
Swislocki ALM, Chen YDI, Golay A, Chang MO, and Reaven GM, (1987), Insulin
suppression of plasma FFA concentration in normal individuals and patients with non
insulin-dependent diabetes mellitus, D ia b e to lo g ia , 30: 622-626.
Tallis GA, Shephard MDS, Whiting MJ, and Sobecki S, (1994), Prediction of LDL
subclass patterns using plasma total apoB / LDL-C and LDL-apoB / Cholesterol
ratio, A th e ro sc le ro s is X , Montral, October, (Abstract No 80), pp 23.
Talmud P, (1993), Genetics and hypertriglyceridemia, Report of a meeting of physicians
and scientists, university college, London, Medical school, The L a n ce t, 342: 482-483.
Taskinen MR, Bogradus C, Kennedy A, and Howard BV, (1985), Multiple distribution of
free fatty acid metabolism in non-insulin-dependent diabetes: effect of oral
hypoglycemic therapy, The Jou rn a l o f C lin ica l In ves tig a tio n , 76: 637-644.
Taskinen MR, Nikkila EA, Valimaki M, Sane T, Kussi T, Kesaniemi A, and Ylikahri R,
(1987), Alcohol-induced changes in serum lipoproteins and in their metabolism,
A m erica n H e a r t J ou rn a l, 113 (No 2, Part 2): 458-464.
References 285
Taskinen MR, Valimaki M, Nikkila EA, Kuusi T, Ehnholm C, and Ylikahri R, (1982),
High-density lipoprotein subfractions and post-heparin plasma lipases in alcoholic men
before and after ethanol withdrawal, M eta b o lism , 31: 1168-1174.
Tatami R, Mabuch H, Ueda K, Haba T, Kametani T, Ito S, Koizumi J, Ohta M, Miyamoto
S, Nakayama A, Kanaya H, Oiwake H, Genda A, and Takeda R, (1981),
Intermediate-density lipoprotein and cholesterol-rich very-low-density lipoprotein in
angiographically determined coronary artery disease, C ircu la tion , 64: 1174-1184.
Taylor PA, and Ward A, (1993), Women, high-density lipoprotein cholesterol and
exercise, A rch ives o f In ternal M edicine, 153: 1178-1184.
Thomas AB, (1991), Glucose metabolism during pregnancy: normal physiology and
implication for diabetes mellitus, Israel Journal o f M edicine, 27: 432-441.
Thompson PD, Cullinane EM, Sady SP, Flynn MM, Bernier DN, Kantor MA, Saritelli
AL, and Herbert PN, (1988), Modest changes in high-density lipoprotein
concentration and metabolism with prolonged exercise training, C ircu la tion , 78: 25
34.
Thomson HJ, de Boer J, and De Inogh H, (1967), Influence of dietary fats on plasma
lipids, P ath o log ia e t M icrob io lg ia , 30: 629-647.
Tikkanen MJ, (1989), Intravascular lipoprotein remodelling: lipolytic enzymes, in Human
p lasm a lipoproteins, Fruchar JC and Shepherd J (editors), Walter deGruyter, Berlin
New York, pp 142-151.
Tikkanen MJ, and Nikkila EA, (1987), Regulation of hepatic lipase and serum lipoprotein
by sex steroids, A m erican H ea rt Journal, 113: 562-567.
References 286
Tomlinson JE, McLean JW, Lawn RM, (1989), Rhesus monkey apolipoprotein (a):
sequence, evaluation, and site of effect, Jou rn a l o f B io lo g ica l C hem istry, 264 (No
10): 5957-5965.
Topping DL, and Turner DM, (1975), Plasma triglyceride secretion in squirrel monkeys:
effects of nicotine, N u trition a n d M eta b o lism , 18 (No 2): 89-98.
Topping DL, Dwyer T, and Weller RA, (1977), Peripheral vascular disease in cigarette
smokers and impaired hepatic metabolism of lipoprotein remnants, The L an cet, 2:
1327-1328.
Tribble DL, and Krauss RM, (1993), HDL and coronary artery disease, A d va n ced in
In ternal M ed icin e, 38: 1-25.
Trimbel ER, and McDowell IFW, (1992), Lipid metabolism and its disorders in diabetes
mellitus, in D ia b e te s a n d A th ero sc le ro s is , Stout RW (editor), Kluwer Academic
Publishers, Netherlands, pp 111-139.
Truswell AS, (1994), Food carbohydrates and plasma lipids: an update, A m erican Journal
o f C lin ica l N u tr itio n , 59 (supple 3): 710S-718S.
Truswell H, (1975), Dietary fibre hypothesis of the aetiology of diabetes mellitus,
D iabetes, 24: 762-765.
Tsunehara CH, Leonetti DL, and Fujimoto WY, (1990), Diet of second-generation
Japanese-American men with and without non-insulin-dependent diabetes, A m erican
Journal o f N u trition , 52: 731-738.
References 287
Tuck M, Lorry D, and Trujillo A, (1990), Salt-sensitive blood pressure and exaggerated
vascular reactivity in the hypertension of diabetes mellitus, A m erican Journal o f
M ed ic in e , 88: 210-216.
Turner RC, (1985), United Kingdom Prospective Diabetes Study III. Prevalence of
hypertension and hypertensive therapy in patients with newly diagnosed diabetes,
H yperten sion , 7 (supple II): 8-13.
Van Amelsvoort JMM, van der Beek A, Siam JJ, and Houtsmuller UMT, (1988), Dietary
influence on the insulin function in the epididymal fat cell of the wistar rat. III. Effect
of the ratio carbohydrate to fat, A nnals o f N u trition a n d M eta b o lism , 32: 138-148.
Van Assche FA, Aerts L, and Holemans K, (1991), Metabolic alterations in adulthood
after intra-uterine development in mother with mild diabetes, D ia b e tes , 40 (supple 2):
106-108.
Van Lenten BJ, Fogelman AM, Jackson RL, Shapiro S, Haberland ME, and Edwards PA,
(1985), Receptor-mediated uptake of remnant lipoproteins by cholesterol loaded
human monocyte-macrophages, Journal o f B io lo g ica l C h em istry , 260: 8783-8788.
Vander AJ, Sherman JH, and Luciano DS, (1994 a), The vascular system, in H um an
p h y s io lo g y : the m ech an ism s o f b o d y fu n ction , 6th edition, MacGraw Hill Inc, pp 429
438.
Vander AJ, Sherman JH, and Luciano DS, (1994), Cardiovascular patterns in health and
disease, in H um an p h y s io lo g y : the m echanism s o f b ody fu n c tio n , Vander AJ,
Sherman JH, and Luciano DS (editors), 6th edition, McGraw Hill Inc, pp 460-472.
References 288
Vander AJ, Sherman JH, and Luciano DS, (1994 b), Control and integration of
carbohydrate, protein and fat metabolism, in H um an p h ysio lo g y : the m echanism o f
b o d y fu n c tio n , 6th edition, Vander AJ, Sherman JH, and Luciano DS (editors),
McGraw Hill Inc, pp 602-624.
Vander AJ, Sherman JH, and Luciano DS, (1994 c), Haemostasis: the prevention of blood
loss, in H um an p h y s io lo g y : the m echanism s o f the body fu n c tio n , Vander AJ,
Sherman JH, and Luciano DS (editors), 6th edition, McGraw-Hill Inc, pp 741-750.
VanGaal L, Rillaerts E, Creten W, and DeLeeuw I, (1988), Relationship of body fat
distribution pattern to atherogenic risk factors in NIDDM. Preliminary results,
D ia b e tes C are, 11: 103-106.
Vergani C, Giudici GA, and Cuchel M, (1990), Clinical significance of
hypertriglyceridemia and low levels of HDL, in B iotech nology o f
dyslipopro te in em ias: app lica tion s in d iagnosis an d con tro l, Lenfanti C, et al
(editors), Raven Press, New York, pp 135-142.
Vermes I, Zeyen LJ, van Room E, and Brandts H, (1989), The role of serum fructosamine
as a screening test for gestational diabetes mellitus, H orm one an d m etabolic
R esearch, 21: 73-76.
Wahrburg U, Martin H, Sandkamp M, Schlte H, and Assmann G, (1992), Comparative
effects of a recommended lipid-lowering diet versus a diet rich in monounsaturated
fatty acids on serum lipid profiles in healthy young adults, A m erican Journal o f
C lin ica l N u tritio n , 56: 678-683.
References 289
Walker M, Agius L, Orskov H, and Albertti KM, (1993), Peripheral and hepatic insulin
sensitivity in non-insulin-dependent diabetes mellitus: effect of non-esterified fatty
acids, M e ta b o lism , 42 (No 5): 601-608.
Walker M, and Alberti KG, (1993), Syndrome X, in Causes of Diabetes, Leslie RDG
(editor), John W iley and Sons Ltd, pp 305-318.
Wallace RB, Hoover J, and Barret-Conner E, (1979), Altered plasma lipoprotein levels
associated with oral contraceptive and estrogen use, The L ancet, 2: 111-115.
Wallentin L, and Sundin B, (1985), Aberrations in lipoprotein lipids in men with coronary
artery disease and the influence of obesity, smoking, and (3-adrenoreceptor blocking
drugs, A th e ro sc le ro s is , 54: 241-249.
Waller KV, W ard KM, Mahan JD, and Wismatt DK, (1989), Current concepts in
proteinuria, C lin ica l C h em istry , 35: 755-765.
Ward Wk, Johnston CLW, Beard JC, Benedetti JJ, Halter JB, and Porte D Jr, (1985),
Insulin resistance and impaired insulin secretion in subjects with histories of
gestational diabetes mellitus, D ia b e te s , 34: 861-869.
Wamick R, Benderson J, and Albers, JJ, (1982), Dextran sulfate-Mg2+ precipitation
procedure for quantitation of high-density lipoprotein cholesterol, C lin ic a l
C h em istry , 28 (No 6): 1379-1388.
Warram JH, Martin BC, Krolewski AS, Soeldner J, and Kahn CR, (1990), Slow glucose
removal rate and hyperinsulinemia precede the development of type II diabetes in the
offspring of diabetic parents, A n n a ls o f In tern a l M ed ic in e , 113: 909-915.

References 290
Wasserman DH, Vranic M, (1986), Interaction between insulin and counter-regulatory
hormones in control of substrate utilization in health and diabetes during exercise,
Diabetes / Metabolism Reviews, 1 (No 4): 359-384.
Wassermann J, Santiago A, Holthofer H, Epstein M, and Schlondorff D, (1989),
Interactions of low-density lipoprotein with rat mesangial cells, K idn ey International,
85: 1168-1174.
Watts GF, Morries RW, Kkan K, and Polak A, (1988), Urinary albumin excretion in
healthy adults subjects: reference values and some factors affecting their
interpretation, C lin ica C him ica A cta , 172: 191-198.
Weidmann P, deCourten M, and Bohlen L, (1993), Insulin resistance, hyperinsulinemia
and hypertension, Journal o f H ypertension , 11 (supple 5): s27-s38.
Weiss PAM, (1988), Gestational diabetes: A survey and the Graz approach to diagnosis
and therapy, in G esta tion a l D ia b e tes , Weiss PAM and Coustan DR (editors),
Springer-Verlag / Wien, pp 1-55.
Weisser B, Gruñe S, Spuhler T, Kistler T, and Vetter WI, (1993), Plasma insulin is
correlated with blood pressure only in subjects with family history of hypertensive or
diabetes mellitus: results from 11001 participants in the Heureka Study, Journal o f
H ypertension , 11 (supple 5): S308-S309.
WHO (1987), Measuring obesity, classification and description of anthropometric data,
R ep o rt on a W H O consu lta tion on the ep idem io logy o f o b esity , Warsaw, 21-23
October 1987, N u trition unit docum ent, E ur / I CP / Nut, 125, Copenhagen.

References 291
W H O T echn ica l R e p o r t Series, (1984), Diet, nutrition, and the prevention of chronic
disease, No 797, Geneva, World Health Organization, pp 203.
WHO, (1985), Report of a study group: Diabetes Mellitus, W orld H ea lth O rgan iza tion
T echn ica l R e p o r t S eries, pp 727.
Widmann MD, and Sunpio BE, (1993), A risk factor for peripheral vascular disease.
A n n als o f V ascu lar S u rg ery , 7: 446-451.
Wilhelmsen L, Suardsudd K, Korsan-Bergtsen K, Larsson B, Welin L, and Tibblin G,
(1984), Fibrinogen as a risk factor for stroke and myocardial infarction, N ew E ngland
Jou rn a l o f M ed ic in e, 311: 501-505.
Willett WC, Stampfer MJ, Manson JE, Colditz GA, Speizer FE, Rosner BA, Sampson
LA, and Hennekens CH, (1993), Intake of trans fatty acids and risk of coronary heart
disease among women, The L a n ce t, 341: 581-585.
Williams RR, Hopkins PN, Hunt SC, Schumacher MC, Stults BM, Wu LL, and Hasstedt
SJ, (1994), Inherited susceptibility to metabolic complications of obesity, in The
G en etics o f O besity , Bouchard C (editor), by CRC Press Inc, pp 147-159.
Williams TP, Krauss RM, Kindel-Joyce S, Dreon DM, Vranizan KM, and Wood PD,
(1986), Relationship of dietary fat, protein, cholesterol, and fibre intake to
atherogenetic lipoproteins in men, A m erican Journal o f C lin ica l N u trition , 44: 788
797.
Williamson JR, Kreisberg RA, Felts PW, (1966), Mechanism for the stimulation of
gluconeogenesis by fatty acids in perfused rat liver, P roceed in g o f N a tion a l A cadem y
o f S c ien ces, USA, 56: 247-254.
References 292
Wilson LM, (1992), Normal renal function, in P a th o p h ysio lo g y , c lin ica l con cep ts o f
d isea se p r o c e s s , Price SA, and Wilson LM (editors), 4th edition, Mosby Year Book
Inc, USA, pp 613-646.
Wilson PWF, Garrison RJ, Abbott RD, and Castelli WP, (1983), Factors associated with
lipoprotein cholesterol levels, A rter io sc le ro sis , 3: 273-281.
Winer RL, (1989), Microalbuminuria: A discussion of disease involvement, B eckm an
P u b lica tion s, 1-11.
Winocour PH, Harland JOE, Millar JP, Laker ME, and Alberti KG, (1992),
Microalbuminuria and associated cardiovascular risk factors in the community,
A th e ro sc le ro s is , 93: 71-81.
Winocour PH, Kaluvya S, Ramaiya K, Brown L, Millar JP, Farrer M, and Neil-HA,
(1992), Relation between insulinemia, body mass index, and lipoprotein composition
in healthy, non-diabetic men and women, A rte r io sc le ro sis a n d T h rom bosis , 12(No 3):
393-402.
Woo J, Cockram CS, Swaminathan R, Lau E, Chan A, and Cheung R, (1992),
Microalbuminuria and other cardiovascular risk factors in non-diabetic subjects,
In tern a tion a l Jou rn a l o f C ard io logy , 37: 345-350.
Woo R, Daniels-Kush R, and Horton ES, (1985), Regulations of energy balance, Annals
R eview s o f N utrition , 5: 411-433.
Wood PD, Haskell WL, Stem MP, Lewis S, and Perry S, (1977), Plasma lipoprotein
distributions in male and female runners, A nnals o f the N ew York A cadem y o f
S c ien ces , 301: 748-763.

References 293
W ood PD, Stenfanick ML, Dreon DM, Fery-Hewitt B, Garay SC, Williams PT, Superko
HR, Fotmann SP, Albers JJ, and Varizan KM, (1988), Changes in plasma lipids and
lipoproteins in overweight men during weight loss through dieting as compared with
exercise, N ew E n g la n d Journal o f M ed ic in e, 319 (No 18): 1173-1179.
Yamell JWG, Baker LAB, Sweetmen PM, Bainton D, O’Brien JR, Whithead PJ, and
Elwood PC, (1991), Fibrinogen, viscosity, and white blood cell count are major risk
factors for ischemic heart disease; The Caerphilly and Speedwell Collaborative Heart
Disease Studies, C ircu la tion , 83 (No 3): 1098-1100.
Yki-Jarvinen H, (1992), Glucose toxicity, E ndocrin o logy R eview s, 13: 415-431.
Yki-Jarvinen H, (1994), Pathogenesis of non-insulin-diabetes mellitus, The L a n ce t, 343:
91-95.
Yki-Jarvinen H, Puhakainen I, and Koivisto VA, (1991), Effect of free fatty acids on
glucose uptake and non-oxidative glycolysis across human forearm tissues in the basal
state and during insulin stimulation, Journal o f C lin ica l E n docrin o logy &
M eta b o lism , 72: 1268-1277.
Yoshino G, Iwai M, Matsuba K, Iwatani I, Matsushita M, Kazumi T, and Baba S, (1989),
Estimation of cholesterol loading of low-density lipoprotein fraction in diabetic
subjects without ultracentrifugation, D ia b e tes R esearch an d C lin ica l P ractice, 7:
155-157.
Yudkin JS, (1993), Microalbuminuria as a risk factor for cardiovascular disease in non
diabetic subjects, in D ia b e tes , obesity , a n d h yperlip idem ias: V. The p lu rim eta b o lic
syn drom e , Tiengo GCA, and Manzato E (editors), Proceeding of the 6th European
References 294
Symposium on Metabolism, Podova, 24-26 may 1993, Excerpta Media International
Congress Series 1039, Elsevier Science Publishers BV, pp 141-152.
Yudkin JS, (1993), Triglycerides and coagulation, Report of a meeting of physicians and
scientists, university college, London, Medical school, The L a n ce t, 342: 784-784.
Yudkin JS, Forrest RD, and Jackson CA, (1988), Microalbuminuria as predictor of
vascular disease in non-diabetic subjects: Islington Diabetes Survey, The L an cet, ii:
530-533.
Zammet P, (1989), Non-insulin-dependent diabetes mellitus: does it really exist? D iabe tic
M ed ic in e , 6: 728-735.
Zavaroni I, Bonora E, Pagliara M, Dallaglio E, Luchetti L, Buonanno G, Bonati PA,
Bergozani M, Gundi L, Passeri M, and Reaven G, (1989), Risk factors for coronary
artery disease in healthy person with hyperinsulinemia and normal glucose tolerance,
N ew E n glan d Jou rn a l o f M edicine, 320: 703-706.
Zimett PZ, Collins VR, Dowse GK, and Knight LT, (1992), Hyperinsulinemia in youth is a
predictor of type II (non-insulin-dependent) diabetes mellitus, D ia b e to lo g ia , 35: 536
541.

APPENDIX I
Demographic Information
F IL E :..................... DATE:
N A M E:............................................................................................
A D D RESS:....................................................................................
TEL EPH O N E N O :...................................................
DATE O F B IR T H :...................................................
Nam e and address of family / personal doctor:
Nam e and address of two relatives / friends (This will help us locate you if you move
from the above address):
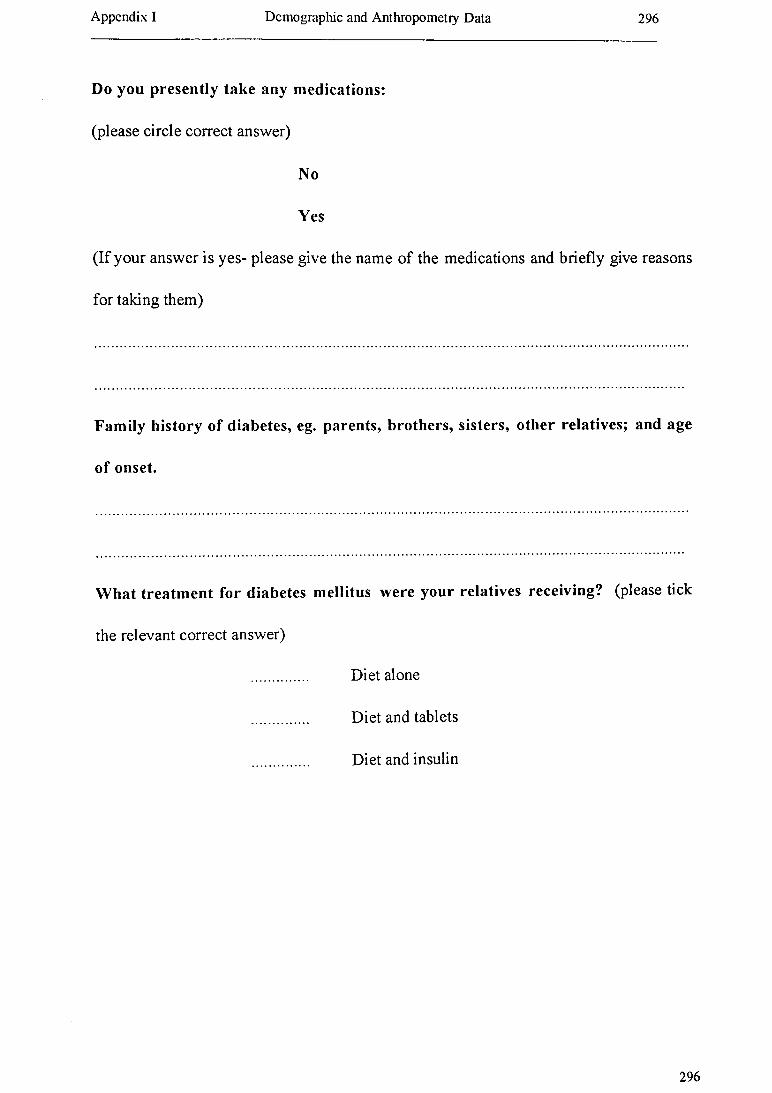
Appendix I Demographic and Anthropometiy Data 296
Do you presently take any medications:
(please circle correct answer)
No
Yes
(If your answer is yes- please give the name of the medications and briefly give reasons
for taking them)
Family history of diabetes, eg. parents, brothers, sisters, other relatives; and age
of onset.
W hat treatm ent for diabetes mellitus were your relatives receiving? (please tick
the relevant correct answer)
.............. Diet alone
.............. Diet and tablets
.............. Diet and insulin
296
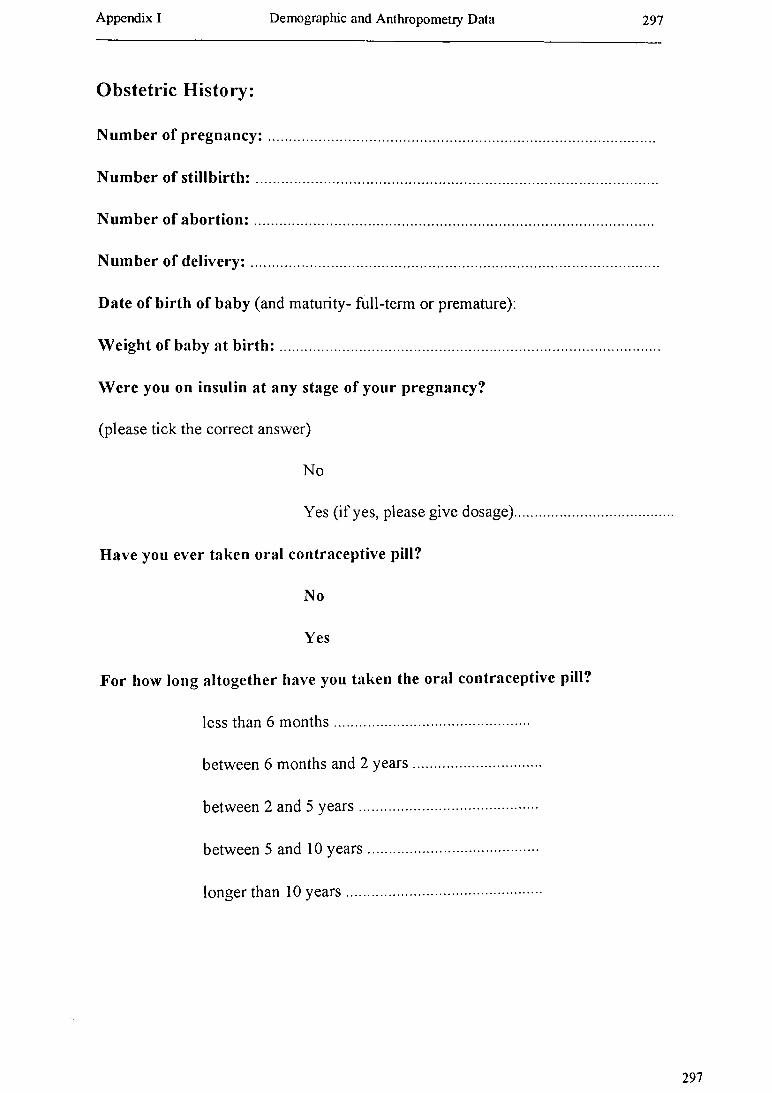
Appendix I Demographic and Anthropometry Data 297
Obstetric History:
Num ber of p regnancy :.................................................................................
Num ber of s tillb irth :....................................................................................
Num ber of a b o rtio n :....................................................................................
Number of delivery :.....................................................................................
Date of birth of baby (and maturity- full-term or premature):
Weight of baby at b i r th : ..............................................................................
W ere you on insulin at any stage of your pregnancy?
(please tick the correct answer)
No
Yes (if yes, please give dosage)...................
Have you ever taken oral contraceptive pill?
No
Yes
For how long altogether have you taken the oral contraceptive pill?
less than 6 m onths................................................
between 6 months and 2 years...............................
between 2 and 5 years............................................
between 5 and 10 years..........................................
longer than 10 years................................................
297
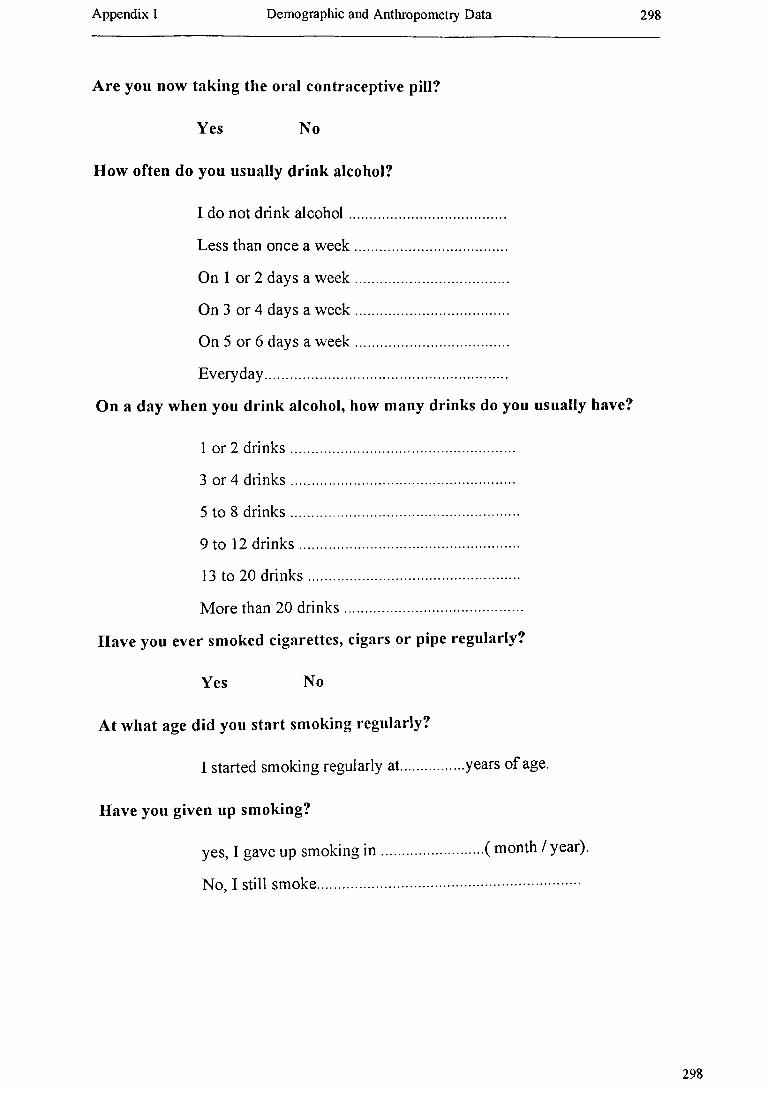
Appendix I Demographic and Anthropometry Data 298
Are you now taking the oral contraceptive pill?
Yes No
How often do you usually drink alcohol?
I do not drink a lco h o l..........................................
Less than once a w e e k ............................................
On 1 or 2 days a w e e k ............................................
On 3 or 4 days a w e e k ............................................
On 5 or 6 days a w e e k ............................................
Everyday......................................................................
On a day when you drink alcohol, how many drinks do you usually have?
1 or 2 drinks..............................................................
3 or 4 drinks................................................................
5 to 8 drinks.................................................................
9 to 12 drinks...............................................................
13 to 20 drinks.............................................................
More than 20 drinks...................................................
Have you ever smoked cigarettes, cigars or pipe regularly?
Yes No
At what age did you start smoking regularly?
I started smoking regularly at..................years of age.
Have you given up smoking?
yes, I gave up smoking i n ............................. ( month / year).
N o, I still sm oke............................................................................
298

Appendix I Demographic and Anthropometry Data 299
If you have given up smoking please answer the following questions:
Now much did you smoke?
week
I used to smoke...................manufactured cigarettes a day
.................... grams ‘hand-rolled’ cigarette tobacco per
.....................cigars per week
.....................grams pipe tobacco per week
A nthropometric Measurements:
Usual weight:................................................ Present weight
H eight....................
W aist m easurement: 1.............................................
2.....................................................
3.........................................
Hip m easurem ent: 1.............................................
2.....................................................
3.........................................
Waist / Hip ratio:....................
Skinfold thickness: 1....................... 2.............. ..........3............. .......... Triceps
1....................... 2.............. ..........3.............. ...........Biceps
1....................... 2 ............. .........3 ............. ......... Subscapular
1............ ...........2.............. .........3............. ..........Suprailiac
Blood pressure: 1 2 3.
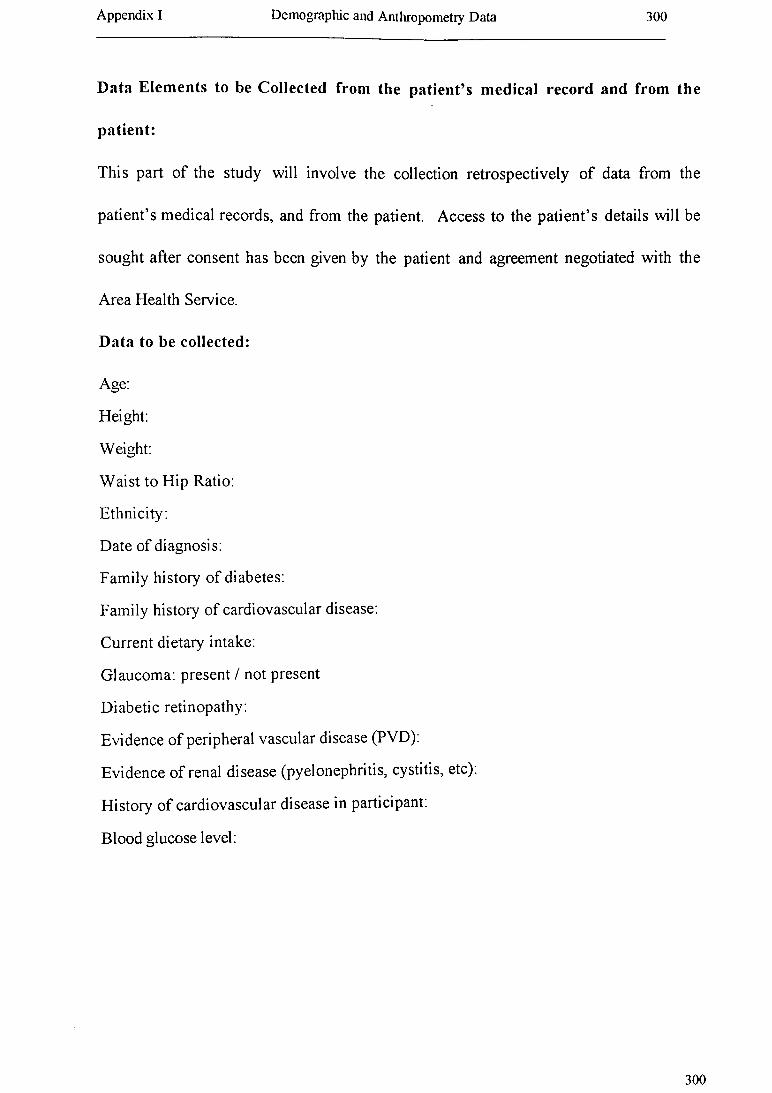
Appendix I Demographic and Anthropometry Data 300
Data Elements to be Collected from the patient’s medical record and from the
patient:
This part of the study will involve the collection retrospectively of data from the
patient’s medical records, and from the patient. Access to the patient’s details will be
sought after consent has been given by the patient and agreement negotiated with the
Area Health Service.
Data to be collected:
Age:
Height:
Weight:
Waist to Hip Ratio:
Ethnicity:
Date of diagnosis:
Family history of diabetes:
Family history of cardiovascular disease:
Current dietary intake:
Glaucoma: present / not present
Diabetic retinopathy:
Evidence of peripheral vascular disease (PVD):
Evidence of renal disease (pyelonephritis, cystitis, etc):
History of cardiovascular disease in participant:
Blood glucose level:
300
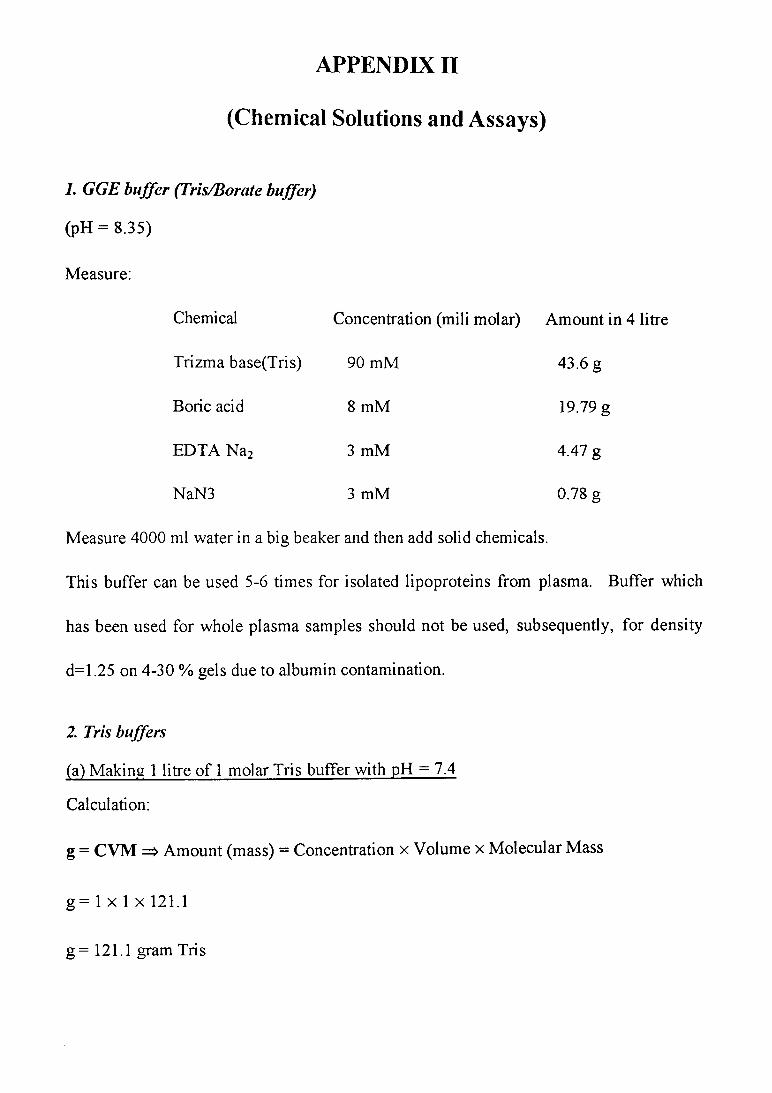
APPENDIX II
(Chemical Solutions and Assays)
1. G G E b u ffer (T ris/B ora te buffer)
(pH = 8.35)
Measure:
Chemical Concentration (mili molar) Amount in 4 litre
Trizma base(Tris) 90 mM 43.6 g
Boric acid 8 mM 19.79 g
EDTA Na2 3 mM 4.47 g
NaN3 3 mM 0.78 g
Measure 4000 ml water in a big beaker and then add solid chemicals.
This buffer can be used 5-6 times for isolated lipoproteins from plasma. Buffer which
has been used for whole plasma samples should not be used, subsequently, for density
d=1.25 on 4-30 % gels due to albumin contamination.
2 Tris buffers
(a) Making 1 litre of 1 molar Tris buffer with pH = 7.4
Calculation:
g = CVM => Amount (mass) = Concentration x Volume x Molecular Mass
g = 1 x 1 x 121.1
g = 121.1 gram Tris

A ppendix II Chem ical Solutions and A ssays 302
This amount o f Tris is dissolved in 1 litre distilled water in a flask.
Solution is put in beaker and pH is measured (should be pH = 7.4), if pH is higher than
7.4, 32% concentrated HCL solution should be added to reach the target pH (pH = 7.4).
This solution will be used as stock to make TBS buffer.
(b) TBS + 0.005% EDTA + 0,02% N aN, (for 5 1)
Measure:
43.83 gN aC L
0.25 g EDTA
1 g NaN3
Mix the measured chemicals with 50 ml of Tris buffer
Measure twice 2 litter of distilled water in volumetric flask and last 1 litter
measure in cylinder (but -50 ml of Tris) (950 ml of water).
This buffer can be used for dialysing and dilution.
2 T rack in g dye
(Sucrose bromophenol blue solution)
Measure and mix:
4 gram of Sucrose (D-glucose)
0.001 gram of bromophenol blue
Add 10 ml o f Tris borate buffer (TBS)
3. G G E s ta in (p ro te in )
Measure 0.4 g page blue stain (brilliant blue)
302
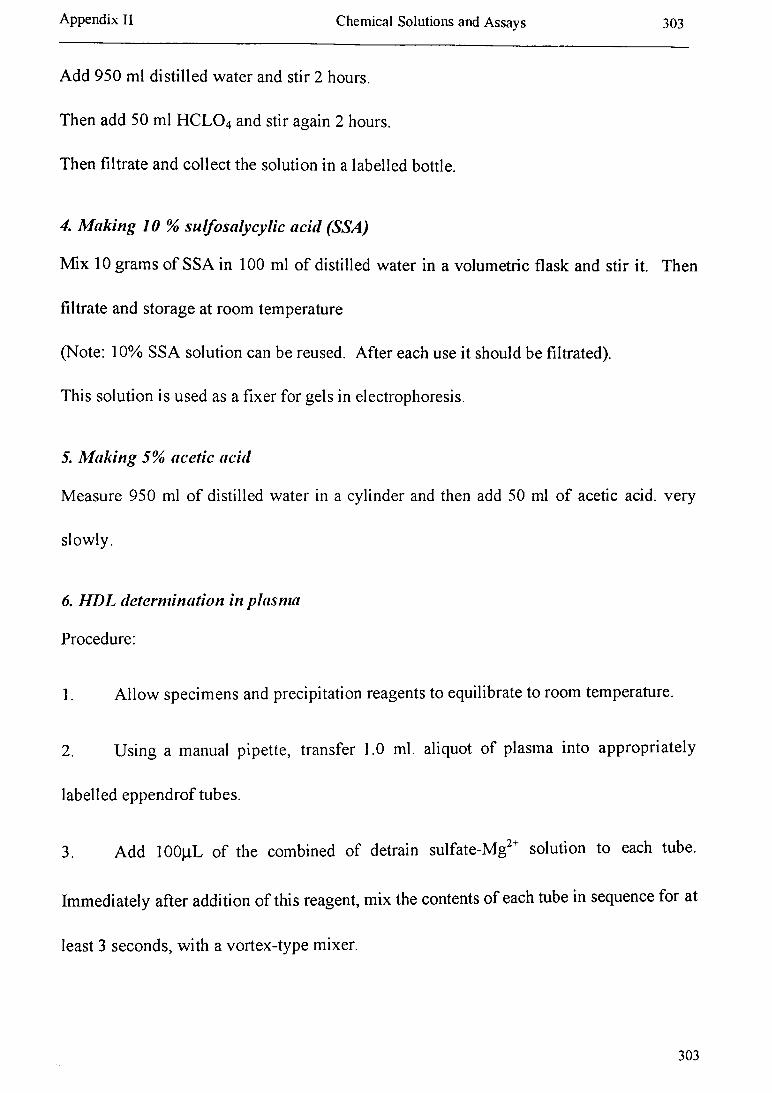
A ppendix II Chem ical Solutions and A ssays 303
Add 950 ml distilled water and stir 2 hours.
Then add 50 ml H C L 04 and stir again 2 hours.
Then filtrate and collect the solution in a labelled bottle.
4. Making 10 % sulfosalycylic acid (SSA)
Mix 10 grams of SSA in 100 ml of distilled water in a volumetric flask and stir it. Then
filtrate and storage at room temperature
(Note: 10% SSA solution can be reused. After each use it should be filtrated).
This solution is used as a fixer for gels in electrophoresis.
5. Making 5% acetic acid
Measure 950 ml of distilled water in a cylinder and then add 50 ml o f acetic acid, very
slowly.
6. HDL determination in plasma
Procedure:
1. Allow specimens and precipitation reagents to equilibrate to room temperature.
2. Using a manual pipette, transfer 1.0 ml. aliquot of plasma into appropriately
labelled eppendrof tubes.
3. Add IOOjiL of the combined of detrain sulfate-Mg2+ solution to each tube.
Immediately after addition of this reagent, mix the contents of each tube in sequence for at
least 3 seconds, with a vortex-type mixer.
303

A ppendix II Chem ical Solutions and A ssays 302
This amount o f Tris is dissolved in 1 litre distilled water in a flask.
Solution is put in beaker and pH is measured (should be pH = 7.4), if pH is higher than
7.4, 32% concentrated HCL solution should be added to reach the target pH (pH = 7.4).
This solution will be used as stock to make TBS buffer.
(b) TBS + 0,005% EDTA + 0.02% NaN, (for 5 1)
Measure:
43.83 gN aC L
0.25 g EDTA
1 g NaN3
Mix the measured chemicals with 50 ml of Tris buffer
Measure twice 2 litter o f distilled water in volumetric flask and last 1 litter
measure in cylinder (but -50 ml of Tris) (950 ml of water).
This buffer can be used for dialysing and dilution.
2. Tracking dye
(Sucrose bromophenol blue solution)
Measure and mix:
4 gram of Sucrose (D-glucose)
0.001 gram of bromophenol blue
Add 10 ml of Tris borate buffer (TBS)
3. GGE stain (protein)
Measure 0.4 g page blue stain (brilliant blue)
302

A ppendix II Chem ical Solutions and A ssays 303
Add 950 ml distilled water and stir 2 hours.
Then add 50 ml H C L 04 and stir again 2 hours.
Then filtrate and collect the solution in a labelled bottle.
4. M a k in g 10 % su lfo sa ly c y lic a c id (SSA )
Mix 10 grams of SSA in 100 ml of distilled water in a volumetric flask and stir it. Then
filtrate and storage at room temperature
(Note: 10% SSA solution can be reused. After each use it should be filtrated).
This solution is used as a fixer for gels in electrophoresis.
5. M a k in g 5% a c e tic a c id
Measure 950 ml o f distilled water in a cylinder and then add 50 ml o f acetic acid, very
slowly.
6. H D L d e term in a tio n in p la sm a
Procedure:
1. Allow specimens and precipitation reagents to equilibrate to room temperature.
2. Using a manual pipette, transfer 1.0 ml. aliquot of plasma into appropriately
labelled eppendrof tubes.
3. Add IOOjiL o f the combined of detrain sulfate-Mg2+ solution to each tube.
Immediately after addition of this reagent, mix the contents of each tube in sequence for at
least 3 seconds, with a vortex-type mixer.
303
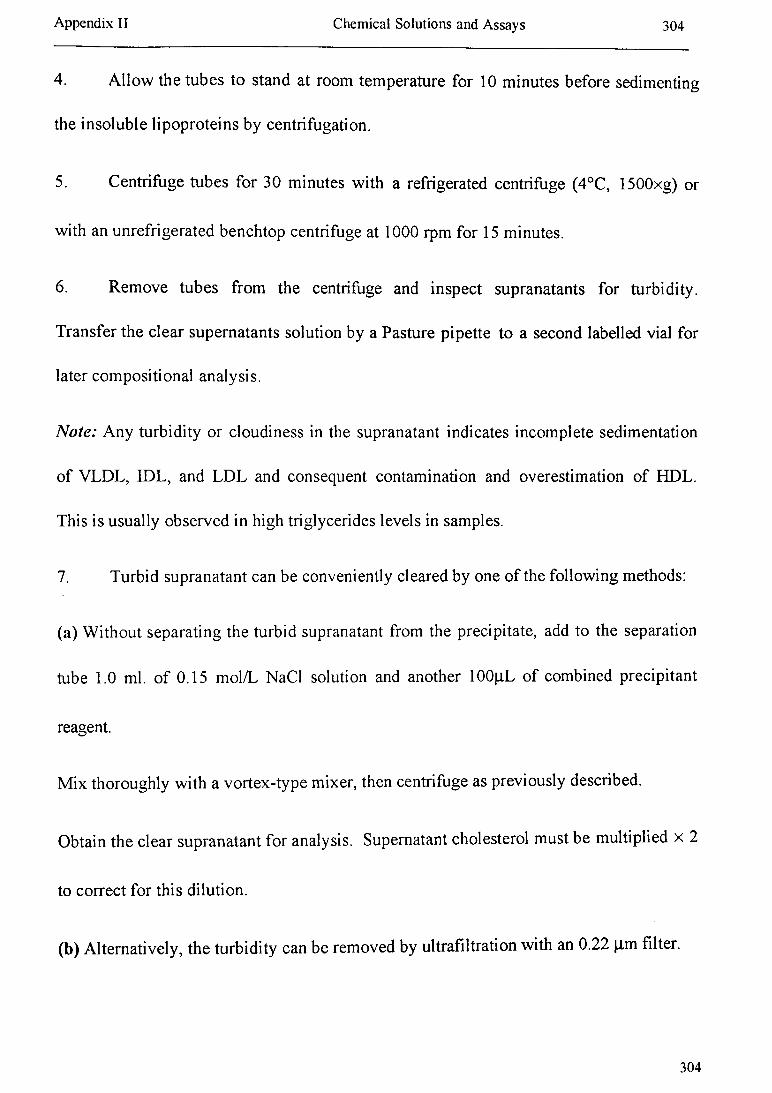
A ppendix II Chem ical Solutions and A ssays 304
4. Allow the tubes to stand at room temperature for 10 minutes before sedimenting
the insoluble lipoproteins by centrifugation.
5. Centrifuge tubes for 30 minutes with a refrigerated centrifuge (4°C, 1500xg) or
with an unrefrigerated benchtop centrifuge at 1000 rpm for 15 minutes.
6. Remove tubes from the centrifuge and inspect supranatants for turbidity.
Transfer the clear supernatants solution by a Pasture pipette to a second labelled vial for
later compositional analysis.
N o te : Any turbidity or cloudiness in the supranatant indicates incomplete sedimentation
of VLDL, IDL, and LDL and consequent contamination and overestimation of HDL.
This is usually observed in high triglycerides levels in samples.
7. Turbid supranatant can be conveniently cleared by one of the following methods:
(a) Without separating the turbid supranatant from the precipitate, add to the separation
tube 1.0 ml. o f 0.15 mol/L NaCl solution and another lOOpL of combined precipitant
reagent.
Mix thoroughly with a vortex-type mixer, then centrifuge as previously described.
Obtain the clear supranatant for analysis. Supernatant cholesterol must be multiplied x 2
to correct for this dilution.
(b) Alternatively, the turbidity can be removed by ultrafiltration with an 0.22 pm filter.
304
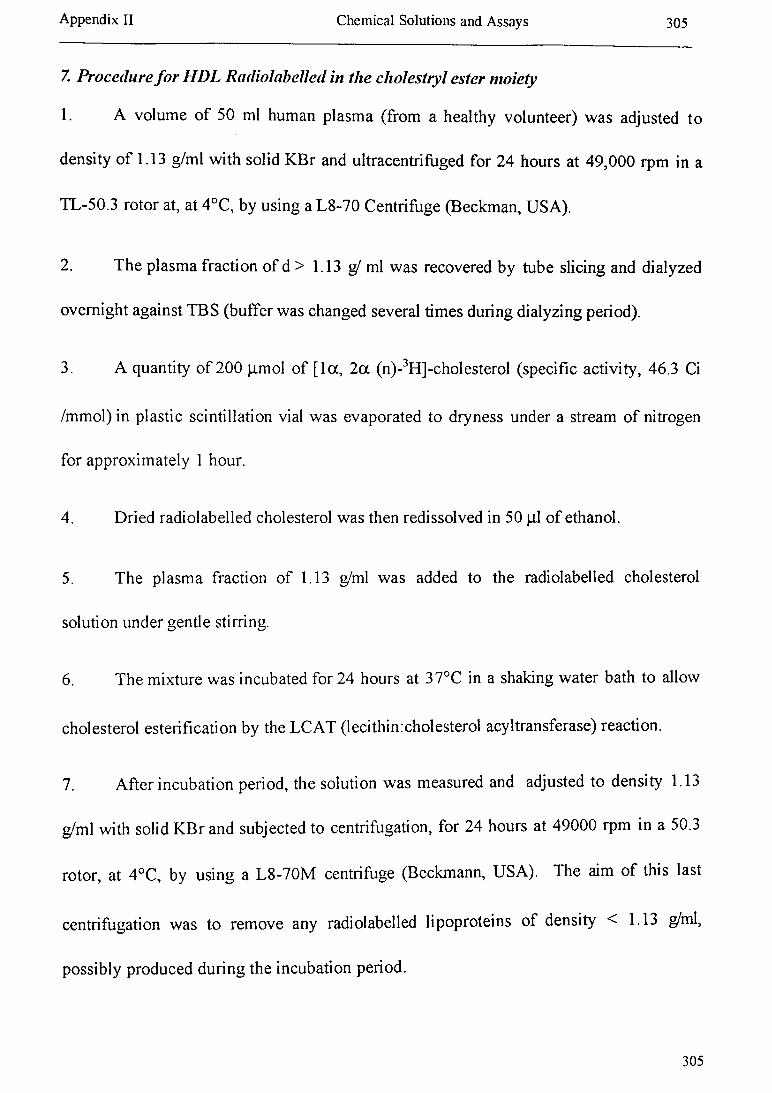
A ppendix II C hem ical Solutions and A ssays 305
7. P ro c ed u re f o r H D L R cu lio labelled in th e c h o le s try l e s te r m oie ty
1. A volume of 50 ml human plasma (from a healthy volunteer) was adjusted to
density of 1.13 g/ml with solid KBr and ultracentrifuged for 24 hours at 49,000 rpm in a
TL-50.3 rotor at, at 4°C, by using a L8-70 Centrifuge (Beckman, USA).
2. The plasma fraction of d > 1.13 g! ml was recovered by tube slicing and dialyzed
overnight against TBS (buffer was changed several times during dialyzing period).
3. A quantity of 200 jimol of [ la , 2 a (n)-3H]-cholesterol (specific activity, 46.3 Ci
/mmol) in plastic scintillation vial was evaporated to dryness under a stream of nitrogen
for approximately 1 hour.
4. Dried radiolab el led cholesterol was then redissolved in 50 jil o f ethanol.
5. The plasma fraction of 1.13 g/ml was added to the radiolabelled cholesterol
solution under gentle stirring.
6. The mixture was incubated for 24 hours at 37°C in a shaking water bath to allow
cholesterol esterification by the LCAT (lecithinxholesterol acyltransferase) reaction.
7. After incubation period, the solution was measured and adjusted to density 1.13
g/ml with solid KBr and subjected to centrifugation, for 24 hours at 49000 rpm in a 50.3
rotor, at 4°C, by using a L8-70M centrifuge (Beckmann, USA). The aim of this last
centrifugation was to remove any radiolabelled lipoproteins of density < 1.13 g/ml,
possibly produced during the incubation period.
305
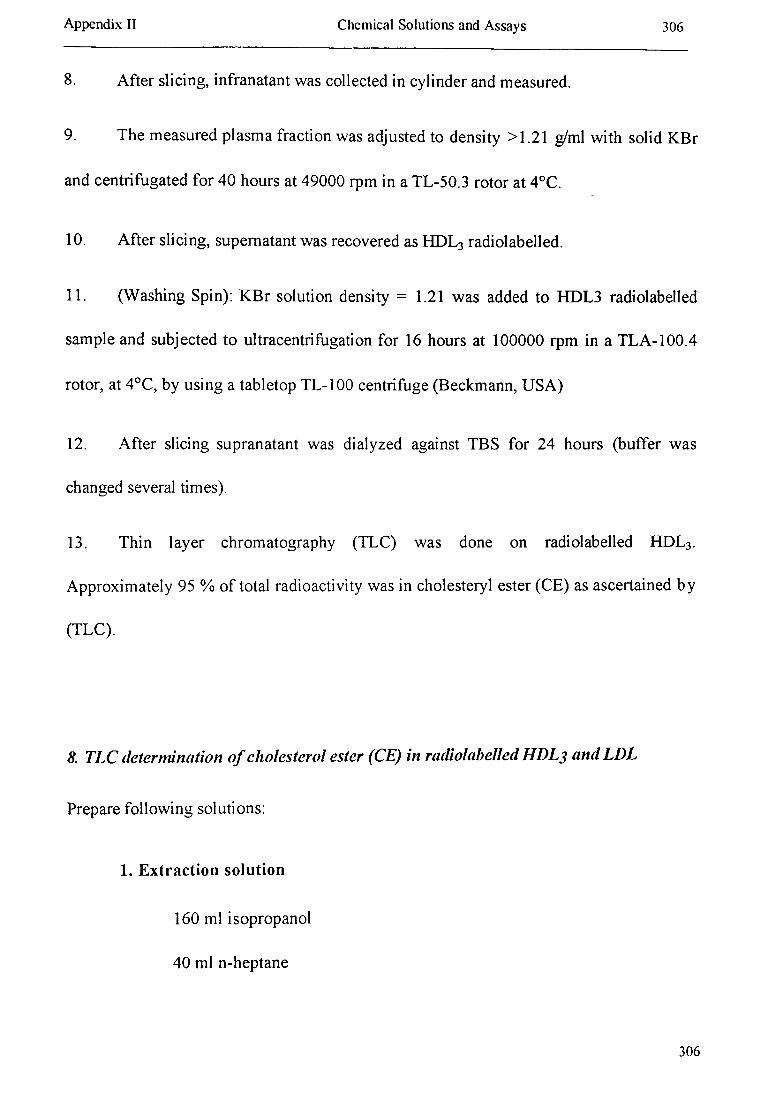
Appendix II Chemical Solutions and A ssays 306
8. After slicing, infranatant was collected in cylinder and measured.
9. The measured plasma fraction was adjusted to density >1.21 g/ml with solid KBr
and centrifugated for 40 hours at 49000 rpm in a TL-50.3 rotor at 4°C.
10. After slicing, supernatant was recovered as HDL3 radiolabelled.
11. (Washing Spin): KBr solution density = 1.21 was added to HDL3 radiolabelled
sample and subjected to ultracentrifugation for 16 hours at 100000 rpm in a TLA-100.4
rotor, at 4°C, by using a tabletop TL-100 centrifuge (Beckmann, USA)
12. After slicing supranatant was dialyzed against TBS for 24 hours (buffer was
changed several times).
13. Thin layer chromatography (TLC) was done on radiolabelled HDL3.
Approximately 95 % of total radioactivity was in cholesteryl ester (CE) as ascertained by
(TLC).
8. TLC determination o f cholesterol ester (CE) in radiolabelled HDL3 and LDL
Prepare following solutions:
1. Extraction solution
160 ml isopropanol
40 ml n-heptane
306

A ppendix II Chem ical Solutions and A ssays 307
4 ml 1 N (0 .5M )H 2S O 4
2. Developing solution for TLC plates
45 ml hexane
20 ml diethyl ether
1.5 ml methanol
1 ml acetic acid
The recovery of cholesterol ester is determined by adding a know amount of ^ C -
cholesteryl oleate to the extraction solution. Prepare stock solution by adding 10 ul ^ C -
cholesteryl oleate to 100 ml extraction solution. Prepare working solution by diluting
stock solution 1:8 with extraction solution (ie. 0.5 ml stock + 3.5 ml extraction solution).
From this, take 2.5 ml at next step.
procedure:
1. Add 5 p.1 radiolabelled HDL3 or radiolabelled LDL to 495 \i\ TBS buffer (pH =
7.4).
2. Add 40 |il unlabelled HDL3 or LDL (carrier lipoprotein)
3. Add 2.5 ml extraction solution (with 14C-cholesteryl oleate)
4. Cap and vortex
5. Stand at room temperature 20 minutes
307
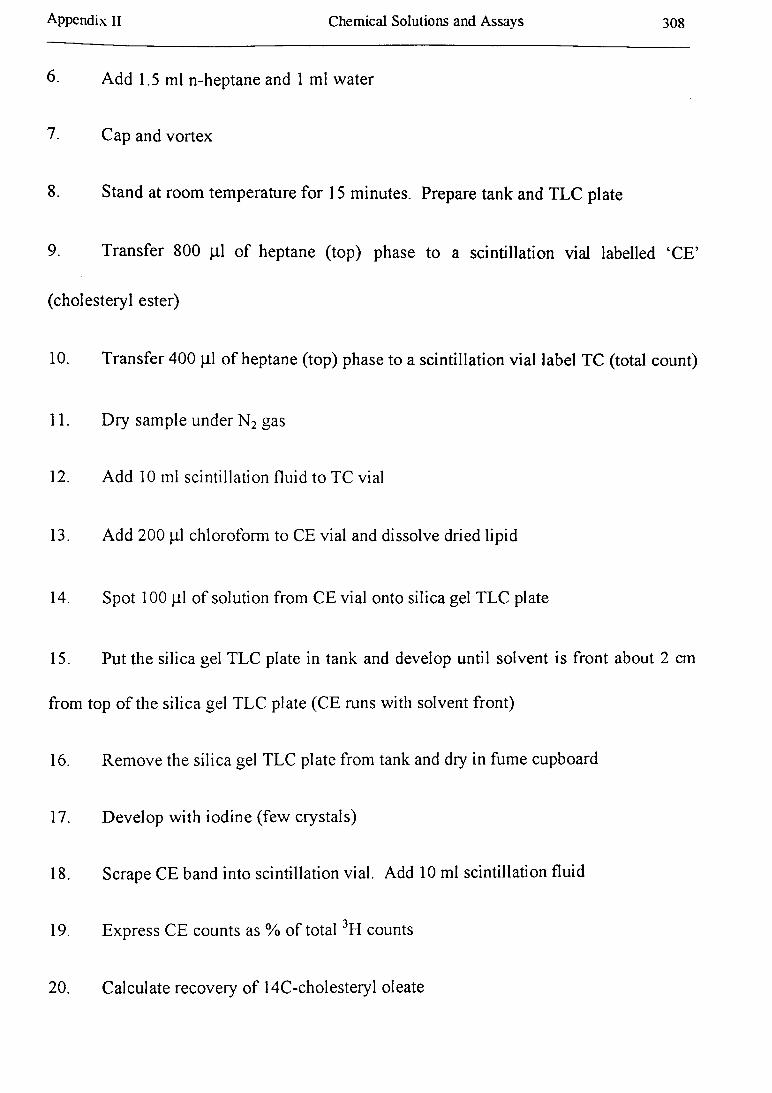
Appendix II C hem ical Solutions and A ssays 308
6. Add 1.5 ml n-heptane and 1 ml water
7. Cap and vortex
8. Stand at room temperature for 15 minutes. Prepare tank and TLC plate
9. Transfer 800 p.1 o f heptane (top) phase to a scintillation vial labelled ‘CE’
(cholesteryl ester)
10. Transfer 400 |il o f heptane (top) phase to a scintillation vial label TC (total count)
11. Dry sample under N 2 gas
12. Add 10 ml scintillation fluid to TC vial
13. Add 200 jil chloroform to CE vial and dissolve dried lipid
14. Spot 100 jil o f solution from CE vial onto silica gel TLC plate
15. Put the silica gel TLC plate in tank and develop until solvent is front about 2 cm
from top o f the silica gel TLC plate (CE runs with solvent front)
16. Remove the silica gel TLC plate from tank and dry in fume cupboard
17. Develop with iodine (few crystals)
18. Scrape CE band into scintillation vial. Add 10 ml scintillation fluid
19. Express CE counts as % of total 3H counts
20. Calculate recovery of 14C-cholesteryl oleate

Appendix II C hem ical Solutions and A ssays 309
CE vial count / TC vial count x 100 = X (% recovery of CE)
9, CETP activity % in plasma Procedure:
1. 100 jil plasma was mixed with 50 \û [3H] HDL3 (containing 2.5 nmol cholesterol.
2.2 x 10⁵ counts/minute per 50 p.1)
2. Incubate it for 3 hours at 37°C.
3. Place the tubes immediately on ice.
4. Precipitated the apo B containing lipoproteins with dextran sulfate-Mg2+
(W am icketal, 1982)
The CETP assay procedure is summarized in Table 1
5. Supranatants (0.8 o f total volume) were collected in plastic scintillation vials. A
volume of 10 mL of scintillation fluid (Instagel, Pachard Instrument Company, IL, USA)
was added to each vial and the radioactivity was assayed for 10 minute in a ‘Hewlett-
Packard scintillation counter’.
The percentage o f radioactivity transferred to apo B containing lipoproteins was
calculated, as the difference between the total radioactivity o f the assay and the
radioactivity o f the supranatant after precipitation of the VLDL, EDL, and LDL, with
adjustment for non-specific transfer.

Appendix II Chem ical Solutions and A ssays 310
Table-1: Summerized CETP assay procedure
Tube TBS h d l 3 plasma Total
volume
Incub
Period
15 Hi Total
volume
Recover
volume
1,2 100
nl50 |il 150 nl 3.h TBS 165 Hi 132 Hi
3,4 100
11150 |il 150 Hi 3.h Dextr
sulfate
165 Hi 132 Hi
5,6 50 nl 100 Hi
(+cont)
150 Hi 3.h Dextr
sulfate
165 Hi 132 Hi
7,8 50 Hi subject
sample
150 Hi 3.h Dextr
sulfate
165 Hi 132 Hi
9,10 50 Hi subject
sample
150 nl 3.h Dextr
sulfate
165 Hi 132 Hi
Incub = Incubation, h = hours, Dextr = Dextran, (+ cont) = positive control, Recover = Recovery.

App
endi
x II
Che
mic
al S
olut
ions
and
Ass
ays
CHOL Contents MPR 1 MPR 2 MPR 3 Preparation and stability of the reagent solution
Bottle 1Cholesterolreagent
10 10 4 MPR 1: Dissolve contents of one bottle 1 by adding 32 ml redist. water.
MPR 2: Dissolve contents of one bottle 1 by adding 100 ml redist. water.
MPR 3: Dissolve contents of one bottle 1 by adding 500 ml redist. water.
The reagent solution is ready to use after 10 minutes.Stable for four weeks at +2 to 8°C
seven days at +15 to 25°C.
MPR 1 1442341 10 x 32 ml 2MPR 2 1442350 1 0 x 100 ml 2MPR 3 236 691 4 x 500 ml
C ho leste ro l CHOD-PAP method
MethodSiedel, J., et al. (1983). Clin. Chem. 29:1075.Kattermann, R., et al. (1984). Clin. Chem. Clin. Biochem. 22: 245.Trinder, P. (1969). Ann. clin. Biochem. 6:24.
Test principle , , ,,_ 1 , , . Cholesterol esterase , , .
Cholesterol esters + H20 --------------------------------» Cholesterol +RCOOH
, , . , _ Cholesterol oxIdase ,Cholesterol + 0 2 --------------------------------> A -cholestenone +
l-|20 2
2 H20 2 + 4-aminophenazone + phenol - 4-(p-benzo- quinone-monoimino)-phenazone + 4 H20
Clinical in terpretation according to the recommendations of the European Atherosclerosis Society’ :
Lipid disorder
CholesterolTriglycerides
< 200 mg/dl< 200 mg/dl •
No
Cholesterol 200-300 mg/dlYes,
if HDL cholesterol < 35 mg/dl
CholesterolTriglycerides
> 300 mg/dl> 200 mg/dl
Yes
Values in mmol/l:Cholesterol: 35 mg/dl = 0.9 mmol/l
200 mg/dl = 5.2 mmol/l 300 mg/dl = 7.8 mmol/l
Triglycerides: 200 mg/dl = 2.3 mmol/l
Sample materialSerum, heparinized plasma or EDTA plasma Stable for six days at +4 to 25°C
four months at -20°C.
ProcedureWavelength: Hg 546 nm (470-560 nm) Spectrophotometer: 500 nm Cuvette: 1 cm light path Incubation temperature: 20-25°C or 37°C Measure against reagent blank (RB).One reagent blank is sufficient for each assay series.
Pipette into test tubes:
RB Sample
sample material reagent solution 2.00 ml
0.02 ml 2.00 ml
Mix, and incubate RB and sample for 10 min al 20-25uC or 5 min at 37°C.Read absorbance of sample against RB within 1 hour =A' ' s a m p le *
Dilution threshold1000 mg/dl (25.9 mmol/l)At higher cholesterol concentrations, dilute 0.1 ml of sample material with 0.2 ml of 0.9% NaCI solution and repeat assay (result x 3).
Calculationof the concentration (c) of cholesterol in the sample:
Wavelength mg/dl mmol/l
Hg 546 nm c = 853 x Asample c = 22.1 x Asampte
500 nm c — 575 x Ason,pie c = 14.9 x Aso,„ple
Concentrations of the reagent solutionTris buffer: 100 mmol/l, pH 7.7; Mg2*: 50 mmol/l; 4-aminophenazone: 1 mmol/l; sodium cholate: 10 mmol/l; phenol:6 mmol/l; 3,4-dichlorophenol: 4 mmol/l; fatty alcohol polyglycol ether: 0.3%; cholesterol esterase § 0.4 U/ml; cholesterol oxidase ^ 0.25 U/ml; peroxidase S 0.2 U/ml
Quality controlAccuracy: Precinorm® U, Precinorm* L, Precipath® U,
Precipath® LPrecision: Precinorm® UPX
Please noteIf difficulties encountered in quality control point to inadequate linear response on the part of the photometer, or if measurements cannot be taken at Hg 546 nm or 500 nm, a calibration curve must be constructed using Preciset® Cholesterol (Cat.No. 125 512). The cholesterol values are read off the curve.
Bilirubin concentrations above 4 mg/dl interfere with the test (results up to 10% too low).
Hemoglobin concentrations up to 200 mg/dl do not affect the test.
Reference1 Study Group, European Atherosclerosis Society.
Strategies for the prevention of coronary heart disease:A policy statement of the European Atherosclerosis Society. (1987). Eur. Heart J. 8:77.
April 1993
493.1264.0381 101 (ii)
B 0EH R IN G ERM A N N H E IM

App
endi
x II
Che
mic
al S
olut
ions
and
Ass
ays
312
Test-Combination Free CholesterolCHOD-PAP method
Enzymatic colorimetric method
Cat. No 310 328 for 2 x 90 ml
Method
Stahler, F., et al. (1977). Med. Lab. 30: 29. Trinder, P. (1969). Ann. din. Biochem. 6: 24.
Test principle. . . „ cholesterol oxidase . . ,. „
cholesterol + 0 , --------------—-------------->-A -choleslenone + H ,0 ,POD
2 H ,O j + 4-amlnophenazone + phenol -------> 4-(p-benzoquinone-mono-iminojphenazone + 4 H ,0
Normal values for Iree cholesterol:
22-30% of total cholesterol
Reference: Wybenga, D. R., and J. A. Inkpen. (1974). Lipids. Page 1421 II in Henry, R J.. el al., eds. Clinical Chemistry: Principles and Technics, 2nd ed. Harper & Row, Publishers. Inc., New York.
. San Francisco, and London.
Sample material
Serum, heparinized plasma or EDTA plasma
Reagents
Contents
•j Buffer (potassium phosphate) Phenol methanol
2 Buffer (potassium phosphate) 4-Aminophenazone methanolhydroxypolyethoxydodecane
q Cholesterol oxidase Peroxidase
Initial concentrations of solutions:
0.4 mo I/I; pH 7.7 20 mmol/l1.85 mol/l
0.4 mol/l; pH 7.7 2 mmol/l1.85 mol/l 0.4%
s 12 U/ml â 8 U/ml
Quality controlFor control of accuracy: Precilip' E.L., Preclnorm L
Preparation and stability of solutions
1 , 2 and 3 Use solutions undiluted.
Stable up to the expiry dale specilied when stored al i 2 to + C .
¿J Cholesterol reagent:Pipette 0.5 ml ol sol. 3 into bottle 2 and add the entire contents ol one bottle 1. or make up stock solution according to the following table:
Number ol samples
solution 1. ml
solution 2, ml
solution 3, ml
ca. 4 5 5 0.05ca. 9 10 10 0.10ca 19 20 20 0.20ca 39 40 40 0.40
Stable for two weeks at -t- 2 to + 8 C two days at- + 15 to 25°C.
CJ Reagent for sample blank:(req'd only for assays on hemolytic or turbid sera)
Mix equal volumes of solutions t and 2 and store away Irom liqhl Stable for two weeks at + 2 to + 8°C
two days at + 15 to 25"C.
Procedure A
Sample material: clear, non-hemolylic serum Wavelength: Hg 546 nm (470-560 nm)Spectrophotometer: 500 nm Glass cuvette: 1 cm light path Incubation temperature: 20-25°C or 37°C
Measure against reagent blank (RB)
One reagent blank is suflicient for each assay series.
Pipette into cuvette:
RB Sample
sample material solution 4 2.00 ml
0.02 ml 2.00 ml
Mix and incubate RB and sample lor 20 min al 20-25°C or 10 min al 37°C. Read absorbance ol sample against RB within 2 hours (AA).
Procedure B
Sample material: serum or plasma Wavelength: Hg 546 nm (470-560 nm) Spectrophotometer: 500 nm Cuvette: 1 cm light path Incubation temperature: 20-25°C or 37°C
Measure against sample blank (SB)
Determine AAnB once per series to correct lor the intrinsic colour of the cholesterol reagent by using redist. water instead of sample in the assay.
Pipette into cuvette:SB Sample
solution 4 - 2.00 mlsolution 5 2.00 ml “sample 0.02 ml 0.02 ml
Mix and incubate SB and sample (or 20 min at 20-25°C or for 10 minat 37’C Read absorbance ol sample against SB within 2 hrs.. andsubtract AAna Irom AA„mpie. AA — AA,ample AArb
Calculationol the concentration (c) of Iree cholesterol in the sample:
Wavelength m g/100 ml mmol/l
Hg 546 nm c = 855 x AA c = 22.1 x AA
500 nm c = 585 x AA c = 15.1 x AA
Please noteIf difficulties encountered in quality control point to inadequate linear response on the part ol the photometer, or If measurements cannot be taken at Hg 546 nm or 500 nm, a calibration curve must be constructed using Preciset"-' Cholesterol (Cat.No. 125 512). The cholesterol values are read off the curve.A slight yellow coloration of solution 2 does not allec! the lest.Even low concentrations of ascorbic acid and u-methyldopa in the specimen depress the free cholesterol level.Solutions 1 and 2 contain methanol, which is poisonous. Do not swallow or inhale vapors. Avoid contact with skin. If solution comes into contact with skin or mucous membranes, flush immediately with large quantities ol water. If solution comes into contact with eyes, immediately flush liberally with water and consult an ophthalmologist.
B oehringer M annhe im GmbH

App
endi
x II
Che
mic
al S
olut
ions
and
Ass
ays
Triglycerides GPO-PAPHigh performanceEnzymatic colorimetric test
Perldochrom® Triglycerides GPO-PAP Cat.No. 701882 for 6 x 13 ml reagent Cat.No. 701 904 for 15 x 32 ml reagent
Test-Combination Triglycerides GPO-PAPCat.No. 701912 for 5 x 100 ml reagent
Additional reagent lor measurement against standard: Precimat1* Glycerol, Cat.No. 166 588
MethodEnzymatic hydrolysis of triglycerides with subsequent determination of the liberated glycerol by colorimetry.
References:Mod. according to Wahleleld, A. W. (1974).Triglycerides. Delermination aller Enzymatic Hydrolysis. Page 183111. in H.U. Bergmeyer, ed. Methods ot Enzymatic Analysis. 2nd English ed. (Transl. Irom 3rd German ed.). Verlag Chemie Weinheim and Academic Press, Inc., New York and London. 4 vols.Nägele, U. (Boehringer Mannheim GmbH), personal communication. Trinder, P. (1969). Ann. Clin. Biochem. 6:24.
Test principle ..lipase-
triglycerides + 3 H ,0 ---------- ► glycerol + 3 RCOOH
glycerol + ATP-----*- glycerol-3-phosphate + ADP
glycerol-3-phosphate + O, — dihydroxyacetone phosphate + H20 2peroxidaseH2Oj + 4-aminophenazone + 4-chlorophenol —c-----------------►
4-(p-benzoquinone-mono-imino)-phenazone + 2 HaO + HCI
Sample materialSerum, heparinized plasma or EDTA plasma
Reagents1 Buffer solution2 Reagent strips or lyophilisate
Reagent concentrations In solution•1 Trls buffer: 0.15 mol/l, pH 7.6; magnesium sulphate: 17.5
mmol/l; EDTA, disodlum salt: 10 mmol/l; 4-chlorophenol: 3.5 mmol/l; sodium cholate: 0.15%; potassium hexacyano- lerrate (II): 6 pmol/l; hydroxypolyethoxy-n-alkanes: 0.12%
p ATP ^ 0.5 mmol/l; 4-aminophenazone: 0.35 mmol/l; lipase ^ 3 U/ml; glycerol phosphate oxidase S 2.5 U/ml; glycerol kinase ^ 0.2 U/ml; peroxidase ^ 0.15 U/ml
Quality controlFor control of accuracy: Precinorm® U, Precinorm* L,
Precipath® U. Precipath"1 LFor precision control: Precinorm''' UPX
Preparation and stability of reagent solutionPeridochrom"Triglycerides GPO-PAPDo not touch the reagent patches or surrounding area.Immerse one reagent strip in one bottle of buffer solution and use to stir the bottle contents for ca. 10 sec. Allow to stand In buffer solution for 5 min, stir once again for ca. 10 sec, and then discard reagent strip.Test-Combination Triglycerides GPO-PAPConnect one bottle 1 to one bottle 2 with one of the adapters provided in the kit and flush several times to ensure complete dissolution of the lyophilisate.Reagent solution from different bottles may be pooled forlarge series Stable for two weeks at +2 to 8°C
two days at +15 to 25°C.
Sample preparationThe sample can be stored up to three days at +4°C
four months at —20°C.
ProcedureWavelength: Hg 546nmSpectrophotometer: 500 nmCuvette: 1 cm light pathIncubation temperature: 20-25°C or 37°CMeasure against reagent blank. One reagent blank Is sufficient for each series.
Pipette Into test tubes:
serum or plasma 0.02 mlreagent solution 2.00 ml
Mix. and incubate at 20-25°C for 10 min.Read absorbance of sample against reagent blank within 60 min **A sample*
If incubating at 37°C (10 min), the absorbance of the standard must be determined once for each assay series using Precimat* Glycerol instead of serum or plasma. The absorbance of the sample and the standard must be read within 30 min.
Calculation via factorObtain the concentration (c) of triglycerides in the sample from the enclosed table of values or calculate as follows:
Incubation temperature: 20-25°C
Wavelength c (mg/100 ml] c (mmol/l]
Hg 546 nm 1040 x Aiamp,e 11.9 x Asampla
500 nm 760 x Aiampl, 8 66 x Asample
Incubation temperature: 20-25°C or 37°C
c (mg/100 ml] — 200 xstandard
c (mmol/l] — 2.29 xA&iandard
If the triglyceride concentration exceeds 1000 mg/100ml (11.4 mmol/l), dilute sample 1 + 5 with 0.9% NaCI solution and repeat assay (result x 6).
Clinical interpretationaccording to the recommendations of the European Atherosclerosis Society:
Lipid disorder
CholesterolTriglycerides
< 200 mg/100 ml< 200 mg/100 ml
No
Cholesterol 200-300 mg/100 mlYes,
if HDL cholesterol < 35 mg/100 ml
CholesterolTriglycerides
> 300 mg/100 ml> 200 mg/100 ml Yes
Values In mmol/l:Cholesterol: 35 mg/100 ml = 0.9 mmol/l
200 mg/100 ml = 5.2 mmol/l 300 mg/100 ml = 7.8 mmol/l
Triglycerides: 200 mg/100 ml = 2.3 mmol/l
Reference: Study Group, European Atherosclerosis Society.Strategies lor the prevention ol coronary heart disease:A policy statement ol the European Atherosclerosis Society. (1987). .Eur. Heart J. 8 :77.
Calculation via standardCalculate the concentration (c) of triglycerides as follows:
Boehringer Mannheim GmbH Diagnostica March 1991
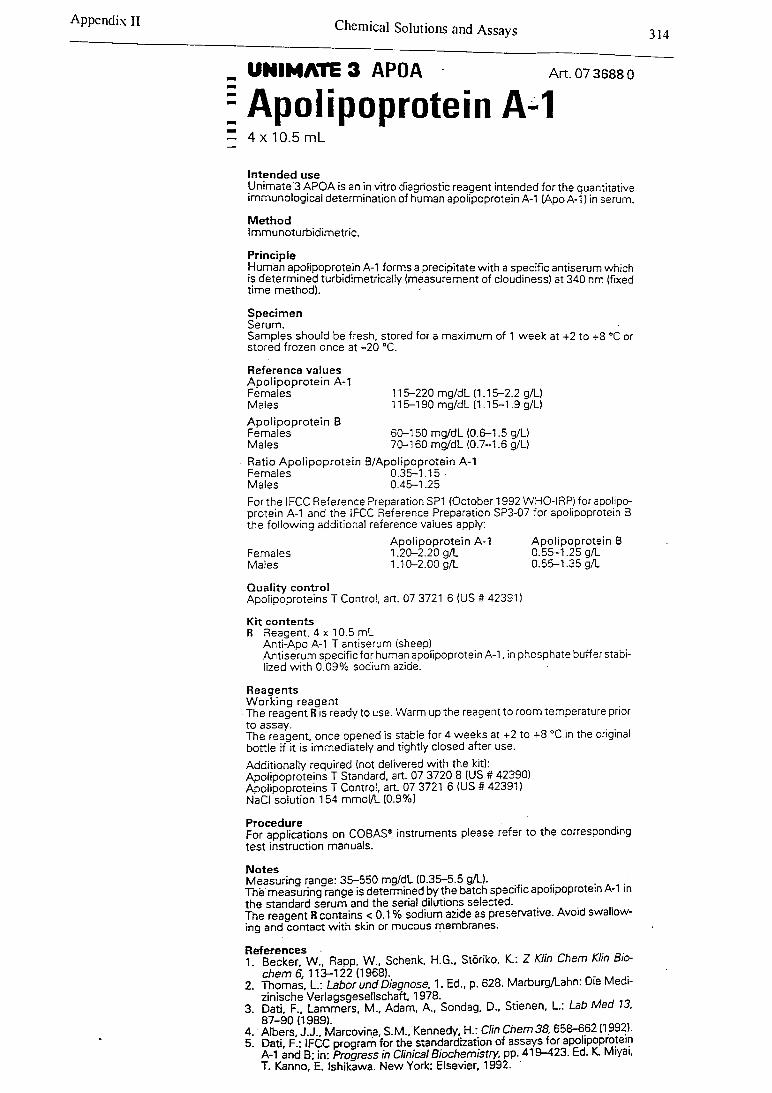
Appendix II Chemical Solutions and Assays 314
UNIMATE 3 APOA
: Apolipoprotein AArt. 07 3688 0
1Intended useUnimate'3 APOA is an in vitro diagnostic reagent intended for the quantitative immunological determination of human apolipoprotein A-1 (Apo A-1) in serum.
MethodImmunoturbidimetric.
PrincipleHuman apolipoprotein A-l forms a precipitate with a specific antiserum which is determined turbidimetrically (measurement of cloudiness) at 340 nm (fixed time method). •
SpecimenSerum. ■Samples should be fresh, stored for a maximum of 1 week at +2 to +8 °C or stored frozen once at -20 °C.
Reference values Apolipoprotein A-1 Females MalesApolipoprotein BFemalesMales
115-220 mg/dL (1.15-2.2 g/L) 115-190 mg/dL (1.15-1.9 g/L)
60-150 mg/dL (0.6-1.5 g/L) 70-160 mg/dL (0.7-1.6 g/L)
Ratio Apolipoprotein B/Apolipoprotein A-1 Females 0.35-1.15 ■Males 0.45-1.25Forthe IFCC Reference Preparation SP1 (October 1992 WHO-IRP) for apolipoprotein A-1 and the IFCC Reference Preparation SP3-07 for apolipoprotein B the following additional reference values apply:
Apolipoprotein A-1 Apolipoprotein BFemales 1.20-2.20 g/L 0.55-1.25 g/LMales 1.10-2.00 g/L 0.55-1.35 g/L
Quality controlApolipoproteins T Control, art. 07 3721 6 (US # 42391)
Kit contentsR Reagent, 4 x 10.5 mL
Anti-Apo A-1 T antiserum (sheep)Antiserum specific for human apolipoprotein A-1, in phosphate buffer stabilized with 0.09% sodium azide.
Reagents Working reagentThe reagent R is ready to use. Warm up the reagent to room temperature prior to assay. . . .The reagent, once opened is stable for 4 weeks at +2 to +8 °C in the original bottle if it is immediately and tightly closed after use.Additionally required (not delivered with the kit):Apolipoproteins T Standard, art. 07 3720 8 (US # 42390)Apolipoproteins T Control, art. 07 3721 6 (US # 42391)NaCI solution 154 mmol/L (0.9%)
ProcedureFor applications on COBAS® instruments please refer to the corresponding test instruction manuals.
NotesMeasuring range: 35-550 mg/dL (0.35-5.5 g/L).The measuring range is determined by the batch specific apolipoprotein A-1 in the standard serum and the serial dilutions selected.The reagent R contains < 0.1 % sodium azide as preservative. Avoid swallowing and contact with skin or mucous membranes.
References , „ _..1 Becker W„ Rapp, W., Schenk, H.G., Storiko, K.: Z Klin Chem Klin Bio-
chem 6, 113-122 (1968). L n u2. Thomas, L.: Labor und Diagnose, 1. Ed., p. 628. Marburg/Lahn. Die Medi
zinische Verlagsgesellschaft, 1978. . ,3. Dati, F., Lammers, M., Adam, A., Sondag, D., Stienen, L.: Lab Med 13,
87—90 (1989)4. Albers, J.J., Marcovina, S.M., Kennedy, H.: Clin Chem 38,658-662 (1992).5. Dati, F.: IFCC program for the standardization of assays for apolipoprotein
A-1 and B; in: Progress in Clinical Biochemistry, pp. 419-423. Ed. K. Miyai, T. Kanno, E. Ishikawa. New York: Elsevier. 1992.
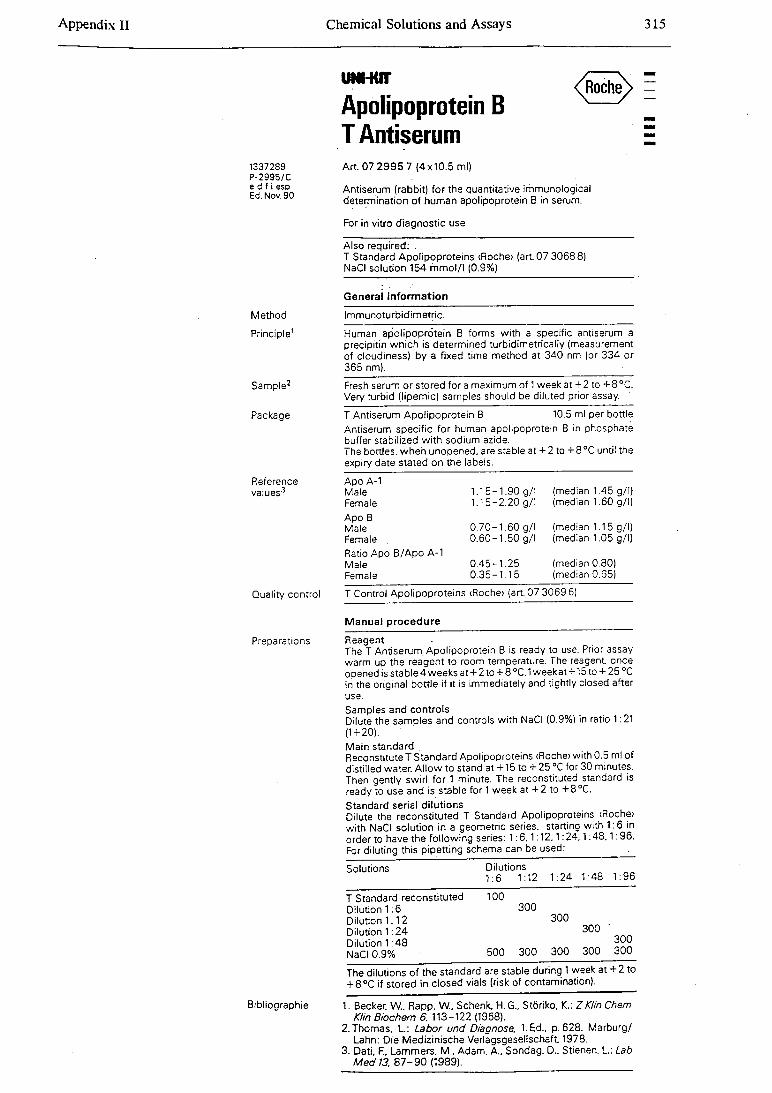
Chemical Solutions and Assays 315endix II
UNMUT
Apolipoprotein B T Antiserum
1337289 P-2995/C e d f ¡ esp Ed.Nov. 90
A rt 07 2995 7 (4x10.5 ml)
Antiserum (rabbit) for the quantitative immunological determination of human apolipoprotein B in serum.
For in vitro diagnostic use
Also required: .T Standard Apolipoproteins (Roche> (art. 07 30688) NaCI solution 154 m mol/l (0.9%)
General information
Method Immunoturbidimetric.
Principle1 Human apolipoprotein B forms with a specific antiserum aprecipitin which is determined turbidimetrically (measurement of cloudiness) by a fixed time method at 340 nm (or 334 or 365 nm).
Sample2 Fresh serum or stored for a maximum of 1 week at + 2 to + 8 °C.Very turbid (lipemic) samples should be diluted prior assay. '
Package T Antiserum Apolipoprotein B 10.5 ml per bottleAntiserum specific for human apolipoprotein B in phosphate buffer stabilized with sodium azide.The bottles, when unopened, are stable at + 2 to +8°C until the expiry date stated on the labels.
Reference Apo A-1values3 Male 1.15-1.90 g/l (median 1.45 g/l)
Female 1.15-2.20 g/l (median 1.60 g/l)
Apo B Male 0.70-1.60 g/l (median 1.15 g/l)Female . 0.60-1.50 g/l (median 1.05 g/l)
Ratio Apo B/Apo A-1 Male 0.45-1.25 (median 0.80)Female 0.35-1.15 (median 0.65)
Quality control T Control Apolipoproteins <Roche> (art. 07 3069 6)
Manual procedure
Preparations Reagent -The T Antiserum. Apolipoprotein B is ready to use. Prior assay warm up the reagent to room temperature. The reagent, once opened is stable 4 weeks at + 2 to + 8 °C. 1 weekat +15 to + 25 °C in the original bottle if it is immediately and tightly closed after use.Samples and controlsDilute the samples and controls with NaCI (0.9%) in ratio 1:21 (1 + 20). ■■Main standardReconstitute T Standard Apolipoproteins <Roche> with 0.5 ml of distilled water. Allow to stand at +15 to + 25 °C for 30 minutes. Then gently swirl for 1 minute. The reconstituted standard is ready to use and is stable for 1 week at + 2 to +8°C.Standard serial dilutionsDilute the reconstituted T Standard Apolipoproteins <Roche> with NaCI solution in a geometric series, starting with 1:6 in order to have the following series: 1 :6 .1 :12.1:24.1:4 8 .1:96. For diluting this pipetting schema can be used: .
Solutions Dilutions 1:6 1:12 1:24 1:48 1:96
T Standard reconstituted Dilution 1:6 Dilution 1:12 Dilution 1:24 Dilution 1:48
100300
300300
300
NaCI 0.9% 500 300 300 300 300
The dilutions of the standard are stable during 1 week at + 2 to + 8°C if stored in closed vials (risk of contamination).
Bibliographie 1. Becker, W.. Rapp. W., Schenk, H. G., Störiko, K.: Z Klin Chem Kim Biochem 6. 113-122 (1968).
2. Thomas. L : Labor und Diagnose. 1.Ed.. p.628. Marburg/ Lahn: Die Medizinische Verlagsgesellschaft. 1978.
3. Dati, F.. Lammers. M., Adam. A.. Sondag. D., Stienen. L.: Lab M ed 13. 8 7 -9 0 (1989).
App
endi
x II
I D
iet a
nd H
ealth
Que
stio
nnai
re B
ookl
et
318
Diet and Health Booklet
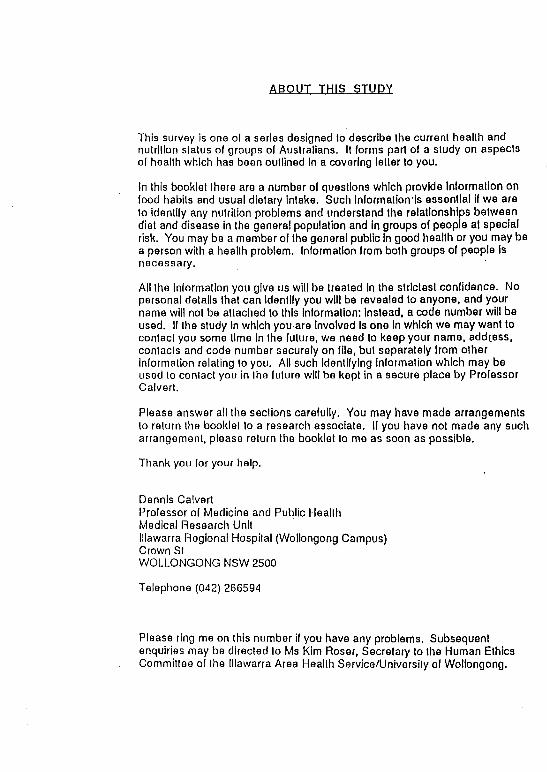
A B O U T T H IS S T U D Y
This survey is one ol a series designed to describe the current health and nutrition status of groups ol Australians. It lorms part ol a study on aspects ol health which has been outlined In a covering letter to you.
In this booklet there are a number ol questions which provide information on lood habits and usual dietary intake. Such information essential il we are to identify any nutrition problems and understand the relationships between diet and disease in the general population and in groups of people at special risk. You may be a member of the general public in good health or you may be a person with a health problem. Information from both groups of people Is necessary.
All the Information you give us will be treated in the strictest confidence. No personal details that can Identity you will be revealed to anyone, and your name will not be attached to this information: instead, a code number will be used. If the study In which you are Involved Is one In which we may want to contact you some time In the future, we need to keep your name, address, contacts and code number securely on file, but separately from other information relating to you. All such identifying information which may be used to contact you in the future will be kept in a secure place by Professor Calvert.
Please answer all the sections carefully. You may have made arrangements to return the booklet to a research associate. If you have not made any such arrangement, please return the booklet to me as soon as possible.
Thank you for your help.
Dennis CalvertProfessor ol Medicine and Public Health Medical Research Unitlllawarra Regional Hospital (Wollongong Campus) Crown StWOLLONGONG NSW 2500
Telephone (042) 266594
Please ring me on this number if you have any problems. Subsequent enquiries may be directed to Ms Kim Roser, Secretary to the Human Ethics Committee of the lllawarra Area Health Service/University of Wollongong.

App
endi
x II
I D
iet a
nd H
ealth
Que
stio
nnai
re B
ookl
etYOUR HEALTH
On1-c n
0-1 In general, how has your health been in the Iasi year? (Please circle one)
Very Good Good Fair Poor Very Poor
Q-2 How much ot an ellect do you think the following things have on the health ol peoplelike yoursell?
(Circle one lor each)
Ealing the wrong foods Bad effect Moderate No effect Don’t know
Smoking Bad effect\ Moderate No effect Don't know
Air and chemical pollullon Bad effect Moderate No effect Don't know
Working In a dirty Job, with dusl or chemicals
Bad effect Moderate No effect Don't know
Drinking loo much alcohol Bad effect Moderate No effect Don't know
Hot having a good dcclor Bad effect Moderate No effect Don’t know
Having parents who have or had poor heallh
Bad effect Moderate No effect Don't know
Not keeping weigh! under control Bad effect Moderate No effect Don't know
Excess slress caused by work, lack ol work or work ail home
Bad effect Moderate No effect Don’t know
Lack ol exercise or physical activity
Bad effect Moderate No effect Don't know
Problems wilhin the lamily Bad effect Moderate No effect Don't know
Nol living In a clean, sale house and neighbourhood
Bad effect Moderate No effect Don't know
Bad luck Bad effect Moderate No effect Don't know
Worries caused by not having enough money
Bad effect
2
Moderate No effect Don't know
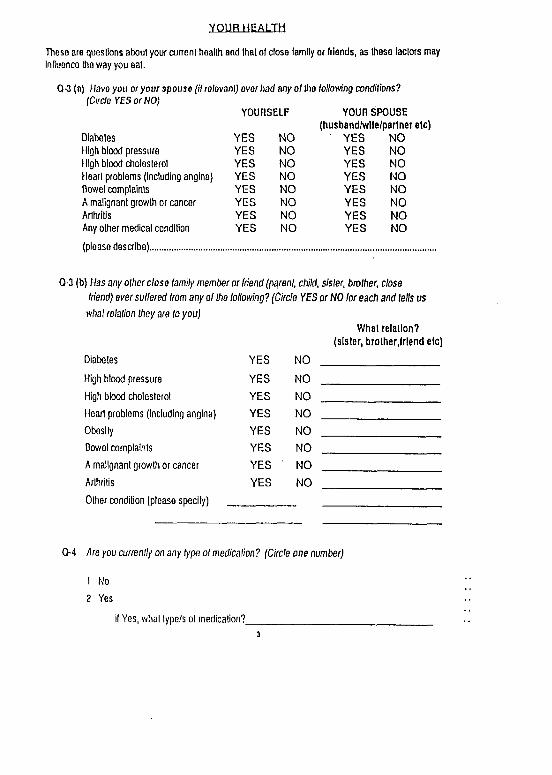
These are questions about your current health and that ol close family or friends, as these factors may Influence the way you eat.
Q-3 (a) Have you or your spouse (if relevant) ever had any ol I he following conditions?(Circle YES or NO)
YOURSELF YOUR SPOUSE(husband/wlfe/partner etc)
Diabetes YES NO YES NOHigh blood pressure YES NO YES NOHigh blood cholesterol YES NO YES NOHeart problems (including angina) YES NO YES NOBowel complaints YES NO YES NOA malignant growth or cancer YES NO YES NOArthritis YES NO YES NOAny other medical condition YES NO YES NO
(please describe).
Q-3 (b) Has any other close lamily member or friend (parent, child, sister, brother, closefriend) ever suffered from any of the following? (Circle YES or NO for each and tells us
what relation they are to you)Whal relation?
(sister, brolher.lrlend etc)Diabetes YES NO
High blood pressure YES NOHigh blood cholesterol YES NOHeart problems (Including angina) YES NOObesity YES NODowel complaints YES NOA malignant growth or cancer YES NOArthritis YES NOOther condition (please specify)
Q-4 Are you currently on any type ol medication? (Circle one number)
1 No2 Yes
if Yes, what lype/s ol medication?.3
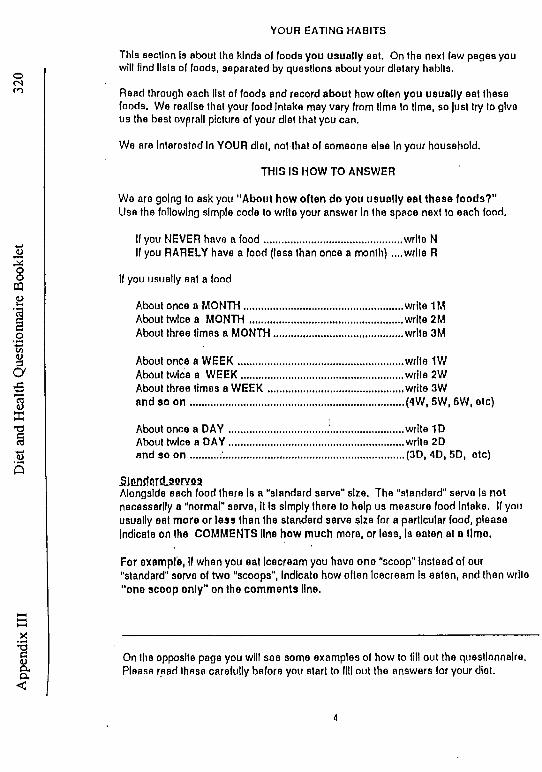
App
endi
x III
D
iet a
nd H
ealth
Que
stio
nnai
re B
ookl
et
320
YOUR EATING HABITS
This section Is about the kinds of foods you usually eat. On the next few pages you will find lists of foods, separated by questions about your dietary habits.
Read through each list of foods and record about how often you usually eat these foods. We realise that your food Intake may vary from time to time, so Just try to give us the best ovprall picture of your diet that you can.
We are interested In YOUR diet, not that of someone else In your household.
THIS IS HOW TO ANSWER
We are going to ask you "About how often do you usually eat these foods?"Use the following simple code to write your answer In the space next to each food.
If you NEVER have a food...........................................write NIf you RARELY have a food (less than once a month) ....write R
If you usually eat a food
About once a MONTH................................................. write 1MAbout twice a MONTH................................................write 2MAbout three times a MONTH........................................write 3M
About once a WEEK.......About twice a WEEK......About three limes a WEEK and so on......................
write 1W write 2W write 3W(4W, 5W, 6W, etc)
About once a DAY About twice a DAY and so on........
write 1D write 2D(3D, 4D.5D, otc)
SUmderd.aQrYflaAlongside each food there Is a "standard serve" size. The "standard" serve Is not necessarily a "normal" serve, It Is simply there to help us measure food Intake. If you usually eat more or Ies9 than the standard serve size for a particular food, please Indicate on the COMMENTS line how much more, or less, Is eaten at a time.
For example, if when you eat Icecream you have one "scoop" Instead of our "standard" serve of two "scoops", Indicate how often Icecream Is eaten, and then write "one scoop only" on the comments line.
On the opposite page you will see some examples of how to fill out the questionnaire. Please read these carefully before you start to fill out the answers for your dlot.
4
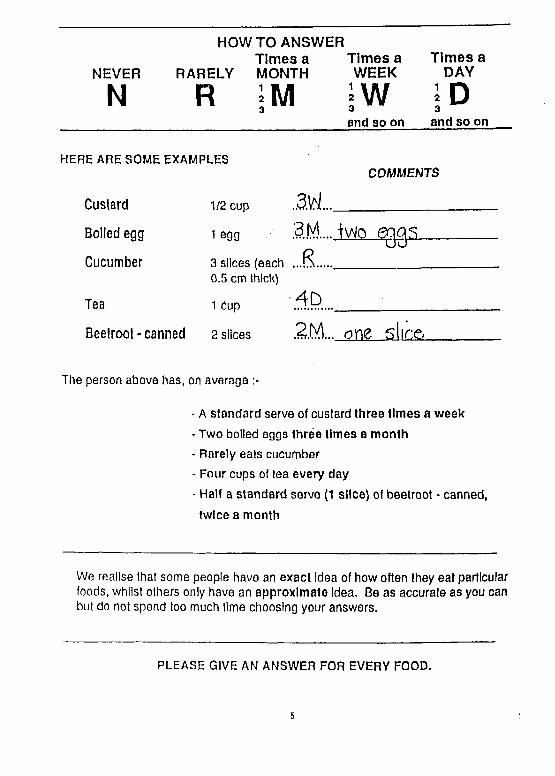
NEVER
N
HOW TO ANSWERTim es a T im es a
RARELY MONTH W EEK
R i M jWand so on
T im es a DAY
and so on
HERE ARE SOME EXAMPLESCOMMENTS
C u stard
B oiled egg
C u cu m b er
T ea
1/2 cup
1 egg
3 slices (each 0.5 cm thick)
1 Cup
M . . .
3M i\rto e q q s
...S ...
4D
C O
B eetro o t - c an n ed 2 slices ,2M.. one slice._______
The person above has, on average
- A standard serve of custard three times a week
- Two boiled eggs three times a month- Rarely eats cucumber- Four cups of tea every day
- Half a standard serve (1 slice) of beetroot - canned,
twice a month
We realise that some people have an exact Idea of how often they eat particular foods, whilst others only have an approximate Idea. Be as accurate as you can but do not spend too much time choosing your answers.
PLEASE GIVE AN ANSWER FOR EVERY FOOD.
5
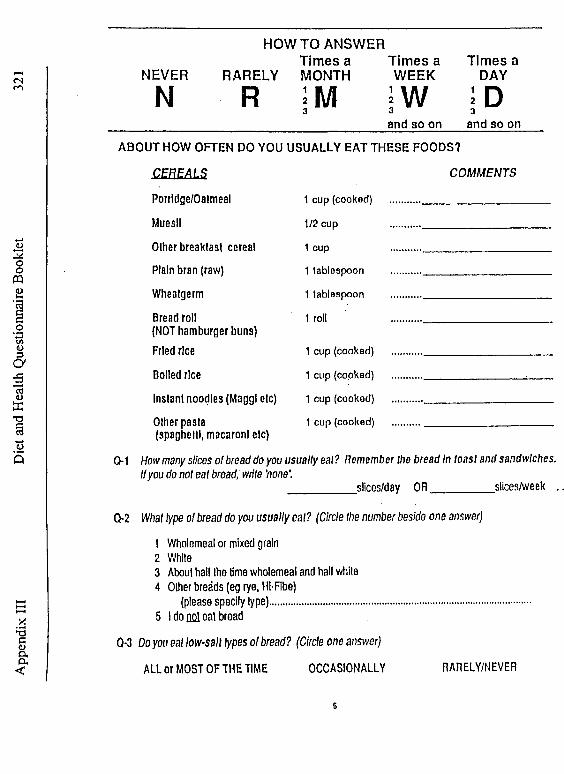
App
endi
x III
D
iet a
nd H
ealth
Que
stion
naire
Boo
klet
<N NEVER
NTimes a Tim es a
RARELY MONTH WEEK
HOWTO ANSWER
R ÏW3and so on
Times a DAY
I D3
and so on
ABO U T HOW OFTEN DO YOU USUALLY EAT THESE FOODS?
CEREALSPorridge/Oalmeal
Muesli
Other breakfast cereal
Plain bran (raw)
Wheatgerm
Bread roll(NOT hamburger buns) Fried rice
Boiled rice
Instant noodles (Maggl etc)
Other pasta(spaghetti, macaroni etc)
C O M M EN TS
1 cup (cooked)
1/2 cup
1 cup
1 tablespoon
1 tablespoon
1 roll
1 cup (cooked)
1 cup (cooked)
1 cup (cooked)
1 cup (cooked)
Q-1 How many slices o l bread do you usually eal? Remember the bread In toast and sandwiches. If you do not eat bread, write 'none'.
_________ slices/day OR_________ slices/week .
Q-2 What type of bread do you usually eal? (Circle Ihe number beside one answer)
1 Wholemeal or mixed grain2 While3 About half Ihe lime wholemeal and hall while4 Other breads (eg rye, HI-FIbe)
(please specify type).......................................................................5 I do nol eal bread
Q-3 Do you eal low-salt types of bread? (Circle one answer)
ALL or MOST OF THE TIME OCCASIONALLY RARELY/NEVER
6

1 Butler2 Polyunsaturated margarine3 Table or cooking margarine4 Reduced-fat margarine (eg Era)5 Drlpping/Lard6 I don't use anything7 I don't eat bread or crackers0 Something else: please name.............................................................................
Q-5 For whatever spread you use is it usually the regular variety or reduced-sail?(Circle one answer)
1 I usually use Ihe regular variety 2 I usually use the reduced-salt variety
Q-6 What types o l breakfast cereals do you most commonly eal?
Please name: ........................................................................................................
Q-7 IIyou eal muesli is if:- (Circle one answer)
1 Homemade muesli 2 Pre-packaged muesli
Q-8 How many cups ol milk do you usually add lo breakfast cereal, porridge or muesli?(Circle Ihe number closes! lo Ihe amount you have)
1 None2 About a hall a cup3 About one cup4 About one and a hall cups5 About two cups or more (please slate how much............................................. )
Q-9 What type of milk do you usually add lo cereals, porridge or muesli? (eg whole milk, Skimmer, Rev, Tone, Trim, powdered skim, Shape, High-Low, goat's milk, condensed/evaporaled milk etc)?
Type ol milk added:...........................................................................................
Q-10 How many teaspoons ol sugar or honey do you usually add lo cereal, porridge or muesli?(Note: I dessertspoon = 2 teaspoons)
Wrile Ihe number of teaspoons you have here: .................
Q-11 Do you add sail lo your porridge? (Circle one number)
1 Yes2 No3 I don't eat porridge
Q-4 Which o l the following do you usually spread on bread or crackers ? (Circle one answer)
7

App
endi
x III
D
iet a
nd H
ealth
Que
stio
nnai
re B
ookl
et
322
HO W TO ANSWER Tim es a T im es a Tim es a
NEVER RARELY MONTH WEEK DAY
N R ; m3 i-W3and so on
J D3and so on
ABOUT HOW OFTEN DO YOU USUALLY EAT THESE FOODS?
C E R E A L F O O D S C O M M E N T S
Crumpet or Muffin 1 ......... .............................
Croissant 1 ......... ...............................
Fruit Loaf/Curranl bread 1 slice ........... .....................................
Sweet bun/Doughnut 1 ......... ...............................
Crispbread/Cracker 2 ......... .............................
Salted biscuits 3 ......... ...............................
Plain sweet biscuits 2 ......... ............................
Fancy biscuits (eg choc-coated) 2 ......... ............................
Cake 1 small cake or ......... ...............................1 slice large cake
Milk pudding (eg rice, sago) i/2cup
Steamed sponge - suet 1/4 small pudding
Q-1 What types of cake do you most commonly eat? (eg fruit cake, cheesecake, sponge cake, iced sponge, tea-cake etc)
Please ñamé ..............................................................
Q-2 Are the cakes you most commonly e a t: (Circle one answer)
1 Pre-made wrapped cakes2 Frozen wrapped cakes (eg Sara-Lee)3 Bought homestyle cakes (eg from bakery)4. Homemade (packet mix)5 Homemade (own Ingredients)6 I do not eat cake a
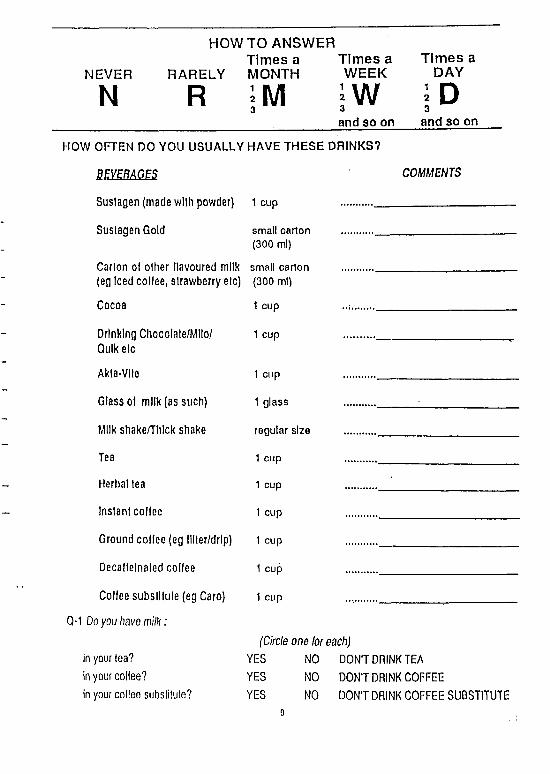
HOWTO ANSWERTim es a T im es a T im es a
NEVER RARELY MONTH W EEK DAY
N R jW I D3
and so on and so on
HOW OFTEN DO YOU USUALLY HAVE THESE DRINKS?
BEVERAGES
Suslagen (made wllh powder) 1 cup
Suslagen Gold small carton (300 ml)
Carton of other flavoured milk (eg Iced coffee, slrawberry etc)
small carton (300 ml)
Cocoa 1 cup
Drinking Chocolate/Mllo/ Qulkelc
1 cup
Akla-Vlle 1 cup
Glass of milk (as such) 1 glass
Milk shake/Thlck shake regular size
Tea 1 cup
Herbal lea 1 cup
Inslanl coffee 1 cup
Ground coffee (eg llller/drlp) 1 cup
Decalfelnaled coflee 1 cup
Coffee subslllule (eg Caro) 1 cup
CM Do you have m ilk :
COMMENTS
(Circle one breach)in your lea? YES NO DON’T DRINK TEAin your coffee? YES NO DON'T DRINK COFFEEin your coffee subslilule? YES NO DON’T DRINK COFFEE SUBSTITUTE
9
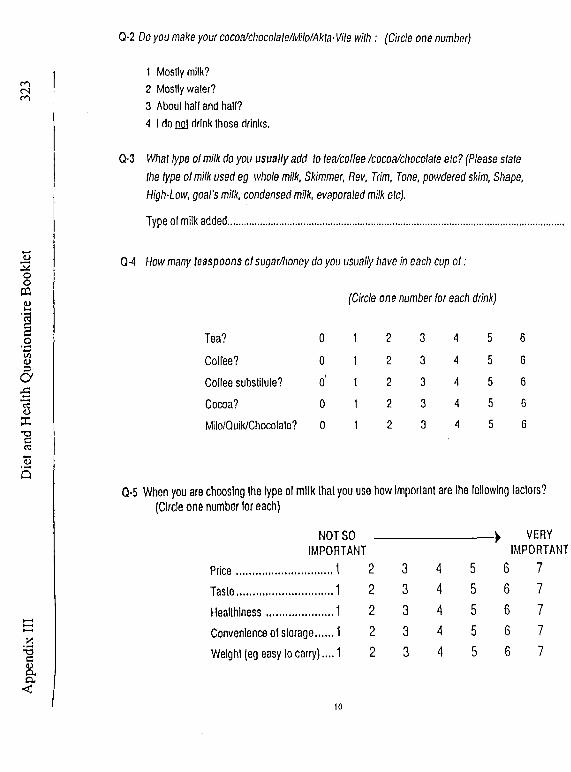
App
endi
x III
D
iet a
nd H
ealth
Que
stio
nnai
re B
ookl
et
1 Mostly milk?2 Mostly waler?3 About hall and hall?4 I do nol drink these drinks.
Q-3 What type of milk do you usually add lo (ea/collee /cocoa/chocolate etc? (Please slate the type of milk used eg whole milk, Skimmer, Rev, Trim, Tone, powdered skim, Shape, High-Low, goal's milk, condensed milk, evaporated milk ole).
Type of milk added.....................................................................................
Q-4 How many teaspoons of sugar/honey do you usually have In each cup o l :
(Circle one number lor each drink)
Q-2 Do you make your cocoa/chocolale/Milo/Akta■ Vile w ith : (Circle one number)
Tea? 0 1 2 3 4 5 6
Coffee? 0 1 2 3 4 5 6
Coffee substitute? o' 1t 2 3 4 5 6
Cocoa? 0 1I 2 3 4 5 6
Milo/Quik/Chocolale? 0 11 2 3 4 5 6
Q-5 When you are choosing Ihe type of milk lhat you use how important are the following factors? (Circle one number for each)
NOT SO IMPORTANT
Price............................. 1 2
Taste............................. 1 2
Healthiness.... . . . . . . . . . . . . . . . . . 1 2
Convenience of storage..... 1 2
Weight (eg easy to carry).... 1 2
> VERY IMPORTANT
3 4 cn 6 7
3 4 cn 6 7
3 4 5 6 7
3 4 5 6 7
CO 4 5 6 7
10
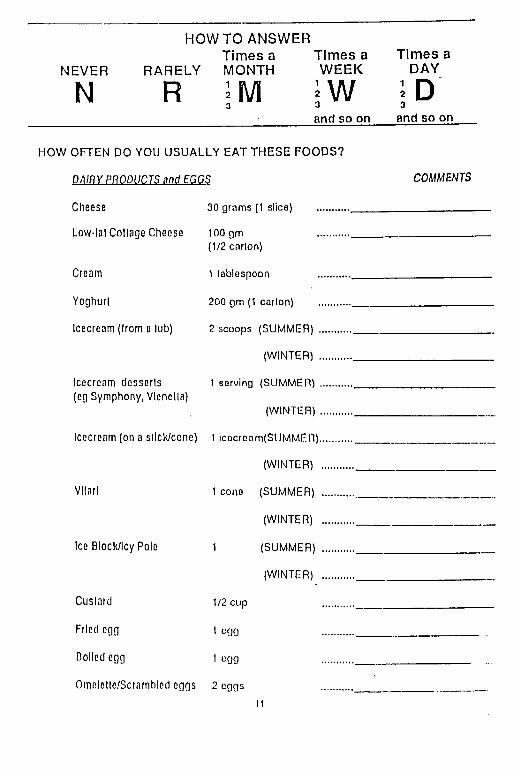
HOW TO ANSWERTim es a T im es a T im es a
N E V E R R A R E L Y M O N T H W E E K D A Y
N R m j w 3and so on and so on
HOW O FTEN DO YO U U S U A LLY EA T TH E S E FO O D S ?
D A IRY PR O DU C TS M d EGGS C O M M EN TS
Cheese 30 qrams (1 slice) ............
Low-lal Collage Cheese 100qm ............(1/2 carlon)
Cream 1 lablespoon ............
Yoghurt 200 qm (1 carlon) ............
Icecream (Irom a lub) 2 scoops (SUMMER! ............
(WINTER) ............
Icecream dcsserls 1 sorvlnq (SUMMER! ...........(eg Symphony, Vlenella)
(WINTER! ...........
Icecream (on a sllck/cone) 1 icocronm(SUMMER!............
(WINTER! ............
Vllarl 1 cone (SUMMER) ............
(WINTER! ............
Ice Block/lcy Pole 1 (SUMMER! ...........
(WINTER! ............
Cuslard 1/2 cup ...........
Fried egg 1 oqq ...........
Dolled egg 1 L’qq ...........
Omolcllc/Scrnmbled eggs 2 oqqs ...........11
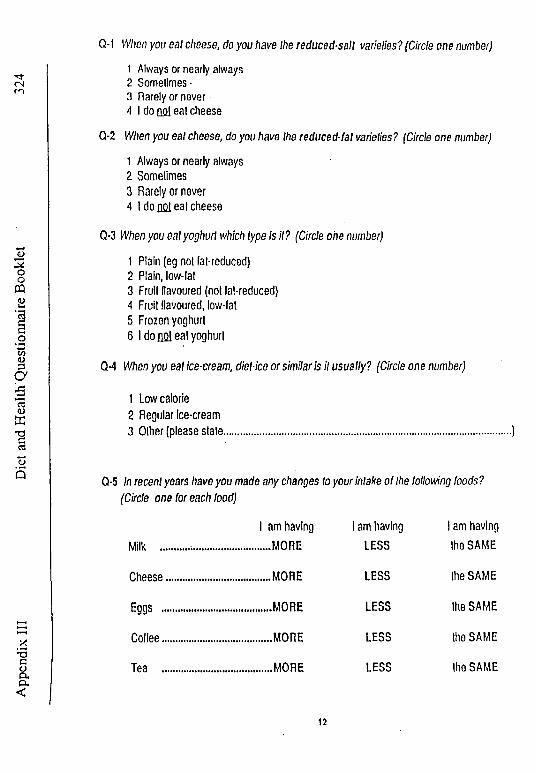
App
endi
x III
D
iet a
nd H
ealth
'Que
stio
nnai
re B
ookl
et
324 1 Always or nearly always
2 Sometimes •3 Rarely or never4 I do no! ealcheese
Q-2 When you eat cheese, do you have the reduced -fa t varieties? (Circle one number)
1 Always or nearly always2 Sometimes3 Rarely or never4 I do £¿1 eat cheese
Q-3 When you eat yoghurt which type is it? (Circle one number)
1 Plain (eg not fat-reduced)2 Plain, low-fat3 Fruit flavoured (not fat-reduced)4 Fruit flavoured, low-fat5 Frozen yoghurt6 I do nol eat yoghurt
Q-1 When you eal cheese, do you have the reduced-salt varieties? (Circle one number)
Q-4 When you eat ice-cream, diet-ice o r s im ila r is it u su a lly? (Circle one num ber)
1 Low calorie2 Regular Ice-cream3 Other (please slate.................................................................................. )
Q-5 In recent years have you m ade any changes to you r intake o f the following foods? (Circle one for each food)
I am having I am having I am havingMilk ........ ....... ............... MORE LESS the SAME
Cheese .............. ............... MORE LESS the SAME
Eggs ............... ............... MORE LESS the SAME
Coflee............... ................MORE LESS the SAME
Tea ............... ................ MORE LESS the SAME
12

HOWTO ANSWERT im es a T im es a T im es a
NEVER RARELY MONTH W EEK DAY
N R 3I wand so on
3and so on
ABOUT HOW OFTEN DO YOU USUALLY EAT THESE FOODS?
MEATS COMMENTS
Sleak (ealen as such)
Pork chop
Lamb chop
Hoast pork/Pork fillet
Roast beef/veal
Roast Iamb
Sausages
Franklurlers/Saveloys
Bacon
Ham
Luncheon meat/Frllz/Devon/ Windsor elc
Continental sausage (Salaml/MettwurstiCabanosst)
Pale/Llver paste
Liver
Kidney
Brains
1 medium
1 chop
2 chops
2 slices
2 slices
2 slices
2 thick or 3 thin
2 thick or 3 thin
2 rashers
3 thin or2 thick slices
3 slices(1 cm thick)
3 slices
1 tablespoon
1/2 liver (150 gm)
2 kidneys
1/2 cup
Pureed meat dishes (canned/bollled)
1/2 cup
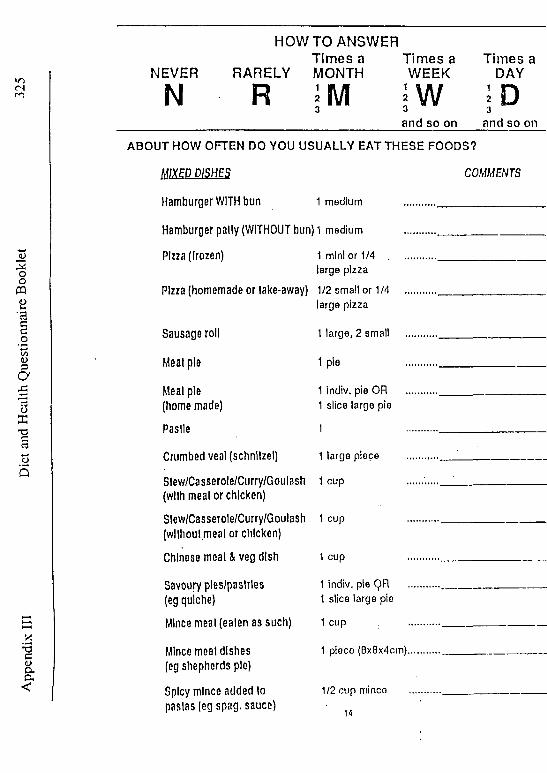
Ap
pen
dix
III
D
iet
anc*
Hea
lth
Qu
esti
on
nai
re B
ookl
et
HOWTO ANSWERTim es a Tim es a Tim es a
NEVER RARELY MONTH WEEK DAY
N R m3 i w W3
and so on and so on
ABOUT HOW OFTEN DO YOU USUALLY EAT THESE FOODS?
M IX E P P IS H E S COMMENTS
Hamburger WITH bun 1 medium ...........
Hamburger pally (WITHOUT bun) 1 medium ...........
Pizza (frozen) 1 mini or 1/4 .................large pizza
Pizza (homemade or take-away) 1/2 small or 1/4 ...........large pizza
Sausage roll 1 large, 2 small ..........
Meat pie 1 pie ..........
Meal pie 1 indiv. pie OR ........(homemade) 1 slice large pie
Paslle 1 ........ •-------------------------
Crumbed veal (schnllzel) 1 large piece ..........
Slew/Casserole/Curry/Goulash 1 cup ..... .(with meat or chicken)
Slew/Casserole/Curry/Goulash 1 cup ..........
(wllhoul meat or chicken)
Chinese meat & veg dish 1 cup .......... ----------------------
Savoury ples/paslrles 1 indiv. pie QR ..........
(eg quiche) 1 slice large pie
Mince meal (ealen as such) 1 cup .........
Mince meat dishes 1 piece (Bx8x4cm).........
(eg shepherds pie)
Spicy mince added to 1/2 cup mince .........
pastas (eg spag. sauce) 14
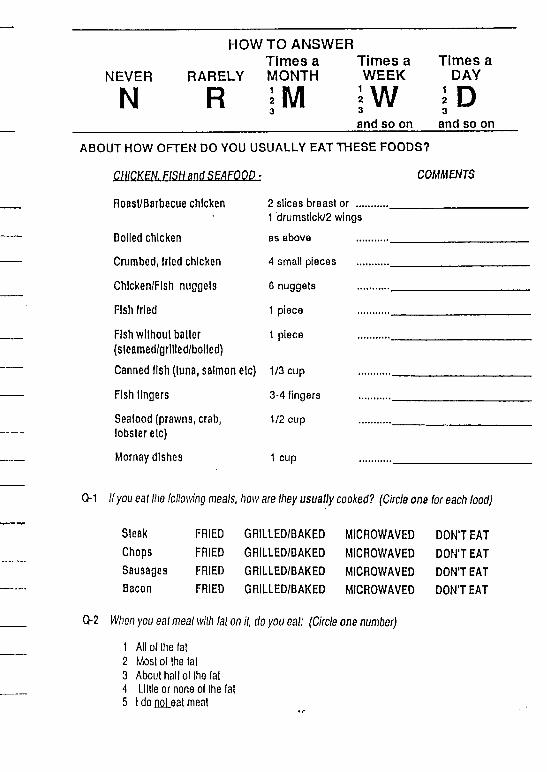
HOWTO ANSWERTimes a Times a Times a
NEVER RARELY MONTH WEEK DAY
N R ; m3 1W3 I D3and so on and so on
ABOUT HOW OFTEN DO YOU USUALLY EAT THESE FOODS?
CHICKEN. FISH and SEAFOOD.: COMMENTS
Roasl/Barbecue chicken
Boiled chicken
Crumbed, fried chicken
Chlcken/Flsh nuggels
Fish fried
Fish without baiter (sleamed/grllled/bolled)
Canned fish (luna, salmon elc)
Fish fingers
Seafood (prawns, crab, lobster elc)
Mornay dishes
2 slices breast or ... 1 drumstick/2 wings
as above
4 small pieces
6 nuggets
1 piece
1 piece
1/3 cup
3-4 fingers
1/2 cup
1 cup
Q-1 IIyou eat the following meals, how are they usually cooked? (Circle one lor each food)
Steak FRIED GRILLED/BAKED MICROWAVED DON'T EATChops FRIED GRILLED/BAKED MICROWAVED DON'T EATSausages FRIED GRILLED/BAKED MICROWAVED DON'T EATBacon FRIED GRILLED/BAKED MICROWAVED DON'T EAT
0 2 When you eat meal with fat on it, do you eat: (Circle one number)
1 All of the lai2 Most of the fat3 About hall ol the faiA Lillie or none ol Ihe fai 5 1 do not eal meal

App
endi
x II
I D
iet a
nd H
eald
l Que
stio
nnai
re B
ookl
et
VO<N
0 3 Do you take the skin oft chicken? (Circle one number)
1 Always or nearly always2 Sometimes (about hall the time or less)3 Rarely (less than a quarter of the time)4 Never5 I do not eat chicken
0 4 If you eat fried fish, In which of the following is it usually coated? (Circle one number)
1 Batter2 Breadcrumbs3 Flour4 Other coating; please name.................................................................5 Fried without coaling
0 5 When you eat fish coated in batter, crumbs etc how often is it: (Circle one (or each)
Coated at home......... ... ALWAYS SOMETIMES RARELY NEVERPre-packed, frozen cooked at home......... ... ALWAYS SOMETIMES RARELY NEVERBought ready cooked from fish shop............ ... ALWAYS SOMETIMES RARELY NEVER
06 How often do you eat complete main meals bough l from the fre eze r section at the shops? (eg Lean Cuisine, TV dinners) (Circle one number)
1 Daily2 About weekly3 About once a fortnight4 About monthly or less5 Never
07 How often do you eat ‘meals in a can* (eg, Irish Stew, ready to heat and eat meats) (Circle one number)
1 Daily2 About weekly3 About once a fortnight4 About monthly or less5 Never
0 8 How often do you eat canned meats such as Camp Pie, corned beef, tinned ham etc(Circle one number)
1 Daily2 About weekly3 About once a fortnight4 About monthly or less5 Never
16
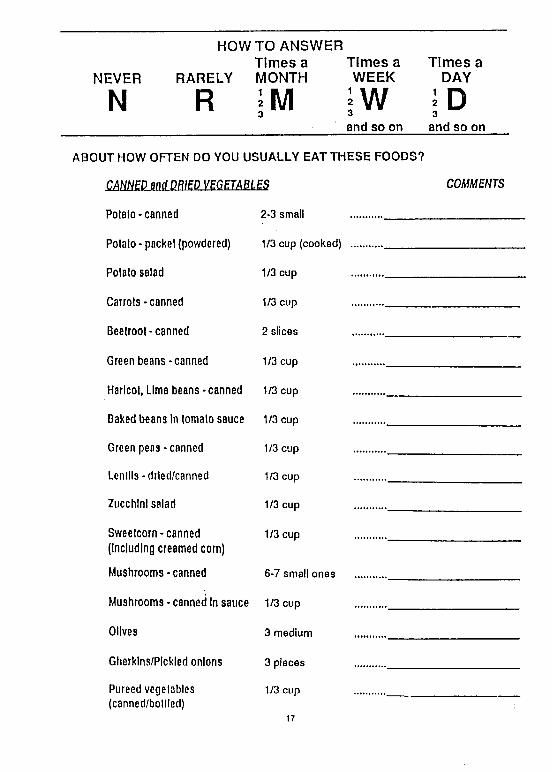
HOWTO ANSWERTimes a Times a Times a
NEVER RARELY MONTH WEEK DAY
N R ¡M ;W ¡D3 « 3and so on and so on
ABOUT HOW OFTEN DO YOU USUALLY EAT THESE FOODS?
CANNED and DRIED VEGETABLES
Potato-canned 2*3 small
Potato-packet (powdered) 1/3 cup (cooked)
Potato salad 1/3 cup
Carrots - canned 1/3 cup
Beetroot-canned 2 slices
Green beans-canned 1/3 cup
Haricot, Lima beans - canned 1/3 cup
Baked beans In tomato sauce 1/3 cup
Green peas - canned 1/3 cup
Lentils -drled/canned 1/3 cup
Zucchini salad 1/3 cup
Sweetcorn-canned (Including creamed corn)
1/3 cup
Mushrooms-canned 6-7 small ones
Mushrooms - canned In sauce 1/3 cup
Olives 3 medium
Gherklns/PIckled onions 3 pieces
Pureed vegetables (canned/bollled)
1/3 cup
17
COMMENTS

Die
t and
Hea
lth Q
uest
ionn
aire
Boo
klet
<N
v.•ac<Daa<
HOW TO ANSWER Times a Times a Times a
NEVER RARELY MONTH WEEK DAY
N R m3 i Wand so on
I D3and so on
The following list of foods contains some vegetables that may be eaten much more frequently at some times of the year than others (eg In the warmer or cooler weather). Please fill in how often each food os eaten in BOTH the warmer months of the year (SUMMER) and the cooler months (WINTER).
For example- If you usually have:
A standard serve of peas about twice a week during the warmer months of the year and about every day during the cooler months:
and:Two medium potatoes (roasted) a week throughout the year:
You would write......Summer Winter
Green peas 1 cup .fr.W.. iLD ...______
Potato*roasted 1 medium ..l.V.1/.. ^ ^
ABOUT HOW OFTEN DO YOU USUALLY EAT THESE FOODS?
SEASONAL VEGETABLES Summer Winter
Potato* fresh Smashed 1/3 cup ........................(with milk)
Potato-fresh, bolted 1 medium ........................
Potato-roasted 1 medium ........................
French Frles/Hot chips 17-18 chips ........................
Potato Gems/ about 5 ......................Pommes Noisettes
Carrots (fresh/frozen) 1/3 cup ........................
Turnip, Swede(fresh/lrozen) 1/3 cup ........................
Broad beans (IreshJIrozen) i/2cup .......................
Green beans (fresh/frozen) i/3cup 18 .......................
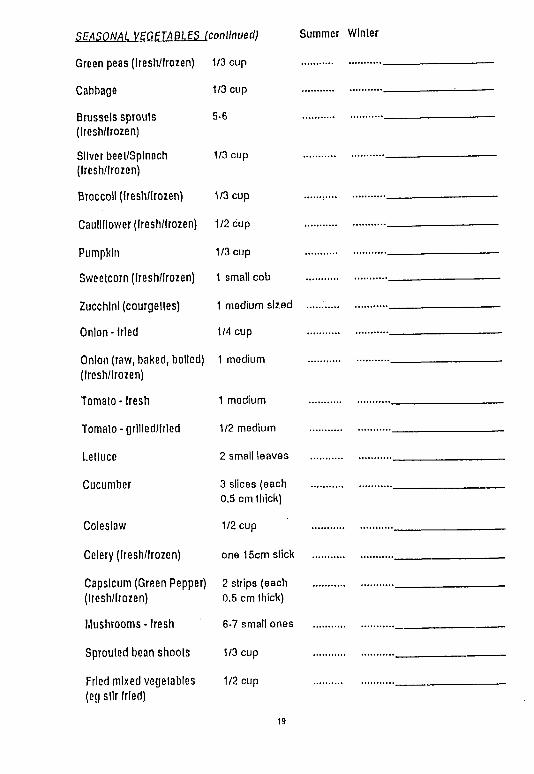
SEASONAL VEGETABLES (continued) Summer Winter
Green peas (Iresh/trozen)
Cabbage
Brussels sprouts (Iresh/lrozen)
Silver beet/Sptnach (Iresh/lrozen)
Broccoli (Iresh/lrozen)
Cauliflower (Iresh/lrozen)
Pumpkin
Sweetcorn (Iresh/lrozen)
Zucchini (courgettes)
Onion-fried
Onion (raw, baked, boiled) (Iresh/lrozen)
1/3 cup
1/3 cup
5-6
1/3 cup
1/3 cup
1/2 cup
1/3 cup
1 small cob
1 medium sized
1/4 cup
1 medium
Tomato - fresh 1 medium
Tomato - grllled/lrled 1/2 medium
Lettuce 2 small leaves
Cucumber 3 slices (each 0.5 cm thick)
Coleslaw 1/2 cup
Celery (Iresh/lrozen) one 15cm stick
Capsicum (Green Pepper) (Iresh/lrozen)
2 strips (each 0.5 cm thick)
Mushrooms - Iresh 6-7 small ones
Sprouted bean shoots 1/3 cup
Fried mixed vegetables (eg stir tried)
1/2 cup
19
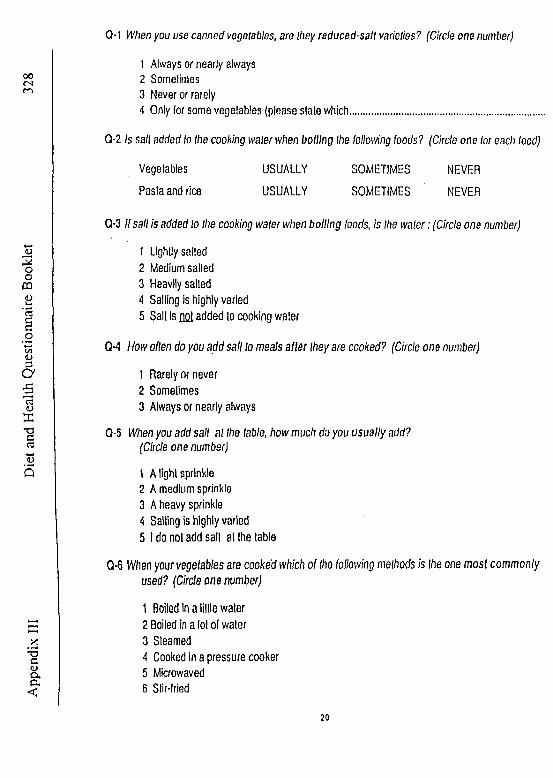
App
endi
x III
D
iet a
nd H
ealth
Que
stio
nnai
re B
ookl
etCM When you use canned vegetables, are they reduced-salt varieties? (Circle one number)
1 Always or nearly always2 Sometimes3 Never or rarely4 Only for some vegetables (please slate which.......................................................
Q-2 Is salt added to the cooking water when boiling the following foods? (Circle one lor each food)
Vegetables USUALLY SOMETIMES NEVER
Pasta and rice USUALLY SOMETIMES ' NEVER
Q*3 If sail is added to Ihe cooking water when boiling foods, is the water: (Circle one number)
1 Lightly sailed2 Medium sailed3 Heavily salted4 Sailing is highly varied5 Salt is flQl added to cooking water
CM H ow often do you a d d sa il to meals a fte r they are cooked? (Circle one number)
1 Rarely or never2 Sometimes3 Always or nearly always
Q-5 When you add salt at Ihe table, how much do you usually add?(Circle one number)
1 A light sprinkle2 A medium sprinkle3 A heavy sprinkle4 Sailing is highly varied5 I do not add salt at Ihe table
Q-6 When your vegetables are cooked which o f the following methods is Ihe one m o s t c o m m o n ly used? (Circle one num ber)
1 Boiled In a little water2 Boiled in a lot ol water3 Steamed4 Cooked in a pressure cooker5 Microwaved6 Stir-fried
20

1 VegeLoble oils (olive, sunflower etc) 4 Drlpplng/lard/mealjulcea2 Cooking or table morgarlne 5 Polyunsaturated margarine3 Butter 6 Nothing
From ¡he list above wrile which type of tat/oil is most commonfy used:
(a) When roasling/frylng meals/lish........................... .......................................
(b) When roasling/frylng vegetables.................................................................
(c) On vegetables when served (eg butter on peas)...............................................
Q-8 Is butter or margarine added to your potatoes when they are mashed? (Circle one number)
1 Yes, always2 Yes, occasionally3 Never
HOWTO ANSWERTimes a Times a Times a
NEVER RARELY MONTH WEEK DAY
N R m3 ■w 3and so on and so or
HOW OFTEN DO YOU USUALLY EAT THESE FOODS?
E E L llI
Orange, Mandarin, Grapefruit 1 medium
Apple, Pear - Iresh/baked 1 medium
Banana 1 medium
Fresh fruit salad 1 cup
Dried fruit (apple/aprlcol etc) 4-5 pieces
Raisins, sultanas or currants 1/3 cup
Fruit In syrup or slewed (Including fruit salads)
1/2 cup
Fruit canned In waler(low-cal) (Including fruit salads)
1/2 cup
Fruit plo or pastry or fritters
1 small pie or 1 slice large
COMMENTS
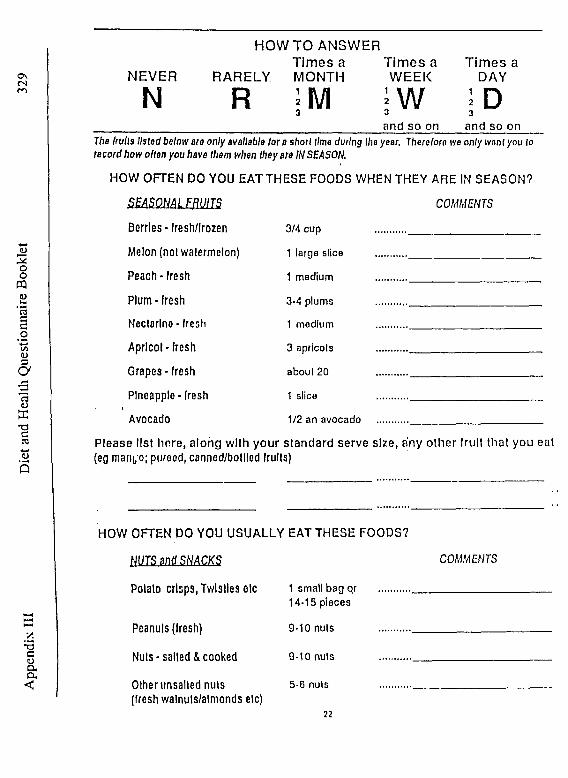
OsCNm
o2ooPQCDVn'3
CD3aa<D
XT3C3O5
*3cCD(Xa<
NEVER
N
HO W TO ANSWERTim es a T im es a T im es a
RARELY MONTH W EEK DAY
; m i w jR Dand so on and so on
The Irull3 listed below are only available tor a short lime during the year. There loro ive only want you to record how often you have them when they are IN SEASON.
HO W OFTEN DO YOU EAT TH ESE FOODS WHEN THEY AR E IN SEASON?
COMMENTSSEASONAL FRUITSBerries * fresh/lrozen 3/4 cup
Melon (nol watermelon) 1 large slice
Peach-fresh 1 medium
Plum-fresh 3-4 plums
Nectarine - fresh 1 medium
Apricot - fresh 3 apricots
Grapes - fresh about 20
Pineapple-Iresh 1 slice
Avocado 1/2 an avocado
Please lis t Im re , a lo n g w ith y o u r s ta n d a rd se rve s ize , any o th e r fru it th a t yo u eat (eg manfo; purecd, canned/bollled fruits)
HOW OFTEN DO YOU U S U A LLY EAT TH ESE FOODS?
HUTS anti SHACKS
Potato crisps, Twlstles etc
COMMENTS
Peanuts (Iresh)
Nuts - salted & cooked
Olher unsalted nuts (fresh walnuls/almonds etc)
1 small bag qr 14-15 pieces
9-10 nuts
9-10 nuts
5-6 nuts
22
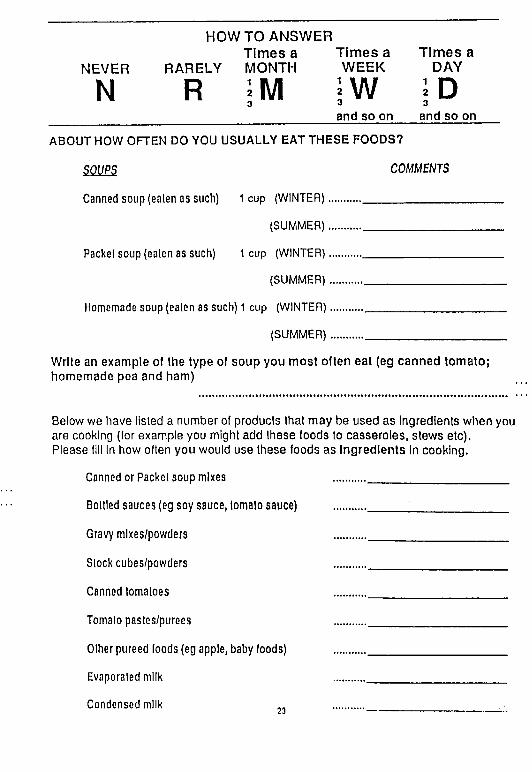
HOWTO ANSWERT im es a T im es a T im es a
NEVER RARELY MONTH W EEK DAY
N R ; m3
i wand so on
I D3
and so on
ABOUT HOW OFTEN DO YOU USUALLY EAT THESE FOODS?
SOUPS COMMENTS
Canned soup (ealen as such) 1 cup (WINTER)..................................................
(SUMMER)..................................................
Packet soup (ealen as such) 1 cup (WINTER)..................................................
(SUMMER)..................................................
Homemade soup (ealen as such) 1 cup (WINTER)..................................................
(SUMMER).................................................
Write an example of the type of soup you most often eat (eg canned tomato; homemade pea and ham)
Below we have listed a number of products that may be used as Ingredients when you are cooking (for example you might add these foods to casseroles, stews etc).Please fill In how often you would use these foods as Ingredients in cooking.
Canned or Packet soup mixes ......... .........................................
Bottled sauces (eg soy sauce, lomalo sauce) ......... ............ ............................
Gravy mlxes/powders ......... .........................................
Slock cubes/powders ......... ........................................
Canned tomatoes ......... ........................................
Tomato pastes/purees ......... ........................................
Olher pureed foods (eg apple, baby foods) ......... .........................................
Evaporated milk ......... .........................................
Condensed milk 23

App
endi
x III
D
iet a
nd H
eallh
Que
stio
nnai
re B
ookl
et
330
HOW TO ANSWER Tim es a Tim es a Tim es a
NEVER RARELY MONTH WEEK DAY
N r ; m3l\l \f3
I D3
a n d s o on a n d so on
ABOUT HOW OFTEN DO YOU USUALLY EAT THESE FOODS?
CONFECTIONERY. JAMS and SAUCES COMMENTS
Chocolate 1 small bar (50 grams)
Chocolale covered bar (eg Mars/Bounly)
Individually wrapped lollies; toffees
Packet lollies (eg Lllesavers/Polos)
Muesli bar/Mealth bar
Honey, Jam, marmalade
Vegemlte, marmite etc
Thick sauces (tomato/HP etc)
Polyunsaturated Mayonnaise/ Salad Cream
Regular Mayonnaise/Salad Cream
Low calorie salad dressings
Polyunsaturated salad dressings
1 bar
4-5 lollies
1 small packet
1 bar
1 tablespoon
1/2 teaspoon
1 tablespoon
1 tablespoon
1 tablespoon
1 tablespoon
1 tablespoon
24
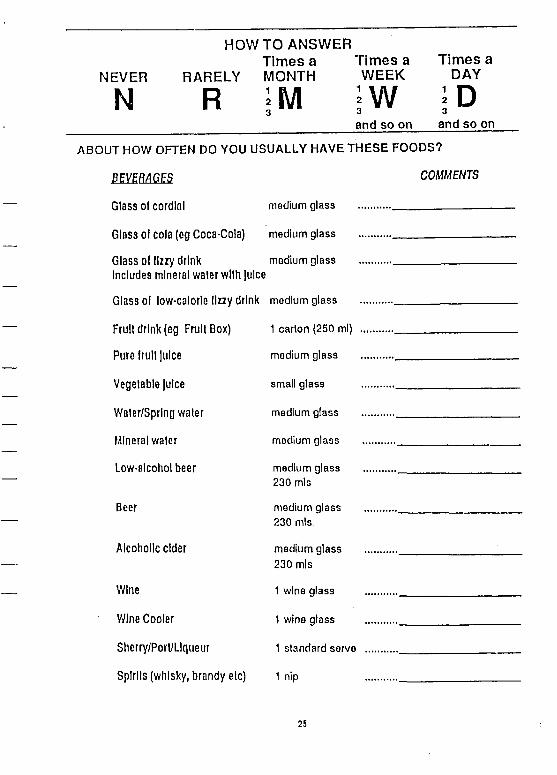
NEVER
N
HOWTO ANSWERTimes a Times a
RARELY MONTH WEEK
I M ?W
Times a DAY
R Dand so on and so on
ABOUT HOW OFTEN DO YOU USUALLY HAVE THESE FOODS?
COMMENTS
Glass ol cordial medium glass
Glass of cola (eg Coca-Cola) medium glass
Glass of fizzy drink Includes mineral waler with Juice
medium glass
Glass of low-calorle llzzy drink medium glass
Fruii drink (eg Fruit Box) 1 carton (250 ml)
Pure fruit Juice medium glass
Vegetable Juice small glass
Water/Sprlng waler medium glass
Mineral waler medium glass
Low-alcohol beer medium glass 230 mis
Beer medium glass 230 mis
Alcoholic cider medium glass 230 mis
Wine 1 wine glass
Wine Cooler 1 wine glass
Sherry/Porl/LIqueur 1 standard serve
Spirits (whisky, brandy elc) 1 nip
25
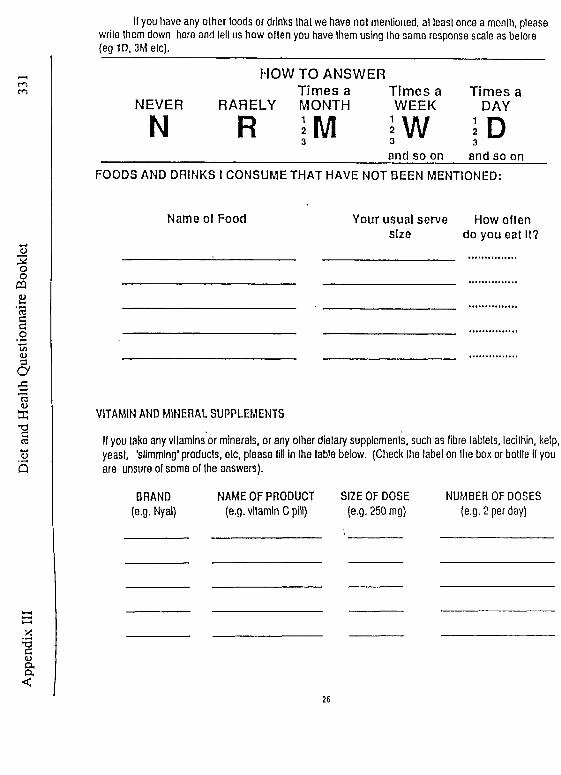
App
endi
x III
D
iet a
nd H
ealth
Que
stio
nnai
re B
ookl
etII you have any other loods or drinks that we have not mentioned, at least once a month, please
write them down here and tell us how olten you have them using the same response scale as before (eg 1D, 3M etc).
HOW TO ANSWERTim es a T im es a Tim es a
NEVER RARELY MONTH WEEK DAY
N R I M3 | W 3
and so on and so onFOODS AND DRINKS I CONSUME THAT HAVE NOT BEEN MENTIONED:
Name of Food Your usual serve size
How often do you eat It?
VITAMIN AND MINERAL SUPPLEMENTS
If you take any vitamins or minerals, or any other dietary supplement, such as fibre tablets, lecithin, kelp, yeast, 'slimming' products, etc, please till in the table below. (Check Ihe label on the box or bottle it you are unsure of some ol Ihe answers).
BRAND NAME OF PRODUCT SIZE OF DOSE(e.g. Nyal) (e.g. vitamin C pill) (e.g. 250 mg)
NUMBER OF DOSES (e.g. 2 per day)
26

S H O P P I N GQ-1 In your household, who does most oflhe shopping? (Circle two It necessary)
1 Self2 Spouse/Partner3 Someone else (specify who............ .................................................................... )
Q-2 How much do you feel that your eating habits are influenced by
(Circle one number breach)NOT
RELEVANT ------- ►MAJOR
INFLUENCE
Lack of money.................. ........ 1 2 3 4 5Transport problems............ .........1 2 3 4 5Availability of foods in shops.. ........ 1 2 3 4 5
Nutritional value of food...... ........ 1 2 3 4 5Physical disabilities............ ........ 1 2 3 4 5Some other factor..............
(please state.......................... 1 2 3 4 5
0 3 Do you ever pay attenlion to the nutrients or ingredients listed on food labels?"(Circle one number)
1 No2 Yes3 Never noticed them
0 4 When you look at the information on food labels, do you ever use it to avoid a particular ingredient ornutnent, or avoid gelling too much of it? (Circle one number)
1 I don’t look al food label information2 No3 Yes - If so, whal do you try to avoid?
(Please be specific)................................................................................
0 5 When you look at the nutrients or ingredients listed on food labels, do you use this information to compare different brands? (Circle one number)
1 I don't look at food label information2 I don't use it to compare brands3 I sometimes use it to compare brands4 I ollen use It to compare brands
27
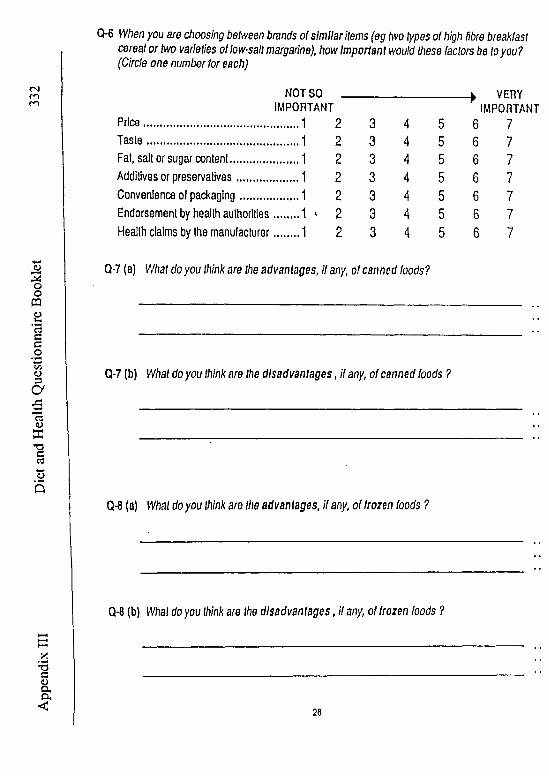
Q-6 When you are choosing between brands of sim ilar items (eg two types of high fibre breakfast cereal or two varieties of low-salt margarine), how Important would these factors be to you?(Circle one number for each)
NOT SO __________________ > VERYIMPORTANT IMPORTANT
Price........................................ ... 1 2 3 4 5 6 7T a s te ....................................... ....1 2 3 4 5 6 7Fat, sail or sugar content............... ....1 2 3 4 5 6 7Additives or preservatives............. ....1 2 3 4 5 6 7Convenience o( packaging.... . . . . . . . . . ....1 2 3 4 5 6 7Endorsement by health authorities........1 v 2 3 4 5 6 7Health claims by the manufacturer..... . . .1 2 3 4 5 6 7
Q-7 (a) What do you think are the advantages, If any, of canned foods?
Q-7 (b) What do you think are the disadvantages, If any, of canned foods ?
Q-8 (a) What do you think are the advantages, If any, of frozen foods ?
Q-8 (b) W/ial do you think are the disadvantages, if any, of frozen foods ?
20
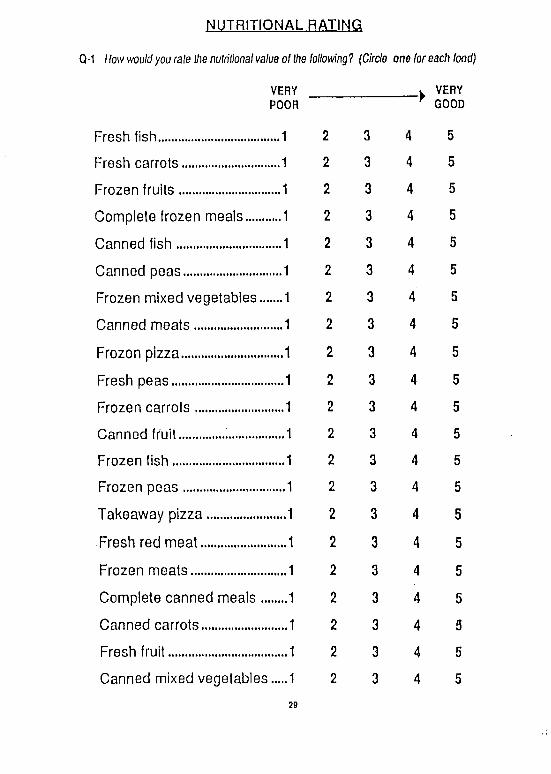
NUTRITIONAL RATING
Q-1 How would you rale Ifw nutritional value of the following? (Circle one (or each food)
VERY _______________ w VERYPOOR 7 GOOD
Fresh fish.......................... ..1 2 3 4 5
Fresh carrots.................... ..1 2 3 4 5
Frozen fruits..................... ..1 2 3 4 5
Complete frozen meals...... ..1 2 3 4 5
Canned fish...................... ..1 2 3 4 5
Canned peas.................... ..1 2 3 4 5
Frozen mixed vegetables...,.1 2 3 4 5
Canned meats................. ....1 2 3 4 5
Frozen pizza........................1 2 3 4 5
Fresh peas....................... ...1 2 3 4 5
Frozen carrots................. ...1 2 3 4 5
Canned fruit..................... ...1 2 3 4 5
Frozen fish....................... ...1 2 3 4 5
Frozen peas.................... ...1 2 3 4 5
Takeaway pizza............... ,...1 2 3 4 5
Fresh red meat................ ....1 2 3 4 5
Frozen meats.................. ....1 2 3 4 5
Complete canned meals ........1 2 3 4 5
Canned carrots................ ....1 2 3 4 5
Fresh fruit....................... ....1 2 3 4 5
Canned mixed vegetables.....1 2 3 4 5
29
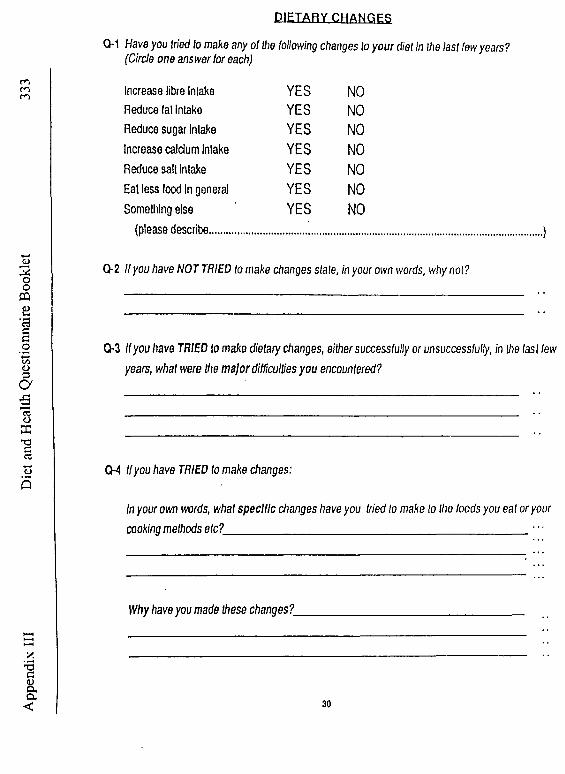
App
endi
x III
D
iet a
nd H
ealth
Que
stio
nnai
re B
ookl
et
333
D IE T A R Y C H A N G E S
Q-1 Have you tried to make any of the following changes to you r diet In the last few years? (Circle one answer for each)
Increase fibre Inlake YES NOReduce fat inlake YES NOReduce sugar Intake YES NOIncrease caldum inlake YES NOReduce sail inlake YES NOEat less food In general YES NOSomething else YES NO
(please describe...........................................................................
Q-2 If you have NOT TRIED to make changes stale, In your own words, why not?
0*3 Ifyou have TRIED to make dietary changes, either successfully or unsuccessfully, in the last few years, whal were the m ajor difficulties you encountered?
CM Ifyou have TRIED to make changes:
In your own words, what specific changes have you tried to make to the foods you eat or your cooking methods etc?___________________________________________ • • •
Why have you made these changes?_
30

CM Whal is your current height? ________ (eel________ inches OR ____________ centimetres
What is your current weight? ______ stones______ pounds OR_________ kilograms
Q-2 About how often do you exercise? (Please circle one number)
1 Less than once a week2 Once or twice a week3 Three times a week or more4 NOT AT ALL-»go to Question 3 below
Q-2(a) About how long do you exercise for each lime? (Circle one number)
1 Less than 20 minutes2 20-30 minutes3 More than 30 minutes
Q-2(b) How much of the exercise you do makes you puff and sweat? (Circle one number)
1 None ol it2 Some of it3 Most or all ol it
Q-3 (a) Have you ever smoked on a regular basis? (Please circle one number)
1 YES2 NO
Q-3 (b) Do you cu rren tly smoke cigarettes, pipes or cigars? (Please circle, and write in amount)
1 YES, I smoke____________ cigs/day
2 YES, I smoke____________ cigars/day
3 YES, I smoke____________ pipes/day
4 NO, I don’t smoke at all
31

App
endi
x II
I D
iet a
nfl H
ealth
Que
stio
nnai
re B
ookl
etBACKGROUND
ÿ -------------- ------------------:— — ---------------------------------------------- ■-------------- -----------I Please answer these questions accurately so that we can examine general relationships between lifestylesI and diet. Let us reassure you aoain that this inlormation will be kept completely conlldenllat
..................... ........................ ....................... .... , JJQ-1 Your sex: (Circle one)
1 Male2 Female
Q-2 Your present age:______ YEARS
Q-3 What is your usual occupation? ,Even if you are retired or otherwise not currently employed, please stale what your occupation usually would be. (Be specilic)
0 4 Are you (circle numbor(s))
0 8 Which one ol these best describes your situation? (Circle one number)
1 Living with spouse or partner anddependent children
2 Living with spouse or partner3 Living alone v/illi dependent children4 Living alone5 living with my family (eg mother, lather,
brother, sister)6 Share house or Hat with others7 Living with my child's family
(eg daughter or son's family)0 Retirement home 9 Another situation; please describe:
1 Employed lull-lime _________________________2 Employed part-time3 Not employed outside the home 0 8 What is your country ol birth?4 Student5 Retired _________________________6 Unemployed
0 9 If you were born overseas, (or how long 0 5 If you live with a spouse or partner, what is . have you lived in Australia?
his/her usual occupation? (Be specific)
YEARS
0 6 lls your spouse/partner (circle number(s))
1 Employed lull-lime2 Employed part-time3 Not employed outside the home4 Student5 Retired6 Unemployed
Q-10 What is the current level of income (before lax) in yo ilr household? (circle number
next to range)
1 nil - $7,000 per year2 $7,001-$15,000 per year ,3 $15,001-$25,000 per year4 $25,001-$40,000 per year5 $40,001 and over per year6 l do not wish to answer this question
32

ft*************************************************************
At this stage, we ask you to please go back through the questionnaire and
check that have answered all questions
YOUR COMMENTS
Thank you very much for your help. We realise that you had to give up
some of your time to answer our questions. We would like you to know that
wc appreciate this help.
We believe that the results from this survey will be useful in determining
what people eat, and in llie future, possible relationships between diet and
disease.
If you have any further comments to make about the design of this
questionnaire please feel free to write them down here. We might be able to
incorporate your suggestions in our future work.
Thank you again for your help.
Copyright CSIRO Division of Human Nutrition. Designed for research
purposes only.