
Precision nutrition: A systematic literature review - WUR eDepot
27
Computers in Biology and Medicine 133 (2021) 104365 Available online 7 April 2021 0010-4825/© 2021 The Authors. Published by Elsevier Ltd. This is an open access article under the CC BY license (http://creativecommons.org/licenses/by/4.0/). Precision nutrition: A systematic literature review Daniel Kirk a , Cagatay Catal b, * , Bedir Tekinerdogan a a Information Technology Group, Wageningen University and Research, Wageningen, the Netherlands b Department of Computer Science and Engineering, Qatar University, Doha, Qatar A R T I C L E INFO Keywords: Precision nutrition Personalized nutrition Machine learning Deep learning Artificial intelligence Systematic literature review ABSTRACT Precision Nutrition research aims to use personal information about individuals or groups of individuals to deliver nutritional advice that, theoretically, would be more suitable than generic advice. Machine learning, a subbranch of Artificial Intelligence, has promise to aid in the development of predictive models that are suitable for Precision Nutrition. As such, recent research has applied machine learning algorithms, tools, and techniques in precision nutrition for different purposes. However, a systematic overview of the state-of-the-art on the use of machine learning in Precision Nutrition is lacking. Therefore, we carried out a Systematic Literature Review (SLR) to provide an overview of where and how machine learning has been used in Precision Nutrition from various aspects, what such machine learning models use as input features, what the availability status of the data used in the literature is, and how the models are evaluated. Nine research questions were defined in this study. We retrieved 4930 papers from electronic databases and 60 primary studies were selected to respond to the research questions. All of the selected primary studies were also briefly discussed in this article. Our results show that fifteen problems spread across seven domains of nutrition and health are present. Four machine learning tasks are seen in the form of regression, classification, recommendation and clustering, with most of these uti- lizing a supervised approach. In total, 30 algorithms were used, with 19 appearing more than once. Models were through the use of four groups of approaches and 23 evaluation metrics. Personalized approaches are promising to reduce the burden of these current problems in nutrition research, and the current review shows Machine Learning can be incorporated into Precision Nutrition research with high performance. Precision Nutrition re- searchers should consider incorporating Machine Learning into their methods to facilitate the integration of many complex features, allowing for the development of high-performance Precision Nutrition approaches. 1. Introduction Remarkable progress has been made over the last few decades in understanding how nutrition interacts with health. However, despite this abundance of knowledge, health conditions related to nutrition are rampant and, in some cases, increasing. Statistics from the World Health Organization show that obesity has almost tripled since 1975, diabetes has almost quadrupled since 1980 and raised blood pressure has almost doubled since 1975 [1]. The multifactorial nature of these conditions makes pinpointing their exact etiology difficult, although one idea that has emerged in recent years is that current approaches to managing these conditions and others do not take into account interindividual variability. Evidence for recommendations for healthy eating guidelines is often obtained from epidemiological or large clinical studies, wherein averages or generic cut-off points are made in an attempt to supply nutritional advice on a population level. However, such generalisation, although practical, fails to capture the individualized nature of the biological effects of nutrition [2]. Such variability is known to exist in bodyweight in response to the same dietary intervention [3], post- prandial glycaemia [4,5], physiological response to salt [6], caffeine metabolism [7], vitamin metabolism [8], and likely many other areas. Such variability can be attributed to factors such as sex, ethnic origin, genetics, metabolic traits, environment, microbiome composition, and probably other yet to be discovered factors [2]. Hence, the concept of precision nutrition (used synonymously here with personalized nutri- tion; both abbreviated PN) on an individual or stratified level has been put forward as an answer to this problem. Aside from the management of chronic diseases, nutrition person- alization is also of use conditions requiring specific dietary consider- ations. Phenylketonuria (commonly known as PKU) is such an instance and is also one of the earliest examples of nutrition personalization. Patients with PKU have mutations in the gene coding for the enzyme * Corresponding author. E-mail addresses: [email protected] (D. Kirk), [email protected], [email protected] (C. Catal), [email protected] (B. Tekinerdogan). Contents lists available at ScienceDirect Computers in Biology and Medicine journal homepage: http://www.elsevier.com/locate/compbiomed https://doi.org/10.1016/j.compbiomed.2021.104365 Received 17 January 2021; Received in revised form 4 March 2021; Accepted 28 March 2021
-
Upload
khangminh22 -
Category
Documents
-
view
0 -
download
0
Transcript of Precision nutrition: A systematic literature review - WUR eDepot
Computers in Biology and Medicine 133 (2021) 104365
Available online 7 April 20210010-4825/© 2021 The Authors. Published by Elsevier Ltd. This is an open access article under the CC BY license (http://creativecommons.org/licenses/by/4.0/).
Precision nutrition: A systematic literature review
Daniel Kirk a, Cagatay Catal b,*, Bedir Tekinerdogan a
a Information Technology Group, Wageningen University and Research, Wageningen, the Netherlands b Department of Computer Science and Engineering, Qatar University, Doha, Qatar
A R T I C L E I N F O
Keywords: Precision nutrition Personalized nutrition Machine learning Deep learning Artificial intelligence Systematic literature review
A B S T R A C T
Precision Nutrition research aims to use personal information about individuals or groups of individuals to deliver nutritional advice that, theoretically, would be more suitable than generic advice. Machine learning, a subbranch of Artificial Intelligence, has promise to aid in the development of predictive models that are suitable for Precision Nutrition. As such, recent research has applied machine learning algorithms, tools, and techniques in precision nutrition for different purposes. However, a systematic overview of the state-of-the-art on the use of machine learning in Precision Nutrition is lacking. Therefore, we carried out a Systematic Literature Review (SLR) to provide an overview of where and how machine learning has been used in Precision Nutrition from various aspects, what such machine learning models use as input features, what the availability status of the data used in the literature is, and how the models are evaluated. Nine research questions were defined in this study. We retrieved 4930 papers from electronic databases and 60 primary studies were selected to respond to the research questions. All of the selected primary studies were also briefly discussed in this article. Our results show that fifteen problems spread across seven domains of nutrition and health are present. Four machine learning tasks are seen in the form of regression, classification, recommendation and clustering, with most of these uti-lizing a supervised approach. In total, 30 algorithms were used, with 19 appearing more than once. Models were through the use of four groups of approaches and 23 evaluation metrics. Personalized approaches are promising to reduce the burden of these current problems in nutrition research, and the current review shows Machine Learning can be incorporated into Precision Nutrition research with high performance. Precision Nutrition re-searchers should consider incorporating Machine Learning into their methods to facilitate the integration of many complex features, allowing for the development of high-performance Precision Nutrition approaches.
1. Introduction
Remarkable progress has been made over the last few decades in understanding how nutrition interacts with health. However, despite this abundance of knowledge, health conditions related to nutrition are rampant and, in some cases, increasing. Statistics from the World Health Organization show that obesity has almost tripled since 1975, diabetes has almost quadrupled since 1980 and raised blood pressure has almost doubled since 1975 [1]. The multifactorial nature of these conditions makes pinpointing their exact etiology difficult, although one idea that has emerged in recent years is that current approaches to managing these conditions and others do not take into account interindividual variability. Evidence for recommendations for healthy eating guidelines is often obtained from epidemiological or large clinical studies, wherein averages or generic cut-off points are made in an attempt to supply nutritional advice on a population level. However, such generalisation,
although practical, fails to capture the individualized nature of the biological effects of nutrition [2]. Such variability is known to exist in bodyweight in response to the same dietary intervention [3], post-prandial glycaemia [4,5], physiological response to salt [6], caffeine metabolism [7], vitamin metabolism [8], and likely many other areas. Such variability can be attributed to factors such as sex, ethnic origin, genetics, metabolic traits, environment, microbiome composition, and probably other yet to be discovered factors [2]. Hence, the concept of precision nutrition (used synonymously here with personalized nutri-tion; both abbreviated PN) on an individual or stratified level has been put forward as an answer to this problem.
Aside from the management of chronic diseases, nutrition person-alization is also of use conditions requiring specific dietary consider-ations. Phenylketonuria (commonly known as PKU) is such an instance and is also one of the earliest examples of nutrition personalization. Patients with PKU have mutations in the gene coding for the enzyme
* Corresponding author. E-mail addresses: [email protected] (D. Kirk), [email protected], [email protected] (C. Catal), [email protected] (B. Tekinerdogan).
Contents lists available at ScienceDirect
Computers in Biology and Medicine
journal homepage: http://www.elsevier.com/locate/compbiomed
https://doi.org/10.1016/j.compbiomed.2021.104365 Received 17 January 2021; Received in revised form 4 March 2021; Accepted 28 March 2021

Computers in Biology and Medicine 133 (2021) 104365
2
responsible for converting phenylalanine to tyrosine. A diet restrictive of phenylalanine and tyrosine supplementation are the only ways to avoid grave complications [9]. The case of PKU represents a fundamental example of how personal information about an individual (in this case, genetics) can shape dietary requirements. Personalized approaches to nutrition would have applicability in the maintenance of general health and for athletes maximising sports performance [10]. It is already the case that genetic testing to supply nutrition advice (among other in-formation) is becoming commercially available and gaining interest [11]. Some studies have also shown increased adherence or more effective behavior change in response to personalized approaches [12, 13]. For example, the Food4Me was a large randomised controlled trial investigating personalized versus generic nutrition advice for inducing dietary behavior change. After 6 months, it was clear that the person-alized advice groups implemented and sustained more dietary changes thought to be better for their health than the generic group [12]. Results such as these suggest promise that nutrition personalization can improve the health of individuals to a greater degree than generic, population-level advice.
Whilst conceptually PN may be appealing, PN approaches can involve the processing of lots of data of different kinds in a way that has not been possible in the past. However, the development of big data analytics, cloud computing, artificial intelligence, and machine learning (ML) has facilitated such data processing in a way and on a scale un-matched by humans. For PN, this means that complex arrays of factors can be integrated to provide precise nutritional advice on an individual or stratified level, facilitating prediction of postprandial glycemia [14], triglycerides [4] and the prediction of cancer [15]. In these scenarios, the use of sophisticated techniques such as ML and deep learning (DL) to interpret multiple factors is of great utility. Aside from the final output of PN, ML is also helpful in the data collection stages required to obtain the data used as features (i.e., the input) for the model. The number and type of features for PN models highly depend on the desired outcome but they can contain in themselves large amounts of data. Common features that are currently being investigated for ML application to acquire data include energy (food and drink) intake, physical and sedentary activity across the day, glycemia and sleep tracking. It is likely more are to come as new features are further identified or methods are developed that facilitate ML-orientated data extraction and data processing.
This integration of ML into both prediction models for PN and data extraction for PN is exciting for the prospect of deriving more accurate PN models. For this reason, knowing how and in which situations ML can be applied would help facilitate future PN work. However, until now this has not been explored in detail. This forms the basis for the moti-vation of the current review. The literature across multiple databases including Web of Science, Scopus, PubMed, and Science Direct was systematically searched to find all literature that was related to PN and used ML in their methodology. The objectives were to provide an overview of where and how ML has been used in PN from various as-pects, what such ML models use as input features, what the availability status of the data used in the literature is, and how the models are evaluated. A full list of the research questions is in Section 3.1. To the best of our knowledge, this is the first Systematic Literature Review (SLR) study that synthesizes the research performed in Precision Nutrition.
The structure of the remaining sections is as follows: Section 2 dis-cusses PN further and describes some similar reviews on the topic before explaining the details of ML further; Section 3 presents the research questions, outlines the applied research methodology, and provides an overview and description of the research papers found; Section 4 dis-cusses the results; Section 5 offers a discussion and describes threats to validity; and Section 6 concludes and suggests avenues for future work. The contribution of this review to the literature is it provides a base for all information relevant to PN-related research utilizing ML, which is currently lacking. Researchers and practitioners can use this review as a reference to gain an understanding of the application of ML in PN-
related research areas, inspiring future work, and progressing the research area.
2. Background and related work
In Section 2.1 PN is discussed in more detail, including related work in the field. Section 2.2 then briefly explains ML and elaborates in concepts relevant to this review.
2.1. Precision nutrition
Precision nutrition is a relatively new discipline, and this is reflected in its nomenclature. There is no universally agreed-upon definition for the terms precision nutrition or personalized nutrition [16]. In some cases, the terms are used with close overlap [17], whilst elsewhere a distinction between the two is attempted [18]. Since there is currently no consensus, the present review makes no distinction between the two. One thing that can be said about these types of approaches, however, is that they aim to use personal information about individuals or groups of individuals to deliver nutritional advice that, theoretically, would be more suitable than generic advice. Note that PN can occur on a group level and still be considered personalized as long as the groups are made based on key characteristics that make the nutritional advice the same for all members within the same group. This is known as stratification and can be considered as a level above PN on an individual level [19]. According to Zeisel, personalization on a stratified level is the real goal of PN since personalization on an individual level will never be possible [17]. Whilst it is certainly true that stratified approaches will be suitable enough in the vast majority of cases, the concept of individualization does not seem unachievable in some circumstances. Predicting post-prandial glycemia seems to be one instance where an individual approach could be applicable and suitable. In this regard, Zeevi et al., in 2015 published one of the most prominent papers in PN research. Pre-diction of glycemia for each individual was attempted based on meal content, meal timing features (e.g., time of consumption, time since prior meal, etc.), activity, blood features, continuous glucose monitoring (CGM) data, and data about the microbiome [5]. Although the methods of assessment in this research may currently be infeasible on a large scale, that may change in the future as data gathering methods become more affordable, and this would certainly be an example on an indi-vidualized level. However, it could also be that groups of individuals within the data can be identified that respond in the same way to the same meal. The level of detail that PN reaches to will ultimately depend on how much the differences within the same stratified group make to the final prediction outcome; how well these differences can be detected by the technology in use; and the cost-effectiveness trade-off between these two. Indeed, taking these points into account, stratification seems likely to be the dominant choice.
PN is founded upon the concept of biological variability between individuals in response to nutrition [19]. Thus, if the variables respon-sible for causing this variation and their effect on a desired outcome variable can be known, the outcome variable can be predicted, and this can be translated into nutrition advice. What, then, are these variables? The answer to this question depends on the desired outcome variable. There is no set of fixed variables that will provide any given output. Instead, features thought to be of importance to predicting the outcome are selected on a per situation basis. In some cases, this can reach to large numbers of individual features. However, they can be separated into groups, here referred to as PN elements. One common PN element is genetics. Genetics is understood as a reason for many obvious examples of variation, such as eye color and hair color, and this is extended to response to nutrition [9]. Indeed, in some circumstances such as PKU, genetics is an extremely relevant feature for PN approaches. There is also some known relationships between genetics and weight manage-ment [20], lactose (as in the case of lactose intolerance) [21], metabolic syndrome [22], and more [17]. However, unlike with eye and hair color,
D. Kirk et al.
Computers in Biology and Medicine 133 (2021) 104365
3
what has become clear is that genetics can rarely explain nutritional response entirely. In some cases, the genetic contribution is virtually absent, as Berry et al. witnessed when predicting postprandial tri-glycerides [4]. Another relevant factor is not only genes alone but also their interaction with nutritional intake, termed nutrigenomics [23]. Genetic variation impacts metabolism of dietary components, but also dietary components regulate gene expression and signaling [23]. Failing to account for this interaction will naturally lead to compromised ac-curacy of PN models, meaning dietary information is often collected in PN approaches. Gene-diet interactions for various chronic conditions are known and as more continue to be discovered, PN approaches consid-ering nutrigenomics can be improved [24].
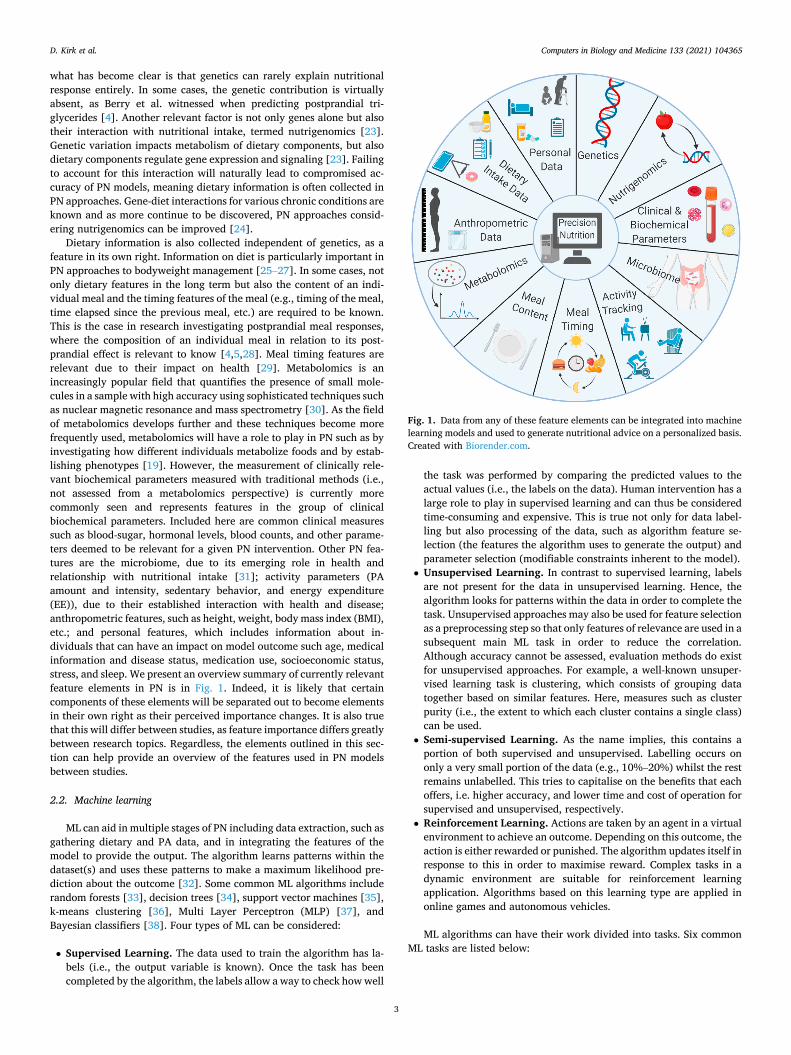
Dietary information is also collected independent of genetics, as a feature in its own right. Information on diet is particularly important in PN approaches to bodyweight management [25–27]. In some cases, not only dietary features in the long term but also the content of an indi-vidual meal and the timing features of the meal (e.g., timing of the meal, time elapsed since the previous meal, etc.) are required to be known. This is the case in research investigating postprandial meal responses, where the composition of an individual meal in relation to its post-prandial effect is relevant to know [4,5,28]. Meal timing features are relevant due to their impact on health [29]. Metabolomics is an increasingly popular field that quantifies the presence of small mole-cules in a sample with high accuracy using sophisticated techniques such as nuclear magnetic resonance and mass spectrometry [30]. As the field of metabolomics develops further and these techniques become more frequently used, metabolomics will have a role to play in PN such as by investigating how different individuals metabolize foods and by estab-lishing phenotypes [19]. However, the measurement of clinically rele-vant biochemical parameters measured with traditional methods (i.e., not assessed from a metabolomics perspective) is currently more commonly seen and represents features in the group of clinical biochemical parameters. Included here are common clinical measures such as blood-sugar, hormonal levels, blood counts, and other parame-ters deemed to be relevant for a given PN intervention. Other PN fea-tures are the microbiome, due to its emerging role in health and relationship with nutritional intake [31]; activity parameters (PA amount and intensity, sedentary behavior, and energy expenditure (EE)), due to their established interaction with health and disease; anthropometric features, such as height, weight, body mass index (BMI), etc.; and personal features, which includes information about in-dividuals that can have an impact on model outcome such age, medical information and disease status, medication use, socioeconomic status, stress, and sleep. We present an overview summary of currently relevant feature elements in PN is in Fig. 1. Indeed, it is likely that certain components of these elements will be separated out to become elements in their own right as their perceived importance changes. It is also true that this will differ between studies, as feature importance differs greatly between research topics. Regardless, the elements outlined in this sec-tion can help provide an overview of the features used in PN models between studies.
2.2. Machine learning
ML can aid in multiple stages of PN including data extraction, such as gathering dietary and PA data, and in integrating the features of the model to provide the output. The algorithm learns patterns within the dataset(s) and uses these patterns to make a maximum likelihood pre-diction about the outcome [32]. Some common ML algorithms include random forests [33], decision trees [34], support vector machines [35], k-means clustering [36], Multi Layer Perceptron (MLP) [37], and Bayesian classifiers [38]. Four types of ML can be considered:
• Supervised Learning. The data used to train the algorithm has la-bels (i.e., the output variable is known). Once the task has been completed by the algorithm, the labels allow a way to check how well
the task was performed by comparing the predicted values to the actual values (i.e., the labels on the data). Human intervention has a large role to play in supervised learning and can thus be considered time-consuming and expensive. This is true not only for data label-ling but also processing of the data, such as algorithm feature se-lection (the features the algorithm uses to generate the output) and parameter selection (modifiable constraints inherent to the model).
• Unsupervised Learning. In contrast to supervised learning, labels are not present for the data in unsupervised learning. Hence, the algorithm looks for patterns within the data in order to complete the task. Unsupervised approaches may also be used for feature selection as a preprocessing step so that only features of relevance are used in a subsequent main ML task in order to reduce the correlation. Although accuracy cannot be assessed, evaluation methods do exist for unsupervised approaches. For example, a well-known unsuper-vised learning task is clustering, which consists of grouping data together based on similar features. Here, measures such as cluster purity (i.e., the extent to which each cluster contains a single class) can be used.
• Semi-supervised Learning. As the name implies, this contains a portion of both supervised and unsupervised. Labelling occurs on only a very small portion of the data (e.g., 10%–20%) whilst the rest remains unlabelled. This tries to capitalise on the benefits that each offers, i.e. higher accuracy, and lower time and cost of operation for supervised and unsupervised, respectively.
• Reinforcement Learning. Actions are taken by an agent in a virtual environment to achieve an outcome. Depending on this outcome, the action is either rewarded or punished. The algorithm updates itself in response to this in order to maximise reward. Complex tasks in a dynamic environment are suitable for reinforcement learning application. Algorithms based on this learning type are applied in online games and autonomous vehicles.
ML algorithms can have their work divided into tasks. Six common ML tasks are listed below:
Fig. 1. Data from any of these feature elements can be integrated into machine learning models and used to generate nutritional advice on a personalized basis. Created with Biorender.com.
D. Kirk et al.

Computers in Biology and Medicine 133 (2021) 104365
4
• Classification. A supervised approach to assigning unseen data values to a given class based on the properties it has. Binary classi-fication is common, where the data can be categorized into one of two classes (i.e., 1 or 0, yes or no). Multiple classification is also possible, wherein class number is greater than two. An example of classification could be predicting presence or absence of disease from medical variables.
• Regression. A supervised task that takes a collection of input vari-ables and uses them to predict a real numerical value as an outcome variable. Predicting blood cholesterol from relevant physiological variables is an example of regression.
• Clustering. An unsupervised method of grouping portions of data together based on similar characteristics. Because it is unsupervised, the logical underpinning that ultimately drives the grouping process may not be apparent beforehand. Hence, patterns can be identified in the data that humans would be unable to notice. Grouping subjects together based on shared characteristics such as metabolic pheno-type is an example of clustering.
• Recommendation. Recommendation systems ultimately use the information available to it to predict the preference a user will have for an output variable. Historical data about the user is used to predict preference, although this differs depending on type of recommender system (i.e., collaborative filtering or content-based systems).
• Dimensionality Reduction. Dimensionality reduction refers to transforming high—dimensional data to low-dimensional data, typically as a preprocessing step before performing a task. This means that only input variables that contribute to the model output are maintained for model input. Reducing input variables in this way improves model performance. It is also possible to reduce the num-ber of data points (i.e., rows) in addition to the features (i.e., columns).
• Anomaly detection. Anomaly detection refers to the process of identifying results that deviate largely from what could be expected [AD]. However, because anomalies, by definition, occur only rarely, having sufficient samples for training data can be an issue. Hence, such anomaly detection algorithms attempt to respond to this issue. Anomaly detection has its most common application in detection of fraudulent bank transactions.
Deep learning (DL) is a sub-branch of ML. It is based on artificial neural networks (ANNs), which are networks designed based on the neuronal connections in the human brain. The term “deep” is added to reflect the number of hidden layers the network has, and this extra depth allows the network to deal with a greater level of complexity than shallow learning (i.e., traditional machine learning) approaches. In this way, DL can deal with certain complex tasks that shallow learning would not perform adequately. However, to do this they require a great deal more data and computational power. Although, if this data can be used for the algorithm, performance will increase, unlike with shallow learning algorithms, which tend to plateau. Note that ANN is not a DL technique per se; its categorization as deep or shallow depends on its depth, namely the number of hidden layers. A shallow ANN with a single hidden layer can be referred to as a Multi-Layer Perceptron (MLP). Ex-amples of DL techniques include Deep Belief Networks [39], Restricted Boltzmann Machines [40], Recurrent Neural Networks (RNN), Long Short Term Memory (LSTM) [41], and Convolutional Neural Networks (CNN) [42].
Deep Belief Networks are structured the same as MLPs but are trained differently. Restricted Boltzmann Machines (a type of ANN) are stacked upon one another, and patterns recognized from the previous layer is used to train the next. This is repeated across all layers until the output is generated. This can be done unsupervised, where features are detected, or by providing a small set of labelled samples to be associated to the patterns. Either way, this saves largely on labelling time. RNNs differ from traditional ANNs in that they deal with sequential data,
which means the input order of the data also has meaning. This is the case in sentences of words, for example, where the word order is rele-vant to convey information. This is achieved by using both new data and previously processed data as input, instead of only forward propagation as in traditional ANNs. Hence, instead of being propagated once only, the network is propagated a number of times equal to the number of sequential steps in the sample. Long Short-Term Memory is the most common RNN algorithm used. Text generation, such as in chatbots, translation, and speech recognition can be attempted using RNNs [41].
CNNs are also based on neural networks and are specialized in pattern recognition, making them suitable for the task of image recog-nition. Since CNNs are largely used for image recognition generally and were mostly used for image recognition in the current literature, they will be explained from an image recognition point of view. CNNs contain convolutional, pooling layers, and fully connected layers stacked on top of one another. In the convolutional layer, filters take an array of pixels (i.e., a small portion of the entire set of pixels) as an input to generate features, which fundamentally represent pieces of information that are distinctive for the image or objects in the image. This array convolves across all the pixels in the whole image, calculating scaler products, and generates features at all positions to form a feature map (or activation map). This is then transformed by a rectified linear unit, making nega-tive values in the scaler product zero, and used as input to the next layer. Pooling layers take each of these filtered arrays in the feature map and make a much smaller image by taking the highest number from each scaler product (i.e., down-sampling), and this again acts as the input for the next layer. Doing this allows the most distinctive features within the image to be retained whilst making the overall size much smaller, reducing computational power. It is often the case that convolutional and pooling layers are stacked multiple times before reaching the final fully connected layer. The fully connected layer forms the final output as in a standard ANN via classification [42–44]. To avoid overfitting in CNN-based models, dropout and batch normalization layers are also utilized.
3. Research methodology
ML has already been applied in some areas of PN-related research. However, no work has currently looked to review the application of ML in PN related areas. The current review aims to fill this knowledge gap in the literature. Due to the young age of both PN and ML as disciplines, it is understandable that few articles exist that focus solely on using ML to generate nutritional advice as a PN output. For this reason, a broader stance was taken to encompass the use of ML in surrounding research areas that relate indirectly to PN, i.e., those that do not contain nutri-tional advice as a model output but are relevant to PN in other ways, such as data collection for PN input variables. The review follows the guidelines set out by Kitchenham et al. which are systematic literature review guidelines for medical literature that has been adopted for soft-ware engineering review papers [45]. This consist of identifying research questions (Section 3.1); defining search strategy, such as search strings and databases used for searches (Section 3.2.1); defining inclu-sion and exclusion criteria (Section 3.2.2); grading the paper quality based on a quality assessment tool (Section 3.3); and finally, data extraction for all of the remaining papers (Section 3.4). An overview of the SLR process can be seen in Fig. 2.
3.1. Research questions
The following research questions were sought to be answered in the current review:
• RQ-1: In which domains of Precision Nutrition-related research has machine learning been applied?
• RQ-2: For which specific Precision Nutrition-related problems has machine learning been applied?
D. Kirk et al.

Computers in Biology and Medicine 133 (2021) 104365
5
• RQ-3: Which Machine Learning tasks are used in Precision Nutrition- related problems?
• RQ-4: Which Machine Learning types are used in Precision Nutrition- related problems?
• RQ-5: Which Machine Learning algorithms are used in Precision Nutrition-related problems?
• RQ-6: What features are used by the Machine Learning models these studies?
• RQ-7 What is the availability status of the datasets used in the literature?
• RQ-8: Which evaluation approaches have been used to assess model efficacy?
• RQ-9: Which evaluation metrics have been used to gauge model efficacy?
Note that the research questions refer to the final output of the ML process and not pre-processing steps. It was sometimes the case that feature selection via dimensionality reduction was performed before the main algorithm was used. This occurred frequently in image recognition papers where convolutional neural networks (CNN) were used. This type of preprocessing was typically excluded and was only retained if it composed a significant portion of the paper. In the majority of the cases and unless otherwise stated, the research questions apply to the main algorithm(s) of the papers.
3.2. Primary study selection
3.2.1. Search terms and databases PN models can consist of tens to over one hundred individual fea-
tures at a time. Searching to include information on ML in all of the potential features used in PN models would be infeasible. Hence, it was decided that the most-encompassing search terms that also returned the
highest proportion of relevant papers was:
“ “Machine learning” + nutrition “.
Although a sub-division of ML, papers utilizing DL approaches did not always mention the term ML. Hence, for completeness, a second search was also performed:
“ “Deep learning” + nutrition “.
The databases selected for the search were ScienceDirect, PubMed, Scopus, and Web of Science. Papers were selected based on the title and the abstract. The number of papers returned using these search terms and databases is shown in Table 1. Additionally, the Google Scholar “related articles” and “cited by” features were used with the [5] paper to identify an extra one and eight papers, respectively. This was performed because the prominence of this paper in the field of PN means that it is highly unlikely any relevant article will not cite [5] in their work. The search strategy and the number of papers in each stage are presented in Fig. 3.
Fig. 2. The SLR process undertaken by us.
Table 1 The number of papers returned from each database using both search queries.
Search terms Before/After abstract & title screening
Database
PubMed Scopus Web of Science
Science Direct
““Machine learning” +nutrition”
Before 462 385 167 3038 After 23 25 9 14
““Deep learning” +nutrition”
Before 67 94 29 688 After 4 16 3 3
D. Kirk et al.

Computers in Biology and Medicine 133 (2021) 104365
6
3.2.2. Inclusion and exclusion criteria Next, the selected articles were read in full while the inclusion and
exclusion criteria were applied. All peer-reviewed papers that used ML for PN or PN-related research were included. The exclusion criteria were as follows:
• Article is not related or relevant to human nutrition (e.g., PN for farm animals)
• Article unrelated to PN • Article language is not English • The full text is unavailable • Article is not a primary study (i.e., review, book chapter, commen-
tary, etc) • Article is related to consumer acceptance of precision nutrition
• Article is not of sufficient quality according to the applied quality assessment scale (discussed below)
3.3. Quality assessment
After selecting the papers and applying the inclusion and exclusion criteria, papers were graded according to the quality assessment criteria presented by Kitchenham et al. as seen in Table 2 [45].
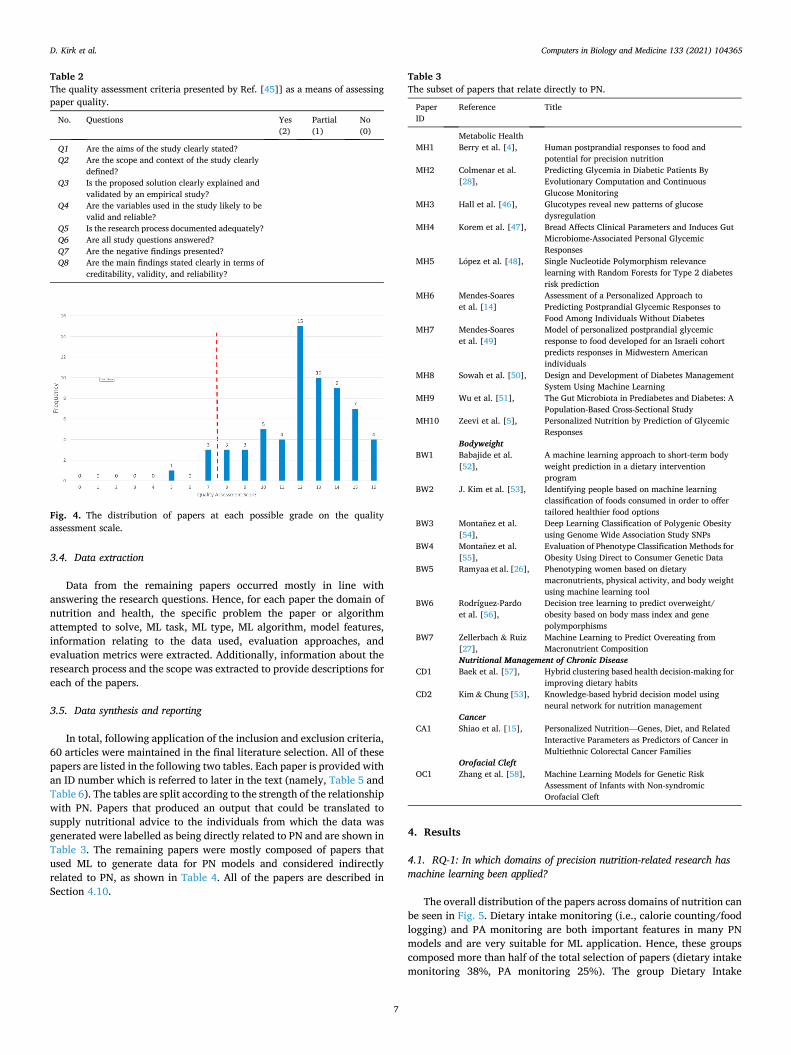
As shown in Fig. 4, 64 papers were quality assessed, after which four were removed leaving a total of 60 papers as the final literature selection.
Fig. 3. The search methodology for identifying relevant papers.
D. Kirk et al.
Computers in Biology and Medicine 133 (2021) 104365
7
3.4. Data extraction
Data from the remaining papers occurred mostly in line with answering the research questions. Hence, for each paper the domain of nutrition and health, the specific problem the paper or algorithm attempted to solve, ML task, ML type, ML algorithm, model features, information relating to the data used, evaluation approaches, and evaluation metrics were extracted. Additionally, information about the research process and the scope was extracted to provide descriptions for each of the papers.
3.5. Data synthesis and reporting
In total, following application of the inclusion and exclusion criteria, 60 articles were maintained in the final literature selection. All of these papers are listed in the following two tables. Each paper is provided with an ID number which is referred to later in the text (namely, Table 5 and Table 6). The tables are split according to the strength of the relationship with PN. Papers that produced an output that could be translated to supply nutritional advice to the individuals from which the data was generated were labelled as being directly related to PN and are shown in Table 3. The remaining papers were mostly composed of papers that used ML to generate data for PN models and considered indirectly related to PN, as shown in Table 4. All of the papers are described in Section 4.10.
4. Results
4.1. RQ-1: In which domains of precision nutrition-related research has machine learning been applied?
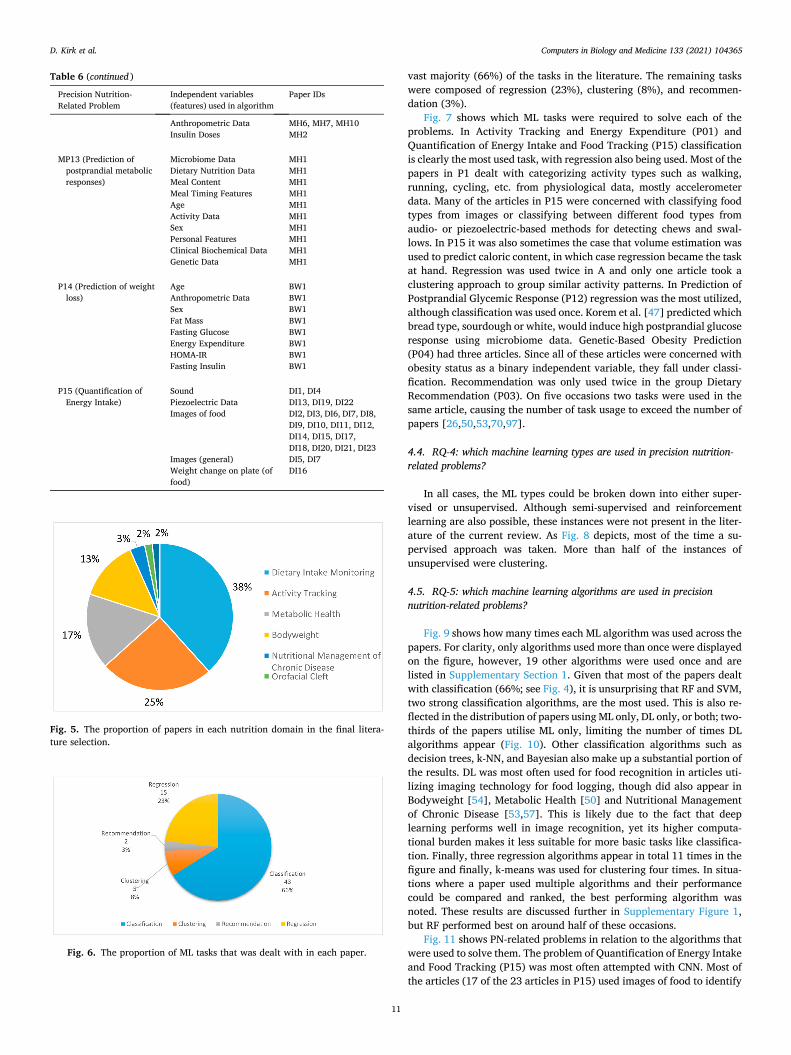
The overall distribution of the papers across domains of nutrition can be seen in Fig. 5. Dietary intake monitoring (i.e., calorie counting/food logging) and PA monitoring are both important features in many PN models and are very suitable for ML application. Hence, these groups composed more than half of the total selection of papers (dietary intake monitoring 38%, PA monitoring 25%). The group Dietary Intake
Table 2 The quality assessment criteria presented by Ref. [45]] as a means of assessing paper quality.
No. Questions Yes (2)
Partial (1)
No (0)
Q1 Are the aims of the study clearly stated? Q2 Are the scope and context of the study clearly
defined? Q3 Is the proposed solution clearly explained and
validated by an empirical study? Q4 Are the variables used in the study likely to be
valid and reliable? Q5 Is the research process documented adequately? Q6 Are all study questions answered? Q7 Are the negative findings presented? Q8 Are the main findings stated clearly in terms of
creditability, validity, and reliability?
Fig. 4. The distribution of papers at each possible grade on the quality assessment scale.
Table 3 The subset of papers that relate directly to PN.
Paper ID
Reference Title
Metabolic Health MH1 Berry et al. [4], Human postprandial responses to food and
potential for precision nutrition MH2 Colmenar et al.
[28], Predicting Glycemia in Diabetic Patients By Evolutionary Computation and Continuous Glucose Monitoring
MH3 Hall et al. [46], Glucotypes reveal new patterns of glucose dysregulation
MH4 Korem et al. [47], Bread Affects Clinical Parameters and Induces Gut Microbiome-Associated Personal Glycemic Responses
MH5 Lopez et al. [48], Single Nucleotide Polymorphism relevance learning with Random Forests for Type 2 diabetes risk prediction
MH6 Mendes-Soares et al. [14]
Assessment of a Personalized Approach to Predicting Postprandial Glycemic Responses to Food Among Individuals Without Diabetes
MH7 Mendes-Soares et al. [49]
Model of personalized postprandial glycemic response to food developed for an Israeli cohort predicts responses in Midwestern American individuals
MH8 Sowah et al. [50], Design and Development of Diabetes Management System Using Machine Learning
MH9 Wu et al. [51], The Gut Microbiota in Prediabetes and Diabetes: A Population-Based Cross-Sectional Study
MH10 Zeevi et al. [5], Personalized Nutrition by Prediction of Glycemic Responses
Bodyweight BW1 Babajide et al.
[52], A machine learning approach to short-term body weight prediction in a dietary intervention program
BW2 J. Kim et al. [53], Identifying people based on machine learning classification of foods consumed in order to offer tailored healthier food options
BW3 Montanez et al. [54],
Deep Learning Classification of Polygenic Obesity using Genome Wide Association Study SNPs
BW4 Montanez et al. [55],
Evaluation of Phenotype Classification Methods for Obesity Using Direct to Consumer Genetic Data
BW5 Ramyaa et al. [26], Phenotyping women based on dietary macronutrients, physical activity, and body weight using machine learning tool
BW6 Rodríguez-Pardo et al. [56],
Decision tree learning to predict overweight/ obesity based on body mass index and gene polymporphisms
BW7 Zellerbach & Ruiz [27],
Machine Learning to Predict Overeating from Macronutrient Composition
Nutritional Management of Chronic Disease CD1 Baek et al. [57], Hybrid clustering based health decision-making for
improving dietary habits CD2 Kim & Chung [53], Knowledge-based hybrid decision model using
neural network for nutrition management Cancer
CA1 Shiao et al. [15], Personalized Nutrition—Genes, Diet, and Related Interactive Parameters as Predictors of Cancer in Multiethnic Colorectal Cancer Families
Orofacial Cleft OC1 Zhang et al. [58], Machine Learning Models for Genetic Risk
Assessment of Infants with Non-syndromic Orofacial Cleft
D. Kirk et al.
Computers in Biology and Medicine 133 (2021) 104365
8
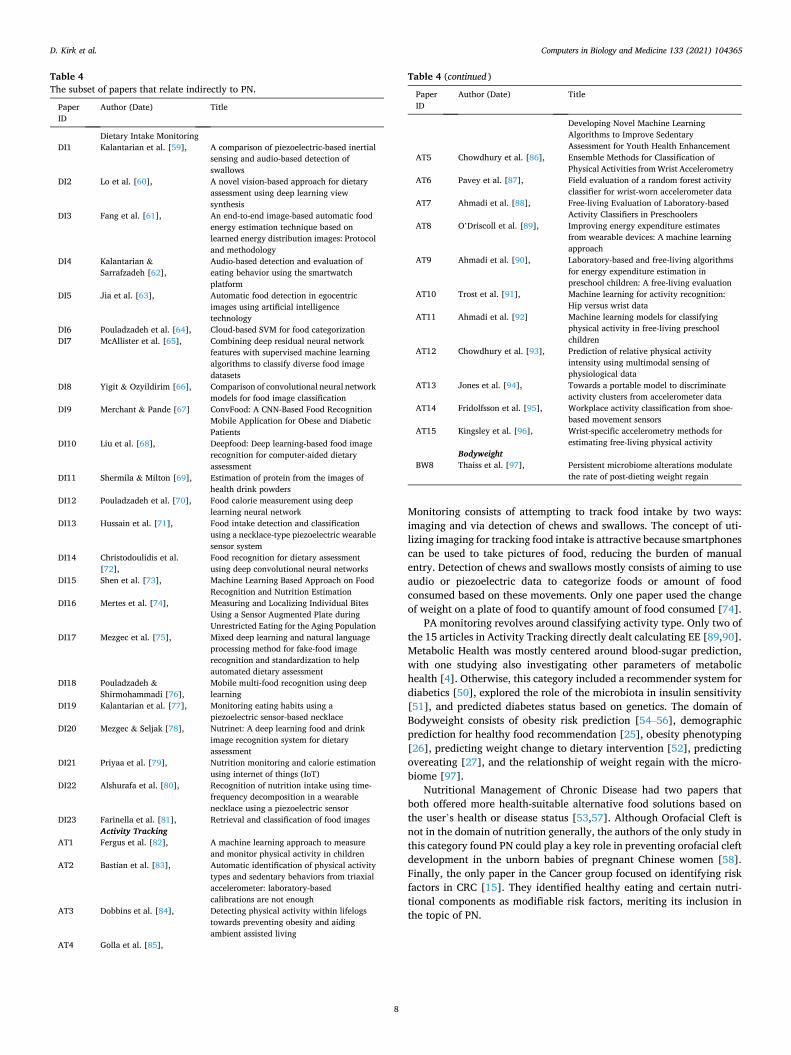
Monitoring consists of attempting to track food intake by two ways: imaging and via detection of chews and swallows. The concept of uti-lizing imaging for tracking food intake is attractive because smartphones can be used to take pictures of food, reducing the burden of manual entry. Detection of chews and swallows mostly consists of aiming to use audio or piezoelectric data to categorize foods or amount of food consumed based on these movements. Only one paper used the change of weight on a plate of food to quantify amount of food consumed [74].
PA monitoring revolves around classifying activity type. Only two of the 15 articles in Activity Tracking directly dealt calculating EE [89,90]. Metabolic Health was mostly centered around blood-sugar prediction, with one studying also investigating other parameters of metabolic health [4]. Otherwise, this category included a recommender system for diabetics [50], explored the role of the microbiota in insulin sensitivity [51], and predicted diabetes status based on genetics. The domain of Bodyweight consists of obesity risk prediction [54–56], demographic prediction for healthy food recommendation [25], obesity phenotyping [26], predicting weight change to dietary intervention [52], predicting overeating [27], and the relationship of weight regain with the micro-biome [97].
Nutritional Management of Chronic Disease had two papers that both offered more health-suitable alternative food solutions based on the user’s health or disease status [53,57]. Although Orofacial Cleft is not in the domain of nutrition generally, the authors of the only study in this category found PN could play a key role in preventing orofacial cleft development in the unborn babies of pregnant Chinese women [58]. Finally, the only paper in the Cancer group focused on identifying risk factors in CRC [15]. They identified healthy eating and certain nutri-tional components as modifiable risk factors, meriting its inclusion in the topic of PN.
Table 4 The subset of papers that relate indirectly to PN.
Paper ID
Author (Date) Title
Dietary Intake Monitoring DI1 Kalantarian et al. [59], A comparison of piezoelectric-based inertial
sensing and audio-based detection of swallows
DI2 Lo et al. [60], A novel vision-based approach for dietary assessment using deep learning view synthesis
DI3 Fang et al. [61], An end-to-end image-based automatic food energy estimation technique based on learned energy distribution images: Protocol and methodology
DI4 Kalantarian & Sarrafzadeh [62],
Audio-based detection and evaluation of eating behavior using the smartwatch platform
DI5 Jia et al. [63], Automatic food detection in egocentric images using artificial intelligence technology
DI6 Pouladzadeh et al. [64], Cloud-based SVM for food categorization DI7 McAllister et al. [65], Combining deep residual neural network
features with supervised machine learning algorithms to classify diverse food image datasets
DI8 Yigit & Ozyildirim [66], Comparison of convolutional neural network models for food image classification
DI9 Merchant & Pande [67] ConvFood: A CNN-Based Food Recognition Mobile Application for Obese and Diabetic Patients
DI10 Liu et al. [68], Deepfood: Deep learning-based food image recognition for computer-aided dietary assessment
DI11 Shermila & Milton [69], Estimation of protein from the images of health drink powders
DI12 Pouladzadeh et al. [70], Food calorie measurement using deep learning neural network
DI13 Hussain et al. [71], Food intake detection and classification using a necklace-type piezoelectric wearable sensor system
DI14 Christodoulidis et al. [72],
Food recognition for dietary assessment using deep convolutional neural networks
DI15 Shen et al. [73], Machine Learning Based Approach on Food Recognition and Nutrition Estimation
DI16 Mertes et al. [74], Measuring and Localizing Individual Bites Using a Sensor Augmented Plate during Unrestricted Eating for the Aging Population
DI17 Mezgec et al. [75], Mixed deep learning and natural language processing method for fake-food image recognition and standardization to help automated dietary assessment
DI18 Pouladzadeh & Shirmohammadi [76],
Mobile multi-food recognition using deep learning
DI19 Kalantarian et al. [77], Monitoring eating habits using a piezoelectric sensor-based necklace
DI20 Mezgec & Seljak [78], Nutrinet: A deep learning food and drink image recognition system for dietary assessment
DI21 Priyaa et al. [79], Nutrition monitoring and calorie estimation using internet of things (IoT)
DI22 Alshurafa et al. [80], Recognition of nutrition intake using time- frequency decomposition in a wearable necklace using a piezoelectric sensor
DI23 Farinella et al. [81], Retrieval and classification of food images Activity Tracking
AT1 Fergus et al. [82], A machine learning approach to measure and monitor physical activity in children
AT2 Bastian et al. [83], Automatic identification of physical activity types and sedentary behaviors from triaxial accelerometer: laboratory-based calibrations are not enough
AT3 Dobbins et al. [84], Detecting physical activity within lifelogs towards preventing obesity and aiding ambient assisted living
AT4 Golla et al. [85],
Table 4 (continued )
Paper ID
Author (Date) Title
Developing Novel Machine Learning Algorithms to Improve Sedentary Assessment for Youth Health Enhancement
AT5 Chowdhury et al. [86], Ensemble Methods for Classification of Physical Activities from Wrist Accelerometry
AT6 Pavey et al. [87], Field evaluation of a random forest activity classifier for wrist-worn accelerometer data
AT7 Ahmadi et al. [88], Free-living Evaluation of Laboratory-based Activity Classifiers in Preschoolers
AT8 O’Driscoll et al. [89], Improving energy expenditure estimates from wearable devices: A machine learning approach
AT9 Ahmadi et al. [90], Laboratory-based and free-living algorithms for energy expenditure estimation in preschool children: A free-living evaluation
AT10 Trost et al. [91], Machine learning for activity recognition: Hip versus wrist data
AT11 Ahmadi et al. [92] Machine learning models for classifying physical activity in free-living preschool children
AT12 Chowdhury et al. [93], Prediction of relative physical activity intensity using multimodal sensing of physiological data
AT13 Jones et al. [94], Towards a portable model to discriminate activity clusters from accelerometer data
AT14 Fridolfsson et al. [95], Workplace activity classification from shoe- based movement sensors
AT15 Kingsley et al. [96], Wrist-specific accelerometry methods for estimating free-living physical activity
Bodyweight BW8 Thaiss et al. [97], Persistent microbiome alterations modulate
the rate of post-dieting weight regain
D. Kirk et al.

Computers in Biology and Medicine 133 (2021) 104365
9
Table 5 Specific Precision Nutrition-Related problems coded with an index letter for correspondence with the graphs. The number of papers that deal with each problem and a brief description of the problem as it relates to PN are also pro-vided. The final column also provides the paper IDs listed in Tables 3 and 4 for reference.
Letter Specific Precision Nutrition-related problem
N.o. Papers
Explanation Paper ID(s)
P01 Activity Tracking and Energy Expenditure
15 Quantifying energy expenditure activity is important for calculating energy balance. Measuring activity is relevant as a measure for heath, as well as a means for calculating energy expenditure. Activity data is a common feature in PN models.
A1, A2, A3, A4, A5, A6, A7, A8, A9, A10, A11, A12, A13, A14, A15
P02 Classification of Glucose Response
1 This problem contained only one paper [46] that dealt with classifying subjects based on their glycaemic responses via clustering. Early recognition of glucose dysregulation as well as the foods that enhance it in an individual allows personalized preventive treatment.
MH3
P03 Dietary Recommendation
4 The papers in this category dealt with recommending healthier foods based on personal information about the users through ML techniques.
BW2, CD1, CD2, MH8
P04 Genetic-Based Obesity Prediction
3 Genetic information is used to predict obesity. Identifying personal genetic predisposition can increase awareness of weight management and encourage earlier treatment [54–56].
BW3, BW4, BW6
P05 Genetic-Based Orofacial Cleft Prediction
1 In this study, Zhang et al. [58] looked for SNPs associated with orofacial cleft in Chinese populations. Defects in variants related to folic acid and vitamin A in pregnant women were shown to pathologically contribute to cleft development in the baby, showing the need for personalized nutritional supplementation in individuals with such variants.
OC1
P06 Genetic-Based Prediction of Diabetes
1 Lopez et al. [48] used SNPs to predict the risk of T2D. Genetically informed-risk prediction can allow preventive treatment approaches or treatment from an early stage.
MH5
P07 Identifying Bodyweight Phenotypes
1 Ramyaa et al. [26] used dietary, PA and personal data to predict bodyweight and then identify phenotypes in women via clustering. It
BW5
Table 5 (continued )
Letter Specific Precision Nutrition-related problem
N.o. Papers
Explanation Paper ID(s)
is suggested that these phenotypes might reflect biological response to macronutrients, meaning personalized dietary recommendations for bodyweight alteration would be valuable.
P08 Macronutrient- Based Prediction of Overeating
1 Based on the idea that nutritional deficiencies may lead to overeating, public food diaries were used by Zellerbach & Ruiz [27] to attempt to identify instances where daily calorie intake exceeds the target amount. Such macronutrient-based prediction can allow personalized food recommendations to reduce overeating instances.
BW7
P09 Microbiome-Based Prediction of Bodyweight
1 It is becoming clear that the microbiome interacts with many systems and parameters of health across the body, including bodyweight [97]. Hence, PN approaches can benefit from including microbiome analysis. Moreover, since the microbiome is modifiable, it can also be a target for changes in health. Thaiss et al. show that the microbiome can be used to predict bodyweight change in mice. From this, targeting the microbiome in a personalized manner could be considered to prevent weight regain following weight loss.
BW8
P10 Microbiome-Based Prediction of Insulin Resistance
1 Wu et al. [51] predict impaired glucose tolerance from microbiome data. The microbiome may thus represent a preventive or treatment outlet for those with impaired glucose tolerance. This may occur medically, but since the microbiome can also be altered nutritionally, a PN approach may be effective in the future.
MH9
P11 Prediction of Colorectal Cancer
1 More so than other cancer types, CRC is influenced by diet. In this study, multiple dietary parameters were identified as predictors of CRC with a ML approach [15]. Especially in those predisposed to CRC, these parameters represent factors that can be modified with a
CA1
(continued on next page)
D. Kirk et al.

Computers in Biology and Medicine 133 (2021) 104365
10
4.2. RQ-2: for which specific precision nutrition-related problems has machine learning been applied?
In addition to nutrition domains, it is also valuable to know how ML tasks and algorithms are used in relation to the specific problems they are trying to solve. In many cases, solving these problems will lead to PN models with better performance, and thus more utility for end-users or patients. These problems are listed below in Table 5. For readability, each problem is coded with a problem number that corresponds to a position on the x-axis of the graphs that follow.
4.3. RQ-3: which machine learning tasks are used in precision nutrition- related problems?
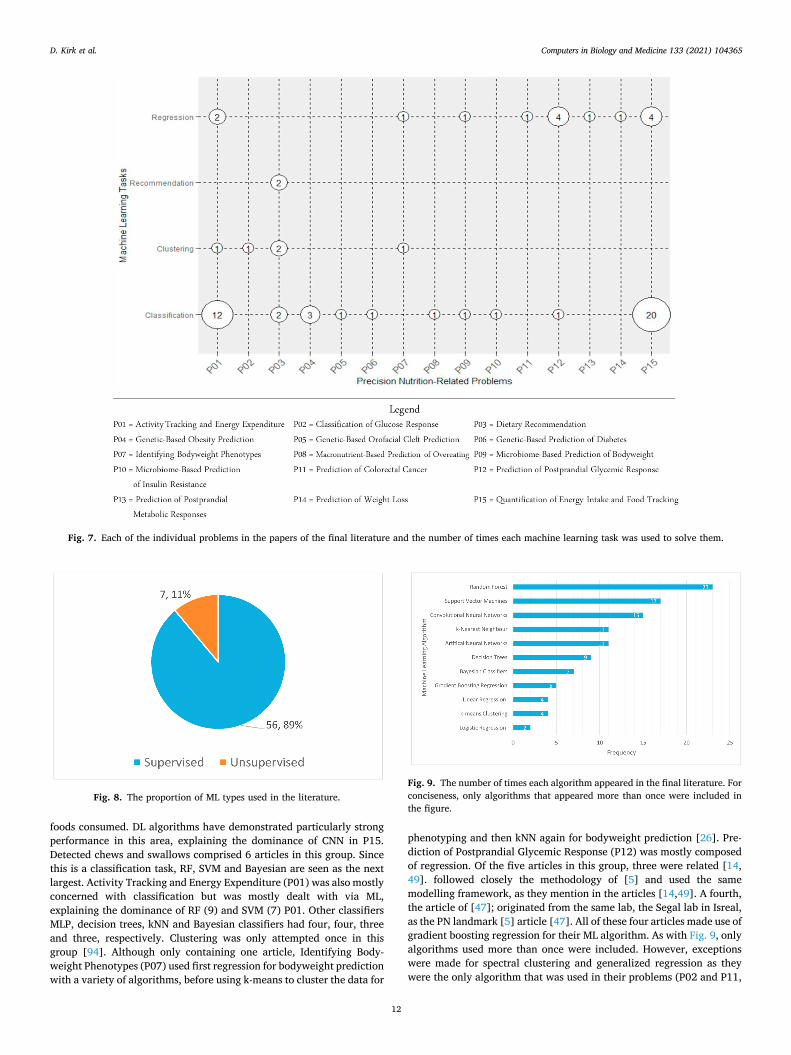
Of the ML tasks discussed in Section 2.2.3, four appear in the present study and their distribution is shown in Fig. 6. Classification takes up the
Table 5 (continued )
Letter Specific Precision Nutrition-related problem
N.o. Papers
Explanation Paper ID(s)
personalized dietary approach.
P12 Prediction of Postprandial Glycemic Response
5 It has now been shown that variability between people in response to the same food exists [4,5,46]. Hence, generalized approaches to blood-sugar control make little sense. In this category, ML techniques are used to predict glycaemic response to foods. Accurate predictions can allow more precise of control of blood-glucose at the individual level.
MH2, MH4, MH6, MH7, MH10
P13 Prediction of Postprandial Metabolic Responses
1 This category is the same in principle as the above, however Berry et al. [4] predicted also postprandial responses of other metabolic parameters, namely triglycerides and C-peptide.
MH1
P14 Prediction of Weight Loss
1 Utilizing ML, weight loss in response to a dietary intervention is predicted. If weight change can be predicted, personalized adjustments can be made to diets based on weight projections to facilitate weight loss success.
BW1
P15 Quantification of Energy Intake and Food Tracking
23 Logging of dietary intake is important in many PN approaches. All instances in this category revolve around utilizing ML in order to obtain food consumption information, which may eventually be used for logging purposes.
DI1, DI2, DI3, DI4, DI5, DI6, DI7, DI8, DI9, DI10, DI11, DI12, DI13, DI14, DI15, DI16, DI17, DI18, DI19, DI20, DI21, DI22, DI23
Table 6 Precision nutrition-related problems and the features the machine learning al-gorithms attempting to solve them use.
Precision Nutrition- Related Problem
Independent variables (features) used in algorithm
Paper IDs
P01 (Activity Tracking +Energy Expenditure)
Accelerometer Data AT1, AT2, AT3, AT4, AT5 AT6, AT7, AT8, AT9, AT10, AT11, AT13, AT14, AT15
Heart Rate AT3, AT8, AT12 Electrodermal Data AT12 Skin Temperature AT8, AT12 Changes in Blood Volume AT8
P02 (Classification of glucose response)
Continuous Glucose Monitoring Data
MH3
P03 (Dietary Recommendation)
Food Preference Data CD1, CD2, MH8 Healthcare Data CD2 Dietary Nutrition Data BW2, CD2 Images of Food MH8
P04 (Genetic-based obesity prediction)
Genetic Information BW3, BW4, BW6
P05 (Genetic-based orofacial cleft prediction)
Genetic Information OC1
P06 (Genetic-based prediction of diabetes)
Genetic Information MH5
P07 (Identifying bodyweight phenotypes)
Dietary Nutrition Data BW5 Physical Activity Data BW5 Ethnicity BW5 Age BW5 Disease Status BW5 Anthropometric Data BW5 Socioeconomic Score BW5 Marital Status BW5
P08 (Macronutrient- based prediction of overeating)
Dietary Nutrition Data BW7
P09 (Microbiome-based prediction of bodyweight)
Microbiome Data BW8
P10 (Microbiome-based prediction of insulin resistance)
Microbiome Data MH9
P11 (Prediction of colorectal cancer)
Age CA1 Sex CA1 Genetic Data CA1 Anthropometric Data CA1 Dietary Nutrition Data CA1
P12 (Prediction of Postprandial Glycemic Response)
Microbiome Data MH4, MH6, MH7, MH10
Dietary Nutrition Data MH6, MH7, MH10 Meal Content MH2, MH6, MH7,
MH10 Meal Timing Features MH6, MH7, MH10 Age MH6, MH7, MH10 Sex MH6, MH7, MH10 Personal Features (see Ref. [5] Supplemental Experimental Procedures)
MH6, MH7, MH10
HbA1c MH6, MH7, MH10 Activity Data MH6, MH7, MH10 Clinical Biochemical Data MH10 Continuous Glucose Monitoring Data
MH2, MH6, MH7, MH10
(continued on next page)
D. Kirk et al.
Computers in Biology and Medicine 133 (2021) 104365
11
vast majority (66%) of the tasks in the literature. The remaining tasks were composed of regression (23%), clustering (8%), and recommen-dation (3%).
Fig. 7 shows which ML tasks were required to solve each of the problems. In Activity Tracking and Energy Expenditure (P01) and Quantification of Energy Intake and Food Tracking (P15) classification is clearly the most used task, with regression also being used. Most of the papers in P1 dealt with categorizing activity types such as walking, running, cycling, etc. from physiological data, mostly accelerometer data. Many of the articles in P15 were concerned with classifying food types from images or classifying between different food types from audio- or piezoelectric-based methods for detecting chews and swal-lows. In P15 it was also sometimes the case that volume estimation was used to predict caloric content, in which case regression became the task at hand. Regression was used twice in A and only one article took a clustering approach to group similar activity patterns. In Prediction of Postprandial Glycemic Response (P12) regression was the most utilized, although classification was used once. Korem et al. [47] predicted which bread type, sourdough or white, would induce high postprandial glucose response using microbiome data. Genetic-Based Obesity Prediction (P04) had three articles. Since all of these articles were concerned with obesity status as a binary independent variable, they fall under classi-fication. Recommendation was only used twice in the group Dietary Recommendation (P03). On five occasions two tasks were used in the same article, causing the number of task usage to exceed the number of papers [26,50,53,70,97].
4.4. RQ-4: which machine learning types are used in precision nutrition- related problems?
In all cases, the ML types could be broken down into either super-vised or unsupervised. Although semi-supervised and reinforcement learning are also possible, these instances were not present in the liter-ature of the current review. As Fig. 8 depicts, most of the time a su-pervised approach was taken. More than half of the instances of unsupervised were clustering.
4.5. RQ-5: which machine learning algorithms are used in precision nutrition-related problems?
Fig. 9 shows how many times each ML algorithm was used across the papers. For clarity, only algorithms used more than once were displayed on the figure, however, 19 other algorithms were used once and are listed in Supplementary Section 1. Given that most of the papers dealt with classification (66%; see Fig. 4), it is unsurprising that RF and SVM, two strong classification algorithms, are the most used. This is also re-flected in the distribution of papers using ML only, DL only, or both; two- thirds of the papers utilise ML only, limiting the number of times DL algorithms appear (Fig. 10). Other classification algorithms such as decision trees, k-NN, and Bayesian also make up a substantial portion of the results. DL was most often used for food recognition in articles uti-lizing imaging technology for food logging, though did also appear in Bodyweight [54], Metabolic Health [50] and Nutritional Management of Chronic Disease [53,57]. This is likely due to the fact that deep learning performs well in image recognition, yet its higher computa-tional burden makes it less suitable for more basic tasks like classifica-tion. Finally, three regression algorithms appear in total 11 times in the figure and finally, k-means was used for clustering four times. In situa-tions where a paper used multiple algorithms and their performance could be compared and ranked, the best performing algorithm was noted. These results are discussed further in Supplementary Figure 1, but RF performed best on around half of these occasions.
Fig. 11 shows PN-related problems in relation to the algorithms that were used to solve them. The problem of Quantification of Energy Intake and Food Tracking (P15) was most often attempted with CNN. Most of the articles (17 of the 23 articles in P15) used images of food to identify
Table 6 (continued )
Precision Nutrition- Related Problem
Independent variables (features) used in algorithm
Paper IDs
Anthropometric Data MH6, MH7, MH10 Insulin Doses MH2
MP13 (Prediction of postprandial metabolic responses)
Microbiome Data MH1 Dietary Nutrition Data MH1 Meal Content MH1 Meal Timing Features MH1 Age MH1 Activity Data MH1 Sex MH1 Personal Features MH1 Clinical Biochemical Data MH1 Genetic Data MH1
P14 (Prediction of weight loss)
Age BW1 Anthropometric Data BW1 Sex BW1 Fat Mass BW1 Fasting Glucose BW1 Energy Expenditure BW1 HOMA-IR BW1 Fasting Insulin BW1
P15 (Quantification of Energy Intake)
Sound DI1, DI4 Piezoelectric Data DI13, DI19, DI22 Images of food DI2, DI3, DI6, DI7, DI8,
DI9, DI10, DI11, DI12, DI14, DI15, DI17, DI18, DI20, DI21, DI23
Images (general) DI5, DI7 Weight change on plate (of food)
DI16
Fig. 5. The proportion of papers in each nutrition domain in the final litera-ture selection.
Fig. 6. The proportion of ML tasks that was dealt with in each paper.
D. Kirk et al.
Computers in Biology and Medicine 133 (2021) 104365
12
foods consumed. DL algorithms have demonstrated particularly strong performance in this area, explaining the dominance of CNN in P15. Detected chews and swallows comprised 6 articles in this group. Since this is a classification task, RF, SVM and Bayesian are seen as the next largest. Activity Tracking and Energy Expenditure (P01) was also mostly concerned with classification but was mostly dealt with via ML, explaining the dominance of RF (9) and SVM (7) P01. Other classifiers MLP, decision trees, kNN and Bayesian classifiers had four, four, three and three, respectively. Clustering was only attempted once in this group [94]. Although only containing one article, Identifying Body-weight Phenotypes (P07) used first regression for bodyweight prediction with a variety of algorithms, before using k-means to cluster the data for
phenotyping and then kNN again for bodyweight prediction [26]. Pre-diction of Postprandial Glycemic Response (P12) was mostly composed of regression. Of the five articles in this group, three were related [14, 49]. followed closely the methodology of [5] and used the same modelling framework, as they mention in the articles [14,49]. A fourth, the article of [47]; originated from the same lab, the Segal lab in Isreal, as the PN landmark [5] article [47]. All of these four articles made use of gradient boosting regression for their ML algorithm. As with Fig. 9, only algorithms used more than once were included. However, exceptions were made for spectral clustering and generalized regression as they were the only algorithm that was used in their problems (P02 and P11,
Fig. 7. Each of the individual problems in the papers of the final literature and the number of times each machine learning task was used to solve them.
Fig. 8. The proportion of ML types used in the literature. Fig. 9. The number of times each algorithm appeared in the final literature. For conciseness, only algorithms that appeared more than once were included in the figure.
D. Kirk et al.

Computers in Biology and Medicine 133 (2021) 104365
13
respectively). 4.6. RQ-6: what features are used by the machine learning models ın these studies?
Machine learning algorithms use features to generate an output.
Fig. 10. The percentage of articles that used shallow learning (i.e., traditional machine learning), deep learning, or both, in the final literature selection.
Fig. 11. Each of the individual problems in the papers of the final literature and the number of times each machine learning algorithm was used to solve them. Only algorithms used more than once were shown, except for spectral clustering and generalized regression, which were shown because they were the only algorithm used to solve their respective problems.
D. Kirk et al.

Computers in Biology and Medicine 133 (2021) 104365
14
Knowing which features are used to solve problems in PN-related research can guide researchers on which variables should be included in model. Hence, Table 6 shows each of the problems and features that were used in the ML algorithm to solve them. In some cases, many features were used in the model. For example, the model of Zeevi et al. [5] used 137 and that of Berry et al. [4] used 110. In other cases, such as those utilizing imagery, features consisted of precise components of the image such as color and shape [70]. In these situations, an attempt was made to summarize groups of similar features together to provide an overview. For example, Zeevi et al. [5]; Mendes-Soares et al. [49] and Mendes-Soares et al. [49] have an element they describe as “Personal Features”, which consists of other features about the person such as stress, sleep, smoking status, etc. Berry et al. [4] also has this element, although the composition is slightly different. In this case, to reduce complication in Table 6, the heading features name “Personal Features” was used, as is used in Zeevi et al. [5]. If, however, specific features within “Personal Features” were used in other studies of the present review (as was the case with Age, Anthropometric Data, Sex, Activity Data) then this was separated as a feature in itself. If specific details about features are required, readers are encouraged to check the papers via the paper IDs corresponding to each problem and feature. Moreover, it should be noted that Table 5 reveals the features that were ultimately used in the model but does not show their contribution in producing the output. Hence, researchers taking inspiration from Table 6 are again encouraged to refer to the individual articles within the specific problem categories to obtain information on the contribution of individual fea-tures; sometimes information on feature contribution is provided [4,15].
4.7. RQ-7 what is the availability status of the datasets used in the literature?
The availability of data is relevant to know in the world of computer science since data represents the raw materials that lead to discovery. Datasets in the papers fell into one of five categories, the name of which and the amount of papers belonging to each can be seen in Fig. 12. Most papers do not mention the availability status of the data they use. This is a necessary distinction from the category “Not available” in that access to the data may be possible in some conditions (e.g. contact with the lead author, on the website of the lab group), but it is not mentioned in the article itself. Papers had their data categorized as not available as data could not be accessed. This occurred on all three occasions due to webpage errors after clicking hyperlinks to the data, or broken links [48, 60,81]. One paper [86] used two datasets that the authors declared as private. The remaining datasets could either be downloaded freely for use or would be granted to researchers who requested it, such as online application or correspondence with article authors. Note that the
number of datasets exceeds the number of articles because some papers used multiple datasets or had different accessibility for different parts of their data.
4.8. RQ-8: which evaluation approaches have been used to assess model efficacy?
Once an ML algorithm has been selected to solve a problem, re-searchers often wish to know how effective it is at doing so. Selecting model parameters that lead to better training performance is natural, however, an issue in selecting these parameters based purely on training data is the occurrence of overfitting. Overfitting occurs when a model performs very well on training data but poorly on unseen data. It is the consequence of the model becoming highly trained to one set of data without regard for generalizability, which is not reflective of real-world scenarios where unseen data will be the input. To deal with this, various evaluation approaches exist that allow testing of the model with unseen data to get a truer representation of model quality.
The evaluation metrics that were encountered in the literature of the present study are shown in Fig. 13. Not all articles evaluated model performance, meaning the number of evaluation approaches was less than the total number of articles. The approaches are described here:
• Split Data: One obvious approach is to simply leave some of the data out from analysis and use it for testing and evaluation. This is denoted in Fig. 13 as “Split Data” and is also known as the hold-out method. This approach was opted for 15 occasions.
• Cross-Validation: Cross-validation methods still consist of splitting the data into training and evaluation sets, but the model is trained on all of the data; that is, in each iteration one portion of the data is used for testing whilst the rest of the data is used for training. This is repeated until every portion of data has been used for training. Commonly, k-fold cross-validation is used, where the data is split into k number of data chunks of equal size. Also included in this category is leave-one-out cross-validation (LOOC) and leave-one- subject-out (LOSO) cross-validation, since they are the same in principle, but these latter approaches consist of training the model at the level of k = n, meaning every individual data point is used once to evaluate the model. This provides a much better measure of perfor-mance, but at the cost of higher computational expense. Cross- validation was most often seen and is currently a popular method for evaluating ML models.
• Independent Cohort Validation: Validation on an independent cohort is an evaluation approach seen more often in life sciences research utilizing ML. Here, a model is trained entirely on one set of data and evaluated on an unseen, cohort. One way in which this
Fig. 12. The number of articles present in each of the five categories of data availability in the final selection of papers.
Fig. 13. The four groups of evaluation methods that were identified in the final literature.
D. Kirk et al.

Computers in Biology and Medicine 133 (2021) 104365
15
differs from previously mentioned approaches, however, is that the unseen cohort may differ in some way from the cohort used for training. A prime example of this is in the paper of Mendes-Soares et al. [49]; wherein a model for blood-glucose prediction trained on an entirely Israeli cohort was tested on an American cohort. The difference in nationality encompasses different genetics, diet and lifestyle, which means generalizability can be thoroughly investigated.
• Akaike Information Criterion: Akaike Information Criterion with correction (AICc) is a statistical approach that allows comparison between models based on maximum likelihood estimates the number of independently adjusted parameters in the model [98]. Only one paper took this approach [15].
4.9. RQ-9: which evaluation metrics have been used to gauge model efficacy?
After developing ML models to solve a problem, it is pertinent to gauge how effective the model is at solving this problem. This differs between problems, depending on which aspect of model performance is most relevant to the problem, and between models, depending on the approach of the model to solving the problem. Moreover, even within the same model and the same problem, multiple evaluation metrics are often used to assess the performance across multiple parameters (e.g., specificity, sensitivity, accuracy, etc.). This can mean comparing models is not always straightforward. Fig. 14 shows the evaluation metrics that were used to gauge model efficacy. Again, only evaluation metrics used more than once are presented. A full list of all of the evaluation metrics can be seen in the Supplementary Section 3.
A description of each of the evaluation metrics shown in Fig. 14 is provided as follows:
• Accuracy refers to the percentage of correctly predicted values.
Accuracy=Predicted Positive
Total Positive(1)
Accuracy is the most common evaluation metric and is especially common in classification tasks. Since most of the literature in this review dealt with classification, this is logical. It is not uncommon to see ac-curacy given as the only metric for the evaluation of a model’s performance.
• Recall is synonymous with Sensitivity. It is the measure of true positives predicted by the model divided by the total number of predicted values. An alternative way to word this is to say it is the number of true positives divided by the combined sum of true posi-tives and false negatives
Recall=True Positives
True Positives + False Negatives(2)
• AUC (Area Under the Curve) refers to the area under a Receiver Operating Characteristics (ROC) curve. The ROC plots true positive rate (typically on the Y-axis) against false positive rate (X-axis). In this way, a curve is made where superior performance is indicated by a curve that approaches the maximum value on the Y-axis and a minimum on the X-axis, indicating a higher true positive and a lower false positive rate. The area under this curve is thus the measure of this where 1 refers to best performance (all positives correctly identified, and negatives incorrectly identified as positives) and 0 is the opposite of this. The AUC value of a prediction model should be larger than 0.5, which is the AUC value of random guessing.
• F1 Score, F Score and F-Measure are all synonymous and consider model quality from two aspects: precision and recall. Since the equation takes both of these factors into account, it can be helpful for gauging model quality when there is no preference for one to be higher than the other. To obtain the F score, the following equation is used:
F1 Score= 2*Precision*Recall
Precision + Recall(3)
• Precision calculates the proportion of correctly identified positives. It is calculated as follows:
Precision=True Positives
True Positives + False Positives(4)
• Pearson’s r, r, or Pearson’s Correlation is a measure of the corre-lation between two variables. Pearson’s R is typically a statistical method for assessing correlation between two variables, but also has utility in gauging ML model efficacy. This occurs in situations where values predicted by the model are compared with real values. Hence, Pearson’s r was seen in models predicted postprandial glucose [4,5, 14,49].
• Root Mean Square Error (RMSE) is a representation of the differ-ence between the predicted values versus the observed values. Hence, the larger RMSE, the worse the model was at predicting outcomes. Regression models often used RMSE as a model evaluation metric [14,26,90]. It is constructed as follows:
RMSE =
∑N
i=1(Predictedi − Actuali)2
N
√
(5)
• Specificity refers to the rate of true negatives identified. It is formulated in Equation (6).
Specificity=True Negatives
True Negatives + False Positives(6)
• Mean Absolute Error (MAE)/Mean Absolute Percentage Error (MAPE) is another metric that evaluates the error between observed and predicted. MAE is very similar to RMSE, although MAE operates on the absolute level, and thus does not require squaring and square rooting
MAE=
∑Ni=1|Predictedi − Actuali|
N(7)
MAPE is similar, except now expressed as a ratio
MAPE=1N
∑N
i=1
Predictedi − Actuali
N
(8)
• Kappa or Cohen’s kappa is another method for comparing observed and expected values. Specifically, Cohen’s kappa compares the observed values with values that could be expected based on
Fig. 14. All of the evaluation metrics that were used more than once in the final selection of literature and the number of times they were used for model scoring is shown.
D. Kirk et al.
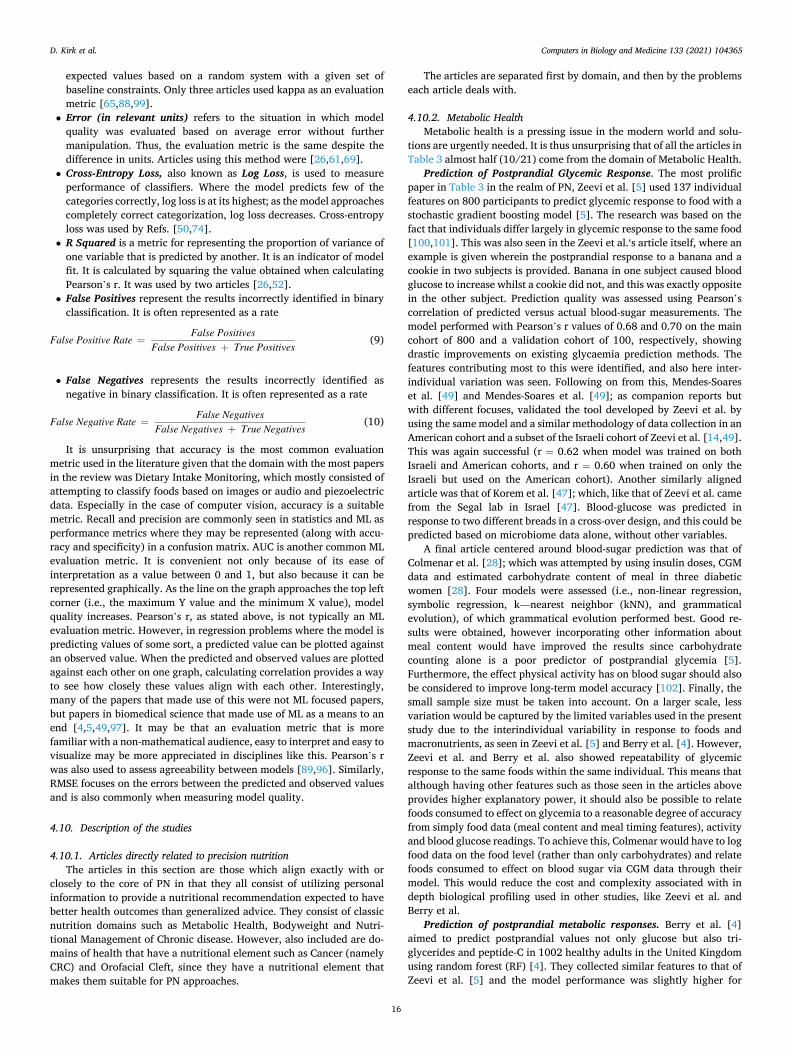
Computers in Biology and Medicine 133 (2021) 104365
16
expected values based on a random system with a given set of baseline constraints. Only three articles used kappa as an evaluation metric [65,88,99].
• Error (in relevant units) refers to the situation in which model quality was evaluated based on average error without further manipulation. Thus, the evaluation metric is the same despite the difference in units. Articles using this method were [26,61,69].
• Cross-Entropy Loss, also known as Log Loss, is used to measure performance of classifiers. Where the model predicts few of the categories correctly, log loss is at its highest; as the model approaches completely correct categorization, log loss decreases. Cross-entropy loss was used by Refs. [50,74].
• R Squared is a metric for representing the proportion of variance of one variable that is predicted by another. It is an indicator of model fit. It is calculated by squaring the value obtained when calculating Pearson’s r. It was used by two articles [26,52].
• False Positives represent the results incorrectly identified in binary classification. It is often represented as a rate
False Positive Rate =False Positives
False Positives + True Positives(9)
• False Negatives represents the results incorrectly identified as negative in binary classification. It is often represented as a rate
False Negative Rate =False Negatives
False Negatives + True Negatives(10)
It is unsurprising that accuracy is the most common evaluation metric used in the literature given that the domain with the most papers in the review was Dietary Intake Monitoring, which mostly consisted of attempting to classify foods based on images or audio and piezoelectric data. Especially in the case of computer vision, accuracy is a suitable metric. Recall and precision are commonly seen in statistics and ML as performance metrics where they may be represented (along with accu-racy and specificity) in a confusion matrix. AUC is another common ML evaluation metric. It is convenient not only because of its ease of interpretation as a value between 0 and 1, but also because it can be represented graphically. As the line on the graph approaches the top left corner (i.e., the maximum Y value and the minimum X value), model quality increases. Pearson’s r, as stated above, is not typically an ML evaluation metric. However, in regression problems where the model is predicting values of some sort, a predicted value can be plotted against an observed value. When the predicted and observed values are plotted against each other on one graph, calculating correlation provides a way to see how closely these values align with each other. Interestingly, many of the papers that made use of this were not ML focused papers, but papers in biomedical science that made use of ML as a means to an end [4,5,49,97]. It may be that an evaluation metric that is more familiar with a non-mathematical audience, easy to interpret and easy to visualize may be more appreciated in disciplines like this. Pearson’s r was also used to assess agreeability between models [89,96]. Similarly, RMSE focuses on the errors between the predicted and observed values and is also commonly when measuring model quality.
4.10. Description of the studies
4.10.1. Articles directly related to precision nutrition The articles in this section are those which align exactly with or
closely to the core of PN in that they all consist of utilizing personal information to provide a nutritional recommendation expected to have better health outcomes than generalized advice. They consist of classic nutrition domains such as Metabolic Health, Bodyweight and Nutri-tional Management of Chronic disease. However, also included are do-mains of health that have a nutritional element such as Cancer (namely CRC) and Orofacial Cleft, since they have a nutritional element that makes them suitable for PN approaches.
The articles are separated first by domain, and then by the problems each article deals with.
4.10.2. Metabolic Health Metabolic health is a pressing issue in the modern world and solu-
tions are urgently needed. It is thus unsurprising that of all the articles in Table 3 almost half (10/21) come from the domain of Metabolic Health.
Prediction of Postprandial Glycemic Response. The most prolific paper in Table 3 in the realm of PN, Zeevi et al. [5] used 137 individual features on 800 participants to predict glycemic response to food with a stochastic gradient boosting model [5]. The research was based on the fact that individuals differ largely in glycemic response to the same food [100,101]. This was also seen in the Zeevi et al.‘s article itself, where an example is given wherein the postprandial response to a banana and a cookie in two subjects is provided. Banana in one subject caused blood glucose to increase whilst a cookie did not, and this was exactly opposite in the other subject. Prediction quality was assessed using Pearson’s correlation of predicted versus actual blood-sugar measurements. The model performed with Pearson’s r values of 0.68 and 0.70 on the main cohort of 800 and a validation cohort of 100, respectively, showing drastic improvements on existing glycaemia prediction methods. The features contributing most to this were identified, and also here inter-individual variation was seen. Following on from this, Mendes-Soares et al. [49] and Mendes-Soares et al. [49]; as companion reports but with different focuses, validated the tool developed by Zeevi et al. by using the same model and a similar methodology of data collection in an American cohort and a subset of the Israeli cohort of Zeevi et al. [14,49]. This was again successful (r = 0.62 when model was trained on both Israeli and American cohorts, and r = 0.60 when trained on only the Israeli but used on the American cohort). Another similarly aligned article was that of Korem et al. [47]; which, like that of Zeevi et al. came from the Segal lab in Israel [47]. Blood-glucose was predicted in response to two different breads in a cross-over design, and this could be predicted based on microbiome data alone, without other variables.
A final article centered around blood-sugar prediction was that of Colmenar et al. [28]; which was attempted by using insulin doses, CGM data and estimated carbohydrate content of meal in three diabetic women [28]. Four models were assessed (i.e., non-linear regression, symbolic regression, k—nearest neighbor (kNN), and grammatical evolution), of which grammatical evolution performed best. Good re-sults were obtained, however incorporating other information about meal content would have improved the results since carbohydrate counting alone is a poor predictor of postprandial glycemia [5]. Furthermore, the effect physical activity has on blood sugar should also be considered to improve long-term model accuracy [102]. Finally, the small sample size must be taken into account. On a larger scale, less variation would be captured by the limited variables used in the present study due to the interindividual variability in response to foods and macronutrients, as seen in Zeevi et al. [5] and Berry et al. [4]. However, Zeevi et al. and Berry et al. also showed repeatability of glycemic response to the same foods within the same individual. This means that although having other features such as those seen in the articles above provides higher explanatory power, it should also be possible to relate foods consumed to effect on glycemia to a reasonable degree of accuracy from simply food data (meal content and meal timing features), activity and blood glucose readings. To achieve this, Colmenar would have to log food data on the food level (rather than only carbohydrates) and relate foods consumed to effect on blood sugar via CGM data through their model. This would reduce the cost and complexity associated with in depth biological profiling used in other studies, like Zeevi et al. and Berry et al.
Prediction of postprandial metabolic responses. Berry et al. [4] aimed to predict postprandial values not only glucose but also tri-glycerides and peptide-C in 1002 healthy adults in the United Kingdom using random forest (RF) [4]. They collected similar features to that of Zeevi et al. [5] and the model performance was slightly higher for
D. Kirk et al.
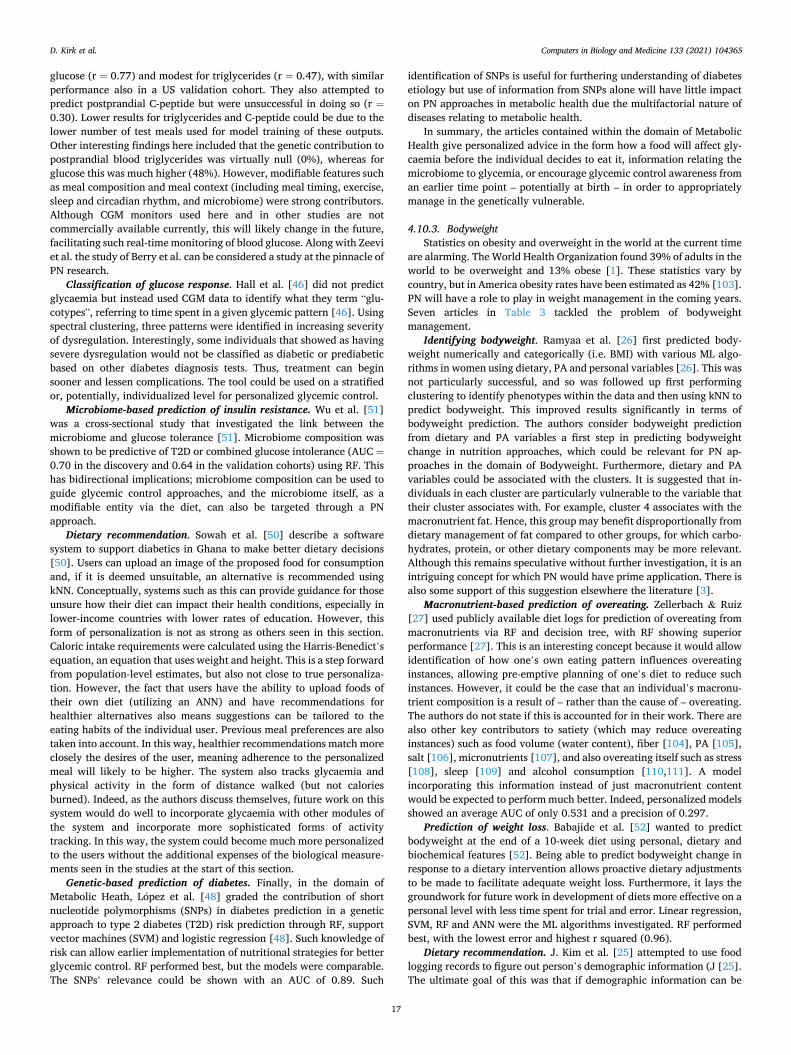
Computers in Biology and Medicine 133 (2021) 104365
17
glucose (r = 0.77) and modest for triglycerides (r = 0.47), with similar performance also in a US validation cohort. They also attempted to predict postprandial C-peptide but were unsuccessful in doing so (r =0.30). Lower results for triglycerides and C-peptide could be due to the lower number of test meals used for model training of these outputs. Other interesting findings here included that the genetic contribution to postprandial blood triglycerides was virtually null (0%), whereas for glucose this was much higher (48%). However, modifiable features such as meal composition and meal context (including meal timing, exercise, sleep and circadian rhythm, and microbiome) were strong contributors. Although CGM monitors used here and in other studies are not commercially available currently, this will likely change in the future, facilitating such real-time monitoring of blood glucose. Along with Zeevi et al. the study of Berry et al. can be considered a study at the pinnacle of PN research.
Classification of glucose response. Hall et al. [46] did not predict glycaemia but instead used CGM data to identify what they term “glu-cotypes”, referring to time spent in a given glycemic pattern [46]. Using spectral clustering, three patterns were identified in increasing severity of dysregulation. Interestingly, some individuals that showed as having severe dysregulation would not be classified as diabetic or prediabetic based on other diabetes diagnosis tests. Thus, treatment can begin sooner and lessen complications. The tool could be used on a stratified or, potentially, individualized level for personalized glycemic control.
Microbiome-based prediction of insulin resistance. Wu et al. [51] was a cross-sectional study that investigated the link between the microbiome and glucose tolerance [51]. Microbiome composition was shown to be predictive of T2D or combined glucose intolerance (AUC =0.70 in the discovery and 0.64 in the validation cohorts) using RF. This has bidirectional implications; microbiome composition can be used to guide glycemic control approaches, and the microbiome itself, as a modifiable entity via the diet, can also be targeted through a PN approach.
Dietary recommendation. Sowah et al. [50] describe a software system to support diabetics in Ghana to make better dietary decisions [50]. Users can upload an image of the proposed food for consumption and, if it is deemed unsuitable, an alternative is recommended using kNN. Conceptually, systems such as this can provide guidance for those unsure how their diet can impact their health conditions, especially in lower-income countries with lower rates of education. However, this form of personalization is not as strong as others seen in this section. Caloric intake requirements were calculated using the Harris-Benedict’s equation, an equation that uses weight and height. This is a step forward from population-level estimates, but also not close to true personaliza-tion. However, the fact that users have the ability to upload foods of their own diet (utilizing an ANN) and have recommendations for healthier alternatives also means suggestions can be tailored to the eating habits of the individual user. Previous meal preferences are also taken into account. In this way, healthier recommendations match more closely the desires of the user, meaning adherence to the personalized meal will likely to be higher. The system also tracks glycaemia and physical activity in the form of distance walked (but not calories burned). Indeed, as the authors discuss themselves, future work on this system would do well to incorporate glycaemia with other modules of the system and incorporate more sophisticated forms of activity tracking. In this way, the system could become much more personalized to the users without the additional expenses of the biological measure-ments seen in the studies at the start of this section.
Genetic-based prediction of diabetes. Finally, in the domain of Metabolic Heath, Lopez et al. [48] graded the contribution of short nucleotide polymorphisms (SNPs) in diabetes prediction in a genetic approach to type 2 diabetes (T2D) risk prediction through RF, support vector machines (SVM) and logistic regression [48]. Such knowledge of risk can allow earlier implementation of nutritional strategies for better glycemic control. RF performed best, but the models were comparable. The SNPs’ relevance could be shown with an AUC of 0.89. Such
identification of SNPs is useful for furthering understanding of diabetes etiology but use of information from SNPs alone will have little impact on PN approaches in metabolic health due the multifactorial nature of diseases relating to metabolic health.
In summary, the articles contained within the domain of Metabolic Health give personalized advice in the form how a food will affect gly-caemia before the individual decides to eat it, information relating the microbiome to glycemia, or encourage glycemic control awareness from an earlier time point – potentially at birth – in order to appropriately manage in the genetically vulnerable.
4.10.3. Bodyweight Statistics on obesity and overweight in the world at the current time
are alarming. The World Health Organization found 39% of adults in the world to be overweight and 13% obese [1]. These statistics vary by country, but in America obesity rates have been estimated as 42% [103]. PN will have a role to play in weight management in the coming years. Seven articles in Table 3 tackled the problem of bodyweight management.
Identifying bodyweight. Ramyaa et al. [26] first predicted body-weight numerically and categorically (i.e. BMI) with various ML algo-rithms in women using dietary, PA and personal variables [26]. This was not particularly successful, and so was followed up first performing clustering to identify phenotypes within the data and then using kNN to predict bodyweight. This improved results significantly in terms of bodyweight prediction. The authors consider bodyweight prediction from dietary and PA variables a first step in predicting bodyweight change in nutrition approaches, which could be relevant for PN ap-proaches in the domain of Bodyweight. Furthermore, dietary and PA variables could be associated with the clusters. It is suggested that in-dividuals in each cluster are particularly vulnerable to the variable that their cluster associates with. For example, cluster 4 associates with the macronutrient fat. Hence, this group may benefit disproportionally from dietary management of fat compared to other groups, for which carbo-hydrates, protein, or other dietary components may be more relevant. Although this remains speculative without further investigation, it is an intriguing concept for which PN would have prime application. There is also some support of this suggestion elsewhere the literature [3].
Macronutrient-based prediction of overeating. Zellerbach & Ruiz [27] used publicly available diet logs for prediction of overeating from macronutrients via RF and decision tree, with RF showing superior performance [27]. This is an interesting concept because it would allow identification of how one’s own eating pattern influences overeating instances, allowing pre-emptive planning of one’s diet to reduce such instances. However, it could be the case that an individual’s macronu-trient composition is a result of – rather than the cause of – overeating. The authors do not state if this is accounted for in their work. There are also other key contributors to satiety (which may reduce overeating instances) such as food volume (water content), fiber [104], PA [105], salt [106], micronutrients [107], and also overeating itself such as stress [108], sleep [109] and alcohol consumption [110,111]. A model incorporating this information instead of just macronutrient content would be expected to perform much better. Indeed, personalized models showed an average AUC of only 0.531 and a precision of 0.297.
Prediction of weight loss. Babajide et al. [52] wanted to predict bodyweight at the end of a 10-week diet using personal, dietary and biochemical features [52]. Being able to predict bodyweight change in response to a dietary intervention allows proactive dietary adjustments to be made to facilitate adequate weight loss. Furthermore, it lays the groundwork for future work in development of diets more effective on a personal level with less time spent for trial and error. Linear regression, SVM, RF and ANN were the ML algorithms investigated. RF performed best, with the lowest error and highest r squared (0.96).
Dietary recommendation. J. Kim et al. [25] attempted to use food logging records to figure out person’s demographic information (J [25]. The ultimate goal of this was that if demographic information can be
D. Kirk et al.
Computers in Biology and Medicine 133 (2021) 104365
18
deduced from food logging data, healthier food options can be recom-mended on a stratified level based on the estimated characteristics of the individual. RF was the best of the models investigated (models were not stated) and predicted gender, age group and race correctly 61%, 43% and 44% of the time, respectively. Although performance was not great, tools like this that personalize suggestions based on demographic data may mean healthier suggestions are more likely to be accepted by the individual since they can be afforded or are more relatable.
Genetic-based obesity prediction. The remaining articles in Body-weight looked at genetic contribution to overweight/obesity develop-ment. Montanez et al. [55] did this via SVM [55], Montanez et al. [54] used a DL approach with MLP deep neural network [54], and [56] used decision trees [56]. Awareness of genetic susceptibility can encourage nutritional strategies for weight management before overweight is present. Again, however, the multifactorial nature of obesity means genetic approaches as a stand-alone approach will be ineffective in treating obesity entirely.
All in all, the papers in the domain of Bodyweight provide as their PN output advice on which food choices might be more suitable for weight management; information that can be helpful for dieters to adjust their diet accordingly; and genetic vulnerability to reduce the risks associated with overweight and obesity across one’s lifespan.
4.10.4. Nutritional Management of Chronic Disease Dietary Recommendation. Nutritional Management of Chronic Dis-
ease is a group composed of two articles that recommended healthier food options to users of the systems according to their chronic disease status. J. C. Kim & Chung [53] developed a system that recommends healthy foods based on the user’s physical and mental health through dietary nutrition, food preference, and healthcare personal data in an ANN (J. C [53]. In the proposed system, data regarding the user’s body and mental status is collected through online services and smart devices. A hybrid approach is used to overcome the shortcomings of each indi-vidual recommender system used. For example, collaborative filtering is used to predict preference based on correlation with the preference of other users but leads to what is known as the cold-start problem, wherein an insufficient amount of data is present to generate any out-comes; however, the use of a neural network is able to overcome this. Testing was performed on 100 participants. The model performed suit-ably against other conventional methods, though also came with the benefit of solving the cold-start problem. In terms of user satisfaction, it scored 3.92/5.
Baek et al. [57] aim to provide nutritional support to individuals with chronic disease in the form of recommendation of suitable dietary alternatives [57]. They outline how different chronic diseases come with different nutritional requirements and that this should be taken into account when aiming to improve dietary habits. Korean National Health and Nutrition Survey data is used, from which chronic disease data, personal features and biochemical and physiological features become features for clustering to identify groups from the data through hybrid clustering. Food products are recommended to each cluster in a strati-fied approach, although an individual’s food preference is also consid-ered when making recommendations. Foods recommended to the user groups are also clustered via k-means in order to recommend similar products. This clustering is done on the basis of calories, macronutrients, sodium, cholesterol, saturated fat and trans-fat. The service ontology has the relations between the health data and the food data. Collaborative filtering is also used to predict universal preference (preference of so-ciety in general for the food). Thus, the current system is a hybrid model that combines these factors to ultimately provided a food recommen-dation on a stratified level with regards to chronic disease status and on a personal level in terms of food preference. Upon evaluation, the hybrid model performs best by allowing both health information and prefer-ence data to be integrated. The concept of using applications like this is attractive because individuals may be unsure how their dietary choices affect their chronic conditions and having constant access to
recommendations on food choices is a convenient and efficient way to help this. Furthermore, digital platforms for nutritional advice delivery pose some other advantages such as scalability, more effective behavior change and, in the future, reduced costs [13]. The model could be improved by also incorporating other components of food that affect health, such as fiber, micronutrients, vitamins, etc. Although this would complicate the model, such components can have profound impacts on health and failing to capture this may mean their intake is neglected in users of the service, leading to other health issues.
Nutritional Management of Chronic Disease presents two recom-mendation systems that aim to provide nutritional support for those with chronic diseases. The development of AI is allowing specialized and personalized information to be delivered to individuals or disease groups at all times and represents a promising avenue for chronic dis-ease management.
4.10.5. Cancer Prediction of colorectal cancer. Generally speaking, cancer would
be considered in the domain of health and not nutrition. However, certain cancer types have a link to nutrition and of these the link be-tween nutrition and colorectal cancer (CRC) is particularly strong [112]. Knowing this, Shiao et al. [15] set out to investigate how diet, genes, the interaction between the two, and other factors could be used to predict CRC in 53 multi-ethnic CRC patients and 53 paired family members [15]. The genes were specific to folate metabolism due to a pre-existing link between this and CRC occurrence. After collecting demographic data, information on dietary intake, anthropometric data, and total number of gene polymorphism mutation in the five genes assessed, the most influential predictors were selected. These were, in descending order of importance, age (under or over 56), gender, total poly-morphisms, a total vegetable intake of 10 ounces, folate intake of 100% the recommended daily intake (RDI), a healthy eating index score (HEI) of 77, overweight BMI, 150% RDI of vitamin B12, 100% of thiamine intake, and MTHFR mutations at position 677 (MTHFR 677). Interaction profiles were also assessed, where it was found that HEI and thiamine intake, BMI status and gender, and BMI status and MTHFR 677 poly-morphism. Generalized regression models were generated on these interaction factors; four individual parameters associated with these interactions (BMI overweight, thiamine, gender, overweight) and four other individual parameters (age, total polymorphisms, vegetable intake, MTHFR 677 SNP). The best performance saw an area under the curve (AUC) of 0.86 and a misclassification rate of 0.21 using general-ized regression with Elastic Net LOO cross-validation as an evaluation approach.
HEI score, folate intake, vegetable intake, thiamine intake and vitamin B12 intake are observed as modifiable risk factors for CRC. Although the identification of these itself is not in the realm of PN, it can give those with a family history of CRC specific dietary intake targets beyond generic advice to “eat healthy”. Since total gene polymorphisms in the genes of the pathway investigated here already enhances CRC risk, eating in a way to reduce the risk of these other, modifiable risk factors can minimize this risk further. This is similar for BMI and MTHFR 677. Whilst BMI should be appropriately managed for many health reasons, advice can be provided specifically to those harboring the MTHFR 677 because there is an interaction between the two risk factors, as seen here. These results are interesting because it shows that PN can have applications beyond classic domains of nutrition and has the potential to show promise elsewhere, in this case cancer. The genes analyzed were chosen based on the results of existing research, but it could also be that this selection is expanded in the future as more correlations between genetic variants and dietary intake are found, providing further specialized advice.
In summary, the only paper identified with a PN theme in the domain of Cancer showed that total genetic polymorphisms of the folate meta-bolism pathway and modifiable dietary factors are predictors of CRC. Individuals known to harbor such SNPs in these genes can look to adjust
D. Kirk et al.

Computers in Biology and Medicine 133 (2021) 104365
19
their diet based on the dietary factors identified by Shiao et al. [15] in order to prevent additional CRC development risk.
4.10.6. Orofacial cleft Genetic-based orofacial cleft prediction. Many syndromes lead to
the development of orofacial cleft, but the most dominant is non- syndromic cleft lip with or without cleft palate (NSCL/P), representing 70% of cases worldwide. NSCL/P development is multifactorial, having both genetic and environmental components. Within the environmental component, nutrition is to know to play a role. Namely, folic acid and vitamin A are reported to be known to be preventive in when consumed in adequate amounts during pregnancy. However, excessive vitamin A consumption can also increase NSCL/P risk, meaning appropriate amounts must be provided. Zhang et al. [58] aimed to validate how effective 43 candidate SNPs were in predicting NSCL/P development in Chinese populations [58]. Multiple ML models were used to assess the risk of these 43 SNPs in causing NSCL/P in Han and Uyghur populations, of which logistic regression performed best. Ultimately, four genetic variants of three genes involved in folic acid and vitamin A were shown to have important roles in NSCL/P development. The knowledge of these genetic defects can lead to personalized nutritional amendment in pregnant women to reduce NSCL/P occurrence. Although this particular case uses only one element of PN (the genetic element) to produce a nutritional recommendation, this may be sufficient to prevent cleft development of the unborn child. Whilst it is true that sufficient folic acid and vitamin A intake is advised in all women during pregnancy for various health reasons [113], the knowledge provided by such SNPs allows an emphasis to be placed on these components in those at risk. This example is different from the other articles discussed above since the relevance of the advice is limited to the time during pregnancy only.
4.10.7. Articles indirectly related to precision nutrition The articles in this section represent the remaining articles found
with the search terms in the databases used and are all listed in Table 4. Their relevance to the topic of PN is more peripheral than the articles in the previous section. All but one of the articles fall within two domains: Dietary Intake Monitoring or Activity Tracking. Their connection with PN is that of tracking energy intake or activity (such as classifying ac-tivity types or predict energy expenditure), which are important for data collection for the dietary intake and activity parameters elements of PN, respectively. Both of these elements are used in many instances of nutrition personalization, and so utilizing ML to help with these pro-cesses will improve accuracy in PN applications. The only other paper belonged to the domain of Bodyweight and showed how microbiome affects weight regain following a diet in mice. The potential to modulate the diet microbiome through specific dietary changes makes the microbiome an interesting target for PN approaches. However, since this was not done in the study, it is considered to PN only indirectly.
4.10.8. Dietary Intake Monitoring Dietary intake is an element of PN in many studies. Especially in
areas of nutrition such as metabolic health and overweight and obesity, the relationship between intake and health outcomes is intimate. To varying degrees of specificity, dietary intake assessment is required in these domains and others. Currently, despite known pitfalls of methods such as dietary recall (24 h or some other time frame, such as 3 days or one week) and food frequency questionnaires [114,115], their use is widespread. More recently, smartphones and applications for food tracking food allow convenient and real-time food logging, reducing recall errors. However, manual entry can also be laborious. Hence, ML techniques in this domain look at ways to make this easier or, alterna-tively, provide methods of tracking for population groups that may be unable to such as the sick or elderly. Due to the large number of articles in this domain covering the same PN-related problem (Food Tracking and Quantification of Energy Intake), articles are divided by their approach to solving this problem into imaging or detection of chews and
swallows. Food tracking and quantification of energy intake - imaging.
Seventeen of the 23 papers in this section attempted food logging via imaging. Pouladzadeh et al. of Ottawa University makes up three of these and rely on user smart phones for photos for calorie tracking. Pouladzadeh et al. [116] put forth a cloud-based method for food clas-sification utilizing SVM [64]. Color, shape, texture, and size were used in the model to distinguish between foods with high accuracy on single foods and much lower accuracy on mixed foods. The method is part of a proposed system that also uses before eating and after eating pictures of the food to estimate volume and therefore calories. Pouladzadeh et al. [70] attempt calorie estimation, but instead of before and after pictures propose two other methods of volume estimation: using the thumb of the user for image scaling and using distance estimation to gauge volume and measure calories [70]. Both perform comparably and overall stan-dard error of calorie estimation is low. For image recognition prior to calorie estimation, a convolutional neural network (CNN) is used, which performs excellently on single foods. Finally, Pouladzadeh & Shirmo-hammadi [76] aims to recognize multiple items within the same meal [76]. Bounding circles are drawn by the user on the image to reduce noise. Accuracy is further increased by using region mining to identify key features in images that allow discrimination between other foods. Using a dataset developed by themselves in 2015 [64], a high average accuracy is obtained (94.11%).
Such a bounding box approach was also included by Liu et al. [68] and increased classification accuracy [68]. Cropping and adding boundaries to images in this way is attractive owed to its ease on smartphones due to touch screen technology. Their system also makes use of smartphone images for food recognition with a CNN with an Inception module. The Inception module allows convolutional layers to be added at these modules, increasing the depth of the network [73]. also use variations of CNN and found Inception-v3 and Inception-v4 perform best on the authors own datasets, as well the Food-101 data-set [73]. Whilst overall accuracy is high, high variability is seen between food types.
Comparisons between CNNs are seen elsewhere. For example, Mer-chant & Pande [75] aim to develop a system for diabetics and the obese [67]. For this, they present a table comparing different models for food classification on the Food-101 dataset. The shallow ML algorithm RF performs poorly (32.72%), whereas most CNNs such as GoogLeNet, Inception-v3 and AlexNet perform well. This is unsurprising since CNNs perform particularly well on image recognition tasks compared to shallow ML approaches. Yigit & Ozyildirim [66] compare pre-trained structures AlexNet and CaffeNet to CNNs trained from scratch for the purpose of food recognition in Food-101 and Food11 datasets. Perfor-mance was comparable across the various models [66]. McAllister et al. [65] used two pretrained CNNs (GoogLeNet and ResNet-152) to extract features from Food 5 K, Food-11, RawFooT-DB and Food-101 datasets [65]. The ML algorithms ANN, SVM, RF and Naive Bayes were trained using the deep features. The advantage of doing this is that the volume of data and computational power required is lowered. Results varied be-tween the datasets, but high accuracy could be achieved in all datasets by at least one of the algorithms.
Mezgec & Seljak [78] developed a food and drink recognition system called NutriNet that used a CNN architecture and compared this to other CNNs and various solver types [78]. Solver types determine the method that minimizes loss in the model, meaning the model performs better. Using a self-built image dataset from Google images, high classification (86.72%) and detection accuracy (94.47%) is attained with NutriNet. Results vary across the tested conditions. Since the model is being developed as part of app for Parkinson’s patients, it was also tested on self-acquired images combined with smartphone shots from Parkinson’s patients, with an accuracy of 55%. Mezgec et al. [75] analyzed food recognition under the fake food buffet (FFB) conditions [75]. Although this was based on fake food and thus did not use real food, it is conceptually the same as other studies in terms of food recognition and
D. Kirk et al.
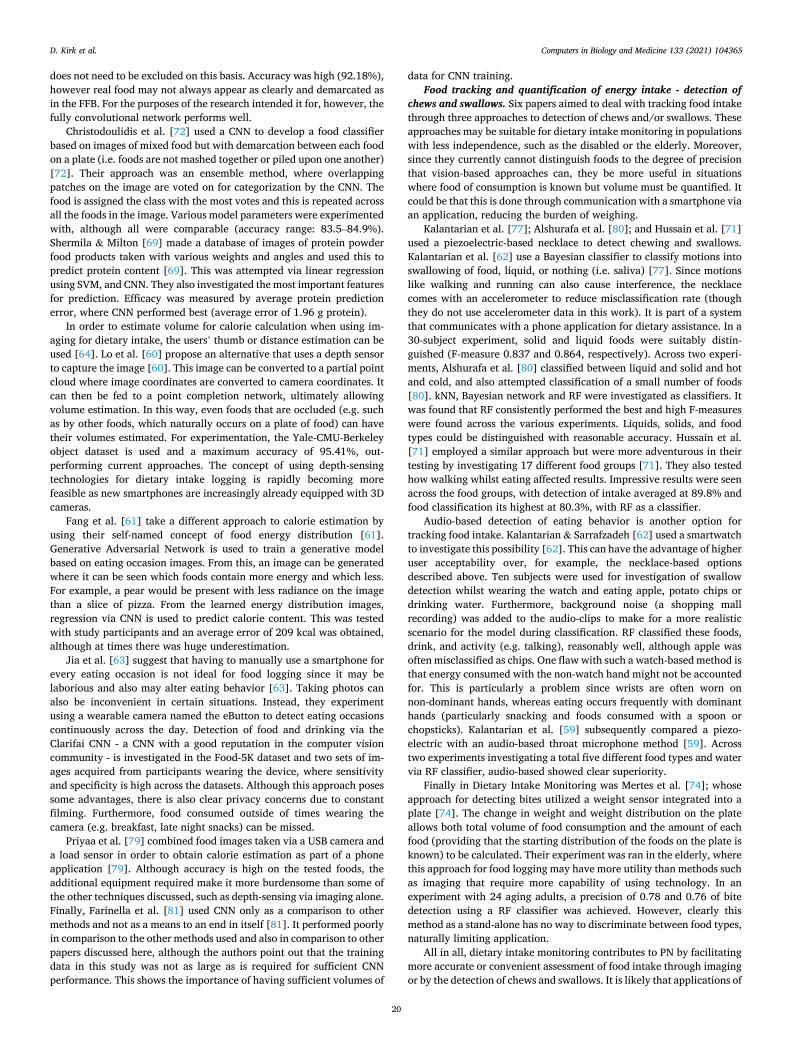
Computers in Biology and Medicine 133 (2021) 104365
20
does not need to be excluded on this basis. Accuracy was high (92.18%), however real food may not always appear as clearly and demarcated as in the FFB. For the purposes of the research intended it for, however, the fully convolutional network performs well.
Christodoulidis et al. [72] used a CNN to develop a food classifier based on images of mixed food but with demarcation between each food on a plate (i.e. foods are not mashed together or piled upon one another) [72]. Their approach was an ensemble method, where overlapping patches on the image are voted on for categorization by the CNN. The food is assigned the class with the most votes and this is repeated across all the foods in the image. Various model parameters were experimented with, although all were comparable (accuracy range: 83.5–84.9%). Shermila & Milton [69] made a database of images of protein powder food products taken with various weights and angles and used this to predict protein content [69]. This was attempted via linear regression using SVM, and CNN. They also investigated the most important features for prediction. Efficacy was measured by average protein prediction error, where CNN performed best (average error of 1.96 g protein).
In order to estimate volume for calorie calculation when using im-aging for dietary intake, the users’ thumb or distance estimation can be used [64]. Lo et al. [60] propose an alternative that uses a depth sensor to capture the image [60]. This image can be converted to a partial point cloud where image coordinates are converted to camera coordinates. It can then be fed to a point completion network, ultimately allowing volume estimation. In this way, even foods that are occluded (e.g. such as by other foods, which naturally occurs on a plate of food) can have their volumes estimated. For experimentation, the Yale-CMU-Berkeley object dataset is used and a maximum accuracy of 95.41%, out-performing current approaches. The concept of using depth-sensing technologies for dietary intake logging is rapidly becoming more feasible as new smartphones are increasingly already equipped with 3D cameras.
Fang et al. [61] take a different approach to calorie estimation by using their self-named concept of food energy distribution [61]. Generative Adversarial Network is used to train a generative model based on eating occasion images. From this, an image can be generated where it can be seen which foods contain more energy and which less. For example, a pear would be present with less radiance on the image than a slice of pizza. From the learned energy distribution images, regression via CNN is used to predict calorie content. This was tested with study participants and an average error of 209 kcal was obtained, although at times there was huge underestimation.
Jia et al. [63] suggest that having to manually use a smartphone for every eating occasion is not ideal for food logging since it may be laborious and also may alter eating behavior [63]. Taking photos can also be inconvenient in certain situations. Instead, they experiment using a wearable camera named the eButton to detect eating occasions continuously across the day. Detection of food and drinking via the Clarifai CNN - a CNN with a good reputation in the computer vision community - is investigated in the Food-5K dataset and two sets of im-ages acquired from participants wearing the device, where sensitivity and specificity is high across the datasets. Although this approach poses some advantages, there is also clear privacy concerns due to constant filming. Furthermore, food consumed outside of times wearing the camera (e.g. breakfast, late night snacks) can be missed.
Priyaa et al. [79] combined food images taken via a USB camera and a load sensor in order to obtain calorie estimation as part of a phone application [79]. Although accuracy is high on the tested foods, the additional equipment required make it more burdensome than some of the other techniques discussed, such as depth-sensing via imaging alone. Finally, Farinella et al. [81] used CNN only as a comparison to other methods and not as a means to an end in itself [81]. It performed poorly in comparison to the other methods used and also in comparison to other papers discussed here, although the authors point out that the training data in this study was not as large as is required for sufficient CNN performance. This shows the importance of having sufficient volumes of
data for CNN training. Food tracking and quantification of energy intake - detection of
chews and swallows. Six papers aimed to deal with tracking food intake through three approaches to detection of chews and/or swallows. These approaches may be suitable for dietary intake monitoring in populations with less independence, such as the disabled or the elderly. Moreover, since they currently cannot distinguish foods to the degree of precision that vision-based approaches can, they be more useful in situations where food of consumption is known but volume must be quantified. It could be that this is done through communication with a smartphone via an application, reducing the burden of weighing.
Kalantarian et al. [77]; Alshurafa et al. [80]; and Hussain et al. [71] used a piezoelectric-based necklace to detect chewing and swallows. Kalantarian et al. [62] use a Bayesian classifier to classify motions into swallowing of food, liquid, or nothing (i.e. saliva) [77]. Since motions like walking and running can also cause interference, the necklace comes with an accelerometer to reduce misclassification rate (though they do not use accelerometer data in this work). It is part of a system that communicates with a phone application for dietary assistance. In a 30-subject experiment, solid and liquid foods were suitably distin-guished (F-measure 0.837 and 0.864, respectively). Across two experi-ments, Alshurafa et al. [80] classified between liquid and solid and hot and cold, and also attempted classification of a small number of foods [80]. kNN, Bayesian network and RF were investigated as classifiers. It was found that RF consistently performed the best and high F-measures were found across the various experiments. Liquids, solids, and food types could be distinguished with reasonable accuracy. Hussain et al. [71] employed a similar approach but were more adventurous in their testing by investigating 17 different food groups [71]. They also tested how walking whilst eating affected results. Impressive results were seen across the food groups, with detection of intake averaged at 89.8% and food classification its highest at 80.3%, with RF as a classifier.
Audio-based detection of eating behavior is another option for tracking food intake. Kalantarian & Sarrafzadeh [62] used a smartwatch to investigate this possibility [62]. This can have the advantage of higher user acceptability over, for example, the necklace-based options described above. Ten subjects were used for investigation of swallow detection whilst wearing the watch and eating apple, potato chips or drinking water. Furthermore, background noise (a shopping mall recording) was added to the audio-clips to make for a more realistic scenario for the model during classification. RF classified these foods, drink, and activity (e.g. talking), reasonably well, although apple was often misclassified as chips. One flaw with such a watch-based method is that energy consumed with the non-watch hand might not be accounted for. This is particularly a problem since wrists are often worn on non-dominant hands, whereas eating occurs frequently with dominant hands (particularly snacking and foods consumed with a spoon or chopsticks). Kalantarian et al. [59] subsequently compared a piezo-electric with an audio-based throat microphone method [59]. Across two experiments investigating a total five different food types and water via RF classifier, audio-based showed clear superiority.
Finally in Dietary Intake Monitoring was Mertes et al. [74]; whose approach for detecting bites utilized a weight sensor integrated into a plate [74]. The change in weight and weight distribution on the plate allows both total volume of food consumption and the amount of each food (providing that the starting distribution of the foods on the plate is known) to be calculated. Their experiment was ran in the elderly, where this approach for food logging may have more utility than methods such as imaging that require more capability of using technology. In an experiment with 24 aging adults, a precision of 0.78 and 0.76 of bite detection using a RF classifier was achieved. However, clearly this method as a stand-alone has no way to discriminate between food types, naturally limiting application.
All in all, dietary intake monitoring contributes to PN by facilitating more accurate or convenient assessment of food intake through imaging or by the detection of chews and swallows. It is likely that applications of
D. Kirk et al.

Computers in Biology and Medicine 133 (2021) 104365
21
these will differ between population groups requiring food logging for PN, and indeed some of the methods discussed above may cease to be used in the future.
4.10.9. Activity Tracking PN approaches – especially those relating to bodyweight and meta-
bolic health – use measures of PA in their models. Such measures can include tracking of sedentary versus active time, intensity of activities, and estimating EE. However, measures of these are not always accurate. In some situations, this information is obtained via only questionnaire. The recent surge in wearable technology is facilitating more accurate and convenient ways to measure PA, and ML is playing an important role in this. The collection of papers in this section is focused on using data obtained from wearable devices to classify activity or estimate energy expenditure. Having such information to incorporate into PN models will improve the accuracy of nutritional recommendations. As with the previous domain, a large number of papers are dealing with the same problem (Activity Tracking + Energy Expenditure) in Activity Tracking, so these papers are split by their approach to solving this.
Activity tracking + energy expenditure - accelerometer data. Twelve of the 15 articles in Activity Tracking used solely accelerometer data. Ahmadi et al. [88] used 31 children in free play in a free-living (i.e. outside of the lab) environment to classify activity as sedentary, light, moderate, walking or running [88]. Accelerometers were worn on both the hip and the non-dominant wrist and RF and SVM were used for data processing. Accuracy was modest and highly similar in both models (66.4% for hip, 59.1% for wrist in RF). Values were lower than in lab-oratory cross-validation, and accuracy was especially low for walking (9–15%), although this may be attributed to different movement pat-terns in preschoolers. Some limitations were addressed by the authors, including the 15 s prediction window being too long to capture the sporadic movements of children, and failure to acknowledge temporal features (such as variability in the preceding and succeeding windows of data). To address some of the shortcomings of Ahmadi et al. [88]; Ahmadi et al. [92] employed the same data analysis across various window sizes and including temporal features [92]. However, only RF was used, and it was trained only on free-living data. The results were much improved, especially for walking. Finally, Ahmadi et al. [90] used a similar design but for EE estimation, with a lab and free-living com-parison, wrist and hip accelerometers, and 20-min free play, again in children. RF, SVM and ANN were used for EE estimation [90]. Estimates varied between models and situations. Unlike other studies and that earlier seen by Ahmadi et al. [88]; free-living versus laboratory results were comparable.
A decrease in classification accuracy when going from a laboratory- based to a free-living experiment is commonly seen in the articles of this section. Bastian et al. [83] investigated how laboratory and free-living values differed [83]. This was done by applying a previously devel-oped laboratory-trained algorithm (Bayesian classifier) on semi-free-living data involving twenty participants performing various movement activities. On this occasion, in line with expectations at the time, significant differences were observed between the laboratory and free-living values. Recalibrating with free-living data also improved accuracy. Thus, caution must be taken when interpreting laboratory-obtained results from accelerometer studies.
[85] trained ML algorithms on free-living and laboratory-controlled datasets using hip and thigh accelerometers [85]. SVM, RF, conditional random fields and hidden Markov model were used as algorithms. The focus was on sitting versus standing since they are particularly difficult to classify. F1-scores were variable under different conditions, with RF performing best under free-living conditions.
Pavey et al. [87] and Chowdhury et al. [86] looked at wrist data. Wrist-worn devices have a higher compliance, making them desirable over accelerometers placed elsewhere. Pavey et al. [87] compared how a wrist-worn accelerometer in laboratory and free-living conditions with a RF classifier could predict activity [87]. In order to have a reference for
difficult activity classification such as stationary versus non-stationary, a thigh-worn accelerometer capable of detecting posture and steps was used. Compared to the laboratory values, the classifier had a lower ac-curacy during the free-living situation, particularly between stepping and non-stepping. The approach of Chowdhury et al. [86] revolved more around the ML algorithm choice rather than the accelerometer [86]. Three unrelated wrist accelerometer datasets with different activity categories were used to assess the performance of Bayesian, kNN, SVM, ANN and ensemble classifiers. The ensemble consisted of RF, boosted DTs, bagged DTs, and a custom ensemble composed of the fusions of the four individual classifiers. Ensembles consistently outperformed indi-vidual classifiers, with RF performing best of the classic ensembles but the custom ensemble having the best overall performance. It is thus not surprising that RF, being an ensemble itself, is often the algorithm of choice for accelerometer data analysis.
On a set of 110 free-living adults, Kingsley et al. [96] investigated how nine wrist-specific accelerometer models (three linear and six ANN) compared to an established hip model for PA activity estimation [96]. Differences were observed between the models in terms of their agree-ment with the results of the hip-worn accelerometer, particularly at the level of sedentary, light and moderate PA where models performed poorly to differentiate. This has clear implications for PN as it shows how algorithm and device choice can impact PA logging results and, subsequently, input variables for PN models. Ultimately, a linear model was shown to be closest to the reference values. Similarly, Trost et al. [91] compared wrist and hip data in children and adolescents across 12 activities [91]. Both exhibited acceptably high accuracies, even between light or stationary PA types such as walking, standing, and sitting. However, it should be noted that this experiment was conducted in a laboratory setting.
Jones et al. [94] took an approach unique to rest of the literature discussed in this section in that they used unsupervised clustering to categorize activities from wrist-worn data [94]. Unsupervised ap-proaches infer patterns without the requirement of labels, which is ad-vantageous since labelling is time expensive. Two labelled laboratory datasets trained a k-means model, which was then applied to three in-dependent datasets, one of which was free-living. Evaluation occurred via measuring the extent a cluster contained one dominant class (cluster purity); the proportion of a class found in one cluster compared to in other clusters (average cluster purity); and the combined purity. Strong results were seen for most of the activity types across the laboratory data. The free-living data was assessed via the proportion of activity type in each cluster, with correspondence to thigh-based accelerometer activPAL for the ground truth on sedentary, standing and stepping. Time spent in each as assessed by k-means was also compared to activPAL time spend in each, since this accelerometer also measures time in each activity. Based on these assessment methods, some differences were seen. An interesting observation, however, is that the choice of wrist was not important in this model. Despite these efforts, there is no suggestion that an unsupervised approach to PA classification would perform su-perior to a supervised classification approach.
Fridolfsson et al. [95] was the only group in the present review to attempt PA classification using a shoe-based sensor, which may have utility in physically active work environments [95]. The study consisted of a laboratory (n = 35) and validation (n = 29, workers were followed by an observer in the workplace) part, with subjects performing various activities in each. Of the three algorithms used – RF, SVM and kNN – RF consistently performed best. Despite this, accuracy was low in the free-living (43%) compared to the laboratory (83%). This can be owed in large part to the difficulty a shoe-based sensor has in distinguishing activity types like sitting and standing. When these activities were combined together into “sedentary”, accuracy greatly increased. Although this is a clear downfall, the authors suggest health effects between these two activity types are similar. Regardless, given the increasing popularity of smart devices such as watches, it seems unlikely shoe-based accelerometers will play much of a role in PA estimation for
D. Kirk et al.
Computers in Biology and Medicine 133 (2021) 104365
22
PN. Activity tracking + energy expenditure - accelerometer and physi-
ological data. Dobbins et al. [84] use both accelerometer and HR data for PA detection [84]. The system is part of a proposed app that allows smart watch communication so users can visualize their data. Data is obtained from two datasets composed of 22 subjects performing nine activities. Multiple accelerometers and a heart-rate monitor were used to obtain the data. Ten algorithms, most of which were non-traditional ML algorithms, were tested for best performance. Feature selection and oversampling was also applied, which improved results. Across the various scenarios, Bayesian classifier was a strong performer throughout.
O’Driscoll et al. [89] made use of accelerometer, HR, body temper-ature, galvanic skin response and participant characteristics such as age, height, body composition and weight to determine EE [89]. Data was collected from various commercial wearables and RF was used for pre-diction on various activity tasks. The ground truth for EE was assumed by metabolic cart (Vyntus CPX), a method that uses oxygen and carbon dioxide in the breath of the patient to estimate EE. All of the models with various combinations of data showed good correlation (r ≥ 0.85). Models with accelerometer data showed the greatest predictive power, whereas HR data was less valuable. This is encouraging given the extra burden associated with HR straps. Although the activity types assessed were not particularly diverse, the study suggests promise for acceler-ometers in estimating EE for PN. The experiment would have to be repeated in a free-living situation for a truer reflection of integrity.
Finally, Fergus et al. [82] investigated PA in children [82]. Their approach consisted of utilizing an ANN with accelerometer data during drawing, jogging, free-play and walking. Multiple features and combi-nations of features were investigated, with accelerometer count of the hip and wrist along and direct observation performing best (accuracy 99.8%). However, direct observation is not a long-term feasible feature for PN in research or the real-world, and nor were other features used in this study (e.g. existing EE estimates, VO2 data).
Activity tracking + energy expenditure - physiological data. Chowdhury et al. [93] was the only study in this section not to make use of accelerometer data, and instead used HR, electrodermal activity and skin temperature data for the goal of PA intensity classification [93]. RF, SVM and ANN were the algorithms of choice investigated for best per-formance on 22 participants across five activities in a non-laboratory environment. Rate of perceived exertion was asked from the partici-pants after activity completion as a reference. The algorithms performed comparably, with SVM offering a slight edge. The clear conclusion from the study is that HR was the best feature for prediction of PA intensity. Even when features were combined and modest improvement was seen, it was non-significant compared to HR alone, demonstrating that other features offered nothing additional to HR data. This is in contrast to the findings of O’Driscoll et al. [89]. Some differences that may explain this include choice of strap, location of strap, different research environ-ments, and different levels of precision (i.e. EE versus PA intensity). Regardless, Chowdhury et al. [93] is suggestive that wrist-strap obtained HR data can be used to classify PA intensity, which could aid with PA data for PN models.
To conclude Activity Tracking for PN, various methods were found in the literature that made use of ML for PA classification, PA intensity estimation or EE estimation. Having more precise ways of measuring such components of PA is important to providing PN models with more accurate input. This is especially important in PN approaches looking at bodyweight or metabolic health, where activity and EE can be crucial components. Incorrectly gauged self-report data in these scenarios would taint PN model accuracy and make PN-based recommendation less valuable.
4.10.10. Bodyweight Microbiome-based prediction of bodyweight. The final paper is in
the domain of Bodyweight. Thaiss et al. [97] investigated the role of the
microbiome in weight gain following a diet [97]. The microbiome has gained attention in recent years due to its impact on many aspects of health. One of these is known to be bodyweight [117]. Thaiss et al. [97] showed that this is the case in mice by identifying a microbiome signature that remains following weight loss in mice susceptible to weight regain. This signature could almost perfectly (AUC = 0.96) predict obesity history, and prediction of the extent of weight regain following reintroduction of high-fat diet also showed good accuracy (R = 0.72).
Further research is required to verify if this also remains true in the human situation. If this is the case, there are implications for PN. Firstly, with the knowledge that individuals have a microbiome signature that makes them susceptible to weight regain following a diet, diets can be adjusted accordingly. It is noted in the study that obesity-induced metabolic derangements are restored upon weight loss much faster than changes in the microbiome. Thus, designing diets that aim to cover not only the weight-loss period but also time it takes for the microbiome to change could be much more successful for long-term weight loss. Moreover, the modifiable nature of the microbiome also makes it an interesting target of personalized approaches. Although this can occur medicinally, the microbiome is also responsive to dietary changes [118]. Hence, PN approaches could include specific dietary modulations or supplementation to alter such microbiome signatures and facilitate long term weight management. However, since such nutritional modulation was not investigated in Thaiss et al. [97]; it can only be speculated and must remain as an article only peripherally related to the topic of PN.
In conclusion, knowledge that the microbiome is a modifiable entity through diet and that it interacts with parameters of health makes it an interesting aspect of PN, as both a feature for model construction and a target variable for modulation. Understanding how PN approaches can alter the microbiome means personalized dietary decisions can be made in response to such microbiome signatures.
5. Discussion
5.1. General discussion
The current review represents the first study to systematically review the literature of applications of ML in research areas related to PN. Sixty papers were identified across four extensive databases using search terms designed to be as comprehensive as possible to obtain research relevant to PN. Furthermore, a quality assessment scheme ensured the papers were of a given standard. Both the disciplines of ML and PN are relatively new, as is highlighted by the fact that none of the papers found in the final literature dated to before 2014. It is highly likely that in the coming years the numbers of papers utilizing ML in PN will greatly in-crease, which is why providing a summary of the current state of the literature as presented here can be helpful for researchers in developing the field of PN. Both PN and ML are complex and have many individual considerations. Hence, a reference that provides all of this information available in one place makes this process less troublesome. The current review considers not only ML application in the final stage of PN (i.e., the generation of a nutrition recommendation outcome) but also in the data collection stages for various elements of PN. A model is only as good as the data it uses for input, and so utilizing ML to enhance the accuracy of data collection will consequently lead to improvements in PN model accuracy. In any of the papers, whenever the availability status of the data was mentioned it was noted, as presented in Section 4.7. In many cases, this was available for research, if not publicly available. Furthermore, it is possible that many of the papers that do not mention the status of their data could be available from the author upon request. The ability to access data in this way allows researchers to develop their own models on the same data, which means better models can be generated. All these points highlight the strength of the current review.
From the findings, some observations can be made. Despite a total of
D. Kirk et al.
Computers in Biology and Medicine 133 (2021) 104365
23
60 papers being present in the final literature, only seven domains of nutrition and health were present, showing that the use of ML in PN is currently being concentrated in a small number of nutrition and health areas. In the case of obesity and metabolic health, there is clear moti-vation to invest more time and resources in solving these crises, given their prominence across the world. Personalized approaches look promising to reducing the burden of these conditions. However, PN also demonstrated application in some other domains such as that of cancer and in the prevention of orofacial cleft development. This can be taken as a sign to suggest that PN may have a broad application. Indeed, as the fields of nutrigenomics, metabolomics, the microbiome, and PN in general develop further, situations where PN can be applied will become more apparent. Research areas known to have a nutritional link should consider combining ML and PN for treatment, prevention, or mainte-nance of optimal health.
The table of features from Table 6 shows how many features various papers required for their models. It should be noted that papers repre-senting prominent research in the field of PN usually utilise multiple features of groups of features. Whilst this not a requisite for PN models, it is certainly in line with the idea that multifactorial diseases such as obesity, diabetes, and cancer will probably not be solved with PN ap-proaches without the use of a lot of data across multiple PN elements. This calls for the need for adequate technology and data processing for effective PN. No papers were identified that included metabolomics in their approach. Metabolomics is concerned with the identification of small molecules in a sample. Whilst the human metabolome is still being characterised, estimates of size are in the degree of tens of thousands, incorporating molecules of many different types [119]. For this reason, papers that used measurements of small molecules as features in models were only considered from a metabolomics perspective if they explicitly stated they took a metabolomics approach or used the sophisticated analysis techniques that is seen in metabolomics research [30]. Other-wise, these features were grouped as “Clinical Biochemical Data”. This only occurred on two occasions, and in both studies they authors use similar group names for such features [4,5]. One reason no papers were found utilizing metabolomics could be that this discipline uses other methods of analysis, rather than ML. It can also be that advances in metabolomics that make it suitable for application in PN have occurred relatively recently [19]. Only recently have attempts been made to categorize reference values for components of the human metabolome [120], and a recent paper used metabolite profiles to characterise interindividual response to diet, showing that metabolomics is more and more being incorporated into PN [121].
There is a fairly clear separation between ML and DL use in the final literature; that is, DL is largely used for imaging for dietary intake assessment, and if ML is used here then DL shows superior performance. Conversely, shallow learning is preferred in other domains. The reason for this is that DL techniques show particularly good performance in computer vision. In order to perform so well, however, they require lots of data and computational power, making them unsuitable in circum-stances without these prerequisites. Despite this, if these requirements are met, they can be expected to perform better than shallow learning techniques, as facilitated by the complexity of their learning architec-ture. As data increases in abundance and computational power increases whilst its price decreases, DL approaches may be employed more so and in other domains of PN.
5.2. Potential threats to validity
The current article is not without limitations. Firstly, the search terms of the review are naturally restrictive; namely, the use of “nutri-tion” as a search term (the other being “machine learning” or “deep learning”) in the searches means articles using machine learning for data collection for some elements of PN will not be found. For example, in models where sleep quality is of importance, ML could be used to aid with sleep categorization [122,123]. Despite this shortcoming, it is hard
to imagine a situation where an article directly related to PN is not returned with the search terms used, with the same being said for many of the indirectly related articles. Next, the databases used to search may have meant some articles were missing in the final literature. Aside from the four databases used in the current study, other databases exist that may contain papers that are absent in the ones we used. In order to reduce the chances of this, Google Scholar and Wiley Online Library were also searched, but after returning no extra results after looking through more than two-thirds of the papers returned from the search, they were ultimately abandoned as databases.
In terms of ML, the current review did not pay attention to machine learning for pre-processing of the data such as feature selection or dimensionality reduction as a separate process to the main outcome. The reason for this is that these are generic processes that can be performed across any discipline, and so have less direct relevance to PN. However, their inclusion may paint a more complete picture of ML in PN. When discussing the features used in the papers, different levels of specificity were used. For example, papers using imaging for dietary intake assessment sometimes had features such as color, shape, and texture listed; however, these were simply grouped together and listed as the feature “Images”. The same is also true for papers such as Zeevi et al. and Berry et al. who had some features in their papers under the grouping “Personal Features”, with the same being followed here (see Table 6). As discussed in Section 4.6, this was done for the sake of conciseness and to provide an overview of the features that could be expected in directly or indirectly related PN articles using ML. However, such overviewing may mask the use of specific features in PN. Table 6 also does not take into account the contribution of the features to the model. This may dilute the importance of certain features, whilst making others seem more relevant than they are. Not all of the studies identified had an equally close relationship with PN. Whilst some can be considered as core PN approaches [4,5,15], others were not designed as PN studies and did not perform consequential experiments to test the efficacy of their findings in impacting health in human subjects. For example [48], aimed to identify relevant SNPs to diabetes. Whilst not at the same degree of complexity and personalization as other studies in the review, it still makes use of personal information to generate a nutritional recom-mendation as an outcome, which in this case is appropriate management of blood-glucose in those harboring such SNPs. Whilst it could be rightly argued that adequate management of blood-glucose is in the interest of everybody, more effort can be made and from a younger age in those with the knowledge that such personalized approaches provide, miti-gating negative effects that might otherwise be more pronounced. This logic is the same in the articles relating genetics to obesity, justifying their inclusion in the current review [54–56]. Regardless, they do not display the same strength as papers like [4] and Zeevi et a. (2015) proving the efficacy of PN approaches.
Aside from the systematic literature review, some challenges to PN generally can also be discussed. Some elements of data collection are reliant on methods with questionable efficacy, such as assessing dietary intake by self-report. Moreover, even with the employment of more advanced methods of assessing these such as the methods discussed in the current review, assignment of calorie estimates is reliant on the accuracy of food database systems. This will inevitably impact the ac-curacy of PN results. In some cases, PN models do not take into account gender, age, medicine use, sleep quality, demographic information and other variables. Whilst it is infeasible to incorporate every possible contributing variable into a PN model, some of this information repre-sents basic personal information that can have a significant effect at reducing the error in PN outcomes [124]. It should also be stated that although PN approaches show promise in outperforming population-based in terms of results, this is not guaranteed. This hy-pothesis should be tested with rigorous large-scale trails to test that this is indeed true [18]. However, in some cases PN systems appear to be far superior to existing methods, as is the case with blood sugar prediction [4,5]. It may also be the case that PN performance exceeds other
D. Kirk et al.
Computers in Biology and Medicine 133 (2021) 104365
24
methods but may fail from a cost-benefit perspective. Whilst techniques for gathering data and presenting PN outcomes can be expected to drop in price and become increasingly more convenient, it may take a long time until this is feasible.
None of the articles made use of online learning methods. Unlike in traditional ML approaches where an equation is optimized on a batch of offline, fixed data, in online learning methods a model is that continually updates itself in response to continuous inflow of new data [125]. If PN has the success of being deployed and used in everyday life circum-stances (for example, in mobile phone apps or something similar), it seems likely that online learning methods will have a role to play in ensuring nutritional recommendations remain accurate with regard to new data continually flowing in. However, as discussed above, PN still has hurdles to overcome and must prove itself to be effective and worth the investment before being deployed for use. Thus, it is understandable that research for now has not yet reached these more practical points. Regardless, this is certainly something for future research to consider implementing. Finally, PN must embrace explainable AI in order to fulfil its potential in the coming years. Explainable AI refers to developing models that not only solve problems, but also present their decision-making process in a way that it is interpretable by humans. The importance of explainable AI has been highlighted in disciplines like medicine [126] and finance [127], where the output of ML models can have important implications and there is a need for professionals to understand how models have arrived at their conclusion and convey this to patients or clients. In PN, it may be the case that models advise against the consumption of one’s favorite foods or encourage lifestyle changes that could require quite some effort to implement. In this regard, it is pertinent for those on the receiving end of PN approaches to know what has motivated such changes. In the current SLR, some studies presented feature importance in their articles [4,5], which indeed sheds some light on the features most relevant for driving decision-making, however concrete explanations on the processes that lead to the ultimate outcome are lacking. Future work should look to incorporate explainable AI into PN models.
6. Conclusion
The current work used a robust search methodology to review the literature on research related to PN that uses ML. To the best of our knowledge, this is the first systematic literature review to do so. Nine research questions were designed to facilitate the extraction as much relevant information as possible to provide an overview of ML in the field of PN. This included PN-orientated questions, such as the domain of the work and the specific problems tackled; ML-orientated questions, such as ML types, tasks, algorithms, features, evaluation, and data availability status; and a combination of the two, as specific problems of PN were linked to ML tasks and algorithms. We offer a contribution to the literature by summarising this information, providing a reference for future PN work looking to utilise ML to go by. To progress the field of PN further, researchers should consider other areas of health known to have a relationship with nutrition. PN and ML in such areas may allow progress due to the fusion of two promising and powerful avenues in disease prevention and treatment. Future work may also benefit from developing systems to integrate various information in PN approaches to deliver to the general population or patients, as was done in a few cases [50,53,57]. Whilst currently PN research is happening in controlled experimental conditions, PN will play a role in everyday life of the general population. Having interfaces such as smartphone apps that can allow user interaction and regular dietary support or delivery of nutri-tional advice will be more convenient than having to discuss such matters during appointments with experts, such as doctors or nutri-tionists. Finally, research to investigate the actual efficacy of PN, the ability of PN to alter behavior, and cost-benefit analyses is required before full confidence that PN can solve the problems that nutrition and health currently faces can be achieved.
Declaration of competing interest
The authors declare that they have no known competing financial interests or personal relationships that could have appeared to influence the work reported in this paper.
Acknowledgment
Open Access funding provided by the Qatar National Library.
Appendix A. Supplementary data
Supplementary data to this article can be found online at https://doi. org/10.1016/j.compbiomed.2021.104365.
References
[1] World Health Organisation, Fact Sheets, 2020. https://www.who.int/ne ws-room/fact-sheets.
[2] J.E. Cecil, K.L. Barton, Inter-individual differences in the nutrition response: from research to recommendations, Proc. Nutr. Soc. 79 (2) (2020) 171–173, https:// doi.org/10.1017/S0029665119001198. Cambridge University Press.
[3] C.D. Gardner, J.F. Trepanowski, L.C.D. Gobbo, M.E. Hauser, J. Rigdon, J.P. A. Ioannidis, M. Desai, A.C. King, Effect of low-fat VS low-carbohydrate diet on 12-month weight loss in overweight adults and the association with genotype pattern or insulin secretion the DIETFITS randomized clinical trial, JAMA - Journal of the American Medical Association 319 (7) (2018) 667–679, https:// doi.org/10.1001/jama.2018.0245.
[4] S.E. Berry, A.M. Valdes, D.A. Drew, F. Asnicar, M. Mazidi, J. Wolf, J. Capdevila, G. Hadjigeorgiou, R. Davies, H. Al Khatib, C. Bonnett, S. Ganesh, E. Bakker, D. Hart, M. Mangino, J. Merino, I. Linenberg, P. Wyatt, J.M. Ordovas, T. D. Spector, Human postprandial responses to food and potential for precision nutrition, Nat. Med. 26 (6) (2020) 964–973, https://doi.org/10.1038/s41591- 020-0934-0.
[5] D. Zeevi, T. Korem, N. Zmora, D. Israeli, D. Rothschild, A. Weinberger, O. Ben- Yacov, D. Lador, T. Avnit-Sagi, M. Lotan-Pompan, J. Suez, J.A. Mahdi, E. Matot, G. Malka, N. Kosower, M. Rein, G. Zilberman-Schapira, L. Dohnalova, M. Pevsner- Fischer, E. Segal, Personalized nutrition by prediction of glycemic responses, Cell 163 (5) (2015) 1079–1094, https://doi.org/10.1016/j.cell.2015.11.001.
[6] A. Grillo, L. Salvi, P. Coruzzi, P. Salvi, G. Parati, Sodium intake and hypertension, Nutrients 11 (9) (2019), https://doi.org/10.3390/nu11091970.
[7] M.C. Cornelis, A. El-Sohemy, H. Campos, Genetic polymorphism of the adenosine A2A receptor is associated with habitual caffeine consumption, Am. J. Clin. Nutr. 86 (1) (2007) 240–244, https://doi.org/10.1093/ajcn/86.1.240.
[8] S. Galmes, F. Serra, A. Palou, Vitamin E metabolic effects and genetic variants: a challenge for precision nutrition in obesity and associated disturbances, Nutrients 10 (12) (2018), https://doi.org/10.3390/nu10121919. MDPI AG.
[9] S. Bashiardes, A. Godneva, E. Elinav, E. Segal, Towards utilization of the human genome and microbiome for personalized nutrition, Curr. Opin. Biotechnol. 51 (2018) 57–63, https://doi.org/10.1016/j.copbio.2017.11.013. Elsevier Ltd.
[10] N.S. Guest, J. Horne, S.M. Vanderhout, A. El-Sohemy, Sport nutrigenomics: personalized nutrition for athletic performance, Frontiers in Nutrition 6 (8) (2019), https://doi.org/10.3389/fnut.2019.00008. Frontiers Media S.A.
[11] O.I. Aruoma, S. Hausman-Cohen, J. Pizano, M.A. Schmidt, D.M. Minich, Y. Joffe, S. Brandhorst, S.J. Evans, D.M. Brady, Personalized nutrition: translating the science of NutriGenomics into practice: proceedings from the 2018 American college of nutrition meeting, J. Am. Coll. Nutr. 38 (4) (2019) 287–301, https:// doi.org/10.1080/07315724.2019.1582980.
[12] C. Celis-Morales, K.M. Livingstone, C.F.M. Marsaux, A.L. Macready, R. Fallaize, C. B. O’Donovan, C. Woolhead, H. Forster, M.C. Walsh, S. Navas-Carretero, R. San- Cristobal, L. Tsirigoti, C.P. Lambrinou, C. Mavrogianni, G. Moschonis, S. Kolossa, J. Hallmann, M. Godlewska, A. Surwiłło, J.C. Mathers, Effect of personalized nutrition on health-related behaviour change: evidence from the Food4Me European randomized controlled trial, Int. J. Epidemiol. 46 (2) (2017) 578–588, https://doi.org/10.1093/ije/dyw186.
[13] C. Celis-Morales, J. Lara, J.C. Mathers, Personalising nutritional guidance for more effective behaviour change, Proc. Nutr. Soc. 74 (2) (2015) 130–138, https://doi.org/10.1017/S0029665114001633.
[14] H. Mendes-Soares, T. Raveh-Sadka, S. Azulay, Y. Ben-Shlomo, Y. Cohen, T. Ofek, J. Stevens, D. Bachrach, P. Kashyap, L. Segal, H. Nelson, Model of personalized postprandial glycemic response to food developed for an Israeli cohort predicts responses in Midwestern American individuals, Am. J. Clin. Nutr. 110 (1) (2019) 63–75, https://doi.org/10.1093/ajcn/nqz028.
[15] S. Shiao, J. Grayson, A. Lie, C. Yu, Personalized nutrition—genes, diet, and related interactive parameters as predictors of cancer in multiethnic colorectal cancer families, Nutrients 10 (6) (2018) 795, https://doi.org/10.3390/ nu10060795.
[16] C.L. Bush, J.B. Blumberg, A. El-Sohemy, D.M. Minich, J.M. Ordovas, D.G. Reed, V. A.Y. Behm, Toward the definition of personalized nutrition: a proposal by the American nutrition association, J. Am. Coll. Nutr. 39 (1) (2020) 5–15, https:// doi.org/10.1080/07315724.2019.1685332. Routledge.
D. Kirk et al.

Computers in Biology and Medicine 133 (2021) 104365
25
[17] S.H. Zeisel, Precision (personalized) nutrition: understanding metabolic heterogeneity, Ann. Rev. Food Sci. Technol 11 (1) (2020) 71–92, https://doi.org/ 10.1146/annurev-food-032519-051736.
[18] J.M. Ordovas, L.R. Ferguson, E.S. Tai, J.C. Mathers, Personalised Nutrition and Health. BMJ (Online), 2018, p. 361, https://doi.org/10.1136/bmj.k2173.
[19] J. de Toro-Martín, B.J. Arsenault, J.P. Despres, M.C. Vohl, Precision nutrition: a review of personalized nutritional approaches for the prevention and management of metabolic syndrome, Nutrients 9 (8) (2017) 913, https://doi.org/ 10.3390/nu9080913. MDPI AG.
[20] L. Goni, M. Cuervo, F.I. Milagro, J.A. Martínez, Future perspectives of personalized weight loss interventions based on nutrigenetic, epigenetic, and metagenomic data, J. Nutr. 146 (4) (2016) 905S–912S, https://doi.org/10.3945/ jn.115.218354.
[21] R. Mattar, D.F. de C. Mazo, F.J. Carrilho, Lactose intolerance: diagnosis, genetic, and clinical factors, Clin. Exp. Gastroenterol. 5 (1) (2012) 113–121, https://doi. org/10.2147/CEG.S32368. Dove Medical Press Ltd.
[22] P. Perez-Martinez, A. Garcia-Rios, J. Delgado-Lista, F. Perez-Jimenez, J. Lopez- Miranda, Metabolic syndrome: evidences for a personalized nutrition, Mol. Nutr. Food Res. 56 (1) (2012) 67–76, https://doi.org/10.1002/mnfr.201100531. Mol Nutr Food Res.
[23] L. Bordoni, R. Gabbianelli, Primers on nutrigenetics and nutri(epi)genomics: origins and development of precision nutrition, Biochimie 160 (2019) 156–171, https://doi.org/10.1016/j.biochi.2019.03.006. Elsevier B.V.
[24] N. Chaudhary, V. Kumar, P. Sangwan, N.C. Pant, A. Saxena, S. Joshi, A.N. Yadav, Personalized nutrition and -omics, in: Reference Module in Food Science, Elsevier, 2020, p. 495, https://doi.org/10.1016/b978-0-08-100596-5.22880-1.
[25] J. Kim, S. Lin, G. Ferrara, J. Hua, E. Seto, Identifying people based on machine learning classification of foods consumed in order to offer tailored healthier food options, Adv. Intell. Sys. Comput. 1131 (2020) 190–194, https://doi.org/ 10.1007/978-3-030-39512-4_30. AISC.
[26] R. Ramyaa, O. Hosseini, G.P. Krishnan, S. Krishnan, Phenotyping women based on dietary macronutrients, physical activity, and body weight using machine learning tools, Nutrients 11 (7) (2019), https://doi.org/10.3390/nu11071681.
[27] K. Zellerbach, C. Ruiz, Machine learning to predict overeating from macronutrient composition, Proceedings - 2019 IEEE International Conference on Bioinformatics and Biomedicine, BIBM (2019) 1268–1270, https://doi.org/ 10.1109/BIBM47256.2019.8983166, 2019.
[28] J.M. Colmenar, S.M. Winkler, G. Kronberger, E. Maqueda, M. Botella, J. I. Hidalgo, Predicting glycemia in diabetic patients by evolutionary computation and continuous glucose monitoring, in: GECCO 2016 Companion - Proceedings of the 2016 Genetic and Evolutionary Computation Conference, 2016, pp. 1393–1400, https://doi.org/10.1145/2908961.2931734.
[29] A. Paoli, G. Tinsley, A. Bianco, T. Moro, The influence of meal frequency and timing on health in humans: the role of fasting, Nutrients 11 (4) (2019), https:// doi.org/10.3390/nu11040719. MDPI AG.
[30] J. Brignardello, E. Holmes, I. Garcia-Perez, Metabolic phenotyping of diet and dietary intake, in: Advances in Food and Nutrition Research, vol. 81, Academic Press Inc, 2017, pp. 231–270, https://doi.org/10.1016/bs.afnr.2016.12.002.
[31] A.A. Kolodziejczyk, D. Zheng, E. Elinav, Diet–microbiota interactions and personalized nutrition, Nat. Rev. Microbiol. 17 (12) (2019) 742–753, https://doi. org/10.1038/s41579-019-0256-8.
[32] M. Rowe, An introduction to machine learning for clinicians, Acad. Med. 94 (10) (2019) 1433–1436, https://doi.org/10.1097/ACM.0000000000002792.
[33] L. Breiman, Random forests, Mach. Learn. 45 (1) (2001) 5–32, https://doi.org/ 10.1023/A:1010933404324.
[34] G.I. Webb, J. Fürnkranz, J. Fürnkranz, J. Fürnkranz, G. Hinton, C. Sammut, J. Sander, M. Vlachos, Y.W. Teh, Y. Yang, D. Mladeni, J. Brank, M. Grobelnik, Y. Zhao, G. Karypis, S. Craw, M.L. Puterman, J. Patrick, Decision tree, in: Encyclopedia of Machine Learning, Springer US, 2011, pp. 263–267, https://doi. org/10.1007/978-0-387-30164-8_204.
[35] N. Cristianini, E. Ricci, Support vector machines, in: Encyclopedia of Algorithms, Springer US, 2008, pp. 928–932, https://doi.org/10.1007/978-0-387-30162-4_ 415.
[36] S. Mannor, X. Jin, J. Han, X. Jin, J. Han, X. Jin, J. Han, X. Zhang, K-means clustering, in: Encyclopedia of Machine Learning, Springer US, 2011, pp. 563–564, https://doi.org/10.1007/978-0-387-30164-8_425.
[37] F. Murtagh, Multilayer perceptrons for classification and regression, Neurocomputing 2 (5–6) (1991) 183–197, https://doi.org/10.1016/0925-2312 (91)90023-5.
[38] G.I. Webb, E. Keogh, R. Miikkulainen, R. Miikkulainen, M. Sebag, Naïve Bayes, in: Encyclopedia of Machine Learning, Springer US, 2011, pp. 713–714, https://doi. org/10.1007/978-0-387-30164-8_576.
[39] G.I. Webb, J. Fürnkranz, J. Fürnkranz, J. Fürnkranz, G. Hinton, C. Sammut, J. Sander, M. Vlachos, Y.W. Teh, Y. Yang, D. Mladeni, J. Brank, M. Grobelnik, Y. Zhao, G. Karypis, S. Craw, M.L. Puterman, J. Patrick, Deep Belief nets, in: Encyclopedia of Machine Learning, Springer US, 2011, pp. 267–269, https://doi. org/10.1007/978-0-387-30164-8_208.
[40] P. Munro, H. Toivonen, G.I. Webb, W. Buntine, P. Orbanz, Y.W. Teh, P. Poupart, C. Sammut, C. Sammut, H. Blockeel, D. Rajnarayan, D. Wolpert, W. Gerstner, C. D. Page, S. Natarajan, G. Hinton, Boltzmann machines, in: Encyclopedia of Machine Learning, Springer US, 2011, pp. 132–136, https://doi.org/10.1007/ 978-0-387-30164-8_83.
[41] A. Sherstinsky, Fundamentals of recurrent neural network (RNN) and long short- term memory (LSTM) network, Phys. Nonlinear Phenom. 404 (2020) 132306, https://doi.org/10.1016/j.physd.2019.132306.
[42] K. O’Shea, R. Nash, An Introduction to Convolutional Neural Networks. Neural and Evolutionary Computing, 2015. http://arxiv.org/abs/1511.08458.
[43] Y. Lecun, Y. Bengio, G. Hinton, Deep learning, Nature 521 (7553) (2015) 436–444, https://doi.org/10.1038/nature14539. Nature Publishing Group.
[44] J. Schmidhuber, Deep Learning in Neural Networks: an Overview, 2014 htt p:// ww w.idsia.ch/juergen/DeepLearning8Oct2014.texCompleteBIBTEXfile.
[45] B. Kitchenham, O. Pearl Brereton, D. Budgen, M. Turner, J. Bailey, S. Linkman, Systematic literature reviews in software engineering - a systematic literature review, Inf. Software Technol. 51 (1) (2009) 7–15, https://doi.org/10.1016/j. infsof.2008.09.009. Elsevier.
[46] H. Hall, D. Perelman, A. Breschi, P. Limcaoco, R. Kellogg, T. McLaughlin, M. Snyder, Glucotypes reveal new patterns of glucose dysregulation, PLoS Biol. 16 (7) (2018), e2005143, https://doi.org/10.1371/journal.pbio.2005143.
[47] T. Korem, D. Zeevi, N. Zmora, O. Weissbrod, N. Bar, M. Lotan-Pompan, T. Avnit- Sagi, N. Kosower, G. Malka, M. Rein, J. Suez, B.Z. Goldberg, A. Weinberger, A. A. Levy, E. Elinav, E. Segal, Bread affects clinical parameters and induces gut microbiome-associated personal glycemic responses, Cell Metabol. 25 (6) (2017) 1243–1253, https://doi.org/10.1016/j.cmet.2017.05.002, e5.
[48] B. Lopez, F. Torrent-Fontbona, R. Vinas, J.M. Fernandez-Real, Single nucleotide polymorphism relevance learning with random forests for type 2 diabetes risk prediction, Artif. Intell. Med. 85 (2018) 43–49, https://doi.org/10.1016/j. artmed.2017.09.005.
[49] H. Mendes-Soares, T. Raveh-Sadka, S. Azulay, K. Edens, Y. Ben-Shlomo, Y. Cohen, T. Ofek, D. Bachrach, J. Stevens, D. Colibaseanu, L. Segal, P. Kashyap, H. Nelson, Assessment of a personalized approach to predicting postprandial glycemic responses to food among individuals without diabetes, JAMA Network Open 2 (2) (2019), e188102, https://doi.org/10.1001/jamanetworkopen.2018.8102.
[50] R.A. Sowah, A.A. Bampoe-Addo, S.K. Armoo, F.K. Saalia, F. Gatsi, B. Sarkodie- Mensah, Design and development of diabetes management system using machine learning, Int. J. Telemed. Appl. (2020), https://doi.org/10.1155/2020/8870141, 2020.
[51] H. Wu, V. Tremaroli, C. Schmidt, A. Lundqvist, L.M. Olsson, M. Kramer, A. Gummesson, R. Perkins, G. Bergstrom, F. Backhed, The gut microbiota in prediabetes and diabetes: a population-based cross-sectional study, Cell Metabol. 32 (3) (2020) 379–390, https://doi.org/10.1016/j.cmet.2020.06.011, e3.
[52] O. Babajide, T. Hissam, P. Anna, G. Anatoliy, A. Astrup, J. Alfredo Martinez, J. M. Oppert, T.I.A. Sørensen, A Machine Learning Approach to Short-Term Body Weight Prediction in a Dietary Intervention Program. Lecture Notes in Computer Science (Including Subseries Lecture Notes in Artificial Intelligence and Lecture Notes in Bioinformatics), 12140 LNCS, 2020, pp. 441–455, https://doi.org/ 10.1007/978-3-030-50423-6_33.
[53] J.C. Kim, K. Chung, Knowledge-based hybrid decision model using neural network for nutrition management, Inf. Technol. Manag. 21 (1) (2020) 29–39, https://doi.org/10.1007/s10799-019-00300-5.
[54] Casimiro A.Curbelo Montanez, P. Fergus, A.C. Montanez, A. Hussain, D. Al- Jumeily, C. Chalmers, Deep learning classification of polygenic obesity using genome wide association study SNPs, in: Proceedings of the International Joint Conference on Neural Networks, 2018-July, 2018, https://doi.org/10.1109/ IJCNN.2018.8489048.
[55] Casimiro Aday Curbelo Montanez, P. Fergus, A. Hussain, D. Al-Jumeily, M. T. Dorak, R. Abdullah, Evaluation of phenotype classification methods for obesity using direct to consumer genetic data, in: Lecture Notes in Computer Science (Including Subseries Lecture Notes in Artificial Intelligence and Lecture Notes in Bioinformatics), 10362 LNCS, 2017, pp. 350–362, https://doi.org/10.1007/978- 3-319-63312-1_31.
[56] C. Rodríguez-Pardo, A. Segura, J.J. Zamorano-Leon, C. Martínez-Santos, D. Martínez, L. Collado-Yurrita, M. Giner, J.M. García-García, J.M. Rodríguez- Pardo, A. Lopez-Farre, Decision tree learning to predict overweight/obesity based on body mass index and gene polymporphisms, Gene 699 (2019) 88–93, https:// doi.org/10.1016/j.gene.2019.03.011.
[57] J.W. Baek, J.C. Kim, J. Chun, K. Chung, Hybrid clustering based health decision- making for improving dietary habits, Technol. Health Care 27 (5) (2019) 459–472, https://doi.org/10.3233/THC-191730.
[58] S.J. Zhang, P. Meng, J. Zhang, P. Jia, J. Lin, X. Wang, F. Chen, X. Wei, Machine learning models for genetic risk assessment of infants with non-syndromic orofacial cleft, Dev. Reprod. Biol. 16 (5) (2018) 354–364, https://doi.org/ 10.1016/j.gpb.2018.07.005.
[59] H. Kalantarian, B. Mortazavi, N. Alshurafa, C. Sideris, T. Le, M. Sarrafzadeh, A comparison of piezoelectric-based inertial sensing and audio-based detection of swallows, Obesity Medicine 1 (2016) 6–14, https://doi.org/10.1016/j. obmed.2016.01.003.
[60] F.P.W. Lo, Y. Sun, J. Qiu, B. Lo, A novel vision-based approach for dietary assessment using deep learning view synthesis, in: 2019 IEEE 16th International Conference on Wearable and Implantable Body Sensor Networks, 2019, May 1, https://doi.org/10.1109/BSN.2019.8771089. BSN 2019 - Proceedings.
[61] S. Fang, Z. Shao, D.A. Kerr, C.J. Boushey, F. Zhu, An end-to-end image-based automatic food energy estimation technique based on learned energy distribution images: protocol and methodology, Nutrients 11 (4) (2019), https://doi.org/ 10.3390/nu11040877.
[62] H. Kalantarian, M. Sarrafzadeh, Audio-based detection and evaluation of eating behavior using the smartwatch platform, Comput. Biol. Med. 65 (2015) 1–9, https://doi.org/10.1016/j.compbiomed.2015.07.013.
[63] W. Jia, Y. Li, R. Qu, T. Baranowski, L.E. Burke, H. Zhang, Y. Bai, J.M. Mancino, G. Xu, Z.H. Mao, M. Sun, Automatic food detection in egocentric images using artificial intelligence technology, Publ. Health Nutr. 22 (7) (2019) 1168–1179, https://doi.org/10.1017/S1368980018000538.
D. Kirk et al.
Computers in Biology and Medicine 133 (2021) 104365
26
[64] P. Pouladzadeh, A. Yassine, S. Shirmohammadi, FooDD: food detection dataset for calorie measurement using food images, Lect. Notes Comput. Sci. 9281 (2015) 441–448, https://doi.org/10.1007/978-3-319-23222-5_54.
[65] P. McAllister, H. Zheng, R. Bond, A. Moorhead, Combining deep residual neural network features with supervised machine learning algorithms to classify diverse food image datasets, Comput. Biol. Med. 95 (2018) 217–233, https://doi.org/ 10.1016/j.compbiomed.2018.02.008.
[66] G. Ozsert Yigit, B.M. Ozyildirim, Comparison of convolutional neural network models for food image classification, in: Proceedings - 2017 IEEE International Conference on INnovations in Intelligent SysTems and Applications, INISTA 2017, 2017, pp. 349–353, https://doi.org/10.1109/INISTA.2017.8001184.
[67] K. Merchant, Y. Pande, ConvFood: a CNN-based food recognition mobile application for obese and diabetic patients, Adv. Intell. Sys. Comput. 882 (2019) 493–502, https://doi.org/10.1007/978-981-13-5953-8_41.
[68] C. Liu, Y. Cao, Y. Luo, G. Chen, V. Vokkarane, Y. Ma, Deepfood: deep learning- based food image recognition for computer-aided dietary assessment, Lect. Notes Comput. Sci. 9677 (2016) 37–48, https://doi.org/10.1007/978-3-319-39601-9_4.
[69] P.J. Shermila, A. Milton, Estimation of protein from the images of health drink powders, J. Food Sci. Technol. 57 (5) (2020) 1887–1895, https://doi.org/ 10.1007/s13197-019-04224-4.
[70] P. Pouladzadeh, P. Kuhad, S.V.B. Peddi, A. Yassine, S. Shirmohammadi, Food calorie measurement using deep learning neural network, in: Conference Record - IEEE Instrumentation and Measurement Technology Conference, 2016-July, 2016, https://doi.org/10.1109/I2MTC.2016.7520547.
[71] G. Hussain, K. Javed, J. Cho, J. Yi, Food intake detection and classification using a necklace-type piezoelectric wearable sensor system, IEICE Trans. Info Syst. E101D (11) (2018) 2795–2807, https://doi.org/10.1587/transinf.2018EDP7076.
[72] S. Christodoulidis, M. Anthimopoulos, S. Mougiakakou, Food recognition for dietary assessment using deep convolutional neural networks, Lect. Notes Comput. Sci. 9281 (2015) 458–465, https://doi.org/10.1007/978-3-319-23222- 5_56.
[73] Z. Shen, A. Shehzad, S. Chen, H. Sun, J. Liu, Machine learning based approach on food recognition and nutrition estimation, Procedia Computer Science 174 (2020) 448–453, https://doi.org/10.1016/j.procs.2020.06.113.
[74] G. Mertes, L. Ding, W. Chen, H. Hallez, J. Jia, B. Vanrumste, Measuring and localizing individual bites using a sensor augmented plate during unrestricted eating for the aging population, IEEE Journal of Biomedical and Health Informatics 24 (5) (2020) 1509–1518, https://doi.org/10.1109/ JBHI.2019.2932011.
[75] S. Mezgec, T. Eftimov, T. Bucher, B. Korousic Seljak, Mixed deep learning and natural language processing method for fake-food image recognition and standardization to help automated dietary assessment, Publ. Health Nutr. 22 (7) (2019) 1193–1202, https://doi.org/10.1017/S1368980018000708.
[76] P. Pouladzadeh, S. Shirmohammadi, Mobile multi-food recognition using deep learning, ACM Trans. Multimed Comput. Commun. Appl 13 (3s) (2017), https:// doi.org/10.1145/3063592.
[77] H. Kalantarian, N. Alshurafa, T. Le, M. Sarrafzadeh, Monitoring eating habits using a piezoelectric sensor-based necklace, Comput. Biol. Med. 58 (2015) 46–55, https://doi.org/10.1016/j.compbiomed.2015.01.005.
[78] S. Mezgec, B.K. Seljak, Nutrinet: a deep learning food and drink image recognition system for dietary assessment, Nutrients 9 (7) (2017), https://doi. org/10.3390/nu9070657.
[79] P. Kamakshi Priyaa, S. Sathyapriya, L. Arockiam, Nutrition monitoring and calorie estimation using internet of things (IoT), Int. J. Innovative Technol. Explor. Eng. 8 (11) (2019) 2669–2672, https://doi.org/10.35940/ijitee. K2072.0981119.
[80] N. Alshurafa, H. Kalantarian, M. Pourhomayoun, J.J. Liu, S. Sarin, B. Shahbazi, M. Sarrafzadeh, Recognition of nutrition intake using time-frequency decomposition in a wearable necklace using a piezoelectric sensor, IEEE Sensor. J. 15 (7) (2015) 3909–3916, https://doi.org/10.1109/JSEN.2015.2402652.
[81] G.M. Farinella, D. Allegra, M. Moltisanti, F. Stanco, S. Battiato, Retrieval and classification of food images, Comput. Biol. Med. 77 (2016) 23–39, https://doi. org/10.1016/j.compbiomed.2016.07.006.
[82] Paul Fergus, A.J. Hussain, J. Hearty, S. Fairclough, L. Boddy, K. Mackintosh, G. Stratton, N. Ridgers, D. Al-Jumeily, A.J. Aljaaf, J. Lunn, A machine learning approach to measure and monitor physical activity in children, Neurocomputing 228 (2017) 220–230, https://doi.org/10.1016/j.neucom.2016.10.040.
[83] T. Bastian, A. Maire, J. Dugas, A. Ataya, C. Villars, F. Gris, E. Perrin, Y. Caritu, M. Doron, S. Blanc, P. Jallon, C. Simon, Automatic identification of physical activity types and sedentary behaviors from triaxial accelerometer: laboratory- based calibrations are not enough, J. Appl. Physiol. 118 (6) (2015) 716–722, https://doi.org/10.1152/japplphysiol.01189.2013.
[84] C. Dobbins, R. Rawassizadeh, E. Momeni, Detecting physical activity within lifelogs towards preventing obesity and aiding ambient assisted living, Neurocomputing 230 (2017) 110–132, https://doi.org/10.1016/j. neucom.2016.02.088.
[85] G.K. Golla, J.A. Carlson, J. Huan, J. Kerr, T. Mitchell, K. Borner, Developing novel machine learning algorithms to improve sedentary assessment for youth health enhancement, in: Proceedings - 2016 IEEE International Conference on Healthcare Informatics, ICHI 2016, 2016, 2016, pp. 375–379, https://doi.org/ 10.1109/ICHI.2016.67.
[86] A.K. Chowdhury, D. Tjondronegoro, V. Chandran, S.G. Trost, Ensemble methods for classification of physical activities from wrist accelerometry, Med. Sci. Sports Exerc. 49 (9) (2017) 1965–1973, https://doi.org/10.1249/ MSS.0000000000001291.
[87] T.G. Pavey, N.D. Gilson, S.R. Gomersall, B. Clark, S.G. Trost, Field evaluation of a random forest activity classifier for wrist-worn accelerometer data, J. Sci. Med. Sport 20 (1) (2017) 75–80, https://doi.org/10.1016/j.jsams.2016.06.003.
[88] M.N. Ahmadi, D. Brookes, A. Chowdhury, T. Pavey, S.G. Trost, Free-living evaluation of laboratory-based activity classifiers in preschoolers, Med. Sci. Sports Exerc. 52 (5) (2020) 1227–1234, https://doi.org/10.1249/ MSS.0000000000002221.
[89] R. O’Driscoll, J. Turicchi, M. Hopkins, G.W. Horgan, G. Finlayson, J.R. Stubbs, Improving energy expenditure estimates from wearable devices: a machine learning approach, J. Sports Sci. 38 (13) (2020) 1496–1505, https://doi.org/ 10.1080/02640414.2020.1746088.
[90] M.N. Ahmadi, A. Chowdhury, T. Pavey, S.G. Trost, Laboratory-based and free- living algorithms for energy expenditure estimation in preschool children: a free- living evaluation, PloS One 15 (5) (2020), https://doi.org/10.1371/journal. pone.0233229.
[91] S.G. Trost, Y. Zheng, W.K. Wong, Machine learning for activity recognition: hip versus wrist data, Physiol. Meas. 35 (11) (2014) 2183–2189, https://doi.org/ 10.1088/0967-3334/35/11/2183.
[92] M.N. Ahmadi, T.G. Pavey, S.G. Trost, Machine learning models for classifying physical activity in free-living preschool children, Sensors 20 (16) (2020) 1–14, https://doi.org/10.3390/s20164364.
[93] A.K. Chowdhury, D. Tjondronegoro, V. Chandran, J. Zhang, S.G. Trost, Prediction of relative physical activity intensity using multimodal sensing of physiological data, Sensors 19 (20) (2019), https://doi.org/10.3390/s19204509.
[94] P. Jones, E.M. Mirkes, T. Yates, C.L. Edwardson, M. Catt, M.J. Davies, K. Khunti, A.V. Rowlands, Towards a portable model to discriminate activity clusters from accelerometer data, Sensors 19 (20) (2019), https://doi.org/10.3390/ s19204504.
[95] J. Fridolfsson, D. Arvidsson, F. Doerks, T.J. Kreidler, S. Grau, Workplace activity classification from shoe-based movement sensors, BMC Biomedical Engineering 2 (1) (2020), https://doi.org/10.1186/s42490-020-00042-4.
[96] M.I.C. Kingsley, R. Nawaratne, P.D. O’Halloran, A.H.K. Montoye, D. Alahakoon, D. De Silva, K. Staley, M. Nicholson, Wrist-specific accelerometry methods for estimating free-living physical activity, J. Sci. Med. Sport 22 (6) (2019) 677–683, https://doi.org/10.1016/j.jsams.2018.12.003.
[97] C.A. Thaiss, S. Itav, D. Rothschild, M.T. Meijer, M. Levy, C. Moresi, L. Dohnalova, S. Braverman, S. Rozin, S. Malitsky, M. Dori-Bachash, Y. Kuperman, I. Biton, A. Gertler, A. Harmelin, H. Shapiro, Z. Halpern, A. Aharoni, E. Segal, E. Elinav, Persistent microbiome alterations modulate the rate of post-dieting weight regain, Nature 540 (7634) (2016) 544–551, https://doi.org/10.1038/ nature20796.
[98] H. Akaike, A new look at the statistical model identification, IEEE Trans. Automat. Contr. 19 (6) (1974) 716–723, https://doi.org/10.1109/ TAC.1974.1100705.
[99] P. Fergus, A. Hussain, J. Hearty, S. Fairclough, L. Boddy, K.A. Mackintosh, G. Stratton, N.D. Ridgers, N. Radi, A machine learning approach to measure and monitor physical activity in children to help fight overweight and obesity, Lect. Notes Comput. Sci. 9226 (2015) 676–688, https://doi.org/10.1007/978-3-319- 22186-1_67.
[100] S. Vega-Lopez, L.M. Ausman, J.L. Griffith, A.H. Lichtenstein, Interindividual variability and intra-individual reproducibility of glycemic index values for commercial white bread, Diabetes Care 30 (6) (2007) 1412–1417, https://doi. org/10.2337/dc06-1598.
[101] R. Vrolix, R.P. Mensink, Variability of the glycemic response to single food products in healthy subjects, Contemp. Clin. Trials 31 (1) (2010) 5–11, https:// doi.org/10.1016/j.cct.2009.08.001.
[102] S.R. Colberg, R.J. Sigal, B. Fernhall, J.G. Regensteiner, B.J. Blissmer, R.R. Rubin, L. Chasan-Taber, A.L. Albright, B. Braun, Exercise and type 2 diabetes: the American college of sports medicine and the American diabetes association: joint position statement, Diabetes Care 33 (12) (2010) e147, https://doi.org/10.2337/ dc10-9990. American Diabetes Association.
[103] C. for D. C and P CDC, Adult Obesity Facts | Overweight & Obesity | CDC, 2020, https://www.cdc.gov/obesity/data/adult.html.
[104] A.K. Hervik, B. Svihus, The role of fiber in energy balance, Journal of Nutrition and Metabolism 2019 (2019), https://doi.org/10.1155/2019/4983657. Hindawi Limited.
[105] J. Dorling, D.R. Broom, S.F. Burns, D.J. Clayton, K. Deighton, L.J. James, J. A. King, M. Miyashita, A.E. Thackray, R.L. Batterham, D.J. Stensel, Acute and chronic effects of exercise on appetite, energy intake, and appetite-related hormones: the modulating effect of adiposity, sex, and habitual physical activity, Nutrients 10 (9) (2018), https://doi.org/10.3390/nu10091140. MDPI AG.
[106] D.P. Bolhuis, A. Costanzo, L.P. Newman, R.S.J. Keast, Salt promotes passive overconsumption of dietary fat in humans, J. Nutr. 146 (4) (2016) 838–845, https://doi.org/10.3945/jn.115.226365.
[107] A. Tremblay, F. Bellisle, Nutrients, satiety, and control of energy intake, Appl. Physiol. Nutr. Metabol. 40 (Issue 10) (2015) 971–979, https://doi.org/10.1139/ apnm-2014-0549. National Research Council of Canada.
[108] A.H. Ans, I. Anjum, V. Satija, A. Inayat, Z. Asghar, I. Akram, B. Shrestha, Neurohormonal regulation of appetite and its relationship with stress: a mini literature review, Cureus 10 (7) (2018), https://doi.org/10.7759/cureus.3032.
[109] G. Beccuti, S. Pannain, Sleep and obesity, Curr. Opin. Clin. Nutr. Metab. Care 14 (4) (2011) 402–412, https://doi.org/10.1097/MCO.0b013e3283479109. NIH Public Access.
[110] S.J. Caton, M. Ball, A. Ahern, M.M. Hetherington, Dose-dependent effects of alcohol on appetite and food intake, Physiol. Behav. 81 (1) (2004) 51–58, https:// doi.org/10.1016/j.physbeh.2003.12.017.
D. Kirk et al.
Computers in Biology and Medicine 133 (2021) 104365
27
[111] G. Traversy, J.P. Chaput, Alcohol consumption and obesity: an update, Current obesity reports 4 (1) (2015) 122–130, https://doi.org/10.1007/s13679-014- 0129-4. Springer.
[112] T.J. Key, K.E. Bradbury, A. Perez-Cornago, R. Sinha, K.K. Tsilidis, S. Tsugane, Diet, nutrition, and cancer risk: what do we know and what is the way forward? BMJ 368 (2020) https://doi.org/10.1136/bmj.m511.
[113] NHS, Vitamins and Minerals - Vitamin A - NHS, 2019. https://www.nhs.uk/cond itions/vitamins-and-minerals/vitamin-a/.
[114] W.S. Rupasinghe, H. Perera, N. Wickramaratne, A comprehensive review on dietary assessment methods in epidemiological research, Journal of Public Health and Nutrition 3 (2) (2020). Allied Academies, https://www.alliedacademies.org/ articles/.
[115] J.-S. Shim, K. Oh, H.C. Kim, Dietary assessment methods in epidemiologic studies, Epidemiology and Health 36 (2014), e2014009, https://doi.org/10.4178/epih/ e2014009.
[116] P. Pouladzadeh, S. Shirmohammadi, A. Bakirov, A. Bulut, A. Yassine, Cloud-based SVM for food categorization, Multimed. Tool. Appl. 74 (14) (2015) 5243–5260, https://doi.org/10.1007/s11042-014-2116-x.
[117] C.D. Davis, The gut microbiome and its role in obesity, Nutr. Today 51 (4) (2016) 167–174, https://doi.org/10.1097/NT.0000000000000167.
[118] R.K. Singh, H.W. Chang, D. Yan, K.M. Lee, D. Ucmak, K. Wong, M. Abrouk, B. Farahnik, M. Nakamura, T.H. Zhu, T. Bhutani, W. Liao, Influence of diet on the gut microbiome and implications for human health, J. Transl. Med. 15 (Issue 1) (2017) 73, https://doi.org/10.1186/s12967-017-1175-y. BioMed Central Ltd.
[119] D.S. Wishart, T. Jewison, A.C. Guo, M. Wilson, C. Knox, Y. Liu, Y. Djoumbou, R. Mandal, F. Aziat, E. Dong, S. Bouatra, I. Sinelnikov, D. Arndt, J. Xia, P. Liu, F. Yallou, T. Bjorndahl, R. Perez-Pineiro, R. Eisner, A. Scalbert, HMDB 3.0-the human metabolome database in 2013, Nucleic Acids Res. 41 (D1) (2013) D801, https://doi.org/10.1093/nar/gks1065.
[120] S. Trabado, A. Al-Salameh, V. Croixmarie, P. Masson, E. Corruble, B. Feve, R. Colle, L. Ripoll, B. Walther, C. Boursier-Neyret, E. Werner, L. Becquemont, P. Chanson, The human plasma-metabolome: reference values in 800 French healthy volunteers; Impact of cholesterol, gender and age, PloS One 12 (3) (2017), https://doi.org/10.1371/journal.pone.0173615.
[121] I. Garcia-Perez, J.M. Posma, E.S. Chambers, J.C. Mathers, J. Draper, M. Beckmann, J.K. Nicholson, E. Holmes, G. Frost, Dietary metabotype modelling predicts individual responses to dietary interventions, Nature Food 1 (6) (2020) 355–364, https://doi.org/10.1038/s43016-020-0092-z.
[122] A. Malafeev, D. Laptev, S. Bauer, X. Omlin, A. Wierzbicka, A. Wichniak, W. Jernajczyk, R. Riener, J. Buhmann, P. Achermann, Automatic human sleep stage scoring using deep neural networks, Front. Neurosci. 12 (NOV) (2018) 781, https://doi.org/10.3389/fnins.2018.00781.
[123] N. Sridhar, A. Shoeb, P. Stephens, A. Kharbouch, D. Shimol, J. Ben Burkart, A. Ghoreyshi, L. Myers, Deep learning for automated sleep staging using instantaneous heart rate, Npj Digital Medicine 3 (1) (2020), https://doi.org/ 10.1038/s41746-020-0291-x.
[124] M. Verma, R. Hontecillas, N. Tubau-Juni, V. Abedi, J. Bassaganya-Riera, Challenges in personalized nutrition and health, Frontiers in Nutrition 5 (2018) 117, https://doi.org/10.3389/fnut.2018.00117. Frontiers Media S.A.
[125] K.P. Murphy, Machine Learning: a Probabilistic Perspective (Adaptive Computation and Machine Learning Series), Mit Press, 2012.
[126] A. Holzinger, G. Langs, H. Denk, K. Zatloukal, H. Müller, Causability and explainability of artificial intelligence in medicine. Wiley Interdisciplinary Reviews: Data Mining and Knowledge Discovery, 2019, https://doi.org/10.1002/ widm.1312.
[127] N. Bussmann, P. Giudici, D. Marinelli, J. Papenbrock, Explainable AI in fintech risk management, Frontiers in Artificial Intelligence (2020), https://doi.org/ 10.3389/frai.2020.00026.
D. Kirk et al.