Possible linkage between East Asian summer drought and North Pacific Oscillation
13
ORIGINAL PAPER Possible linkage between East Asian summer drought and North Pacific Oscillation Ki-Seon Choi & Su-Bin Oh & Hi-Ryong Byun & R. H. Kripalani & Do-Woo Kim Received: 18 November 2009 / Accepted: 6 April 2010 / Published online: 24 April 2010 # Springer-Verlag 2010 Abstract The May North Pacific Oscillation Index and the summer (May and June–July–August—JJA) Effective Drought Index have a strong negative correlation in the East Asian region, particularly in northern China, Korea, and the southwestern regions of Japan (here termed “Northeast Asia”); this signifies an intensification of the summer drought during positive North Pacific Index (NPI) phase in this region, and the presence of such a phenom- enon has been observed in this study. The low-south/high- north anomalous pressure pattern forming in all layers of the troposphere in Northeast Asian region has been a cause of drought. This unusual pressure pattern gives rise to a cold northeasterly and intensifies downward flow and reduces relative humidity. In addition, this cold northeast- erly hinders the northward movement of the western North Pacific high and reduces the frequency of tropical cyclones passing through this region, thereby further intensifying drought. 1 Introduction Studies on the variations in East Asian summer droughts have been limited. Min et al. (2003) first examined the variability of Korean droughts and then analyzed the spatiotemporal correlation of this variation to droughts in the various regions of East Asia. Zou et al. (2005) showed that, of the regions of China, droughts have recently been most severe in Northeast China. Park et al. (2009) showed that convection in East Asia is suppressed during drought years due to the western North Pacific high (WNPH) and East Asian jet being positioned further south than average. These studies treat variations in drought directly but focus on variations in annual or spring rather than summer droughts. In many studies, precipitation is employed to define the wetness and dryness of each year ’ s summer and examine the causes of the variations therein (e.g., Tao and Chen 1987; Ding and Chan 2005). However, because synoptic systems in the summer are more complicated than in the winter and spring, the causes of variation in wetness and dryness of summer have not yet been entirely clarified (Chang et al. 2000; Liang and Wang 1998; Lau et al. 2000; Tao and Zhang 1998). Therefore, there have been efforts to diagnose East Asian wetness and dryness during the summer based on climate conditions in the preceding spring or May, when the synoptic systems impacting summer precipitation variation are somewhat simpler. As representative studies, there are studies on the relations between the boreal spring Antarctic Oscillation (AAO) and Yangtze River valley summer rainfall (Gao et al. 2003; Xue et al. 2004; Wang and Fan 2005; Fan 2006; Sun et al. 2009). These studies commonly indicated that, with the approach of summer, convection in the Maritime Continent which had intensified during the spring (March, April, May) in the positive AAO phase then moved northward to the Yangtze River. Gong and Ho (2003) analyzed the relation of the May Arctic Oscillation (AO) to East Asian summer rainfall and then demonstrated that downwelling in the midlatitude region (20°–40° N) of East Asia intensified through the summer due to the upper K.-S. Choi Korea Meteorological Administration, Seoul, Republic of Korea S.-B. Oh : H.-R. Byun (*) : R. H. Kripalani : D.-W. Kim Department of Environmental Atmospheric Sciences, Pukyong National University, Daeyeon 3-Dong Nam-Gu, Busan 608-737, Republic of Korea e-mail: [email protected] Theor Appl Climatol (2011) 103:81–93 DOI 10.1007/s00704-010-0286-7
-
Upload
independent -
Category
Documents
-
view
2 -
download
0
Transcript of Possible linkage between East Asian summer drought and North Pacific Oscillation

ORIGINAL PAPER
Possible linkage between East Asian summer droughtand North Pacific Oscillation
Ki-Seon Choi & Su-Bin Oh & Hi-Ryong Byun &
R. H. Kripalani & Do-Woo Kim
Received: 18 November 2009 /Accepted: 6 April 2010 /Published online: 24 April 2010# Springer-Verlag 2010
Abstract The May North Pacific Oscillation Index and thesummer (May and June–July–August—JJA) EffectiveDrought Index have a strong negative correlation in theEast Asian region, particularly in northern China, Korea,and the southwestern regions of Japan (here termed“Northeast Asia”); this signifies an intensification of thesummer drought during positive North Pacific Index (NPI)phase in this region, and the presence of such a phenom-enon has been observed in this study. The low-south/high-north anomalous pressure pattern forming in all layers ofthe troposphere in Northeast Asian region has been a causeof drought. This unusual pressure pattern gives rise to acold northeasterly and intensifies downward flow andreduces relative humidity. In addition, this cold northeast-erly hinders the northward movement of the western NorthPacific high and reduces the frequency of tropical cyclonespassing through this region, thereby further intensifyingdrought.
1 Introduction
Studies on the variations in East Asian summer droughtshave been limited. Min et al. (2003) first examined thevariability of Korean droughts and then analyzed thespatiotemporal correlation of this variation to droughts in
the various regions of East Asia. Zou et al. (2005) showedthat, of the regions of China, droughts have recently beenmost severe in Northeast China. Park et al. (2009) showedthat convection in East Asia is suppressed during droughtyears due to the western North Pacific high (WNPH) andEast Asian jet being positioned further south than average.These studies treat variations in drought directly but focuson variations in annual or spring rather than summerdroughts.
In many studies, precipitation is employed to define thewetness and dryness of each year’s summer and examinethe causes of the variations therein (e.g., Tao and Chen1987; Ding and Chan 2005). However, because synopticsystems in the summer are more complicated than in thewinter and spring, the causes of variation in wetness anddryness of summer have not yet been entirely clarified(Chang et al. 2000; Liang and Wang 1998; Lau et al. 2000;Tao and Zhang 1998).
Therefore, there have been efforts to diagnose East Asianwetness and dryness during the summer based on climateconditions in the preceding spring or May, when thesynoptic systems impacting summer precipitation variationare somewhat simpler. As representative studies, there arestudies on the relations between the boreal spring AntarcticOscillation (AAO) and Yangtze River valley summerrainfall (Gao et al. 2003; Xue et al. 2004; Wang and Fan2005; Fan 2006; Sun et al. 2009). These studies commonlyindicated that, with the approach of summer, convection inthe Maritime Continent which had intensified during thespring (March, April, May) in the positive AAO phase thenmoved northward to the Yangtze River. Gong and Ho(2003) analyzed the relation of the May Arctic Oscillation(AO) to East Asian summer rainfall and then demonstratedthat downwelling in the midlatitude region (20°–40° N) ofEast Asia intensified through the summer due to the upper
K.-S. ChoiKorea Meteorological Administration,Seoul, Republic of Korea
S.-B. Oh :H.-R. Byun (*) :R. H. Kripalani :D.-W. KimDepartment of Environmental Atmospheric Sciences,Pukyong National University,Daeyeon 3-Dong Nam-Gu,Busan 608-737, Republic of Koreae-mail: [email protected]
Theor Appl Climatol (2011) 103:81–93DOI 10.1007/s00704-010-0286-7

tropospheric jet stream moving further north than averageduring May in the positive AO phase. Although the abovestudies brought out the significance of the climaticconditions of the preceding spring to East Asian summerwetness and dryness, these but have an unsatisfactory focuson the impact of Antarctic climate at great distances fromEast Asia. Thus, further understanding of the impact ofsynoptic systems around East Asia is still needed.
On the other hand, several studies have sought todiagnose spring climate conditions in regions closer to EastAsia. Park and Schubert (1997) analyzed the East Asiandrought that occurred in summer 1994 as caused by thesuppression of the supply of moisture from the westernPacific and Indian Oceans by both the early development ofupper-level anticyclone in East Asia induced by orographicforcing by the Tibetan plateau and the abnormal develop-ment of the Eurasian wave during the preceding spring. Xinet al. (2006) indicated that the inflow of northwesterlies dueto upper-level cooling in eastern Tibet during the precedingspring is a cause of the recent insufficient early-springprecipitation south of the Yangtze River. These studies alsohave the limitation of defining the intensity of drought interms of precipitation. This is because, meteorologically,the phenomenon of drought does not occur due to atemporary insufficiency of precipitation. A recent study hasshown that the positive phase of the Indian Ocean Dipolemode during autumn could induce a drought over EastAsia–west Pacific region during the forthcoming summer(Kripalani et al. 2009).
In the present study, the summer (May–August) droughtin East Asia is diagnosed using the Effective Drought Index(hereafter EDI) (Byun and Wilhite 1999), and a possiblecause of a drought is sought in the May North PacificOscillation (NPO). Walker and Bliss (1932) discovered thepresence of a north–south seesaw phenomenon in the sealevel between subtropics south of 40° N and high latitudesfrom eastern Siberia to western Canada also in the Pacificsector, resembling the North Atlantic Oscillation. Theydefined these north–south oscillation phenomena occurringin the North Pacific as the NPO. Subsequent to this earlyresearch, many studies have reviewed the occurrencemechanisms of the NPO and its impact on various regions(Rogers 1981; Wallace and Gutzler 1981; Hameed andPittalwala 1991; Li and Li 1999; Pierce 2002; Guo and Sun2004; Yeh and Kirtman 2004; D’Arrigo et al. 2005; Li et al.2007; Wang et al. 2007; Linkin and Nigam 2008).However, the majority of these studies emphasize the coldseason when the NPO can be clearly observed andaccordingly focus analysis on the climatic variations inNorth America by the NPO. Thus, it is the case that therehave been no in-depth studies of the impact of the NPO onthe climate variations in East Asian regions. Only Wang etal. (2007) has studied the relationships between the
frequency of typhoon occurrence in the western NorthPacific and the NPO in the summer (June–September).They have shown that there is a high degree of correlationbetween the two variables and that when the correlation ishigh a low-south/high-north anomalous pressure pattern isintensified in the North Pacific.
In this study also, the May NPI is used in the analysis.May in East Asia is the transitional period between springand the summer rainy season (Mei-yu in China, Changmain Korea, and Baiu in Japan), and the large-scale conditionsin this season are important because it can be linked to theintensity of summer rainfall. In particular, in the case ofKorea, as May is the month during which droughts mostfrequently occur, if drought intensifies in this period, it ischaracteristic that the drought will continue through theremainder of that year and the following spring (Byun et al.1992a). In addition, as mentioned above, the majority ofstudies on summer precipitation or drought variations inEast Asia have chiefly focused on the regions of China, butthis study seeks to examine summer drought variations inEast Asia from a wider perspective including not onlyChina but also Korea and Japan.
The data, methods, and definitions are described in“Section 2”. The relations between EDI and NPI areexamined in “Section 3”, and the synoptic characteristicsof the correlations between these two indices are analyzedin “Section 4”. This study is summarized in “Section 5”.
2 Data, methods, and definitions
2.1 Data
This study utilized the May and summer monthly meanrainfall observed at a total of 210 weather stations in EastAsia (146 in China, 13 in Korea, 51 in Japan) excludingarid regions west of 90° E, for the 1954–2008 period(55 years). The rainfall data from these three countries areavailable for use from the China Meteorological Adminis-tration, Korea Meteorological Administration, and JapanMeteorological Agency. Thus, “East Asia” in this study isdefined as the region comprising China, Korea, and Japan.Rainfall quantity is used as input data for the calculation ofthe EDI.
We use the geopotential height, horizontal wind, airtemperature, and relative humidity data reanalyzed by theNational Centers for Environmental Prediction–NationalCenter for Atmospheric Research (NCEP–NCAR) (Kalnayet al. 1996; Kistler et al. 2001) for 55 years. This NCEP–NCAR reanalysis data has a horizontal resolution of 2.5°×2.5° latitude–longitude and is available for the period from1948 to the present. In addition, The NOAA ExtendedReconstructured Sea Surface Temperature (SST; Reynolds
82 K.-S. Choi et al.

et al. 2002) data are composed at 2°×2° of latitude andlongitude and monthly intervals.
The information about TC activity is obtained from thebest track archives of the Regional Specialized Meteoro-logical Center, Tokyo Typhoon Center. The data setsconsist of names, longitude and latitude positions, mini-mum surface pressures, and maximum sustained windspeeds measured every 6 h for tropical cyclones (TCs) for55 years. TCs are generally divided into four grades basedon their maximum sustained wind speed (MSWS): tropicaldepression (TD; MSWS<34 kts), tropical storm (TS;34 kts≤MSWS≤47 kts), severe tropical storm (STS;48 kts≤MSWS≤63 kts), and typhoon (TY; MSWS≥64 kts). The present study focuses on these four TC grades,as well as on extratropical cyclones (ECs) that transitionedfrom TCs. These were included because ECs do damage inthe mid-latitudes of East Asia.
2.2 Methods
To calculate the TC passage frequency, each TC position isbinned into a corresponding 5°×5° grid box, and even if theTC entered that grid box several times it is only countedonce.
The ENSO events are classified as warm (SSTA≥0.5°C),cold (SSTA≤−0.5°C), and normal (−0.5°C<SSTA<0.5°C)events based on the SST anomalies (SSTA) in the Niño-3.4region (5° N–5° S, 170° W–120° W). Here, the climatologyindicates an average for 55 years.
For the significance test, this study uses the statisticalmethod of Student’s t test (e.g., Ho et al. 2004). In case thattwo independent time series follow a t distribution and theirtime averages are denoted as x1 and x2, respectively, the teststatistic is given by
t ¼ x1 � x2
s21=n1 þ s22=n2� �1=2
where S1 and S2 are standard deviations and n1 and n2 arenumbers of the two time series, respectively. From theabove formula, if the absolute value of t is greater than thecritical values with a level of significance, the nullhypothesis would be rejected at the α(×100)% significancelevel.
2.3 Effective Drought Index
Since droughts are generated by a long-term lack ofprecipitation, it is difficult to define the degree and periodof a drought in terms of precipitations. Therefore, it isneeded to make an objective definition of the degree andperiod of a drought by using drought indexes wherechanges of weather factors rather than changes of precip-
itations are applied. Because PDSI (Palmer 1965), which ismost often used, is calculated as a monthly index, it isdifficult to diagnose drought on a real-time basis. SPI(McKee et al. 1993, 1995) has a different calculation perioddepending on the subjective views of researchers so thatdrought index also is different depending on studies. TheEDI takes into consideration all these issues. This index iswhat summed day-accumulated precipitations along a timefunction and the usefulness of which has been proven inmany studie. (Byun and Lee 2002; Yamaguchi and Shinoda2002; Morid et al. 2006; Akhtari et al. 2008). The EDI iscalculated from the following equations according to thepaper of Byun et al. (2008).
EPj ¼Xi
n¼1
Xn
m¼1
Pm
!
=n
!!
ð1Þ
PRNj ¼ DEPj=Xj
N¼1
1=Nð Þ !
ð2Þ
EDIj ¼ PRNj=St PRNj
� � ð3ÞIn Eq. 1, EPi represents the valid accumulations of
precipitation and Pm represents the precipitation level for aday, “m” days prior to a specific date. The “i” in Eq. 1begins from 365. Therefore, EP becomes the validaccumulation of precipitation for 365 days from a particulardate. DEP in Eq. 2 represents the deviation of EP fromMEP (30-year average EP for the calendar date); the yearsfrom 1976 to 2005 were used for MEP in this research.Meanwhile, “j” represents the addition of days when DEPwas successively negative to “i” (with 1 day subtractedfrom the total), which then becomes the accumulatedprecipitation date. For example, when DEP is negative fortwo consecutive days, “i” becomes 366 (=365 + 2 - 1) andthe calculation begins once again. Therefore, the dryingeffect on the soil from a drought that occurred 7 years agois reflected in the EDI. PRN represents the precipitationlevel that is required for DEP to become negative andsatisfy the standards of the previous year. The criteria ofsummer drought conditions based on EDI standardizedvalues as follows: 0.0 to -1.0 ‘dry condition’, -1.0 to -2.0‘drought’, and values below -2.0 are defined as ‘severedrought’. For detailed explanations, please refer to Byunand Wilhite (1999).
2.4 North Pacific Index
There are several ways of defining the NPI. Wallace andGutzler (1981) and Wang et al. (2007) used the normalizedsea level pressure (SLP) difference between the point
Possible linkage between East Asian summer drought and North Pacific Oscillation 83

(65° N, 170° E) near the Bering Sea and point (25° N,165° E) in the subtropical North Pacific to represent theNPO. Guo and Sun (2004) defined an index in a similar waybut replaced the SLP difference of two particular points asthe SLP difference over two areas. Another definition isbased on the Empirical Orthogonal Function analysis of SLPin the North Pacific region (Yeh and Kirtman 2004).Different definitions tend to give quite similar results. Inthis study also, the NPI for May for 55 years was obtainedby the following formula according to the definitions ofWallace and Gutzler (1981) and Wang et al. (2007).
NPI ¼ SLPP1 65N;170Eð Þ � SLPP2 25N;165Eð Þ
Generally, the NPO influences Asia-Pacific regions incold seasons when the NPO is most active. However,Thompson and Wallace (2000) and Gong and Ho (2003)stressed that the Northern Hemisphere (NH) teleconnectionpatterns including a NPO account for a large portion of thetotal variance in the atmospheric circulation during warmseasons as well as cold seasons. They also addressed thatwinter NH teleconnection patterns have long memory andthen feed back to climate systems with time lags.
3 Correlation analysis between EDI and NPI
In this section, in order to observe what sort of correlationin variation is present between the May NPI and May andsummer droughts in the East Asian region, the contempo-raneous correlation of May NPI and EDI, and the lagcorrelation with summer EDI, was examined for eachweather observation station in East Asia (Fig. 1). However,this study does not remove linear trends of two variables,
because their trends may be also important in the seasonalprediction of EDI in a future study.
In May, in northern China, all locations in Korea, andsouthwestern Japan, a negative correlation exceeding -0.3 isapparent (Fig. 1a). In particular, the southern region ofKorea and regions of Japan west of 135° E show a negativecorrelation greater than -0.35. At some weather observationstations in the three areas, there is a negative correlationexceeding -0.4. Among the three regions, the greatestnumber of observation stations with a negative correlationgreater than -0.4 is observed in southwestern Japan. Thegreatest negative correlations in the three regions are -0.41in northern China [Changzhi (36.03° N, 113.04° E)], -0.44in Korea [Chupungnyong (36.22° N, 128.00° E)], and-0.47 in southwestern Japan [Shimonoseki (33.94° N,130.93° E), Wakayama (34.23° N, 135.17° E)].
In the summer, the majority of regions apart fromsouthern China show a negative correlation of EDI to theMay NPI (Fig. 1b). The highest positive correlation insouthern China was observed as 0.43 at Heyuan (23.73° N,114.68° E). While the negative correlations centered onnorthern China weaken somewhat in May, the region with anegative correlation greater than -0.2 expands into centralChina. In southwestern Japan, the regions with a negativecorrelation greater than -0.3 were reduced compared to May.Weather observation stations with a negative correlationgreater than -0.4 are again most common in northern China,with only two such locations in Japan. In contrast, in Koreaan increase compared to May can be confirmed. However,overall, there are no substantial changes from May onwardfor regions with a negative correlation in the summer.Therefore, it is apparent that the out-of-phase correlationbetween the May NPI and May and summer EDI is strongprimarily in northern China, Korea, and southwestern Japan.
(a)
North China Korea
Japan
(b)
Fig. 1 Spatial distributions of correlation coefficients a between North Pacific Index and Effective Drought Index in May and b between NPI inMay and EDI averaged for JJA. Dots indicate that correlations are significant at 95% confidence level
84 K.-S. Choi et al.

Henceforth, spatial distribution with respect to therelationships between NPI and EDI has been considered.Now, in order to observe the covariation over time betweenthe two indices, the East Asian region was first divided intothree regions. The three regions are located at the samelatitude, within the 30°–40° N, 110°–140° E area, and aredefined as North China (21 stations), Korea (13 stations),and Japan (24 stations) (boxes in Fig. 1). In addition, thesethree regions have a negative correlation exceeding -0.3 inthe contemporaneous correlation of May EDI and NPI, withthe exception of North China (where five of the 21 stationshave a negative correlation of less than -0.3). In this study,these three regions are defined collectively as “NortheastAsia.” Next, the time series of averaged May and summerEDI with May NPI was analyzed for each of the threeregions and for Northeast Asia (Fig. 2). In May, although inthe above correlation distribution there was no locationwith a negative correlation exceeding -0.5, Japan shows astrong negative correlation exceeding -0.5. In addition, theNorth China and Korea regions each have a negativecorrelation of -0.49 and -0.45, respectively, greater than forthe individual locations in the spatial distribution, althoughstill lower than Japan. In the summer, Korea indeed showsa negative correlation exceeding -0.5. This is because, asobserved above, the number of locations with a negativecorrelation exceeding -0.4 is higher in the summer than inMay, unlike in the other two regions. In contrast, the othertwo regions show a negative correlation of less than -0.5,with the correlation weaker than in May. In particular, thecorrelation in North China fell to below -0.4. This is believedto be due to the fact that the effect includes locations with alow correlation, including the Shantung Peninsula, as can beseen in Fig. 1b. It appears that an analysis must beconducted locally as to this reverse phenomenon that occursonly in Korea among the three regions.
In addition, the correlation for Northeast Asia, averagingover these three regions, is higher than the correlation forthe three regions separately. In the case of May, a strongnegative correlation closes to -0.6 was noted, and in thesummer as well a substantial negative correlation of -0.55was established. Thus, it is evident that the May NPI has acontinuing impact from May into the summer on the EDIvariations in East Asia and specifically in Northeast Asia.
4 Difference between positive and negative NPI phases
In order to more clearly observe the impact of May NPO ondrought conditions in East Asia from May through thesummer, this study first selected years with El Niño or LaNiña events in May. The El Niño and La Niña yearsselected were 9 and 11 years during the entire analysisperiod of 55 years, respectively. Subsequently, from among
the remaining 35 years that are neither El Niño nor La Niñayears, the 11 highest NPI (positive NPI phase) and the 11lowest NPI years (negative NPI phase) were selected,respectively, and then the difference between these twophases was analyzed. Since the anomalies associated withpositive and negative NPI phases tend to have oppositepatterns, the composite difference will be shown hereafter.Here, the difference refers to the difference obtained bysubtracting the average for the negative NPI phase (1954,1961, 1962, 1963, 1965, 1969, 1980, 1990, 1994, 2003,2004) from the average for the positive NPI phase (1957,1959, 1960, 1967, 1968, 1978, 1981, 1984, 2001, 2005,2007). The total 22 years selected for analysis account for63% of the remaining 35-year period. In addition, of theselected 11 years on the two phases, those positive NPIphase with El Niño or La Niña events in summer were oneEl Niño year (1957) and two El Niño years (1963, 1965)and one La Niña year (1954) for negative NPI phase.Therefore, for each NPI phase, it is evident that there wasvirtually no impact of El Niño or La Niña in summer.
4.1 Spatial distribution of EDI
Prior to analyzing the atmospheric circulation featuresassociated with the difference between positive NPI andnegative NPI phases, in this section, the spatial distributionof differences in EDI between the two phases in East Asiais examined (Fig. 3). Here, negative EDI signifies thatdrought is more severe in positive NPI phase than innegative NPI phase. Overall, the spatial distributions forMay and summer were both similar to Fig. 1. In May, thecenter of drought is located in the above-defined NortheastAsian region (North China, Korea, and Japan) (Fig. 3a).Even in the Yangtze basin (30° N, 110°–120° E), a greaterseverity of drought is evident in positive NPI phase. In thesummer, the center of the drought region that had beenlocated in North China divides between this region andcentral China, and its intensity is greater in central China(Fig. 3b). This center of drought extending from southwestto northeast through central China into Korea and Japan hasthe same location climatologically as the East Asiansummer monsoon rain band. Thus, from this finding it isapparent that the summer rainfall was lower in positive NPIphase. In actuality, although not shown in this study, it wasevident even from the rainfall distribution differencebetween the two phases that rainfall was less in thoseregions that were in greater drought in the May and summerof positive NPI phase.
4.2 Large-scale atmospheric environments
As indicated above, it was observed that drought is moresevere in Northeast Asia in positive NPI phase than in
Possible linkage between East Asian summer drought and North Pacific Oscillation 85
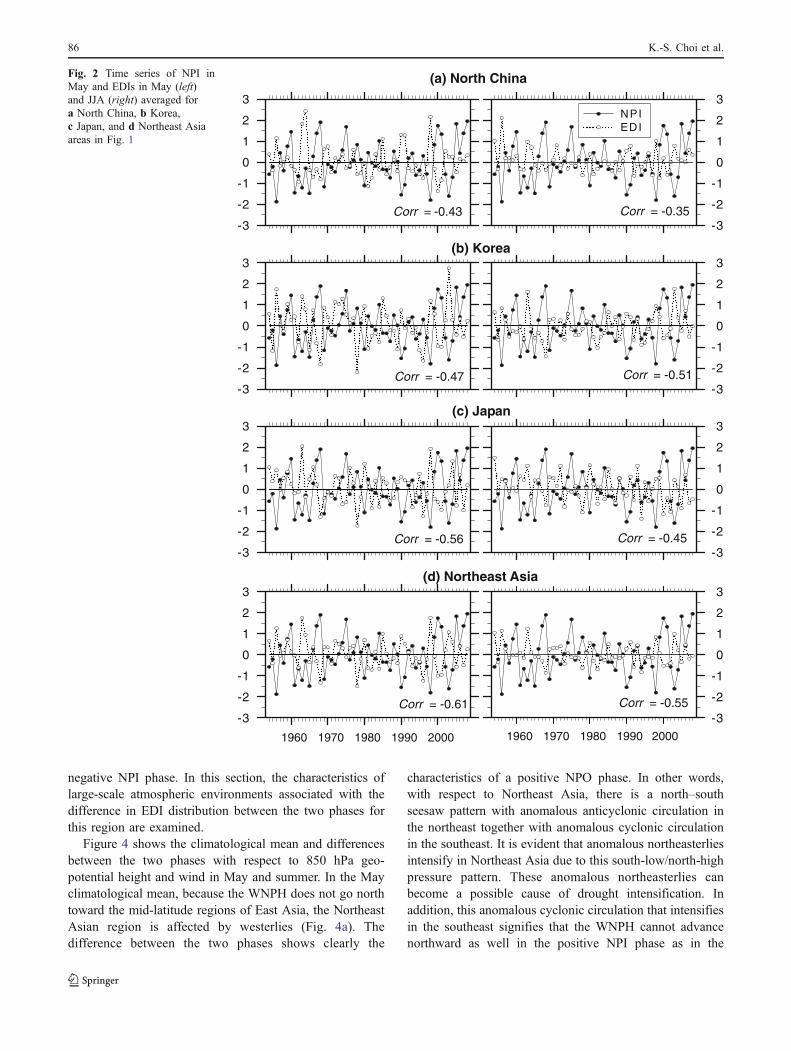
negative NPI phase. In this section, the characteristics oflarge-scale atmospheric environments associated with thedifference in EDI distribution between the two phases forthis region are examined.
Figure 4 shows the climatological mean and differencesbetween the two phases with respect to 850 hPa geo-potential height and wind in May and summer. In the Mayclimatological mean, because the WNPH does not go northtoward the mid-latitude regions of East Asia, the NortheastAsian region is affected by westerlies (Fig. 4a). Thedifference between the two phases shows clearly the
characteristics of a positive NPO phase. In other words,with respect to Northeast Asia, there is a north–southseesaw pattern with anomalous anticyclonic circulation inthe northeast together with anomalous cyclonic circulationin the southeast. It is evident that anomalous northeasterliesintensify in Northeast Asia due to this south-low/north-highpressure pattern. These anomalous northeasterlies canbecome a possible cause of drought intensification. Inaddition, this anomalous cyclonic circulation that intensifiesin the southeast signifies that the WNPH cannot advancenorthward as well in the positive NPI phase as in the
Corr = -0.43-3
-2
-1
0
1
2
3
Corr = -0.35-3
-2
-1
0
1
2
3NPIEDI
Corr = -0.47-3
-2
-1
0
1
2
3
Corr = -0.51-3
-2
-1
0
1
2
3
Corr = -0.56-3
-2
-1
0
1
2
3
Corr = -0.45-3
-2
-1
0
1
2
3
Corr = -0.61
1960 1970 1980 1990 2000
-3
-2
-1
0
1
2
3
Corr = -0.55
1960 1970 1980 1990 2000
-3
-2
-1
0
1
2
3
(b) Korea
(a) North China
(c) Japan
(d) Northeast Asia
Fig. 2 Time series of NPI inMay and EDIs in May (left)and JJA (right) averaged fora North China, b Korea,c Japan, and d Northeast Asiaareas in Fig. 1
86 K.-S. Choi et al.

negative NPI phase. Climatologically, the WNPH increasesrainfall caused by the atmospheric instability due to theinflow of a large quantity of warm and humid air in EastAsia during the warm season.
In summer climatological mean, Northeast Asia isimpacted by southwesterlies blowing from the Indiansummer monsoon due to the northward movement of theWNPH (Fig. 4b). Although with reference to Northeast Asiathe north–south seesaw pattern weakened somewhat com-pared to May in the differences between the two phases,overall a structure appears that is similar to the May pressurepatterns. Therefore, even in the summer of positive NPI phase,it is evident that the anomalous northeasterlies intensifiedleading to continued drought in Northeast Asia, because theWNPH cannot advance northward. This south-low/north-highpressure pattern appearing in the difference between the twophases at 850 hPa in May and summer, and the consequentintensification of anomalous easterlies into Northeast Asia,was confirmed at all levels of the troposphere (not shown).
The presence of an upper-level jet, in general, intensifieslow-level convergence and upwelling which facilitatesprecipitation and is used as a basis for determining thedegree of northward advancement of the WNPH (Liang andWang 1998; Lau et al. 2000). Accordingly, the WNPH thatdid not advance into Northeast Asia in May and summer ofpositive NPI phase can be confirmed by the intensity of the200 hPa zonal wind (Fig. 5). In the May climatologicalmean, the center of the upper-level jet is positioned inNortheast Asia and expands equatorially to 30° N (Fig. 5a).This is related to the fact that Northeast Asia is impacted bywesterlies in the 850 hPa climatological mean in Fig. 4a,and the WNPH is unable to advance into this region.However, from the difference between the two phases, it is
evident that, with respect to Northeast Asia, in positive NPIphase anomalous westerlies and anomalous easterlies pre-dominate in the south and north, respectively. This signifiesthat in May of positive NPI phase the WNPH is unable toadvance as far northward as in negative NPI phase and thatbecause the westerlies are not predominant due to this, theenvironment is unfavorable for precipitation.
In the summer climatological mean, the upper-level jet islocated west of Northeast Asia (Fig. 5b). This signifies thatthe WNPH has advanced into this region, as observed forthe 850 hPa climatological mean in Fig. 4b. The differencebetween the two phases shows a spatial pattern similar toMay. Although the width of the anomalous easterliesnarrows in the vicinity of Northeast Asia, it is evident thatthey are more prevalent in the summer of positive NPIphase, along a southwest to northeast direction from centralChina through Korea and Japan to the Aleutian Islands. Inaddition, the strengthening of the anomalous easterlies inthe region extending from central China through Korea andJapan coincides with the drought center in Fig. 3b. Incontrast, in both May and summer, it is evident thatanomalous westerlies intensified in southern China duringpositive NPI phase. This coincides with the non-droughtcondition during May and summer for that region as shownin Fig. 3. This is because, due to the failure of the WNPH toadvance northward inMay and summer of positive NPI phase,somewhat more warm and humid air is instead supplied to thisregion.
Above, it was observed that the low-south/high-northpressure pattern with reference to Northeast Asia isintensified due to the WNPH not advancing northward inMay and summer of positive NPI phase. The influx ofanomalous northeasterlies into Northeast Asia due to this
(a) May (b) JJA
Fig. 3 Spatial distributions of mean EDI difference between 11 positive (POS) NPI years and 11 negative (NEG) NPI years in a May and b JJA.POS and NEG NPI years were selected in the NPI time series in May. Dots indicate that differences are significant at 95% confidence level
Possible linkage between East Asian summer drought and North Pacific Oscillation 87

pressure pattern may cause lowering of air temperature inthis region. This can be confirmed in the difference betweenthe two phases and the May and summer climatologicalmeans with respect to 850 hPa air temperature (Fig. 6). Inthe climatological means for May and summer, a thermaltrough forms along the coast of East Asia. This seems toform due to differences in specific heat that arise betweencontinent and ocean during the warm season. From thedifference between the two phases in May, anomalous coldair temperature is located in the regions extended fromcentral China to south of the Aleutian Islands, includingNortheast Asia (Fig. 6a). This means that the 850 hPa airtemperature in this region is lower in May of positive NPIphase. In the summer, the majority of the East Asianlandmass above 40° N exhibits anomalous cold airtemperature (Fig. 6b). In particular, anomalous cold airtemperature is present from the drought center in central
China through Korea and Japan. This implies that, even inthe summer of positive NPI phase, the temperature in thisregion is colder. In contrast, a positive value appears insouthern China for both May and summer. The intensifica-tion of this anomalous cold air temperature in NortheastAsia that manifests in the difference between the twophases at 850 hPa in May and summer was confirmed at alllevels of the troposphere (not shown).
The degree of development of upwelling and downwel-ling due to differences in the strength of upper-level zonalwind in Northeast Asia between the two phases can beobserved in the latitude–height vertical circulation averagedalong the Northeast Asian longitude range 110°–140° E(Fig. 7a) In both May and summer, in the Northeast Asianlatitude of 30°–40° N (dashed line box), anomalousdownward flows develop in positive NPI phase. Inparticular, in May the center of anomalous downward flows
(a) May
(b) JJA
Fig. 4 Climatology (left) and composite of difference between 11POS NPI years and 11 NEG NPI years of 850 hPa geopotential heightand wind (a) in May and (b) JJA. Contour intervals are 20 and 10 gpmin May and in JJA for climatology, and 10 and 3 gpm for difference
between the two phases, respectively. Shaded areas are significant atthe 95% confidence level and thick arrows are significant at the 90%confidence level
88 K.-S. Choi et al.

is located in the latitude band of Northeast Asia. This isbecause of the effect of anomalous cold northeasterliesintensified through all the layers of the troposphere in thisregion. Thus, these anomalous downward flows have apositive impact on the intensification of May and summerdrought in positive NPI phase. In contrast, the center ofanomalous upward flows in both May and summer is locatedin the southern China latitude band 20°–25° N, which is acause of the formation of rainfall or non-drought in this regionduring positive NPI phase. On the other hand, it is evident thatthe intensified anomalous downward flows in the latitudeband of Northeast Asia in May and summer of positive NPIphase assist in the formation of anomalous low relativehumidity through the troposphere in this region (Fig. 7b). As aresult, Northeast Asia possesses an atmospheric environmentthat enables the intensification of drought throughout the
troposphere. In addition, anomalous high relative humidity isshown in the latitude band of southern China.
4.3 Tracks of summer tropical cyclones
The countries located in the mid-latitudes of East Asia(including China, Korea, and Japan) suffer enormous damageto life and property in the summer due to tropical cyclones(TCs). As discussed in the “Introduction”, after the summerthe dry weather of cold season continues for several monthsin these regions; if there is not sufficient precipitation duringthe summer, severe droughts may occur. Therefore, TCs thatmake landfall or affect in the summer are also an excellentsource of water resources for these regions.
Accordingly, in this section, the difference in TC passagefrequency between the two phases and the summer
(a) May
(b) JJA
Fig. 5 Same as in Fig. 4 but for 200 hPa zonal wind. Contourintervals are 5 m s−1 for climatology, and 1.5 and 0.5 m s−1 in Mayand in JJA for composite differences between the two phases,
respectively. Shaded areas indicate regions greater than 25 m s−1 forclimatology and greater than the 95% confidence level for differencebetween the two phases
Possible linkage between East Asian summer drought and North Pacific Oscillation 89

climatological mean were analyzed within a 5°×5° latitude/longitude grid box (Fig. 8). The reason for examining onlythe frequency of summer TCs is that the frequency of TCsthat impact the mid-latitudes of East Asia climatologicallyis low in May. In the climatological mean, the main track ofTCs can be regarded as dividing into two bands (Fig. 8a).The first track moves from the ocean east of the Philippinesto the South China Sea, while the second passes from theocean east of the Philippines through the East China Sea toKorea and Japan. Korea and Japan, located on this secondtrack, are each affected by climatologically two to threeTCs per summer. In contrast, the impact of TC on northChina is less (climatologically one TC per summer). Thecharacteristics of TC frequency can be seen clearly from thedifference between the two phases. Here, filled (open)circles indicate that the frequency of TCs in the summer ofpositive (negative) NPI phase is greater. In the summer of
positive NPI phase, in which drought is more severe thannegative NPI phase, TCs chiefly move over the westernNorth Pacific. Their frequency in southern China is alsoshown. This is the role played in the formation of non-drought in southern China. On the contrary, TCs in negativeNPI phase have a high frequency primarily from the oceaneast of the Philippines to the East China Sea and on toKorea and Japan. In other words, there is a high frequencyof moving along the coast of East Asia. This is the same asthe latter of the two primary tracks for the summerclimatological mean. This result implies that the countrieslocated on the coast of East Asia need to focus more closelyto the damage caused by TCs during the summer ofnegative NPI phase. In Northeast Asia, the frequency is alsogreater in negative NPI phase. Therefore, in the summer ofpositive NPI phase in which the drought had been moresevere in these regions, it seems that the probability of the
(b) JJA
(a) May
Fig. 6 Same as in Fig. 4 but for 850 hPa air temperature in a May and b JJA. Contour intervals are 2°C for climatology, and 0.4°C and 0.2°C inMay and JJA for composite differences between the two phases. Shaded areas are significant at the 95% confidence level
90 K.-S. Choi et al.

(a) Climatology (JJA) (b) POS minus NEG (JJA)
0 to 1
1 to 2
2 to 3
3 to 4
0.0 to -0.3
-0.3 to -0.6
-0.6 to
0.0 to 0.3
0.3 to 0.6
0.6 to
Fig. 8 Tropical cyclone passage frequency within the grid box of 5°×5° latitude–longitude for a climatology in JJA and b mean differencebetween 11 POS NPI years and 11 NEG NPI years in JJA. In b, small dots are significant at the 95% confidence level
(b) Relative humidity
(a) Vertical flow
Fig. 7 Composite differences of latitude–pressure cross-section of avertical flow with vertical velocity and b relative humidity averagedalong 110°–140° E between 11 POS NPI years and 11 NEG NPI yearsin May (left) and JJA (right). Shaded areas indicate positive values.
Contour intervals are 0.3 hPa s−1 for vertical velocity and 1% forrelative humidity. Dashed line box indicates a latitude band ofNortheast Asia
Possible linkage between East Asian summer drought and North Pacific Oscillation 91

return to the normal from drought is low or that droughtintensifies due to low frequency of TCs.
The cause of this difference in frequency of summer TCsbetween the two phases can be found in the difference in850 hPa geopotential height and wind between the twophases (Fig. 4b). In the summer of positive NPI phase,anomalous northeasterlies intensify along the coast of EastAsia, from eastern Siberia to the Indochina peninsula.These intensified anomalous northeasterlies hinder themovement of TCs into these regions. In general, TCs havecharacteristically moved north along the western peripheryof the WNPH. Therefore, their low frequency in NortheastAsia implies that the WNPH is unable to advancenorthwards in the summer of positive NPI phase. Instead,TCs show a somewhat greater frequency in the westernNorth Pacific due to intensified anomalous cycloniccirculation in the vicinity of the East China Sea.
5 Concluding remarks
Variations in May and summer drought in East Asia withrespect to May NPO were examined for the past 55 years(1954–2008). The drought condition was diagnosed usingthe EDI, and the normalized SLP difference between apoint in the vicinity of the Bering Sea (65° N, 170° E) and apoint in the subtropical North Pacific (25° N, 165° E) wasdefined as NPI. The May NPI showed a high negativecorrelation in the contemporaneous correlation with theMay EDI and the negative lag correlation with the summerEDI at each weather station in the mid-latitude region ofEast Asia. In other words, if the SLP anomaly of thenorthern location in the north Pacific is greater than the SLPanomaly of the southern location in the north Pacific inMay, this implies an intensification of May and summerdrought in the mid-latitude region of East Asia. In addition,when the mid-latitude region of East Asia was divided intothe three regions North China, Korea, and southwest Japan(referred to collectively as “Northeast Asia”), the May andsummer EDI in these regions showed an even highernegative correlation with May NPI.
The negative correlation between these two indices wasanalyzed through the difference between the May NPI forthe 11 highest NPI years and the 11 lowest NPI years, withEl Niño and La Niña years excluded. Drought thatintensified in the May and summer of positive NPI yearswas due to the intensification of anomalous cold northeast-erlies at all levels of the troposphere due to anomalouscyclonic circulation in the southeast of Northeast Asia andanomalous anticyclonic circulation in the northeast. Thisanomalous cyclonic circulation that intensified in thesoutheast of Northeast Asia implied a failure of the WNPHto advance northward; this could be confirmed through the
weakening of upper-level westerlies in the same region. Inaddition, the anomalous cold northeasterlies that intensifiedat all levels of the troposphere in this region gave rise toanomalous downward flow and anomalous low relativehumidity.
The difference between these two phases in thefrequency of summer TCs in Northeast Asia was examined.While TCs in positive NPI years tended to move over thewestern North Pacific, TCs in negative NPI years mainlymoved along the East Asian coast. This is because theanomalous northeasterlies that are intensified along the EastAsian coast due to the failure of the WNPH to advancenorthward in the summer of positive NPI years provide anunfavorable environment for TC landfall. Thus, it wasdetermined that, if a drought occurs in Northeast Asia in thesummer of a positive NPI year, the possibility of the returnto the normal from the drought situation was unlikely dueto the low TC frequency in North East.
This study used the May NPI to diagnose the East Asiandrought condition for that month and the summer andexamined diverse large-scale atmospheric environmentsthat contribute to drought. However, it seems that thephysical mechanism that NPO has an effect on variations ofEDI in the East Asia is still insufficiency. In the futurestudy, we will explain the possible physical mechanismbetween the two variations using the dynamic model.
Acknowledgments This work was funded by the Korea Meteoro-logical Administration Research and Development Program underGrant CATER 2006-2306.
References
Akhtari R, Morid S, Mahdian MH, Smakhtin V (2008) Assessment ofareal interpolation methods for spatial analysis of SPI and EDIdrought indices. Int J Climatol 29:135–145
Byun HR, Lee DK (2002) Defining three rainy seasons and thehydrological summer monsoon in Korea using available waterresources index. J Meteor Soc Japan 80:33–44
Byun HR, Wilhite DA (1999) Objective quantification of droughtseverity and duration. J Clim 12:2747–2756
Byun HR, Lee DK, Jeong CH (1992a) A study on the atmosphericcirculation during the dry period before the Changma. Part I:existence and characteristics. Asia-Pacific J Atmos Sci 28:72–85(in Korean with English abstract)
Byun HR, Lee SJ, Saeid M, Choi KS, Lee SM, Kim DW (2008) Studyon the predicities of droughts in Korea. Asia-Pacific J Atmos Sci44:417–441
Chang CP, Zhang YS, Li T (2000) Interannual and interdecadalvariations of the East Asian summer monsoon and tropicalPacific SSTs. Part I: roles of the subtropical ridges. J Clim13:4310–4325
D’Arrigo R, Wilson E, Deser C, Wiles G, Cook E, Villalba E,Tudhope A, Cole J, Linsley B (2005) Tropical–north pacificclimate linkages over the past four centuries. J Clim 18:5253–5265
92 K.-S. Choi et al.

Ding YH, Chan JCL (2005) The East Asian summer monsoon: anoverview. Meteor Atmos Phys 89:117–142
FanK (2006) Atmospheric circulation in southern hemisphere and summerrainfall over Yangtze River valley. Chin J Geophys 49:672–679
Gao H, Xue F, Wang HJ (2003) Influence of interannual variability ofAntarctic oscillation on Mei-yu along the Yangtze and HuaiheRiver valley and its importance to prediction. Chin Sci Bull48:61–67
Gong DY, Ho CH (2003) Arctic oscillation signals in the East Asiansummer monsoon. J Geophys Res 108. doi:10.1029/2002JD002193
Guo D, Sun ZB (2004) Relationship of winter North Pacificoscillation anomalies with the East Asian winter monsoon andthe weather and climate in China. J Nanjing Institute Meteor27:461–470, in Chinese
Hameed S, Pittalwala I (1991) The North Pacific oscillation:observations compared with simulations in a general circulationmodel. Clim Dyn 6:113–122
Ho CH, Bail JJ, Kim JH, Gong DY (2004) Interdecadal changes insummertime typhoon tracks. J Clim 17:1767–1776
Kalnay E, Kanamitsu M, Kistler R et al (1996) The NCEP/NCAR 40-year reanalysis project. Bull Am Meteorol Soc 77:437–471
Kistler R, Kalnay E, Collins W et al (2001) The NCEP–NCAR 50-year reanalysis: monthly means CD-ROM and documentation.Bull Am Meteor Soc 82:247–267
Kripalani RH, Oh JH, Chaundhari HS (2009) Delayed influence of theIndian Ocean Dipole mode on the East Asia–West Pacificmonsoon: possible mechanism. Int J Climatol. doi:10.1002/joc.1890 (published online)
Lau KM, Kim KM, Yang S (2000) Dynamical and boundary forcingcharacteristics of regional components of the Asian summermonsoon. J Clim 13:2461–2482
Liang XZ,WangWC (1998) Association between China monsoon rainfalland tropospheric jets. Quar J R Meteorol Soc 124:2597–2623
Li C, Li G (1999) Variation of the NAO and NPO associated withclimate jump in the 1960s. Chin Sci Bull 44:1983–1987
LiW, ChenW, Huang R (2007) Changes in the variability of North Pacificoscillation around 1975/1976 and its relationship with East Asianwinter climate. J Geophys Res 112. doi:10.1029/2006JD008054
Linkin ME, Nigam S (2008) The North Pacific oscillation–WestPacific teleconnection pattern: mature-phase structure and winterimpacts. J Clim 21:1979–1997
McKee TB, Doesken NJ, Kleist J (1993) The relationship of droughtfrequency and duration to time scales. In: Proceedings of the 8thConference of Applied Climatology, 17–22 January 1993,Anaheim, CA. Am Meteor Soc, pp 179–184
McKee TB, Doesken NJ, Kleist J (1995) Drought monitoring withmultiple time scales. In: Proceedings of the 9th Conference onApplied Climatology, 15–20 January 1995, Dallas, TX. AmMeteor Soc, pp 233–236
Min SK, Kwon WT, Park EH, Choi YE (2003) Spatial and temporalcomparisons of droughts over Korea with East Asia. Int JClimatol 23:223–233
Morid S, Smakhtin V, Moghaddasi M (2006) Comparison of sevenmeteorological indices for drought monitoring in Iran. Int JClimatol 26:971–985
Palmer WC (1965) Meteorological drought. US Weather Bureauresearch paper 45, p 58
Park CK, Schubert SD (1997) On the nature of the 1994 East Asiansummer drought. J Clim 10:1056–1070
Park JS, Jhun JG, Kwon MH (2009) Prominent features of large-scale atmospheric circulation during spring droughts overnortheast Asia. Int J Climatol. doi:10.1002/joc.1948 (publishedonline)
Pierce DW (2002) The role of sea surface temperatures in interactionsbetween ENSO and the North Pacific oscillation. J Clim15:1295–1308
Reynolds RW, Rayner NA, Smith TM, Stokes DC, Wang W (2002)An improved in situ and satellite SST analysis for climate. J Clim15:1609–1625
Rogers JC (1981) The North Pacific oscillation. Int J Climatol 1:39–57
Sun J, Wang H, Yuan W (2009) A possible mechanism for the co-variability of the boreal spring Antarctic Oscillation and theYangtze River valley summer rainfall. Int J Climatol 29:1276–1284
Tao SY, Chen LX (1987) A review of recent research on the EastAsian summer monsoon in China. In: Chang C-P, KrishnamurtiTN (eds) Monsoon Meteorology, Oxford University Press, pp60–92
Tao SY, Zhang Q (1998) Response of the East Asian summermonsoon to ENSO events. Acta Meteorologica Sinica 22:399–407 (in Chinese with English abstract)
Walker GT, Bliss EW (1932) World weather V. Memoirs Roy MeteorSoc 4:53–84
Wallace JM (2000) North Atlantic oscillation/annular mode: twoparadigms–one phenomenon. Q J R Meteorol Soc 126:791–805
Wallace JM, Gutzler DS (1981) Teleconnections in the geopotentialheight during the Northern Hemisphere winter. Mon WeatherRev 109:784–812
Wang HJ, Fan K (2005) Central-north China precipitation asreconstructed from the Qing dynasty: signal of the Antarcticatmospheric oscillation. Geophys Res Lett 32. doi:10.1029/2005GL024562
Wang HJ, Sun JQ, Fan K (2007) Relationship between the NorthPacific Oscillation and typhoon and hurricane frequencies. SciChina Ser D: Earth Sci 50:1409–1416
Xin X, Yu R, Zhou T, Wang B (2006) Drought in late spring of SouthChina in recent decades. J Clim 19:3197–3206
Xue F, Wang HJ, He JH (2004) Interannual variability of Mascarenehigh and Australian high and their influences on East Asiansummer monsoon. J Meteorol Soc Jpn 82:1173–1186
Yamaguchi Y, Shinoda M (2002) Soil moisture modeling based onmultiyear observations in the Sahel. J Appl Meteorol 41:1140–1146
Yeh SW, Kirtman BP (2004) The North Pacific oscillation—ENSOand internal atmospheric variability. Geophys Res Lett 31.doi:10.1029/2004GL019983
Zou XK, Zhai PM, Zhang Q (2005) Variations in droughts overChina: 1951–2003. Geophys Res Lett 32:L04707. doi:10.1029/2004GL021853
Possible linkage between East Asian summer drought and North Pacific Oscillation 93