
Learning Expressive Linkage Rules from Sparse Data
22
Semantic Web 0 (2016) 1–0 1 IOS Press Learning Expressive Linkage Rules from Sparse Data Petar Petrovski, Christian Bizer Data and Web Science Group, University of Mannheim, B6, 26, 68159 Mannheim E-mail: [email protected], [email protected] Abstract. A central problem in the context of the Web of Data, as well as in data integration in general is to identify entities in different data sources that describe the same real-world object. There exists a large body of research on entity resolution. Interestingly, most of the existing research focuses on entity resolution on dense data, meaning data that does not contain too many missing values. This paper sets a different focus and explores learning expressive linkage rules from as well as applying these rules to sparse web data, i.e. data exhibiting a large amount of missing values. Such data is a common challenge in various application domains including e-commerce, online hotel booking, or online recruiting. We propose and compare three entity resolution methods that employ genetic programming to learn expressive linkage rules from sparse data. First, we introduce the GenLinkGL algorithm which learns groups of matching rules and applies specific rules out of these groups depending on which values are missing from a pair of records. Next, we propose GenLinkSA, which employs selective aggregation operators within rules. These operators exclude misleading similarity scores (which result from missing values) from the aggregations, but on the other hand also penalize the uncertainty that results from missing values. Finally, we introduce GenLinkComb, a method which combines the central ideas of the previous two into one integrated method. We evaluate all methods using six benchmark datasets: three of them are e-commerce product datasets, the other datasets describe restaurants, movies, and drugs. We show improvements of up to 16% F-measure compared to handwritten rules, on average 12% F-measure improvement compared to the original GenLink algorithm, 15% compared to EAGLE, 8% compared to FEBRL, and 5% compared to CoSum-P. Keywords: Entity Resolution, Sparse Data, Linkage Rules, Genetic Programming, Link Discovery 1. Introduction As companies move to integrate data from even larger numbers of internal and external data sources and as more and more structured data is becoming available on the public Web, the problem of finding records in different data sources that describe the same real-world object is moving into the focus within even more application scenarios. There exists an extensive body of research on entity resolution in the Linked Data [20, 32, 34] as well as the databases commu- nity [6, 14]. However, most existing entity resolution approaches focus on dense data [8, 20, 33, 34]. This paper sets an alternative focus and explores learning expressive linkage (matching) rules from as well as ap- plying these rules to sparse data, i.e. data that contains a large amount of missing values. A prominent example of an application domain that involves data exhibiting lots of missing values is e- commerce. Matching product data from different web- sites (e.g. Amazon and eBay) is difficult as most web- sites publish heterogeneous product descriptions us- ing proprietary schemata which vary widely concern- ing their level of detail [31]. For instance in [40], we analyzed product data from 32 popular e-shops. The shops use within each product category (mobile phones, headphones, TVs) approximately 30 different attributes to describe items. The subset of the attributes that are used depends on the e-shop and even on the specific product. This leaves a data aggregator that col- lects product data for many e-shops into a rich schema with lots of missing values. In [20], we presented GenLink, a supervised learn- ing algorithm that employs genetic programming to 1570-0844/16/$35.00 c 2016 – IOS Press and the authors. All rights reserved
-
Upload
khangminh22 -
Category
Documents
-
view
1 -
download
0
Transcript of Learning Expressive Linkage Rules from Sparse Data

Semantic Web 0 (2016) 1–0 1IOS Press
Learning Expressive Linkage Rules fromSparse DataPetar Petrovski, Christian BizerData and Web Science Group, University of Mannheim, B6, 26, 68159 MannheimE-mail: [email protected], [email protected]
Abstract.A central problem in the context of the Web of Data, as well as in data integration in general is to identify entities in different
data sources that describe the same real-world object. There exists a large body of research on entity resolution. Interestingly,most of the existing research focuses on entity resolution on dense data, meaning data that does not contain too many missingvalues. This paper sets a different focus and explores learning expressive linkage rules from as well as applying these rules tosparse web data, i.e. data exhibiting a large amount of missing values. Such data is a common challenge in various applicationdomains including e-commerce, online hotel booking, or online recruiting. We propose and compare three entity resolutionmethods that employ genetic programming to learn expressive linkage rules from sparse data. First, we introduce the GenLinkGLalgorithm which learns groups of matching rules and applies specific rules out of these groups depending on which values aremissing from a pair of records. Next, we propose GenLinkSA, which employs selective aggregation operators within rules. Theseoperators exclude misleading similarity scores (which result from missing values) from the aggregations, but on the other handalso penalize the uncertainty that results from missing values. Finally, we introduce GenLinkComb, a method which combinesthe central ideas of the previous two into one integrated method. We evaluate all methods using six benchmark datasets: three ofthem are e-commerce product datasets, the other datasets describe restaurants, movies, and drugs. We show improvements of upto 16% F-measure compared to handwritten rules, on average 12% F-measure improvement compared to the original GenLinkalgorithm, 15% compared to EAGLE, 8% compared to FEBRL, and 5% compared to CoSum-P.
Keywords: Entity Resolution, Sparse Data, Linkage Rules, Genetic Programming, Link Discovery
1. Introduction
As companies move to integrate data from evenlarger numbers of internal and external data sourcesand as more and more structured data is becomingavailable on the public Web, the problem of findingrecords in different data sources that describe the samereal-world object is moving into the focus within evenmore application scenarios. There exists an extensivebody of research on entity resolution in the LinkedData [20, 32, 34] as well as the databases commu-nity [6, 14]. However, most existing entity resolutionapproaches focus on dense data [8, 20, 33, 34]. Thispaper sets an alternative focus and explores learningexpressive linkage (matching) rules from as well as ap-plying these rules to sparse data, i.e. data that containsa large amount of missing values.
A prominent example of an application domain thatinvolves data exhibiting lots of missing values is e-commerce. Matching product data from different web-sites (e.g. Amazon and eBay) is difficult as most web-sites publish heterogeneous product descriptions us-ing proprietary schemata which vary widely concern-ing their level of detail [31]. For instance in [40],we analyzed product data from 32 popular e-shops.The shops use within each product category (mobilephones, headphones, TVs) approximately 30 differentattributes to describe items. The subset of the attributesthat are used depends on the e-shop and even on thespecific product. This leaves a data aggregator that col-lects product data for many e-shops into a rich schemawith lots of missing values.
In [20], we presented GenLink, a supervised learn-ing algorithm that employs genetic programming to
1570-0844/16/$35.00 c© 2016 – IOS Press and the authors. All rights reserved

2 Learning Expressive Linkage Rules from Sparse Data
learn expressive linkage rules from a set of existing ref-erence links. These rules consist of attribute-specificpreprocessing operations, attribute-specific compar-isons, linear and non-linear aggregations, as well asdifferent weights and thresholds. The evaluation ofGenLink has shown that the algorithm delivers goodresults with F-measures above 95% on different densedatasets such as sider-drugbank, LinkedMDB, restau-rants [20]. As shown in the evaluation section of thispaper, GenLink as well as other entity resolution meth-ods run into problems once the datasets to be matchedare not dense, but contain larger amounts of missingvalues.
In order to overcome the challenge of missing val-ues, this article introduces and evaluates three methodsthat build on the GenLink algorithm. First, we presentGenLink Group Learning (GenLinkGL), an approachthat groups linkage rules based on product attribute di-versity, thus successfully circumventing missing val-ues. Next, we introduce the GenLink Selective Ag-gregations (GenLinkSA) algorithm which extends theoriginal approach with selective aggregation operatorsto ignore and penalize comparisons that include miss-ing values. Finally, we introduce GenLinkComb, an al-gorithm that combines the central ideas of the previoustwo into a integrated method. We evaluate all meth-ods using six benchmark datasets: three of them are e-commerce product datasets, the other datasets describerestaurants, movies, and drugs.
The rest of this paper is structured as follows: Sec-tion 2 formally introduces the problem of entity reso-lution. Section 3 gives an overview of the GenLink al-gorithm. Subsequently, in Section 4 we introduce Gen-LinkGL, GenLinkSA and GenLinkComb methods fordealing with sparse data. Section 5 presents the resultsof the experimental evaluation in which we comparethe proposed methods with various baselines as wellas other entity resolution systems. Section 6 discussesthe related work.
2. Problem Statement
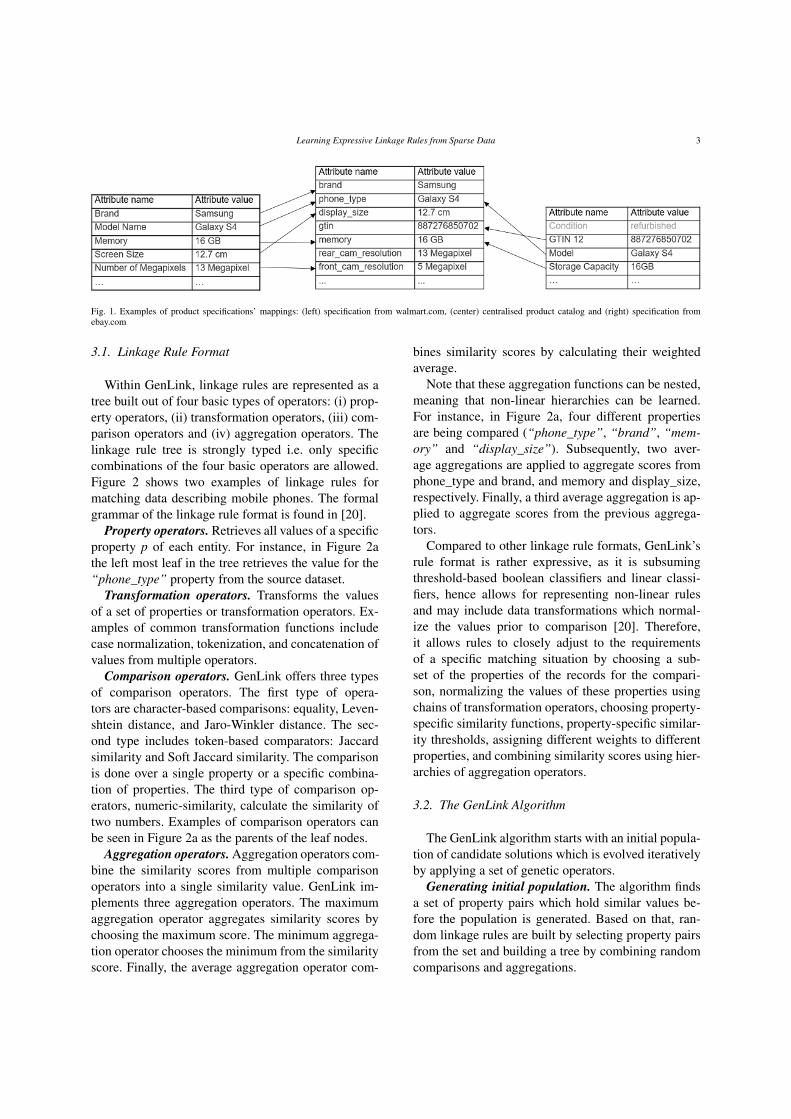
We consider two datasets, A the source, and Bthe target dataset. Each entity e ∈ A ∪ B consistsof a set of attribute-value pairs (properties) e ={(p1, v1), (p1, v2), . . . , (pn, vn)}, where the attributesare numeric, categorical or free-text. For instance, anentity representing a product might be described bythe name, UPC, color, camera properties as shown inFigure 1. Our goal is to learn a matching rule that de-
termines whether a pair of entities (ea, eb) representsthe same real-world object. Or formally [15], given thetwo datasets A and B, the objective is to find the set Mconsisting of all pairs of entities for which a relation∼R holds:
M = {(ea, eb); ea ∼R eb, ea ∈ A, eb ∈ B} (1)
Additionally, we compute its complement set U de-fined as:
U = (A× B) \ M (2)
The purpose of relation ∼R is to relate all entitieswhich represent the same real-world object [15].
To infer a rule specifying the conditions which musthold true for a pair of entities to be part of M, we relyon a set of positive correspondences R+ ⊆ M thatcontains pairs of entities for which the ∼R relation isknown to hold (i.e. which identify the same real worldobject) . Analogously, we rely on negative correspon-dences R− ⊆ U that contain pairs of entities for whichthe ∼R relation is known not to hold (i.e. which iden-tify different real world objects)..
Given the correspondences, we can define the pur-pose of the learning algorithm as learning matchingrules from a set of correspondences:
m : 2(A×B) × 2(A×B) → (A× B→ [0, 1]) (3)
The first argument in the above formula denotes aset of positive reference links, while the second argu-ment denotes a set of negative reference links. The re-sult of the learning algorithm is a linkage rule whichshould cover as many reference links as possible whilegeneralising to unknown pairs.
3. Preliminaries
GenLink is a supervised algorithm for learning ex-pressive linkage rules for a given entity matching task.As all three algorithms that are introduced in this paperbuild on GenLink, this section summarises the maincomponents of the GenLink algorithm. The full detailsof the algorithm are presented in [20].
Learning Expressive Linkage Rules from Sparse Data 3
Fig. 1. Examples of product specifications’ mappings: (left) specification from walmart.com, (center) centralised product catalog and (right) specification fromebay.com
3.1. Linkage Rule Format
Within GenLink, linkage rules are represented as atree built out of four basic types of operators: (i) prop-erty operators, (ii) transformation operators, (iii) com-parison operators and (iv) aggregation operators. Thelinkage rule tree is strongly typed i.e. only specificcombinations of the four basic operators are allowed.Figure 2 shows two examples of linkage rules formatching data describing mobile phones. The formalgrammar of the linkage rule format is found in [20].
Property operators. Retrieves all values of a specificproperty p of each entity. For instance, in Figure 2athe left most leaf in the tree retrieves the value for the“phone_type” property from the source dataset.
Transformation operators. Transforms the valuesof a set of properties or transformation operators. Ex-amples of common transformation functions includecase normalization, tokenization, and concatenation ofvalues from multiple operators.
Comparison operators. GenLink offers three typesof comparison operators. The first type of opera-tors are character-based comparisons: equality, Leven-shtein distance, and Jaro-Winkler distance. The sec-ond type includes token-based comparators: Jaccardsimilarity and Soft Jaccard similarity. The comparisonis done over a single property or a specific combina-tion of properties. The third type of comparison op-erators, numeric-similarity, calculate the similarity oftwo numbers. Examples of comparison operators canbe seen in Figure 2a as the parents of the leaf nodes.
Aggregation operators. Aggregation operators com-bine the similarity scores from multiple comparisonoperators into a single similarity value. GenLink im-plements three aggregation operators. The maximumaggregation operator aggregates similarity scores bychoosing the maximum score. The minimum aggrega-tion operator chooses the minimum from the similarityscore. Finally, the average aggregation operator com-
bines similarity scores by calculating their weightedaverage.
Note that these aggregation functions can be nested,meaning that non-linear hierarchies can be learned.For instance, in Figure 2a, four different propertiesare being compared (“phone_type”, “brand”, “mem-ory” and “display_size”). Subsequently, two aver-age aggregations are applied to aggregate scores fromphone_type and brand, and memory and display_size,respectively. Finally, a third average aggregation is ap-plied to aggregate scores from the previous aggrega-tors.
Compared to other linkage rule formats, GenLink’srule format is rather expressive, as it is subsumingthreshold-based boolean classifiers and linear classi-fiers, hence allows for representing non-linear rulesand may include data transformations which normal-ize the values prior to comparison [20]. Therefore,it allows rules to closely adjust to the requirementsof a specific matching situation by choosing a sub-set of the properties of the records for the compari-son, normalizing the values of these properties usingchains of transformation operators, choosing property-specific similarity functions, property-specific similar-ity thresholds, assigning different weights to differentproperties, and combining similarity scores using hier-archies of aggregation operators.
3.2. The GenLink Algorithm
The GenLink algorithm starts with an initial popula-tion of candidate solutions which is evolved iterativelyby applying a set of genetic operators.
Generating initial population. The algorithm findsa set of property pairs which hold similar values be-fore the population is generated. Based on that, ran-dom linkage rules are built by selecting property pairsfrom the set and building a tree by combining randomcomparisons and aggregations.

4 Learning Expressive Linkage Rules from Sparse Data
Selection. The population of linkage rules is bredand the quality of the linkage rules is assessed by afitness function relying on user-provided training data.The purpose of the fitness function is to assign a valueto each linkage rule which indicates how close thegiven linkage rule is to the desired solution. The al-gorithm uses Matthews Correlation Coefficient (MCC)as fitness measure. MCC [27] is defined as the degreeof the correlation between the actual and predictedclasses or formally:
MCC =tp× tn− f p× f n√
(tp + f p)(tp + f n)(tn + f p)(tn + f n)
(4)
The training data consists of a set of positive corre-spondences (linking entities identifying the same real-world object) and a set of negative correspondences(stating that entities identify different objects). Theprediction of the linkage rule is compared with thepositive correspondences, counting true positives andfalse negatives, the negative correspondences, count-ing false positives and true negatives. In order to pre-vent linkage rules from growing too large and poten-tially overfitting to the training data, we penalize link-age rules based on the number of operators:
f itness = MCC − 0.05× operatorcount (5)
Once the fitness is calculated for the entire popula-tion, GenLink selects individuals for reproduction byemploying the tournament selection method.
Crossover. GenLink applies six types of crossoveroperators:
1. Function crossover. The function crossover se-lects one comparison operator at random in eachlinkage rule and interchanges the similarity func-tions between the selected operators.
2. Operators crossover. The operators crossover isdesigned to combine aggregation operators fromtwo linkage rules, by selecting an aggregationfrom each linkage rule and combining their re-spective comparisons. The crossover selects allcomparisons from both aggregations and removeseach comparison with a probability of 50%.
3. Aggregator crossover. In order to learn aggrega-tion hierarchies, the aggregation crossover oper-ator selects a random aggregation or comparisonoperator in the first linkage rule and replaces it
with a random aggregation or comparison opera-tor from the second linkage rule.
4. Transformation crossover. This crossover buildschains of transformations. To recombine thetransformations of two linkage rules the transfor-mation operators of both rules are combined byrandomly selecting an upper and a lower trans-formation operator, recombining their paths viaa two point crossover and removing duplicatedtransformations.
5. Threshold crossover and Weight crossover. Thelast two types of crossovers are used to recombinethresholds and weights respectively, for a randomcomparison operator in each linkage rules, by av-eraging their thresholds/weights.
An in-depth discussion of the crossover operators isprovided in [20].
4. Approaches
In [39] we have shown that the GenLink algorithmstruggles to optimise property selection for sparsedatasets. On an e-commerce dataset containing manylow-density attributes the algorithm only reached a F-measure of less than 80%, in contrast to the above95% results that are often reached on dense datasets. Inthe following, we propose three algorithms that buildon the GenLink algorithm and enable it to properlyexploit sparse properties. The GenLinkGL algorithmbuilds a group of matching rules for the given match-ing task (group generation) and applies the group ofmatching rules to create new correspondences (groupapplication). Next we introduce selective aggrega-tions, new operators within the GenLink algorithm thatcan better deal with missing values. Finally, we intro-duce GenLinkComb approach, integrating the centralideas of the previous two methods into a single com-bined method.
4.1. The GenLinkGL Algorithm
The GenLink algorithm lacks the capability to opti-mise property selection when dealing with sparse data.The algorithm will select a combination of dense prop-erties while sparse properties will rarely be selected.This behavior influences adversely cases in which val-ues from relatively dense properties are missing. Forinstance, when matching product data describing mo-bile phones from different e-shops, the brand, phone

Learning Expressive Linkage Rules from Sparse Data 5
(a)
(b)
Fig. 2. Example of two rules from the group for the phone category together with the coverage of each rule
type, and memory properties will be rather importantfor the matching decisions and these attributes willalso likely be rather dense as they are provided bymany e-shops. Therefore, GenLink will focus on theseattributes and due to the penalty on large rules (com-pare Equation 5) will not include alternative attributecombinations involving low-density properties, suchas gtin,1 display size, or operating system. In cases inwhich a value of one of these dense attributes is miss-ing, the algorithm will likely fail to discover the cor-rect match, while by exploiting a combination of alter-native low-density attributes it would have been pos-sible to recognize that the both records describe thesame product. Including all alternative attribute combi-nations into a single linkage rule would result in ratherlarge rules containing multiple alternative branchesthat encode the different attribute combinations. Dueto the penalty for large rules from Equation 5, only themost important alternative attribute combinations willbe included into the rules, whereas combinations hav-ing a lower coverage will be left unused.
A way to deal with this problem could be to loosenthe size penalty in Equation 5, however removing (or
1Global Trade Item Number (GTIN) is an identifier for trade items, devel-oped by GS1. – www.gtin.info/
loosening) the penalty has the potential to result in anoverfitted model. Thus, it might not improve the resultsof our approach. With GenLink Group Learning (Gen-LinkGL), we choose an alternative approach - insteadof trying to grow very large rules that cover differentattribute combinations, we learn sets of rules in whicheach rule is optimized for a specific property combi-nation. The method allows us to separate more clearlythe issue of avoiding overfitting rules while still beingable to cover multiple property combinations. By com-bining multiple combinations of properties in a group,the learning algorithm is given the freedom to optimizematching rules not only for the most common attributecombinations, but also for less common combinationsinvolving sparse properties, as a result increasing theoverall recall. In the following, we describe how Gen-LinkGL combines rules into groups and later selects arule from the group in order to match a pair of recordshaving a specific property combination.
Group generation. The basic idea of the first al-gorithm, presented in Algorithm 1, is that by group-ing different linkage rules with different propertieswe could circumvent the missing values in the data.The initial group is populated with the fittest individ-ual from the population generated by GenLink. Sub-sequently, an initial fitness for this group is computedusing the MCC (compare Equation 4).

6 Learning Expressive Linkage Rules from Sparse Data
Algorithm 1 Generating a group
Input:Group← rule top fitness matching ruleP ← Rules All matching rules in the available pop-ulationOutput:The fittest groupfor all i ∈ P do
if i.properties 6⊂ Group.properties thenPotentialGroup← insert(Group, i)if f itness(PotentialGroup) > f itness(Group)then
Group = PotentialGroupend if
end ifend forreturn G
Motivated by the GenLink algorithm, our algorithmbuilds a group that maximises fitness. To do that ateach learning iteration, the algorithm iterates throughthe entire population of linkage rules and combinestheir individual fitness. We restrict the combination tolinkage rules whose properties are not a subset of theproperties of the group and include a linkage rule thathas at least one new property that is not present in thegroup. We combine the fitness of the linkage rules bysumming the number of correctly predicted instancesin the training set (compare Equations 6 and 7), calcu-lating for each individual the percentage of the cover-age of training examples in the group. Once the cor-rectly predicted instances are summed the current fit-ness function is applied to the group. If the fitnessof that combination is greater than the current fittestgroup, the new group becomes the best group. As anoutput the algorithm gives the fittest group.
tpgroup =
|G|∑i=1
distinct tpi,
f pgroup = |R+| − tpgroup
(6)
tngroup =
|G|∑i=1
distinct tni,
f ngroup = |R−| − tngroup
(7)
Algorithm 1 can potentially lead to groups con-taining a large number of rules, up to the completepopulation of learned rules. In such case the algo-rithm is prone to overfitting, since the population mightcapture the entire training set. In order to preventthis, we penalize groups containing a large numberof rules: f itnessgroup = MCCgroup − c × rulecount.Where, c = (0.001, 0.003, 0.005) is a small constant,strictly depending on the number of individuals in thepopulation. The larger the population, the bigger thechance for overfitting. Therefore, the constant shouldbe higher for larger populations in order to penalise thefitness more. By penalizing the fitness by the numberof members in the group, we ensure that there will beno unneeded bloating of the learned group.
For example, let the linkage rule in Figure 2a be thefittest individual after the n − th learning iteration ofthe algorithm. The initial group contains this linkagerule. The group would not be able to correctly predictcorrespondences that could only have been matchedby a combination of the gtin, phone_type and memoryproperties. At the first iteration we combine the groupwith the linkage rule in Figure 2b which exploits thegtin property in cases in which this property is filled(coverage of training examples 0.053). As a result, thecorrespondences above could be captured by the groupleading to better fitness.
Algorithm 2 Applying a group to set of pairs formatching
Input:G ← group of matching rulesPairs← pairs for matchingOutput:Linked instancesResult← nilfor all pair ∈ Pairs do
for all rule ∈ G doif pair.properties ≡ rule.properties then
Result← match(pair, rule)break
end ifend forif 6 ∃match then
Result← match(pair,G.top)end if
end forreturn Result
Group application. As an input the second algo-rithm, presented in Algorithm 2, takes the output of Al-

Learning Expressive Linkage Rules from Sparse Data 7
gorithm 1 and a set of pairs to be matched. The individ-uals in the input group are sorted by the percentage ofcoverage. Sorting enables Algorithm 2 to find the moreinfluential individual rules in less iterations. For eachpair the algorithm iterates through the group of match-ing rules. If the pair to be matched contains the sameproperties as in the matching rule, the matching ruleis applied. If there is no matching rule which has theexact properties as the instances, the top matching ruleis applied. For instance, when matching (a) the spec-ification from walmart.com with the product catalogand (b) the specification from ebay.com with the prod-uct catalog from Figure 1, the algorithm would use thefirst rule from Figure 2 for the a pair, but use the sec-ond matching rule from Figure 2 for the b pair sincein b one of the specifications does not have a value forthe display_size attribute, however it contains a gtinattribute.
Property diversity is an underlying factor behind thismethod. Since the prime goal is to enlarge the com-bination of properties that are used for matching, it isimperative that the dataset contains a diverse range ofproperties. More precisely, if the dataset has a smallernumber of properties, the number of combination ofproperties that can be made by grouping linkage rulesis smaller. Therefore, this approach would not improvemuch upon GenLink when dealing with datasets withsmaller number of properties.
4.2. The GenLinkSA Algorithm
An alternative to learning groups of small rules spe-cializing on a specific property combination each isto learn larger rules covering more properties and ap-ply a penalty for the uncertainty that arises from val-ues missing in these properties. For instance, a largerrule could rely on five properties for deciding whethertwo records match. If two of the five properties havemissing values, the remaining three properties can stillbe used for the matching decision. Nevertheless, a de-cision based on three properties should be consideredless certain than a decision based on five properties.In order to compensate for this uncertainty, we couldrequire the values of the remaining three properties tobe more similar than the values of the five propertiesin the original case in order to decide for a match.The GenLink Selective Aggregations (GenLinkSA) al-gorithm implements this idea by changing the behaviorof the comparison operators as well as the aggregationoperators in the original GenLink algorithm.
Null-enabled Comparison Operators. The originalGenLink algorithm does not distinguish between a pairof different values and a pair of values containing amissing value. In both cases, the algorithm assigns thesimilarity score 0. This is problematic when similarityscores from multiple comparison operators are com-bined using the aggregation function average or mini-mum, as the resulting similarity score will be unnatu-rally low for the case of missing values. In order to dealwith this problem, GenLinkSA amends the compari-son operators with the possibility to return the valuenull: a GenLinkSA comparison operator will returnnull if one or both values are missing. If both valuesare filled, the operator will apply its normal similarityfunction and return a value in the range [0, .., 1].
Selective Aggregation Operators. The GenLink ag-gregation operators calculate a single similarity scorefrom the similarity values of multiple comparisonoperators using a specific aggregation function suchas weighted average, minimum, or maximum. Gen-LinkSA adjusts the aggregation operators to apply theaggregation function only to non-null values. In orderto compensate the uncertainty that results from miss-ing values (comparison operators returning the valuenull), the similarity score that results from the aggrega-tion is reduced by constant factor α for each compari-son operators that returns a null value. In this way, allnon-null similarity scores are aggregated and a penaltyis applied for each property pair containing missingvalues. Formally, a GenLink aggregation is defined bythe following:
S a : (S ∗ × N∗ × Fa)→ S
(s, w, f a)→ ((ea, eb)→ f a(se,w))
with se : (s1(ea, eb), s2(ea, eb), .., sn(ea, eb))
(8)
The first argument S ∗ contains the similarity scoresreturned by the operators of this aggregation while thesecond argument N∗ contains a weight for each of theoperators, finally the third argument Fa represents theaggregation function that is applied to compute thesimilarity score S .

8 Learning Expressive Linkage Rules from Sparse Data
Fig. 3. GenLinkSA rule for the phone category
Given the aggregation operators, we can now defineGenLinkSA’s selective aggregation operators as:
S a : (S ∗ × N∗ × Fa)→ S
(s, w, f a)→ ((ea, eb)→ f a(se,w))− υ
with se : (s1(ea, eb), s2(ea, eb), .., sn(ea, eb)),
υ = β× | { si(ea, eb) | si(ea, eb)→ null ∧ si ∈ se } |
(9)
Where the uncertainty factor υ is defined as thenumber of null values multiplied by a small valuedconstant factor β = (0.01, 0.03, 0.05). The uncertaintyfactor serves to penalize the rule for each null similar-ity operator. As the overall similarity score is reducedby the uncertainty factor, the values of the non-nullproperties must be more similar in order to reach thesame similarity score as for a pair in which all proper-ties are filled.
For example, let the rule learned by the GenLinkSAalgorithm be the one shown in Figure 3 and let in-stances for matching be (a) the specification from wal-mart.com that should be matched with the product cat-alog and (b) the specification from ebay.com to bematched with the product catalog from Figure 1. Whenmatching (a) only a small penalty will be applied sincefor five out of six comparisons a non-null similar-ity score will be returned and only the comparisonfor one property (comp_os) will be penalised. On theother hand, the pair (b) will be heavily penalised sincefour of the six comparisons will return null values.Evidently, this method will discourage high similarityscores in the presence of missing values and will thusrefrain from considering borderline cases with missingvalues as matches, resulting in a higher precision.
4.3. The GenLinkComb Algorithm
GenLinkGL and GenLinkSA tackle the issue of miss-ing values differently. Namely, GenLinkGL strives togroup matching rules exploiting different combina-tions of properties and thus is able to apply alterna-tive rules given that values of important properties aremissing. By being able to exploit alternative propertycombinations, GenLinkGL is tailored to improve re-call. On the other hand, by penalizing comparisonswith missing values, GenLinkSA incentivises learn-ing matching rules that include more properties andsubstantially lowers the similarity scores of uncertainpairs, and by that improves precision. As the basicideas behind GenLinkGL and GenLinkSA do not ex-clude each other but are complementary, a combina-tion of both methods into a single integrated methodcould combine their advantages: optimize rules for al-ternative attribute combinations while at the same timedealing with the uncertainty that arises from miss-ing values inside the rules. The GenLinkComb algo-rithm achieves this by combining the GenLinkSA andthe GenLinkGL algorithms as follows: GenLinkCombuses the GenLinkSA algorithm to evolve the popula-tion of linkage rules. In each iteration of the learningprocess, GenLinkComb groups the learned rules to-gether using the GenLinkGL algorithm. By being ableto deal with missing values either inside the rules us-ing the selective aggregation operators or within thegrouping of rules, the GenLinkComb learning algo-rithm has a higher degree of freedom in searching fora good solution.
5. Evaluation
The evaluation of the aforementioned methods wasconducted using six benchmark datasets: three e-commerce product datasets, and three other datasets

Learning Expressive Linkage Rules from Sparse Data 9
describing restaurants, movies, and drugs. In addi-tion to comparing GenLinkGL, GenLinkSA, and Gen-LinkComb with each other, we also compare theapproaches to existing systems including CoSum-P,FEBRL, EAGLE, COSY, MARLIN, ObjectCoref, andRiMOM. The following section will describe the sixbenchmark datasets, give details about the experimen-tal setup, and present and discuss the results of thematching experiments.
5.1. Datasets
Product Matching Datasets. We use three differentproduct datasets for the evaluation:
Abt-Buy dataset: The dataset includes correspon-dences between 1081 products from Abt.com and1092 from Buy.com. The full input mapping con-tains 1.2 million correspondences, from which1000 are annotated as positive correspondences(matches). Each entity of the dataset might con-tain up to four properties: product name, descrip-tion, manufacturer and price. The dataset was in-troduced in [23]. Since the content of the prod-uct name property is a short text listing variousproduct features rather than the actual name of theproduct, we extract the product properties shownin Table 1 from the product name values using thedictionary-based method presented in [41]. Wechoose the Abt-Buy dataset because it is widelyused to evaluate different matching systems [5, 9].
Amazon-Google dataset: The dataset includes corre-spondences between 1363 products from Amazonand 103,226 from Google. The full input map-ping contains 4.4 million correspondences, fromwhich 1000 are annotated as matches. Each entityof the dataset contains the same properties as theAbt-Buy dataset. This dataset is presented in [23].We perform the same extraction of properties asin the Abt-Buy dataset. The Amazon-Google dataset has also been widely used as benchmark dataset [23].
WDC Product Matching Gold Standard: This goldstandard [40] for product matching contains cor-respondences between 1500 products (500 eachfrom the categories headphones, mobile phones,and TVs), collected from 32 different websitesand a unified product catalog containing 150products with the following distribution: (1) Head-phones - 50, (2) Phones - 50, and (3) TVs - 50.The data in the catalog has been scraped from
Table 1
Properties together with their density in the Abt-Buy and Amazon-Googledatasets.
Dataset Property Density (A / B) %
Abt-Buy
Original AttributesProduct Name 100
Description 63Manufacturer 48
Price 36Extracted Attributes
Model 91Brand 72
Amazon-Google
Original AttributesProduct Name 100
Description 70Manufacturer 52
Price 31Extracted Attributes
Model 88Brand 76
leading shopping services, like Google Shop-ping, or directly from the vendor’s website. Thegold standard contains 500 positive correspon-dences (matches) and more than 25000 nega-tive correspondences (non-matches) per category.Compared to the Amazon-Google and Abt-Buydatasets, the WDC Product Matching Gold Stan-dard is more heterogeneous as the data has beencollected from different websites. The gold stan-dard also features a richer integrated schema con-taining over 30 different properties for each prod-uct category.
Other Entity Resolution Datasets. In order to beable to compare our approaches to more reference sys-tems, as well as to showcase the ability of our algo-rithms to perform on datasets from different applica-tion domains, we run experiments with three additionalbenchmark datasets which were used in [20]:
Restaurant dataset: The dataset contains correspon-dences between 864 restaurant entities from theFodor’s and Zagat’s restaurant guides. Specifi-cally, 112 duplicate records were identified.
Sider-Drugbank dataset: The dataset contains corre-spondences between 924 drug entities in the Siderdataset and 4772 drug entities in the Drugbankdataset. Specifically, there have been 859 dupli-cate records identified.
LinkedMDB dataset This dataset contains 100 cor-respondences between 373 movies. The authorsnote that special care was taken to include rel-evant corner cases such as movies which sharethe same title but have been produced in differentyears.

10 Learning Expressive Linkage Rules from Sparse Data
Table 2
Properties and property density of the WDC Product Matching Gold Standard,Restaurants, Sider-Drugbank and LinkedMDB datasets. Note that propertieshaving a density below 10% are not included into the table.
Dataset Property Density (A / B) %
WDCPr Gold Standard
HeadphonesBrand 97 / 100
Item Type 87 / 100MPN 60 / 86Color 56 / 96
Sensitivity 53 / 88Impedance 53 / 92Cup Type 47 / 38
Form Factor 43 / 77Magnet Mat. 27 / 51Diaphragm 25 / 35
PhonesPhone Type 91 / 100
Memory 87 / 95Brand 86 / 100Color 79 / 43
Display Size 71 / 92Rear Cam. Res. 70 / 85
OS 64 / 64Display Res. 48 / 53
Processor 28 / 36Front Cam. Res. 20 / 66
TVsBrand 100 / 100
Item Type 91 / 100Display Type 81 / 85Display Size 65 / 96Display Res 55 / 87
Tot. Size 51 / 74Ref. Rate 50 / 96
Img. Asp. Rat. 38 / 60Connectivity 35 / 61Resp. Time 10 / 25
Restaurant
Name 100Address 100Contact 100
Type 100
Sider-DrugbankName 100 / 100
Indication 100 / 93
LinkedMDB
Name 100 / 100Director 100 / 100Rel Date 100 / 100Studio 95 / 97
Tables 1 and 2 give an overview of densities ofproperties in the six evaluation datasets. If the den-sity of a property differs in the source (A) and the tar-get (B) dataset, both densities are reported. For theAbt-Buy and Amazon-Google datasets, we show alloriginal property densities as well as the density ofthe extracted properties. As stated before, the prod-uct datasets exhibit more sparsity. The Abt-Buy andAmazon-Google datasets follow a similar distribution
in which only the product name property has a den-sity of 100%. It is worth to note that the product nameproperty in these datasets is actually a short descriptionof the product mentioning different properties ratherthan the actual product name. WDC Product MatchingGold Standard contains a small set of properties witha density above 90% while most properties belong tothe long tail of rather sparse properties [40].
5.2. Experimental Setup
Baselines. As baselines for the WDC dataset, we re-peat TF-IDF cosine similarity and Paragrph2Vec ex-periments presented in [40], additionally we learn adecision tree and a random forest as baselines. Thefirst baseline, considers pair-wise matching of productdescriptions for which TF-IDF vectors are calculatedusing the bag-of-word feature extraction method. Thesecond baseline, considers building a Paragraph2Vecmodel [25] for product names using 50 latent fea-tures and the Distributed Bag-of-Words model. Deci-sion trees and random forests are learned in Rapid-miner2 using grid search parameter optimization aswell as offering the learning algorithm different simi-larity metrics (e.g. Jaro-Winkler, Jaccard, numeric).
Other Entity Resolution Systems. In order to set theGenLink results into context, we also ran the WDCGold Standard experiments with EAGLE [36], a super-vised matching system that also employs genetic pro-gramming,3, FEBRL [9]4 an entity resolution systemthat internally employs an SVM, and CoSum-P [46],an unsupervised system that treats entity resolution asa graph summarization problem. We pre-compute at-tribute similarities for CoSum-P as described in [46].
Additionally, we provide a comparison to handwrit-ten Silk rules. These rules are composed of up to sixproperties for each product category and were writ-ten by the authors of the article using their knowl-edge about the respective domains as well as statis-tics about the datasets. As an example, the hand-written rule that was used for matching headphones,shown in Figure 4, implements the intuition that if thevery sparse properties html:gtin or html:mpn matchexactly, the record pair should be considered as amatch. If these numbers are not present or do notmatch, the rule should fall back to averaging the sim-ilarity of the properties html:model, html:impedence
2RapidMiner is a data science software platform - https://rapidminer.com/3http://aksw.org/Projects/LIMES.html4https://sourceforge.net/projects/febrl/

Learning Expressive Linkage Rules from Sparse Data 11
and html:headphone_cup_type giving most weight tohtml:model.
GenLinkGL, GenLinkSA, and GenLinkComb.The GenLinkGL, GenlinkSA, and GenLinkComb
algorithms were implemented on top of the SilkFramework.5 The source code of the original Gen-Link implementation.6 as well as the source code ofGenLinkGL, GenlinkSA, GenLinkComb algorithms7
is publicly available, so all results presented in this ar-ticle can be replicated. Table 3 gives an overview ofthe aggregation, comparison, and transformation func-tions the algorithms could choose from in the experi-ments. It should be noted that for each aggregation op-erator there exists also a selective aggregation opera-tor. Hyper parameters are set using grid search. Eventhough grid search was run for each dataset, the result-ing parameter values were the same for all datasets.Table 4 summarises the parameters that were used forGenLink and its variants in the experiments. All exper-iments are run 10 times and the results are averaged.
GenLink and its variants as well as EAGLE weretrained on a balanced dataset consisting of 66% pos-itive correspondences and the same number negativecorrespondences. The systems were evaluated after-wards using the remaining 33% of the correspon-dences. For training FEBRL, we calculated TF-IDFscores and cosine similarity for all pairs given in thedataset. As with GenLink and EAGLE, FEBRL wastrained on 66% of the data and evaluated on the rest.For the experiments on the Abt-Buy and Amazon-Google datasets, all systems were trained using theoriginal as well as the extracted attribute-value pairs.
Preprocessing. The restaurants, movies, and drugsdatasets have an original density of over 90%. In orderto use them to evaluate how the different approachesperform on sparse data, we systematically removed25%, 50% and 75% of the values. More precisely, wefirst randomly sample 50% of properties (not includ-ing the name property) and for those we randomly se-lect 25%, 50% and 75% of the values and removed therest, thus introducing greater percentage of null val-ues in the datasets. We do not remove values from allproperties since we want to recreate the sparseness asin the product datasets as close as possible. We do notremove the name property since it is the only relevant
5www.silkframework.org6https://github.com/silk-framework/silk To be noted that the 2.6.0 version
was used for the experiments.7https://github.com/petrovskip/silk.2.6-GenLinkSA and https:
//github.com/petrovskip/silk.2.6-GenLinkGL
Table 3
Available aggregation comparison and transformation functions. The transfor-mation functions are used only for non-product datasets
Comparison Aggregation TransformationsExact Similarity Average Tokenize
Levenstein Distance Maximum Lower CaseJaccard Similarity Minimum ConcatenateNumber Similarity
Table 4
GenLink (GL/SA/Comb) Parameters
Parameter ValuePopulation size |P| 1000
Maximum iterations I 100Selection method Tournament selectionTournament size 10
Probability of Crossover 50%Probability of Mutation 50%
Stop Condition F-measure = 1.0Matching Rule Penalty c 0.03Uncertainty constant β 0.05
identifier for a human, i.e without it even a human can-not decide whether two entities are the same.
5.3. Product Matching Results
Table 5 gives an overview of the matching results onthe WDC Product Matching Gold Standard dataset. Asbaselines, we take TF-IDF cosine similarity and Para-grph2Vec experiments presented in [40], and decisiontree and random forest explained above. Moreover, wecompare results from: (i) handwritten matching rules;,(ii) the GenLink algorithm, (iii) GenLinkGL, (iv) Gen-LinkSA and (v) GenLinkComb. Additionally, we com-pare to three state-of-the-art matching systems for thisdataset: (i) EAGLE [36], (ii) FEBRL [23] and (iii)CoSum-P [46] as explained above.
As expected both baselines perform poorly for eachproduct category. Specifically, TF-IDF could not cap-ture enough details of a given entity. Paragaph2Vec,improves on the TF-IDF baseline by including the se-mantic relations between the words of a given record.However, the semantic relationships do not prove to besufficient. The third baseline however, a decision treeapproach, is already an adequate baseline as it consis-tently comes close to the handwritten rules. Moreover,the random forest model gives very good results on allthree datasets. With that said, it is to be expected tohave better results for both decision tree and randomforest with a better feature extraction model as provenin Ristoski et al. [42].
EAGLE [36] and GenLink [20] improve on thebaselines since they have the ability to optimise the

12 Learning Expressive Linkage Rules from Sparse Data
Fig. 4. Handwritten matching rule for the headphones category
thresholds for comparisons and the weights withinaggregations. Both methods have comparable resultswith the handwritten rules. The first method that showsa better performance than the handwritten rules for allproduct categories is FEBRL [9]. Because of FEBRL’sSVM implementation is optimized for entity resolu-tion, the system seems to be able to capture more nu-anced relationships between data points than the hand-written rules. The main difficulty of the FEBRL is re-call. In addition, the method has problems with match-ing corner cases.
The more recent approach, CoSum-P [46], over-comes the results of FEBRL. The graph summariza-tion approach is able to successfully generalise entitiesbased on pair-wise pre-computed property similaritiesthat refer to the same entity into one super node. How-ever, having no supervision (ability to learn from nega-tive examples) the algorithm suffers from lower preci-sion due to the inability to distinguish between closelyrelated entities. For instance, "name: iphone 6; mem-ory: 16gb" and "iphone 6s; memory: 16gb" would givea high pre-computed similarity score, and thus will beclustered together. Without negative references there isno way for the approach to differentiate between thesetwo products.
All of the GenLinkGL, GenLinkSA, and Gen-LinkComb consistently outperform results to CoSum-P, FEBRL and the handwritten rules, according to theFriedman [non-parametric rank] test [16] with signif-icance level of 0.01 6 p 6 0.05.8 Additionally, theyconsistently show significant improvement over EA-
8The Friedman [non-parametric rank] test was performed on the averagedF-measure results
GLE and GenLink according to the McNemar’s test[30] with significance level of p 6 0, 01. For in-stance, when comparing FEBRL to the GenLinkGLalgorithm, we can notice significantly worse recall re-sults. The GenLinkGL algorithm decreases the num-ber of false negatives by learning sets of rules in whicheach rule is optimized for a specific property combina-tion. Hence, the algorithm is successfully circumvent-ing missing values, and in turn exhibits a jump in re-call. Correspondingly, the GenLinkSA algorithm givesbetter results for headphones and TVs and comparableresults for phones in F-measure compared to FEBRL,mostly due to the jump in precision. The precisionjump occurs since the selective aggregation operatorssubstantially lower matching scores of uncertain pair-ings due to the uncertainty factor. Due to this penalty,pairs with missing values which otherwise would haveborderline similarity will not be considered matches.Both the jump in recall of GenLinkGL and the jumpin precision of GenLinkSA contribute to improve thematching and the algorithms have comparable resultsin F-measure. Finally, GenLinkComb shows signifi-cantly better performance in F-measure than the restof the tested field, due to the fact that the combina-tion method is able of both preserving precision bypenalising borderline cases with missing values andpreserving recall by successfully exploiting alternativeattribute combinations.
Category wise, the headphones category proves tobe an easier matching task obtaining the best resultswith 94% F-measure. Headphones have a smallernumber of distinct properties and therefore e-shopstend to more consistently describe products withthe same attributes compared to the other two cate-

Learning Expressive Linkage Rules from Sparse Data 13
Table 5
Matching results per category for the WDC Product Matching Gold Standard
HeadphonesPrecision Recall F-measure
Baseline TF-IDF Cosine 0.622 0.559 0.588Baseline Pargraph2vec 0.667 0.685 0.675Baseline Decision Tree 0.892 0.712 0.791Baseline Random Forest 0.891 0.764 0.822Handwritten Rule 0.841 0.838 0.839EAGLE [36] 0.661 0.905 0.763GenLink [20] 0.692 0.946 0.799CoSum-P [46] 0.795 0.868 0.830FEBRL [9] 0.884 0.837 0.850GenLinkGL 0.837 0.924 0.888GenLinkSA 0.922 0.925 0.923GenLinkComb 0.920 0.961 0.940
PhonesPrecision Recall F-measure
Baseline TF-IDF Cosine 0.385 0.676 0.491Baseline Pargraph2vec 0.497 0.624 0.553Baseline Decision Tree 0.751 0.600 0.667Baseline Random Forest 0.771 0.726 0.747Handwritten Rule 0.656 0.722 0.687EAGLE [36] 0.699 0.672 0.685GenLink [20] 0.708 0.715 0.712CoSum-P [46] 0.746 0.821 0.781FEBRL [9] 0.792 0.748 0.776GenLinkGL 0.742 0.894 0.808GenLinkSA 0.813 0.737 0.773GenLinkComb 0.815 0.886 0.849
TVsPrecision Recall F-measure
Baseline TF-IDF Cosine 0.661 0.474 0.554Baseline Pargraph2vec 0.654 0.553 0.572Baseline Decision Tree 0.839 0.714 0.771Baseline Random Forest 0.785 0.810 0.797Handwritten Rule 0.782 0.716 0.747EAGLE [36] 0.722 0.674 0.697GenLink [20] 0.790 0.711 0.748CoSum-P [46] 0.779 0.814 0.796FEBRL [9] 0.807 0.747 0.775GenLinkGL 0.791 0.875 0.819GenLinkSA 0.864 0.745 0.810GenLinkComb 0.863 0.815 0.838
gories. The TVs and phones category reach similar F-measures of 83.8% and 84.9% respectively.
Table 6 shows the averaged results of the algorithmsand their standard deviation values. The stability ofGenLink and GenLinkSA is improved by GenLinkGLand GenLinkComb. The latter, group multiple individ-uals, thus increasing the probability to converge to theoptimal solution.
Comparison of the learned matching rules. In or-der to explain the differences in the results of Gen-LinkSA, GenLinkGL, and GenLinkComb, we analyzeand compare the rules that were learned by the three
Table 6
Standard deviation of the GenLink Algorithms on the WDC dataset
HeadphonesAverage F-score Standard Dev.
GenLink 0.799 ±0.054GenLinkGL 0.888 ±0.029GenLinkSA 0.923 ±0.051GenLinkComb 0.940 ±0.034
PhonesAverage F-score Standard Dev.
GenLink 0.712 ±0.092GenLinkGL 0.804 ±0.035GenLinkSA 0.773 ±0.095GenLinkComb 0.849 ±0.039
TVsAverage F-score Standard Dev.
GenLink 0.748 ±0.087GenLinkGL 0.819 ±0.042GenLinkSA 0.910 ±0.087GenLinkComb 0.838 ±0.047
algorithm for matching using the expample of mobilephones. Figure 3 shows the GenLinkSA rule that waslearned. As we can see, the rules uses six propertieswhich are combined using a hierarchy of average ag-gregations. Within the hierarchy, more weight is putonto a branch containing four properties, as well ason the properties brand and phone_type within thisbranch. The GenLinkGL algorithm has learned a groupconsisting of 12 matching rules that use 15 distinctproperties for matching phones. Table 7 shows the topfive rules from the GenLinkGL approach sorted bytheir coverage. More than 50% of the rules contain themodel (phone_type) and the display size (disp_size)attributes. It is interesting to examine the coverage ofthe learned rules: The first rule was applied to match80% of the pairs in the training data. The second rulewas only used for 5% of the cases, the next rule for 2%and so on, meaning that the data contained one dom-inant attribute combination (the one exploited by thefirst rule) while by specializing on alternative combi-nations (like the second rule involving the gtin prop-erty) still improved the overall result. Furthermore,most of the learned matching rules use similar com-binations of aggregation functions (average aggrega-tion). The only exception is the second rule whichuses the property gtin. Namely, the gtin property byitself is enough to identify the specific product, thusthe maximum aggregation function is used. For match-ing phones, the GenLinkComb algorithm has learneda group that only consists of five matching rules whichuse 10 distinct properties. Consequently it achieves abetter F1-performance using less rules and less prop-

14 Learning Expressive Linkage Rules from Sparse Data
Table 7
Property, Comparisons, Aggregations and Training example coverage for thetop 5 rules in the learned group for phone category learned by GenLinkGL
Properties Comps. 1st 2nd CoverageAgg. Agg.
phone_type ExactAvg
Avg 0.800brand Levens.dips_size Levens.
Avgmemory Levens.gtin Exact
Max0.053memory Levens.
Avgphone_type Levens.phone_type Exact
AvgAvg 0.020
brand Levens.proc_type Exact
Avgcore_count Exactphone_type Exact
AvgAvg 0.017
comp_os Levens.rear_cam_res Jaccard
Avgfront_cam_res Jaccarddisp_size Exact
AvgAvg 0.013
brand Exactrear_cam_res Jaccard
Avgdisp_res Jaccard
erties compared to GenLinkGL. Table 8 shows therules that were learnt by the GenLinkComb algorithm,again sorted by coverage. Interestingly, the rules havea more homogenous coverage distribution than theGenLinkGL rules. Instead of generating low-coveragerules for exotic property combinations as GenLinkGLdoes, GenLinkComb generate less groups which ex-ploit more properties each and uses the selective aggre-gations and the uncertainty penalty to deal with miss-ing values within these properties. The property com-position also supports this argument: The robust prop-erty composition of GenLinkComb suggests that thelearned matching rules in the group contain more nu-anced differences, while GenLinkGL has more irregu-lar property composition.
Amazon-Google and Abt-Buy Results. To evaluatethe algorithms on datasets having lower number ofdistinct properties (see Table 1), we applied the algo-rithms to the Amazon-Google and Abt-Buy datasets.The results of these experiments are given in Ta-ble 9 and Table 10. As reference systems, apart ofFEBRL, the best performing approaches found in lit-erature are listed. Table 9 gives results on the match-ing experiment done on the Amazon-Google dataset.GenLinkComb outperforms a commercial system [23]based on manually set attribute-level similarity thresh-olds. The commercial system [23] derives matchingrules similar to the handwritten rules in WDC Prod-uct Matching Gold Standard and therefore is inferior tothe GenLinkComb. CoSum-P [46], shows comparable
Table 8
Property, Comparisons, and Training example coverage and Normalizedthreshold mean for the top 5 rules in the learned group for phone categorylearned by GenLinkComb
Properties Comps. 1st 2nd 3rd CoverageAgg. Agg. Agg.
phone_type Levens.Avg
Min0.492
brand Levens.
Avgmemory Jaccard
Avgdips_size Jaccardmemory Exact.
Minphone_type Levens.phone_type Exact
Min
0.221memory Exact.
Minrear_cam_res Jaccard
Avgmemory Levens.
Avgdips_size Levens.phone_type Exact
AvgAvg
Avg 0.215
brand Levens.memory Levens..
Avgrear_cam_res Jaccarddips_size Jaccard
Avgcomp_os Levens.phone_tupe Exact
MinMin
Avg0.037
memory Levens.phone_type Levens.proc_type Exactphone_type Levens.
Min
Min 0.035
memory Exactmemory Levens.
MinAvg
front_cam_res Jaccarddisp_res Jaccard
Avgphone_type Jaccard
results to GenLinkComb. As the datasets only have alow number of properties and as these properties oftencontain multi-word texts, the token-similarity basedapproach of CoSum-P can play its strength, leadingto much better relative results compared to the WDCGold Standard (Table 5).
Table 10 gives results on the matching experimentdone on the Abt-Buy dataset. As with previous datasetsGenLinkComb shows the best performance in termsof F-Measure. Both, FEBRL’s SVM classifier [9] andMARLIN [5]9 give comparable results to both Gen-LinkSA and GenLinkGL. This is to be expected, as thefeatures for both FEBRL and MARLIN were manuallyengineered for the given datasets whereas our methodsselect features automatically. Moreover, the SVM’s forboth FEBRL and MARLIN were trained with largerfeature sets than our approaches (five matchers on twoproperties).
When comparing the results of the experiments withWDC Product Matching Gold Standard to the resultsof the Abt-Buy and Amazon-Google datasets it be-
9Results from experiments with FEBRL and MARLIN are published in [23]

Learning Expressive Linkage Rules from Sparse Data 15
Table 9
Product matching results for the Amazon-Google dataset
Precision Recall F-measureGenLink [20] 0.493 0.571 0.513GenLinkGL 0.501 0.813 0.604GenLinkSA 0.691 0.632 0.643GenLinkComb 0.690 0.651 0.669
Reference Systems F-measureCoSum-P [46] 0.639 0.695 0.666FEBRL [9] 0.601COSY [23] 0.622
Table 10
Product matching results for the Abt-Buy dataset
Precision Recall F-measureGenLink [20] 0.632 0.694 0.661GenLinkGL 0.650 0.833 0.730GenLinkSA 0.721 0.714 0.717GenLinkComb 0.723 0.798 0.758
Reference Systems F-measureFEBRL [9] 0.713MARLIN [5] 0.708
comes evident that the GenLink variants perform bet-ter on datasets containing a large number of propertiesthan on dataset containing only a smaller number ofproperties.
5.4. Other Domains Results
Generally, for all datasets we can conclude that ourmethods find it difficult to find the correct matcheswhen dealing with severely sparse data (25%). Ad-ditionally, GenLinkComb and GenLinkSA have sim-ilar performance and both tend to outperform Gen-LinkGL for every dataset for the sparser settings. Incontrast, when the datasets have 75% property density,our methods perform close to the results of referencesystems achieved on the datasets with more than 90%property density.
Table 11 gives results on the matching experimentdone on the Restaurant dataset. GenLinkSA and Gen-LinkComb perform closest to the reference systems,while GenLinkGL does not show any improvement onthis dataset. Due to low number of properties that thisdataset has GenLinkComb and GenLinkGL show lit-tle improvement compared to the other methods. Con-sequently, GenLInkComb and GenLinkGL cannot findenough matching rules with alternative attributes togroup, making GenLinkComb to boil down to Gen-LinkSA and GenLinkGL to boil down to GenLink.Density wise, all three methods follow the same down-ward trend when the dataset is more sparse, keeping
Table 11
Results for the Restaurants dataset
Density25% 50% 75%
F-measure F-measure F-measureGenLink [20] 0.651 0.654 0.909GenLinkGL 0.642 0.661 0.905GenLinkSA 0.654 0.660 0.938GenLinkComb 0.653 0.664 0.936
Reference Systems on original dense dataset F-measureGenLink [20] 0.993Carvalho et al.[7] 0.980
Table 12
Results for the Sider-Drugbank dataset
Density25% 50% 75%
F-measure F-measure F-measureGenLink [20] 0.345 0.388 0.837GenLinkGL 0.399 0.424 0.875GenLinkSA 0.401 0.422 0.871GenLinkComb 0.402 0.422 0.872
Reference Systems on original dense dataset F-measureObjectCoref [19] 0.464RiMOM[45] 0.504GenLink [20] 0.970
the relative improvements of GenLinkSA and Gen-LinkGL in comparison to GenLink.
Table 12 gives results on the matching experimentdone on the Sider-Drugbank dataset. Even thoughwe systematically lowered the quality of the dataset,GenLink still outperforms the state-of-the-art [19, 45]systems for the case of 75% property density. Withthat said, GenLinkGL and GenLinkSA reach consid-erably better results in recall and precision respec-tively. When the data become severely sparse, like inthe case of 25% our methods show an increase of5% in F-measure compared to GenLink. Similarly tothe Restaurant dataset the GenLinkComb does not im-prove over GenLinkSA as again the grouping algo-rithm could not find any suitable rules with alternativeattributes for grouping.
Table 13 gives results on the matching experimentdone on the LinkedMDB dataset, which contains moreproperties compared to the other two datasets. In thiscase GenLinkComb outperforms other variations ofGenLink even when data spareness is severe. Un-like with the Restaurants and Sider-Drugbank datasetsGenLinkComb successfully finds rules with alternativeattributes to group and thus increasing F-measure by5% compared to GenLinkSA.

16 Learning Expressive Linkage Rules from Sparse Data
Table 13
Results for the LinkedMDB dataset
Density25% 50% 75%
F-measure F-measure F-measureGenLink [20] 0.540 0.587 0.873GenLinkGL 0.550 0.627 0.911GenLinkSA 0.559 0.624 0.920GenLinkComb 0.611 0.658 0.952
Reference Systems on original dense dataset F-measureEAGLE [36] 0.941GenLink [20] 0.999
Table 14
Average runtimes on the WDC Product Matching dataset
Training time (sec.) Application time (sec.)GenLink [20] 360.3 99.9GenLinkGL 510.5 113.4GenLinkSA 355.9 85.1GenLinkComb 508.2 113.3
Reference SystemsEAGLE [36] 347.4 3.5CoSum-P [46] N/A 78.4
5.5. Runtimes Discussion
Table 14 shows the average training as well as appli-cation runtimes in seconds of GenLink and its variantsas well as EAGLE and CoSum-P on the WDC Prod-uct Matching dataset. The experiments have been con-ducted using a Intel(R) Xeon CPU with 6 cores avail-able while the Java heap space has been restricted to4GB. On average, it took GenLink and GenLinkSAapproximately 6 minutes to learn a matching rule us-ing the maximum number of iterations (see Table 4 forthe exact configuration), while it took GenLinkGL andGenLinkComb 8.5 minutes to learn a group of rules.Similar to GenLink, EAGLE learns a matching rulefor the same dataset in just under 6 minutes. However,when comparing application run times, GenLink andits variants are at least 24.3 times slower than EAGLE.This result is explained by the fact that GenLink andits variants in their current implementation scale super-linear with the number of records, as we do not applyany blocking. Compared to CoSum-P, GenLink and itsvariants are between 7 to 35 seconds slower.
6. Related Work
Entity resolution has been extensively studied underdifferent names such as record linkage [1, 8, 18, 34],reference reconciliation [13], coreference resolution
[26, 33]. In the following, we review a set of represen-tative entity resolution approaches; while we refer totutorials [17] and surveys [6, 10, 44] for more through-out reviews.
Distance-based entity resolution approaches focuson learning a pairwise distance metric between enti-ties and then either set a distance threshold or builda pairwise classifier to determine which entities aremerged. Such pairwise classifiers can be categorisedinto threshold based boolean classifiers and linear clas-sifiers. One of the first generic approaches for entityresolution based on boolean classifiers is presented at[2]. The approach is based on the assumption that theentity resolution process consists of iterative match-ing and merging which results in a set of mergedrecords that cannot be further matched or merged witheach other. The authors also assume that matching andmerging can be done if similar values exists, thereforetheir approach would not be able to match or mergerecords with missing values.
One of the most popular method to model distance-based entity resolution approaches is with linear clas-sifiers. There are two popular applications of SVMs toentity matching MARLIN (Multiply Adaptive RecordLinkage with INduction) [5] and FEBRL (Freely Ex-tensible Biomedical Record Linkage) [9]. While thereare numerous studies that propose approaches for han-dling missing values in SVMs, for instance [38], theseoptimizations are often expensive and to our knowl-edge are not used in matching approaches.
An important use cases of entity resolution is match-ing of product data. Following the same trend fromabove various studies show optimization approachesof linear classifiers for product resolution. For in-stance, Kannan et al. [22] learn a logistic regressionmodel on product attributes extracted from a dictio-nary model. Similarly, in [24] the authors extend theFEBRL approach from [23] with more detailed fea-tures. Finally, in [41], the authors compare variousclassifiers for product resolution (SVMs, Random For-est, Naive Bayes) with features extracted from a dictio-nary method and multiple Conditional Random Fields(CRFs) models. The authors, extended their work in[42], where they present extraction models with latentcontinuous features for product matching and classifi-cation, proving that more sophisticated feature extrac-tion methods significantly improve traditional machinelearning methods for entity resolution.
The entire process of entity resolution can be un-supervised [11, 28, 37, 46] or supervised [33, 34].To compare learning entity resolution methods, semi-

Learning Expressive Linkage Rules from Sparse Data 17
automatic baseline approaches are used. These ap-proaches are based on a definition of effective linkingspecifications that excel in one-to-one matching tasksincluding TF-IDF or Paragraph2Vec with cosine sim-ilarity or based on other similarity functions as pre-sented in Hassanzadeh et al. [18]. Limes [34] and Silk[20] are examples of supervised entity resolution sys-tems that focus on combining expressive comparisonswith good run-time behavior. Both Limes and Silklearn linkage rules employing similar genetic program-ming approaches, i.e EAGLE [36] and GenLink re-spectively. In addition to GenLink, Silk provides Ac-tiveGenLink an active learning approach presented inIsele et al. [21]. As shown throughout this paper, bothalgorithms do not handle missing values well.
Contrary to the above, in Ngomo et al. [35], the au-thors present RAVEN - an entity resolution approachbased on perceptron learning. Namely, RAVEN treatsthe discovery of link specifications as a classificationproblem. It discovers link specifications by first find-ing class and property mappings between knowledgebases automatically, after which it computes linear andboolean classifiers that can be used as link specifica-tions. However, similar to FEBRL the main limita-tion of RAVEN is that only linear and boolean classi-fiers can be learned, making optimization for matchingsparse data expensive.
There is another direction of work which focuses oncollective entity resolution. For instance, Bhattacharyaand Getoor [4] proposed a novel relational clusteringalgorithm that uses both property and relational infor-mation between the entities of same type for determin-ing the underlying entities. However, the defined clus-ter similarity measure depends primarily on propertyvalue similarity, thus missing values will have effect onthe cluster similarity measure. Another collective en-tity resolution approach is introduced in [3] where theauthors use an extended LDA model to perform entityresolution for authors and publications simultaneously.
In contrast, [29, 43] use probabilistic model for cap-turing the dependence among multiple matching deci-sions. Specifically, CRFs have been successfully ap-plied to the entity resolution domain [29] and is one ofthe most popular approaches in generic entity resolu-tion. On another hand, a well-founded integrated solu-tion to the entity-resolution problem based on MarkovLogic is proposed in [43]. However the approach ap-ply the closed-world assumption, i.e.whatever is notobserved is assumed to be false in the world.
One of the first works in the Semantic Web onthe topic of unsupervised entity resolution is Nikolov
et al. [37]. The authors present a genetic algorithmfor matching, similar to EAGLE [36] and GenLink[20]. However, instead of providing reference linksas basis for calculating fitness, the authors propose a"pseudo F-measure"; an approximation to F-measurebased on indicators gathered from the datasets. Specif-ically, the fitness function proposed by the author as-sumes datasets not to contain any duplicates. This as-sumption is violated by many real world datasets. Forinstance, the WDC dataset contains many offers for thesame product all originating from eBay.
CoSum [46] and idMesh [12] are two represen-tative unsupervised graph-based entity resolution ap-proaches. CoSum and idMesh are both treating entityresolution are graph summarisation problem, i.e. gen-erating super-nodes by clustering entities and in thecase of CoSum by applying collective matching tech-niques. Both approaches employ sophisticated genericsimilarity metrics. Nevertheless, dues to not using neg-ative evidence, they likely run into problems for usecases in which small syntactic differences matter, suchas product type Lul5X versus Lul6X. As shown by thegood results of CoSum-P [46] on the Amazon-Googledataset (see Section 5.3), unsupervised approaches canexcel in use cases that involve rather unstructured, tex-tual data. But due to not using domain-specific evi-dence, they likely reach lower relative results for usecases that require domain-specific similarity metricsand attribute weights.
7. Conclusion
The article introduces three methods for learningexpressive linkage rules from sparse data. The firstmethod learns groups of matching rules which are eachspecialized on a specific combination of non-NULLproperties. Moreover, we introduce new operators tothe GenLink algorithm: selective aggregation opera-tors. These operators assign lower similarity values topairings with missing values which in turn boosts pre-cision. Finally, we presented a method that integratesthe central ideas of the previous two methods intoone combined method. We evaluate the three methodson six different datasets, three of them are of the e-commerce domain (as one of the domains that often in-volves sparse datasets), and the other three datasets arebenchmark datasets that were used in previous work.We show improvements of up to 16% F-measure com-pared to handwritten rules, on average 12% F-measureimprovement compared to the original GenLink algo-

18 Learning Expressive Linkage Rules from Sparse Data
rithm, 15% compared to EAGLE, 8% compared toFEBRL, and 5% compared to CoSum-P. In addition,we show that the method using group matching rulesimproves recall up to 15%, while selective aggregationoperators mostly improve precision of up to 16%. Thecombination that encompasses these methods allowsfor improvement of up to 5% F-measure compared tothe GenLinkGL and GenLinkSA themselves.
As a general conclusion, the high gains in F-measure clearly shows that identity resolution systemsshould take sparse data into account and not only fo-cus on dense datasets. When benchmarking and com-paring systems, it is important to not only use denseevaluation datasets, but also test on dataset with vary-ing attribute density like the WDC Product MatchingGold Standard [40].
References
[1] Arasu, A., Götz, M., Kaushik, R.: On active learning of record match-ing packages. In: Proceedings of the 2010 ACM SIGMOD InternationalConference on Management of Data. pp. 783–794. SIGMOD ’10, ACM,New York, NY, USA (2010)
[2] Benjelloun, O., Garcia-Molina, H., Menestrina, D., Su, Q., Whang, S.E.,Widom, J.: Swoosh: a generic approach to entity resolution. The VLDBJournal—The International Journal on Very Large Data Bases 18(1),255–276 (2009)
[3] Bhattacharya, I., Getoor, L.: A Latent Dirichlet Model for UnsupervisedEntity Resolution, pp. 47–58 (2006)
[4] Bhattacharya, I., Getoor, L.: Collective entity resolution in relationaldata. ACM Trans. Knowl. Discov. Data 1(1) (Mar 2007)
[5] Bilenko, M., Mooney, R.J.: Adaptive duplicate detection using learnablestring similarity measures. In: Proceedings of the Ninth ACM SIGKDDInternational Conference on Knowledge Discovery and Data Mining. pp.39–48. KDD ’03, ACM, New York, NY, USA (2003)
[6] Brizan, D.G., Tansel, A.U.: A. survey of entity resolution and recordlinkage methodologies. Communications of the IIMA 6(3), 5 (2015)
[7] de Carvalho, M.G., Gonçalves, M.A., Laender, A.H.F., da Silva, A.S.:Learning to deduplicate. In: Proceedings of the 6th ACM/IEEE-CS JointConference on Digital Libraries. pp. 41–50. JCDL ’06, ACM, New York,NY, USA (2006)
[8] Christen, P.: Automatic record linkage using seeded nearest neighbourand support vector machine classification. In: Proceedings of the 14thACM SIGKDD International Conference on Knowledge Discovery andData Mining. pp. 151–159. KDD ’08, ACM, New York, NY, USA (2008)
[9] Christen, P.: Febrl: A freely available record linkage system with agraphical user interface. In: Proceedings of the Second AustralasianWorkshop on Health Data and Knowledge Management - Volume 80.pp. 17–25. HDKM ’08, Australian Computer Society, Inc., Darlinghurst,Australia, Australia (2008)
[10] Christen, P.: A survey of indexing techniques for scalable record linkageand deduplication. IEEE transactions on knowledge and data engineer-ing 24(9), 1537–1555 (2012)
[11] Cohen, W.W., Richman, J.: Learning to match and cluster large high-dimensional data sets for data integration. In: Proceedings of the EighthACM SIGKDD International Conference on Knowledge Discovery andData Mining. pp. 475–480. KDD ’02, ACM, New York, NY, USA (2002)
[12] Cudré-Mauroux, P., Haghani, P., Jost, M., Aberer, K., De Meer, H.:idmesh: Graph-based disambiguation of linked data. In: Proceedings ofthe 18th International Conference on World Wide Web. pp. 591–600.WWW ’09, ACM, New York, NY, USA (2009)
[13] Dong, X., Halevy, A., Madhavan, J.: Reference reconciliation in com-plex information spaces. In: Proceedings of the 2005 ACM SIGMODInternational Conference on Management of Data. pp. 85–96. SIGMOD’05, ACM, New York, NY, USA (2005)
[14] Elmagarmid, A.K., Ipeirotis, P.G., Verykios, V.S.: Duplicate record de-tection: A survey. Knowledge and Data Engineering, IEEE Transactionson 19(1), 1–16 (2007)
[15] Fellegi, I.P., Sunter, A.B.: A theory for record linkage. Journal of theAmerican Statistical Association 64(328), 1183–1210 (1969)
[16] Friedman, M.: The use of ranks to avoid the assumption of normalityimplicit in the analysis of variance. Journal of the American Statisti-cal Association 32(200), 675–701 (1937), https://www.tandfonline.com/doi/abs/10.1080/01621459.1937.10503522
[17] Getoor, L., Machanavajjhala, A.: Entity resolution: theory, practice &open challenges. Proceedings of the VLDB Endowment 5(12), 2018–2019 (2012)
[18] Hassanzadeh, O., Pu, K.Q., Yeganeh, S.H., Miller, R.J., Popa, L.,Hernández, M.A., Ho, H.: Discovering linkage points over web data.Proc. VLDB Endow. 6(6), 445–456 (Apr 2013), http://dx.doi.org/10.14778/2536336.2536345
[19] Hu, W., Chen, J., Cheng, G., Qu, Y.: Objectcoref & falcon-ao: Re-sults for oaei 2010. In: Proceedings of the 5th International Conferenceon Ontology Matching - Volume 689. pp. 158–165. OM’10, CEUR-WS.org, Aachen, Germany, Germany (2010)
[20] Isele, R., Bizer, C.: Learning expressive linkage rules using genetic pro-gramming. Proceedings of the VLDB Endowment 5(11), 1638–1649(2012)
[21] Isele, R., Bizer, C.: Active learning of expressive linkage rules usinggenetic programming. Web Semant. 23, 2–15 (Dec 2013), http://dx.doi.org/10.1016/j.websem.2013.06.001
[22] Kannan, A., Givoni, I.E., Agrawal, R., Fuxman, A.: Matching unstruc-tured product offers to structured product specifications. In: Proceedingsof the 17th ACM SIGKDD International Conference on Knowledge Dis-covery and Data Mining. pp. 404–412. KDD ’11, ACM, New York, NY,USA (2011)
[23] Köpcke, H., Thor, A., Rahm, E.: Evaluation of entity resolution ap-proaches on real-world match problems. Proceedings of the VLDB En-dowment 3(1-2), 484–493 (2010)
[24] Köpcke, H., Thor, A., Thomas, S., Rahm, E.: Tailoring entity resolutionfor matching product offers. In: Proceedings of the 15th InternationalConference on Extending Database Technology. pp. 545–550. EDBT’12, ACM, New York, NY, USA (2012)
[25] Le, Q., Mikolov, T.: Distributed representations of sentences and docu-ments. In: Xing, E.P., Jebara, T. (eds.) Proceedings of the 31st Interna-tional Conference on Machine Learning. Proceedings of Machine Learn-ing Research, vol. 32, pp. 1188–1196. PMLR, Bejing, China (22–24 Jun2014)
[26] Lee, H., Chang, A., Peirsman, Y., Chambers, N., Surdeanu, M.,Jurafsky, D.: Deterministic coreference resolution based on entity-centric, precision-ranked rules. Computational Linguistics 39(4), 885–916 (2013)
[27] Matthews, B.W.: Comparison of the predicted and observed secondarystructure of t4 phage lysozyme. Biochimica et Biophysica Acta (BBA)-Protein Structure 405(2), 442–451 (1975)
[28] McCallum, A., Nigam, K., Ungar, L.H.: Efficient clustering of high-dimensional data sets with application to reference matching. In: Pro-ceedings of the Sixth ACM SIGKDD International Conference onKnowledge Discovery and Data Mining. pp. 169–178. KDD ’00, ACM,New York, NY, USA (2000)
[29] McCallum, A., Wellner, B.: Conditional models of identity uncertaintywith application to noun coreference. In: NIPS. pp. 905–912 (2004)
[30] McNemar, Q.: Note on the sampling error of the difference betweencorrelated proportions or percentages. Psychometrika 12(2), 153–157(1947)
[31] Meusel, R., Petrovski, P., Bizer, C.: The WebDataCommons Microdata,RDFa and Microformat Dataset Series, pp. 277–292. Springer Interna-tional Publishing, Cham (2014)
[32] Nentwig, M., Hartung, M., Ngomo, A.N., Rahm, E.: A survey of currentlink discovery frameworks. Semantic Web 8(3), 419–436 (2017), https://doi.org/10.3233/SW-150210
[33] Ng, V., Cardie, C.: Improving machine learning approaches to corefer-ence resolution. In: Proceedings of the 40th Annual Meeting on Associ-ation for Computational Linguistics. pp. 104–111. ACL ’02, Associationfor Computational Linguistics, Stroudsburg, PA, USA (2002)
[34] Ngomo, A.C.N., Auer, S.: Limes: A time-efficient approach for large-scale link discovery on the web of data. In: Proceedings of the Twenty-Second International Joint Conference on Artificial Intelligence - Vol-ume Volume Three. pp. 2312–2317. IJCAI’11, AAAI Press (2011)

Learning Expressive Linkage Rules from Sparse Data 19
[35] Ngomo, A.C.N., Lehmann, J., Auer, S., Höffner, K.: Raven - activelearning of link specifications. In: Proceedings of the 6th InternationalConference on Ontology Matching - Volume 814. pp. 25–36. OM’11,CEUR-WS.org, Aachen, Germany, Germany (2011), http://dl.acm.org/citation.cfm?id=2887541.2887544
[36] Ngonga Ngomo, A.C., Lyko, K.: Eagle: Efficient active learning of linkspecifications using genetic programming. The Semantic Web: Researchand Applications pp. 149–163 (2012)
[37] Nikolov, A., d’Aquin, M., Motta, E.: Unsupervised learning of link dis-covery configuration. In: Simperl, E., Cimiano, P., Polleres, A., Corcho,O., Presutti, V. (eds.) The Semantic Web: Research and Applications. pp.119–133. Springer Berlin Heidelberg, Berlin, Heidelberg (2012)
[38] Pelckmans, K., Brabanter, J.D., Suykens, J., Moor, B.D.: Handlingmissing values in support vector machine classifiers. Neural Networks18(5âAS6), 684 – 692 (2005), {IJCNN} 2005
[39] Petrovski, P., Bryl, V., Bizer, C.: Integrating product data from websitesoffering microdata markup. In: Proceedings of the 23rd InternationalConference on World Wide Web. pp. 1299–1304. WWW ’14 Compan-ion, ACM, New York, NY, USA (2014)
[40] Petrovski, P., Primpeli, A., Meusel, R., Bizer, C.: The WDC Gold Stan-dards for Product Feature Extraction and Product Matching, pp. 73–86.Springer International Publishing, Cham (2017)
[41] Ristoski, P., Mika, P.: Enriching Product Ads with Metadata from HTMLAnnotations, pp. 151–167. Springer International Publishing, Cham(2016)
[42] Ristoski, P., Petrovski, P., Mika, P., Paulheim, H.: A machine learningapproach for product matching and categorization. Semantic Web Jour-nal (2017)
[43] Singla, P., Domingos, P.: Entity resolution with markov logic. In: SixthInternational Conference on Data Mining (ICDM’06). pp. 572–582 (Dec2006)
[44] Winkler, W.E.: Matching and record linkage. Business survey methods1, 355–384 (1995)
[45] Winkler, W.E.: Methods for record linkage and bayesian networks. Tech.rep., Technical report, Statistical Research Division, US Census Bureau,Washington, DC (2002)
[46] Zhu, L., Ghasemi-Gol, M., Szekely, P., Galstyan, A., Knoblock, C.A.:Unsupervised Entity Resolution on Multi-type Graphs, pp. 649–667.Springer International Publishing, Cham (2016)

Dear reviewers, dear editors thank you very much for the feedback on our article. We have improved the article to address all of your comments and are now sending you a revised version together with point-by-point explanations on how we addressed each of your comments. The explanations are found below. Best regards, Christian Bizer and Petar Petrovski
Answers to the Reviewer Comments Review #3 Submitted by Anonymous Recommendation: Minor Revision Comment R3R2C1: R1C2: The formulation is still incorrect and should read "The evaluation of GenLink has shown that the algorithm delivers good results with F-measures above 95\% on different dense datasets such as sider-drugbank, LinkedMDB, restaurants [19]. Answer R3R2C1: This has been corrected and now reads as you suggested. Comment R3R2C2: R1C5: I'm afraid the meaning of M is still not clearly described. The paper reads "the subset M consisting of all pairs" and does not state what M is a subset of. Do you simply mean set? Please fix. Answer R3R2C2: We simply mean set. Sorry for the confusion. This has been fixed and now reads: “...the objective is to find the set M consisting of all pairs of entities...”
Comment R3R2C3: - R1C6: The text now reads "a relation ~R". Do you mean owl:sameAs? If yes, please say so. If not, please define ~R formally. Answer R3R2C3: With ~R we mean all relations (including owl:sameAs) that relate entities to each other which represent the same real-world object. We have clarified this in the paper.
Comment R3R2C4: - R1C14: "removing (or loosening) the penalty has the potential to result with overfitted model and thus would not improve results" Do you mean "removing (or loosening) the penalty has the potential to result in an overfitted model. Thus, it might not improve the results of our approach"? Please check. Answer R3R2C4: Yes, we do mean that. We have changed the paper accordingly. Comment R3R2C5: - R1C15d: While I agree with the potential for improvement as to the runtimes and would like said fact to be added to the discussion, I'm afraid I disagree with the authors w.r.t. reporting runtime results. It is

only fair to state runtimes (and the hardware on which the runtimes were achieved) so that other researchers know what to expect when aiming to use or extend your approach. Hence, I must repeat my request for a table of the runtimes one the different datasets being added to the paper. It'd be especially helpful if the runtimes of the other algorithms were added as well. Answer R3R2C5: We have added a table reporting the runtimes (Table 14) and added a section discussing the runtimes (Section 5.5) in which we compare the train and application runtimes of GenLink, GenLinkGL, GenLinkSA, GenLinkComb, EAGLE and CoSum-P (application runtime only) and point out that GenLinkGL, GenLinkSA, GenLinkComb in their current implementation do not apply any blocking.
Comment R3R2C6: - R1C21: I would argue that seeing the manual rule would actually help the reader get an idea of the complexity of the problem at hand. Hence, I'd still suggest that it is added. Answer R3R2C6: We have added the handwritten rule that was used for matching headphones as an example to the paper. See Figure 4 and discussion in Section 5.2.
Comment R3R2C7: - R1C28: The authors seem to mix up the LIMES framework and the LIMES algorithm. The paper describing the framework is (Ngonga Ngomo, 2012) and I guess the authors mean the framework when they talk about LIMES.
Answer R3R2C7: We mean the LIMES algorithm. As we already said before, the reference that we cite is the most widely cited reference on LIMES and we would like to keep it and not cite a less known paper.
Comment R3R2C8: - Equation 6. Do you mean $|\cup_{i=1}^|G| tp_i|$? You redefine i on the top of your sum, making your equation incorrect. Please check. Answer R3R2C8: This has been corrected in the paper. Comment R3R2C9: - Equation 7. See Eq. 6. Answer R3R2C9: This has been corrected in the paper.
Comment R3R2C10: - How do you know when to switch to a larger value of $c$. Any insights? Answer R3R2C10: Hyper parameters are set using grid search including $c$. The the constant should be higher for larger populations in order to lower the chance for overfitting in larger populations. This is explained in the paper now in more detail (see Section 4.1).
Comment R3R2C11: - Again, you use * and \times to mean multiplication (see Eq. 5 and the fitness_group equation). This was already pointed out in my last review and correction was claimed. I would be thankful if the authors could check their manuscript anew for such inconsistencies.

Answer R3R2C11: This has been corrected in the paper.
Experiments Comment R3R2C12: - Table 4: Please add the variable name to the labels (e.g., \alpha, \beta) Answer R3R2C12: This has been refined in the paper (see Table 4)
Comment R3R2C13: - The authors train on 66% of the data and evaluate on 33%. Why do they not use the standard protocol of n-fold validations? In all other cases, it could be that their results are just an artifact of the slices chosen (which is unlikely given the significance of their results but should still be checked). Please clarify or switch to an n-fold cross-validation. Any reason for the 3-fold instead of 10-fold validation commonly used? Answer R3R2C13: We evaluated all approaches using the same setting (66/33 split) and verified the significance of the results. We consider this a valid experimental setup.
Comment R3R2C14: - Statistical test. The authors do not describe what they test exactly. Do you compare the average F-measures achieve over 10 runs or do you compare single runs? Answer R3R2C14: We perform the Friedman [non-parametric rank] test on the average runs. This has been clarified in the paper.
Comment R3R2C15: - " Correspondingly, the GenLinkSA algorithm gives comparable results in F-measure compared to FEBRL, mostly due to the jump in precision". It seems to me that your approach is commonly better than FEBRL. Please check. Answer R3R2C15: This has been clarified in the paper and now read: " Correspondingly, the GenLinkSA algorithm gives better results for headphones and TVs and comparable results for phones in F-measure compared to FEBRL, mostly due to the jump in precision"
Comment R3R2C16: Typos "Additionally, find" => Additionally, we find [Do you mean we compute. You don't really need to find U once you have M] Please mind the punctuation after your equations. Footnotes should be placed after punctuation marks. Answer R3R2C16: The typos were corrected.