
Longitudinal Variations of the Stratospheric Quasi-biennial Oscillation
20
15 FEBRUARY 2004 383 HAMILTON ET AL. q 2004 American Meteorological Society Longitudinal Variation of the Stratospheric Quasi-Biennial Oscillation KEVIN HAMILTON Department of Meteorology, and International Pacific Research Center, University of Hawaii at Manoa, Honolulu, Hawaii ALBERT HERTZOG AND FRANC ¸ OIS VIAL Laboratoire de Me ´te ´orologie Dynamique, CNRS, Palaiseau, France GEORGIY STENCHIKOV Department of Environmental Sciences, Rutgers University, New Brunswick, New Jersey (Manuscript received 11 March 2003, in final form 21 August 2003) ABSTRACT The longitudinal dependence of interannual variations of tropical stratospheric wind is examined in a detailed general circulation model simulation and in the limited observations available. A version of the SKYHI model is run with an imposed zonally symmetric zonal momentum source that forces the zonal-mean zonal wind evolution in the tropical stratosphere to be close to an estimate of the observed zonal wind based on radiosonde observations at Singapore during the period 1978–99. This amounts to a kind of simple assimilation model in which only the zonal-mean wind field in the tropical stratosphere is assimilated, and other quantities are allowed to vary freely. A total of five experiments were run, one covering the full 1978–99 period and four for 1989–99. The results at and above about 30 hPa are fairly simple to characterize. When the zonal-mean wind near the equator at a particular level is easterly, the monthly mean wind has only very small zonal contrasts. When mean westerlies are present near the equator, significant zonal asymmetries occur at low latitudes, most notably easterly anomalies over South America and westerly anomalies in the eastern Pacific region. These anomalies generally display a continuous meridional phase propagation with the extratropical quasi-stationary eddy field in the winter hemisphere. The net result is a significantly weaker peak-to-peak amplitude of the quasi-biennial oscillation (QBO) in zonal wind over the South American sector than over the rest of the equatorial band. The zonal contrast in QBO amplitude near 10 hPa exceeds 10%. In the lower stratosphere the zonal asymmetries in the prevailing wind are fairly small. Asymmetries seem to reflect the upward extension of the tropospheric Walker circulation, and are less strongly modulated by the quasi-biennial oscillation in zonal-mean circulation. The model results were checked against limited station observations at Nairobi (1.38S, 36.78E), Singapore (1.48N, 103.98E), Rochambeau (4.88N, 52.48W), and Bogota (4.78N, 74.18W). Overall reasonable agreement was found between the monthly mean zonal winds in the model simulation and these station data. The low-latitude wind field in monthly mean NCEP gridded analyses was also examined. These analyses have some obviously unrealistic features in the tropical stratosphere, but some of the behavior seen in the SKYHI model simulations can be identified as well in the NCEP analyses. 1. Introduction The quasi-biennial oscillation (QBO) accounts for a major fraction of the interannual variability of the cir- culation of the tropical stratosphere and has significant effects on aspects of extratropical circulation as well (see Baldwin et al. 2001 for a review). Almost all ob- servational studies of the QBO have been based on the assumption that the oscillation in prevailing wind (as Corresponding author address: Kevin Hamilton, International Pa- cific Research Center, University of Hawaii at Manoa, Honolulu, HI 96822. E-mail: [email protected] represented by the monthly mean) is nearly zonally sym- metric. The circulation in the near-equatorial region of the stratosphere is rather poorly observed due to the scarcity of balloon radiosonde stations near the equator regularly reporting winds in the stratosphere and the limited usefulness of satellite temperature retrievals in deriving winds near the equator. In an early study, Bel- mont and Dartt (1968) attempted to use available ra- diosonde data at 50 hPa (and lower levels) to examine the longitudinal variations in the QBO. They mostly focussed on trying to characterize longitudinal varia- tions in the phase of the QBO, with the conclusion that near the equator the phase propagation is very rapid,
Transcript of Longitudinal Variations of the Stratospheric Quasi-biennial Oscillation

15 FEBRUARY 2004 383H A M I L T O N E T A L .
q 2004 American Meteorological Society
Longitudinal Variation of the Stratospheric Quasi-Biennial Oscillation
KEVIN HAMILTON
Department of Meteorology, and International Pacific Research Center, University of Hawaii at Manoa, Honolulu, Hawaii
ALBERT HERTZOG AND FRANCOIS VIAL
Laboratoire de Meteorologie Dynamique, CNRS, Palaiseau, France
GEORGIY STENCHIKOV
Department of Environmental Sciences, Rutgers University, New Brunswick, New Jersey
(Manuscript received 11 March 2003, in final form 21 August 2003)
ABSTRACT
The longitudinal dependence of interannual variations of tropical stratospheric wind is examined in a detailedgeneral circulation model simulation and in the limited observations available. A version of the SKYHI modelis run with an imposed zonally symmetric zonal momentum source that forces the zonal-mean zonal windevolution in the tropical stratosphere to be close to an estimate of the observed zonal wind based on radiosondeobservations at Singapore during the period 1978–99. This amounts to a kind of simple assimilation model inwhich only the zonal-mean wind field in the tropical stratosphere is assimilated, and other quantities are allowedto vary freely. A total of five experiments were run, one covering the full 1978–99 period and four for1989–99.
The results at and above about 30 hPa are fairly simple to characterize. When the zonal-mean wind near theequator at a particular level is easterly, the monthly mean wind has only very small zonal contrasts. When meanwesterlies are present near the equator, significant zonal asymmetries occur at low latitudes, most notably easterlyanomalies over South America and westerly anomalies in the eastern Pacific region. These anomalies generallydisplay a continuous meridional phase propagation with the extratropical quasi-stationary eddy field in the winterhemisphere. The net result is a significantly weaker peak-to-peak amplitude of the quasi-biennial oscillation(QBO) in zonal wind over the South American sector than over the rest of the equatorial band. The zonal contrastin QBO amplitude near 10 hPa exceeds 10%.
In the lower stratosphere the zonal asymmetries in the prevailing wind are fairly small. Asymmetries seemto reflect the upward extension of the tropospheric Walker circulation, and are less strongly modulated by thequasi-biennial oscillation in zonal-mean circulation.
The model results were checked against limited station observations at Nairobi (1.38S, 36.78E), Singapore(1.48N, 103.98E), Rochambeau (4.88N, 52.48W), and Bogota (4.78N, 74.18W). Overall reasonable agreement wasfound between the monthly mean zonal winds in the model simulation and these station data. The low-latitudewind field in monthly mean NCEP gridded analyses was also examined. These analyses have some obviouslyunrealistic features in the tropical stratosphere, but some of the behavior seen in the SKYHI model simulationscan be identified as well in the NCEP analyses.
1. Introduction
The quasi-biennial oscillation (QBO) accounts for amajor fraction of the interannual variability of the cir-culation of the tropical stratosphere and has significanteffects on aspects of extratropical circulation as well(see Baldwin et al. 2001 for a review). Almost all ob-servational studies of the QBO have been based on theassumption that the oscillation in prevailing wind (as
Corresponding author address: Kevin Hamilton, International Pa-cific Research Center, University of Hawaii at Manoa, Honolulu, HI96822.E-mail: [email protected]
represented by the monthly mean) is nearly zonally sym-metric. The circulation in the near-equatorial region ofthe stratosphere is rather poorly observed due to thescarcity of balloon radiosonde stations near the equatorregularly reporting winds in the stratosphere and thelimited usefulness of satellite temperature retrievals inderiving winds near the equator. In an early study, Bel-mont and Dartt (1968) attempted to use available ra-diosonde data at 50 hPa (and lower levels) to examinethe longitudinal variations in the QBO. They mostlyfocussed on trying to characterize longitudinal varia-tions in the phase of the QBO, with the conclusion thatnear the equator the phase propagation is very rapid,
384 VOLUME 61J O U R N A L O F T H E A T M O S P H E R I C S C I E N C E S
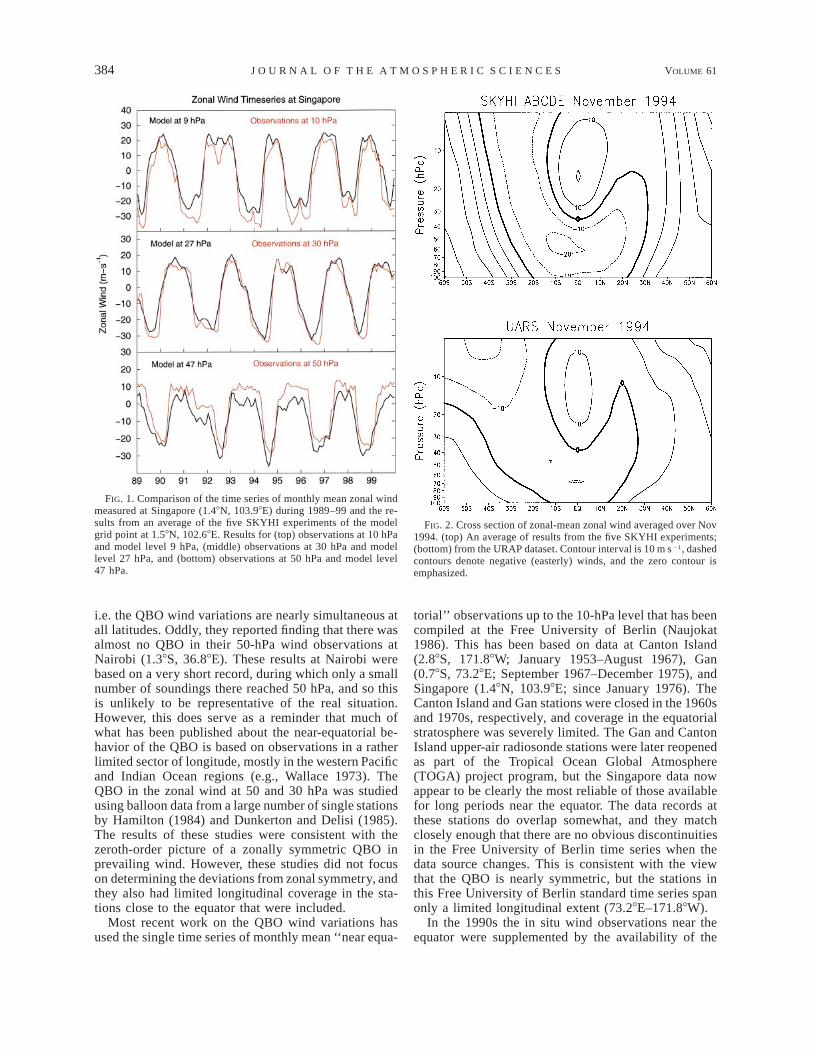
FIG. 1. Comparison of the time series of monthly mean zonal windmeasured at Singapore (1.48N, 103.98E) during 1989–99 and the re-sults from an average of the five SKYHI experiments of the modelgrid point at 1.58N, 102.68E. Results for (top) observations at 10 hPaand model level 9 hPa, (middle) observations at 30 hPa and modellevel 27 hPa, and (bottom) observations at 50 hPa and model level47 hPa.
FIG. 2. Cross section of zonal-mean zonal wind averaged over Nov1994. (top) An average of results from the five SKYHI experiments;(bottom) from the URAP dataset. Contour interval is 10 m s21, dashedcontours denote negative (easterly) winds, and the zero contour isemphasized.
i.e. the QBO wind variations are nearly simultaneous atall latitudes. Oddly, they reported finding that there wasalmost no QBO in their 50-hPa wind observations atNairobi (1.38S, 36.88E). These results at Nairobi werebased on a very short record, during which only a smallnumber of soundings there reached 50 hPa, and so thisis unlikely to be representative of the real situation.However, this does serve as a reminder that much ofwhat has been published about the near-equatorial be-havior of the QBO is based on observations in a ratherlimited sector of longitude, mostly in the western Pacificand Indian Ocean regions (e.g., Wallace 1973). TheQBO in the zonal wind at 50 and 30 hPa was studiedusing balloon data from a large number of single stationsby Hamilton (1984) and Dunkerton and Delisi (1985).The results of these studies were consistent with thezeroth-order picture of a zonally symmetric QBO inprevailing wind. However, these studies did not focuson determining the deviations from zonal symmetry, andthey also had limited longitudinal coverage in the sta-tions close to the equator that were included.
Most recent work on the QBO wind variations hasused the single time series of monthly mean ‘‘near equa-
torial’’ observations up to the 10-hPa level that has beencompiled at the Free University of Berlin (Naujokat1986). This has been based on data at Canton Island(2.88S, 171.88W; January 1953–August 1967), Gan(0.78S, 73.28E; September 1967–December 1975), andSingapore (1.48N, 103.98E; since January 1976). TheCanton Island and Gan stations were closed in the 1960sand 1970s, respectively, and coverage in the equatorialstratosphere was severely limited. The Gan and CantonIsland upper-air radiosonde stations were later reopenedas part of the Tropical Ocean Global Atmosphere(TOGA) project program, but the Singapore data nowappear to be clearly the most reliable of those availablefor long periods near the equator. The data records atthese stations do overlap somewhat, and they matchclosely enough that there are no obvious discontinuitiesin the Free University of Berlin time series when thedata source changes. This is consistent with the viewthat the QBO is nearly symmetric, but the stations inthis Free University of Berlin standard time series spanonly a limited longitudinal extent (73.28E–171.88W).
In the 1990s the in situ wind observations near theequator were supplemented by the availability of the

15 FEBRUARY 2004 385H A M I L T O N E T A L .
FIG. 3. The zonal wind at 9 hPa and 1.58N averaged over JFM periods of 11 individual years (1989–99) in SKYHI experiment E.
high-resolution Doppler interferometer (HRDI) obser-vations from the Upper Atmosphere Research Satellite(UARS). Much of the research performed with the HRDIwinds has emphasized either zonal means or the meandiurnal cycle, both of which allow considerable aver-aging to reduce the signal-to-noise ratio below that ofthe raw wind values. However, Ortland (1997) has ex-amined the zonal asymmetries in 2-week averages ofthe wind as measured by HRDI during several years,but concentrating on the 30–35-km altitude level (about10–5 hPa) in the 1994–95 boreal winter period. Heshowed that the quasi-stationary wave field in the mid-latitudes propagated from the Northern Hemisphere ex-tratropics into the equatorial region, leading to large-scale zonal asymmetries in the equatorial prevailingwind. O’Sullivan (1997a) has examined the nitrous ox-ide concentrations along the 10-hPa surface in borealwinter as measured by the Cryogenic Limb Array EtalonSpectrometer (CLAES) instrument on UARS. Heshowed that, when mean westerlies are present on theequator at this level, the nitrous oxide concentrationsshow significant deviations from zonal symmetry evenon the equator and in the summer hemisphere Tropics.
The patterns of nitrous oxide appear consistent withlarge-scale quasi-stationary waves propagating from thewinter hemisphere and breaking on the summer side ofthe equator.
The issue of zonal asymmetries in the prevailingstratospheric equatorial wind has been studied in modelsof various levels of sophistication. Matsuno (1970) con-structed a linear model of the three-dimensional winterstationary wave field in the Northern Hemisphere strato-sphere employing a specified zonal-mean state witheasterlies on the equator and hence a critical surface forthe stationary waves off the equator. He found that thecritical surface effectively shut off any propagation ofthe stationary waves to the equator. The issue of howthe presence of a low-latitude critical surface affectsplanetary wave propagation has been addressed sincein barotropic (or shallow water) systems through studiesemploying nonlinear numerical models (e.g., Waugh etal. 1994; Polvani et al. 1995; O’Sullivan 1997b). Thesestudies suggest that stationary waves forced in the win-ter extratropics can propagate to the equator and indeedinto the summer hemisphere when the equatorial mean

386 VOLUME 61J O U R N A L O F T H E A T M O S P H E R I C S C I E N C E S
FIG. 4. The zonal wind at 9 hPa and 1.58N averaged over JFM periods of those individual years in which the zonal mean was westerly.Results shown for each of the five SKYHI experiments.
winds are westerly, but will be excluded from propa-gating to low latitudes by equatorial easterlies.
The effect of tropical stratospheric mean winds onthe stationary wave field has also been studied in ex-periments conducted with 3D comprehensive generalcirculation models (GCMs). Hamilton and Yuan (1992)performed seasonal integrations with initial conditionsat the beginning of boreal winter with either strong west-erly or easterly mean jets imposed in the tropical strato-sphere. The subsequent evolution of the quasi-stationaryeddy field over the winter depended strongly on the signof the initial tropical jet, with waves reaching the equa-tor when the tropical mean winds were westerly, at leastabove about the 30-hPa level. Similar results are ap-parent in GCM experiments reported by Balachandranand Rind (1995, see their Fig. 7). Hamilton (1998, here-after H98) performed a multidecadal integration of aGCM with an imposed, somewhat idealized, QBO cyclein the tropical stratospheric mean wind. The main focusof H98 was on other aspects of the QBO, but H98 didshow results for the equatorial stationary wave field near
10 hPa, and once again found evidence for a mean flowmodulation of the near-equatorial stationary wave field.
The present paper reports on a project that has ex-tended the earlier GCM studies to a series of integrationsincorporating the most realistic possible mean flowQBO, and then considers how well the model resultsfor the eddies are supported in the available limitedobservational record. The aim is to use models and ob-servations to arrive at as complete as possible pictureof the behavior of the deviations from zonal symmetryin the prevailing stratospheric circulation near the equa-tor.
An understanding of the issue of zonal asymmetriesin the equatorial wind is of interest for a number ofreasons. Monitoring the phase of the QBO now reliesalmost exclusively on the balloon observations at Sin-gapore, raising the issue of how representative the singlestation data is for the whole equatorial band.
The equatorial middle atmosphere poses particularchallenges for data assimilation efforts, due to the verylimited in situ wind observations and to the difficulty

15 FEBRUARY 2004 387H A M I L T O N E T A L .
FIG. 5. The zonal wind at 9 hPa and 1.58N averaged over AMJ periods of those individual years in which the zonal mean waswesterly. Results shown for the mean of the five SKYHI experiments.
of using dynamical balance to relate satellite radiometerobservations of temperature and the wind field. Thereare indications that even the QBO in zonal-mean month-ly mean quantities is somewhat misrepresented in cur-rent state-of-the-art meteorological analyses, with a ten-dency for the analyses to underestimate peak QBO ex-tremes when judged against the available station ob-servations (Pawson and Fiorino 1998, 1999; Huesmannand Hitchman 2001). Recent comparisons of analyzedwinds [from the European Centre for Medium-RangeWeather Forecasts (ECMWF)] with observations fromlong-lived superpressure balloons (floating at a level ofconstant density) suggest that instantaneous fields ofhorizontal wind may be very poorly represented by theanalyses in the equatorial lower stratosphere (Vial et al.2001). An understanding of the behavior of the quasi-stationary eddy field would be useful in evaluating cur-rent analyses in the equatorial stratosphere.
The role that mean momentum transports by quasi-stationary eddies may play in the dynamics of the equa-
torial QBO itself has been considered in earlier mod-eling studies (Dunkerton 1983, 1997; Hamilton andYuan 1992; H98). In particular, Dunkerton (1983) sug-gested that the effects of quasi-stationary eddies prop-agating from the winter hemisphere to the Tropics couldaccount for the observed tendency of the QBO meanwind accelerations to have a weak phase locking withthe annual cycle.
The present paper will report on results from a GCMstudy in which the zonal-mean wind structure in thetropical stratosphere was constrained to vary in a man-ner close to that observed in a 22-yr period (1978–99).The result is a kind of assimilation model, but one inwhich only observations of the zonal-mean wind in thetropical stratosphere are assimilated while the rest ofthe circulation evolves freely. The results for the quasi-stationary eddy field near the equator are examined andcompared with available station observations, as wellas gridded meteorological analyses.
The paper is organized as follows. The model em-

388 VOLUME 61J O U R N A L O F T H E A T M O S P H E R I C S C I E N C E S
FIG. 6. As in Fig. 5, but for the JAS period.
ployed and the experimental design are described insection 2. The model results for QBO modulation ofeddy fields near the equator are reviewed in section 3.Section 4 considers the available station observationsof stratospheric wind near the equator and compares thestation observations to the present model simulations.Section 5 briefly reviews the low-latitude eddy field ingridded meteorological analyses and its relation to thepresent model simulations. Section 6 discusses the rolethe QBO modulation of the of the eddy transports mayplay the forcing of the QBO itself. Conclusions are sum-marized in section 7.
2. Model and experiments
The present study uses a version of the GeophysicalFluid Dynamics Laboratory (GFDL) GCM called SKY-HI (Fels et al. 1980; Hamilton et al. 1995; H98). Thisversion is updated from that used in Hamilton et al.(1995) and H98 by the inclusion of a prognostic cloudscheme and improved radiative transfer algorithms (see
Schwarzkopf and Ramaswamy 1999). The inconsisten-cy in zonal filtering of the surface pressure and windfields at high latitudes described in H98 has also beencorrected in the present SKYHI version. The versionused here is discretized on a 38–3.68 latitude–longitudegrid and on the standard 40 SKYHI levels (e.g., Fels etal. 1980) from the ground to 0.0096 hPa (about 80-kmaltitude). As in H98, the basic model is modified byincluding an additional zonally symmetric zonal mo-mentum source. In the present project this source isdesigned to force a QBO in the zonal-mean wind in thetropical middle atmosphere close that actually observedduring the 22-yr period 1978–99.
The zonal momentum equation in the model is mod-ified by including a relaxation term as follows:
]u (u 2 u )pre5 · · · 1 , (1)]t t
where is the zonal-mean zonal wind in the model;upre is a prescribed function depending on time, latitude,u

15 FEBRUARY 2004 389H A M I L T O N E T A L .
FIG. 7. Zonal wind at the 9-hPa level averaged over Jan 1997 andover the five SKYHI experiments. (top) The zonal wind with contourinterval of 10 m s21 and dashed contours denote negative (easterly)winds. (bottom) The deviation of the wind values from the zonalmean. Contour interval is 3 m s21 and dashed contours denote neg-ative (easterly) anomalies.
FIG. 8. Horizontal wind vectors at 5 hPa for Nov 1994 mean ofthe five SKYHI experiments: (top) raw values and (bottom) deviationsfrom zonal mean. The arrow near the lower right of each gives thescale in meters per second.
and pressure that represents the ‘‘target’’ wind distri-bution toward which the model is being forced. Thetime scale for relaxation t is taken from H98 and is afunction of height and latitude; t is 5 days at the equatorand 30 hPa, and the relaxation becomes weaker (andhence, t becomes longer) at higher latitudes and at high-er and lower altitudes. The relaxation is not appliedbelow 103 hPa or poleward of 308 latitude.
In the present project the aim is to force the modelmean state as near as possible to the actual mean windsduring the 22-yr period 1978–99. A difficulty, of course,is that reliable observations in the low-latitude strato-sphere that are obviously representative of the zonalmean are not available. The present approach was tobase the pre on the monthly mean of the radiosondeuwind at Singapore. Despite the limited sampling, thisstill seems preferable to using the available griddedanalyses which typically underestimate the peak am-plitudes of the QBO at low latitudes (e.g., Pawson andFiorino 1998, 1999).
Specifically the pre was written as clim 1 qbo whereu u uclim represents the long-term mean and mean annualu
cycle, and qbo is the interannual QBO variation; climu uwas computed for each model level and latitude froma long control run, then qbo was taken to be equatoriallyutrapped so that
2 2u (u, p) 5 U (p) exp(2u /D ),qbo e (2)
where p is pressure, u is latitude, and D was taken tobe 138. Between 100 and 10 hPa, Ue(p) was computed
as the deseasonalized Singapore wind observations low-passed to include only periods longer than 6 months.At pressures less than 10 hPa, the values of Ue(p) wereextrapolated upward and backward in time, assuming aconstant downward phase progression of about 2 kmmonth21 and assuming that the amplitude drops off withheight above 10 hPa to zero around 40 km.
The separation of pre into the climatological com-uponent and the QBO component is designed to allow asmooth transition in the mean wind between the low-latitude region with the imposed relaxation and the high-er-latitude region in which the model is completely freeto produce its own circulation. The downside of thisapproach is that biases in the control model climatologywill be present in the QBO experiments as well.
Five QBO-perturbed experiments were performed.Four of these were 11-yr integrations in which the QBOforcing was based on the Singapore observations fromJanuary 1989 through December 1999. These experi-ments (labelled ‘‘A,’’ ‘‘B,’’ ‘‘C,’’ and ‘‘D’’) differedfrom each other only by the initial conditions, whichwere taken from 1 January snapshots from four differentyears of a control run of the model. The fifth experiment(‘‘E’’) was a 22-yr integration with forcing based ondata from 1978–99. In this paper attention will be fo-cused mainly on the 1989–99 period, and many resultswill be presented in terms of the mean of all five ex-periments.
Figure 1 shows the time series of monthly mean zonalwind from the Singapore radiosonde observations (red)and from the average of the five simulations at the near-
390 VOLUME 61J O U R N A L O F T H E A T M O S P H E R I C S C I E N C E S
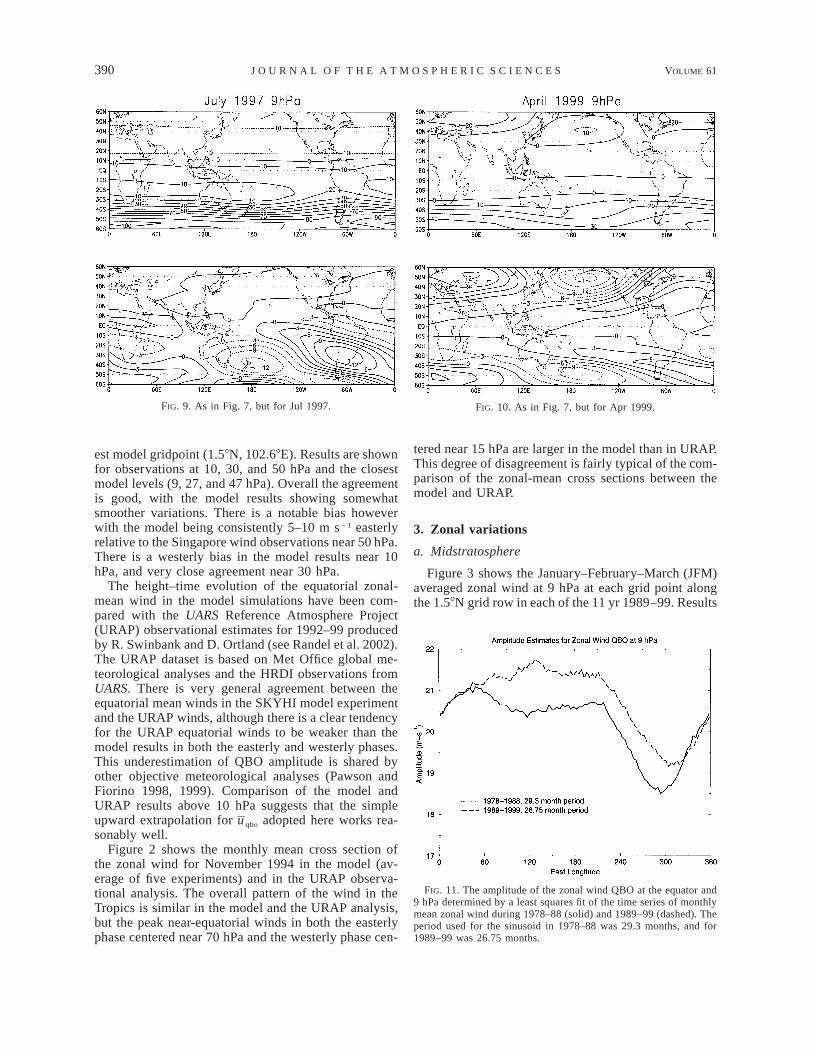
FIG. 9. As in Fig. 7, but for Jul 1997. FIG. 10. As in Fig. 7, but for Apr 1999.
FIG. 11. The amplitude of the zonal wind QBO at the equator and9 hPa determined by a least squares fit of the time series of monthlymean zonal wind during 1978–88 (solid) and 1989–99 (dashed). Theperiod used for the sinusoid in 1978–88 was 29.3 months, and for1989–99 was 26.75 months.
est model gridpoint (1.58N, 102.68E). Results are shownfor observations at 10, 30, and 50 hPa and the closestmodel levels (9, 27, and 47 hPa). Overall the agreementis good, with the model results showing somewhatsmoother variations. There is a notable bias howeverwith the model being consistently 5–10 m s21 easterlyrelative to the Singapore wind observations near 50 hPa.There is a westerly bias in the model results near 10hPa, and very close agreement near 30 hPa.
The height–time evolution of the equatorial zonal-mean wind in the model simulations have been com-pared with the UARS Reference Atmosphere Project(URAP) observational estimates for 1992–99 producedby R. Swinbank and D. Ortland (see Randel et al. 2002).The URAP dataset is based on Met Office global me-teorological analyses and the HRDI observations fromUARS. There is very general agreement between theequatorial mean winds in the SKYHI model experimentand the URAP winds, although there is a clear tendencyfor the URAP equatorial winds to be weaker than themodel results in both the easterly and westerly phases.This underestimation of QBO amplitude is shared byother objective meteorological analyses (Pawson andFiorino 1998, 1999). Comparison of the model andURAP results above 10 hPa suggests that the simpleupward extrapolation for qbo adopted here works rea-usonably well.
Figure 2 shows the monthly mean cross section ofthe zonal wind for November 1994 in the model (av-erage of five experiments) and in the URAP observa-tional analysis. The overall pattern of the wind in theTropics is similar in the model and the URAP analysis,but the peak near-equatorial winds in both the easterlyphase centered near 70 hPa and the westerly phase cen-
tered near 15 hPa are larger in the model than in URAP.This degree of disagreement is fairly typical of the com-parison of the zonal-mean cross sections between themodel and URAP.
3. Zonal variations
a. Midstratosphere
Figure 3 shows the January–February–March (JFM)averaged zonal wind at 9 hPa at each grid point alongthe 1.58N grid row in each of the 11 yr 1989–99. Results

15 FEBRUARY 2004 391H A M I L T O N E T A L .
FIG. 12. The zonal wind at 47 hPa and 1.58N averaged over JFM of individual years (1989–99) and averaged over the five SKYHIexperiments.
are shown for just experiment E. The equatorial windat this level-in this season is strongly easterly in theyears 1989, 1991, 1994, 1996, and 1998. In these pe-riods, there seems to be almost no zonal contrast in theprevailing wind. In the other six JFM periods the meanwind is westerly and significant zonal asymmetries areapparent. The exact structure of the asymmetry differsfrom year to year, but the weakest westerly appearsalmost always in the 3008–3308E (308–608W) sector. Inthe 1997 results the contrast between strongest andweakest JFM westerlies is about 13 m s21, but thiscontrast is at least 8.6 m s21 in each of the six JFMperiods when the mean wind is westerly.
Figure 4 shows the same quantity as Fig. 3 but foronly the westerly cases, and now plotted for each in-dividual model run. There are some variations from runto run, but the overall pattern is reasonably consistent.This occurs despite the fact that the extratropical strato-spheric circulation in individual boreal winters can dif-fer widely among the separate realizations. As an ex-ample, the 28-hPa zonal-mean zonal wind averaged
poleward of 608N and over JFM 1997 varies from 12.8to 25.7 m s21 among the five SKYHI realizations.
To the extent that the dynamics of the eddies in theSKYHI model is realistic, this implies that the zonalasymmetry in the prevailing wind at the equator is large-ly a predictable function of the low-latitude zonal-meanwind. This is an important simplification and suggeststhat the full three-dimensional structure of the low-lat-itude QBO could be captured by an assimilation modelthat had realistic zonal-mean tropical stratosphericwinds imposed.
Figures 5 and 6 show the 9-hPa zonal wind averagedover April–May–June (AMJ) and July–August–Septem-ber (JAS) in individual years for which the mean windis westerly. In each season there is a clear pattern ofzonal asymmetry in the years with westerly mean winds.A similar pattern is seen in October–November–Decem-ber (OND) means (not shown). The zonal contrastsalong the latitude row are weaker in AMJ, JAS, andOND than in JFM, but only slightly weaker. There aresome systematic seasonal changes in the shape of the
392 VOLUME 61J O U R N A L O F T H E A T M O S P H E R I C S C I E N C E S
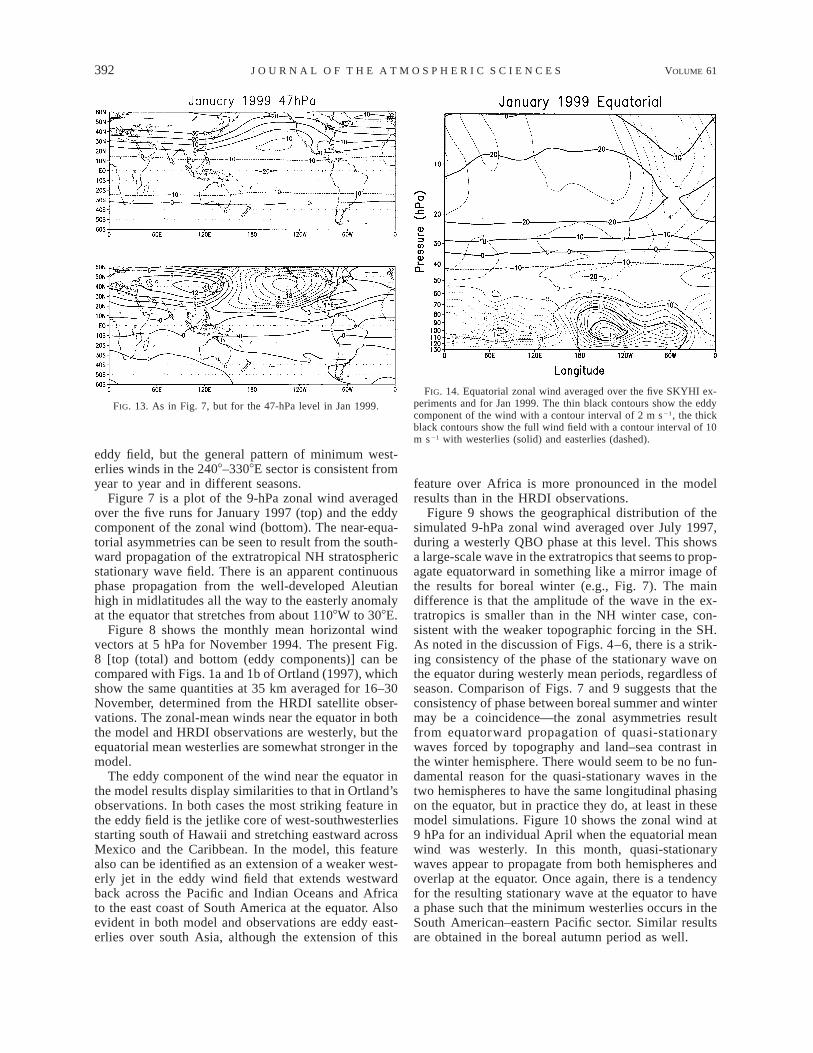
FIG. 13. As in Fig. 7, but for the 47-hPa level in Jan 1999.FIG. 14. Equatorial zonal wind averaged over the five SKYHI ex-
periments and for Jan 1999. The thin black contours show the eddycomponent of the wind with a contour interval of 2 m s21, the thickblack contours show the full wind field with a contour interval of 10m s21 with westerlies (solid) and easterlies (dashed).
eddy field, but the general pattern of minimum west-erlies winds in the 2408–3308E sector is consistent fromyear to year and in different seasons.
Figure 7 is a plot of the 9-hPa zonal wind averagedover the five runs for January 1997 (top) and the eddycomponent of the zonal wind (bottom). The near-equa-torial asymmetries can be seen to result from the south-ward propagation of the extratropical NH stratosphericstationary wave field. There is an apparent continuousphase propagation from the well-developed Aleutianhigh in midlatitudes all the way to the easterly anomalyat the equator that stretches from about 1108W to 308E.
Figure 8 shows the monthly mean horizontal windvectors at 5 hPa for November 1994. The present Fig.8 [top (total) and bottom (eddy components)] can becompared with Figs. 1a and 1b of Ortland (1997), whichshow the same quantities at 35 km averaged for 16–30November, determined from the HRDI satellite obser-vations. The zonal-mean winds near the equator in boththe model and HRDI observations are westerly, but theequatorial mean westerlies are somewhat stronger in themodel.
The eddy component of the wind near the equator inthe model results display similarities to that in Ortland’sobservations. In both cases the most striking feature inthe eddy field is the jetlike core of west-southwesterliesstarting south of Hawaii and stretching eastward acrossMexico and the Caribbean. In the model, this featurealso can be identified as an extension of a weaker west-erly jet in the eddy wind field that extends westwardback across the Pacific and Indian Oceans and Africato the east coast of South America at the equator. Alsoevident in both model and observations are eddy east-erlies over south Asia, although the extension of this
feature over Africa is more pronounced in the modelresults than in the HRDI observations.
Figure 9 shows the geographical distribution of thesimulated 9-hPa zonal wind averaged over July 1997,during a westerly QBO phase at this level. This showsa large-scale wave in the extratropics that seems to prop-agate equatorward in something like a mirror image ofthe results for boreal winter (e.g., Fig. 7). The maindifference is that the amplitude of the wave in the ex-tratropics is smaller than in the NH winter case, con-sistent with the weaker topographic forcing in the SH.As noted in the discussion of Figs. 4–6, there is a strik-ing consistency of the phase of the stationary wave onthe equator during westerly mean periods, regardless ofseason. Comparison of Figs. 7 and 9 suggests that theconsistency of phase between boreal summer and wintermay be a coincidence—the zonal asymmetries resultfrom equatorward propagation of quasi-stationarywaves forced by topography and land–sea contrast inthe winter hemisphere. There would seem to be no fun-damental reason for the quasi-stationary waves in thetwo hemispheres to have the same longitudinal phasingon the equator, but in practice they do, at least in thesemodel simulations. Figure 10 shows the zonal wind at9 hPa for an individual April when the equatorial meanwind was westerly. In this month, quasi-stationarywaves appear to propagate from both hemispheres andoverlap at the equator. Once again, there is a tendencyfor the resulting stationary wave at the equator to havea phase such that the minimum westerlies occurs in theSouth American–eastern Pacific sector. Similar resultsare obtained in the boreal autumn period as well.

15 FEBRUARY 2004 393H A M I L T O N E T A L .
FIG. 15. Time series of monthly mean zonal wind at the 28-hPa level for SKYHI grid points near the Singapore (1.58N, 102.68E),Nairobi (1.58S, 37.88E), Rochambeau (4.58N, 52.28W), and Bogota (4.58N, 73.88W) stations. Results are an average of the five SKYHIexperiments.
The QBO modulation of the stationary wave fieldnear the equator affects the longitudinal modulation ofthe amplitude of the QBO wind variations. The easterlyextremes of the QBO should be similar at all locationsalong the equatorial band, but the westerly extremesshould be weaker over the South American–eastern Pa-cific sector. Characterizing the amplitude of the some-what irregular QBO is problematic. The approach adopt-ed by Reed (1965) and Belmont and Dartt (1968),among others, is to just perform a least squares fit of asinusoid to a portion of a time series, allowing straight-forward determination of both an amplitude and phase.A limitation of this approach is that the amplitude de-termination will not be stable—as longer time series arefit, the determined amplitude will decrease, reflectingthe nonmonochromatic nature of the QBO signal. How-ever, amplitude and phase estimates useful for presentpurposes can be obtained by fitting segments of data
spanning a few periods. Figure 11 shows the amplitudeestimates obtained this way for the first 11 yr (1978–88) and the last 11 yr (1989–99) of experiment E. Foreach segment, a least squares fit of a sinusoid was per-formed varying the amplitude, period, and phase. Thebest-fit periods of 1978–88 turned out to be 29.3 months,and for 1989–99 it was 26.75 months. The best-fit phasedetermination was remarkably constant at all longitudes(less than 10 days contrast). The least squares fit am-plitude shown in Fig. 11 displays a significant (morethan 10%) zonal variation. As expected the minimumamplitude is around 2708–3308E (908–308W).
b. Lower stratosphere
Figure 12 shows the JFM mean wind at 47 hPa and1.58N averaged over the five experiments for each ofthe 11 yr 1989–99. The zonal contrasts are fairly small

394 VOLUME 61J O U R N A L O F T H E A T M O S P H E R I C S C I E N C E S
FIG. 16. Time series of monthly mean zonal wind at the 30-hPa level from radiosonde observations at Singapore (1.368N, 103.988E),Nairobi (1.308S, 36.758E), Rochambeau (4.838N, 52.368W), and Bogota (4.708N, 74.138W) for the 28-hPa level.
in each year (less than about 4 m s 21 ). The zonalvariations appear to be less dependent on the phaseof the QBO, than in the middle stratosphere. Figure13 shows the geographical distribution of the 47-hPazonal wind averaged over January 1999 in the sameformat as in Fig. 7. Even though this is a time ofstrong mean equatorial easterlies at this level, zonalcontrasts are still present along the equator, withanomalous easterlies of up to 3 m s 21 from 1208–3008E and comparably strong westerly anomalies inthe Southern Hemisphere. This pattern seems to havea large component that is unconnected with the sta-tionary wave field in the extratropical winter hemi-sphere, in strong contrast with the behavior docu-mented earlier at the 9-hPa level.
Figure 14 shows the equatorial height–zonal sectionof the January 1999 mean zonal wind. The deviations
from zonal mean at each level are shown by the thincontours. At and above 30 hPa, there are mean west-erlies, and the eddy field is dominated by the easterlyanomaly in the 2708–3308E (908–308W) sector docu-mented in detail at the 9-hPa level earlier. As shownabove, this behavior is consistent with the propagationof extratropical stationary waves from the winter hemi-sphere to the equator. Below about 60 hPa the eddy fieldappears to be dominated by an extension of the tropo-spheric Walker circulation (note the zonal divergenceabove the western equatorial Pacific/Indonesia region),which is usually regarded as the response to zonal con-trasts in tropospheric heating in the Tropics itself. Thishas little dependence on the phase of the QBO. The 50-hPa level seems to be a kind of transition between thetwo regimes. Results for boreal summer are similar inthe region below 50 hPa.
15 FEBRUARY 2004 395H A M I L T O N E T A L .
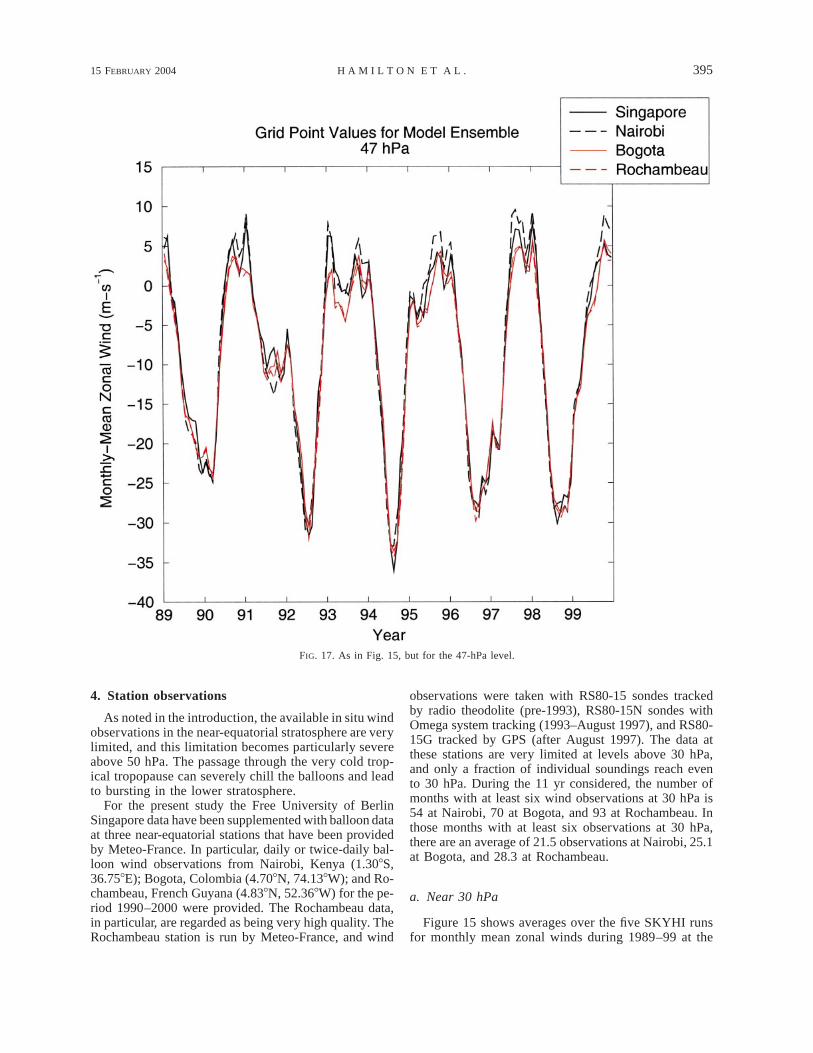
FIG. 17. As in Fig. 15, but for the 47-hPa level.
4. Station observations
As noted in the introduction, the available in situ windobservations in the near-equatorial stratosphere are verylimited, and this limitation becomes particularly severeabove 50 hPa. The passage through the very cold trop-ical tropopause can severely chill the balloons and leadto bursting in the lower stratosphere.
For the present study the Free University of BerlinSingapore data have been supplemented with balloon dataat three near-equatorial stations that have been providedby Meteo-France. In particular, daily or twice-daily bal-loon wind observations from Nairobi, Kenya (1.308S,36.758E); Bogota, Colombia (4.708N, 74.138W); and Ro-chambeau, French Guyana (4.838N, 52.368W) for the pe-riod 1990–2000 were provided. The Rochambeau data,in particular, are regarded as being very high quality. TheRochambeau station is run by Meteo-France, and wind
observations were taken with RS80-15 sondes trackedby radio theodolite (pre-1993), RS80-15N sondes withOmega system tracking (1993–August 1997), and RS80-15G tracked by GPS (after August 1997). The data atthese stations are very limited at levels above 30 hPa,and only a fraction of individual soundings reach evento 30 hPa. During the 11 yr considered, the number ofmonths with at least six wind observations at 30 hPa is54 at Nairobi, 70 at Bogota, and 93 at Rochambeau. Inthose months with at least six observations at 30 hPa,there are an average of 21.5 observations at Nairobi, 25.1at Bogota, and 28.3 at Rochambeau.
a. Near 30 hPa
Figure 15 shows averages over the five SKYHI runsfor monthly mean zonal winds during 1989–99 at the

396 VOLUME 61J O U R N A L O F T H E A T M O S P H E R I C S C I E N C E S
FIG. 18. As in Fig. 16, but at the 50-hPa level.
28-hPa level from the model grid points nearest the fourstations Singapore, Nairobi, Bogota, and Rochambeau.Figure 16 shows the monthly mean observations at thefour stations for the slightly different 11-yr period1990–2000. Points are plotted only when at least sixobservations are available in a given month.
The results in Figs. 15 and 16 are displayed so thatthe data from the South American stations are in redand the Nairobi and Singapore data are in black. In themodel results the two South American stations are verysimilar and the Singapore and Nairobi results are alsoreasonably close in most months. The systematic con-trast between the model results at the South Americangrid points and the Singapore/Nairobi grid points is con-sistent with the geographical variation of the prevailingwind documented above. Notably, the westerly phaseof the QBO cycle is significantly weaker at the South
American grid points, while the easterly extremes aremore similar among the grid points. The peak-to-peakamplitude of the QBO at the South American grid pointsis ;10%–15% less than at the Singapore location.
The actual observations in Fig. 16 are noisier thanthe model simulation results, which is understandablesince the monthly mean observational values are subjectto considerable sampling errors and also any randomobservational errors in the individual soundings. Theoverall picture at the four stations is reasonably con-sistent with the model results, however. The Bogota andRochambeau results are fairly similar in most months.The South American station observations are mostlyclose to the Singapore data in the easterly phase of theQBO, but display weaker winds over most of the west-erly phase. Interestingly, the major exceptions to thisoccur in the first few months of 1995 and then again in

15 FEBRUARY 2004 397H A M I L T O N E T A L .
FIG. 19. (top) The Jan 1997 mean of the 10-hPa zonal wind fieldcomputed from the NCEP reanalyses. Contour interval is 10 m s21
and negative values are denoted by dashed contours. (bottom) Thedeviation of the zonal wind from the zonal average. Contour intervalis 3 m s21 and negative values are denoted by dashed contours.
FIG. 20. As in Fig. 19, but for Jul 1997.
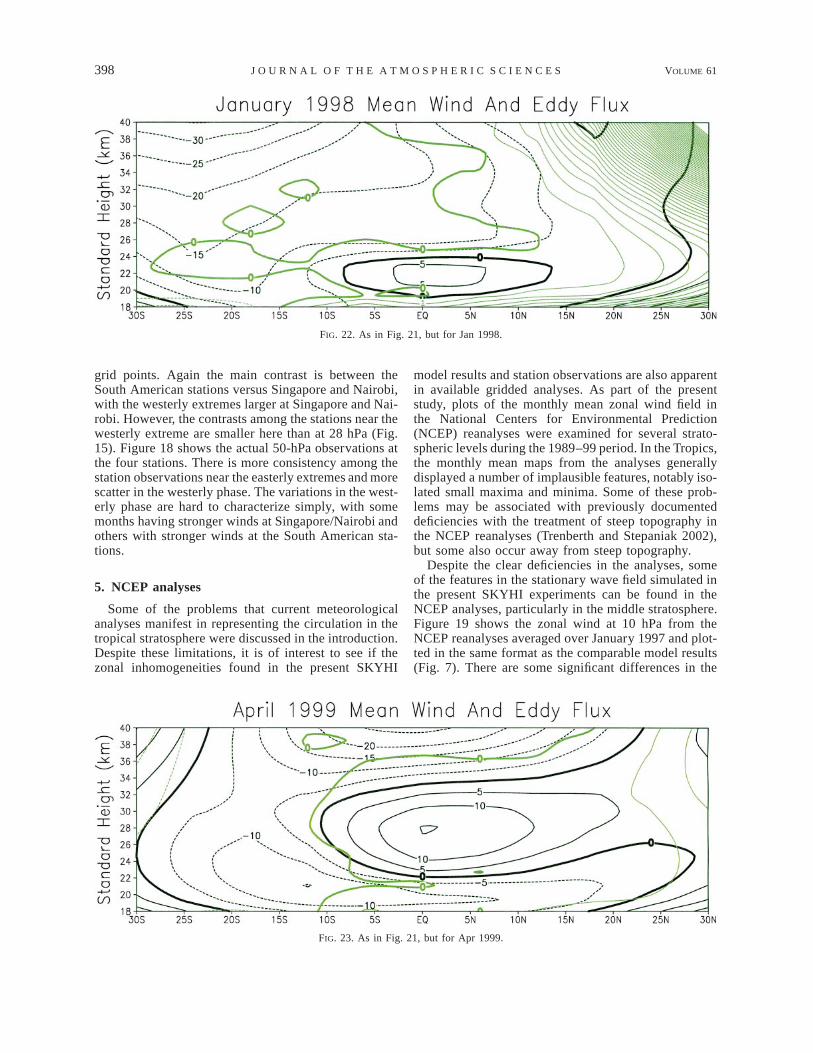
FIG. 21. The black contours show the zonal-mean zonal wind averaged over Jan 1999 and over the five SKYHI experiments. The contourinterval is 5 m s21, easterly winds are denoted by dashed contours and the zero contour is emphasized. The green contours show the eddyhorizontal momentum transport term computed from the monthly mean wind values. The contour interval is 1 m 2 s22, negative valuesu9y9(i.e., southward transport of westerly mean momentum) are denoted by dashed contours, and the zero contour is emphasized.
the last few months of 1999, when the westerly phasein the Singapore data has an unusual weakening. Themodel simulation data in Fig. 15 shows a similar dropin the contrast between Bogota/Rochambeau and Sin-gapore at precisely the same times.
The data coverage at Nairobi is rather spotty and, inparticular, there are only a very few months with suf-ficient data to define a reasonable monthly mean duringeasterly QBO phases. However, even these limited datasuggest that the QBO in the zonal wind has a similar
peak-to-peak amplitude at Nairobi as at Singapore, andcertainly these data rule out the suggestion of Belmontand Dartt (1968) that the QBO is particularly weak nearNairobi. In the SKYHI model at 28 hPa (Fig. 15) theSingapore and Nairobi results are quite similar, with aslight tendency for the westerly extremes to be a littlestronger at Nairobi. The observations are noisier but thesimilar tendency can be seen.
b. Near 50 hPa
Figure 17 shows the results for the average of thefive SKYHI runs at 47 hPa for the same four ‘‘Station’’
398 VOLUME 61J O U R N A L O F T H E A T M O S P H E R I C S C I E N C E S
FIG. 22. As in Fig. 21, but for Jan 1998.
FIG. 23. As in Fig. 21, but for Apr 1999.
grid points. Again the main contrast is between theSouth American stations versus Singapore and Nairobi,with the westerly extremes larger at Singapore and Nai-robi. However, the contrasts among the stations near thewesterly extreme are smaller here than at 28 hPa (Fig.15). Figure 18 shows the actual 50-hPa observations atthe four stations. There is more consistency among thestation observations near the easterly extremes and morescatter in the westerly phase. The variations in the west-erly phase are hard to characterize simply, with somemonths having stronger winds at Singapore/Nairobi andothers with stronger winds at the South American sta-tions.
5. NCEP analyses
Some of the problems that current meteorologicalanalyses manifest in representing the circulation in thetropical stratosphere were discussed in the introduction.Despite these limitations, it is of interest to see if thezonal inhomogeneities found in the present SKYHI
model results and station observations are also apparentin available gridded analyses. As part of the presentstudy, plots of the monthly mean zonal wind field inthe National Centers for Environmental Prediction(NCEP) reanalyses were examined for several strato-spheric levels during the 1989–99 period. In the Tropics,the monthly mean maps from the analyses generallydisplayed a number of implausible features, notably iso-lated small maxima and minima. Some of these prob-lems may be associated with previously documenteddeficiencies with the treatment of steep topography inthe NCEP reanalyses (Trenberth and Stepaniak 2002),but some also occur away from steep topography.
Despite the clear deficiencies in the analyses, someof the features in the stationary wave field simulated inthe present SKYHI experiments can be found in theNCEP analyses, particularly in the middle stratosphere.Figure 19 shows the zonal wind at 10 hPa from theNCEP reanalyses averaged over January 1997 and plot-ted in the same format as the comparable model results(Fig. 7). There are some significant differences in the

15 FEBRUARY 2004 399H A M I L T O N E T A L .
FIG. 24. As in Fig. 21, but for Jul 1999.
FIG. 25. Time series of monthly mean quantities for the equator and 9 hPa, for each of the five SKYHI experiments. (top) The northwardeddy flux of zonal momentum associated with the monthly mean fields. (middle) The zonal-mean zonal wind. (bottom) The forcing of thezonal mean flow acceleration from the divergence of the horizontal eddy momentum flux associated with monthly mean fields.

400 VOLUME 61J O U R N A L O F T H E A T M O S P H E R I C S C I E N C E S
near-equatorial zonal-mean winds for this month: in theSKYHI simulation the equatorial mean westerlies arestronger and the region of mean westerlies stretchesfurther into the SH than in the NCEP analyses. Closeexamination of the NCEP results shows that the stron-gest westerlies are present only in an isolated ‘‘bull’seye’’ around Singapore. In the rest of the equatorialzone, the NCEP results are presumably more affectedby the satellite temperature retrievals, which by them-selves lead to an underestimate of wind shears. Thepresent SKYHI simulations more plausibly employ theSingapore observations as the primary determinant ofthe zonal-mean wind near the equator at this level.
The presence of the apparent bull’s-eye near Singa-pore is only one of a number of implausible features inthe NCEP analyses for this month. The noisy results inthe vicinity of the Andes Mountains is also almost cer-tainly unrealistic at this level and is consistent with theproblems in the NCEP reanalyses noted earlier by Tren-berth and Stepaniak (2002). It is also possible that thecontrast seen between the results over tropical Africaand the adjacent oceans may primarily reflect differ-ences in data coverage.
If one ignores these presumed deficiencies and con-centrates on the largest scales, then the NCEP resultsin Fig. 19 do have some resemblance to the SKYHIsimulation results shown in Fig. 7. Notably both picturesshow a large-scale stationary wave propagating fromthe NH to the equator, with rough agreement in ampli-tudes and phase. A similar pattern of overall agreementin the structure of the large-scale wave field can be seenin Fig. 20, which shows the 10-hPa NCEP result av-eraged for July 1997 and the comparable SKYHI resultin Fig. 9. Once again, the NCEP results also show smallspatial scale structures that are not plausible in a month-ly mean wind field.
The monthly mean NCEP analyses of the wind in theequatorial lower stratosphere (e.g., 50 or 70 hPa) tendto be even noisier and it is hard to subjectively determinewhich features are likely to be real. Paradoxically, thefact that the lower-stratospheric analyses look worsethan the upper-stratospheric analyses may reflect the in-creased station data available at lower levels. If the anal-ysis scheme cannot reconcile the smooth temperatureretrieval data from satellites and the station data, thenincreasing the number of stations may just add to thenoise that appears in the final product.
The present results may shed light on the issue ofhow to improve the current meteorological analyses inthe tropical stratosphere. The fact that assimilating onlythe zonal-mean wind seems to work quite well and leadseven to results that are somewhat repeatable among theSKYHI model realizations, suggests that, in the tropicalstratosphere at least, it may make sense to assimilatethe zonal mean and eddy components separately, withthe zonal mean being strongly constrained by the high-est-quality station wind observations, and only weaklyby the satellite temperature observations. In general, the
satellite observations should probably be given smallweight in the tropical stratosphere; it may be better torely on the model dynamics to properly take care of theeddy propagation from midlatitudes and even the up-ward extension of the Walker circulation that may bean important component of the circulation in the equa-torial lower stratosphere.
6. QBO modulation of eddy momentum transports
The possibility that the Reynolds stresses associatedwith quasi-stationary eddies forced in the extratropicaltroposphere could affect the zonal-mean QBO near theequator has been raised in earlier studies (e.g., Dunk-erton 1983). The southwest–northeast phase tilts evidentfor the waves in the NH (and northwest–southeast tiltsin the SH) show, as expected, that the Reynolds stressassociated with these waves effectively transports neg-ative (westward) mean momentum from the extratropicstoward the equator. The divergence of the stress willresult in forcing of mean easterly (i.e., westward) ac-celerations at low latitudes.
Figure 21 shows the zonal-mean zonal wind and thezonal mean of the product of the monthly mean eddyzonal and eddy meridional wind components ( )[u]9[y]9for January 1999, averaged over the five SKYHI ex-periments. Here, [ ] represents a monthly mean and, asbefore, the overbar represents a zonal mean, and theprime denotes the deviation from the zonal mean. Aboveabout 23 km there are mean westerlies on the equator,and the positive values of extend from the NH[u]9[y]9extratropics across the equator. The values of [u]9[y]9near the equator are, of course, much smaller than athigher northern latitudes. However, even of or-[u]9[y]9der 1 m2 s22 can be significant for the momentum budgetin the tropical stratosphere.
Figure 22 shows the same quantities for January 1998when mean easterlies dominated most of the tropicalstratosphere. In this case the is almost zero near[u]9[y]9the equator. The region of significant extends[u]9[y]9somewhat equatorward of the zero wind line near 258N,but does not even approach the equator. This is verytypical of the NH winter cases with mean easterlies onthe equator, and is consistent with the earlier indicationsthat quasi-stationary waves are virtually absent from theequator above 30 hPa when the mean winds are easterly.
Figure 23 shows the same quantities for April 1999,when there was strong equatorial mean westerlies. Asseen earlier in Fig. 10, there is penetration of quasi-stationary eddies to the equator in this month, but, nearthe equator, the tilt of the wave phase with latitude issmall. This is reflected in the very small values of
in Fig. 23.[u]9[y]9Figure 24 shows the same quantities for July 1999,
when there were still strong mean westerlies over muchof the low-latitude stratosphere. Now the dominant
is negative and is associated with eddies prop-[u]9[y]9agating from the SH.

15 FEBRUARY 2004 401H A M I L T O N E T A L .
The net result of these fluxes is to produce a forcingof the mean flow near the equator with strong modu-lation by the QBO and by the annual and semiannualsignals. Figure 25 shows time series of the 9-hPa month-ly mean values of 1) the equatorial mean wind (middle),2) the flux at the equator associated with the[u]9[y]9monthly mean eddy field (top), and 3) the zonal forceper unit mass F associated with the divergence of theflux at the equator (bottom). Here, F is defined as
1 ]2F 5 2 ([u]9[y]9 cos u).
2a cos u ]u
In Fig. 25 results are plotted individually for each ofthe five SKYHI experiments. The mean winds amongthe experiments are almost identical, of course, but alsothe flux and even flux divergence are fairly consistentamong the five cases. The fluxes show the expectedannual and QBO modulations: they are nearly zero dur-ing times of mean easterlies, and during the westerlyQBO phases the fluxes are positive (negative) in boreal(austral) winter as the waves propagate from the winterhemisphere. The eddy forcing of the mean flow F isalmost always negative, corresponding to a forcing ofmean easterly (westward) accelerations. The magnitudeof F reaches as much as 0.5 m s21 day21 in some months,which is quite significant relative to the actual meanflow accelerations in the QBO. This forcing is modu-lated by the QBO and is only significant during periodsof mean westerlies. It also has a strong semiannual de-pendence corresponding the the annual cycle seen in thefluxes themselves.
7. Conclusions
This project has aimed at understanding the standingeddy patterns near the equator in the stratosphere andhow these patterns are modulated by the seasonal andquasi-biennial cycles. In order to do this, three ratherimperfect tools were used: 1) a GCM that must havesome significant deficiencies in the tropical stratospheresince it does not spontaneously simulate a QBO, 2) sta-tion wind observations that are likely reasonably ac-curate but suffer from severe spatial sampling limita-tions, and 3) gridded analyses that have some obviousdeficiencies in the tropical stratosphere. Despite the lim-itations of the model and data employed, a fairly con-sistent picture of the zonal asymmetries in the prevailingwind near the equator has emerged. The model resultsshow that, near the equator the zonal asymmetry in pre-vailing winds above about 30 hPa is controlled by thepropagation of quasi-stationary waves from midlati-tudes. When there are mean westerlies over the equatorat some level, the quasi-stationary waves from the win-ter hemisphere (or from both hemispheres in fall/spring)can propagate to the equator. The phase of these quasi-stationary waves is such that the weakest prevailingwesterlies over the equator occur over South Americaand the ocean areas to the west. When there are mean
easterlies at low latitudes, the quasi-stationary wavesare excluded from the equatorial band and there is al-most no zonal asymmetry in the prevailing wind.
The net result is a significantly weaker peak-to-peakamplitude of the QBO in zonal wind over the SouthAmerican–eastern Pacific sector than over the rest ofthe equatorial band. Near 10 hPa, this contrast exceeds10%. The phase of the QBO in the simulations hasalmost no zonal variation at all.
Below about 30 hPa, the stationary eddies in the pre-vailing wind are fairly small. Zonal asymmetries seemto reflect the upward extension of the tropospheric Walk-er circulation, and are not strongly modulated by theQBO in zonal-mean circulation.
The model simulations confirm the suggestion thatthe Reynolds stress divergences associated with the qua-si-stationary eddies may play a significant role in thedynamics of the QBO, at least above about 30 hPa. Thiscomponent of the eddy forcing acts to reduce thestrength of the mean westerlies and could play a rolein at least the initial easterly-to-westerly transitions inthe QBO. This forcing also has a strong semiannualmodulation, and thus it could be responsible for thecoupling seen in observations between the QBO tran-sitions and the seasonal cycle.
Acknowledgments. The authors thank Barbara Nau-jokat for providing the Singapore wind data. V. Ra-maswamy and M. Daniel Schwarzkopf of GFDL pro-vided important support and practical assistance. TheIPRC is supported in part by the Frontier Research Sys-tem for Global Change. K. Hamilton’s work was sup-ported by NASA Grant NAG 5-12214. G. Stenchikov’swork was supported by NASA Grant NAG 5-9792 andNSF Grant ATM-9988419.
REFERENCES
Balachandran, N. K., and D. Rind, 1995: Modeling the effects of UVvariability and the QBO on the troposphere–stratosphere system.Part I: The middle atmosphere. J. Climate, 8, 2058–2079.
Baldwin, M. P., and Coauthors, 2001: The quasi-biennial oscillation.Rev. Geophys., 39, 179–229.
Belmont, A. D., and D. G. Dartt, 1968: Variation with longitude ofthe quasi-biennial oscillation. Mon. Wea. Rev., 96, 767–777.
Dunkerton, T. J., 1983: Laterally propagating Rossby waves in theeasterly acceleration phase of the quasi-biennial oscillation. At-mos.–Ocean, 21, 55–68.
——, 1997: The role of gravity waves in the quasi-biennial oscil-lation. J. Geophys. Res., 102, 26 053–26 076.
——, and D. P. Delisi, 1985: Climatology of the equatorial lowerstratosphere. J. Atmos. Sci., 42, 376–396.
Fels, S. B., J. D. Mahlman, M. D. Schwarzkopf, and R. S. Sinclair,1980: Stratospheric sensitivity to perturbations in ozone and car-bon dioxide: Radiative and dynamical responses. J. Atmos. Sci.,37, 2265–2297.
Hamilton, K., 1984: Mean wind evolution through the quasi-biennialcycle of the tropical lower stratosphere. J. Atmos. Sci., 41, 2113–2125.
——, 1998: An imposed quasi-biennial oscillation in a comprehen-sive general circulation model: Response of the tropical andextratropical circulation. J. Atmos. Sci., 55, 2393–2418.

402 VOLUME 61J O U R N A L O F T H E A T M O S P H E R I C S C I E N C E S
——, and L. Yuan, 1992: Experiments on tropical stratospheric mean-wind variations in a spectral general circulation model. J. Atmos.Sci., 49, 2464–2483.
——, R. J. Wilson, J. D. Mahlman, and L. J. Umscheid, 1995: Cli-matology of the SKYHI troposphere–stratosphere–mesospheregeneral circulation model. J. Atmos. Sci., 52, 5–43.
Huesmann, A. S., and M. H. Hitchman, 2001: The stratospheric quasi-biennial oscillation in the NCEP reanalyses: Climatologicalstructures. J. Geophys. Res., 106, 11 859–11 874.
Matsuno, T., 1970: Vertical propagation of stationary planetary wavesin the winter Northern Hemisphere. J. Atmos. Sci., 27, 871–883.
Naujokat, B., 1986: An update of the observed quasi-biennial oscil-lation of the stratospheric winds over the tropics. J. Atmos. Sci.,43, 1873–1877.
Ortland, D. A., 1997: Rossby wave propagation into the tropicalstratosphere observed by the High-Resolution Doppler Imager.Geophys. Res. Lett., 24, 1999–2002.
O’Sullivan, D., 1997a: Cross-equatorially radiating stratosphericRossby waves. Geophys. Res. Lett., 24, 1483–1486.
——, 1997b: Interaction of extratropical Rossby waves with westerlyquasi-biennial oscillation winds. J. Geophys. Res., 102, 19 461–19 470.
Pawson, S., and M. Fiorino, 1998: A comparison of reanalyses in thetropical stratosphere. Part 2: The quasi-biennial oscillation. Cli-mate Dyn., 14, 645–658.
——, and ——, 1999: A comparison of reanalyses in the tropical
stratosphere. Part 3: Inclusion of the pre-satellite data era. Cli-mate Dyn., 15, 241–250.
Polvani, L. M., D. W. Waugh, and R. A. Plumb, 1995: On the sub-tropical edge of the stratospheric surf zone. J. Atmos. Sci., 52,1288–1309.
Randel, W. J., and Coauthors, 2002: SPARC intercomparison of mid-dle atmosphere climatologies. World Meteorological Organiza-tion Tech. Doc. 1142, 96 pp.
Reed, R. J., 1965: The present status of the 26-month oscillation.Bull. Amer. Meteor. Soc., 46, 374–386.
Schwarzkopf, M. D., and V. Ramaswamy, 1999: Radiative effects ofCH4, N2O, halocarbons and the foreign-broadened water con-tinuum: A GCM experiment. J. Geophys. Res., 104, 9467–9488.
Trenberth, K. E., and D. P. Stepaniak, 2002: A pathological problemwith NCEP reanalyses in the stratosphere. J. Climate, 15, 690–695.
Vial, F., A. Hertzog, C. R. Mechoso, C. Basdevant, P. Cocquerez, V.Dubourg, and F. Nouel, 2001: A study of the dynamics of theequatorial lower stratosphere by use of ultra-long-duration bal-loons. 1. Planetary scales. J. Geophys. Res., 106, 22 725–22 743.
Wallace, J. M., 1973: The general circulation of the tropical lowerstratosphere. Rev. Geophys. Space Phys., 11, 191–222.
Waugh, D. W., R. A. Plumb, and L. M. Polvani, 1994: Nonlinear,barotropic response to a localized topographic forcing: Forma-tion of a ‘‘tropical surf zone’’ and its effect on interhemisphericpropagation. J. Atmos. Sci., 51, 1401–1416.