Frozen-in anticyclones occurring in polar Northern Hemisphere during springtime: Characterization,...
16
Frozen‐in anticyclones occurring in polar Northern Hemisphere during springtime: Characterization, occurrence and link with quasi‐biennial oscillation R. Thiéblemont, 1 N. Huret, 1 Y. J. Orsolini, 2 A. Hauchecorne, 3 and M.‐A. Drouin 1 Received 30 March 2011; revised 13 July 2011; accepted 18 July 2011; published 20 October 2011. [1] During winter, the polar vortex forms a dynamical barrier in the arctic stratosphere which prevents large scale exchanges between the high latitude and tropical regions. Nevertheless, the occurrence of thin tropical air mass intrusions at the edge of the polar vortex have in fact been detected and modeled. These structures could play an important role in improving our knowledge of the balance between chemical and dynamical processes associated with the ozone budget. After the final stratospheric warming in springtime, the breakdown of the polar vortex occurs and the summer circulation starts to develop. Air mass intrusions from the tropics can be trapped at polar latitudes and persist until August in the anticyclone, advected by summer easterlies. These structures, named “frozen‐in anticyclones” (FrIACs), have already been observed in 2003 and 2005 by MIPAS‐ENVISAT and MLS‐AURA tracer measurements. We present here a new case of FrIAC in 2007 highlighted using MLS‐AURA measurements. In order to better understand the dynamical conditions required for such events and the associated processes, we performed a climatology of tropical air mass intrusions using a potential vorticity contour advection model. This climatology reveals a preferred path for exchanges between the polar and tropical stratospheres. Using ERA‐Iterim wind and temperature reanalysis from ECMWF, we have established links between FrIAC occurrences and Rossby wave activity. There is evidence that FrIACs can exist if no major sudden stratospheric warming occurs during the polar vortex phase and their development seems favorable if the tropical quasi‐biennial oscillation is in the easterly phase. Citation: Thiéblemont, R., N. Huret, Y. J. Orsolini, A. Hauchecorne, and M.‐A. Drouin (2011), Frozen‐in anticyclones occurring in polar Northern Hemisphere during springtime: Characterization, occurrence and link with quasi‐biennial oscillation, J. Geophys. Res., 116, D20110, doi:10.1029/2011JD016042. 1. Introduction [2] The ozone budget at high latitudes depends critically on the balance between transport and chemical (in gaseous or heterogeneous phase) processes. Tropical air slowly ascends in the upward branch of the Brewer‐Dobson circulation and remains to some extent isolated from higher latitudes. How- ever, many observations have revealed much faster transport out of the tropics and midlatitudes [Ray et al., 1999; Waugh, 1996] with different amplitudes depending on the season [Hoor et al., 2002]. The persistence of these intrusions at polar latitudes during winter leads to the development of low ozone pockets (LOPs) [Manney et al., 1995; Harvey et al., 2008]. There is great interest in improving our understand- ing of how and where air masses are transported from the tropics to higher latitudes much more rapidly than predicted by the Brewer‐Dobson circulation process. Such fast trans- port of chemical compounds could have great impact on the stratospheric ozone budget at high latitudes [Lahoz et al., 2007]. [3] The Arctic polar vortex breakdown during the final warming marks the onset of a westward summer circulation. However, air masses mix rather slowly in the summer stratosphere, and long‐lived winter vortex remnants [Durry and Hauchecorne, 2005], tropical intrusions to high lati- tudes [Huret et al., 2006], and “frozen‐in” anticyclones [Manney et al., 2006b] have been reported. Using the SLIMCAT chemical transport model, Orsolini [2001] showed that vortex air masses remain in the summer polar stratosphere until August but stated that additional measure- ments are required to confirm this finding. Using satellite measurements of N 2 O from the Earth Observing System Microwave Limb Sounder (EOS‐ MLS), Manney et al. [2006b] revealed residual polar vortex air masses that were well identified spatially until at least mid‐July in 2005 which 1 Laboratoire de Physique et Chimie de l’Environnement et de l’Espace/ CNRS, Université d’Orléans, Orleans, France. 2 Norwegian Institute for Air Research, Kjeller, Norway. 3 Laboratoire Atmosphères, Milieux, Observations Spatiales, Guyancourt, France. Copyright 2011 by the American Geophysical Union. 0148‐0227/11/2011JD016042 JOURNAL OF GEOPHYSICAL RESEARCH, VOL. 116, D20110, doi:10.1029/2011JD016042, 2011 D20110 1 of 16
Transcript of Frozen-in anticyclones occurring in polar Northern Hemisphere during springtime: Characterization,...

Frozen‐in anticyclones occurring in polar Northern Hemisphereduring springtime: Characterization, occurrence and linkwith quasi‐biennial oscillation
R. Thiéblemont,1 N. Huret,1 Y. J. Orsolini,2 A. Hauchecorne,3 and M.‐A. Drouin1
Received 30 March 2011; revised 13 July 2011; accepted 18 July 2011; published 20 October 2011.
[1] During winter, the polar vortex forms a dynamical barrier in the arctic stratospherewhich prevents large scale exchanges between the high latitude and tropical regions.Nevertheless, the occurrence of thin tropical air mass intrusions at the edge of the polarvortex have in fact been detected and modeled. These structures could play an importantrole in improving our knowledge of the balance between chemical and dynamicalprocesses associated with the ozone budget. After the final stratospheric warming inspringtime, the breakdown of the polar vortex occurs and the summer circulation startsto develop. Air mass intrusions from the tropics can be trapped at polar latitudes andpersist until August in the anticyclone, advected by summer easterlies. These structures,named “frozen‐in anticyclones” (FrIACs), have already been observed in 2003 and 2005 byMIPAS‐ENVISAT and MLS‐AURA tracer measurements. We present here a newcase of FrIAC in 2007 highlighted using MLS‐AURA measurements. In order tobetter understand the dynamical conditions required for such events and the associatedprocesses, we performed a climatology of tropical air mass intrusions using a potentialvorticity contour advection model. This climatology reveals a preferred path forexchanges between the polar and tropical stratospheres. Using ERA‐Iterim wind andtemperature reanalysis from ECMWF, we have established links between FrIACoccurrences and Rossby wave activity. There is evidence that FrIACs can exist if no majorsudden stratospheric warming occurs during the polar vortex phase and their developmentseems favorable if the tropical quasi‐biennial oscillation is in the easterly phase.
Citation: Thiéblemont, R., N. Huret, Y. J. Orsolini, A. Hauchecorne, and M.‐A. Drouin (2011), Frozen‐in anticyclonesoccurring in polar Northern Hemisphere during springtime: Characterization, occurrence and link with quasi‐biennial oscillation,J. Geophys. Res., 116, D20110, doi:10.1029/2011JD016042.
1. Introduction
[2] The ozone budget at high latitudes depends critically onthe balance between transport and chemical (in gaseous orheterogeneous phase) processes. Tropical air slowly ascendsin the upward branch of the Brewer‐Dobson circulation andremains to some extent isolated from higher latitudes. How-ever, many observations have revealed much faster transportout of the tropics and midlatitudes [Ray et al., 1999; Waugh,1996] with different amplitudes depending on the season[Hoor et al., 2002]. The persistence of these intrusions atpolar latitudes during winter leads to the development of lowozone pockets (LOPs) [Manney et al., 1995; Harvey et al.,
2008]. There is great interest in improving our understand-ing of how and where air masses are transported from thetropics to higher latitudes much more rapidly than predictedby the Brewer‐Dobson circulation process. Such fast trans-port of chemical compounds could have great impact on thestratospheric ozone budget at high latitudes [Lahoz et al.,2007].[3] The Arctic polar vortex breakdown during the final
warming marks the onset of a westward summer circulation.However, air masses mix rather slowly in the summerstratosphere, and long‐lived winter vortex remnants [Durryand Hauchecorne, 2005], tropical intrusions to high lati-tudes [Huret et al., 2006], and “frozen‐in” anticyclones[Manney et al., 2006b] have been reported. Using theSLIMCAT chemical transport model, Orsolini [2001]showed that vortex air masses remain in the summer polarstratosphere until August but stated that additional measure-ments are required to confirm this finding. Using satellitemeasurements of N2O from the Earth Observing SystemMicrowave Limb Sounder (EOS‐MLS), Manney et al.[2006b] revealed residual polar vortex air masses that werewell identified spatially until at least mid‐July in 2005 which
1Laboratoire de Physique et Chimie de l’Environnement et de l’Espace/CNRS, Université d’Orléans, Orleans, France.
2Norwegian Institute for Air Research, Kjeller, Norway.3Laboratoire Atmosphères, Milieux, Observations Spatiales, Guyancourt,
France.
Copyright 2011 by the American Geophysical Union.0148‐0227/11/2011JD016042
JOURNAL OF GEOPHYSICAL RESEARCH, VOL. 116, D20110, doi:10.1029/2011JD016042, 2011
D20110 1 of 16
partly confirmed the calculations by Orsolini [2001]. Theyalso identified long‐lived “frozen‐in” anticyclones (herein-after referred as FrIACs) circling the pole, and originatingfrom lower latitudes. Lahoz et al. [2007] presented a newpicture of the spring and summer polar stratosphere usingalong‐trackmeasurements by theMIPAS instrument onboardthe ENVISAT satellite. They further identified FrIACs inCH4 MIPAS data for the year 2003. The paper of Allen et al.[2011] investigates the 2005 FrIAC case. They used a hier-archy of 2D (isentropic) and 3D models in order to describeand understand the evolution of FrIACs. These studieshave improved our knowledge of dynamical conditions inthe polar region during spring and summer and addressedthe following question: “how common are FrIAC occur-rences?.” Besides this question of their occurrence, theprocesses responsible for such events have been investi-gated in the present paper.[4] This study focuses on FrIAC occurrences and inter‐
annual variability to examine the processes driving suchevents. We use satellite data obtained by the MicrowaveLimb Sounder (MLS, V2.2) instrument from 2005 to 2009.We also perform simulations with the potential vorticitycontour advection model “Modèle Isentrope de transportMéso‐échelle de l’Ozone Stratosphérique par Advection”(MIMOSA) [Hauchecorne et al., 2002] for the 850 K sur-face (∼31 km), over the 2000–2009 period to build a cli-matology of FrIACs. The simulations have been performedusing the horizontal winds, pressure and temperature fieldsprovided by the ERA‐Interim reanalysis [Dee et al., 2011]from the European Center for Medium‐Range WeatherForecast (ECMWF).[5] Section 2 of the paper is dedicated to describing the
tools used in this study. In Section 3, a new FrIAC eventoccurring in spring 2007 is reported and characterized. Thedynamical state of the stratosphere as well as its evolutionduring springtime is compared for the three years withFrIAC events (2003, 2005 and 2007). Section 4 is devotedto the identification of the favorable dynamical conditionsfor the development of FrIACs: i) Rossby wave activity, ii)the occurrence of sudden stratospheric warmings, and iii)the phase of the quasi‐biennial oscillation (QBO) in thetropical region. Finally, in Section 5 we summarize ouranalysis highlighting processes responsible for the FrIACoccurrences.
2. Tools
2.1. Chemical and Temperature Data From EOS MLSInstrument
[6] The MLS instrument onboard the Earth ObservingSystem (EOS) Aura satellite observes the millimeter andsub‐millimeter thermal emissions from the limb of theEarth’s atmosphere. Detailed information about the mea-surement technique, the spectral bands observed and thetarget molecules can be found in the work of Waters et al.[2006]. MLS measurements of the middle stratospherehave a ∼3–4 km (depending on the species) vertical reso-lution which becomes poorer (>6 km) in the upper strato-sphere/lower mesosphere. The precision varies typicallyranging from 0.03 ppm by volume (hereinafter ppmv) and25 parts per billion by volume (hereinafter ppbv) at 100 hPato 0.3 ppmv and 16 ppbv at ∼1 hPa for O3 and N2O
respectively [Froidevaux et al., 2008; Lambert et al., 2007].The measurements of H2O volume mixing ratio and tem-perature have a precision equal to 0.3 ppmv and 2.5 Krespectively on the 100–0.1 hPa vertical range [Lambertet al., 2007; Schwartz et al., 2008]. The publicly avail-able version 2.2 MLS measurements were used in thisstudy. The data were filtered to select only measurementswith values of status even, quality >1.0, convergence <1.5,and positive precision. These flags are provided in the “EOSMLS Level 2 data quality and description document”available for V2.2 [Livesey et al., 2007].[7] The MLS temperature measurements were used to
provide interpolated data profiles on isentropic surfaces byfitting a spline function to the measurements. Along‐trackmeasurements on isentropic surface were then linearlyinterpolated onto a regular grid with an elementary square of3°/3° resolution in longitude/latitude.
2.2. MIMOSA
[8] In order to perform MIMOSA simulations, we usedthe ERA‐Interim reanalysis [Dee et al., 2011] from theECMWF model. ERA‐Interim is the latest ECMWFreanalysis which is based on version Cy31r2 of the modelwith a spectral truncation of T255L corresponding to aresolution of 0.7° in latitude and longitude. ERA‐Interimfields are provided over the whole period from 1989 to thepresent onto 37 pressure levels from 1000 hPa to 1 hPa or60 model levels from 1000 hPa to 0.1 hPa. For this study,we used the ERA‐Interim 37 pressure level outputs with avertical resolution of 3 km approximately in the strato-sphere. More details on ERA‐Interim reanalysis are avail-able in the paper of Dee et al. [2011].[9] Potential vorticity (PV) maps have been calculated
using the MIMOSA contour advection model [Hauchecorneet al., 2002]. This model performs high resolution advectioncalculations based on the ECMWF analyzed wind, pressureand temperature fields to provide PV fields on isentropicsurfaces. MIMOSA initially computes the PV field using theERA‐ Interim analysis at a resolution of 1.125° in latitudeand longitude (T106) which is vertically interpolated on anisentropic surface. This field is then interpolated on theoriginal x‐y grid centered on the North Pole with a hori-zontal resolution of 37 × 37 km (three grid points/degree)and advected with a time step of one hour.[10] To preserve the homogeneity of the field, a regrid-
ding of the PV field on the original grid is made every 6 h.The information on diabatic changes in the PV field at largescales can be extracted from the ERA‐Interim fields. In theMIMOSA model this is done by applying to the advectedfield a relaxation toward the ERA‐Interim PV field calcu-lations every ten days. This technique allows MIMOSA torun continuously over periods of several months in order tofollow the evolution of dynamical barriers and fine scalestructures such as vortex remnants and tropical intrusions[Orsolini, 2001; Marchand et al., 2003; Huret et al., 2006].[11] A series of ten runs has been performed with the
MIMOSA model at the 850 K (∼31 km, ∼10 hPa) isentropicsurface for the whole period 2000–2009. A long‐time run ofeight months starting the 1st January has been performed forevery year. The results obtained in this way have been usedto investigate in detail the dynamical conditions associatedwith FrIAC and tropical intrusion events occurring in winter
THIÉBLEMONT ET AL.: FRIAC OCCURRENCES IN ARCTIC STRATOSPHERE D20110D20110
2 of 16

and spring. In addition, zonal wind, meridional wind andtemperature fields from the ERA‐Interim reanalysis havebeen used to establish a climatology of the NorthernHemisphere heat fluxes and zonal wind conditions over thelast decade. This climatology allowed us to improve theoverall understanding of dynamical conditions responsibleof FrIAC occurrences.
3. Recent FrIAC Episodes
[12] MIMOSA simulations and satellite measurementsfrom MLS over the years 2005 to 2009 have been used tostudy FrIAC events. During this period a new case has beenhighlighted during spring 2007.
3.1. The New FrIAC Event on 2007
[13] Figure 1 shows a polar projection of the H2O mixingratio from the MLS measurements during the first stage ofthis FrIAC event (27 April 2007, Figure 1a), when thetropical intrusion was under development, and at a later
stage when the tropical air mass was circling around thepolar region (the 24 May 2007, Figure 1b). At the latterstage, the FrIAC was a well defined dynamical structurerelatively isolated from the surrounding air. It was trapped inthe easterly circulation above 70°N north, and persisted untilthe beginning of July 2007. We have compared the 850Kisentropic surface H2O mixing ratio measurements from theMLS instrument to PV maps from the MIMOSA model.Comparisons of the H2O mixing ratio and the PV fields leadus to accept the MIMOSA model as a valid means ofrepresenting the evolution of this structure.[14] Table 1 summarizes the main characteristic of this
2007 event, as well as the 2005 event described by Manneyet al. [2006b] and the 2003 event [Lahoz et al., 2007]. Theduration of the 2003 event was roughly of one and a halfmonths whereas the 2007 event lasted more than 2 months,and the 2005 event more than four months. These FrIAClifetimes are based on tracer measurements. We report alsotypical values of potential vorticity on the 850K surface inthe core of the FrIAC and in the surrounding air while
Figure 1. (a, b) Isocontours of water vapor mixing ratio (ppmv) from the MLS instrument interpolated onthe 850K isentropic surface and (c, d) potential vorticity maps simulated by MIMOSA model. Figures 1aand 1c show 27 April 2007 during the intrusion leading to the FrIAC. Figures 1b and 1d show 24 May2007 when the FrIAC is trapped at high latitudes. In Figure 1 and in remaining figures, potential vorticityis plotted in pvu (10−6 km2 kg−1 s−1).
THIÉBLEMONT ET AL.: FRIAC OCCURRENCES IN ARCTIC STRATOSPHERE D20110D20110
3 of 16

FrIACs remained in the polar region. For the 2005 and 2007events the characteristic values of PV are quite similar forthe core of the FrIAC as well as for the surrounding airmasses. The 2003 event appears to have been the least intenseas its minimum in PV was the shallowest and its duration theshortest (Table 1). This relatively lower PV value suggests anintrusion originating from the border between the subtropicsand midlatitudes in the Northern Hemisphere which conse-quently persisted only for a few weeks.[15] A comparison of the 2005 and 2007 FrIAC trajec-
tories when they were located at latitudes higher than 60°Nis shown in Figure 2. Their location can be followed basedon the location of the maximum value of the N2O mixingratio in the core of the FrIAC at 10 hPa. The 2007 eventfrom 28 April to 30 June was located approximately at70°N, with four rotations occurring during two monthsbefore it disappeared. For the 2005 event the trajectory of theFrIAC core was more northward at approximately 70–80°N,with seven rotations around the pole occurring during fourand a half months. From the tropical intrusion (29 March2005) to mid‐April, the FrIAC was in its “spin‐up phase”[Allen et al., 2011] associated with the period before the shiftfrom winter westerlies to summer easterlies that occurredduring the final stratospheric warming (FSW). The FrIAC
was then advected by westerlies (until 13 April 2005) beforeit was trapped in the easterly regime. This phase did notoccur for the FrIAC event in 2007, which was directlyadvected by the summer easterlies after its intrusion.[16] To investigate the vertical structure of both FrIAC
events (2005 and 2007) we have selected the vertical profilesof N2O, H2O and O3 within FrIAC cores as they circlearound the globe. The criterion applied to select the pointswas based on the maximum value of the N2O mixing ratio ateach MLS level 100.0, 68.1, 46.4, 31.6, 21.5, 14.5, 10.0, 6.8and 4.6 hPa northward of 60°N. Then we could follow thevertical evolution of the different species in Figure 3 as afunction of time along the FrIAC tracks. The N2O 140 ppbvand 180 ppbv isocontours are marked by the black solidand dashed lines respectively. The vertical extent of bothepisodes in their initial stages is similar extending overthe [21.5–7] hPa pressure range in 2007 (Figures 3a, 3b,and 3c) and the [21.5–5] hPa pressure range in 2005(Figures 3d, 3e, and 3f). Although the FrIAC signaturesseem extended down to 21.5 hPa in the Figure 3, we havechosen this limit which corresponds to the lowest MLS levelwhere the FrIACs are detected. Below this limit, the selectedpoints depict the maximum of N2O northward of 60°Nwhich do not correspond to the FrIAC anomalies.[17] The vertical N2O profiles (Figures 3a and 3d) reveal a
similar behavior of both FrIACs with altitude. The verticalextent of the FrIACs appears to decrease with time whilekeeping their strongest signature at 10 hPa and 14 hPa in2007 and 2005 respectively depicted by the 180 N2O ppbvisocontours. In their recent paper, Allen et al. [2011] high-light two dynamical phases of the evolution of the 2005FrIAC following the “spin‐up phase.” During the “anticy-clonic phase,” the FrIAC is trapped in the developingsummer easterlies (April–May) and seems resistant to theweak vertical wind shear. In late May, the dynamical sig-nature of the anticyclone decays due to diabatic processesexposing the tracer anomaly to the horizontal and verticalwind shear during the “shearing phase.” This late phase ischaracterized by the vertical tilt of the FrIAC. The “shearing
Table 1. Main Characteristics of 2003, 2005 and 2007 FrIACEvents
2003 2005 2007
Intrusion April 15th March 27th April 27thEnd Late May Mid August Early JulyPV (pvu),Minimumin the FrIAC
150 54 80
PV (pvu),Surroundingthe FrIAC
350 370 350
References Lahoz et al.[2007]
Manney et al.[2006b]
This paper
Figure 2. Paths of the core of FrIACs in (left) 2007 and (right) 2005 at 10 hPa. The FrIAC core is wherethe maximum value of the N2O mixing ratio is located, based on EOS‐MLS observations. The color codecorresponds to the dates (format MM/DD) associated with the FrIAC locations. Black (red) square cor-responds to the start (finish) of the FrIAC trajectories, respectively.
THIÉBLEMONT ET AL.: FRIAC OCCURRENCES IN ARCTIC STRATOSPHERE D20110D20110
4 of 16

phase,” corresponding to the period after the vertical solidline (Figures 3a and 3d), appears in the N2O isocontours as aprogressive decrease in the vertical extent from 21.5 hPa inlate May to 10 hPa (2007) and 14 hPa (2005). In 2007, thetropical intrusion leading to the FrIAC occurred one month
later than in 2005. As a consequence, the “anticyclonicphase,” corresponding to the period before the vertical solidline (Figure 3a), was shorter ending in late May as it did in2005 (Figure 3d). The close timing of transition between the“anticyclonic phase” and the “shearing phase” support the
Figure 3. Time evolution of vertical profiles of N2O, H2O and O3 volume mixing ratios inside theFrIAC cores in (a, b, c) 2007 and (d, e, f) 2005 obtained from the AURA‐MLS instrument. The dailyvertical profiles were selected using the criterion of maximum mixing ratio of N2O northward of 60 Nfor each MLS pressure level in the range [100–5] hPa. The black and dashed isocontours displayed oneach figure correspond to 180 ppbv and 140 ppbv N2O respectively. The vertical black solid line corre-sponds to the transition between the “anticyclonic phase” and the “shearing phase,” in 2007 and 2005.The horizontal black solid line depicts the lowest MLS level where the FrIACs have been detected(21.5 hPa). White areas indicate a lack of data.
THIÉBLEMONT ET AL.: FRIAC OCCURRENCES IN ARCTIC STRATOSPHERE D20110D20110
5 of 16

dynamical arguments put forward by Allen et al. [2011]about the timescales of radiative damping.[18] However, the duration of the “shearing phase” is very
different between the two cases. Examination of the per-sistence of the N2O and H2O anomalies reveals that the“shearing phase” lasted one and an half months longer in2005 than in 2007. Several additional investigations wouldbe needed to improve our understanding of such variability.In particular, it would be interesting to investigate in moredetail the link between the tilt of the FrIAC caused by thewind shear and the associated mixing processes.[19] Both the 140 ppbv and 180 ppbv N2O isocontours
have been overlaid on the H2O and O3 time evolution inthe core of the FrIACs. The tropical low H2O mixing ratioof 5 ppmv corresponds approximately to the 140 ppbvN2O FrIAC signal (dashed isocontour). Note that for the2005 case the H2O 5 ppmv signal persisted until the end ofAugust. The 4.2–4.4 ppmv H2O mixing ratio signal cor-responds to the 180 ppbv N2O signal (black isocontour).[20] Regarding O3, the tropical high values observed of
greater than 7 ppmv at the beginning of the FrIAC eventsdisappear very quickly (in a few days) compared to N2O andH2O tracer signals. This high ozone mixing ratio signalin the FrIAC cases (Figures 3c and 3f) also appear inapproximately the same range of pressure [21.5–7] hPa asfor the passive tracers. Immediately after the FrIAC intru-sions, the decrease in ozone mixing ratio is faster in theuppermost levels, near 10 hPa, than in the lowest oneswhere the ozone signal decreases slowly, near 20 hPa. Thismean that the FrIAC ozone signal durations depend moreon the gaseous chemistry and the photochemistry than onmixing processes seen mainly on FrIAC tracers signalsduring the “shearing phase” in late‐May. Further modelinginvestigations would be necessary to improve our under-standing of specific chemistry inside the core of the FrIACs.
3.2. Dynamical Conditions During FrIAC RecentEpisodes (2003, 2005, 2007)
[21] Zonal wind Hovmöller diagrams interpolated on the850K isentropic surface (Figure 4) show the dynamicalevolution of the stratosphere at midlatitudes (49.5°N) fromJanuary to the end of July. The dashed black lines corre-
spond to the FrIAC intrusion dates. During the three per-iods of interest, the midlatitudes were dominated by theridge/trough pair Aleutian High/Polar Vortex (zonal wavenumber 1) respectively seen by the alternation between theeasterly circulation of the Aleutian High (hereafter AH) inthe [100°E–280°E] sector and the westerly circulation ofthe polar vortex in the [280°E–100°E] sector. The persis-tence of the AH and the polar vortex suggests that thewave activity was maintained during the whole January/May period, alternating in time between strong and weakamplitudes. During 2003 and 2005, the signature of theAH/Polar Vortex in the zonal wind fields was still presentwhen the FrIAC intrusions occurred before decreasing andturning to the weak summer easterly circulation. Thisfeature was weaker in 2007.[22] Analysis of zonal winds and potential vorticity maps
during the FrIAC intrusions reveal strong similarities as theFigure 5 suggests. MIMOSA PV isocontours and ERA‐Interim zonal winds are shown at the 850 K isentropicsurfaces when the tropical air mass reached the midlatitudeson the 13 April 2003 (Figures 5a and 5d), the 24 March2005 (Figures 5b and 5e) and the 25 April 2007 (Figures 5cand 5f). Tropical/vortex air mass signatures have, respec-tively, low/high PV values represented in blue/yellow. Atthe time of the intrusions, the polar vortex had already brokenup, following the onset of the final warming, and the asso-ciated remnants were spread over the Northern Hemisphere.The PVmaps show episodes of Rossby waves breaking in themidlatitude “surf zone” [McIntyre and Palmer, 1983, 1984]when the tropical intrusions occurred, depicted by theinversion of the latitudinal PV gradient [Baldwin and Holton,1988; Hitchman and Huesmann, 2007] located in the ranges[135°E–145°E, 40°N–60°N], [45°E–90°E, 25°N–60°N] and[135°E–170°E, 30°N–60°N] for the 2003 (Figure 5a), 2005(Figure 5b) and 2007 (Figure 5c) cases respectively.[23] In 2003 (Figure 5a), the vortex remnants with a PV
value higher than 400 pvu were located over Eurasia andNorth Atlantic. Relatively low PV values were locatedmainly southward of 30°N and an anomaly of low PV can beseen centered on [180°E, 55°N] corresponding to tropical airmasses trapped into the AH a few days earlier. The tropicalair intrusion started to develop above east Africa, just
Figure 4. Hovmöller diagrams (longitude VS time) of zonal wind fields at 49.5°N from ERA‐Interimreanalysis interpolated on the 850K isentropic surface for (a) 2003, (b) 2005 and (c) 2007. The color coderanges from dark blue (strong easterlies) to dark red (strong westerlies). The black dashed line corre-sponds to the FrIAC intrusion date.
THIÉBLEMONT ET AL.: FRIAC OCCURRENCES IN ARCTIC STRATOSPHERE D20110D20110
6 of 16

southward of the main vortex remnant, and on April 13th isseen to have been advected to the North Pole between thepolar vortex and the AH near 120°E at midlatitudes.[24] The tropical intrusion in 2007 (Figure 5c) was similar
to the 2003 event following the same trajectory and occur-ring approximately at the same time period. However, it canbe seen that the vortex remnants were thinner and the resi-dues of tropical air masses trapped into the AH did notappear. As occurred in the 2003 case, a stretched vortexremnant was located just Northward of the tropical intrusion[135°E, 40°N].[25] In 2005, an early and strong final stratospheric
warming [Manney et al., 2006a] occurred in mid‐March (seesection 4.1). This warming was characterized by the dis-
placement of the polar vortex toward midlatitudes, and wasfollowed by a deep tropical intrusion trapped at polar lati-tudes and the break up of the polar vortex. The anticyclonecorresponding to the intrusion is located at 135°E and 65°Nin the PV map of the 24 March (Figure 5b). At the sametime, two deep tropical intrusions developed at midlatitudessouthward of the main vortex remnants. The intrusionstarting above Africa merged with the anticyclone alreadypresent leading to the FrIAC development. The other trop-ical intrusion, above the Atlantic Ocean, remained confinedat midlatitudes before dispersing a few days later.[26] Comparison with the Hovmöller diagrams of zonal
winds at 49.5°N (Figure 4) shows that the zero zonal windlines oscillating around 100°E correspond roughly to the
Figure 5. (a, b, c) Northern Hemisphere maps of PV isocontours calculated using the MIMOSA modeland (d, e, f) zonal winds from the ERA‐interim reanalysis during the FrIAC intrusions on the 850 K isen-tropic surface in (top) 2003, (middle) 2005 and (bottom) 2007.
THIÉBLEMONT ET AL.: FRIAC OCCURRENCES IN ARCTIC STRATOSPHERE D20110D20110
7 of 16
tropical intrusion locations seen in PV maps at midlatitudes(Figure 5). This region has been previously identified byHarvey and Hitchman [1996] as the preferred location forexchanges from the subtropics to the extratropics at the westedge of the AH. The PV maps also reveal that the southwarddisplacement of the vortex remnants at midlatitudes seemsto be a necessary condition leading to the growth of thetropical intrusion located just southward.[27] The zonal circulation can be divided into three sep-
arated regions (Figures 5d, 5e, and 5f). The inter‐tropicalzone which, in each case, was driven by the easterly phaseof the quasi‐biennial oscillation from 0° to 30°N; the mid-latitude “belt” from 30°N to 55°N dominated by a westerlyflow that has been previously reported by Waugh [1996] asa necessary condition for intrusion toward the pole; and thepolar region which started to reverse toward the easterlysummer regime. The meridional gradient of zonal windbetween tropical and midlatitudes was strong, suggesting aregion of intense horizontal shearing. In the region wherethe vortex remnants were mainly located, a strong cycloniccell appeared a few days before the tropical intrusion.During the growth of the intrusion southward of the rem-nants, an anticyclonic cell developed, with the zero zonalwind line centered on the trajectory of the tropical intrusion.Comparing this cell between the 2003, 2005 and 2007
events shows that the intensity of the tropical intrusionseems to depend on the horizontal zonal wind shear. Thestronger the anticyclonic cell, and the more intense theshearing, the more likely is tropical air to be transportedpoleward from low latitudes.[28] After having characterized the dynamical conditions
during several observed FrIAC events, we investigate inmore details the entire last decade to understand why suchevents do or do not develop.
4. Climatological Occurrences of FrIACs:The Role of Stratospheric Warmings and theQuasi‐Biennial Oscillation
4.1. Link With Major Sudden Stratospheric Warmings
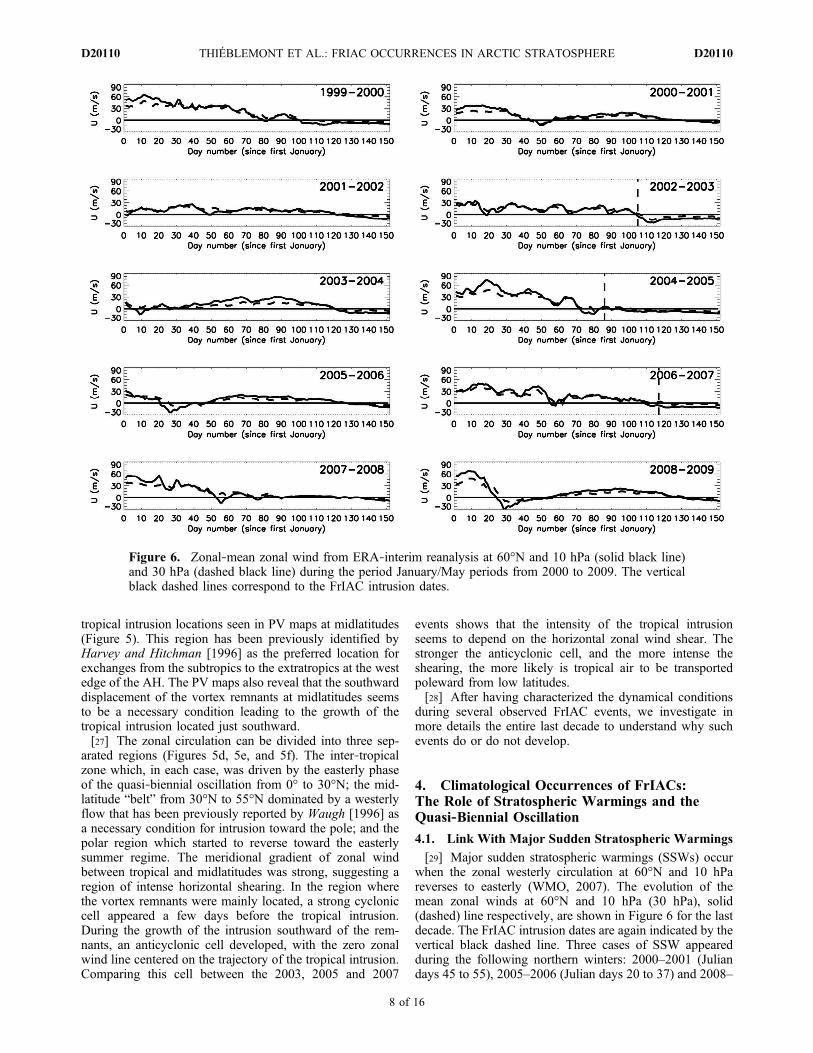
[29] Major sudden stratospheric warmings (SSWs) occurwhen the zonal westerly circulation at 60°N and 10 hPareverses to easterly (WMO, 2007). The evolution of themean zonal winds at 60°N and 10 hPa (30 hPa), solid(dashed) line respectively, are shown in Figure 6 for the lastdecade. The FrIAC intrusion dates are again indicated by thevertical black dashed line. Three cases of SSW appearedduring the following northern winters: 2000–2001 (Juliandays 45 to 55), 2005–2006 (Julian days 20 to 37) and 2008–
Figure 6. Zonal‐mean zonal wind from ERA‐interim reanalysis at 60°N and 10 hPa (solid black line)and 30 hPa (dashed black line) during the period January/May periods from 2000 to 2009. The verticalblack dashed lines correspond to the FrIAC intrusion dates.
THIÉBLEMONT ET AL.: FRIAC OCCURRENCES IN ARCTIC STRATOSPHERE D20110D20110
8 of 16
2009 (Julian days 23 to 50). They are also characterized bythe temporary reversal of the zonal circulation from west-erlies to easterlies at 30 hPa, underlying the strong intensityof the SSW. They were then followed by the recovery of aweak undisturbed polar vortex. During the 2001–2002 and2003–2004 winters, an early SSW occurs before the Julianday 0 and at the Julian days 4 to 14 respectively. The 2007–2008 winter shows a strong westerly circulation weakenedby a late SSW (Julian days 52 to 60), which prevented therecovery of the vortex. The winters described previously(2000–2001, 2001–2002, 2003–2004, 2005–2006, 2007–2008 and 2008–2009) are characterized by a slow transitionto summer easterlies during a late final warming whichoccurred in early May (after Julian day 120).[30] On the other hand, the 1999–2000, 2002–2003,
2004–2005 and 2006–2007 winters show common features,with a strong and disturbed polar vortex which decreasedprogressively until an abrupt and early final warmingoccurred in mid‐April (Julian day 105). In 2003, the firstSSW occurred about day 18 characterized by the displace-ment of the polar vortex along the Greenwich meridianthrough midlatitudes. The polar vortex was then subject tostrong oscillations between the mid and polar latitudes due
to the propagation of planetary waves (seen on MIMOSAoutputs but not shown here). This is suggested by theintense fluctuations of the zonal mean zonal winds thatoccurred at 10 hPa and 60°N (Figure 6). However, the polarwesterlies were maintained until the final warming when theFrIAC was pulled to polar latitudes. In 2005, a strongstratospheric warming occurred during the late winter/earlyspring, allowing the FrIAC intrusion. This strong SSW canbe considered as a kind of precursor to the final warmingwhich took place ten days later.[31] In 2007, the polar night jet was weakened by a short
SSW (Julian days 55 to 58) characterized by the displace-ment of the polar vortex over Northern Europe. In this case,the MIMOSA PV maps show that the vortex was notdestroyed, allowing it to maintain high PV values as was thecase in 2003.[32] The propagation of planetary waves is investigated
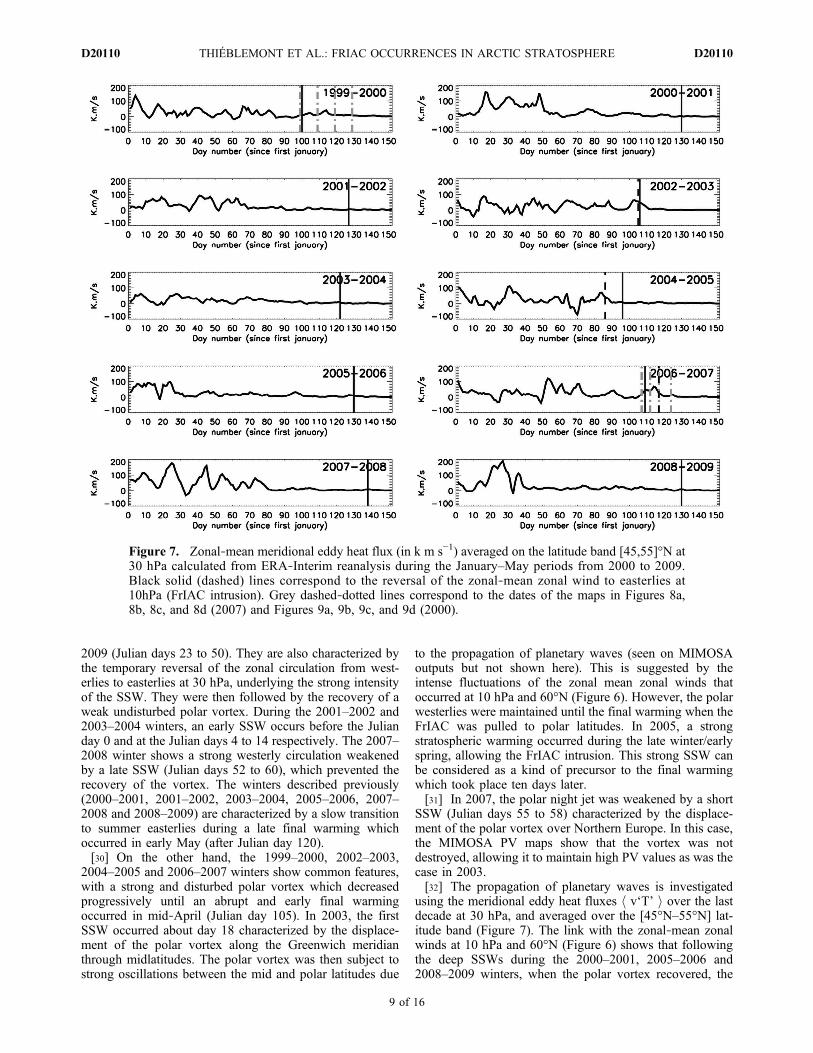
using the meridional eddy heat fluxes h v‘T’ i over the lastdecade at 30 hPa, and averaged over the [45°N–55°N] lat-itude band (Figure 7). The link with the zonal‐mean zonalwinds at 10 hPa and 60°N (Figure 6) shows that followingthe deep SSWs during the 2000–2001, 2005–2006 and2008–2009 winters, when the polar vortex recovered, the
Figure 7. Zonal‐mean meridional eddy heat flux (in k m s−1) averaged on the latitude band [45,55]°N at30 hPa calculated from ERA‐Interim reanalysis during the January–May periods from 2000 to 2009.Black solid (dashed) lines correspond to the reversal of the zonal‐mean zonal wind to easterlies at10hPa (FrIAC intrusion). Grey dashed‐dotted lines correspond to the dates of the maps in Figures 8a,8b, 8c, and 8d (2007) and Figures 9a, 9b, 9c, and 9d (2000).
THIÉBLEMONT ET AL.: FRIAC OCCURRENCES IN ARCTIC STRATOSPHERE D20110D20110
9 of 16

upward propagation of Rossby waves was inhibited afterthe Julian days 50, 30 and 40 respectively (Figure 7).[33] Figure 6 shows that the 2001–2002, 2003–2004 and
2007–2008 winters are characterized by a weak and undis-turbed polar night jet following the SSWs which occuraround the Julian days 0, 10 and 55 respectively. In theseyears, first the decrease then the suppression of the upwardheat flux occurs approximately 50 days before the finalwarming. Very weak heat fluxes during the final warmingprevent the intrusion of tropical air masses.[34] The years that include FrIACs events exhibit similar
behavior in the heat flux. The planetary wave propagation ismaintained during the entire period from January to the finalwarming, when a peak in heat flux is seen. These results arein good agreement with those depicted by the zonal wind’sHovmöller diagrams (Figure 4). The FrIAC intrusionoccurs, in each case, soon after the last peak in the heat flux,suggesting sufficient wave activity to allow the tropical airmass to move toward the polar latitudes.[35] During the last decade, several cases of major SSWs
have been reported: in February 2001 [Jacobi et al., 2003],January 2004 [Manney et al., 2005; Liu et al., 2009], January2006 [Manney et al., 2009], February 2008 [Coy et al., 2009]and January 2009 [Manney et al., 2009]. In particular, thelast three cases have been studied by Orsolini et al. [2010]using the GOES‐5 analysis. These latter shown that theshifting of the zonal wind phase to easterly during the SSWpropagates downward and then removes the critical line,where the zonal mean zonal winds is equal to zero, in the
lower stratospheric layers. This leads to the inhibition of theupward propagation of planetary waves [Tomikawa, 2010]which play a crucial role on the mechanisms that operateduring FrIAC events. The three cases of FrIACs recordedduring the last decade show similar winter dynamical con-ditions, viz. absence of a major SSW and preservation ofplanetary wave activity until the FSW. In spite of thesepropitious conditions during the 1999–2000 winter, a FrIACintrusion did not occur. We now propose to investigate indetail for 2006–2007 the necessary conditions for a FrIACevent to occur and to compare them to the conditions in1999–2000 around the period of the FSW.
4.2. Comparison of 2007 and 2000 Conditions
[36] Four stages of the final warming between the 17April and 4 May 2007 identified using 850K PV maps areshown Figure 8 with the associated ERA‐Interim zonalmean eddy heat fluxes at 30 hPa in the [45°N–55°N] latituderange in 2006–2007 (Figure 7). The gray vertical dashed‐dotted lines in Figure 7 correspond to the dates of the fourstages (Figure 8) and the vertical solid line depicts the dateof the final warming as before.[37] On the 17 April 2007 (Figure 8a), the polar vortex (in
green/yellow) started to be irreversibly distorted into thinfilaments spreading at midlatitudes over North America andNorth East Asia. At this stage, the heat flux in 2006–2007(Julian day 107, Figure 7) started to increase sharply leadingto the weakening of the polar vortex.
Figure 8. PV maps calculated using the MIMOSA model on the 850 K isentropic surface for spring2007. Four dates are shown: (a) April 17th, (b) April 22nd, (c) April 27th and (d) May 4th 2007.
THIÉBLEMONT ET AL.: FRIAC OCCURRENCES IN ARCTIC STRATOSPHERE D20110D20110
10 of 16

[38] By the 22 April 2007 (Figure 8b), the polar vortex hadbeen displaced toward midlatitudes, and it then broke up intohigh PV remnants due to the strong planetary wave activity.The associated heat flux (Julian day 112, Figure 7) increasedto 40 k m s−1. A high PV remnant which included a strongcyclonic cell (not shown) was located above Mongolia.Midlatitude planetary‐wave breaking began in the weakzonal wind region (southward of the “westerly belt”),depicted by the meridional PV gradient inversion locatedaround [30°N; 135°E] (Figure 8b). It allowed the advection ofa tropical air mass (low PV) southward of the vortex remnantsto form the dipolar PV cell centered around [120°E, 40°N].[39] On the 27 April 2007 (Figure 8c), the tropical
intrusion quickly advected to polar latitudes in a thin fila-ment along with the northward vortex remnants over thepole. At this date, the heat flux sharply decreased charac-terizing the end of the winter planetary wave episode. Twodays earlier, the heat flux in 2006–2007 (Figure 7) reachedits maximum higher than 60 k m s−1, which correlated withthe onset of the tropical intrusion (Figure 5c) toward polarlatitudes by the 25 April 2007.[40] By the 4May 2007 (Figure 8d), the FrIACwas located
at polar latitudes and advected with the summer easterlies; thehigh PV vortex remnants had dissipated and the heat fluxincreased a final time before falling to 0 km s−1, thus showingthat planetary waves could not propagate further in thesummer easterlies.[41] In order to improve our understanding of the
mechanisms behind the FrIAC formation, northern spring
2000 has been investigated in the same way (Figures 9 and 7).On the 8 April, 2000 (Figure 9a), the polar vortex was locatedover Northern Europe and started to be weakened by erosioninto thin filaments advected at midlatitudes. These PV con-tours are similar to the first map (Figure 8a) of the 2006–2007event. At the same time, the heat flux started to increase.Before the 18 April 2000 (Figure 9b) the vortex had beendisplaced to midlatitudes corresponding to the first peak inthe heat flux at the Julian day 105 (1999–2000, Figure 7) andwas then distorted into a major remnant located over Europeand West Asia.[42] Five days later, when the maximum in heat flux was
reached (1999–2000, Figure 7), the remnant was separatedinto two lobes and a wave breaking event started (notshown). Then a lobe is advected over North America, whilethe other remained over the Himalayan Chain (Figure 9c)while a precursor of tropical intrusion developed southwardforming the dipolar PV cell.[43] On the 28 April 2000, following the wave breaking
event, the heat flux (1999–2000, Figure 7), has decreasedsharply. By the 8th of May, 2000 (Figure 9d), the stationarydipolar cell had considerably weakened, as seen in thedecrease of the remnant area and the PV value as well as theintensity of the tropical air mass vorticity.[44] The detailed comparison between these two cases
enables us to establish the dynamical conditions and thechronology needed for the FrIAC intrusions. The planetarywaves drive the tropical intrusion mechanisms as we haveshown previously. If the wave activity still persists until the
Figure 9. PV maps calculated using the MIMOSA model on 850 K isentropic surface for spring 2000.Four dates are shown: (a) April 8th, (b) April 18th, (c) April 28th and (d) May 8th 2000.
THIÉBLEMONT ET AL.: FRIAC OCCURRENCES IN ARCTIC STRATOSPHERE D20110D20110
11 of 16

final warming, then the FrIAC events can be initiated. Thepolar vortex, which starts to weaken, is displaced towardmidlatitudes driven by the wave propagation. At this stage,the vortex breaks up into remnants of high PV values andleads to a strong horizontal shearing between the remnantwesterlies and the tropical zonal flow. This favors the for-mation of a dipolar PV cell arising from the association ofvortex remnants (poleward) trapped in a cyclonic circulationand a tropical air mass (equatorward) trapped in an anticy-clonic circulation. Wave breaking events then occur in thevicinity of the anticyclone to homogenize the PV gradient.Such episodes inhibit the upward propagation of planetarywaves as diagnosed in the heat flux fields. Subsequently, ifthe wave breaking is sufficiently strong, the tropical air massis pulled poleward during the wave breaking episode asoccurred for the 2006–2007 case, or else the dipolar cellpersists a few days before finally weakening as occurred inthe 1999–2000 case. Moreover, the zonal mean zonal windand associated heat flux in 2000 (Figures 6 and 7) allow usto identify a short SSW around the Julian day 80 which isfollowed by the decrease of the heat flux before the onset ofthe FSW. This suggests that the late SSW during the spring1999–2000 could be partly responsible for the weak waveactivity preventing any tropical intrusion.
4.3. Is There a Link Between FrIACs and the Quasi‐Biennial Oscillation Phase?
[45] The QBO plays a major role in the dynamical evolu-tion of the middle stratosphere [Baldwin et al., 2001]. Severalstudies have been undertaken to establish a link between thephase of the QBO and its influence on the Northern polarstratosphere. Based on a statistical study of the 1962–1977
period,Holton and Tan [1980, 1982] pointed out the fact thatthe easterly phase of the QBO could facilitate the occurrenceof a major SSW. They showed that during the easterly phaseof the QBO, the stratospheric polar vortex is weaker, warmer,and more disturbed. They suggested that the QBO phase inthe tropics modulates the effectiveness of the waveguide forthe midlatitude planetary waves that propagate through thewinter stratosphere. The Holton and Tan relationship (HThereafter) has been since re‐examined by several observa-tional and modeling statistical studies that included externalfactors such as the solar activity or the influence of the upperstratosphere [Naito and Hirota, 1997; Gray et al., 2004; Luet al., 2008; Naoe and Shibata, 2010]. It seems to be nowgenerally assumed that the HT relationship between thetemperature of the polar vortex and the QBO phase is veri-fied. However, diagnostic analysis of the Eliassen‐Palm fluxdoes not show more poleward propagation in the midlatitudestratosphere as the HT mechanism suggests.[46] The mean zonal wind at 10 hPa of the last decade from
the equator to the North Pole is represented in Figure 10. Thelatitude band between 0°N and 25°N is driven by the QBOwhich is, at 10 hPa, in the westerly phase during the 2001–2002, 2003–2004, 2005–2006 and 2007–2008 winters and inthe easterly phase during 1999–2000, 2002–2003, 2004–2005, 2006–2007 and 2008–2009 winters. For the 2000–2001 winter, the phase of the QBO at 10 hPa is not clearlydefined.[47] Northward of 25°N, the behavior of the zonally
averaged zonal wind depicts the alternation between theeastward dynamical regime of the winter (polar vortex)stratosphere and the summer (anticyclone) stratosphereassociated with easterlies. The major SSWs of 2000–2001,
Figure 10. Zonal mean of the zonal wind from ERA‐Interim reanalysis at 10 hPa as a function of timefrom January 2000 to January 2010 over the 0°N–90°N latitude range. Red color corresponds to westerlycirculation and blue color to easterly circulation. The vertical black dashed line corresponds to the FrIACintrusion dates.
THIÉBLEMONT ET AL.: FRIAC OCCURRENCES IN ARCTIC STRATOSPHERE D20110D20110
12 of 16

2003–2004, 2005–2006 and 2008–2009 winters are char-acterized by a robust reversal of the zonal circulationnorthward of 60N for several weeks. Figure 10 shows thatthree of the four observed major SSWs occur under thewesterly phase (2003–2004; 2005–2006) or during thetransition phase (2001–2002) of the QBO which is not ingood agreement with the HT statistical relationship butsimilar to the results of Lu et al. [2008], although we con-sider here only 10 years of data.[48] The intrusions associated with FrIACs (vertical
dashed line in Figure 10) in 2003, 2005 and 2007 occurredwhen the QBO was easterly in the [50–3] hPa, [40–1.5] hPaand [40–3] hPa ranges respectively, and, as seen previously,no deep SSW occurred during winter. The 1981–1982 and1993–1994 FrIAC cases pointed out by Manney et al.[2006b] were accompanied by an easterly circulation atthe tropics in the [100–5] hPa and [50–2] hPa rangesrespectively. Hence, the five winters corresponding toknown FrIAC events are characterized by an easterly QBOphase around 10 hPa.[49] In addition, we have considered the occurrences of
tropical intrusions during the last decade under both theeasterly phase of the QBO (QBO‐E) and thewesterly phase ofthe QBO (QBO‐W), and for the January/February (Figure 11)and March/April (Figure 12) periods. Using MIMOSA PVcalculations, we have considered the frequency of occurrence(in percent) defined by PV values lower than the daily zonalmean PV at 30°N computed with MIMOSA results. The2000–2001 winter was not taken into account because theQBO phase was undefined (Figure 10).
[50] The frequency of intrusions during the January/February period (Figure 11) shows that most tropical intru-sions occur at the location of the AH anticyclone for both,QBO‐W (top) and QBO‐E (bottom) with a frequency higherthan 20%. The minimum of tropical intrusion frequenciescorresponds to the statistical main location of the polar vortex[Harvey et al., 2002]. A secondary maximum correspondingto zonal wave number 2 was recorded over the Atlantic Oceanand corresponds to the region where intrusions occur underQBO‐E conditions rather than QBO‐W conditions. Themaximum frequency of tropical intrusions reaches highervalues (30%) for the QBO‐E case than for the QBO‐W case(20%). This suggests that the AH is extended more polewardand the vortex more equatorward along the prime meridian(top) under the QBO‐W. Figure 11 suggests that during theJanuary/February months over the last decade and under aneasterly QBO, the number of tropical intrusions is higher thanunder a westerly QBO, underlining the intensification of theAH. Looking at the QBO‐E conditions, two maxima appearabove the East/North Asia and the West Europe. This cor-relation with the AH is mainly due to the trapping of thetropical air masses by the anticyclonic circulation which is themechanism responsible for the formation of low ozonepockets during winter [Harvey et al., 2008]. For a very deeptropical intrusion, the PV value is low and consequently, thetropical air mass maintains its PV signature several days intothe AH. The tropical air masses trapped into the AH comefrom South West Asia where the second maximum appears.However, in this region, tropical air masses can either bequickly advected to high latitudes or, on the contrary, remainconfined to low latitudes.[51] The March/April period, corresponding to the Winter/
Summer transition, is shown in Figure 12. The frequency oftropical intrusions globally is lower than for the January/
Figure 11. Frequency of occurrence (in percent) of airmass with PV lower than the zonal‐mean PV at 30°N and850 K during January/February for the QBO westerly phase(years 2002, 2004, 2006, 2008) on the top and the QBOeasterly phase (years 2000, 2003, 2005, 2007, 2009) on bot-tom. Dark contours are for frequencies higher than 16%.
Figure 12. As for Figure 11 but for the March–Aprilperiod. The shaded contours are higher than 4%.
THIÉBLEMONT ET AL.: FRIAC OCCURRENCES IN ARCTIC STRATOSPHERE D20110D20110
13 of 16
February period. At the statistical main location of the AH,maximum value is not much higher than 8%. The frequenciesare also higher for QBO‐E conditions than for QBO‐W. Near40°N, the highest frequencies (greater than 4%) are distrib-uted in the [135°W–180°E] ([45°W–180°E]) longitude rangefor the QBO‐W (QBO‐E) cases respectively. The maximumfrequency location at 40°N previously identified (Figure 11)appears in the same longitudinal range for both QBO‐Wand QBO‐E. This region which includes frequency valueshigher than 16% where the dipolar cells have beendetected (Figures 8 and 9), is similarly located around120°E for QBO‐W and 80°E for QBO‐E conditions. TheQBO‐E high frequency region shows that the tropicalintrusions are more easily advected poleward than underQBO‐W conditions.[52] However, during the last decade, among the 4 major
SSWs, 3 of them in 2003–2004, 2005–2006 and 2007–2008occurred under QBO‐W conditions. This fact should beconsidered when analyzing the diagrams of tropical intru-sion frequency (Figures 11 and 12). The difference seen inthe frequency values between the QBO‐W (lower) andQBO‐E (higher) could partly be attributed to the occurrenceof SSWs which lead to the inhibition of planetary wavepropagation necessary for tropical intrusions and FrIACsoccurrences as we have shown in the section 4.1. We dis-cuss now whether the phase of the QBO could be a sig-nificant factor in the occurrence of FrIACs events, inparticular considering the wave breaking events.[53] Peters and Waugh [1996] classified the poleward
Rossby wave breaking in the upper troposphere/lowerstratosphere into two types, following the classification ofthe equatorward Rossby wave breaking first introduced byThorncroft et al. [1993]. Type 1 (P1) in which the intrudedridges tilt upstream into a thin filament before beingadvected cyclonically in a cyclonic shear zone, and type 2(P2) in which the intruded air tilts downstream into a broadfilament before it wraps up anticyclonically, in an anticy-clonic shear zone. This classification has been established inorder to explain the exchanges between the upper tropicaltroposphere and the lower polar stratosphere (around the330‐K surface). As has been suggested by Knox and Harvey[2005], breaking events would be modulated by the back-ground zonal‐mean zonal shear induced by the QBO.[54] Following the argument of Peters and Waugh [1996]
but for the mid stratosphere, the results show that FrIACsevents would be favored by the easterly phase of the QBO,increasing the anticyclonic shear within the midlatitudeswesterly belt. Figures 8 and 9 show that FrIACs are initiallyassociated with a P2 breaking event characterized by a fil-ament of low PV advected poleward which wraps upanticyclonically. Furthermore, the wave breaking eventsduring FrIAC are located in an anticyclonic shear zone andnear a region of weak zonal wind (see Hövmoller diagrams,Figure 4) in good agreement with the above studies [Petersand Waugh, 1996; Knox and Harvey, 2005].
5. Summary and Conclusions
[55] Using MLS satellite measurements we have high-lighted a new case of FrIAC event in 2007 and compared itto the 2005 event [Manney et al., 2006b]. Mixing ratiovalues of N2O, H2O and O3 for the 2007 FrIAC are quite
similar to those of the 2005 event. However, the duration ofthe 2007 FrIAC, as diagnosed in long‐lived species, is muchshorter. The 2007 event arises from a tropical intrusionoccurring one month later than in the 2005 case and underthe summer polar easterlies. Therefore, the 2007 FrIAC isimmediately trapped into the summer circulation during the“anticyclonic phase” before tilting in altitude, in a similarfashion to the 2005 case, in late‐May. This phase named“shearing phase” is one and a half months shorter than in2005 [Allen et al., 2011]. Ozone mixing ratios in the core ofthe FrIACs rapidly decrease due to chemistry, ten days afterthe tropical intrusion. These results suggest that furthermodeling investigations and measurements are necessary toimprove our understanding of FrIAC events. In particular,i) the specific chemistry associated with ozone inside thecore of the FrIACs, ii) the causes for the different persistenceof the FrIAC tracer signatures in 2005 and 2007. Improve-ments on the chemistry could lead to a better understandingof the ozone depletion associated with FrIACs which couldinfluence the ozone budget in the same way that low ozonepockets do [Harvey et al., 2008].[56] FrIAC dynamical investigations have been performed
for the 2003 [Lahoz et al., 2007], 2005 [Manney et al.,2006b] and 2007 (this study) cases. Using MIMOSA PVcalculations and ERA‐Interim temperature and wind fieldsover the entire last decade, we described the stages leadingto their development. During an early FSW, planetary wavepropagation induces the displacement of the polar vortex atmidlatitudes. Wave breaking events then occur in thevicinity of a region of weak zonal wind southward of the“westerly belt” allowing the formation of the dipolar PVcell. Finally the tropical intrusion is quickly advected towardthe poles along the mean longitude Aleutian High/PolarVortex boundary. Then tropical air is trapped in the polarsummer easterlies polar circulation.[57] A climatology of meridional heat flux at 30 hPa in the
45°N–55°N latitude range from January to June and zonalmean zonal wind at 30 hPa and 10 hPa at 60°N enables theevolution of the dynamical conditions over the last decade tobe followed. Deep SSWs which occurred in 2000–2001,2003–2004, 2005–2006 and 2008–2009 are associated withzonal wind circulation reversal propagating down to 30 hPaand lead to the inhibition of the planetary wave upwardpropagation. The FrIAC years are associated with a persis-tent planetary wave activity until an early/abrupt FSWwithout a prior major SSW. Regarding SSWs and waveactivity, the 1999–2000 springtime conditions appear tofavor FrIAC development. However, the heat flux was halfthat during 2002–2003, 2004–2005 and 2006–2007 condi-tions so the wave activity was insufficient to allow theadvection of the tropical air mass in the polar region.[58] Finally, we have investigated the possible link
between FrIAC events and the phase of the QBO based ona climatology of tropical intrusions based on January/February and March/April periods. We obtained the highesttropical intrusion frequencies under QBO‐E. The threeFrIACs identified over the last decade and the two cases innorthern spring of 1982 and 1994 (not shown) reported byManney et al. [2006b] occurred also during an easterly QBOphase. Using the arguments of Peters and Waugh [1996]applied to the lower stratosphere; we surmised that zonalwind anticyclonic shears between the tropical easterly
THIÉBLEMONT ET AL.: FRIAC OCCURRENCES IN ARCTIC STRATOSPHERE D20110D20110
14 of 16

circulation and midlatitude “westerly belt” could favor“P2” type wave breaking events.[59] As a conclusion FrIAC events appear to be able to
develop in an early and abrupt FSW if no previous majorSSW (which inhibits the planetary wave upward propaga-tion) has occurred and if the QBO is in easterly phase whichintensifies the anticyclonic zonal wind shear between thetropics and midlatitudes. The impact of the QBO on thepolar stratosphere is currently not well understood, partic-ularly with regard to the associated dynamical processes.Additional studies are needed to improve our understandingof the dynamical mechanisms behind the QBO link.Extending the climatology to cover the period from 1960using ERA‐40 reanalysis from ECMWF outputs is planned,and additional chemical measurements and modeling studiesare needed to understand the chemistry within the core ofthe FrIAC and to evaluate the potential impact of suchevents on stratospheric chemistry.
[60] Acknowledgments. This study has been conducted within theframework of the STRAPOLETE project supported by the “Agence Natio-nale de la Recherche ANR (STRAPOLETE project ANR 08 BLAN 0300),the “Institut Polaire Paul Emile Victor” (IPEV) and the “Centre Nationald’Etudes Spatiales (CNES).” Y.O.R. was supported by the NorwegianResearch Council (Project Arctic Lis). We thank ETHER for access to data-base (Pôle thématique du CNES). We acknowledge the EOS‐MLS instru-ment science team for the satellite data and the European Centre forMedium‐Range Weather Forecasts for providing the ERA‐Interim data.We also thank Xavier Vallières for fruitful discussions and the refereesfor their thorough comments on the manuscript.
ReferencesAllen, D. R., A. R. Douglass, G. L. Manney, S. E. Strahan, J. C. Krosschell,J. V. Trueblood, J. E. Nielsen, S. Pawson, and Z. Zhu (2011), Modelingthe frozen‐in anticyclone in the 2005 Arctic summer stratosphere, Atmos.Chem. Phys., 11, 4557–4576, doi:10.5194/acp-11-4557-2011.
Baldwin, M. P., and J. R. Holton (1988), Climatology of the stratosphericpolar vortex and planetary wave breaking, J. Atmos. Sci., 45, 1123–1142,doi:10.1175/1520-0469(1988)045<1123:COTSPV>2.0.CO;2.
Baldwin, M. P., et al. (2001), The quasi‐biennial oscillation, Rev. Geophys.,39, 179–229, doi:10.1029/1999RG000073.
Coy, L., S. Eckermann, and K. Hoppel (2009), Planetary wave breakingand tropospheric forcing as seen in the stratospheric sudden warmingof 2006, J. Atmos. Sci., 66, 495–507, doi:10.1175/2008JAS2784.1.
Dee, D. P., et al. (2011), The ERA‐Interim reanalysis: Configuration andperformance of the data assimilation system, Q. J. R. Meteorol. Soc.,137, 553–597, doi:10.1002/qj.828.
Durry, G., and A. Hauchecorne (2005), Evidence for long‐lived polar vor-tex air in the mid‐latitude summer stratosphere from in situ laser diodeCH4 and H2O measurements, Atmos. Chem. Phys., 5, 1467–1472,doi:10.5194/acp-5-1467-2005.
Froidevaux, L., et al. (2008), Validation of Aura Microwave Limb Sounderstratospheric ozone measurements, J. Geophys. Res., 113, D15S20,doi:10.1029/2007JD008771.
Gray, L. J., S. Crooks, C. Pascoe, S. Sparrow, and M. Palmer (2004), Solarand QBO influences on the timing of stratospheric sudden warmings, J.Atmos. Sci., 61, 2777–2796, doi:10.1175/JAS-3297.1.
Harvey, V. L., and M. H. Hitchman (1996), A climatology of the AleutianHigh, J. Atmos. Sci., 53, 2088–2101, doi:10.1175/1520-0469(1996)053<2088:ACOTAH>2.0.CO;2.
Harvey, V. L., R. B. Pierce, T. D. Fairlie, and M. H. Hitchman (2002), Aclimatology of stratospheric polar vortices and anticyclones, J. Geophys.Res., 107(D20), 4442, doi:10.1029/2001JD001471.
Harvey, V. L., C. E. Randall, G. L. Manney, and C. S. Singleton (2008),Low‐ozone pockets observed by EOS‐MLS, J. Geophys. Res., 113,D17112, doi:10.1029/2007JD009181.
Hauchecorne, A., S. Godin, M. Marchand, B. Heese, and C. Souprayen(2002), Quantification of the transport of chemical constituents fromthe polar vortex to midlatitudes in the lower stratosphere using thehigh‐resolution advection model MIMOSA and effective diffusivity, J.Geophys. Res., 107(D20), 8289, doi:10.1029/2001JD000491.
Hitchman, M. H., and A. S. Huesmann (2007), A seasonal climatology ofRossby wave breaking in the 320–2000 K layer, J. Atmos. Sci., 64,1922–1940, doi:10.1175/JAS3927.1.
Holton, J. R., and H.‐C. Tan (1980), The influence of the equatorial quasi‐biennial oscillation on the global circulation at 50 mb, J. Atmos. Sci., 37,2200–2208, doi:10.1175/1520-0469(1980)037<2200:TIOTEQ>2.0.CO;2.
Holton, J. R., and H.‐C. Tan (1982), The quasi‐biennial oscillation in theNorthern Hemisphere lower stratosphere, J. Meteorol. Soc. Jpn., 60,140–148.
Hoor, P., H. Fischer, L. Lange, J. Lelieveld, and D. Brunner (2002), Sea-sonal variations of a mixing layer in the lowermost stratosphere as iden-tified by the CO‐O3 correlation from in situ measurements, J. Geophys.Res., 107(D5), 4044, doi:10.1029/2000JD000289.
Huret, N., M. Pirre, A. Hauchecorne, C. Robert, and V. Catoire (2006), Onthe vertical structure of the stratosphere at midlatitudes during the firststage of the polar vortex formation and in the polar region in the presenceof a large mesospheric descent, J. Geophys. Res., 111, D06111,doi:10.1029/2005JD006102.
Jacobi, C., D. Kürschner, H. G. Muller, D. Pancheva, N. J. Mitchell, and B.Naujokat (2003), Response of the mesopause region dynamics to theFebruary 2001 stratospheric warming, J. Atmos. Sol. Terr. Phys., 65,843–855, doi:10.1016/S1364-6826(03)00086-5.
Knox, J. A., and V. L. Harvey (2005), Global climatology of inertial insta-bility and Rossby wave breaking in the stratosphere, J. Geophys. Res.,110, D06108, doi:10.1029/2004JD005068.
Lahoz, W. A., A. J. Geer, and Y. J. Orsolini (2007), Northern Hemispherestratospheric summer from MIPAS observations, Q. J. R. Meteorol. Soc.,133, 197–211, doi:10.1002/qj.24.
Lambert, A., et al. (2007), Validation of the Aura Microwave LimbSounder middle atmosphere water vapour and nitrous oxide measure-ments, J. Geophys. Res., 112, D24S36, doi:10.1029/2007JD008724.
Liu, Y., C. X. Liu, H. P. Wang, X. X. Tie, S. T. Gao, D. Kinnison, and G.Brasseur (2009), Atmospheric tracers during the 2003–2004 stratosphericwarming event and impact of ozone intrusions in the troposphere, Atmos.Chem. Phys., 9, 2157–2170, doi:10.5194/acp-9-2157-2009.
Livesey, N. J., et al. (2007), Version 2.2 level 2 data quality and descriptiondocument, Tech. Rep. JPL D‐33509, Jet Propul. Lab., Pasadena, Calif.
Lu, H., M. P. Baldwin, L. J. Gray, and M. J. Jarvis (2008), Decadal‐scalechanges in the effect of the QBO on the northern stratospheric polar vor-tex, J. Geophys. Res., 113, D10114, doi:10.1029/2007JD009647.
Manney, G., L. Froidevaux, J. Waters, R. Zurek, J. Gille, J. Kumer, J.Mergenthaler, A. Roche, A. O’Neill, and R. Swinbank (1995), Formationof low‐ozone pockets in the middle stratospheric anticyclone during win-ter, J. Geophys. Res., 100(D7), 13,939–13,950, doi:10.1029/95JD00372.
Manney, G. L., K. Krüger, J. L. Sabutis, S. A. Sena, and S. Pawson (2005),The remarkable 2003–2004 winter and other recent warm winters in theArctic stratosphere since the late 1990s, J. Geophys. Res., 110, D04107,doi:10.1029/2004JD005367.
Manney, G. L., M. L. Santee, L. Froidevaux, K. Hoppel, N. J. Livesey,and J. W. Waters (2006a), EOS MLS observations of ozone loss in the2004–2005 Arctic winter, Geophys. Res. Lett., 33 , L04802,doi:10.1029/2005GL024494.
Manney, G. L., N. J. Livesey, C. J. Jimenez, H. C. Pumphrey, M. L. Santee,I. A. MacKenzie, and J. W. Waters (2006b), EOS Microwave LimbSounder observations of “frozen‐in” anticyclonic air in Arctic summer,Geophys. Res. Lett., 33, L06810, doi:10.1029/2005GL025418.
Manney, G. L., et al. (2009), Satellite observations and modeling of trans-port in the upper troposphere through the lower mesosphere during the2006 major stratospheric sudden warming, Atmos. Chem. Phys., 9,4775–4795, doi:10.5194/acp-9-4775-2009.
Marchand, M., S. Godin, A. Hauchecorne, F. Lefèvre, S. Bekki, and M.Chipperfield (2003), Influence of polar ozone loss on northern midlatituderegions estimated by a high‐resolution chemistry transport model duringwinter 1999/2000, J. Geophys. Res., 108(D5), 8326, doi:10.1029/2001JD000906.
McIntyre, M. E., and T. N. Palmer (1983), Breaking planetary‐waves in thestratosphere, Nature, 305, 593–600, doi:10.1038/305593a0.
McIntyre, M. E., and T. N. Palmer (1984), The surf zone in the stratosphere,J. Atmos. Terr. Phys., 46, 825–849, doi:10.1016/0021-9169(84)90063-1.
Naito, Y., and I. Hirota (1997), Interannual variability of the northern win-ter stratospheric circulation related to the QBO and the solar cycle, J.Meteorol. Soc. Jpn., 75, 925–937.
Naoe, H., and K. Shibata (2010), Equatorial quasi‐biennial oscillationinfluence on northern winter extratropical circulation, J. Geophys. Res.,115, D19102, doi:10.1029/2009JD012952.
Orsolini, Y. J. (2001), Long‐lived tracer patterns in the summer polarstratosphere, Geophys. Res. Lett., 28(20), 3855–3858, doi:10.1029/2001GL013103.
THIÉBLEMONT ET AL.: FRIAC OCCURRENCES IN ARCTIC STRATOSPHERE D20110D20110
15 of 16

Orsolini, Y. J., J. Urban, D. P. Murtagh, S. Lossow, and V. Limpasuvan(2010), Descent from the polar mesosphere and anomalously high strato-pause observed in 8 years of water vapor and temperature satellite obser-vations by the Odin Sub‐Millimeter Radiometer, J. Geophys. Res., 115,D12305, doi:10.1029/2009JD013501.
Peters, D., and D. W. Waugh (1996), Influence of barotropic shear onthe poleward advection of upper tropospheric air, J. Atmos. Sci., 53,3013–3031, doi:10.1175/1520-0469(1996)053<3013:IOBSOT>2.0.CO;2.
Ray, E., F. Moore, J. Elkins, G. Dutton, D. Fahey, H. Vömel, S. Oltmans,and K. Rosenlof (1999), Transport into the Northern Hemisphere lower-most stratosphere revealed by in situ tracer measurements, J. Geophys.Res., 104(D21), 26,565–26,580, doi:10.1029/1999JD900323.
Schwartz, M. J., et al. (2008), Validation of the Aura Microwave LimbSounder temperature and geopotential height measurements, J. Geophys.Res., 113, D15S11, doi:10.1029/2007JD008783.
Thorncroft, C. D., B. J. Hoskins, and M. E. McIntyre (1993), Two para-digms of baroclinic‐wave life‐cycle behaviour, Q. J. R. Meteorol. Soc.,109, 737–761.
Tomikawa, Y. (2010), Persistence of easterly wind during major strato-spheric sudden warmings, J. Clim., 23, 5258–5267, doi:10.1175/2010JCLI3507.1.
Waters, J. W., et al. (2006), The Earth Observing System Microwave LimbSounder (EOS MLS) on the Aura satellite, IEEE Trans. Geosci. RemoteSens., 44, 1075–1092, doi:10.1109/TGRS.2006.873771.
Waugh, D. W. (1996), Seasonal variation of isentropic transport out of thetropical stratosphere, J. Geophys. Res., 101(D2), 4007–4023,doi:10.1029/95JD03160.
M.‐A. Drouin, N. Huret, and R. Thiéblemont, Laboratoire de Physique etChimie de l’Environnement et de l’Espace/CNRS, Université d’Orléans,3A Ave. de la Recherche scientifique, Orléans F‐45071, France. (marc‐antoine.drouin@cnrs‐orleans.fr; nathalie.huret@cnrs‐orleans.fr; remi.thieblemont@cnrs‐orleans.fr)A. Hauchecorne, LATMOS, Quartier des Garennes, 11 Blvd. d’Alembert,
Guyancourt F‐78280, France. ([email protected])Y. J. Orsolini, NILU, PO Box 100, N‐2027 Kjeller, Norway. (yvan.
THIÉBLEMONT ET AL.: FRIAC OCCURRENCES IN ARCTIC STRATOSPHERE D20110D20110
16 of 16